Razer Blade 18 2024 评论:市场上首款配备迷你 LED 和雷电 5 的笔记本电脑
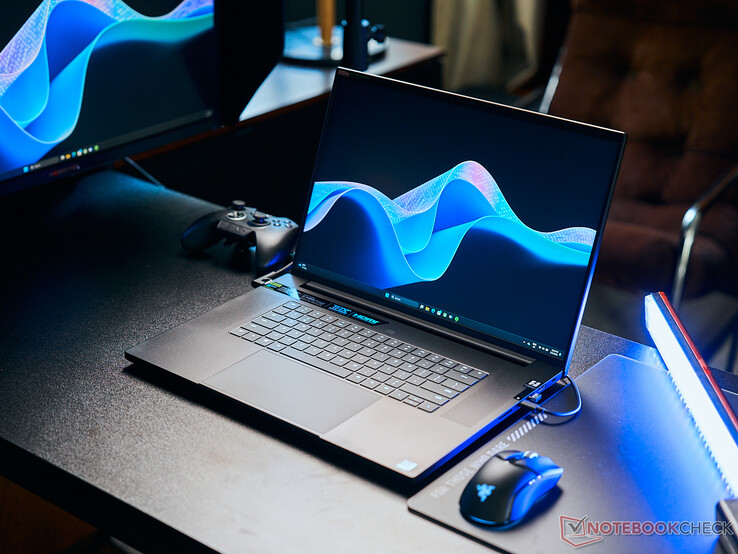
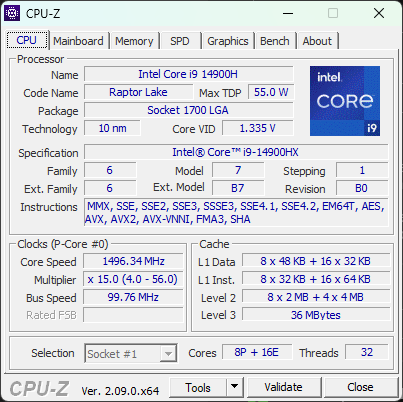
Razer Blade 18 于 2023 年首次亮相,其设计灵感主要来自老款 Blade 17。2024 年的最新改版采用了与前一年相同的机箱设计,但增加了更多高级功能,以吸引性能猎手和发烧友。这些新选项包括酷睿 i9-14900HX Raptor Lake CPU、雷电 5 连接和可选的 4K 16:10 200 Hz IPS 显示屏。尤其是后两者,它们将首先在 Razer 系统上亮相,然后才会出现在其他制造商的产品上。
我们评测的配置配备了 175 WGeForce RTX 4090 GPU、2 TB SSD 和 2560 x 1600 300 Hz Mini-LED 显示屏,售价约为 4500 美元。其他 SKU 则配备GeForce RTX 4070/4080 或前面提到的 4K 200 Hz IPS 显示屏,但目前所有配置均采用相同的酷睿 i9-14900HX CPU。另一种水银白仅适用于部分配置。
刀锋 18 的竞争对手不在少数,包括 微星 Titan 18, 华硕 ROG Strix Scar 18, 宏碁掠夺者 Helios 18或庞大的 Alienware m18 R2.
更多 Razer 评论:
潜在的竞争对手比较
Rating | Date | Model | Weight | Height | Size | Resolution | Price |
|---|---|---|---|---|---|---|---|
| 90.5 % v7 (old) | 05 / 2024 | Razer Blade 18 2024 RZ09-0509 i9-14900HX, GeForce RTX 4090 Laptop GPU | 3.1 kg | 21.9 mm | 18.00" | 2560x1600 | |
| 89.5 % v7 (old) | 03 / 2024 | Alienware m18 R2 i9-14900HX, GeForce RTX 4090 Laptop GPU | 4 kg | 26.7 mm | 18.00" | 2560x1600 | |
| 87.2 % v7 (old) | 08 / 2023 | Asus ROG Strix Scar 17 G733PYV-LL053X R9 7945HX3D, GeForce RTX 4090 Laptop GPU | 2.9 kg | 28.3 mm | 17.30" | 2560x1440 | |
| 88.8 % v7 (old) | 01 / 2024 | MSI Titan 18 HX A14VIG i9-14900HX, GeForce RTX 4090 Laptop GPU | 3.6 kg | 32.1 mm | 18.00" | 3840x2400 | |
| 88.3 % v7 (old) | 02 / 2024 | Asus ROG Strix Scar 18 G834JYR (2024) i9-14900HX, GeForce RTX 4090 Laptop GPU | 3.1 kg | 30.8 mm | 18.00" | 2560x1600 | |
| 91.1 % v7 (old) | 02 / 2024 | Razer Blade 16 2024, RTX 4090 i9-14900HX, GeForce RTX 4090 Laptop GPU | 2.5 kg | 22 mm | 16.00" | 2560x1600 |
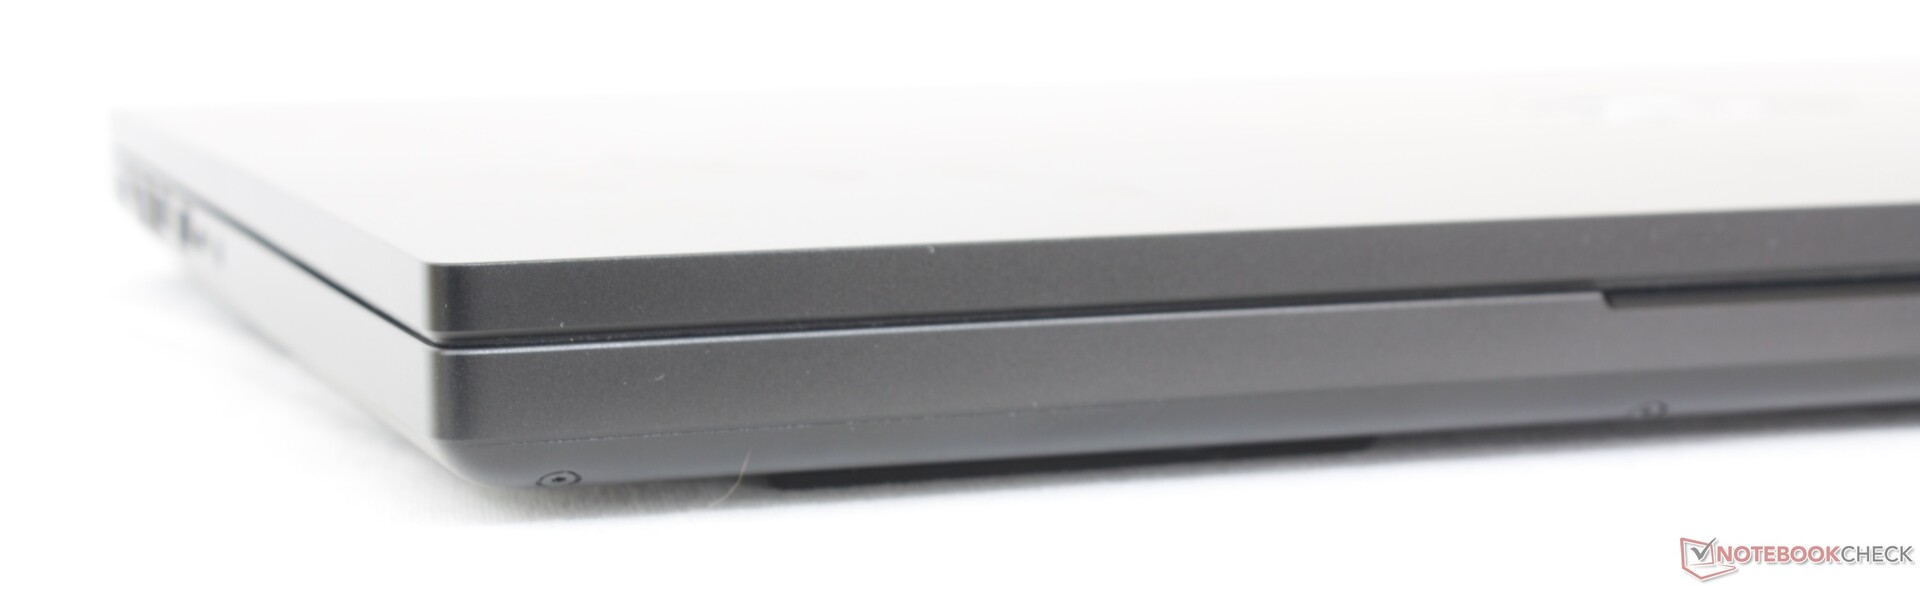
案例 - 锋利如初
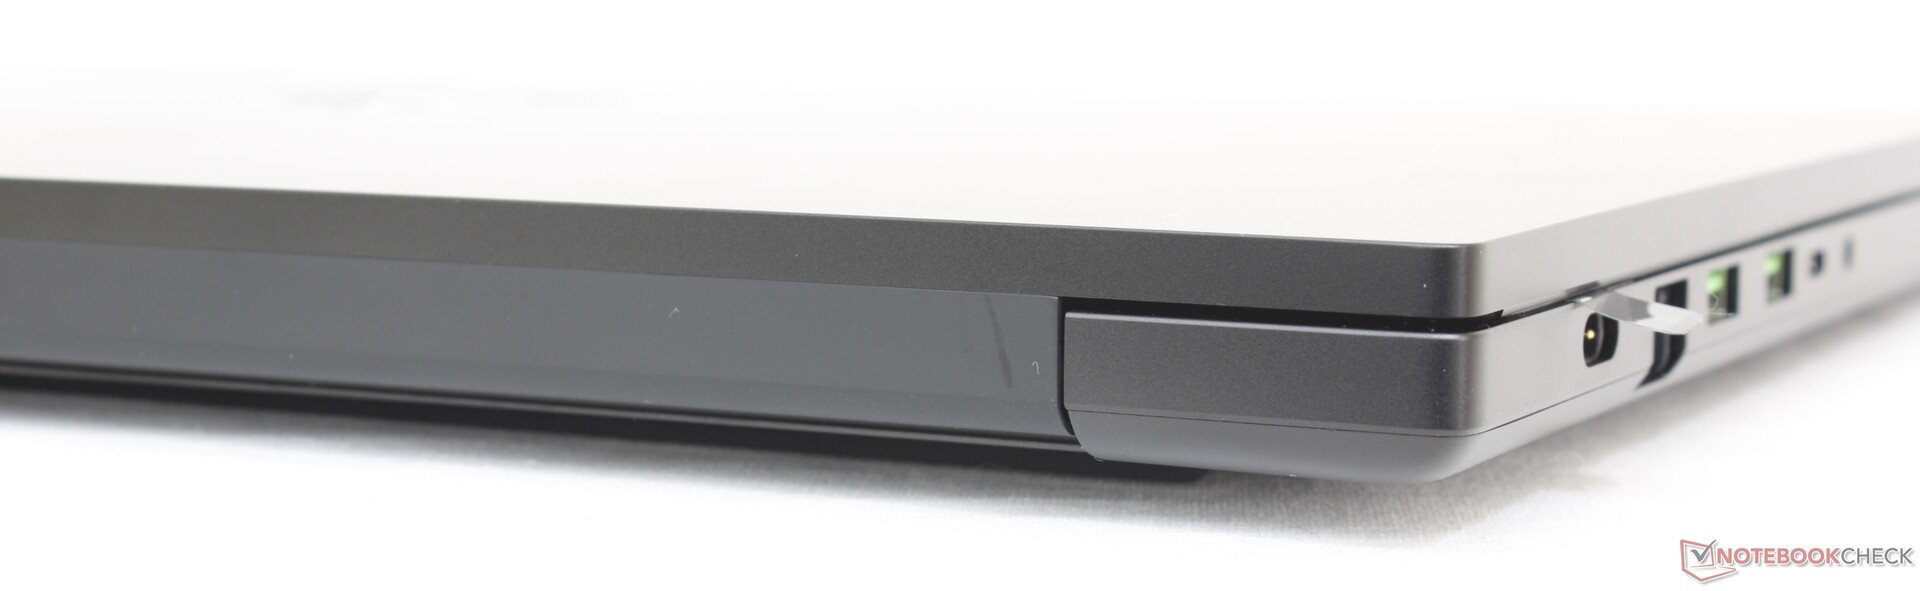
我们建议您查看 我们对 2023 款刀锋 18 的评论了解该机型的更多物理特性,因为我们的所有评论仍适用于 2024 版本。虽然键盘或机身没有任何变化,但实际上有一个小细节可以帮助我们直观地区分这两款机型:2024 机型现在包括一个手动网络摄像头滑块,而 2023 机型则没有。
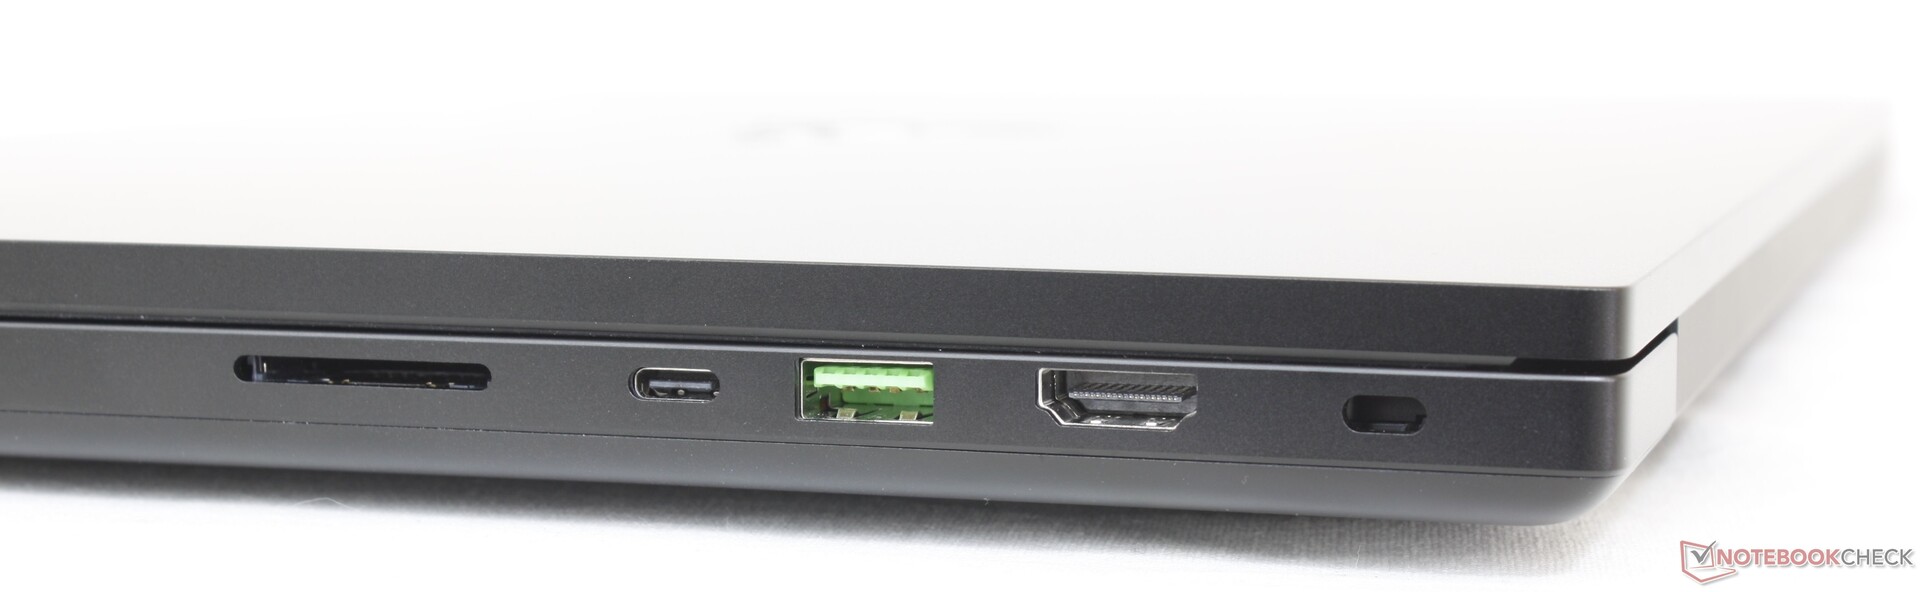
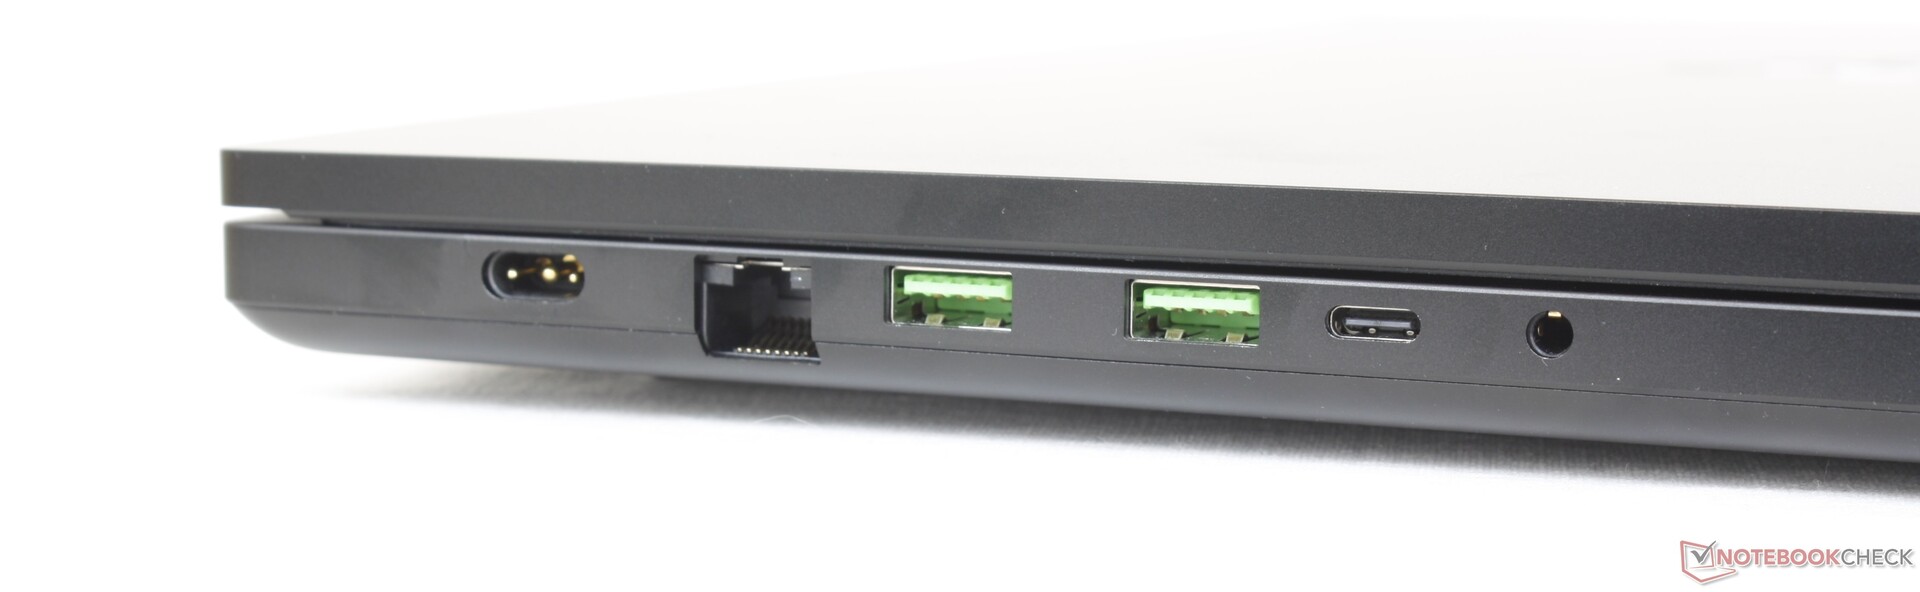
连接性 - 利用 Thunderbolt 5 着眼未来

2024 型号的 Thunderbolt 4 端口已升级为 Thunderbolt 5。请注意,这只适用于右侧边缘的 Type-C 端口,因此左侧边缘的 Type-C 端口仍仅限于 USB 3.2 Gen.2 连接。与 Thunderbolt 4 相比,Thunderbolt 5 支持双倍带宽(80 Gbps 对 40 Gbps),并为要求更高的外部设备(如 eGPU)预留了额外通道。
Thunderbolt 5 规格还支持高达 240 W 的下行充电。不过,在 Blade 18 上,USB-C 充电仍被限制在 100 W,不到主桶式 330 W AC 适配器的三分之一。公平地说,到目前为止,还没有笔记本电脑支持 240 W USB-C 全速充电,因为要充分利用新规格,还需要额外的硬件调整。
SD 读卡器
| SD Card Reader | |
| average JPG Copy Test (av. of 3 runs) | |
| Alienware m18 R2 (Toshiba Exceria Pro SDXC 64 GB UHS-II) | |
| Razer Blade 18 2024 RZ09-0509 (Toshiba Exceria Pro SDXC 64 GB UHS-II) | |
| Razer Blade 16 2024, RTX 4090 | |
| MSI Titan 18 HX A14VIG (Toshiba Exceria Pro SDXC 64 GB UHS-II) | |
| maximum AS SSD Seq Read Test (1GB) | |
| Razer Blade 18 2024 RZ09-0509 (Toshiba Exceria Pro SDXC 64 GB UHS-II) | |
| Alienware m18 R2 (Toshiba Exceria Pro SDXC 64 GB UHS-II) | |
| Razer Blade 16 2024, RTX 4090 | |
| MSI Titan 18 HX A14VIG (Toshiba Exceria Pro SDXC 64 GB UHS-II) | |
交流
无线局域网已升级到英特尔 BE200,支持蓝牙 5.4 和 Wi-Fi 7。不过,绝大多数用户仍然没有 Wi-Fi 7 路由器,因此目前只有少数用户会注意到性能的提升。
| Networking | |
| iperf3 transmit AXE11000 | |
| Razer Blade 16 2024, RTX 4090 | |
| Razer Blade 18 2024 RZ09-0509 | |
| MSI Titan 18 HX A14VIG | |
| Asus ROG Strix Scar 18 G834JYR (2024) | |
| Alienware m18 R2 | |
| iperf3 receive AXE11000 | |
| Asus ROG Strix Scar 18 G834JYR (2024) | |
| Razer Blade 16 2024, RTX 4090 | |
| Razer Blade 18 2024 RZ09-0509 | |
| Alienware m18 R2 | |
| MSI Titan 18 HX A14VIG | |
| iperf3 transmit AXE11000 6GHz | |
| Razer Blade 16 2024, RTX 4090 | |
| Razer Blade 18 2024 RZ09-0509 | |
| MSI Titan 18 HX A14VIG | |
| Alienware m18 R2 | |
| iperf3 receive AXE11000 6GHz | |
| Razer Blade 16 2024, RTX 4090 | |
| MSI Titan 18 HX A14VIG | |
| Razer Blade 18 2024 RZ09-0509 | |
| Alienware m18 R2 | |
网络摄像头
除了为保护隐私而新增的快门滑块外,500 万像素 + 红外网络摄像头没有任何变化。有趣的是,与竞争对手 Titan HX 一样,这是唯一配备 500 万像素网络摄像头的 18 英寸游戏笔记本电脑、 Alienware m18 R2和 ROG Strix Scar 18 相比,仅配备了 1MP 至 2MP 摄像头。


维护
2024 型号前角附近的扬声器稍大一些。除此之外,与 2023 型相比没有明显的区别。
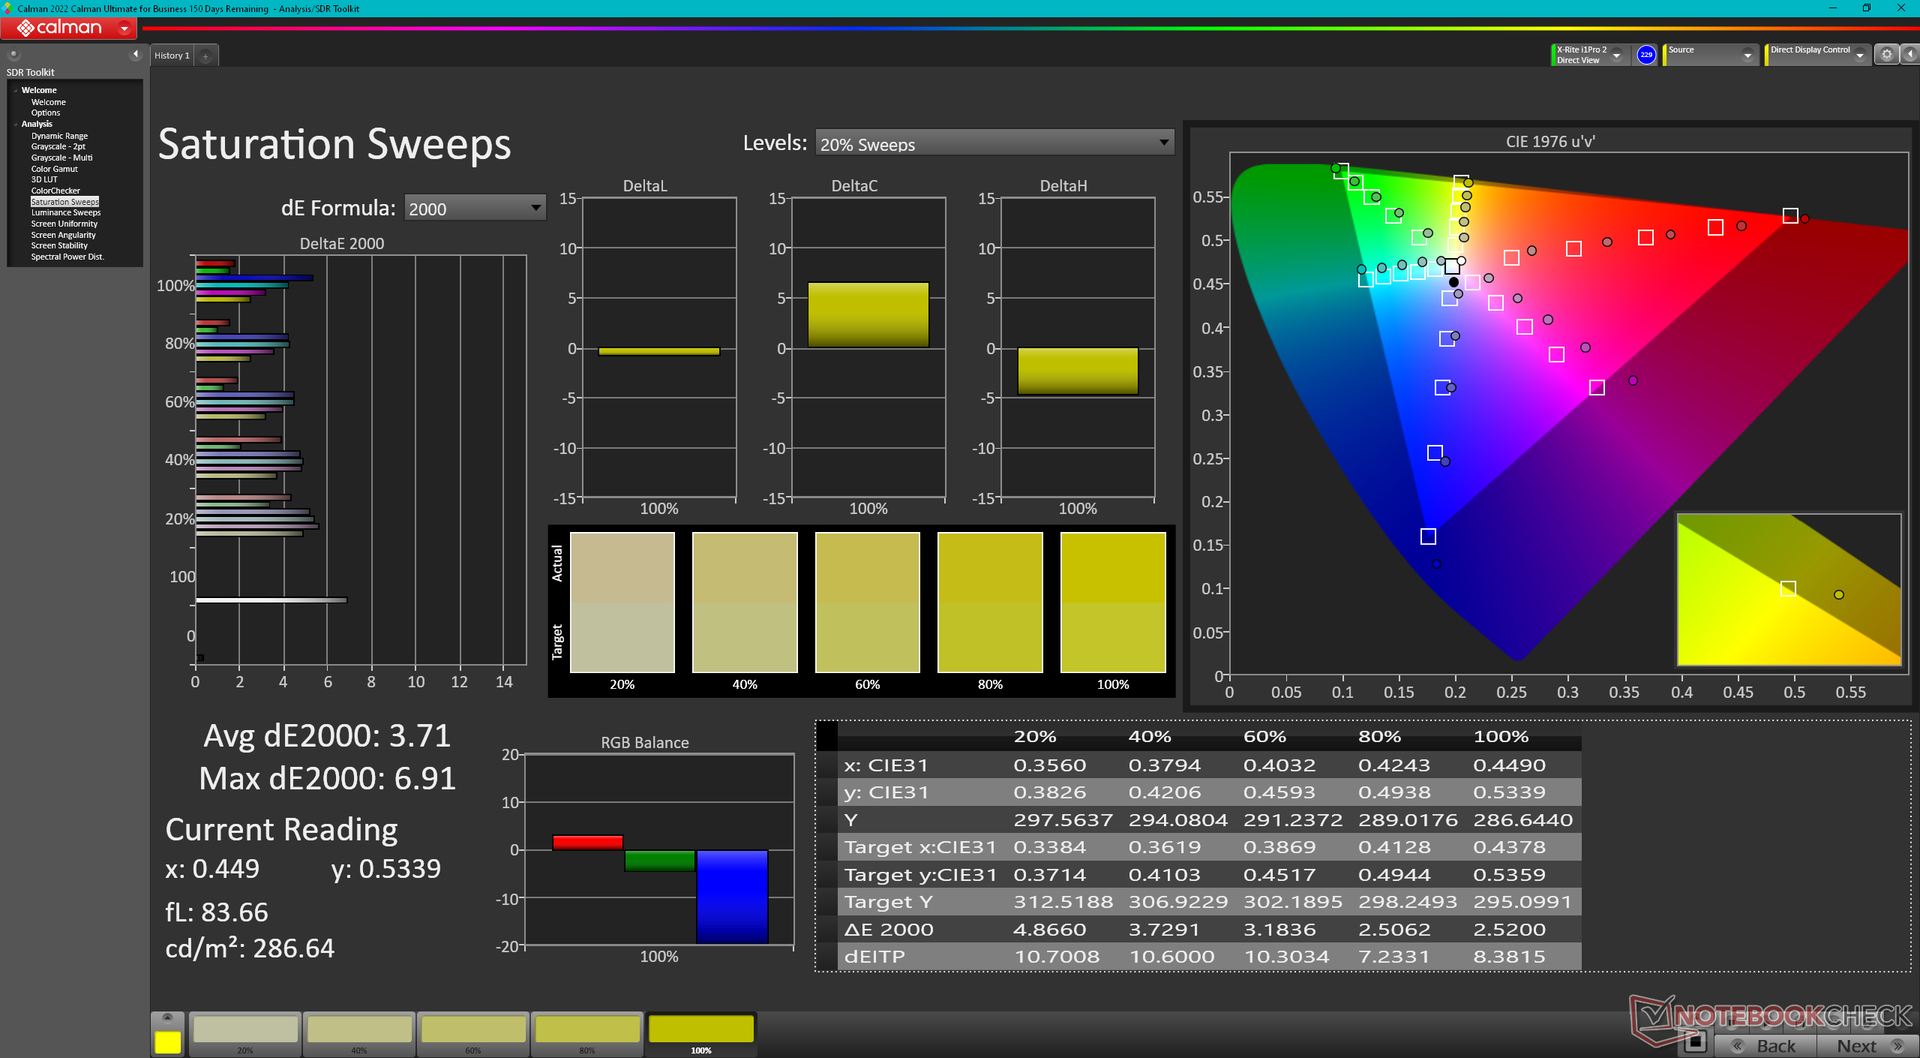
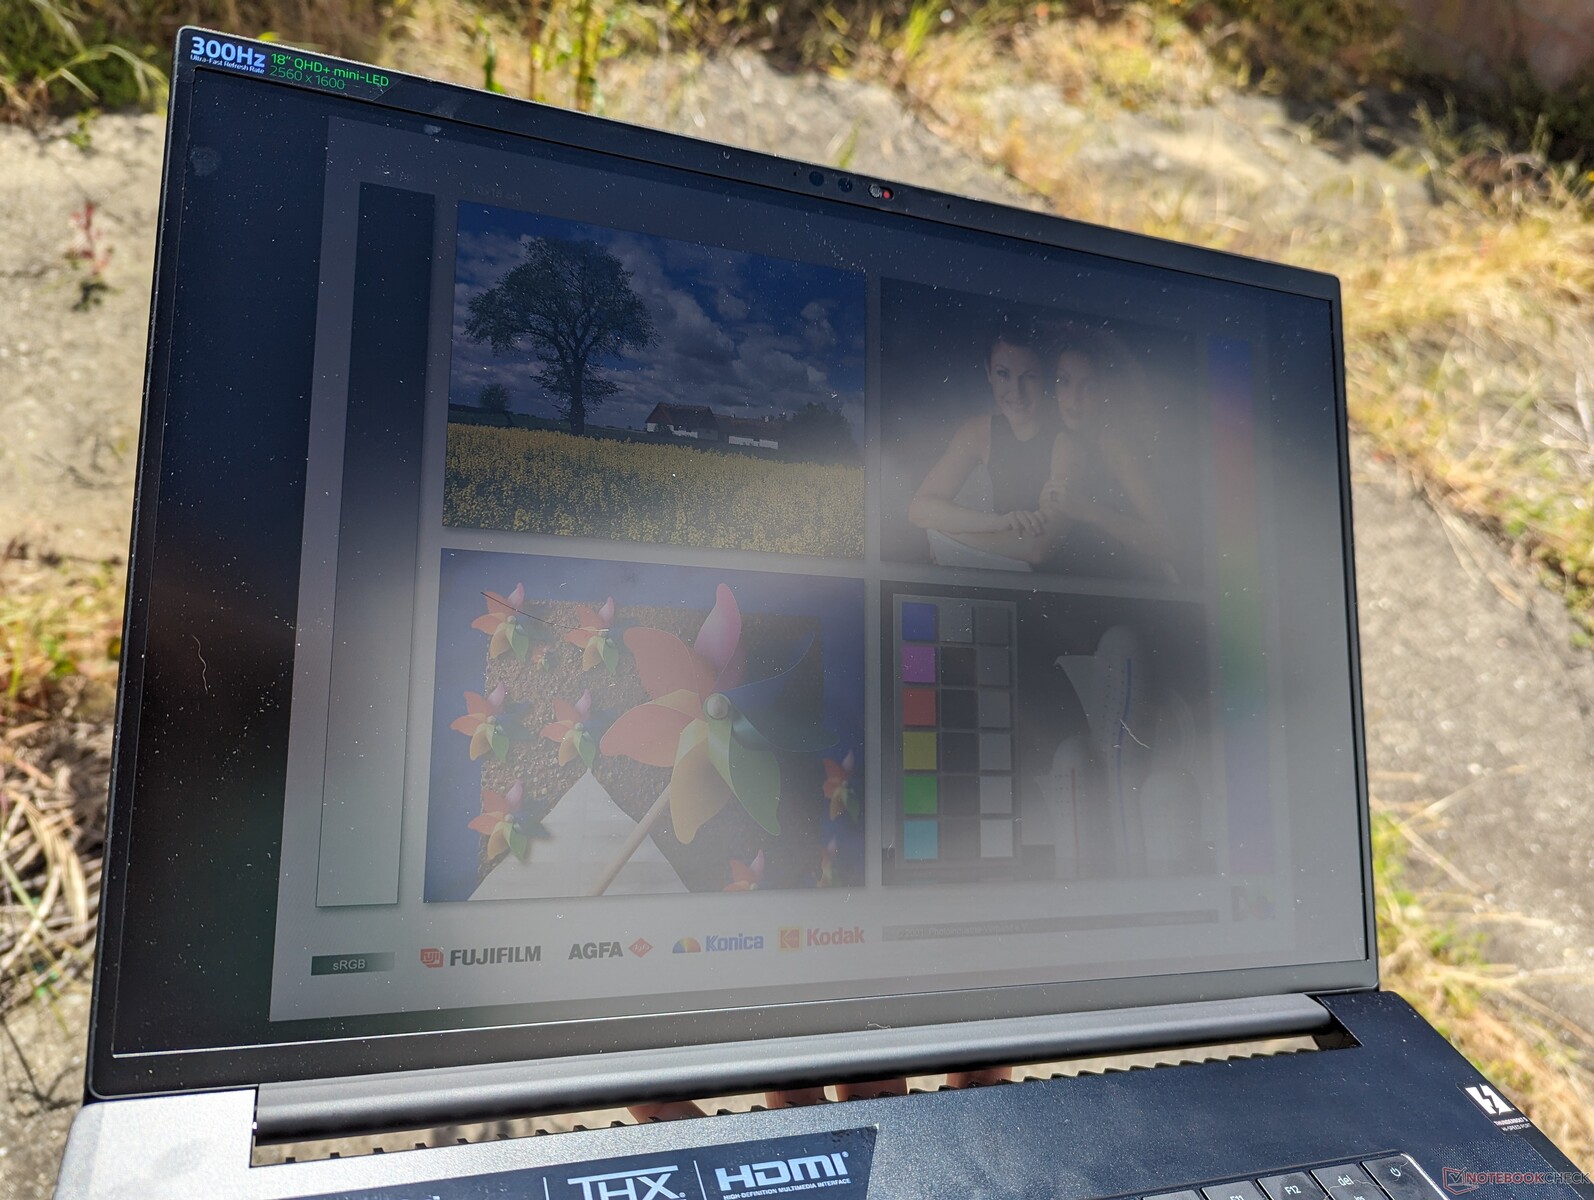
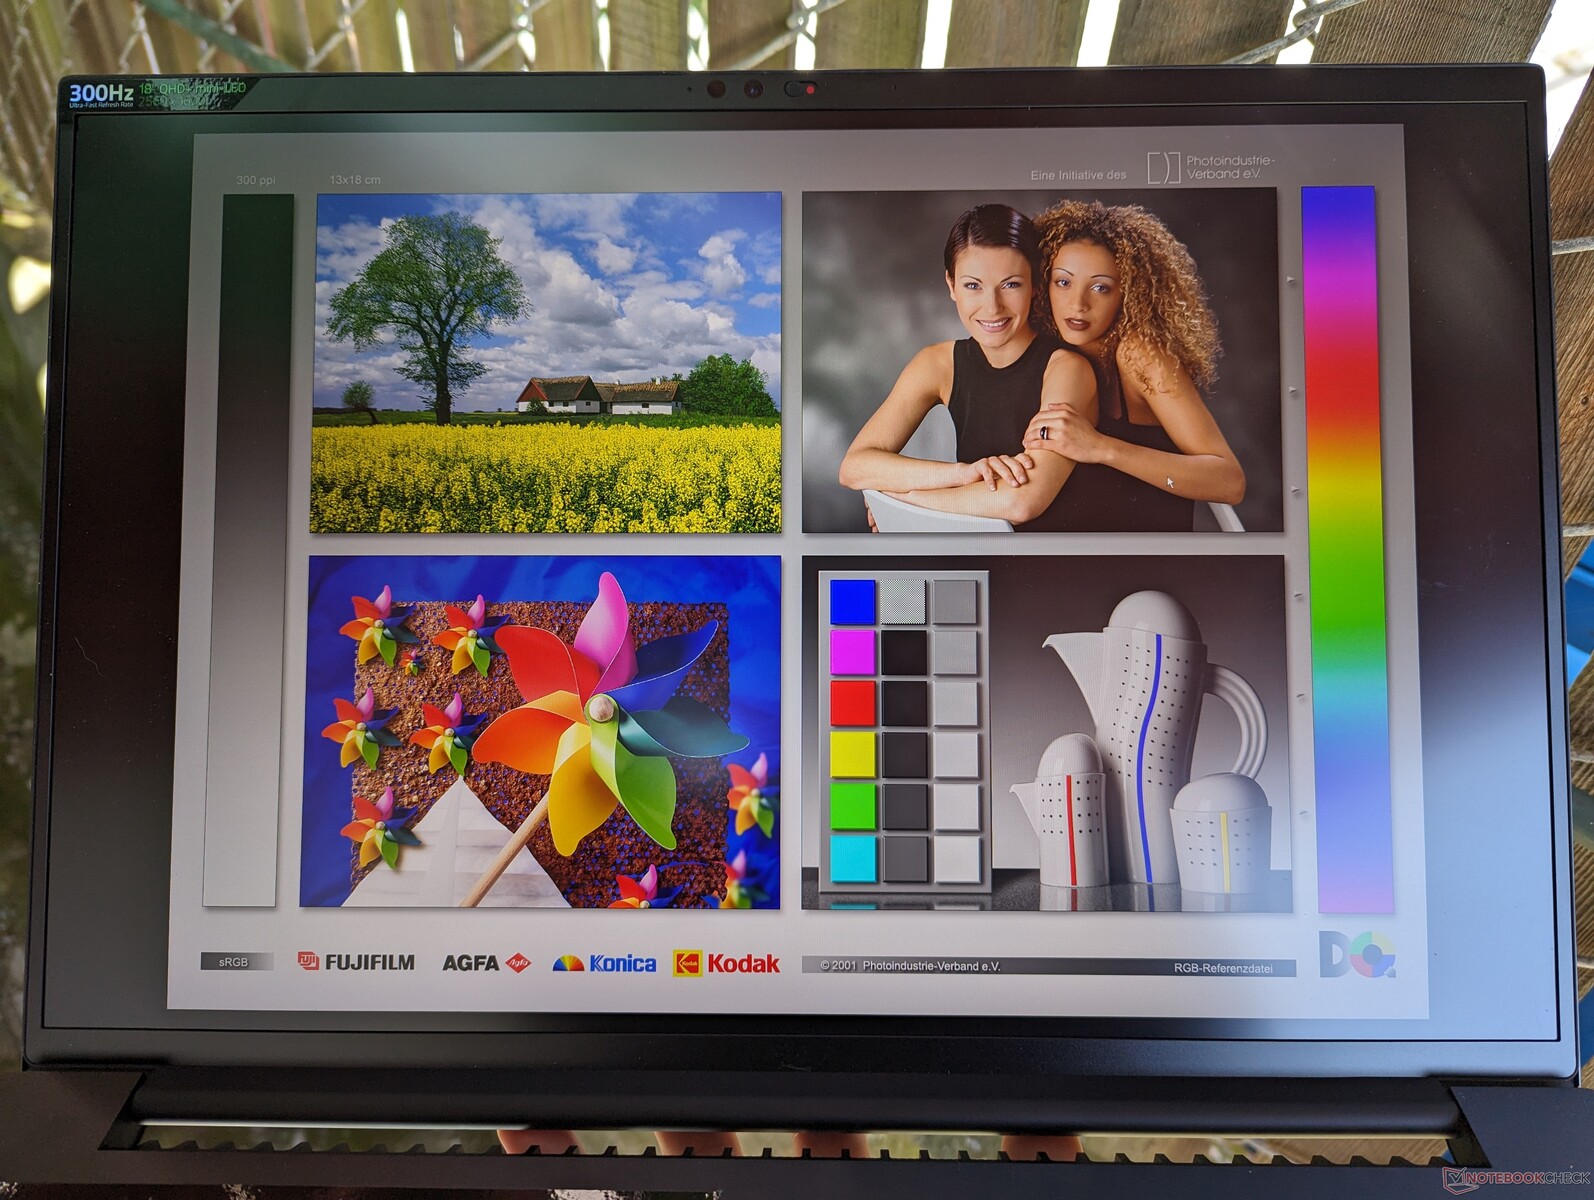
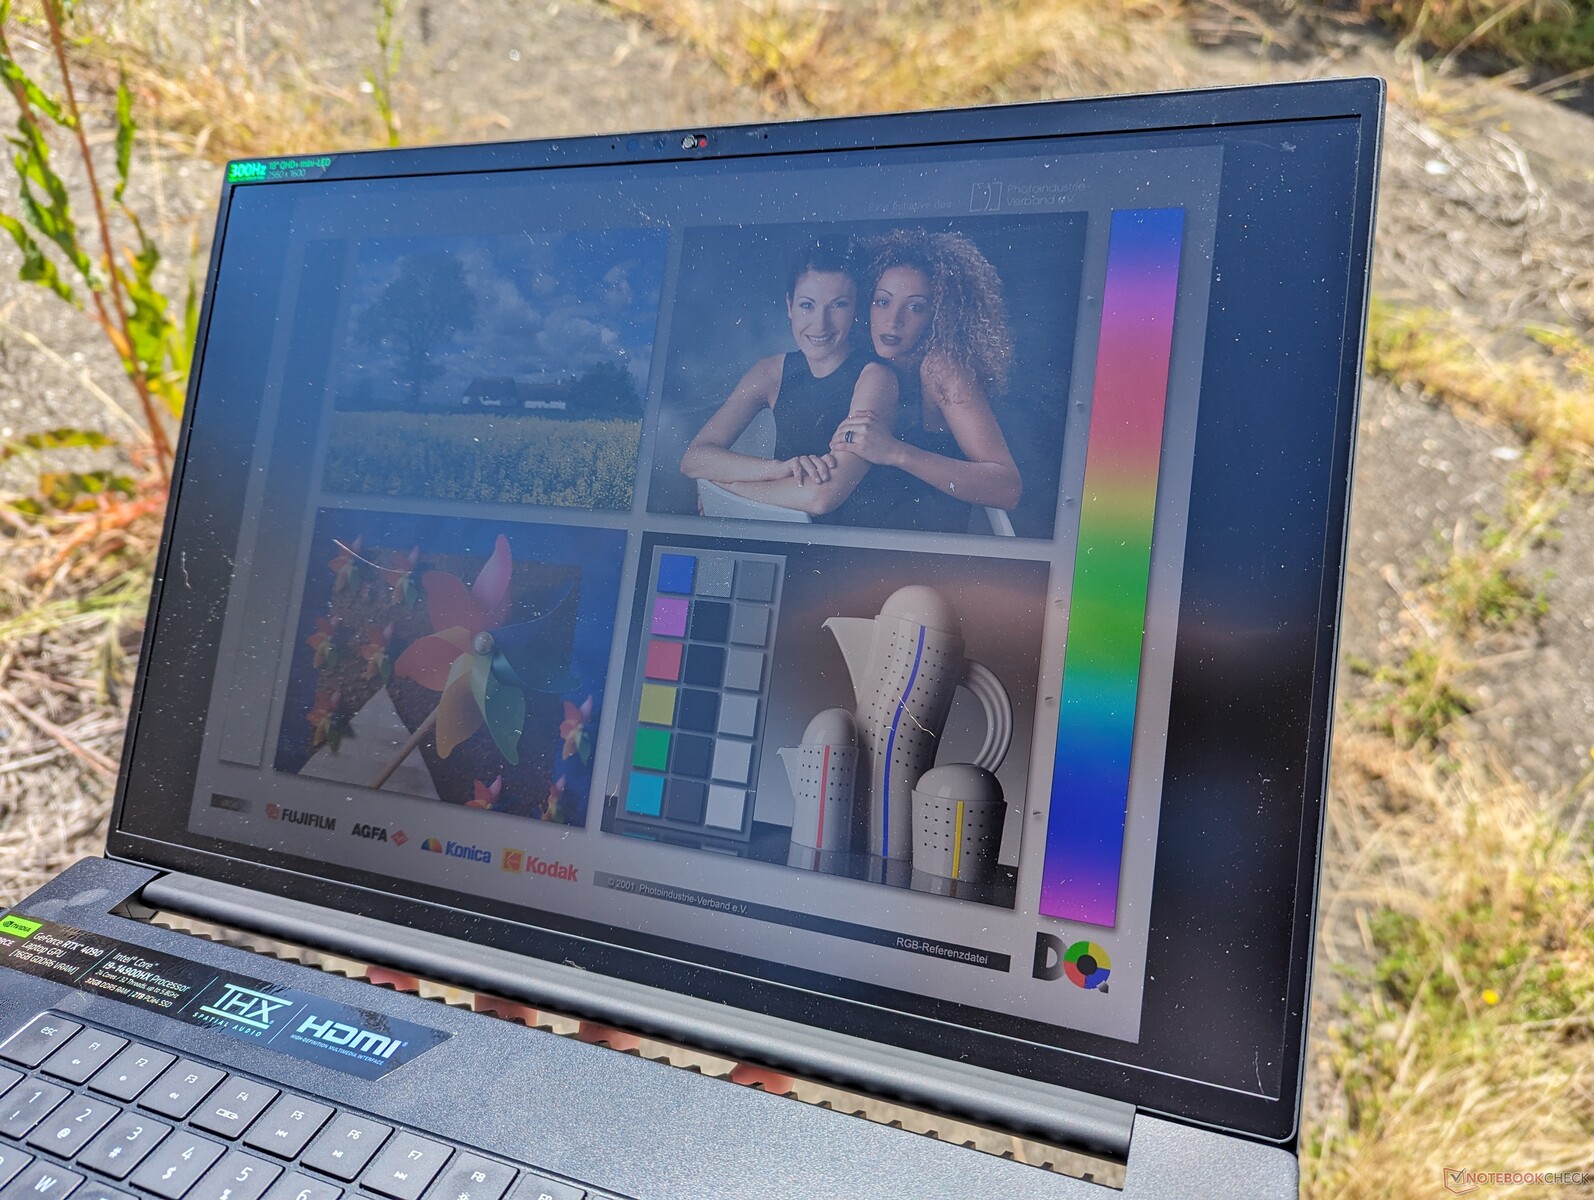
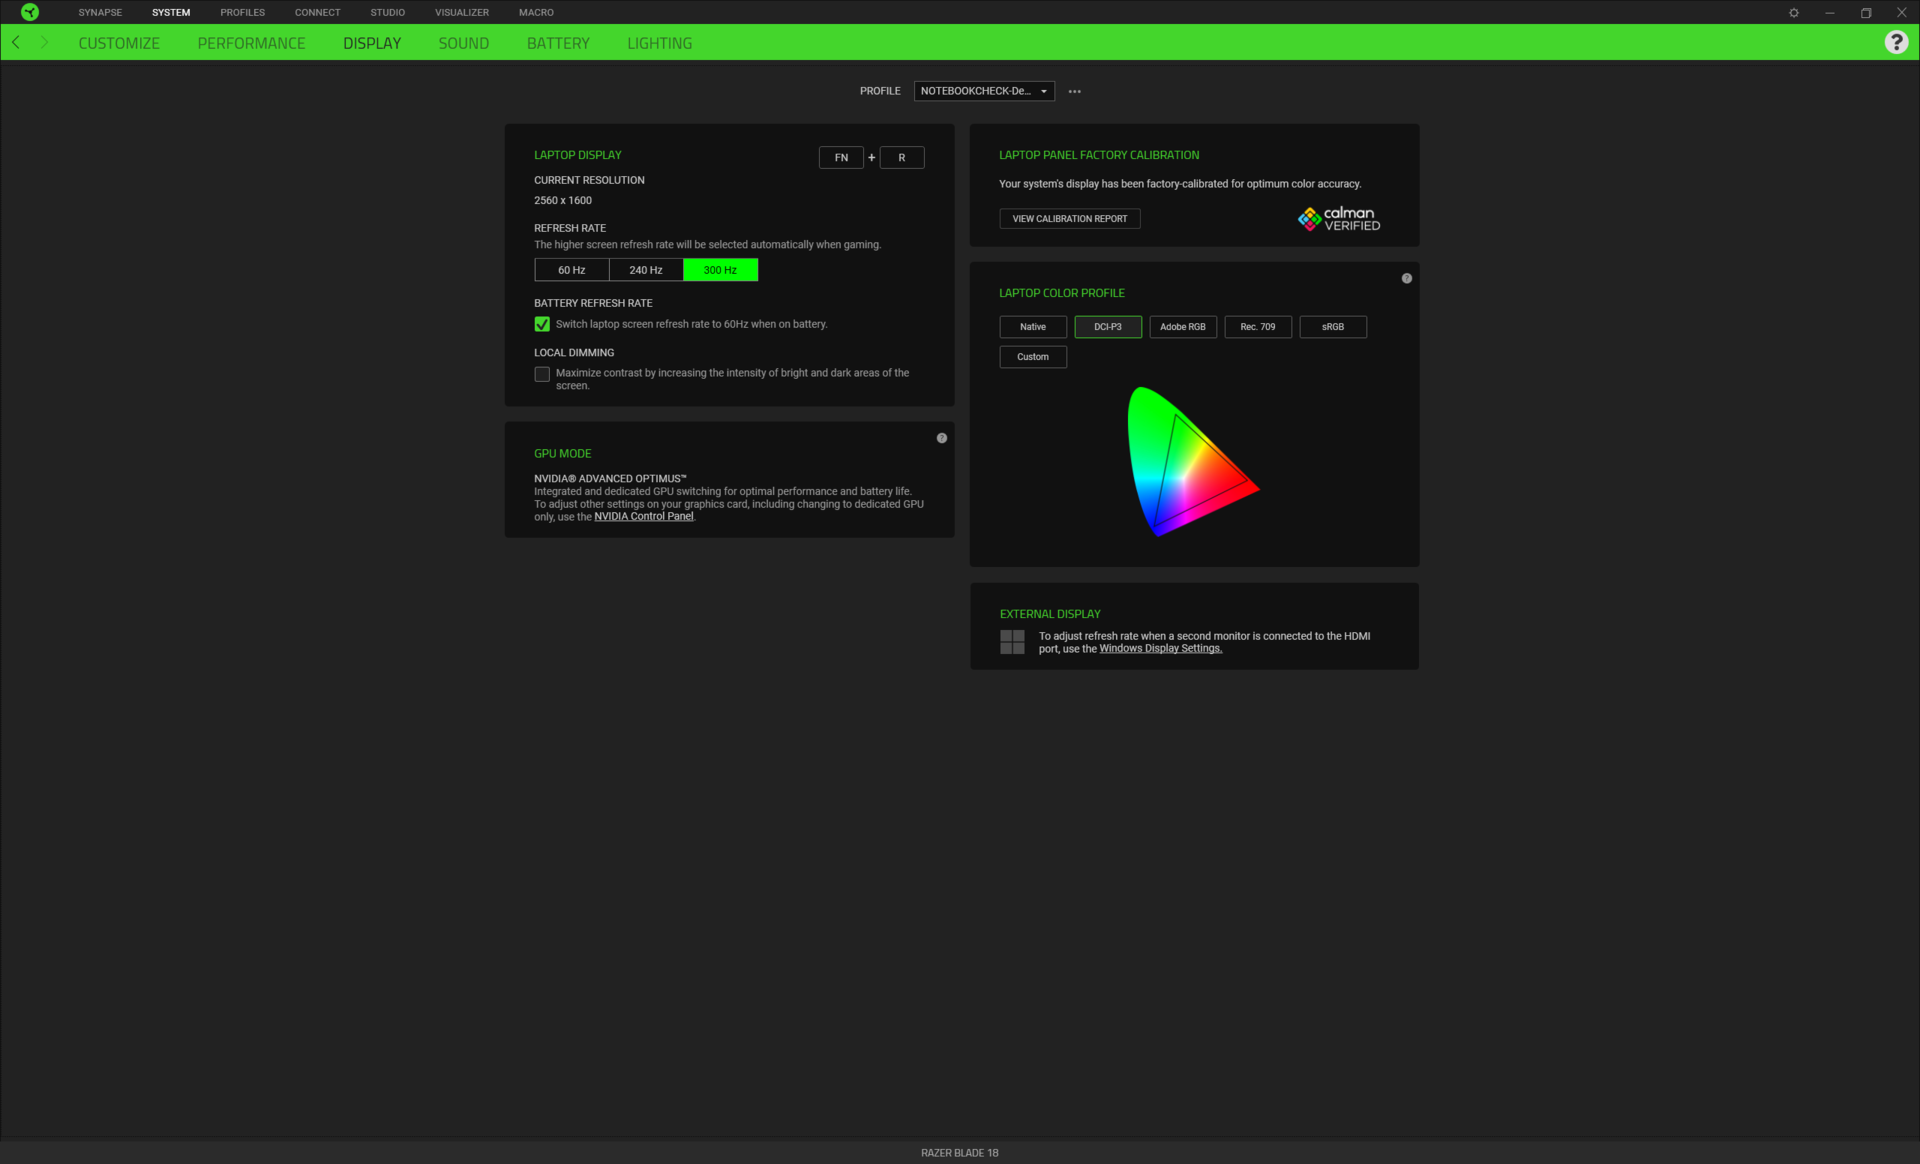
显示屏 - QHD+ 300 Hz Mini-LED
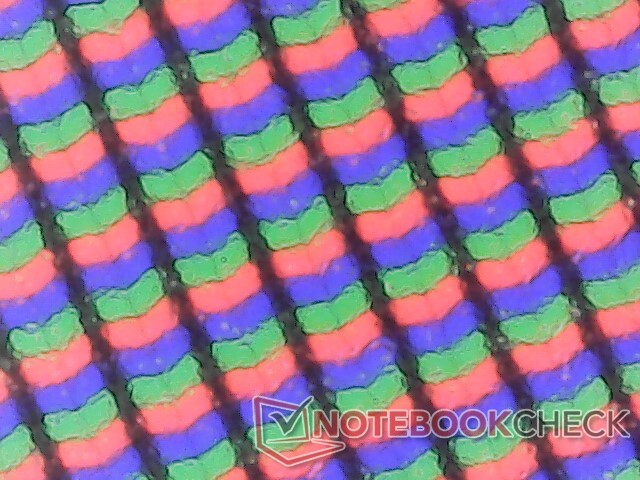
今年,2023 款刀锋 18 上的 QHD+ 240 Hz 面板换成了两种新的选择:
- QHD+ (2560 x 1600)、300 Hz、Mini-LED、HDR1000
- 4K UHD+(3840 x 2400),200 赫兹,IPS,HDR400
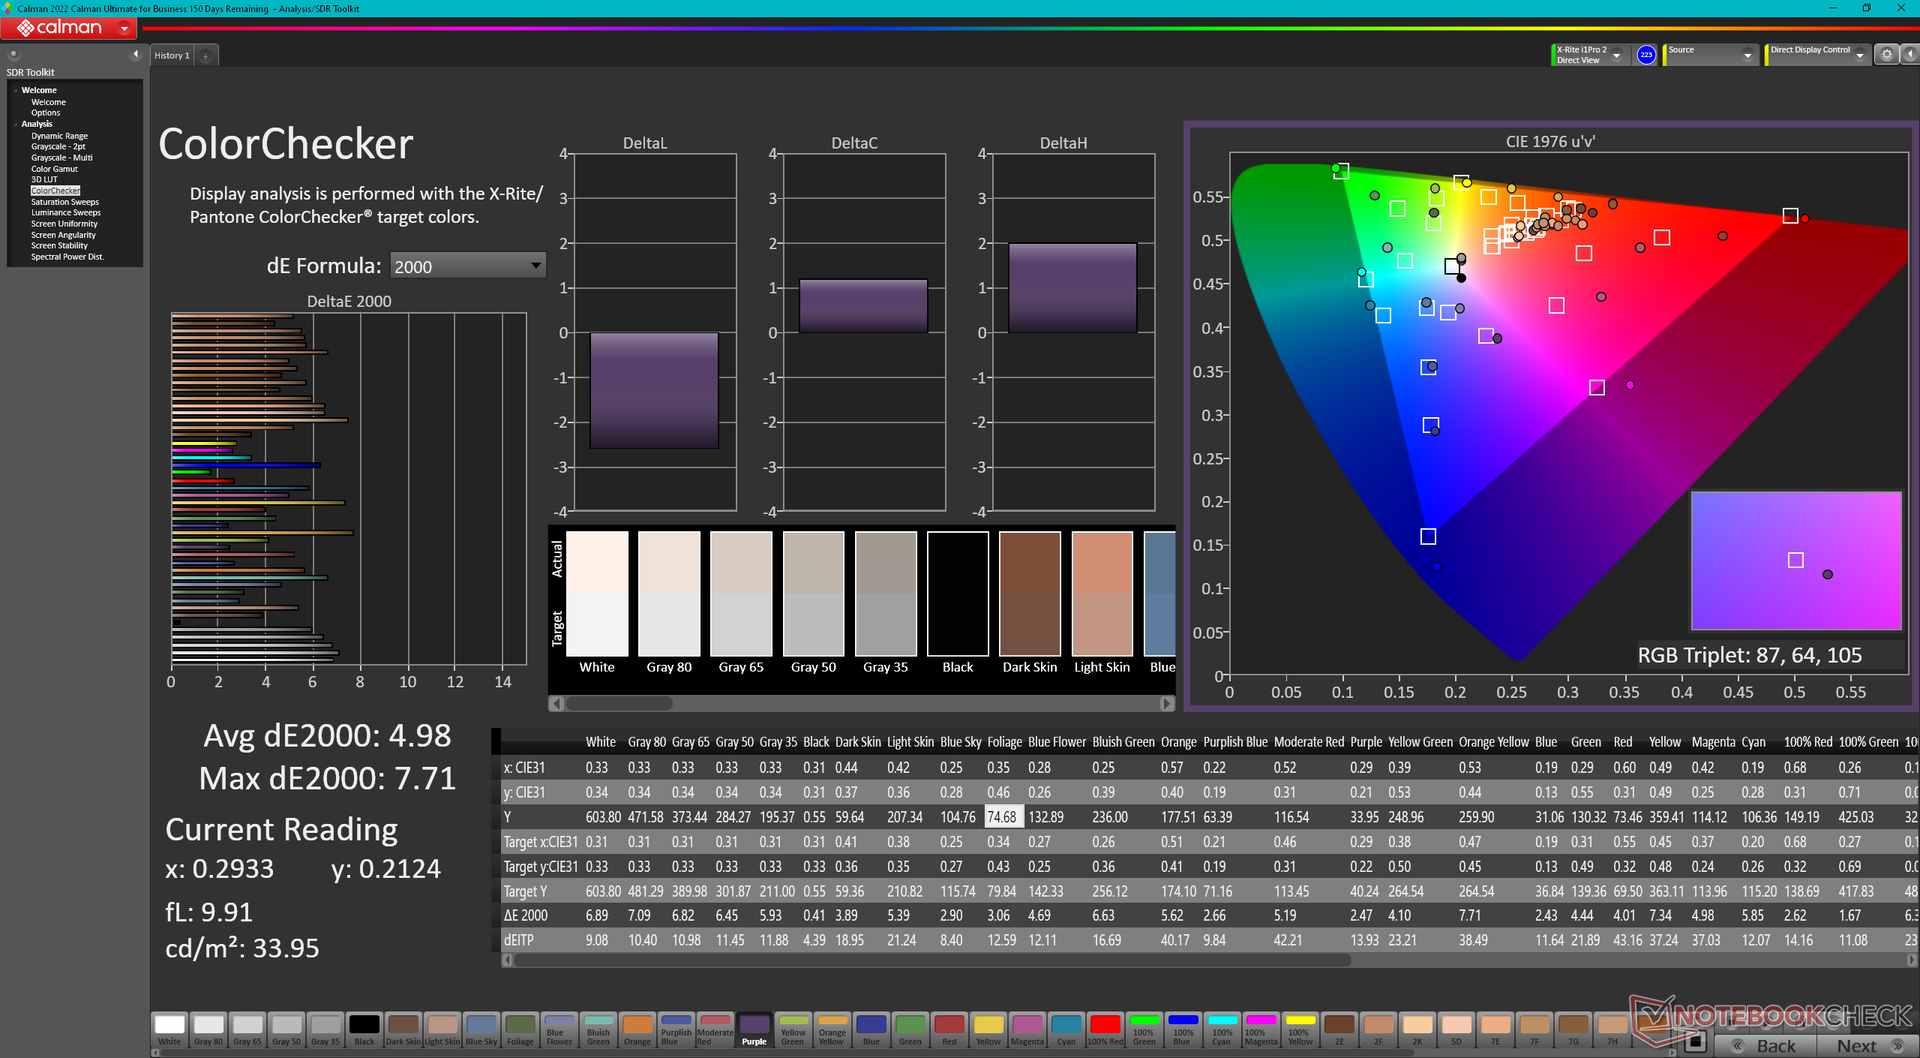
这两款面板均提供 G-Sync、出厂校准、全 DCI-P3 色彩和 <3 毫秒的快速响应时间,可同时满足硬核游戏和大多数编辑任务的需求。我们的特定测试设备配置了粗体选项。请注意,在ROG Strix Scar 18 上也可以找到这种一模一样的京东方 NE180QDM-NM1 面板,这意味着 Razer 和华硕笔记本电脑可以提供类似的观看体验。
与 IPS 和 OLED 相比,mini-LED 可提供比 IPS 更深的黑阶和比 OLED 更亮的白阶,从而更好地满足 HDR 要求。例如,采用高端 IPS 或 OLED 面板的笔记本电脑通常能满足 HDR400 或 HDR500 的要求,而 mini-LED 通常能满足 HDR1000 的要求,从而实现更生动的多媒体播放。当同时启用 HDR 和局部调光功能时,我们的 Blade 18 的最大亮度可达 1227 尼特,而当启用 HDR 但关闭局部调光功能时,最大亮度仅为 712 尼特。在 SDR 模式下,亮度被限制在约 600 尼特,这仍然比其他大多数游戏笔记本电脑亮得多。
| 显示设置 | SDR 模式/本地调光关闭 | SDR 模式/本地调光开启 | HDR 模式(本地调光关闭 | HDR 模式(打开本地调光 |
| 最大亮度(尼特) | 605 | 602 | 712 | 1227 |
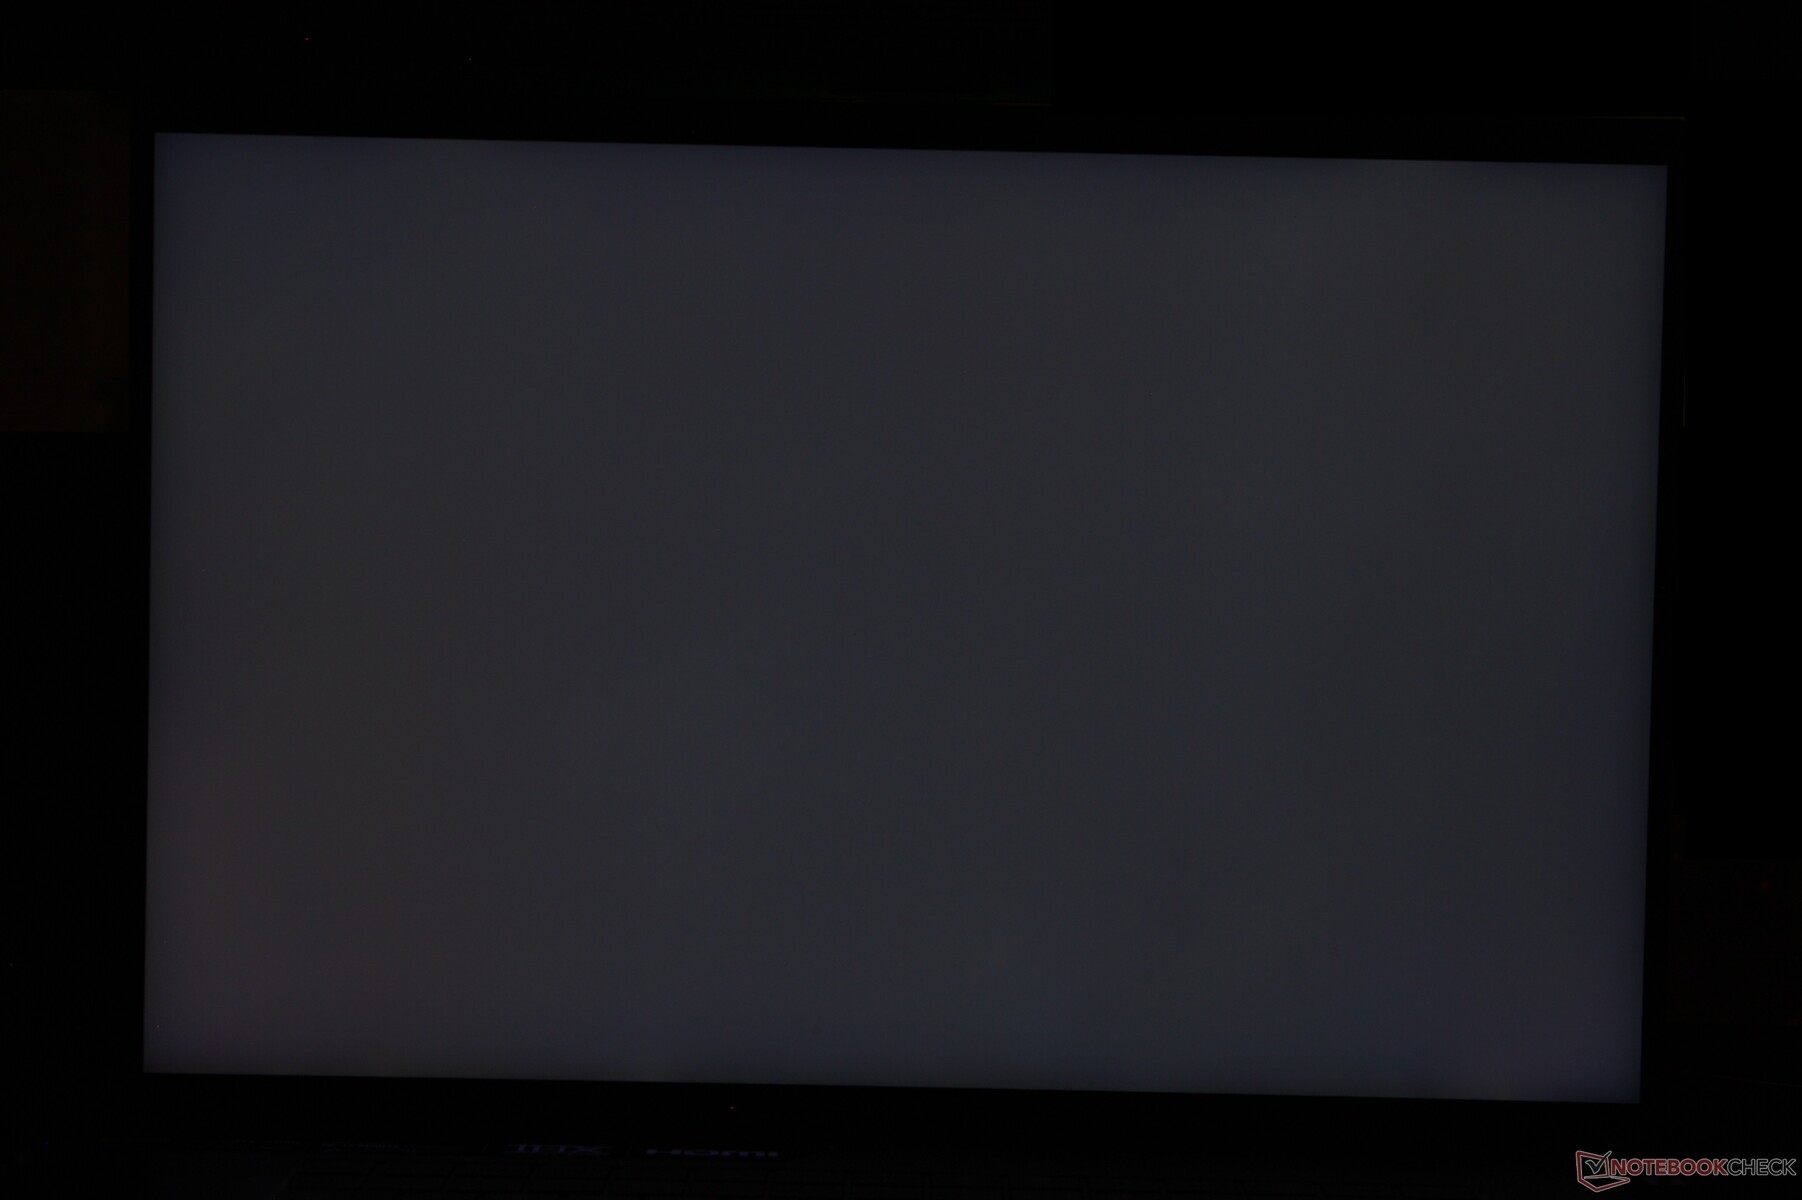

黑阶和对比度也会受到局部调光的影响。在关闭局部调光的情况下,我们测得的黑阶为 0.62 尼特,而在开启局部调光的情况下为 0.22 尼特,对比度要高得多,尤其是在启用 HDR 时。由于其固有的 "光晕 "效应,浏览或编辑时可能不需要甚至不建议使用局部调光,但对于 HDR 视频和游戏来说,其缺点并不明显,因此值得启用。
请注意,面板刷新率仅在 dGPU 模式下最高支持 300 Hz,否则在 Optimus 模式下只能达到 240 Hz。只有 Optimus 模式才支持低至 60 Hz 的动态刷新率。
| |||||||||||||||||||||||||
Brightness Distribution: 97 %
Center on Battery: 605.4 cd/m²
Contrast: 976:1 (Black: 0.62 cd/m²)
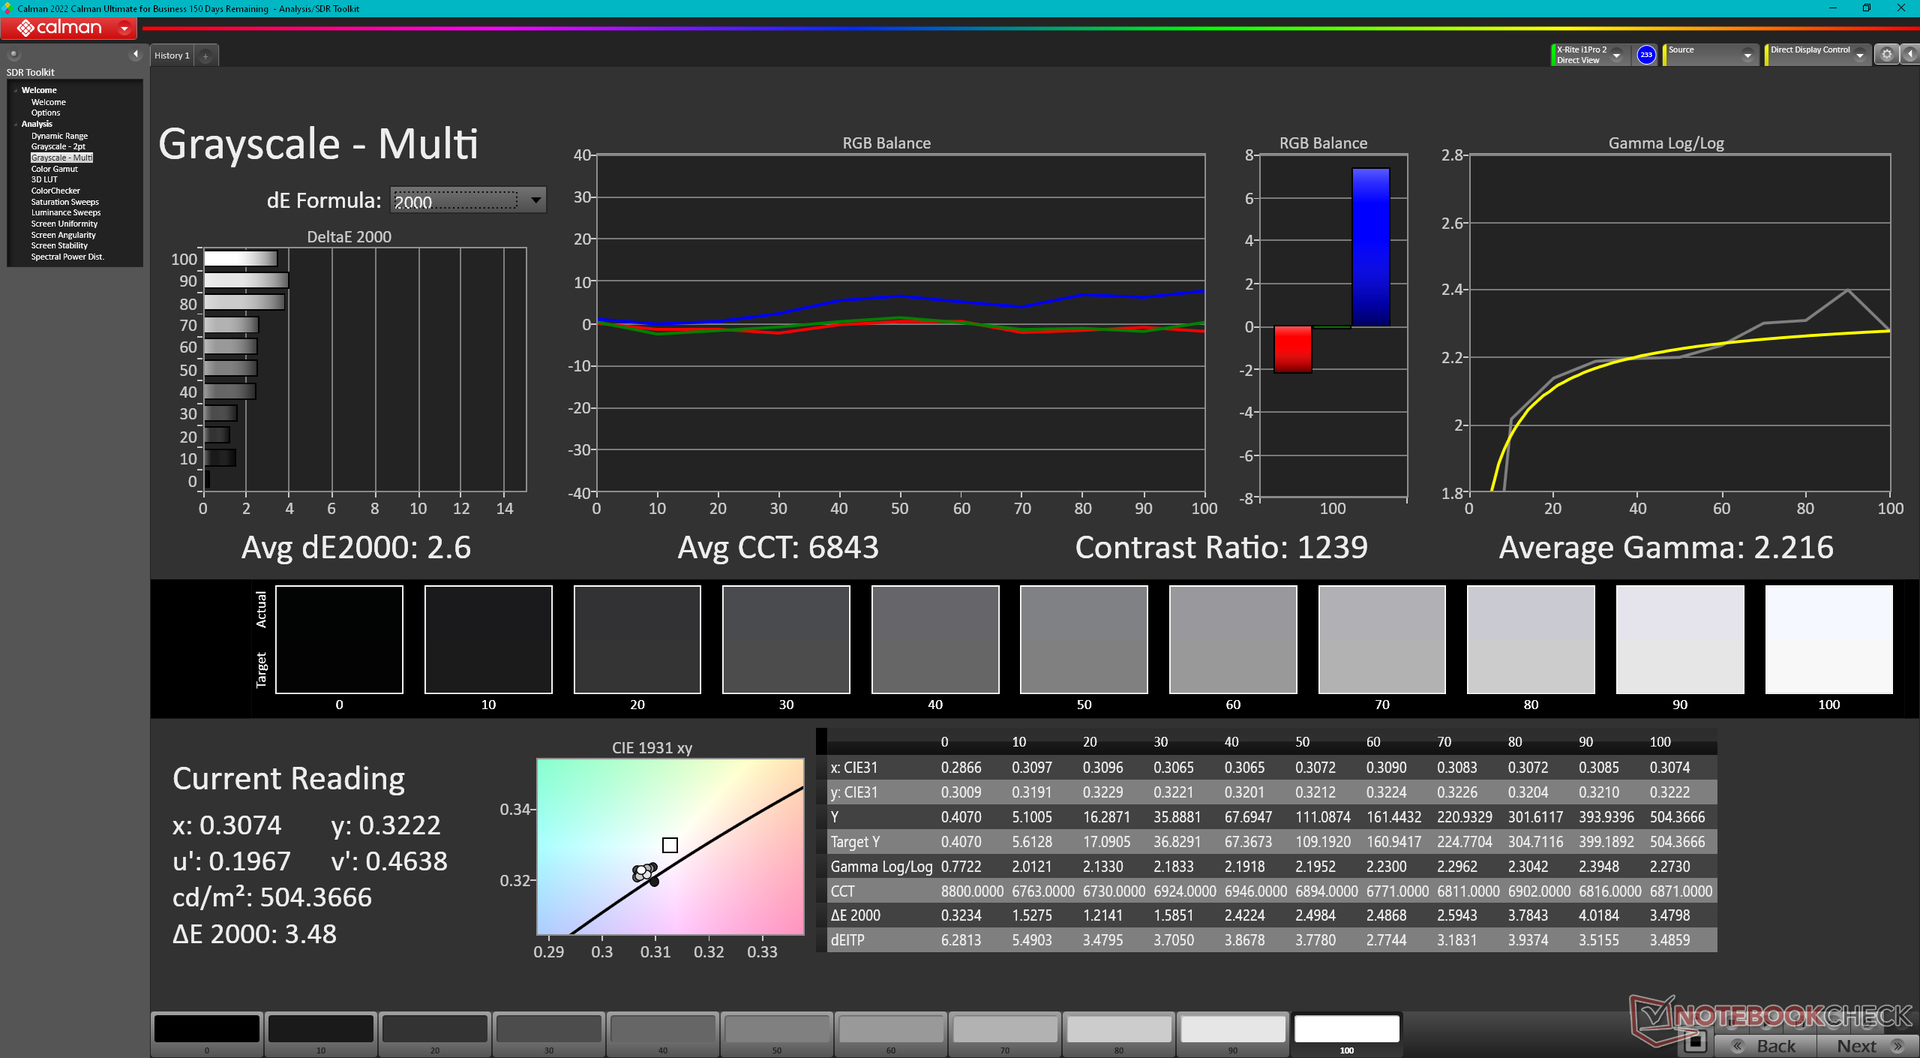
ΔE ColorChecker Calman: 1.53 | ∀{0.5-29.43 Ø4.71}
ΔE Greyscale Calman: 2.6 | ∀{0.09-98 Ø4.96}
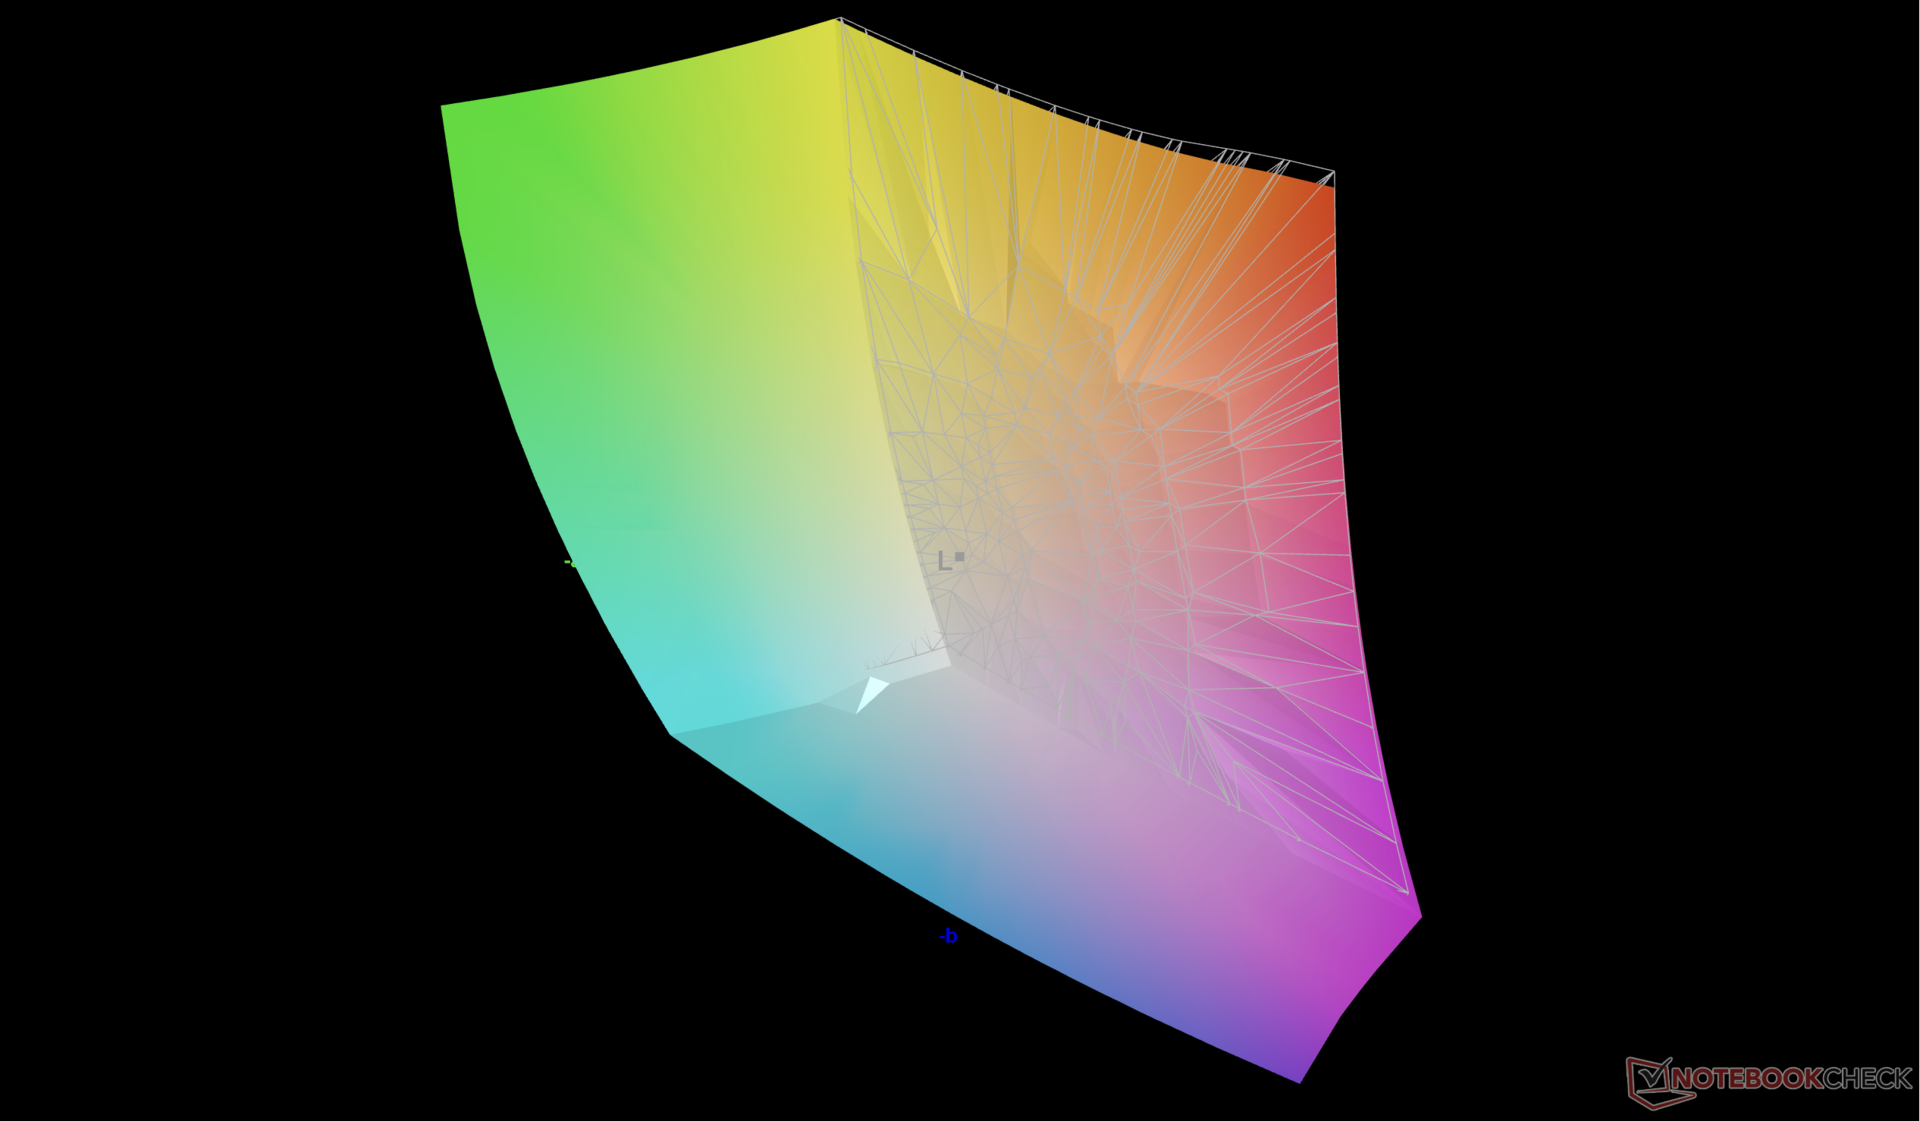
86.9% AdobeRGB 1998 (Argyll 3D)
100% sRGB (Argyll 3D)
99% Display P3 (Argyll 3D)
Gamma: 2.22
CCT: 6843 K
| Razer Blade 18 2024 RZ09-0509 BOE NE180QDM-NM1, Mini-LED, 2560x1600, 18" | Razer Blade 18 RTX 4070 AU Optronics B180QAN01.0, IPS, 2560x1600, 18" | Alienware m18 R2 BOE NE18NZ1, IPS, 2560x1600, 18" | MSI Titan 18 HX A14VIG AU Optronics B180ZAN01.0, Mini-LED, 3840x2400, 18" | Asus ROG Strix Scar 18 G834JYR (2024) BOE NE180QDM-NM1, Mini LED, 2560x1600, 18" | |
|---|---|---|---|---|---|
| Display | -1% | 0% | -1% | 2% | |
| Display P3 Coverage (%) | 99 | 96.9 -2% | 97.8 -1% | 98.1 -1% | 99.9 1% |
| sRGB Coverage (%) | 100 | 99.8 0% | 99.5 0% | 99.8 0% | 100 0% |
| AdobeRGB 1998 Coverage (%) | 86.9 | 85.3 -2% | 88.9 2% | 86.2 -1% | 90 4% |
| Response Times | 44% | 28% | -249% | -17% | |
| Response Time Grey 50% / Grey 80% * (ms) | 7.6 ? | 4.2 ? 45% | 5.3 ? 30% | 8.6 ? -13% | 12 ? -58% |
| Response Time Black / White * (ms) | 14 ? | 8 ? 43% | 10.4 ? 26% | 81.8 ? -484% | 10.7 ? 24% |
| PWM Frequency (Hz) | 26444 ? | 2592 ? | 5733 ? | ||
| Screen | -20% | -26% | -45% | 202% | |
| Brightness middle (cd/m²) | 605.4 | 549.6 -9% | 271.8 -55% | 467.5 -23% | 937 55% |
| Brightness (cd/m²) | 600 | 524 -13% | 275 -54% | 459 -23% | 934 56% |
| Brightness Distribution (%) | 97 | 89 -8% | 78 -20% | 90 -7% | 89 -8% |
| Black Level * (cd/m²) | 0.62 | 0.53 15% | 0.27 56% | 0.066 89% | |
| Contrast (:1) | 976 | 1037 6% | 1007 3% | 14197 1355% | |
| Colorchecker dE 2000 * | 1.53 | 3.32 -117% | 2.48 -62% | 3.77 -146% | 1.52 1% |
| Colorchecker dE 2000 max. * | 4.15 | 6.63 -60% | 5.59 -35% | 6.12 -47% | 2.82 32% |
| Greyscale dE 2000 * | 2.6 | 2 23% | 3.7 -42% | 3.2 -23% | 1.7 35% |
| Gamma | 2.22 99% | 2.29 96% | 2.2 100% | 2.43 91% | 2.042 108% |
| CCT | 6843 95% | 6319 103% | 6355 102% | 6478 100% | 6578 99% |
| Colorchecker dE 2000 calibrated * | 2.7 | 0.56 | 2.94 | 1.21 | |
| Total Average (Program / Settings) | 8% /
-6% | 1% /
-12% | -98% /
-70% | 62% /
122% |
* ... smaller is better
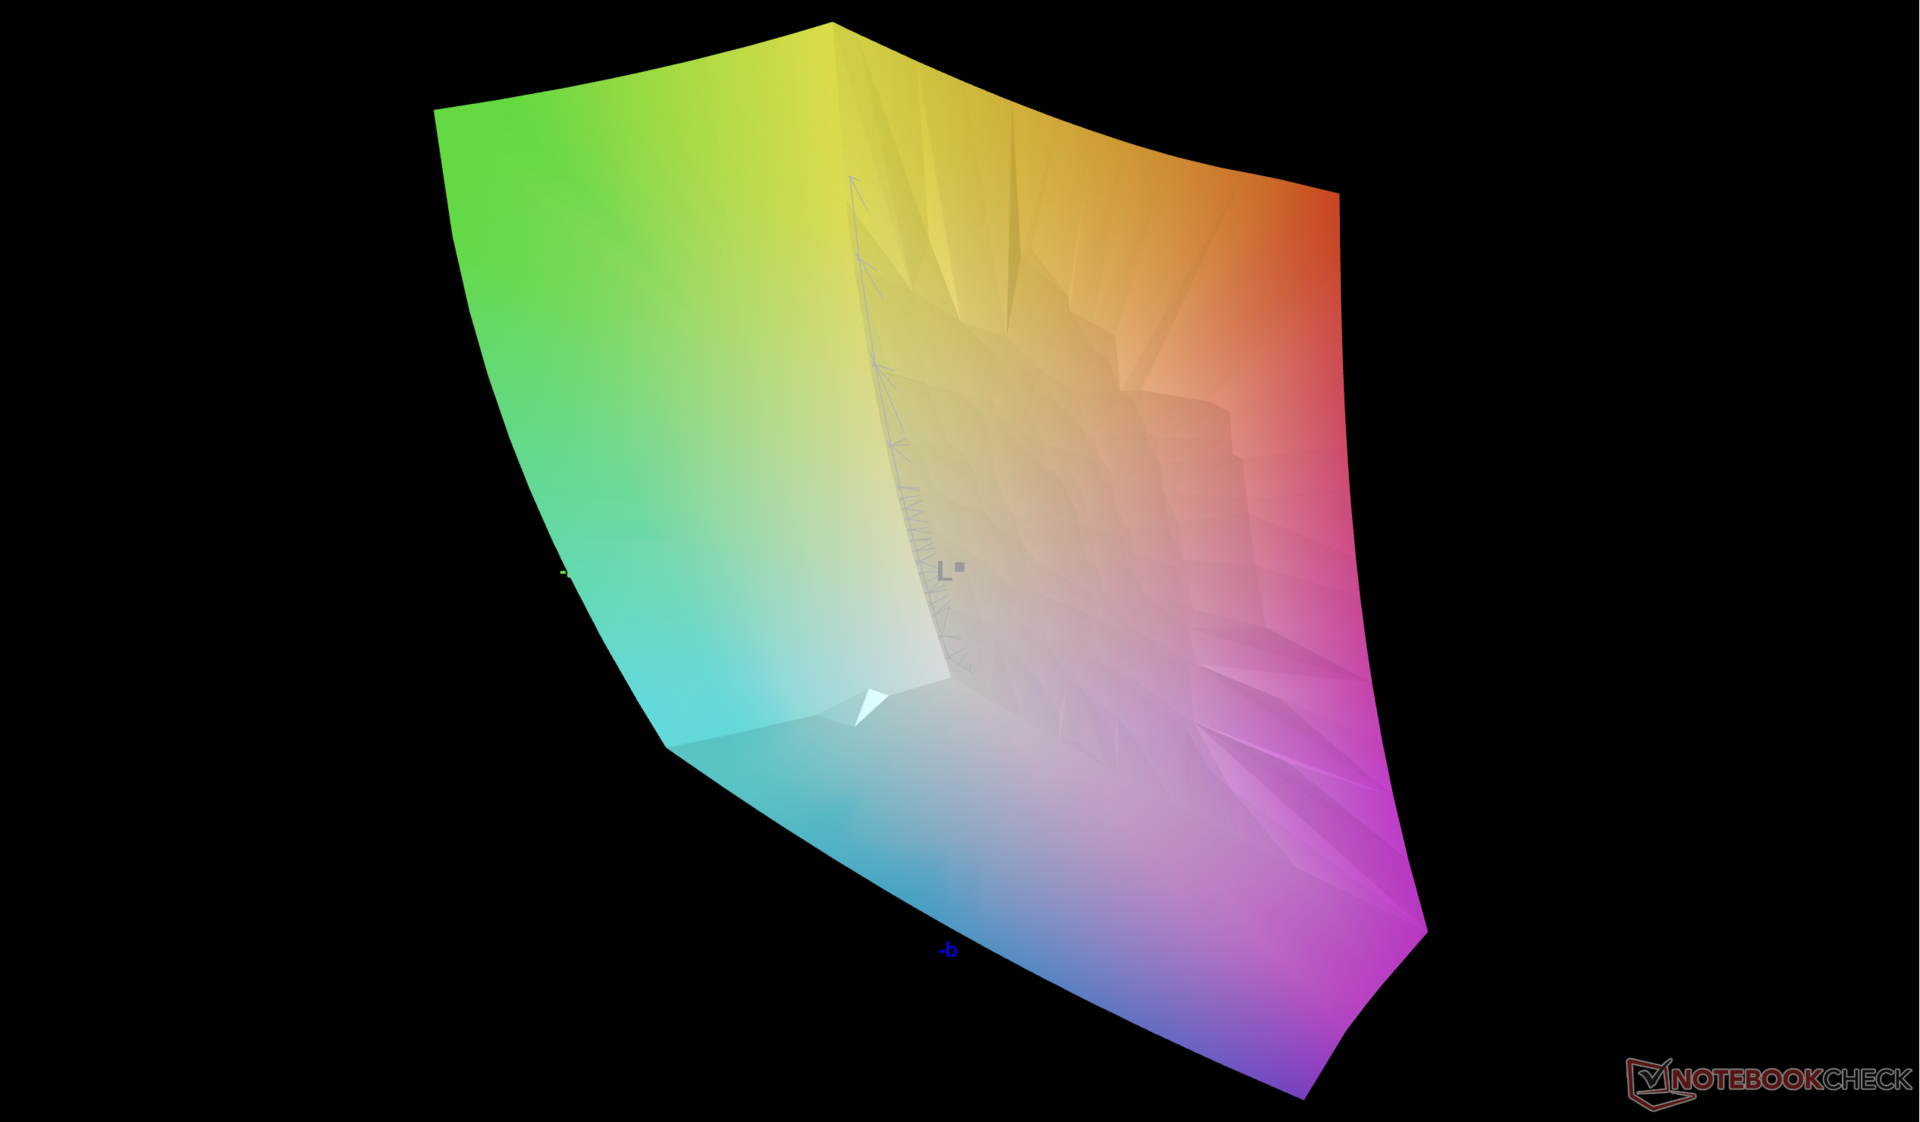
P3 标准完全符合宣传要求。sRGB 色彩的平均 DeltaE 灰度值和 ColorChecker 值分别仅为 2.6 和 1.53,非常准确,但 P3 色彩即使设置为 P3 模式也更加不准确。例如,色温设置为 P3 时,5600K 会自动变暖。在不同 GPU 模式之间切换时,P3 颜色的表现方式可能存在错误。
Display Response Times
| ↔ Response Time Black to White | ||
|---|---|---|
| 14 ms ... rise ↗ and fall ↘ combined | ↗ 6.6 ms rise | 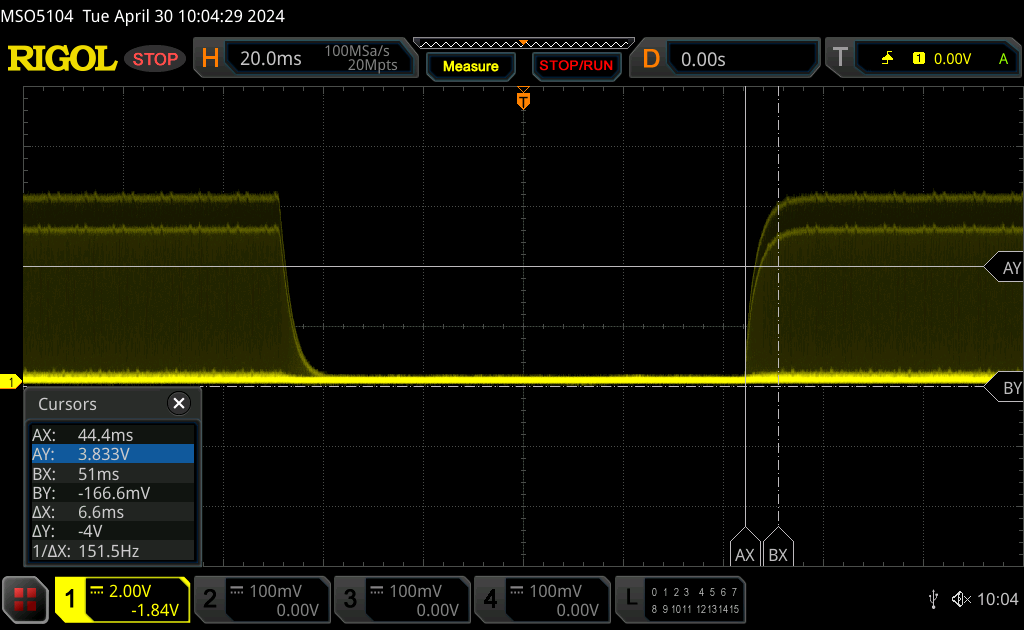 |
| ↘ 7.4 ms fall | ||
| The screen shows good response rates in our tests, but may be too slow for competitive gamers. In comparison, all tested devices range from 0.1 (minimum) to 240 (maximum) ms. » 34 % of all devices are better. This means that the measured response time is better than the average of all tested devices (19.8 ms). | ||
| ↔ Response Time 50% Grey to 80% Grey | ||
| 7.6 ms ... rise ↗ and fall ↘ combined | ↗ 3.6 ms rise | 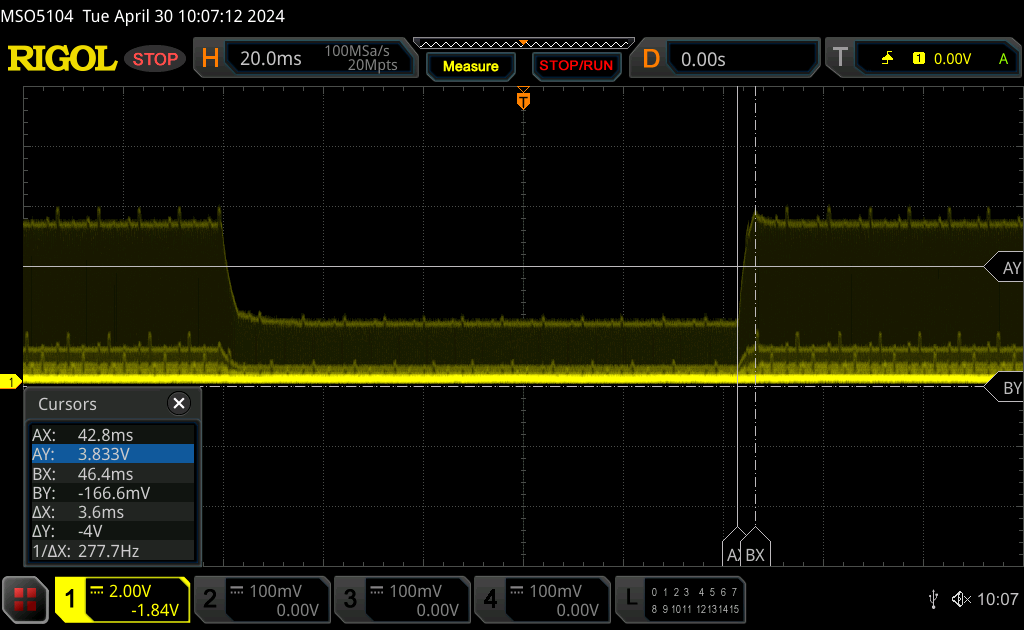 |
| ↘ 4 ms fall | ||
| The screen shows very fast response rates in our tests and should be very well suited for fast-paced gaming. In comparison, all tested devices range from 0.165 (minimum) to 636 (maximum) ms. » 20 % of all devices are better. This means that the measured response time is better than the average of all tested devices (31 ms). | ||
Screen Flickering / PWM (Pulse-Width Modulation)
| Screen flickering / PWM detected | 26444 Hz | ≤ 100 % brightness setting | 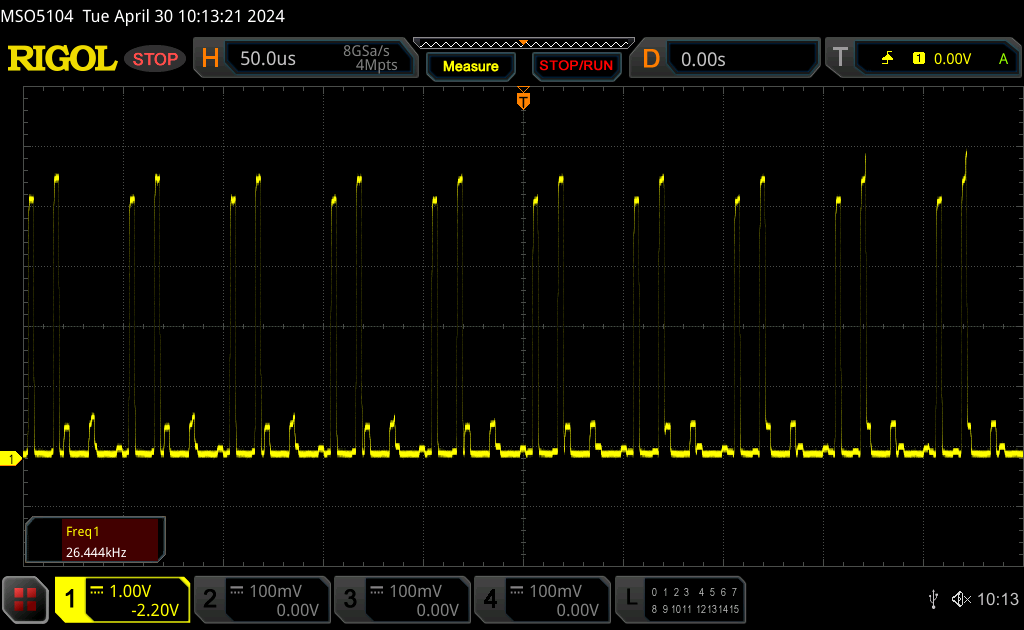 |
The display backlight flickers at 26444 Hz (worst case, e.g., utilizing PWM) Flickering detected at a brightness setting of 100 % and below. There should be no flickering or PWM above this brightness setting. The frequency of 26444 Hz is quite high, so most users sensitive to PWM should not notice any flickering. In comparison: 52 % of all tested devices do not use PWM to dim the display. If PWM was detected, an average of 7754 (minimum: 5 - maximum: 343500) Hz was measured. | |||
闪烁现象与其他配备微型 LED 选件的笔记本电脑非常相似。不过,其频率极高,因此不太可能对敏感用户造成眼睛疲劳。当亮度降低到 50% 以下时,闪烁的强度也会明显降低,因此降低亮度也不失为一个好主意。

在阴凉处的室外能见度也不错,尤其是哑光覆盖层能最大限度地减少眩光。不过,仍应避免阳光直射,以获得最佳的观看体验。
性能 - 一如既往
测试条件
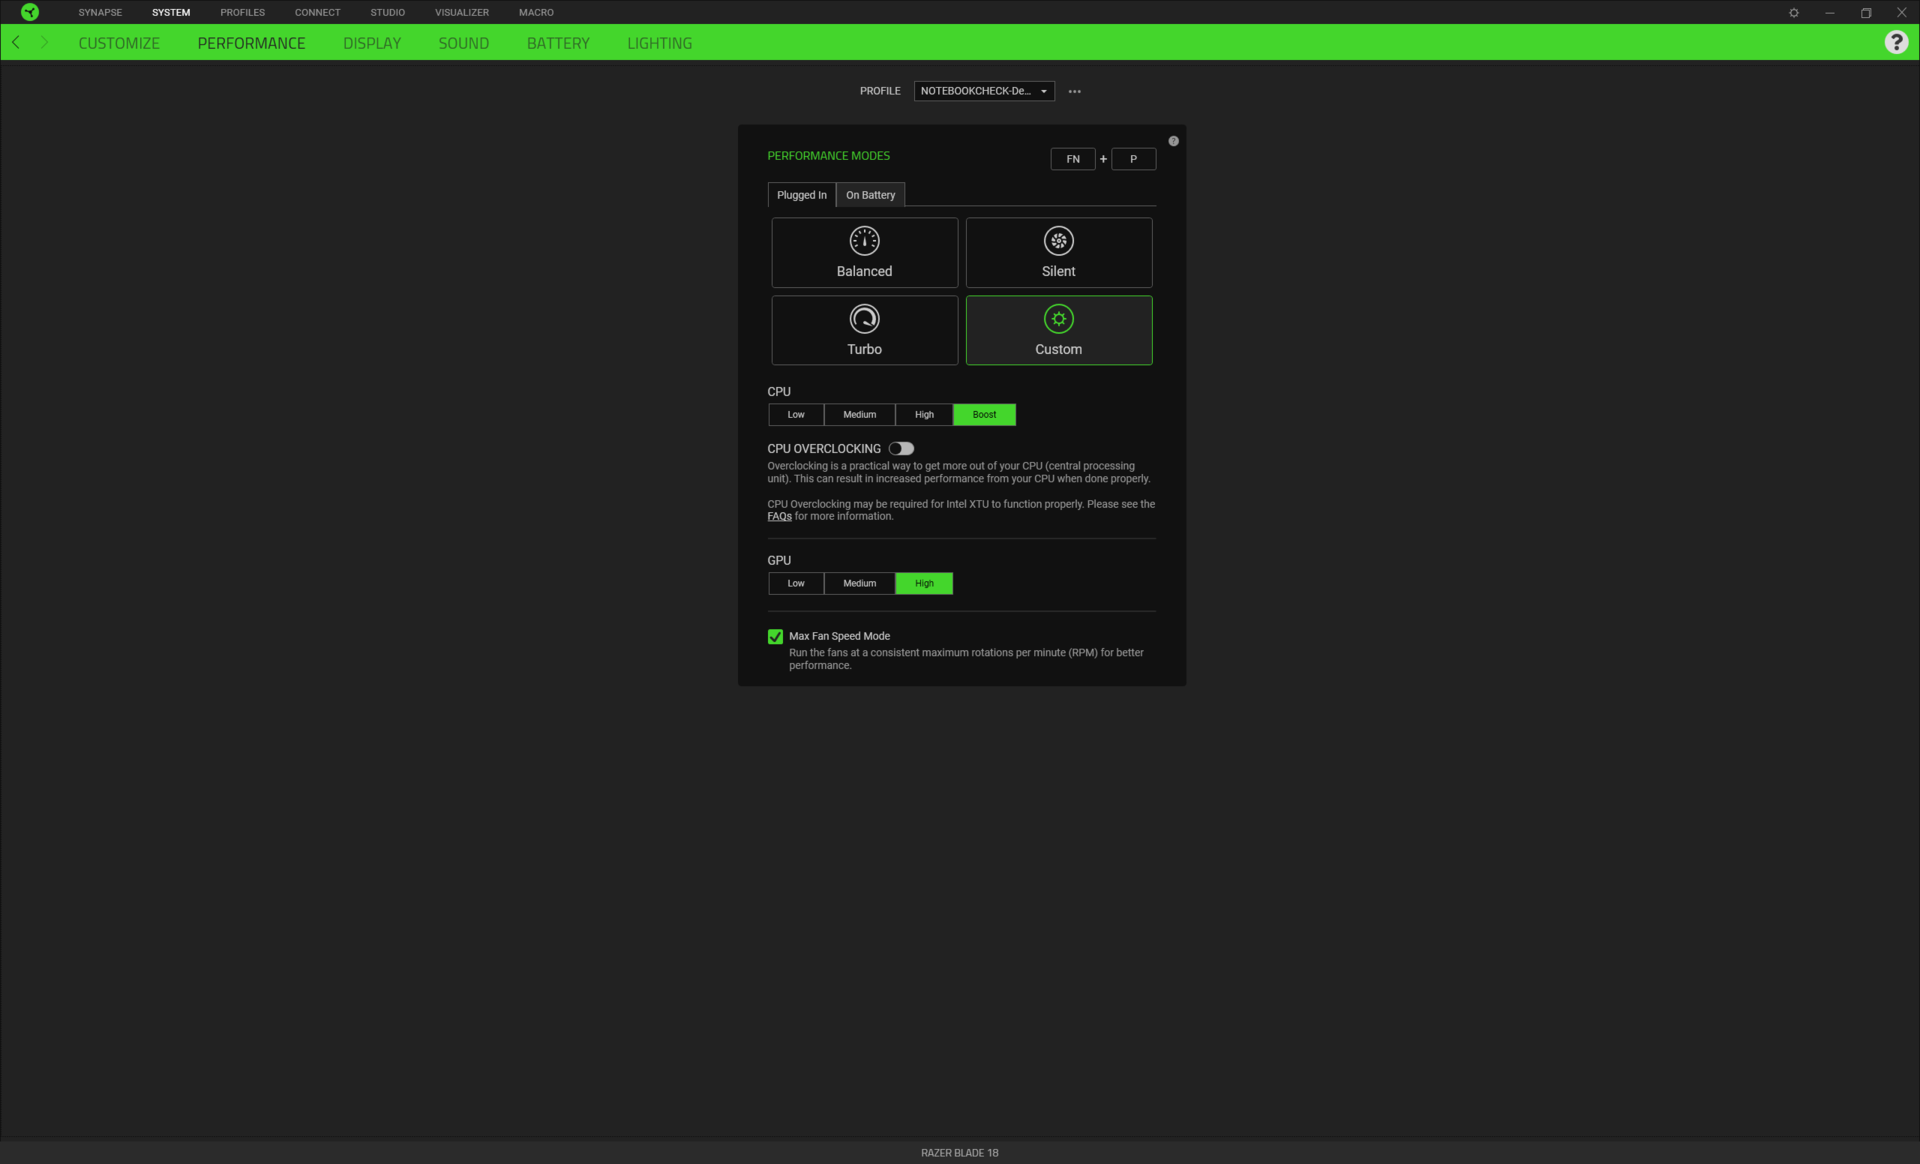
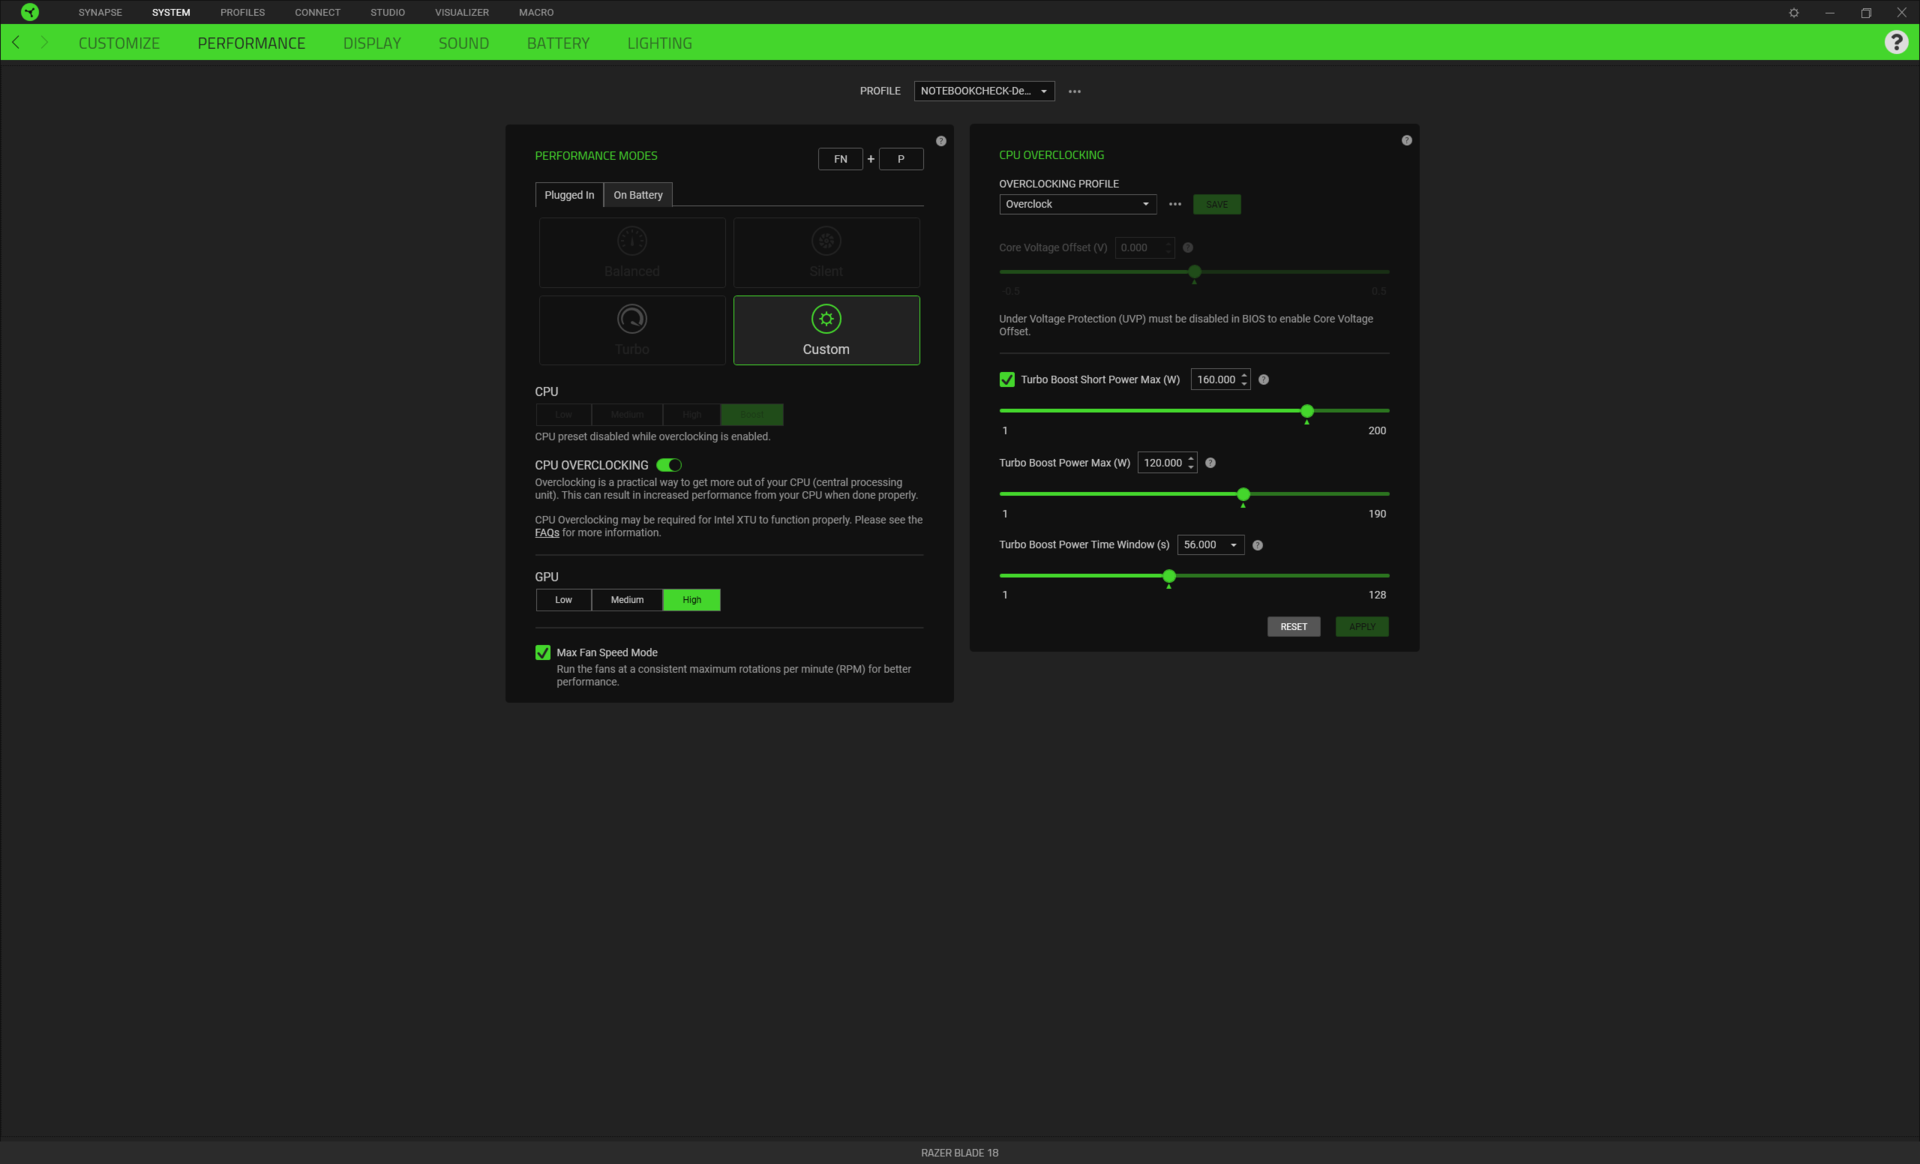
Razer 不断更新 Synapse,增加新的功能和复选框,以改进自定义功能。今年新增了 Turbo 模式、最大风扇模式以及色彩配置文件和调整刷新率热键等集成显示功能。请注意,正如我们下面的测试所显示的那样,新的 Turbo 模式基本上等同于自定义模式。Razer 表示,他们添加 Turbo 模式是为了让用户更容易选择 "最佳 "游戏模式,但我们认为这可能会产生相反的效果,因为现在有太多令人困惑的模式可供选择。除非另有说明,否则我们下面的所有测试都是在 "自定义 "模式下进行的,CPU 和 GPU 分别设置为 "加速 "和 "高"。
也许最重要的功能是 "显示 "选项卡下的本地调光切换。有趣的是,尽管局部调光是 mini-LED 的主要卖点之一,但 Razer 默认关闭了这一功能。如上所述,切换该功能会极大地影响 HDR 模式下的亮度水平。
处理器
而从第 12 代 酷睿 i9-12900HX到第 13 代 酷睿 i9-13900HX性能提升 25% 至 30%,而从第 13 代酷睿 i9-13900HX 跳转到第 14 代 酷睿 i9-14900HX 基本上是一条平线。在单线程和多线程工作负载中,2023 和 2024 Blade 18 型号之间的基准测试结果相差 5 个百分点。i9-14900HX 被非正式地描述为 i9-13900HX 的换代产品,我们的数据也反映了这一点。
| 性能参数 | CineBench R23 xT 分数(分) | CPU 持续功耗水平(瓦) | 赛博朋克 2077 QHD 超高清(FPS) |
| 均衡 | 14269 | 55 -> 45 | 65.13 |
| 涡轮 | 27029 | 135 -> 125 | 84.69 |
| 定制/最大风扇开启 | 27167 | 135 -> 125 | 85.46 |
有趣的是,我们的 Razer 系统的 CPU 运算结果会比大多数采用相同 CPU 的其他游戏笔记本电脑稍慢,但始终如一,例如 Alienware m18 R2或微星 Titan 18 HX。我们怀疑这是故意为之,以便通过 Synapse 软件获得更大的超频空间。 如上表所示,CPU Turbo Boost 性能和 TDP 水平与不同的电源配置文件相关联。
Cinebench R15 Multi Loop
Cinebench R23: Multi Core | Single Core
Cinebench R20: CPU (Multi Core) | CPU (Single Core)
Cinebench R15: CPU Multi 64Bit | CPU Single 64Bit
Blender: v2.79 BMW27 CPU
7-Zip 18.03: 7z b 4 | 7z b 4 -mmt1
Geekbench 6.7: Multi-Core | Single-Core
Geekbench 5.5: Multi-Core | Single-Core
HWBOT x265 Benchmark v2.2: 4k Preset
LibreOffice : 20 Documents To PDF
R Benchmark 2.5: Overall mean
* ... smaller is better
AIDA64: FP32 Ray-Trace | FPU Julia | CPU SHA3 | CPU Queen | FPU SinJulia | FPU Mandel | CPU AES | CPU ZLib | FP64 Ray-Trace | CPU PhotoWorxx
| Performance rating | |
| Asus ROG Strix Scar 17 G733PYV-LL053X | |
| Alienware m18 R2 | |
| MSI Titan 18 HX A14VIG | |
| Razer Blade 16 2024, RTX 4090 | |
| Asus ROG Strix Scar 18 G834JYR (2024) | |
| Average of class Gaming | |
| Razer Blade 18 2024 RZ09-0509 | |
| Average Intel Core i9-14900HX | |
| AIDA64 / FP32 Ray-Trace | |
| Asus ROG Strix Scar 17 G733PYV-LL053X | |
| Average of class Gaming (10227 - 85542, n=105, last 2 years) | |
| MSI Titan 18 HX A14VIG | |
| Alienware m18 R2 | |
| Razer Blade 16 2024, RTX 4090 | |
| Asus ROG Strix Scar 18 G834JYR (2024) | |
| Razer Blade 18 2024 RZ09-0509 | |
| Average Intel Core i9-14900HX (13098 - 33474, n=36) | |
| AIDA64 / FPU Julia | |
| Asus ROG Strix Scar 17 G733PYV-LL053X | |
| MSI Titan 18 HX A14VIG | |
| Alienware m18 R2 | |
| Average of class Gaming (51376 - 238426, n=105, last 2 years) | |
| Asus ROG Strix Scar 18 G834JYR (2024) | |
| Razer Blade 18 2024 RZ09-0509 | |
| Razer Blade 16 2024, RTX 4090 | |
| Average Intel Core i9-14900HX (67573 - 166040, n=36) | |
| AIDA64 / CPU SHA3 | |
| Asus ROG Strix Scar 17 G733PYV-LL053X | |
| MSI Titan 18 HX A14VIG | |
| Alienware m18 R2 | |
| Average of class Gaming (2180 - 10115, n=105, last 2 years) | |
| Asus ROG Strix Scar 18 G834JYR (2024) | |
| Razer Blade 16 2024, RTX 4090 | |
| Razer Blade 18 2024 RZ09-0509 | |
| Average Intel Core i9-14900HX (3589 - 7979, n=36) | |
| AIDA64 / CPU Queen | |
| Asus ROG Strix Scar 17 G733PYV-LL053X | |
| MSI Titan 18 HX A14VIG | |
| Asus ROG Strix Scar 18 G834JYR (2024) | |
| Alienware m18 R2 | |
| Razer Blade 16 2024, RTX 4090 | |
| Average Intel Core i9-14900HX (118405 - 148966, n=36) | |
| Razer Blade 18 2024 RZ09-0509 | |
| Average of class Gaming (49785 - 173351, n=90, last 2 years) | |
| AIDA64 / FPU SinJulia | |
| Asus ROG Strix Scar 17 G733PYV-LL053X | |
| MSI Titan 18 HX A14VIG | |
| Alienware m18 R2 | |
| Asus ROG Strix Scar 18 G834JYR (2024) | |
| Razer Blade 16 2024, RTX 4090 | |
| Razer Blade 18 2024 RZ09-0509 | |
| Average Intel Core i9-14900HX (10475 - 18517, n=36) | |
| Average of class Gaming (4424 - 33636, n=105, last 2 years) | |
| AIDA64 / FPU Mandel | |
| Asus ROG Strix Scar 17 G733PYV-LL053X | |
| Average of class Gaming (25115 - 128721, n=105, last 2 years) | |
| Alienware m18 R2 | |
| MSI Titan 18 HX A14VIG | |
| Razer Blade 16 2024, RTX 4090 | |
| Asus ROG Strix Scar 18 G834JYR (2024) | |
| Razer Blade 18 2024 RZ09-0509 | |
| Average Intel Core i9-14900HX (32543 - 83662, n=36) | |
| AIDA64 / CPU AES | |
| Asus ROG Strix Scar 17 G733PYV-LL053X | |
| Average Intel Core i9-14900HX (86964 - 241777, n=36) | |
| MSI Titan 18 HX A14VIG | |
| Alienware m18 R2 | |
| Razer Blade 16 2024, RTX 4090 | |
| Asus ROG Strix Scar 18 G834JYR (2024) | |
| Razer Blade 18 2024 RZ09-0509 | |
| Average of class Gaming (39258 - 247074, n=105, last 2 years) | |
| AIDA64 / CPU ZLib | |
| MSI Titan 18 HX A14VIG | |
| Alienware m18 R2 | |
| Asus ROG Strix Scar 17 G733PYV-LL053X | |
| Razer Blade 16 2024, RTX 4090 | |
| Razer Blade 18 2024 RZ09-0509 | |
| Average Intel Core i9-14900HX (1054 - 2292, n=36) | |
| Asus ROG Strix Scar 18 G834JYR (2024) | |
| Average of class Gaming (574 - 2531, n=105, last 2 years) | |
| AIDA64 / FP64 Ray-Trace | |
| Asus ROG Strix Scar 17 G733PYV-LL053X | |
| Average of class Gaming (5509 - 45446, n=105, last 2 years) | |
| Alienware m18 R2 | |
| MSI Titan 18 HX A14VIG | |
| Razer Blade 16 2024, RTX 4090 | |
| Razer Blade 18 2024 RZ09-0509 | |
| Asus ROG Strix Scar 18 G834JYR (2024) | |
| Average Intel Core i9-14900HX (6809 - 18349, n=36) | |
| AIDA64 / CPU PhotoWorxx | |
| Alienware m18 R2 | |
| Asus ROG Strix Scar 18 G834JYR (2024) | |
| Razer Blade 16 2024, RTX 4090 | |
| Razer Blade 18 2024 RZ09-0509 | |
| Average Intel Core i9-14900HX (23903 - 54702, n=36) | |
| Average of class Gaming (12271 - 89891, n=105, last 2 years) | |
| Asus ROG Strix Scar 17 G733PYV-LL053X | |
| MSI Titan 18 HX A14VIG | |
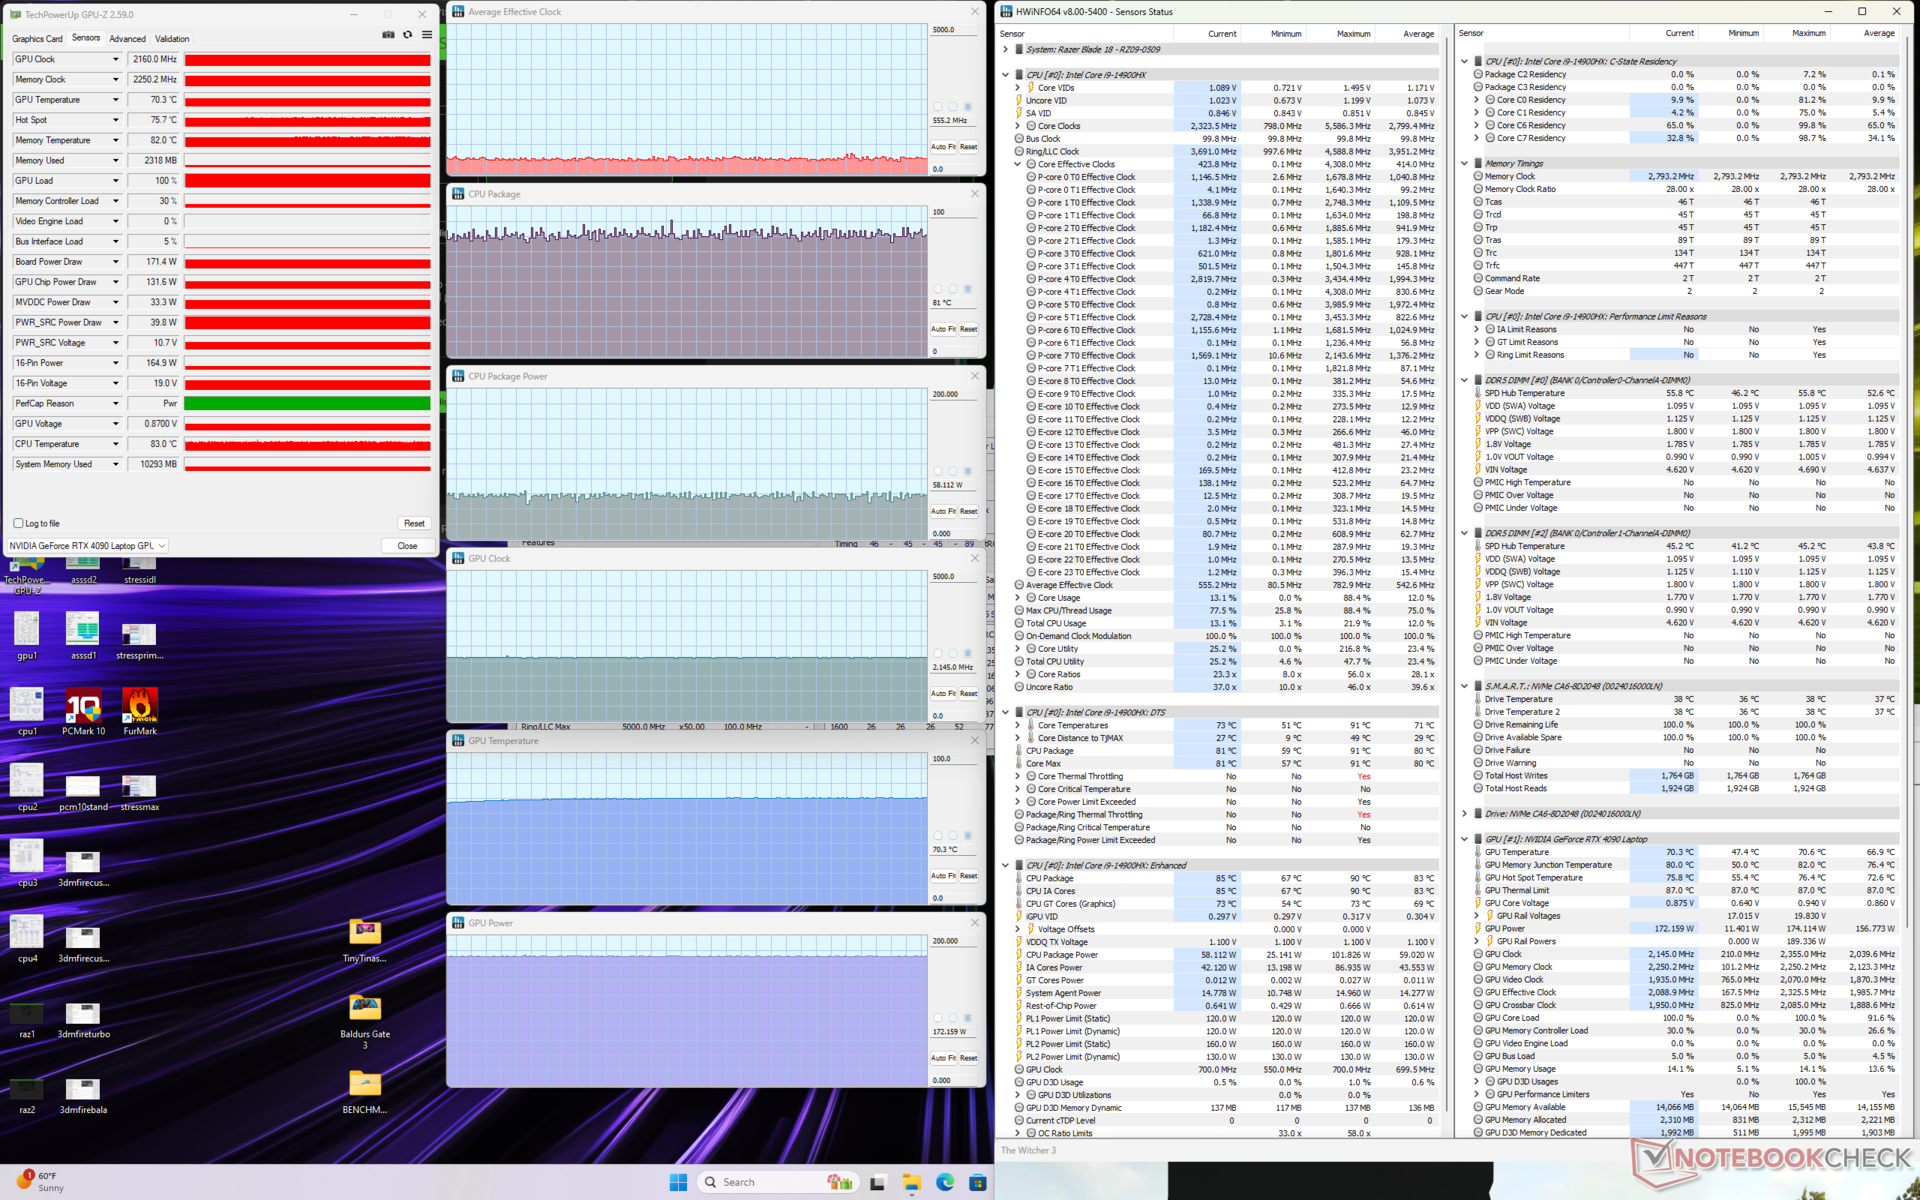
压力测试
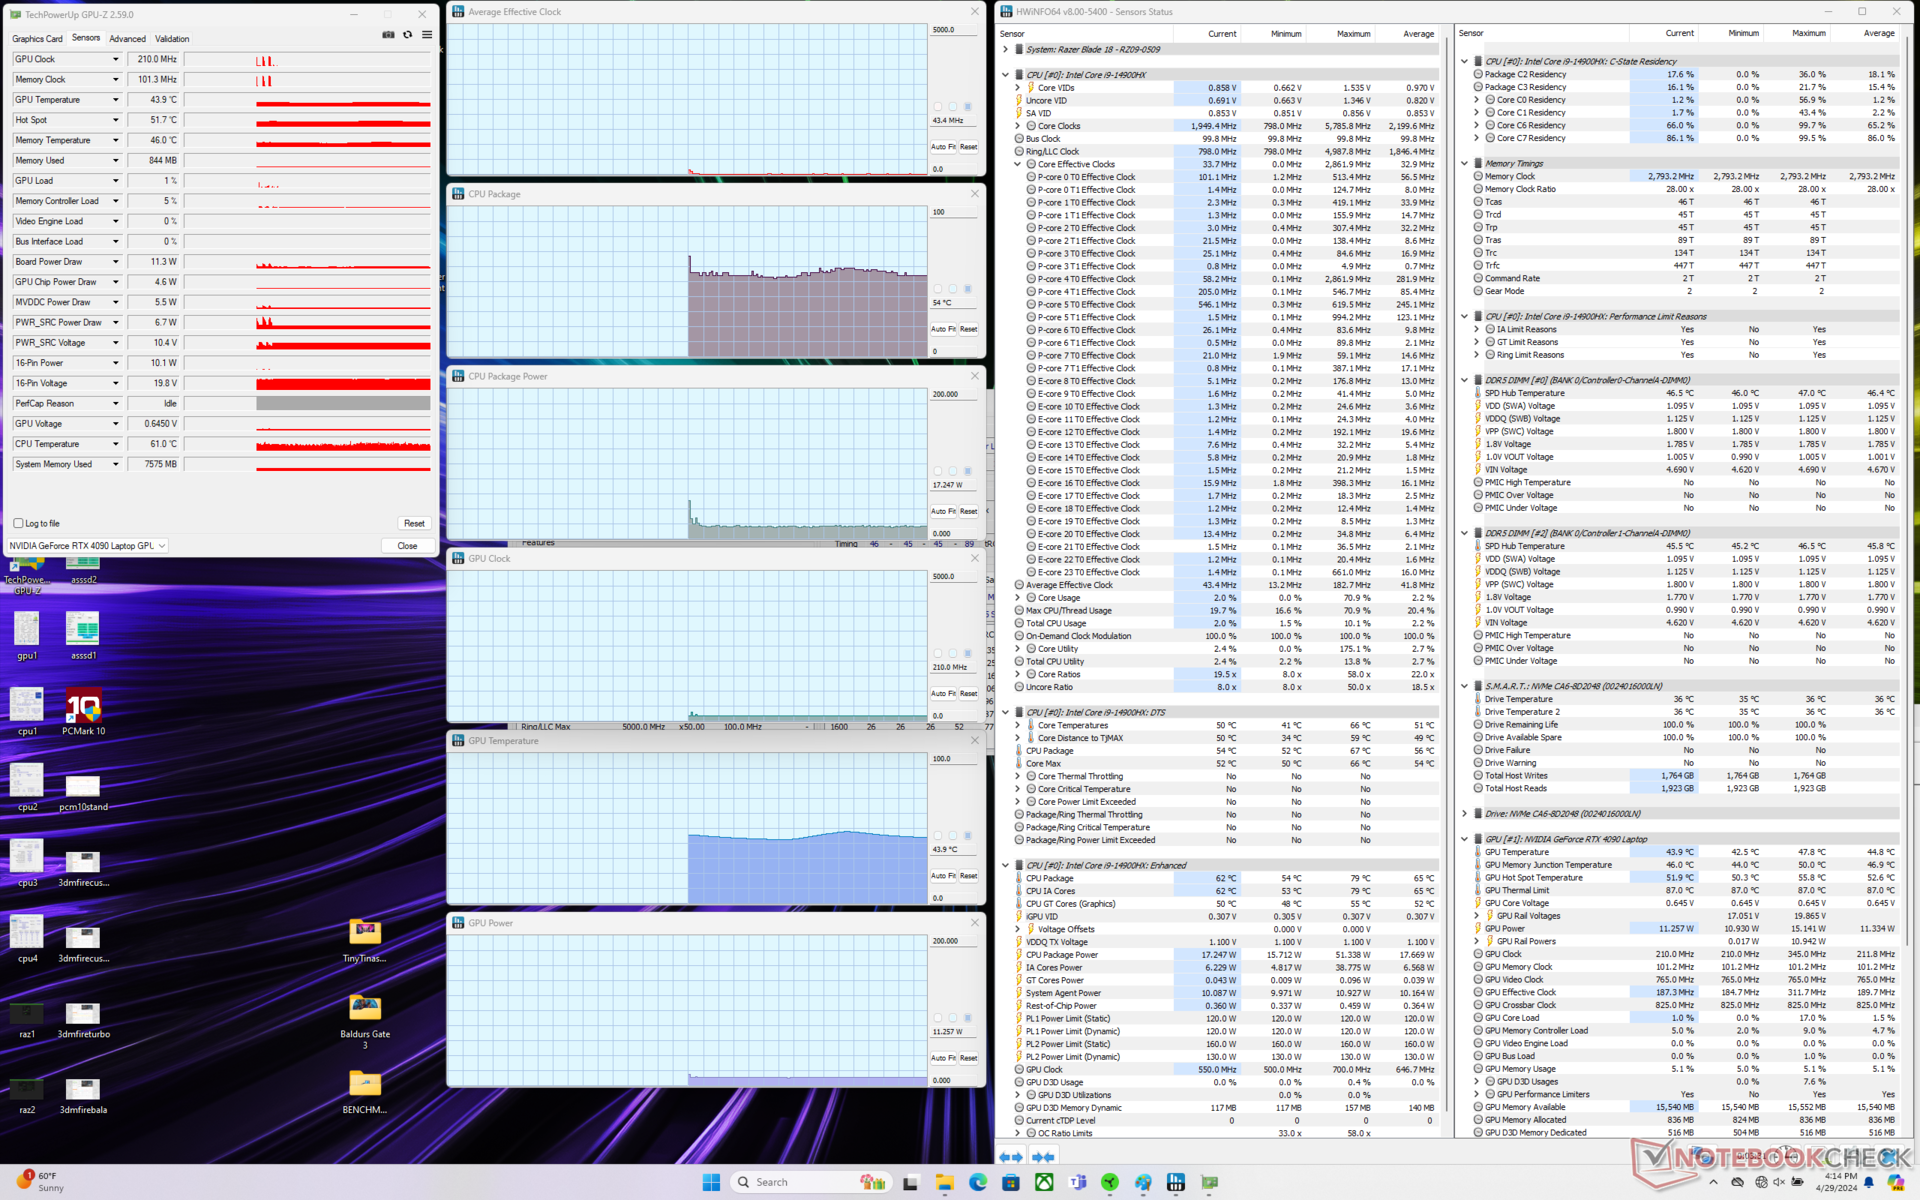
运行 Prime95 时的 CPU 功耗稳定在 117 W 左右,非常接近我们去年在 Blade 18 上记录的 114 W。 酷睿 i9-13950HX.
运行 Witcher 3显示最大风扇开启和最大风扇关闭之间没有重大性能差异,因为 GPU 板功耗几乎保持不变,稳定在 172 瓦。CPU 和 GPU 的温度将分别稳定在 80 C 和 74 C,而重量更大、速度更快的 Alienware m18 R2 则分别为 87 C 和 64 C。
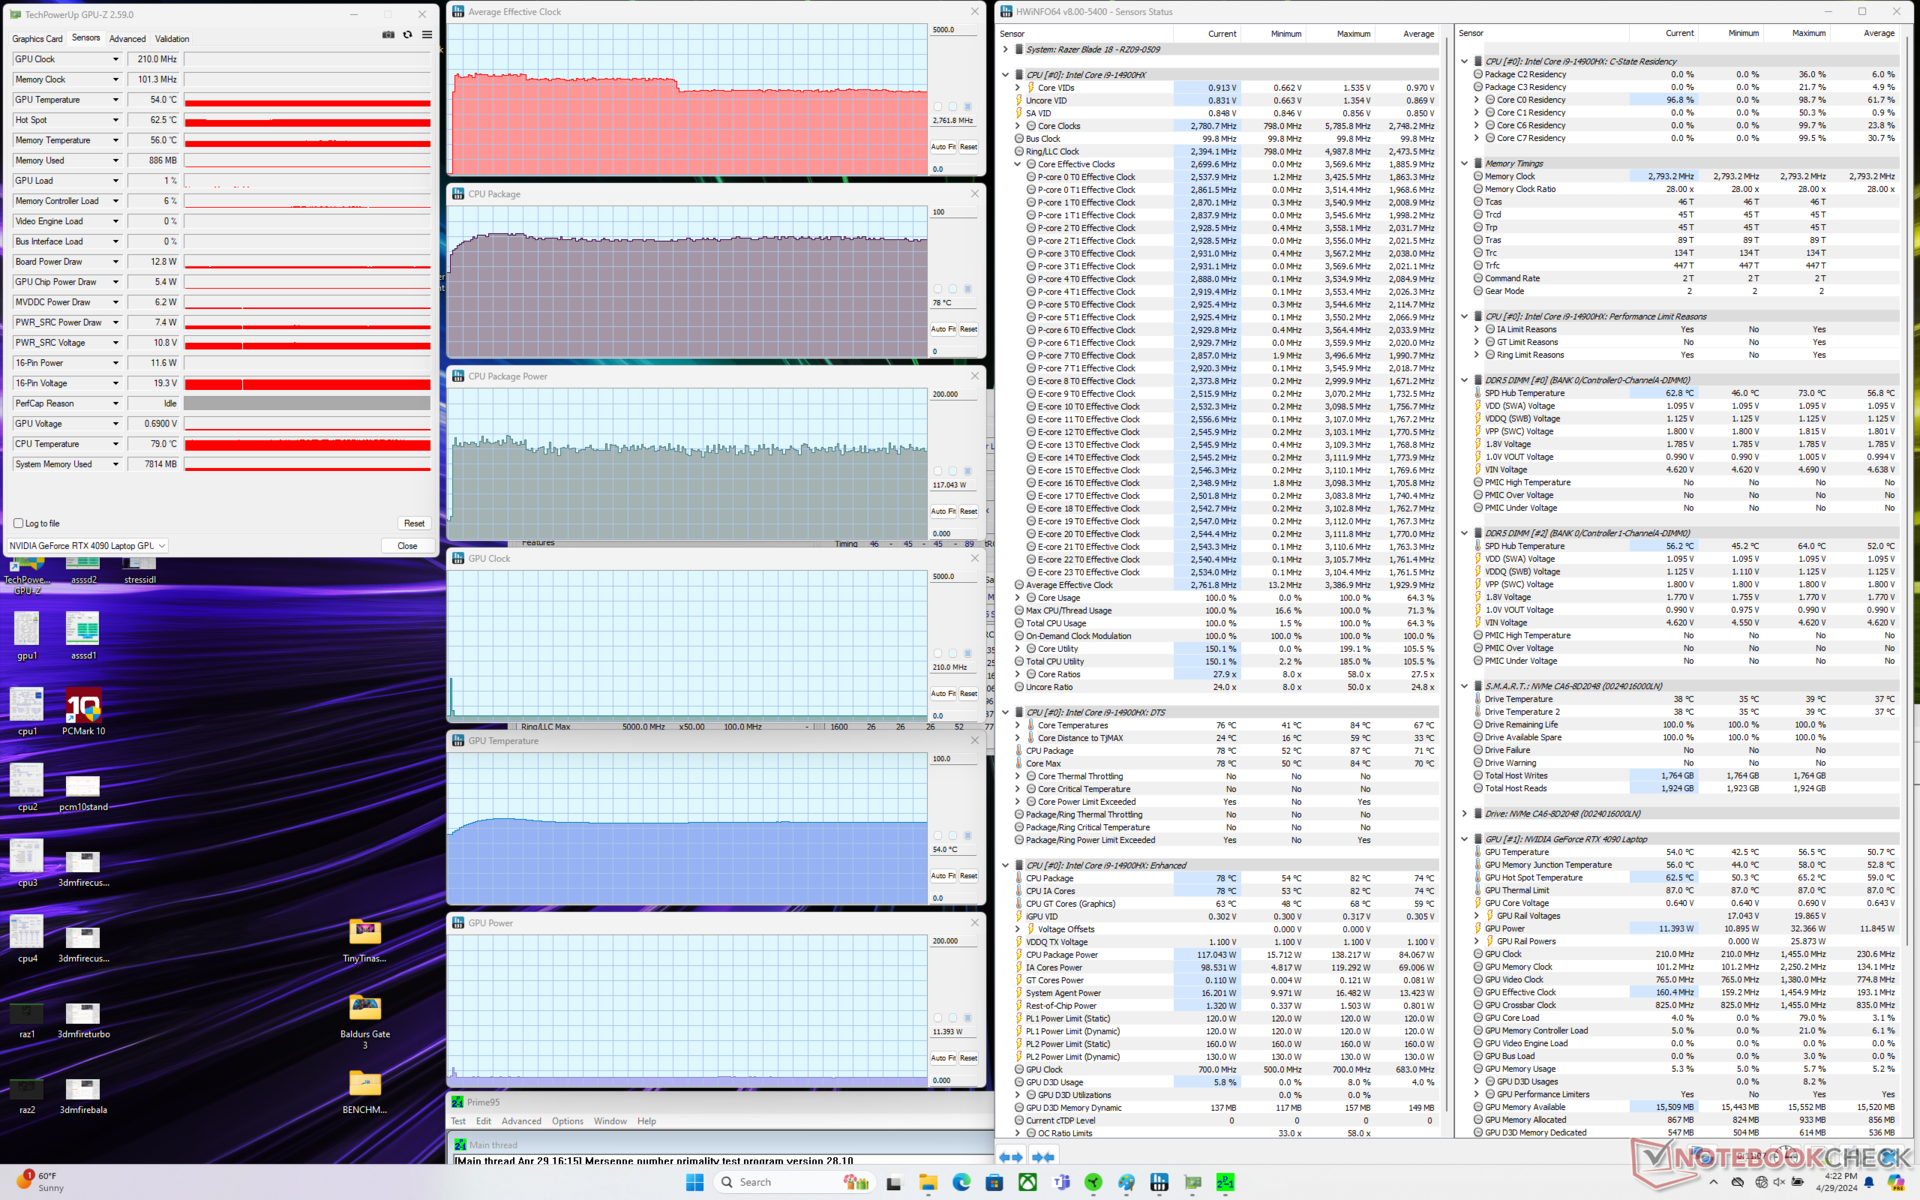
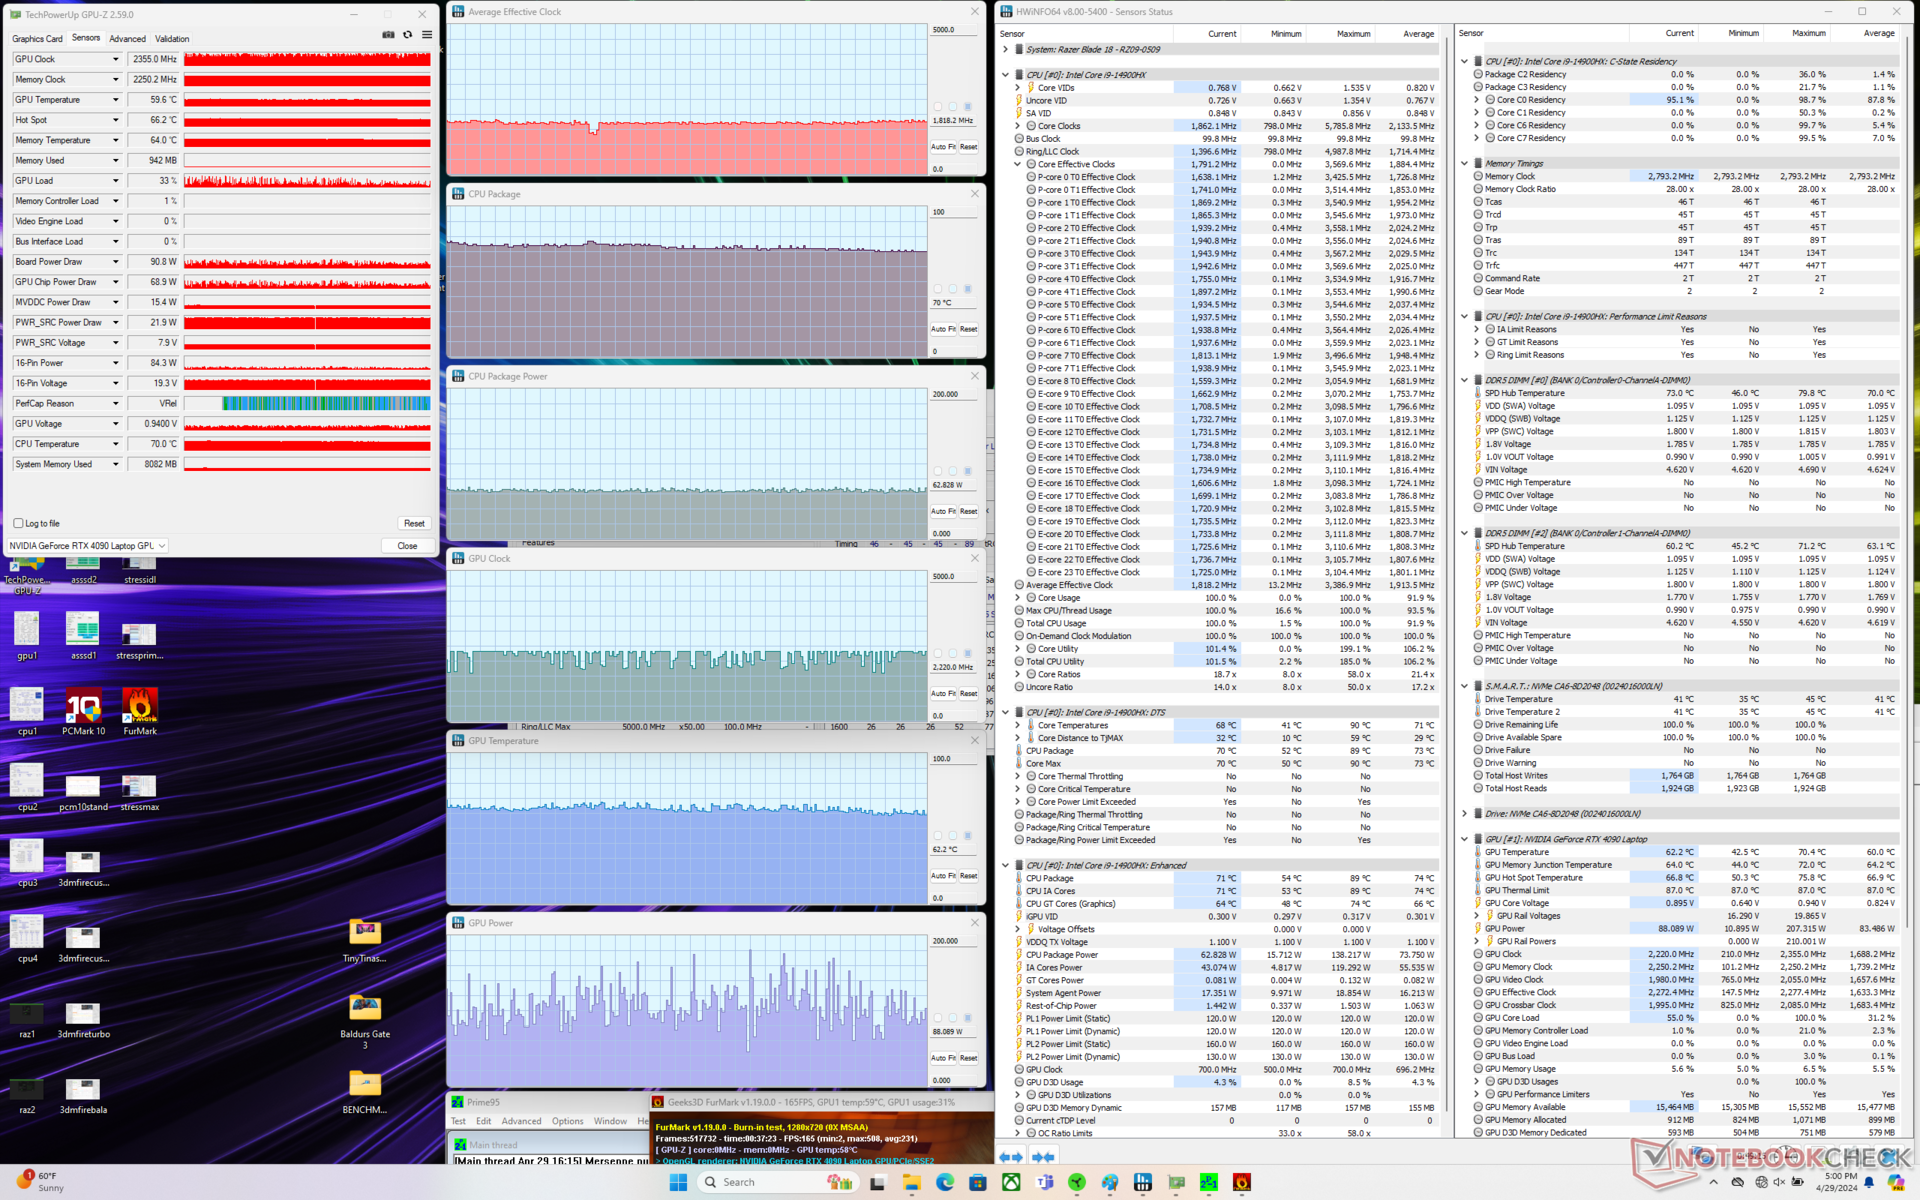
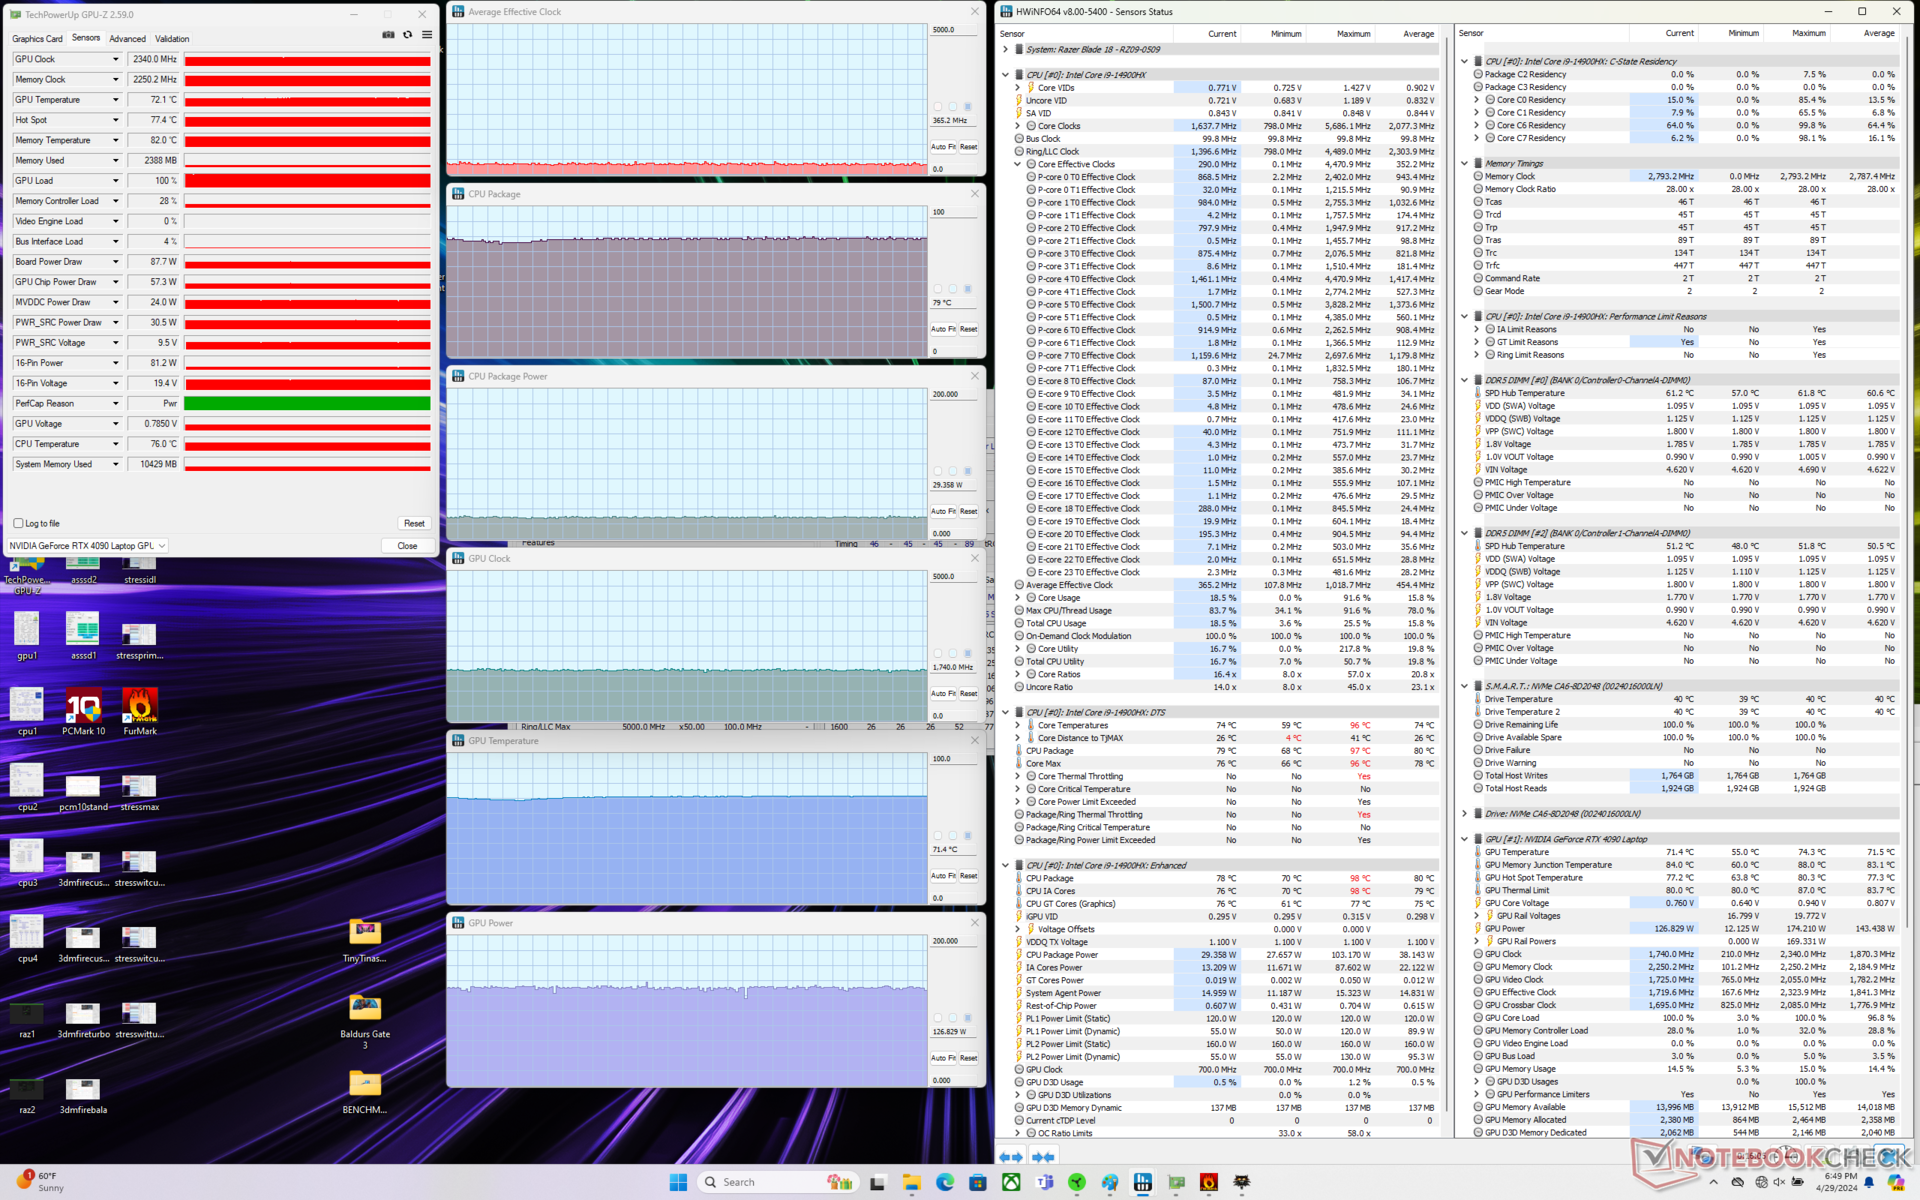
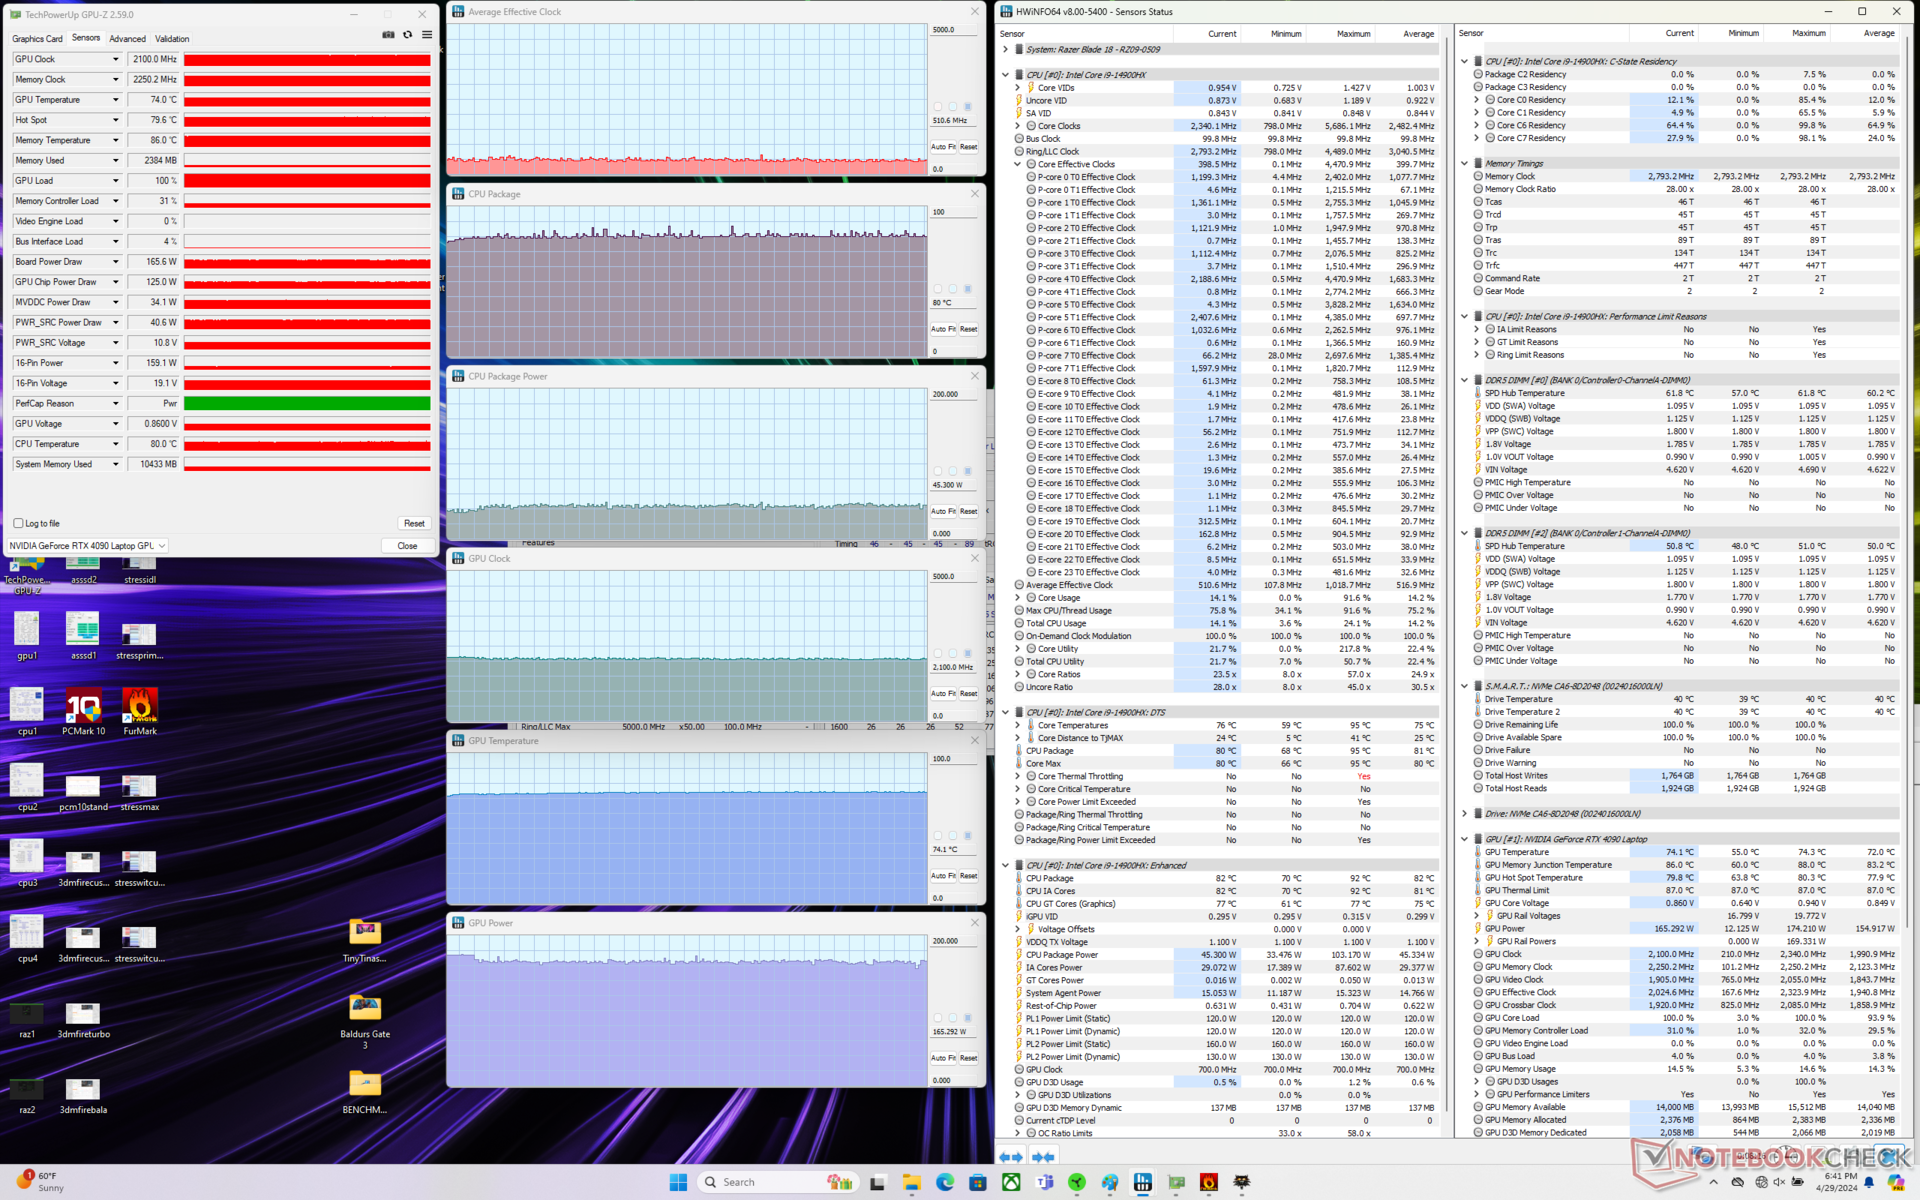
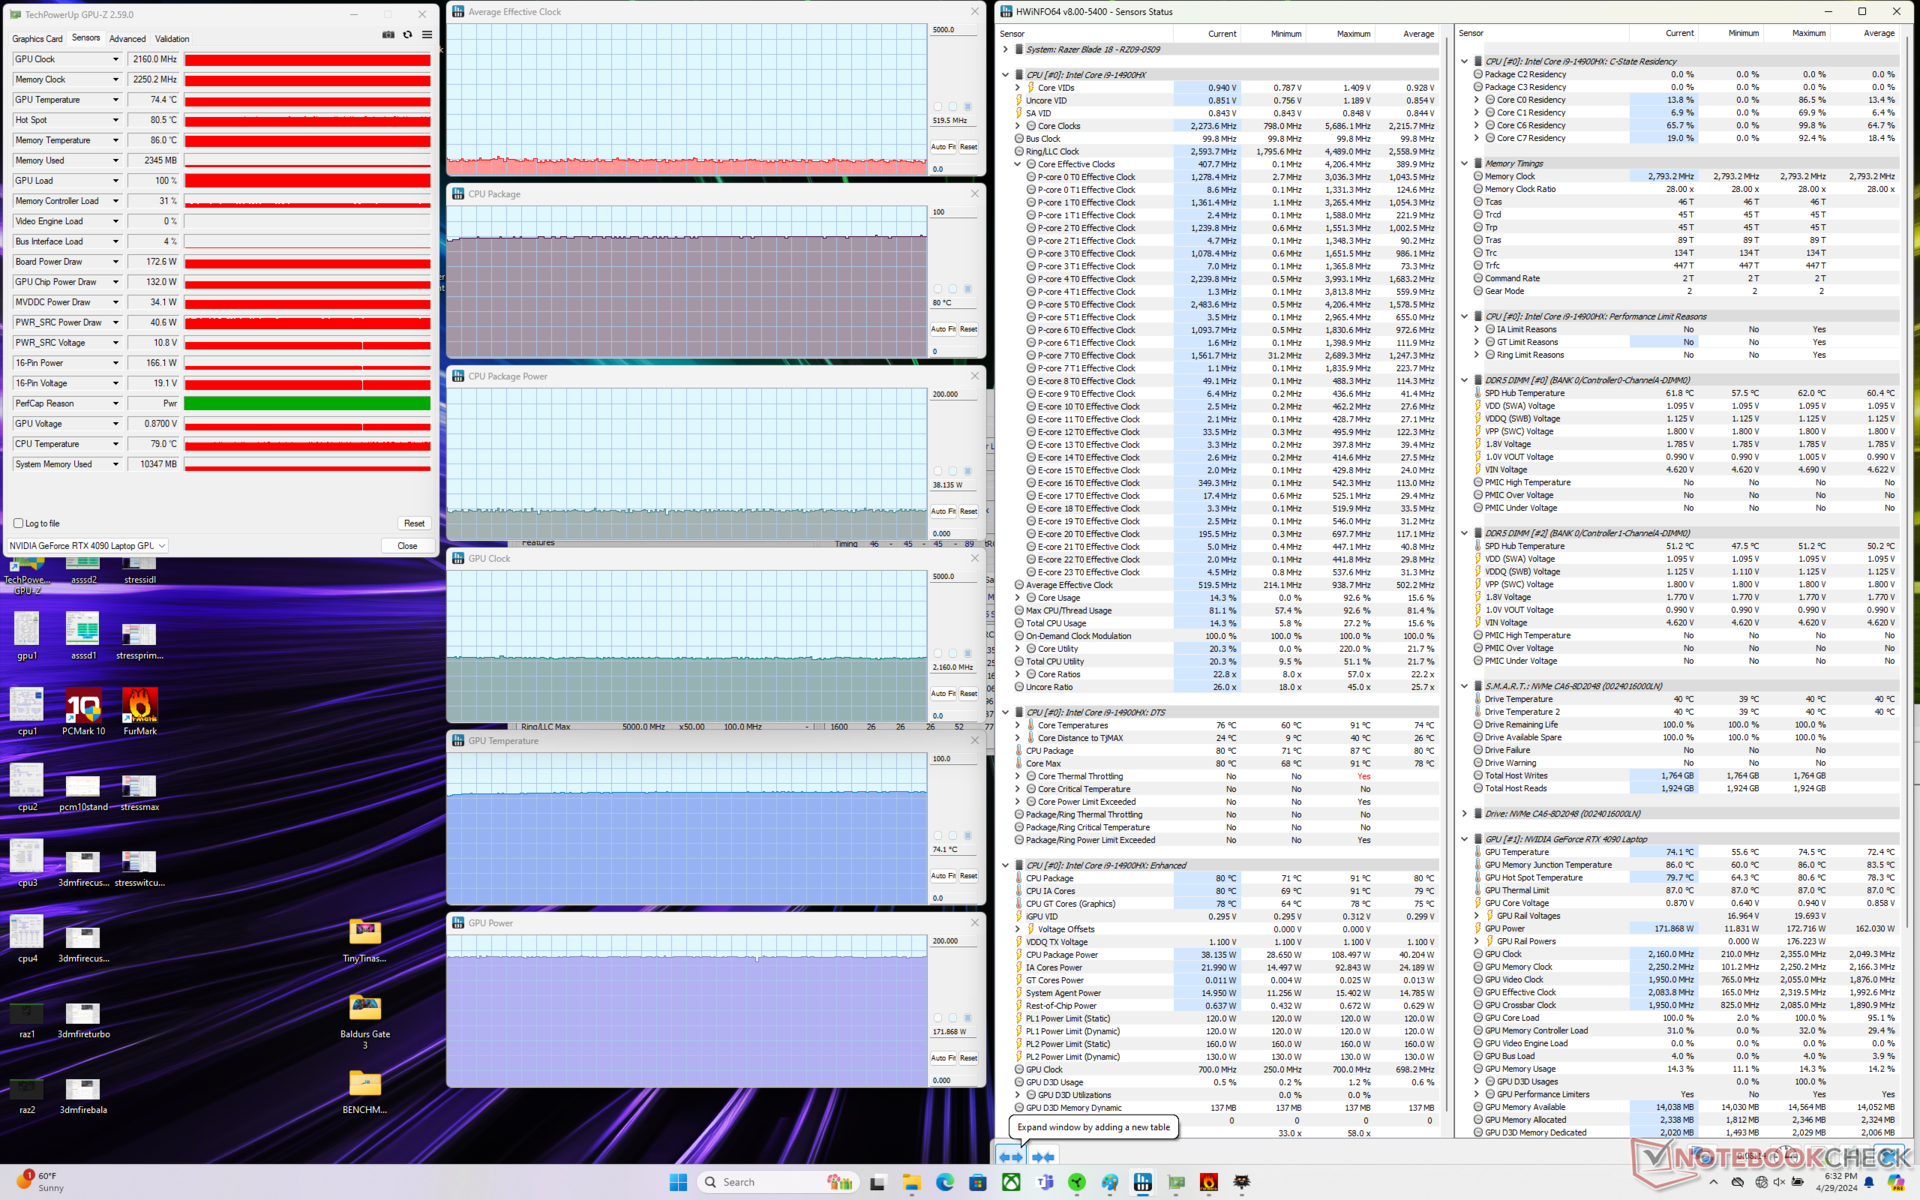
| CPU 平均有效时钟 (GHz) | GPU 时钟 (MHz) | CPU 平均温度 (°C) | GPU 平均温度 (°C) | GPU 板功耗 | |
| 系统闲置 | -- | -- | 54 | 44 | -- |
| Prime95 压力 | 2.8 | -- | 78 | 54 | -- |
| Prime95 + FurMark Stress | 1.8 | 1515 - 2340 | 70 | 62 | 42 - 181 |
| Witcher 3 压力(自定义模式,最大风扇打开) | ~0.6 | 2145 | 81 | 70 | 172 |
| Witcher 3 压力(自定义模式,最大风扇关闭) | ~0.5 | 2160 | 80 | 74 | 172 |
| Witcher 3 压力(涡轮增压模式) | ~0.5 | 2100 | 80 | 74 | 165 |
| Witcher 3 压力(平衡模式) | ~0.4 | 1740 | 79 | 71 | 127 |
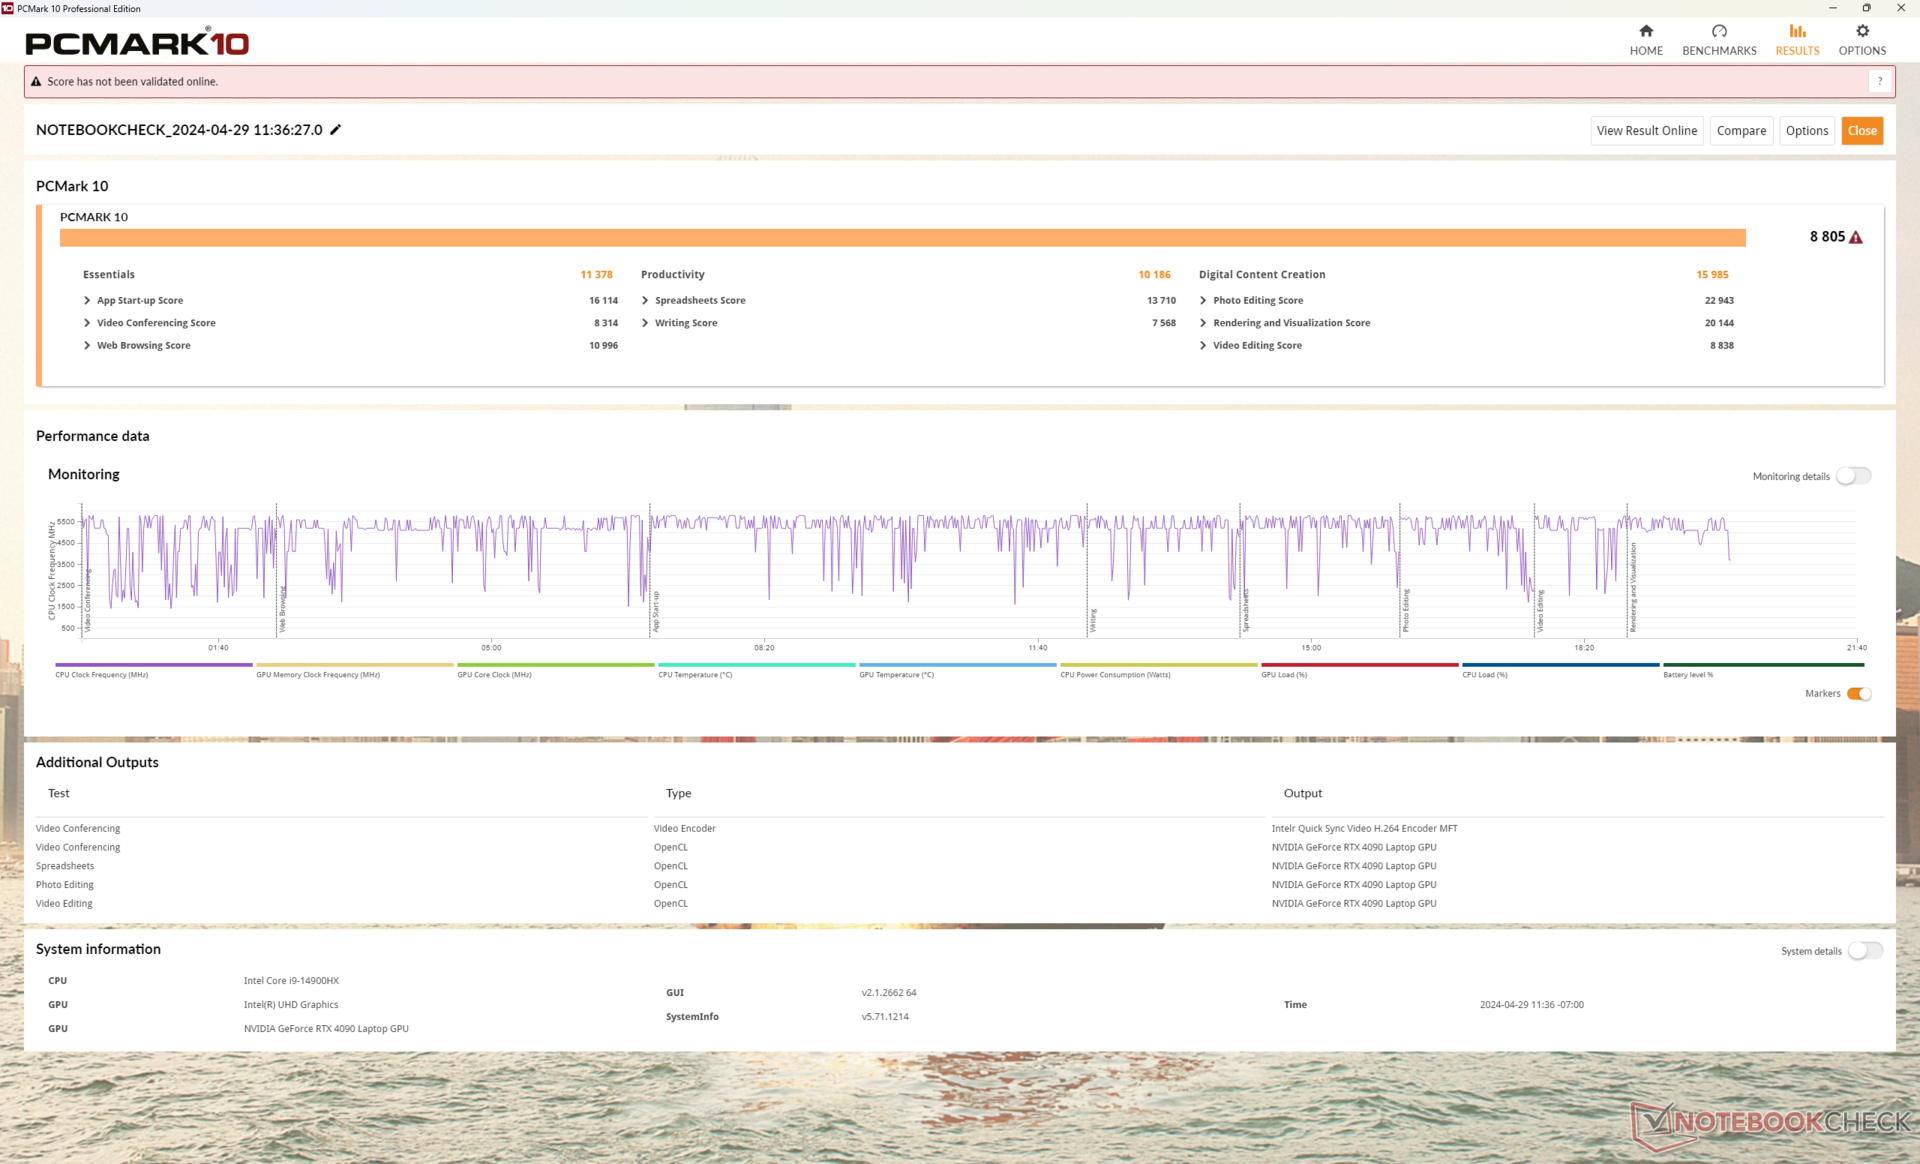
系统性能
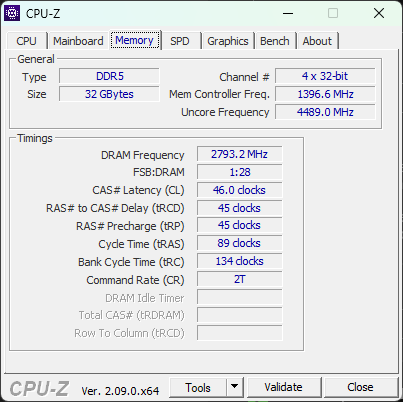
PCMark 分数与采用类似 Raptor Lake-HX CPU 和GeForce RTX 4090 GPU 的其他游戏笔记本电脑相当,包括采用较老 Core i9-13900HX 处理器的系统。 酷睿 i9-13900HX.内存速度与 2023 型号相比没有变化。
当系统进入睡眠模式时,我们遇到了几个错误。当设置为 dGPU 模式时,系统在睡眠模式下的运行温度会持续很高。如果设置为 Optimus 模式,系统会正常进入睡眠模式。从睡眠模式唤醒时,屏幕有时也会冻结几秒钟。
同时,我们在 2023 机型上遇到的 G-Sync 问题在 2024 机型上没有出现。
CrossMark: Overall | Productivity | Creativity | Responsiveness
WebXPRT 3: Overall
WebXPRT 4: Overall
Mozilla Kraken 1.1: Total
| PCMark 10 / Score | |
| Alienware m18 R2 | |
| Asus ROG Strix Scar 17 G733PYV-LL053X | |
| MSI Titan 18 HX A14VIG | |
| Razer Blade 18 2024 RZ09-0509 | |
| Asus ROG Strix Scar 18 G834JYR (2024) | |
| Average Intel Core i9-14900HX, NVIDIA GeForce RTX 4090 Laptop GPU (8230 - 9234, n=13) | |
| Razer Blade 16 2024, RTX 4090 | |
| PCMark 10 / Essentials | |
| MSI Titan 18 HX A14VIG | |
| Asus ROG Strix Scar 17 G733PYV-LL053X | |
| Alienware m18 R2 | |
| Asus ROG Strix Scar 18 G834JYR (2024) | |
| Razer Blade 18 2024 RZ09-0509 | |
| Average Intel Core i9-14900HX, NVIDIA GeForce RTX 4090 Laptop GPU (10778 - 11628, n=13) | |
| Razer Blade 16 2024, RTX 4090 | |
| PCMark 10 / Productivity | |
| Alienware m18 R2 | |
| Razer Blade 16 2024, RTX 4090 | |
| Asus ROG Strix Scar 17 G733PYV-LL053X | |
| Average Intel Core i9-14900HX, NVIDIA GeForce RTX 4090 Laptop GPU (9458 - 11759, n=13) | |
| Asus ROG Strix Scar 18 G834JYR (2024) | |
| MSI Titan 18 HX A14VIG | |
| Razer Blade 18 2024 RZ09-0509 | |
| PCMark 10 / Digital Content Creation | |
| MSI Titan 18 HX A14VIG | |
| Alienware m18 R2 | |
| Asus ROG Strix Scar 17 G733PYV-LL053X | |
| Razer Blade 18 2024 RZ09-0509 | |
| Asus ROG Strix Scar 18 G834JYR (2024) | |
| Average Intel Core i9-14900HX, NVIDIA GeForce RTX 4090 Laptop GPU (13219 - 16462, n=13) | |
| Razer Blade 16 2024, RTX 4090 | |
| CrossMark / Overall | |
| Asus ROG Strix Scar 18 G834JYR (2024) | |
| Razer Blade 16 2024, RTX 4090 | |
| Average Intel Core i9-14900HX, NVIDIA GeForce RTX 4090 Laptop GPU (1877 - 2344, n=10) | |
| Asus ROG Strix Scar 17 G733PYV-LL053X | |
| Alienware m18 R2 | |
| Razer Blade 18 2024 RZ09-0509 | |
| MSI Titan 18 HX A14VIG | |
| CrossMark / Productivity | |
| Asus ROG Strix Scar 18 G834JYR (2024) | |
| Razer Blade 16 2024, RTX 4090 | |
| Average Intel Core i9-14900HX, NVIDIA GeForce RTX 4090 Laptop GPU (1738 - 2162, n=10) | |
| Asus ROG Strix Scar 17 G733PYV-LL053X | |
| Razer Blade 18 2024 RZ09-0509 | |
| Alienware m18 R2 | |
| MSI Titan 18 HX A14VIG | |
| CrossMark / Creativity | |
| Asus ROG Strix Scar 18 G834JYR (2024) | |
| Razer Blade 16 2024, RTX 4090 | |
| Asus ROG Strix Scar 17 G733PYV-LL053X | |
| Alienware m18 R2 | |
| Average Intel Core i9-14900HX, NVIDIA GeForce RTX 4090 Laptop GPU (2195 - 2660, n=10) | |
| Razer Blade 18 2024 RZ09-0509 | |
| MSI Titan 18 HX A14VIG | |
| CrossMark / Responsiveness | |
| Asus ROG Strix Scar 18 G834JYR (2024) | |
| Average Intel Core i9-14900HX, NVIDIA GeForce RTX 4090 Laptop GPU (1478 - 2327, n=10) | |
| Razer Blade 16 2024, RTX 4090 | |
| Alienware m18 R2 | |
| Razer Blade 18 2024 RZ09-0509 | |
| Asus ROG Strix Scar 17 G733PYV-LL053X | |
| MSI Titan 18 HX A14VIG | |
| WebXPRT 3 / Overall | |
| Asus ROG Strix Scar 17 G733PYV-LL053X | |
| Razer Blade 18 2024 RZ09-0509 | |
| Razer Blade 16 2024, RTX 4090 | |
| MSI Titan 18 HX A14VIG | |
| Alienware m18 R2 | |
| Average Intel Core i9-14900HX, NVIDIA GeForce RTX 4090 Laptop GPU (279 - 339, n=10) | |
| Asus ROG Strix Scar 18 G834JYR (2024) | |
| WebXPRT 4 / Overall | |
| Asus ROG Strix Scar 17 G733PYV-LL053X | |
| Alienware m18 R2 | |
| Asus ROG Strix Scar 18 G834JYR (2024) | |
| Average Intel Core i9-14900HX, NVIDIA GeForce RTX 4090 Laptop GPU (246 - 309, n=8) | |
| MSI Titan 18 HX A14VIG | |
| Mozilla Kraken 1.1 / Total | |
| Average Intel Core i9-14900HX, NVIDIA GeForce RTX 4090 Laptop GPU (428 - 535, n=11) | |
| MSI Titan 18 HX A14VIG | |
| Razer Blade 16 2024, RTX 4090 | |
| Asus ROG Strix Scar 18 G834JYR (2024) | |
| Razer Blade 18 2024 RZ09-0509 | |
| Alienware m18 R2 | |
| Asus ROG Strix Scar 17 G733PYV-LL053X | |
* ... smaller is better
| PCMark 10 Score | 8805 points | |
Help | ||
| AIDA64 / Memory Copy | |
| Asus ROG Strix Scar 18 G834JYR (2024) | |
| Alienware m18 R2 | |
| Razer Blade 16 2024, RTX 4090 | |
| Razer Blade 18 RTX 4070 | |
| Razer Blade 18 2024 RZ09-0509 | |
| Average Intel Core i9-14900HX (38028 - 83392, n=36) | |
| MSI Titan 18 HX A14VIG | |
| Asus ROG Strix Scar 17 G733PYV-LL053X | |
| AIDA64 / Memory Read | |
| Asus ROG Strix Scar 18 G834JYR (2024) | |
| Razer Blade 16 2024, RTX 4090 | |
| Razer Blade 18 RTX 4070 | |
| Alienware m18 R2 | |
| Razer Blade 18 2024 RZ09-0509 | |
| Average Intel Core i9-14900HX (43306 - 87568, n=36) | |
| Asus ROG Strix Scar 17 G733PYV-LL053X | |
| MSI Titan 18 HX A14VIG | |
| AIDA64 / Memory Write | |
| Asus ROG Strix Scar 18 G834JYR (2024) | |
| Alienware m18 R2 | |
| Razer Blade 18 RTX 4070 | |
| Razer Blade 16 2024, RTX 4090 | |
| Average Intel Core i9-14900HX (37146 - 80589, n=36) | |
| Razer Blade 18 2024 RZ09-0509 | |
| Asus ROG Strix Scar 17 G733PYV-LL053X | |
| MSI Titan 18 HX A14VIG | |
| AIDA64 / Memory Latency | |
| MSI Titan 18 HX A14VIG | |
| Asus ROG Strix Scar 17 G733PYV-LL053X | |
| Razer Blade 18 2024 RZ09-0509 | |
| Alienware m18 R2 | |
| Average Intel Core i9-14900HX (76.1 - 105, n=36) | |
| Razer Blade 18 RTX 4070 | |
| Razer Blade 16 2024, RTX 4090 | |
| Asus ROG Strix Scar 18 G834JYR (2024) | |
* ... smaller is better
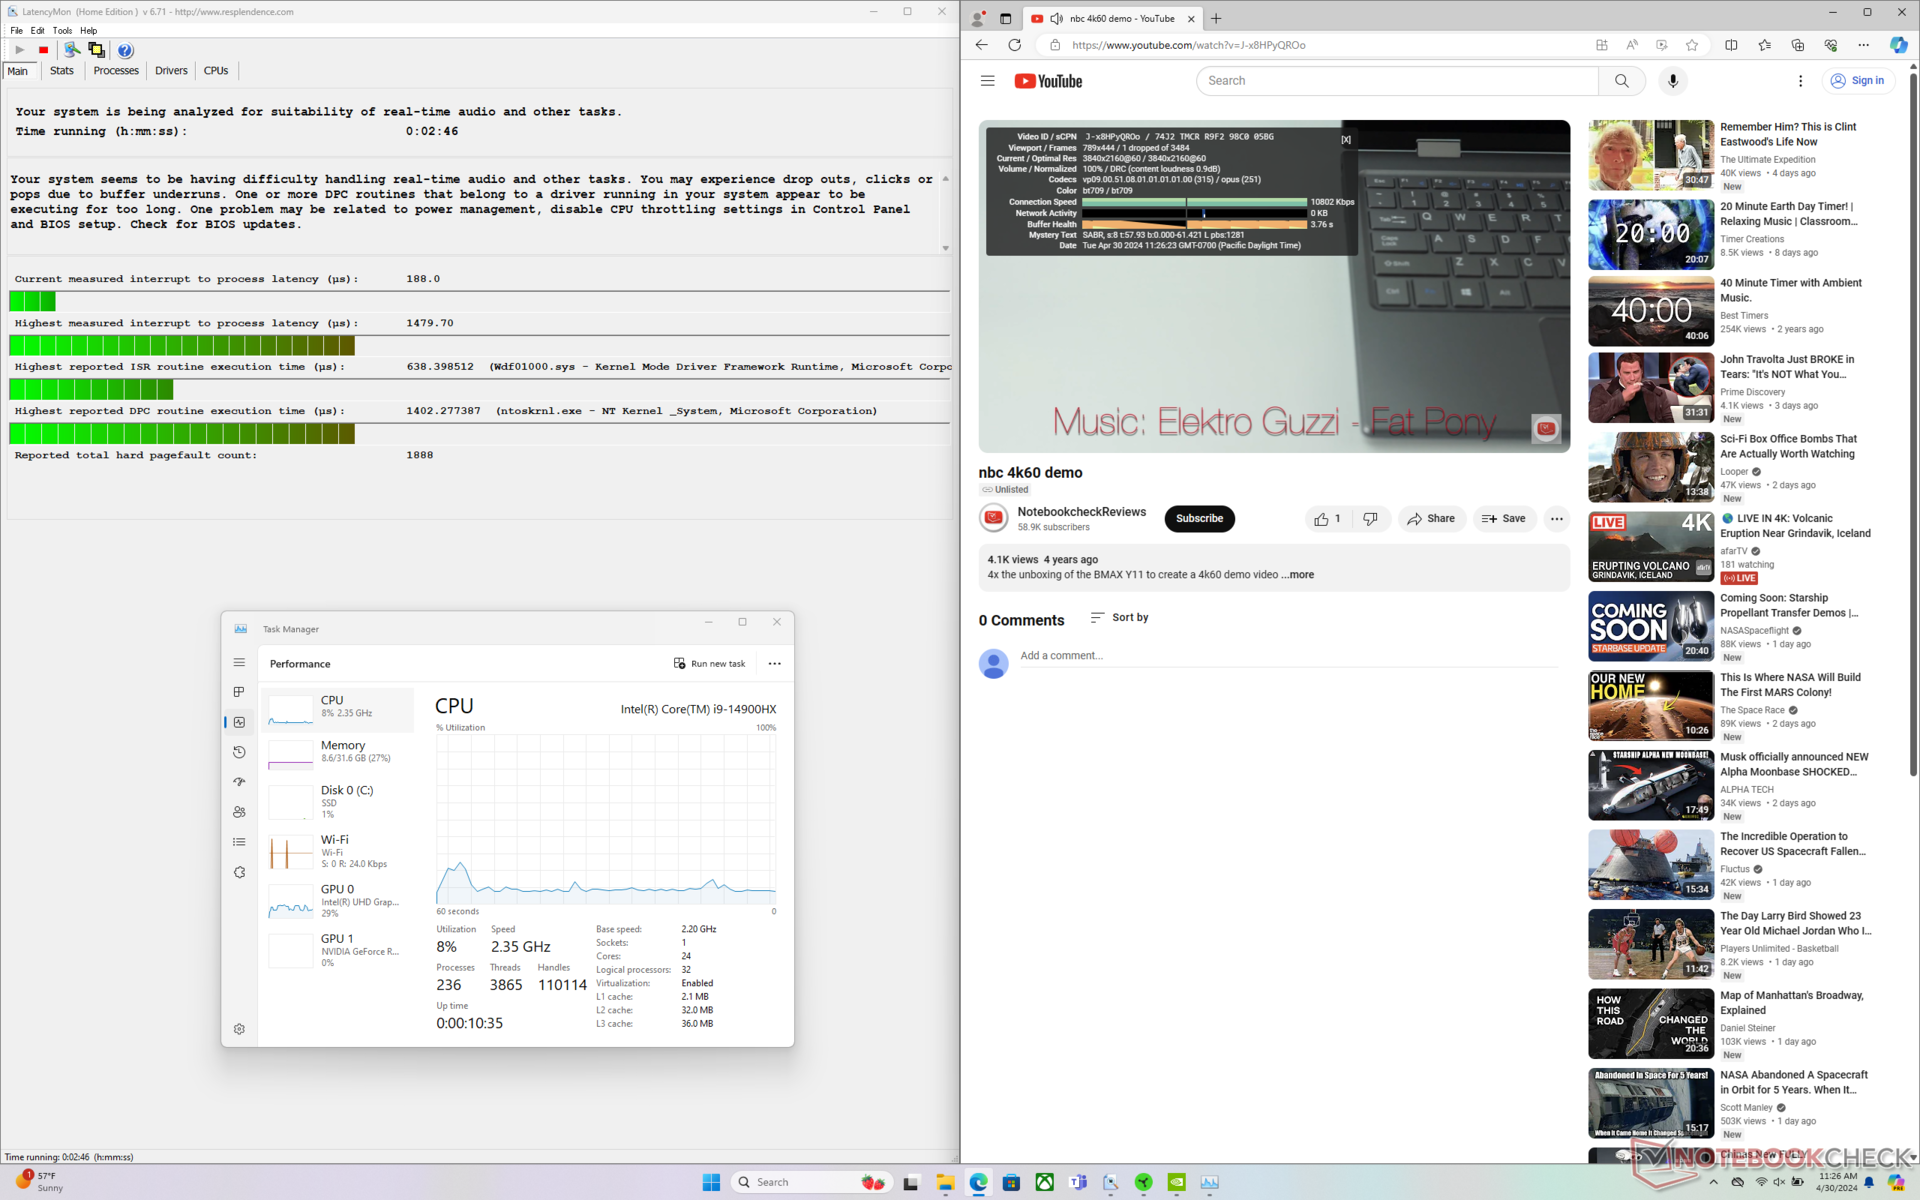
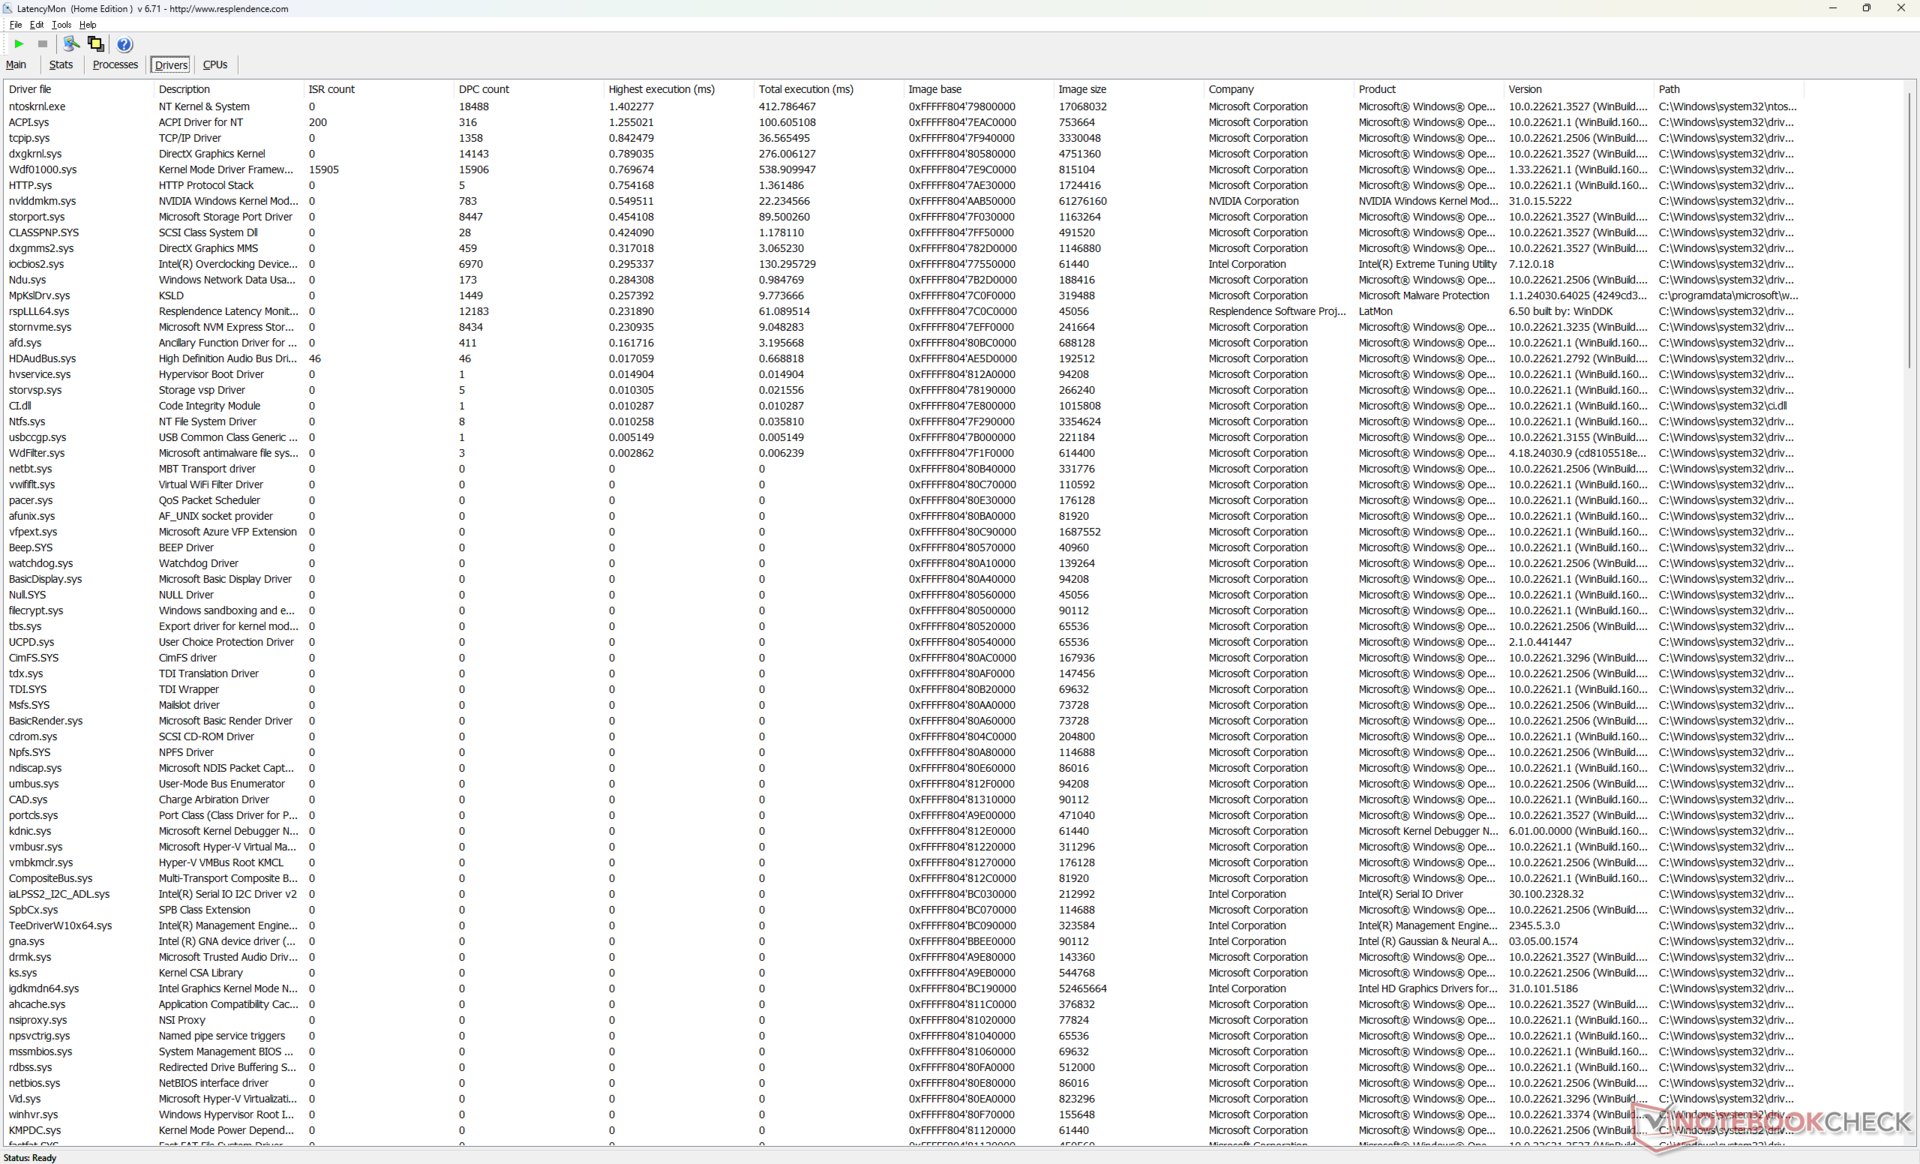
DPC 延迟
LatencyMon 仅在打开我们主页的多个浏览器标签时显示了轻微的 DPC 问题。4K60 视频播放也非常完美,除了截图时的一帧之外,没有任何掉帧记录。
| DPC Latencies / LatencyMon - interrupt to process latency (max), Web, Youtube, Prime95 | |
| Alienware m18 R2 | |
| MSI Titan 18 HX A14VIG | |
| Razer Blade 18 2024 RZ09-0509 | |
| Razer Blade 16 2024, RTX 4090 | |
| Asus ROG Strix Scar 18 G834JYR (2024) | |
| Asus ROG Strix Scar 17 G733PYV-LL053X | |
* ... smaller is better
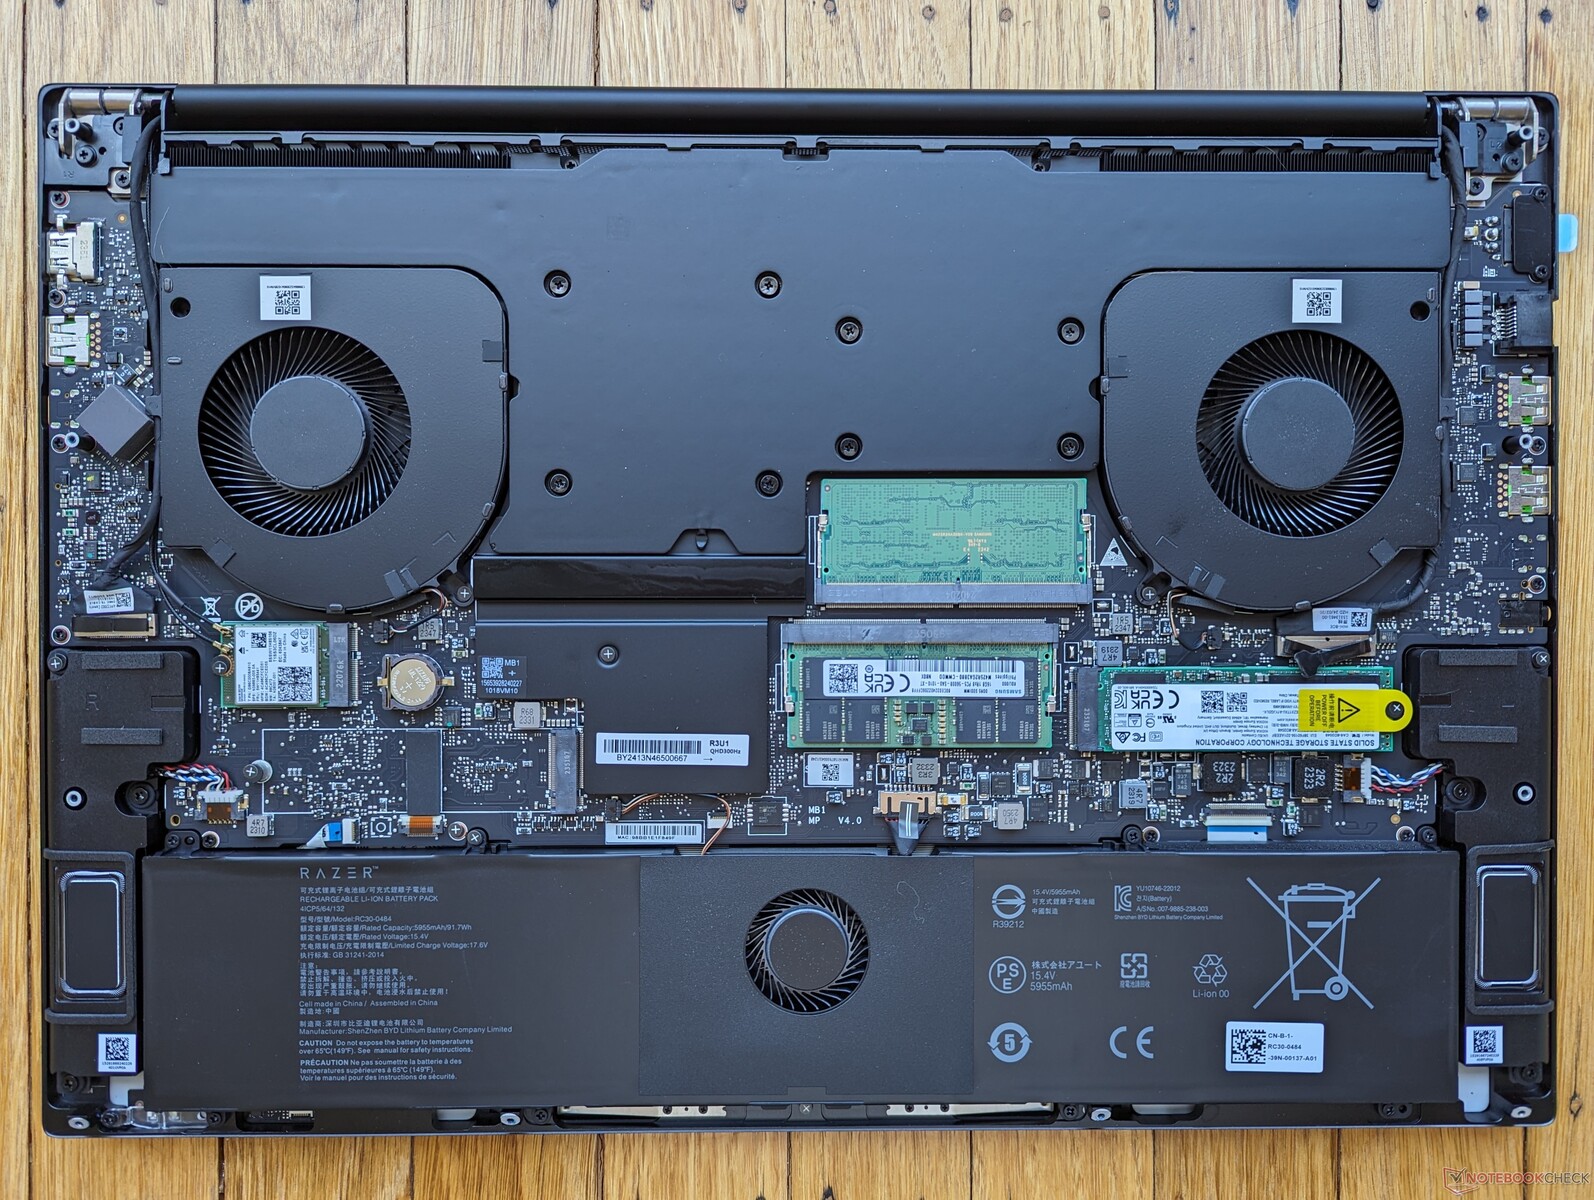
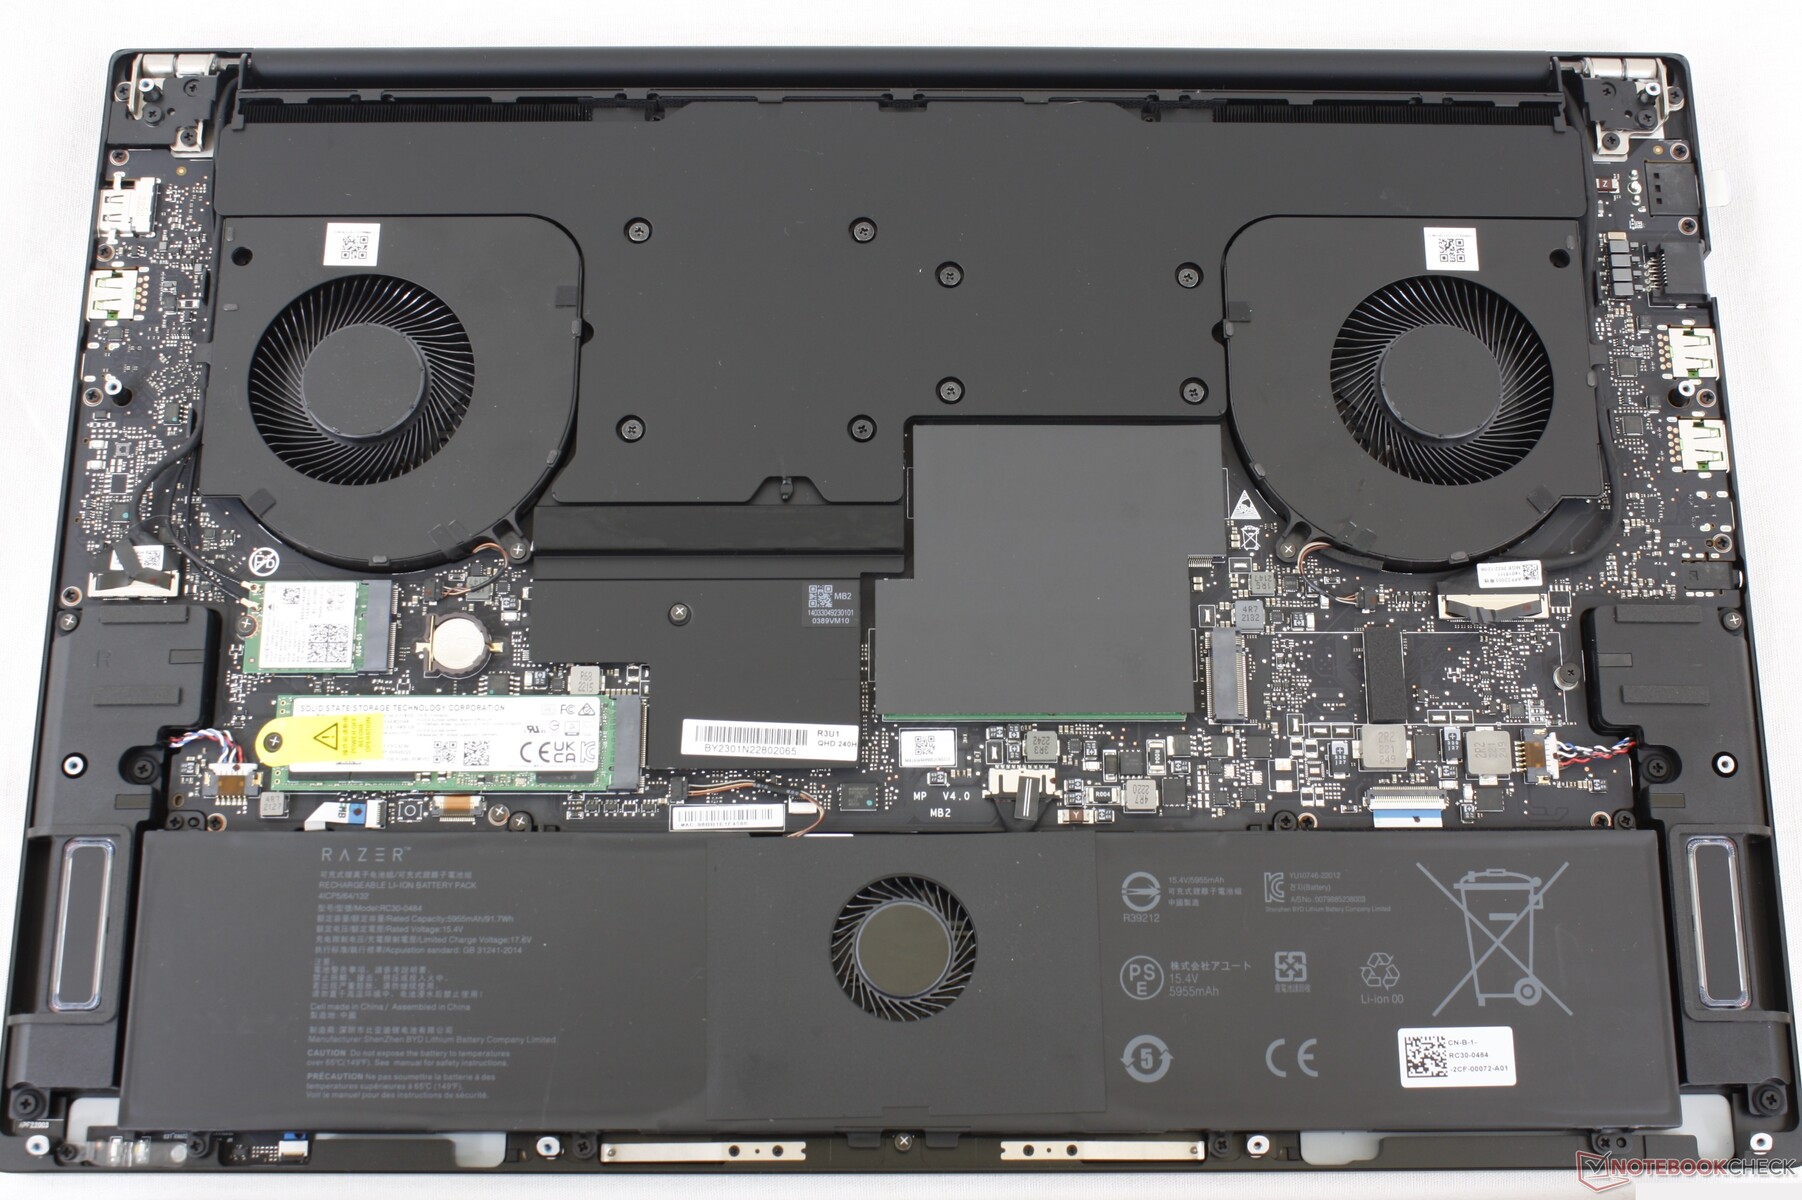
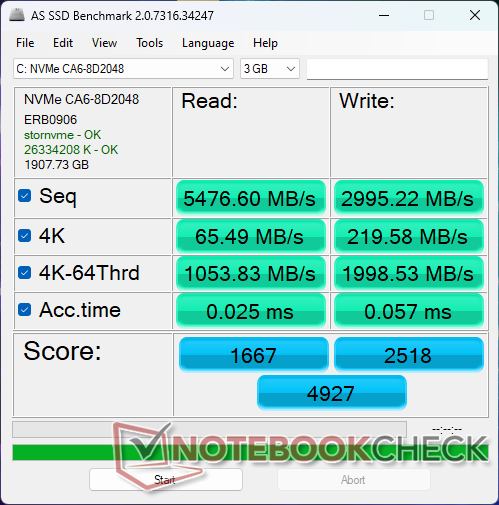
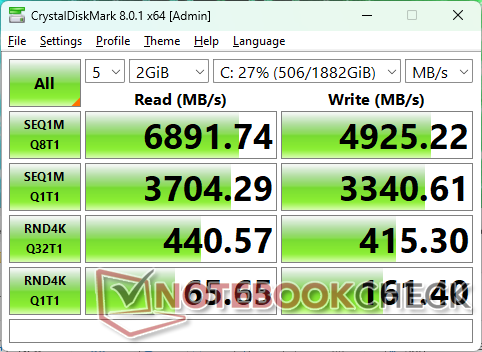
存储设备
我们的 2023 和 2024 Blade 18 设备都配备了 美光 CA6NVMe 固态硬盘,而其他大多数刀锋机型配备的是三星硬盘。较小的 4K 块的读写速度可能偏慢,但在其他方面没有表现出性能节流问题。
可能由于成本和供应有限的原因,没有提供 PCIe5 SSD 选项。

* ... smaller is better
Disk Throttling: DiskSpd Read Loop, Queue Depth 8
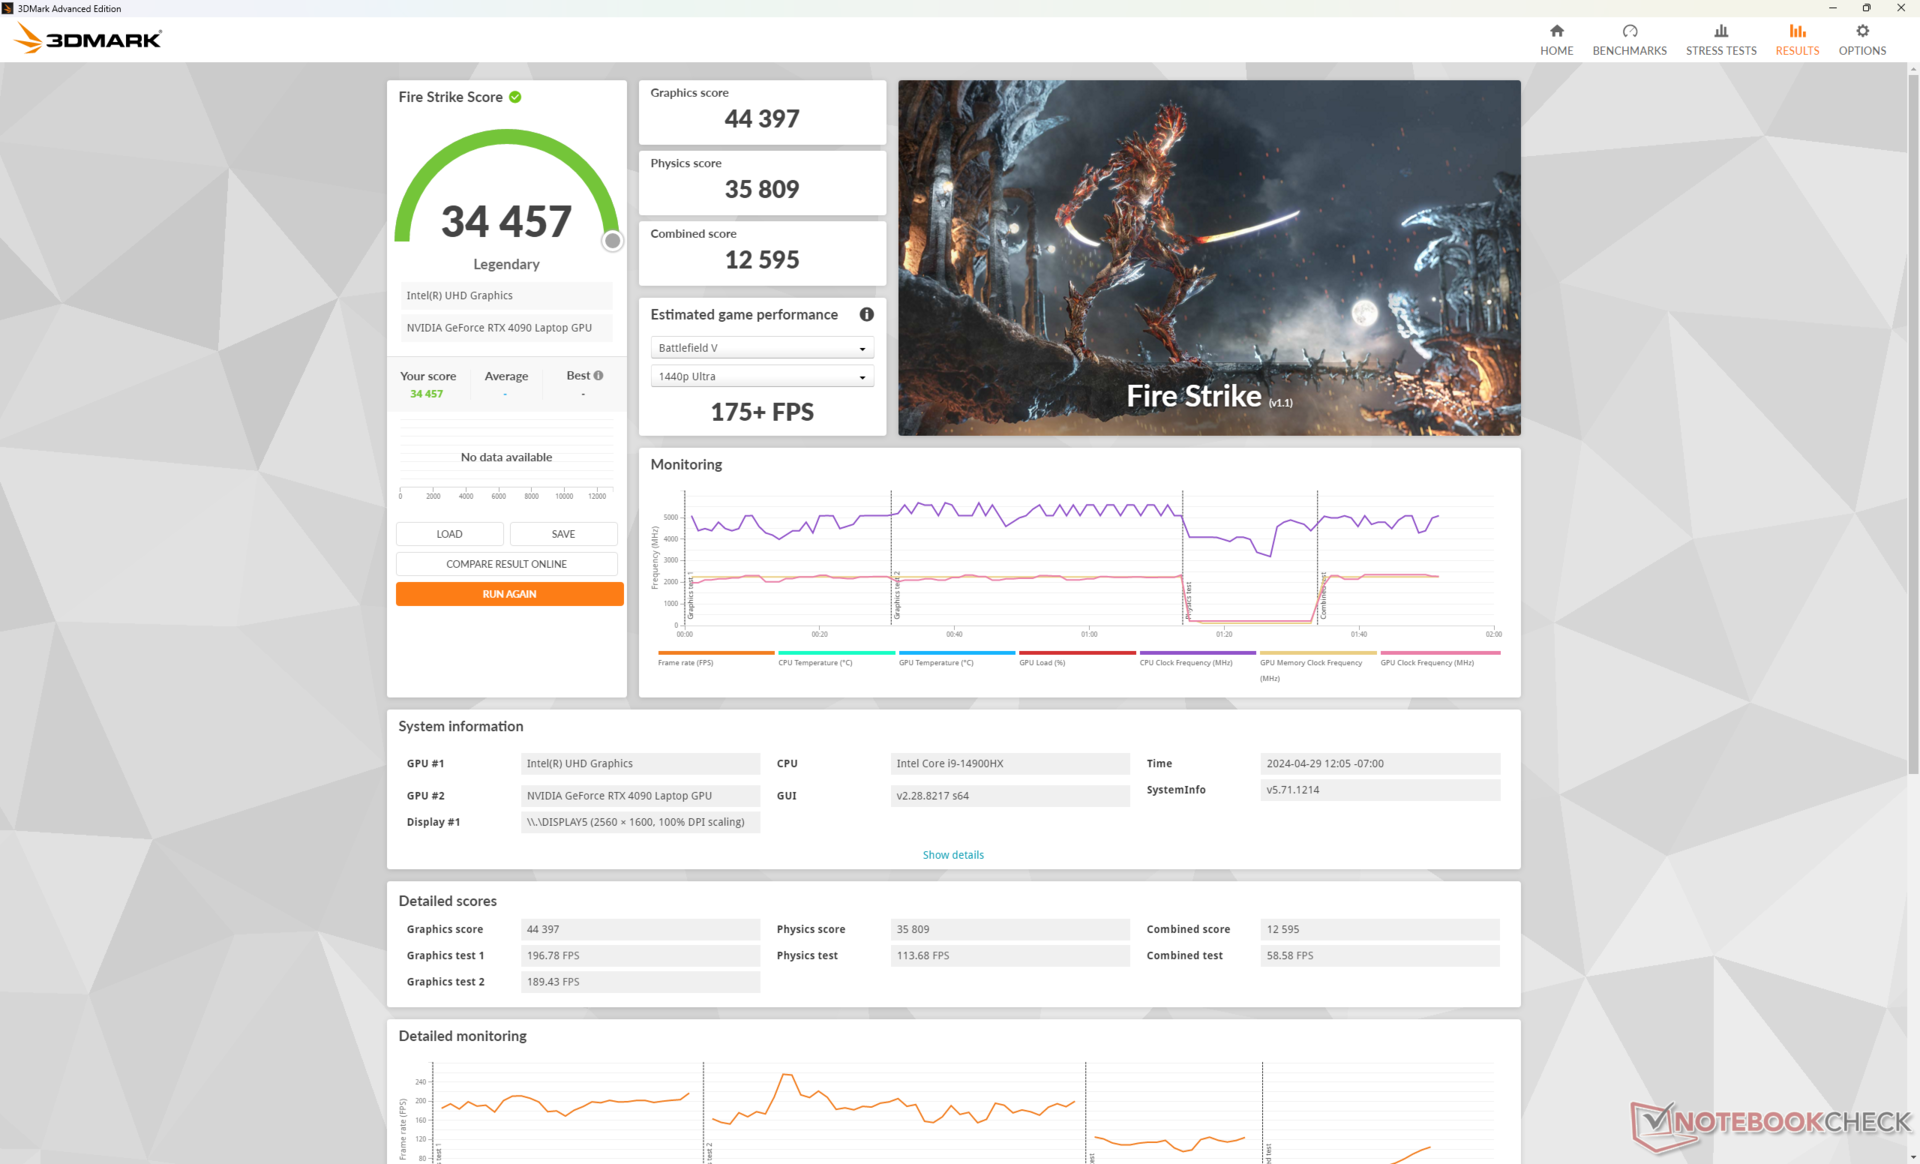
游戏性能 - RTX 4090 连续第二年蝉联冠军
原始图形性能 移动版GeForce RTX 4090与 刀锋 16同样采用 175 W TGP 图形处理器。因此,Blade 18 运行游戏的速度不会明显快于同类产品。降级到 RTX 4080或 4070 配置预计会分别影响约 10% 和 35% 至 40% 的性能。微星 微星泰坦 18 HX运行相同 GPU 的速度比雷蛇稍快,但体积和重量也要大得多。
请记住,最大风扇模式对系统性能几乎没有影响,如下表Fire Strike 结果所示。因此,没有必要启用最大风扇模式来充分发挥 GPU 的性能。即使是 Turbo 模式,在游戏时似乎也不会对性能产生重大影响。
| 电源配置文件 | 图形得分 | 物理得分 | 综合得分 |
| 自定义配置文件(最大风扇开启 | 44702 | 38887 | 12094 |
| 自定义配置文件(最大风扇关闭 | 44397 (-1%) | 35809 (-8%) | 12595 (-0%) |
| 涡轮模式 | 44111 (-1%) | 33180 (-15%) | 13065 (-0%) |
| 平衡模式 | 36832 (-18%) | 25159 (-35%) | 6109 (-49%) |
| 电池电量 | 18581 (-58%) | 23066 (-41%) | 5093 (-58%) |
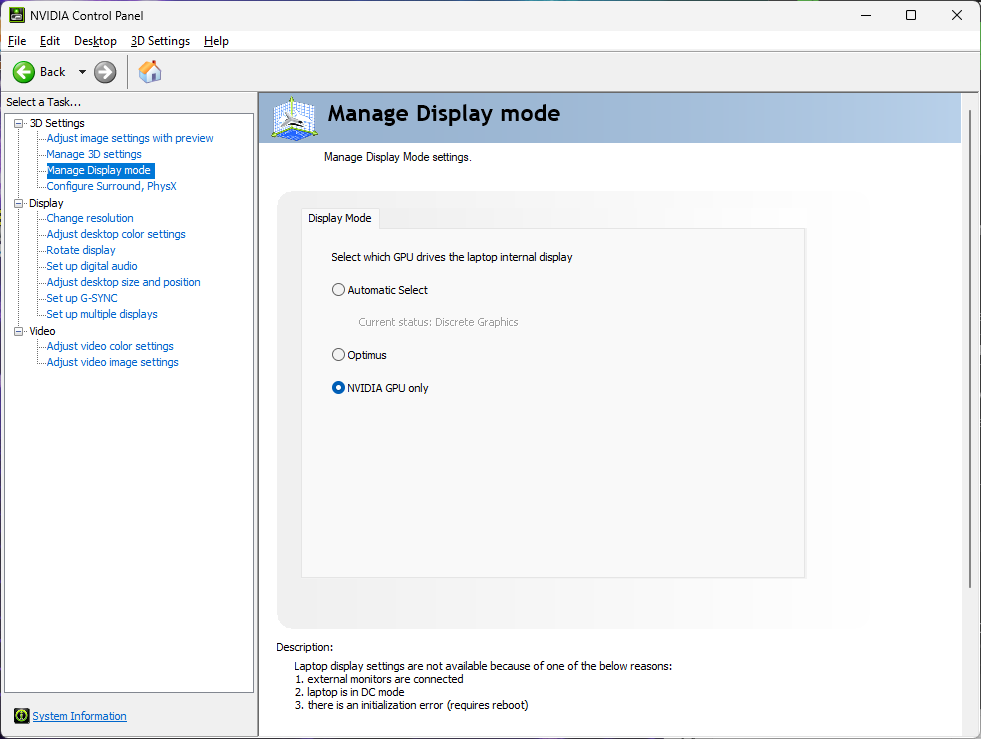
支持高级 Optimus,可在 dGPU 和 Optimus 模式之间切换。不过,与最近的 Alienware 笔记本电脑.
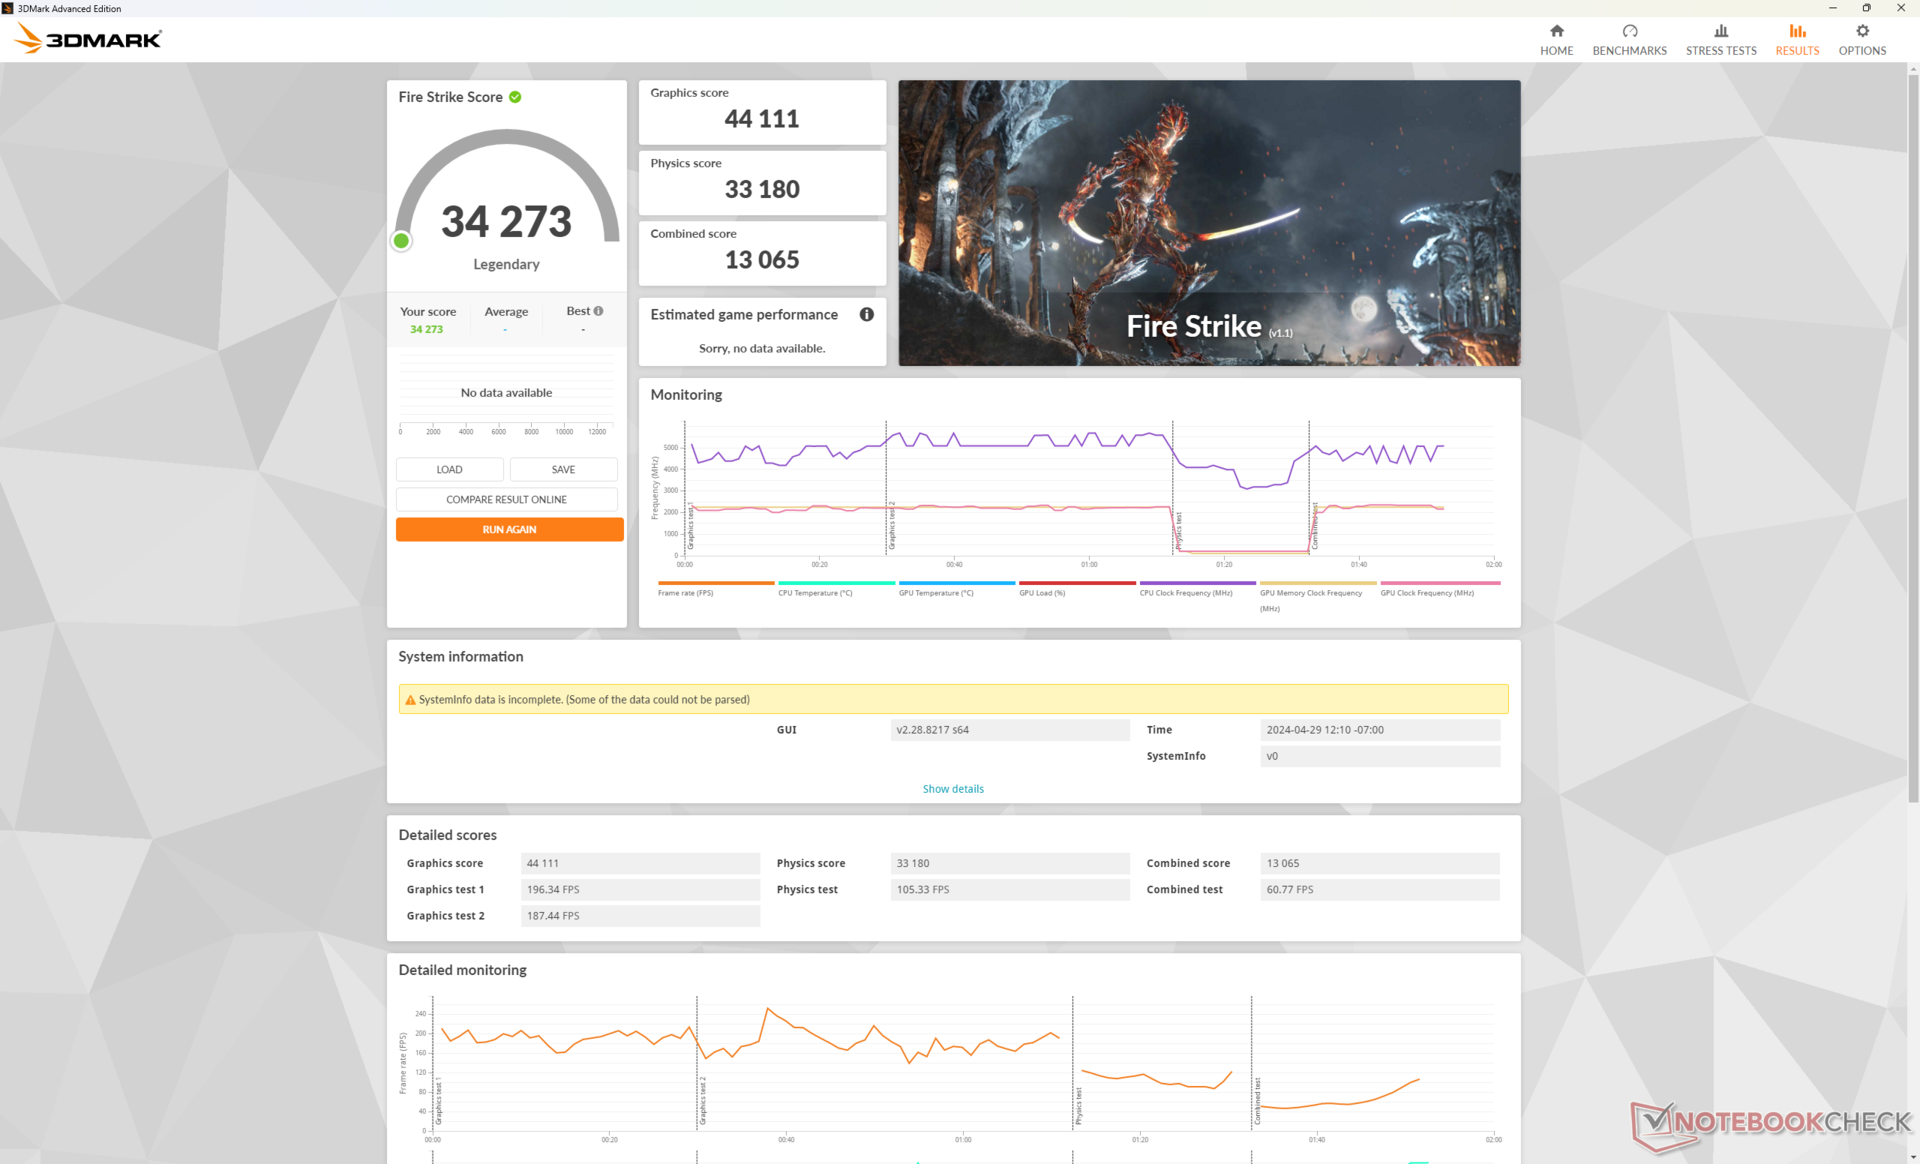
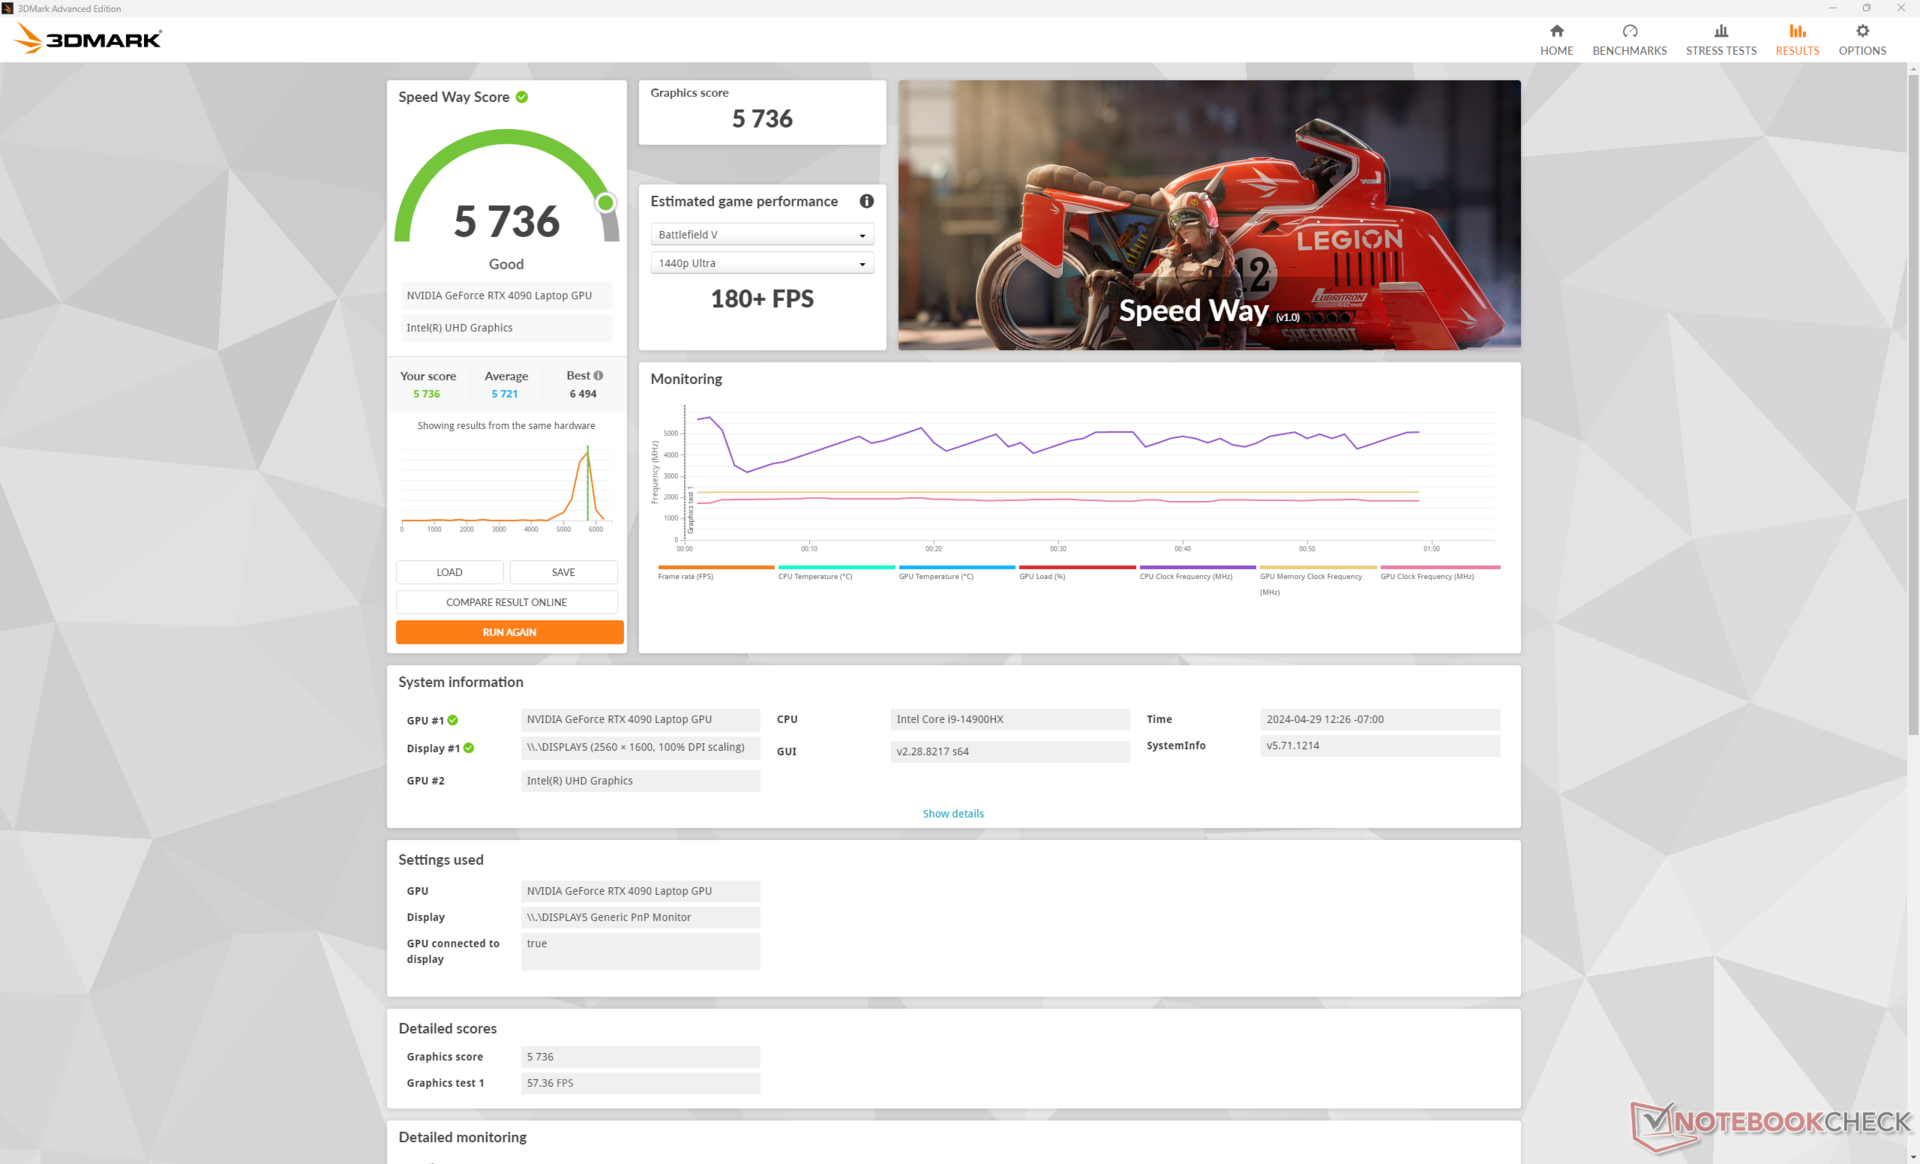
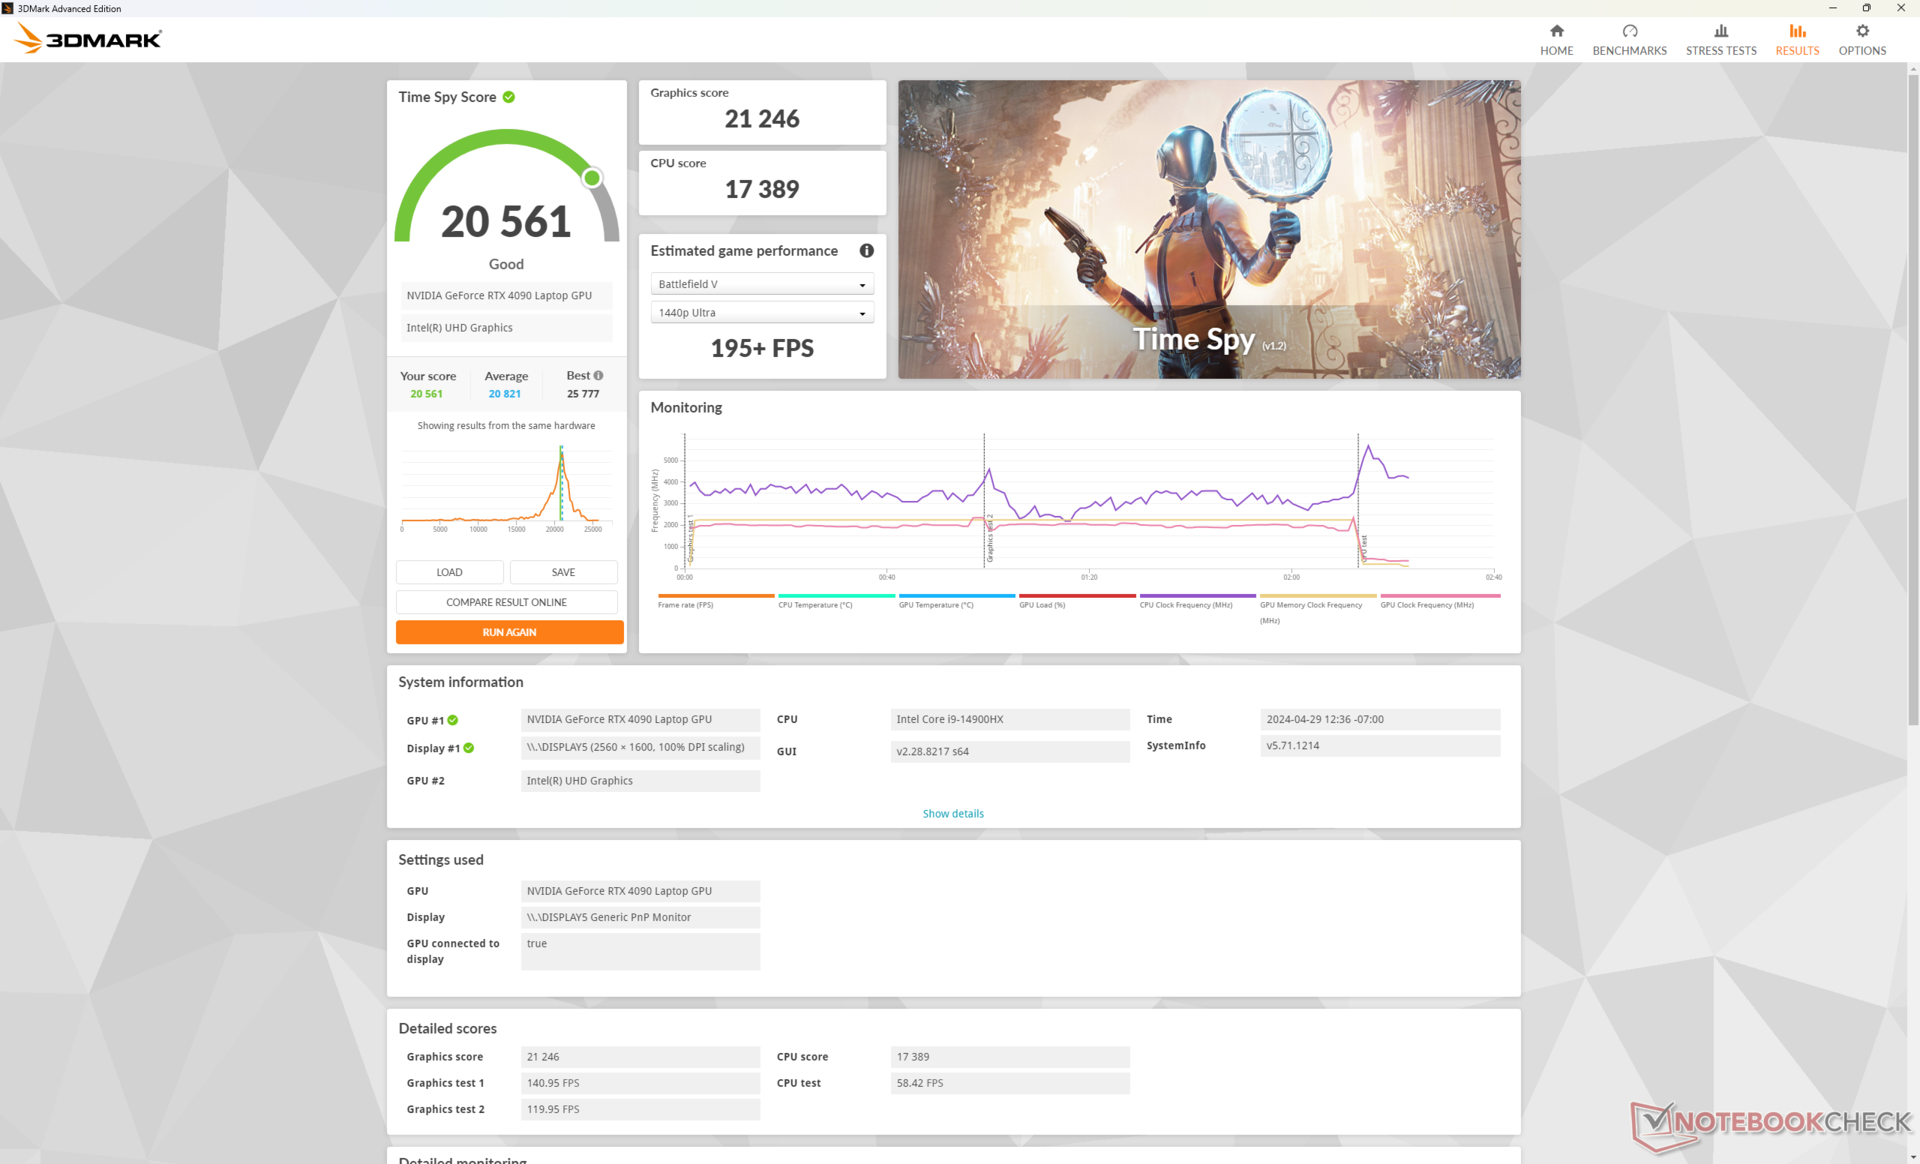
| 3DMark 11 Performance | 45938 points | |
| 3DMark Fire Strike Score | 34597 points | |
| 3DMark Time Spy Score | 20561 points | |
Help | ||
* ... smaller is better
| The Witcher 3 - 1920x1080 Ultra Graphics & Postprocessing (HBAO+) | |
| MSI Titan 18 HX A14VIG | |
| Asus ROG Strix Scar 17 G733PYV-LL053X | |
| Alienware m18 R2 | |
| Razer Blade 16 2024, RTX 4090 | |
| Average of class Gaming (104.7 - 240, n=7, last 2 years) | |
| Razer Blade 18 2024 RZ09-0509 | |
| Asus ROG Strix Scar 18 G834JYR (2024) | |
Witcher 3 FPS Chart
| low | med. | high | ultra | QHD | 4K DLSS | 4K | |
|---|---|---|---|---|---|---|---|
| GTA V (2015) | 129.8 | 126.6 | 165.4 | ||||
| The Witcher 3 (2015) | 193 | 154.6 | 149.8 | ||||
| Dota 2 Reborn (2015) | 213 | 191.8 | 180.5 | 164 | 147 | ||
| Final Fantasy XV Benchmark (2018) | 156.9 | 139.1 | 87.3 | ||||
| X-Plane 11.11 (2018) | 183.8 | 158.2 | 127.2 | 107.2 | |||
| Strange Brigade (2018) | 325 | 268 | 149.2 | ||||
| F1 23 (2023) | 110.9 | 73.1 | 37.1 | ||||
| Baldur's Gate 3 (2023) | 160.5 | 119.2 | 94.4 | 70.5 | |||
| Cyberpunk 2077 (2023) | 101.25 | 83.38 | 37.38 | ||||
| Assassin's Creed Mirage (2023) | 124 | 114 | 98 | 73 | |||
| Alan Wake 2 (2023) | 114.1 | 79.4 | 60.8 | 42.3 | |||
| Call of Duty Modern Warfare 3 2023 (2023) | 174 | 132 | 92 | 87 |
排放 - 只在必要时才发出响声
系统噪音
风扇噪音普遍高于我们在 2023 Blade 18 上记录的噪音,这主要是由于我们的 GPU 配置不同。即使设置为平衡和 Optimus 模式,风扇也会在 24 到 29 dB(A) 之间频繁跳动。这种噪音足以引起注意,但绝不会造成困扰。
也许对游戏玩家来说最重要的是,风扇噪音会因电源配置文件设置的不同而大相径庭。当运行 Witcher 3最大风扇模式激活时,风扇噪音高达 61 dB(A),而关闭最大风扇模式时仅为 54 dB(A)。由于在默认设置下开启和关闭最大风扇没有性能差异,我们建议在游戏时关闭最大风扇以降低噪音水平。涡轮模式下的风扇噪音与关闭最大风扇时的噪音相同,这与我们上述的性能结果一致。
与竞争对手相比,Blade 18 的噪音即使不比 Alienware m18 R2 或 ROG Strix Scar 18运行在相同的GeForce RTX 4090 GPU 上。当风扇音量达到 50 分贝(A)以上时,建议佩戴耳机,特别是在游戏中,脚步声和其他细小的音频提示对游戏至关重要。
Noise level
| Idle |
| 23.9 / 28.2 / 29 dB(A) |
| Load |
| 36.8 / 61.1 dB(A) |
 | ||
30 dB silent 40 dB(A) audible 50 dB(A) loud |
||
min: | ||
| Razer Blade 18 2024 RZ09-0509 GeForce RTX 4090 Laptop GPU, i9-14900HX | Razer Blade 18 RTX 4070 GeForce RTX 4070 Laptop GPU, i9-13950HX, SSSTC CA6-8D1024 | Alienware m18 R2 GeForce RTX 4090 Laptop GPU, i9-14900HX, SK Hynix PC811 HFS002TEM9X152N | MSI Titan 18 HX A14VIG GeForce RTX 4090 Laptop GPU, i9-14900HX, 2x Samsung PM9A1a MZVL22T0HDLB (RAID 0) | Asus ROG Strix Scar 18 G834JYR (2024) GeForce RTX 4090 Laptop GPU, i9-14900HX, Samsung PM9A1a MZVL22T0HDLB | Razer Blade 16 2024, RTX 4090 GeForce RTX 4090 Laptop GPU, i9-14900HX, Samsung PM9A1 MZVL22T0HBLB | |
|---|---|---|---|---|---|---|
| Noise | 7% | 3% | 1% | -5% | 6% | |
| off / environment * (dB) | 23.4 | 23.5 -0% | 23.6 -1% | 22.8 3% | 24 -3% | 23 2% |
| Idle Minimum * (dB) | 23.9 | 23.8 -0% | 23.8 -0% | 23.8 -0% | 27 -13% | 23 4% |
| Idle Average * (dB) | 28.2 | 23.8 16% | 26.1 7% | 23.8 16% | 28 1% | 23 18% |
| Idle Maximum * (dB) | 29 | 26.8 8% | 31.5 -9% | 28 3% | 32 -10% | 27.66 5% |
| Load Average * (dB) | 36.8 | 37.3 -1% | 31.5 14% | 38 -3% | 50 -36% | 43.76 -19% |
| Witcher 3 ultra * (dB) | 54.1 | 48 11% | 52.1 4% | 57.3 -6% | 50 8% | 46.81 13% |
| Load Maximum * (dB) | 61.1 | 53.5 12% | 56.6 7% | 62.8 -3% | 52 15% | 50.37 18% |
* ... smaller is better
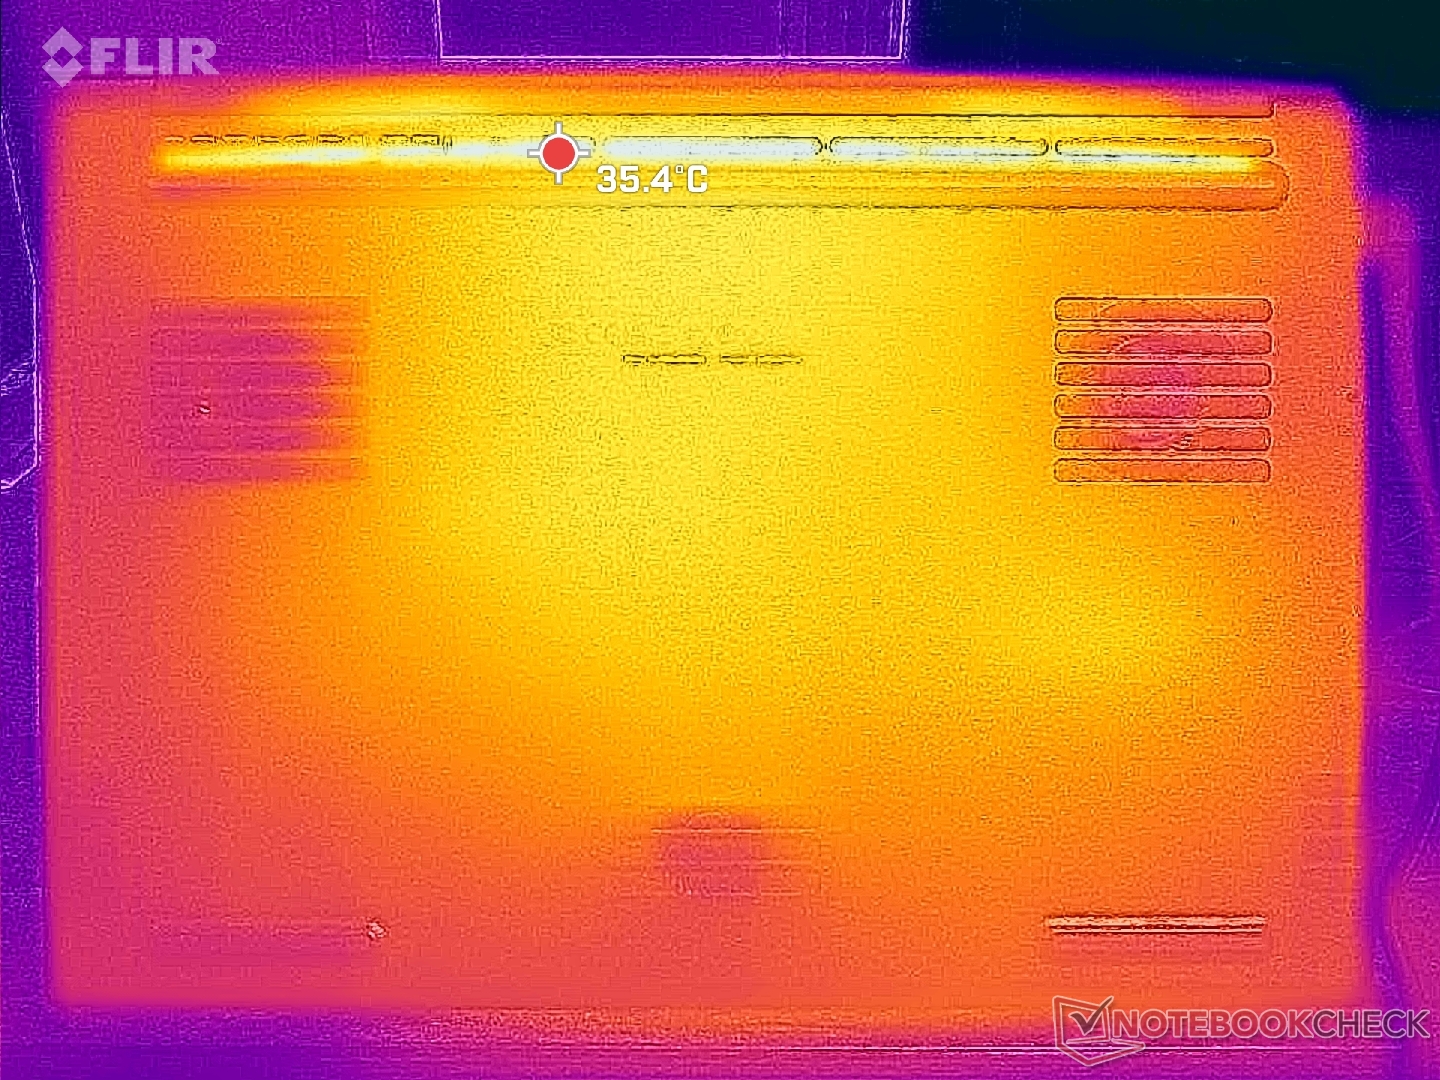
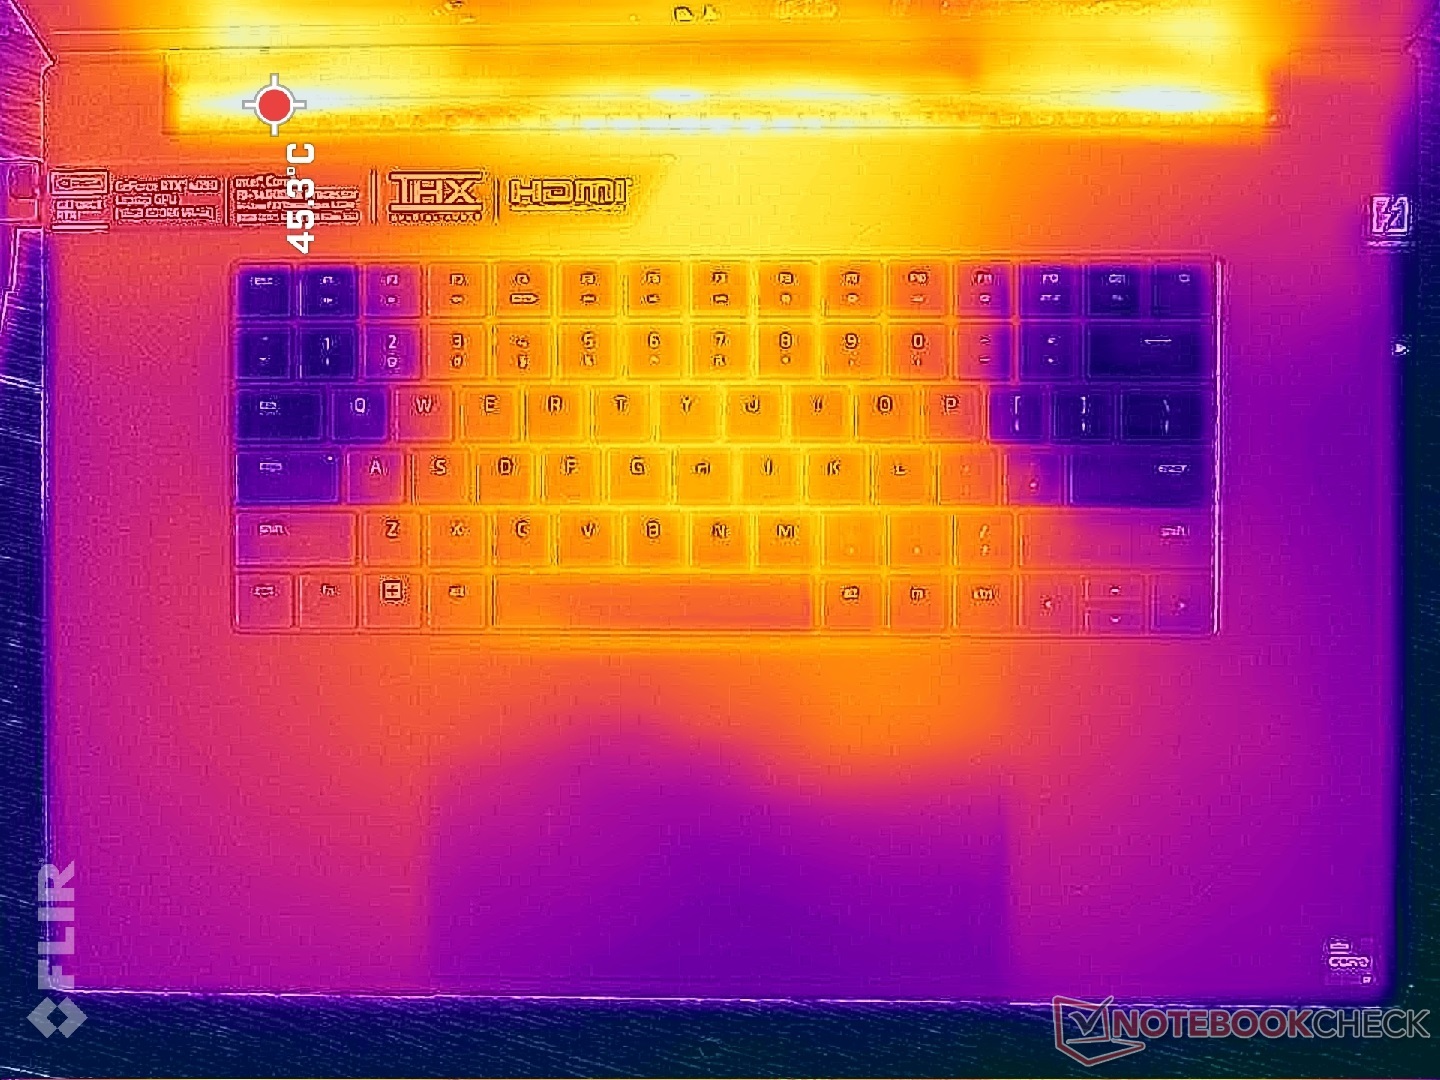
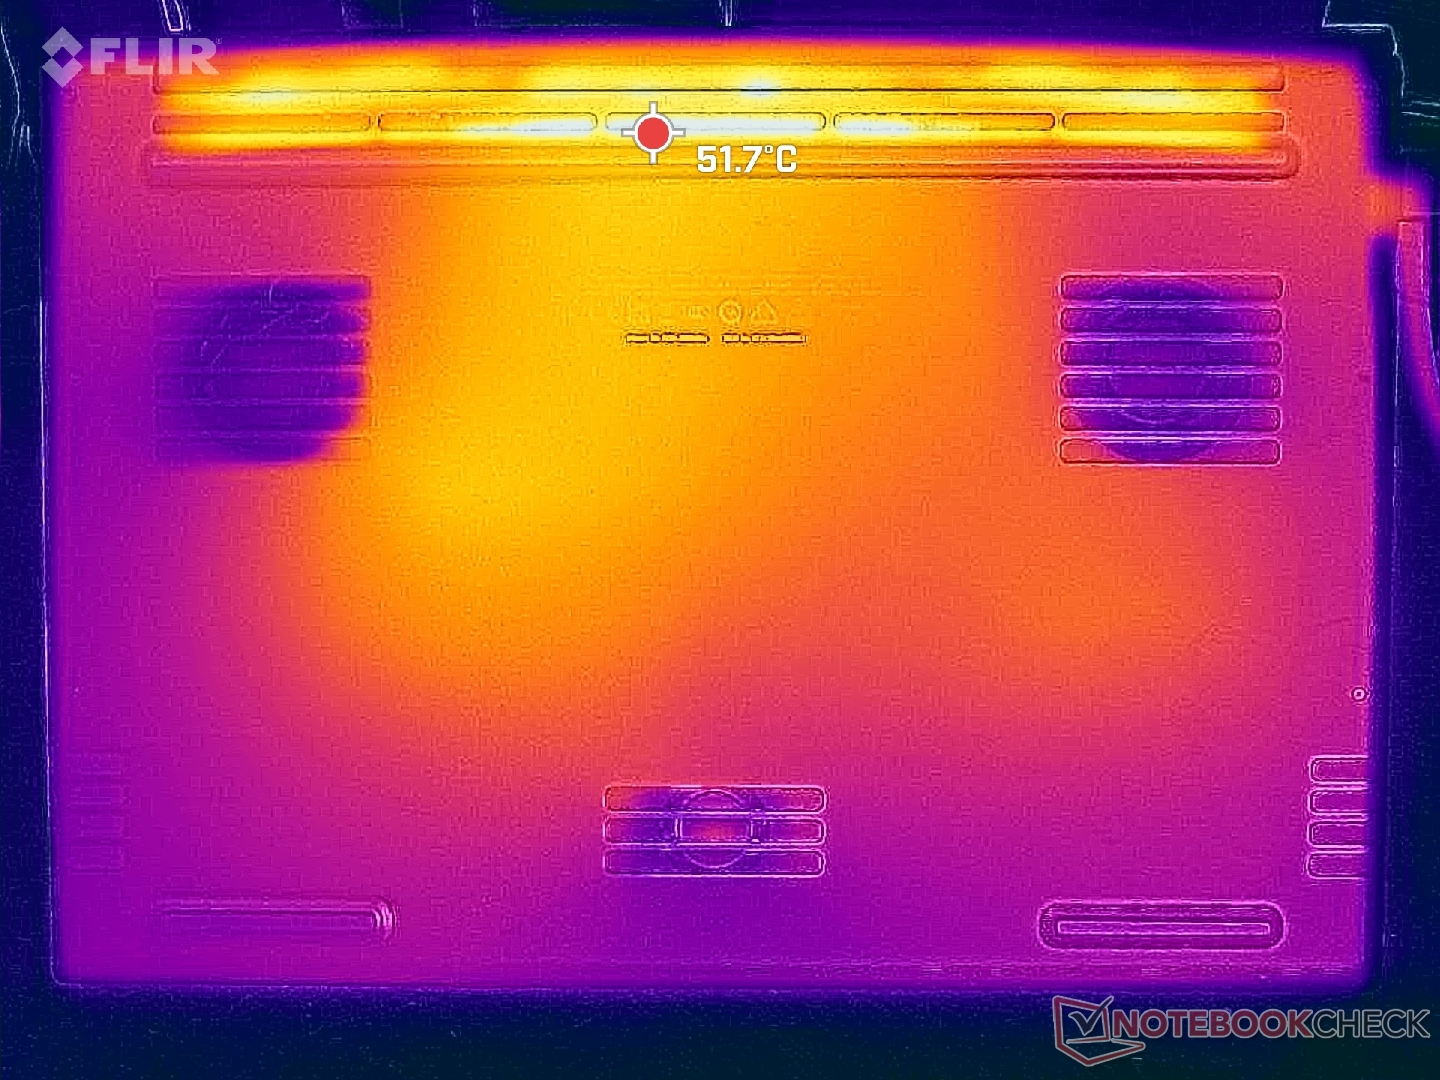
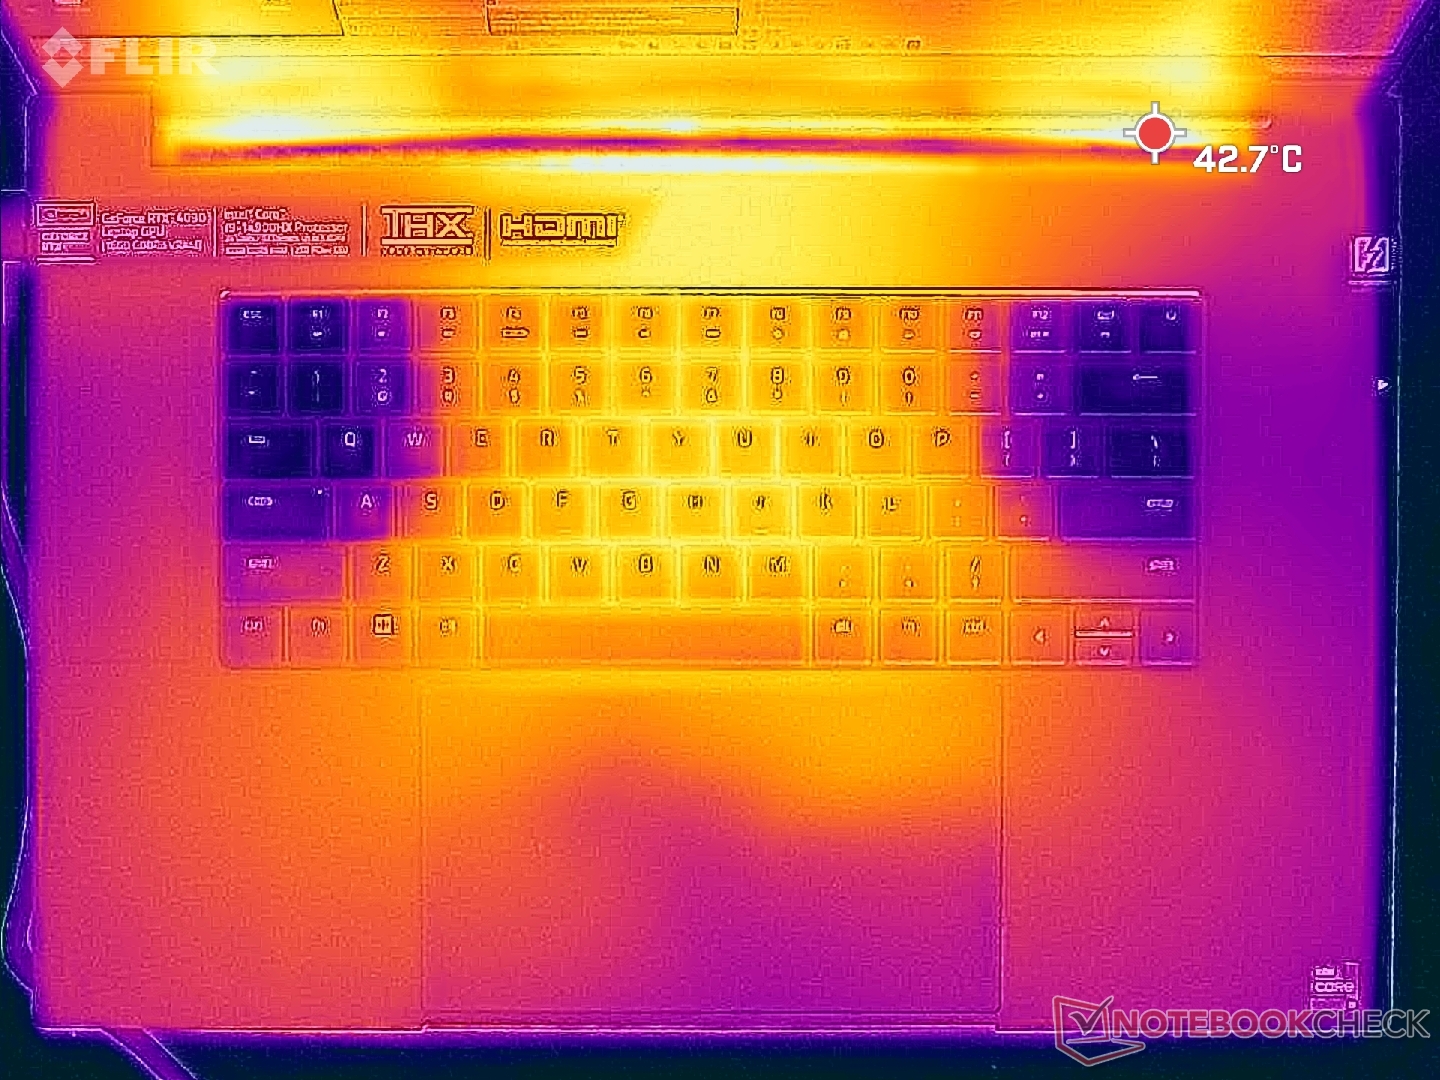
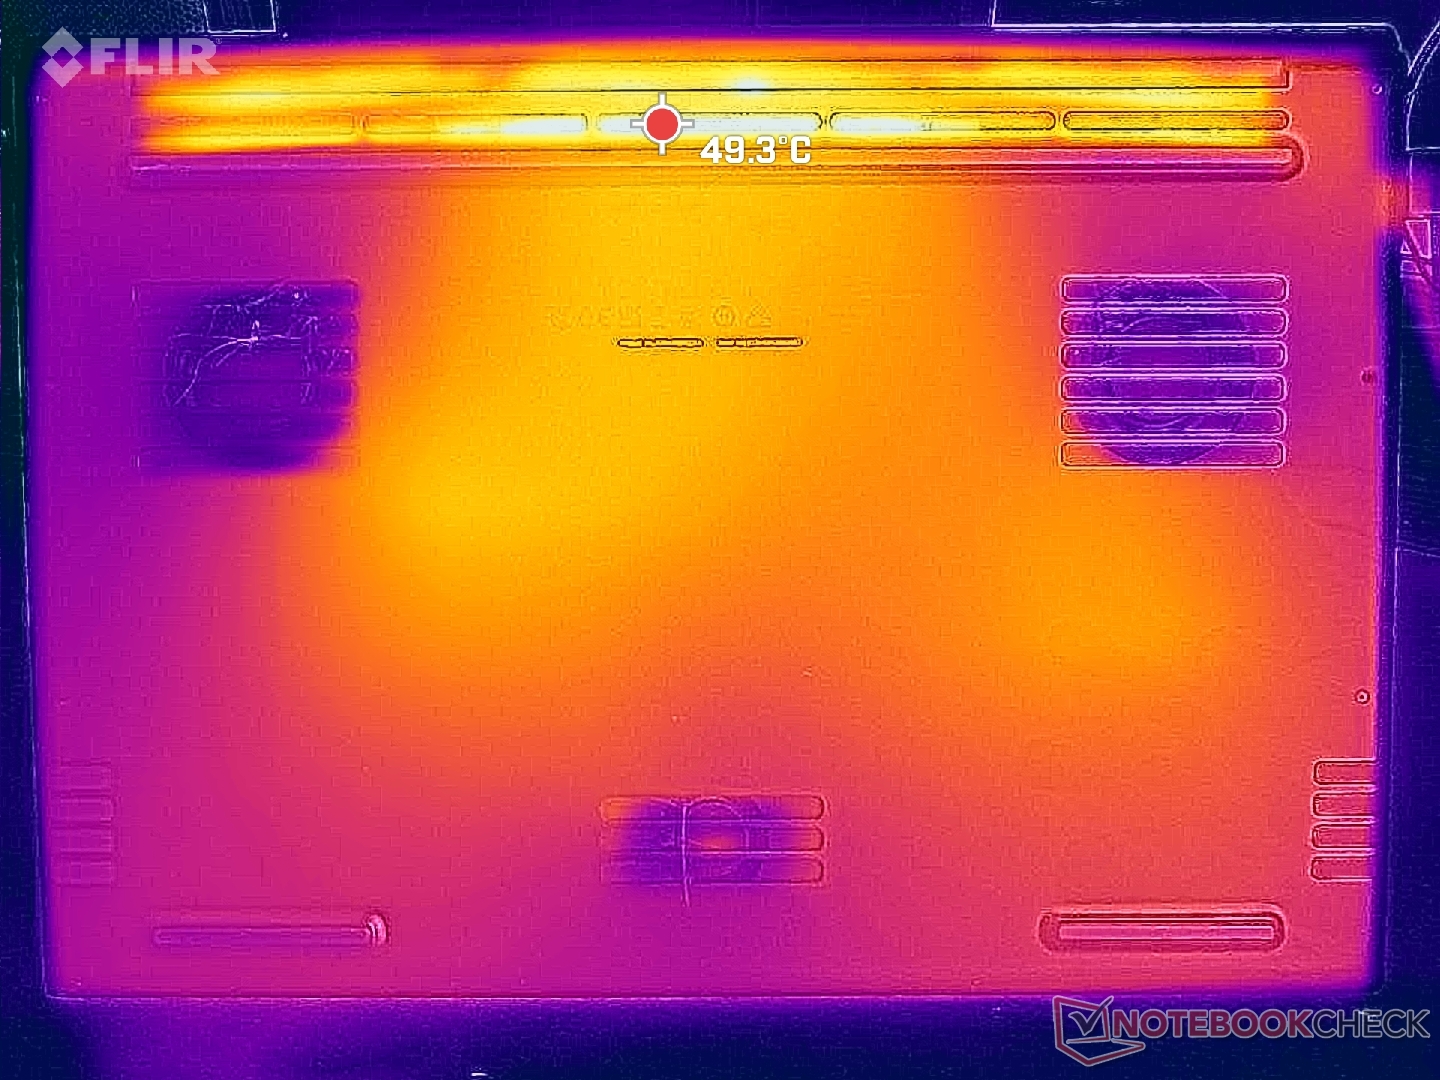
温度
游戏时的表面温度明显高于我们在 2023 设备上记录的温度,但这主要还是因为我们配置的 GPU 不同。Razer 没有对底层散热解决方案进行任何改动。
Razer 电源模块仍然是市场上体积最小、温度最高的。例如,我们的适配器在游戏时会达到 63 摄氏度以上,而 Alienware m18 R2 适配器仅为 54 摄氏度。氮化镓充电器设计温度较高。
(±) The maximum temperature on the upper side is 43.2 °C / 110 F, compared to the average of 40.4 °C / 105 F, ranging from 21.2 to 68.8 °C for the class Gaming.
(±) The bottom heats up to a maximum of 42.6 °C / 109 F, compared to the average of 43.2 °C / 110 F
(+) In idle usage, the average temperature for the upper side is 31.3 °C / 88 F, compared to the device average of 33.9 °C / 93 F.
(±) Playing The Witcher 3, the average temperature for the upper side is 34.9 °C / 95 F, compared to the device average of 33.9 °C / 93 F.
(±) The palmrests and touchpad can get very hot to the touch with a maximum of 36.2 °C / 97.2 F.
(-) The average temperature of the palmrest area of similar devices was 28.8 °C / 83.8 F (-7.4 °C / -13.4 F).
| Razer Blade 18 2024 RZ09-0509 Intel Core i9-14900HX, NVIDIA GeForce RTX 4090 Laptop GPU | Razer Blade 18 RTX 4070 Intel Core i9-13950HX, NVIDIA GeForce RTX 4070 Laptop GPU | Alienware m18 R2 Intel Core i9-14900HX, NVIDIA GeForce RTX 4090 Laptop GPU | MSI Titan 18 HX A14VIG Intel Core i9-14900HX, NVIDIA GeForce RTX 4090 Laptop GPU | Asus ROG Strix Scar 18 G834JYR (2024) Intel Core i9-14900HX, NVIDIA GeForce RTX 4090 Laptop GPU | Razer Blade 16 2024, RTX 4090 Intel Core i9-14900HX, NVIDIA GeForce RTX 4090 Laptop GPU | |
|---|---|---|---|---|---|---|
| Heat | 12% | -4% | 7% | 3% | 7% | |
| Maximum Upper Side * (°C) | 43.2 | 39.2 9% | 41.2 5% | 37.8 13% | 49 -13% | 45 -4% |
| Maximum Bottom * (°C) | 42.6 | 35.6 16% | 34.6 19% | 37.6 12% | 47 -10% | 45 -6% |
| Idle Upper Side * (°C) | 36 | 31.8 12% | 42.8 -19% | 34.8 3% | 29 19% | 29 19% |
| Idle Bottom * (°C) | 36.4 | 33.2 9% | 43.6 -20% | 36 1% | 31 15% | 30 18% |
* ... smaller is better
发言人
Razer Blade 18 2024 RZ09-0509 audio analysis
(+) | speakers can play relatively loud (85.2 dB)
Bass 100 - 315 Hz
(±) | reduced bass - on average 5.3% lower than median
(+) | bass is linear (6.5% delta to prev. frequency)
Mids 400 - 2000 Hz
(+) | balanced mids - only 4.5% away from median
(±) | linearity of mids is average (7.1% delta to prev. frequency)
Highs 2 - 16 kHz
(+) | balanced highs - only 2.9% away from median
(+) | highs are linear (4% delta to prev. frequency)
Overall 100 - 16.000 Hz
(+) | overall sound is linear (9.3% difference to median)
Compared to same class
» 3% of all tested devices in this class were better, 2% similar, 95% worse
» The best had a delta of 6%, average was 18%, worst was 132%
Compared to all devices tested
» 3% of all tested devices were better, 1% similar, 96% worse
» The best had a delta of 4%, average was 23%, worst was 134%
Apple MacBook Pro 16 2021 M1 Pro audio analysis
(+) | speakers can play relatively loud (84.7 dB)
Bass 100 - 315 Hz
(+) | good bass - only 3.8% away from median
(+) | bass is linear (5.2% delta to prev. frequency)
Mids 400 - 2000 Hz
(+) | balanced mids - only 1.3% away from median
(+) | mids are linear (2.1% delta to prev. frequency)
Highs 2 - 16 kHz
(+) | balanced highs - only 1.9% away from median
(+) | highs are linear (2.7% delta to prev. frequency)
Overall 100 - 16.000 Hz
(+) | overall sound is linear (4.6% difference to median)
Compared to same class
» 0% of all tested devices in this class were better, 0% similar, 100% worse
» The best had a delta of 5%, average was 17%, worst was 45%
Compared to all devices tested
» 0% of all tested devices were better, 0% similar, 100% worse
» The best had a delta of 4%, average was 23%, worst was 134%
能源管理
耗电量
由于 2023 和 2024 两款测试机的显示屏和 GPU 不同,耗电量较高是意料之中的。在 Optimus 模式、最低亮度级别和 60 Hz 刷新率下,在桌面上空转大约需要 25 W,而在 dGPU 模式、最高亮度级别和 300 Hz 刷新率下空转则需要超过 2 倍的功耗。
运行Witcher 3 时,在类似条件下,搭载 RTX 4090 的 2024 测试机比搭载 RTX 4070 的 2023 测试机多耗电约 70 瓦。因此,低端 RTX 4070 配置配备了较小的 280 瓦 GaN 适配器,而 RTX 4080/4090 配置配备了稍大的 330 瓦 GaN 适配器(~18 x 7.5 x 2.5 厘米对 ~16.3 x 7 x 2.5 厘米)。
| Off / Standby | |
| Idle | |
| Load |
|
Key:
min: | |
| Razer Blade 18 2024 RZ09-0509 i9-14900HX, GeForce RTX 4090 Laptop GPU, , Mini-LED, 2560x1600, 18" | Razer Blade 18 RTX 4070 i9-13950HX, GeForce RTX 4070 Laptop GPU, SSSTC CA6-8D1024, IPS, 2560x1600, 18" | Alienware m18 R2 i9-14900HX, GeForce RTX 4090 Laptop GPU, SK Hynix PC811 HFS002TEM9X152N, IPS, 2560x1600, 18" | MSI Titan 18 HX A14VIG i9-14900HX, GeForce RTX 4090 Laptop GPU, 2x Samsung PM9A1a MZVL22T0HDLB (RAID 0), Mini-LED, 3840x2400, 18" | Asus ROG Strix Scar 18 G834JYR (2024) i9-14900HX, GeForce RTX 4090 Laptop GPU, Samsung PM9A1a MZVL22T0HDLB, Mini LED, 2560x1600, 18" | |
|---|---|---|---|---|---|
| Power Consumption | 10% | 3% | 3% | 26% | |
| Idle Minimum * (Watt) | 25.4 | 24.5 4% | 10.6 58% | 13.2 48% | 14 45% |
| Idle Average * (Watt) | 37.7 | 34.1 10% | 20.9 45% | 25.4 33% | 17 55% |
| Idle Maximum * (Watt) | 57.9 | 47.7 18% | 40 31% | 53.5 8% | 24 59% |
| Load Average * (Watt) | 128.4 | 140 -9% | 201.1 -57% | 151.4 -18% | 143 -11% |
| Witcher 3 ultra * (Watt) | 273.1 | 202 26% | 358 -31% | 336 -23% | 251 8% |
| Load Maximum * (Watt) | 297.9 | 261 12% | 378.9 -27% | 395.2 -33% | 302 -1% |
* ... smaller is better
电池寿命
运行时间与之前差不多,甚至略微延长了 20 分钟左右。需要注意的是,我们的 WLAN 测试已经考虑了 Optimus 模式和较慢的 60 Hz 刷新率,这意味着在 dGPU 模式下,如果同时激活局部调光和高刷新率,电池寿命会更短。
期望 18 英寸游戏本的长续航时间是不现实的,但竞争对手如 ROG Strix Scar 18或 Alienware m18 R2 等竞争对手在这方面仍然胜过 Razer。
| Razer Blade 18 2024 RZ09-0509 i9-14900HX, GeForce RTX 4090 Laptop GPU, 91.7 Wh | Razer Blade 18 RTX 4070 i9-13950HX, GeForce RTX 4070 Laptop GPU, 91.7 Wh | Alienware m18 R2 i9-14900HX, GeForce RTX 4090 Laptop GPU, 97 Wh | MSI Titan 18 HX A14VIG i9-14900HX, GeForce RTX 4090 Laptop GPU, 99.9 Wh | Asus ROG Strix Scar 18 G834JYR (2024) i9-14900HX, GeForce RTX 4090 Laptop GPU, 90 Wh | Razer Blade 16 2024, RTX 4090 i9-14900HX, GeForce RTX 4090 Laptop GPU, 95.2 Wh | |
|---|---|---|---|---|---|---|
| Battery runtime | 9% | 9% | 1% | 53% | 28% | |
| Reader / Idle (h) | 6.6 | 7 6% | 5.9 -11% | 10.2 55% | ||
| WiFi v1.3 (h) | 4.4 | 4 -9% | 4.8 9% | 4.2 -5% | 7.7 75% | 5.5 25% |
| Load (h) | 1 | 1.3 30% | 1.2 20% | 1.3 30% | 1.3 30% | |
| H.264 (h) | 7.5 | 7.6 |
Pros
Cons
结论 - 关于这些新的显示选项
由于今年没有采用新的 Nvidia GPU,而且新的 Raptor Lake-HX 更新系列也没有带来真正的收益,Razer 不得不从其他方面入手,使 2024 Blade 18 比外观相同的前代产品 2023 更具吸引力。在这种情况下,最新型号包括新的显示屏选项,同时支持 Thunderbolt 5,成为市场上首批同时拥有迷你 LED 和下一代 Thunderbolt 的游戏笔记本电脑之一。其他一些较小的更新,如 Wi-Fi 7 和网络摄像头快门,虽然受欢迎,但也只是小升级。不喜欢这些特定功能的玩家可以考虑 2023 款刀锋 18它能以低数百美元的价格提供相同的游戏性能和用户体验。
Thunderbolt 5、迷你 LED 和 Wi-Fi 7 使 2024 Blade 18 有别于以往的产品。不过,性能猎手们会发现,2023 和 2024 型号之间没有什么大的区别。
至于笔记本电脑上的 mini-LED,在支持 HDR 和局部调光的游戏和视频中,该面板可发挥最佳性能。否则,你将不得不根据工作负荷不断切换局部调光,以避免光晕效应。如果你打算将 Blade 18 主要用于游戏和多媒体,那么 2K mini LED 显示屏可能是最佳选择。相反,如果用户很少启用 HDR,并希望 Blade 18 主要用于内容创建、编辑或 CAD 等专业用途,则应考虑更高分辨率的 4K IPS 配置,它与 18 英寸大屏幕尺寸搭配得很好。在这方面,Razer 已经做到了两全其美。
最后,值得一提的是,4K mini-LED 在 微星泰坦 18而 Razer 则没有。代价是微星系统不支持 G-Sync,因此目前还没有 "终极 "18 英寸 mini-LED 面板。
价格和供应情况
亚马逊现已开始销售我们的迷你 LED 配置,售价 4500 美元。用户也可以直接从 Razer 购买https://www.razer.com/gaming-laptops/razer-blade-18/select-model2023 和 2024 型号之间的更多配置选项。
Razer Blade 18 2024 RZ09-0509
- 05/05/2024 v7 (old)
Allen Ngo
Transparency
The selection of devices to be reviewed is made by our editorial team. The test sample was provided to the author as a loan by the manufacturer or retailer for the purpose of this review. The lender had no influence on this review, nor did the manufacturer receive a copy of this review before publication. There was no obligation to publish this review. As an independent media company, Notebookcheck is not subjected to the authority of manufacturers, retailers or publishers.
This is how Notebookcheck is testing
Every year, Notebookcheck independently reviews hundreds of laptops and smartphones using standardized procedures to ensure that all results are comparable. We have continuously developed our test methods for around 20 years and set industry standards in the process. In our test labs, high-quality measuring equipment is utilized by experienced technicians and editors. These tests involve a multi-stage validation process. Our complex rating system is based on hundreds of well-founded measurements and benchmarks, which maintains objectivity. Further information on our test methods can be found here.
Price comparison

