宏碁掠夺者 Helios 18 2024 笔记本电脑评测:18 英寸游戏玩家的新硬件

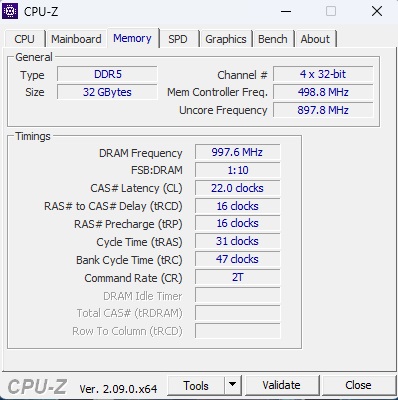
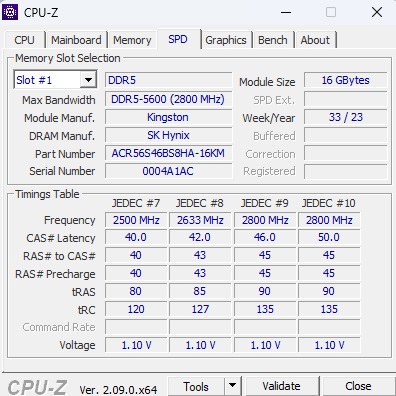
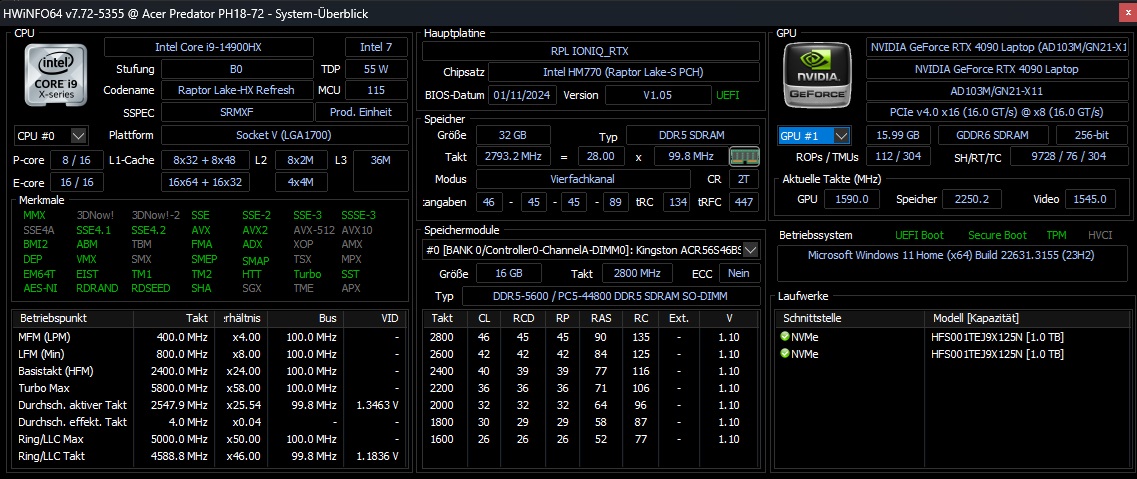
2023 年,宏碁开始销售 18 英寸笔记本电脑。虽然我们的 第一台测试设备配备了 酷睿 i9-13900HX和 GeForce RTX 4080而后续机型的测试配置则配备了 酷睿 i9-14900HX和 GeForce RTX 4090.保持不变的是笔记本电脑强大的 Mini-LED 面板,它几乎完全不打折扣地给人留下了深刻印象(稍后详述)。宏碁安装了 2x 16 GB DDR5-5600 内存和两个 RAID-0 格式的 NVMe-SSD(M.2 2280),每个存储空间为 1 TB。在进行测试时,这款笔记本电脑尚未在美国上市,因此我们还无法提供有关其 MRSP 的任何信息。
掠夺者 Helios 18 的竞争对手包括 18 英寸游戏机,如 微星 Titan 18 HX A14以及 华硕 ROG Strix Scar 18 G834和 Alienware m18 R1-所有这些设备都作为对比设备列于表中。
潜在的竞争对手比较
Rating | Date | Model | Weight | Height | Size | Resolution | Price |
|---|---|---|---|---|---|---|---|
| 87.1 % v7 (old) | 03 / 2024 | Acer Predator Helios 18 PH18-72-98MW i9-14900HX, GeForce RTX 4090 Laptop GPU | 3.3 kg | 29.5 mm | 18.00" | 2560x1600 | |
| 88.8 % v7 (old) | 01 / 2024 | MSI Titan 18 HX A14VIG i9-14900HX, GeForce RTX 4090 Laptop GPU | 3.6 kg | 32.1 mm | 18.00" | 3840x2400 | |
| 88.3 % v7 (old) | 02 / 2024 | Asus ROG Strix Scar 18 G834JYR (2024) i9-14900HX, GeForce RTX 4090 Laptop GPU | 3.1 kg | 30.8 mm | 18.00" | 2560x1600 | |
| 88.3 % v7 (old) | 10 / 2023 | Acer Predator Helios 18 N23Q2 i9-13900HX, GeForce RTX 4080 Laptop GPU | 3.2 kg | 29.15 mm | 18.00" | 2560x1600 | |
| 89.2 % v7 (old) | 11 / 2023 | Alienware m18 R1 AMD R9 7945HX, Radeon RX 7900M | 3.9 kg | 26.7 mm | 18.00" | 1920x1200 |
案例
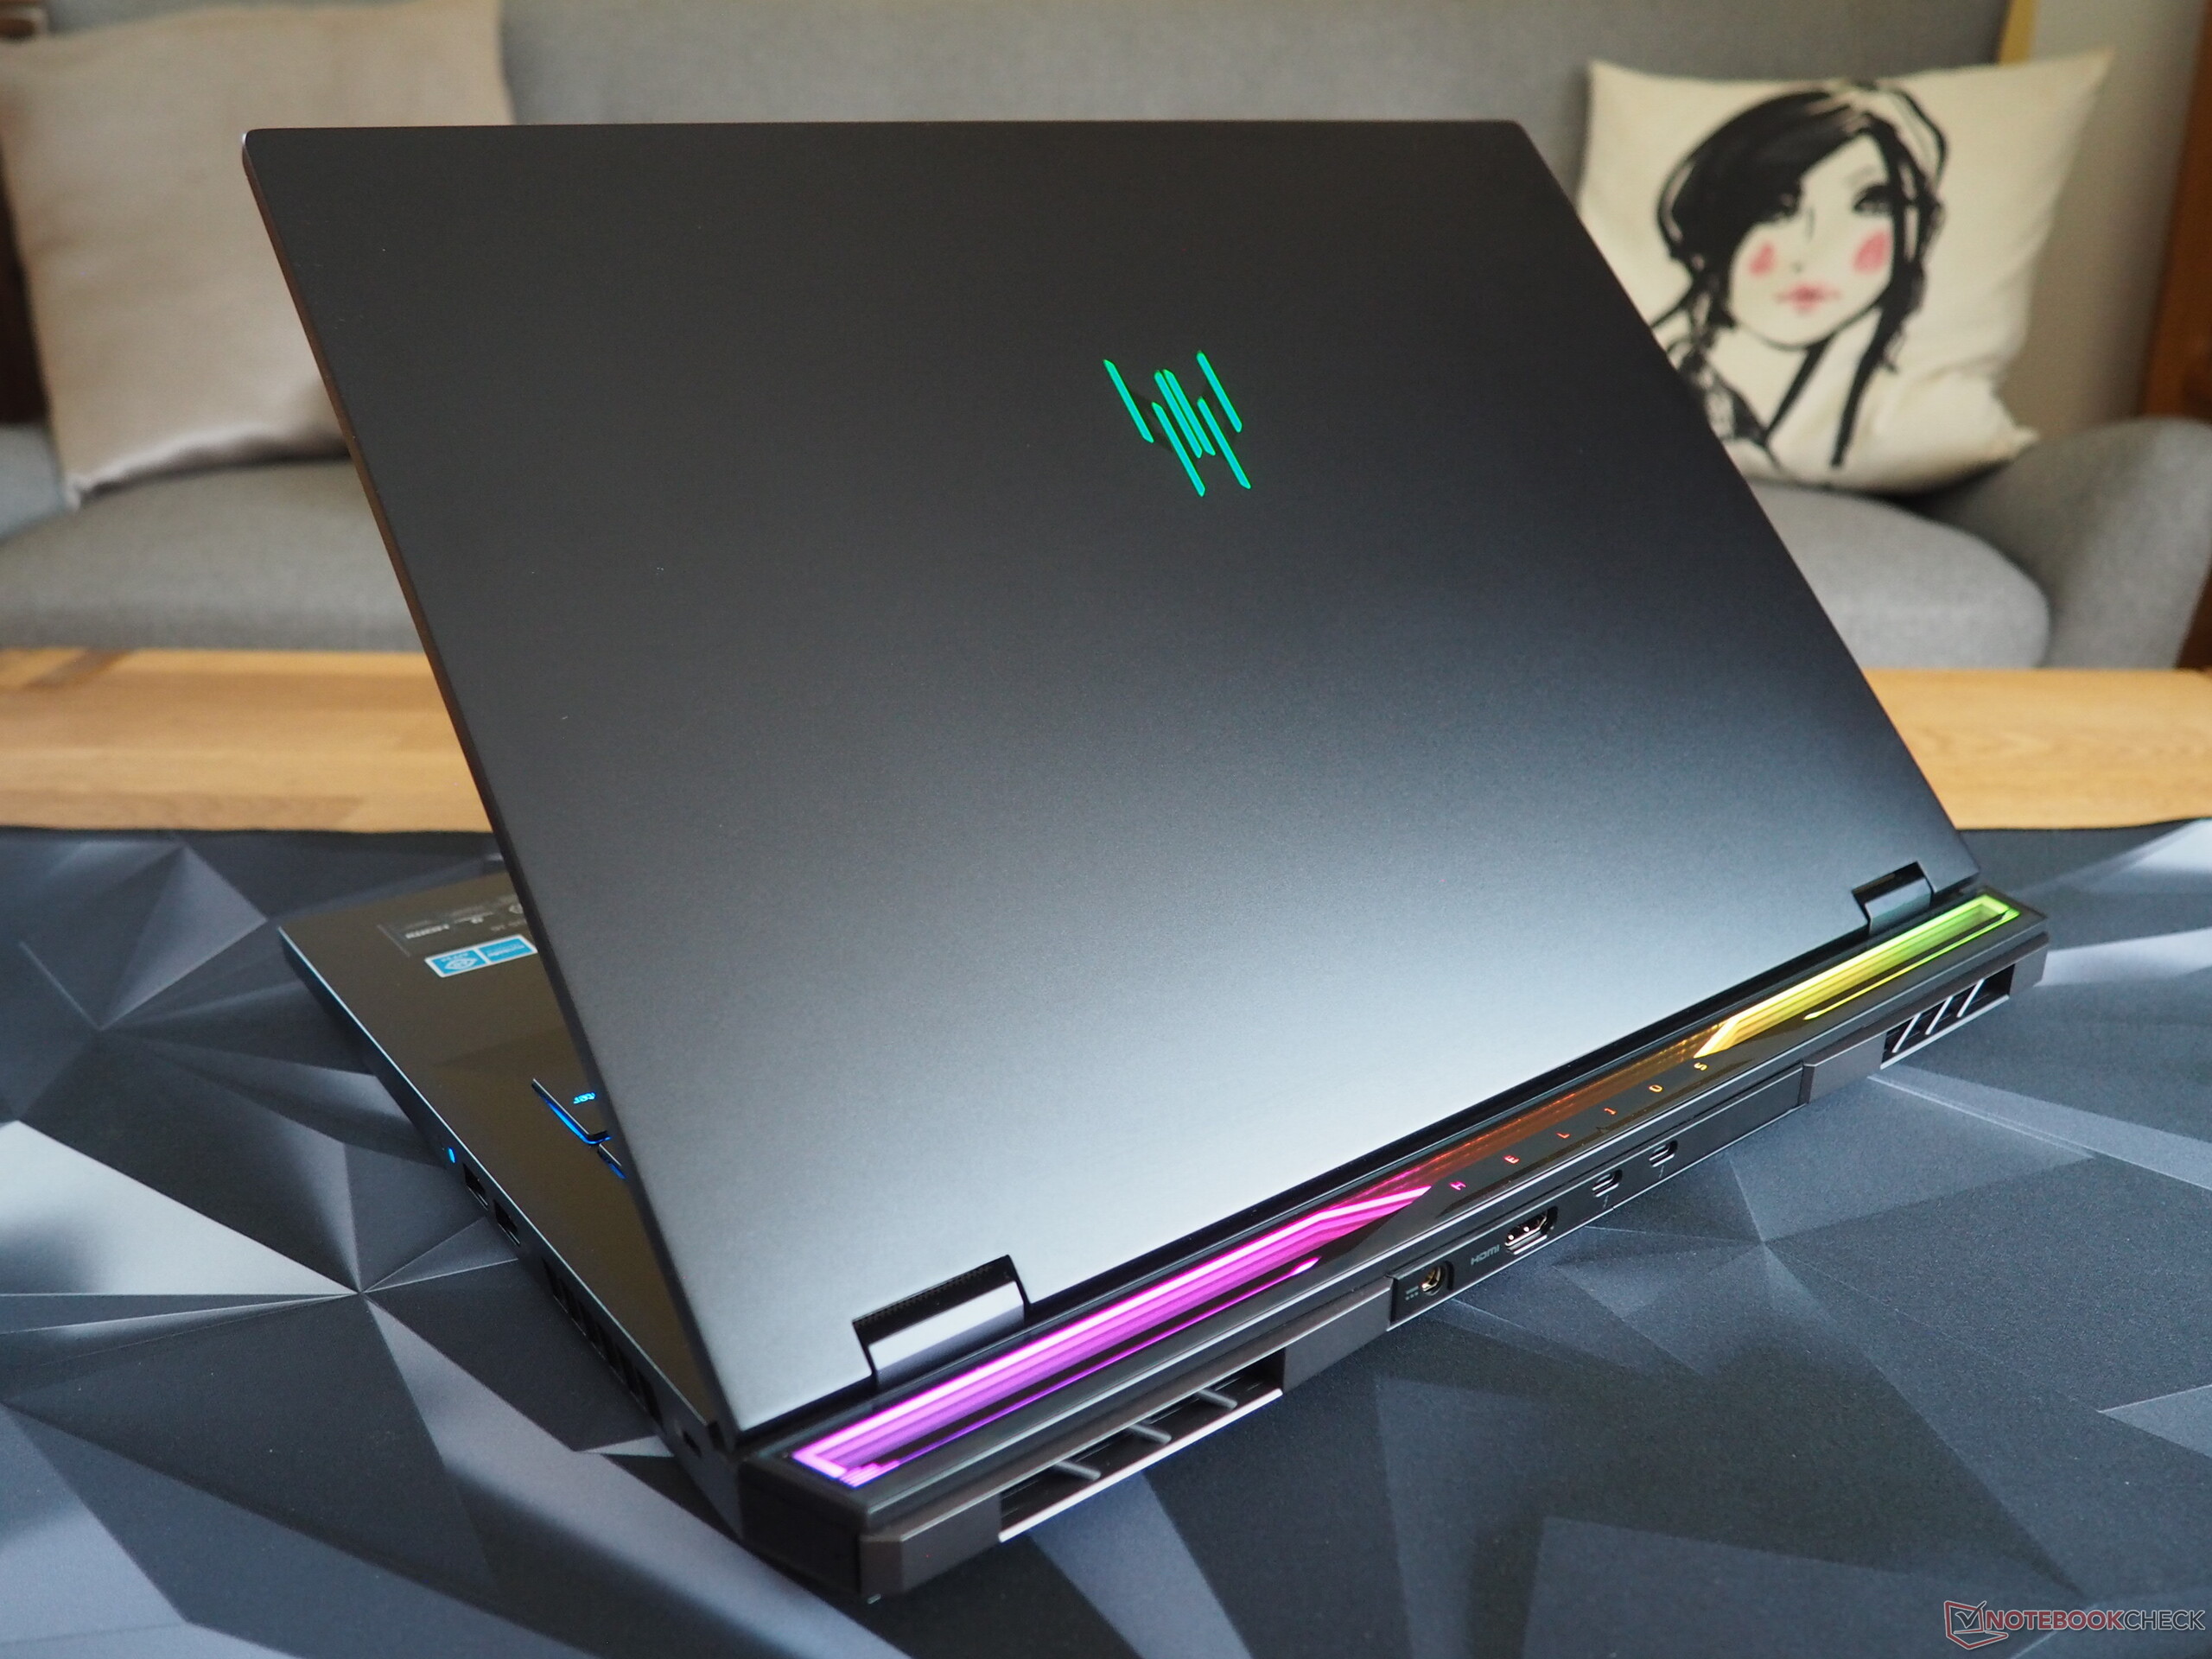
说到这款设备的外壳,宏碁(Acer)保持了前代产品的原貌--不过仔细观察,你会发现有一些变化。制造商更换了键盘型号,并重新设计了机身背面的时尚灯带。这款笔记本电脑的盖子和底座顶部均由金属制成,因此仍然给人以高品质的感觉。我们对该设备的做工也没有任何负面评价。如果有的话,宏碁可以改进笔记本的铰链,因为它们有时会有点晃动。虽然机盖可以更加稳固,键盘的某些部分在用力按压时也会被推入,但我们仍然认为它的外壳是稳定的。它的设计既不沉闷,也不过分俏皮。

在重量方面,Predator Helios 18 属于中等水平。3.3 公斤的重量比华硕 ROG Strix Scar 18 重,但比微星 Titan 18 和 Alienware m18 轻。
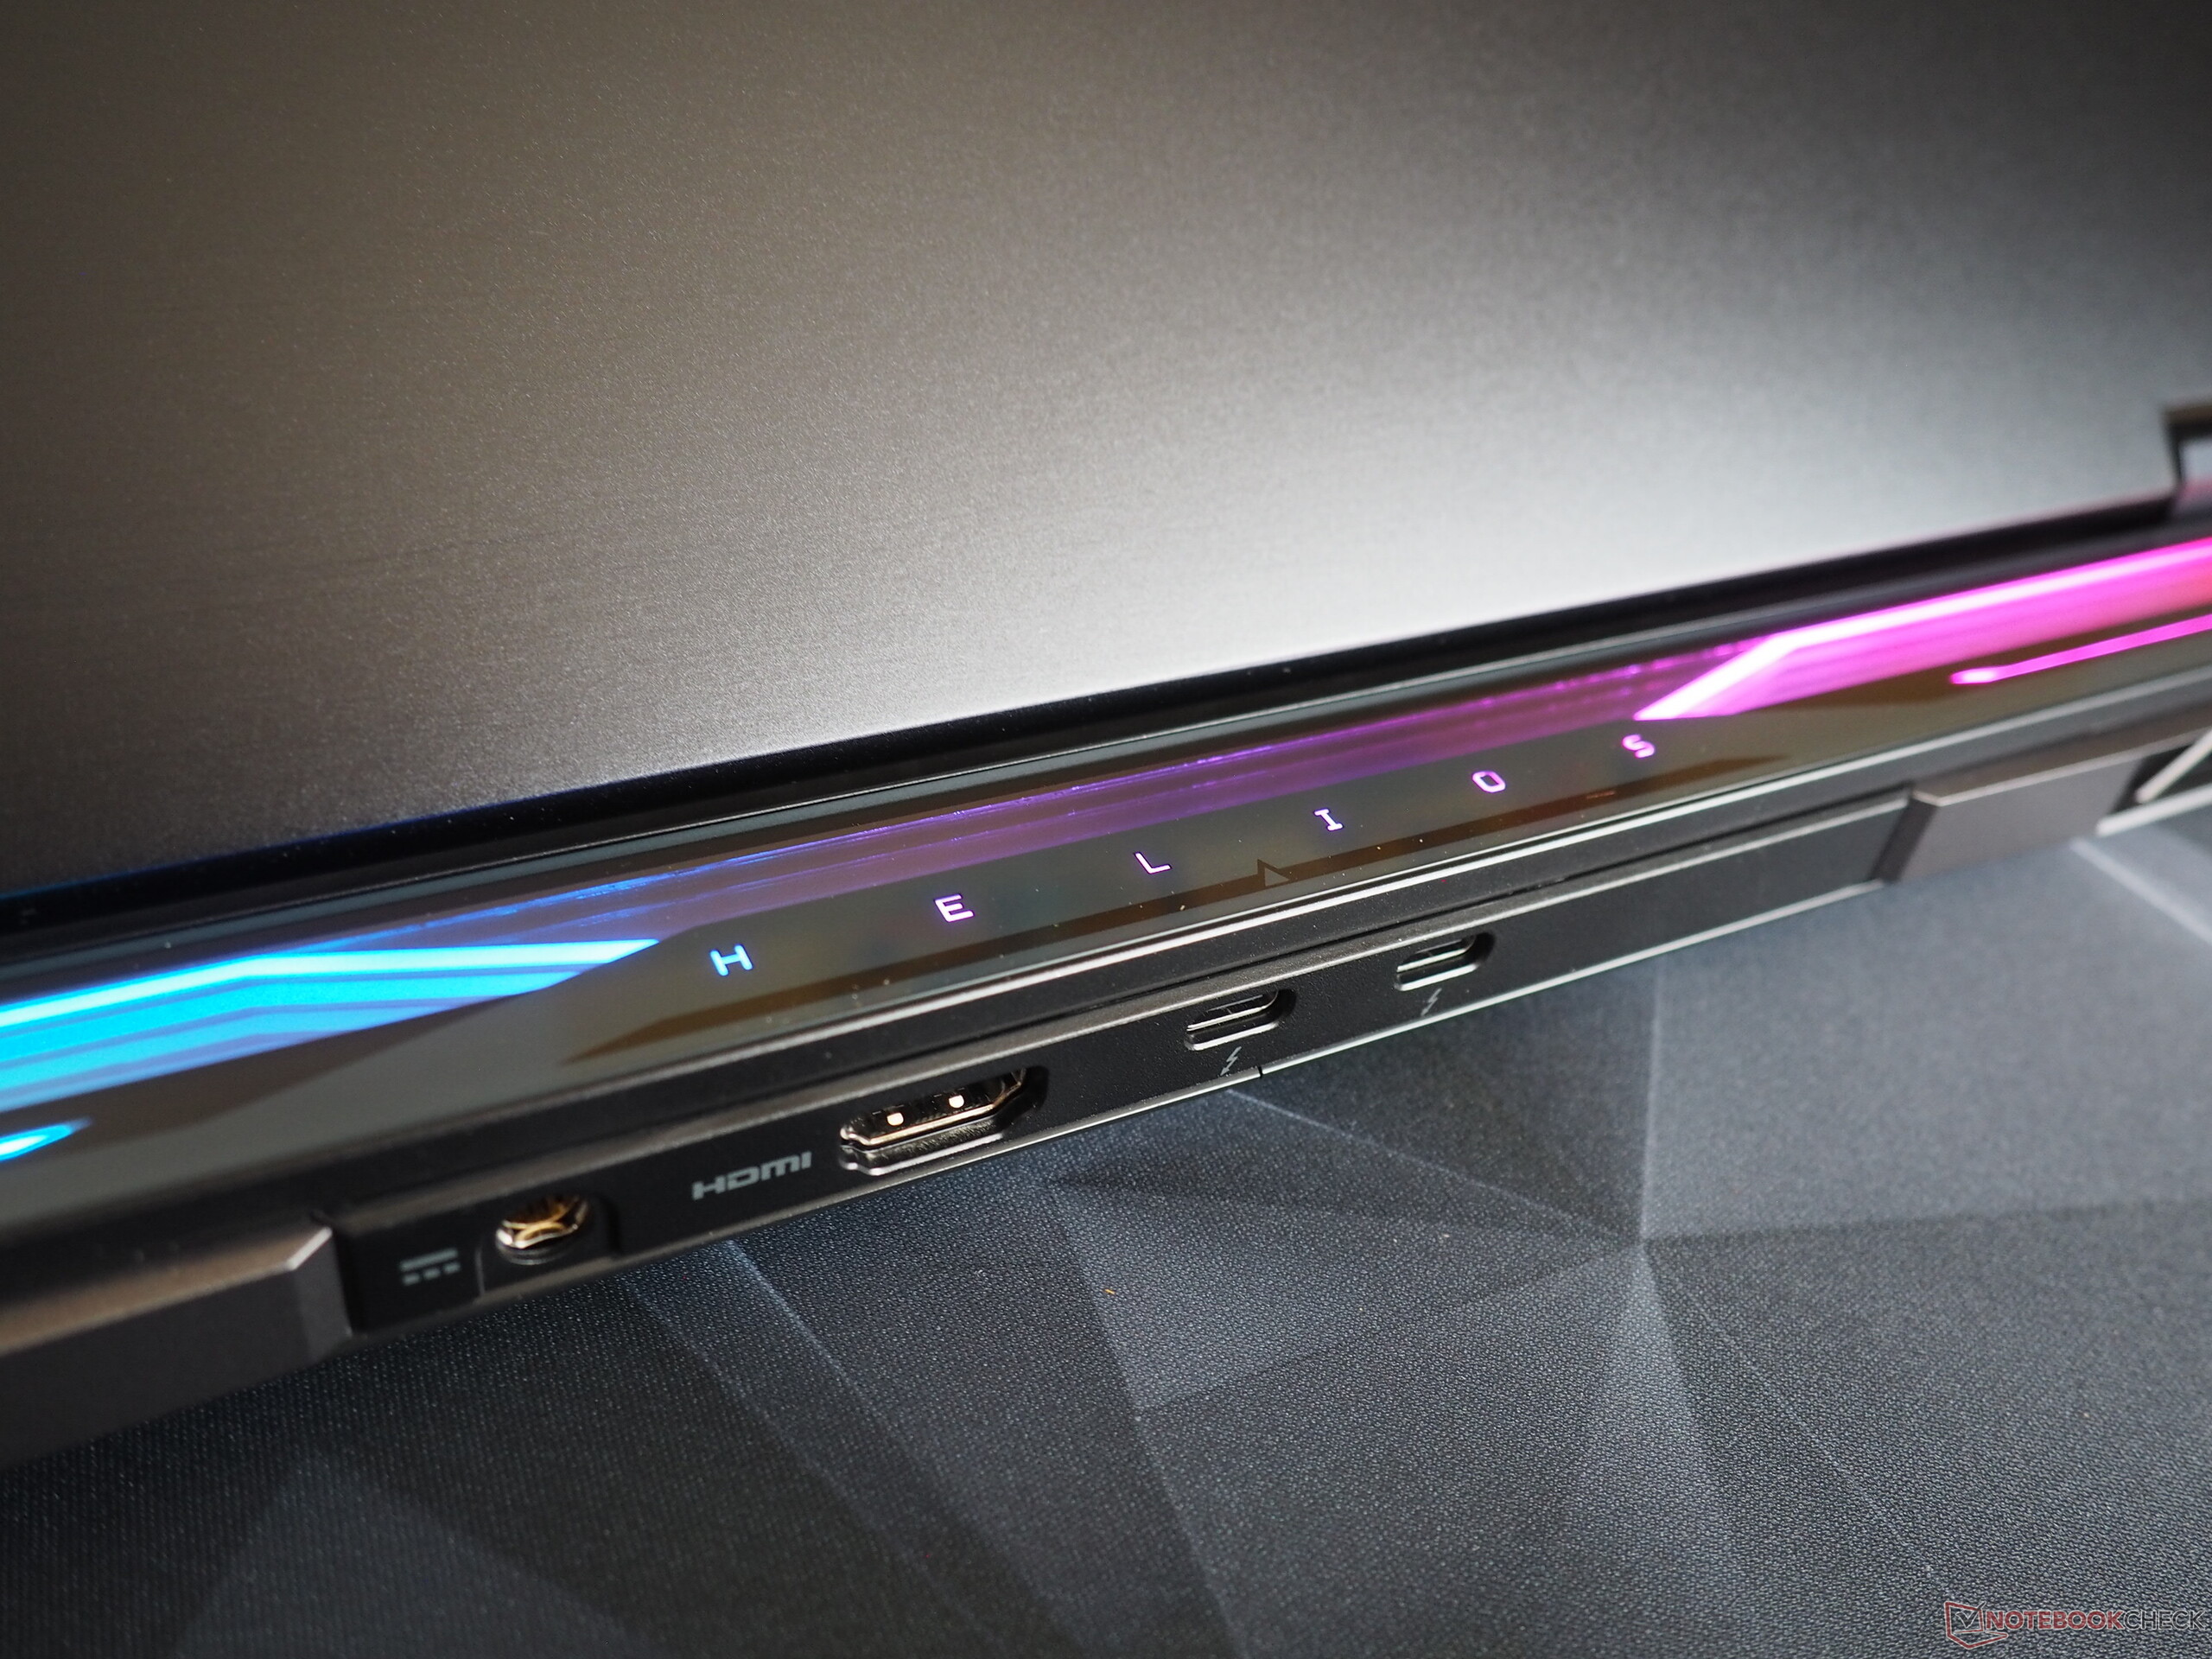
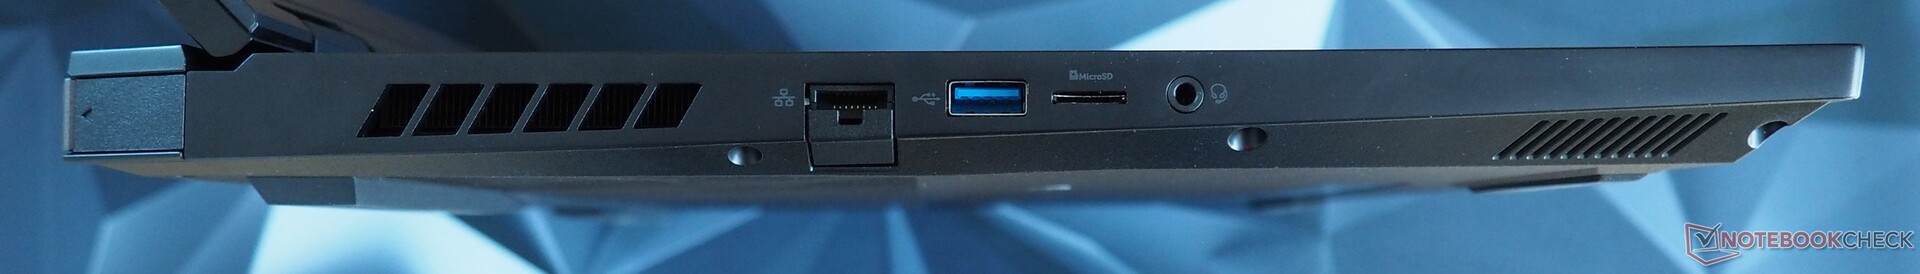
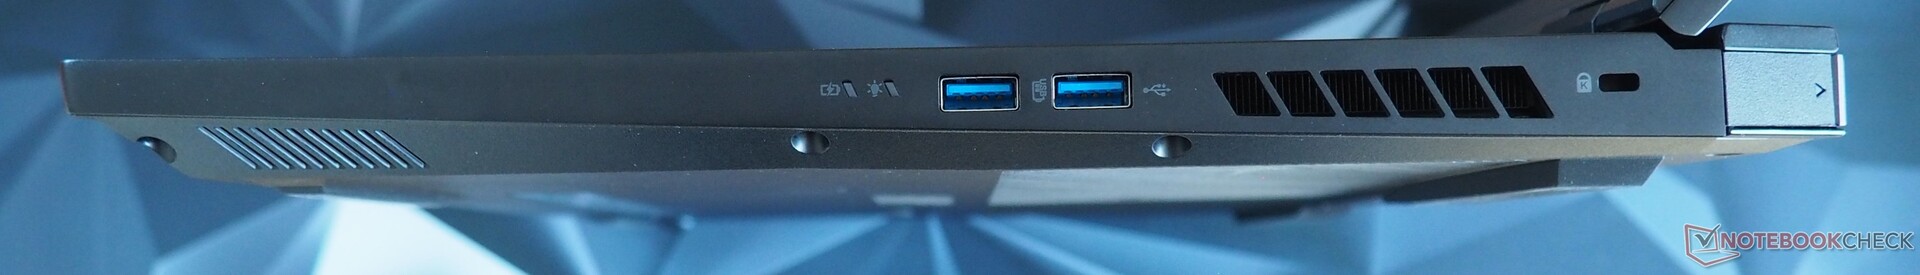
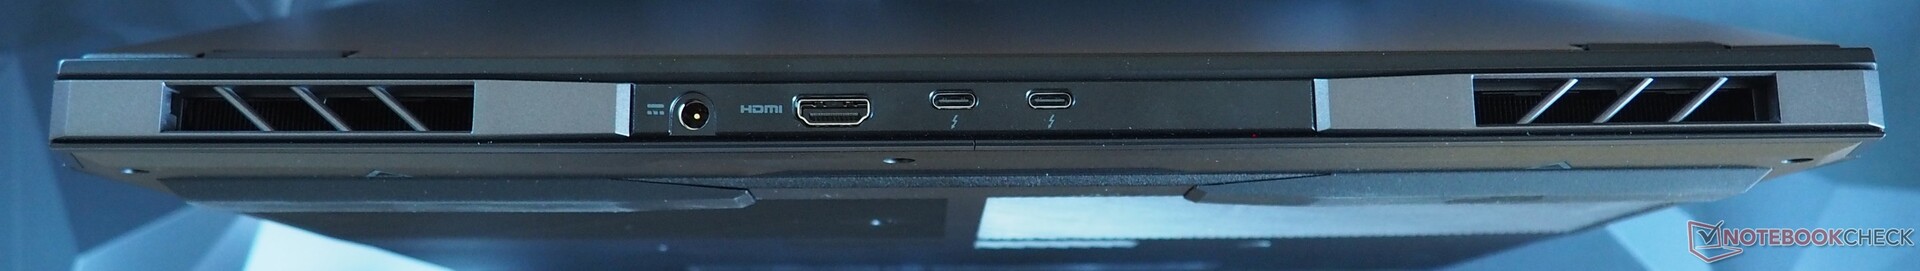
连接性
该设备的连接选项非常现代化。背面有一个 HDMI 2.1 输出端口和两个 Thunderbolt 4 端口(包括 DisplayPort 和 Power Delivery),右侧有两个 USB 3.2 Gen-2 端口(A 型)和一个 Kensington 锁插槽。左侧还有一个 RJ45 端口、一个 USB 3.0 端口(A 型)、一个 microSD 读卡器和一个音频插孔。
SD 读卡器
安装的读卡器速度一般。只有 Alienware m18 能在一定程度上使用我们的参考卡,在这方面给我们留下了深刻印象。
| SD Card Reader | |
| average JPG Copy Test (av. of 3 runs) | |
| Alienware m18 R1 AMD (Toshiba Exceria Pro SDXC 64 GB UHS-II) | |
| Average of class Gaming (20.9 - 210, n=54, last 2 years) | |
| Acer Predator Helios 18 PH18-72-98MW (AV PRO microSD 128 GB V60) | |
| MSI Titan 18 HX A14VIG (Toshiba Exceria Pro SDXC 64 GB UHS-II) | |
| Acer Predator Helios 18 N23Q2 | |
| maximum AS SSD Seq Read Test (1GB) | |
| Alienware m18 R1 AMD (Toshiba Exceria Pro SDXC 64 GB UHS-II) | |
| Average of class Gaming (25.5 - 261, n=51, last 2 years) | |
| MSI Titan 18 HX A14VIG (Toshiba Exceria Pro SDXC 64 GB UHS-II) | |
| Acer Predator Helios 18 PH18-72-98MW (AV PRO microSD 128 GB V60) | |
| Acer Predator Helios 18 N23Q2 | |
交流
新款 Helios 18 配备了最先进的 Wi-Fi 7 芯片,但由于缺乏合适的硬件,我们只能对其进行有限的测试。在我们的标准测试中,其 Wi-Fi 模块的性能(发送)一直很稳定,(接收)性能也非常好。
网络摄像头
由于采用了全高清分辨率,安装的网络摄像头比大多数笔记本电脑更清晰,但在色彩准确度方面仍有改进的余地。

")
")
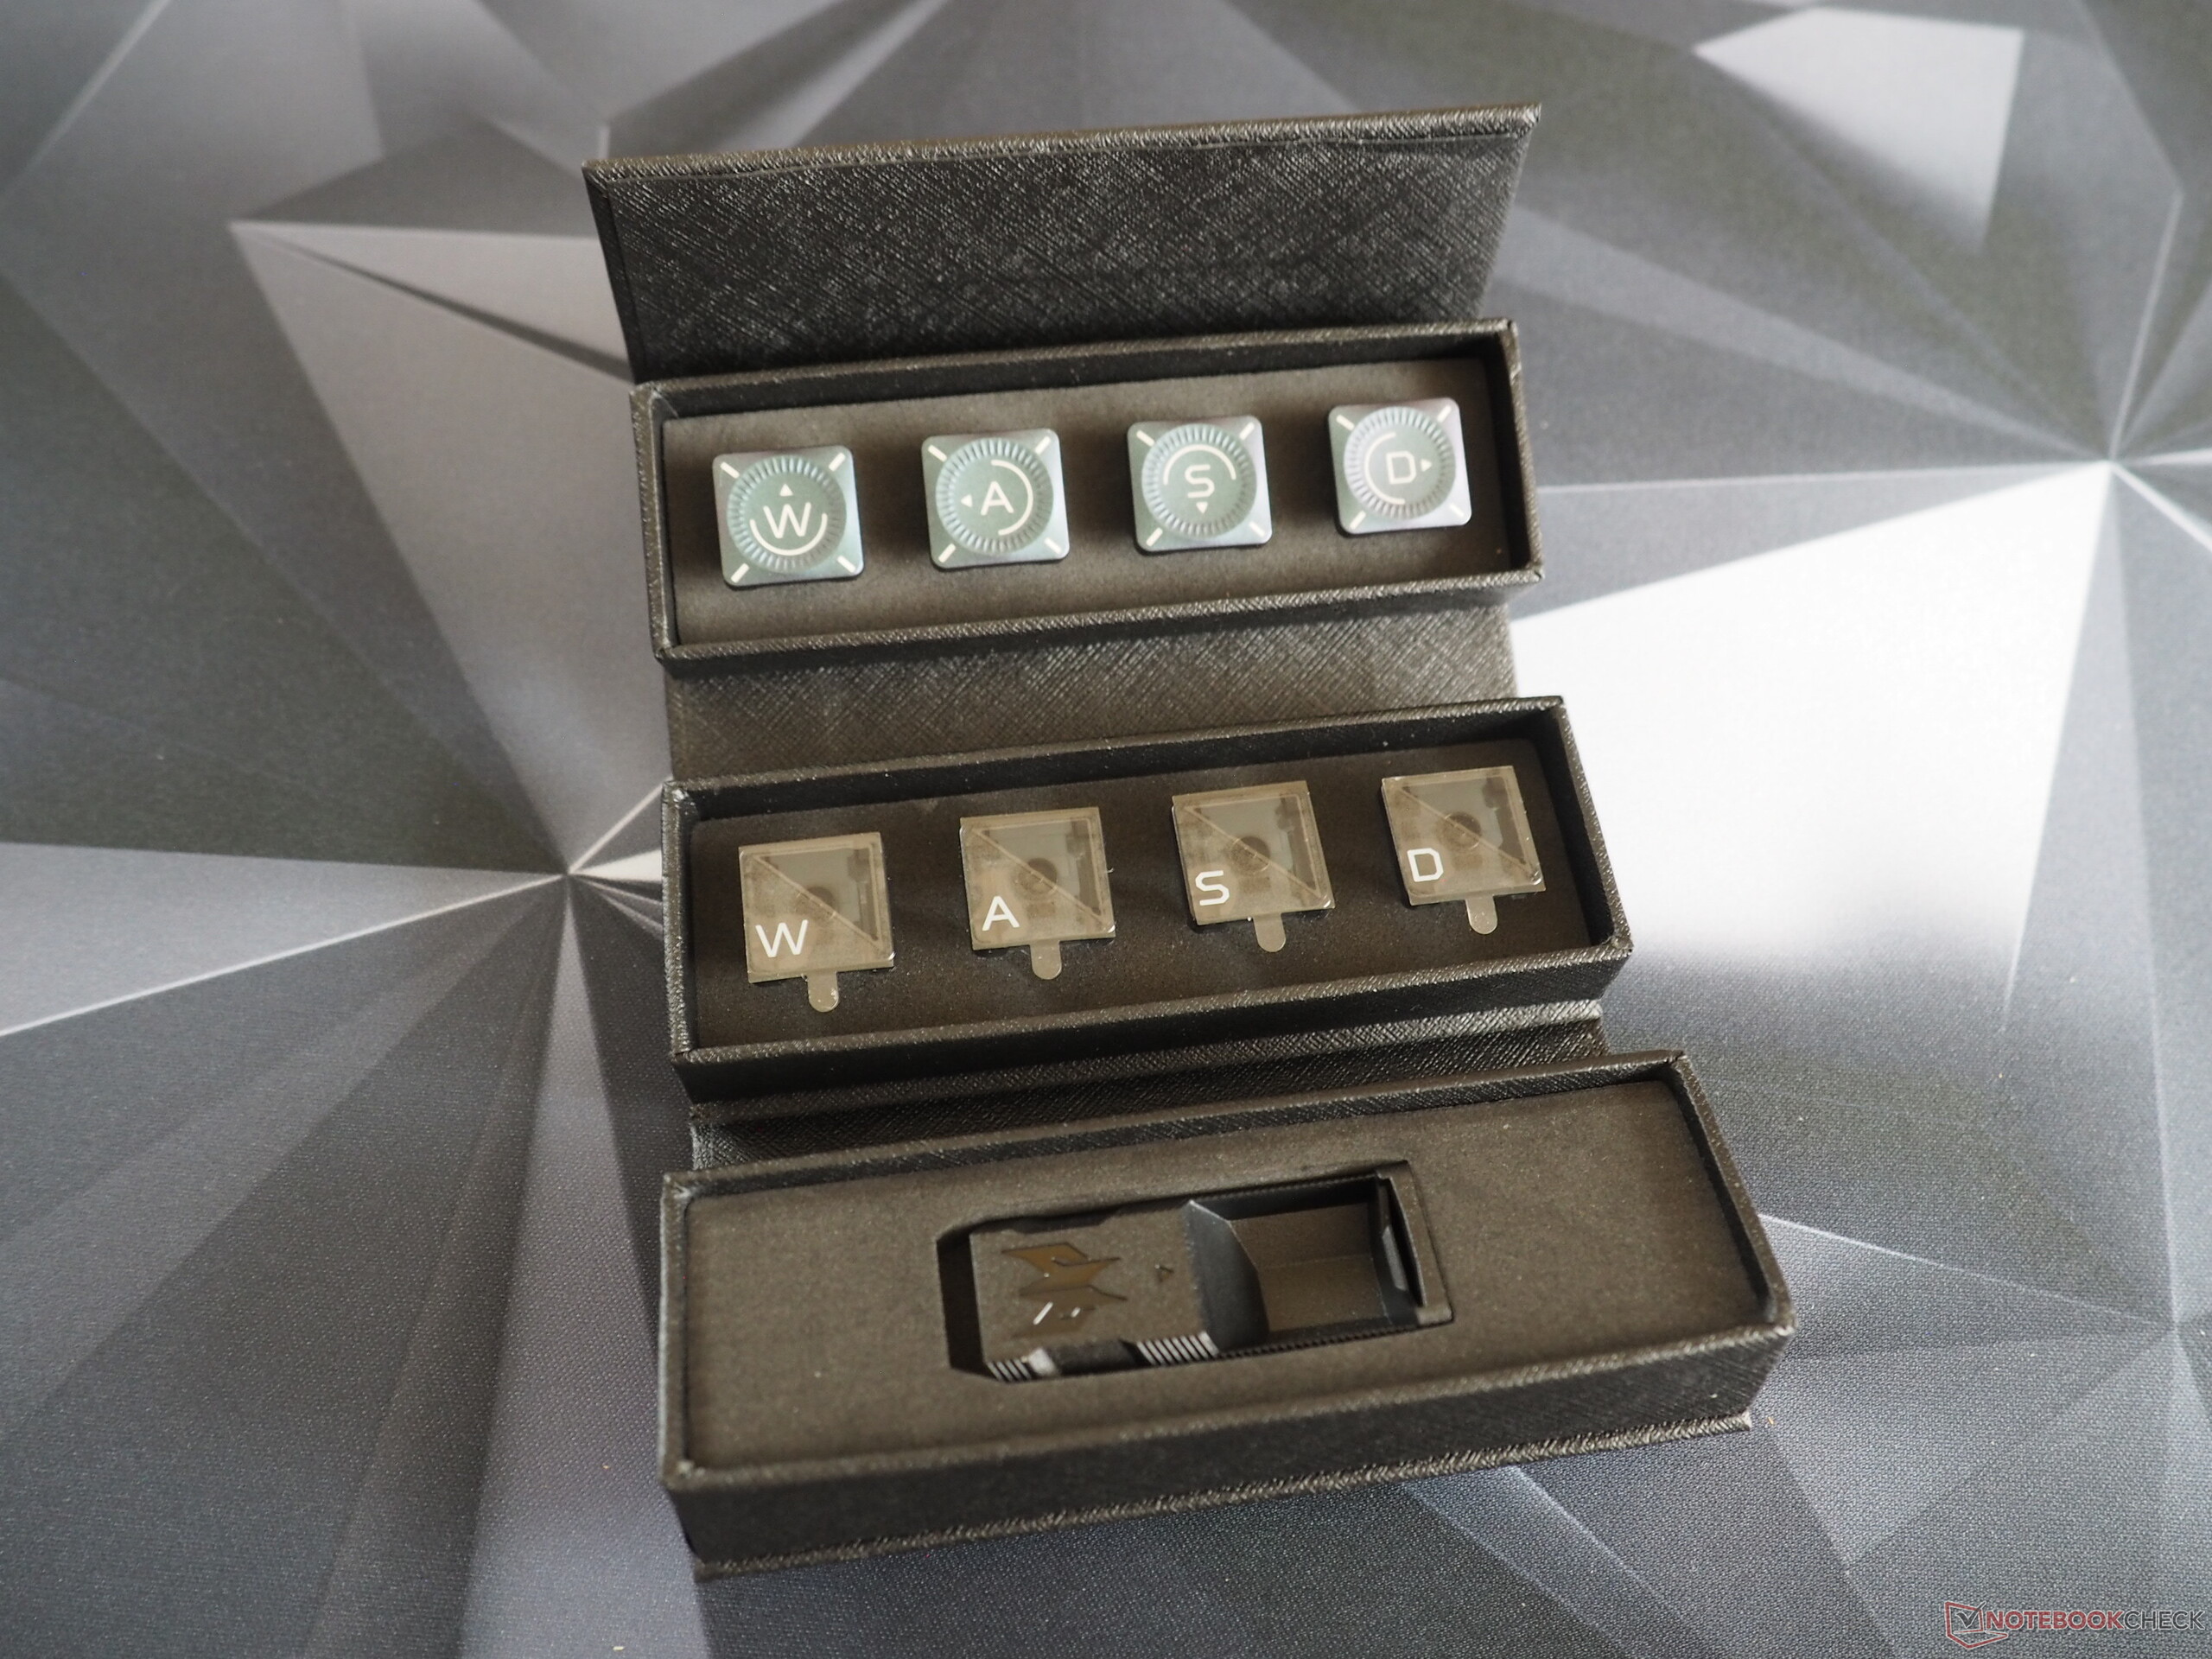
配件
Predator Helios 18 拥有一个有趣的特殊功能:它的包装盒中不仅有设备背面的可更换风扇网罩,还有两套不同的 WASD 键和一些键杆。不出所料,随附的 330 瓦电源装置相当笨重。
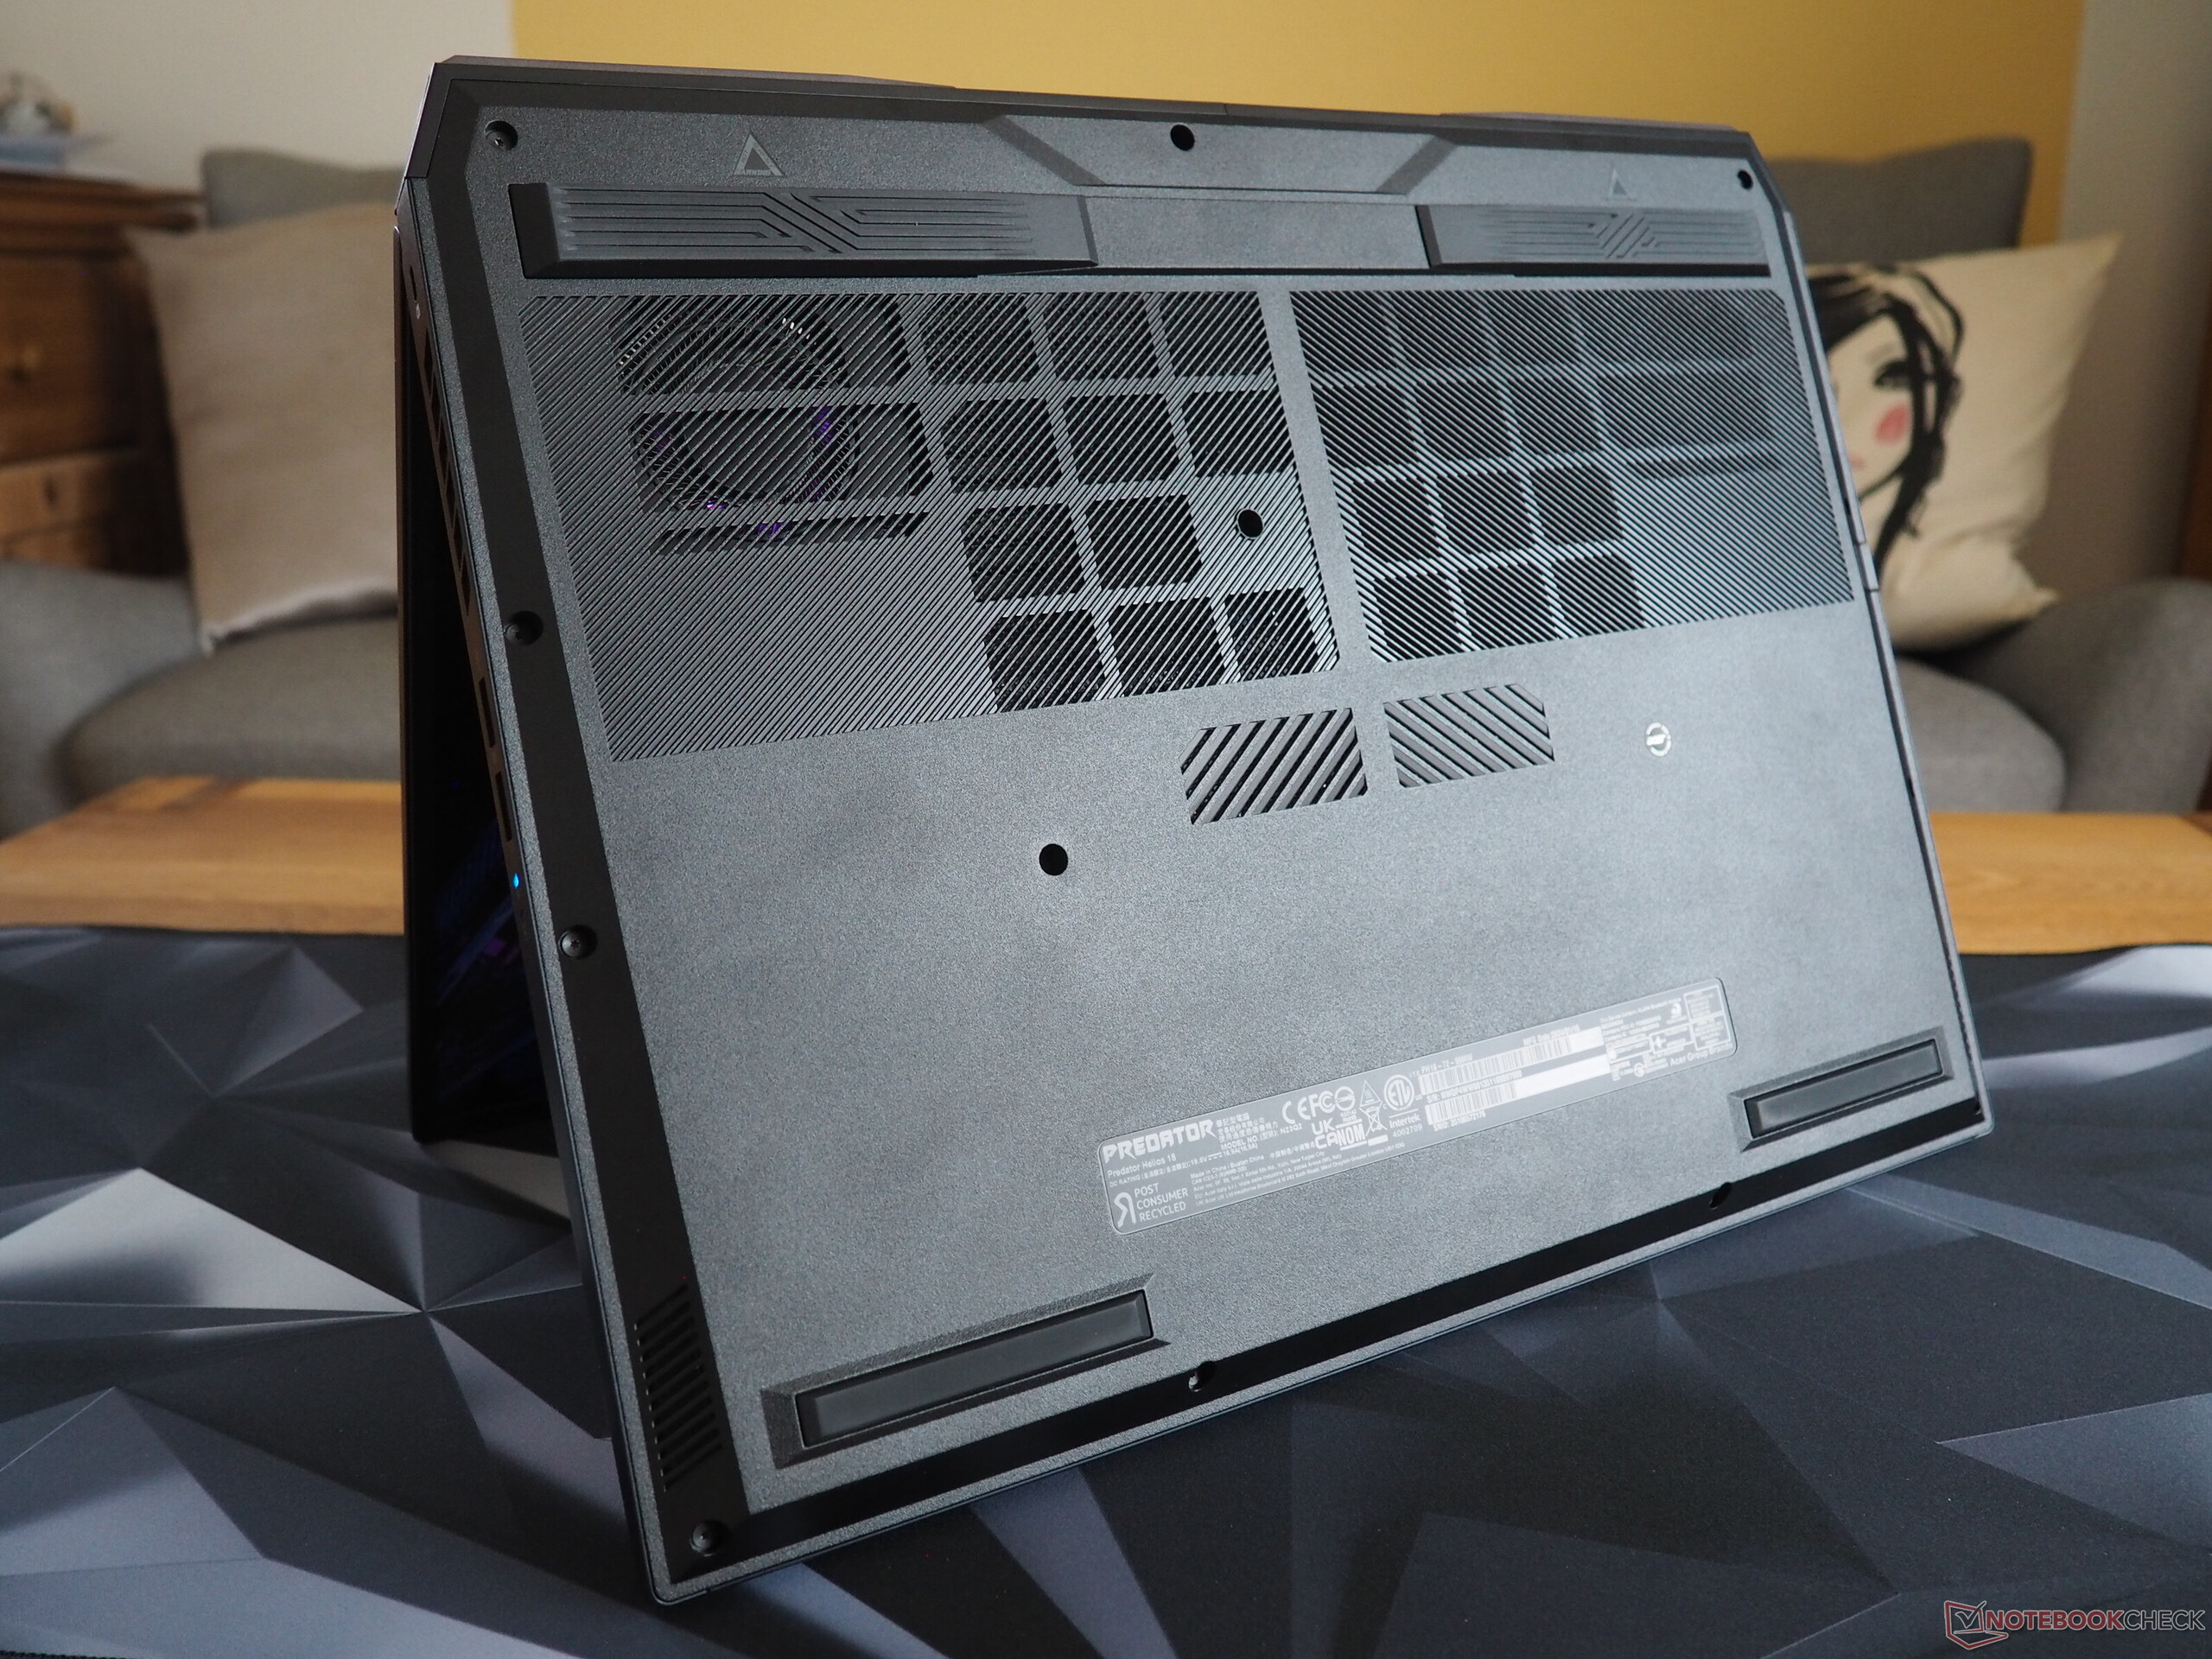
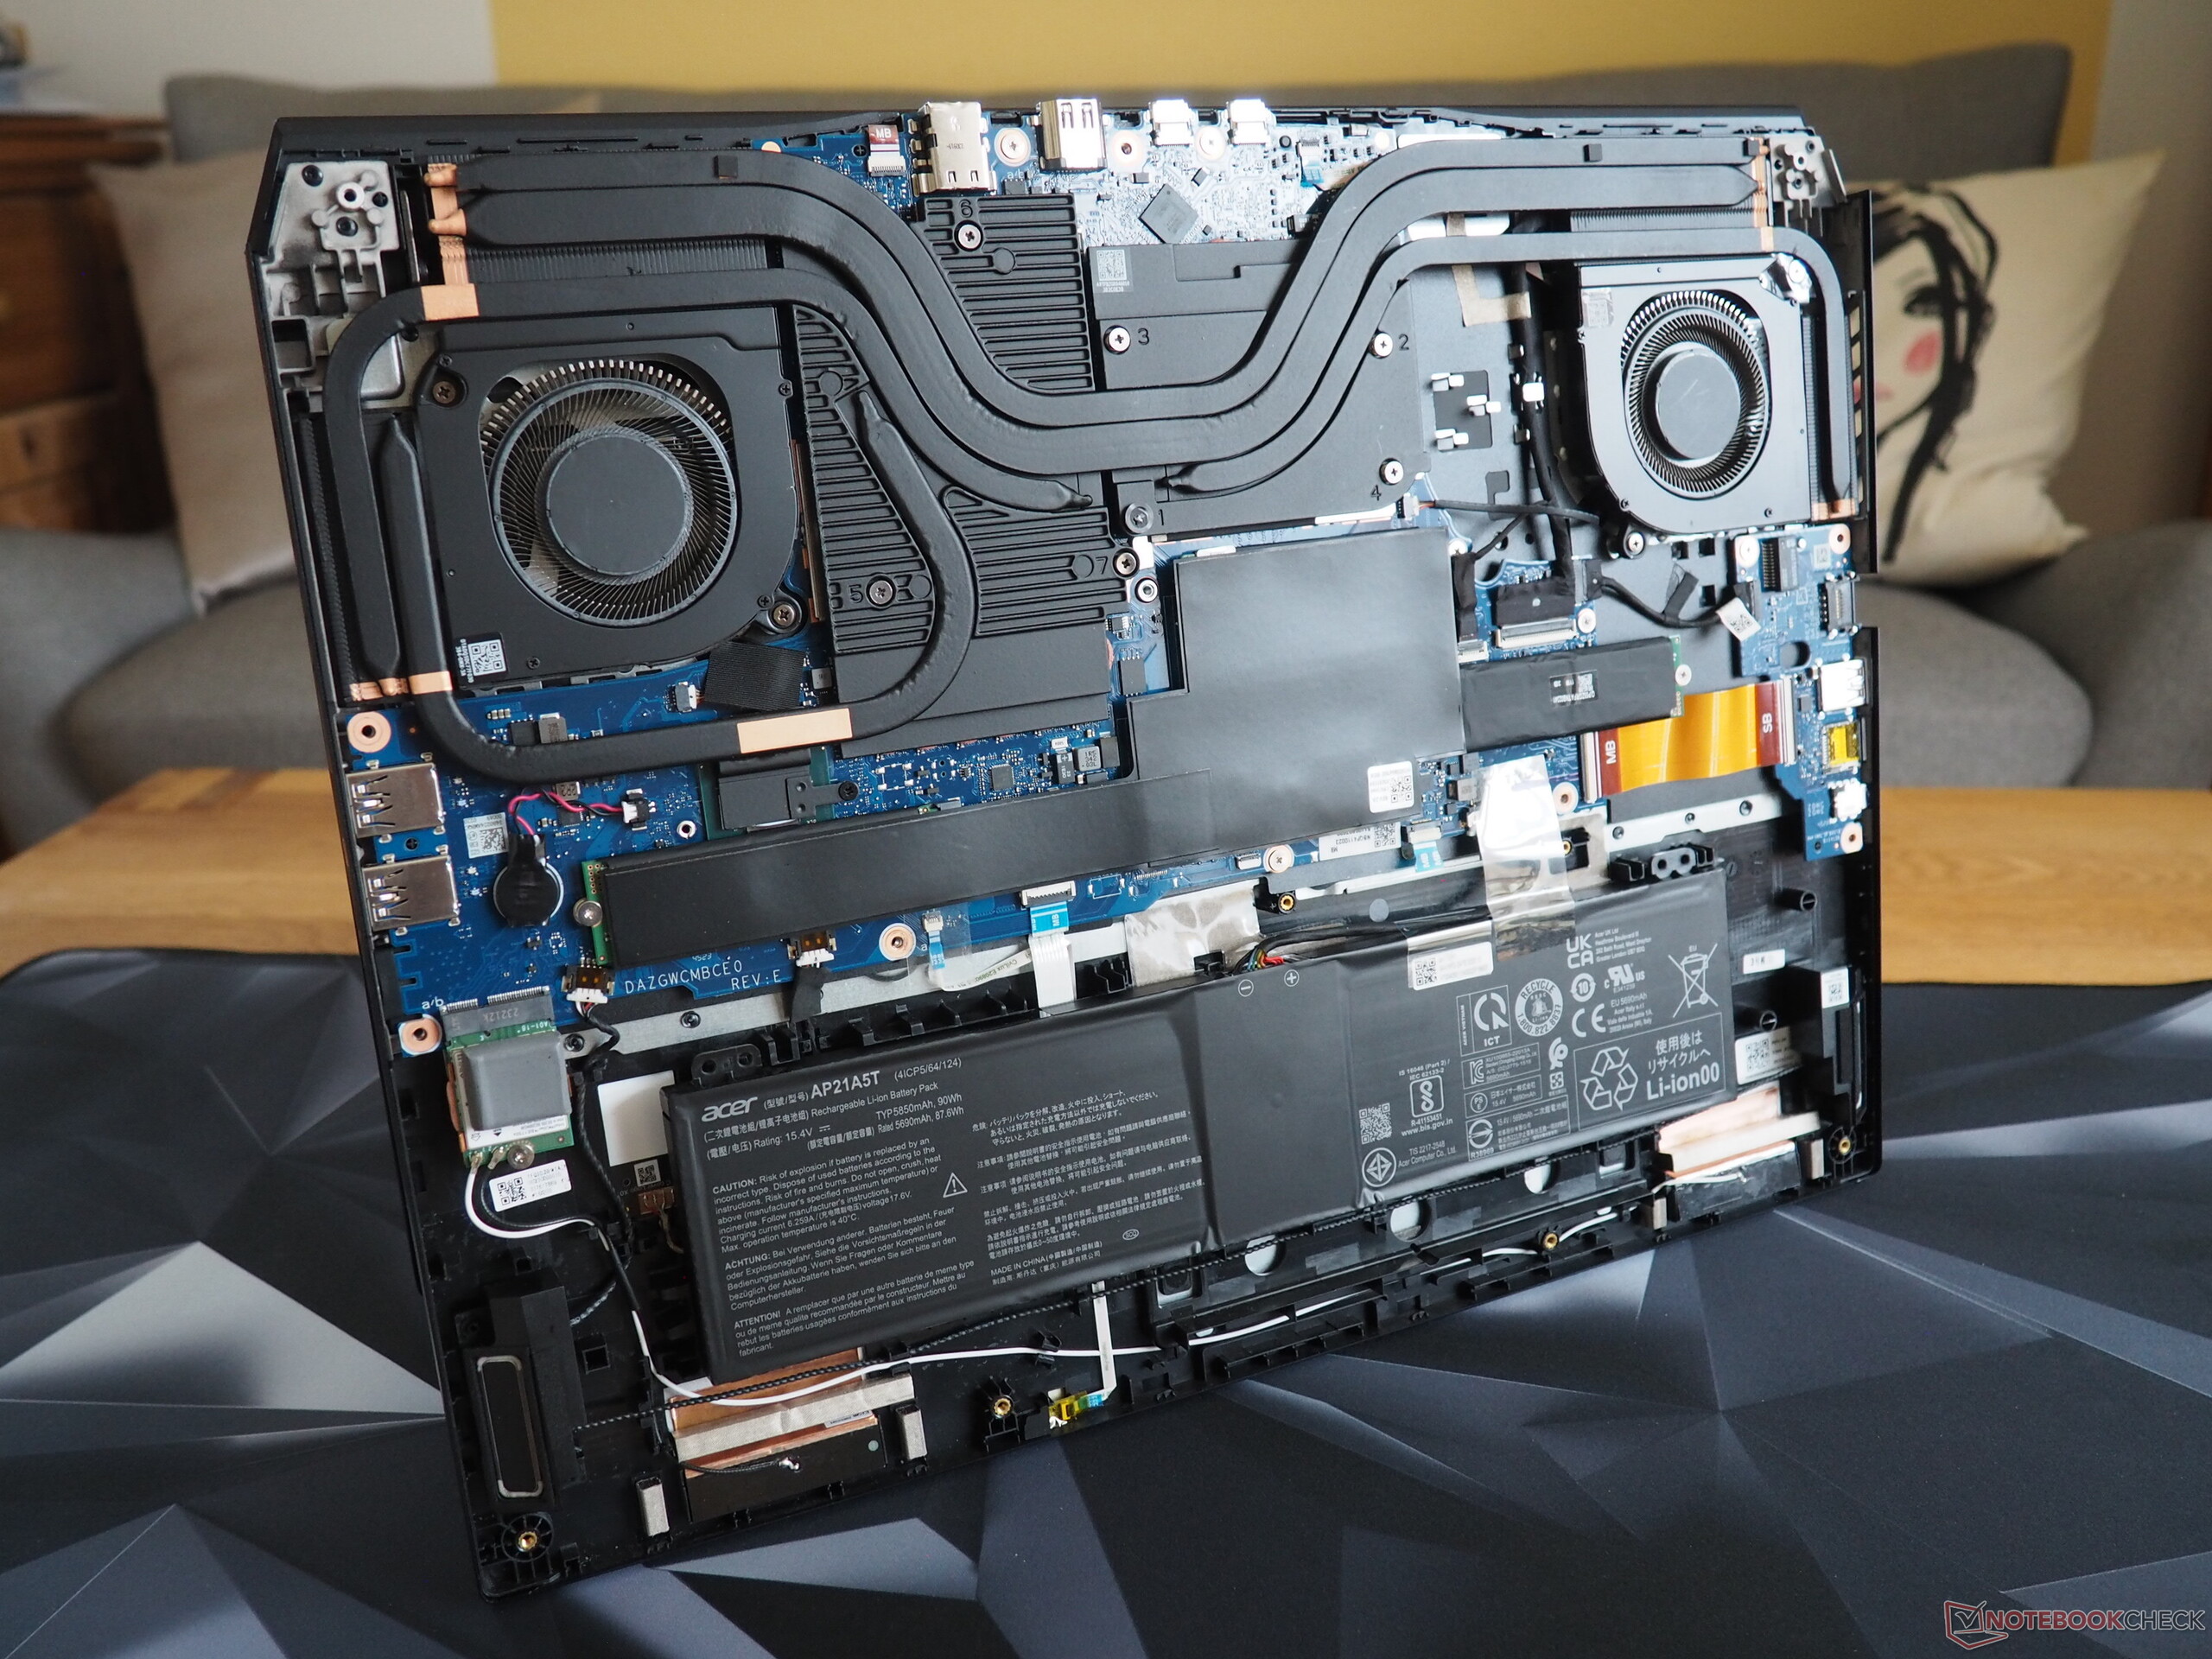
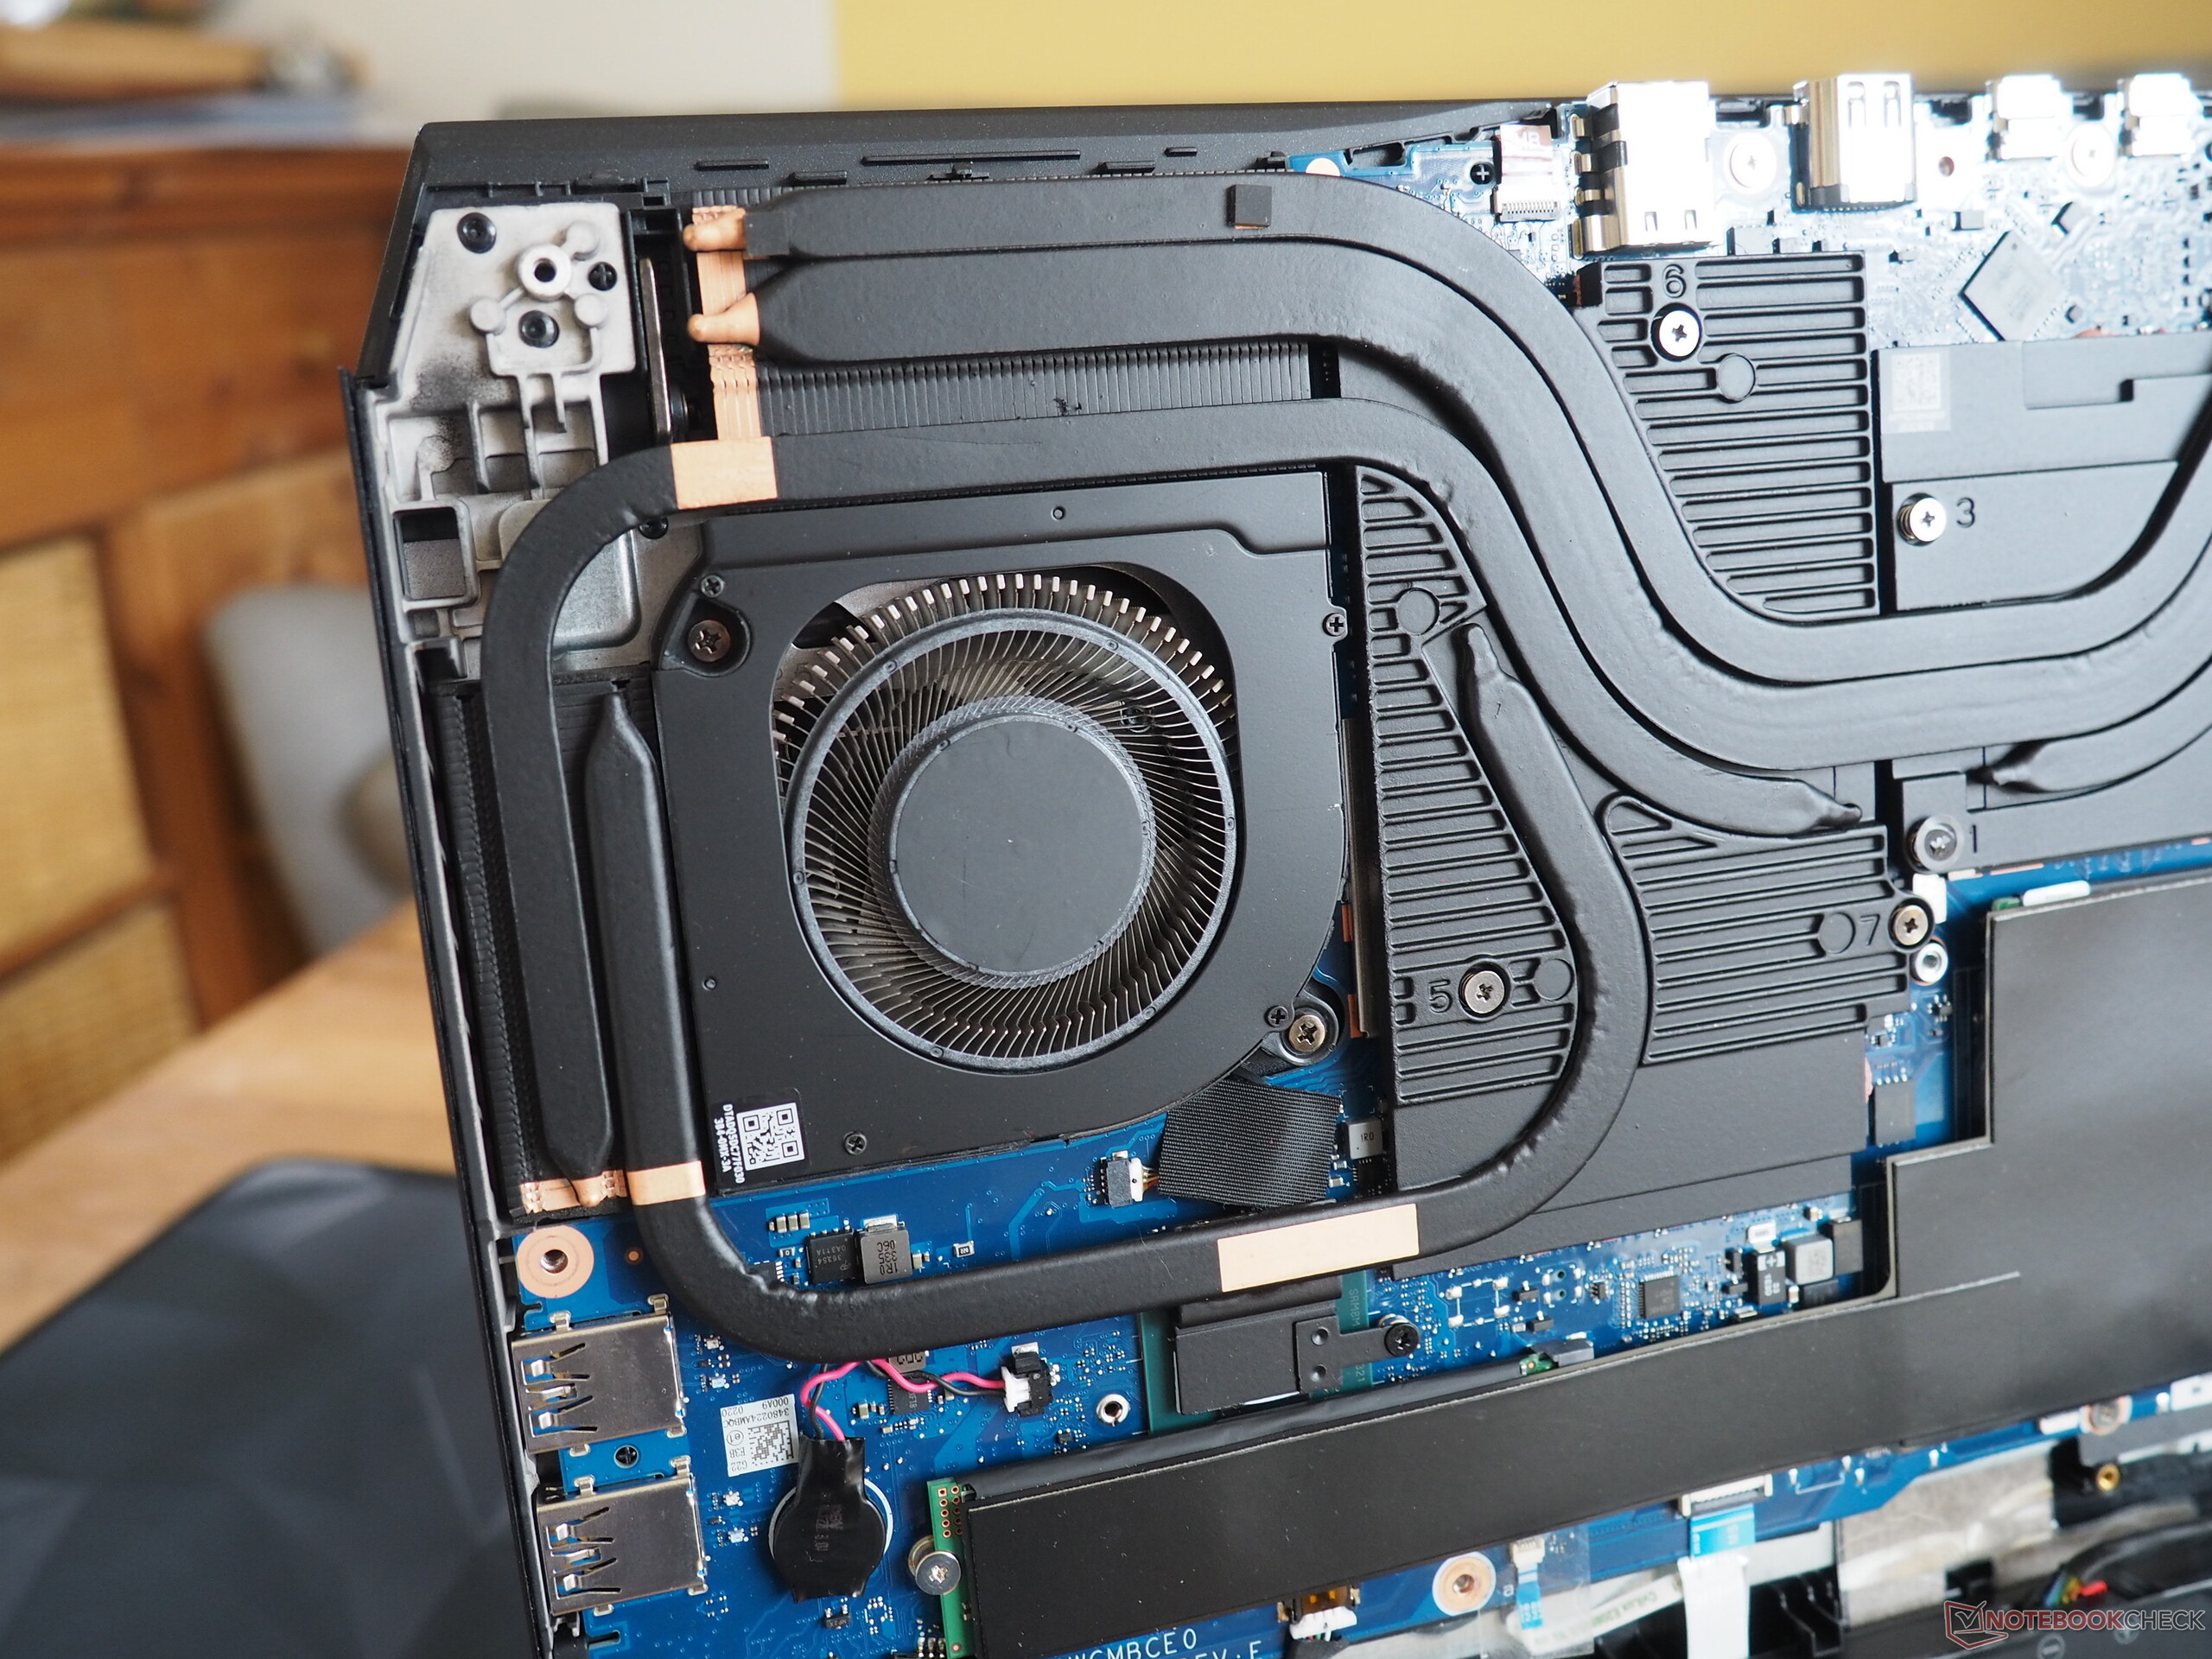
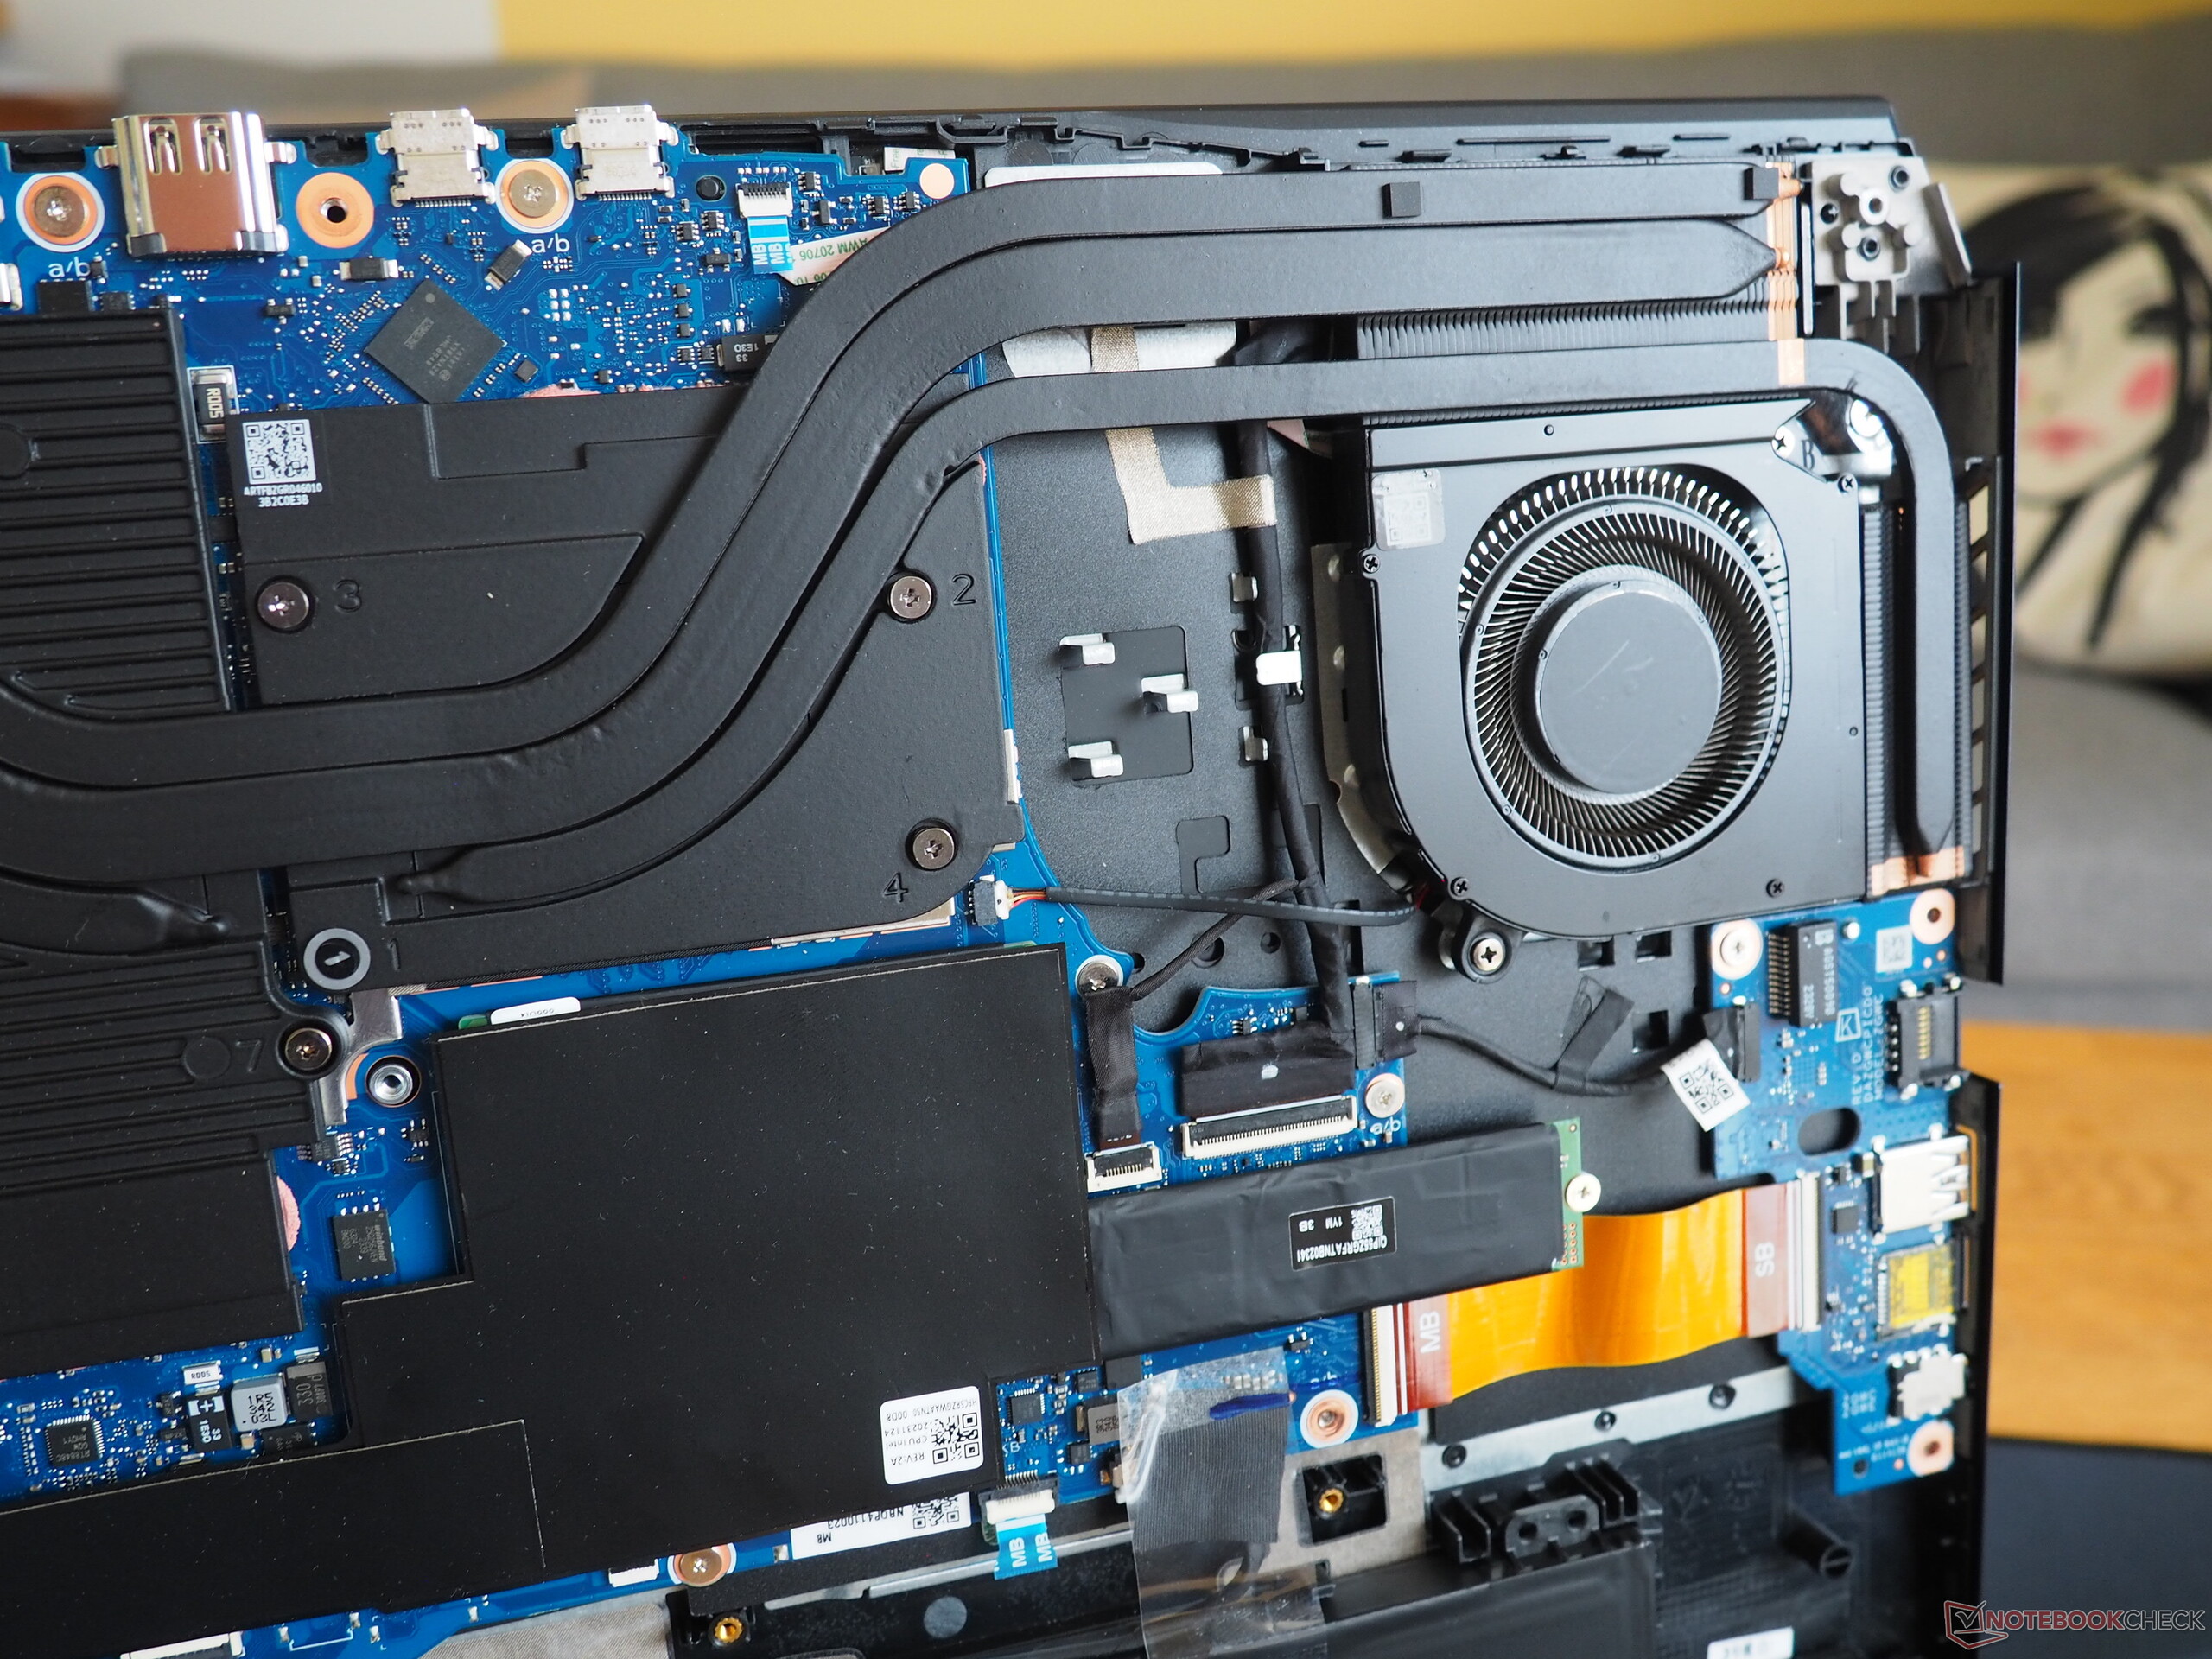
维护
它的维护选项让我们喜忧参半。拧下 14 颗 Torx 螺钉并撬开底板需要花费相当长的时间,此外,宏碁使用的保修封条(覆盖一颗螺钉)甚至可能会吓跑许多用户。在内部,你至少可以接触到冷却系统、电池、无线局域网模块、内存和固态硬盘。不过,后两者都被薄膜和垫子覆盖,更换起来并不方便。
保修
该笔记本电脑提供 24 个月的保修服务。
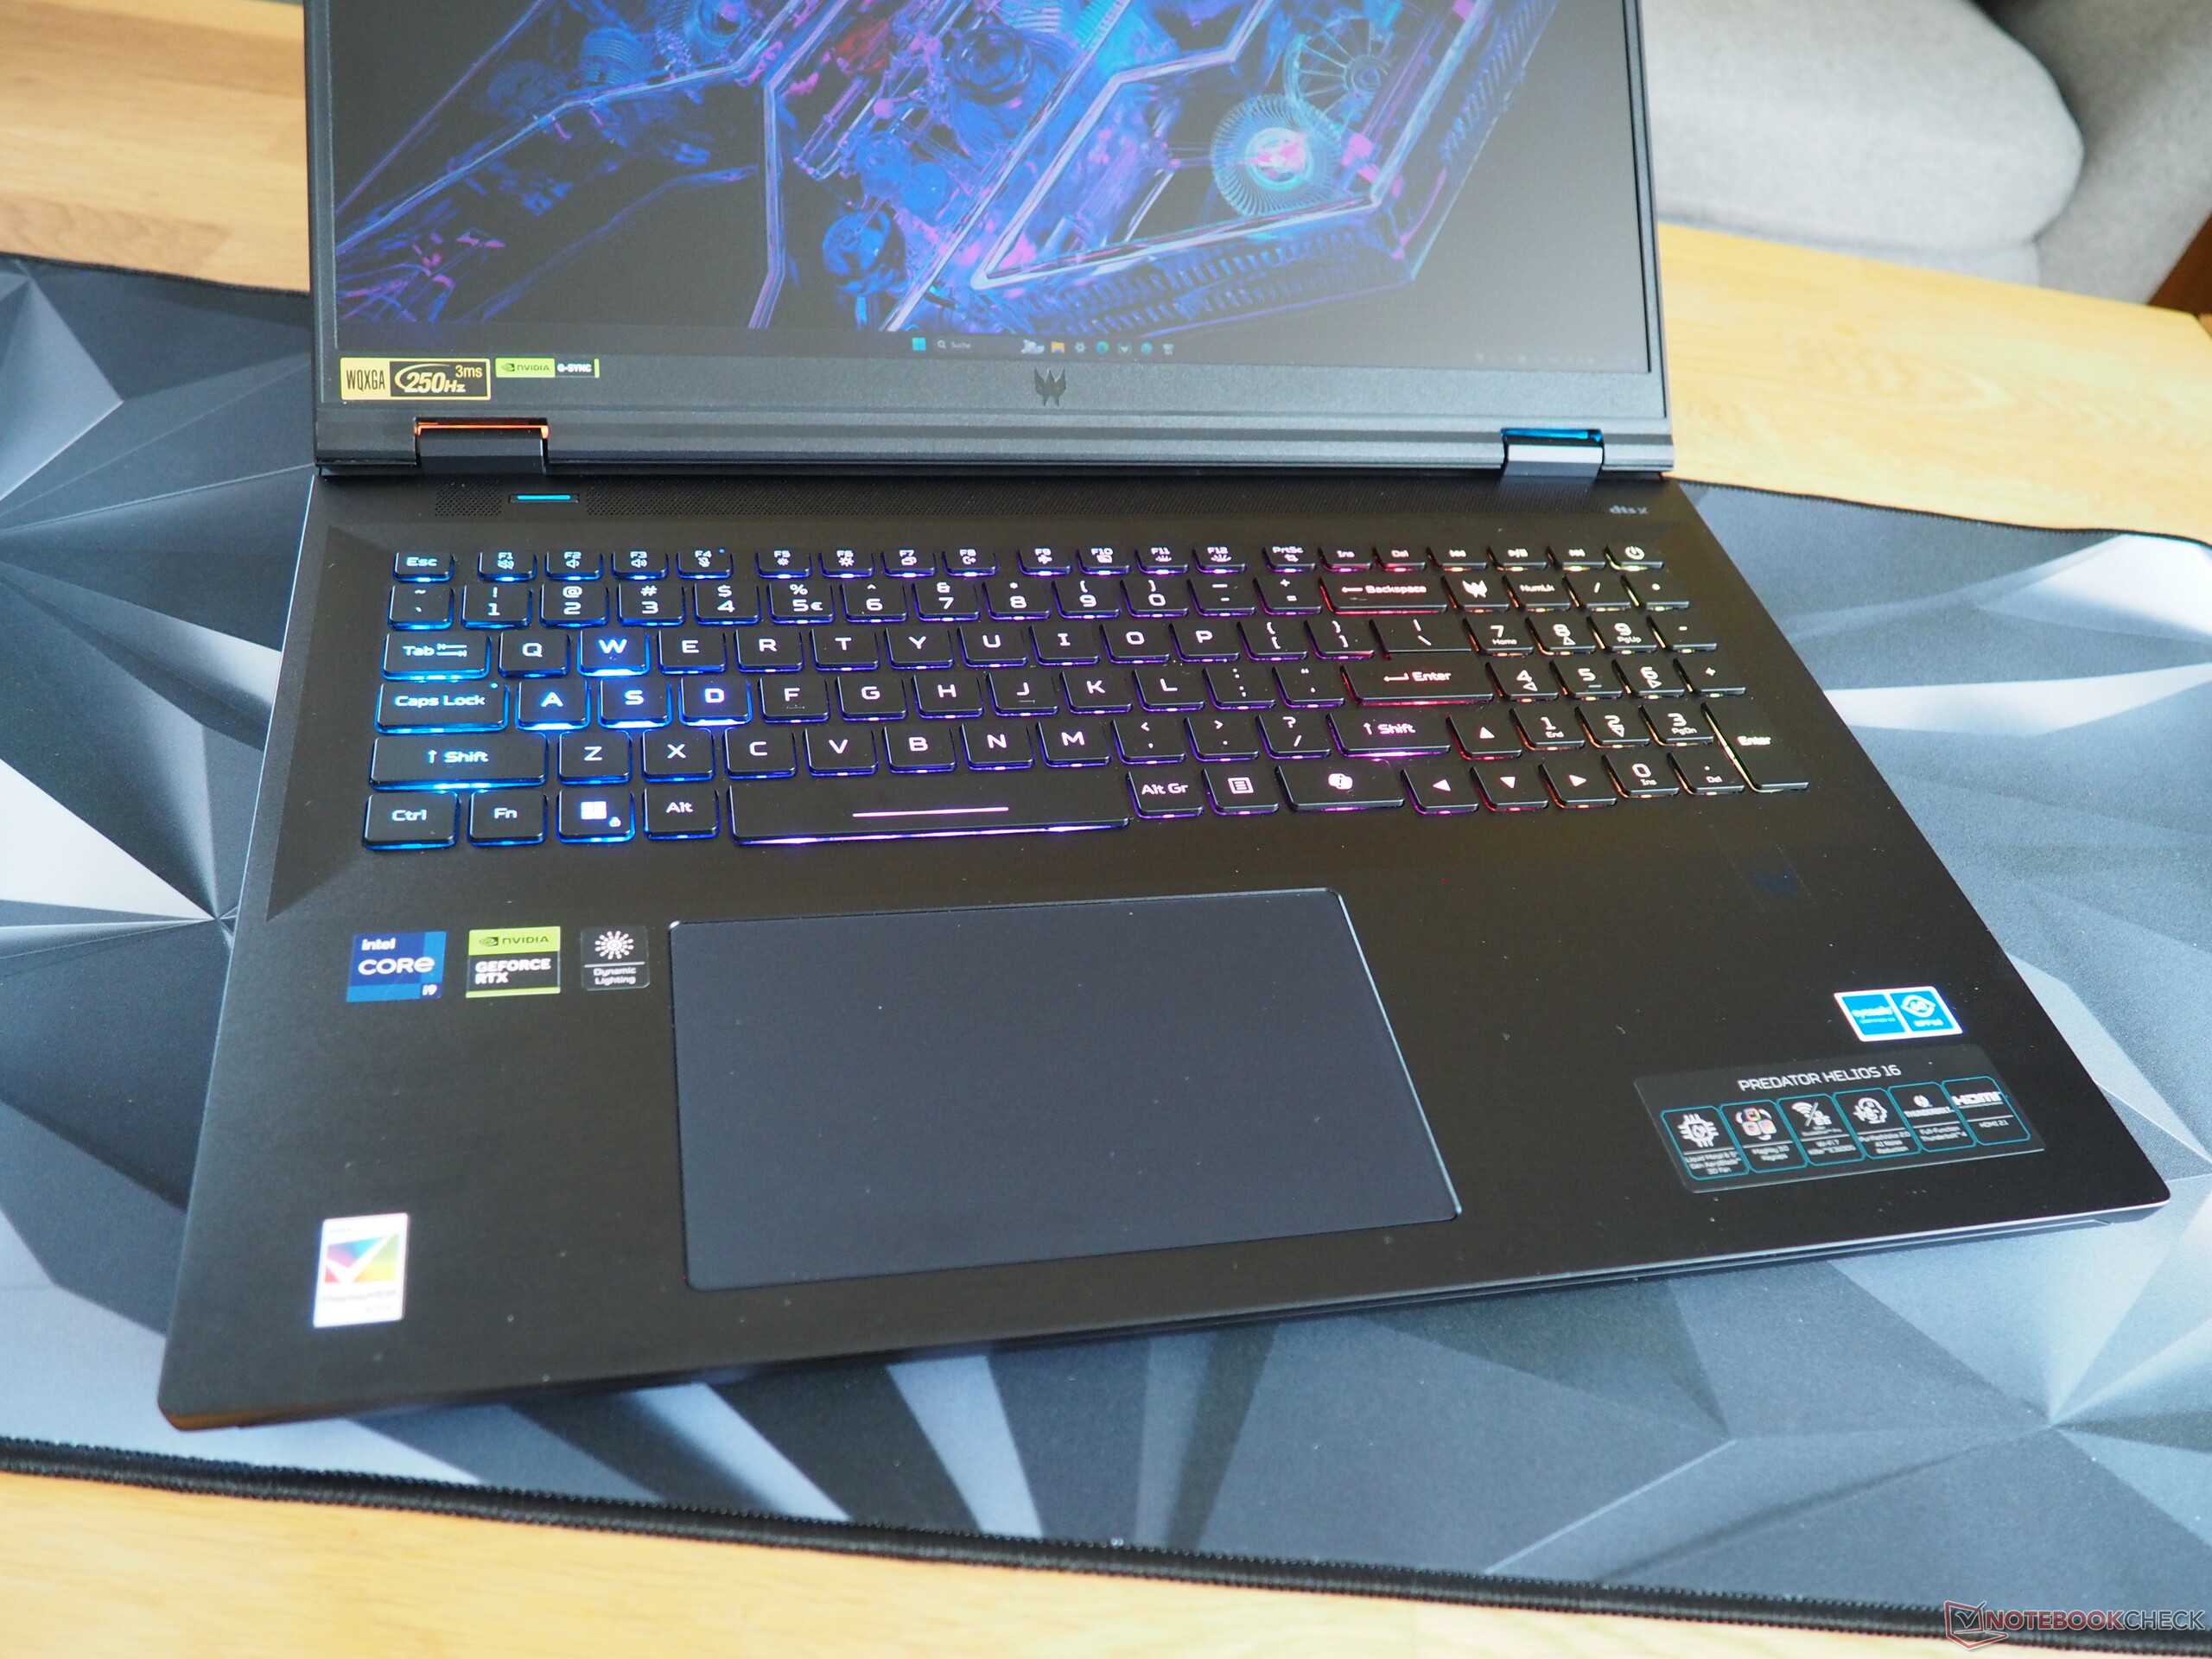
输入设备
键盘
我们认为,这款笔记本电脑的灯光(单键 RGB)还可以再均匀一些。作为一款经典的橡胶圆顶键盘,它的键入手感出奇的好,只是声音有点大。除了一些细节(修改过的数字键盘),它的布局还是不错的。与其他制造商相比,宏碁没有做太多尝试,大多数功能都很实用。此外,宏碁笔记本电脑的按键尺寸(如大小合适的方向键)也值得称赞。
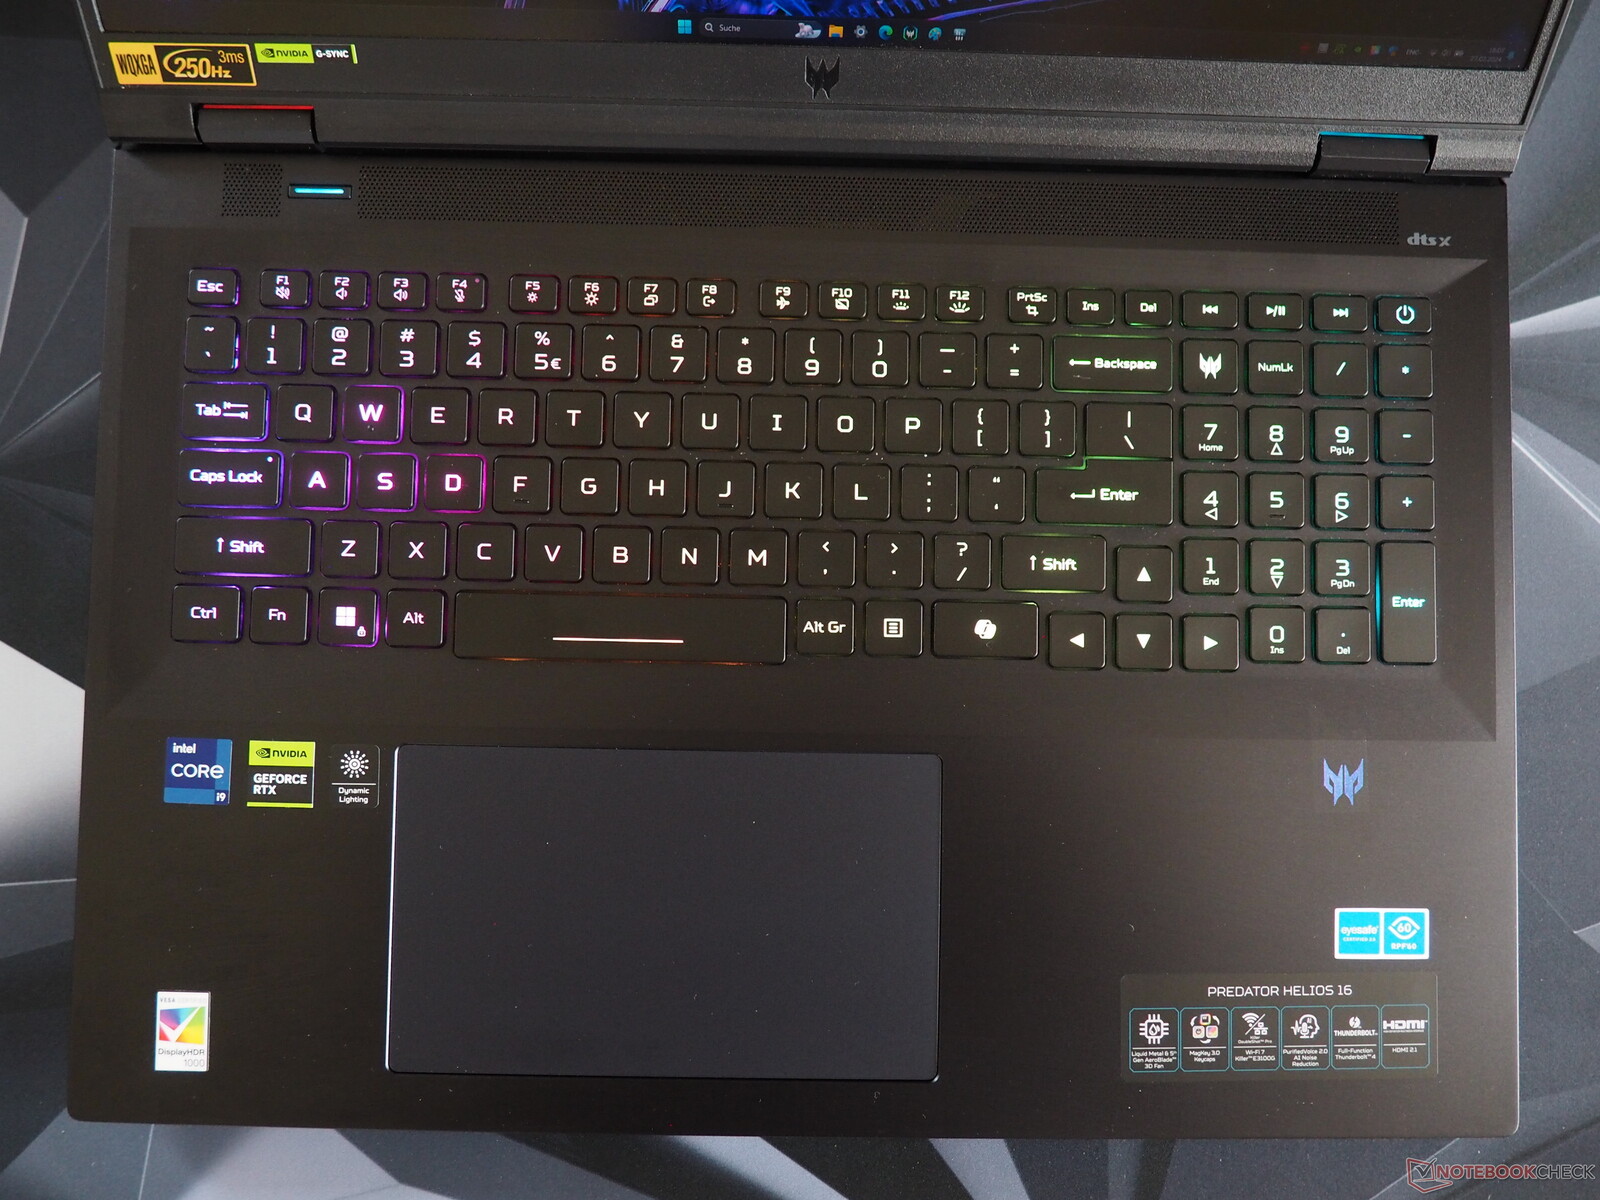
触摸板
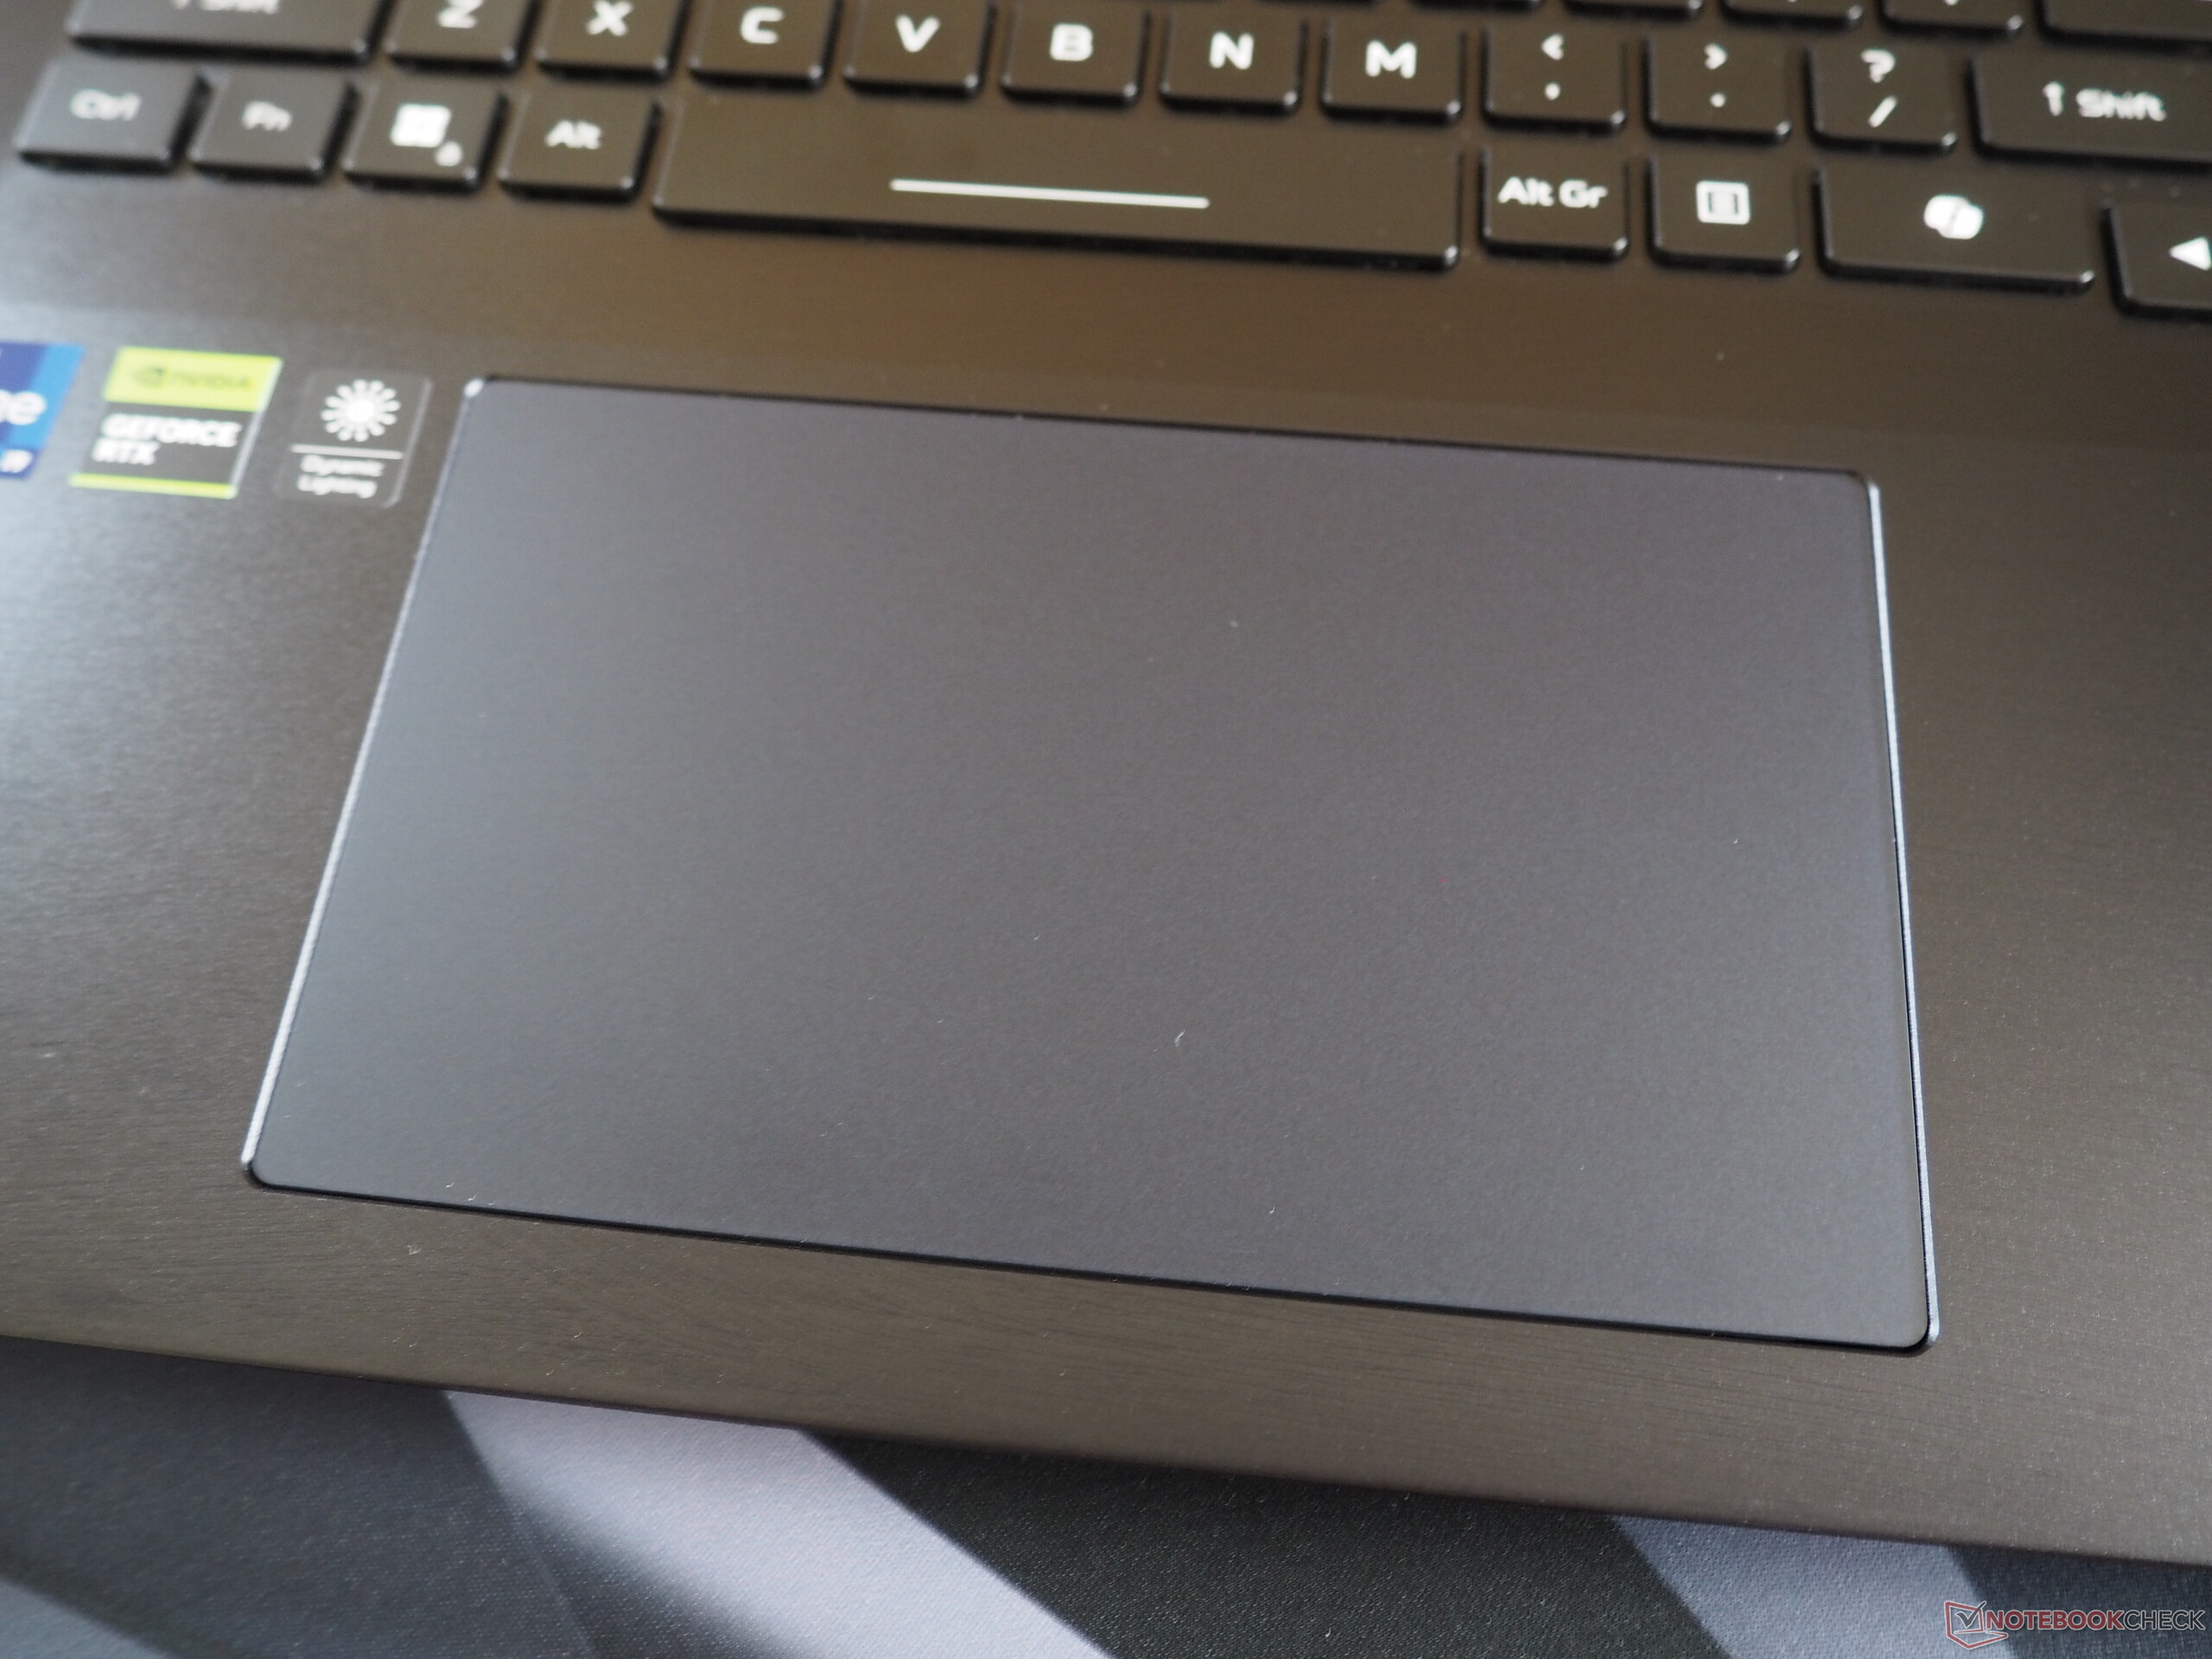
它的触摸板也几乎完美无瑕。它的尺寸为 15 x 9 厘米,非常宽大,无需抬起手指即可长时间移动。此外,它光滑的表面还能确保手指在触摸板上顺利滑动。在手势支持和精确度方面,我们没有发现任何不足之处。
显示屏
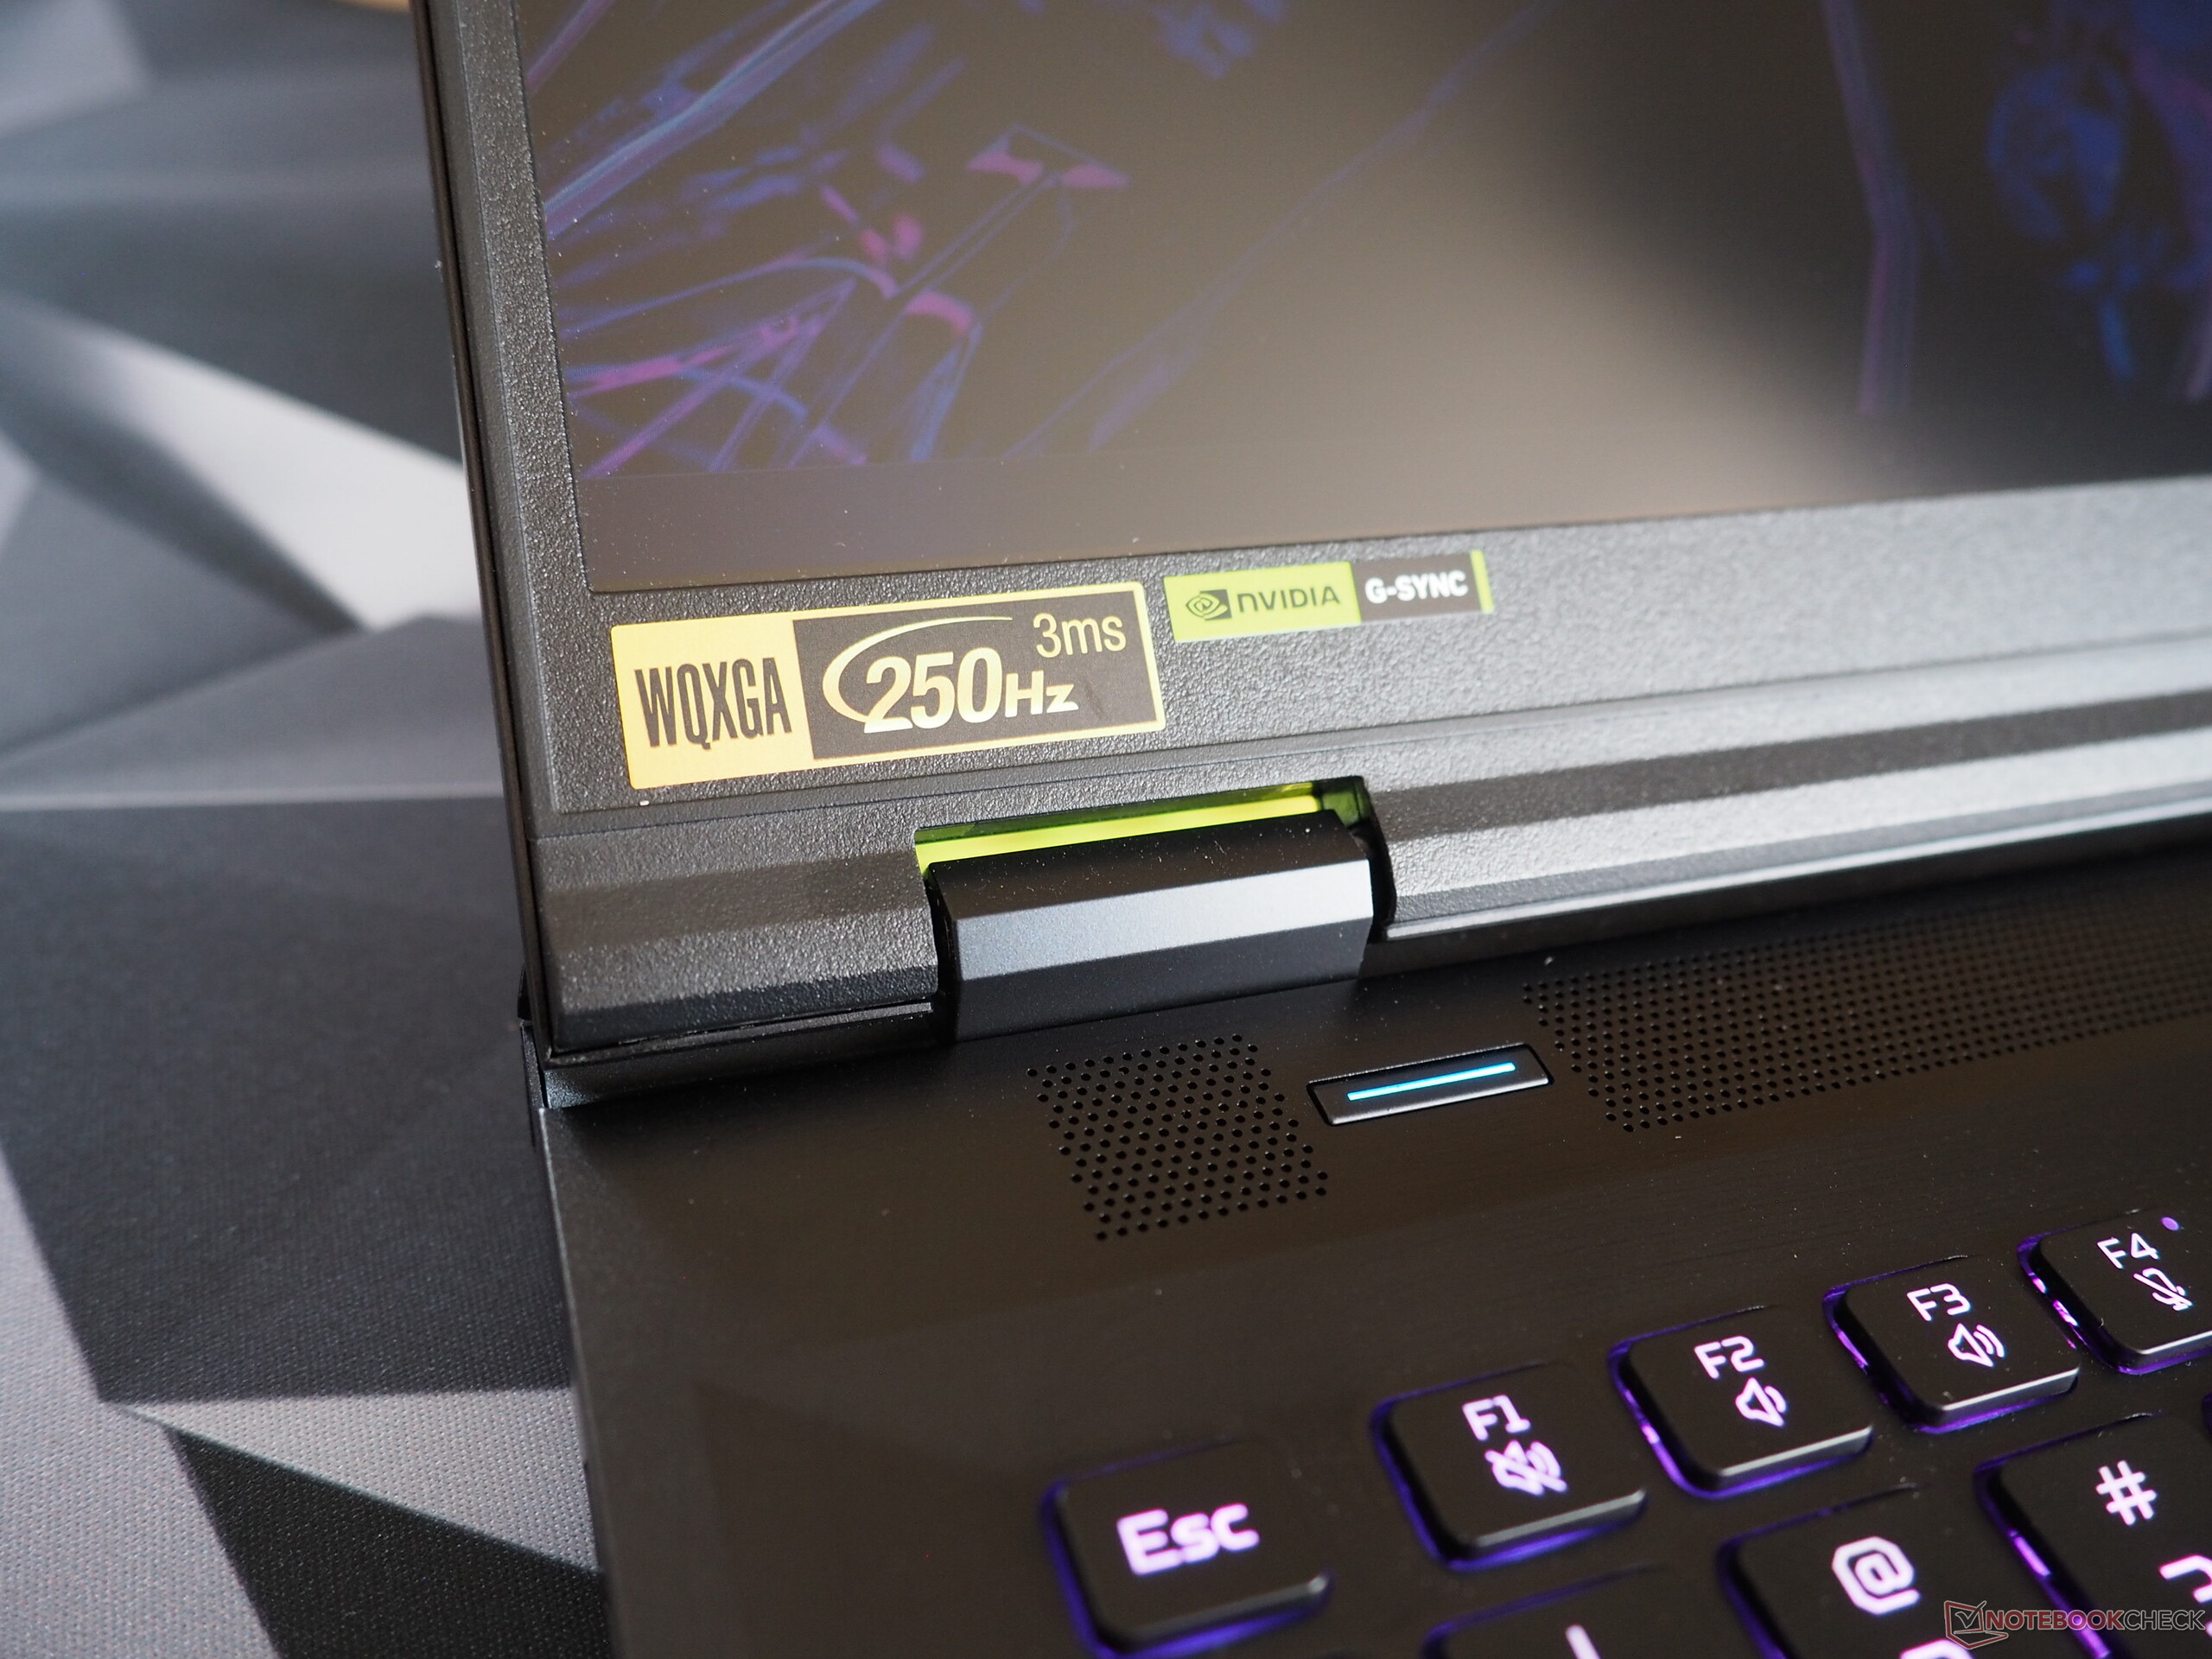
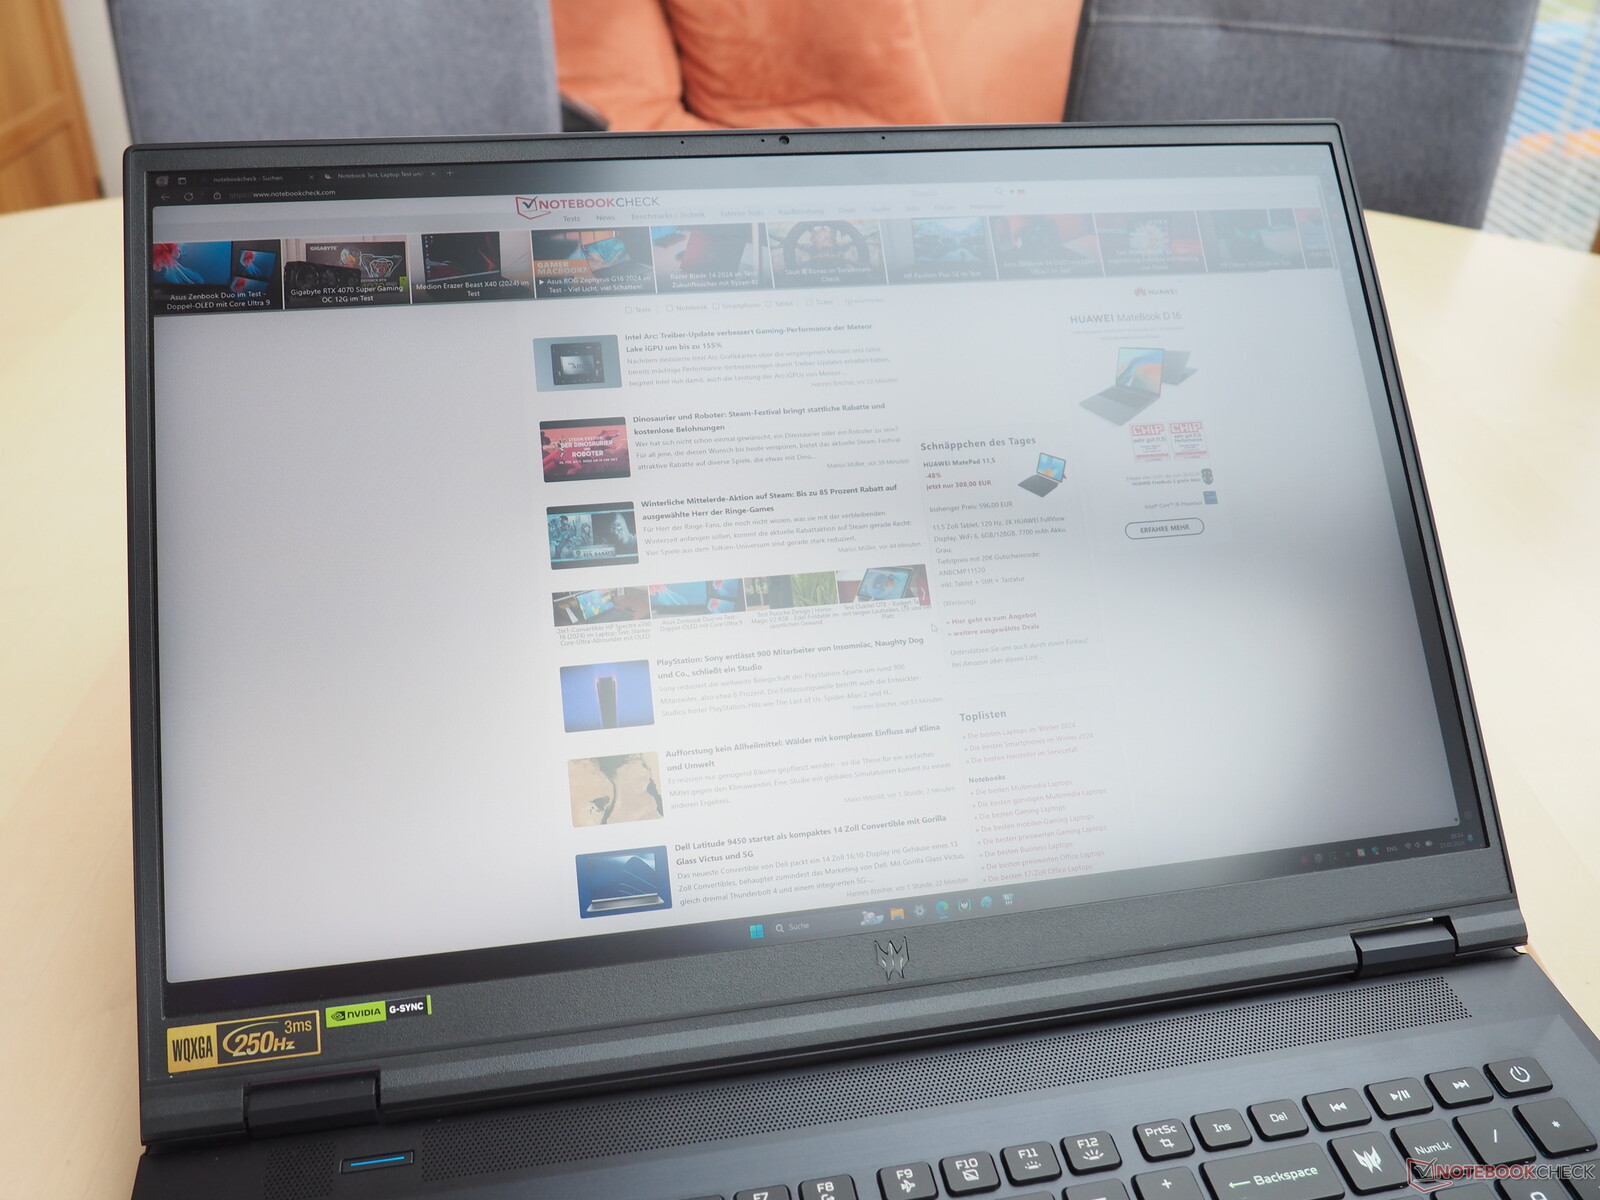
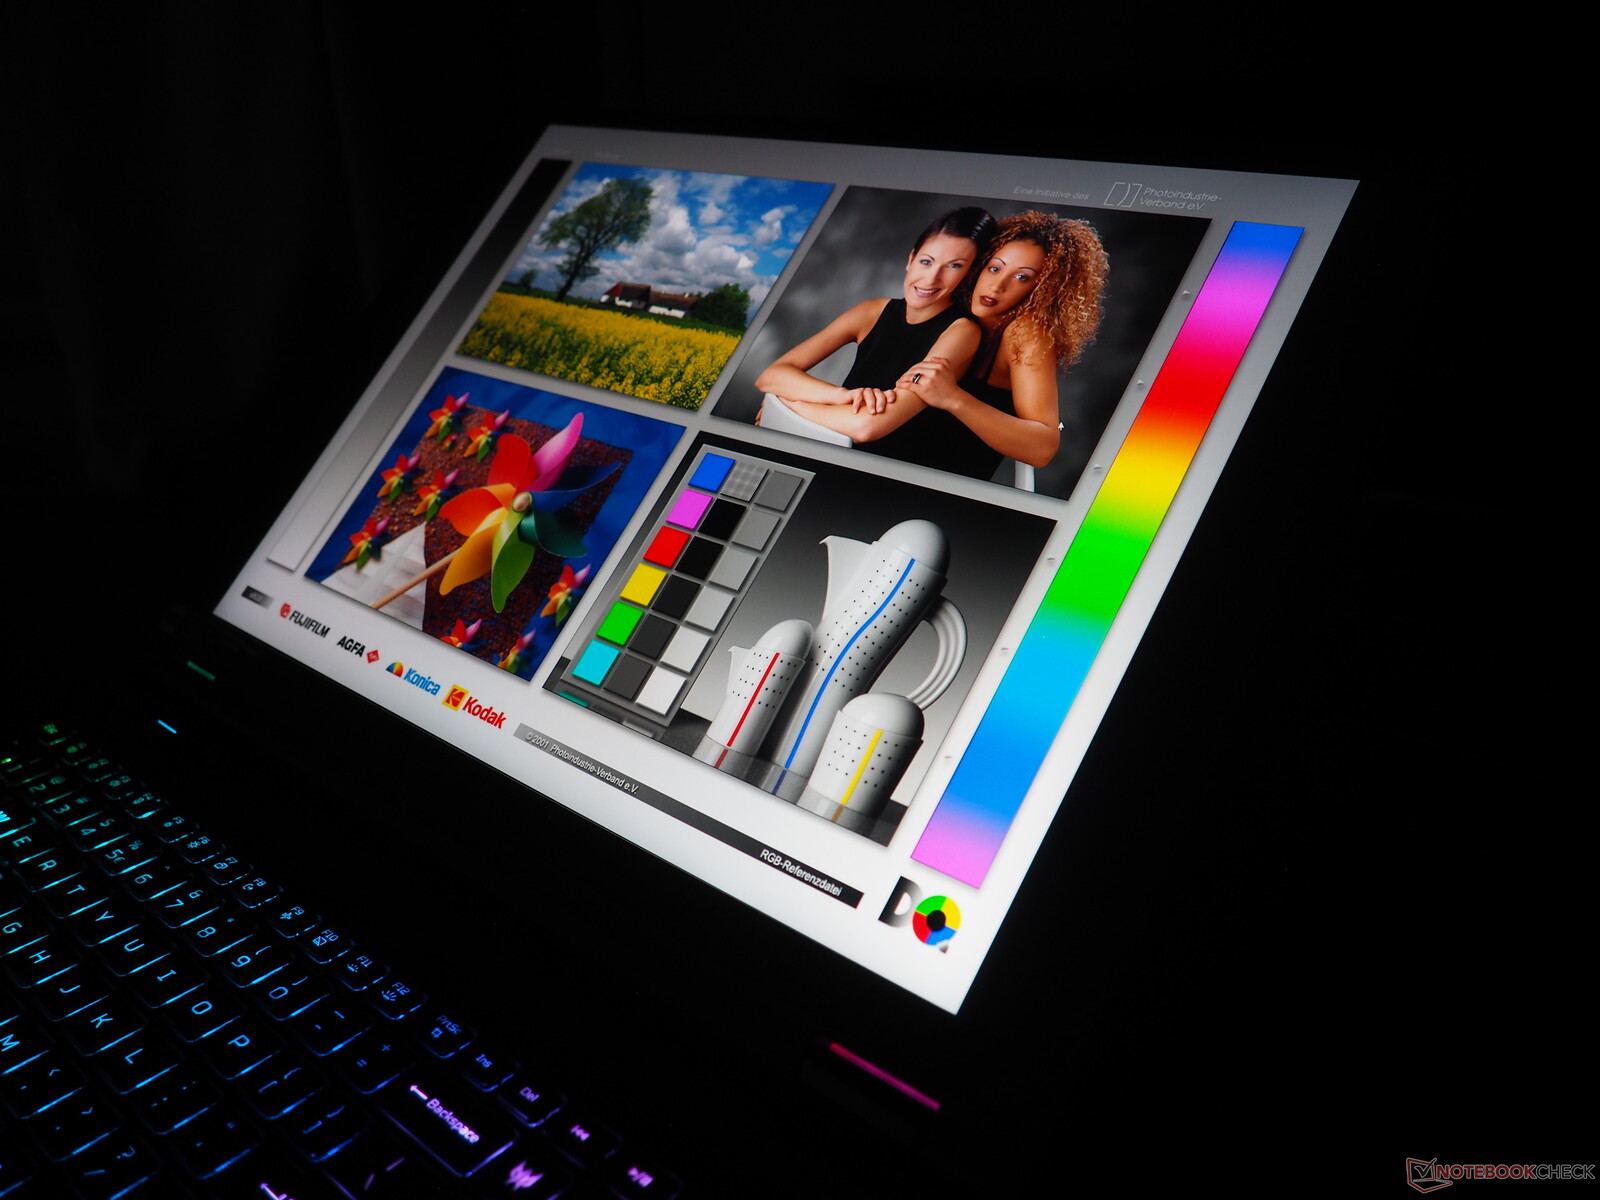
2024 版本继承了前代产品的 Mini-LED 显示屏(WQXGA、16:10、250 Hz、HDR1000)。如果不考虑其在所有亮度下的闪烁现象(幸好这只是敏感用户的问题),这种技术与标准的 IPS 面板相比优势明显。
| |||||||||||||||||||||||||
Brightness Distribution: 93 %
Center on Battery: 722 cd/m²
Contrast: 18050:1 (Black: 0.04 cd/m²)
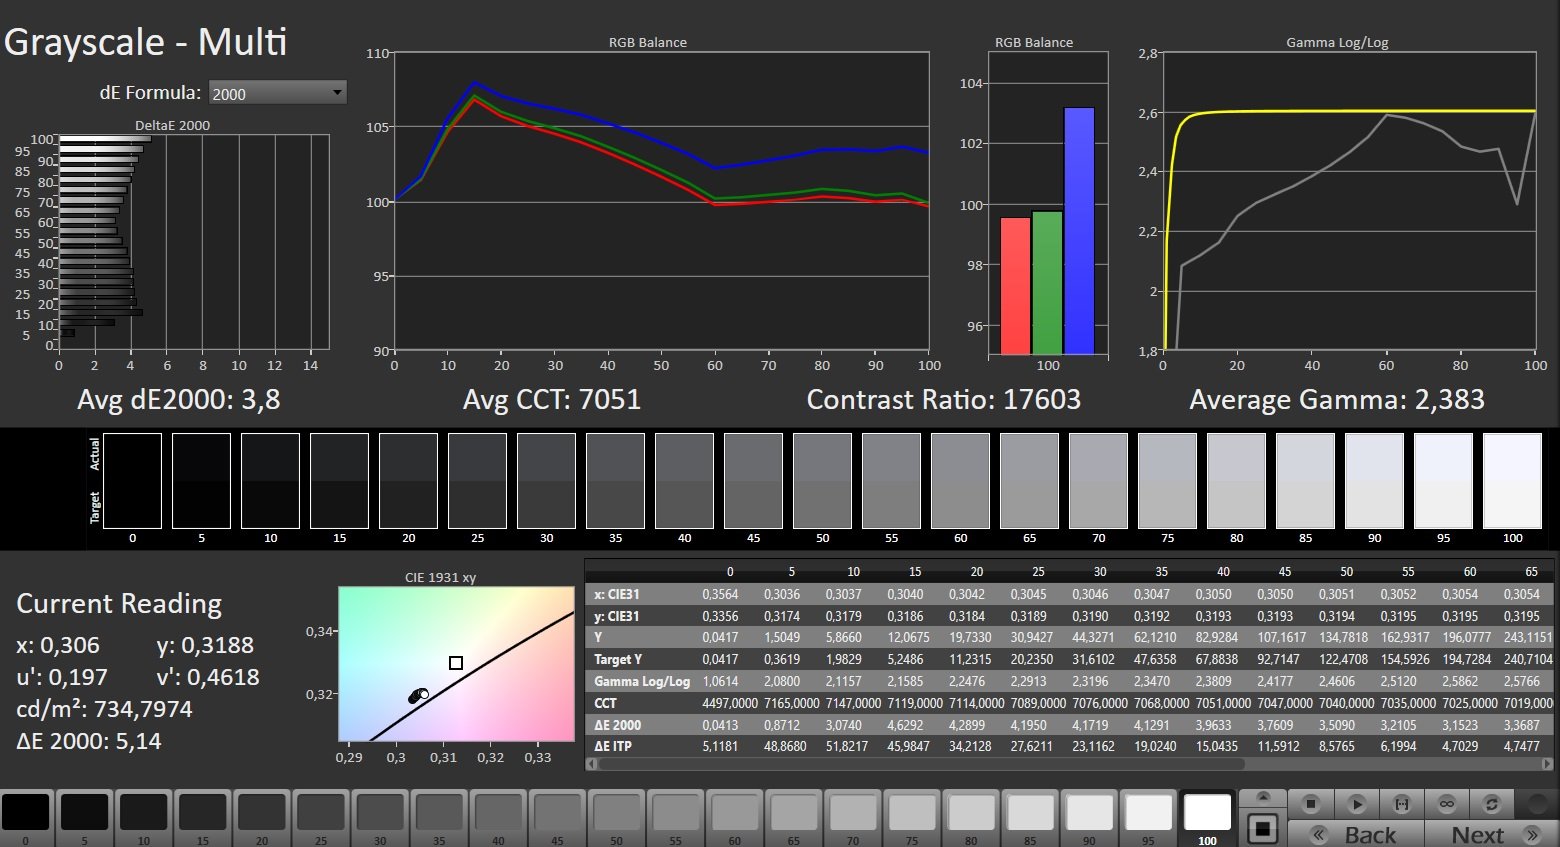
ΔE ColorChecker Calman: 3.4 | ∀{0.5-29.43 Ø4.71}
calibrated: 1.6
ΔE Greyscale Calman: 3.8 | ∀{0.09-98 Ø4.96}
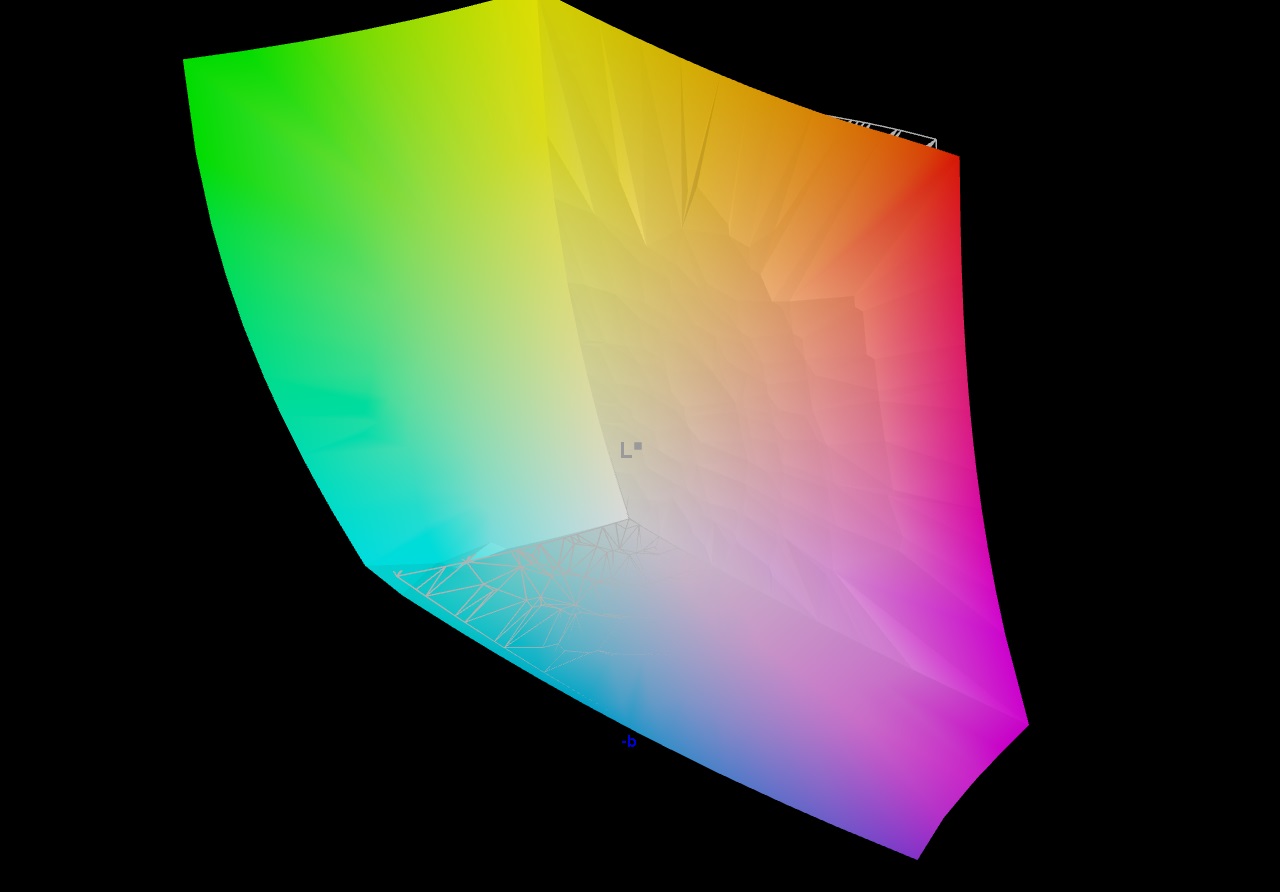
91.6% AdobeRGB 1998 (Argyll 3D)
100% sRGB (Argyll 3D)
99.7% Display P3 (Argyll 3D)
Gamma: 2.383
CCT: 7051 K
| Acer Predator Helios 18 PH18-72-98MW B180QAN01.2 (AUO45A8), Mini-LED, 2560x1600, 18" | MSI Titan 18 HX A14VIG AU Optronics B180ZAN01.0, Mini-LED, 3840x2400, 18" | Asus ROG Strix Scar 18 G834JYR (2024) BOE NE180QDM-NM1, Mini LED, 2560x1600, 18" | Acer Predator Helios 18 N23Q2 AUO45A8 (B180QAN01.2), IPS, 2560x1600, 18" | Alienware m18 R1 AMD BOE NE18NZ1, IPS, 1920x1200, 18" | |
|---|---|---|---|---|---|
| Display | -3% | -1% | 0% | -1% | |
| Display P3 Coverage (%) | 99.7 | 98.1 -2% | 99.9 0% | 99.8 0% | 98.5 -1% |
| sRGB Coverage (%) | 100 | 99.8 0% | 100 0% | 100 0% | 99.7 0% |
| AdobeRGB 1998 Coverage (%) | 91.6 | 86.2 -6% | 90 -2% | 91.8 0% | 88.7 -3% |
| Response Times | -187% | -6% | 2% | 55% | |
| Response Time Grey 50% / Grey 80% * (ms) | 8 ? | 8.6 ? -8% | 12 ? -50% | 7.6 ? 5% | 2.8 ? 65% |
| Response Time Black / White * (ms) | 17.6 ? | 81.8 ? -365% | 10.7 ? 39% | 17.8 ? -1% | 9.6 ? 45% |
| PWM Frequency (Hz) | 4832 ? | 2592 ? | 5733 ? | 2509 | |
| Screen | -24% | 17% | -82% | -54% | |
| Brightness middle (cd/m²) | 722 | 467.5 -35% | 937 30% | 360 -50% | 319.6 -56% |
| Brightness (cd/m²) | 724 | 459 -37% | 934 29% | 355 -51% | 304 -58% |
| Brightness Distribution (%) | 93 | 90 -3% | 89 -4% | 92 -1% | 87 -6% |
| Black Level * (cd/m²) | 0.04 | 0.066 -65% | 0.21 -425% | 0.25 -525% | |
| Contrast (:1) | 18050 | 14197 -21% | 1714 -91% | 1278 -93% | |
| Colorchecker dE 2000 * | 3.4 | 3.77 -11% | 1.52 55% | 3.82 -12% | 1.22 64% |
| Colorchecker dE 2000 max. * | 5.32 | 6.12 -15% | 2.82 47% | 7.38 -39% | 3.1 42% |
| Colorchecker dE 2000 calibrated * | 1.6 | 2.94 -84% | 1.21 24% | 2.24 -40% | 0.47 71% |
| Greyscale dE 2000 * | 3.8 | 3.2 16% | 1.7 55% | 5.06 -33% | 0.8 79% |
| Gamma | 2.383 92% | 2.43 91% | 2.042 108% | 2.52 87% | 2.23 99% |
| CCT | 7051 92% | 6478 100% | 6578 99% | 5657 115% | 6471 100% |
| Total Average (Program / Settings) | -71% /
-46% | 3% /
10% | -27% /
-53% | 0% /
-27% |
* ... smaller is better
首先是令人印象深刻的亮度:平均 724 cd/m² 的亮度意味着即使在超亮环境下(指室外)也能使用该设备。结合约 0.04 cd/m² 的超低黑值,该屏幕可提供约 18,000:1 的高对比度。此外,它还具有广泛的色彩空间覆盖范围--虽然不能完全覆盖 AdobeRGB,但却能覆盖 100% 的 sRGB 和 DCI-P3,令人印象深刻。
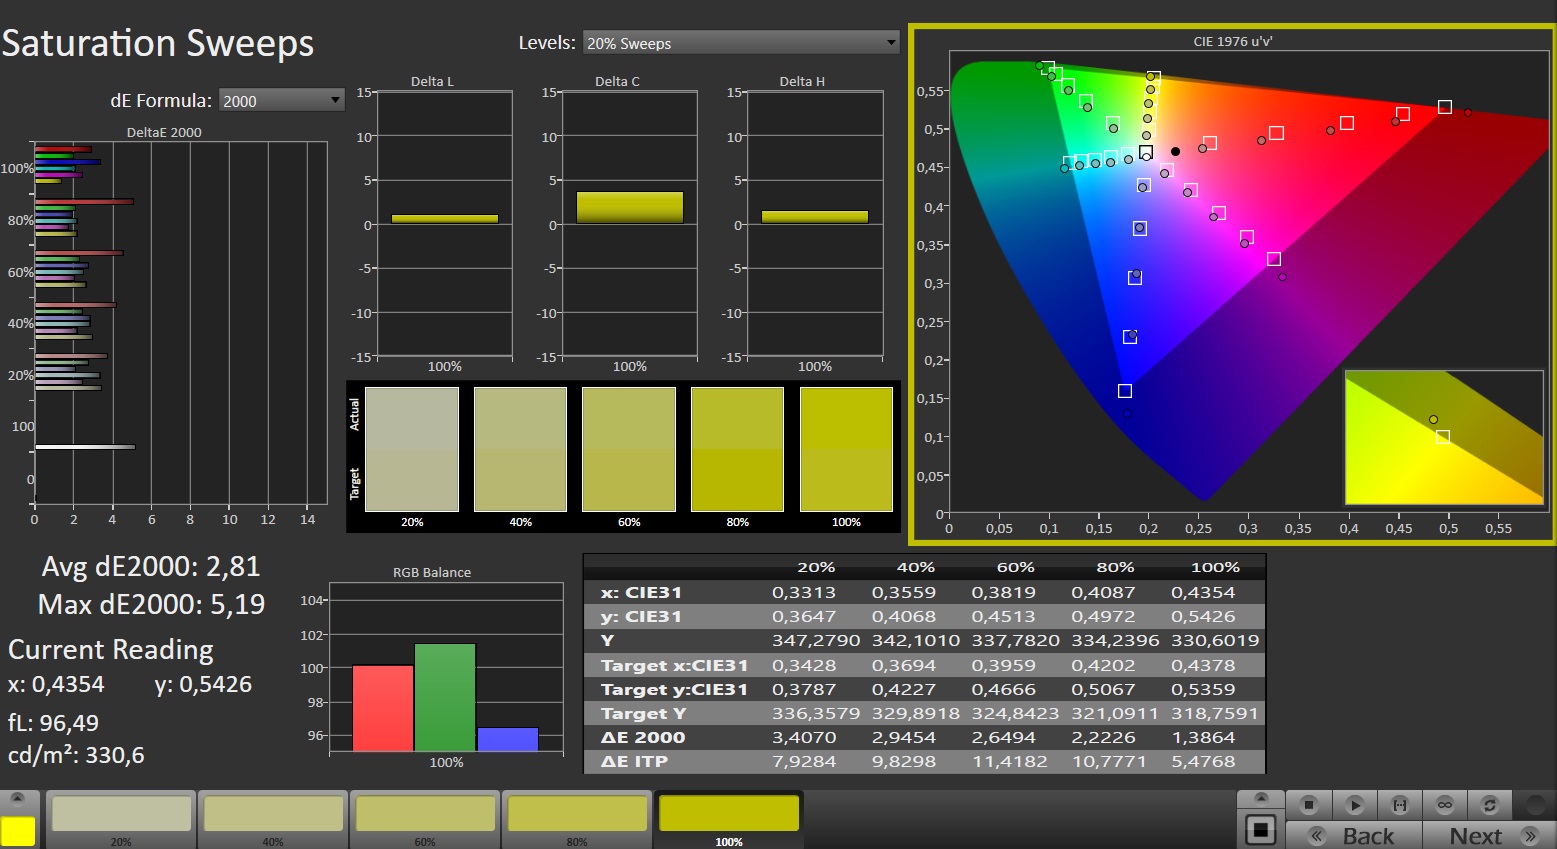
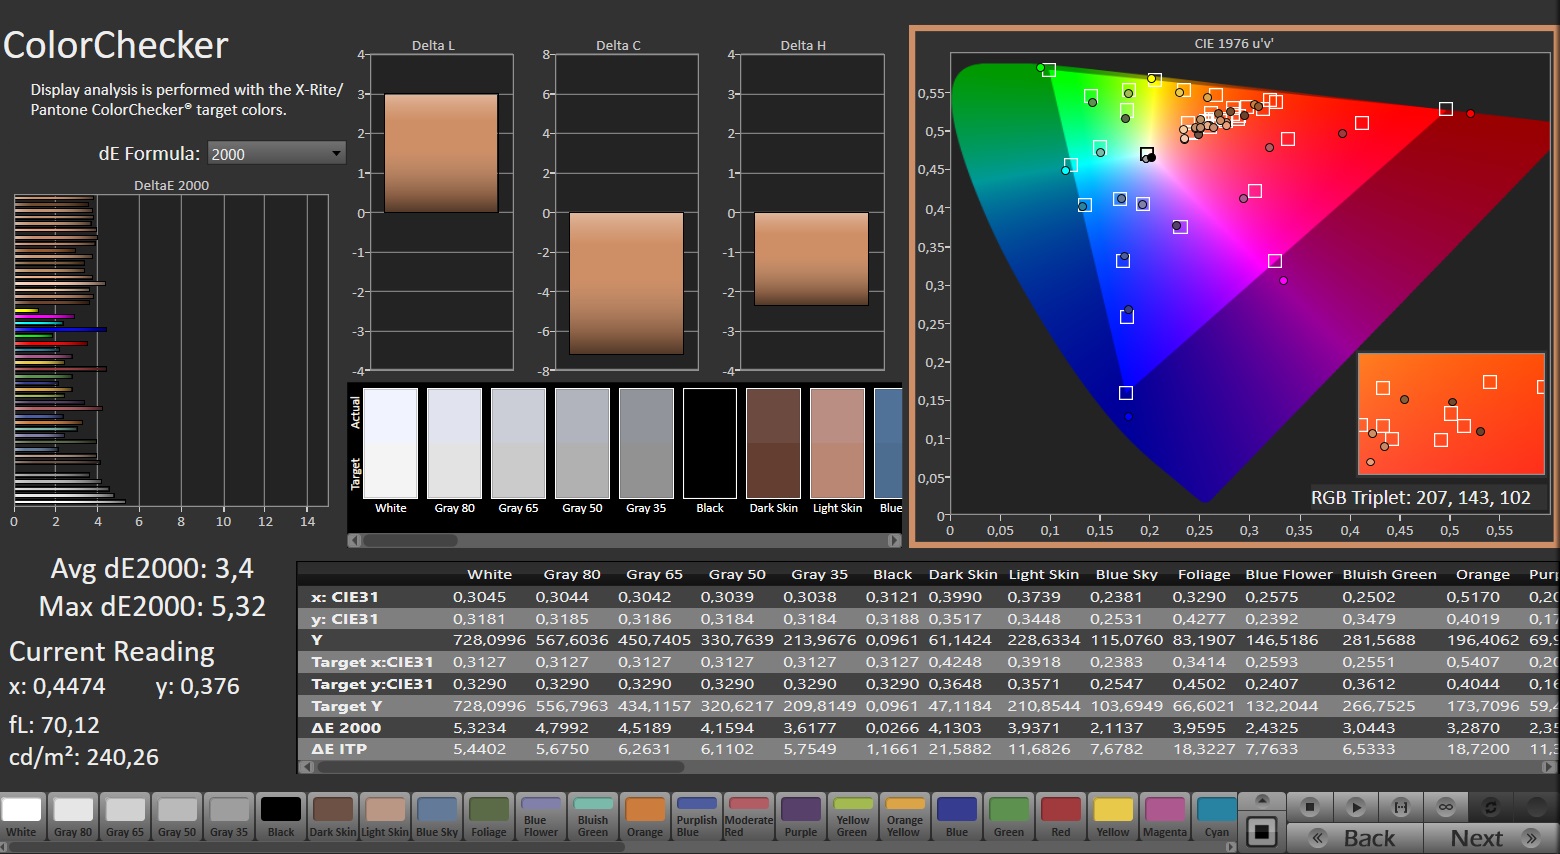
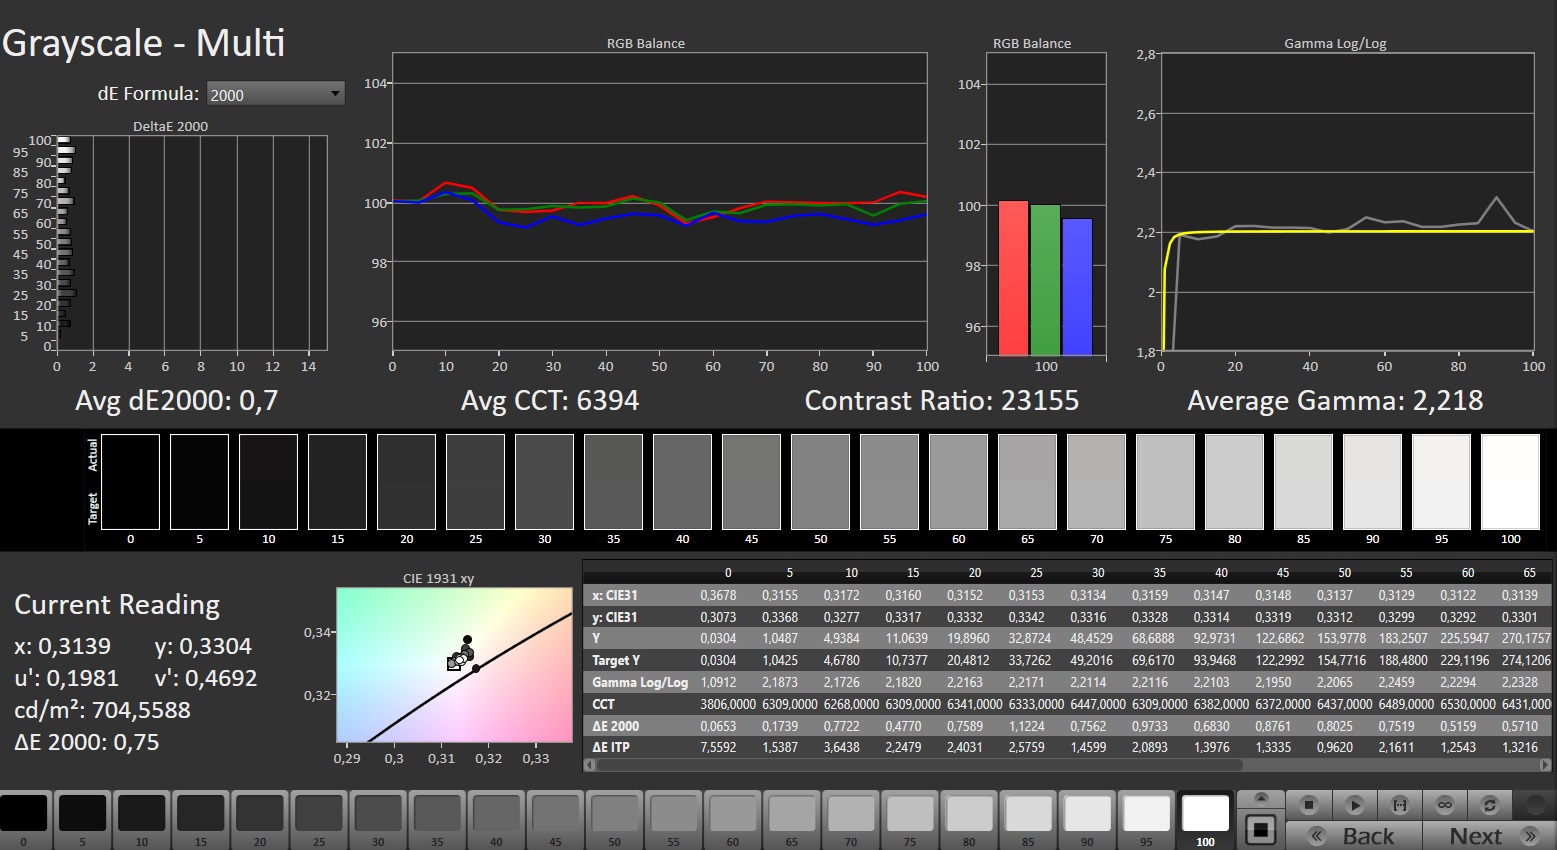
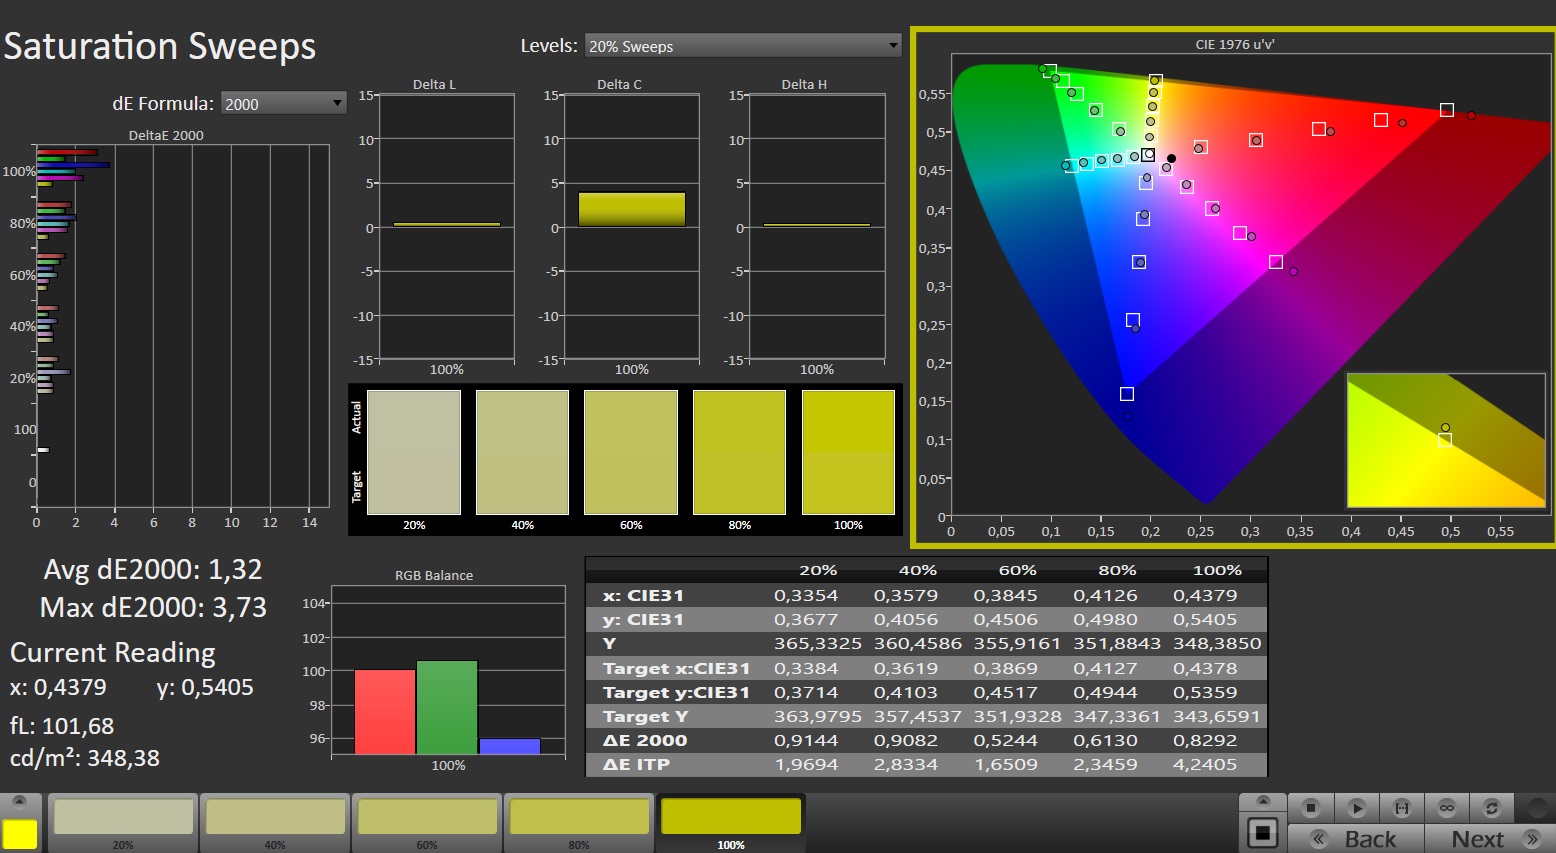
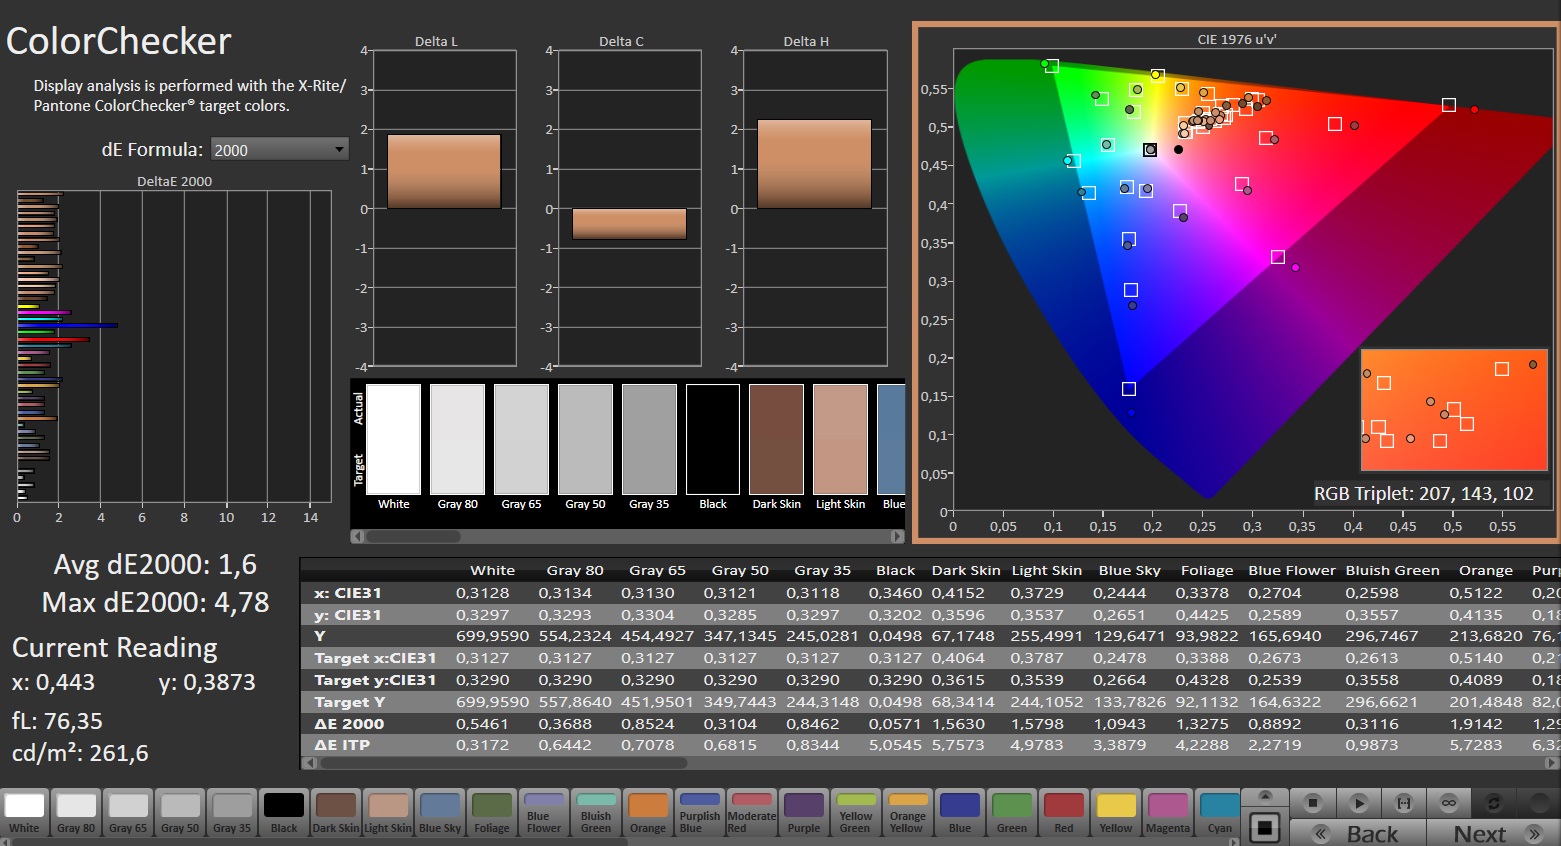
遗憾的是,它的色彩精确度并不是开箱即用的最佳产品,因此专业用户在购买后应进行校准(我们的 ICC 文件链接在上)。


它的响应时间还算不错,但无法与 OLED 面板相比,后者的对比度和黑度都更好。另一方面,它们也有自己的弱点(如通常是反光表面)。
Display Response Times
| ↔ Response Time Black to White | ||
|---|---|---|
| 17.6 ms ... rise ↗ and fall ↘ combined | ↗ 15.2 ms rise | 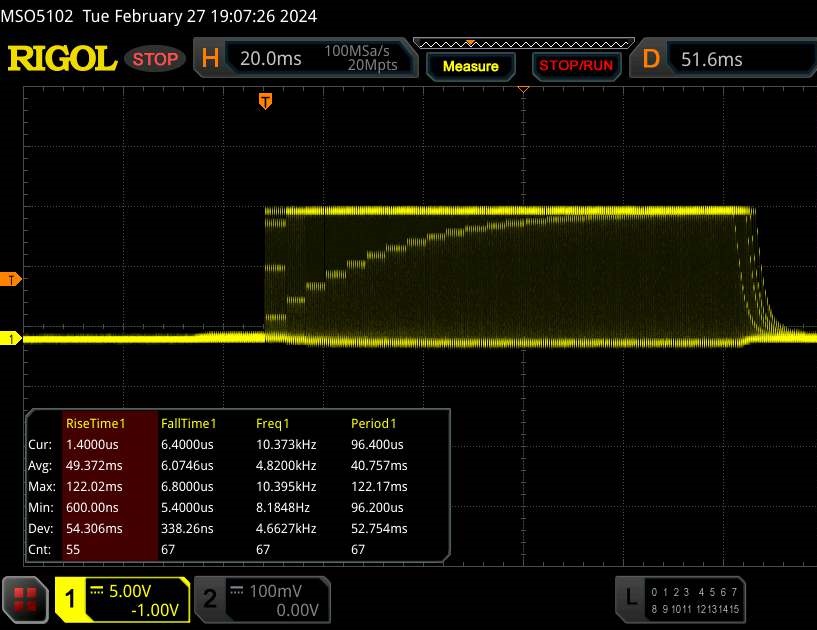 |
| ↘ 2.4 ms fall | ||
| The screen shows good response rates in our tests, but may be too slow for competitive gamers. In comparison, all tested devices range from 0.1 (minimum) to 240 (maximum) ms. » 40 % of all devices are better. This means that the measured response time is better than the average of all tested devices (19.8 ms). | ||
| ↔ Response Time 50% Grey to 80% Grey | ||
| 8 ms ... rise ↗ and fall ↘ combined | ↗ 4.9 ms rise | 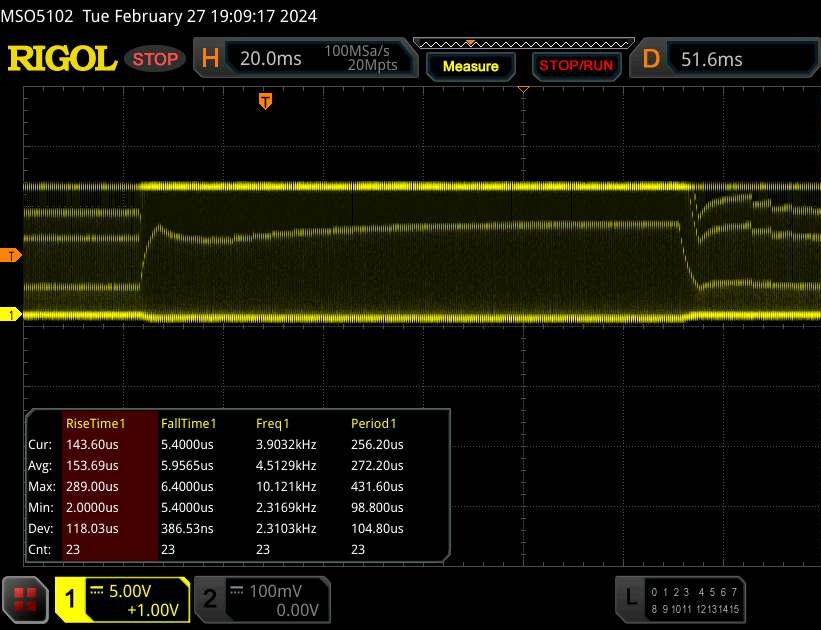 |
| ↘ 3.1 ms fall | ||
| The screen shows fast response rates in our tests and should be suited for gaming. In comparison, all tested devices range from 0.165 (minimum) to 636 (maximum) ms. » 21 % of all devices are better. This means that the measured response time is better than the average of all tested devices (31 ms). | ||
Screen Flickering / PWM (Pulse-Width Modulation)
| Screen flickering / PWM detected | 4832 Hz | ≤ 100 % brightness setting |  |
The display backlight flickers at 4832 Hz (worst case, e.g., utilizing PWM) Flickering detected at a brightness setting of 100 % and below. There should be no flickering or PWM above this brightness setting. The frequency of 4832 Hz is quite high, so most users sensitive to PWM should not notice any flickering. In comparison: 52 % of all tested devices do not use PWM to dim the display. If PWM was detected, an average of 7757 (minimum: 5 - maximum: 343500) Hz was measured. | |||

性能
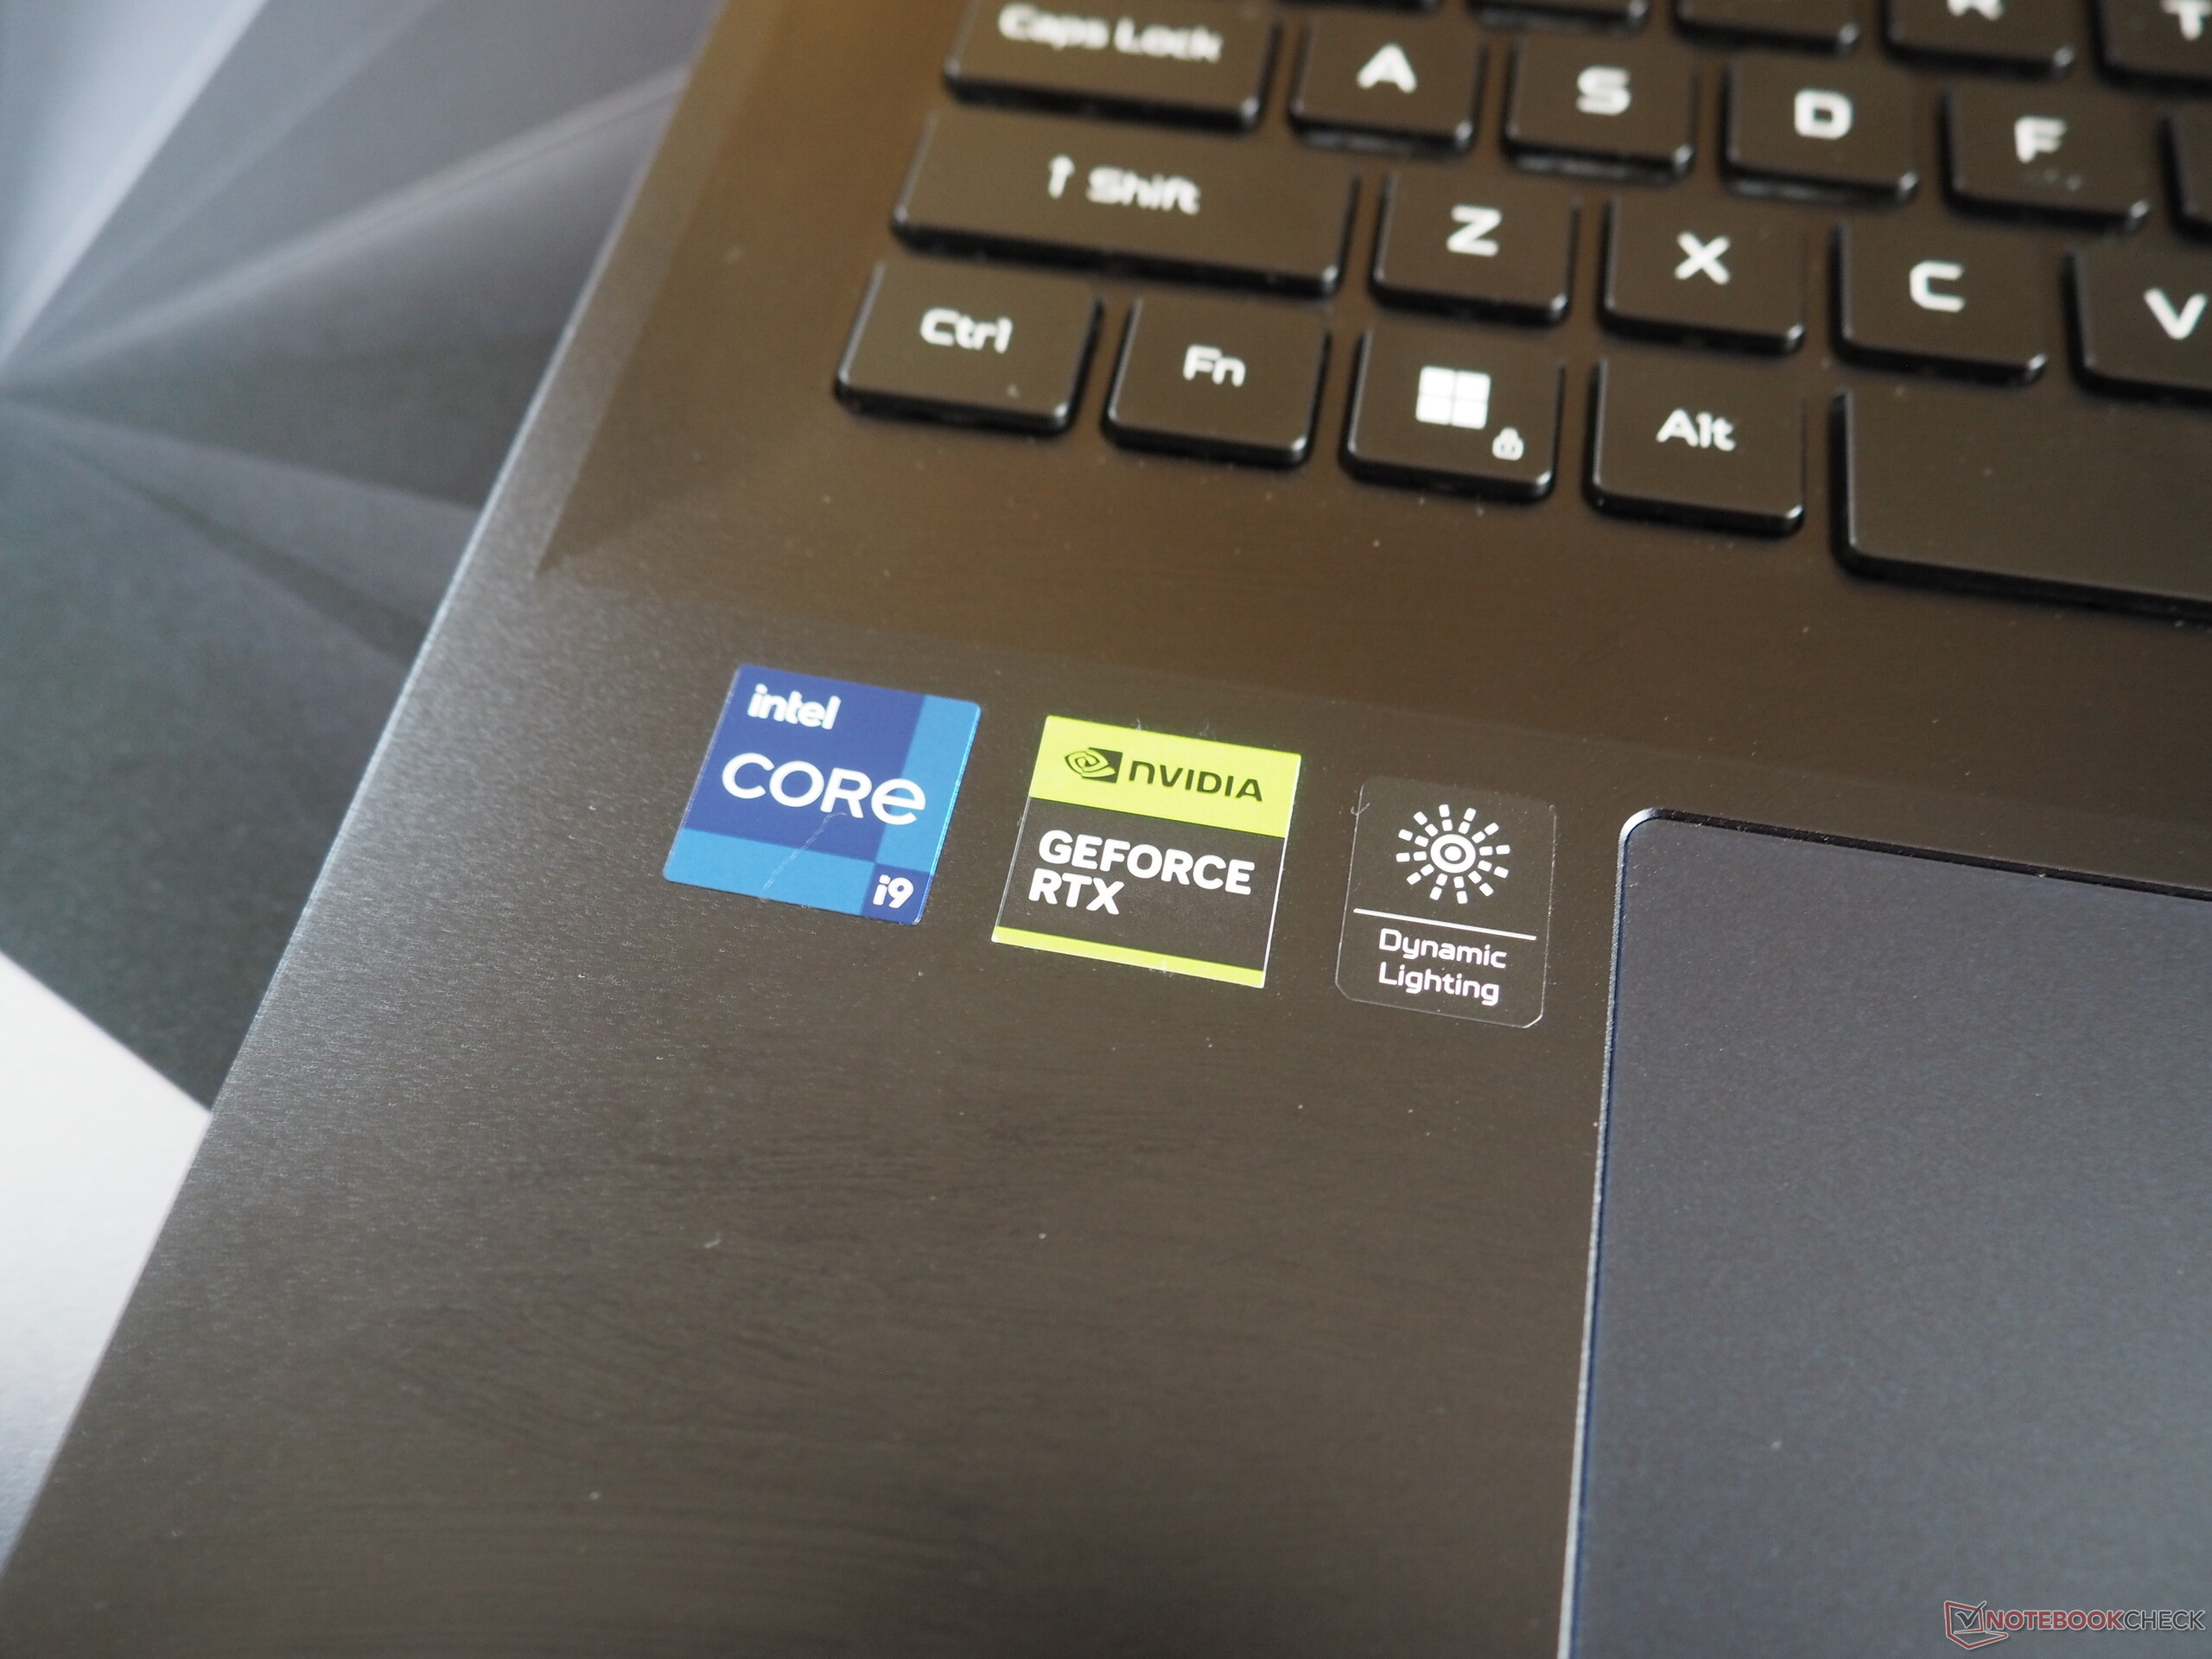
Predator Helios 18 的组件是游戏笔记本电脑中的顶级型号。32 GB 内存和 2 TB 存储空间足以满足未来几年大多数用户的需求。它的 CPU 和 GPU 也是如此,由于笔记本电脑的显示屏分辨率为 2,560 x 1,600 像素,这两个部件都还没有达到极限。

测试条件
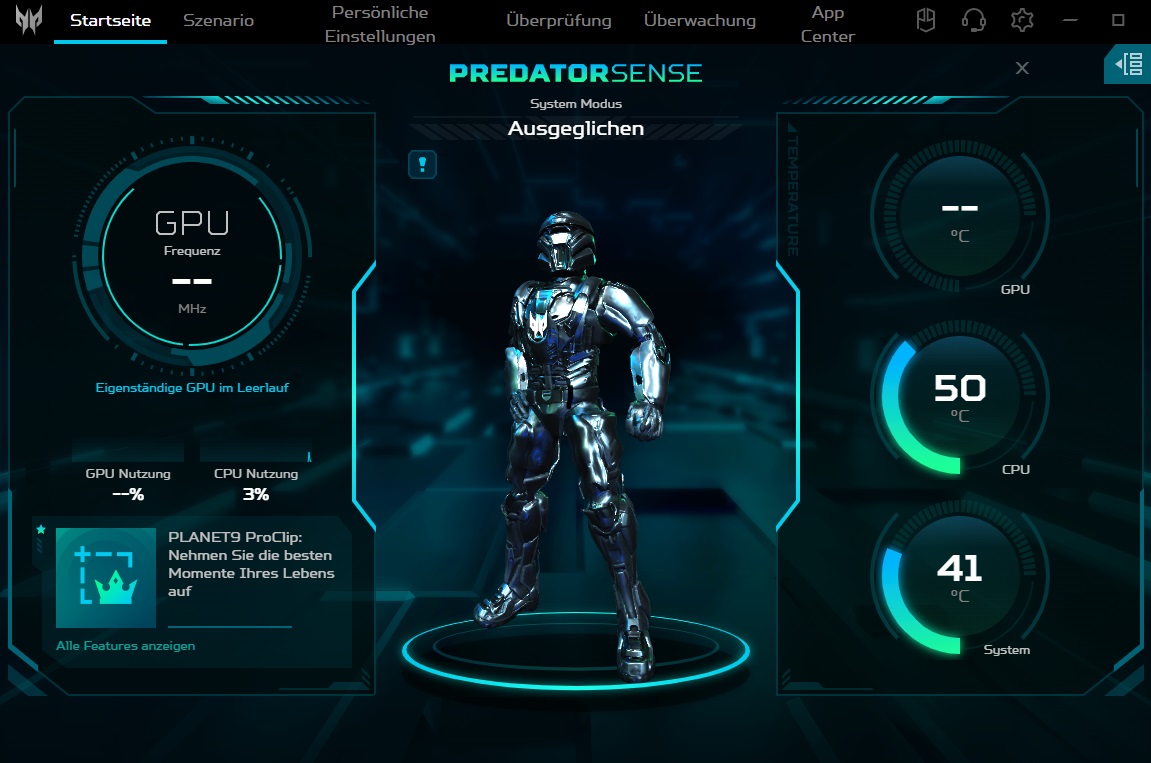
在预装的制造商软件(Predator Sense)中,"场景 "下列出了几种工作模式,它们对性能和噪音排放有很大影响。由于 18 英寸笔记本电脑在涡轮增压模式下噪音极大(游戏时大于 60 分贝),因此所有测量均在性能模式下进行。因此,测定的速度和噪音值只能在一定程度上与前代产品进行比较。
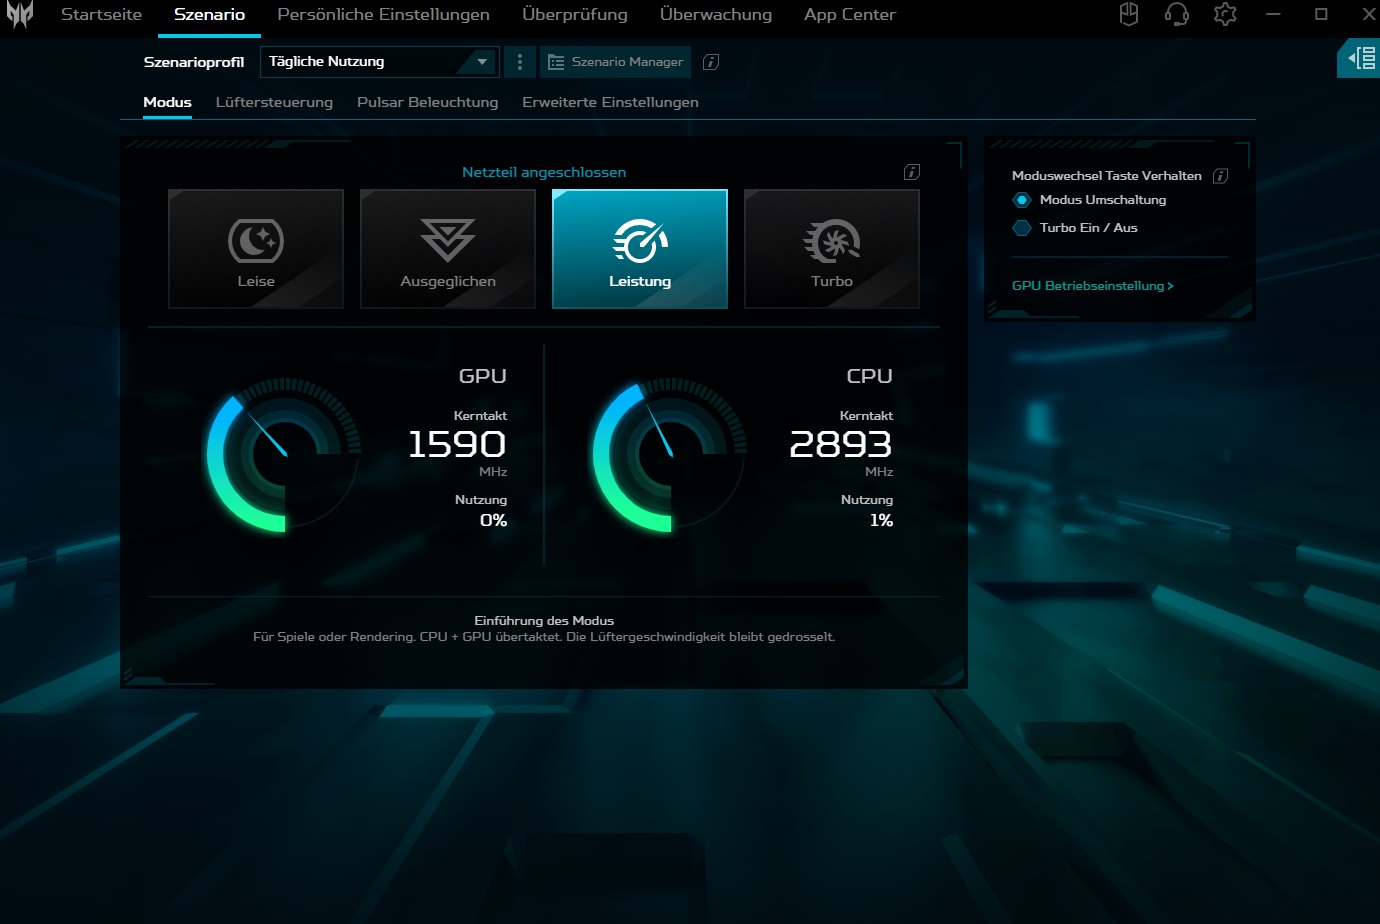
| Witcher 3 (FHD/Ultra) | 静音 | 平衡 | 性能 | 涡轮增压 |
| 噪音 | 38 dB(A) 43 dB(A) 49 dB(A) 61 dB(A) | |||
| 性能 | 130 fps 160 fps 180 fps 200 fps |
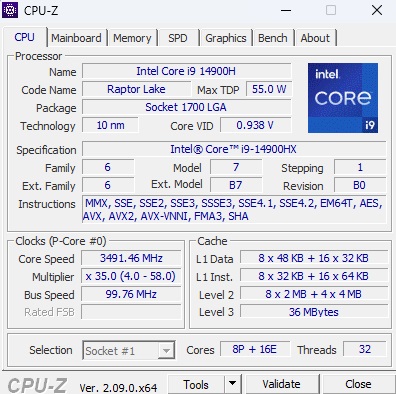
处理器
酷睿 i9-14900HX 是英特尔 "猛禽湖 "系列中的顶级型号,虽然功耗较高,但性能卓越。英特尔利用 8 个带超线程的性能核心和 16 个不带 HT 的效率核心,实现了 32 个并行线程。在性能模式下,CPU 的性能略低于平均水平(与之前的平均水平相比下降了 6%)。此外,正如我们的 Cinebench 循环所显示的那样(见图),在较长的负载期间其性能会下降。而任何竞争设备都没有出现这种情况。
Cinebench R15 Multi continuous test
* ... smaller is better
AIDA64: FP32 Ray-Trace | FPU Julia | CPU SHA3 | CPU Queen | FPU SinJulia | FPU Mandel | CPU AES | CPU ZLib | FP64 Ray-Trace | CPU PhotoWorxx
| Performance rating | |
| Alienware m18 R1 AMD | |
| Acer Predator Helios 18 N23Q2 | |
| MSI Titan 18 HX A14VIG | |
| Asus ROG Strix Scar 18 G834JYR (2024) | |
| Average of class Gaming | |
| Average Intel Core i9-14900HX | |
| Acer Predator Helios 18 PH18-72-98MW | |
| AIDA64 / FP32 Ray-Trace | |
| Alienware m18 R1 AMD | |
| Average of class Gaming (10227 - 85542, n=105, last 2 years) | |
| MSI Titan 18 HX A14VIG | |
| Acer Predator Helios 18 N23Q2 | |
| Asus ROG Strix Scar 18 G834JYR (2024) | |
| Average Intel Core i9-14900HX (13098 - 33474, n=36) | |
| Acer Predator Helios 18 PH18-72-98MW | |
| AIDA64 / FPU Julia | |
| Alienware m18 R1 AMD | |
| MSI Titan 18 HX A14VIG | |
| Average of class Gaming (51376 - 238426, n=105, last 2 years) | |
| Acer Predator Helios 18 N23Q2 | |
| Asus ROG Strix Scar 18 G834JYR (2024) | |
| Average Intel Core i9-14900HX (67573 - 166040, n=36) | |
| Acer Predator Helios 18 PH18-72-98MW | |
| AIDA64 / CPU SHA3 | |
| Alienware m18 R1 AMD | |
| MSI Titan 18 HX A14VIG | |
| Acer Predator Helios 18 N23Q2 | |
| Average of class Gaming (2180 - 10115, n=105, last 2 years) | |
| Asus ROG Strix Scar 18 G834JYR (2024) | |
| Average Intel Core i9-14900HX (3589 - 7979, n=36) | |
| Acer Predator Helios 18 PH18-72-98MW | |
| AIDA64 / CPU Queen | |
| Alienware m18 R1 AMD | |
| MSI Titan 18 HX A14VIG | |
| Asus ROG Strix Scar 18 G834JYR (2024) | |
| Acer Predator Helios 18 PH18-72-98MW | |
| Average Intel Core i9-14900HX (118405 - 148966, n=36) | |
| Acer Predator Helios 18 N23Q2 | |
| Average of class Gaming (49785 - 173351, n=90, last 2 years) | |
| AIDA64 / FPU SinJulia | |
| Alienware m18 R1 AMD | |
| MSI Titan 18 HX A14VIG | |
| Asus ROG Strix Scar 18 G834JYR (2024) | |
| Acer Predator Helios 18 N23Q2 | |
| Average Intel Core i9-14900HX (10475 - 18517, n=36) | |
| Acer Predator Helios 18 PH18-72-98MW | |
| Average of class Gaming (4424 - 33636, n=105, last 2 years) | |
| AIDA64 / FPU Mandel | |
| Alienware m18 R1 AMD | |
| Average of class Gaming (25115 - 128721, n=105, last 2 years) | |
| MSI Titan 18 HX A14VIG | |
| Acer Predator Helios 18 N23Q2 | |
| Asus ROG Strix Scar 18 G834JYR (2024) | |
| Average Intel Core i9-14900HX (32543 - 83662, n=36) | |
| Acer Predator Helios 18 PH18-72-98MW | |
| AIDA64 / CPU AES | |
| Acer Predator Helios 18 N23Q2 | |
| Alienware m18 R1 AMD | |
| Average Intel Core i9-14900HX (86964 - 241777, n=36) | |
| MSI Titan 18 HX A14VIG | |
| Asus ROG Strix Scar 18 G834JYR (2024) | |
| Acer Predator Helios 18 PH18-72-98MW | |
| Average of class Gaming (39258 - 247074, n=105, last 2 years) | |
| AIDA64 / CPU ZLib | |
| Alienware m18 R1 AMD | |
| MSI Titan 18 HX A14VIG | |
| Acer Predator Helios 18 N23Q2 | |
| Average Intel Core i9-14900HX (1054 - 2292, n=36) | |
| Asus ROG Strix Scar 18 G834JYR (2024) | |
| Acer Predator Helios 18 PH18-72-98MW | |
| Average of class Gaming (574 - 2531, n=105, last 2 years) | |
| AIDA64 / FP64 Ray-Trace | |
| Alienware m18 R1 AMD | |
| Average of class Gaming (5509 - 45446, n=105, last 2 years) | |
| MSI Titan 18 HX A14VIG | |
| Acer Predator Helios 18 N23Q2 | |
| Asus ROG Strix Scar 18 G834JYR (2024) | |
| Average Intel Core i9-14900HX (6809 - 18349, n=36) | |
| Acer Predator Helios 18 PH18-72-98MW | |
| AIDA64 / CPU PhotoWorxx | |
| Acer Predator Helios 18 N23Q2 | |
| Asus ROG Strix Scar 18 G834JYR (2024) | |
| Acer Predator Helios 18 PH18-72-98MW | |
| Average Intel Core i9-14900HX (23903 - 54702, n=36) | |
| Average of class Gaming (12271 - 89891, n=105, last 2 years) | |
| Alienware m18 R1 AMD | |
| MSI Titan 18 HX A14VIG | |
系统性能
其系统性能也不足以获得第一名。其 PCMark 10 总分与前代产品相当。该设备的内存达到了 DDR5-5600 内存的典型性能水平。
CrossMark: Overall | Productivity | Creativity | Responsiveness
WebXPRT 3: Overall
WebXPRT 4: Overall
Mozilla Kraken 1.1: Total
| PCMark 10 / Score | |
| Alienware m18 R1 AMD | |
| MSI Titan 18 HX A14VIG | |
| Asus ROG Strix Scar 18 G834JYR (2024) | |
| Average Intel Core i9-14900HX, NVIDIA GeForce RTX 4090 Laptop GPU (8230 - 9234, n=13) | |
| Acer Predator Helios 18 N23Q2 | |
| Average of class Gaming (5828 - 12414, n=93, last 2 years) | |
| Acer Predator Helios 18 PH18-72-98MW | |
| PCMark 10 / Essentials | |
| Alienware m18 R1 AMD | |
| MSI Titan 18 HX A14VIG | |
| Asus ROG Strix Scar 18 G834JYR (2024) | |
| Average Intel Core i9-14900HX, NVIDIA GeForce RTX 4090 Laptop GPU (10778 - 11628, n=13) | |
| Acer Predator Helios 18 PH18-72-98MW | |
| Acer Predator Helios 18 N23Q2 | |
| Average of class Gaming (8810 - 11935, n=97, last 2 years) | |
| PCMark 10 / Productivity | |
| Alienware m18 R1 AMD | |
| Average of class Gaming (6845 - 25323, n=95, last 2 years) | |
| Average Intel Core i9-14900HX, NVIDIA GeForce RTX 4090 Laptop GPU (9458 - 11759, n=13) | |
| Asus ROG Strix Scar 18 G834JYR (2024) | |
| Acer Predator Helios 18 N23Q2 | |
| MSI Titan 18 HX A14VIG | |
| Acer Predator Helios 18 PH18-72-98MW | |
| PCMark 10 / Digital Content Creation | |
| Alienware m18 R1 AMD | |
| MSI Titan 18 HX A14VIG | |
| Asus ROG Strix Scar 18 G834JYR (2024) | |
| Average Intel Core i9-14900HX, NVIDIA GeForce RTX 4090 Laptop GPU (13219 - 16462, n=13) | |
| Acer Predator Helios 18 N23Q2 | |
| Average of class Gaming (7602 - 19954, n=95, last 2 years) | |
| Acer Predator Helios 18 PH18-72-98MW | |
| CrossMark / Overall | |
| Asus ROG Strix Scar 18 G834JYR (2024) | |
| Acer Predator Helios 18 N23Q2 | |
| Average Intel Core i9-14900HX, NVIDIA GeForce RTX 4090 Laptop GPU (1877 - 2344, n=10) | |
| Average of class Gaming (1366 - 2409, n=94, last 2 years) | |
| Alienware m18 R1 AMD | |
| MSI Titan 18 HX A14VIG | |
| CrossMark / Productivity | |
| Acer Predator Helios 18 N23Q2 | |
| Asus ROG Strix Scar 18 G834JYR (2024) | |
| Average Intel Core i9-14900HX, NVIDIA GeForce RTX 4090 Laptop GPU (1738 - 2162, n=10) | |
| Average of class Gaming (1386 - 2254, n=94, last 2 years) | |
| Alienware m18 R1 AMD | |
| MSI Titan 18 HX A14VIG | |
| CrossMark / Creativity | |
| Asus ROG Strix Scar 18 G834JYR (2024) | |
| Acer Predator Helios 18 N23Q2 | |
| Average Intel Core i9-14900HX, NVIDIA GeForce RTX 4090 Laptop GPU (2195 - 2660, n=10) | |
| Average of class Gaming (1343 - 2786, n=94, last 2 years) | |
| Alienware m18 R1 AMD | |
| MSI Titan 18 HX A14VIG | |
| CrossMark / Responsiveness | |
| Acer Predator Helios 18 N23Q2 | |
| Asus ROG Strix Scar 18 G834JYR (2024) | |
| Average Intel Core i9-14900HX, NVIDIA GeForce RTX 4090 Laptop GPU (1478 - 2327, n=10) | |
| Average of class Gaming (1226 - 2334, n=94, last 2 years) | |
| Alienware m18 R1 AMD | |
| MSI Titan 18 HX A14VIG | |
| WebXPRT 3 / Overall | |
| Alienware m18 R1 AMD | |
| MSI Titan 18 HX A14VIG | |
| Average Intel Core i9-14900HX, NVIDIA GeForce RTX 4090 Laptop GPU (279 - 339, n=10) | |
| Asus ROG Strix Scar 18 G834JYR (2024) | |
| Acer Predator Helios 18 N23Q2 | |
| Average of class Gaming (220 - 532, n=98, last 2 years) | |
| WebXPRT 4 / Overall | |
| Asus ROG Strix Scar 18 G834JYR (2024) | |
| Alienware m18 R1 AMD | |
| Average Intel Core i9-14900HX, NVIDIA GeForce RTX 4090 Laptop GPU (246 - 309, n=8) | |
| MSI Titan 18 HX A14VIG | |
| Average of class Gaming (165 - 354, n=98, last 2 years) | |
| Mozilla Kraken 1.1 / Total | |
| Alienware m18 R1 AMD | |
| Average of class Gaming (391 - 590, n=100, last 2 years) | |
| Acer Predator Helios 18 N23Q2 | |
| Average Intel Core i9-14900HX, NVIDIA GeForce RTX 4090 Laptop GPU (428 - 535, n=11) | |
| MSI Titan 18 HX A14VIG | |
| Asus ROG Strix Scar 18 G834JYR (2024) | |
| Acer Predator Helios 18 PH18-72-98MW | |
* ... smaller is better
| PCMark 10 Score | 8230 points | |
Help | ||
| AIDA64 / Memory Copy | |
| Asus ROG Strix Scar 18 G834JYR (2024) | |
| Acer Predator Helios 18 N23Q2 | |
| Acer Predator Helios 18 PH18-72-98MW | |
| Average Intel Core i9-14900HX (38028 - 83392, n=36) | |
| Average of class Gaming (21750 - 129946, n=105, last 2 years) | |
| MSI Titan 18 HX A14VIG | |
| Alienware m18 R1 AMD | |
| AIDA64 / Memory Read | |
| Asus ROG Strix Scar 18 G834JYR (2024) | |
| Acer Predator Helios 18 N23Q2 | |
| Acer Predator Helios 18 PH18-72-98MW | |
| Average Intel Core i9-14900HX (43306 - 87568, n=36) | |
| Average of class Gaming (22956 - 118858, n=105, last 2 years) | |
| Alienware m18 R1 AMD | |
| MSI Titan 18 HX A14VIG | |
| AIDA64 / Memory Write | |
| Asus ROG Strix Scar 18 G834JYR (2024) | |
| Average of class Gaming (22297 - 135096, n=105, last 2 years) | |
| Acer Predator Helios 18 N23Q2 | |
| Average Intel Core i9-14900HX (37146 - 80589, n=36) | |
| Acer Predator Helios 18 PH18-72-98MW | |
| Alienware m18 R1 AMD | |
| MSI Titan 18 HX A14VIG | |
| AIDA64 / Memory Latency | |
| Average of class Gaming (75.3 - 259, n=105, last 2 years) | |
| MSI Titan 18 HX A14VIG | |
| Alienware m18 R1 AMD | |
| Average Intel Core i9-14900HX (76.1 - 105, n=36) | |
| Acer Predator Helios 18 N23Q2 | |
| Acer Predator Helios 18 PH18-72-98MW | |
| Asus ROG Strix Scar 18 G834JYR (2024) | |
* ... smaller is better
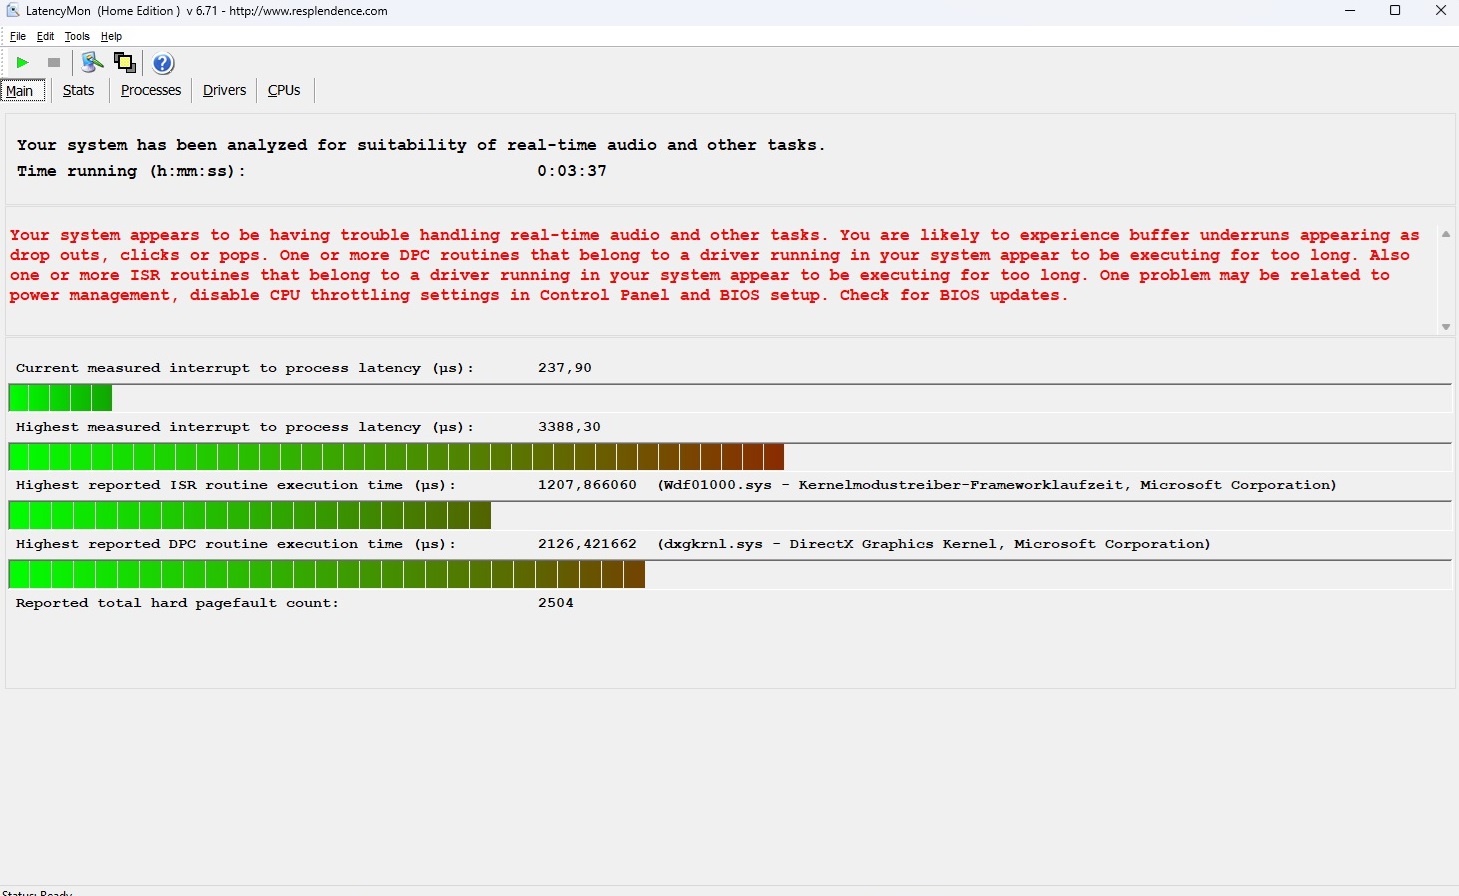
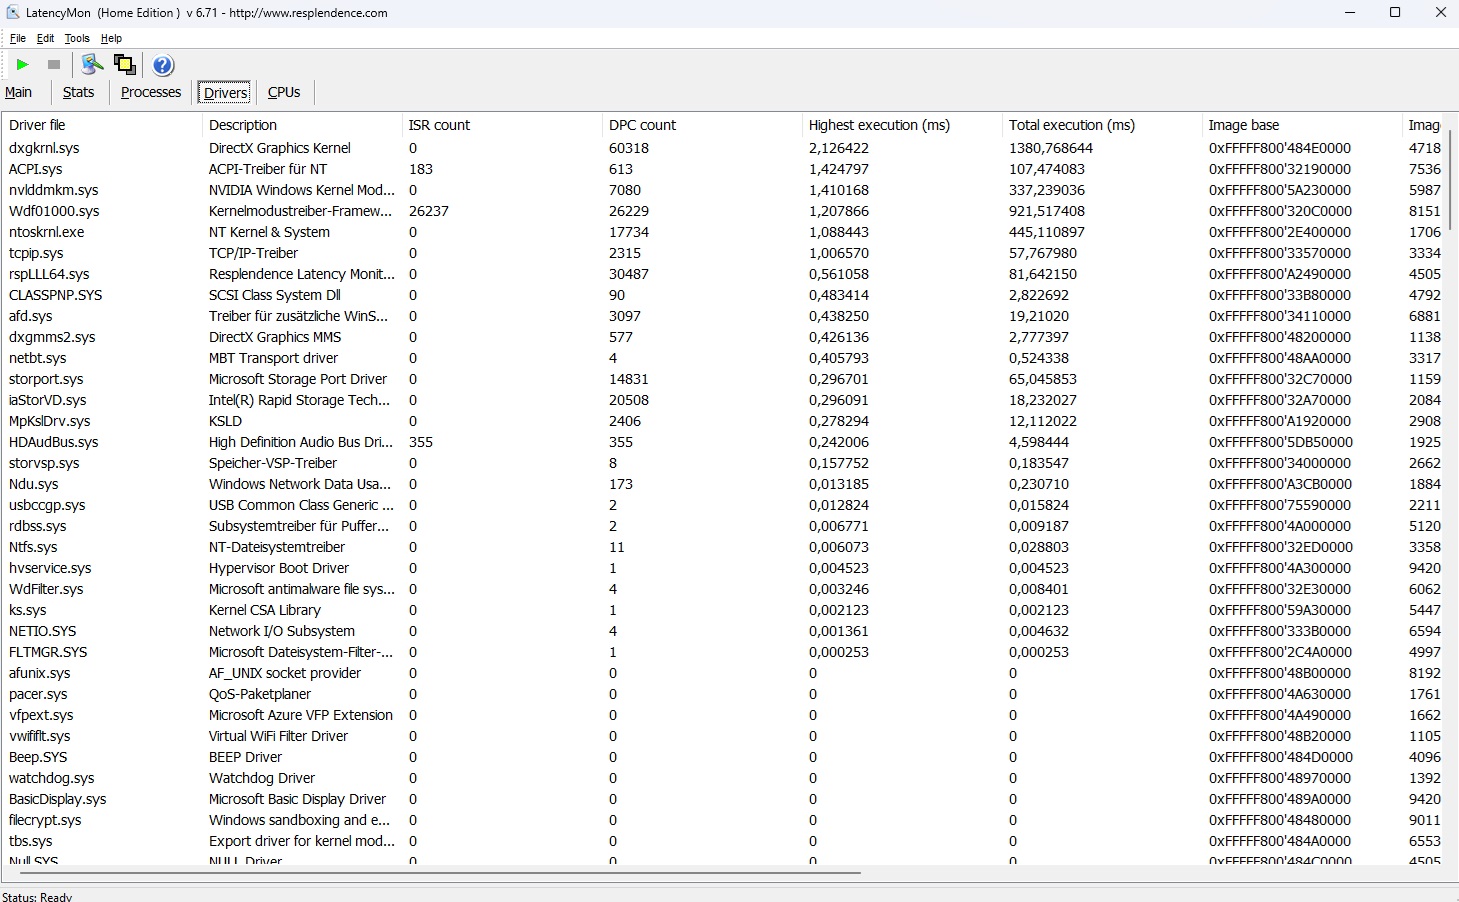
DPC 延迟
这款笔记本电脑的延迟时间可能大大低于旧版 Helios 18,但根据 LatencyMon 工具的分析,对于某些使用领域(实时音频和视频编辑)来说,延迟时间仍然过高。
| DPC Latencies / LatencyMon - interrupt to process latency (max), Web, Youtube, Prime95 | |
| Acer Predator Helios 18 N23Q2 | |
| Acer Predator Helios 18 PH18-72-98MW | |
| MSI Titan 18 HX A14VIG | |
| Alienware m18 R1 AMD | |
| Asus ROG Strix Scar 18 G834JYR (2024) | |
* ... smaller is better
存储设备
正如我们在介绍中提到的,宏碁将两个 NVMe 固态硬盘组合成一个 Raid 0 阵列。乍一看,这在连续读取和写入速度方面都达到了一流的效果。不过,笔记本电脑的散热似乎不太理想,因为我们在循环测试中发现,一段时间后性能偶尔会出现波动。

* ... smaller is better
Reading continuous performance: DiskSpd Read Loop, Queue Depth 8
图形卡
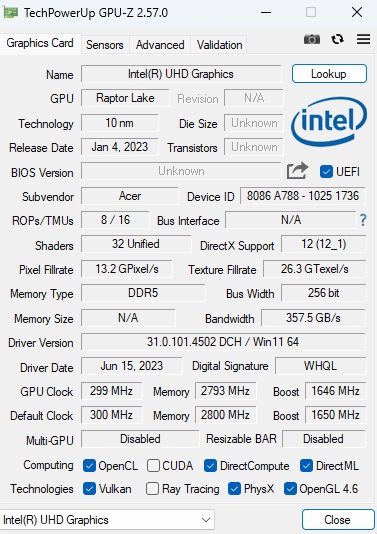
GeForce RTX 4090 基于 Ada Lovelace 架构,是目前 Nvidia 最强大的笔记本显卡。它拥有 9,728 个着色器单元和 16GB GDDR6 VRAM,尤其是宏碁选择了 175 瓦的最大 TGP。即便如此,其 GPU 在性能模式下的表现仍不尽如人意。与 CPU 测试类似,它的性能比 RTX 4090 之前的平均水平低 6%。
| 3DMark 11 Performance | 44065 points | |
| 3DMark Cloud Gate Standard Score | 59876 points | |
| 3DMark Fire Strike Score | 33907 points | |
| 3DMark Time Spy Score | 18542 points | |
Help | ||
* ... smaller is better
游戏性能
| The Witcher 3 - 1920x1080 Ultra Graphics & Postprocessing (HBAO+) | |
| MSI Titan 18 HX A14VIG | |
| Average NVIDIA GeForce RTX 4090 Laptop GPU (139.2 - 216, n=35) | |
| Average of class Gaming (104.7 - 240, n=7, last 2 years) | |
| Asus ROG Strix Scar 18 G834JYR (2024) | |
| Acer Predator Helios 18 PH18-72-98MW | |
| Acer Predator Helios 18 N23Q2 | |
| Alienware m18 R1 AMD | |
| Skull & Bones - 2560x1440 Ultra High Preset AA:T | |
| Average NVIDIA GeForce RTX 4090 Laptop GPU (85 - 98, n=3) | |
| Asus ROG Zephyrus M16 | |
| Acer Predator Helios 18 PH18-72-98MW | |
| Prince of Persia The Lost Crown - 2560x1440 Ultra Preset AA:SM | |
| Asus ROG Zephyrus M16 | |
| Average NVIDIA GeForce RTX 4090 Laptop GPU (355 - 356, n=2) | |
| Acer Predator Helios 18 PH18-72-98MW | |
| Average of class Gaming (352 - 357, n=4, last 2 years) | |
| Lords of the Fallen - 2560x1440 Ultra Preset | |
| XMG Neo 17 E23 | |
| Average NVIDIA GeForce RTX 4090 Laptop GPU (43 - 51.9, n=2) | |
| Acer Predator Helios 18 PH18-72-98MW | |
| Counter-Strike 2 - 2560x1440 Very High Preset | |
| XMG Neo 17 E23 | |
| Average NVIDIA GeForce RTX 4090 Laptop GPU (156.6 - 188.7, n=2) | |
| Acer Predator Helios 18 PH18-72-98MW | |
| Average of class Gaming (15.7 - 224, n=5, last 2 years) | |
| Lies of P - 2560x1440 Best Preset | |
| XMG Neo 17 E23 | |
| Average NVIDIA GeForce RTX 4090 Laptop GPU (136.4 - 173.1, n=2) | |
| Acer Predator Helios 18 PH18-72-98MW | |
| EA Sports WRC - 2560x1440 Ultra Preset AA:Epic AF:16x | |
| XMG Neo 17 E23 | |
| Average NVIDIA GeForce RTX 4090 Laptop GPU (97.9 - 103, n=2) | |
| Acer Predator Helios 18 PH18-72-98MW | |
| Armored Core 6 - 2560x1440 Maximum Preset | |
| XMG Neo 17 E23 | |
| Average NVIDIA GeForce RTX 4090 Laptop GPU (92 - 114.7, n=2) | |
| Acer Predator Helios 18 PH18-72-98MW | |
| Average of class Gaming (n=1last 2 years) | |
| Atlas Fallen - 2560x1440 Very High Preset | |
| XMG Neo 17 E23 | |
| Average NVIDIA GeForce RTX 4090 Laptop GPU (128.3 - 171.1, n=2) | |
| Acer Predator Helios 18 PH18-72-98MW | |
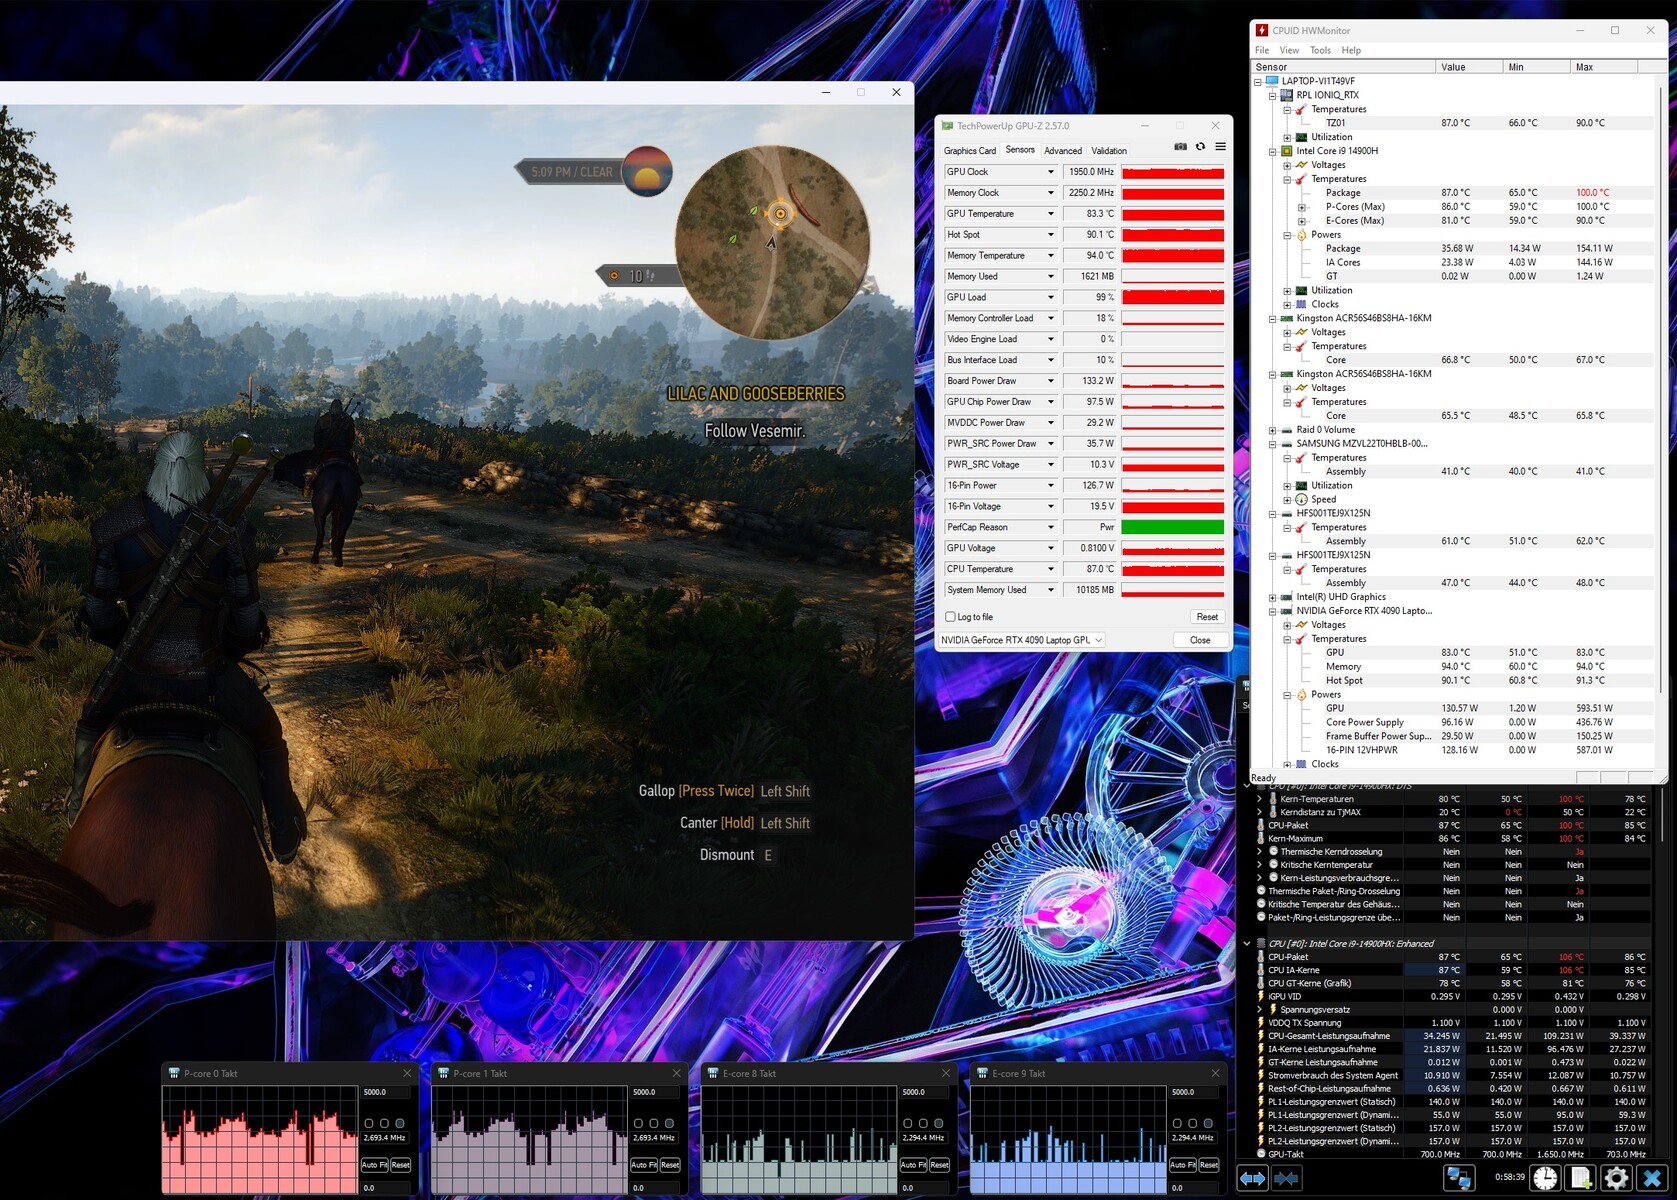
为了测试 GPU 在较长时间内的性能表现,我们让 Helios 18 与角色扮演游戏进行了较量 游戏Witcher 3进行了大约60分钟的测试。结果如何?我们注意到帧速率完全没有下降。
Witcher 3 FPS diagram
| low | med. | high | ultra | QHD | |
|---|---|---|---|---|---|
| GTA V (2015) | 180.4 | 134 | 126.4 | ||
| The Witcher 3 (2015) | 180 | ||||
| Dota 2 Reborn (2015) | 226 | 205 | 192.8 | 178.3 | |
| Final Fantasy XV Benchmark (2018) | 157.1 | 131.9 | |||
| X-Plane 11.11 (2018) | 183.7 | 148.3 | 114.5 | ||
| Far Cry 5 (2018) | 146 | 123 | 115 | ||
| Strange Brigade (2018) | 329 | 305 | 243 | ||
| Atlas Fallen (2023) | 182 | 161 | 128.3 | ||
| Armored Core 6 (2023) | 109.3 | 103.5 | 92 | ||
| The Crew Motorfest (2023) | 60 | 60 | 60 | ||
| Lies of P (2023) | 208 | 187 | 136.4 | ||
| Counter-Strike 2 (2023) | 234 | 189.7 | 156.6 | ||
| Lords of the Fallen (2023) | 87.3 | 64.2 | 43 | ||
| EA Sports WRC (2023) | 135.2 | 115.1 | 97.9 | ||
| Prince of Persia The Lost Crown (2024) | 357 | 356 | 355 | ||
| Skull & Bones (2024) | 133 | 106 | 85 | ||
| Last Epoch (2024) | 203 | 190 | 145.5 |
排放量
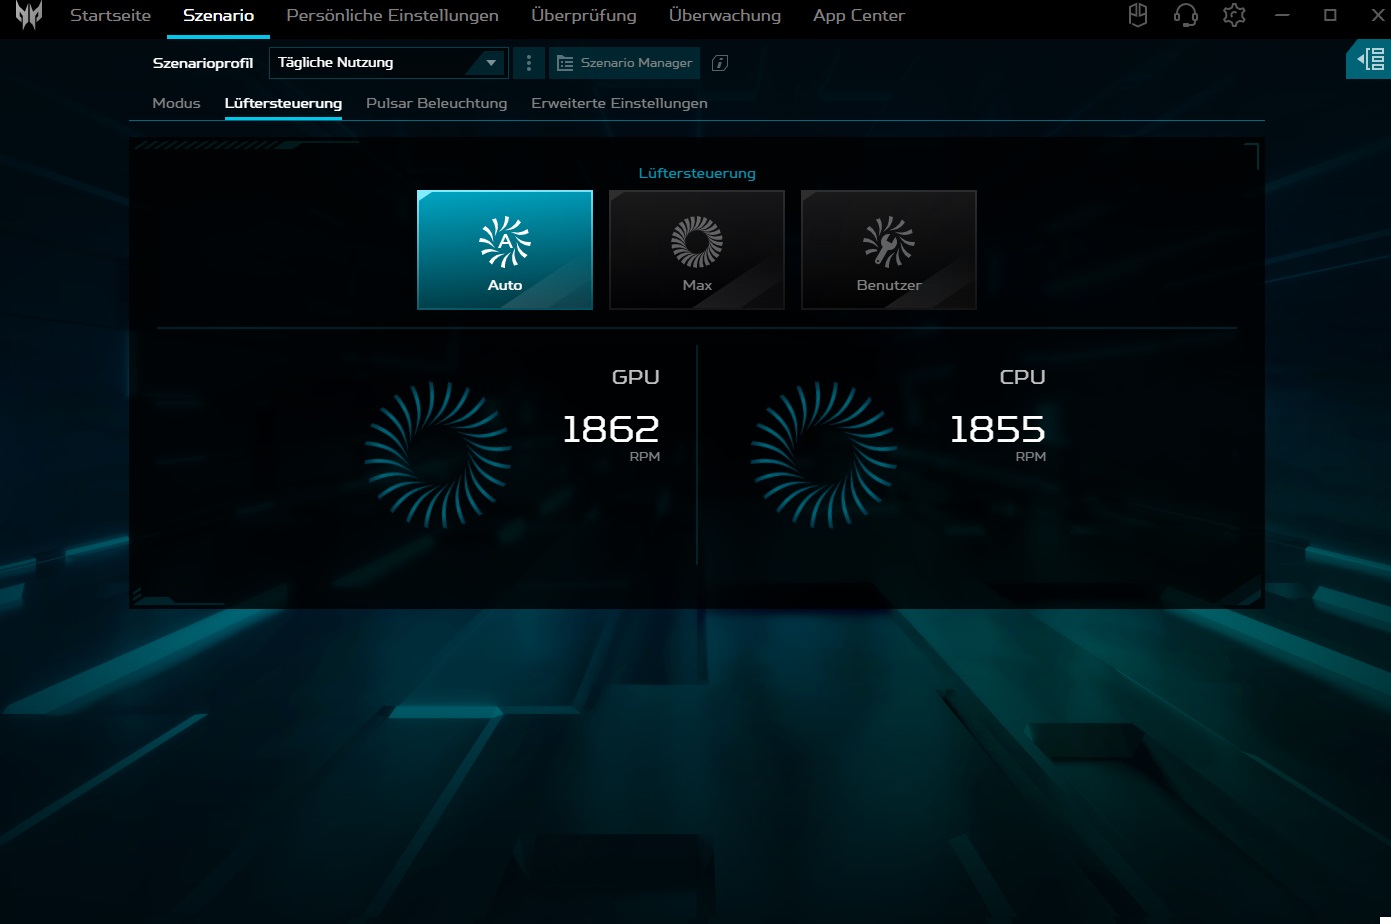
噪音排放
Predator Helios 18 最大的缺点之一是风扇控制能力较弱。在平衡模式下,当笔记本电脑空转时,风扇有时会开始不必要地旋转。在性能模式和涡轮增压模式下,这种情况会更加频繁和严重。在负载情况下,这款 18 英寸设备的表现并无异常。在 3D 使用中,性能模式下的噪音值为 48 至 51 dB(A),但并不夸张。
Noise level
| Idle |
| 30 / 36 / 44 dB(A) |
| Load |
| 48 / 51 dB(A) |
 | ||
30 dB silent 40 dB(A) audible 50 dB(A) loud |
||
min: | ||
| Acer Predator Helios 18 PH18-72-98MW i9-14900HX, GeForce RTX 4090 Laptop GPU | MSI Titan 18 HX A14VIG i9-14900HX, GeForce RTX 4090 Laptop GPU | Asus ROG Strix Scar 18 G834JYR (2024) i9-14900HX, GeForce RTX 4090 Laptop GPU | Acer Predator Helios 18 N23Q2 i9-13900HX, GeForce RTX 4080 Laptop GPU | Alienware m18 R1 AMD R9 7945HX, Radeon RX 7900M | |
|---|---|---|---|---|---|
| Noise | 12% | 8% | 12% | 15% | |
| off / environment * (dB) | 25 | 22.8 9% | 24 4% | 23 8% | 22.4 10% |
| Idle Minimum * (dB) | 30 | 23.8 21% | 27 10% | 23 23% | 23 23% |
| Idle Average * (dB) | 36 | 23.8 34% | 28 22% | 23 36% | 23.4 35% |
| Idle Maximum * (dB) | 44 | 28 36% | 32 27% | 23 48% | 33.5 24% |
| Load Average * (dB) | 48 | 38 21% | 50 -4% | 45.26 6% | 33.5 30% |
| Witcher 3 ultra * (dB) | 49 | 57.3 -17% | 50 -2% | 59.82 -22% | 53.6 -9% |
| Load Maximum * (dB) | 51 | 62.8 -23% | 52 -2% | 59.94 -18% | 53.6 -5% |
* ... smaller is better
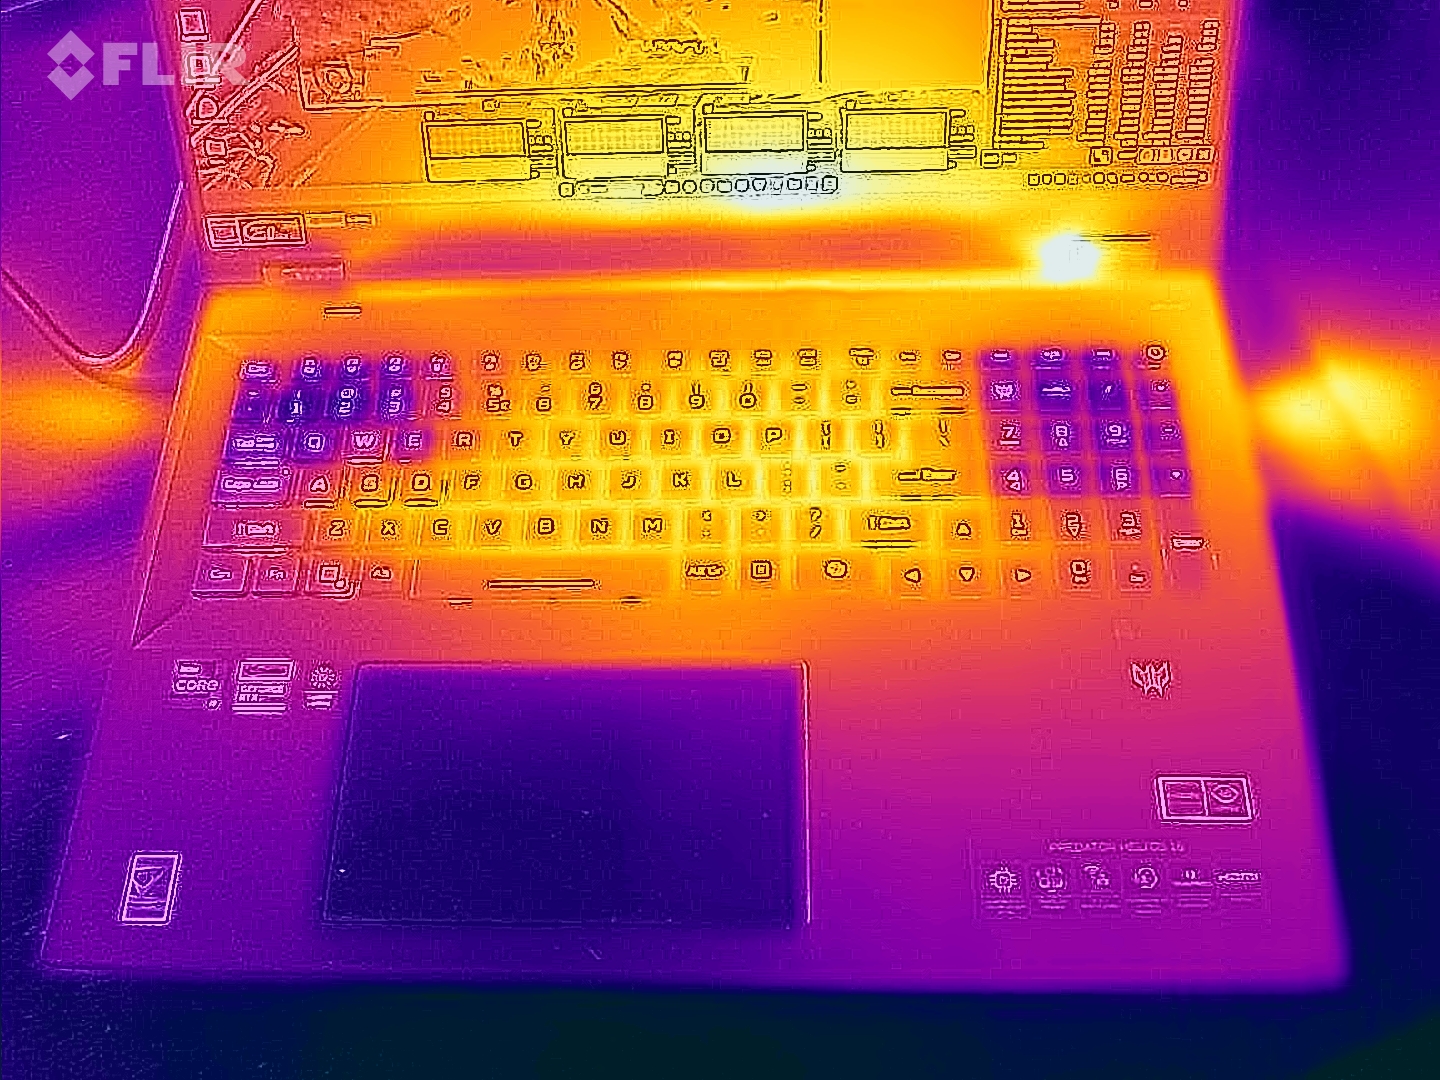
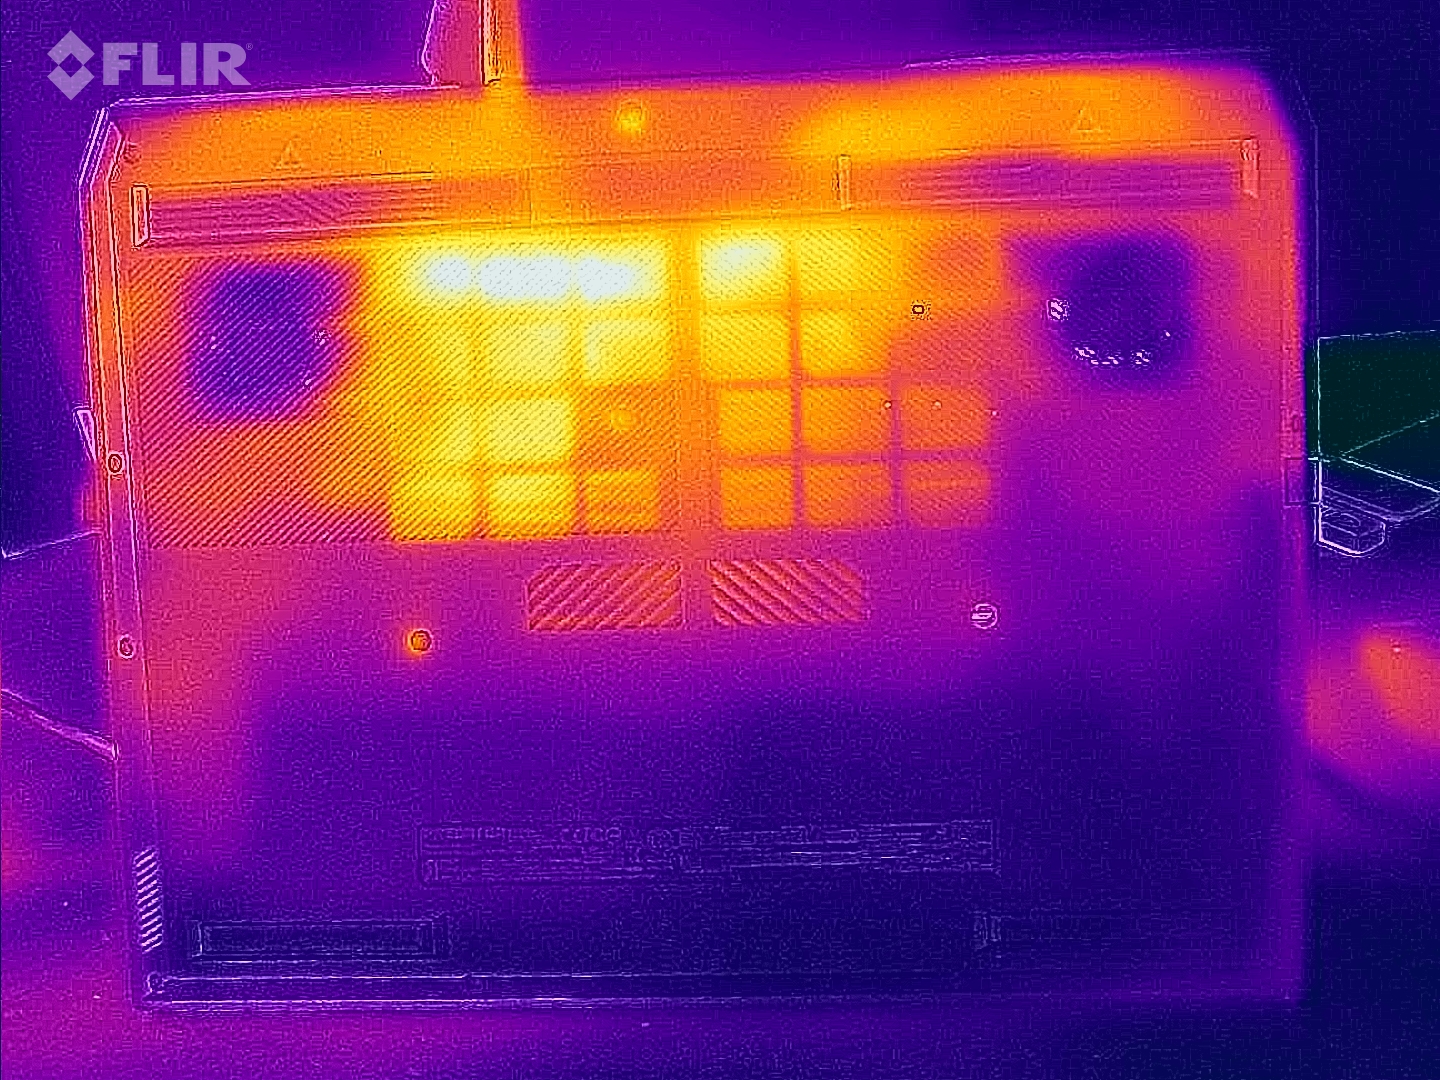
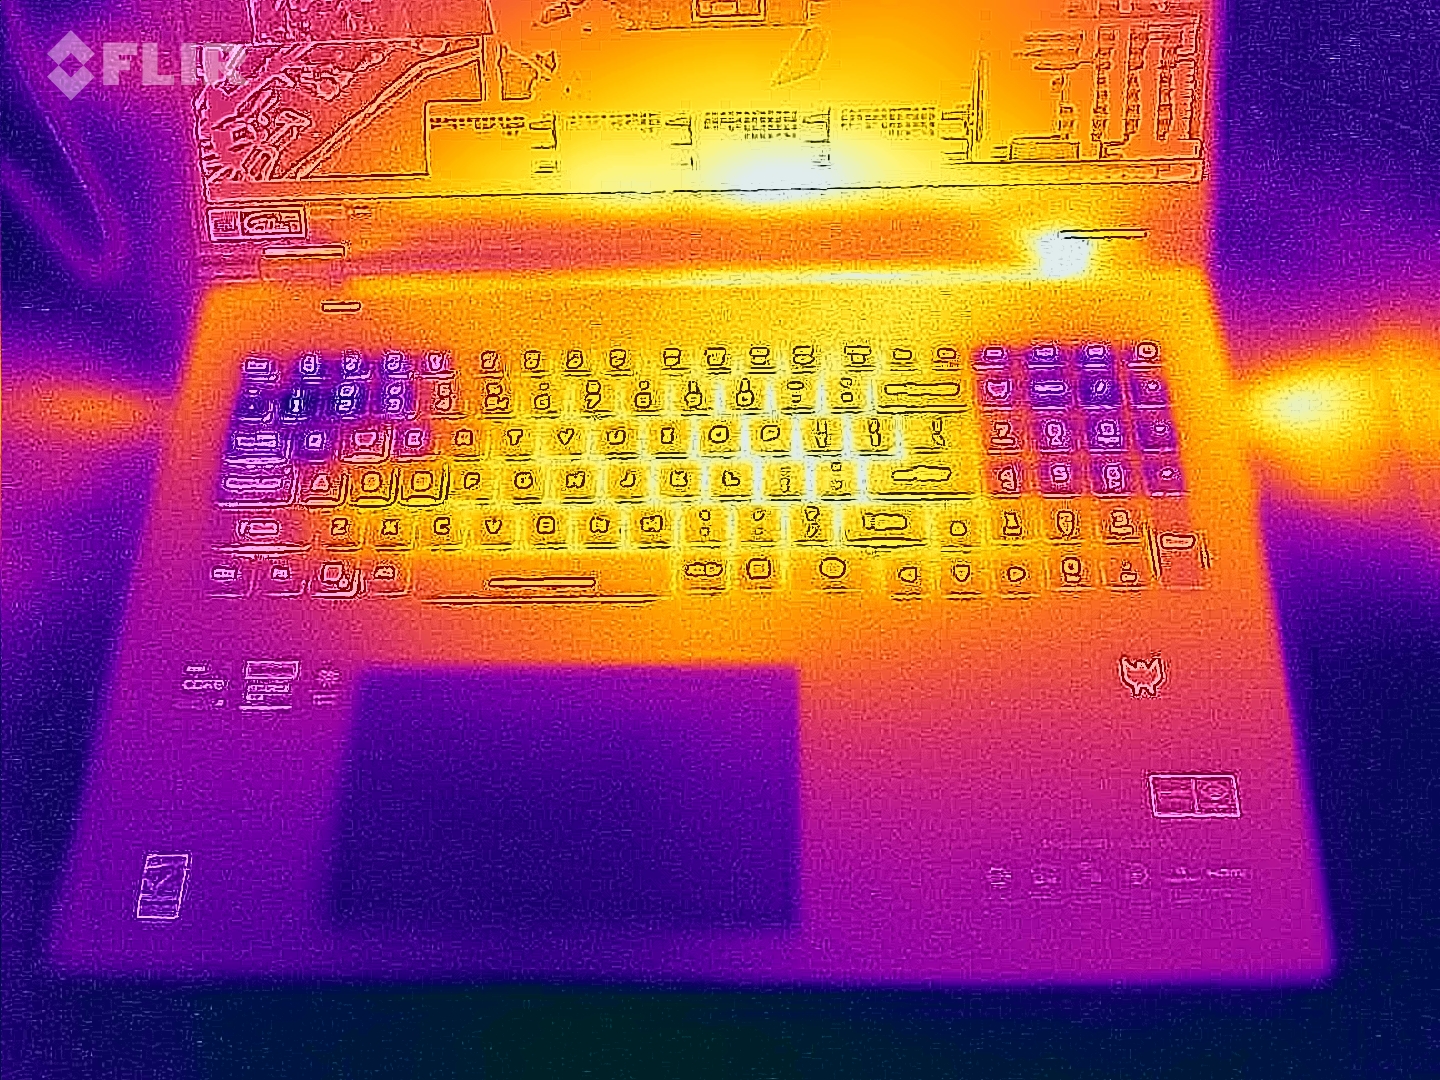
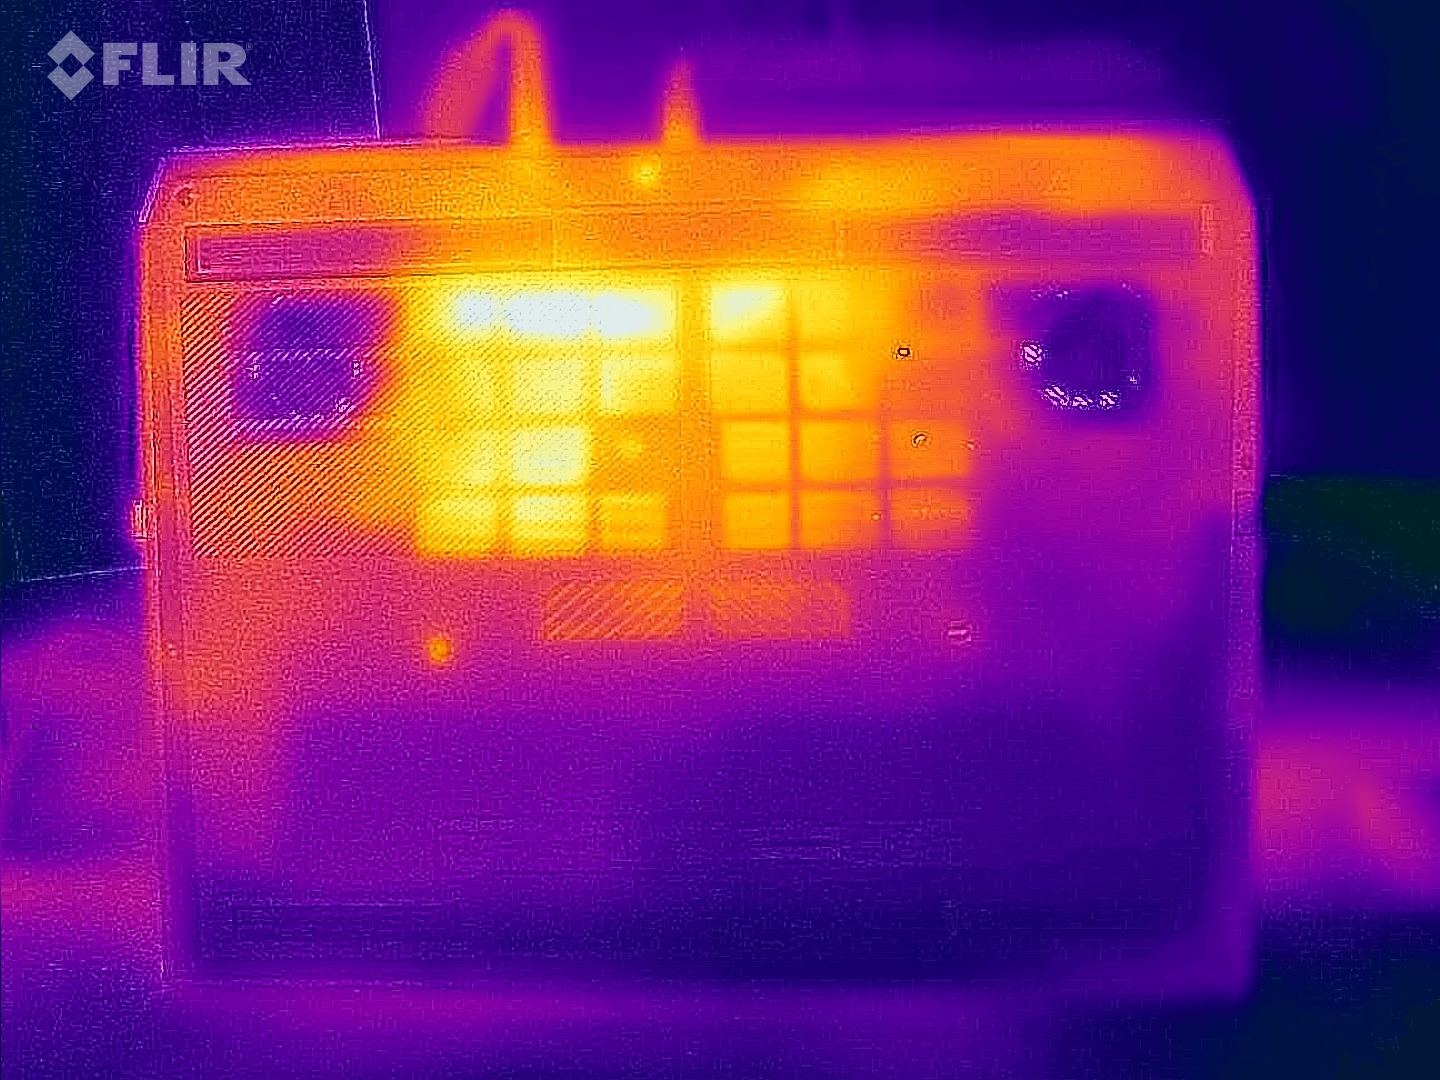
温度
笔记本机箱底部的发热量最大。在 60 分钟的压力测试后,我们测得某些部分的温度超过了 50 °C,这意味着你不能把设备放在膝盖上玩游戏。顶部的温度仍然较低,最高可达 43 °C。空闲时,温度值相当适中,平均为 29 °C(顶部)和 30 °C(底部),完全没有问题。
(±) The maximum temperature on the upper side is 43 °C / 109 F, compared to the average of 40.4 °C / 105 F, ranging from 21.2 to 68.8 °C for the class Gaming.
(-) The bottom heats up to a maximum of 59 °C / 138 F, compared to the average of 43.2 °C / 110 F
(+) In idle usage, the average temperature for the upper side is 29.2 °C / 85 F, compared to the device average of 33.9 °C / 93 F.
(-) Playing The Witcher 3, the average temperature for the upper side is 38.9 °C / 102 F, compared to the device average of 33.9 °C / 93 F.
(+) The palmrests and touchpad are reaching skin temperature as a maximum (33 °C / 91.4 F) and are therefore not hot.
(-) The average temperature of the palmrest area of similar devices was 28.8 °C / 83.8 F (-4.2 °C / -7.6 F).
| Acer Predator Helios 18 PH18-72-98MW i9-14900HX, GeForce RTX 4090 Laptop GPU | MSI Titan 18 HX A14VIG i9-14900HX, GeForce RTX 4090 Laptop GPU | Asus ROG Strix Scar 18 G834JYR (2024) i9-14900HX, GeForce RTX 4090 Laptop GPU | Acer Predator Helios 18 N23Q2 i9-13900HX, GeForce RTX 4080 Laptop GPU | Alienware m18 R1 AMD R9 7945HX, Radeon RX 7900M | |
|---|---|---|---|---|---|
| Heat | 8% | 6% | 1% | 14% | |
| Maximum Upper Side * (°C) | 43 | 37.8 12% | 49 -14% | 35 19% | 40.2 7% |
| Maximum Bottom * (°C) | 59 | 37.6 36% | 47 20% | 56 5% | 37.4 37% |
| Idle Upper Side * (°C) | 32 | 34.8 -9% | 29 9% | 34 -6% | 31.6 1% |
| Idle Bottom * (°C) | 34 | 36 -6% | 31 9% | 39 -15% | 30.6 10% |
* ... smaller is better
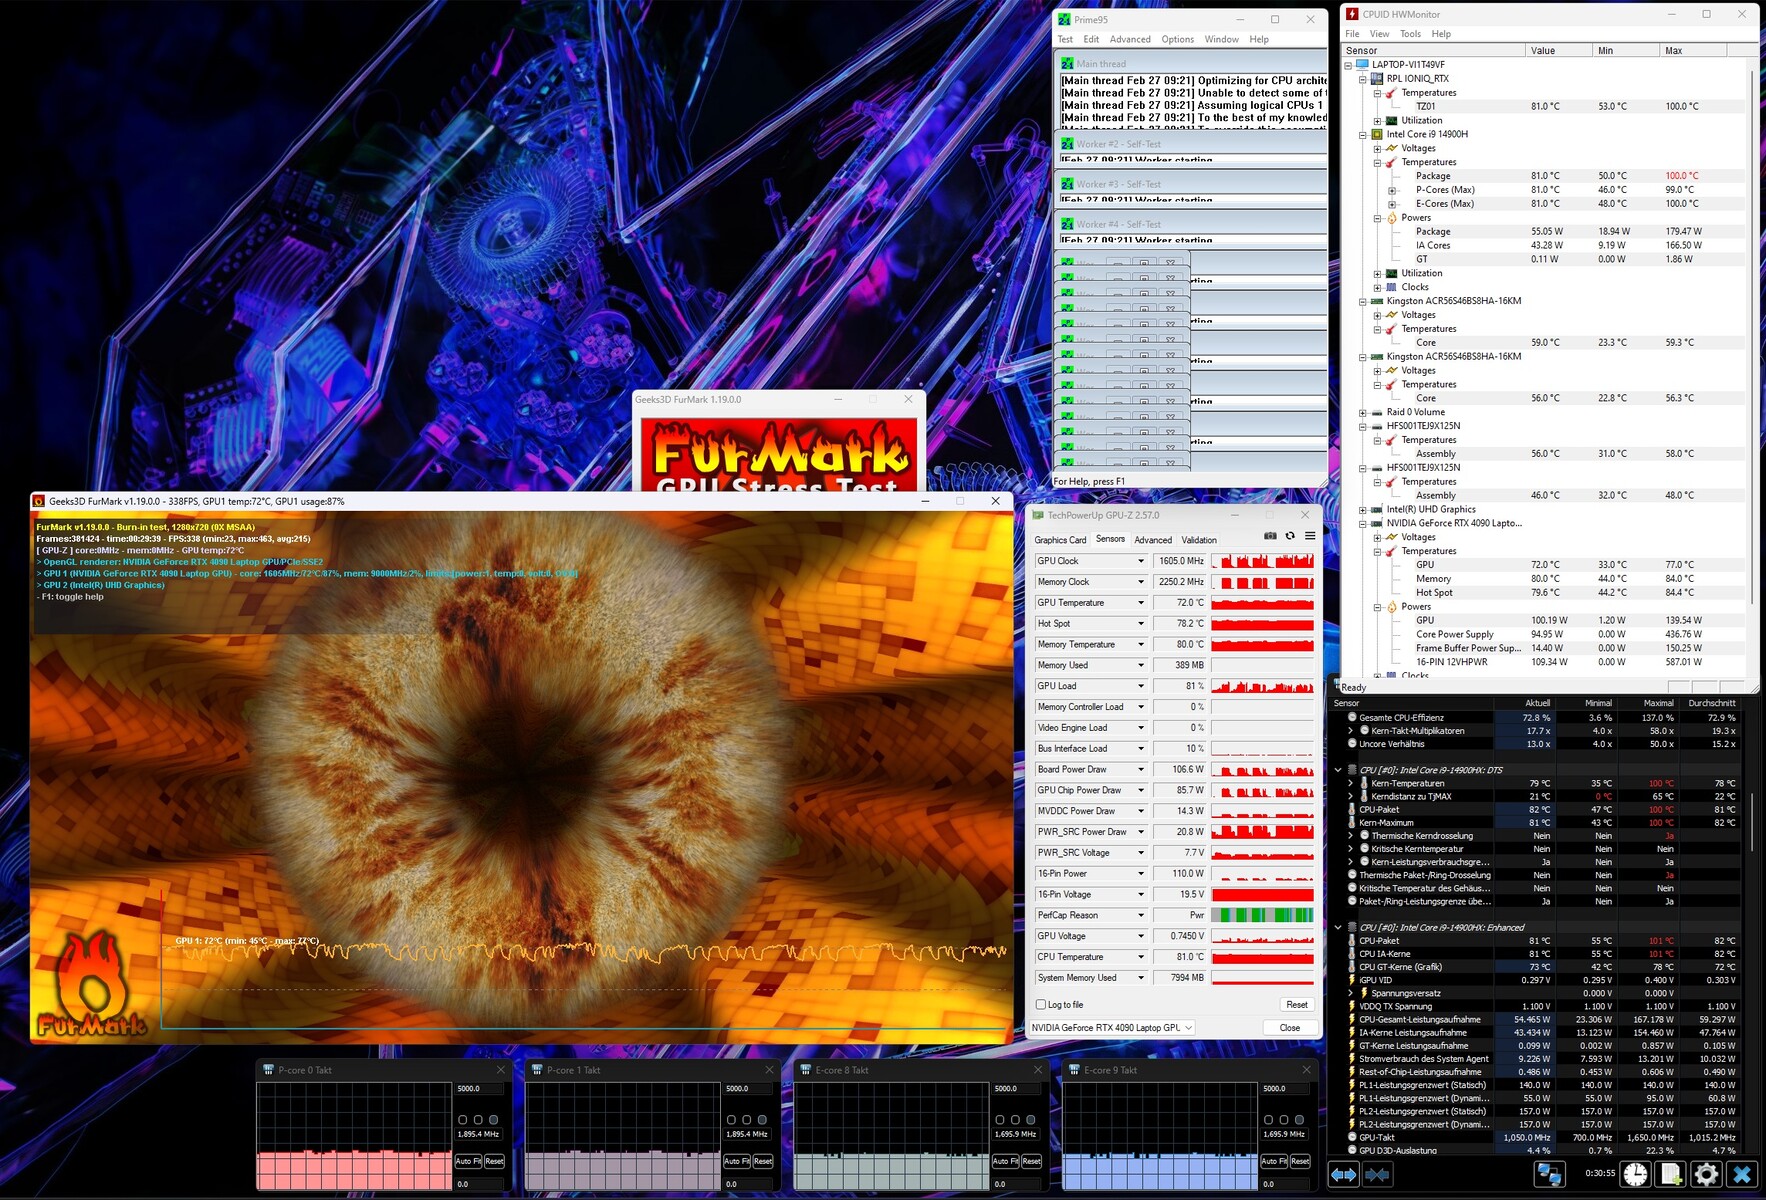
压力测试
我们使用 Furmark 和 Prime95 工具进行的压力测试并未将组件推向极限。酷睿 i9-14900HX 的温度约为 81 °C,而GeForce RTX 4090 的温度约为 72 °C(热点 78 °C)。不过,由于时钟频率较高,硬件在游戏模式下会变得更热。在 Witcher 3 中,我们的工具测得温度约为 87 ℃(CPU)和 83 ℃(GPU)。
发言人
我们的音频分析证实,新款 Predator Helios 18 的音质比上一代更好。虽然低音仍然可以更有力,但中高音现在更加明显。85 dB(A)的最大音量也足以满足大多数用户的需求。
Acer Predator Helios 18 PH18-72-98MW audio analysis
(+) | speakers can play relatively loud (85 dB)
Bass 100 - 315 Hz
(-) | nearly no bass - on average 21.1% lower than median
(±) | linearity of bass is average (10.7% delta to prev. frequency)
Mids 400 - 2000 Hz
(+) | balanced mids - only 2.9% away from median
(+) | mids are linear (5.6% delta to prev. frequency)
Highs 2 - 16 kHz
(+) | balanced highs - only 2.7% away from median
(+) | highs are linear (3.6% delta to prev. frequency)
Overall 100 - 16.000 Hz
(+) | overall sound is linear (13.6% difference to median)
Compared to same class
» 20% of all tested devices in this class were better, 7% similar, 73% worse
» The best had a delta of 6%, average was 18%, worst was 132%
Compared to all devices tested
» 15% of all tested devices were better, 4% similar, 82% worse
» The best had a delta of 4%, average was 23%, worst was 134%
MSI Titan 18 HX A14VIG audio analysis
(+) | speakers can play relatively loud (89.2 dB)
Bass 100 - 315 Hz
(-) | nearly no bass - on average 17.6% lower than median
(±) | linearity of bass is average (8% delta to prev. frequency)
Mids 400 - 2000 Hz
(+) | balanced mids - only 1.8% away from median
(+) | mids are linear (3.7% delta to prev. frequency)
Highs 2 - 16 kHz
(+) | balanced highs - only 1.2% away from median
(+) | highs are linear (2% delta to prev. frequency)
Overall 100 - 16.000 Hz
(+) | overall sound is linear (9.9% difference to median)
Compared to same class
» 5% of all tested devices in this class were better, 2% similar, 94% worse
» The best had a delta of 6%, average was 18%, worst was 132%
Compared to all devices tested
» 4% of all tested devices were better, 1% similar, 95% worse
» The best had a delta of 4%, average was 23%, worst was 134%
Asus ROG Strix Scar 18 G834JYR (2024) audio analysis
(+) | speakers can play relatively loud (82 dB)
Bass 100 - 315 Hz
(±) | reduced bass - on average 5.6% lower than median
(+) | bass is linear (6.8% delta to prev. frequency)
Mids 400 - 2000 Hz
(±) | higher mids - on average 5.7% higher than median
(+) | mids are linear (2.8% delta to prev. frequency)
Highs 2 - 16 kHz
(±) | reduced highs - on average 7.2% lower than median
(±) | linearity of highs is average (7.2% delta to prev. frequency)
Overall 100 - 16.000 Hz
(+) | overall sound is linear (13% difference to median)
Compared to same class
» 18% of all tested devices in this class were better, 3% similar, 79% worse
» The best had a delta of 6%, average was 18%, worst was 132%
Compared to all devices tested
» 13% of all tested devices were better, 3% similar, 85% worse
» The best had a delta of 4%, average was 23%, worst was 134%
Acer Predator Helios 18 N23Q2 audio analysis
(+) | speakers can play relatively loud (82.74 dB)
Bass 100 - 315 Hz
(-) | nearly no bass - on average 17.6% lower than median
(±) | linearity of bass is average (9.8% delta to prev. frequency)
Mids 400 - 2000 Hz
(±) | higher mids - on average 9.1% higher than median
(±) | linearity of mids is average (8.8% delta to prev. frequency)
Highs 2 - 16 kHz
(±) | higher highs - on average 5.3% higher than median
(+) | highs are linear (6.4% delta to prev. frequency)
Overall 100 - 16.000 Hz
(±) | linearity of overall sound is average (20.3% difference to median)
Compared to same class
» 72% of all tested devices in this class were better, 6% similar, 23% worse
» The best had a delta of 6%, average was 18%, worst was 132%
Compared to all devices tested
» 53% of all tested devices were better, 8% similar, 39% worse
» The best had a delta of 4%, average was 23%, worst was 134%
Alienware m18 R1 AMD audio analysis
(+) | speakers can play relatively loud (84.2 dB)
Bass 100 - 315 Hz
(-) | nearly no bass - on average 22.7% lower than median
(-) | bass is not linear (15.8% delta to prev. frequency)
Mids 400 - 2000 Hz
(+) | balanced mids - only 1.5% away from median
(+) | mids are linear (3.8% delta to prev. frequency)
Highs 2 - 16 kHz
(+) | balanced highs - only 3.6% away from median
(+) | highs are linear (5.5% delta to prev. frequency)
Overall 100 - 16.000 Hz
(±) | linearity of overall sound is average (16.5% difference to median)
Compared to same class
» 42% of all tested devices in this class were better, 7% similar, 51% worse
» The best had a delta of 6%, average was 18%, worst was 132%
Compared to all devices tested
» 28% of all tested devices were better, 6% similar, 66% worse
» The best had a delta of 4%, average was 23%, worst was 134%
电源管理
耗电量
宏碁可以对设备的功耗进行一些微调。尽管这款 18 英寸笔记本电脑具有主动图形切换功能,但在闲置模式下仍需要消耗大量电能,即 31 至 43 瓦。大多数竞争对手和老款 Helios 在这方面做得要好得多。我们的测试设备可能还存在一个错误。
| Off / Standby | |
| Idle | |
| Load |
|
Key:
min: | |
| Acer Predator Helios 18 PH18-72-98MW i9-14900HX, GeForce RTX 4090 Laptop GPU | MSI Titan 18 HX A14VIG i9-14900HX, GeForce RTX 4090 Laptop GPU | Asus ROG Strix Scar 18 G834JYR (2024) i9-14900HX, GeForce RTX 4090 Laptop GPU | Acer Predator Helios 18 N23Q2 i9-13900HX, GeForce RTX 4080 Laptop GPU | Alienware m18 R1 AMD R9 7945HX, Radeon RX 7900M | Average of class Gaming | |
|---|---|---|---|---|---|---|
| Power Consumption | -3% | 24% | 22% | -34% | 38% | |
| Idle Minimum * (Watt) | 31 | 13.2 57% | 14 55% | 16 48% | 30.3 2% | 13 ? 58% |
| Idle Average * (Watt) | 35 | 25.4 27% | 17 51% | 19 46% | 55.6 -59% | 18.7 ? 47% |
| Idle Maximum * (Watt) | 43 | 53.5 -24% | 24 44% | 21.3 50% | 101.1 -135% | 24.3 ? 43% |
| Load Average * (Watt) | 144 | 151.4 -5% | 143 1% | 124 14% | 160.3 -11% | 110.2 ? 23% |
| Witcher 3 ultra * (Watt) | 228 | 336 -47% | 251 -10% | 289 -27% | 216 5% | |
| Load Maximum * (Watt) | 318 | 395.2 -24% | 302 5% | 319 -0% | 332.1 -4% | 258 ? 19% |
* ... smaller is better
Power consumption Witcher 3 / stress test
Power consumption with external monitor
运行时间
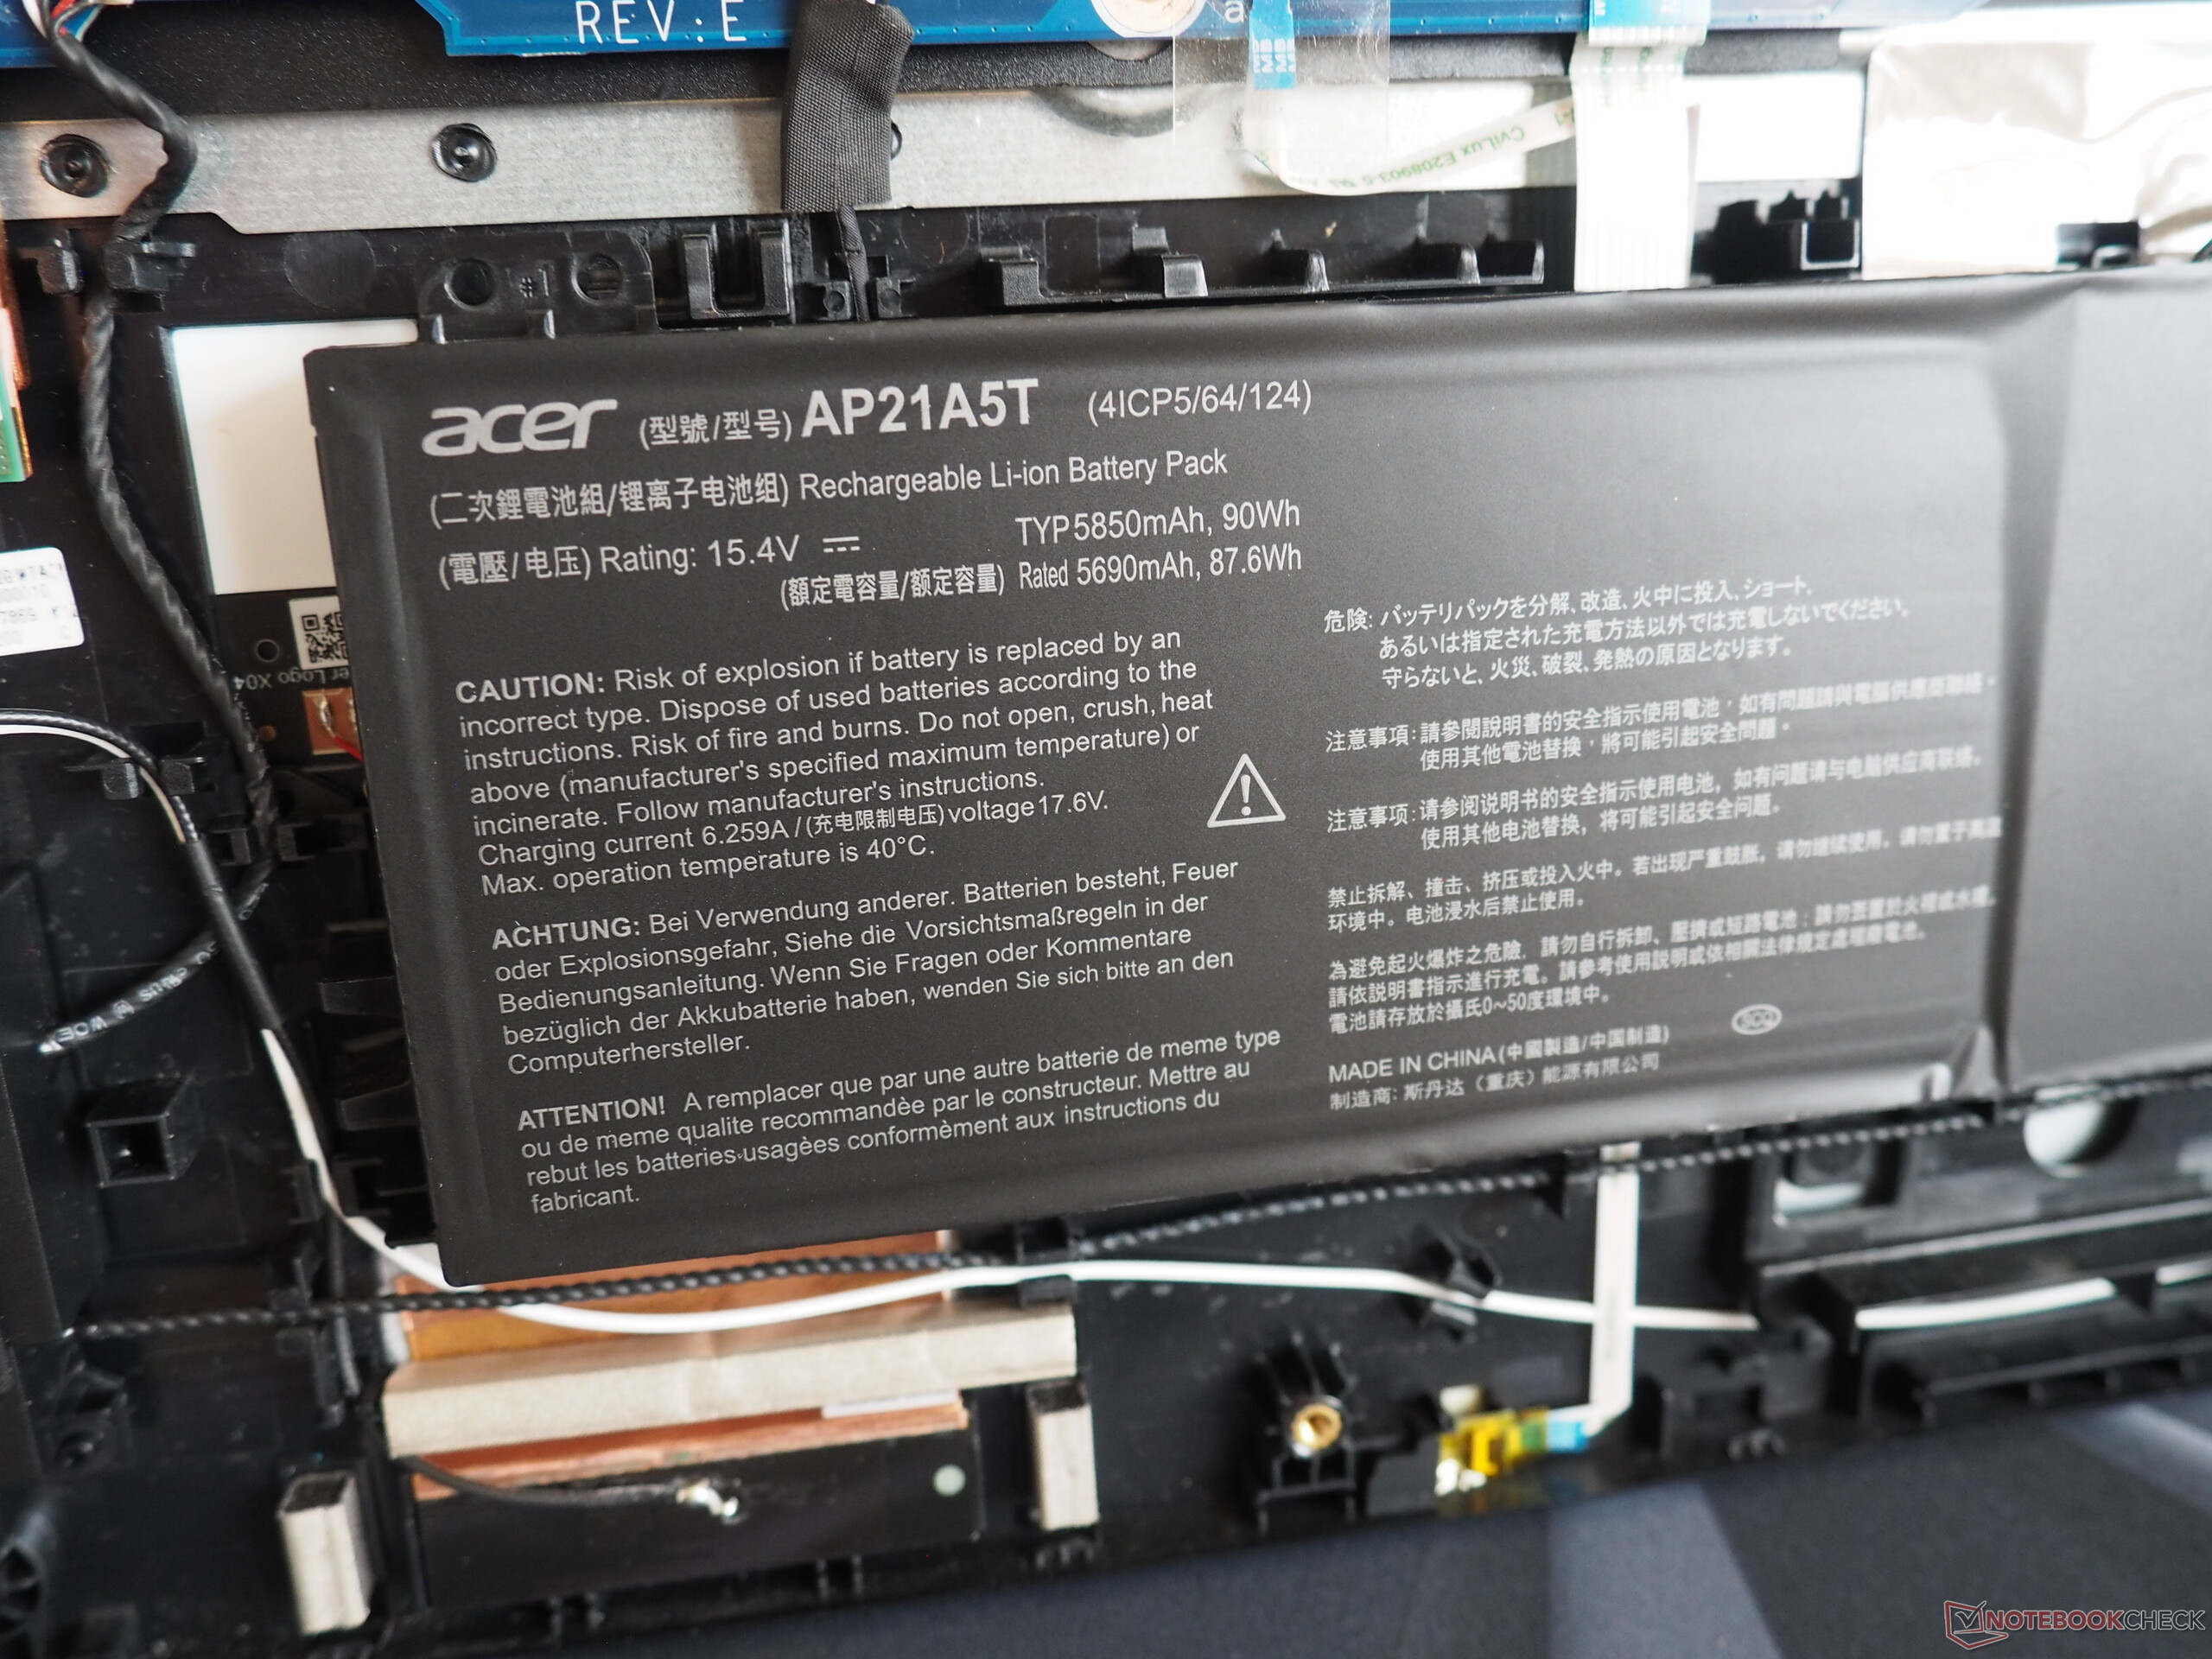
其高功率要求导致电池续航时间非常有限。在亮度降至 150 cd/m² 的 WLAN 测试中,Predator Helios 18 的续航时间仅为 3 个多小时。相比之下,ROG Strix Scar 18 的续航时间则超过了 7 小时。总的来说,90 瓦时的电池容量并不小。
| Acer Predator Helios 18 PH18-72-98MW i9-14900HX, GeForce RTX 4090 Laptop GPU, 90 Wh | MSI Titan 18 HX A14VIG i9-14900HX, GeForce RTX 4090 Laptop GPU, 99.9 Wh | Asus ROG Strix Scar 18 G834JYR (2024) i9-14900HX, GeForce RTX 4090 Laptop GPU, 90 Wh | Acer Predator Helios 18 N23Q2 i9-13900HX, GeForce RTX 4080 Laptop GPU, 90 Wh | Alienware m18 R1 AMD R9 7945HX, Radeon RX 7900M, 97 Wh | Average of class Gaming | |
|---|---|---|---|---|---|---|
| Battery runtime | 20% | 80% | 47% | -46% | 80% | |
| WiFi v1.3 (h) | 3.2 | 4.2 31% | 7.7 141% | 4.4 38% | 1.4 -56% | 7.11 ? 122% |
| Load (h) | 1.1 | 1.2 9% | 1.3 18% | 1.7 55% | 0.7 -36% | 1.502 ? 37% |
| Reader / Idle (h) | 5.9 | 10.2 | 4.5 | 8.16 ? | ||
| H.264 (h) | 7.5 | 4.8 | 8.32 ? |
Pros
Cons
判决
2024 版本是对现有的 掠夺者太阳神18.
性能方面,其 酷睿 i9-14900HX和 GeForce RTX 4090和旧版 酷睿 i9-13900HX和 GeForce RTX 4080.另一方面,其宽高比为 16:10 的 WQXGA-MiniLED 显示屏继续提供令人印象深刻的画质(亮度、对比度、色彩空间等)。此外,还有出色的输入设备和现代化的连接选项(2x Thunderbolt 4)。
预算充足、要求苛刻的游戏玩家一定能享受到全方位的无忧体验。
不过,就目前的状态而言,Predator Helios 18 刚刚错过了 "非常好 "的评价。除了风扇控制(有时会导致恼人的转速)之外,宏碁还可以修改笔记本电脑的空闲功耗,目前这仍然会导致运行时间不足。
目前市场上可能还没有许多竞争对手,但它们至少与该设备不相上下--无论是 微星泰坦 18还是 华硕 ROG Strix Scar 18.
价格和供应情况
在撰写本文时,搭载酷睿 i9-14900HX 和GeForce RTX 4090 的 Predator Helios 18 尚未在美国发售。
Acer Predator Helios 18 PH18-72-98MW
- 02/27/2024 v7 (old)
Florian Glaser
Transparency
The selection of devices to be reviewed is made by our editorial team. The test sample was provided to the author as a loan by the manufacturer or retailer for the purpose of this review. The lender had no influence on this review, nor did the manufacturer receive a copy of this review before publication. There was no obligation to publish this review. As an independent media company, Notebookcheck is not subjected to the authority of manufacturers, retailers or publishers.
This is how Notebookcheck is testing
Every year, Notebookcheck independently reviews hundreds of laptops and smartphones using standardized procedures to ensure that all results are comparable. We have continuously developed our test methods for around 20 years and set industry standards in the process. In our test labs, high-quality measuring equipment is utilized by experienced technicians and editors. These tests involve a multi-stage validation process. Our complex rating system is based on hundreds of well-founded measurements and benchmarks, which maintains objectivity. Further information on our test methods can be found here.
Price comparison

