华硕ROG Strix Scar 18 2023 G834JY评测--配备RTX 4090的游戏笔记本
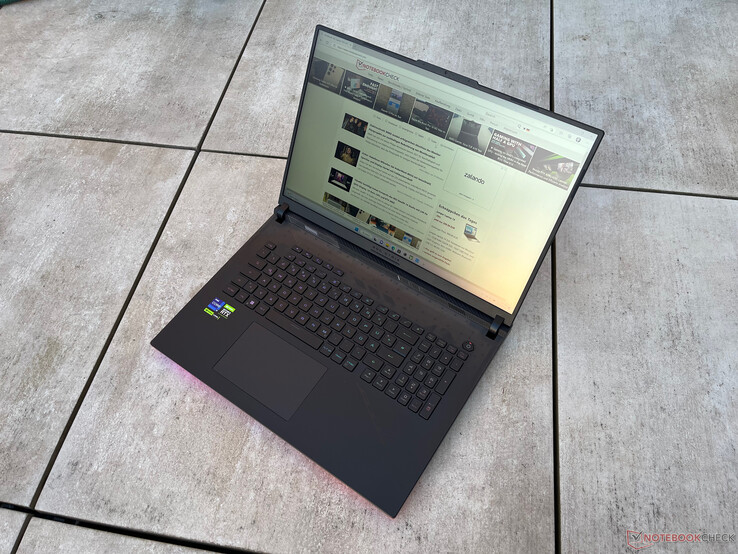
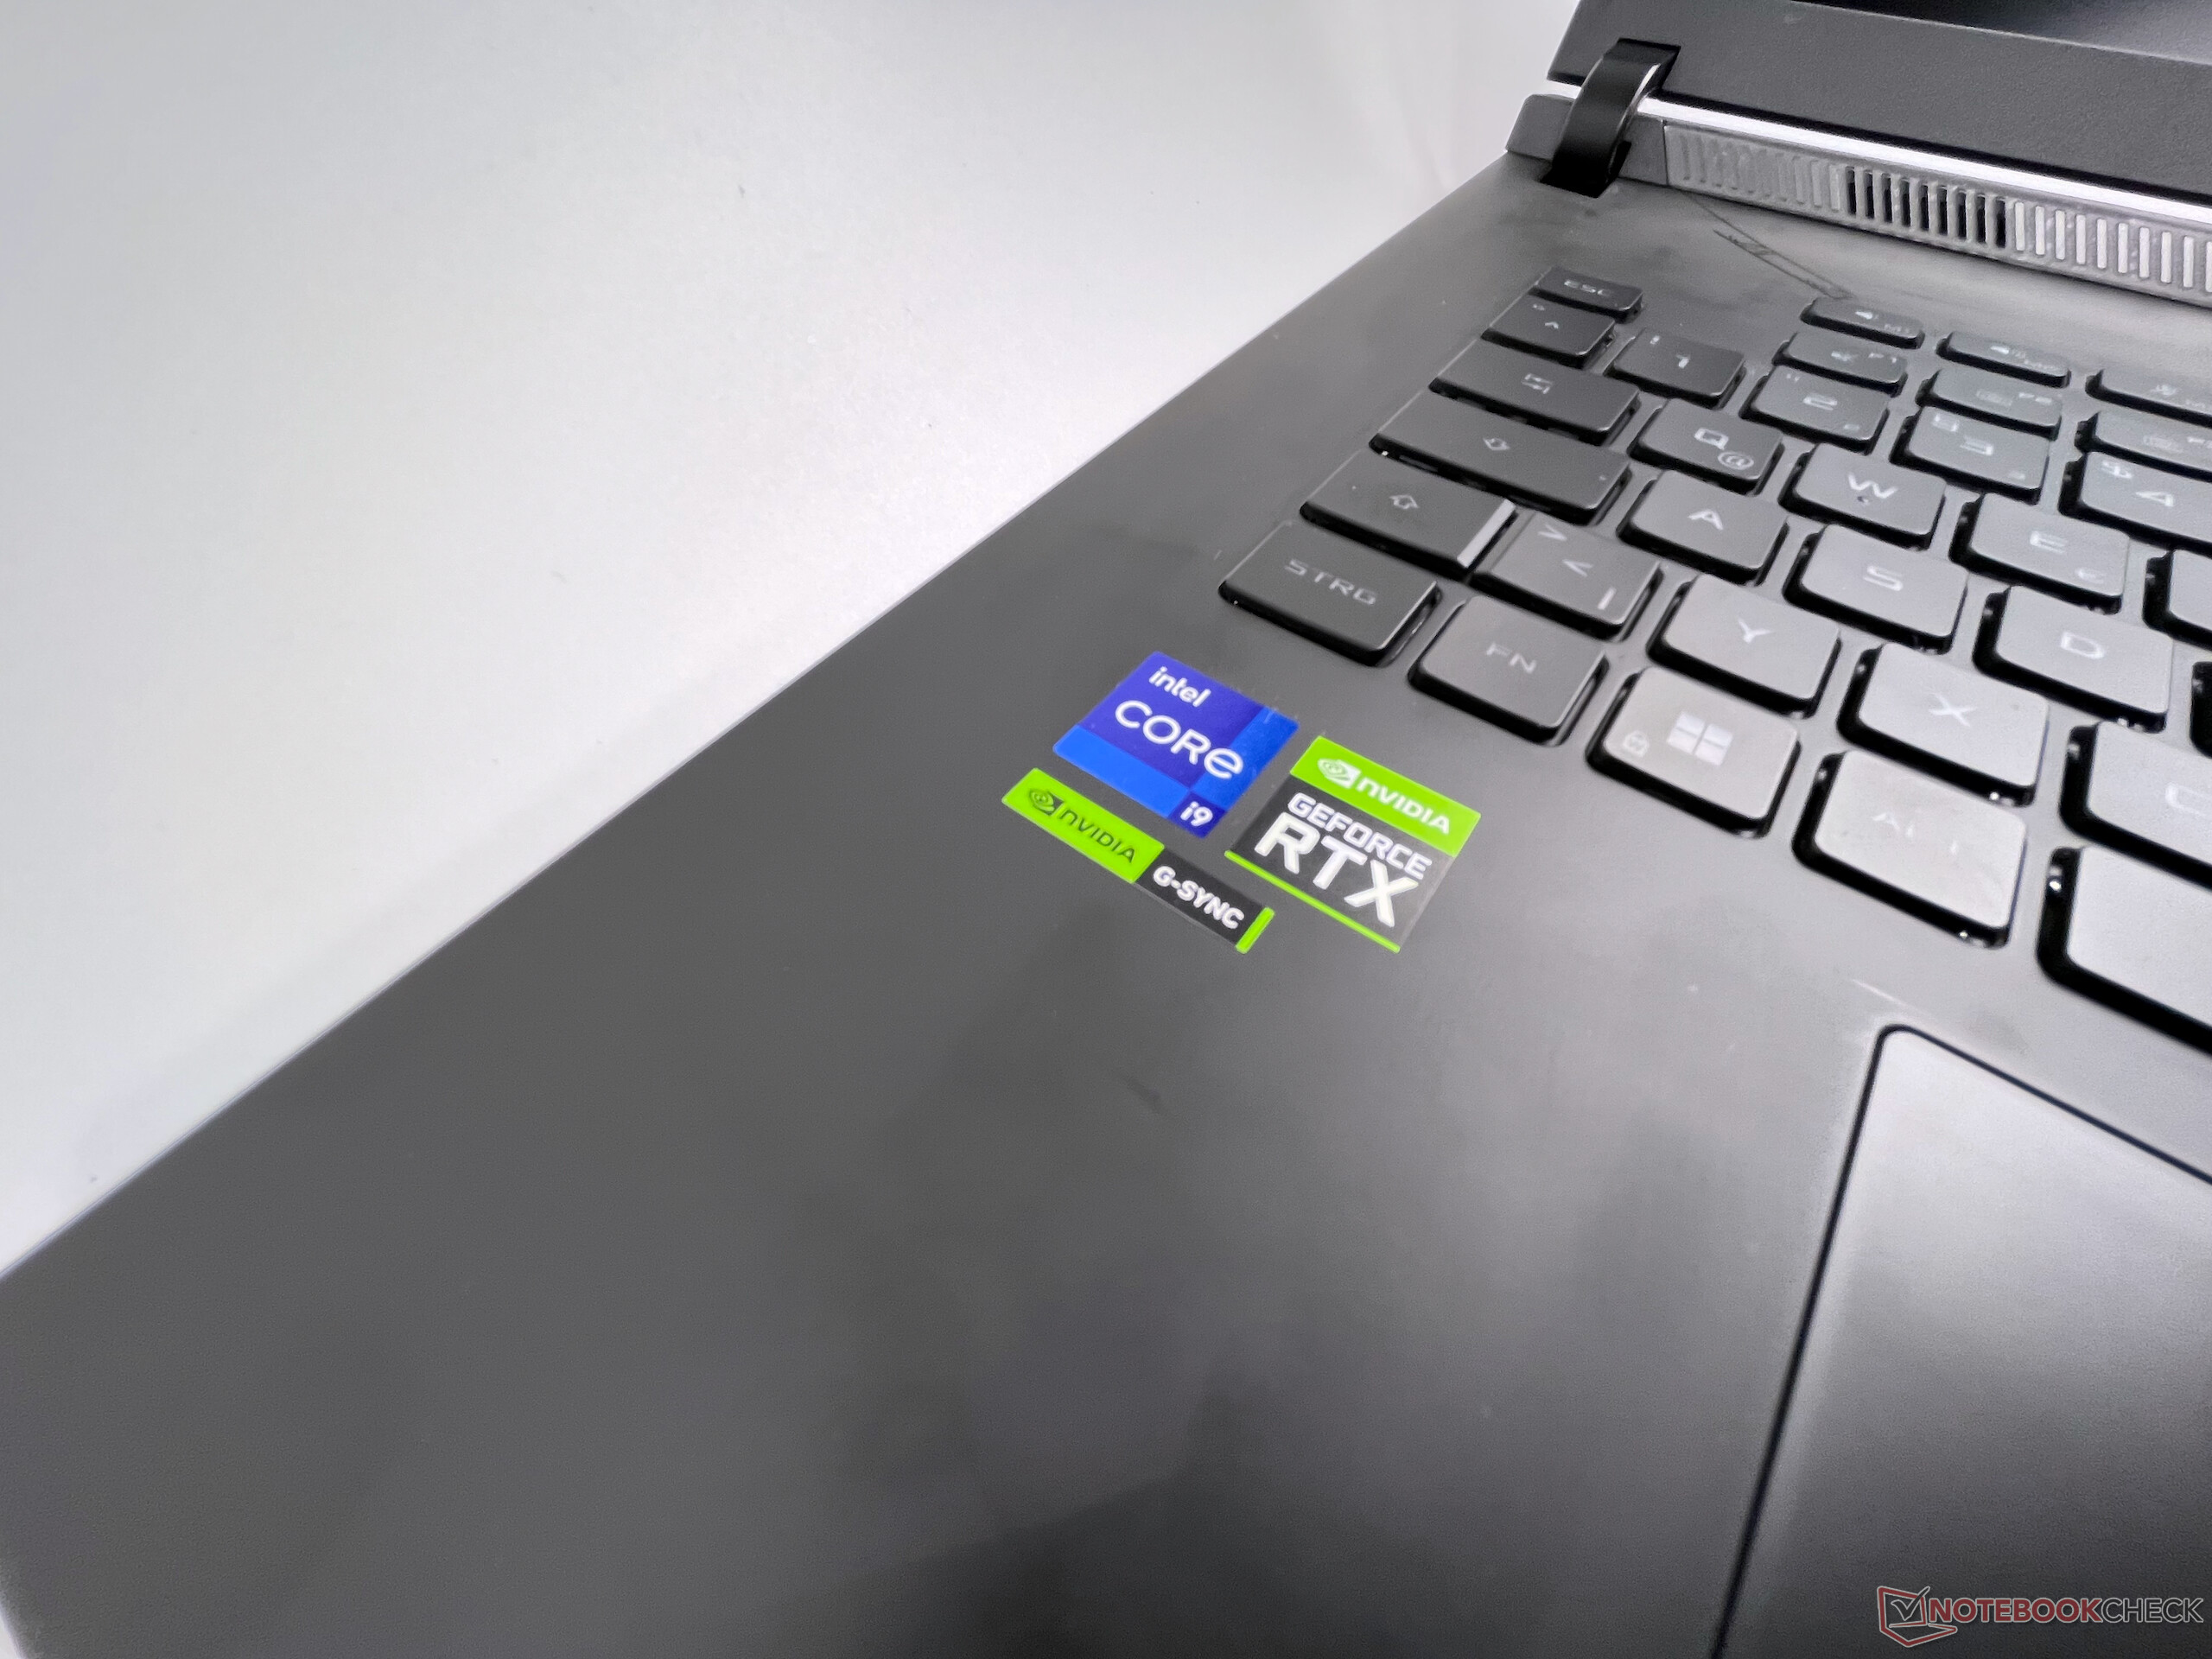
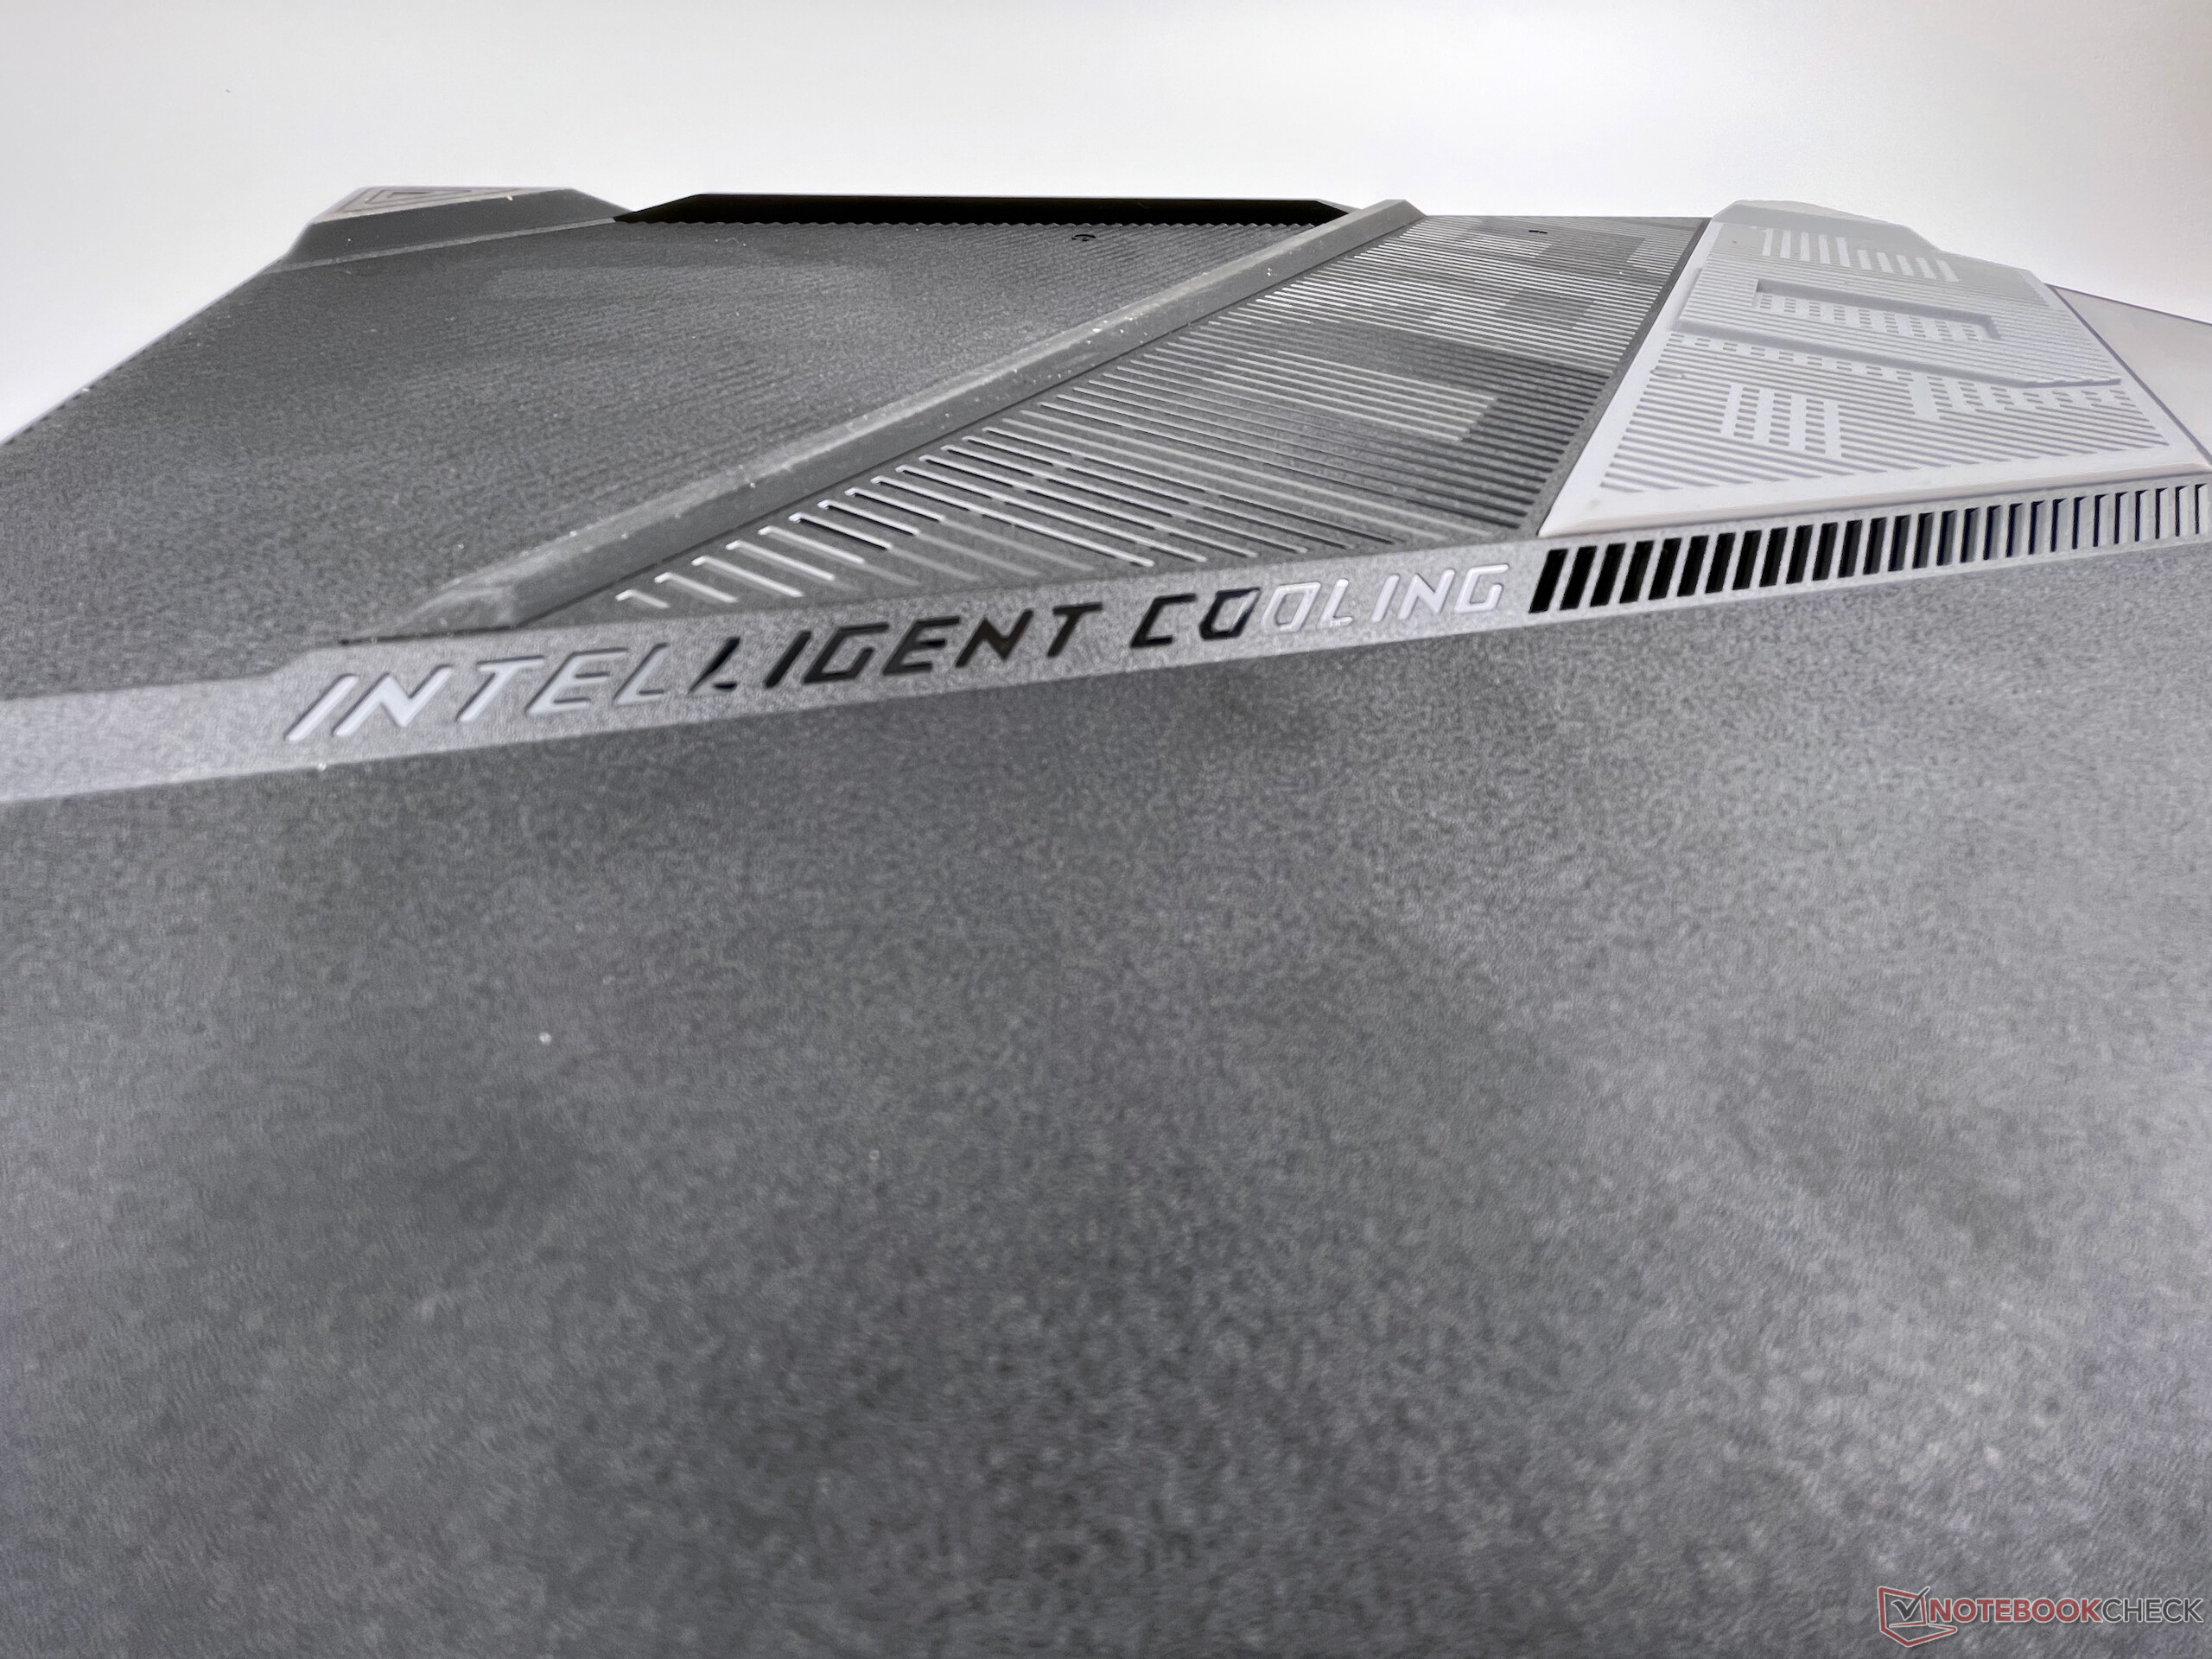
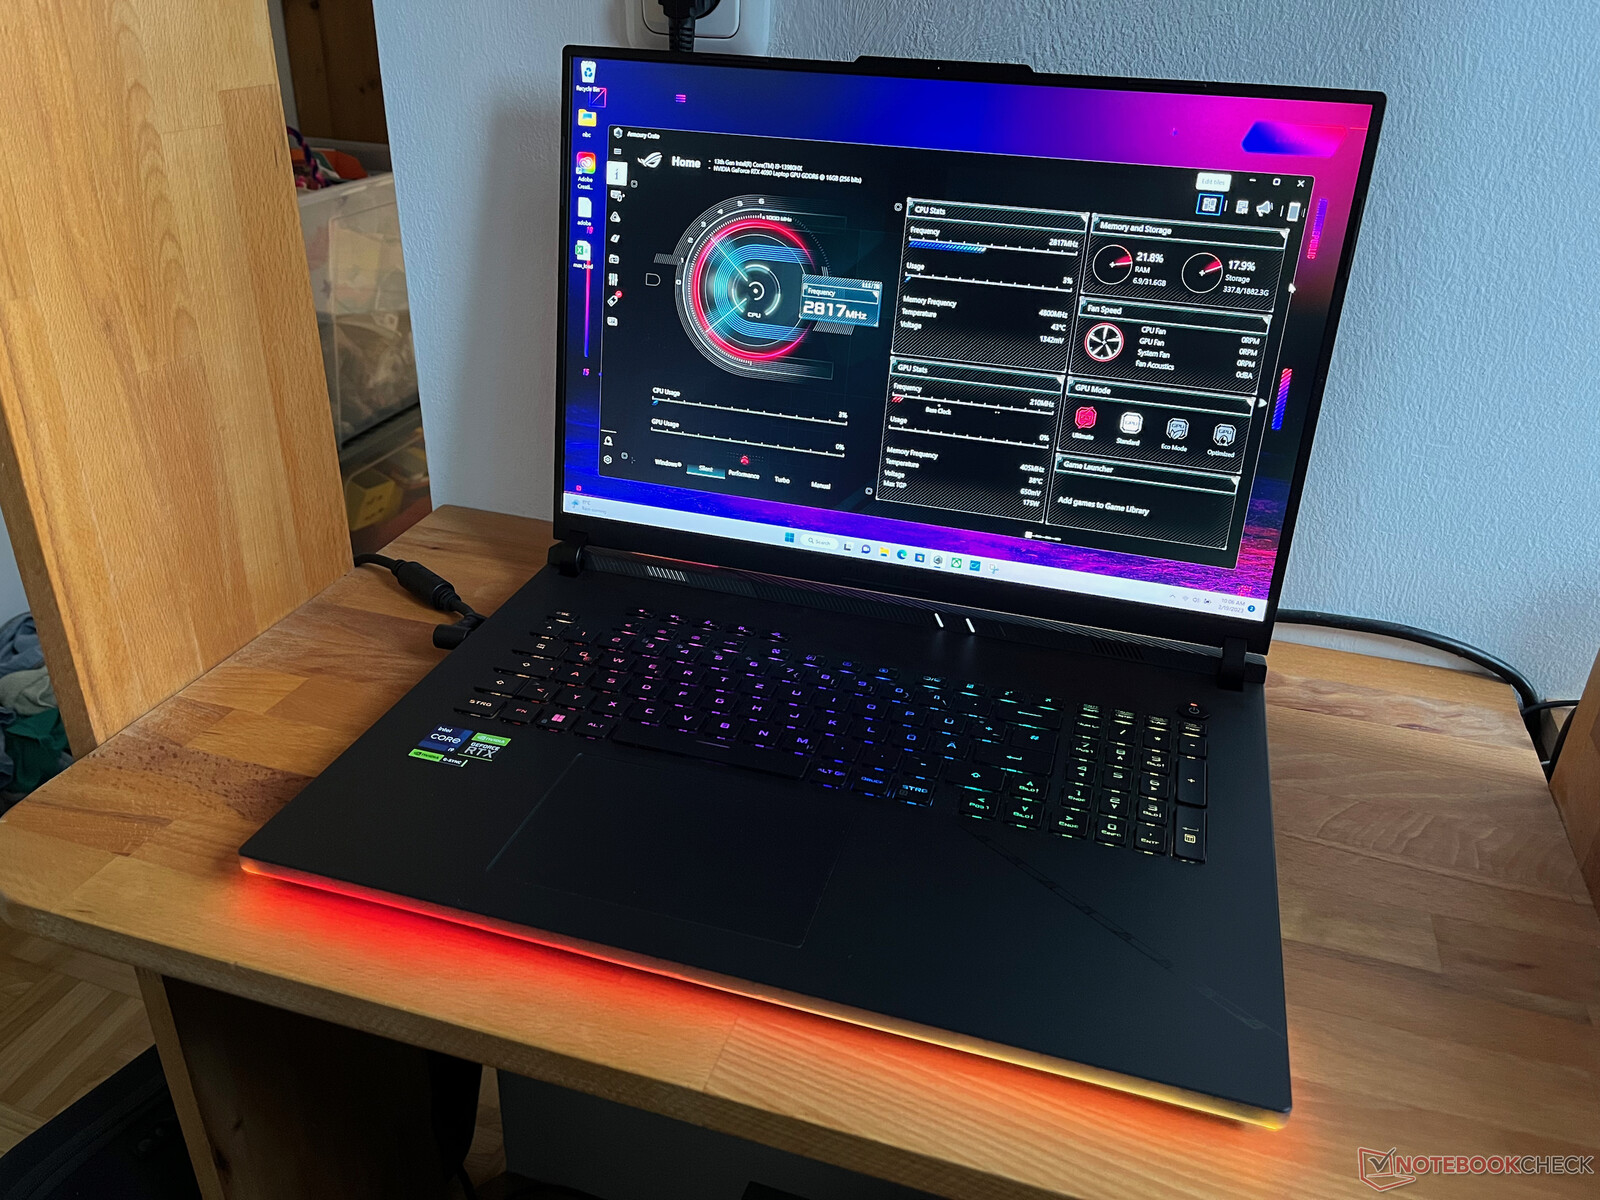
随着ROG Strix Scar 18的推出,华硕也加入了18英寸游戏怪物复兴的潮流。在发布会上,有一个新的情况下,与 RTX 4080和 RTX 4090笔记本GPU由我们的测试装置使用。在CPU方面,华硕使用新的HX系列,这意味着你得到了目前市场上最快的笔记本电脑组件。大机箱不仅被18英寸QHD+显示屏完全使用,而且还容纳了一个带有三个风扇的新冷却系统,这应该是为了控制耗电的组件。在下面的测试中,我们详细了解了目前在英国上市的配备RTX 4090、32GB GDDR5内存和2x 1-TB SSD的G834JY-N6005W。
潜在的竞争对手比较
Rating | Date | Model | Weight | Height | Size | Resolution | Price |
|---|---|---|---|---|---|---|---|
| 86.6 % v7 (old) | 02 / 2023 | Asus ROG Strix Scar 18 2023 G834JY-N6005W i9-13980HX, GeForce RTX 4090 Laptop GPU | 3.1 kg | 30.8 mm | 18.00" | 2560x1600 | |
| 89 % v7 (old) | 02 / 2023 | MSI Titan GT77 HX 13VI i9-13950HX, GeForce RTX 4090 Laptop GPU | 3.5 kg | 23 mm | 17.30" | 3840x2160 | |
| 89.4 % v7 (old) | 02 / 2023 | Lenovo Legion Pro 7 16IRX8H i9-13900HX, GeForce RTX 4080 Laptop GPU | 2.7 kg | 26 mm | 16.00" | 2560x1600 | |
| 91.2 % v7 (old) | 02 / 2023 | Razer Blade 16 Early 2023 i9-13950HX, GeForce RTX 4080 Laptop GPU | 2.4 kg | 21.99 mm | 16.00" | 2560x1600 | |
| 86.9 % v7 (old) | 11 / 2022 | Asus ROG Strix Scar 17 SE G733CX-LL014W i9-12950HX, GeForce RTX 3080 Ti Laptop GPU | 2.9 kg | 28.3 mm | 17.30" | 2560x1440 | |
| 88.3 % v7 (old) | 08 / 2022 | MSI Titan GT77 12UHS i9-12900HX, GeForce RTX 3080 Ti Laptop GPU | 3.3 kg | 23 mm | 17.30" | 1920x1080 | |
| 85.4 % v7 (old) | 03 / 2023 | HP Omen 17-ck2097ng i9-13900HX, GeForce RTX 4080 Laptop GPU | 2.8 kg | 27 mm | 17.30" | 2560x1440 |
案例
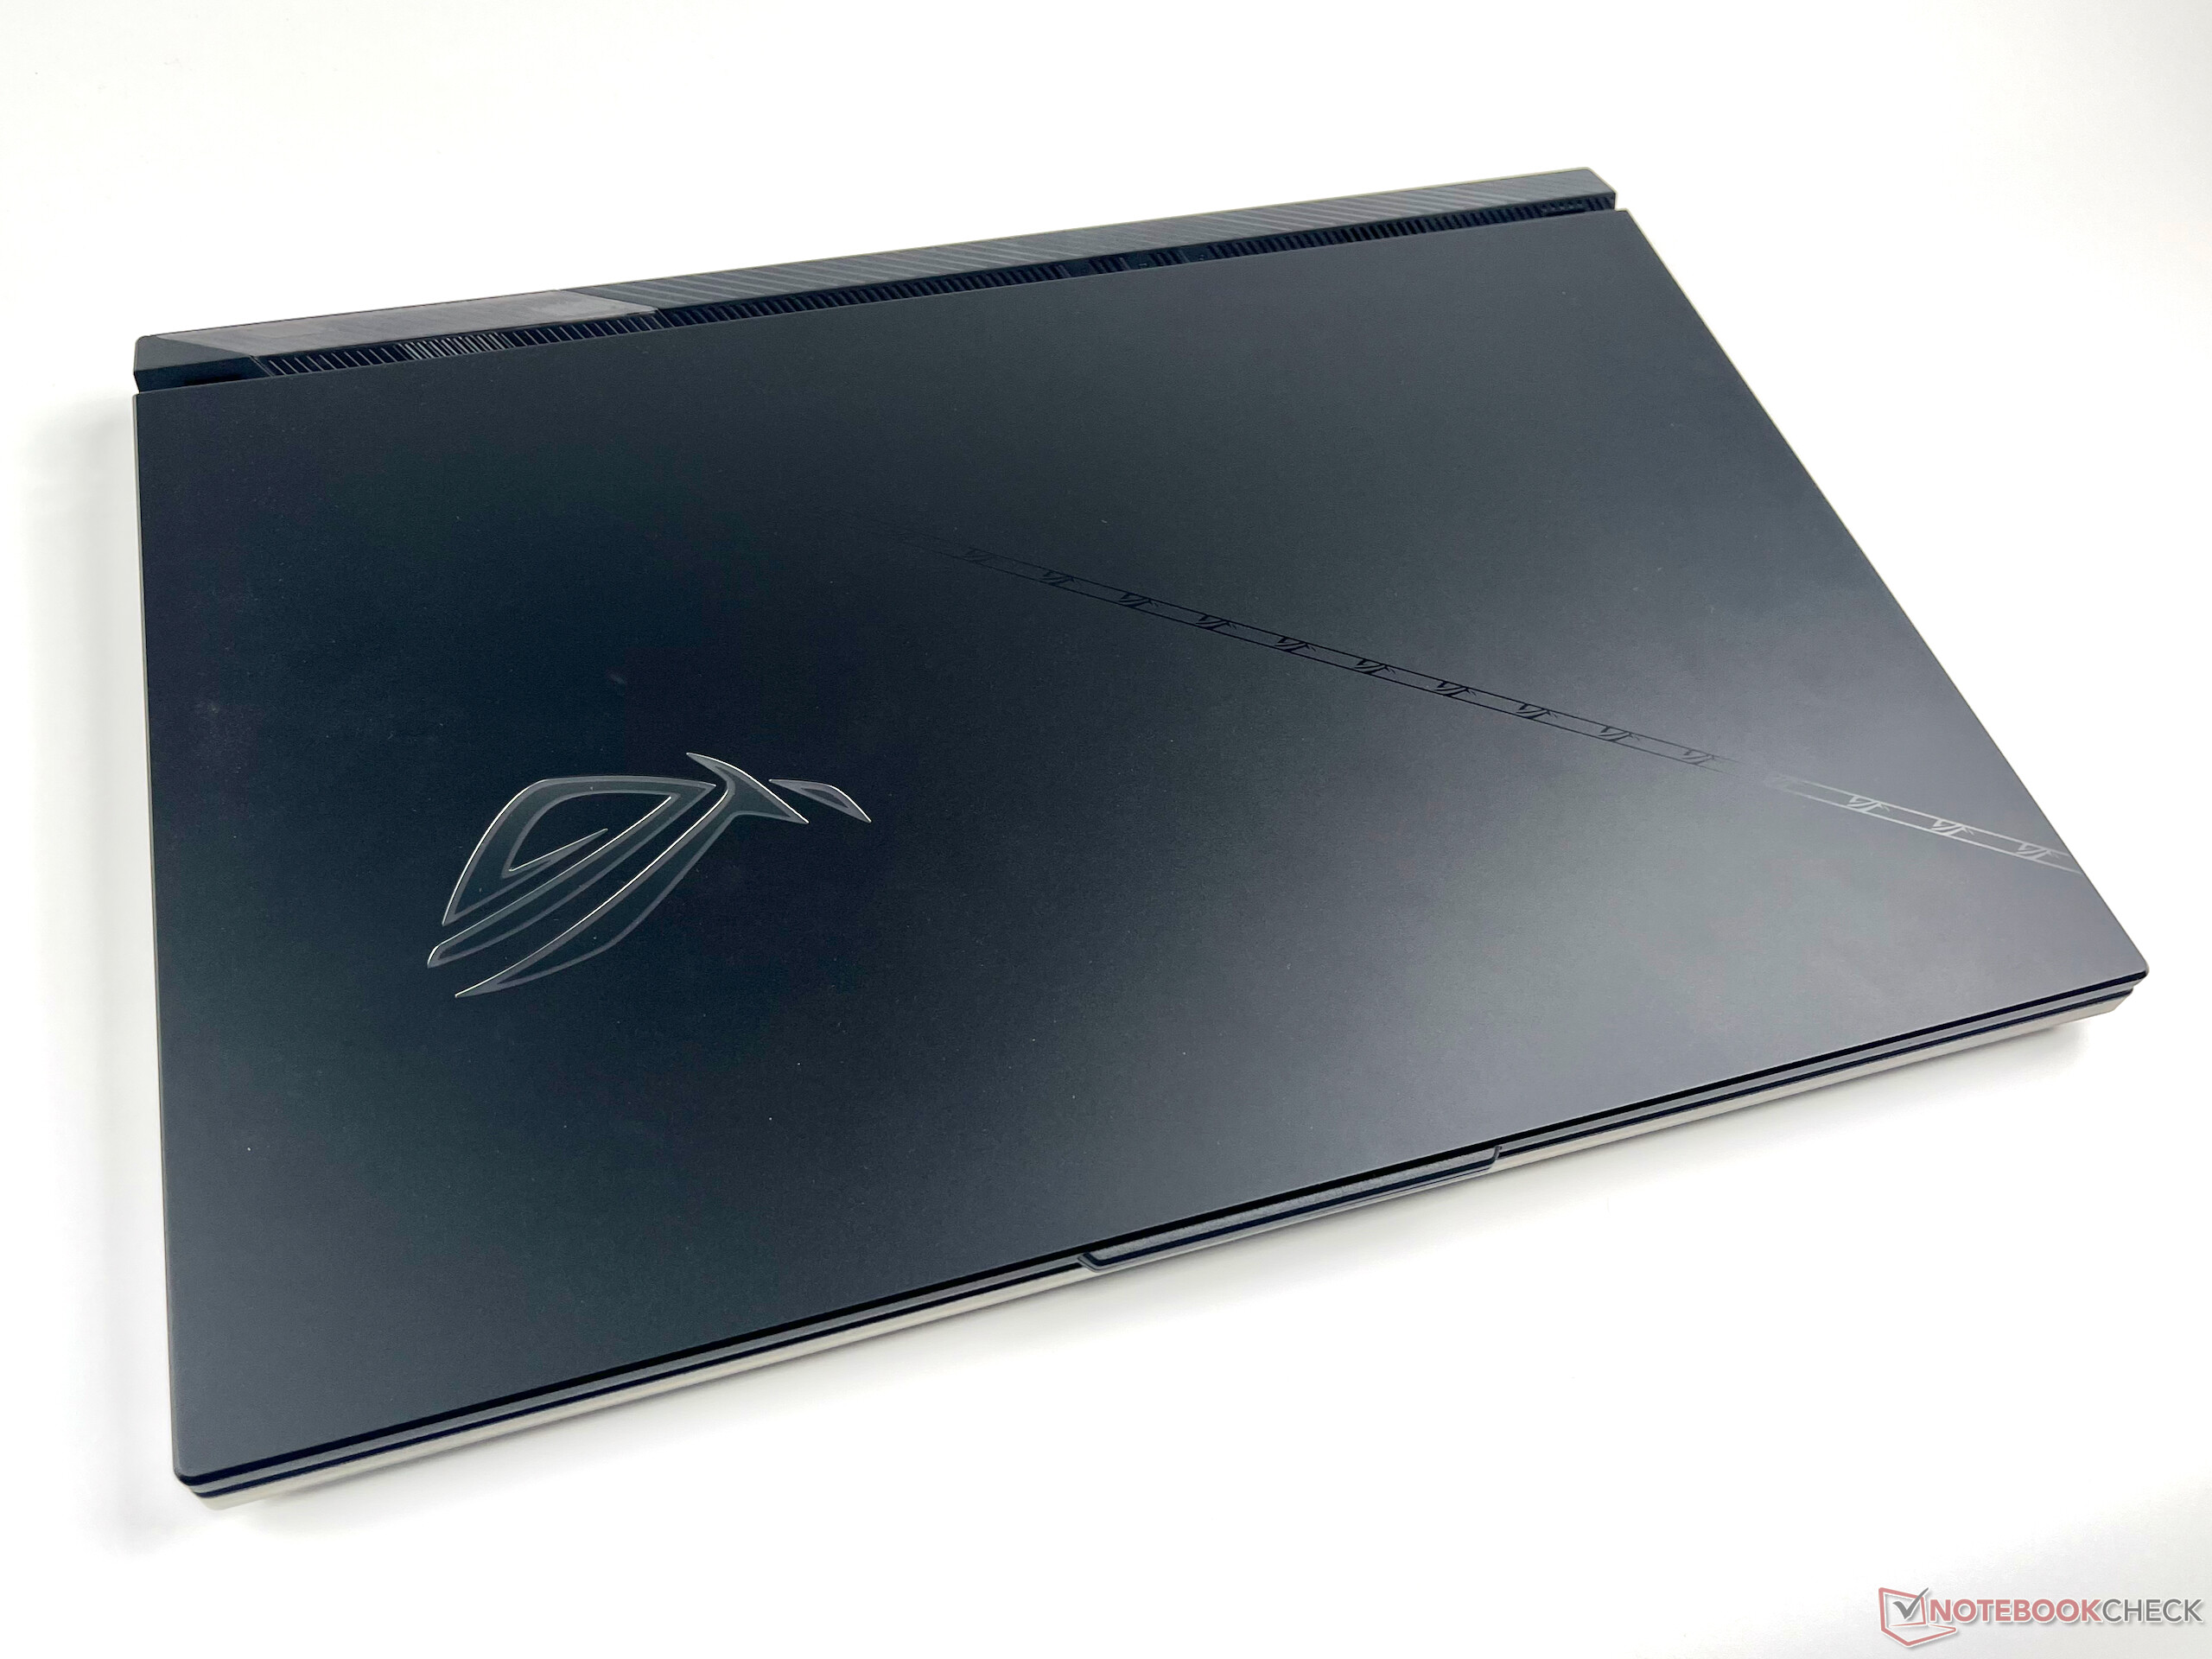
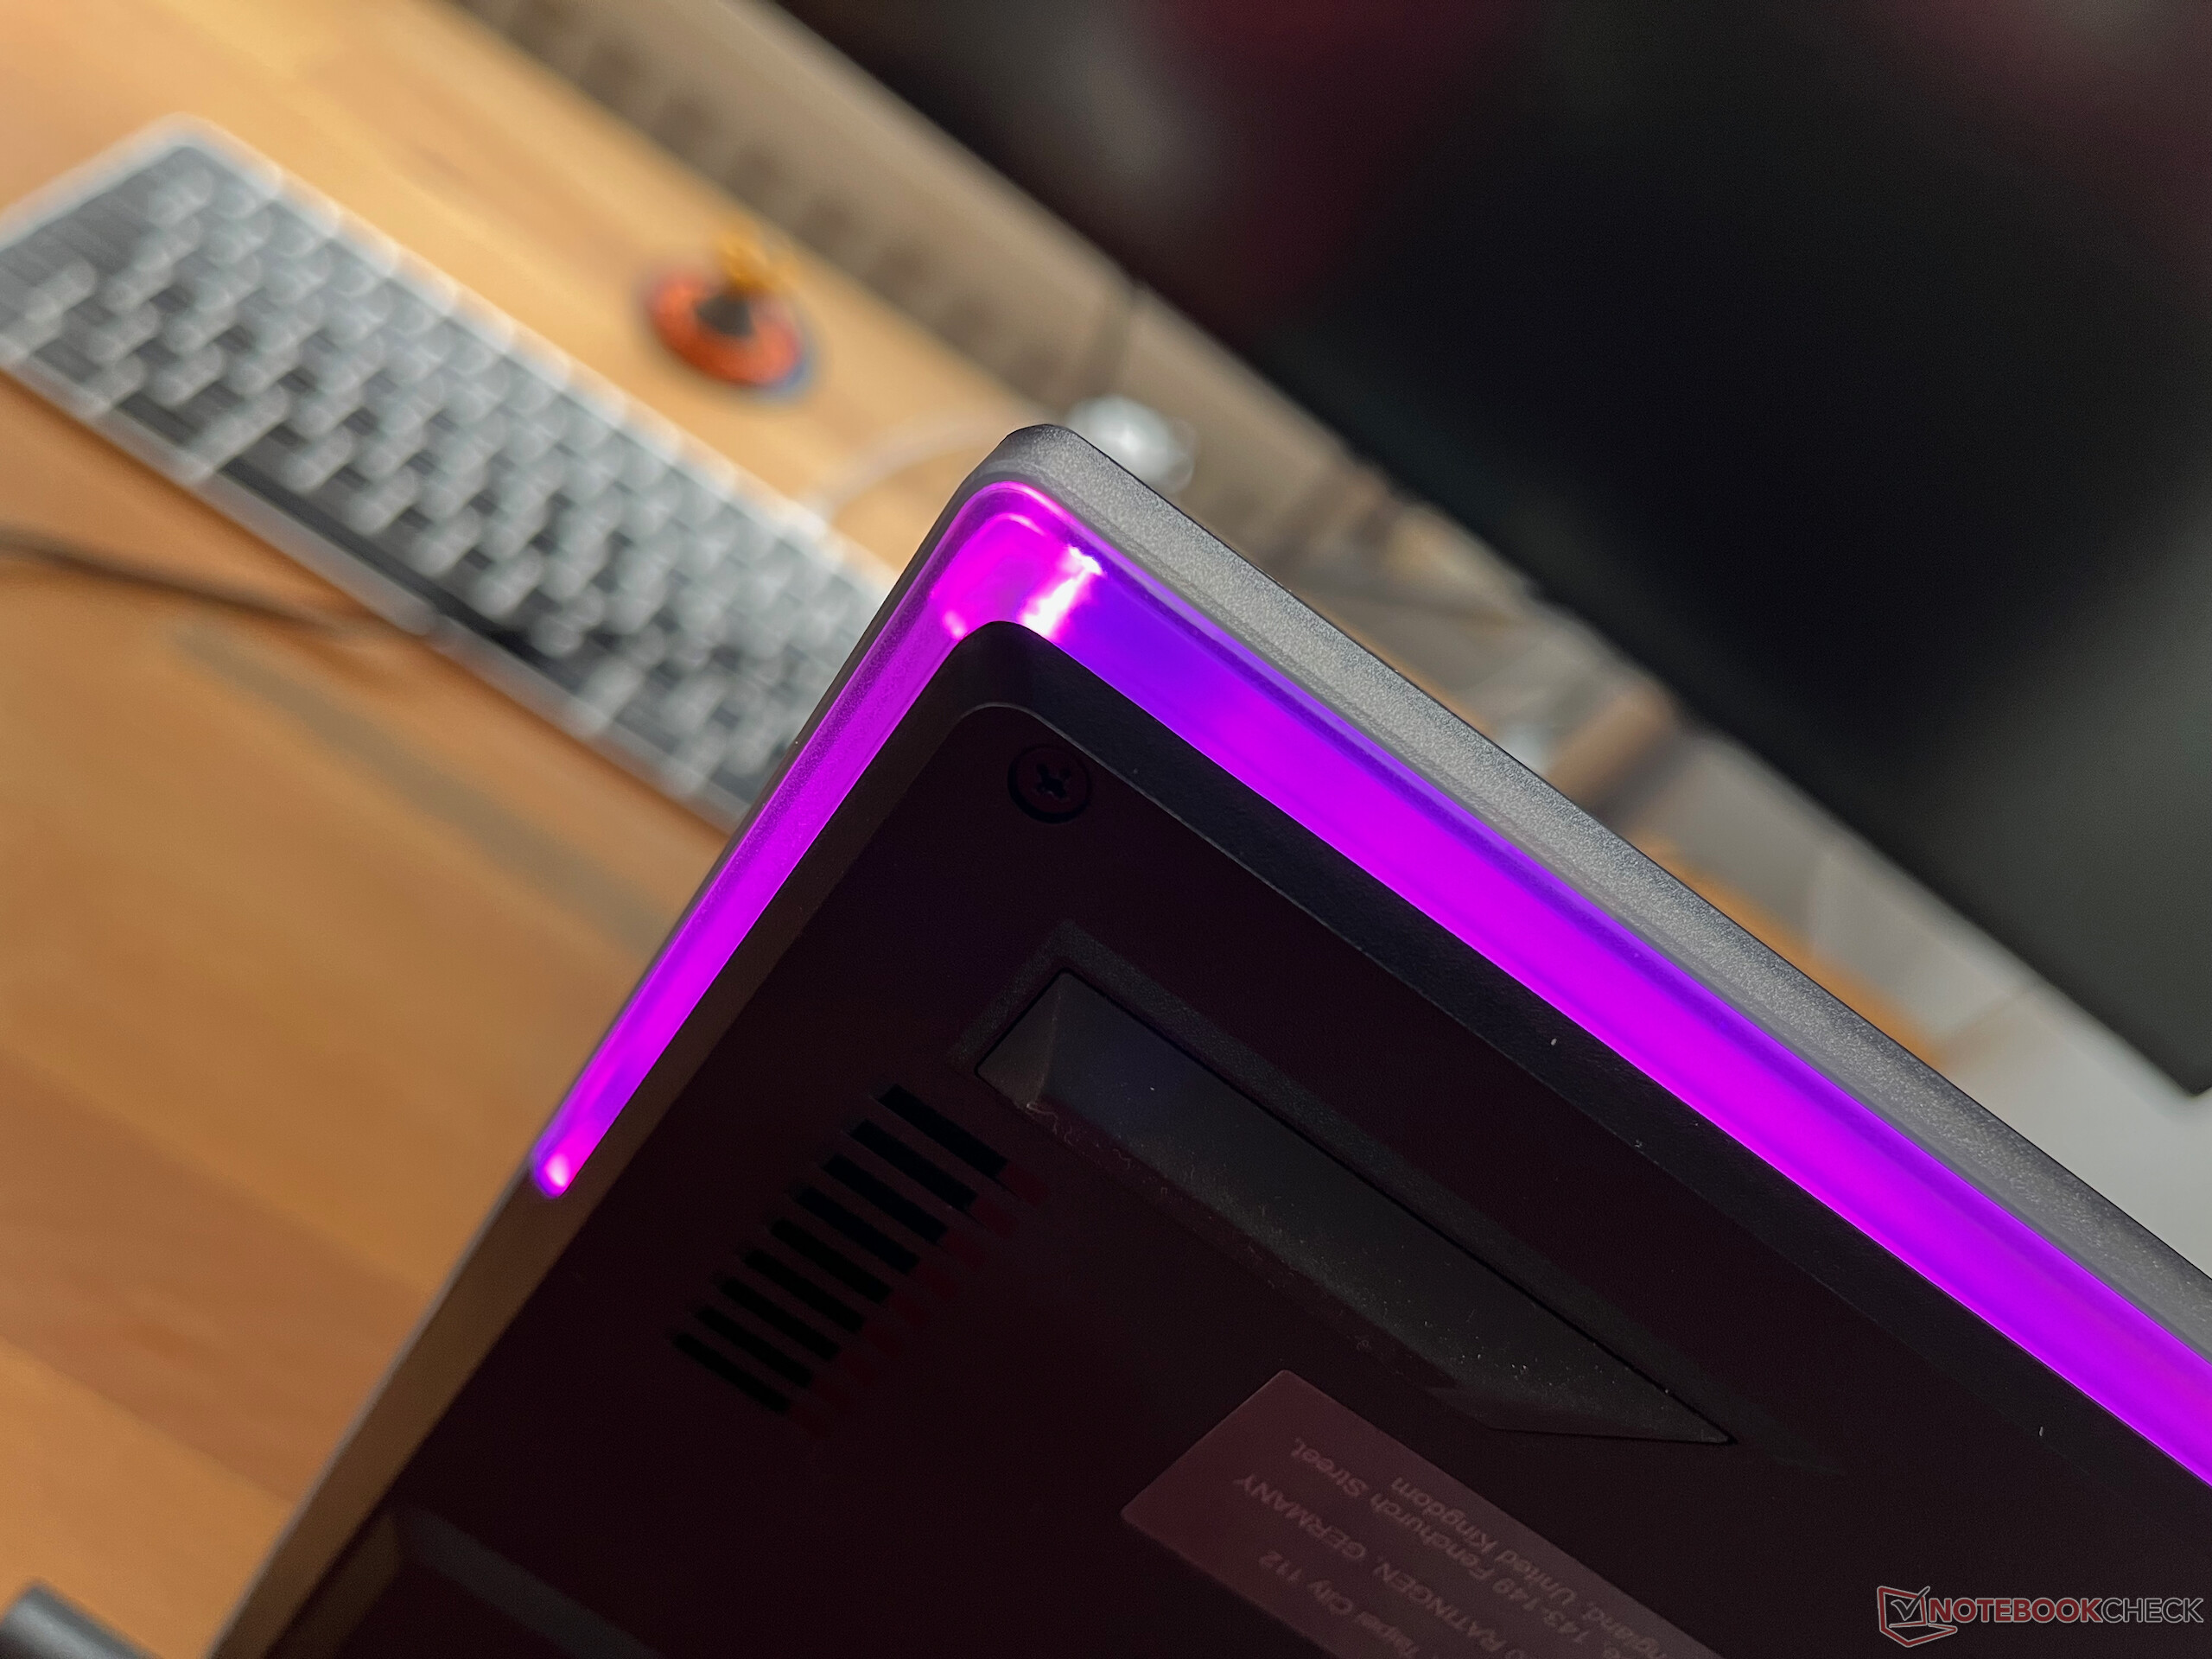
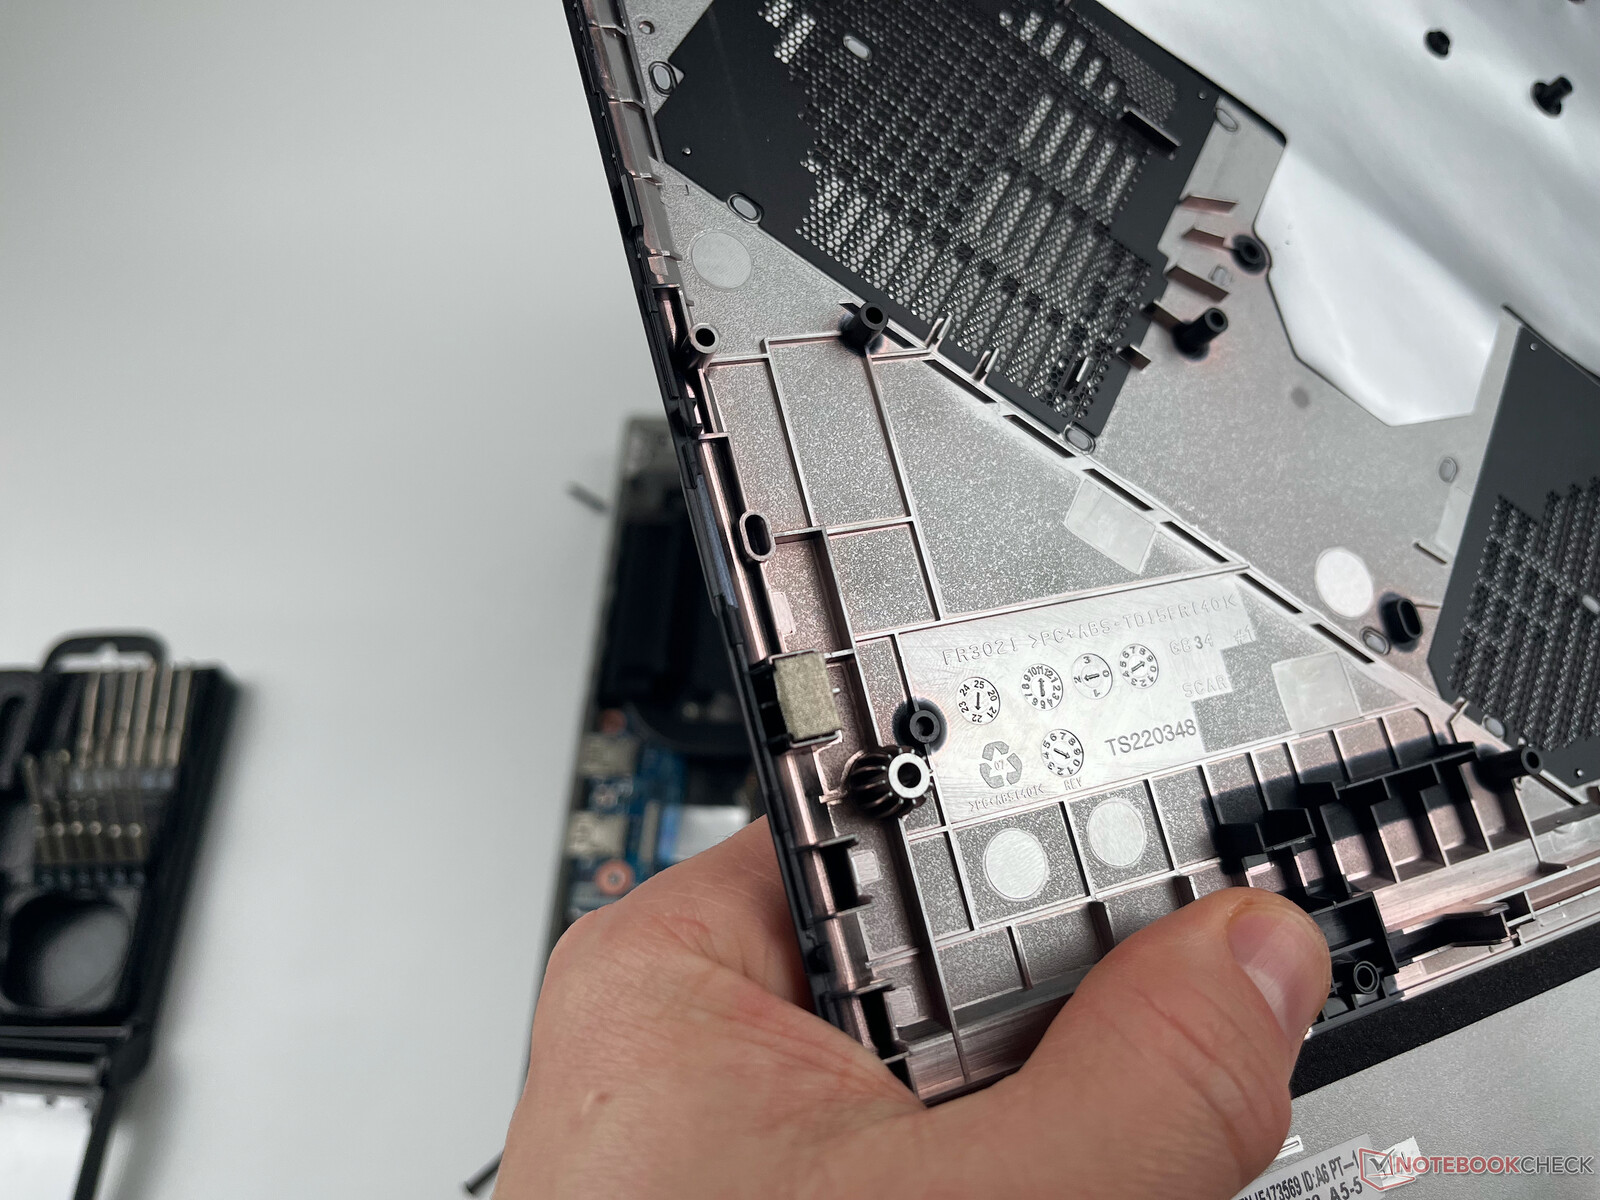
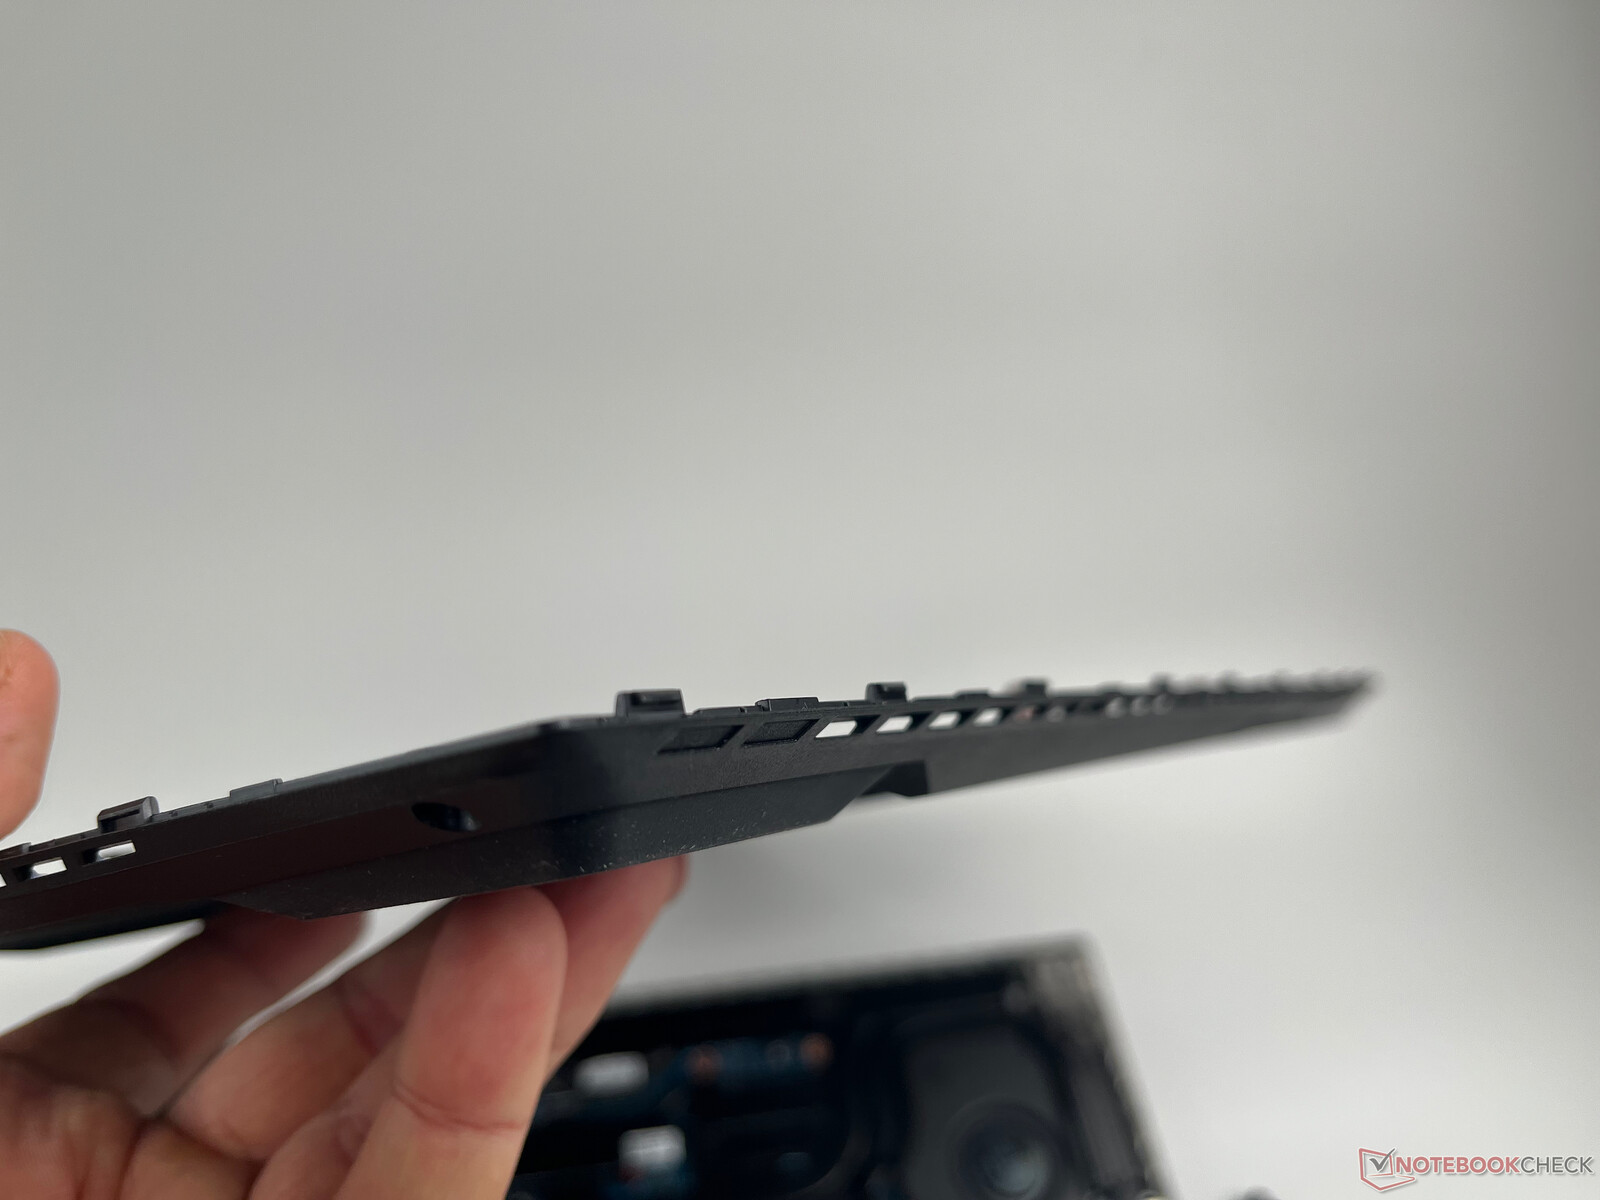
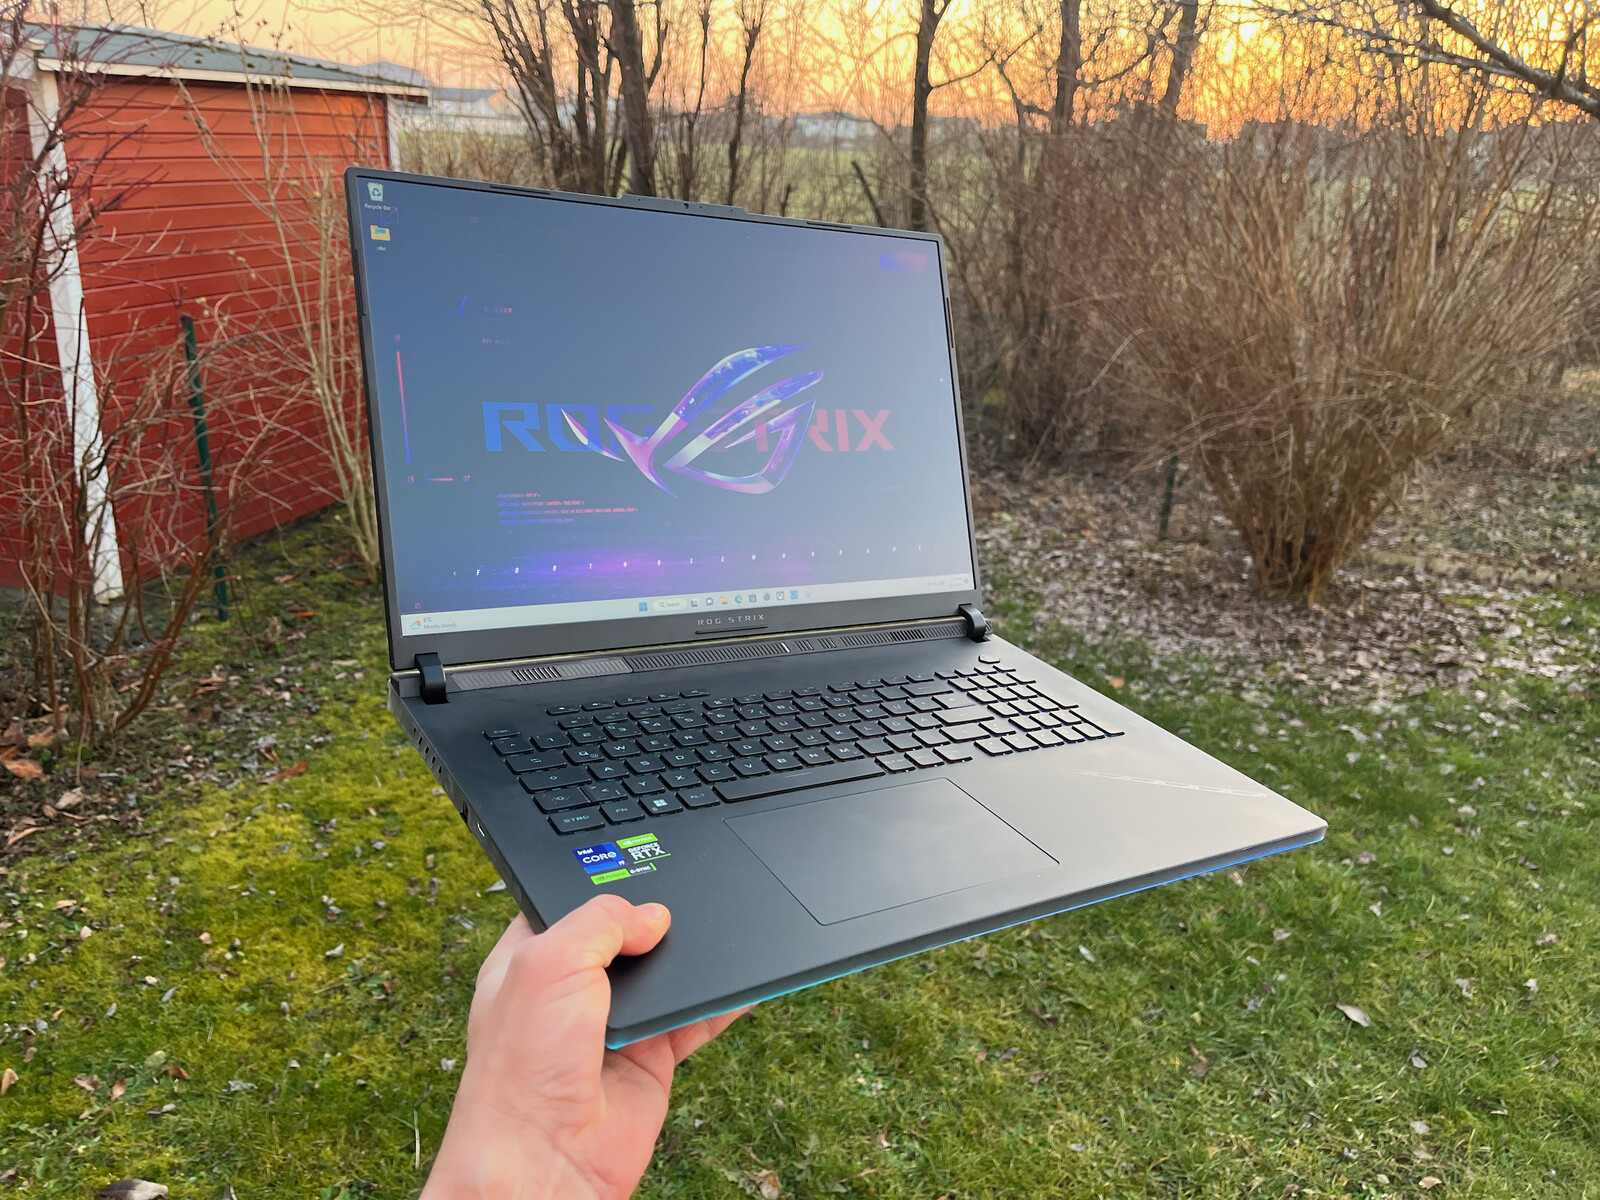
这款机箱应该是通过大量使用RGB LED和透明的机箱元素来实现的。同时,基本设计相对谨慎,相当有吸引力。只有侧面的透明表面看起来有点廉价。底座单元本身是由塑料制成的,并没有给人以高质量的感觉。当把它抬起来的时候,它也会稍微翘起来。另一方面,铝制显示屏盖子明显更稳定,也给显示屏提供了足够的保护。
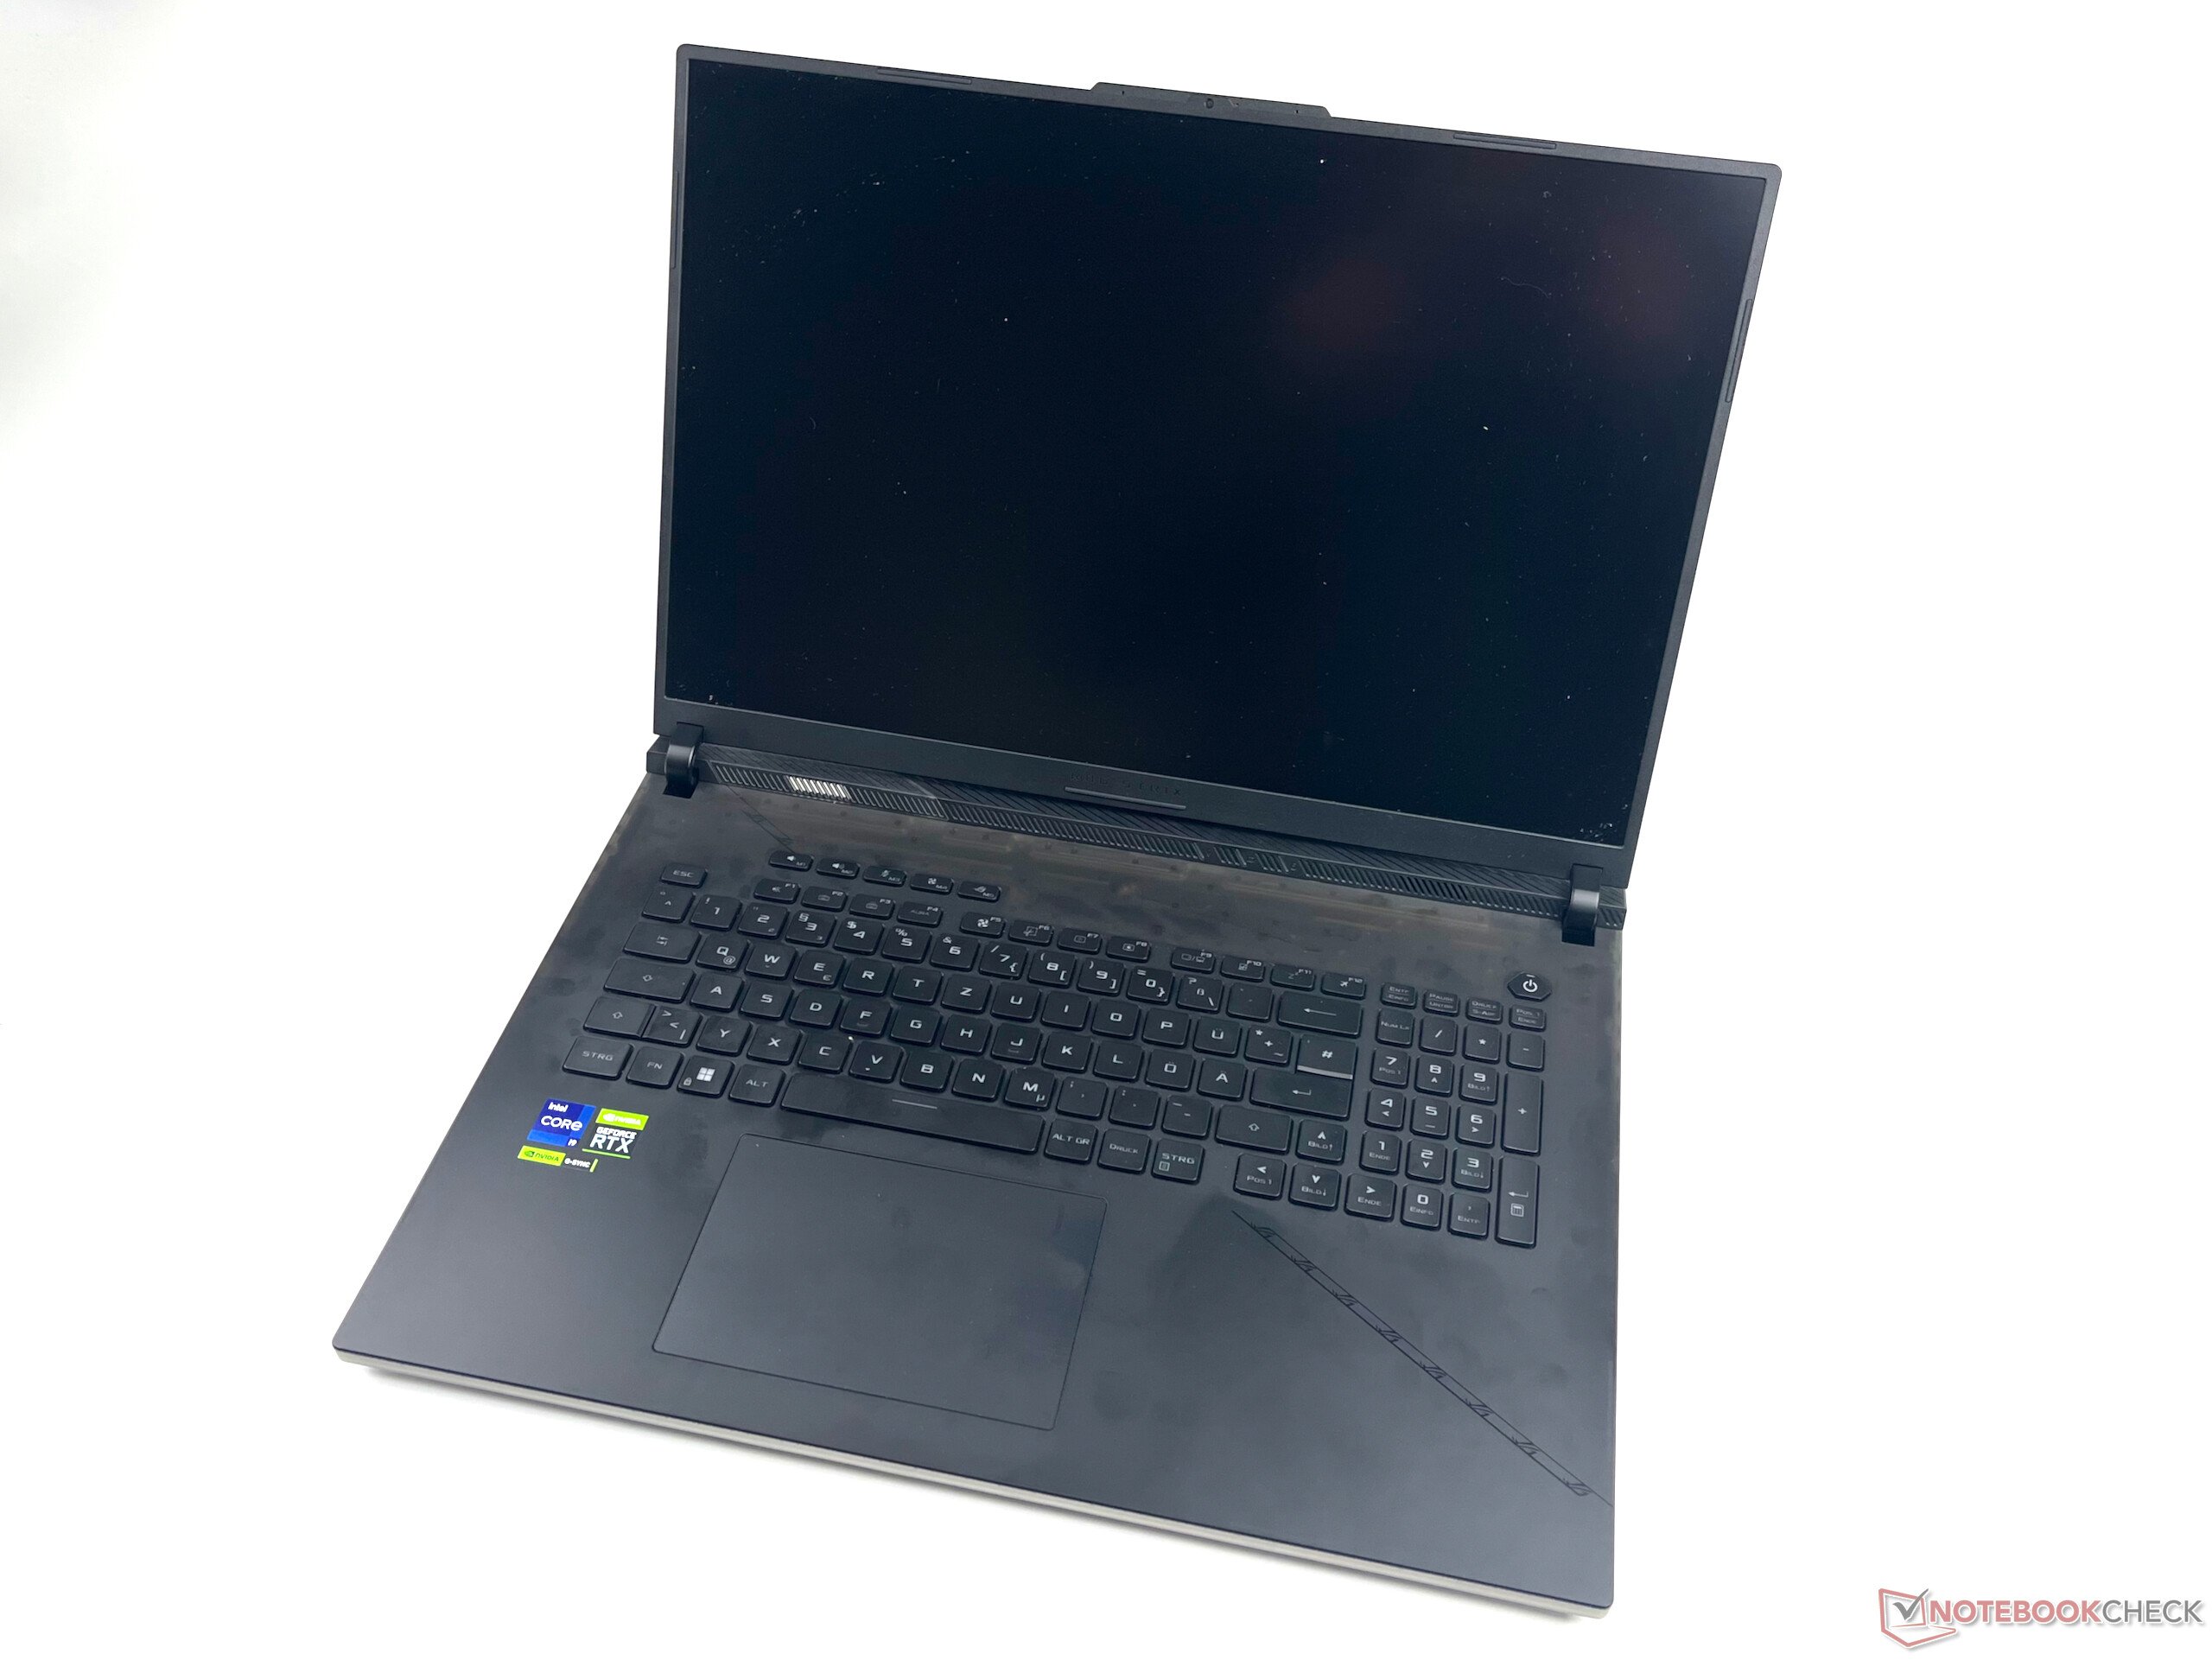

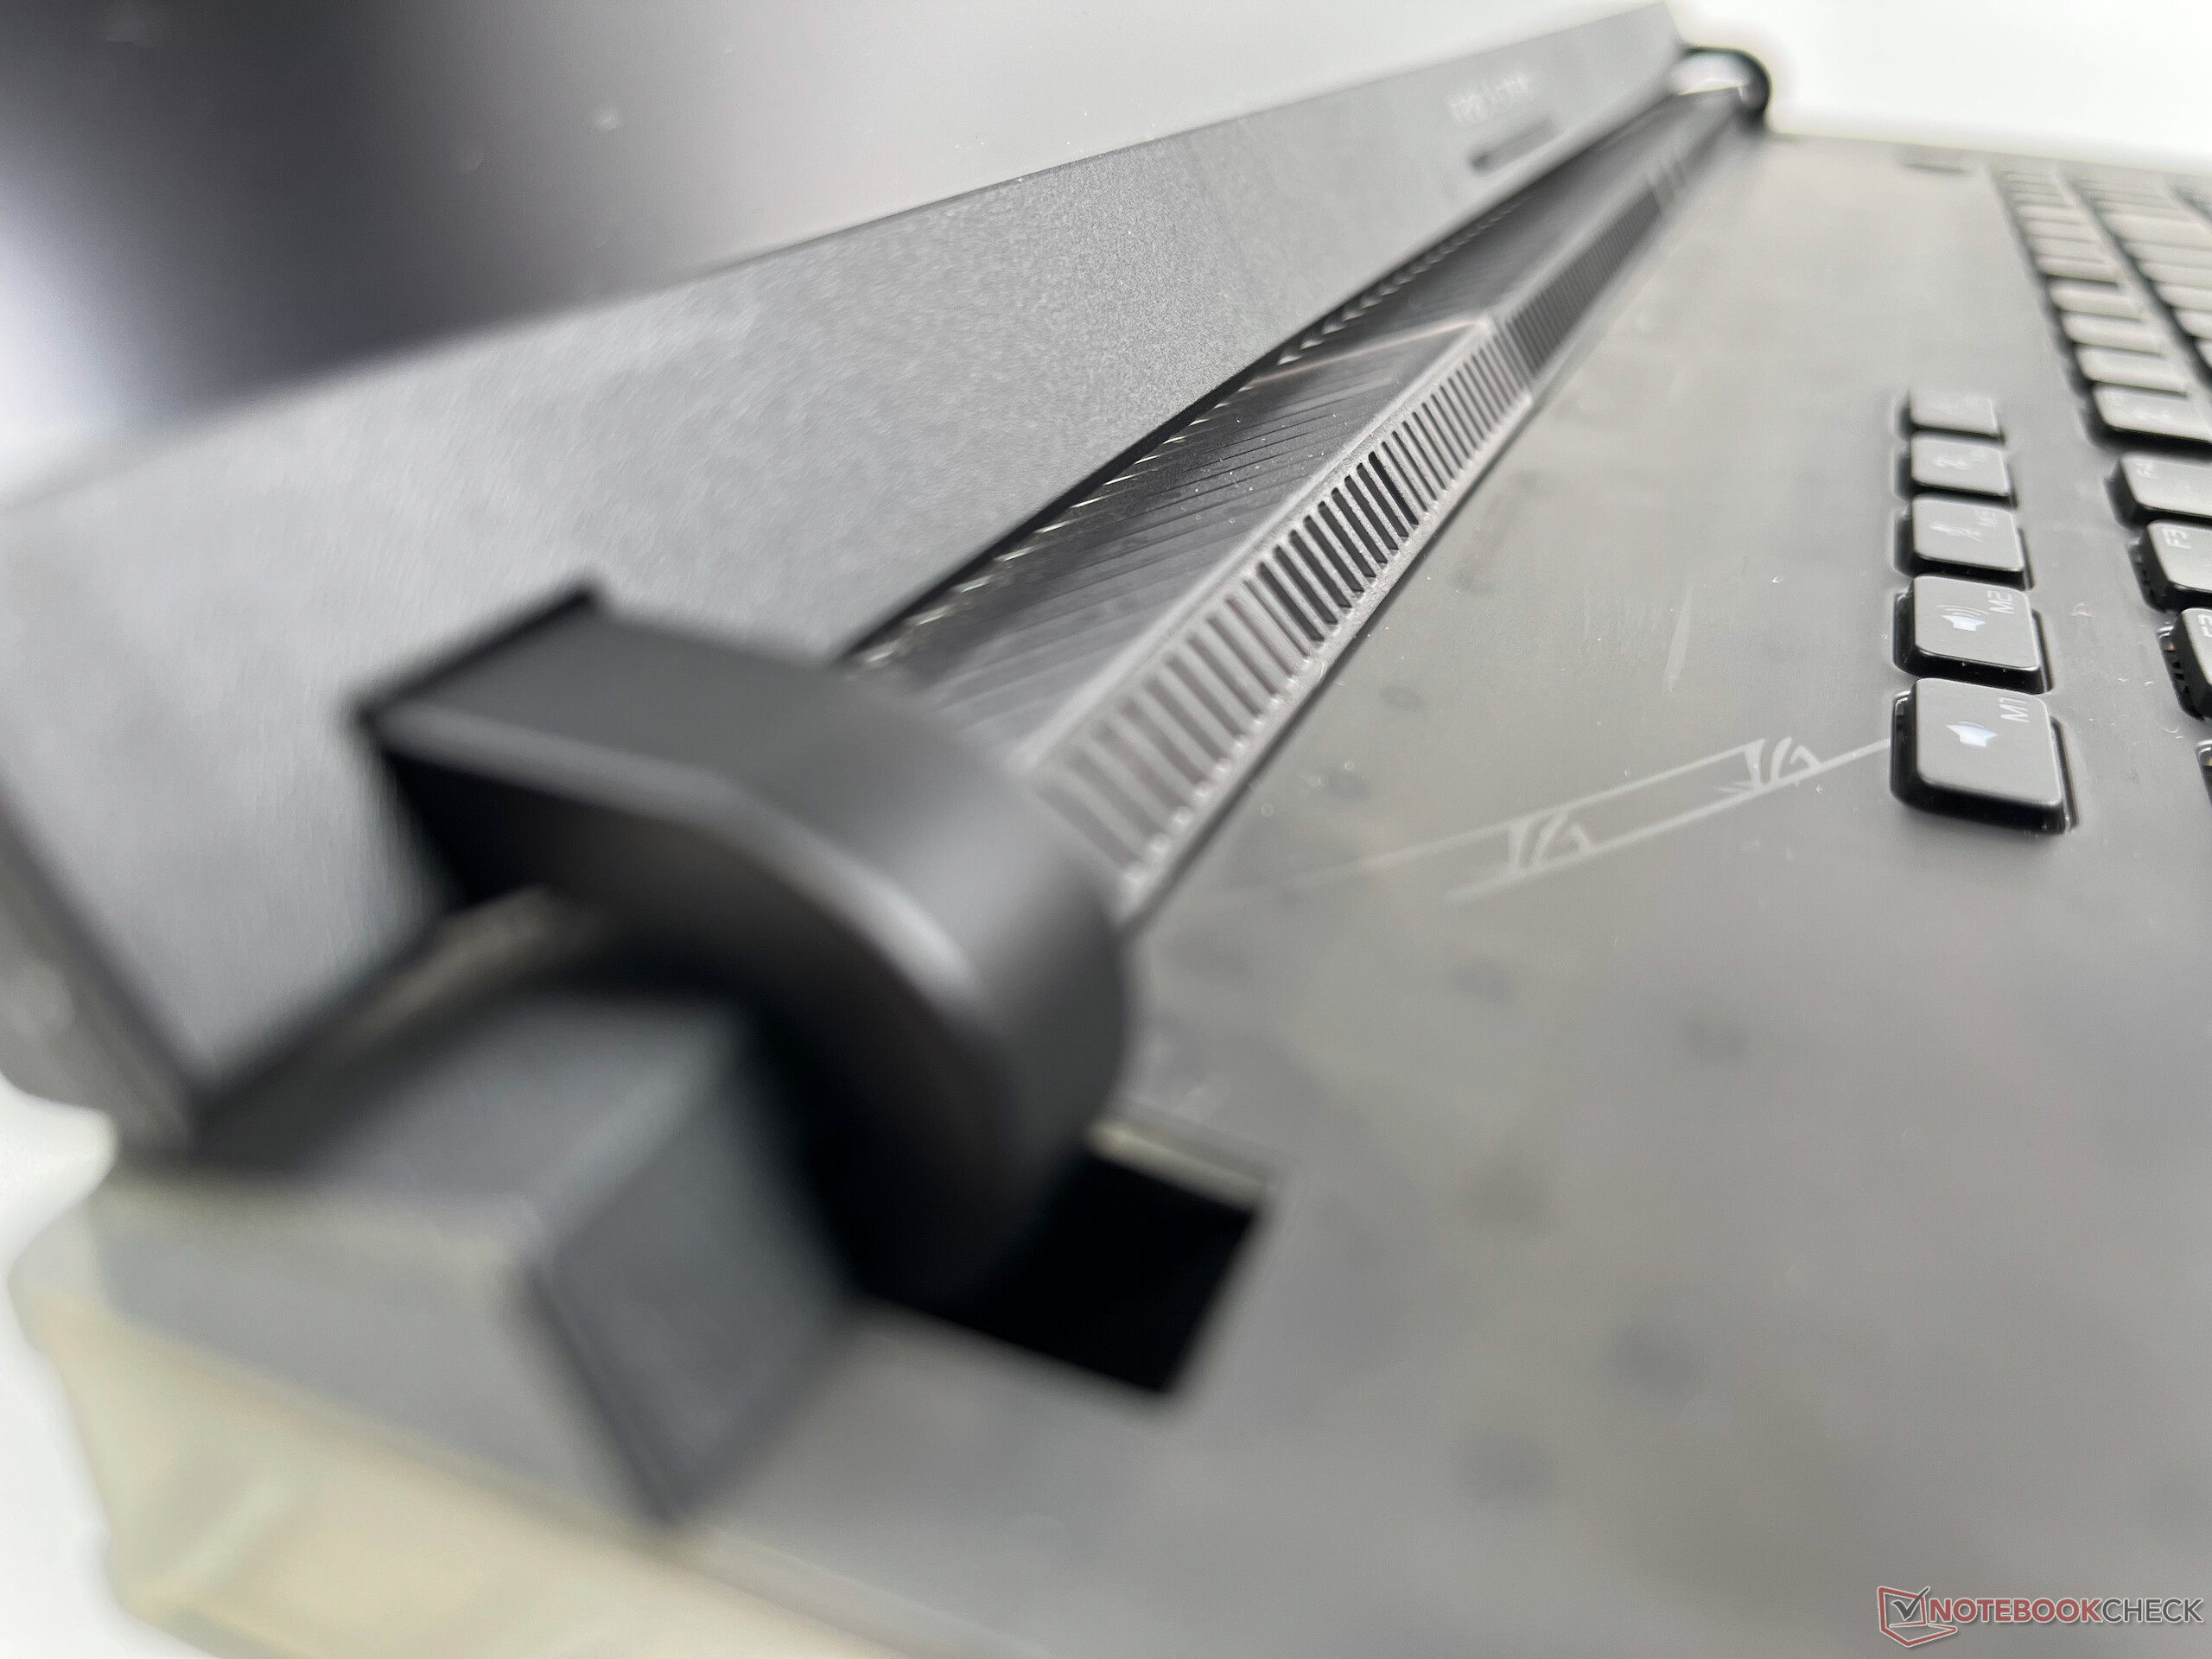
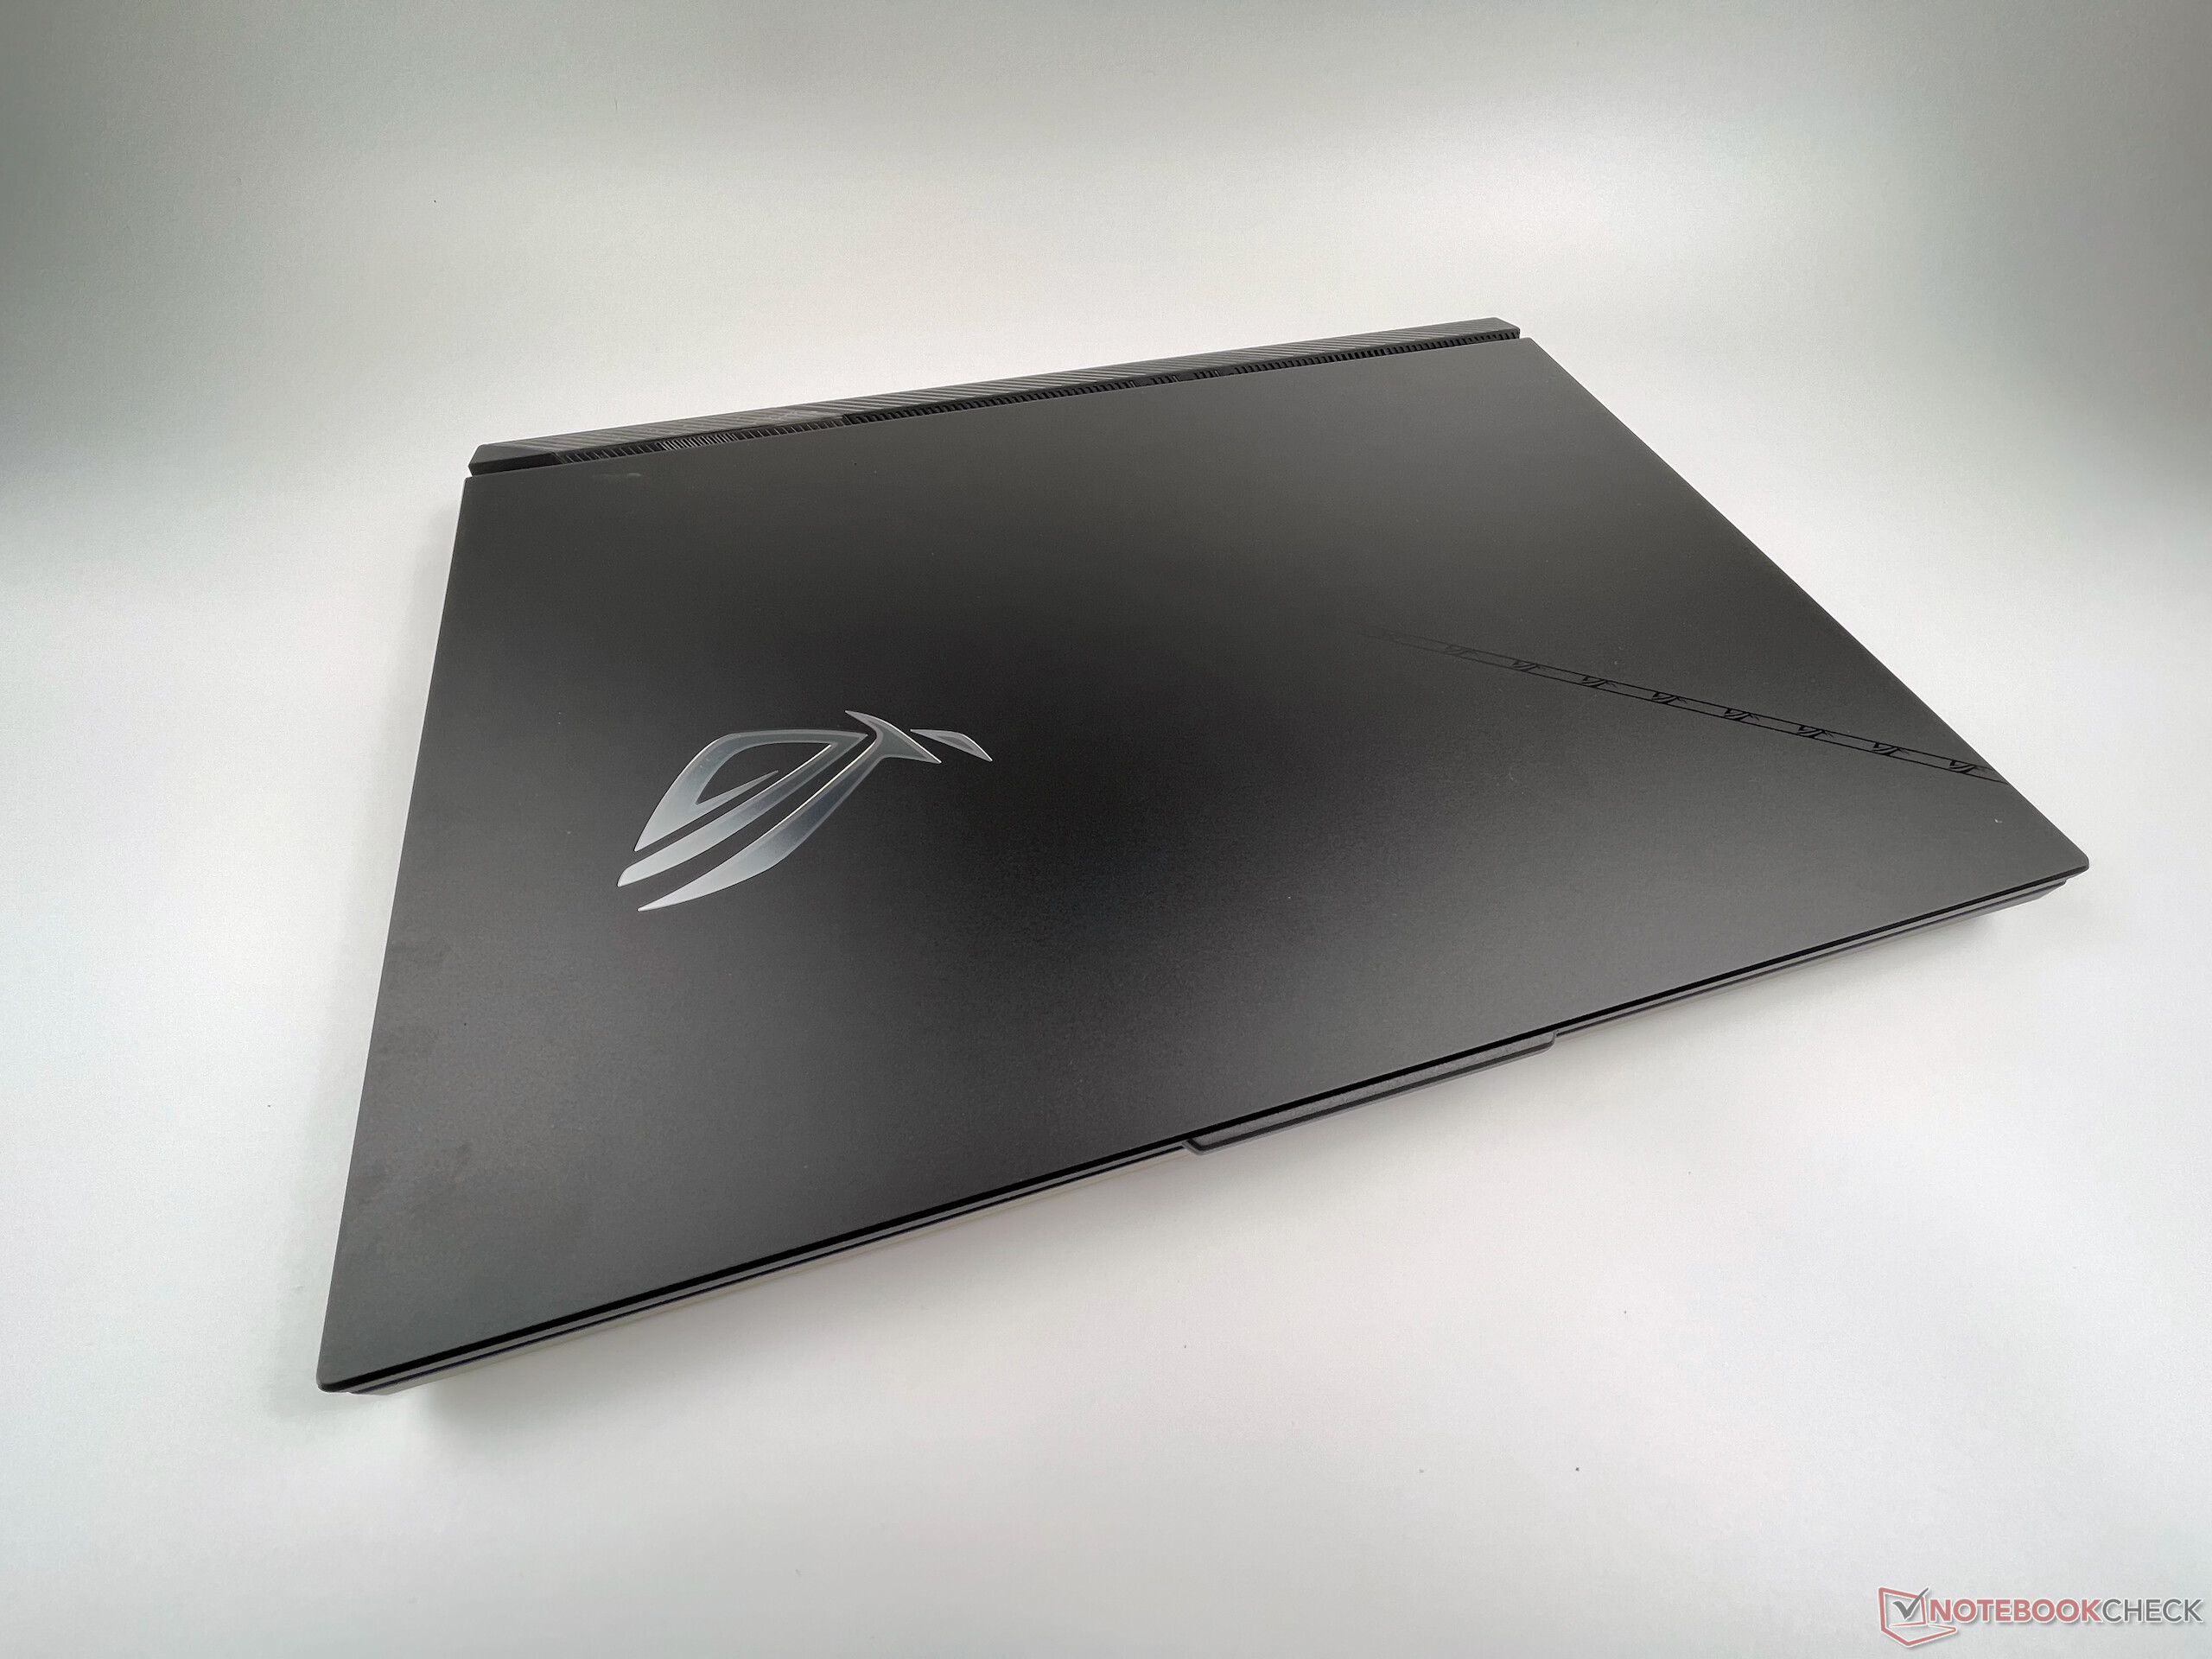
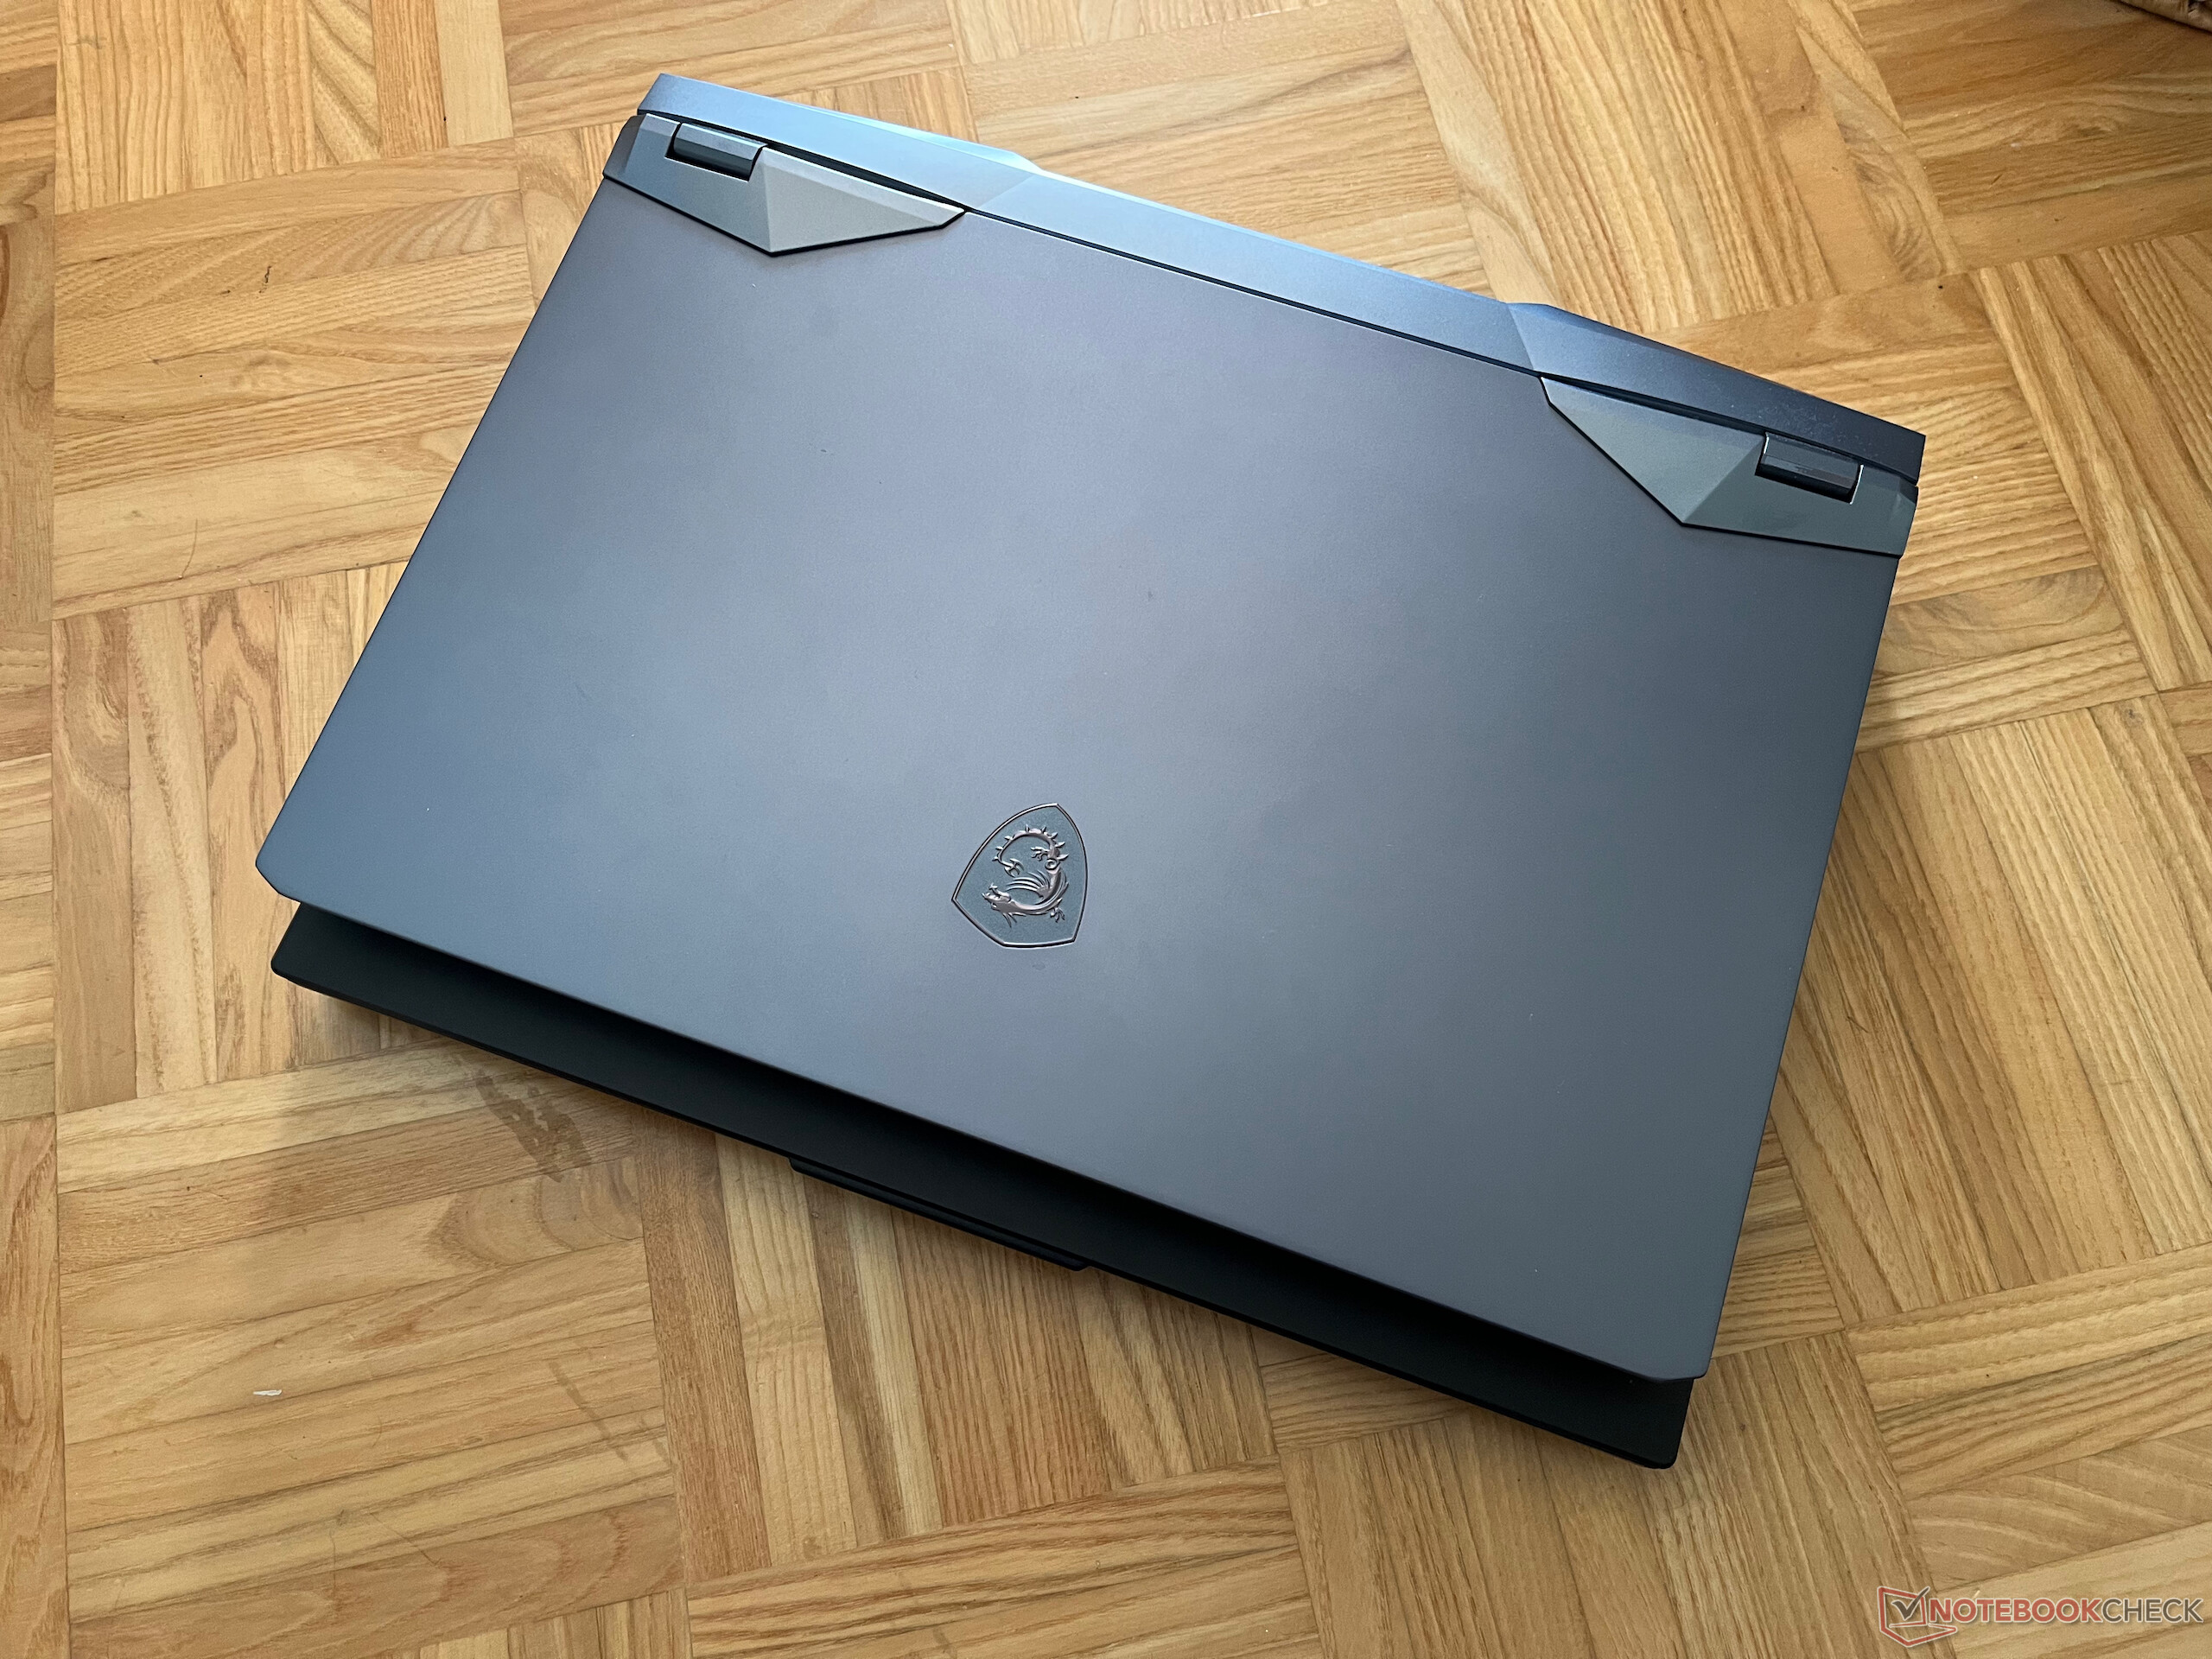
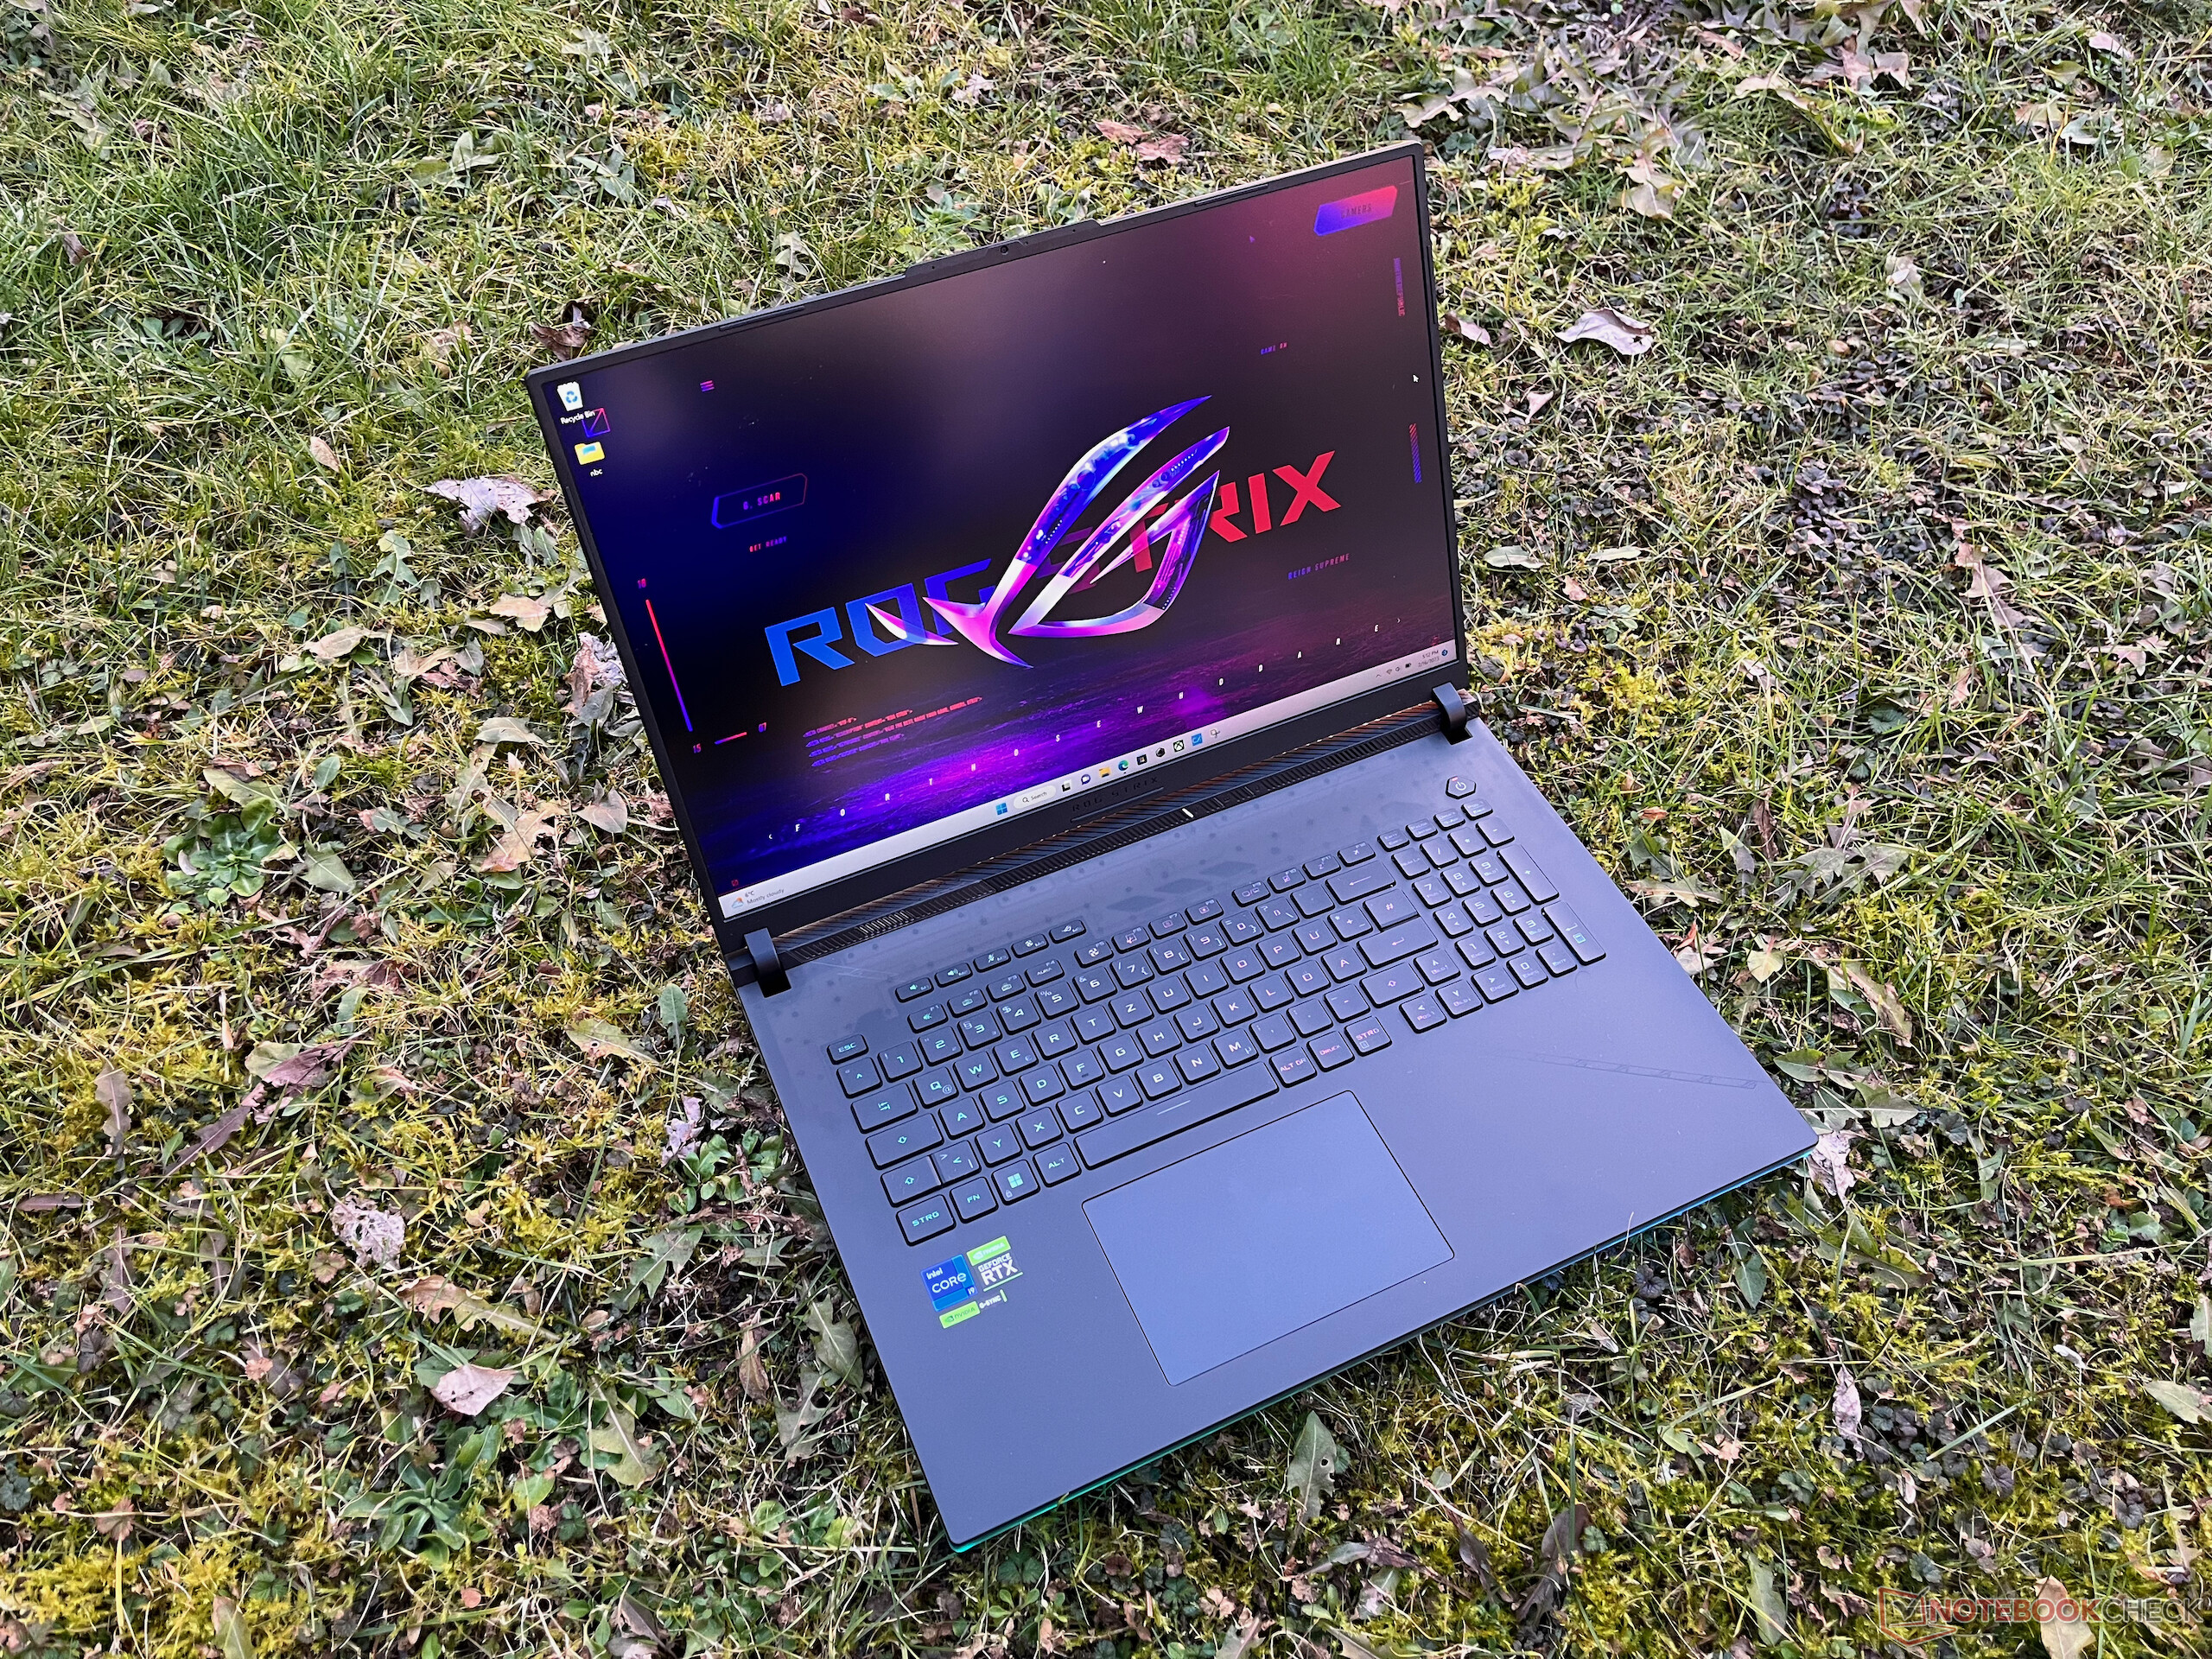
箱子的大小是由巨大的18英寸显示屏决定的,大大超过了大多数17英寸笔记本电脑。另一方面,基本单元并不十分巨大,使笔记本电脑看起来比实际情况要小一点。
设备
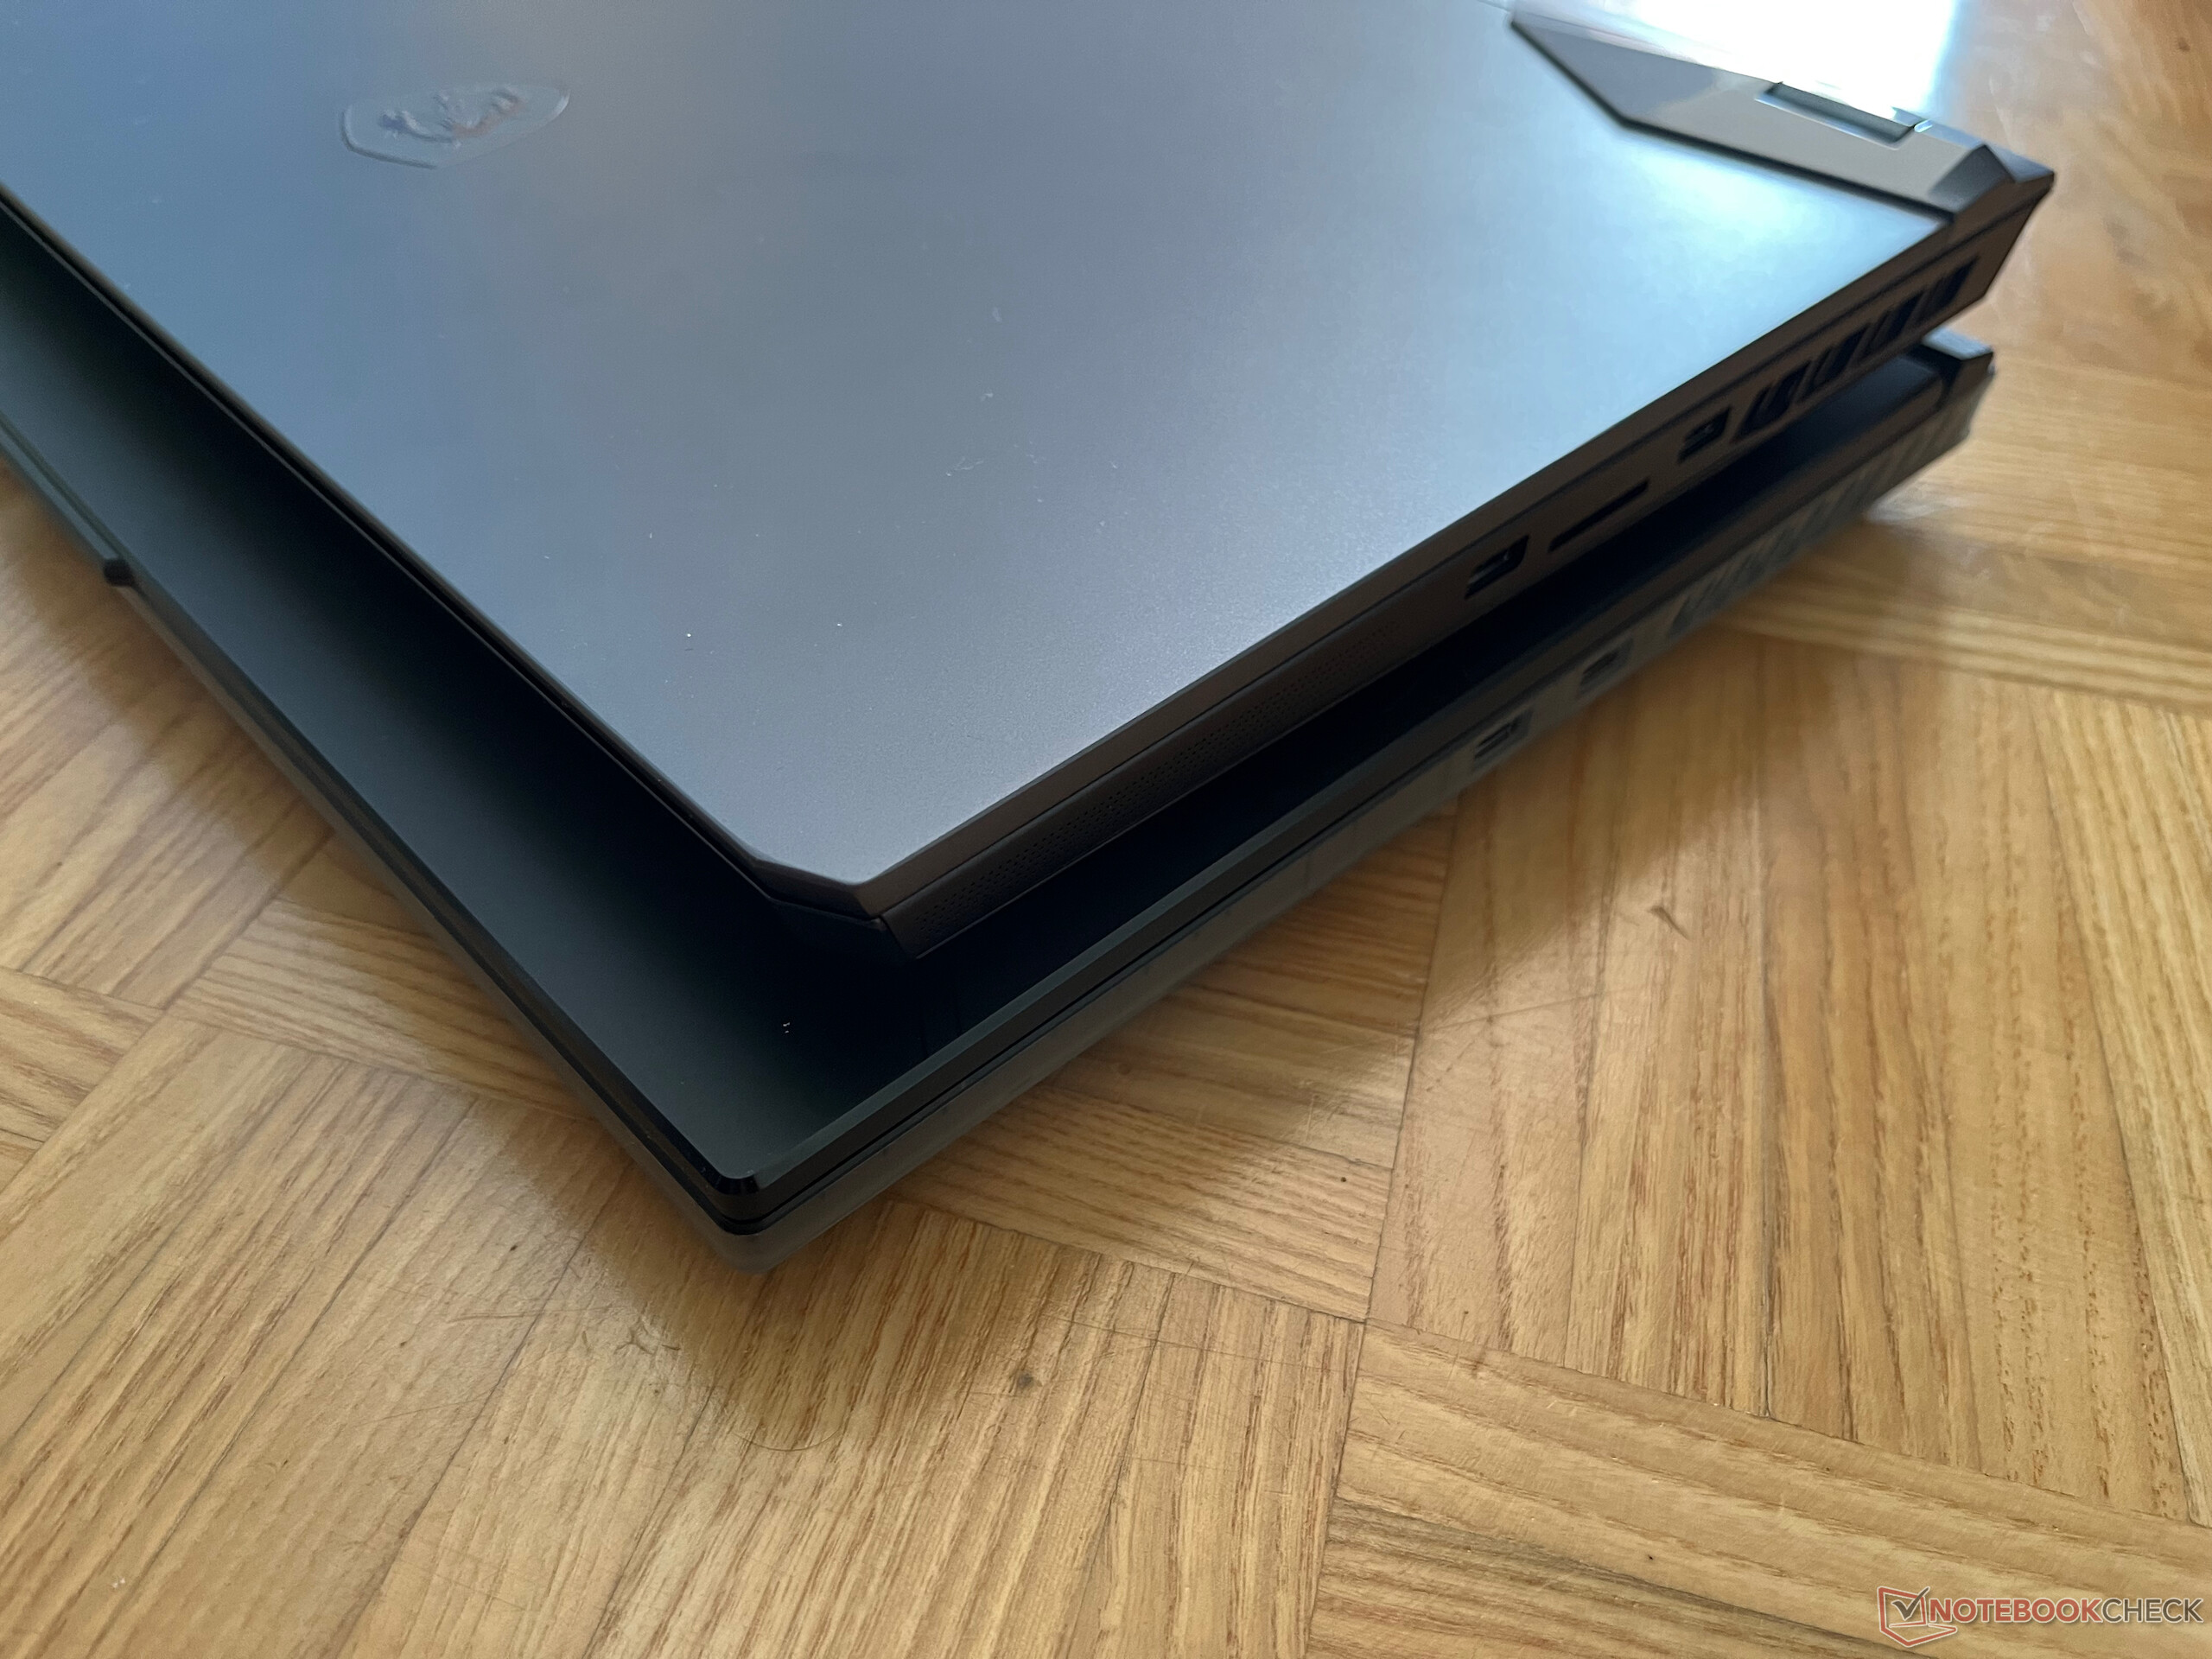
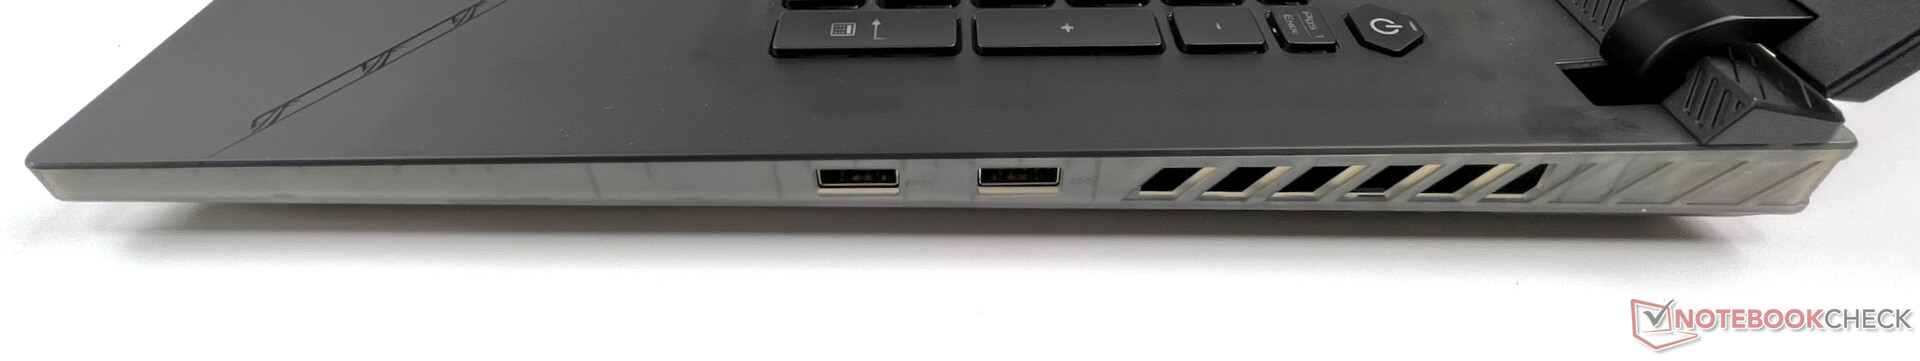
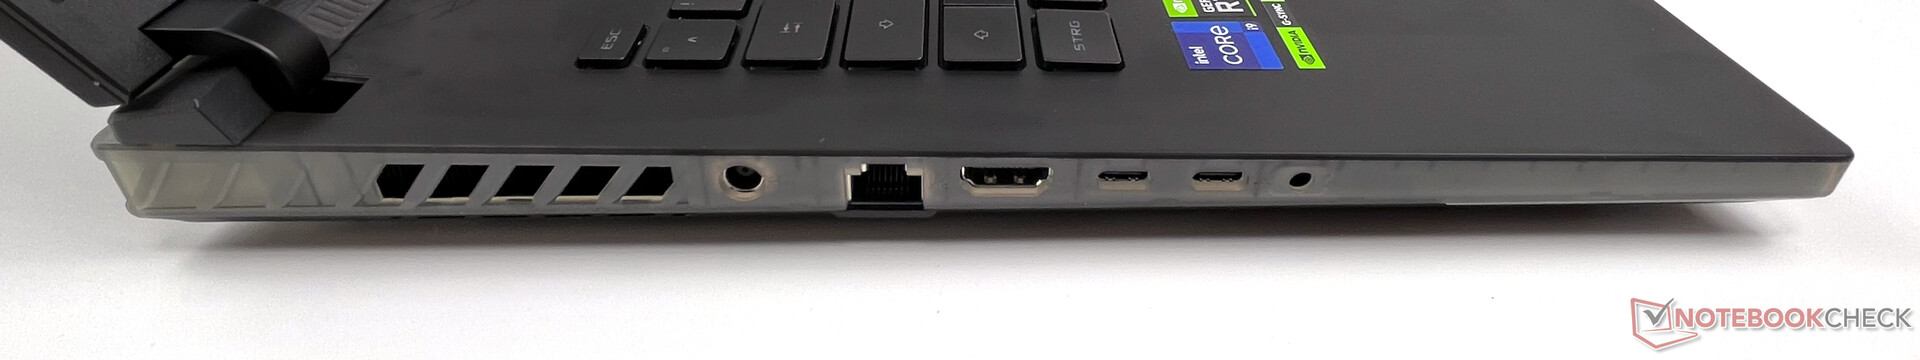
所有的端口都在机箱的左侧和右侧。不幸的是,这在桌面操作中不太理想,因为你总是可以看到电缆。 此外,两个USB-A接口都放在右侧向中间的位置,使得电缆的位置对右手使用鼠标的人来说不太理想。对于左撇子用户来说,网线会碍手碍脚。
我们对连接设备也有一些抱怨。两个USB-C端口中只有一个支持Thunderbolt,另一个支持Power Delivery,但有一些限制。在我们的测试中,MacBook Air M1充电器能够以30瓦的功率为笔记本电脑充电,但在Windows中没有通知。45瓦的Anker Nano 2根本没有为笔记本电脑充电。在积极的一面,我们也要提到2.5G比特的网络连接。
沟通
在通信选项方面,华硕为无线连接提供了M.2格式的快速英特尔Wi-Fi 6E AX211卡,为有线2.5-Gbit LAN连接提供了Realtek RTL8125芯片。在我们的测试中,两者都没有任何干扰,但AX211卡没有找到我们的华硕ROG Rapture GT-AX11000路由器的6-GHz网络。不幸的是,Wi-Fi 6E在我们的测试中找到网络时仍然是一击即中。
另一方面,Wi-Fi 6网络中的数据速率非常好,没有任何掉线。
网络摄像头
不幸的是,内置的720p高清网络摄像头只能满足视频电话的最低要求。良好的光线条件在这里很重要,因为我们在背光下或黑暗中得到的结果几乎无法使用。


")
")
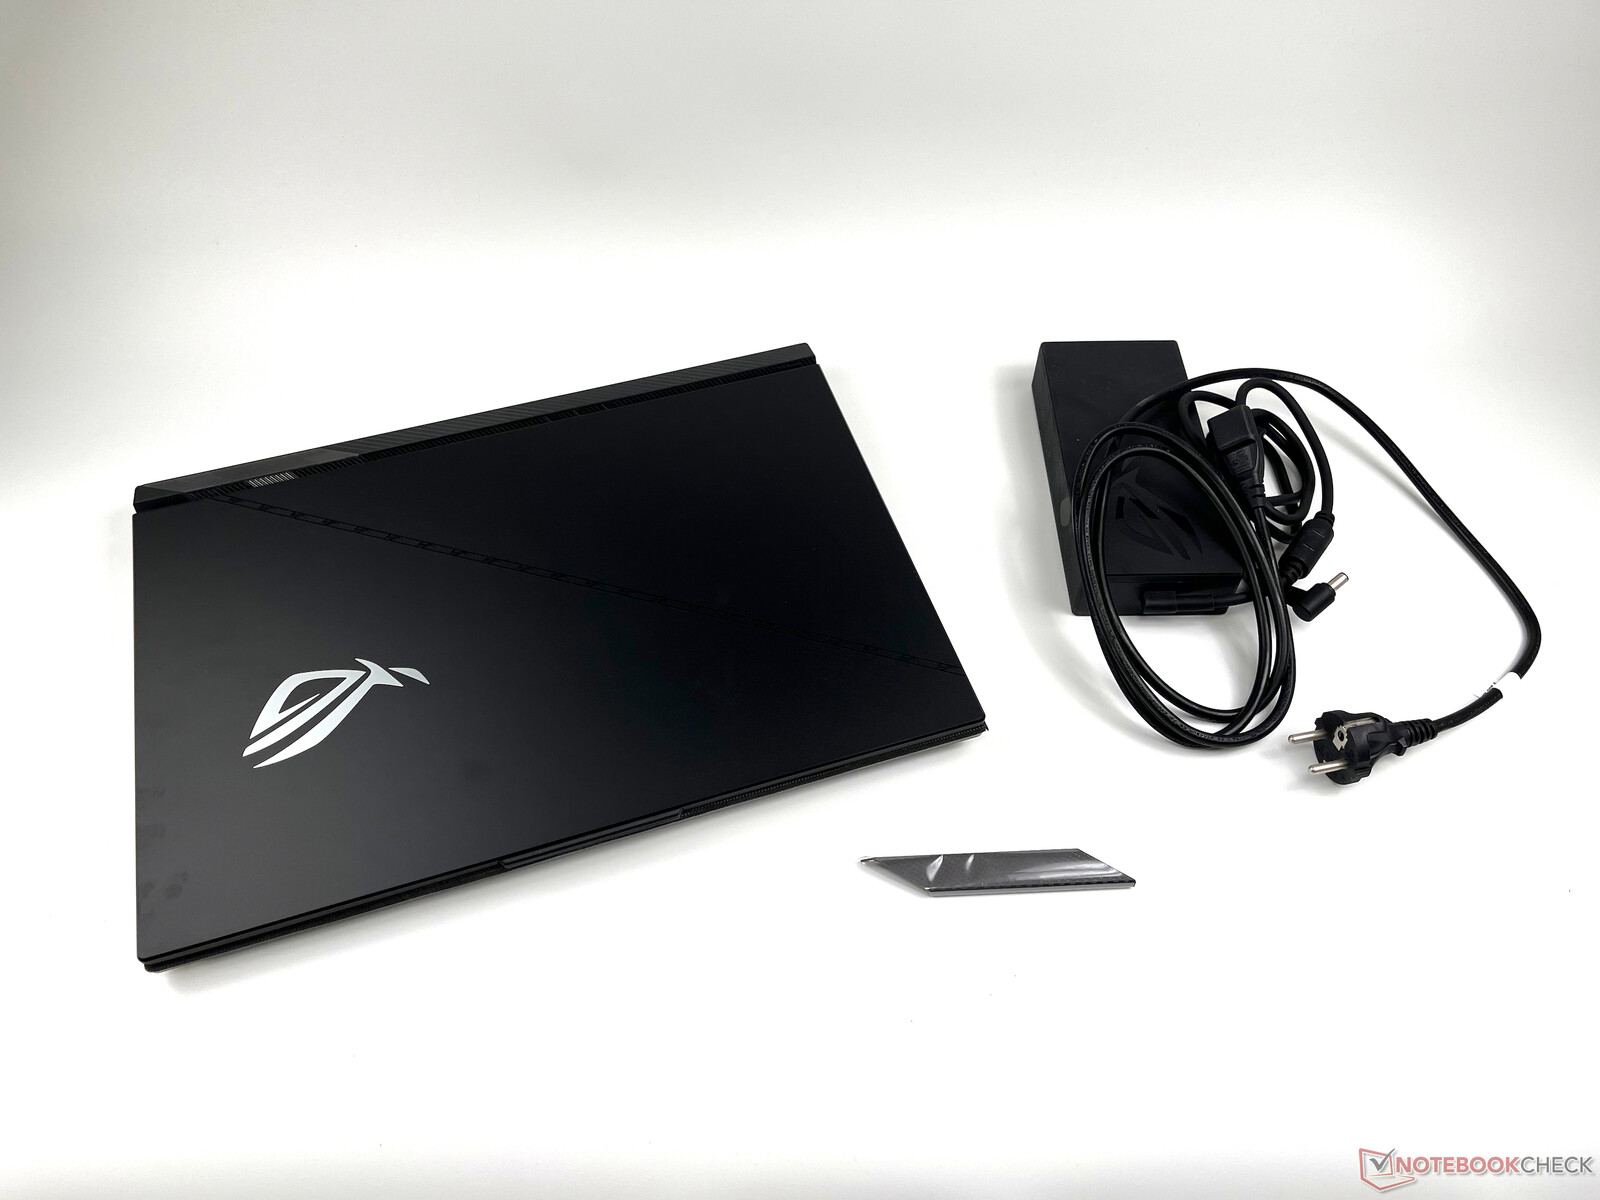
辅料
盒子里只包括一个额外的 "盔甲帽",它可以在显示屏下方的左侧更换。帽子是用磁力固定的,可能是为了给你一个选择,使设备个性化。
维护
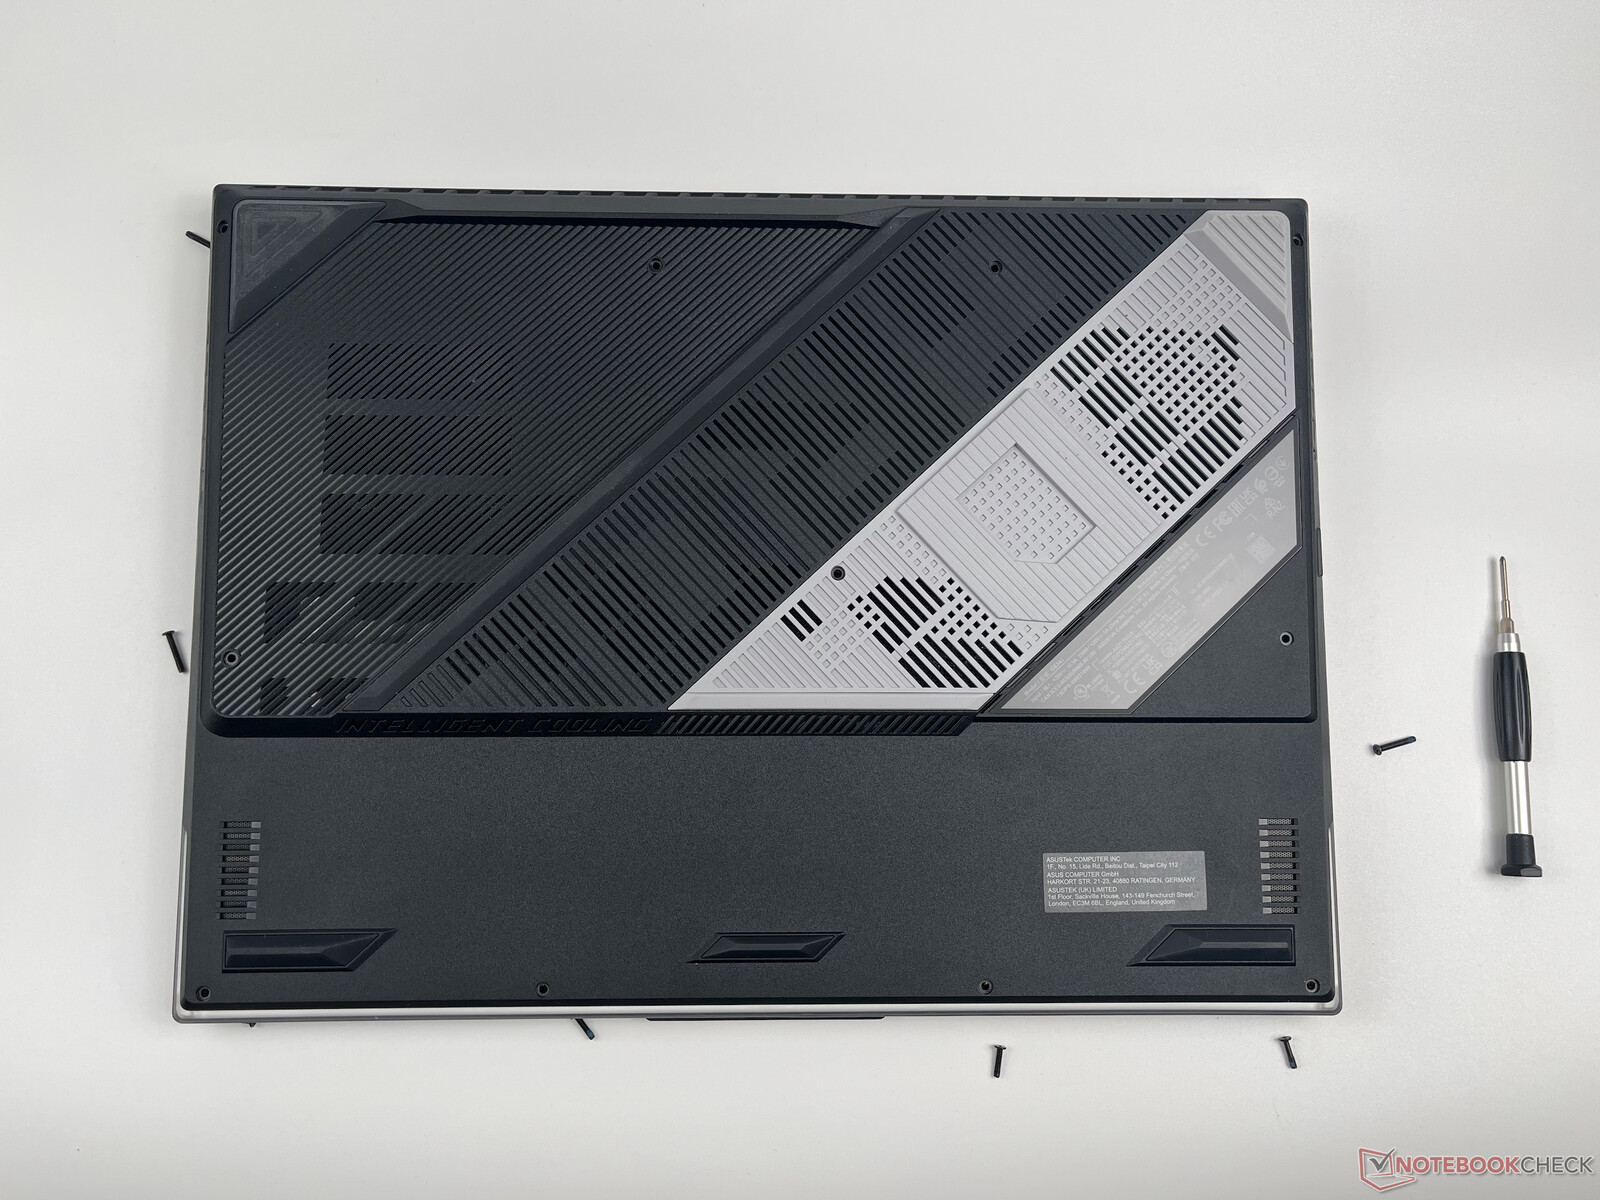
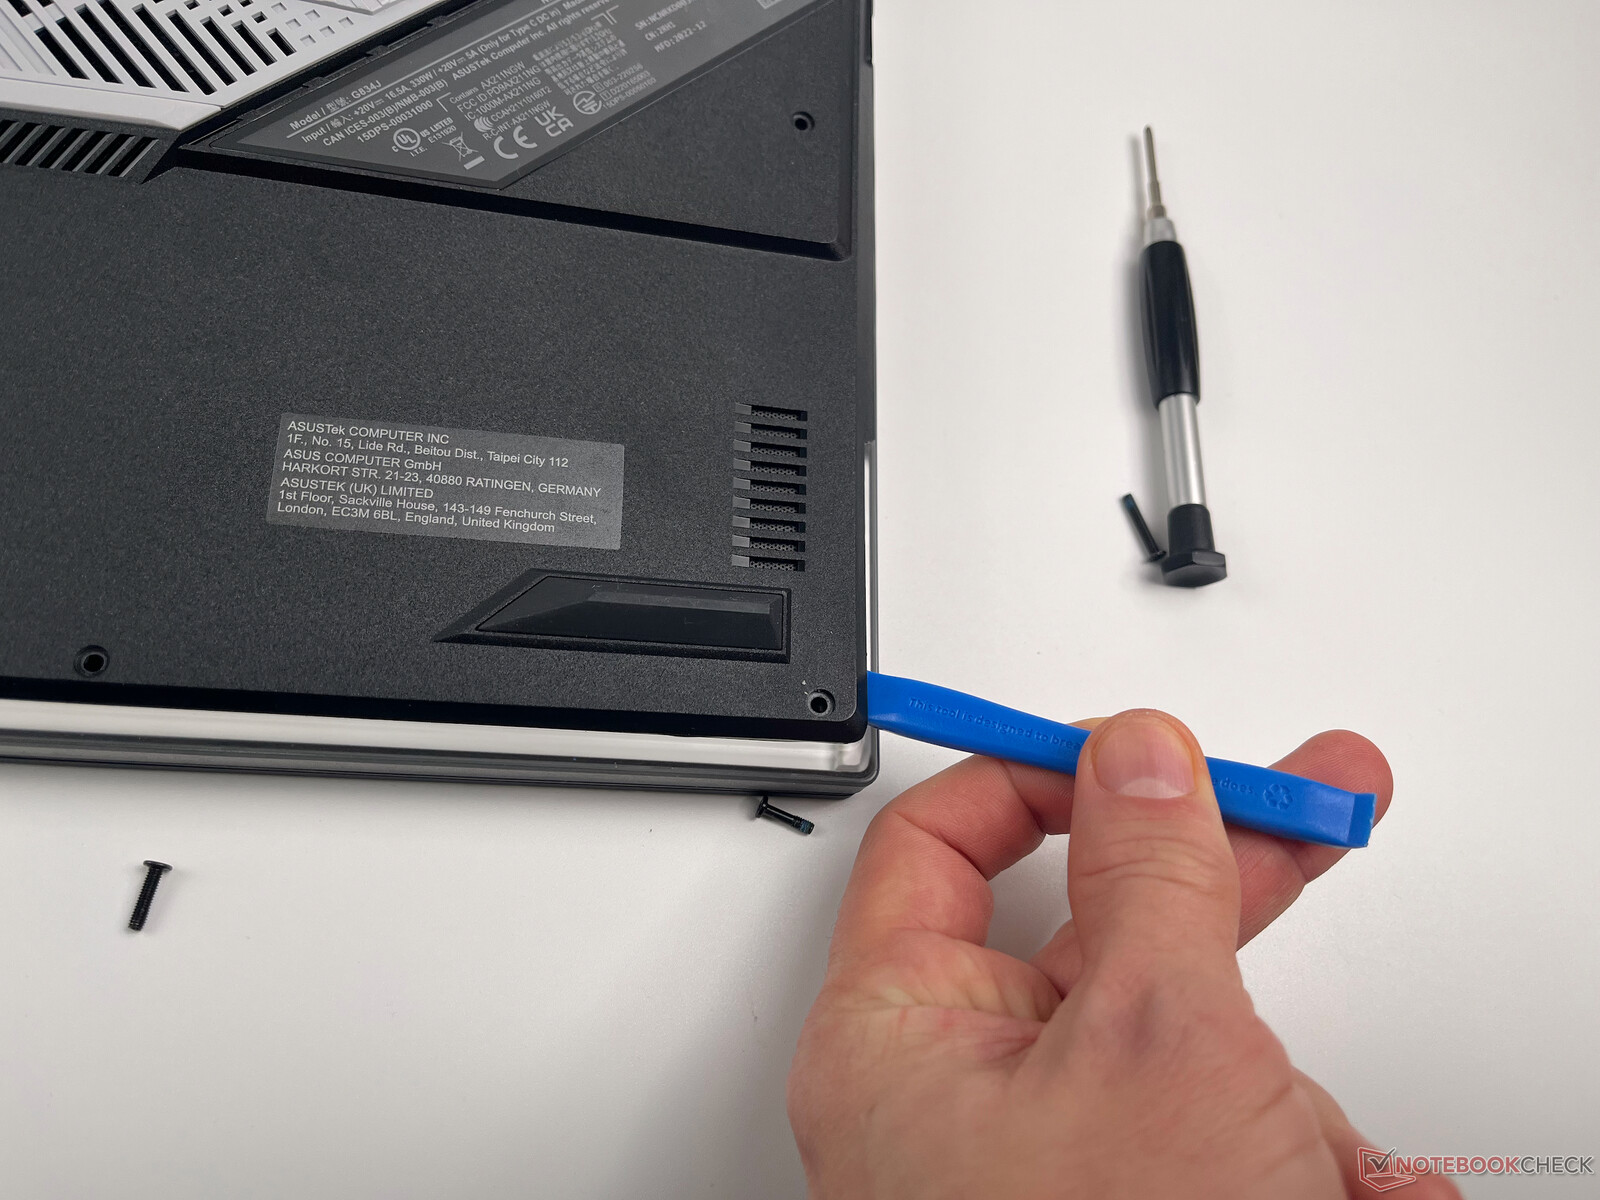
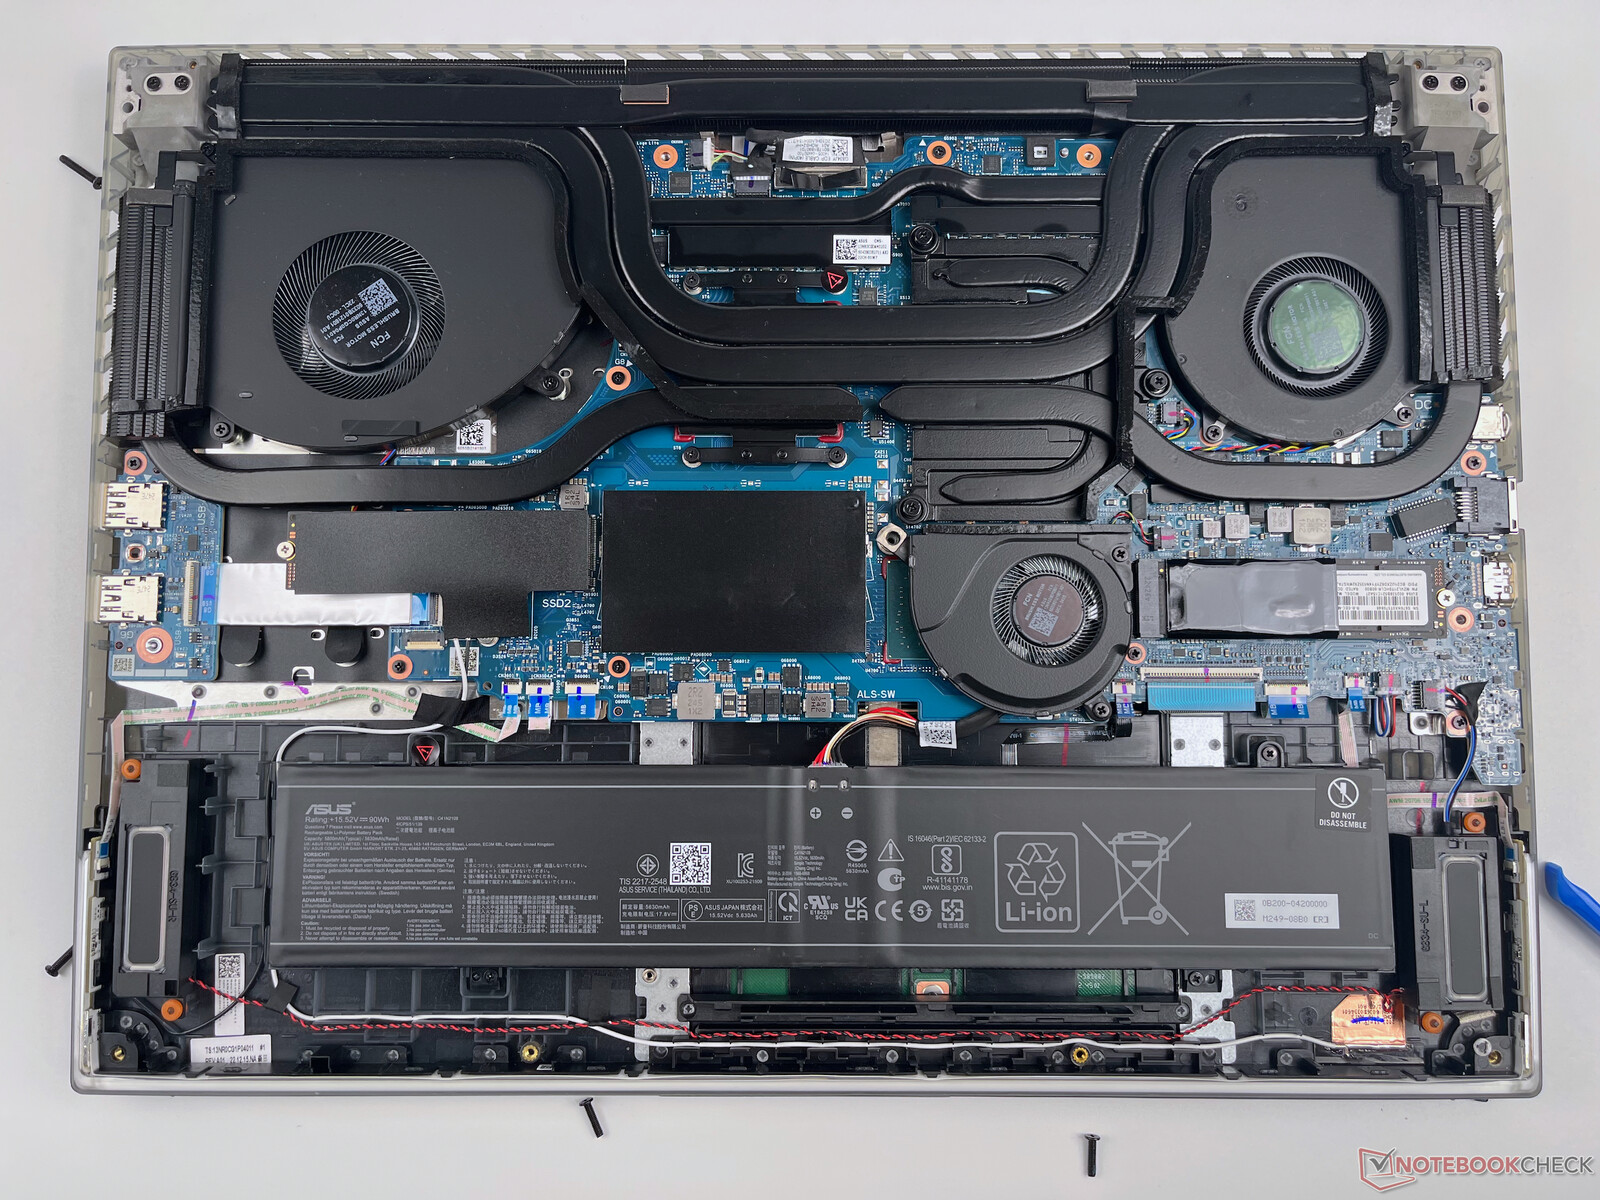
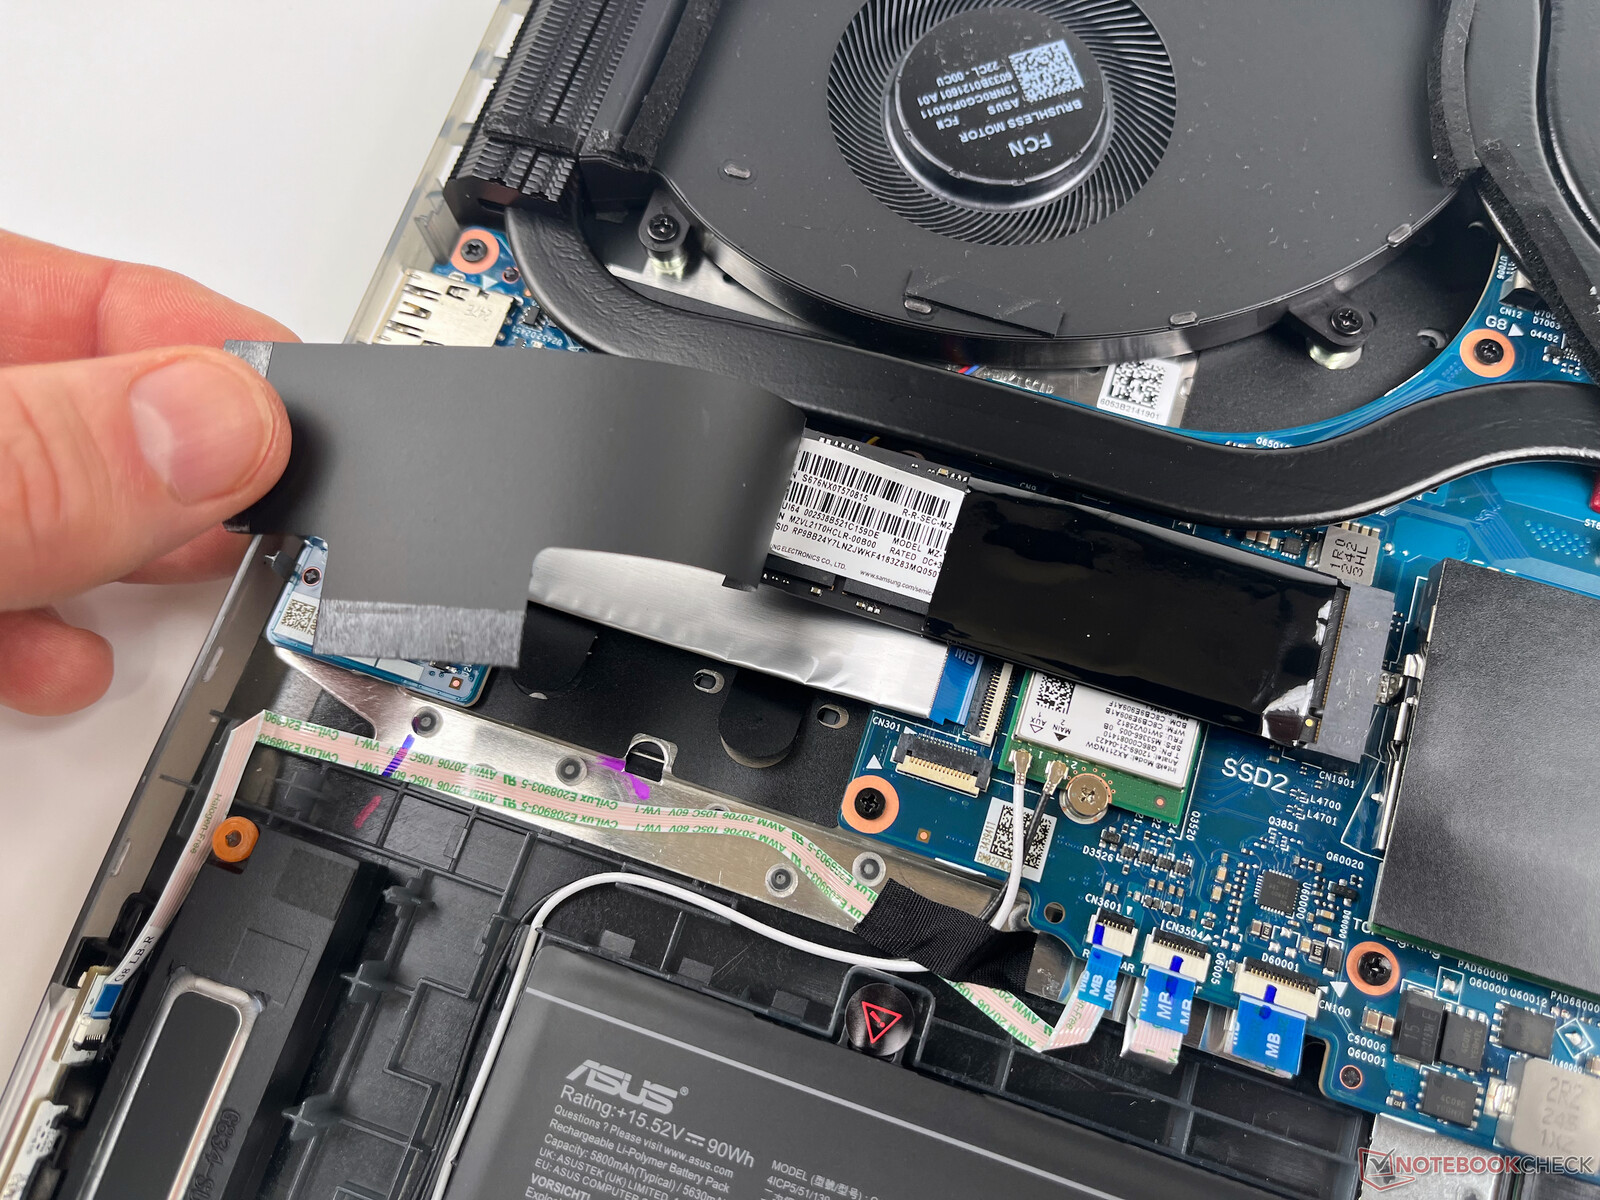
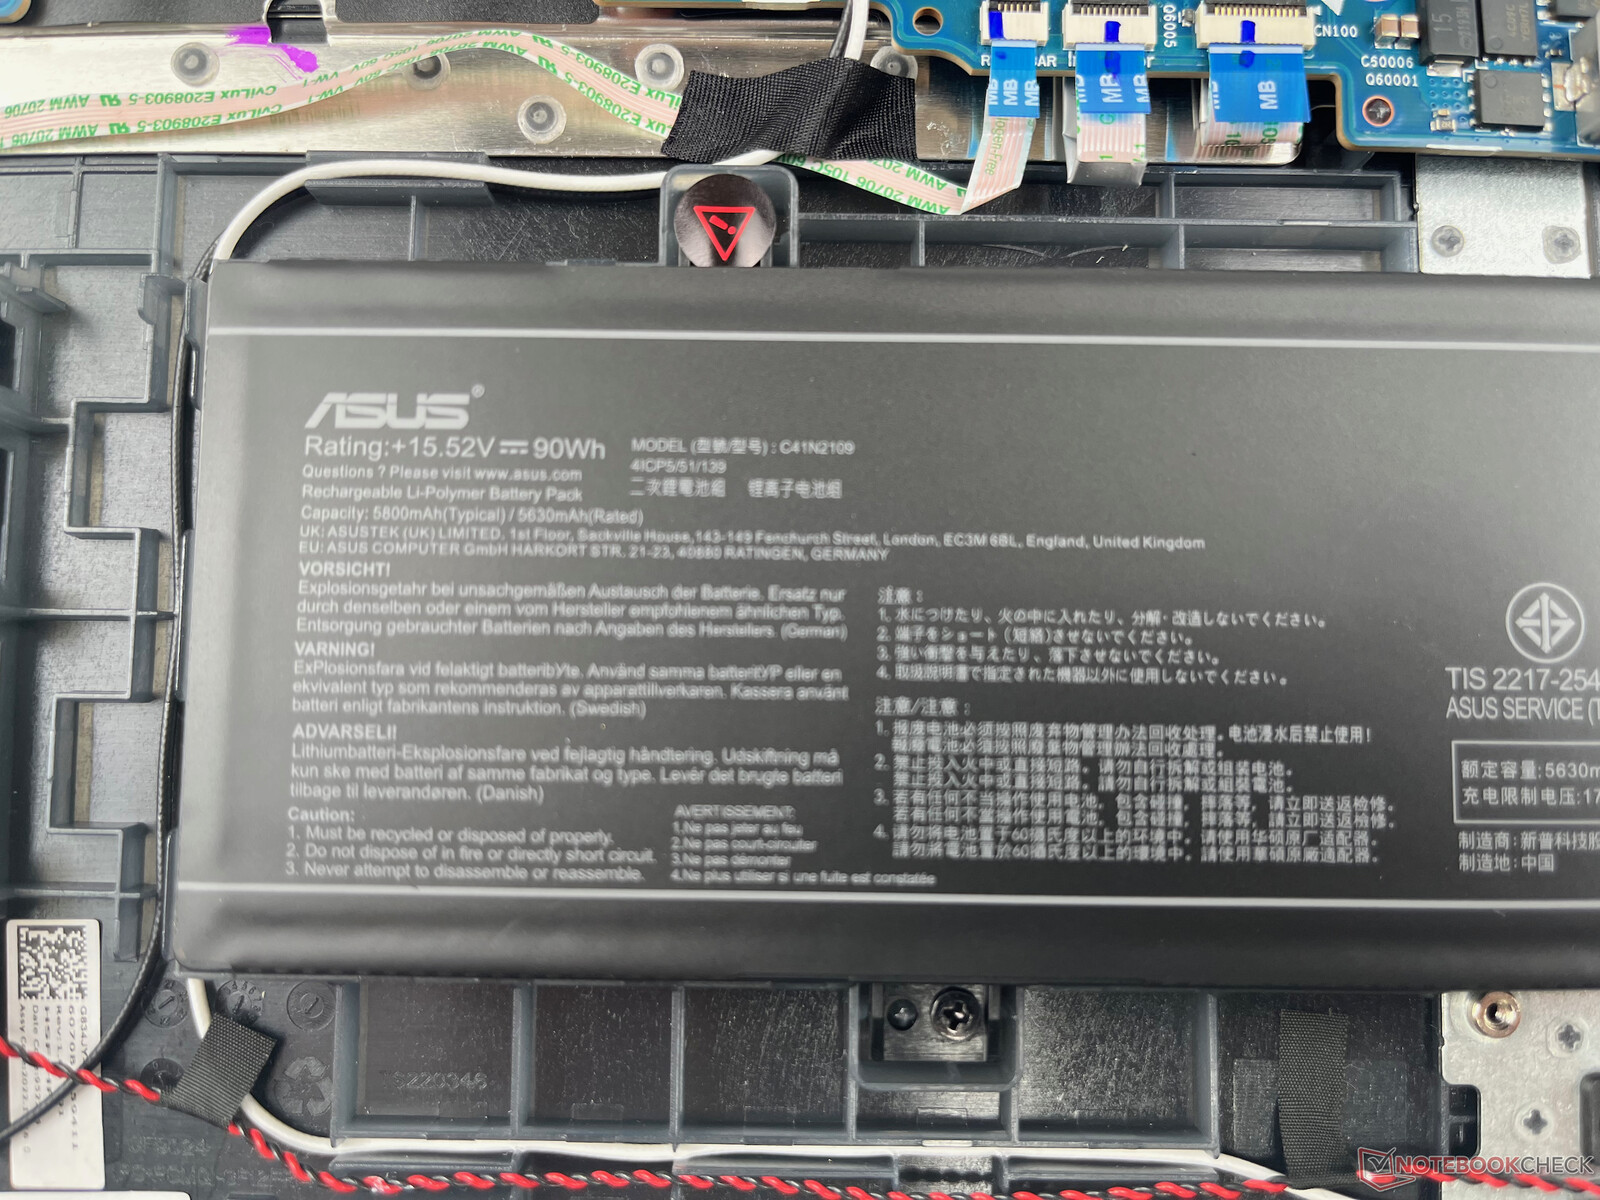
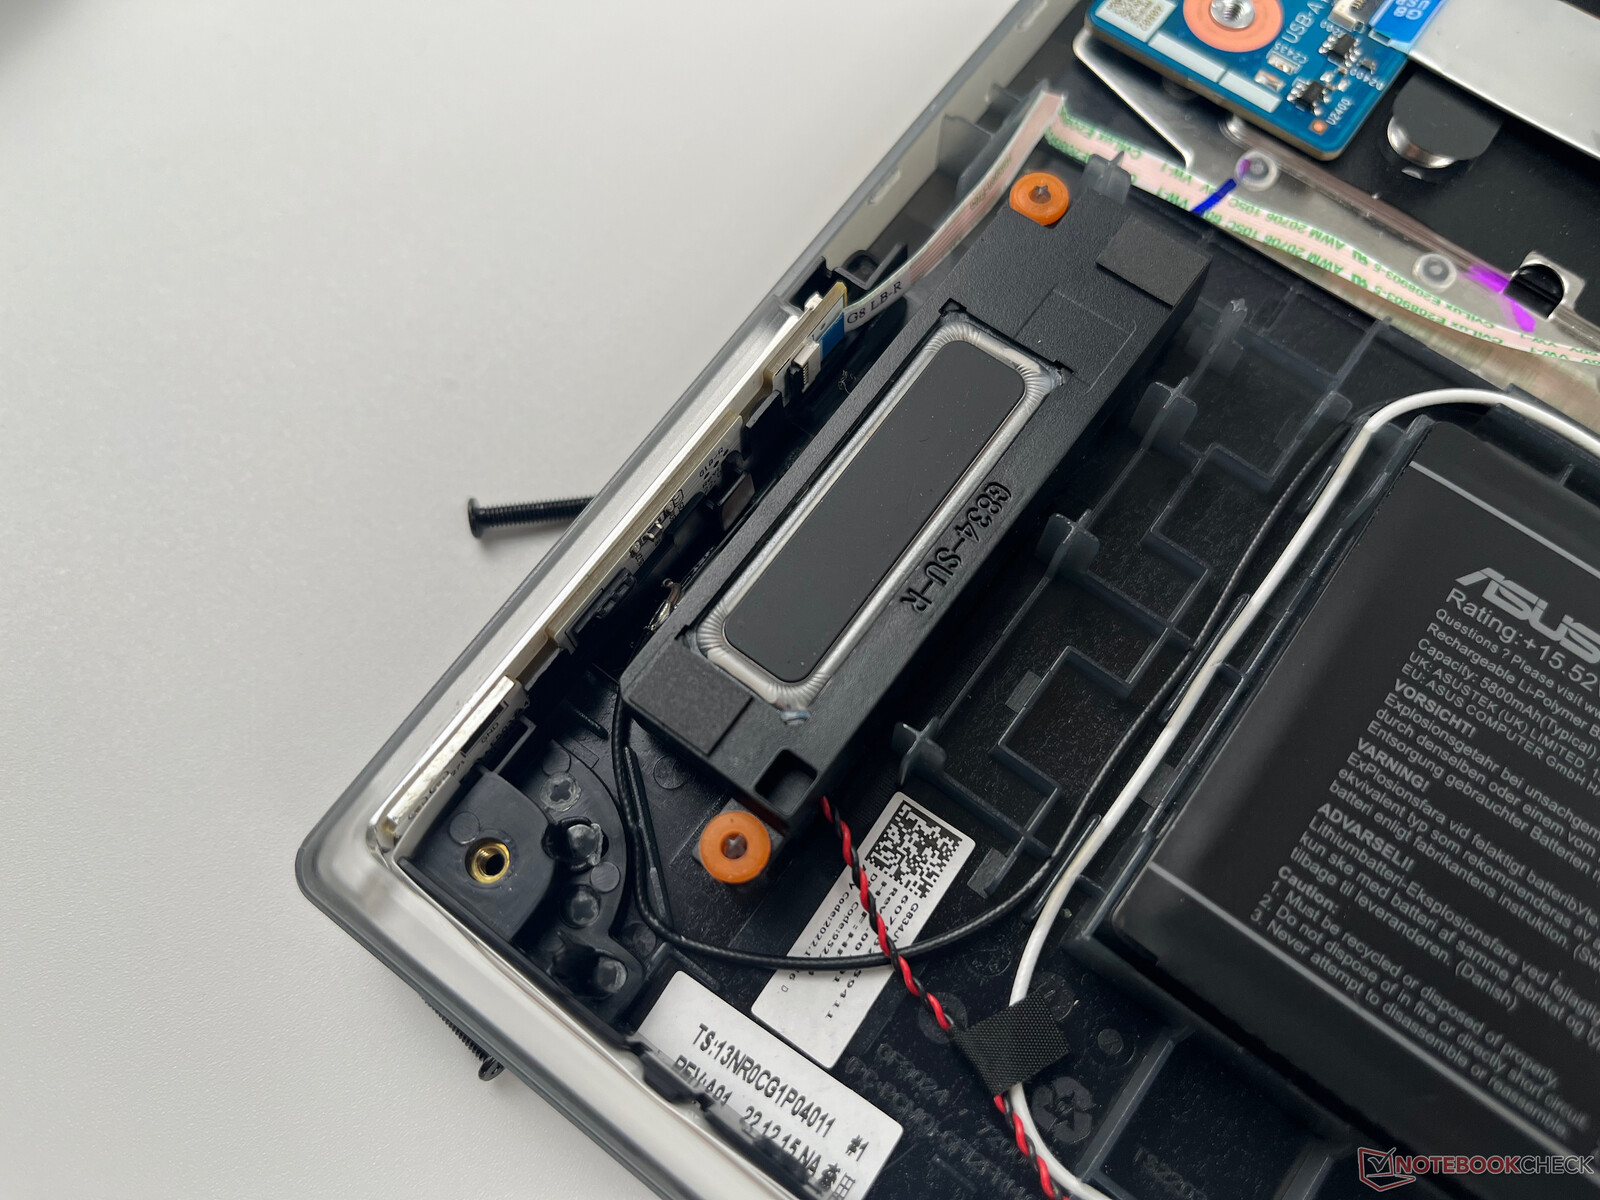
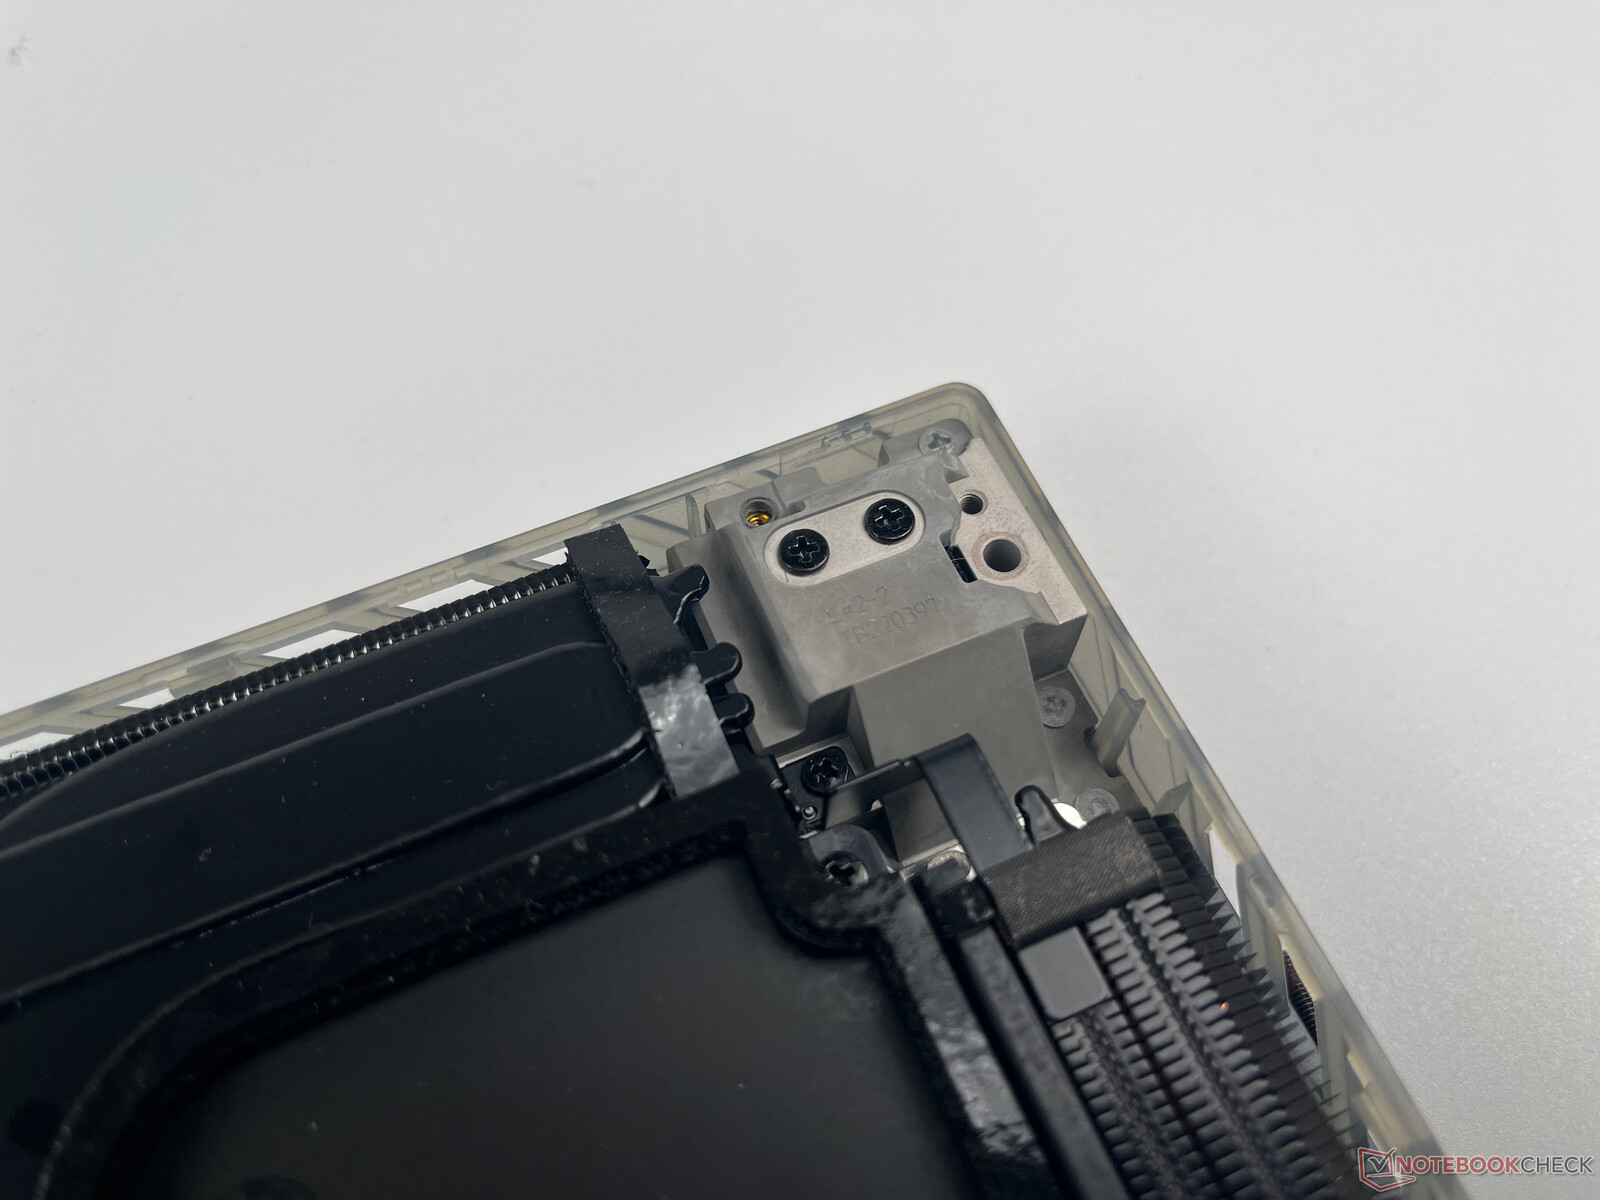
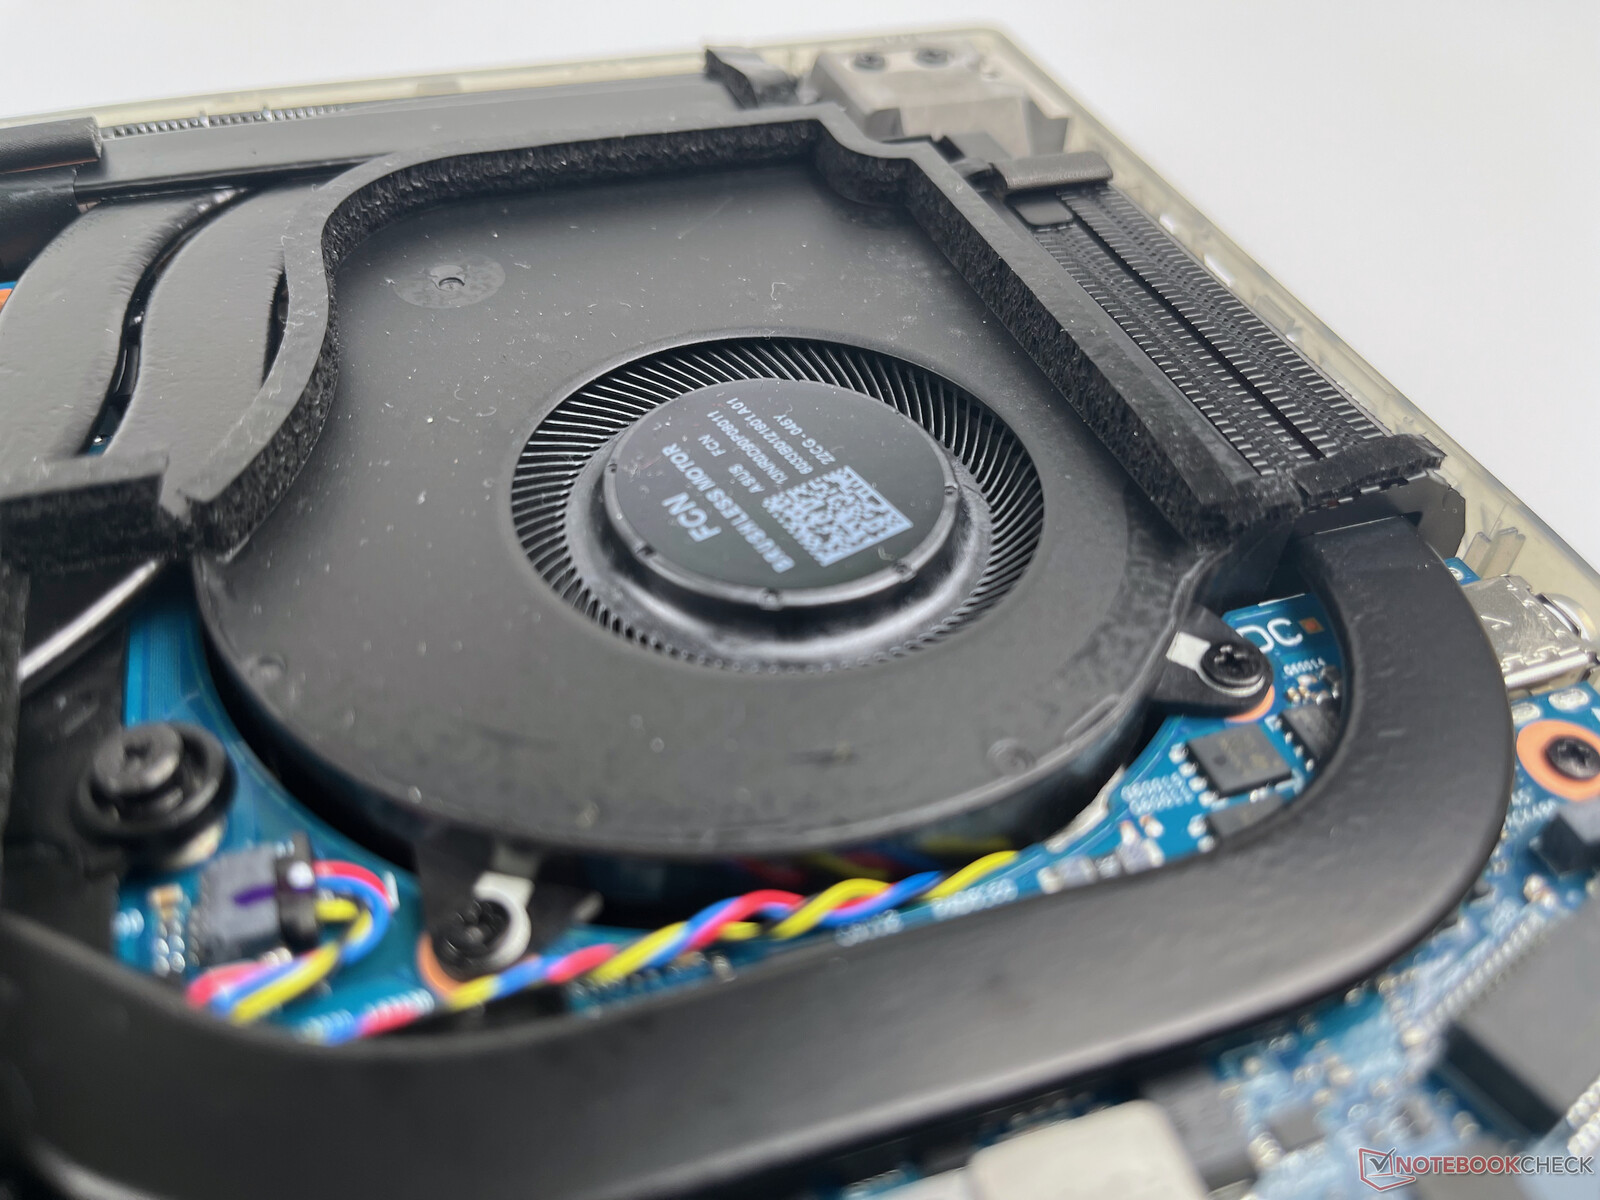
ROG Strix G18系列的内部是比较容易从机箱的底部进入的。你首先要卸下许多飞利浦螺丝,然后用撬具松开边缘的塑料夹子。这在我们的测试设备上相对容易做到(从前面的角落开始),幸运的是,打开机箱时没有一个塑料夹子断裂。
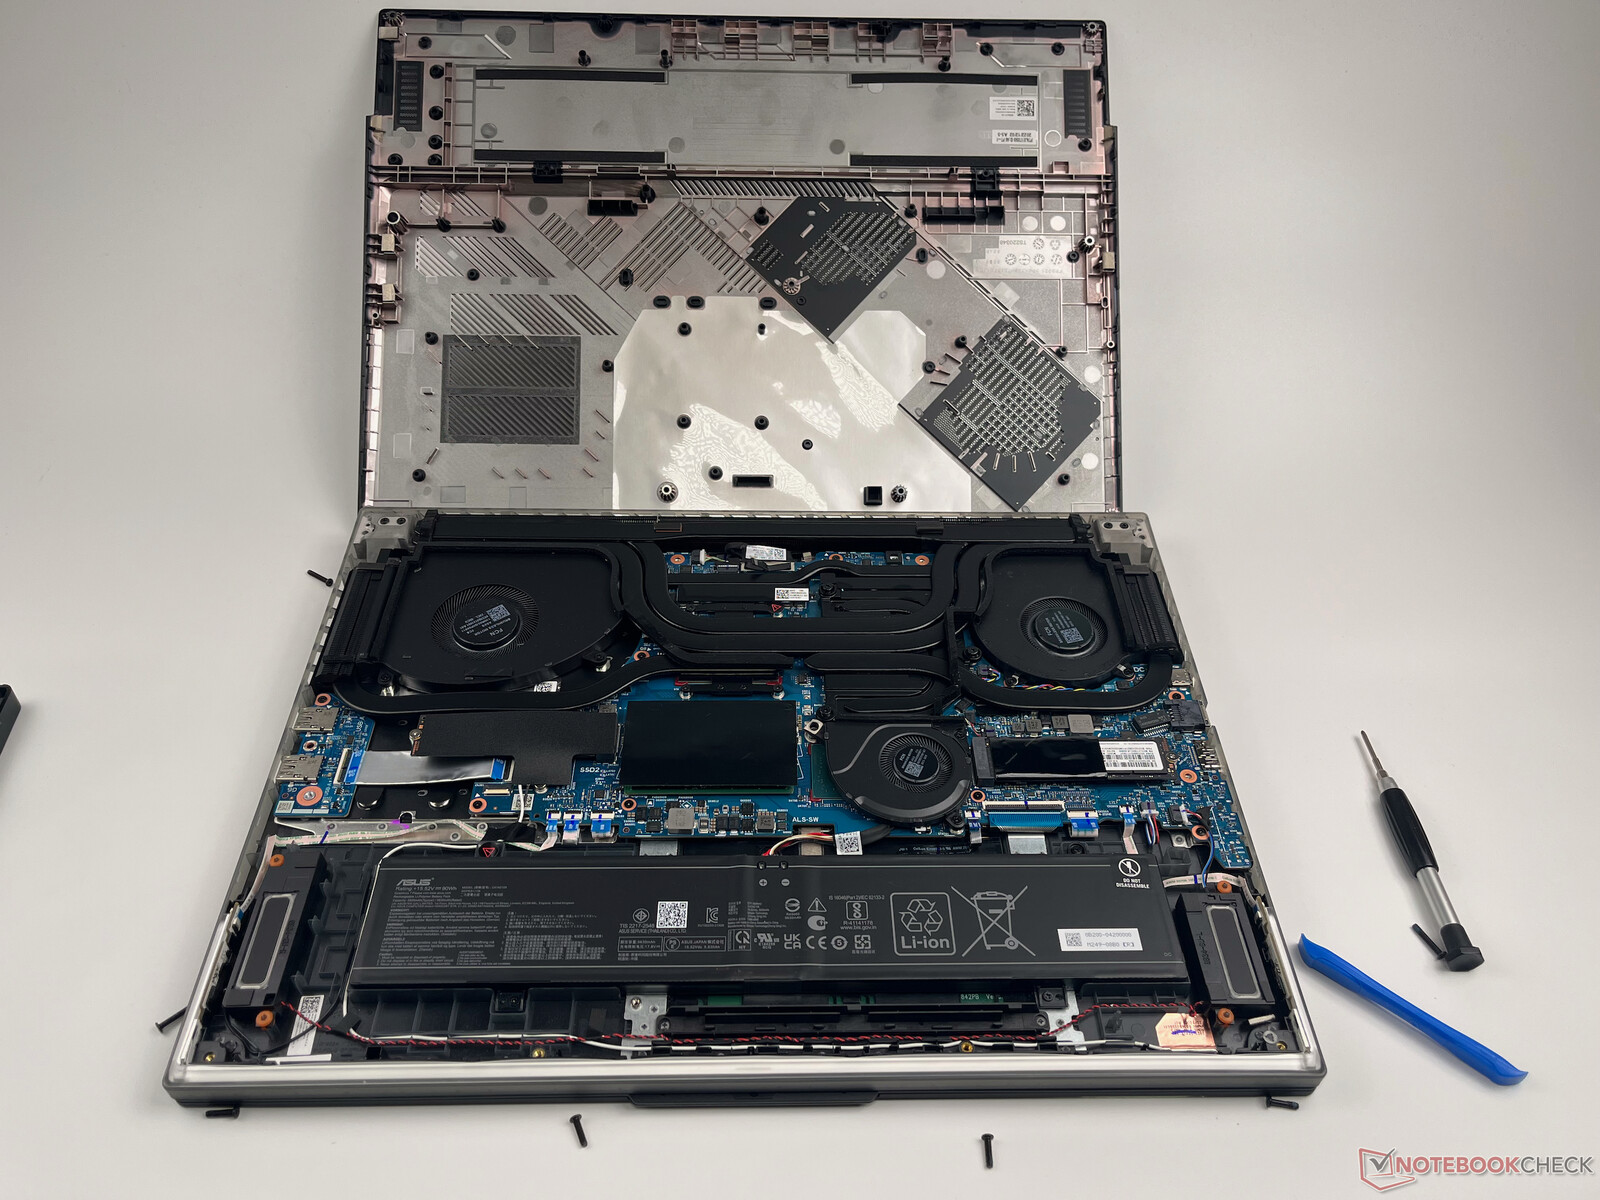
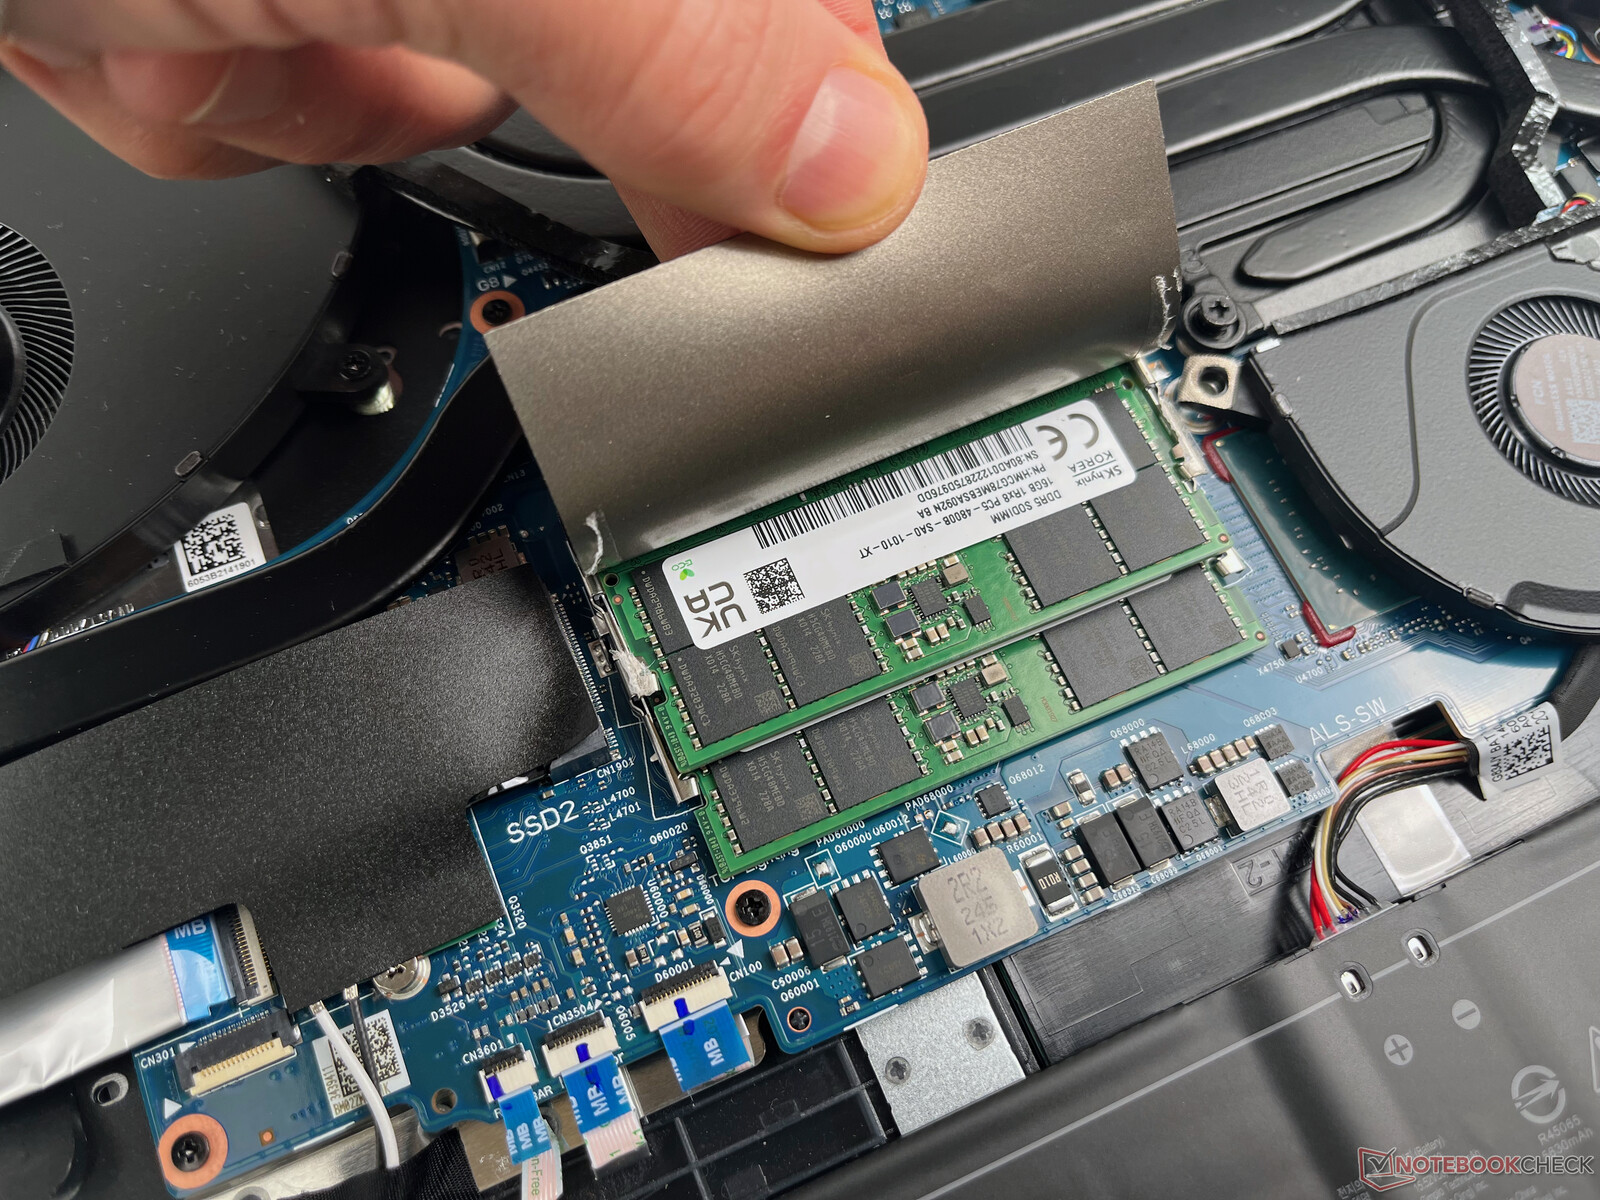
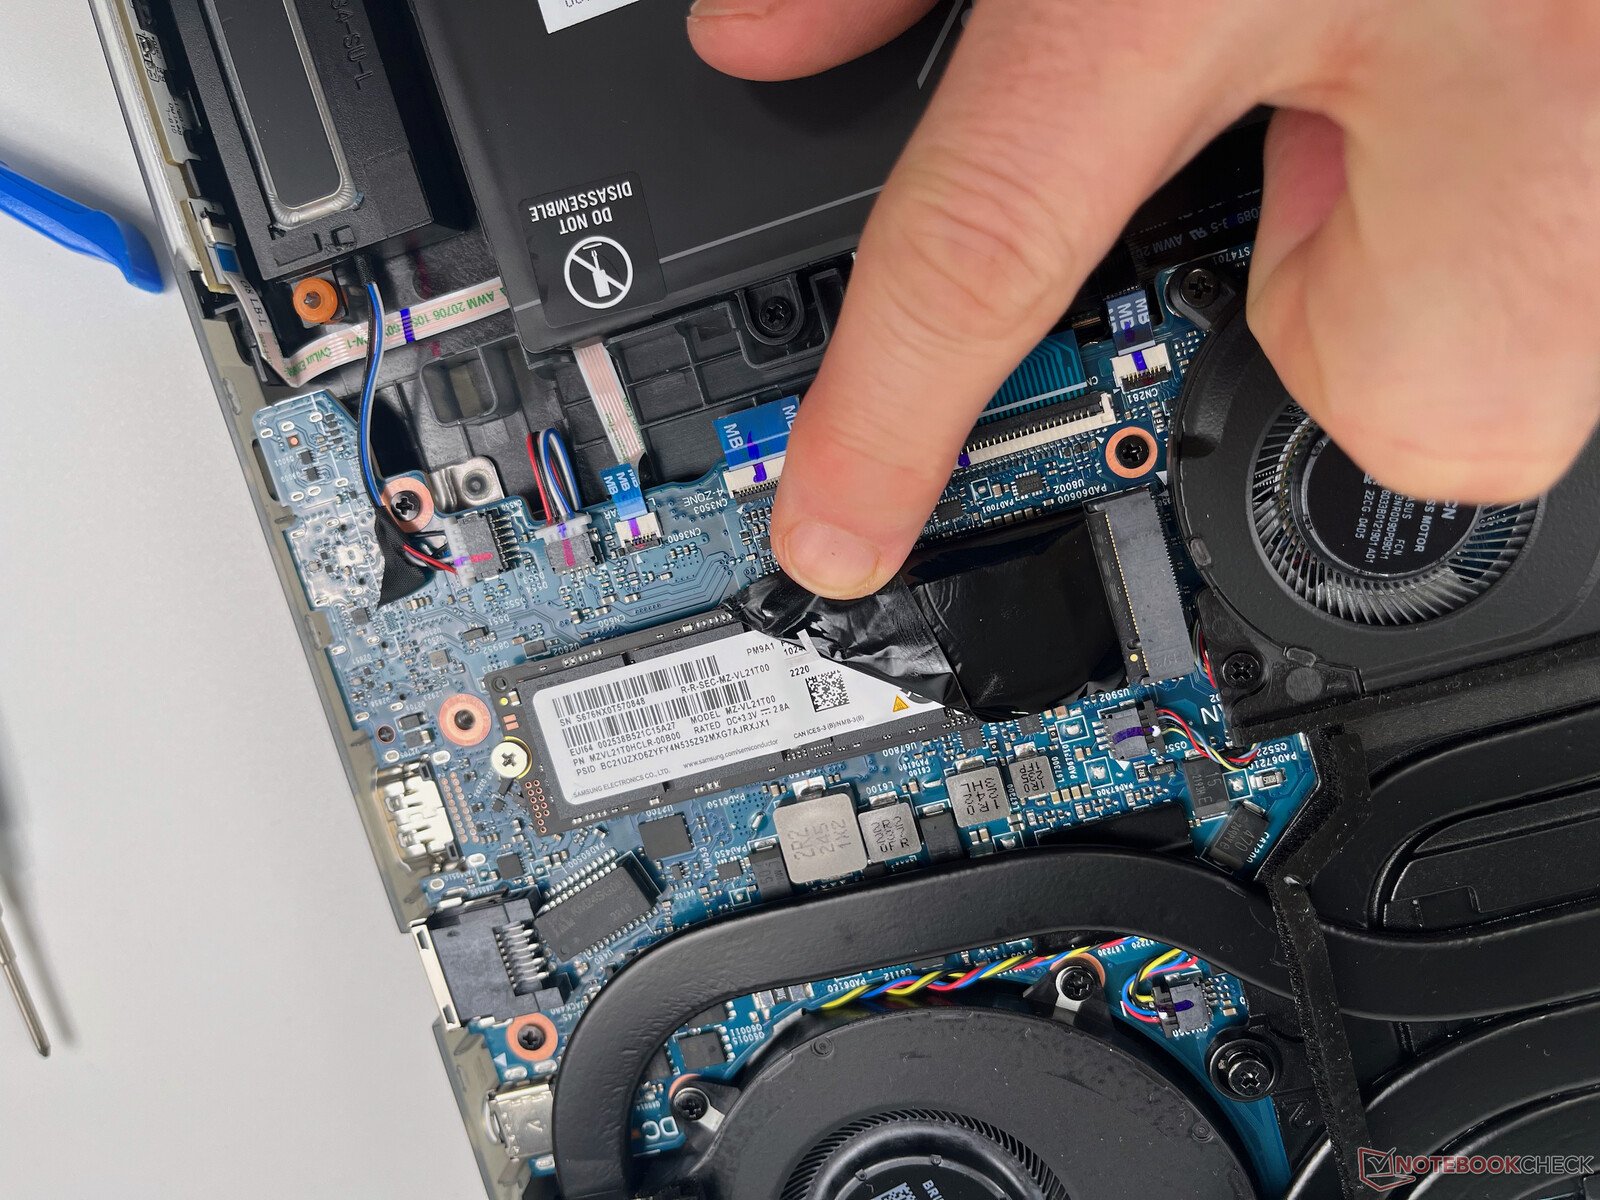
在笔记本内部,我们看到两个用于PCIe固态硬盘的M.2-2280插槽(两个都被占用,用于RAID-0系统),一个用于WLAN卡的M.2插槽,以及两个内存插槽(也都被占用),最多可容纳64GB GDDR5内存。所有的风扇也都可以接触到,并且可以很容易地进行清洁。电池是用螺丝固定在机箱内的,所以它应该也比较容易更换。
担保
华硕只提供一年的常规保修(在德国提供的型号为两年)。没有提到更换零件或任何类似的保修。
输入设备
键盘
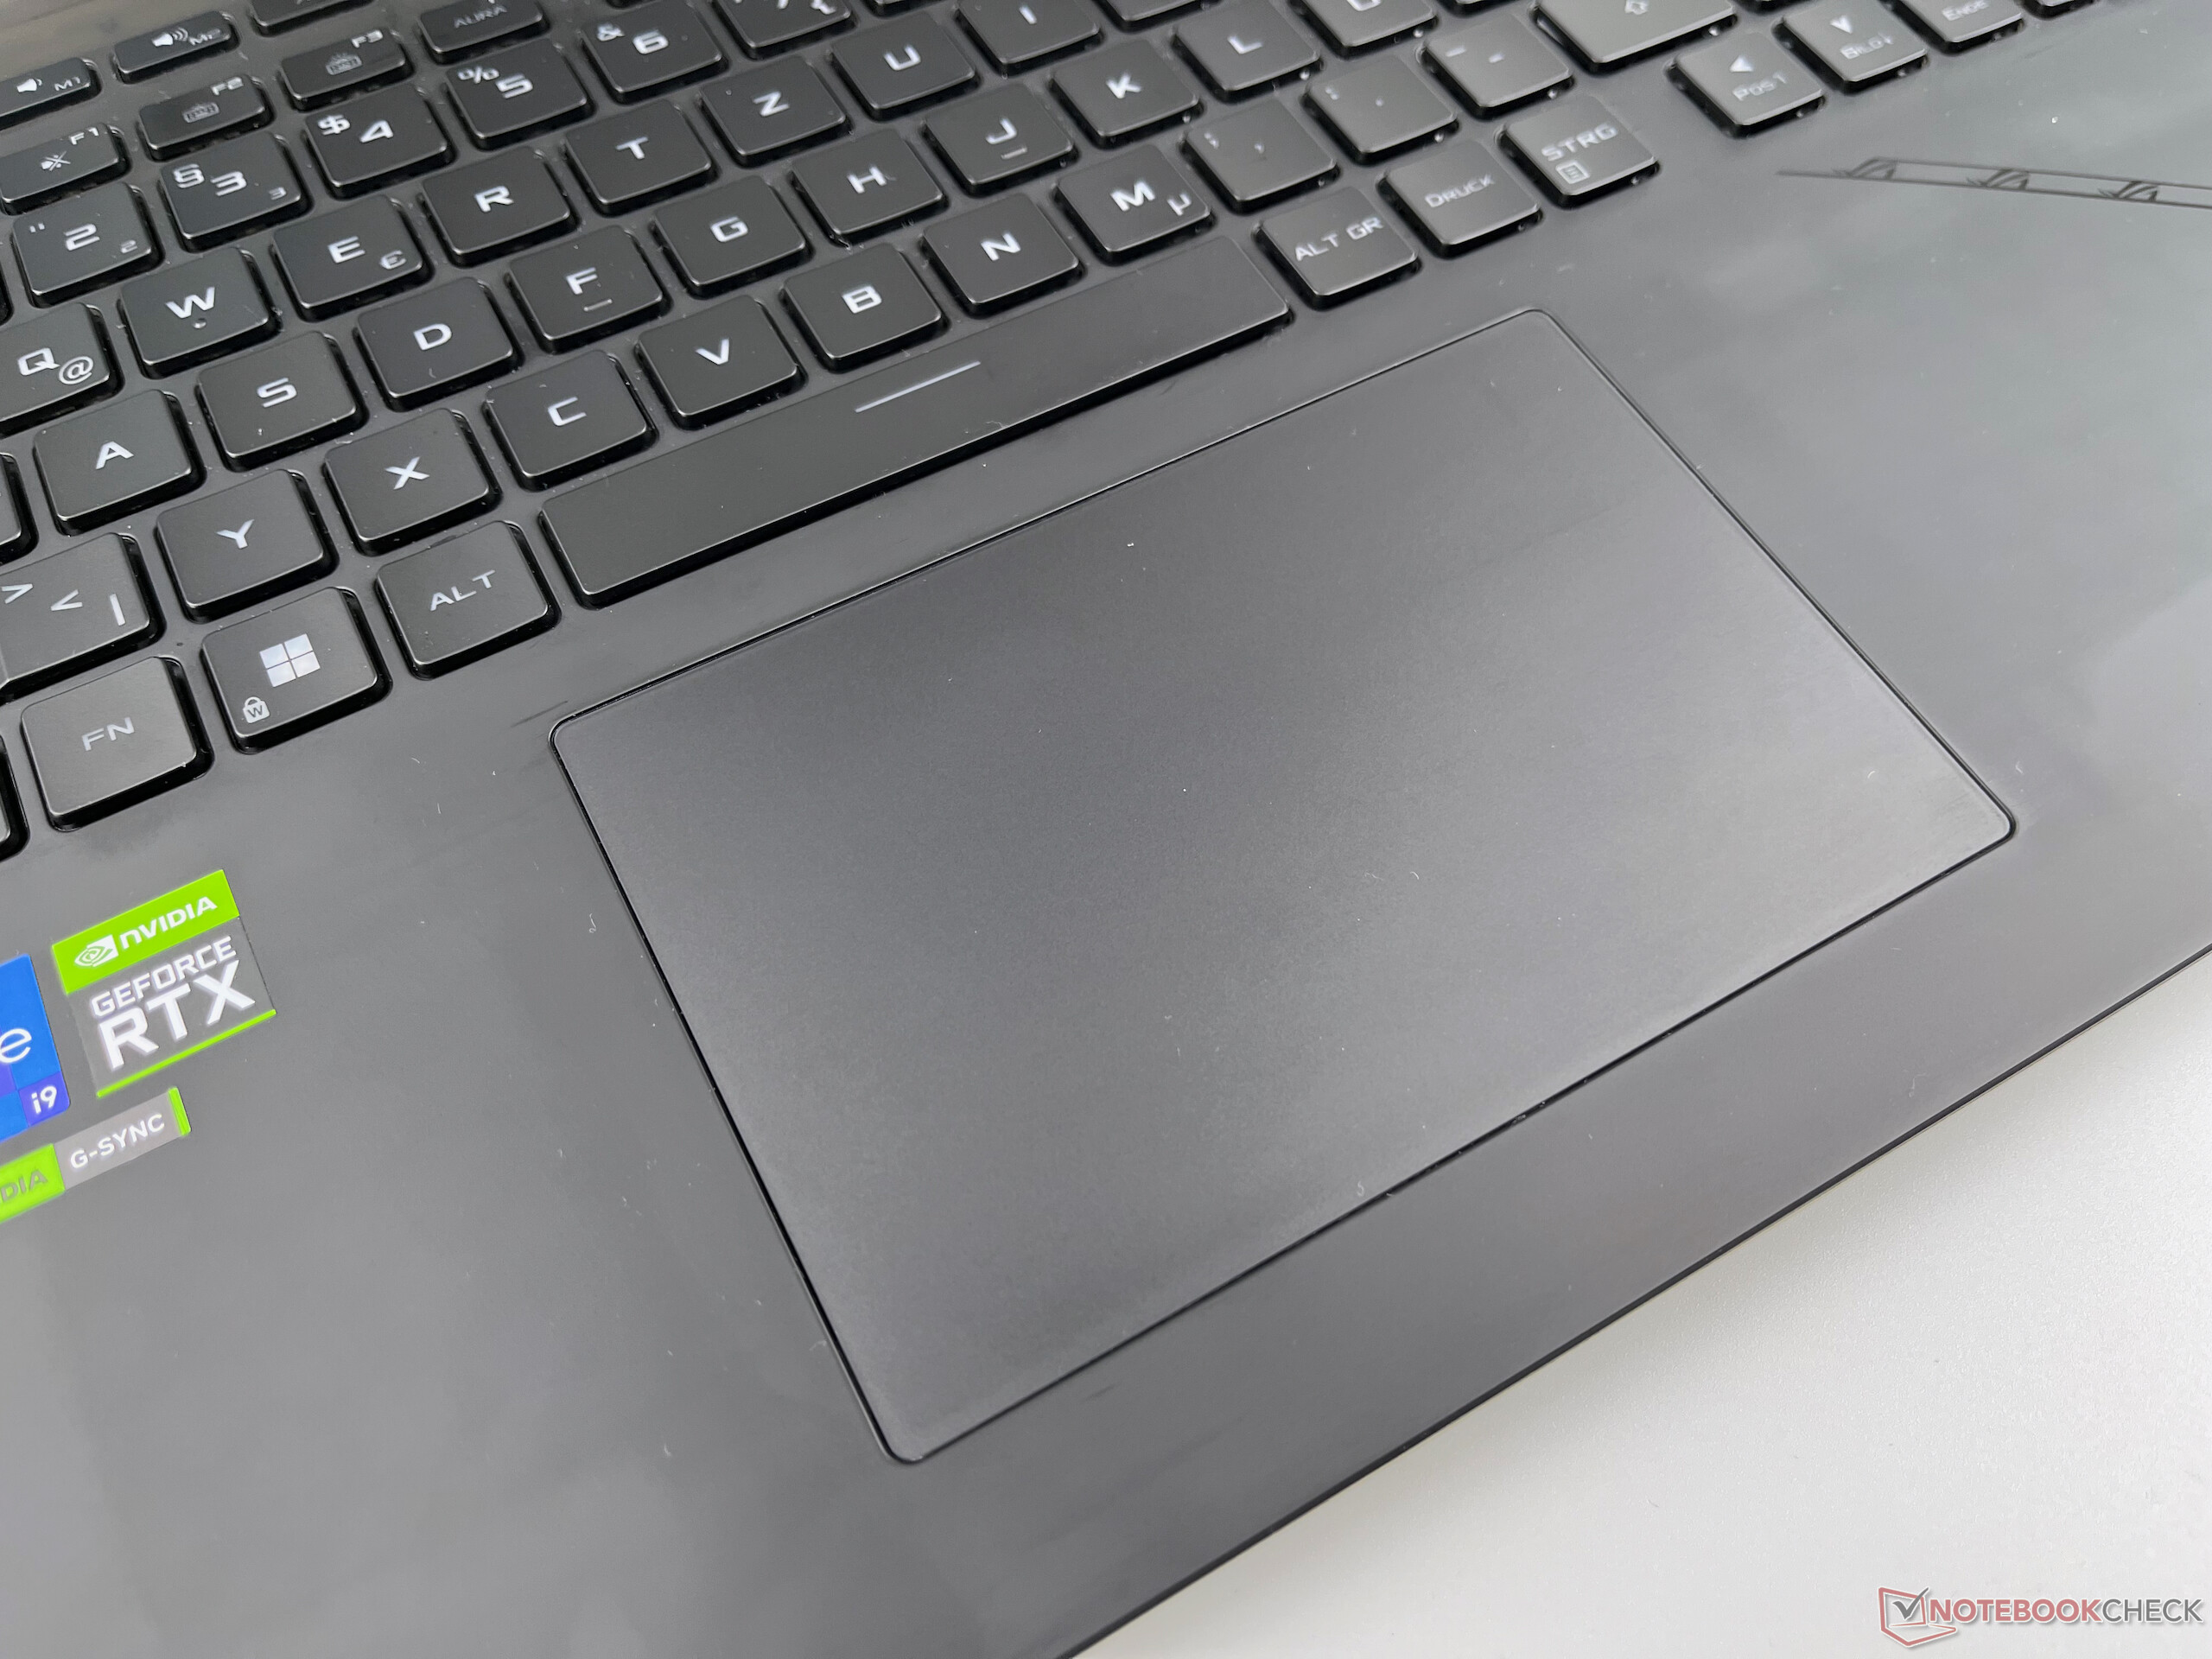
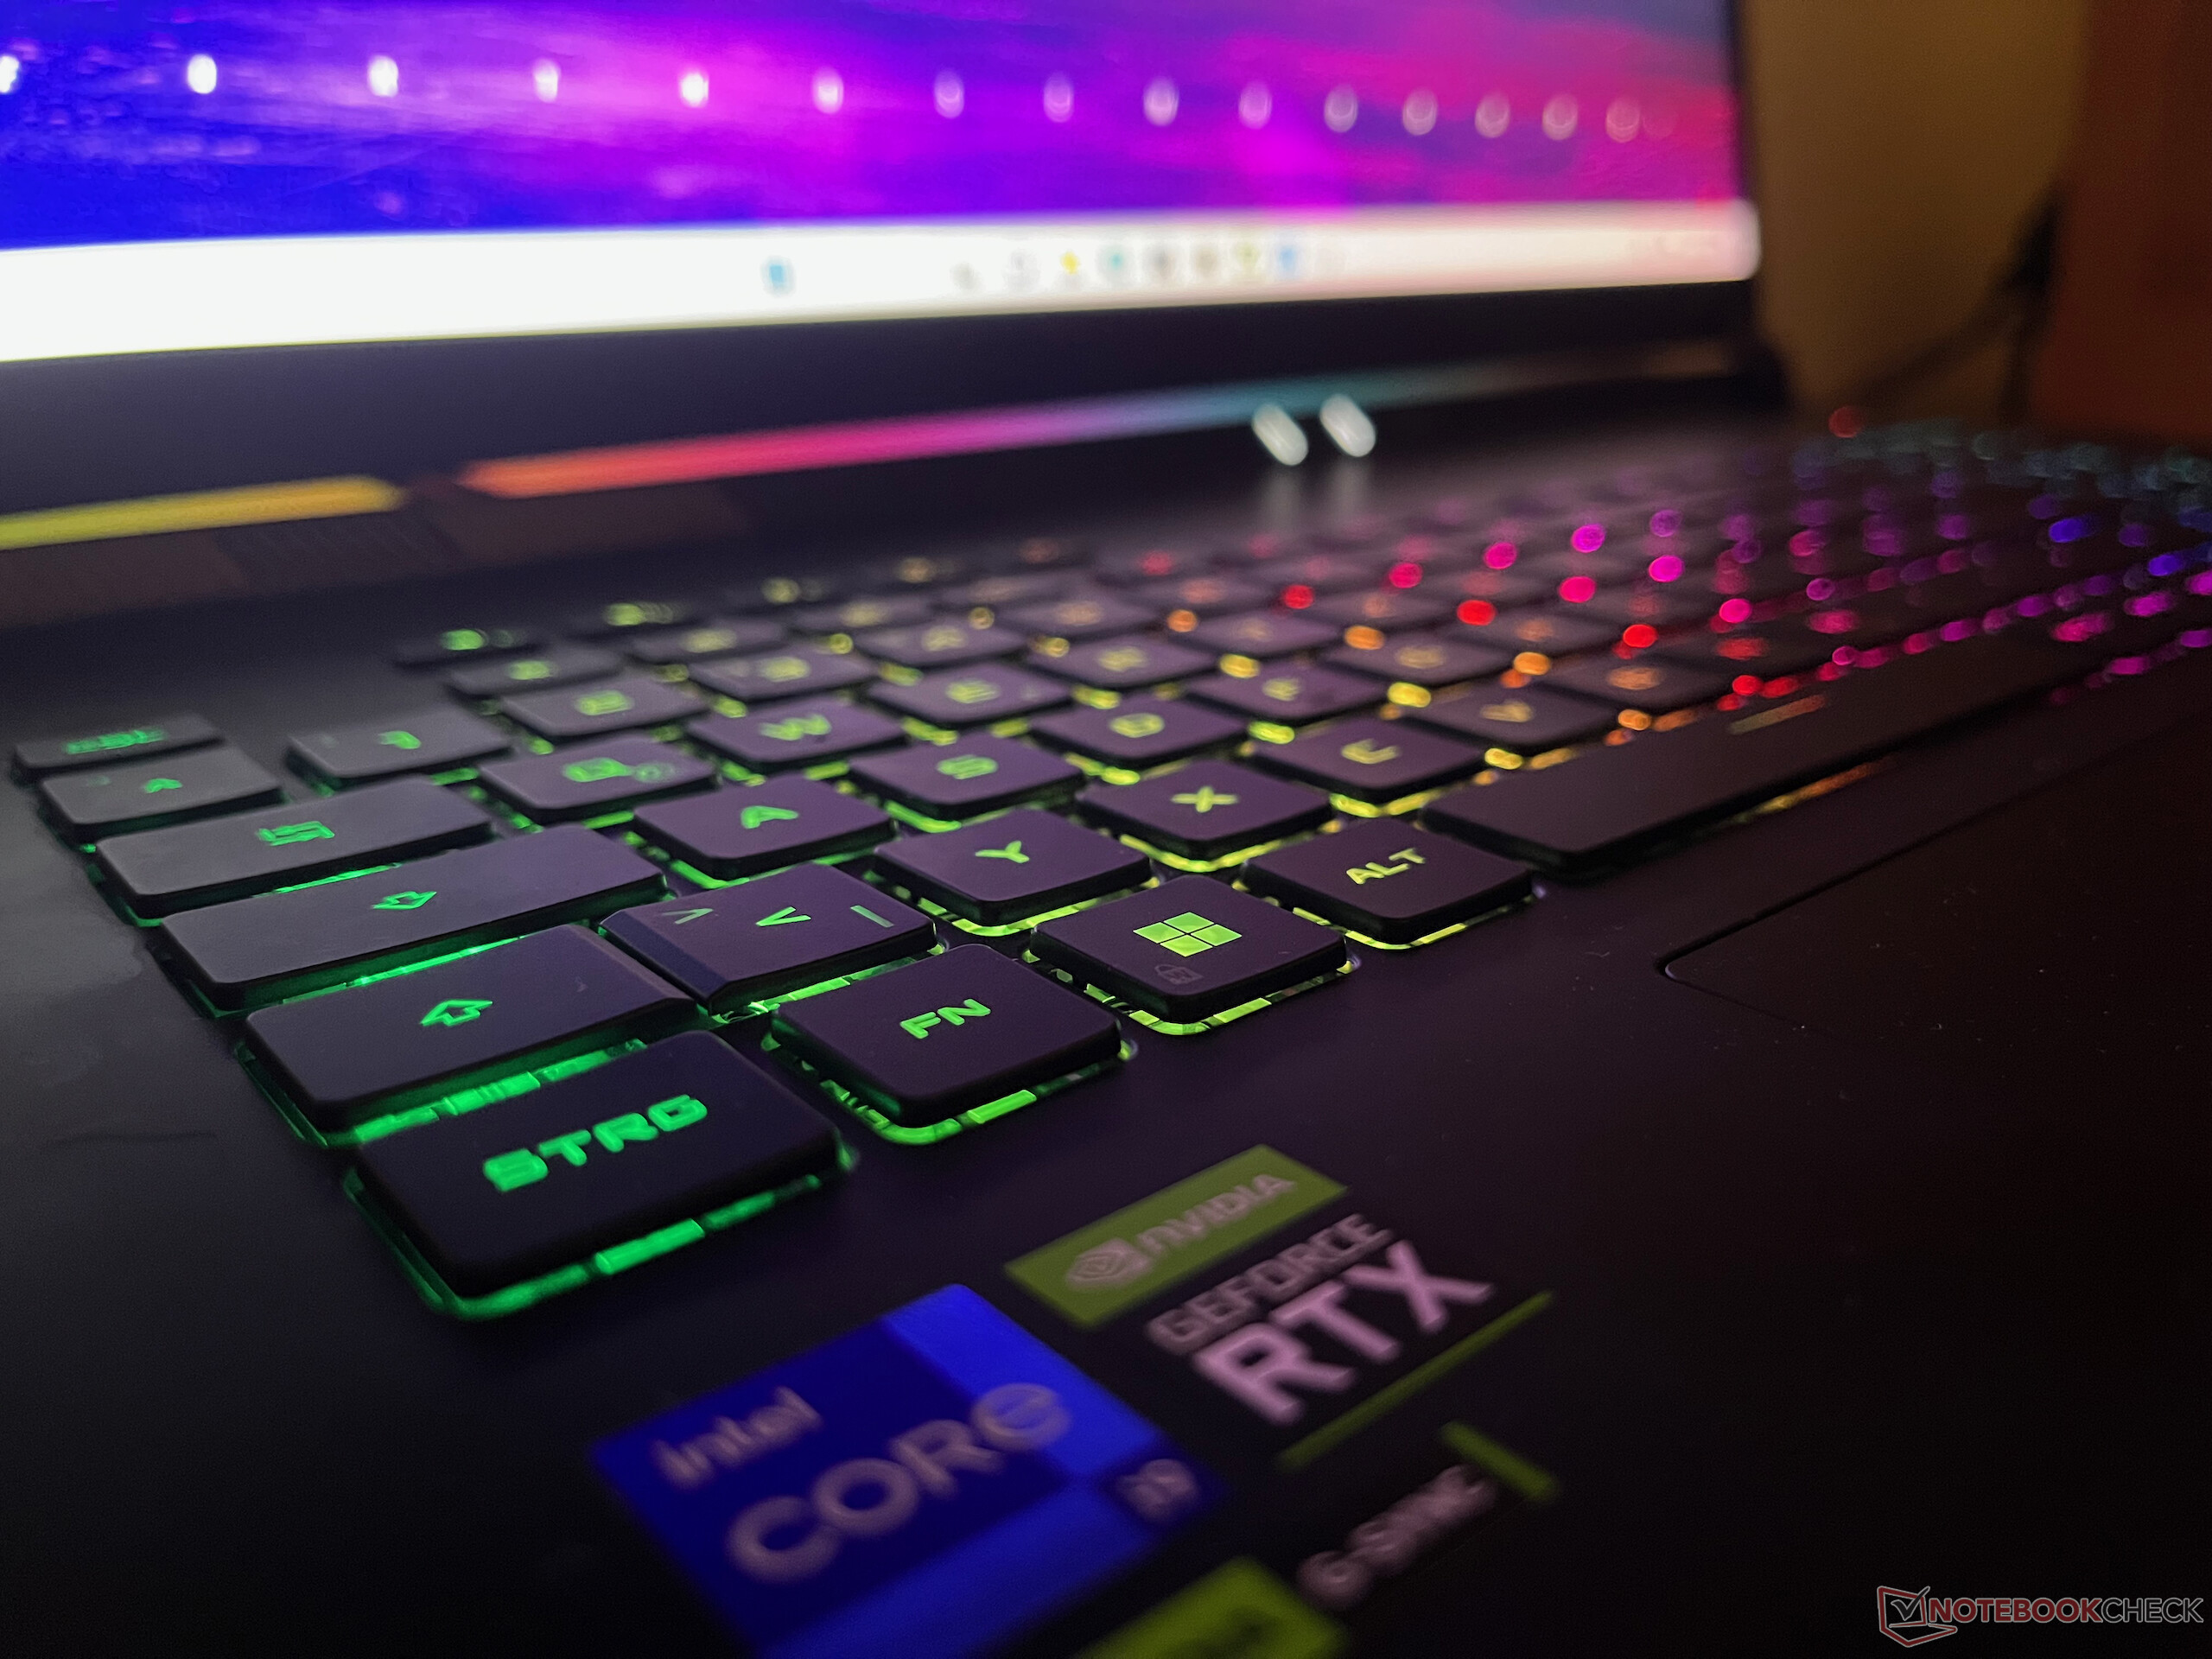
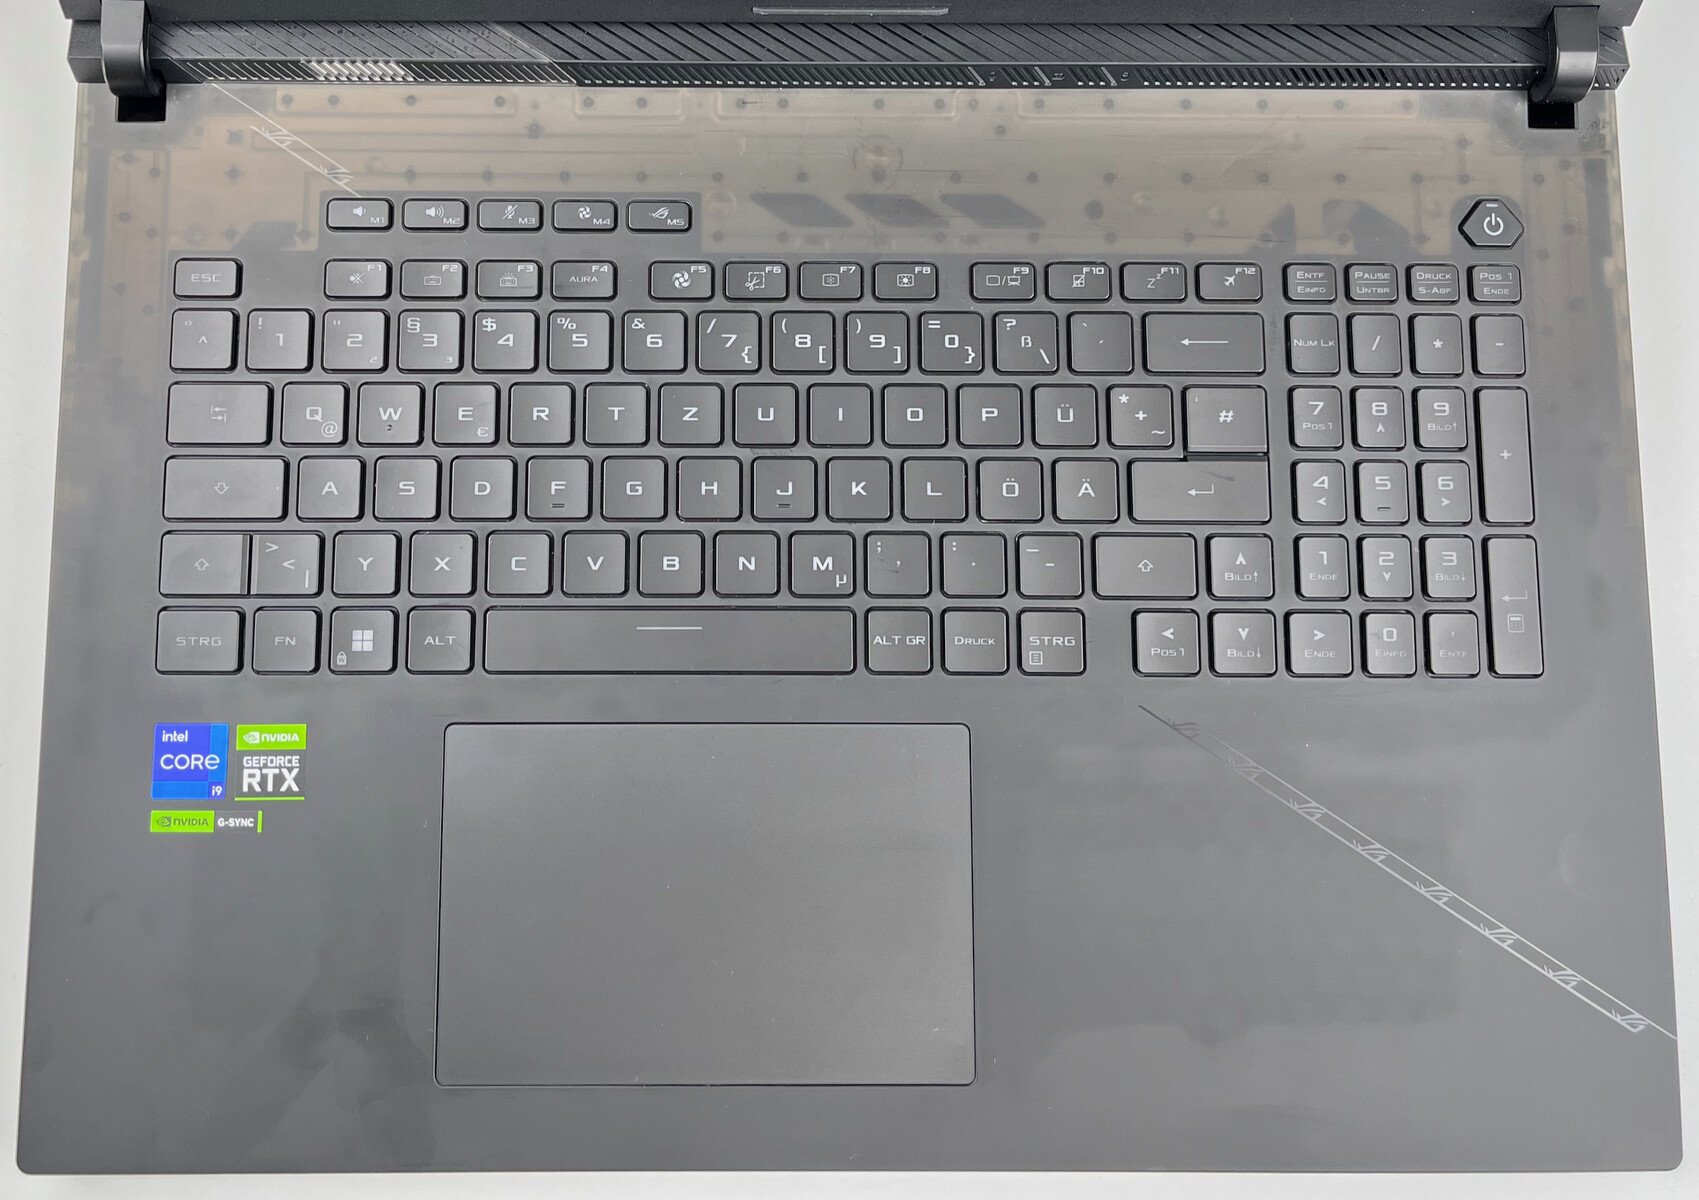
除了数字块之外,这里使用的全尺寸键盘还包括双倍使用的F1-F12行上面的五个特殊按键。小鸡键提供了足够的键程和安静的行程。在第一次打字测试中,作者达到了每分钟85字的好成绩,准确率为96%。独立按键的内置RGB背光可以通过许多动画进行个性化设置。在N个键的滚动测试中,我们没有看到任何限制(最大达到24个同时按键)。
触摸板
大型触摸板提供了一个玻璃表面和出色的滑动特性。在我们的测试中,多点触控工作无懈可击,下部4/5的区域也可以舒适地点击。然而,在右下角的点击经常被识别为按下鼠标右键,导致一些错误的输入。
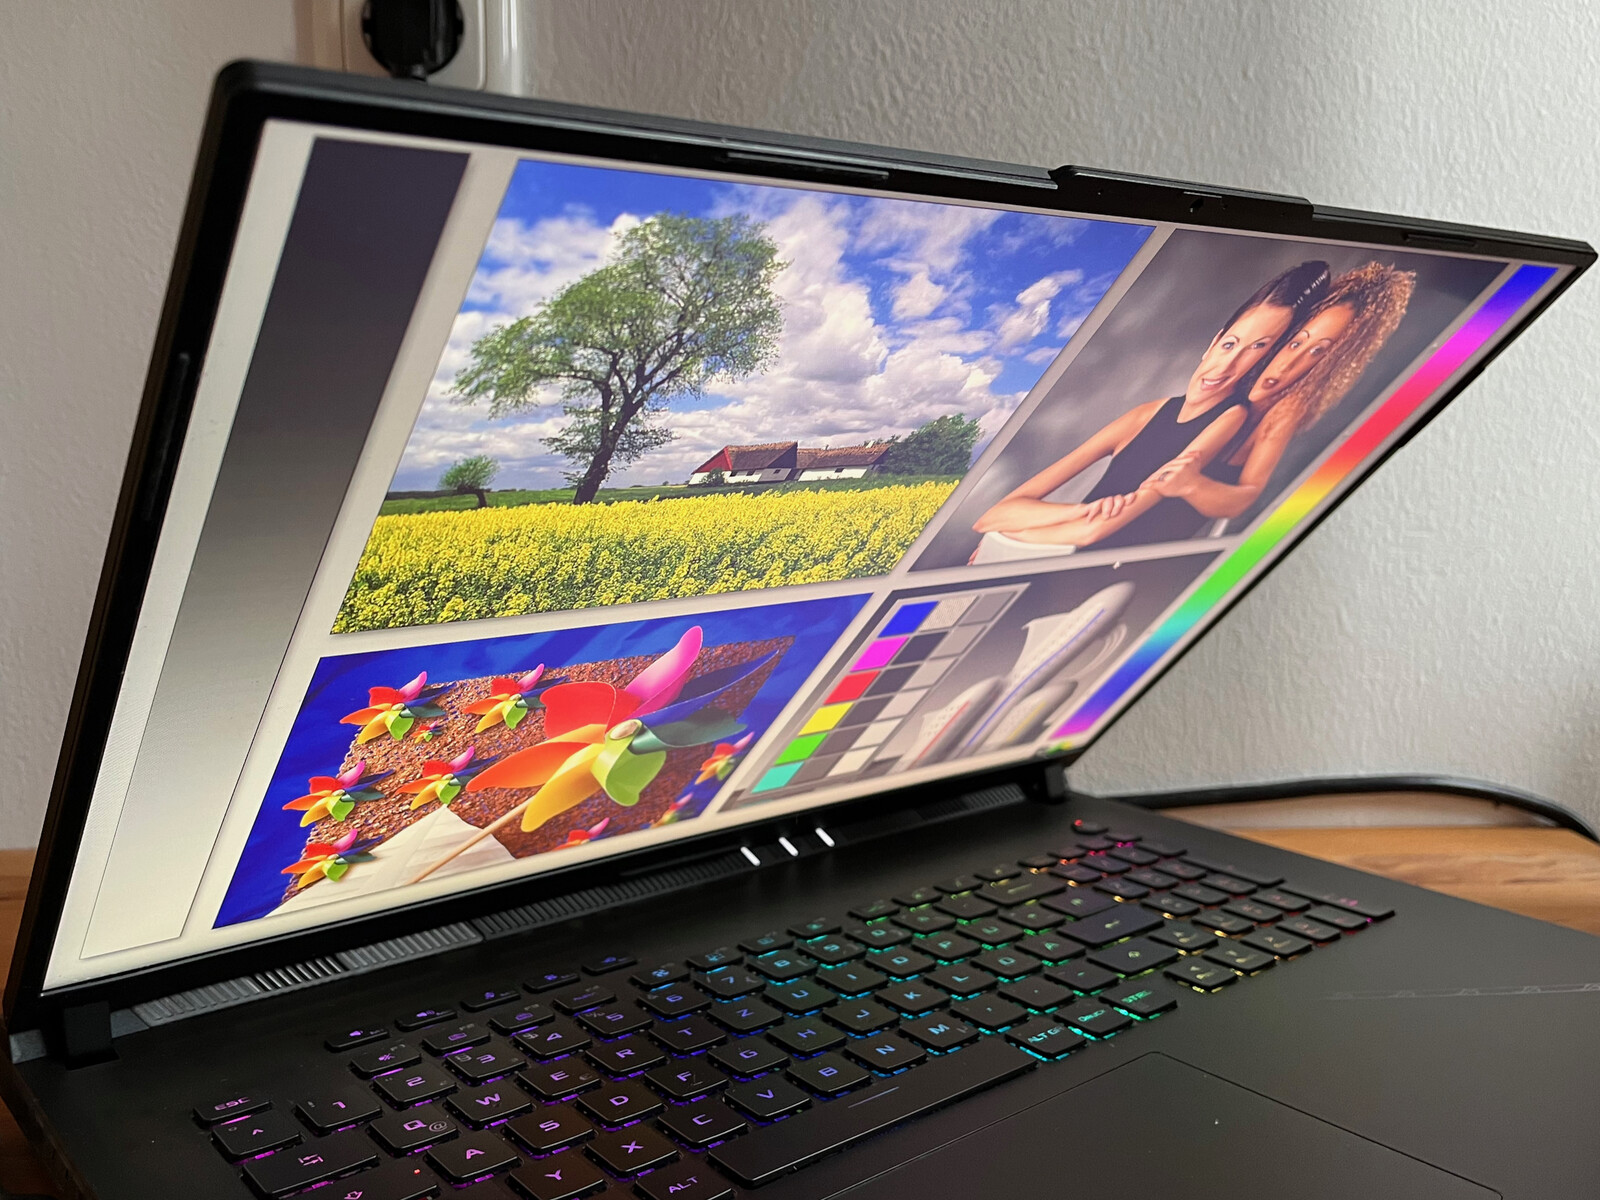
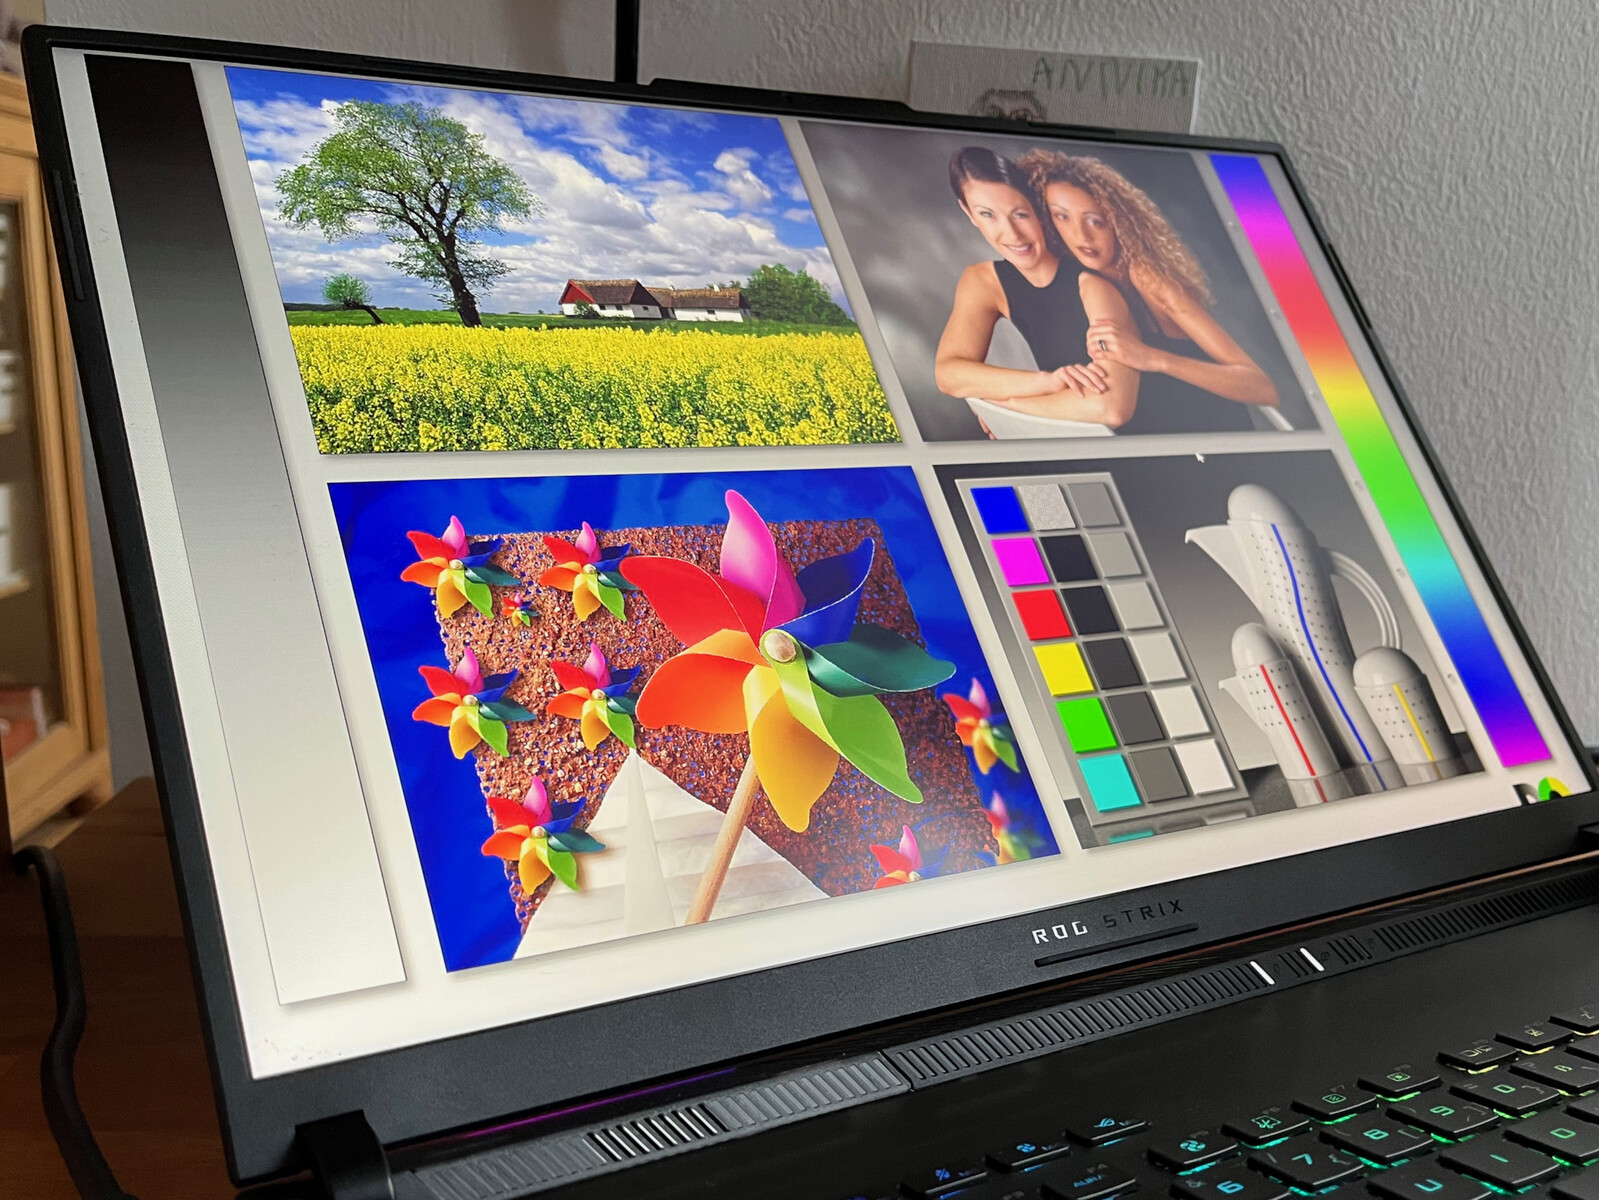
显示
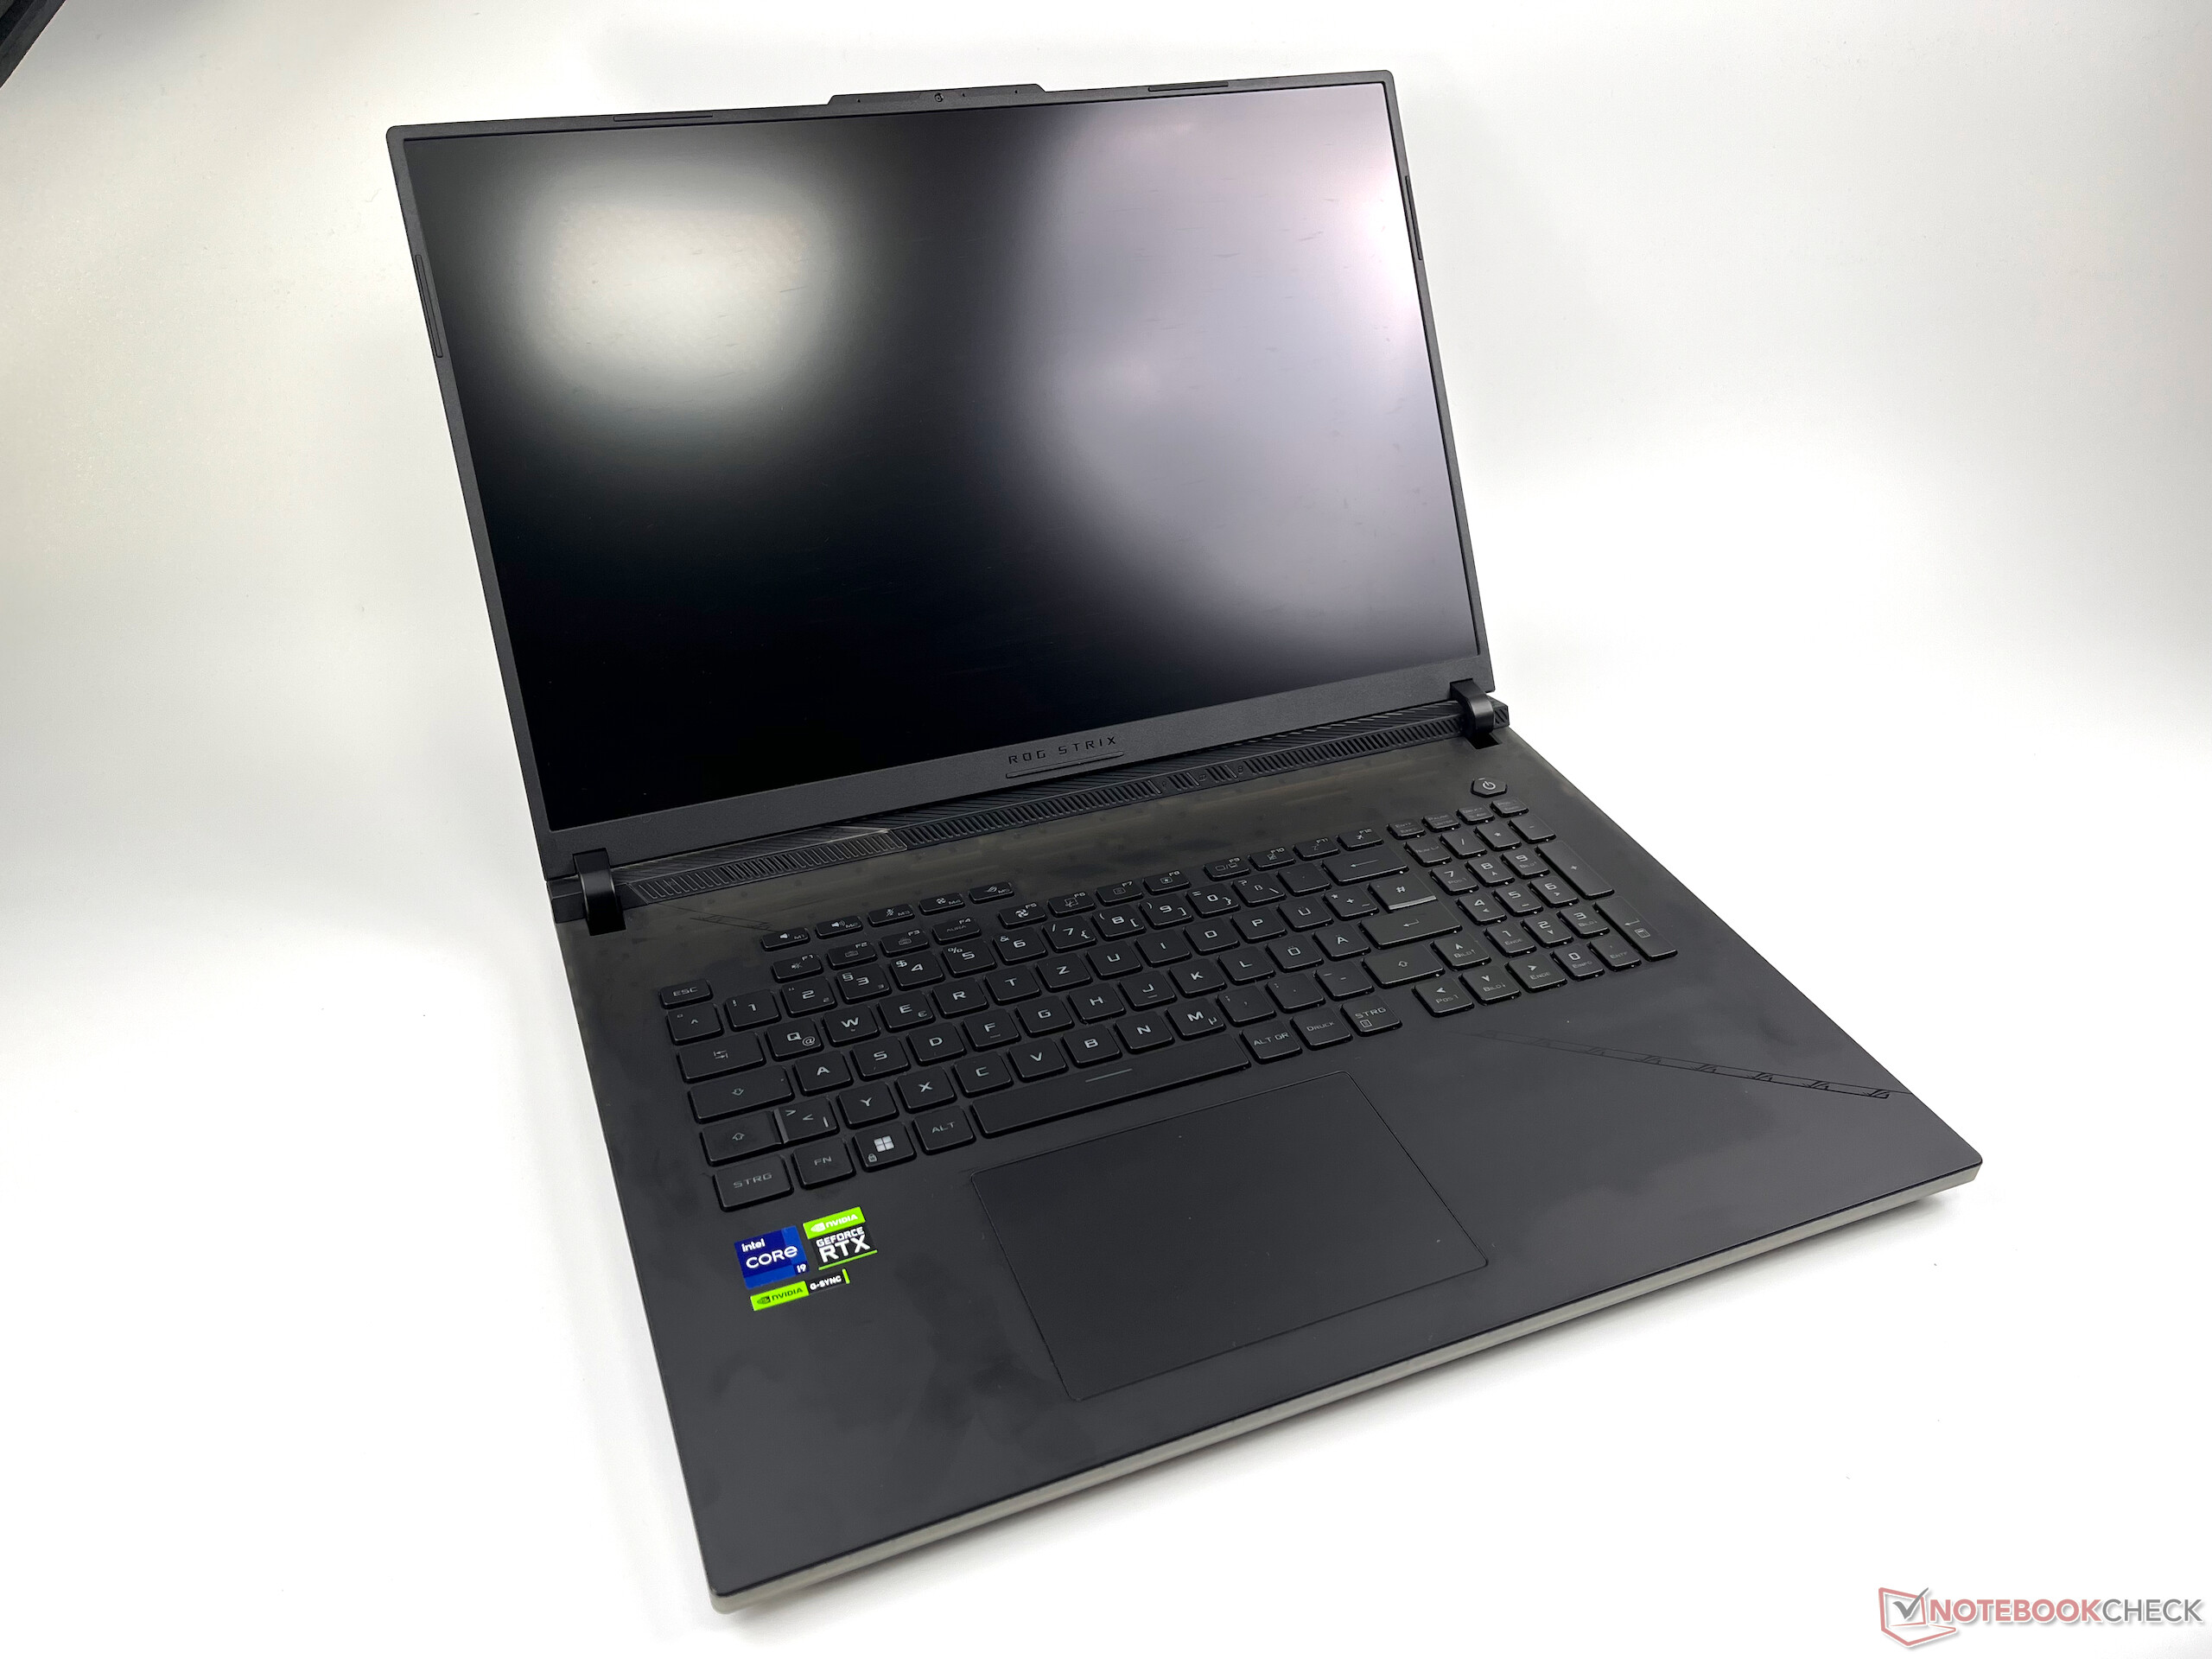
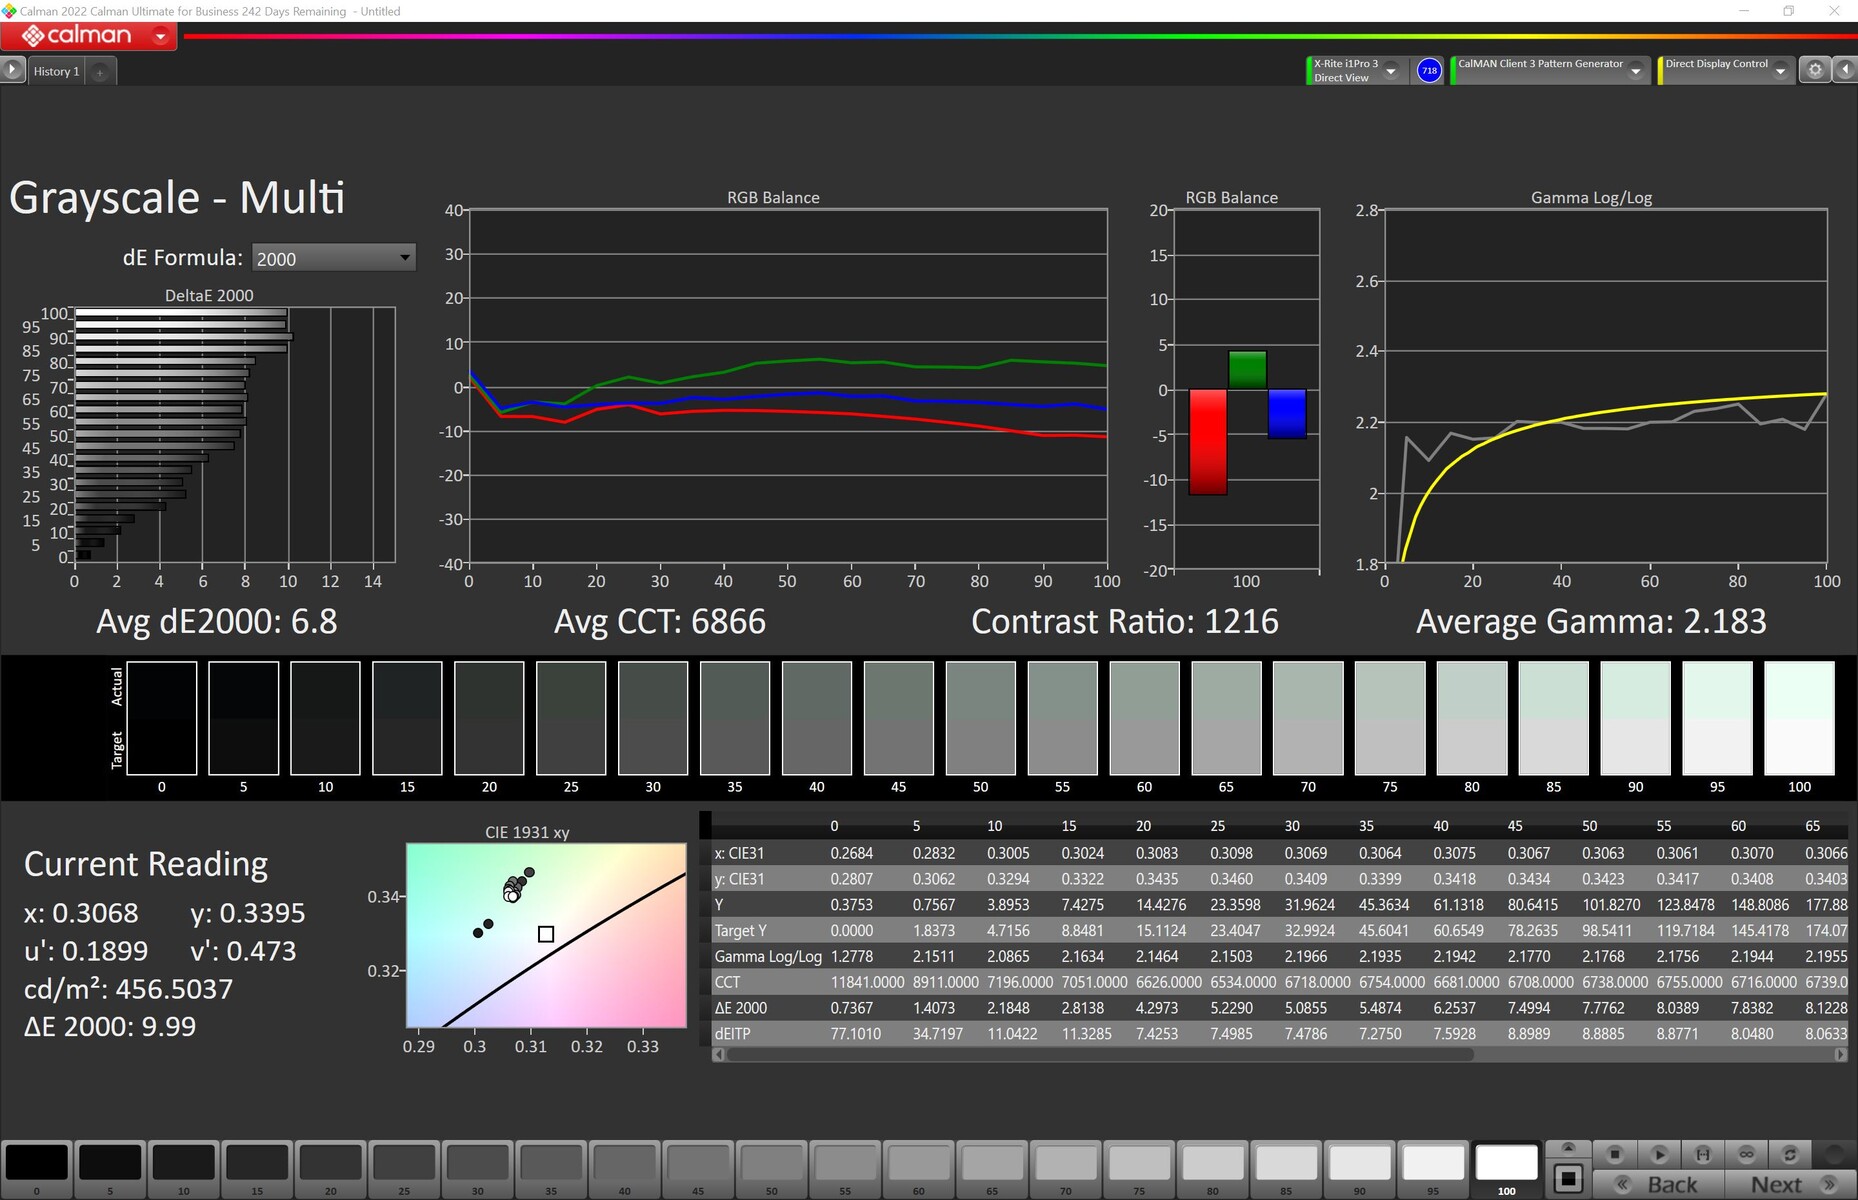
根据规格表,新的18英寸显示屏具有众多功能,如G-Sync、240赫兹、QHD+、3毫秒快速响应时间和DCI-P3色彩空间覆盖。在亮度方面,这个大型18英寸显示屏并没有完全达到承诺的500尼特。然而,亮度在室内肯定总是足够的,而且亮度分布也很好,达到86%。我们的测试装置没有显示任何可见的背光渗漏。
| |||||||||||||||||||||||||
Brightness Distribution: 86 %
Center on Battery: 490 cd/m²
Contrast: 907:1 (Black: 0.54 cd/m²)
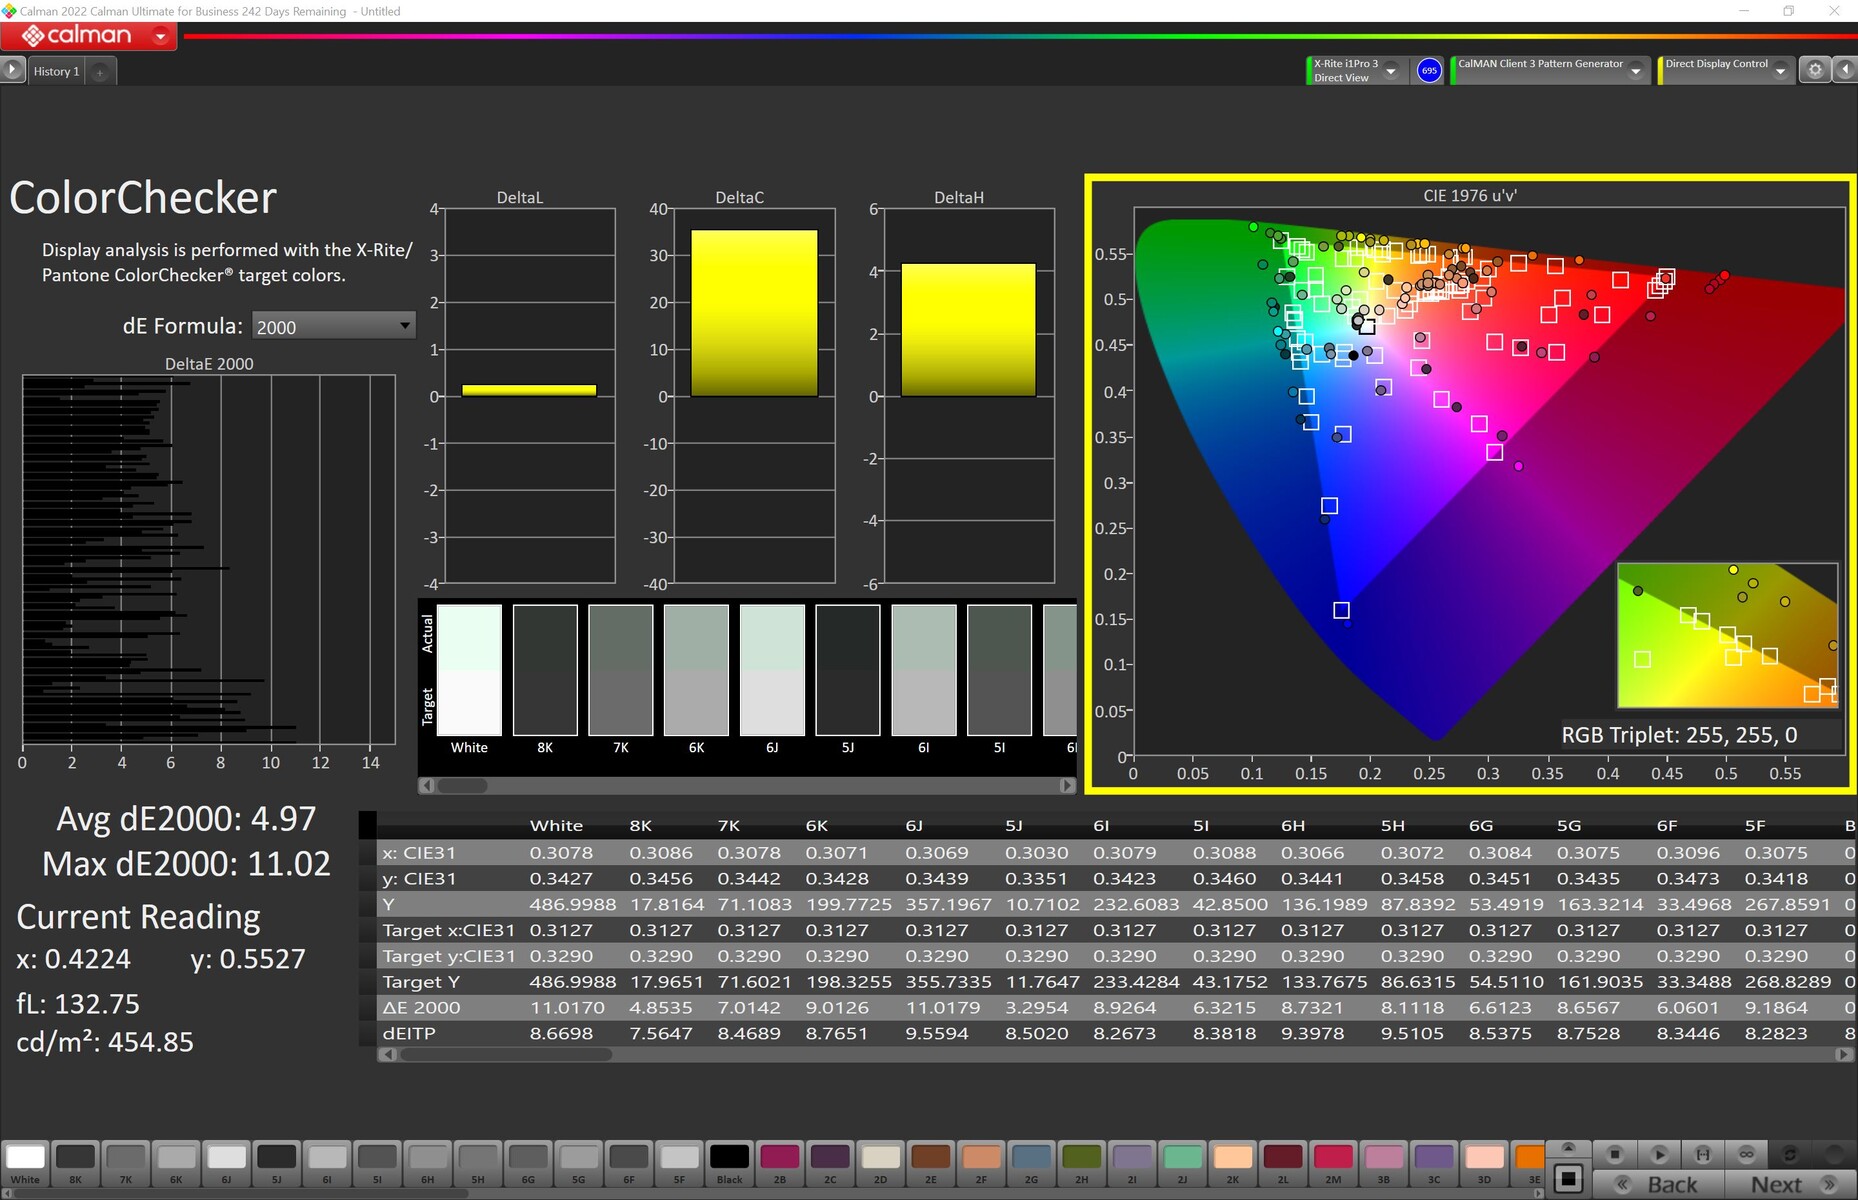
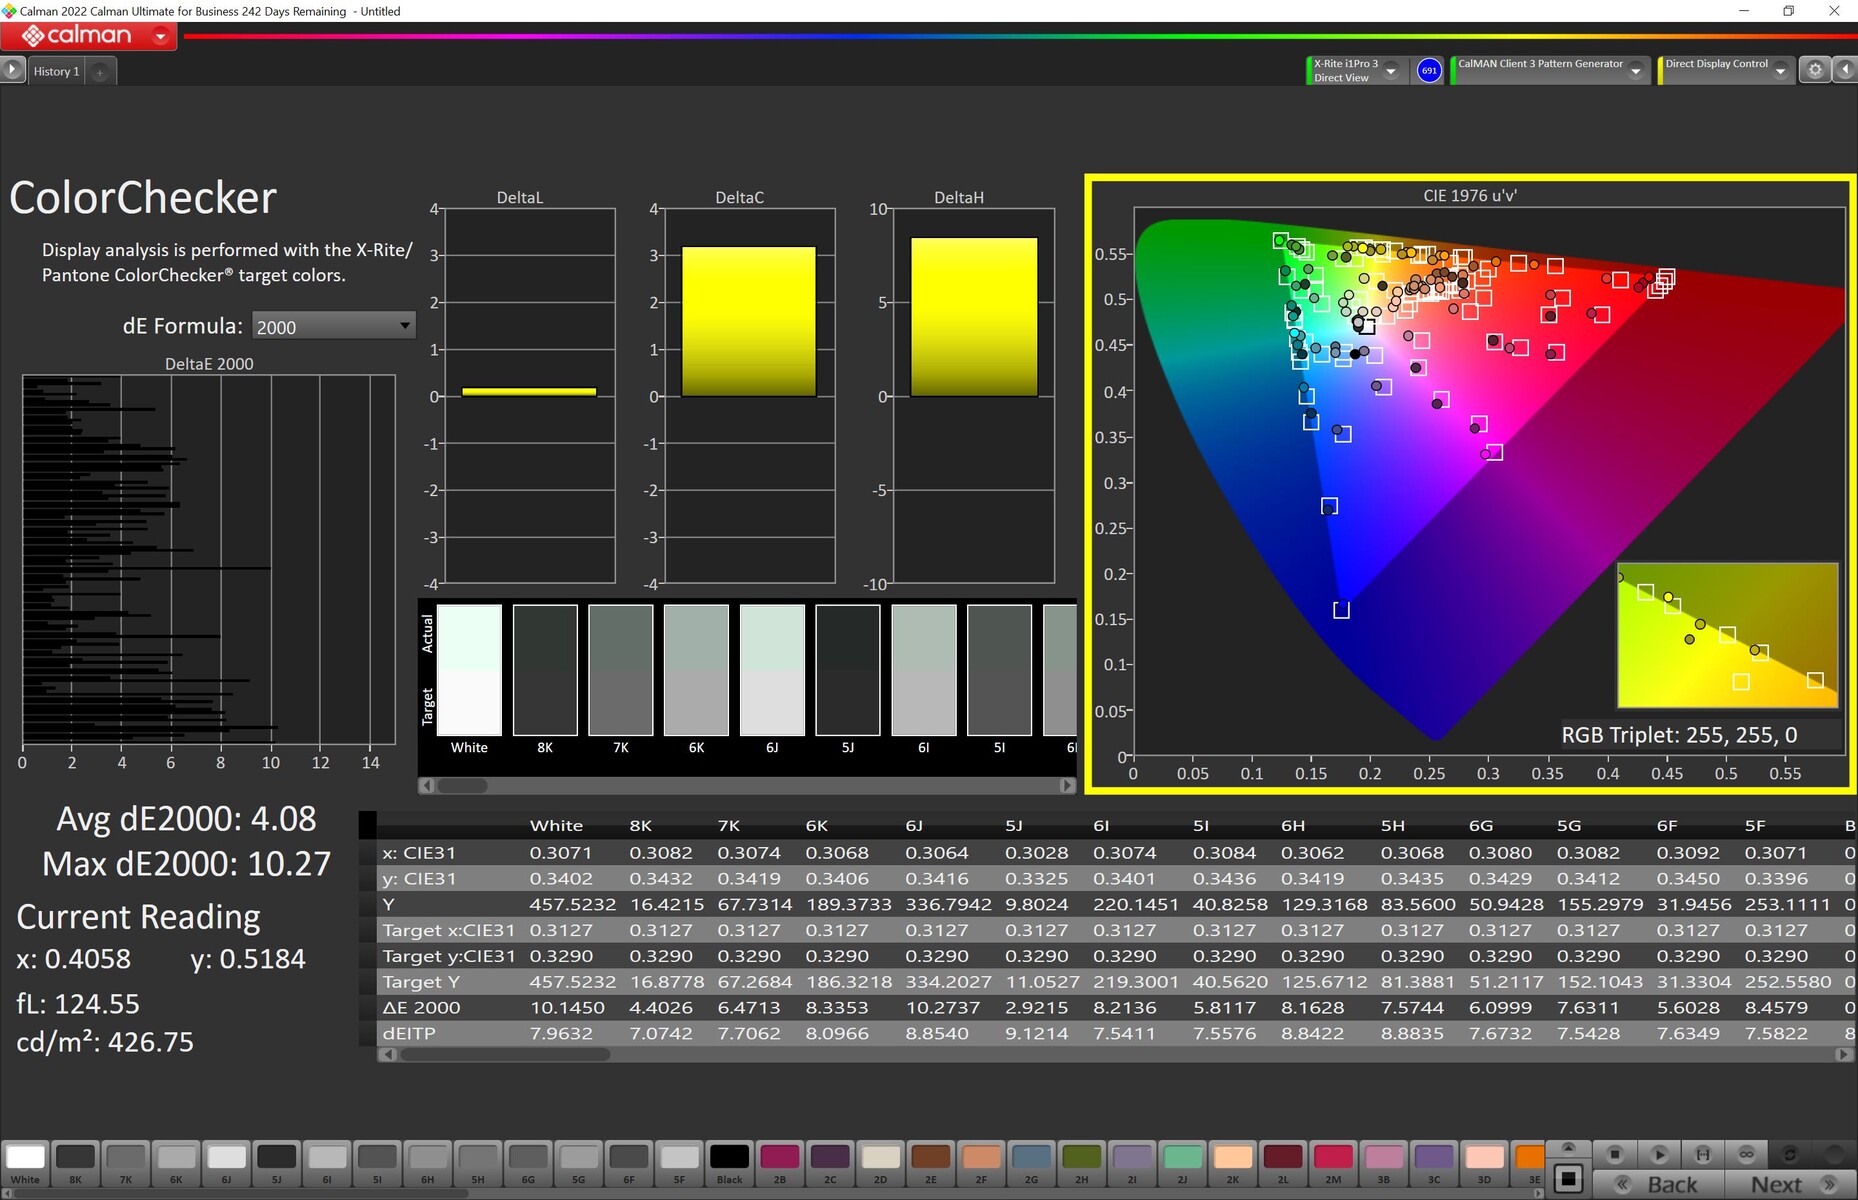
ΔE ColorChecker Calman: 4.97 | ∀{0.5-29.43 Ø4.71}
calibrated: 2.97
ΔE Greyscale Calman: 7.2 | ∀{0.09-98 Ø4.96}
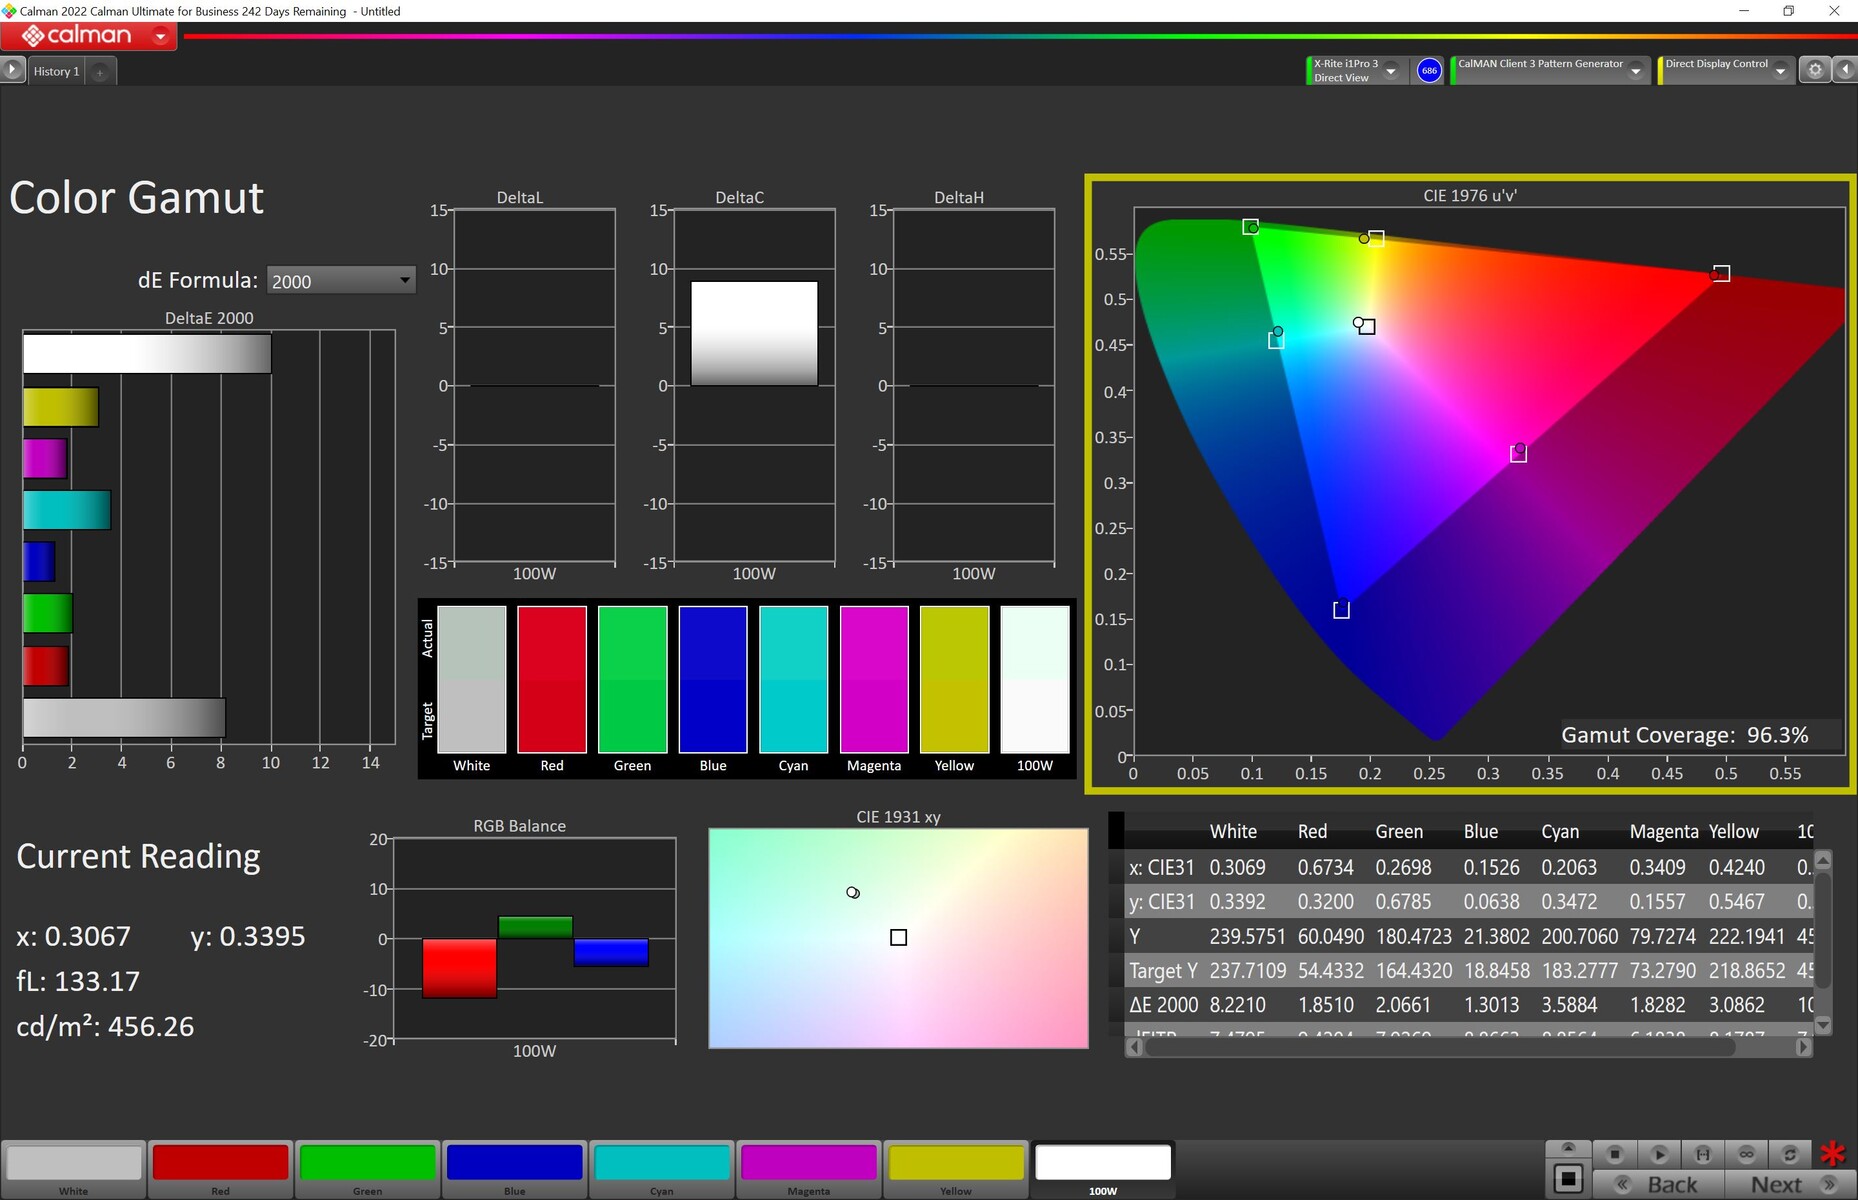
100% sRGB (Calman 2D)
84.9% AdobeRGB 1998 (Argyll 3D)
99.9% sRGB (Argyll 3D)
97.2% Display P3 (Argyll 3D)
Gamma: 2.161
CCT: 6515 K
| Asus ROG Strix Scar 18 2023 G834JY-N6005W NE180QDM-NZ2, IPS, 2560x1600, 18" | Razer Blade 18 RTX 4070 AU Optronics B180QAN01.0, IPS, 2560x1600, 18" | MSI Titan GT77 HX 13VI B173ZAN06.C, Mini-LED, 3840x2160, 17.3" | Asus ROG Strix Scar 17 SE G733CX-LL014W NE173QHM-NZ2, IPS, 2560x1440, 17.3" | |
|---|---|---|---|---|
| Display | 0% | 2% | 0% | |
| Display P3 Coverage (%) | 97.2 | 96.9 0% | 94.9 -2% | 97.1 0% |
| sRGB Coverage (%) | 99.9 | 99.8 0% | 99.9 0% | 99.9 0% |
| AdobeRGB 1998 Coverage (%) | 84.9 | 85.3 0% | 92.4 9% | 84.8 0% |
| Response Times | 15% | -410% | -11% | |
| Response Time Grey 50% / Grey 80% * (ms) | 5.41 ? | 4.2 ? 22% | 38.4 ? -610% | 5.7 ? -5% |
| Response Time Black / White * (ms) | 8.62 ? | 8 ? 7% | 26.6 ? -209% | 10.1 ? -17% |
| PWM Frequency (Hz) | 2380 ? | |||
| Screen | 22% | 74253% | 29% | |
| Brightness middle (cd/m²) | 490 | 549.6 12% | 606 24% | 320 -35% |
| Brightness (cd/m²) | 468 | 524 12% | 602 29% | 303 -35% |
| Brightness Distribution (%) | 86 | 89 3% | 93 8% | 87 1% |
| Black Level * (cd/m²) | 0.54 | 0.53 2% | 0.0001 100% | 0.3 44% |
| Contrast (:1) | 907 | 1037 14% | 6060000 668037% | 1067 18% |
| Colorchecker dE 2000 * | 4.97 | 3.32 33% | 4.8 3% | 1.1 78% |
| Colorchecker dE 2000 max. * | 11.02 | 6.63 40% | 8.2 26% | 2.7 75% |
| Colorchecker dE 2000 calibrated * | 2.97 | 2.7 9% | 1.8 39% | |
| Greyscale dE 2000 * | 7.2 | 2 72% | 6.5 10% | 1.1 85% |
| Gamma | 2.161 102% | 2.29 96% | 2.63 84% | 2.13 103% |
| CCT | 6515 100% | 6319 103% | 6596 99% | 6599 98% |
| Total Average (Program / Settings) | 12% /
16% | 24615% /
47676% | 6% /
16% |
* ... smaller is better
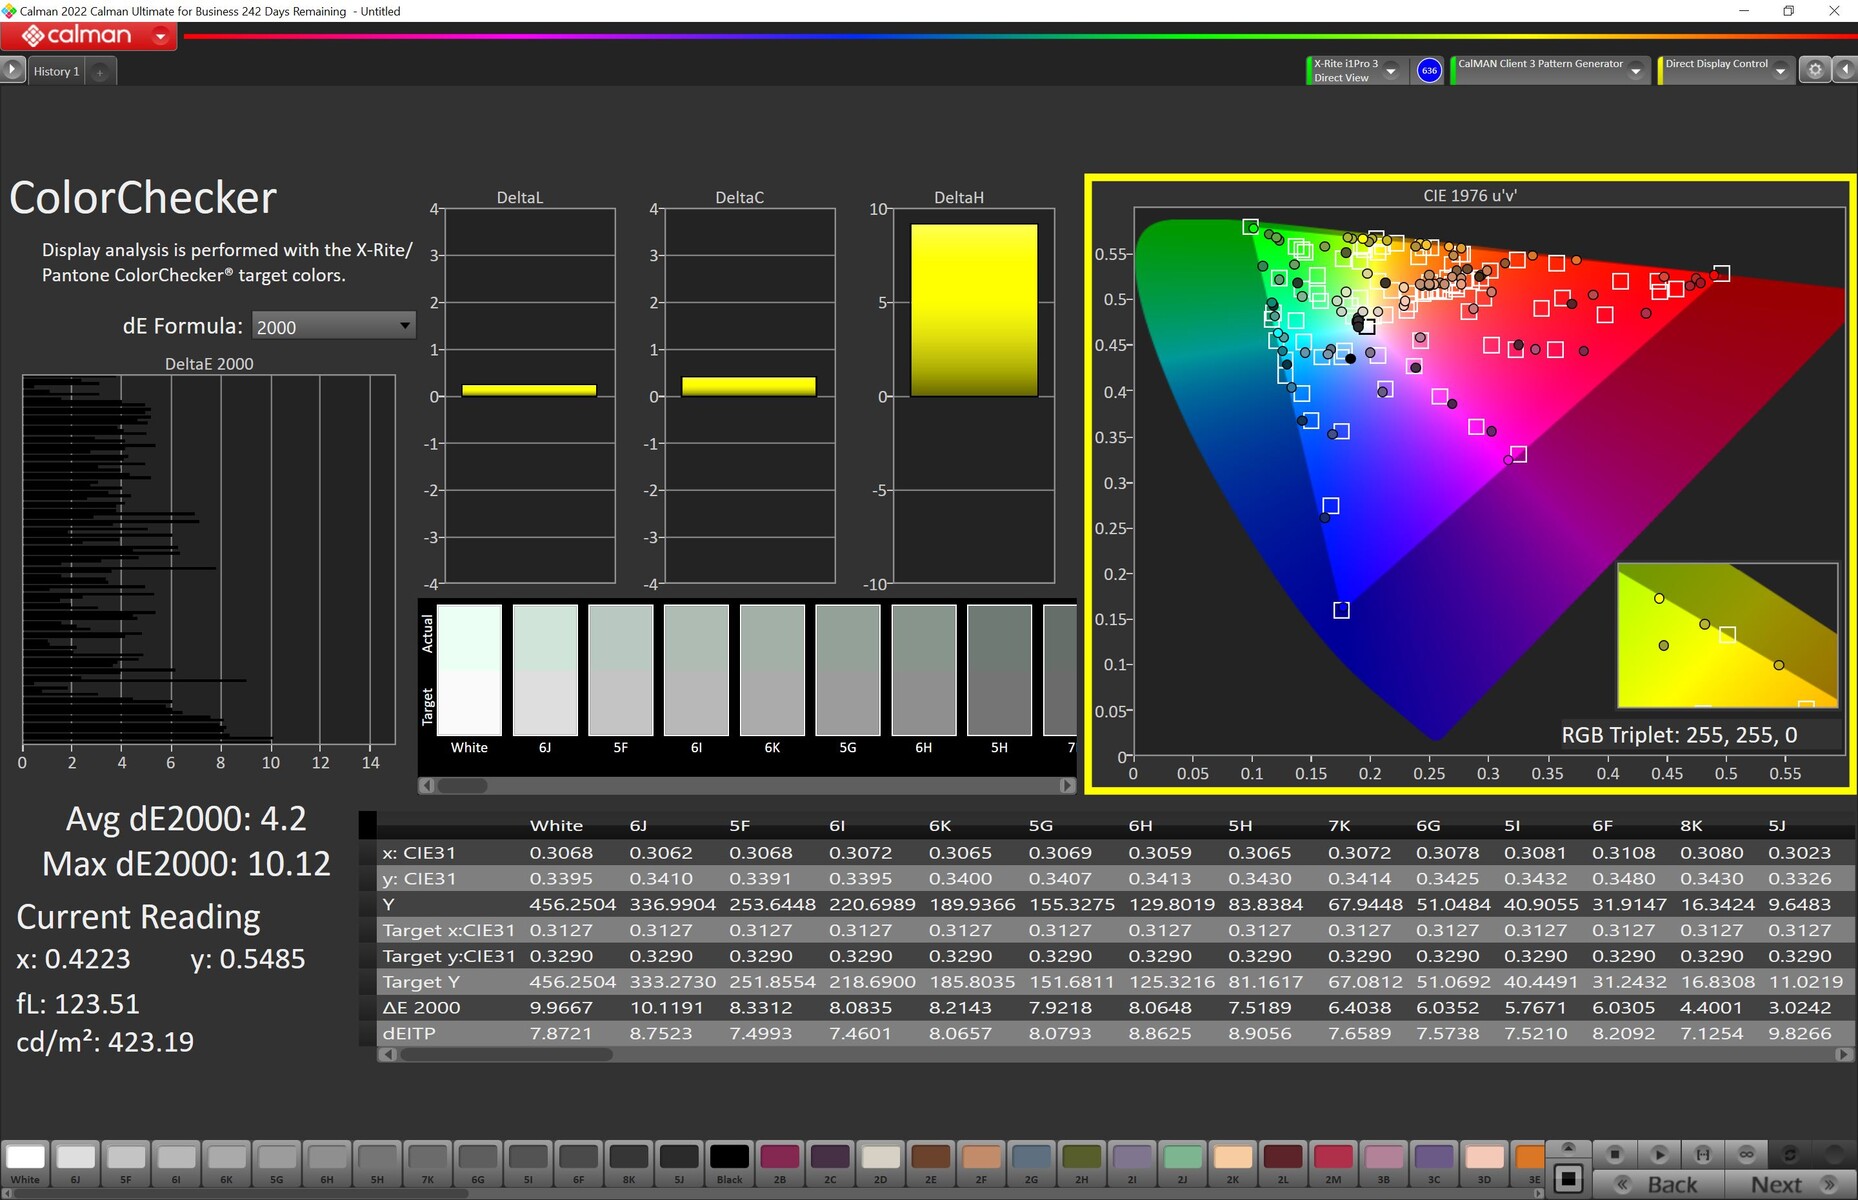
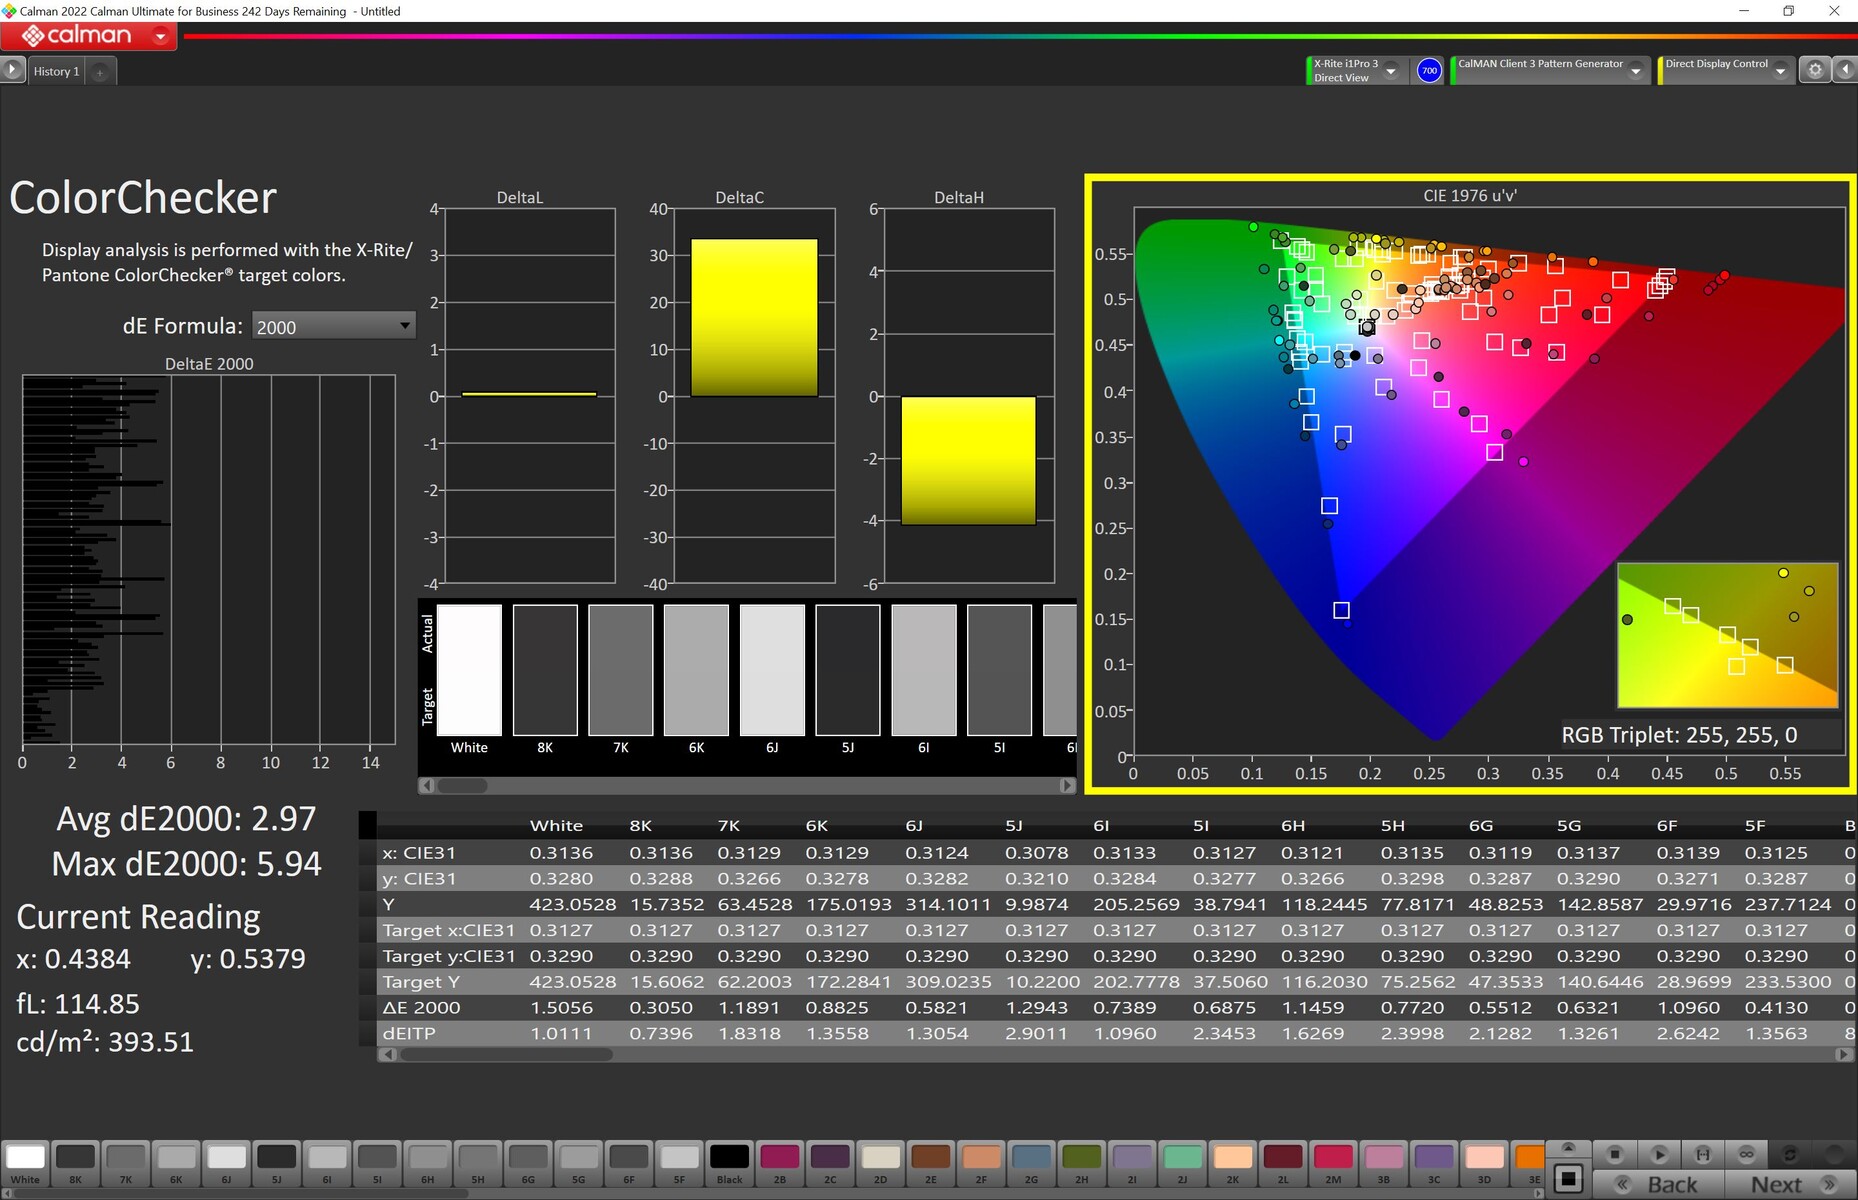
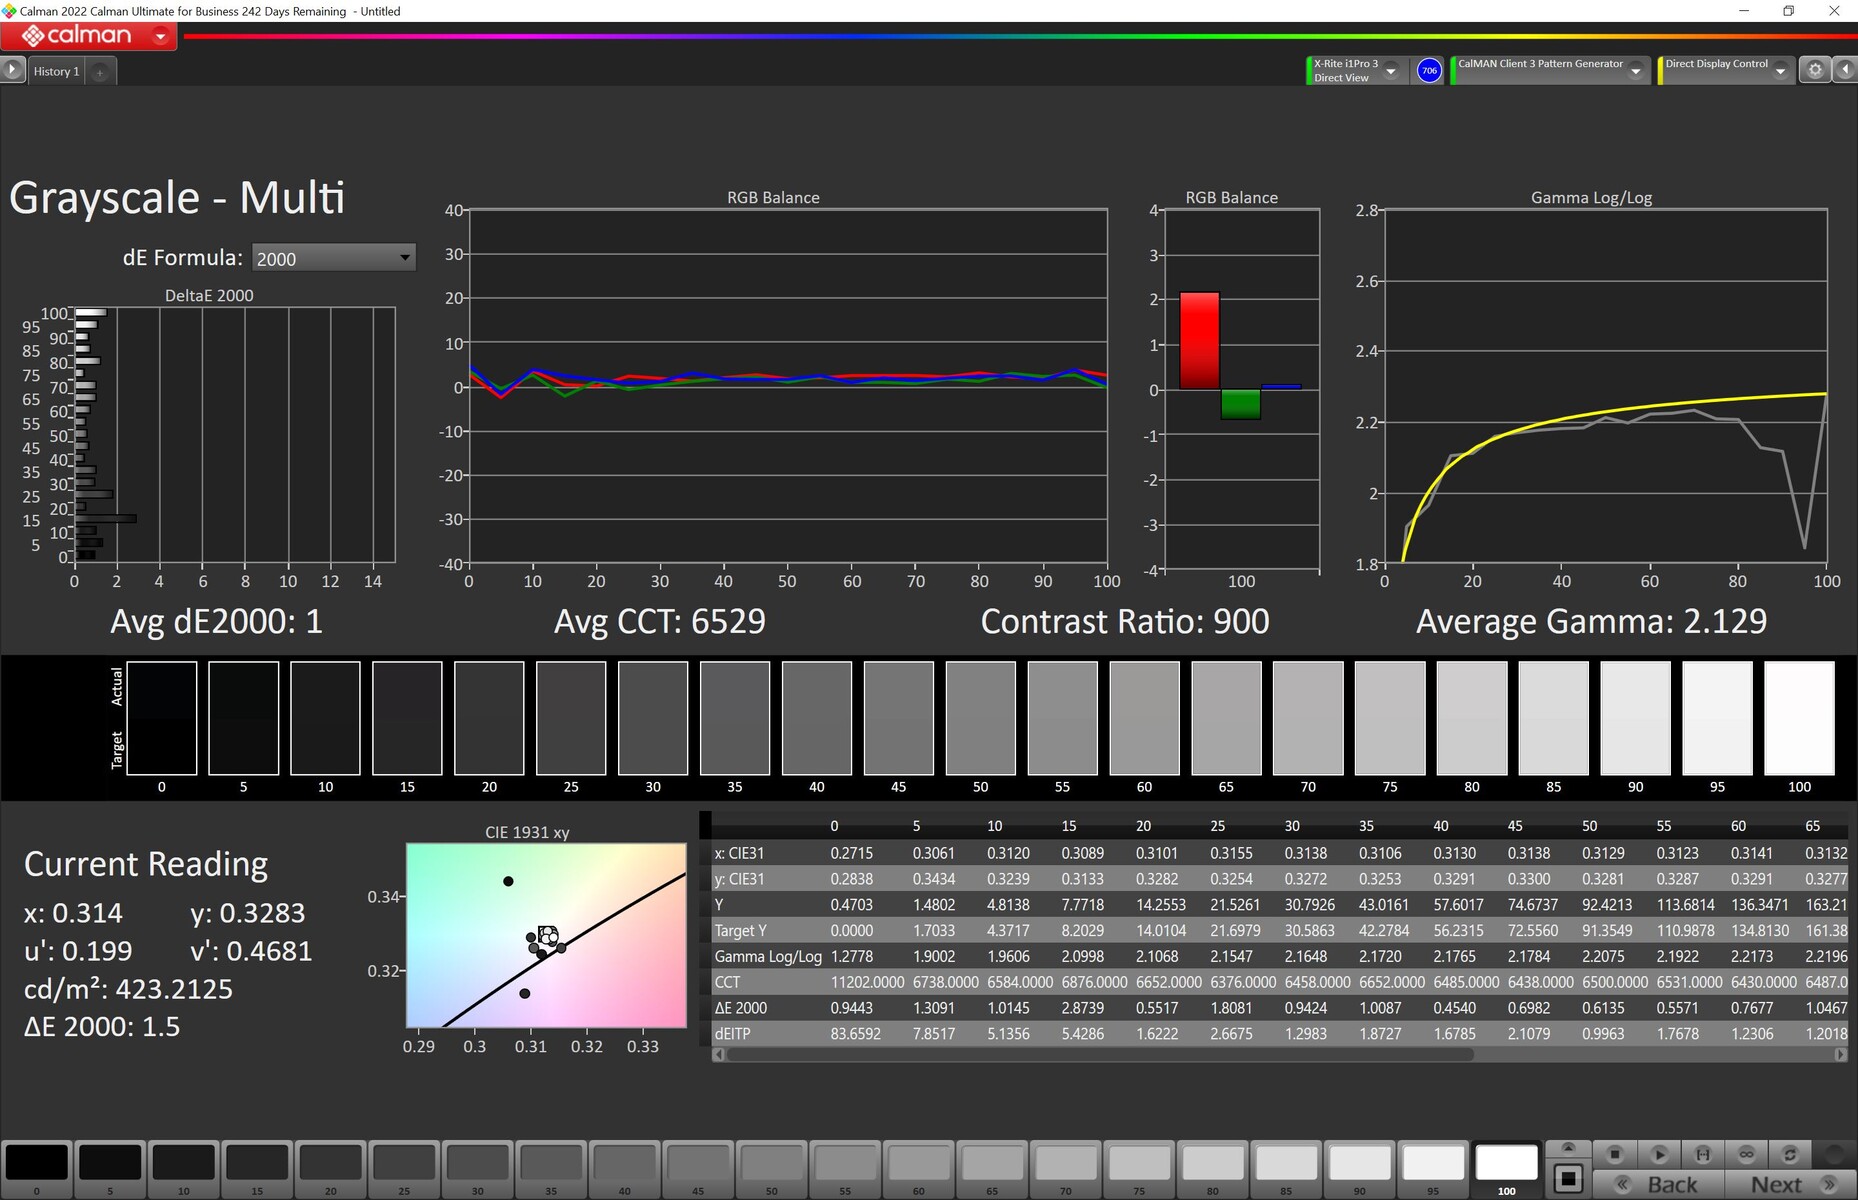
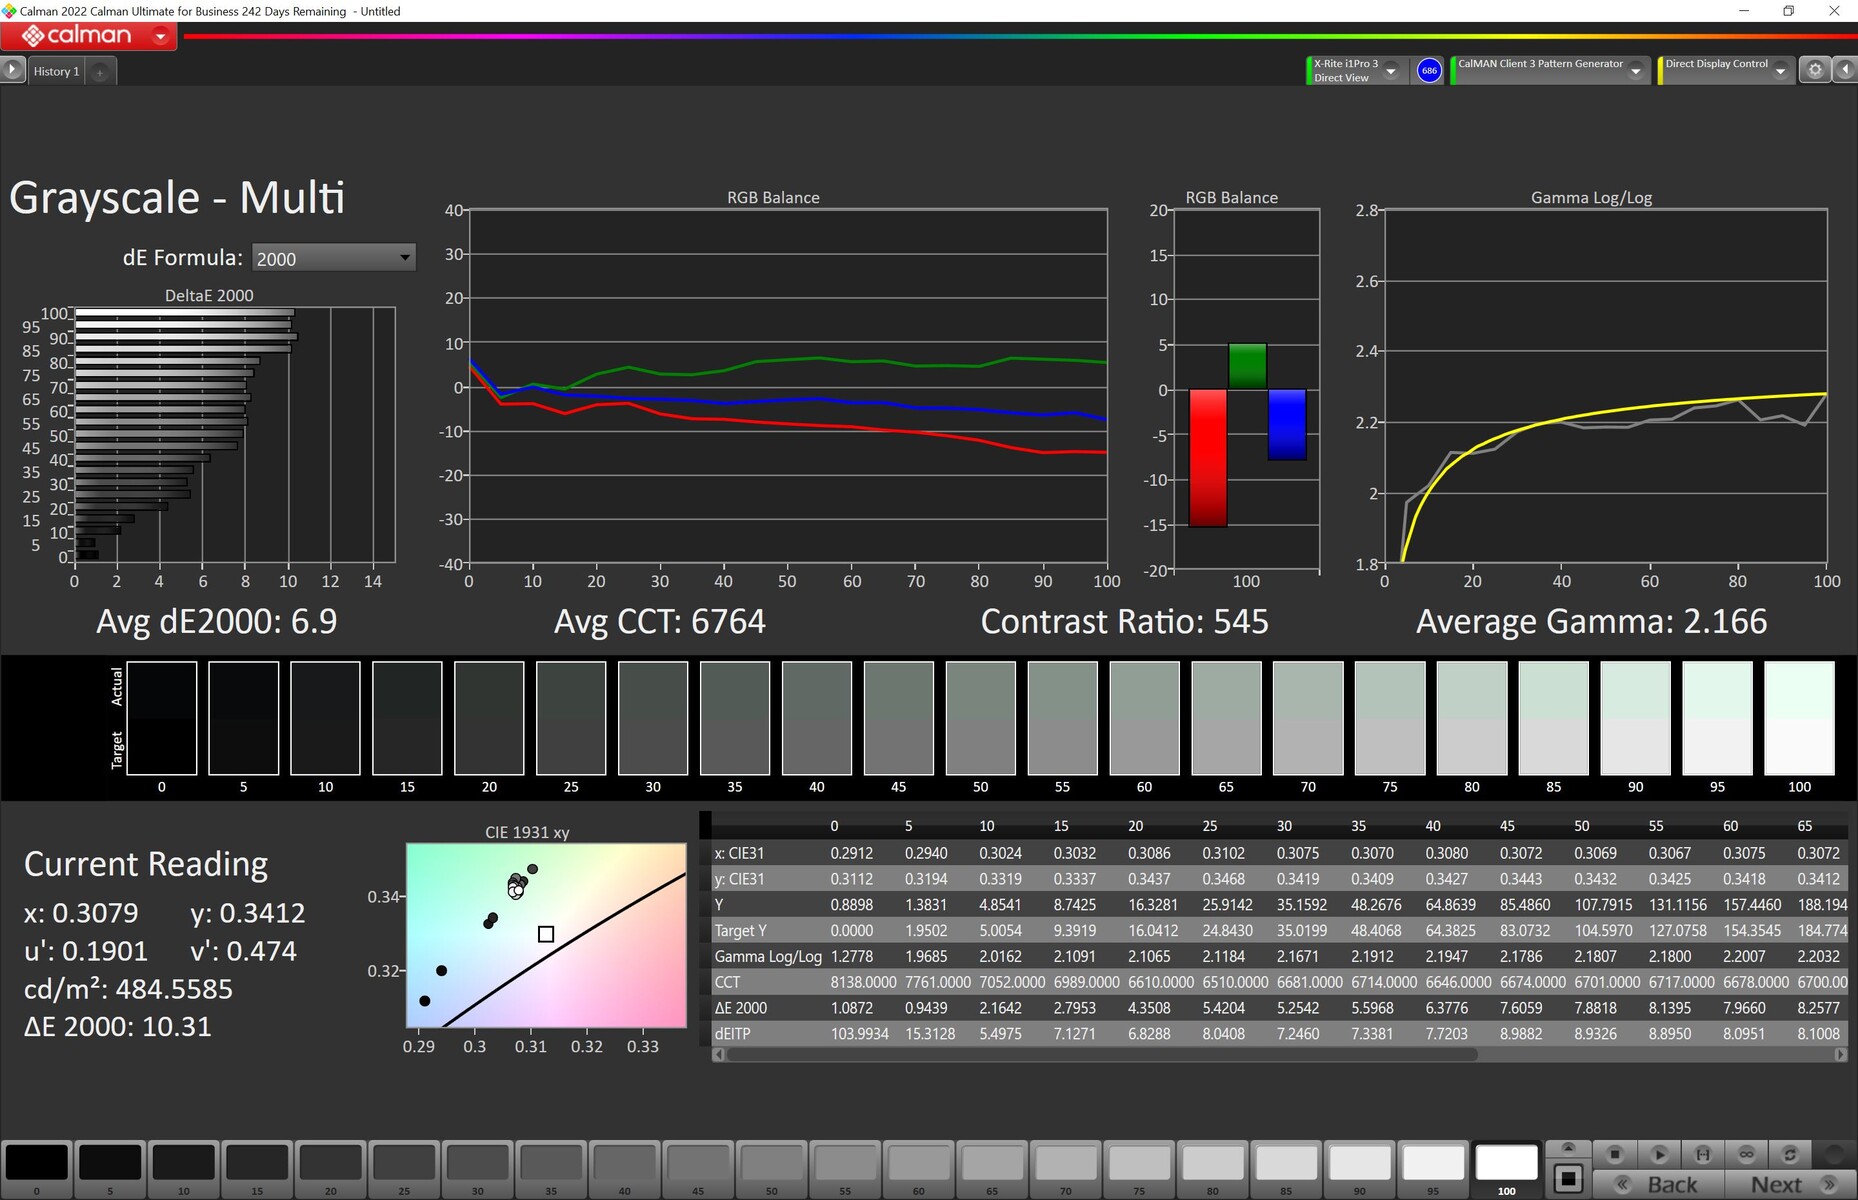
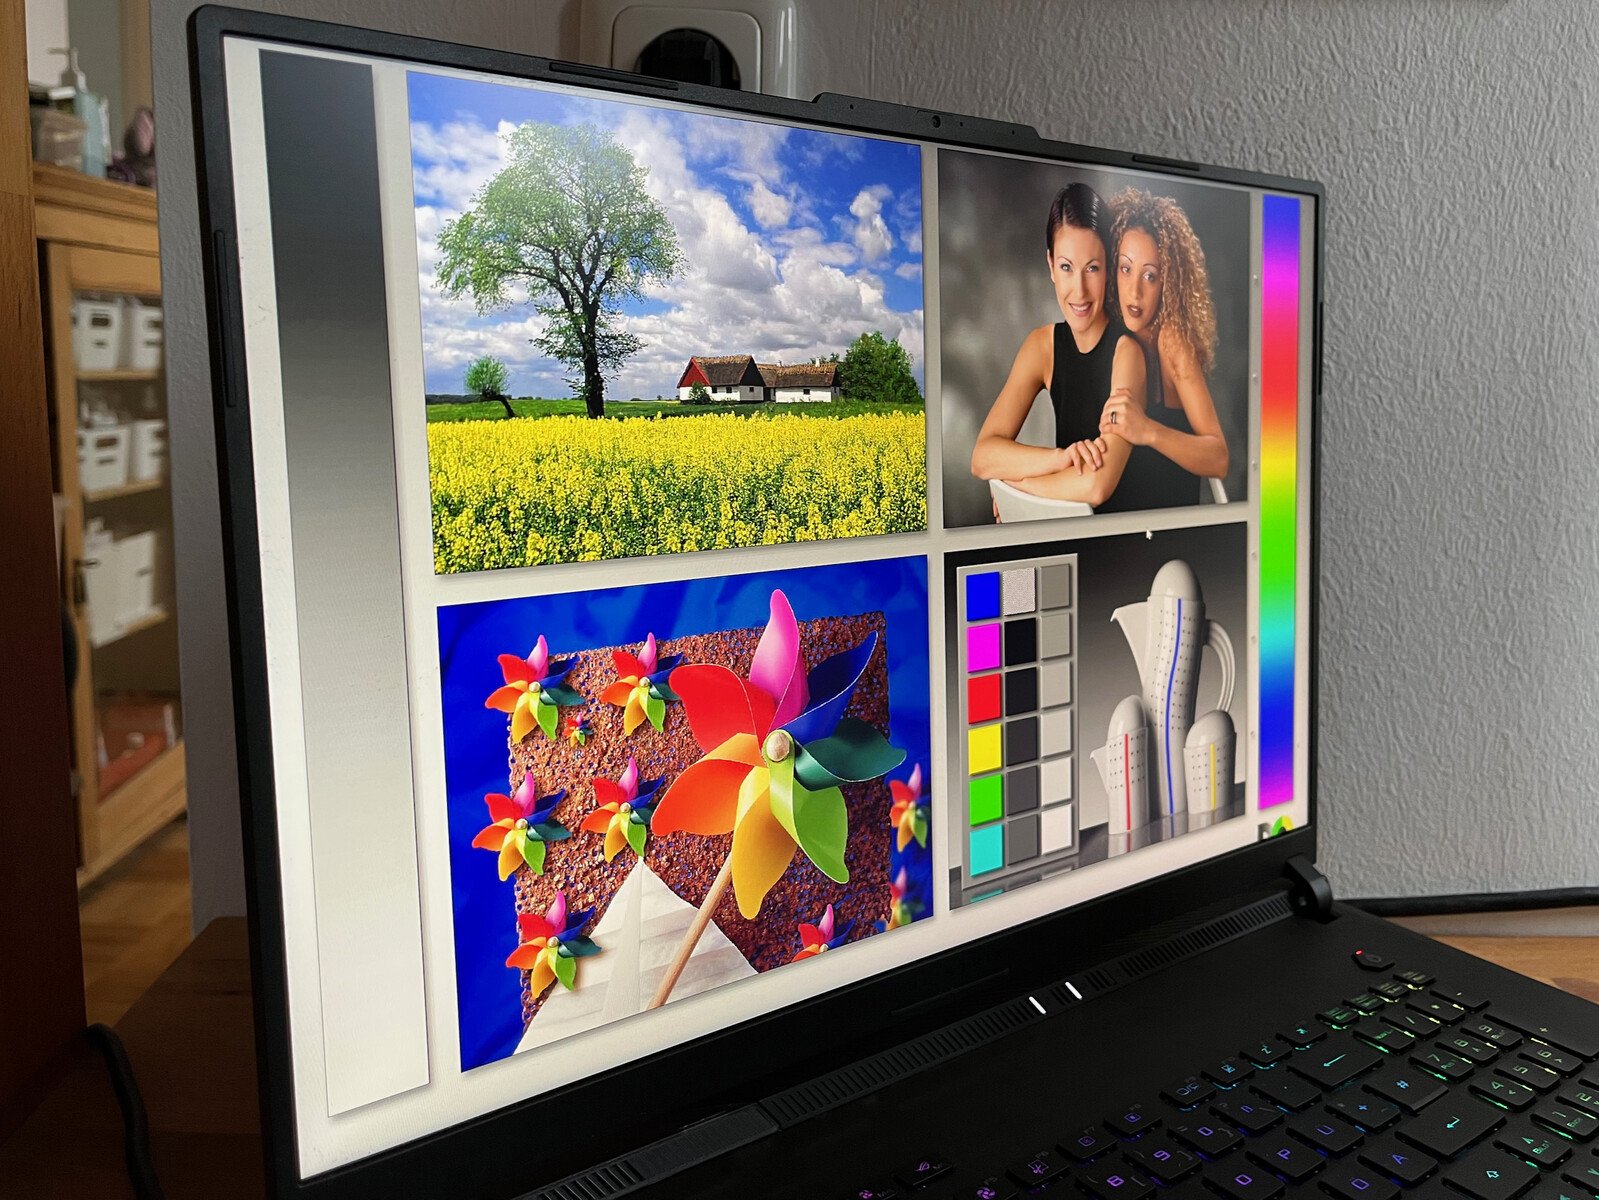
测量的色彩空间涵盖了Display-P3色彩空间的97%,因此也适用于高要求的任务(在校准之后)。在色彩准确性方面,结果取决于所使用的预设。在Armory Crate工具中,华硕在GameVisual下提供了四种不同模式:Native、sRGB、DCI-P3和Display P3。在Native模式下,我们的测试设备的显示器有一个很明显的、可测量的蓝色色调,也表现为ΔE值几乎为5。在用我们的i1Pro 3进行校准后,我们取得了明显改善的结果--尤其是在极端值中。校准后,该显示器也适用于图像处理。

在这里使用的NE180QDM-NZ2面板中,显示亮度不是通过PWM控制的,而且我们的测量设备没有发现任何闪烁(在所有的亮度水平上)。我们能够确认在灰色变化期间承诺的3毫秒响应时间。为了实现这一点,华硕使用了最小的超速,但我们没有注意到任何负面影响。因此,结合240赫兹的刷新率,该显示器是游戏的理想选择。
Display Response Times
| ↔ Response Time Black to White | ||
|---|---|---|
| 8.62 ms ... rise ↗ and fall ↘ combined | ↗ 3.68 ms rise | 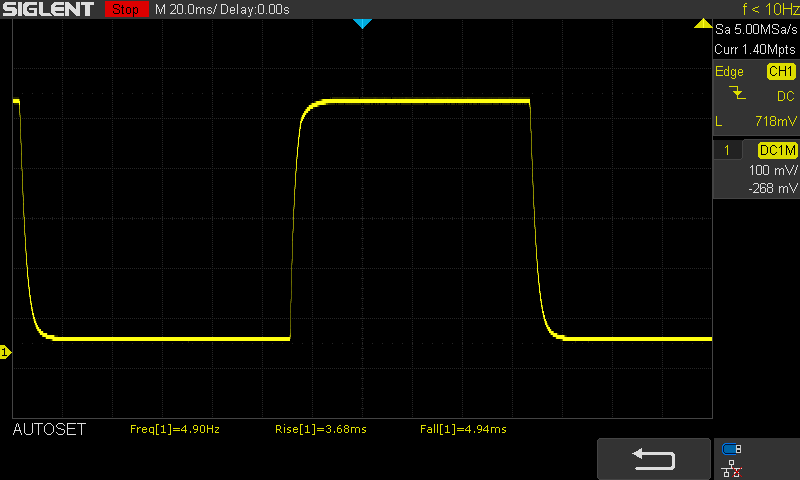 |
| ↘ 4.94 ms fall | ||
| The screen shows fast response rates in our tests and should be suited for gaming. In comparison, all tested devices range from 0.1 (minimum) to 240 (maximum) ms. » 24 % of all devices are better. This means that the measured response time is better than the average of all tested devices (19.8 ms). | ||
| ↔ Response Time 50% Grey to 80% Grey | ||
| 5.41 ms ... rise ↗ and fall ↘ combined | ↗ 2.57 ms rise | 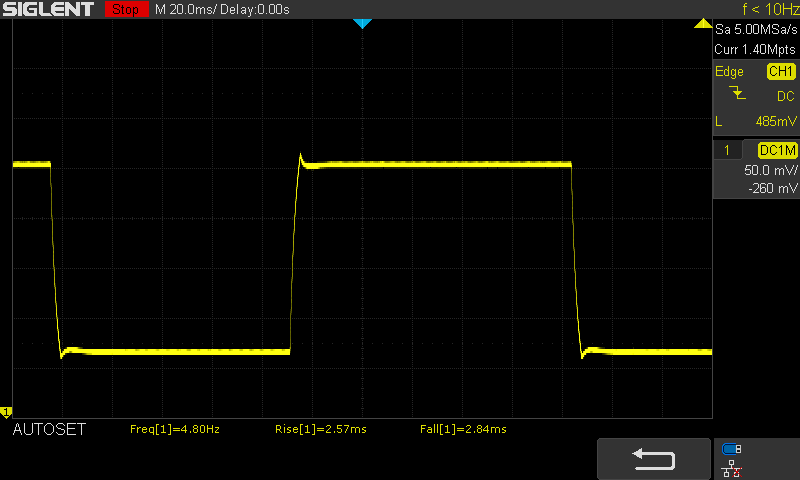 |
| ↘ 2.84 ms fall | ||
| The screen shows very fast response rates in our tests and should be very well suited for fast-paced gaming. In comparison, all tested devices range from 0.165 (minimum) to 636 (maximum) ms. » 18 % of all devices are better. This means that the measured response time is better than the average of all tested devices (31 ms). | ||
Screen Flickering / PWM (Pulse-Width Modulation)
| Screen flickering / PWM not detected |  | ||
In comparison: 52 % of all tested devices do not use PWM to dim the display. If PWM was detected, an average of 7754 (minimum: 5 - maximum: 343500) Hz was measured. | |||
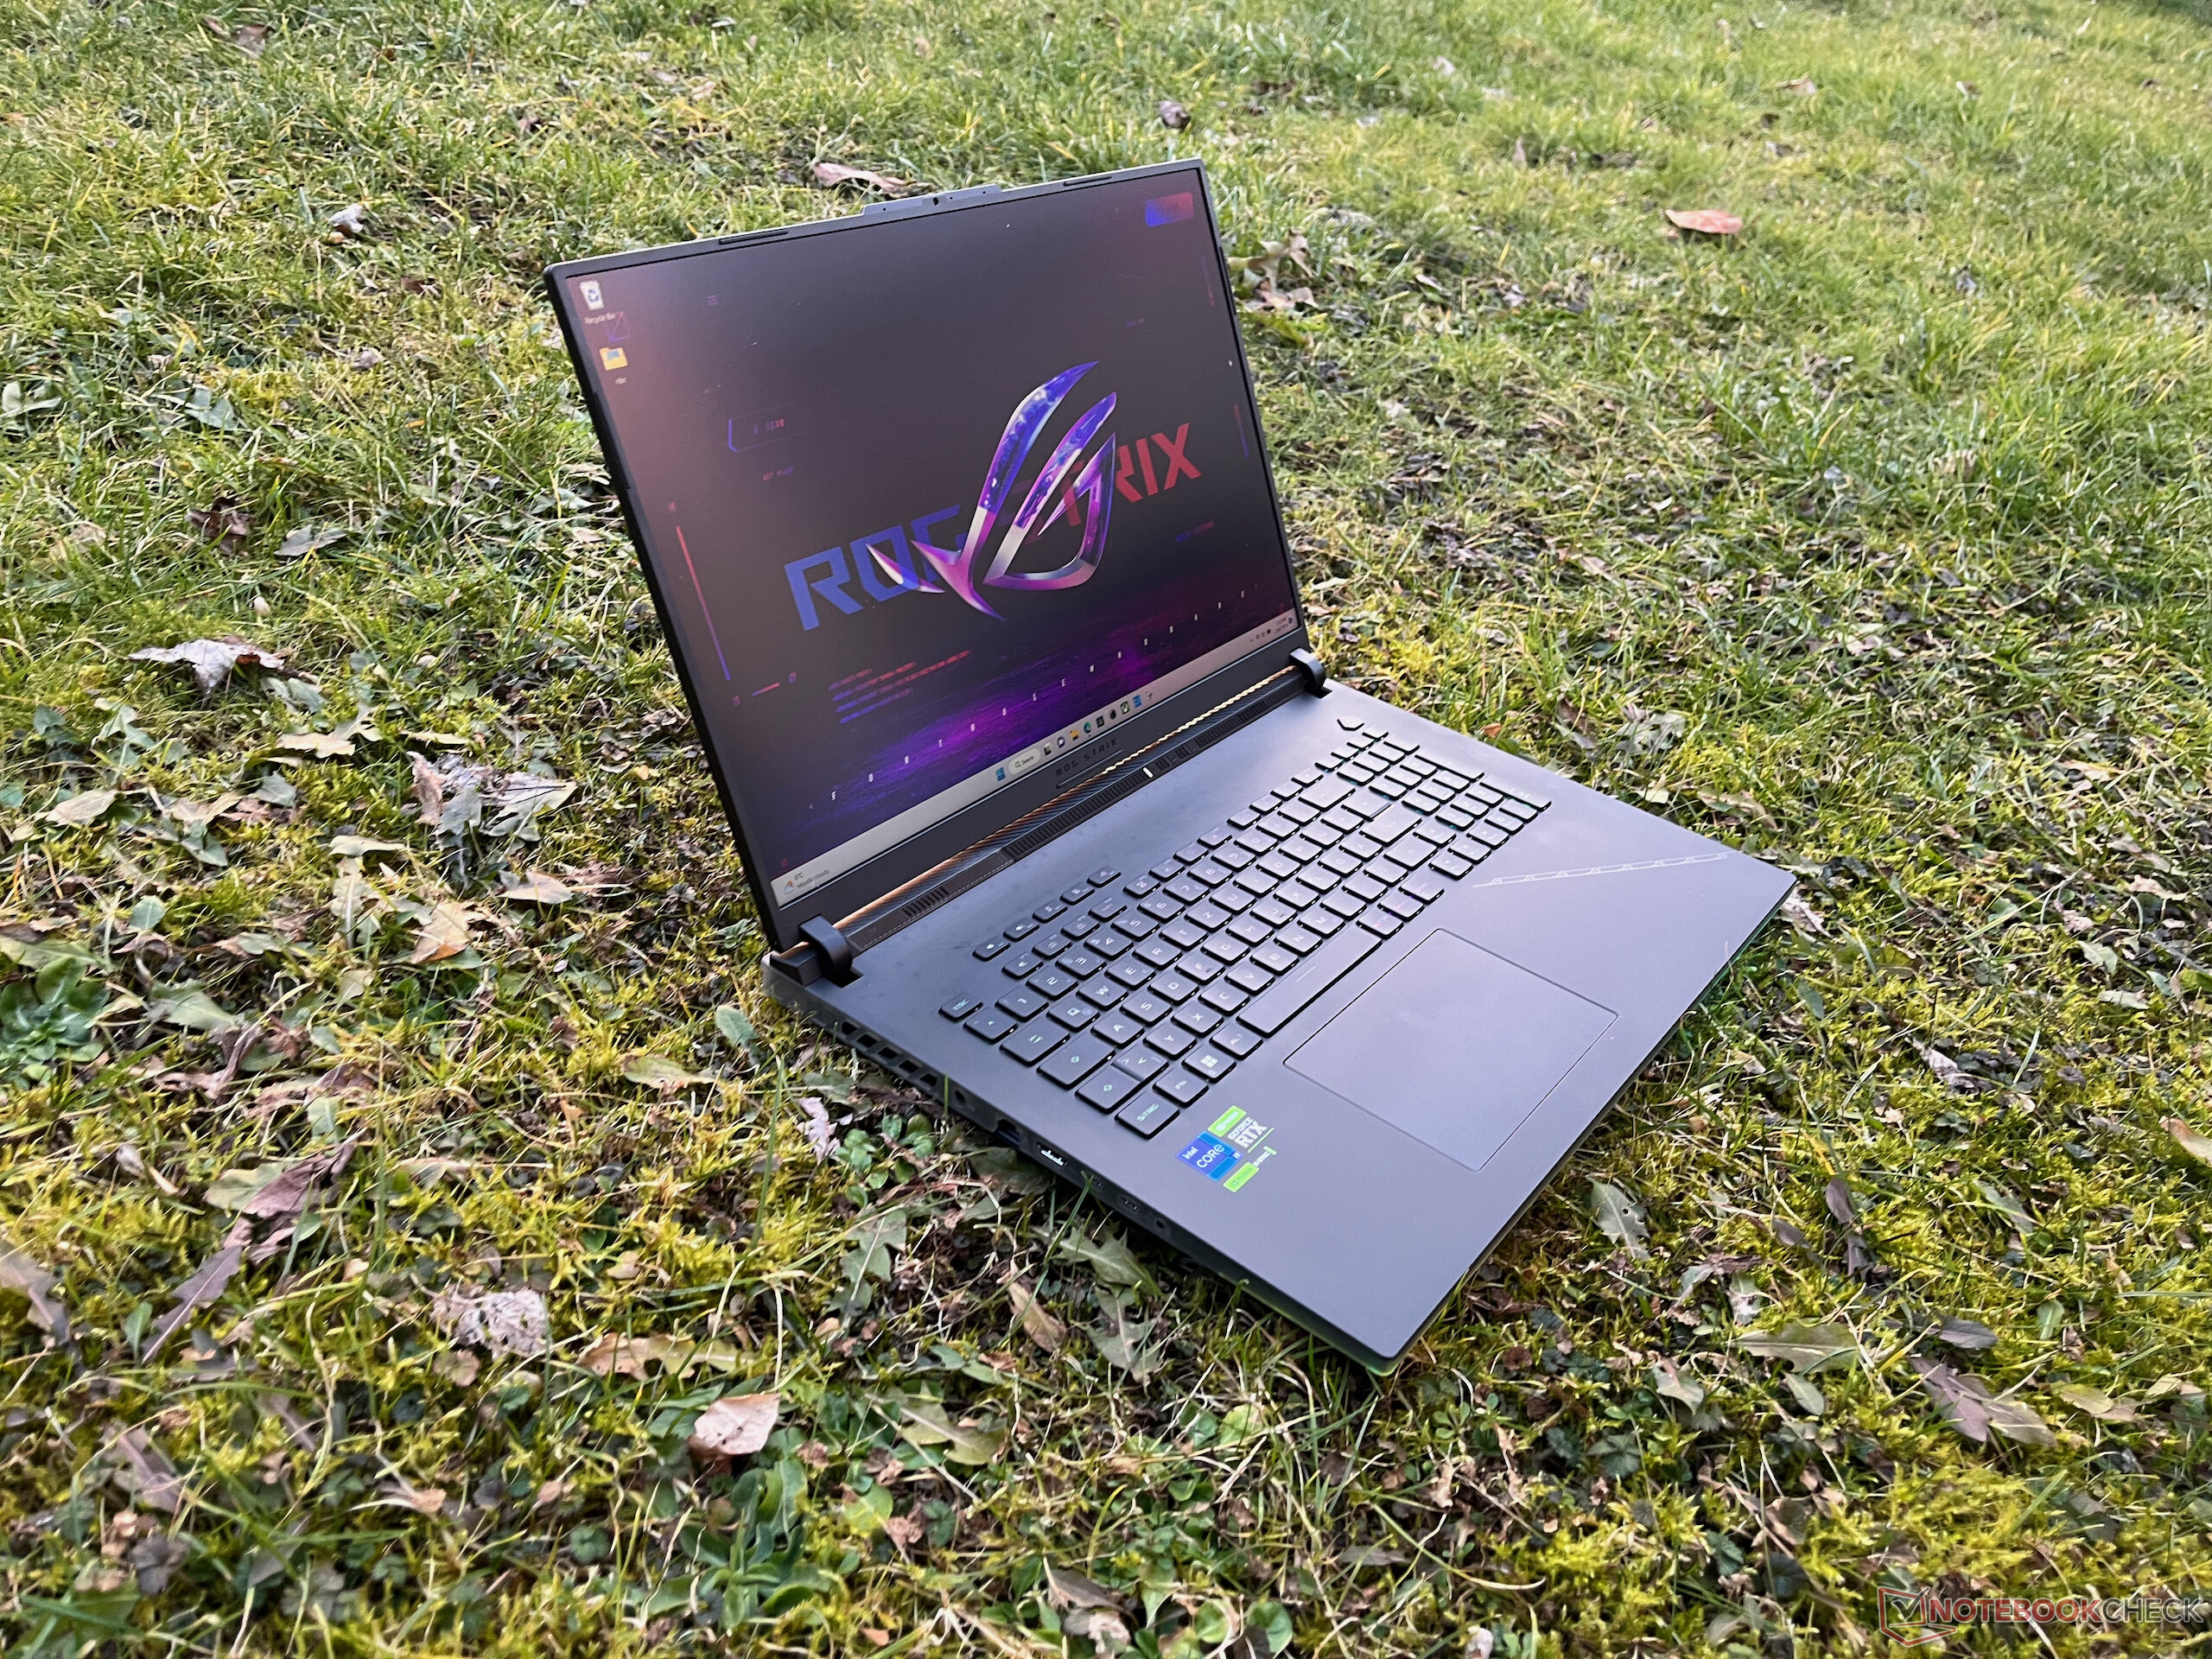
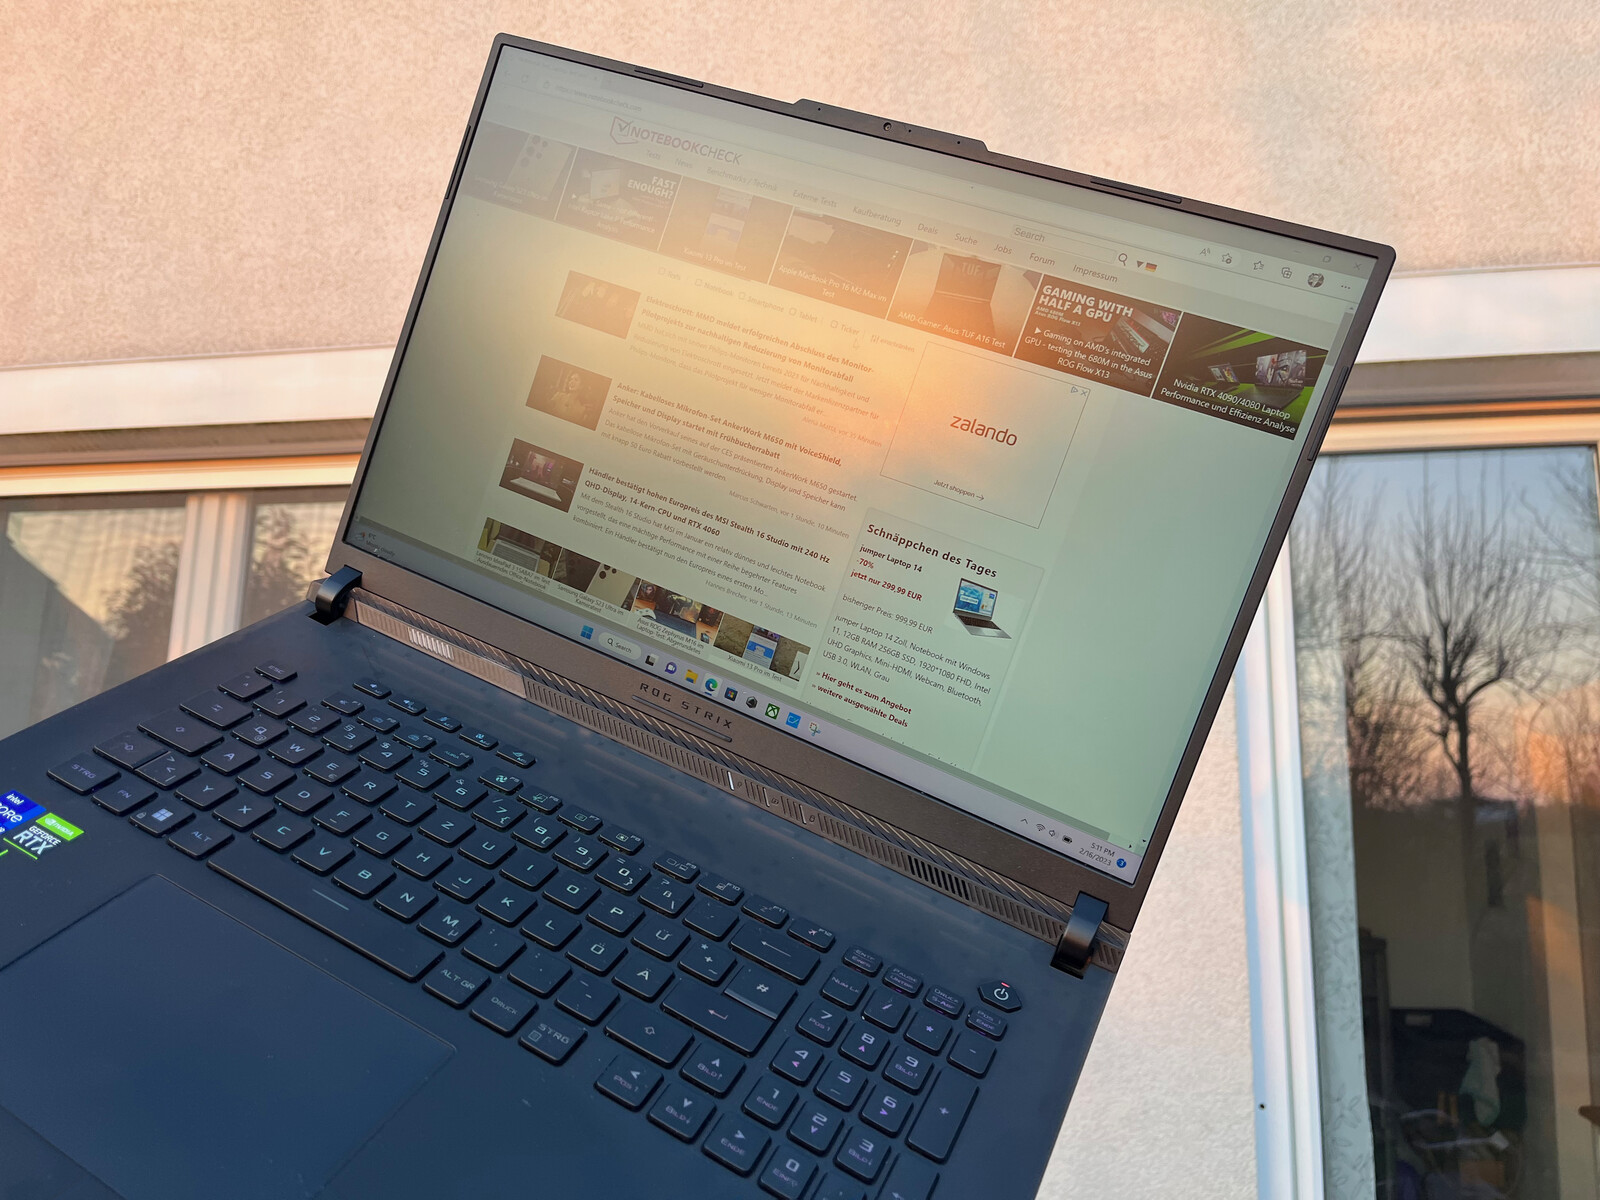
由于磨砂显示表面和良好的最大亮度,ROG Strix Scar 18理论上也可以在户外轻松使用。虽然近500尼特对于夏季的明亮阳光来说是不够的,但在阴凉处或晚间的阳光下,就像我们的图片一样,它们是相当足够的。
由于采用了IPS级面板,可视角度非常好。陡峭的视角带来的亮度损失仍在限制范围内,而且主观上不存在明显的色彩失真。

业绩
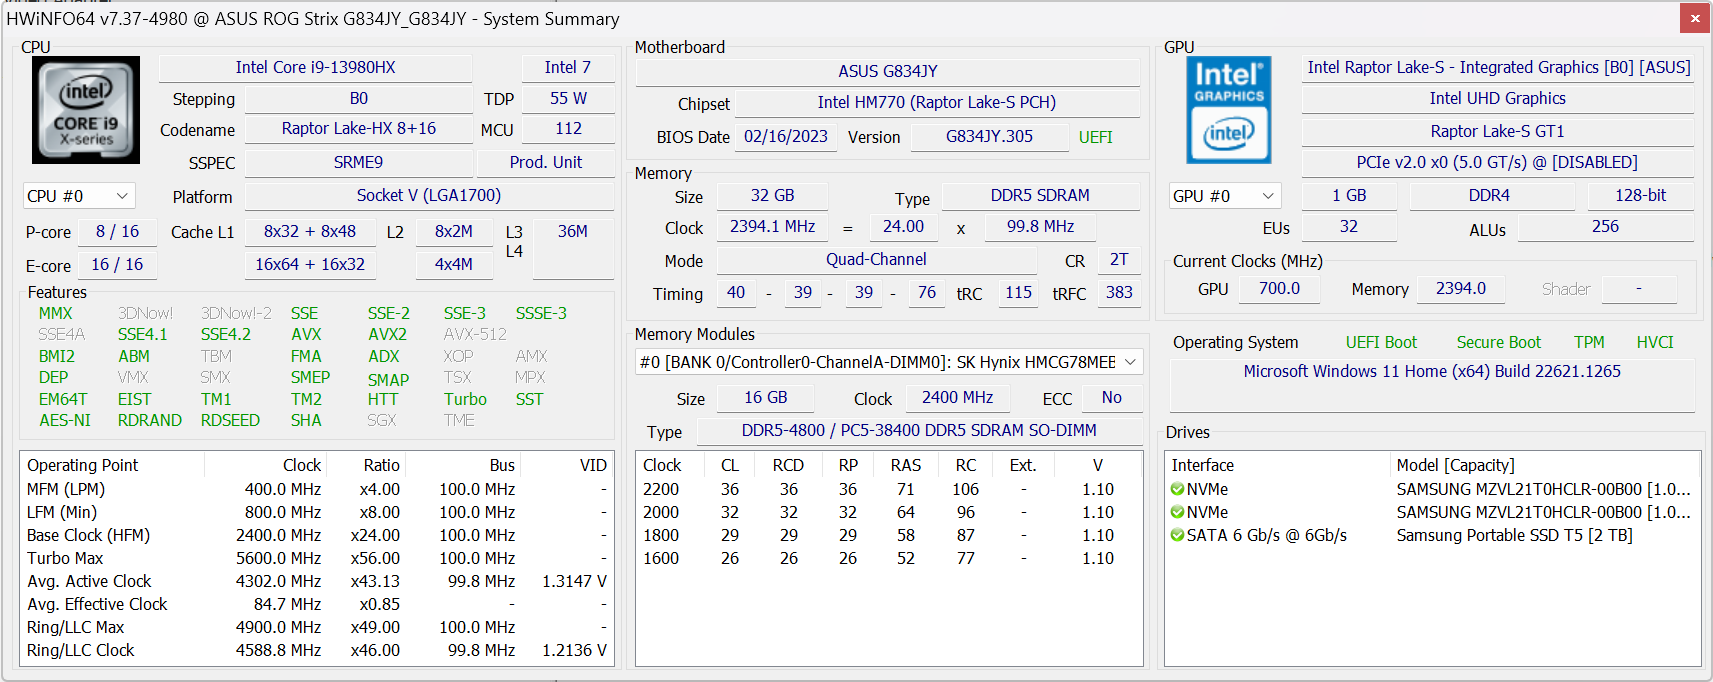
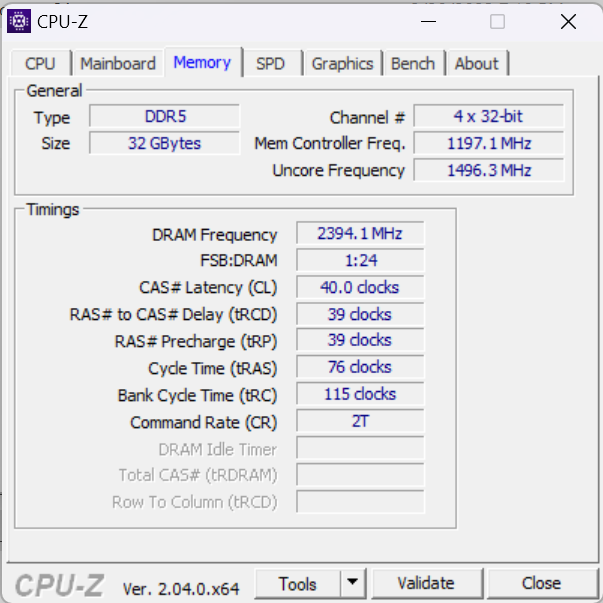
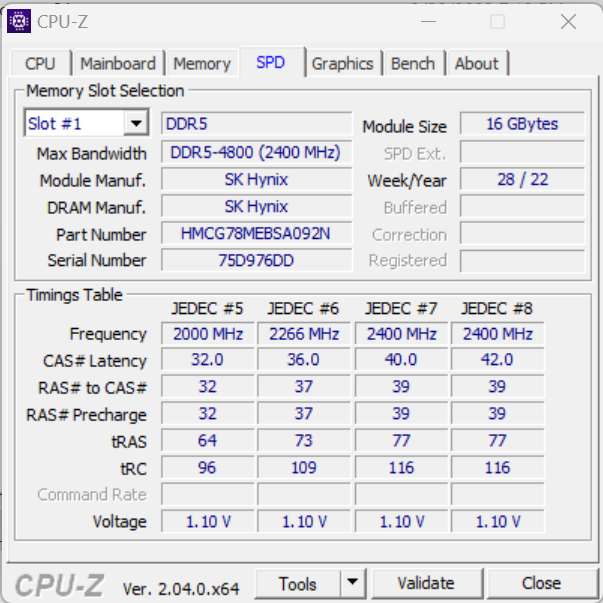
我们的测试装置Scar 18能够在性能测量中多次得分。华硕使用了目前最快的移动显卡,GeForce RTX 4090,也使最大功耗达到175瓦。华硕在处理器上也没有偷工减料,使用了英特尔的移动顶级型号。该英特尔酷睿i9-13980HX是基于新的猛禽湖系列,提供24个核心和一个相当大的5.6 GHz的最大提升。存储量也很可观,有32GB的DDR5内存。然而,4800MB/s的存储速度比竞争对手的一些型号略低。最后,在一个RAID-0系统中还有两个1TB的固态硬盘。
测试条件
我们在涡轮模式和终极GPU模式下进行了性能测试。利用这一点,RTX 4090的连接通过MUX固定,并最小化地超频了50MHz。此外,我们还测试了性能模式(交付状态下默认)和标准GPU模式(MSHybrid Optimus切换)。
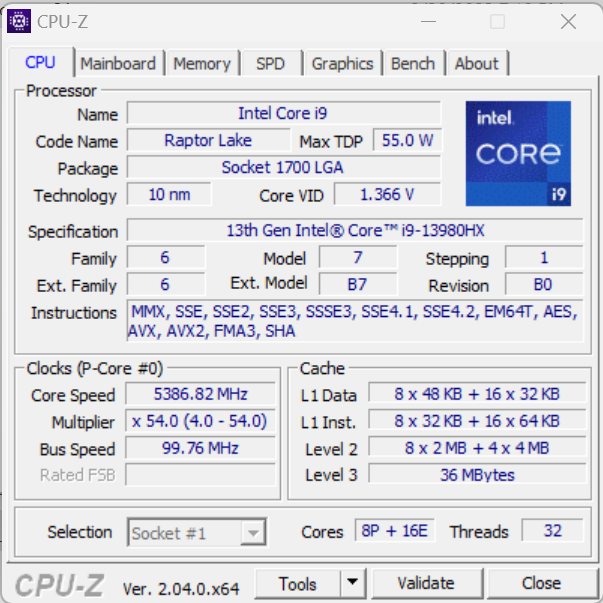
处理器
芯片英特尔酷睿i9-13980HX是目前英特尔用于笔记本电脑的顶级型号。它基于新的Raptor Lake系列,在技术上可与 酷睿i9-13900K台式机处理器.该CPU包含8个具有超线程的猛禽湖性能核心,时钟速度高达5.6GHz。较小的Gracemont Efficiency核心不提供超线程,其时钟速度高达4GHz。总的来说,该CPU能够使用32MB二级缓存,英特尔指定的TDP为157瓦(PL2)和55瓦(PL1)。华硕规定CPU的运行功率为65瓦(PL1),但HWInfo64中的PL1和PL2值显示为175瓦。在基准测试中,CPU开始时为175瓦,然后在96°C(205°F)时进入热极限,之后TDP被降低到135瓦。在静音模式下,TDP被降低到100W/65W,这也导致了性能的大幅下降。
在我们的处理器基准测试中,ROG Strix 18的i9-13980HX也能够勉强领先竞争对手的13900HX和13950HX CPU。然而,这只是涡轮模式的情况,在性能模式下,Strix Scar 18只在新的13000HX CPU的领域中处于中间位置。但即使如此,采用i9-12950HX处理器的旧设备仍被明显超越。
Cinebench R15 Multi Constant Load Test
Cinebench R23: Multi Core | Single Core
Cinebench R20: CPU (Multi Core) | CPU (Single Core)
Cinebench R15: CPU Multi 64Bit | CPU Single 64Bit
Blender: v2.79 BMW27 CPU
7-Zip 18.03: 7z b 4 | 7z b 4 -mmt1
Geekbench 5.5: Multi-Core | Single-Core
HWBOT x265 Benchmark v2.2: 4k Preset
LibreOffice : 20 Documents To PDF
R Benchmark 2.5: Overall mean
| CPU Performance rating | |
| Intel Core i9-13900K @253W | |
| Intel NUC13 Raptor Canyon | |
| Asus ROG Strix Scar 18 2023 G834JY-N6005W | |
| MSI Titan GT77 HX 13VI | |
| Lenovo Legion Pro 7 16IRX8H | |
| Average Intel Core i9-13980HX | |
| Schenker XMG Neo 16 Raptor Lake | |
| Razer Blade 18 RTX 4070 | |
| Asus ROG Strix Scar 18 2023 G834JY-N6005W | |
| Razer Blade 16 Early 2023 | |
| Average of class Gaming | |
| MSI Raider GE77 HX 12UHS | |
| Asus ROG Strix Scar 17 SE G733CX-LL014W | |
| Dell Precision 7000 7670 Performance | |
| Cinebench R23 / Multi Core | |
| Intel Core i9-13900K @253W | |
| MSI Titan GT77 HX 13VI | |
| Intel NUC13 Raptor Canyon | |
| Asus ROG Strix Scar 18 2023 G834JY-N6005W | |
| Average Intel Core i9-13980HX (28301 - 33052, n=11) | |
| Lenovo Legion Pro 7 16IRX8H | |
| Schenker XMG Neo 16 Raptor Lake | |
| Schenker XMG Neo 16 Raptor Lake | |
| Schenker XMG Neo 16 Raptor Lake | |
| Razer Blade 18 RTX 4070 | |
| Asus ROG Strix Scar 18 2023 G834JY-N6005W | |
| Razer Blade 16 Early 2023 | |
| Average of class Gaming (10488 - 42661, n=107, last 2 years) | |
| MSI Raider GE77 HX 12UHS | |
| Asus ROG Strix Scar 17 SE G733CX-LL014W | |
| Dell Precision 7000 7670 Performance | |
| Cinebench R23 / Single Core | |
| Intel Core i9-13900K @253W | |
| Intel NUC13 Raptor Canyon | |
| Asus ROG Strix Scar 18 2023 G834JY-N6005W | |
| MSI Titan GT77 HX 13VI | |
| Asus ROG Strix Scar 18 2023 G834JY-N6005W | |
| Average Intel Core i9-13980HX (1825 - 2169, n=9) | |
| Razer Blade 18 RTX 4070 | |
| Schenker XMG Neo 16 Raptor Lake | |
| Lenovo Legion Pro 7 16IRX8H | |
| Razer Blade 16 Early 2023 | |
| Average of class Gaming (1166 - 2415, n=107, last 2 years) | |
| MSI Raider GE77 HX 12UHS | |
| Asus ROG Strix Scar 17 SE G733CX-LL014W | |
| Dell Precision 7000 7670 Performance | |
| Cinebench R20 / CPU (Multi Core) | |
| Intel Core i9-13900K @253W | |
| Intel NUC13 Raptor Canyon | |
| MSI Titan GT77 HX 13VI | |
| Asus ROG Strix Scar 18 2023 G834JY-N6005W | |
| Average Intel Core i9-13980HX (10353 - 12437, n=10) | |
| Lenovo Legion Pro 7 16IRX8H | |
| Schenker XMG Neo 16 Raptor Lake | |
| Razer Blade 18 RTX 4070 | |
| Asus ROG Strix Scar 18 2023 G834JY-N6005W | |
| Average of class Gaming (4029 - 16433, n=106, last 2 years) | |
| MSI Raider GE77 HX 12UHS | |
| Razer Blade 16 Early 2023 | |
| Asus ROG Strix Scar 17 SE G733CX-LL014W | |
| Dell Precision 7000 7670 Performance | |
| Cinebench R20 / CPU (Single Core) | |
| Intel Core i9-13900K @253W | |
| Intel NUC13 Raptor Canyon | |
| Asus ROG Strix Scar 18 2023 G834JY-N6005W | |
| MSI Titan GT77 HX 13VI | |
| Asus ROG Strix Scar 18 2023 G834JY-N6005W | |
| Razer Blade 18 RTX 4070 | |
| Average Intel Core i9-13980HX (717 - 825, n=10) | |
| Lenovo Legion Pro 7 16IRX8H | |
| Average of class Gaming (442 - 913, n=106, last 2 years) | |
| Schenker XMG Neo 16 Raptor Lake | |
| MSI Raider GE77 HX 12UHS | |
| Razer Blade 16 Early 2023 | |
| Asus ROG Strix Scar 17 SE G733CX-LL014W | |
| Dell Precision 7000 7670 Performance | |
| Cinebench R15 / CPU Multi 64Bit | |
| Intel Core i9-13900K @253W | |
| Intel NUC13 Raptor Canyon | |
| MSI Titan GT77 HX 13VI | |
| Schenker XMG Neo 16 Raptor Lake | |
| Schenker XMG Neo 16 Raptor Lake | |
| Lenovo Legion Pro 7 16IRX8H | |
| Asus ROG Strix Scar 18 2023 G834JY-N6005W | |
| Average Intel Core i9-13980HX (4358 - 5172, n=11) | |
| Razer Blade 16 Early 2023 | |
| Razer Blade 18 RTX 4070 | |
| Asus ROG Strix Scar 18 2023 G834JY-N6005W | |
| Average of class Gaming (1578 - 6330, n=105, last 2 years) | |
| MSI Raider GE77 HX 12UHS | |
| Asus ROG Strix Scar 17 SE G733CX-LL014W | |
| Dell Precision 7000 7670 Performance | |
| Cinebench R15 / CPU Single 64Bit | |
| Intel Core i9-13900K @253W | |
| Intel NUC13 Raptor Canyon | |
| Asus ROG Strix Scar 18 2023 G834JY-N6005W | |
| Asus ROG Strix Scar 18 2023 G834JY-N6005W | |
| Average Intel Core i9-13980HX (289 - 312, n=11) | |
| Lenovo Legion Pro 7 16IRX8H | |
| MSI Titan GT77 HX 13VI | |
| Razer Blade 18 RTX 4070 | |
| Average of class Gaming (188.8 - 350, n=106, last 2 years) | |
| Schenker XMG Neo 16 Raptor Lake | |
| Schenker XMG Neo 16 Raptor Lake | |
| MSI Raider GE77 HX 12UHS | |
| Asus ROG Strix Scar 17 SE G733CX-LL014W | |
| Razer Blade 16 Early 2023 | |
| Dell Precision 7000 7670 Performance | |
| Blender / v2.79 BMW27 CPU | |
| Dell Precision 7000 7670 Performance | |
| Asus ROG Strix Scar 17 SE G733CX-LL014W | |
| MSI Raider GE77 HX 12UHS | |
| Average of class Gaming (79 - 330, n=104, last 2 years) | |
| Razer Blade 16 Early 2023 | |
| Asus ROG Strix Scar 18 2023 G834JY-N6005W | |
| Schenker XMG Neo 16 Raptor Lake | |
| Razer Blade 18 RTX 4070 | |
| Average Intel Core i9-13980HX (97 - 136, n=10) | |
| Lenovo Legion Pro 7 16IRX8H | |
| Asus ROG Strix Scar 18 2023 G834JY-N6005W | |
| Intel NUC13 Raptor Canyon | |
| MSI Titan GT77 HX 13VI | |
| Intel Core i9-13900K @253W | |
| 7-Zip 18.03 / 7z b 4 | |
| Intel Core i9-13900K @253W | |
| MSI Titan GT77 HX 13VI | |
| Intel NUC13 Raptor Canyon | |
| Asus ROG Strix Scar 18 2023 G834JY-N6005W | |
| Lenovo Legion Pro 7 16IRX8H | |
| Schenker XMG Neo 16 Raptor Lake | |
| Average Intel Core i9-13980HX (104616 - 129804, n=10) | |
| Razer Blade 18 RTX 4070 | |
| Asus ROG Strix Scar 18 2023 G834JY-N6005W | |
| Razer Blade 16 Early 2023 | |
| Average of class Gaming (33491 - 148086, n=105, last 2 years) | |
| MSI Raider GE77 HX 12UHS | |
| Asus ROG Strix Scar 17 SE G733CX-LL014W | |
| Dell Precision 7000 7670 Performance | |
| 7-Zip 18.03 / 7z b 4 -mmt1 | |
| Intel Core i9-13900K @253W | |
| Intel NUC13 Raptor Canyon | |
| Asus ROG Strix Scar 18 2023 G834JY-N6005W | |
| Lenovo Legion Pro 7 16IRX8H | |
| Asus ROG Strix Scar 18 2023 G834JY-N6005W | |
| Average Intel Core i9-13980HX (6230 - 7163, n=10) | |
| MSI Titan GT77 HX 13VI | |
| Razer Blade 18 RTX 4070 | |
| Schenker XMG Neo 16 Raptor Lake | |
| Razer Blade 16 Early 2023 | |
| Average of class Gaming (4199 - 7436, n=105, last 2 years) | |
| MSI Raider GE77 HX 12UHS | |
| Asus ROG Strix Scar 17 SE G733CX-LL014W | |
| Dell Precision 7000 7670 Performance | |
| Geekbench 5.5 / Multi-Core | |
| Intel Core i9-13900K @253W | |
| Intel NUC13 Raptor Canyon | |
| Lenovo Legion Pro 7 16IRX8H | |
| Asus ROG Strix Scar 18 2023 G834JY-N6005W | |
| Schenker XMG Neo 16 Raptor Lake | |
| MSI Titan GT77 HX 13VI | |
| Average Intel Core i9-13980HX (18475 - 22200, n=10) | |
| Razer Blade 18 RTX 4070 | |
| Asus ROG Strix Scar 18 2023 G834JY-N6005W | |
| Razer Blade 16 Early 2023 | |
| Average of class Gaming (6460 - 28263, n=105, last 2 years) | |
| MSI Raider GE77 HX 12UHS | |
| Asus ROG Strix Scar 17 SE G733CX-LL014W | |
| Dell Precision 7000 7670 Performance | |
| Geekbench 5.5 / Single-Core | |
| Intel Core i9-13900K @253W | |
| Asus ROG Strix Scar 18 2023 G834JY-N6005W | |
| Intel NUC13 Raptor Canyon | |
| Asus ROG Strix Scar 18 2023 G834JY-N6005W | |
| Average of class Gaming (986 - 2474, n=105, last 2 years) | |
| Average Intel Core i9-13980HX (1796 - 2139, n=10) | |
| MSI Titan GT77 HX 13VI | |
| Razer Blade 18 RTX 4070 | |
| Lenovo Legion Pro 7 16IRX8H | |
| Schenker XMG Neo 16 Raptor Lake | |
| MSI Raider GE77 HX 12UHS | |
| Dell Precision 7000 7670 Performance | |
| Asus ROG Strix Scar 17 SE G733CX-LL014W | |
| Razer Blade 16 Early 2023 | |
| HWBOT x265 Benchmark v2.2 / 4k Preset | |
| Intel Core i9-13900K @253W | |
| Intel NUC13 Raptor Canyon | |
| Asus ROG Strix Scar 18 2023 G834JY-N6005W | |
| MSI Titan GT77 HX 13VI | |
| Lenovo Legion Pro 7 16IRX8H | |
| Average Intel Core i9-13980HX (27 - 33.4, n=9) | |
| Razer Blade 18 RTX 4070 | |
| Schenker XMG Neo 16 Raptor Lake | |
| Asus ROG Strix Scar 18 2023 G834JY-N6005W | |
| Average of class Gaming (11.5 - 44.4, n=105, last 2 years) | |
| Razer Blade 16 Early 2023 | |
| MSI Raider GE77 HX 12UHS | |
| Asus ROG Strix Scar 17 SE G733CX-LL014W | |
| Dell Precision 7000 7670 Performance | |
| LibreOffice / 20 Documents To PDF | |
| Average of class Gaming (33.2 - 88.8, n=105, last 2 years) | |
| Razer Blade 16 Early 2023 | |
| MSI Titan GT77 HX 13VI | |
| Schenker XMG Neo 16 Raptor Lake | |
| Lenovo Legion Pro 7 16IRX8H | |
| Dell Precision 7000 7670 Performance | |
| Razer Blade 18 RTX 4070 | |
| Average Intel Core i9-13980HX (35 - 51.4, n=10) | |
| MSI Raider GE77 HX 12UHS | |
| Intel NUC13 Raptor Canyon | |
| Asus ROG Strix Scar 18 2023 G834JY-N6005W | |
| Asus ROG Strix Scar 18 2023 G834JY-N6005W | |
| Asus ROG Strix Scar 17 SE G733CX-LL014W | |
| Intel Core i9-13900K @253W | |
| R Benchmark 2.5 / Overall mean | |
| Dell Precision 7000 7670 Performance | |
| Average of class Gaming (0.3439 - 0.759, n=106, last 2 years) | |
| Asus ROG Strix Scar 17 SE G733CX-LL014W | |
| MSI Raider GE77 HX 12UHS | |
| Razer Blade 16 Early 2023 | |
| MSI Titan GT77 HX 13VI | |
| Lenovo Legion Pro 7 16IRX8H | |
| Average Intel Core i9-13980HX (0.3793 - 0.4462, n=10) | |
| Razer Blade 18 RTX 4070 | |
| Asus ROG Strix Scar 18 2023 G834JY-N6005W | |
| Intel NUC13 Raptor Canyon | |
| Schenker XMG Neo 16 Raptor Lake | |
| Asus ROG Strix Scar 18 2023 G834JY-N6005W | |
| Intel Core i9-13900K @253W | |
Cinebench R23: Multi Core | Single Core
Cinebench R20: CPU (Multi Core) | CPU (Single Core)
Cinebench R15: CPU Multi 64Bit | CPU Single 64Bit
Blender: v2.79 BMW27 CPU
7-Zip 18.03: 7z b 4 | 7z b 4 -mmt1
Geekbench 5.5: Multi-Core | Single-Core
HWBOT x265 Benchmark v2.2: 4k Preset
LibreOffice : 20 Documents To PDF
R Benchmark 2.5: Overall mean
* ... smaller is better
AIDA64: FP32 Ray-Trace | FPU Julia | CPU SHA3 | CPU Queen | FPU SinJulia | FPU Mandel | CPU AES | CPU ZLib | FP64 Ray-Trace | CPU PhotoWorxx
| Performance rating | |
| Intel Core i9-13900K @253W | |
| Intel NUC13 Raptor Canyon | |
| Asus ROG Strix Scar 18 2023 G834JY-N6005W | |
| MSI Titan GT77 HX 13VI | |
| Lenovo Legion Pro 7 16IRX8H | |
| Average Intel Core i9-13980HX | |
| Average of class Gaming | |
| Schenker XMG Neo 16 Raptor Lake | |
| Razer Blade 18 RTX 4070 | |
| Asus ROG Strix Scar 18 2023 G834JY-N6005W | |
| Razer Blade 16 Early 2023 | |
| MSI Raider GE77 HX 12UHS | |
| Asus ROG Strix Scar 17 SE G733CX-LL014W | |
| Dell Precision 7000 7670 Performance | |
| AIDA64 / FP32 Ray-Trace | |
| Intel Core i9-13900K @253W | |
| Average of class Gaming (10227 - 85542, n=105, last 2 years) | |
| MSI Titan GT77 HX 13VI | |
| Asus ROG Strix Scar 18 2023 G834JY-N6005W | |
| Intel NUC13 Raptor Canyon | |
| Schenker XMG Neo 16 Raptor Lake | |
| Lenovo Legion Pro 7 16IRX8H | |
| Average Intel Core i9-13980HX (21332 - 29553, n=9) | |
| Razer Blade 18 RTX 4070 | |
| Razer Blade 16 Early 2023 | |
| Razer Blade 16 Early 2023 | |
| Razer Blade 16 Early 2023 | |
| Asus ROG Strix Scar 18 2023 G834JY-N6005W | |
| MSI Raider GE77 HX 12UHS | |
| Asus ROG Strix Scar 17 SE G733CX-LL014W | |
| Dell Precision 7000 7670 Performance | |
| AIDA64 / FPU Julia | |
| Intel Core i9-13900K @253W | |
| MSI Titan GT77 HX 13VI | |
| Intel NUC13 Raptor Canyon | |
| Average of class Gaming (51376 - 238426, n=105, last 2 years) | |
| Asus ROG Strix Scar 18 2023 G834JY-N6005W | |
| Lenovo Legion Pro 7 16IRX8H | |
| Average Intel Core i9-13980HX (108001 - 148168, n=9) | |
| Razer Blade 18 RTX 4070 | |
| Schenker XMG Neo 16 Raptor Lake | |
| Asus ROG Strix Scar 18 2023 G834JY-N6005W | |
| Razer Blade 16 Early 2023 | |
| Razer Blade 16 Early 2023 | |
| Razer Blade 16 Early 2023 | |
| MSI Raider GE77 HX 12UHS | |
| Asus ROG Strix Scar 17 SE G733CX-LL014W | |
| Dell Precision 7000 7670 Performance | |
| AIDA64 / CPU SHA3 | |
| Intel Core i9-13900K @253W | |
| MSI Titan GT77 HX 13VI | |
| Asus ROG Strix Scar 18 2023 G834JY-N6005W | |
| Intel NUC13 Raptor Canyon | |
| Lenovo Legion Pro 7 16IRX8H | |
| Schenker XMG Neo 16 Raptor Lake | |
| Average Intel Core i9-13980HX (5264 - 7142, n=9) | |
| Average of class Gaming (2180 - 10115, n=105, last 2 years) | |
| Razer Blade 16 Early 2023 | |
| Razer Blade 16 Early 2023 | |
| Razer Blade 16 Early 2023 | |
| Razer Blade 18 RTX 4070 | |
| Asus ROG Strix Scar 18 2023 G834JY-N6005W | |
| MSI Raider GE77 HX 12UHS | |
| Asus ROG Strix Scar 17 SE G733CX-LL014W | |
| Dell Precision 7000 7670 Performance | |
| AIDA64 / CPU Queen | |
| Intel Core i9-13900K @253W | |
| Intel NUC13 Raptor Canyon | |
| Asus ROG Strix Scar 18 2023 G834JY-N6005W | |
| Asus ROG Strix Scar 18 2023 G834JY-N6005W | |
| MSI Titan GT77 HX 13VI | |
| Average Intel Core i9-13980HX (126758 - 143409, n=9) | |
| Razer Blade 18 RTX 4070 | |
| Schenker XMG Neo 16 Raptor Lake | |
| Razer Blade 16 Early 2023 | |
| Razer Blade 16 Early 2023 | |
| Lenovo Legion Pro 7 16IRX8H | |
| Average of class Gaming (49785 - 173351, n=90, last 2 years) | |
| Asus ROG Strix Scar 17 SE G733CX-LL014W | |
| Dell Precision 7000 7670 Performance | |
| MSI Raider GE77 HX 12UHS | |
| AIDA64 / FPU SinJulia | |
| Intel Core i9-13900K @253W | |
| Intel NUC13 Raptor Canyon | |
| Asus ROG Strix Scar 18 2023 G834JY-N6005W | |
| MSI Titan GT77 HX 13VI | |
| Schenker XMG Neo 16 Raptor Lake | |
| Average Intel Core i9-13980HX (13785 - 17117, n=9) | |
| Razer Blade 18 RTX 4070 | |
| Asus ROG Strix Scar 18 2023 G834JY-N6005W | |
| Razer Blade 16 Early 2023 | |
| Razer Blade 16 Early 2023 | |
| Razer Blade 16 Early 2023 | |
| Lenovo Legion Pro 7 16IRX8H | |
| Average of class Gaming (4424 - 33636, n=105, last 2 years) | |
| MSI Raider GE77 HX 12UHS | |
| Asus ROG Strix Scar 17 SE G733CX-LL014W | |
| Dell Precision 7000 7670 Performance | |
| AIDA64 / FPU Mandel | |
| Intel Core i9-13900K @253W | |
| Average of class Gaming (25115 - 128721, n=105, last 2 years) | |
| MSI Titan GT77 HX 13VI | |
| Asus ROG Strix Scar 18 2023 G834JY-N6005W | |
| Intel NUC13 Raptor Canyon | |
| Lenovo Legion Pro 7 16IRX8H | |
| Average Intel Core i9-13980HX (53398 - 73758, n=9) | |
| Schenker XMG Neo 16 Raptor Lake | |
| Razer Blade 18 RTX 4070 | |
| Asus ROG Strix Scar 18 2023 G834JY-N6005W | |
| Razer Blade 16 Early 2023 | |
| Razer Blade 16 Early 2023 | |
| Razer Blade 16 Early 2023 | |
| MSI Raider GE77 HX 12UHS | |
| Asus ROG Strix Scar 17 SE G733CX-LL014W | |
| Dell Precision 7000 7670 Performance | |
| AIDA64 / CPU AES | |
| Intel Core i9-13900K @253W | |
| MSI Raider GE77 HX 12UHS | |
| Asus ROG Strix Scar 17 SE G733CX-LL014W | |
| Razer Blade 16 Early 2023 | |
| Razer Blade 16 Early 2023 | |
| Razer Blade 16 Early 2023 | |
| MSI Titan GT77 HX 13VI | |
| Asus ROG Strix Scar 18 2023 G834JY-N6005W | |
| Intel NUC13 Raptor Canyon | |
| Lenovo Legion Pro 7 16IRX8H | |
| Average Intel Core i9-13980HX (105169 - 136520, n=9) | |
| Schenker XMG Neo 16 Raptor Lake | |
| Razer Blade 18 RTX 4070 | |
| Asus ROG Strix Scar 18 2023 G834JY-N6005W | |
| Average of class Gaming (39258 - 247074, n=105, last 2 years) | |
| Dell Precision 7000 7670 Performance | |
| AIDA64 / CPU ZLib | |
| Intel Core i9-13900K @253W | |
| MSI Titan GT77 HX 13VI | |
| Asus ROG Strix Scar 18 2023 G834JY-N6005W | |
| Intel NUC13 Raptor Canyon | |
| Lenovo Legion Pro 7 16IRX8H | |
| Average Intel Core i9-13980HX (1513 - 2039, n=9) | |
| Schenker XMG Neo 16 Raptor Lake | |
| Razer Blade 16 Early 2023 | |
| Razer Blade 16 Early 2023 | |
| Razer Blade 16 Early 2023 | |
| Razer Blade 18 RTX 4070 | |
| Asus ROG Strix Scar 18 2023 G834JY-N6005W | |
| Average of class Gaming (574 - 2531, n=105, last 2 years) | |
| MSI Raider GE77 HX 12UHS | |
| Asus ROG Strix Scar 17 SE G733CX-LL014W | |
| Dell Precision 7000 7670 Performance | |
| AIDA64 / FP64 Ray-Trace | |
| Intel Core i9-13900K @253W | |
| Average of class Gaming (5509 - 45446, n=105, last 2 years) | |
| MSI Titan GT77 HX 13VI | |
| Asus ROG Strix Scar 18 2023 G834JY-N6005W | |
| Intel NUC13 Raptor Canyon | |
| Lenovo Legion Pro 7 16IRX8H | |
| Average Intel Core i9-13980HX (11431 - 16325, n=9) | |
| Schenker XMG Neo 16 Raptor Lake | |
| Razer Blade 18 RTX 4070 | |
| Razer Blade 16 Early 2023 | |
| Razer Blade 16 Early 2023 | |
| Razer Blade 16 Early 2023 | |
| Asus ROG Strix Scar 18 2023 G834JY-N6005W | |
| MSI Raider GE77 HX 12UHS | |
| Asus ROG Strix Scar 17 SE G733CX-LL014W | |
| Dell Precision 7000 7670 Performance | |
| AIDA64 / CPU PhotoWorxx | |
| Razer Blade 16 Early 2023 | |
| Razer Blade 16 Early 2023 | |
| Razer Blade 16 Early 2023 | |
| Razer Blade 18 RTX 4070 | |
| Intel Core i9-13900K @253W | |
| Lenovo Legion Pro 7 16IRX8H | |
| MSI Raider GE77 HX 12UHS | |
| Average Intel Core i9-13980HX (37069 - 52949, n=9) | |
| Intel NUC13 Raptor Canyon | |
| Average of class Gaming (12271 - 89891, n=105, last 2 years) | |
| Schenker XMG Neo 16 Raptor Lake | |
| Asus ROG Strix Scar 18 2023 G834JY-N6005W | |
| Asus ROG Strix Scar 18 2023 G834JY-N6005W | |
| Dell Precision 7000 7670 Performance | |
| Asus ROG Strix Scar 17 SE G733CX-LL014W | |
| MSI Titan GT77 HX 13VI | |
AIDA64: FP32 Ray-Trace | FPU Julia | CPU SHA3 | CPU Queen | FPU SinJulia | FPU Mandel | CPU AES | CPU ZLib | FP64 Ray-Trace | CPU PhotoWorxx
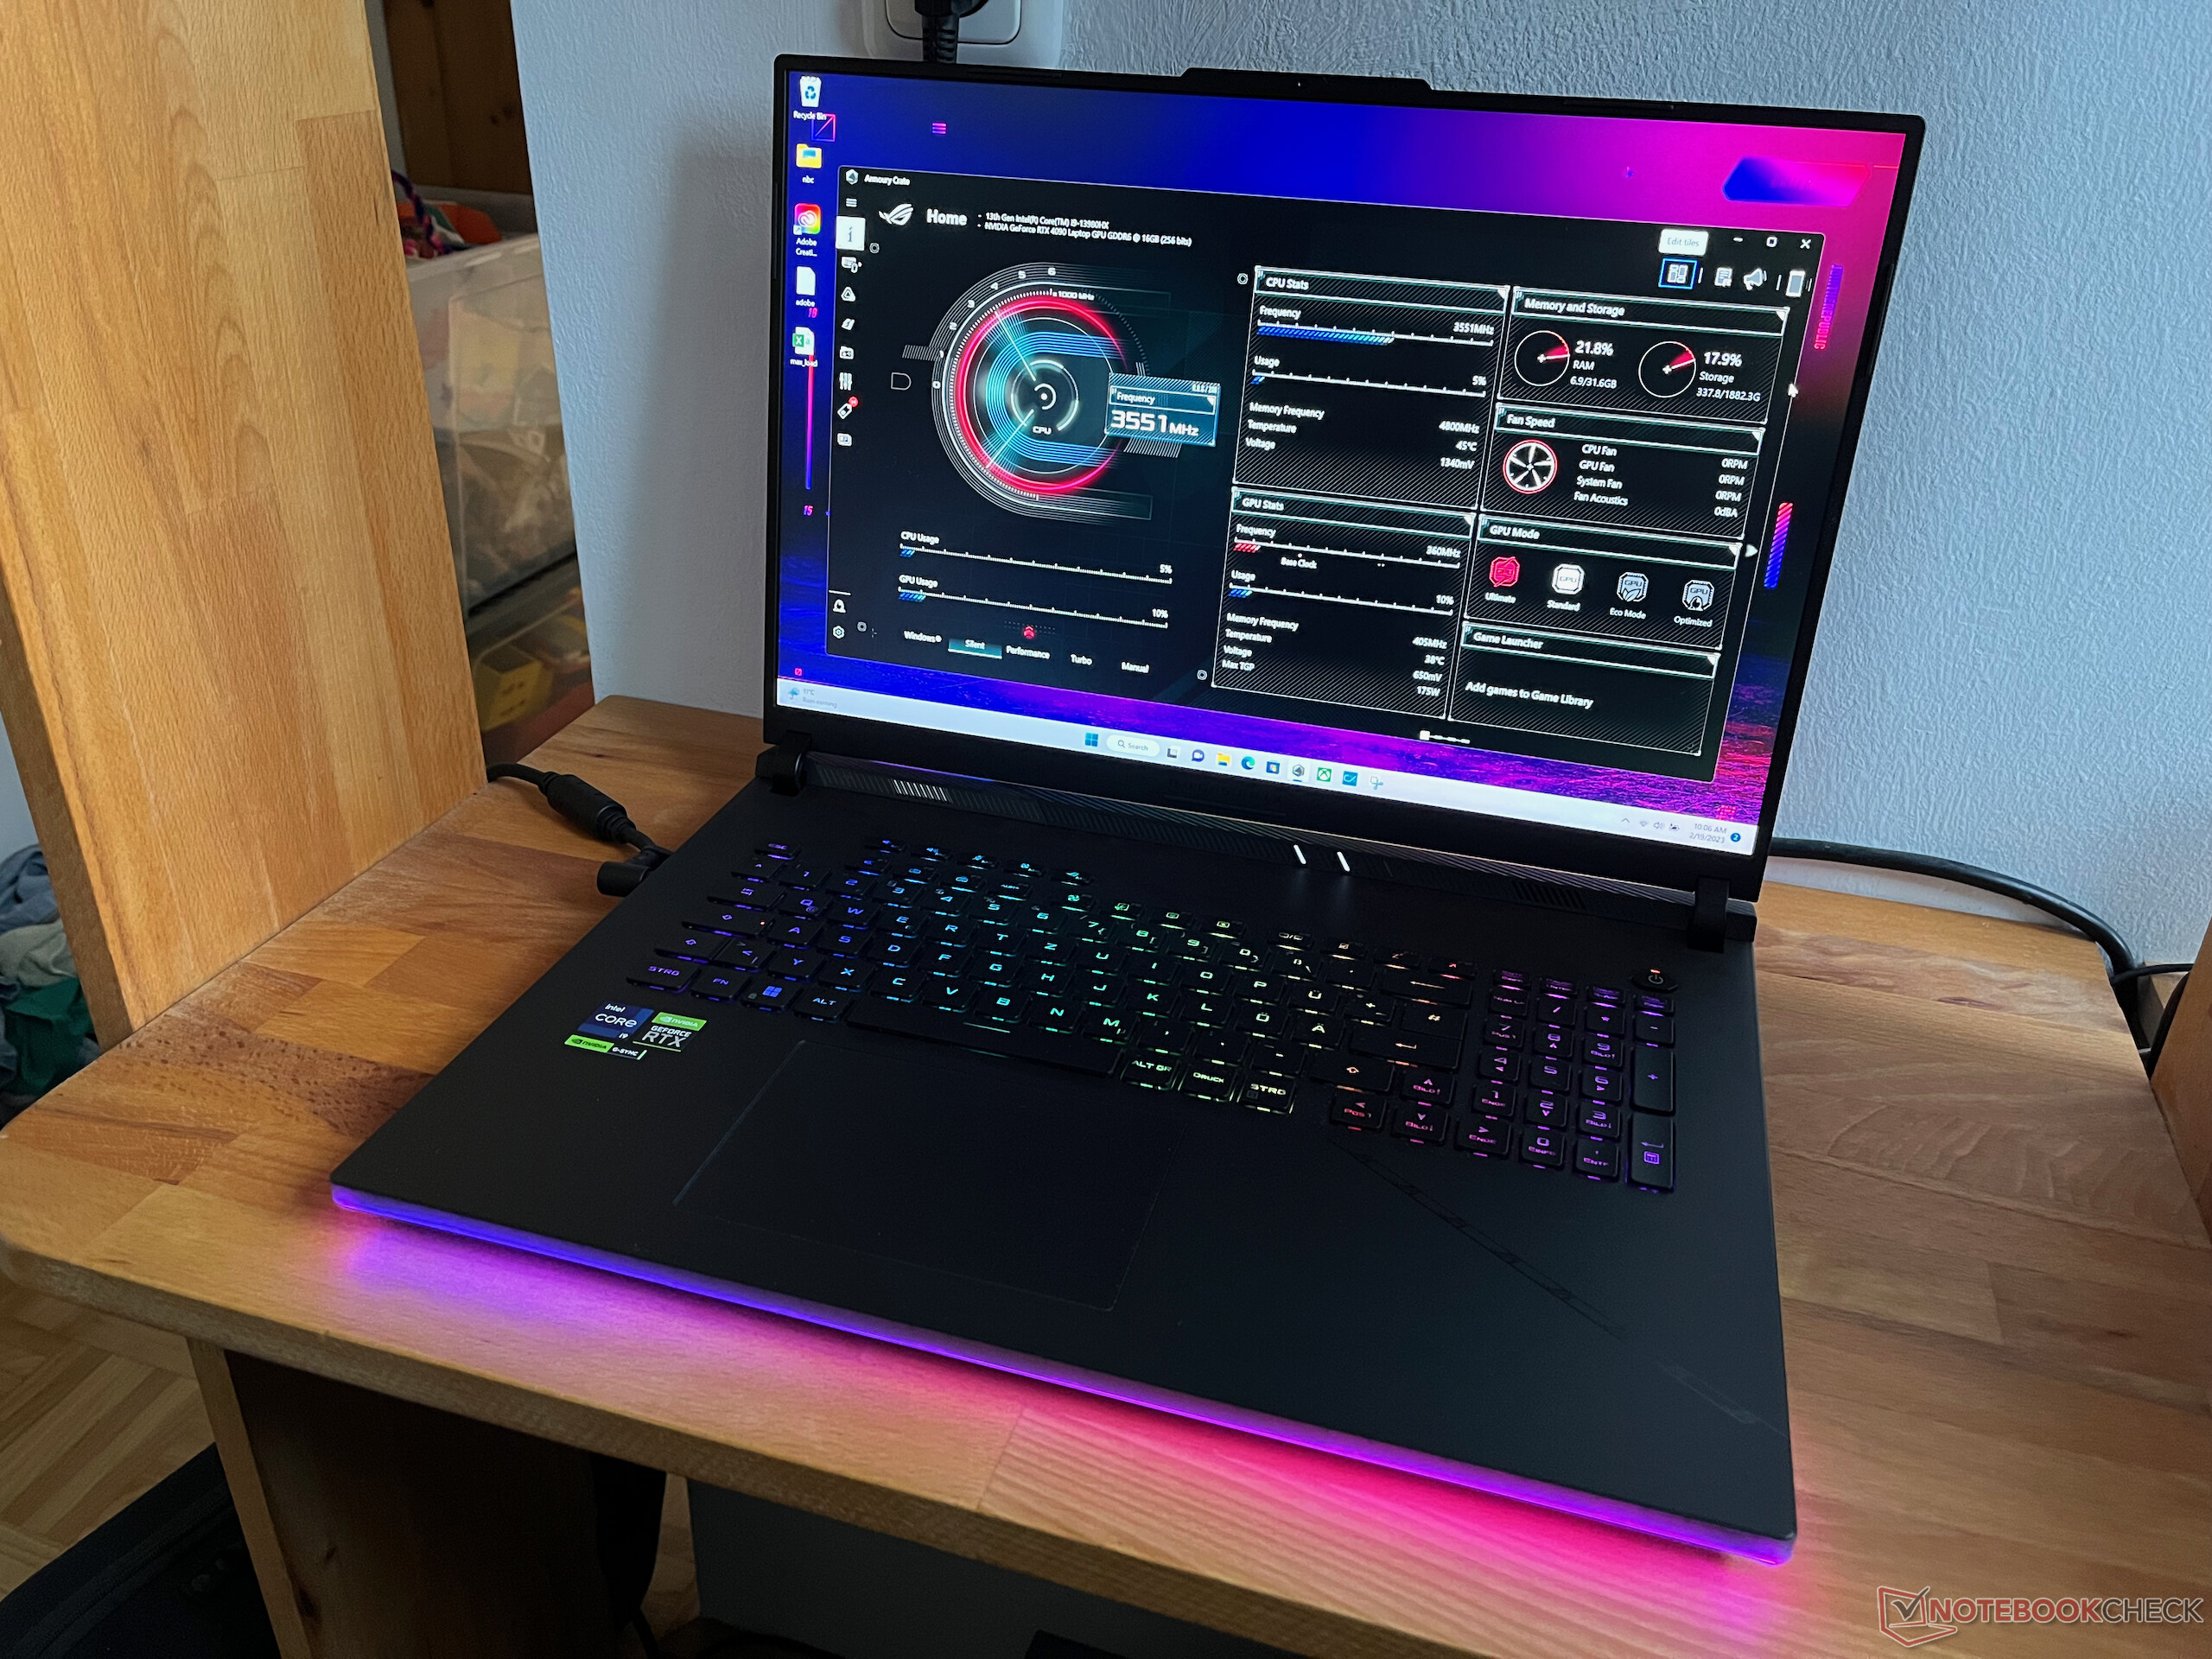
系统性能
强大的硬件也能在一般的系统性能上得分。在PCMark 10中,Scar 18达到了一个顶级的位置,目前只有强大的台式机和微星Titan GT77 HX 13VI勉强超过。在CrossMark中,其结果也是处于顶级水平。即使一些笔记本电脑能够排在Strix Scar 18的前面,但距离非常小,最多只有4%(微星Titan GT77 12UHS目前是最快的笔记本电脑,而最快的台式机则取得了24%的高分)。
在存储基准测试中,你可以很容易地看到DDR5-4800存储的影响。采用更快的DDR5-5600主存储器的系统,如Razer Blade 16,仍然能够取得明显的优势。这是华硕没有使用现有最快组件的少数领域之一,但在实践中影响相对较小。
CrossMark: Overall | Productivity | Creativity | Responsiveness
| PCMark 10 / Score | |
| Intel NUC13 Raptor Canyon | |
| MSI Titan GT77 HX 13VI | |
| Average Intel Core i9-13980HX, NVIDIA GeForce RTX 4090 Laptop GPU (8650 - 9068, n=4) | |
| Asus ROG Strix Scar 18 2023 G834JY-N6005W | |
| Average of class Gaming (5828 - 12414, n=93, last 2 years) | |
| Razer Blade 16 Early 2023 | |
| Lenovo Legion Pro 7 16IRX8H | |
| Razer Blade 18 RTX 4070 | |
| Asus ROG Strix Scar 17 SE G733CX-LL014W | |
| MSI Raider GE77 HX 12UHS | |
| Dell Precision 7000 7670 Performance | |
| PCMark 10 / Essentials | |
| MSI Titan GT77 HX 13VI | |
| Lenovo Legion Pro 7 16IRX8H | |
| Razer Blade 18 RTX 4070 | |
| Intel NUC13 Raptor Canyon | |
| Dell Precision 7000 7670 Performance | |
| Average Intel Core i9-13980HX, NVIDIA GeForce RTX 4090 Laptop GPU (11215 - 11644, n=3) | |
| Razer Blade 16 Early 2023 | |
| Average of class Gaming (8810 - 11935, n=97, last 2 years) | |
| Asus ROG Strix Scar 17 SE G733CX-LL014W | |
| MSI Raider GE77 HX 12UHS | |
| PCMark 10 / Productivity | |
| Average of class Gaming (6845 - 25323, n=95, last 2 years) | |
| Intel NUC13 Raptor Canyon | |
| Lenovo Legion Pro 7 16IRX8H | |
| Average Intel Core i9-13980HX, NVIDIA GeForce RTX 4090 Laptop GPU (10125 - 11067, n=3) | |
| Asus ROG Strix Scar 17 SE G733CX-LL014W | |
| MSI Titan GT77 HX 13VI | |
| MSI Raider GE77 HX 12UHS | |
| Razer Blade 18 RTX 4070 | |
| Razer Blade 16 Early 2023 | |
| Dell Precision 7000 7670 Performance | |
| PCMark 10 / Digital Content Creation | |
| MSI Titan GT77 HX 13VI | |
| Intel NUC13 Raptor Canyon | |
| Average Intel Core i9-13980HX, NVIDIA GeForce RTX 4090 Laptop GPU (15052 - 16012, n=3) | |
| Razer Blade 16 Early 2023 | |
| Average of class Gaming (7602 - 19954, n=95, last 2 years) | |
| Razer Blade 18 RTX 4070 | |
| Lenovo Legion Pro 7 16IRX8H | |
| Asus ROG Strix Scar 17 SE G733CX-LL014W | |
| MSI Raider GE77 HX 12UHS | |
| Dell Precision 7000 7670 Performance | |
| CrossMark / Overall | |
| Intel Core i9-13900K @253W | |
| Intel NUC13 Raptor Canyon | |
| MSI Raider GE77 HX 12UHS | |
| MSI Titan GT77 HX 13VI | |
| Razer Blade 18 RTX 4070 | |
| Asus ROG Strix Scar 17 SE G733CX-LL014W | |
| Asus ROG Strix Scar 18 2023 G834JY-N6005W | |
| Average Intel Core i9-13980HX, NVIDIA GeForce RTX 4090 Laptop GPU (1935 - 2176, n=4) | |
| Asus ROG Strix Scar 18 2023 G834JY-N6005W | |
| Schenker XMG Neo 16 Raptor Lake | |
| Average of class Gaming (1366 - 2409, n=94, last 2 years) | |
| Dell Precision 7000 7670 Performance | |
| Razer Blade 16 Early 2023 | |
| CrossMark / Productivity | |
| Intel Core i9-13900K @253W | |
| Intel NUC13 Raptor Canyon | |
| MSI Raider GE77 HX 12UHS | |
| MSI Titan GT77 HX 13VI | |
| Razer Blade 18 RTX 4070 | |
| Asus ROG Strix Scar 17 SE G733CX-LL014W | |
| Asus ROG Strix Scar 18 2023 G834JY-N6005W | |
| Average Intel Core i9-13980HX, NVIDIA GeForce RTX 4090 Laptop GPU (1764 - 2005, n=4) | |
| Asus ROG Strix Scar 18 2023 G834JY-N6005W | |
| Average of class Gaming (1386 - 2254, n=94, last 2 years) | |
| Schenker XMG Neo 16 Raptor Lake | |
| Dell Precision 7000 7670 Performance | |
| Razer Blade 16 Early 2023 | |
| CrossMark / Creativity | |
| Intel Core i9-13900K @253W | |
| Intel NUC13 Raptor Canyon | |
| Asus ROG Strix Scar 18 2023 G834JY-N6005W | |
| MSI Titan GT77 HX 13VI | |
| Average Intel Core i9-13980HX, NVIDIA GeForce RTX 4090 Laptop GPU (2267 - 2469, n=4) | |
| Razer Blade 18 RTX 4070 | |
| Asus ROG Strix Scar 18 2023 G834JY-N6005W | |
| Schenker XMG Neo 16 Raptor Lake | |
| Asus ROG Strix Scar 17 SE G733CX-LL014W | |
| MSI Raider GE77 HX 12UHS | |
| Average of class Gaming (1343 - 2786, n=94, last 2 years) | |
| Dell Precision 7000 7670 Performance | |
| Razer Blade 16 Early 2023 | |
| CrossMark / Responsiveness | |
| Intel Core i9-13900K @253W | |
| MSI Raider GE77 HX 12UHS | |
| Asus ROG Strix Scar 17 SE G733CX-LL014W | |
| Intel NUC13 Raptor Canyon | |
| Razer Blade 18 RTX 4070 | |
| MSI Titan GT77 HX 13VI | |
| Average of class Gaming (1226 - 2334, n=94, last 2 years) | |
| Average Intel Core i9-13980HX, NVIDIA GeForce RTX 4090 Laptop GPU (1556 - 1904, n=4) | |
| Asus ROG Strix Scar 18 2023 G834JY-N6005W | |
| Asus ROG Strix Scar 18 2023 G834JY-N6005W | |
| Schenker XMG Neo 16 Raptor Lake | |
| Dell Precision 7000 7670 Performance | |
| Razer Blade 16 Early 2023 | |
CrossMark: Overall | Productivity | Creativity | Responsiveness
| PCMark 10 Score | 8764 points | |
Help | ||
| AIDA64 / Memory Copy | |
| Razer Blade 16 Early 2023 | |
| Razer Blade 16 Early 2023 | |
| Razer Blade 16 Early 2023 | |
| Lenovo Legion Pro 7 16IRX8H | |
| Razer Blade 18 RTX 4070 | |
| Intel Core i9-13900K @253W | |
| Average of class Gaming (21750 - 129946, n=105, last 2 years) | |
| Average Intel Core i9-13980HX (62189 - 80776, n=9) | |
| MSI Raider GE77 HX 12UHS | |
| Intel NUC13 Raptor Canyon | |
| Asus ROG Strix Scar 18 2023 G834JY-N6005W | |
| Schenker XMG Neo 16 Raptor Lake | |
| Asus ROG Strix Scar 18 2023 G834JY-N6005W | |
| Dell Precision 7000 7670 Performance | |
| MSI Titan GT77 HX 13VI | |
| Asus ROG Strix Scar 17 SE G733CX-LL014W | |
| AIDA64 / Memory Read | |
| Razer Blade 16 Early 2023 | |
| Razer Blade 16 Early 2023 | |
| Razer Blade 16 Early 2023 | |
| Razer Blade 18 RTX 4070 | |
| Lenovo Legion Pro 7 16IRX8H | |
| Intel Core i9-13900K @253W | |
| Average Intel Core i9-13980HX (62624 - 89096, n=9) | |
| Schenker XMG Neo 16 Raptor Lake | |
| Asus ROG Strix Scar 18 2023 G834JY-N6005W | |
| Asus ROG Strix Scar 18 2023 G834JY-N6005W | |
| Average of class Gaming (22956 - 118858, n=105, last 2 years) | |
| Intel NUC13 Raptor Canyon | |
| MSI Raider GE77 HX 12UHS | |
| Asus ROG Strix Scar 17 SE G733CX-LL014W | |
| Dell Precision 7000 7670 Performance | |
| MSI Titan GT77 HX 13VI | |
| AIDA64 / Memory Write | |
| Razer Blade 16 Early 2023 | |
| Razer Blade 16 Early 2023 | |
| Razer Blade 16 Early 2023 | |
| Average of class Gaming (22297 - 135096, n=105, last 2 years) | |
| Razer Blade 18 RTX 4070 | |
| Intel Core i9-13900K @253W | |
| Lenovo Legion Pro 7 16IRX8H | |
| Average Intel Core i9-13980HX (59912 - 79917, n=9) | |
| Intel NUC13 Raptor Canyon | |
| Schenker XMG Neo 16 Raptor Lake | |
| Asus ROG Strix Scar 18 2023 G834JY-N6005W | |
| MSI Raider GE77 HX 12UHS | |
| Asus ROG Strix Scar 18 2023 G834JY-N6005W | |
| Asus ROG Strix Scar 17 SE G733CX-LL014W | |
| Dell Precision 7000 7670 Performance | |
| MSI Titan GT77 HX 13VI | |
| AIDA64 / Memory Latency | |
| Average of class Gaming (75.3 - 259, n=105, last 2 years) | |
| Razer Blade 16 Early 2023 | |
| Razer Blade 16 Early 2023 | |
| Razer Blade 16 Early 2023 | |
| Intel NUC13 Raptor Canyon | |
| MSI Titan GT77 HX 13VI | |
| Schenker XMG Neo 16 Raptor Lake | |
| Asus ROG Strix Scar 18 2023 G834JY-N6005W | |
| Asus ROG Strix Scar 18 2023 G834JY-N6005W | |
| Average Intel Core i9-13980HX (79.4 - 93.2, n=9) | |
| Asus ROG Strix Scar 17 SE G733CX-LL014W | |
| Dell Precision 7000 7670 Performance | |
| Razer Blade 18 RTX 4070 | |
| MSI Raider GE77 HX 12UHS | |
| Lenovo Legion Pro 7 16IRX8H | |
| Intel Core i9-13900K @253W | |
* ... smaller is better
DPC延迟
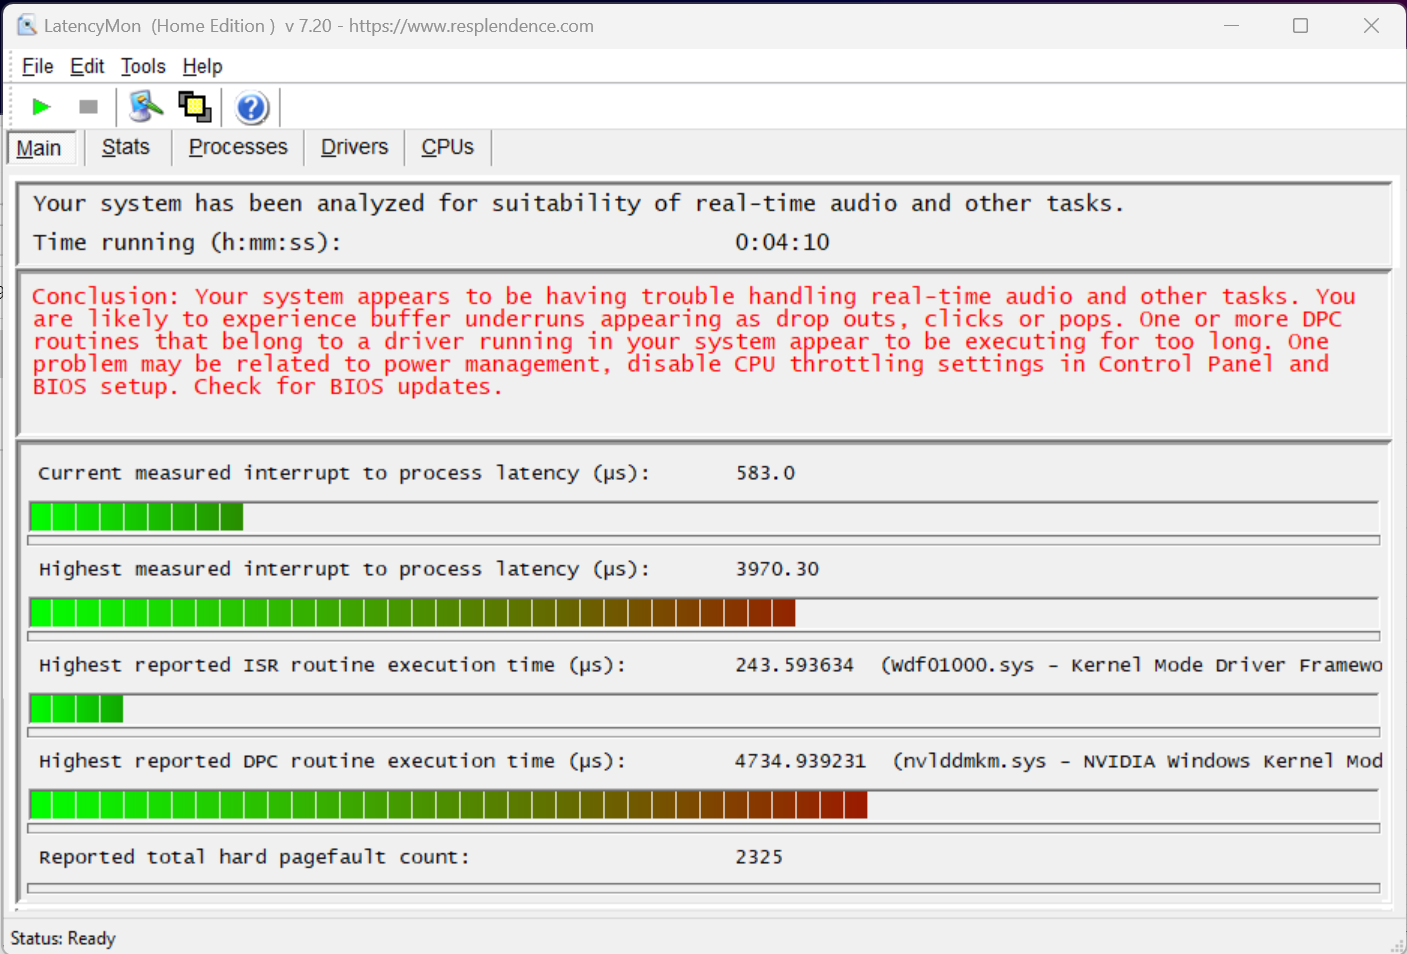
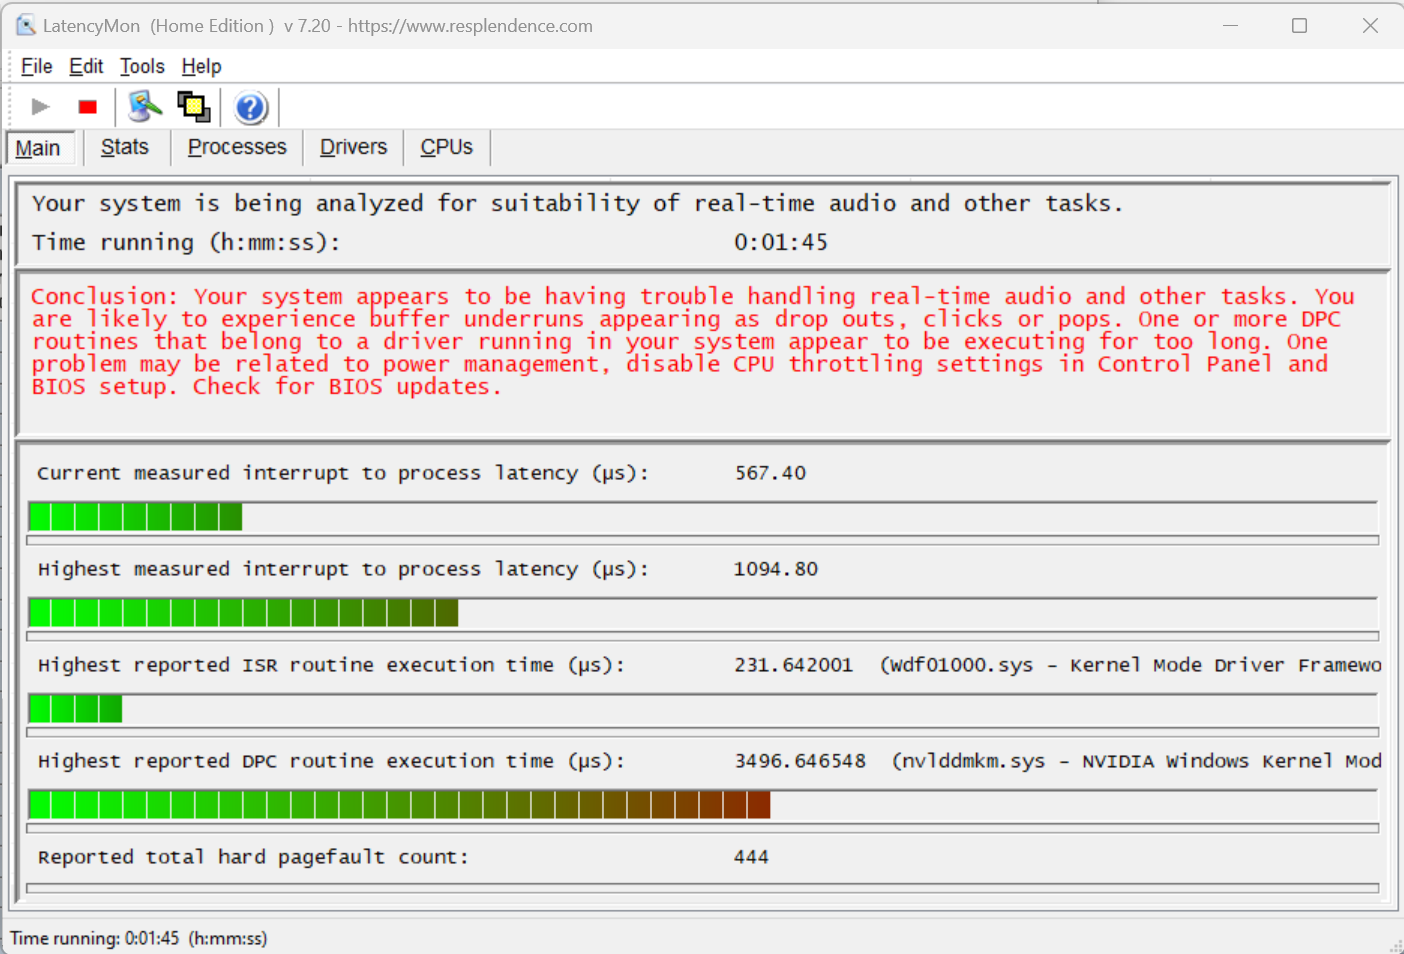
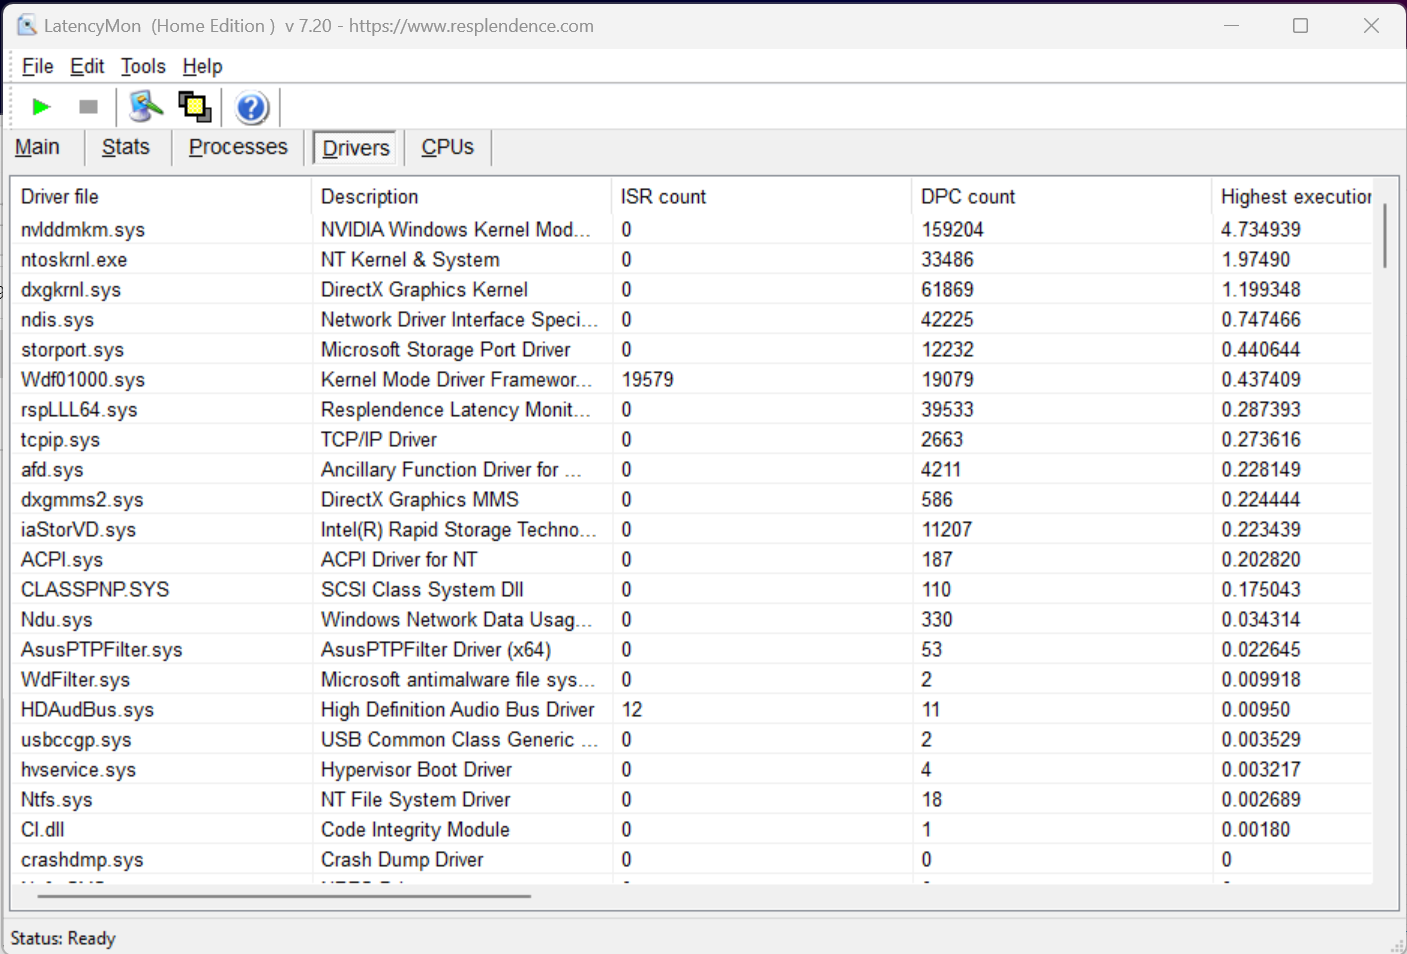
在DPC延迟方面,华硕笔记本电脑在所有测试的笔记本电脑中只处于中间位置。根据LatencyMon,Nvidia驱动程序在这里出了问题,这可能会在实时应用程序中产生一些问题。我们在Ultimate GPU(无Optimus)的Turbo模式下进行了测试,理论上这比混合模式或省电模式更适合。 不幸的是,在这个设备级别中,DPC性能较弱并不是一个例外。
| DPC Latencies / LatencyMon - interrupt to process latency (max), Web, Youtube, Prime95 | |
| MSI Titan GT77 HX 13VI | |
| Asus ROG Strix Scar 17 SE G733CX-LL014W | |
| Razer Blade 16 Early 2023 | |
| Dell Precision 7000 7670 Performance | |
| MSI Raider GE77 HX 12UHS | |
| Razer Blade 18 RTX 4070 | |
| Asus ROG Strix Scar 18 2023 G834JY-N6005W | |
| Lenovo Legion Pro 7 16IRX8H | |
* ... smaller is better
存储解决方案
华硕在Scar 18 G834JY-N6005W中使用了两个快速的三星PM9A1固态硬盘,每个都有1TB的存储空间,组成RAID-0系统。尽管这样做速度略有提高,但故障的可能性和耗电量也会增加。然而,在与具有相同RAID系统的Legion 5 Pro 16IAH7H的比较中,华硕Scar被超越了--甚至以很大的优势。但这并不是因为散热问题,在恒定的负载下,性能保持不变。

* ... smaller is better
Disk Throttling: DiskSpd Read Loop, Queue Depth 8
图形卡
华硕ROG Strix Scar 18中的展示品显然是 NvidiaGeForce RTX 4090 笔记本GPU.虽然这个名字表明与 RTX 4090桌面GPU但该移动版本与 桌面RTX 4080(相同的芯片),而且性能仍然低于 桌面RTX 4070 Ti.但至少,华硕提供了RTX 4090移动版的最快版本,具有175瓦的TGP(150瓦+25瓦的动态提升),甚至将GPU稍微超频了50MHz。
与RTX 4090相比,在MSI Titan GT77 HX 13VI相比,Strix G18仍然勉强排在后面,尽管有超频。RTX 4080笔记本电脑也明显被超越,而采用旧的 RTX 3080 Ti 笔记本GPU的顶级型号仍然远远落后。
| 3DMark 06 Standard Score | 67702 points | |
| 3DMark 11 Performance | 46985 points | |
| 3DMark Ice Storm Standard Score | 277937 points | |
| 3DMark Cloud Gate Standard Score | 70984 points | |
| 3DMark Fire Strike Score | 36408 points | |
| 3DMark Fire Strike Extreme Score | 24278 points | |
| 3DMark Time Spy Score | 20166 points | |
Help | ||
* ... smaller is better
游戏性能
游戏基准测试显示了与合成基准测试中已经出现的类似情况。作为一个特殊的功能,RTX 4000系列现在还提供了对DLSS 3的支持与帧生成。在支持的游戏中,RTX 4090能够在这里大幅提升帧率。这也使得4K中的光线追踪效果在流畅的帧率下成为可能。然而,显示器的240赫兹只能在要求不高的游戏中,在2,560 x 1,600像素的原生分辨率中得到充分利用。
| GTA V - 1920x1080 Highest AA:4xMSAA + FX AF:16x | |
| Intel NUC13 Raptor Canyon | |
| Lenovo Legion Pro 7 16IRX8H | |
| Asus ROG Strix Scar 18 2023 G834JY-N6005W | |
| Asus ROG Strix Scar 18 2023 G834JY-N6005W | |
| MSI Titan GT77 HX 13VI | |
| Razer Blade 16 Early 2023 | |
| Schenker XMG Neo 16 Raptor Lake | |
| MSI Raider GE77 HX 12UHS | |
| Average of class Gaming (48.3 - 186.9, n=94, last 2 years) | |
| Asus ROG Strix Scar 17 SE G733CX-LL014W | |
| Razer Blade 18 RTX 4070 | |
| Dell Precision 7000 7670 Performance | |
| Final Fantasy XV Benchmark - 1920x1080 High Quality | |
| MSI Titan GT77 HX 13VI | |
| Schenker XMG Neo 16 Raptor Lake | |
| Intel NUC13 Raptor Canyon | |
| Asus ROG Strix Scar 18 2023 G834JY-N6005W | |
| Asus ROG Strix Scar 18 2023 G834JY-N6005W | |
| Lenovo Legion Pro 7 16IRX8H | |
| Razer Blade 16 Early 2023 | |
| Average of class Gaming (41 - 215, n=95, last 2 years) | |
| MSI Raider GE77 HX 12UHS | |
| Asus ROG Strix Scar 17 SE G733CX-LL014W | |
| Razer Blade 18 RTX 4070 | |
| Dell Precision 7000 7670 Performance | |
| Strange Brigade - 1920x1080 ultra AA:ultra AF:16 | |
| MSI Titan GT77 HX 13VI | |
| Asus ROG Strix Scar 18 2023 G834JY-N6005W | |
| Intel NUC13 Raptor Canyon | |
| Schenker XMG Neo 16 Raptor Lake | |
| Asus ROG Strix Scar 18 2023 G834JY-N6005W | |
| Razer Blade 16 Early 2023 | |
| Lenovo Legion Pro 7 16IRX8H | |
| Average of class Gaming (76.3 - 458, n=87, last 2 years) | |
| Asus ROG Strix Scar 17 SE G733CX-LL014W | |
| MSI Raider GE77 HX 12UHS | |
| Razer Blade 18 RTX 4070 | |
| Dell Precision 7000 7670 Performance | |
| Dota 2 Reborn - 1920x1080 ultra (3/3) best looking | |
| Intel NUC13 Raptor Canyon | |
| Razer Blade 16 Early 2023 | |
| Asus ROG Strix Scar 18 2023 G834JY-N6005W | |
| Asus ROG Strix Scar 18 2023 G834JY-N6005W | |
| MSI Titan GT77 HX 13VI | |
| Lenovo Legion Pro 7 16IRX8H | |
| Razer Blade 18 RTX 4070 | |
| Schenker XMG Neo 16 Raptor Lake | |
| Asus ROG Strix Scar 17 SE G733CX-LL014W | |
| MSI Raider GE77 HX 12UHS | |
| Average of class Gaming (84.8 - 248, n=107, last 2 years) | |
| Dell Precision 7000 7670 Performance | |
在我们用TheWitcher 3 进行的负载测试以及3DMarkTime Spy 压力测试中,华硕G834JY保持了稳定的性能,没有任何下降。TheWitcher 3 中可见的波动是由于白天和夜晚之间的变化造成的。
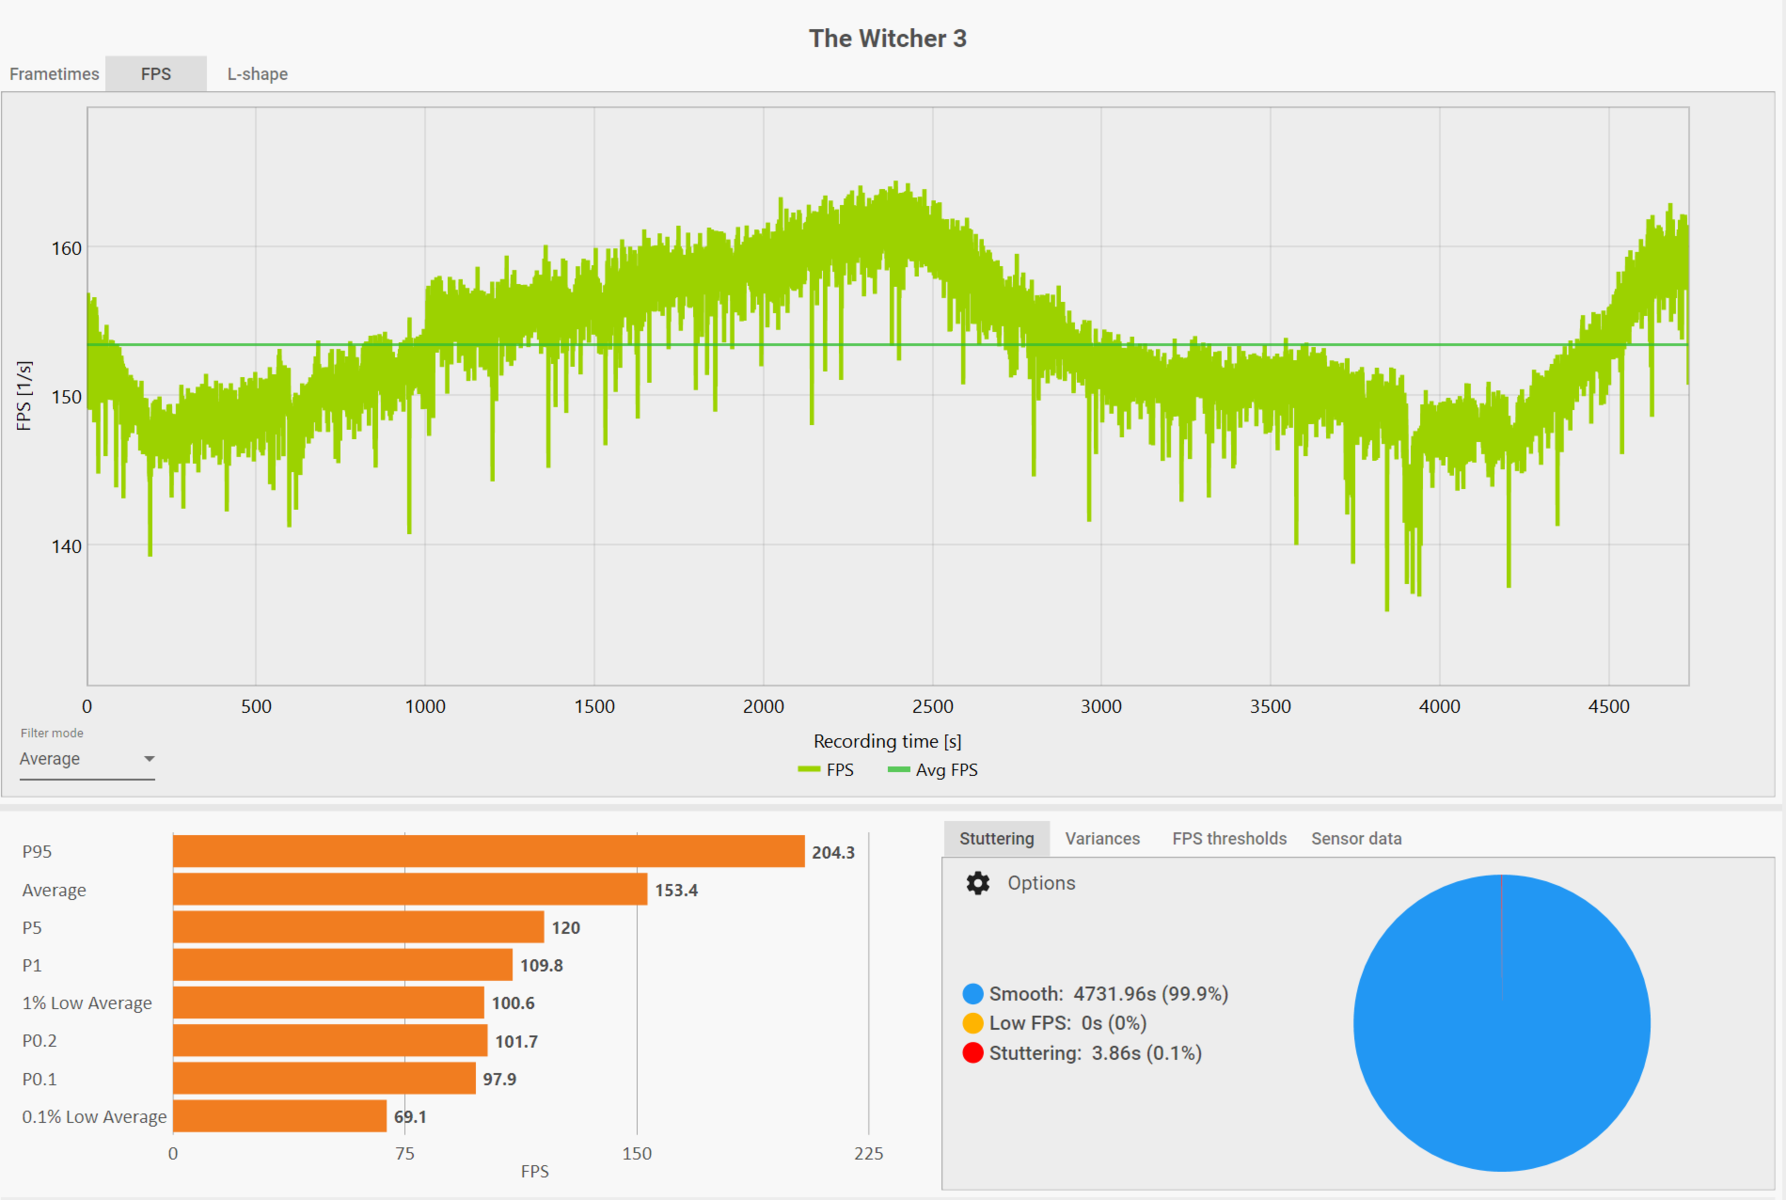
The Witcher 3 FPS Chart
| low | med. | high | ultra | QHD | 4K DLSS | 4K | |
|---|---|---|---|---|---|---|---|
| Counter-Strike: GO (2012) | 516 | 314 | |||||
| GTA V (2015) | 187.4 | 185.7 | 184.8 | 141.3 | 139.1 | 175.7 | |
| Dota 2 Reborn (2015) | 237 | 207.7 | 201.75 | 190.2 | 178.6 | ||
| Deus Ex Mankind Divided (2016) | 169 | ||||||
| Final Fantasy XV Benchmark (2018) | 224 | 208 | 177.6 | 146.7 | 90.1 | ||
| X-Plane 11.11 (2018) | 211 | 186.8 | 142.8 | ||||
| Far Cry 5 (2018) | 197 | 181 | 172 | 158 | 153 | 107 | |
| Strange Brigade (2018) | 496 | 403 | 386 | 366 | 292 | 154.7 | |
| Shadow of the Tomb Raider (2018) | 143.7 | 121.2 | 87.3 | ||||
| Control (2019) | 184.4 | 123.2 | 72.6 | ||||
| Horizon Zero Dawn (2020) | 184 | 154 | 145 | 127 | 92 | ||
| Flight Simulator 2020 (2020) | 74 | 74 | 96.8 | 51.2 | |||
| Battlefield 2042 (2021) | 172.6 | 138.9 | 85.4 | ||||
| Halo Infinite (2021) | 128.9 | 77 | 57.3 | ||||
| Elden Ring (2022) | 60 | 60 | 60 | 60 | 60 | 60 | |
| Cyberpunk 2077 1.6 (2022) | 119.7 | 94.5 | |||||
| Vampire Bloodhunt (2022) | 290 | 242 | 138.3 | ||||
| F1 22 (2022) | 319 | 308 | 273 | 124.5 | 75 | 42.4 | |
| FIFA 23 (2022) | 183.7 | 182.6 | 162.4 | ||||
| A Plague Tale Requiem (2022) | 96.8 | 72 | 82.3 | 41 | |||
| Uncharted Legacy of Thieves Collection (2022) | 108.2 | 103.1 | 62.9 | ||||
| Call of Duty Modern Warfare 2 2022 (2022) | 170 | 127 | 112 | 81 | |||
| Spider-Man Miles Morales (2022) | 109.1 | 103.8 | 73.2 | ||||
| Need for Speed Unbound (2022) | 124.2 | 111.8 | 84.3 | ||||
| High On Life (2023) | 180.3 | 120.2 | 52 | ||||
| The Witcher 3 v4 (2023) | 137.6 | 96.6 | 49 |
排放
噪声水平
在负载情况下,三个内置风扇明显在与强大的组件进行斗争。即使噪音特性仍然非常舒适,但高达55.8分贝(风扇在4900、5500和6400 RPM时)仍然非常响亮。在游戏时,良好的扬声器发出的声音会被淹没一些,建议你在这里使用耳机。 如果你在游戏中使用240赫兹的显示屏,并达到高帧率,我们的测试装置不幸地产生了明显的线圈啸叫。这从100帧开始就可以听到,而且根据游戏的不同,会变得有点烦人。
在空闲运行期间,这三个风扇也可以长时间保持关闭状态,但只有在静音模式和使用集成GPU时才会如此。然而,在大多数情况下,它们在冲浪时不会保持完全关闭,但在2000-3000转/分的最低风扇水平是舒适安静的,低于33分贝(A)。
Noise level
| Idle |
| 23.9 / 32.6 / 32.6 dB(A) |
| Load |
| 35.9 / 55.8 dB(A) |
 | ||
30 dB silent 40 dB(A) audible 50 dB(A) loud |
||
min: | ||
| Asus ROG Strix Scar 18 2023 G834JY-N6005W GeForce RTX 4090 Laptop GPU, i9-13980HX, 2x Samsung PM9A1 MZVL21T0HCLR (RAID 0) | Razer Blade 18 RTX 4070 GeForce RTX 4070 Laptop GPU, i9-13950HX, SSSTC CA6-8D1024 | Lenovo Legion Pro 7 16IRX8H GeForce RTX 4080 Laptop GPU, i9-13900HX, Samsung PM9A1 MZVL21T0HCLR | Razer Blade 16 Early 2023 GeForce RTX 4080 Laptop GPU, i9-13950HX, SSSTC CA6-8D1024 | MSI Titan GT77 HX 13VI GeForce RTX 4090 Laptop GPU, i9-13950HX, Samsung PM9A1 MZVL22T0HBLB | MSI Raider GE77 HX 12UHS GeForce RTX 3080 Ti Laptop GPU, i9-12900HX, Samsung PM9A1 MZVL22T0HBLB | Asus ROG Strix Scar 17 SE G733CX-LL014W GeForce RTX 3080 Ti Laptop GPU, i9-12950HX, Samsung PM9A1 MZVL22T0HBLB | |
|---|---|---|---|---|---|---|---|
| Noise | 8% | -5% | 11% | -9% | -17% | 13% | |
| off / environment * (dB) | 23.9 | 23.5 2% | 24 -0% | 23 4% | 24.6 -3% | 26 -9% | 23.9 -0% |
| Idle Minimum * (dB) | 23.9 | 23.8 -0% | 26 -9% | 23 4% | 29.2 -22% | 26 -9% | 23.9 -0% |
| Idle Average * (dB) | 32.6 | 23.8 27% | 28 14% | 23 29% | 29.2 10% | 34 -4% | 23.9 27% |
| Idle Maximum * (dB) | 32.6 | 26.8 18% | 34 -4% | 23.6 28% | 29.2 10% | 46 -41% | 23.9 27% |
| Load Average * (dB) | 35.9 | 37.3 -4% | 47 -31% | 39 -9% | 50.7 -41% | 50 -39% | 34.3 4% |
| Load Maximum * (dB) | 55.8 | 53.5 4% | 56 -0% | 51.3 8% | 61 -9% | 57 -2% | 45.9 18% |
| Witcher 3 ultra * (dB) | 48 | 55 | 51.6 | 53.3 | 55 |
* ... smaller is better
温度
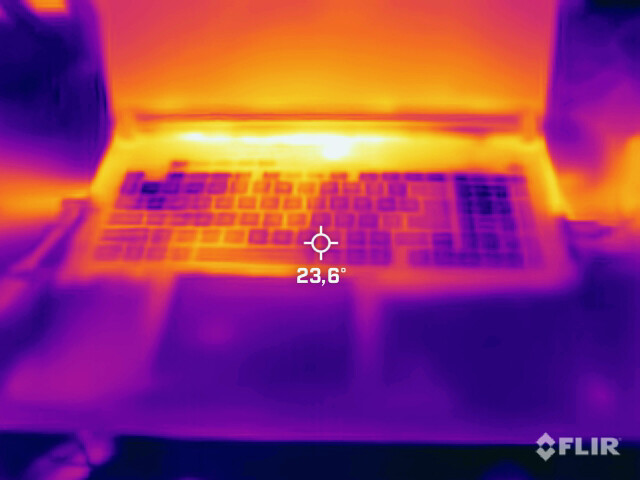
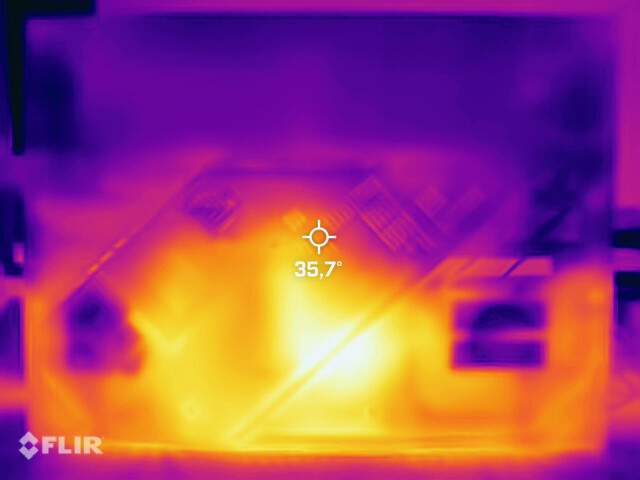
温度方面的结果好坏参半。机箱中被触及的相关区域,如掌托和键盘,即使在较长的压力情况下也能保持舒适的温度。但在游戏时,机箱顶部区域的热点会相对变热,最高可达55℃(131°F)。
(-) The maximum temperature on the upper side is 54 °C / 129 F, compared to the average of 40.4 °C / 105 F, ranging from 21.2 to 68.8 °C for the class Gaming.
(-) The bottom heats up to a maximum of 46 °C / 115 F, compared to the average of 43.2 °C / 110 F
(+) In idle usage, the average temperature for the upper side is 27.2 °C / 81 F, compared to the device average of 33.9 °C / 93 F.
(±) Playing The Witcher 3, the average temperature for the upper side is 36 °C / 97 F, compared to the device average of 33.9 °C / 93 F.
(+) The palmrests and touchpad are cooler than skin temperature with a maximum of 28 °C / 82.4 F and are therefore cool to the touch.
(±) The average temperature of the palmrest area of similar devices was 28.8 °C / 83.8 F (+0.8 °C / 1.4 F).
| Asus ROG Strix Scar 18 2023 G834JY-N6005W Intel Core i9-13980HX, NVIDIA GeForce RTX 4090 Laptop GPU | Razer Blade 16 Early 2023 Intel Core i9-13950HX, NVIDIA GeForce RTX 4080 Laptop GPU | MSI Titan GT77 HX 13VI Intel Core i9-13950HX, NVIDIA GeForce RTX 4090 Laptop GPU | MSI Raider GE77 HX 12UHS Intel Core i9-12900HX, NVIDIA GeForce RTX 3080 Ti Laptop GPU | Asus ROG Strix Scar 17 SE G733CX-LL014W Intel Core i9-12950HX, NVIDIA GeForce RTX 3080 Ti Laptop GPU | |
|---|---|---|---|---|---|
| Heat | 9% | 13% | -23% | -4% | |
| Maximum Upper Side * (°C) | 54 | 40 26% | 40.6 25% | 53 2% | 48.8 10% |
| Maximum Bottom * (°C) | 46 | 37.6 18% | 41.1 11% | 58 -26% | 52.4 -14% |
| Idle Upper Side * (°C) | 30 | 32.4 -8% | 26.2 13% | 38 -27% | 30.4 -1% |
| Idle Bottom * (°C) | 31 | 31.4 -1% | 30.3 2% | 43 -39% | 34.1 -10% |
* ... smaller is better
压力测试
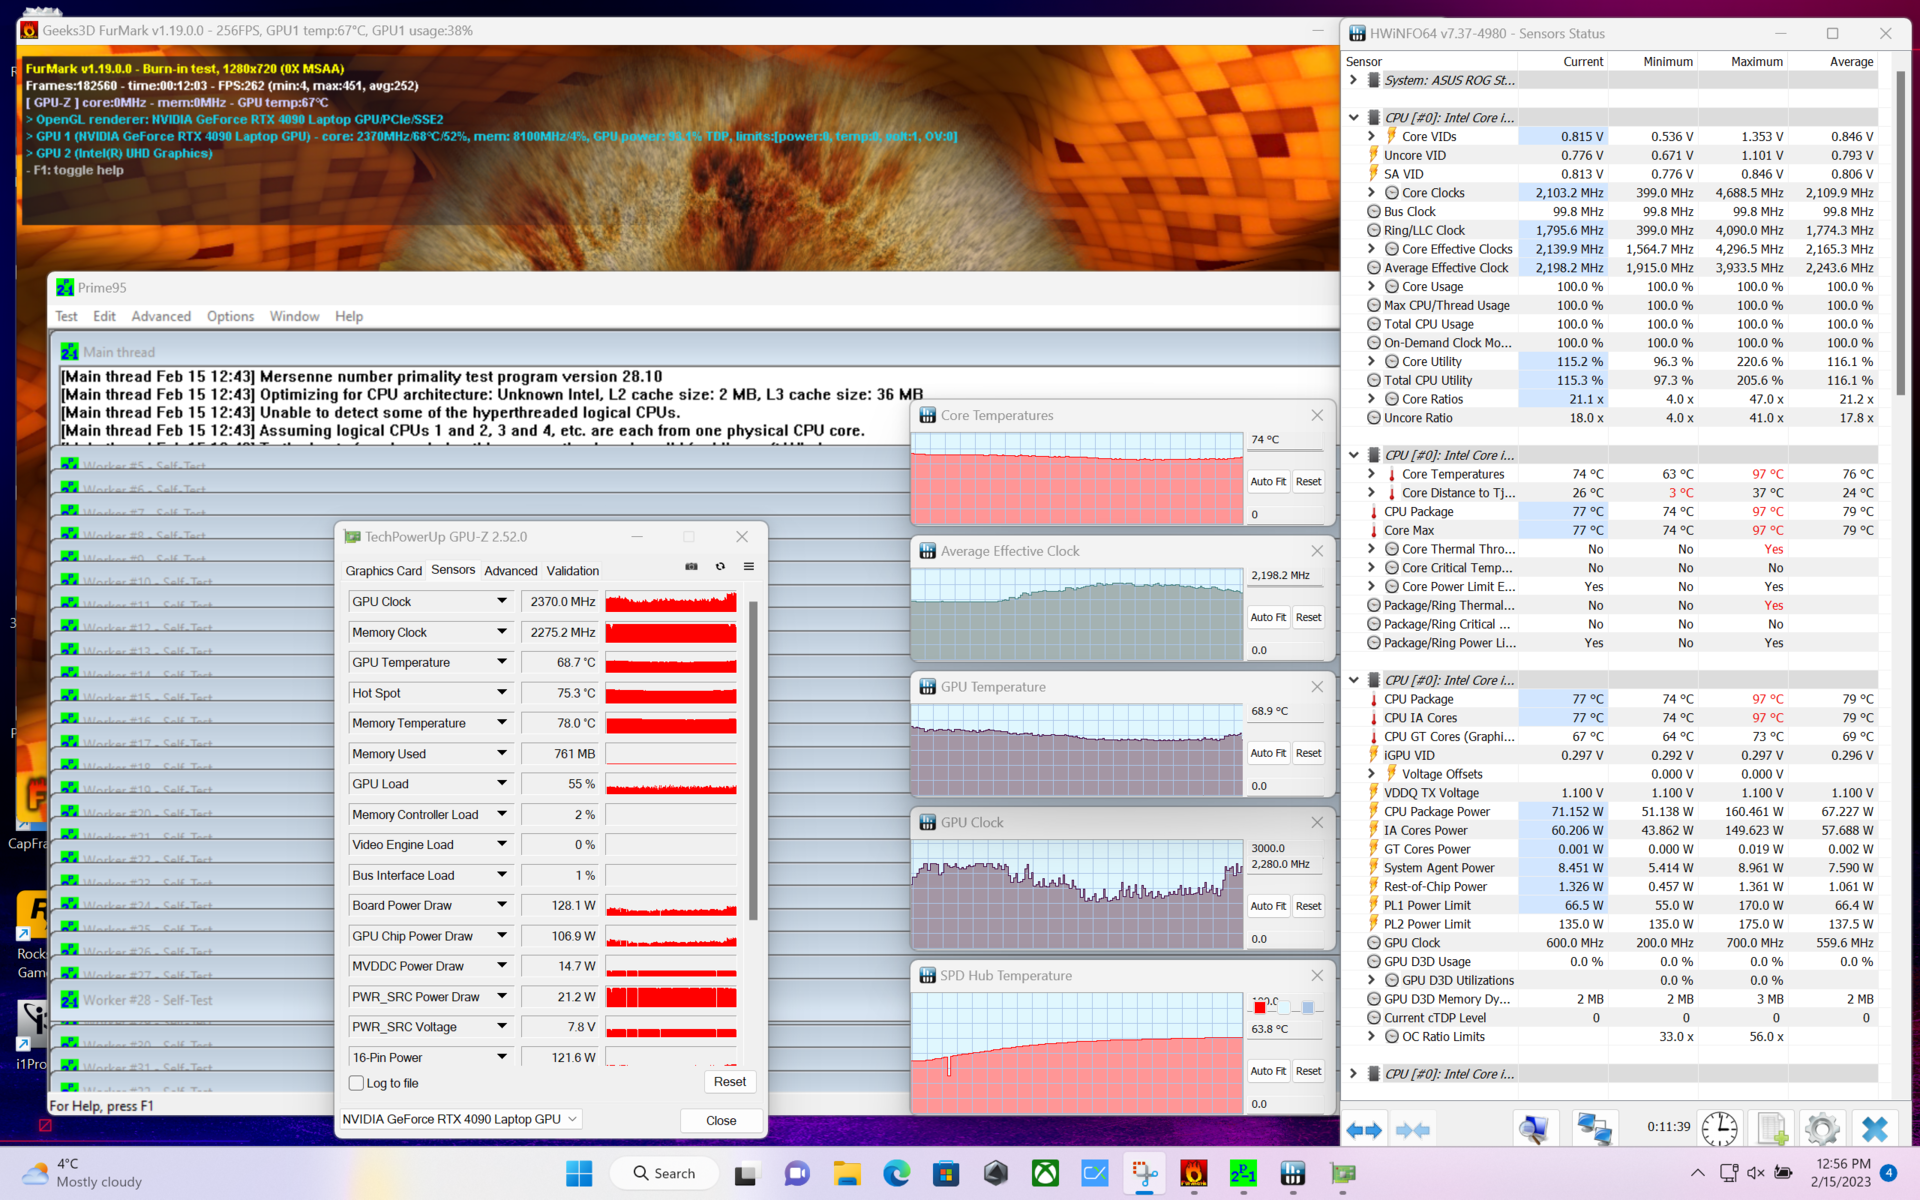
在压力测试中,CPU的内部温度变化很大。这可以追溯到不断调整的时钟速度,它不断将CPU推向接近100℃(212°F)的大关。在GPU方面,情况就不那么严重了,RTX 4090的最高温度只达到了70°C(158°F)。
在游戏时,CPU的温度仍然略微不那么极端。我们测量了81°C(178°F,《赛博朋克2077》)和90°C(194°F,《Witcher 3 》)之间。另一方面,在72°C(162°F,《赛博朋克2077》)和77°C(171°F,《Witcher 3 》)之间,GPU的温度比压力测试时略高。
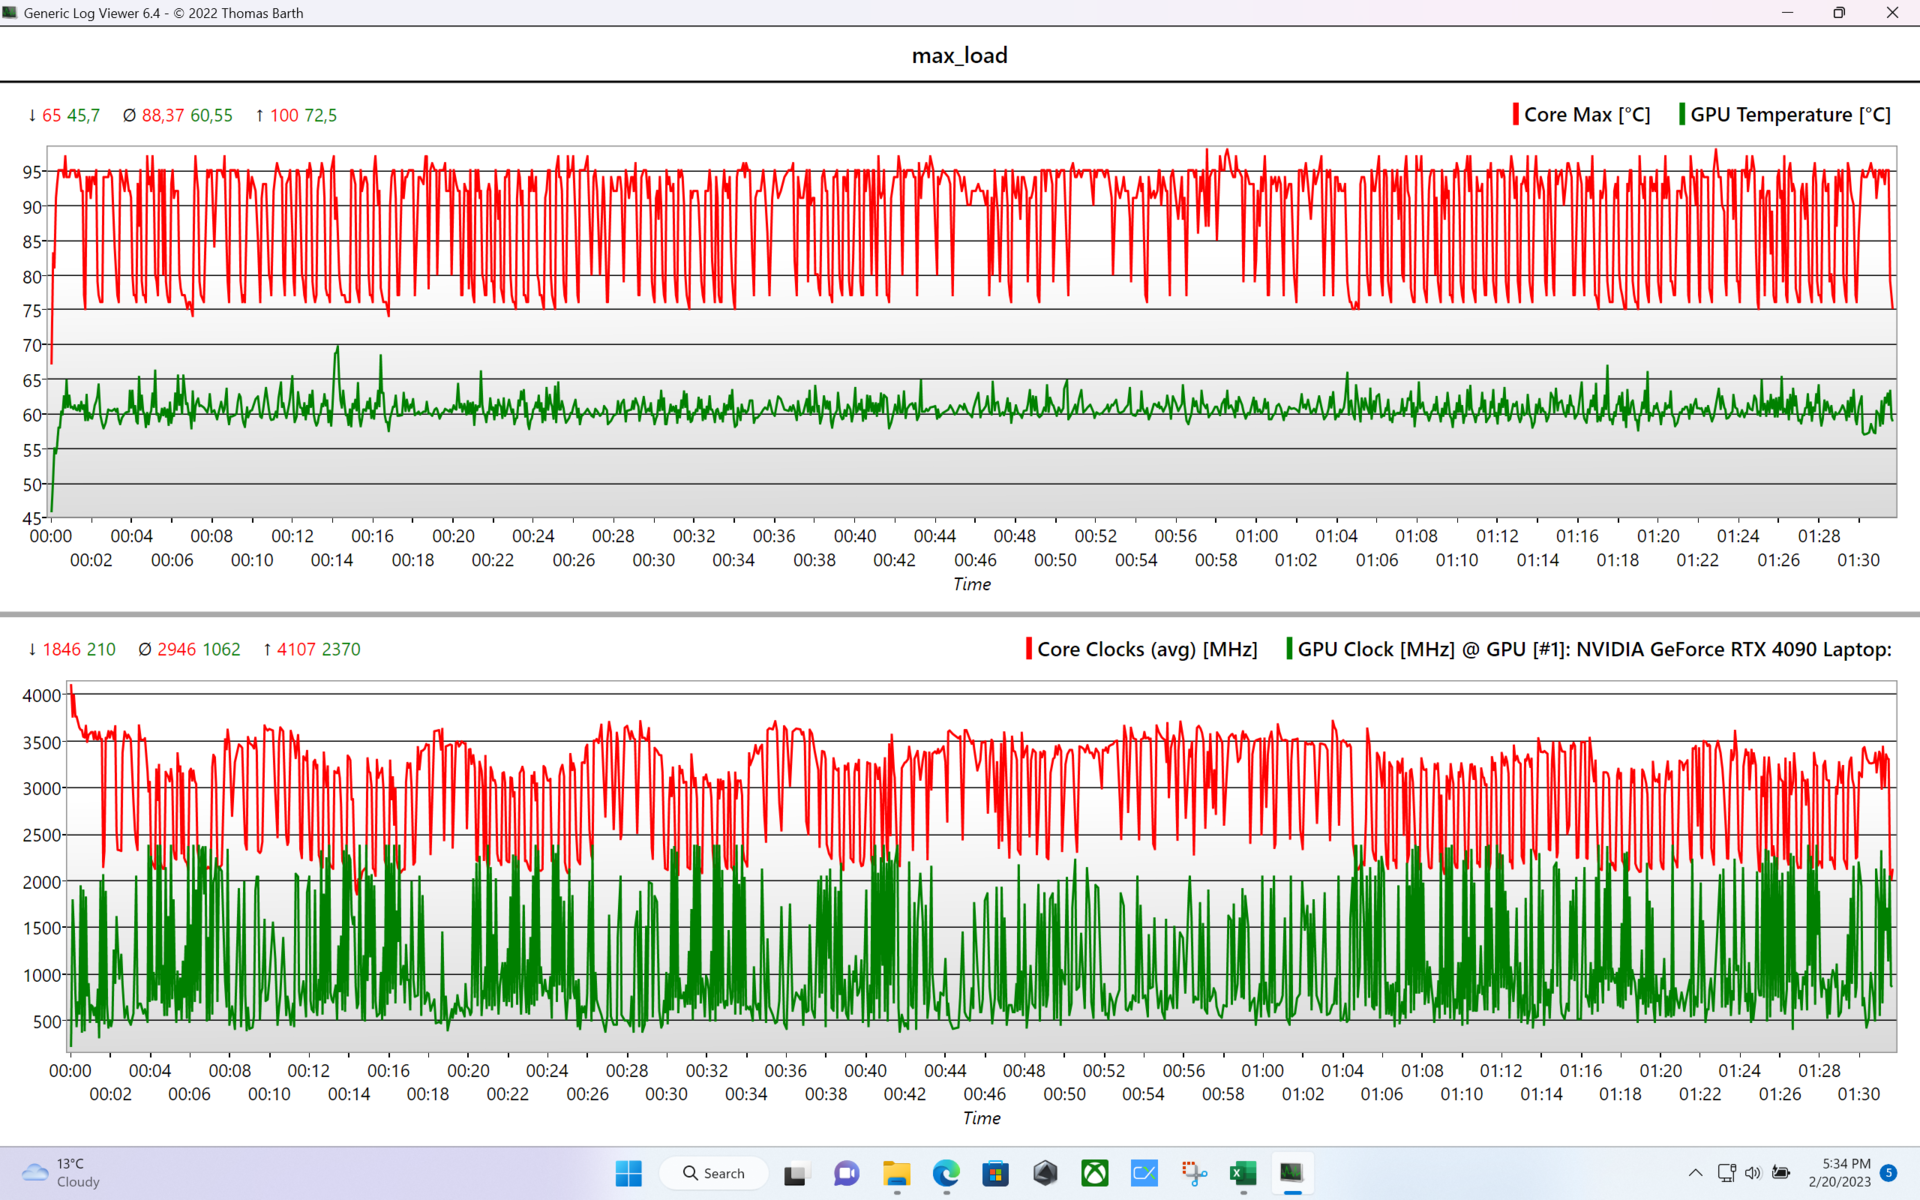
| E-Cores CPU Clock (GHz) | P-CoresCPU Clock (GHz) | GPU Clock (MHz) | CPU平均温度(℃) | GPU平均温度(℃) | |
| 系统空闲(静音) | 1.4 | 1.8 | 0 | 42 | 0 |
| 系统空闲(涡轮) | 1.6 | 2.1 | 210 | 44 | 39 |
| Prime95压力(涡轮) | 3 | 3.5 | 210 | 92 | 56 |
| Prime95 + FurMark 压力(涡轮) | 1.6 | 2.1 | 2260 | 80 | 73 |
| Witcher 3 应力 | 3.7 | 4.6 | 1995 | 90 | 77 |
发言人
内置扬声器的低音相对较重,但提供了主观上有吸引力的性能,适合于笔记本电脑的游戏目的。在日常条件下,最大音量也足够大。
Asus ROG Strix Scar 18 2023 G834JY-N6005W audio analysis
(+) | speakers can play relatively loud (82.7 dB)
Bass 100 - 315 Hz
(+) | good bass - only 4.8% away from median
(±) | linearity of bass is average (7% delta to prev. frequency)
Mids 400 - 2000 Hz
(±) | higher mids - on average 9% higher than median
(+) | mids are linear (5% delta to prev. frequency)
Highs 2 - 16 kHz
(+) | balanced highs - only 3.7% away from median
(+) | highs are linear (6.1% delta to prev. frequency)
Overall 100 - 16.000 Hz
(±) | linearity of overall sound is average (19% difference to median)
Compared to same class
» 63% of all tested devices in this class were better, 8% similar, 28% worse
» The best had a delta of 6%, average was 18%, worst was 132%
Compared to all devices tested
» 45% of all tested devices were better, 7% similar, 47% worse
» The best had a delta of 4%, average was 23%, worst was 134%
Apple MacBook Pro 16 2021 M1 Pro audio analysis
(+) | speakers can play relatively loud (84.7 dB)
Bass 100 - 315 Hz
(+) | good bass - only 3.8% away from median
(+) | bass is linear (5.2% delta to prev. frequency)
Mids 400 - 2000 Hz
(+) | balanced mids - only 1.3% away from median
(+) | mids are linear (2.1% delta to prev. frequency)
Highs 2 - 16 kHz
(+) | balanced highs - only 1.9% away from median
(+) | highs are linear (2.7% delta to prev. frequency)
Overall 100 - 16.000 Hz
(+) | overall sound is linear (4.6% difference to median)
Compared to same class
» 0% of all tested devices in this class were better, 0% similar, 100% worse
» The best had a delta of 5%, average was 17%, worst was 45%
Compared to all devices tested
» 0% of all tested devices were better, 0% similar, 100% worse
» The best had a delta of 4%, average was 23%, worst was 134%
电源管理
消耗功率
由于强大的硬件,该系统的耗电量非常高。最突出的是待机功耗非常高,总是在5瓦和10瓦之间交替出现。故障可能还在于LED照明,即使在待机时也有动画。
| Off / Standby | |
| Idle | |
| Load |
|
Key:
min: | |
| Asus ROG Strix Scar 18 2023 G834JY-N6005W i9-13980HX, GeForce RTX 4090 Laptop GPU, 2x Samsung PM9A1 MZVL21T0HCLR (RAID 0), IPS, 2560x1600, 18" | Razer Blade 16 Early 2023 i9-13950HX, GeForce RTX 4080 Laptop GPU, SSSTC CA6-8D1024, IPS, 2560x1600, 16" | MSI Titan GT77 HX 13VI i9-13950HX, GeForce RTX 4090 Laptop GPU, Samsung PM9A1 MZVL22T0HBLB, Mini-LED, 3840x2160, 17.3" | MSI Raider GE77 HX 12UHS i9-12900HX, GeForce RTX 3080 Ti Laptop GPU, Samsung PM9A1 MZVL22T0HBLB, IPS, 3840x2160, 17.3" | Asus ROG Strix Scar 17 SE G733CX-LL014W i9-12950HX, GeForce RTX 3080 Ti Laptop GPU, Samsung PM9A1 MZVL22T0HBLB, IPS, 2560x1440, 17.3" | Average of class Gaming | |
|---|---|---|---|---|---|---|
| Power Consumption | 9% | 13% | 15% | 6% | 28% | |
| Idle Minimum * (Watt) | 17.3 | 15.2 12% | 14 19% | 13 25% | 19.3 -12% | 13 ? 25% |
| Idle Average * (Watt) | 27 | 22.8 16% | 21.6 20% | 19 30% | 26.5 2% | 19 ? 30% |
| Idle Maximum * (Watt) | 46 | 49.8 -8% | 24.8 46% | 29 37% | 27.1 41% | 24.6 ? 47% |
| Load Average * (Watt) | 133 | 121.2 9% | 122.5 8% | 143 -8% | 141 -6% | 110.7 ? 17% |
| Load Maximum * (Watt) | 329 | 273.7 17% | 418 -27% | 352 -7% | 307.9 6% | 259 ? 21% |
| Witcher 3 ultra * (Watt) | 242 | 265 | 247 | 225 |
* ... smaller is better
Power Consumption The Witcher 3 / Stress Test
Power Consumption with External Monitor
电池寿命
由于耗电量大的组件,90瓦时容量的电池无法产生任何记录值。在Optimus模式下(停用GPU),静音模式,并将亮度降低到150cd/m²,你仍然可以脱离电网工作几个小时。我们的WLAN测试在这种模式下运行的时间略多于7小时。然而,如果你想在电池运行中玩游戏,你不仅要忍受明显降低的性能,而且在我们的测试中,电池寿命仍然只持续了约一个小时(没有帧率限制),用TheWitcher 3 。
在系统关闭的情况下,电池在1小时40分钟后完全充电,或在空闲运行的情况下,电池在1小时45分钟后完全充电。当时电源提供的最大功率为117瓦特。
| Asus ROG Strix Scar 18 2023 G834JY-N6005W i9-13980HX, GeForce RTX 4090 Laptop GPU, 90 Wh | Razer Blade 16 Early 2023 i9-13950HX, GeForce RTX 4080 Laptop GPU, 95.2 Wh | MSI Titan GT77 HX 13VI i9-13950HX, GeForce RTX 4090 Laptop GPU, 99.9 Wh | MSI Raider GE77 HX 12UHS i9-12900HX, GeForce RTX 3080 Ti Laptop GPU, 99.99 Wh | Asus ROG Strix Scar 17 SE G733CX-LL014W i9-12950HX, GeForce RTX 3080 Ti Laptop GPU, 90 Wh | Average of class Gaming | |
|---|---|---|---|---|---|---|
| Battery runtime | 21% | 6% | 30% | -41% | 29% | |
| H.264 (h) | 7 | 6 -14% | 6.5 -7% | 8.32 ? 19% | ||
| WiFi v1.3 (h) | 7.1 | 6.1 -14% | 5.3 -25% | 5.4 -24% | 4.2 -41% | 7.11 ? 0% |
| Witcher 3 ultra (h) | 0.9 | |||||
| Load (h) | 0.9 | 1.4 56% | 1.4 56% | 2 122% | 1.502 ? 67% | |
| Reader / Idle (h) | 8.9 | 9.8 | 8.27 ? |
Pros
Cons
判决书
华硕ROG Strix SCAR 18 (2023) G834JY是一款高端游戏笔记本电脑,华硕配备了目前最强大的移动组件。这个大箱子里有一个非常好的18英寸显示屏,为游戏玩家提供了快速的响应时间,G-SYNC和良好的图像质量。但G834JY的亮点肯定是强大的硬件,配备了Core i9-13980HX,GeForce RTX 4090 Laptop GPU(175 W TGP),以及RAID-0 NVMe SSD。虽然这些组件在负载下会产生大量的热量,但华硕通过三风扇冷却系统、蒸汽室热管和液态金属膏将其控制得很好。
ROG Strix SCAR 18是一个全面的整体包装,以高昂的价格提供令人印象深刻的性能值。
我们唯一的抱怨点是很小的,比如我们的测试设备在高帧率下的线圈啸叫,糟糕的网络摄像头,或者端口的定位,在某些情况下可能不是最佳的。
作为替代品,你可以从Alienware(m18 R1)和Razer(Blade 18)获得配备RTX 4090 GPU的18英寸机型。微星公司提供速度最低的Titan GT77 HX 13VI ,配备17英寸显示屏。那些可以忍受稍低性能的人可以看看基于RTX 4080的型号,它们明显更实惠。G834JZ版本的Scar 18在这里也可能是一个有趣的选择。
价格和可用性
我们测试的G834JY-N6000W目前只在英国有售,3999.99英镑(清单价格)。.一些美国商店提供G834JY-XS97目前售价3899.99美元(华硕缺货),而亚马逊提供的G834JY-XS97售价为5390美元。
Asus ROG Strix Scar 18 2023 G834JY-N6005W
- 03/07/2023 v7 (old)
Klaus Hinum
Transparency
The selection of devices to be reviewed is made by our editorial team. The test sample was provided to the author as a loan by the manufacturer or retailer for the purpose of this review. The lender had no influence on this review, nor did the manufacturer receive a copy of this review before publication. There was no obligation to publish this review. As an independent media company, Notebookcheck is not subjected to the authority of manufacturers, retailers or publishers.
This is how Notebookcheck is testing
Every year, Notebookcheck independently reviews hundreds of laptops and smartphones using standardized procedures to ensure that all results are comparable. We have continuously developed our test methods for around 20 years and set industry standards in the process. In our test labs, high-quality measuring equipment is utilized by experienced technicians and editors. These tests involve a multi-stage validation process. Our complex rating system is based on hundreds of well-founded measurements and benchmarks, which maintains objectivity. Further information on our test methods can be found here.
Price comparison

