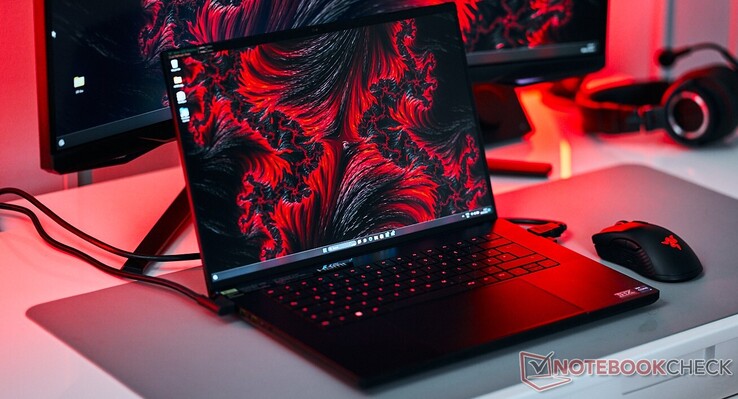
Razer Blade 16 Early 2023 RTX 4090评论:酷睿i9-13950HX巨兽,全球首款双模迷你LED UHD+显示屏
新的 雷蛇刀片16越来越多的猛禽湖-HX和RTX 40系列游戏笔记本电脑加入了这个名单,这些笔记本电脑除了厨房水槽之外,什么都有,而且价格和一辆二手车一样高。
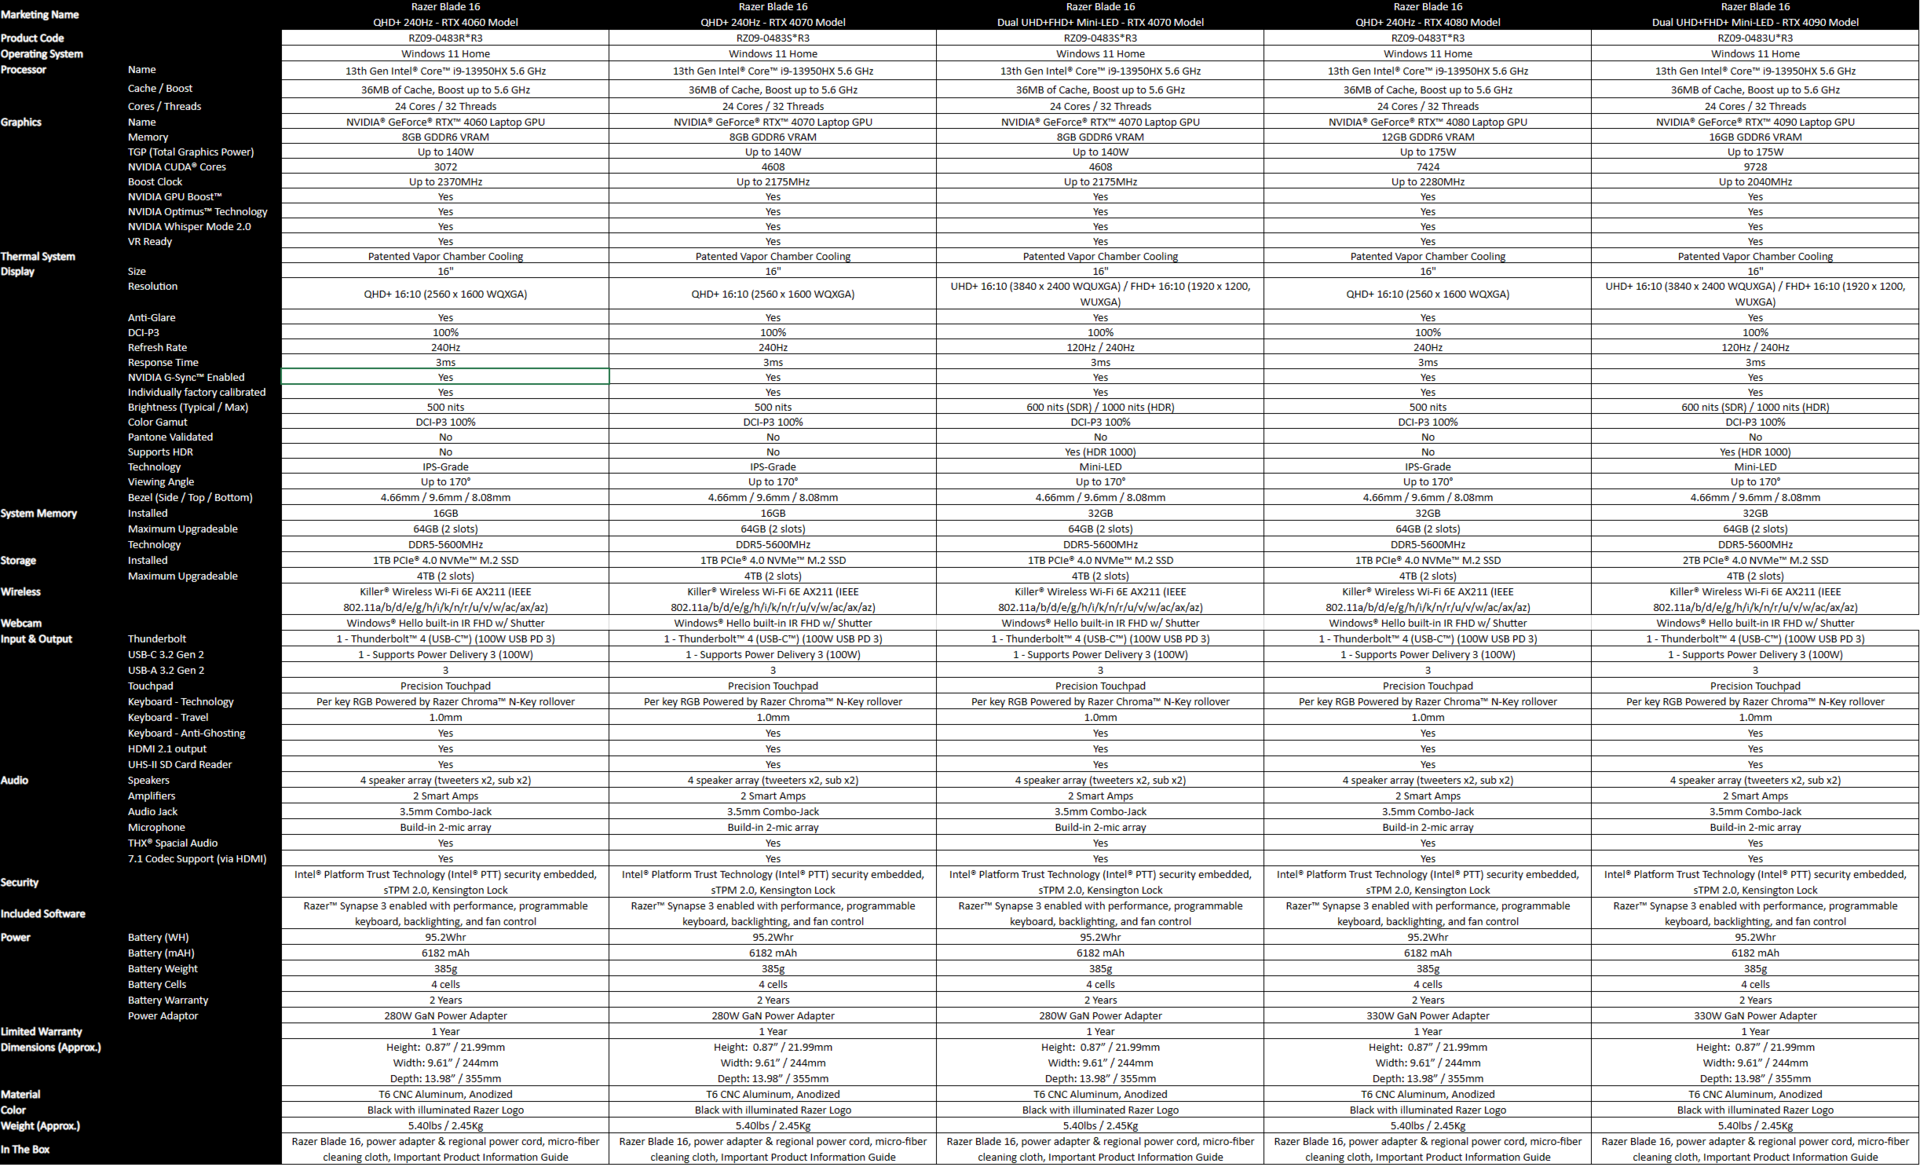
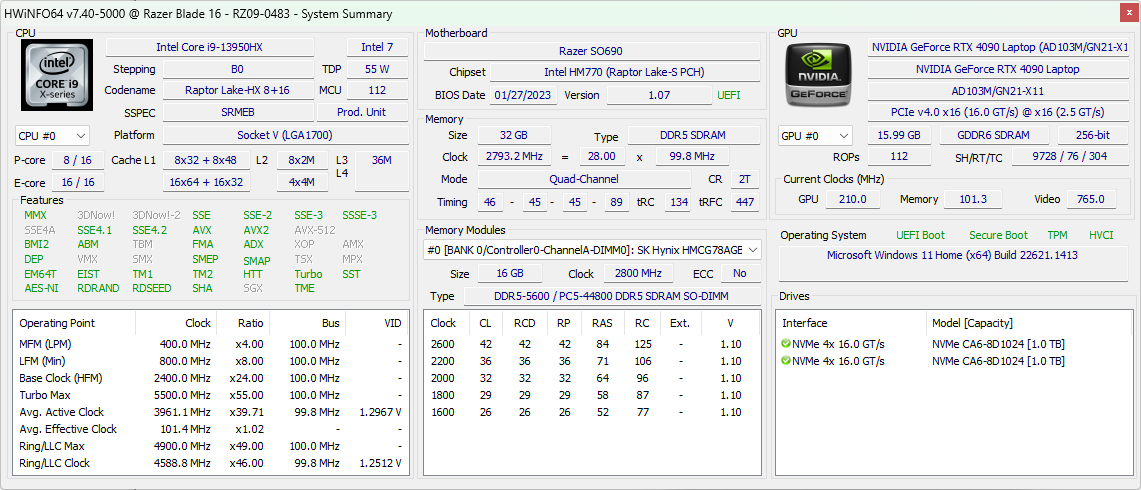
我们的测试样品由Nvidia印度公司提供,采用的是 酷睿i9-13950HX, RTX 4090笔记本GPU, 16英寸双模迷你LED UHD显示屏,32GB DDR5-5600内存,2x 1TB NVMe SSD,以及95.2WHr电池。Razer不在印度销售其产品,但这一配置将使你花费4,300美元或5,000欧元。
我们以前曾审查过Razer Blade 16 Early 2023由英特尔酷睿i9-13950HX和NvidiaGeForce RTX 4080 Laptop GPU和另一款 刀片18采用相同的CPU和RTX 4070笔记本GPU.
在这篇评论中,我们测试了RTX 4090笔记本GPU变体的Blade 16 Early 2023,将其与今年的最新设备进行比较,并看看在已经相当大的配置上再花700美元是否有真正的好处。
机箱、输入设备和其他内部设备与RTX 4080版本的Blade 16相同,所以我们在这里只简单地谈一下。
潜在的竞争对手比较
Rating | Date | Model | Weight | Height | Size | Resolution | Price |
|---|---|---|---|---|---|---|---|
| 89.8 % v7 (old) | 03 / 2023 | Razer Blade 16 Early 2023 RTX 4090 i9-13950HX, GeForce RTX 4090 Laptop GPU | 2.5 kg | 21.99 mm | 16.00" | 3840x2400 | |
| 89.9 % v7 (old) | 03 / 2023 | Eluktronics Mech-17 GP2 i9-13900HX, GeForce RTX 4090 Laptop GPU | 2.9 kg | 27 mm | 17.00" | 2560x1600 | |
| 88 % v7 (old) | 04 / 2023 | Asus Zephyrus Duo 16 GX650PY-NM006W R9 7945HX, GeForce RTX 4090 Laptop GPU | 2.7 kg | 29.7 mm | 16.00" | 2560x1600 | |
| 89 % v7 (old) | 02 / 2023 | MSI Titan GT77 HX 13VI i9-13950HX, GeForce RTX 4090 Laptop GPU | 3.5 kg | 23 mm | 17.30" | 3840x2160 | |
| 86.6 % v7 (old) | 02 / 2023 | Asus ROG Strix Scar 18 2023 G834JY-N6005W i9-13980HX, GeForce RTX 4090 Laptop GPU | 3.1 kg | 30.8 mm | 18.00" | 2560x1600 | |
| 89.4 % v7 (old) | 03 / 2023 | Asus ROG Zephyrus M16 GU604VY-NM042X i9-13900H, GeForce RTX 4090 Laptop GPU | 2.3 kg | 22.9 mm | 16.00" | 2560x1600 | |
| 88.4 % v7 (old) | 03 / 2023 | Asus ROG Strix G16 G614JZ i9-13980HX, GeForce RTX 4080 Laptop GPU | 2.4 kg | 30.4 mm | 16.00" | 2560x1600 | |
| 91.2 % v7 (old) | 02 / 2023 | Razer Blade 16 Early 2023 i9-13950HX, GeForce RTX 4080 Laptop GPU | 2.4 kg | 21.99 mm | 16.00" | 2560x1600 | |
| 89.4 % v7 (old) | 02 / 2023 | Lenovo Legion Pro 7 16IRX8H i9-13900HX, GeForce RTX 4080 Laptop GPU | 2.7 kg | 26 mm | 16.00" | 2560x1600 | |
| 91.4 % v7 (old) | 02 / 2023 | Razer Blade 18 RTX 4070 i9-13950HX, GeForce RTX 4070 Laptop GPU | 3 kg | 21.9 mm | 18.00" | 2560x1600 |
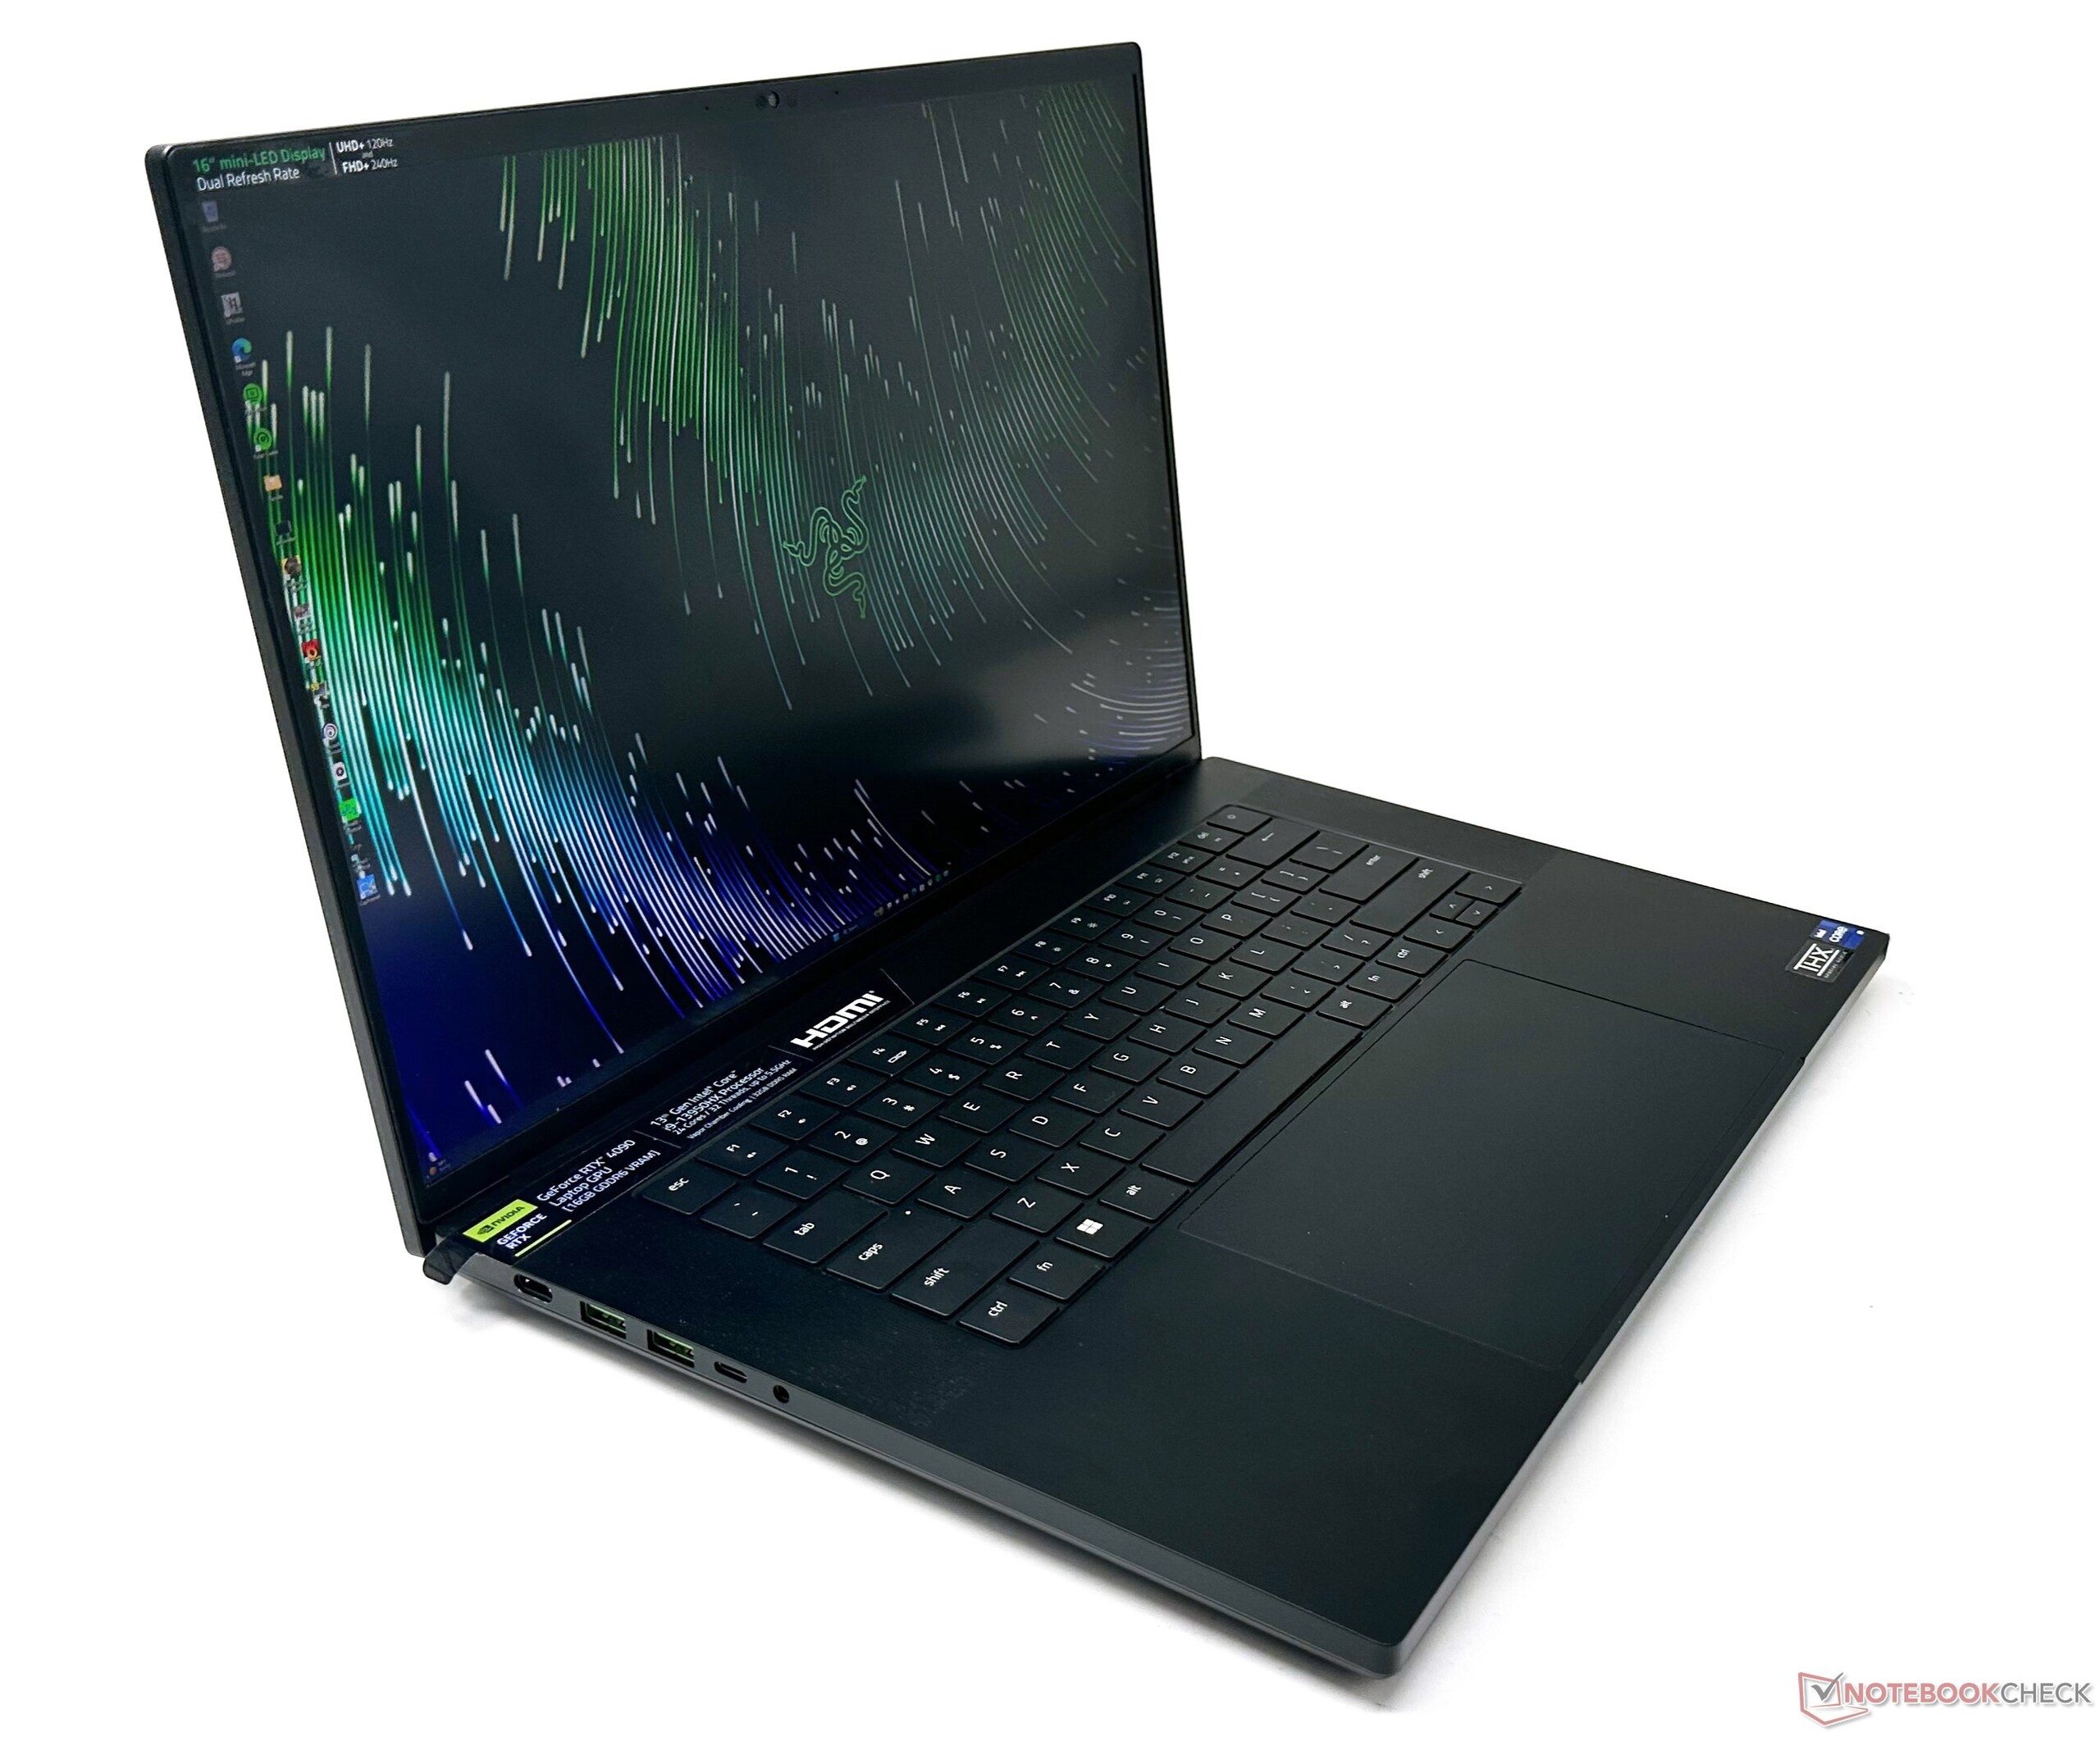
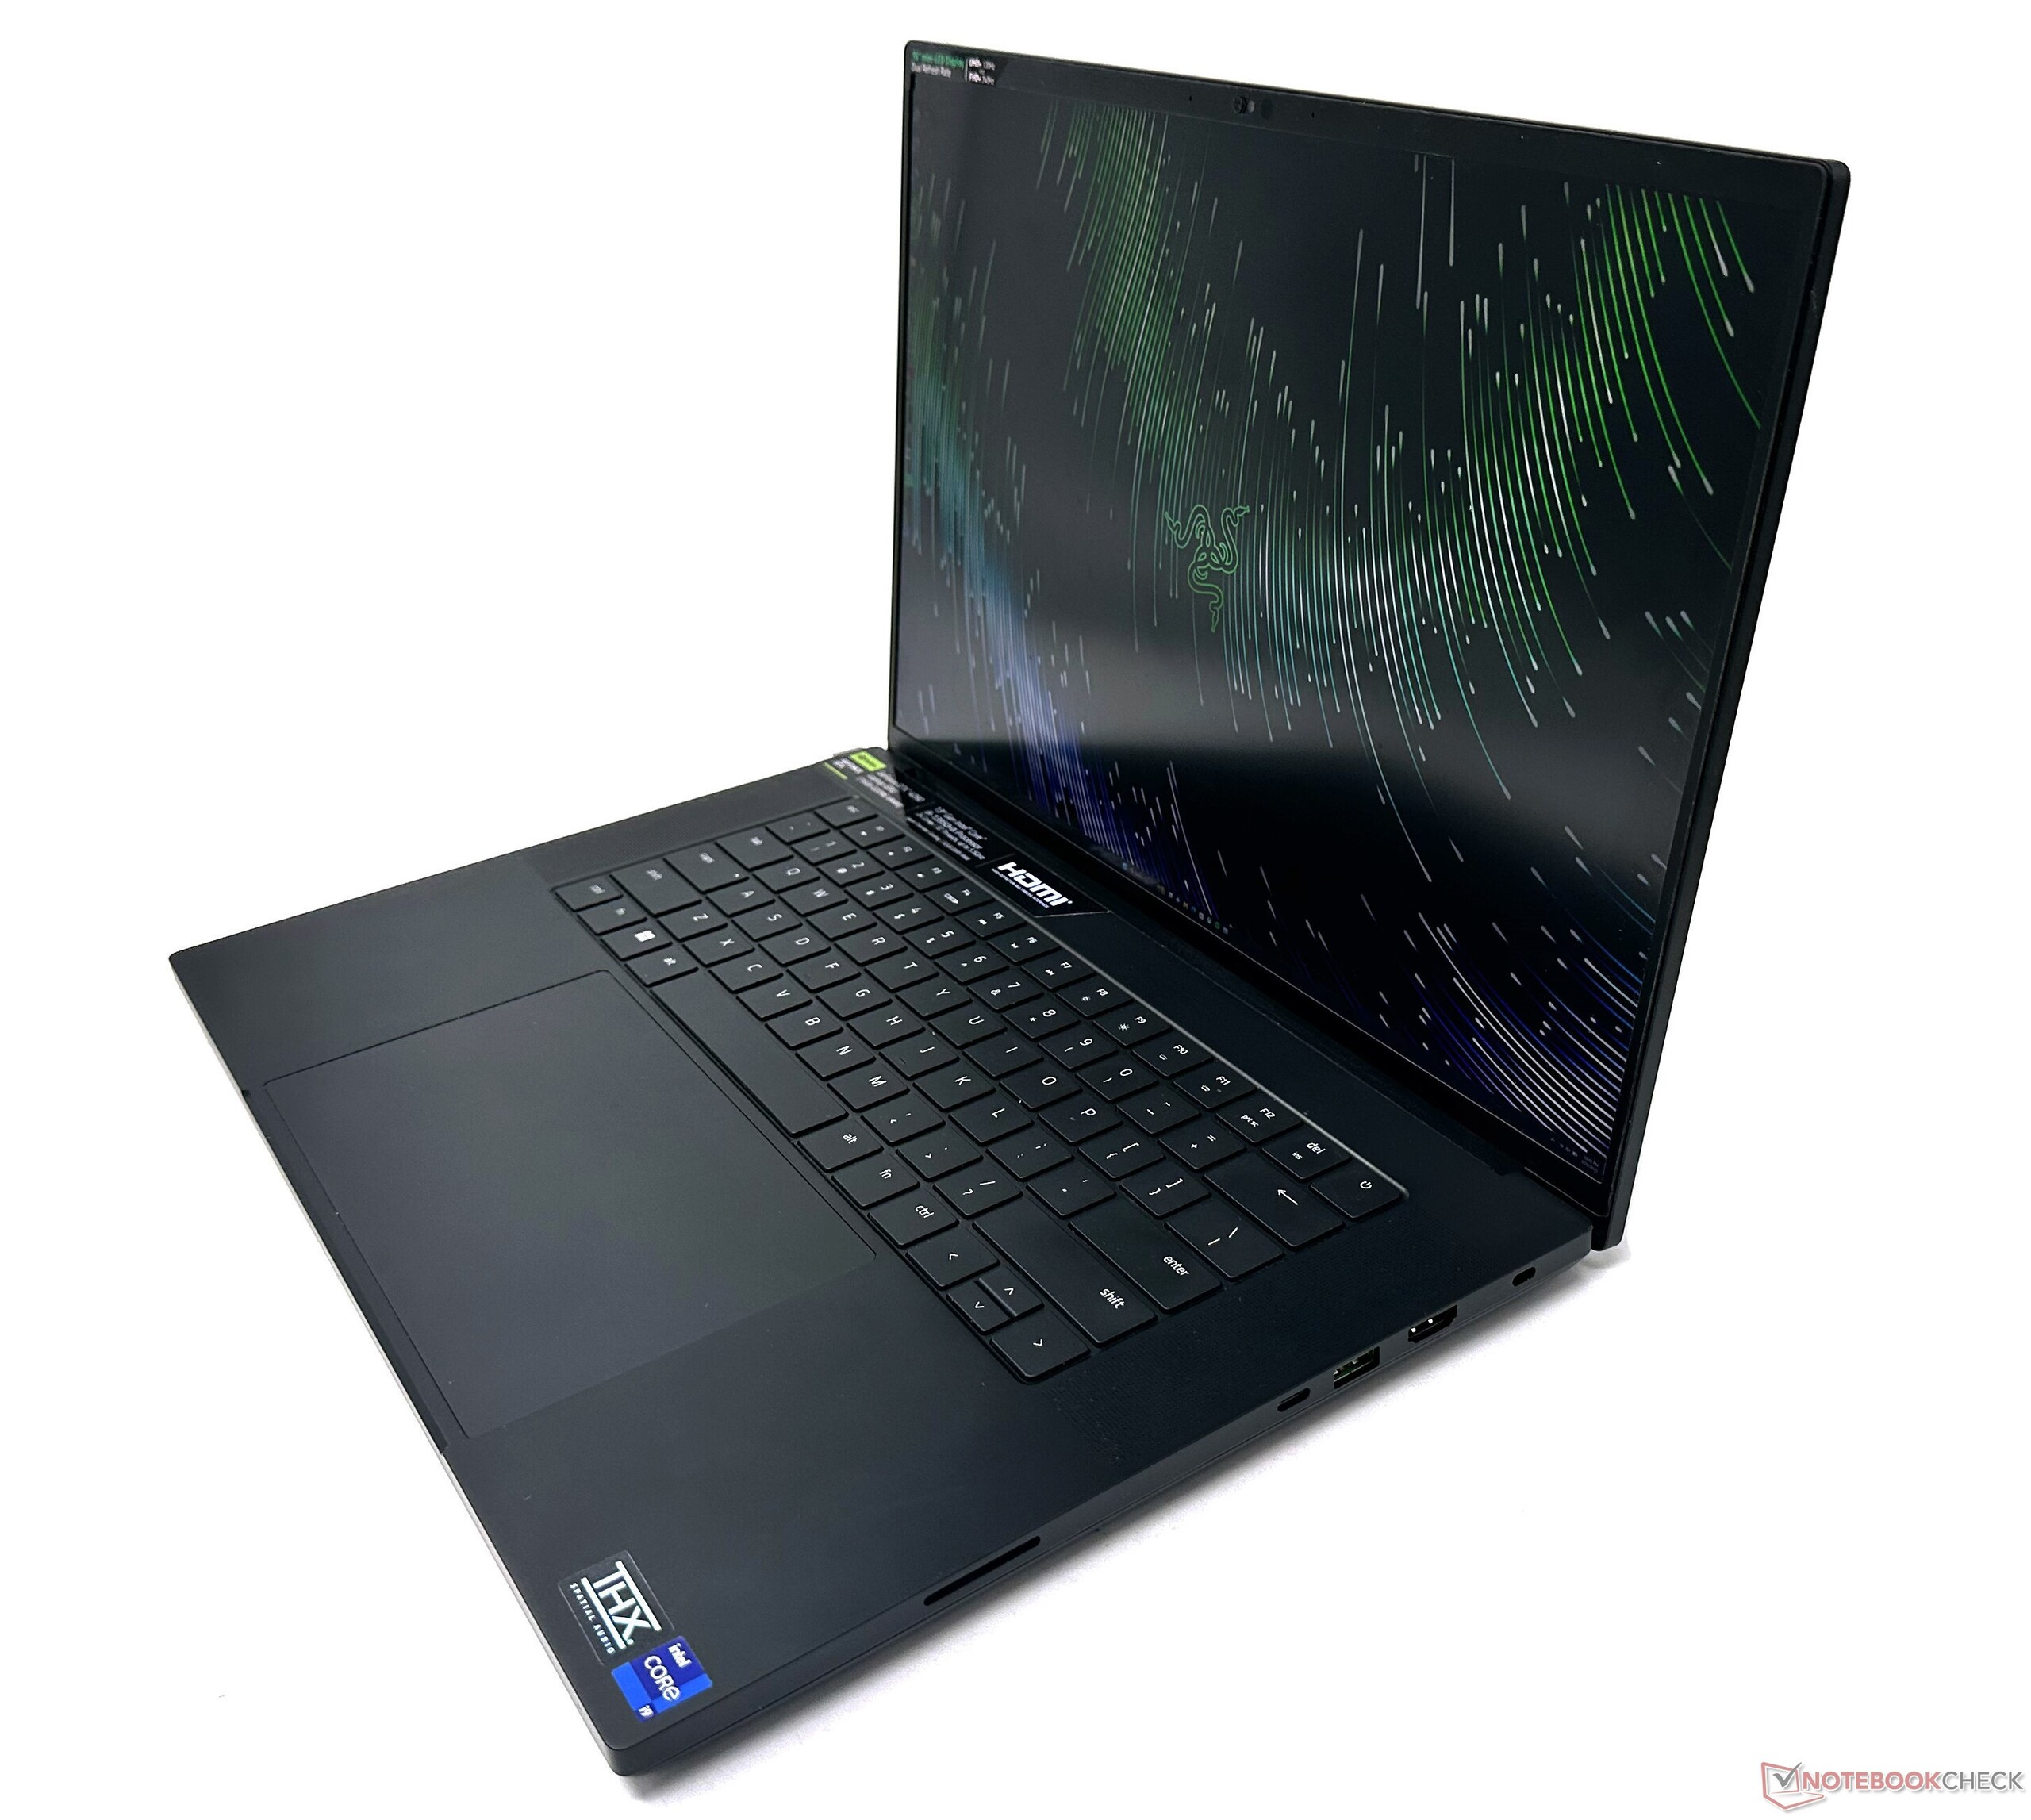
外壳:真正的Razer风格的高级和坚固的外壳
刀片16采用阳极氧化铝处理,让人联想到MacBook Pro,与我们之前测试过的大量Razers类似。优质的机箱感觉非常坚固,弯曲度非常小,也只有在故意施加大量压力的情况下才会如此。
雷蛇Blade 16比华硕ROG Zephyrus更纤细。 华硕ROG Zephyrus Duo 16而且绝对比 联想Legion Pro 7和 MSI Titan GT77 HX 13VI.这款 华硕ROG Zephyrus M16在整体尺寸方面几乎与Blade 16 Early 2023相同。
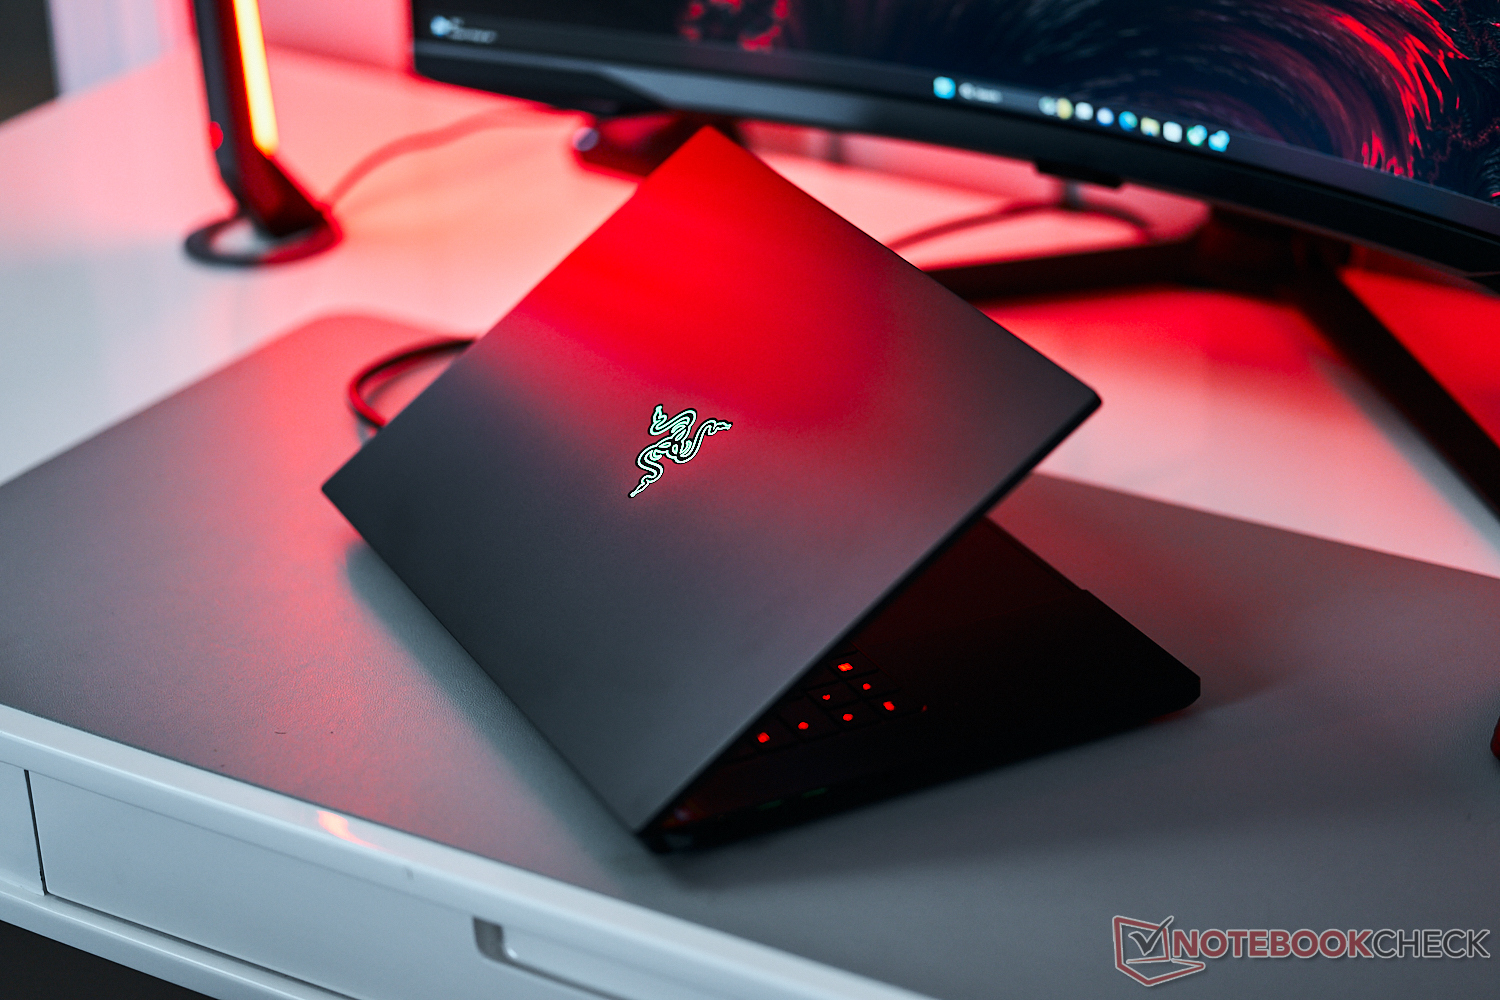
机箱采用了简约的设计,唯一的照明效果是盖子背面特有的雷蛇标志。然而,这个盖子是一块污垢和指纹磁铁,要保持它的清洁是很烦人的。用一根手指打开盖子很容易,没有稳定性问题。
连接性:高通量SD卡和Wi-Fi
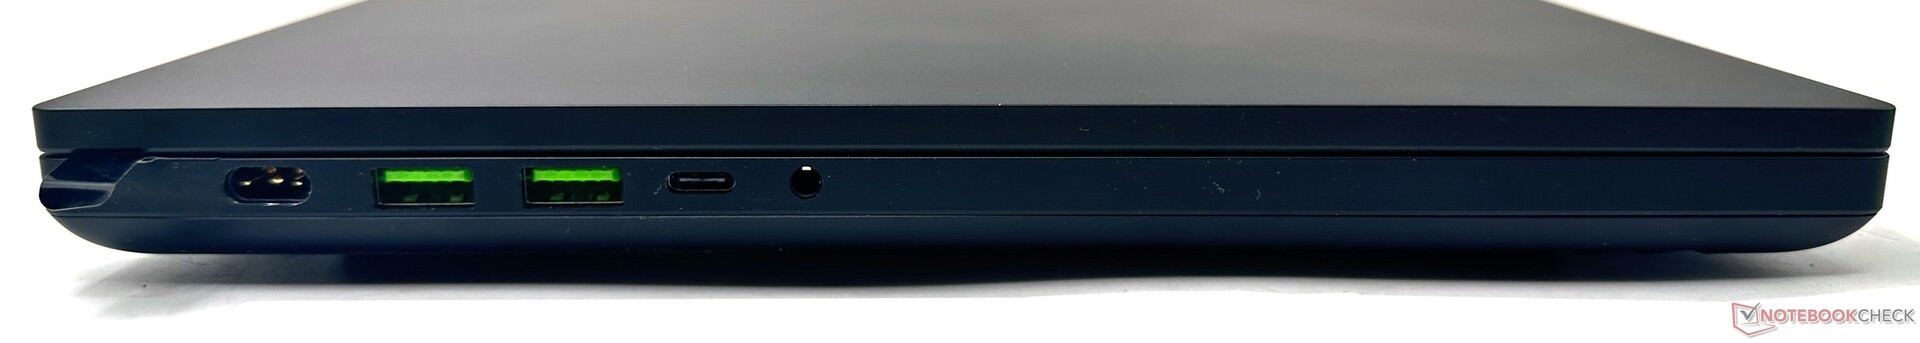
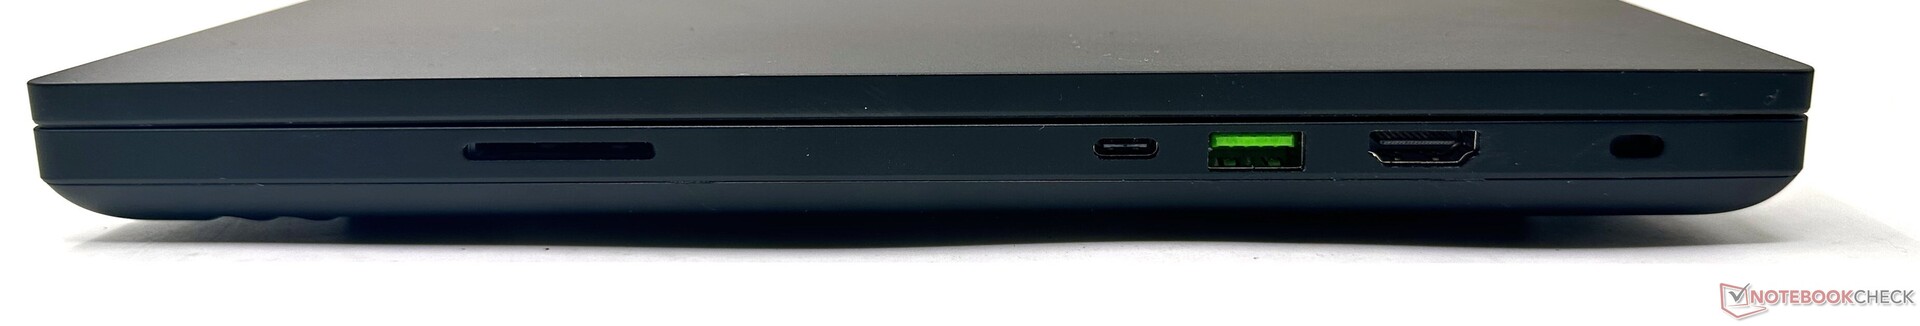
刀片16提供了一个足够的端口选择。Razer使用一个专有的充电端口,向后兼容去年的 刀片15和 刀锋17.连接器没有与机箱平齐,这可能是一些人的不满。
两个USB Type-C端口的功率输出都可以达到100W。说到Type-C,Blade 16只提供一个Thunderbolt 4,另一个是USB 3.2 Gen2 Type-C。
雷蛇本可以为Blade 16配备两个Thunderbolt 4端口的。另外,Type-C端口没有标记,所以你必须注意Thunderbolt 4实际上是在右边的那个,而不是左边的那个。
一个Kensington锁插槽是存在的。然而,没有RJ-45千兆以太网端口是一个遗憾,因为这台笔记本电脑并不完全渴望瘦小。
SD卡阅读器
雷蛇继续在游戏笔记本中使用一些最快的SD读卡器,而Blade 16也不例外。尽管Blade 16 Early 2023的读卡器在顺序测试中落后于华硕ROG Zephyrus Duo 16,但在JPG文件复制测试中,它能够寸步不让地超越后者。
| SD Card Reader | |
| average JPG Copy Test (av. of 3 runs) | |
| Razer Blade 18 RTX 4070 (Angelibird AV Pro V60) | |
| Razer Blade 16 Early 2023 RTX 4090 (Angelbird AV PRO 128 GB V60) | |
| Asus ROG Zephyrus M16 GU604VY-NM042X | |
| Asus Zephyrus Duo 16 GX650PY-NM006W (Angelbird AV Pro V60) | |
| Average of class Gaming (20.9 - 210, n=54, last 2 years) | |
| Razer Blade 16 Early 2023 (AV PRO microSD 128 GB V60) | |
| MSI Titan GT77 HX 13VI (Angelibird AV Pro V60) | |
| Eluktronics Mech-17 GP2 (Angelibird AV Pro V60) | |
| maximum AS SSD Seq Read Test (1GB) | |
| Asus Zephyrus Duo 16 GX650PY-NM006W (Angelbird AV Pro V60) | |
| Razer Blade 18 RTX 4070 (Angelibird AV Pro V60) | |
| Razer Blade 16 Early 2023 (AV PRO microSD 128 GB V60) | |
| Razer Blade 16 Early 2023 RTX 4090 (Angelbird AV PRO 128 GB V60) | |
| Asus ROG Zephyrus M16 GU604VY-NM042X | |
| Average of class Gaming (25.5 - 261, n=51, last 2 years) | |
| Eluktronics Mech-17 GP2 (Angelibird AV Pro V60) | |
| MSI Titan GT77 HX 13VI (Angelibird AV Pro V60) | |
沟通
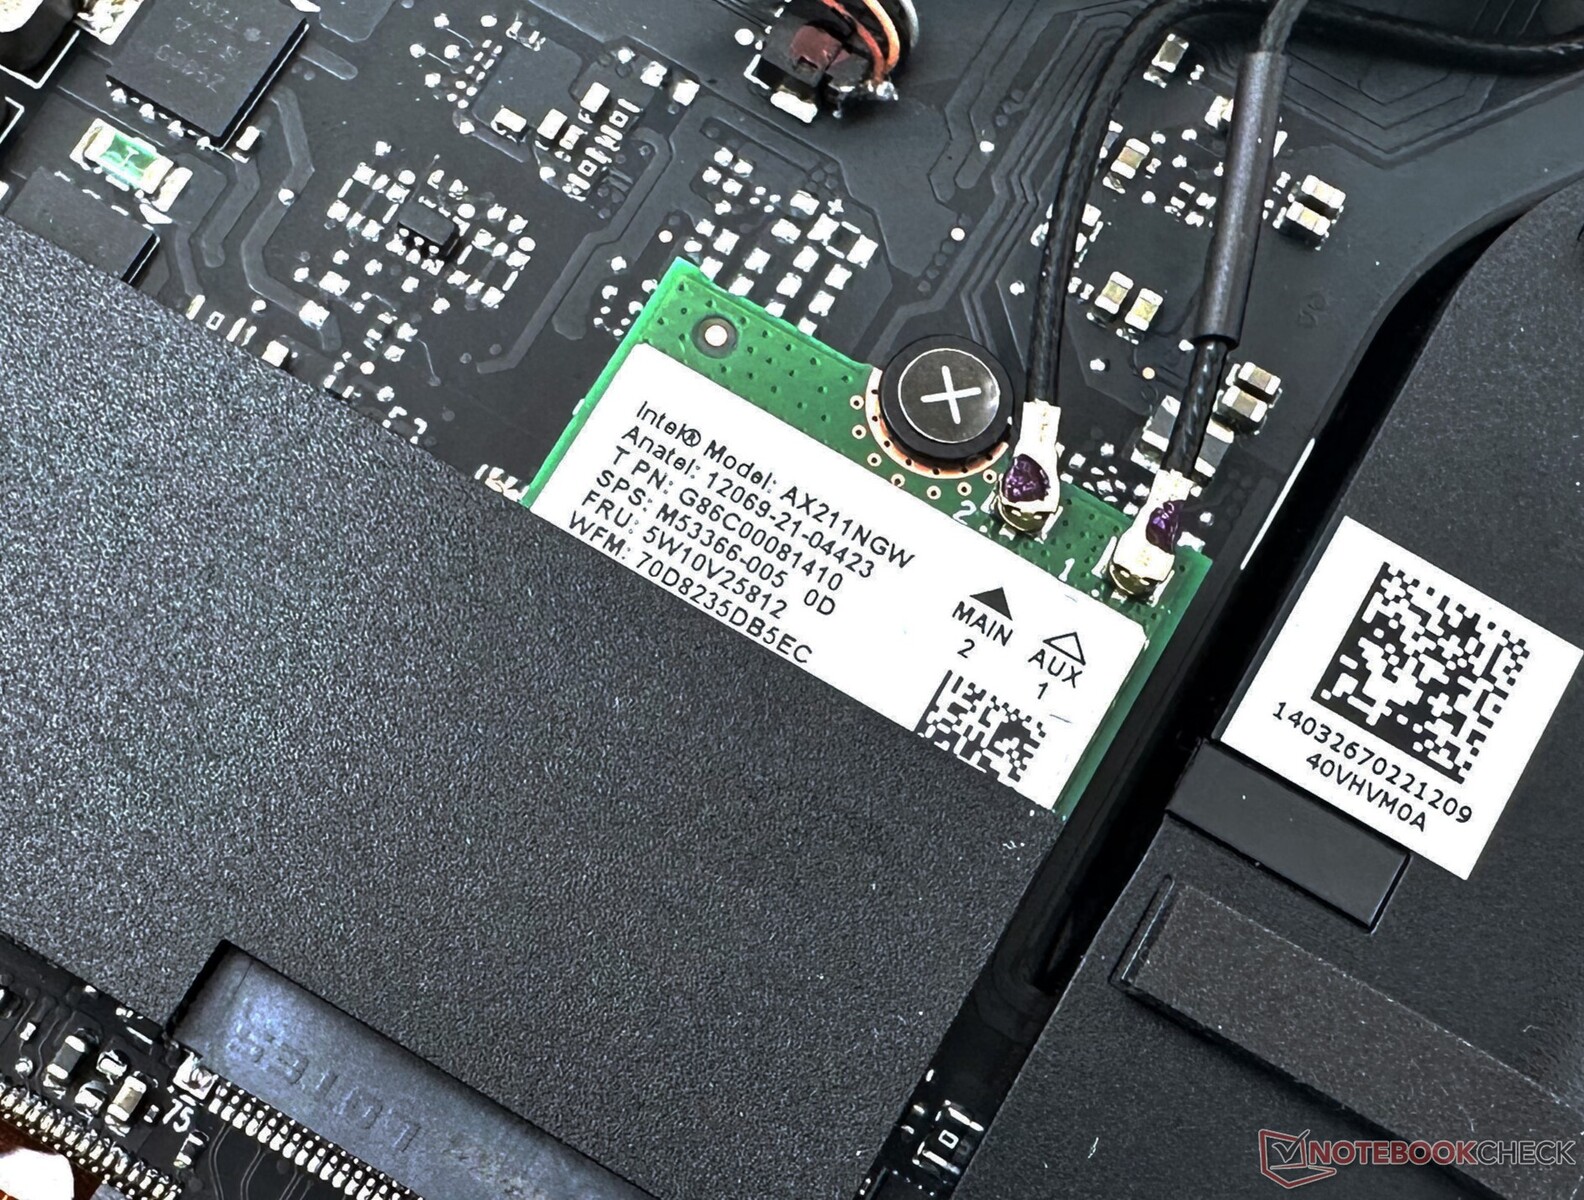
刀片16配备了一个英特尔Wi-Fi 6E AX211无线局域网模块。使用我们参考的华硕ROG Rapture GT-AXE11000路由器对Wi-Fi性能进行了测试,距离笔记本电脑1米,视线清晰,没有其他连接设备或外部干扰。
网络性能在5GHz和6GHz频段都相当稳定。使用6GHz频段比5GHz频段没有真正的吞吐量优势,因为两者的传输速率基本相同。
也就是说,如果你有一个兼容的路由器,并希望减少来自其他大量5GHz客户端的干扰,6GHz选项仍然是一个不错的选择。
网络摄像头
1080p网络摄像头显示出较高的色彩偏差,特别是在蓝色阴影下。锐度是可以接受的,但有可感知的噪音。总的来说,该输出是体面的,足够用于视频通话和工作。


安全问题
刀片16支持通过红外传感器进行基于Windows Hello的登录。面部识别速度很快,工作起来没有什么问题。与Blade 18不同的是,为网络摄像头提供了一个物理快门。存在一个TPM 2.0模块。
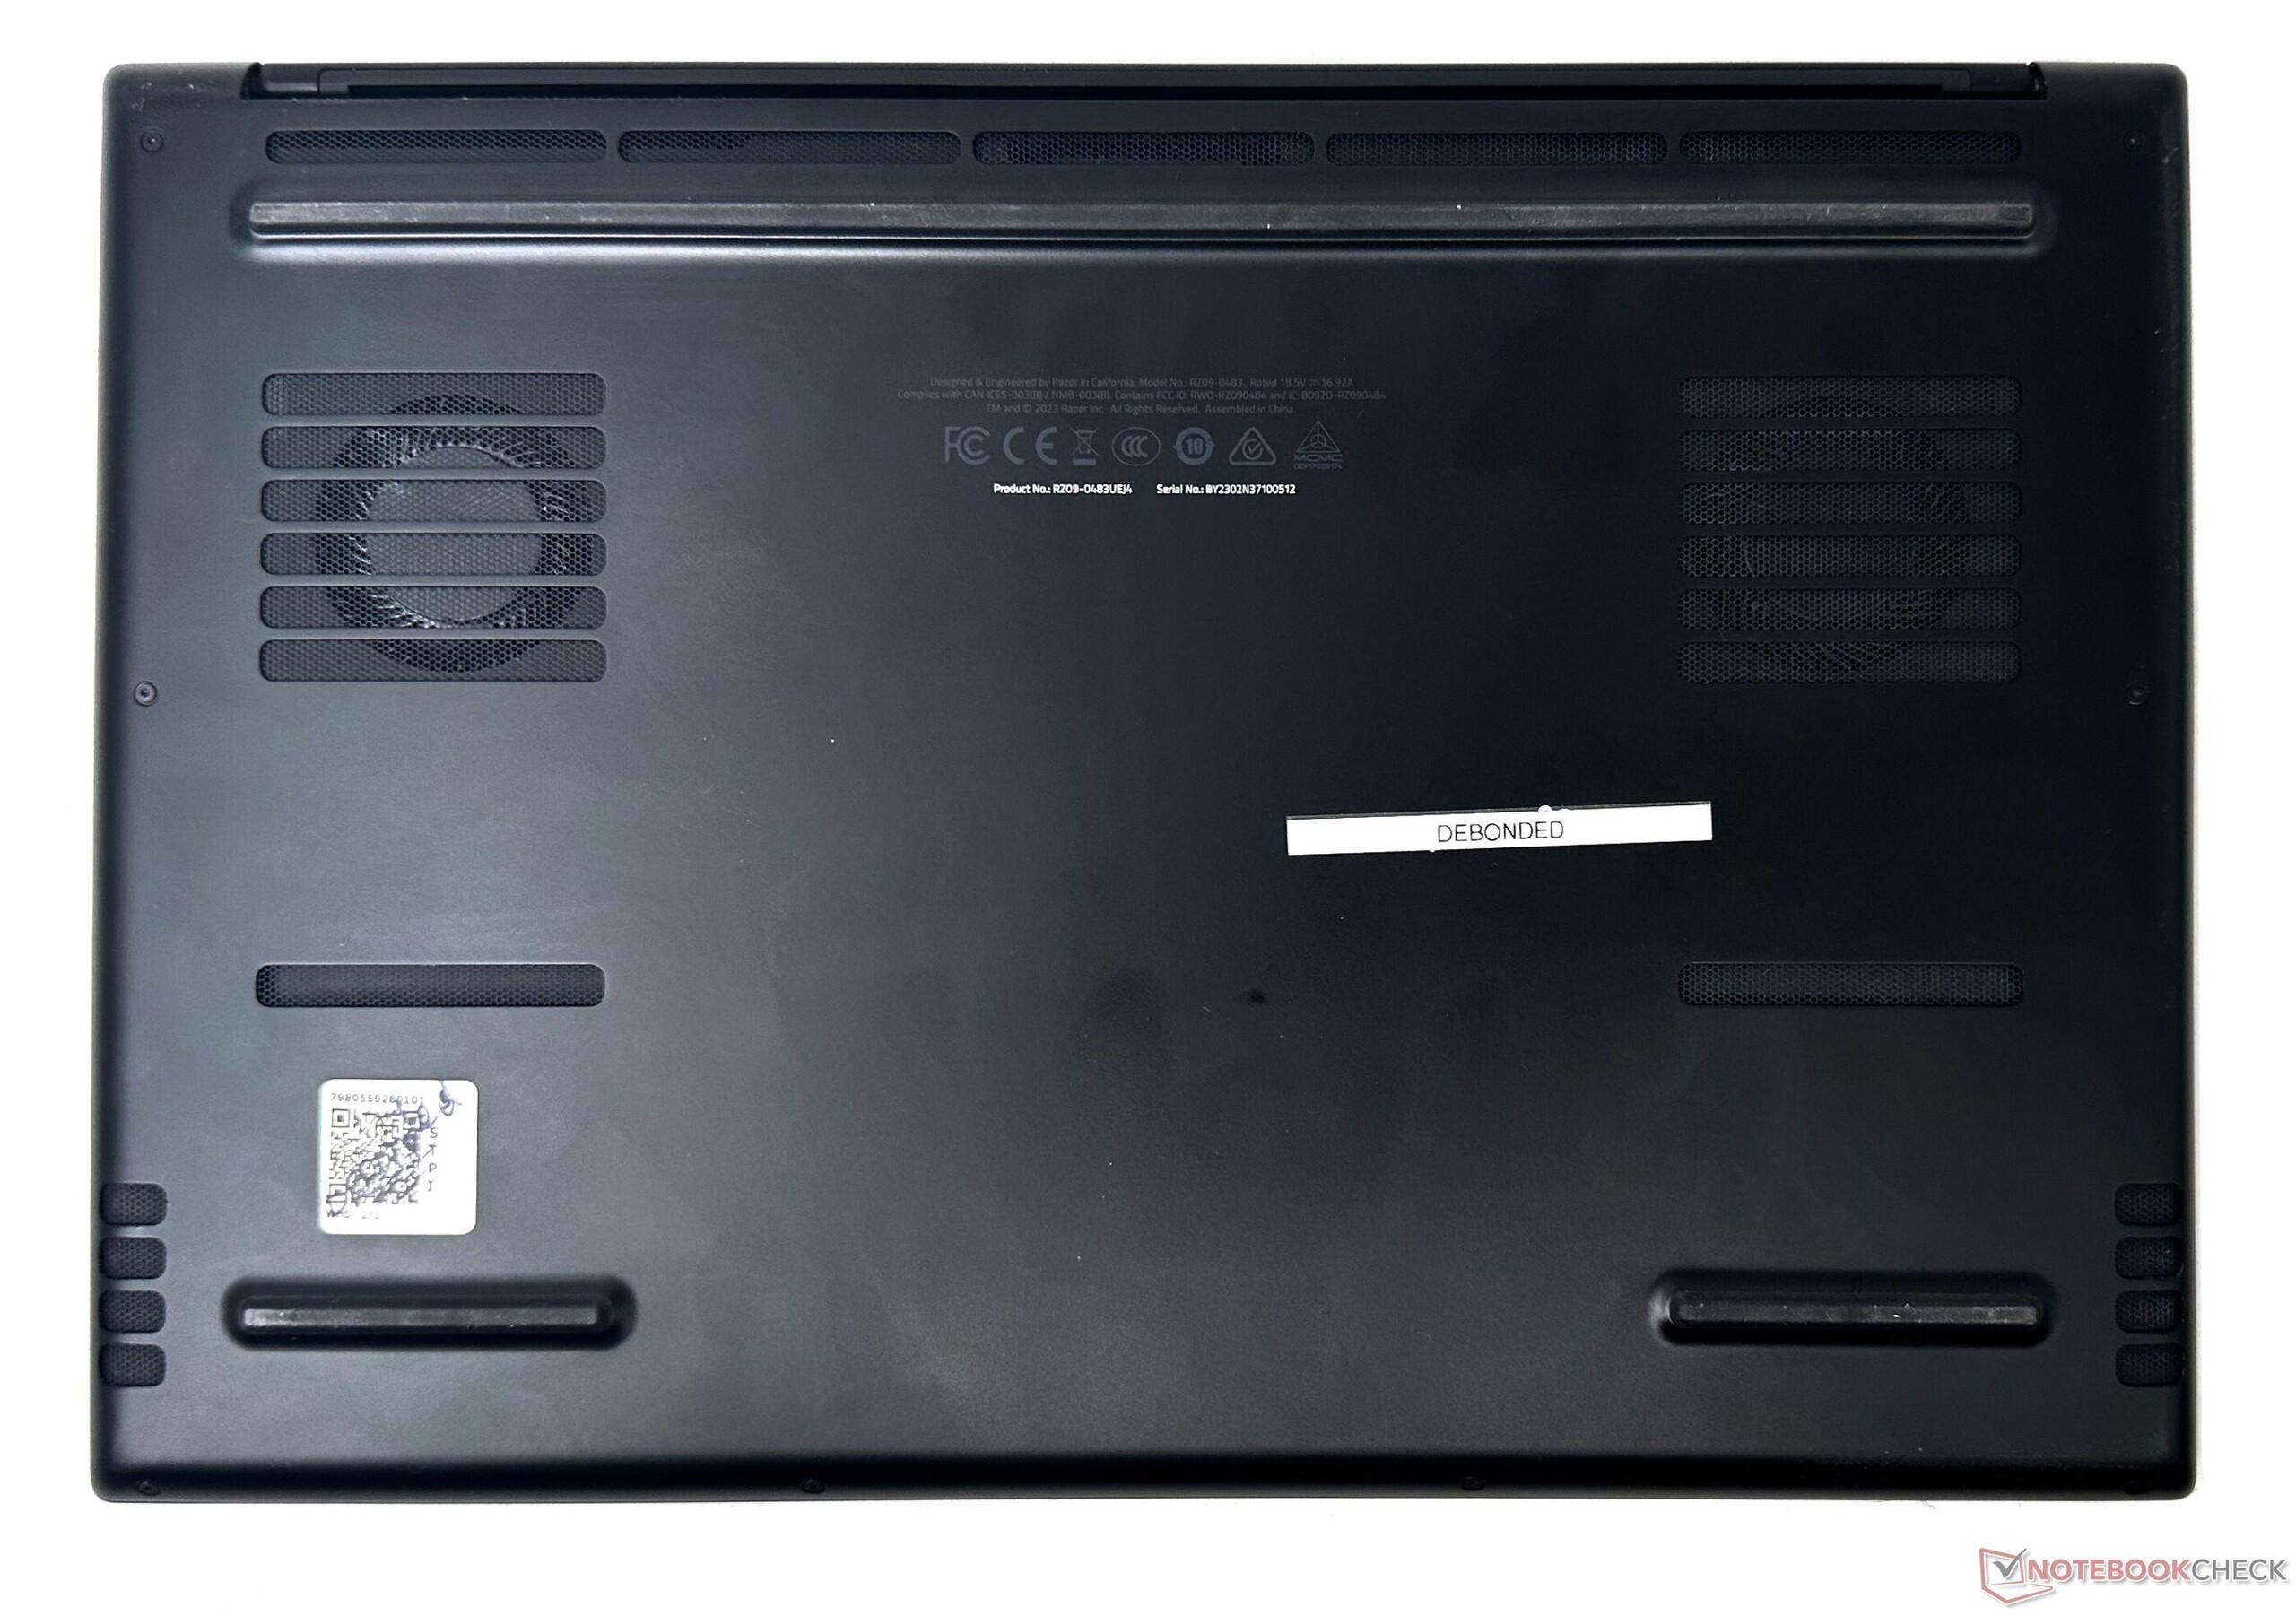
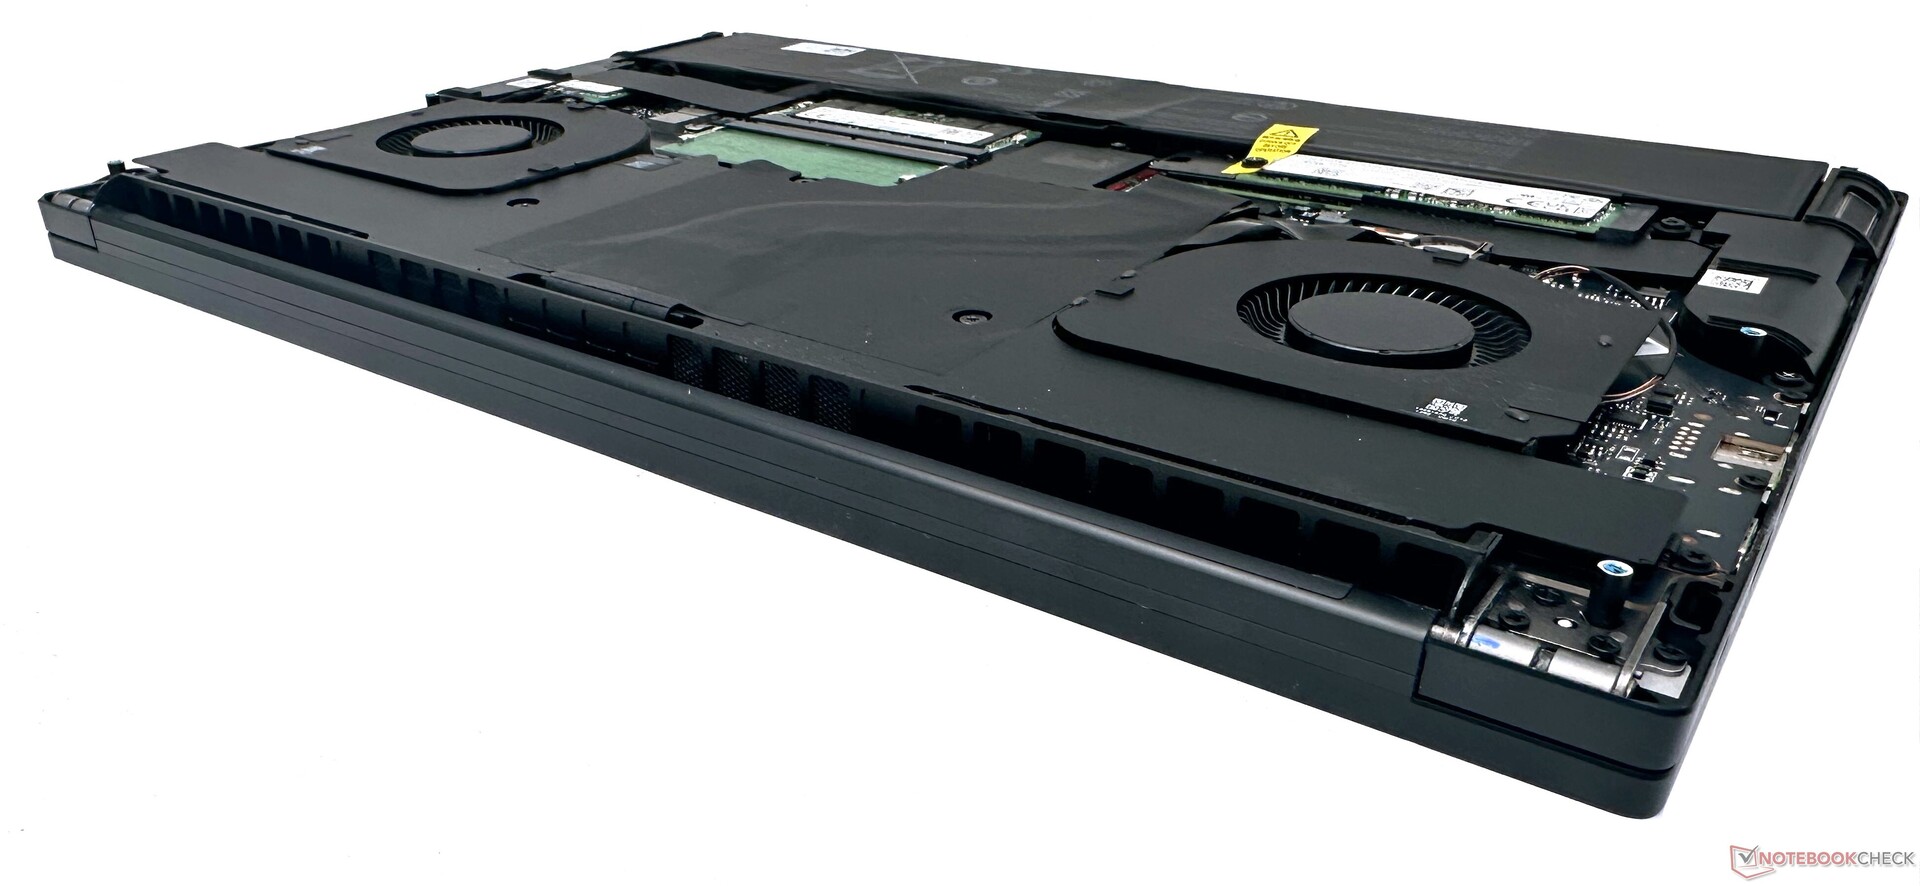
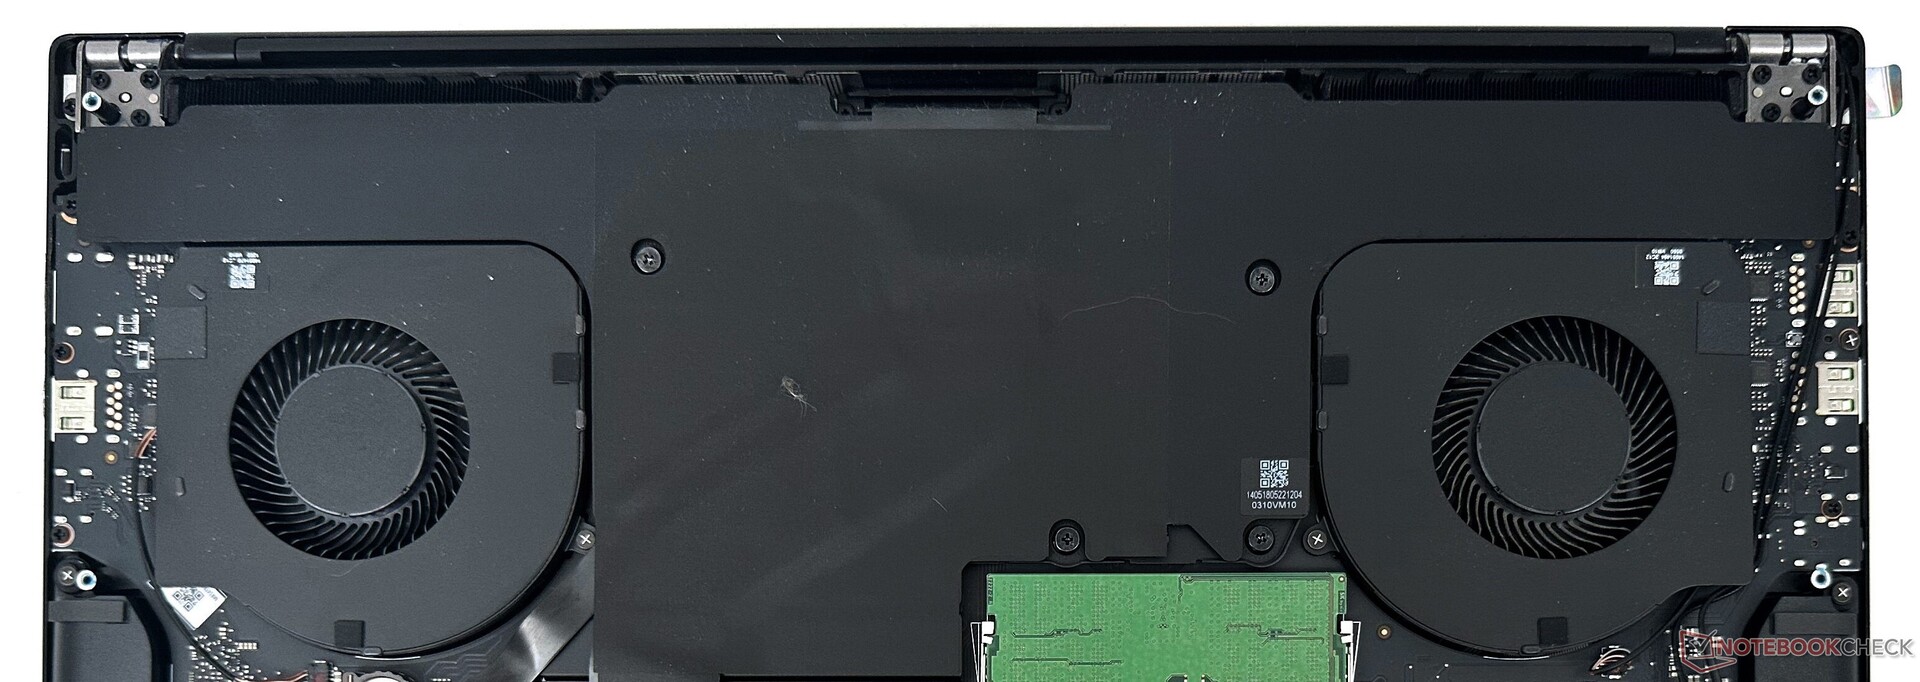
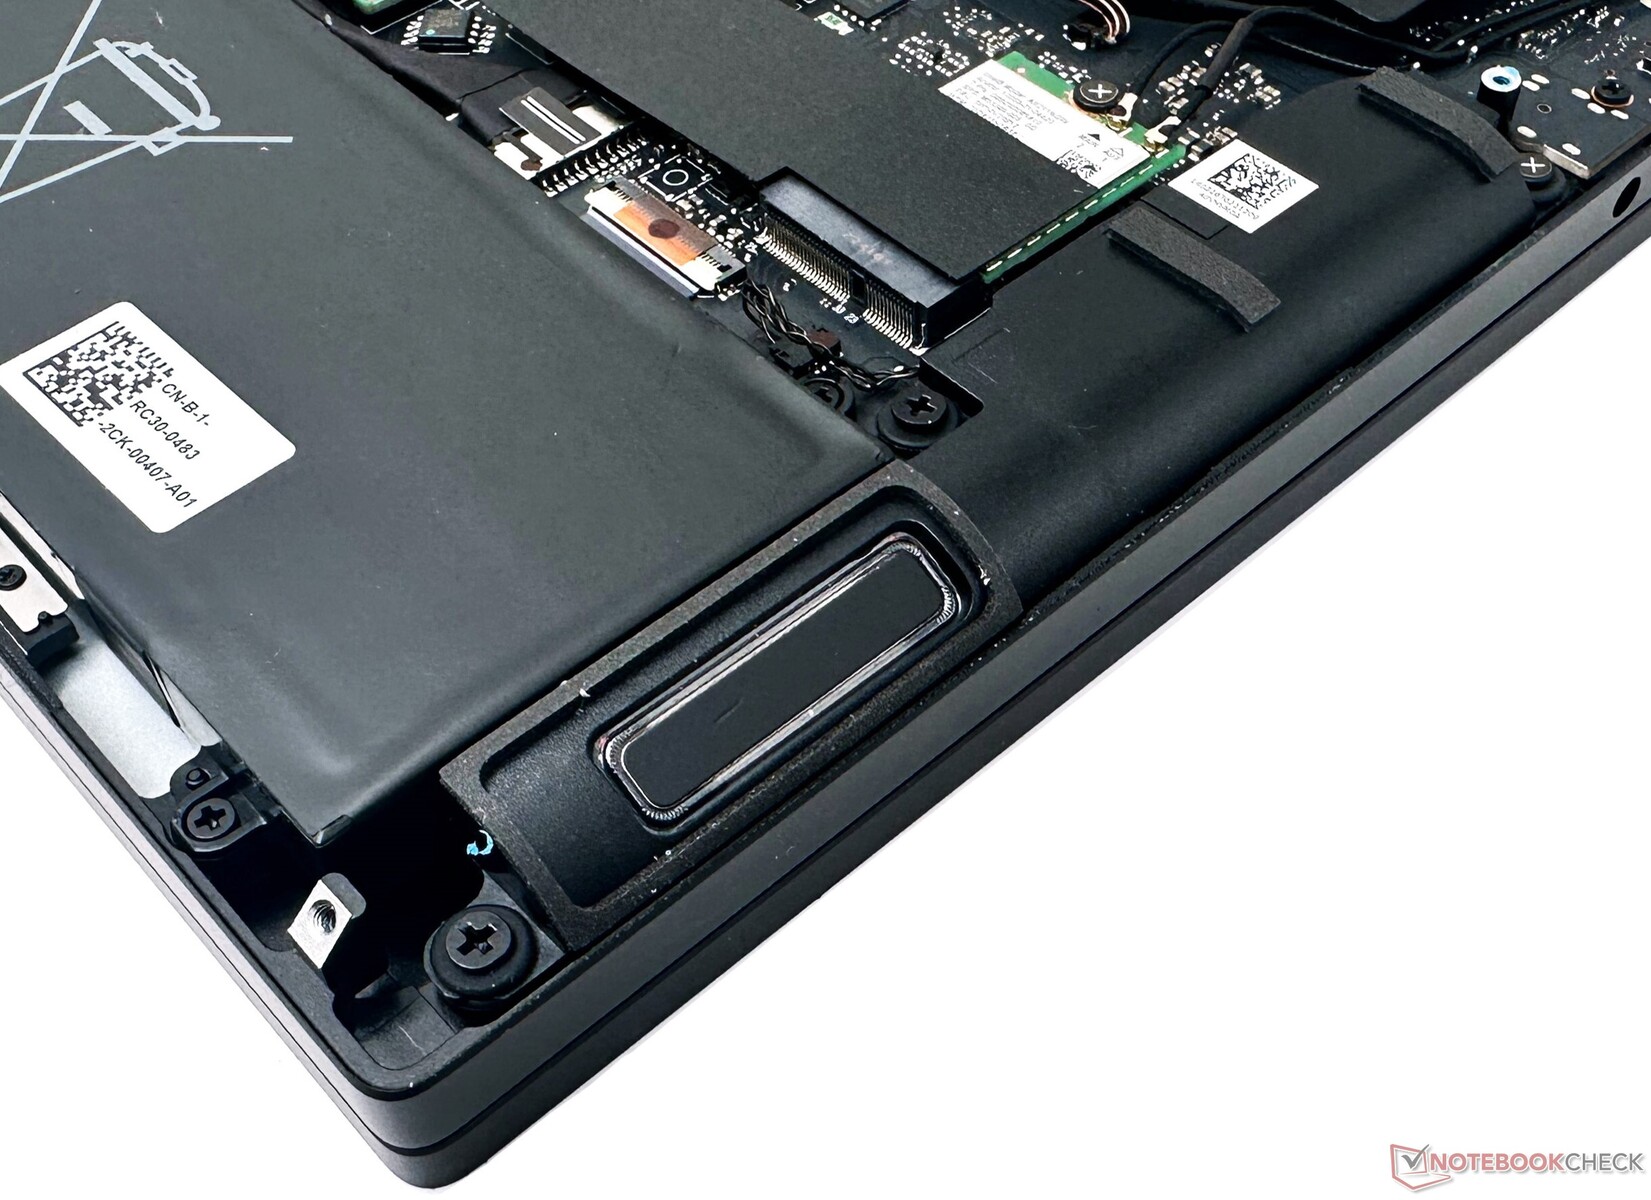
维护
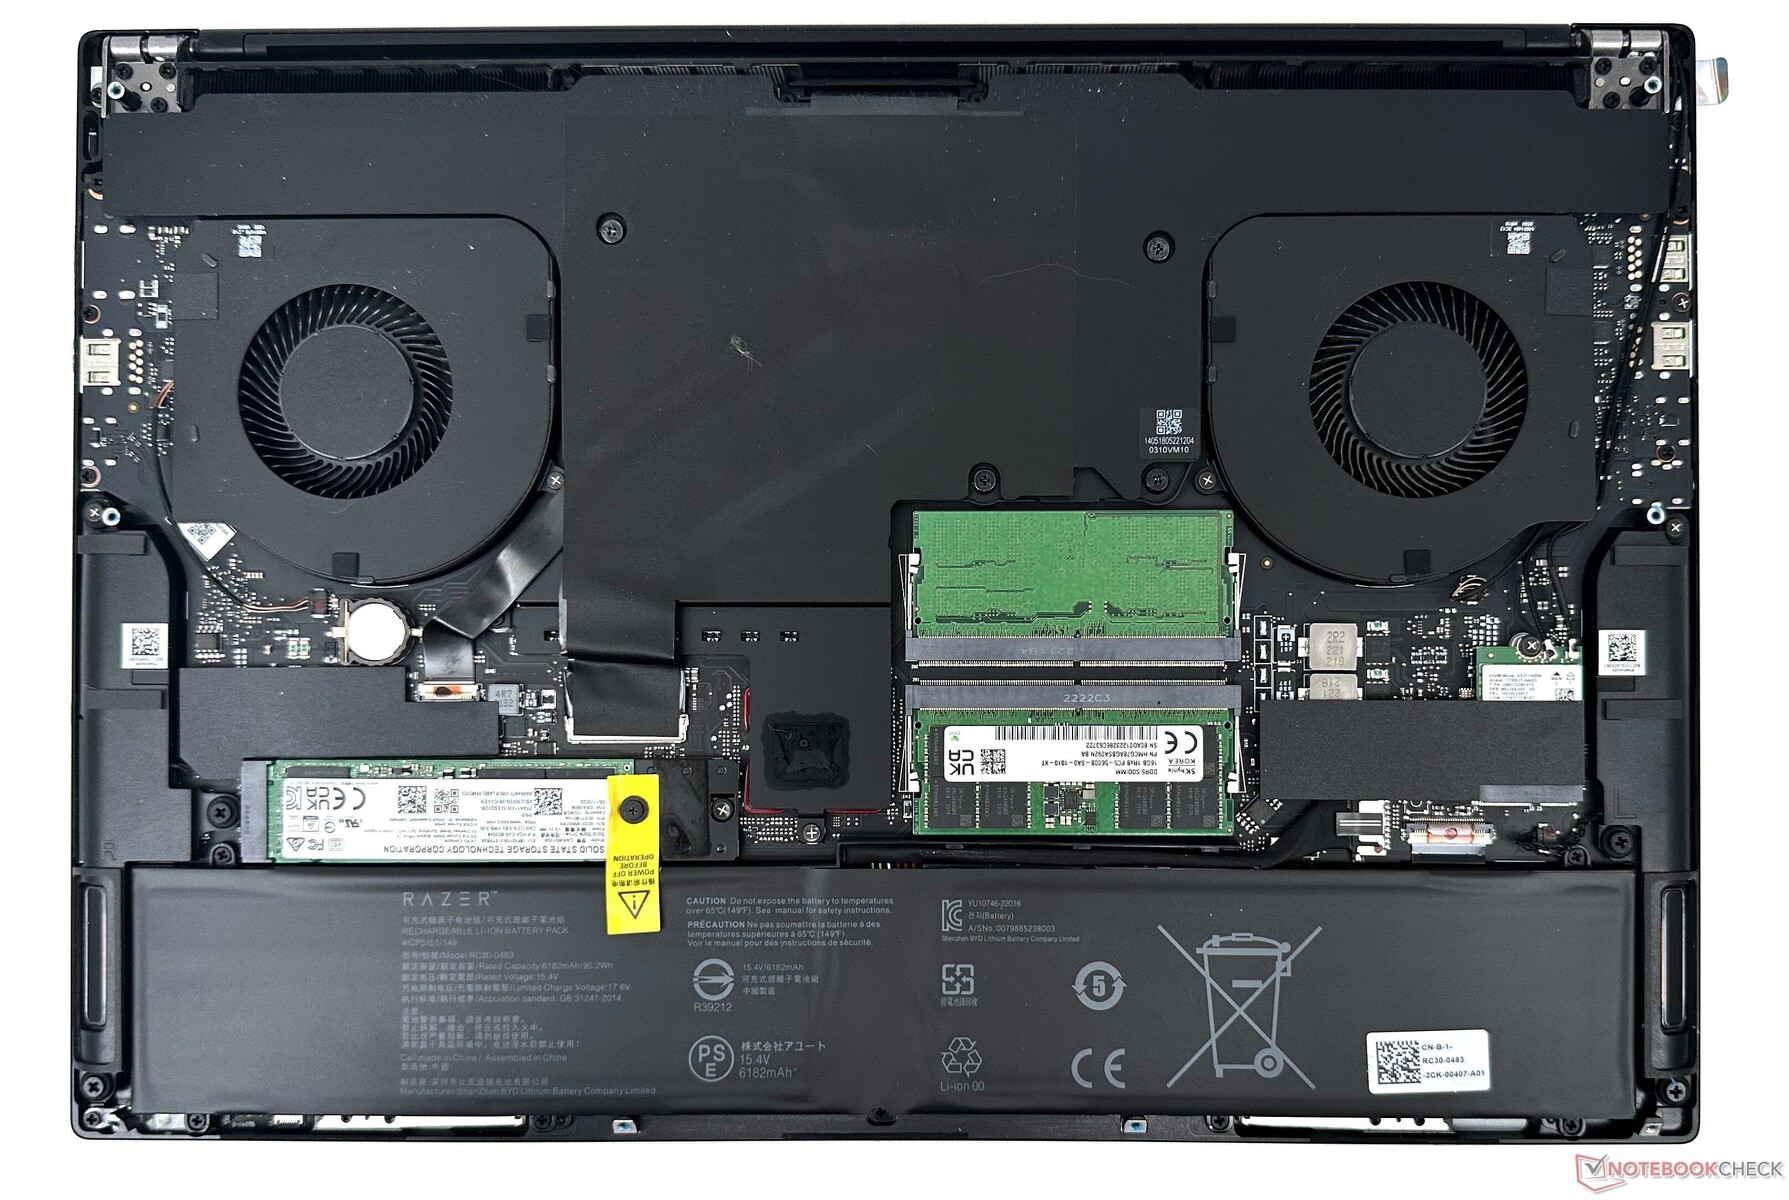
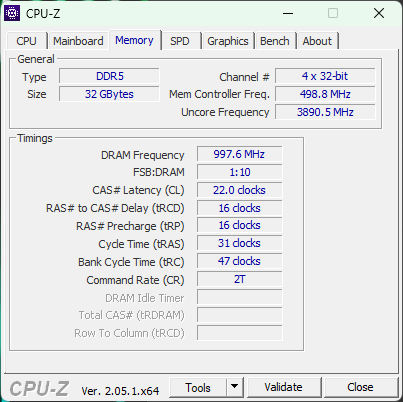
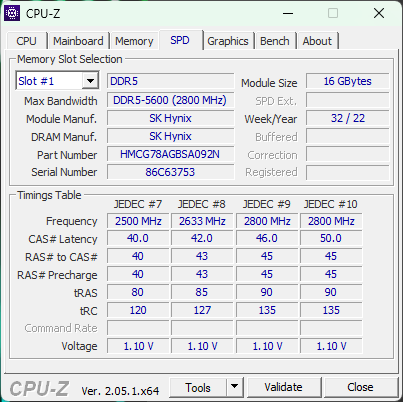
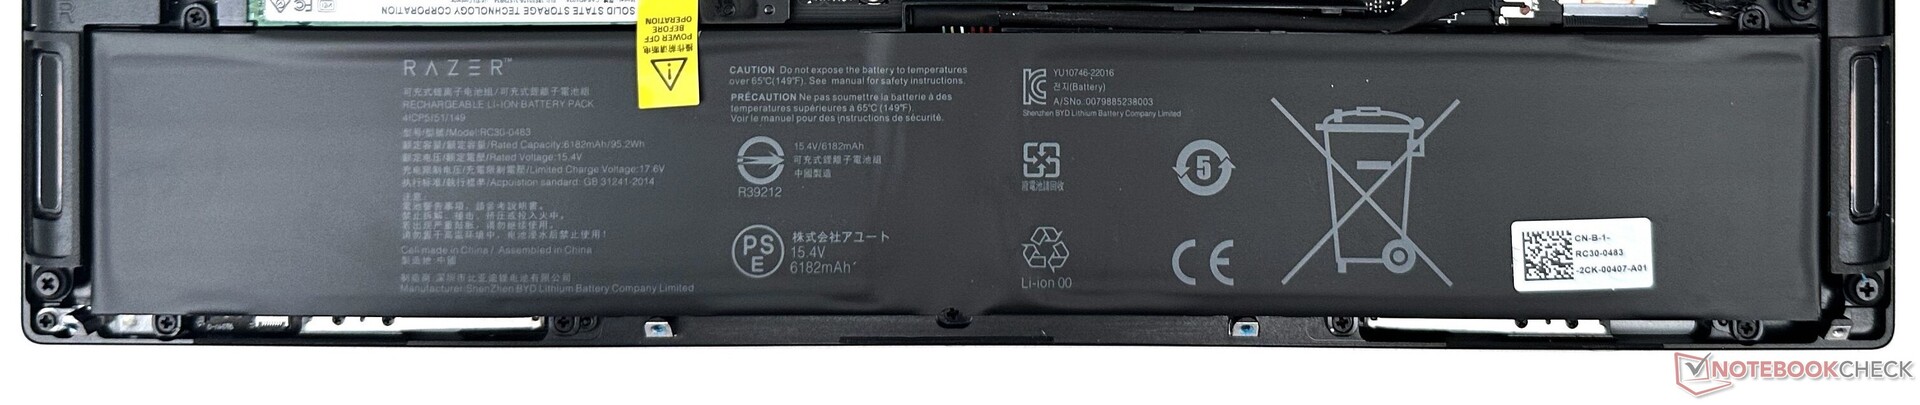
卸下八个T5螺丝,就可以打开底板,露出巨大的蒸汽室冷却系统。如果需要的话,DDR5-5600内存、NVMe固态硬盘和Wi-Fi卡可以被换掉。双电池组也可以被拧开并更换。
这里需要注意的一点是,Razer只在其支持网站上提供BIOS和固件更新。.在大多数情况下,来自英特尔和Nvidia的官方通用驱动用于WLAN和图形,工作起来没有问题。
但是,如果你因为某些原因必须清除或更换整个驱动器,请确保事先有一份工厂恢复镜像的副本。事先准备好。下载恢复镜像需要用Razer账户登录并输入设备的序列号。
配件和保修
我们的Blade 16装置带有一个330W的GaN电源适配器和通常的文书工作作为标准。
Razer为Blade 16提供了一年的标准保修,为电池提供了两年的保修。可以单独购买另外一年的延长保修,但这不适用于电池。
输入设备:与早期的刀片没有太大区别
键盘
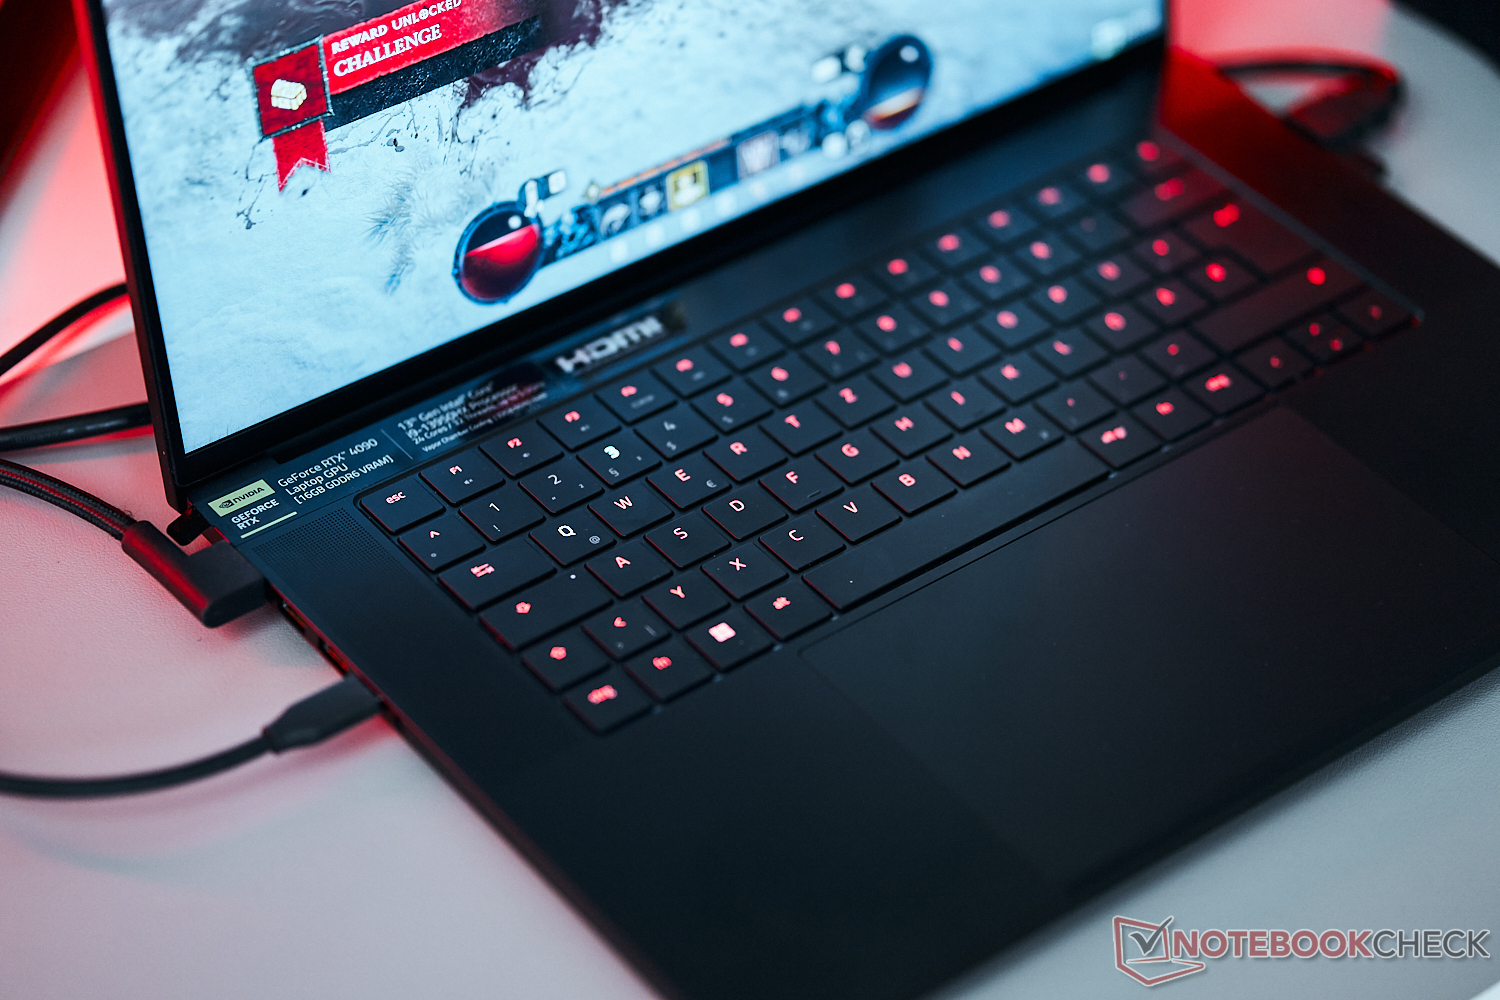
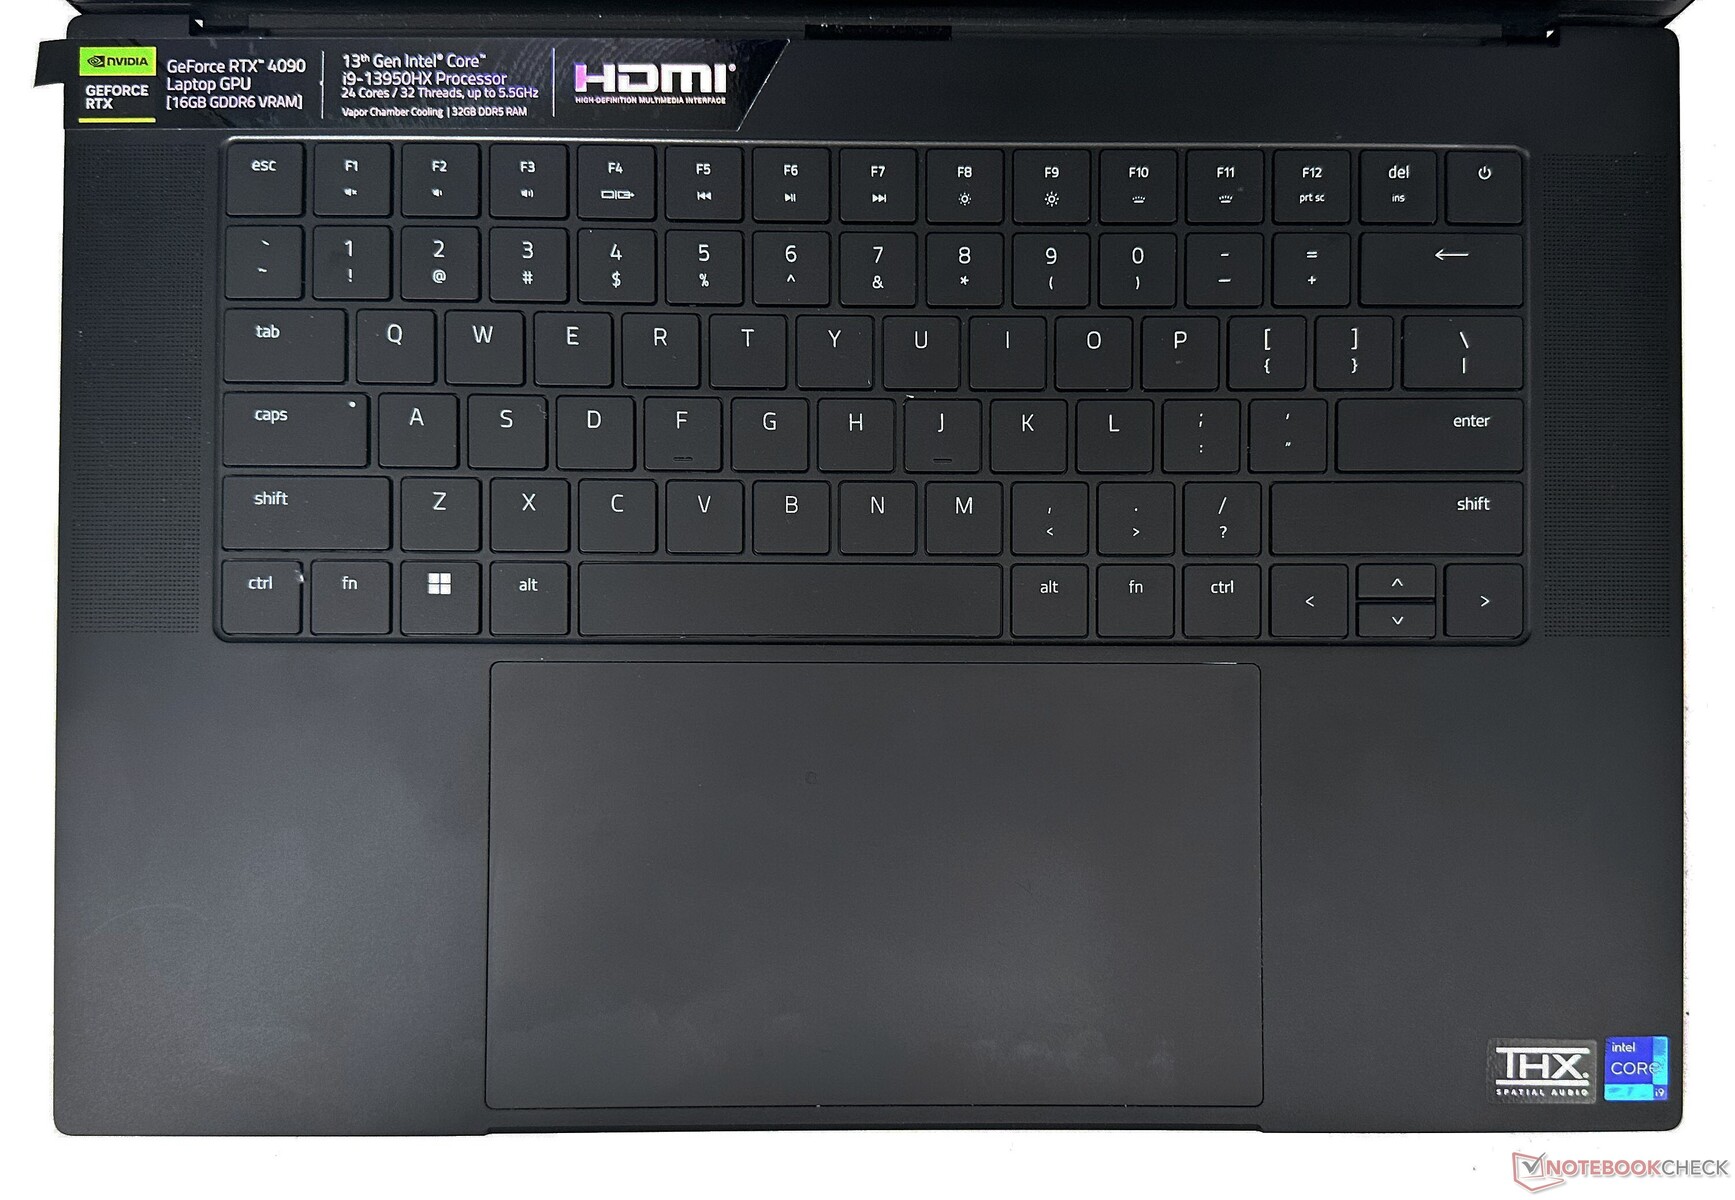
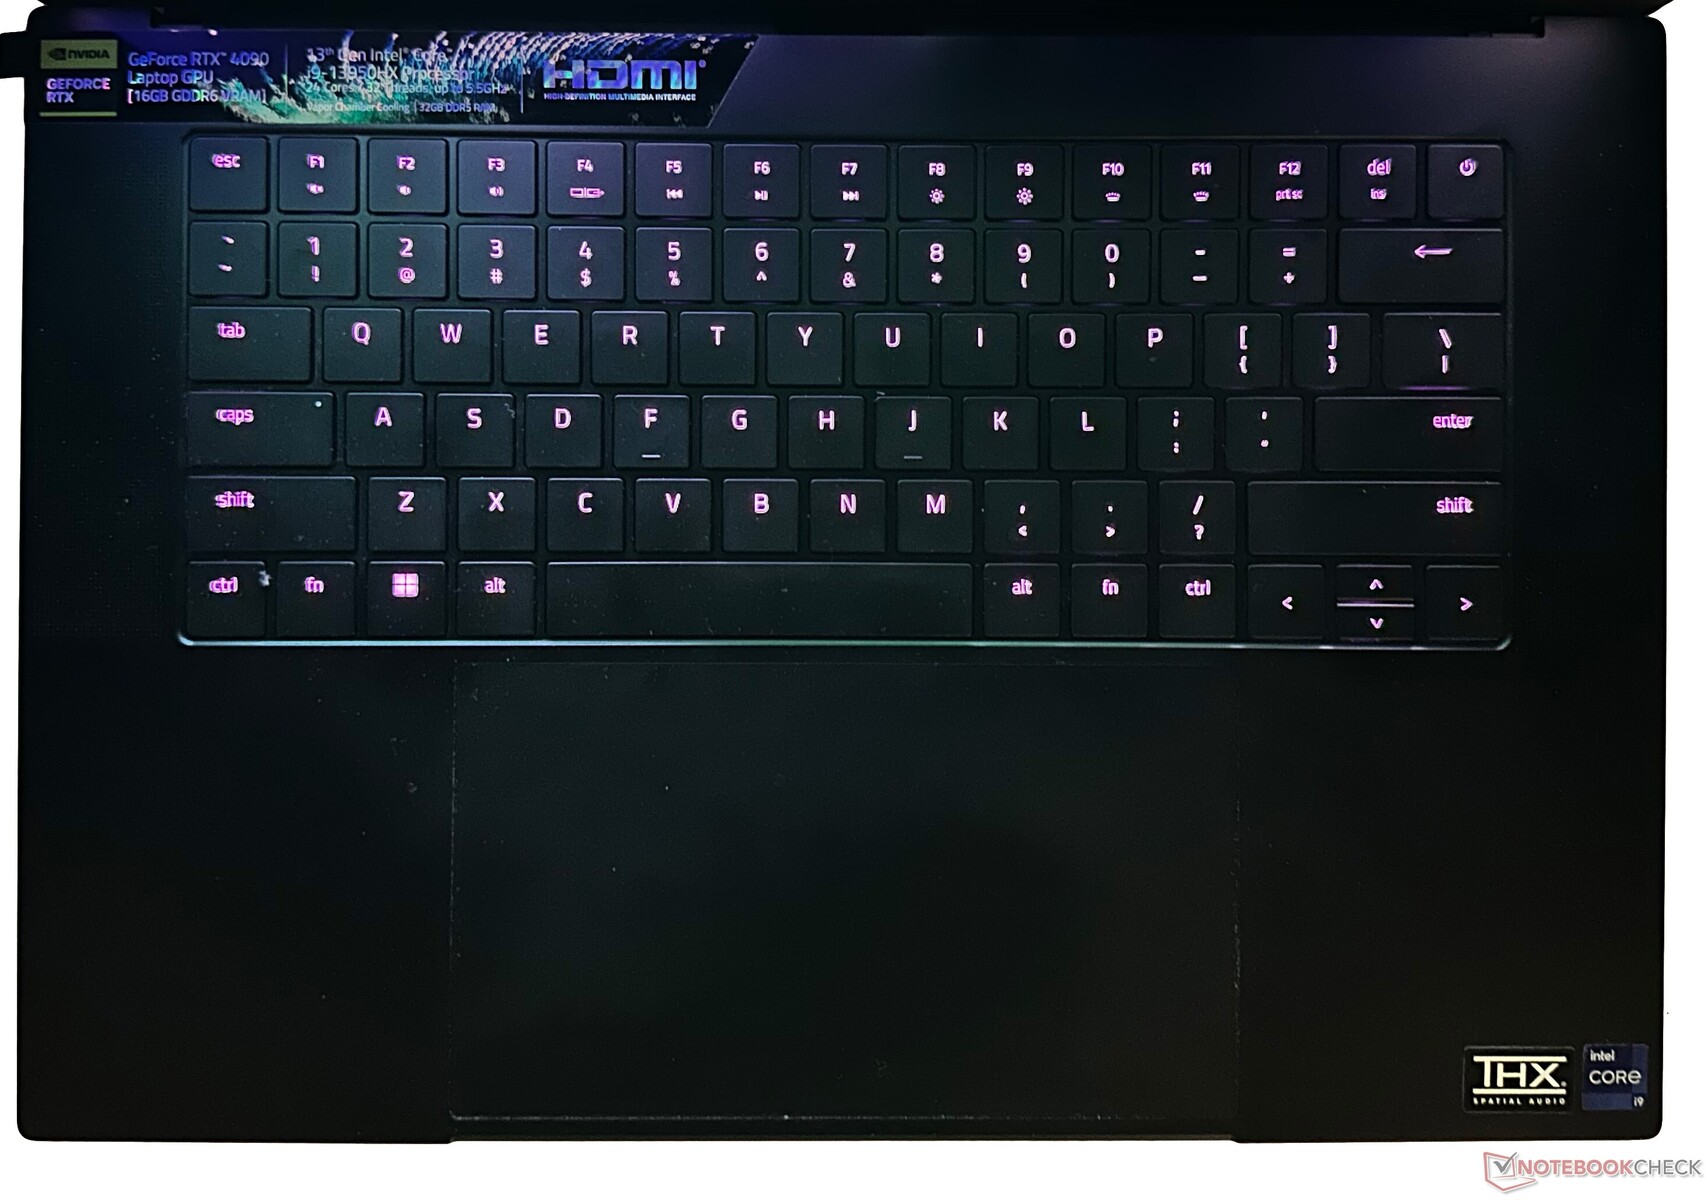
Razer在键盘上采用了传统的薄膜按键开关。键是平的,有很好的驱动力和触感,但提供一个短的1毫米行程距离。键盘支持Razer Chroma RGB效果和N键翻转。背光强度可在15个步骤中调节。
居中的定位将吸引那些不介意没有数字键盘的人。然而,习惯于较长的右Shift键和较短的上下方向键会显得很麻烦。
刀片16的键盘不能与微星Titan GT77或Schenker XMG Neo 17M等相提并论。 申克XMG Neo 17 M22提供机械开关。虽然Razer的实现在大多数情况下是很好的,但在这个键盘上输入长篇文件确实感觉有点吃力。
触摸板
宽敞的9.5厘米x17厘米的玻璃触摸板是2023年刀片的新产品,有一个大的滑行区域,支持WindowsPrecision 手势。整个表面是可点击的,反应灵敏,但触觉感觉有些模糊。
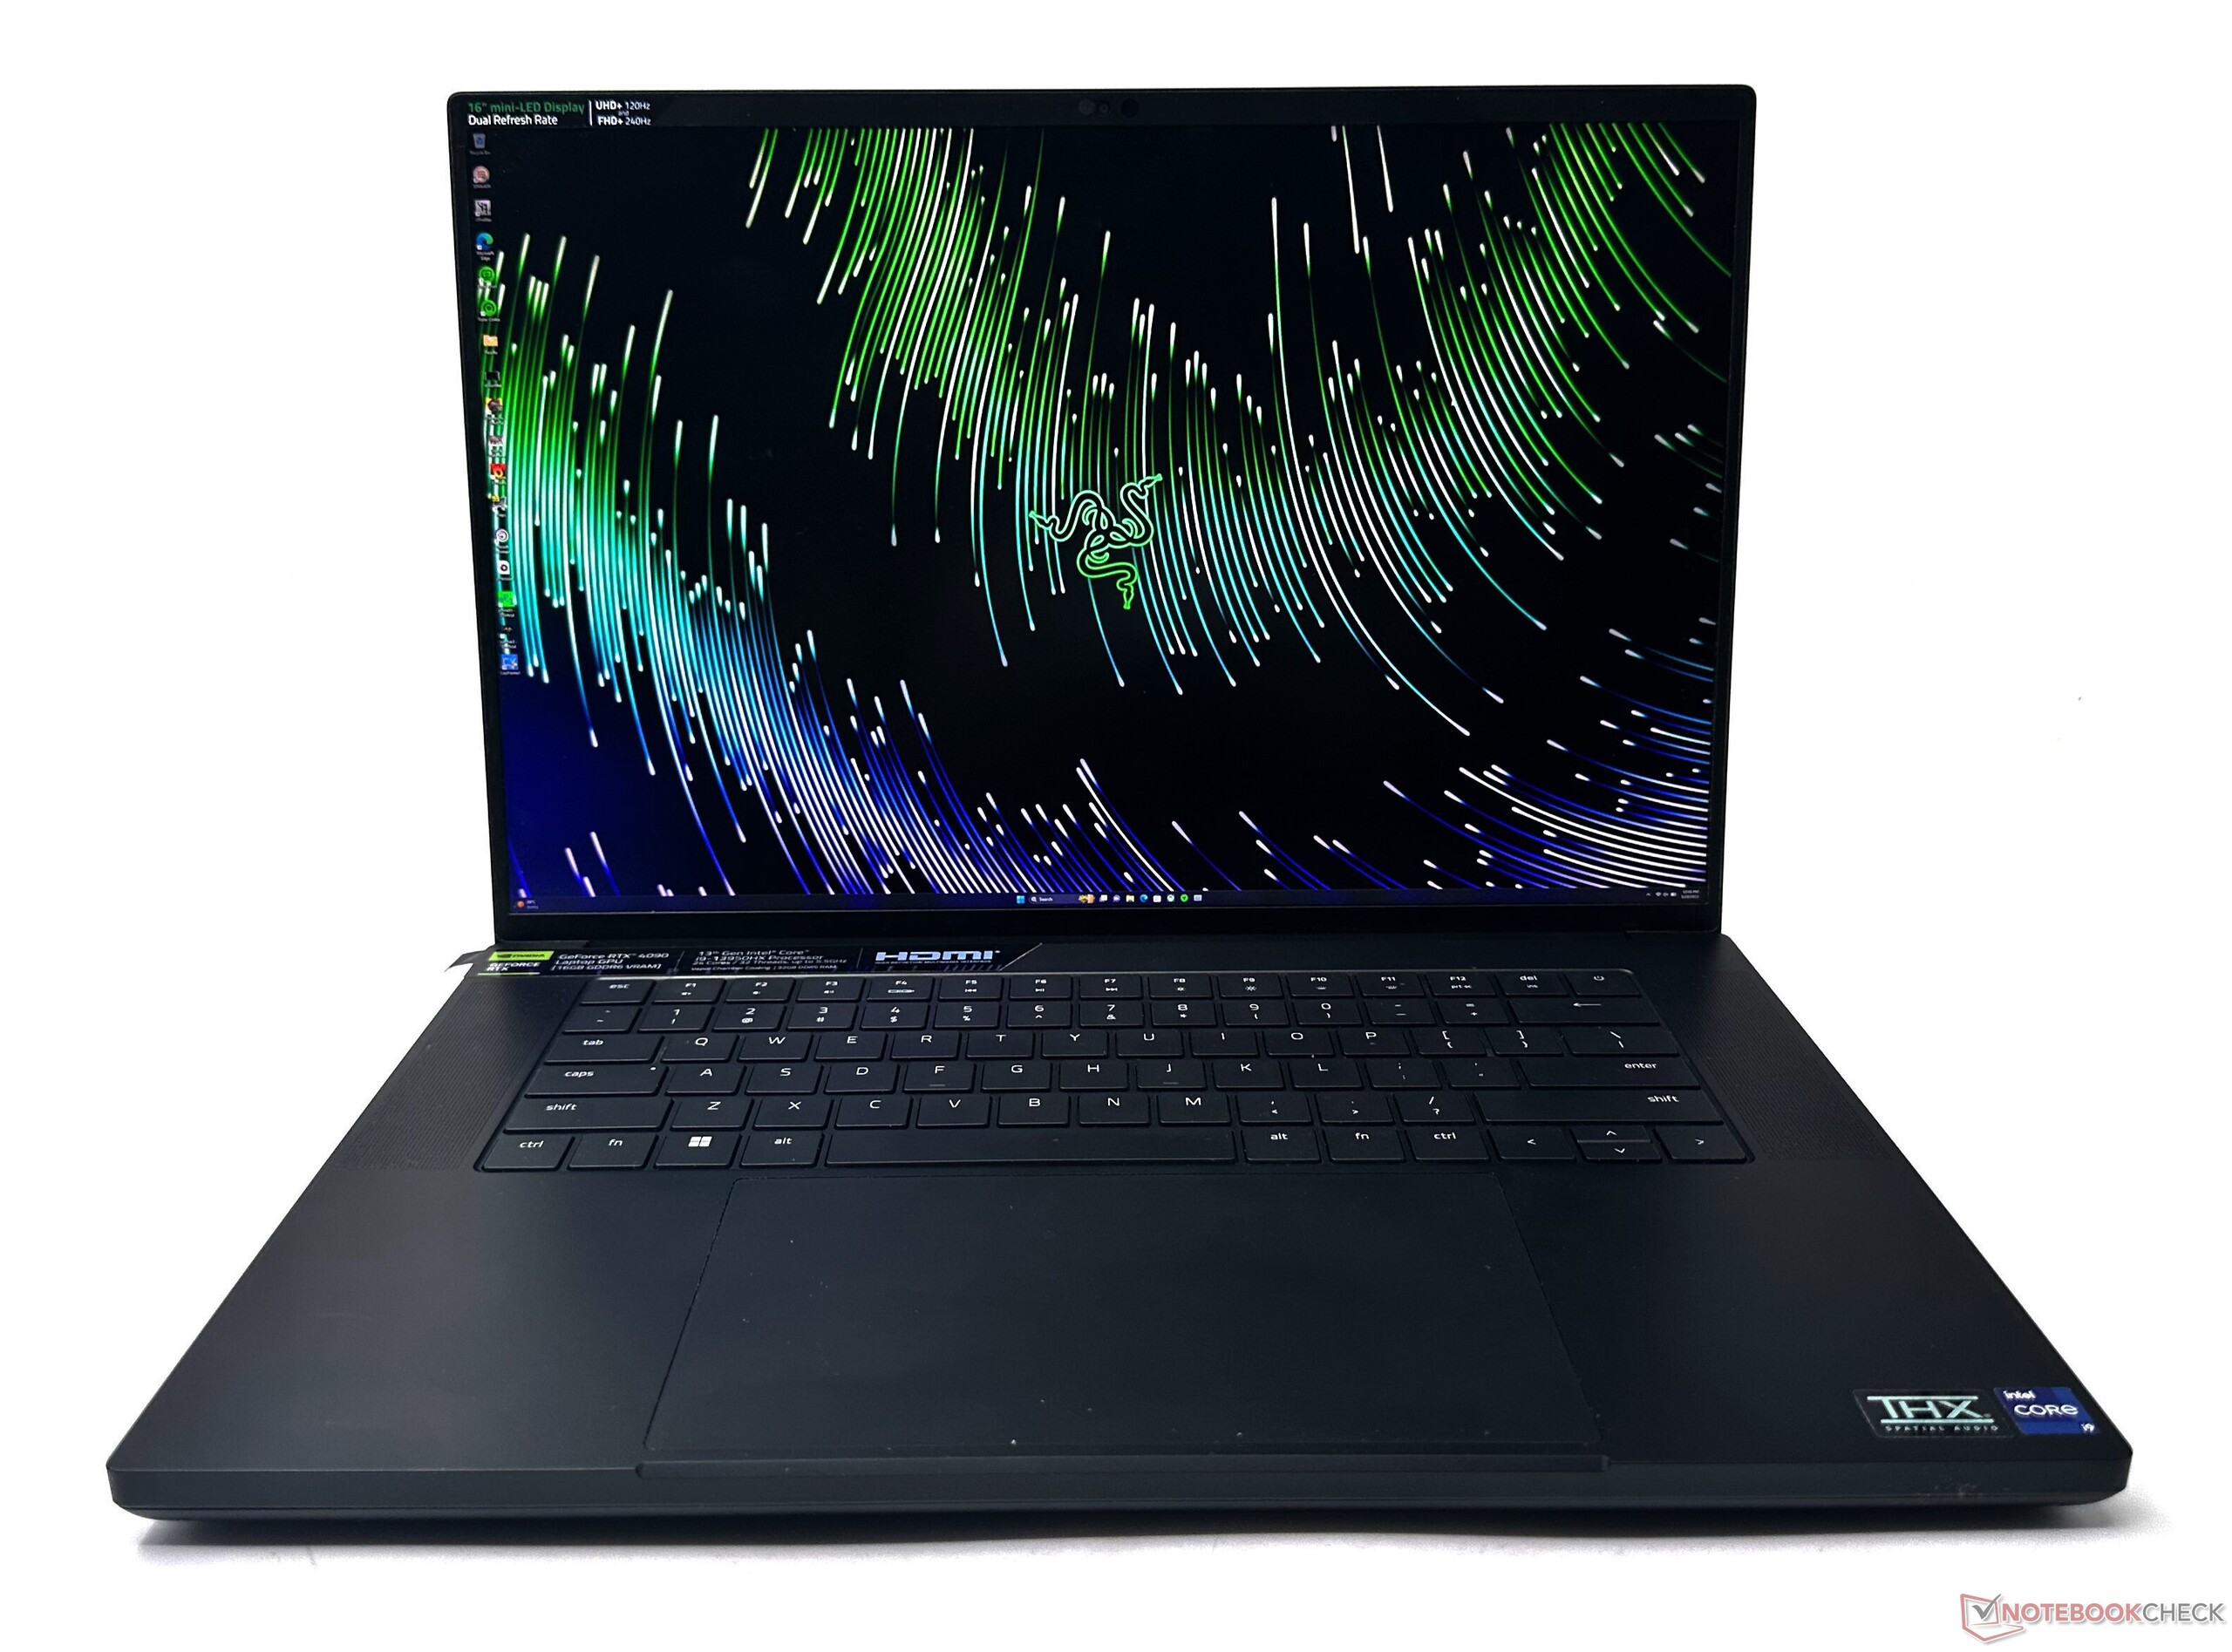
显示:明亮、接近OLED质量的双模式迷你LED,具有高PWM功能
Blade 16 Early 2023提供了一个首创的双模式迷你LED显示屏。我们的测试装置在测试过程中提出了几个耐人寻味的见解。
我们的设备的AUO面板最初遭受了一个图像保留的错误,它将墙纸的一部分永久地刻在显示屏上(除了关闭时),这是一个令人讨厌的体验。然而,Razer现在已经,发布了一个固件补丁 ,完全解决了这个问题。
Blade 16 Early 2023是首款提供16:10双模式显示选项的笔记本电脑。用户可以在UHD+(3840 x 2400)120赫兹和FHD+(1920 x 1200)240赫兹原生面板模式之间转换,这是一个完美的整数缩放。更高的分辨率可以帮助创造性的工作流程,而240赫兹的FHD+在竞争性游戏中也很方便。
雷蛇没有说明调光区的确切数量,但我们预计它们将超过1000个,与微星Titan GT77 HX 13VI类似。支持Nvidia G-Sync,但只在dGPU模式下。
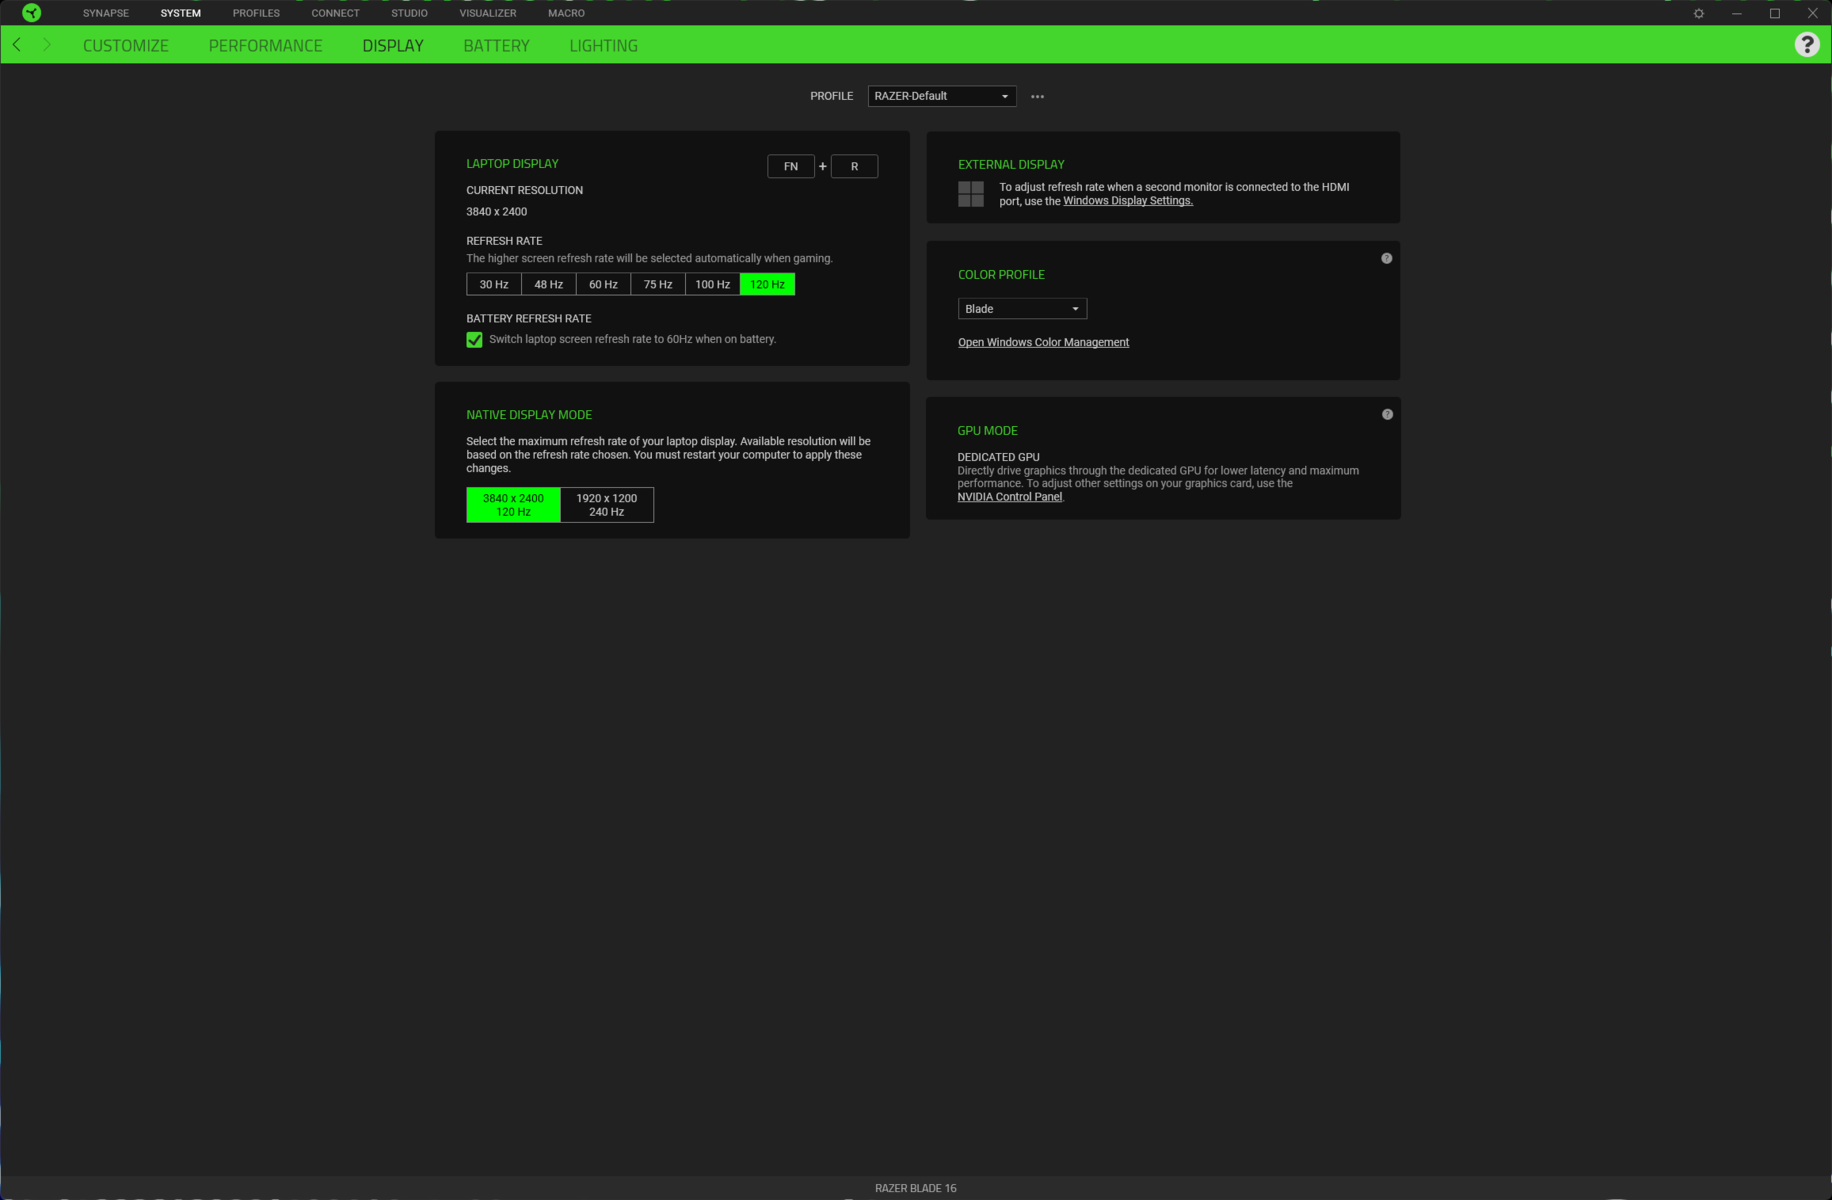
显示模式可以通过Razer Synapse(需要重新启动)或从BIOS改变。在这里,我们遇到了几个特殊情况中的第一个。如果你在BIOS中把分辨率改为FHD+,你就不能从UEFI界面改回UHD+。相反,你将不得不依靠Synapse来切换到UHD+。这一点没有详细说明,可能会使第一次使用的人感到困惑。
我们在UHD+ 120 Hz模式下进行了所有测试,因为对于任何在笔记本电脑上花费超过四千美元的人来说,这是合理的选择。
近距离观看时,子像素矩阵看起来有些颗粒感。有趣的是,我们看到UHD+模式下的矩阵看起来相当清晰和明确。人们期望在切换到FHD+模式时有更大的像素尺寸,但我们在这里看到相同大小的像素。
我们还可以看到子像素矩阵的模糊性和混叠伪影--它不像UHD+模式那样锐利,与原生FHD面板相比也绝对不那么锐利。似乎Razer只是简单地缩小了4K分辨率并使用了时间抖动。
在玩快节奏的射击游戏时,这可能不会构成太大的问题,但我们建议在大多数情况下坚持使用原生UHD+分辨率。在高曝光下没有观察到背光渗漏。


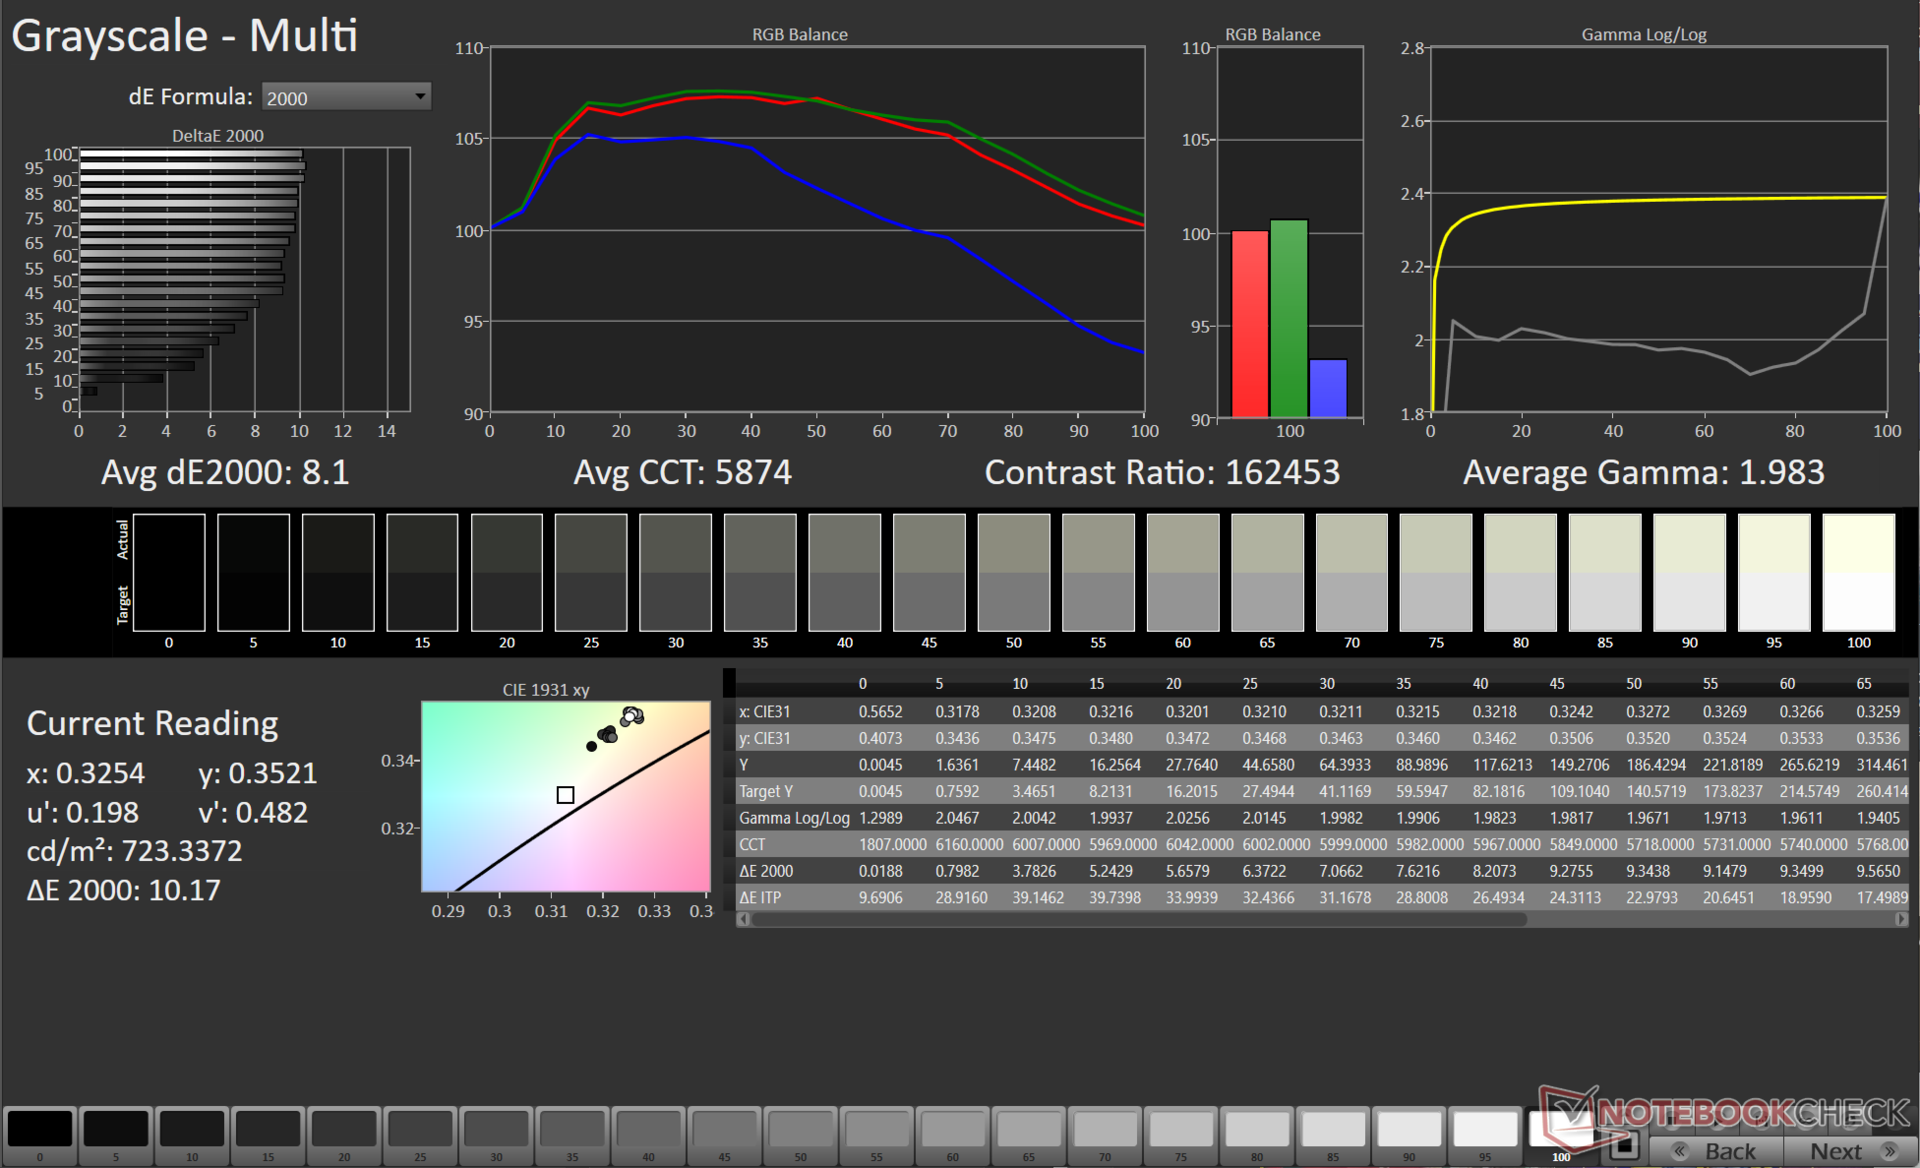
2023年Razer Blade 16的面板被官方评为提供1000尼特的峰值亮度。我们观察到94%的优秀亮度分布,在SDR模式下的峰值为752尼特。
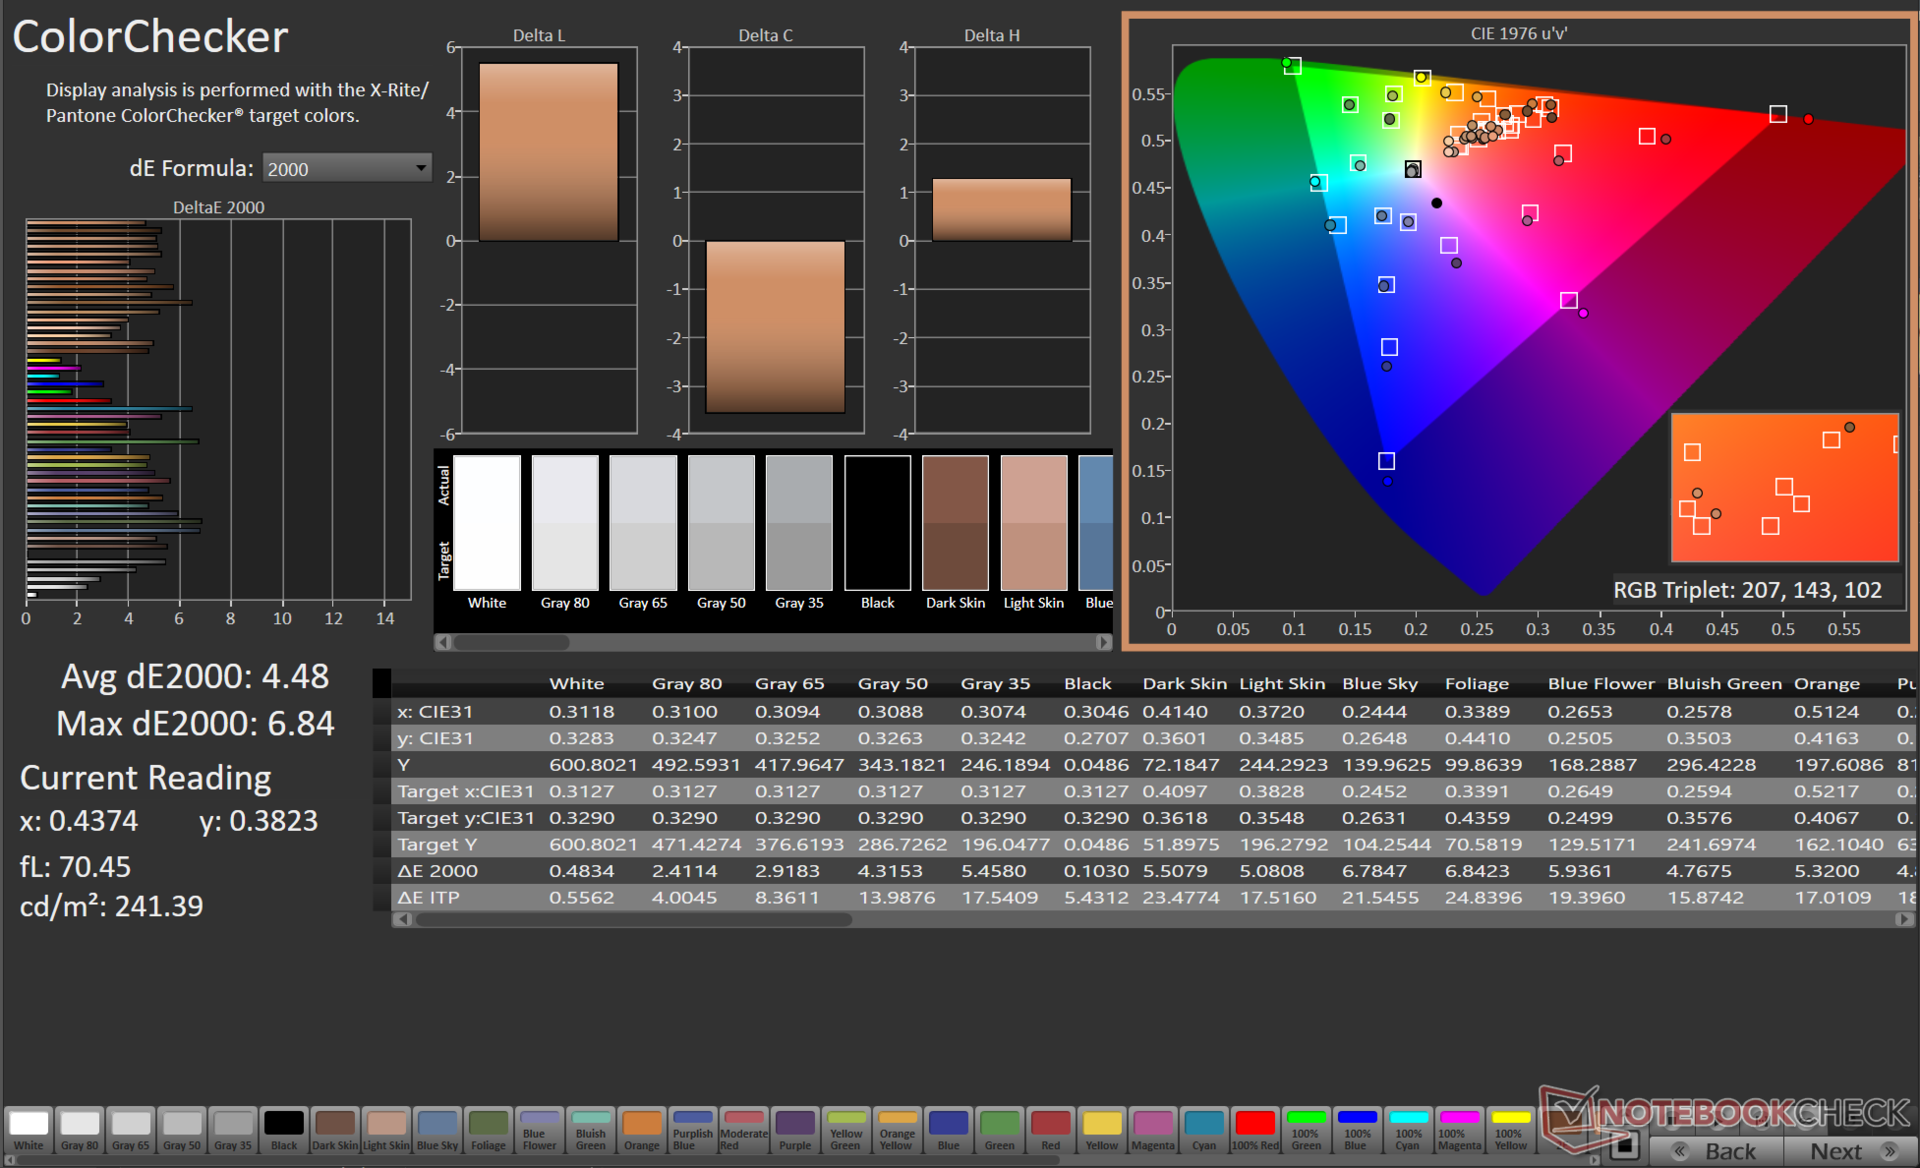
由于某些原因,只有在使用默认的Windows色彩配置文件时才能获得这些数值,这也是我们下面测量的基础。刀锋16在出厂时已进行了校准,但使用这种ICC配置文件会使亮度水平下降100尼特。
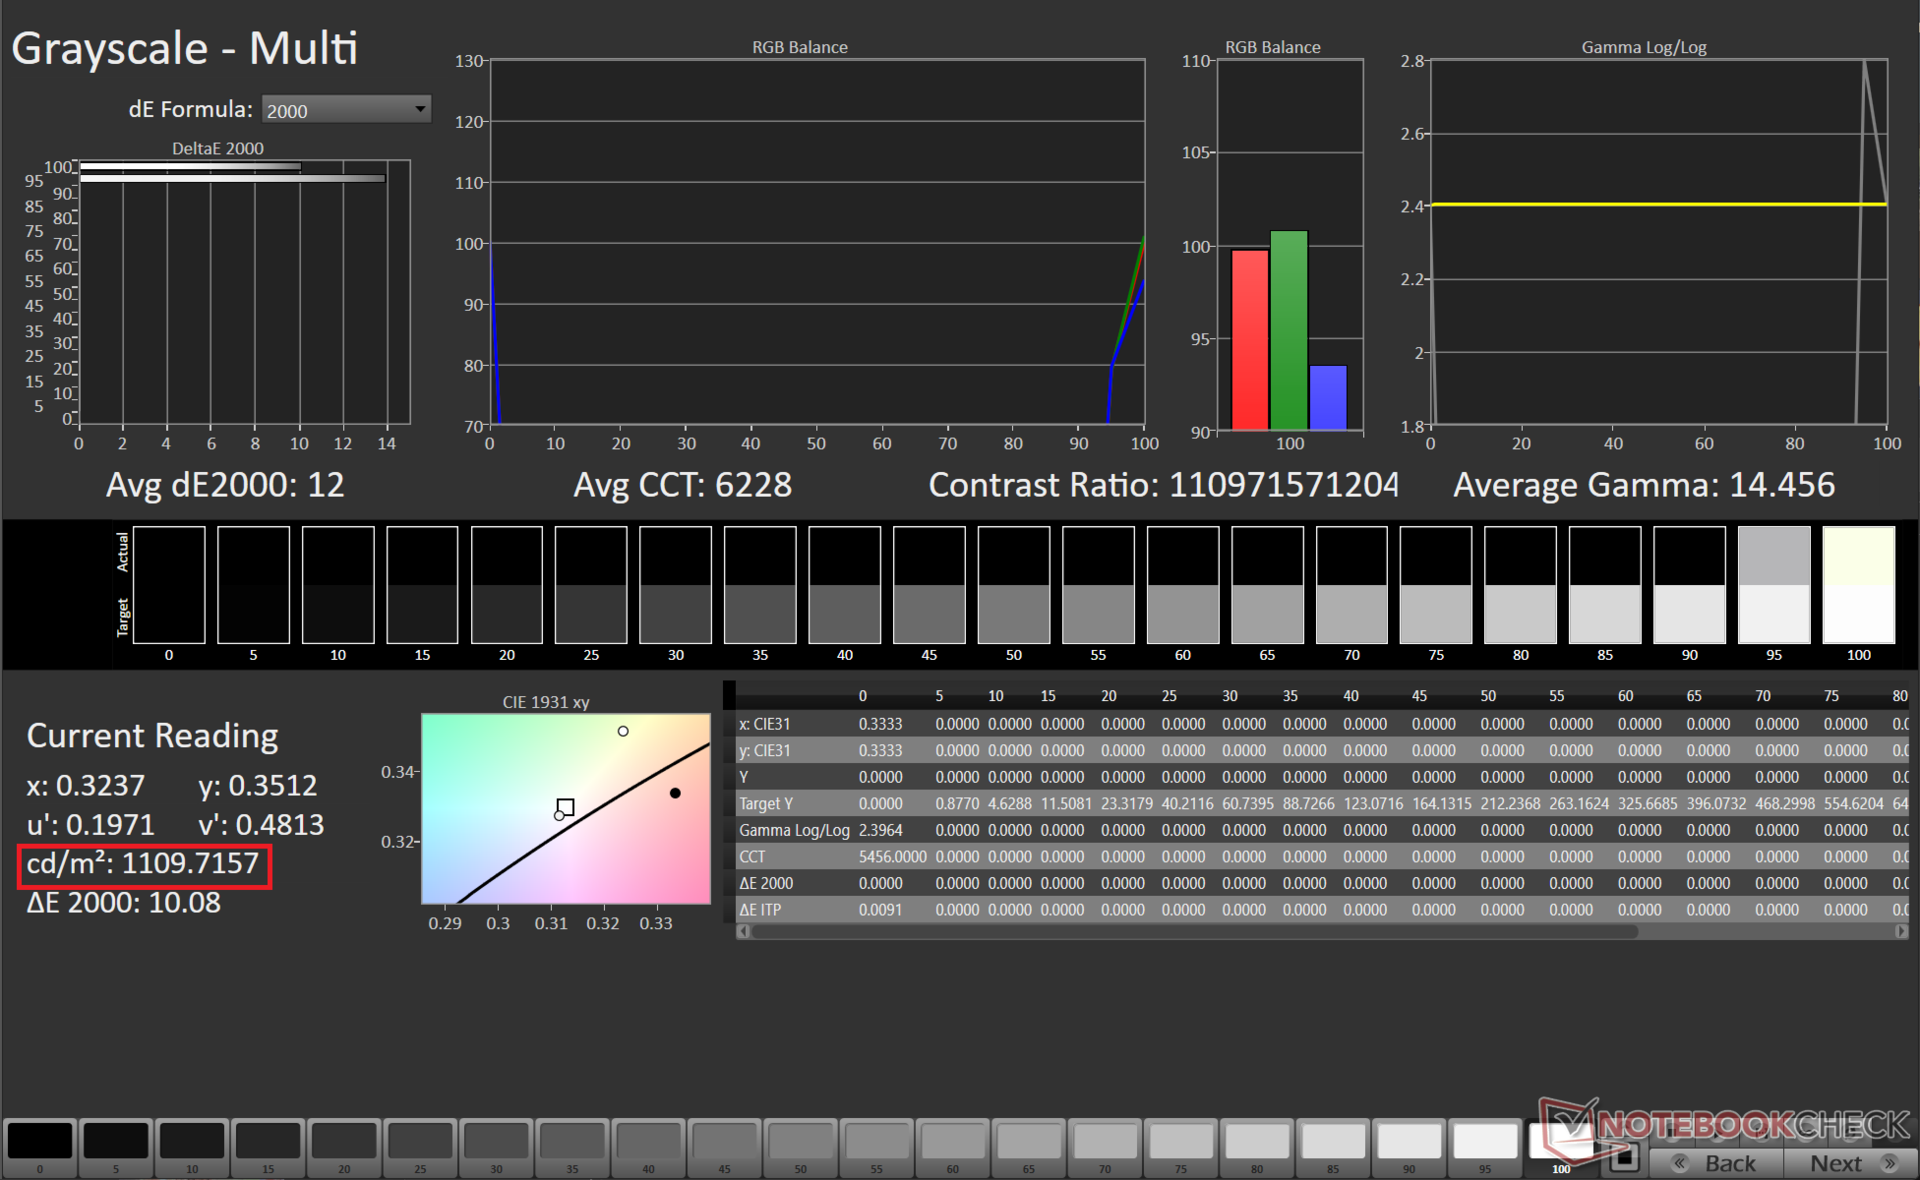
我们在HDR模式下测量到接近1110尼特,100%的白色图像。这并不完全是 Apple MacBook Pro 16水平,但仍然是一个优秀的亮度,尽管如此。
除了一个工厂校准的ICC文件外,没有预设的颜色配置文件。在UHD+模式下,用户可以直接从Windows显示设置或Razer Synapse选择所需的配置文件。然而,这些选项在FHD+模式下是不可用的。
| |||||||||||||||||||||||||
Brightness Distribution: 94 %
Center on Battery: 723 cd/m²
Contrast: 162222:1 (Black: 0.0045 cd/m²)
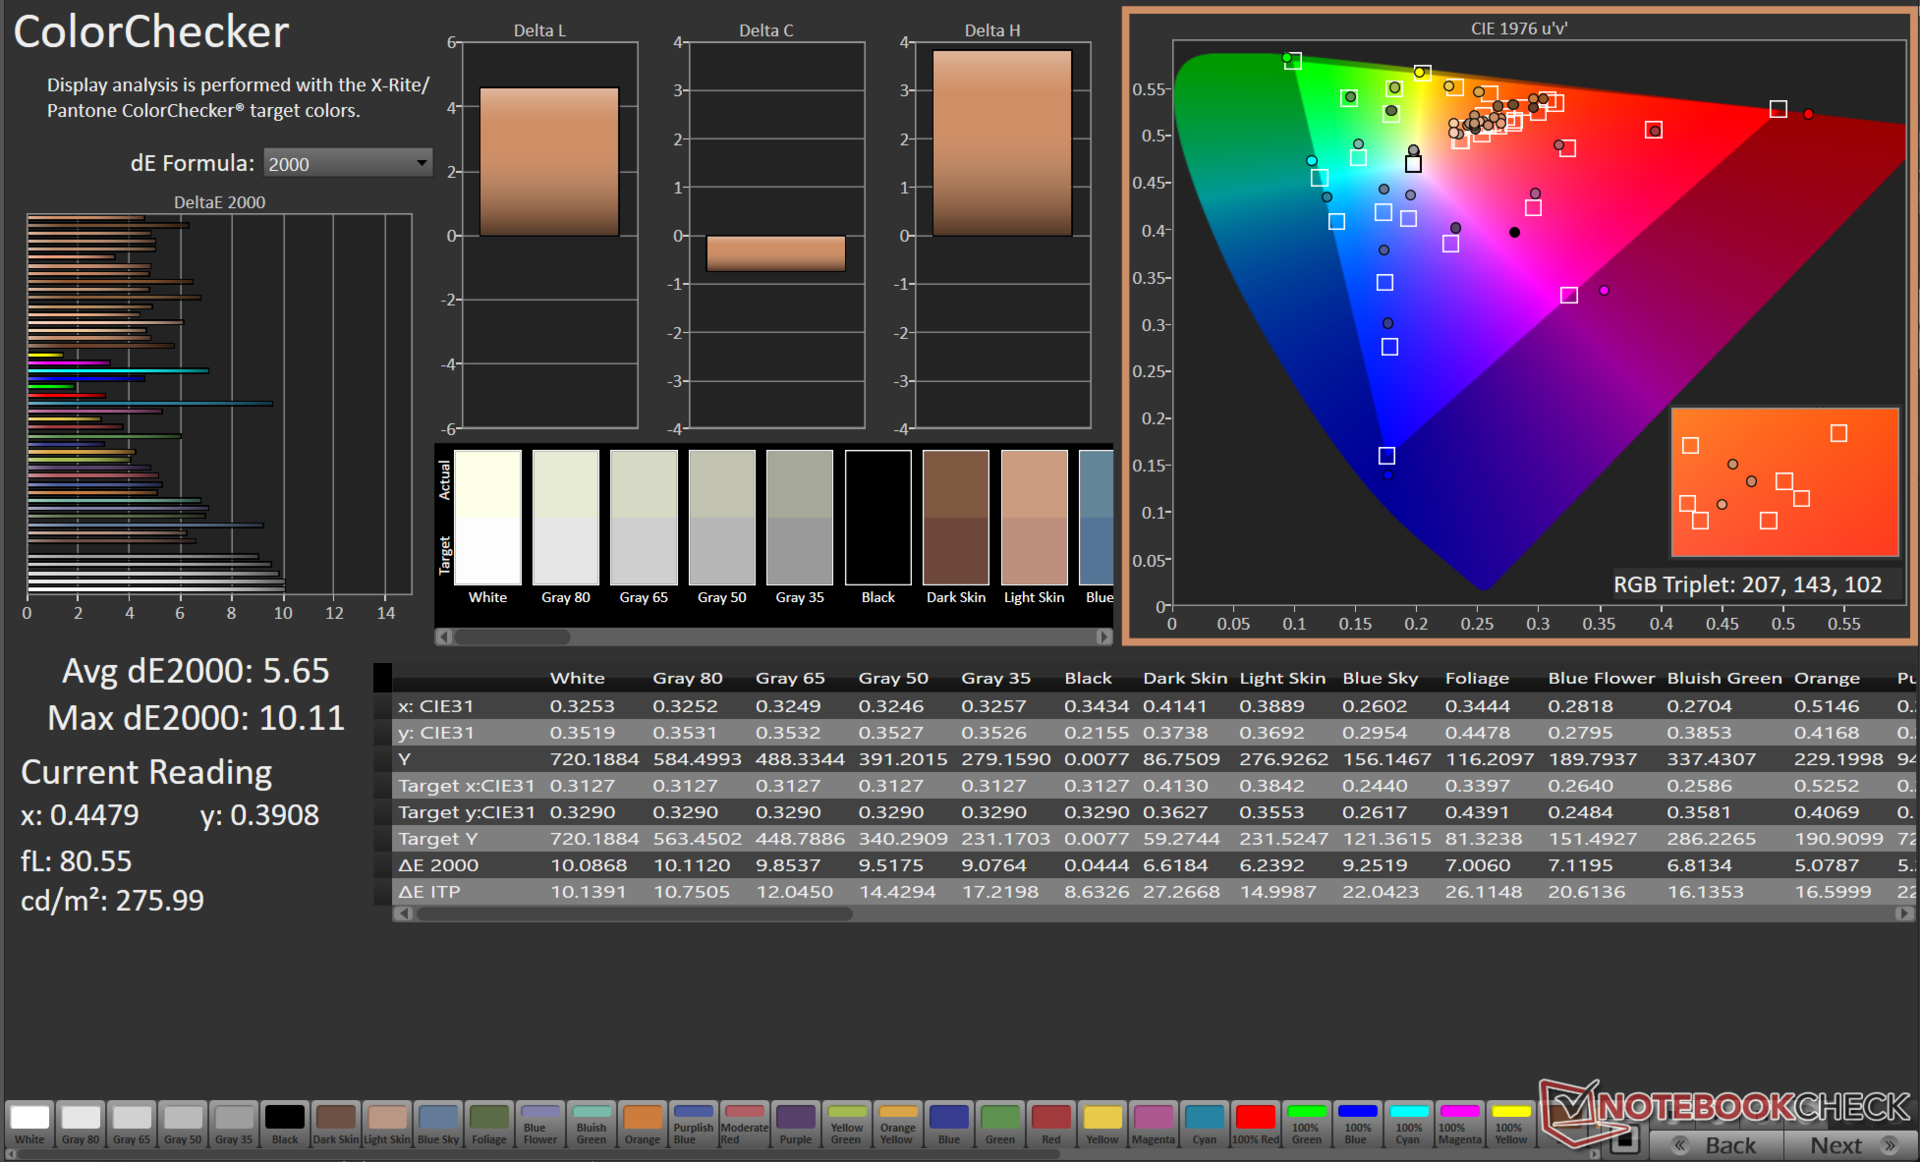
ΔE ColorChecker Calman: 5.65 | ∀{0.5-29.43 Ø4.72}
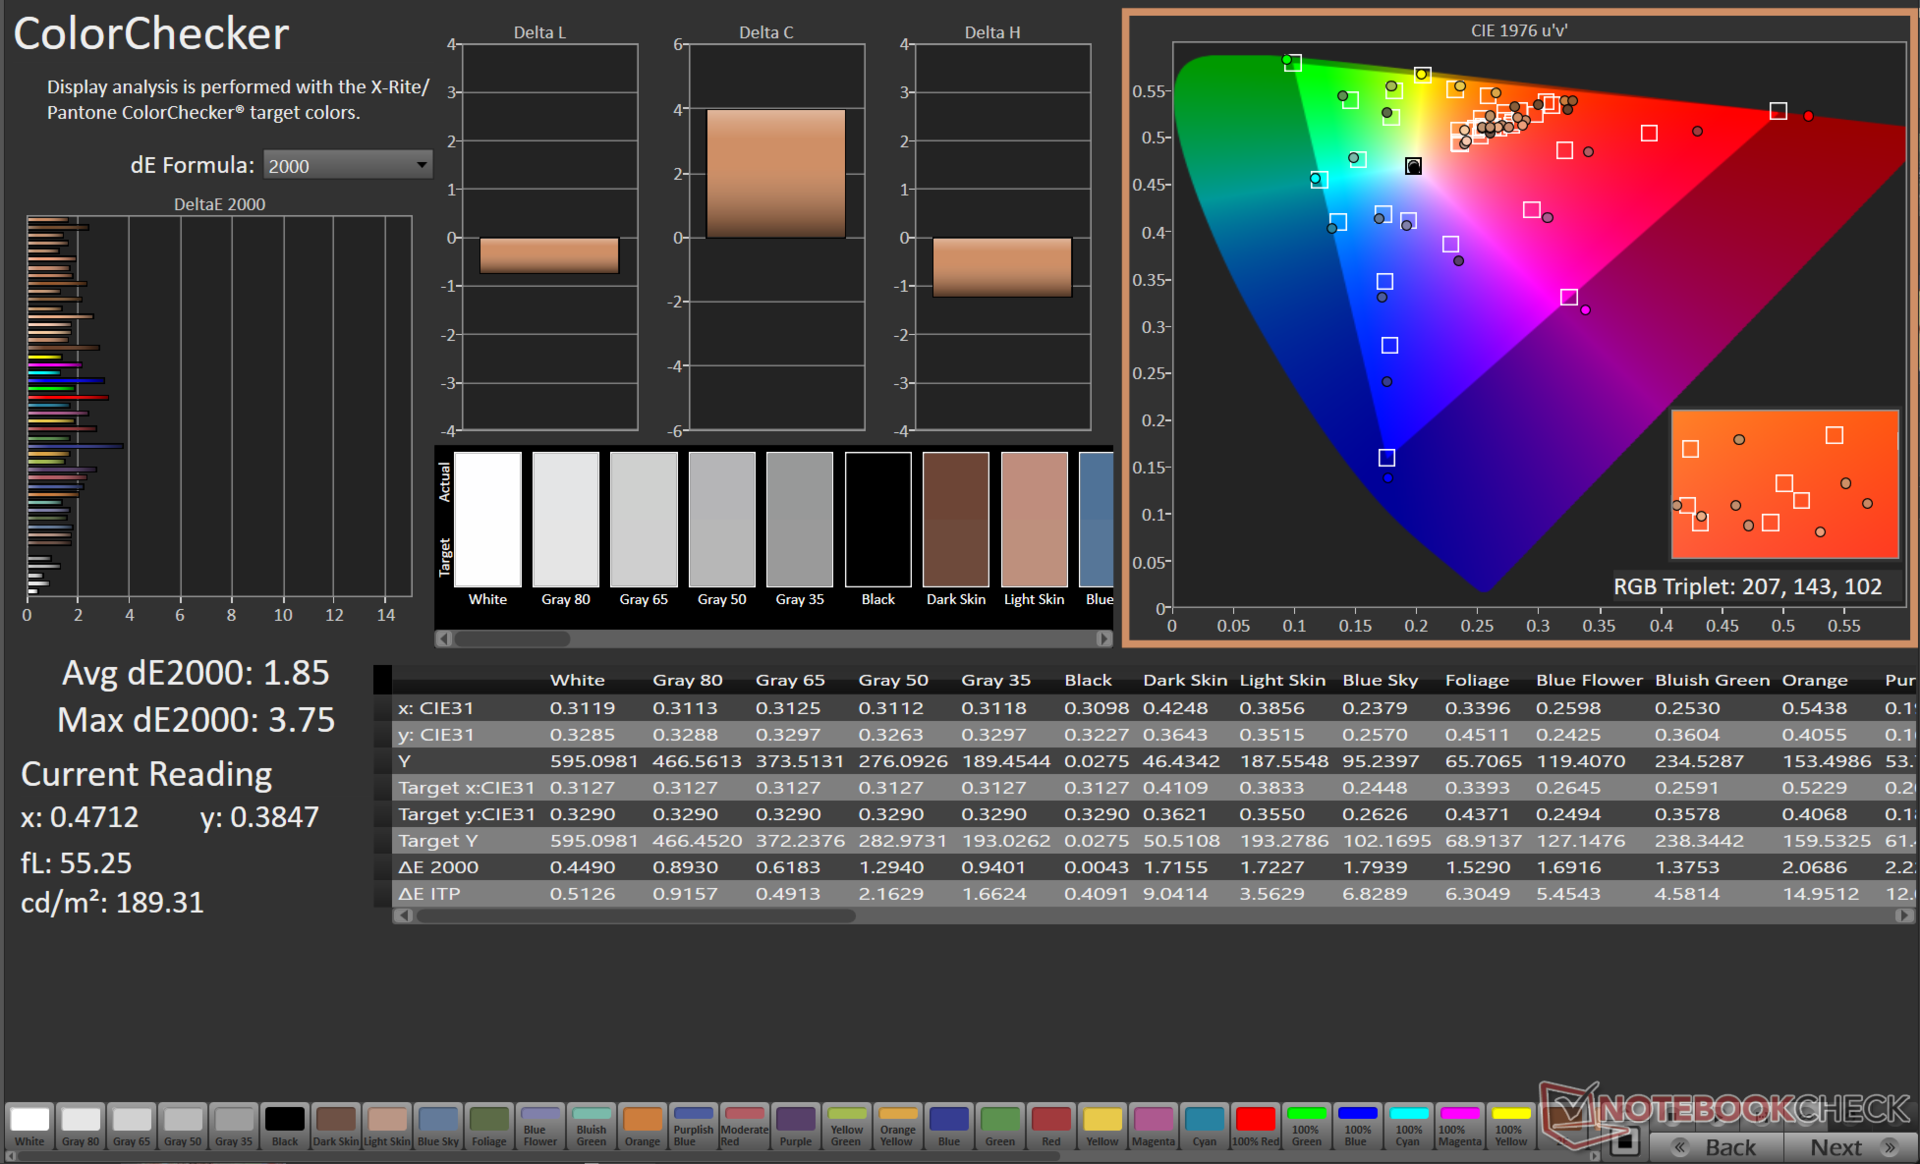
calibrated: 1.85
ΔE Greyscale Calman: 8.1 | ∀{0.09-98 Ø4.97}
90.9% AdobeRGB 1998 (Argyll 3D)
100% sRGB (Argyll 3D)
99.9% Display P3 (Argyll 3D)
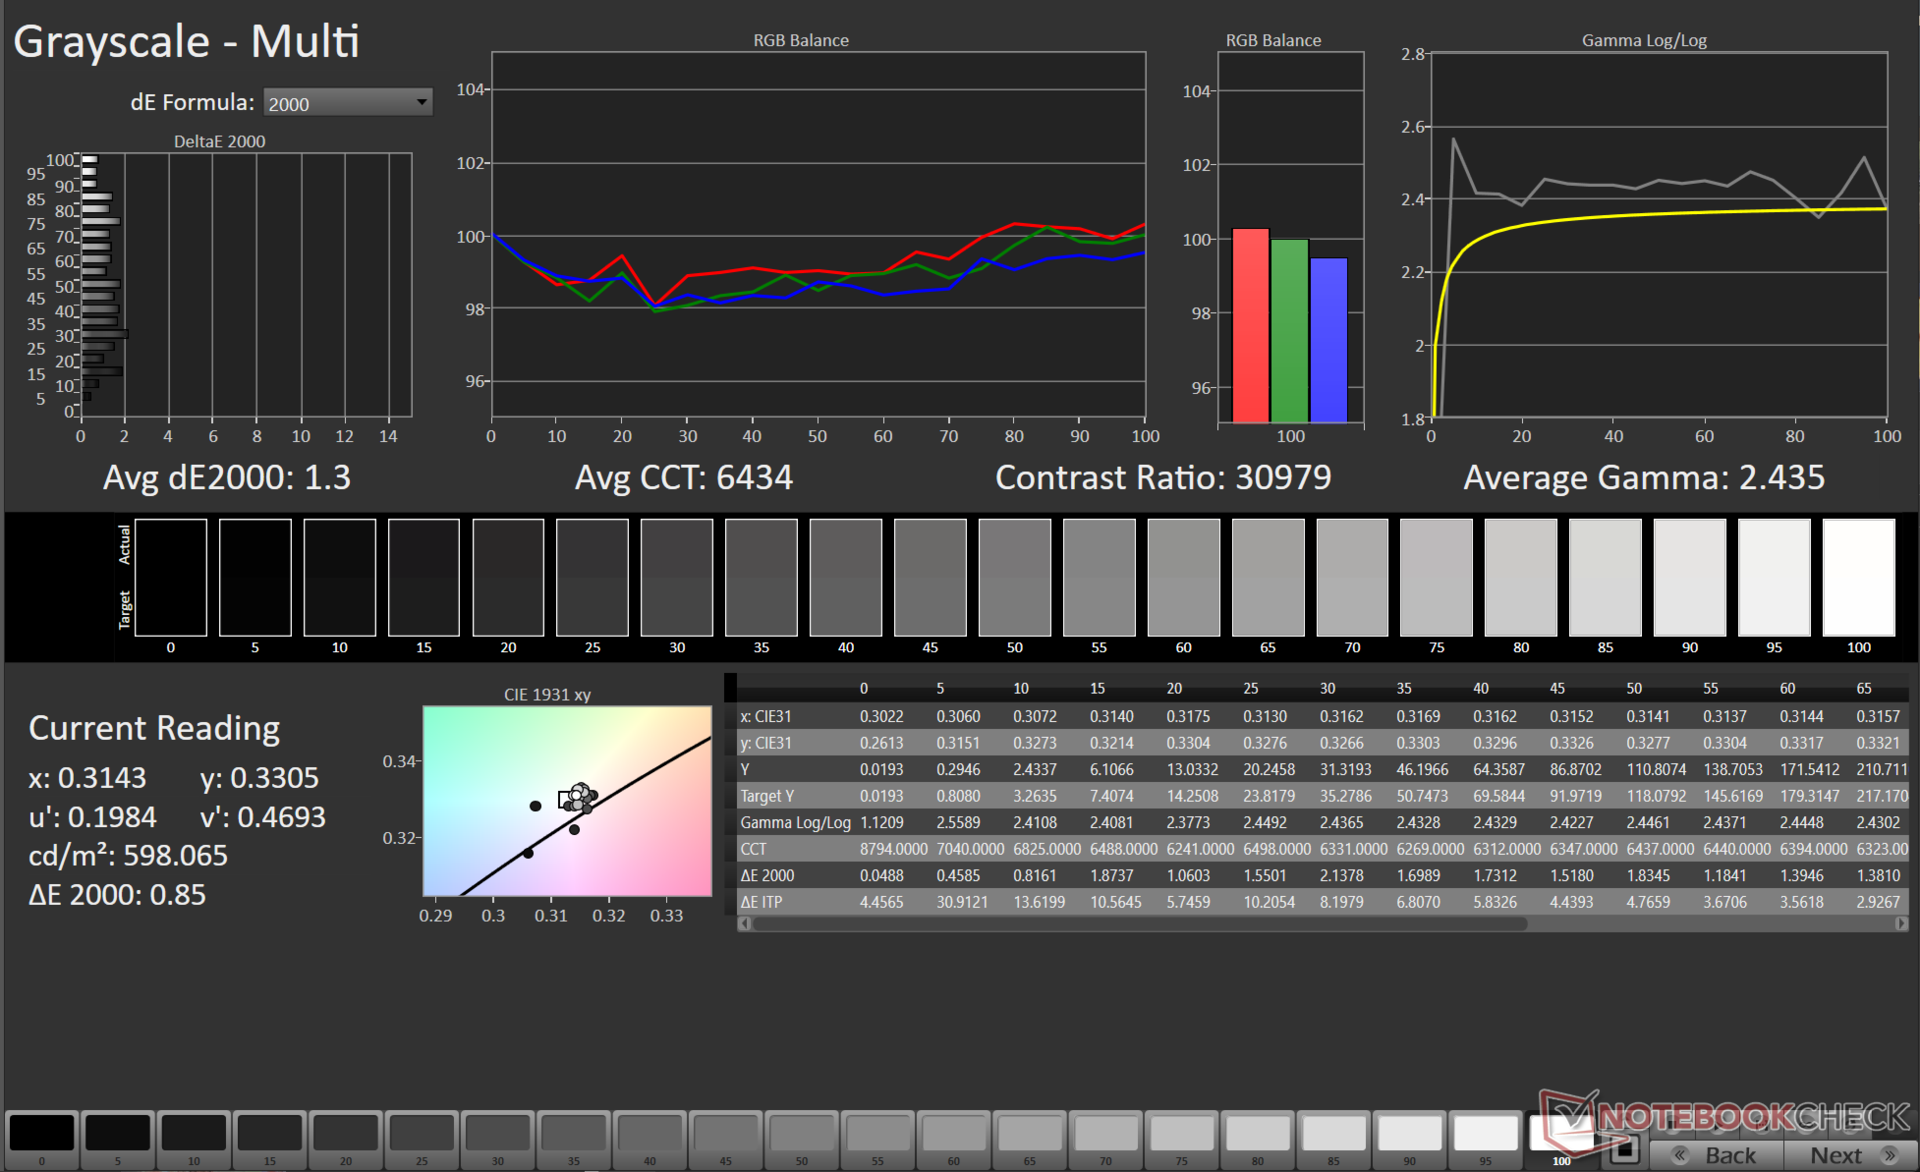
Gamma: 1.98
CCT: 5874 K
| Razer Blade 16 Early 2023 RTX 4090 AUO B160ZAN01.U, mini-LED, 3840x2400, 16" | Asus Zephyrus Duo 16 GX650PY-NM006W NE160QDM-NM4, MiniLED, 2560x1600, 16" | MSI Titan GT77 HX 13VI B173ZAN06.C, Mini-LED, 3840x2160, 17.3" | Asus ROG Strix G16 G614JZ TL160ADMP03-0, IPS, 2560x1600, 16" | Lenovo Legion Pro 7 16IRX8H MNG007DA2-3 (CSO1628), IPS, 2560x1600, 16" | Razer Blade 18 RTX 4070 AU Optronics B180QAN01.0, IPS, 2560x1600, 18" | |
|---|---|---|---|---|---|---|
| Display | -0% | -1% | -3% | -18% | -3% | |
| Display P3 Coverage (%) | 99.9 | 99.4 -1% | 94.9 -5% | 97 -3% | 69.1 -31% | 96.9 -3% |
| sRGB Coverage (%) | 100 | 100 0% | 99.9 0% | 99.9 0% | 99.7 0% | 99.8 0% |
| AdobeRGB 1998 Coverage (%) | 90.9 | 90.8 0% | 92.4 2% | 84.9 -7% | 71.2 -22% | 85.3 -6% |
| Response Times | 10% | -110% | 70% | 35% | 73% | |
| Response Time Grey 50% / Grey 80% * (ms) | 10.2 ? | 15.2 ? -49% | 38.4 ? -276% | 5.1 ? 50% | 12.3 ? -21% | 4.2 ? 59% |
| Response Time Black / White * (ms) | 62.04 ? | 19 ? 69% | 26.6 ? 57% | 6.6 ? 89% | 5.9 ? 90% | 8 ? 87% |
| PWM Frequency (Hz) | 2420 ? | 12000 ? | 2380 ? | |||
| Screen | -147% | 417% | -1018% | -962% | -1303% | |
| Brightness middle (cd/m²) | 730 | 712 -2% | 606 -17% | 470 -36% | 511 -30% | 549.6 -25% |
| Brightness (cd/m²) | 729 | 703 -4% | 602 -17% | 459 -37% | 469 -36% | 524 -28% |
| Brightness Distribution (%) | 94 | 95 1% | 93 -1% | 93 -1% | 86 -9% | 89 -5% |
| Black Level * (cd/m²) | 0.0045 | 0.07 -1456% | 0.0001 98% | 0.42 -9233% | 0.4 -8789% | 0.53 -11678% |
| Contrast (:1) | 162222 | 10171 -94% | 6060000 3636% | 1119 -99% | 1278 -99% | 1037 -99% |
| Colorchecker dE 2000 * | 5.65 | 1.7 70% | 4.8 15% | 1.86 67% | 0.95 83% | 3.32 41% |
| Colorchecker dE 2000 max. * | 10.11 | 4 60% | 8.2 19% | 3.87 62% | 2.07 80% | 6.63 34% |
| Colorchecker dE 2000 calibrated * | 1.85 | 1.2 35% | 1.8 3% | 0.93 50% | 0.91 51% | 2.7 -46% |
| Greyscale dE 2000 * | 8.1 | 2.8 65% | 6.5 20% | 2.7 67% | 0.6 93% | 2 75% |
| Gamma | 1.98 111% | 2.21 100% | 2.63 84% | 2.246 98% | 2.176 101% | 2.29 96% |
| CCT | 5874 111% | 6978 93% | 6596 99% | 6711 97% | 6545 99% | 6319 103% |
| Total Average (Program / Settings) | -46% /
-93% | 102% /
252% | -317% /
-645% | -315% /
-617% | -411% /
-828% |
* ... smaller is better
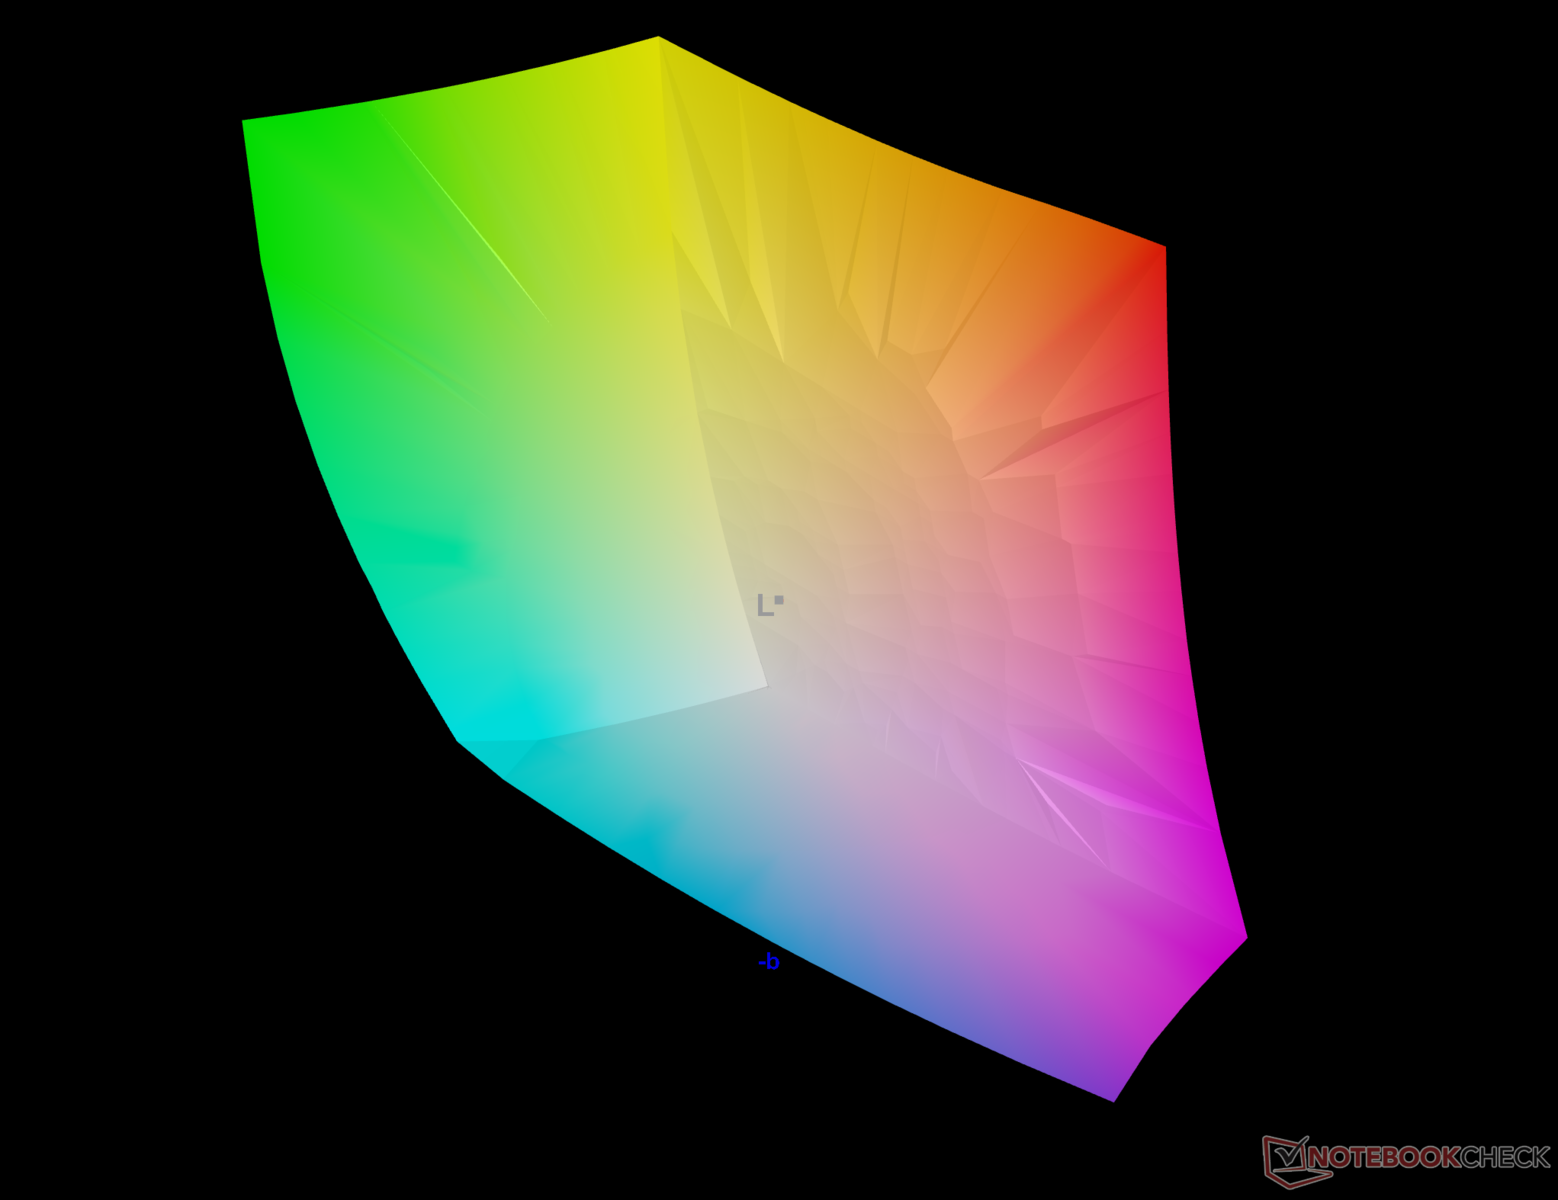
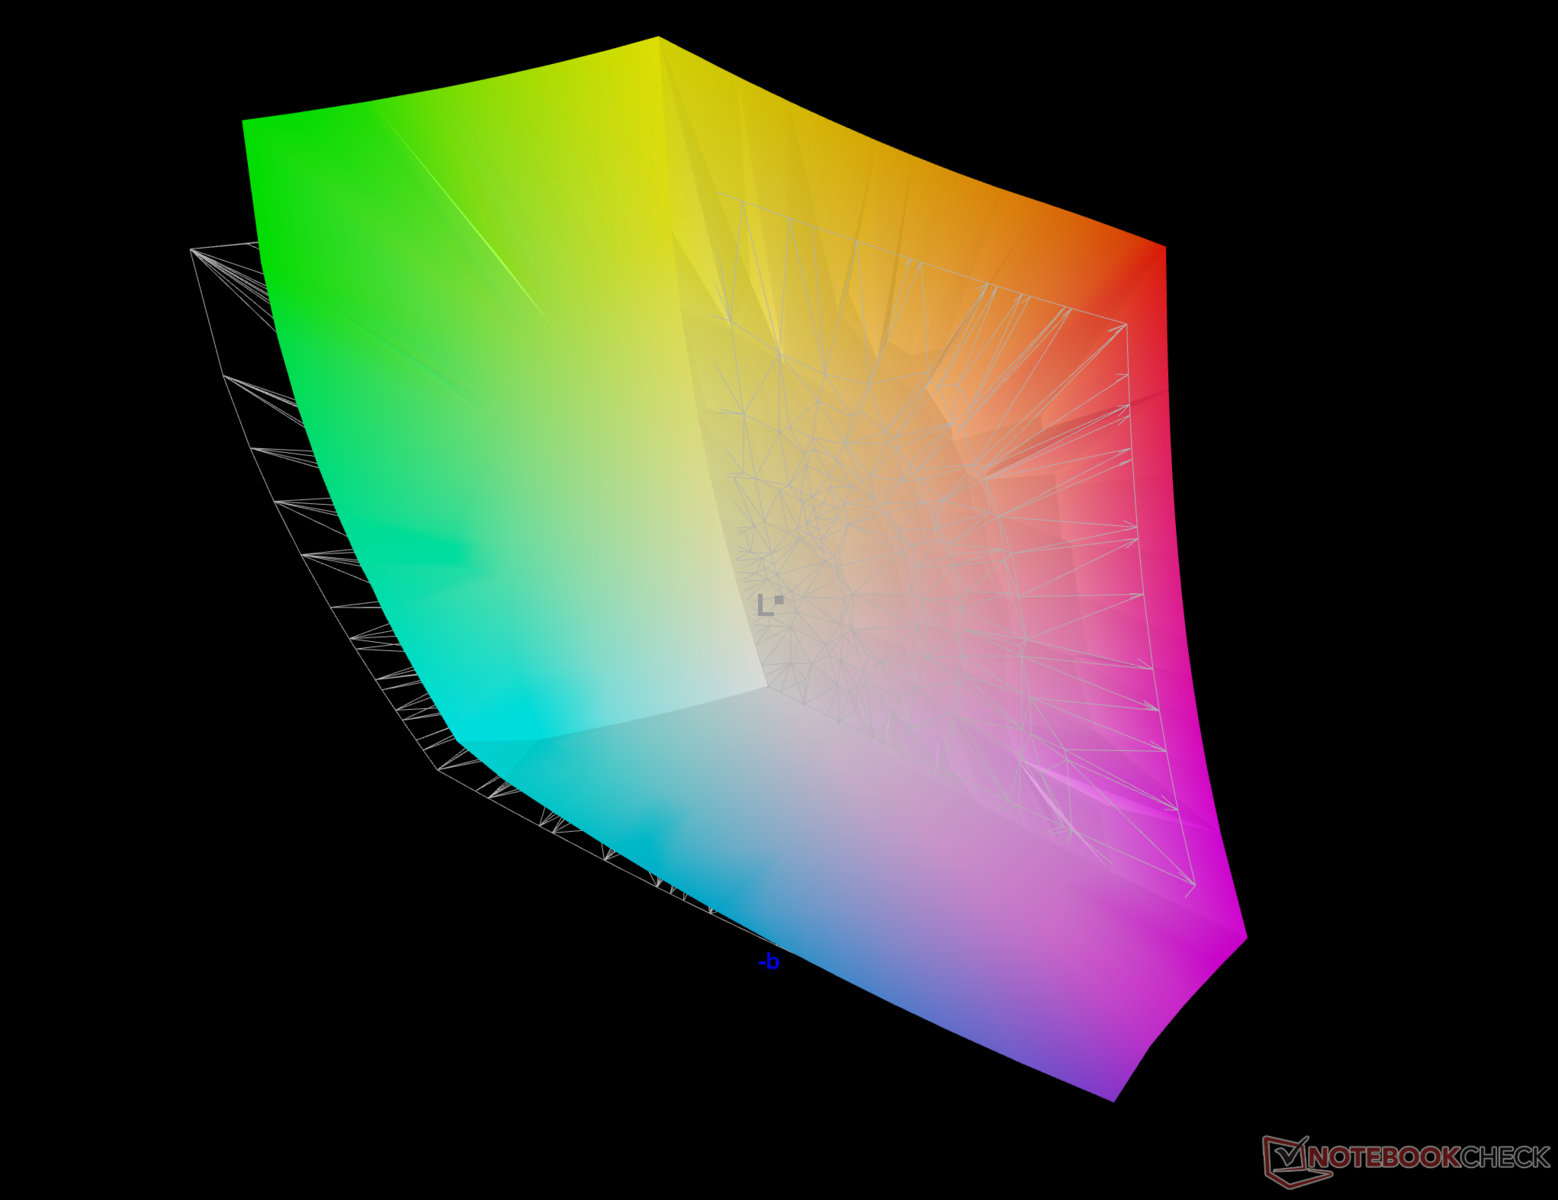
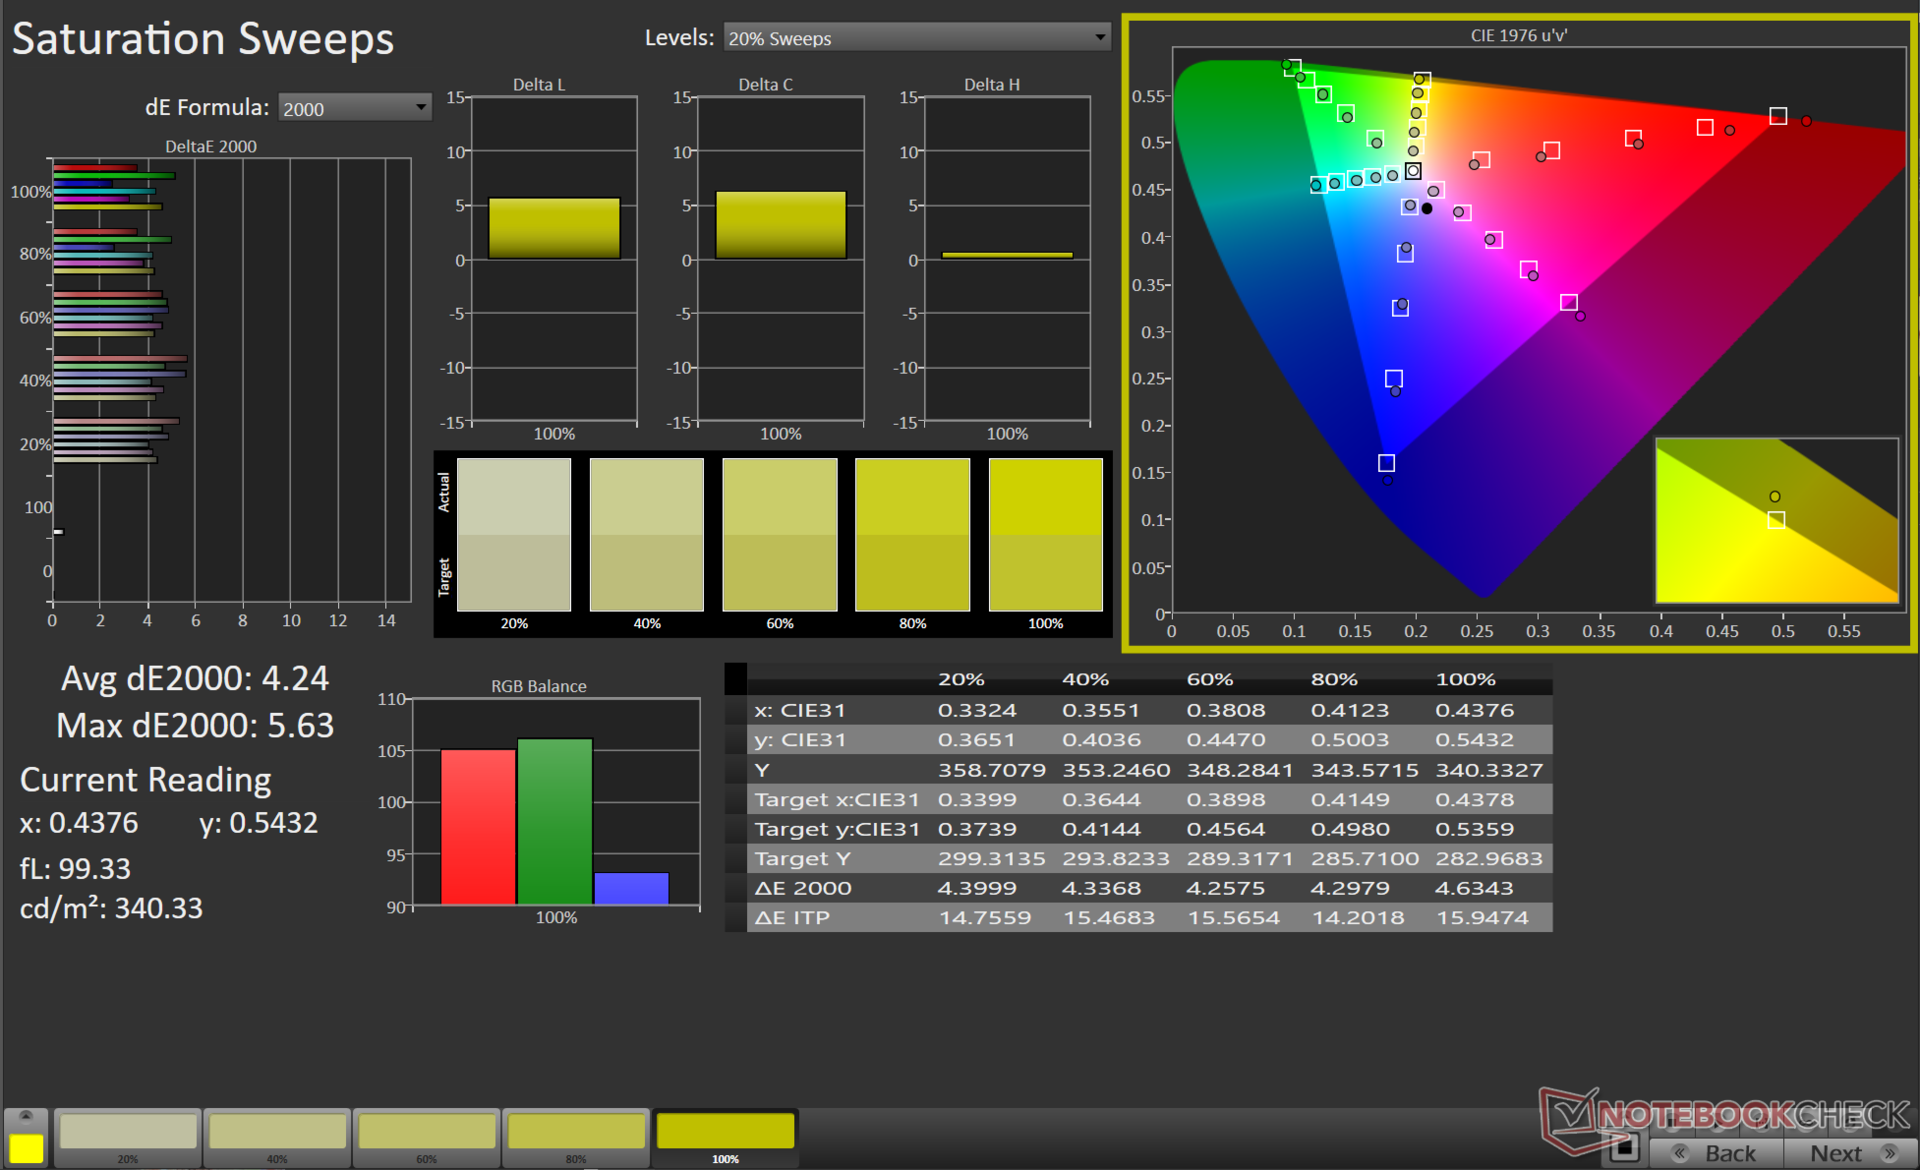
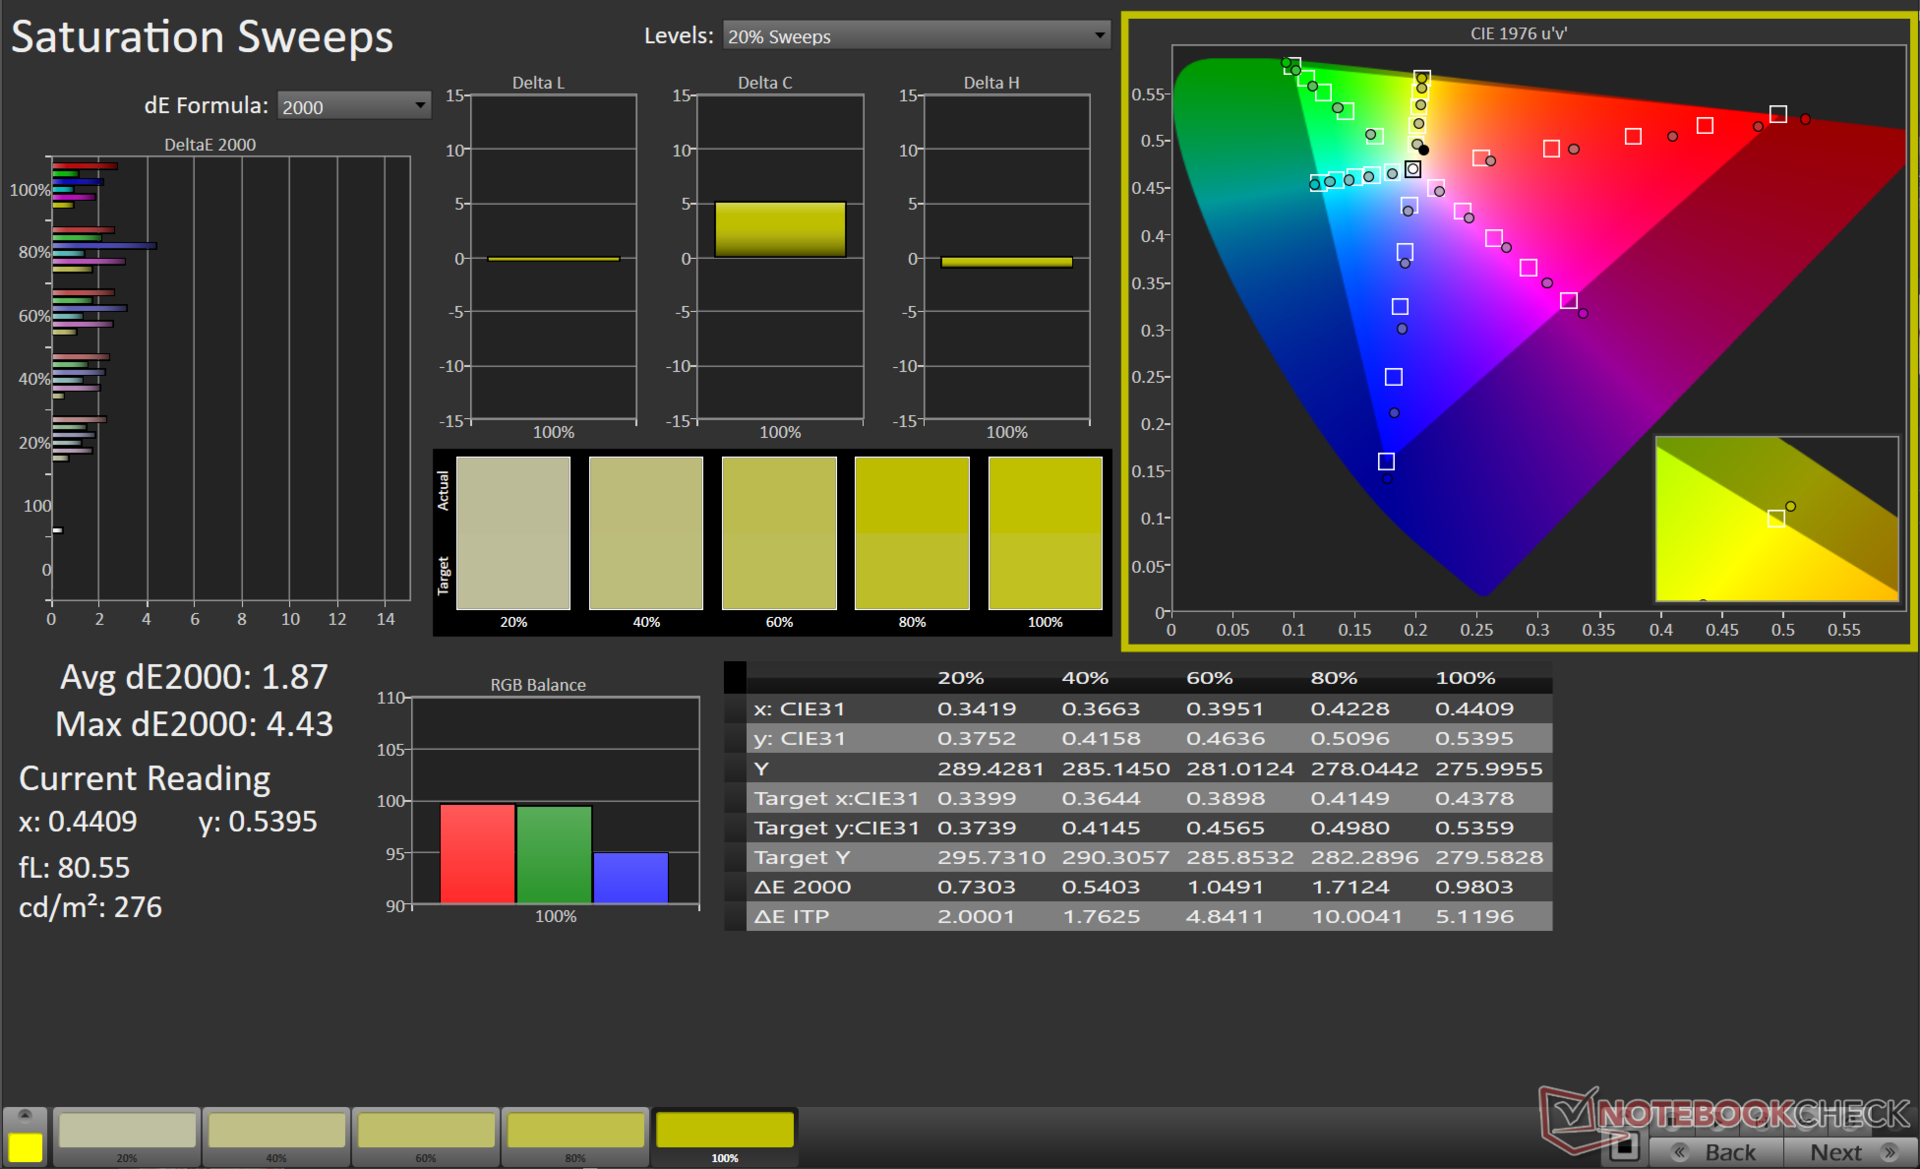
Razer宣传该面板的DCI-P3覆盖率为100%,而我们的测量结果也证实了这一点。我们还观察到sRGB色域的完整覆盖率和Adobe RGB的91%的出色覆盖率,这意味着Blade 16的显示屏对游戏玩家和内容创作者来说都是适用的。
从主观上讲,迷你LED显示屏是一种视觉享受,具有接近无限的黑色和强烈的色彩。仔细观察会发现有一些花屏现象,但这并不令人分心,不会妨碍观看体验。
这是你能得到的最接近OLED的质量,同时也能获得高亮度水平的好处。

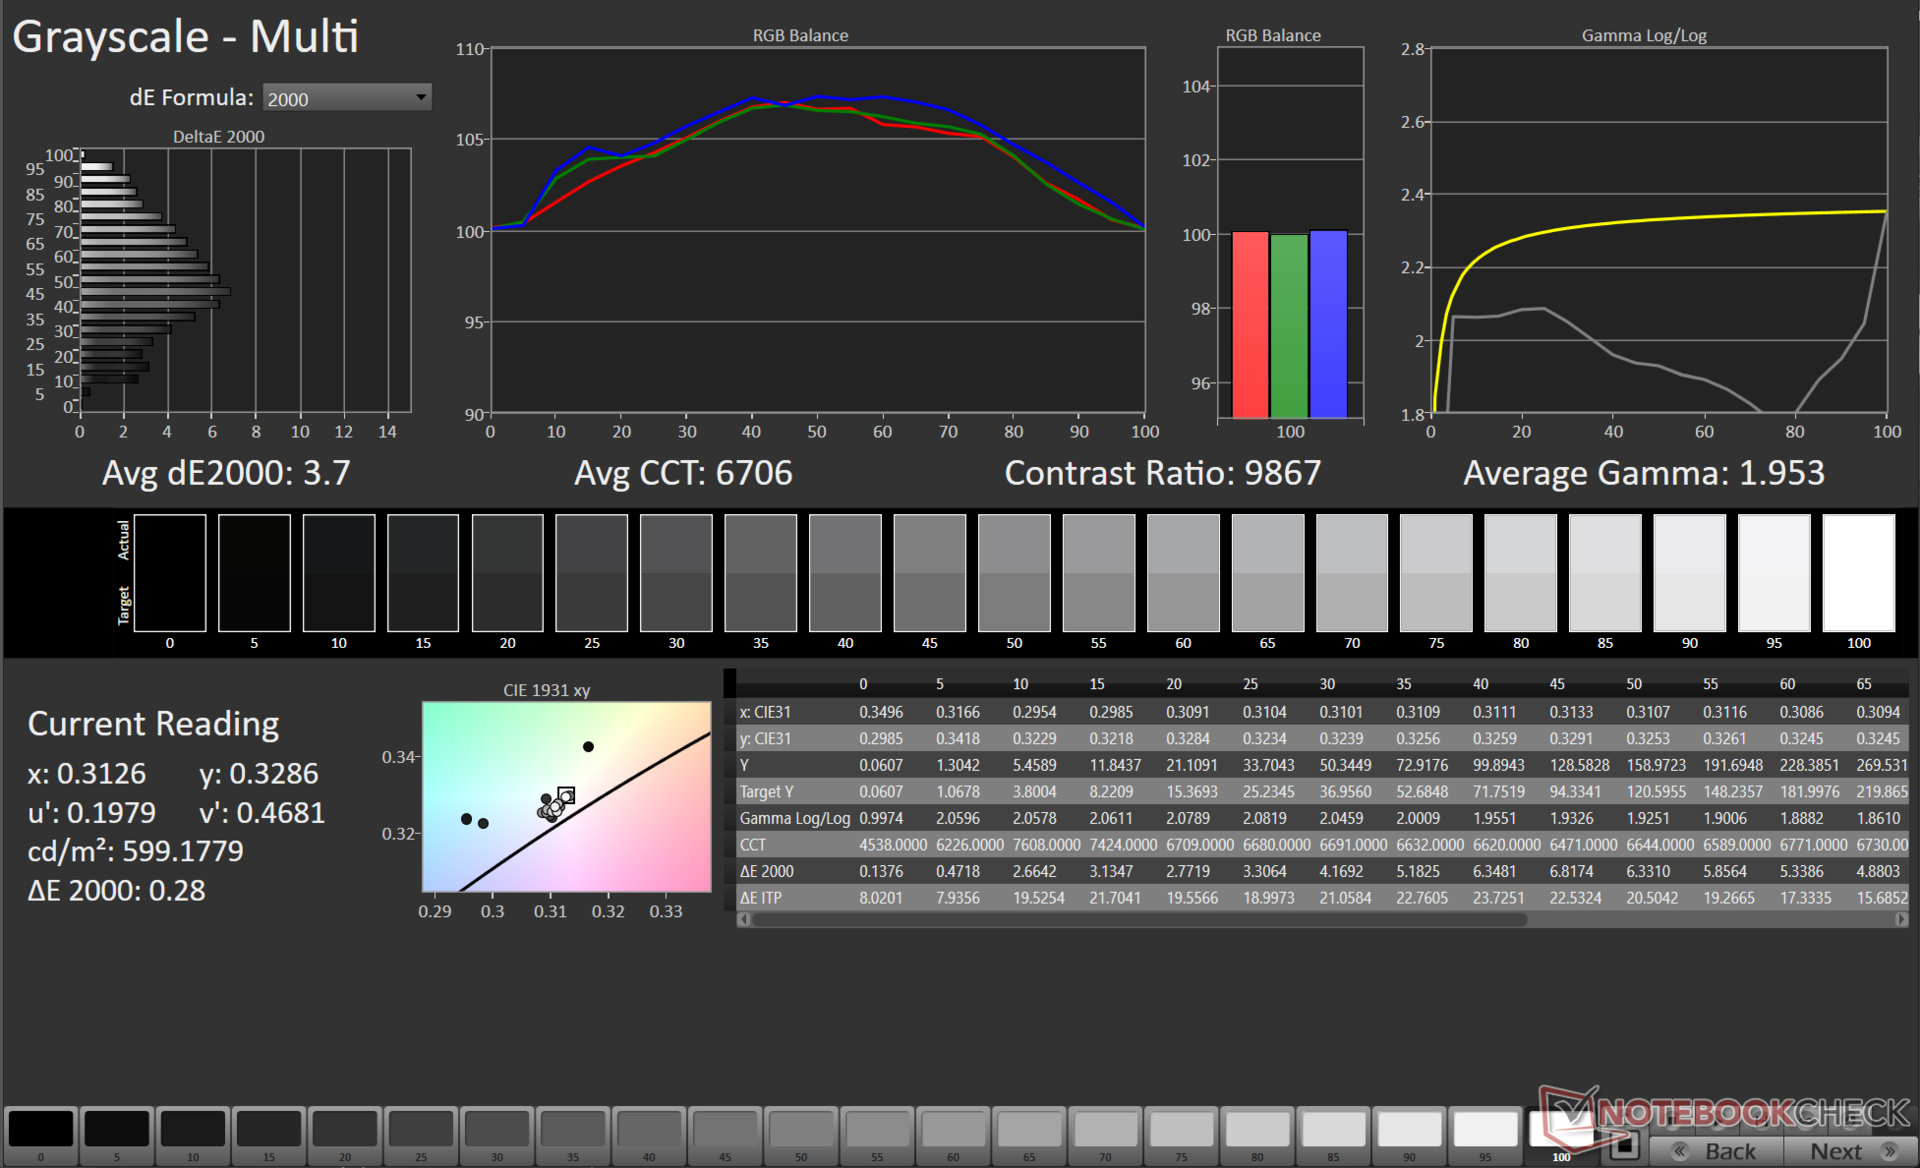
尽管工厂校准似乎降低了SDR的整体亮度,但与Windows默认ICC配置文件的值相比,Delta E值要好得多。也就是说,工厂色彩校准并不完美,有很多改进的余地。
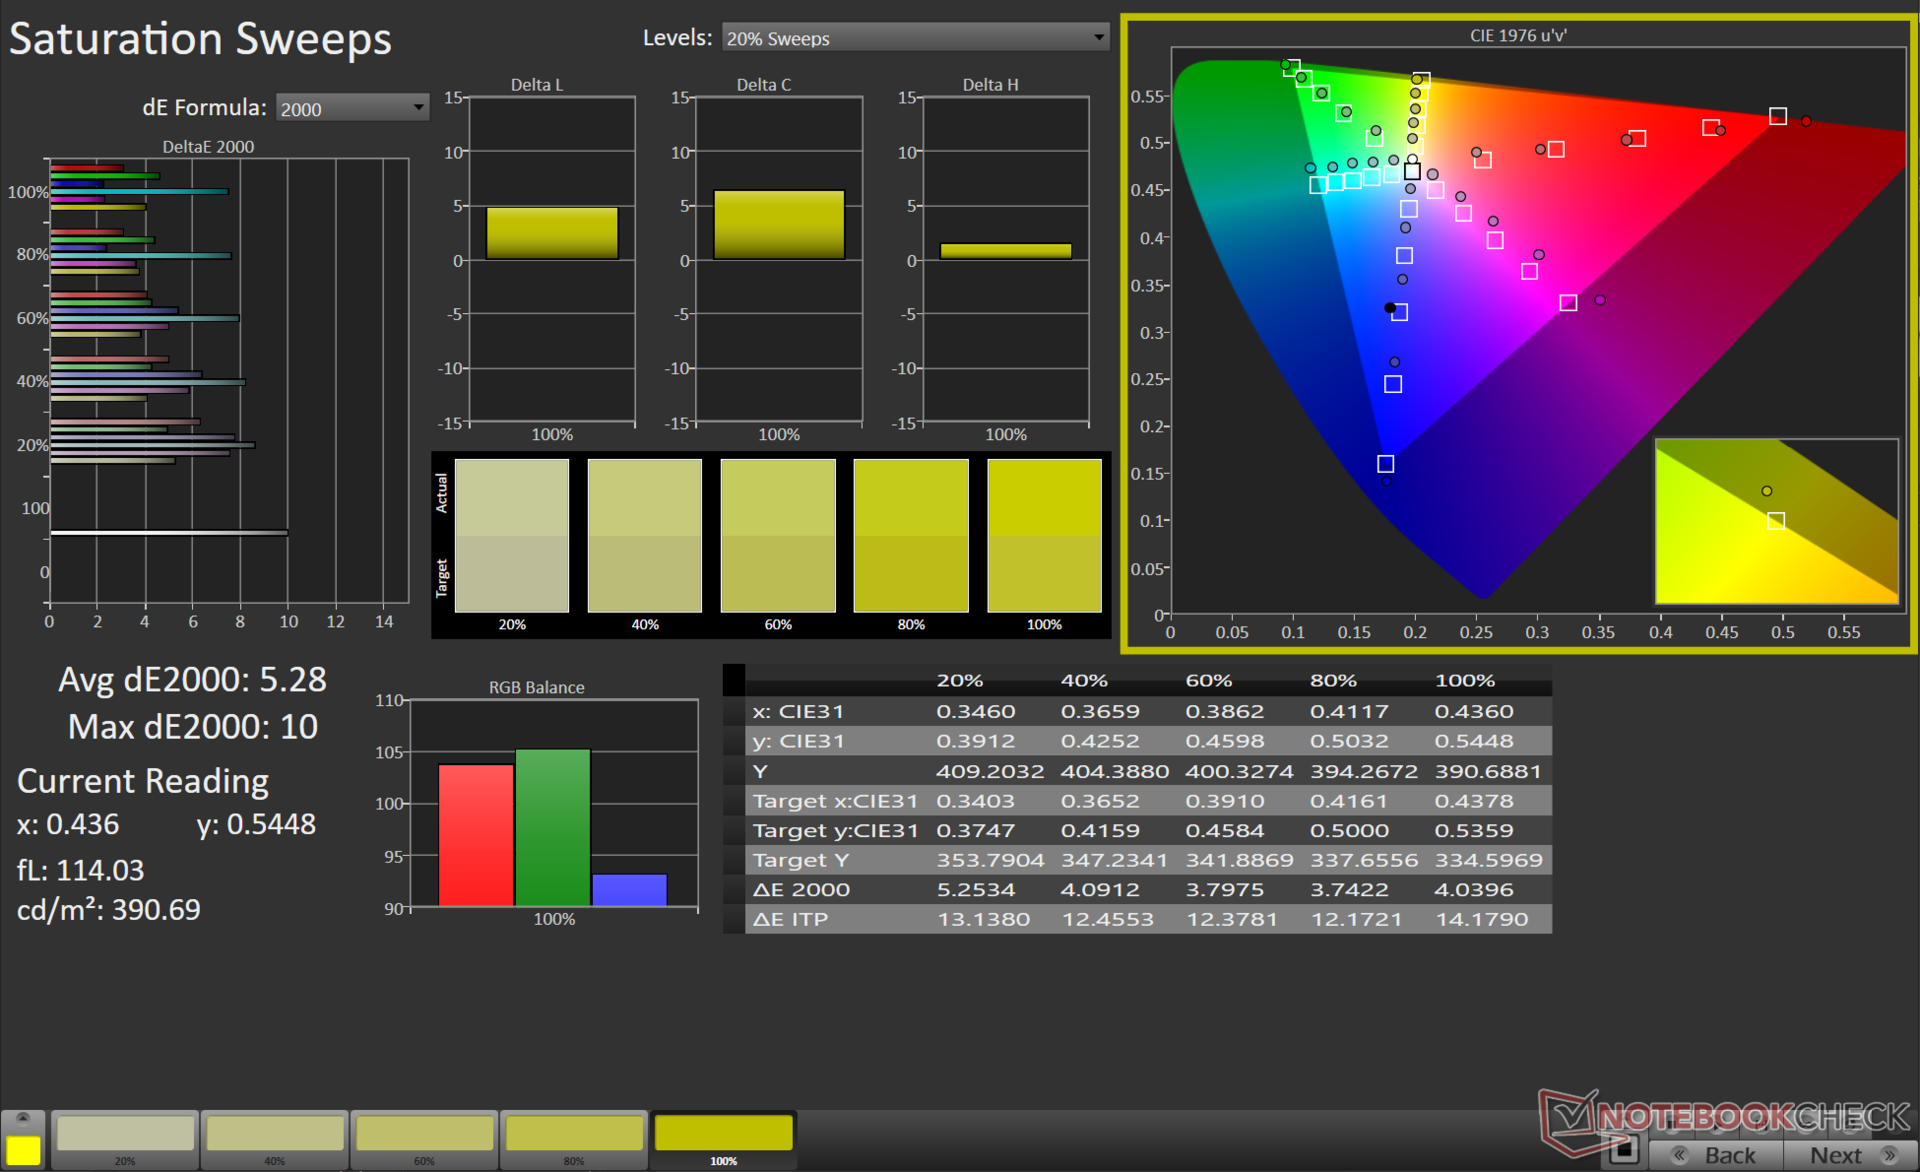
我们使用X-Rite i1Basic Pro 3分光光度计和Portrait Displays的Calman Ultimate色彩校准软件在DCI-P3色彩空间中校准了Blade 16的显示屏。
我们的校准程序使灰度和ColorChecker测量中的平均Delta E值明显改善,分别为1.3和1.85。红色和100%的蓝色显示出最高的偏差,但最大的Delta E值为3.75,对于大多数创造性的工作流程来说仍然是相当适用的。请注意,校准后的亮度水平再次下降。
校准后的ICC文件可以从上面的链接下载。
Display Response Times
| ↔ Response Time Black to White | ||
|---|---|---|
| 62.04 ms ... rise ↗ and fall ↘ combined | ↗ 58.04 ms rise | 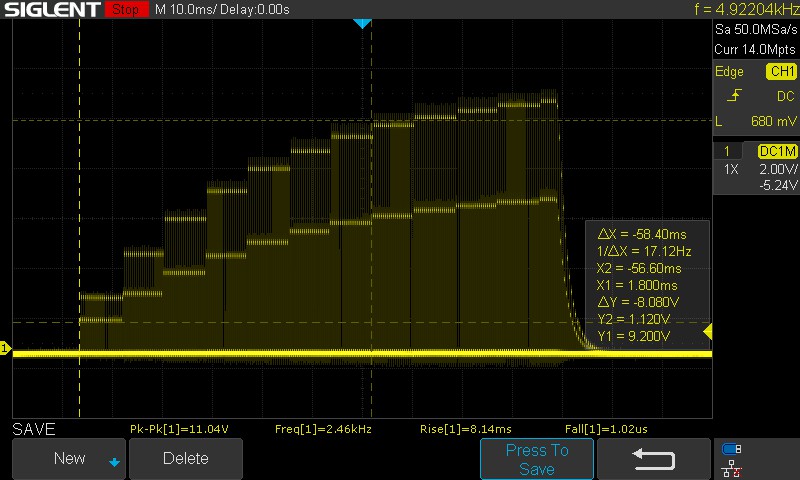  |
| ↘ 4 ms fall | ||
| The screen shows slow response rates in our tests and will be unsatisfactory for gamers. In comparison, all tested devices range from 0.1 (minimum) to 240 (maximum) ms. » 100 % of all devices are better. This means that the measured response time is worse than the average of all tested devices (19.8 ms). | ||
| ↔ Response Time 50% Grey to 80% Grey | ||
| 10.2 ms ... rise ↗ and fall ↘ combined | ↗ 5.8 ms rise |  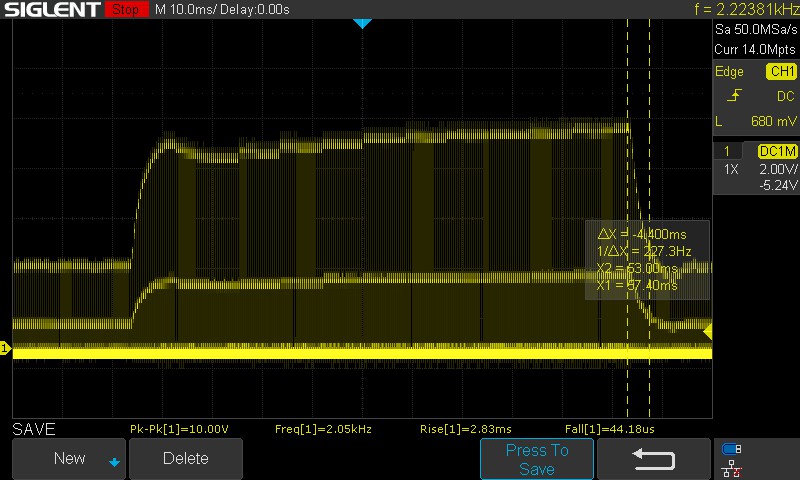 |
| ↘ 4.4 ms fall | ||
| The screen shows good response rates in our tests, but may be too slow for competitive gamers. In comparison, all tested devices range from 0.165 (minimum) to 636 (maximum) ms. » 24 % of all devices are better. This means that the measured response time is better than the average of all tested devices (31 ms). | ||
迷你LED阵列使得准确测量响应时间变得有点复杂。高闪烁意味着我们不得不在整个脉冲范围内进行数据采样,并手动确定上升和下降时间。因此,上面提到的数值对于游戏笔记本来说似乎高于正常值,特别是在100%黑色到100%的过渡期。
Razer宣传的响应时间为3毫秒,但不清楚这个数值是在什么条件下获得的。我们使用了100%的SDR亮度设置,但Razer有可能选择了更低的亮度。也就是说,120赫兹的刷新率似乎并没有导致任何可察觉的重影问题。
Screen Flickering / PWM (Pulse-Width Modulation)
| Screen flickering / PWM detected | 2420 Hz | ≤ 100 % brightness setting | 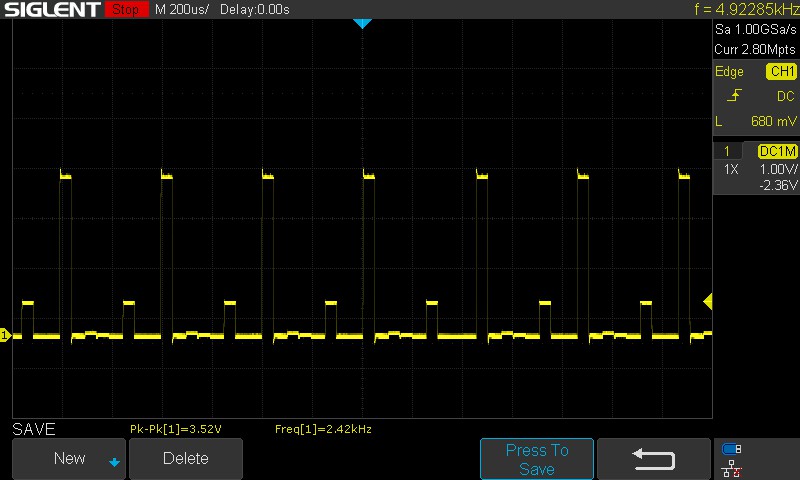 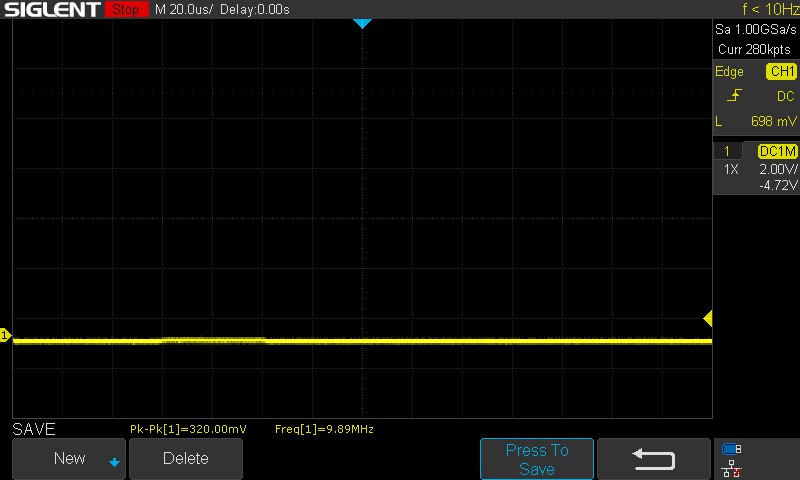 |
The display backlight flickers at 2420 Hz (worst case, e.g., utilizing PWM) Flickering detected at a brightness setting of 100 % and below. There should be no flickering or PWM above this brightness setting. The frequency of 2420 Hz is quite high, so most users sensitive to PWM should not notice any flickering. In comparison: 52 % of all tested devices do not use PWM to dim the display. If PWM was detected, an average of 7769 (minimum: 5 - maximum: 343500) Hz was measured. | |||
我们观察到,在所有测试的亮度水平上,PWM为2,420赫兹,这已经足够高了。在0%的亮度下,PWM增加到9.89MHz,这和没有闪烁一样好。
高亮度水平有助于在户外获得良好的观看体验,即使在阳光直射下也是如此。可视角度非常稳定,只有在极端情况下亮度损失很小。


性能:酷睿i9-13950HX和RTX 4090组合落后于竞争对手
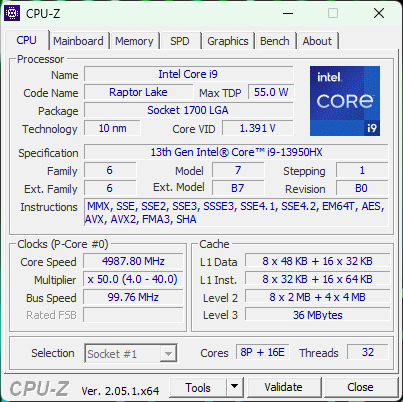
我们的Razer Blade 16 Early 2023装置采用了 英特尔酷睿i9-13950HX和 NvidiaGeForce RTX 4090 笔记本电脑GPU.买家还可以选择其他几种刀片16的配置,如介绍中所示。
请注意,双模式迷你LED显示屏只适用于采用RTX 4070笔记本GPU和RTX 4090笔记本GPU的配置。
测试条件
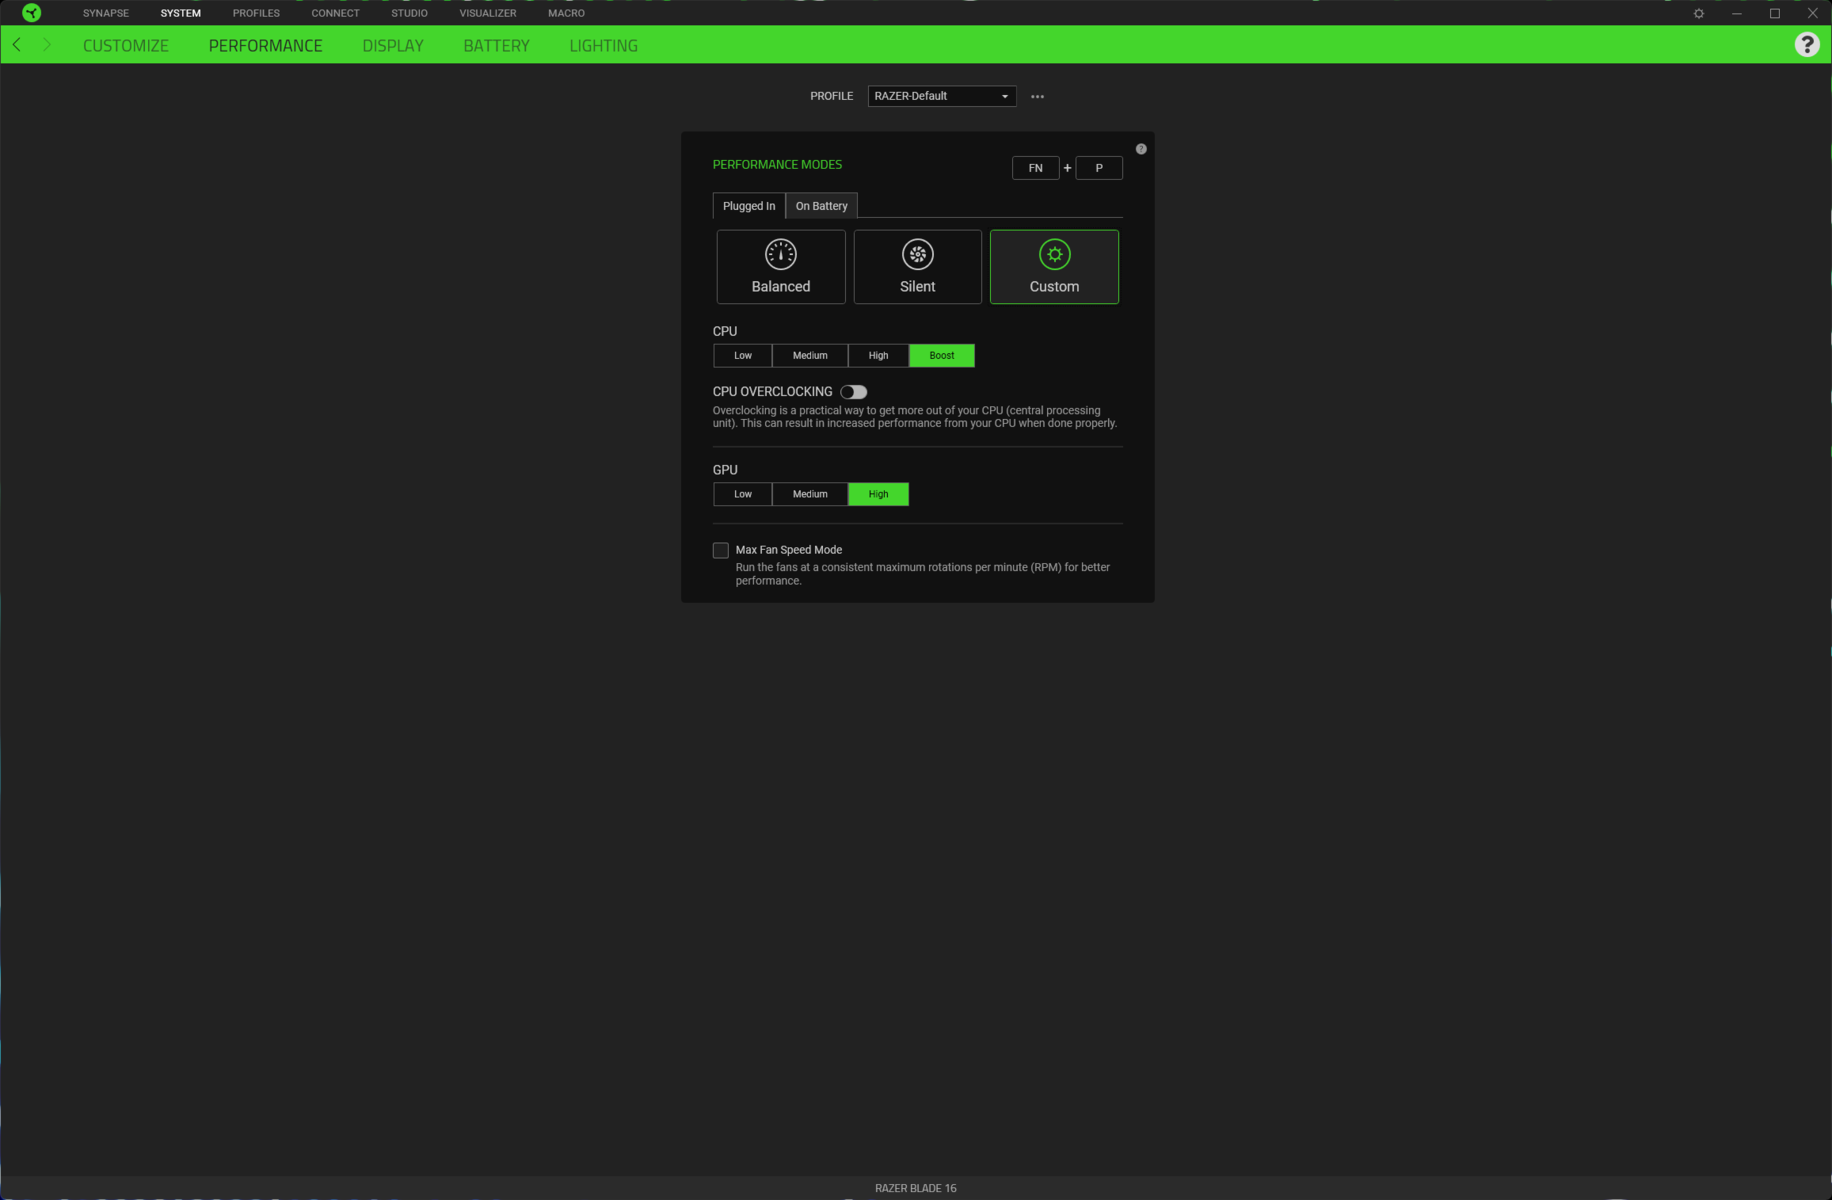
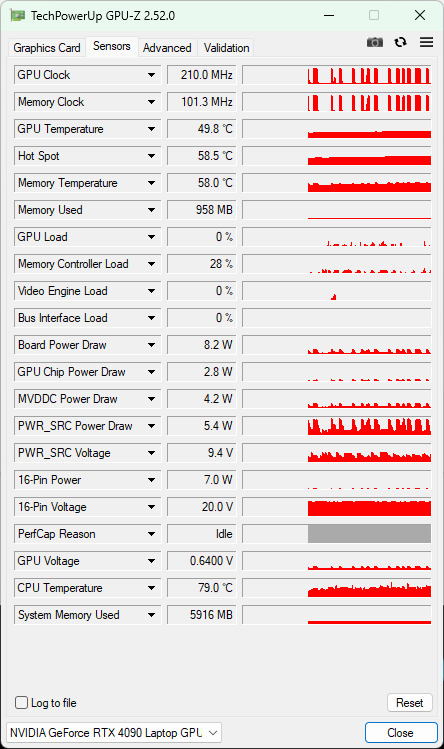
Razer Synapse允许根据需要改变各种性能模式。为了让Core i9-13950HX和RTX 4090充分施展它们的力量,我们使用了带有CPU Boost和GPU High选项的自定义模式。这导致了110W的持续PL1和130W的短时爆发式提升。
我们使用dGPU模式来运行图形测试。笔记本电脑支持高级优化,所以你可以很容易地在MSHybrid和dGPU之间直接从Nvidia控制面板切换,而不必重新启动。测试期间,G-Sync被禁用。
性能模式的选择会对散热和噪音排放产生影响。下表说明了PL1和PL2在每种性能设置下的变化。
只有平衡模式是以电池电量提供的。我们在电池测试中使用了这种模式,并启用了自动切换到60 Hz刷新率的选项。
| 性能模式 | PL1(PBP)/ Tau | PL2(MTP)/ Tau |
|---|---|---|
| 静音 | 32.5 W / 56 s | 37 W / 2.44 ms |
| 平衡模式 | 54 W / 56 s | 55 W / 2.44 ms |
| 定制(CPU Boost / GPU High) | 110 W / 56 s | 130 W / 2.44 ms |
处理器
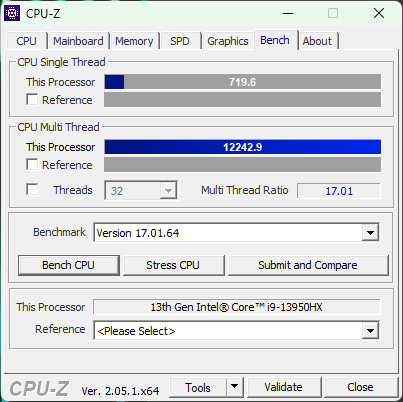
英特尔酷睿i9-13950HX是猛禽湖-HX部件,有24个核心和32个线程,可以实现5.5GHz的单核提升。
当我们审查配备RTX 4080的Razer Blade 16时,竞争者大多是由英特尔Alder Lake和AMD Ryzen 6000系列芯片驱动的设备。
在过去一个月左右,英特尔13代和AMD Ryzen 7000系列笔记本不断涌现。这使我们能够做一个更现代的比较,不幸的是,2023年的刀片16都在最新的竞争中挣扎。
尽管有一个强大的蒸汽室冷却器,但配备RTX 4090的Blade 16在Cinebench R15多核循环测试中未能保持良好的性能。 我们看到在第19次运行时下降了29%,然后在第21次循环中恢复了速度。 这与配备RTX 4080的Blade 16不同,后者显示了良好的持续性能。
Cinebench R15 Multi Loop
累计性能比平均水平提高了17%,是一个不错的成绩。 酷睿i9-12950HX.这款 酷睿i9-13900HX联想Legion Pro 7中的酷睿i9-13950HX由于其130W/185W的高PL1/PL2值,轻松超过了Blade 16的酷睿i9-13950HX。
同样,微星Titan GT77 HX 13VI的CPU与Blade 16的CPU相同,由于其150 W PL1和220 W PL2,能够在CPU基准测试中获得更高的累积分数。
该 AMD Ryzen 9 7945HX华硕ROG Zephyrus Duo 16中的AMD Ryzen 9 7945HX在整体上比Blade 16中的Core i9-13950HX领先12%。
Cinebench R23: Multi Core | Single Core
Cinebench R20: CPU (Multi Core) | CPU (Single Core)
Cinebench R15: CPU Multi 64Bit | CPU Single 64Bit
Blender: v2.79 BMW27 CPU
7-Zip 18.03: 7z b 4 | 7z b 4 -mmt1
Geekbench 5.5: Multi-Core | Single-Core
HWBOT x265 Benchmark v2.2: 4k Preset
LibreOffice : 20 Documents To PDF
R Benchmark 2.5: Overall mean
| CPU Performance rating | |
| Average Intel Core i9-13900K | |
| Eluktronics Mech-17 GP2 | |
| Asus ROG Strix Scar 18 2023 G834JY-N6005W | |
| Asus Zephyrus Duo 16 GX650PY-NM006W | |
| MSI Titan GT77 HX 13VI | |
| Lenovo Legion Pro 7 16IRX8H | |
| Asus ROG Strix G16 G614JZ | |
| Razer Blade 18 RTX 4070 | |
| Razer Blade 16 Early 2023 RTX 4090 | |
| Razer Blade 16 Early 2023 | |
| Average of class Gaming | |
| Asus ROG Zephyrus M16 GU604VY-NM042X | |
| Average Intel Core i9-12950HX | |
| Cinebench R23 / Multi Core | |
| Average Intel Core i9-13900K (32592 - 40103, n=4) | |
| Asus Zephyrus Duo 16 GX650PY-NM006W | |
| MSI Titan GT77 HX 13VI | |
| Eluktronics Mech-17 GP2 | |
| Asus ROG Strix Scar 18 2023 G834JY-N6005W | |
| Lenovo Legion Pro 7 16IRX8H | |
| Asus ROG Strix G16 G614JZ | |
| Razer Blade 18 RTX 4070 | |
| Razer Blade 16 Early 2023 RTX 4090 | |
| Razer Blade 16 Early 2023 | |
| Average of class Gaming (10488 - 40970, n=110, last 2 years) | |
| Average Intel Core i9-12950HX (16277 - 23113, n=7) | |
| Asus ROG Zephyrus M16 GU604VY-NM042X | |
| Cinebench R23 / Single Core | |
| Average Intel Core i9-13900K (2203 - 2272, n=4) | |
| Asus ROG Strix Scar 18 2023 G834JY-N6005W | |
| Asus ROG Strix G16 G614JZ | |
| MSI Titan GT77 HX 13VI | |
| Eluktronics Mech-17 GP2 | |
| Razer Blade 18 RTX 4070 | |
| Lenovo Legion Pro 7 16IRX8H | |
| Razer Blade 16 Early 2023 | |
| Average of class Gaming (1166 - 2356, n=110, last 2 years) | |
| Asus ROG Zephyrus M16 GU604VY-NM042X | |
| Razer Blade 16 Early 2023 RTX 4090 | |
| Asus Zephyrus Duo 16 GX650PY-NM006W | |
| Average Intel Core i9-12950HX (1465 - 1922, n=7) | |
| Cinebench R20 / CPU (Multi Core) | |
| Average Intel Core i9-13900K (13415 - 15181, n=4) | |
| Asus Zephyrus Duo 16 GX650PY-NM006W | |
| MSI Titan GT77 HX 13VI | |
| Eluktronics Mech-17 GP2 | |
| Asus ROG Strix Scar 18 2023 G834JY-N6005W | |
| Asus ROG Strix G16 G614JZ | |
| Lenovo Legion Pro 7 16IRX8H | |
| Razer Blade 18 RTX 4070 | |
| Razer Blade 16 Early 2023 RTX 4090 | |
| Average of class Gaming (4029 - 16108, n=109, last 2 years) | |
| Razer Blade 16 Early 2023 | |
| Average Intel Core i9-12950HX (6625 - 8777, n=7) | |
| Asus ROG Zephyrus M16 GU604VY-NM042X | |
| Cinebench R20 / CPU (Single Core) | |
| Average Intel Core i9-13900K (828 - 870, n=4) | |
| Asus ROG Strix Scar 18 2023 G834JY-N6005W | |
| Asus ROG Strix G16 G614JZ | |
| MSI Titan GT77 HX 13VI | |
| Eluktronics Mech-17 GP2 | |
| Razer Blade 18 RTX 4070 | |
| Lenovo Legion Pro 7 16IRX8H | |
| Average of class Gaming (442 - 895, n=109, last 2 years) | |
| Asus Zephyrus Duo 16 GX650PY-NM006W | |
| Razer Blade 16 Early 2023 RTX 4090 | |
| Asus ROG Zephyrus M16 GU604VY-NM042X | |
| Razer Blade 16 Early 2023 | |
| Average Intel Core i9-12950HX (703 - 741, n=7) | |
| Cinebench R15 / CPU Multi 64Bit | |
| Average Intel Core i9-13900K (5321 - 6191, n=8) | |
| Asus Zephyrus Duo 16 GX650PY-NM006W | |
| MSI Titan GT77 HX 13VI | |
| Eluktronics Mech-17 GP2 | |
| Lenovo Legion Pro 7 16IRX8H | |
| Asus ROG Strix Scar 18 2023 G834JY-N6005W | |
| Asus ROG Strix G16 G614JZ | |
| Asus ROG Strix G16 G614JZ | |
| Razer Blade 16 Early 2023 | |
| Razer Blade 18 RTX 4070 | |
| Razer Blade 16 Early 2023 RTX 4090 | |
| Average of class Gaming (1578 - 6271, n=108, last 2 years) | |
| Average Intel Core i9-12950HX (2464 - 3530, n=7) | |
| Asus ROG Zephyrus M16 GU604VY-NM042X | |
| Cinebench R15 / CPU Single 64Bit | |
| Average Intel Core i9-13900K (299 - 328, n=8) | |
| Asus ROG Strix Scar 18 2023 G834JY-N6005W | |
| Asus Zephyrus Duo 16 GX650PY-NM006W | |
| Asus ROG Strix G16 G614JZ | |
| Asus ROG Strix G16 G614JZ | |
| Lenovo Legion Pro 7 16IRX8H | |
| MSI Titan GT77 HX 13VI | |
| Eluktronics Mech-17 GP2 | |
| Razer Blade 18 RTX 4070 | |
| Average of class Gaming (188.8 - 343, n=109, last 2 years) | |
| Asus ROG Zephyrus M16 GU604VY-NM042X | |
| Razer Blade 16 Early 2023 RTX 4090 | |
| Razer Blade 16 Early 2023 | |
| Average Intel Core i9-12950HX (167 - 276, n=7) | |
| Blender / v2.79 BMW27 CPU | |
| Average Intel Core i9-12950HX (138 - 193, n=7) | |
| Asus ROG Zephyrus M16 GU604VY-NM042X | |
| Average of class Gaming (80 - 330, n=107, last 2 years) | |
| Razer Blade 16 Early 2023 RTX 4090 | |
| Razer Blade 16 Early 2023 | |
| Razer Blade 18 RTX 4070 | |
| Asus ROG Strix G16 G614JZ | |
| Lenovo Legion Pro 7 16IRX8H | |
| Asus ROG Strix Scar 18 2023 G834JY-N6005W | |
| Eluktronics Mech-17 GP2 | |
| MSI Titan GT77 HX 13VI | |
| Asus Zephyrus Duo 16 GX650PY-NM006W | |
| Average Intel Core i9-13900K (80 - 101, n=7) | |
| 7-Zip 18.03 / 7z b 4 | |
| Average Intel Core i9-13900K (127201 - 148053, n=5) | |
| Asus Zephyrus Duo 16 GX650PY-NM006W | |
| MSI Titan GT77 HX 13VI | |
| Eluktronics Mech-17 GP2 | |
| Asus ROG Strix Scar 18 2023 G834JY-N6005W | |
| Lenovo Legion Pro 7 16IRX8H | |
| Razer Blade 18 RTX 4070 | |
| Asus ROG Strix G16 G614JZ | |
| Razer Blade 16 Early 2023 | |
| Razer Blade 16 Early 2023 RTX 4090 | |
| Average of class Gaming (33491 - 148086, n=108, last 2 years) | |
| Asus ROG Zephyrus M16 GU604VY-NM042X | |
| Average Intel Core i9-12950HX (65637 - 85019, n=7) | |
| 7-Zip 18.03 / 7z b 4 -mmt1 | |
| Average Intel Core i9-13900K (7176 - 7539, n=5) | |
| Asus Zephyrus Duo 16 GX650PY-NM006W | |
| Asus ROG Strix Scar 18 2023 G834JY-N6005W | |
| Lenovo Legion Pro 7 16IRX8H | |
| Eluktronics Mech-17 GP2 | |
| Asus ROG Strix G16 G614JZ | |
| MSI Titan GT77 HX 13VI | |
| Razer Blade 18 RTX 4070 | |
| Razer Blade 16 Early 2023 RTX 4090 | |
| Razer Blade 16 Early 2023 | |
| Average of class Gaming (4199 - 7436, n=108, last 2 years) | |
| Asus ROG Zephyrus M16 GU604VY-NM042X | |
| Average Intel Core i9-12950HX (6022 - 6318, n=7) | |
| Geekbench 5.5 / Multi-Core | |
| Average Intel Core i9-13900K (22448 - 24157, n=5) | |
| Lenovo Legion Pro 7 16IRX8H | |
| Asus ROG Strix Scar 18 2023 G834JY-N6005W | |
| Eluktronics Mech-17 GP2 | |
| MSI Titan GT77 HX 13VI | |
| Razer Blade 18 RTX 4070 | |
| Asus Zephyrus Duo 16 GX650PY-NM006W | |
| Asus ROG Strix G16 G614JZ | |
| Razer Blade 16 Early 2023 | |
| Average of class Gaming (6460 - 27010, n=108, last 2 years) | |
| Razer Blade 16 Early 2023 RTX 4090 | |
| Asus ROG Zephyrus M16 GU604VY-NM042X | |
| Average Intel Core i9-12950HX (14028 - 16009, n=7) | |
| Geekbench 5.5 / Single-Core | |
| Average Intel Core i9-13900K (2106 - 2290, n=5) | |
| Asus Zephyrus Duo 16 GX650PY-NM006W | |
| Asus ROG Strix Scar 18 2023 G834JY-N6005W | |
| Eluktronics Mech-17 GP2 | |
| Average of class Gaming (986 - 2474, n=108, last 2 years) | |
| Asus ROG Strix G16 G614JZ | |
| MSI Titan GT77 HX 13VI | |
| Razer Blade 18 RTX 4070 | |
| Lenovo Legion Pro 7 16IRX8H | |
| Asus ROG Zephyrus M16 GU604VY-NM042X | |
| Razer Blade 16 Early 2023 RTX 4090 | |
| Average Intel Core i9-12950HX (1847 - 1945, n=7) | |
| Razer Blade 16 Early 2023 | |
| HWBOT x265 Benchmark v2.2 / 4k Preset | |
| Average Intel Core i9-13900K (34.5 - 42.6, n=5) | |
| Asus Zephyrus Duo 16 GX650PY-NM006W | |
| Eluktronics Mech-17 GP2 | |
| Asus ROG Strix Scar 18 2023 G834JY-N6005W | |
| MSI Titan GT77 HX 13VI | |
| Lenovo Legion Pro 7 16IRX8H | |
| Razer Blade 18 RTX 4070 | |
| Razer Blade 16 Early 2023 RTX 4090 | |
| Asus ROG Strix G16 G614JZ | |
| Razer Blade 16 Early 2023 | |
| Average of class Gaming (11.5 - 44.3, n=108, last 2 years) | |
| Average Intel Core i9-12950HX (18.6 - 26.5, n=7) | |
| Asus ROG Zephyrus M16 GU604VY-NM042X | |
| LibreOffice / 20 Documents To PDF | |
| Asus Zephyrus Duo 16 GX650PY-NM006W | |
| Razer Blade 16 Early 2023 RTX 4090 | |
| Asus ROG Zephyrus M16 GU604VY-NM042X | |
| Average of class Gaming (19 - 88.8, n=108, last 2 years) | |
| Asus ROG Strix G16 G614JZ | |
| Razer Blade 16 Early 2023 | |
| MSI Titan GT77 HX 13VI | |
| Lenovo Legion Pro 7 16IRX8H | |
| Razer Blade 18 RTX 4070 | |
| Average Intel Core i9-12950HX (34.7 - 45.4, n=7) | |
| Asus ROG Strix Scar 18 2023 G834JY-N6005W | |
| Average Intel Core i9-13900K (30.3 - 41.6, n=5) | |
| Eluktronics Mech-17 GP2 | |
| R Benchmark 2.5 / Overall mean | |
| Average Intel Core i9-12950HX (0.4251 - 0.4515, n=7) | |
| Average of class Gaming (0.3439 - 0.759, n=109, last 2 years) | |
| Razer Blade 16 Early 2023 | |
| Asus ROG Zephyrus M16 GU604VY-NM042X | |
| MSI Titan GT77 HX 13VI | |
| Asus Zephyrus Duo 16 GX650PY-NM006W | |
| Lenovo Legion Pro 7 16IRX8H | |
| Razer Blade 16 Early 2023 RTX 4090 | |
| Razer Blade 18 RTX 4070 | |
| Asus ROG Strix G16 G614JZ | |
| Eluktronics Mech-17 GP2 | |
| Asus ROG Strix Scar 18 2023 G834JY-N6005W | |
| Average Intel Core i9-13900K (0.3468 - 0.3911, n=5) | |
* ... smaller is better
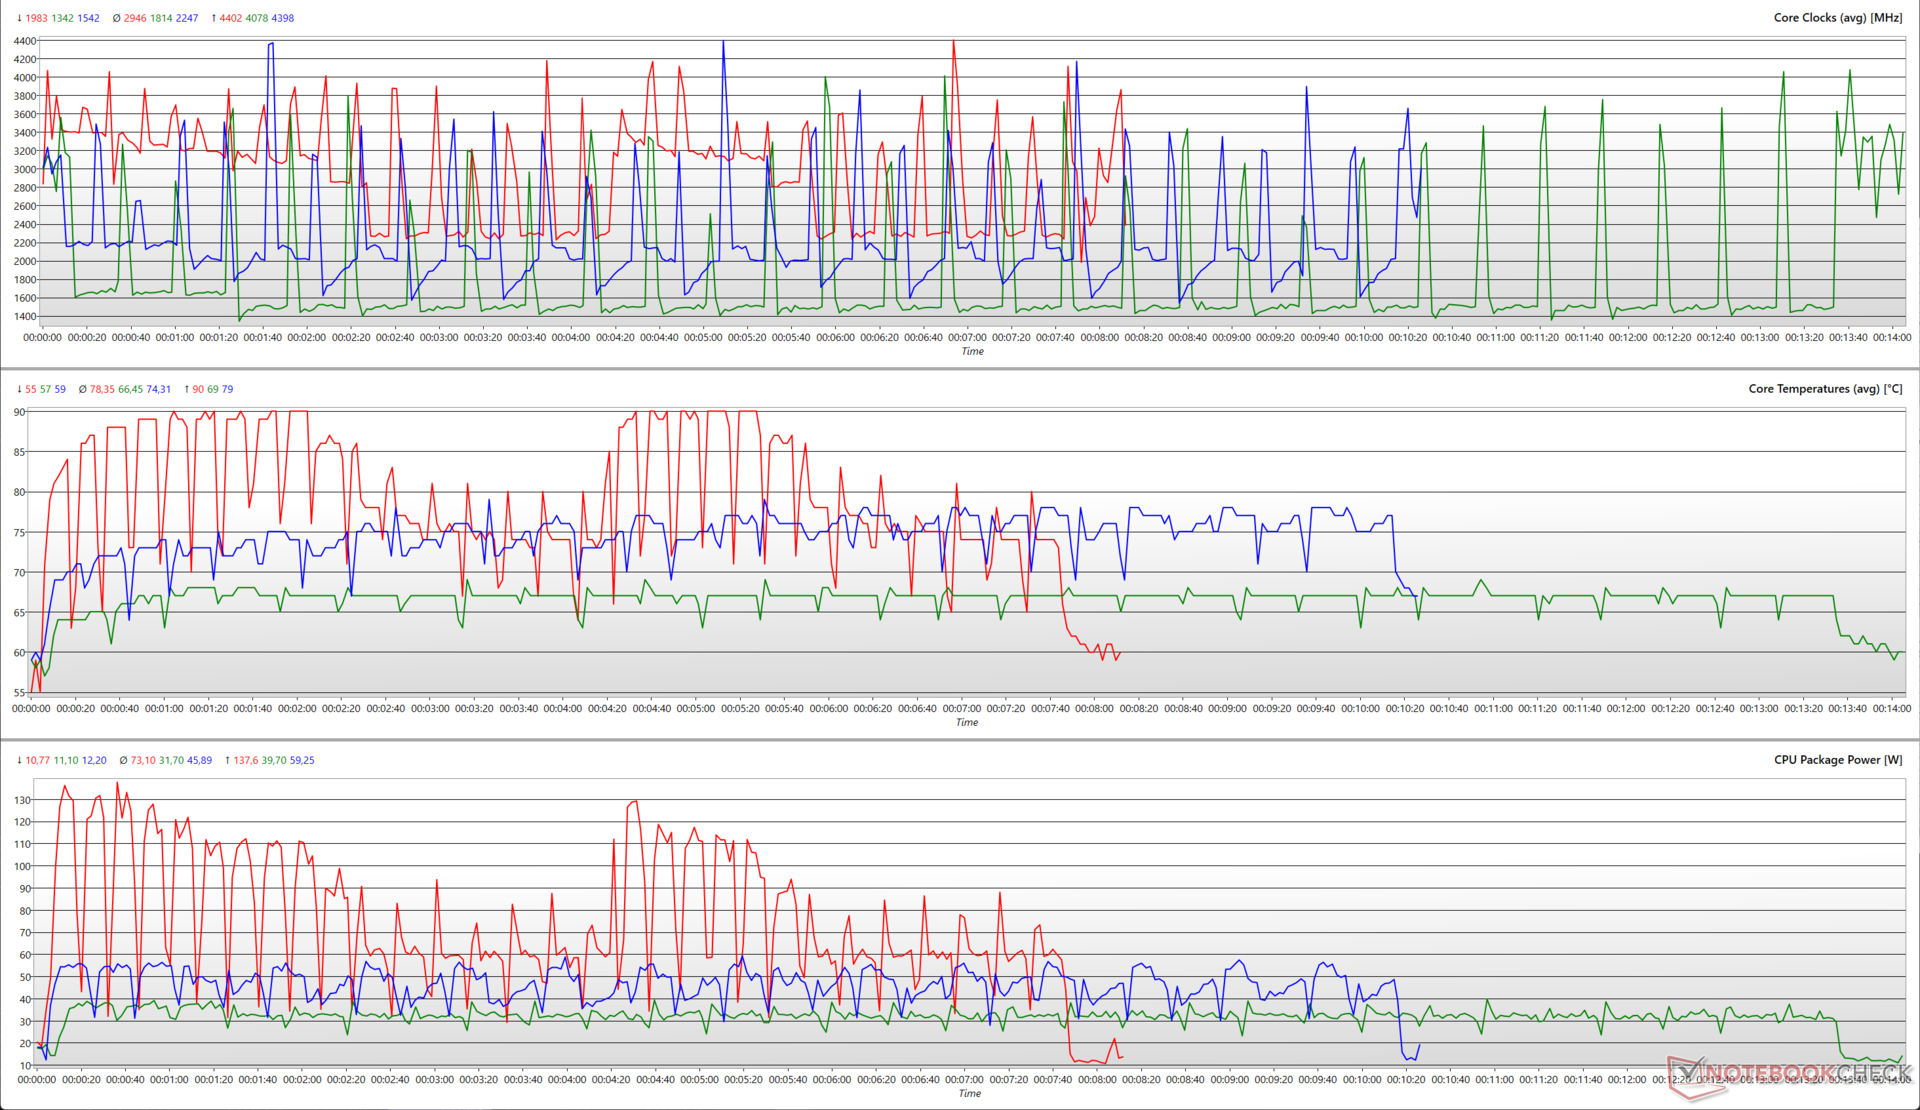
在Cinebench R15循环测试中看到的不寻常的图表也反映在可用的性能模式下评估各种CPU参数。在平衡和静音模式下运行循环测试时,没有看到这种模式。
在自定义设置中,我们看到封装功率达到最大137.6W,导致4.4GHz的最大提升,核心温度高达90℃。可能是Razer在核心温度达到90°C时,实施了苛刻的温度容忍度。这导致封装功率下降到74瓦,然后再恢复到130瓦,循环往复。
在这种情况下,平衡模式似乎有点宽松。我们看到时钟接近4.4GHz,峰值封装功率为59W,最大核心温度为79℃。这种模式对于大多数使用情况来说应该是足够的。
静音模式在时钟方面受到相当大的冲击,但峰值核心温度是可控的69℃,同时最大消耗39.7瓦。
在电池方面,Blade 16运行在平衡模式下。虽然单核性能只受到5%的打击,但在Cinebench R20中,多核得分下降了57%。也就是说,降低的性能应该仍然足以在移动中完成一些工作。
Razer Blade 16 Early 2023总体上提供了良好的CPU性能,但相对较低的功率限制使其在竞争中处于不利地位。
AIDA64: FP32 Ray-Trace | FPU Julia | CPU SHA3 | CPU Queen | FPU SinJulia | FPU Mandel | CPU AES | CPU ZLib | FP64 Ray-Trace | CPU PhotoWorxx
| Performance rating | |
| Eluktronics Mech-17 GP2 | |
| MSI Titan GT77 HX 13VI | |
| Asus ROG Strix Scar 18 2023 G834JY-N6005W | |
| Lenovo Legion Pro 7 16IRX8H | |
| Asus ROG Strix G16 G614JZ | |
| Razer Blade 18 RTX 4070 | |
| Average of class Gaming | |
| Average Intel Core i9-13950HX | |
| Razer Blade 16 Early 2023 RTX 4090 | |
| Razer Blade 16 Early 2023 | |
| Asus ROG Zephyrus M16 GU604VY-NM042X | |
查看我们专门的 英特尔酷睿i9-13950HX页面了解更多信息和性能比较。
系统性能
PCMark 10总分显示,Razer Blade 16落后于Ryzen 9 7945HX驱动的Zephyrus Duo 16 17%,但这些设备在CrossMark总分中显示出或多或少相同的性能。
在日常使用中,我们没有遇到任何关于系统性能和响应性的问题。
CrossMark: Overall | Productivity | Creativity | Responsiveness
| PCMark 10 / Score | |
| Asus Zephyrus Duo 16 GX650PY-NM006W | |
| Eluktronics Mech-17 GP2 | |
| MSI Titan GT77 HX 13VI | |
| Asus ROG Strix Scar 18 2023 G834JY-N6005W | |
| Average of class Gaming (5828 - 11574, n=95, last 2 years) | |
| Asus ROG Zephyrus M16 GU604VY-NM042X | |
| Average Intel Core i9-13950HX, NVIDIA GeForce RTX 4090 Laptop GPU (7597 - 8884, n=2) | |
| Razer Blade 16 Early 2023 | |
| Lenovo Legion Pro 7 16IRX8H | |
| Razer Blade 18 RTX 4070 | |
| Razer Blade 16 Early 2023 RTX 4090 | |
| Asus ROG Strix G16 G614JZ | |
| PCMark 10 / Essentials | |
| Asus Zephyrus Duo 16 GX650PY-NM006W | |
| Asus ROG Strix G16 G614JZ | |
| Eluktronics Mech-17 GP2 | |
| MSI Titan GT77 HX 13VI | |
| Lenovo Legion Pro 7 16IRX8H | |
| Razer Blade 18 RTX 4070 | |
| Asus ROG Zephyrus M16 GU604VY-NM042X | |
| Average Intel Core i9-13950HX, NVIDIA GeForce RTX 4090 Laptop GPU (10903 - 11761, n=2) | |
| Razer Blade 16 Early 2023 | |
| Razer Blade 16 Early 2023 RTX 4090 | |
| Average of class Gaming (8810 - 12600, n=99, last 2 years) | |
| PCMark 10 / Productivity | |
| Asus Zephyrus Duo 16 GX650PY-NM006W | |
| Asus ROG Zephyrus M16 GU604VY-NM042X | |
| Average of class Gaming (6845 - 21327, n=97, last 2 years) | |
| Lenovo Legion Pro 7 16IRX8H | |
| Eluktronics Mech-17 GP2 | |
| MSI Titan GT77 HX 13VI | |
| Razer Blade 18 RTX 4070 | |
| Average Intel Core i9-13950HX, NVIDIA GeForce RTX 4090 Laptop GPU (8330 - 9851, n=2) | |
| Razer Blade 16 Early 2023 RTX 4090 | |
| Razer Blade 16 Early 2023 | |
| Asus ROG Strix G16 G614JZ | |
| PCMark 10 / Digital Content Creation | |
| MSI Titan GT77 HX 13VI | |
| Eluktronics Mech-17 GP2 | |
| Average Intel Core i9-13950HX, NVIDIA GeForce RTX 4090 Laptop GPU (13099 - 16424, n=2) | |
| Razer Blade 16 Early 2023 | |
| Asus Zephyrus Duo 16 GX650PY-NM006W | |
| Average of class Gaming (7602 - 19657, n=97, last 2 years) | |
| Razer Blade 16 Early 2023 RTX 4090 | |
| Asus ROG Zephyrus M16 GU604VY-NM042X | |
| Asus ROG Strix G16 G614JZ | |
| Razer Blade 18 RTX 4070 | |
| Lenovo Legion Pro 7 16IRX8H | |
| CrossMark / Overall | |
| Eluktronics Mech-17 GP2 | |
| Asus ROG Strix G16 G614JZ | |
| MSI Titan GT77 HX 13VI | |
| Razer Blade 18 RTX 4070 | |
| Asus ROG Strix Scar 18 2023 G834JY-N6005W | |
| Average Intel Core i9-13950HX, NVIDIA GeForce RTX 4090 Laptop GPU (2019 - 2139, n=2) | |
| Asus Zephyrus Duo 16 GX650PY-NM006W | |
| Razer Blade 16 Early 2023 RTX 4090 | |
| Average of class Gaming (1366 - 2409, n=95, last 2 years) | |
| Asus ROG Zephyrus M16 GU604VY-NM042X | |
| Razer Blade 16 Early 2023 | |
| CrossMark / Productivity | |
| Asus ROG Strix G16 G614JZ | |
| Eluktronics Mech-17 GP2 | |
| MSI Titan GT77 HX 13VI | |
| Razer Blade 18 RTX 4070 | |
| Asus Zephyrus Duo 16 GX650PY-NM006W | |
| Average Intel Core i9-13950HX, NVIDIA GeForce RTX 4090 Laptop GPU (1909 - 1977, n=2) | |
| Asus ROG Strix Scar 18 2023 G834JY-N6005W | |
| Razer Blade 16 Early 2023 RTX 4090 | |
| Average of class Gaming (1386 - 2254, n=95, last 2 years) | |
| Asus ROG Zephyrus M16 GU604VY-NM042X | |
| Razer Blade 16 Early 2023 | |
| CrossMark / Creativity | |
| Eluktronics Mech-17 GP2 | |
| Asus ROG Strix Scar 18 2023 G834JY-N6005W | |
| MSI Titan GT77 HX 13VI | |
| Asus ROG Strix G16 G614JZ | |
| Razer Blade 18 RTX 4070 | |
| Asus Zephyrus Duo 16 GX650PY-NM006W | |
| Average Intel Core i9-13950HX, NVIDIA GeForce RTX 4090 Laptop GPU (2222 - 2423, n=2) | |
| Average of class Gaming (1343 - 2729, n=95, last 2 years) | |
| Asus ROG Zephyrus M16 GU604VY-NM042X | |
| Razer Blade 16 Early 2023 RTX 4090 | |
| Razer Blade 16 Early 2023 | |
| CrossMark / Responsiveness | |
| Asus ROG Strix G16 G614JZ | |
| Razer Blade 18 RTX 4070 | |
| MSI Titan GT77 HX 13VI | |
| Eluktronics Mech-17 GP2 | |
| Average Intel Core i9-13950HX, NVIDIA GeForce RTX 4090 Laptop GPU (1792 - 1861, n=2) | |
| Razer Blade 16 Early 2023 RTX 4090 | |
| Average of class Gaming (1226 - 2334, n=95, last 2 years) | |
| Asus Zephyrus Duo 16 GX650PY-NM006W | |
| Asus ROG Zephyrus M16 GU604VY-NM042X | |
| Asus ROG Strix Scar 18 2023 G834JY-N6005W | |
| Razer Blade 16 Early 2023 | |
| PCMark 8 Home Score Accelerated v2 | 4861 points | |
| PCMark 8 Creative Score Accelerated v2 | 5206 points | |
| PCMark 10 Score | 7597 points | |
Help | ||
* ... smaller is better
DPC延时
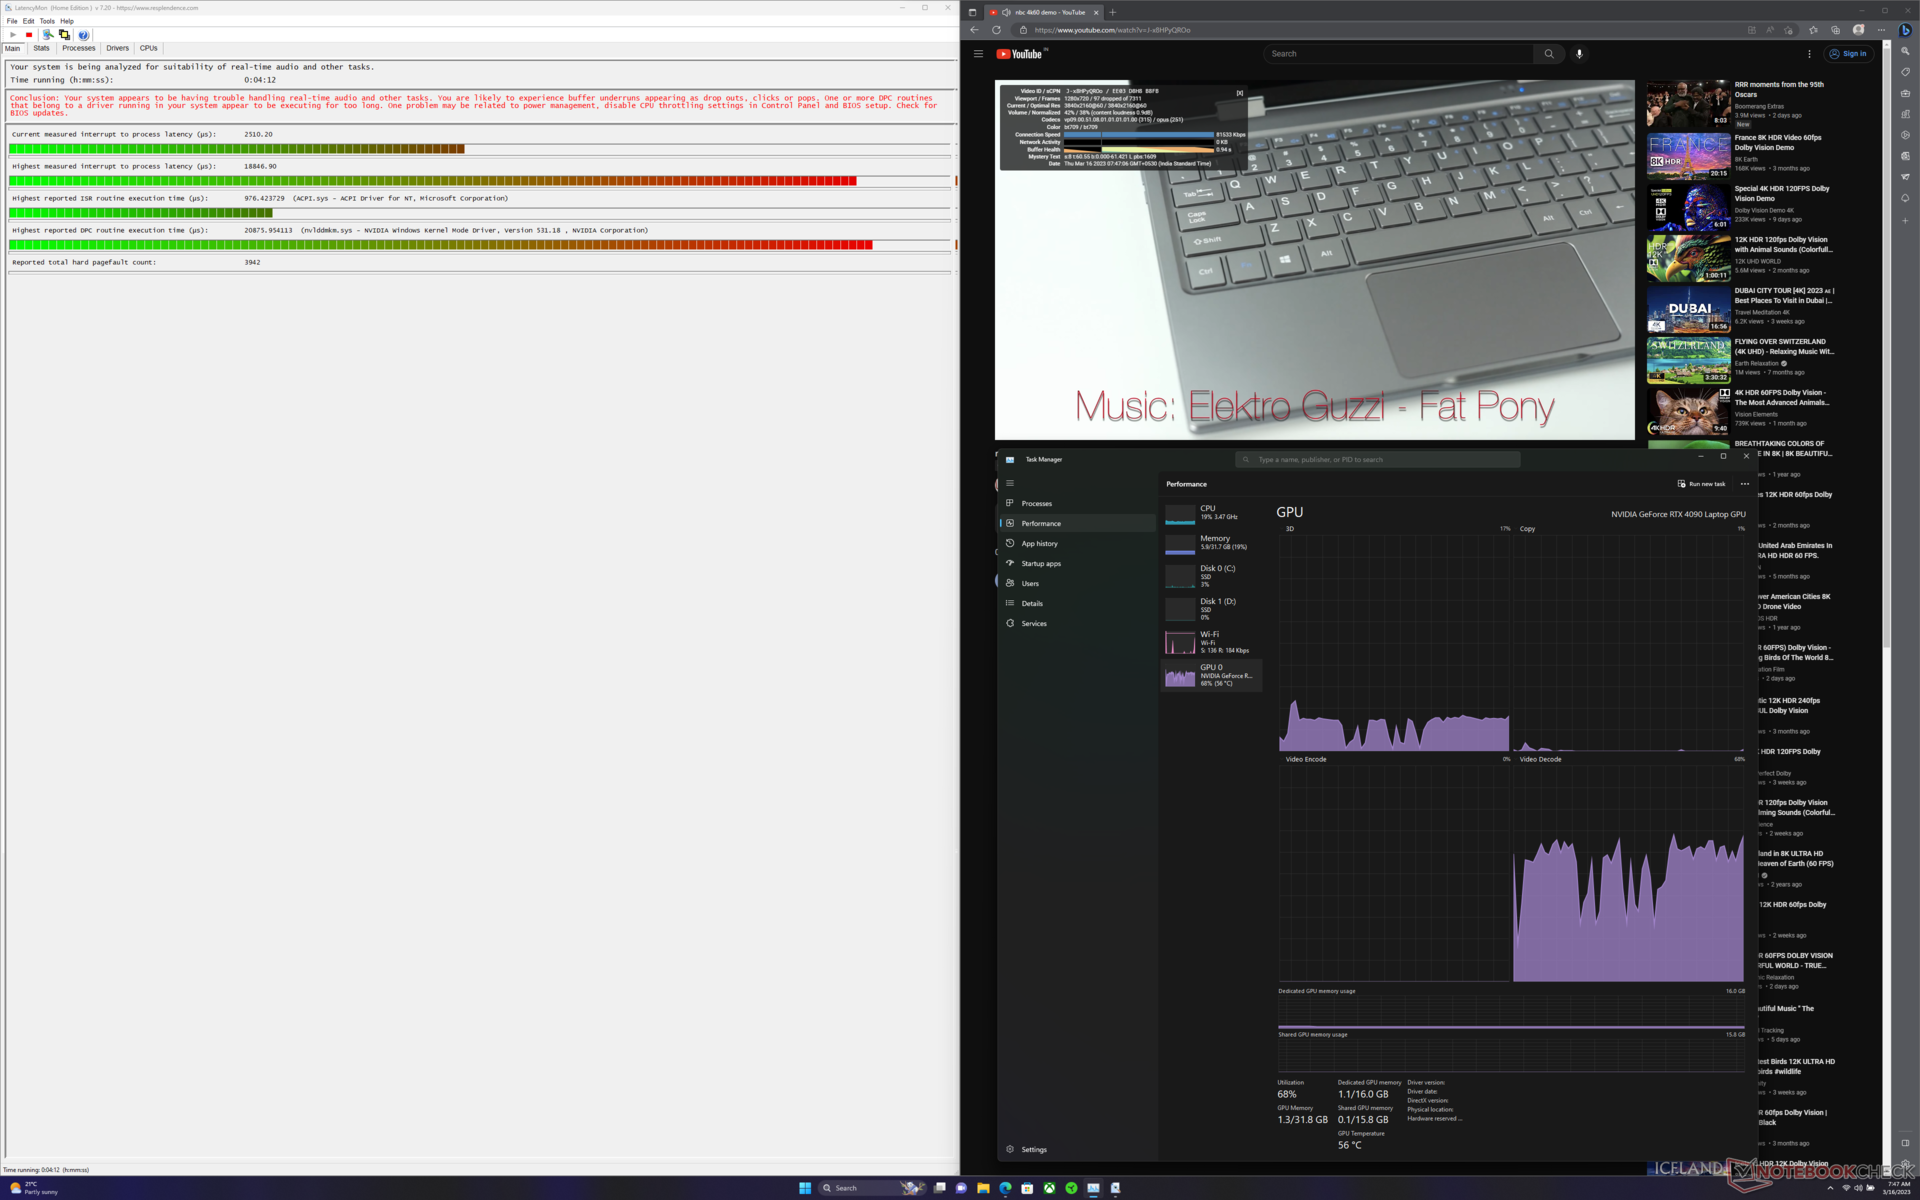
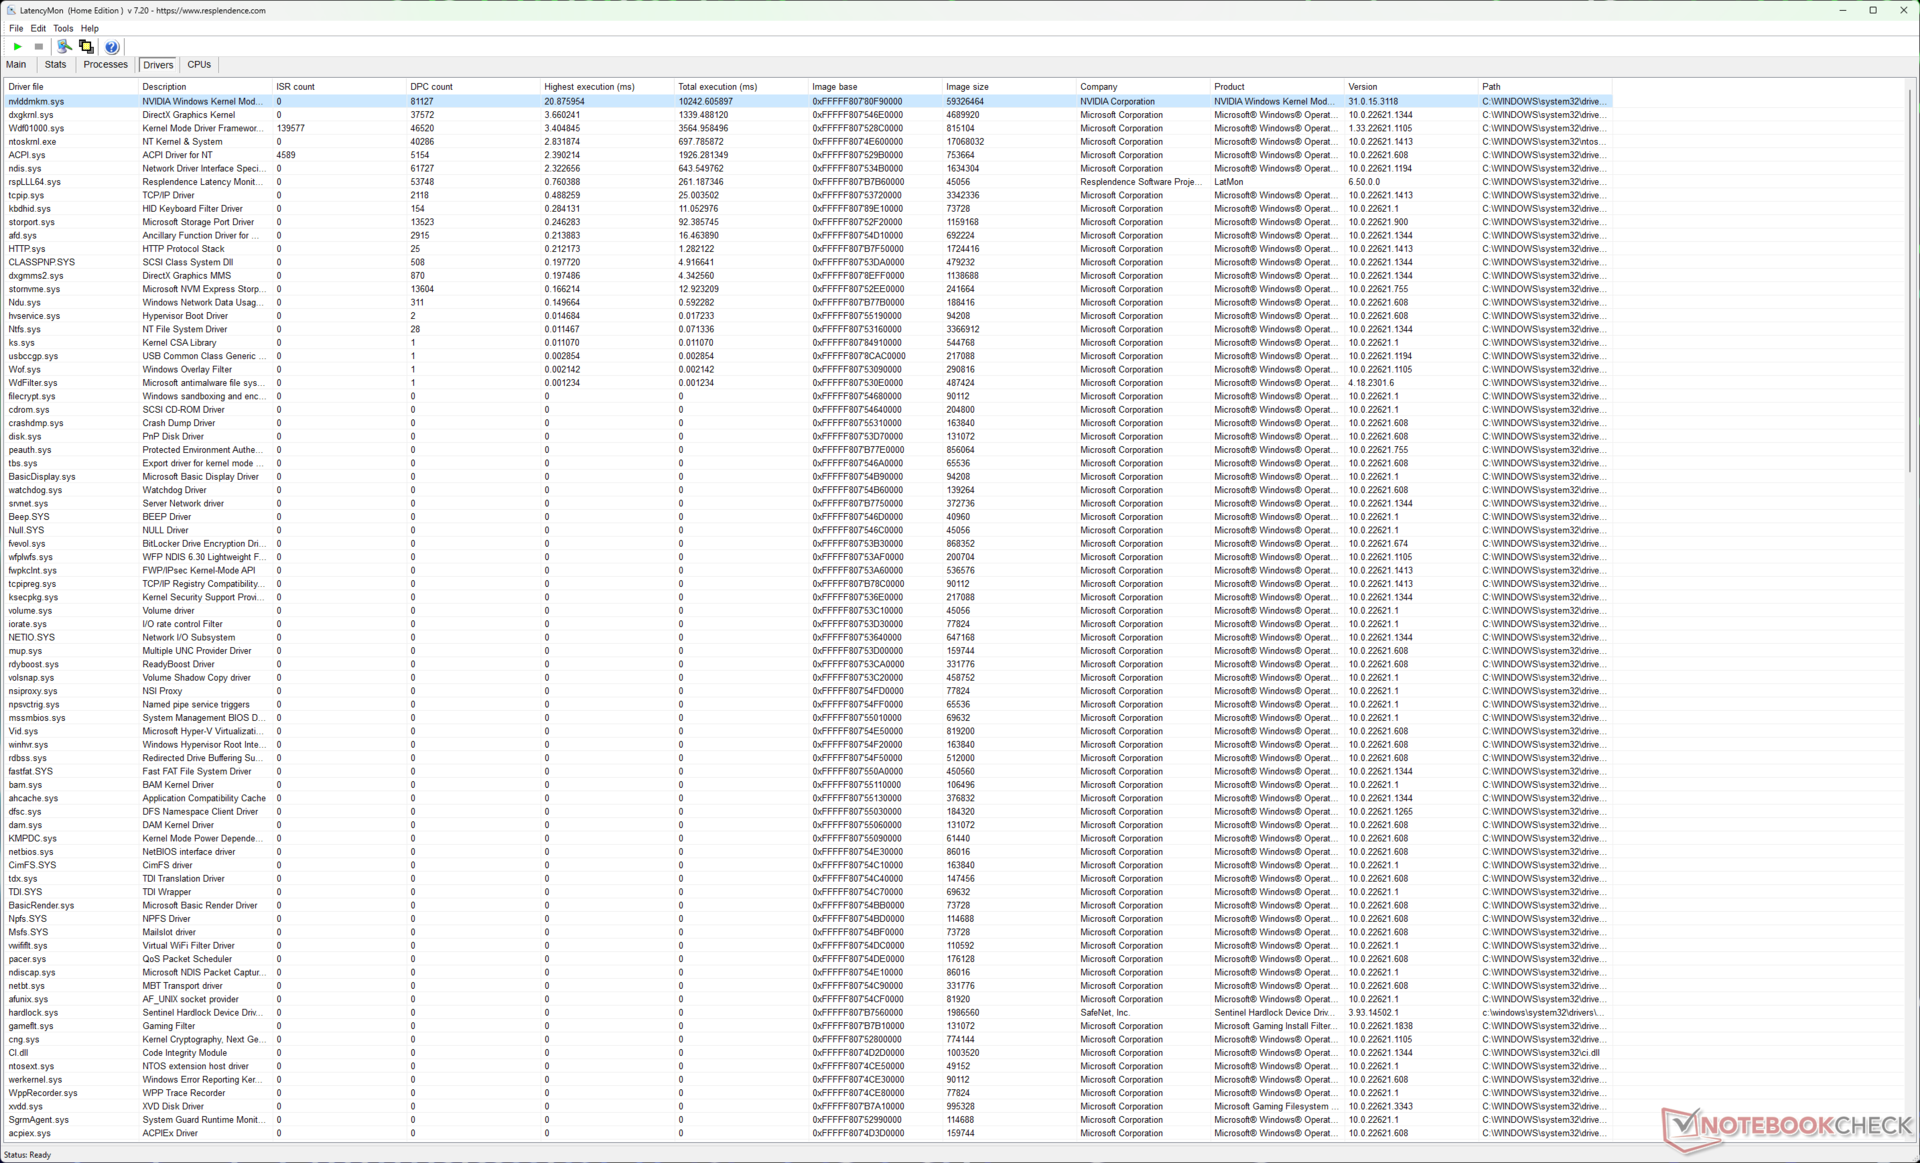
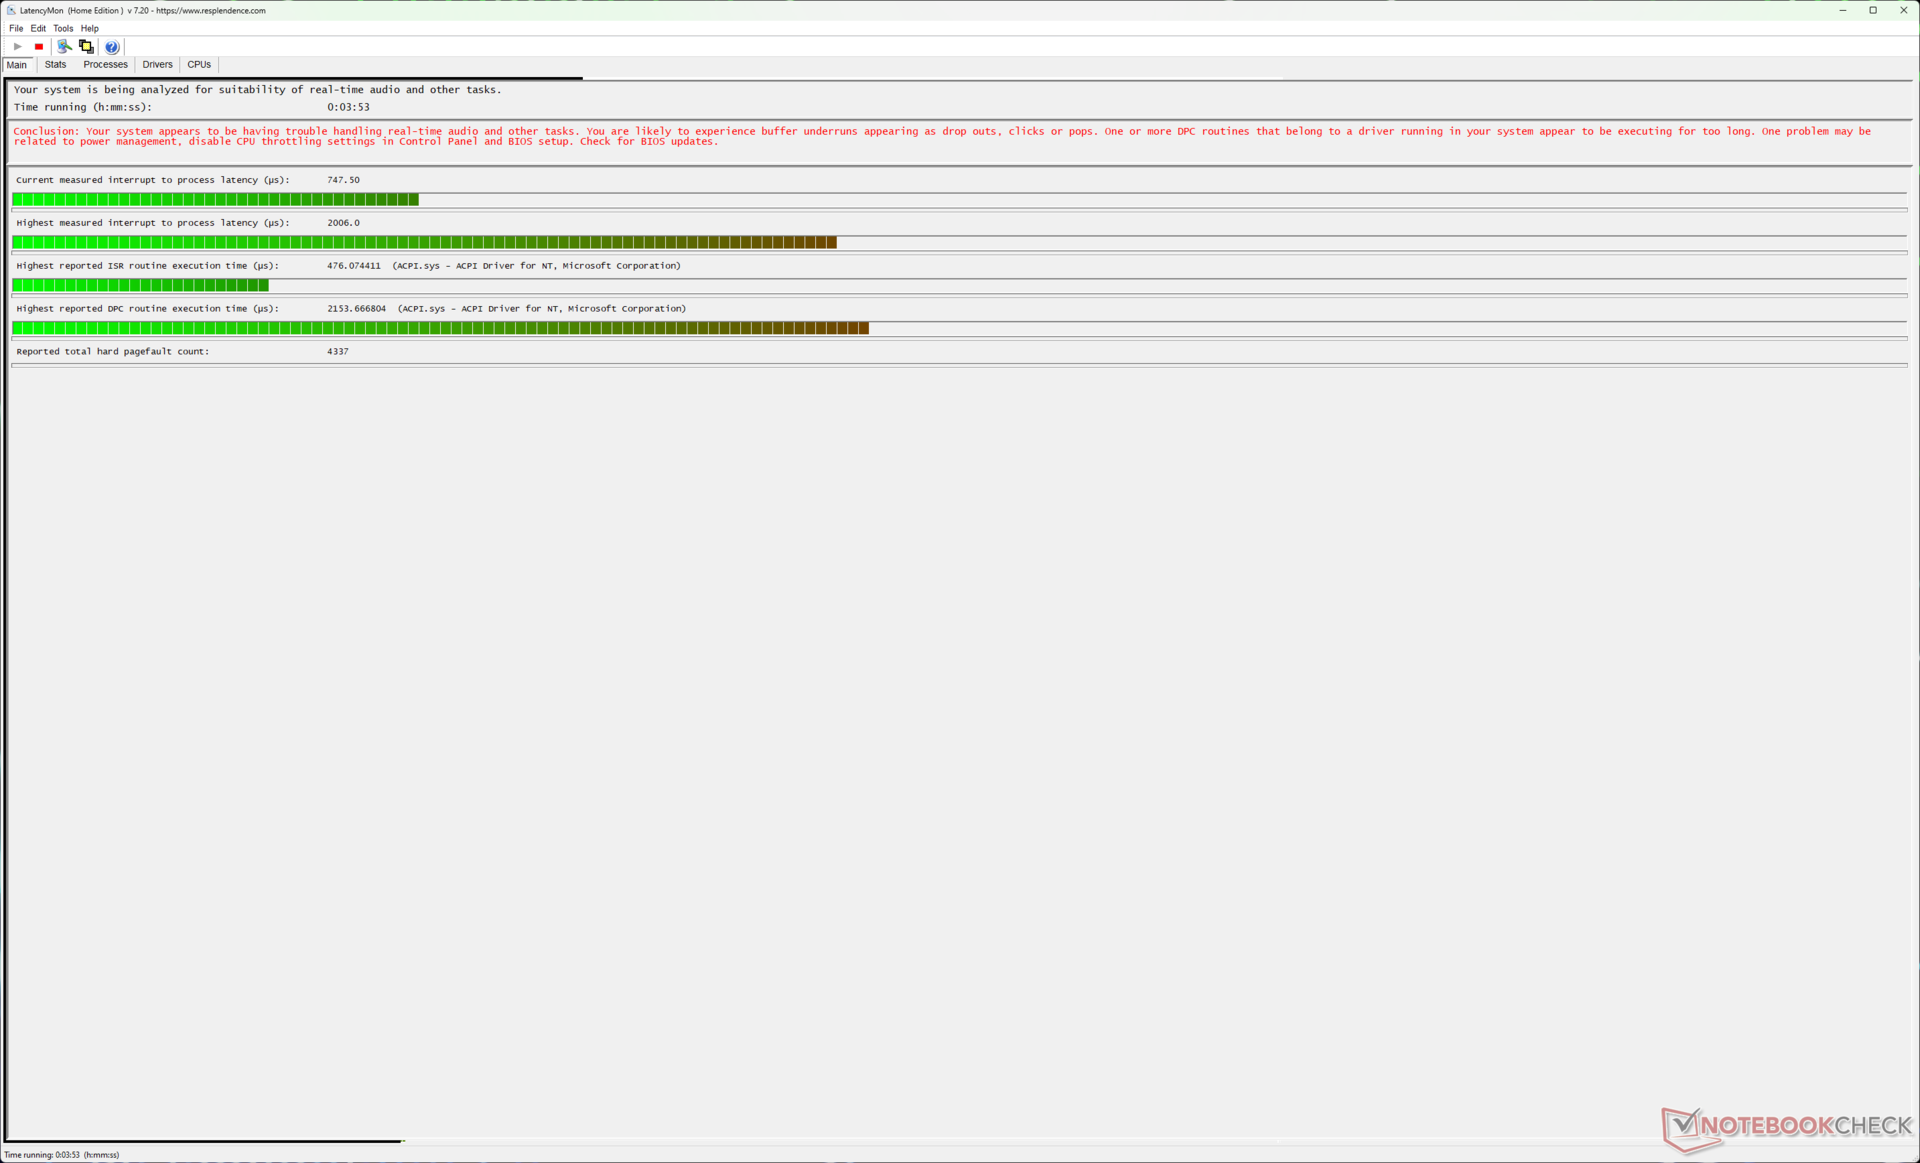
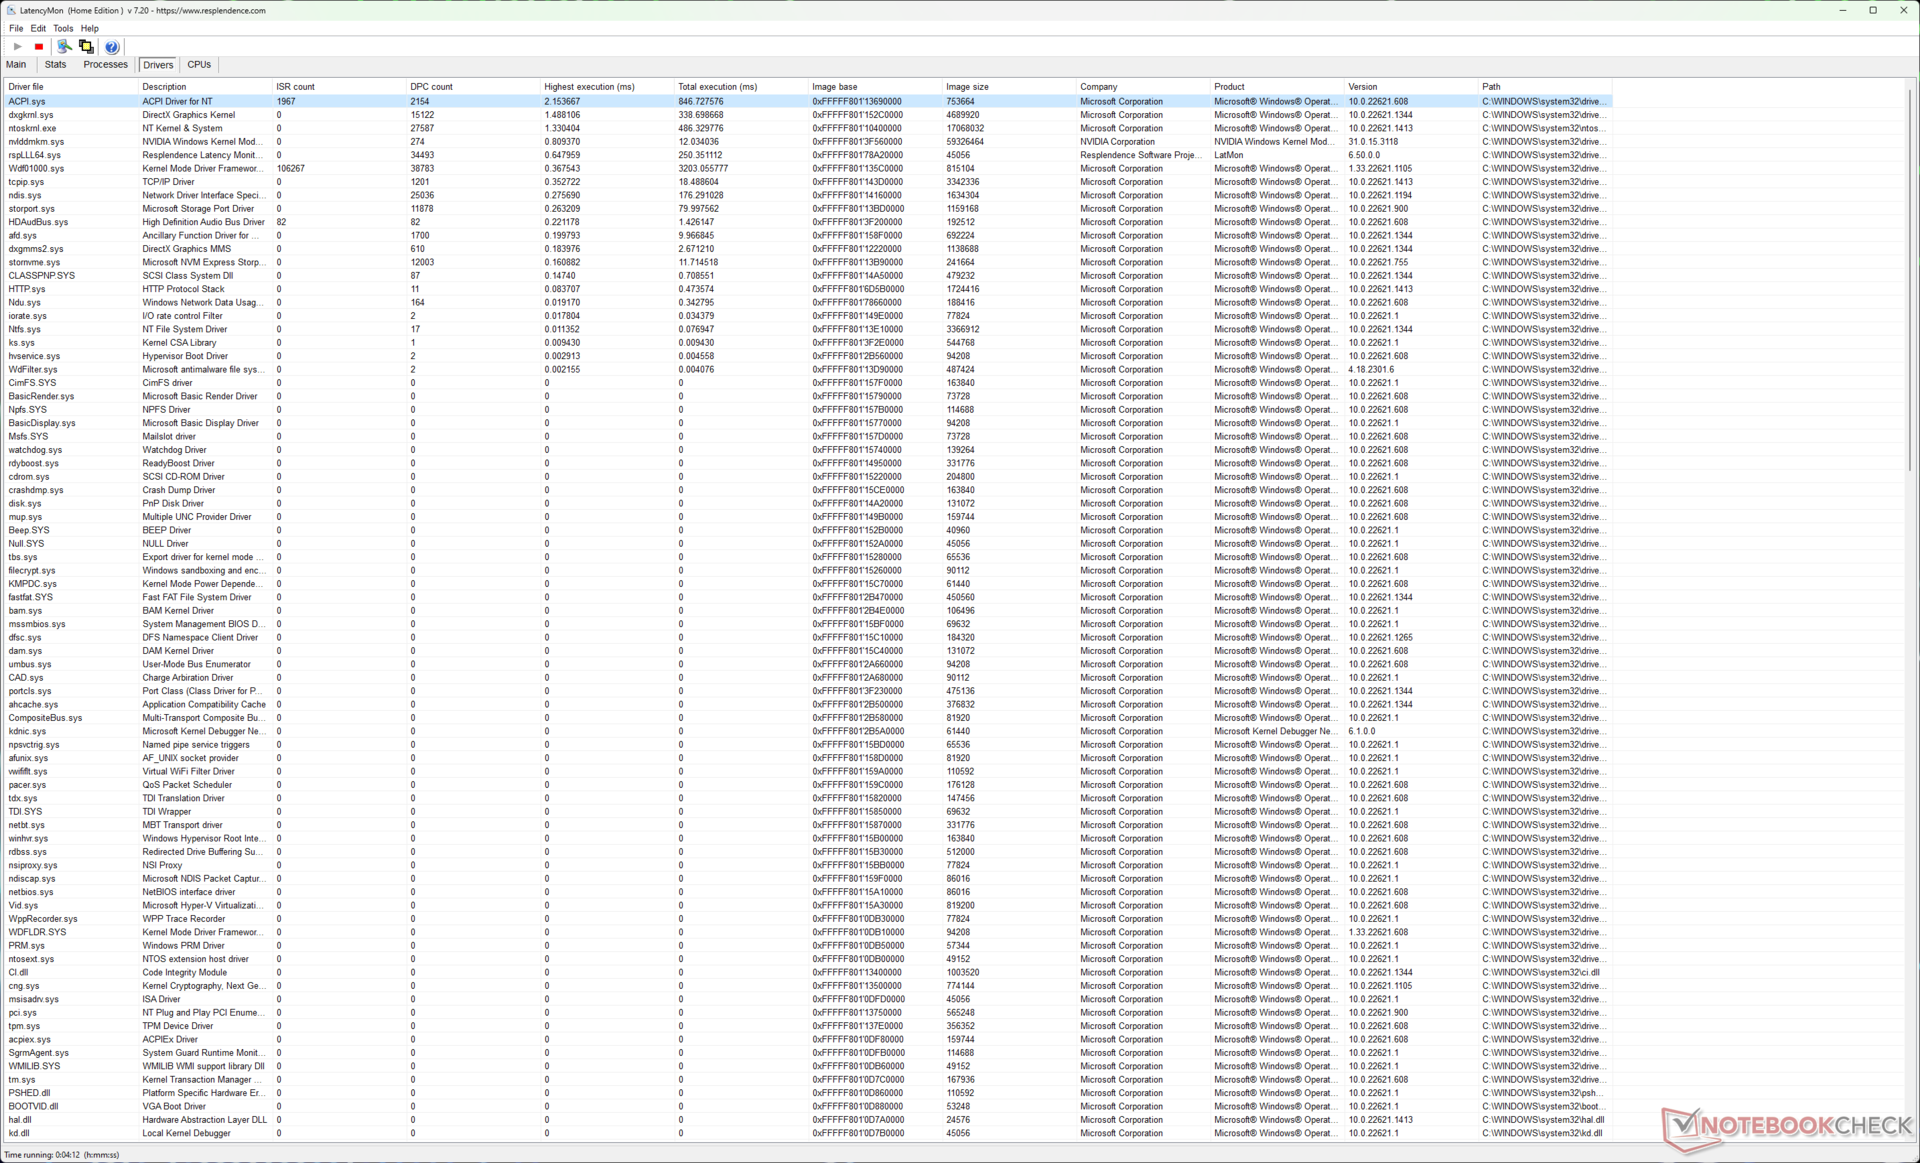
GeForce 驱动程序中有一个的已知错误导致高DPC延迟。Nvidia也承认https://us.download.nvidia.com/Windows/531.29/531.29-win11-win10-release-notes.pdf用LatencyMon测量时,Release 530 Driver for Windows会导致DPC延迟增加。
因此,我们观察到在dGPU模式下,中断到处理的延迟非常高,达到18,846.9微秒,同时GPU使用率也很高。这可以追溯到Nvidia内核模式驱动程序的20.87毫秒的高执行时间。
在MSHybrid模式下,中断到处理的最高延迟值下降到一个更合理但仍然很高的2,006微秒。
如此高的DPC延迟会给实时音频和视频编辑工作流程带来问题,这对这种配置和价格来说并不理想。
| DPC Latencies / LatencyMon - interrupt to process latency (max), Web, Youtube, Prime95 | |
| Razer Blade 16 Early 2023 RTX 4090 (dGPU) | |
| Razer Blade 16 Early 2023 RTX 4090 (MSHybrid) | |
| Asus Zephyrus Duo 16 GX650PY-NM006W | |
| MSI Titan GT77 HX 13VI | |
| Asus ROG Zephyrus M16 GU604VY-NM042X | |
| Asus ROG Strix G16 G614JZ | |
| Razer Blade 16 Early 2023 (Edge 109.0.1518.70) | |
| Razer Blade 18 RTX 4070 (Edge 110.0.1587.46) | |
| Asus ROG Strix Scar 18 2023 G834JY-N6005W | |
| Eluktronics Mech-17 GP2 (Edge 110.0.1587.57) | |
| Lenovo Legion Pro 7 16IRX8H | |
* ... smaller is better
更多关于LatencyMon的比较可以在我们的 DPC延时排名页面上看到。
存储设备
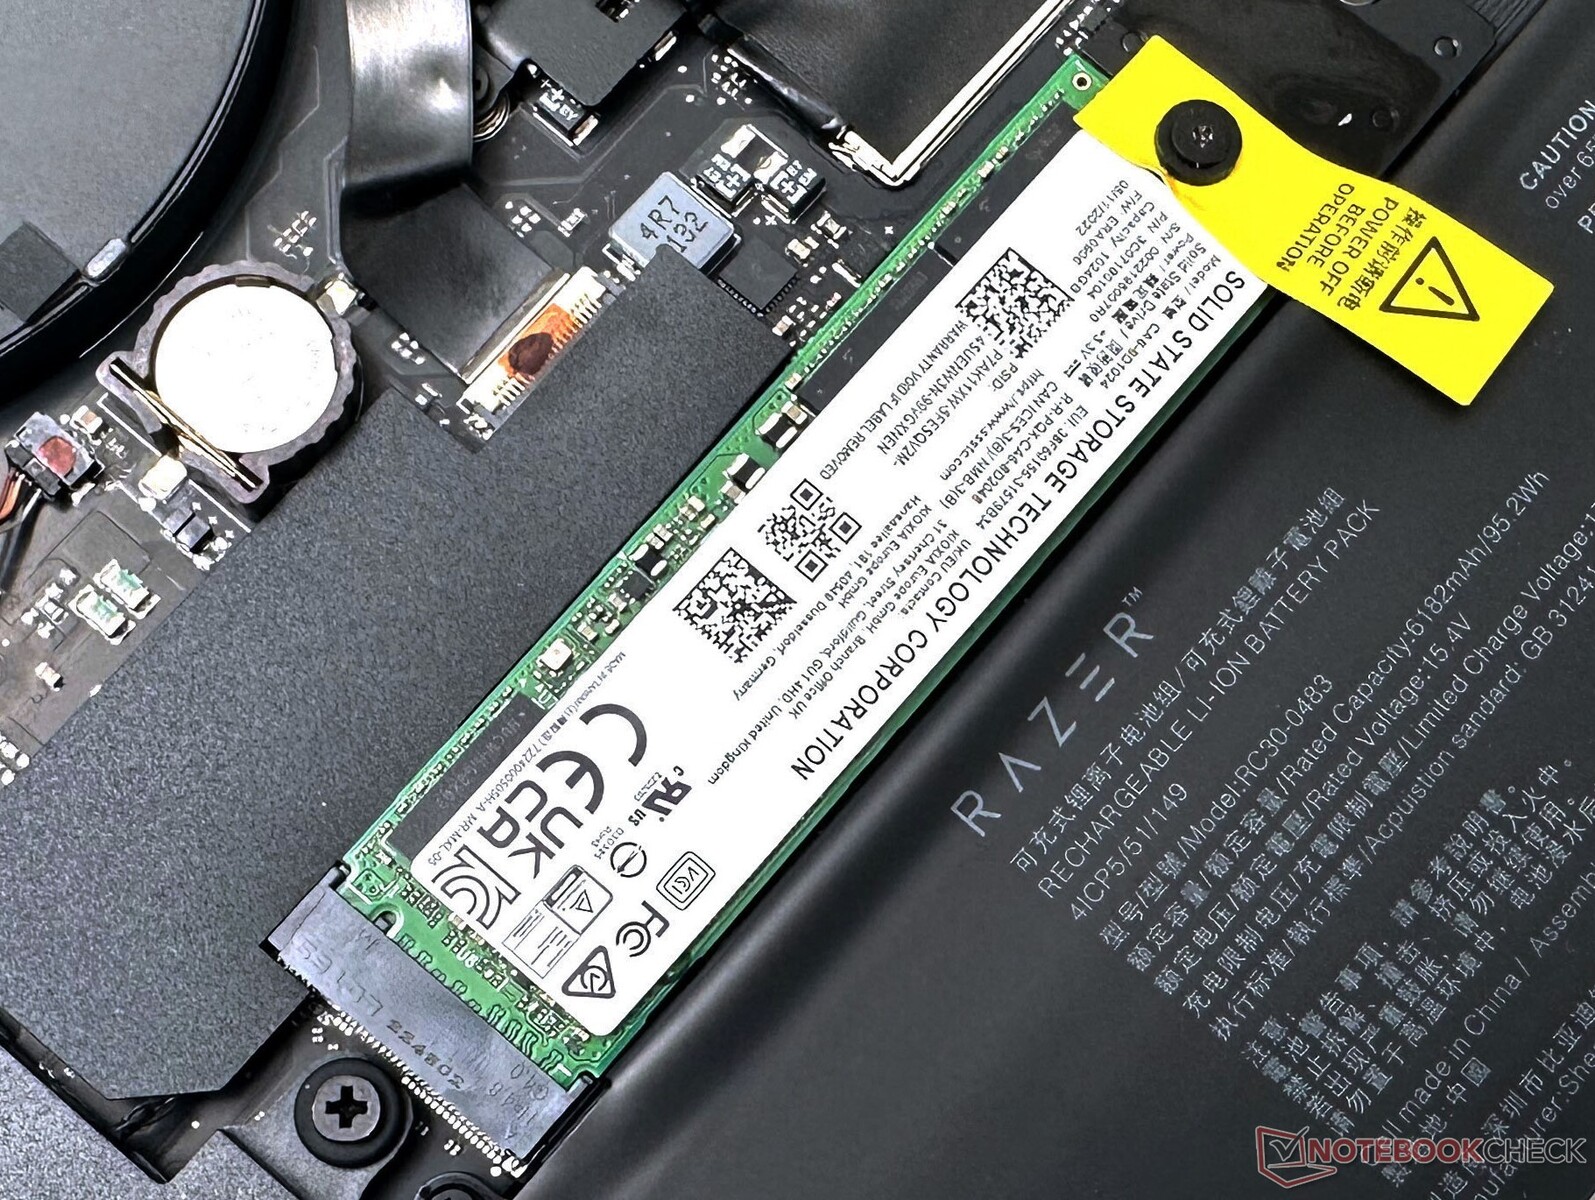
我们的Blade 16 Early 2023设备配备了固态存储技术公司(SSTC)的两块1TB NVMe SSD。NVMe驱动器彼此堆叠在一起,主驱动器在下面,以有效利用主板空间。
整体磁盘性能符合预期,但它不能与基于三星PM9A1的配置相媲美。然而,4K写入性能,比大多数竞争者要好。
在我们的DiskSpd读取循环测试中,该硬盘在队列深度为8的初始部分能够维持得相当好,然后从循环31开始就会出现节流。
没有添加2.5英寸SATA驱动器的空间。

* ... smaller is better
Disk Throttling: DiskSpd Read Loop, Queue Depth 8
请参考我们的 SSD和HDD基准测试页面了解更多存储设备的比较。
GPU性能
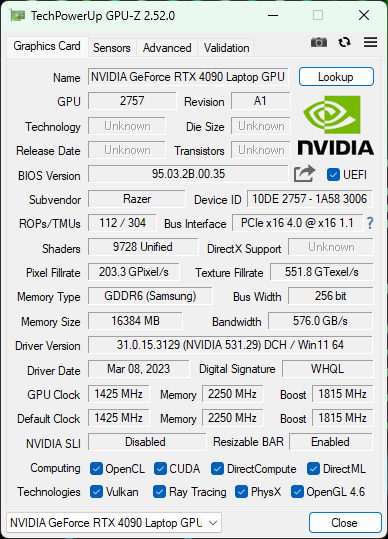
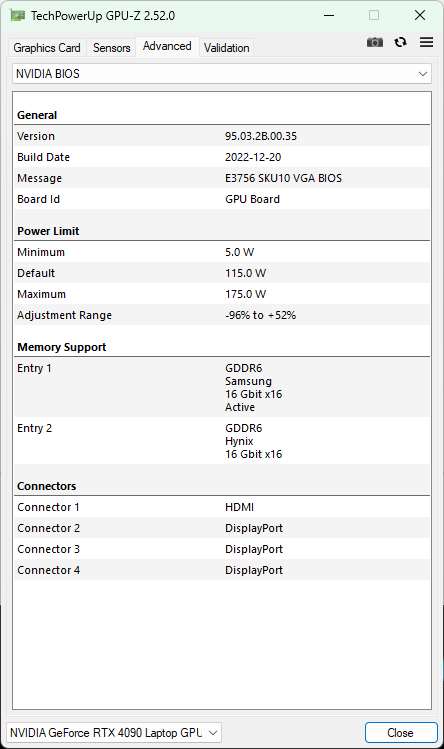
我们的Blade 16设备配备了一个 NvidiaGeForce RTX 4090 笔记本电脑GPU它的额定性能为175 W TGP。Razer没有说明动态提升值,但考虑到RTX 4090笔记本GPU的实际最大功率为150 W TGP,我们认为它是25 W。
Blade 16中的RTX 4090在整个3DMark性能方面并没有真正名列前茅。刀锋16早期2023 RTX 4090总体上领先于RTX 4080 SKU 8%,但落后于其他RTX 4090重量级产品,如微星Titan GT77 HX 13VI、 华硕ROG Strix Scar 18, Eluktronics Mech-17 GP2,以及 华硕ROG Zephyrus Duo 16.
华硕 华硕ROG Strix G16搭配RTX 4080,以微弱优势超越了刀锋16。
| 3DMark 11 Performance | 41433 points | |
| 3DMark Ice Storm Standard Score | 244104 points | |
| 3DMark Cloud Gate Standard Score | 52227 points | |
| 3DMark Fire Strike Score | 31174 points | |
| 3DMark Fire Strike Extreme Score | 22713 points | |
| 3DMark Time Spy Score | 18599 points | |
Help | ||
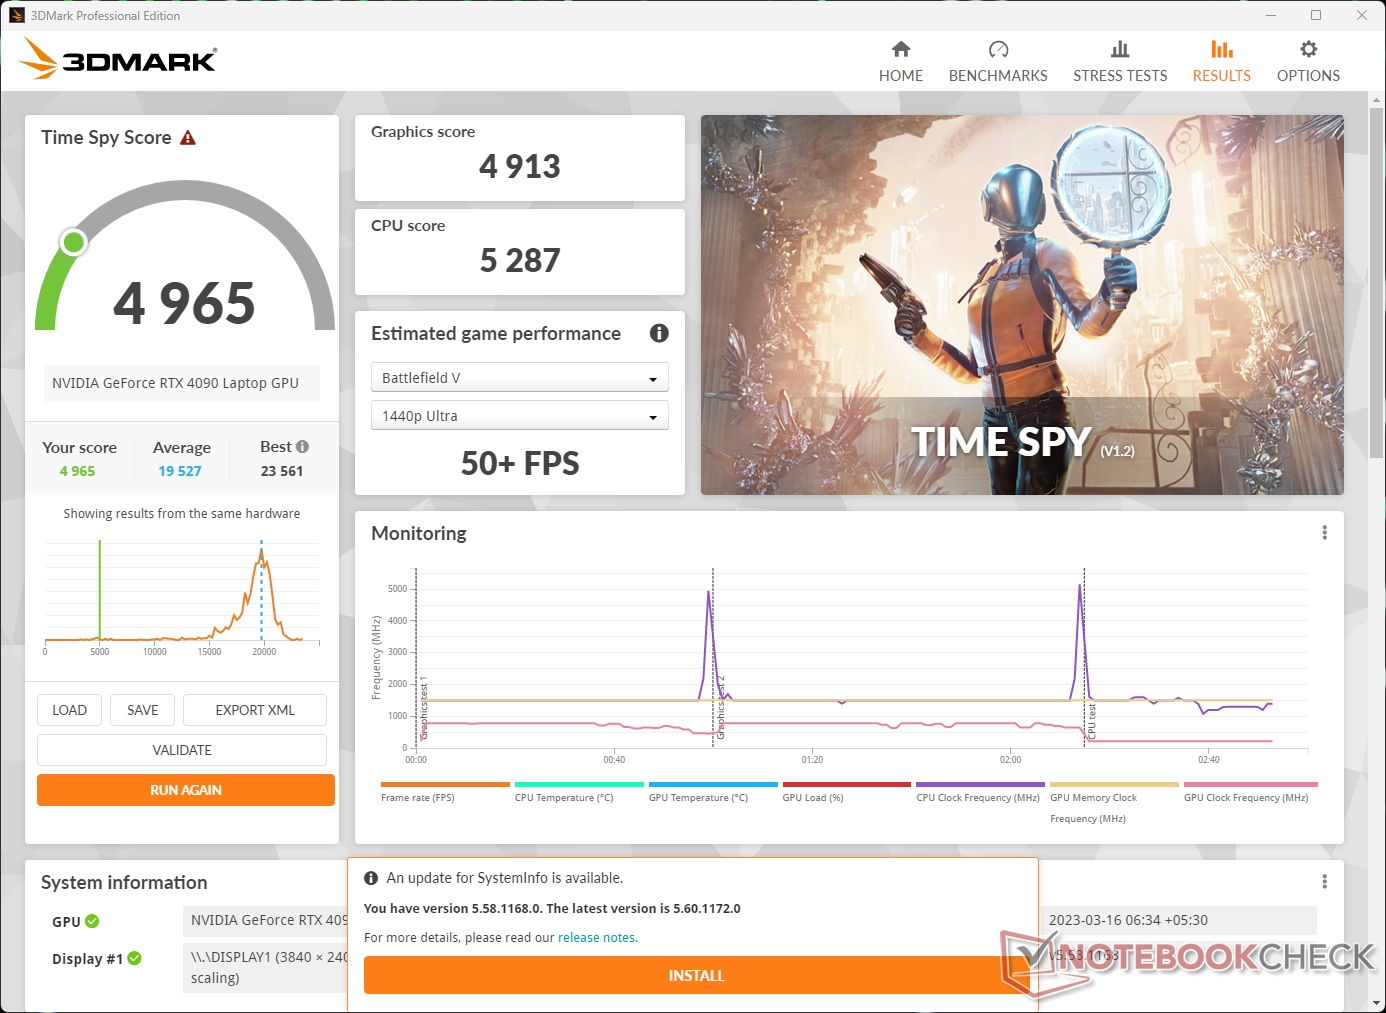
电池上的GPU性能会受到相当大的冲击。3DMarkTime Spy 图形分数在电池供电时下降了75%。根据该基准,这应该仍然提供足够的性能,在1440p Ultra下以50帧的速度播放《战地5》。
在Optix和Classroom CUDA测试中,Blender 3.3看到Blade 16中的RTX 4090与其他类似配置的笔记本电脑性能相当,但与Ryzen 9 7945HX驱动的Zephyrus Duo 16的Classroom CPU相比,该笔记本电脑要慢52%。
| Blender / v3.3 Classroom OPTIX/RTX | |
| Razer Blade 18 RTX 4070 | |
| Average of class Gaming (9 - 32, n=109, last 2 years) | |
| Razer Blade 16 Early 2023 | |
| Asus ROG Zephyrus M16 GU604VY-NM042X | |
| Lenovo Legion Pro 7 16IRX8H | |
| Asus ROG Strix G16 G614JZ | |
| Asus Zephyrus Duo 16 GX650PY-NM006W | |
| Average NVIDIA GeForce RTX 4090 Laptop GPU (9 - 19, n=39) | |
| MSI Titan GT77 HX 13VI | |
| Razer Blade 16 Early 2023 RTX 4090 | |
| Asus ROG Strix Scar 18 2023 G834JY-N6005W | |
| Eluktronics Mech-17 GP2 | |
| Blender / v3.3 Classroom CUDA | |
| Razer Blade 18 RTX 4070 | |
| Average of class Gaming (15 - 233, n=110, last 2 years) | |
| Lenovo Legion Pro 7 16IRX8H | |
| Razer Blade 16 Early 2023 | |
| Asus ROG Strix G16 G614JZ | |
| Asus Zephyrus Duo 16 GX650PY-NM006W | |
| Average NVIDIA GeForce RTX 4090 Laptop GPU (16 - 24, n=39) | |
| Asus ROG Strix Scar 18 2023 G834JY-N6005W | |
| Asus ROG Strix Scar 18 2023 G834JY-N6005W | |
| Asus ROG Zephyrus M16 GU604VY-NM042X | |
| MSI Titan GT77 HX 13VI | |
| Razer Blade 16 Early 2023 RTX 4090 | |
| Eluktronics Mech-17 GP2 | |
| Blender / v3.3 Classroom CPU | |
| Asus ROG Zephyrus M16 GU604VY-NM042X | |
| Average of class Gaming (122 - 565, n=105, last 2 years) | |
| Razer Blade 16 Early 2023 RTX 4090 | |
| Razer Blade 16 Early 2023 | |
| Average NVIDIA GeForce RTX 4090 Laptop GPU (144 - 305, n=39) | |
| Razer Blade 18 RTX 4070 | |
| Lenovo Legion Pro 7 16IRX8H | |
| Asus ROG Strix G16 G614JZ | |
| Asus ROG Strix Scar 18 2023 G834JY-N6005W | |
| MSI Titan GT77 HX 13VI | |
| Eluktronics Mech-17 GP2 | |
| Asus Zephyrus Duo 16 GX650PY-NM006W | |
* ... smaller is better
游戏性能
刀锋16 RTX 4090在1080p Ultra下的累积游戏性能仅低于Zephyrus Duo 16,但与配备RTX 4070笔记本GPU的刀锋18相比,显示出15%的体面收益。微星Titan GT77和ROG Strix Scar 18都领先我们的测试单元13%,而Eluktronics Mech-17 GP2则在排行榜上名列前茅。
这些笔记本电脑有更高的PL2,在1080p等CPU限制的分辨率中可以派上用场。
在大多数游戏中,我们看到在更高的分辨率下也有类似的趋势。在原生4K Ultra下的光线追踪与可玩的帧率并不是一个令人愉快的体验。然而,玩家可以在支持的游戏中利用DLSS 3 Frame Generation来实现显著的帧数提升。
| F1 2021 | |
| 1920x1080 Ultra High Preset + Raytracing AA:T AF:16x | |
| MSI Titan GT77 HX 13VI | |
| Average NVIDIA GeForce RTX 4090 Laptop GPU (151.6 - 271, n=7) | |
| Asus Zephyrus Duo 16 GX650PY-NM006W | |
| Razer Blade 16 Early 2023 RTX 4090 | |
| 2560x1440 Ultra High Preset + Raytracing AA:T AF:16x | |
| MSI Titan GT77 HX 13VI | |
| Average NVIDIA GeForce RTX 4090 Laptop GPU (140 - 204, n=7) | |
| Asus Zephyrus Duo 16 GX650PY-NM006W | |
| Razer Blade 16 Early 2023 RTX 4090 | |
| 3840x2160 Ultra High Preset + Raytracing AA:T AF:16x | |
| MSI Titan GT77 HX 13VI | |
| Average NVIDIA GeForce RTX 4090 Laptop GPU (89.9 - 115.1, n=5) | |
| Razer Blade 16 Early 2023 RTX 4090 | |
Witcher 3 FPS图表
当用TheWitcher 3 ,在1080p Ultra条件下,Blade 16保持相对稳定,但我们确实看到偶尔的帧数下降。
| low | med. | high | ultra | QHD | 4K DLSS | 4K | |
|---|---|---|---|---|---|---|---|
| GTA V (2015) | 186.6 | 187.3 | 181.6 | 128.7 | 120.5 | 153.5 | |
| The Witcher 3 (2015) | 452 | 408 | 322 | 174.8 | 130 | ||
| Dota 2 Reborn (2015) | 234.8 | 209.9 | 200.2 | 183.5 | 170.8 | ||
| Final Fantasy XV Benchmark (2018) | 194.5 | 155.9 | 122.2 | 115.7 | 83.9 | ||
| X-Plane 11.11 (2018) | 197.3 | 172.1 | 135.6 | 113.1 | |||
| Far Cry 5 (2018) | 162 | 167 | 144 | 146 | 100 | ||
| Strange Brigade (2018) | 432 | 380 | 350 | 328 | 256 | 129.5 | |
| F1 2021 (2021) | 433 | 341 | 299 | 151.6 | 151.5 | 103.6 | |
| Cyberpunk 2077 1.6 (2022) | 100.7 | 97.5 | 96.6 | 86.7 | 45.4 | ||
| F1 22 (2022) | 254 | 264 | 223 | 114.3 | 79.7 | 44 | |
| Call of Duty Modern Warfare 2 2022 (2022) | 177 | 169 | 160 | 154 | 122 | 112 | 75 |
| The Witcher 3 v4 (2023) | 220 | 154.1 | 137.5 | 120.4 | 83.3 | 41.6 |
更多信息可以在我们专门的 NvidiaGeForce RTX 4090 Laptop GPU页面。此外,请务必查看我们对 RTX 4080和RTX 4090,以及 RTX 4050, RTX 4060, 和RTX 4070 笔记本电脑GPU进行详细的性能比较。
排放:高噪音和高热量输出
系统噪音
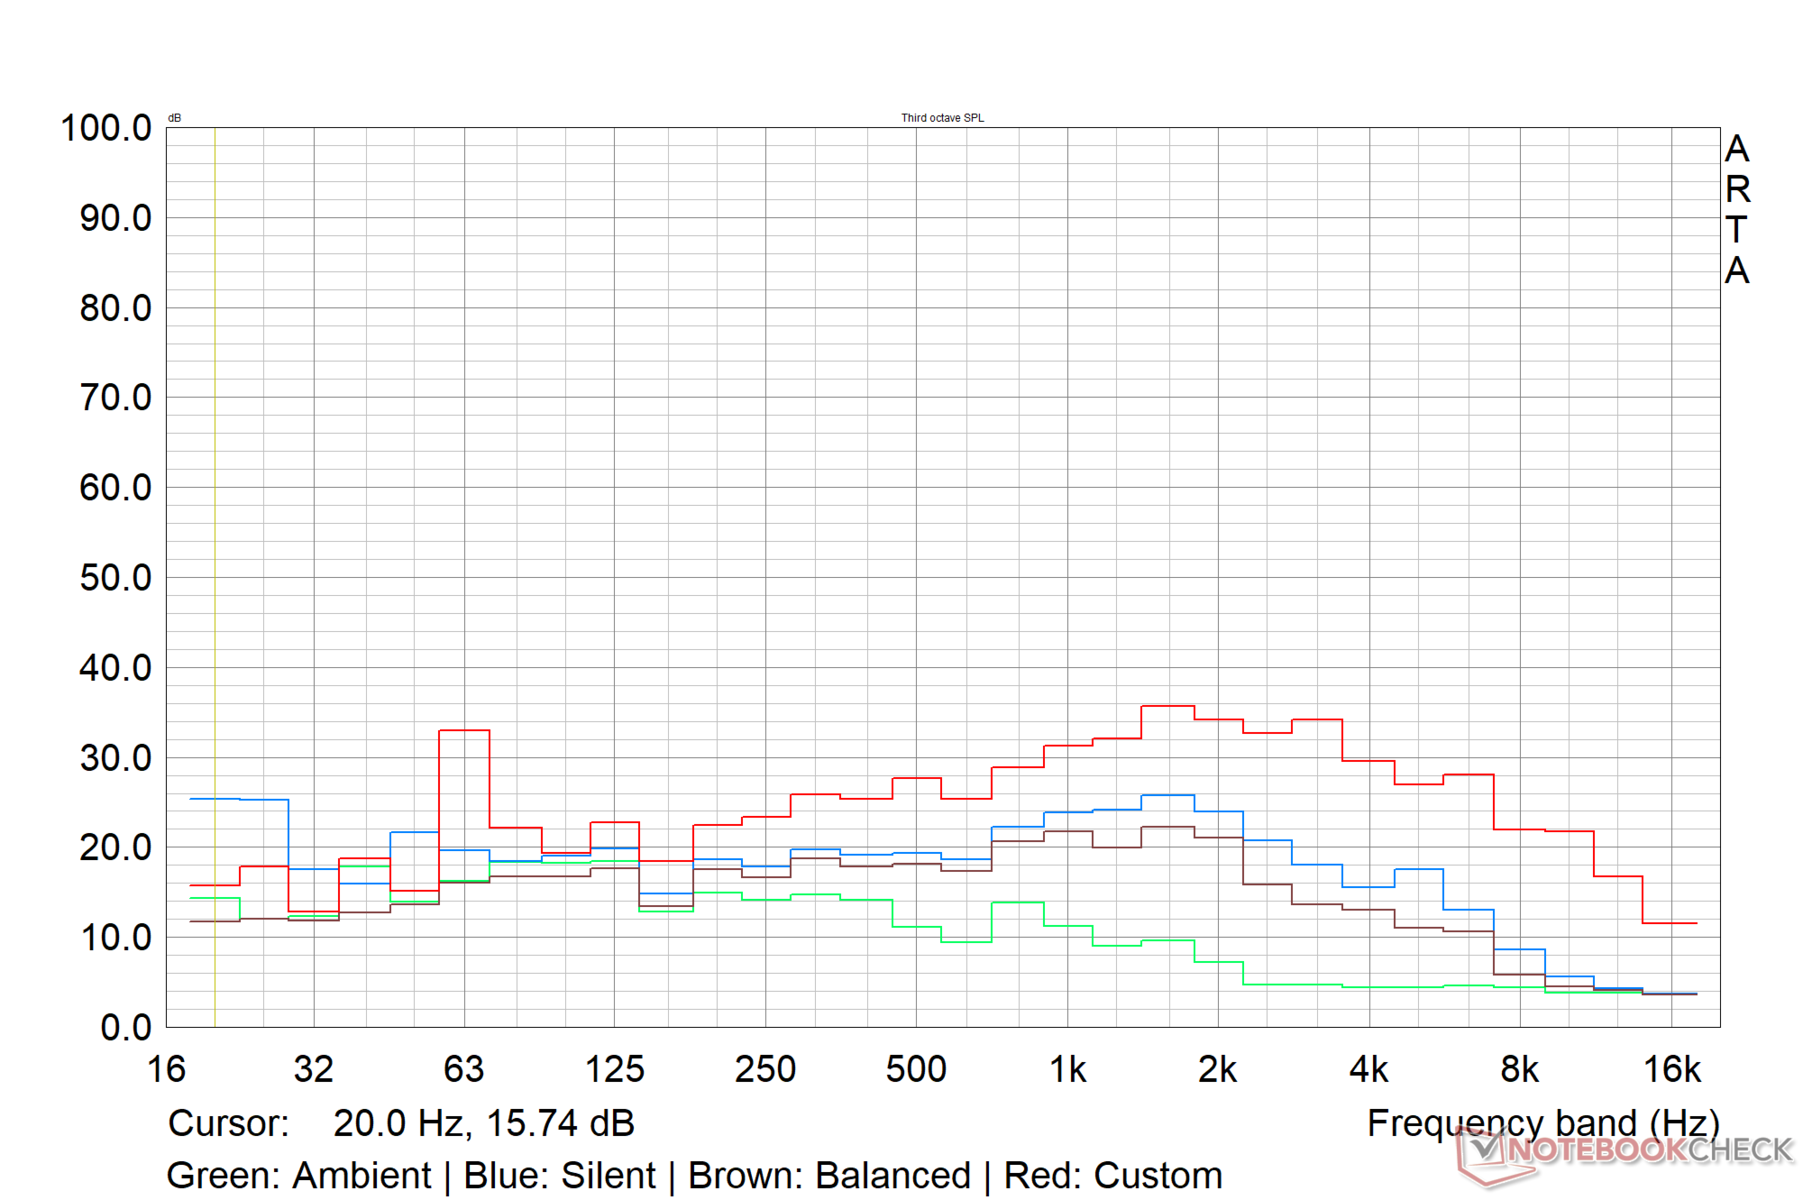
刀锋16在受到压力时,其风扇的转速会相当高。在Prime95和FurMark的综合负载下,我们记录的最大声压级(SPL)为46.7 db(A),在测试的自定义配置文件中,在1080p Ultra下的 Witcher 3。
平衡模式下的风扇噪音更容易忍受,其最大发射量仅徘徊在41分贝(A)的水平。在静音模式下,无论负载如何,风扇噪音始终保持在35分贝(A)以下。
| 性能设置 | 空闲分贝(A) | 负载平均分贝(A) | 负载最大分贝(A) | Witcher 3 分贝(A) |
|---|---|---|---|---|
| 静音 | 23.65 | 33.12 | 31.03 | 33.90 |
| 平衡型 | 23.65 | 30.03 | 38.20 | 40.69 |
| 定制(CPU Boost / GPU High) | 23.65 | 43.35 | 46.72 | 46.65 |
Noise level
| Idle |
| 23.65 / 23.65 / 23.65 dB(A) |
| Load |
| 43.35 / 46.72 dB(A) |
 | ||
30 dB silent 40 dB(A) audible 50 dB(A) loud |
||
min: | ||
| Razer Blade 16 Early 2023 RTX 4090 i9-13950HX, GeForce RTX 4090 Laptop GPU | Eluktronics Mech-17 GP2 i9-13900HX, GeForce RTX 4090 Laptop GPU | Asus Zephyrus Duo 16 GX650PY-NM006W R9 7945HX, GeForce RTX 4090 Laptop GPU | MSI Titan GT77 HX 13VI i9-13950HX, GeForce RTX 4090 Laptop GPU | Razer Blade 16 Early 2023 i9-13950HX, GeForce RTX 4080 Laptop GPU | Lenovo Legion Pro 7 16IRX8H i9-13900HX, GeForce RTX 4080 Laptop GPU | Razer Blade 18 RTX 4070 i9-13950HX, GeForce RTX 4070 Laptop GPU | |
|---|---|---|---|---|---|---|---|
| Noise | -15% | -20% | -21% | -2% | -19% | -5% | |
| off / environment * (dB) | 20.84 | 25.2 -21% | 23.9 -15% | 24.6 -18% | 23 -10% | 24 -15% | 23.5 -13% |
| Idle Minimum * (dB) | 23.65 | 28 -18% | 23.9 -1% | 29.2 -23% | 23 3% | 26 -10% | 23.8 -1% |
| Idle Average * (dB) | 23.65 | 28 -18% | 32.9 -39% | 29.2 -23% | 23 3% | 28 -18% | 23.8 -1% |
| Idle Maximum * (dB) | 23.65 | 30.4 -29% | 36.5 -54% | 29.2 -23% | 23.6 -0% | 34 -44% | 26.8 -13% |
| Load Average * (dB) | 43.35 | 41 5% | 42.9 1% | 50.7 -17% | 39 10% | 47 -8% | 37.3 14% |
| Witcher 3 ultra * (dB) | 46.7 | 50.7 -9% | 51.2 -10% | 53.3 -14% | 51.6 -10% | 55 -18% | 48 -3% |
| Load Maximum * (dB) | 46.72 | 52.6 -13% | 56 -20% | 61 -31% | 51.3 -10% | 56 -20% | 53.5 -15% |
* ... smaller is better
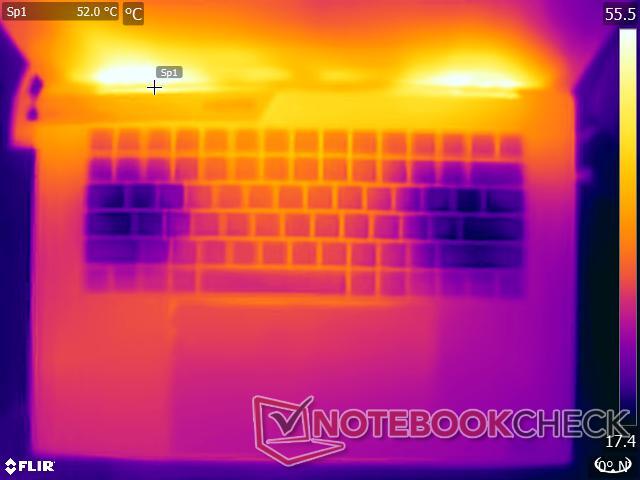
温度
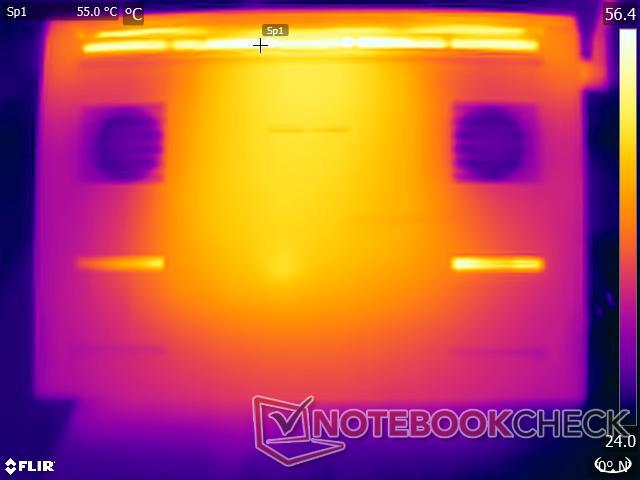
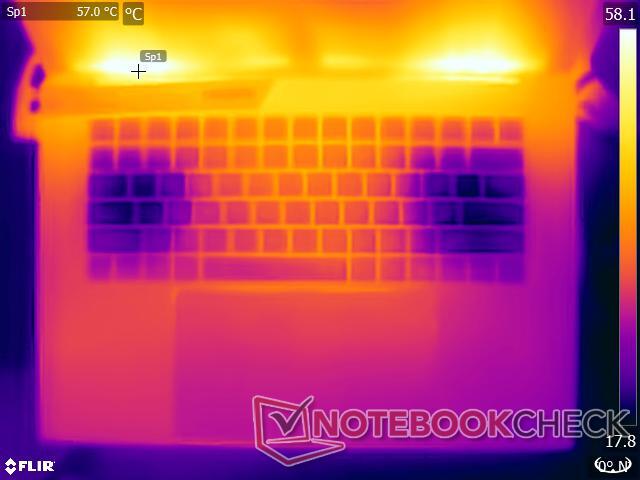
当涉及到负载下的表面温度时,Razer Blade 16并不完全是一个冷静的客户。我们记录了最高的54.2°C,同时在1080p Ultra下用TheWitcher 3进行压力测试,而Prime95和FurMark的综合负载导致机箱顶部中心的热点为52°C。
大部分的热量都集中在顶排。笔记本电脑的底部会变得相当热,所以我们不建议在运行重负载时将设备放在腿上使用。在这种情况下,平衡型或静音型更适合。
掌托部位不会异常发热,但我们确实在左右掌托和触摸板上记录了约40℃的热点。
(-) The maximum temperature on the upper side is 52 °C / 126 F, compared to the average of 40.4 °C / 105 F, ranging from 21.2 to 68.8 °C for the class Gaming.
(-) The bottom heats up to a maximum of 47.6 °C / 118 F, compared to the average of 43.2 °C / 110 F
(+) In idle usage, the average temperature for the upper side is 30.6 °C / 87 F, compared to the device average of 33.9 °C / 93 F.
(-) Playing The Witcher 3, the average temperature for the upper side is 44.9 °C / 113 F, compared to the device average of 33.9 °C / 93 F.
(-) The palmrests and touchpad can get very hot to the touch with a maximum of 40.6 °C / 105.1 F.
(-) The average temperature of the palmrest area of similar devices was 28.8 °C / 83.8 F (-11.8 °C / -21.3 F).
显示器部分地阻挡了排气管,导致该区域的热量积聚过多。显示器底座也因此而大幅升温。
理想情况下,Razer应该在显示器底座和排风口之间提供更多的间隙。


| Razer Blade 16 Early 2023 RTX 4090 i9-13950HX, GeForce RTX 4090 Laptop GPU | Eluktronics Mech-17 GP2 i9-13900HX, GeForce RTX 4090 Laptop GPU | Asus Zephyrus Duo 16 GX650PY-NM006W R9 7945HX, GeForce RTX 4090 Laptop GPU | MSI Titan GT77 HX 13VI i9-13950HX, GeForce RTX 4090 Laptop GPU | Razer Blade 16 Early 2023 i9-13950HX, GeForce RTX 4080 Laptop GPU | Lenovo Legion Pro 7 16IRX8H i9-13900HX, GeForce RTX 4080 Laptop GPU | Razer Blade 18 RTX 4070 i9-13950HX, GeForce RTX 4070 Laptop GPU | |
|---|---|---|---|---|---|---|---|
| Heat | 11% | 8% | 15% | 11% | -6% | 12% | |
| Maximum Upper Side * (°C) | 52 | 39 25% | 44.2 15% | 40.6 22% | 40 23% | 48 8% | 39.2 25% |
| Maximum Bottom * (°C) | 47.6 | 44 8% | 46.8 2% | 41.1 14% | 37.6 21% | 49 -3% | 35.6 25% |
| Idle Upper Side * (°C) | 33 | 31 6% | 29.2 12% | 26.2 21% | 32.4 2% | 40 -21% | 31.8 4% |
| Idle Bottom * (°C) | 30.6 | 29.8 3% | 30.2 1% | 30.3 1% | 31.4 -3% | 33 -8% | 33.2 -8% |
* ... smaller is better
压力测试
刀片16使用一个蒸汽室冷却系统,以保持其强大的组件冷却。蒸气室在防止过度节流方面做得很好,我们的压力测试证明了这一点。
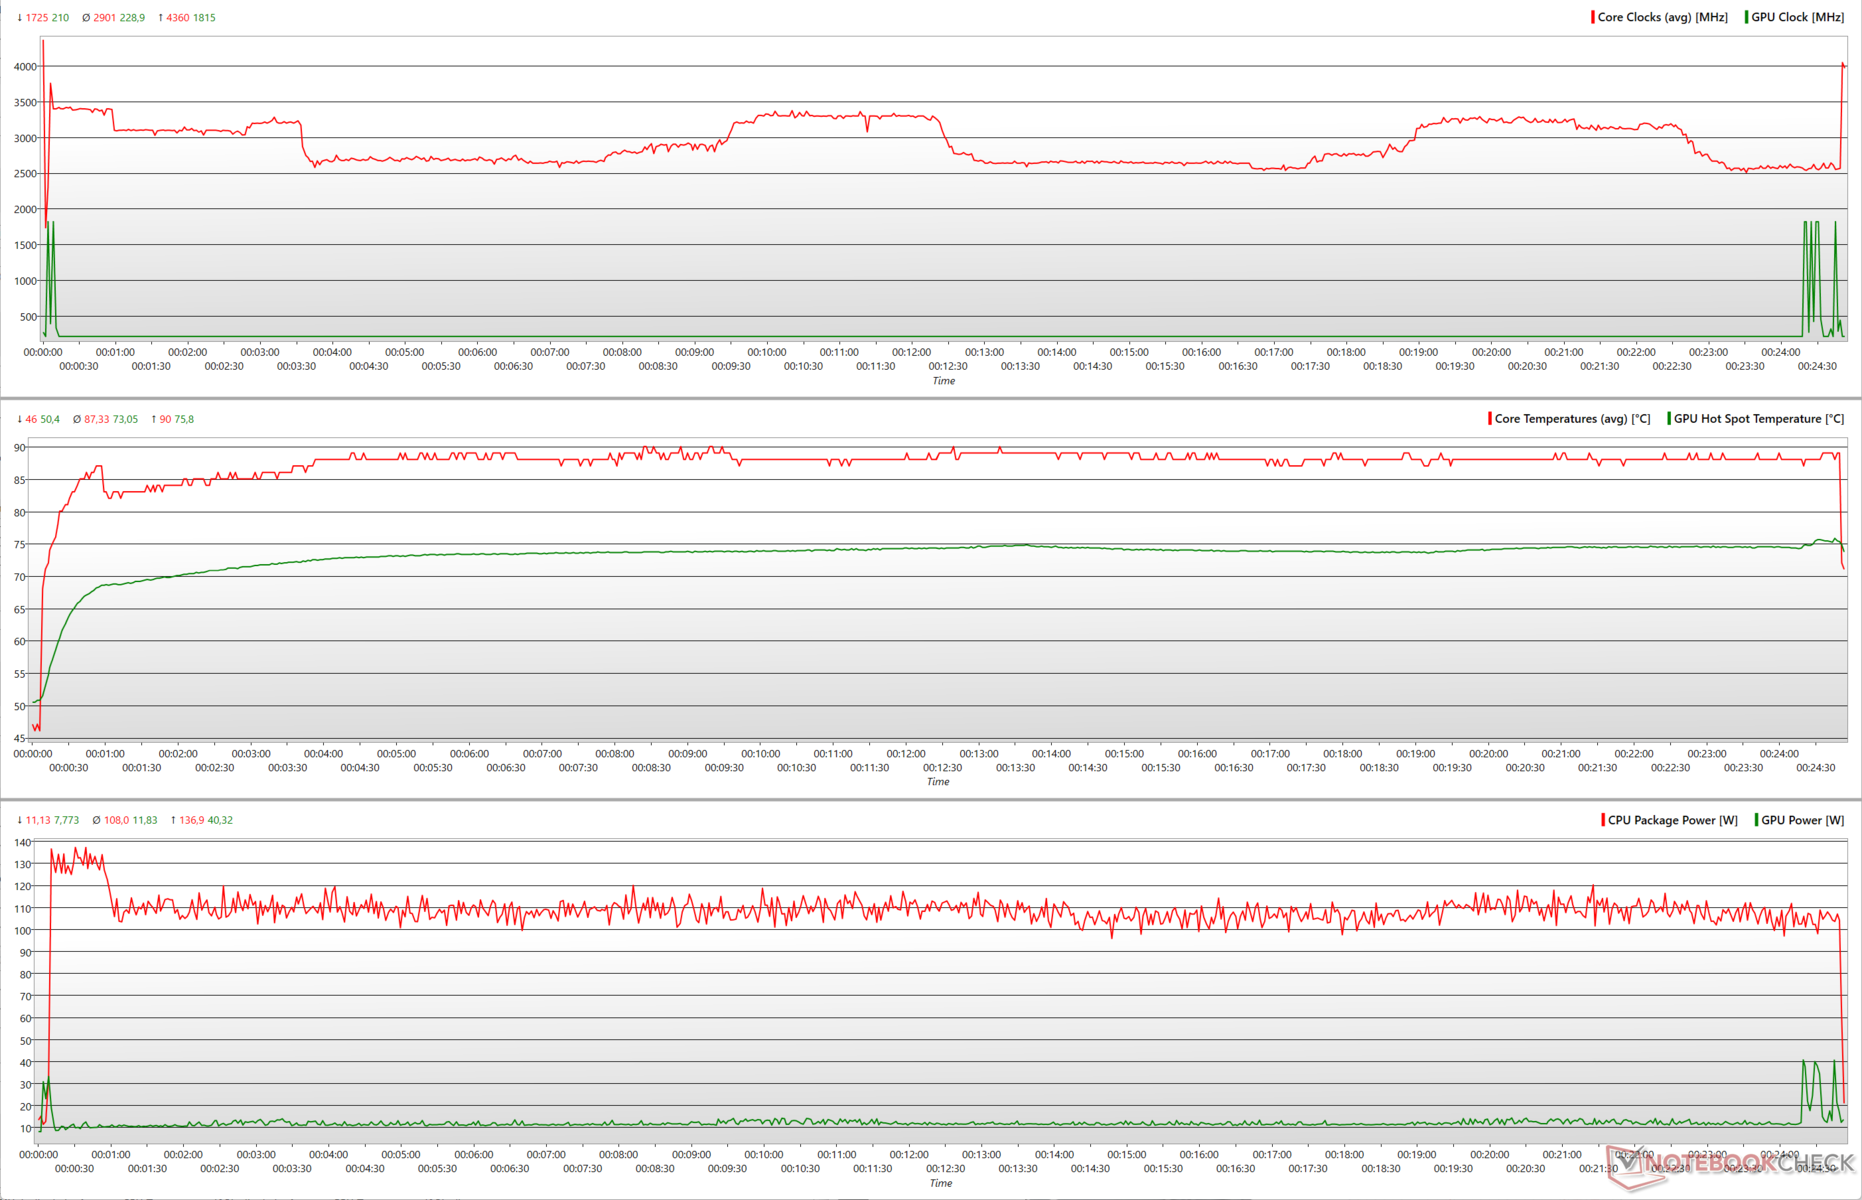
当用Prime95原地大型FFT进行压力测试时,显示酷睿i9-13950HX提升到4.36 GHz,而核心温度达到90℃。在测试的剩余时间里,CPU可以瞬间利用高达137W的功率,然后下降到大约100W。
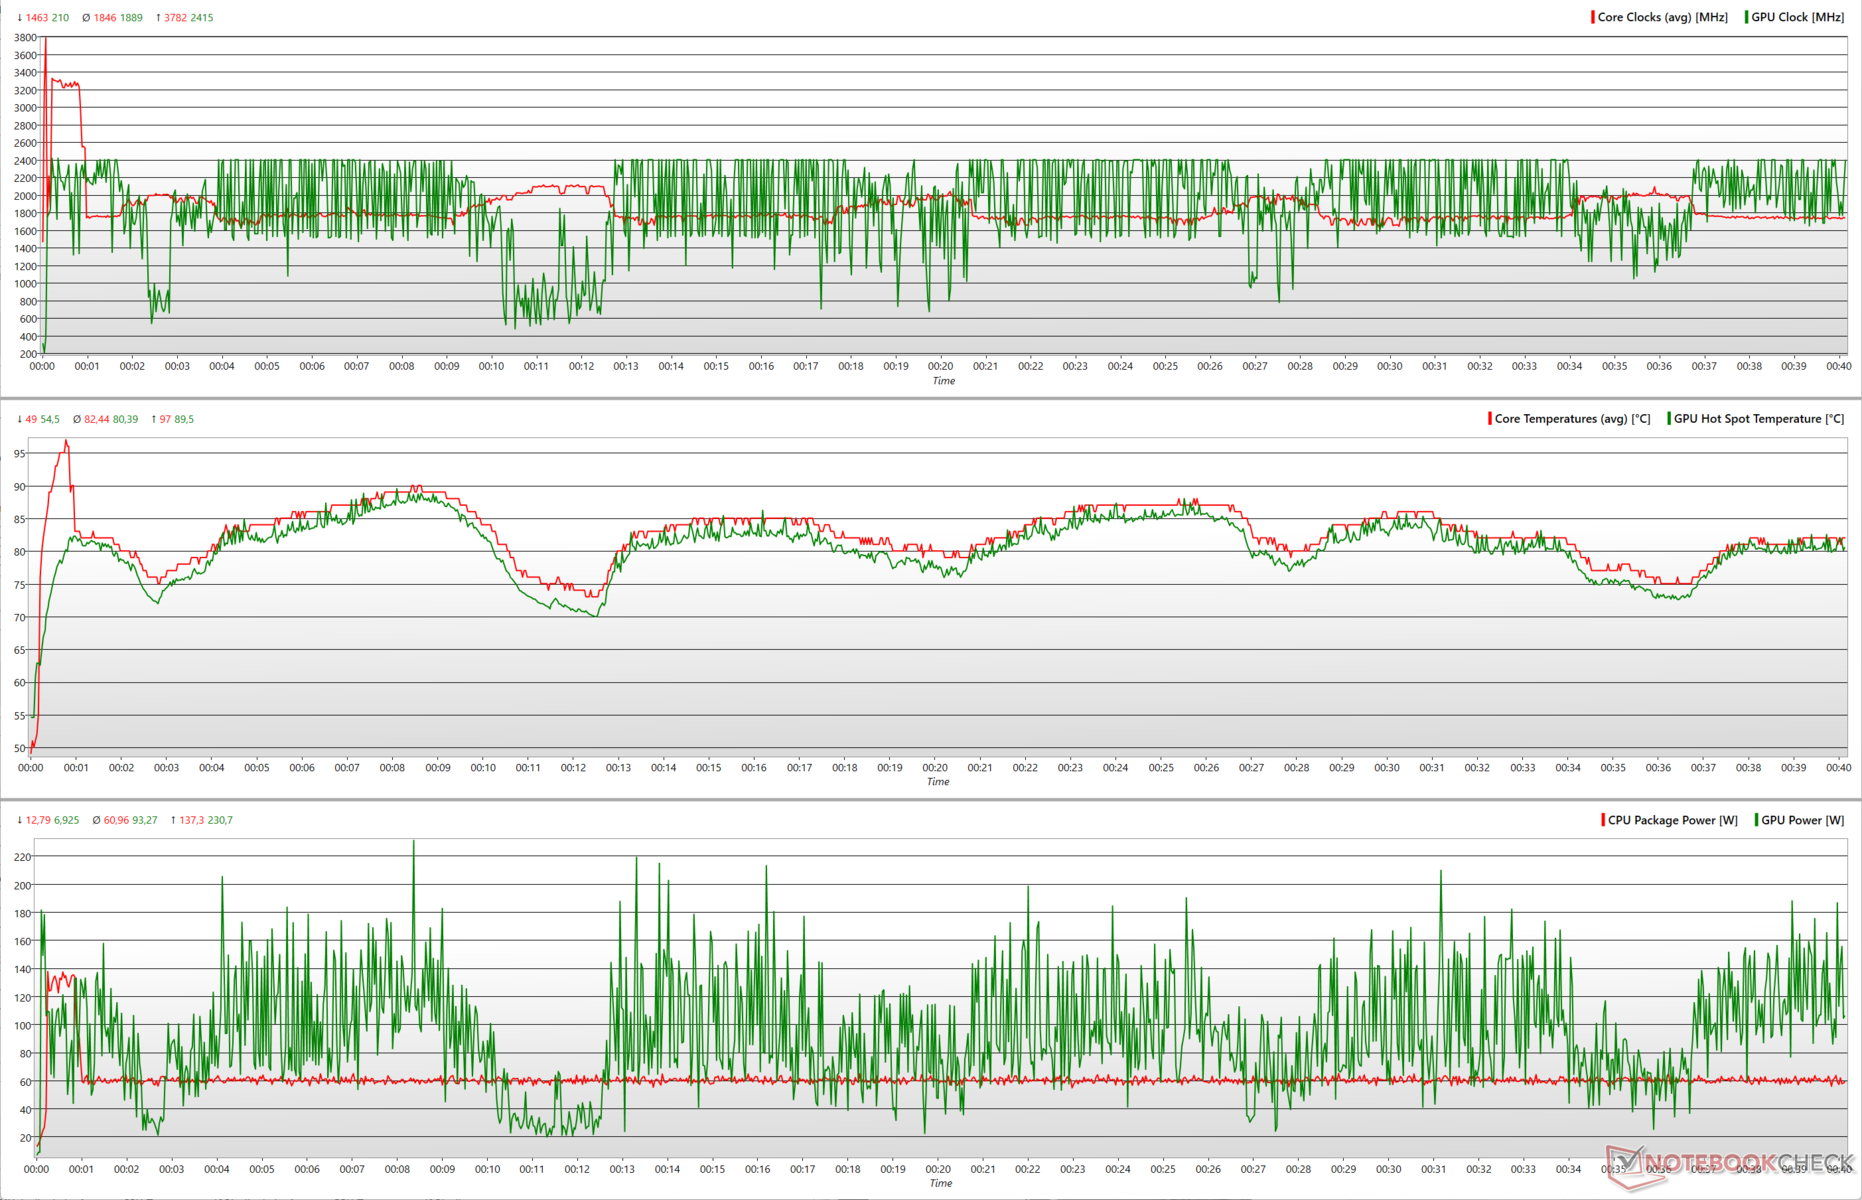
在加入FurMark后,在无AA的情况下以1280 x 720运行,Blade 16牺牲了一些CPU功率,为RTX 4090 Laptop GPU提供了一些空间。然而,每当CPU试图从1.8 GHz提升到约2.2 GHz时,GPU的时钟就会明显下降。
与单独的Prime95压力相比,组合负载中的平均CPU封装功率从108 W下降到61 W。这使得RTX 4090能够吸收这些额外的功率,瞬间峰值高达231 W,导致峰值时钟为2415 MHz。
在TheWitcher 31080p Ultra的压力下,GPU的时钟和功率保持相对稳定。平均CPU封装功率进一步降低到42.7瓦,使RTX 4090能够舒适地在157瓦左右的平均水平上行驶。Core i9-13950HX和RTX 4090的平均时钟都接近2.1GHz。
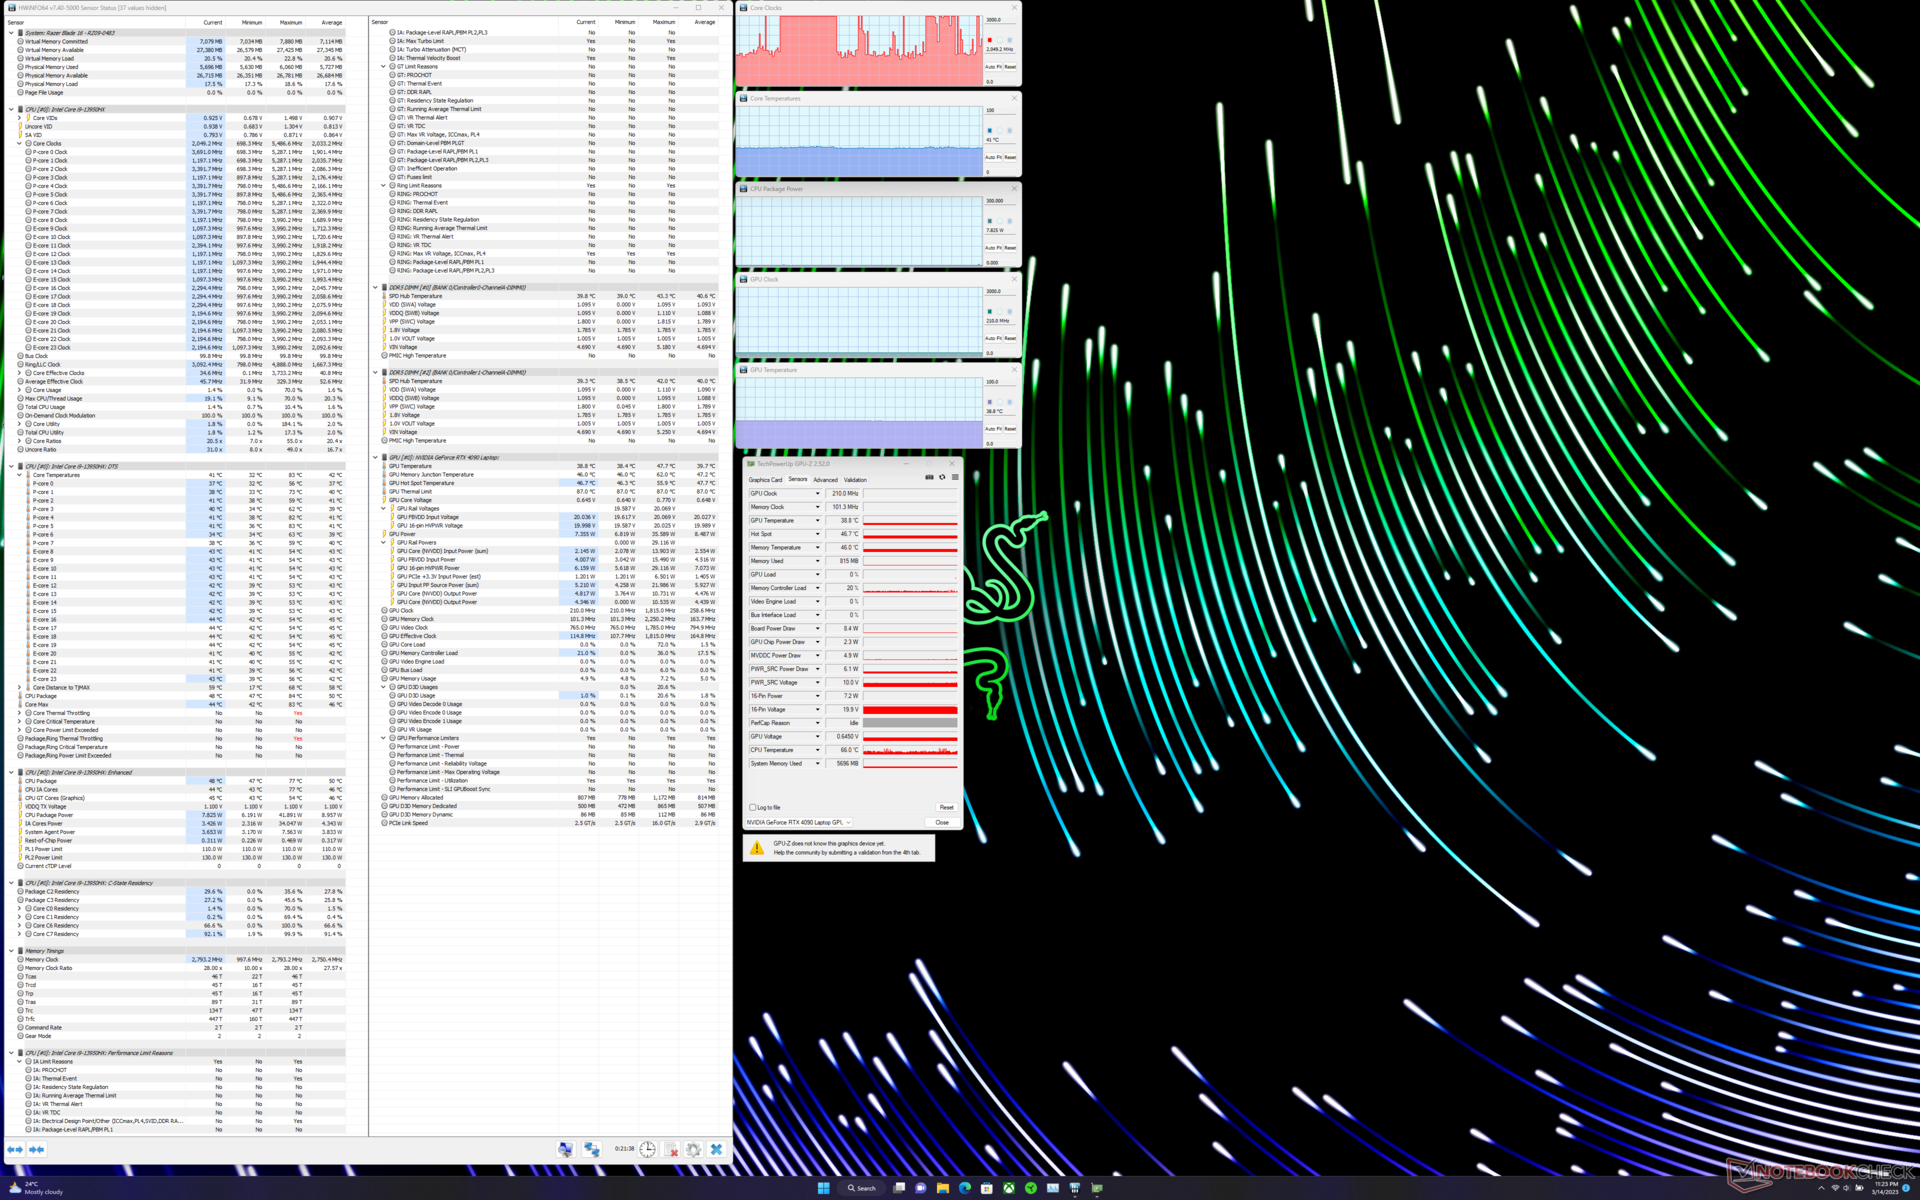
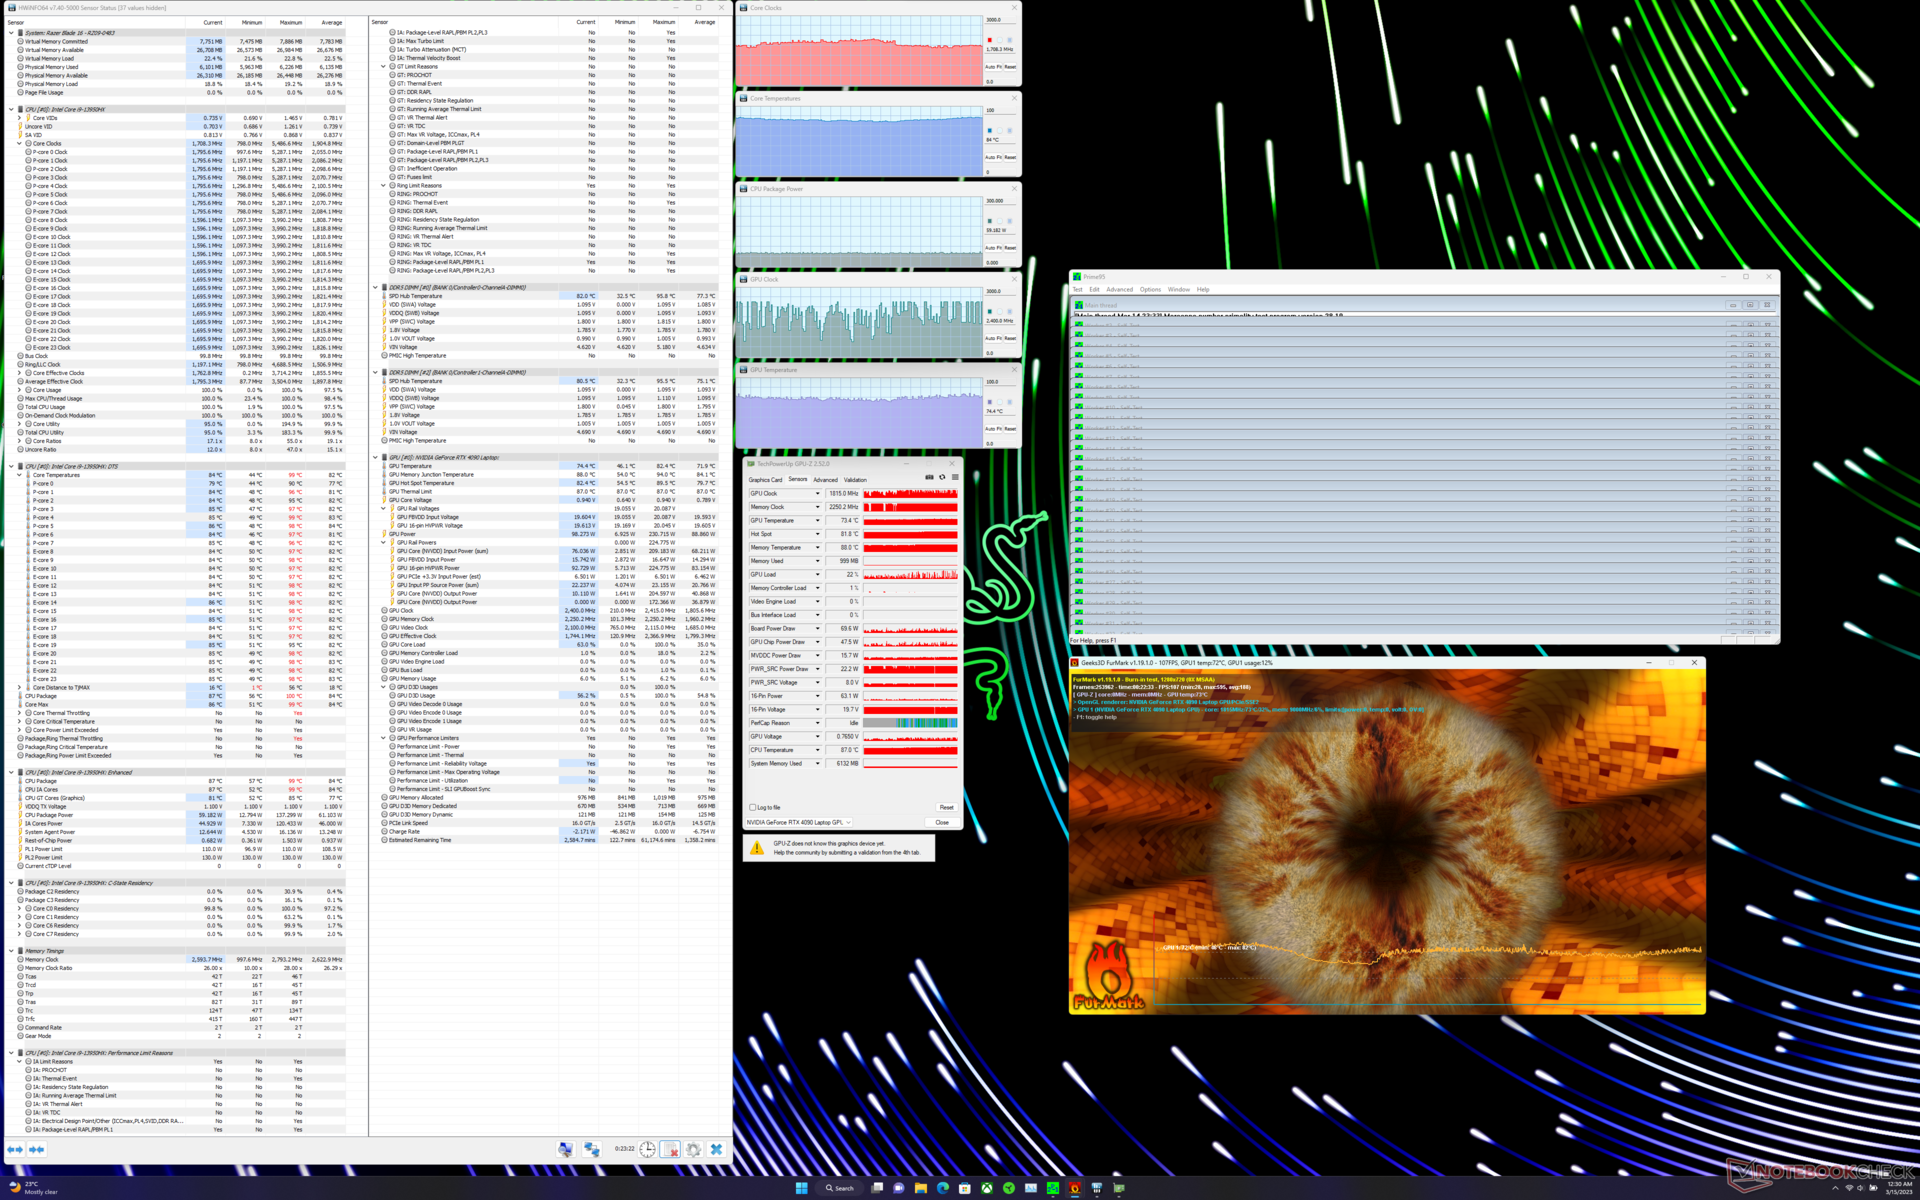
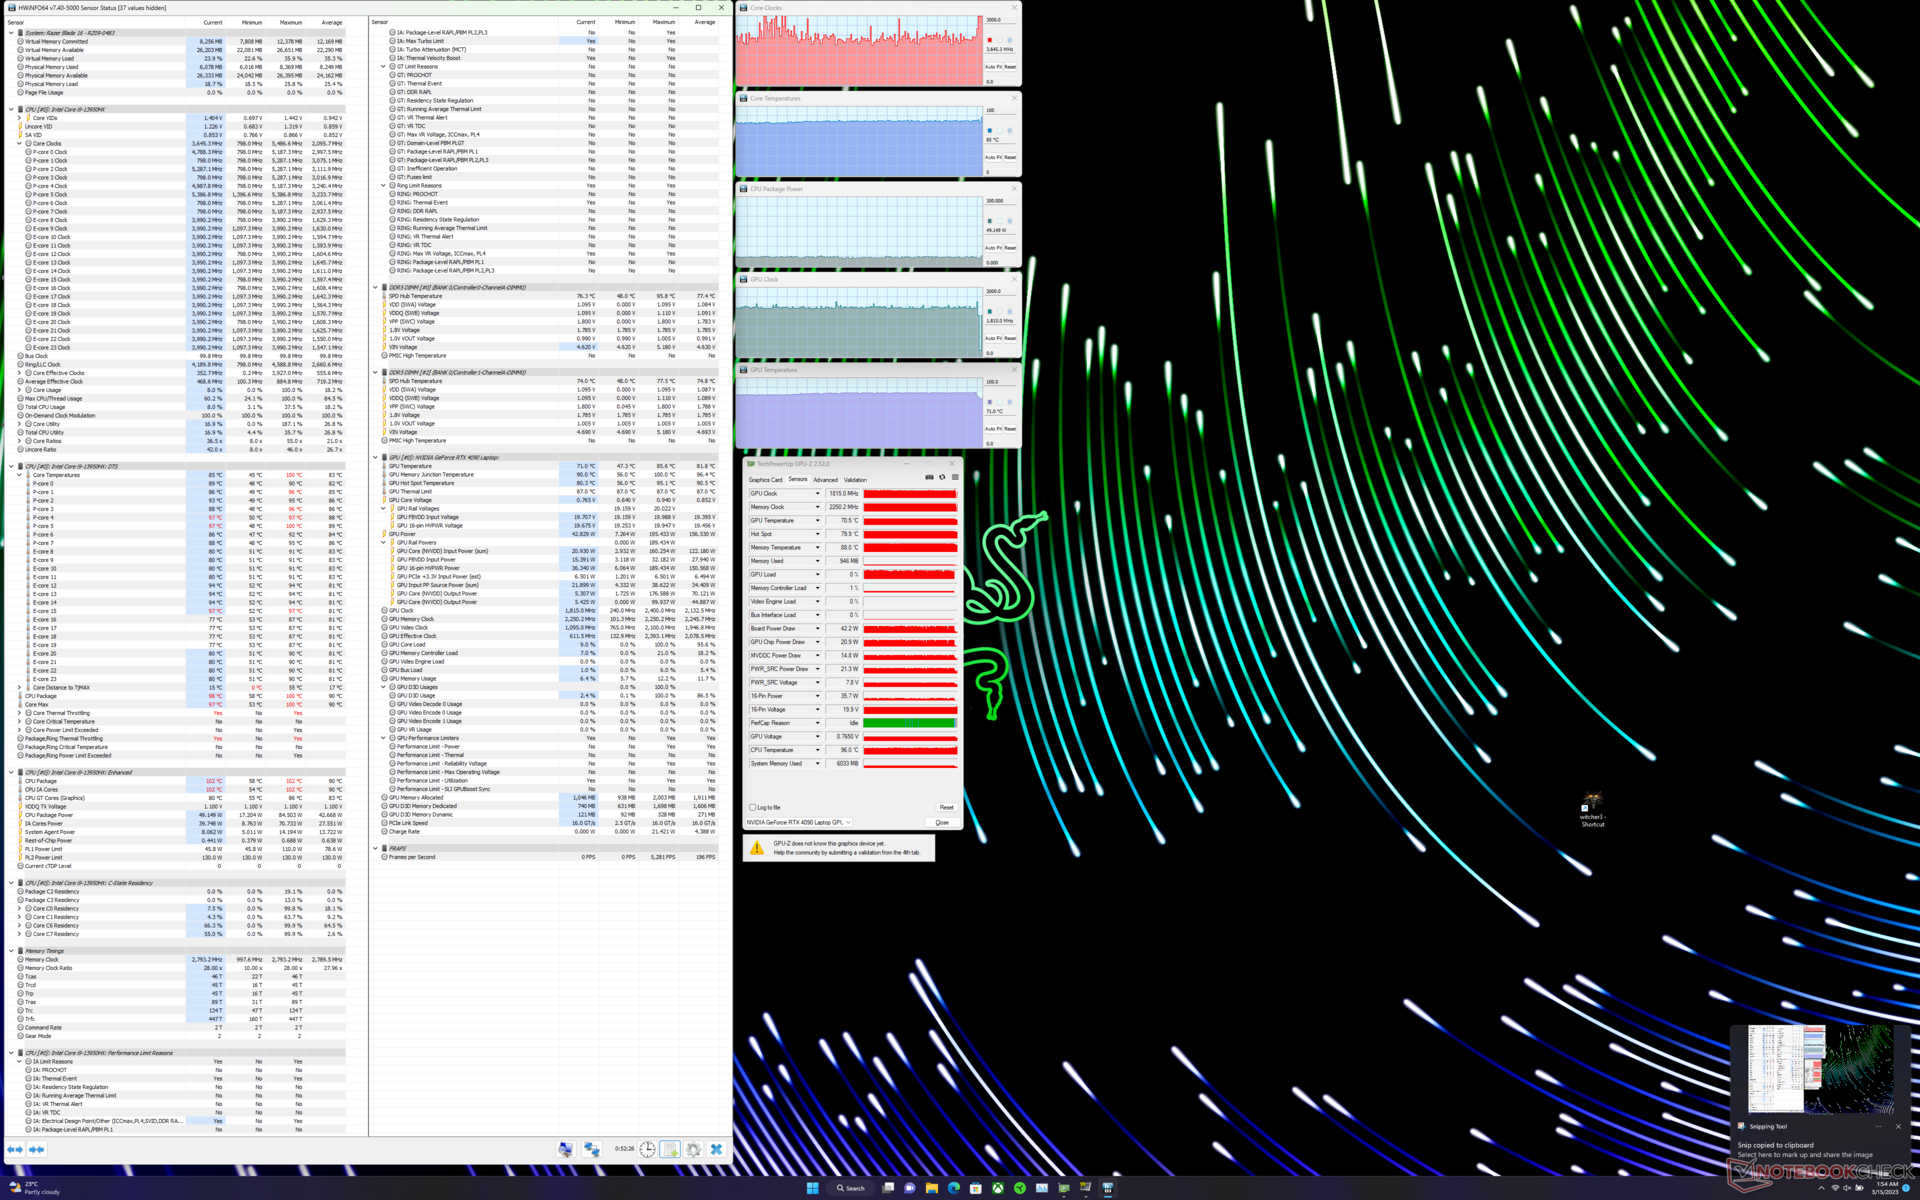
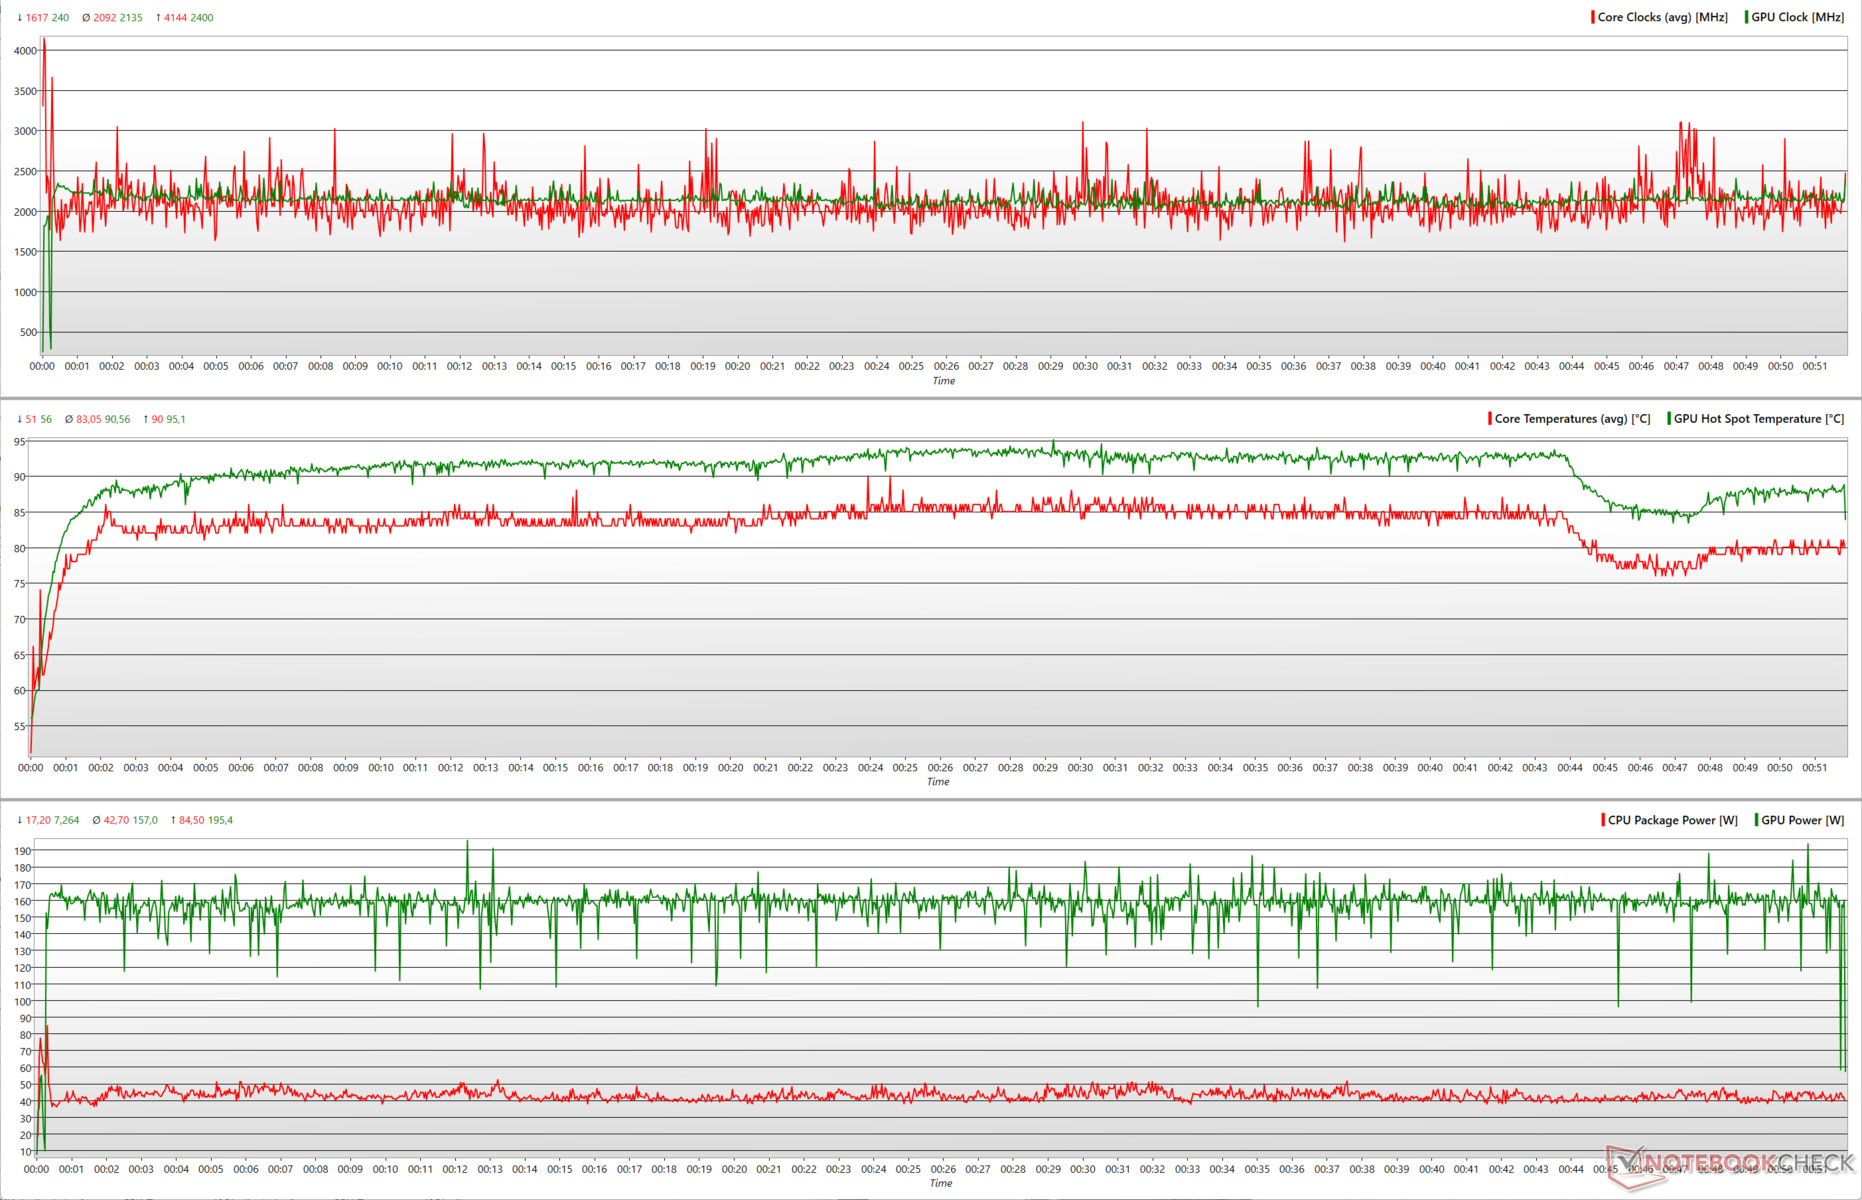
| 压力测试 | CPU时钟(GHz) | GPU时钟(MHz) | CPU平均温度(℃) | GPU平均温度(℃) |
| 系统空闲 | 2.05 | 210 | 42 | 39.7 |
| Prime95 | 2.56 | 210 | 87 | 63.1 |
| Prime95 + FurMark | 1.70 | 1,815 | 82 | 72 |
| TheWitcher 3 | 3.64 | 1,815 | 83 | 81.8 |
发言人
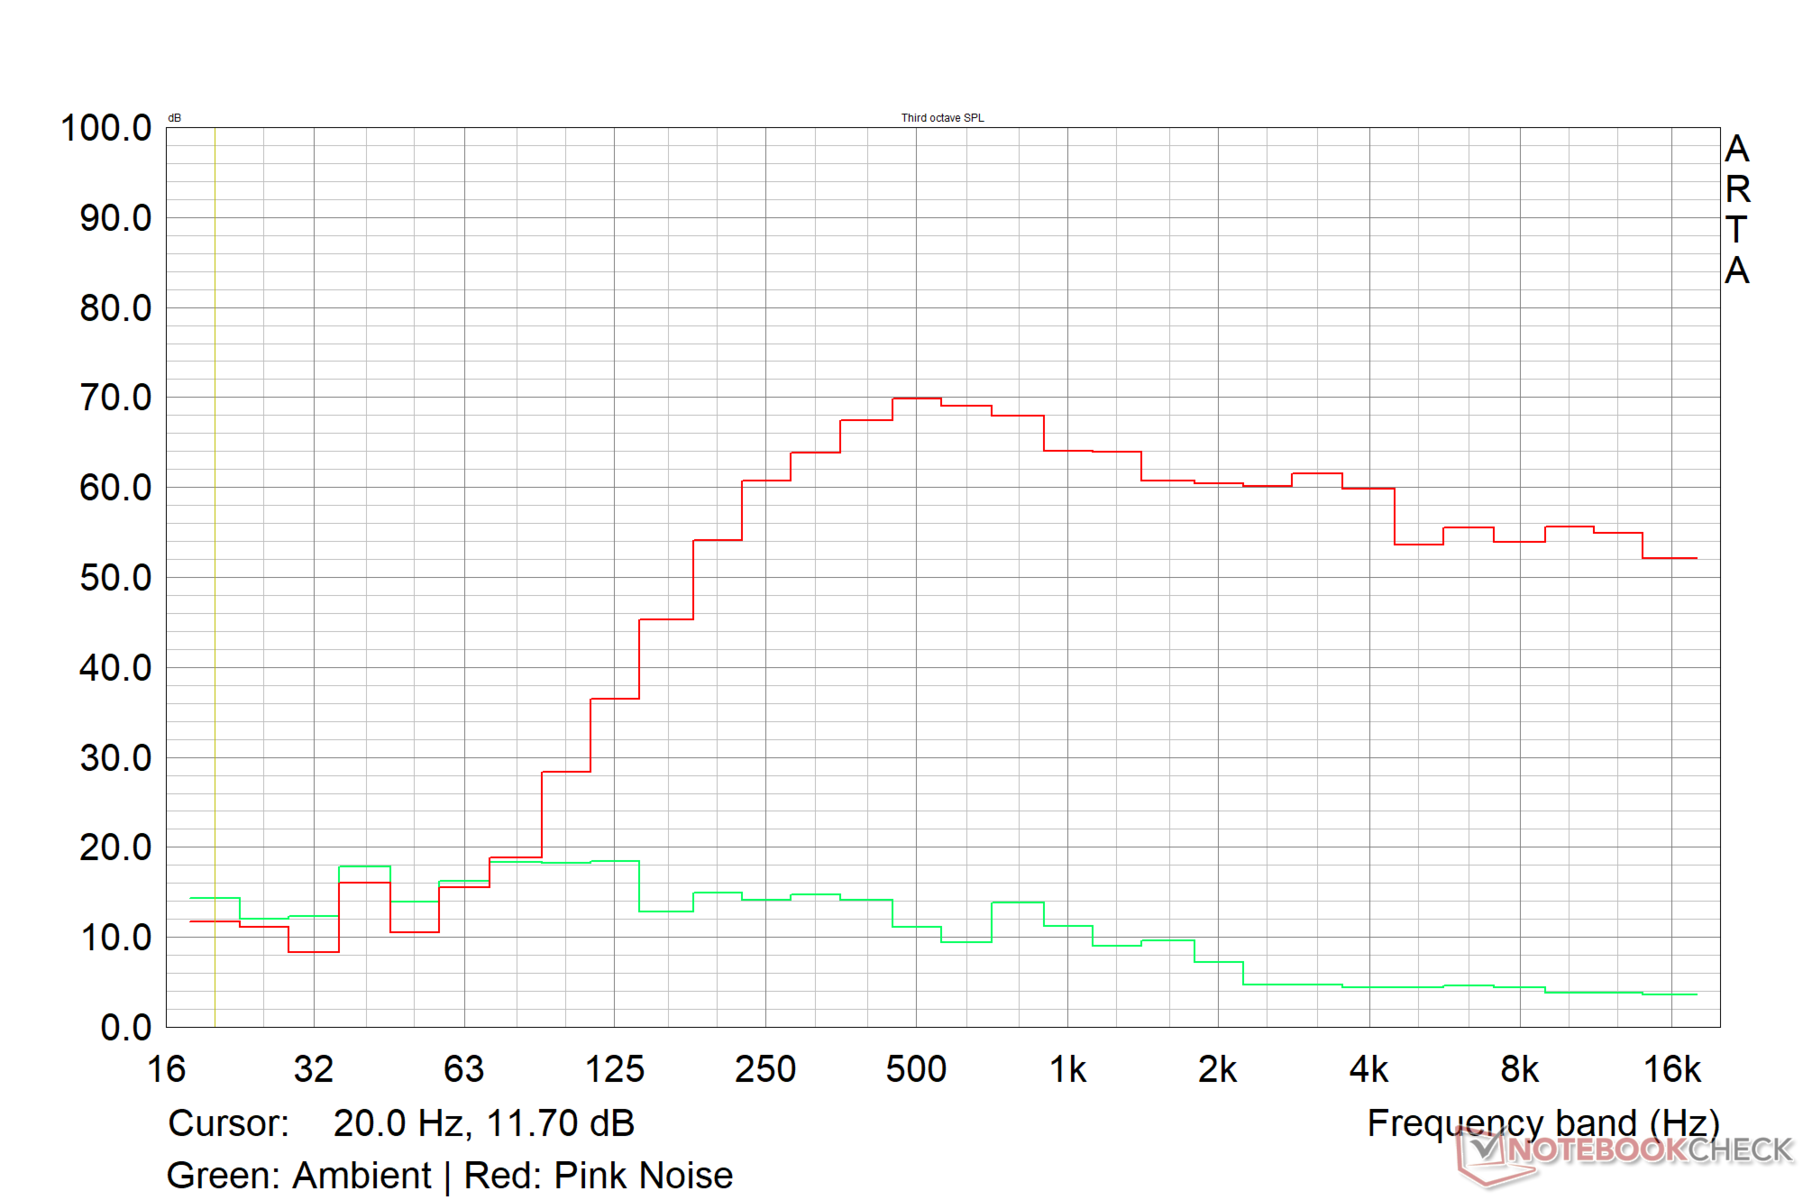
众所周知,Razer为其Blades配备了体面的板载扬声器,Blade 16也不例外。刀锋16配备了两个扬声器和两个低音扬声器,由两个智能放大器供电。
75 dB(A)的峰值声压级似乎比我们之前在Blade 16 RTX 4080和Blade 18上看到的要低一些,但它的声音足以填满一个中等大小的房间。
低音响应很好,但考虑到专用低音单元的存在,肯定会更好。中音和高音层次分明,这对于休闲聆听来说应该是足够的。其他音频连接选项包括一个3.5毫米组合音频插孔和蓝牙5.3。
Razer提供了THX空间音频功能,但不幸的是,即使在更新了音频驱动后,我们也无法让该应用程序工作。
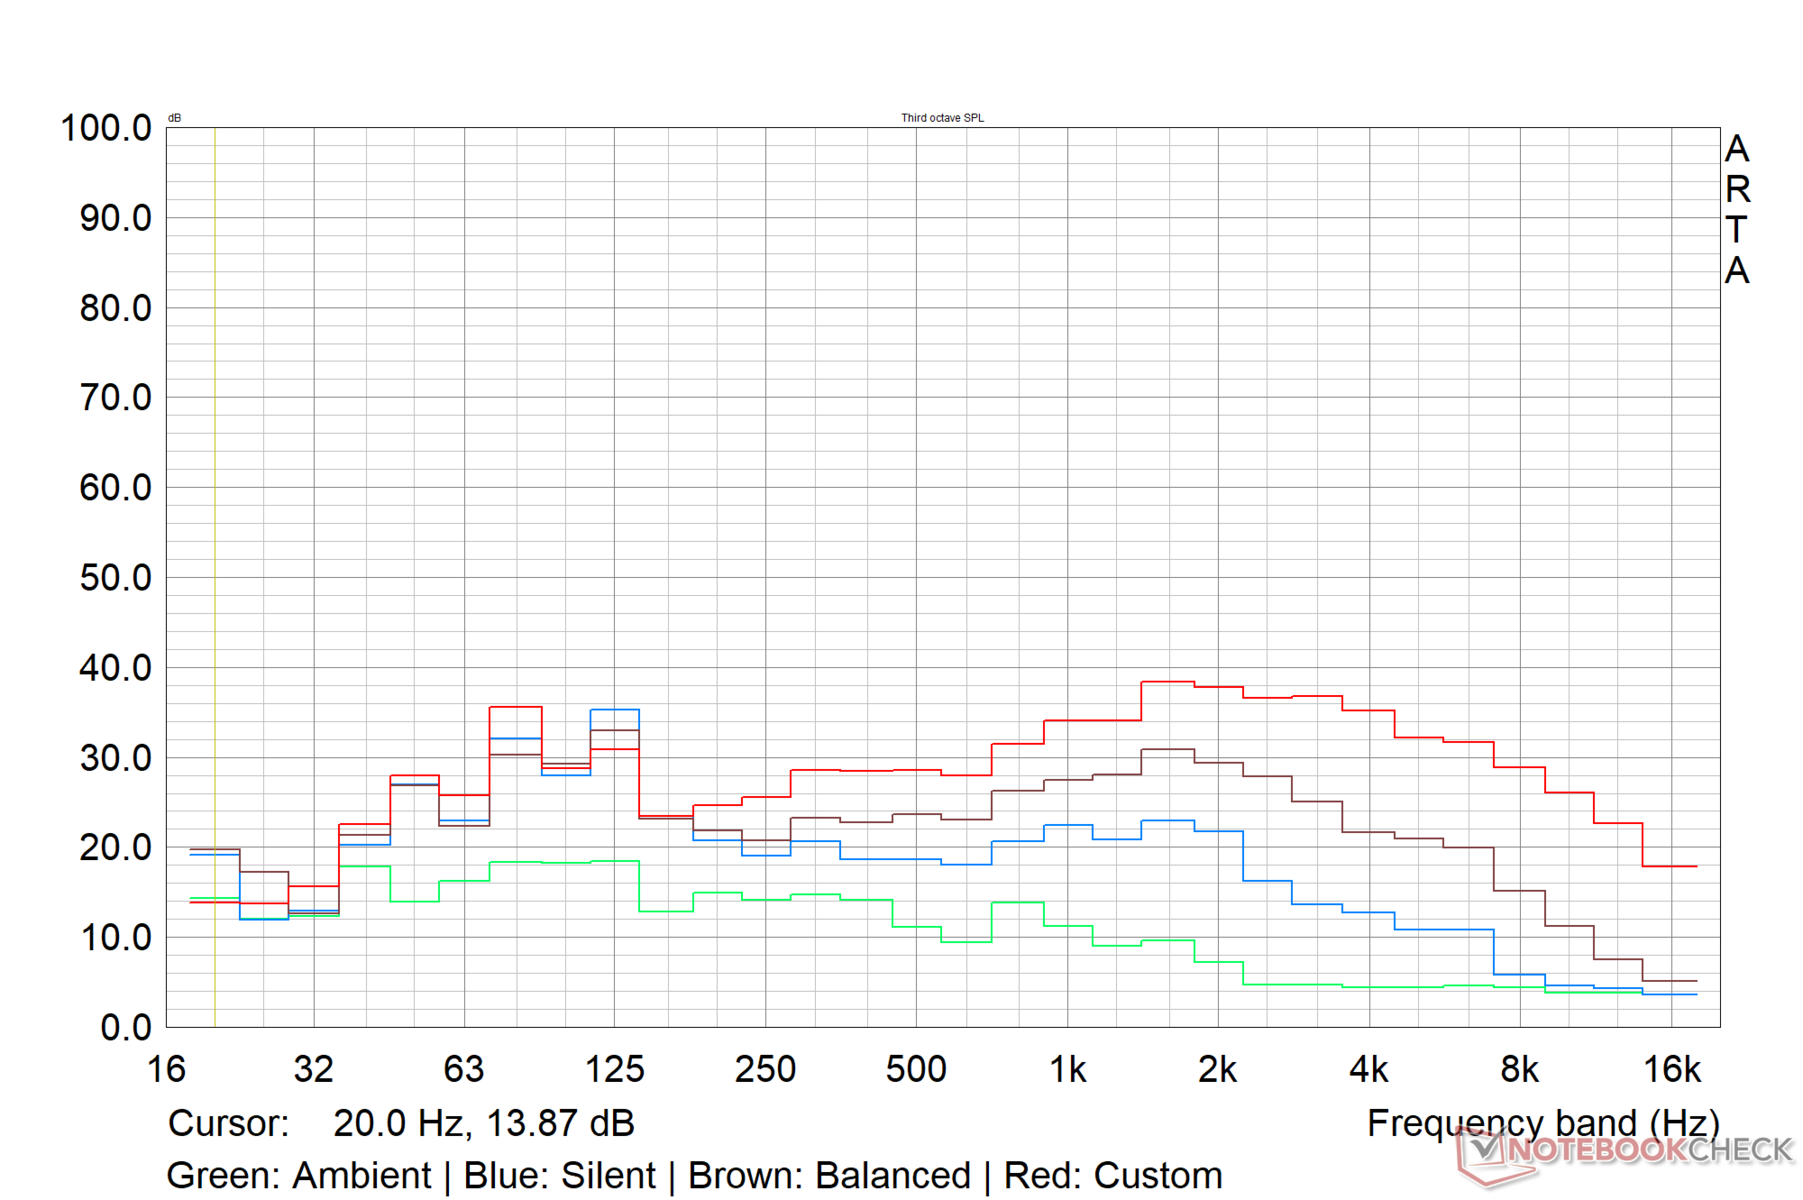
Razer Blade 16 Early 2023 RTX 4090 audio analysis
(±) | speaker loudness is average but good (75 dB)
Bass 100 - 315 Hz
(±) | reduced bass - on average 13.4% lower than median
(±) | linearity of bass is average (14.8% delta to prev. frequency)
Mids 400 - 2000 Hz
(±) | higher mids - on average 5.3% higher than median
(+) | mids are linear (3.8% delta to prev. frequency)
Highs 2 - 16 kHz
(+) | balanced highs - only 3.4% away from median
(+) | highs are linear (4.2% delta to prev. frequency)
Overall 100 - 16.000 Hz
(±) | linearity of overall sound is average (15.6% difference to median)
Compared to same class
» 36% of all tested devices in this class were better, 6% similar, 58% worse
» The best had a delta of 6%, average was 18%, worst was 132%
Compared to all devices tested
» 23% of all tested devices were better, 5% similar, 72% worse
» The best had a delta of 4%, average was 24%, worst was 134%
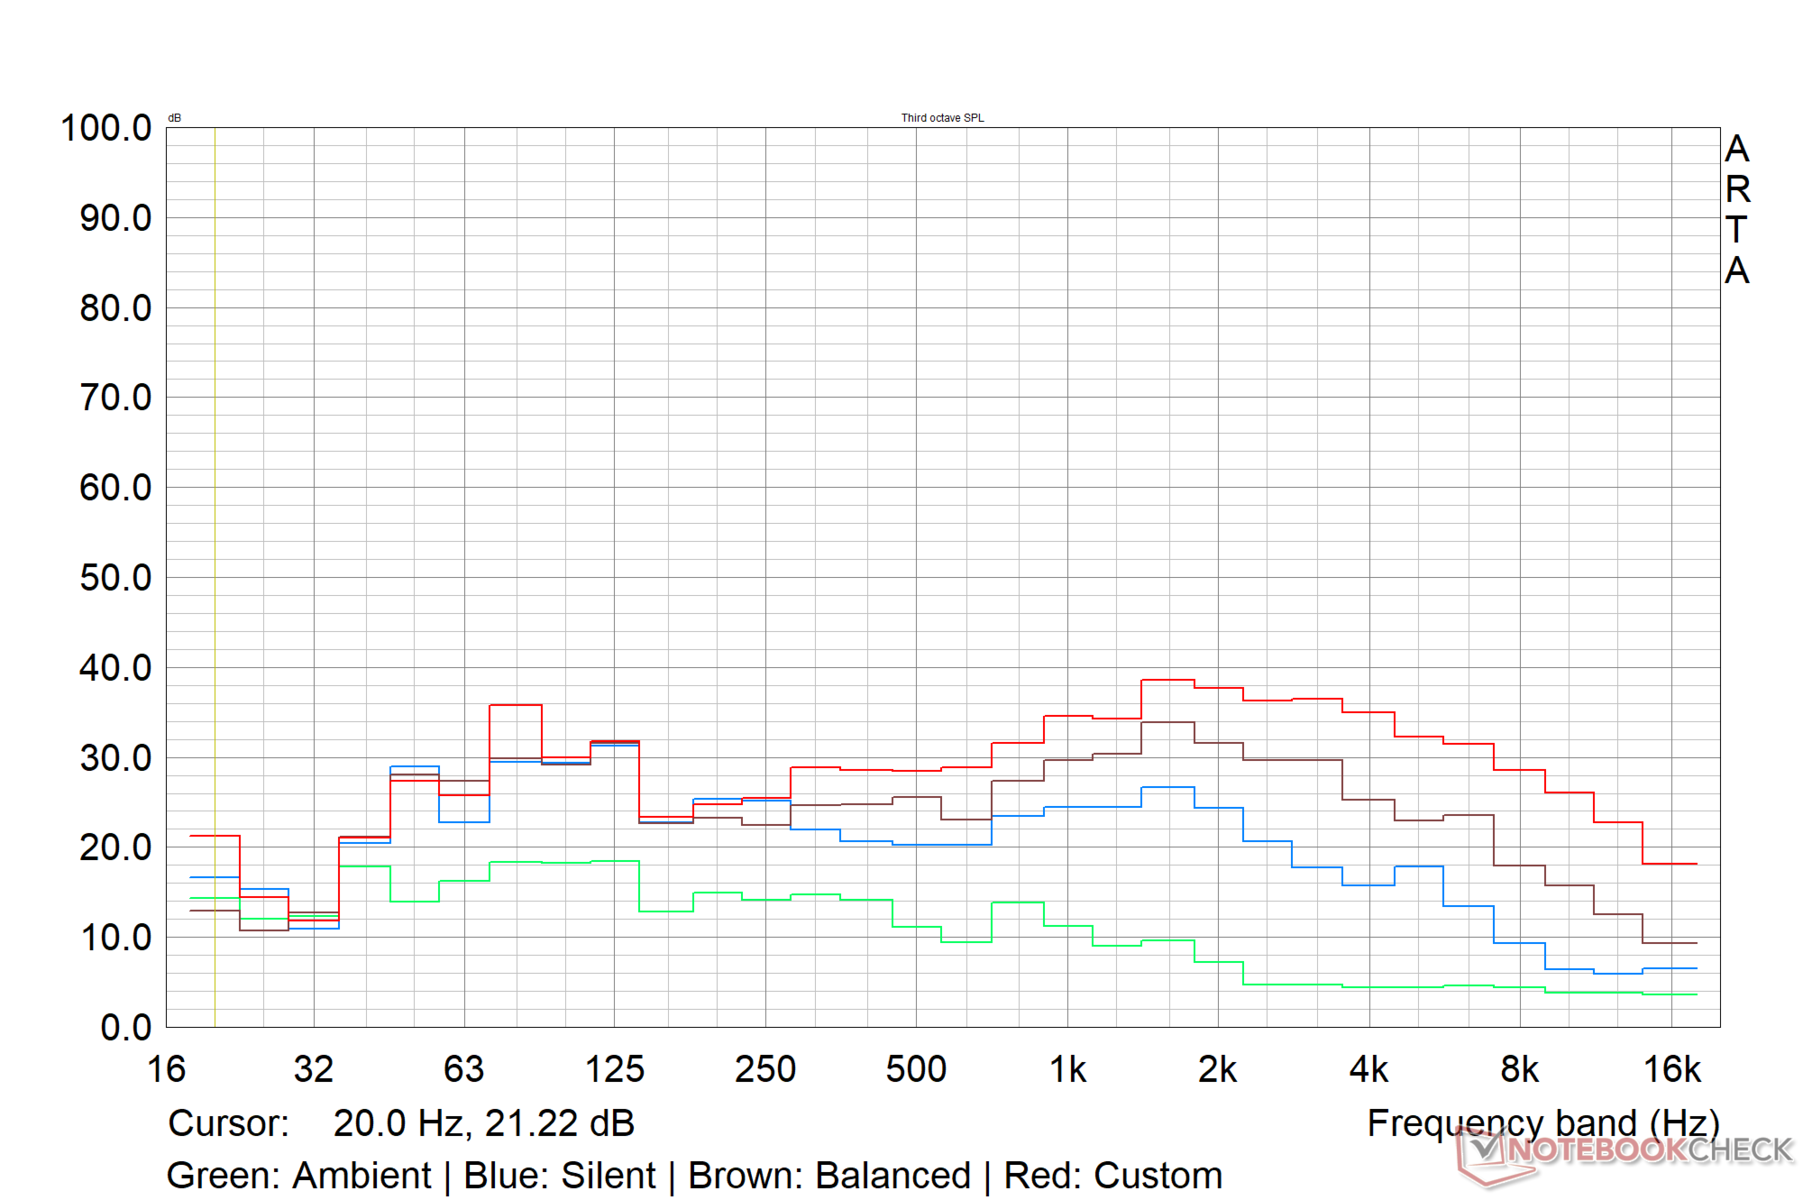
Apple MacBook Pro 16 2021 M1 Pro audio analysis
(+) | speakers can play relatively loud (84.7 dB)
Bass 100 - 315 Hz
(+) | good bass - only 3.8% away from median
(+) | bass is linear (5.2% delta to prev. frequency)
Mids 400 - 2000 Hz
(+) | balanced mids - only 1.3% away from median
(+) | mids are linear (2.1% delta to prev. frequency)
Highs 2 - 16 kHz
(+) | balanced highs - only 1.9% away from median
(+) | highs are linear (2.7% delta to prev. frequency)
Overall 100 - 16.000 Hz
(+) | overall sound is linear (4.6% difference to median)
Compared to same class
» 0% of all tested devices in this class were better, 0% similar, 100% worse
» The best had a delta of 5%, average was 17%, worst was 45%
Compared to all devices tested
» 0% of all tested devices were better, 0% similar, 100% worse
» The best had a delta of 4%, average was 24%, worst was 134%
能源管理:为配置提供经济的电力消耗
消耗功率
刀锋16 RTX 4090的空闲功耗偏高,但对于给定的配置来说,负载下的功耗似乎相当经济。 该功耗模式与我们在上述压力测试中的观察结果基本吻合。
我们在自定义配置文件中记录的最大负载下的峰值功耗接近287W,因此提供的330W GaN电源适配器应该足以满足Blade 16的能源需求。与竞争对手的同类适配器相比,Razer的GaN电源砖更加紧凑和便携。
| Off / Standby | |
| Idle | |
| Load |
|
Key:
min: | |
| Razer Blade 16 Early 2023 RTX 4090 i9-13950HX, GeForce RTX 4090 Laptop GPU, mini-LED, 3840x2400, 16" | Eluktronics Mech-17 GP2 i9-13900HX, GeForce RTX 4090 Laptop GPU, IPS, 2560x1600, 17" | Asus Zephyrus Duo 16 GX650PY-NM006W R9 7945HX, GeForce RTX 4090 Laptop GPU, MiniLED, 2560x1600, 16" | MSI Titan GT77 HX 13VI i9-13950HX, GeForce RTX 4090 Laptop GPU, Mini-LED, 3840x2160, 17.3" | Razer Blade 16 Early 2023 i9-13950HX, GeForce RTX 4080 Laptop GPU, IPS, 2560x1600, 16" | Lenovo Legion Pro 7 16IRX8H i9-13900HX, GeForce RTX 4080 Laptop GPU, IPS, 2560x1600, 16" | Razer Blade 18 RTX 4070 i9-13950HX, GeForce RTX 4070 Laptop GPU, IPS, 2560x1600, 18" | Average NVIDIA GeForce RTX 4090 Laptop GPU | Average of class Gaming | |
|---|---|---|---|---|---|---|---|---|---|
| Power Consumption | 12% | 9% | 14% | 11% | 12% | 2% | 15% | 33% | |
| Idle Minimum * (Watt) | 27.5 | 14 49% | 19.2 30% | 14 49% | 15.2 45% | 18 35% | 24.5 11% | 16.2 ? 41% | 13.2 ? 52% |
| Idle Average * (Watt) | 34.4 | 19.3 44% | 29.7 14% | 21.6 37% | 22.8 34% | 24 30% | 34.1 1% | 23.1 ? 33% | 18.9 ? 45% |
| Idle Maximum * (Watt) | 35.4 | 36.8 -4% | 30.8 13% | 24.8 30% | 49.8 -41% | 32 10% | 47.7 -35% | 34.2 ? 3% | 24.5 ? 31% |
| Load Average * (Watt) | 147.8 | 117.2 21% | 126 15% | 122.5 17% | 121.2 18% | 130 12% | 140 5% | 130.5 ? 12% | 108.8 ? 26% |
| Witcher 3 ultra * (Watt) | 256 | 304 -19% | 258 -1% | 265 -4% | 242 5% | 260 -2% | 202 21% | ||
| Load Maximum * (Watt) | 286.7 | 342.5 -19% | 330 -15% | 418 -46% | 273.7 5% | 320 -12% | 261 9% | 324 ? -13% | 254 ? 11% |
* ... smaller is better
Power Consumption: The Witcher 3 / Stress test
Power Consumption: External monitor
电池寿命
在我们的标准化Wi-Fi浏览测试中,所提供的95.2WHr的双电池组在150尼特下实现了5.45小时的运行时间。这只比雷蛇Blade 16 RTX 4080略胜一筹。
在150尼特下的视频播放运行时间比竞争对手好很多,接近8.5小时。
考虑到强大的内部结构,电池在负载下只能维持约1.5小时。配备RTX 4080和99.9WHr电池的联想Legion Pro 7可以持续53%的时间。
| Razer Blade 16 Early 2023 RTX 4090 i9-13950HX, GeForce RTX 4090 Laptop GPU, 95.2 Wh | Eluktronics Mech-17 GP2 i9-13900HX, GeForce RTX 4090 Laptop GPU, 99 Wh | Asus Zephyrus Duo 16 GX650PY-NM006W R9 7945HX, GeForce RTX 4090 Laptop GPU, 90 Wh | MSI Titan GT77 HX 13VI i9-13950HX, GeForce RTX 4090 Laptop GPU, 99.9 Wh | Razer Blade 16 Early 2023 i9-13950HX, GeForce RTX 4080 Laptop GPU, 95.2 Wh | Lenovo Legion Pro 7 16IRX8H i9-13900HX, GeForce RTX 4080 Laptop GPU, 99.9 Wh | Razer Blade 18 RTX 4070 i9-13950HX, GeForce RTX 4070 Laptop GPU, 91.7 Wh | Average of class Gaming | |
|---|---|---|---|---|---|---|---|---|
| Battery runtime | -12% | -38% | -13% | 3% | 19% | -19% | 8% | |
| H.264 (h) | 8.4 | 3.8 -55% | 6 -29% | 8.28 ? -1% | ||||
| WiFi v1.3 (h) | 5.8 | 5.1 -12% | 4 -31% | 5.3 -9% | 6.1 5% | 5.1 -12% | 4 -31% | 6.96 ? 20% |
| Witcher 3 ultra (h) | 1.6 | |||||||
| Load (h) | 1.4 | 1 -29% | 1.4 0% | 1.4 0% | 2.1 50% | 1.3 -7% | 1.47 ? 5% | |
| Reader / Idle (h) | 8.9 | 6.4 | 7 | 8.71 ? |
Pros
Cons
评语:发烧友的刀锋16,对性能鉴赏家来说并不那么重要
配备RTX 4090笔记本GPU的Razer Blade 16 Early 2023第一眼就唤起了人们的兴奋。光滑的16英寸机箱看起来和感觉都很好,雷蛇必须赞扬它在极简主义和游戏美学之间取得了正确的平衡。虽然很坚固,但由于所有的污渍,它很快就会变成一个碍眼的东西。
Razer在2023年的Blade 16上做对了很多事情。高吞吐量的SD读卡器、稳定的Wi-Fi 6E、体面的1080p网络摄像头、充足的I/O和增加的触摸板面积都是Blade 16的好兆头。键盘很好,有明亮的背光,但雷蛇本可以实现更长的行程和/或纳入光学键。
双模式迷你LED显示屏是Blade 16 Early 2023的主要USP,这也是世界上第一款采用双模式的笔记本电脑。在UHD+ 120赫兹和FHD+ 240赫兹模式之间切换的能力,对同时进行游戏的创作者来说很有用。
然而,在所有的炒作之外,双模式的实施并不完美。切换不是动态的,每次都需要重新启动。此外,FHD+模式显示出明显的模糊画面,而且人们失去了改变颜色配置文件的能力。然而,在UHD+模式下,Blade 16的显示屏以高亮度和华丽的SDR/HDR视觉效果脱颖而出,尽可能地接近OLED质量。
Razer Blade 16 Early 2023是一个诱人的前景,其价格令人瞠目结舌。拥有酷睿i9-13950HX,175W RTX 4090笔记本GPU,以及充满活力的双模式UHD+迷你LED显示屏,新的Razer Blade 16检查了2023年高端游戏笔记本电脑的大部分盒子。然而,以4300美元的价格,人们会期待一个各方面都近乎完美的笔记本电脑,但这里的情况并非如此"。
Blade 16 Early 2023采用了顶级的硬件,包括 英特尔酷睿i9-13950HX和 NvidiaGeForce RTX 4090 笔记本电脑GPU.虽然这个组合轻松地战胜了去年的高端旗舰游戏笔记本电脑,而没有打破汗水,但在2023年,事情已经开始变得极具竞争力。
刀片16落后于其他高端游戏笔记本电脑,如 微星Titan GT77 HX 13VI, 联想Legion Pro 7,以及 华硕ROG Zephyrus Duo 16在CPU性能方面。当涉及到图形负载时,性能的差距有些缩小了。
RTX 4090笔记本电脑的GPU有时会被RTX 4080笔记本电脑的GPU所掩盖。 RTX 4080笔记本GPU由于CPU瓶颈,在1080p Ultra下,该卡在QHD和4K下表现良好,具体取决于标题。任何使用光线追踪的4K Ultra游戏计划都需要启用DLSS 2或DLSS 3 Frame Generation以获得可玩的帧率。
刀锋16的散热能力很强,但肯定还有改进的余地。蒸气室在保持部件冷却方面做得不错,但它不能完全控制CPU和GPU在自定义电源配置文件中的最大负载。
高的表面温度可能是一个障碍。风扇的噪音水平对于这种口径的游戏笔记本来说是正常的。板载的声音质量在大多数情况下是可用的。
闲置时的功耗很高,但考虑到配置,在负载下却出奇的经济。新的GaN电源适配器的占地面积大大减少,能够毫无问题地提供330W。对于简单的网页浏览和低亮度水平的视频播放来说,电池寿命是不错的。任何程度的压力都会使电池寿命下降。
总的来说,对于4300美元的要价来说,Razer Blade 16 Early 2023是一个混合袋。如果你已经是Razer的粉丝,升级到最新的规格应该能提供切实的性能优势,以及Razer笔记本电脑闻名的所有诡计。
或者你可以通过选择以下产品来节省700美元 刀片16早期2023 RTX 4080.这两个SKU之间的性能差异在这一点上不值得额外的要价。
新的Blade 16还将吸引那些将显示质量置于其他方面之上的人。然而,如果你只追求性能数字,今年的Blade 16有严重的竞争者,他们踢了屁股。
而我们才刚刚开始!
价格和可用性
Razer Blade 16 Early 2023 RTX 4090
- 03/23/2023 v7 (old)
Vaidyanathan Subramaniam
Transparency
The selection of devices to be reviewed is made by our editorial team. The test sample was provided to the author as a loan by the manufacturer or retailer for the purpose of this review. The lender had no influence on this review, nor did the manufacturer receive a copy of this review before publication. There was no obligation to publish this review. As an independent media company, Notebookcheck is not subjected to the authority of manufacturers, retailers or publishers.
This is how Notebookcheck is testing
Every year, Notebookcheck independently reviews hundreds of laptops and smartphones using standardized procedures to ensure that all results are comparable. We have continuously developed our test methods for around 20 years and set industry standards in the process. In our test labs, high-quality measuring equipment is utilized by experienced technicians and editors. These tests involve a multi-stage validation process. Our complex rating system is based on hundreds of well-founded measurements and benchmarks, which maintains objectivity. Further information on our test methods can be found here.
Price comparison

