Notebookcheck Logo

英特尔 Raptor Lake-HX 更新分析 - 单核性能更强的酷睿 i9-14900HX

性能先于效率。 英特尔的 Raptor Lake-HX Refresh 是其最快的移动处理器的升级版,该处理器用于功能强大的多媒体和游戏笔记本电脑,有望在游戏和单核场景中发挥更好的性能。我们对新款酷睿 i9-14900HX 进行了测试,并与旧款酷睿 i9-13900HX 和 AMD Ryzen 9 7945HX 进行了比较。
Benchmark Intel Laptop / Notebook Gaming Raptor Lake Windows

去年 12 月,英特尔发布了其全新的 Meteor-Lake 系列酷睿-超移动处理器(点击此处进行评测)。在此回顾),该处理器首次采用瓦片/芯片设计,运行功耗介于 28 瓦到 115 瓦之间。对于功能更强大的 HX 移动处理器,英特尔继续沿用其著名的 Raptor-Lake 基因,并将新芯片命名为 "Raptor Lake Refresh",而原有的 "Core i9-14xxxHX "标签则保持不变。总体而言,这些内核的架构和配置没有任何变化,但其最大涡轮时钟频率有所提高。除了更强的单核性能外,英特尔还承诺新处理器将在单核/多核混合负载下提供更好的性能--这尤其是游戏所需要的。当然,我们希望验证这一点,并将把新的酷睿 i9-14900HX 与旧的第 13 代处理器(酷睿 i9-13900HX、酷睿 i9-13900HX、酷睿 i9-14900HX)进行比较。酷睿 i9-13900HX, 酷睿 i9-13950HX, 酷睿 i9-13980HX)以及 AMD 的两款旗舰产品,即 Ryzen 9 7945HXRyzen 9 7945HX3D.

第 14 代猛禽 Lake-HX 概览

英特尔对其第 14 代 Raptor-Lake-HX 型号阵容进行了小幅调整,酷睿 i9-14900HX 现已成为新的移动处理器旗舰产品。目前,由于酷睿 i9-13950HX 和酷睿 i9-13980HX 还没有后继型号,因此它也是唯一一款拥有 24 个内核(32 个线程)的 HX 芯片。我们也不知道这些型号是否会有后继产品。酷睿 i9-13950HX 的时钟频率发生了变化,它的八个 P 核心现在可以达到 5.8 GHz(一个或两个活动核心,否则最高 5.2 GHz),甚至超过了酷睿 i9-13980HX 的时钟频率。 酷睿 i9-13980HX高出 200 MHz,Core i9-13900HX 高出 400 MHz。16 个 E 核的最大时钟频率现在高达 4.1 GHz(而不是 4.0 GHz)。高速缓存大小仍为 36 MB,英特尔仍规定基本功耗为 55 瓦,最大功耗为 157 瓦。不过,从过去的经验来看,第 13 代 HX 型号的功耗可能会更高。

Raptor Lake-HX SKU(来源:英特尔)
Raptor Lake-HX 平台功能(来源:英特尔)

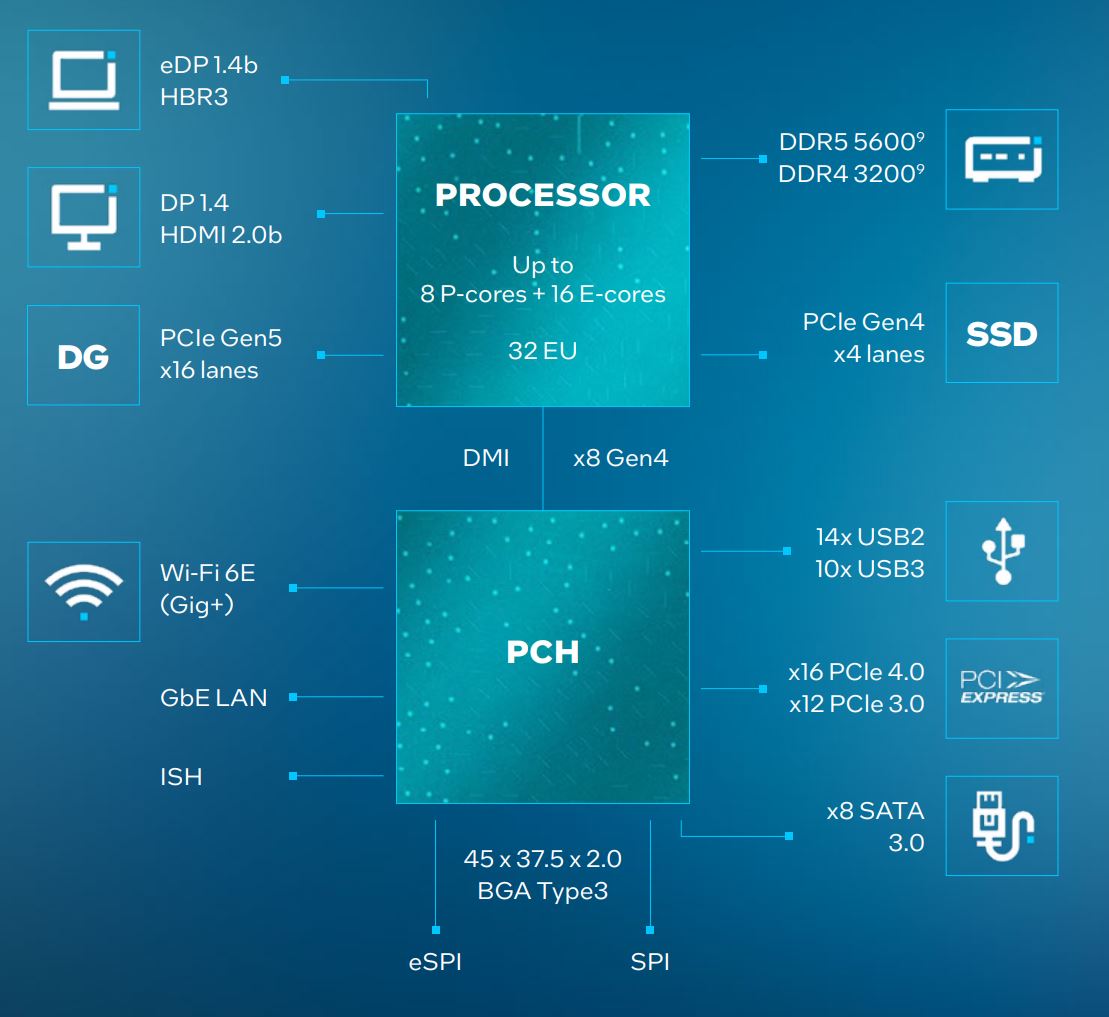
酷睿 i7-14700HX 增加了四个 E 核心,使总核心数从 16 个增加到 20 个(28 个线程)。此外,它们的时钟频率也有所提高。酷睿 i7-14650HX、酷睿 i5-14500HX 和酷睿 i5-14450HX 则完善了产品阵容。HX 处理器的总数从 9 个减少到 5 个。新的 HX 型号最大支持 192 GB 内存(DDR5-5600)。

Raptor Lake-HX 可选配 Wi-Fi 7
可选配通过 USB-C 接口进行 240 瓦充电的 Thunderbolt 5。

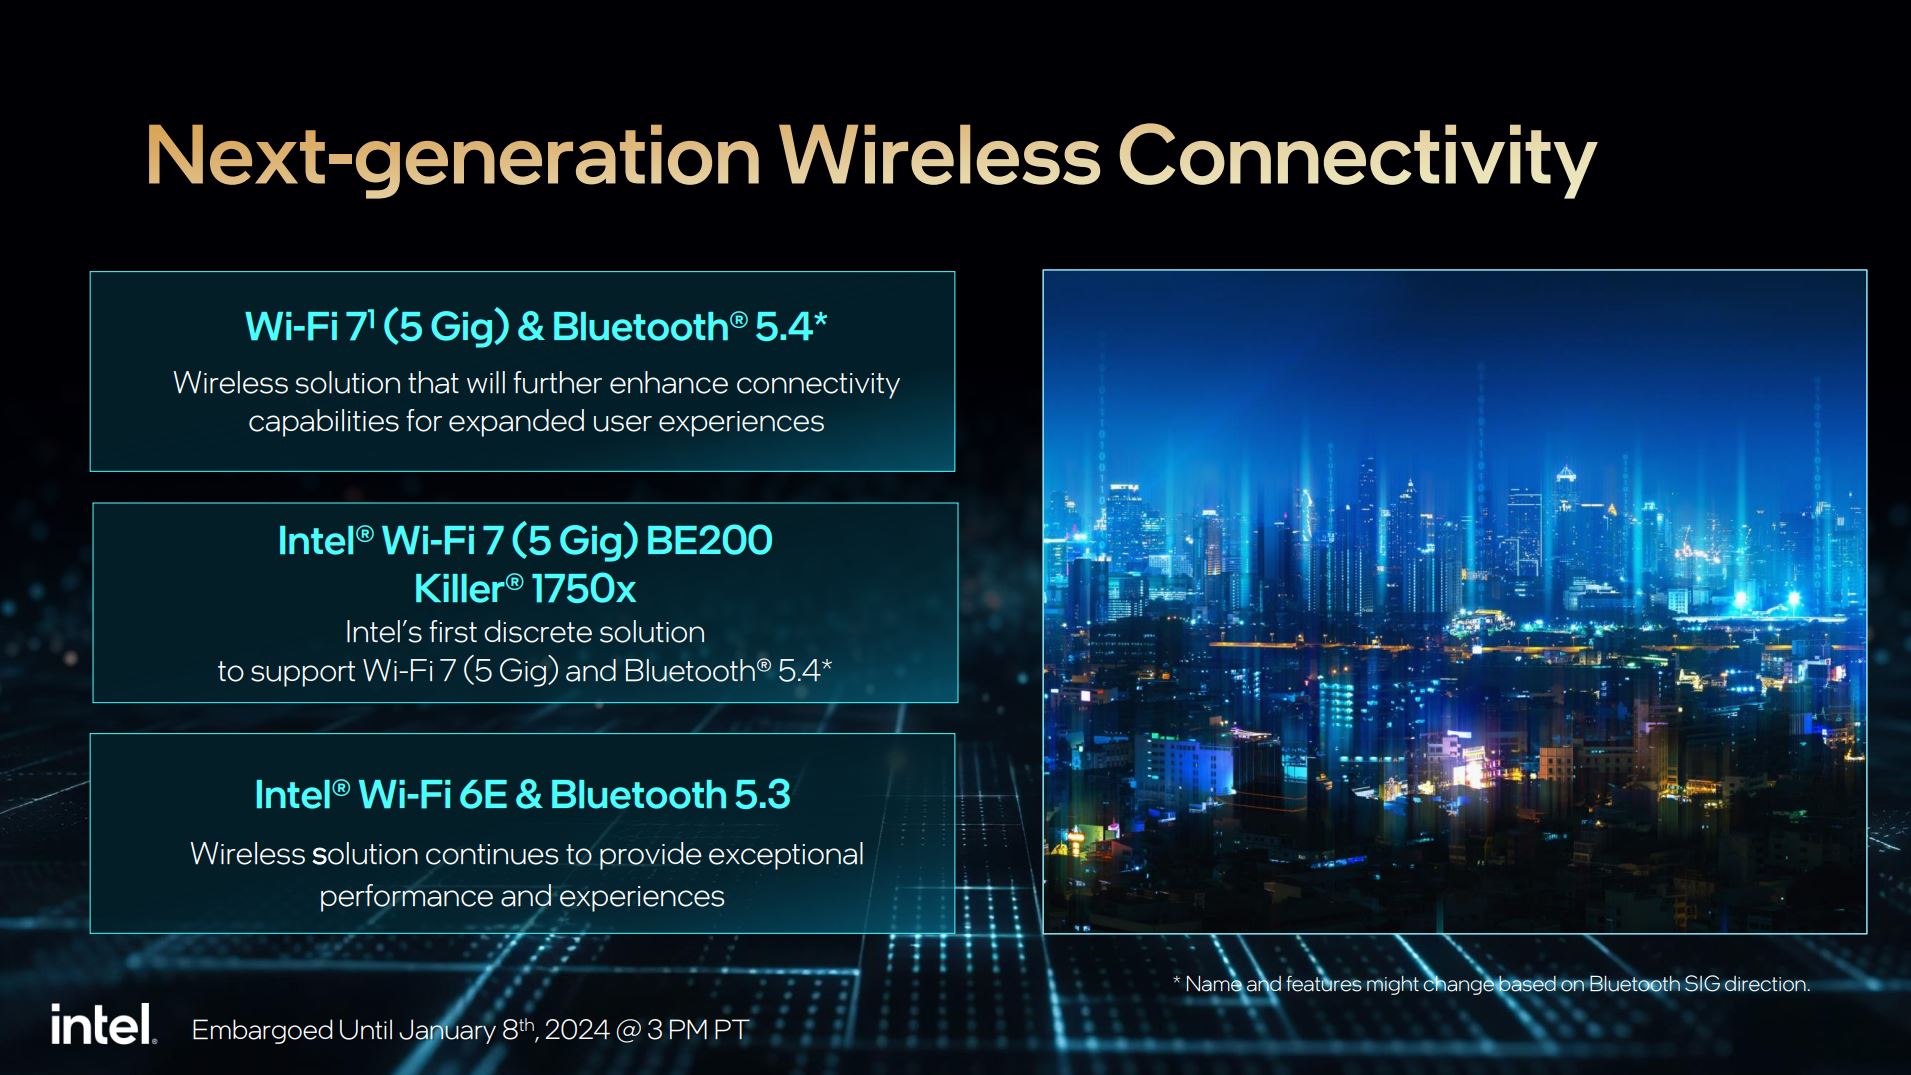
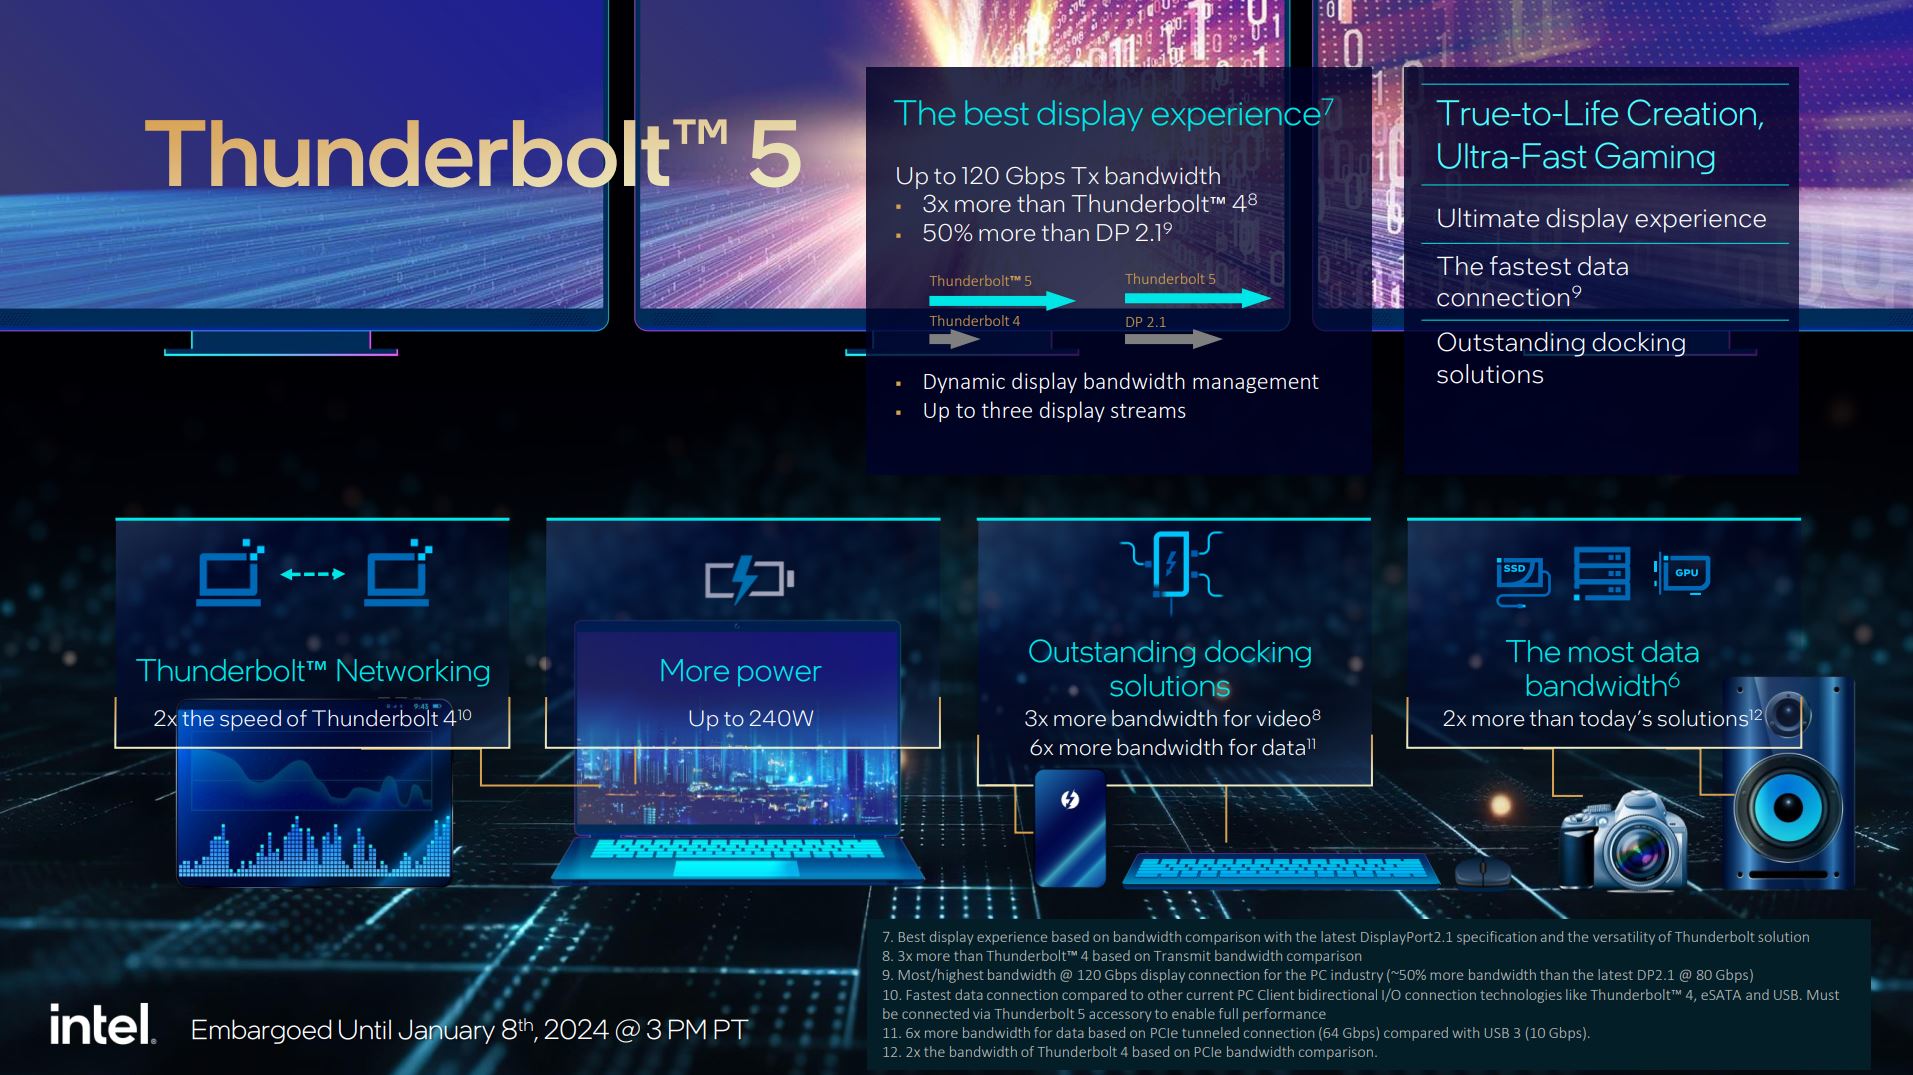
在连接性方面,它们支持 Wi-Fi 7 或 Thunderbolt 5 等最新功能,但只是可选功能。在这种情况下,一切都取决于各个制造商决定为用户提供哪些功能。此外,所有 HX 机型都可以超频,而且借助英特尔自带的 XTU 软件,超频非常方便。

测试系统 - XMG Neo 17 (E24)

XMG Neo 17 (E24)
XMG Neo 17 (E24)

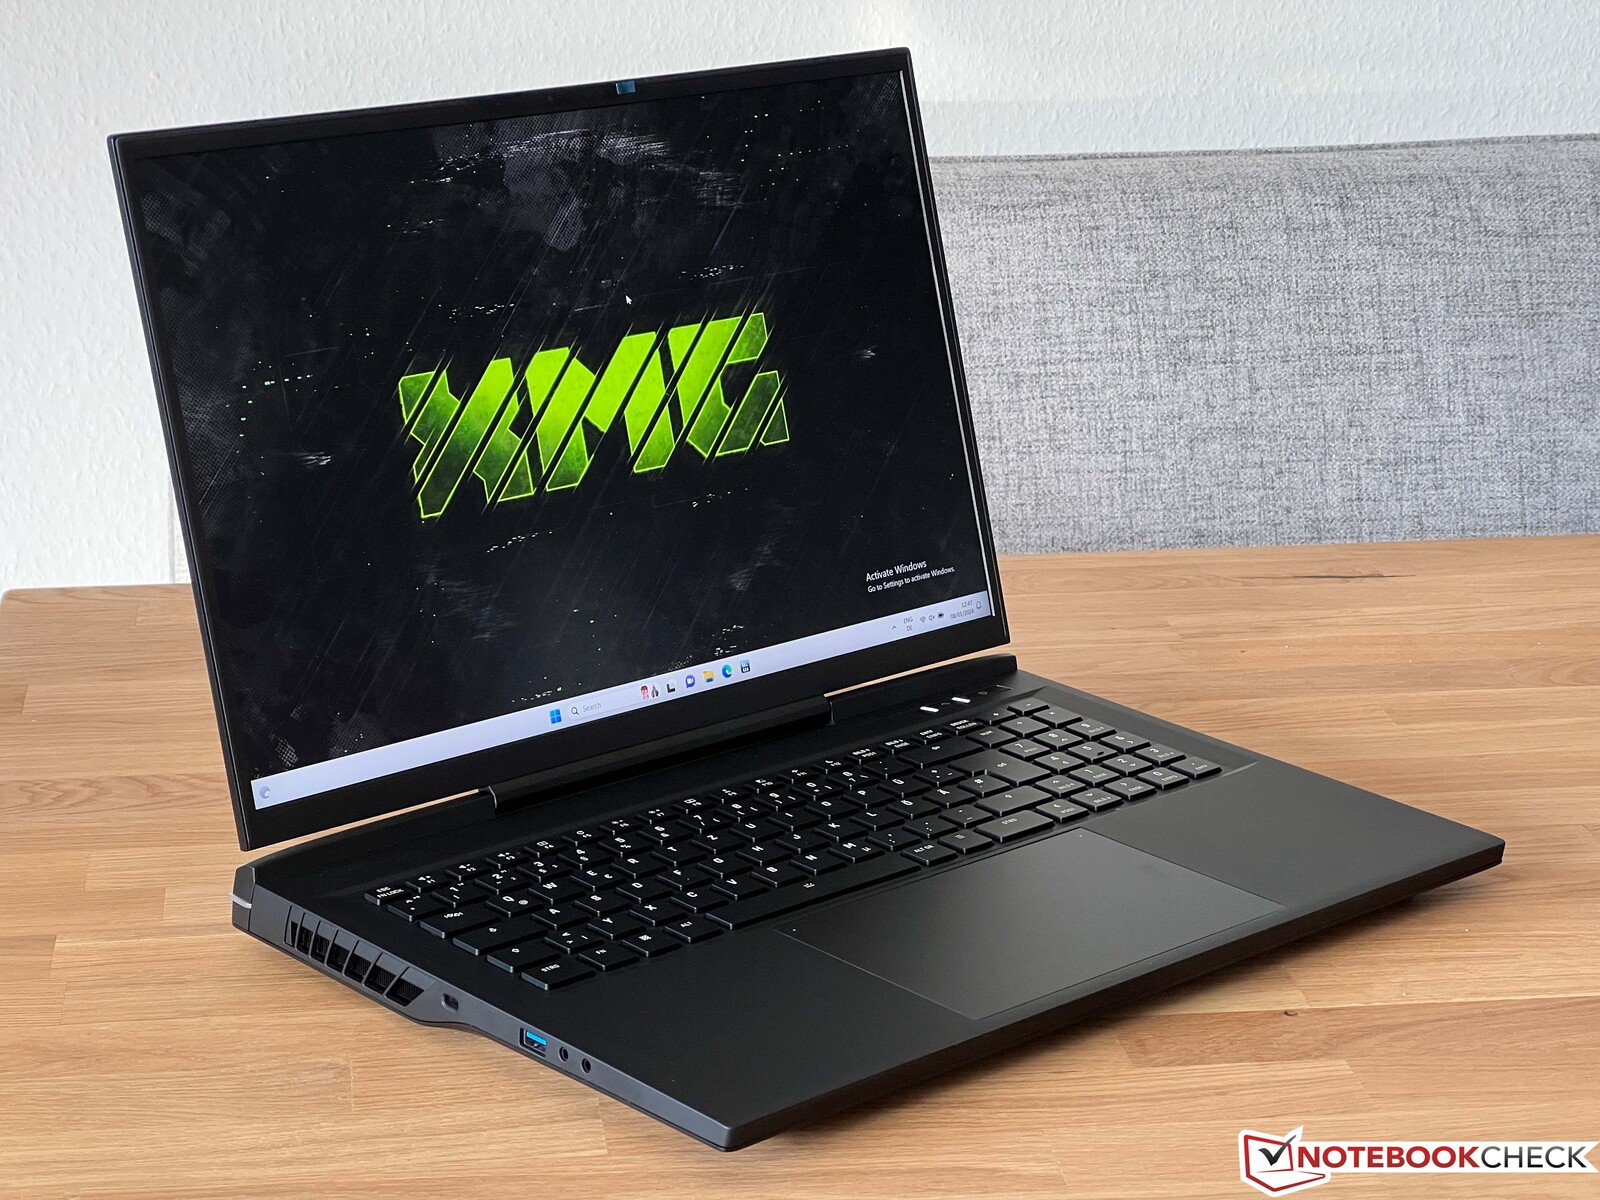
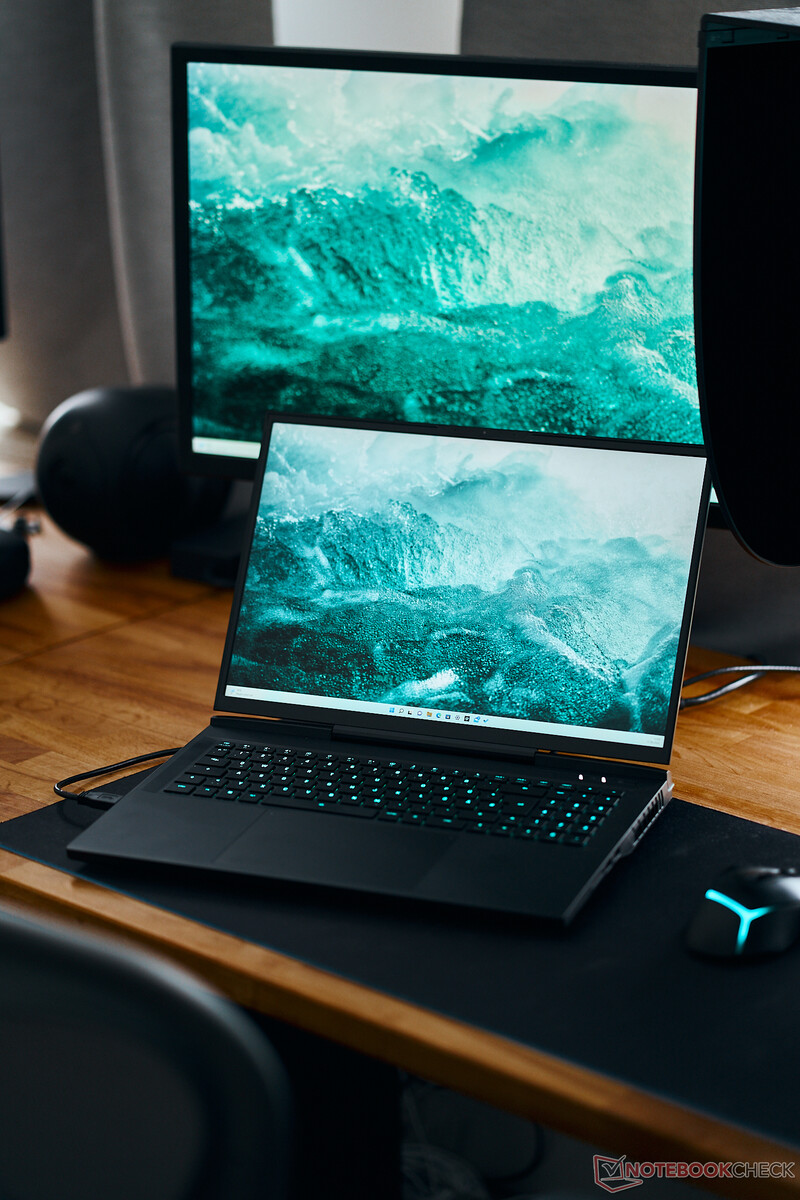
作为测试系统,我们收到了新款 XMG Neo 17 (E24)它配备了酷睿 i9-14900HX、专用的 NvidiaGeForce RTX 4090 笔记本电脑以及 32 GB DDR5-5600 内存。新款 XMG Neo 17(E24)采用了与 2023 版相同的机箱,但内部有不少不同之处。其中包括新的纯 iGPU 模式,电池可以通过 USB-C(100 瓦)充电,Oasis 水冷系统的热管现在可以更好地覆盖 CPU 区域。Neo 17 还可以在 BIOS 中降低 CPU 的电压(欠压)。

该设备继续使用兼容 G-Sync 的 17 英寸 IPS 面板,分辨率为 2,560 x 1,600 像素,宽高比为 16:10,刷新率为 240 Hz。您可以在静音薄膜键盘和可选机械键盘(Cherry MX Ultra Low Profile Tactile Switches)之间进行选择。

HWiNFO XMG Neo 17 (E24)

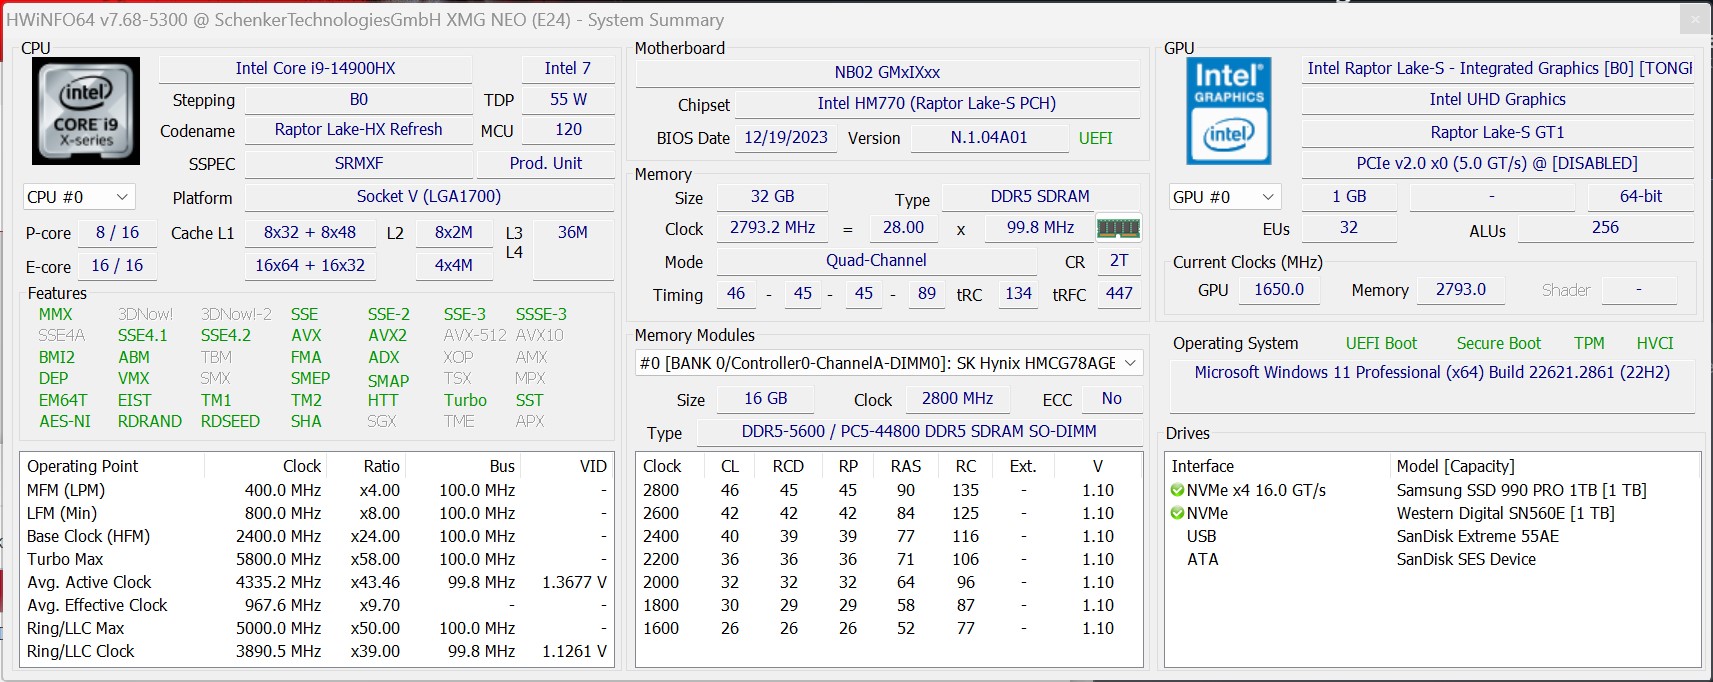
GPU 的最大功耗为 150 瓦(动态提升功耗为 25 瓦),而处理器的最大功耗为 160 瓦(PL4:250 瓦)--不过,我们在测试中测得的功耗为 170 瓦。我们在没有使用额外的 Oasis 水冷系统的情况下完成了以下基准测试。我们将很快发布 XMG Neo 17 E24 的全面评测。

请注意:在使用外接显示器进行功耗测量时,专用显卡处于激活状态--许多对比系统也是如此。视频输出的配置主要取决于笔记本制造商的配置,XMG Neo 17 (E24) 的 HDMI 输出和 USB-C 端口直接连接到 dGPU。

单核性能和效率

得益于高达 5.8 GHz 的更高涡轮时钟频率,英特尔进一步提高了其单核性能,使新的酷睿 i9-14900HX 比酷睿 i9-13980HX 超前 3 个百分点。 酷睿 i9-13980HX和最快的 酷睿 i9-13900HX领先 9%。Apple新的 M3 Max(16 个 CPU 内核)落后 13%,但在 Geekbench 6.2 和新的 Cinebench 2024 中领先于新的酷睿 i9-14900HX。AMD 的 Ryzen 9 7945HX以 15% 的差距落败。

Cinebench R23: Single Core
Cinebench R20: CPU (Single Core)
Cinebench R15: CPU Single 64Bit
7-Zip 18.03: 7z b 4 -mmt1
Geekbench 5.5: Single-Core
Geekbench 6.2: Single-Core
Cinebench 2024: CPU Single Core
Cinebench R23 / Single Core
Intel Core i9-14900HX
SCHENKER XMG Neo 17 2024 Engineering Sample
2232 Points
Intel Core i9-13980HX
MSI Titan GT77 HX 13VI
2169 Points -3%
Intel Core i9-13950HX
MSI Titan GT77 HX 13VI
2100 Points -6%
Intel Core i9-13900HX
SCHENKER XMG Neo 16 Raptor Lake
2055 Points -8%
Intel Core i9-13900HX
Lenovo Legion Pro 7 16IRX8H
2043 Points -8%
Intel Core i9-13950HX
Razer Blade 16 Early 2023
2029 Points -9%
Apple M3 Max 16-Core
Apple MacBook Pro 16 2023 M3 Max
1968 Points -12%
AMD Ryzen 9 7945HX
Asus Zephyrus Duo 16 GX650PY-NM006W
1940 Points -13%
AMD Ryzen 9 7945HX
Asus ROG Strix G17 G713PI (Turbo Mode)
1936 Points -13%
AMD Ryzen 9 7945HX3D
Asus ROG Strix Scar 17 G733PYV-LL053X
1935 Points -13%
Intel Core i9-12900HX
MSI Titan GT77 12UHS
1913 Points -14%
AMD Ryzen 9 7945HX
Asus ROG Strix G17 G713PI
1863 Points -17%
AMD Ryzen 9 6900HX
Asus ROG Zephyrus Duo 16 GX650RX
1566 Points -30%
AMD Ryzen 9 6900HX
SCHENKER XMG Neo 17 M22
1557 Points -30%
Cinebench R20 / CPU (Single Core)
Intel Core i9-14900HX
SCHENKER XMG Neo 17 2024 Engineering Sample
859 Points
Intel Core i9-13980HX
MSI Titan GT77 HX 13VI
825 Points -4%
Intel Core i9-13950HX
MSI Titan GT77 HX 13VI
803 Points -7%
Intel Core i9-13900HX
Lenovo Legion Pro 7 16IRX8H
788 Points -8%
Intel Core i9-13900HX
SCHENKER XMG Neo 16 Raptor Lake
756 Points -12%
AMD Ryzen 9 7945HX
Asus Zephyrus Duo 16 GX650PY-NM006W
756 Points -12%
AMD Ryzen 9 7945HX3D
Asus ROG Strix Scar 17 G733PYV-LL053X
755 Points -12%
AMD Ryzen 9 7945HX
Asus ROG Strix G17 G713PI (Turbo Mode)
753 Points -12%
Intel Core i9-13950HX
Razer Blade 16 Early 2023
742 Points -14%
Intel Core i9-12900HX
MSI Titan GT77 12UHS
738 Points -14%
AMD Ryzen 9 7945HX
Asus ROG Strix G17 G713PI
712 Points -17%
AMD Ryzen 9 6900HX
SCHENKER XMG Neo 17 M22
605 Points -30%
AMD Ryzen 9 6900HX
Asus ROG Zephyrus Duo 16 GX650RX
595 Points -31%
Apple M3 Max 16-Core
Apple MacBook Pro 16 2023 M3 Max
497 Points -42%
Cinebench R15 / CPU Single 64Bit
Intel Core i9-14900HX
SCHENKER XMG Neo 17 2024 Engineering Sample
320 Points
Intel Core i9-13980HX
MSI Titan GT77 HX 13VI
312 Points -2%
AMD Ryzen 9 7945HX3D
Asus ROG Strix Scar 17 G733PYV-LL053X
311 Points -3%
AMD Ryzen 9 7945HX
Asus Zephyrus Duo 16 GX650PY-NM006W
307 Points -4%
Intel Core i9-13900HX
Lenovo Legion Pro 7 16IRX8H
301 Points -6%
AMD Ryzen 9 7945HX
Asus ROG Strix G17 G713PI (Turbo Mode)
301 Points -6%
Intel Core i9-13950HX
MSI Titan GT77 HX 13VI
300 Points -6%
Intel Core i9-13900HX
SCHENKER XMG Neo 16 Raptor Lake
295 Points -8%
Intel Core i9-13900HX
SCHENKER XMG Neo 16 Raptor Lake
294 Points -8%
AMD Ryzen 9 7945HX
Asus ROG Strix G17 G713PI
294 Points -8%
Intel Core i9-12900HX
MSI Titan GT77 12UHS
278 Points -13%
Intel Core i9-13950HX
Razer Blade 16 Early 2023
274 Points -14%
Apple M3 Max 16-Core
Apple MacBook Pro 16 2023 M3 Max
269 Points -16%
AMD Ryzen 9 6900HX
Asus ROG Zephyrus Duo 16 GX650RX
249 Points -22%
AMD Ryzen 9 6900HX
SCHENKER XMG Neo 17 M22
248 Points -22%
7-Zip 18.03 / 7z b 4 -mmt1
AMD Ryzen 9 7945HX3D
Asus ROG Strix Scar 17 G733PYV-LL053X
7573 MIPS +2%
Intel Core i9-14900HX
SCHENKER XMG Neo 17 2024 Engineering Sample
7405 MIPS
AMD Ryzen 9 7945HX
Asus ROG Strix G17 G713PI (Turbo Mode)
7379 MIPS 0%
AMD Ryzen 9 7945HX
Asus ROG Strix G17 G713PI
7332 MIPS -1%
AMD Ryzen 9 7945HX
Asus Zephyrus Duo 16 GX650PY-NM006W
7319 MIPS -1%
Intel Core i9-13900HX
Lenovo Legion Pro 7 16IRX8H
7035 MIPS -5%
Intel Core i9-13980HX
MSI Titan GT77 HX 13VI
7018 MIPS -5%
Intel Core i9-13950HX
MSI Titan GT77 HX 13VI
6897 MIPS -7%
Intel Core i9-13900HX
SCHENKER XMG Neo 16 Raptor Lake
6800 MIPS -8%
Intel Core i9-13950HX
Razer Blade 16 Early 2023
6445 MIPS -13%
Intel Core i9-12900HX
MSI Titan GT77 12UHS
6256 MIPS -16%
AMD Ryzen 9 6900HX
SCHENKER XMG Neo 17 M22
5872 MIPS -21%
AMD Ryzen 9 6900HX
Asus ROG Zephyrus Duo 16 GX650RX
5727 MIPS -23%
Geekbench 5.5 / Single-Core
Apple M3 Max 16-Core
Apple MacBook Pro 16 2023 M3 Max
2331 Points +7%
Intel Core i9-14900HX
SCHENKER XMG Neo 17 2024 Engineering Sample
2184 Points
Intel Core i9-13980HX
MSI Titan GT77 HX 13VI
2139 Points -2%
AMD Ryzen 9 7945HX3D
Asus ROG Strix Scar 17 G733PYV-LL053X
2133 Points -2%
AMD Ryzen 9 7945HX
Asus Zephyrus Duo 16 GX650PY-NM006W
2132 Points -2%
AMD Ryzen 9 7945HX
Asus ROG Strix G17 G713PI (Turbo Mode)
2103 Points -4%
AMD Ryzen 9 7945HX
Asus ROG Strix G17 G713PI
2053 Points -6%
Intel Core i9-13950HX
MSI Titan GT77 HX 13VI
2043 Points -6%
Intel Core i9-13900HX
Lenovo Legion Pro 7 16IRX8H
2025 Points -7%
Intel Core i9-13900HX
SCHENKER XMG Neo 16 Raptor Lake
2023 Points -7%
Intel Core i9-12900HX
MSI Titan GT77 12UHS
1923 Points -12%
Intel Core i9-13950HX
Razer Blade 16 Early 2023
1805 Points -17%
AMD Ryzen 9 6900HX
Asus ROG Zephyrus Duo 16 GX650RX
1594 Points -27%
AMD Ryzen 9 6900HX
SCHENKER XMG Neo 17 M22
1590 Points -27%
Geekbench 6.2 / Single-Core
Apple M3 Max 16-Core
Apple MacBook Pro 16 2023 M3 Max
3096 Points +2%
Intel Core i9-14900HX
SCHENKER XMG Neo 17 2024 Engineering Sample (6.2.1)
3045 Points
AMD Ryzen 9 7945HX3D
Asus ROG Strix Scar 17 G733PYV-LL053X
2916 Points -4%
Cinebench 2024 / CPU Single Core
Apple M3 Max 16-Core
Apple MacBook Pro 16 2023 M3 Max
139 Points +7%
Intel Core i9-14900HX
SCHENKER XMG Neo 17 2024 Engineering Sample
130 Points
AMD Ryzen 9 7945HX3D
Asus ROG Strix Scar 17 G733PYV-LL053X
115 Points -12%
Cinebench R23: Single Core
Cinebench R20: CPU (Single Core)
Cinebench R15: CPU Single 64Bit
7-Zip 18.03: 7z b 4 -mmt1
Geekbench 5.5: Single-Core
Geekbench 6.2: Single-Core
Cinebench 2024: CPU Single Core
封装功率 酷睿 i9-14900HX Cinebench R23 单通道

如果我们看看功耗,情况就会略有不同。去年的 "猛禽-湖 "CPU 的性能核心功耗约为 34-36 瓦,而新的酷睿 i9-14900HX 因其更高的 5.8 GHz 涡轮主频(IA 核心,封装功耗更高),在纯单核负载下功耗为 38 瓦。因此,AMD 的 CPU 效率要高出很多,不过,AMD 型号和新酷睿 i9-14900HX 的测试结果有些失真,因为在我们测量功耗时,专用 GPU 处于激活状态,我们测量的是整个系统的功耗。而在老款 Raptor-Lake-HX 机型上,只有 iGPU 处于活动状态。英特尔和 AMD 都无法与Apple 当前的 M3 Max(单核负载下约 5.5 瓦)相比。

Power Consumption / Cinebench R23 Single Power Efficiency - external Monitor
Apple M3 Max 16-Core
Apple MacBook Pro 16 2023 M3 Max
113.8 Points per Watt +338%
Intel Core i9-13950HX
MSI Titan GT77 HX 13VI
28.5 Points per Watt +10%
AMD Ryzen 9 7945HX
Asus ROG Strix G17 G713PI
28.2 Points per Watt +8%
Intel Core i9-12900HX
MSI Titan GT77 12UHS
27.8 Points per Watt +7%
AMD Ryzen 9 7945HX3D
Asus ROG Strix Scar 17 G733PYV-LL053X
26.9 Points per Watt +3%
AMD Ryzen 9 7945HX
Asus ROG Strix G17 G713PI
26.8 Points per Watt +3%
AMD Ryzen 9 7945HX
Asus Zephyrus Duo 16 GX650PY-NM006W
26.4 Points per Watt +2%
Intel Core i9-14900HX
SCHENKER XMG Neo 17 2024 Engineering Sample
26 Points per Watt
Power Consumption / Cinebench R23 Single (external Monitor)
Intel Core i9-14900HX
SCHENKER XMG Neo 17 2024 Engineering Sample
85.8 (78.3min, 81.4P1 - 168.8max) Watt *
Intel Core i9-13950HX
MSI Titan GT77 HX 13VI
73.8 (69.8min, 70.2P1 - 100.2max) Watt * +14%
AMD Ryzen 9 7945HX
Asus Zephyrus Duo 16 GX650PY-NM006W
73.4 (69.8min, 69.9P1 - 99.9max) Watt * +14%
AMD Ryzen 9 7945HX
Asus ROG Strix G17 G713PI (Turbo Mode)
72.2 (62.6min, 63.8P1 - 92.5max) Watt * +16%
AMD Ryzen 9 7945HX3D
Asus ROG Strix Scar 17 G733PYV-LL053X
71.9 (70.8min, 71P1 - 86max) Watt * +16%
Intel Core i9-12900HX
MSI Titan GT77 12UHS
68.7 (63.7min, 64.8P1 - 87.6max) Watt * +20%
AMD Ryzen 9 7945HX
Asus ROG Strix G17 G713PI
66.1 (57.7min, 58.2P1 - 93.6max) Watt * +23%
Apple M3 Max 16-Core
Apple MacBook Pro 16 2023 M3 Max
17.3 (16.2min, 16.2P1 - 21.4max) Watt * +80%

* ... smaller is better

多核性能

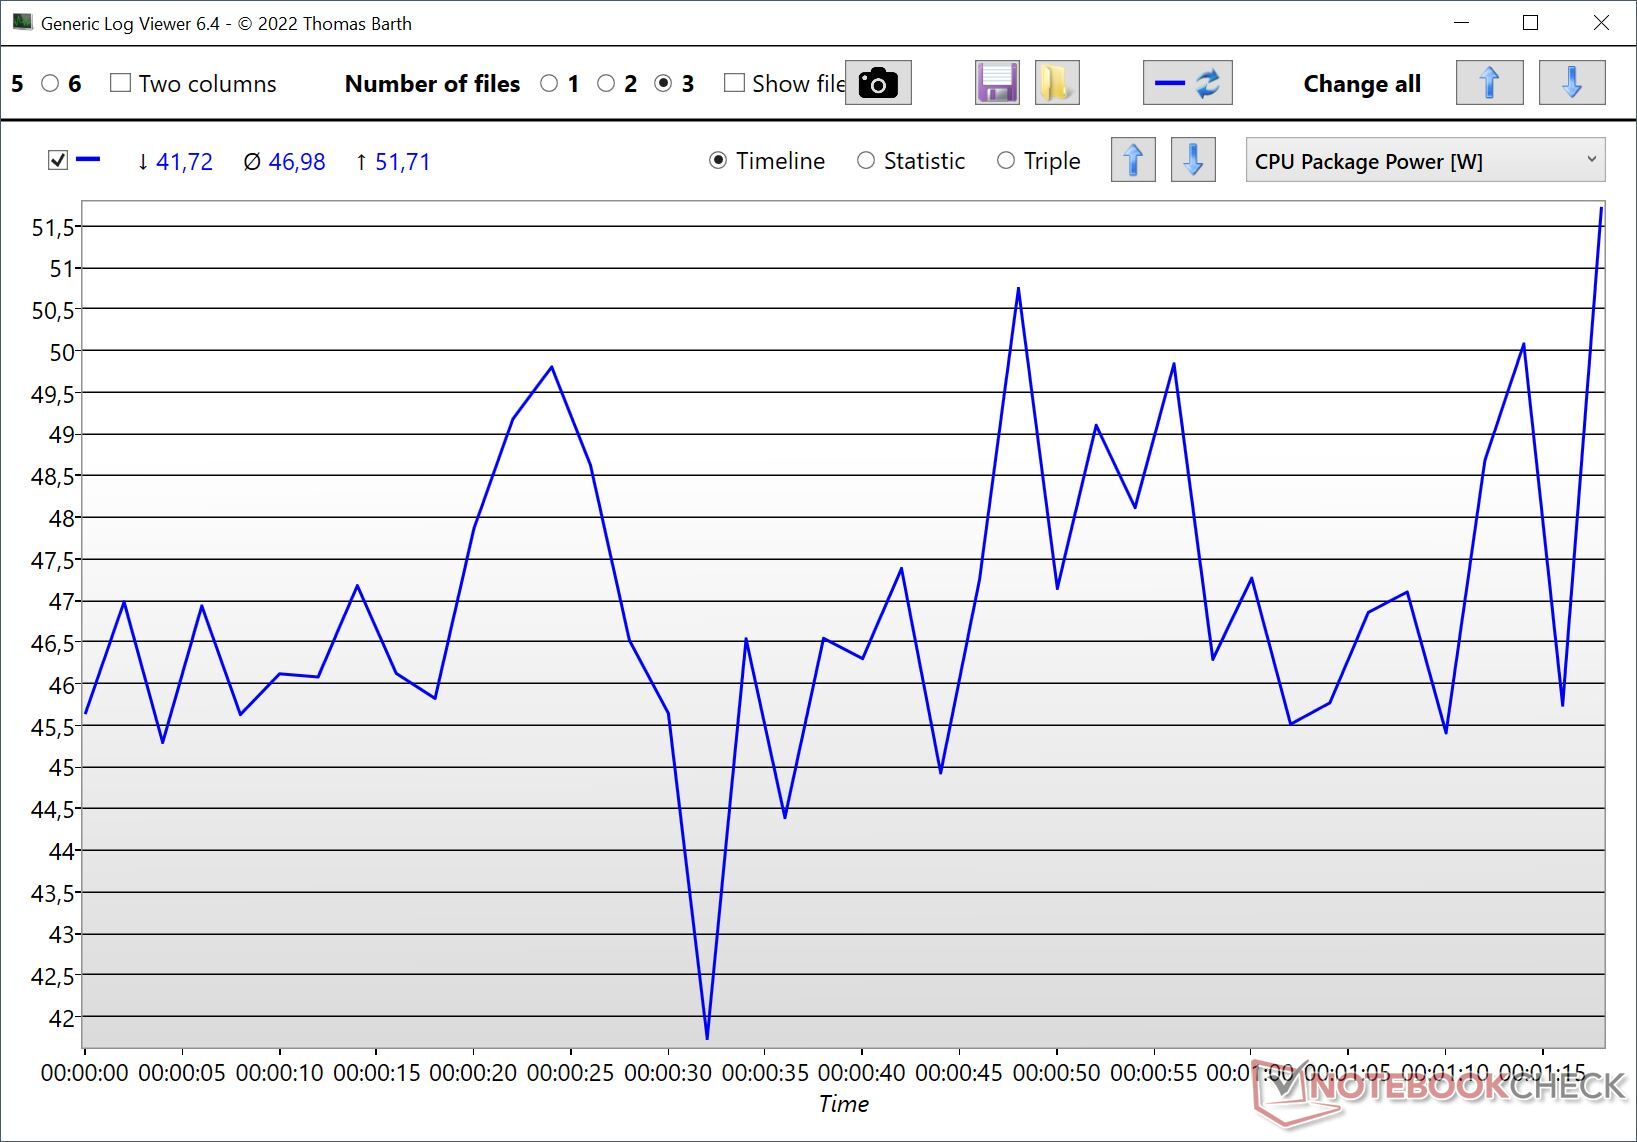
Raptor Lake-HX Refresh 的多核性能基本上没有任何变化,而酷睿 i9-14900HX 的实际性能则取决于每台笔记本电脑的功耗限制。在基准测试中,XMG Neo 17(E24)的封装功率平均为 160 瓦,这也是它比酷睿 i9-13900HX 略胜一筹的原因。微星 Titan GT77 HX 内的酷睿 i9-13950HX 和酷睿 i9-13980HX 都有优势,因为它们在基准测试开始时的功耗允许超过 200 瓦。AMD 型号 Ryzen 9 7945HX 和 Ryzen 9 7945HX3D 的速度也稍快一些。

Cinebench R23: Multi Core
Cinebench R20: CPU (Multi Core)
Cinebench R15: CPU Multi 64Bit
Blender: v2.79 BMW27 CPU | v3.3 Classroom CPU
7-Zip 18.03: 7z b 4
Geekbench 5.5: Multi-Core
Cinebench 2024: CPU Multi Core
Geekbench 6.2: Multi-Core
Cinebench R23 / Multi Core
AMD Ryzen 9 7945HX
Asus Zephyrus Duo 16 GX650PY-NM006W
34521 (32987.6min - 34521.3max) Points +7%
AMD Ryzen 9 7945HX
Asus ROG Strix G17 G713PI (Turbo Mode)
34202 Points +6%
Intel Core i9-13950HX
MSI Titan GT77 HX 13VI
33277 Points +3%
Intel Core i9-13980HX
MSI Titan GT77 HX 13VI
33052 Points +2%
AMD Ryzen 9 7945HX3D
Asus ROG Strix Scar 17 G733PYV-LL053X
32782 Points +1%
AMD Ryzen 9 7945HX
Asus ROG Strix G17 G713PI
32379 Points 0%
Intel Core i9-14900HX
SCHENKER XMG Neo 17 2024 Engineering Sample
32336 Points
Intel Core i9-13900HX
Lenovo Legion Pro 7 16IRX8H
30162 Points -7%
Intel Core i9-13900HX
SCHENKER XMG Neo 16 Raptor Lake
28707 (26191.7min - 28706.8max) Points -11%
Intel Core i9-13900HX
SCHENKER XMG Neo 16 Raptor Lake
28010 (26406.1min - 28009.8max) Points -13%
Intel Core i9-13900HX
SCHENKER XMG Neo 16 Raptor Lake
26703 Points -17%
Intel Core i9-13950HX
Razer Blade 16 Early 2023
26736 (22394.1min - 26736.1max) Points -17%
Apple M3 Max 16-Core
Apple MacBook Pro 16 2023 M3 Max
24024 Points -26%
Intel Core i9-12900HX
MSI Titan GT77 12UHS
22982 Points -29%
AMD Ryzen 9 6900HX
Asus ROG Zephyrus Duo 16 GX650RX
14085 Points -56%
Cinebench R20 / CPU (Multi Core)
AMD Ryzen 9 7945HX
Asus ROG Strix G17 G713PI (Turbo Mode)
13769 Points +13%
AMD Ryzen 9 7945HX
Asus Zephyrus Duo 16 GX650PY-NM006W
13457 Points +10%
AMD Ryzen 9 7945HX3D
Asus ROG Strix Scar 17 G733PYV-LL053X
13033 Points +7%
Intel Core i9-13950HX
MSI Titan GT77 HX 13VI
12648 Points +3%
Intel Core i9-13980HX
MSI Titan GT77 HX 13VI
12437 Points +2%
Intel Core i9-14900HX
SCHENKER XMG Neo 17 2024 Engineering Sample
12233 Points
Intel Core i9-13900HX
Lenovo Legion Pro 7 16IRX8H
11500 Points -6%
Intel Core i9-13900HX
SCHENKER XMG Neo 16 Raptor Lake
11289 Points -8%
AMD Ryzen 9 7945HX
Asus ROG Strix G17 G713PI
10025 Points -18%
Intel Core i9-13950HX
Razer Blade 16 Early 2023
8697 Points -29%
Intel Core i9-12900HX
MSI Titan GT77 12UHS
8667 Points -29%
Apple M3 Max 16-Core
Apple MacBook Pro 16 2023 M3 Max
6327 Points -48%
AMD Ryzen 9 6900HX
Asus ROG Zephyrus Duo 16 GX650RX
5489 Points -55%
Cinebench R15 / CPU Multi 64Bit
AMD Ryzen 9 7945HX
Asus ROG Strix G17 G713PI (Turbo Mode)
5663 Points +16%
AMD Ryzen 9 7945HX3D
Asus ROG Strix Scar 17 G733PYV-LL053X
5600 (5177.32min - 5599.89max) Points +15%
AMD Ryzen 9 7945HX
Asus Zephyrus Duo 16 GX650PY-NM006W
5554 (5255.55min - 5554.01max) Points +14%
Intel Core i9-13950HX
MSI Titan GT77 HX 13VI
5227 (4889.98min - 5226.71max) Points +7%
AMD Ryzen 9 7945HX
Asus ROG Strix G17 G713PI
5205 (4749.47min - 5204.94max) Points +7%
Intel Core i9-13980HX
MSI Titan GT77 HX 13VI
5172 (4917.63min - 5171.97max) Points +6%
Intel Core i9-13900HX
SCHENKER XMG Neo 16 Raptor Lake
4913 Points +1%
Intel Core i9-13900HX
SCHENKER XMG Neo 16 Raptor Lake
4875 (4298.3min - 4875.08max) Points 0%
Intel Core i9-14900HX
SCHENKER XMG Neo 17 2024 Engineering Sample
4875 (4783.54min - 4875.08max) Points
Intel Core i9-13900HX
Lenovo Legion Pro 7 16IRX8H
4819 (4429.68min - 4819.28max) Points -1%
Intel Core i9-13950HX
Razer Blade 16 Early 2023
4529 (4463.29min - 4528.99max) Points -7%
Intel Core i9-12900HX
MSI Titan GT77 12UHS
3570 (3259.45min - 3569.52max) Points -27%
Apple M3 Max 16-Core
Apple MacBook Pro 16 2023 M3 Max
3401 (3260min - 3401max) Points -30%
AMD Ryzen 9 6900HX
Asus ROG Zephyrus Duo 16 GX650RX
2292 Points -53%
Blender / v2.79 BMW27 CPU
AMD Ryzen 9 6900HX
Asus ROG Zephyrus Duo 16 GX650RX
220 Seconds * -116%
Apple M3 Max 16-Core
Apple MacBook Pro 16 2023 M3 Max
215 Seconds * -111%
Intel Core i9-12900HX
MSI Titan GT77 12UHS
147 Seconds * -44%
Intel Core i9-13950HX
Razer Blade 16 Early 2023
114 Seconds * -12%
Intel Core i9-13900HX
SCHENKER XMG Neo 16 Raptor Lake
111 Seconds * -9%
Intel Core i9-13900HX
Lenovo Legion Pro 7 16IRX8H
105 Seconds * -3%
Intel Core i9-14900HX
SCHENKER XMG Neo 17 2024 Engineering Sample
102 Seconds *
Intel Core i9-13980HX
MSI Titan GT77 HX 13VI
101 Seconds * +1%
Intel Core i9-13950HX
MSI Titan GT77 HX 13VI
100 Seconds * +2%
AMD Ryzen 9 7945HX
Asus ROG Strix G17 G713PI
100 Seconds * +2%
AMD Ryzen 9 7945HX
Asus ROG Strix G17 G713PI (Turbo Mode)
95 Seconds * +7%
AMD Ryzen 9 7945HX3D
Asus ROG Strix Scar 17 G733PYV-LL053X
95 Seconds * +7%
AMD Ryzen 9 7945HX
Asus Zephyrus Duo 16 GX650PY-NM006W
93 Seconds * +9%
Blender / v3.3 Classroom CPU
Intel Core i9-12900HX
MSI Titan GT77 12UHS
263 Seconds * -47%
Intel Core i9-13950HX
Razer Blade 16 Early 2023 (3.3.3)
207 Seconds * -16%
Intel Core i9-13900HX
SCHENKER XMG Neo 16 Raptor Lake (3.3.3)
200 Seconds * -12%
Apple M3 Max 16-Core
Apple MacBook Pro 16 2023 M3 Max
194 Seconds * -8%
Intel Core i9-13900HX
Lenovo Legion Pro 7 16IRX8H (3.3.3)
192 Seconds * -7%
Intel Core i9-14900HX
SCHENKER XMG Neo 17 2024 Engineering Sample (3.3.3)
179 Seconds *
Intel Core i9-13980HX
MSI Titan GT77 HX 13VI (3.3.3)
176 Seconds * +2%
Intel Core i9-13950HX
MSI Titan GT77 HX 13VI (3.3.3)
175 Seconds * +2%
AMD Ryzen 9 7945HX
Asus ROG Strix G17 G713PI
158 Seconds * +12%
AMD Ryzen 9 7945HX3D
Asus ROG Strix Scar 17 G733PYV-LL053X (3.3.3)
150 Seconds * +16%
AMD Ryzen 9 7945HX
Asus Zephyrus Duo 16 GX650PY-NM006W (3.3.3)
147 Seconds * +18%
7-Zip 18.03 / 7z b 4
AMD Ryzen 9 7945HX
Asus ROG Strix G17 G713PI (Turbo Mode)
140471 MIPS +11%
AMD Ryzen 9 7945HX3D
Asus ROG Strix Scar 17 G733PYV-LL053X
136201 MIPS +7%
AMD Ryzen 9 7945HX
Asus Zephyrus Duo 16 GX650PY-NM006W
135927 MIPS +7%
Intel Core i9-13950HX
MSI Titan GT77 HX 13VI
127295 MIPS 0%
Intel Core i9-14900HX
SCHENKER XMG Neo 17 2024 Engineering Sample
127108 MIPS
Intel Core i9-13980HX
MSI Titan GT77 HX 13VI
125720 MIPS -1%
AMD Ryzen 9 7945HX
Asus ROG Strix G17 G713PI
123364 MIPS -3%
Intel Core i9-13900HX
Lenovo Legion Pro 7 16IRX8H
122254 MIPS -4%
Intel Core i9-13900HX
SCHENKER XMG Neo 16 Raptor Lake
118715 MIPS -7%
Intel Core i9-13950HX
Razer Blade 16 Early 2023
109330 MIPS -14%
Intel Core i9-12900HX
MSI Titan GT77 12UHS
86234 MIPS -32%
AMD Ryzen 9 6900HX
Asus ROG Zephyrus Duo 16 GX650RX
64457 MIPS -49%
Geekbench 5.5 / Multi-Core
Apple M3 Max 16-Core
Apple MacBook Pro 16 2023 M3 Max
22816 Points +6%
Intel Core i9-14900HX
SCHENKER XMG Neo 17 2024 Engineering Sample
21606 Points
Intel Core i9-13900HX
Lenovo Legion Pro 7 16IRX8H
21058 Points -3%
Intel Core i9-13900HX
SCHENKER XMG Neo 16 Raptor Lake
20784 Points -4%
Intel Core i9-13950HX
MSI Titan GT77 HX 13VI
20634 Points -4%
Intel Core i9-13980HX
MSI Titan GT77 HX 13VI
20329 Points -6%
AMD Ryzen 9 7945HX
Asus ROG Strix G17 G713PI (Turbo Mode)
19954 Points -8%
AMD Ryzen 9 7945HX3D
Asus ROG Strix Scar 17 G733PYV-LL053X
19875 Points -8%
AMD Ryzen 9 7945HX
Asus Zephyrus Duo 16 GX650PY-NM006W
19583 Points -9%
AMD Ryzen 9 7945HX
Asus ROG Strix G17 G713PI
18372 Points -15%
Intel Core i9-13950HX
Razer Blade 16 Early 2023
18152 Points -16%
Intel Core i9-12900HX
MSI Titan GT77 12UHS
16250 Points -25%
AMD Ryzen 9 6900HX
Asus ROG Zephyrus Duo 16 GX650RX
10167 Points -53%
Cinebench 2024 / CPU Multi Core
Intel Core i9-14900HX
SCHENKER XMG Neo 17 2024 Engineering Sample
1780 Points
AMD Ryzen 9 7945HX3D
Asus ROG Strix Scar 17 G733PYV-LL053X
1772 Points 0%
Apple M3 Max 16-Core
Apple MacBook Pro 16 2023 M3 Max
1612 Points -9%
Geekbench 6.2 / Multi-Core
Apple M3 Max 16-Core
Apple MacBook Pro 16 2023 M3 Max
21243 Points +14%
Intel Core i9-14900HX
SCHENKER XMG Neo 17 2024 Engineering Sample (6.2.1)
18643 Points
AMD Ryzen 9 7945HX3D
Asus ROG Strix Scar 17 G733PYV-LL053X
16957 Points -9%
Cinebench R23: Multi Core
Cinebench R20: CPU (Multi Core)
Cinebench R15: CPU Multi 64Bit
Blender: v2.79 BMW27 CPU | v3.3 Classroom CPU
7-Zip 18.03: 7z b 4
Geekbench 5.5: Multi-Core
Cinebench 2024: CPU Multi Core
Geekbench 6.2: Multi-Core

* ... smaller is better

封装功率 酷睿 i9-14900HX Cinebench R23 多核处理器

在测试效率时,必须注意专用 GPU 处于激活状态。由于总消耗值较高,其影响要小于单核测试。酷睿 i9-14900HX 可能领先于大多数英特尔同类产品,但 AMD 的龙腾系列 Ryzen 9 7945HX 在效率方面却遥遥领先。Apple 的效率名列前茅不足为奇,但新的 M3 Max 首次达到了接近小型 HX 处理器(酷睿 i7)的性能水平。

Power Consumption / Cinebench R23 Multi Power Efficiency - external Monitor
Apple M3 Max 16-Core
Apple MacBook Pro 16 2023 M3 Max
306 Points per Watt +111%
AMD Ryzen 9 7945HX3D
Asus ROG Strix Scar 17 G733PYV-LL053X
207 Points per Watt +43%
AMD Ryzen 9 7945HX
Asus Zephyrus Duo 16 GX650PY-NM006W
194.4 Points per Watt +34%
AMD Ryzen 9 7945HX
Asus ROG Strix G17 G713PI
191.1 Points per Watt +32%
Intel Core i9-13980HX
Asus ROG Strix Scar 18 2023 G834JY-N6005W
160.9 Points per Watt +11%
Intel Core i9-14900HX
SCHENKER XMG Neo 17 2024 Engineering Sample
145 Points per Watt
Intel Core i9-13950HX
Razer Blade 16 Early 2023 RTX 4090
144.1 Points per Watt -1%
Intel Core i9-13900HX
Lenovo Legion Pro 7 RTX4090
141.4 Points per Watt -2%
Intel Core i9-13950HX
MSI Titan GT77 HX 13VI
135.3 Points per Watt -7%
Intel Core i9-12900HX
MSI Titan GT77 12UHS
122.6 Points per Watt -15%
Power Consumption / Cinebench R23 Multi (external Monitor)
Intel Core i9-13950HX
MSI Titan GT77 HX 13VI
246 (227min, 227P1 - 264max) Watt * -10%
Intel Core i9-14900HX
SCHENKER XMG Neo 17 2024 Engineering Sample
223 (216min, 216P1 - 229max) Watt *
Intel Core i9-13900HX
Lenovo Legion Pro 7 RTX4090
220 (215min, 215P1 - 224max) Watt * +1%
Intel Core i9-13950HX
Razer Blade 16 Early 2023 RTX 4090
197.3 (191.9min, 192.7P1 - 200max) Watt * +12%
Intel Core i9-12900HX
MSI Titan GT77 12UHS
187.5 (166.8min, 167.1P1 - 230max) Watt * +16%
Intel Core i9-13900HX
SCHENKER XMG Neo 16 E23
182.4 (172.3min, 172.3P1 - 207max) Watt * +18%
AMD Ryzen 9 7945HX
Asus ROG Strix G17 G713PI (Turbo Mode)
179 (171.5min, 171.8P1 - 181.3max) Watt * +20%
AMD Ryzen 9 7945HX
Asus Zephyrus Duo 16 GX650PY-NM006W
177.6 (166.7min, 166.8P1 - 187.3max) Watt * +20%
Intel Core i9-13980HX
Asus ROG Strix Scar 18 2023 G834JY-N6005W
175.9 (93.7min, 95.8P1 - 193.7max) Watt * +21%
AMD Ryzen 9 7945HX3D
Asus ROG Strix Scar 17 G733PYV-LL053X
158.5 (149.9min, 150.4P1 - 171.1max) Watt * +29%
Intel Core i7-13700HX
Aorus 15X ASF
148.3 (116.3min, 116.3P1 - 185.2max) Watt * +33%
Apple M3 Max 16-Core
Apple MacBook Pro 16 2023 M3 Max
78.6 (71.7min, 73.3P1 - 80.2max) Watt * +65%

* ... smaller is better

低功耗限制下的性能

与之前的分析文章一样,我们也考察了其在较低功率限制下的性能,并将结果汇总到下表中。很快,有两件事变得清晰起来。首先,归根结底,酷睿 i9-14900HX 基本上就是一款涡轮时钟更高的酷睿 i9-13900HX,而在功耗更低的情况下,两款芯片的性能差别并不大。其次,你可以清楚地看到,AMD 可以用更低的功耗提供相同的多核性能。M3 Max Apple M3 Max也给人留下了深刻印象--在功耗相当的情况下,它的性能比酷睿 i9-14900HX 快约 32%。

Cinebench R23 Multi
功率限制 Core i9-14900HX Core i9-13900HX Core i9-13950HX Core i9-13980HX Ryzen 9 7945HX Ryzen 9 7945HX3D M3 最大 16 核
170 瓦 31,958 31,903
150 瓦 30,308 30,655 30,623
130 瓦 28,933 28,239 29,141 29,281 34,202
115 瓦 27,750 27,369 28,199 28,073 33,361
100 瓦 26,323 25,942 26,653 26,507 32,947 32,977
80 瓦 23,334 23,216 23,950 23,766 30,907 30,804
55 瓦 18,258 18,843 19,772 19,478 26,045 24,024

空闲时的耗电量

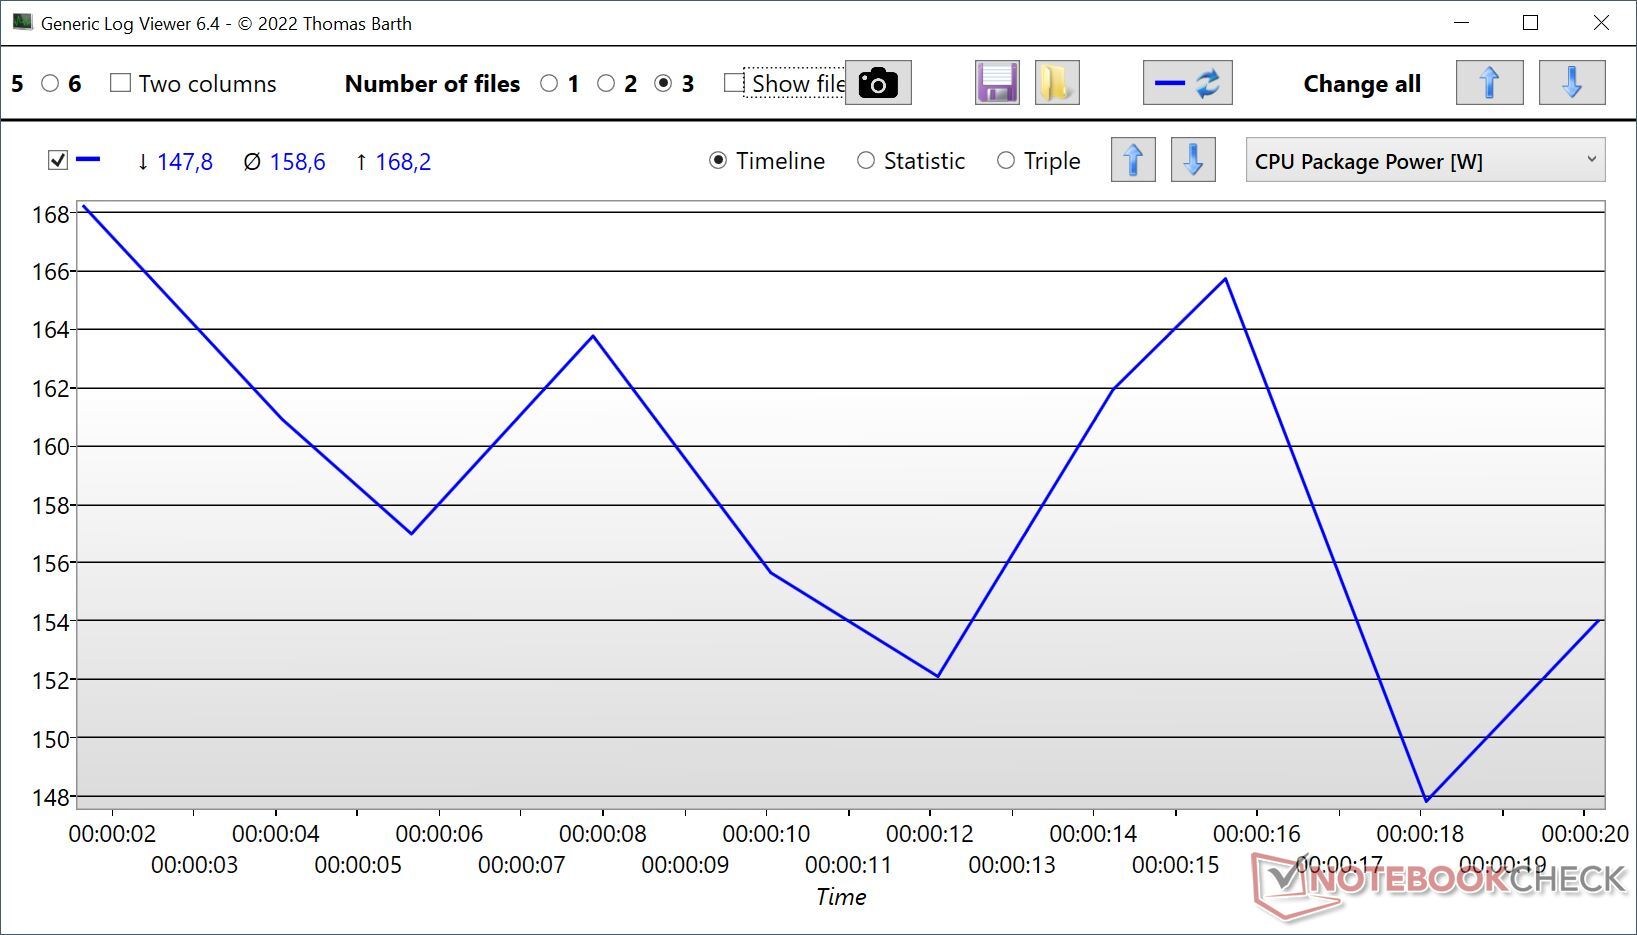
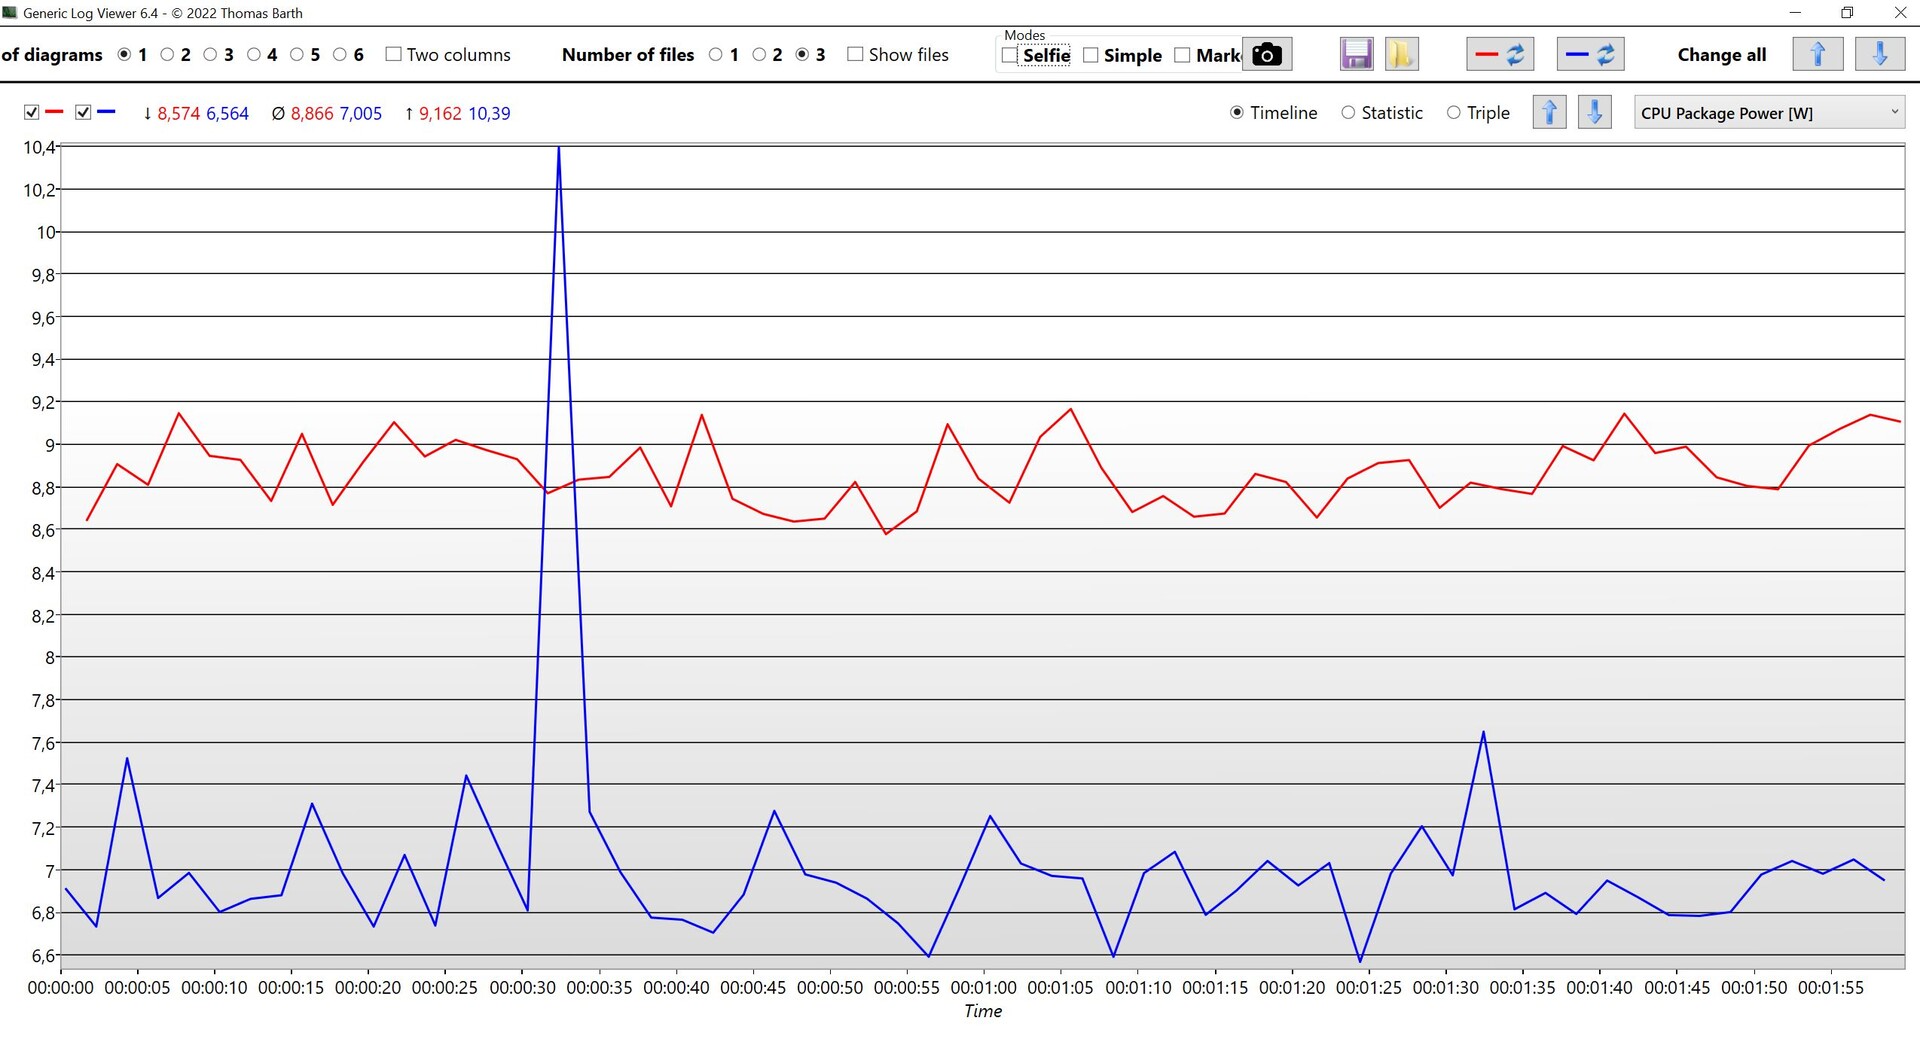
我们还将新酷睿 i9-14900HX 在空闲模式下的功耗与 AMD Ryzen 9 7945HX3D两种型号的性能设置尽可能接近。在此,我们注意到酷睿 i9-14900HX 略胜一筹,在理想情况下功耗约为 7 瓦。而采用芯片组设计的 Ryzen 9 7945HX3D 在空闲时的平均功耗为 8.9 瓦。

空闲模式下的 CPU 封装功率(蓝色:Core i9-14900HX,红色:Ryzen 9 7945HX3D)

游戏性能

与 CPU 基准测试不同的是,处理器在玩游戏时并不总是满载,而是单核/多核混合负载。其中一个指标就是它在 3DMark 测试中的 CPU 得分,在比较Time Spy 的结果时,我们注意到它比 Core i9-13900HX 高出 10%。 酷睿 i9-13900HX而新的酷睿 i9-14900HX 与去年的 酷睿 i9-13980HX.

3DMark - 2560x1440 Time Spy CPU
Lenovo Legion 9 16IRX8
Intel Core i9-13980HX, NVIDIA GeForce RTX 4090 Laptop GPU
17712 Points +4%
Alienware m18 R1
Intel Core i9-13980HX, NVIDIA GeForce RTX 4090 Laptop GPU
17525 Points +3%
MSI Raider GE78 HX 13VI
Intel Core i9-13980HX, NVIDIA GeForce RTX 4090 Laptop GPU
17026 Points 0%
SCHENKER XMG Neo 17 2024 Engineering Sample
Intel Core i9-14900HX, NVIDIA GeForce RTX 4090 Laptop GPU
16982 Points
Asus ROG Strix Scar 18 2023 G834JY-N6005W
Intel Core i9-13980HX, NVIDIA GeForce RTX 4090 Laptop GPU
15908 Points -6%
MSI Titan GT77 HX 13VI
Intel Core i9-13950HX, NVIDIA GeForce RTX 4090 Laptop GPU
15403 Points -9%
Lenovo Legion Pro 7 RTX4090
Intel Core i9-13900HX, NVIDIA GeForce RTX 4090 Laptop GPU
15066 Points -11%
Asus ROG Strix Scar 17 G733PYV-LL053X
AMD Ryzen 9 7945HX3D, NVIDIA GeForce RTX 4090 Laptop GPU
14131 Points -17%
SCHENKER Key 17 Pro (Early 23)
Intel Core i9-13900HX, NVIDIA GeForce RTX 4090 Laptop GPU
14048 Points -17%
Asus ROG Strix Scar 17 G733PY-XS96
AMD Ryzen 9 7945HX, NVIDIA GeForce RTX 4090 Laptop GPU
13140 Points -23%
Lenovo Legion Pro 5 16ARX8
AMD Ryzen 7 7745HX, NVIDIA GeForce RTX 4070 Laptop GPU
11477 Points -32%
Average of class
  (353 - 23721, n=2294)
7399 Points -56%

游戏性能 1080p

当然,使用不同的笔记本电脑来比较处理器的游戏性能并不理想,因为在处理器和显卡的功耗限制配置方面总会存在细微差别。在新闻文件中,英特尔展示了其在 1080p 下的高细节结果,在我们看来,这并不太现实。如果要显示 1080p 分辨率,那么至少要达到最高细节,因为没有强大的专用显卡,就没有 HX 处理器。总的来说,酷睿 i9-14900HX 的性能不错,但与前代机型相比并无太大提升。从上一代酷睿 i9 HX 处理器升级肯定是不值得的。在某些游戏中 AMD Ryzen 9 7945HX3D在某些游戏中,配备 3D 缓存的 AMD Ryzen 9 7945HX3D 具有相当大的优势,再次成为最佳移动游戏 CPU。

The Witcher 3 - 1920x1080 Ultra Graphics & Postprocessing (HBAO+)
Alienware m18 R1
Intel Core i9-13980HX, NVIDIA GeForce RTX 4090 Laptop GPU
213.9 (205min) fps +9%
MSI Raider GE78 HX 13VI
Intel Core i9-13980HX, NVIDIA GeForce RTX 4090 Laptop GPU
213.4 (72.4P0.1, 144.6P1) fps +9%
Lenovo Legion 9 16IRX8
Intel Core i9-13980HX, NVIDIA GeForce RTX 4090 Laptop GPU
208.7 (191min) fps +7%
Asus ROG Strix Scar 17 G733PYV-LL053X
AMD Ryzen 9 7945HX3D, NVIDIA GeForce RTX 4090 Laptop GPU
207 fps +6%
SCHENKER Key 17 Pro (Early 23)
Intel Core i9-13900HX, NVIDIA GeForce RTX 4090 Laptop GPU
206 (176min) fps +5%
Asus ROG Strix Scar 17 G733PY-XS96
AMD Ryzen 9 7945HX, NVIDIA GeForce RTX 4090 Laptop GPU
203.8 (186min) fps +4%
Lenovo Legion Pro 7 RTX4090
Intel Core i9-13900HX, NVIDIA GeForce RTX 4090 Laptop GPU
200 (174min) fps +2%
MSI Titan GT77 HX 13VI
Intel Core i9-13950HX, NVIDIA GeForce RTX 4090 Laptop GPU
198.9 (190min, 191P1) fps +2%
SCHENKER XMG Neo 17 2024 Engineering Sample
Intel Core i9-14900HX, NVIDIA GeForce RTX 4090 Laptop GPU
195.8 (176min, 187P1) fps
Lenovo Legion Pro 5 16ARX8
AMD Ryzen 7 7745HX, NVIDIA GeForce RTX 4070 Laptop GPU
119.8 (114min) fps -39%
Average of class
  (1.2 - 328, n=2210)
59.1 fps -70%
GTA V - 1920x1080 Highest Settings possible AA:4xMSAA + FX AF:16x
Asus ROG Strix Scar 17 G733PYV-LL053X
AMD Ryzen 9 7945HX3D, NVIDIA GeForce RTX 4090 Laptop GPU
167.7 (1.87min, 111.1P1) fps +10%
SCHENKER XMG Neo 17 2024 Engineering Sample
Intel Core i9-14900HX, NVIDIA GeForce RTX 4090 Laptop GPU
151.8 (3.32min, 111.1P1) fps
Lenovo Legion 9 16IRX8
Intel Core i9-13980HX, NVIDIA GeForce RTX 4090 Laptop GPU
150.7 (3min, 111.1P1) fps -1%
Alienware m18 R1
Intel Core i9-13980HX, NVIDIA GeForce RTX 4090 Laptop GPU
149 (3.13min, 111.1P1) fps -2%
Lenovo Legion Pro 7 RTX4090
Intel Core i9-13900HX, NVIDIA GeForce RTX 4090 Laptop GPU
143.6 (4.39min, 100P1) fps -5%
SCHENKER Key 17 Pro (Early 23)
Intel Core i9-13900HX, NVIDIA GeForce RTX 4090 Laptop GPU
142.3 (4.44min, 100P1) fps -6%
MSI Raider GE78 HX 13VI
Intel Core i9-13980HX, NVIDIA GeForce RTX 4090 Laptop GPU
142 (2.92min, 90.9P1) fps -6%
Asus ROG Strix Scar 18 2023 G834JY-N6005W
Intel Core i9-13980HX, NVIDIA GeForce RTX 4090 Laptop GPU
141.3 (4.69min, 100P1) fps -7%
MSI Titan GT77 HX 13VI
Intel Core i9-13950HX, NVIDIA GeForce RTX 4090 Laptop GPU
140.9 (3.54min, 83.3P1) fps -7%
Lenovo Legion Pro 5 16ARX8
AMD Ryzen 7 7745HX, NVIDIA GeForce RTX 4070 Laptop GPU
119.9 (3.81min, 76.9P1) fps -21%
Asus ROG Strix Scar 17 G733PY-XS96
AMD Ryzen 9 7945HX, NVIDIA GeForce RTX 4090 Laptop GPU
112.6 (4.54min, 71.4P1) fps -26%
Average of class
  (2.1 - 182, n=1316)
62.6 fps -59%
Final Fantasy XV Benchmark - 1920x1080 High Quality
Alienware m18 R1
Intel Core i9-13980HX, NVIDIA GeForce RTX 4090 Laptop GPU
194.8 fps +7%
MSI Titan GT77 HX 13VI
Intel Core i9-13950HX, NVIDIA GeForce RTX 4090 Laptop GPU
187.4 fps +2%
MSI Raider GE78 HX 13VI
Intel Core i9-13980HX, NVIDIA GeForce RTX 4090 Laptop GPU
183.3 fps 0%
SCHENKER Key 17 Pro (Early 23)
Intel Core i9-13900HX, NVIDIA GeForce RTX 4090 Laptop GPU
183.1 fps 0%
SCHENKER XMG Neo 17 2024 Engineering Sample
Intel Core i9-14900HX, NVIDIA GeForce RTX 4090 Laptop GPU
182.9 fps
Lenovo Legion 9 16IRX8
Intel Core i9-13980HX, NVIDIA GeForce RTX 4090 Laptop GPU
181.3 fps -1%
Lenovo Legion Pro 7 RTX4090
Intel Core i9-13900HX, NVIDIA GeForce RTX 4090 Laptop GPU
181.2 fps -1%
Asus ROG Strix Scar 17 G733PYV-LL053X
AMD Ryzen 9 7945HX3D, NVIDIA GeForce RTX 4090 Laptop GPU
180 fps -2%
Asus ROG Strix Scar 18 2023 G834JY-N6005W
Intel Core i9-13980HX, NVIDIA GeForce RTX 4090 Laptop GPU
177.6 fps -3%
Asus ROG Strix Scar 17 G733PY-XS96
AMD Ryzen 9 7945HX, NVIDIA GeForce RTX 4090 Laptop GPU
163.9 fps -10%
Lenovo Legion Pro 5 16ARX8
AMD Ryzen 7 7745HX, NVIDIA GeForce RTX 4070 Laptop GPU
119.9 fps -34%
Average of class
  (0.84 - 237, n=1449)
63.8 fps -65%
Strange Brigade - 1920x1080 ultra AA:ultra AF:16
Asus ROG Strix Scar 17 G733PYV-LL053X
AMD Ryzen 9 7945HX3D, NVIDIA GeForce RTX 4090 Laptop GPU
420 (64.7min, 302P1) fps +12%
Lenovo Legion 9 16IRX8
Intel Core i9-13980HX, NVIDIA GeForce RTX 4090 Laptop GPU
387 (23.7min, 277P1) fps +3%
SCHENKER Key 17 Pro (Early 23)
Intel Core i9-13900HX, NVIDIA GeForce RTX 4090 Laptop GPU
378 (20.6min, 257P1) fps +1%
MSI Raider GE78 HX 13VI
Intel Core i9-13980HX, NVIDIA GeForce RTX 4090 Laptop GPU
378 (54.7min, 251P1) fps +1%
SCHENKER XMG Neo 17 2024 Engineering Sample
Intel Core i9-14900HX, NVIDIA GeForce RTX 4090 Laptop GPU
376 (106.6min, 279P1) fps
MSI Titan GT77 HX 13VI
Intel Core i9-13950HX, NVIDIA GeForce RTX 4090 Laptop GPU
373 (29.9min, 272P1) fps -1%
Alienware m18 R1
Intel Core i9-13980HX, NVIDIA GeForce RTX 4090 Laptop GPU
373 (73.3min, 273P1) fps -1%
Asus ROG Strix Scar 18 2023 G834JY-N6005W
Intel Core i9-13980HX, NVIDIA GeForce RTX 4090 Laptop GPU
366 (29.1min, 263P1) fps -3%
Lenovo Legion Pro 7 RTX4090
Intel Core i9-13900HX, NVIDIA GeForce RTX 4090 Laptop GPU
347 (87.7min, 252P1) fps -8%
Lenovo Legion Pro 5 16ARX8
AMD Ryzen 7 7745HX, NVIDIA GeForce RTX 4070 Laptop GPU
223 (89min, 167.8P1) fps -41%
Average of class
  (9.7 - 602, n=1189)
123.3 fps -67%
Dota 2 Reborn - 1920x1080 ultra (3/3) best looking
Asus ROG Strix Scar 17 G733PYV-LL053X
AMD Ryzen 9 7945HX3D, NVIDIA GeForce RTX 4090 Laptop GPU
220 (175min) fps +23%
Alienware m18 R1
Intel Core i9-13980HX, NVIDIA GeForce RTX 4090 Laptop GPU
194.2 (157.6min) fps +9%
Lenovo Legion 9 16IRX8
Intel Core i9-13980HX, NVIDIA GeForce RTX 4090 Laptop GPU
193.1 (162.4min) fps +8%
Asus ROG Strix Scar 18 2023 G834JY-N6005W
Intel Core i9-13980HX, NVIDIA GeForce RTX 4090 Laptop GPU
190.2 (160.9min) fps +6%
MSI Titan GT77 HX 13VI
Intel Core i9-13950HX, NVIDIA GeForce RTX 4090 Laptop GPU
185.9 (157.5min) fps +4%
SCHENKER Key 17 Pro (Early 23)
Intel Core i9-13900HX, NVIDIA GeForce RTX 4090 Laptop GPU
182.5 (149.3min) fps +2%
Lenovo Legion Pro 7 RTX4090
Intel Core i9-13900HX, NVIDIA GeForce RTX 4090 Laptop GPU
182.1 (154.2min) fps +2%
Lenovo Legion Pro 5 16ARX8
AMD Ryzen 7 7745HX, NVIDIA GeForce RTX 4070 Laptop GPU
182 (152.8min) fps +2%
MSI Raider GE78 HX 13VI
Intel Core i9-13980HX, NVIDIA GeForce RTX 4090 Laptop GPU
178.8 (148.8min) fps 0%
SCHENKER XMG Neo 17 2024 Engineering Sample
Intel Core i9-14900HX, NVIDIA GeForce RTX 4090 Laptop GPU
178.8 (152.1min) fps
Asus ROG Strix Scar 17 G733PY-XS96
AMD Ryzen 9 7945HX, NVIDIA GeForce RTX 4090 Laptop GPU
139 (118.5min) fps -22%
Average of class
  (4.6 - 268, n=1993)
86.1 fps -52%
X-Plane 11.11 - 1920x1080 high (fps_test=3)
Asus ROG Strix Scar 17 G733PYV-LL053X
AMD Ryzen 9 7945HX3D, NVIDIA GeForce RTX 4090 Laptop GPU
166.2 fps +23%
Alienware m18 R1
Intel Core i9-13980HX, NVIDIA GeForce RTX 4090 Laptop GPU
143.5 fps +6%
Asus ROG Strix Scar 18 2023 G834JY-N6005W
Intel Core i9-13980HX, NVIDIA GeForce RTX 4090 Laptop GPU
142.8 fps +6%
Lenovo Legion 9 16IRX8
Intel Core i9-13980HX, NVIDIA GeForce RTX 4090 Laptop GPU
140.1 fps +4%
SCHENKER Key 17 Pro (Early 23)
Intel Core i9-13900HX, NVIDIA GeForce RTX 4090 Laptop GPU
136.6 fps +1%
Lenovo Legion Pro 7 RTX4090
Intel Core i9-13900HX, NVIDIA GeForce RTX 4090 Laptop GPU
136.4 fps +1%
SCHENKER XMG Neo 17 2024 Engineering Sample
Intel Core i9-14900HX, NVIDIA GeForce RTX 4090 Laptop GPU
135.3 fps
MSI Titan GT77 HX 13VI
Intel Core i9-13950HX, NVIDIA GeForce RTX 4090 Laptop GPU
134.2 fps -1%
MSI Titan GT77 HX 13VI
Intel Core i9-13950HX, NVIDIA GeForce RTX 4090 Laptop GPU
134.1 fps -1%
MSI Raider GE78 HX 13VI
Intel Core i9-13980HX, NVIDIA GeForce RTX 4090 Laptop GPU
126.4 fps -7%
Lenovo Legion Pro 5 16ARX8
AMD Ryzen 7 7745HX, NVIDIA GeForce RTX 4070 Laptop GPU
117.8 fps -13%
Asus ROG Strix Scar 17 G733PY-XS96
AMD Ryzen 9 7945HX, NVIDIA GeForce RTX 4090 Laptop GPU
94.3 fps -30%
Average of class
  (2.65 - 188.1, n=1904)
58.6 fps -57%
Shadow of the Tomb Raider - 1920x1080 Highest Preset AA:T
Asus ROG Strix Scar 17 G733PYV-LL053X
AMD Ryzen 9 7945HX3D, NVIDIA GeForce RTX 4090 Laptop GPU
271 fps +28%
Asus ROG Strix Scar 17 G733PY-XS96
AMD Ryzen 9 7945HX, NVIDIA GeForce RTX 4090 Laptop GPU
228 fps +8%
MSI Raider GE78 HX 13VI
Intel Core i9-13980HX, NVIDIA GeForce RTX 4090 Laptop GPU
219 fps +3%
MSI Titan GT77 HX 13VI
Intel Core i9-13950HX, NVIDIA GeForce RTX 4090 Laptop GPU
214 fps +1%
SCHENKER XMG Neo 17 2024 Engineering Sample
Intel Core i9-14900HX, NVIDIA GeForce RTX 4090 Laptop GPU
212 fps
Lenovo Legion Pro 5 16ARX8
AMD Ryzen 7 7745HX, NVIDIA GeForce RTX 4070 Laptop GPU
168 fps -21%
Asus ROG Strix Scar 18 2023 G834JY-N6005W
Intel Core i9-13980HX, NVIDIA GeForce RTX 4090 Laptop GPU
143.7 fps -32%
Average of class
  (6 - 375, n=612)
100.8 fps -52%
F1 22 - 1920x1080 Ultra High Preset AA:T AF:16x
Alienware m18 R1
Intel Core i9-13980HX, NVIDIA GeForce RTX 4090 Laptop GPU
144.7 (124min, 94P1) fps +15%
MSI Titan GT77 HX 13VI
Intel Core i9-13950HX, NVIDIA GeForce RTX 4090 Laptop GPU
138.2 (118min, 84P1) fps +9%
MSI Raider GE78 HX 13VI
Intel Core i9-13980HX, NVIDIA GeForce RTX 4090 Laptop GPU
137.1 (115min, 79P1) fps +9%
Asus ROG Strix Scar 17 G733PYV-LL053X
AMD Ryzen 9 7945HX3D, NVIDIA GeForce RTX 4090 Laptop GPU
135.9 (118min, 98P1) fps +8%
Lenovo Legion 9 16IRX8
Intel Core i9-13980HX, NVIDIA GeForce RTX 4090 Laptop GPU
130.8 (95min, 78P1) fps +4%
Lenovo Legion Pro 7 RTX4090
Intel Core i9-13900HX, NVIDIA GeForce RTX 4090 Laptop GPU
129.2 (105min, 83P1) fps +2%
SCHENKER XMG Neo 17 2024 Engineering Sample
Intel Core i9-14900HX, NVIDIA GeForce RTX 4090 Laptop GPU
126.3 (109min, 83P1) fps
Asus ROG Strix Scar 18 2023 G834JY-N6005W
Intel Core i9-13980HX, NVIDIA GeForce RTX 4090 Laptop GPU
124.5 (107min, 87P1) fps -1%
Asus ROG Strix Scar 17 G733PY-XS96
AMD Ryzen 9 7945HX, NVIDIA GeForce RTX 4090 Laptop GPU
116.3 (86min, 73P1) fps -8%
Lenovo Legion Pro 5 16ARX8
AMD Ryzen 7 7745HX, NVIDIA GeForce RTX 4070 Laptop GPU
84.1 (71min, 59P1) fps -33%
Average of class
  (5.09 - 221, n=483)
60.8 fps -52%
F1 23 - 1920x1080 Ultra High Preset AA:T AF:16x
Asus ROG Strix Scar 17 G733PYV-LL053X
AMD Ryzen 9 7945HX3D, NVIDIA GeForce RTX 4090 Laptop GPU
132 (107min, 102P1) fps +11%
MSI Raider GE78 HX 13VI
Intel Core i9-13980HX, NVIDIA GeForce RTX 4090 Laptop GPU
129.8 (104min, 98P1) fps +9%
SCHENKER XMG Neo 17 2024 Engineering Sample
Intel Core i9-14900HX, NVIDIA GeForce RTX 4090 Laptop GPU
119.3 (95min, 90P1) fps
Average of class
  (5 - 226, n=200)
57.3 fps -52%
Far Cry 5 - 1920x1080 Ultra Preset AA:T
Asus ROG Strix Scar 17 G733PYV-LL053X
AMD Ryzen 9 7945HX3D, NVIDIA GeForce RTX 4090 Laptop GPU
218 fps +35%
SCHENKER XMG Neo 17 2024 Engineering Sample
Intel Core i9-14900HX, NVIDIA GeForce RTX 4090 Laptop GPU
162 fps
MSI Titan GT77 HX 13VI
Intel Core i9-13950HX, NVIDIA GeForce RTX 4090 Laptop GPU
160 fps -1%
Asus ROG Strix Scar 18 2023 G834JY-N6005W
Intel Core i9-13980HX, NVIDIA GeForce RTX 4090 Laptop GPU
158 (117min) fps -2%
Lenovo Legion 9 16IRX8
Intel Core i9-13980HX, NVIDIA GeForce RTX 4090 Laptop GPU
158 (102min) fps -2%
Asus ROG Strix Scar 17 G733PY-XS96
AMD Ryzen 9 7945HX, NVIDIA GeForce RTX 4090 Laptop GPU
145 (106min) fps -10%
Average of class
  (1 - 278, n=1015)
83.7 fps -48%
Far Cry 6 - 1920x1080 Ultra Graphics Quality + HD Textures AA:T
Asus ROG Strix Scar 17 G733PYV-LL053X
AMD Ryzen 9 7945HX3D, NVIDIA GeForce RTX 4090 Laptop GPU
167 fps +7%
SCHENKER XMG Neo 17 2024 Engineering Sample
Intel Core i9-14900HX, NVIDIA GeForce RTX 4090 Laptop GPU
156 fps
MSI Titan GT77 HX 13VI
Intel Core i9-13950HX, NVIDIA GeForce RTX 4090 Laptop GPU
144 fps -8%
Asus ROG Strix Scar 17 G733PY-XS96
AMD Ryzen 9 7945HX, NVIDIA GeForce RTX 4090 Laptop GPU
112 (91min) fps -28%
Lenovo Legion Pro 5 16ARX8
AMD Ryzen 7 7745HX, NVIDIA GeForce RTX 4070 Laptop GPU
110 (74min) fps -29%
Average of class
  (4.67 - 223, n=284)
95.4 fps -39%
Call of Duty Modern Warfare 2 2022 - 1920x1080 Extreme Quality Preset AA:T2X Filmic SM
Asus ROG Strix Scar 17 G733PYV-LL053X
AMD Ryzen 9 7945HX3D, NVIDIA GeForce RTX 4090 Laptop GPU
182 fps +8%
Asus ROG Strix Scar 17 G733PY-XS96
AMD Ryzen 9 7945HX, NVIDIA GeForce RTX 4090 Laptop GPU
180 (103min) fps +7%
MSI Raider GE78 HX 13VI
Intel Core i9-13980HX, NVIDIA GeForce RTX 4090 Laptop GPU
177 (102min) fps +5%
MSI Titan GT77 HX 13VI
Intel Core i9-13950HX, NVIDIA GeForce RTX 4090 Laptop GPU
176 fps +5%
Asus ROG Strix Scar 18 2023 G834JY-N6005W
Intel Core i9-13980HX, NVIDIA GeForce RTX 4090 Laptop GPU
170 (98P1) fps +1%
SCHENKER XMG Neo 17 2024 Engineering Sample
Intel Core i9-14900HX, NVIDIA GeForce RTX 4090 Laptop GPU
168 fps
Lenovo Legion Pro 5 16ARX8
AMD Ryzen 7 7745HX, NVIDIA GeForce RTX 4070 Laptop GPU
108 (61min) fps -36%
Average of class
  (12 - 285, n=120)
105.1 fps -37%
Cyberpunk 2077 1.6 - 1920x1080 Ultra Preset
Asus ROG Strix Scar 17 G733PYV-LL053X
AMD Ryzen 9 7945HX3D, NVIDIA GeForce RTX 4090 Laptop GPU
157 fps +21%
MSI Raider GE78 HX 13VI
Intel Core i9-13980HX, NVIDIA GeForce RTX 4090 Laptop GPU
135.14 (44.88min) fps +4%
MSI Titan GT77 HX 13VI
Intel Core i9-13950HX, NVIDIA GeForce RTX 4090 Laptop GPU
135 fps +4%
Asus ROG Strix Scar 17 G733PY-XS96
AMD Ryzen 9 7945HX, NVIDIA GeForce RTX 4090 Laptop GPU
133.8 (57.7min) fps +3%
Lenovo Legion 9 16IRX8
Intel Core i9-13980HX, NVIDIA GeForce RTX 4090 Laptop GPU
131.4 (23.8min) fps +1%
SCHENKER XMG Neo 17 2024 Engineering Sample
Intel Core i9-14900HX, NVIDIA GeForce RTX 4090 Laptop GPU
130 fps
Alienware m18 R1
Intel Core i9-13980HX, NVIDIA GeForce RTX 4090 Laptop GPU
127.92 (32.4min) fps -2%
Asus ROG Strix Scar 18 2023 G834JY-N6005W
Intel Core i9-13980HX, NVIDIA GeForce RTX 4090 Laptop GPU
119.7 (69min) fps -8%
Lenovo Legion Pro 5 16ARX8
AMD Ryzen 7 7745HX, NVIDIA GeForce RTX 4070 Laptop GPU
98.9 (35.5min) fps -24%
Average of class
  (5 - 241, n=374)
73.2 fps -44%
Cyberpunk 2077 2.0 Phantom Liberty - 1920x1080 Ultra Preset (FSR off)
Asus ROG Strix Scar 17 G733PYV-LL053X
AMD Ryzen 9 7945HX3D, NVIDIA GeForce RTX 4090 Laptop GPU
142.8 fps +16%
Lenovo Legion 9 16IRX8
Intel Core i9-13980HX, NVIDIA GeForce RTX 4090 Laptop GPU
131.22 (31.65min) fps +7%
MSI Raider GE78 HX 13VI
Intel Core i9-13980HX, NVIDIA GeForce RTX 4090 Laptop GPU
127 (36.47min) fps +4%
SCHENKER XMG Neo 17 2024 Engineering Sample
Intel Core i9-14900HX, NVIDIA GeForce RTX 4090 Laptop GPU
122.7 (16.4min) fps
Average of class
  (2.3 - 216, n=183)
72.5 fps -41%

游戏性能 QHD

在 QHD 分辨率下,处理器的影响变得更小,GPU 的决定性作用更大。同样,英特尔的 HX 处理器都有类似的表现,所有 i9 型号都非常适合游戏。Ryzen 9 7945HX3D 在运行《Far Cry 5》、《GTA V》或《F1 2023》等多款游戏时仍能提供更高的性能

Shadow of the Tomb Raider - 2560x1440 Highest Preset AA:T
Asus ROG Strix Scar 17 G733PYV-LL053X
NVIDIA GeForce RTX 4090 Laptop GPU, R9 7945HX3D, SK hynix PC801 HFS001TEJ9X101N
199 fps +13%
Asus ROG Strix Scar 17 G733PY-XS96
NVIDIA GeForce RTX 4090 Laptop GPU, R9 7945HX, SK hynix PC801 HFS001TEJ9X101N
190 fps +8%
MSI Titan GT77 HX 13VI
NVIDIA GeForce RTX 4090 Laptop GPU, i9-13950HX, Samsung PM9A1 MZVL22T0HBLB
187 fps +6%
Lenovo Legion Pro 7 RTX4090
NVIDIA GeForce RTX 4090 Laptop GPU, i9-13900HX, Samsung PM9A1 MZVL21T0HCLR
185 fps +5%
SCHENKER XMG Neo 17 2024 Engineering Sample
NVIDIA GeForce RTX 4090 Laptop GPU, i9-14900HX
176 fps
Alienware M18 R1 QHD
NVIDIA GeForce RTX 4090 Laptop GPU, i9-13900HX
175 fps -1%
Asus ROG Strix Scar 18 2023 G834JY-N6005W
NVIDIA GeForce RTX 4090 Laptop GPU, i9-13980HX, 2x Samsung PM9A1 MZVL21T0HCLR (RAID 0)
121.2 fps -31%
Lenovo Legion Pro 5 16ARX8
NVIDIA GeForce RTX 4070 Laptop GPU, R7 7745HX, Samsung PM9A1 MZVL21T0HCLR
110 fps -37%
Far Cry 5 - 2560x1440 Ultra Preset AA:T
Asus ROG Strix Scar 17 G733PYV-LL053X
NVIDIA GeForce RTX 4090 Laptop GPU, R9 7945HX3D, SK hynix PC801 HFS001TEJ9X101N
194 fps +24%
MSI Titan GT77 HX 13VI
NVIDIA GeForce RTX 4090 Laptop GPU, i9-13950HX, Samsung PM9A1 MZVL22T0HBLB
159 fps +1%
Lenovo Legion 9 16IRX8
NVIDIA GeForce RTX 4090 Laptop GPU, i9-13980HX, 2x SK Hynix HFS001TEJ9X115N (RAID 0)
157 (111min - 208max) fps 0%
SCHENKER XMG Neo 17 2024 Engineering Sample
NVIDIA GeForce RTX 4090 Laptop GPU, i9-14900HX
157 fps
Asus ROG Strix Scar 18 2023 G834JY-N6005W
NVIDIA GeForce RTX 4090 Laptop GPU, i9-13980HX, 2x Samsung PM9A1 MZVL21T0HCLR (RAID 0)
153 (107min - 197max) fps -3%
Asus ROG Strix Scar 17 G733PY-XS96
NVIDIA GeForce RTX 4090 Laptop GPU, R9 7945HX, SK hynix PC801 HFS001TEJ9X101N
142 (104min - 189max) fps -10%
Far Cry 6 - 2560x1440 Ultra Graphics Quality + HD Textures AA:T
Asus ROG Strix Scar 17 G733PYV-LL053X
NVIDIA GeForce RTX 4090 Laptop GPU, R9 7945HX3D, SK hynix PC801 HFS001TEJ9X101N
146 fps +4%
SCHENKER XMG Neo 17 2024 Engineering Sample
NVIDIA GeForce RTX 4090 Laptop GPU, i9-14900HX
141 fps
MSI Titan GT77 HX 13VI
NVIDIA GeForce RTX 4090 Laptop GPU, i9-13950HX, Samsung PM9A1 MZVL22T0HBLB
135 fps -4%
Alienware M18 R1 QHD
NVIDIA GeForce RTX 4090 Laptop GPU, i9-13900HX
128 (104min - 155max) fps -9%
Asus ROG Strix Scar 17 G733PY-XS96
NVIDIA GeForce RTX 4090 Laptop GPU, R9 7945HX, SK hynix PC801 HFS001TEJ9X101N
109 (88min - 120max) fps -23%
Lenovo Legion Pro 5 16ARX8
NVIDIA GeForce RTX 4070 Laptop GPU, R7 7745HX, Samsung PM9A1 MZVL21T0HCLR
88 (57min - 99max) fps -38%
Final Fantasy XV Benchmark - 2560x1440 High Quality
MSI Titan GT77 HX 13VI
NVIDIA GeForce RTX 4090 Laptop GPU, i9-13950HX, Samsung PM9A1 MZVL22T0HBLB
162.9 fps +6%
Alienware m18 R1
NVIDIA GeForce RTX 4090 Laptop GPU, i9-13980HX, SK hynix PC801 HFS001TEJ9X101N
159.5 fps +4%
Lenovo Legion 9 16IRX8
NVIDIA GeForce RTX 4090 Laptop GPU, i9-13980HX, 2x SK Hynix HFS001TEJ9X115N (RAID 0)
158.4 fps +3%
SCHENKER Key 17 Pro (Early 23)
NVIDIA GeForce RTX 4090 Laptop GPU, i9-13900HX, Samsung 990 Pro 2 TB MZVL72T0HDLB
156.4 fps +2%
Lenovo Legion Pro 7 RTX4090
NVIDIA GeForce RTX 4090 Laptop GPU, i9-13900HX, Samsung PM9A1 MZVL21T0HCLR
154 fps 0%
SCHENKER XMG Neo 17 2024 Engineering Sample
NVIDIA GeForce RTX 4090 Laptop GPU, i9-14900HX
153.5 fps
Asus ROG Strix Scar 17 G733PYV-LL053X
NVIDIA GeForce RTX 4090 Laptop GPU, R9 7945HX3D, SK hynix PC801 HFS001TEJ9X101N
151.2 fps -1%
Asus ROG Strix Scar 17 G733PY-XS96
NVIDIA GeForce RTX 4090 Laptop GPU, R9 7945HX, SK hynix PC801 HFS001TEJ9X101N
151 fps -2%
Asus ROG Strix Scar 18 2023 G834JY-N6005W
NVIDIA GeForce RTX 4090 Laptop GPU, i9-13980HX, 2x Samsung PM9A1 MZVL21T0HCLR (RAID 0)
146.7 fps -4%
Lenovo Legion Pro 5 16ARX8
NVIDIA GeForce RTX 4070 Laptop GPU, R7 7745HX, Samsung PM9A1 MZVL21T0HCLR
119.9 fps -22%
GTA V - 2560x1440 Highest Settings possible AA:4xMSAA + FX AF:16x
Asus ROG Strix Scar 17 G733PYV-LL053X
NVIDIA GeForce RTX 4090 Laptop GPU, R9 7945HX3D, SK hynix PC801 HFS001TEJ9X101N
160.6 (2.82min, 111.1P1 - 363max) fps +11%
Alienware m18 R1
NVIDIA GeForce RTX 4090 Laptop GPU, i9-13980HX, SK hynix PC801 HFS001TEJ9X101N
145.5 (2.46min, 111.1P1 - 281max) fps 0%
Lenovo Legion 9 16IRX8
NVIDIA GeForce RTX 4090 Laptop GPU, i9-13980HX, 2x SK Hynix HFS001TEJ9X115N (RAID 0)
145.3 (4.06min, 100P1 - 332max) fps 0%
SCHENKER XMG Neo 17 2024 Engineering Sample
NVIDIA GeForce RTX 4090 Laptop GPU, i9-14900HX
145.2 (2.65min, 100P1 - 265max) fps
SCHENKER Key 17 Pro (Early 23)
NVIDIA GeForce RTX 4090 Laptop GPU, i9-13900HX, Samsung 990 Pro 2 TB MZVL72T0HDLB
141.5 (28.6min, 100P1 - 268max) fps -3%
Asus ROG Strix Scar 18 2023 G834JY-N6005W
NVIDIA GeForce RTX 4090 Laptop GPU, i9-13980HX, 2x Samsung PM9A1 MZVL21T0HCLR (RAID 0)
139.1 (3.59min, 90.9P1 - 238max) fps -4%
MSI Titan GT77 HX 13VI
NVIDIA GeForce RTX 4090 Laptop GPU, i9-13950HX, Samsung PM9A1 MZVL22T0HBLB
138.5 (3.45min, 76.9P1 - 256max) fps -5%
Lenovo Legion Pro 7 RTX4090
NVIDIA GeForce RTX 4090 Laptop GPU, i9-13900HX, Samsung PM9A1 MZVL21T0HCLR
137.7 (3.84min, 90.9P1 - 304max) fps -5%
Asus ROG Strix Scar 17 G733PY-XS96
NVIDIA GeForce RTX 4090 Laptop GPU, R9 7945HX, SK hynix PC801 HFS001TEJ9X101N
114.8 (5.12min, 71.4P1 - 204max) fps -21%
Lenovo Legion Pro 5 16ARX8
NVIDIA GeForce RTX 4070 Laptop GPU, R7 7745HX, Samsung PM9A1 MZVL21T0HCLR
93.2 (3.72min, 62.5P1 - 175.2max) fps -36%
F1 22 - 2560x1440 Ultra High Preset AA:T AF:16x
Alienware m18 R1
NVIDIA GeForce RTX 4090 Laptop GPU, i9-13980HX, SK hynix PC801 HFS001TEJ9X101N
92.2 (79min, 74P1 - 106max) fps +4%
Asus ROG Strix Scar 17 G733PY-XS96
NVIDIA GeForce RTX 4090 Laptop GPU, R9 7945HX, SK hynix PC801 HFS001TEJ9X101N
92.1 (75min, 60P1 - 107max) fps +4%
Asus ROG Strix Scar 17 G733PYV-LL053X
NVIDIA GeForce RTX 4090 Laptop GPU, R9 7945HX3D, SK hynix PC801 HFS001TEJ9X101N
91.8 (78min, 76P1 - 105max) fps +3%
Lenovo Legion 9 16IRX8
NVIDIA GeForce RTX 4090 Laptop GPU, i9-13980HX, 2x SK Hynix HFS001TEJ9X115N (RAID 0)
90.9 (76min, 56P1 - 105max) fps +2%
Alienware M18 R1 QHD
NVIDIA GeForce RTX 4090 Laptop GPU, i9-13900HX
90.6 (77min, 72P1 - 106max) fps +2%
MSI Titan GT77 HX 13VI
NVIDIA GeForce RTX 4090 Laptop GPU, i9-13950HX, Samsung PM9A1 MZVL22T0HBLB
90.1 (78min, 71P1 - 104max) fps +2%
SCHENKER XMG Neo 17 2024 Engineering Sample
NVIDIA GeForce RTX 4090 Laptop GPU, i9-14900HX
88.7 (77min, 67P1 - 104max) fps
Lenovo Legion Pro 7 RTX4090
NVIDIA GeForce RTX 4090 Laptop GPU, i9-13900HX, Samsung PM9A1 MZVL21T0HCLR
85.2 (72min, 40P1 - 96max) fps -4%
Asus ROG Strix Scar 18 2023 G834JY-N6005W
NVIDIA GeForce RTX 4090 Laptop GPU, i9-13980HX, 2x Samsung PM9A1 MZVL21T0HCLR (RAID 0)
75 (23min, 32P1 - 96max) fps -15%
Lenovo Legion Pro 5 16ARX8
NVIDIA GeForce RTX 4070 Laptop GPU, R7 7745HX, Samsung PM9A1 MZVL21T0HCLR
54.8 (47min, 45P1 - 65max) fps -38%
F1 23 - 2560x1440 Ultra High Preset AA:T AF:16x
Asus ROG Strix Scar 17 G733PYV-LL053X
NVIDIA GeForce RTX 4090 Laptop GPU, R9 7945HX3D, SK hynix PC801 HFS001TEJ9X101N
85.1 (67min, 67P1 - 100max) fps +11%
SCHENKER XMG Neo 17 2024 Engineering Sample
NVIDIA GeForce RTX 4090 Laptop GPU, i9-14900HX
76.9 (59min, 61P1 - 94max) fps
Call of Duty Modern Warfare 2 2022 - 2560x1440 Extreme Quality Preset AA:T2X Filmic SM
Asus ROG Strix Scar 17 G733PYV-LL053X
NVIDIA GeForce RTX 4090 Laptop GPU, R9 7945HX3D, SK hynix PC801 HFS001TEJ9X101N
136 fps +10%
MSI Titan GT77 HX 13VI
NVIDIA GeForce RTX 4090 Laptop GPU, i9-13950HX, Samsung PM9A1 MZVL22T0HBLB
135 fps +9%
Asus ROG Strix Scar 17 G733PY-XS96
NVIDIA GeForce RTX 4090 Laptop GPU, R9 7945HX, SK hynix PC801 HFS001TEJ9X101N
135 (69min) fps +9%
Lenovo Legion Pro 7 RTX4090
NVIDIA GeForce RTX 4090 Laptop GPU, i9-13900HX, Samsung PM9A1 MZVL21T0HCLR
132 (67min) fps +6%
Alienware M18 R1 QHD
NVIDIA GeForce RTX 4090 Laptop GPU, i9-13900HX
132 (69min) fps +6%
Asus ROG Strix Scar 18 2023 G834JY-N6005W
NVIDIA GeForce RTX 4090 Laptop GPU, i9-13980HX, 2x Samsung PM9A1 MZVL21T0HCLR (RAID 0)
127 (65P1) fps +2%
SCHENKER XMG Neo 17 2024 Engineering Sample
NVIDIA GeForce RTX 4090 Laptop GPU, i9-14900HX
124 fps
Lenovo Legion Pro 5 16ARX8
NVIDIA GeForce RTX 4070 Laptop GPU, R7 7745HX, Samsung PM9A1 MZVL21T0HCLR
77 (39min) fps -38%
Cyberpunk 2077 1.6 - 2560x1440 Ultra Preset
Asus ROG Strix Scar 17 G733PYV-LL053X
NVIDIA GeForce RTX 4090 Laptop GPU, R9 7945HX3D, SK hynix PC801 HFS001TEJ9X101N
116 fps +22%
Asus ROG Strix Scar 17 G733PY-XS96
NVIDIA GeForce RTX 4090 Laptop GPU, R9 7945HX, SK hynix PC801 HFS001TEJ9X101N
104.3 (34.5min - 159.2max) fps +9%
Alienware m18 R1
NVIDIA GeForce RTX 4090 Laptop GPU, i9-13980HX, SK hynix PC801 HFS001TEJ9X101N
102.16 (48.9min - 193.9max) fps +7%
Alienware M18 R1 QHD
NVIDIA GeForce RTX 4090 Laptop GPU, i9-13900HX
102.16 (41.4min - 165.62max) fps +7%
Lenovo Legion Pro 7 RTX4090
NVIDIA GeForce RTX 4090 Laptop GPU, i9-13900HX, Samsung PM9A1 MZVL21T0HCLR
100.93 (30.73min - 162.33max) fps +6%
Lenovo Legion 9 16IRX8
NVIDIA GeForce RTX 4090 Laptop GPU, i9-13980HX, 2x SK Hynix HFS001TEJ9X115N (RAID 0)
98.8 (28.3min - 147.2max) fps +4%
MSI Titan GT77 HX 13VI
NVIDIA GeForce RTX 4090 Laptop GPU, i9-13950HX, Samsung PM9A1 MZVL22T0HBLB
98 fps +3%
SCHENKER XMG Neo 17 2024 Engineering Sample
NVIDIA GeForce RTX 4090 Laptop GPU, i9-14900HX
95.3 fps
Asus ROG Strix Scar 18 2023 G834JY-N6005W
NVIDIA GeForce RTX 4090 Laptop GPU, i9-13980HX, 2x Samsung PM9A1 MZVL21T0HCLR (RAID 0)
94.5 (72min - 127max) fps -1%
Lenovo Legion Pro 5 16ARX8
NVIDIA GeForce RTX 4070 Laptop GPU, R7 7745HX, Samsung PM9A1 MZVL21T0HCLR
58.1 (37.8min - 93.4max) fps -39%
Cyberpunk 2077 2.0 Phantom Liberty - 2560x1440 Ultra Preset (FSR off)
Asus ROG Strix Scar 17 G733PYV-LL053X
NVIDIA GeForce RTX 4090 Laptop GPU, R9 7945HX3D, SK hynix PC801 HFS001TEJ9X101N
93.4 fps +6%
Lenovo Legion 9 16IRX8
NVIDIA GeForce RTX 4090 Laptop GPU, i9-13980HX, 2x SK Hynix HFS001TEJ9X115N (RAID 0)
89.55 (28.01min - 139.33max) fps +2%
SCHENKER XMG Neo 17 2024 Engineering Sample
NVIDIA GeForce RTX 4090 Laptop GPU, i9-14900HX
88.2 (17.8min - 124.4max) fps

结论:酷睿 i9-14900HX 只是一个小更新

评测的申克 XMG Neo 17 (E24) 内的英特尔酷睿 i9-14900HX。测试设备由全球国际货运代理有限公司提供。

英特尔在 2024 年对其 HX 移动处理器进行了小幅更新,但在新的 Raptor-Lake-HX-Refresh 型号上看不到大的变化或改进。总的来说,处理器阵容有所缩减,第 13 代 HX 型号从 9 款减少到 5 款。酷睿 i9-14900HX 现在是唯一的顶级型号,拥有 24 个核心和 32 个线程。其最大涡轮增压频率提高到了 5.8 GHz,从而提高了单核性能。在许多测试中,英特尔成功地从Apple 手中夺回了性能桂冠。然而,更高的性能只是更高的消耗的结果,这意味着它的效率也不是最高的。

说到多核性能,这主要取决于每台笔记本电脑设定的功耗限制--总的来说,新酷睿 i9-14900HX 与旧的第 13 代酷睿 i9-HX 机型并无太大区别。在玩游戏时,新的 Raptor Lake-HX Refresh 也能在不少游戏中受益于单核性能的提升,但到最后,你几乎无法察觉到区别--尤其是在最高画质设置和高分辨率下。处理器和显卡的功耗限制在其中再次发挥了重要作用。AMD 的Ryzen 9 7945HX3D 带有 3D V-Cache 的处理器在某些游戏中的速度仍然要快一些,因此,在效率和游戏性能方面,它仍然是最好的移动 HX CPU。

英特尔提高了新酷睿 i9-14900HX 的最大涡轮时钟频率,尤其改善了其单核性能。Raptor Lake-HX Refresh 无法从任何其他改进中受益,不过,由于 AMD HX CPU 的灾难性供应,它也不必如此。

至少,理论上是这样,因为目前市场上几乎没有配备 Ryzen 9 7945HX3D 的笔记本电脑。而酷睿 i9-14900HX 很快就会出现在每一台高端游戏/多媒体笔记本电脑上,这使得它在 2024 年占据市场主导地位变得轻而易举。这款处理器并不差,但英特尔并没有在这一领域做出巨大努力,也没有提供任何重大进步。从第 13 代酷睿 i9-HX 型号升级完全没有意义,而从酷睿 i9-12900HX 等 Alder-Lake 芯片升级可能更有意义,因为它仍然使用 Nvidia 的旧 RTX-3000 基因。

Please share our article, every link counts!
> Notebookcheck中文版(NBC中国) > 评测 > 英特尔 Raptor Lake-HX 更新分析 - 单核性能更强的酷睿 i9-14900HX
Andreas Osthoff, 2024-01-10 (Update: 2024-01-10)