联想Legion Pro 7 16笔记本电脑回顾:得益于RTX 4090的全面游戏能力

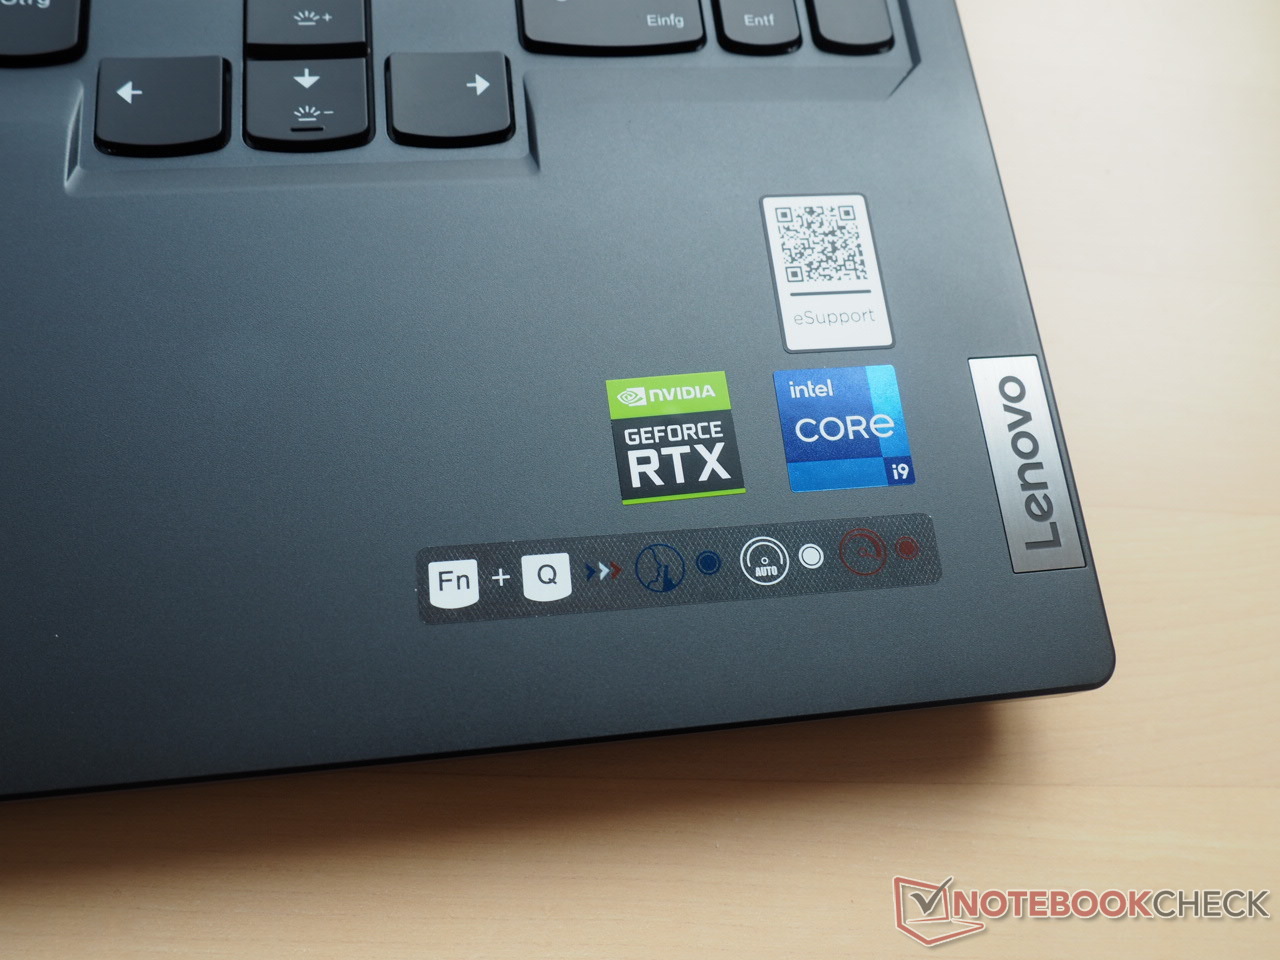
这款Legion Pro 7 16IRX8H不仅是最强大的,也是最昂贵的游戏笔记本之一。目前,你必须支付至少4,500欧元的组合,以获得 酷睿i9-13900HX, GeForce RTX 4090, 32GB内存(2x 16GB DDR5-5600),2TB大容量存储(2x 1TB NVMe SSD)和240Hz显示屏(2660 x 1600像素)。每个玩家都必须决定他是否要支持制造商目前的价格政策,这似乎与任何通货膨胀无关。
Legion Pro 7的竞争者包括其他16和17英寸范围内的RTX 4090高端玩家,如 Razer Blade 16,以及 XMG Neo 16,以及 华硕Strix Scar 17和 MSI Titan GT77.更加便宜的姐妹型号,配备 RTX 4080也出现在表格中作为对比设备。
潜在的竞争对手比较
Rating | Date | Model | Weight | Height | Size | Resolution | Price |
|---|---|---|---|---|---|---|---|
| 88.8 % v7 (old) | 06 / 2023 | Lenovo Legion Pro 7 RTX4090 i9-13900HX, GeForce RTX 4090 Laptop GPU | 2.7 kg | 26 mm | 16.00" | 2560x1600 | |
| 89.8 % v7 (old) | 03 / 2023 | Razer Blade 16 Early 2023 RTX 4090 i9-13950HX, GeForce RTX 4090 Laptop GPU | 2.5 kg | 21.99 mm | 16.00" | 3840x2400 | |
| 88.3 % v7 (old) | 04 / 2023 | Asus ROG Strix Scar 17 G733PY-XS96 R9 7945HX, GeForce RTX 4090 Laptop GPU | 2.9 kg | 28.3 mm | 17.30" | 2560x1440 | |
| 87.7 % v7 (old) | 04 / 2023 | Schenker XMG Neo 16 E23 i9-13900HX, GeForce RTX 4090 Laptop GPU | 2.5 kg | 29.9 mm | 16.00" | 2560x1600 | |
| 89 % v7 (old) | 02 / 2023 | MSI Titan GT77 HX 13VI i9-13950HX, GeForce RTX 4090 Laptop GPU | 3.5 kg | 23 mm | 17.30" | 3840x2160 | |
| 89.4 % v7 (old) | 02 / 2023 | Lenovo Legion Pro 7 16IRX8H i9-13900HX, GeForce RTX 4080 Laptop GPU | 2.7 kg | 26 mm | 16.00" | 2560x1600 |
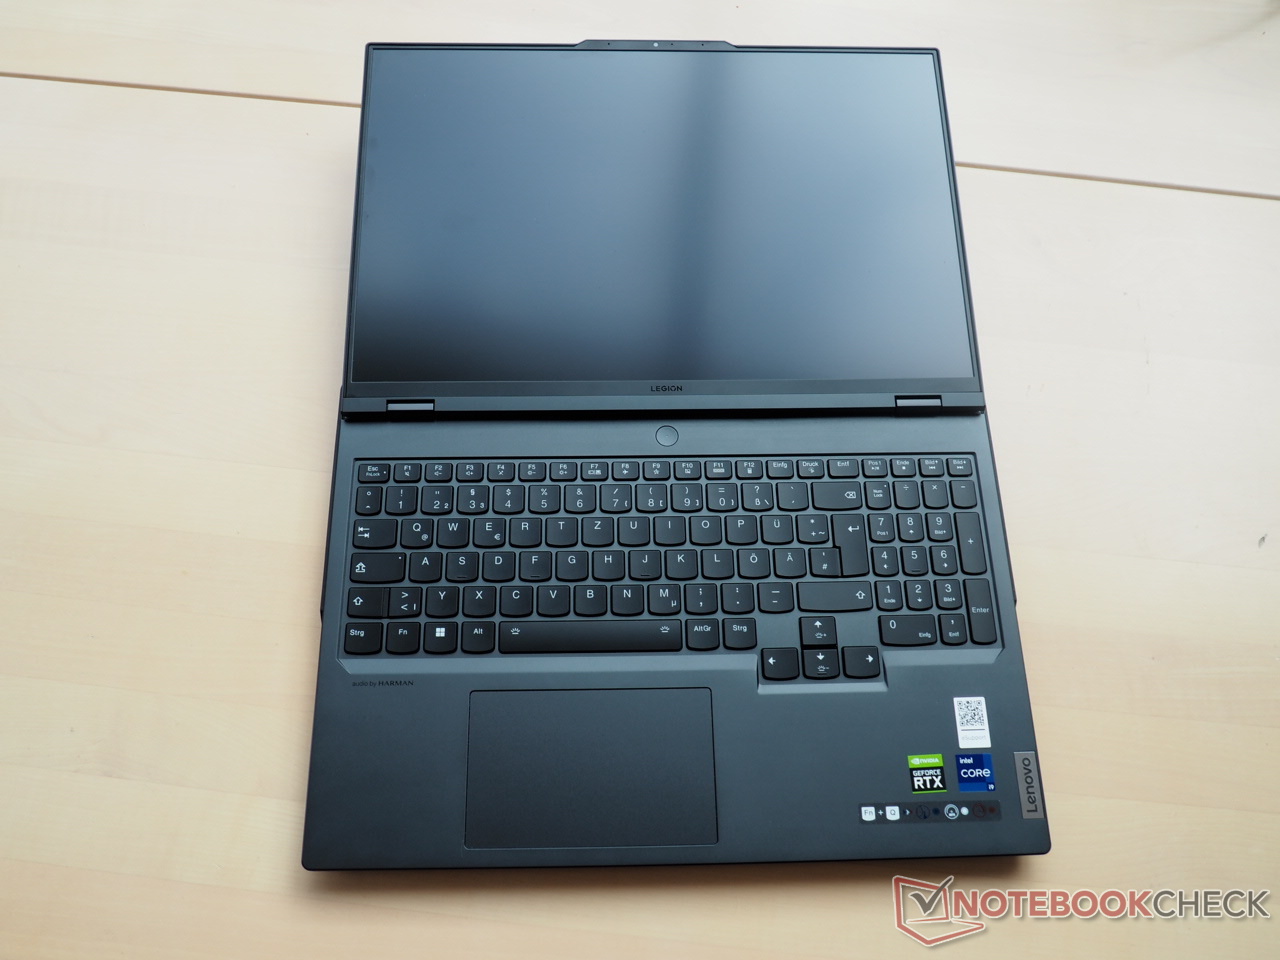
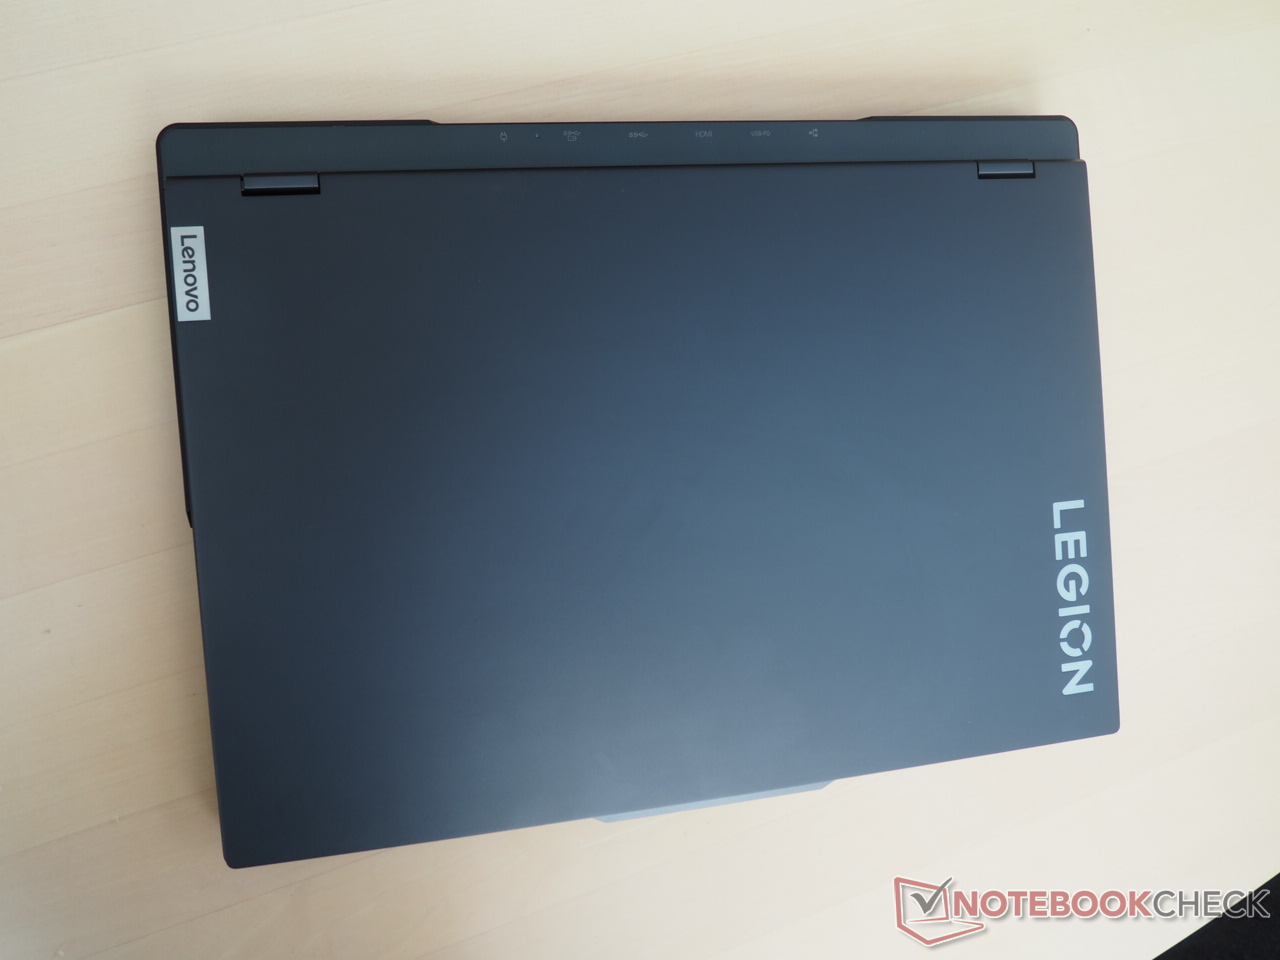
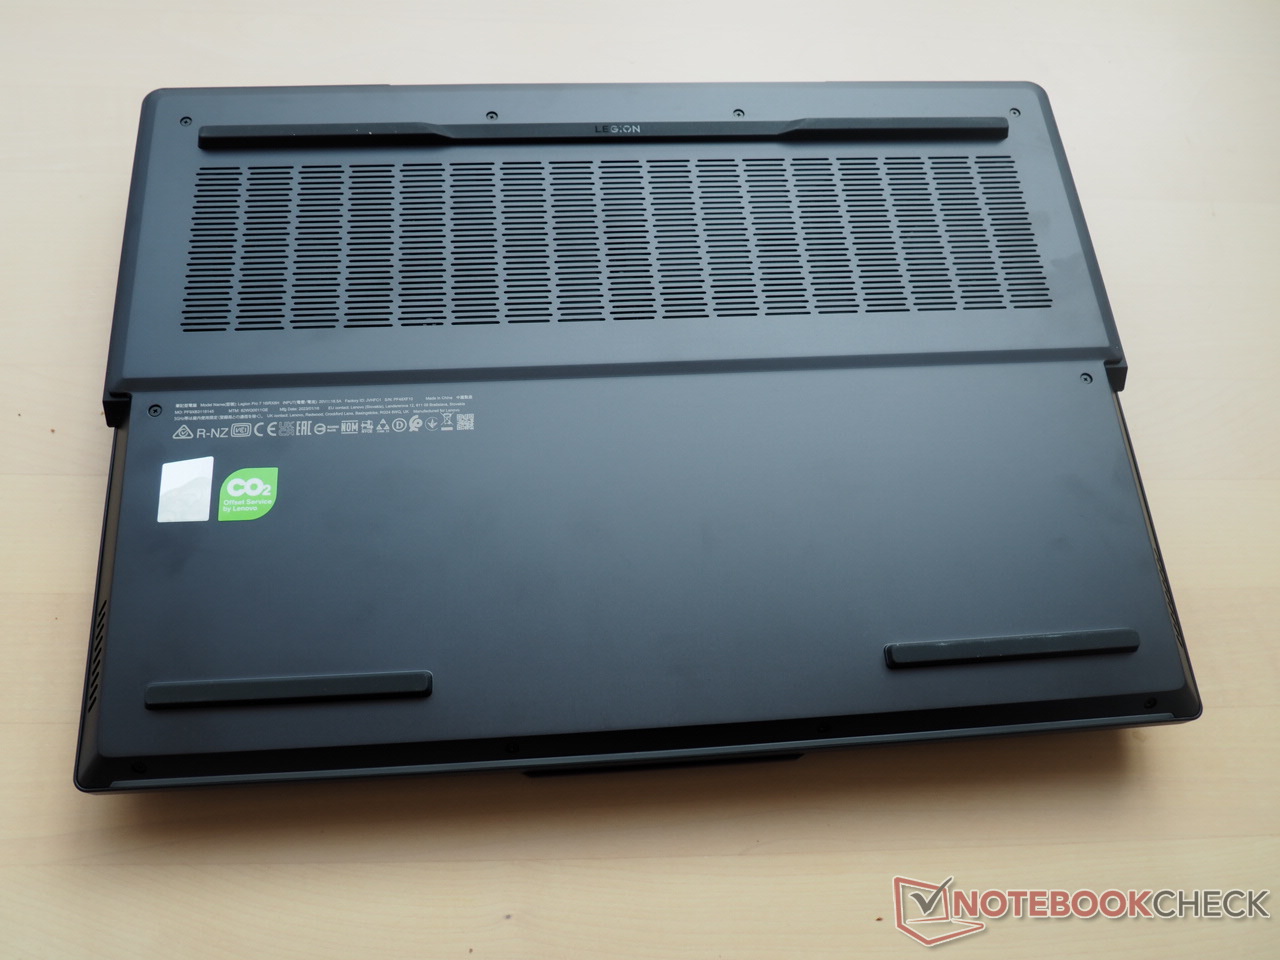
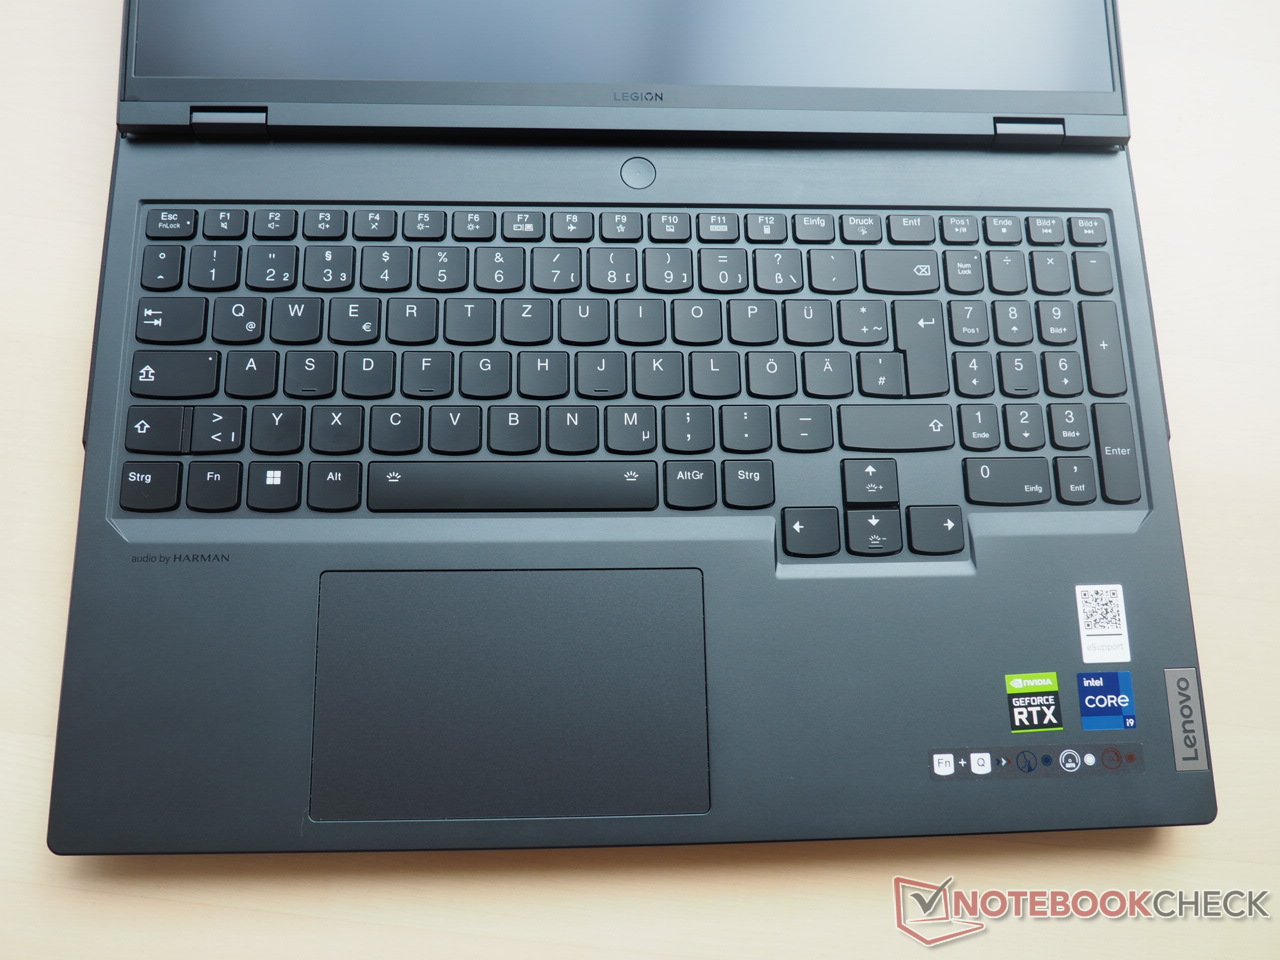
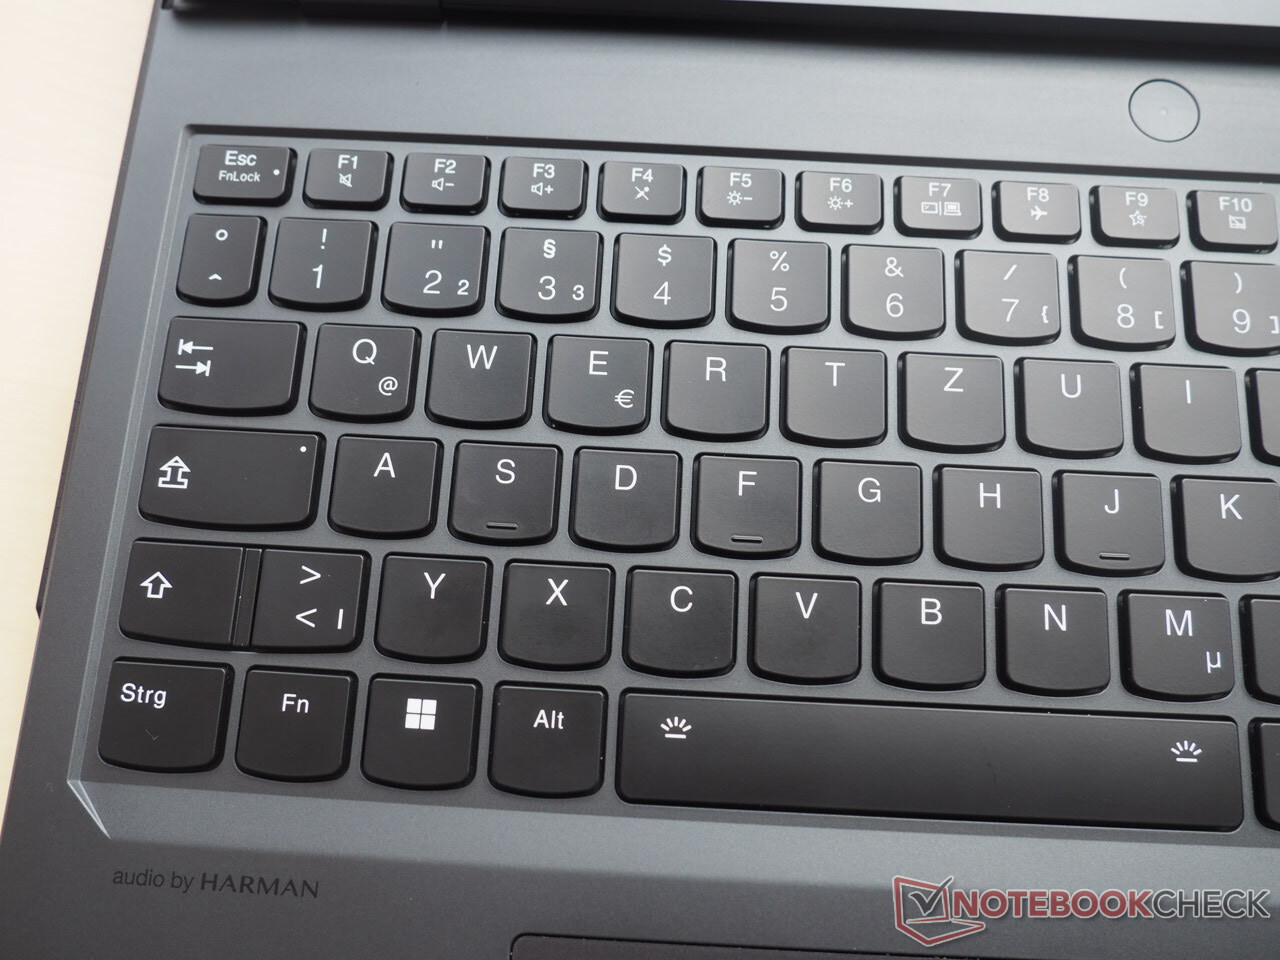
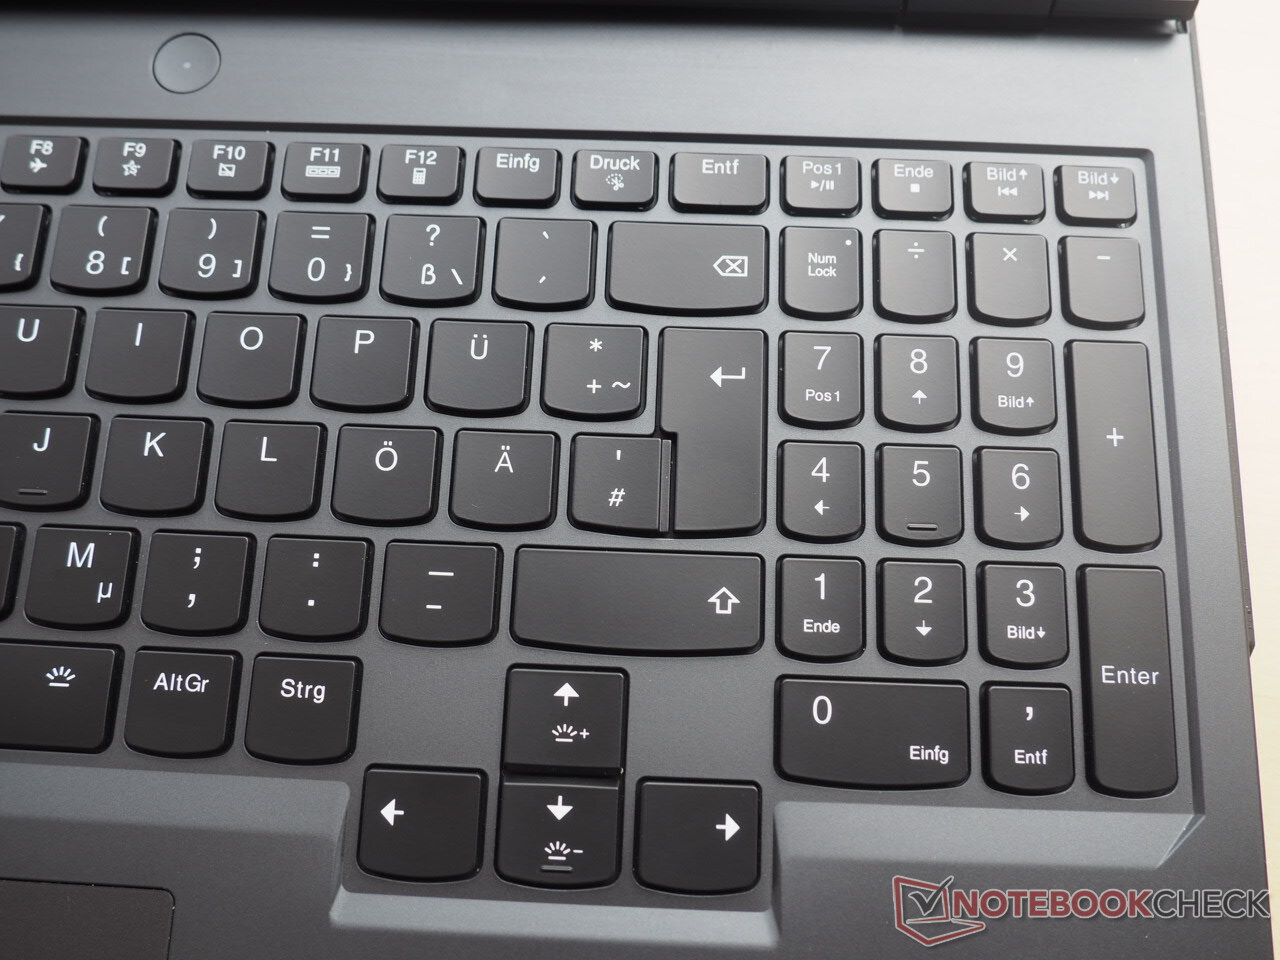
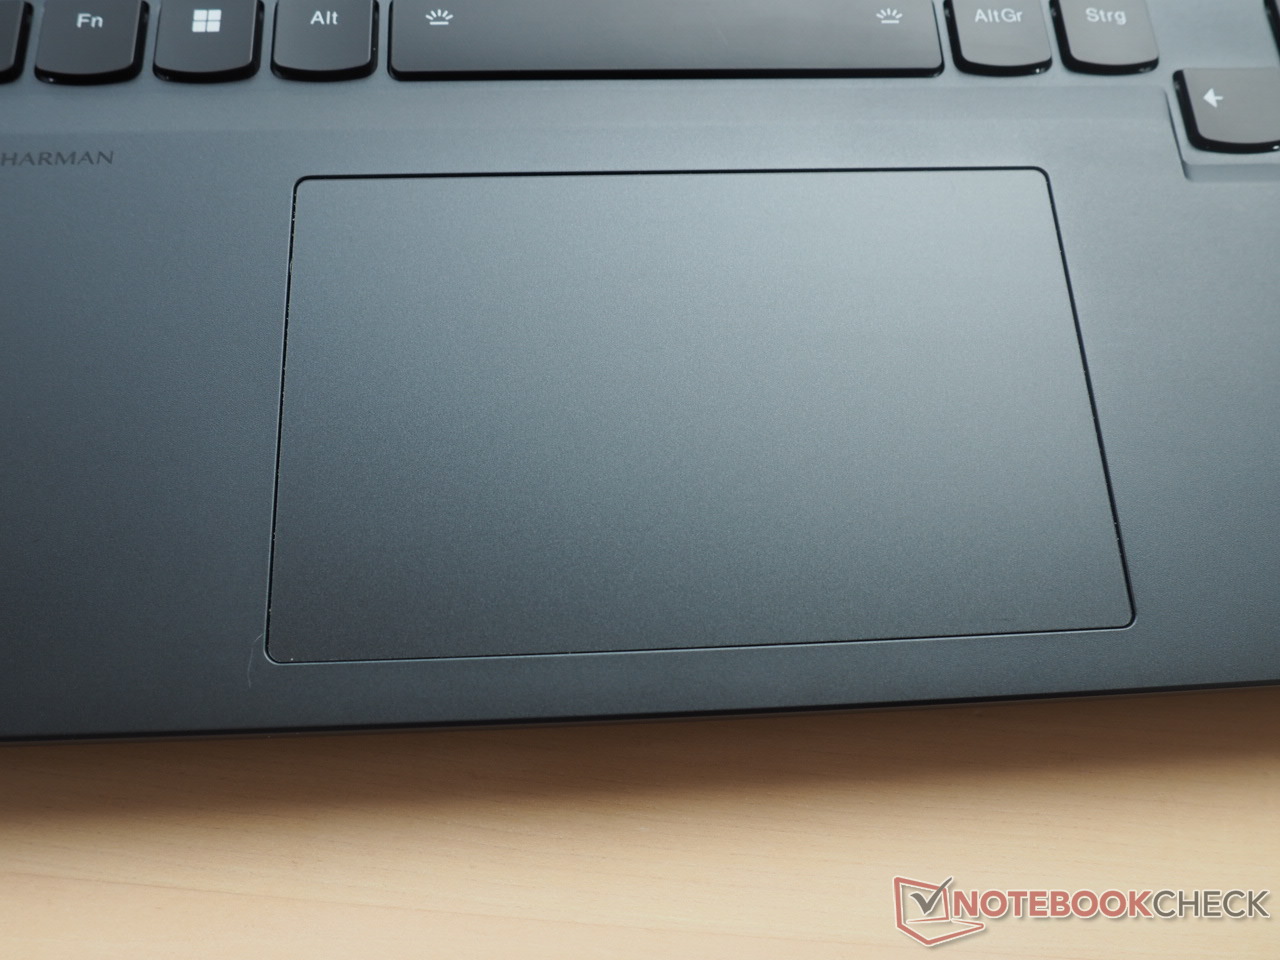
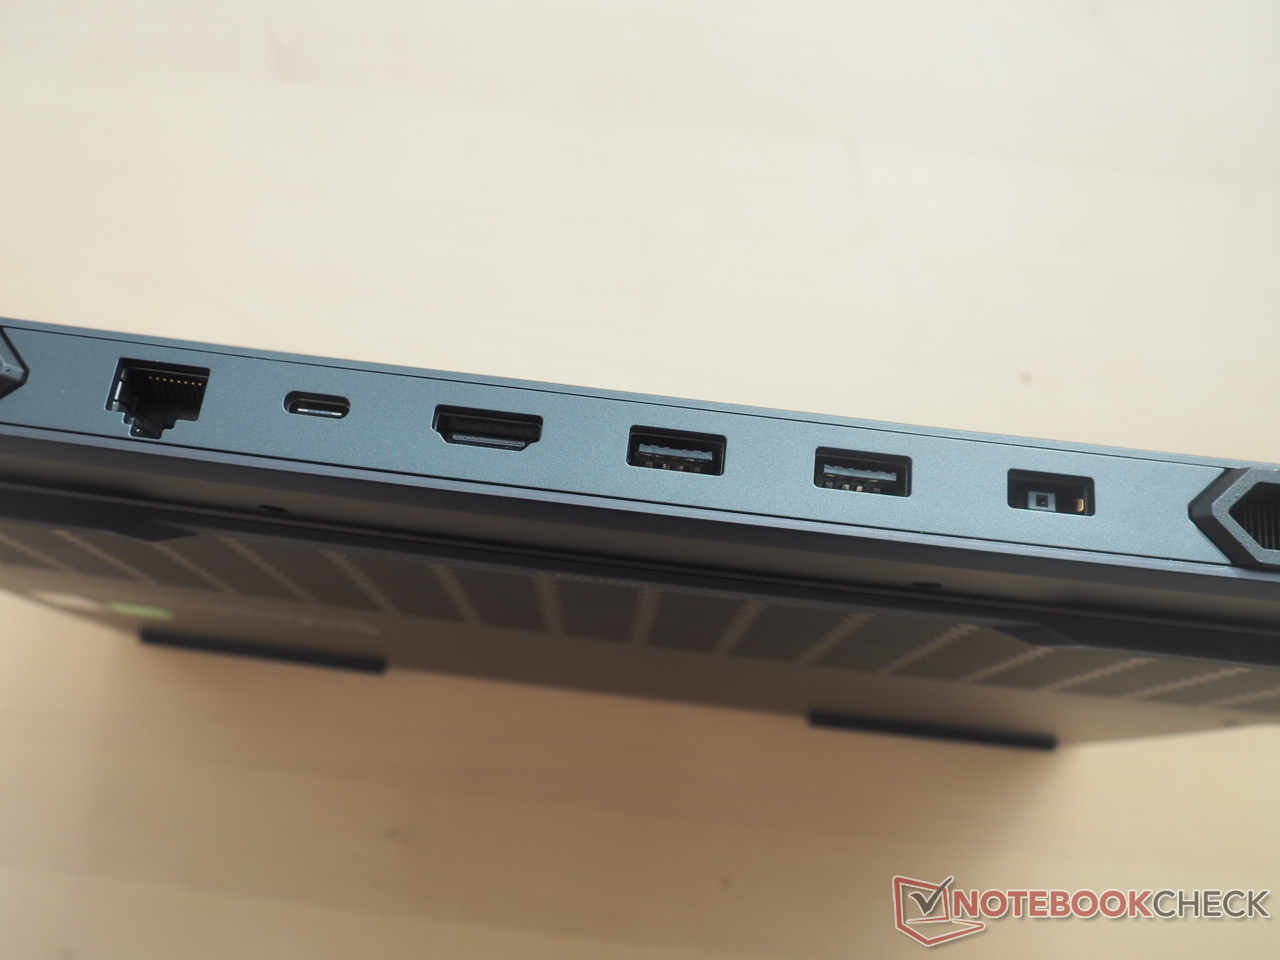
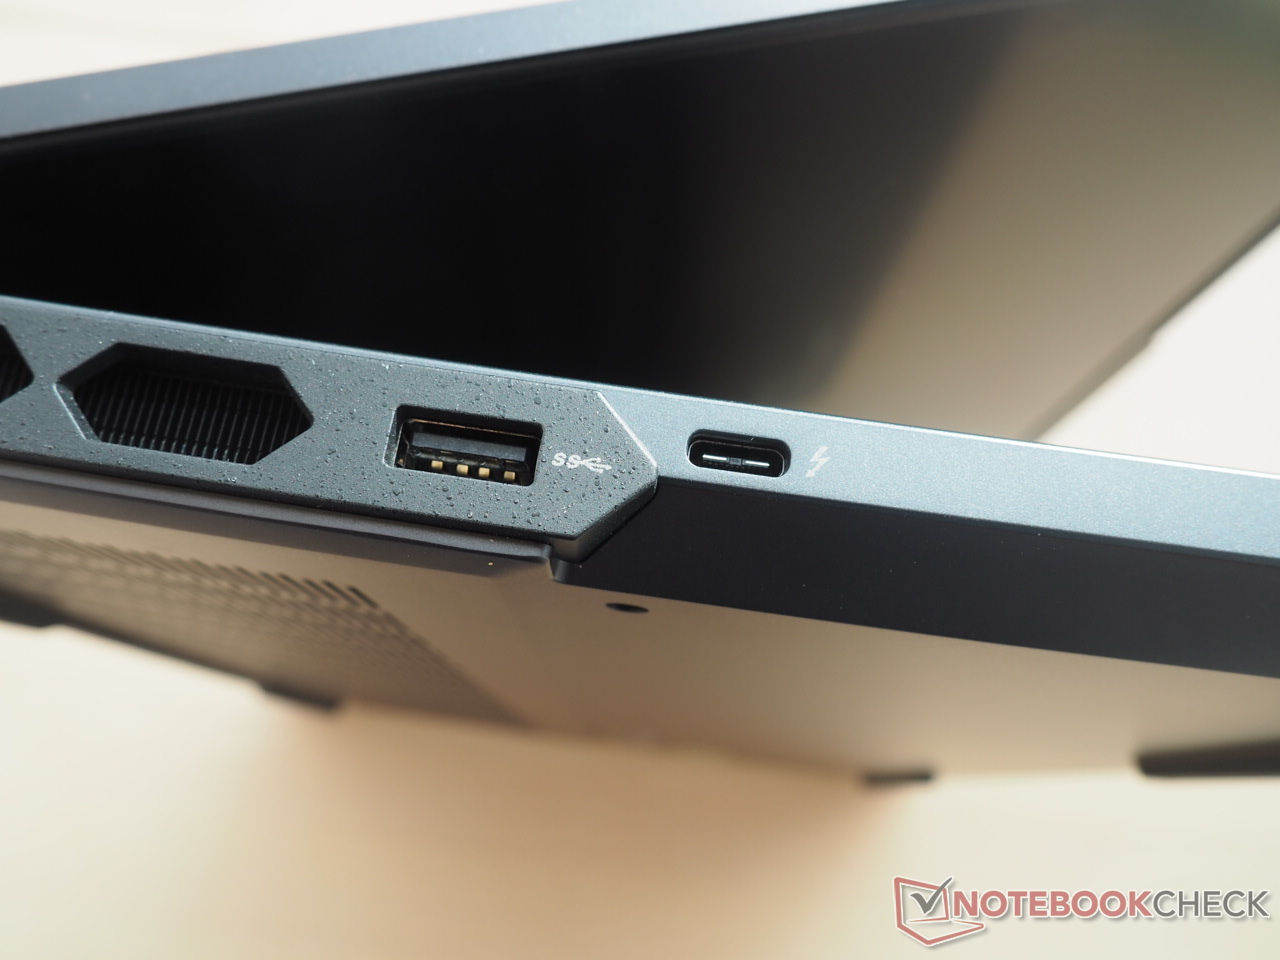
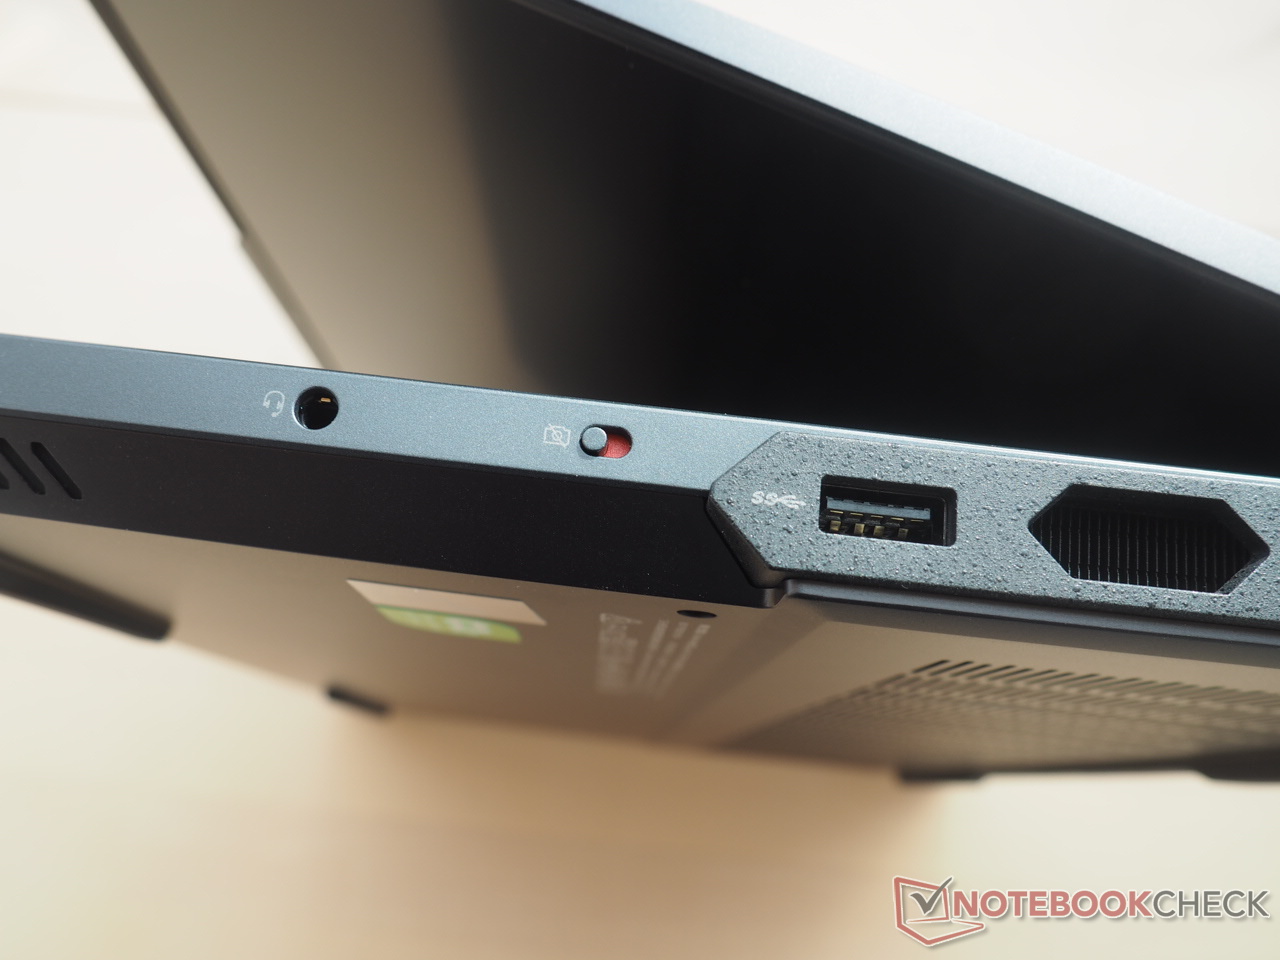
由于这款机箱在结构上与已经测试过的变体相同,我们在这篇文章中不会再讨论关于机箱、端口和输入设备的细节。你可以在下面的评论中找到相应的信息 链接的评论.
沟通
网络摄像头


显示
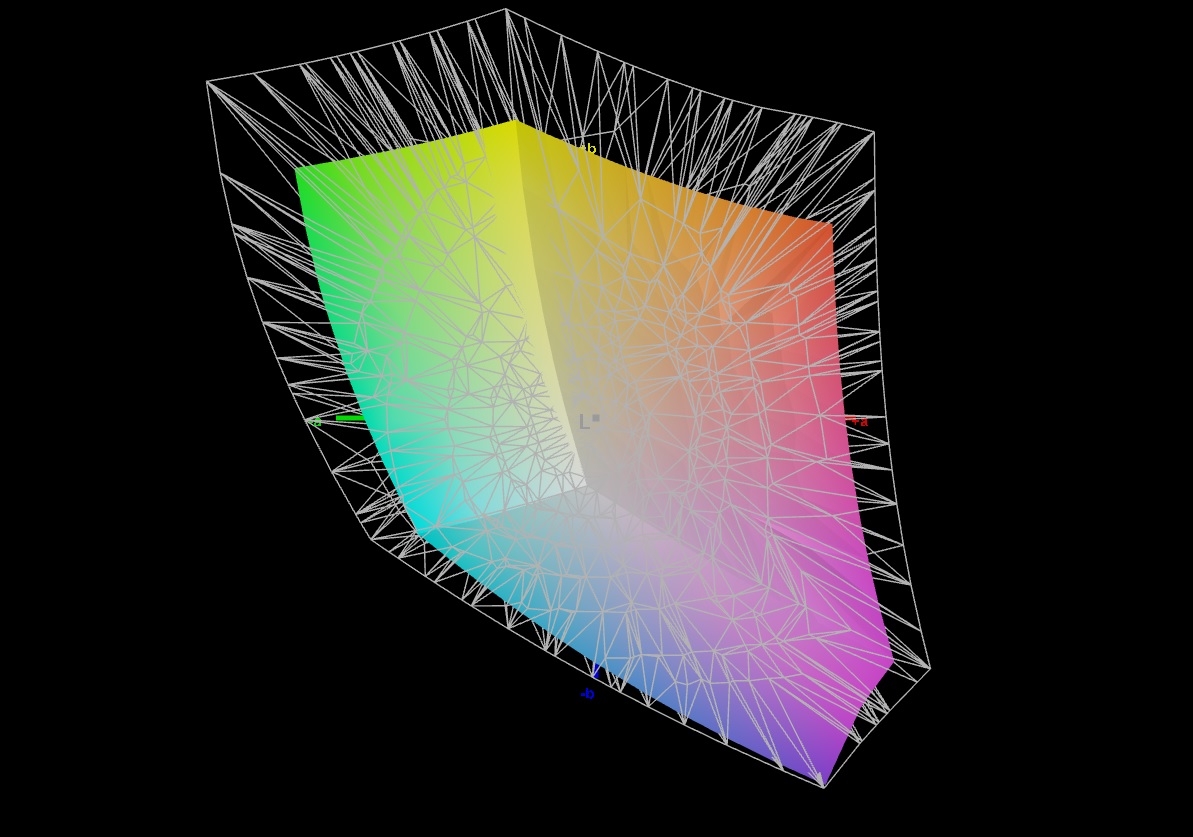
除了外壳,显示屏也与4080版本相同。 这是一个好消息,因为我们上次测试证实,WQXGA屏幕几乎在各方面都令人印象深刻。
| |||||||||||||||||||||||||
Brightness Distribution: 91 %
Center on Battery: 491 cd/m²
Contrast: 1228:1 (Black: 0.4 cd/m²)
ΔE ColorChecker Calman: 1.6 | ∀{0.5-29.43 Ø4.71}
calibrated: 0.97
ΔE Greyscale Calman: 3 | ∀{0.09-98 Ø4.96}
71.6% AdobeRGB 1998 (Argyll 3D)
99.8% sRGB (Argyll 3D)
69.5% Display P3 (Argyll 3D)
Gamma: 2.211
CCT: 6979 K
| Lenovo Legion Pro 7 RTX4090 MNG007DA2-3 (CSO1628), IPS, 2560x1600, 16" | Razer Blade 16 Early 2023 RTX 4090 AUO B160ZAN01.U, mini-LED, 3840x2400, 16" | Asus ROG Strix Scar 17 G733PY-XS96 NE173QHM-NZ2, IPS, 2560x1440, 17.3" | Schenker XMG Neo 16 E23 BOE0AF0 NE160QDM-NZ1, IPS, 2560x1600, 16" | MSI Titan GT77 HX 13VI B173ZAN06.C, Mini-LED, 3840x2160, 17.3" | Lenovo Legion Pro 7 16IRX8H MNG007DA2-3 (CSO1628), IPS, 2560x1600, 16" | |
|---|---|---|---|---|---|---|
| Display | 24% | 20% | -3% | 22% | -1% | |
| Display P3 Coverage (%) | 69.5 | 99.9 44% | 98 41% | 67.3 -3% | 94.9 37% | 69.1 -1% |
| sRGB Coverage (%) | 99.8 | 100 0% | 100 0% | 96.7 -3% | 99.9 0% | 99.7 0% |
| AdobeRGB 1998 Coverage (%) | 71.6 | 90.9 27% | 85.6 20% | 68.9 -4% | 92.4 29% | 71.2 -1% |
| Response Times | -622% | -53% | -60% | -365% | -21% | |
| Response Time Grey 50% / Grey 80% * (ms) | 10.9 ? | 10.2 ? 6% | 6.2 ? 43% | 14.5 ? -33% | 38.4 ? -252% | 12.3 ? -13% |
| Response Time Black / White * (ms) | 4.6 ? | 62.04 ? -1249% | 11.4 ? -148% | 8.6 ? -87% | 26.6 ? -478% | 5.9 ? -28% |
| PWM Frequency (Hz) | 2420 ? | 2380 ? | ||||
| Screen | 1412% | 11% | -5% | 54786% | 21% | |
| Brightness middle (cd/m²) | 491 | 730 49% | 322.5 -34% | 372 -24% | 606 23% | 511 4% |
| Brightness (cd/m²) | 472 | 729 54% | 317 -33% | 349 -26% | 602 28% | 469 -1% |
| Brightness Distribution (%) | 91 | 94 3% | 86 -5% | 88 -3% | 93 2% | 86 -5% |
| Black Level * (cd/m²) | 0.4 | 0.0045 99% | 0.29 28% | 0.32 20% | 0.0001 100% | 0.4 -0% |
| Contrast (:1) | 1228 | 162222 13110% | 1112 -9% | 1163 -5% | 6060000 493385% | 1278 4% |
| Colorchecker dE 2000 * | 1.6 | 5.65 -253% | 1.15 28% | 2.06 -29% | 4.8 -200% | 0.95 41% |
| Colorchecker dE 2000 max. * | 5.15 | 10.11 -96% | 3.03 41% | 3 42% | 8.2 -59% | 2.07 60% |
| Colorchecker dE 2000 calibrated * | 0.97 | 1.85 -91% | 0.56 42% | 1.5 -55% | 1.8 -86% | 0.91 6% |
| Greyscale dE 2000 * | 3 | 8.1 -170% | 1.7 43% | 1.9 37% | 6.5 -117% | 0.6 80% |
| Gamma | 2.211 100% | 1.98 111% | 2.27 97% | 2.312 95% | 2.63 84% | 2.176 101% |
| CCT | 6979 93% | 5874 111% | 6299 103% | 6747 96% | 6596 99% | 6545 99% |
| Total Average (Program / Settings) | 271% /
824% | -7% /
4% | -23% /
-12% | 18148% /
35172% | -0% /
10% |
* ... smaller is better
不管是亮度(~470 cd/m²)、对比度(~1,230:1)还是色彩准确性(平均DeltaE 1.6):测得的数值对IPS面板来说是非常公正的。响应时间也是令人满意的,这主要归功于240赫兹的刷新率。在色彩空间方面还有改进的余地。虽然100%的sRGB对于游戏笔记本来说已经足够了,但对于专业用户来说,大约72%的AdobeRGB覆盖率和70%的DCI-P3都有点差。其他竞争者在这里提供更多(见表)。
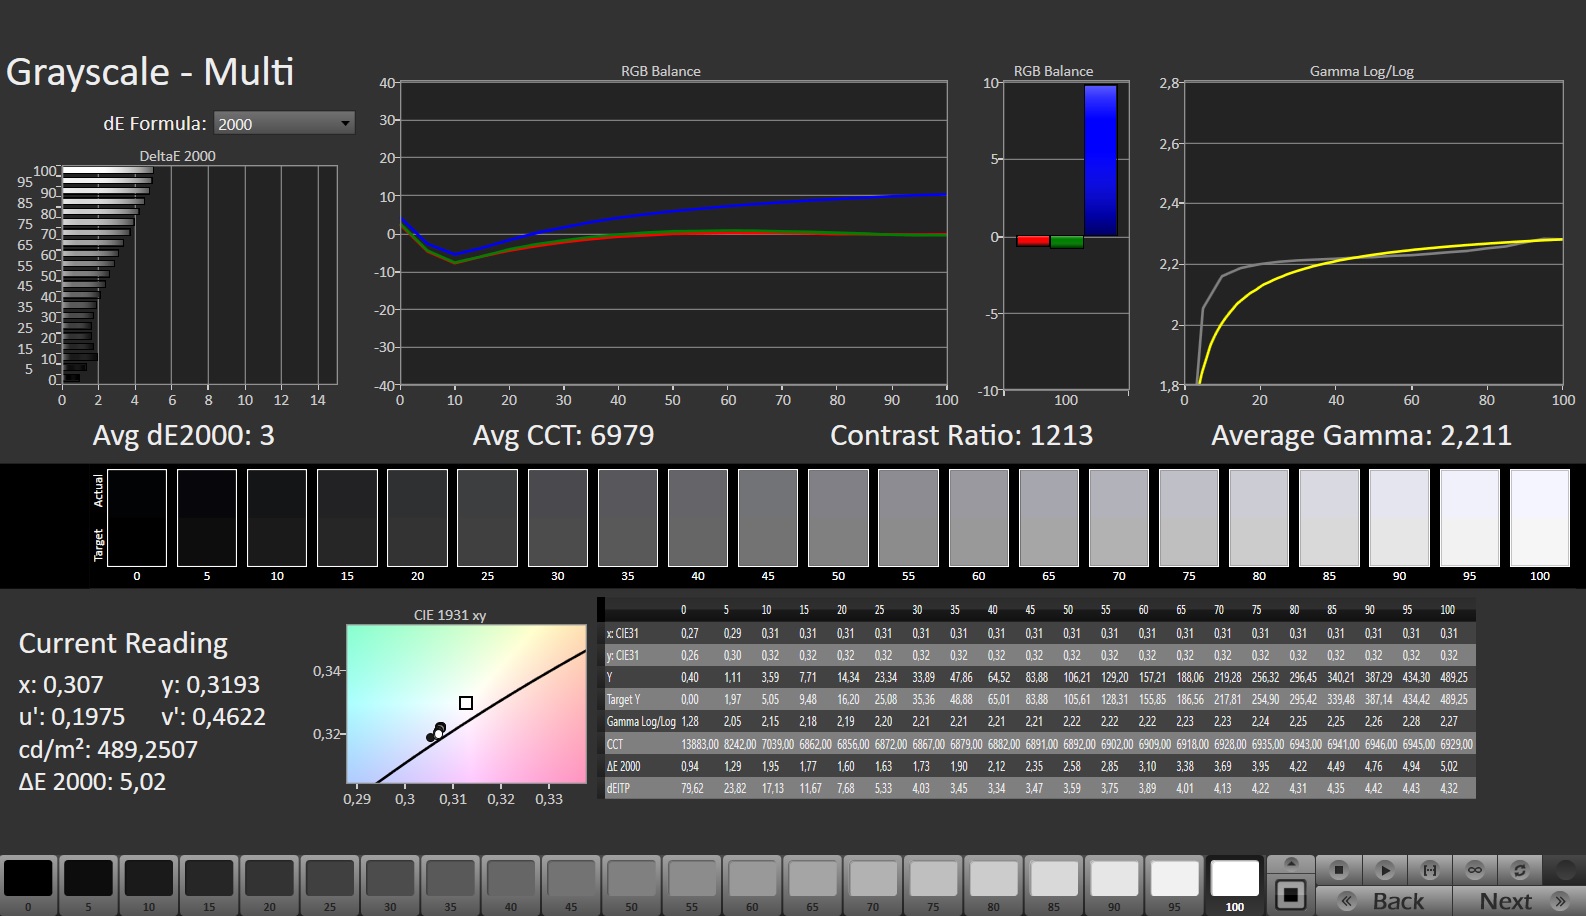
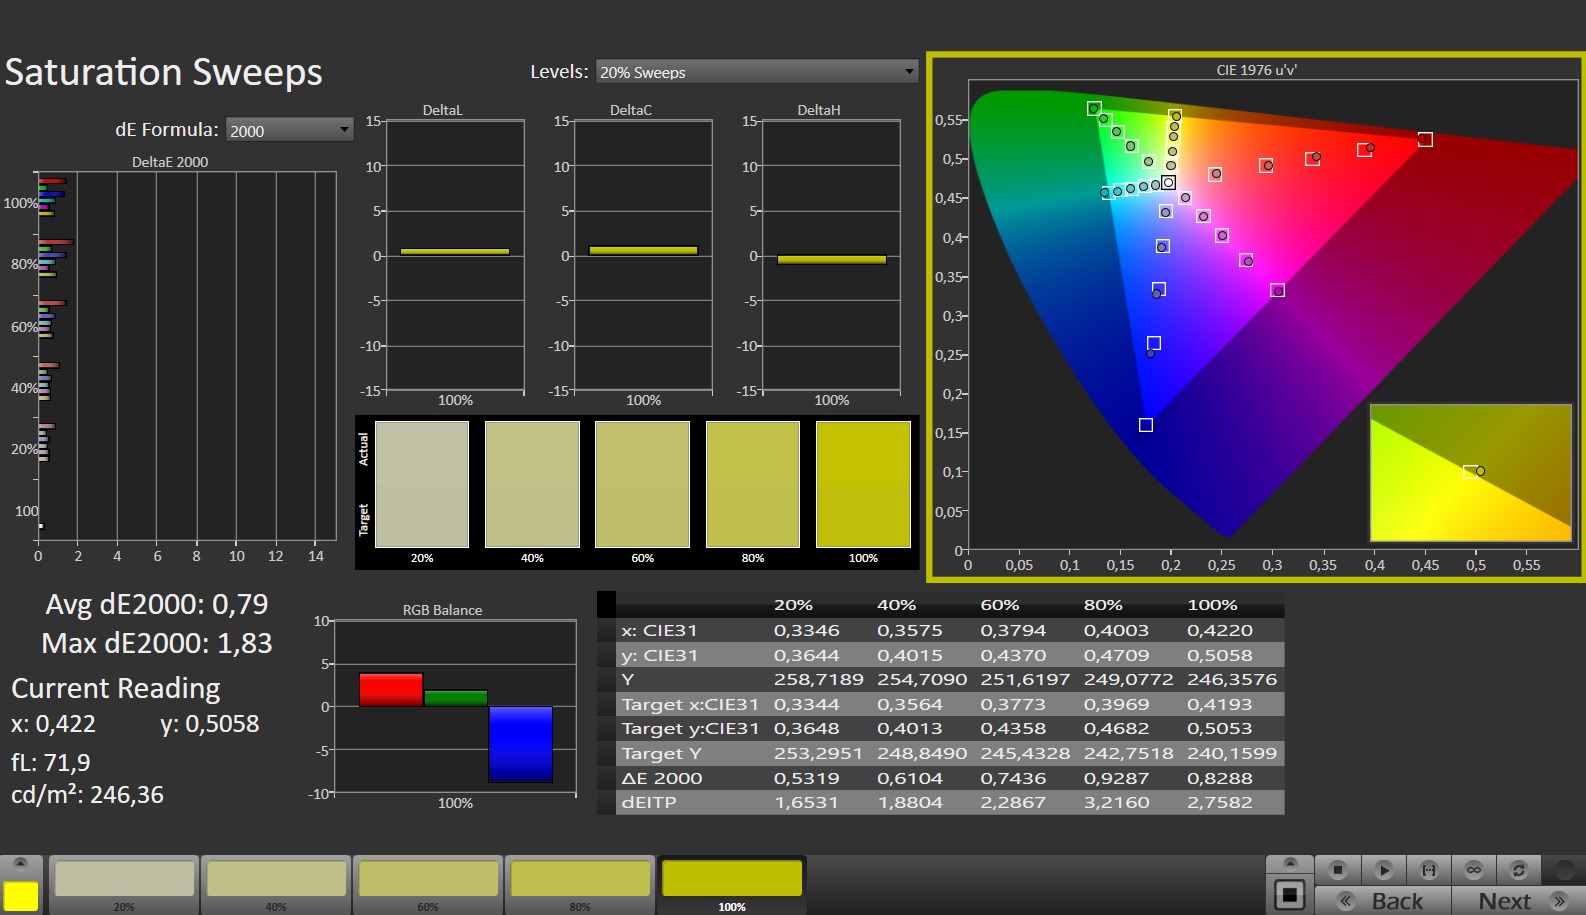
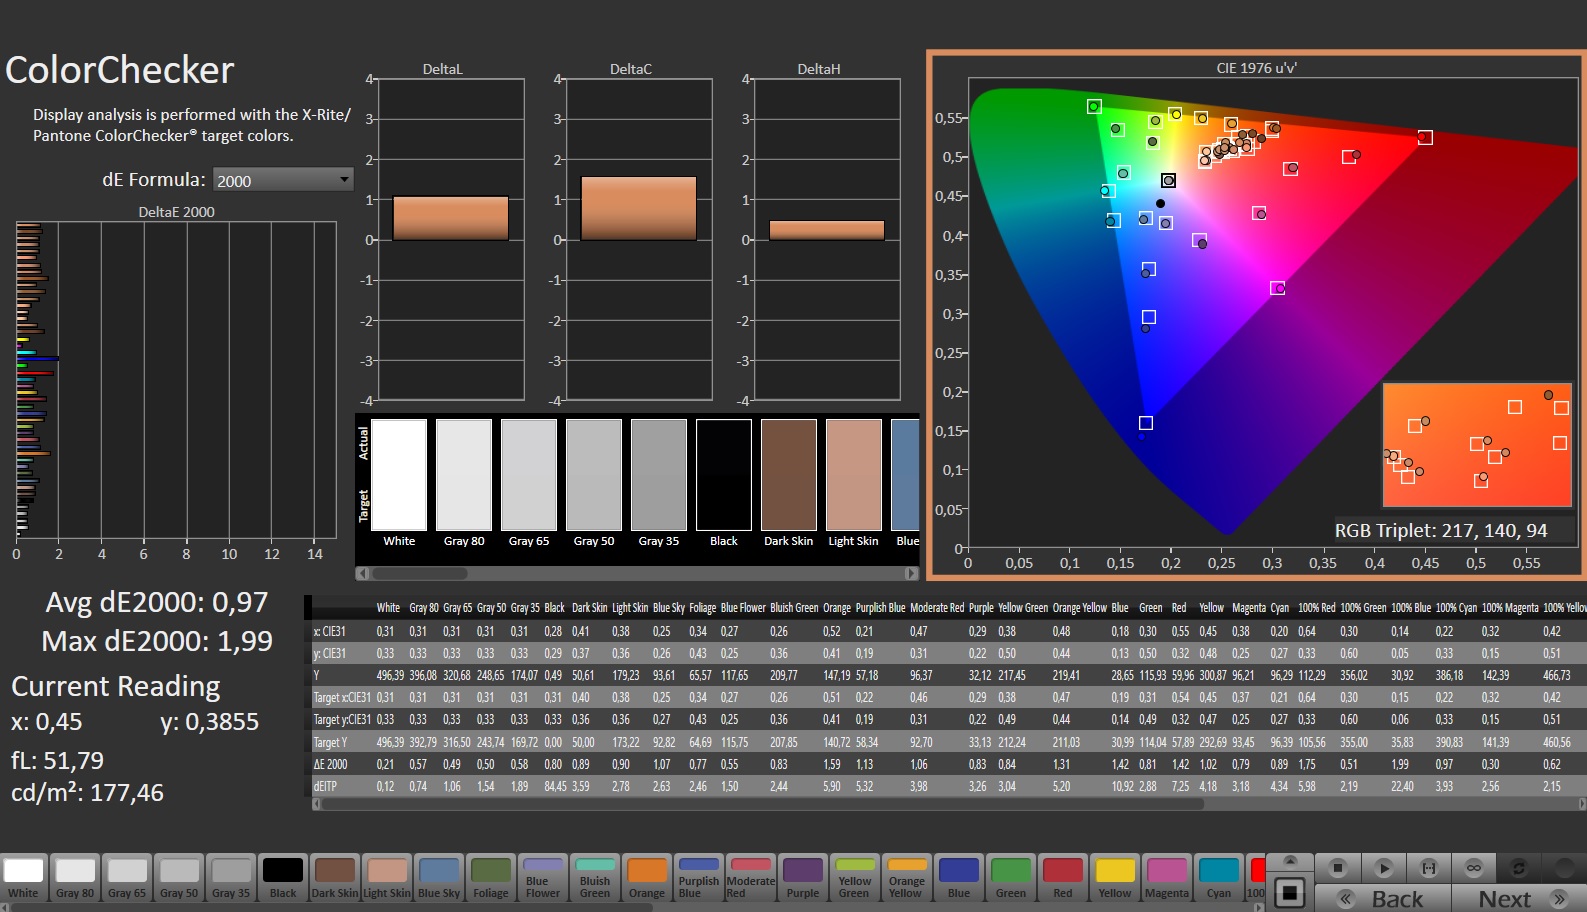
总的来说,该显示屏给人留下了良好到非常好的印象,尽管它在技术上还达不到像Razer Blade 16和MSI Titan GT 77那样的迷你LED面板的水平。
Display Response Times
| ↔ Response Time Black to White | ||
|---|---|---|
| 4.6 ms ... rise ↗ and fall ↘ combined | ↗ 1.6 ms rise | 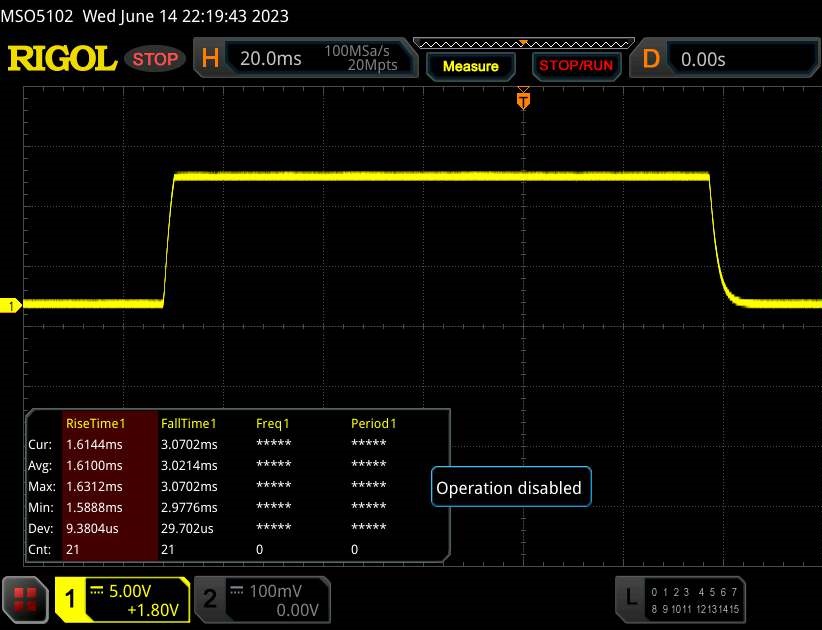 |
| ↘ 3 ms fall | ||
| The screen shows very fast response rates in our tests and should be very well suited for fast-paced gaming. In comparison, all tested devices range from 0.1 (minimum) to 240 (maximum) ms. » 17 % of all devices are better. This means that the measured response time is better than the average of all tested devices (19.8 ms). | ||
| ↔ Response Time 50% Grey to 80% Grey | ||
| 10.9 ms ... rise ↗ and fall ↘ combined | ↗ 5.1 ms rise | 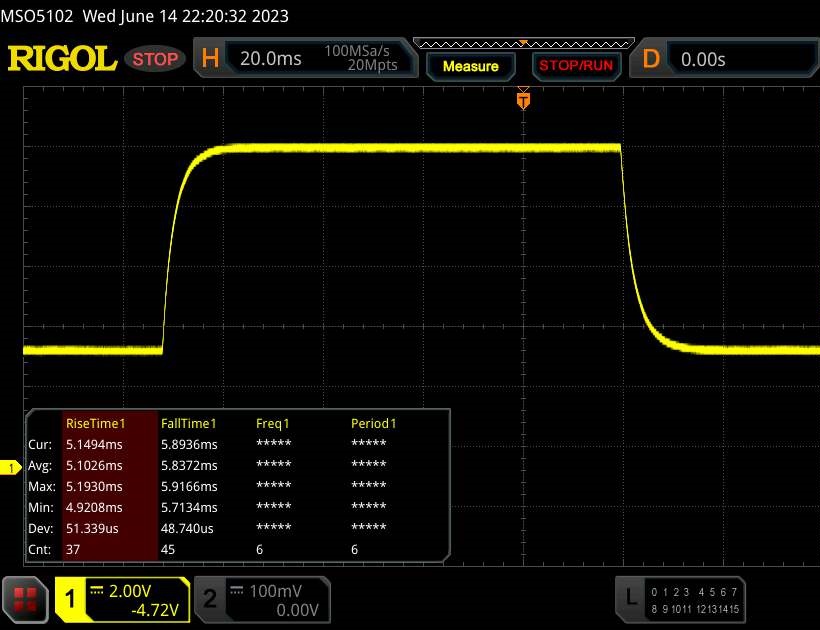 |
| ↘ 5.8 ms fall | ||
| The screen shows good response rates in our tests, but may be too slow for competitive gamers. In comparison, all tested devices range from 0.165 (minimum) to 636 (maximum) ms. » 25 % of all devices are better. This means that the measured response time is better than the average of all tested devices (31 ms). | ||
Screen Flickering / PWM (Pulse-Width Modulation)
| Screen flickering / PWM not detected | 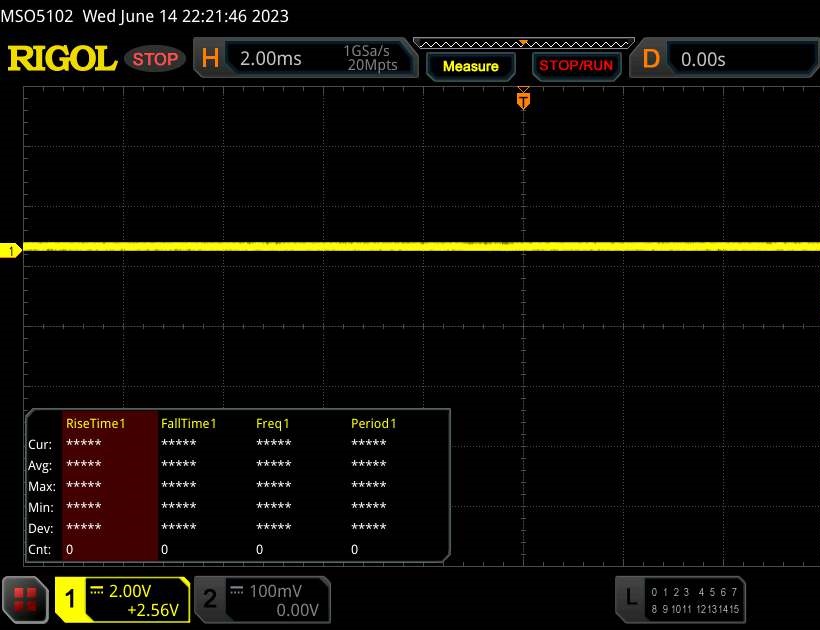 | ||
In comparison: 52 % of all tested devices do not use PWM to dim the display. If PWM was detected, an average of 7757 (minimum: 5 - maximum: 343500) Hz was measured. | |||
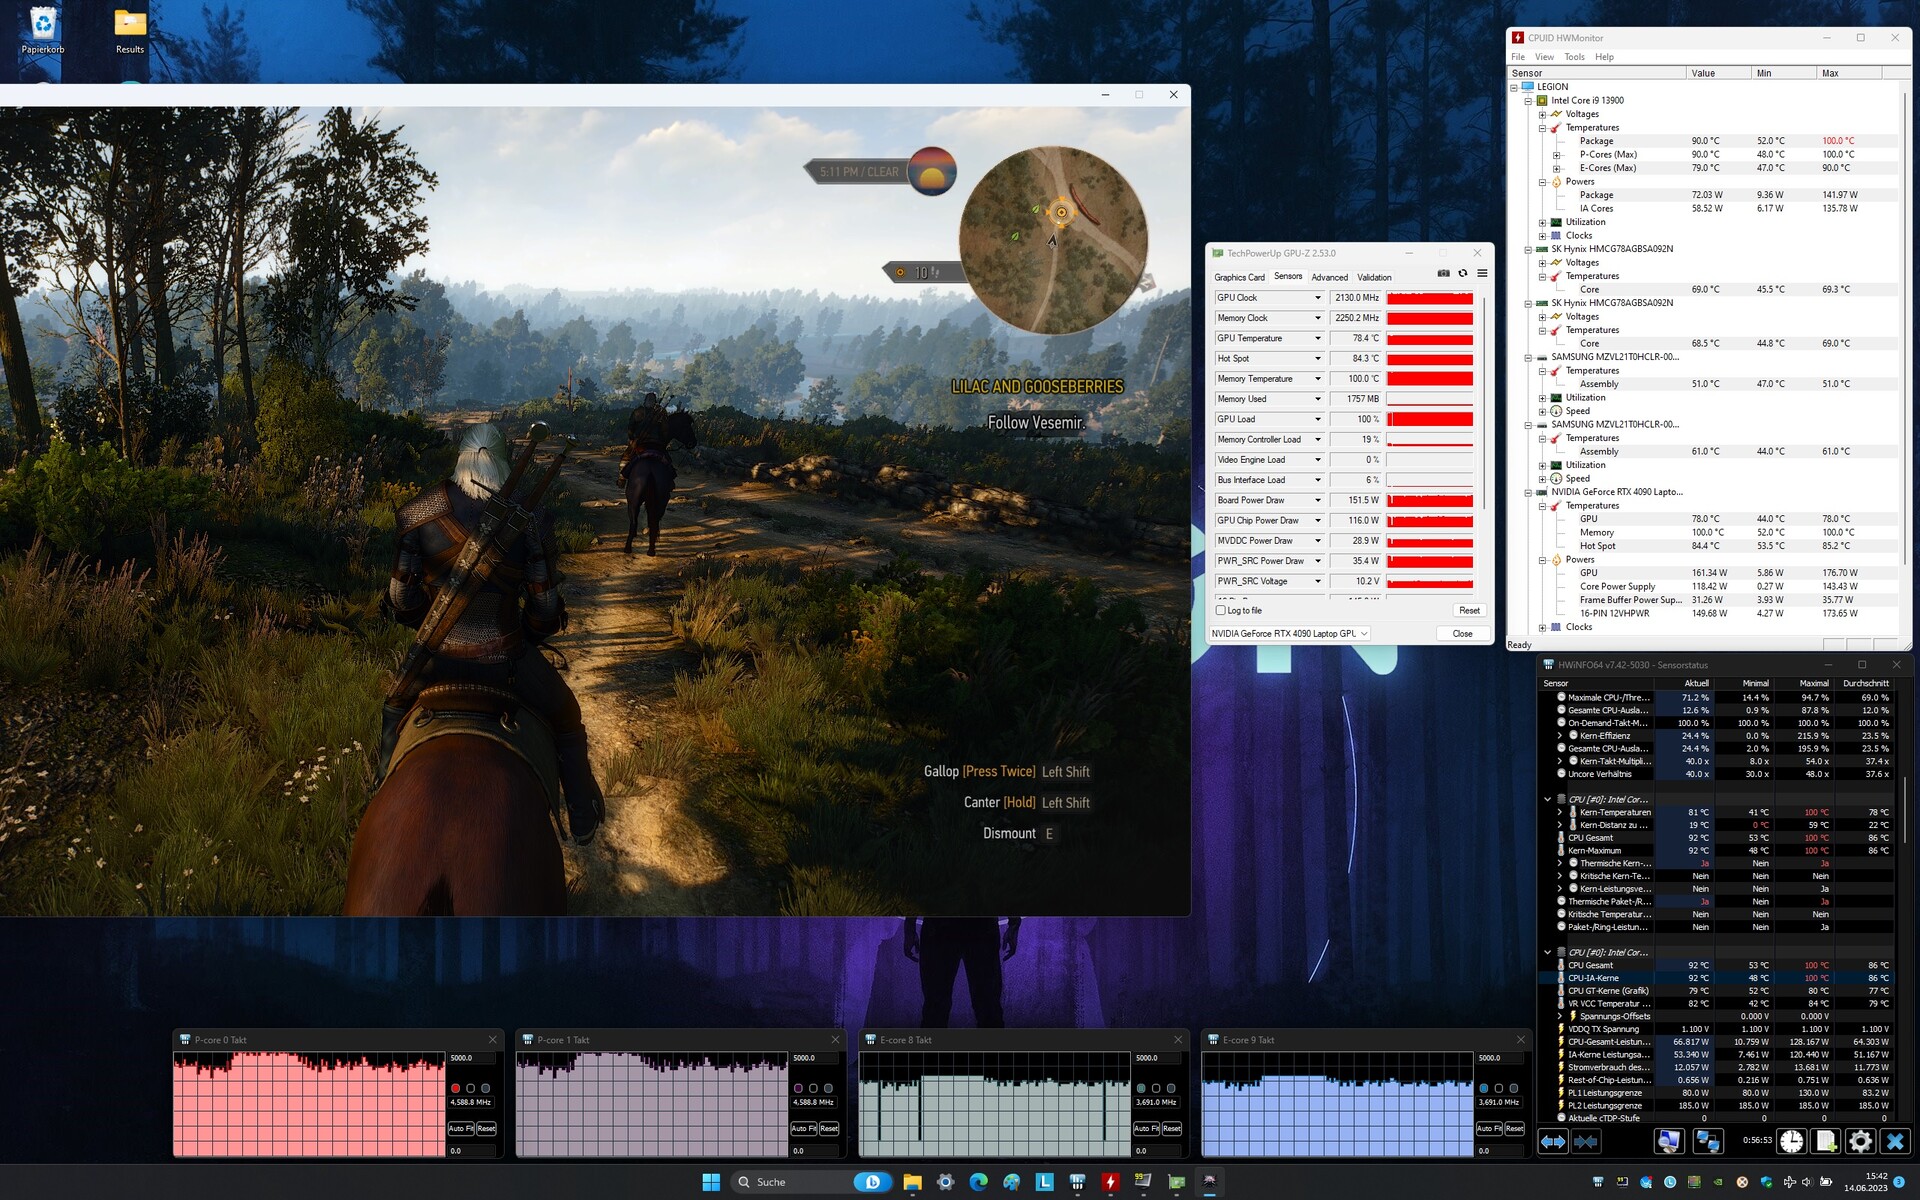
业绩
Legion Pro 7 16IRX8H在价格和性能方面处于绝对上风。这款16英寸的笔记本提供了足够的储备,为未来几年的新游戏做好了准备。虽然CPU和GPU是焊接的(这在现代笔记本电脑中很常见),但如果需要,工作内存和大容量存储可以被替换。
测试条件
预装的联想Vantage软件包含许多定制系统的选项。热量模式和可选的混合模式尤其相关。除了电池测量(平衡与图形切换)之外,我们所有的测试都是在性能模式下进行的,并有一个永久激活的dGPU。
| 静音模式 | 平衡模式 | 性能模式 | |
| CPU PL1 (HWiNFO) | 55 W | 80 W | 130 W |
| CPU PL2 (HWiNFO) | 65 W | 119 W | 185 W |
| 噪音 (Witcher 3 @FHD/Ultra) | ~37 dB(A) | ~47 dB(A) | ~53 dB(A) |
| 性能 (Witcher 3 @FHD/Ultra) | 40 FPS (锁定) | ~160 FPS | ~200 FPS |
处理器
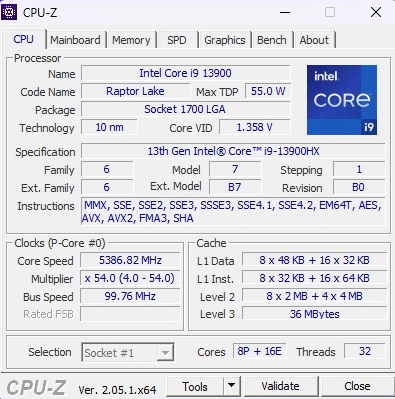
正如预期的那样, 酷睿i9-13900HX提供了与RTX 4080型号非常相似的性能。猛禽湖芯片的性能在较长时间内也相当稳定(见Cinebench循环)。一般来说,CPU的性能略高于迄今为止确定的13900HX的平均水平。英特尔将8个带超线程的性能核心和16个不带超线程的效率核心结合起来,这意味着总共有32个平行线程。
Cinebench R15 Multi Loop
* ... smaller is better
AIDA64: FP32 Ray-Trace | FPU Julia | CPU SHA3 | CPU Queen | FPU SinJulia | FPU Mandel | CPU AES | CPU ZLib | FP64 Ray-Trace | CPU PhotoWorxx
| Performance rating | |
| Asus ROG Strix Scar 17 G733PY-XS96 | |
| MSI Titan GT77 HX 13VI | |
| Lenovo Legion Pro 7 RTX4090 | |
| Lenovo Legion Pro 7 16IRX8H | |
| Schenker XMG Neo 16 E23 | |
| Average of class Gaming | |
| Average Intel Core i9-13900HX | |
| Razer Blade 16 Early 2023 RTX 4090 | |
| AIDA64 / FP32 Ray-Trace | |
| Asus ROG Strix Scar 17 G733PY-XS96 | |
| Average of class Gaming (10227 - 85542, n=105, last 2 years) | |
| MSI Titan GT77 HX 13VI | |
| Lenovo Legion Pro 7 RTX4090 | |
| Lenovo Legion Pro 7 16IRX8H | |
| Average Intel Core i9-13900HX (17589 - 27615, n=22) | |
| Schenker XMG Neo 16 E23 | |
| Razer Blade 16 Early 2023 RTX 4090 | |
| AIDA64 / FPU Julia | |
| Asus ROG Strix Scar 17 G733PY-XS96 | |
| MSI Titan GT77 HX 13VI | |
| Average of class Gaming (51376 - 238426, n=105, last 2 years) | |
| Lenovo Legion Pro 7 RTX4090 | |
| Lenovo Legion Pro 7 16IRX8H | |
| Average Intel Core i9-13900HX (88686 - 137015, n=22) | |
| Schenker XMG Neo 16 E23 | |
| Razer Blade 16 Early 2023 RTX 4090 | |
| AIDA64 / CPU SHA3 | |
| Asus ROG Strix Scar 17 G733PY-XS96 | |
| MSI Titan GT77 HX 13VI | |
| Lenovo Legion Pro 7 16IRX8H | |
| Lenovo Legion Pro 7 RTX4090 | |
| Average of class Gaming (2180 - 10115, n=105, last 2 years) | |
| Schenker XMG Neo 16 E23 | |
| Average Intel Core i9-13900HX (4362 - 7029, n=22) | |
| Razer Blade 16 Early 2023 RTX 4090 | |
| AIDA64 / CPU Queen | |
| Asus ROG Strix Scar 17 G733PY-XS96 | |
| MSI Titan GT77 HX 13VI | |
| Razer Blade 16 Early 2023 RTX 4090 | |
| Schenker XMG Neo 16 E23 | |
| Lenovo Legion Pro 7 RTX4090 | |
| Lenovo Legion Pro 7 16IRX8H | |
| Average Intel Core i9-13900HX (125644 - 141385, n=22) | |
| Average of class Gaming (49785 - 173351, n=90, last 2 years) | |
| AIDA64 / FPU SinJulia | |
| Asus ROG Strix Scar 17 G733PY-XS96 | |
| MSI Titan GT77 HX 13VI | |
| Lenovo Legion Pro 7 16IRX8H | |
| Lenovo Legion Pro 7 RTX4090 | |
| Average Intel Core i9-13900HX (12334 - 17179, n=22) | |
| Schenker XMG Neo 16 E23 | |
| Average of class Gaming (4424 - 33636, n=105, last 2 years) | |
| Razer Blade 16 Early 2023 RTX 4090 | |
| AIDA64 / FPU Mandel | |
| Asus ROG Strix Scar 17 G733PY-XS96 | |
| Average of class Gaming (25115 - 128721, n=105, last 2 years) | |
| MSI Titan GT77 HX 13VI | |
| Lenovo Legion Pro 7 RTX4090 | |
| Lenovo Legion Pro 7 16IRX8H | |
| Average Intel Core i9-13900HX (43850 - 69202, n=22) | |
| Schenker XMG Neo 16 E23 | |
| Razer Blade 16 Early 2023 RTX 4090 | |
| AIDA64 / CPU AES | |
| Schenker XMG Neo 16 E23 | |
| Razer Blade 16 Early 2023 RTX 4090 | |
| Asus ROG Strix Scar 17 G733PY-XS96 | |
| Average Intel Core i9-13900HX (89413 - 237881, n=22) | |
| MSI Titan GT77 HX 13VI | |
| Lenovo Legion Pro 7 RTX4090 | |
| Lenovo Legion Pro 7 16IRX8H | |
| Average of class Gaming (39258 - 247074, n=105, last 2 years) | |
| AIDA64 / CPU ZLib | |
| Asus ROG Strix Scar 17 G733PY-XS96 | |
| MSI Titan GT77 HX 13VI | |
| Lenovo Legion Pro 7 16IRX8H | |
| Lenovo Legion Pro 7 RTX4090 | |
| Schenker XMG Neo 16 E23 | |
| Average Intel Core i9-13900HX (1284 - 1958, n=22) | |
| Razer Blade 16 Early 2023 RTX 4090 | |
| Average of class Gaming (574 - 2531, n=105, last 2 years) | |
| AIDA64 / FP64 Ray-Trace | |
| Asus ROG Strix Scar 17 G733PY-XS96 | |
| Average of class Gaming (5509 - 45446, n=105, last 2 years) | |
| MSI Titan GT77 HX 13VI | |
| Lenovo Legion Pro 7 16IRX8H | |
| Lenovo Legion Pro 7 RTX4090 | |
| Average Intel Core i9-13900HX (9481 - 15279, n=22) | |
| Schenker XMG Neo 16 E23 | |
| Razer Blade 16 Early 2023 RTX 4090 | |
| AIDA64 / CPU PhotoWorxx | |
| Razer Blade 16 Early 2023 RTX 4090 | |
| Lenovo Legion Pro 7 RTX4090 | |
| Schenker XMG Neo 16 E23 | |
| Lenovo Legion Pro 7 16IRX8H | |
| Average Intel Core i9-13900HX (42994 - 51994, n=22) | |
| Average of class Gaming (12271 - 89891, n=105, last 2 years) | |
| MSI Titan GT77 HX 13VI | |
| Asus ROG Strix Scar 17 G733PY-XS96 | |
系统性能
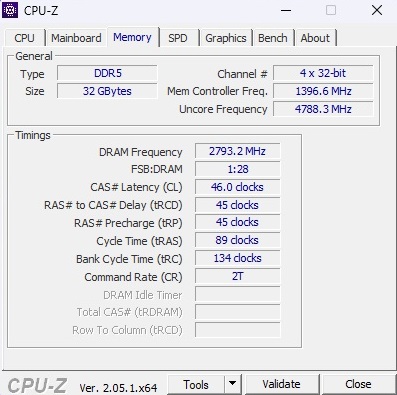
系统功率也处于非常高的水平:PCMark 10中的8158分比RTX 4080模型的结果高出几个百分点。相比之下,DDR5工作内存的基准测试结果也令人印象深刻。
CrossMark: Overall | Productivity | Creativity | Responsiveness
| PCMark 10 / Score | |
| MSI Titan GT77 HX 13VI | |
| Asus ROG Strix Scar 17 G733PY-XS96 | |
| Average Intel Core i9-13900HX, NVIDIA GeForce RTX 4090 Laptop GPU (7690 - 9331, n=8) | |
| Average of class Gaming (5828 - 12414, n=93, last 2 years) | |
| Schenker XMG Neo 16 E23 | |
| Lenovo Legion Pro 7 RTX4090 | |
| Lenovo Legion Pro 7 16IRX8H | |
| Razer Blade 16 Early 2023 RTX 4090 | |
| PCMark 10 / Essentials | |
| MSI Titan GT77 HX 13VI | |
| Lenovo Legion Pro 7 16IRX8H | |
| Average Intel Core i9-13900HX, NVIDIA GeForce RTX 4090 Laptop GPU (10972 - 11983, n=8) | |
| Asus ROG Strix Scar 17 G733PY-XS96 | |
| Lenovo Legion Pro 7 RTX4090 | |
| Schenker XMG Neo 16 E23 | |
| Razer Blade 16 Early 2023 RTX 4090 | |
| Average of class Gaming (8810 - 11935, n=97, last 2 years) | |
| PCMark 10 / Productivity | |
| Average of class Gaming (6845 - 25323, n=95, last 2 years) | |
| Lenovo Legion Pro 7 16IRX8H | |
| Average Intel Core i9-13900HX, NVIDIA GeForce RTX 4090 Laptop GPU (9038 - 11680, n=8) | |
| Asus ROG Strix Scar 17 G733PY-XS96 | |
| MSI Titan GT77 HX 13VI | |
| Schenker XMG Neo 16 E23 | |
| Lenovo Legion Pro 7 RTX4090 | |
| Razer Blade 16 Early 2023 RTX 4090 | |
| PCMark 10 / Digital Content Creation | |
| MSI Titan GT77 HX 13VI | |
| Asus ROG Strix Scar 17 G733PY-XS96 | |
| Schenker XMG Neo 16 E23 | |
| Lenovo Legion Pro 7 RTX4090 | |
| Average of class Gaming (7602 - 19954, n=95, last 2 years) | |
| Average Intel Core i9-13900HX, NVIDIA GeForce RTX 4090 Laptop GPU (10605 - 16395, n=8) | |
| Razer Blade 16 Early 2023 RTX 4090 | |
| Lenovo Legion Pro 7 16IRX8H | |
| CrossMark / Overall | |
| MSI Titan GT77 HX 13VI | |
| Schenker XMG Neo 16 E23 | |
| Average Intel Core i9-13900HX, NVIDIA GeForce RTX 4090 Laptop GPU (1825 - 2295, n=8) | |
| Razer Blade 16 Early 2023 RTX 4090 | |
| Asus ROG Strix Scar 17 G733PY-XS96 | |
| Average of class Gaming (1366 - 2409, n=94, last 2 years) | |
| CrossMark / Productivity | |
| MSI Titan GT77 HX 13VI | |
| Average Intel Core i9-13900HX, NVIDIA GeForce RTX 4090 Laptop GPU (1666 - 2166, n=8) | |
| Schenker XMG Neo 16 E23 | |
| Razer Blade 16 Early 2023 RTX 4090 | |
| Average of class Gaming (1386 - 2254, n=94, last 2 years) | |
| Asus ROG Strix Scar 17 G733PY-XS96 | |
| CrossMark / Creativity | |
| Schenker XMG Neo 16 E23 | |
| MSI Titan GT77 HX 13VI | |
| Average Intel Core i9-13900HX, NVIDIA GeForce RTX 4090 Laptop GPU (2162 - 2514, n=8) | |
| Asus ROG Strix Scar 17 G733PY-XS96 | |
| Average of class Gaming (1343 - 2786, n=94, last 2 years) | |
| Razer Blade 16 Early 2023 RTX 4090 | |
| CrossMark / Responsiveness | |
| MSI Titan GT77 HX 13VI | |
| Average Intel Core i9-13900HX, NVIDIA GeForce RTX 4090 Laptop GPU (1441 - 2275, n=8) | |
| Razer Blade 16 Early 2023 RTX 4090 | |
| Schenker XMG Neo 16 E23 | |
| Average of class Gaming (1226 - 2334, n=94, last 2 years) | |
| Asus ROG Strix Scar 17 G733PY-XS96 | |
| PCMark 10 Score | 8158 points | |
Help | ||
| AIDA64 / Memory Copy | |
| Razer Blade 16 Early 2023 RTX 4090 | |
| Lenovo Legion Pro 7 RTX4090 | |
| Lenovo Legion Pro 7 16IRX8H | |
| Schenker XMG Neo 16 E23 | |
| Average Intel Core i9-13900HX (67716 - 79193, n=22) | |
| Average of class Gaming (21750 - 129946, n=105, last 2 years) | |
| MSI Titan GT77 HX 13VI | |
| Asus ROG Strix Scar 17 G733PY-XS96 | |
| AIDA64 / Memory Read | |
| Lenovo Legion Pro 7 RTX4090 | |
| Razer Blade 16 Early 2023 RTX 4090 | |
| Lenovo Legion Pro 7 16IRX8H | |
| Schenker XMG Neo 16 E23 | |
| Average Intel Core i9-13900HX (73998 - 88462, n=22) | |
| Average of class Gaming (22956 - 118858, n=105, last 2 years) | |
| MSI Titan GT77 HX 13VI | |
| Asus ROG Strix Scar 17 G733PY-XS96 | |
| AIDA64 / Memory Write | |
| Lenovo Legion Pro 7 RTX4090 | |
| Razer Blade 16 Early 2023 RTX 4090 | |
| Average of class Gaming (22297 - 135096, n=105, last 2 years) | |
| Average Intel Core i9-13900HX (65472 - 77045, n=22) | |
| Schenker XMG Neo 16 E23 | |
| Lenovo Legion Pro 7 16IRX8H | |
| MSI Titan GT77 HX 13VI | |
| Asus ROG Strix Scar 17 G733PY-XS96 | |
| AIDA64 / Memory Latency | |
| Average of class Gaming (75.3 - 259, n=105, last 2 years) | |
| MSI Titan GT77 HX 13VI | |
| Razer Blade 16 Early 2023 RTX 4090 | |
| Schenker XMG Neo 16 E23 | |
| Average Intel Core i9-13900HX (75.3 - 91.1, n=22) | |
| Lenovo Legion Pro 7 RTX4090 | |
| Lenovo Legion Pro 7 16IRX8H | |
| Asus ROG Strix Scar 17 G733PY-XS96 | |
* ... smaller is better
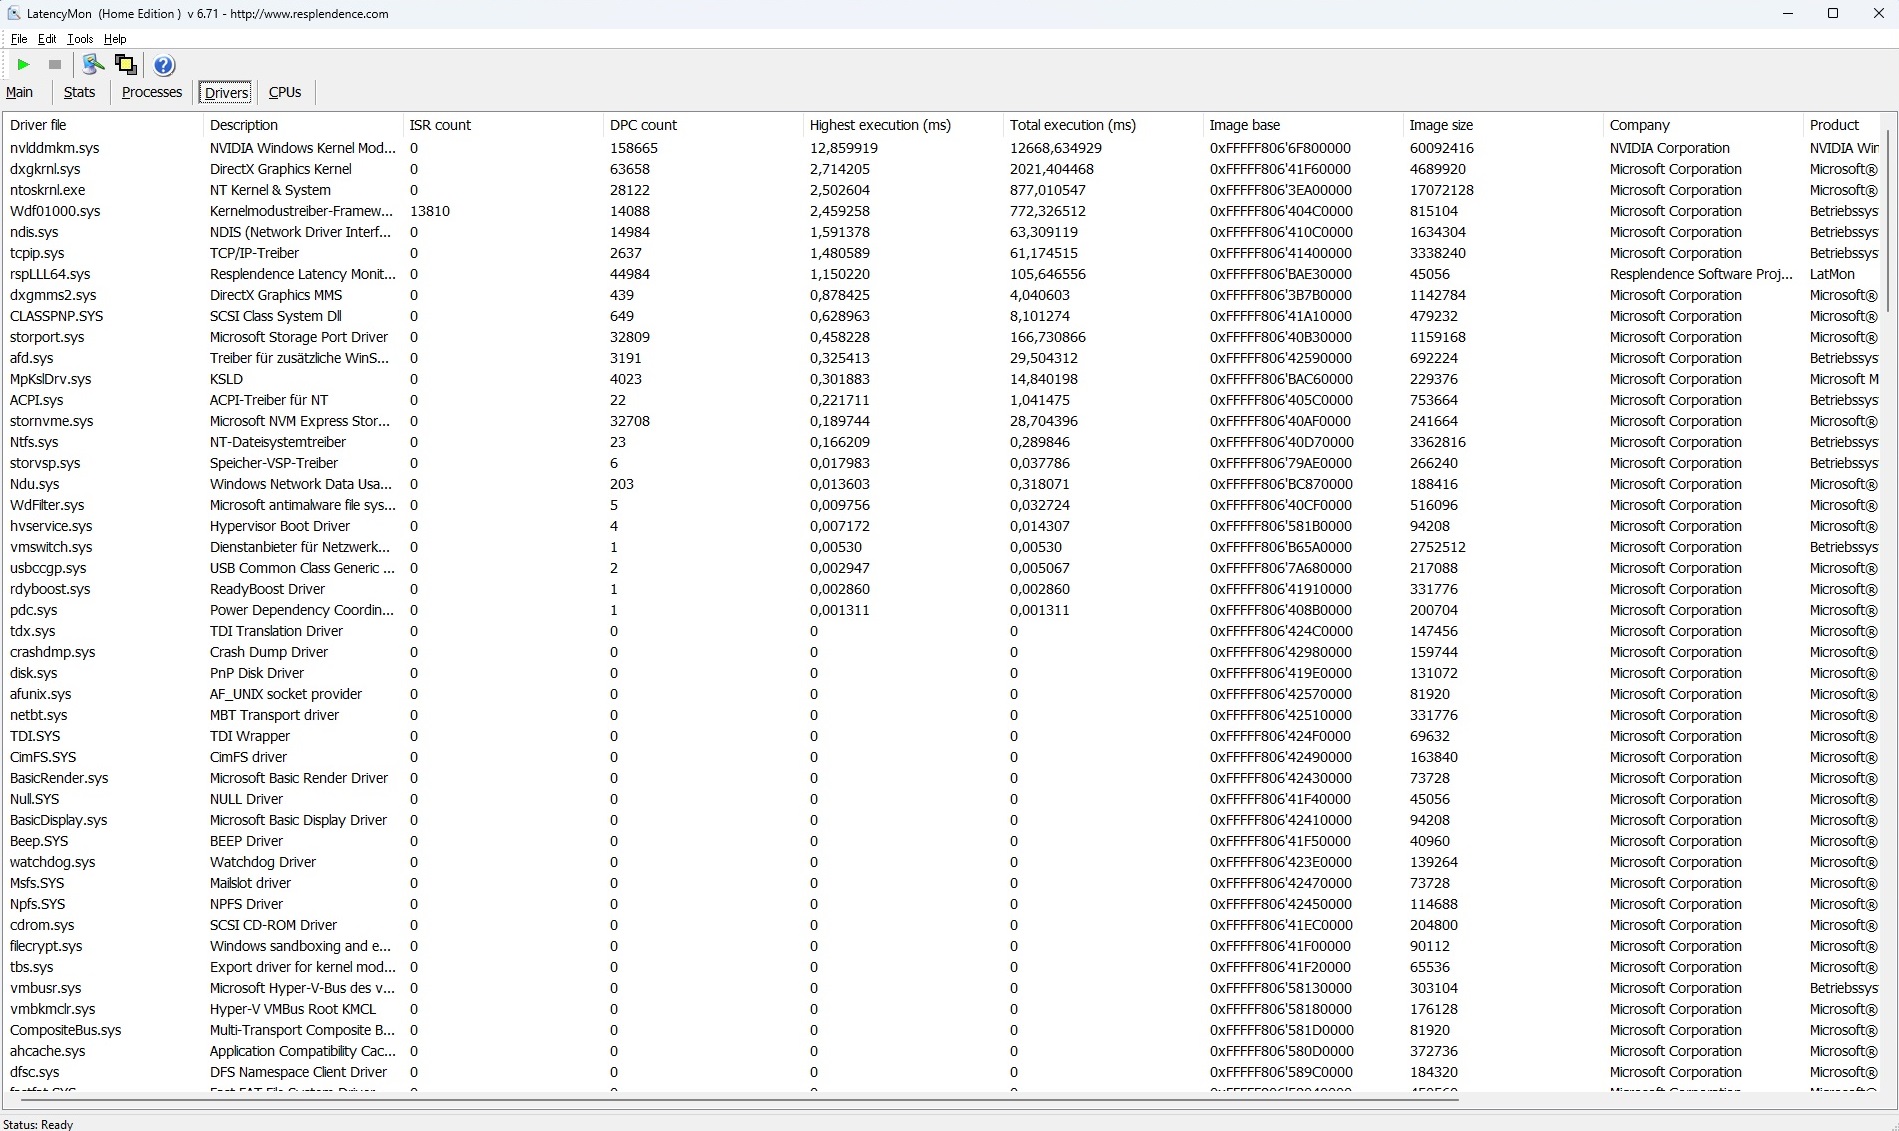
DPC延迟
测试配置在延迟方面的表现不尽如人意。根据LatencyMon工具,由于数值极高,16-incher在其交付状态下不适合进行实时音频和视频编辑。有趣的是,RTX 4080版本的延迟明显更低。
| DPC Latencies / LatencyMon - interrupt to process latency (max), Web, Youtube, Prime95 | |
| Lenovo Legion Pro 7 RTX4090 | |
| Schenker XMG Neo 16 E23 | |
| MSI Titan GT77 HX 13VI | |
| Asus ROG Strix Scar 17 G733PY-XS96 | |
| Lenovo Legion Pro 7 16IRX8H | |
* ... smaller is better
大容量存储
联想没有安装更大的固态硬盘,而是简单地使用了便宜的Legion 型号的两个1-TB的固态硬盘,完全占据了M.2插槽。流行的三星PM9A1取得了非常好的效果,但在较长时间的负载中经常要处理较强的波动或下降--如Pro 7的情况。然而,这种现象也影响到其他制造商的NVMe SSD(见图)。

* ... smaller is better
Continuous read: DiskSpd Read Loop, Queue Depth 8
图形卡
的 GeForce RTX 4090是目前最快的移动游戏显卡。来自Nvidia的Ada-Lovelace一代的顶级型号配备了9,728个着色器和16GB GDDR6内存。当涉及到合成基准时,Legion Pro 7在RTX 4090的竞争中排名居中,它也依靠175瓦的最大TGP(包括动态提升)。
| 3DMark 11 Performance | 44779 points | |
| 3DMark Fire Strike Score | 34742 points | |
| 3DMark Time Spy Score | 20039 points | |
Help | ||
* ... smaller is better
游戏性能
16英寸的显示器在游戏测试中尤其发挥了它的力量。目前的游戏在原生分辨率下运行流畅(我们的QHD基准测试是以2,560 x 1,440而不是2,560 x 1,600像素创建的),即使在最大的细节下,也几乎总是能达到60 FPS以上。即使在4K显示器上,完全设置通常也不会有问题--即使没有DLSS或帧生成的帮助。
| The Witcher 3 - 1920x1080 Ultra Graphics & Postprocessing (HBAO+) | |
| Schenker XMG Neo 16 E23 | |
| Asus ROG Strix Scar 17 G733PY-XS96 | |
| Lenovo Legion Pro 7 RTX4090 | |
| MSI Titan GT77 HX 13VI | |
| Average NVIDIA GeForce RTX 4090 Laptop GPU (139.2 - 216, n=35) | |
| Average of class Gaming (104.7 - 240, n=7, last 2 years) | |
| Lenovo Legion Pro 7 16IRX8H | |
| Razer Blade 16 Early 2023 RTX 4090 | |
| Call of Duty Modern Warfare 2 2022 | |
| 3840x2160 Extreme Quality Preset AA:T2X Filmic SM | |
| MSI Titan GT77 HX 13VI | |
| Asus ROG Strix Scar 17 G733PY-XS96 | |
| Lenovo Legion Pro 7 RTX4090 | |
| Average NVIDIA GeForce RTX 4090 Laptop GPU (63 - 86, n=12) | |
| Razer Blade 16 Early 2023 RTX 4090 | |
| Lenovo Legion Pro 7 16IRX8H | |
| 2560x1440 Extreme Quality Preset AA:T2X Filmic SM | |
| MSI Titan GT77 HX 13VI | |
| Asus ROG Strix Scar 17 G733PY-XS96 | |
| Lenovo Legion Pro 7 RTX4090 | |
| Average NVIDIA GeForce RTX 4090 Laptop GPU (104 - 137, n=14) | |
| Razer Blade 16 Early 2023 RTX 4090 | |
| Lenovo Legion Pro 7 16IRX8H | |
| A Plague Tale Requiem | |
| 3840x2160 Ultra Preset | |
| Lenovo Legion Pro 7 RTX4090 | |
| Average NVIDIA GeForce RTX 4090 Laptop GPU (33.1 - 43.8, n=3) | |
| Lenovo Legion Pro 7 16IRX8H | |
| 2560x1440 Ultra Preset | |
| Lenovo Legion Pro 7 RTX4090 | |
| Average NVIDIA GeForce RTX 4090 Laptop GPU (58.9 - 77.2, n=3) | |
| Lenovo Legion Pro 7 16IRX8H | |
| Spider-Man Miles Morales | |
| 3840x2160 Very High Preset AA:T | |
| MSI Titan GT77 HX 13VI | |
| Lenovo Legion Pro 7 RTX4090 | |
| Average NVIDIA GeForce RTX 4090 Laptop GPU (65.7 - 84.3, n=7) | |
| Lenovo Legion Pro 7 16IRX8H | |
| 2560x1440 Very High Preset AA:T | |
| MSI Titan GT77 HX 13VI | |
| Lenovo Legion Pro 7 RTX4090 | |
| Average NVIDIA GeForce RTX 4090 Laptop GPU (93.3 - 119.8, n=7) | |
| Lenovo Legion Pro 7 16IRX8H | |
像往常一样,我们测试了GPU的性能是否在较长的负载下保持不变,用 的方式进行测试。Witcher 3.与竞争对手类似,除了轻微的波动外,我们没有注意到任何性能下降或类似情况。
Witcher 3 FPS-Diagramm
| low | med. | high | ultra | QHD | 4K | |
|---|---|---|---|---|---|---|
| GTA V (2015) | 186.3 | 186.9 | 184.9 | 143.6 | 137.7 | 173.6 |
| The Witcher 3 (2015) | 200 | |||||
| Dota 2 Reborn (2015) | 230 | 204 | 193.9 | 182.1 | 175.1 | |
| Final Fantasy XV Benchmark (2018) | 223 | 212 | 181.2 | 154 | 91.7 | |
| X-Plane 11.11 (2018) | 201 | 177.7 | 136.4 | 111.7 | ||
| Strange Brigade (2018) | 439 | 369 | 359 | 347 | 302 | 158.4 |
| Shadow of the Tomb Raider (2018) | 185 | 120 | ||||
| Cyberpunk 2077 1.6 (2022) | 100.93 | 50.05 | ||||
| F1 22 (2022) | 301 | 303 | 279 | 129.2 | 85.2 | 45.9 |
| A Plague Tale Requiem (2022) | 77.2 | 43.8 | ||||
| Call of Duty Modern Warfare 2 2022 (2022) | 132 | 82 | ||||
| Spider-Man Miles Morales (2022) | 108.1 | 80 | ||||
| The Witcher 3 v4 (2023) | 101.2 | 48.7 | ||||
| The Last of Us (2023) | 85.8 | 45.7 |
排放
噪声排放
如此强大的高端组件的最大缺点是噪音的发展,这一点不足为奇。在性能模式下,16英寸处理器在3D应用中的噪音在48 dB(A)(平均3DMark 06)和55 dB(A)(最大压力测试)之间。在游戏中,你可以期待大约53 dB(A),如果不戴耳机,这也是非常令人不快的。闲置时的情况要轻松得多。虽然风扇偶尔会有点响(例如在开机时),但平均28至30分贝(A)是可以接受的,特别是因为如果需要的话,可以使用静音或平衡模式。
Noise level
| Idle |
| 28 / 30 / 38 dB(A) |
| Load |
| 48 / 55 dB(A) |
 | ||
30 dB silent 40 dB(A) audible 50 dB(A) loud |
||
min: | ||
| Lenovo Legion Pro 7 RTX4090 i9-13900HX, GeForce RTX 4090 Laptop GPU | Razer Blade 16 Early 2023 RTX 4090 i9-13950HX, GeForce RTX 4090 Laptop GPU | Asus ROG Strix Scar 17 G733PY-XS96 R9 7945HX, GeForce RTX 4090 Laptop GPU | Schenker XMG Neo 16 E23 i9-13900HX, GeForce RTX 4090 Laptop GPU | MSI Titan GT77 HX 13VI i9-13950HX, GeForce RTX 4090 Laptop GPU | Lenovo Legion Pro 7 16IRX8H i9-13900HX, GeForce RTX 4080 Laptop GPU | |
|---|---|---|---|---|---|---|
| Noise | 18% | 14% | -10% | 1% | 4% | |
| off / environment * (dB) | 25 | 20.84 17% | 22.7 9% | 25 -0% | 24.6 2% | 24 4% |
| Idle Minimum * (dB) | 28 | 23.65 16% | 23.5 16% | 31 -11% | 29.2 -4% | 26 7% |
| Idle Average * (dB) | 30 | 23.65 21% | 27.7 8% | 33 -10% | 29.2 3% | 28 7% |
| Idle Maximum * (dB) | 38 | 23.65 38% | 27.7 27% | 42 -11% | 29.2 23% | 34 11% |
| Load Average * (dB) | 48 | 43.35 10% | 30.5 36% | 58 -21% | 50.7 -6% | 47 2% |
| Witcher 3 ultra * (dB) | 53 | 46.7 12% | 51.4 3% | 57 -8% | 53.3 -1% | 55 -4% |
| Load Maximum * (dB) | 55 | 46.72 15% | 54.1 2% | 59 -7% | 61 -11% | 56 -2% |
* ... smaller is better
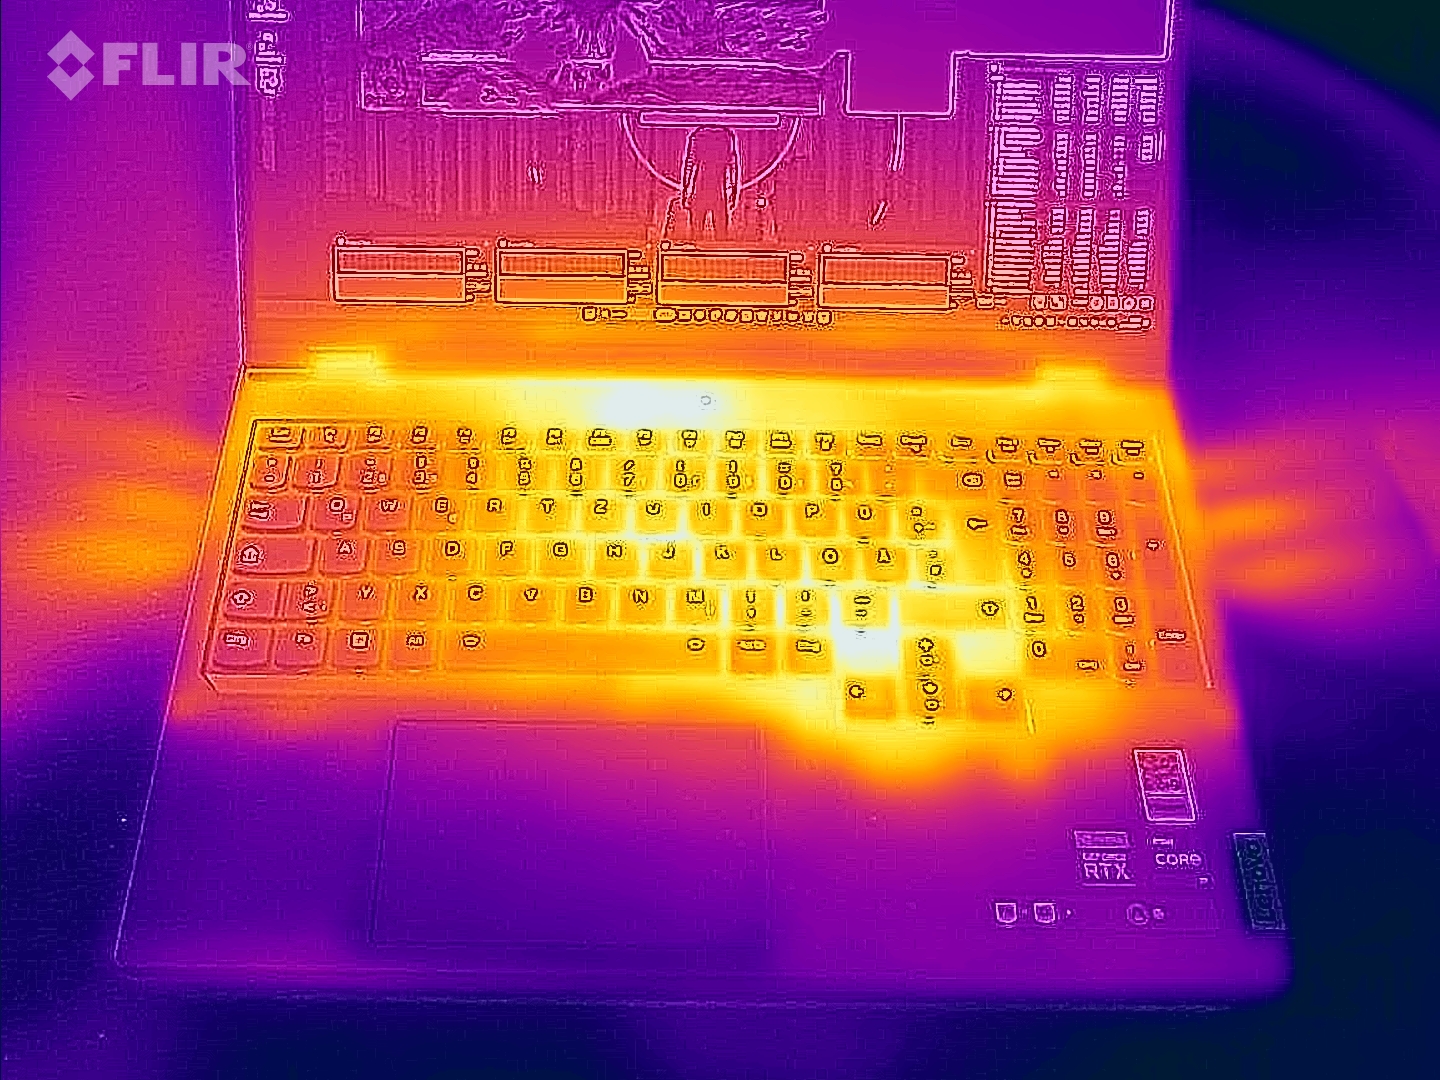
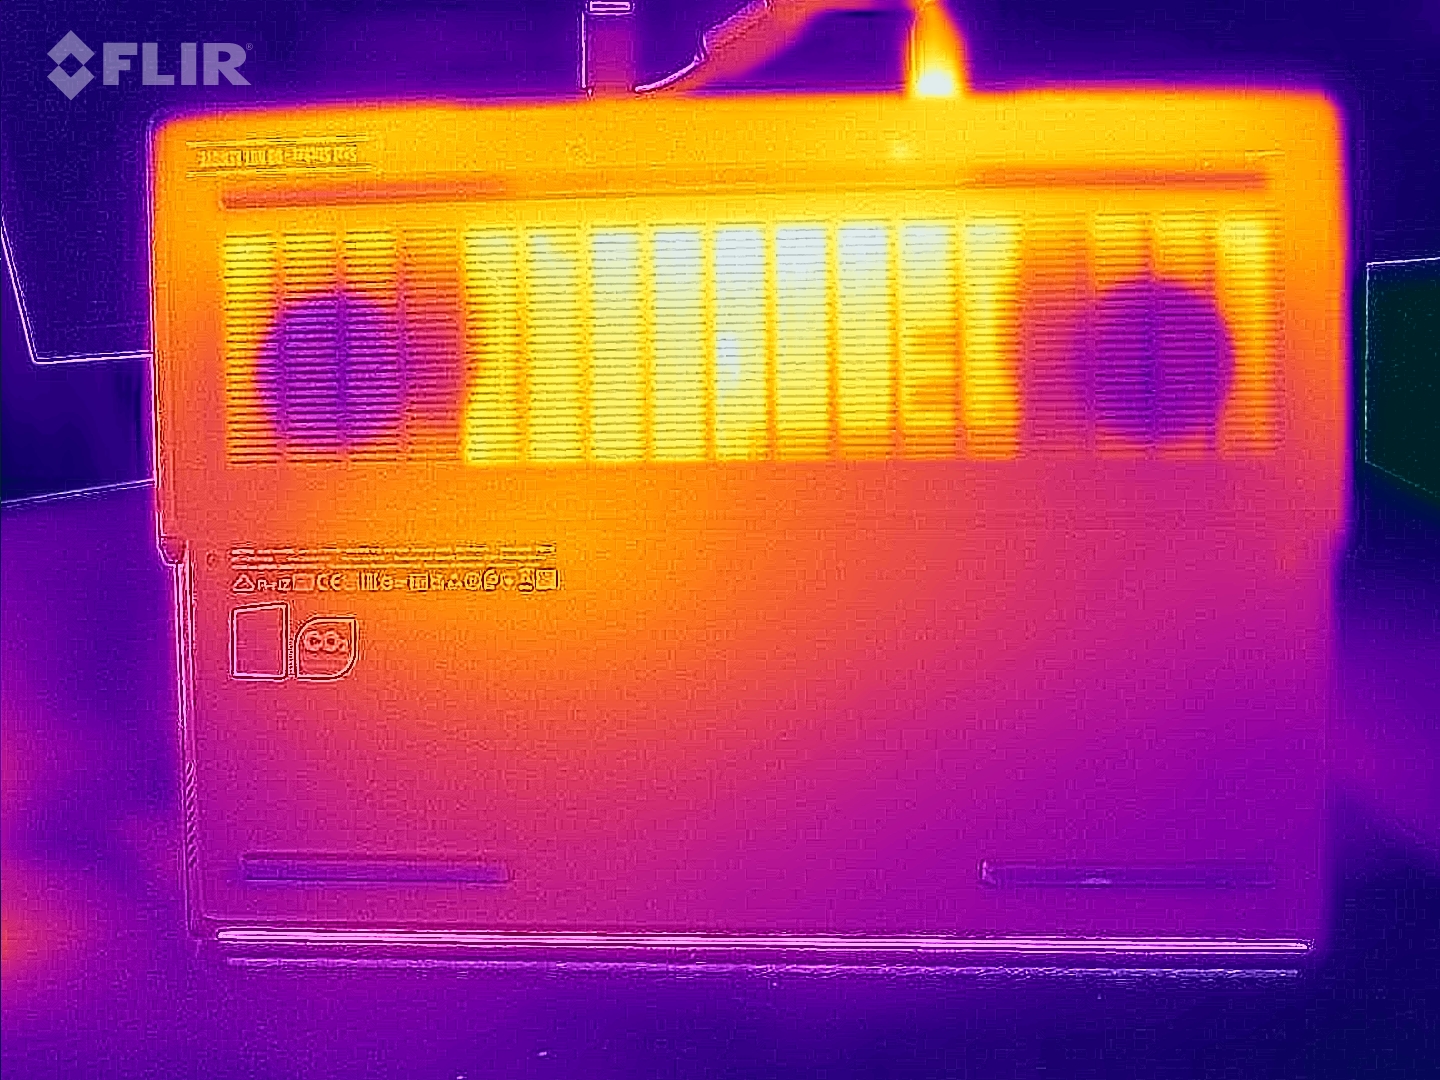
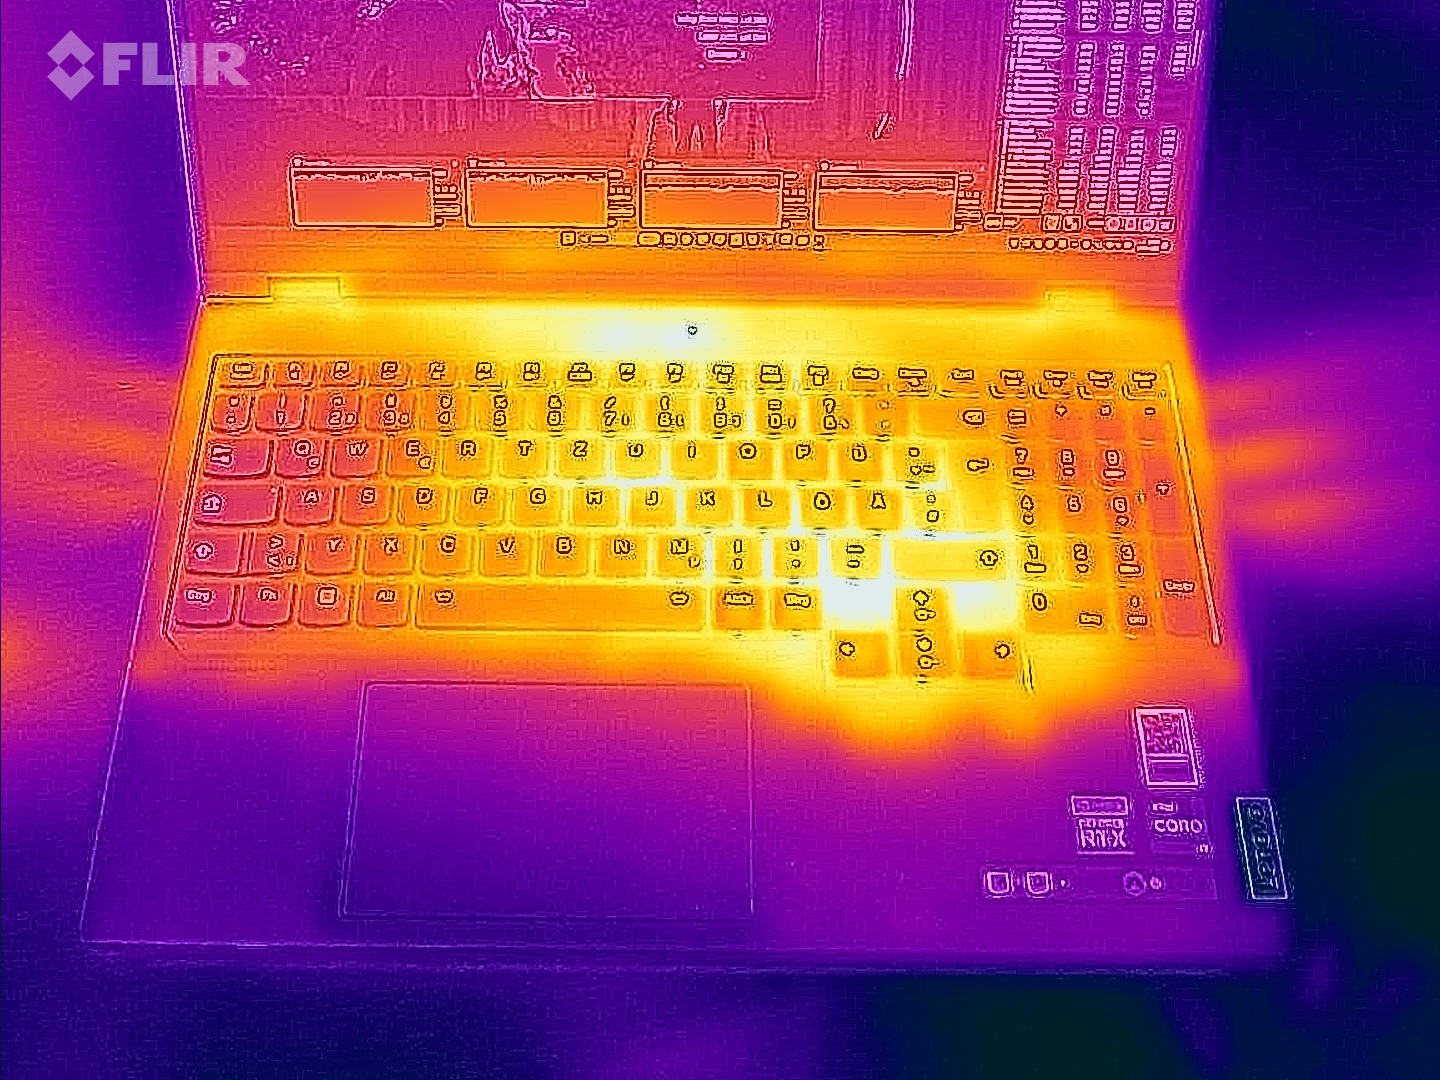
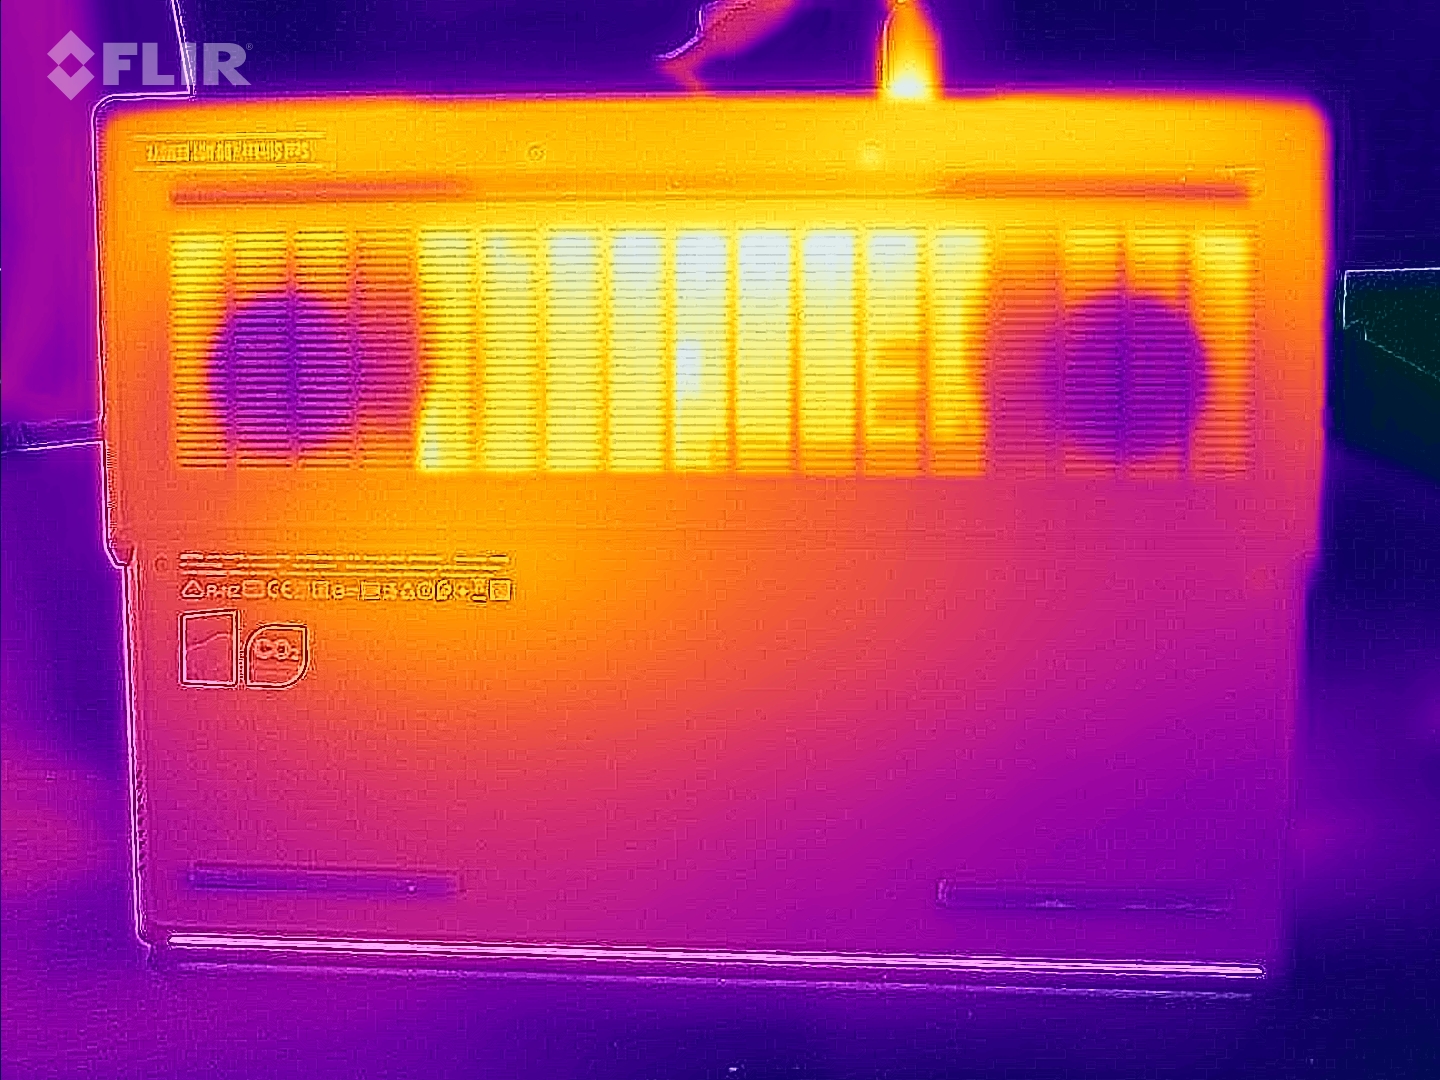
温度
该机箱的温度比竞争对手高,顶部最高为53℃,底部最高为59℃。在闲置模式下,温度的发展仍然在限制范围内。例如,掌托的温度达到29°C左右,这是一个适度的速度。
(-) The maximum temperature on the upper side is 53 °C / 127 F, compared to the average of 40.4 °C / 105 F, ranging from 21.2 to 68.8 °C for the class Gaming.
(-) The bottom heats up to a maximum of 59 °C / 138 F, compared to the average of 43.2 °C / 110 F
(+) In idle usage, the average temperature for the upper side is 31 °C / 88 F, compared to the device average of 33.9 °C / 93 F.
(-) Playing The Witcher 3, the average temperature for the upper side is 45.4 °C / 114 F, compared to the device average of 33.9 °C / 93 F.
(-) The palmrests and touchpad can get very hot to the touch with a maximum of 45 °C / 113 F.
(-) The average temperature of the palmrest area of similar devices was 28.8 °C / 83.8 F (-16.2 °C / -29.2 F).
| Lenovo Legion Pro 7 RTX4090 Intel Core i9-13900HX, NVIDIA GeForce RTX 4090 Laptop GPU | Razer Blade 16 Early 2023 RTX 4090 Intel Core i9-13950HX, NVIDIA GeForce RTX 4090 Laptop GPU | Asus ROG Strix Scar 17 G733PY-XS96 AMD Ryzen 9 7945HX, NVIDIA GeForce RTX 4090 Laptop GPU | Schenker XMG Neo 16 E23 Intel Core i9-13900HX, NVIDIA GeForce RTX 4090 Laptop GPU | MSI Titan GT77 HX 13VI Intel Core i9-13950HX, NVIDIA GeForce RTX 4090 Laptop GPU | Lenovo Legion Pro 7 16IRX8H Intel Core i9-13900HX, NVIDIA GeForce RTX 4080 Laptop GPU | |
|---|---|---|---|---|---|---|
| Heat | 7% | 25% | 14% | 20% | 1% | |
| Maximum Upper Side * (°C) | 53 | 52 2% | 34.6 35% | 50 6% | 40.6 23% | 48 9% |
| Maximum Bottom * (°C) | 59 | 47.6 19% | 35.6 40% | 51 14% | 41.1 30% | 49 17% |
| Idle Upper Side * (°C) | 34 | 33 3% | 27.2 20% | 28 18% | 26.2 23% | 40 -18% |
| Idle Bottom * (°C) | 32 | 30.6 4% | 30 6% | 26 19% | 30.3 5% | 33 -3% |
* ... smaller is better
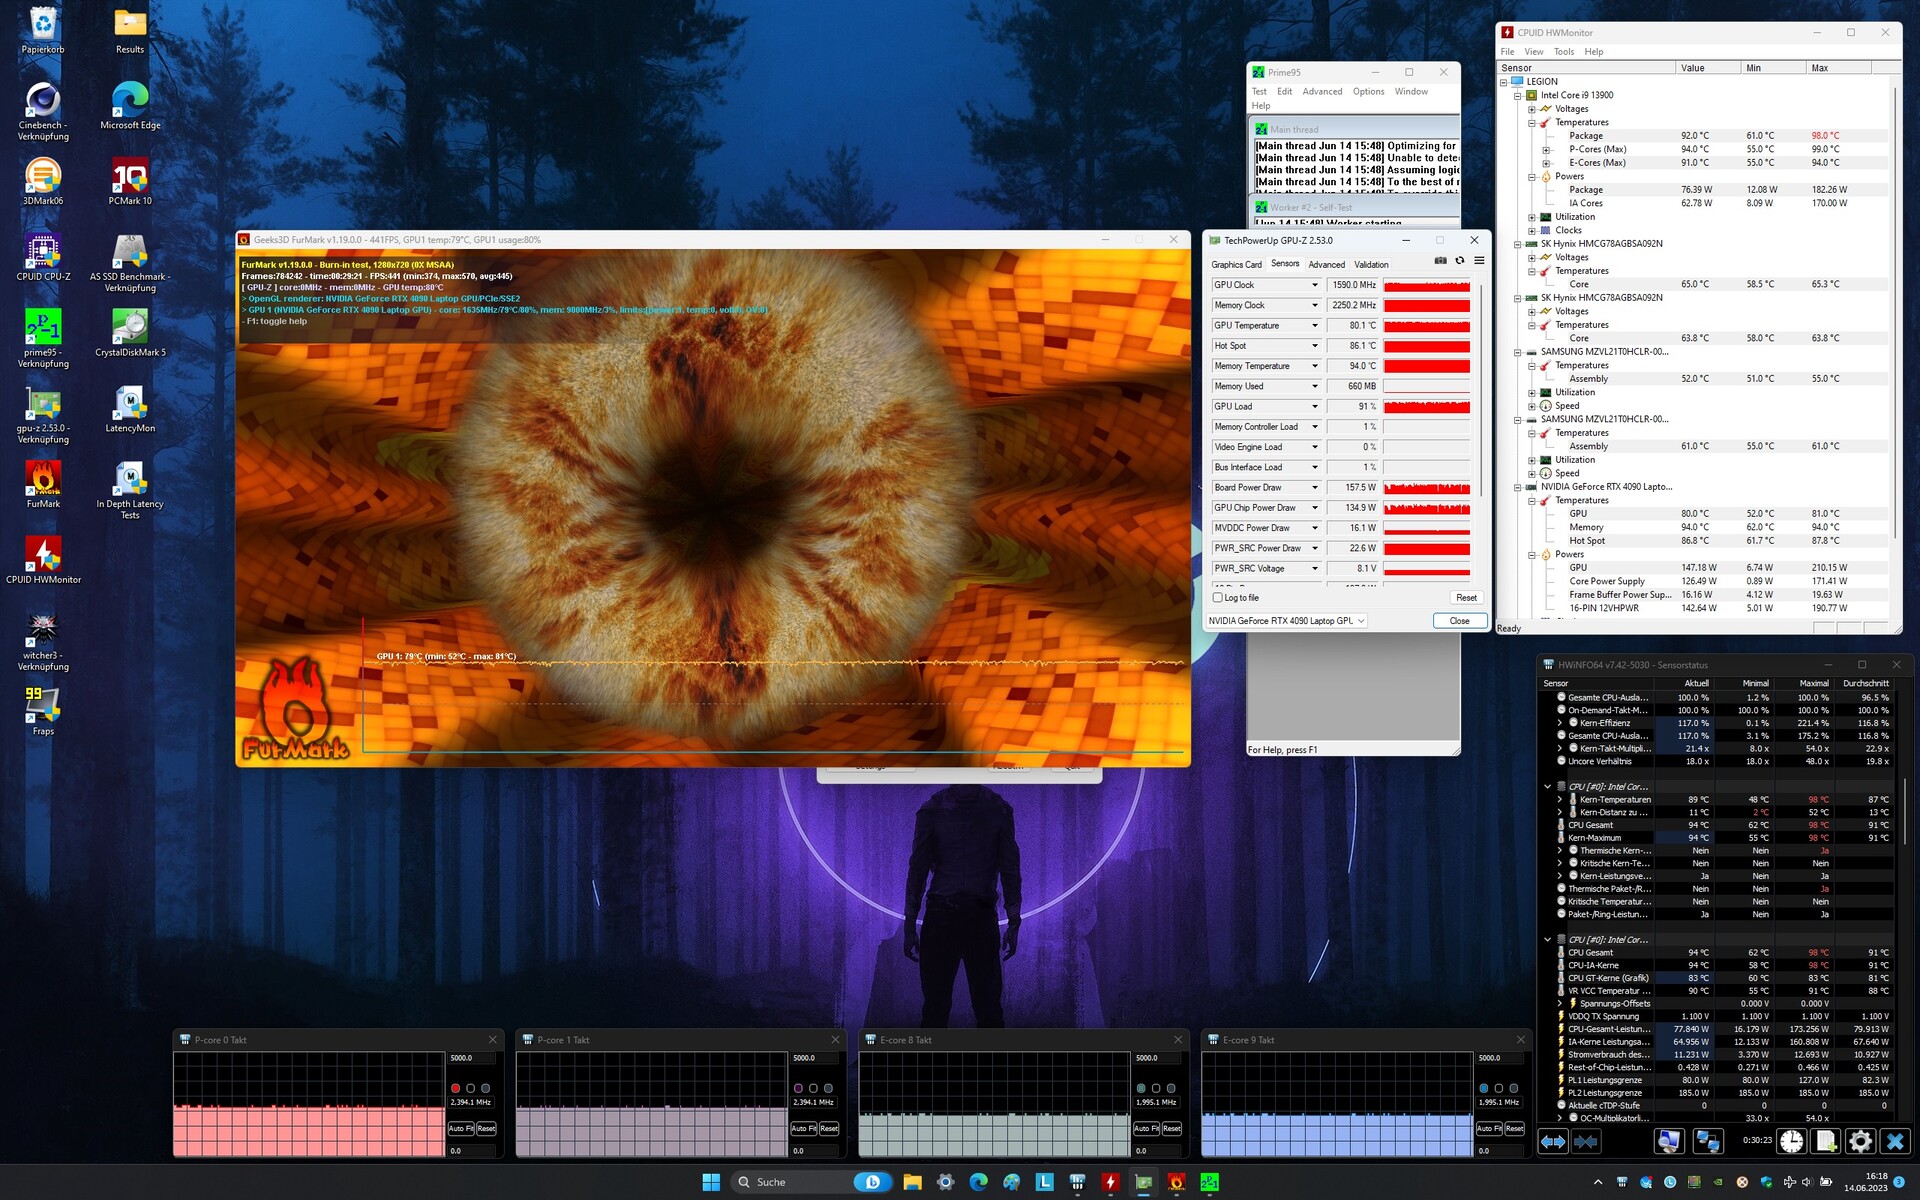
压力测试
在使用FurMark和Prime95工具进行的压力测试中没有问题。虽然CPU的温度超过了90℃,但它并没有低于基本时钟的速度。GPU(约80°C)的表现与此类似。
演讲者
Lenovo Legion Pro 7 RTX4090 audio analysis
(+) | speakers can play relatively loud (82 dB)
Bass 100 - 315 Hz
(±) | reduced bass - on average 5.6% lower than median
(+) | bass is linear (6.8% delta to prev. frequency)
Mids 400 - 2000 Hz
(+) | balanced mids - only 4.8% away from median
(+) | mids are linear (5.1% delta to prev. frequency)
Highs 2 - 16 kHz
(+) | balanced highs - only 1.7% away from median
(+) | highs are linear (4% delta to prev. frequency)
Overall 100 - 16.000 Hz
(+) | overall sound is linear (8.7% difference to median)
Compared to same class
» 3% of all tested devices in this class were better, 1% similar, 97% worse
» The best had a delta of 6%, average was 18%, worst was 132%
Compared to all devices tested
» 3% of all tested devices were better, 1% similar, 97% worse
» The best had a delta of 4%, average was 23%, worst was 134%
Razer Blade 16 Early 2023 RTX 4090 audio analysis
(±) | speaker loudness is average but good (75 dB)
Bass 100 - 315 Hz
(±) | reduced bass - on average 13.4% lower than median
(±) | linearity of bass is average (14.8% delta to prev. frequency)
Mids 400 - 2000 Hz
(±) | higher mids - on average 5.3% higher than median
(+) | mids are linear (3.8% delta to prev. frequency)
Highs 2 - 16 kHz
(+) | balanced highs - only 3.4% away from median
(+) | highs are linear (4.2% delta to prev. frequency)
Overall 100 - 16.000 Hz
(±) | linearity of overall sound is average (15.6% difference to median)
Compared to same class
» 36% of all tested devices in this class were better, 6% similar, 58% worse
» The best had a delta of 6%, average was 18%, worst was 132%
Compared to all devices tested
» 23% of all tested devices were better, 5% similar, 72% worse
» The best had a delta of 4%, average was 23%, worst was 134%
电源管理
消耗功率
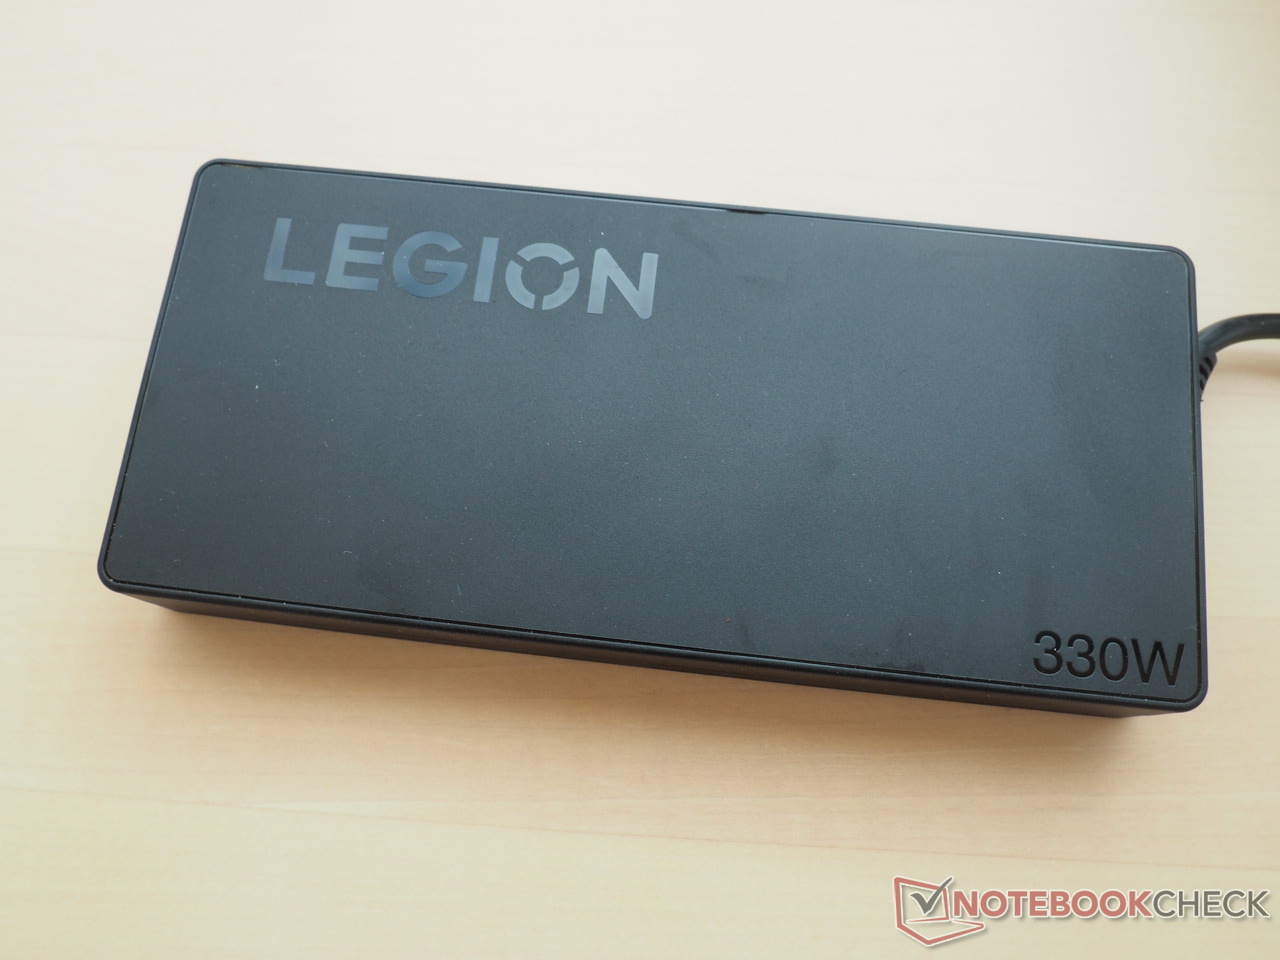
即使一些对手的消耗更少,但对于RTX 4090设备来说,其功耗是典型的。虽然我们在空闲模式下测得20至35瓦,但在负载下却在136至320瓦之间。因此,附带的330瓦电源的尺寸是足够的。
| Off / Standby | |
| Idle | |
| Load |
|
Key:
min: | |
| Lenovo Legion Pro 7 RTX4090 i9-13900HX, GeForce RTX 4090 Laptop GPU | Razer Blade 16 Early 2023 RTX 4090 i9-13950HX, GeForce RTX 4090 Laptop GPU | Asus ROG Strix Scar 17 G733PY-XS96 R9 7945HX, GeForce RTX 4090 Laptop GPU | Schenker XMG Neo 16 E23 i9-13900HX, GeForce RTX 4090 Laptop GPU | MSI Titan GT77 HX 13VI i9-13950HX, GeForce RTX 4090 Laptop GPU | Lenovo Legion Pro 7 16IRX8H i9-13900HX, GeForce RTX 4080 Laptop GPU | Average of class Gaming | |
|---|---|---|---|---|---|---|---|
| Power Consumption | -11% | 8% | 14% | 10% | 6% | 25% | |
| Idle Minimum * (Watt) | 20 | 27.5 -38% | 14.5 27% | 8 60% | 14 30% | 18 10% | 13 ? 35% |
| Idle Average * (Watt) | 25 | 34.4 -38% | 21.1 16% | 18 28% | 21.6 14% | 24 4% | 19 ? 24% |
| Idle Maximum * (Watt) | 35 | 35.4 -1% | 42.8 -22% | 28 20% | 24.8 29% | 32 9% | 24.6 ? 30% |
| Load Average * (Watt) | 136 | 147.8 -9% | 116.7 14% | 133 2% | 122.5 10% | 130 4% | 110.7 ? 19% |
| Witcher 3 ultra * (Watt) | 282 | 256 9% | 278 1% | 294 -4% | 265 6% | 260 8% | |
| Load Maximum * (Watt) | 320 | 286.7 10% | 279.6 13% | 399 -25% | 418 -31% | 320 -0% | 259 ? 19% |
* ... smaller is better
Power consumption Witcher 3 / Stresstest
Power consumption external monitor
电池寿命
Legion Pro 7的电池寿命既不坏也不特别好。这款16英寸的产品在显示亮度降低到150cd/m²的情况下,在我们的实际WLAN测试中,可以维持5小时左右。
| Lenovo Legion Pro 7 RTX4090 i9-13900HX, GeForce RTX 4090 Laptop GPU, 99.9 Wh | Razer Blade 16 Early 2023 RTX 4090 i9-13950HX, GeForce RTX 4090 Laptop GPU, 95.2 Wh | Asus ROG Strix Scar 17 G733PY-XS96 R9 7945HX, GeForce RTX 4090 Laptop GPU, 90 Wh | Schenker XMG Neo 16 E23 i9-13900HX, GeForce RTX 4090 Laptop GPU, 99 Wh | MSI Titan GT77 HX 13VI i9-13950HX, GeForce RTX 4090 Laptop GPU, 99.9 Wh | Lenovo Legion Pro 7 16IRX8H i9-13900HX, GeForce RTX 4080 Laptop GPU, 99.9 Wh | Average of class Gaming | |
|---|---|---|---|---|---|---|---|
| Battery runtime | 14% | -20% | 31% | 4% | 0% | 39% | |
| WiFi v1.3 (h) | 5.1 | 5.8 14% | 4.1 -20% | 6.7 31% | 5.3 4% | 5.1 0% | 7.11 ? 39% |
| H.264 (h) | 8.4 | 5.8 | 6 | 8.32 ? | |||
| Witcher 3 ultra (h) | 1.6 | 1.4 | |||||
| Load (h) | 1.4 | 1.4 | 2.1 | 1.502 ? | |||
| Reader / Idle (h) | 6.4 | 8.27 ? |
Pros
Cons
判决书
那些能够接受至少4500欧元的高昂价格的人将在Legion Pro 7中找到一个几乎彻底成功的16英寸格式的高端游戏机。
联想不仅依靠稳定和高质量的外观机箱,而且还依靠良好的输入设备。连接性(包括Thunderbolt 4)和WQXGA显示屏也会让大多数买家满意。16:10屏幕(240赫兹)除其他外,提供了良好的亮度,令人信服的色彩准确性,以及IPS标准的短响应时间。
在消极方面,我们会有--不幸的是,高端笔记本很常见--负载下的温度和噪音发展非常高。如果没有耳机,性能模式是没有乐趣的。我们建议在这里使用静音或平衡模式。
总的来说,带有RTX 4090 的Legion Pro 7--像RTX 4080型号 --仍然得到非常好的评价,因此属于市场上最好的高端笔记本电脑。
如果你希望它更安静和/或更轻,你应该看看 刀锋16.这个来自Razer的竞争对手在测试中的得分甚至略高。
Lenovo Legion Pro 7 RTX4090
- 06/16/2023 v7 (old)
Florian Glaser
Transparency
The selection of devices to be reviewed is made by our editorial team. The test sample was provided to the author as a loan by the manufacturer or retailer for the purpose of this review. The lender had no influence on this review, nor did the manufacturer receive a copy of this review before publication. There was no obligation to publish this review. As an independent media company, Notebookcheck is not subjected to the authority of manufacturers, retailers or publishers.
This is how Notebookcheck is testing
Every year, Notebookcheck independently reviews hundreds of laptops and smartphones using standardized procedures to ensure that all results are comparable. We have continuously developed our test methods for around 20 years and set industry standards in the process. In our test labs, high-quality measuring equipment is utilized by experienced technicians and editors. These tests involve a multi-stage validation process. Our complex rating system is based on hundreds of well-founded measurements and benchmarks, which maintains objectivity. Further information on our test methods can be found here.
Price comparison
