Medion Erazer Beast X40回顾:配备RTX 4090的游戏笔记本
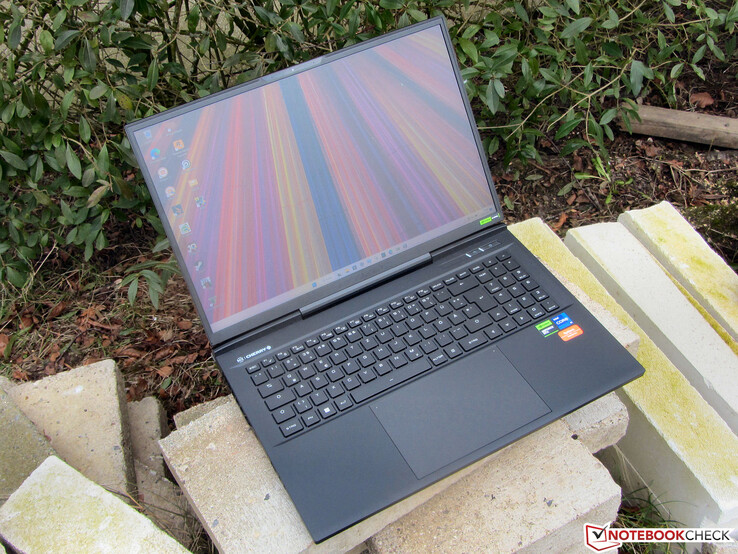
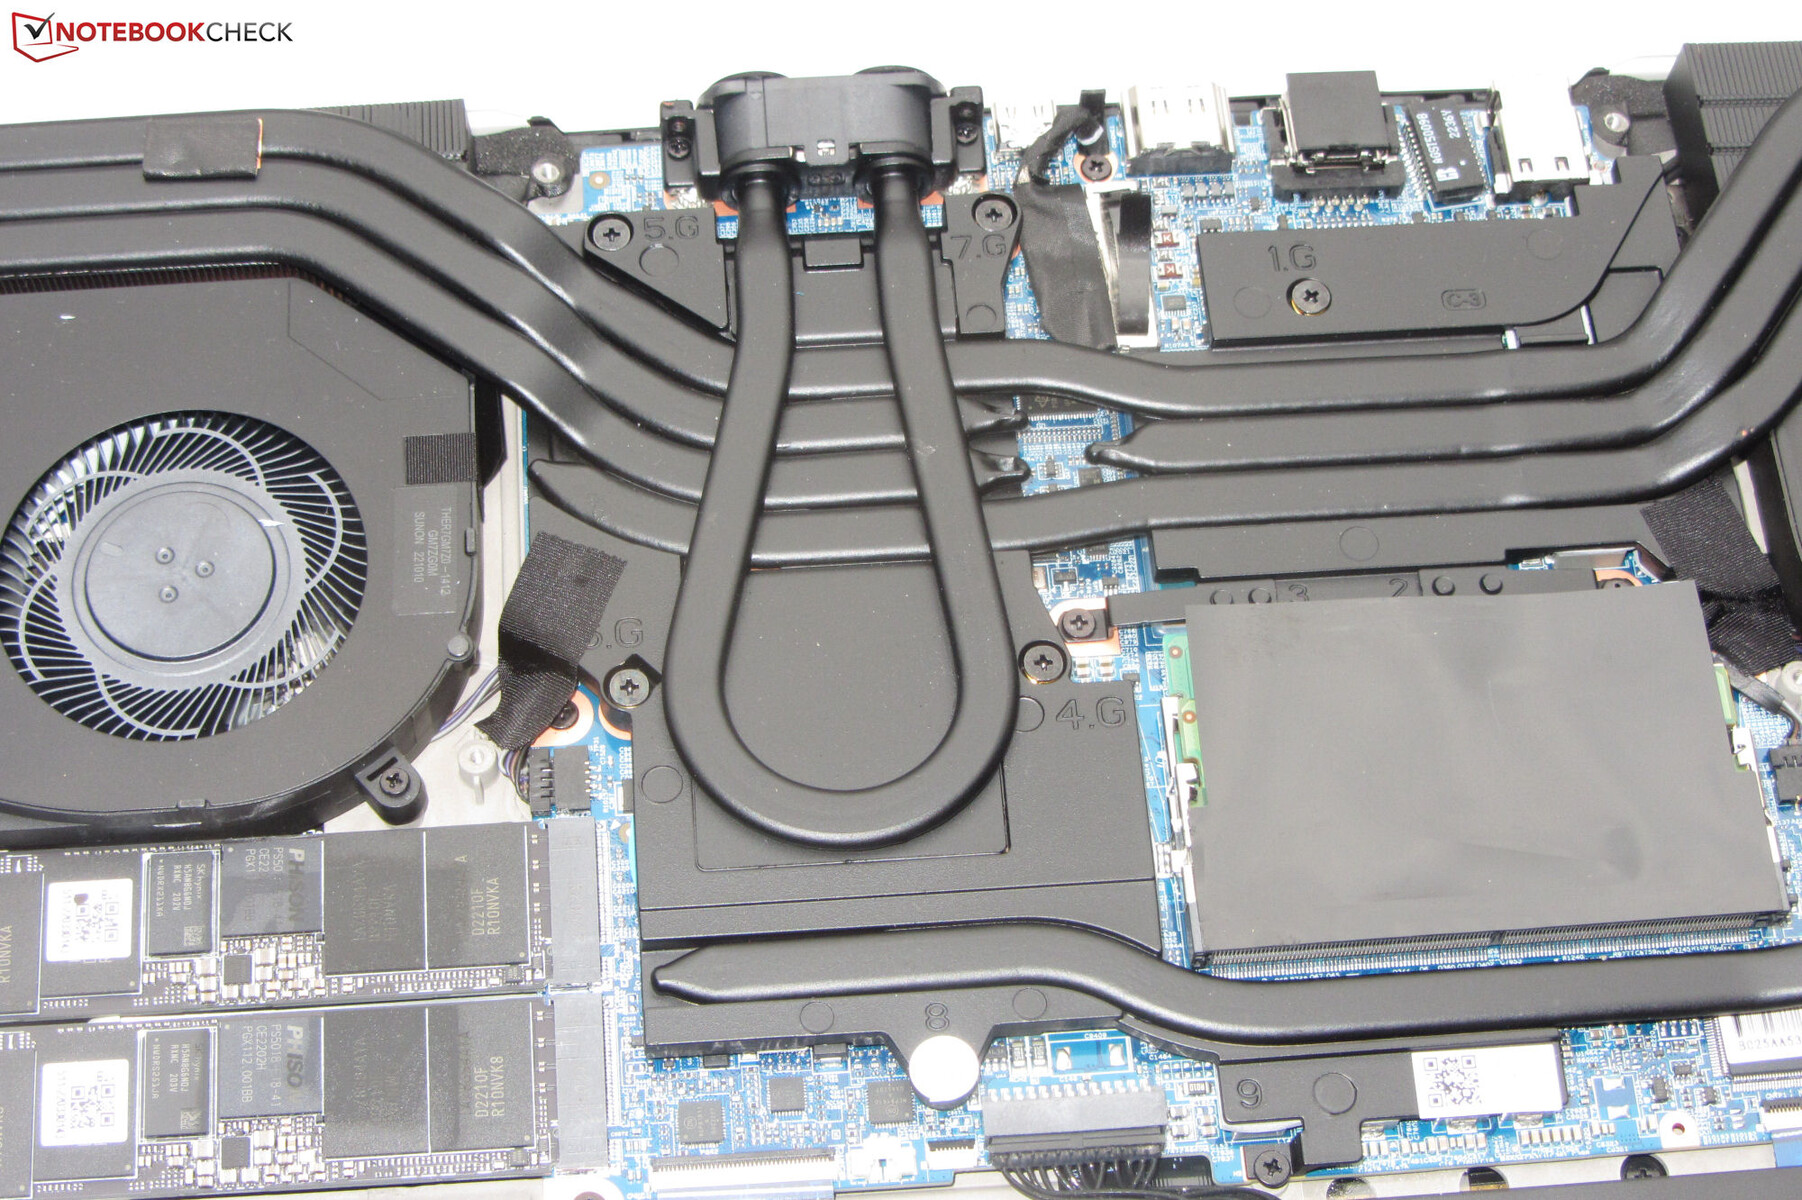
尽管它属于游戏笔记本电脑的范畴,但Erazer Beast X40也被设想用于其他非常苛刻的使用场景。必要的计算性能是由Raptor Lake CPU和Ada Lovelace GPU提供的。与它的前辈 相比,这款笔记本电脑已经得到了重大改造:Medion为其提供了新的屏幕宽高比(16:10而不是16:9),一个可选水冷的冷却系统,以及一个机械键盘。
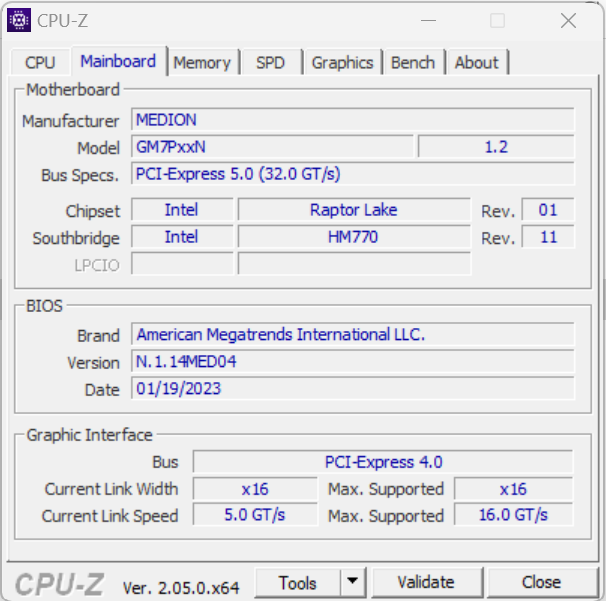
X40基于同方的裸机(GM7PX9N),与用于XMG Neo 17的裸机基本相同。 XMG Neo 17.它的竞争对手是 MSI Titan GT77 HX 13VI, Alienware x17 R2 P48E, Razer Blade 16 (2023年初)和 华硕ROG Strix Scar 18 2023 G834JY.
潜在的竞争对手比较
Rating | Date | Model | Weight | Height | Size | Resolution | Price |
|---|---|---|---|---|---|---|---|
| 88.4 % v7 (old) | 03 / 2023 | Medion Erazer Beast X40 i9-13900HX, GeForce RTX 4090 Laptop GPU | 2.9 kg | 33 mm | 17.00" | 2560x1600 | |
| 89 % v7 (old) | 02 / 2023 | MSI Titan GT77 HX 13VI i9-13950HX, GeForce RTX 4090 Laptop GPU | 3.5 kg | 23 mm | 17.30" | 3840x2160 | |
| 91.2 % v7 (old) | 02 / 2023 | Razer Blade 16 Early 2023 i9-13950HX, GeForce RTX 4080 Laptop GPU | 2.4 kg | 21.99 mm | 16.00" | 2560x1600 | |
| 87.6 % v7 (old) | 09 / 2022 | Schenker XMG Neo 17 M22 R9 6900HX, GeForce RTX 3080 Ti Laptop GPU | 2.8 kg | 27 mm | 17.00" | 2560x1600 | |
| 89.2 % v7 (old) | 05 / 2022 | Alienware x17 R2 P48E i9-12900HK, GeForce RTX 3080 Ti Laptop GPU | 3.1 kg | 20.9 mm | 17.30" | 1920x1080 | |
| 86.6 % v7 (old) | 02 / 2023 | Asus ROG Strix Scar 18 2023 G834JY-N6005W i9-13980HX, GeForce RTX 4090 Laptop GPU | 3.1 kg | 30.8 mm | 18.00" | 2560x1600 |
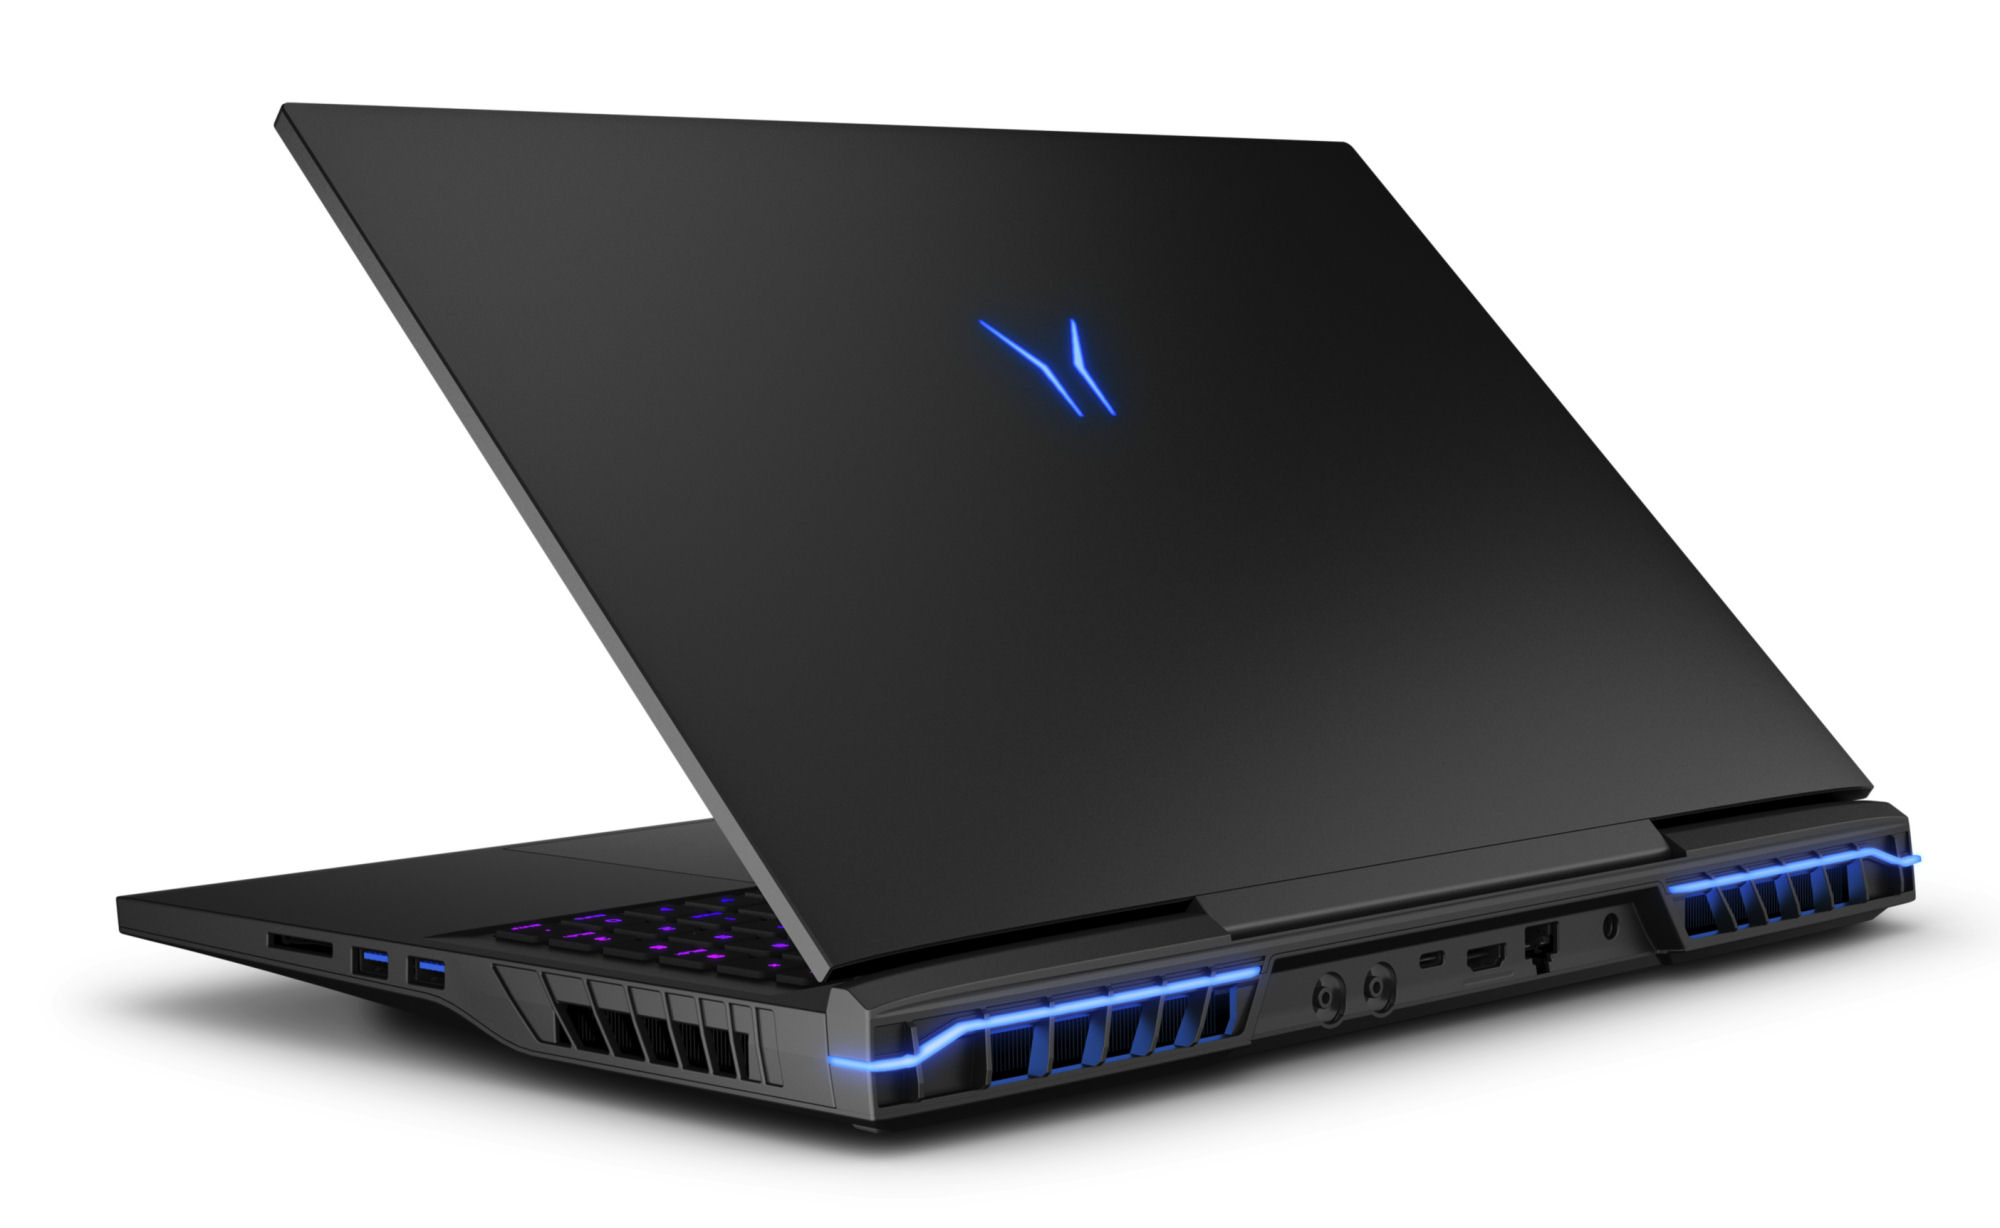
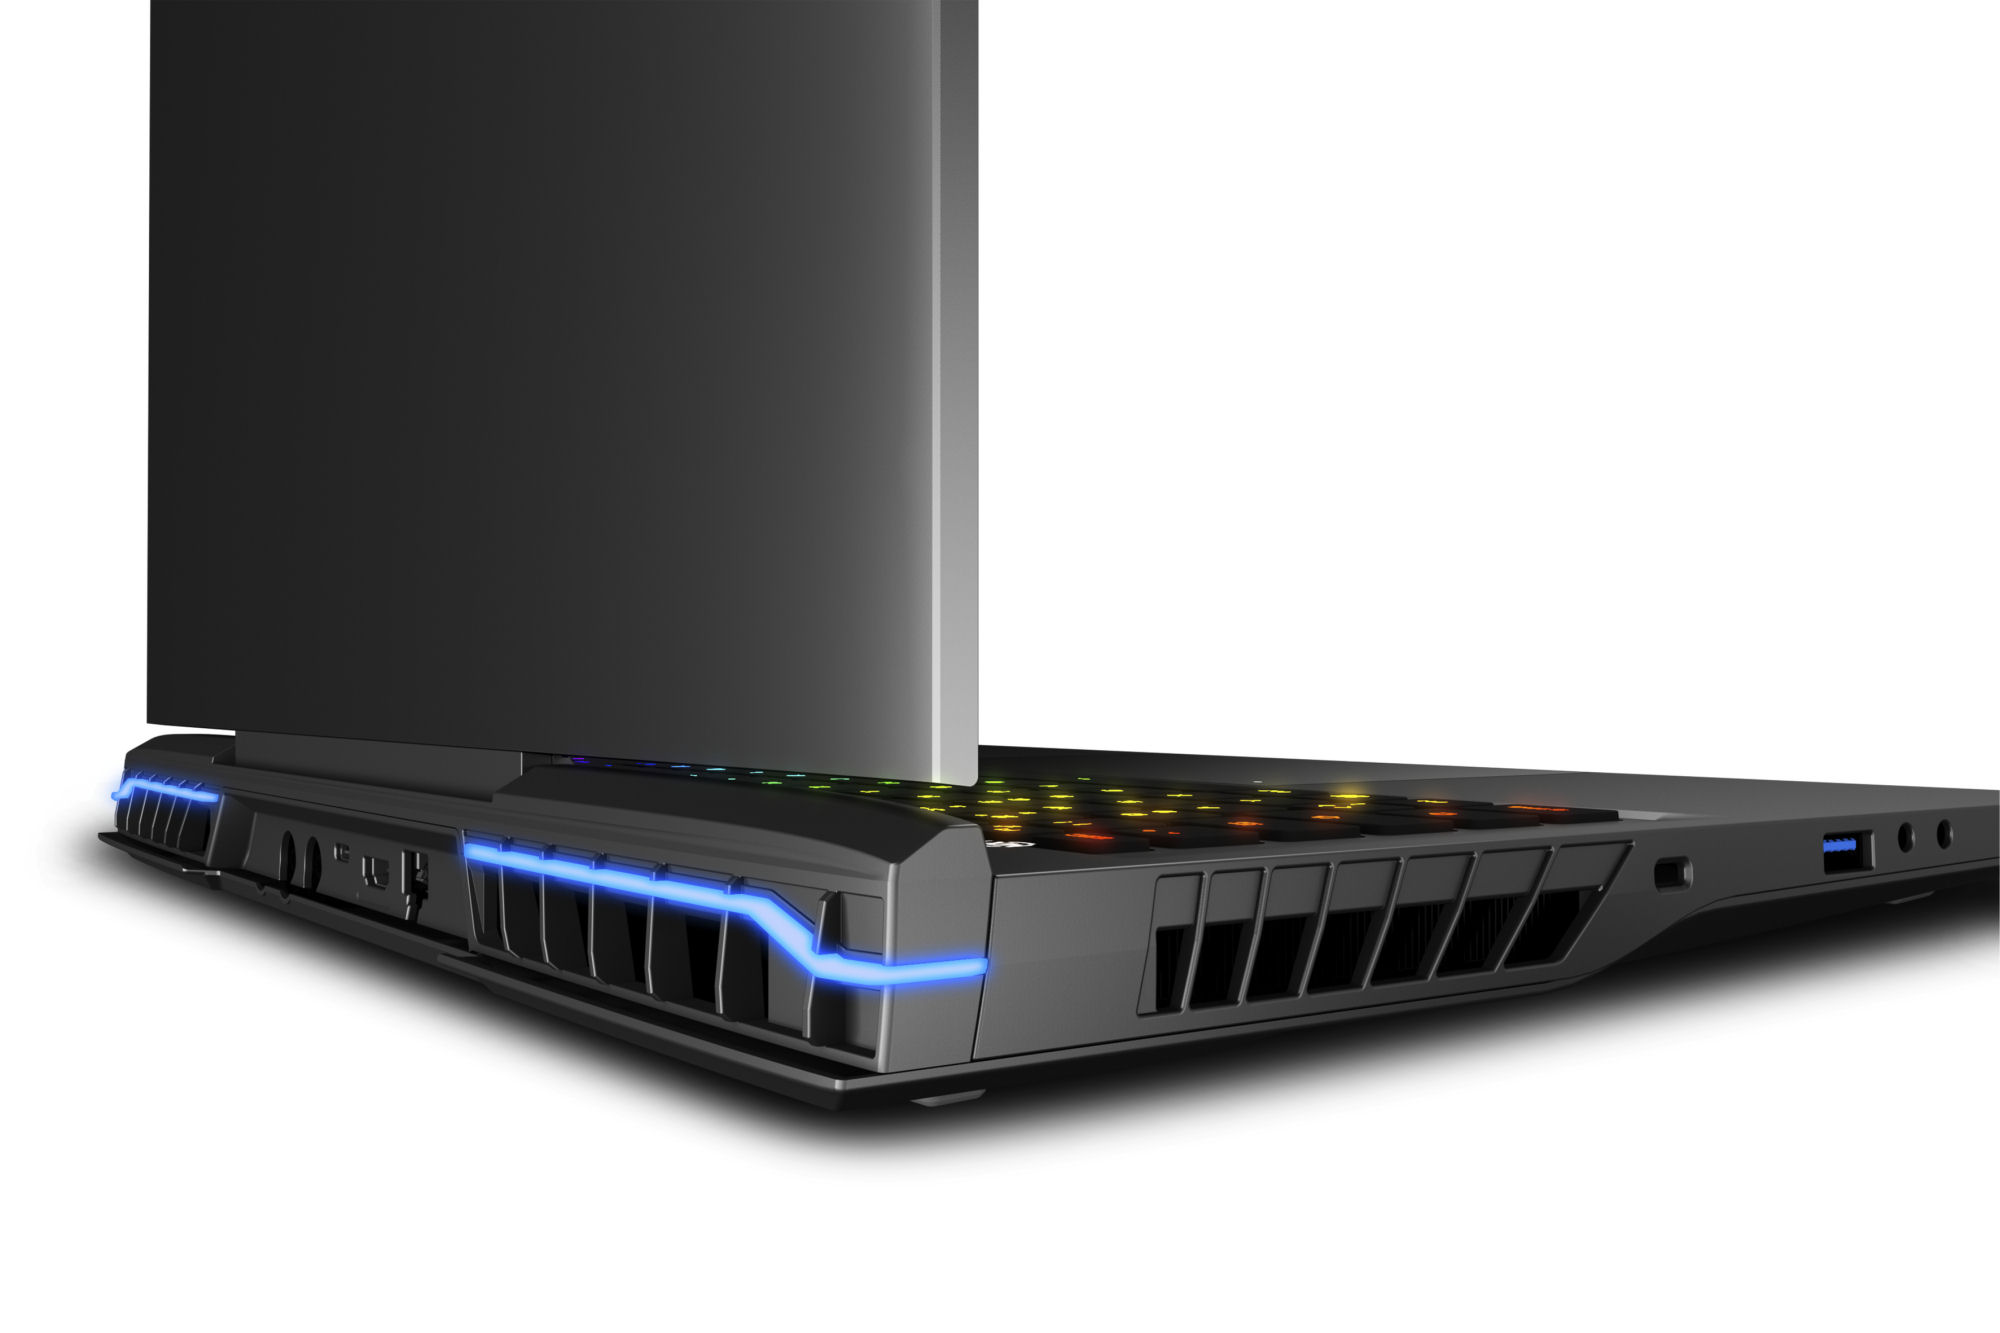
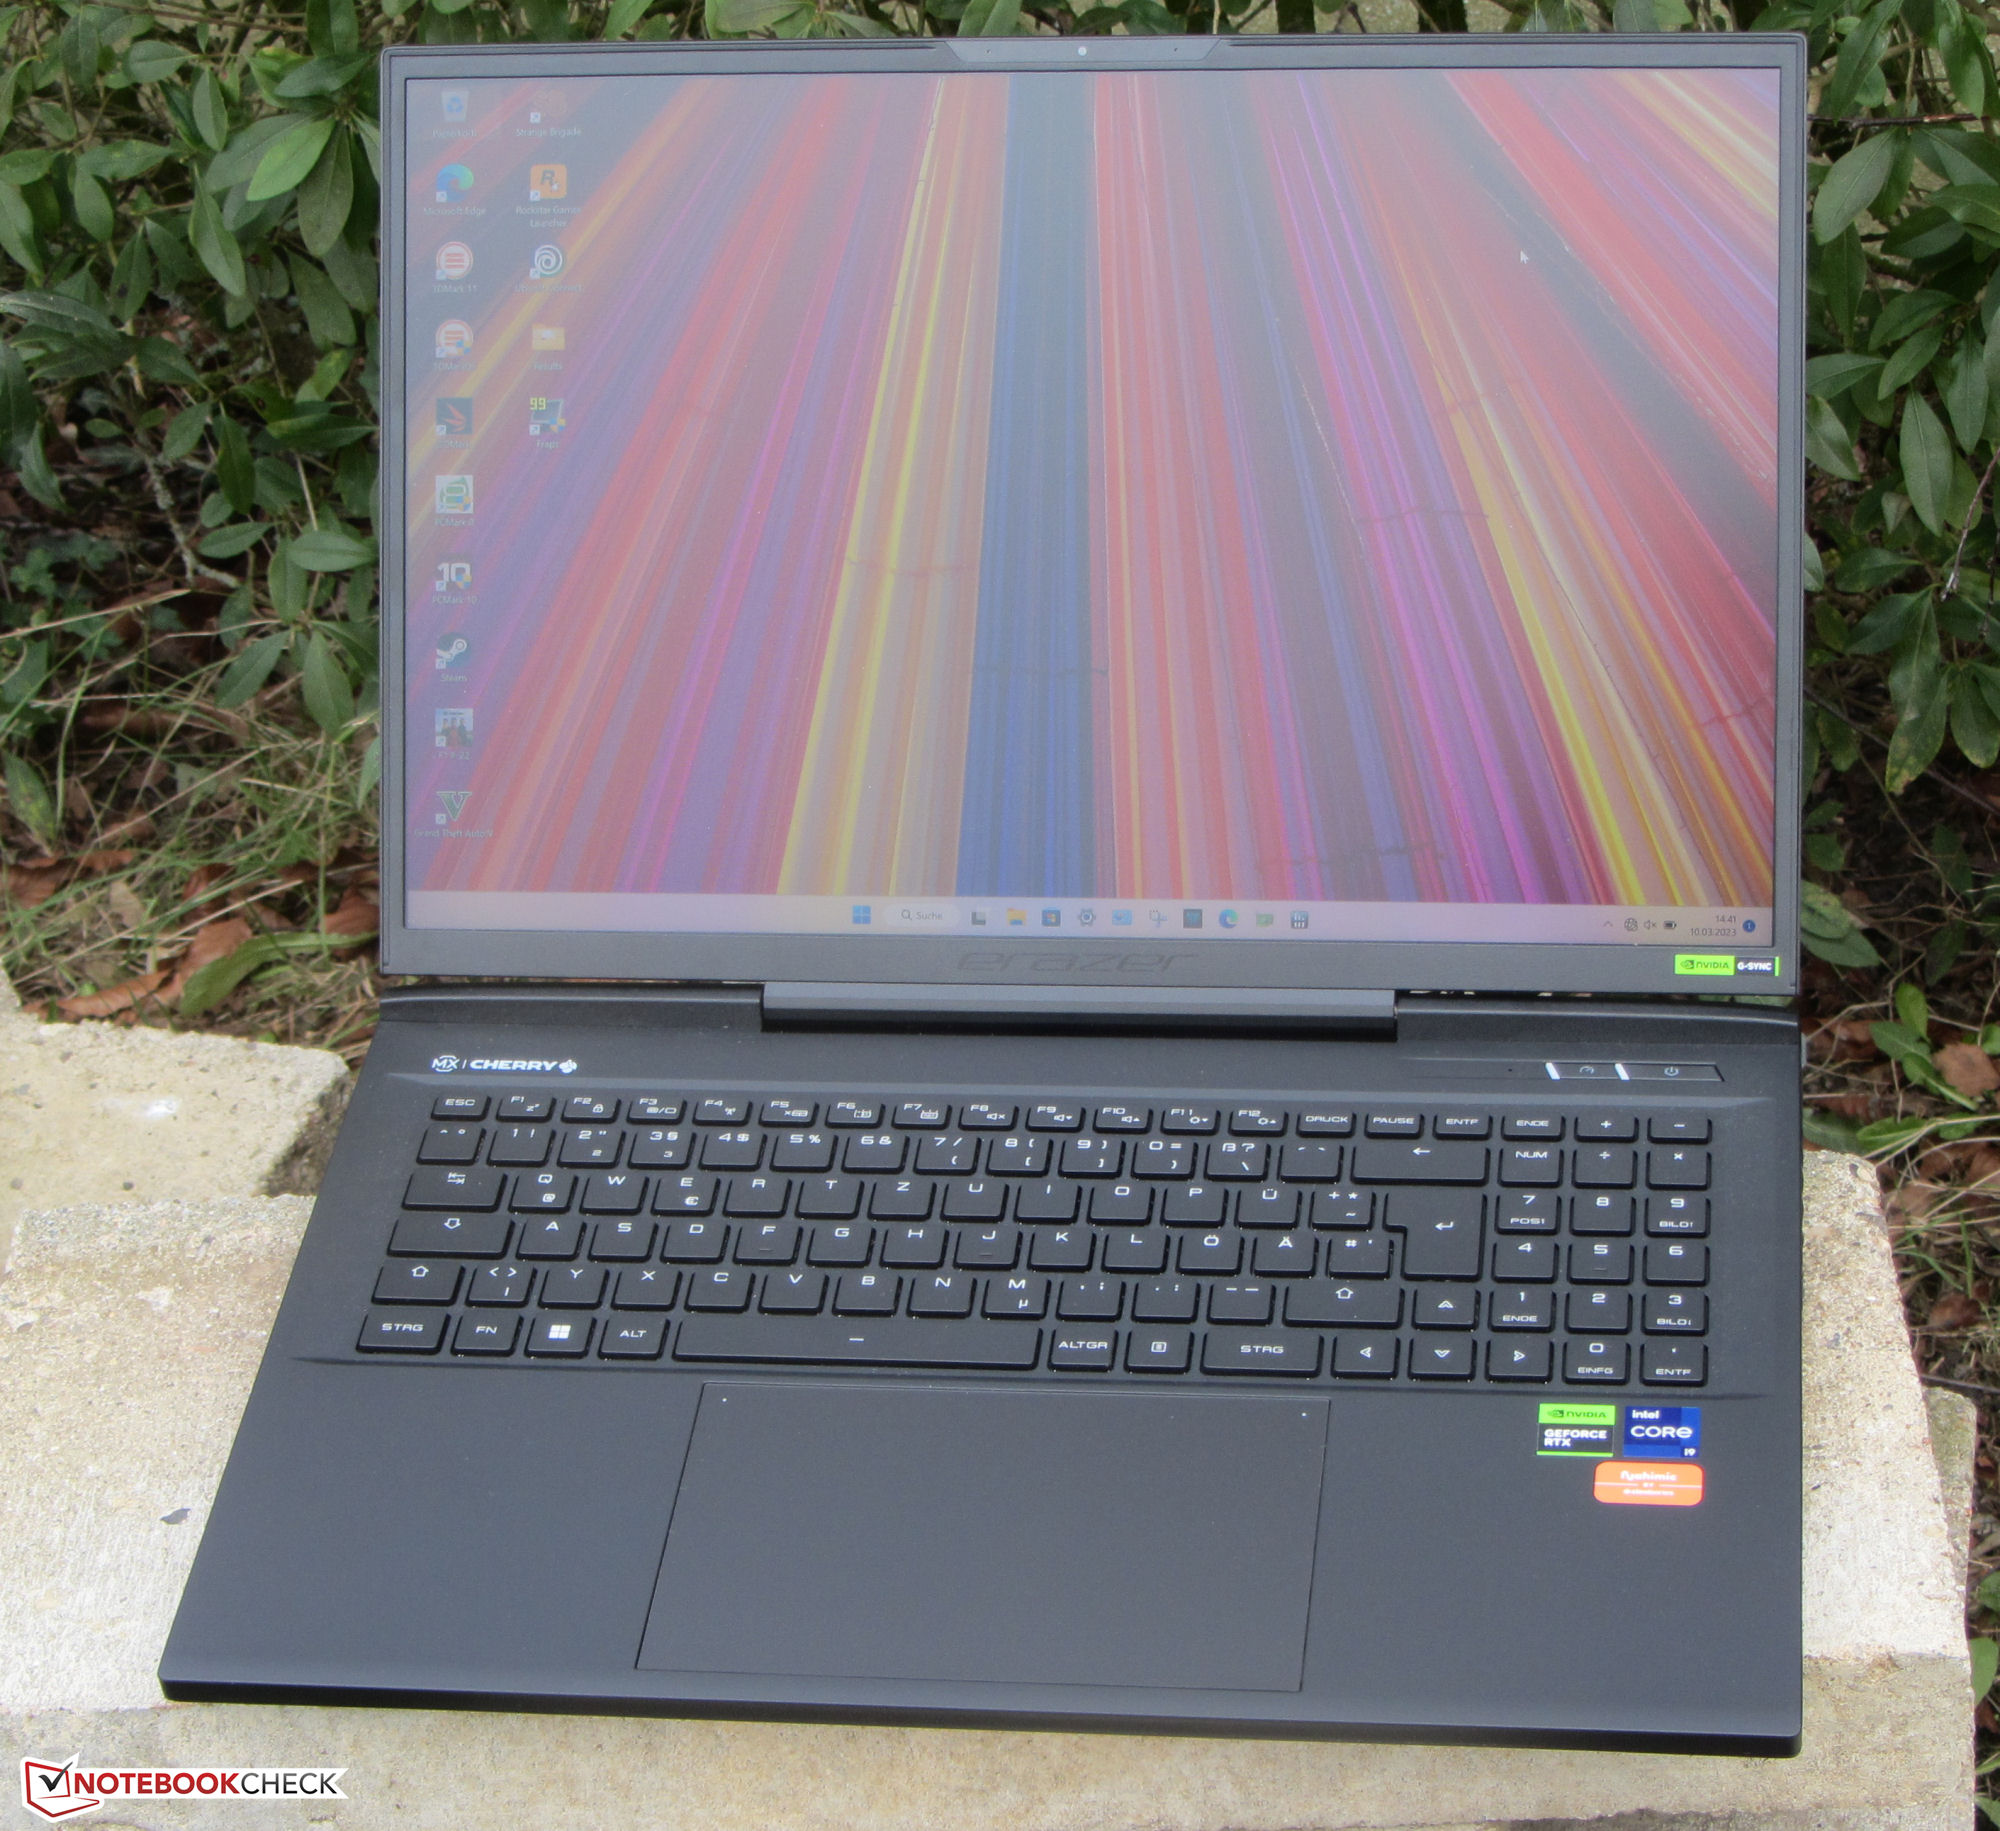
外壳 - Erazer有一个金属底盘
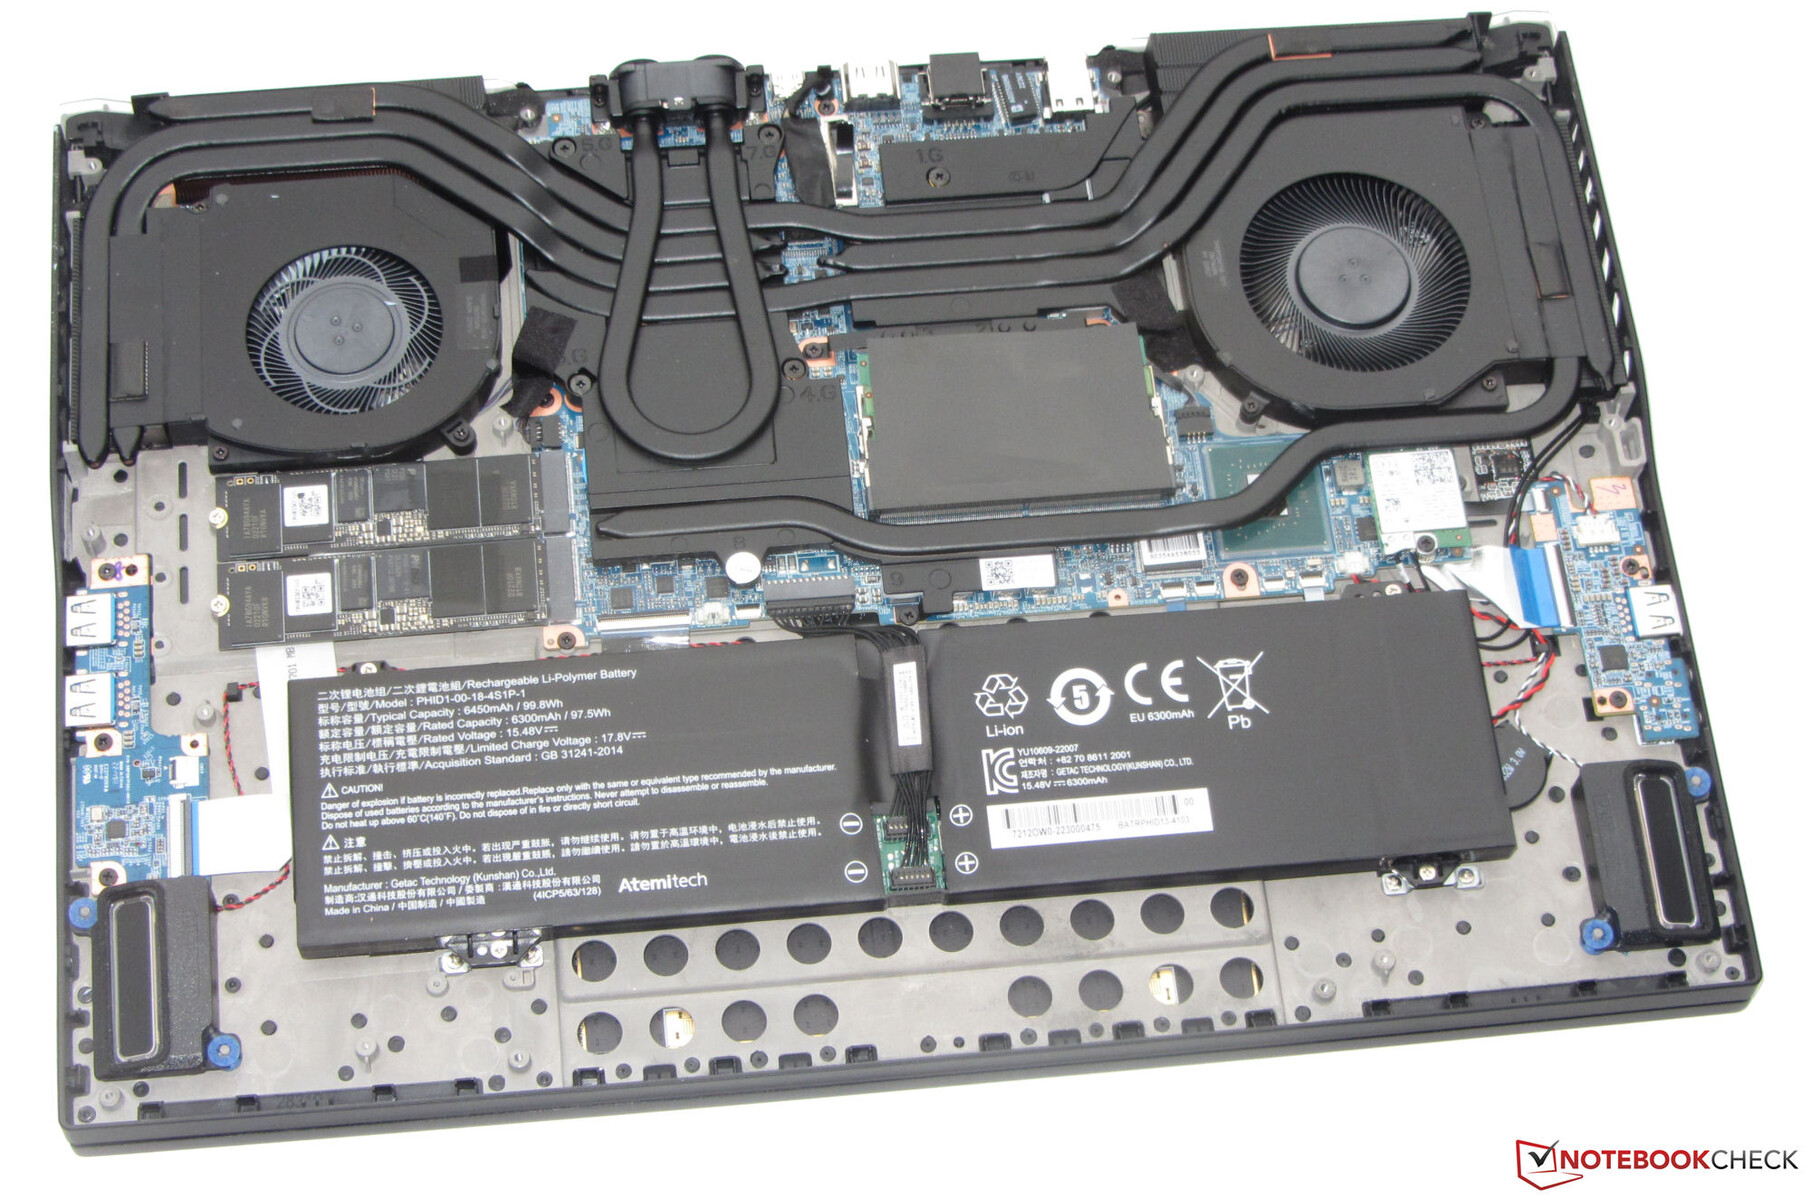
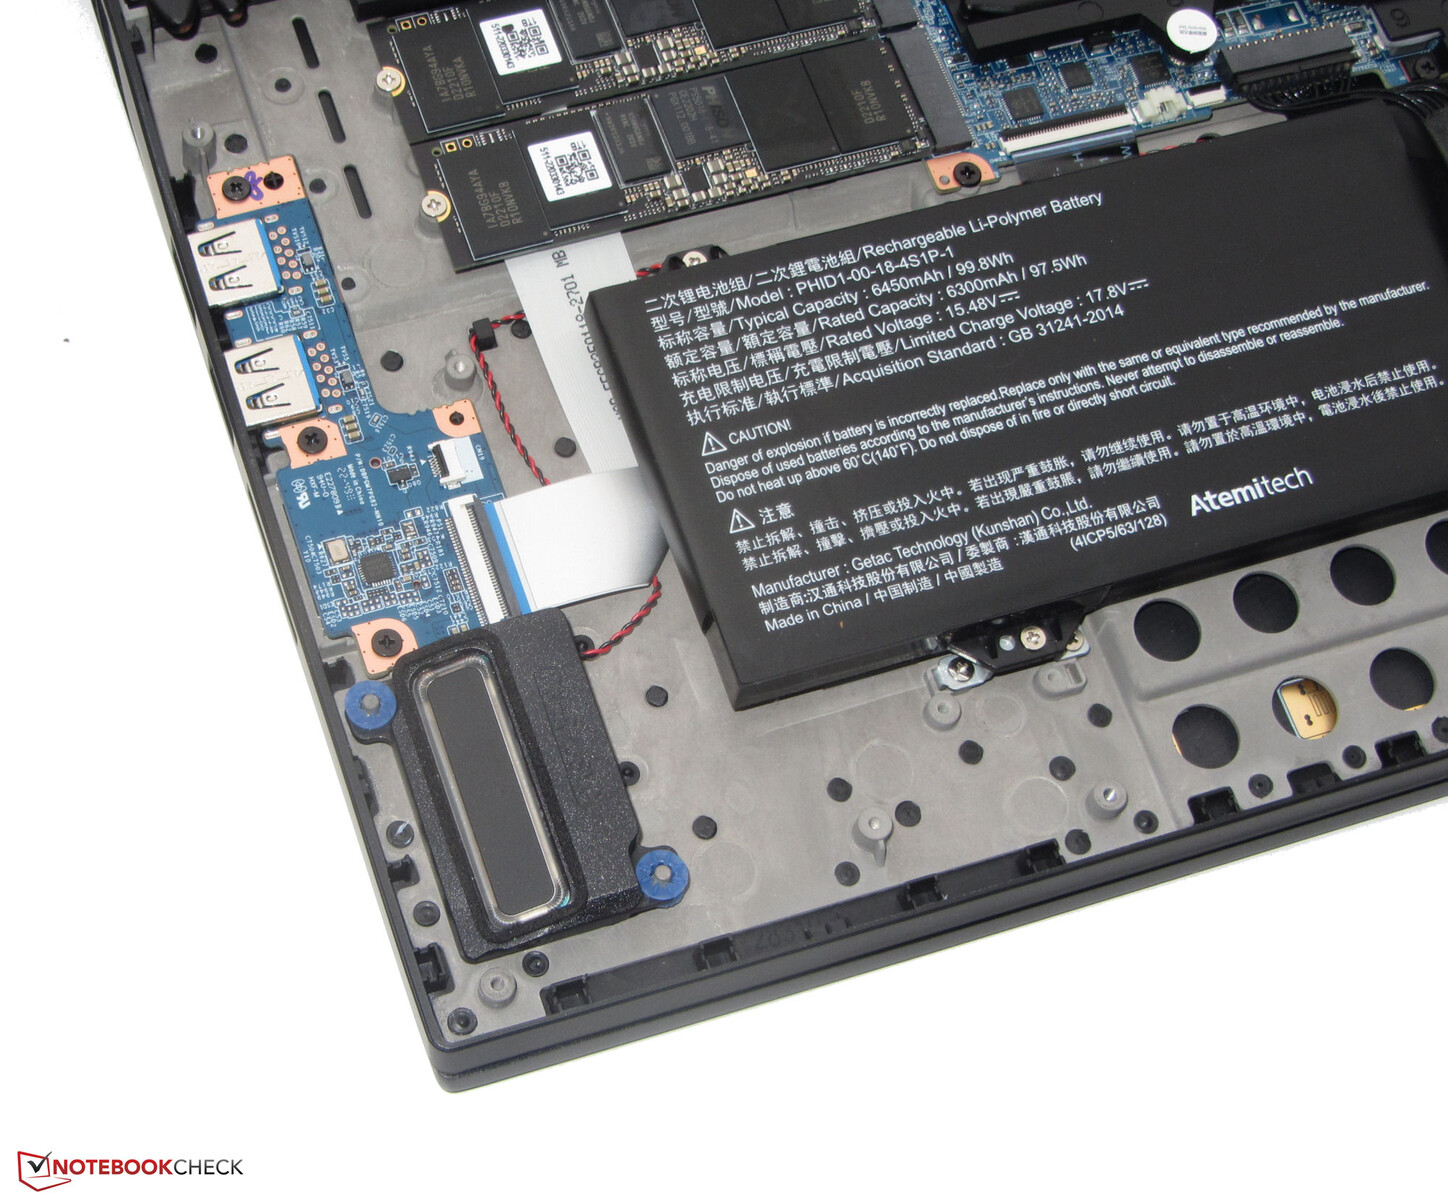
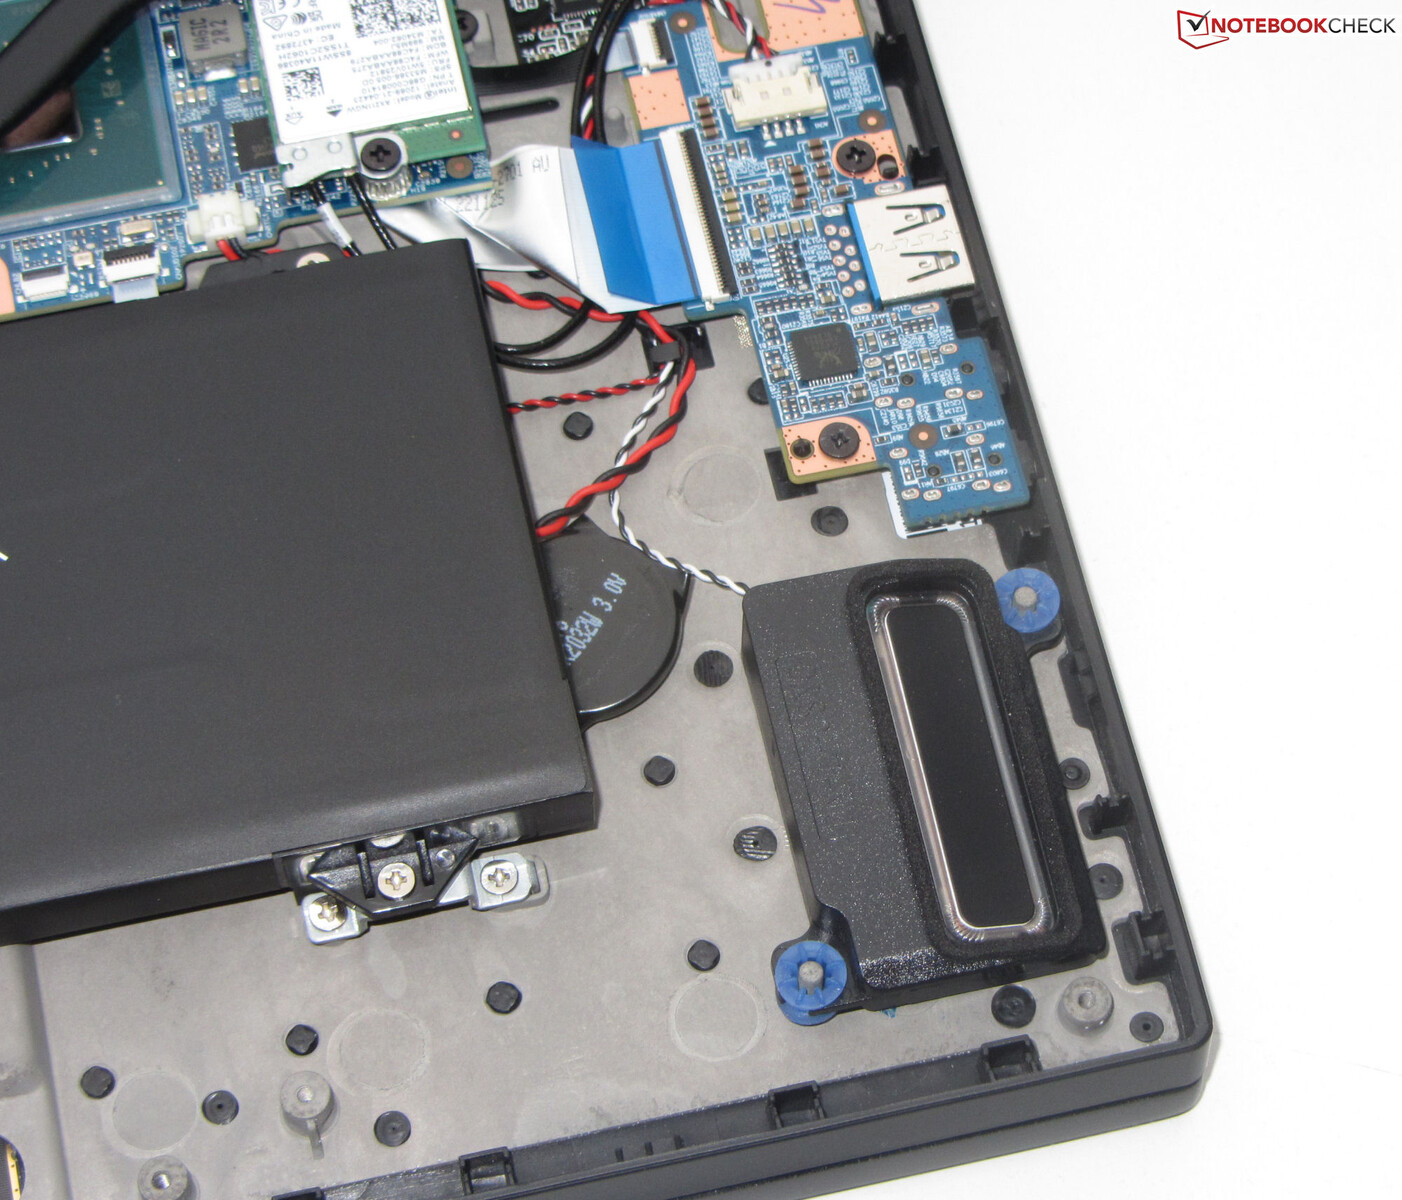
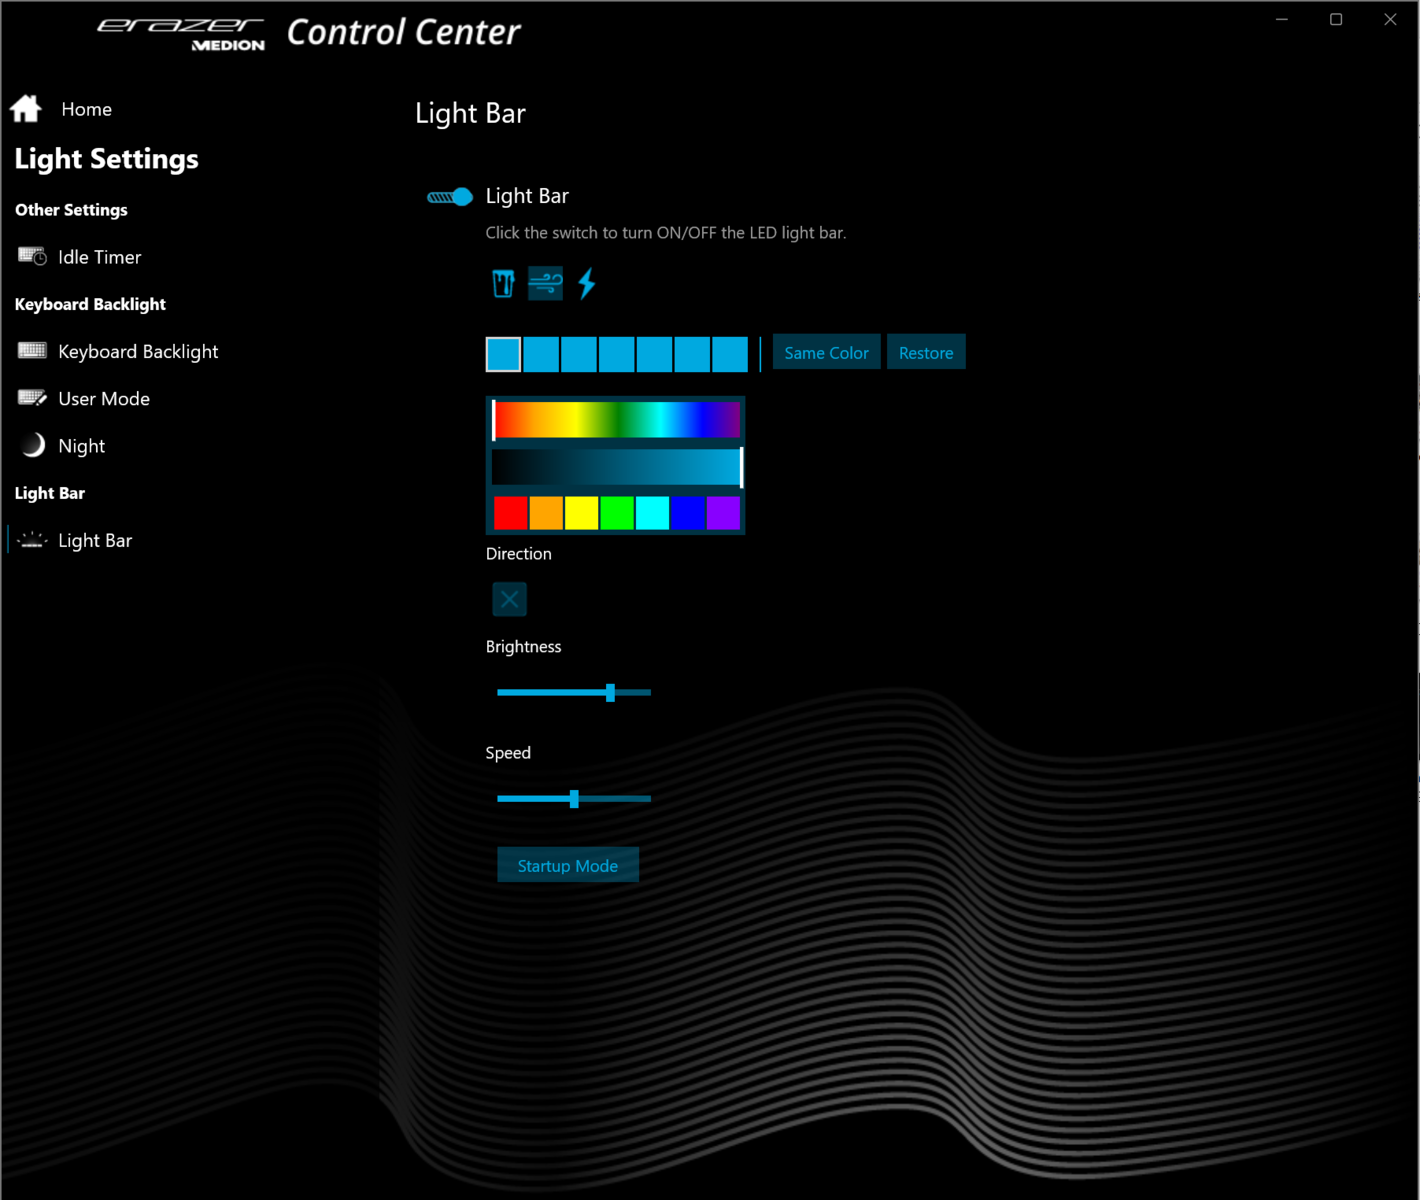
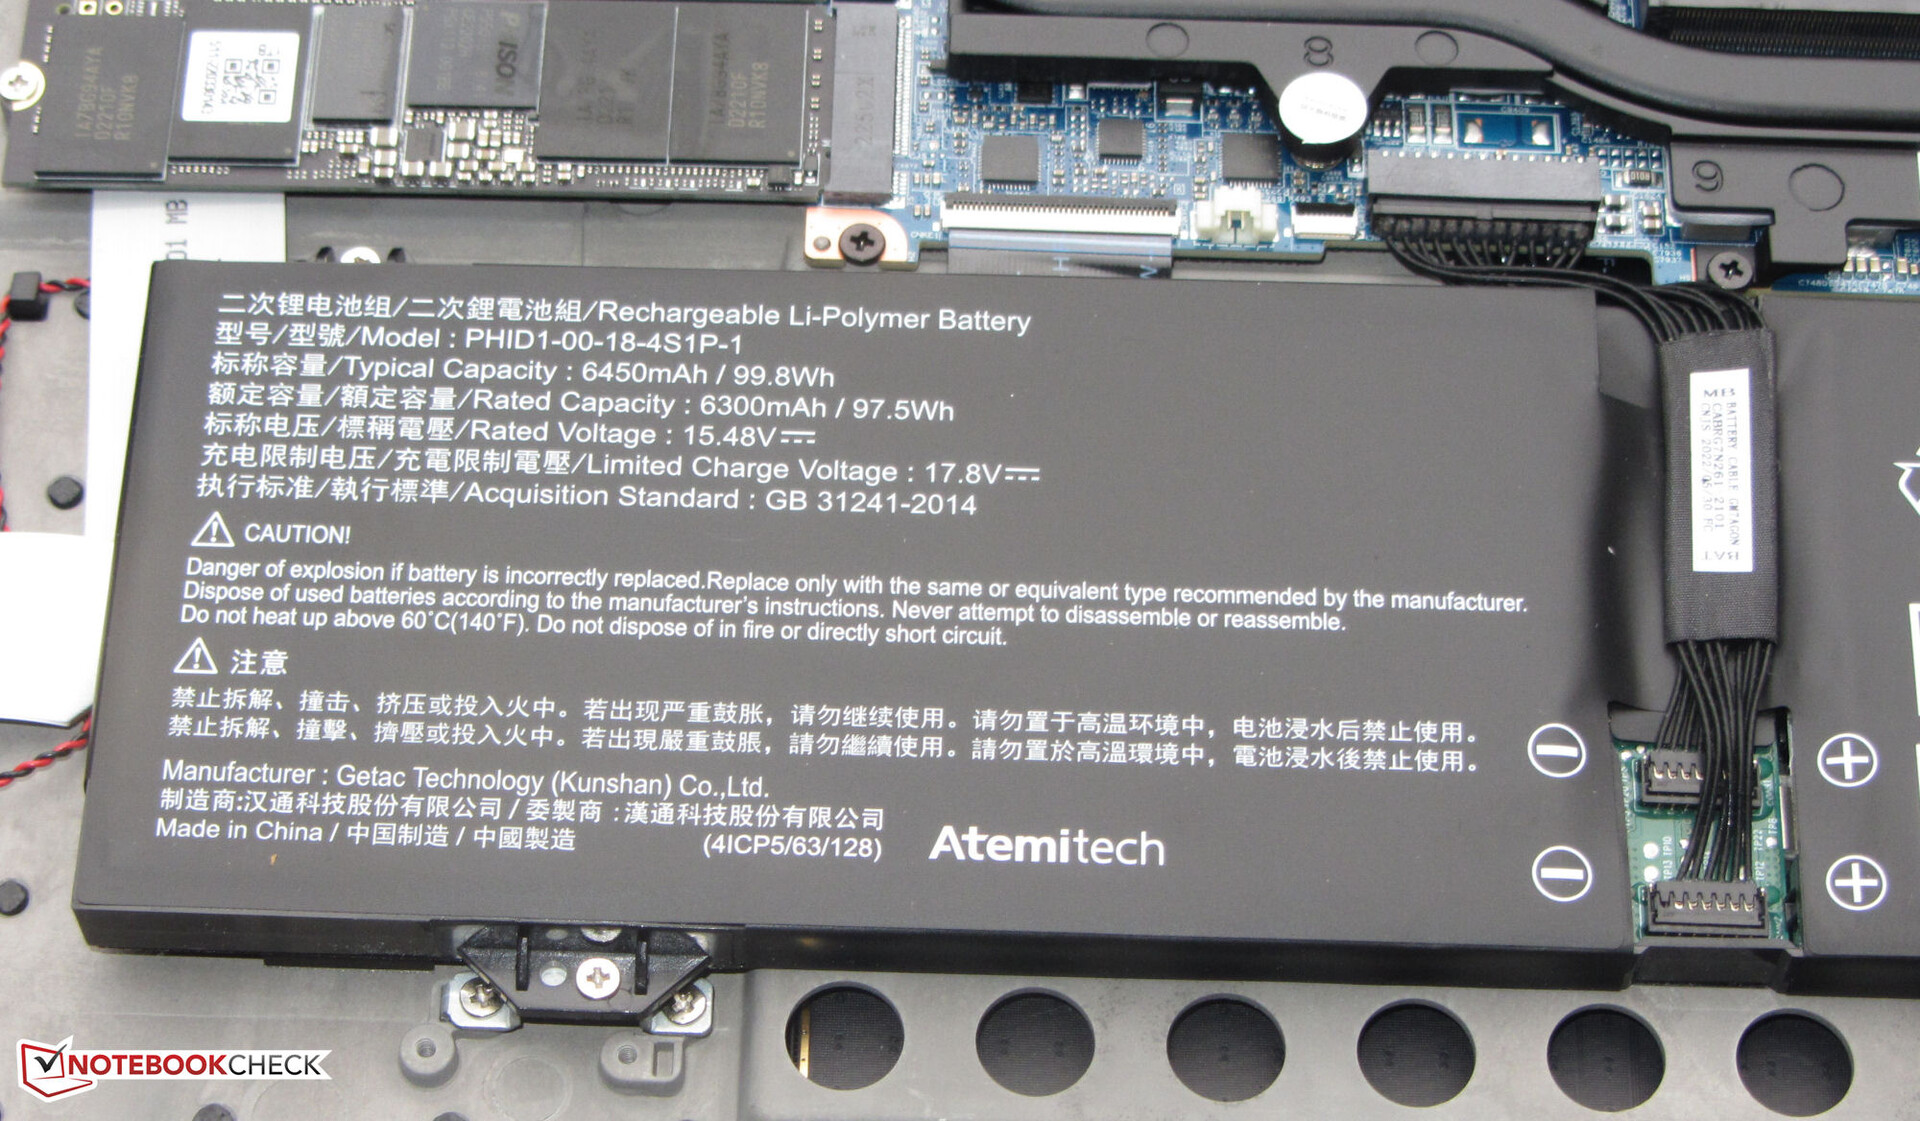
Erazer Beast X40摒弃了响亮和华丽的外观,而采用了低调的设计,在专业环境中不会引人注目。与它的前辈一样,X40使用黑色金属底盘,并进行了磨砂处理。底座部分覆盖着一层抓地力强的橡胶涂层。键盘背光(RGB)以及后部排气口上方的两个完全可配置的LED条(RGB)为笔记本电脑提供了一抹色彩。电池是用螺丝钉固定的,而不是用胶水粘住的,一旦取下底盖,就可以接触到其余的内部零件。
在我们的评测单元上,我们没有注意到任何做工问题。机箱中的缝隙很好,也很紧密,制造过程中没有留下多余的材料。几乎不可能扭动底座部分。盖子可以稍微弯曲,但弯曲的程度是完全可以接受的。铰链将显示屏牢牢地固定在原处,并允许屏幕向后折叠,折叠的角度可达140度左右。笔记本电脑的盖子不能用一只手打开。
Medion Erazer Beast X40是我们比较中最紧凑的设备之一,在重量方面处于中间位置。
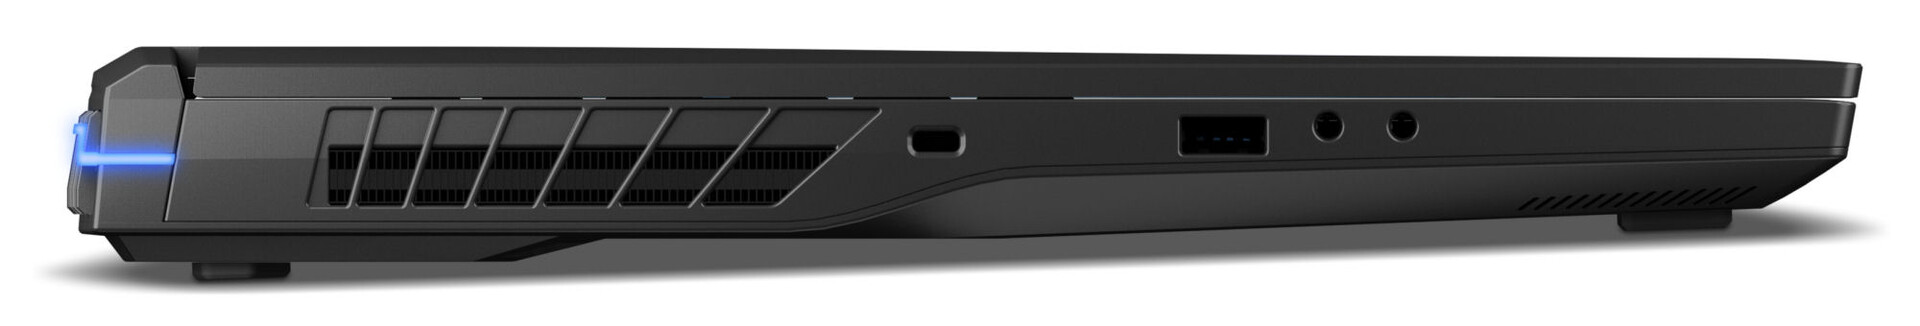
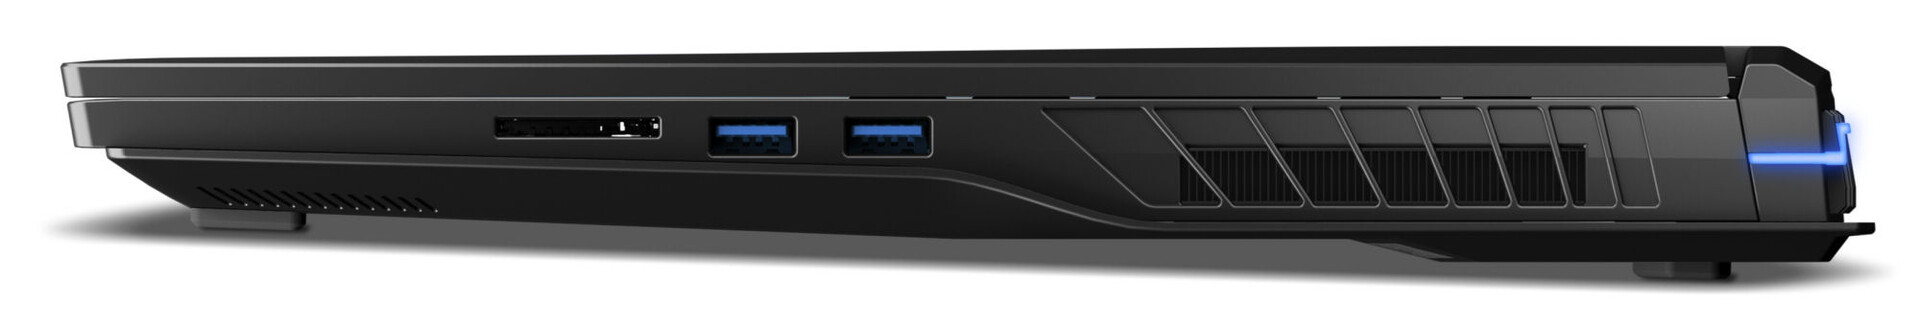
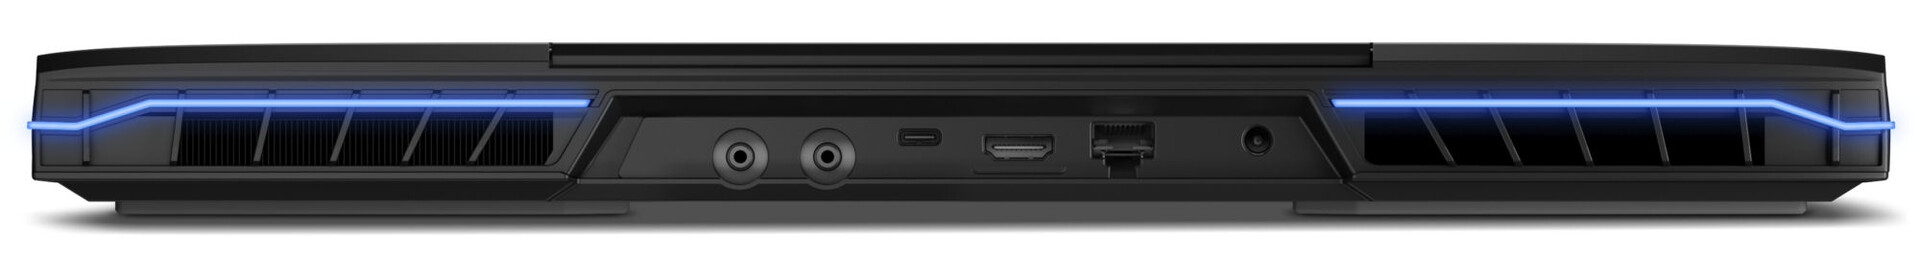
规格--野兽的Thunderbolt 4
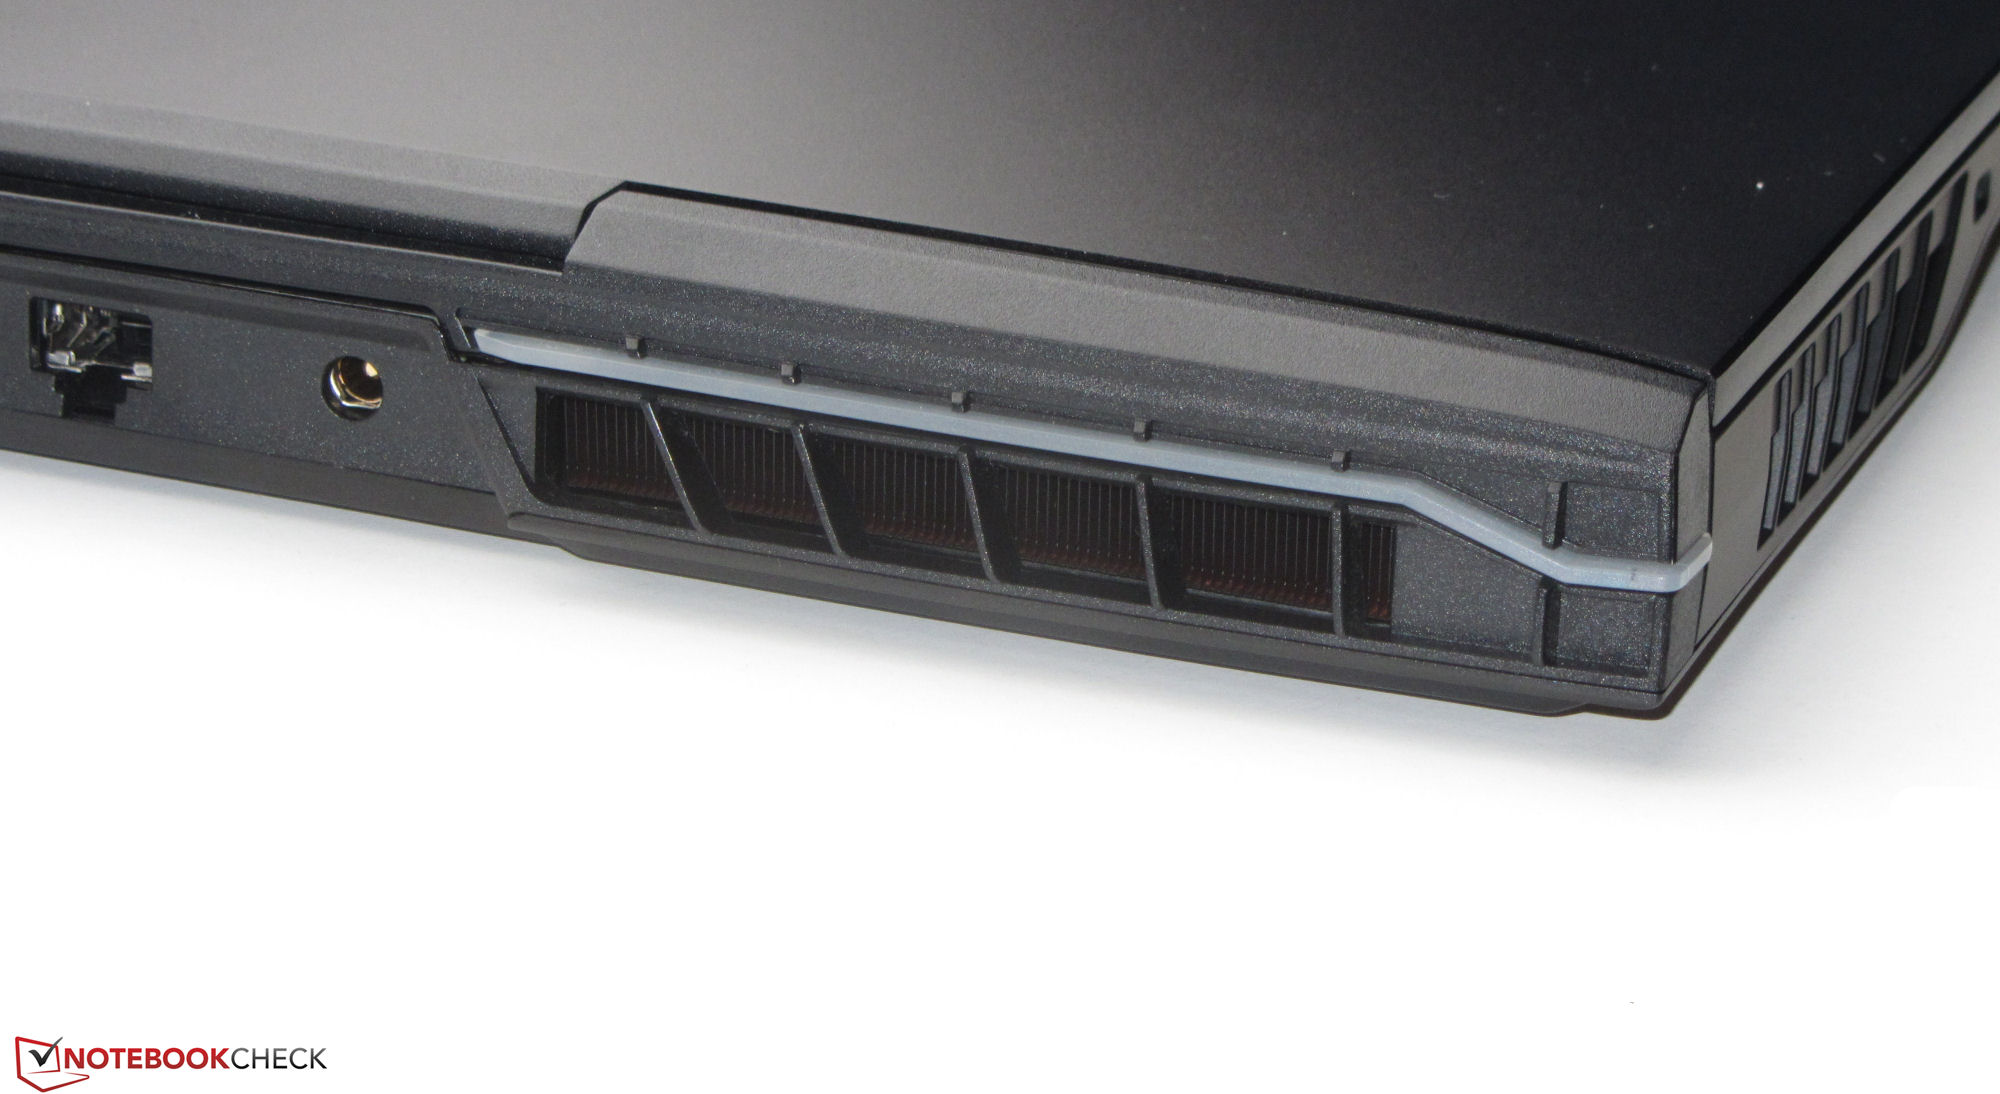
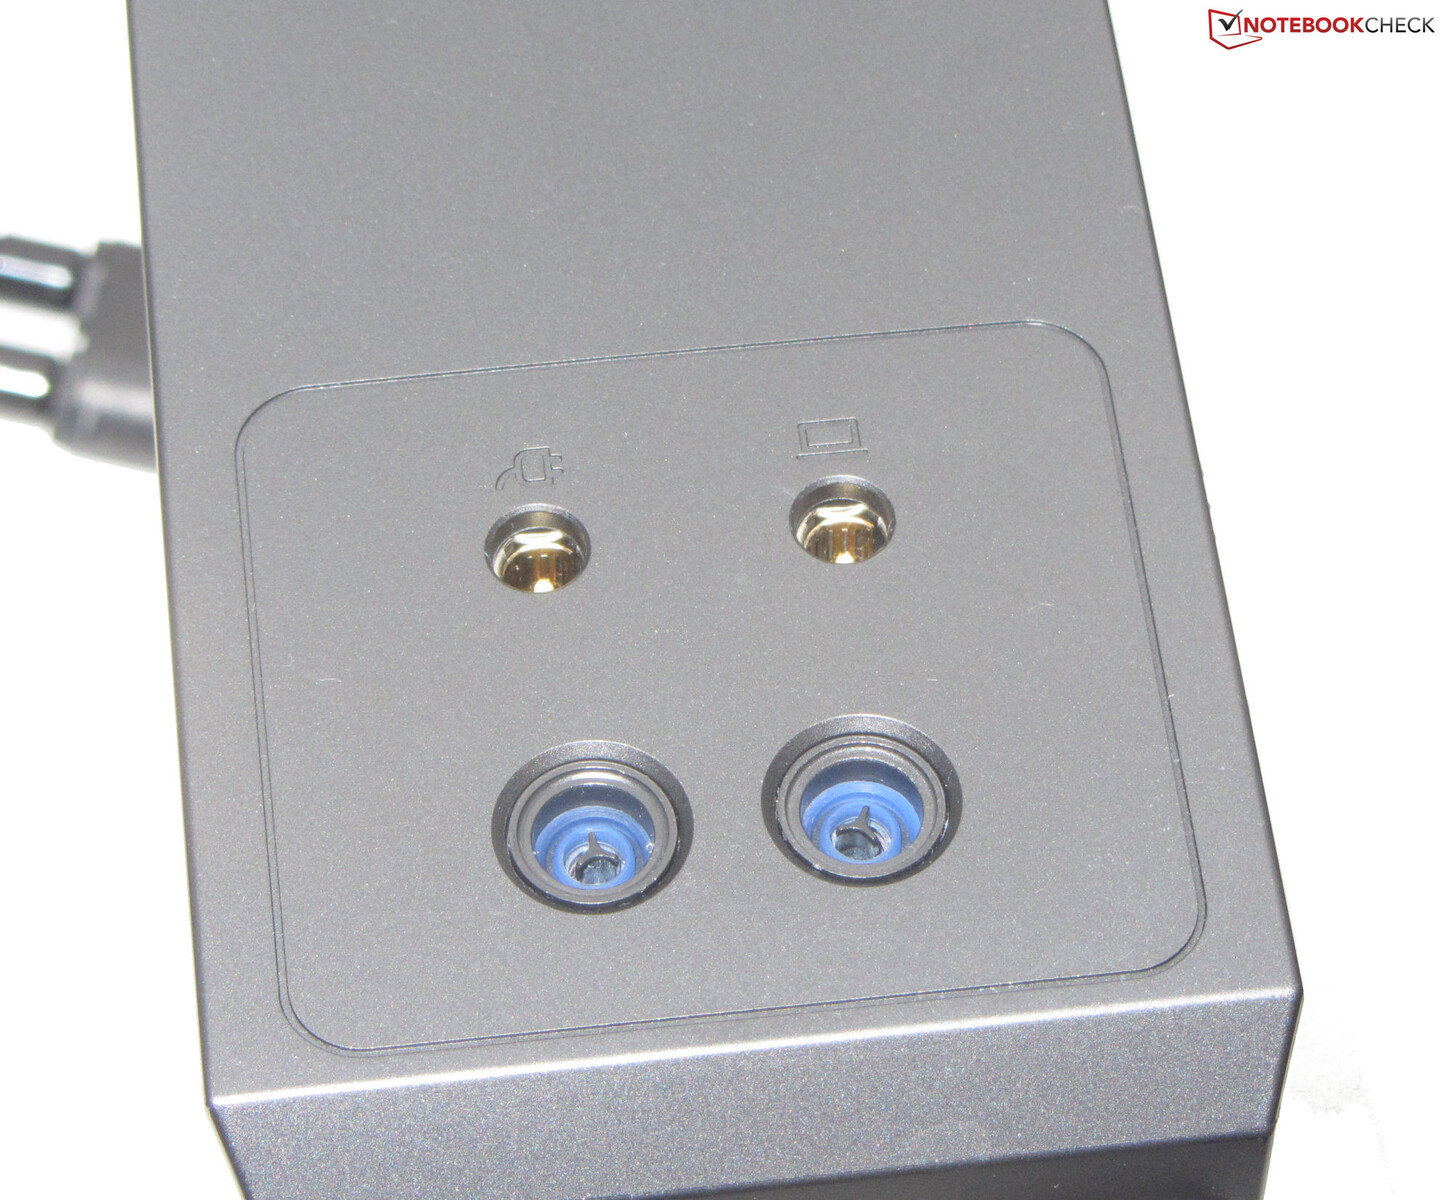
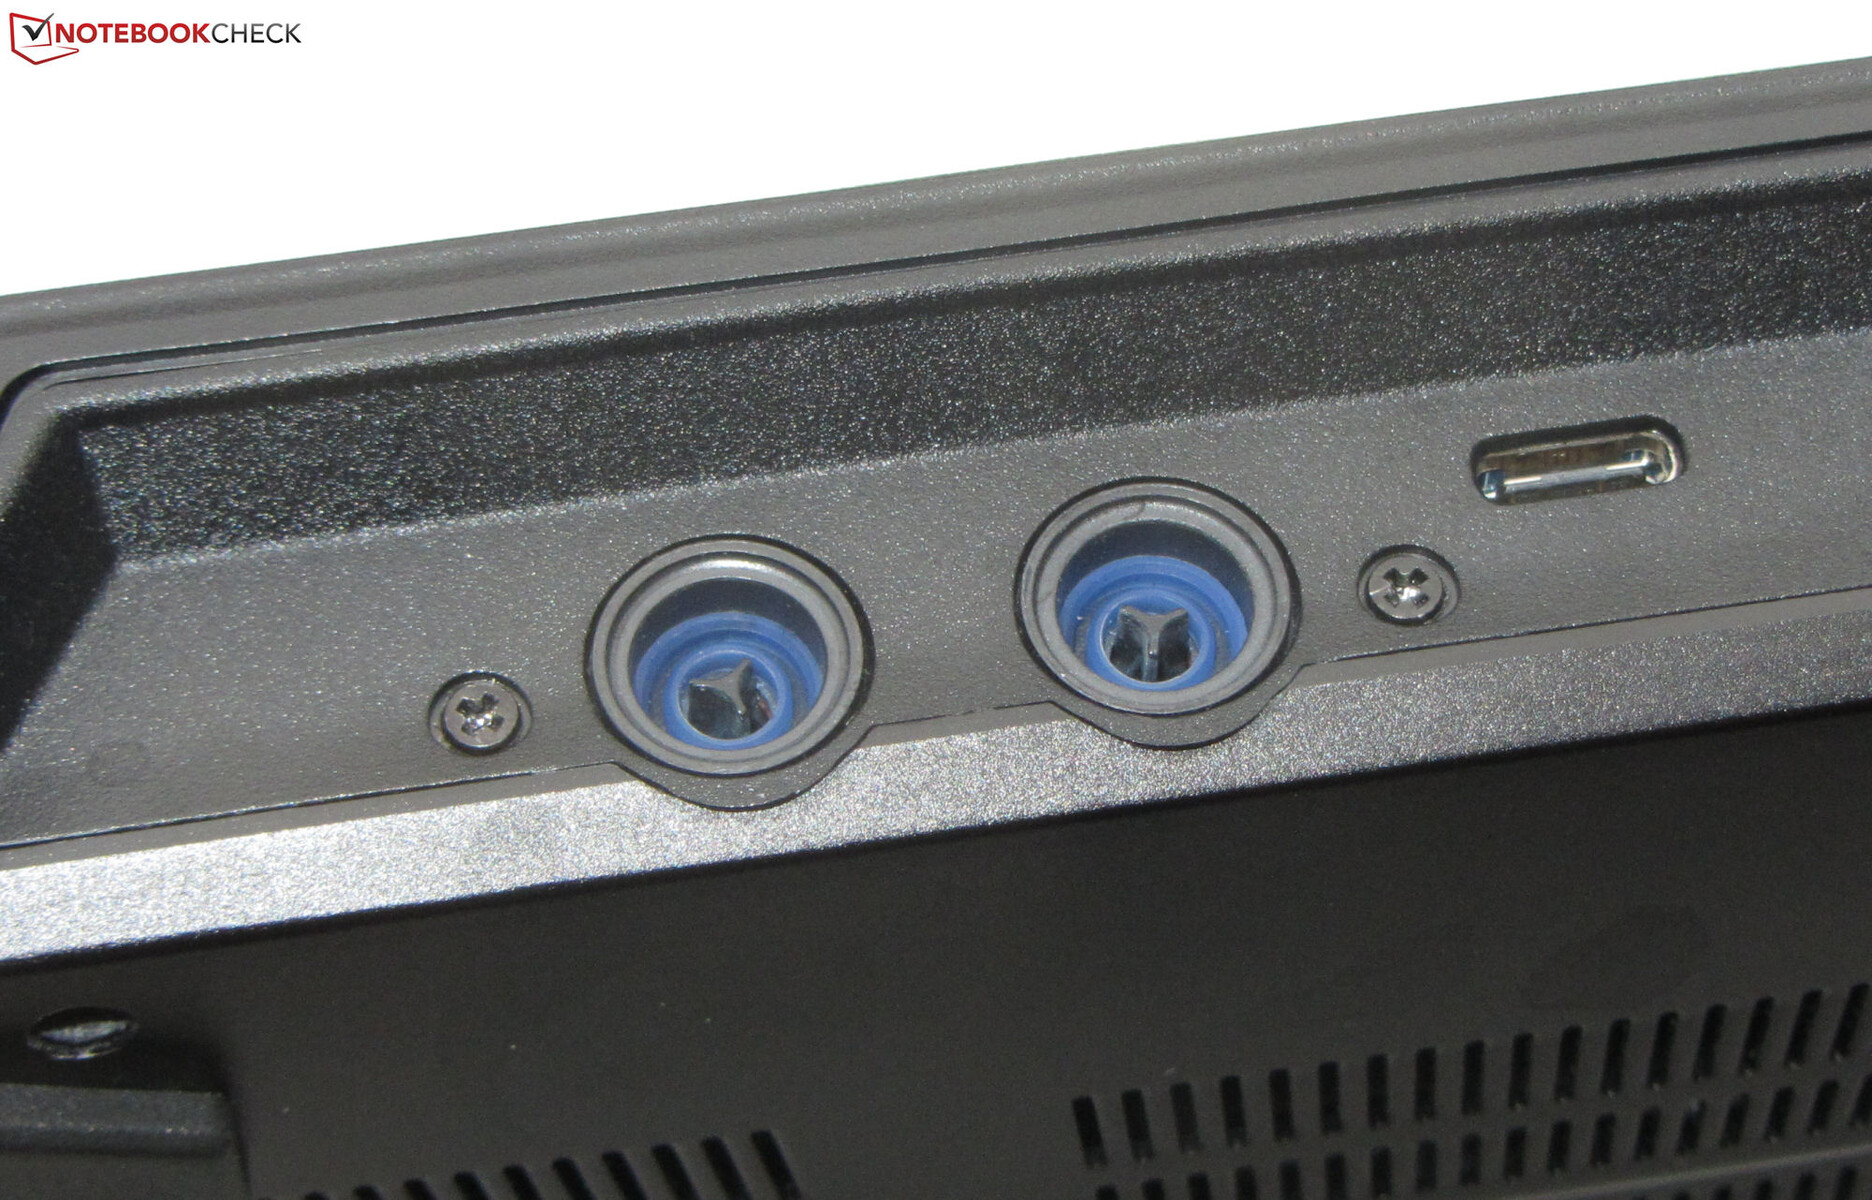
Erazer有三个USB-A端口(2个USB 3.2 Gen 1,1个USB 3.2 Gen 2)和一个USB-C端口(Thunderbolt 4)。后者不支持Power Delivery,但能够输出DisplayPort信号。笔记本电脑总共有两个视频输出(HDMI 2.1,DP),两个音频插孔(耳机和麦克风输入),一个千兆以太网端口和一个肯辛顿插槽。在后面,你还会发现用于可选的水冷解决方案的连接器。
SD卡阅读器
SD读卡器是一个中等速度的模型,与我们的AV Pro microSD 128 GB V60参考卡一起使用,在传输250张每张约5MB的JPEG图像时,设法达到77MB/s的速度,在复制大块数据时达到86MB/s。
| SD Card Reader | |
| average JPG Copy Test (av. of 3 runs) | |
| Alienware x17 R2 P48E (AV Pro V60) | |
| Average of class Gaming (20.9 - 210, n=54, last 2 years) | |
| Razer Blade 16 Early 2023 (AV PRO microSD 128 GB V60) | |
| MSI Titan GT77 HX 13VI (Angelibird AV Pro V60) | |
| Medion Erazer Beast X40 (AV PRO microSD 128 GB V60) | |
| Schenker XMG Neo 17 M22 (AV PRO microSD 128 GB V60) | |
| maximum AS SSD Seq Read Test (1GB) | |
| Alienware x17 R2 P48E (AV Pro V60) | |
| Razer Blade 16 Early 2023 (AV PRO microSD 128 GB V60) | |
| Average of class Gaming (25.5 - 261, n=51, last 2 years) | |
| MSI Titan GT77 HX 13VI (Angelibird AV Pro V60) | |
| Medion Erazer Beast X40 (AV PRO microSD 128 GB V60) | |
连接性
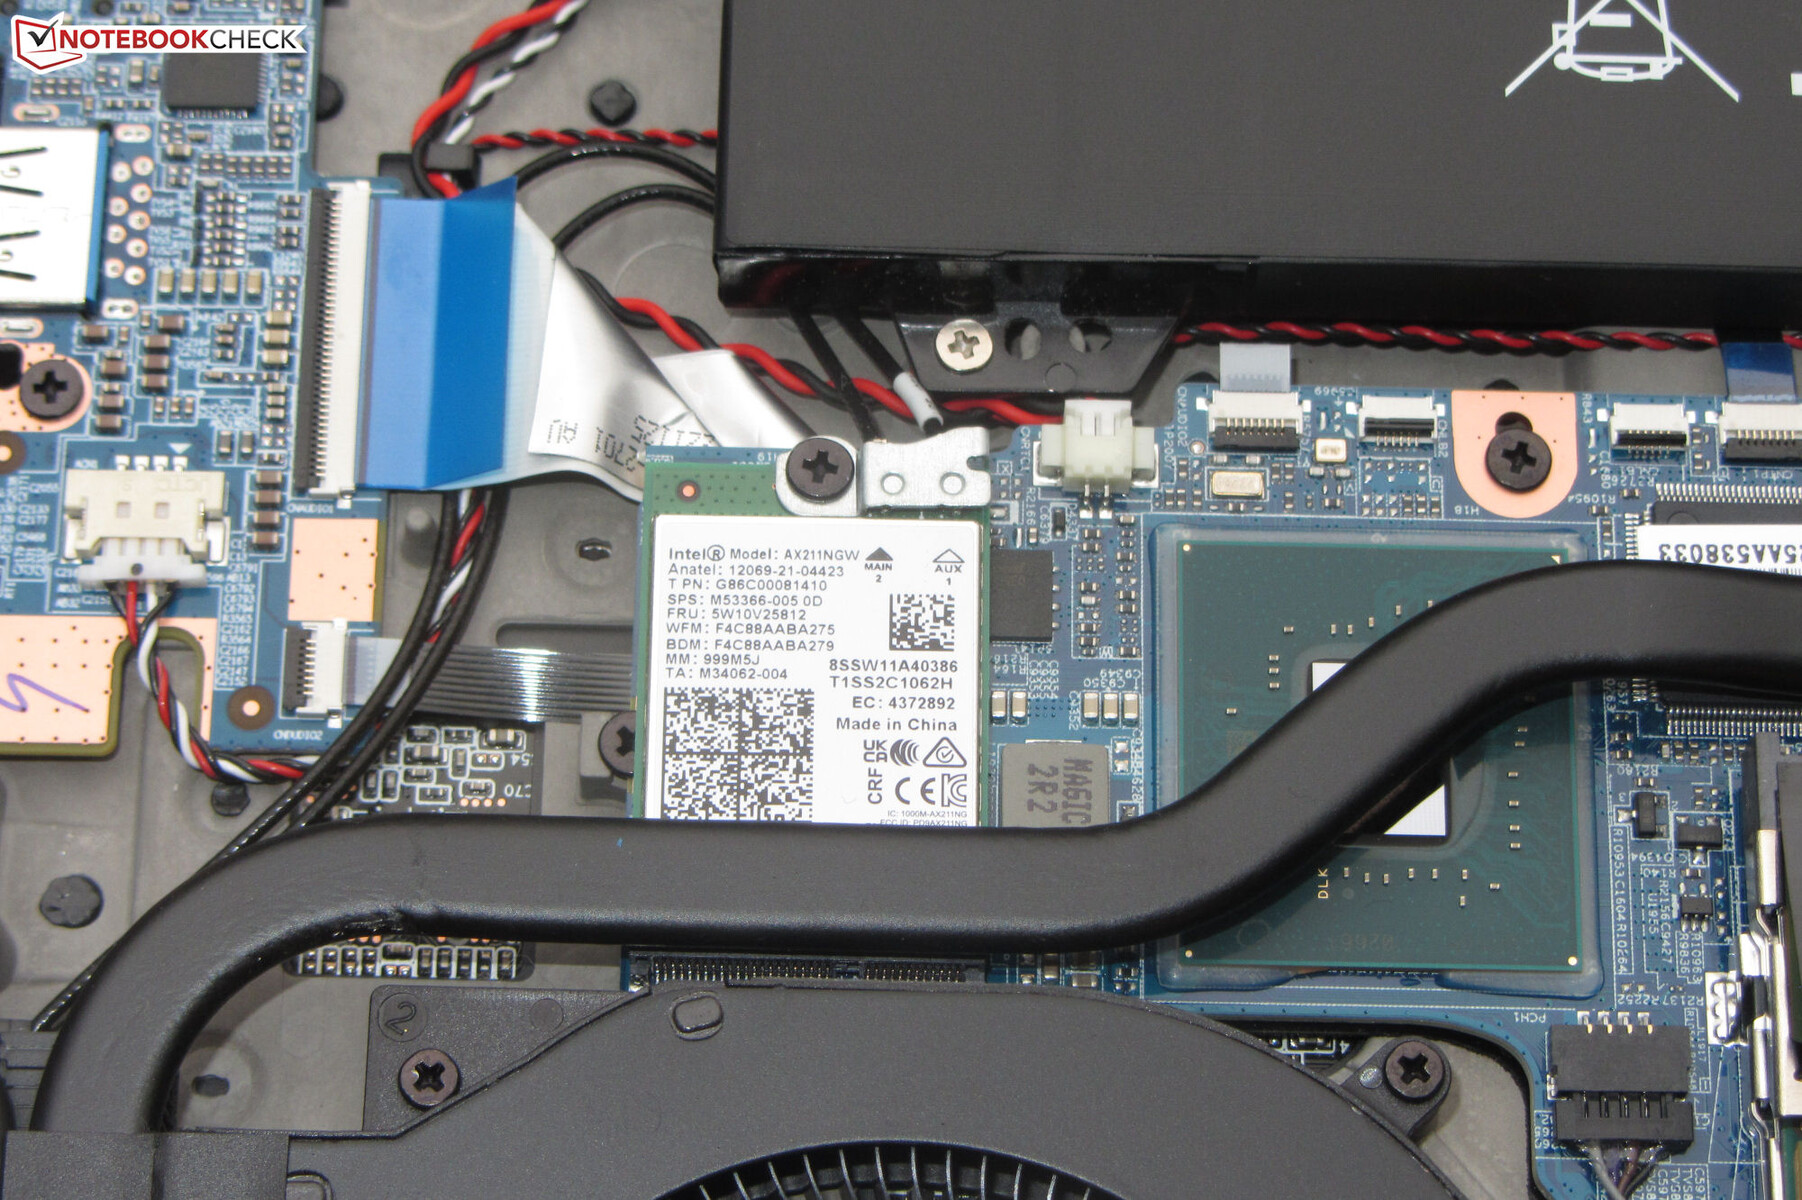
在最佳条件下(周围没有其他Wi-Fi设备,笔记本电脑和服务器PC之间距离较短),Erazer通过Wi-Fi提供了出色的传输速率,因为Medion决定采用英特尔AX211 Wi-Fi 6E模块。有线网络连接由Realtek RTL8125千兆以太网芯片处理,其速度高达2.5Gbit/s。
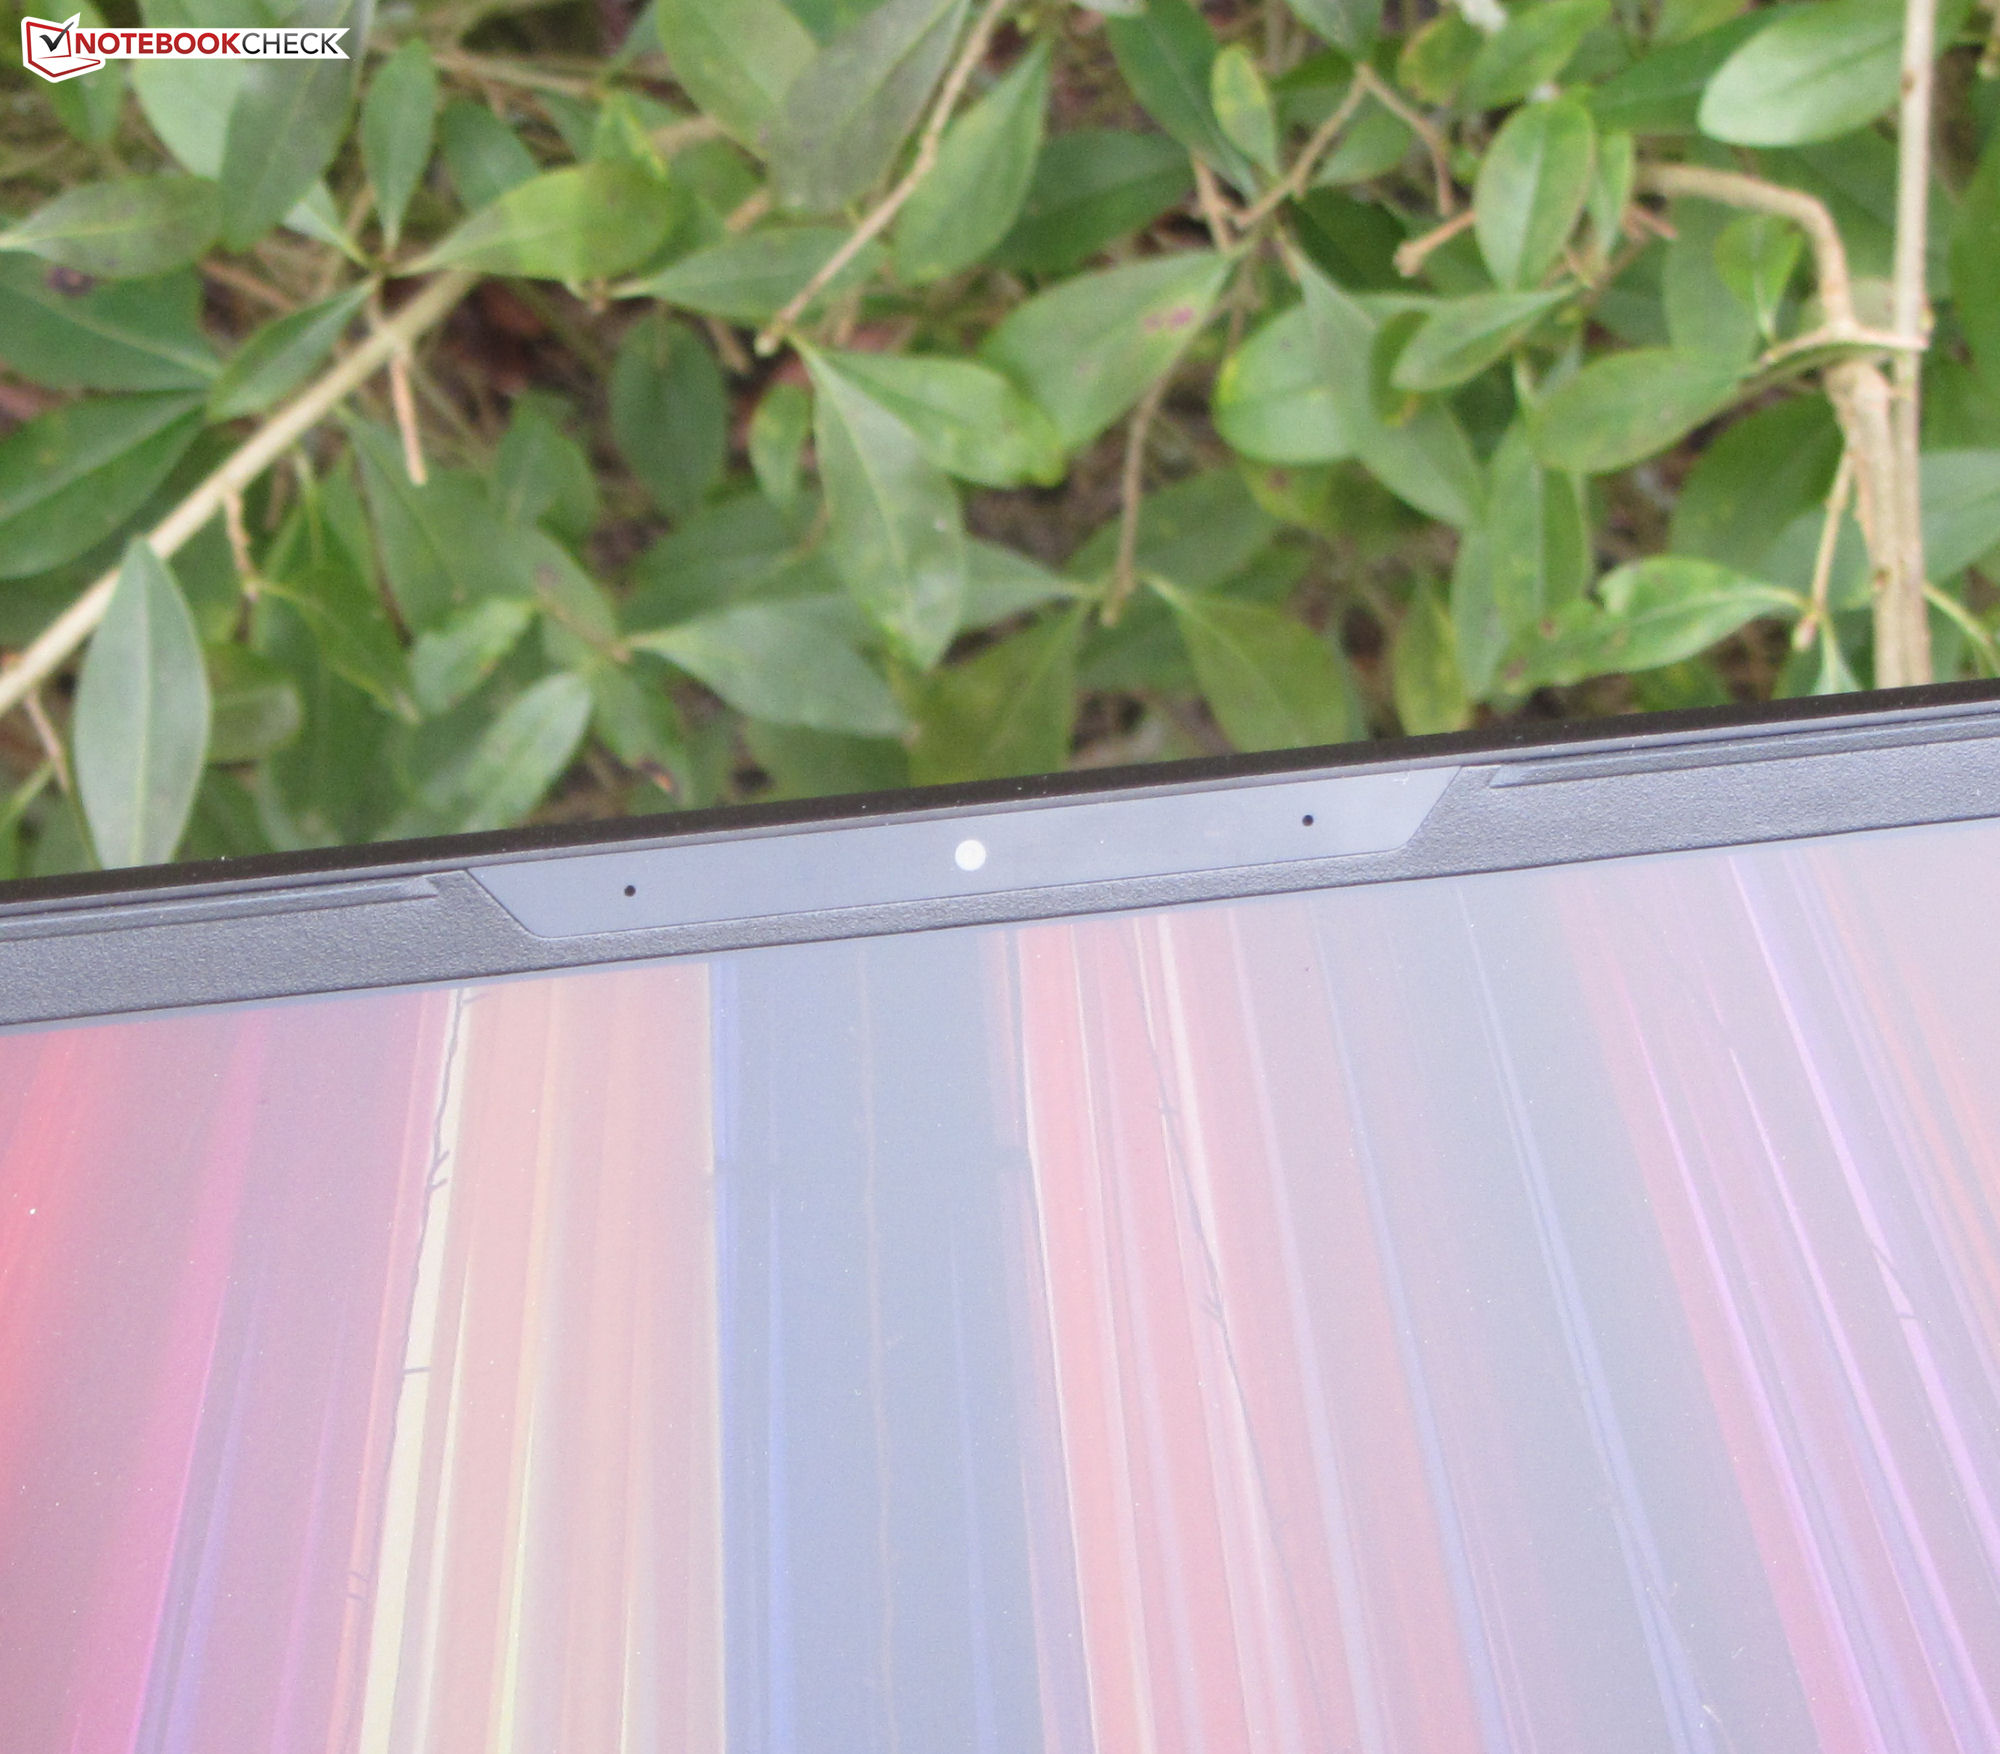
网络摄像头
210万像素的网络摄像头能以1,920 x 1,080的最大分辨率捕捉图像。它在色彩准确性方面有所欠缺:摄像头产生的色彩与参考色有很大偏差。网络摄像头上没有机械的隐私快门。


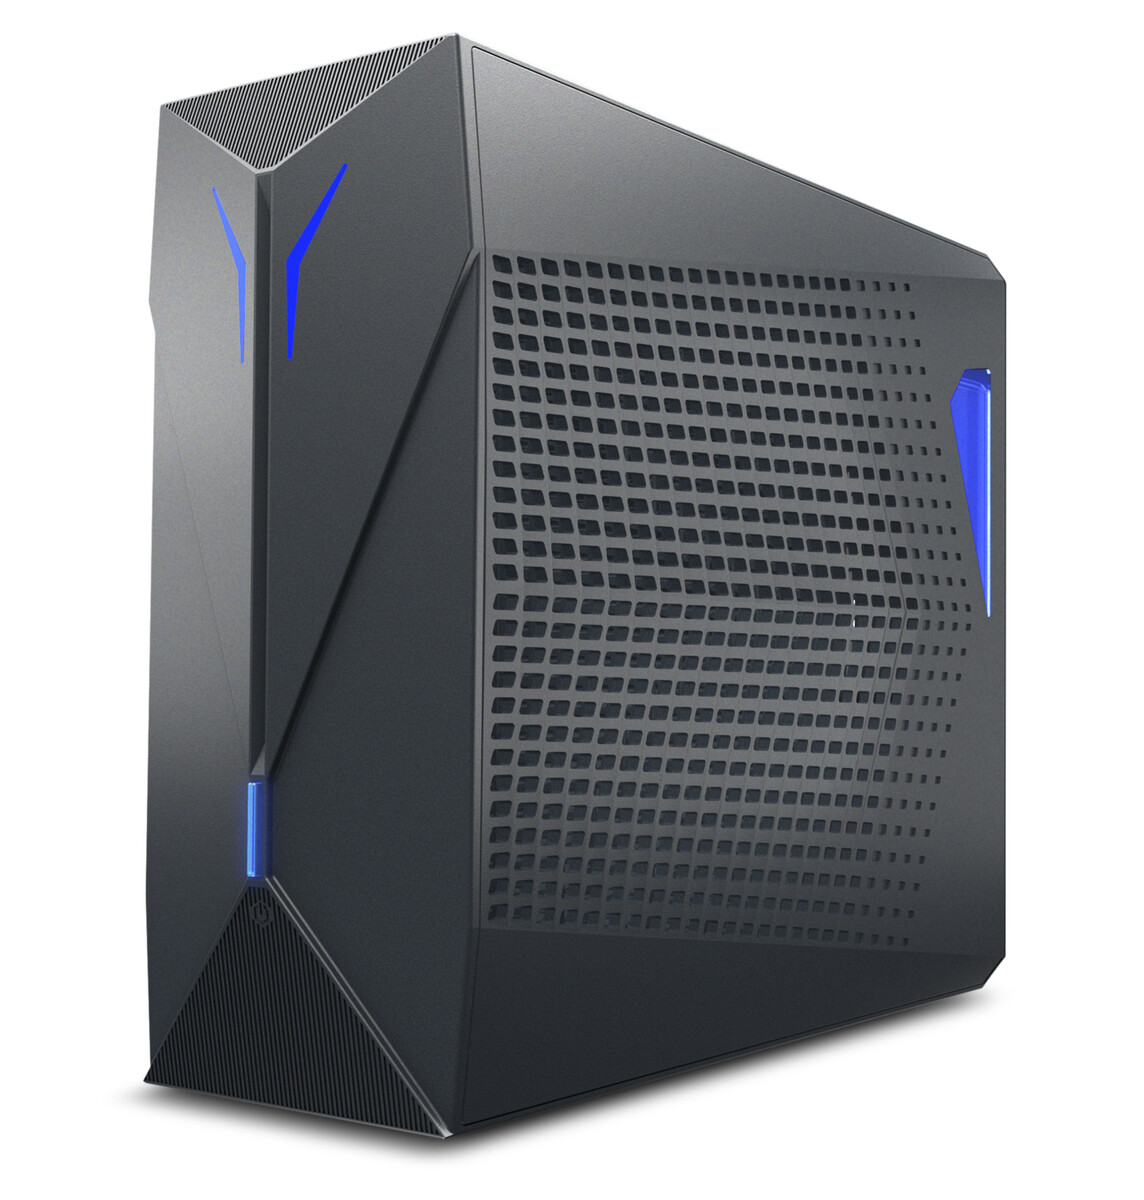
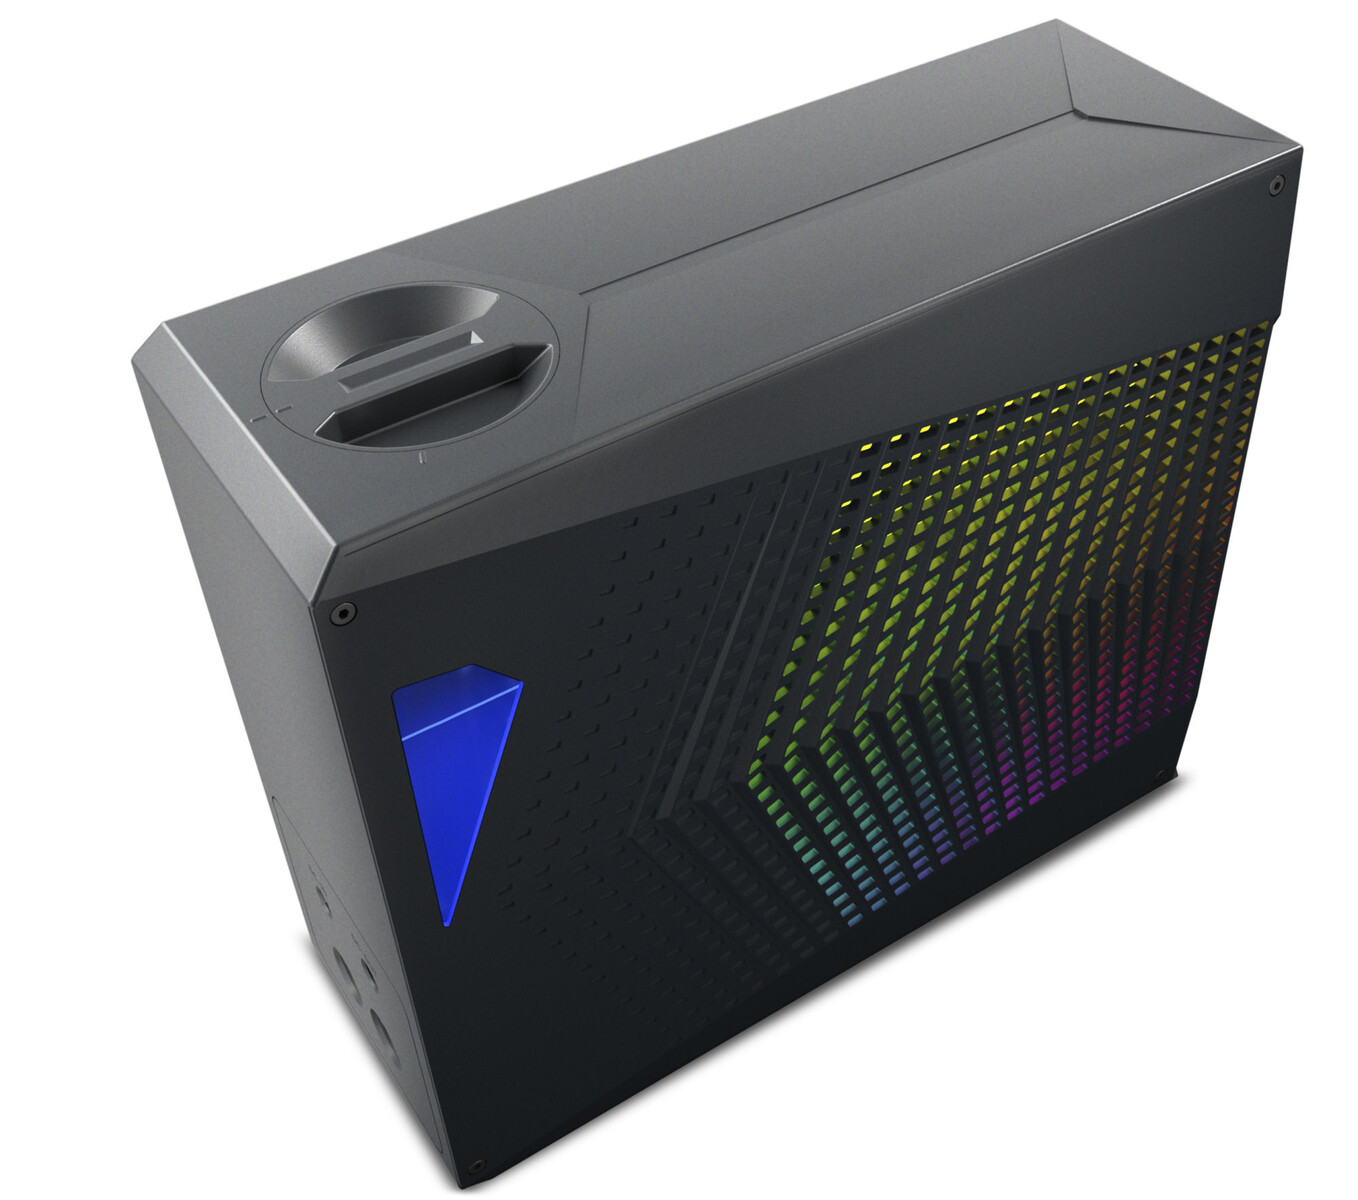
辅料
笔记本电脑除了通常的文件和电源适配器外,没有其他附件。Medion提供了一个可选的外部水冷却解决方案,价格约为250欧元(270美元),该公司也提供给我们进行测试。
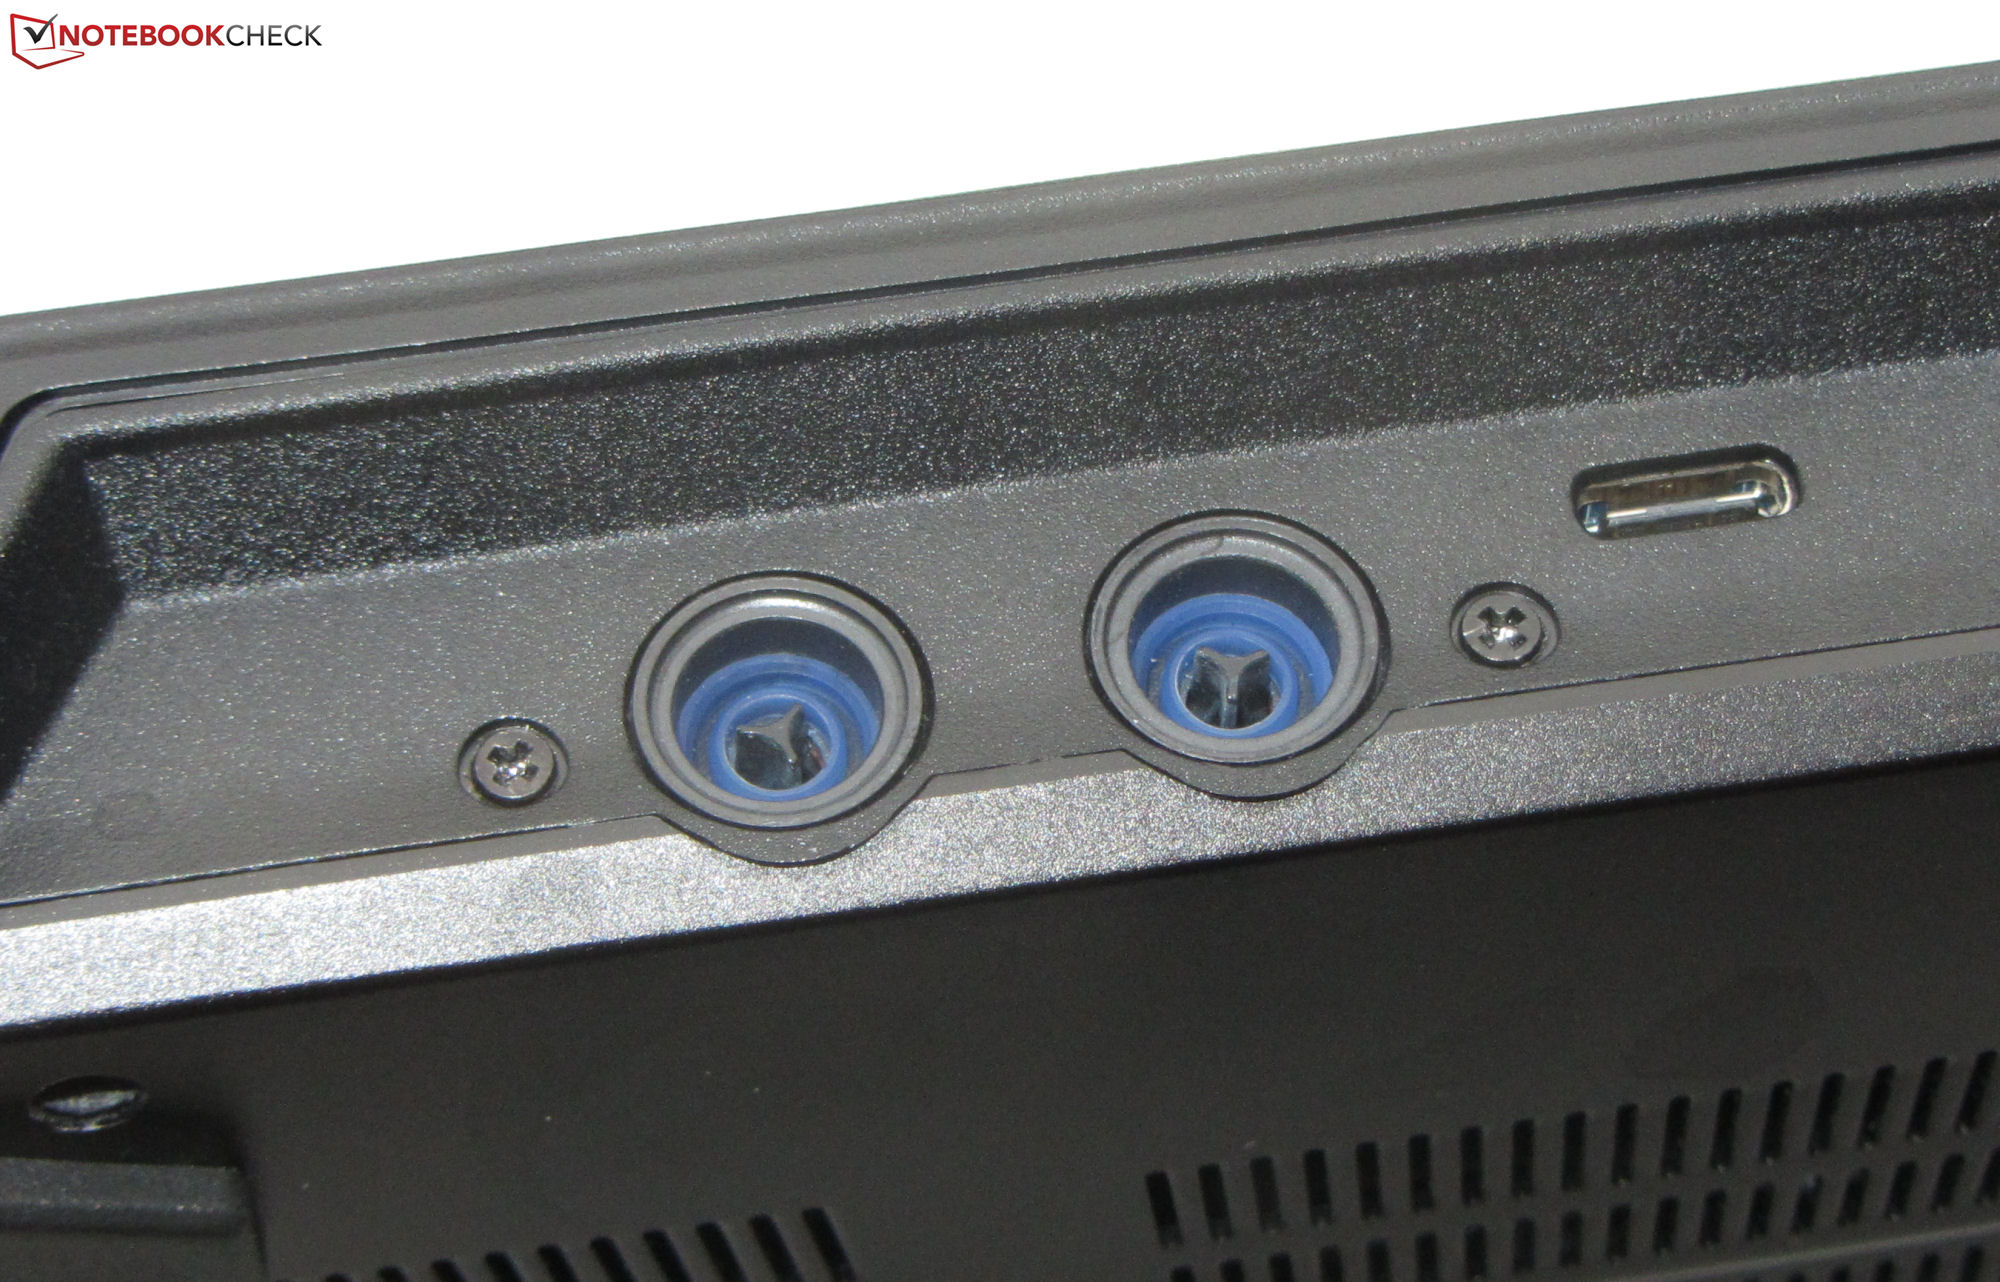
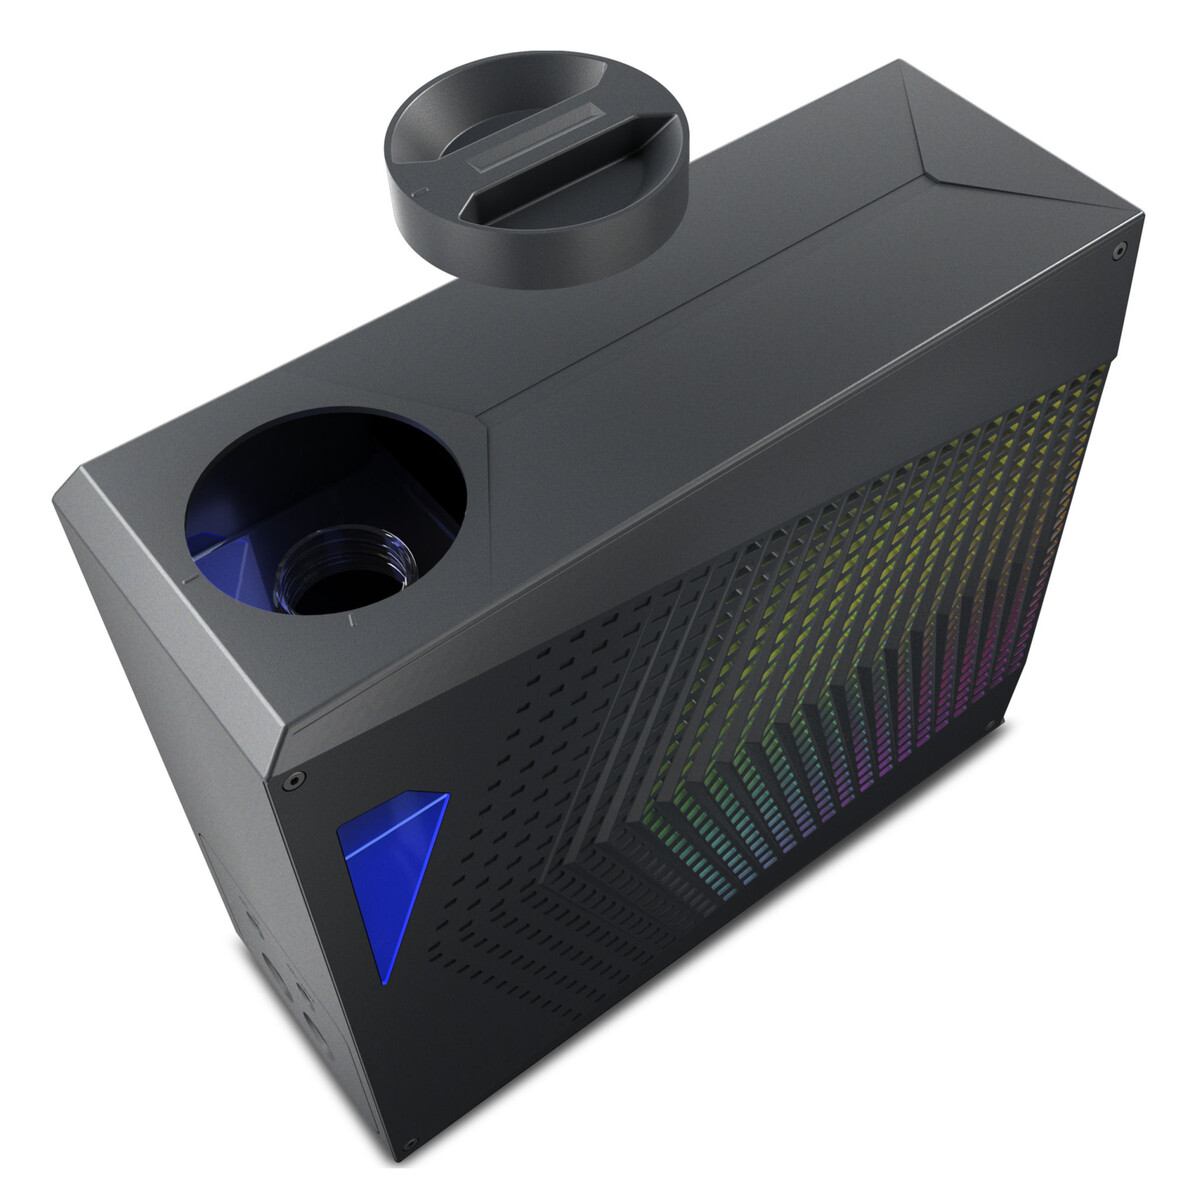
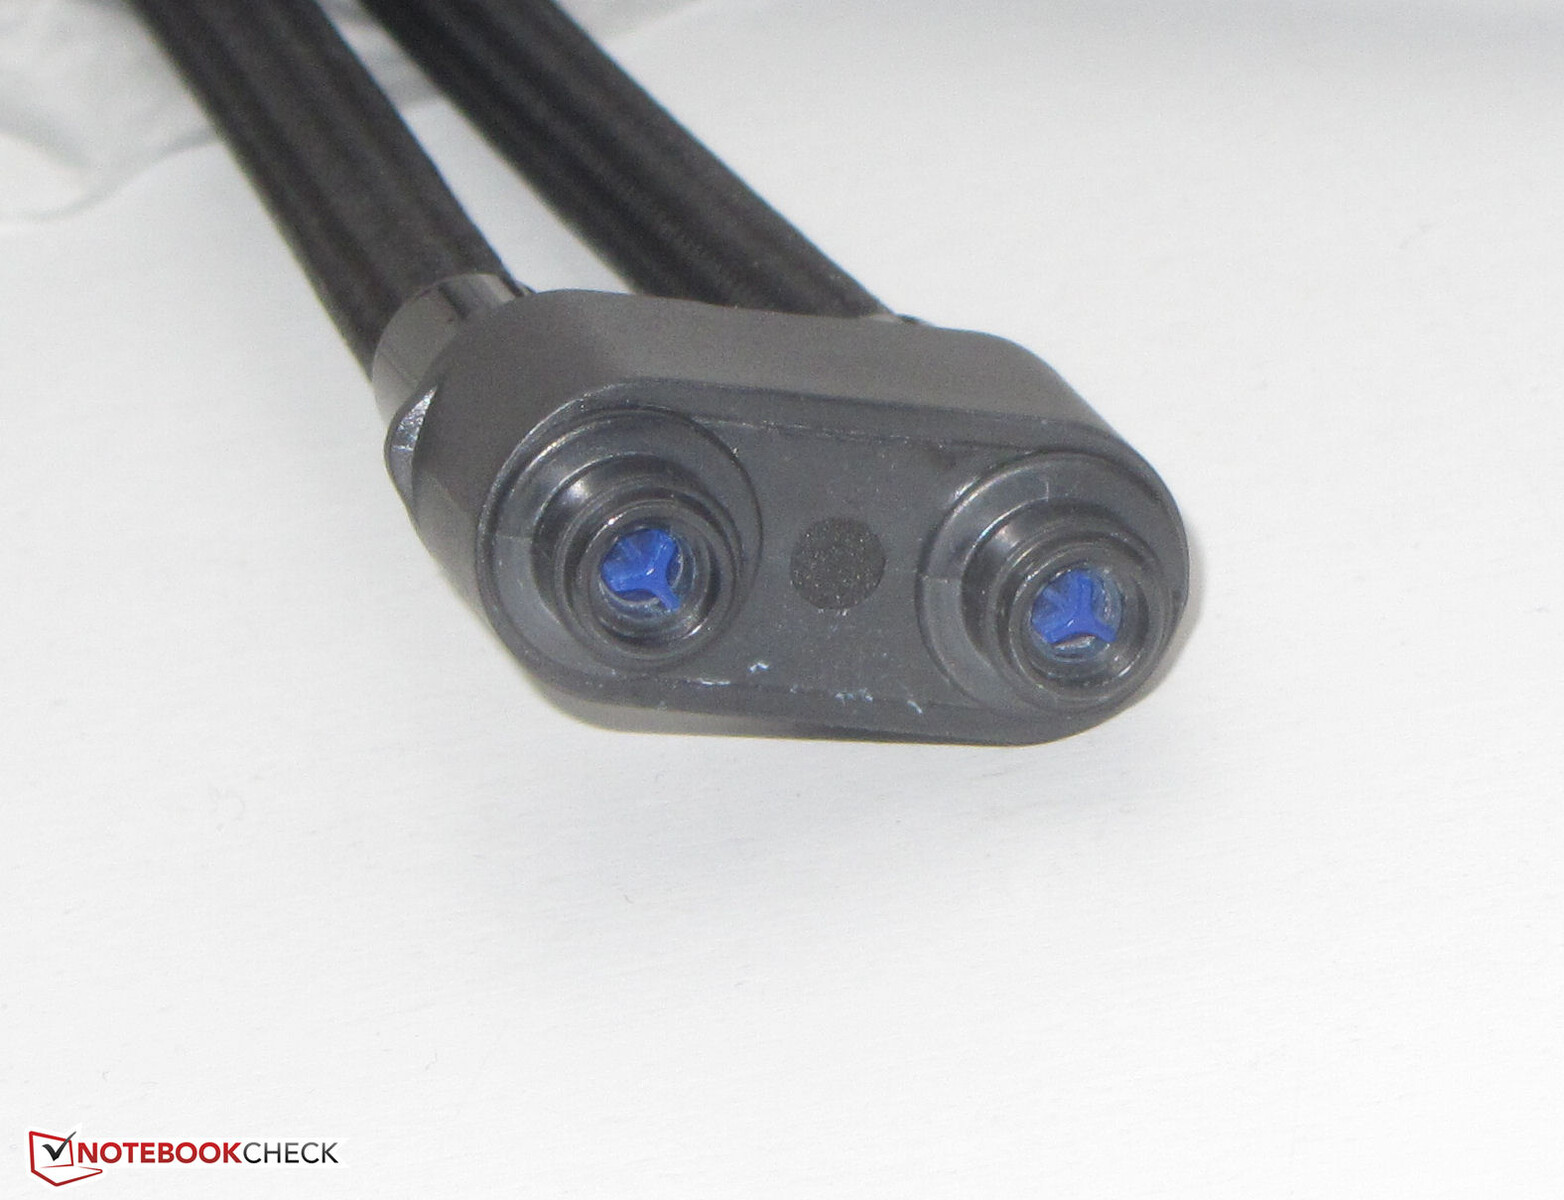
这个小型冷却装置相当容易使用:只需将蒸馏水注入其中,连接电缆和管道,然后将其打开。笔记本电脑和外部冷却装置通过蓝牙相互通信,连接会自动建立。笔记本电脑的充电器为X40和冷却装置提供电源。水管是用磁力固定的--不需要紧固螺丝。然而,当你断开水管连接时,可能会有几滴水漏出。
维护
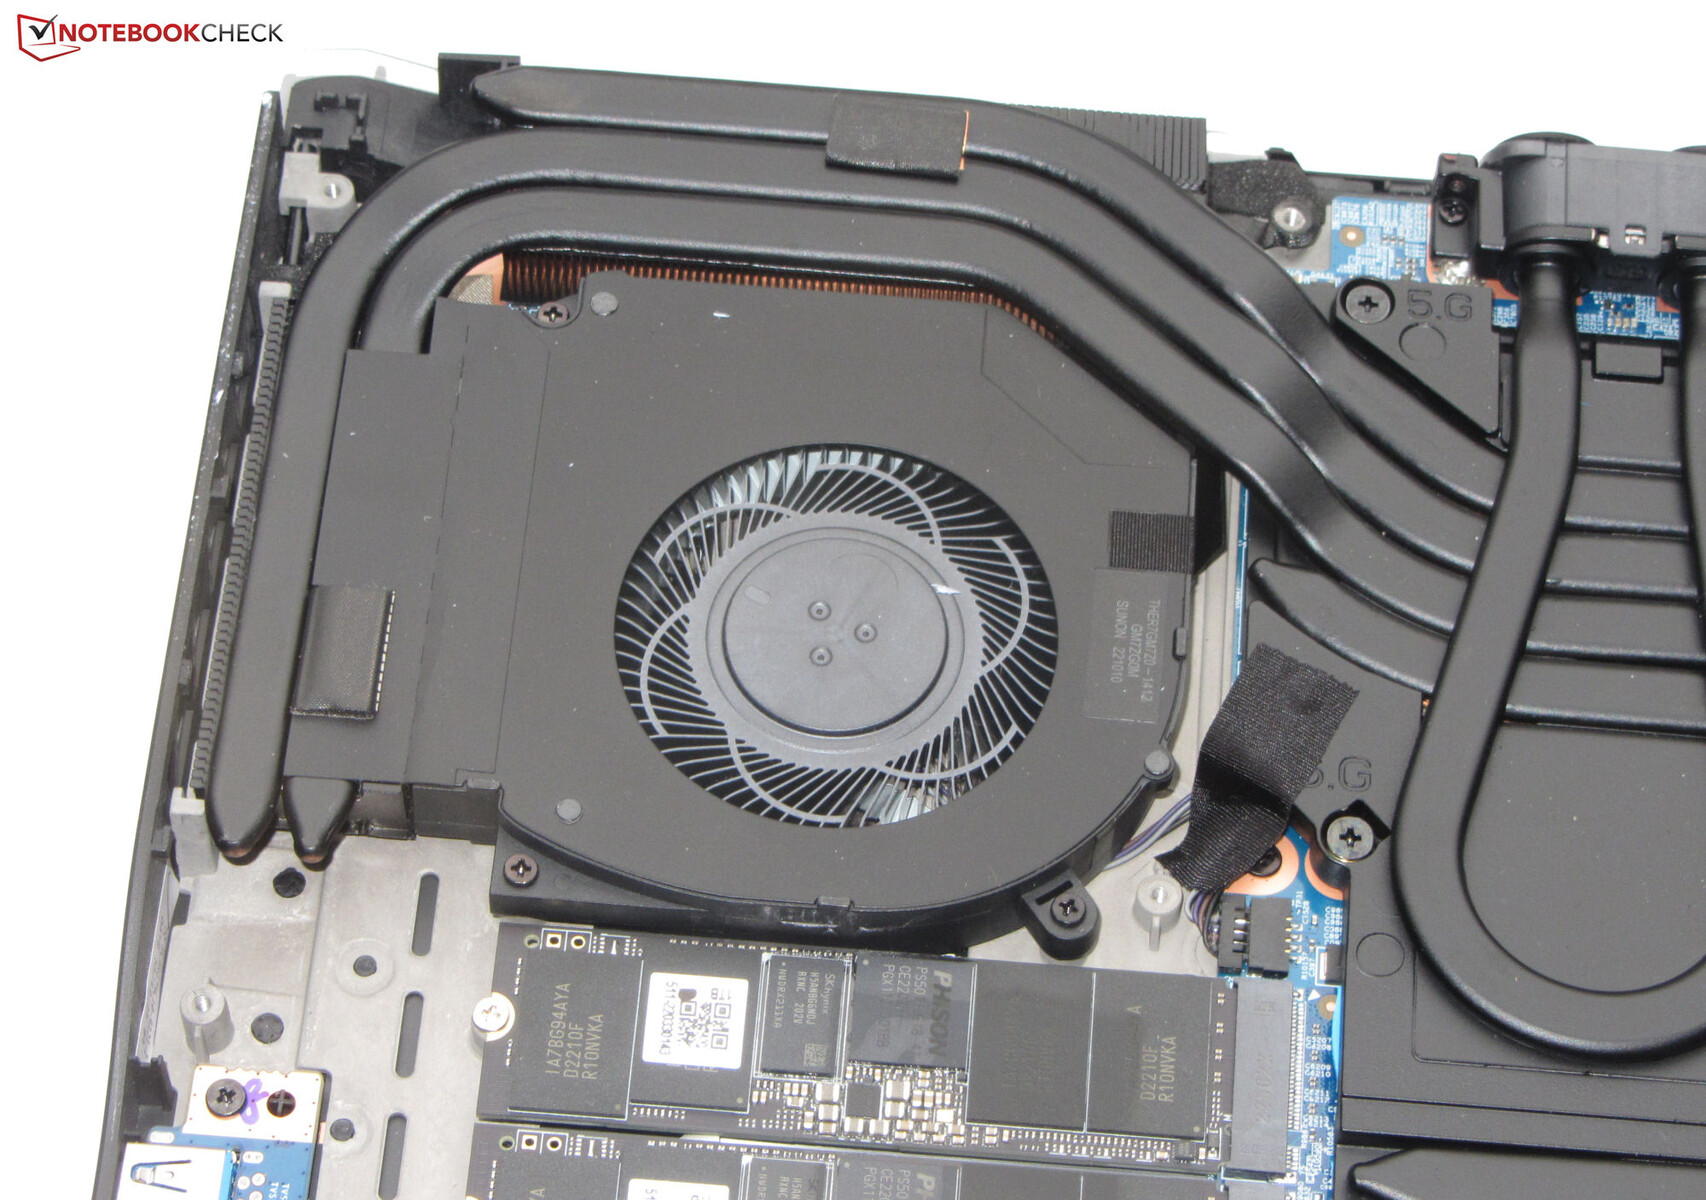
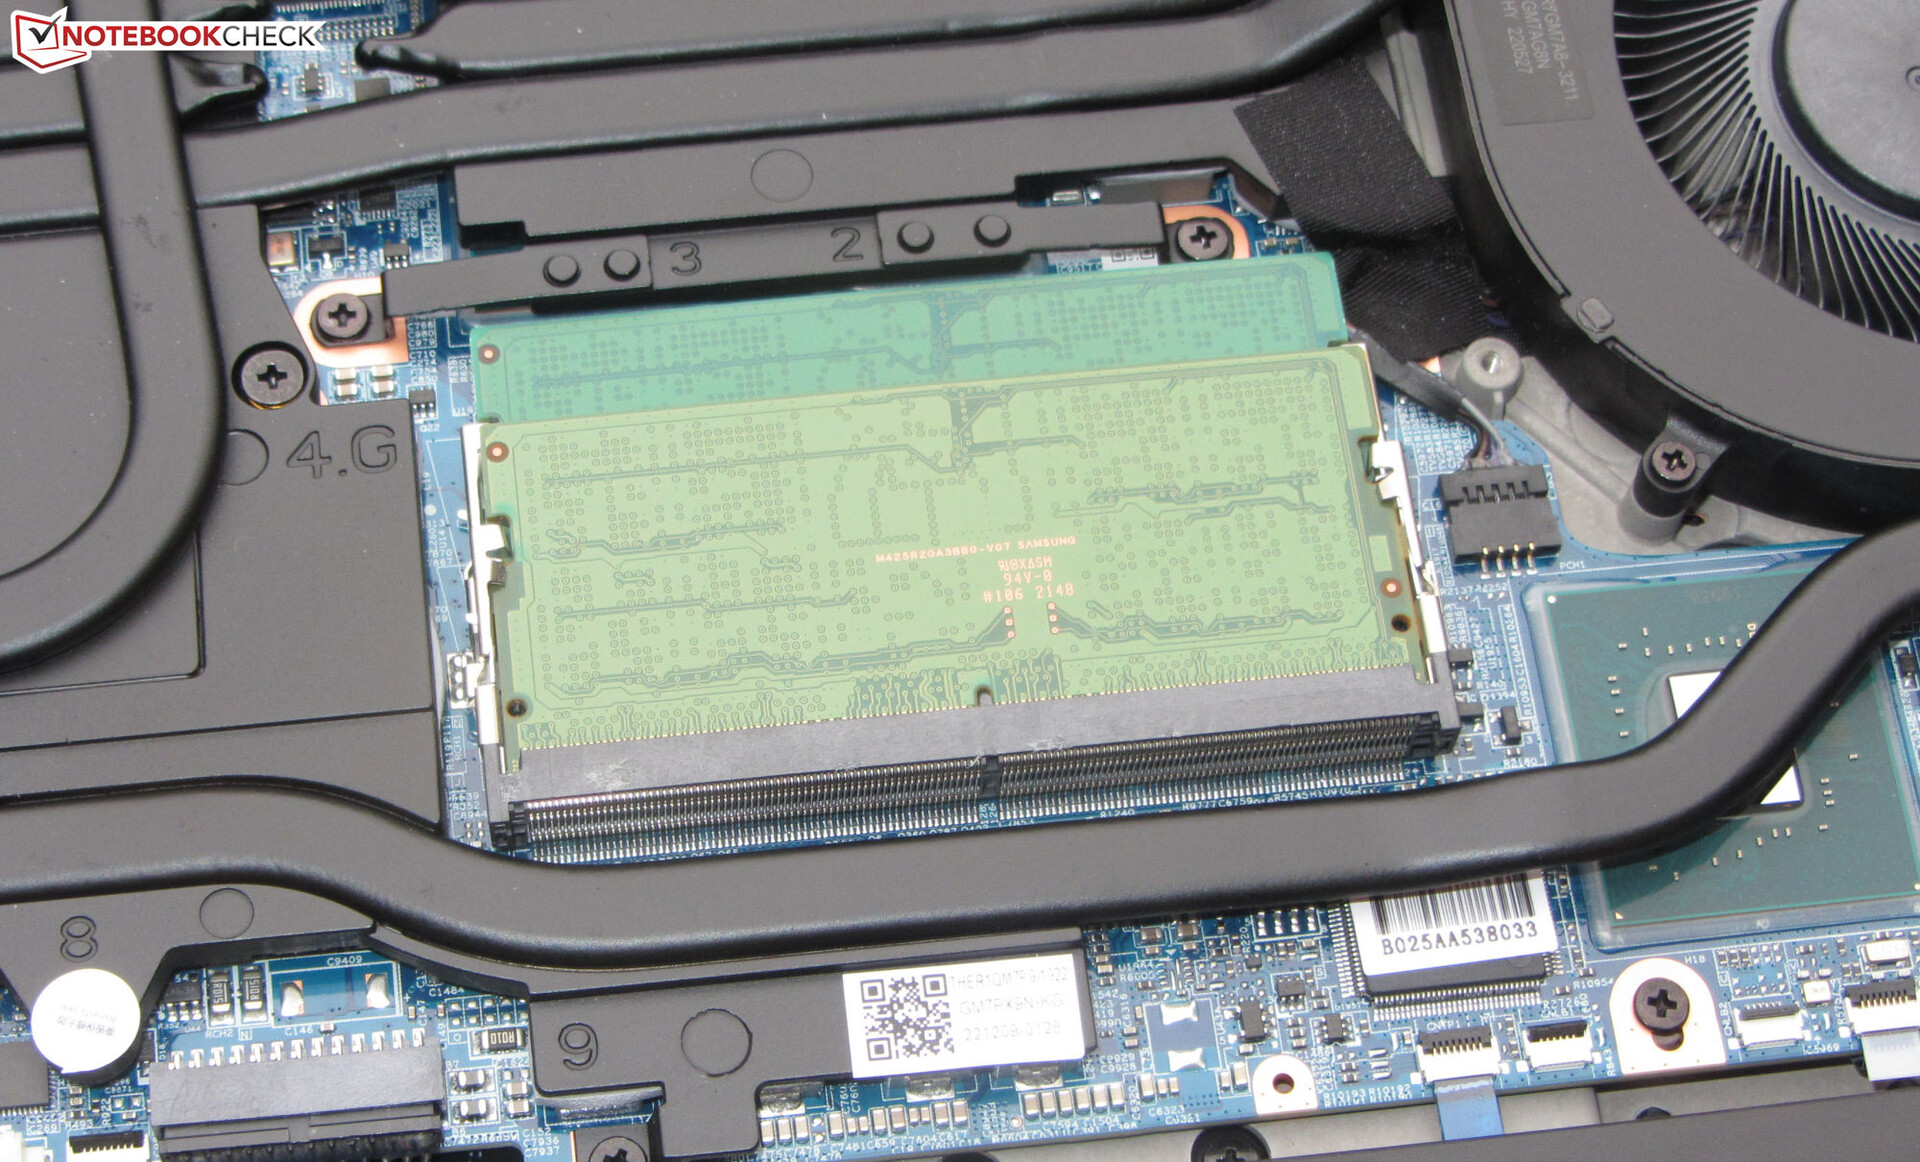
要拆下底盖,你需要解开底面的所有螺丝,以及背面水冷接头旁边的另外两个螺丝。之后,底盖可以通过排气口急速拉开。卸下盖子可以让你接触到内存插槽(两个都在使用)、两个PCIe 4.0固态硬盘、Wi-Fi模块、风扇、BIOS电池和可充电电池。
担保
Medion为Erazer提供两年的保修。有升级选项,但必须在Medion的网上商店与笔记本电脑一起购买。购买笔记本电脑后,你不能升级或延长保修期。将保修期延长一年需要花费近200欧元(216美元)。
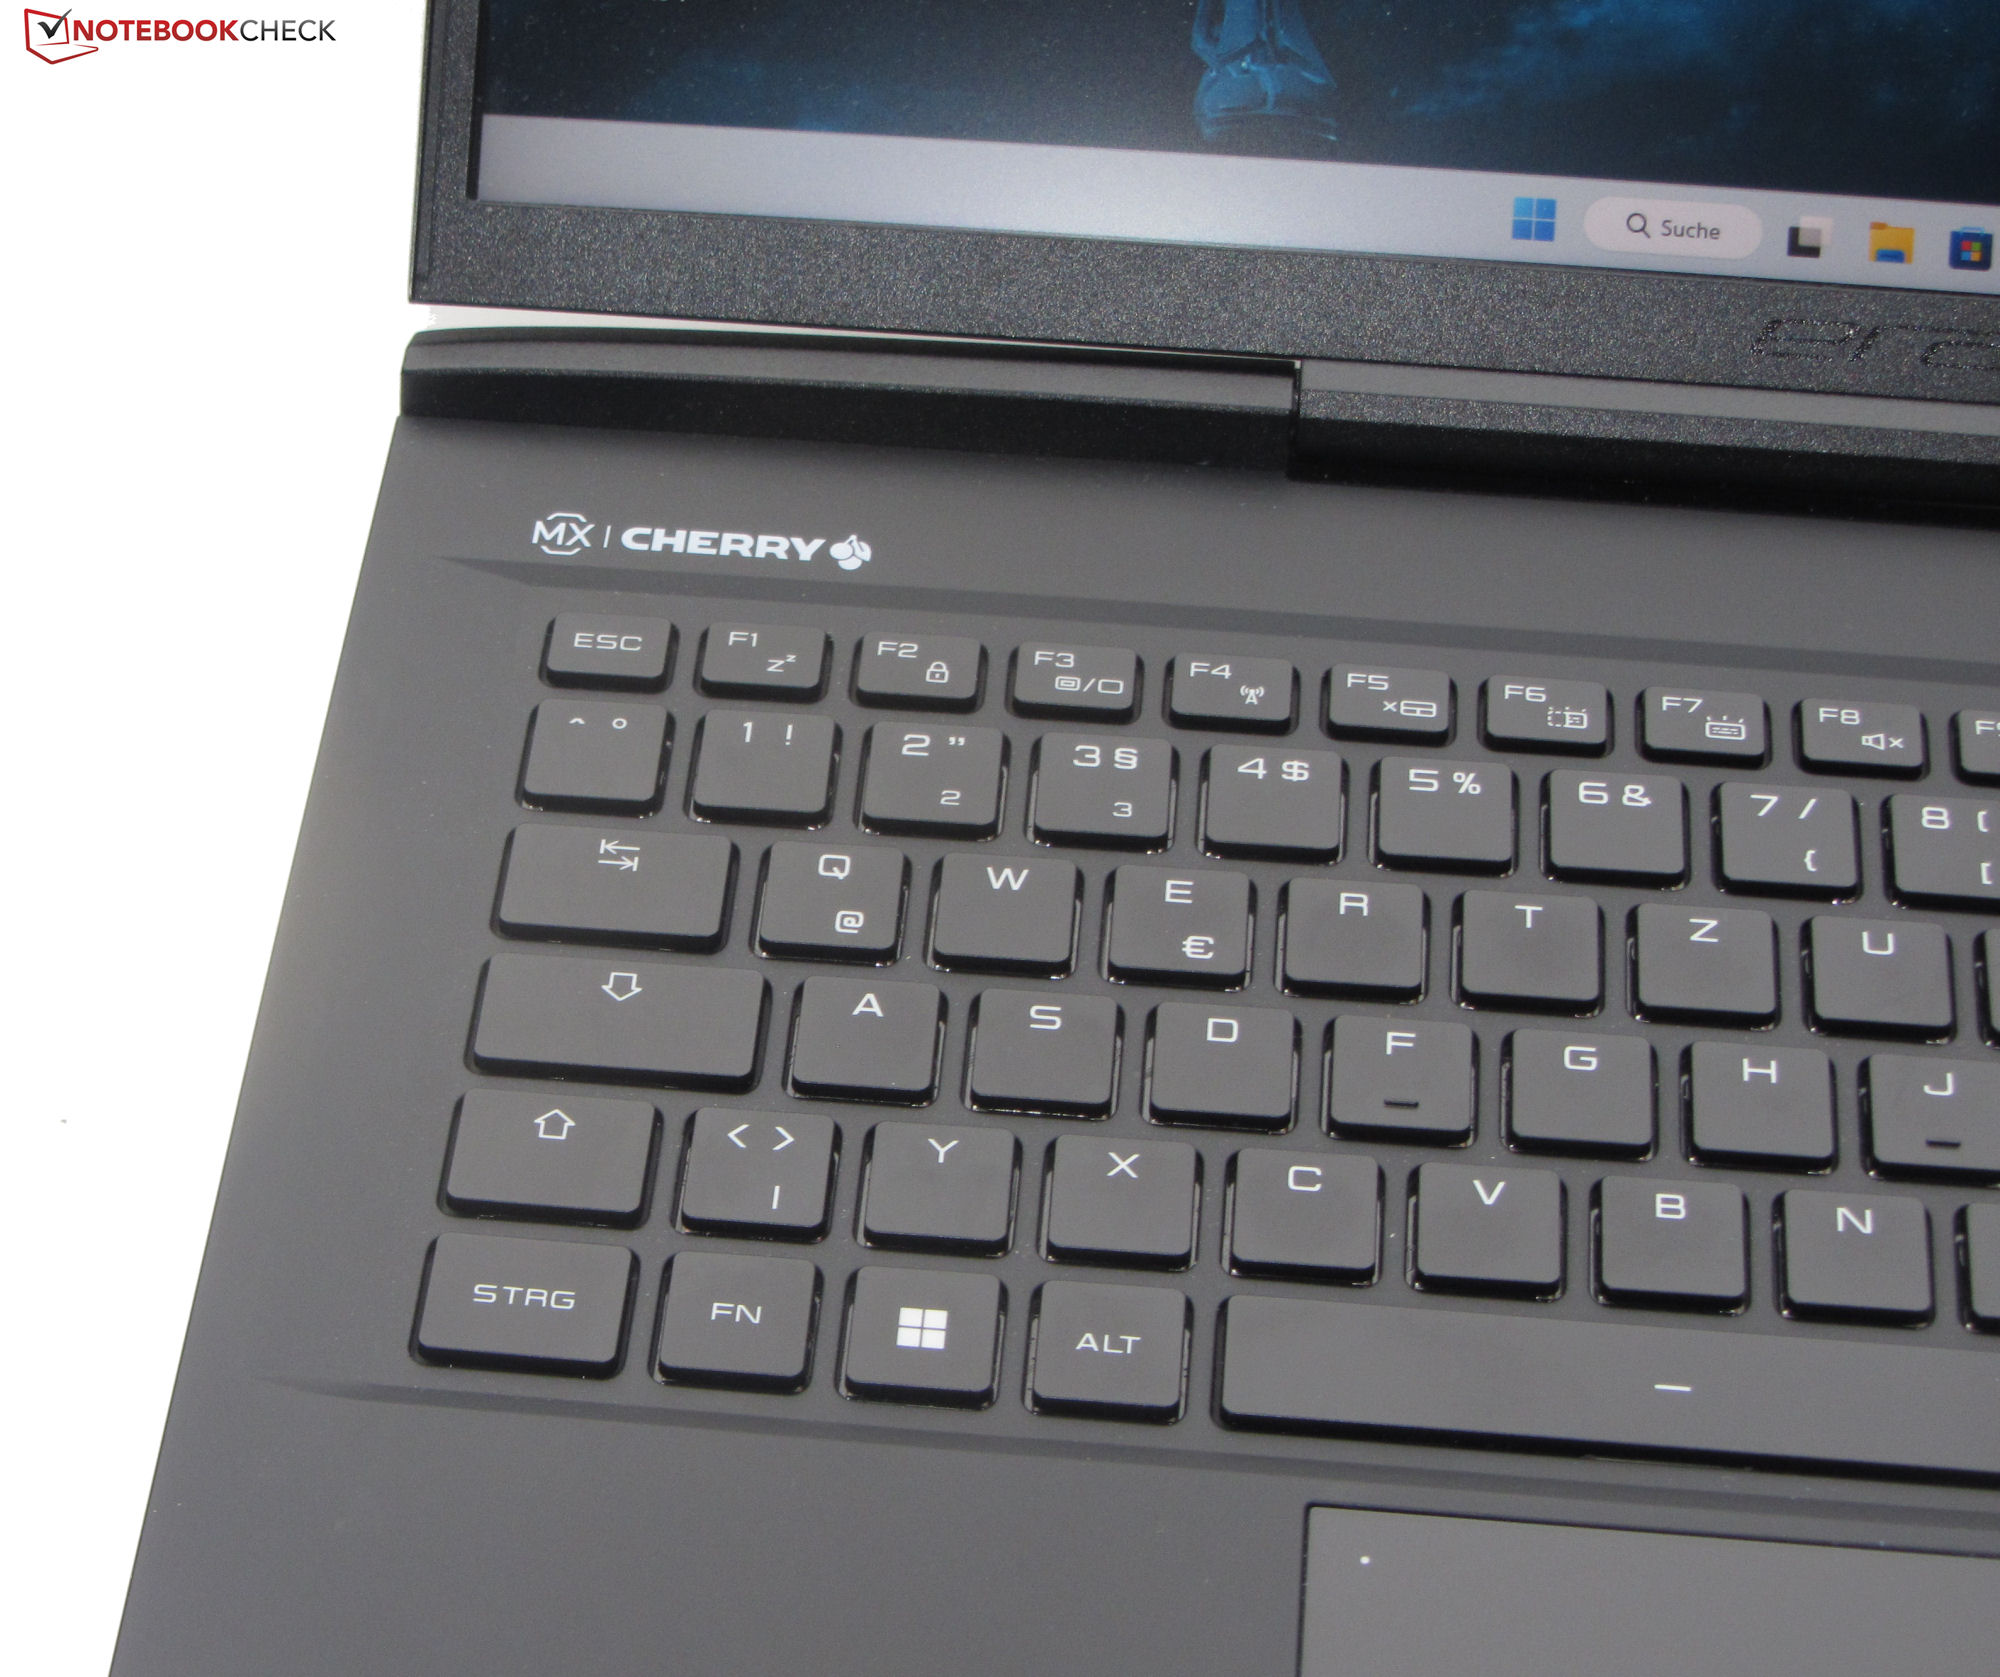
输入设备 - 带Cherry MX开关的机械键盘
键盘
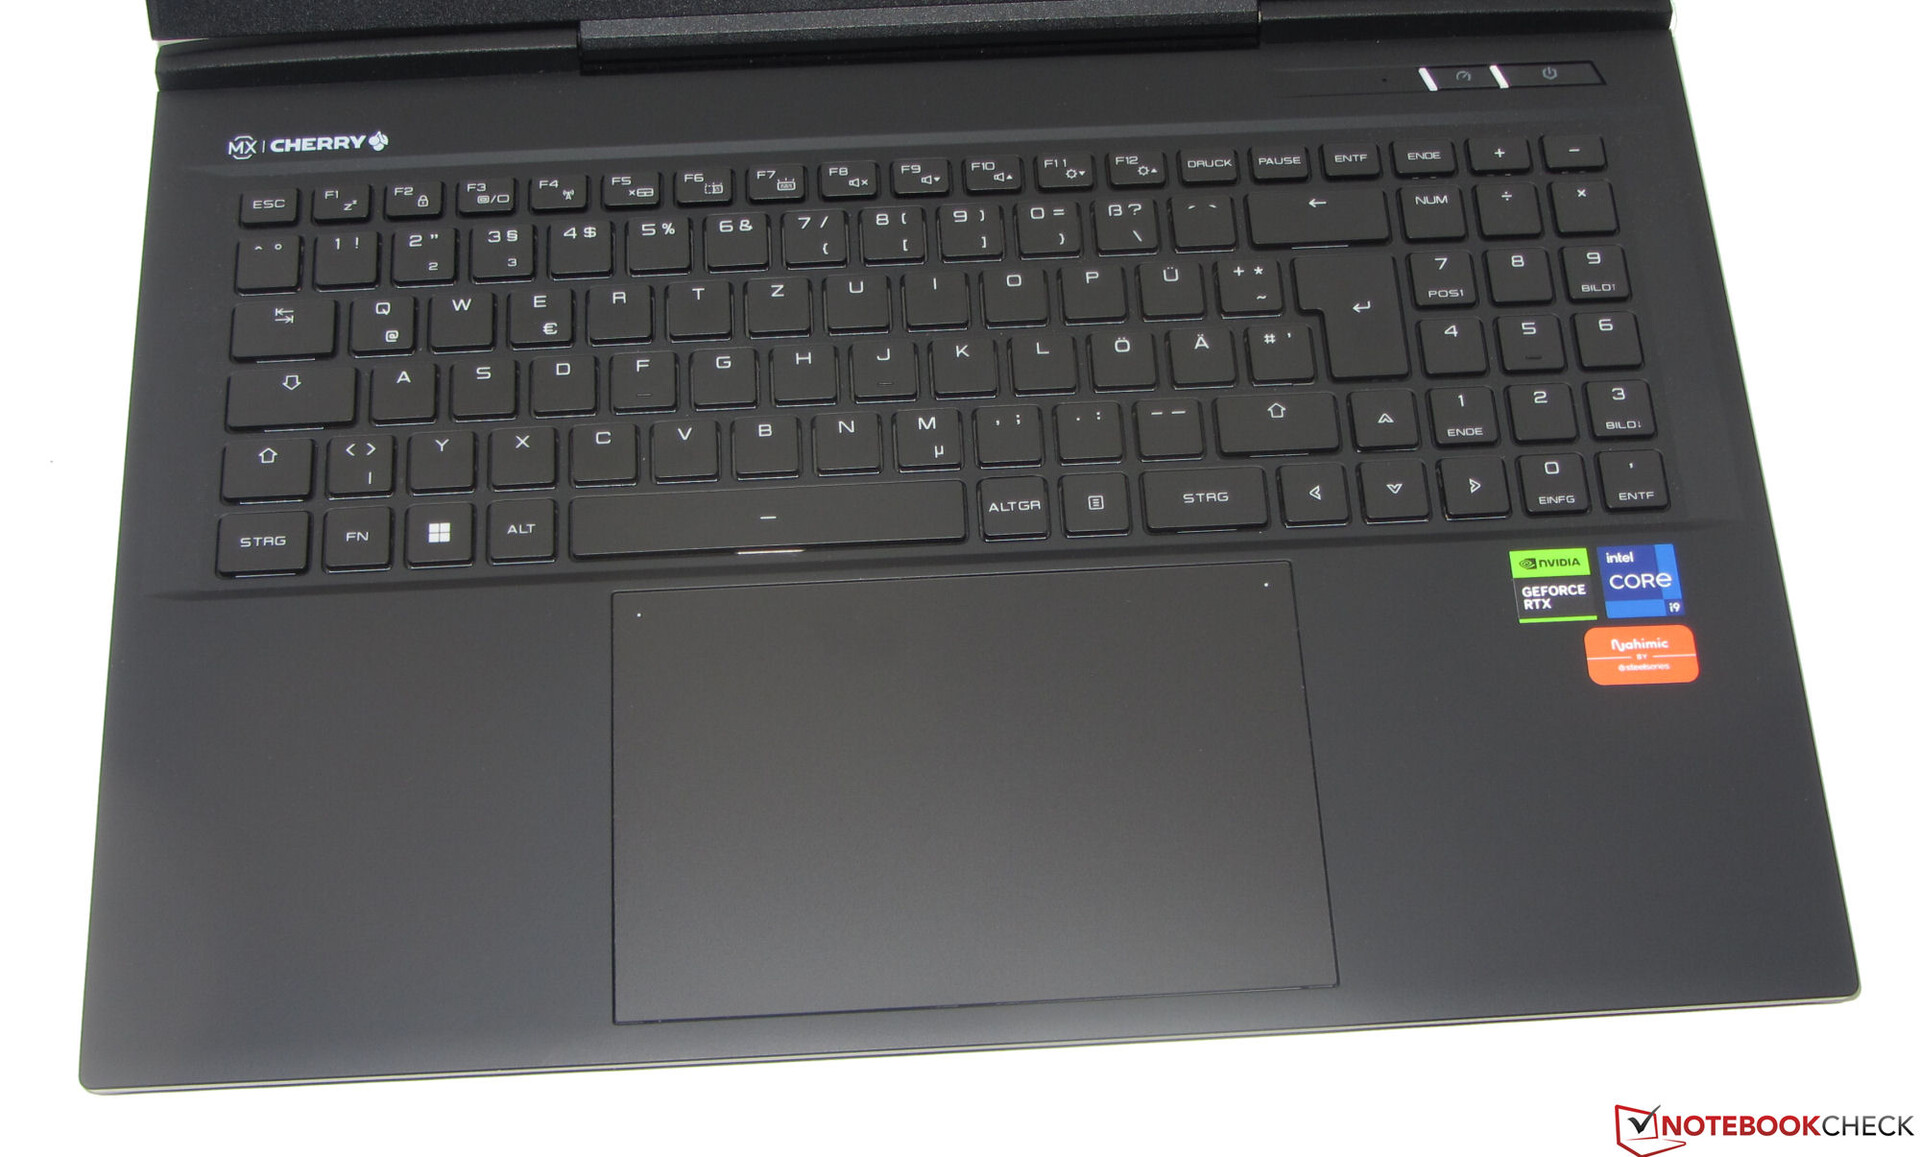
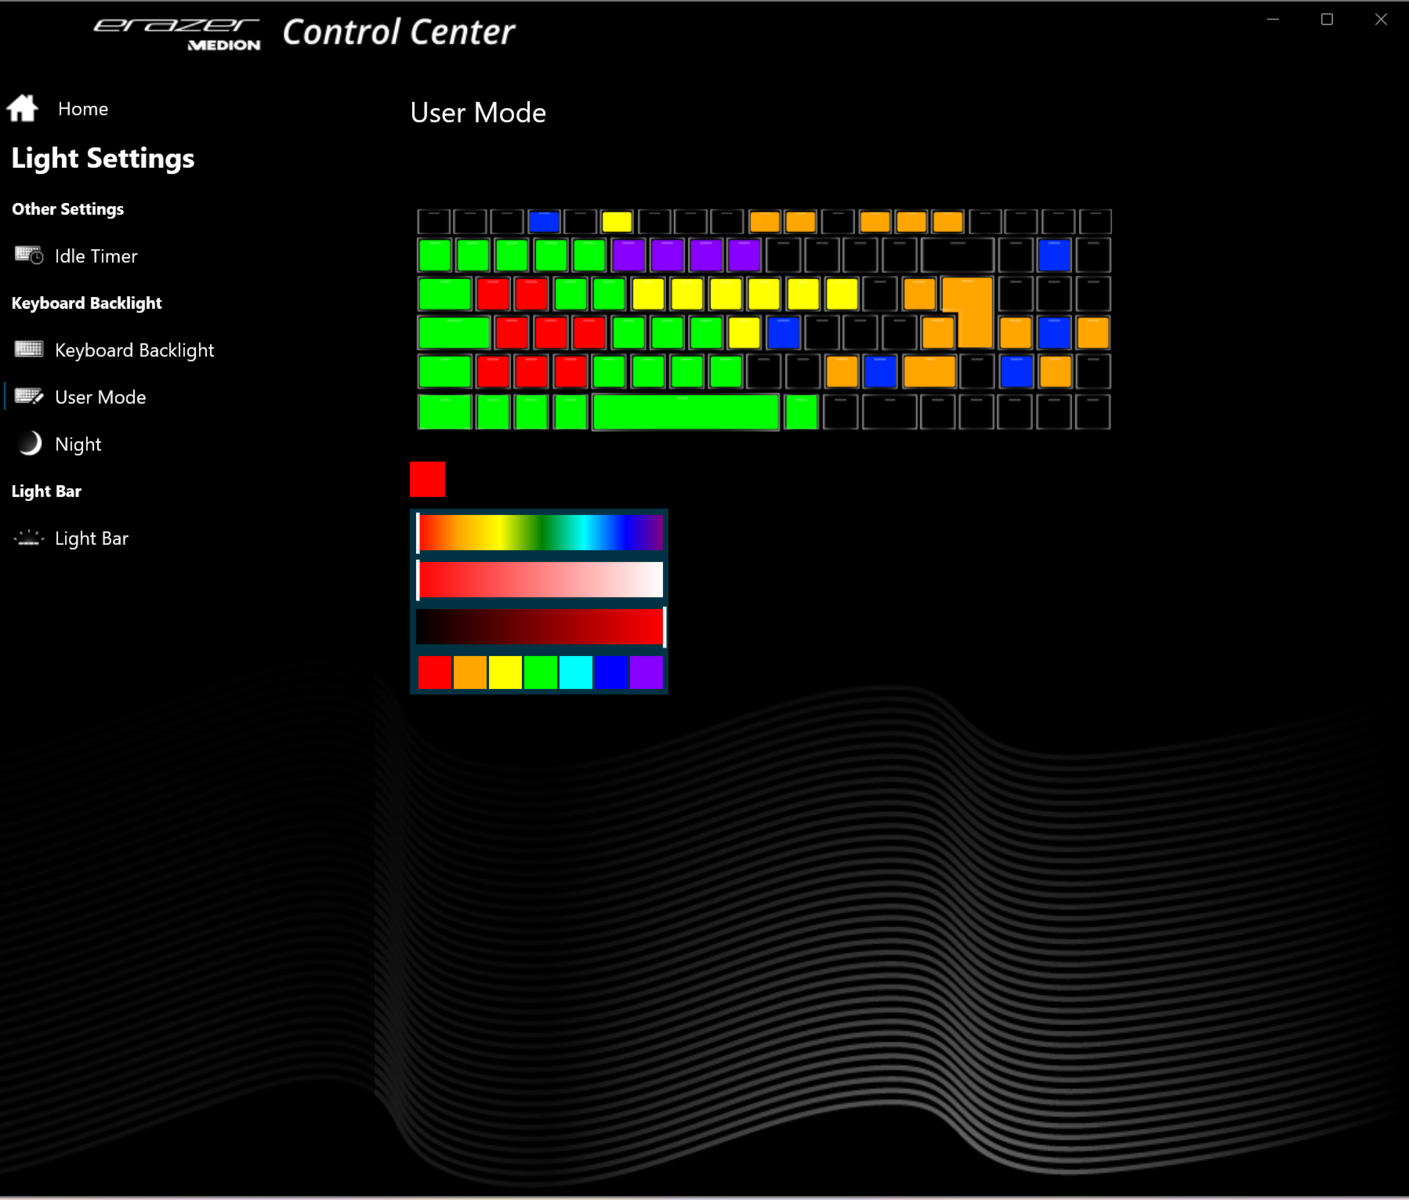
机械键盘通常以其精确的输入和反馈以及优质的打字感觉而闻名--这在X40的键盘上也不例外。它的Cherry MX开关提供了一个适度的行程和一个听觉和触觉的启动点。当你打字时,键盘不会弯曲。有两个功能键可以让你把每个键的RGB照明调整到四个亮度级别中的一个。总的来说,Erazer Beast X40有一个全方位的奇妙键盘。
触摸板
尺寸约为15.5 x 10厘米(6.1 x 3.9"),多点触控点击板有一个光滑的表面,让你的手指轻松滑过。它提供了一个短的行程和一个明显的点击点。触摸板的上角有状态指示灯。点击左边的LED灯将启用或禁用整个触摸板,而右边的LED灯只用于打开或关闭触摸板的右半部分。
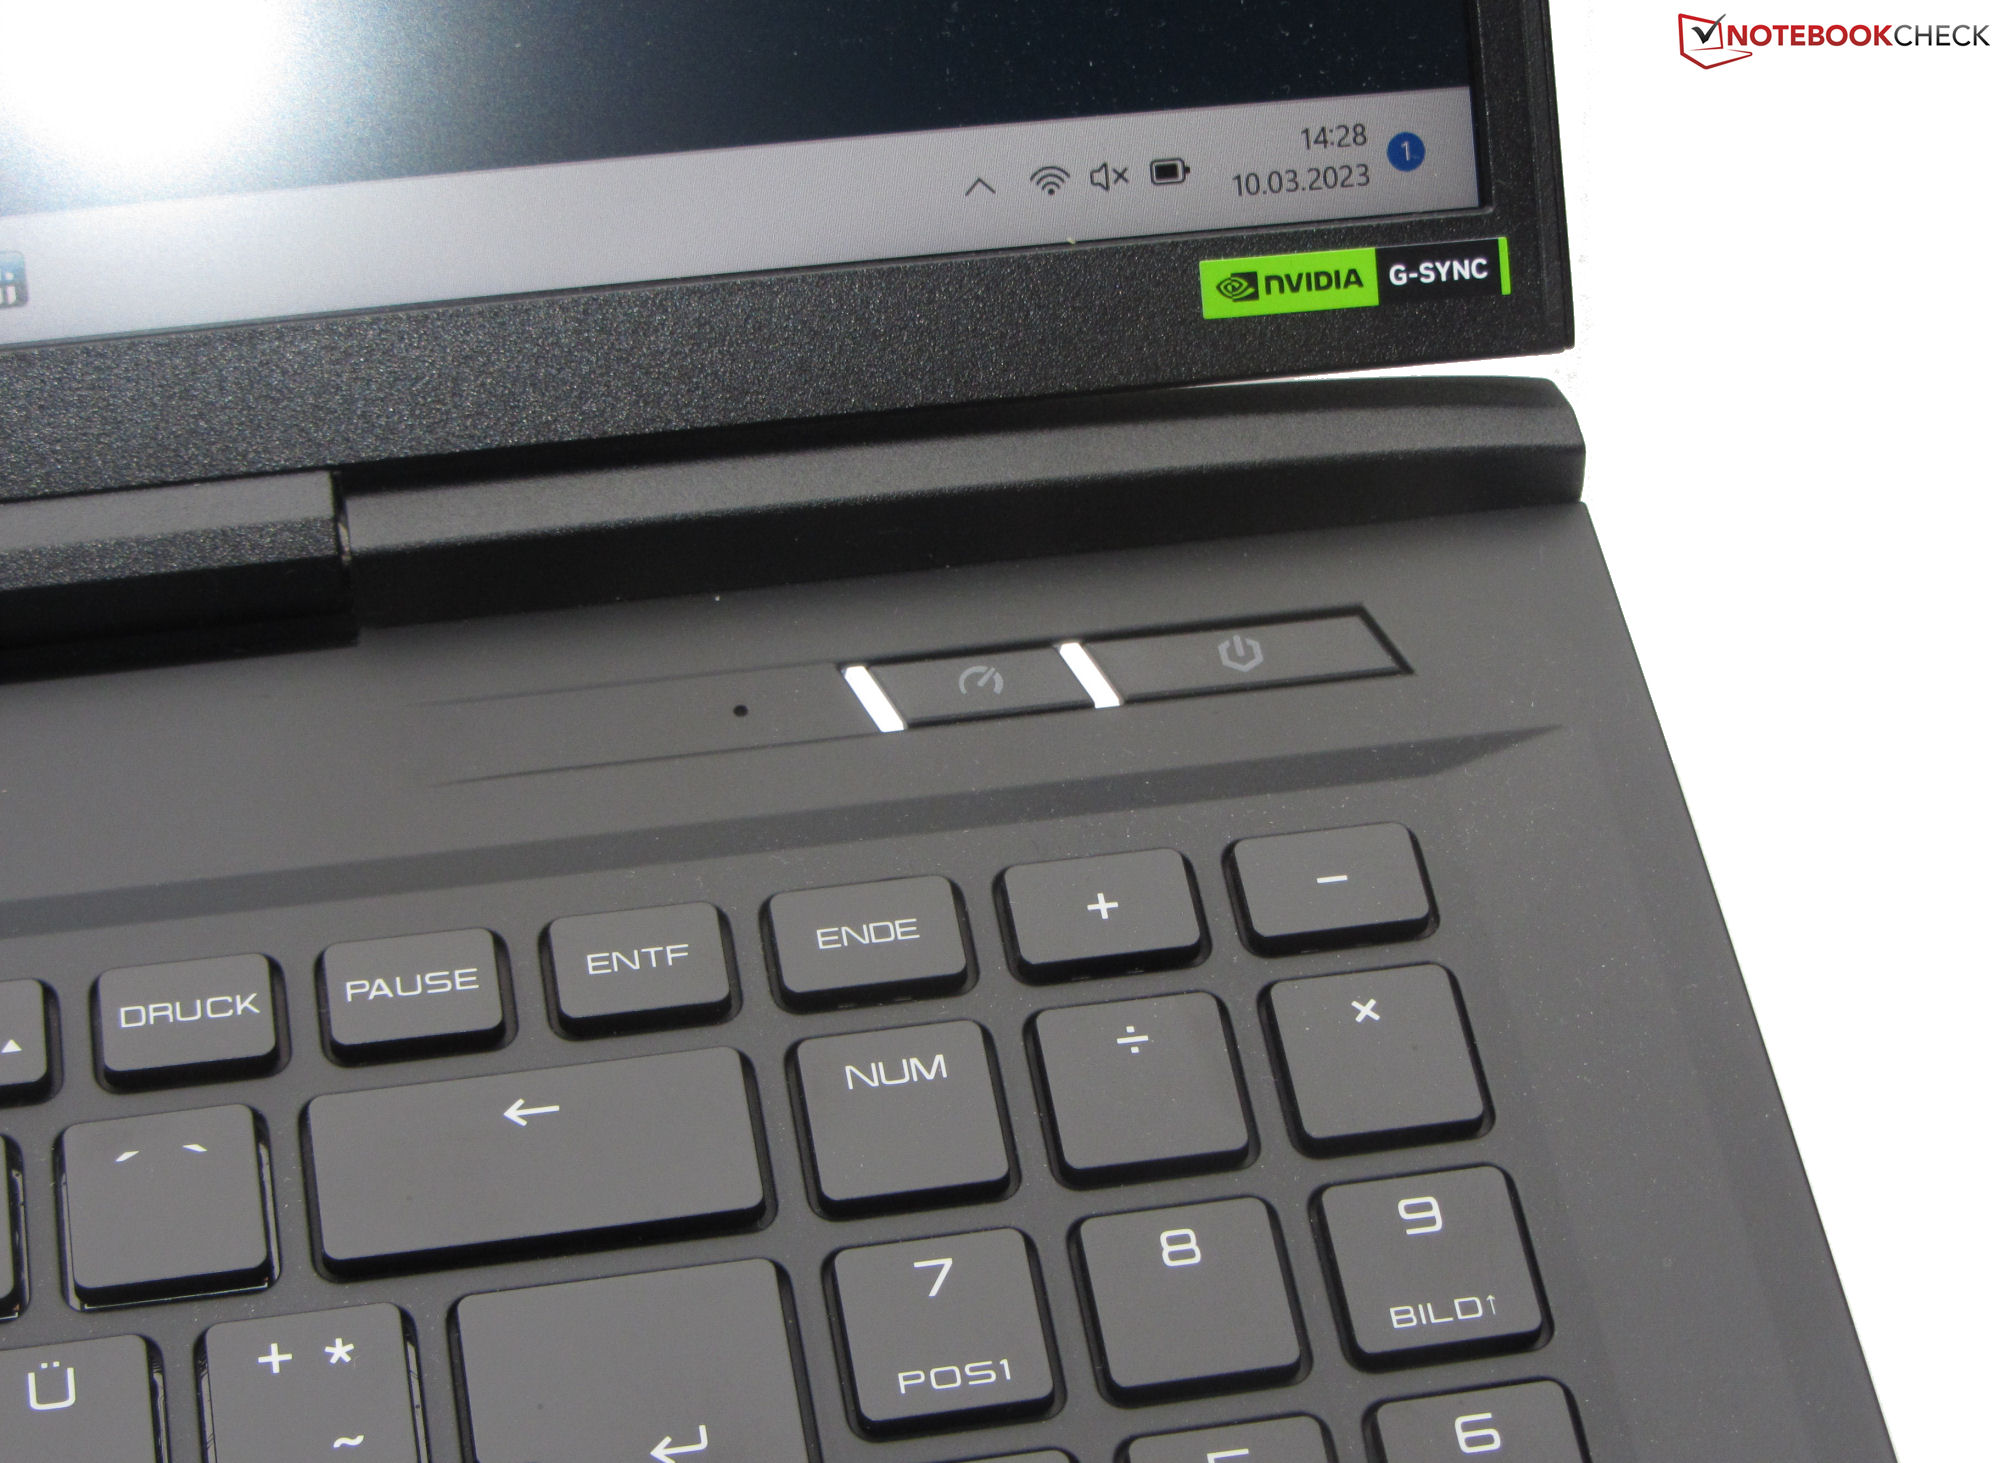
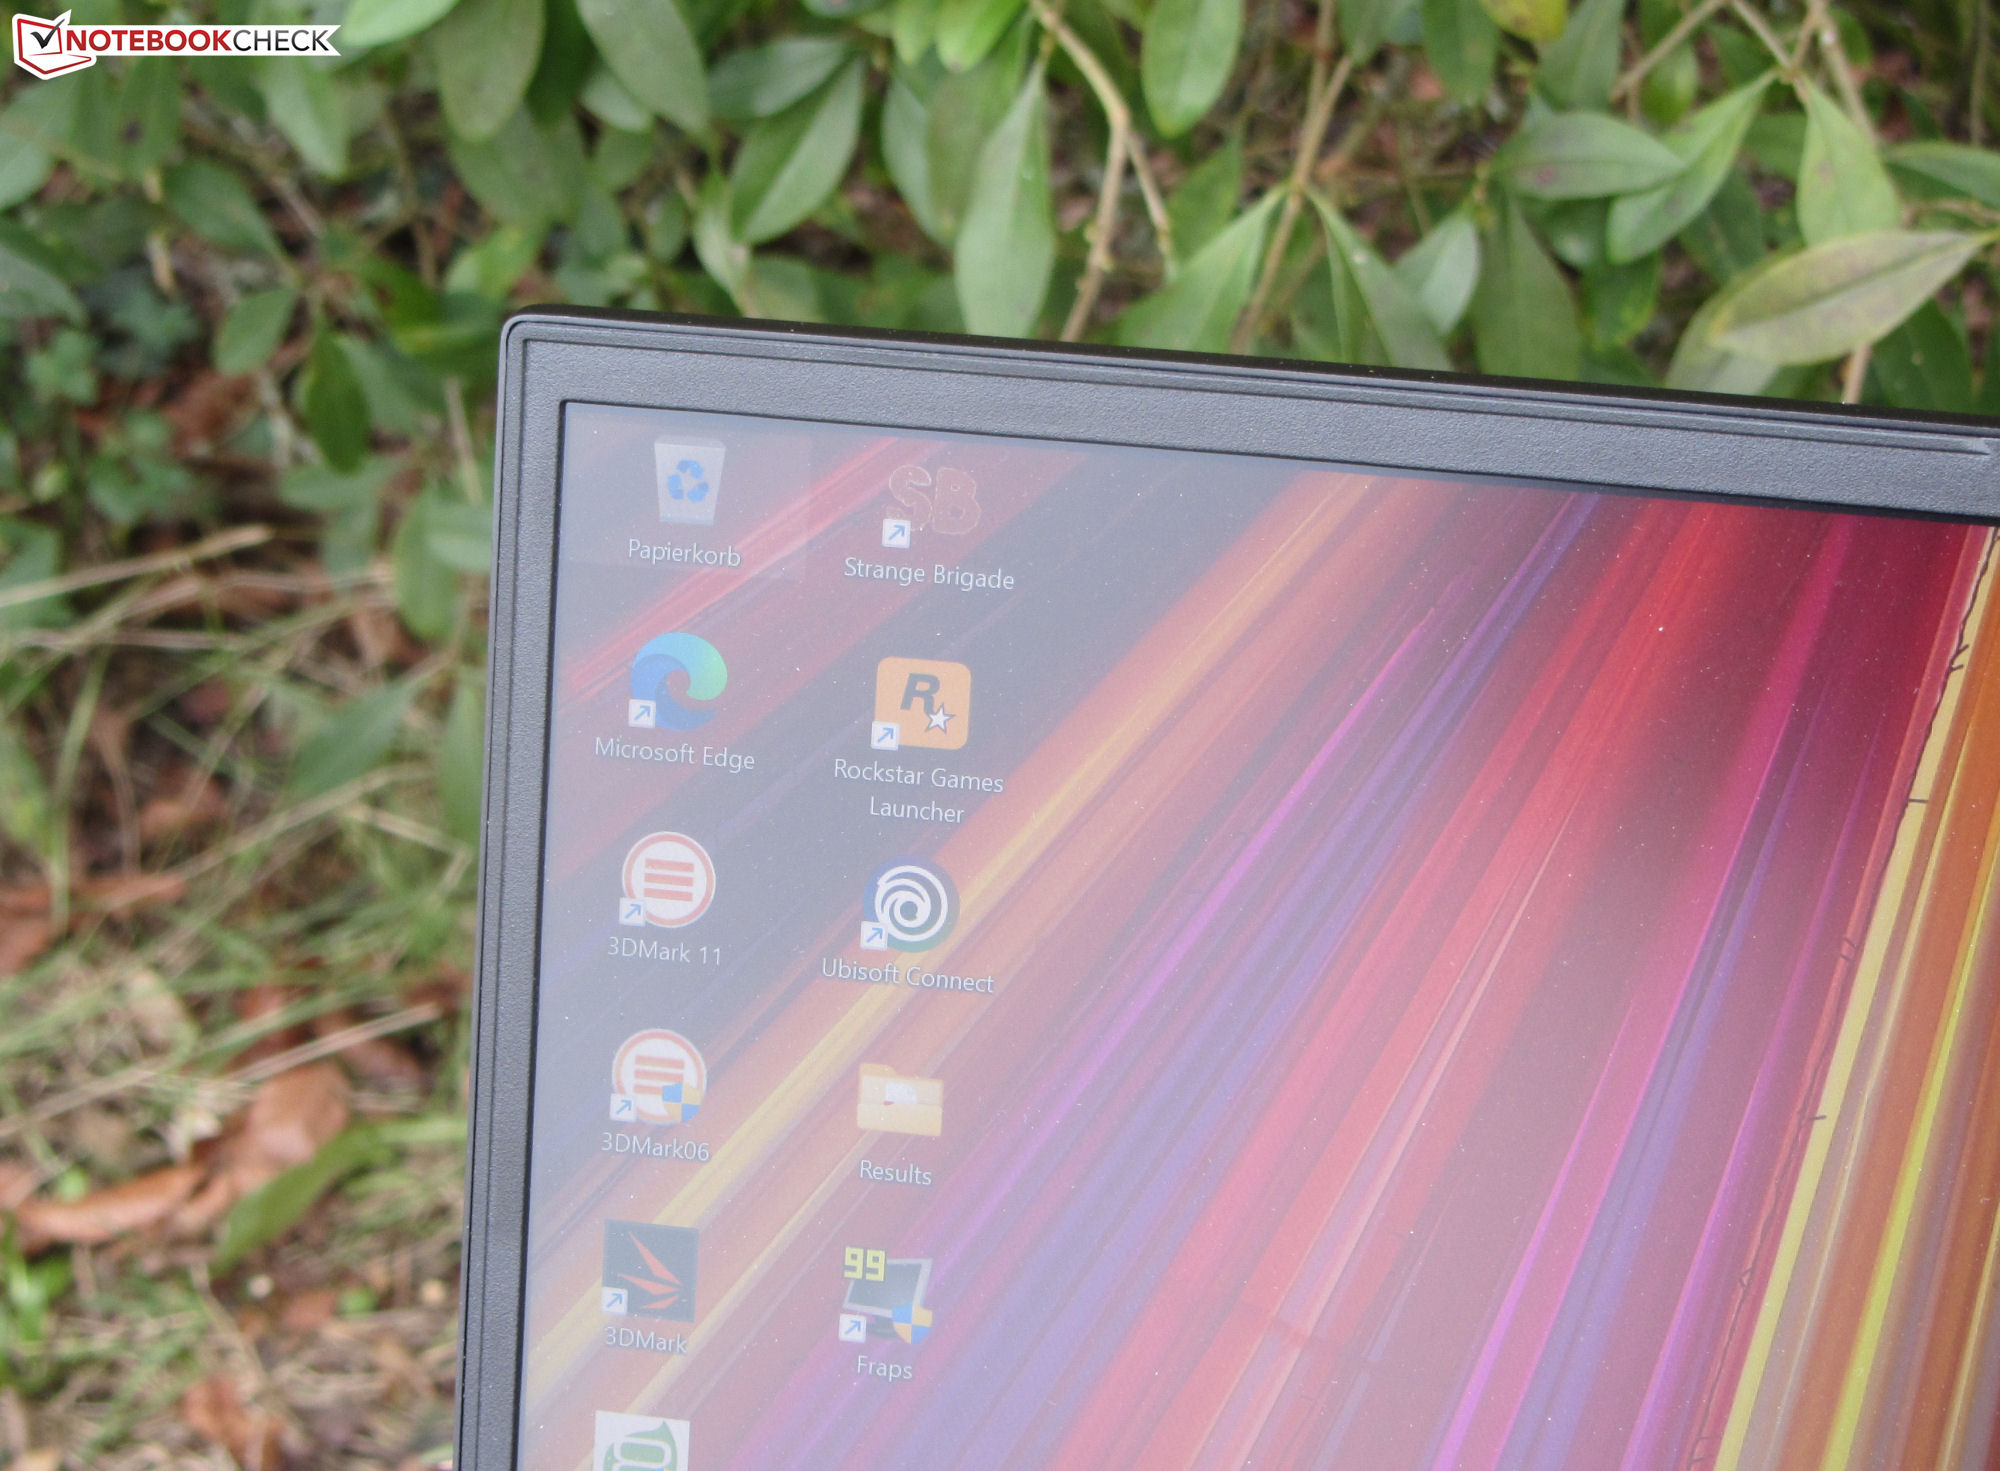
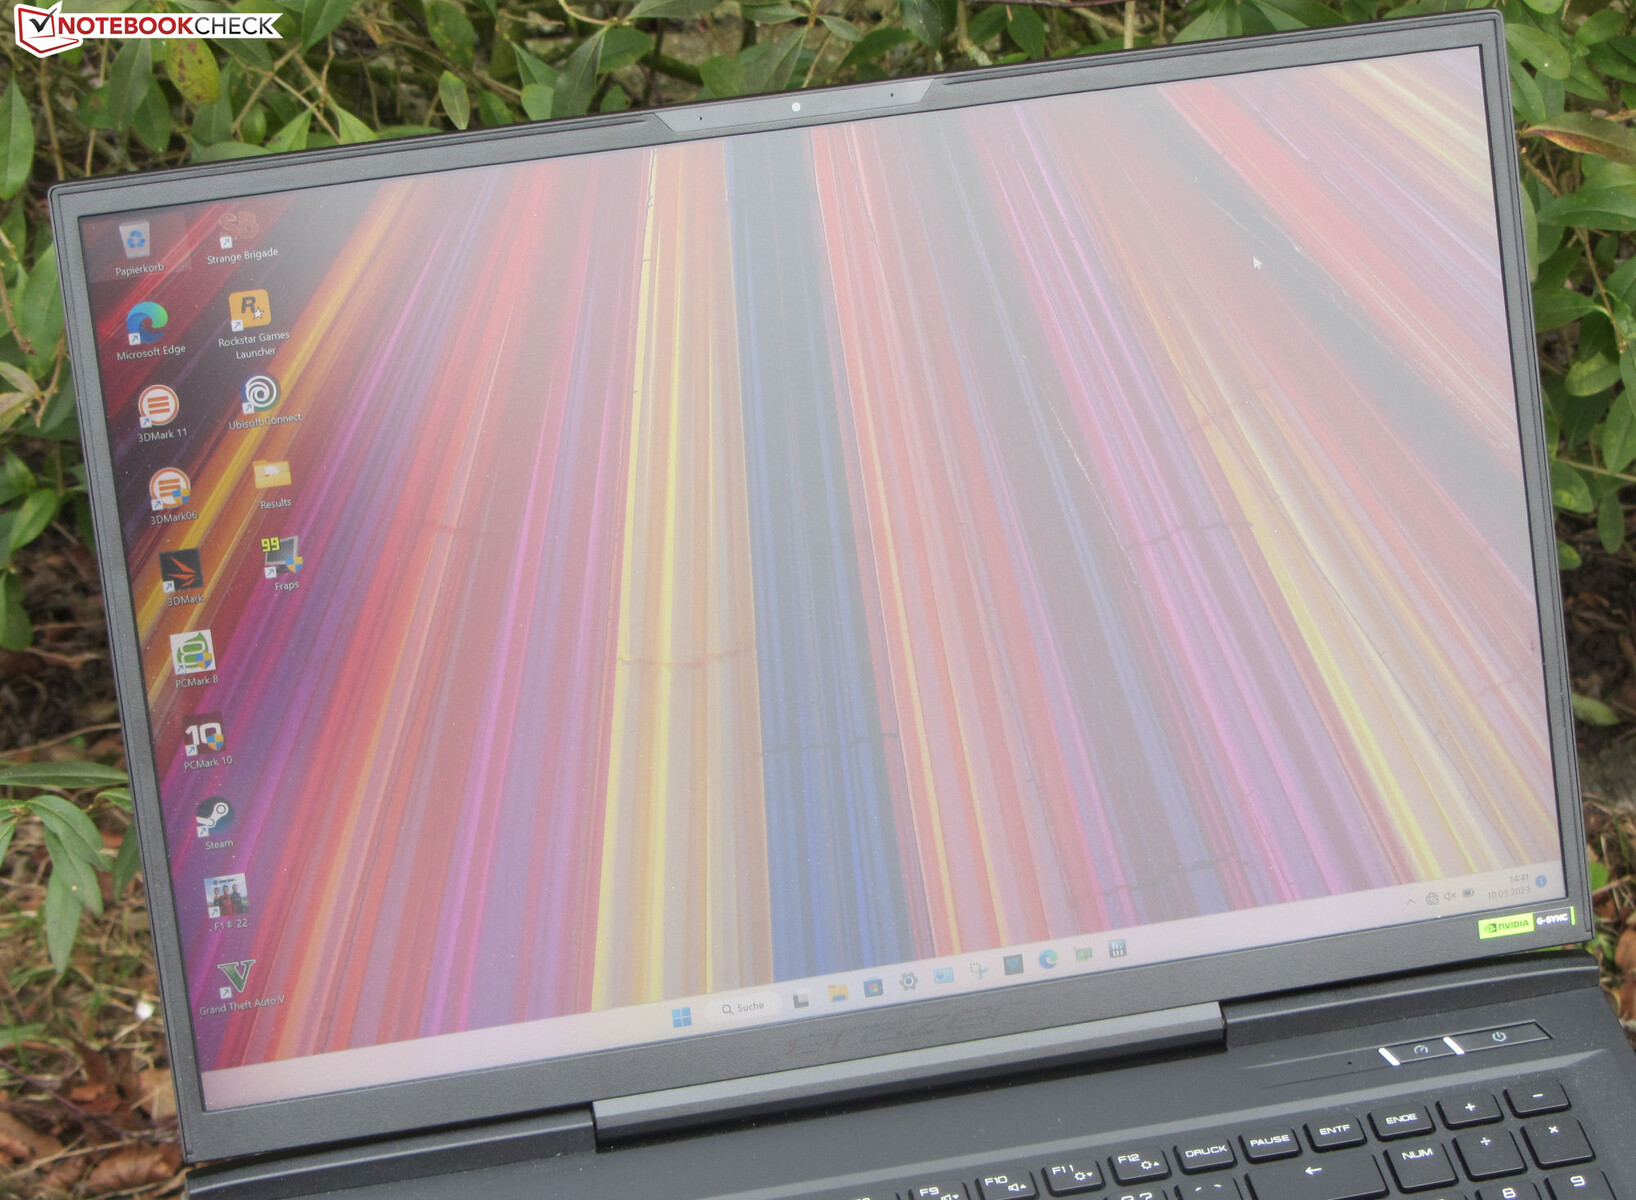
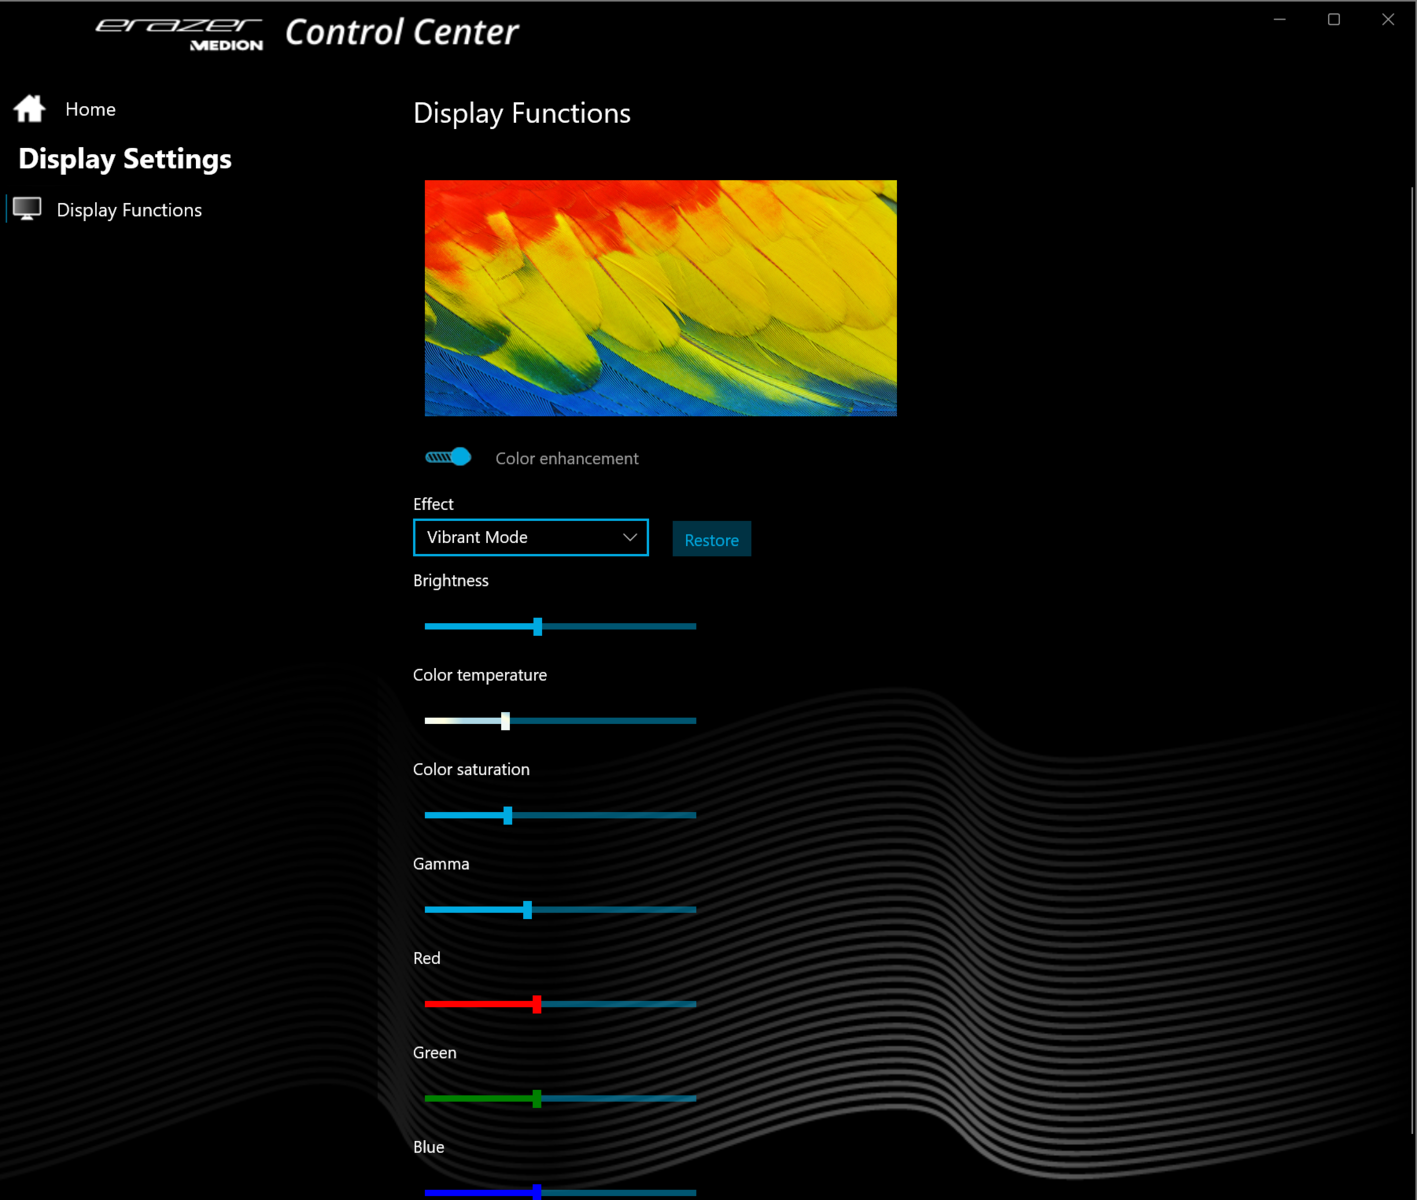
显示屏 - QHD+,长宽比为16:10
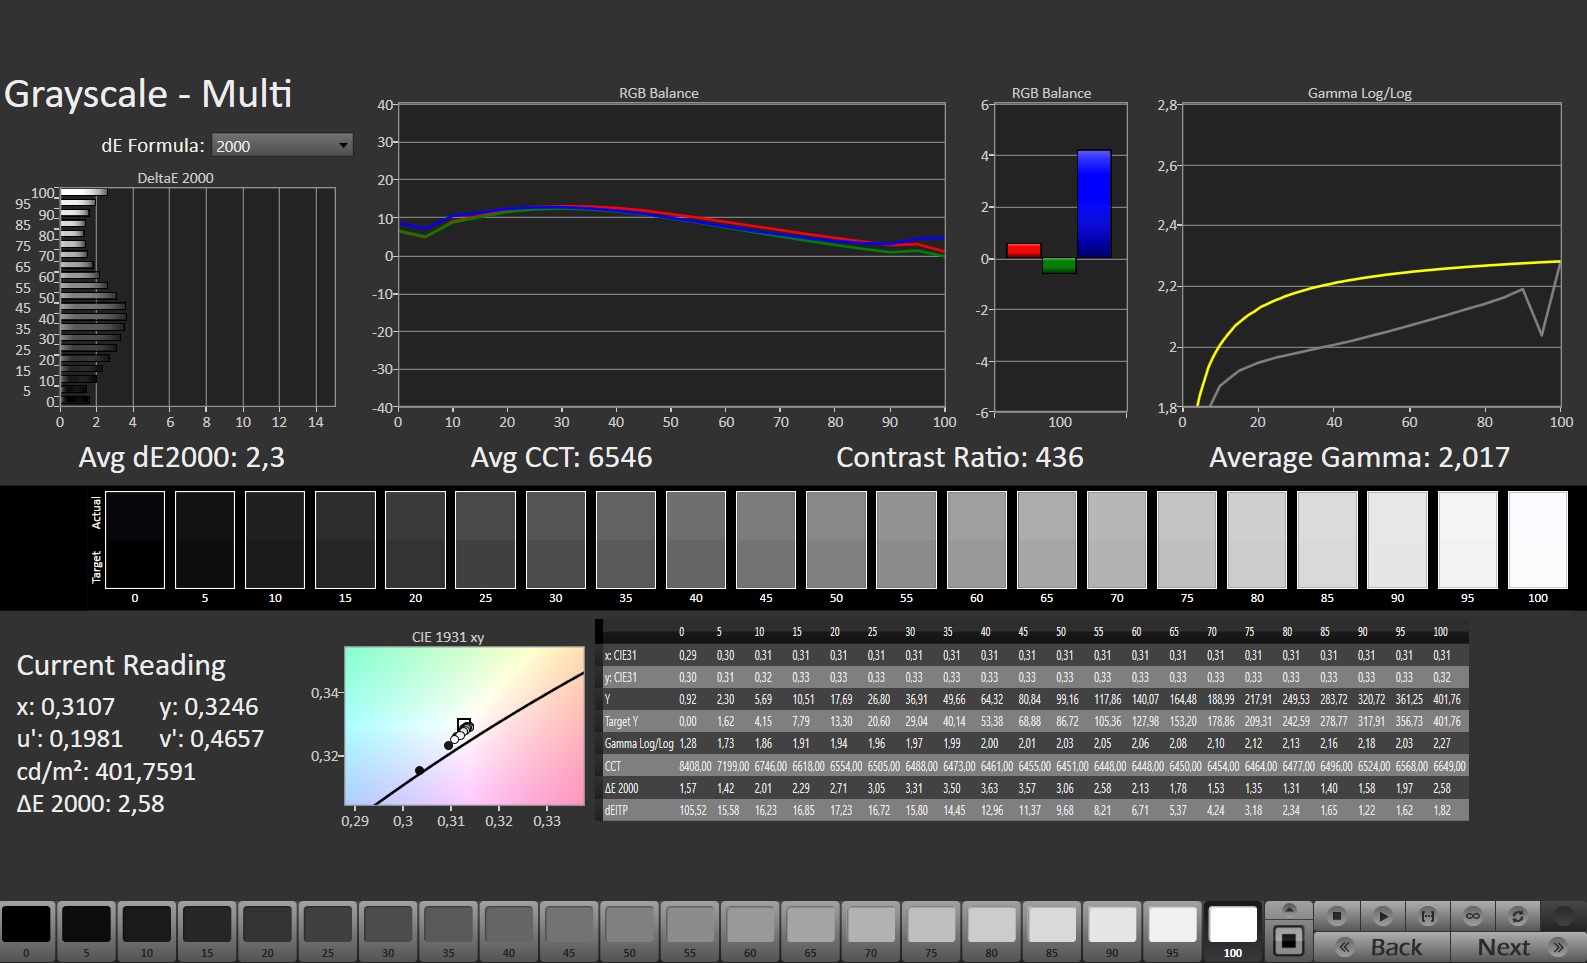
17英寸亚光IPS显示屏(2,560 x 1,440)具有16:10的长宽比,并以足够的亮度、快速响应时间、高刷新率(240Hz)和没有PWM闪烁而脱颖而出。但是它的对比度没有达到人们认为的好水平(>1,000:1)。
该面板支持G-Sync,这项技术有助于显示器的刷新率动态地适应GPU输出的帧率。这旨在提供更流畅的观看体验,特别是在游戏时。
| |||||||||||||||||||||||||
Brightness Distribution: 90 %
Center on Battery: 384 cd/m²
Contrast: 853:1 (Black: 0.45 cd/m²)
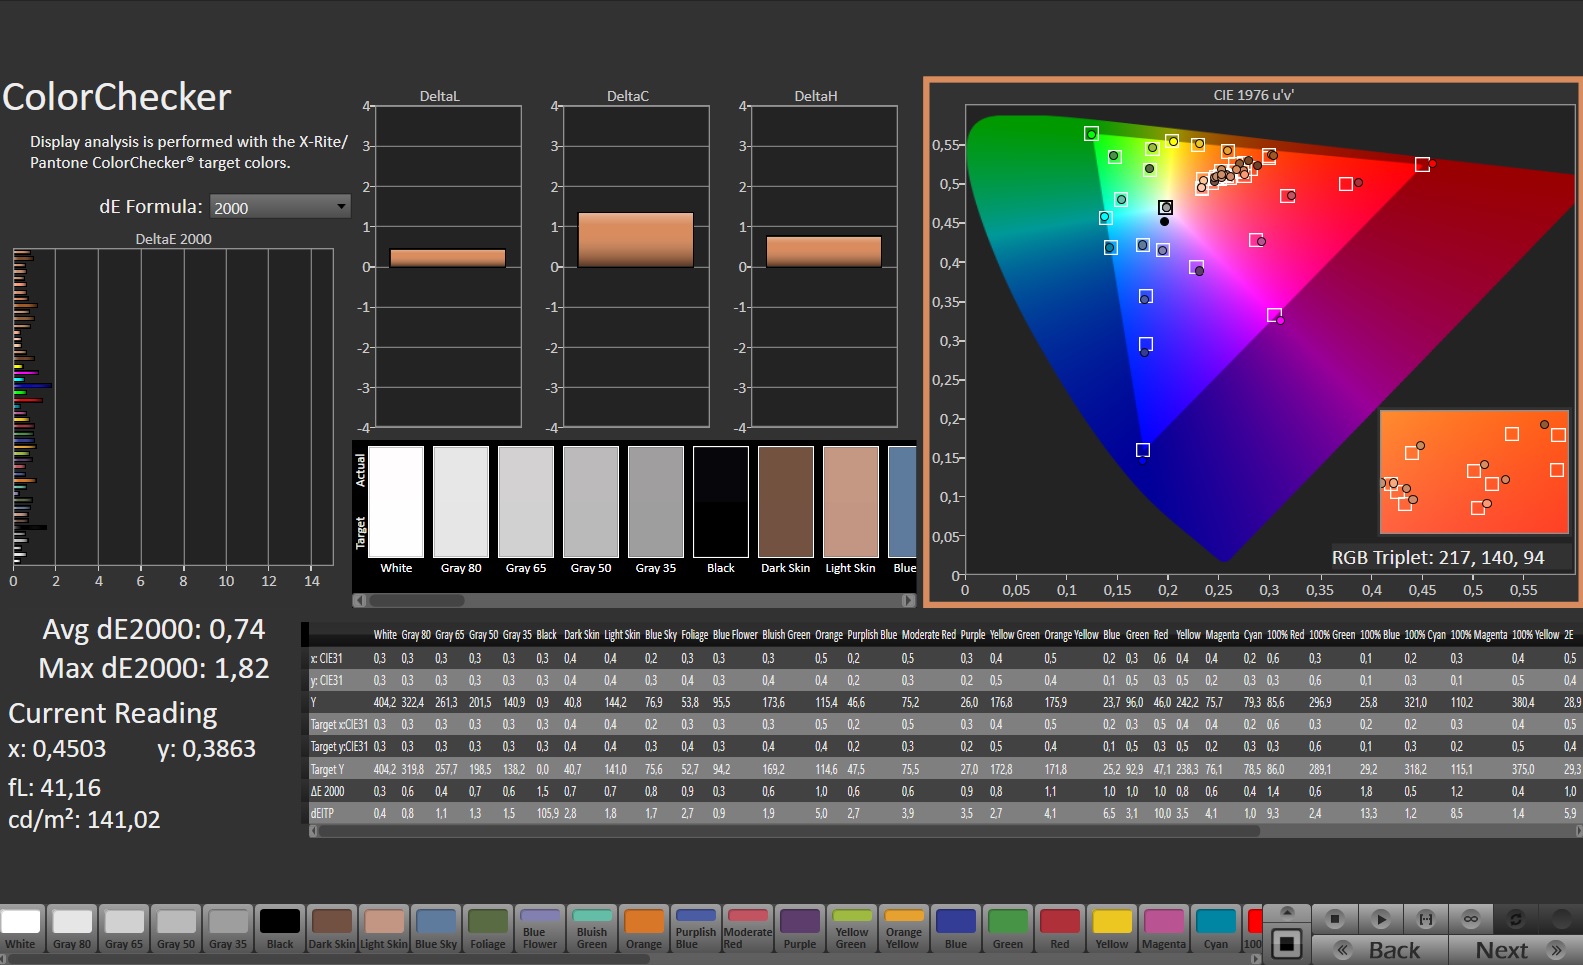
ΔE ColorChecker Calman: 2.05 | ∀{0.5-29.43 Ø4.71}
calibrated: 0.74
ΔE Greyscale Calman: 2.3 | ∀{0.09-98 Ø4.96}
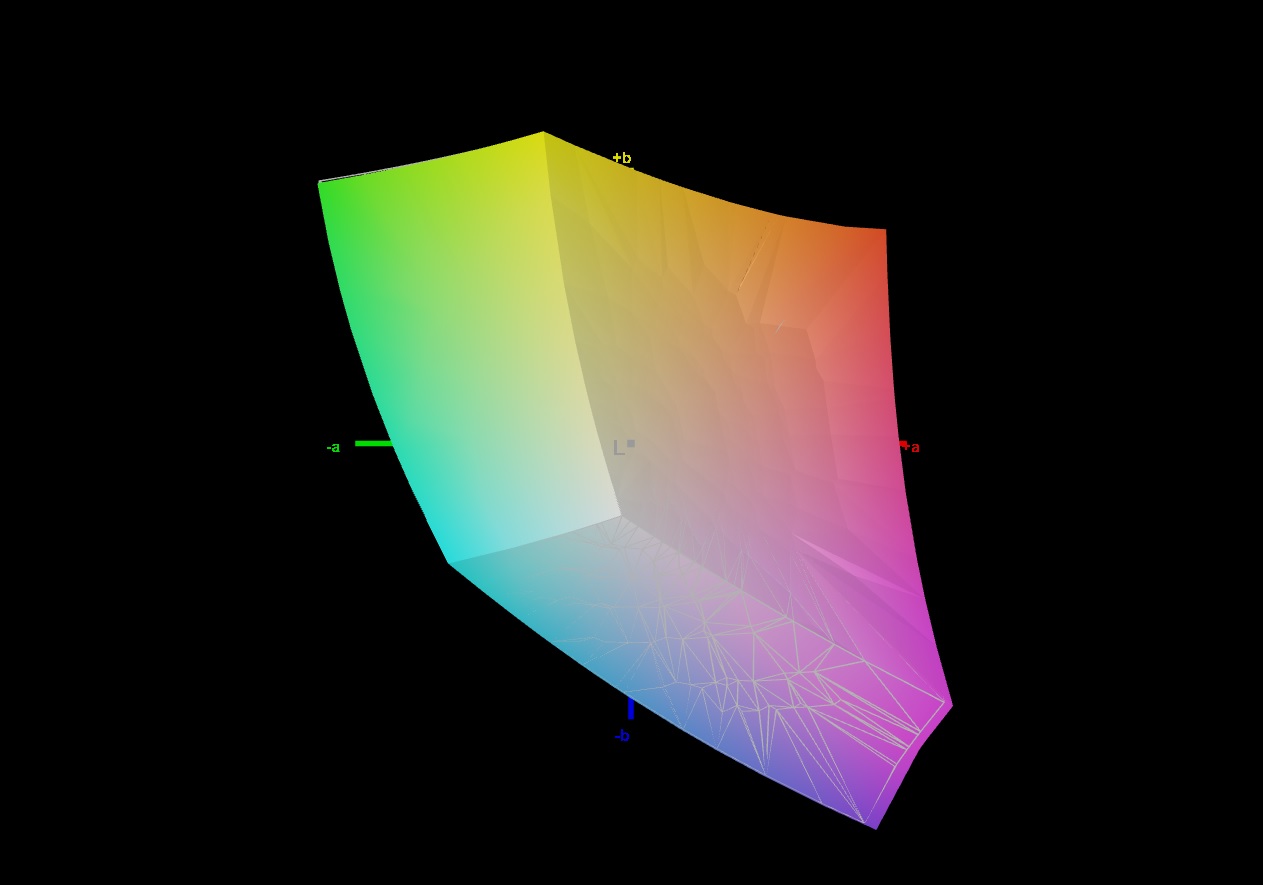
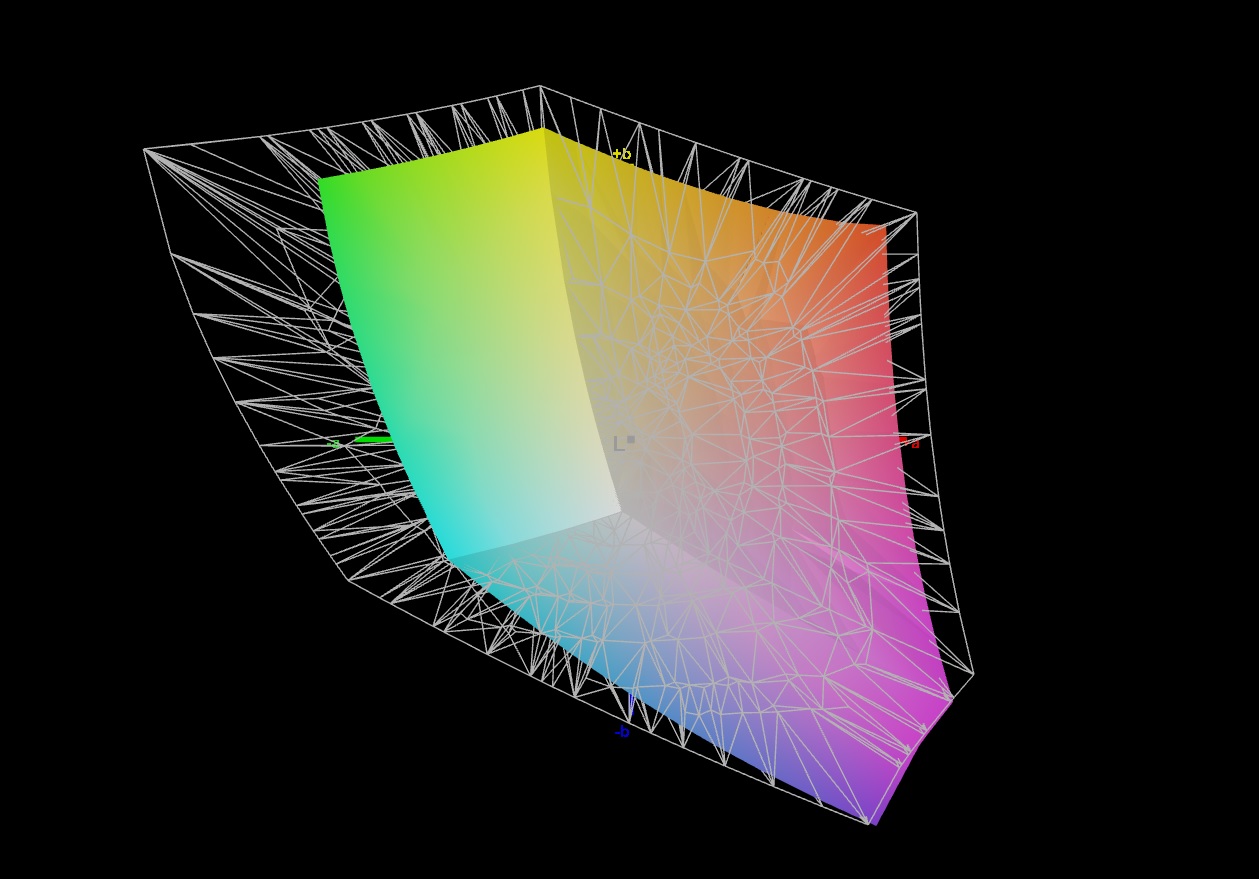
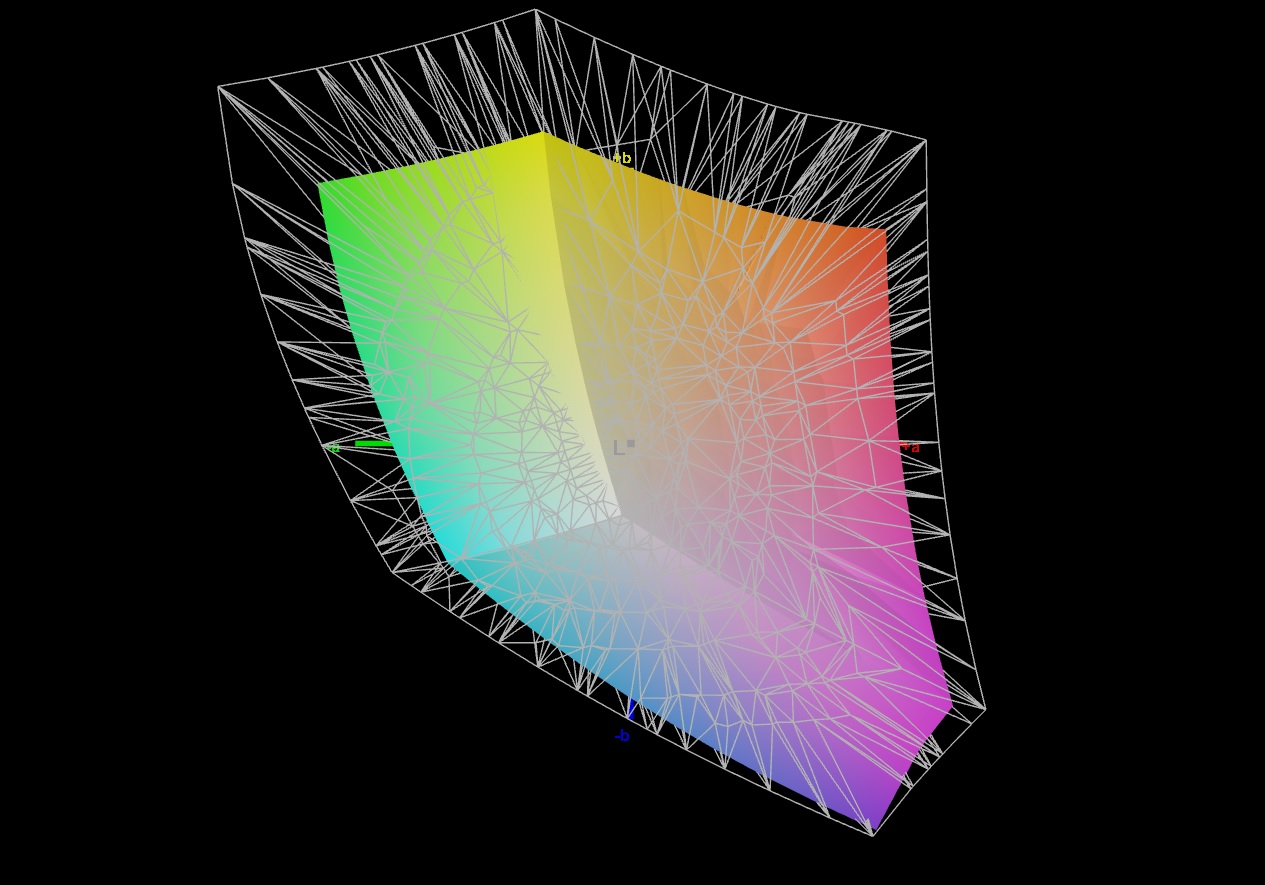
69.4% AdobeRGB 1998 (Argyll 3D)
99.8% sRGB (Argyll 3D)
68.6% Display P3 (Argyll 3D)
Gamma: 2.017
CCT: 6546 K
| Medion Erazer Beast X40 BOE NE170QDM-NZ1, IPS, 2560x1600, 17" | MSI Titan GT77 HX 13VI B173ZAN06.C, Mini-LED, 3840x2160, 17.3" | Razer Blade 16 Early 2023 CSOT T3 MNG007DA4-1, IPS, 2560x1600, 16" | Schenker XMG Neo 17 M22 BOE0A99, IPS, 2560x1600, 17" | Alienware x17 R2 P48E AU Optronics B173HAN, IPS, 1920x1080, 17.3" | Asus ROG Strix Scar 18 2023 G834JY-N6005W NE180QDM-NZ2, IPS, 2560x1600, 18" | |
|---|---|---|---|---|---|---|
| Display | 24% | 24% | 0% | 10% | 21% | |
| Display P3 Coverage (%) | 68.6 | 94.9 38% | 98.5 44% | 69 1% | 79.2 15% | 97.2 42% |
| sRGB Coverage (%) | 99.8 | 99.9 0% | 100 0% | 99.8 0% | 99.8 0% | 99.9 0% |
| AdobeRGB 1998 Coverage (%) | 69.4 | 92.4 33% | 89.7 29% | 69.6 0% | 79.6 15% | 84.9 22% |
| Response Times | -248% | -9% | 12% | -17% | 19% | |
| Response Time Grey 50% / Grey 80% * (ms) | 11.3 ? | 38.4 ? -240% | 6.6 ? 42% | 10.8 ? 4% | 12.4 ? -10% | 5.41 ? 52% |
| Response Time Black / White * (ms) | 7.5 ? | 26.6 ? -255% | 12 ? -60% | 6.1 ? 19% | 9.2 ? -23% | 8.62 ? -15% |
| PWM Frequency (Hz) | 2380 ? | |||||
| Screen | 78886% | -6% | 11% | -22% | -92% | |
| Brightness middle (cd/m²) | 384 | 606 58% | 456.8 19% | 415 8% | 365.4 -5% | 490 28% |
| Brightness (cd/m²) | 377 | 602 60% | 437 16% | 399 6% | 344 -9% | 468 24% |
| Brightness Distribution (%) | 90 | 93 3% | 83 -8% | 90 0% | 85 -6% | 86 -4% |
| Black Level * (cd/m²) | 0.45 | 0.0001 100% | 0.35 22% | 0.43 4% | 0.29 36% | 0.54 -20% |
| Contrast (:1) | 853 | 6060000 710334% | 1305 53% | 965 13% | 1260 48% | 907 6% |
| Colorchecker dE 2000 * | 2.05 | 4.8 -134% | 3.7 -80% | 1.44 30% | 3.17 -55% | 4.97 -142% |
| Colorchecker dE 2000 max. * | 3.64 | 8.2 -125% | 6.42 -76% | 2.33 36% | 7.69 -111% | 11.02 -203% |
| Colorchecker dE 2000 calibrated * | 0.74 | 1.8 -143% | 0.66 11% | 0.89 -20% | 0.51 31% | 2.97 -301% |
| Greyscale dE 2000 * | 2.3 | 6.5 -183% | 2.6 -13% | 1.8 22% | 5.3 -130% | 7.2 -213% |
| Gamma | 2.017 109% | 2.63 84% | 2.3 96% | 2.132 103% | 2.18 101% | 2.161 102% |
| CCT | 6546 99% | 6596 99% | 6108 106% | 6327 103% | 5879 111% | 6515 100% |
| Total Average (Program / Settings) | 26221% /
50682% | 3% /
-0% | 8% /
9% | -10% /
-15% | -17% /
-52% |
* ... smaller is better
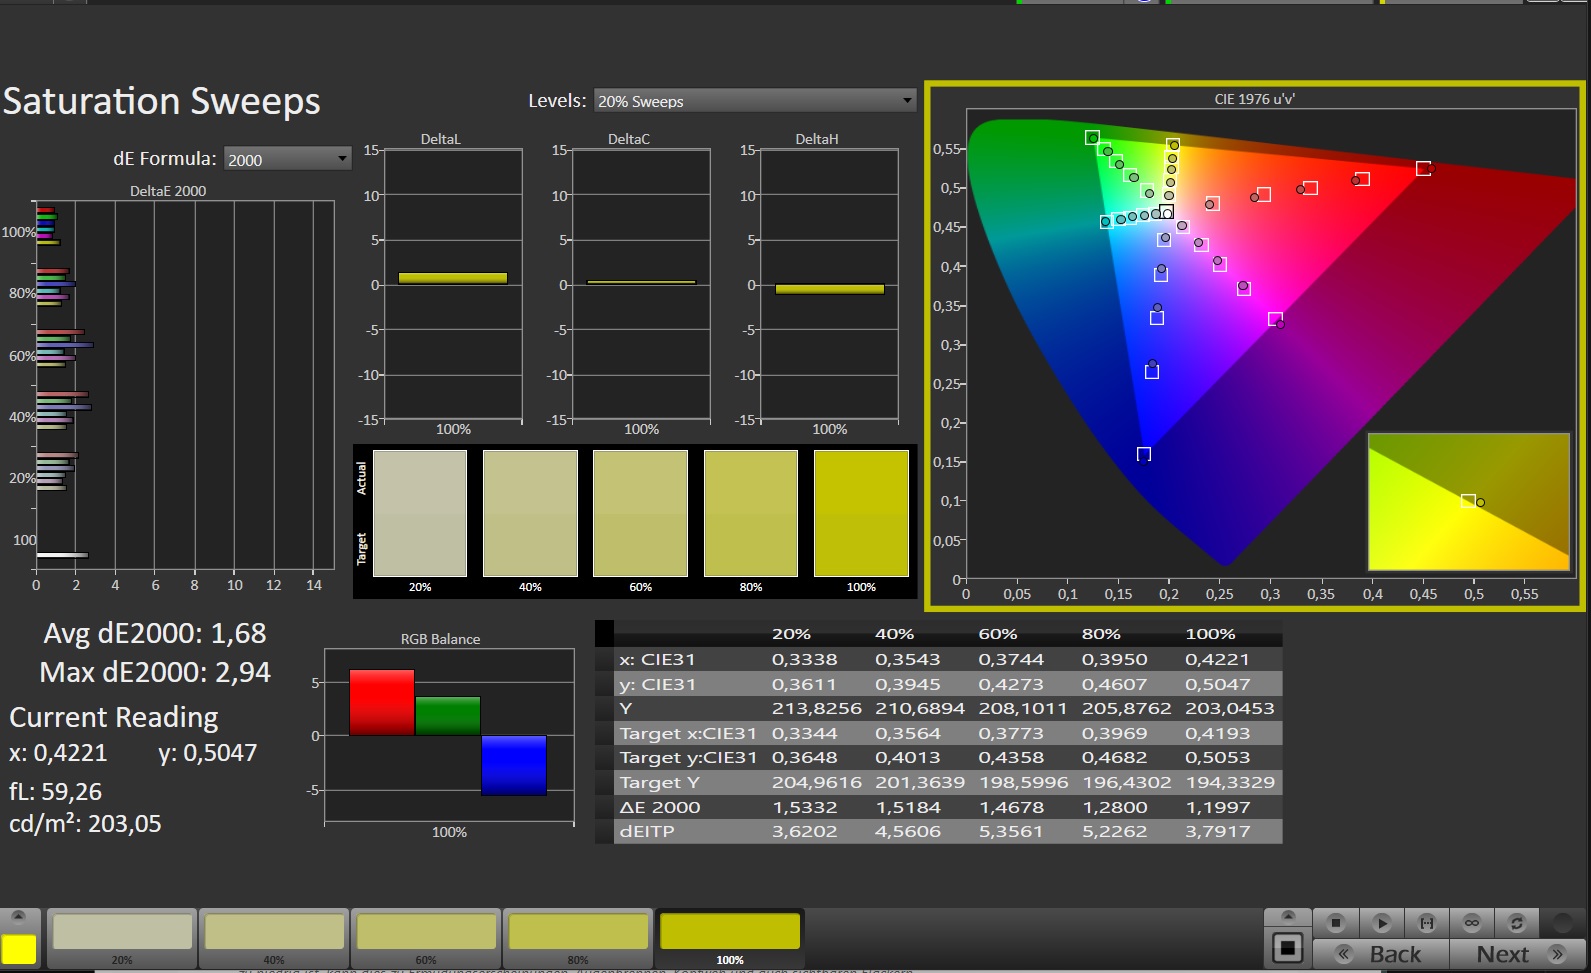
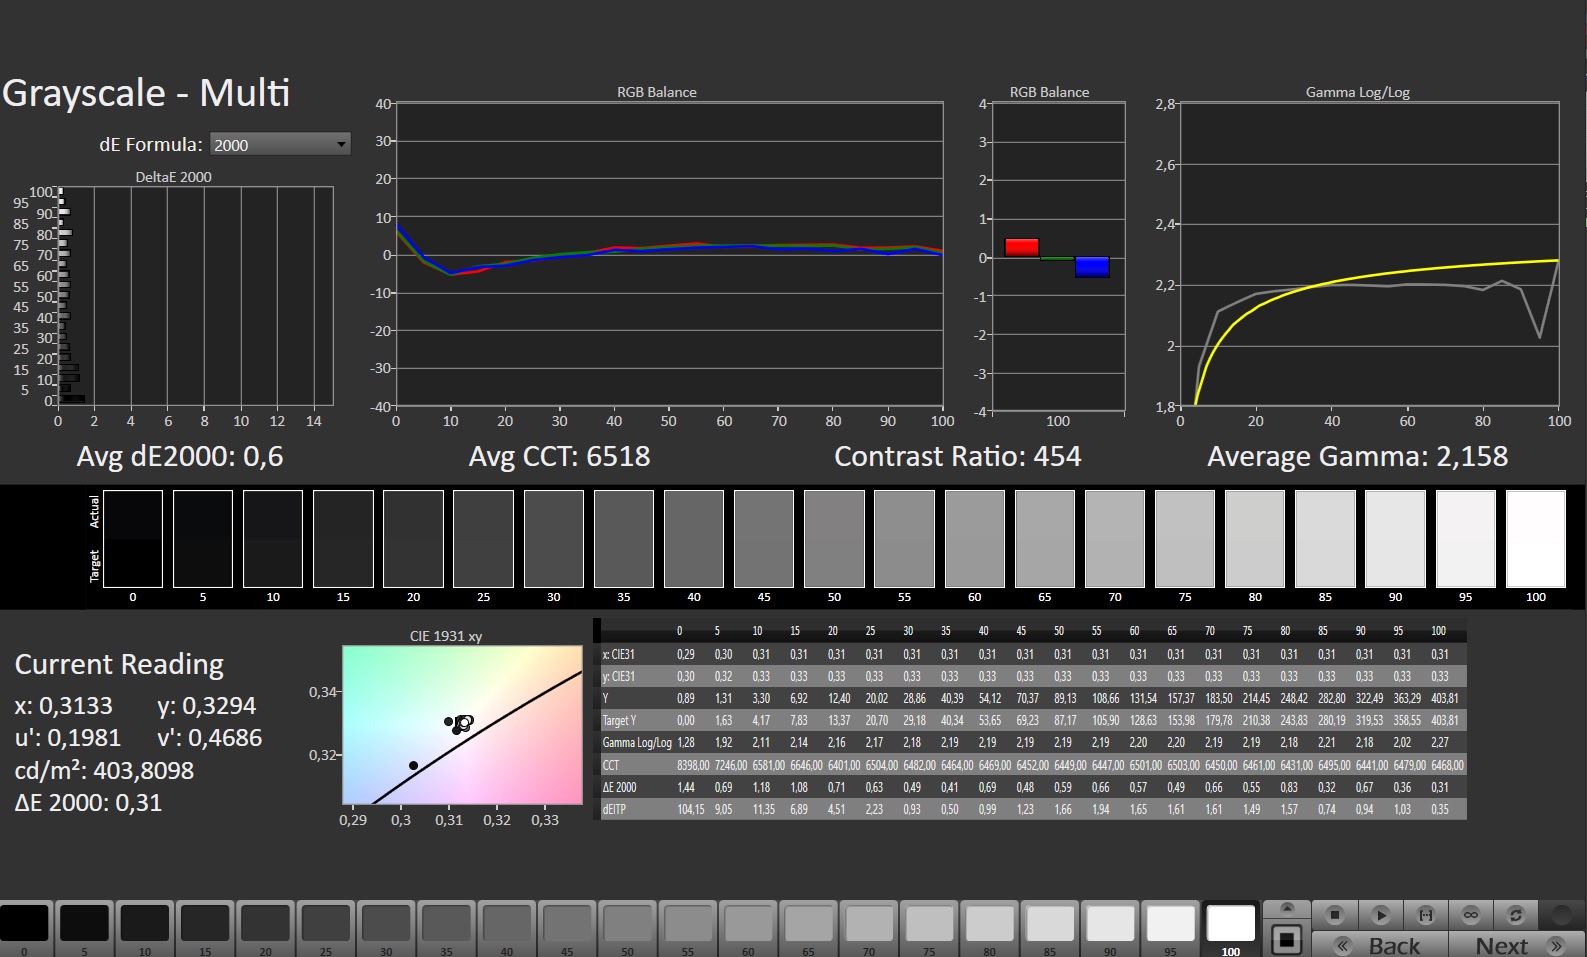
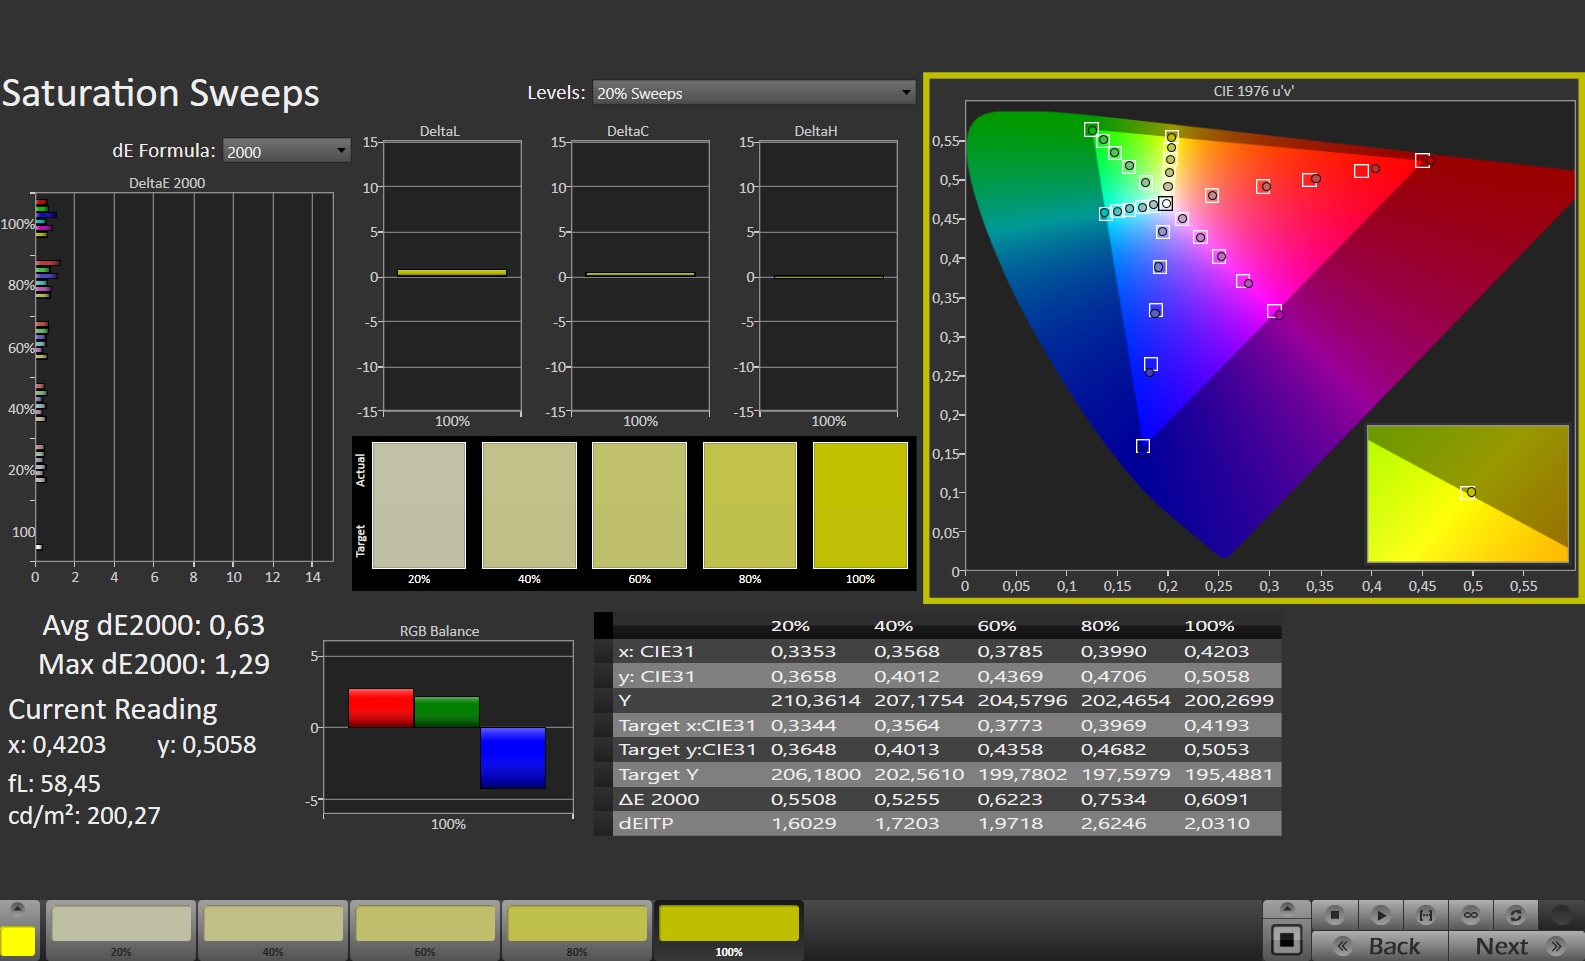
这款显示器在开箱后就已经有了很好的色彩还原能力。它的平均色差大约为2,明显低于被认为是好的阈值(Delta E < 3)。校准显示器后,平均色差降至0.74,并使灰度更加平衡。该面板能够覆盖整个sRGB色彩空间,但不能覆盖AdobeRGB和DCI-P3。一些竞争性笔记本电脑上的显示屏在色彩覆盖方面表现更好。

Display Response Times
| ↔ Response Time Black to White | ||
|---|---|---|
| 7.5 ms ... rise ↗ and fall ↘ combined | ↗ 3.3 ms rise | 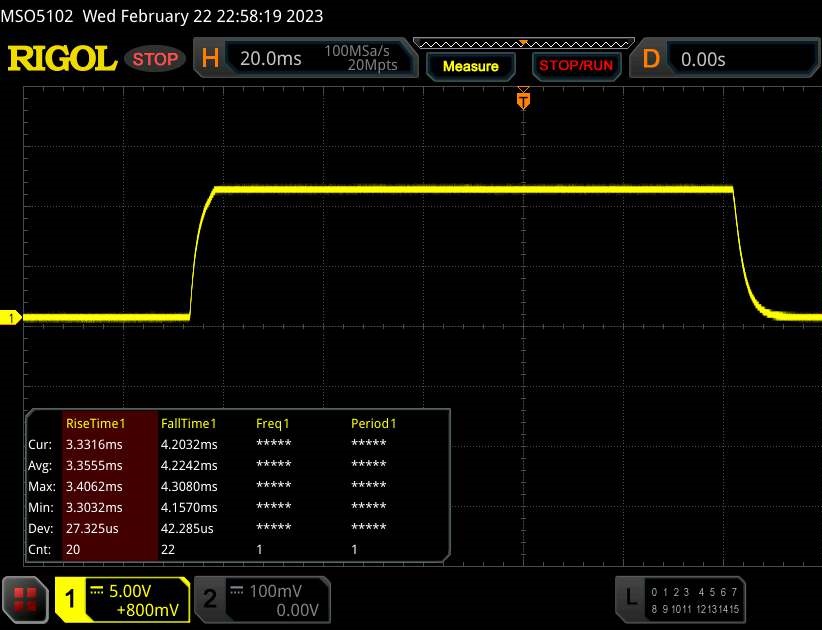 |
| ↘ 4.2 ms fall | ||
| The screen shows very fast response rates in our tests and should be very well suited for fast-paced gaming. In comparison, all tested devices range from 0.1 (minimum) to 240 (maximum) ms. » 22 % of all devices are better. This means that the measured response time is better than the average of all tested devices (19.8 ms). | ||
| ↔ Response Time 50% Grey to 80% Grey | ||
| 11.3 ms ... rise ↗ and fall ↘ combined | ↗ 5.4 ms rise | 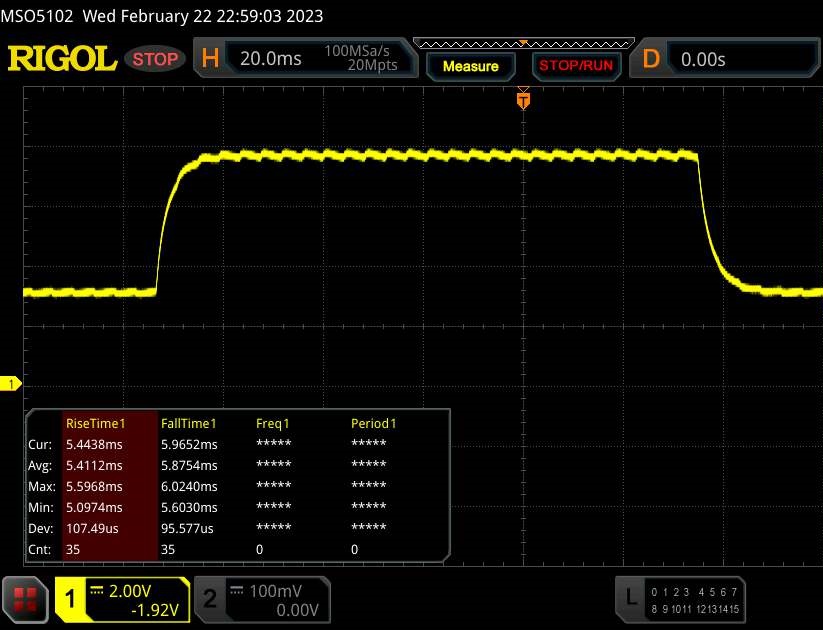 |
| ↘ 5.9 ms fall | ||
| The screen shows good response rates in our tests, but may be too slow for competitive gamers. In comparison, all tested devices range from 0.165 (minimum) to 636 (maximum) ms. » 25 % of all devices are better. This means that the measured response time is better than the average of all tested devices (31 ms). | ||
Screen Flickering / PWM (Pulse-Width Modulation)
| Screen flickering / PWM not detected | 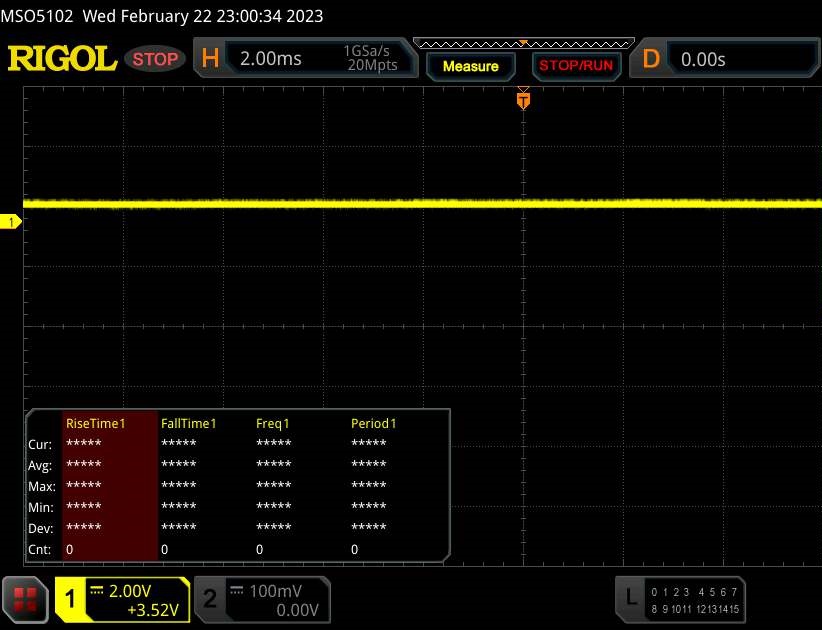 | ||
In comparison: 52 % of all tested devices do not use PWM to dim the display. If PWM was detected, an average of 7757 (minimum: 5 - maximum: 343500) Hz was measured. | |||
IPS面板具有宽广的视角,从任何位置都可以轻松阅读。只要太阳不是太亮,该显示屏在户外肯定是可用的。

表现 - 猛禽湖与阿达-洛夫莱斯的结合
尽管它的设计主要是考虑到QHD+游戏,但Erazer Beast X40在视频编辑和渲染等应用中也有不错的表现。所需的计算能力由Raptor Lake和Ada Lovelace提供。本评论中的X40型号可以以大约4500欧元(4856美元)的价格买到。但Medion还提供了一个略低规格的配置(RTX 4080和1TB SSD;其他方面相同),价格为3500欧元(3777美元)。
测试条件
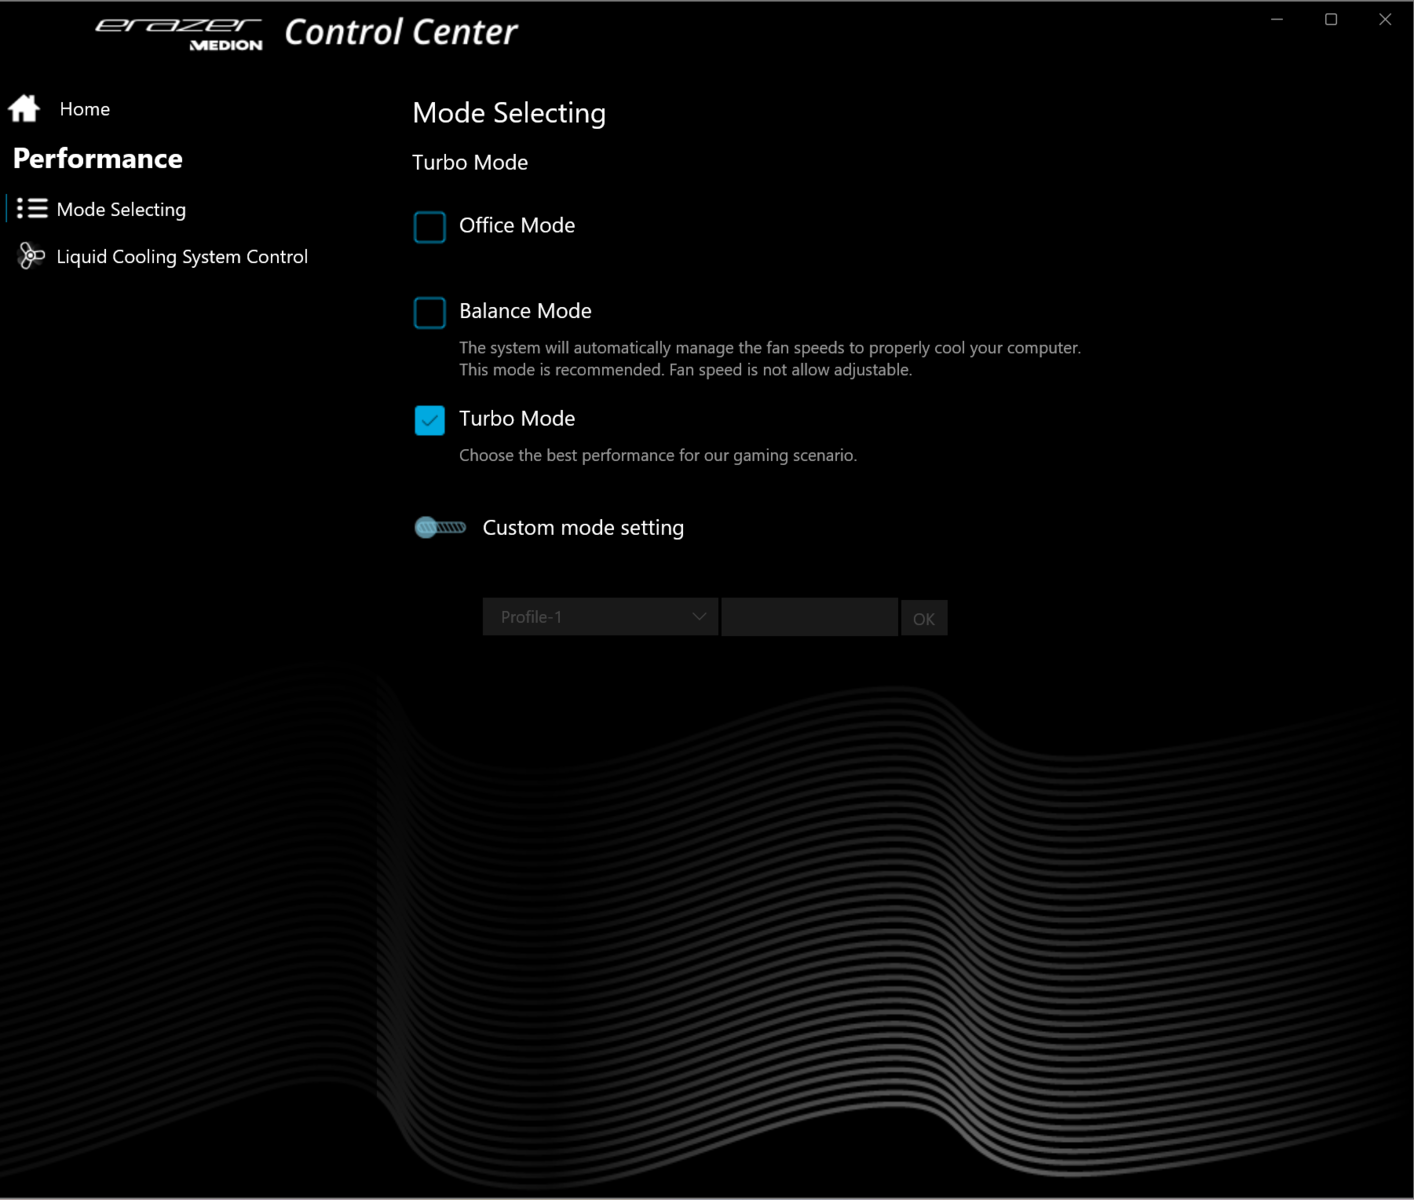
有三种制造商指定的性能模式:办公室、平衡和涡轮。我们使用Turbo模式进行基准测试,使用Office模式进行电池寿命测试,并在两种情况下都启用了Nvidia Optimus。完成这些测试后,我们在启用dGPU模式和连接外部水冷装置的情况下运行了更多基准测试。你可以在对比表中找到这些额外测试的结果,但在评级时不考虑这些结果。
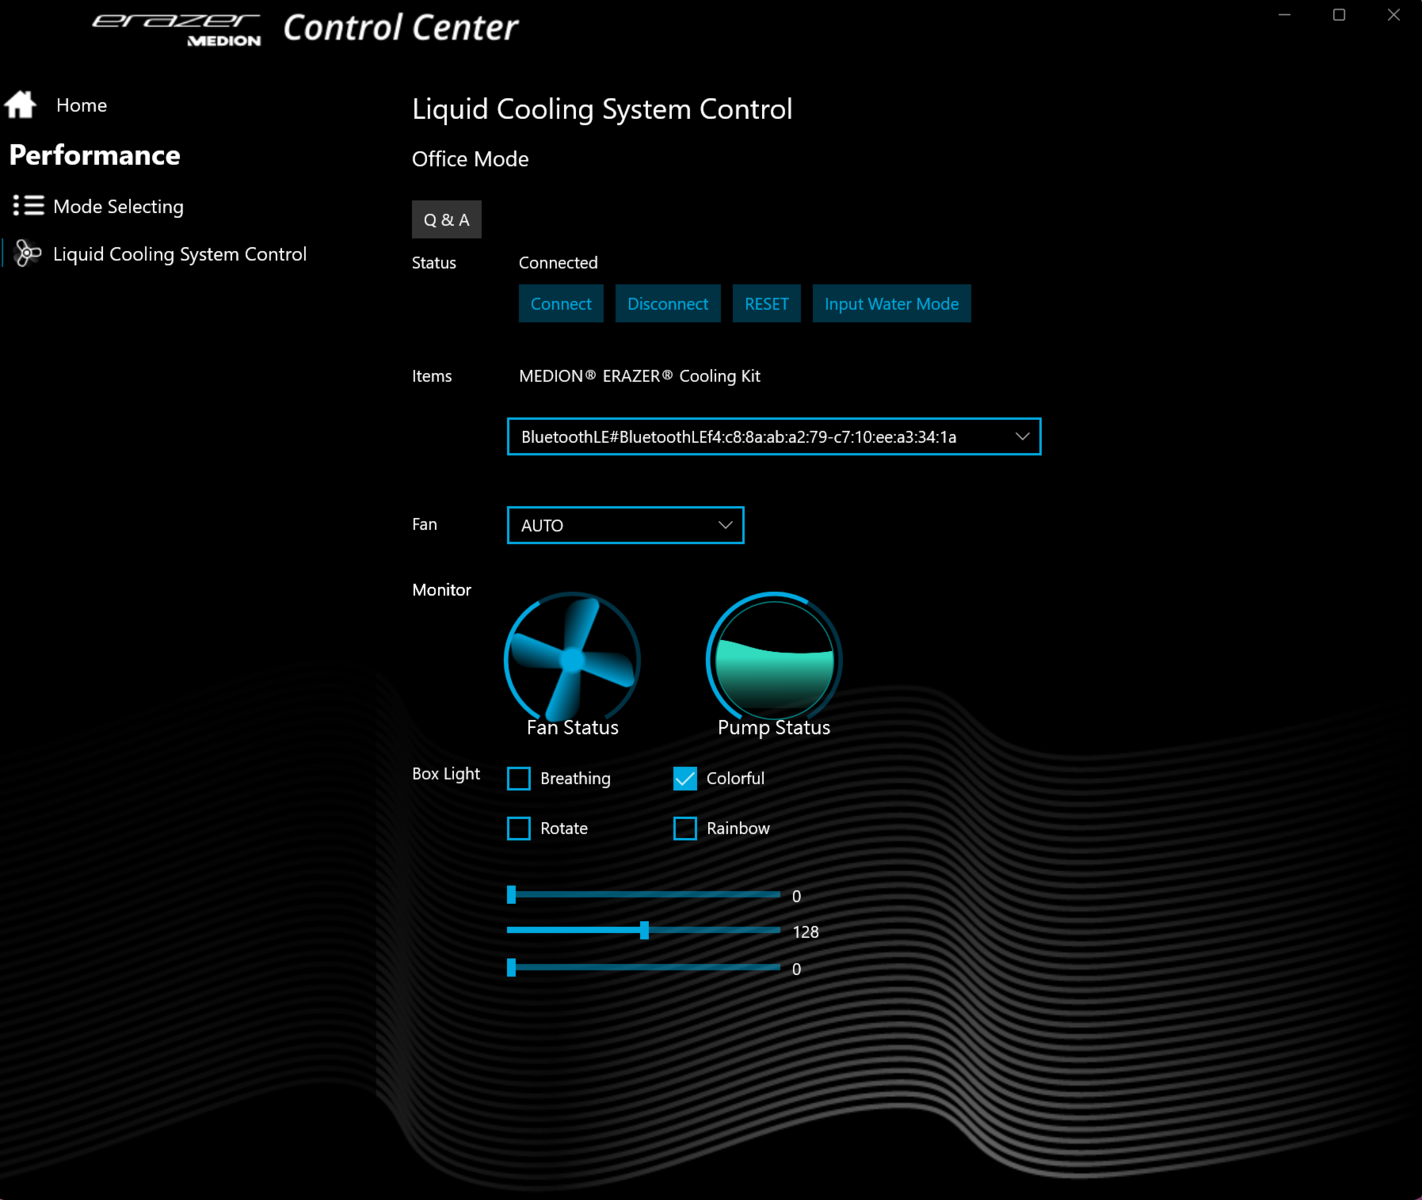
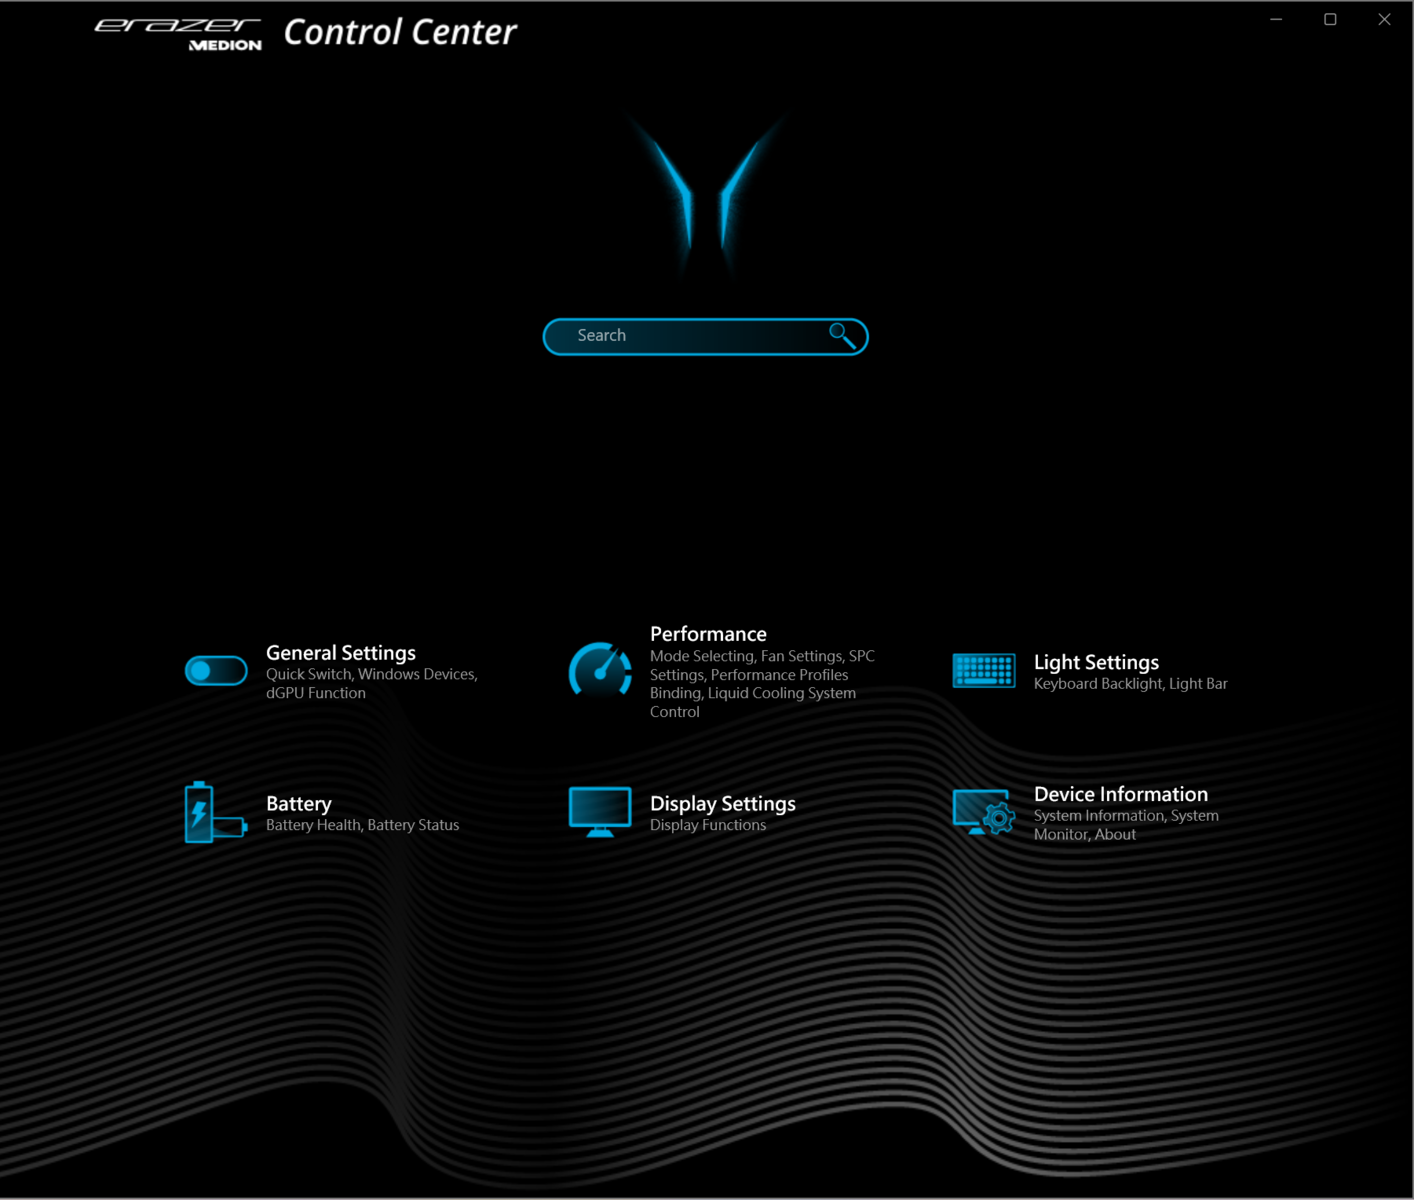
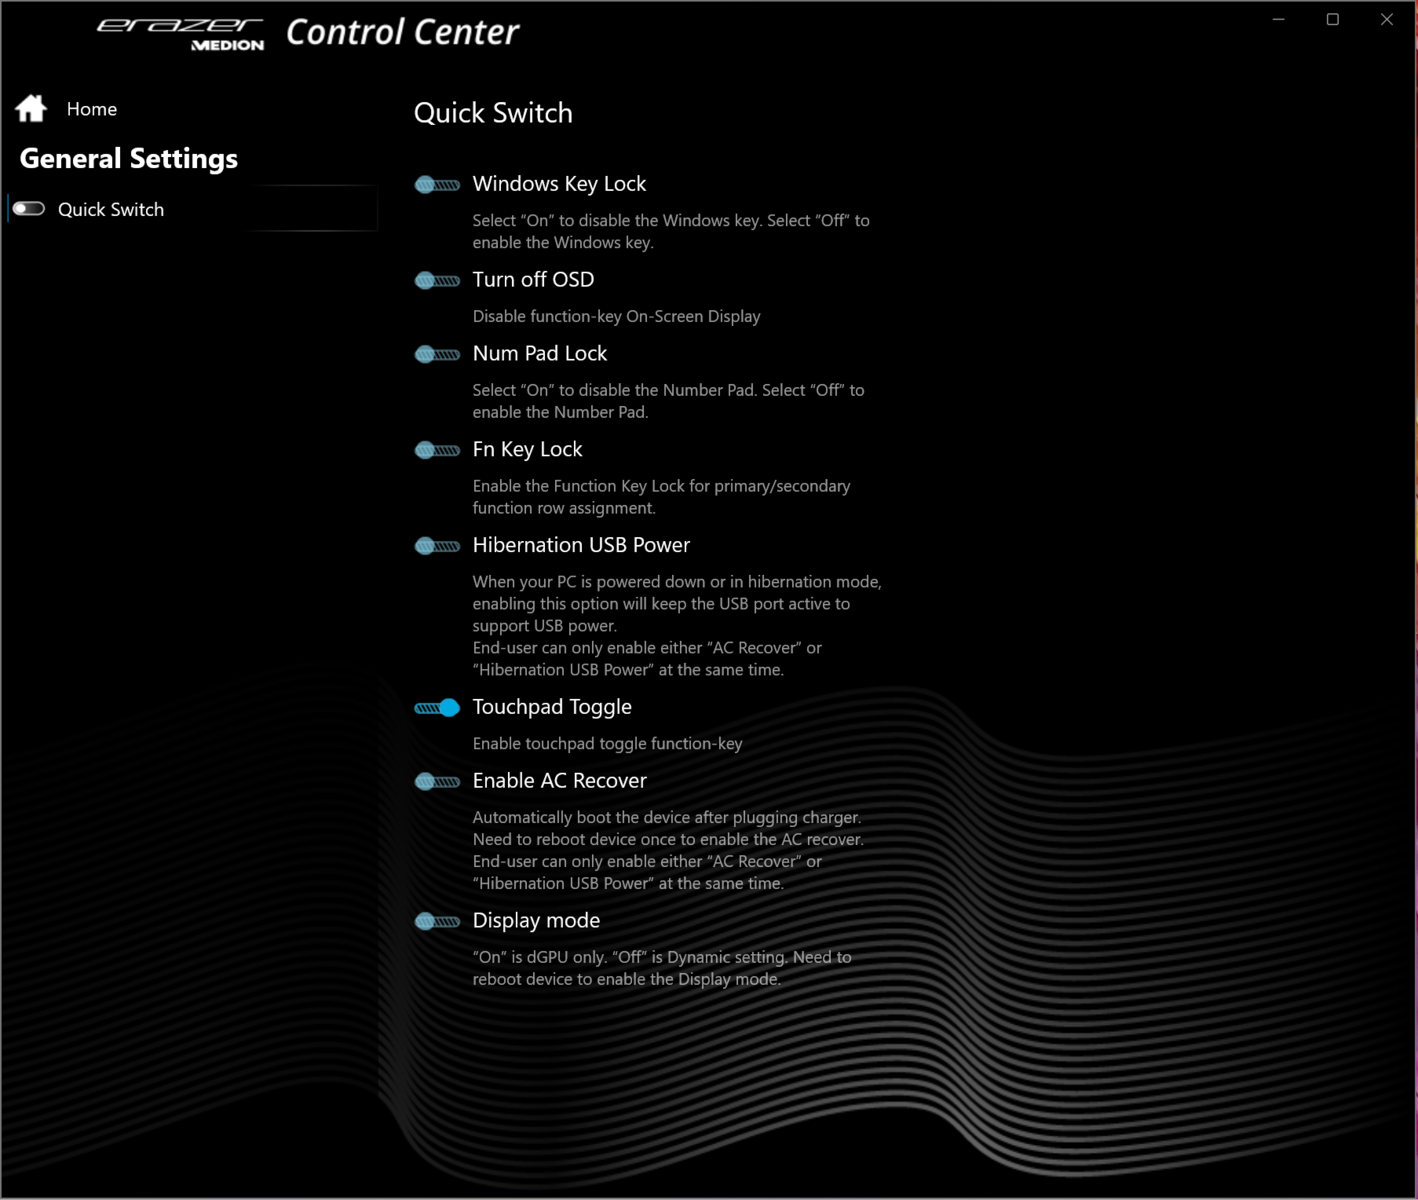
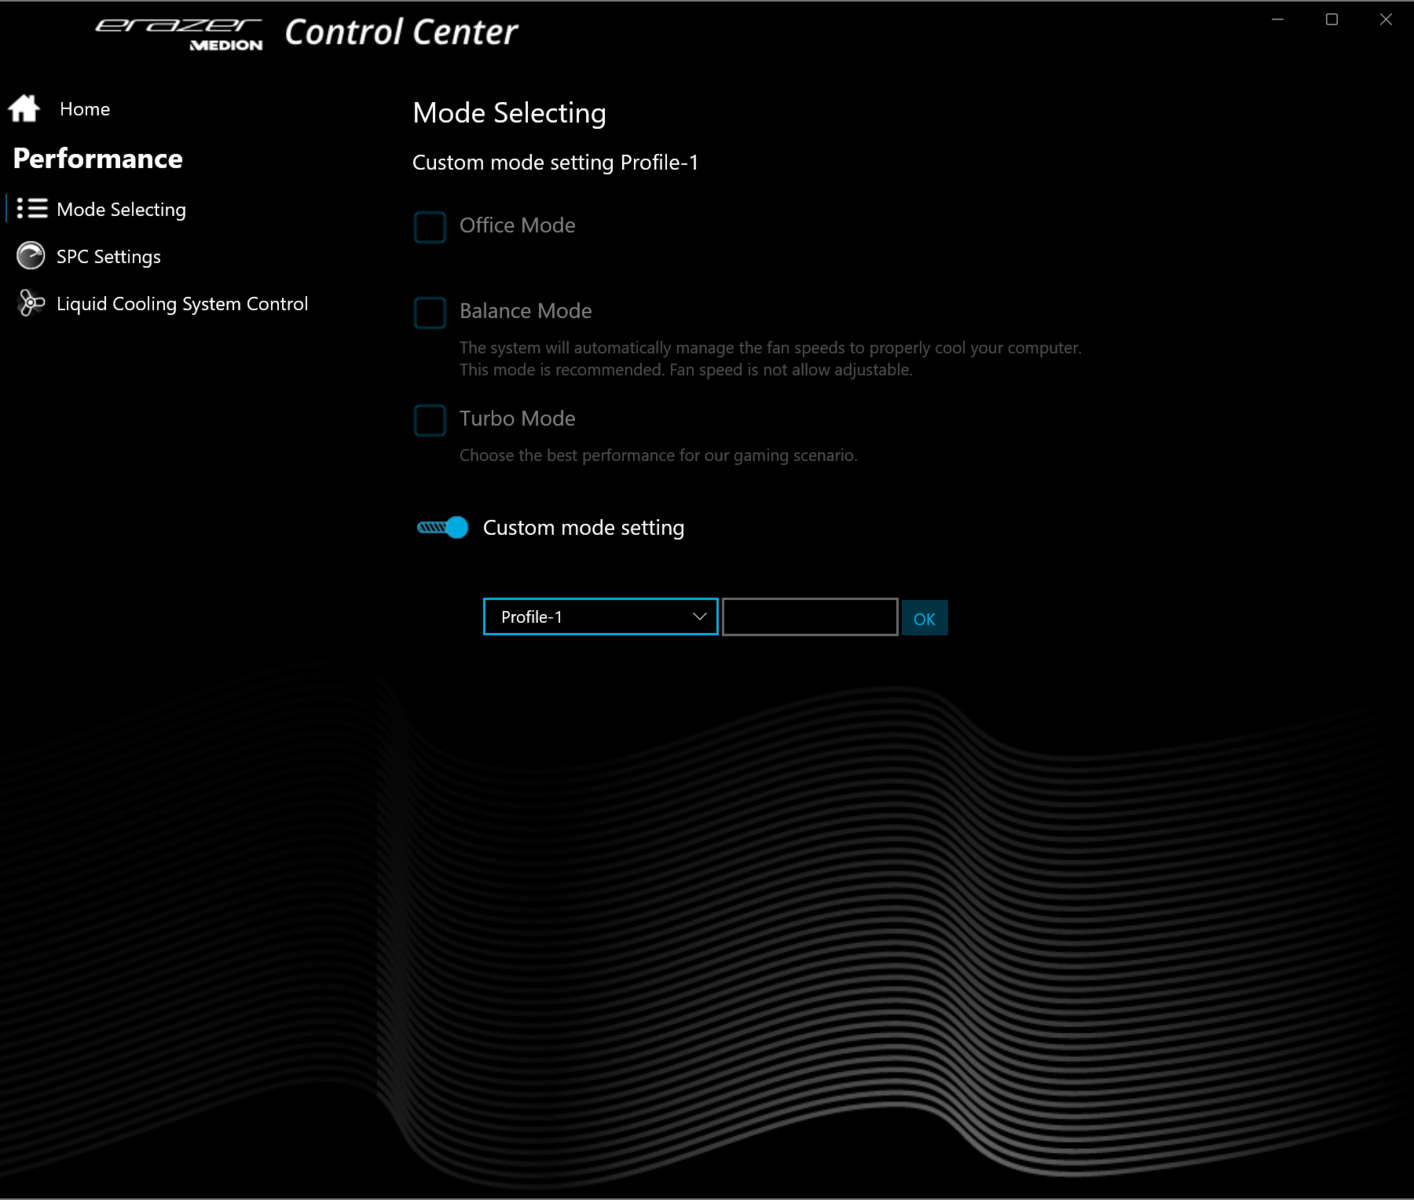
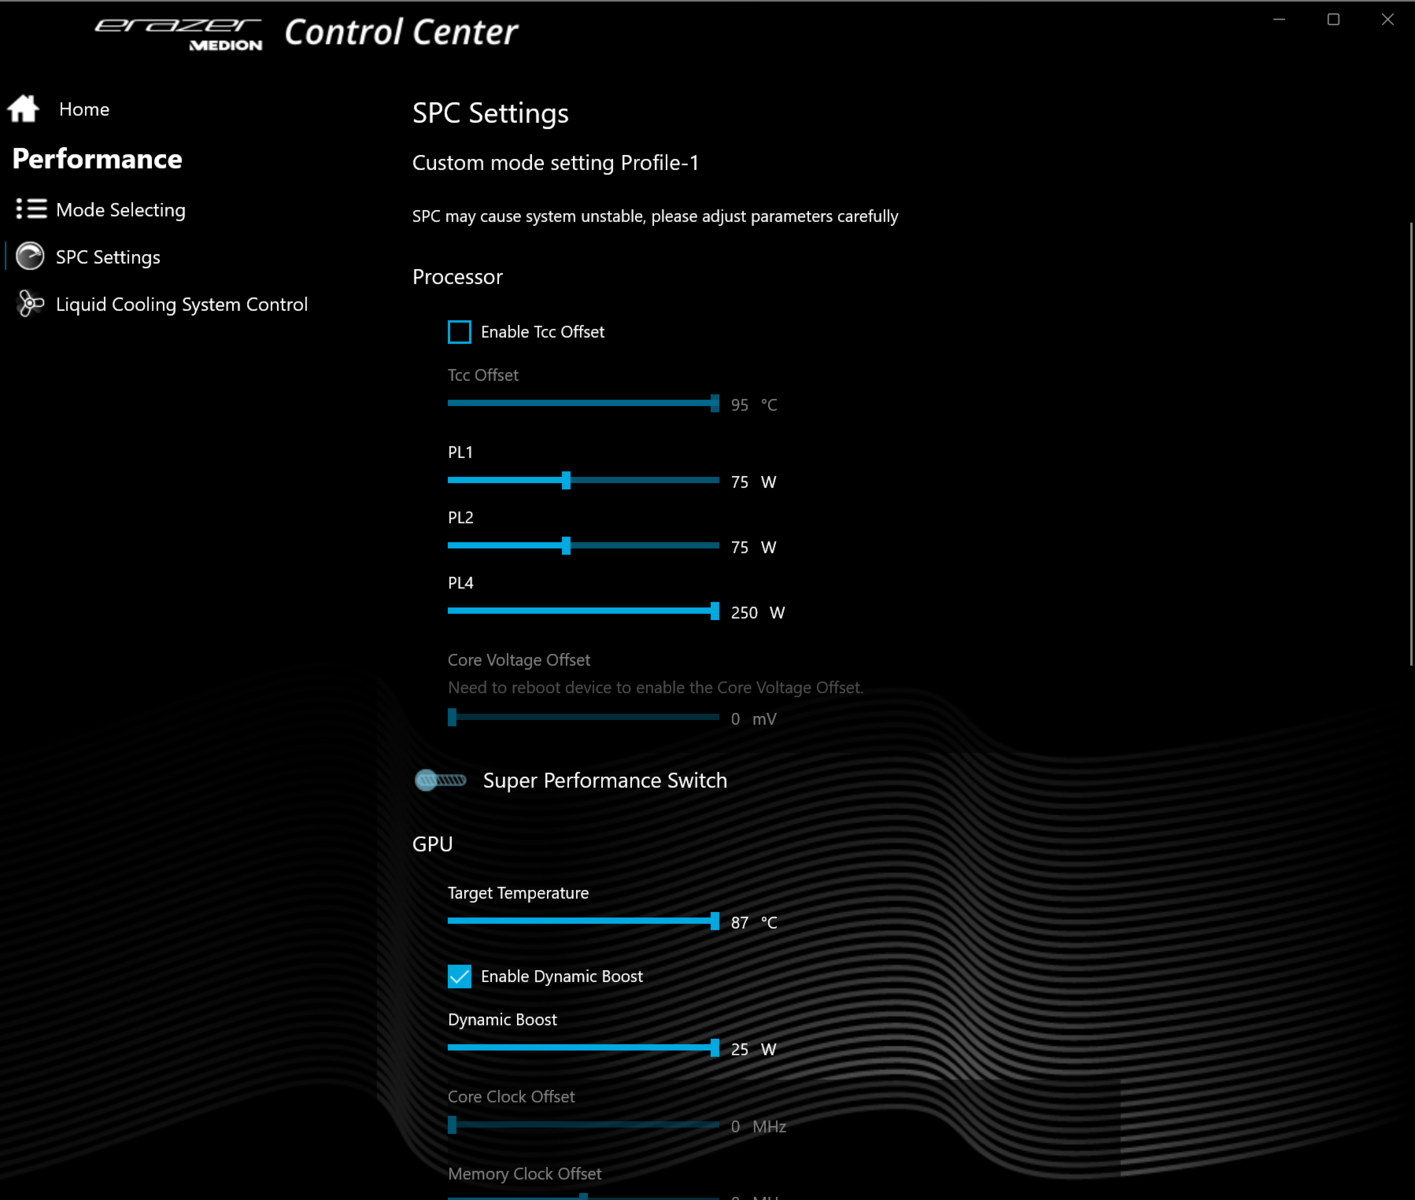
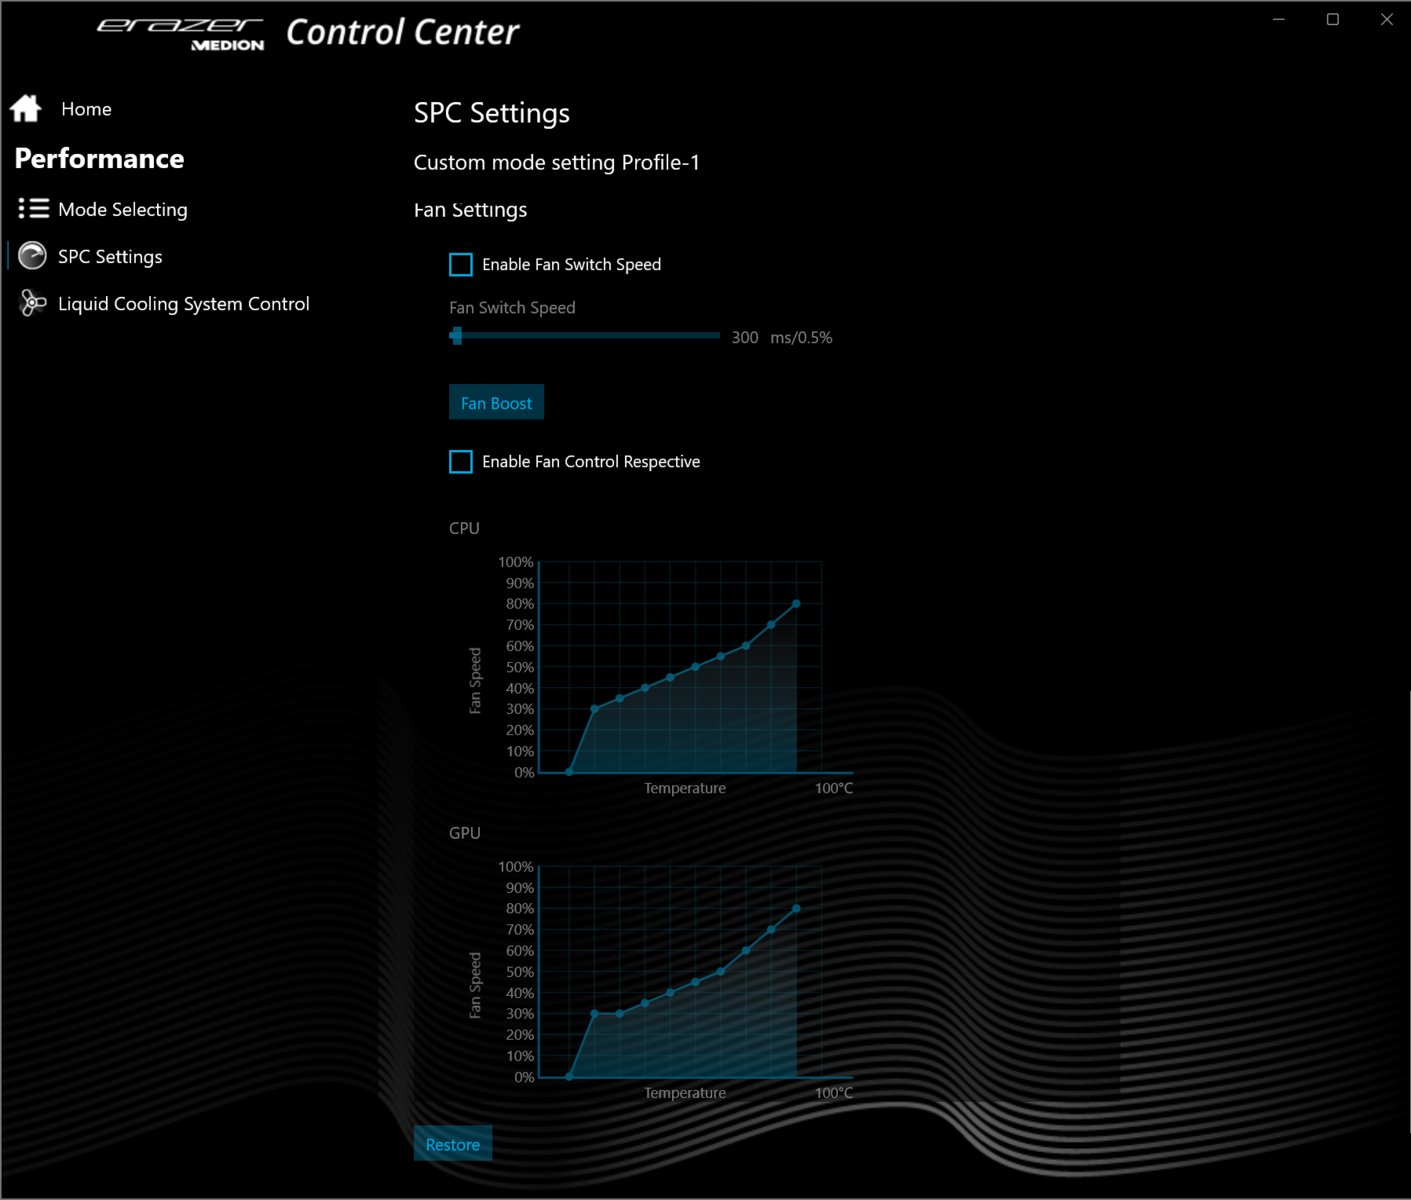
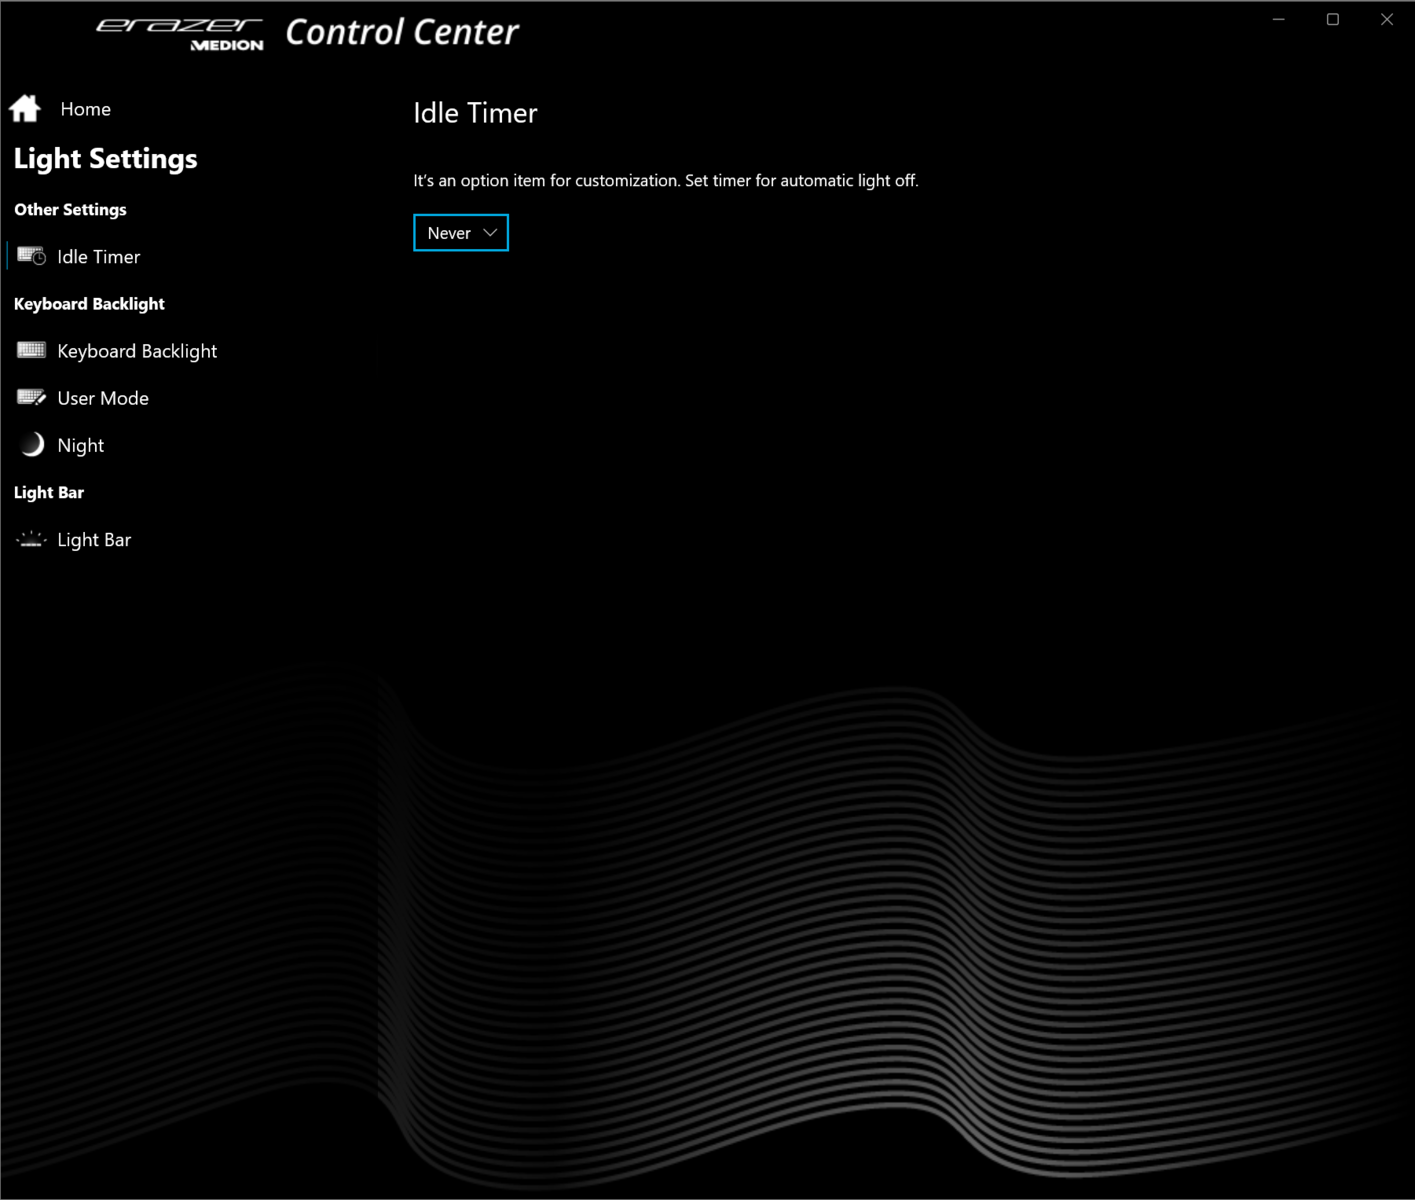
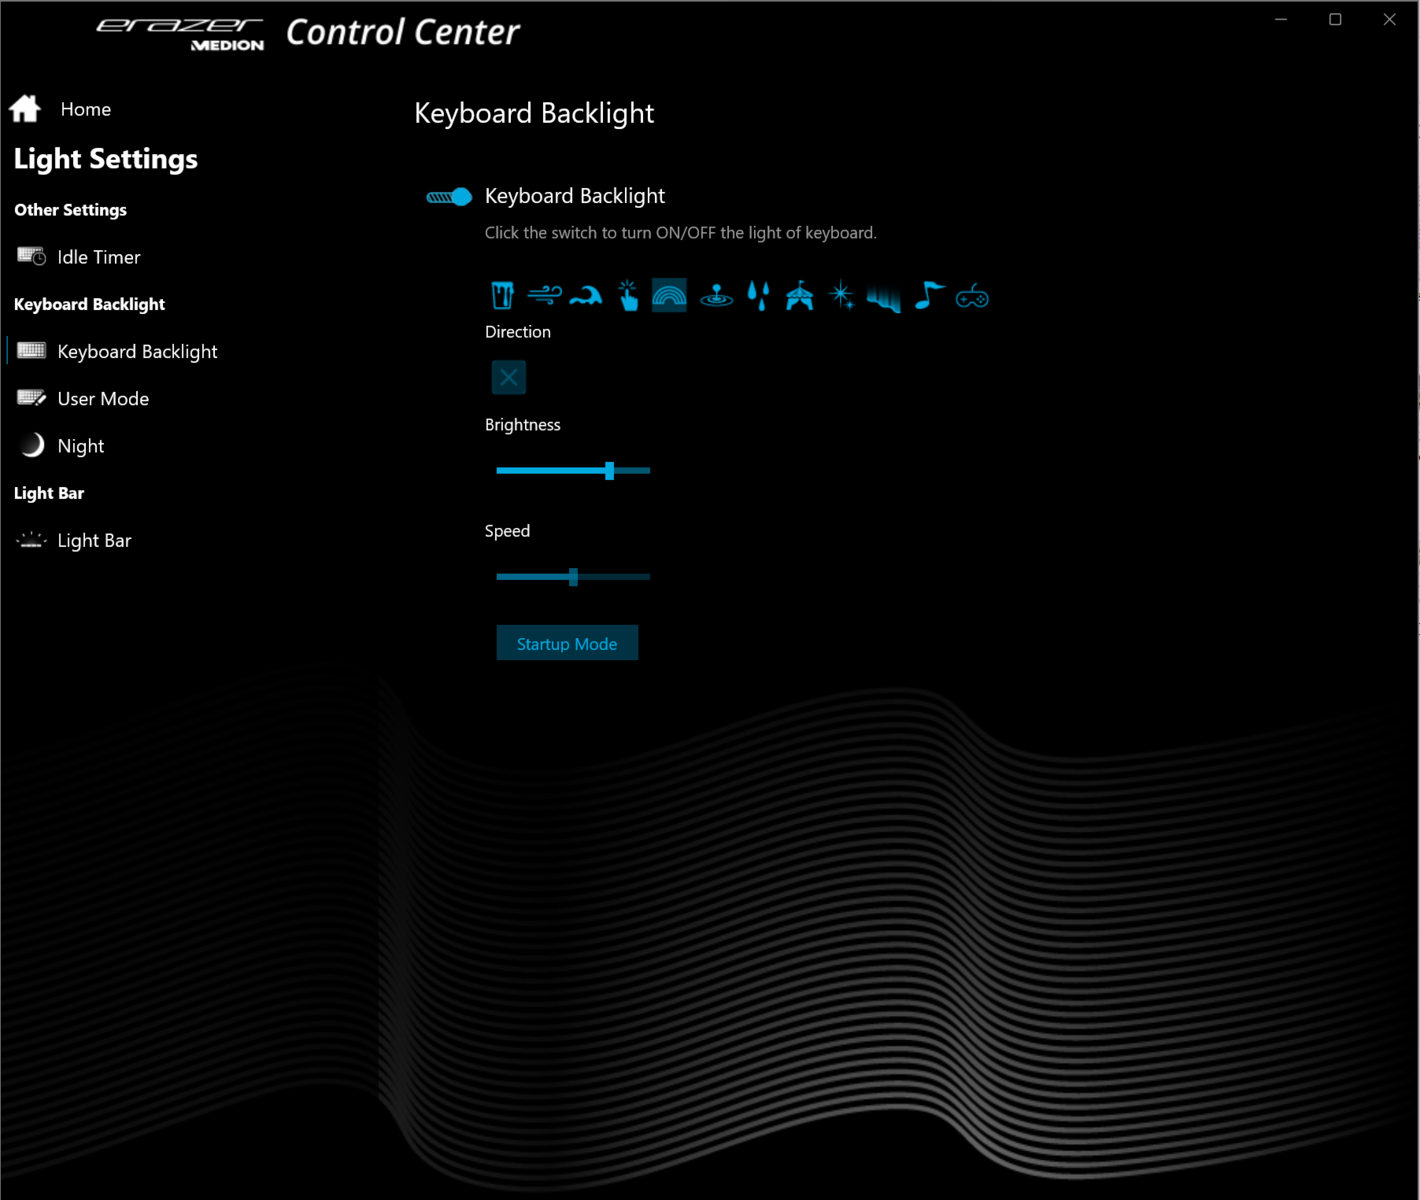
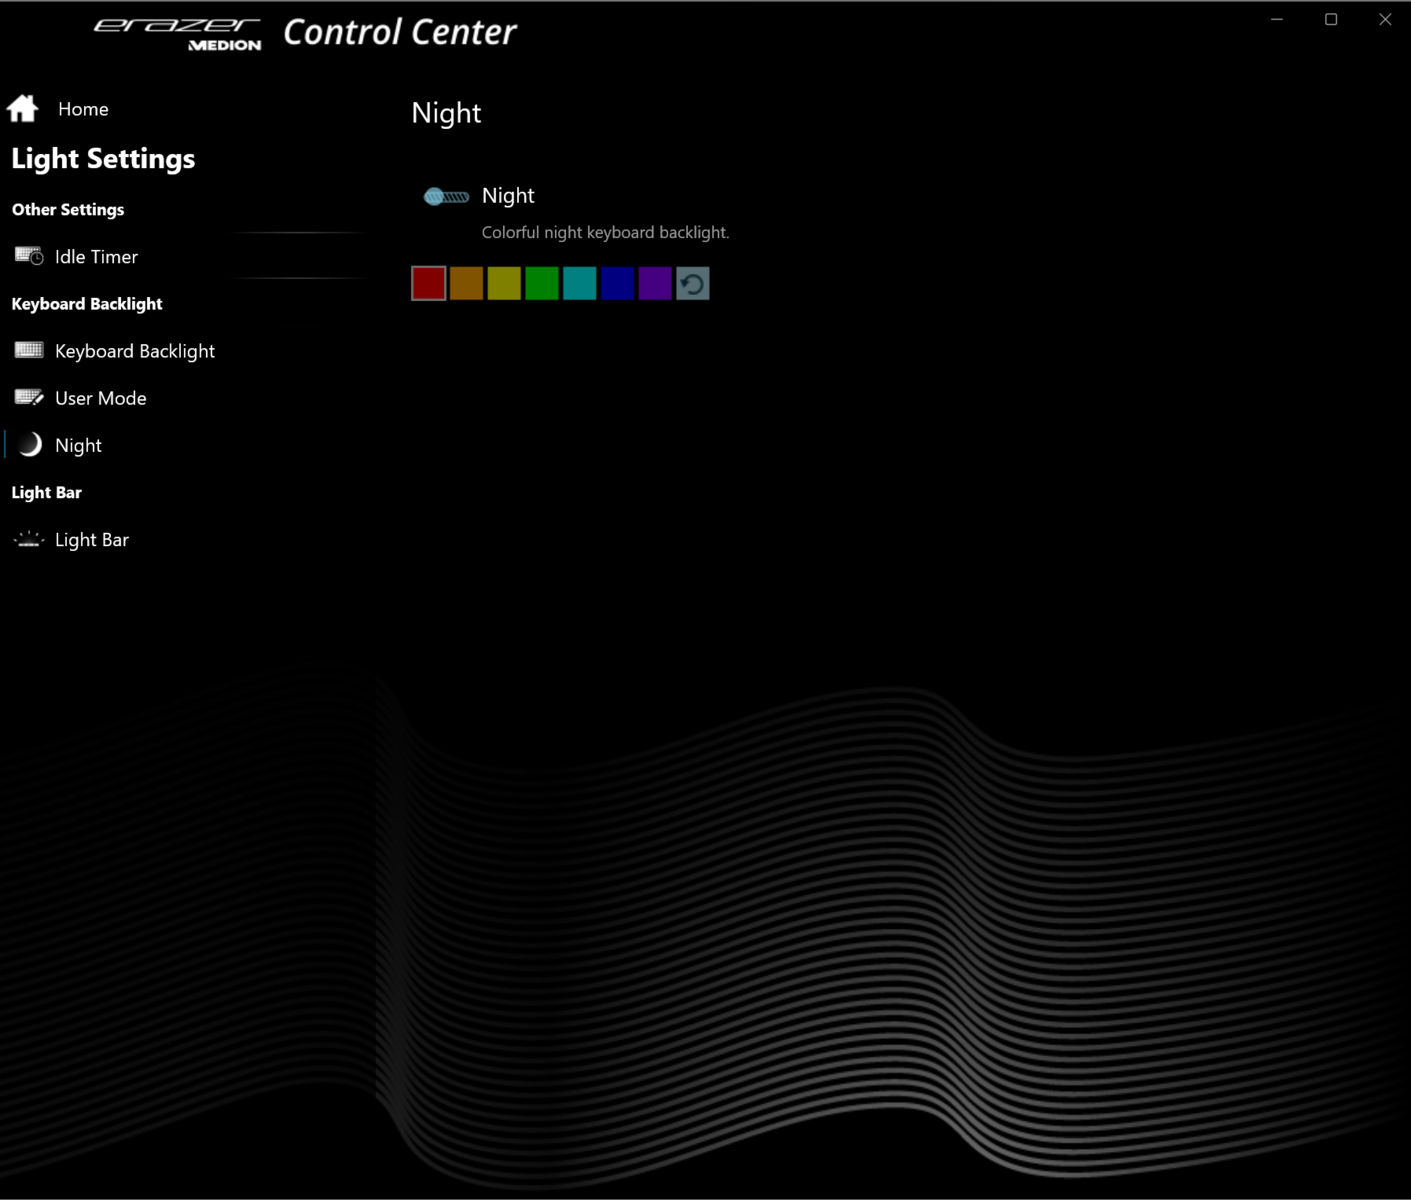
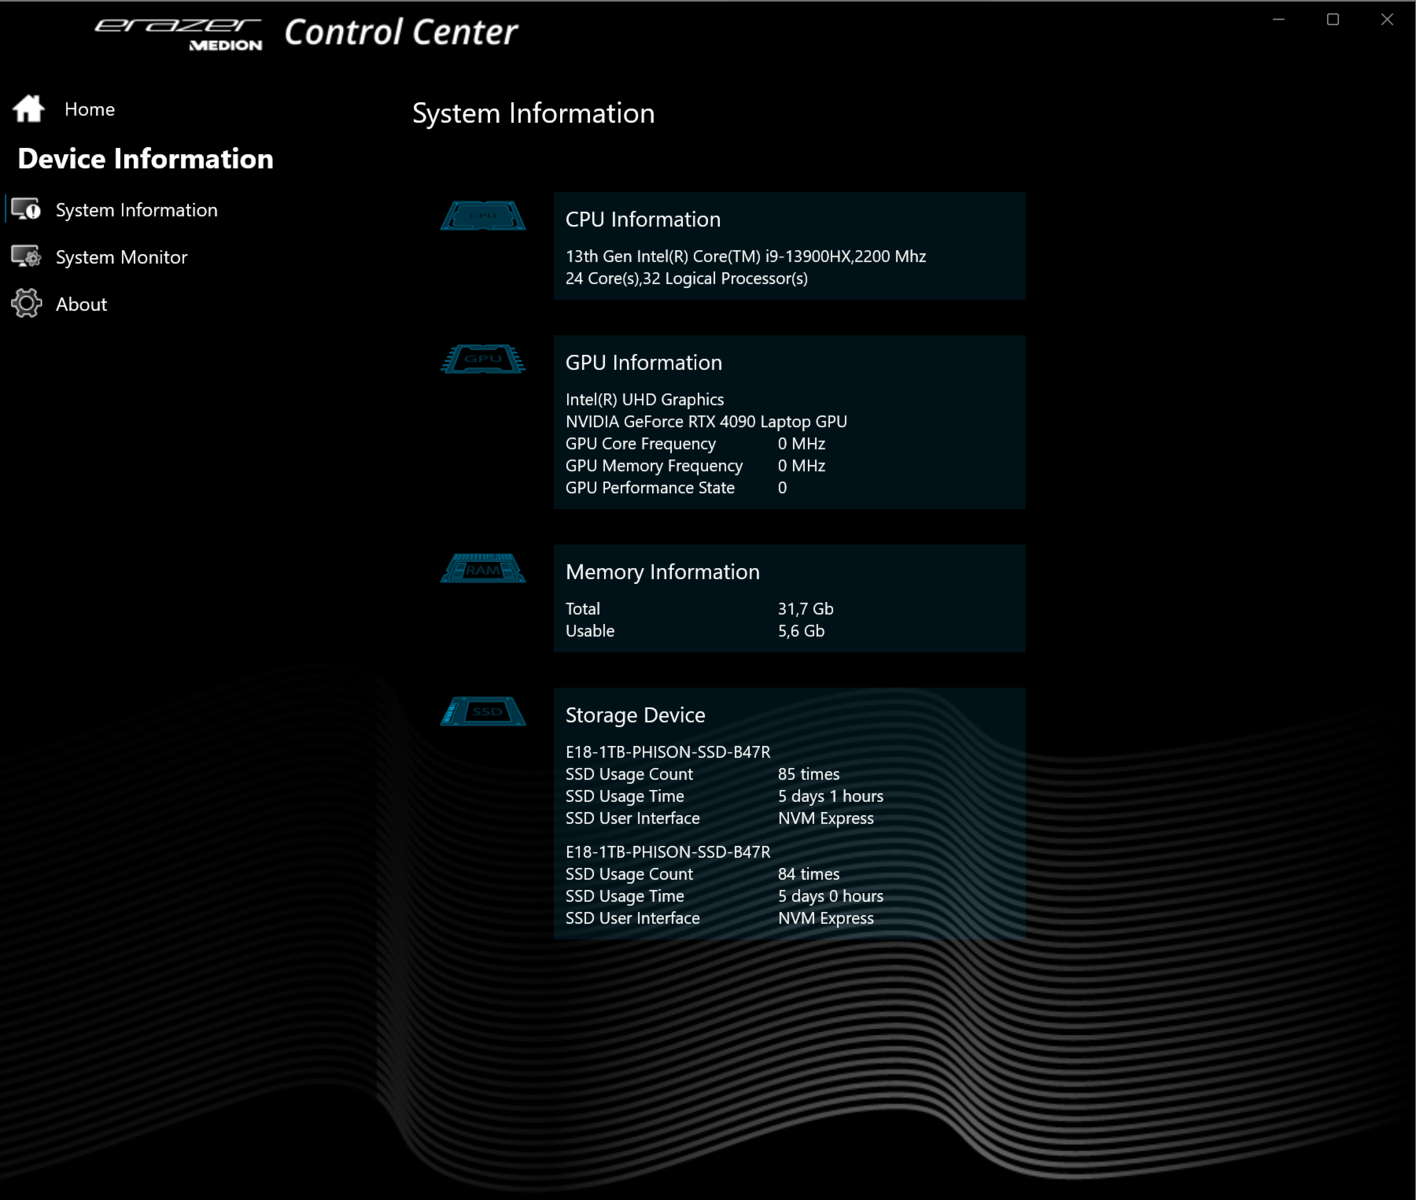
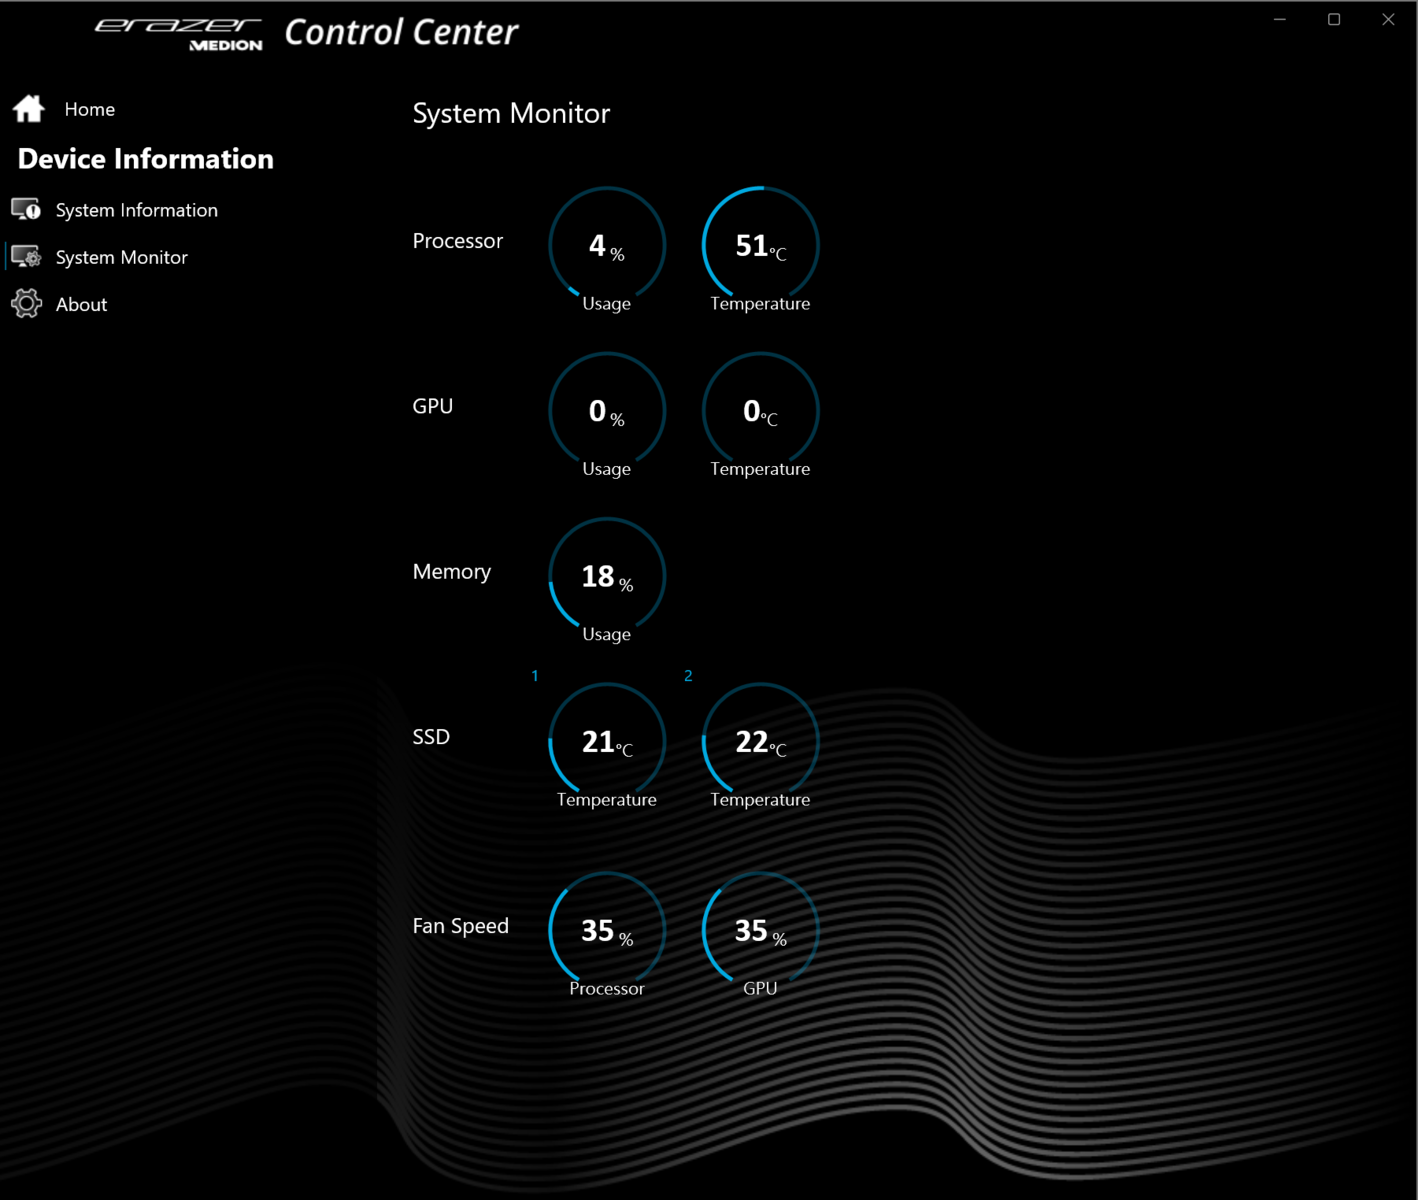
用户可以使用电源按钮旁边的一个专用按钮在三种模式之间进行切换。一个LED状态指示灯显示当前启用的模式。也可以使用预装的控制中心软件创建定制的配置文件。例如,你可以指定CPU的功率限制、GPU的TGP、温度限制等等。
注意:我们在控制中心软件中使用的是英文用户界面,因为德文翻译有一些问题。该软件可以让你在两种语言之间切换。
| 涡轮模式 | 平衡模式 | 办公模式 | |
|---|---|---|---|
| 功率限制1 | 160瓦 | 160瓦 | 160瓦 |
| 功率限制2 | 160瓦 | 160瓦 | 160瓦 |
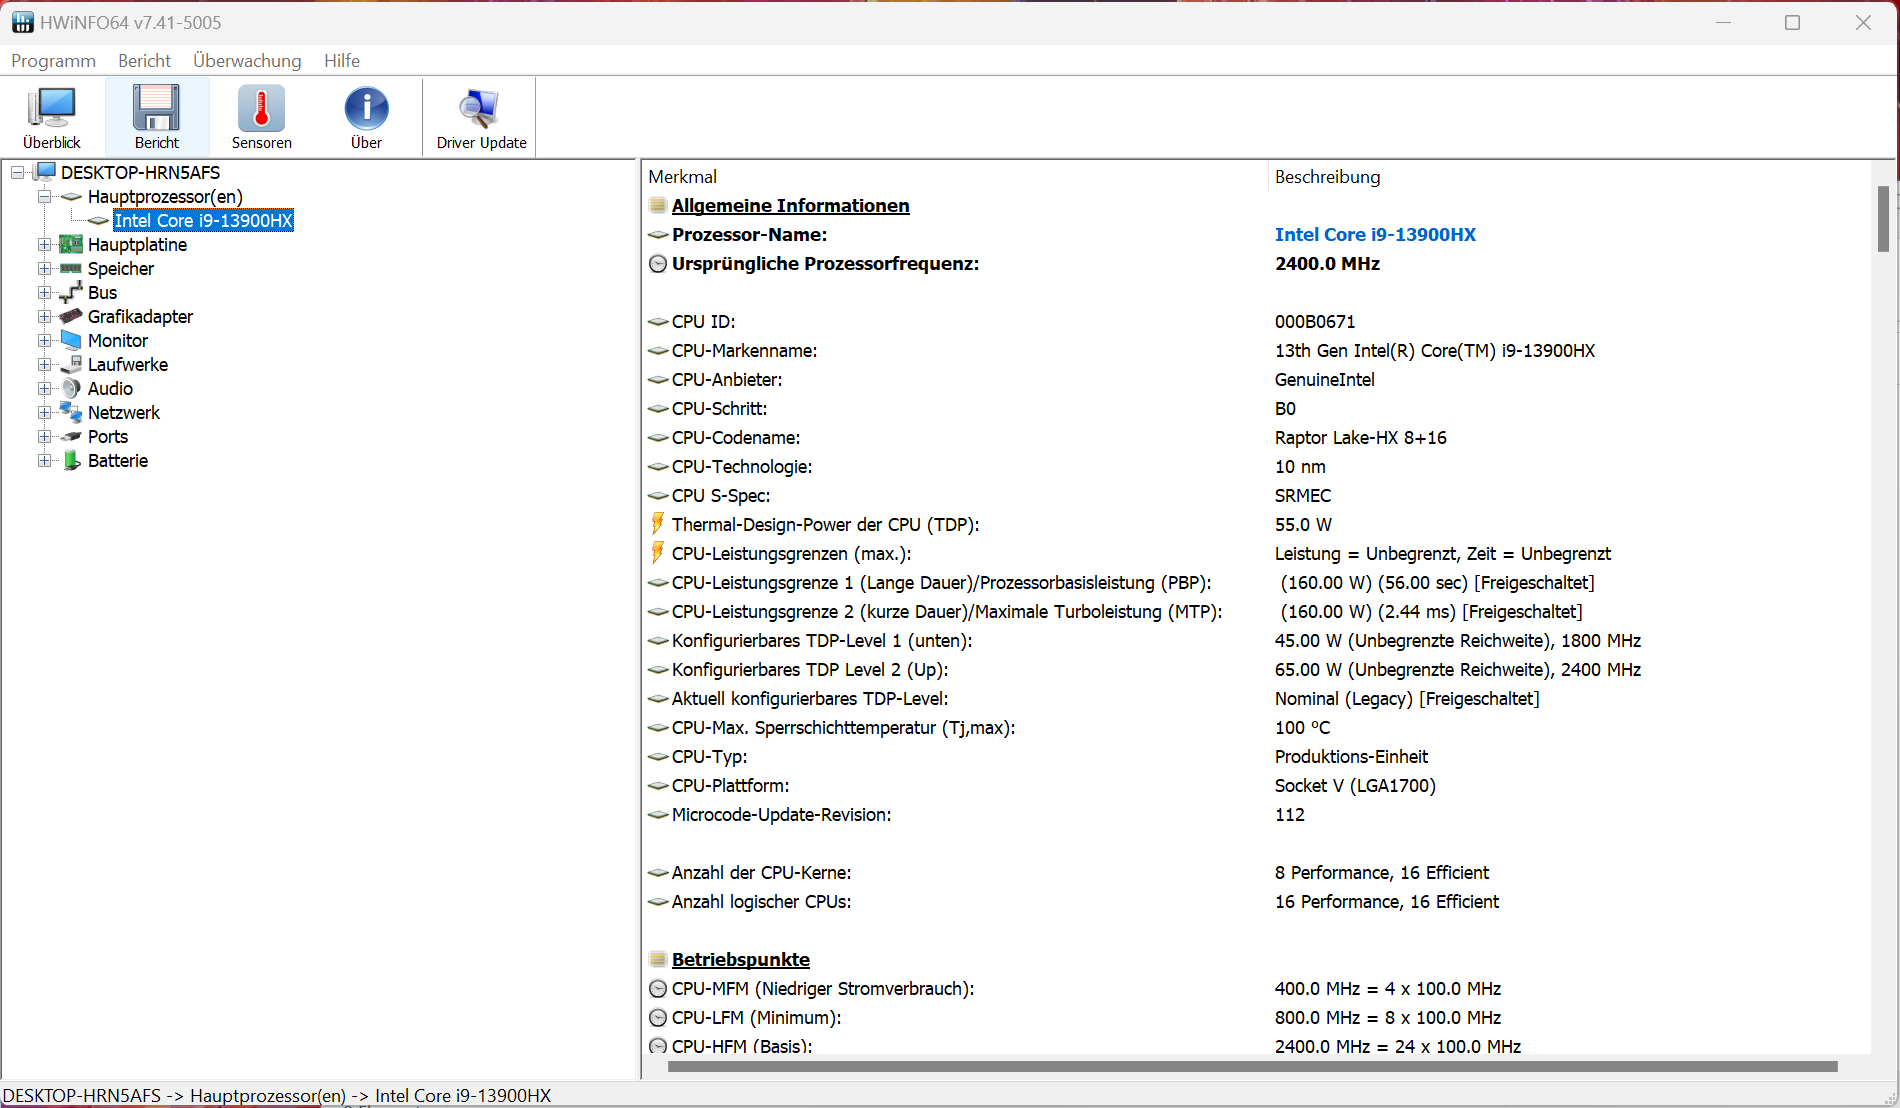
处理器
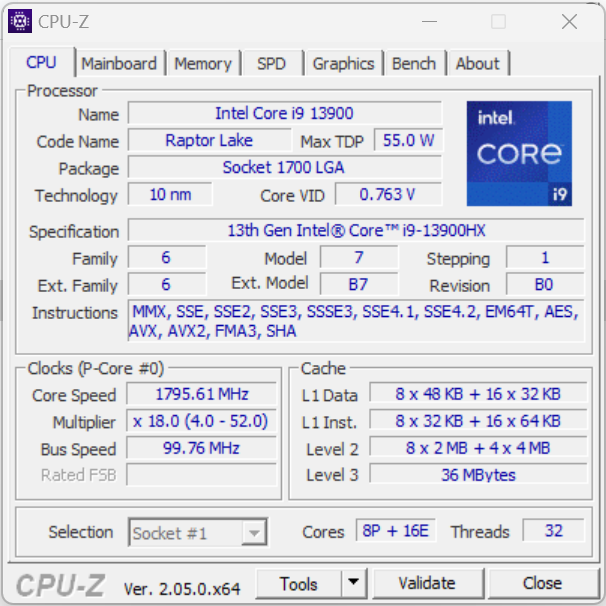
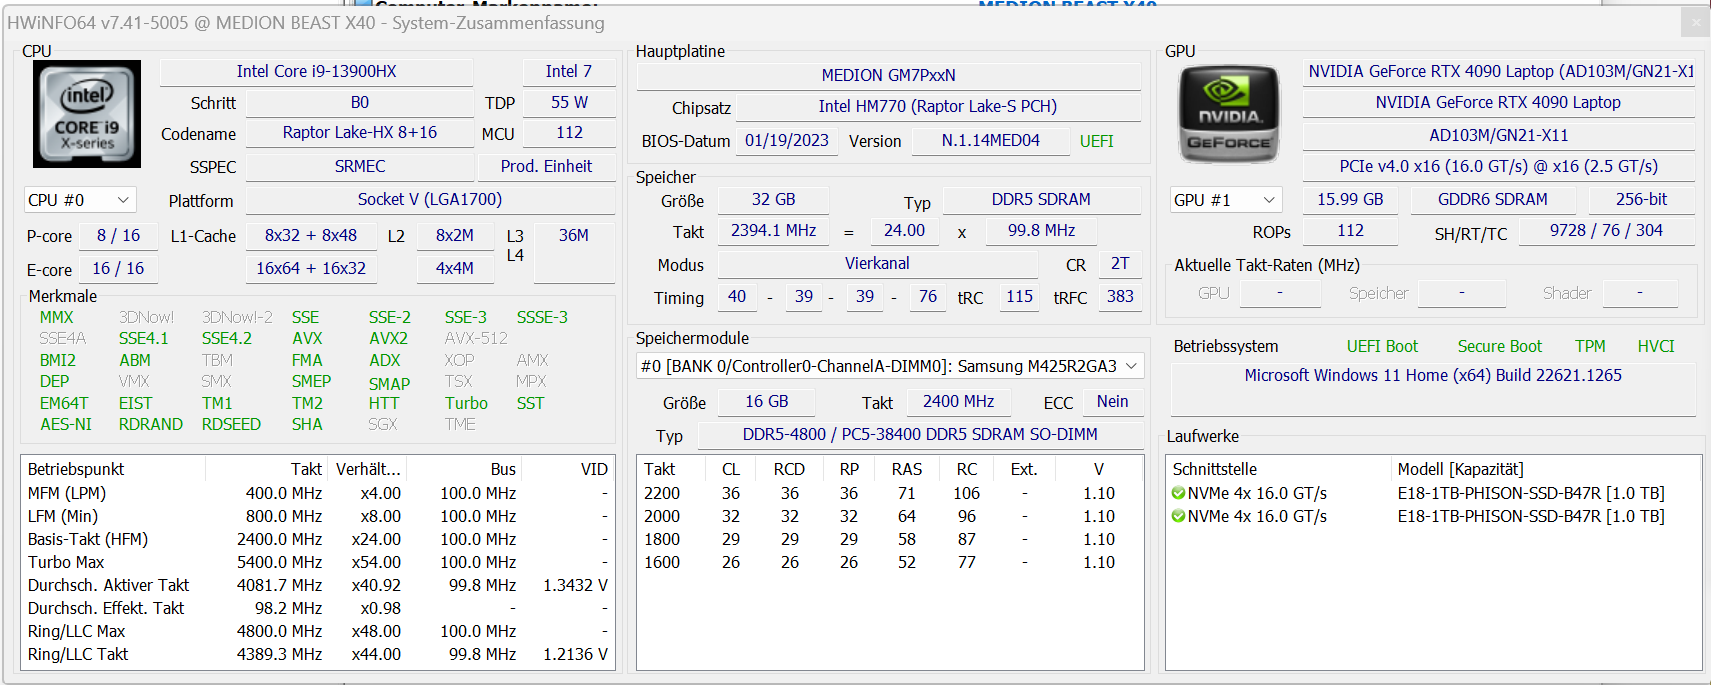
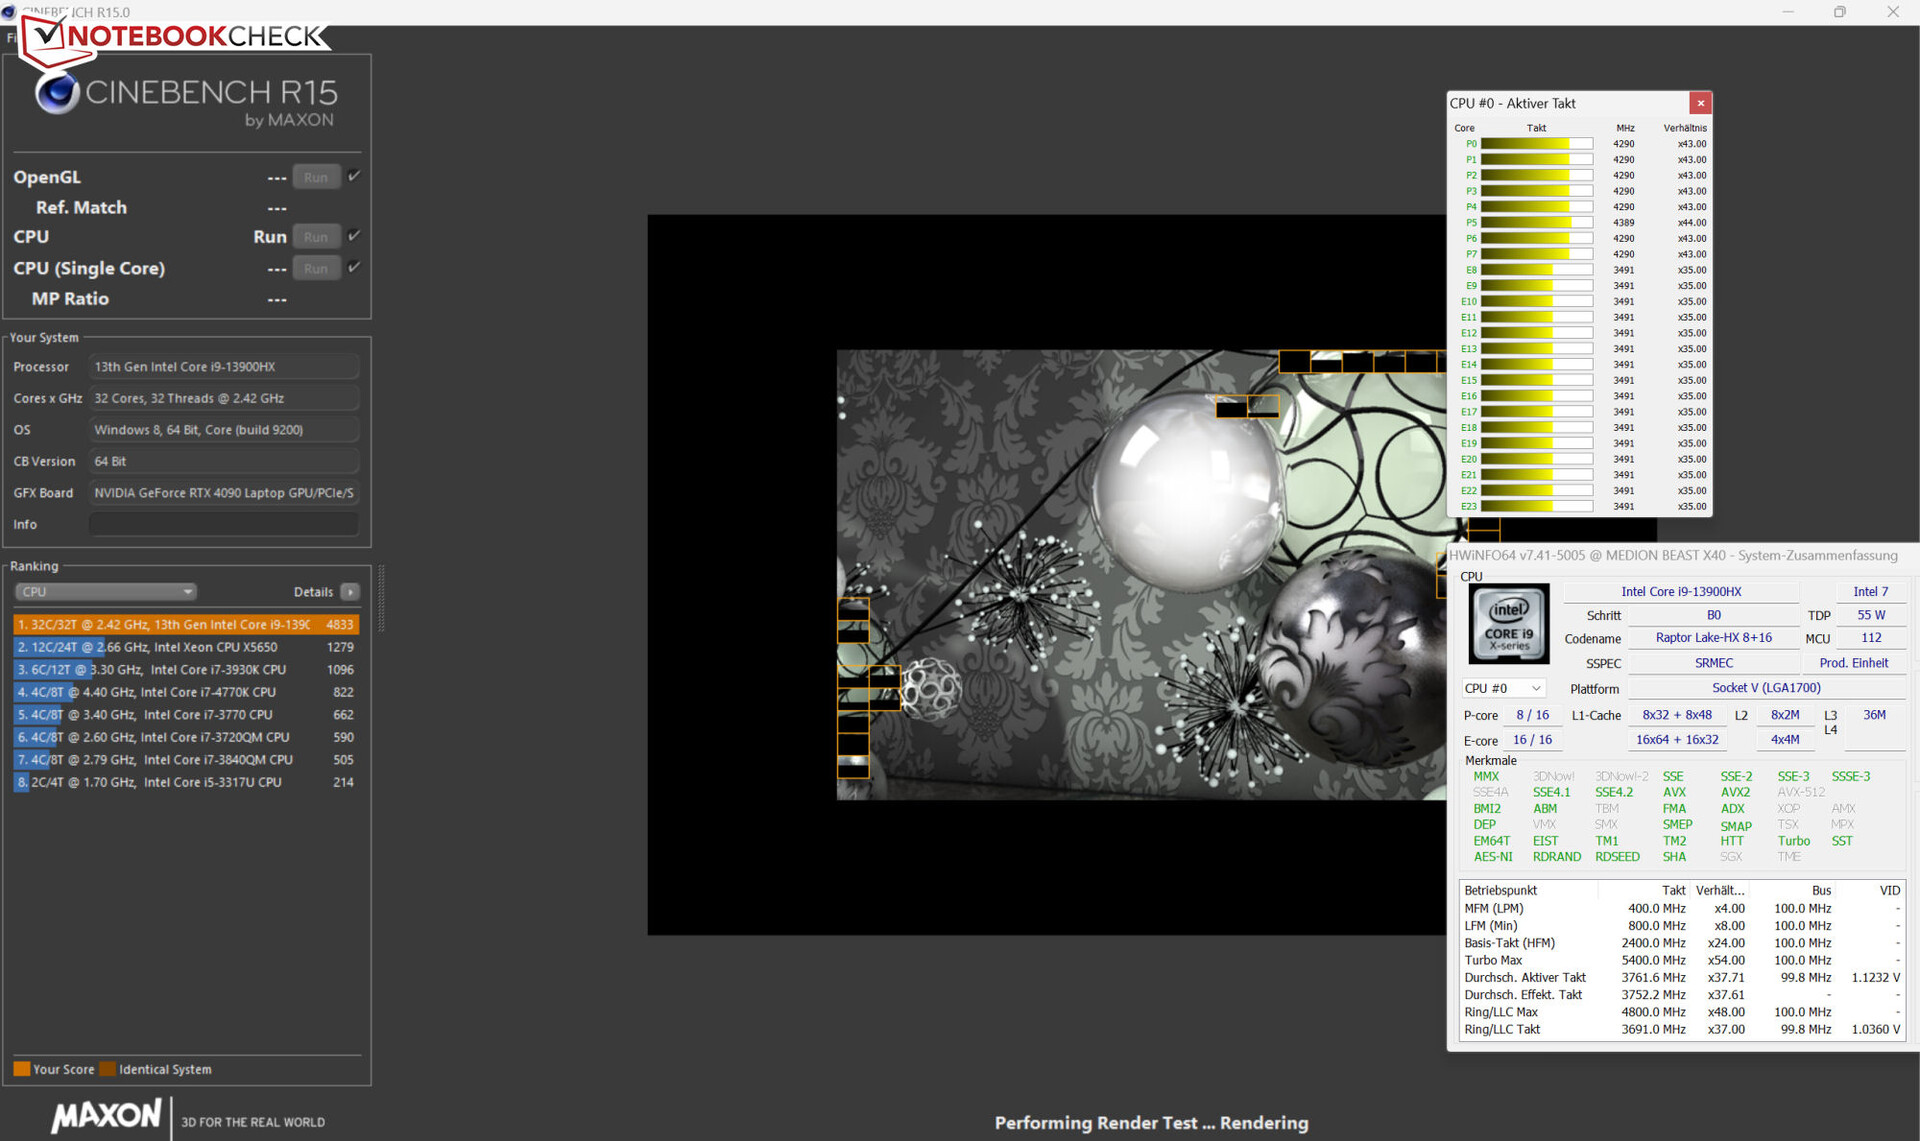
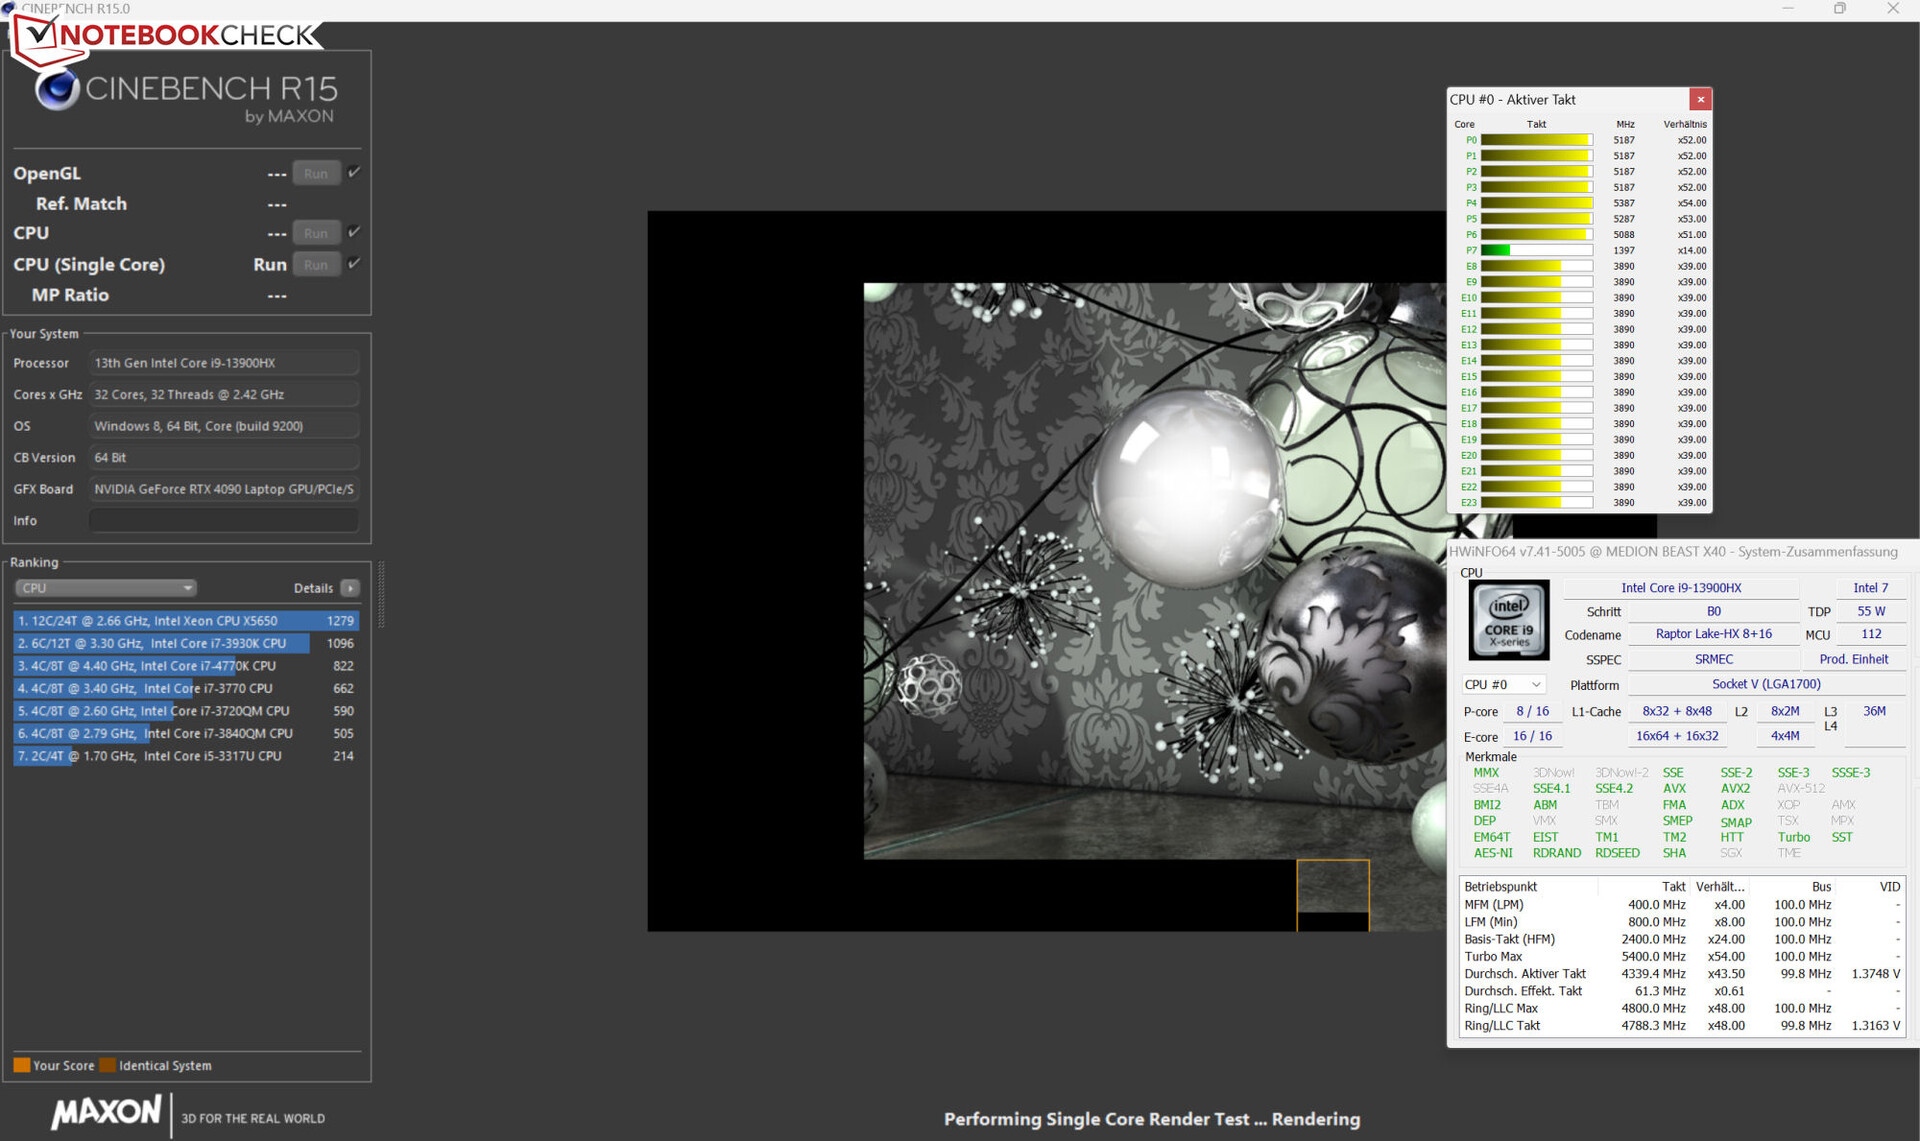
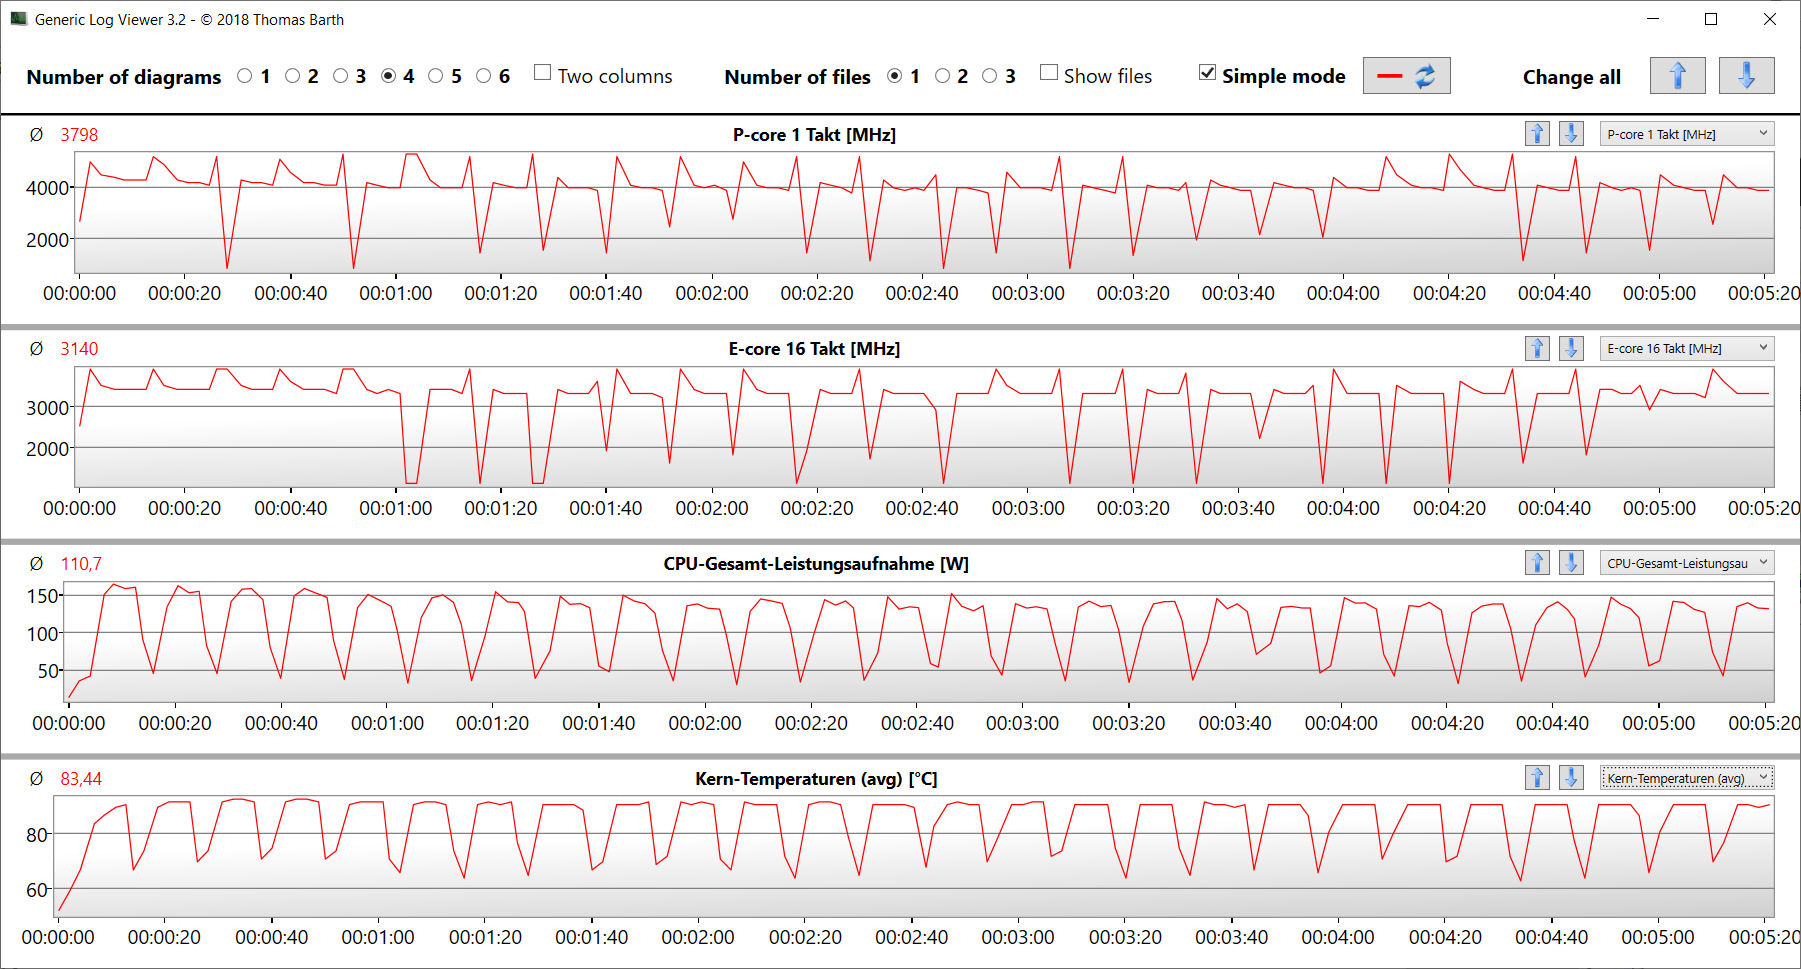
Core i9-13900HX (Raptor Lake)由八个性能核心(超线程,2.2至5.4 GHz)和十六个效率核心(无超线程,1.6至3.9 GHz)组成,总共有40个逻辑核心。获得的基准测试结果略高于CPU能够产生的平均水平。
在插上Erazer Beast X40的情况下,其CPU在高至最大的时钟速度下运行Cinebench R15。在电池供电的情况下,单线程性能只略微降低(得分:228),而多线程性能则受到了相当大的打击(得分:1154)。循环运行Cinebench 15表明,在主电源上,CPU能够以高提升速度持续运行。
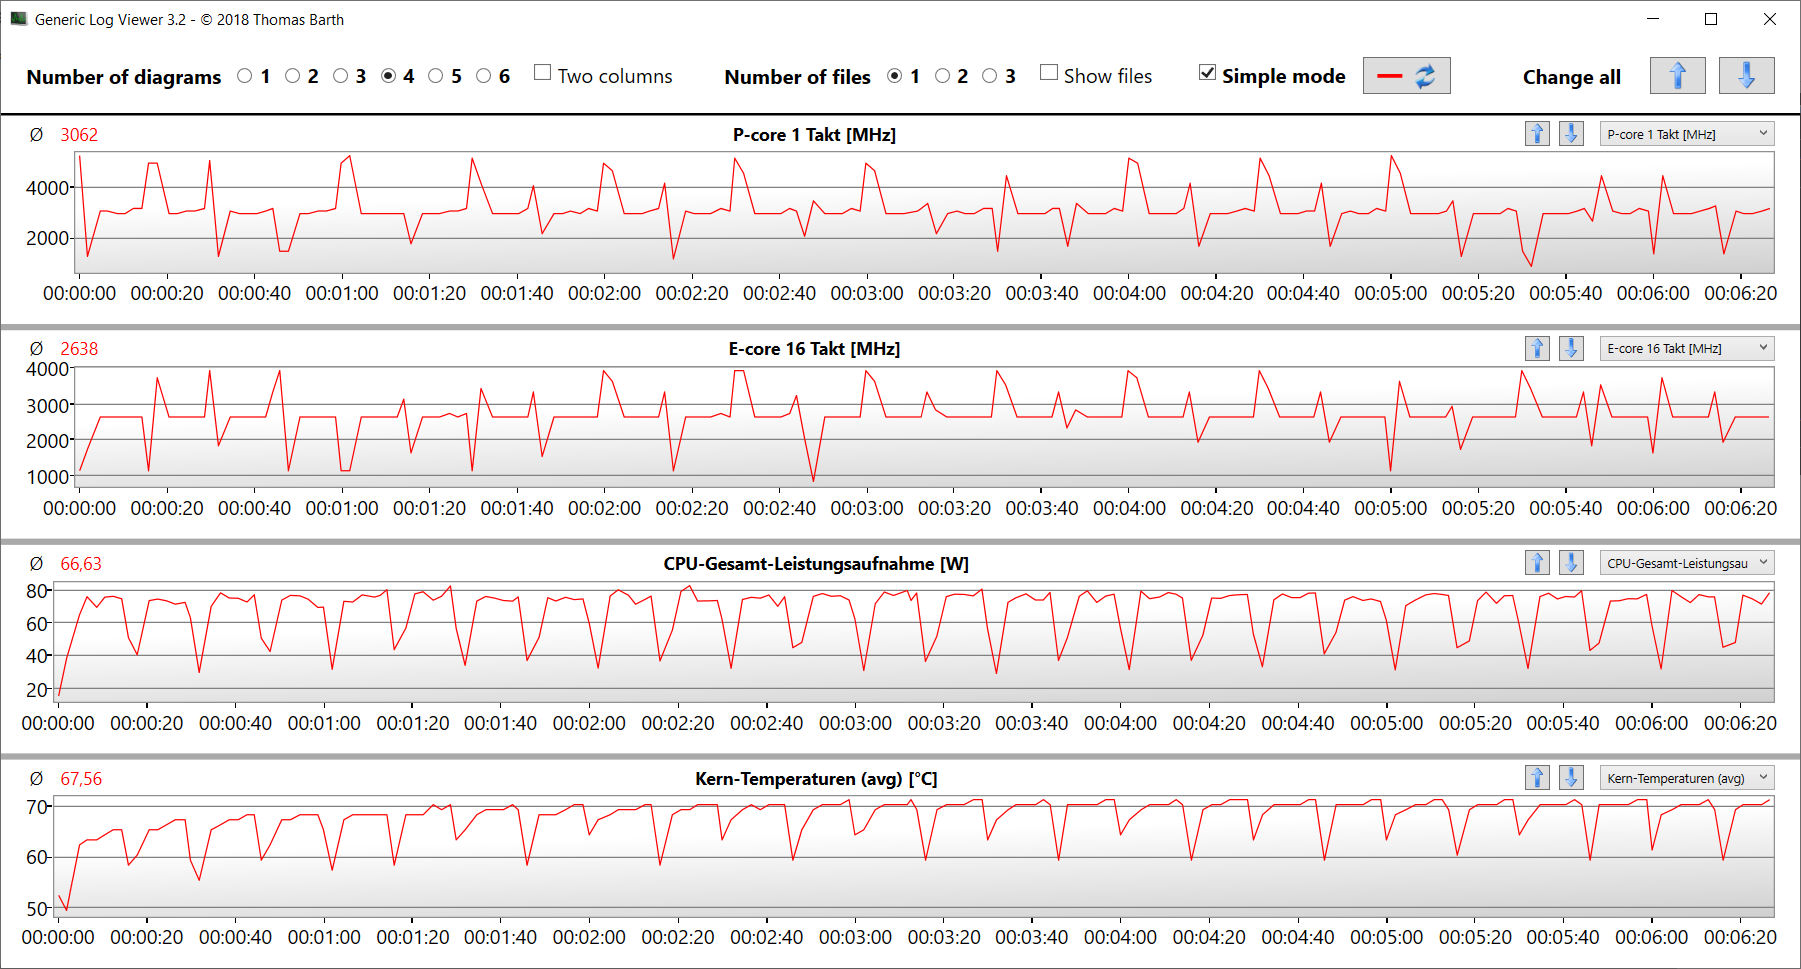
使用水冷装置并没有带来任何性能上的大幅提升。尽管如此,在持续的多线程负载下,CPU的性能更加稳定(CB15循环),CPU的平均温度下降了约5℃(9℉)。
Cinebench R15 Multi Sustained Load
| CPU Performance rating - Percent | |
| Asus ROG Strix Scar 18 2023 G834JY-N6005W | |
| MSI Titan GT77 HX 13VI | |
| Medion Erazer Beast X40 | |
| Medion Erazer Beast X40 | |
| Average Intel Core i9-13900HX | |
| Razer Blade 16 Early 2023 | |
| Average of class Gaming | |
| Alienware x17 R2 P48E | |
| Schenker XMG Neo 17 M22 | |
| Cinebench R20 | |
| CPU (Multi Core) | |
| MSI Titan GT77 HX 13VI | |
| Asus ROG Strix Scar 18 2023 G834JY-N6005W | |
| Medion Erazer Beast X40 (dGPU, Cooling) | |
| Medion Erazer Beast X40 | |
| Average Intel Core i9-13900HX (9152 - 12541, n=21) | |
| Average of class Gaming (4029 - 16433, n=106, last 2 years) | |
| Razer Blade 16 Early 2023 | |
| Alienware x17 R2 P48E | |
| Schenker XMG Neo 17 M22 | |
| CPU (Single Core) | |
| Asus ROG Strix Scar 18 2023 G834JY-N6005W | |
| MSI Titan GT77 HX 13VI | |
| Medion Erazer Beast X40 (dGPU, Cooling) | |
| Average Intel Core i9-13900HX (722 - 810, n=21) | |
| Medion Erazer Beast X40 | |
| Average of class Gaming (442 - 913, n=106, last 2 years) | |
| Razer Blade 16 Early 2023 | |
| Alienware x17 R2 P48E | |
| Schenker XMG Neo 17 M22 | |
| Cinebench R15 | |
| CPU Multi 64Bit | |
| MSI Titan GT77 HX 13VI | |
| Medion Erazer Beast X40 | |
| Medion Erazer Beast X40 (dGPU, Cooling) | |
| Medion Erazer Beast X40 (dGPU, Cooling) | |
| Asus ROG Strix Scar 18 2023 G834JY-N6005W | |
| Razer Blade 16 Early 2023 | |
| Average Intel Core i9-13900HX (3913 - 4970, n=22) | |
| Average of class Gaming (1578 - 6330, n=105, last 2 years) | |
| Alienware x17 R2 P48E | |
| Schenker XMG Neo 17 M22 | |
| CPU Single 64Bit | |
| Asus ROG Strix Scar 18 2023 G834JY-N6005W | |
| MSI Titan GT77 HX 13VI | |
| Medion Erazer Beast X40 | |
| Average of class Gaming (188.8 - 350, n=106, last 2 years) | |
| Medion Erazer Beast X40 (dGPU, Cooling) | |
| Medion Erazer Beast X40 (dGPU, Cooling) | |
| Average Intel Core i9-13900HX (247 - 304, n=22) | |
| Razer Blade 16 Early 2023 | |
| Alienware x17 R2 P48E | |
| Schenker XMG Neo 17 M22 | |
| Blender - v2.79 BMW27 CPU | |
| Schenker XMG Neo 17 M22 | |
| Alienware x17 R2 P48E | |
| Average of class Gaming (79 - 330, n=104, last 2 years) | |
| Average Intel Core i9-13900HX (101 - 153, n=22) | |
| Razer Blade 16 Early 2023 | |
| Medion Erazer Beast X40 | |
| Asus ROG Strix Scar 18 2023 G834JY-N6005W | |
| Medion Erazer Beast X40 (dGPU, Cooling) | |
| MSI Titan GT77 HX 13VI | |
| HWBOT x265 Benchmark v2.2 - 4k Preset | |
| Asus ROG Strix Scar 18 2023 G834JY-N6005W | |
| MSI Titan GT77 HX 13VI | |
| Medion Erazer Beast X40 (dGPU, Cooling) | |
| Medion Erazer Beast X40 | |
| Average Intel Core i9-13900HX (23.5 - 34.4, n=22) | |
| Average of class Gaming (11.5 - 44.4, n=105, last 2 years) | |
| Razer Blade 16 Early 2023 | |
| Alienware x17 R2 P48E | |
| Schenker XMG Neo 17 M22 | |
| LibreOffice - 20 Documents To PDF | |
| Schenker XMG Neo 17 M22 | |
| Average of class Gaming (33.2 - 88.8, n=105, last 2 years) | |
| Razer Blade 16 Early 2023 | |
| MSI Titan GT77 HX 13VI | |
| Medion Erazer Beast X40 | |
| Average Intel Core i9-13900HX (32.8 - 51.1, n=21) | |
| Alienware x17 R2 P48E | |
| Medion Erazer Beast X40 (dGPU, Cooling) | |
| Asus ROG Strix Scar 18 2023 G834JY-N6005W | |
| R Benchmark 2.5 - Overall mean | |
| Schenker XMG Neo 17 M22 | |
| Alienware x17 R2 P48E | |
| Average of class Gaming (0.3439 - 0.759, n=106, last 2 years) | |
| Razer Blade 16 Early 2023 | |
| MSI Titan GT77 HX 13VI | |
| Average Intel Core i9-13900HX (0.375 - 0.4564, n=22) | |
| Medion Erazer Beast X40 | |
| Medion Erazer Beast X40 (dGPU, Cooling) | |
| Asus ROG Strix Scar 18 2023 G834JY-N6005W | |
* ... smaller is better
AIDA64: FP32 Ray-Trace | FPU Julia | CPU SHA3 | CPU Queen | FPU SinJulia | FPU Mandel | CPU AES | CPU ZLib | FP64 Ray-Trace | CPU PhotoWorxx
| Performance rating | |
| MSI Titan GT77 HX 13VI | |
| Asus ROG Strix Scar 18 2023 G834JY-N6005W | |
| Medion Erazer Beast X40 | |
| Medion Erazer Beast X40 | |
| Average of class Gaming | |
| Average Intel Core i9-13900HX | |
| Razer Blade 16 Early 2023 | |
| Schenker XMG Neo 17 M22 | |
| Alienware x17 R2 P48E | |
| AIDA64 / FP32 Ray-Trace | |
| Average of class Gaming (10227 - 85542, n=105, last 2 years) | |
| MSI Titan GT77 HX 13VI (v6.85.6300) | |
| Asus ROG Strix Scar 18 2023 G834JY-N6005W (v6.85.6300) | |
| Medion Erazer Beast X40 (v6.75.6100, dGPU, Cooling) | |
| Medion Erazer Beast X40 (v6.75.6100) | |
| Razer Blade 16 Early 2023 (v6.85.6300) | |
| Razer Blade 16 Early 2023 (v8.20.8100) | |
| Razer Blade 16 Early 2023 (v6.92.6600) | |
| Average Intel Core i9-13900HX (17589 - 27615, n=22) | |
| Schenker XMG Neo 17 M22 (v6.70.6000) | |
| Alienware x17 R2 P48E (v6.50.5800) | |
| AIDA64 / FPU Julia | |
| MSI Titan GT77 HX 13VI (v6.85.6300) | |
| Average of class Gaming (51376 - 238426, n=105, last 2 years) | |
| Asus ROG Strix Scar 18 2023 G834JY-N6005W (v6.85.6300) | |
| Medion Erazer Beast X40 (v6.75.6100, dGPU, Cooling) | |
| Medion Erazer Beast X40 (v6.75.6100) | |
| Razer Blade 16 Early 2023 (v6.85.6300) | |
| Razer Blade 16 Early 2023 (v8.20.8100) | |
| Razer Blade 16 Early 2023 (v6.92.6600) | |
| Average Intel Core i9-13900HX (88686 - 137015, n=22) | |
| Schenker XMG Neo 17 M22 (v6.70.6000) | |
| Alienware x17 R2 P48E (v6.50.5800) | |
| AIDA64 / CPU SHA3 | |
| MSI Titan GT77 HX 13VI (v6.85.6300) | |
| Asus ROG Strix Scar 18 2023 G834JY-N6005W (v6.85.6300) | |
| Medion Erazer Beast X40 (v6.75.6100, dGPU, Cooling) | |
| Medion Erazer Beast X40 (v6.75.6100) | |
| Average of class Gaming (2180 - 10115, n=105, last 2 years) | |
| Razer Blade 16 Early 2023 (v6.85.6300) | |
| Razer Blade 16 Early 2023 (v6.92.6600) | |
| Razer Blade 16 Early 2023 (v8.20.8100) | |
| Average Intel Core i9-13900HX (4362 - 7029, n=22) | |
| Alienware x17 R2 P48E (v6.50.5800) | |
| Schenker XMG Neo 17 M22 (v6.70.6000) | |
| AIDA64 / CPU Queen | |
| Asus ROG Strix Scar 18 2023 G834JY-N6005W (v6.85.6300) | |
| MSI Titan GT77 HX 13VI (v6.85.6300) | |
| Razer Blade 16 Early 2023 (v6.92.6600) | |
| Razer Blade 16 Early 2023 (v6.85.6300) | |
| Medion Erazer Beast X40 (v6.75.6100, dGPU, Cooling) | |
| Average Intel Core i9-13900HX (125644 - 141385, n=22) | |
| Medion Erazer Beast X40 (v6.75.6100) | |
| Average of class Gaming (49785 - 173351, n=90, last 2 years) | |
| Alienware x17 R2 P48E (v6.50.5800) | |
| Schenker XMG Neo 17 M22 (v6.70.6000) | |
| AIDA64 / FPU SinJulia | |
| Asus ROG Strix Scar 18 2023 G834JY-N6005W (v6.85.6300) | |
| MSI Titan GT77 HX 13VI (v6.85.6300) | |
| Medion Erazer Beast X40 (v6.75.6100, dGPU, Cooling) | |
| Medion Erazer Beast X40 (v6.75.6100) | |
| Razer Blade 16 Early 2023 (v6.85.6300) | |
| Razer Blade 16 Early 2023 (v8.20.8100) | |
| Razer Blade 16 Early 2023 (v6.92.6600) | |
| Average Intel Core i9-13900HX (12334 - 17179, n=22) | |
| Average of class Gaming (4424 - 33636, n=105, last 2 years) | |
| Schenker XMG Neo 17 M22 (v6.70.6000) | |
| Alienware x17 R2 P48E (v6.50.5800) | |
| AIDA64 / FPU Mandel | |
| Average of class Gaming (25115 - 128721, n=105, last 2 years) | |
| MSI Titan GT77 HX 13VI (v6.85.6300) | |
| Asus ROG Strix Scar 18 2023 G834JY-N6005W (v6.85.6300) | |
| Medion Erazer Beast X40 (v6.75.6100, dGPU, Cooling) | |
| Medion Erazer Beast X40 (v6.75.6100) | |
| Razer Blade 16 Early 2023 (v6.85.6300) | |
| Razer Blade 16 Early 2023 (v8.20.8100) | |
| Razer Blade 16 Early 2023 (v6.92.6600) | |
| Average Intel Core i9-13900HX (43850 - 69202, n=22) | |
| Schenker XMG Neo 17 M22 (v6.70.6000) | |
| Alienware x17 R2 P48E (v6.50.5800) | |
| AIDA64 / CPU AES | |
| Razer Blade 16 Early 2023 (v6.92.6600) | |
| Razer Blade 16 Early 2023 (v8.20.8100) | |
| Razer Blade 16 Early 2023 (v6.85.6300) | |
| Average Intel Core i9-13900HX (89413 - 237881, n=22) | |
| MSI Titan GT77 HX 13VI (v6.85.6300) | |
| Schenker XMG Neo 17 M22 (v6.70.6000) | |
| Asus ROG Strix Scar 18 2023 G834JY-N6005W (v6.85.6300) | |
| Medion Erazer Beast X40 (v6.75.6100, dGPU, Cooling) | |
| Medion Erazer Beast X40 (v6.75.6100) | |
| Average of class Gaming (39258 - 247074, n=105, last 2 years) | |
| Alienware x17 R2 P48E (v6.50.5800) | |
| AIDA64 / CPU ZLib | |
| MSI Titan GT77 HX 13VI (v6.85.6300) | |
| Asus ROG Strix Scar 18 2023 G834JY-N6005W (v6.85.6300) | |
| Medion Erazer Beast X40 (v6.75.6100, dGPU, Cooling) | |
| Medion Erazer Beast X40 (v6.75.6100) | |
| Razer Blade 16 Early 2023 (v6.85.6300) | |
| Razer Blade 16 Early 2023 (v6.92.6600) | |
| Razer Blade 16 Early 2023 (v8.20.8100) | |
| Average Intel Core i9-13900HX (1284 - 1958, n=22) | |
| Average of class Gaming (574 - 2531, n=105, last 2 years) | |
| Alienware x17 R2 P48E (v6.50.5800) | |
| Schenker XMG Neo 17 M22 (v6.70.6000) | |
| AIDA64 / FP64 Ray-Trace | |
| Average of class Gaming (5509 - 45446, n=105, last 2 years) | |
| MSI Titan GT77 HX 13VI (v6.85.6300) | |
| Asus ROG Strix Scar 18 2023 G834JY-N6005W (v6.85.6300) | |
| Medion Erazer Beast X40 (v6.75.6100, dGPU, Cooling) | |
| Medion Erazer Beast X40 (v6.75.6100) | |
| Razer Blade 16 Early 2023 (v6.85.6300) | |
| Razer Blade 16 Early 2023 (v6.92.6600) | |
| Razer Blade 16 Early 2023 (v8.20.8100) | |
| Average Intel Core i9-13900HX (9481 - 15279, n=22) | |
| Schenker XMG Neo 17 M22 (v6.70.6000) | |
| Alienware x17 R2 P48E (v6.50.5800) | |
| AIDA64 / CPU PhotoWorxx | |
| Razer Blade 16 Early 2023 (v6.85.6300) | |
| Razer Blade 16 Early 2023 (v6.92.6600) | |
| Razer Blade 16 Early 2023 (v8.20.8100) | |
| Average Intel Core i9-13900HX (42994 - 51994, n=22) | |
| Average of class Gaming (12271 - 89891, n=105, last 2 years) | |
| Medion Erazer Beast X40 (v6.75.6100, dGPU, Cooling) | |
| Asus ROG Strix Scar 18 2023 G834JY-N6005W (v6.85.6300) | |
| Medion Erazer Beast X40 (v6.75.6100) | |
| MSI Titan GT77 HX 13VI (v6.85.6300) | |
| Alienware x17 R2 P48E (v6.50.5800) | |
| Schenker XMG Neo 17 M22 (v6.70.6000) | |
系统性能
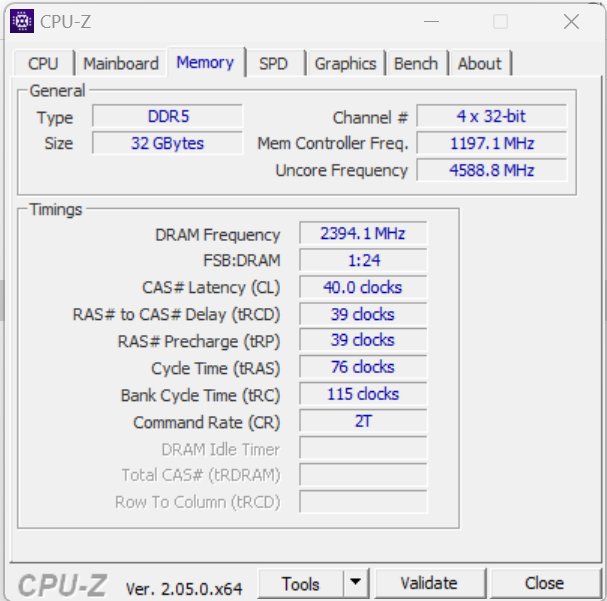
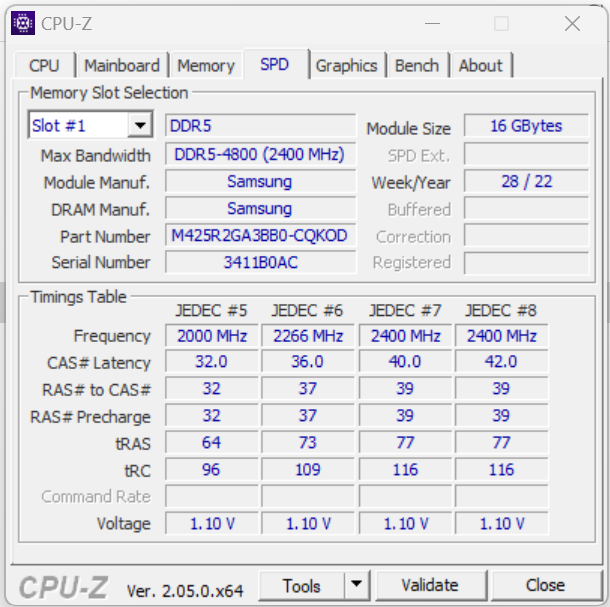
这个迅捷的系统内部的硬件为游戏和渲染等任务提供了足够的性能。这款笔记本电脑配备了32GB的内存,以双通道模式运行。而且内存的传输率是典型的DDR5-4800内存。更重要的是,在我们的测试中,该系统还提供了极佳的PCMark结果。
CrossMark: Overall | Productivity | Creativity | Responsiveness
| PCMark 10 / Score | |
| Medion Erazer Beast X40 (dGPU, Cooling) | |
| MSI Titan GT77 HX 13VI | |
| Asus ROG Strix Scar 18 2023 G834JY-N6005W | |
| Average Intel Core i9-13900HX, NVIDIA GeForce RTX 4090 Laptop GPU (7690 - 9331, n=8) | |
| Average of class Gaming (5828 - 12414, n=93, last 2 years) | |
| Alienware x17 R2 P48E | |
| Medion Erazer Beast X40 | |
| Razer Blade 16 Early 2023 | |
| Schenker XMG Neo 17 M22 | |
| PCMark 10 / Essentials | |
| MSI Titan GT77 HX 13VI | |
| Medion Erazer Beast X40 (dGPU, Cooling) | |
| Average Intel Core i9-13900HX, NVIDIA GeForce RTX 4090 Laptop GPU (10972 - 11983, n=8) | |
| Medion Erazer Beast X40 | |
| Alienware x17 R2 P48E | |
| Razer Blade 16 Early 2023 | |
| Average of class Gaming (8810 - 11935, n=97, last 2 years) | |
| Schenker XMG Neo 17 M22 | |
| PCMark 10 / Productivity | |
| Medion Erazer Beast X40 (dGPU, Cooling) | |
| Medion Erazer Beast X40 | |
| Average of class Gaming (6845 - 25323, n=95, last 2 years) | |
| Average Intel Core i9-13900HX, NVIDIA GeForce RTX 4090 Laptop GPU (9038 - 11680, n=8) | |
| Alienware x17 R2 P48E | |
| MSI Titan GT77 HX 13VI | |
| Schenker XMG Neo 17 M22 | |
| Razer Blade 16 Early 2023 | |
| PCMark 10 / Digital Content Creation | |
| MSI Titan GT77 HX 13VI | |
| Medion Erazer Beast X40 (dGPU, Cooling) | |
| Razer Blade 16 Early 2023 | |
| Average of class Gaming (7602 - 19954, n=95, last 2 years) | |
| Average Intel Core i9-13900HX, NVIDIA GeForce RTX 4090 Laptop GPU (10605 - 16395, n=8) | |
| Alienware x17 R2 P48E | |
| Medion Erazer Beast X40 | |
| Schenker XMG Neo 17 M22 | |
| CrossMark / Overall | |
| Medion Erazer Beast X40 (dGPU, Cooling) | |
| MSI Titan GT77 HX 13VI | |
| Medion Erazer Beast X40 | |
| Average Intel Core i9-13900HX, NVIDIA GeForce RTX 4090 Laptop GPU (1825 - 2295, n=8) | |
| Asus ROG Strix Scar 18 2023 G834JY-N6005W | |
| Average of class Gaming (1366 - 2409, n=94, last 2 years) | |
| Alienware x17 R2 P48E | |
| Schenker XMG Neo 17 M22 | |
| Razer Blade 16 Early 2023 | |
| CrossMark / Productivity | |
| Medion Erazer Beast X40 (dGPU, Cooling) | |
| Medion Erazer Beast X40 | |
| MSI Titan GT77 HX 13VI | |
| Average Intel Core i9-13900HX, NVIDIA GeForce RTX 4090 Laptop GPU (1666 - 2166, n=8) | |
| Asus ROG Strix Scar 18 2023 G834JY-N6005W | |
| Average of class Gaming (1386 - 2254, n=94, last 2 years) | |
| Alienware x17 R2 P48E | |
| Schenker XMG Neo 17 M22 | |
| Razer Blade 16 Early 2023 | |
| CrossMark / Creativity | |
| Asus ROG Strix Scar 18 2023 G834JY-N6005W | |
| MSI Titan GT77 HX 13VI | |
| Medion Erazer Beast X40 (dGPU, Cooling) | |
| Medion Erazer Beast X40 | |
| Average Intel Core i9-13900HX, NVIDIA GeForce RTX 4090 Laptop GPU (2162 - 2514, n=8) | |
| Average of class Gaming (1343 - 2786, n=94, last 2 years) | |
| Alienware x17 R2 P48E | |
| Schenker XMG Neo 17 M22 | |
| Razer Blade 16 Early 2023 | |
| CrossMark / Responsiveness | |
| Medion Erazer Beast X40 (dGPU, Cooling) | |
| MSI Titan GT77 HX 13VI | |
| Medion Erazer Beast X40 | |
| Average Intel Core i9-13900HX, NVIDIA GeForce RTX 4090 Laptop GPU (1441 - 2275, n=8) | |
| Average of class Gaming (1226 - 2334, n=94, last 2 years) | |
| Alienware x17 R2 P48E | |
| Asus ROG Strix Scar 18 2023 G834JY-N6005W | |
| Schenker XMG Neo 17 M22 | |
| Razer Blade 16 Early 2023 | |
| PCMark 8 Home Score Accelerated v2 | 4936 points | |
| PCMark 8 Work Score Accelerated v2 | 6075 points | |
| PCMark 10 Score | 7932 points | |
Help | ||
| AIDA64 / Memory Copy | |
| Razer Blade 16 Early 2023 | |
| Razer Blade 16 Early 2023 | |
| Razer Blade 16 Early 2023 | |
| Average Intel Core i9-13900HX (67716 - 79193, n=22) | |
| Average of class Gaming (21750 - 129946, n=105, last 2 years) | |
| Medion Erazer Beast X40 | |
| Asus ROG Strix Scar 18 2023 G834JY-N6005W | |
| MSI Titan GT77 HX 13VI | |
| Alienware x17 R2 P48E | |
| Schenker XMG Neo 17 M22 | |
| AIDA64 / Memory Read | |
| Razer Blade 16 Early 2023 | |
| Razer Blade 16 Early 2023 | |
| Razer Blade 16 Early 2023 | |
| Average Intel Core i9-13900HX (73998 - 88462, n=22) | |
| Asus ROG Strix Scar 18 2023 G834JY-N6005W | |
| Medion Erazer Beast X40 | |
| Average of class Gaming (22956 - 118858, n=105, last 2 years) | |
| MSI Titan GT77 HX 13VI | |
| Alienware x17 R2 P48E | |
| Schenker XMG Neo 17 M22 | |
| AIDA64 / Memory Write | |
| Razer Blade 16 Early 2023 | |
| Razer Blade 16 Early 2023 | |
| Razer Blade 16 Early 2023 | |
| Average of class Gaming (22297 - 135096, n=105, last 2 years) | |
| Average Intel Core i9-13900HX (65472 - 77045, n=22) | |
| Asus ROG Strix Scar 18 2023 G834JY-N6005W | |
| Medion Erazer Beast X40 | |
| MSI Titan GT77 HX 13VI | |
| Schenker XMG Neo 17 M22 | |
| Alienware x17 R2 P48E | |
| AIDA64 / Memory Latency | |
| Average of class Gaming (75.3 - 259, n=105, last 2 years) | |
| Razer Blade 16 Early 2023 | |
| Razer Blade 16 Early 2023 | |
| Razer Blade 16 Early 2023 | |
| Alienware x17 R2 P48E | |
| MSI Titan GT77 HX 13VI | |
| Schenker XMG Neo 17 M22 | |
| Asus ROG Strix Scar 18 2023 G834JY-N6005W | |
| Medion Erazer Beast X40 | |
| Average Intel Core i9-13900HX (75.3 - 91.1, n=22) | |
* ... smaller is better
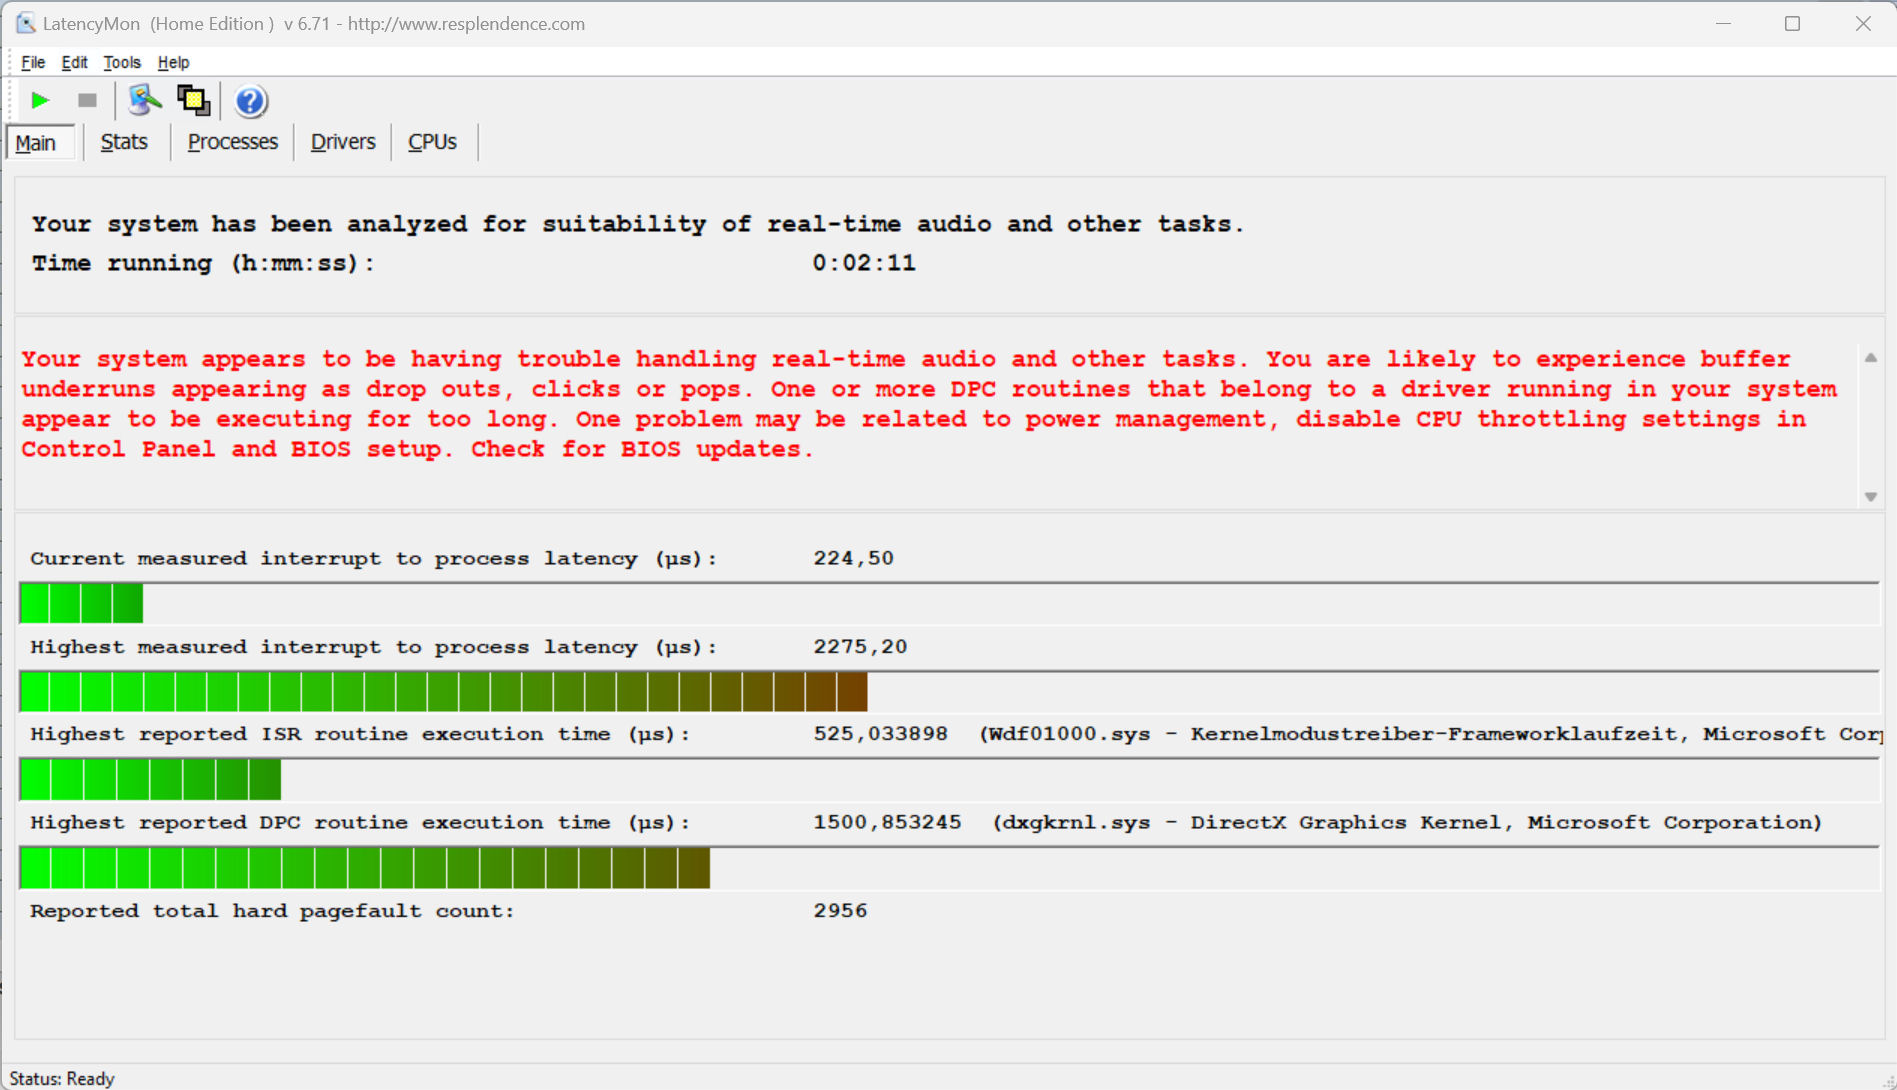
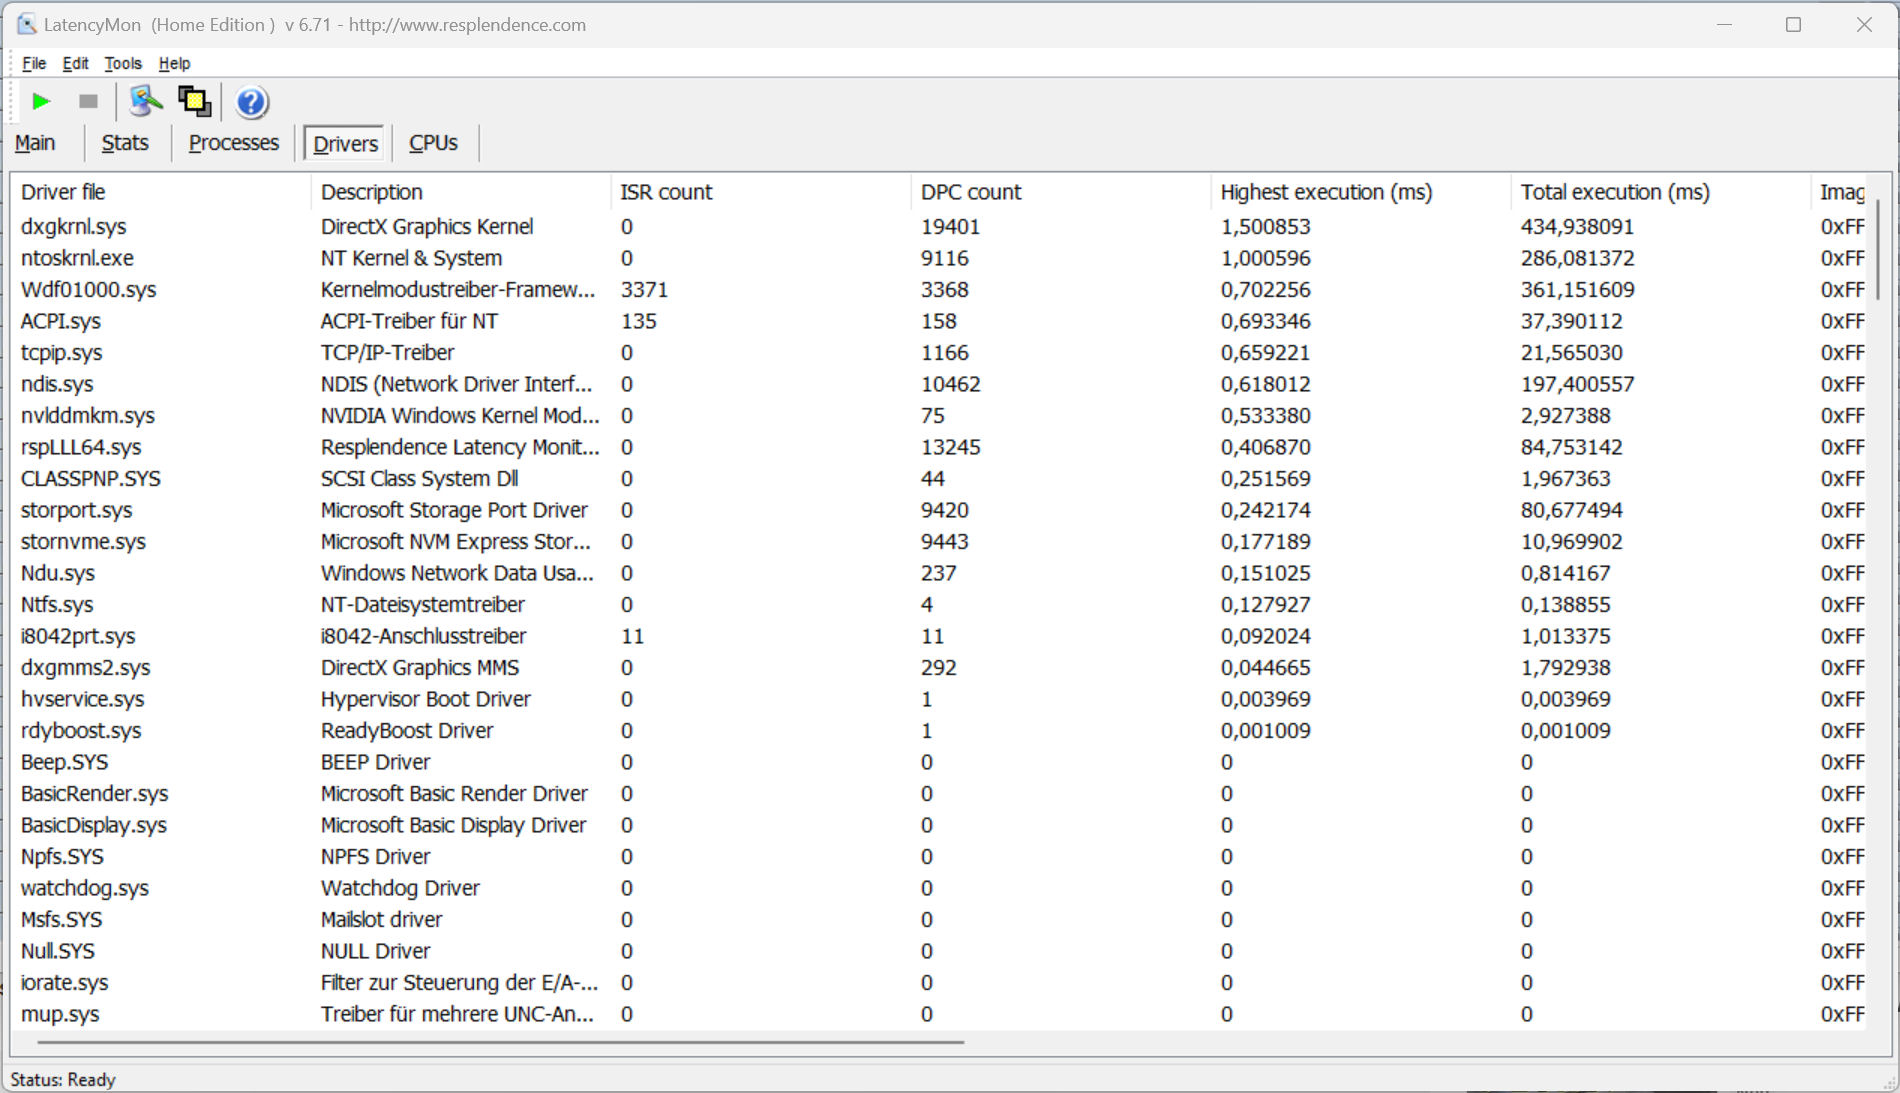
DPC延时
我们的标准化延迟监测测试,包括网页浏览、4K视频播放和Prime95高负荷,发现了一些问题。该系统似乎不适合于实时视频和音频处理。我们希望未来的软件更新将有助于纠正这些问题。
| DPC Latencies / LatencyMon - interrupt to process latency (max), Web, Youtube, Prime95 | |
| MSI Titan GT77 HX 13VI | |
| Schenker XMG Neo 17 M22 | |
| Razer Blade 16 Early 2023 | |
| Medion Erazer Beast X40 | |
| Alienware x17 R2 P48E | |
| Asus ROG Strix Scar 18 2023 G834JY-N6005W | |
* ... smaller is better
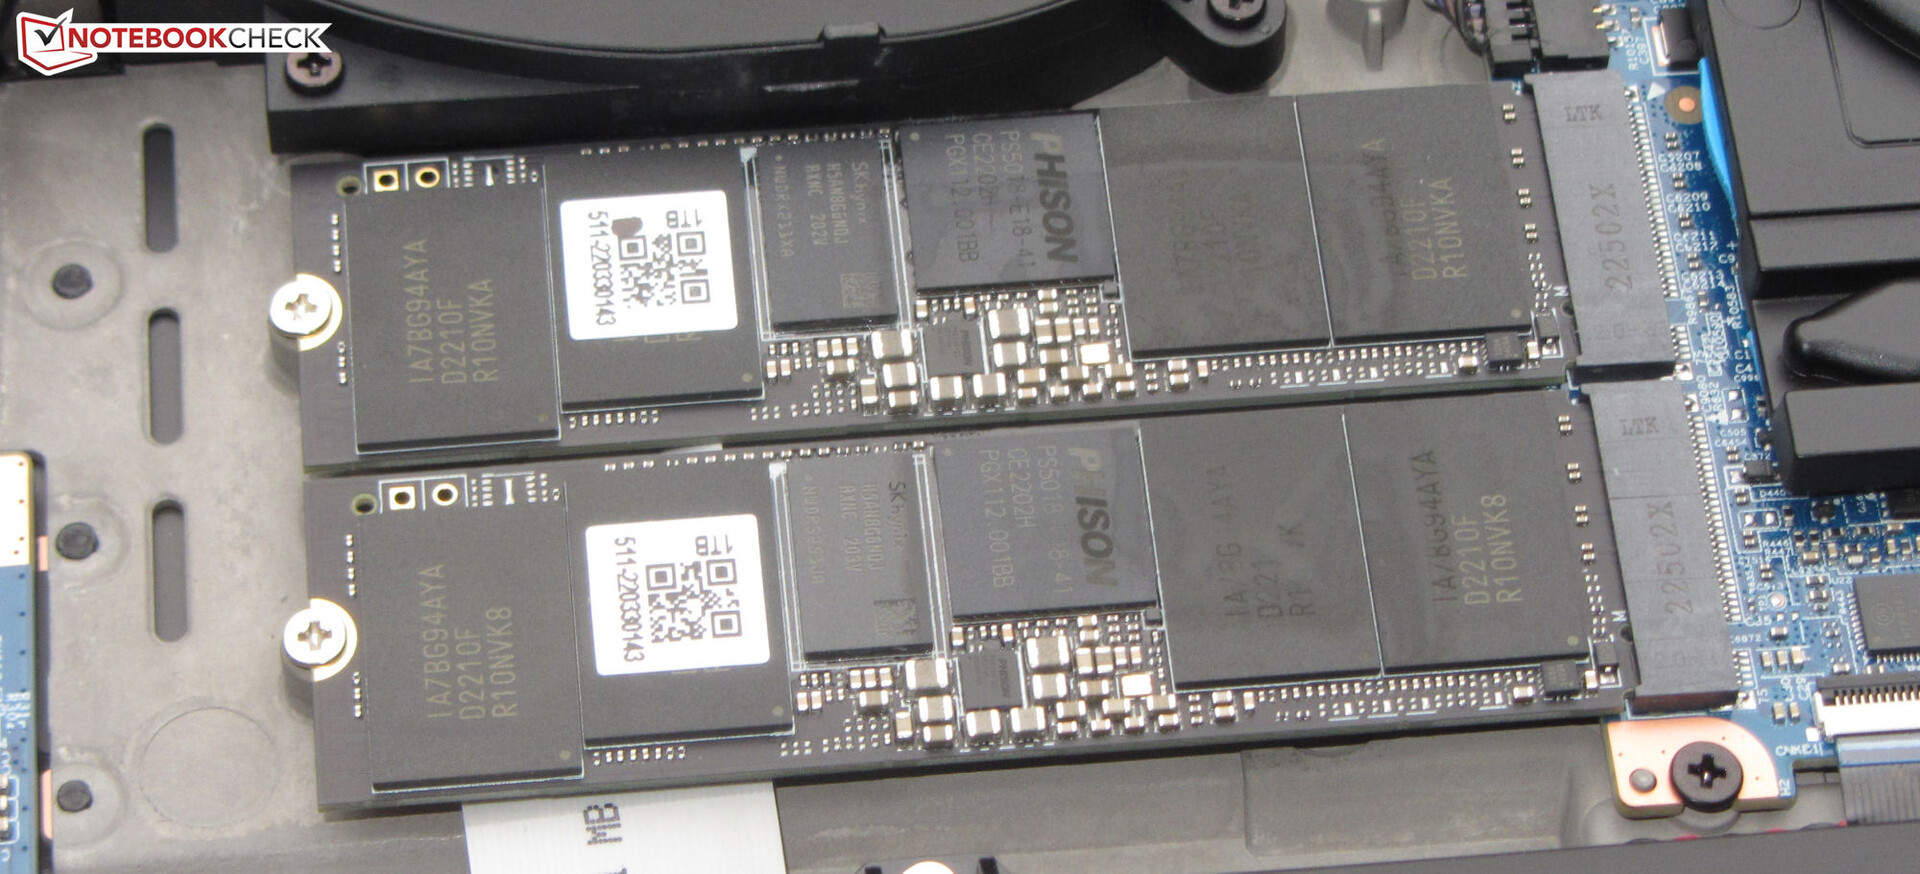
大容量存储
Medion为我们的X40评测单元配备了两块由Phison制造的1TB SSD(PCIe 4.0,M.2-2280)。其中一个作为系统驱动器,另一个用于数据存储。不仅这些固态硬盘没有形成RAID配置,而且笔记本电脑本身也不支持RAID。所包含的驱动器并不属于市场上最好的固态硬盘。即便如此,它们仍然提供了很好的性能。另一个值得一提的事情是,我们没有注意到任何由热节流引起的性能下降。

* ... smaller is better
Sustained Load Read: DiskSpd Read Loop, Queue Depth 8
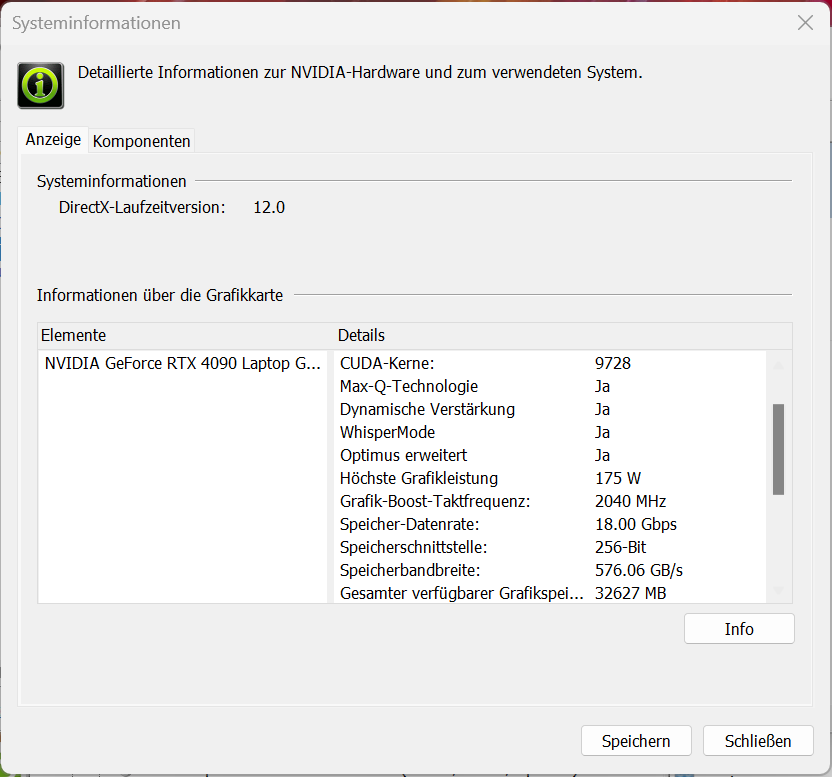
图形卡
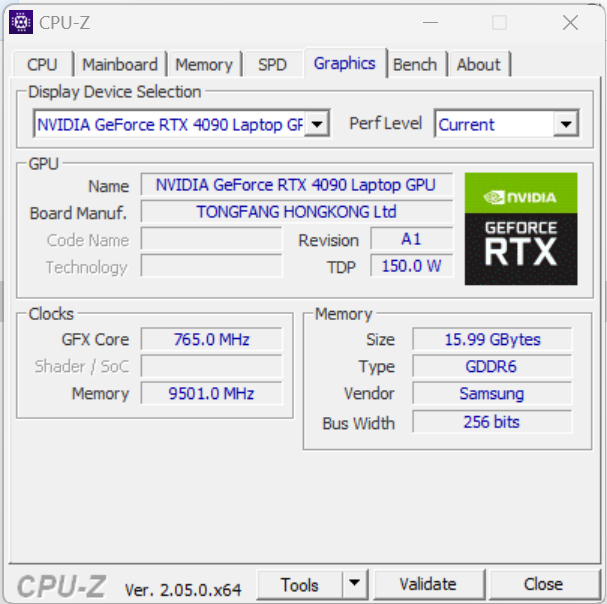
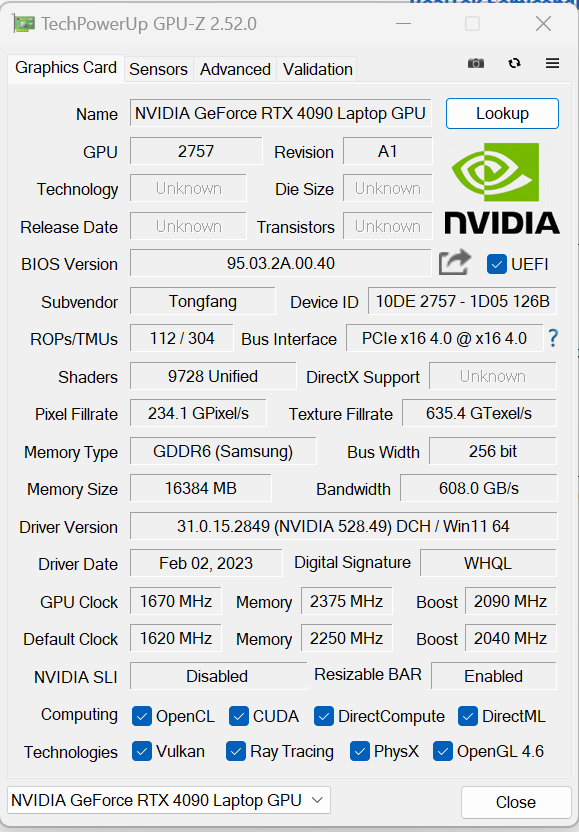
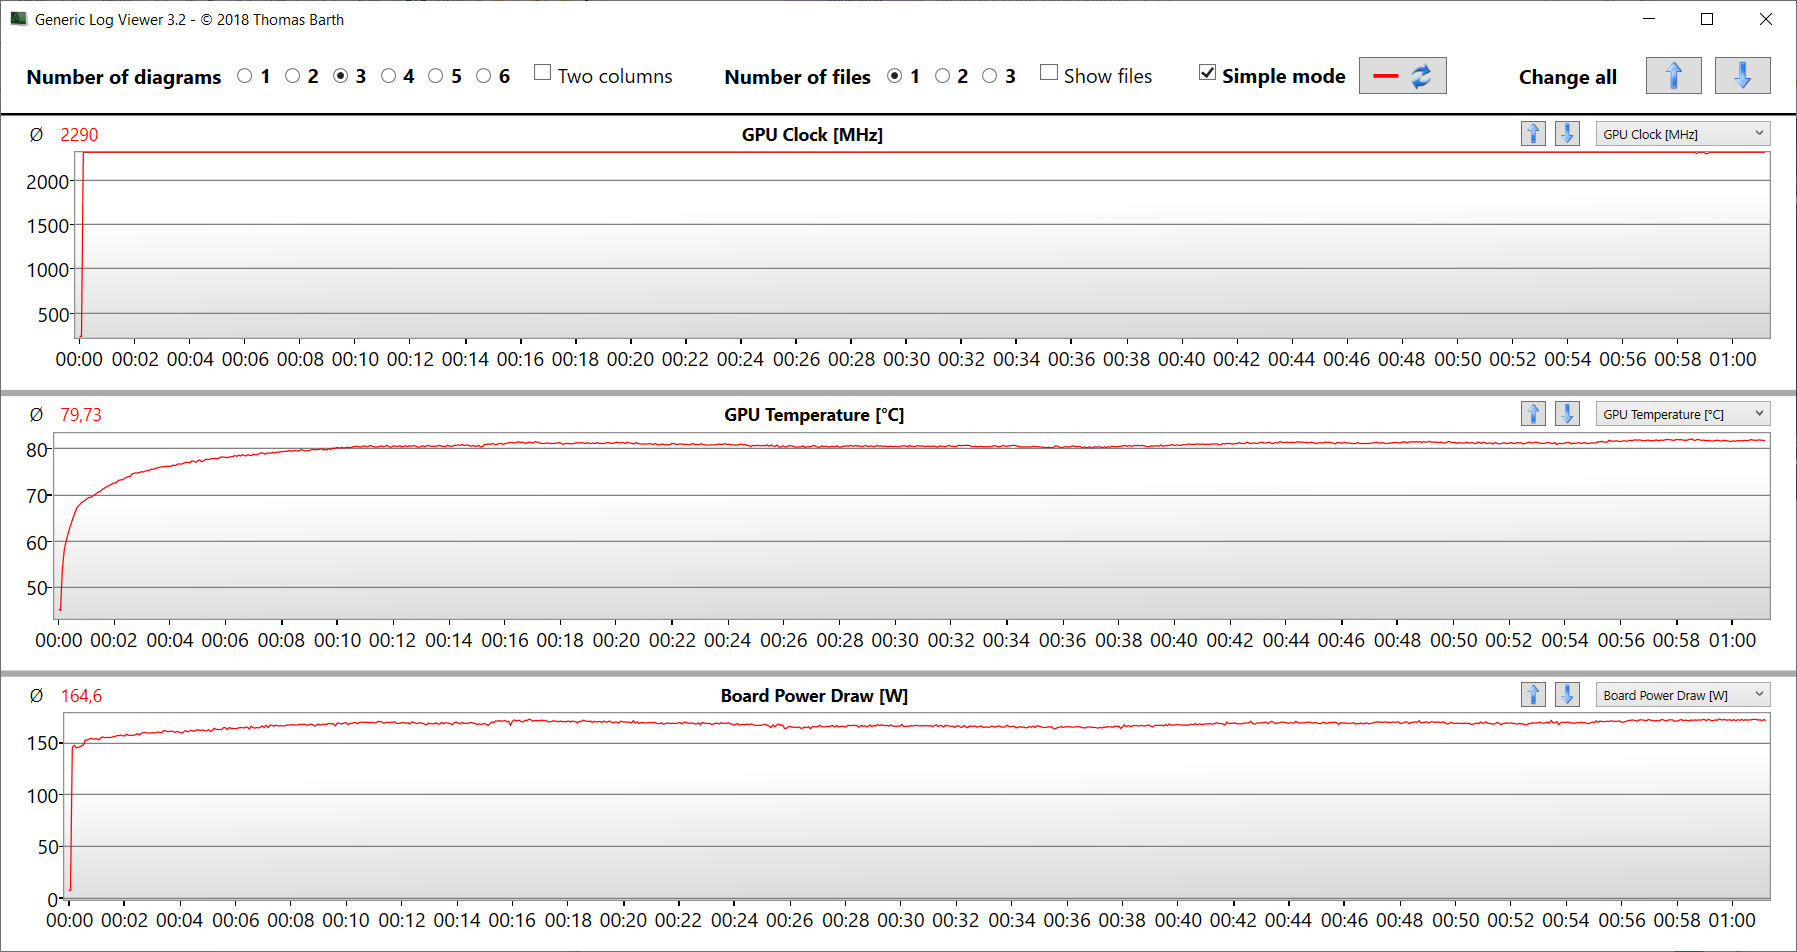
GeForce RTX 4090 Laptop 是Nvidia目前的旗舰移动GPU。它具有9,728个着色单元,256位内存总线和16,384 MB的高速GDDR6内存。RTX 4090有高达175瓦的TGP供其支配(150瓦+25瓦动态提升)--这已经是很高了。但在我们的Witcher 3 测试中,TGP并没有得到充分利用。
基准测试结果与(Optimus模式)持平,或略好于(dGPU模式)我们迄今为止从RTX 4090笔记本电脑平均看到的结果。这款笔记本电脑还支持高级优化模式。在dGPU和Optimus模式之间切换不需要重新启动计算机。
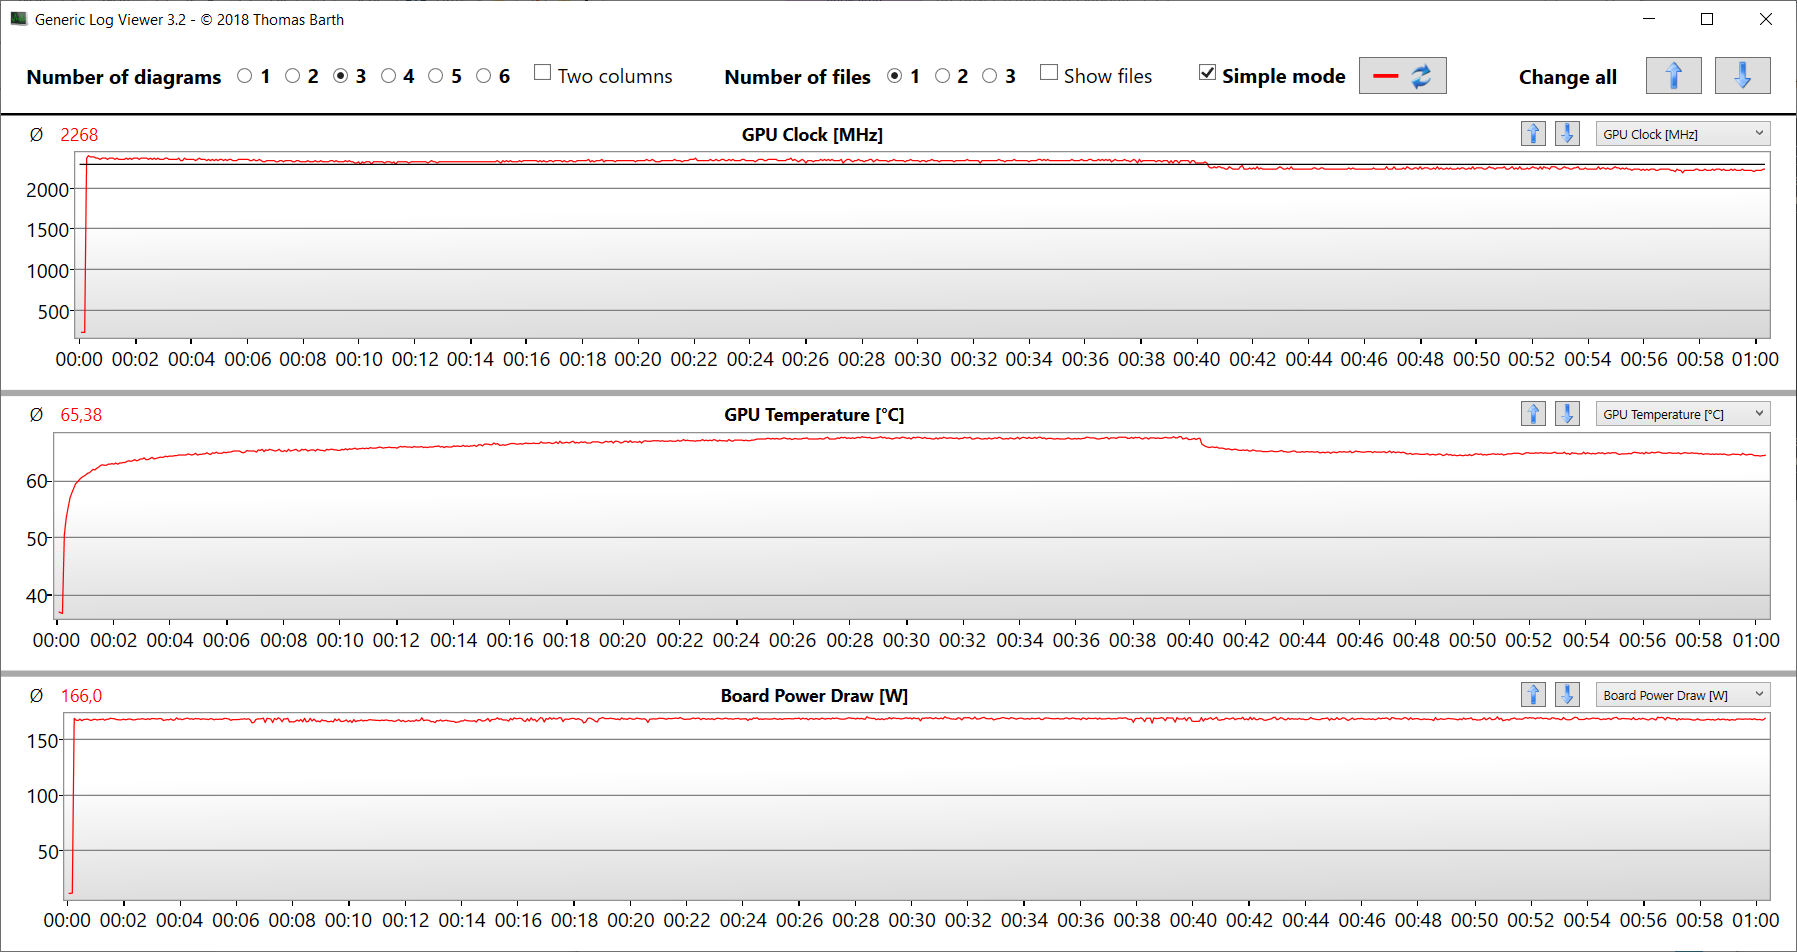
可选的水冷可以在一些基准测试和游戏中带来轻微的性能提升。Witcher 3例如,在我们的测试过程中,"DGPU "以更高的帧率运行。GPU的平均温度也比只使用空气冷却时低。
| 3DMark Performance rating - Percent | |
| MSI Titan GT77 HX 13VI -1! | |
| Medion Erazer Beast X40 | |
| Medion Erazer Beast X40 | |
| Asus ROG Strix Scar 18 2023 G834JY-N6005W | |
| Medion Erazer Beast X40 | |
| Average NVIDIA GeForce RTX 4090 Laptop GPU | |
| Razer Blade 16 Early 2023 -1! | |
| Average of class Gaming | |
| Alienware x17 R2 P48E | |
| Schenker XMG Neo 17 M22 -1! | |
| 3DMark 11 - 1280x720 Performance GPU | |
| Medion Erazer Beast X40 (dGPU, Cooling) | |
| MSI Titan GT77 HX 13VI | |
| Medion Erazer Beast X40 | |
| Medion Erazer Beast X40 (dGPU) | |
| Average NVIDIA GeForce RTX 4090 Laptop GPU (54073 - 73027, n=42) | |
| Asus ROG Strix Scar 18 2023 G834JY-N6005W | |
| Razer Blade 16 Early 2023 | |
| Average of class Gaming (21841 - 80022, n=104, last 2 years) | |
| Alienware x17 R2 P48E | |
| Schenker XMG Neo 17 M22 | |
| 3DMark 06 Standard Score | 60717 points | |
| 3DMark 11 Performance | 47487 points | |
| 3DMark Cloud Gate Standard Score | 66757 points | |
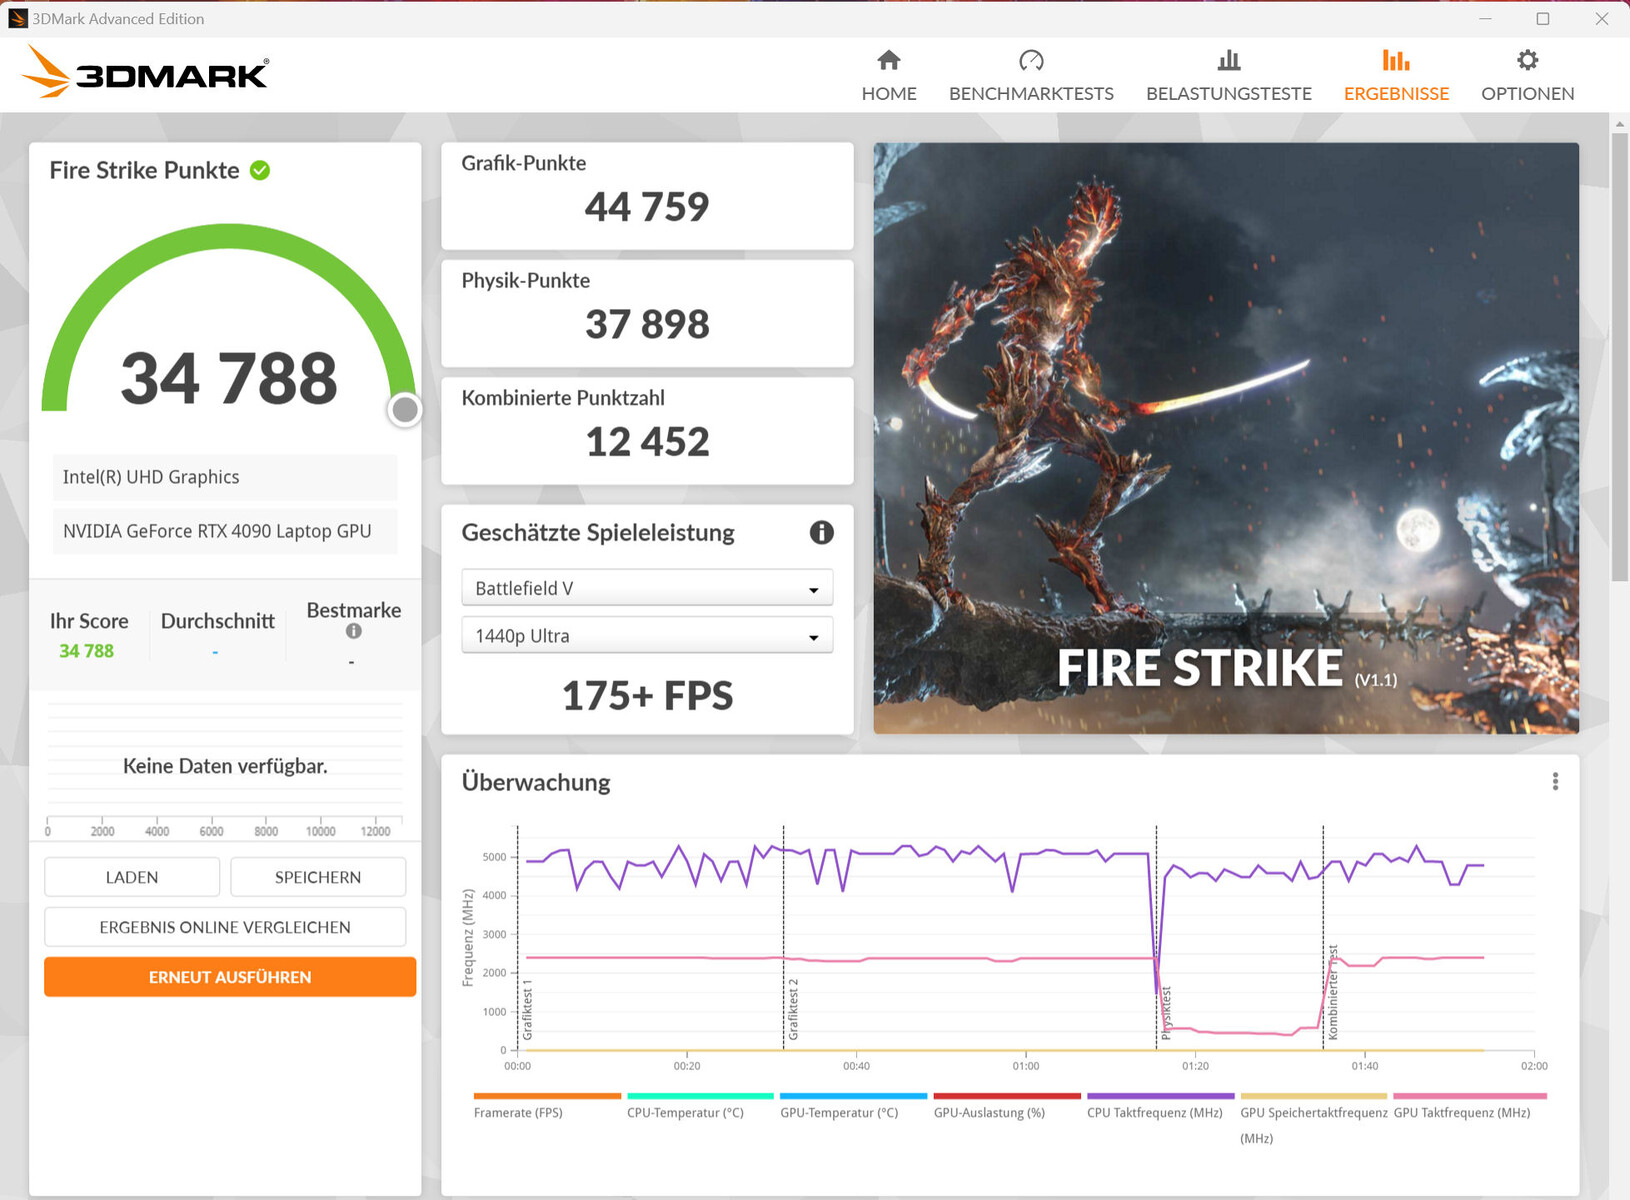
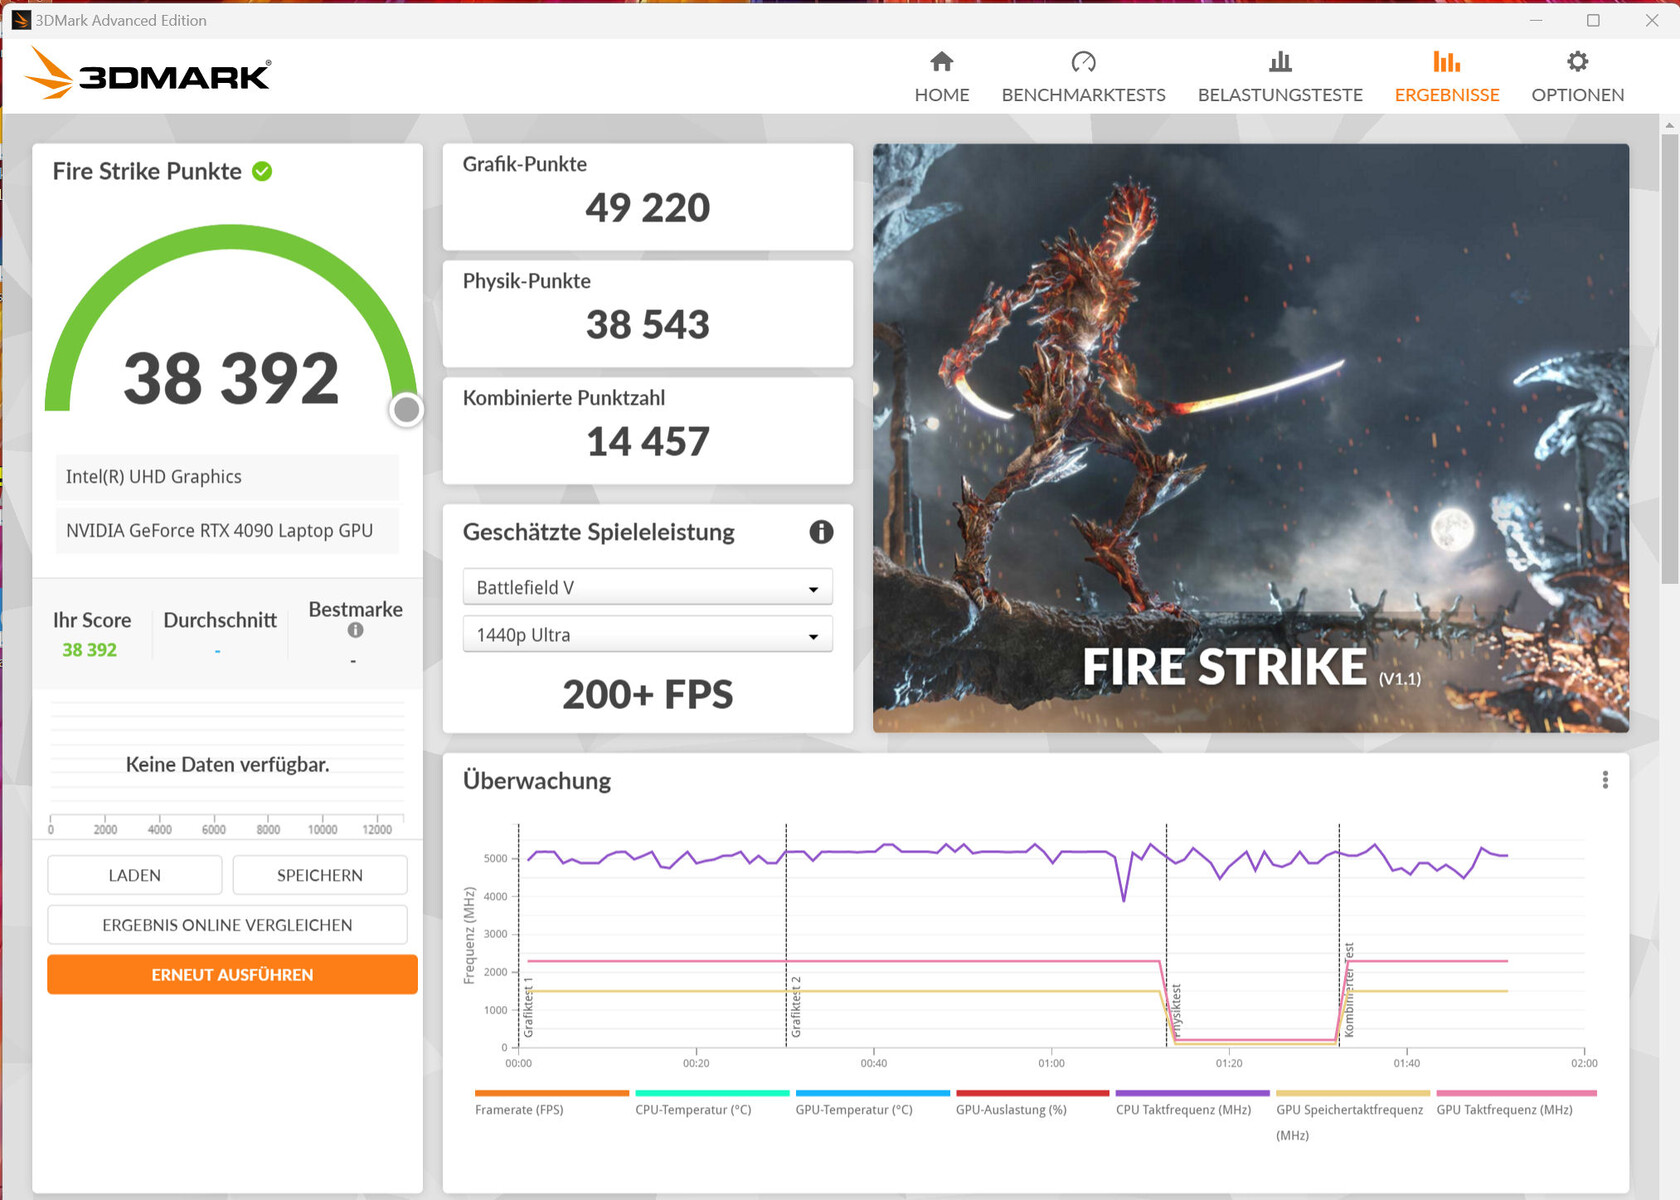
| 3DMark Fire Strike Score | 34788 points | |
| 3DMark Time Spy Score | 19708 points | |
Help | ||
| Blender | |
| v3.3 Classroom OPTIX/RTX | |
| Average of class Gaming (9 - 32, n=106, last 2 years) | |
| Razer Blade 16 Early 2023 (3.3.3) | |
| Medion Erazer Beast X40 (3.3.3) | |
| Average NVIDIA GeForce RTX 4090 Laptop GPU (9 - 19, n=39) | |
| Medion Erazer Beast X40 (3.3.3, dGPU, Cooling) | |
| MSI Titan GT77 HX 13VI (3.3.3) | |
| Asus ROG Strix Scar 18 2023 G834JY-N6005W (3.3.3) | |
| Medion Erazer Beast X40 (3.3.3, dGPU) | |
| v3.3 Classroom CUDA | |
| Average of class Gaming (15 - 228, n=106, last 2 years) | |
| Razer Blade 16 Early 2023 (3.3.3) | |
| Medion Erazer Beast X40 (3.3.3) | |
| Medion Erazer Beast X40 (3.3.3, dGPU, Cooling) | |
| Average NVIDIA GeForce RTX 4090 Laptop GPU (16 - 24, n=39) | |
| Asus ROG Strix Scar 18 2023 G834JY-N6005W (3.3.3) | |
| Asus ROG Strix Scar 18 2023 G834JY-N6005W (3.3.3) | |
| Medion Erazer Beast X40 (3.3.3, dGPU) | |
| MSI Titan GT77 HX 13VI (3.3.3) | |
| Geekbench 5.5 | |
| OpenCL Score | |
| Medion Erazer Beast X40 (dGPU) | |
| MSI Titan GT77 HX 13VI | |
| Asus ROG Strix Scar 18 2023 G834JY-N6005W | |
| Average NVIDIA GeForce RTX 4090 Laptop GPU (6841 - 237138, n=39) | |
| Medion Erazer Beast X40 | |
| Medion Erazer Beast X40 (dGPU, Cooling) | |
| Razer Blade 16 Early 2023 | |
| Average of class Gaming (80702 - 277970, n=101, last 2 years) | |
| Alienware x17 R2 P48E | |
| Schenker XMG Neo 17 M22 | |
| Vulkan Score 5.5 | |
| Medion Erazer Beast X40 (dGPU, Cooling) | |
| Average of class Gaming (18857 - 246759, n=76, last 2 years) | |
| Average NVIDIA GeForce RTX 4090 Laptop GPU (49663 - 163089, n=28) | |
| MSI Titan GT77 HX 13VI | |
| Alienware x17 R2 P48E | |
| Medion Erazer Beast X40 (dGPU) | |
| Razer Blade 16 Early 2023 | |
| Asus ROG Strix Scar 18 2023 G834JY-N6005W | |
| V-Ray Benchmark Next 4.10 | |
| GPU | |
| Asus ROG Strix Scar 18 2023 G834JY-N6005W (v4.10.07 ) | |
| MSI Titan GT77 HX 13VI (v4.10.07 ) | |
| Medion Erazer Beast X40 (v4.10.07 ) | |
| Medion Erazer Beast X40 (v4.10.07, dGPU) | |
| Average NVIDIA GeForce RTX 4090 Laptop GPU (873 - 1334, n=30) | |
| Medion Erazer Beast X40 (v4.10.07, dGPU, Cooling ) | |
| Average of class Gaming (427 - 1627, n=99, last 2 years) | |
| Schenker XMG Neo 17 M22 (v4.10.07 ) | |
| CPU | |
| MSI Titan GT77 HX 13VI (v4.10.07 ) | |
| Medion Erazer Beast X40 (v4.10.07, dGPU, Cooling) | |
| Asus ROG Strix Scar 18 2023 G834JY-N6005W (v4.10.07 ) | |
| Medion Erazer Beast X40 (v4.10.07 ) | |
| Medion Erazer Beast X40 (v4.10.07, dGPU) | |
| Average NVIDIA GeForce RTX 4090 Laptop GPU (18206 - 37629, n=30) | |
| Average of class Gaming (10048 - 45327, n=97, last 2 years) | |
| Schenker XMG Neo 17 M22 (v4.10.07 ) | |
* ... smaller is better
游戏性能
X40让用户在QHD+和最大设置下玩游戏。如果你把笔记本电脑连接到适当的显示器上,就有可能使用更高的分辨率。我们测试的游戏通常以类似于我们到目前为止从RTX 4090所看到的帧率运行。根据游戏的情况,你可能能够通过直接从GeForce GPU驱动显示器来获得更高的帧率。
| Performance rating - Percent | |
| Medion Erazer Beast X40 | |
| Medion Erazer Beast X40 | |
| Asus ROG Strix Scar 18 2023 G834JY-N6005W -1! | |
| MSI Titan GT77 HX 13VI | |
| Medion Erazer Beast X40 | |
| Average NVIDIA GeForce RTX 4090 Laptop GPU | |
| Razer Blade 16 Early 2023 | |
| Average of class Gaming | |
| Alienware x17 R2 P48E | |
| Schenker XMG Neo 17 M22 | |
| The Witcher 3 - 1920x1080 Ultra Graphics & Postprocessing (HBAO+) | |
| Medion Erazer Beast X40 (dGPU) | |
| Medion Erazer Beast X40 (dGPU, Cooling) | |
| MSI Titan GT77 HX 13VI | |
| Average NVIDIA GeForce RTX 4090 Laptop GPU (139.2 - 216, n=35) | |
| Average of class Gaming (104.7 - 240, n=7, last 2 years) | |
| Medion Erazer Beast X40 | |
| Razer Blade 16 Early 2023 | |
| Alienware x17 R2 P48E | |
| Schenker XMG Neo 17 M22 | |
| GTA V - 1920x1080 Highest AA:4xMSAA + FX AF:16x | |
| Medion Erazer Beast X40 (dGPU) | |
| Medion Erazer Beast X40 | |
| Medion Erazer Beast X40 (dGPU, Cooling) | |
| Asus ROG Strix Scar 18 2023 G834JY-N6005W | |
| MSI Titan GT77 HX 13VI | |
| Razer Blade 16 Early 2023 | |
| Average NVIDIA GeForce RTX 4090 Laptop GPU (91.1 - 167.7, n=40) | |
| Average of class Gaming (48.3 - 186.9, n=94, last 2 years) | |
| Alienware x17 R2 P48E | |
| Schenker XMG Neo 17 M22 | |
| Final Fantasy XV Benchmark - 1920x1080 High Quality | |
| MSI Titan GT77 HX 13VI (1.3) | |
| Medion Erazer Beast X40 (1.3, dGPU) | |
| Medion Erazer Beast X40 (1.3, dGPU, Cooling) | |
| Asus ROG Strix Scar 18 2023 G834JY-N6005W (1.3) | |
| Medion Erazer Beast X40 (1.3) | |
| Average NVIDIA GeForce RTX 4090 Laptop GPU (122.2 - 201, n=40) | |
| Razer Blade 16 Early 2023 (1.3) | |
| Average of class Gaming (41 - 215, n=95, last 2 years) | |
| Alienware x17 R2 P48E (1.3) | |
| Schenker XMG Neo 17 M22 (1.3) | |
| Strange Brigade - 1920x1080 ultra AA:ultra AF:16 | |
| Medion Erazer Beast X40 (1.47.22.14 D3D12, dGPU, Cooling) | |
| Medion Erazer Beast X40 (1.47.22.14 D3D12, dGPU) | |
| MSI Titan GT77 HX 13VI (1.47.22.14 D3D12) | |
| Asus ROG Strix Scar 18 2023 G834JY-N6005W (1.47.22.14 D3D12) | |
| Medion Erazer Beast X40 (1.47.22.14 D3D12) | |
| Average NVIDIA GeForce RTX 4090 Laptop GPU (233 - 421, n=39) | |
| Razer Blade 16 Early 2023 (1.47.22.14 D3D12) | |
| Average of class Gaming (76.3 - 458, n=87, last 2 years) | |
| Alienware x17 R2 P48E (1.47.22.14 D3D12) | |
| Schenker XMG Neo 17 M22 (1.47.22.14 D3D12) | |
| Dota 2 Reborn - 1920x1080 ultra (3/3) best looking | |
| Razer Blade 16 Early 2023 | |
| Asus ROG Strix Scar 18 2023 G834JY-N6005W | |
| MSI Titan GT77 HX 13VI | |
| Medion Erazer Beast X40 (dGPU, Cooling) | |
| Medion Erazer Beast X40 (dGPU) | |
| Average NVIDIA GeForce RTX 4090 Laptop GPU (115.7 - 220, n=42) | |
| Medion Erazer Beast X40 | |
| Alienware x17 R2 P48E | |
| Average of class Gaming (84.8 - 248, n=107, last 2 years) | |
| Schenker XMG Neo 17 M22 | |
| X-Plane 11.11 - 1920x1080 high (fps_test=3) | |
| Asus ROG Strix Scar 18 2023 G834JY-N6005W | |
| Razer Blade 16 Early 2023 | |
| Medion Erazer Beast X40 (dGPU) | |
| Medion Erazer Beast X40 (dGPU, Cooling) | |
| MSI Titan GT77 HX 13VI | |
| MSI Titan GT77 HX 13VI | |
| Average NVIDIA GeForce RTX 4090 Laptop GPU (77.8 - 166.2, n=46) | |
| Medion Erazer Beast X40 | |
| Alienware x17 R2 P48E | |
| Average of class Gaming (55.5 - 143.5, n=109, last 2 years) | |
| Schenker XMG Neo 17 M22 | |
| Returnal | |
| 1920x1080 Epic Preset | |
| Average NVIDIA GeForce RTX 4090 Laptop GPU (141 - 155, n=3) | |
| Medion Erazer Beast X40 | |
| 2560x1440 Epic Preset | |
| Average NVIDIA GeForce RTX 4090 Laptop GPU (113 - 119, n=3) | |
| Medion Erazer Beast X40 | |
| 1920x1080 Epic Preset + Epic Ray-Tracing | |
| Average NVIDIA GeForce RTX 4090 Laptop GPU (126 - 128, n=2) | |
| Medion Erazer Beast X40 | |
| Atomic Heart | |
| 1920x1080 Atomic Preset | |
| Average NVIDIA GeForce RTX 4090 Laptop GPU (128.6 - 166, n=3) | |
| Medion Erazer Beast X40 | |
| 2560x1440 Atomic Preset | |
| Average NVIDIA GeForce RTX 4090 Laptop GPU (93.8 - 135, n=3) | |
| Medion Erazer Beast X40 | |
| Hogwarts Legacy | |
| 1920x1080 Ultra Preset AA:High T | |
| Medion Erazer Beast X40 | |
| Average of class Gaming (n=1last 2 years) | |
| Average NVIDIA GeForce RTX 4090 Laptop GPU (41.2 - 166.1, n=4) | |
| 2560x1440 Ultra Preset AA:High T | |
| Medion Erazer Beast X40 | |
| Average of class Gaming (n=1last 2 years) | |
| Average NVIDIA GeForce RTX 4090 Laptop GPU (40.6 - 125.9, n=4) | |
| 1920x1080 Ultra Preset + Full Ray Tracing AA:High T | |
| Medion Erazer Beast X40 | |
| Average NVIDIA GeForce RTX 4090 Laptop GPU (52.2 - 67, n=3) | |
| Company of Heroes 3 | |
| 1920x1080 Maximum Settings | |
| Average NVIDIA GeForce RTX 4090 Laptop GPU (215 - 235, n=2) | |
| Medion Erazer Beast X40 | |
| 2560x1440 Maximum Settings | |
| Average NVIDIA GeForce RTX 4090 Laptop GPU (176.4 - 194.8, n=2) | |
| Medion Erazer Beast X40 | |
| Sons of the Forest | |
| 1920x1080 Ultra Preset AA:T | |
| Average NVIDIA GeForce RTX 4090 Laptop GPU (85.7 - 93.9, n=2) | |
| Medion Erazer Beast X40 | |
| 2560x1440 Ultra Preset AA:T | |
| Average NVIDIA GeForce RTX 4090 Laptop GPU (85.2 - 89.6, n=2) | |
| Medion Erazer Beast X40 | |
为了测试笔记本电脑是否能在较长时间内以基本稳定的帧率运行游戏,我们在不移动玩家角色的情况下以全高清和最大质量设置运行了大约60分钟的《Witcher 3 》。我们没有观察到帧率的任何下降。
Witcher 3 FPS graph
| low | med. | high | ultra | QHD | |
|---|---|---|---|---|---|
| GTA V (2015) | 187.5 | 187.1 | 186 | 151.3 | 145.3 |
| The Witcher 3 (2015) | 586.4 | 511.4 | 363.8 | 195.1 | |
| Dota 2 Reborn (2015) | 215 | 193.5 | 182.6 | 171.5 | |
| Final Fantasy XV Benchmark (2018) | 232 | 207 | 176.2 | 146.7 | |
| X-Plane 11.11 (2018) | 187.1 | 162.9 | 128.3 | ||
| Far Cry 5 (2018) | 199 | 172 | 167 | 158 | 151 |
| Strange Brigade (2018) | 515 | 387 | 369 | 365 | 292 |
| Hunt Showdown (2020) | 367 | 285 | 262 | 168 | |
| Death Stranding (2020) | 179 | 171.4 | 166.6 | 163 | 162.1 |
| Yakuza Like a Dragon (2020) | 179.7 | 167.7 | 166.6 | 152.3 | 138.1 |
| Back 4 Blood (2021) | 403 | 309 | 309 | 327 | |
| Guardians of the Galaxy (2021) | 163 | 160 | 158 | 152 | 141 |
| Riders Republic (2021) | 209 | 200 | 185 | 179 | 146 |
| Elex 2 (2022) | 118.2 | 117.1 | 116.2 | 116.2 | 116.7 |
| F1 22 (2022) | 301 | 290 | 268 | 118.2 | 79.9 |
| The Quarry (2022) | 278 | 211 | 177.3 | 146.1 | 100.2 |
| Hogwarts Legacy (2023) | 242 | 204 | 186.5 | 166.1 | 125.9 |
| Returnal (2023) | 178 | 171 | 164 | 146 | 113 |
| Atomic Heart (2023) | 205 | 161.8 | 144.2 | 128.6 | 93.8 |
| Company of Heroes 3 (2023) | 285.3 | 262.9 | 235.2 | 215.2 | 176.4 |
| Sons of the Forest (2023) | 96.1 | 90 | 87.9 | 85.7 | 85.2 |
排放物 - Erazer笔记本电脑可能会有相当大的噪音
噪声排放
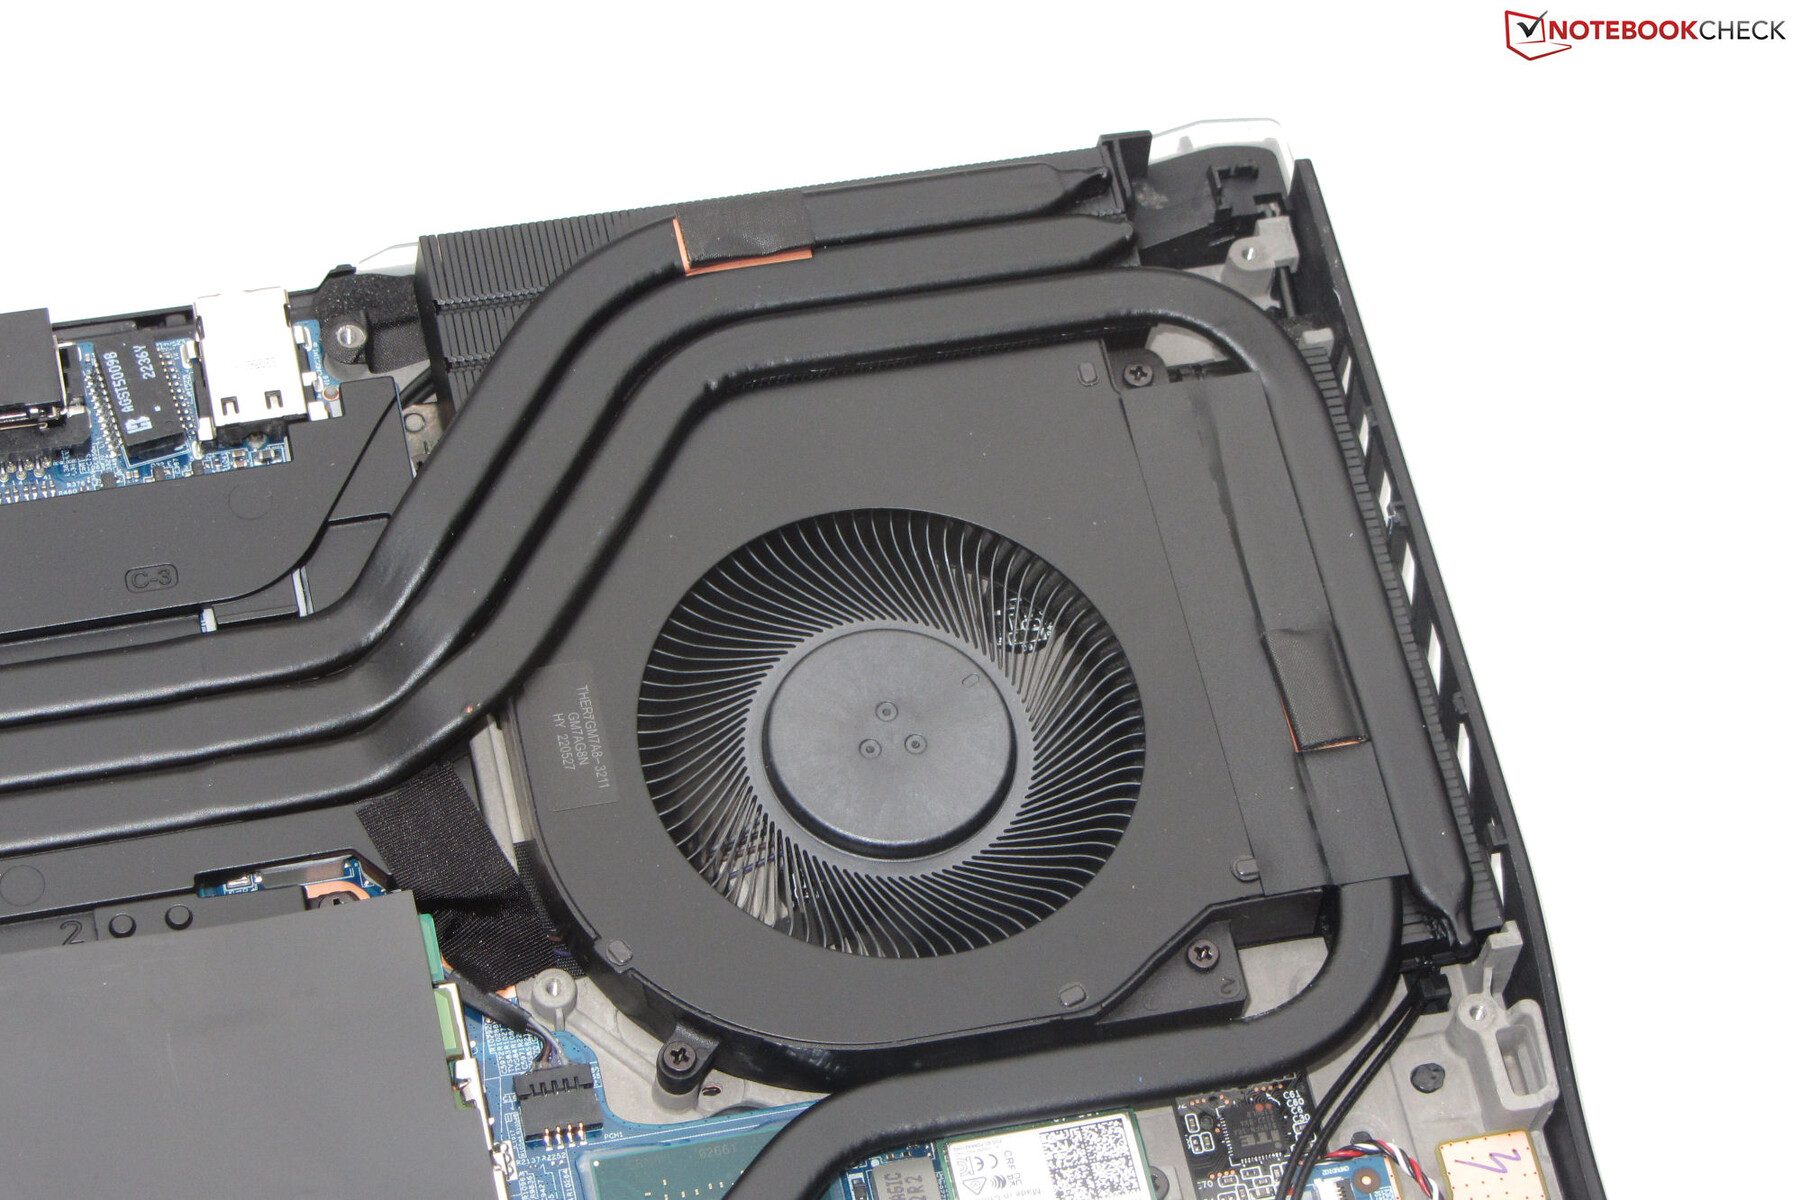
笔记本电脑在日常使用中相对安静(如办公应用、网络浏览)。风扇甚至可能偶尔会停止转动。不足为奇的是,X40在重负荷下会变得相当响亮,在压力测试和Witcher 3 测试中产生高达53 dB(A)的噪音。尽管噪音水平相当高,但两个风扇产生的声音整体上是可以忍受的:嗖嗖的噪音伴随着铿锵的呼啸声,随着风扇速度的增加,逐渐变成了轻快的呼啸声。
当连接外部水冷装置时,笔记本电脑的风扇会减轻。然而,该装置本身也增加了整体噪音:尽管泵在使用时相对安静,但冷却器内的风扇会发出更多的喧嚣。综合考虑,我们认为使用水冷装置时,整体噪音更令人愉快。
Noise level
| Idle |
| 25 / 29 / 35 dB(A) |
| Load |
| 51 / 53 dB(A) |
 | ||
30 dB silent 40 dB(A) audible 50 dB(A) loud |
||
min: | ||
| Medion Erazer Beast X40 GeForce RTX 4090 Laptop GPU, i9-13900HX | MSI Titan GT77 HX 13VI GeForce RTX 4090 Laptop GPU, i9-13950HX | Razer Blade 16 Early 2023 GeForce RTX 4080 Laptop GPU, i9-13950HX | Schenker XMG Neo 17 M22 GeForce RTX 3080 Ti Laptop GPU, R9 6900HX | Alienware x17 R2 P48E GeForce RTX 3080 Ti Laptop GPU, i9-12900HK | Asus ROG Strix Scar 18 2023 G834JY-N6005W GeForce RTX 4090 Laptop GPU, i9-13980HX | |
|---|---|---|---|---|---|---|
| Noise | -3% | 13% | -3% | 15% | 4% | |
| off / environment * (dB) | 24 | 24.6 -3% | 23 4% | 26 -8% | 22.7 5% | 23.9 -0% |
| Idle Minimum * (dB) | 25 | 29.2 -17% | 23 8% | 26 -4% | 23.1 8% | 23.9 4% |
| Idle Average * (dB) | 29 | 29.2 -1% | 23 21% | 29 -0% | 23.1 20% | 32.6 -12% |
| Idle Maximum * (dB) | 35 | 29.2 17% | 23.6 33% | 40 -14% | 23.1 34% | 32.6 7% |
| Load Average * (dB) | 51 | 50.7 1% | 39 24% | 47 8% | 31.9 37% | 35.9 30% |
| Witcher 3 ultra * (dB) | 51 | 53.3 -5% | 51.6 -1% | 52 -2% | 52.5 -3% | |
| Load Maximum * (dB) | 53 | 61 -15% | 51.3 3% | 54 -2% | 52.5 1% | 55.8 -5% |
* ... smaller is better
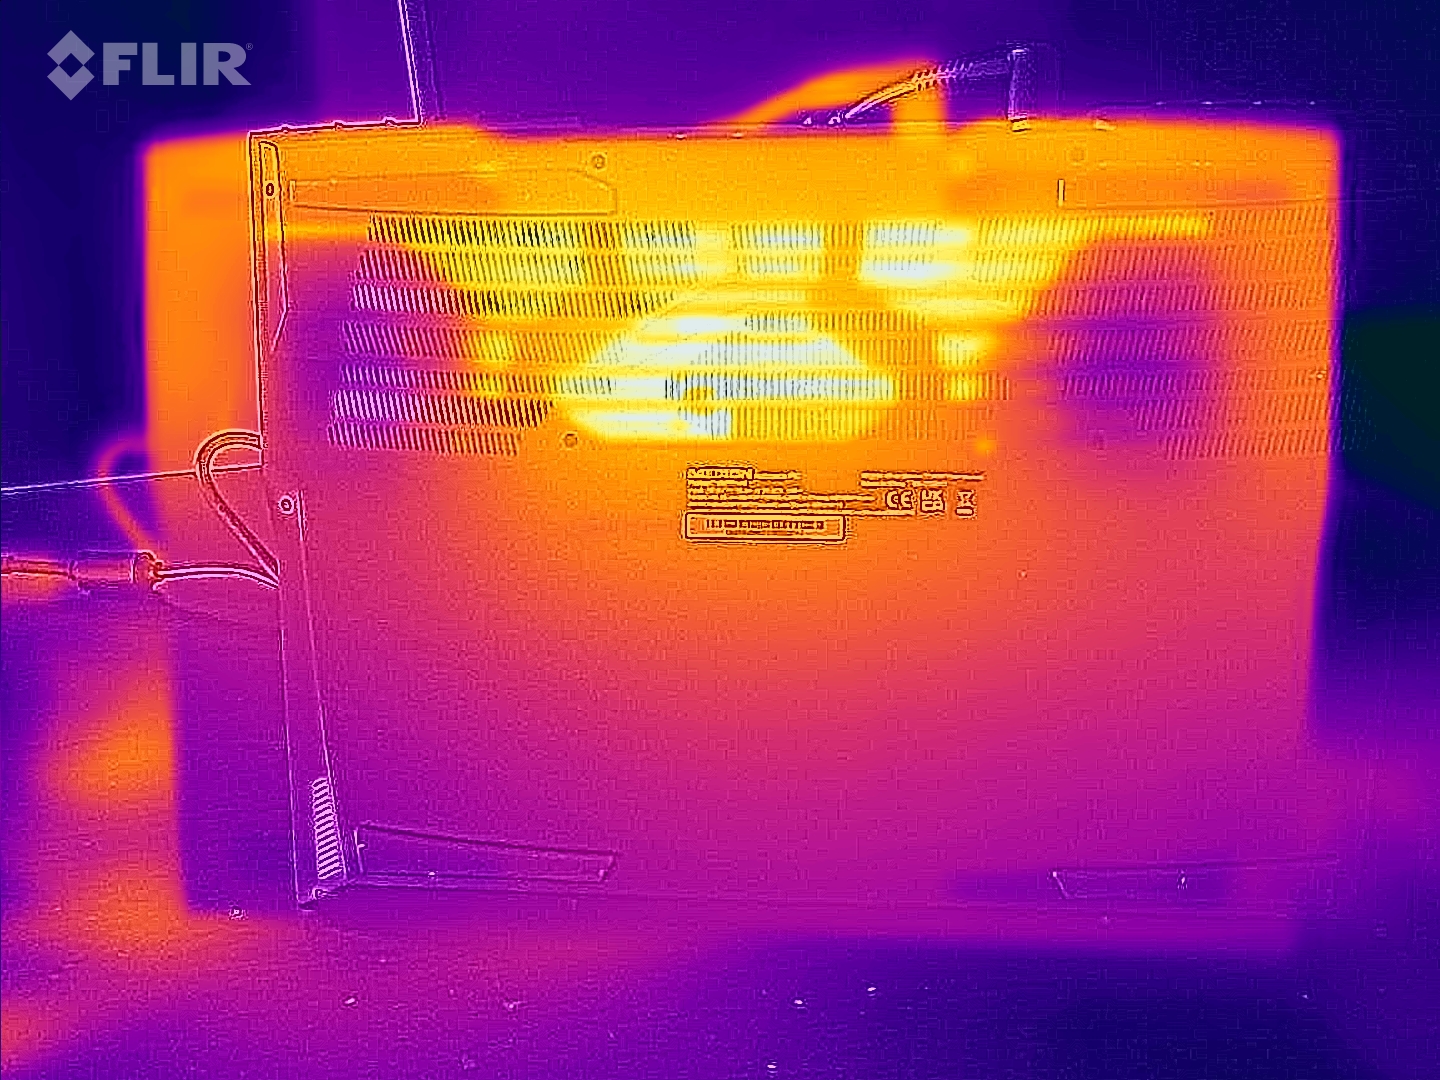
温度
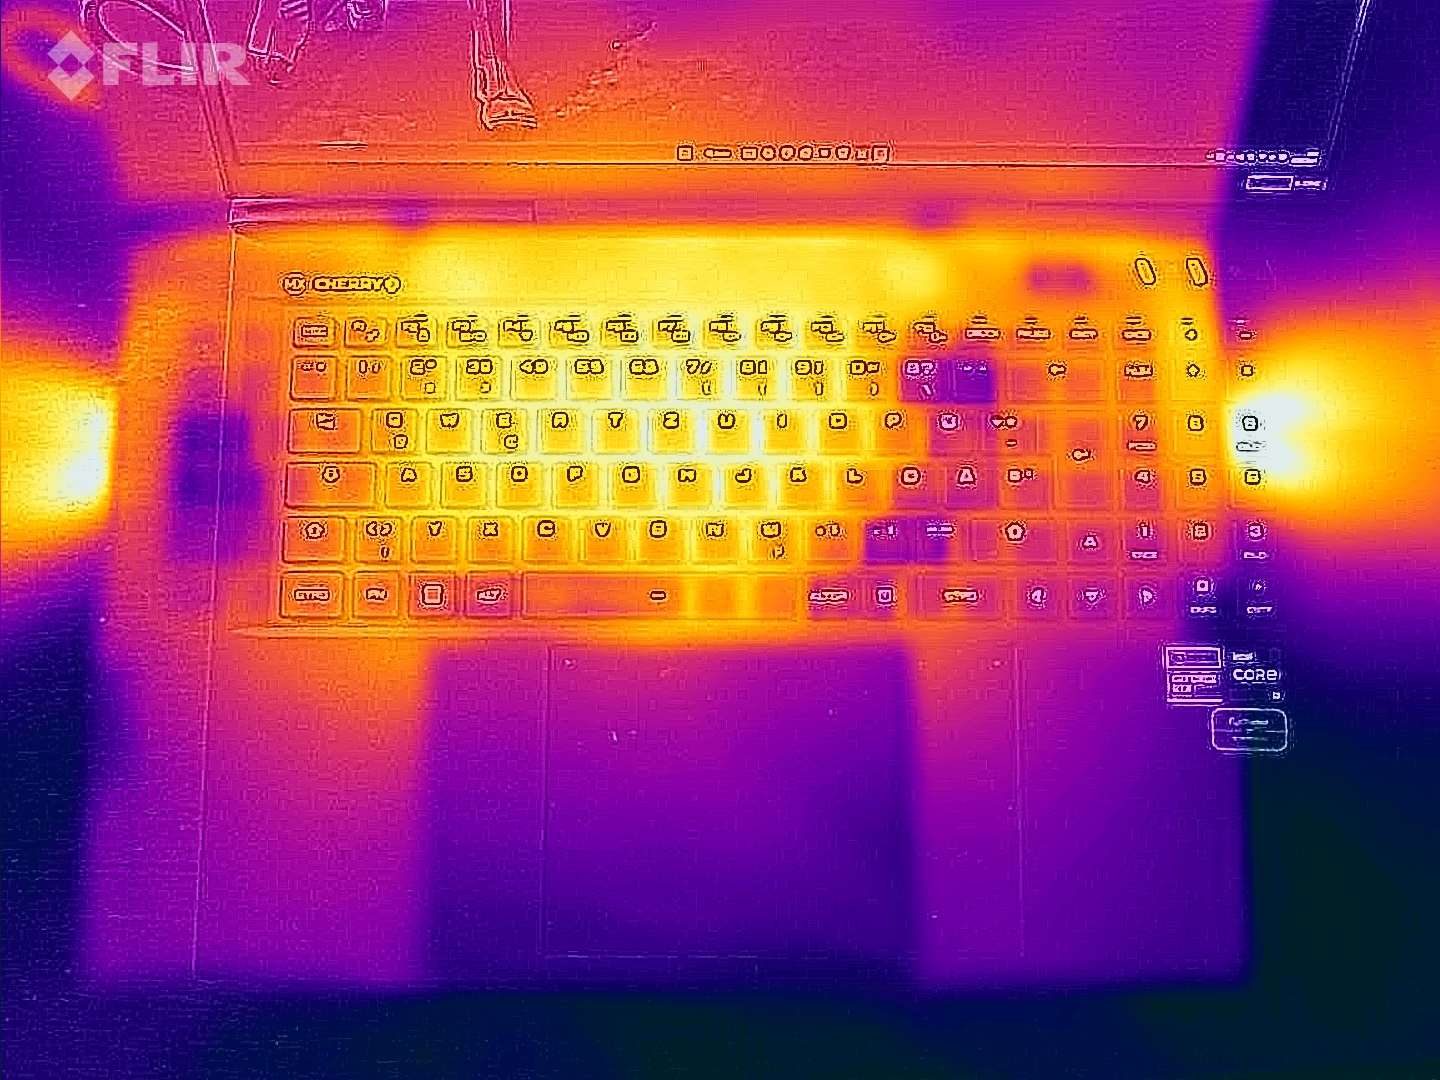
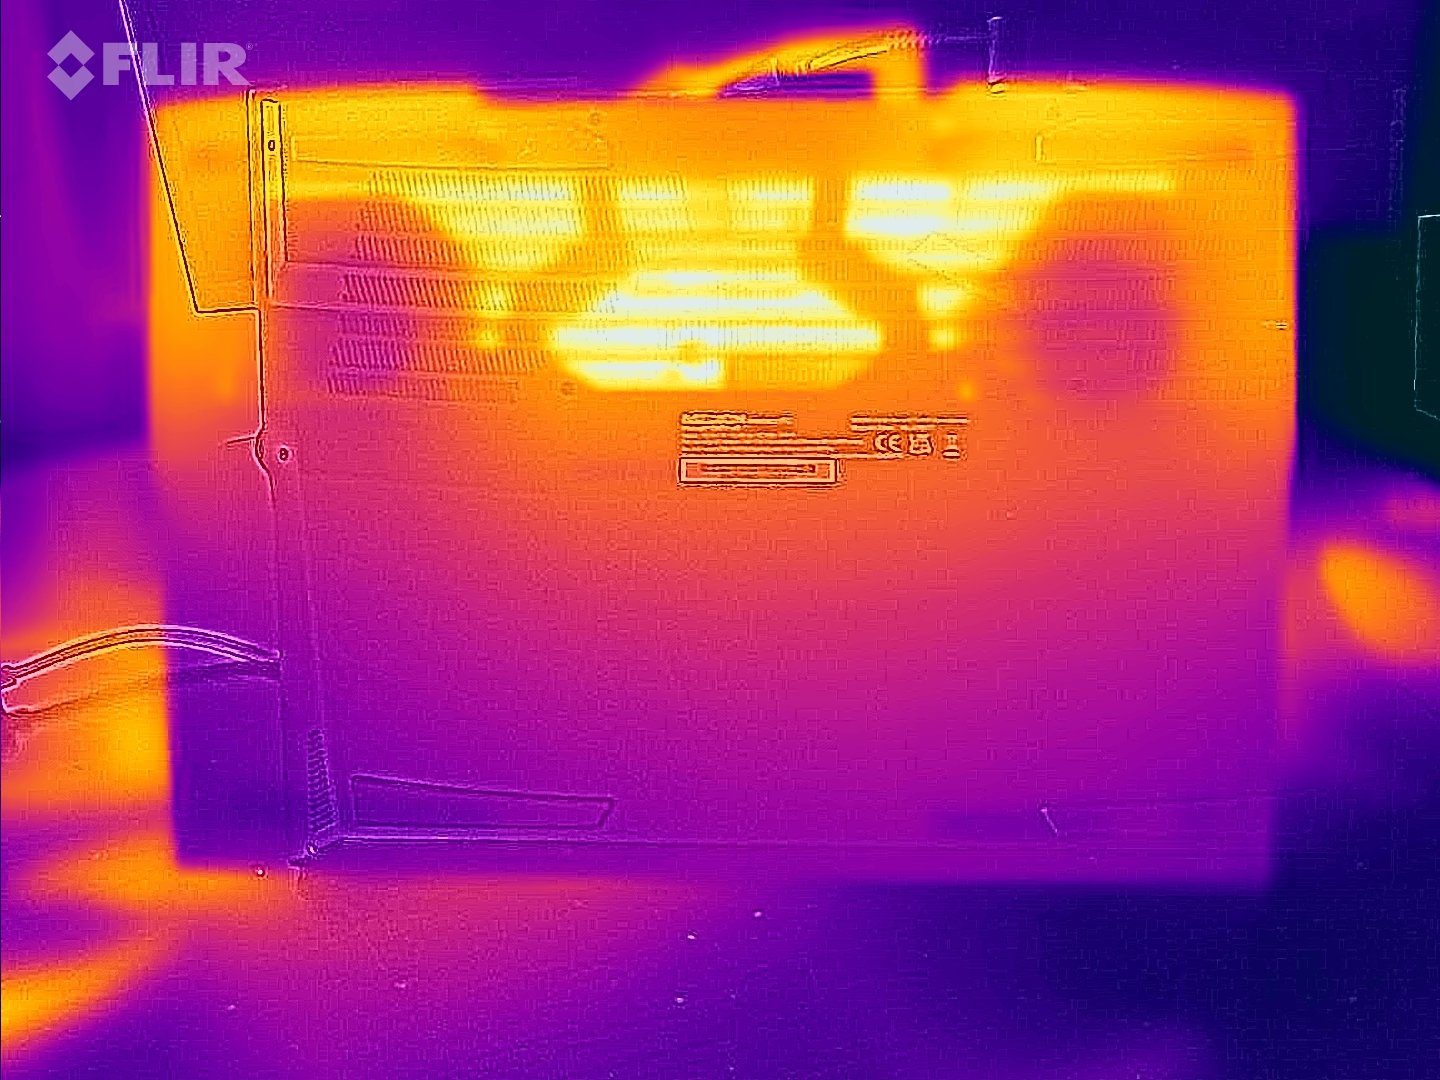
在日常使用情况下,如运行办公软件和互联网浏览器,机箱温度保持在一个可接受的范围内。正如我们在压力测试和Witcher 3 测试中注意到的那样,笔记本电脑在负载下会明显发热,但不会过度发热。CPU的温度也没有让我们担心的理由。
(-) The maximum temperature on the upper side is 48 °C / 118 F, compared to the average of 40.4 °C / 105 F, ranging from 21.2 to 68.8 °C for the class Gaming.
(-) The bottom heats up to a maximum of 52 °C / 126 F, compared to the average of 43.2 °C / 110 F
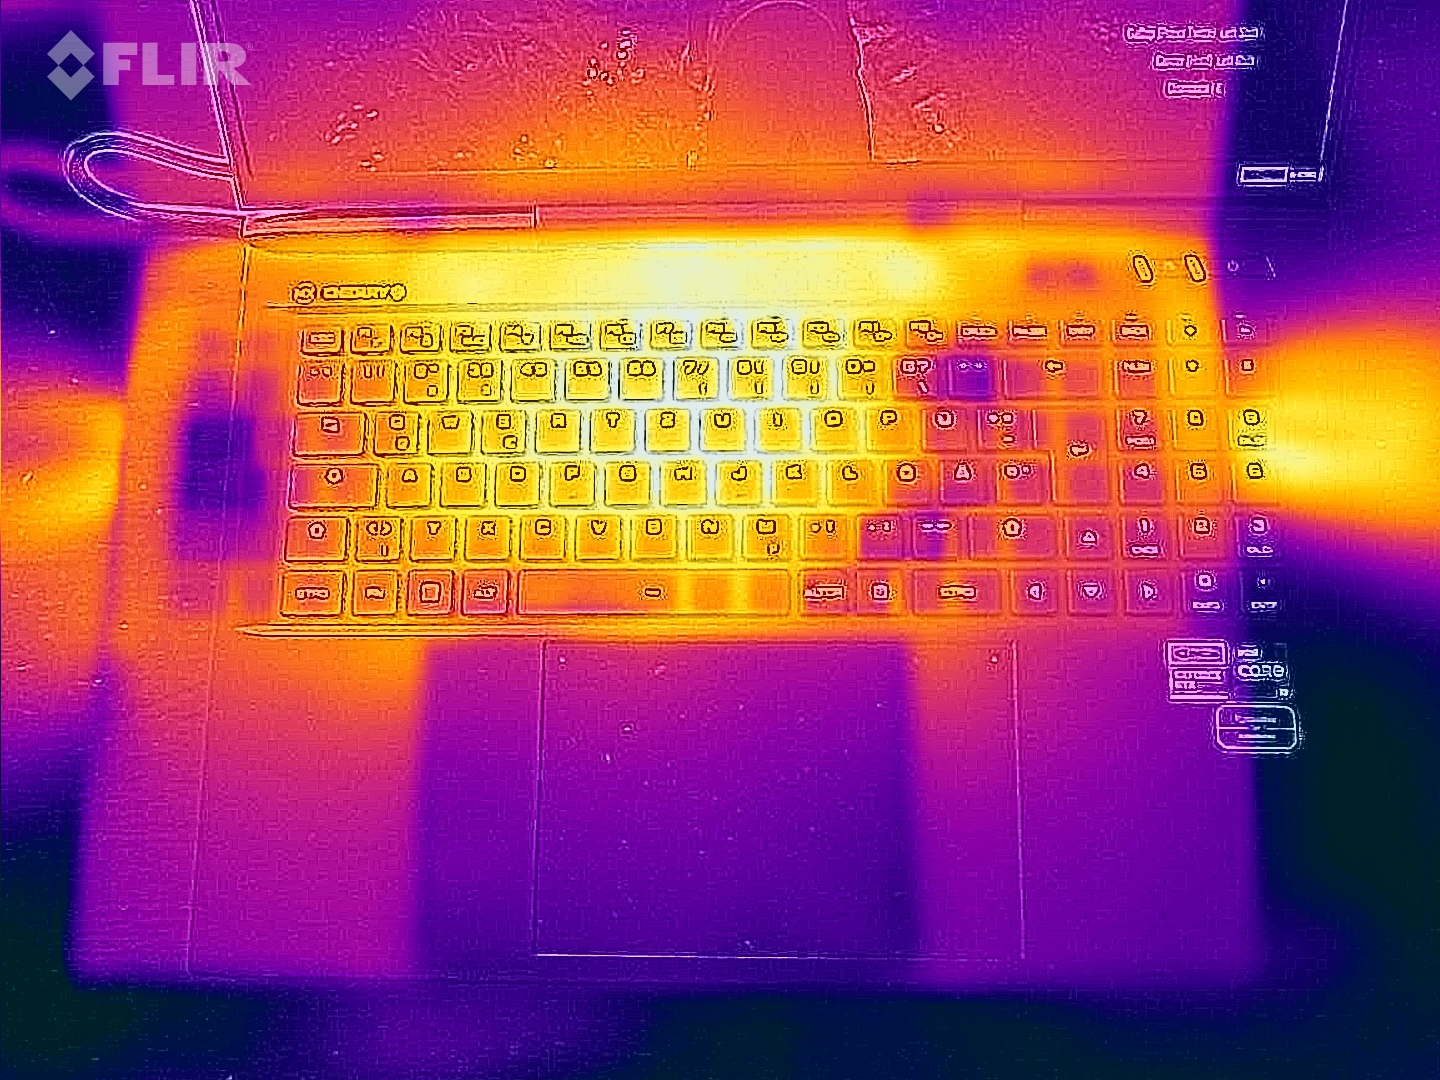
(+) In idle usage, the average temperature for the upper side is 28.2 °C / 83 F, compared to the device average of 33.9 °C / 93 F.
(-) Playing The Witcher 3, the average temperature for the upper side is 40.7 °C / 105 F, compared to the device average of 33.9 °C / 93 F.
(+) The palmrests and touchpad are reaching skin temperature as a maximum (34 °C / 93.2 F) and are therefore not hot.
(-) The average temperature of the palmrest area of similar devices was 28.8 °C / 83.8 F (-5.2 °C / -9.4 F).
| Medion Erazer Beast X40 Intel Core i9-13900HX, NVIDIA GeForce RTX 4090 Laptop GPU | MSI Titan GT77 HX 13VI Intel Core i9-13950HX, NVIDIA GeForce RTX 4090 Laptop GPU | Razer Blade 16 Early 2023 Intel Core i9-13950HX, NVIDIA GeForce RTX 4080 Laptop GPU | Schenker XMG Neo 17 M22 AMD Ryzen 9 6900HX, NVIDIA GeForce RTX 3080 Ti Laptop GPU | Alienware x17 R2 P48E Intel Core i9-12900HK, NVIDIA GeForce RTX 3080 Ti Laptop GPU | Asus ROG Strix Scar 18 2023 G834JY-N6005W Intel Core i9-13980HX, NVIDIA GeForce RTX 4090 Laptop GPU | |
|---|---|---|---|---|---|---|
| Heat | 13% | 9% | -2% | 4% | -0% | |
| Maximum Upper Side * (°C) | 48 | 40.6 15% | 40 17% | 49 -2% | 49.6 -3% | 54 -13% |
| Maximum Bottom * (°C) | 52 | 41.1 21% | 37.6 28% | 52 -0% | 42.4 18% | 46 12% |
| Idle Upper Side * (°C) | 30 | 26.2 13% | 32.4 -8% | 30 -0% | 29.2 3% | 30 -0% |
| Idle Bottom * (°C) | 31 | 30.3 2% | 31.4 -1% | 33 -6% | 32 -3% | 31 -0% |
* ... smaller is better
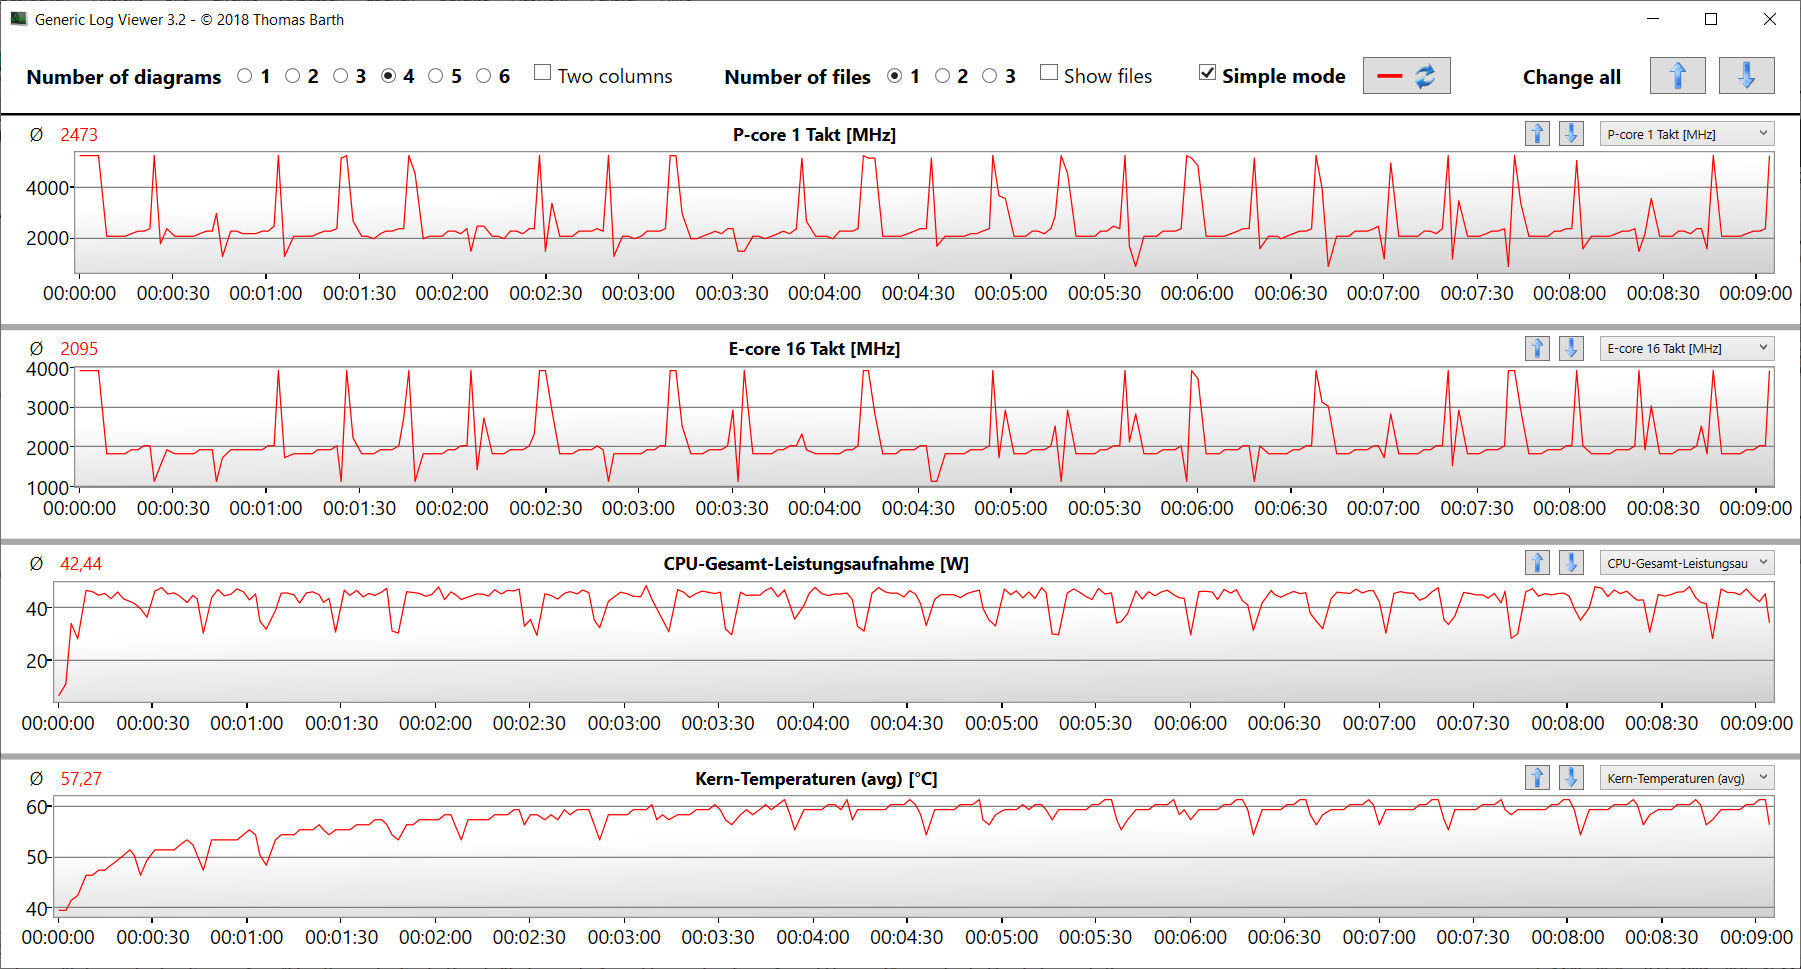
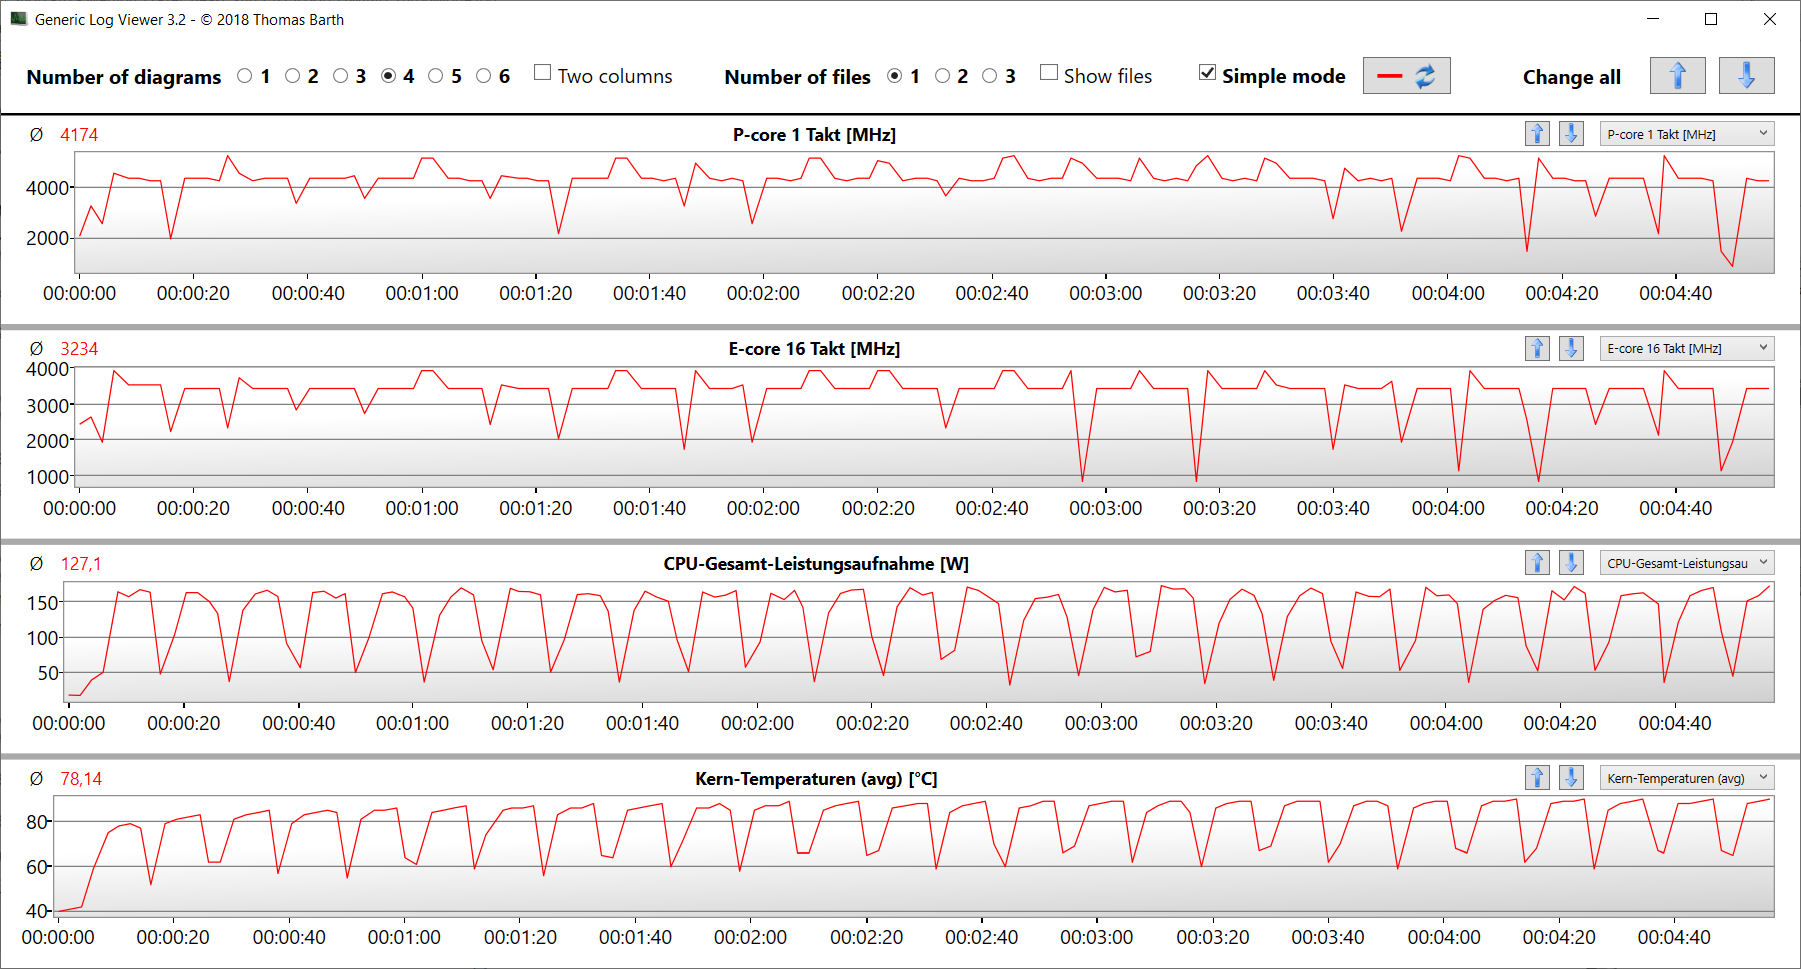
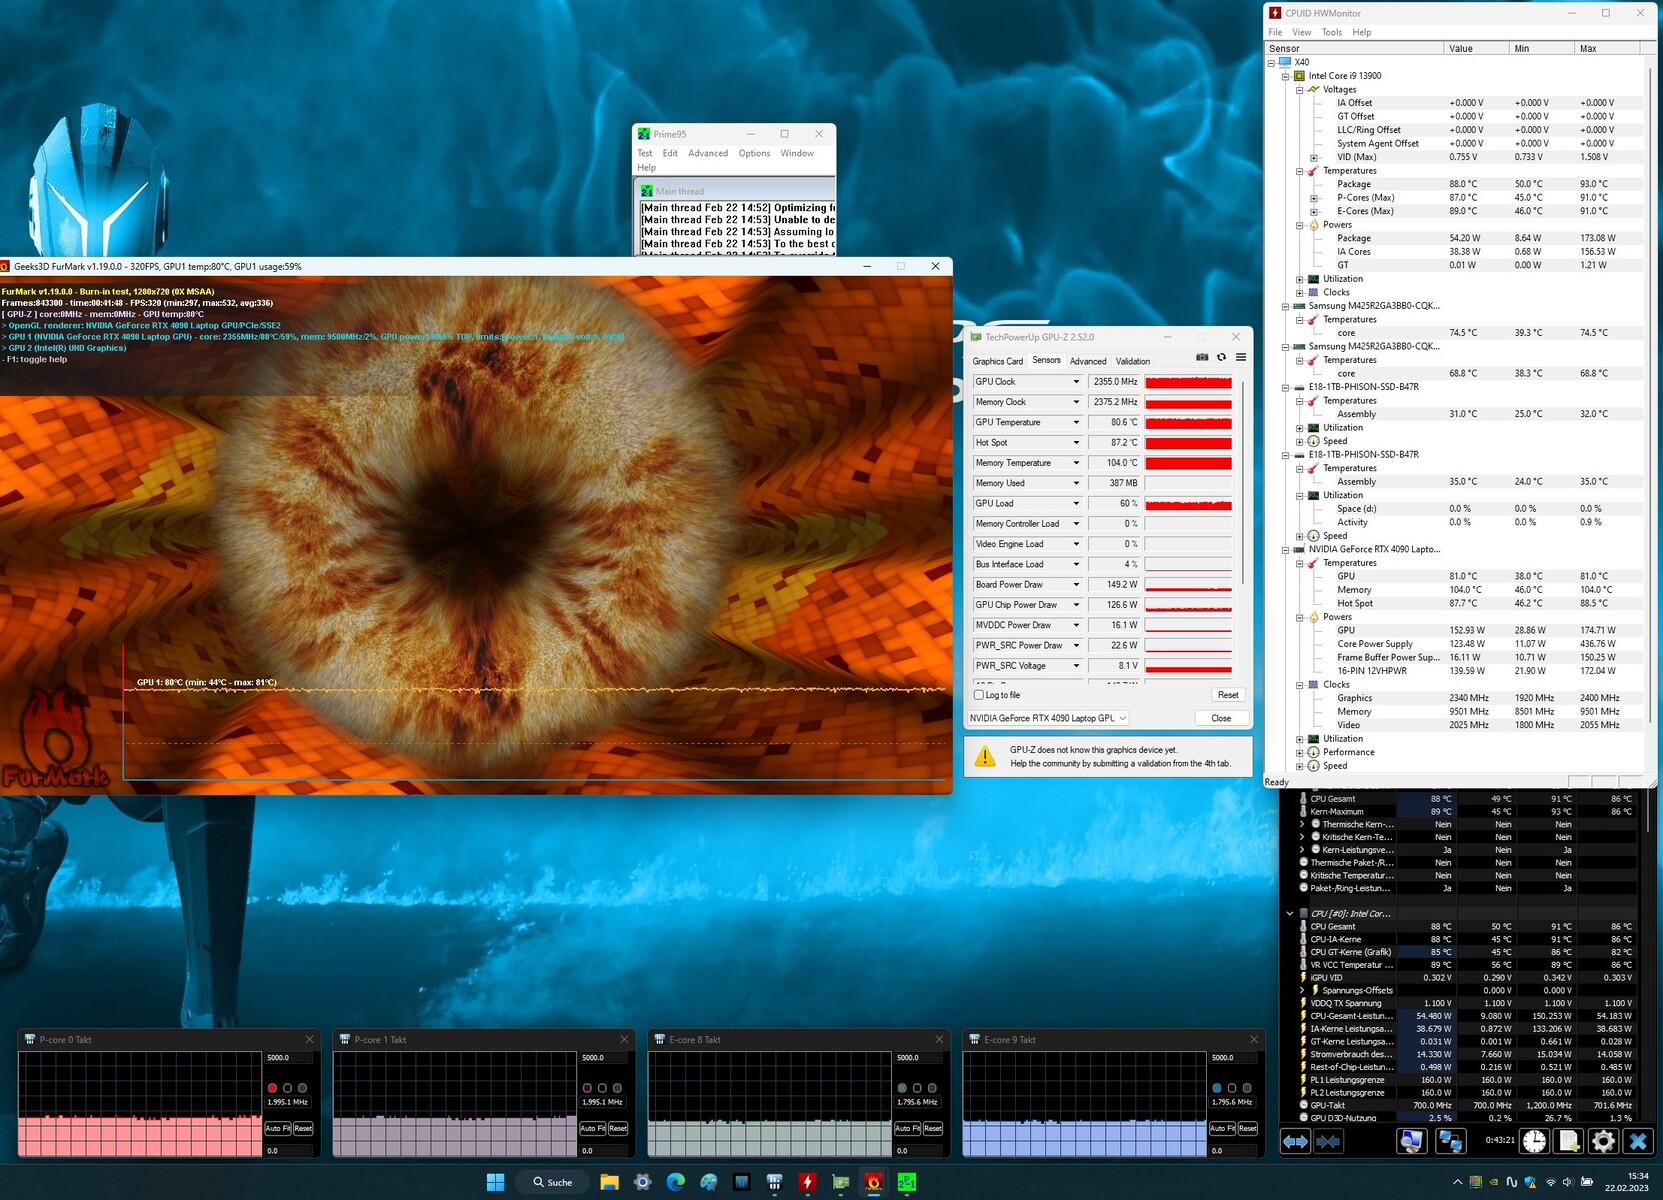
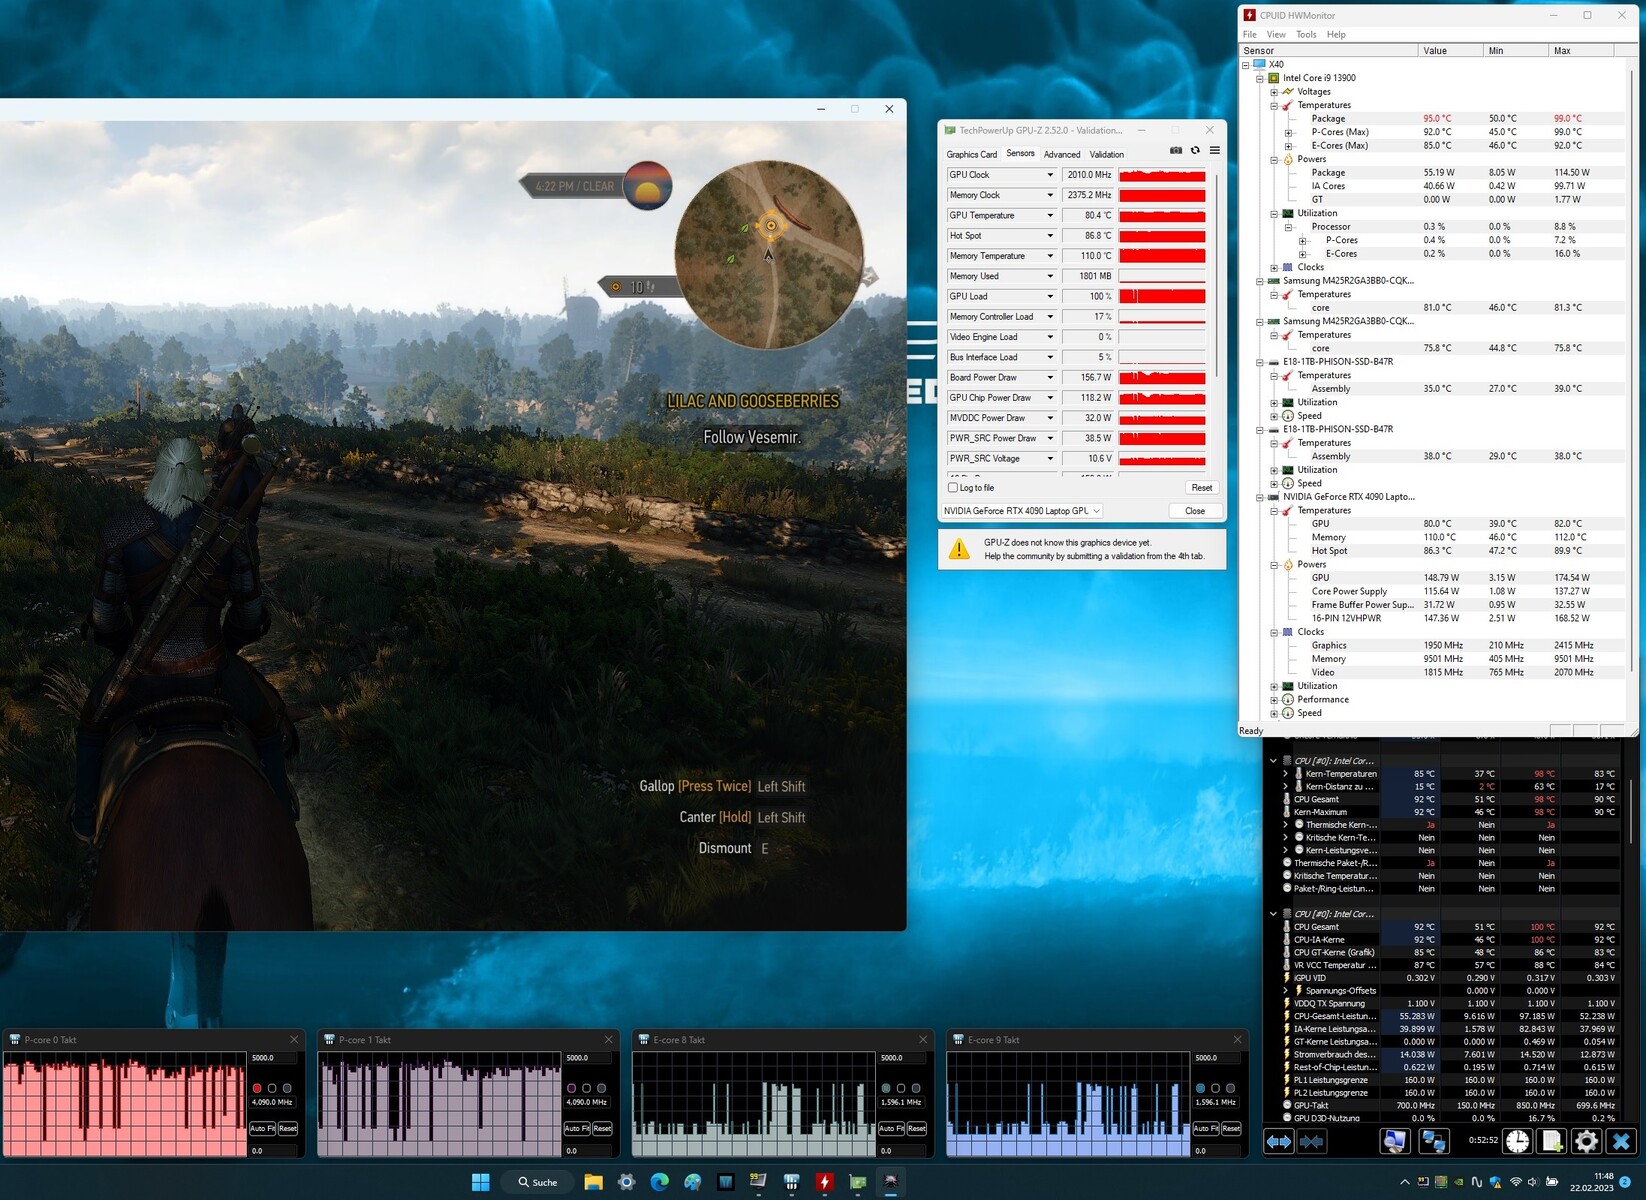
压力测试
对于压力测试,我们让Prime95和FurMark运行了很长时间。它代表了一种极端情况,旨在评估系统在全负荷下的稳定性。CPU开始时的时钟速度很高(P-cores:4 GHz,E-cores:3.3 GHz),而GPU在1至1.5 GHz之间波动。大约5分钟后,CPU的P-cores和E-cores分别逐渐下降到2GHz和1.8GHz,但GPU的时钟攀升到大约2.3至2.4GHz。
发言人
立体声扬声器听起来还不错,但几乎不产生任何低音。我们建议使用一副耳机或外部扬声器以获得更好的音频体验。
Medion Erazer Beast X40 audio analysis
(+) | speakers can play relatively loud (88 dB)
Bass 100 - 315 Hz
(-) | nearly no bass - on average 20.2% lower than median
(±) | linearity of bass is average (8.4% delta to prev. frequency)
Mids 400 - 2000 Hz
(±) | higher mids - on average 5.5% higher than median
(+) | mids are linear (6.5% delta to prev. frequency)
Highs 2 - 16 kHz
(+) | balanced highs - only 3.1% away from median
(+) | highs are linear (5.8% delta to prev. frequency)
Overall 100 - 16.000 Hz
(±) | linearity of overall sound is average (16.1% difference to median)
Compared to same class
» 39% of all tested devices in this class were better, 7% similar, 54% worse
» The best had a delta of 6%, average was 18%, worst was 132%
Compared to all devices tested
» 26% of all tested devices were better, 5% similar, 69% worse
» The best had a delta of 4%, average was 23%, worst was 134%
MSI Titan GT77 HX 13VI audio analysis
(+) | speakers can play relatively loud (90.1 dB)
Bass 100 - 315 Hz
(±) | reduced bass - on average 14.3% lower than median
(±) | linearity of bass is average (7.5% delta to prev. frequency)
Mids 400 - 2000 Hz
(+) | balanced mids - only 3.5% away from median
(+) | mids are linear (3.2% delta to prev. frequency)
Highs 2 - 16 kHz
(+) | balanced highs - only 1.9% away from median
(+) | highs are linear (3.8% delta to prev. frequency)
Overall 100 - 16.000 Hz
(+) | overall sound is linear (11.1% difference to median)
Compared to same class
» 8% of all tested devices in this class were better, 3% similar, 89% worse
» The best had a delta of 6%, average was 18%, worst was 132%
Compared to all devices tested
» 7% of all tested devices were better, 2% similar, 91% worse
» The best had a delta of 4%, average was 23%, worst was 134%
电源管理 - X40提供相当好的耐力
消耗功率
在Witcher 3 测试中,X40的功耗平均为280瓦,在压力测试中短暂地达到363瓦的峰值。虽然在Witcher 3 测试过程中,功耗略有下降,但在整个压力测试中,它的功耗是波动的。在空闲状态下,笔记本对内部硬件的耗电量相当正常。附带的充电器额定功率为330瓦,因此可以为笔记本电脑提供足够的电力。
| Off / Standby | |
| Idle | |
| Load |
|
Key:
min: | |
| Medion Erazer Beast X40 i9-13900HX, GeForce RTX 4090 Laptop GPU | MSI Titan GT77 HX 13VI i9-13950HX, GeForce RTX 4090 Laptop GPU | Razer Blade 16 Early 2023 i9-13950HX, GeForce RTX 4080 Laptop GPU | Schenker XMG Neo 17 M22 R9 6900HX, GeForce RTX 3080 Ti Laptop GPU | Alienware x17 R2 P48E i9-12900HK, GeForce RTX 3080 Ti Laptop GPU | Asus ROG Strix Scar 18 2023 G834JY-N6005W i9-13980HX, GeForce RTX 4090 Laptop GPU | Average NVIDIA GeForce RTX 4090 Laptop GPU | Average of class Gaming | |
|---|---|---|---|---|---|---|---|---|
| Power Consumption | -5% | -14% | 31% | -42% | -30% | -15% | 8% | |
| Idle Minimum * (Watt) | 11 | 14 -27% | 15.2 -38% | 7 36% | 24.1 -119% | 17.3 -57% | 16.2 ? -47% | 13 ? -18% |
| Idle Average * (Watt) | 18 | 21.6 -20% | 22.8 -27% | 11 39% | 28.5 -58% | 27 -50% | 23.1 ? -28% | 19 ? -6% |
| Idle Maximum * (Watt) | 30 | 24.8 17% | 49.8 -66% | 17 43% | 60 -100% | 46 -53% | 34.2 ? -14% | 24.6 ? 18% |
| Load Average * (Watt) | 136 | 122.5 10% | 121.2 11% | 92 32% | 128.7 5% | 133 2% | 130.5 ? 4% | 110.7 ? 19% |
| Witcher 3 ultra * (Watt) | 280 | 265 5% | 242 14% | 221 21% | 254 9% | |||
| Load Maximum * (Watt) | 363 | 418 -15% | 273.7 25% | 306 16% | 323 11% | 329 9% | 324 ? 11% | 259 ? 29% |
* ... smaller is better
Power consumption Witcher 3 / Stress test
Power consumption with external monitor
电池寿命
在Wi-Fi测试(使用脚本自动访问网站)和视频测试(以全高清方式循环播放H.264编码的短片《Big Buck Bunny》)中,17英寸笔记本电脑分别持续了6小时22分钟和6小时56分钟。在这两项测试中,笔记本电脑的所有省电功能都被禁用,屏幕亮度被设置为大约150cd/m²。当我们进行视频测试时,无线适配器也被禁用。
总的来说,对于这样一台高性能的笔记本电脑,Erazer的电池寿命非常好。它可以超过大多数竞争对手,甚至那些具有相同电池容量的竞争对手。
| Medion Erazer Beast X40 i9-13900HX, GeForce RTX 4090 Laptop GPU, 99.8 Wh | MSI Titan GT77 HX 13VI i9-13950HX, GeForce RTX 4090 Laptop GPU, 99.9 Wh | Razer Blade 16 Early 2023 i9-13950HX, GeForce RTX 4080 Laptop GPU, 95.2 Wh | Schenker XMG Neo 17 M22 R9 6900HX, GeForce RTX 3080 Ti Laptop GPU, 99 Wh | Alienware x17 R2 P48E i9-12900HK, GeForce RTX 3080 Ti Laptop GPU, 87 Wh | Asus ROG Strix Scar 18 2023 G834JY-N6005W i9-13980HX, GeForce RTX 4090 Laptop GPU, 90 Wh | Average of class Gaming | |
|---|---|---|---|---|---|---|---|
| Battery runtime | -19% | -12% | 15% | -62% | -14% | -0% | |
| Reader / Idle (h) | 9.4 | 8.9 -5% | 12 28% | 3.9 -59% | 8.27 ? -12% | ||
| H.264 (h) | 6.9 | 6 -13% | 6.6 -4% | 7 1% | 8.32 ? 21% | ||
| WiFi v1.3 (h) | 6.4 | 5.3 -17% | 6.1 -5% | 9 41% | 2 -69% | 7.1 11% | 7.11 ? 11% |
| Load (h) | 1.9 | 1.4 -26% | 1.4 -26% | 1.8 -5% | 0.8 -58% | 0.9 -53% | 1.502 ? -21% |
| Witcher 3 ultra (h) | 0.9 |
Pros
Cons
结论 - 卓越的高端游戏笔记本

Medion Erazer Beast X40是一款专为高要求使用场景设计的笔记本电脑,如视频编辑、渲染和游戏。这些应用所需的计算能力是由目前最强大的CPU-GPU组合之一提供的:一个 酷睿i9-13900HX搭配 GeForce RTX 4090.
该处理器和显卡能够在高时钟速度下持续运行,而且X40产生的热量和噪音对于这类设备来说相当正常。
总而言之,Erazer Beast X40是一款引人注目的笔记本电脑,适合游戏和其他高要求的应用。
哑光的17英寸16:10显示屏(QHD,IPS,240Hz,G-Sync,sRGB)在大多数情况下看起来很棒。唯一的缺点是,它的对比度略微太低。极好的机械键盘(带RGB照明)使笔记本电脑看起来更有吸引力。那些从未使用过机械键盘的人将获得全新的打字体验。笔记本电脑上的Thunderbolt 4端口开辟了扩展选项(如外部GPU,对接解决方案),但不支持Power Delivery。
Erazer Beast X40的一个可能替代品是 华硕ROG Strix Scar 18 2023 G834JY.华硕ROG以其18英寸16:10 QHD+面板、更多内存(64GB)和RAID支持而脱颖而出。它的价格约为4,800欧元(5,177美元),与 "野兽 "处于同一价格档次。如果钱不是问题,你可以看一下微星Titan GT77 HX 13V作为另一个选择。它的CPU性能略高,有三个SSD插槽,支持RAID和四个内存插槽。具有出色对比度的特别明亮的迷你LED显示屏是该设备的一个亮点。但整体包装将使你花费约6,600欧元(7,120美元)。
对水冷的评价
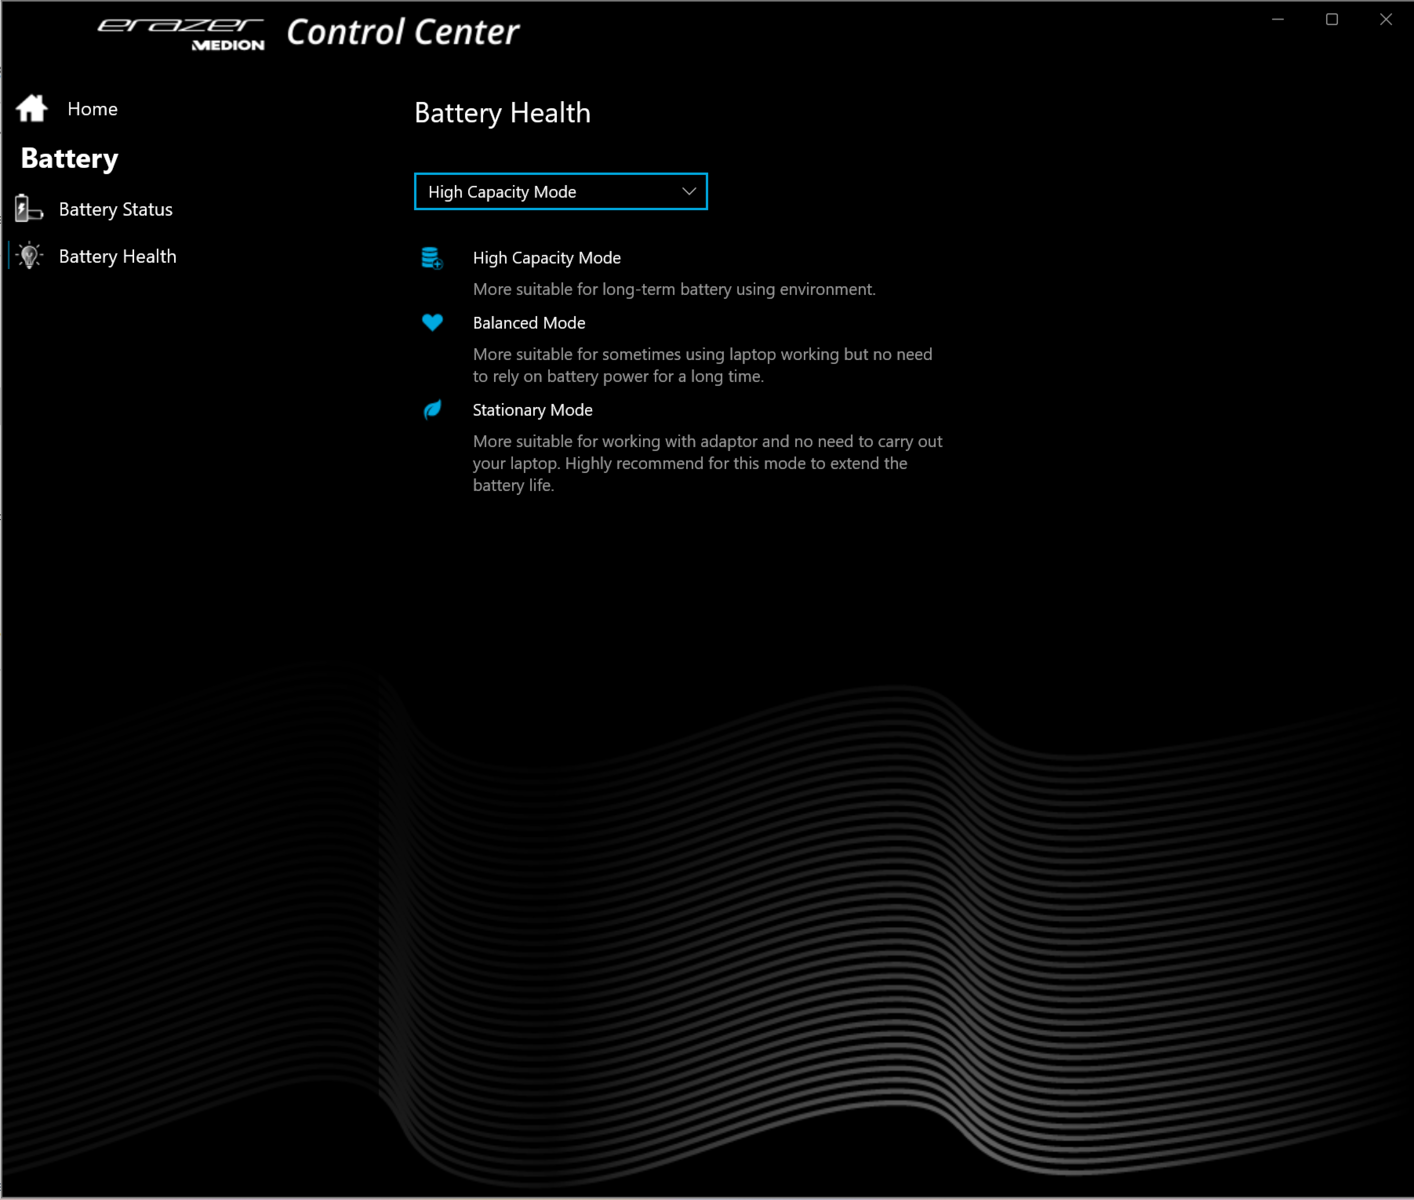
可选的水冷装置从根本上做到了它应该做的:提高性能(Medion承诺最多可提高10%)并减少热量和噪音。然而,在实际使用中,性能的提高是相当温和的,而且笔记本电脑被限制在一个固定的地方。剩下的唯一优势是更低的温度和噪音水平。这些好处是否值得多花250欧元(270美元),要由每个X40的所有者来决定。
价格和可用性
在德国,Medion Erazer Beast X40的评测配置可从Saturn.de获得。并标价为4,499欧元(4,856美元)。
Medion Erazer Beast X40
- 03/20/2023 v7 (old)
Sascha Mölck
Transparency
The selection of devices to be reviewed is made by our editorial team. The test sample was provided to the author as a loan by the manufacturer or retailer for the purpose of this review. The lender had no influence on this review, nor did the manufacturer receive a copy of this review before publication. There was no obligation to publish this review. As an independent media company, Notebookcheck is not subjected to the authority of manufacturers, retailers or publishers.
This is how Notebookcheck is testing
Every year, Notebookcheck independently reviews hundreds of laptops and smartphones using standardized procedures to ensure that all results are comparable. We have continuously developed our test methods for around 20 years and set industry standards in the process. In our test labs, high-quality measuring equipment is utilized by experienced technicians and editors. These tests involve a multi-stage validation process. Our complex rating system is based on hundreds of well-founded measurements and benchmarks, which maintains objectivity. Further information on our test methods can be found here.
Price comparison

