华硕ROG Zephyrus M16(2023)笔记本电脑评测:RTX 4090与超亮的Mini-LED显示屏

作为 "老 "一代CPU/GPU的最后一个例子,我们最近审查了 ROG Zephyrus M16它配备了一个酷睿i9-12900H和一个RTX 3070 Ti.但现在,M16的外形已经发生了变化,这次配备的是酷睿i9-13900H和一个RTX 4090装在一个 "AniMe Matrix "机箱内。后者略有变化,因为矩阵变得更加精细。我们已经详细了解了这些变化,并调查了M16是否能与RTX 4090相处。
不言而喻,我们将新设备与前代产品以及其他高端游戏机进行了比较。由于RTX 4090通常出现在较大的笔记本电脑中,我们还看了18英寸的华硕ROG Strix Scar 18或17英寸的MSI Titan GT77.我们还考虑了这两款 联想Legion Pro 7 16IRX和 Razer Blade 16都是竞争对手。
潜在的竞争对手比较
Rating | Date | Model | Weight | Height | Size | Resolution | Price |
|---|---|---|---|---|---|---|---|
| 89.4 % v7 (old) | 03 / 2023 | Asus ROG Zephyrus M16 GU604VY-NM042X i9-13900H, GeForce RTX 4090 Laptop GPU | 2.3 kg | 22.9 mm | 16.00" | 2560x1600 | |
| 87.8 % v7 (old) | 02 / 2023 | Asus ROG Zephyrus M16 GU603Z i9-12900H, GeForce RTX 3070 Ti Laptop GPU | 2.1 kg | 19.9 mm | 16.00" | 2560x1600 | |
| 86.6 % v7 (old) | 02 / 2023 | Asus ROG Strix Scar 18 2023 G834JY-N6005W i9-13980HX, GeForce RTX 4090 Laptop GPU | 3.1 kg | 30.8 mm | 18.00" | 2560x1600 | |
| 89 % v7 (old) | 02 / 2023 | MSI Titan GT77 HX 13VI i9-13950HX, GeForce RTX 4090 Laptop GPU | 3.5 kg | 23 mm | 17.30" | 3840x2160 | |
| 89.4 % v7 (old) | 02 / 2023 | Lenovo Legion Pro 7 16IRX8H i9-13900HX, GeForce RTX 4080 Laptop GPU | 2.7 kg | 26 mm | 16.00" | 2560x1600 | |
| 91.2 % v7 (old) | 02 / 2023 | Razer Blade 16 Early 2023 i9-13950HX, GeForce RTX 4080 Laptop GPU | 2.4 kg | 21.99 mm | 16.00" | 2560x1600 |
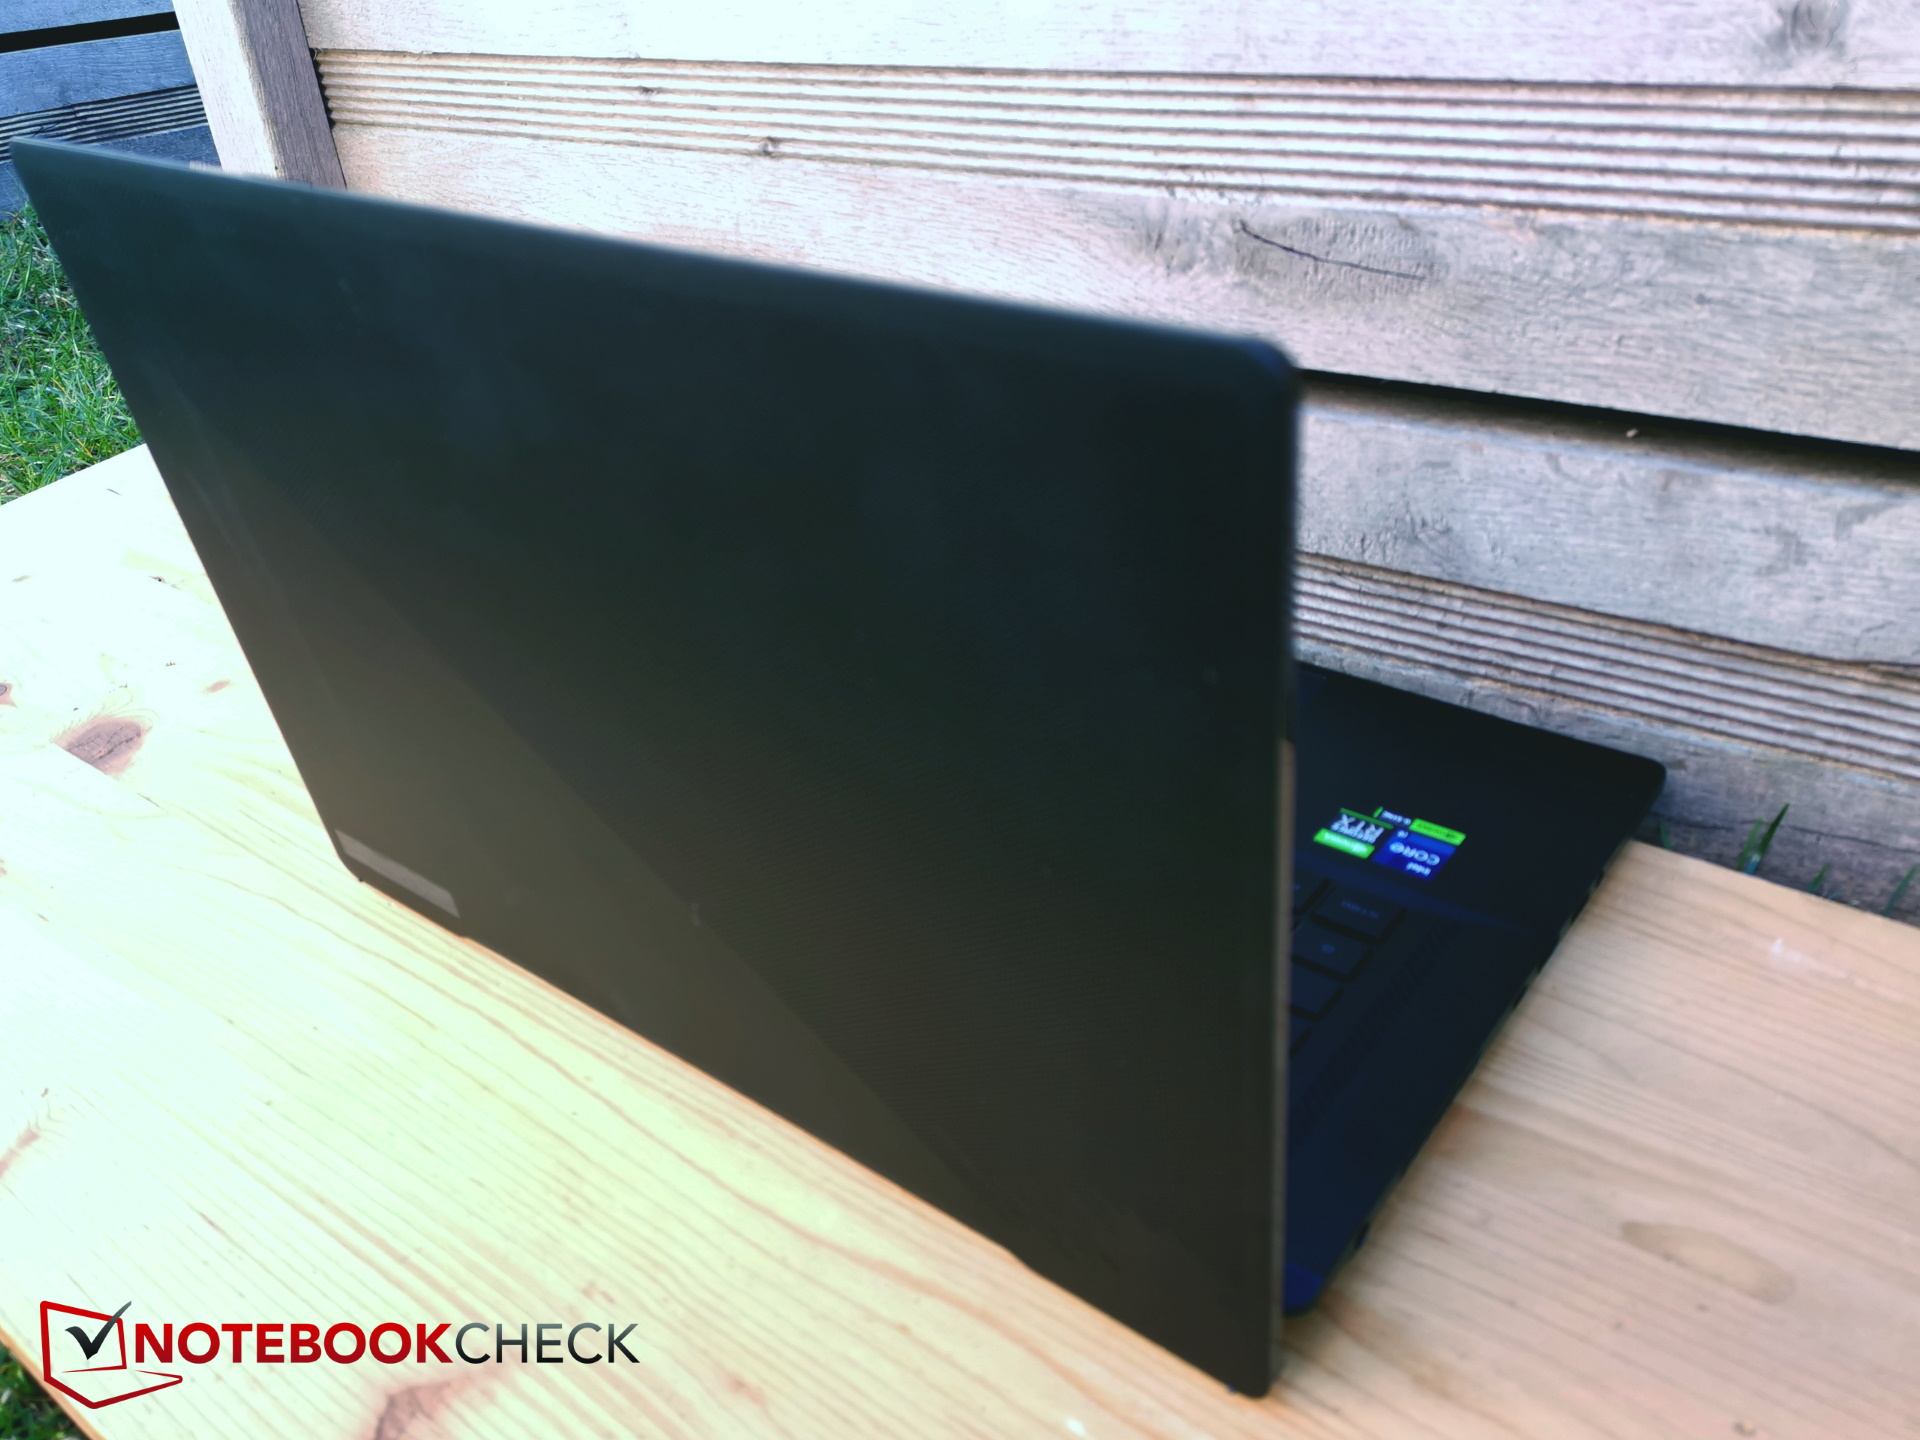
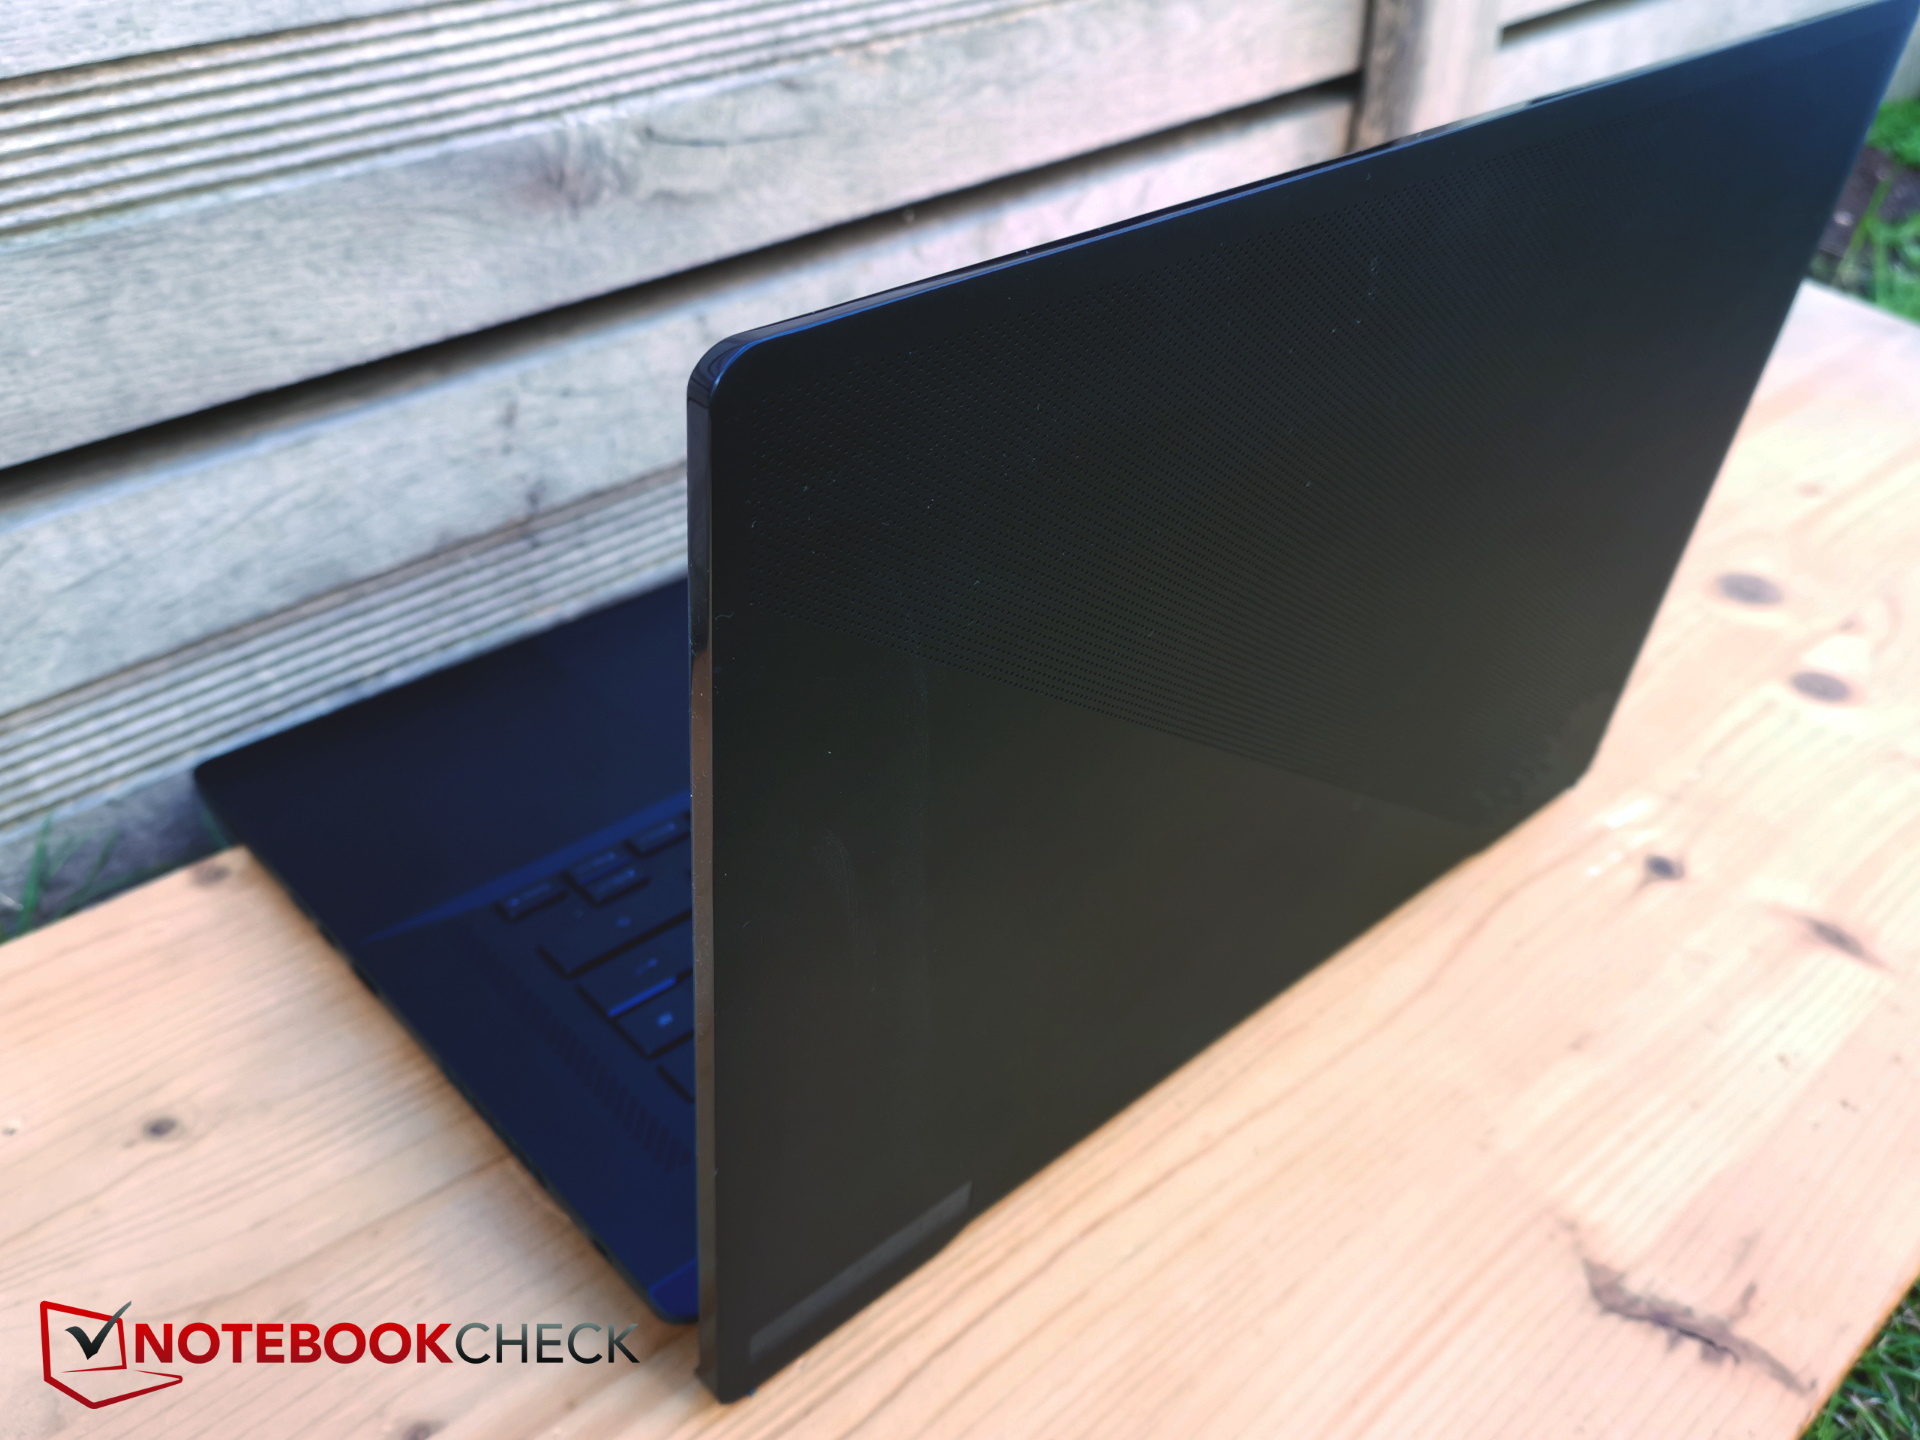
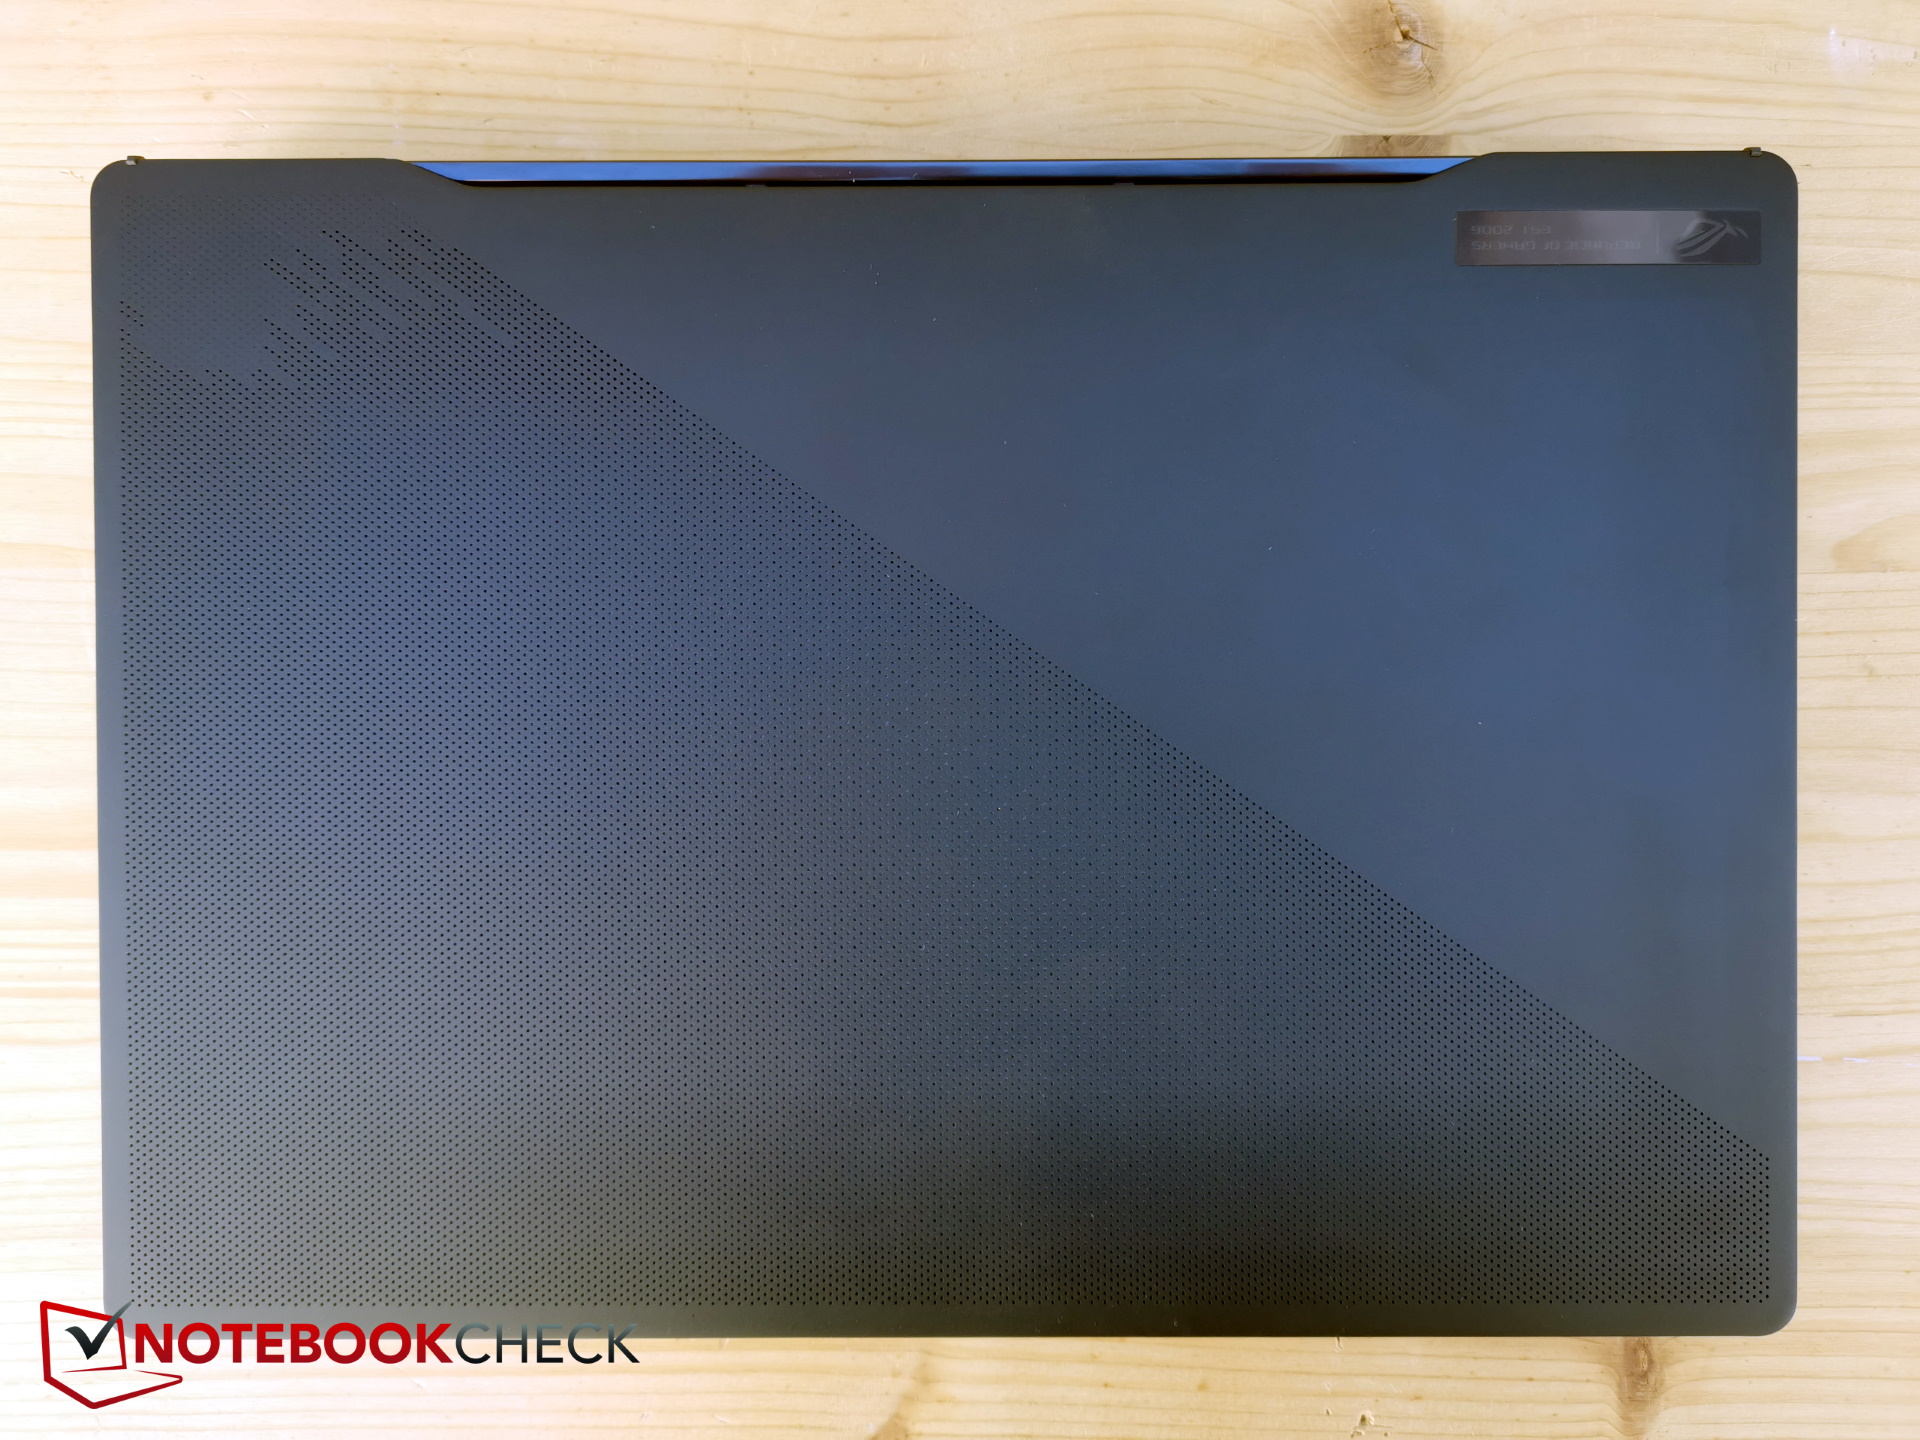
案例--AniMe Matrix是一个令人震惊的案例
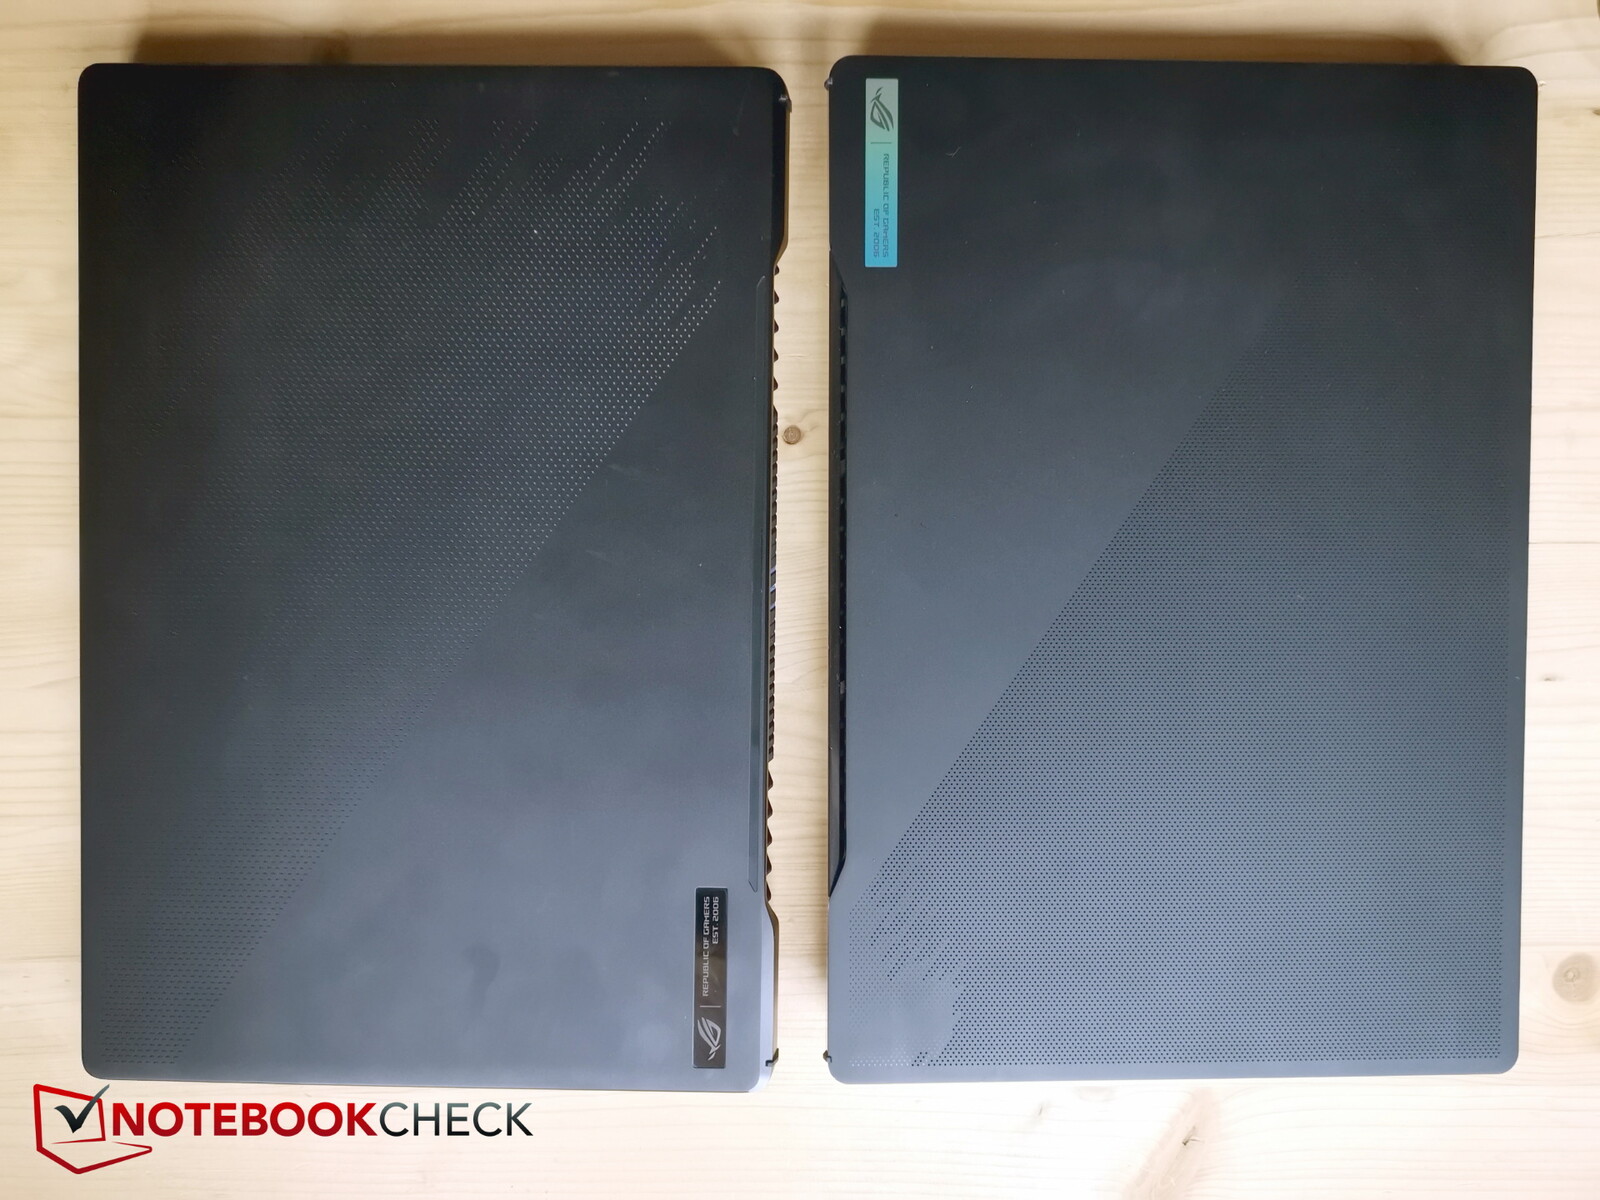
技嘉今年修改了机箱,但乍一看,很难发现任何明显的差异。机箱继续由黑色塑料制成,现在稍微厚一些。
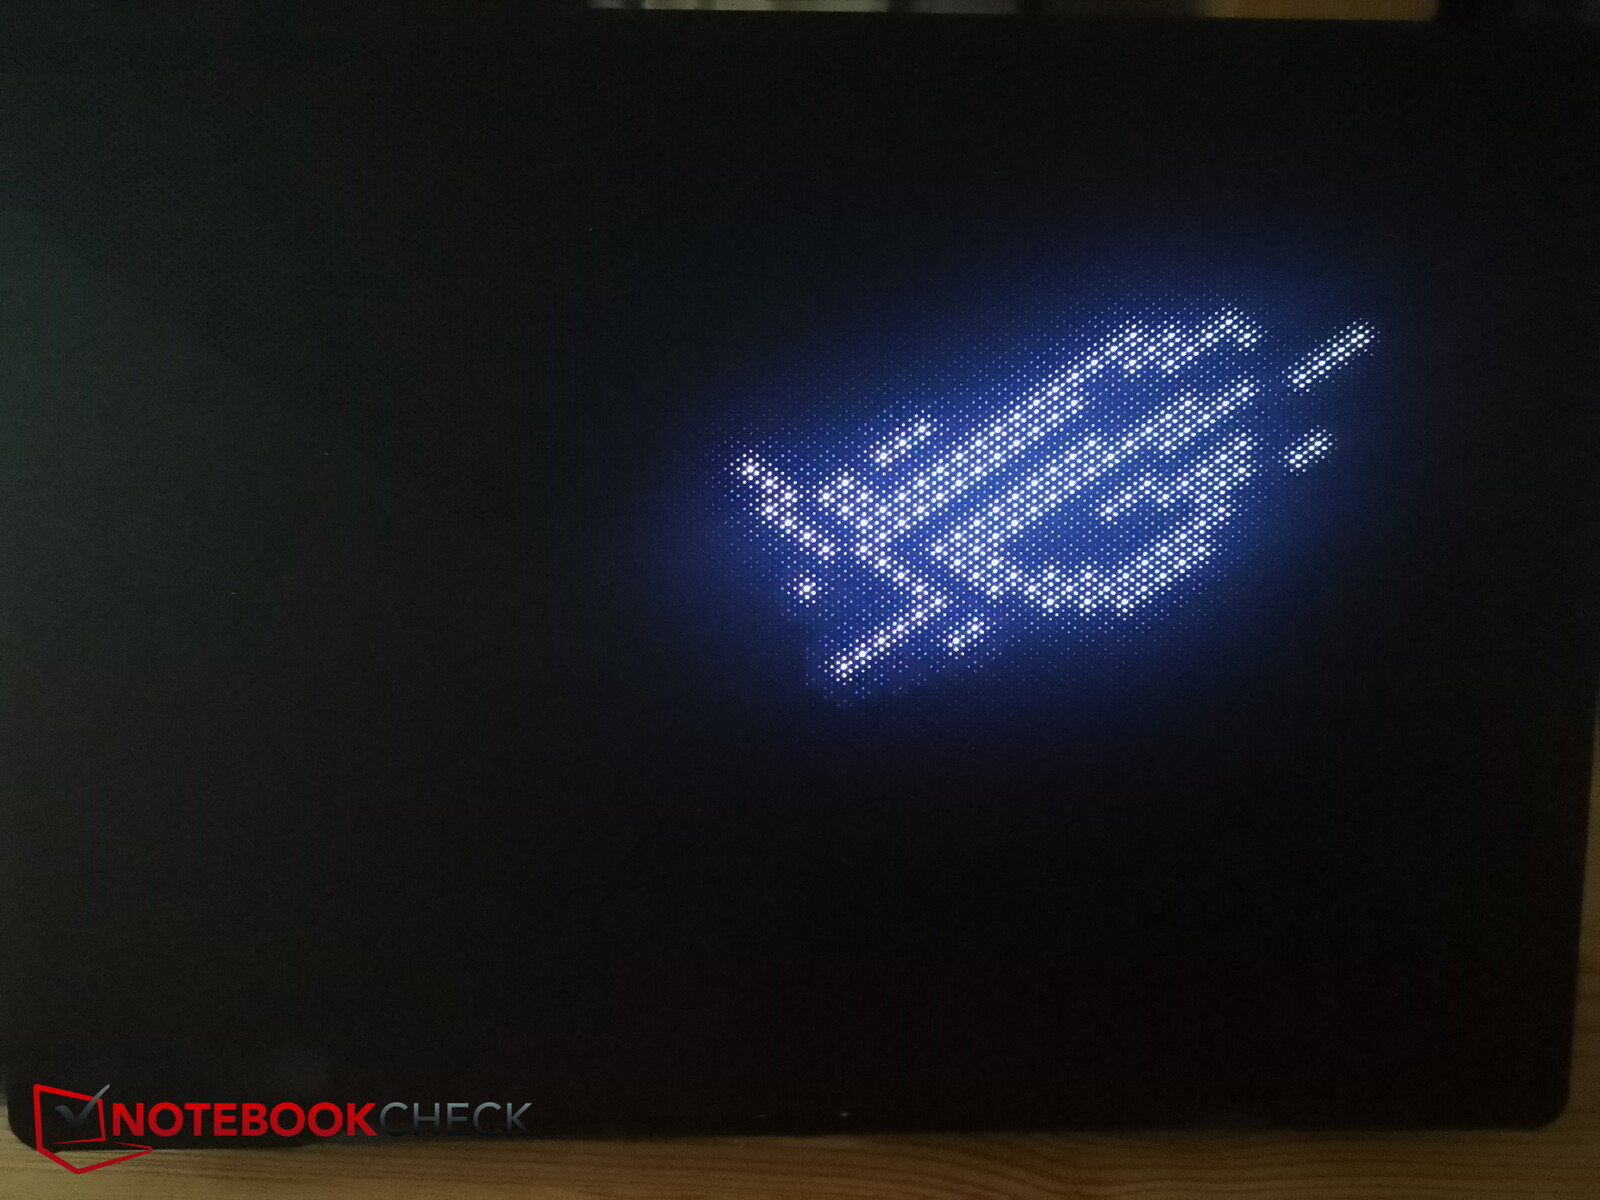
顶面的所谓AniMe矩阵比以前更精细、更详细,可以显示简单、移动的标识或带有附加效果的文字。一方面,这很酷,但它不仅可能增加设备的功耗,而且当笔记本电脑打开时,用户基本上看不到它。出于这个原因,这种效果更多是为了给旁观者留下深刻印象。
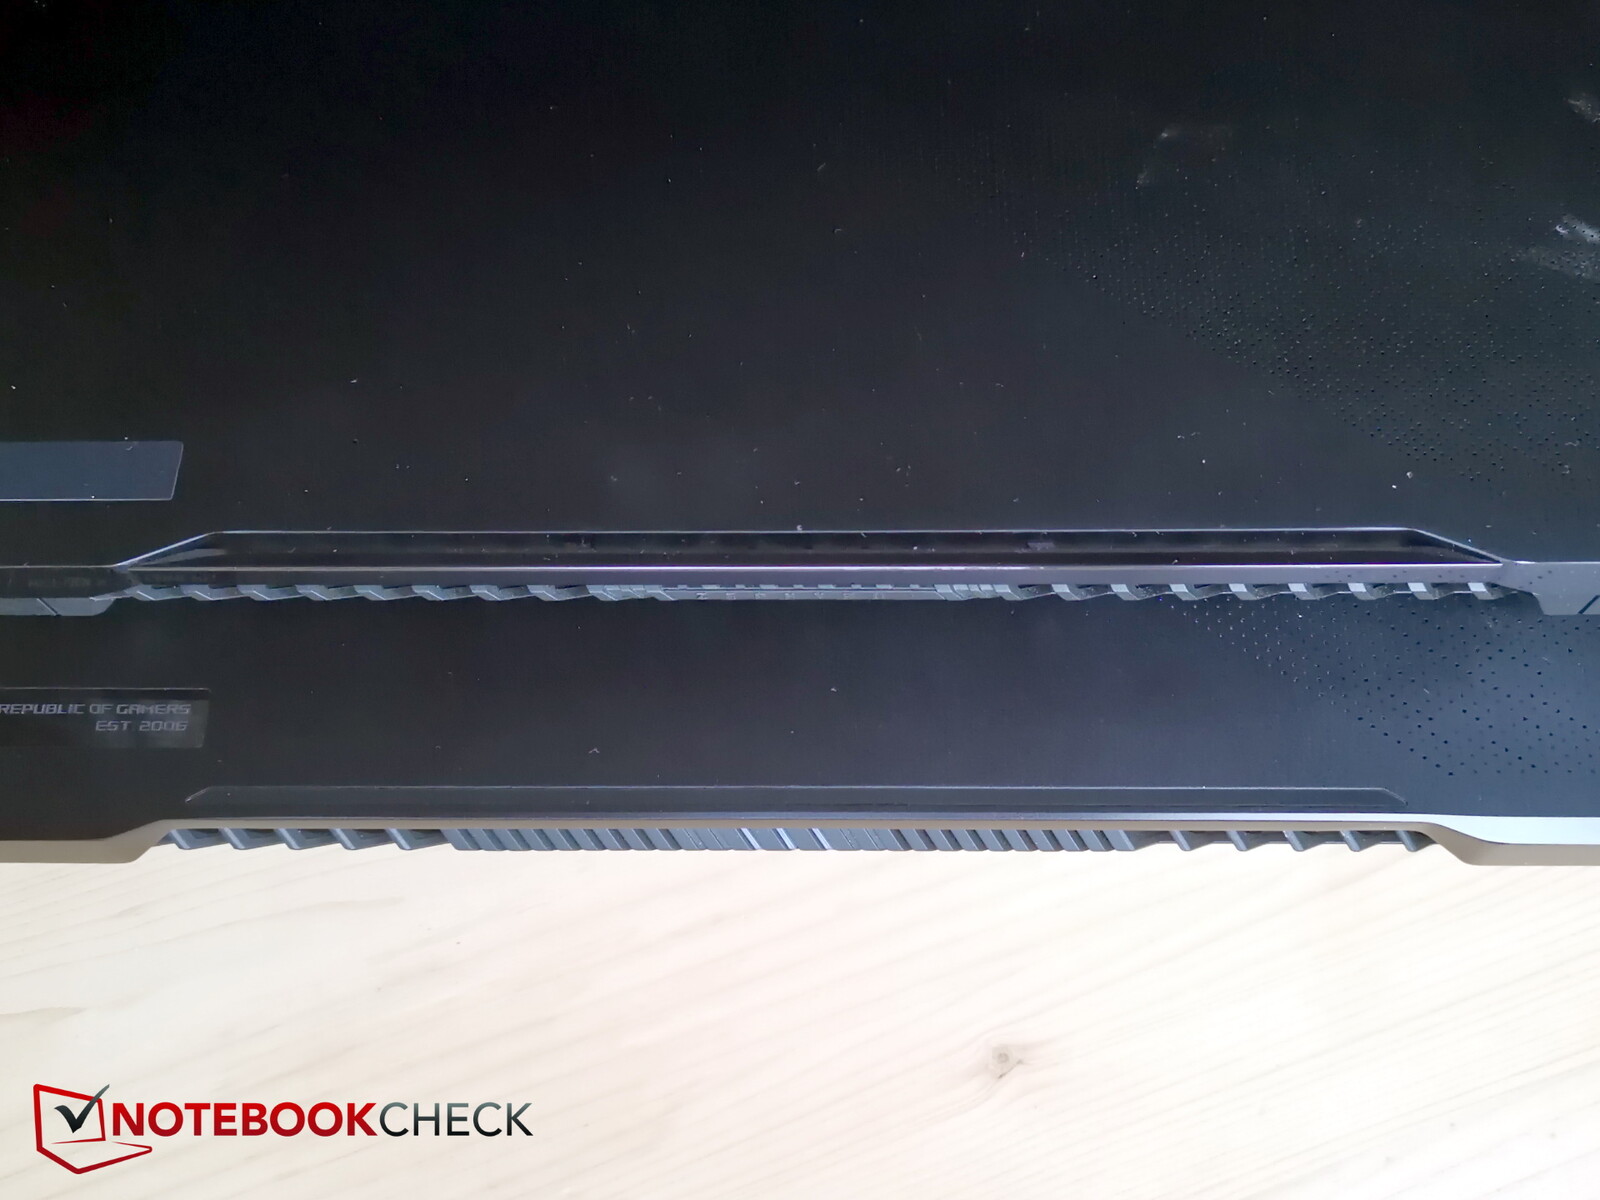
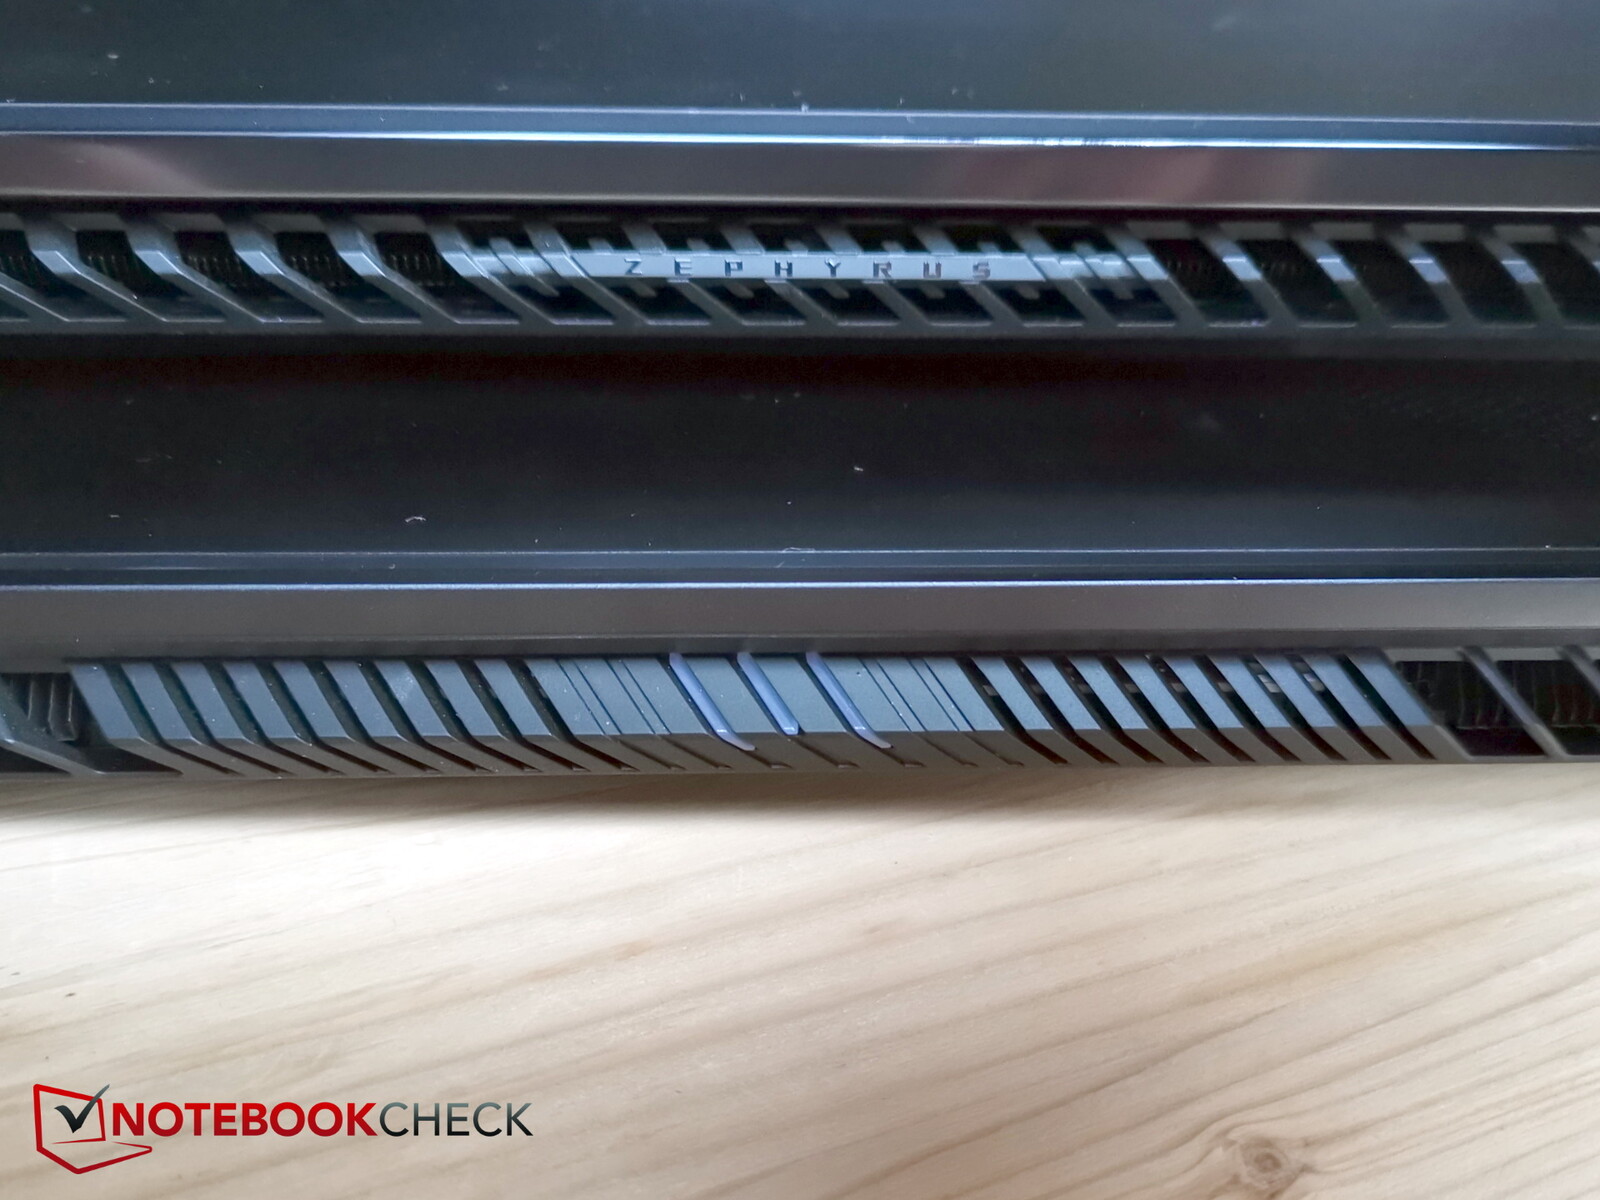
我们对盖子后部顶部的空白黑色塑料条没有印象。它看起来有些廉价,不是很稳定,而且已经开始出现磨损的迹象。总而言之,几乎所有侧面的通风格栅都有轻微改变,端口位置也是如此。
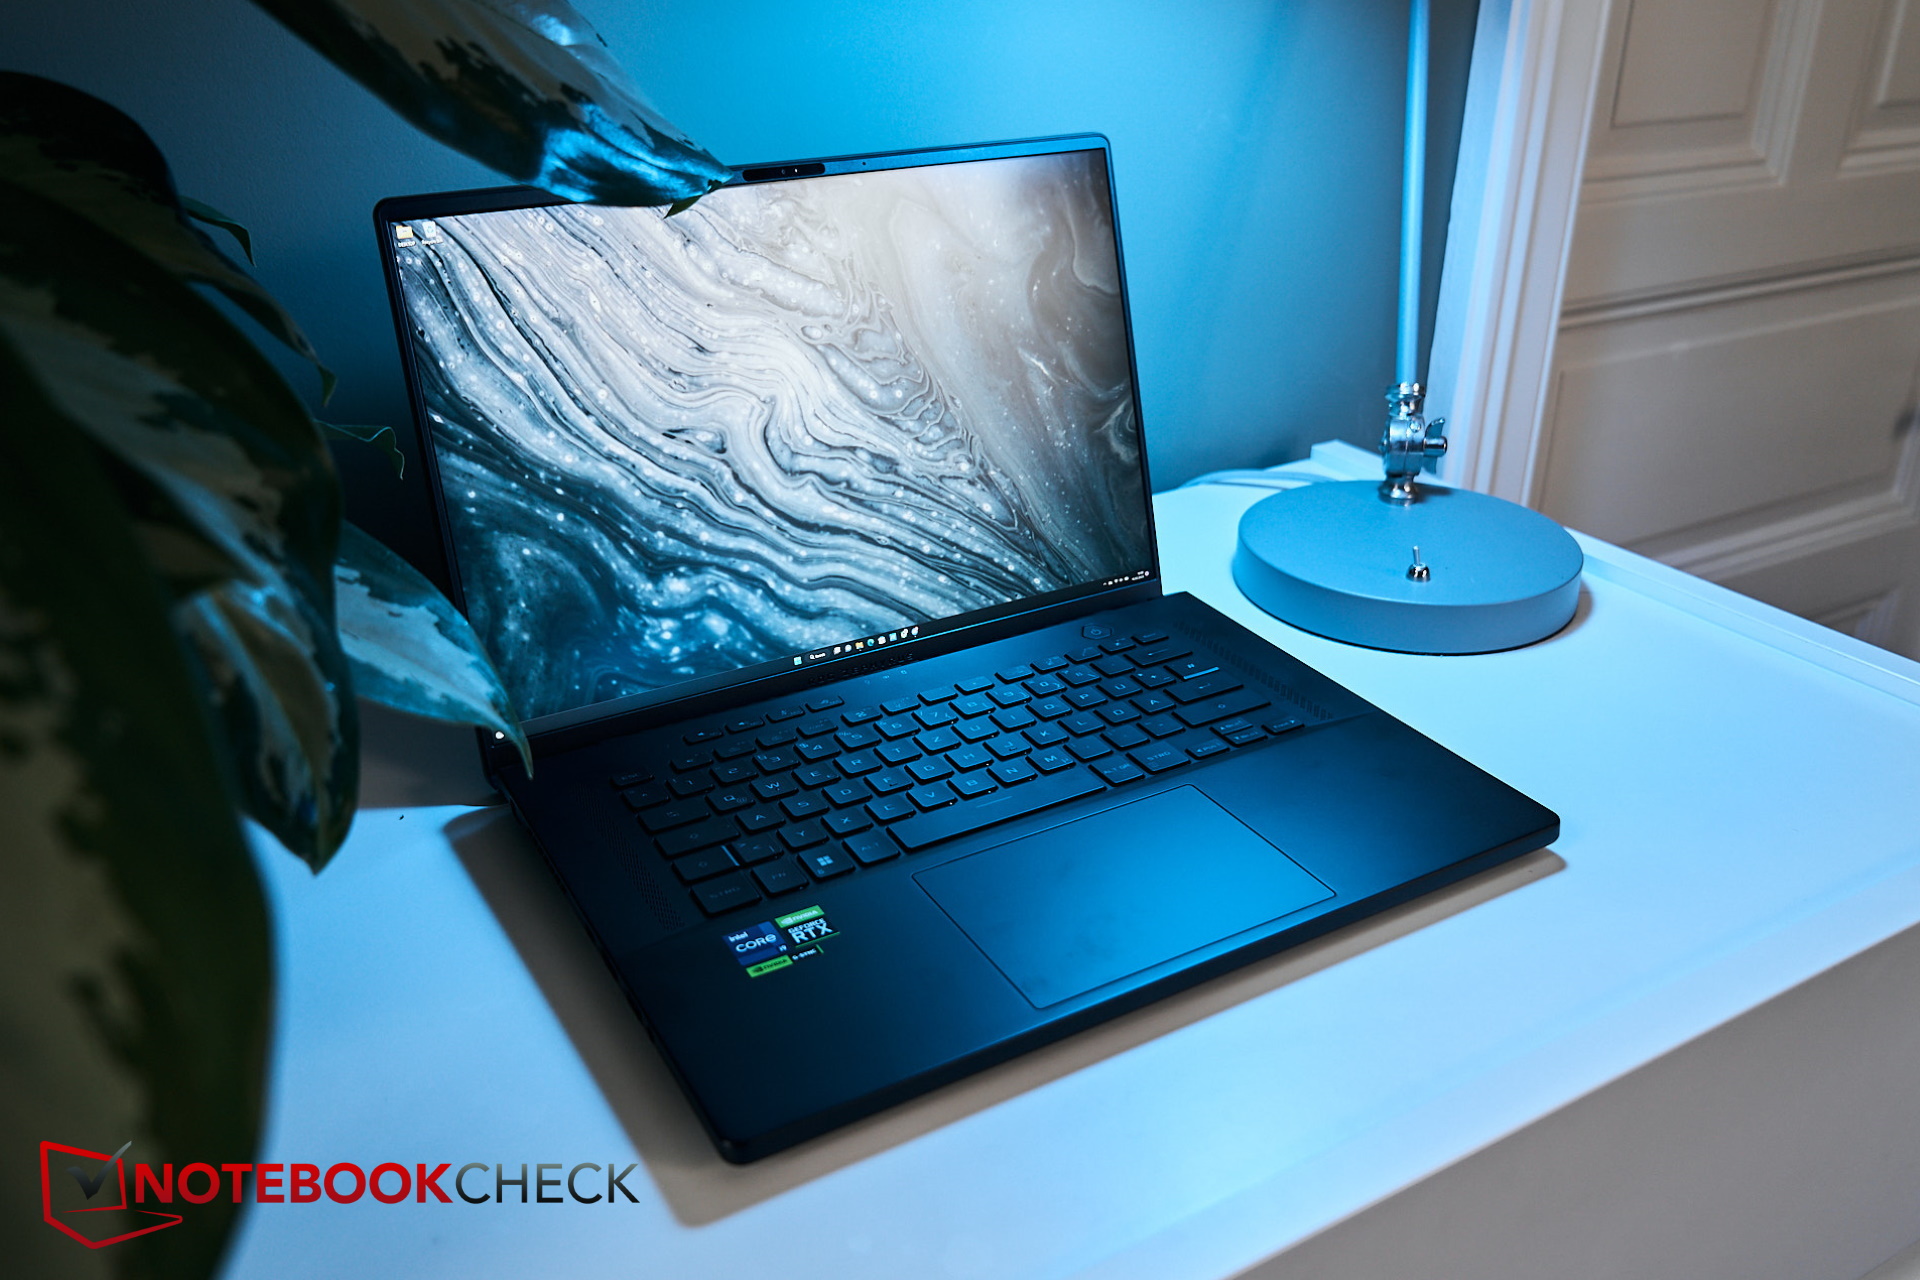
底座似乎很坚固,但在试图扭转箱子时,吱吱嘎嘎的声音相当大。同样,显示屏的盖子也是如此,它很容易被弯曲。铰链将显示器固定得相当牢固,并确保盖子可以打开到180度的角度。打开笔记本时,有两件事向用户展示了自己--键盘略微抬起,显示屏边框相当纤细。


不寻常的是,与前代产品相比,该设备的占地面积有所增加。 前代产品.与使设备更小、更薄、更轻的趋势相反,新的M16略大,而且比上一代机型厚3毫米。
这款Razer Blade 16只薄了1毫米,而联想Legion Pro 7略厚,这意味着新的M16处于中间位置,在重量方面也是如此。
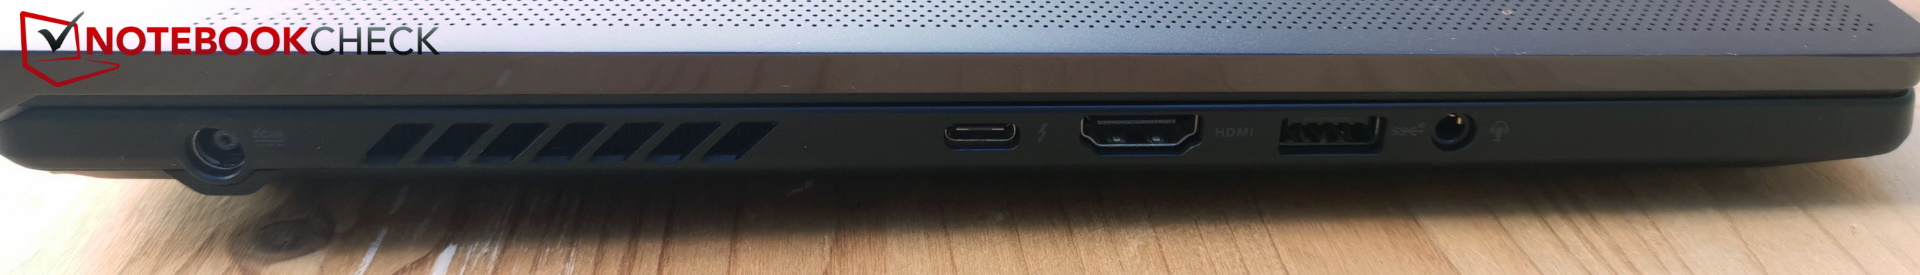
特点 - 一个没有LAN端口的游戏机
在这个领域,也不是一切都变好了:局域网端口被简单地省略了,这意味着对于那些寻求最短延迟和最快连接的游戏玩家来说,只有通过适配器才能实现快速的互联网连接。
其中一个USB-C端口已经从左侧游走到右侧。这意味着设备的左侧有更多的空间。在后面,你仍然只能找到风扇格栅,这导致缺乏空间容纳更多的连接器,如HDMI或缺少的LAN端口。
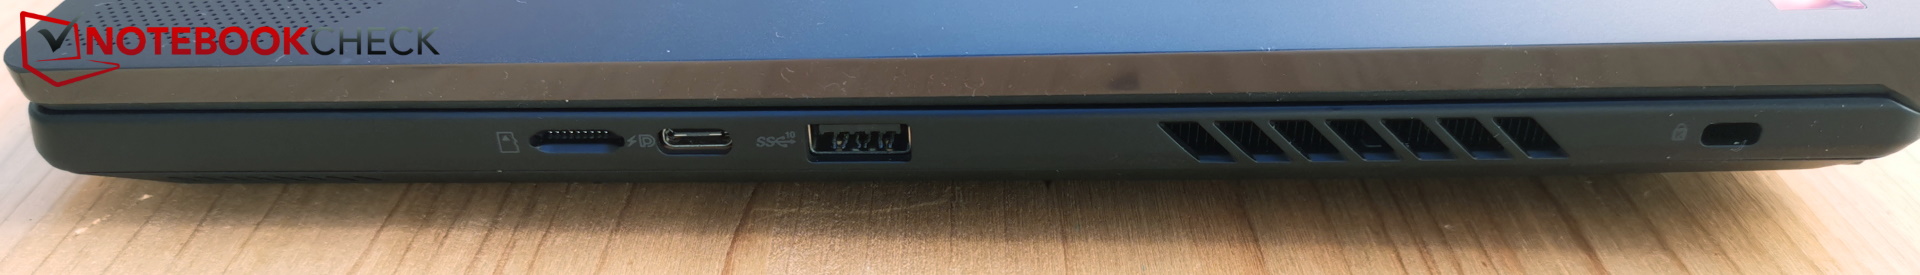
SD卡阅读器
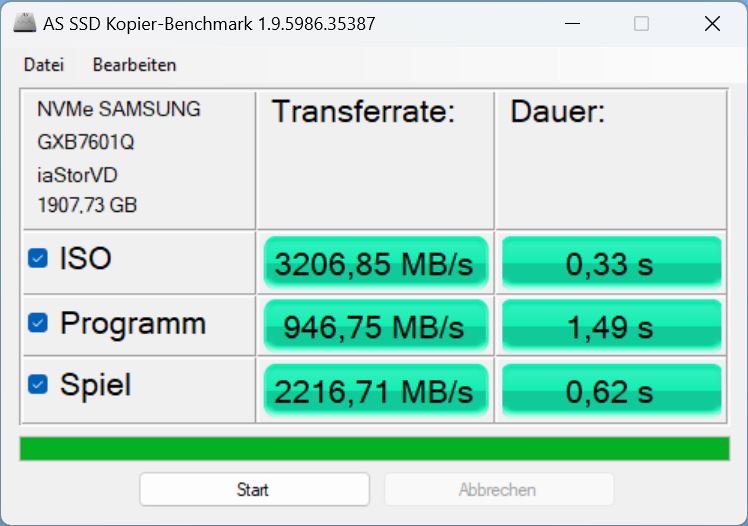
至少这台笔记本电脑配备了一个内置的SD卡读卡器,虽然不幸的是这只用于microSD卡,但它仍然非常快。我们能够使用AV PRO microSD 128 GB V60参考卡在6秒内将一个1GB的图像复制到桌面上。
| SD Card Reader | |
| average JPG Copy Test (av. of 3 runs) | |
| Asus ROG Zephyrus M16 GU604VY-NM042X | |
| Asus ROG Zephyrus M16 GU603Z | |
| Average of class Gaming (20.9 - 210, n=54, last 2 years) | |
| Razer Blade 16 Early 2023 (AV PRO microSD 128 GB V60) | |
| MSI Titan GT77 HX 13VI (Angelibird AV Pro V60) | |
| maximum AS SSD Seq Read Test (1GB) | |
| Asus ROG Zephyrus M16 GU603Z | |
| Razer Blade 16 Early 2023 (AV PRO microSD 128 GB V60) | |
| Asus ROG Zephyrus M16 GU604VY-NM042X | |
| Average of class Gaming (25.5 - 261, n=51, last 2 years) | |
| MSI Titan GT77 HX 13VI (Angelibird AV Pro V60) | |
沟通
不幸的是,制造商取消了局域网端口,也没有包括一个适配器。
无线连接是由英特尔AX210 WiFi 6E模块负责的。该模块在2.4GHz、5GHz和6GHz下传输。
传输速率是快速和稳定的。
网络摄像头
在这一领域,制造商终于升级到全高清摄像头,该机型甚至有一个红外传感器,用于使用Windows Hello登录Windows。然而,图像有明显的黄色色调,颜色偏差相对较高。


安全问题
TPM和Kensington连接器都在板上,但缺少指纹传感器,不幸的是,还缺少一个物理网络摄像头快门。
辅料
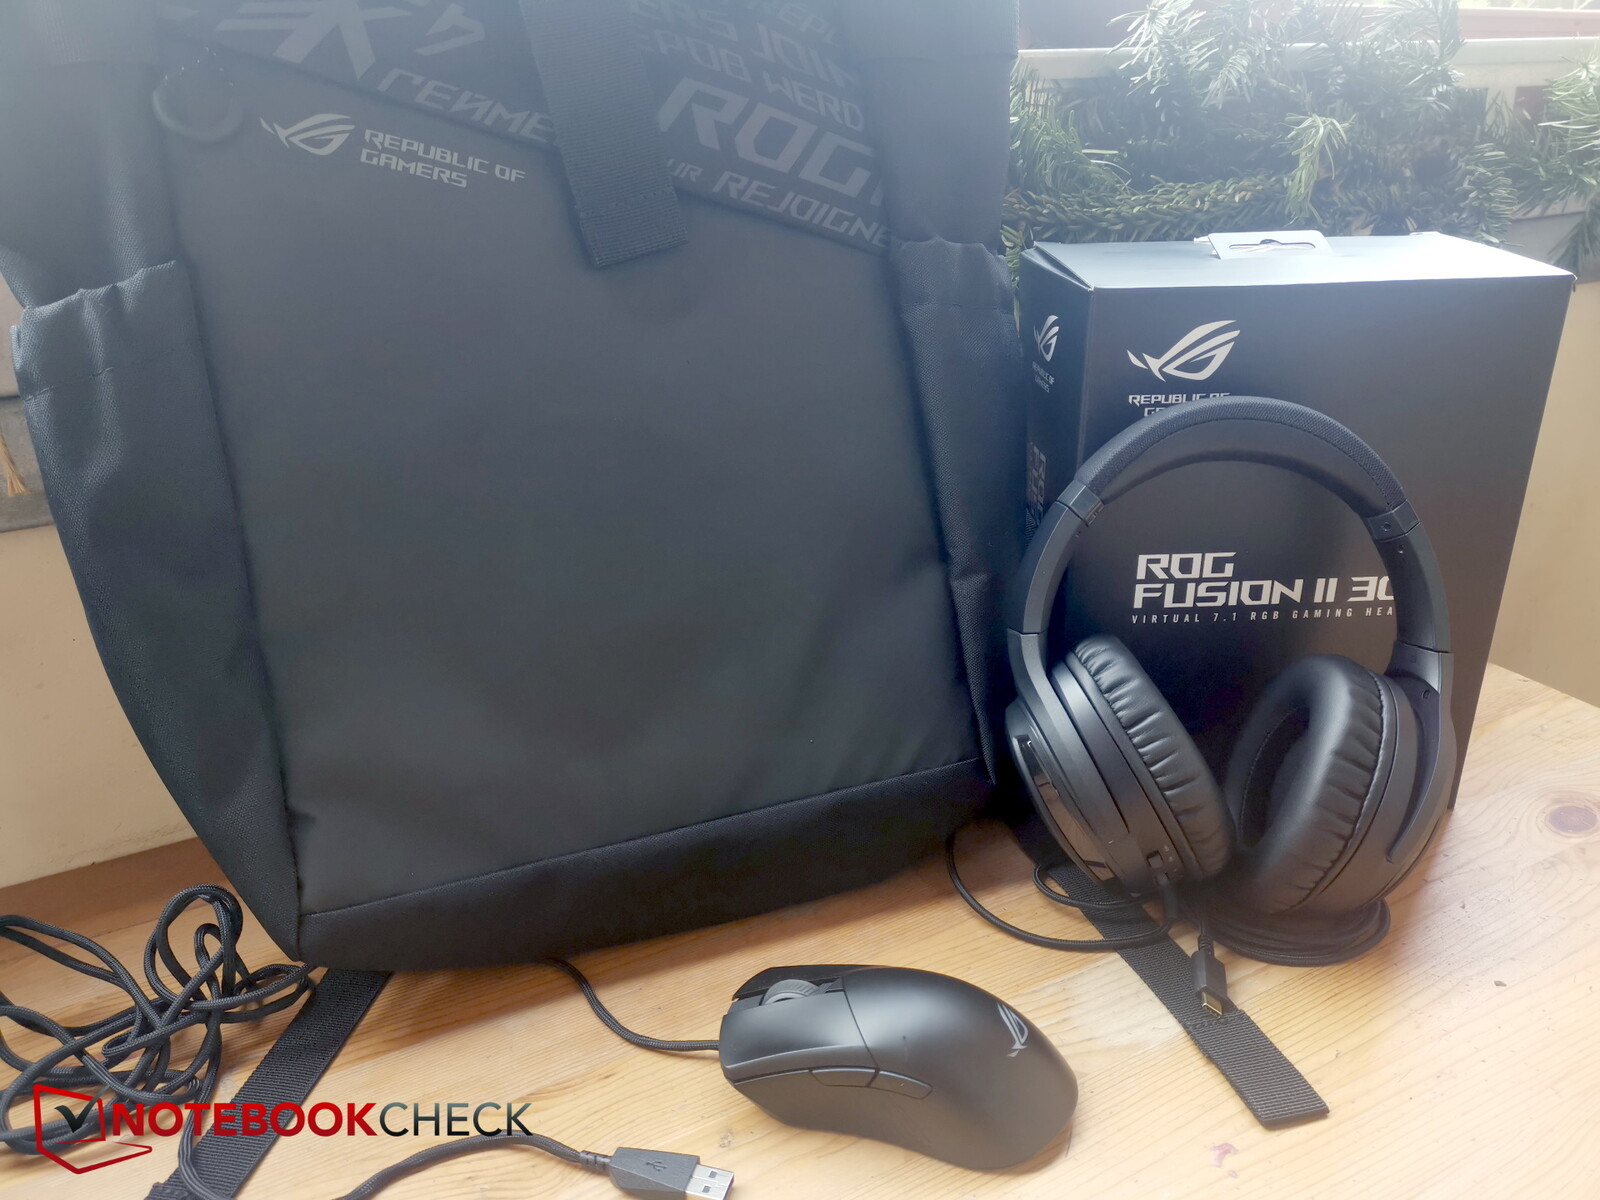
我们的评测模型装在一个巨大的包装里,让我们想起了一个发电站。相比之下,包括相当多的配件。例如,一个带有笔记本电脑隔间的手提包,一个鼠标(ROG Gladius III)以及耳机(ROG Fusion II 300),都印有ROG品牌。
根据华硕的说法,这些配件与我们的配置模型一起,但M16也可以作为独立的设备购买。
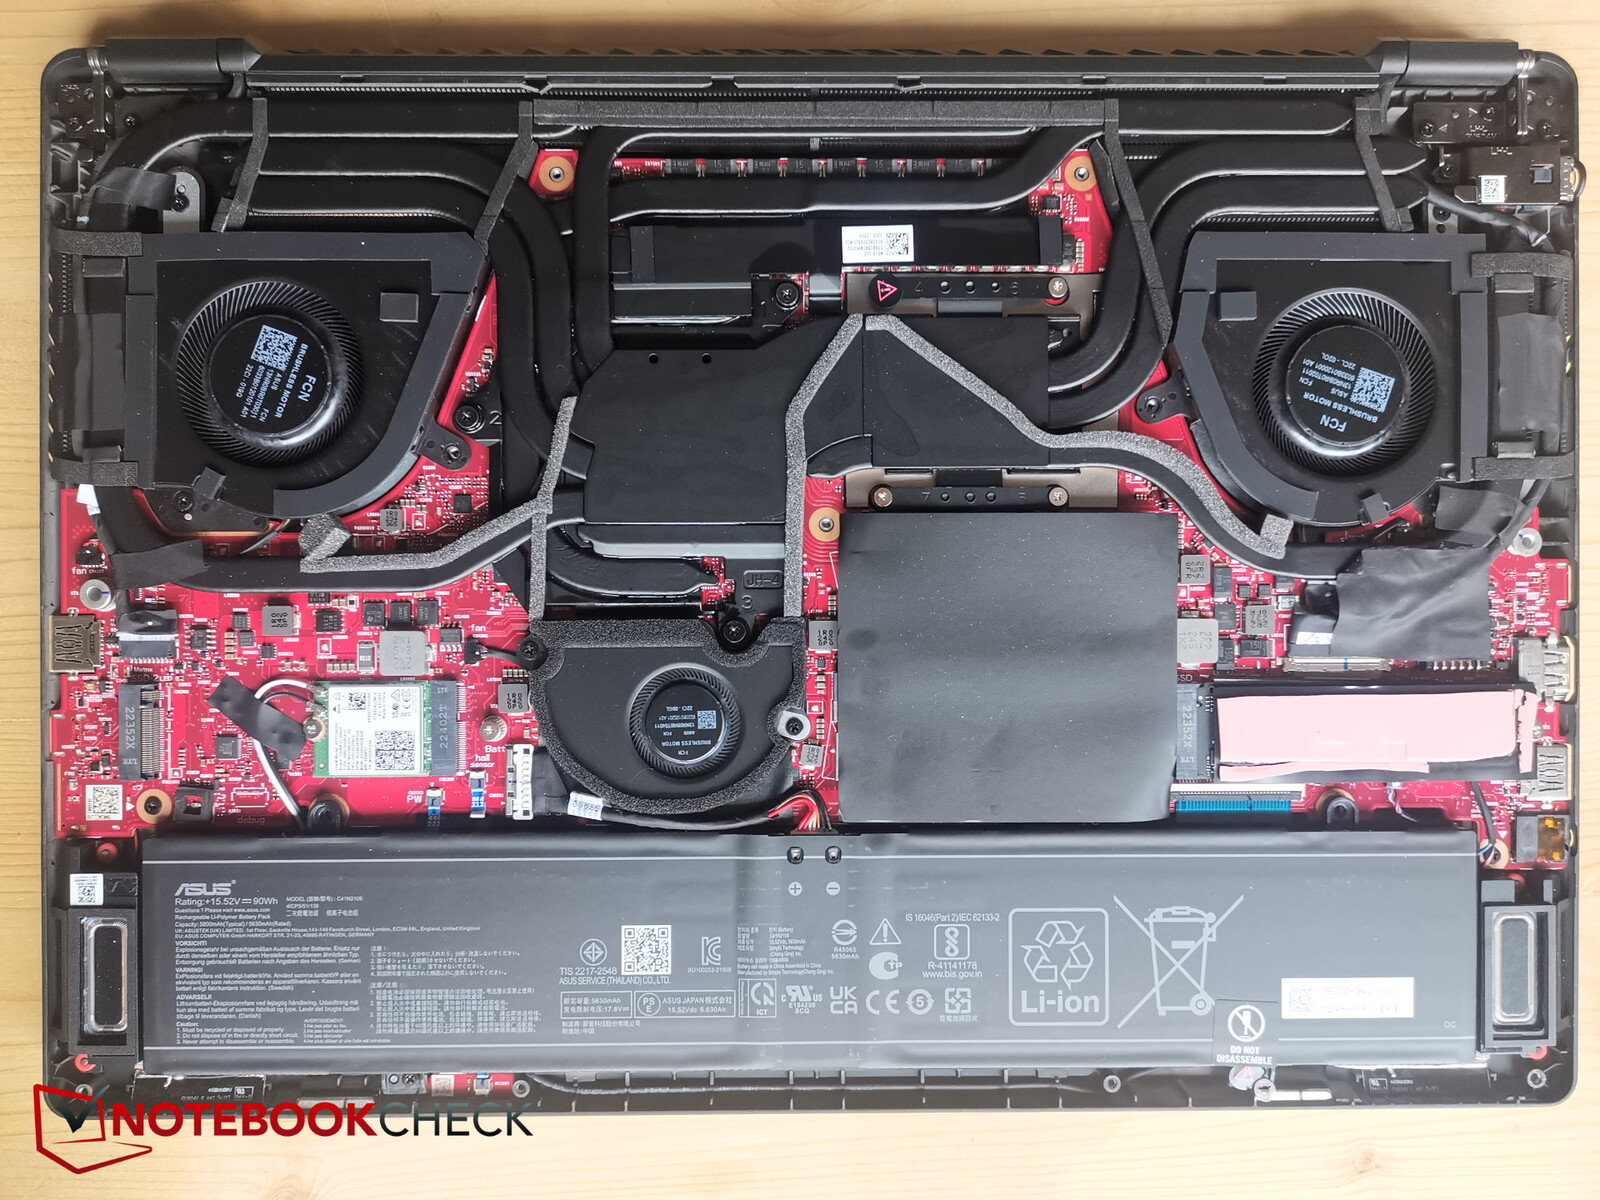
维护
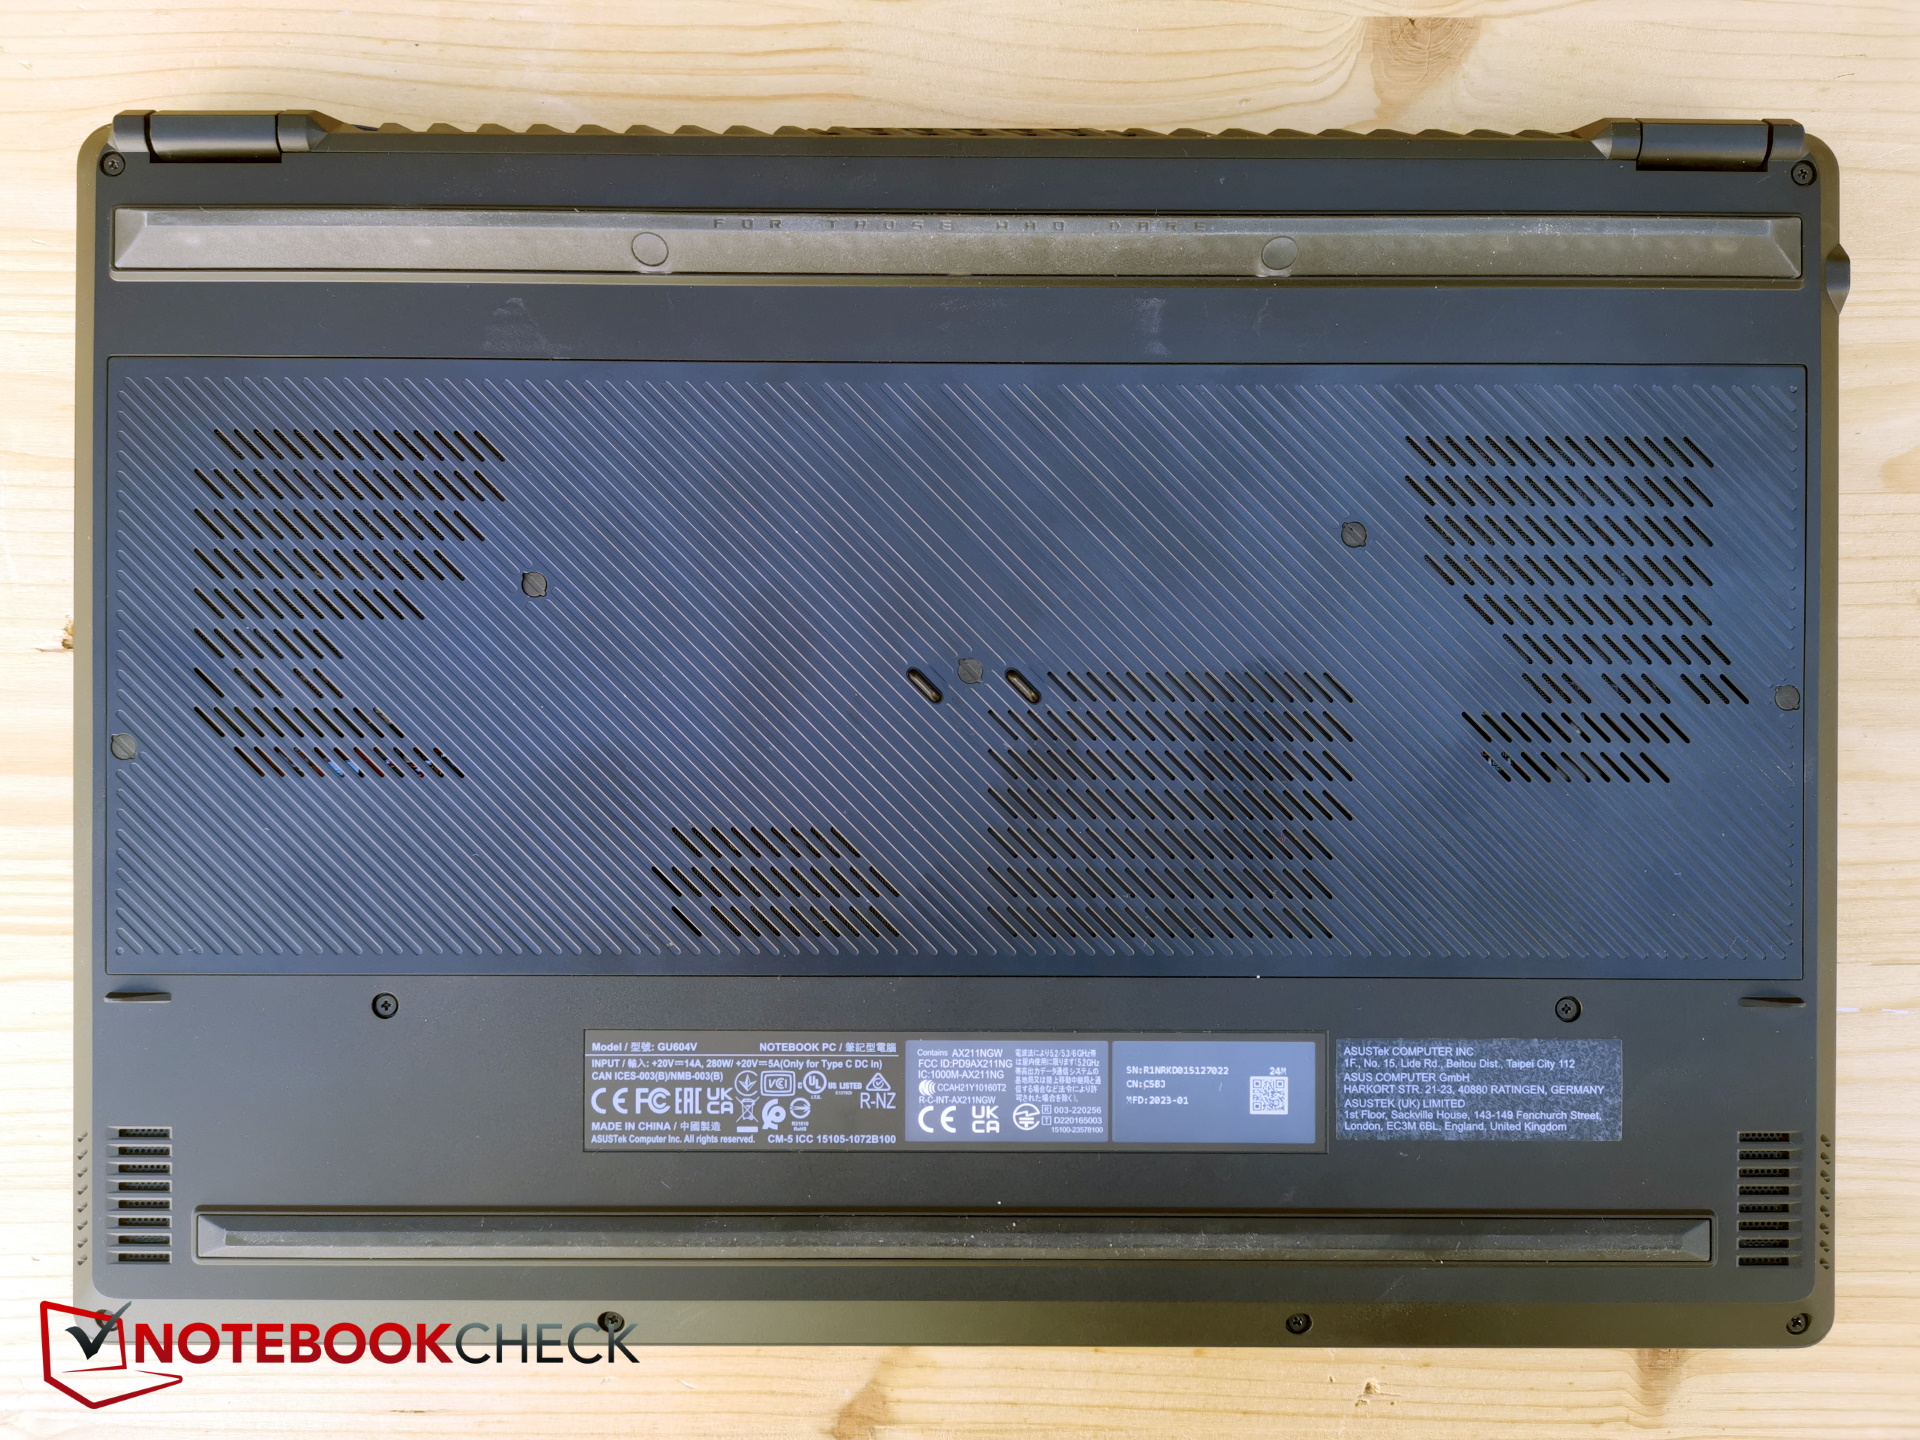
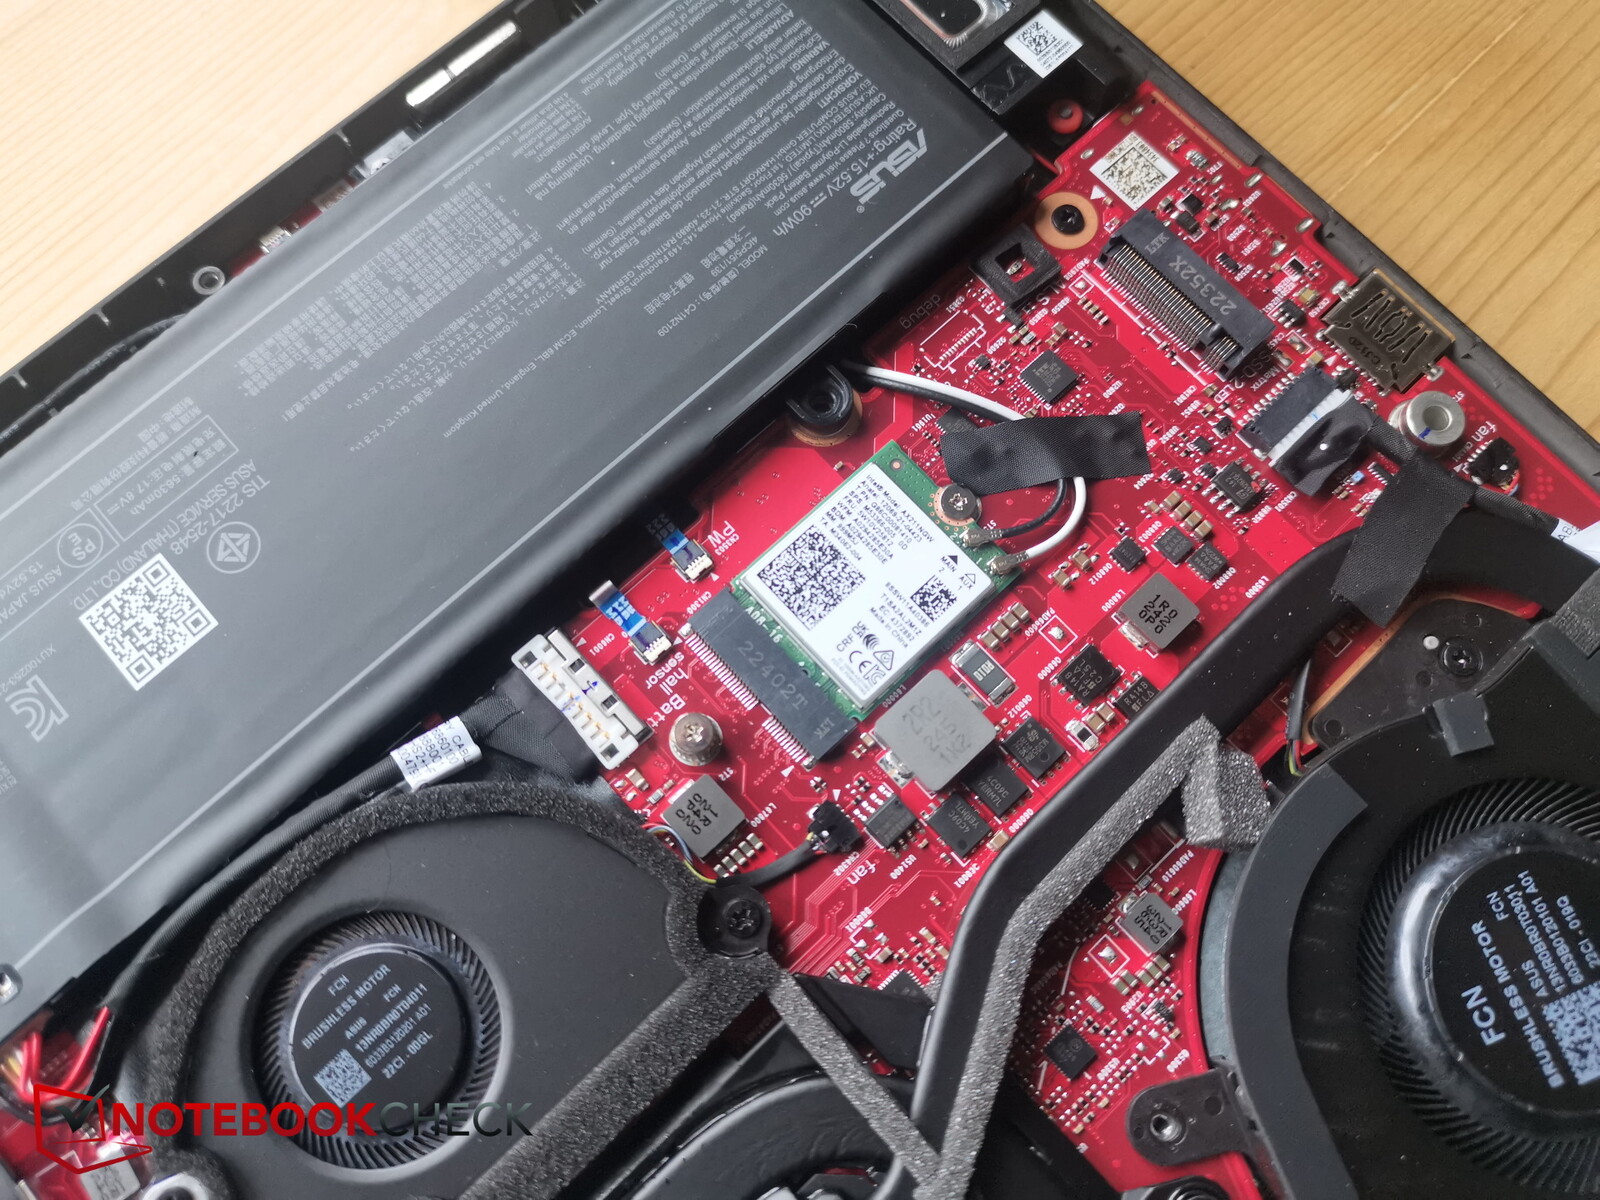
在设备的底部,有15个十字头螺钉等待拆卸。不幸的是,其中7个(!)位于胶合的橡胶塞下面,拆卸起来很麻烦,很烦人,而且是不必要的用户不友好。
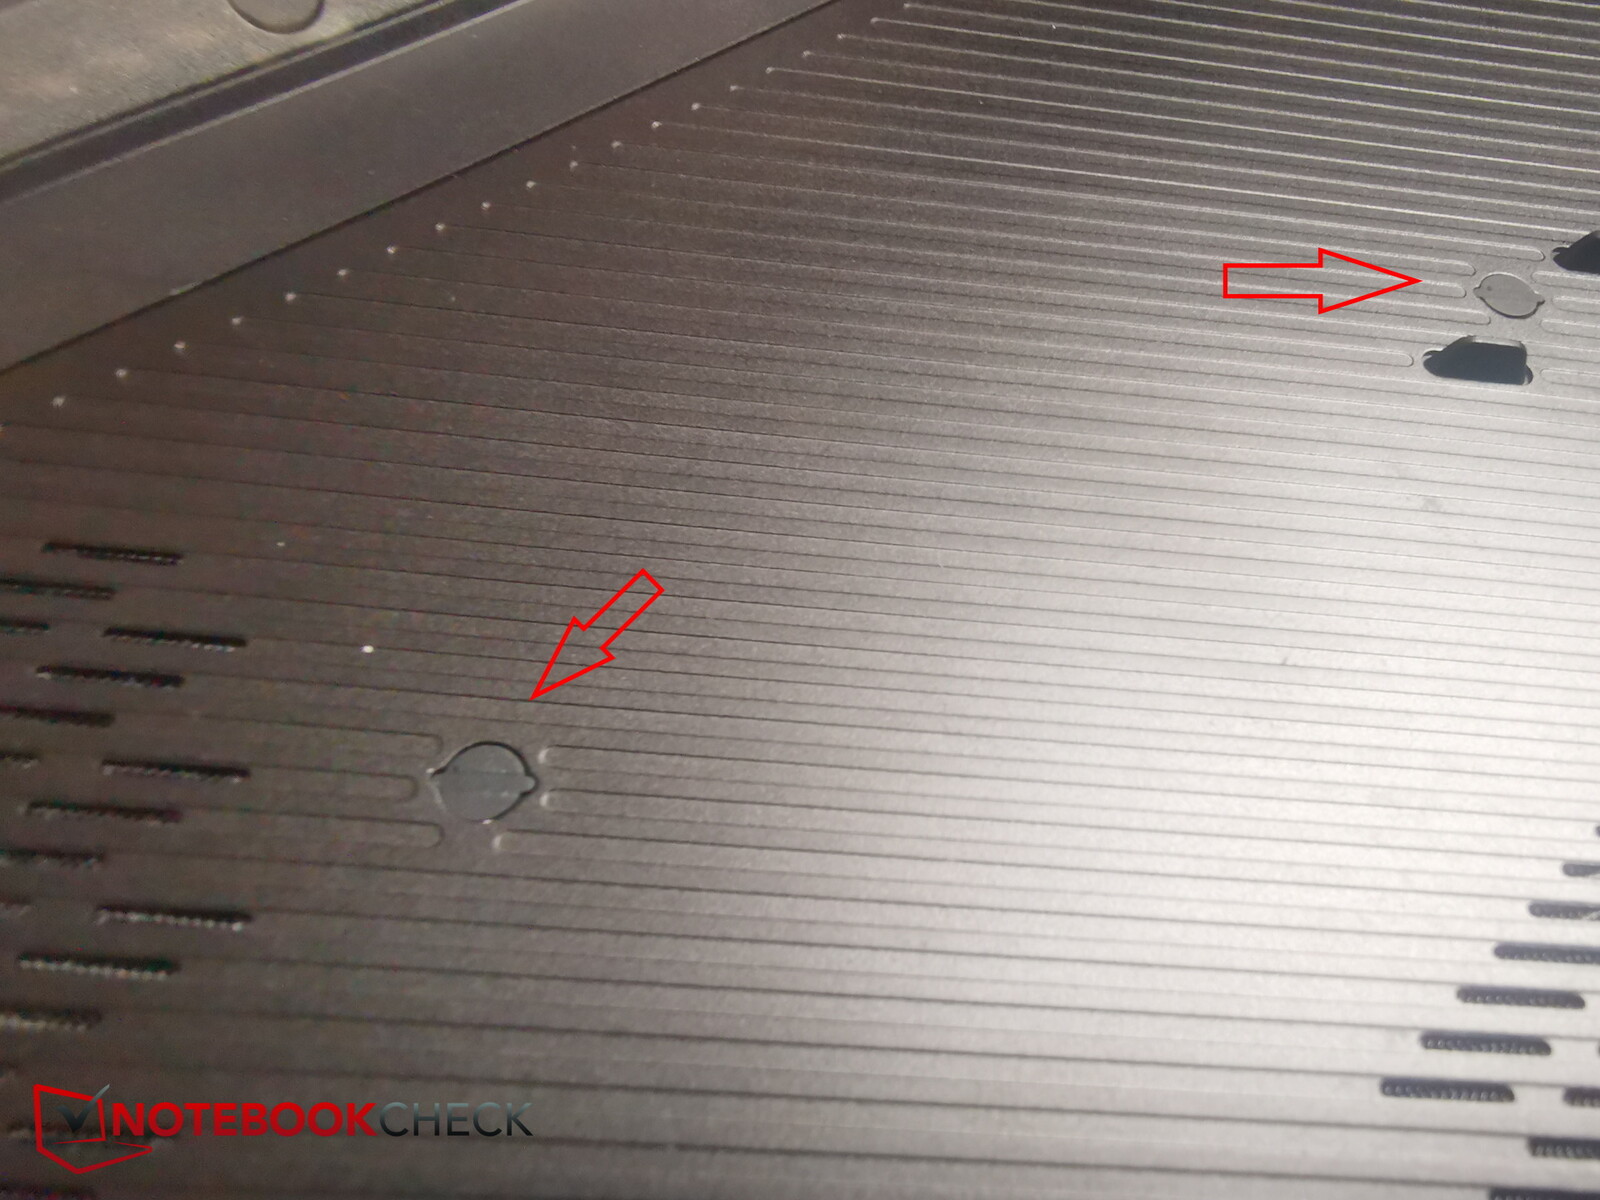
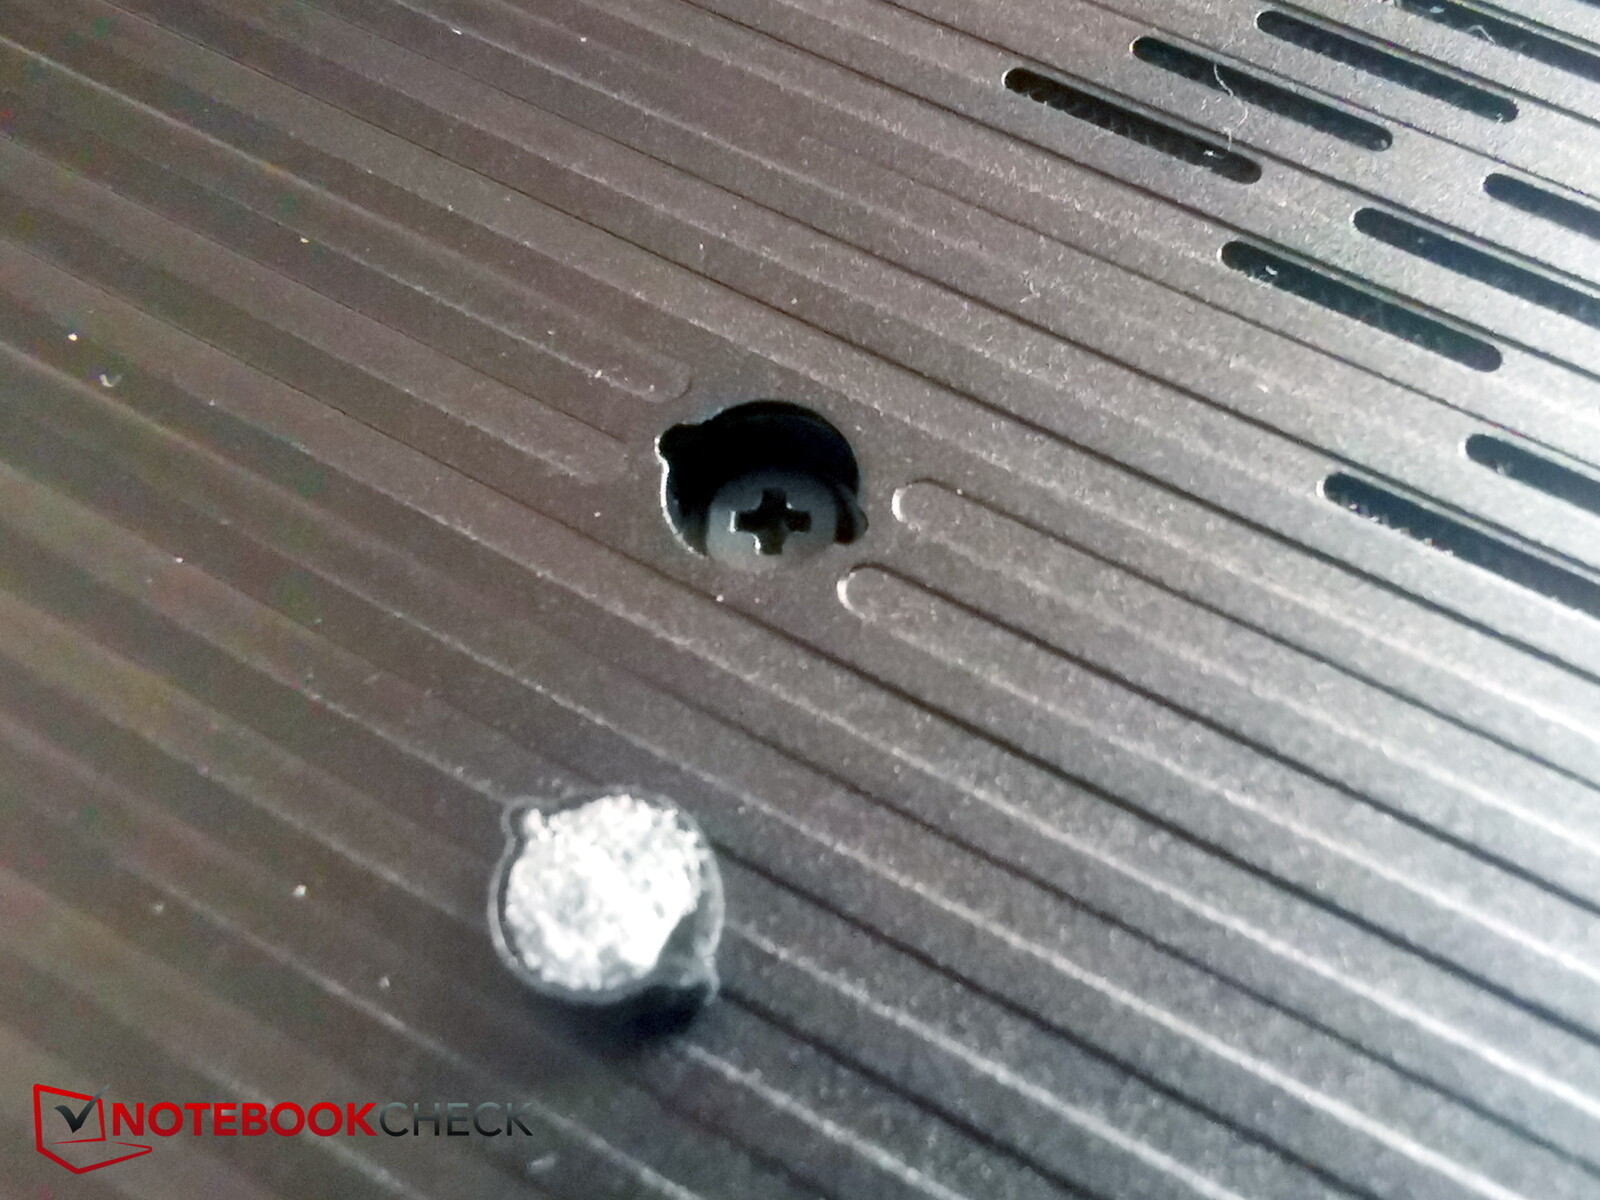
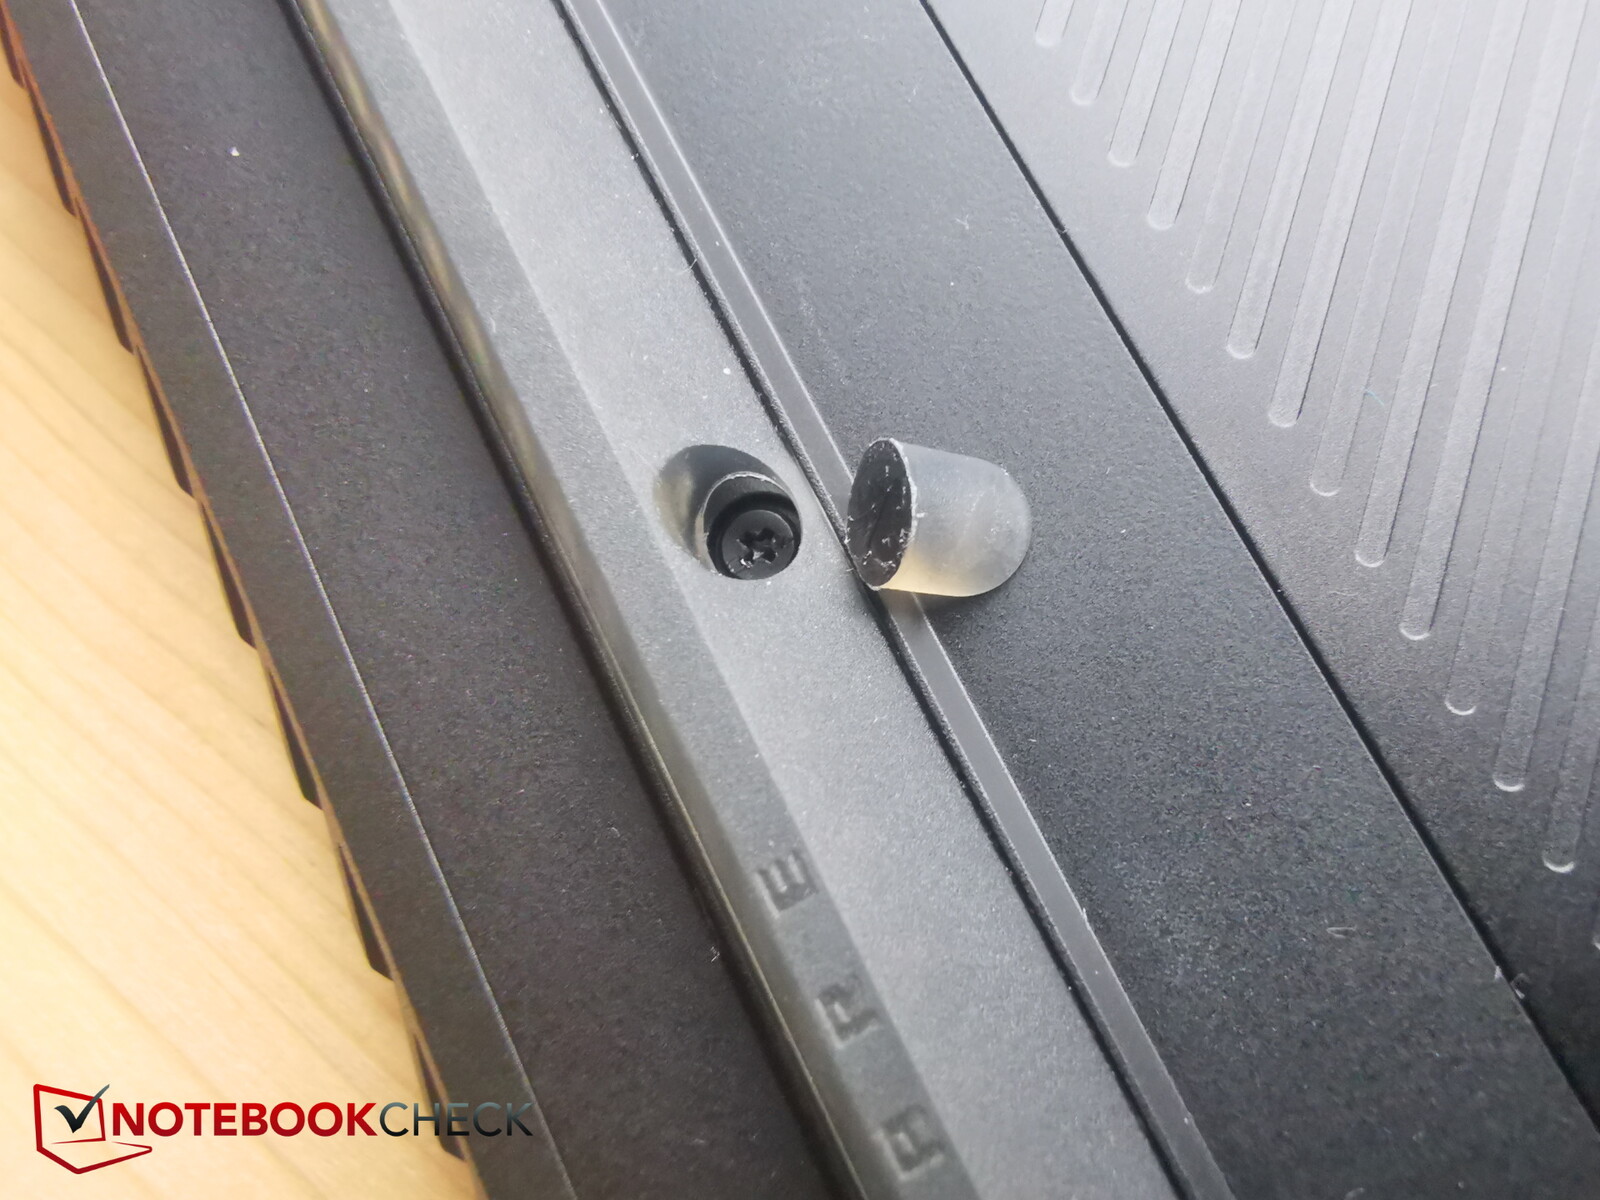
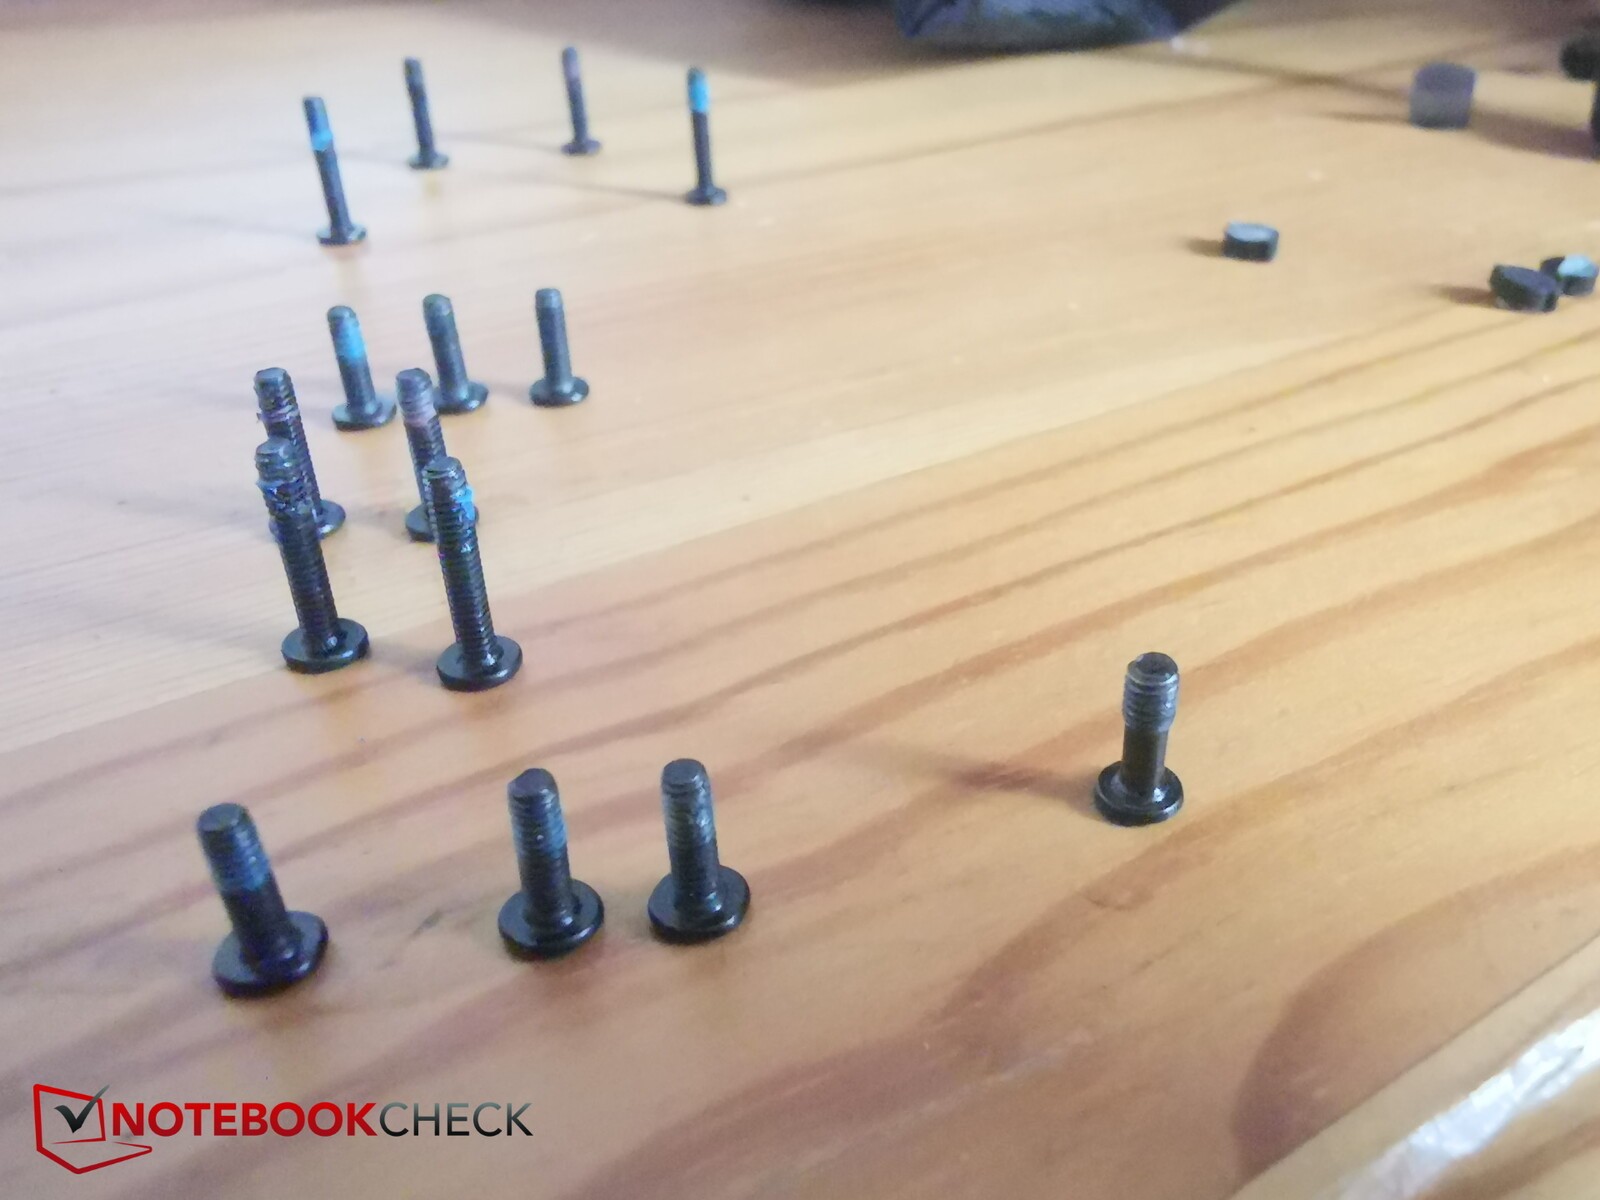
总而言之,我们发现了4种不同长度/类型的螺丝!因此值得注意的是,哪些是属于哪里的!因此,值得注意的是,哪些是属于哪里的。连同7个隐藏的螺丝和SO-DIMM内存,M16可以说是难以升级或维修的。
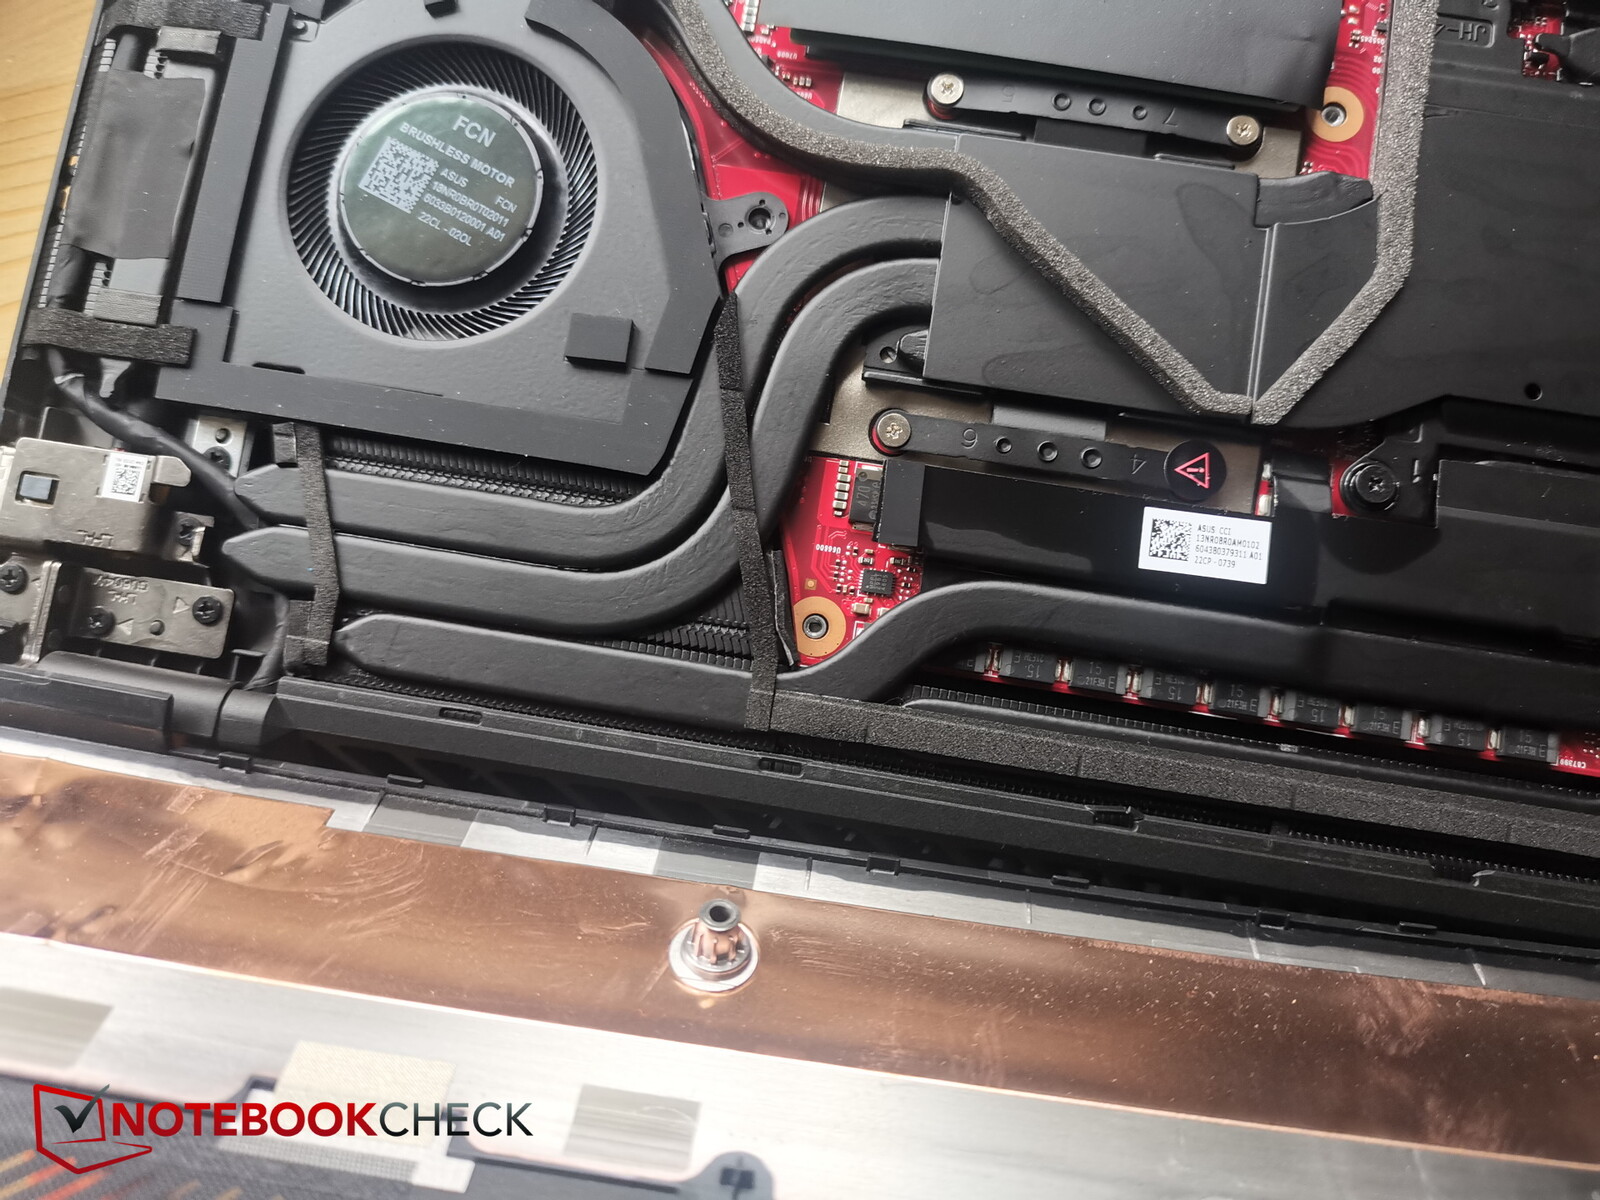
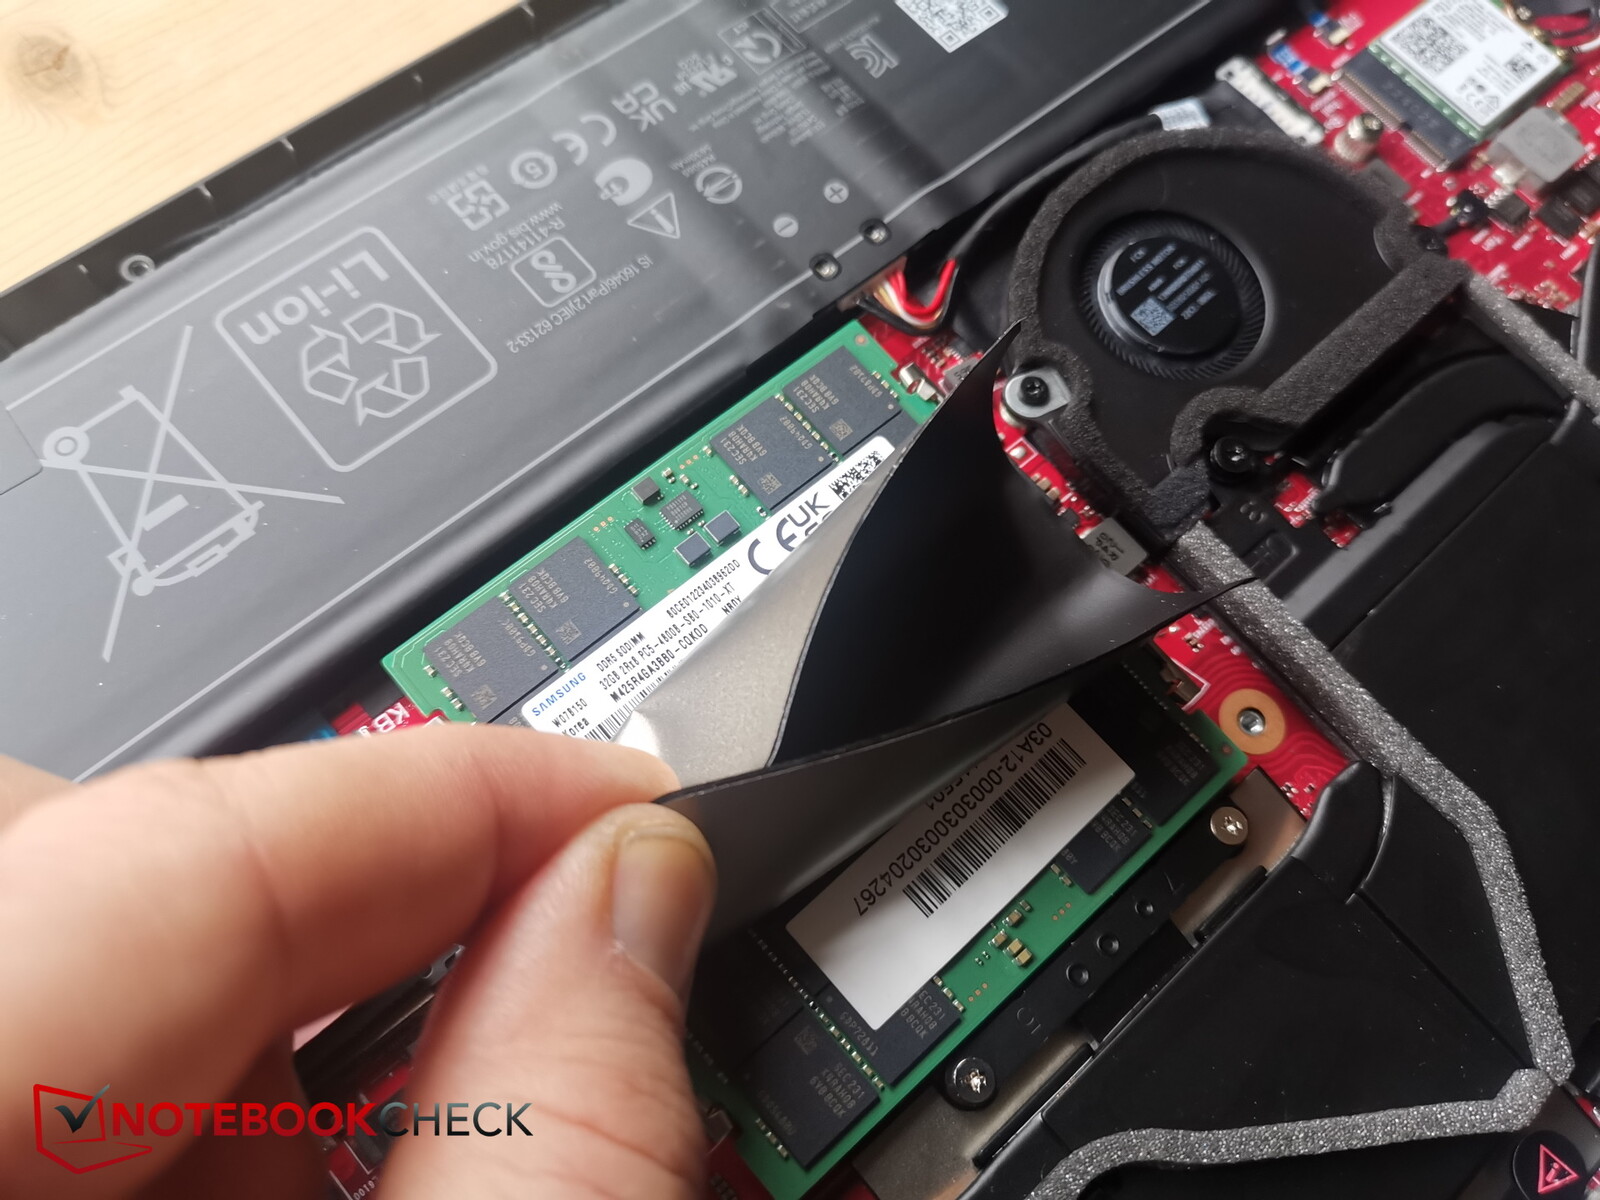
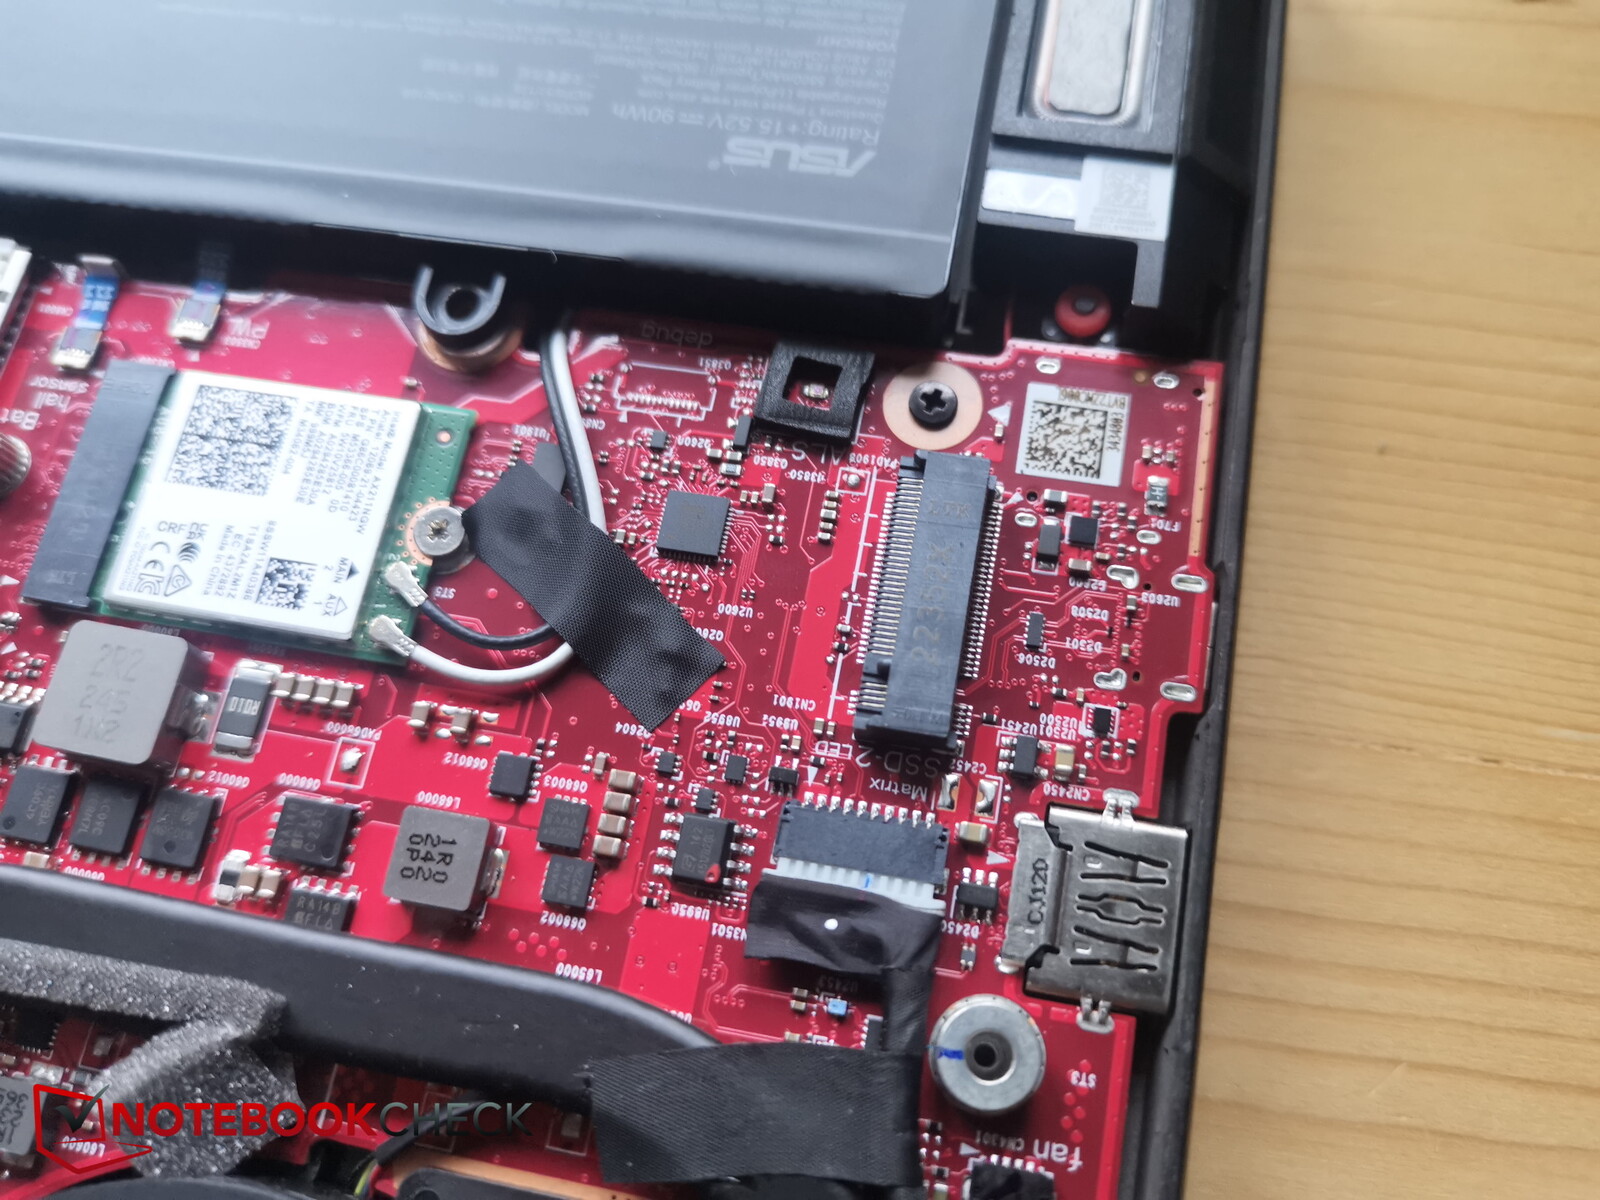
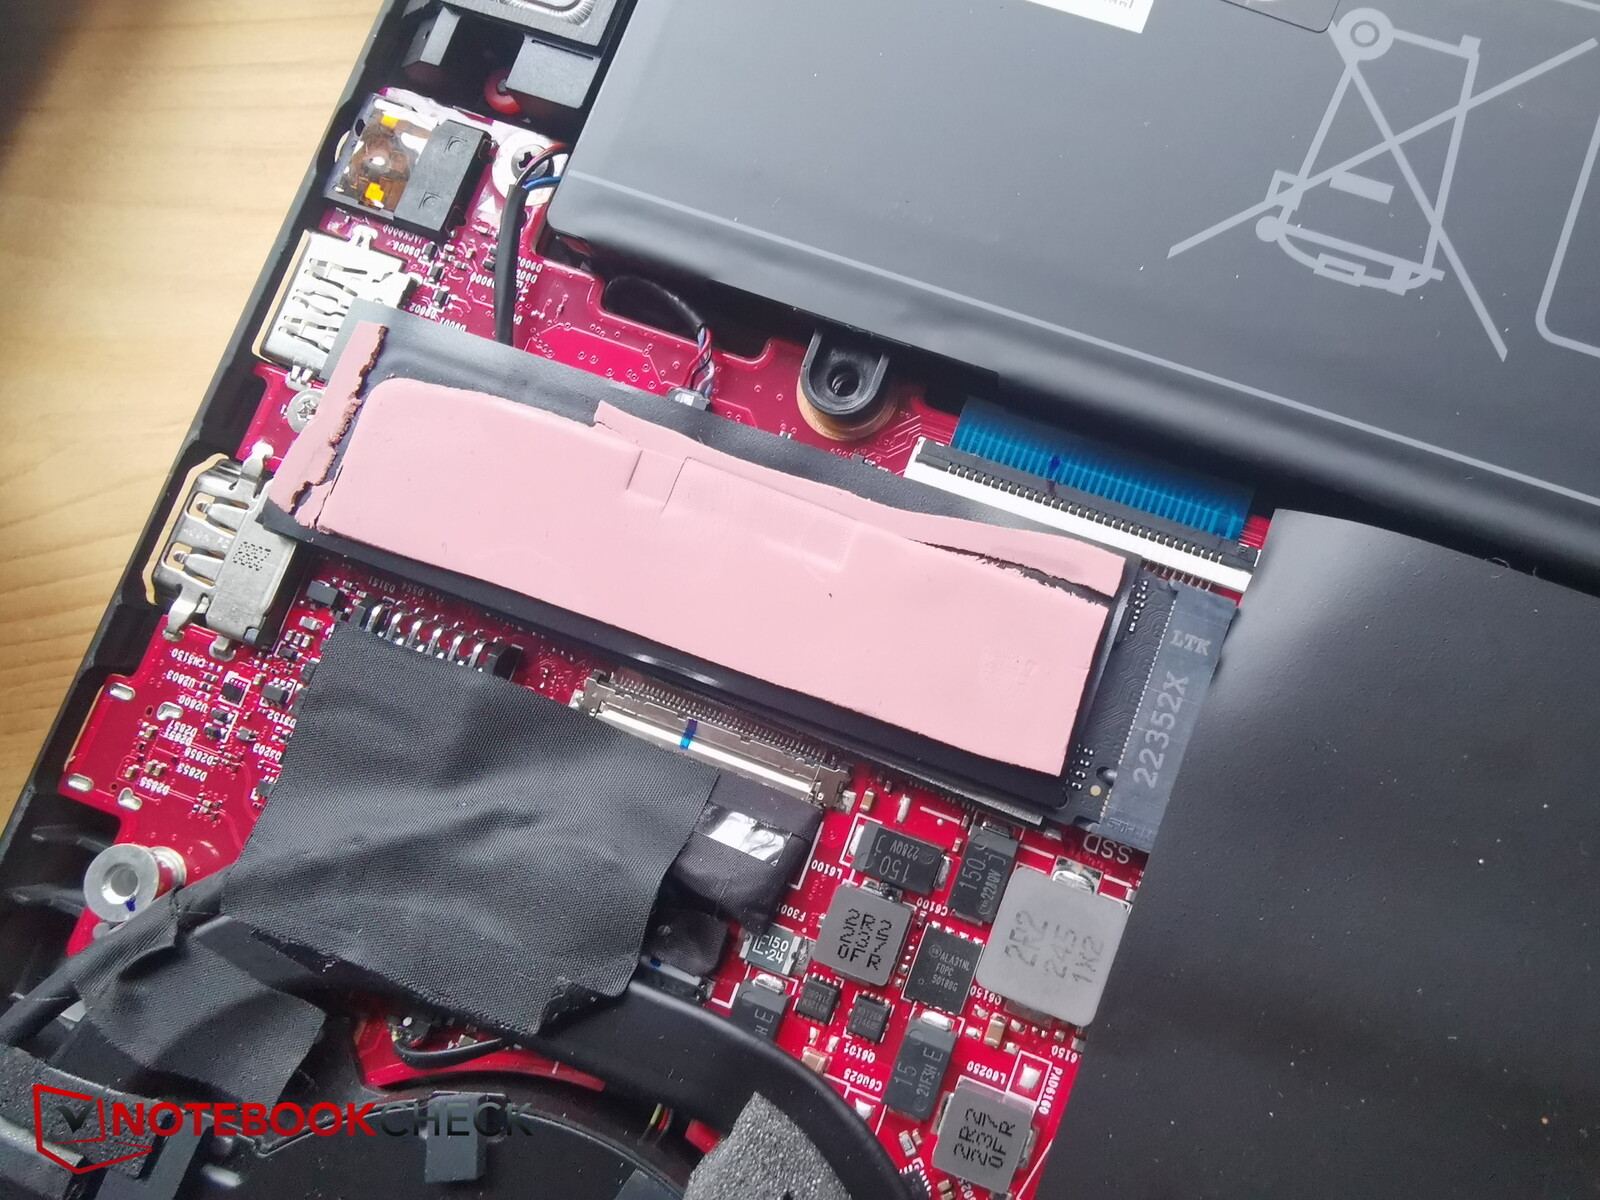
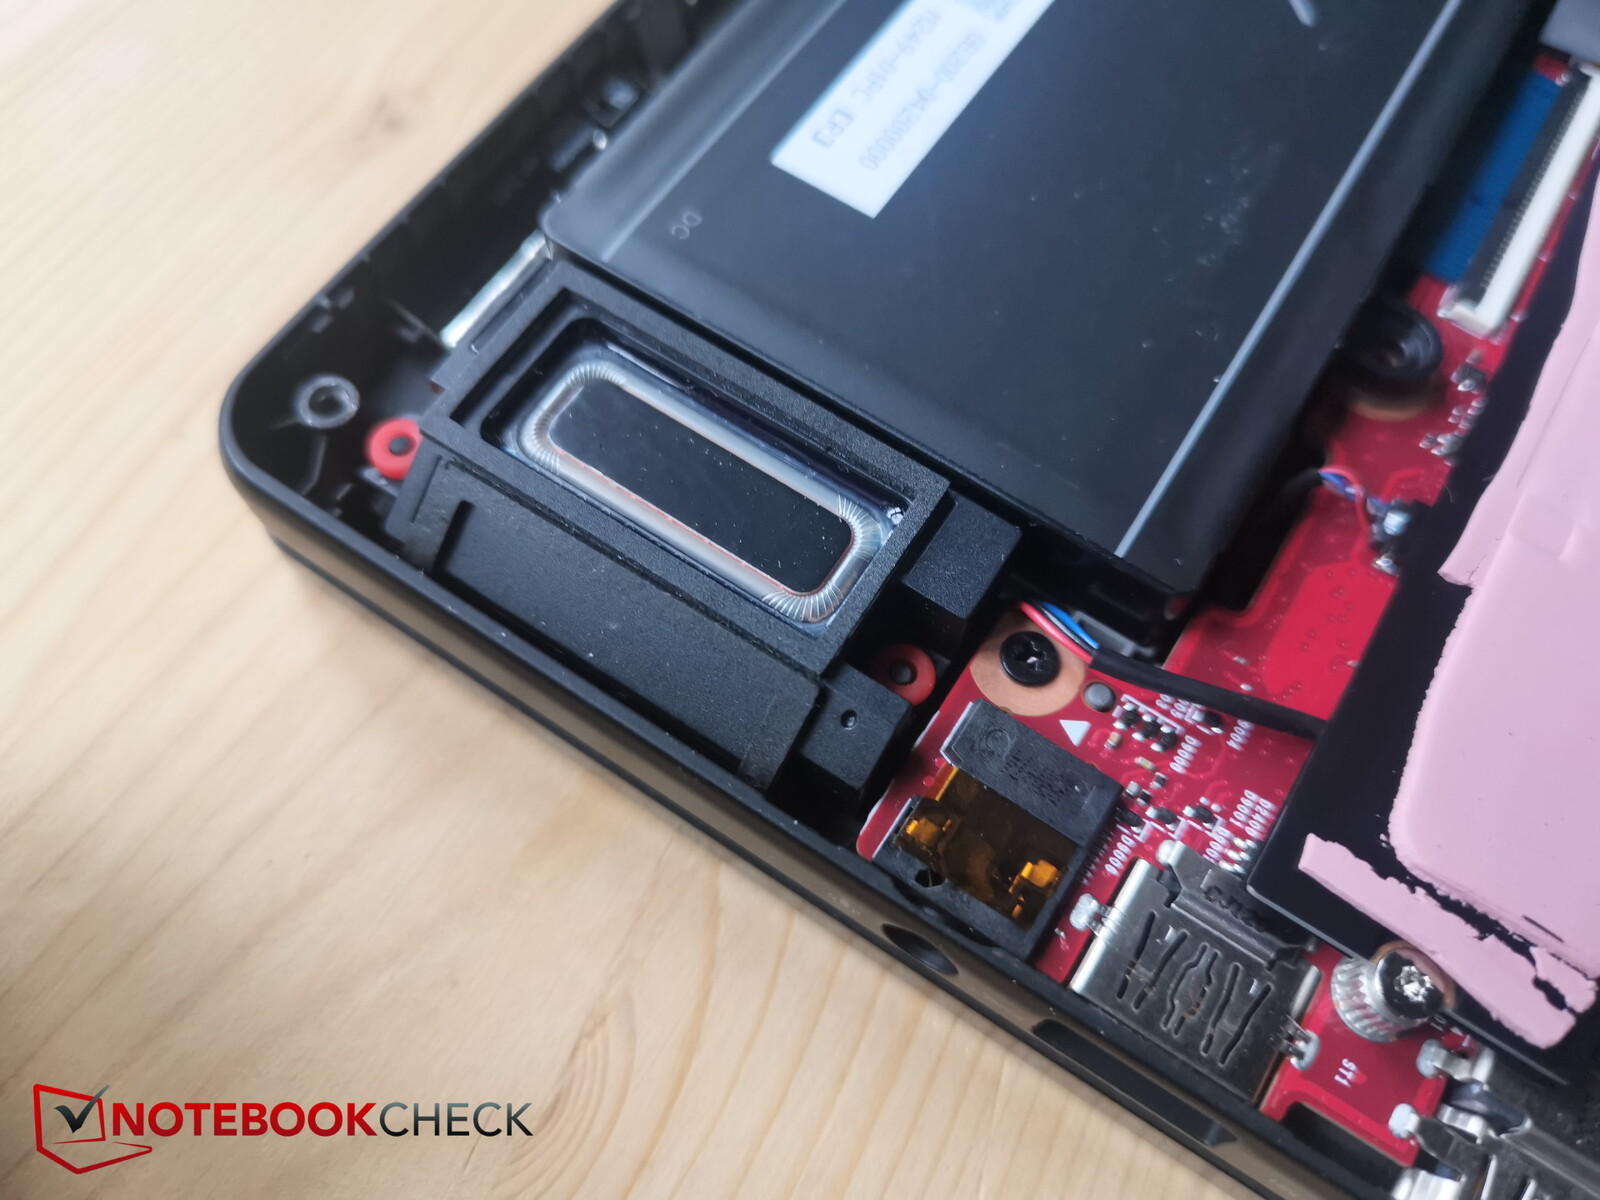
至少底板可以很容易地被撬开。在内部,可以接触到三个风扇、电池、SSD、第二个M.2 SSD插槽、可更换的WiFi模块以及SO-DIMM内存插槽。
冷却系统包括2个正常大小的风扇和一个额外的小风扇,估计是位于图形单元的顶部。固态硬盘拥有一个冷却垫,在我们的评测模型中看起来相当粗糙。
担保
Gigabyte的笔记本电脑有24个月的保证。
输入设备 - 有点浅的按键和一个大的触摸板
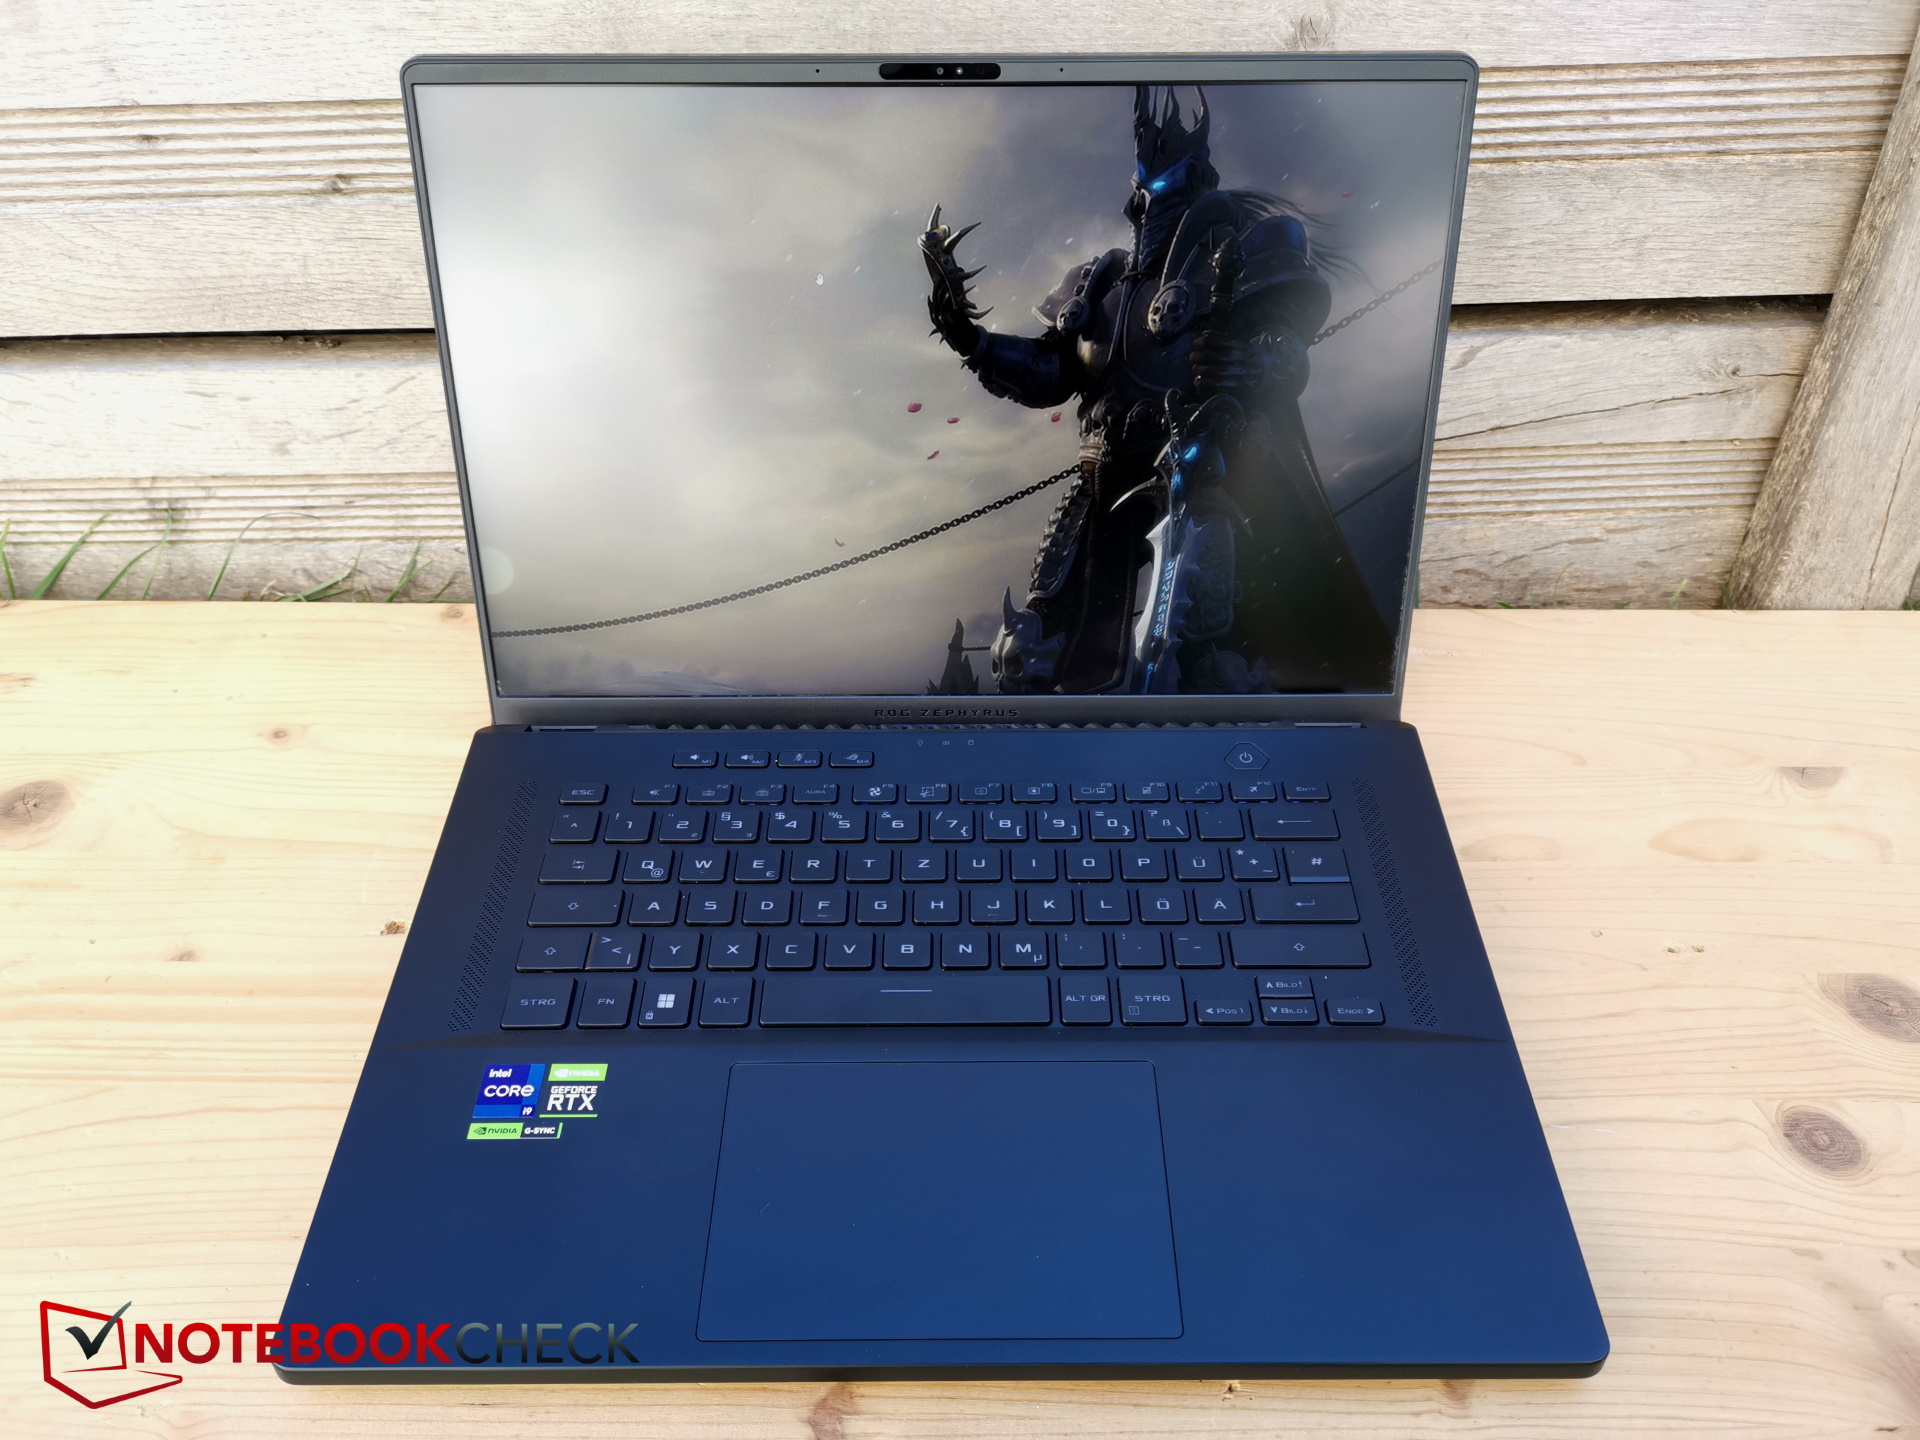
键盘
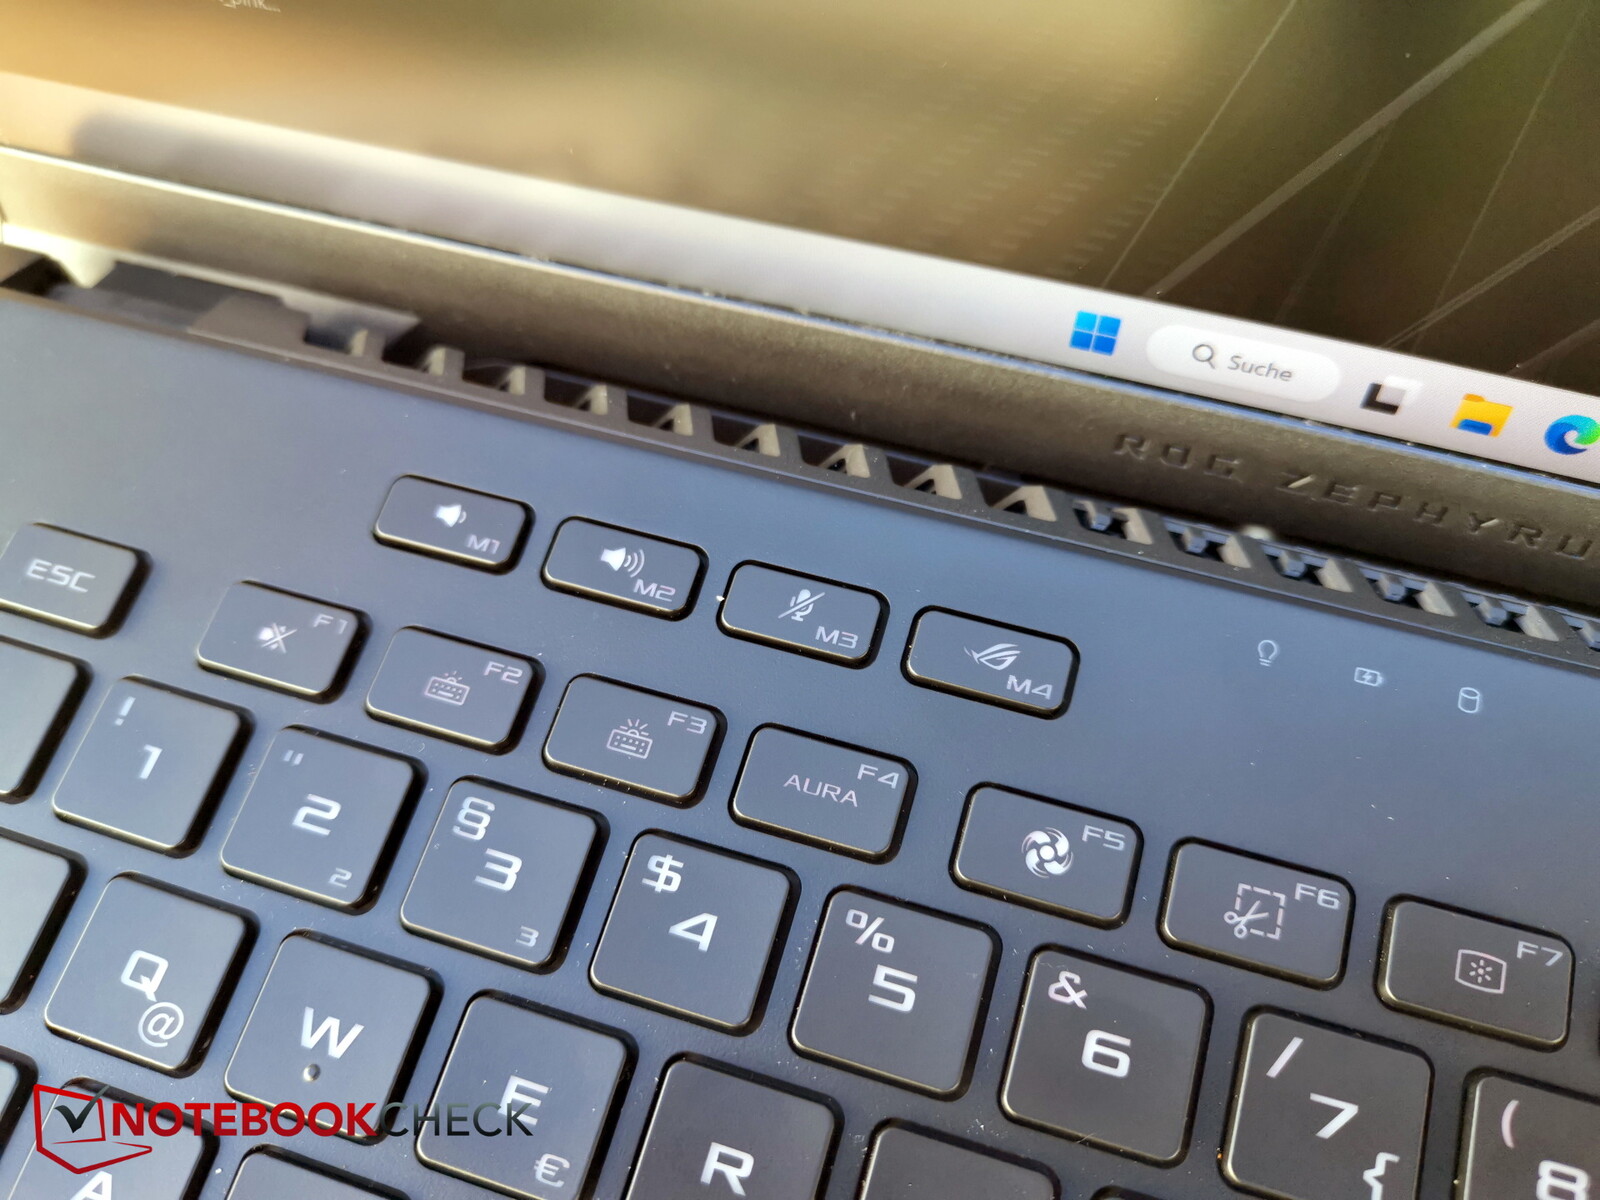
布局看起来非常宽敞。在左上方,华硕为音量控制、麦克风和华硕的控制中心加入了四个额外的特殊按键。这些也可以手动配置。
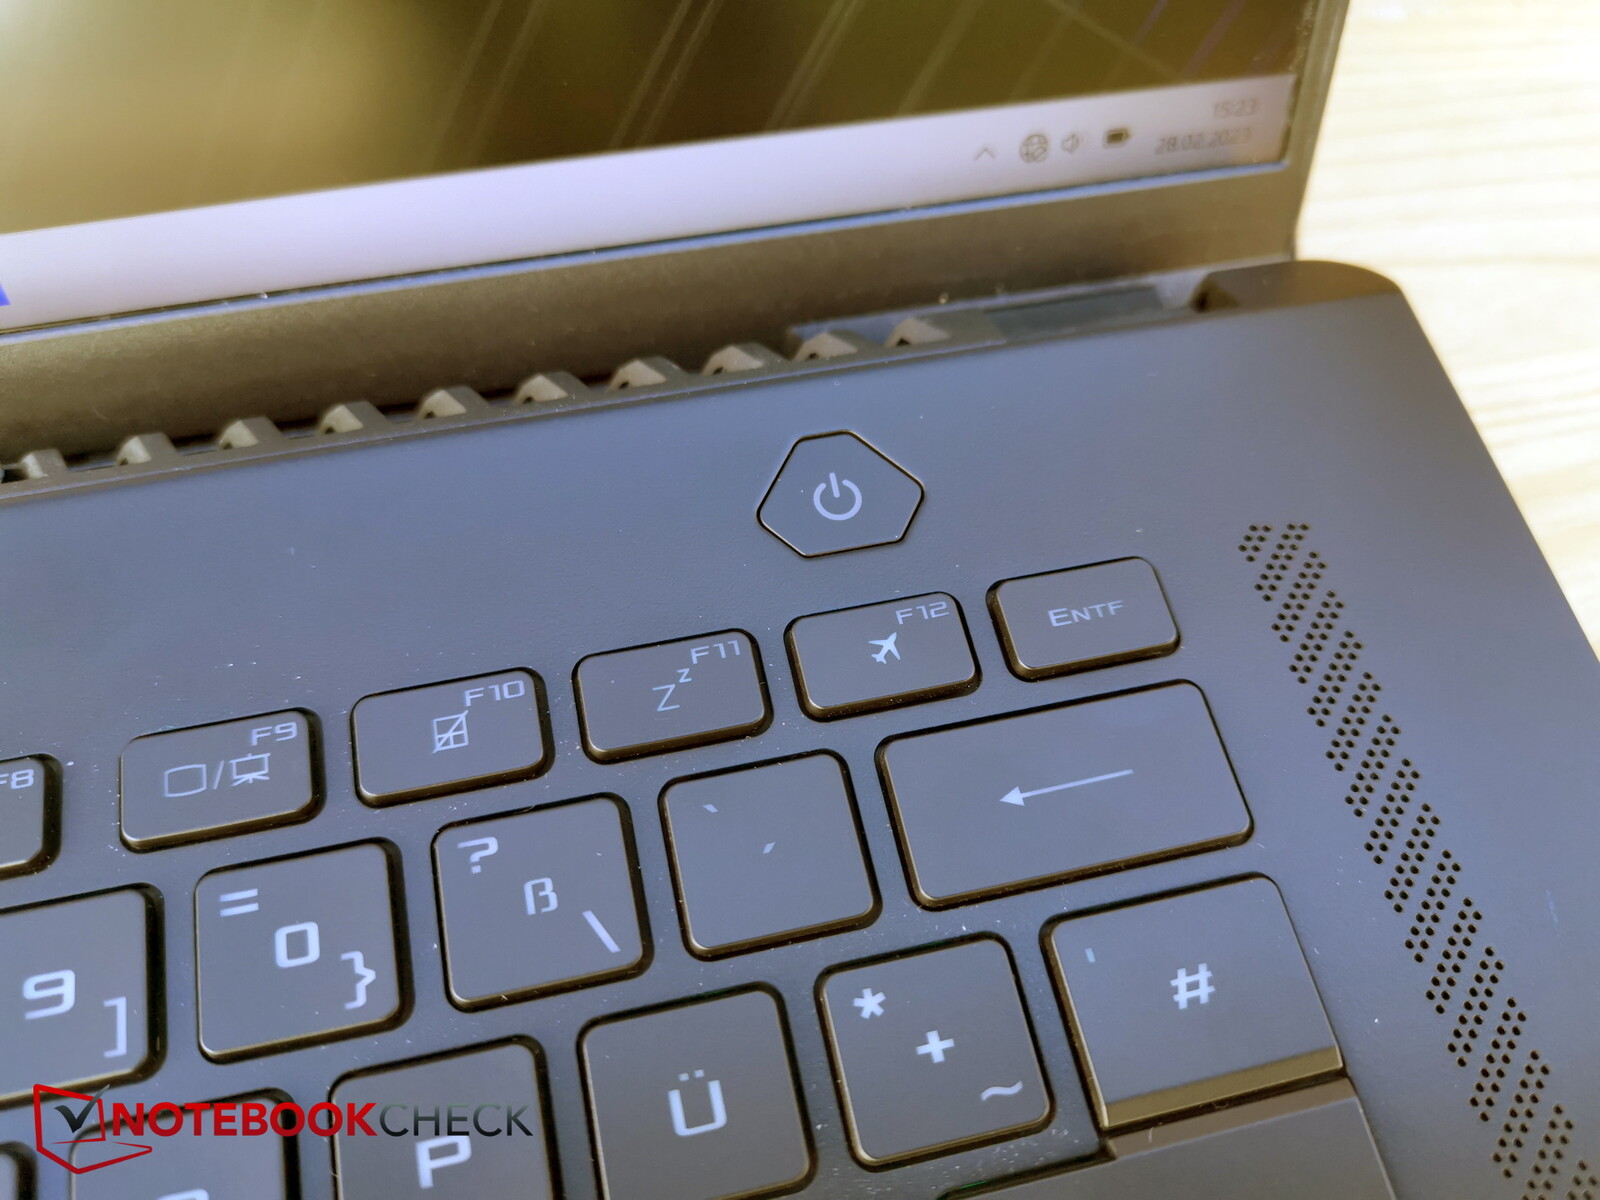
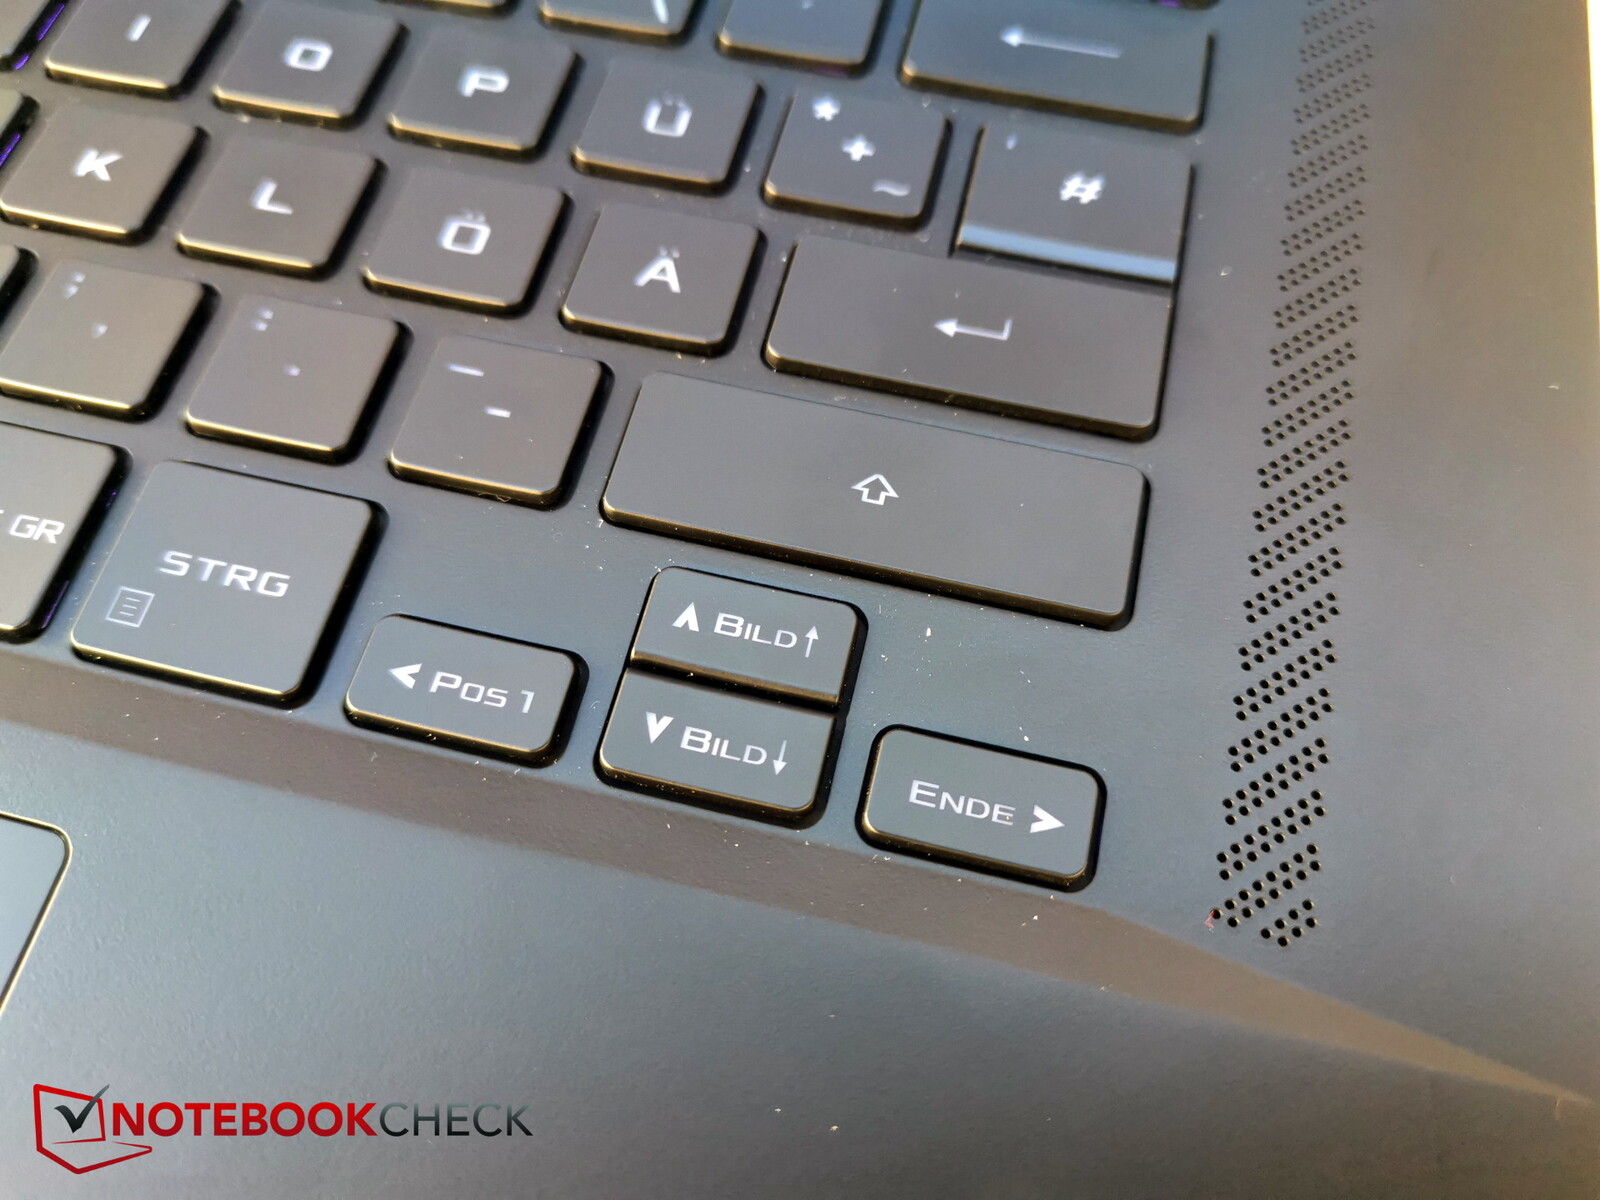
不幸的是,方向键非常狭窄,而且电源键,典型的这类键盘,是一个单独的键。尽管是一个16英寸的设备,但没有数字键盘。
键拥有非常短的行程,反馈有点浅,但仍然足够精确。总的来说,虽然打字的体验相当好,但我们更希望按键更清晰一些。打字的噪音是中等的。
3级背光以不同的RGB颜色照亮,但只有单区。
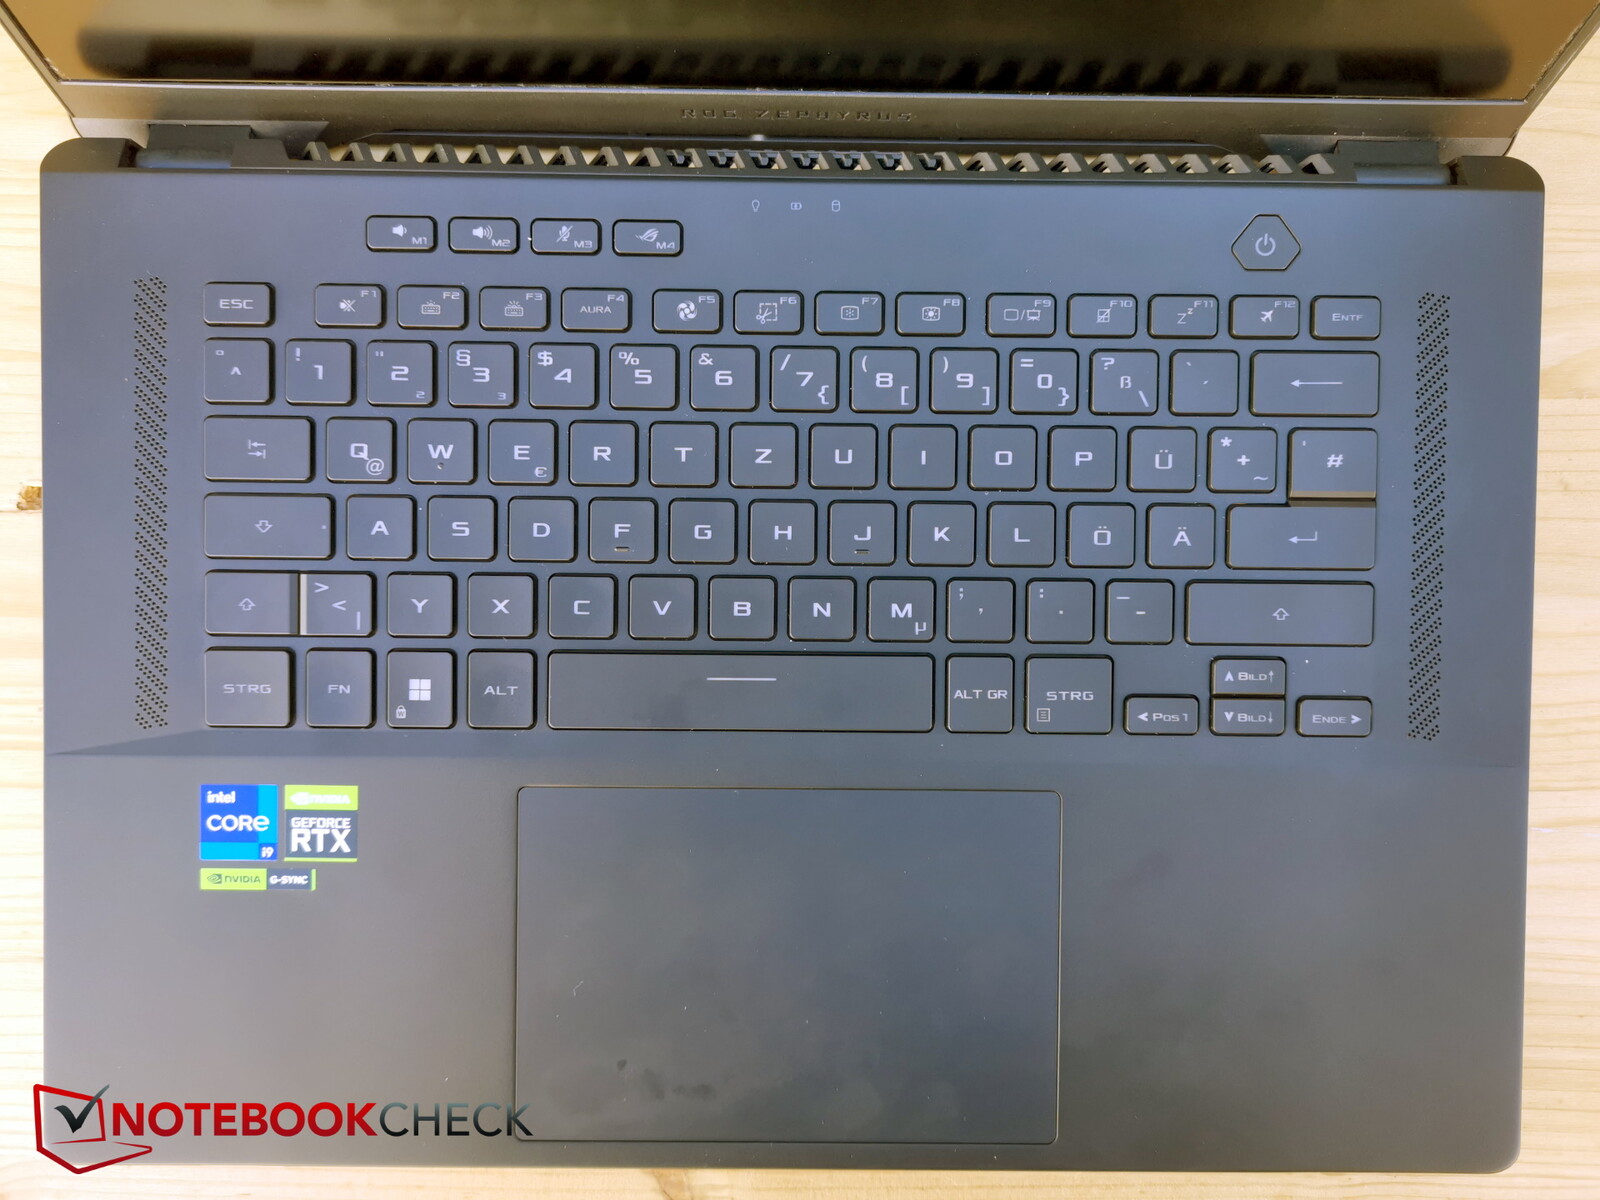
触摸板
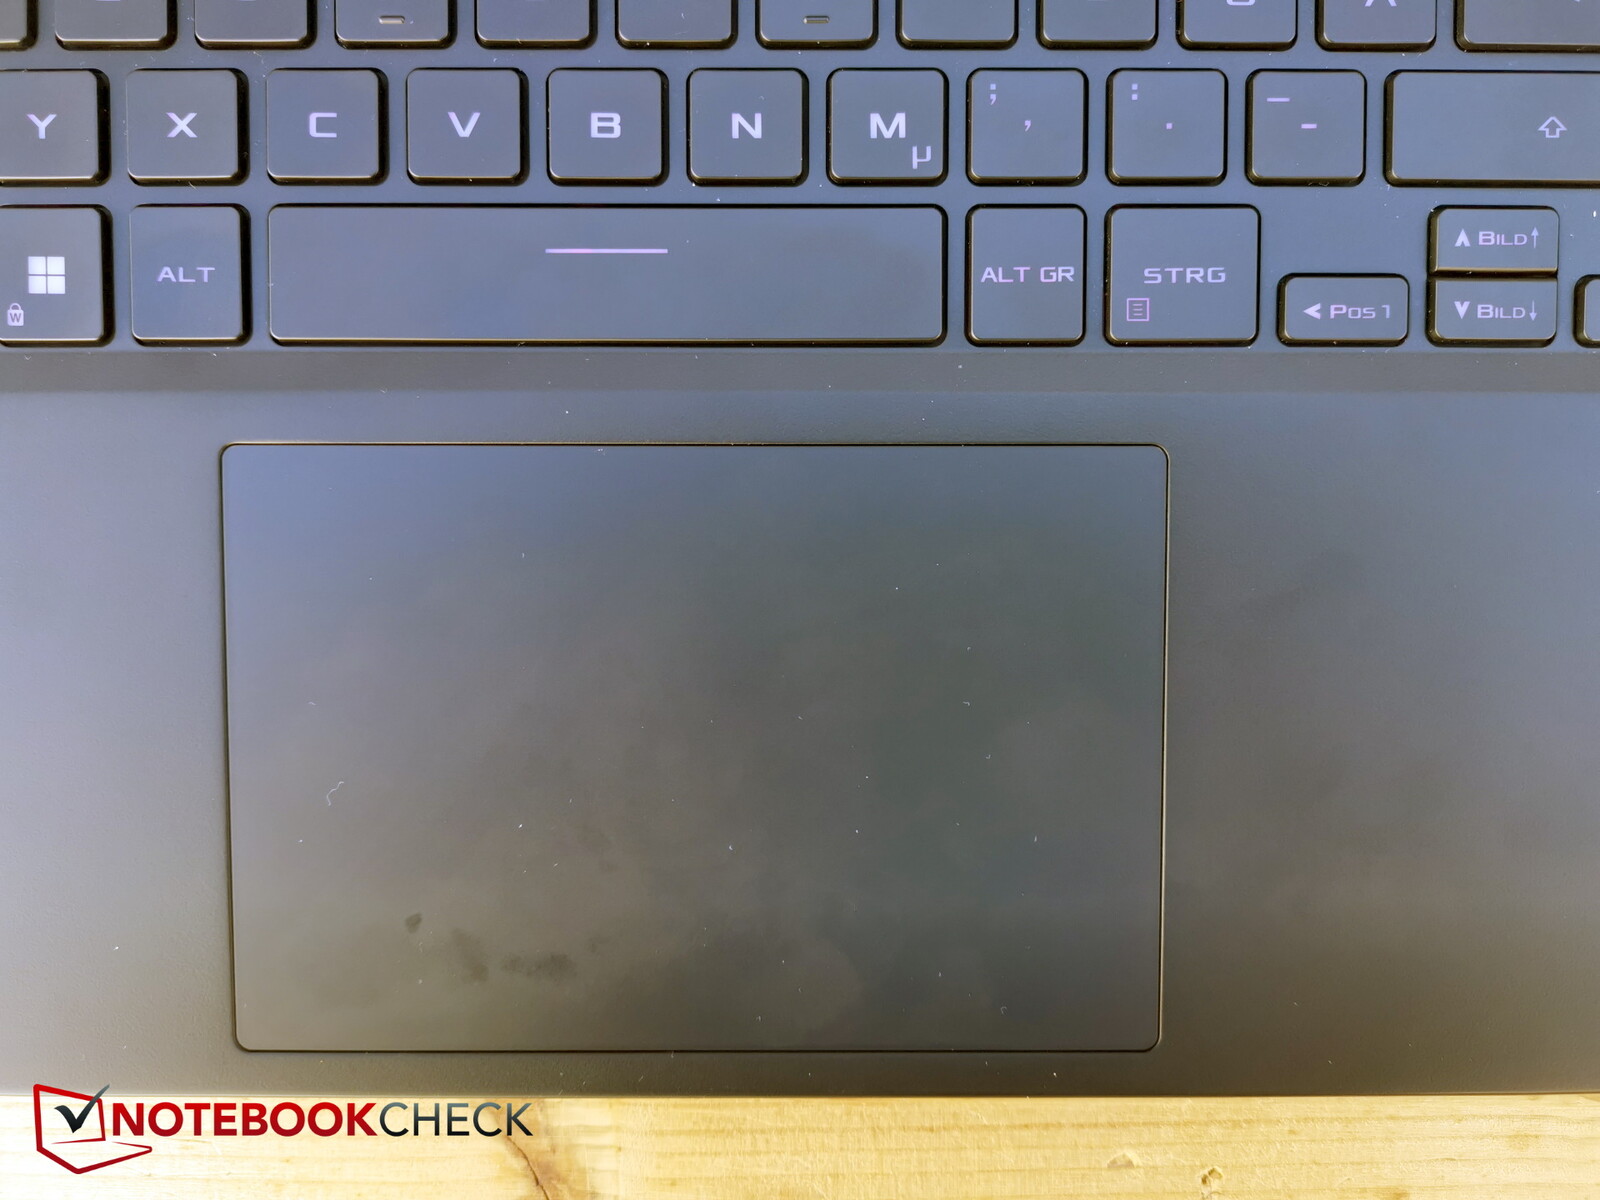
大型触摸板(约13 x 8.5厘米)略微偏向右侧,即使执行较长的动作,也能提供流畅的刷卡体验。
集成的按键有一个短而好的压力点,反馈清晰。咔哒声可以说是安静到适度。
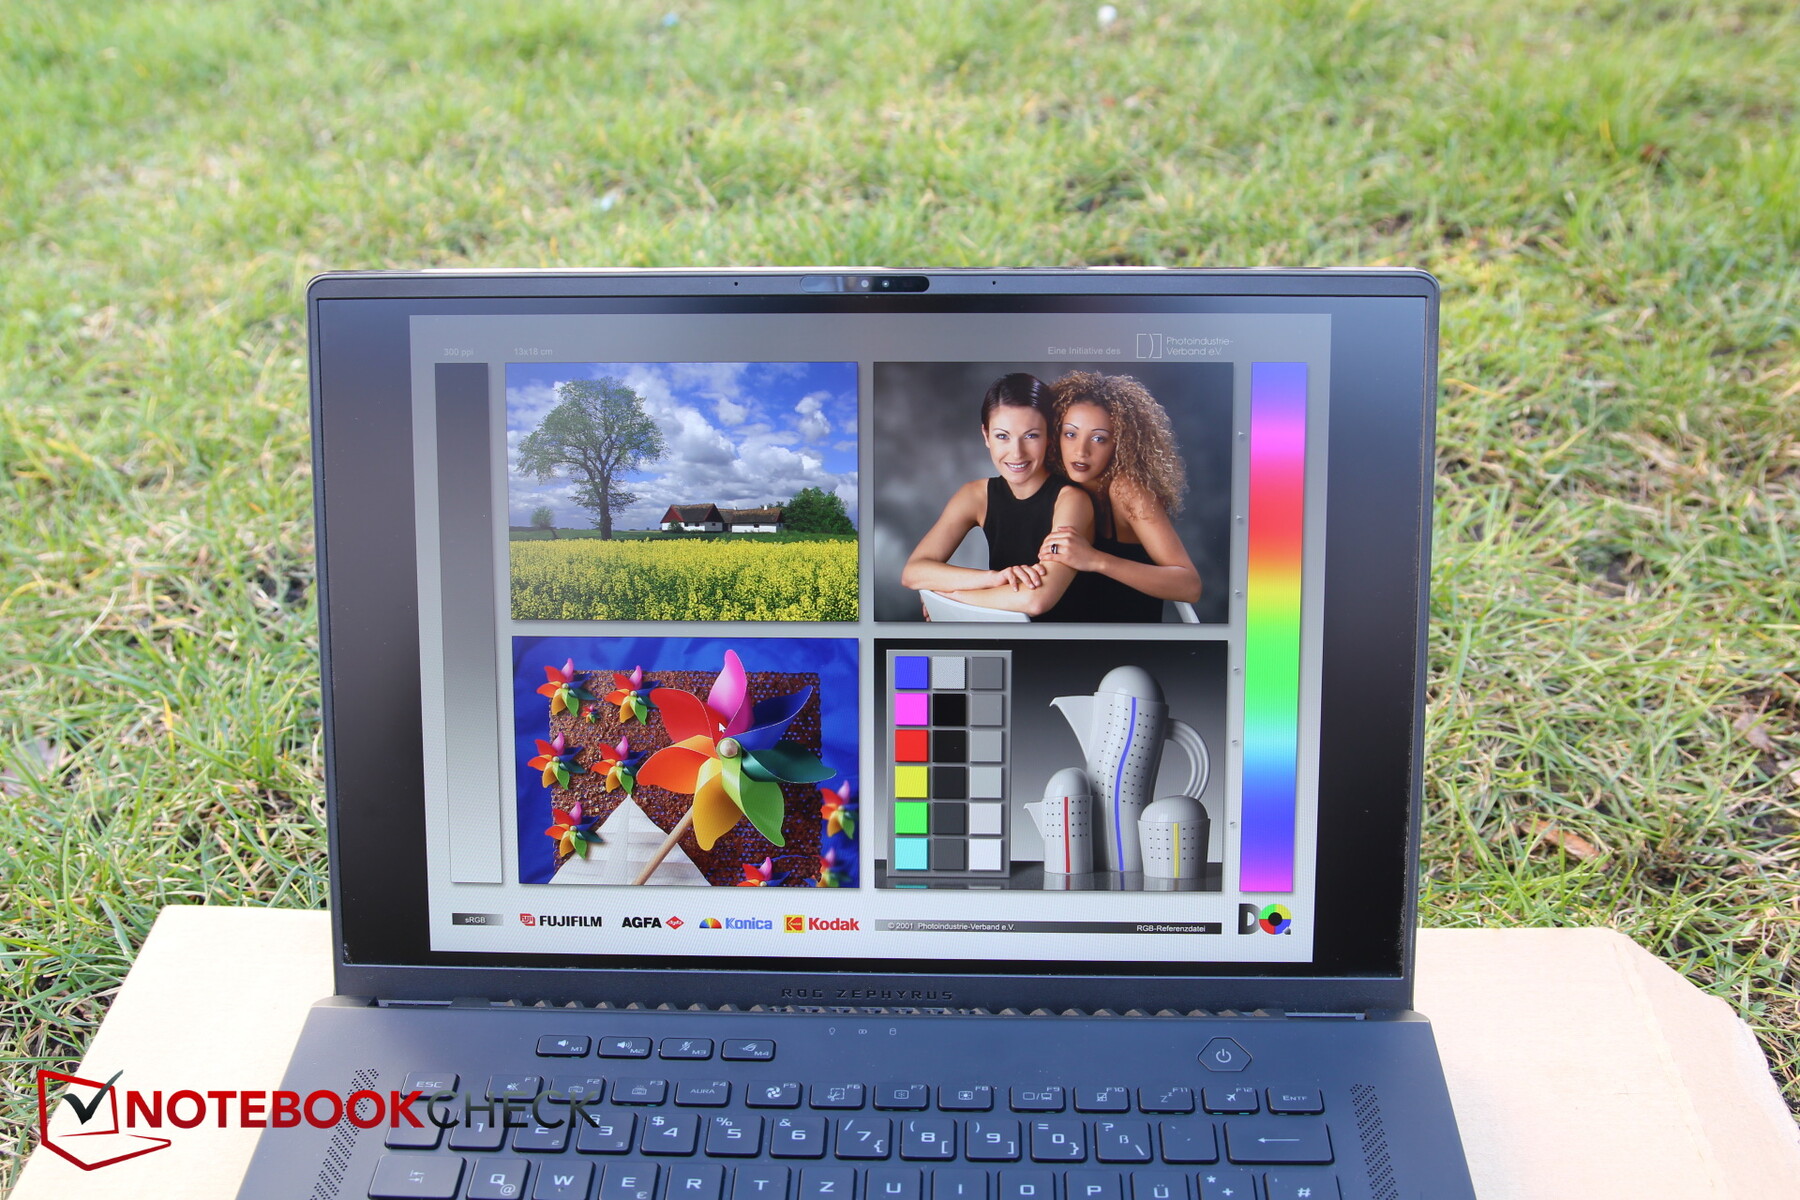
显示屏 - 非常明亮的Mini-LED,带HDR功能
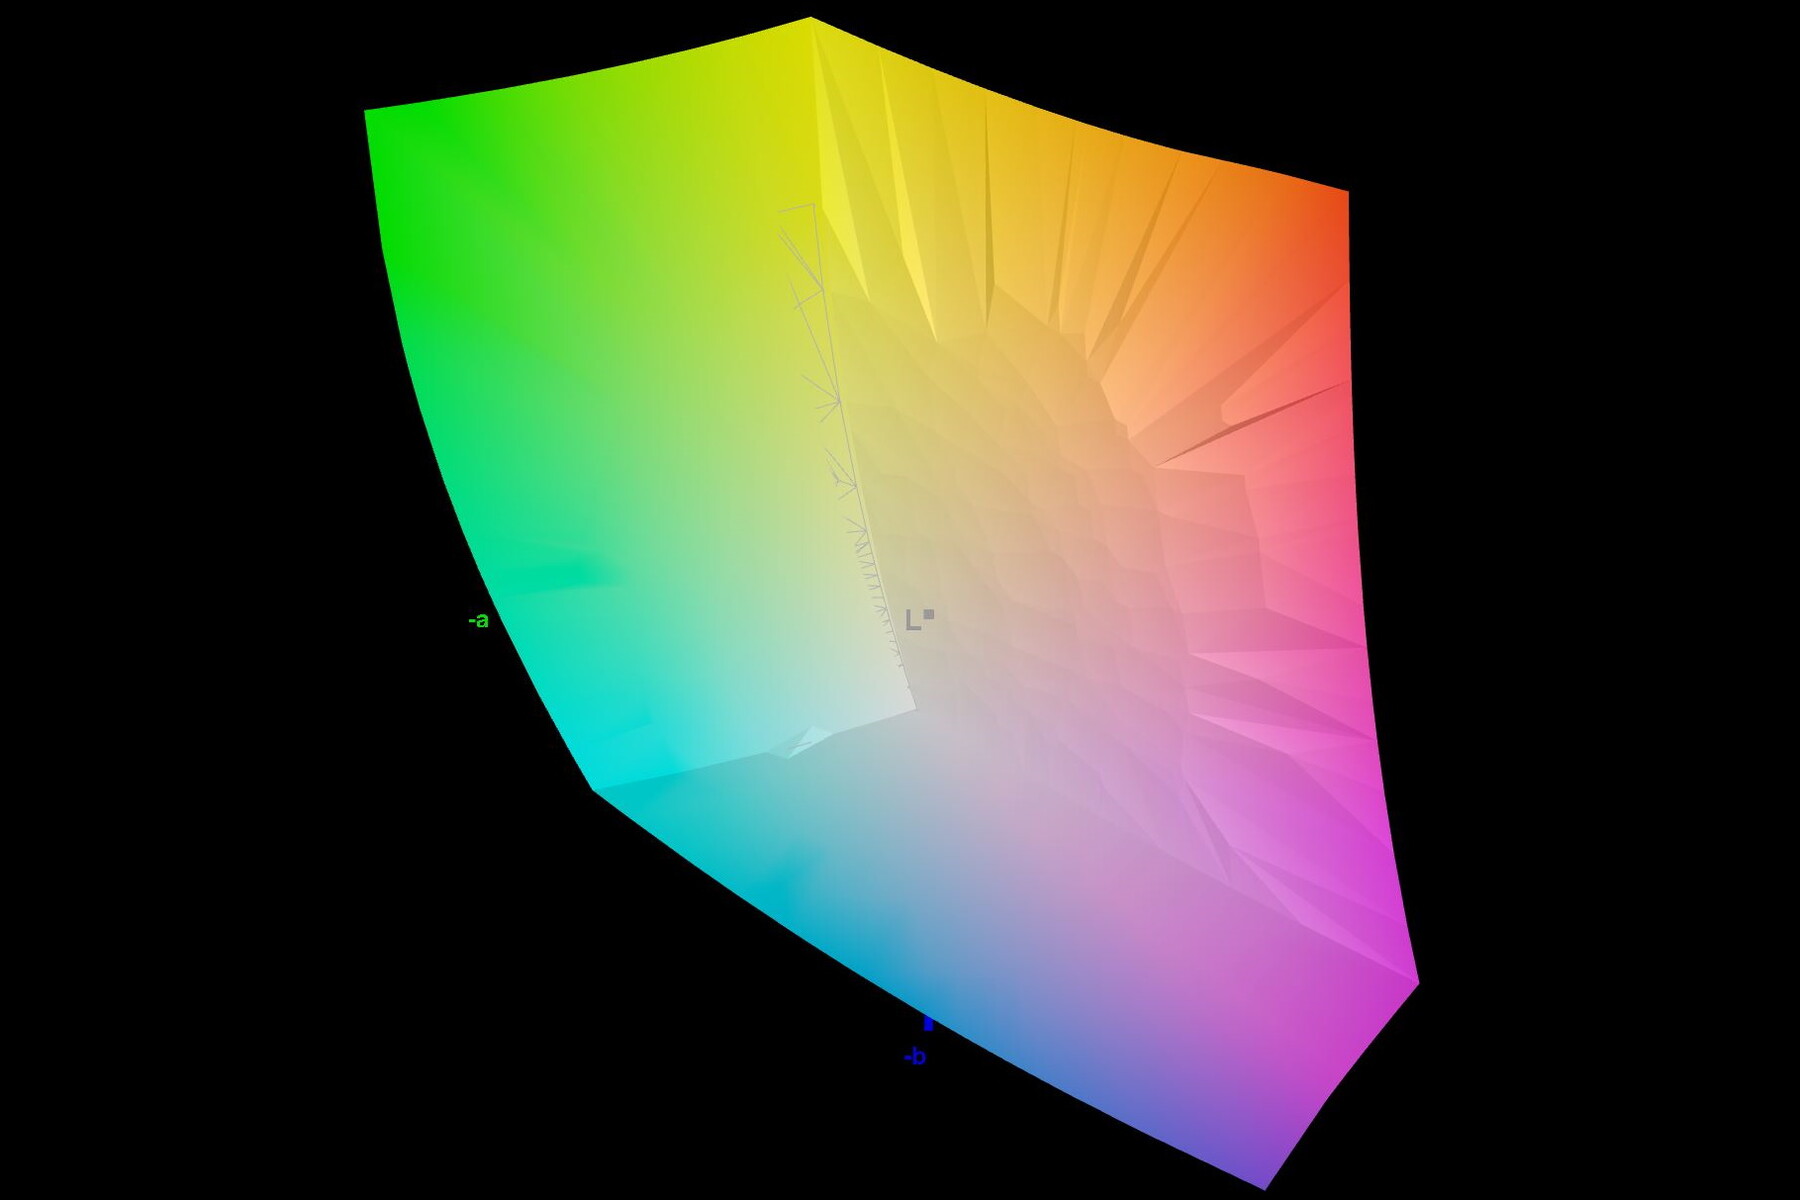
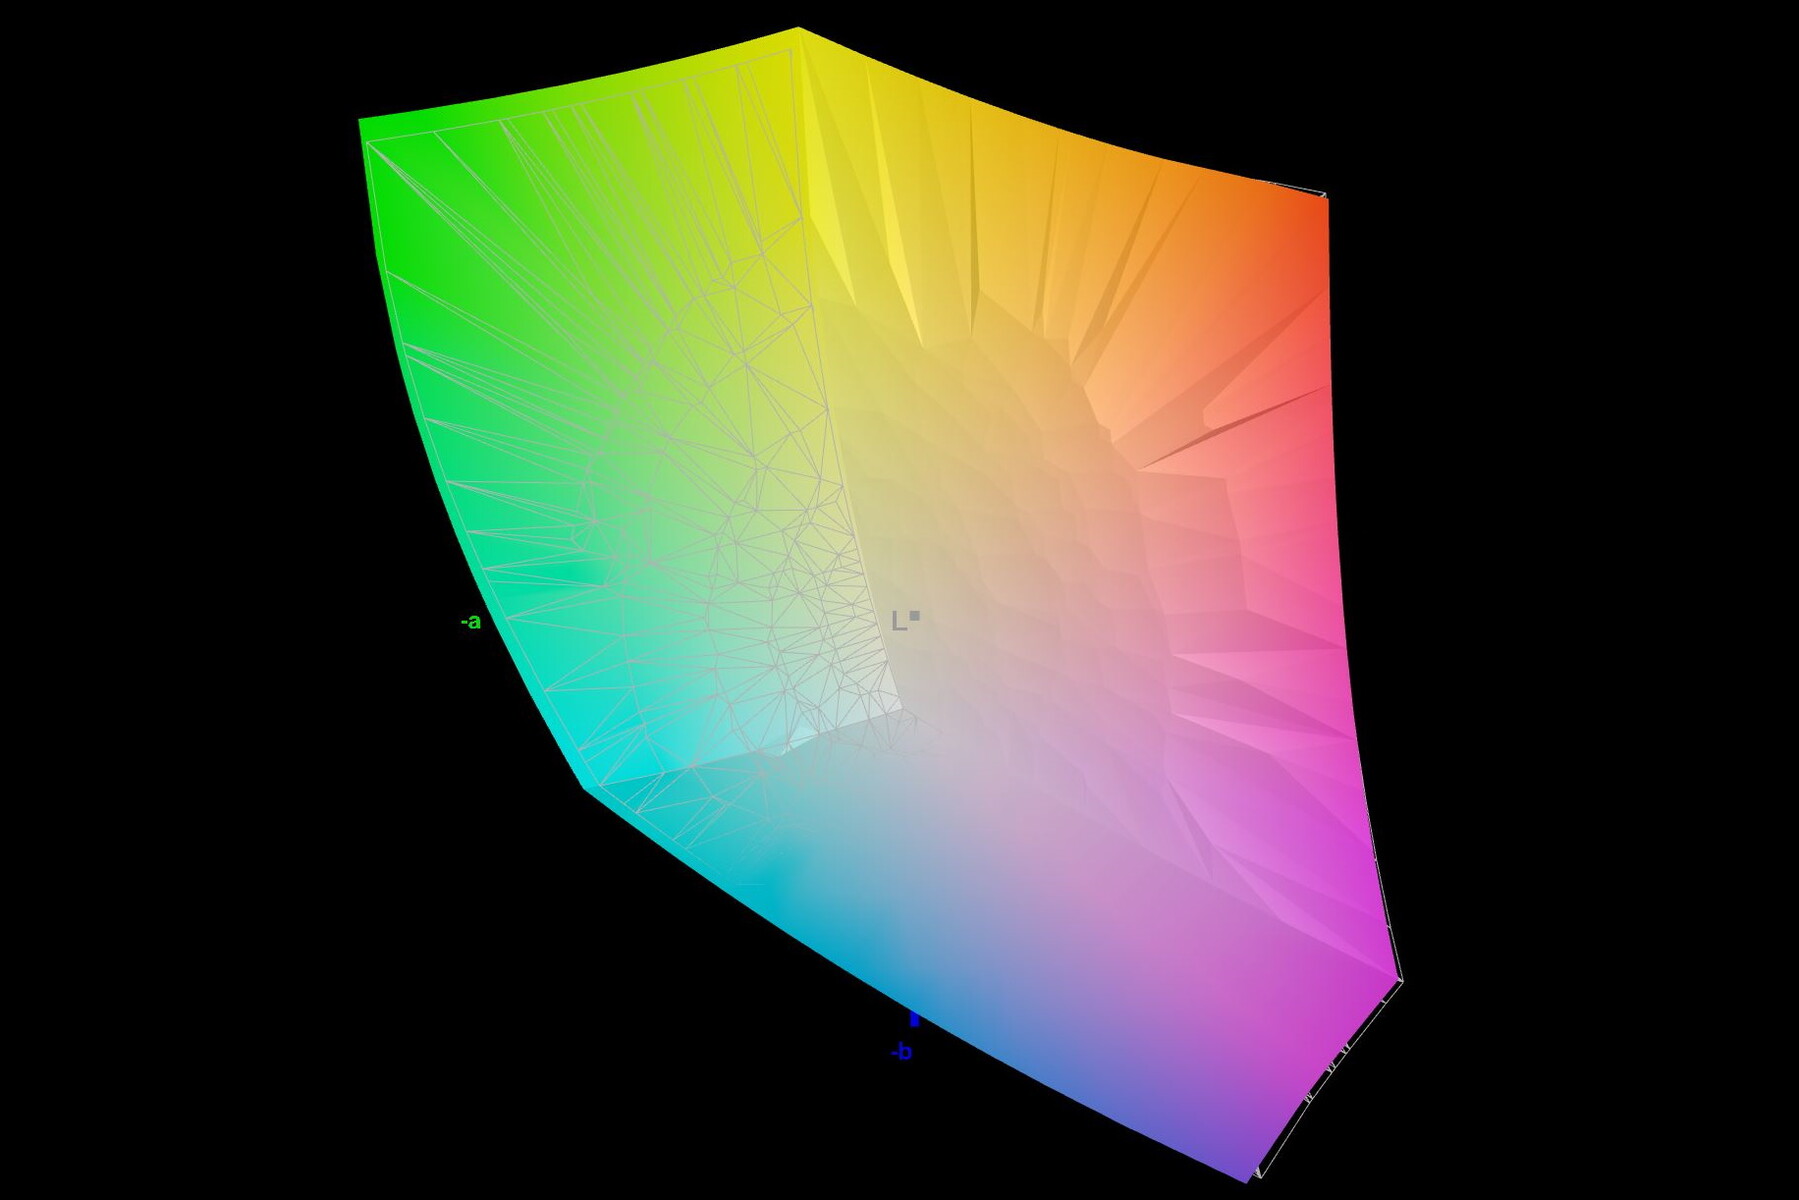
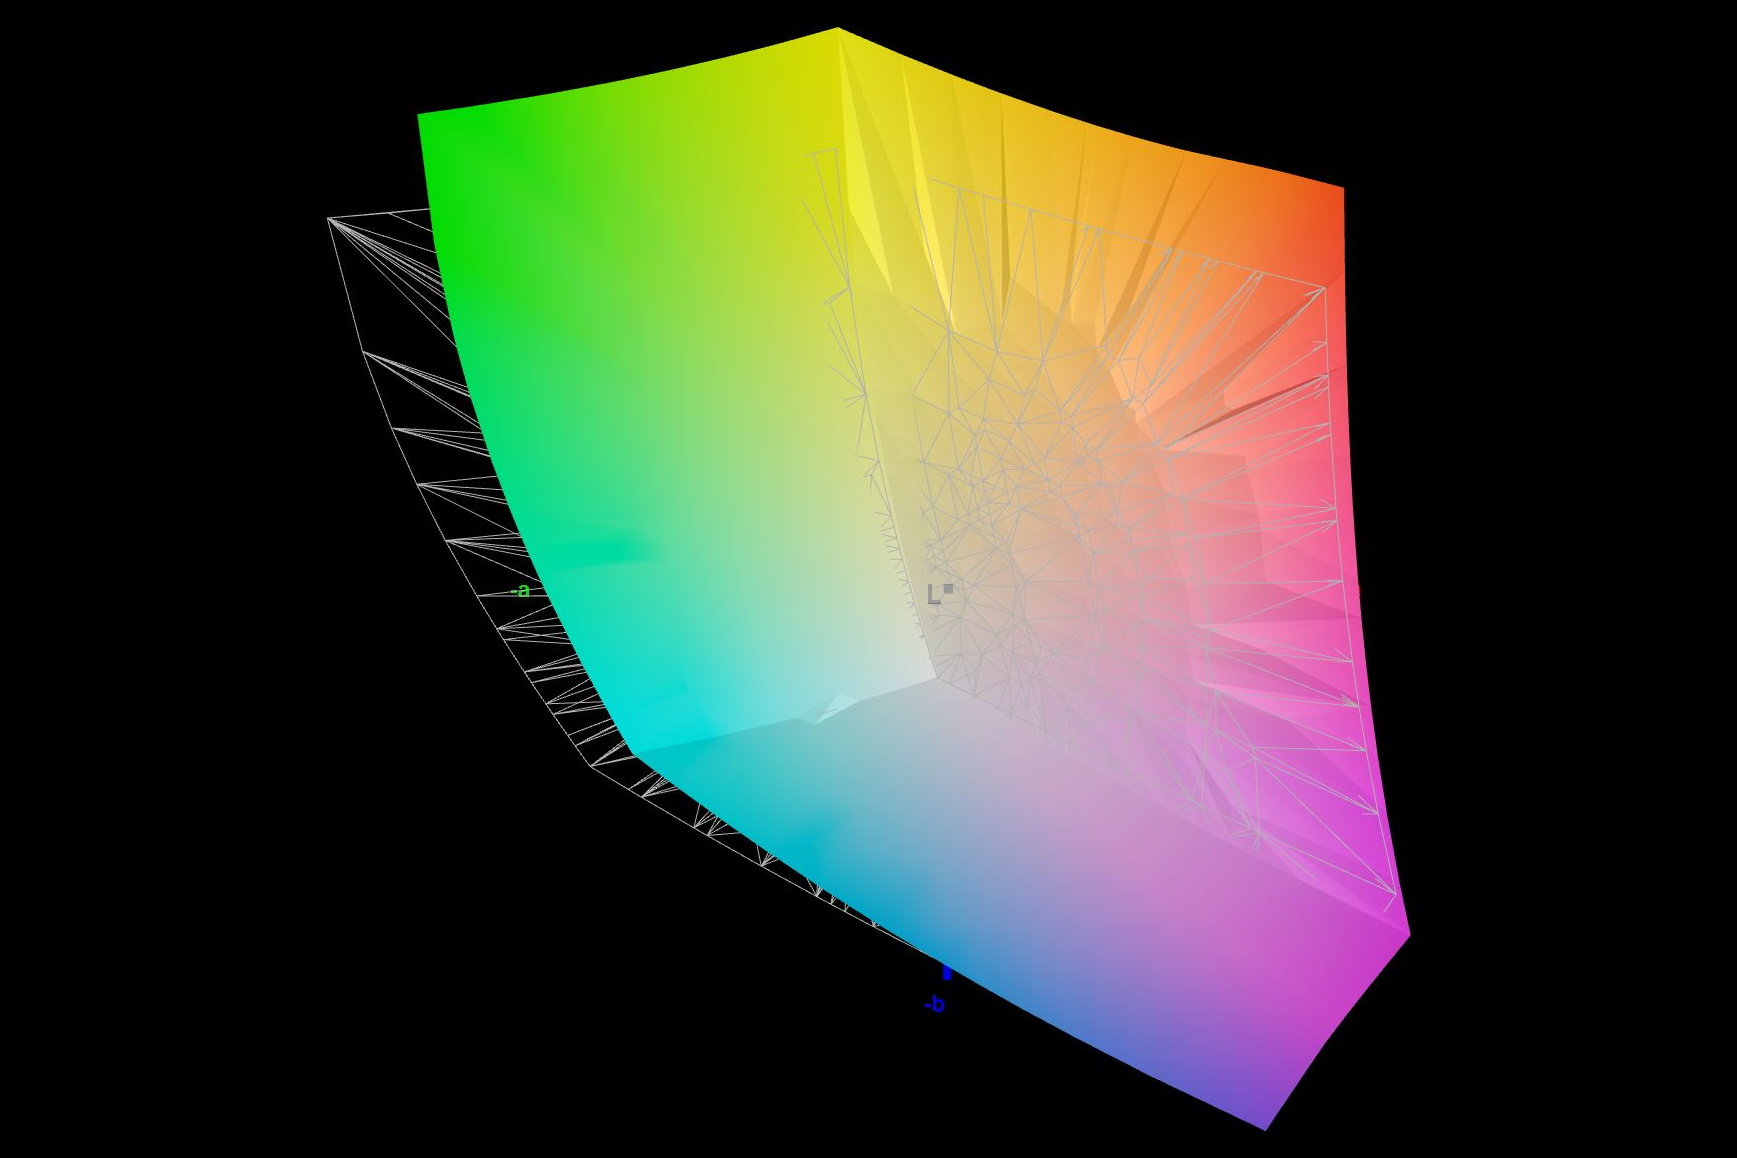
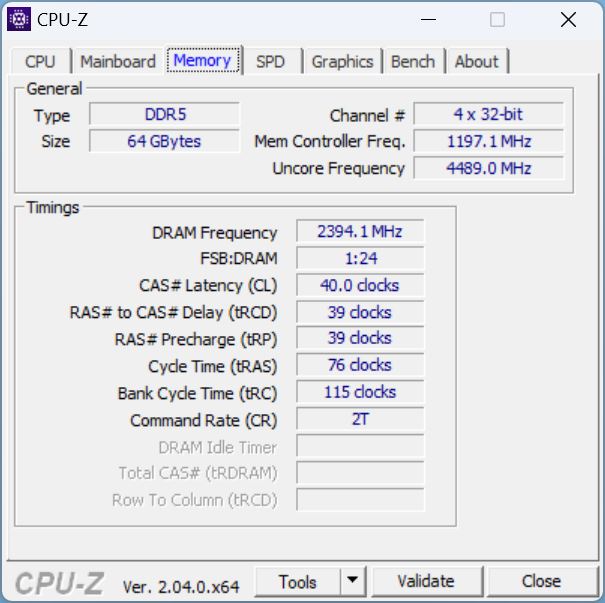
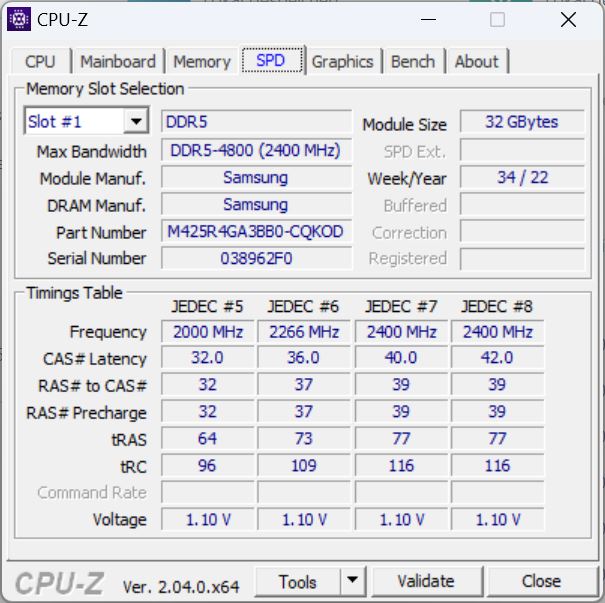
制造商再次选择了一个哑光、16:10的IPS显示屏,分辨率为2560 x 1600像素。然而,这不是同一块面板,因为它带有一个新的版本号,现在是由Mini-LED技术背光。华硕没有透露该面板采用的调光区数量。
在处理Mini-LED时,有几件事必须考虑:只有在使用华硕自己的控制中心,即Armory Crate软件将背光设置为多区时,才能实现最大亮度。在HDR模式下,这是自动设置的,如果HDR被停用(SDR模式是经过校准的,颜色偏差较小),面板会自动照亮个别区域。使用这种设置,亮度约低100尼特。
在下文中,我们强调激活多区的SDR模式值。然而,这种模式对于图像处理并不理想。
黑色水平也令人惊讶。使用单区背光时,这只有0.55,但对比度很差。只有在使用多区设置时,这才下降到一个优秀的0.03。这也是我们在激活多区的情况下进行测量的原因之一。
我们测量的亮度约为627尼特(多区,否则约为519尼特)。在92%的情况下,照明效果非常好,亮度在显示屏的右侧逐渐减弱。与前代产品相比,该面板的刷新率已从165赫兹提高到240赫兹。
| |||||||||||||||||||||||||
Brightness Distribution: 92 %
Center on Battery: 634 cd/m²
Contrast: 21133:1 (Black: 0.03 cd/m²)
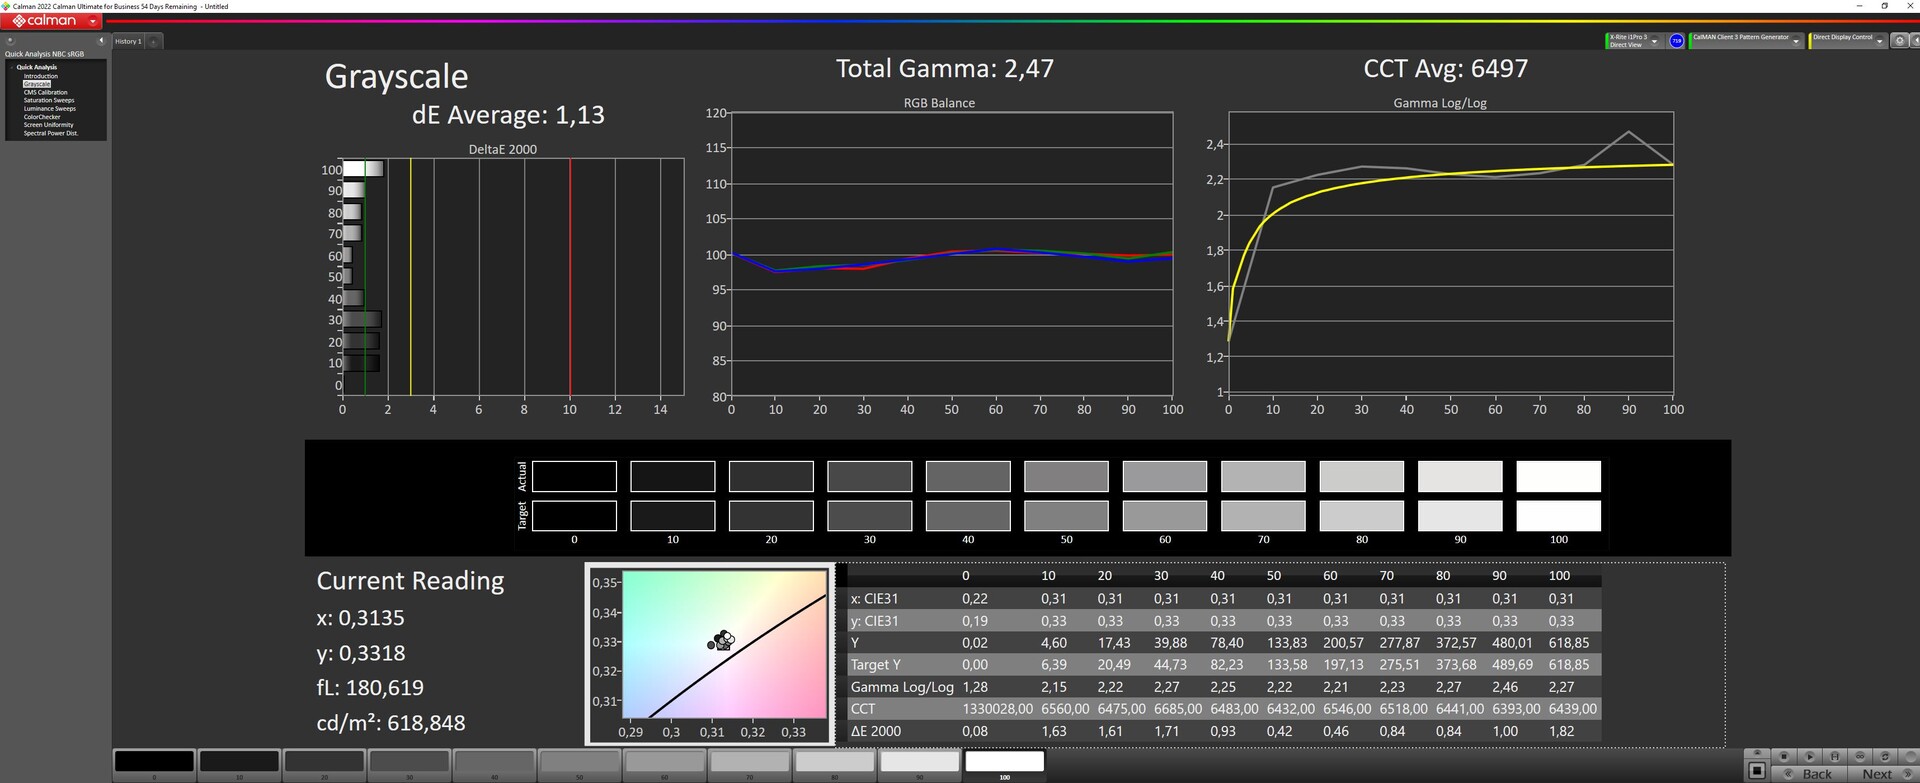
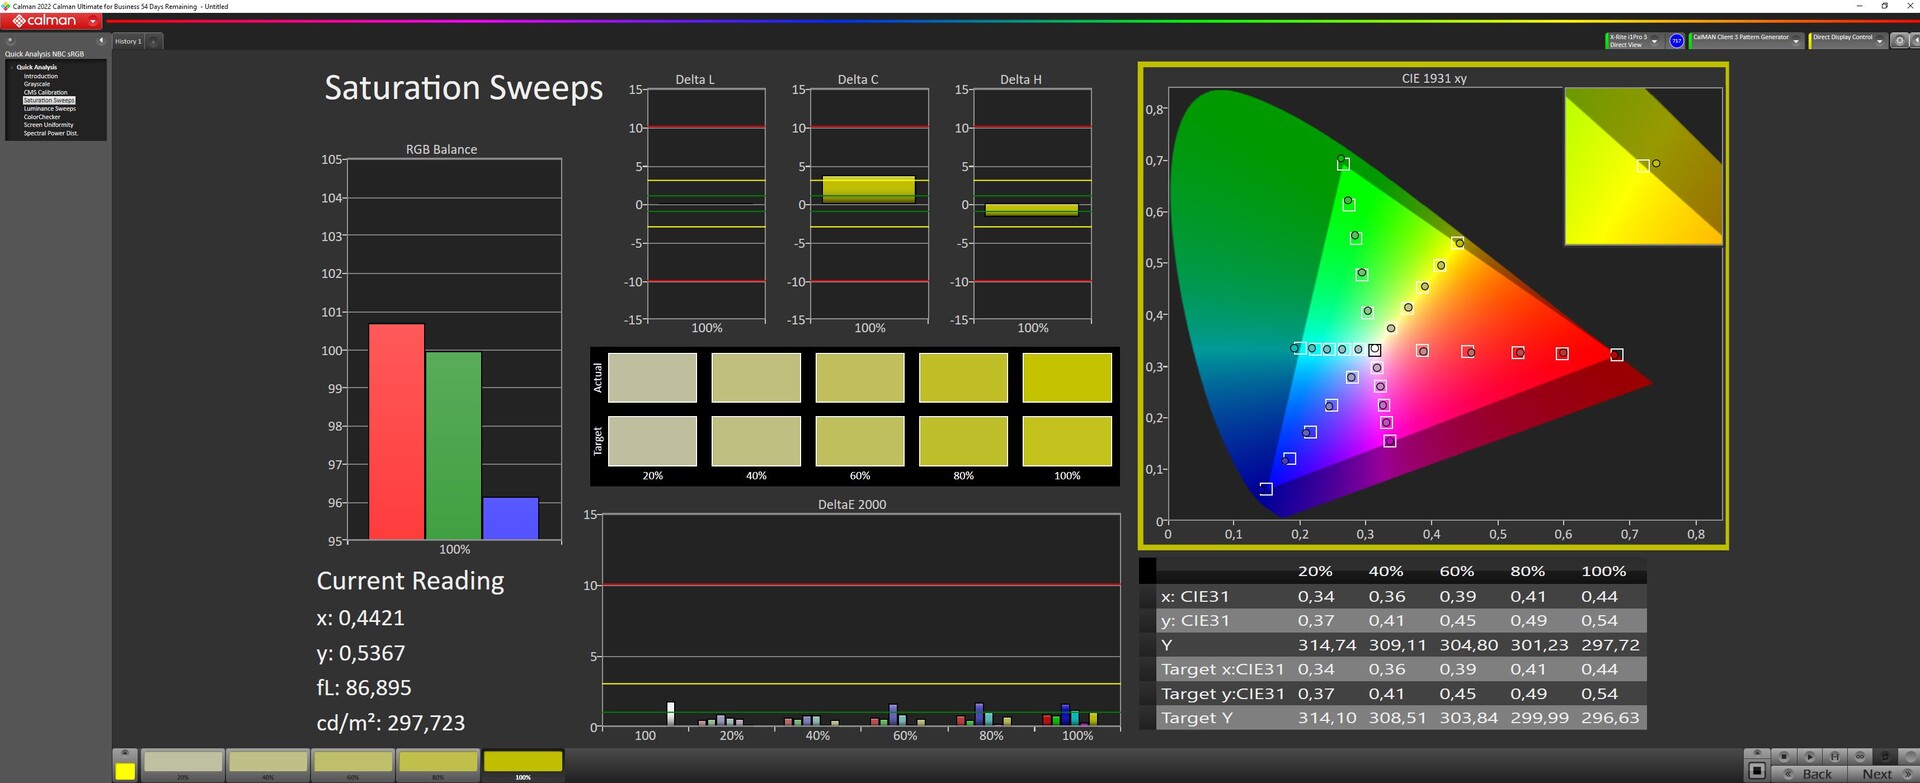
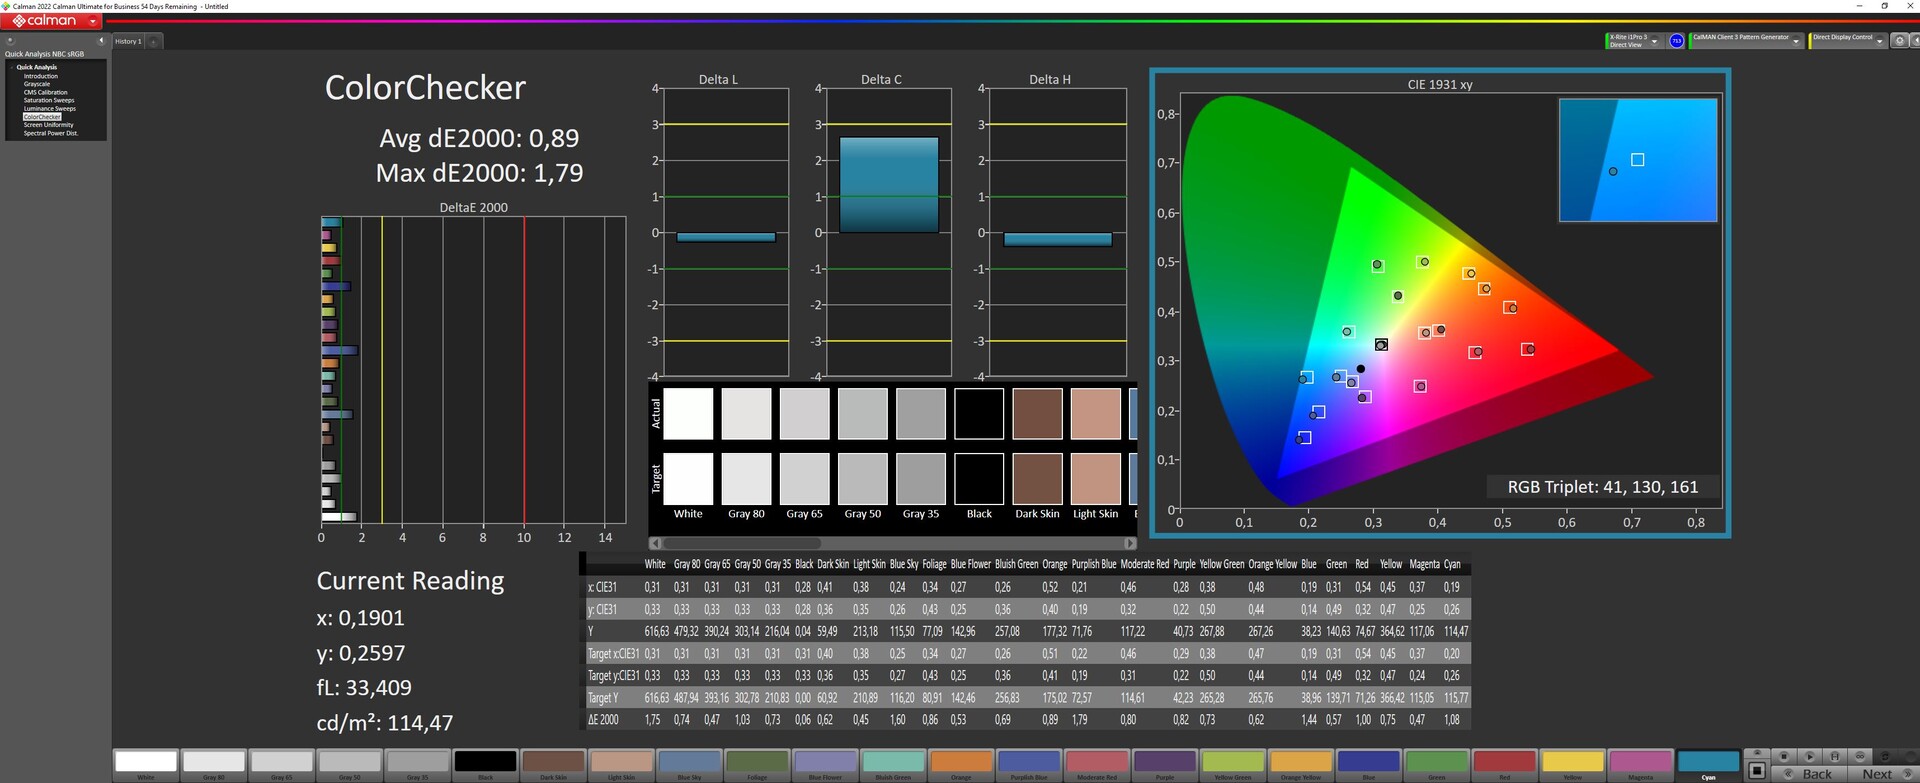
ΔE ColorChecker Calman: 0.89 | ∀{0.5-29.43 Ø4.73}
calibrated: 0.91
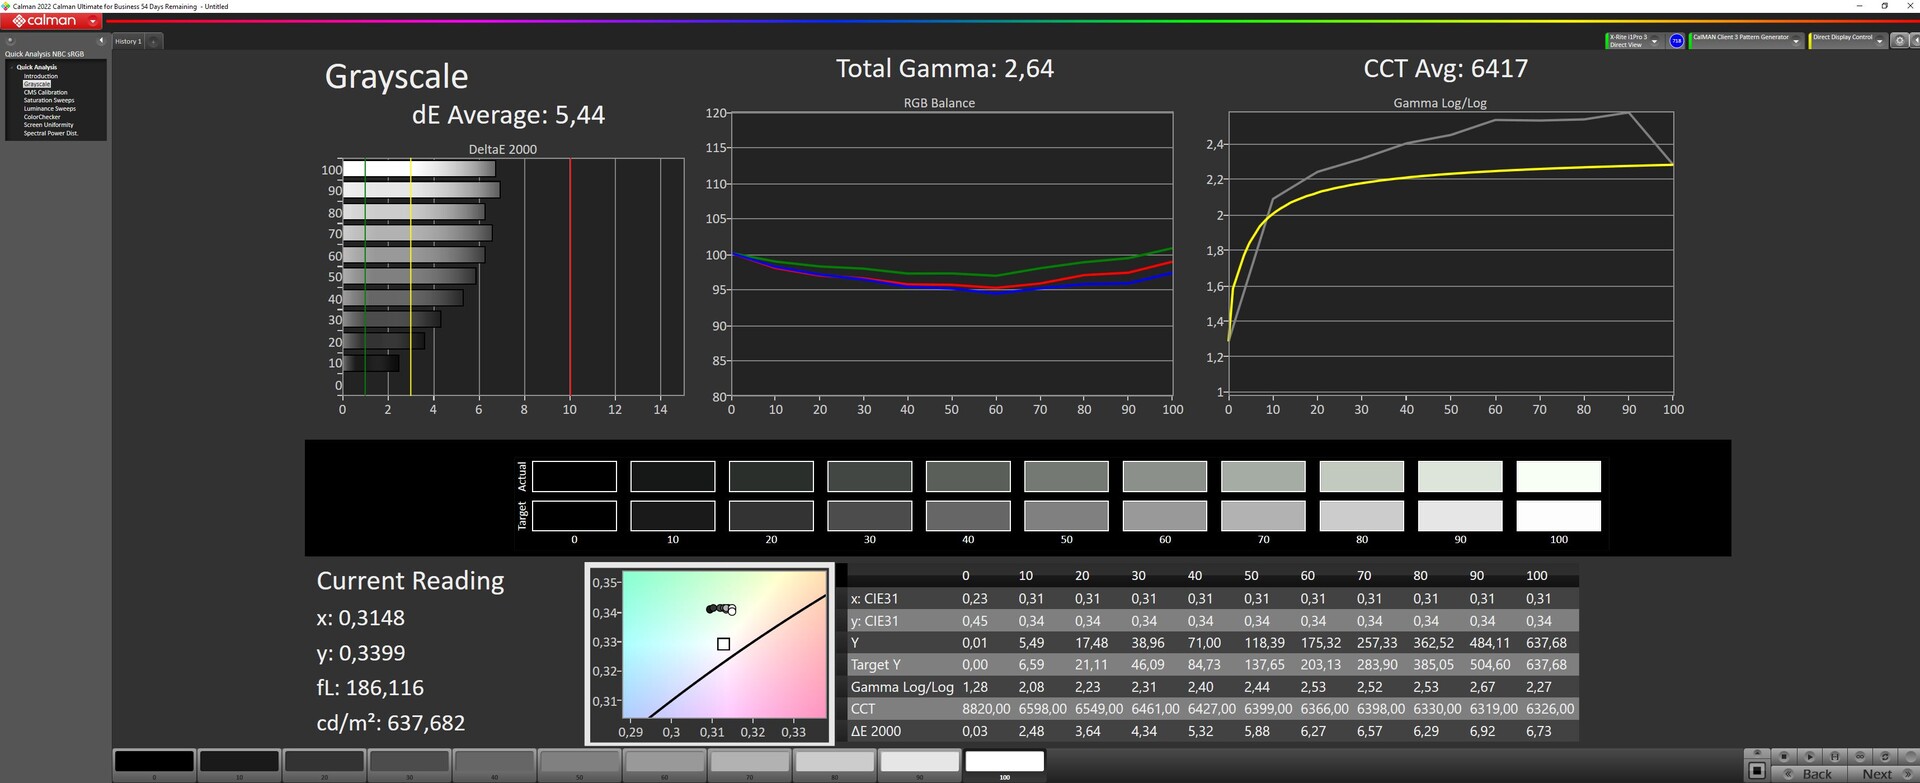
ΔE Greyscale Calman: 1.13 | ∀{0.09-98 Ø4.97}
90.01% AdobeRGB 1998 (Argyll 3D)
99.9% sRGB (Argyll 3D)
99.33% Display P3 (Argyll 3D)
Gamma: 2.47
CCT: 6497 K
| Asus ROG Zephyrus M16 GU604VY-NM042X BOE0B74 (NE160QDM-NM4, IPS, 2560x1600, 16" | Asus ROG Zephyrus M16 GU603Z BOE0A0B (BOE CQ NE160QDM-NY3), IPS, 2560x1600, 16" | Asus ROG Strix Scar 18 2023 G834JY-N6005W NE180QDM-NZ2, IPS, 2560x1600, 18" | MSI Titan GT77 HX 13VI B173ZAN06.C, Mini-LED, 3840x2160, 17.3" | Lenovo Legion Pro 7 16IRX8H MNG007DA2-3 (CSO1628), IPS, 2560x1600, 16" | Razer Blade 16 Early 2023 CSOT T3 MNG007DA4-1, IPS, 2560x1600, 16" | |
|---|---|---|---|---|---|---|
| Display | -5% | -3% | -0% | -17% | -0% | |
| Display P3 Coverage (%) | 99.33 | 92.8 -7% | 97.2 -2% | 94.9 -4% | 69.1 -30% | 98.5 -1% |
| sRGB Coverage (%) | 99.9 | 98.5 -1% | 99.9 0% | 99.9 0% | 99.7 0% | 100 0% |
| AdobeRGB 1998 Coverage (%) | 90.01 | 83.1 -8% | 84.9 -6% | 92.4 3% | 71.2 -21% | 89.7 0% |
| Response Times | 76% | 80% | 17% | 78% | 73% | |
| Response Time Grey 50% / Grey 80% * (ms) | 50.8 ? | 7.6 ? 85% | 5.41 ? 89% | 38.4 ? 24% | 12.3 ? 76% | 6.6 ? 87% |
| Response Time Black / White * (ms) | 29.6 ? | 10 ? 66% | 8.62 ? 71% | 26.6 ? 10% | 5.9 ? 80% | 12 ? 59% |
| PWM Frequency (Hz) | 12000 | 2380 ? | ||||
| Screen | -181% | -399% | 3033% | -150% | -212% | |
| Brightness middle (cd/m²) | 634 | 497 -22% | 490 -23% | 606 -4% | 511 -19% | 456.8 -28% |
| Brightness (cd/m²) | 627 | 481 -23% | 468 -25% | 602 -4% | 469 -25% | 437 -30% |
| Brightness Distribution (%) | 92 | 82 -11% | 86 -7% | 93 1% | 86 -7% | 83 -10% |
| Black Level * (cd/m²) | 0.03 | 0.21 -600% | 0.54 -1700% | 0.0001 100% | 0.4 -1233% | 0.35 -1067% |
| Contrast (:1) | 21133 | 2367 -89% | 907 -96% | 6060000 28576% | 1278 -94% | 1305 -94% |
| Colorchecker dE 2000 * | 0.89 | 3.53 -297% | 4.97 -458% | 4.8 -439% | 0.95 -7% | 3.7 -316% |
| Colorchecker dE 2000 max. * | 1.79 | 6.15 -244% | 11.02 -516% | 8.2 -358% | 2.07 -16% | 6.42 -259% |
| Colorchecker dE 2000 calibrated * | 0.91 | 3.53 -288% | 2.97 -226% | 1.8 -98% | 0.91 -0% | 0.66 27% |
| Greyscale dE 2000 * | 1.13 | 1.74 -54% | 7.2 -537% | 6.5 -475% | 0.6 47% | 2.6 -130% |
| Gamma | 2.47 89% | 2.2 100% | 2.161 102% | 2.63 84% | 2.176 101% | 2.3 96% |
| CCT | 6497 100% | 6418 101% | 6515 100% | 6596 99% | 6545 99% | 6108 106% |
| Total Average (Program / Settings) | -37% /
-107% | -107% /
-245% | 1017% /
1952% | -30% /
-89% | -46% /
-126% |
* ... smaller is better
华硕宣传该设备具有100%的DCI P3,这一点我们的分析能够证实。AdobeRGB的再现率为90%。
开箱后,该面板被很好地校准(SDR),其DeltaE灰度和ColorChecker值仅为1.13和0.89。一个新的校准几乎无法改善问题。灰度DeltaE略有下降,而ColorChecker的偏差略有增加。
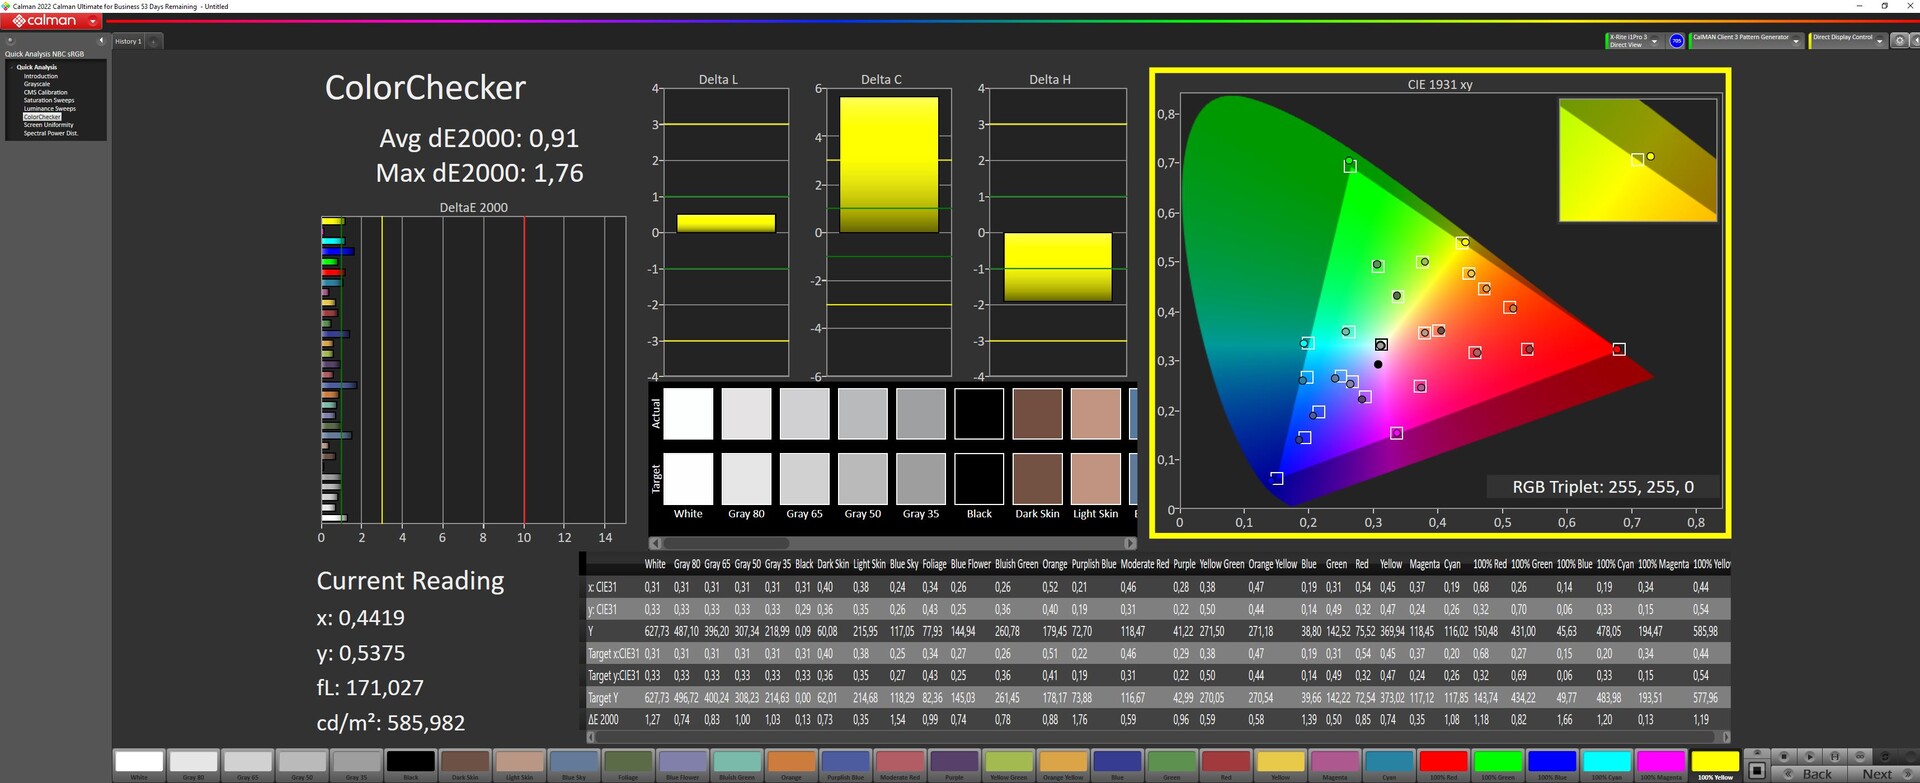
然而,在HDR模式下,校准已经消失了(见下面屏幕截图的最后一行)。


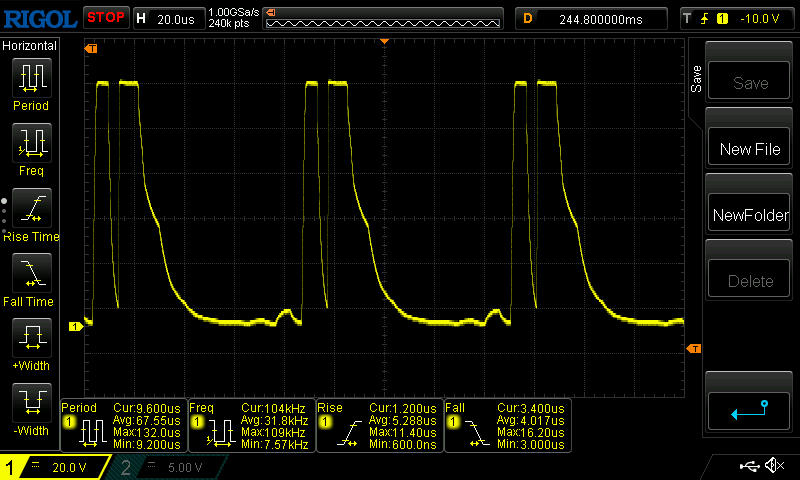
在我们的评测模型中,确定响应时间并不容易,因为至少12kHz的PWM频率(见下文)与响应时间曲线相重叠。华硕将其规定为3毫秒,但没有透露他们使用的测量技术。在全亮度下,我们测量的结果是30至50毫秒,一方面,这很高,但也可能受到重叠的PWM频率的影响。
Display Response Times
| ↔ Response Time Black to White | ||
|---|---|---|
| 29.6 ms ... rise ↗ and fall ↘ combined | ↗ 25 ms rise |  |
| ↘ 4.6 ms fall | ||
| The screen shows relatively slow response rates in our tests and may be too slow for gamers. In comparison, all tested devices range from 0.1 (minimum) to 240 (maximum) ms. » 79 % of all devices are better. This means that the measured response time is worse than the average of all tested devices (19.9 ms). | ||
| ↔ Response Time 50% Grey to 80% Grey | ||
| 50.8 ms ... rise ↗ and fall ↘ combined | ↗ 27.6 ms rise |  |
| ↘ 23.2 ms fall | ||
| The screen shows slow response rates in our tests and will be unsatisfactory for gamers. In comparison, all tested devices range from 0.165 (minimum) to 636 (maximum) ms. » 87 % of all devices are better. This means that the measured response time is worse than the average of all tested devices (31.1 ms). | ||
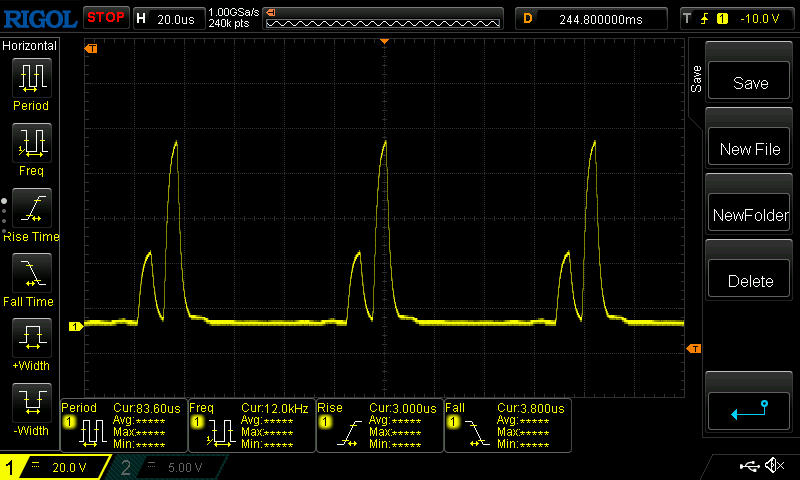
Screen Flickering / PWM (Pulse-Width Modulation)
| Screen flickering / PWM detected | 12000 Hz |  | |
The display backlight flickers at 12000 Hz (worst case, e.g., utilizing PWM) . The frequency of 12000 Hz is quite high, so most users sensitive to PWM should not notice any flickering. In comparison: 52 % of all tested devices do not use PWM to dim the display. If PWM was detected, an average of 7794 (minimum: 5 - maximum: 343500) Hz was measured. | |||
PWM是用来调节亮度的。在亮度为100%至83%时,频率为12千赫,这对通常对PWM敏感的人来说甚至不应该被注意到。低于这个数值时,频率继续上升,在69至100千赫兹之间。
在户外,哑光表面确保了相对较高的亮度以及非常好的可读性,至少在阴凉处是如此。从上面看显示屏时应注意,因为图像很快就会被冲淡。


性能 - 涡轮机缺少一个火花
从纸面上看,新的M16应该是16英寸机身中的一个重量级性能:猛禽湖 酷睿i9-13900H, Nvidia Geforce RTX 4090和64GB内存,向所有可能的性能王位竞争者抛出了挑战。
测试条件
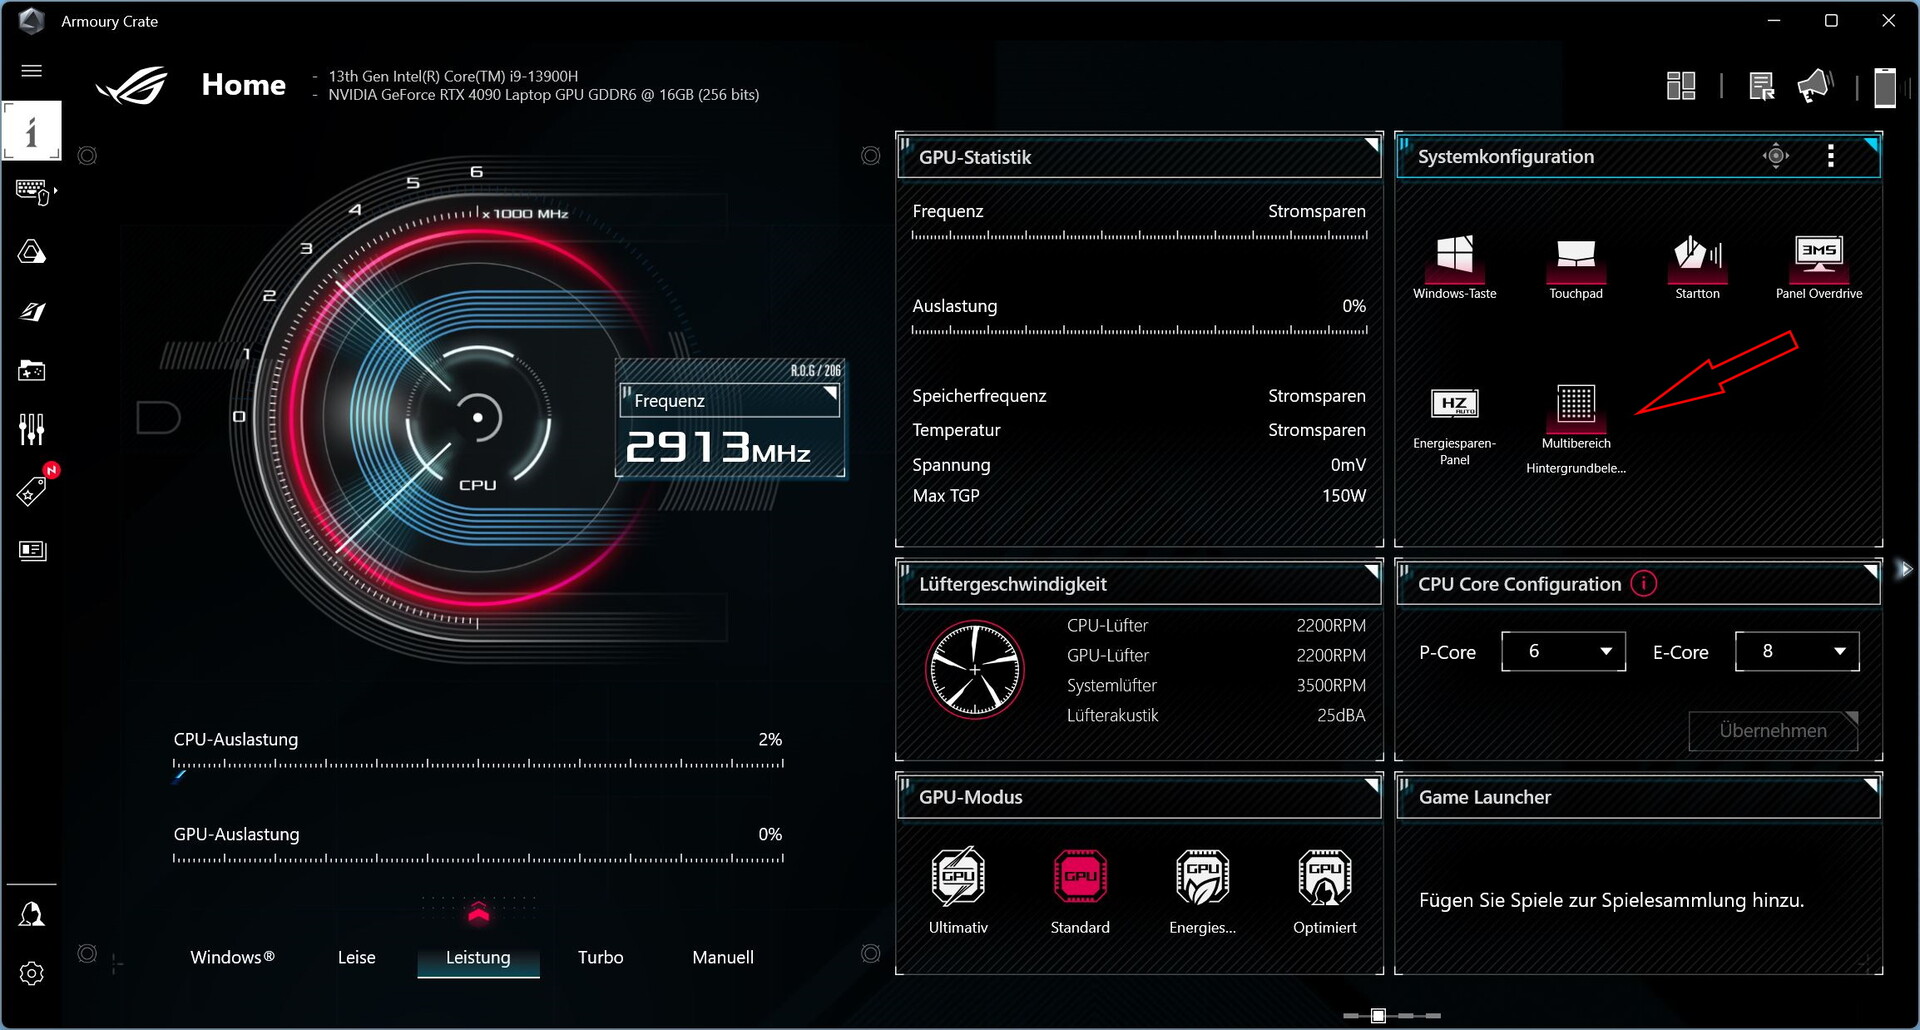
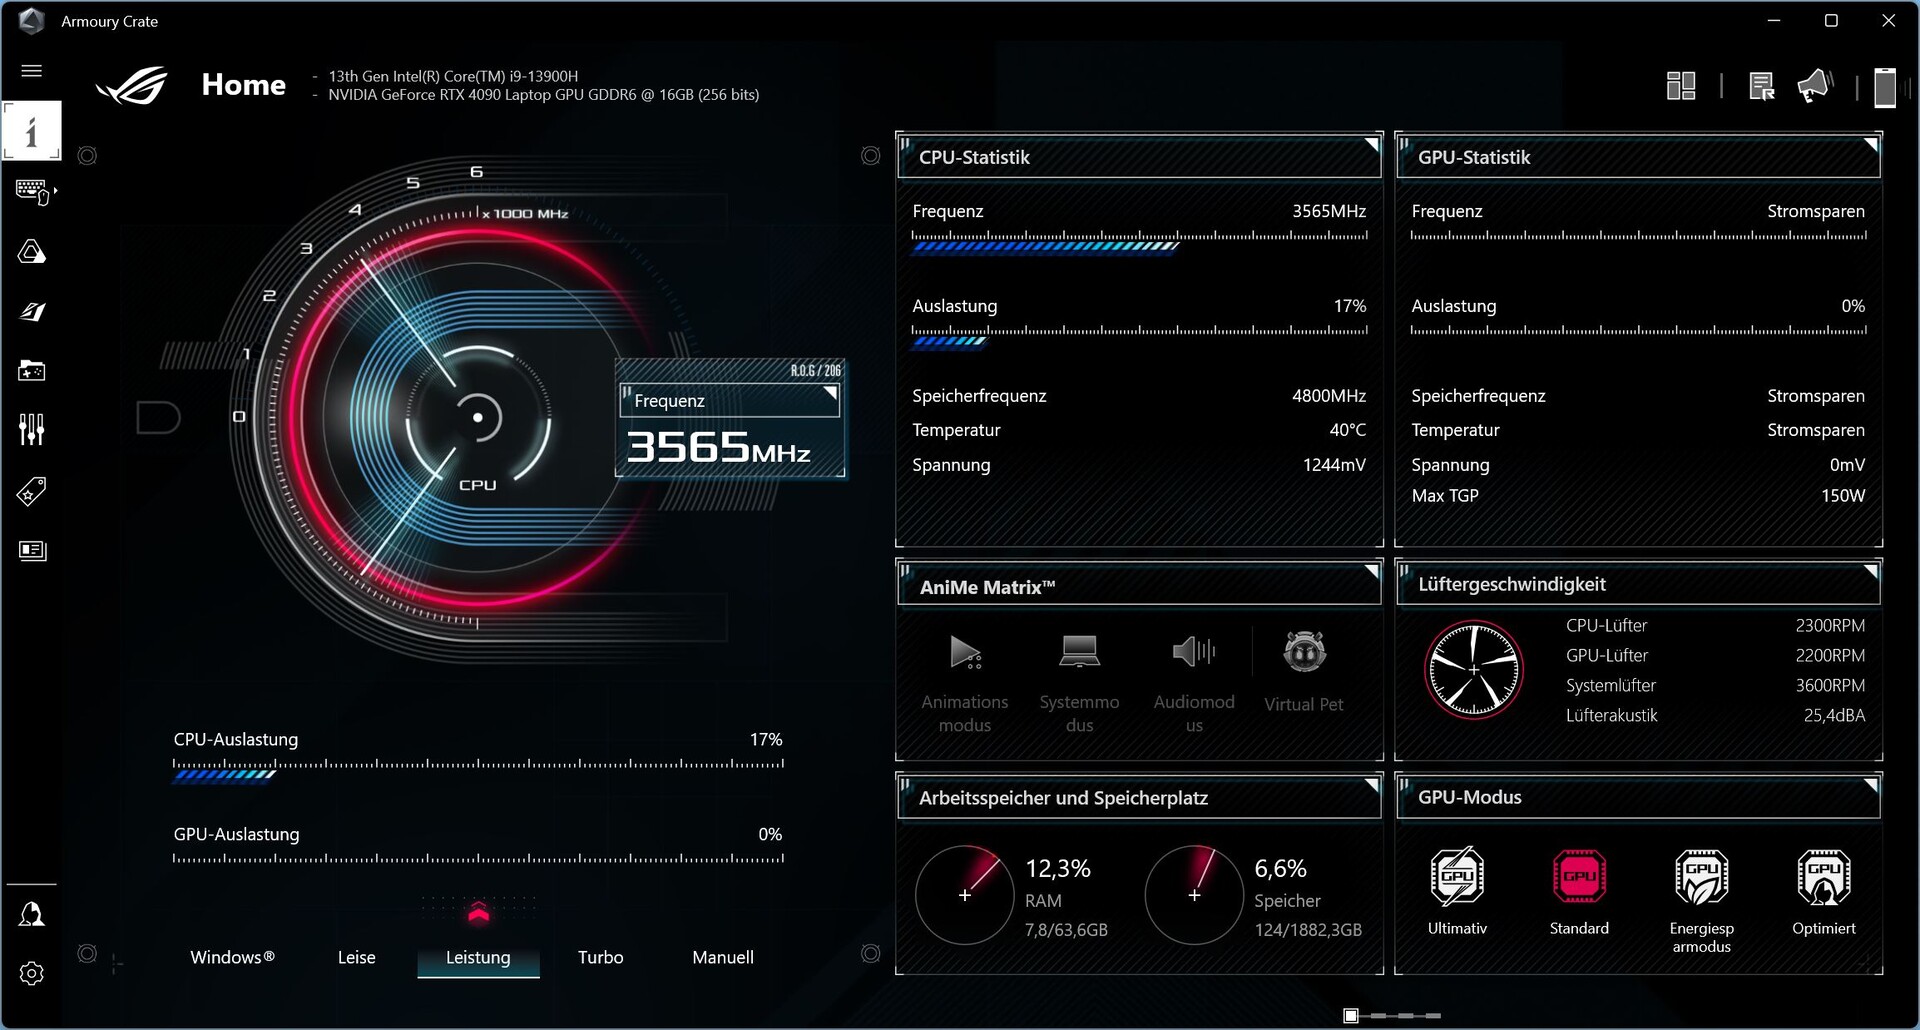
华硕的游戏玩家控制中心是软件Amoury Crate。除了各种性能模式外,这里是所有重要设置的地方,也是诸如AniMe Matrix和风扇曲线可以定制的地方。
在我们的基准测试中,我们在应用程序中选择了涡轮模式,以获得尽可能好的结果。由于前一代产品的高噪音排放,其前身使用性能模式进行测试,是更类似于平衡模式的东西。

处理器
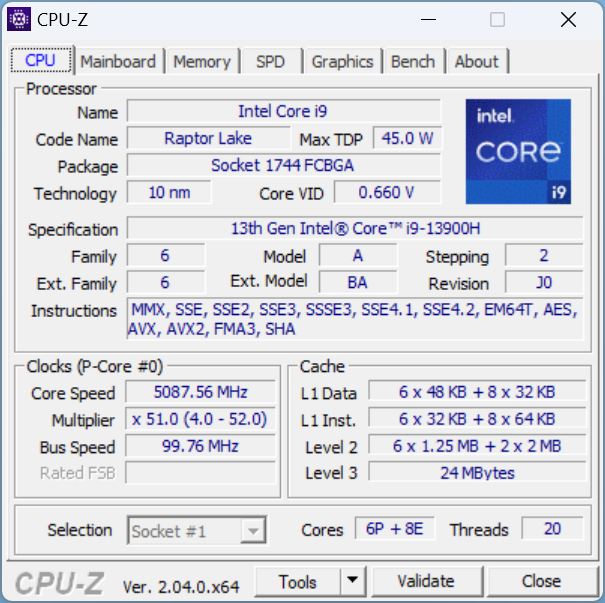
到现在为止,酷睿i9-13900H是唯一的CPU选项,也是英特尔新猛禽湖系列中最强大的处理器之一。它提供了6个P核和8个E核,前者的涡轮增压频率高达5.4GHz。E核的基本时钟速度为1.9GHz。
在我们的Cinebench循环中,M16超过了整个配置上一代CPU的竞争对手。然而,即使与功能明显不足的i7-12700H相比,差距也相对较小。 i7-12700H中发现的惠普Omen 16.与前代产品相比,其领先优势同样很小,性能模式下的得分可能几乎相同。
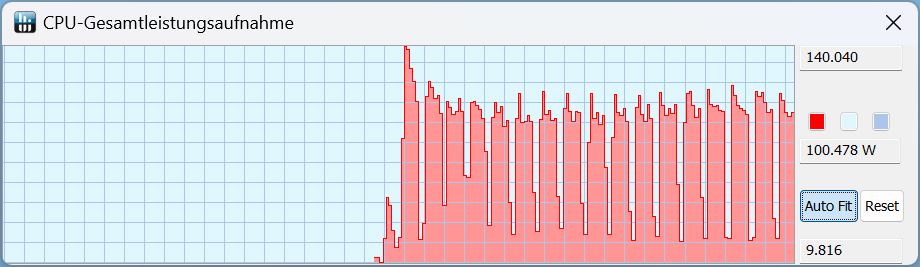
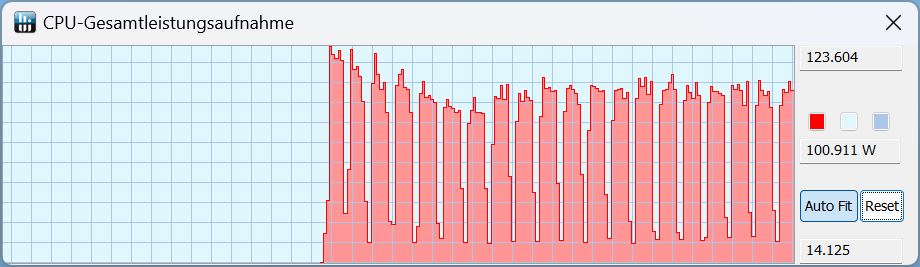
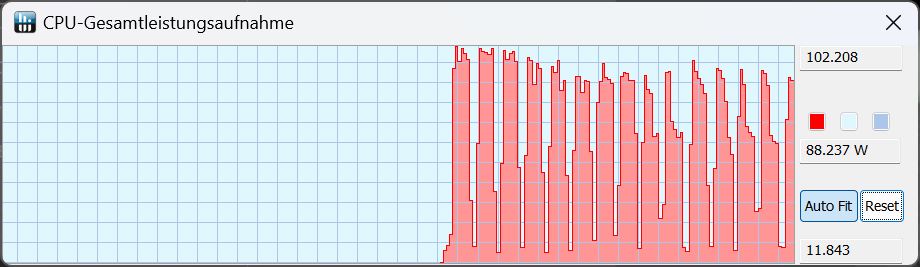
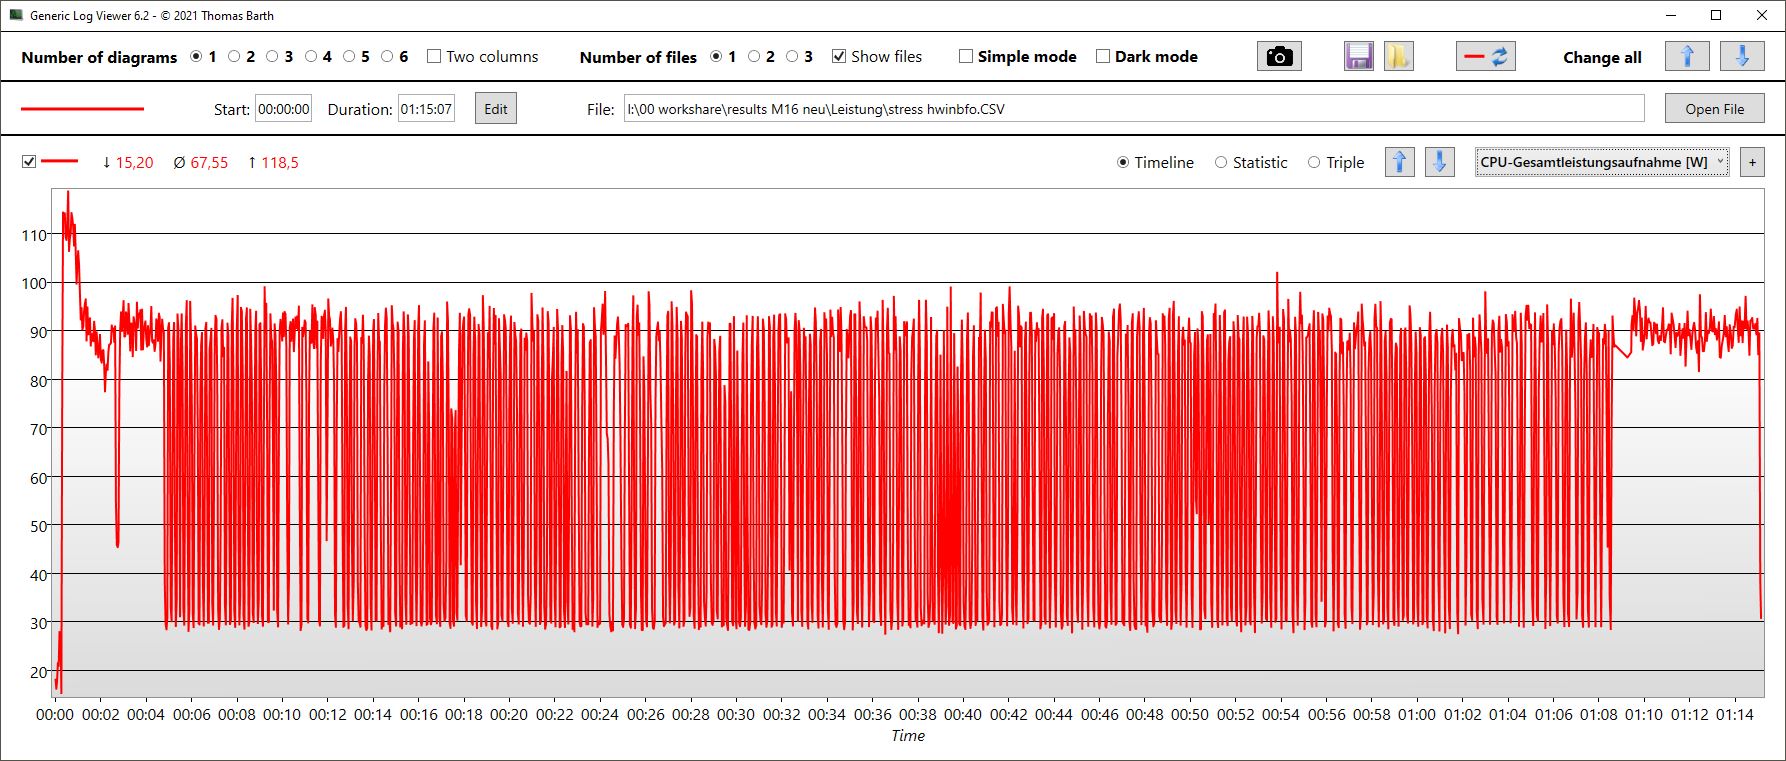
看一下TDP,第一个Turbo模式的运行峰值为140瓦,其他的运行都在100瓦左右。
在性能模式下,最初的140瓦峰值下降到大约120瓦,但在这里,TDP通常也是在大约100瓦的位置。
在安静模式下,峰值消失了,TDP在60瓦和最大100瓦之间。
在电池模式下,相同模式(静音)下的性能甚至更低,短暂的最大功率为34瓦,在较长的持续负载时间内只达到20瓦多一点的功率。
Cinebench R15 Multi Continuous
Cinebench R23: Multi Core | Single Core
Cinebench R20: CPU (Multi Core) | CPU (Single Core)
Cinebench R15: CPU Multi 64Bit | CPU Single 64Bit
Blender: v2.79 BMW27 CPU
7-Zip 18.03: 7z b 4 | 7z b 4 -mmt1
Geekbench 5.5: Multi-Core | Single-Core
HWBOT x265 Benchmark v2.2: 4k Preset
LibreOffice : 20 Documents To PDF
R Benchmark 2.5: Overall mean
| CPU Performance rating | |
| Schenker XMG Neo 16 Raptor Lake | |
| Average of class Gaming | |
| Asus ROG Zephyrus M16 GU604VY-NM042X | |
| MSI Creator Z16P B12UHST | |
| Lenovo Legion 5 Pro 16 G7 i7 RTX 3070Ti | |
| Asus ROG Zephyrus M16 GU603Z | |
| Acer Predator Triton 300 SE | |
| Average Intel Core i9-13900H | |
| HP Omen 17-ck1075ng | |
| Razer Blade 15 RZ09-0421NGG3-R3G1 | |
| Cinebench R23 / Multi Core | |
| Schenker XMG Neo 16 Raptor Lake | |
| Schenker XMG Neo 16 Raptor Lake | |
| Schenker XMG Neo 16 Raptor Lake | |
| Average of class Gaming (10488 - 40970, n=112, last 2 years) | |
| Asus ROG Zephyrus M16 GU604VY-NM042X | |
| Lenovo Legion 5 Pro 16 G7 i7 RTX 3070Ti | |
| MSI Creator Z16P B12UHST | |
| Average Intel Core i9-13900H (11997 - 20385, n=28) | |
| Razer Blade 15 RZ09-0421NGG3-R3G1 | |
| Acer Predator Triton 300 SE | |
| Asus ROG Zephyrus M16 GU603Z | |
| HP Omen 17-ck1075ng | |
| Cinebench R23 / Single Core | |
| Schenker XMG Neo 16 Raptor Lake | |
| Average of class Gaming (1166 - 2356, n=112, last 2 years) | |
| Asus ROG Zephyrus M16 GU604VY-NM042X | |
| MSI Creator Z16P B12UHST | |
| Acer Predator Triton 300 SE | |
| Average Intel Core i9-13900H (1297 - 2054, n=26) | |
| Asus ROG Zephyrus M16 GU603Z | |
| Lenovo Legion 5 Pro 16 G7 i7 RTX 3070Ti | |
| HP Omen 17-ck1075ng | |
| Razer Blade 15 RZ09-0421NGG3-R3G1 | |
| Cinebench R20 / CPU (Multi Core) | |
| Schenker XMG Neo 16 Raptor Lake | |
| Average of class Gaming (4029 - 16108, n=111, last 2 years) | |
| Asus ROG Zephyrus M16 GU604VY-NM042X | |
| Lenovo Legion 5 Pro 16 G7 i7 RTX 3070Ti | |
| MSI Creator Z16P B12UHST | |
| Average Intel Core i9-13900H (4935 - 7716, n=25) | |
| Razer Blade 15 RZ09-0421NGG3-R3G1 | |
| Acer Predator Triton 300 SE | |
| Asus ROG Zephyrus M16 GU603Z | |
| HP Omen 17-ck1075ng | |
| Cinebench R20 / CPU (Single Core) | |
| Average of class Gaming (442 - 895, n=111, last 2 years) | |
| Schenker XMG Neo 16 Raptor Lake | |
| Asus ROG Zephyrus M16 GU604VY-NM042X | |
| MSI Creator Z16P B12UHST | |
| Acer Predator Triton 300 SE | |
| Average Intel Core i9-13900H (428 - 792, n=25) | |
| Asus ROG Zephyrus M16 GU603Z | |
| Lenovo Legion 5 Pro 16 G7 i7 RTX 3070Ti | |
| HP Omen 17-ck1075ng | |
| Razer Blade 15 RZ09-0421NGG3-R3G1 | |
| Cinebench R15 / CPU Multi 64Bit | |
| Schenker XMG Neo 16 Raptor Lake | |
| Schenker XMG Neo 16 Raptor Lake | |
| Average of class Gaming (1578 - 6271, n=111, last 2 years) | |
| Asus ROG Zephyrus M16 GU604VY-NM042X | |
| Lenovo Legion 5 Pro 16 G7 i7 RTX 3070Ti | |
| MSI Creator Z16P B12UHST | |
| Average Intel Core i9-13900H (2061 - 3100, n=26) | |
| Razer Blade 15 RZ09-0421NGG3-R3G1 | |
| Asus ROG Zephyrus M16 GU603Z | |
| HP Omen 17-ck1075ng | |
| HP Omen 17-ck1075ng | |
| Acer Predator Triton 300 SE | |
| Cinebench R15 / CPU Single 64Bit | |
| Schenker XMG Neo 16 Raptor Lake | |
| Schenker XMG Neo 16 Raptor Lake | |
| Average of class Gaming (188.8 - 343, n=111, last 2 years) | |
| Asus ROG Zephyrus M16 GU604VY-NM042X | |
| MSI Creator Z16P B12UHST | |
| Acer Predator Triton 300 SE | |
| Average Intel Core i9-13900H (211 - 297, n=26) | |
| Lenovo Legion 5 Pro 16 G7 i7 RTX 3070Ti | |
| Asus ROG Zephyrus M16 GU603Z | |
| HP Omen 17-ck1075ng | |
| HP Omen 17-ck1075ng | |
| Razer Blade 15 RZ09-0421NGG3-R3G1 | |
| Blender / v2.79 BMW27 CPU | |
| HP Omen 17-ck1075ng | |
| Razer Blade 15 RZ09-0421NGG3-R3G1 | |
| Average Intel Core i9-13900H (166 - 268, n=24) | |
| Acer Predator Triton 300 SE | |
| Asus ROG Zephyrus M16 GU603Z | |
| MSI Creator Z16P B12UHST | |
| Lenovo Legion 5 Pro 16 G7 i7 RTX 3070Ti | |
| Asus ROG Zephyrus M16 GU604VY-NM042X | |
| Average of class Gaming (80 - 330, n=109, last 2 years) | |
| Schenker XMG Neo 16 Raptor Lake | |
| 7-Zip 18.03 / 7z b 4 | |
| Schenker XMG Neo 16 Raptor Lake | |
| Average of class Gaming (33491 - 148086, n=110, last 2 years) | |
| Asus ROG Zephyrus M16 GU604VY-NM042X | |
| MSI Creator Z16P B12UHST | |
| Lenovo Legion 5 Pro 16 G7 i7 RTX 3070Ti | |
| Average Intel Core i9-13900H (45045 - 79032, n=25) | |
| Asus ROG Zephyrus M16 GU603Z | |
| Acer Predator Triton 300 SE | |
| Razer Blade 15 RZ09-0421NGG3-R3G1 | |
| HP Omen 17-ck1075ng | |
| 7-Zip 18.03 / 7z b 4 -mmt1 | |
| Schenker XMG Neo 16 Raptor Lake | |
| Average of class Gaming (4199 - 7436, n=110, last 2 years) | |
| Asus ROG Zephyrus M16 GU604VY-NM042X | |
| Asus ROG Zephyrus M16 GU603Z | |
| MSI Creator Z16P B12UHST | |
| Average Intel Core i9-13900H (3665 - 6600, n=25) | |
| Lenovo Legion 5 Pro 16 G7 i7 RTX 3070Ti | |
| HP Omen 17-ck1075ng | |
| Acer Predator Triton 300 SE | |
| Razer Blade 15 RZ09-0421NGG3-R3G1 | |
| Geekbench 5.5 / Multi-Core | |
| Schenker XMG Neo 16 Raptor Lake | |
| Average of class Gaming (6460 - 27010, n=110, last 2 years) | |
| Asus ROG Zephyrus M16 GU604VY-NM042X | |
| MSI Creator Z16P B12UHST | |
| Lenovo Legion 5 Pro 16 G7 i7 RTX 3070Ti | |
| Acer Predator Triton 300 SE | |
| Asus ROG Zephyrus M16 GU603Z | |
| Average Intel Core i9-13900H (9094 - 15410, n=26) | |
| Razer Blade 15 RZ09-0421NGG3-R3G1 | |
| HP Omen 17-ck1075ng | |
| Geekbench 5.5 / Single-Core | |
| Average of class Gaming (986 - 2474, n=110, last 2 years) | |
| Schenker XMG Neo 16 Raptor Lake | |
| Asus ROG Zephyrus M16 GU604VY-NM042X | |
| Average Intel Core i9-13900H (1140 - 2043, n=26) | |
| MSI Creator Z16P B12UHST | |
| Acer Predator Triton 300 SE | |
| Asus ROG Zephyrus M16 GU603Z | |
| HP Omen 17-ck1075ng | |
| Lenovo Legion 5 Pro 16 G7 i7 RTX 3070Ti | |
| Razer Blade 15 RZ09-0421NGG3-R3G1 | |
| HWBOT x265 Benchmark v2.2 / 4k Preset | |
| Schenker XMG Neo 16 Raptor Lake | |
| Average of class Gaming (11.5 - 44.3, n=110, last 2 years) | |
| Asus ROG Zephyrus M16 GU604VY-NM042X | |
| Lenovo Legion 5 Pro 16 G7 i7 RTX 3070Ti | |
| MSI Creator Z16P B12UHST | |
| Asus ROG Zephyrus M16 GU603Z | |
| Acer Predator Triton 300 SE | |
| Average Intel Core i9-13900H (14.1 - 22.3, n=25) | |
| Razer Blade 15 RZ09-0421NGG3-R3G1 | |
| HP Omen 17-ck1075ng | |
| LibreOffice / 20 Documents To PDF | |
| Razer Blade 15 RZ09-0421NGG3-R3G1 | |
| Asus ROG Zephyrus M16 GU604VY-NM042X | |
| Average of class Gaming (19 - 88.8, n=110, last 2 years) | |
| Average Intel Core i9-13900H (34.4 - 82.8, n=25) | |
| Schenker XMG Neo 16 Raptor Lake | |
| HP Omen 17-ck1075ng | |
| Asus ROG Zephyrus M16 GU603Z | |
| Lenovo Legion 5 Pro 16 G7 i7 RTX 3070Ti | |
| Acer Predator Triton 300 SE | |
| MSI Creator Z16P B12UHST | |
| R Benchmark 2.5 / Overall mean | |
| Razer Blade 15 RZ09-0421NGG3-R3G1 | |
| HP Omen 17-ck1075ng | |
| Lenovo Legion 5 Pro 16 G7 i7 RTX 3070Ti | |
| Average Intel Core i9-13900H (0.4052 - 0.723, n=25) | |
| Asus ROG Zephyrus M16 GU603Z | |
| MSI Creator Z16P B12UHST | |
| Average of class Gaming (0.3439 - 0.759, n=111, last 2 years) | |
| Acer Predator Triton 300 SE | |
| Asus ROG Zephyrus M16 GU604VY-NM042X | |
| Schenker XMG Neo 16 Raptor Lake | |
* ... smaller is better
AIDA64: FP32 Ray-Trace | FPU Julia | CPU SHA3 | CPU Queen | FPU SinJulia | FPU Mandel | CPU AES | CPU ZLib | FP64 Ray-Trace | CPU PhotoWorxx
| Performance rating | |
| MSI Titan GT77 HX 13VI | |
| Asus ROG Strix Scar 18 2023 G834JY-N6005W | |
| Lenovo Legion Pro 7 16IRX8H | |
| Average of class Gaming | |
| Razer Blade 16 Early 2023 | |
| Asus ROG Zephyrus M16 GU604VY-NM042X | |
| Asus ROG Zephyrus M16 GU603Z | |
| Average Intel Core i9-13900H | |
| AIDA64 / FP32 Ray-Trace | |
| Average of class Gaming (10227 - 85542, n=109, last 2 years) | |
| MSI Titan GT77 HX 13VI | |
| Asus ROG Strix Scar 18 2023 G834JY-N6005W | |
| Lenovo Legion Pro 7 16IRX8H | |
| Razer Blade 16 Early 2023 | |
| Razer Blade 16 Early 2023 | |
| Razer Blade 16 Early 2023 | |
| Asus ROG Zephyrus M16 GU604VY-NM042X | |
| Asus ROG Zephyrus M16 GU603Z | |
| Average Intel Core i9-13900H (6788 - 19557, n=25) | |
| AIDA64 / FPU Julia | |
| MSI Titan GT77 HX 13VI | |
| Asus ROG Strix Scar 18 2023 G834JY-N6005W | |
| Average of class Gaming (51376 - 238426, n=109, last 2 years) | |
| Lenovo Legion Pro 7 16IRX8H | |
| Razer Blade 16 Early 2023 | |
| Razer Blade 16 Early 2023 | |
| Razer Blade 16 Early 2023 | |
| Asus ROG Zephyrus M16 GU604VY-NM042X | |
| Average Intel Core i9-13900H (22551 - 95579, n=25) | |
| Asus ROG Zephyrus M16 GU603Z | |
| AIDA64 / CPU SHA3 | |
| MSI Titan GT77 HX 13VI | |
| Asus ROG Strix Scar 18 2023 G834JY-N6005W | |
| Lenovo Legion Pro 7 16IRX8H | |
| Razer Blade 16 Early 2023 | |
| Razer Blade 16 Early 2023 | |
| Razer Blade 16 Early 2023 | |
| Average of class Gaming (2180 - 9817, n=109, last 2 years) | |
| Asus ROG Zephyrus M16 GU604VY-NM042X | |
| Average Intel Core i9-13900H (2491 - 4270, n=25) | |
| Asus ROG Zephyrus M16 GU603Z | |
| AIDA64 / CPU Queen | |
| Asus ROG Strix Scar 18 2023 G834JY-N6005W | |
| MSI Titan GT77 HX 13VI | |
| Razer Blade 16 Early 2023 | |
| Razer Blade 16 Early 2023 | |
| Lenovo Legion Pro 7 16IRX8H | |
| Asus ROG Zephyrus M16 GU604VY-NM042X | |
| Average of class Gaming (49785 - 173351, n=100, last 2 years) | |
| Asus ROG Zephyrus M16 GU603Z | |
| Average Intel Core i9-13900H (65121 - 120936, n=25) | |
| AIDA64 / FPU SinJulia | |
| Asus ROG Strix Scar 18 2023 G834JY-N6005W | |
| MSI Titan GT77 HX 13VI | |
| Razer Blade 16 Early 2023 | |
| Razer Blade 16 Early 2023 | |
| Razer Blade 16 Early 2023 | |
| Lenovo Legion Pro 7 16IRX8H | |
| Average of class Gaming (4424 - 33636, n=109, last 2 years) | |
| Asus ROG Zephyrus M16 GU604VY-NM042X | |
| Average Intel Core i9-13900H (6108 - 11631, n=25) | |
| Asus ROG Zephyrus M16 GU603Z | |
| AIDA64 / FPU Mandel | |
| MSI Titan GT77 HX 13VI | |
| Average of class Gaming (25115 - 128721, n=109, last 2 years) | |
| Asus ROG Strix Scar 18 2023 G834JY-N6005W | |
| Lenovo Legion Pro 7 16IRX8H | |
| Razer Blade 16 Early 2023 | |
| Razer Blade 16 Early 2023 | |
| Razer Blade 16 Early 2023 | |
| Asus ROG Zephyrus M16 GU604VY-NM042X | |
| Average Intel Core i9-13900H (11283 - 48474, n=25) | |
| Asus ROG Zephyrus M16 GU603Z | |
| AIDA64 / CPU AES | |
| Razer Blade 16 Early 2023 | |
| Razer Blade 16 Early 2023 | |
| Razer Blade 16 Early 2023 | |
| MSI Titan GT77 HX 13VI | |
| Asus ROG Strix Scar 18 2023 G834JY-N6005W | |
| Asus ROG Zephyrus M16 GU603Z | |
| Lenovo Legion Pro 7 16IRX8H | |
| Average of class Gaming (39258 - 247074, n=109, last 2 years) | |
| Average Intel Core i9-13900H (3691 - 149377, n=25) | |
| Asus ROG Zephyrus M16 GU604VY-NM042X | |
| AIDA64 / CPU ZLib | |
| MSI Titan GT77 HX 13VI | |
| Asus ROG Strix Scar 18 2023 G834JY-N6005W | |
| Lenovo Legion Pro 7 16IRX8H | |
| Razer Blade 16 Early 2023 | |
| Razer Blade 16 Early 2023 | |
| Razer Blade 16 Early 2023 | |
| Average of class Gaming (574 - 2531, n=109, last 2 years) | |
| Asus ROG Zephyrus M16 GU604VY-NM042X | |
| Average Intel Core i9-13900H (789 - 1254, n=25) | |
| Asus ROG Zephyrus M16 GU603Z | |
| AIDA64 / FP64 Ray-Trace | |
| Average of class Gaming (5509 - 45446, n=109, last 2 years) | |
| MSI Titan GT77 HX 13VI | |
| Asus ROG Strix Scar 18 2023 G834JY-N6005W | |
| Lenovo Legion Pro 7 16IRX8H | |
| Razer Blade 16 Early 2023 | |
| Razer Blade 16 Early 2023 | |
| Razer Blade 16 Early 2023 | |
| Asus ROG Zephyrus M16 GU604VY-NM042X | |
| Asus ROG Zephyrus M16 GU603Z | |
| Average Intel Core i9-13900H (3655 - 10716, n=25) | |
| AIDA64 / CPU PhotoWorxx | |
| Razer Blade 16 Early 2023 | |
| Razer Blade 16 Early 2023 | |
| Razer Blade 16 Early 2023 | |
| Lenovo Legion Pro 7 16IRX8H | |
| Asus ROG Zephyrus M16 GU604VY-NM042X | |
| Average of class Gaming (12271 - 89891, n=109, last 2 years) | |
| Asus ROG Strix Scar 18 2023 G834JY-N6005W | |
| Asus ROG Zephyrus M16 GU603Z | |
| MSI Titan GT77 HX 13VI | |
| Average Intel Core i9-13900H (10871 - 50488, n=25) | |
系统性能
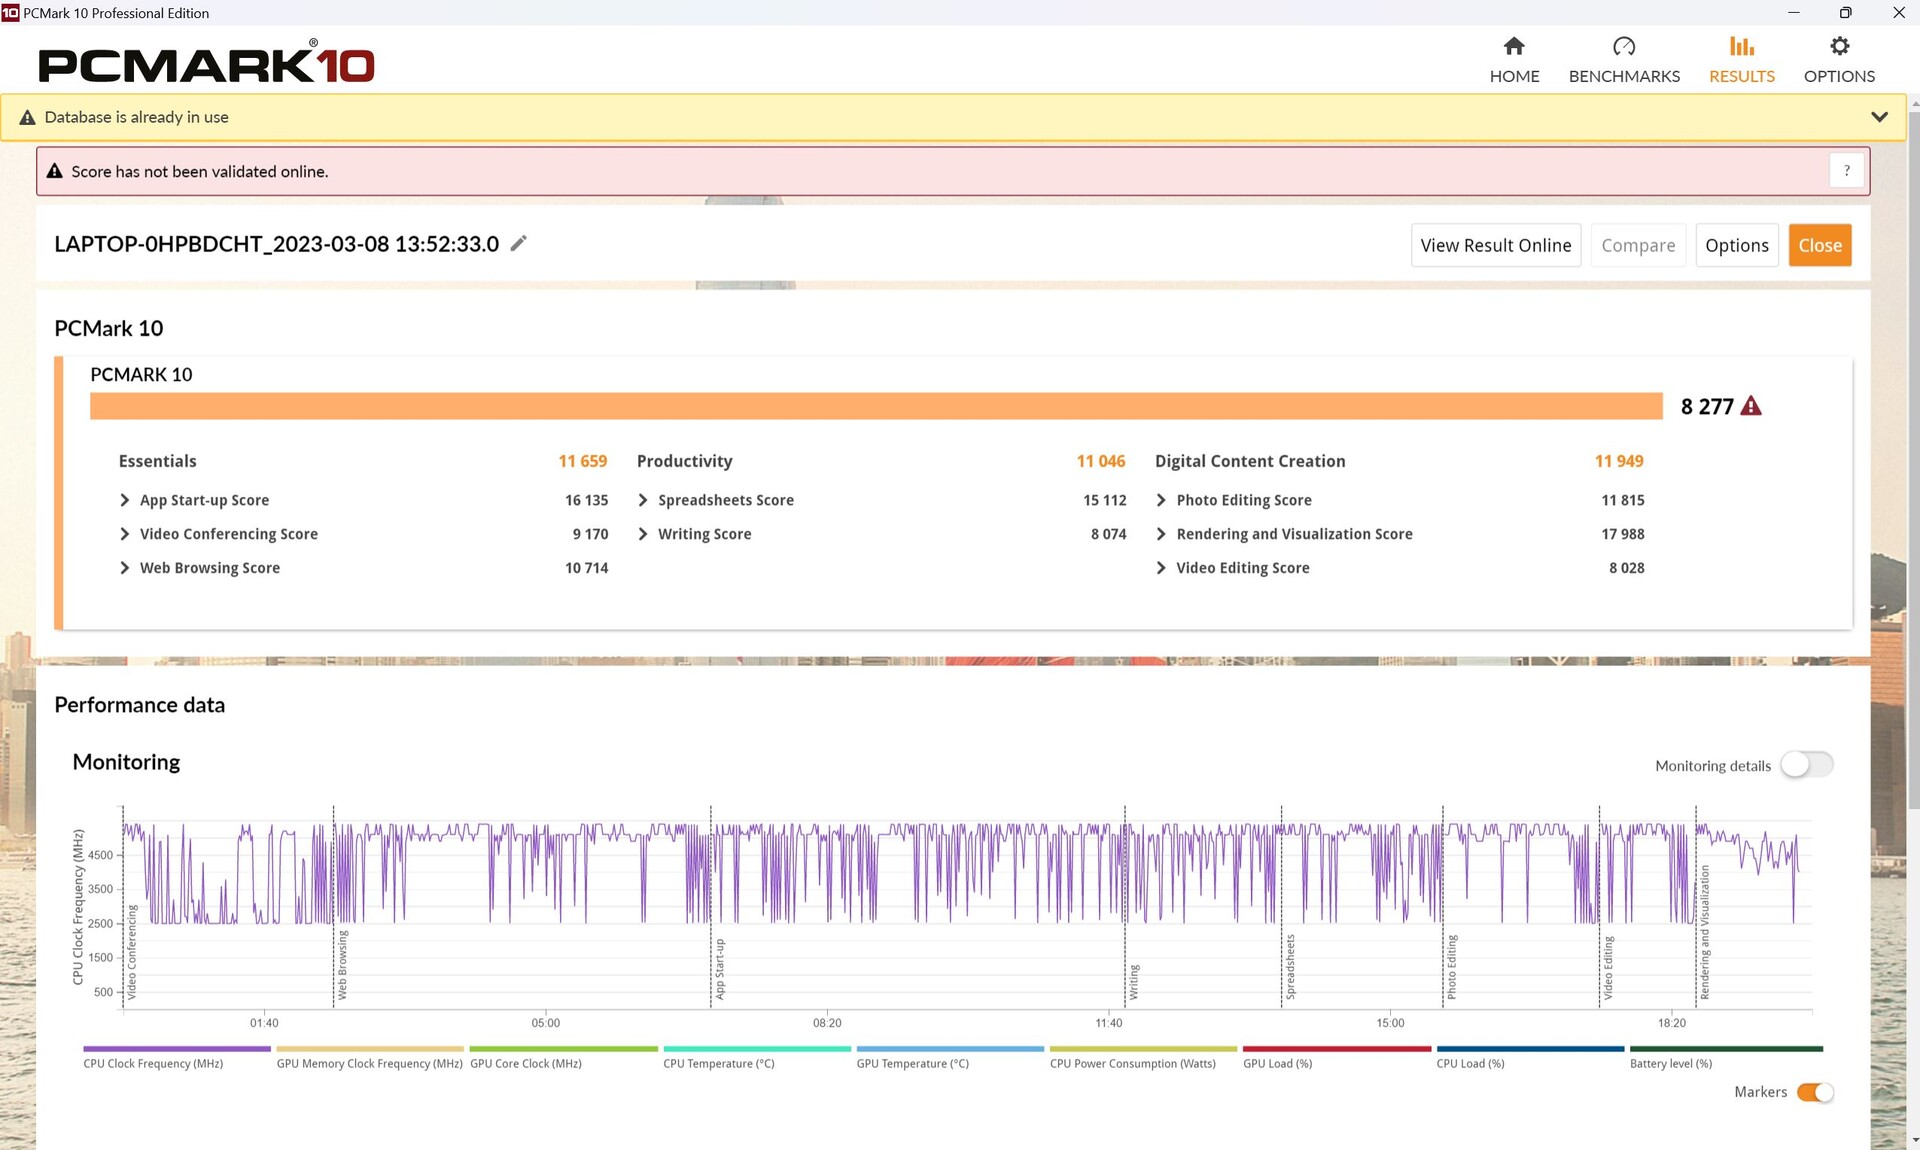
我们的M16在PCMark10中没有表现出任何大的弱点,但也不能完全指责它超过了上一代的竞争对手。它的Legion 7实际上要快几个百分点。在数字内容创作测试中,分数有些令人失望,特别是在编辑和渲染领域。
CrossMark: Overall | Productivity | Creativity | Responsiveness
| PCMark 10 / Score | |
| Lenovo Legion 7 16IAX7-82TD004SGE | |
| Average of class Gaming (5828 - 11574, n=95, last 2 years) | |
| Asus ROG Zephyrus M16 GU604VY-NM042X | |
| Alienware x17 R2 P48E | |
| Average Intel Core i9-13900H, NVIDIA GeForce RTX 4090 Laptop GPU (7985 - 8277, n=2) | |
| MSI Creator Z16P B12UHST | |
| Acer Predator Triton 500 SE PT516-52s-70KX | |
| Alienware x15 R2 P111F | |
| Asus ROG Zephyrus Duo 16 GX650RX | |
| PCMark 10 / Essentials | |
| Asus ROG Zephyrus M16 GU604VY-NM042X | |
| Average Intel Core i9-13900H, NVIDIA GeForce RTX 4090 Laptop GPU (11500 - 11659, n=2) | |
| Alienware x17 R2 P48E | |
| Lenovo Legion 7 16IAX7-82TD004SGE | |
| Alienware x15 R2 P111F | |
| MSI Creator Z16P B12UHST | |
| Acer Predator Triton 500 SE PT516-52s-70KX | |
| Average of class Gaming (8810 - 12600, n=99, last 2 years) | |
| Asus ROG Zephyrus Duo 16 GX650RX | |
| PCMark 10 / Productivity | |
| MSI Creator Z16P B12UHST | |
| Asus ROG Zephyrus M16 GU604VY-NM042X | |
| Lenovo Legion 7 16IAX7-82TD004SGE | |
| Average Intel Core i9-13900H, NVIDIA GeForce RTX 4090 Laptop GPU (10526 - 11046, n=2) | |
| Average of class Gaming (6845 - 18766, n=97, last 2 years) | |
| Alienware x15 R2 P111F | |
| Alienware x17 R2 P48E | |
| Acer Predator Triton 500 SE PT516-52s-70KX | |
| Asus ROG Zephyrus Duo 16 GX650RX | |
| PCMark 10 / Digital Content Creation | |
| Lenovo Legion 7 16IAX7-82TD004SGE | |
| Average of class Gaming (7602 - 19657, n=97, last 2 years) | |
| Alienware x17 R2 P48E | |
| Asus ROG Zephyrus M16 GU604VY-NM042X | |
| Average Intel Core i9-13900H, NVIDIA GeForce RTX 4090 Laptop GPU (11412 - 11949, n=2) | |
| MSI Creator Z16P B12UHST | |
| Acer Predator Triton 500 SE PT516-52s-70KX | |
| Alienware x15 R2 P111F | |
| Asus ROG Zephyrus Duo 16 GX650RX | |
| CrossMark / Overall | |
| Lenovo Legion 7 16IAX7-82TD004SGE | |
| Schenker XMG Neo 16 Raptor Lake | |
| Average of class Gaming (1366 - 2409, n=97, last 2 years) | |
| Asus ROG Zephyrus M16 GU604VY-NM042X | |
| Average Intel Core i9-13900H, NVIDIA GeForce RTX 4090 Laptop GPU (n=1) | |
| Alienware x15 R2 P111F | |
| Alienware x17 R2 P48E | |
| Acer Predator Triton 500 SE PT516-52s-70KX | |
| Asus ROG Zephyrus Duo 16 GX650RX | |
| Razer Blade 15 RZ09-0421NGG3-R3G1 | |
| CrossMark / Productivity | |
| Lenovo Legion 7 16IAX7-82TD004SGE | |
| Alienware x15 R2 P111F | |
| Average of class Gaming (1386 - 2254, n=97, last 2 years) | |
| Asus ROG Zephyrus M16 GU604VY-NM042X | |
| Average Intel Core i9-13900H, NVIDIA GeForce RTX 4090 Laptop GPU (n=1) | |
| Schenker XMG Neo 16 Raptor Lake | |
| Alienware x17 R2 P48E | |
| Acer Predator Triton 500 SE PT516-52s-70KX | |
| Asus ROG Zephyrus Duo 16 GX650RX | |
| Razer Blade 15 RZ09-0421NGG3-R3G1 | |
| CrossMark / Creativity | |
| Schenker XMG Neo 16 Raptor Lake | |
| Lenovo Legion 7 16IAX7-82TD004SGE | |
| Asus ROG Zephyrus M16 GU604VY-NM042X | |
| Average Intel Core i9-13900H, NVIDIA GeForce RTX 4090 Laptop GPU (n=1) | |
| Average of class Gaming (1343 - 2729, n=97, last 2 years) | |
| Alienware x15 R2 P111F | |
| Alienware x17 R2 P48E | |
| Acer Predator Triton 500 SE PT516-52s-70KX | |
| Razer Blade 15 RZ09-0421NGG3-R3G1 | |
| Asus ROG Zephyrus Duo 16 GX650RX | |
| CrossMark / Responsiveness | |
| Lenovo Legion 7 16IAX7-82TD004SGE | |
| Acer Predator Triton 500 SE PT516-52s-70KX | |
| Alienware x15 R2 P111F | |
| Asus ROG Zephyrus Duo 16 GX650RX | |
| Average of class Gaming (1226 - 2334, n=97, last 2 years) | |
| Alienware x17 R2 P48E | |
| Asus ROG Zephyrus M16 GU604VY-NM042X | |
| Average Intel Core i9-13900H, NVIDIA GeForce RTX 4090 Laptop GPU (n=1) | |
| Schenker XMG Neo 16 Raptor Lake | |
| Razer Blade 15 RZ09-0421NGG3-R3G1 | |
| PCMark 10 Score | 8277 points | |
Help | ||
| AIDA64 / Memory Copy | |
| Razer Blade 16 Early 2023 | |
| Razer Blade 16 Early 2023 | |
| Razer Blade 16 Early 2023 | |
| Lenovo Legion Pro 7 16IRX8H | |
| Average of class Gaming (21750 - 129946, n=109, last 2 years) | |
| Asus ROG Zephyrus M16 GU604VY-NM042X | |
| Asus ROG Strix Scar 18 2023 G834JY-N6005W | |
| MSI Titan GT77 HX 13VI | |
| Asus ROG Zephyrus M16 GU603Z | |
| Average Intel Core i9-13900H (37448 - 74486, n=25) | |
| AIDA64 / Memory Read | |
| Razer Blade 16 Early 2023 | |
| Razer Blade 16 Early 2023 | |
| Razer Blade 16 Early 2023 | |
| Lenovo Legion Pro 7 16IRX8H | |
| Asus ROG Strix Scar 18 2023 G834JY-N6005W | |
| Average of class Gaming (22956 - 118858, n=109, last 2 years) | |
| Asus ROG Zephyrus M16 GU604VY-NM042X | |
| Asus ROG Zephyrus M16 GU603Z | |
| MSI Titan GT77 HX 13VI | |
| Average Intel Core i9-13900H (41599 - 75433, n=25) | |
| AIDA64 / Memory Write | |
| Razer Blade 16 Early 2023 | |
| Razer Blade 16 Early 2023 | |
| Razer Blade 16 Early 2023 | |
| Average of class Gaming (22297 - 135096, n=109, last 2 years) | |
| Asus ROG Zephyrus M16 GU604VY-NM042X | |
| Lenovo Legion Pro 7 16IRX8H | |
| Asus ROG Strix Scar 18 2023 G834JY-N6005W | |
| Asus ROG Zephyrus M16 GU603Z | |
| Average Intel Core i9-13900H (36152 - 88505, n=25) | |
| MSI Titan GT77 HX 13VI | |
| AIDA64 / Memory Latency | |
| Average of class Gaming (75.3 - 259, n=109, last 2 years) | |
| Razer Blade 16 Early 2023 | |
| Razer Blade 16 Early 2023 | |
| Razer Blade 16 Early 2023 | |
| MSI Titan GT77 HX 13VI | |
| Asus ROG Strix Scar 18 2023 G834JY-N6005W | |
| Average Intel Core i9-13900H (75.8 - 102.3, n=25) | |
| Asus ROG Zephyrus M16 GU603Z | |
| Asus ROG Zephyrus M16 GU604VY-NM042X | |
| Lenovo Legion Pro 7 16IRX8H | |
* ... smaller is better
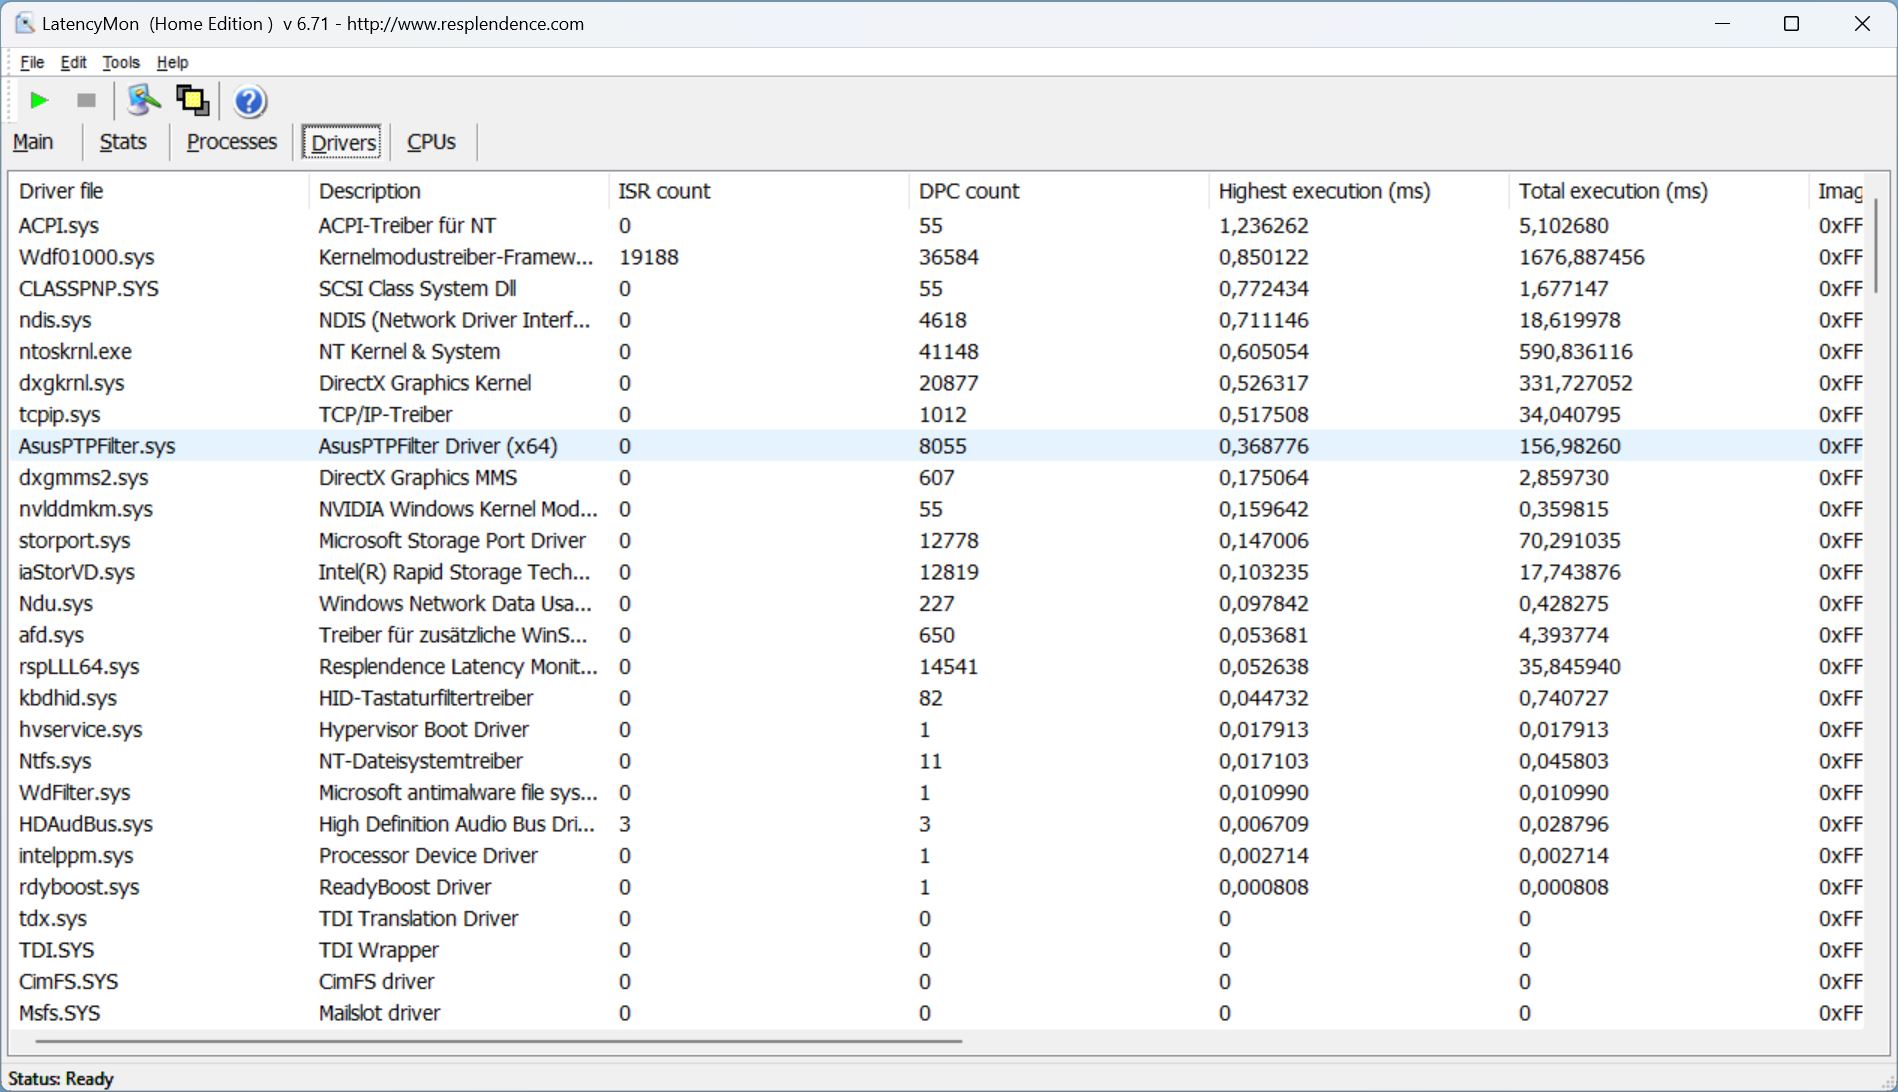
DPC延迟
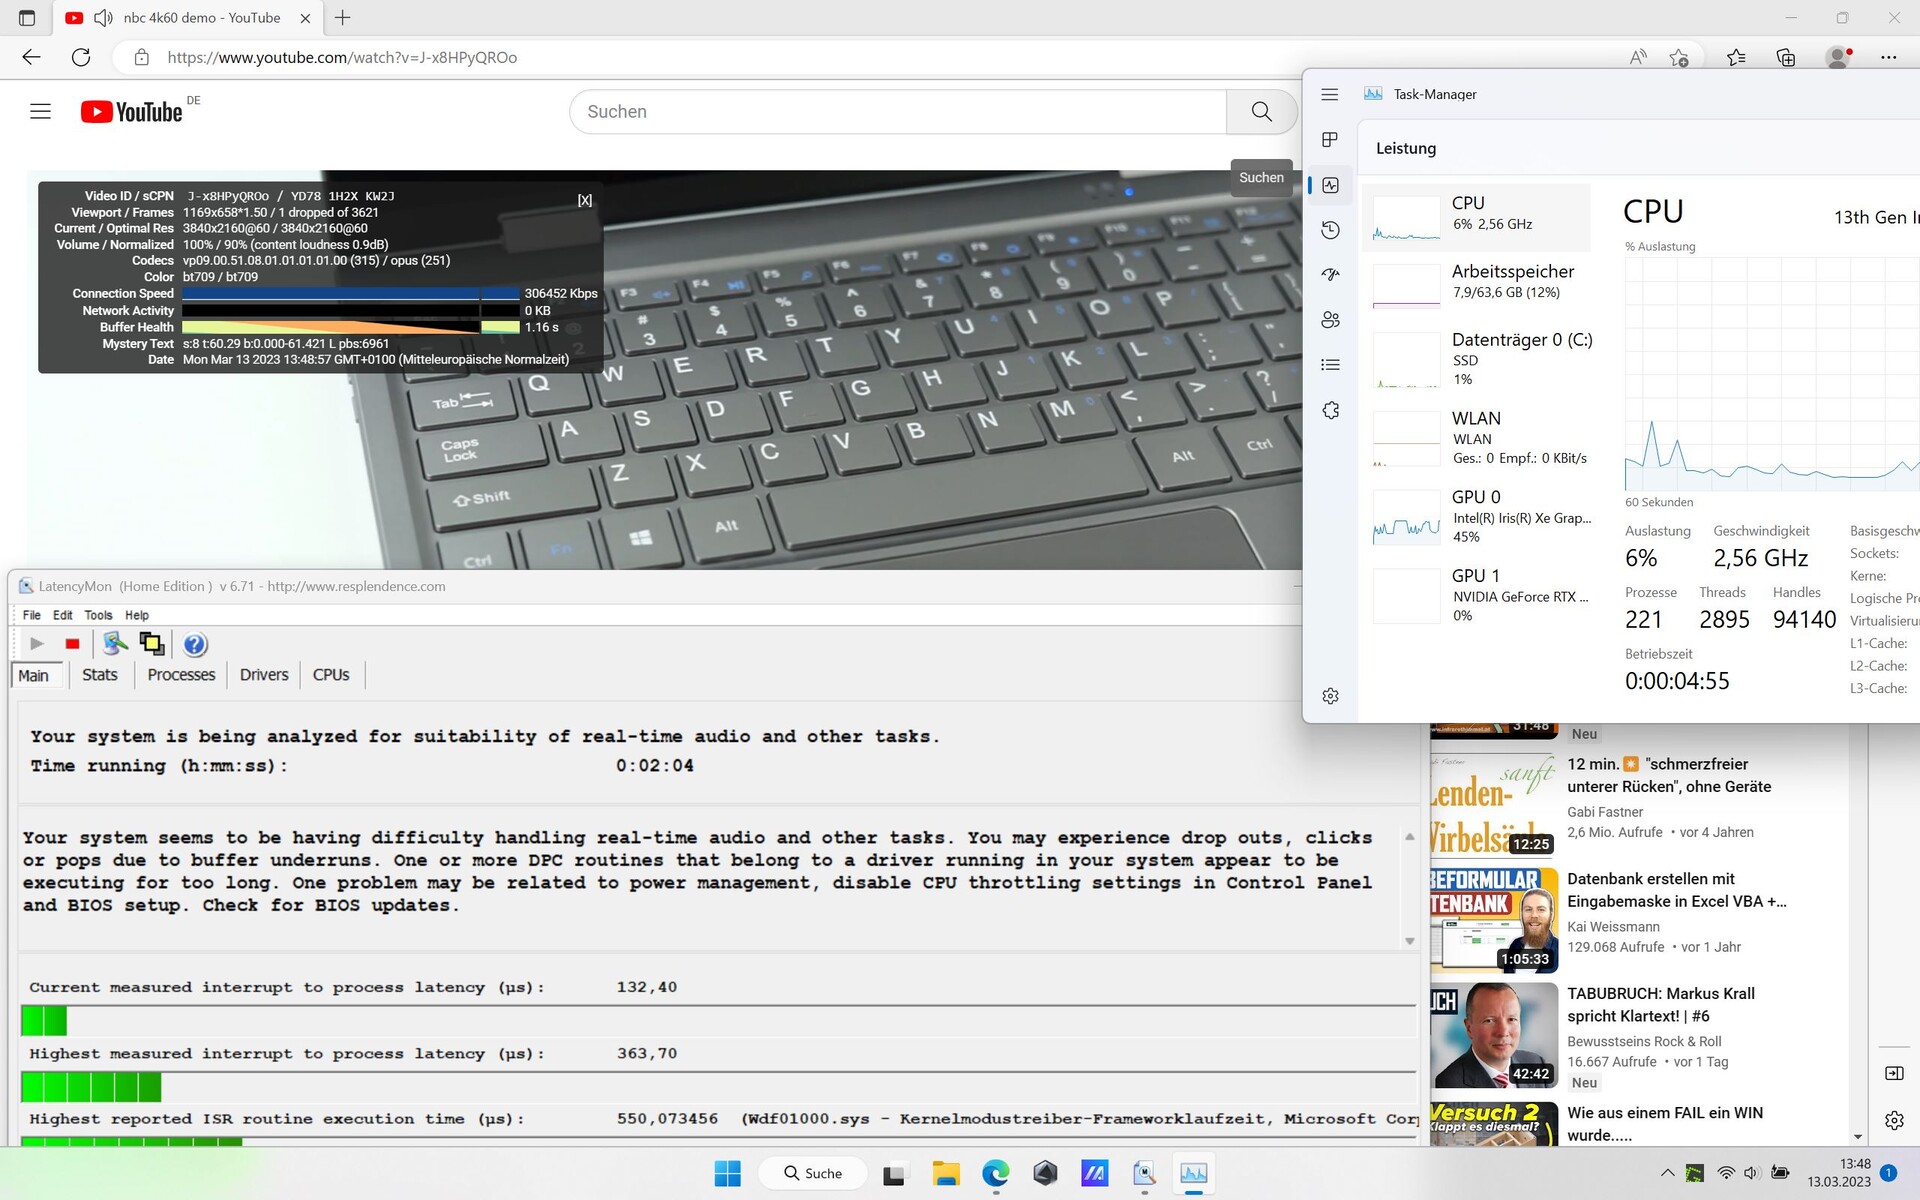
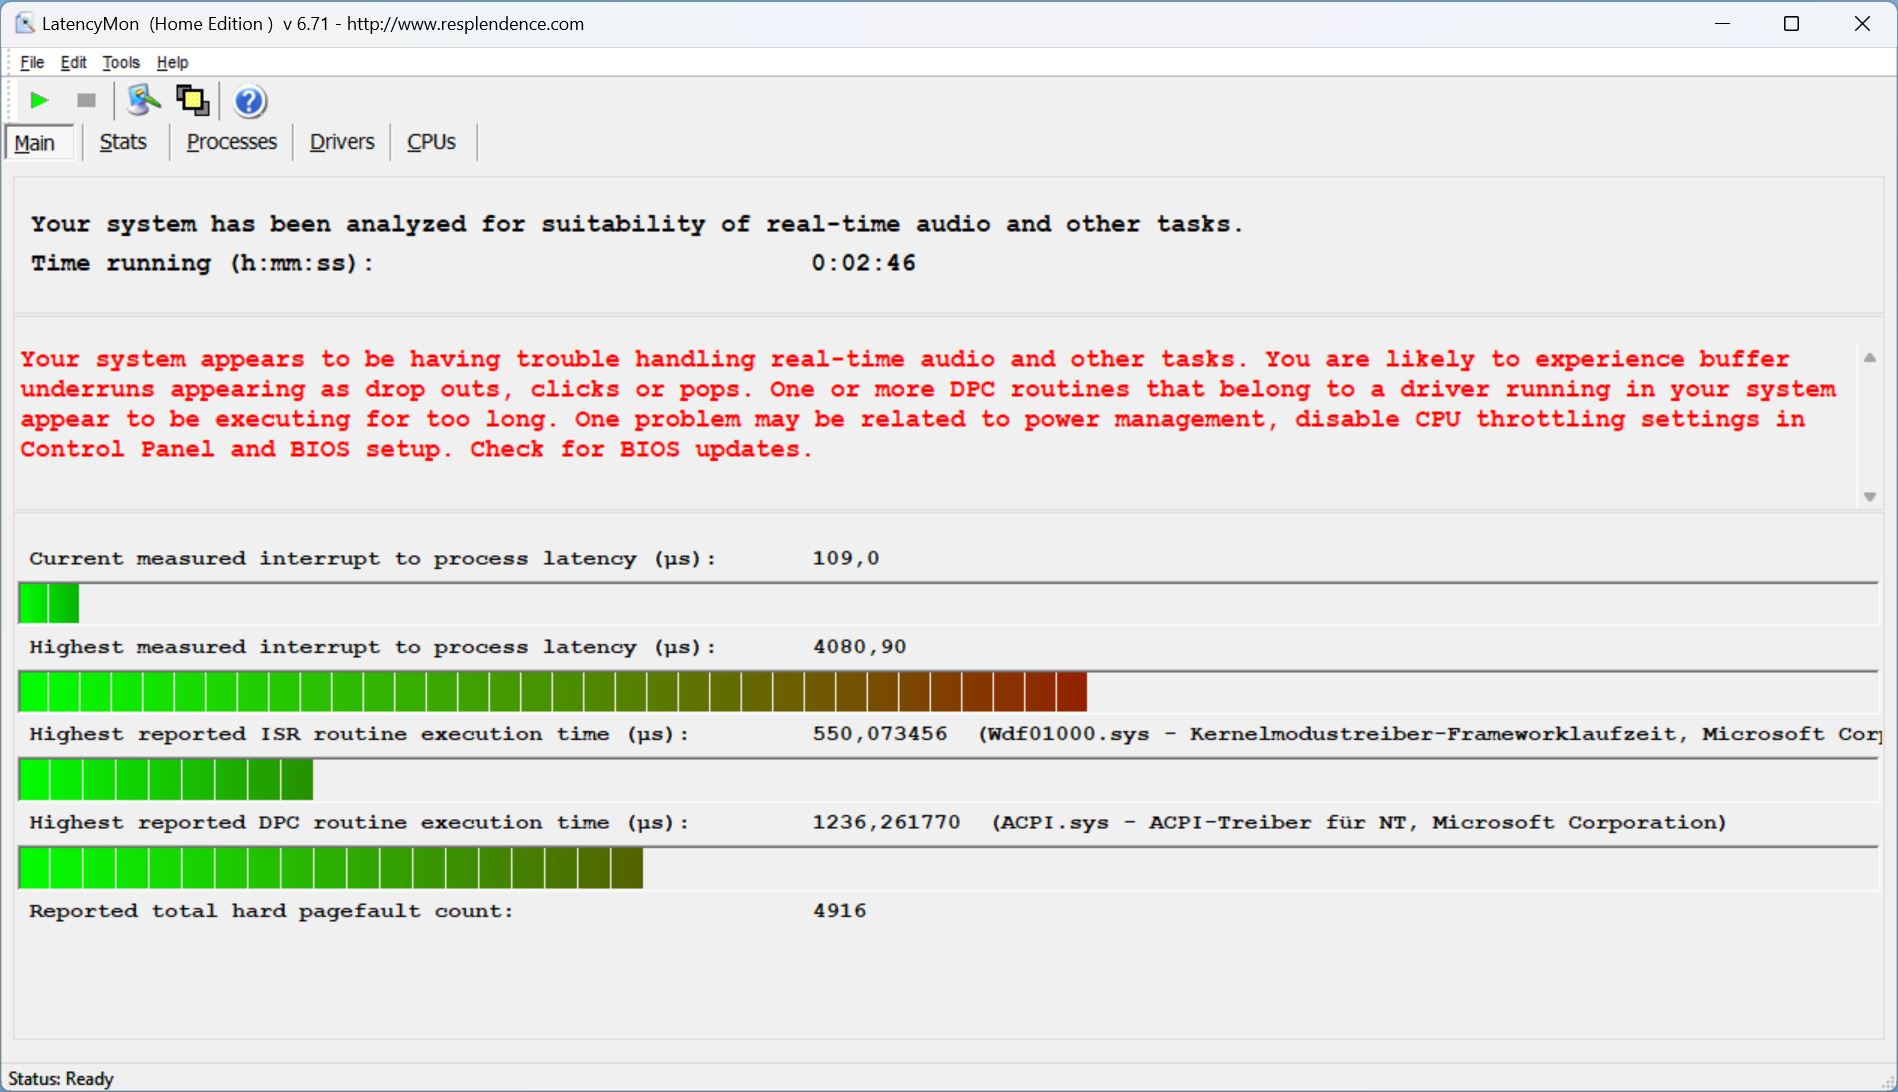
当面临打开多个浏览器标签的挑战时,M16并没有出汗。一切看起来都很好,直到在播放我们的4k/60帧的YouTube视频和随后的Prime95中出现了大的延迟。到那时为止,实际上已经是很好的数值,但却暴涨了好几倍。
这样一来,M16的延迟明显高于上一代的竞争对手。新一代的驱动程序似乎还不够成熟,这一点从微星泰坦的类似的高延迟值中可以看出。微星泰坦.
| DPC Latencies / LatencyMon - interrupt to process latency (max), Web, Youtube, Prime95 | |
| MSI Titan GT77 HX 13VI | |
| Asus ROG Zephyrus M16 GU604VY-NM042X | |
| Razer Blade 16 Early 2023 | |
| Asus ROG Strix Scar 18 2023 G834JY-N6005W | |
| Asus ROG Zephyrus M16 GU603Z | |
| Lenovo Legion Pro 7 16IRX8H | |
* ... smaller is better
大容量存储
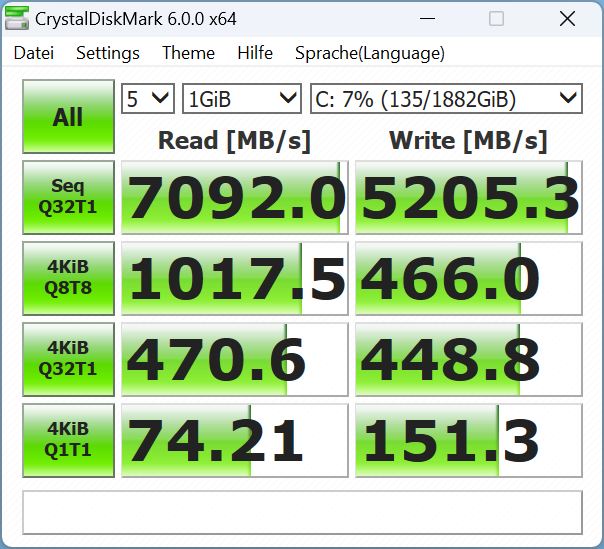
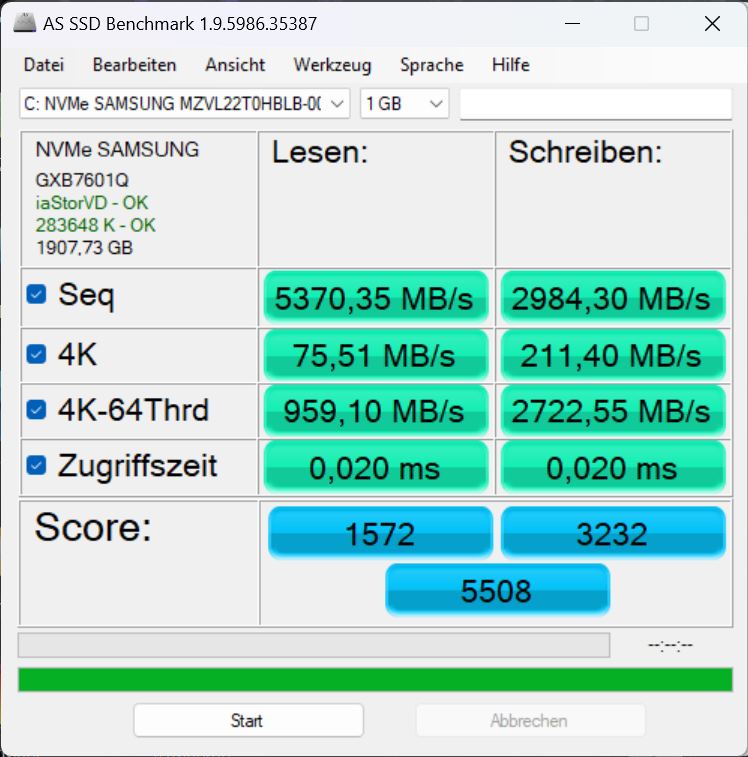
我们的配置有一个NVMe SSD三星PM9A1,有四个PCIe 4通道,容量为2TB,在我们的最佳SSD列表中排名第11位。 最佳固态硬盘列表中排名第11位.
M16的固态硬盘性能比这种类型的固态硬盘所能预期的要低20%左右。然而,在实际使用中,这在很大程度上不会被注意到,从积极的一面来看,性能在较长时间内是稳定的。

* ... smaller is better
Continuous performance Read: DiskSpd Read Loop, Queue Depth 8
图形卡
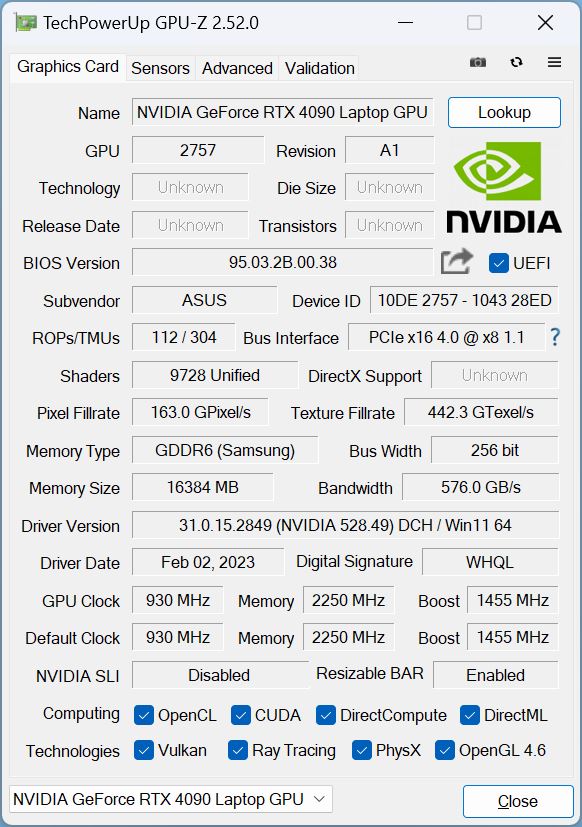
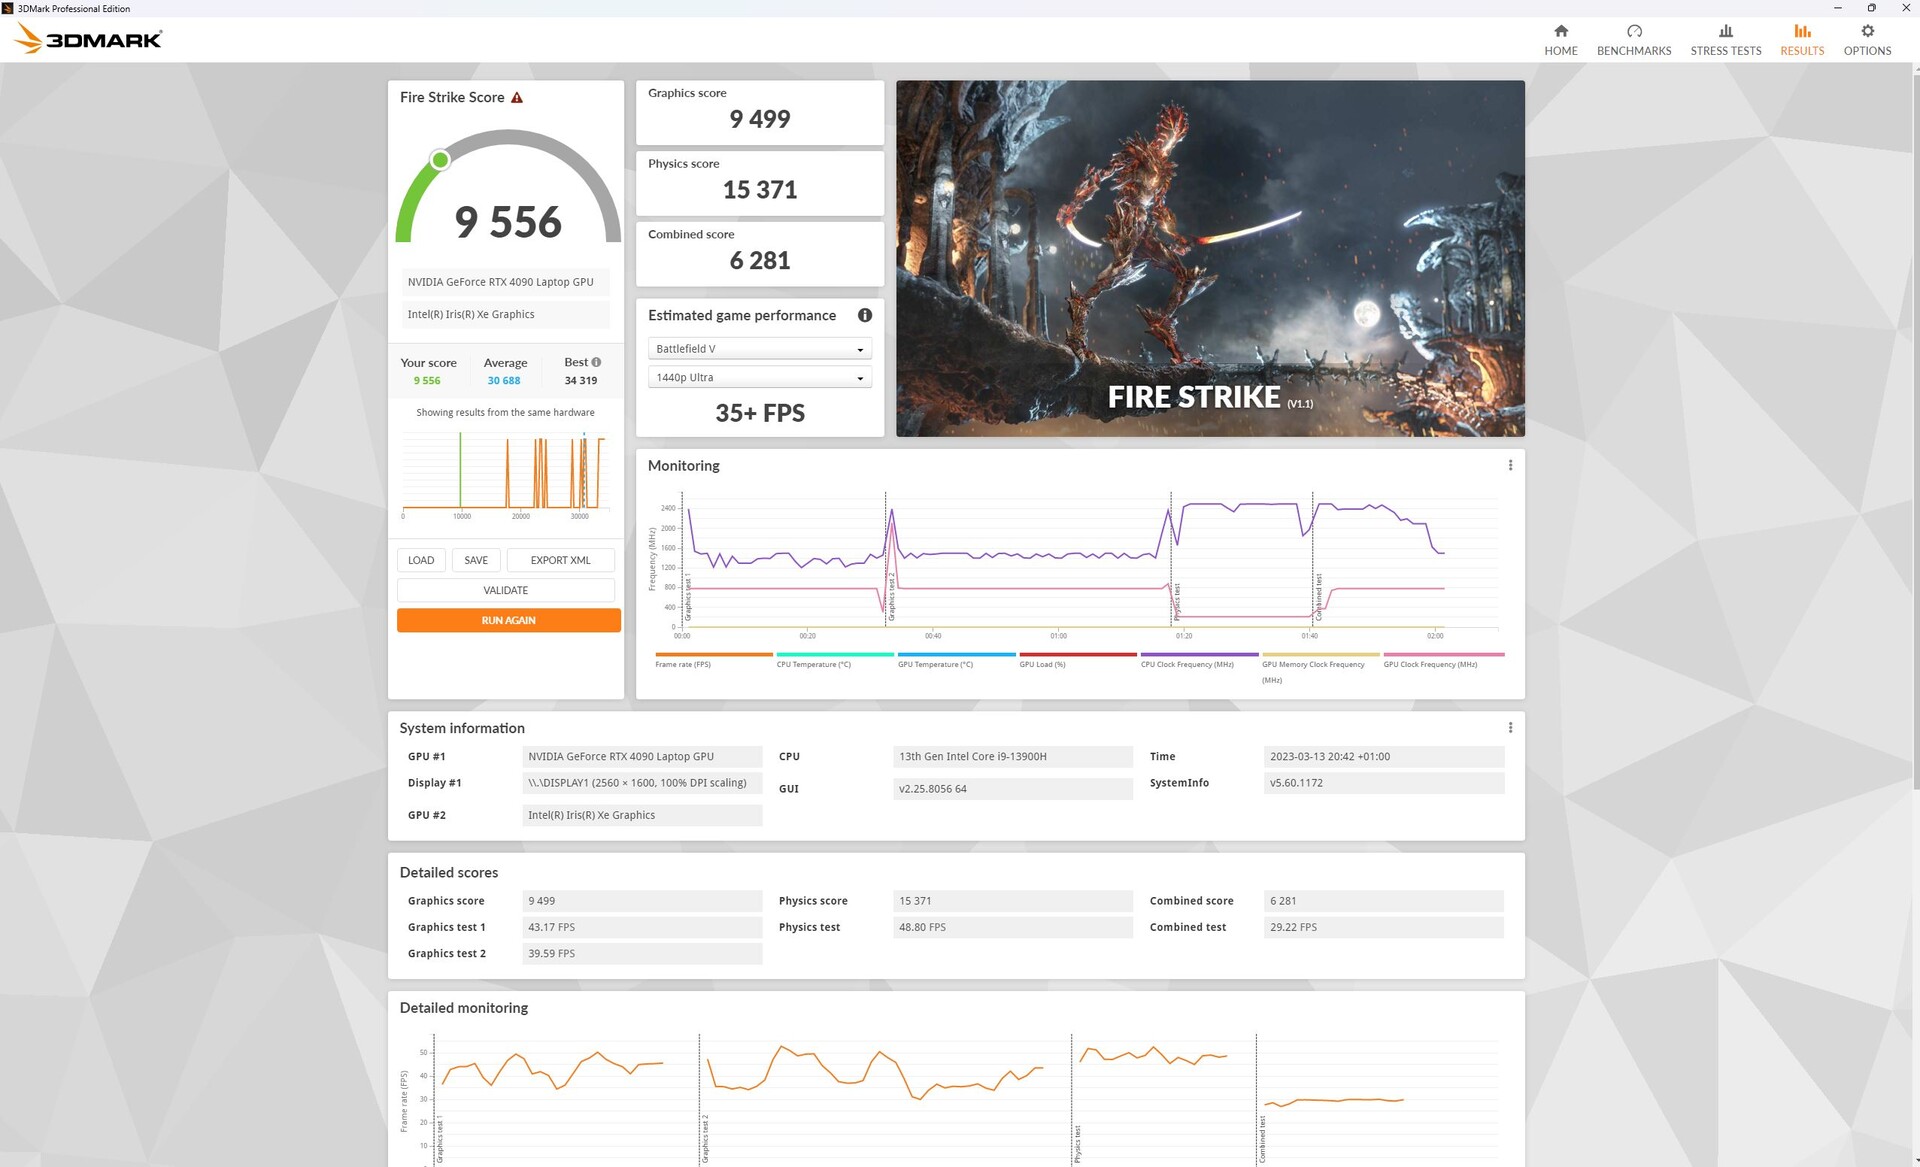
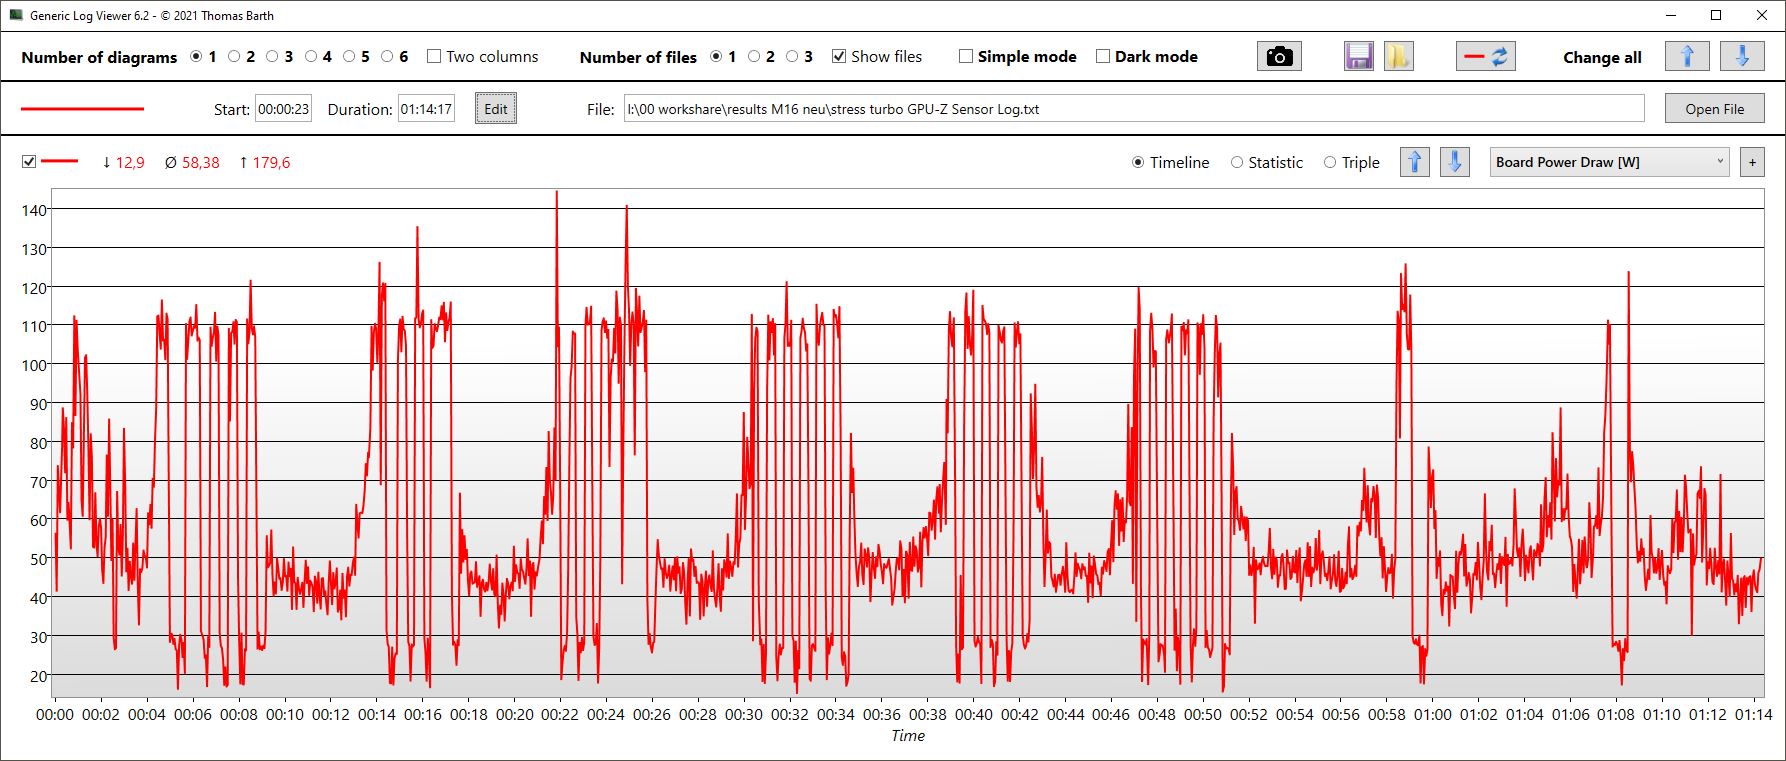
有了新的M16,你可以在以下方面进行选择 RTX 4070, RTX 4080和 RTX 4090.在我们的配置中,顶级型号是目前最快的笔记本电脑GPU,其功耗在80至150瓦之间,外加15瓦的动态提升。M16的最大功耗为150瓦,其中包括25瓦的动态提升。
在3DMark基准测试中,偶尔会出现通过Optimus或MSHybrid/Standard将显示设备切换到dGPU的问题,有时会导致测试由iGPU启动。同样在这个领域,似乎驱动程序还没有完全成熟。如果有疑问,dGPU应该被手动激活(MUX)。
到目前为止,我们只测试了RTX 4090与HX处理器配对的情况(见竞争情况)。根据我们(仍然)有限的数据库,M16的GPU在所有测试中都比该卡的平均速度慢10%左右,这多少有点不令人意外。这款Razer Blade 16配有稍慢的RTX 4080,仅落后4%。
在电池模式下,3D性能急剧下降,在Fire Strike ,从最初的44,000分只剩下9,000分,代表了几乎80%的下降!

| 3DMark Performance rating - Percent | |
| Schenker XMG Neo 16 Raptor Lake | |
| Average NVIDIA GeForce RTX 4090 Laptop GPU | |
| Asus ROG Zephyrus M16 GU604VY-NM042X | |
| Razer Blade 16 Early 2023 | |
| Average of class Gaming | |
| Lenovo Legion 7 16IAX7-82TD004SGE -1! | |
| Asus ROG Strix Scar 17 SE G733CX-LL014W | |
| MSI Raider GE66 12UHS | |
| Alienware x15 R2 P111F | |
| Acer Predator Triton 500 SE PT516-52s-70KX -1! | |
| Razer Blade 15 RZ09-0421NGG3-R3G1 -1! | |
| Asus ROG Zephyrus M16 GU603Z -1! | |
| 3DMark 11 Performance | 41060 points | |
| 3DMark Fire Strike Score | 33550 points | |
| 3DMark Time Spy Score | 15939 points | |
Help | ||
* ... smaller is better
游戏性能
| The Witcher 3 - 1920x1080 Ultra Graphics & Postprocessing (HBAO+) | |
| MSI Titan GT77 HX 13VI | |
| Asus ROG Zephyrus M16 GU604VY-NM042X | |
| Lenovo Legion Pro 7 16IRX8H | |
| Razer Blade 16 Early 2023 | |
| Average of class Gaming (95 - 240, n=8, last 2 years) | |
| Asus ROG Zephyrus M16 GU603Z | |
| Far Cry 6 | |
| 2560x1440 Ultra Graphics Quality + HD Textures AA:T | |
| MSI Titan GT77 HX 13VI | |
| Schenker XMG Neo 16 Raptor Lake | |
| Average NVIDIA GeForce RTX 4090 Laptop GPU (85 - 146, n=12) | |
| Razer Blade 16 Early 2023 | |
| Asus ROG Zephyrus M16 GU604VY-NM042X | |
| Average of class Gaming (74.5 - 116.7, n=2, last 2 years) | |
| 1920x1080 Ultra Graphics Quality + HD Textures + DXR AA:T | |
| Razer Blade 16 Early 2023 | |
| MSI Titan GT77 HX 13VI | |
| Schenker XMG Neo 16 Raptor Lake | |
| Average of class Gaming (n=1last 2 years) | |
| Asus ROG Zephyrus M16 GU604VY-NM042X | |
| Average NVIDIA GeForce RTX 4090 Laptop GPU (81 - 116, n=5) | |
| Tiny Tina's Wonderlands - 2560x1440 Badass Preset (DX12) | |
| Schenker XMG Neo 16 Raptor Lake | |
| MSI Titan GT77 HX 13VI | |
| Average NVIDIA GeForce RTX 4090 Laptop GPU (103.4 - 137.8, n=14) | |
| Asus ROG Zephyrus M16 GU604VY-NM042X | |
| Average of class Gaming (58.9 - 111.2, n=3, last 2 years) | |
| Spider-Man Miles Morales - 2560x1440 Very High Preset AA:T | |
| Schenker XMG Neo 16 Raptor Lake | |
| MSI Titan GT77 HX 13VI | |
| Average NVIDIA GeForce RTX 4090 Laptop GPU (93.3 - 119.8, n=7) | |
| Asus ROG Strix Scar 18 2023 G834JY-N6005W | |
| Lenovo Legion Pro 7 16IRX8H | |
| Asus ROG Zephyrus M16 GU604VY-NM042X | |
在我们的Witcher 3 压力测试一小时后,真的很明显,性能与RTX 4080处于同一水平。RTX 4080搭配HX处理器的水平。尽管如此,性能还是一如既往的高。
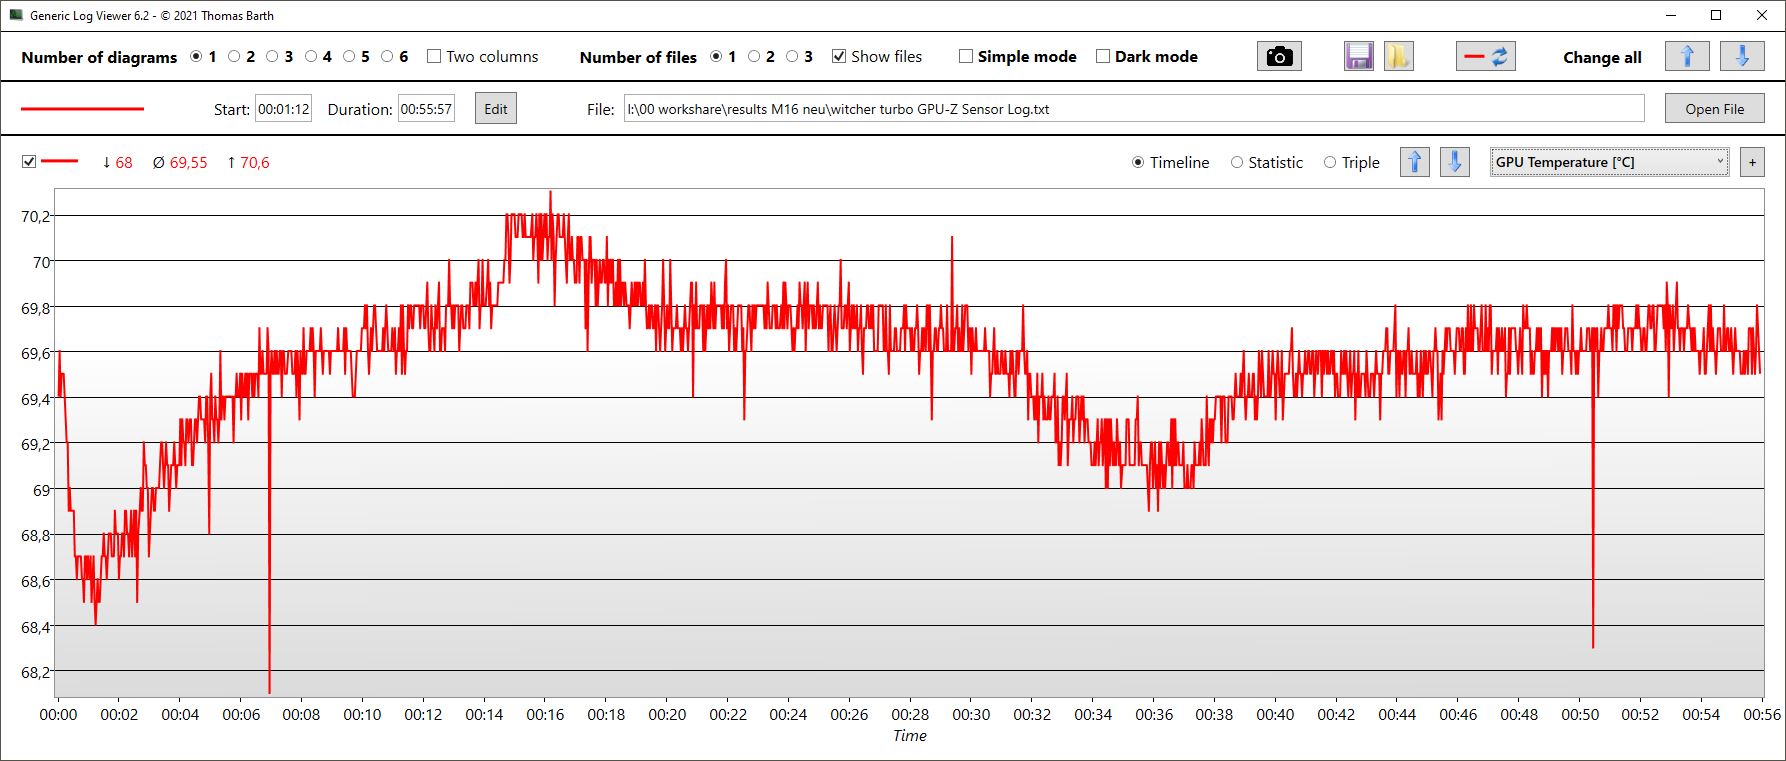
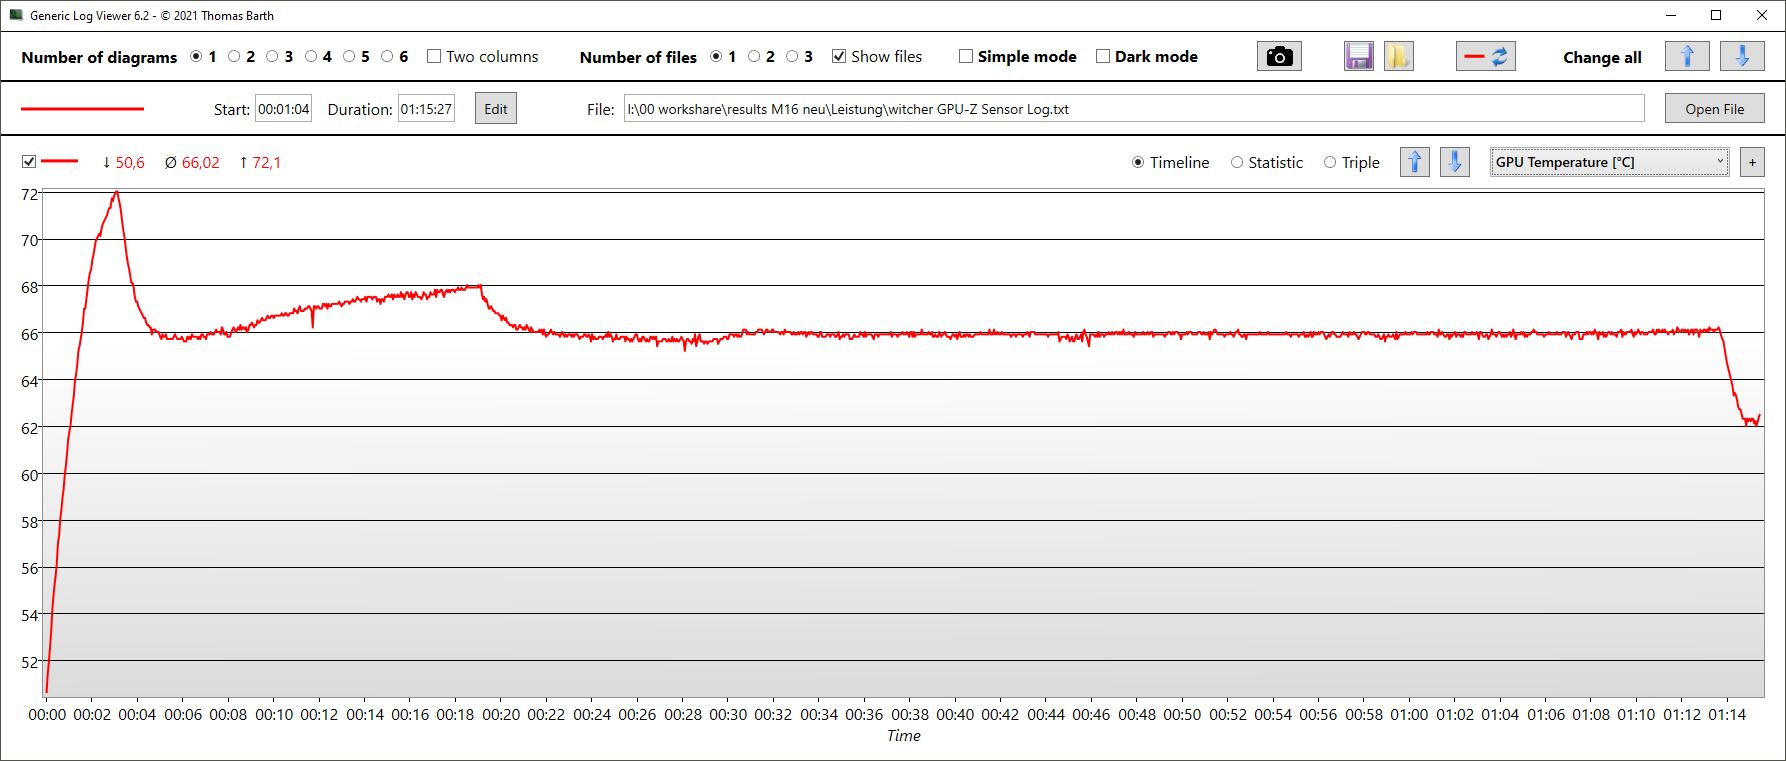
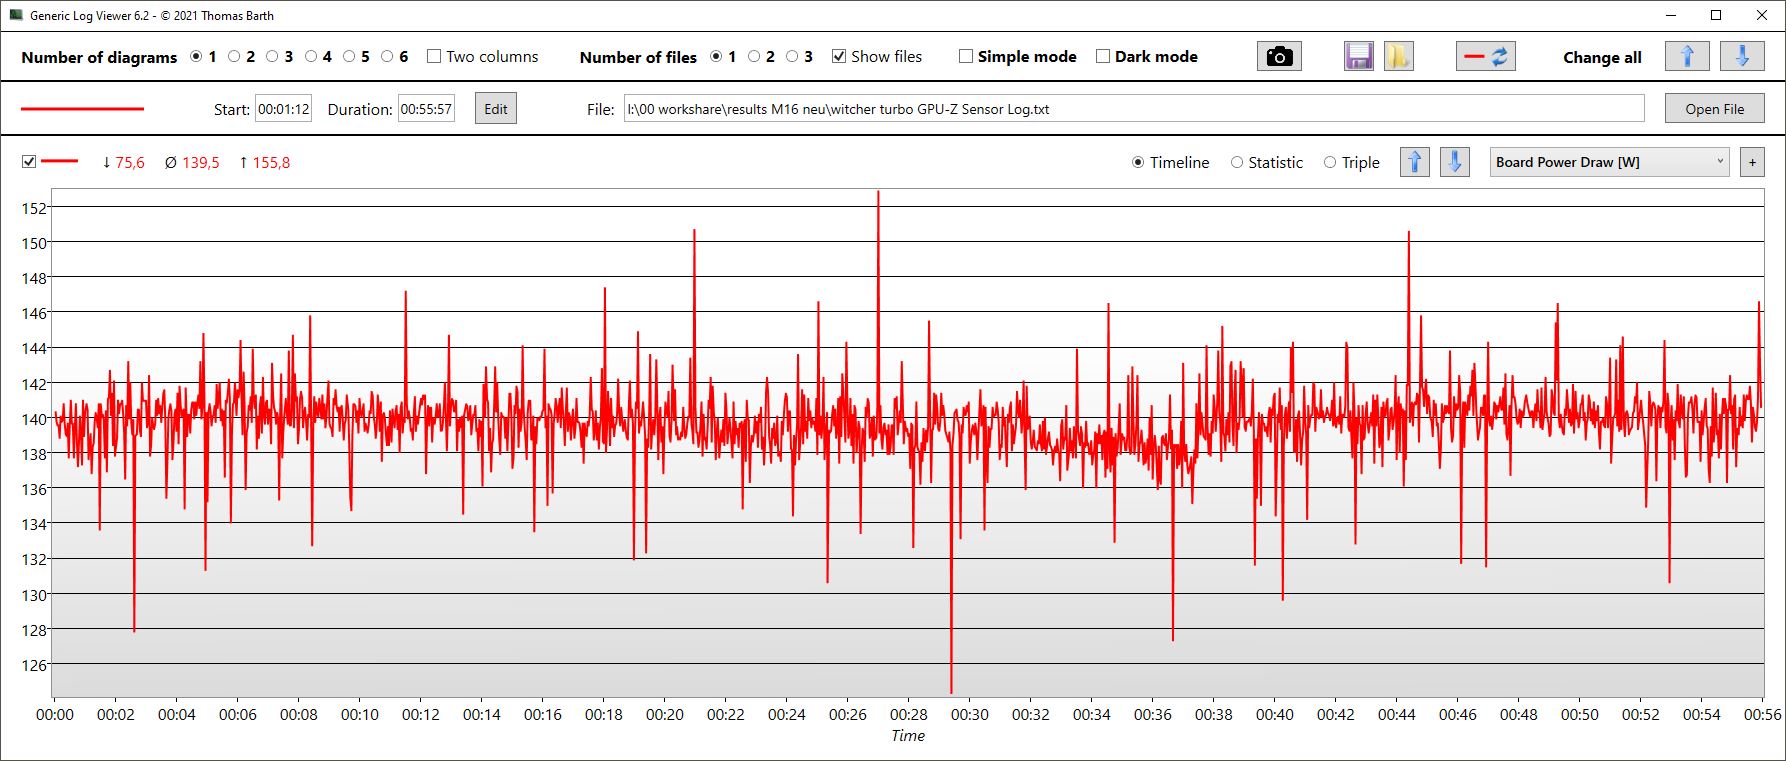
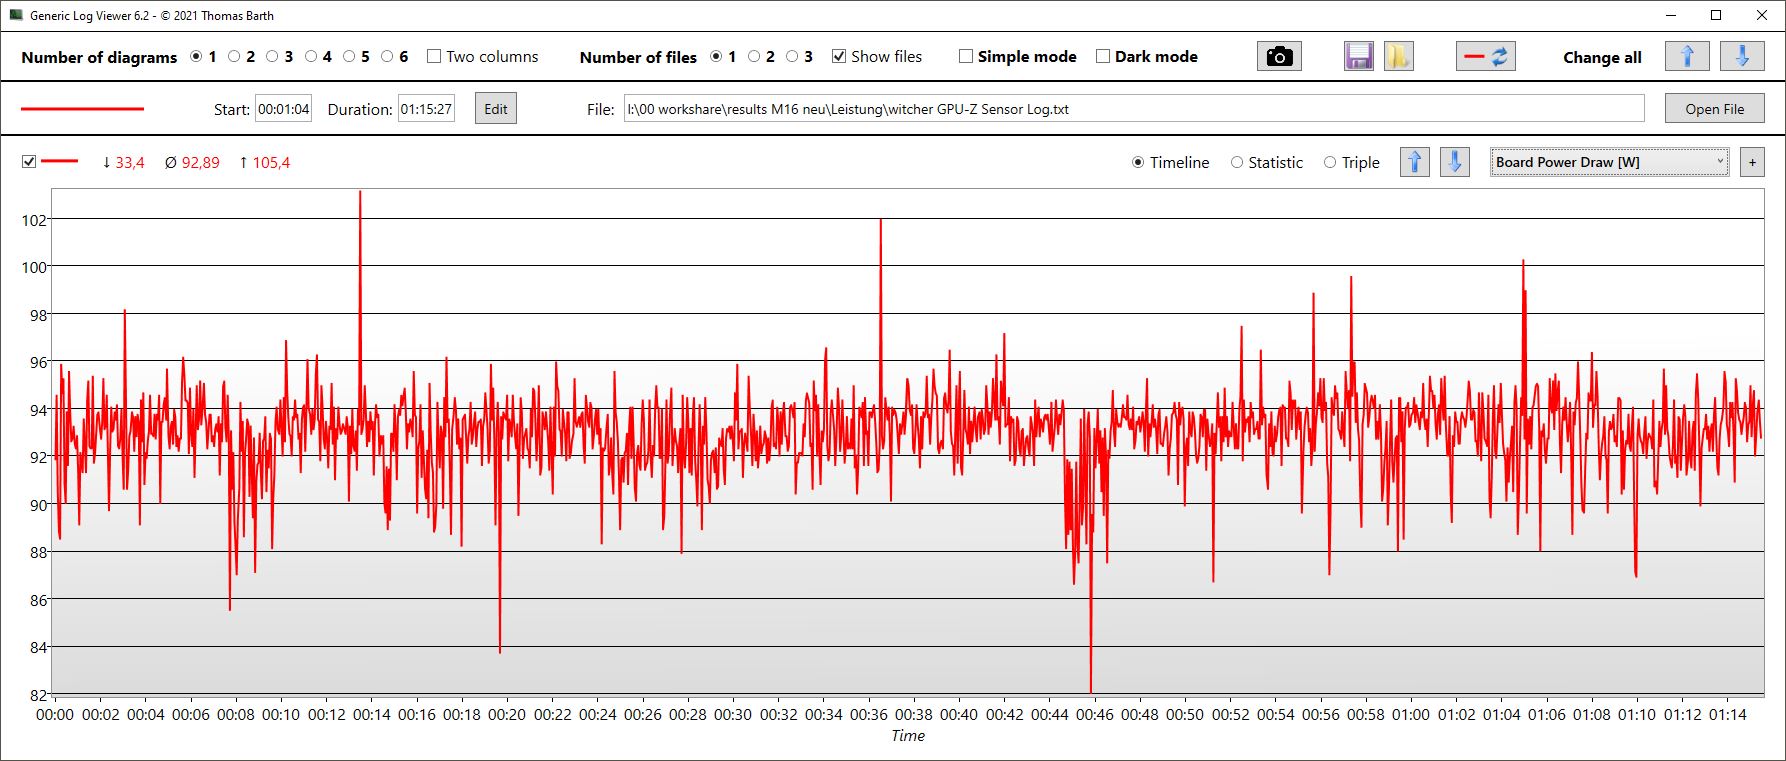
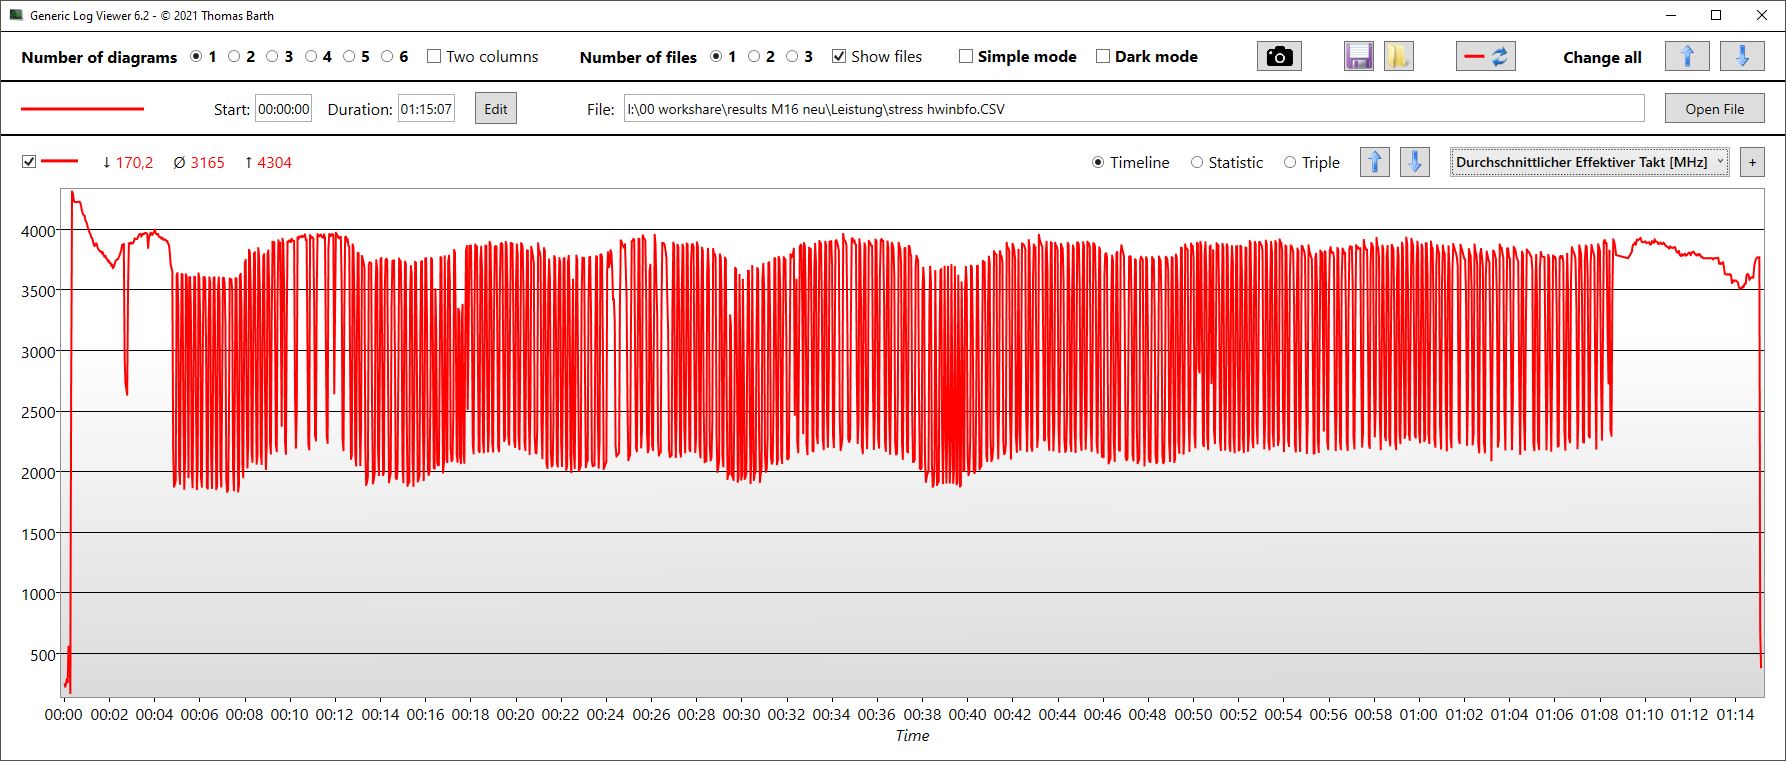
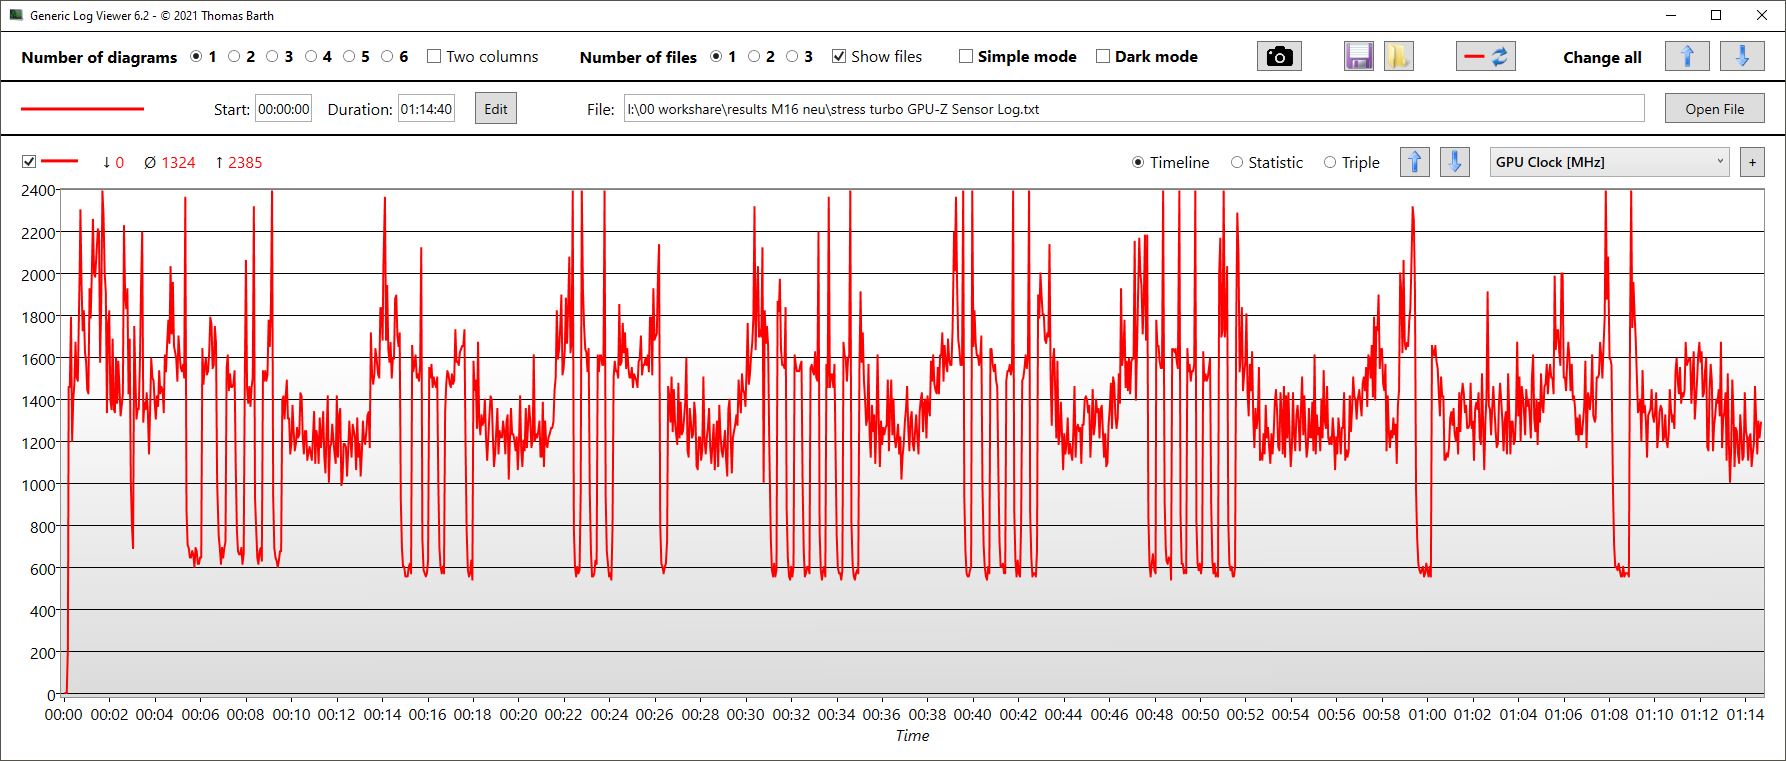
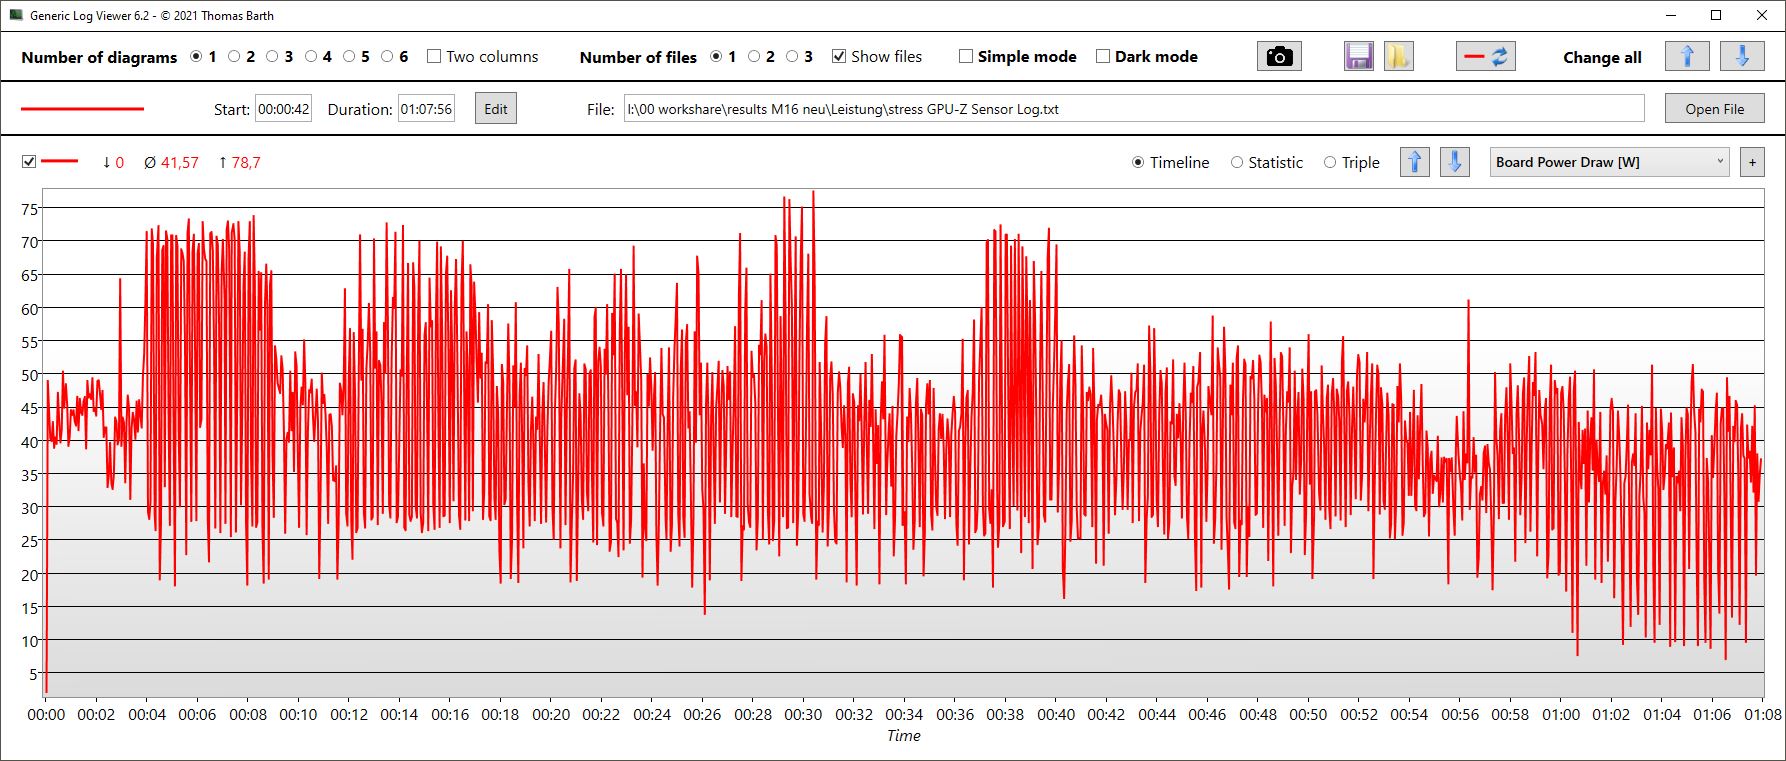
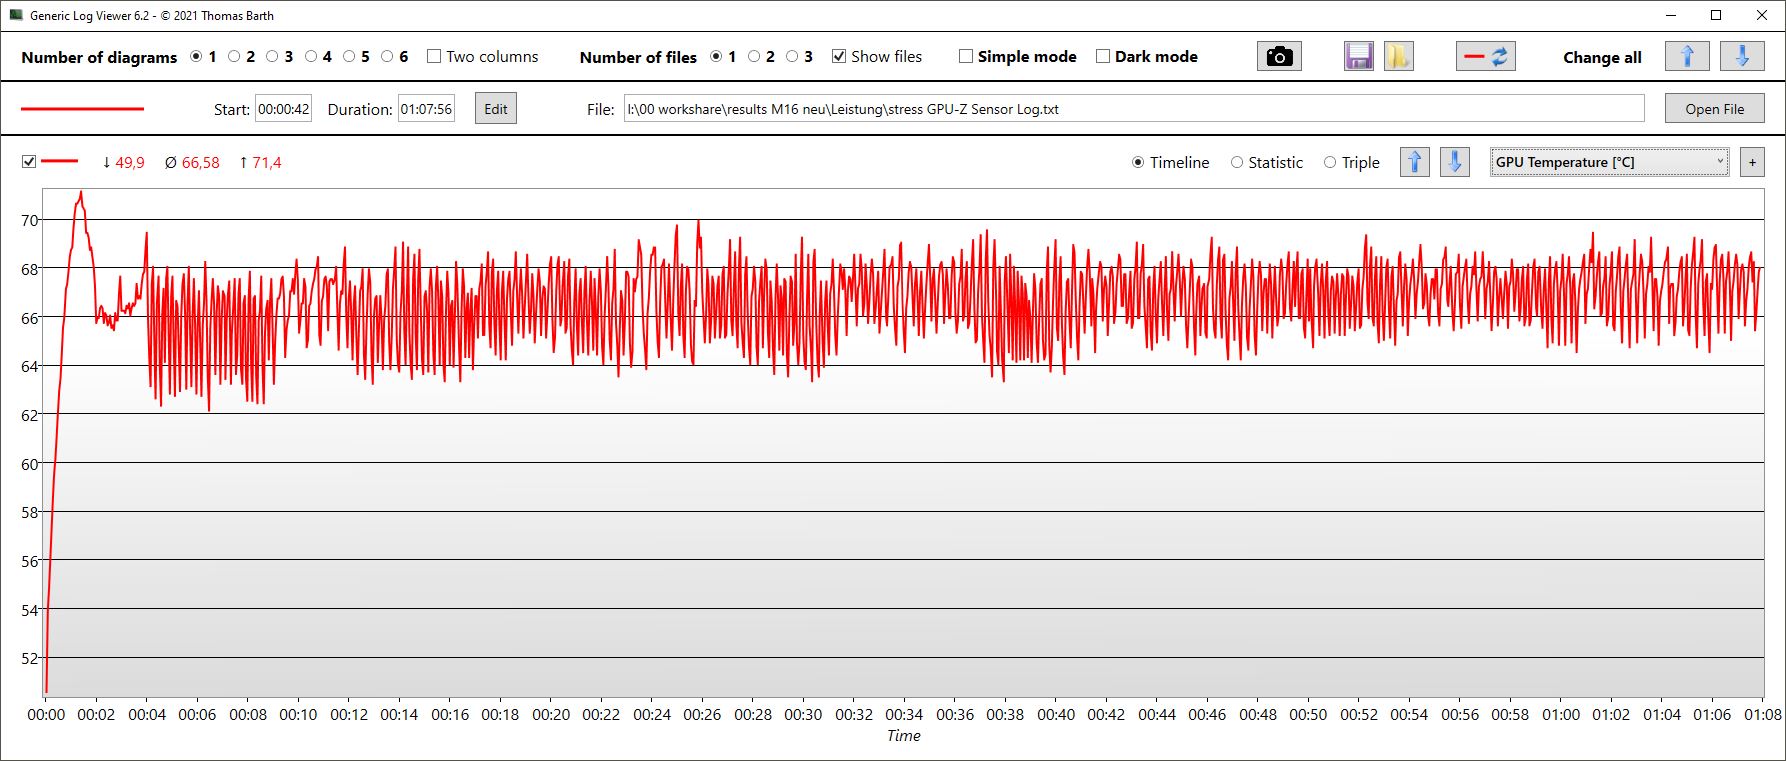
我们的GPU-Z日志数据很好地突出了Turbo和Performance模式之间的差异:时钟频率(1.9GHz对1.5GHz),温度(70对66℃),功耗(140对93瓦),甚至内存时钟速度(2275对2250MHz)都不同。帧率从175左右下降到大约145帧。
Witcher 3 FPS diagram
| low | med. | high | ultra | QHD | 4K DLSS | 4K | |
|---|---|---|---|---|---|---|---|
| GTA V (2015) | 186 | 183.1 | 179.8 | 127.7 | 123 | ||
| The Witcher 3 (2015) | 444 | 371 | 305 | 178 | |||
| Dota 2 Reborn (2015) | 192.9 | 177.3 | 169.9 | 160.7 | 161.9 | ||
| Final Fantasy XV Benchmark (2018) | 199.1 | 184.5 | 158.6 | 129.5 | |||
| X-Plane 11.11 (2018) | 177.2 | 154.7 | 116.4 | 121.8 | |||
| Far Cry 5 (2018) | 195 | 168 | 156 | 133 | 145 | ||
| Strange Brigade (2018) | 445 | 357 | 343 | 315 | 255 | ||
| Shadow of the Tomb Raider (2018) | 172 | 150 | 90 | ||||
| Watch Dogs Legion (2020) | 102 | 91 | 58 | ||||
| Assassin´s Creed Valhalla (2020) | 126 | 111 | 69 | ||||
| Far Cry 6 (2021) | 111 | 108 | 73 | ||||
| Dying Light 2 (2022) | 145.2 | 103.4 | 53.6 | ||||
| Cyberpunk 2077 1.6 (2022) | 104.49 | 75.69 | 41.9 | ||||
| Tiny Tina's Wonderlands (2022) | 144.06 | 109.64 | 62.33 | ||||
| A Plague Tale Requiem (2022) | 59.4 | ||||||
| Call of Duty Modern Warfare 2 2022 (2022) | 148 | 111 | 98 | 69 | |||
| Spider-Man Miles Morales (2022) | 98.1 | 93.3 | 65.7 | ||||
| The Callisto Protocol (2022) | 113.23 | 90.48 | 53.5 |
排放 - 毫无疑问,涡轮机的声音很大
噪声排放
在安静模式下,风扇在空闲时大多不活动,在轻度负载下也是如此,如写作或上网。即使在制造商认为类似于平衡模式的 "性能"模式下,风扇也经常在空闲时运转。
对于我们的基准测试,我们使用涡轮模式。风扇只是在空闲时可以忍受,从来没有安静过,只有在重载时才会咆哮到最大。在这一点上,它们保持在一个恒定的57分贝,使其成为同类产品中最响亮的笔记本电脑之一。只有微星Titan GT77在最大负荷下的声音更大,但在游戏时至少更安静。值得指出的是,许多笔记本电脑有一个涡轮增压模式,风扇在空闲时以最大速度运行,这就是为什么我们经常避免使用这种测试模式。M16的涡轮模式有些不同,但在游戏时,耳机仍然是必须的。
在性能模式下,噪音水平是可以容忍的,与竞争对手相当。在Witcher 3 ,我们只测得49分贝,而不是57分贝。作为回报,游戏性能下降了约15%至18%。
Noise level
| Idle |
| 24 / 29.96 / 34.27 dB(A) |
| Load |
| 35.89 / 57.54 dB(A) |
 | ||
30 dB silent 40 dB(A) audible 50 dB(A) loud |
||
min: | ||
| Asus ROG Zephyrus M16 GU604VY-NM042X GeForce RTX 4090 Laptop GPU, i9-13900H, Samsung PM9A1 MZVL22T0HBLB | Asus ROG Zephyrus M16 GU603Z GeForce RTX 3070 Ti Laptop GPU, i9-12900H, Micron 3400 1TB MTFDKBA1T0TFH | Asus ROG Strix Scar 18 2023 G834JY-N6005W GeForce RTX 4090 Laptop GPU, i9-13980HX, 2x Samsung PM9A1 MZVL21T0HCLR (RAID 0) | MSI Titan GT77 HX 13VI GeForce RTX 4090 Laptop GPU, i9-13950HX, Samsung PM9A1 MZVL22T0HBLB | Lenovo Legion Pro 7 16IRX8H GeForce RTX 4080 Laptop GPU, i9-13900HX, Samsung PM9A1 MZVL21T0HCLR | Razer Blade 16 Early 2023 GeForce RTX 4080 Laptop GPU, i9-13950HX, SSSTC CA6-8D1024 | |
|---|---|---|---|---|---|---|
| Noise | -2% | -0% | -7% | -3% | 11% | |
| off / environment * (dB) | 24 | 23 4% | 23.9 -0% | 24.6 -3% | 24 -0% | 23 4% |
| Idle Minimum * (dB) | 24 | 23 4% | 23.9 -0% | 29.2 -22% | 26 -8% | 23 4% |
| Idle Average * (dB) | 29.96 | 24 20% | 32.6 -9% | 29.2 3% | 28 7% | 23 23% |
| Idle Maximum * (dB) | 34.27 | 47 -37% | 32.6 5% | 29.2 15% | 34 1% | 23.6 31% |
| Load Average * (dB) | 35.89 | 47.91 -33% | 35.9 -0% | 50.7 -41% | 47 -31% | 39 -9% |
| Witcher 3 ultra * (dB) | 57.5 | 48.91 15% | 53.3 7% | 55 4% | 51.6 10% | |
| Load Maximum * (dB) | 57.54 | 50.25 13% | 55.8 3% | 61 -6% | 56 3% | 51.3 11% |
* ... smaller is better
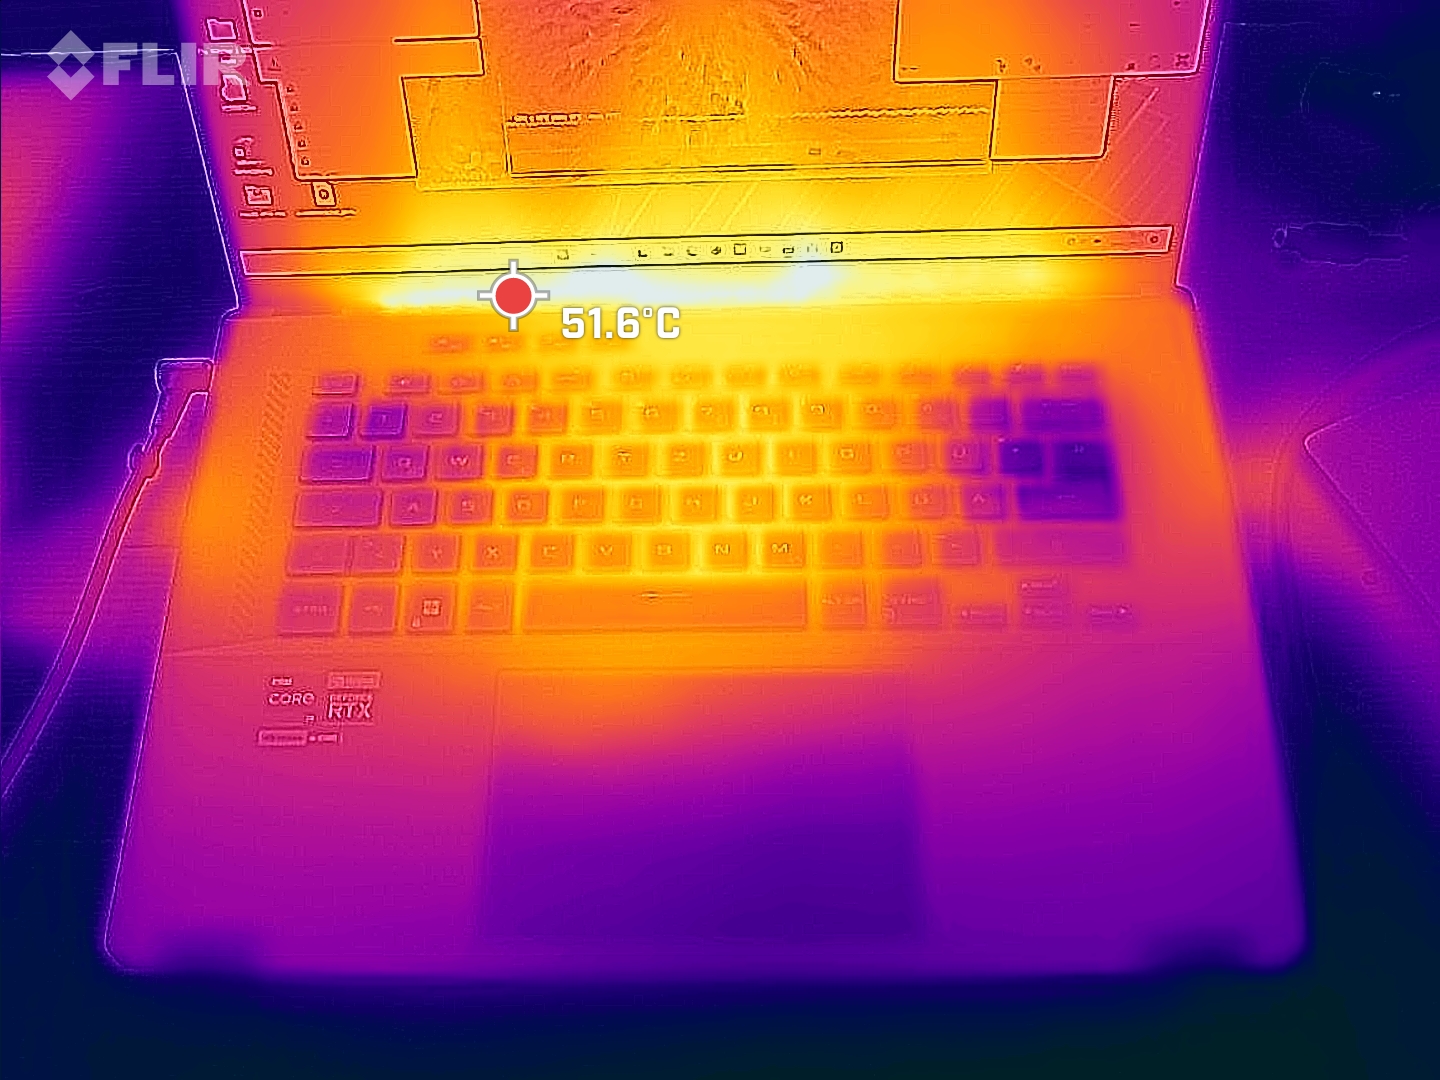
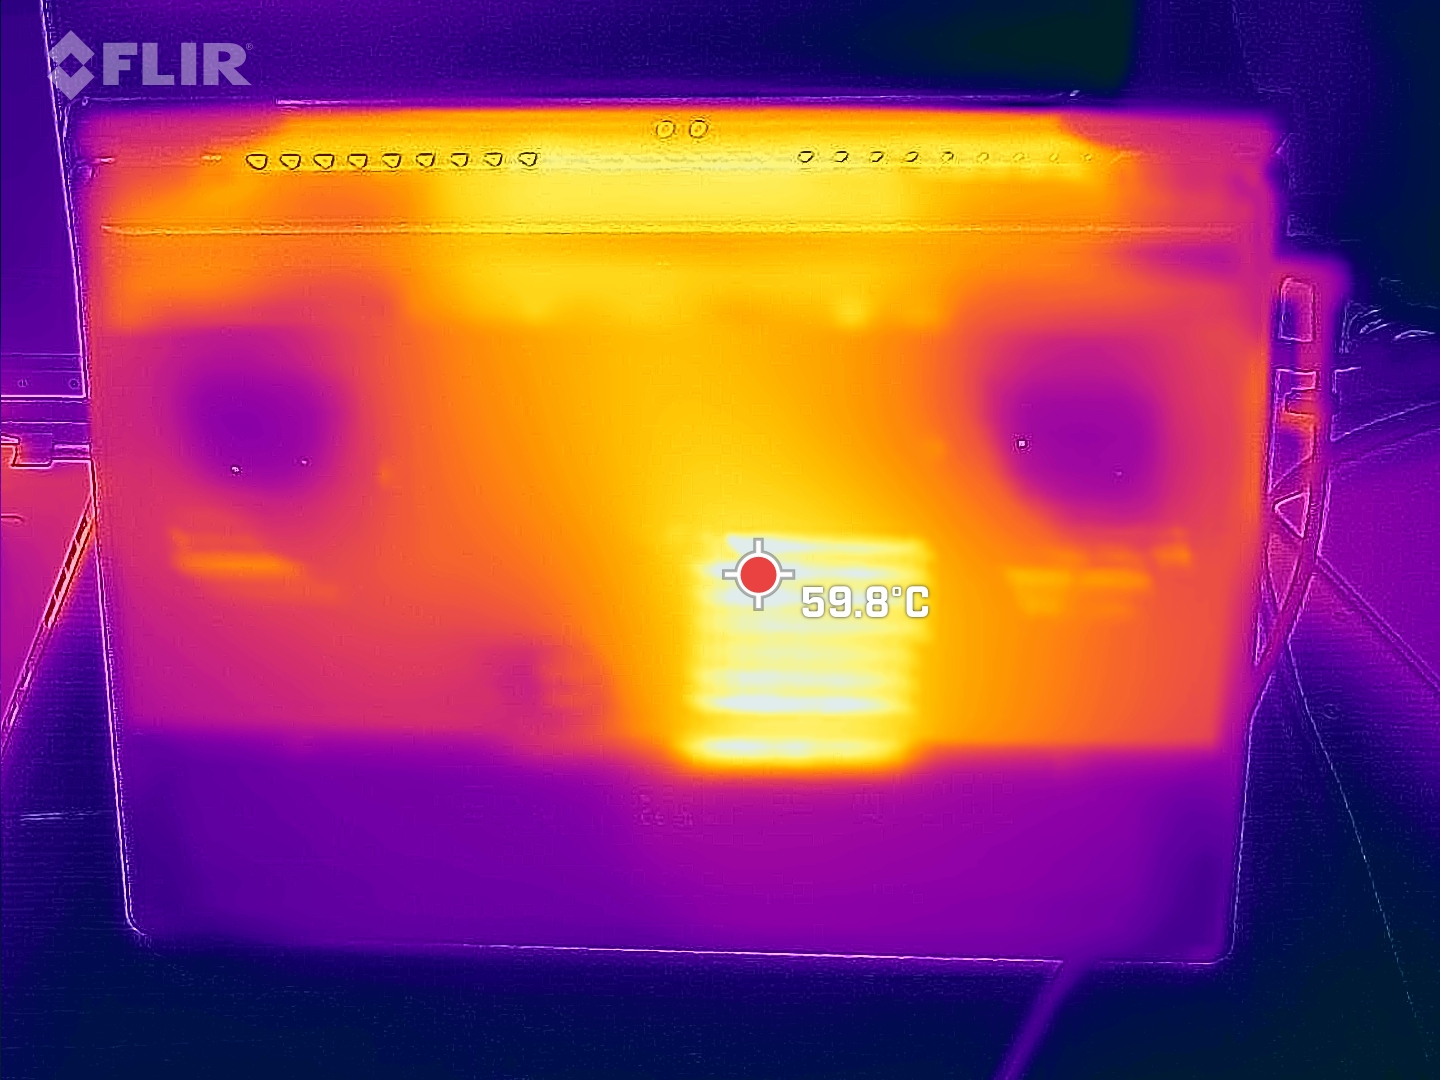
温度
M16有点热,特别是在设备的底部。在最大压力下,测得的热点略低于60℃,它们可以在中央和背面找到。游戏时,热点本身的温度只达到50℃左右。
相比之下,掌托大部分时间保持凉爽,这也部分适用于WASD键。
(-) The maximum temperature on the upper side is 50 °C / 122 F, compared to the average of 40.4 °C / 105 F, ranging from 21.2 to 68.8 °C for the class Gaming.
(-) The bottom heats up to a maximum of 58 °C / 136 F, compared to the average of 43.2 °C / 110 F
(+) In idle usage, the average temperature for the upper side is 24 °C / 75 F, compared to the device average of 33.9 °C / 93 F.
(-) Playing The Witcher 3, the average temperature for the upper side is 38.1 °C / 101 F, compared to the device average of 33.9 °C / 93 F.
(±) The palmrests and touchpad can get very hot to the touch with a maximum of 37 °C / 98.6 F.
(-) The average temperature of the palmrest area of similar devices was 28.8 °C / 83.8 F (-8.2 °C / -14.8 F).
| Asus ROG Zephyrus M16 GU604VY-NM042X Intel Core i9-13900H, NVIDIA GeForce RTX 4090 Laptop GPU | Asus ROG Zephyrus M16 GU603Z Intel Core i9-12900H, NVIDIA GeForce RTX 3070 Ti Laptop GPU | Asus ROG Strix Scar 18 2023 G834JY-N6005W Intel Core i9-13980HX, NVIDIA GeForce RTX 4090 Laptop GPU | MSI Titan GT77 HX 13VI Intel Core i9-13950HX, NVIDIA GeForce RTX 4090 Laptop GPU | Lenovo Legion Pro 7 16IRX8H Intel Core i9-13900HX, NVIDIA GeForce RTX 4080 Laptop GPU | Razer Blade 16 Early 2023 Intel Core i9-13950HX, NVIDIA GeForce RTX 4080 Laptop GPU | |
|---|---|---|---|---|---|---|
| Heat | -6% | -3% | 10% | -13% | 5% | |
| Maximum Upper Side * (°C) | 50 | 52 -4% | 54 -8% | 40.6 19% | 48 4% | 40 20% |
| Maximum Bottom * (°C) | 58 | 51 12% | 46 21% | 41.1 29% | 49 16% | 37.6 35% |
| Idle Upper Side * (°C) | 26 | 29 -12% | 30 -15% | 26.2 -1% | 40 -54% | 32.4 -25% |
| Idle Bottom * (°C) | 28 | 33 -18% | 31 -11% | 30.3 -8% | 33 -18% | 31.4 -12% |
* ... smaller is better
压力测试
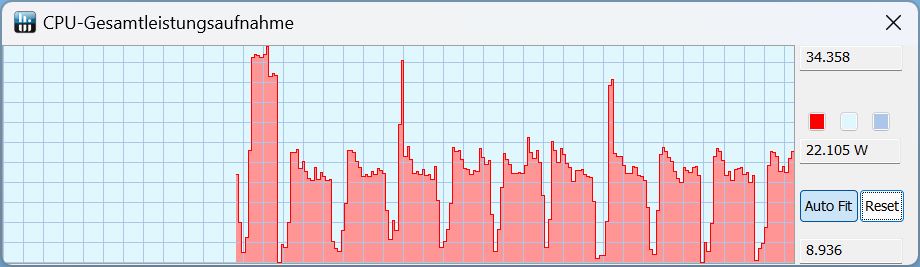
在压力测试中,CPU时钟在2.2和4GHz之间波动,即时钟速度在较长时间内徘徊在高端。与此平行,CPU的功耗也有变化,平均为77瓦。然而,它也可以上升到120瓦,并再次下降到40瓦。根据其他数值,温度以类似的方式波动,CPU加热到98℃,平均为88℃。
在性能模式下,与CPU的差别实际上并不大,温度、功耗和时钟速度彼此之间没有特别大的差别,但仍然以高速度波动。
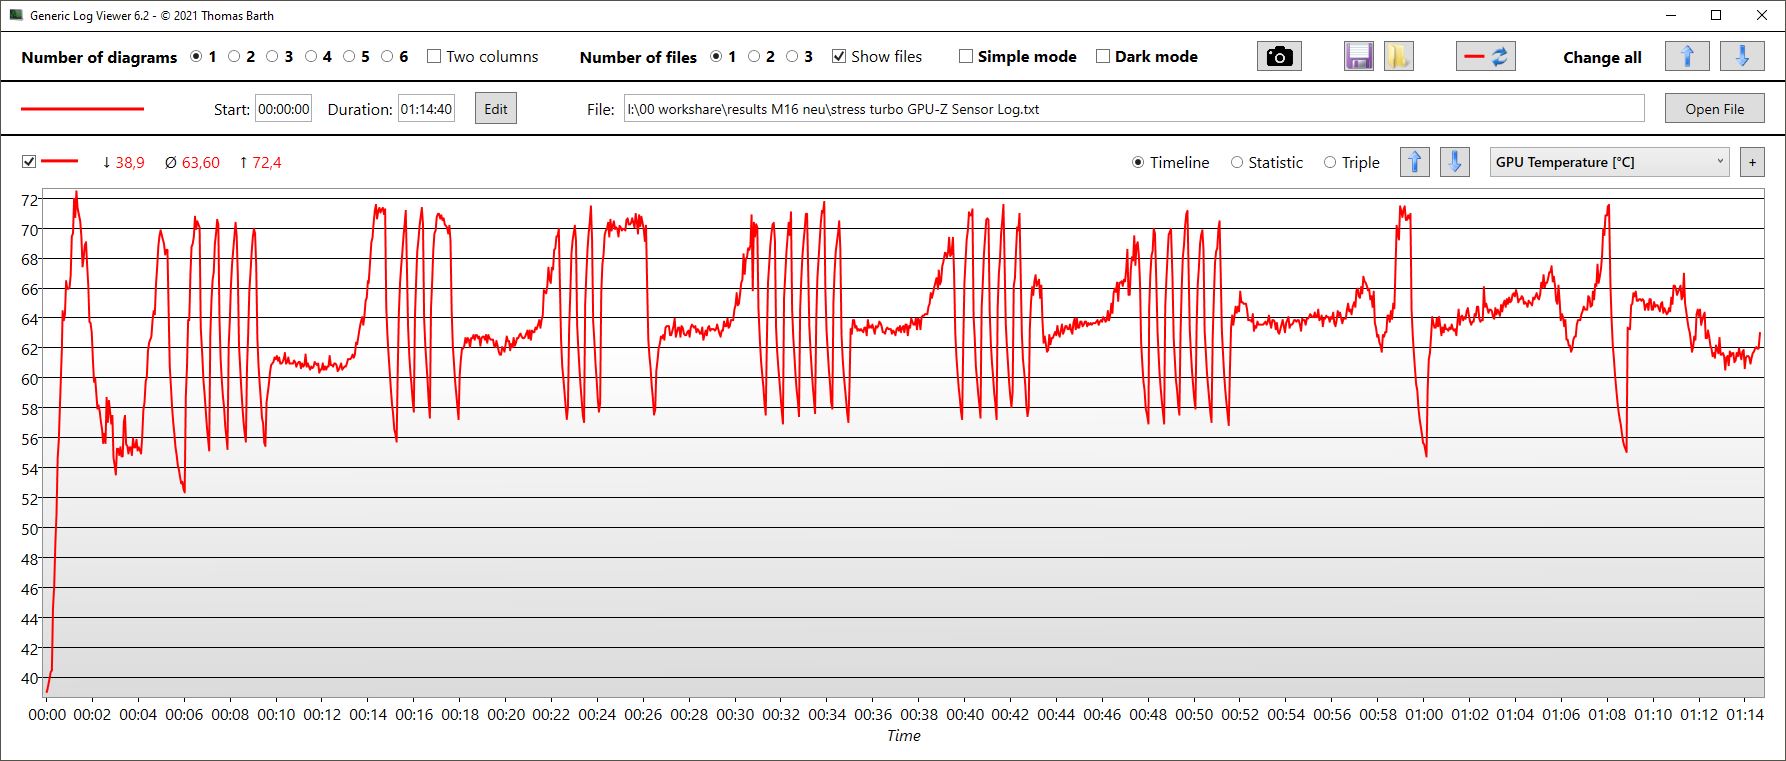
GPU的数值(甚至是内存时钟)波动非常强烈。核心时钟速度平均为1.3GHz,功耗平均为58瓦,温度约为64℃。
在性能模式下,这些数值只是略低。时钟速度下降了200MHz左右,温度同样很高,功耗在42瓦左右。
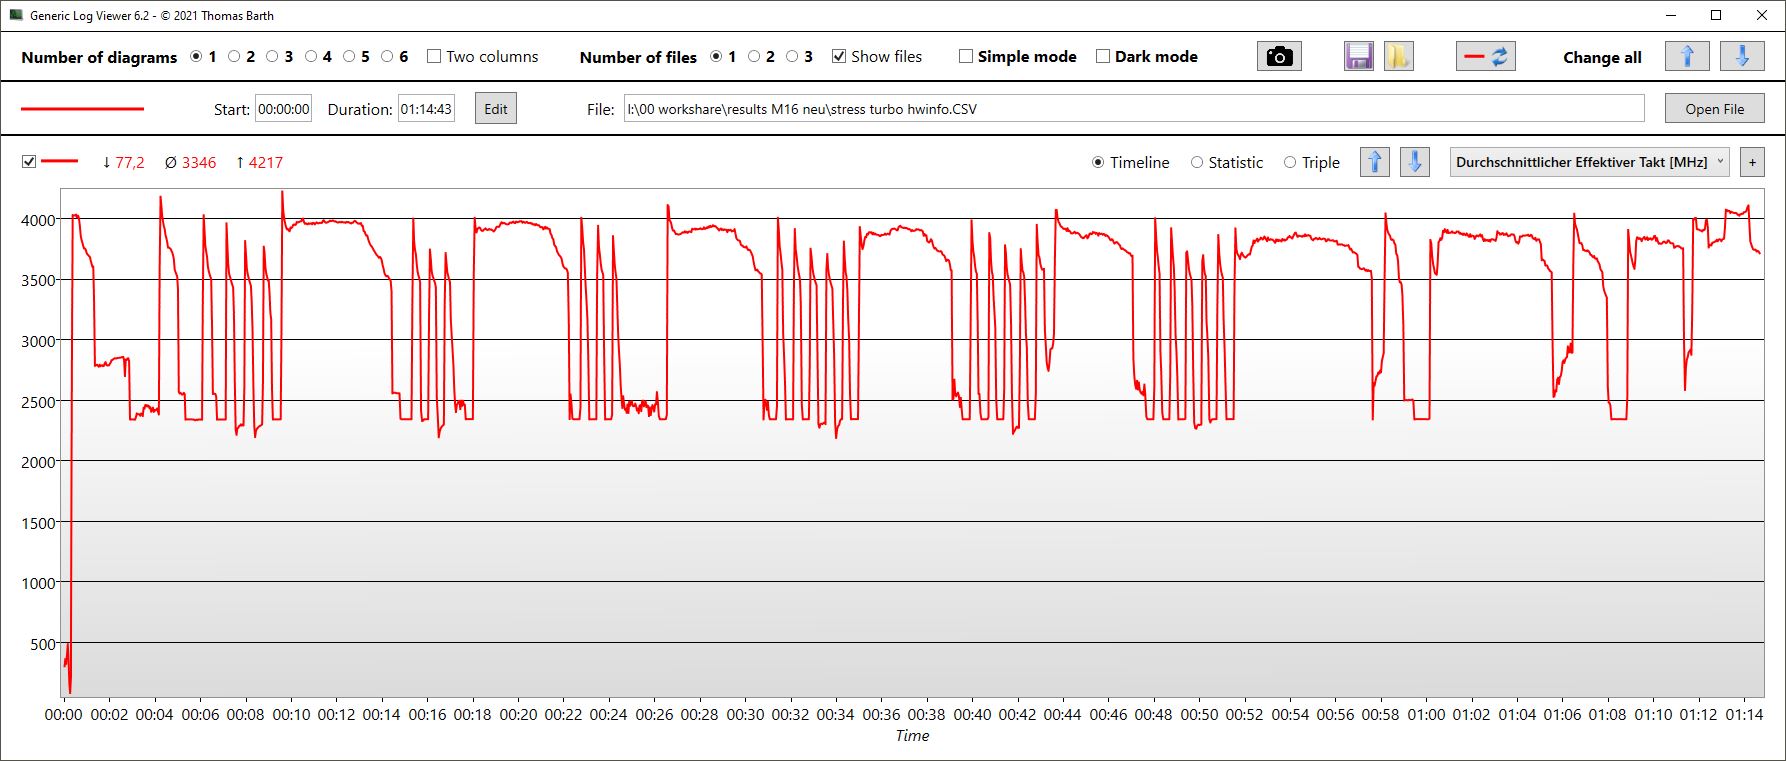
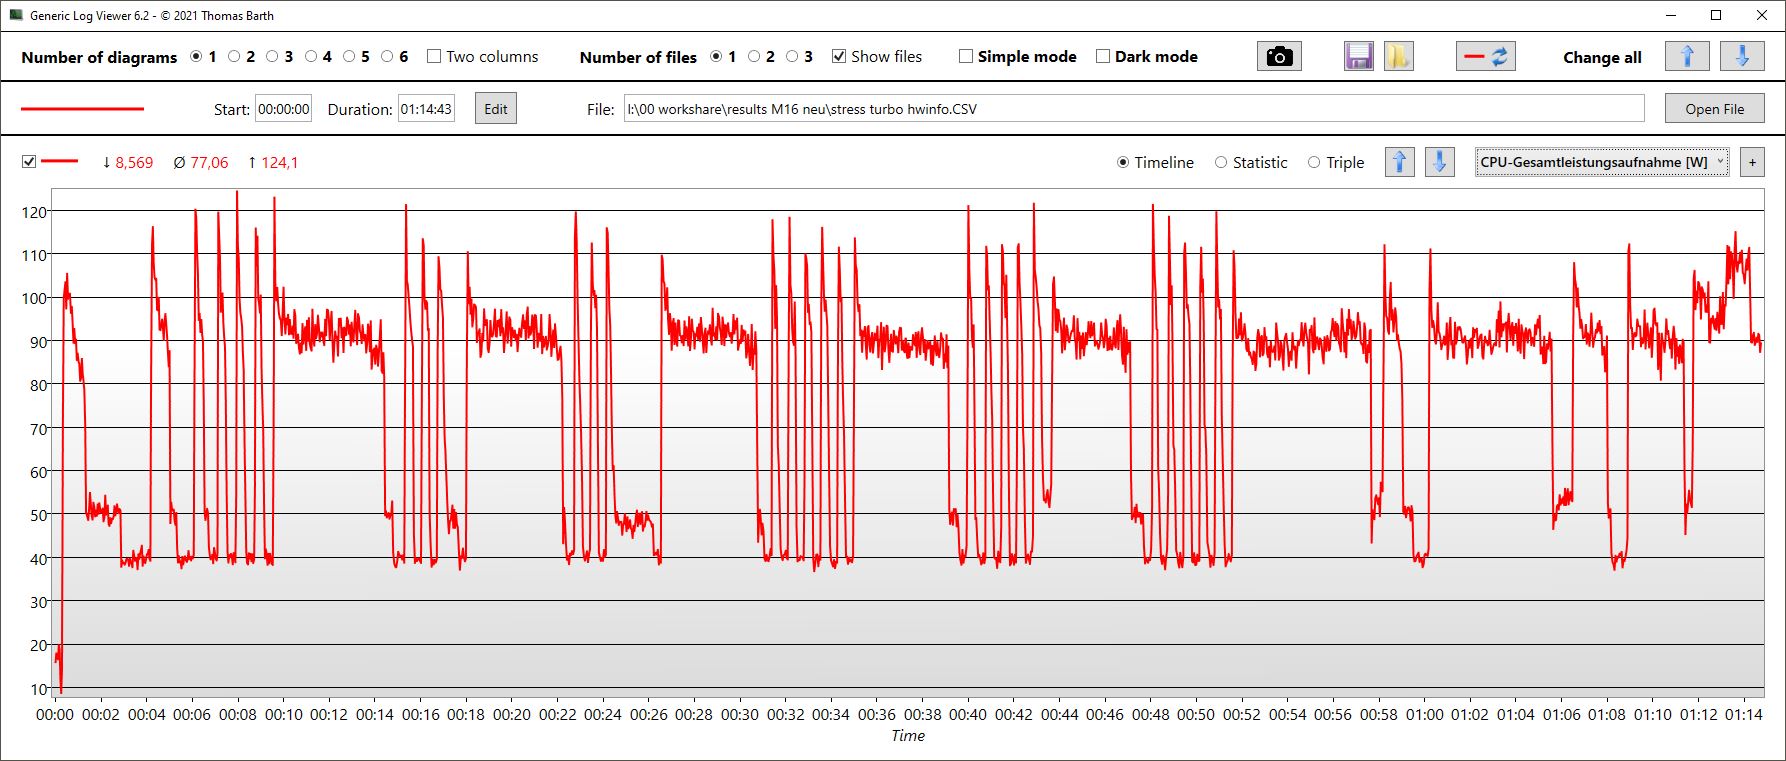
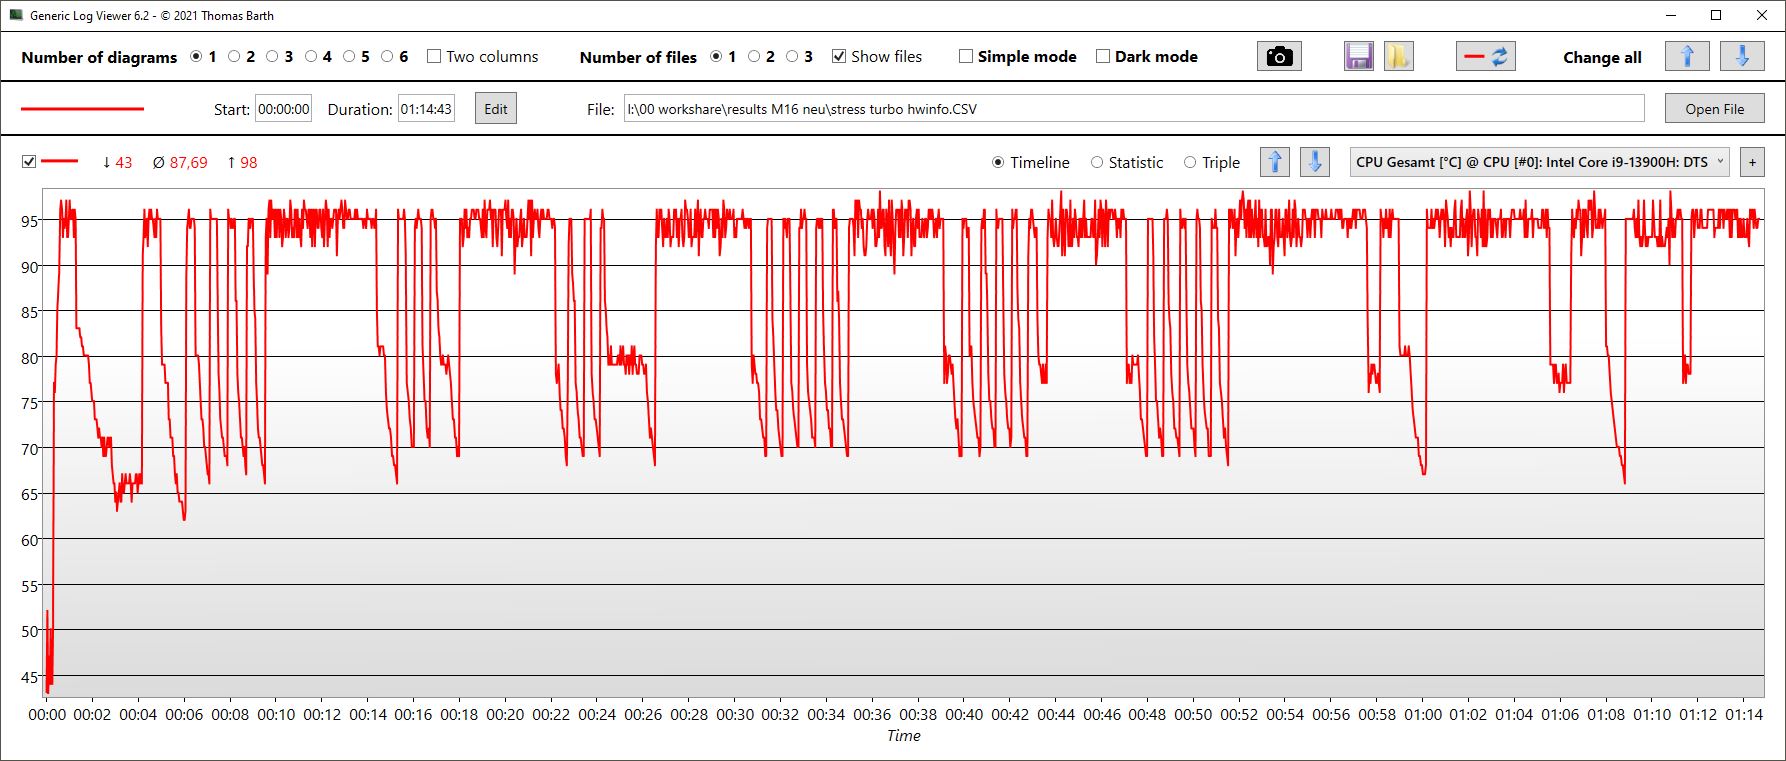
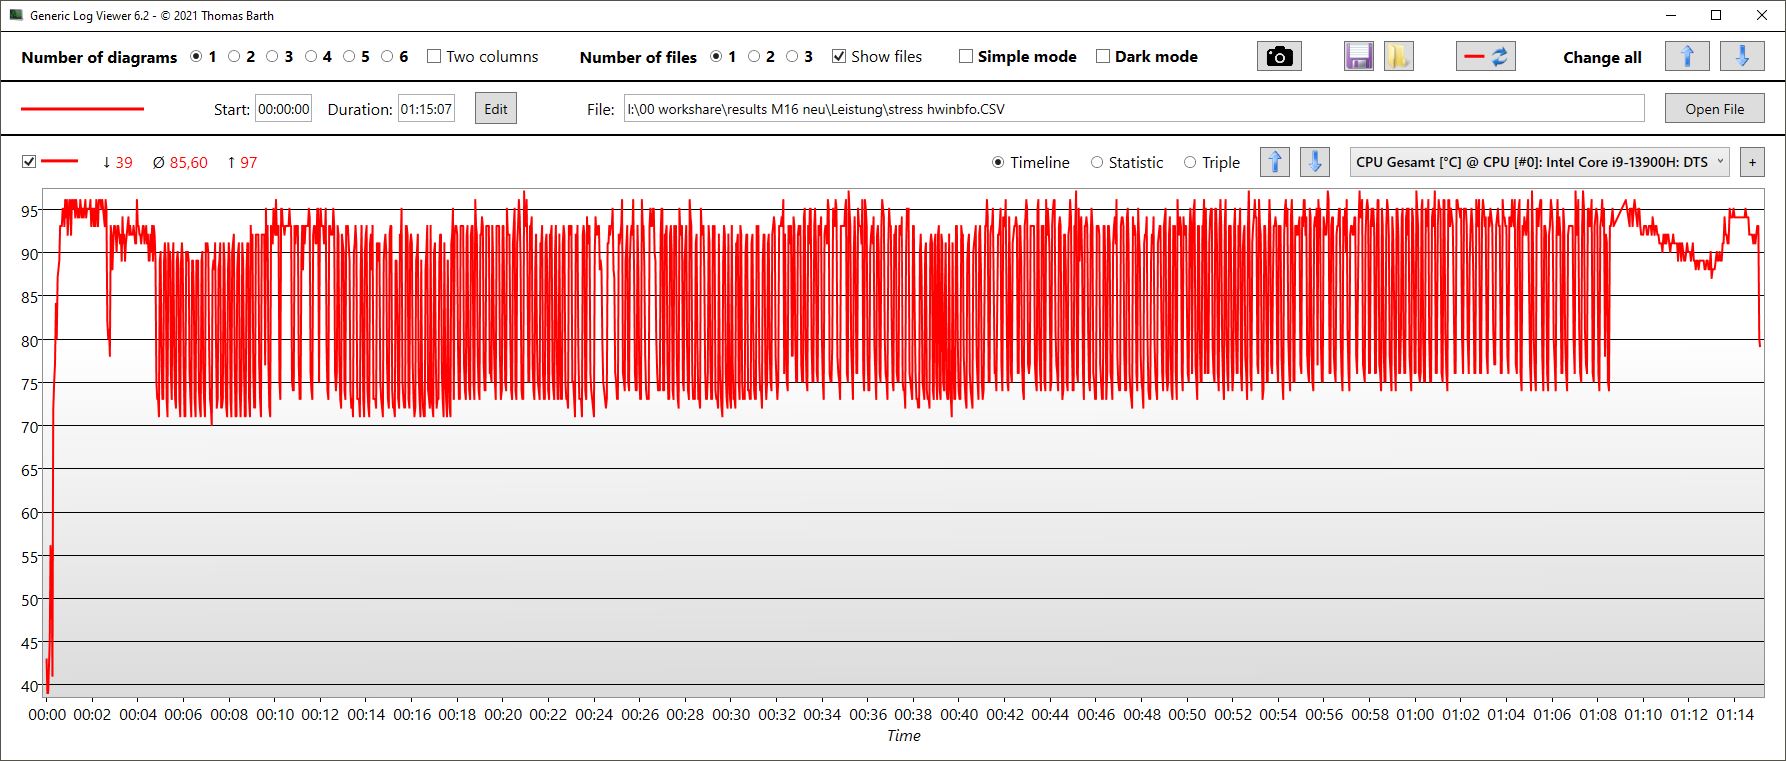
| CPU时钟(GHz) | GPU时钟(MHz) | CPU平均温度(℃) | GPU平均温度(℃) | |
| Prime95 + FurMark 压力 | 3,3 | 1.324 | 88 | 64 |
| Witcher 3 应力 | 668 | 1.830 | 69 | 70 |
发言人
与许多其他制造商相比,华硕为笔记本电脑配备了四个扬声器而不是两个。这有一个积极的效果,因为它们可以变得相对响亮,提供平衡的中音和高音,甚至低音也比不幸的和典型的竞争时的情况更有力。
通过3.5毫米音频插孔连接外部模拟设备,可以获得额外的音频乐趣。
Asus ROG Zephyrus M16 GU604VY-NM042X audio analysis
(+) | speakers can play relatively loud (84.45 dB)
Bass 100 - 315 Hz
(±) | reduced bass - on average 11.5% lower than median
(±) | linearity of bass is average (10.1% delta to prev. frequency)
Mids 400 - 2000 Hz
(+) | balanced mids - only 4.1% away from median
(+) | mids are linear (4.9% delta to prev. frequency)
Highs 2 - 16 kHz
(+) | balanced highs - only 1.9% away from median
(+) | highs are linear (4.9% delta to prev. frequency)
Overall 100 - 16.000 Hz
(+) | overall sound is linear (11.1% difference to median)
Compared to same class
» 8% of all tested devices in this class were better, 3% similar, 89% worse
» The best had a delta of 6%, average was 18%, worst was 132%
Compared to all devices tested
» 7% of all tested devices were better, 2% similar, 92% worse
» The best had a delta of 4%, average was 24%, worst was 134%
Razer Blade 16 Early 2023 audio analysis
(+) | speakers can play relatively loud (88.2 dB)
Bass 100 - 315 Hz
(-) | nearly no bass - on average 16.4% lower than median
(±) | linearity of bass is average (10.8% delta to prev. frequency)
Mids 400 - 2000 Hz
(+) | balanced mids - only 2.5% away from median
(+) | mids are linear (2.4% delta to prev. frequency)
Highs 2 - 16 kHz
(+) | balanced highs - only 4.9% away from median
(±) | linearity of highs is average (7.9% delta to prev. frequency)
Overall 100 - 16.000 Hz
(+) | overall sound is linear (12.6% difference to median)
Compared to same class
» 16% of all tested devices in this class were better, 3% similar, 81% worse
» The best had a delta of 6%, average was 18%, worst was 132%
Compared to all devices tested
» 11% of all tested devices were better, 2% similar, 86% worse
» The best had a delta of 4%, average was 24%, worst was 134%
电源管理 - 高效的游戏,高空闲消耗
消耗功率
设置为最小亮度、安静和飞行模式,空闲使用时的消耗量约为20瓦,有点高。当游戏和重载时,英特尔HX处理器会显得比一些类似能力的HX竞争对手(甚至那些有RTX 4080的)消耗更多的电力。
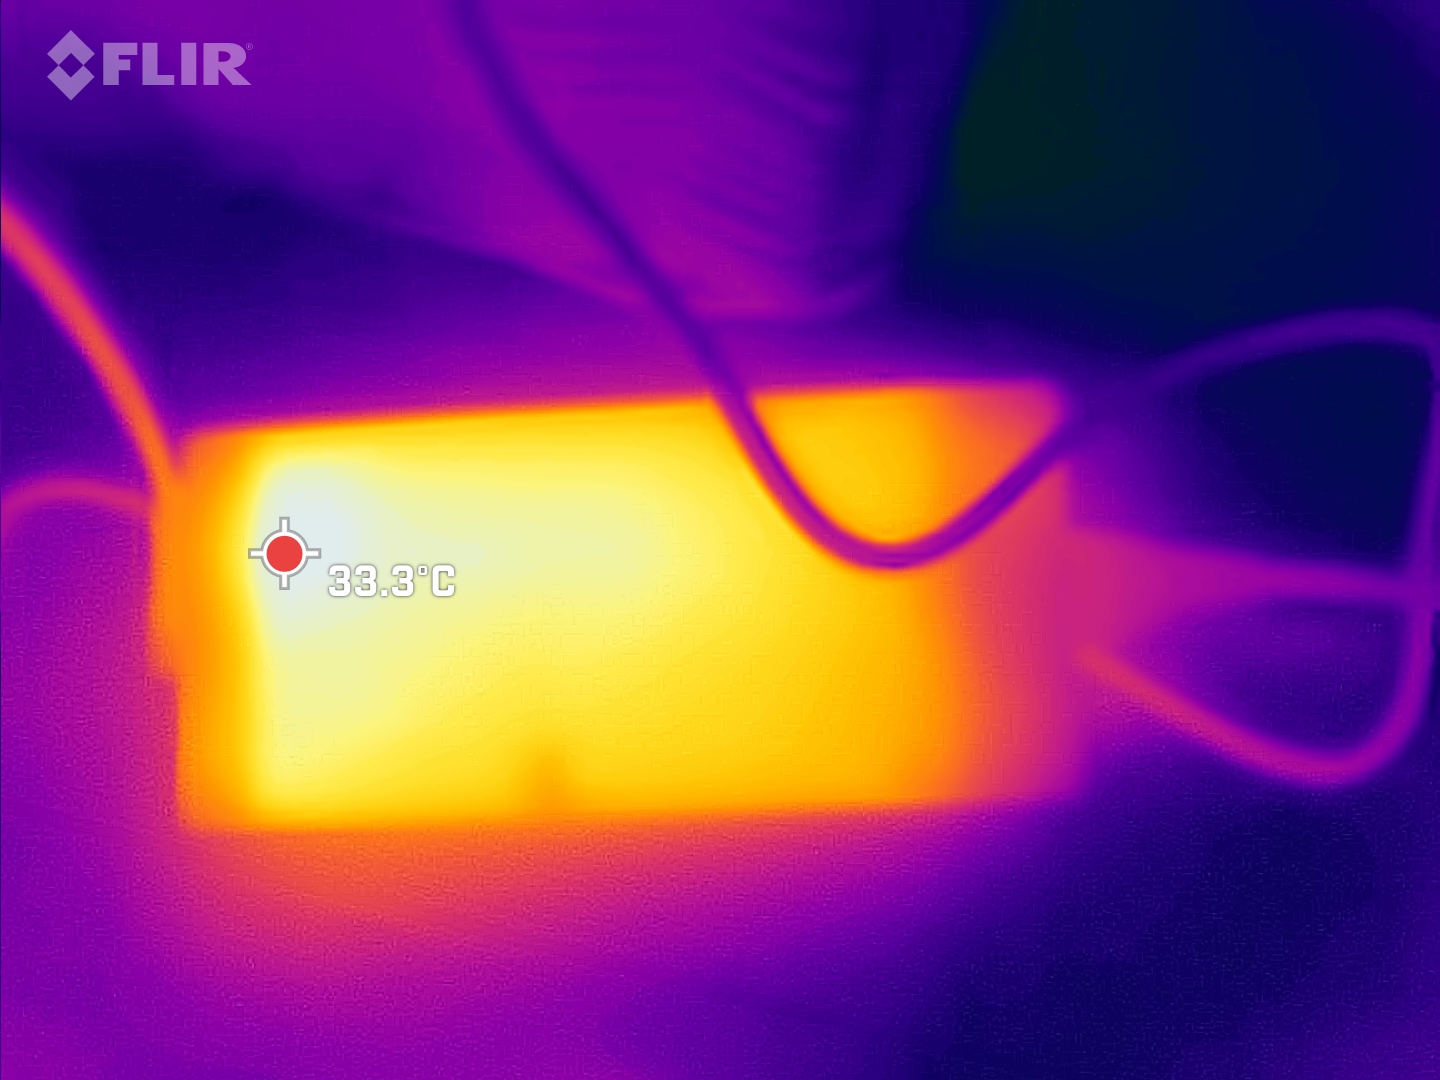
在很短的时间内,我们在大型但平坦的电源装置(约18 x 8.3 x 2.5厘米)上测量了最大267瓦的负载峰值。这是为280瓦设计的,因此提供了足够的储备。
| Off / Standby | |
| Idle | |
| Load |
|
Key:
min: | |
| Asus ROG Zephyrus M16 GU604VY-NM042X i9-13900H, GeForce RTX 4090 Laptop GPU, Samsung PM9A1 MZVL22T0HBLB, IPS, 2560x1600, 16" | Asus ROG Zephyrus M16 GU603Z i9-12900H, GeForce RTX 3070 Ti Laptop GPU, Micron 3400 1TB MTFDKBA1T0TFH, IPS, 2560x1600, 16" | Asus ROG Strix Scar 18 2023 G834JY-N6005W i9-13980HX, GeForce RTX 4090 Laptop GPU, 2x Samsung PM9A1 MZVL21T0HCLR (RAID 0), IPS, 2560x1600, 18" | MSI Titan GT77 HX 13VI i9-13950HX, GeForce RTX 4090 Laptop GPU, Samsung PM9A1 MZVL22T0HBLB, Mini-LED, 3840x2160, 17.3" | Lenovo Legion Pro 7 16IRX8H i9-13900HX, GeForce RTX 4080 Laptop GPU, Samsung PM9A1 MZVL21T0HCLR, IPS, 2560x1600, 16" | Razer Blade 16 Early 2023 i9-13950HX, GeForce RTX 4080 Laptop GPU, SSSTC CA6-8D1024, IPS, 2560x1600, 16" | Average NVIDIA GeForce RTX 4090 Laptop GPU | Average of class Gaming | |
|---|---|---|---|---|---|---|---|---|
| Power Consumption | 24% | -26% | -10% | -14% | -17% | -11% | 12% | |
| Idle Minimum * (Watt) | 20 | 10.8 46% | 17.3 13% | 14 30% | 18 10% | 15.2 24% | 16.2 ? 19% | 13.2 ? 34% |
| Idle Average * (Watt) | 24 | 17 29% | 27 -13% | 21.6 10% | 24 -0% | 22.8 5% | 23.1 ? 4% | 18.9 ? 21% |
| Idle Maximum * (Watt) | 25 | 17.8 29% | 46 -84% | 24.8 1% | 32 -28% | 49.8 -99% | 34.2 ? -37% | 24.3 ? 3% |
| Load Average * (Watt) | 107 | 116 -8% | 133 -24% | 122.5 -14% | 130 -21% | 121.2 -13% | 130.5 ? -22% | 108 ? -1% |
| Witcher 3 ultra * (Watt) | 208 | 144 31% | 265 -27% | 260 -25% | 242 -16% | |||
| Load Maximum * (Watt) | 267 | 220 18% | 329 -23% | 418 -57% | 320 -20% | 273.7 -3% | 324 ? -21% | 254 ? 5% |
* ... smaller is better
Power consumption Witcher 3 / Stress test
Power consumption with an external monitor
电池寿命
Zephyrus M16的电池容量为90瓦,这意味着华硕笔记本电脑在降低亮度时可以实现约4.5小时的WiFi使用。
在全亮度下,可以实现3小时的互联网冲浪(多区Mini-LED)。在降低亮度的情况下,这可以上升到近4.5小时。
总而言之,电池寿命不是特别好,这是由于高闲置消耗造成的。
| Asus ROG Zephyrus M16 GU604VY-NM042X i9-13900H, GeForce RTX 4090 Laptop GPU, 90 Wh | Asus ROG Zephyrus M16 GU603Z i9-12900H, GeForce RTX 3070 Ti Laptop GPU, 90 Wh | Asus ROG Strix Scar 18 2023 G834JY-N6005W i9-13980HX, GeForce RTX 4090 Laptop GPU, 90 Wh | MSI Titan GT77 HX 13VI i9-13950HX, GeForce RTX 4090 Laptop GPU, 99.9 Wh | Lenovo Legion Pro 7 16IRX8H i9-13900HX, GeForce RTX 4080 Laptop GPU, 99.9 Wh | Razer Blade 16 Early 2023 i9-13950HX, GeForce RTX 4080 Laptop GPU, 95.2 Wh | Average of class Gaming | |
|---|---|---|---|---|---|---|---|
| Battery runtime | 24% | 14% | -1% | -5% | -5% | 29% | |
| H.264 (h) | 4.8 | 7.3 52% | 7 46% | 6 25% | 8.26 ? 72% | ||
| WiFi v1.3 (h) | 4.3 | 7.4 72% | 7.1 65% | 5.3 23% | 5.1 19% | 6.1 42% | 7.02 ? 63% |
| Load (h) | 2.9 | 1.4 -52% | 0.9 -69% | 1.4 -52% | 2.1 -28% | 1.4 -52% | 1.47 ? -49% |
| Witcher 3 ultra (h) | 0.9 | ||||||
| Reader / Idle (h) | 6.4 | 8.9 | 8.71 ? |
Pros
Cons
评语--(尚未)像其前辈那样进行优化

当谈到最新一代的笔记本电脑时,制造商喜欢给我们发送高端系统。而且,是的,RTX 4090和英特尔Gen13不仅在纸面上令人印象深刻。与上一代相比,性能和效率都有明显提高。更重要的是,奇妙的迷你LED星云显示屏是主要亮点的竞争者,几乎能把CPU和GPU放在阴影下。
我们已经发现它的前辈是一个全面的、优化的游戏机。一般来说,但不是明确的,这也适用于新的华硕M16。与目前大多数新的笔记本电脑类似,我们正在处理CPU和GPU方面的双代飞跃。然而,这种变化并不总是顺利地运行。目前,许多RTX 40笔记本电脑由于尚未最终确定的驱动程序优化而遭受高延迟。此外,M16的空闲功耗有些过高。这导致了次优的电池寿命,但在软件更新的帮助下,这一点是可以解决的。另外,由于许多隐藏的螺丝和SO-DIMM内存,华硕给维护工作带来了不必要的困难,这也让人有点恼火。此外,省略了一个LAN端口,这对玩家来说很难理解,而且最高端的RTX 4090与H CPU的运行速度 "只 "相当于一个RTX 4080搭配HX CPU的速度。
华硕ROG Zephyrus M16搭配RTX 4090是一个强大的游戏包,配备了梦幻般的迷你LED显示屏,并且功率充足--即使是在4K下。然而,价格很高,有一些小问题需要解决。
对于许多人来说,非常高的价格将是一个真正的缺点,但是,像往常一样,当可能的(更便宜的)替代品到达时,我们将广泛地审查它们。
价格和可用性
目前,只能预购新的M16。然而,该机器计划在本月(2023年3月)出现。
Asus ROG Zephyrus M16 GU604VY-NM042X
- 03/15/2023 v7 (old)
Christian Hintze
Transparency
The selection of devices to be reviewed is made by our editorial team. The test sample was provided to the author as a loan by the manufacturer or retailer for the purpose of this review. The lender had no influence on this review, nor did the manufacturer receive a copy of this review before publication. There was no obligation to publish this review. As an independent media company, Notebookcheck is not subjected to the authority of manufacturers, retailers or publishers.
This is how Notebookcheck is testing
Every year, Notebookcheck independently reviews hundreds of laptops and smartphones using standardized procedures to ensure that all results are comparable. We have continuously developed our test methods for around 20 years and set industry standards in the process. In our test labs, high-quality measuring equipment is utilized by experienced technicians and editors. These tests involve a multi-stage validation process. Our complex rating system is based on hundreds of well-founded measurements and benchmarks, which maintains objectivity. Further information on our test methods can be found here.
Price comparison

