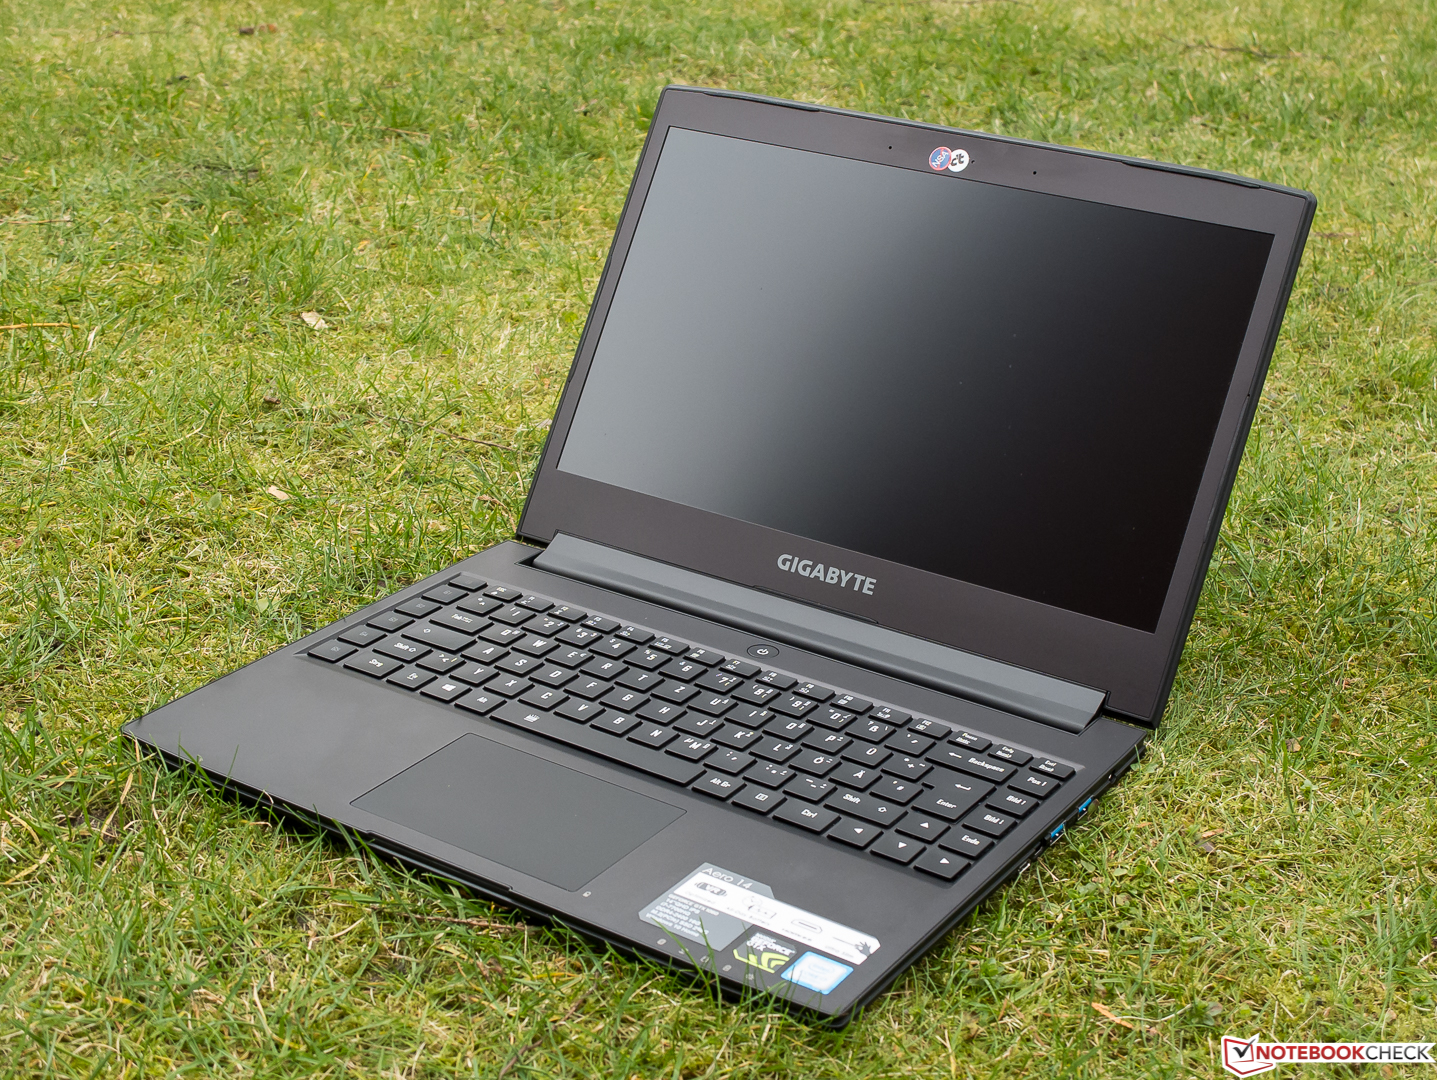
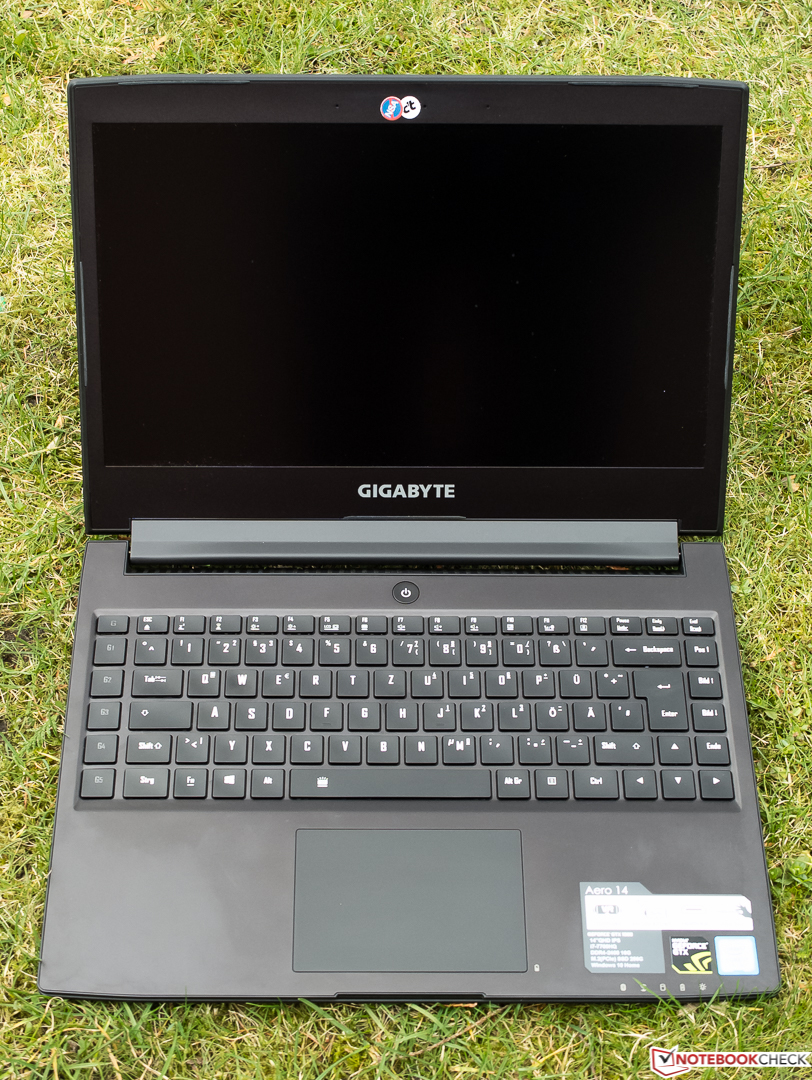
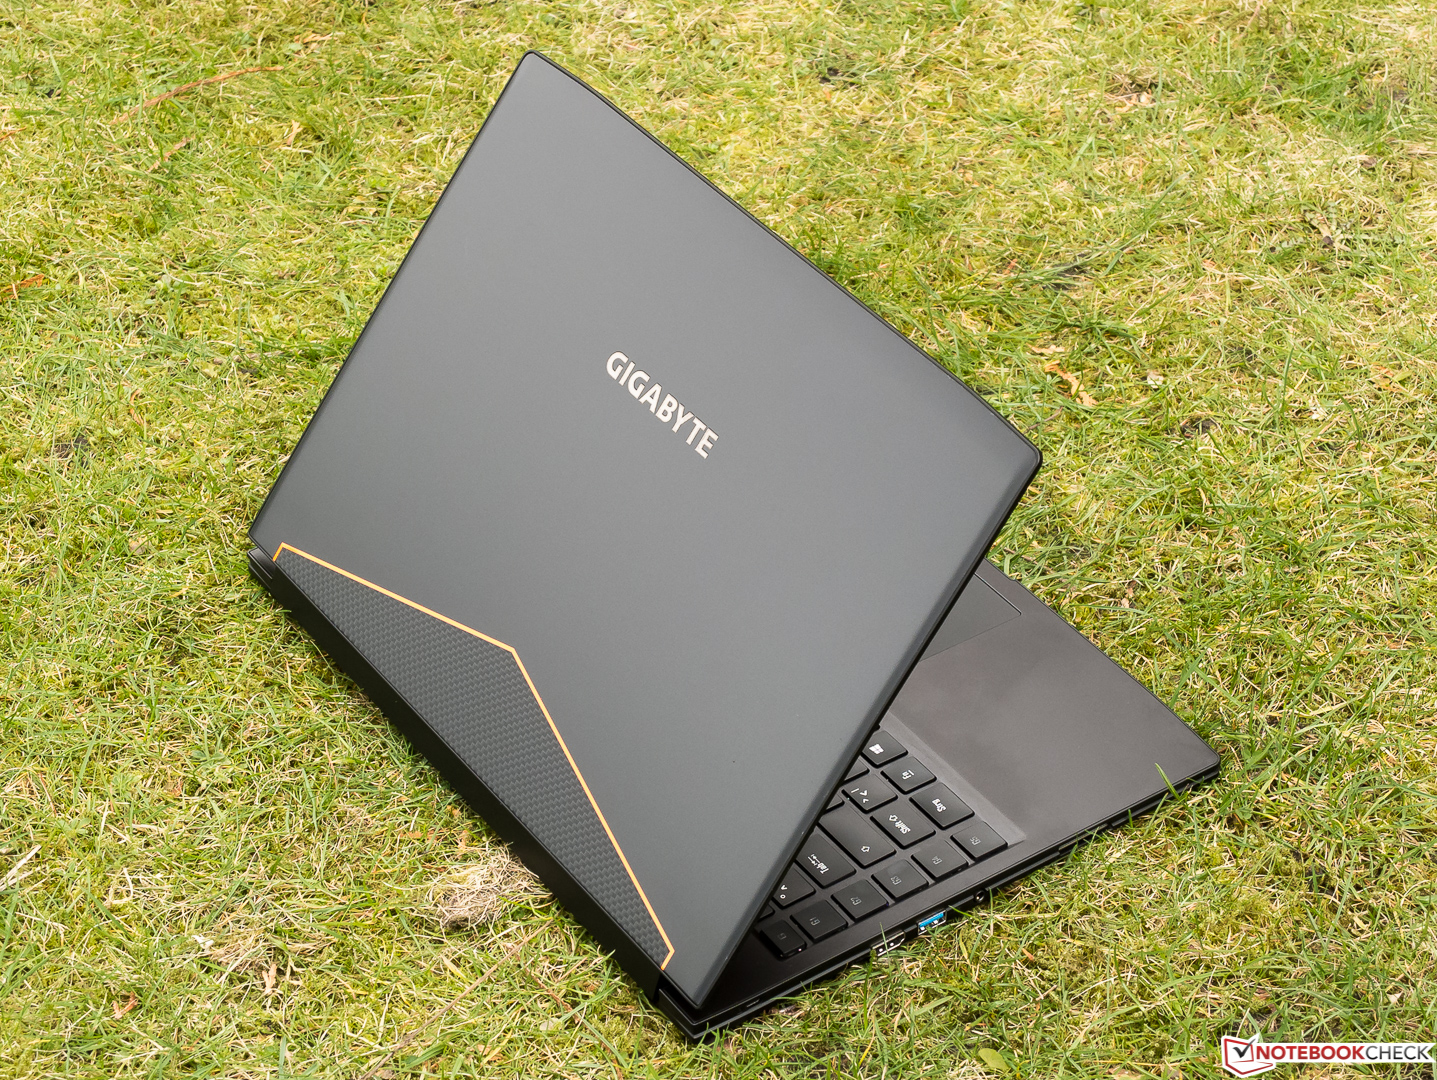
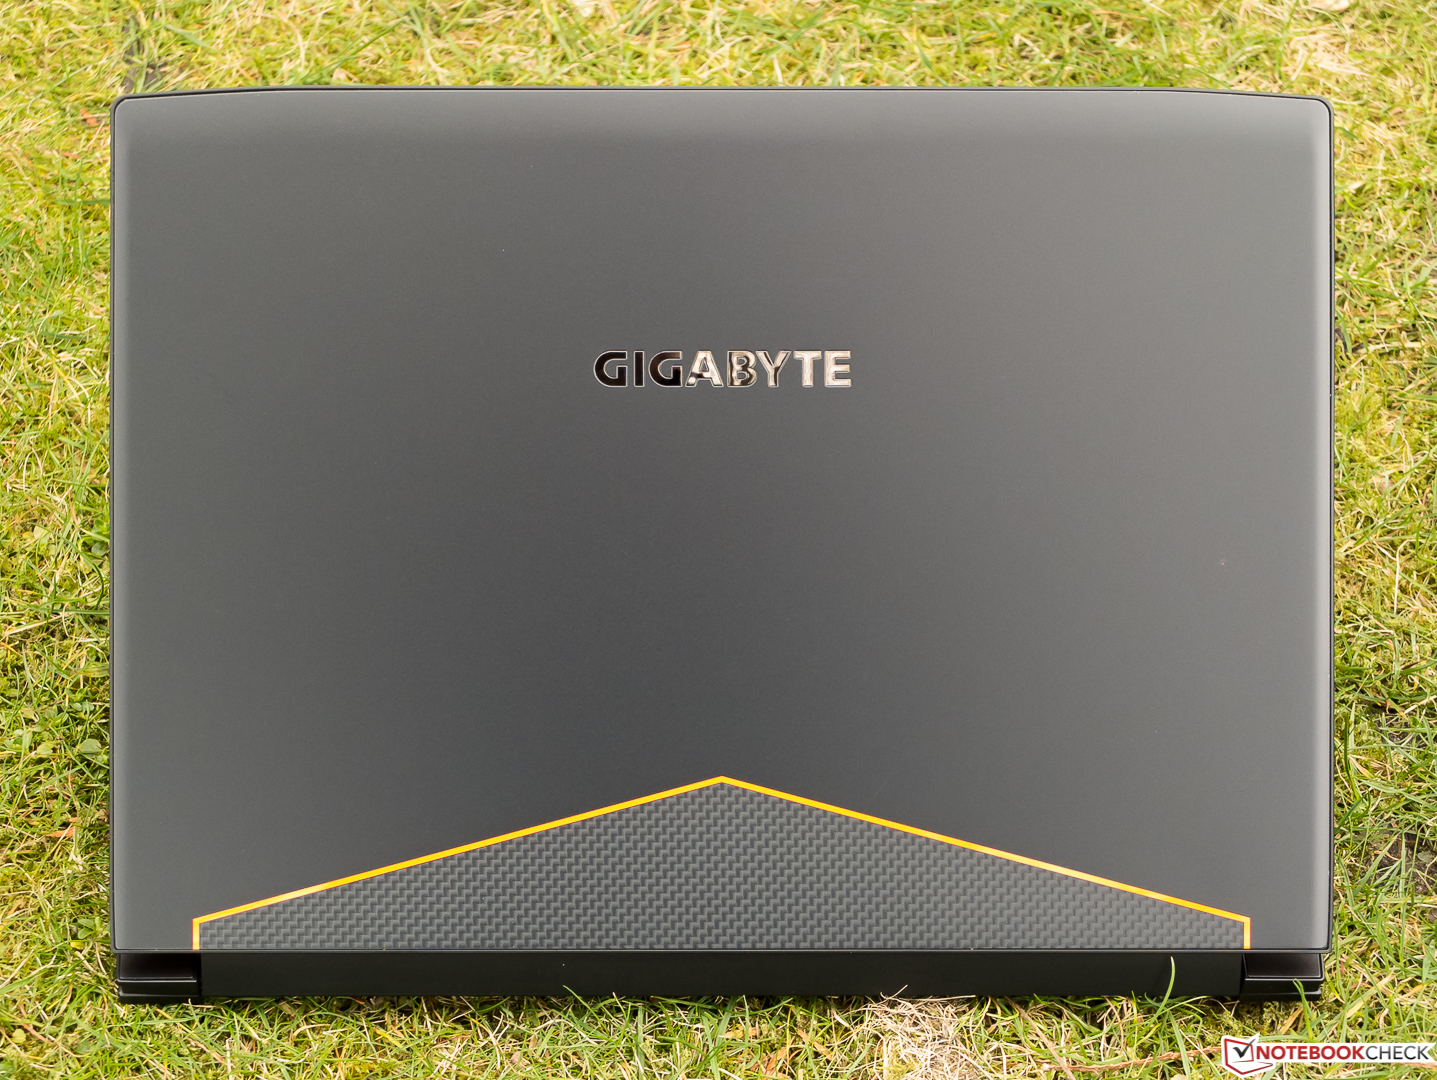
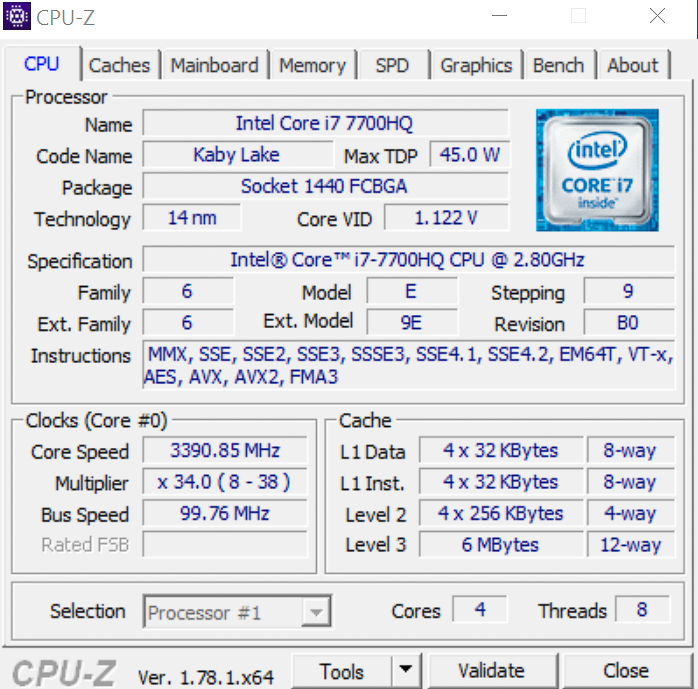
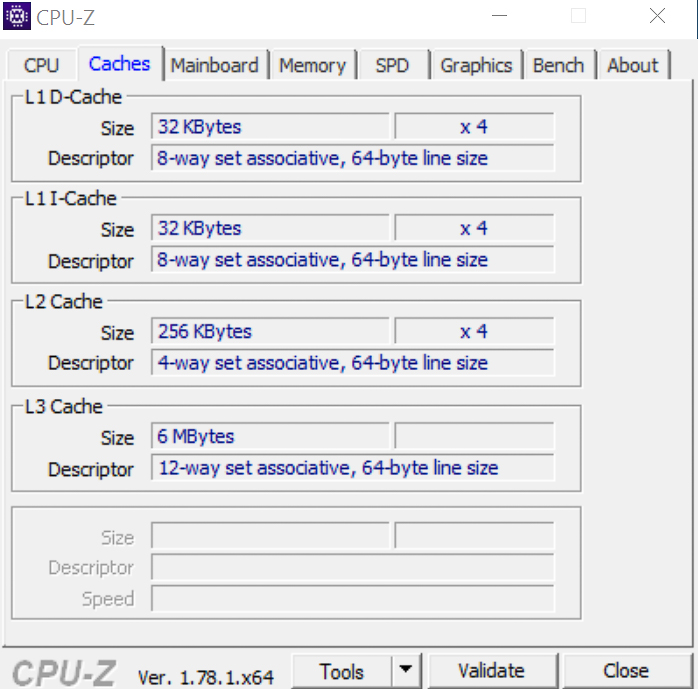
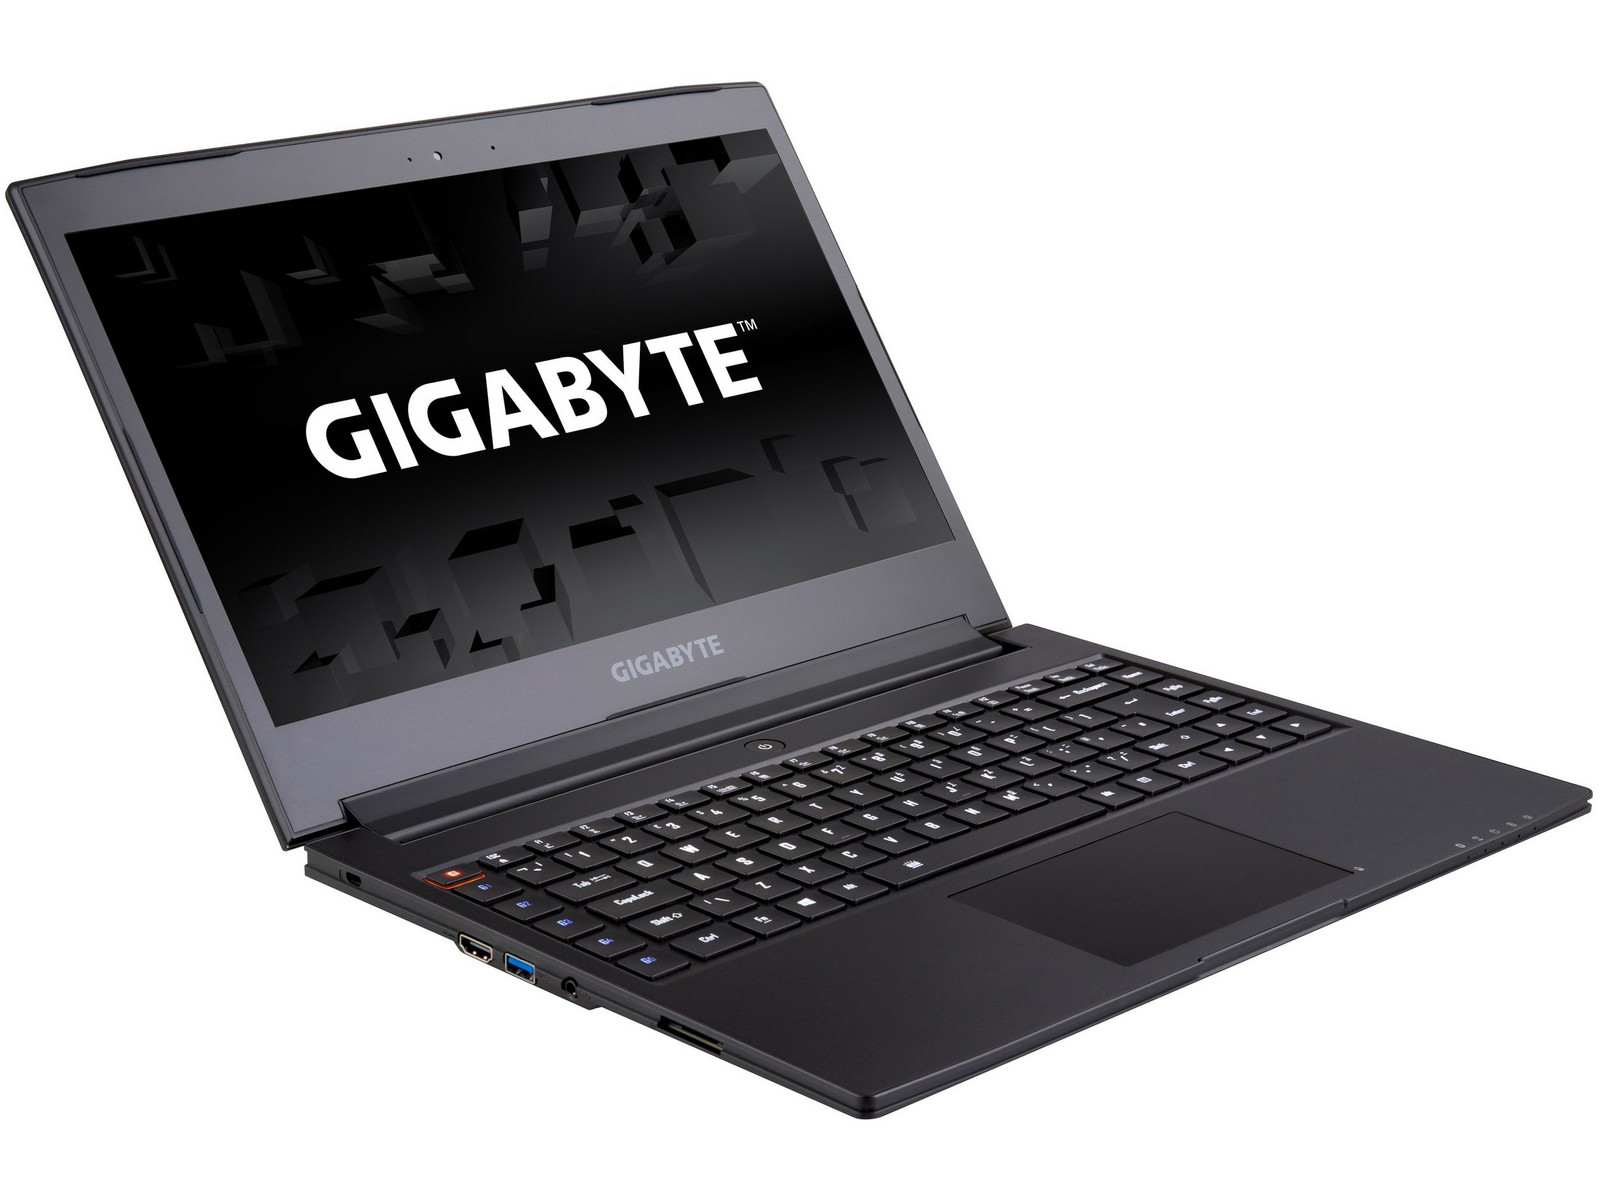
技嘉 Aero 14 (7700HQ, GTX 1060) 笔记本电脑简短评测
| SD Card Reader | |
| average JPG Copy Test (av. of 3 runs) | |
| Schenker XMG P407 | |
| Gigabyte Aero 14 | |
| MSI GS43VR 6RE-006US | |
| maximum AS SSD Seq Read Test (1GB) | |
| Schenker XMG P407 | |
| Gigabyte Aero 14 | |
| MSI GS43VR 6RE-006US | |
| Networking | |
| iperf3 transmit AX12 | |
| Razer Blade (2016) | |
| Gigabyte Aero 14 | |
| Schenker XMG P407 | |
| iperf3 receive AX12 | |
| Gigabyte Aero 14 | |
| Razer Blade (2016) | |
| Schenker XMG P407 | |
| |||||||||||||||||||||||||
Brightness Distribution: 79 %
Center on Battery: 290 cd/m²
Contrast: 967:1 (Black: 0.3 cd/m²)
ΔE ColorChecker Calman: 4.59 | ∀{0.5-29.43 Ø4.71}
ΔE Greyscale Calman: 4.32 | ∀{0.09-98 Ø4.96}
92% sRGB (Argyll 1.6.3 3D)
59% AdobeRGB 1998 (Argyll 1.6.3 3D)
65.5% AdobeRGB 1998 (Argyll 3D)
91.8% sRGB (Argyll 3D)
64.4% Display P3 (Argyll 3D)
Gamma: 2.25
CCT: 7320 K
| Gigabyte Aero 14 LG Philips LP140QH1-SPF1 (LGD049A), , 2560x1440, 14" | MSI GS43VR 6RE-006US Name: LG Philips LP140WF3-SPD1, ID: LGD046D, , 1920x1080, 14" | Schenker XMG P407 LG Philips LP140WF3-SPD1 (LGD046D), , 1920x1080, 14" | Razer Blade (2016) Sharp LQ140Z1JW01 (SHP1401), , 3200x1800, 14" | |
|---|---|---|---|---|
| Display | -3% | -6% | 4% | |
| Display P3 Coverage (%) | 64.4 | 65.5 2% | 64.5 0% | 66.9 4% |
| sRGB Coverage (%) | 91.8 | 86.4 -6% | 82.1 -11% | 96.8 5% |
| AdobeRGB 1998 Coverage (%) | 65.5 | 63.1 -4% | 60 -8% | 68.2 4% |
| Response Times | 13% | -12% | -24% | |
| Response Time Grey 50% / Grey 80% * (ms) | 41 ? | 31.6 ? 23% | 47 ? -15% | 41 ? -0% |
| Response Time Black / White * (ms) | 25 ? | 24.4 ? 2% | 27 ? -8% | 37 ? -48% |
| PWM Frequency (Hz) | 200 ? | |||
| Screen | 10% | 3% | 30% | |
| Brightness middle (cd/m²) | 290 | 288.4 -1% | 298 3% | 328 13% |
| Brightness (cd/m²) | 257 | 282 10% | 282 10% | 328 28% |
| Brightness Distribution (%) | 79 | 83 5% | 80 1% | 69 -13% |
| Black Level * (cd/m²) | 0.3 | 0.35 -17% | 0.27 10% | 0.22 27% |
| Contrast (:1) | 967 | 824 -15% | 1104 14% | 1491 54% |
| Colorchecker dE 2000 * | 4.59 | 2.61 43% | 4.42 4% | 1.91 58% |
| Colorchecker dE 2000 max. * | 8.68 | 7.34 15% | 8.57 1% | 3.23 63% |
| Greyscale dE 2000 * | 4.32 | 1.18 73% | 4.11 5% | 1.69 61% |
| Gamma | 2.25 98% | 2.24 98% | 2.5 88% | 2.3 96% |
| CCT | 7320 89% | 6506 100% | 6329 103% | 6418 101% |
| Color Space (Percent of AdobeRGB 1998) (%) | 59 | 56.4 -4% | 54 -8% | 63 7% |
| Color Space (Percent of sRGB) (%) | 92 | 86.4 -6% | 82 -11% | 97 5% |
| Total Average (Program / Settings) | 7% /
8% | -5% /
-1% | 3% /
18% |
* ... smaller is better
Display Response Times
| ↔ Response Time Black to White | ||
|---|---|---|
| 25 ms ... rise ↗ and fall ↘ combined | ↗ 4 ms rise | 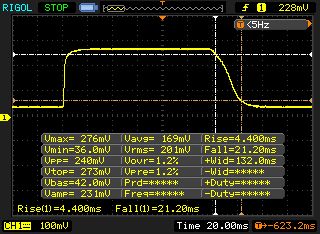 |
| ↘ 21 ms fall | ||
| The screen shows relatively slow response rates in our tests and may be too slow for gamers. In comparison, all tested devices range from 0.1 (minimum) to 240 (maximum) ms. » 59 % of all devices are better. This means that the measured response time is worse than the average of all tested devices (19.8 ms). | ||
| ↔ Response Time 50% Grey to 80% Grey | ||
| 41 ms ... rise ↗ and fall ↘ combined | ↗ 17 ms rise | 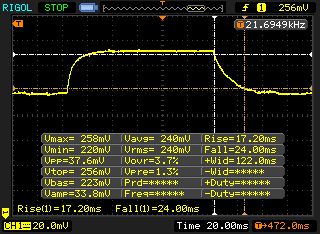 |
| ↘ 24 ms fall | ||
| The screen shows slow response rates in our tests and will be unsatisfactory for gamers. In comparison, all tested devices range from 0.165 (minimum) to 636 (maximum) ms. » 65 % of all devices are better. This means that the measured response time is worse than the average of all tested devices (30.9 ms). | ||
Screen Flickering / PWM (Pulse-Width Modulation)
| Screen flickering / PWM not detected | 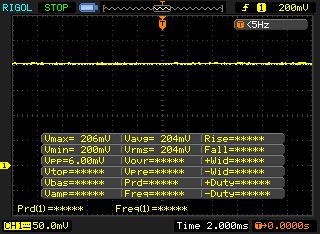 | ||
In comparison: 52 % of all tested devices do not use PWM to dim the display. If PWM was detected, an average of 7748 (minimum: 5 - maximum: 343500) Hz was measured. | |||
| Cinebench R15 | |
| CPU Single 64Bit | |
| Gigabyte Aero 14 | |
| Schenker XMG P407 | |
| Razer Blade (2016) | |
| MSI GS43VR 6RE-006US | |
| CPU Multi 64Bit | |
| Schenker XMG P407 | |
| Gigabyte Aero 14 | |
| MSI GS43VR 6RE-006US | |
| Razer Blade (2016) | |
| PCMark 8 | |
| Home Score Accelerated v2 | |
| Schenker XMG P407 | |
| MSI GS43VR 6RE-006US | |
| Gigabyte Aero 14 | |
| Razer Blade (2016) | |
| Work Score Accelerated v2 | |
| Schenker XMG P407 | |
| MSI GS43VR 6RE-006US | |
| Gigabyte Aero 14 | |
| Razer Blade (2016) | |
| PCMark 8 Home Score Accelerated v2 | 3717 points | |
| PCMark 8 Work Score Accelerated v2 | 4702 points | |
Help | ||
| Gigabyte Aero 14 LiteOn CX2-8B256 | MSI GS43VR 6RE-006US SanDisk SD8SN8U1T001122 | Schenker XMG P407 Samsung SM961 MZVPW256 m.2 PCI-e | Razer Blade (2016) Samsung PM951 NVMe MZVLV512 | |
|---|---|---|---|---|
| CrystalDiskMark 3.0 | -68% | 19% | -12% | |
| Read Seq (MB/s) | 1584 | 335.3 -79% | 1345 -15% | 1296 -18% |
| Write Seq (MB/s) | 795 | 299 -62% | 1502 89% | 603 -24% |
| Read 512 (MB/s) | 985 | 223 -77% | 320.3 -67% | 655 -34% |
| Write 512 (MB/s) | 814 | 246.7 -70% | 1276 57% | 604 -26% |
| Read 4k (MB/s) | 44.93 | 17.68 -61% | 58.9 31% | 42.22 -6% |
| Write 4k (MB/s) | 131.2 | 35.31 -73% | 171 30% | 139.6 6% |
| Read 4k QD32 (MB/s) | 602 | 247.4 -59% | 625 4% | 573 -5% |
| Write 4k QD32 (MB/s) | 441 | 156.3 -65% | 539 22% | 480 9% |

| 3DMark - 1920x1080 Fire Strike Graphics | |
| MSI GS43VR 6RE-006US | |
| Gigabyte Aero 14 | |
| Razer Blade (2016) | |
| Schenker XMG P407 | |
| 3DMark 11 - 1280x720 Performance GPU | |
| MSI GS43VR 6RE-006US | |
| Gigabyte Aero 14 | |
| Razer Blade (2016) | |
| Schenker XMG P407 | |
| 3DMark 11 Performance | 11868 points | |
| 3DMark Cloud Gate Standard Score | 20574 points | |
| 3DMark Fire Strike Score | 9778 points | |
Help | ||
| The Witcher 3 - 1920x1080 Ultra Graphics & Postprocessing (HBAO+) | |
| Gigabyte Aero 14 | |
| Razer Blade (2016) | |
| low | med. | high | ultra | |
|---|---|---|---|---|
| The Witcher 3 (2015) | 38.3 | |||
| Anno 2205 (2015) | 77.5 | 29 | ||
| The Division (2016) | 46.9 | 37.8 | ||
| For Honor (2017) | 56 () | 42 () | ||
| Ghost Recon Wildlands (2017) | 66.2 | 60.1 | 35.7 |
Noise level
| Idle |
| 31 / 32 / 33 dB(A) |
| Load |
| 42 / 53 dB(A) |
 | ||
30 dB silent 40 dB(A) audible 50 dB(A) loud |
||
min: | ||
(-) The maximum temperature on the upper side is 58.3 °C / 137 F, compared to the average of 36.8 °C / 98 F, ranging from 21 to 71 °C for the class Multimedia.
(-) The bottom heats up to a maximum of 59.8 °C / 140 F, compared to the average of 39.1 °C / 102 F
(+) In idle usage, the average temperature for the upper side is 22.9 °C / 73 F, compared to the device average of 31.3 °C / 88 F.
(-) Playing The Witcher 3, the average temperature for the upper side is 40.7 °C / 105 F, compared to the device average of 31.3 °C / 88 F.
(+) The palmrests and touchpad are reaching skin temperature as a maximum (34.5 °C / 94.1 F) and are therefore not hot.
(-) The average temperature of the palmrest area of similar devices was 28.7 °C / 83.7 F (-5.8 °C / -10.4 F).
Gigabyte Aero 14 audio analysis
(±) | speaker loudness is average but good (79 dB)
Bass 100 - 315 Hz
(±) | reduced bass - on average 10.6% lower than median
(±) | linearity of bass is average (13.7% delta to prev. frequency)
Mids 400 - 2000 Hz
(+) | balanced mids - only 3.6% away from median
(±) | linearity of mids is average (8% delta to prev. frequency)
Highs 2 - 16 kHz
(+) | balanced highs - only 2.1% away from median
(+) | highs are linear (5.1% delta to prev. frequency)
Overall 100 - 16.000 Hz
(+) | overall sound is linear (12.8% difference to median)
Compared to same class
» 24% of all tested devices in this class were better, 5% similar, 71% worse
» The best had a delta of 5%, average was 17%, worst was 45%
Compared to all devices tested
» 12% of all tested devices were better, 3% similar, 85% worse
» The best had a delta of 4%, average was 23%, worst was 134%
Razer Blade (2016) audio analysis
(±) | speaker loudness is average but good (79 dB)
Bass 100 - 315 Hz
(±) | reduced bass - on average 8.4% lower than median
(±) | linearity of bass is average (11.2% delta to prev. frequency)
Mids 400 - 2000 Hz
(+) | balanced mids - only 4.6% away from median
(+) | mids are linear (4.3% delta to prev. frequency)
Highs 2 - 16 kHz
(+) | balanced highs - only 4.3% away from median
(+) | highs are linear (5.5% delta to prev. frequency)
Overall 100 - 16.000 Hz
(±) | linearity of overall sound is average (17.1% difference to median)
Compared to same class
» 46% of all tested devices in this class were better, 12% similar, 42% worse
» The best had a delta of 6%, average was 18%, worst was 132%
Compared to all devices tested
» 31% of all tested devices were better, 8% similar, 61% worse
» The best had a delta of 4%, average was 23%, worst was 134%
MSI GS43VR 6RE-006US audio analysis
(±) | speaker loudness is average but good (76.7 dB)
Bass 100 - 315 Hz
(-) | nearly no bass - on average 17.5% lower than median
(±) | linearity of bass is average (12% delta to prev. frequency)
Mids 400 - 2000 Hz
(+) | balanced mids - only 3.9% away from median
(±) | linearity of mids is average (9.5% delta to prev. frequency)
Highs 2 - 16 kHz
(±) | higher highs - on average 6.4% higher than median
(±) | linearity of highs is average (8.5% delta to prev. frequency)
Overall 100 - 16.000 Hz
(±) | linearity of overall sound is average (28.9% difference to median)
Compared to same class
» 95% of all tested devices in this class were better, 2% similar, 4% worse
» The best had a delta of 6%, average was 18%, worst was 132%
Compared to all devices tested
» 87% of all tested devices were better, 2% similar, 11% worse
» The best had a delta of 4%, average was 23%, worst was 134%
Schenker XMG P407 audio analysis
(±) | speaker loudness is average but good (78 dB)
Bass 100 - 315 Hz
(-) | nearly no bass - on average 19.2% lower than median
(±) | linearity of bass is average (11% delta to prev. frequency)
Mids 400 - 2000 Hz
(+) | balanced mids - only 4.4% away from median
(±) | linearity of mids is average (9.6% delta to prev. frequency)
Highs 2 - 16 kHz
(+) | balanced highs - only 3.7% away from median
(+) | highs are linear (5.5% delta to prev. frequency)
Overall 100 - 16.000 Hz
(±) | linearity of overall sound is average (20.5% difference to median)
Compared to same class
» 73% of all tested devices in this class were better, 5% similar, 22% worse
» The best had a delta of 6%, average was 18%, worst was 132%
Compared to all devices tested
» 54% of all tested devices were better, 8% similar, 38% worse
» The best had a delta of 4%, average was 23%, worst was 134%
| Off / Standby | |
| Idle | |
| Load |
|
Key:
min: | |
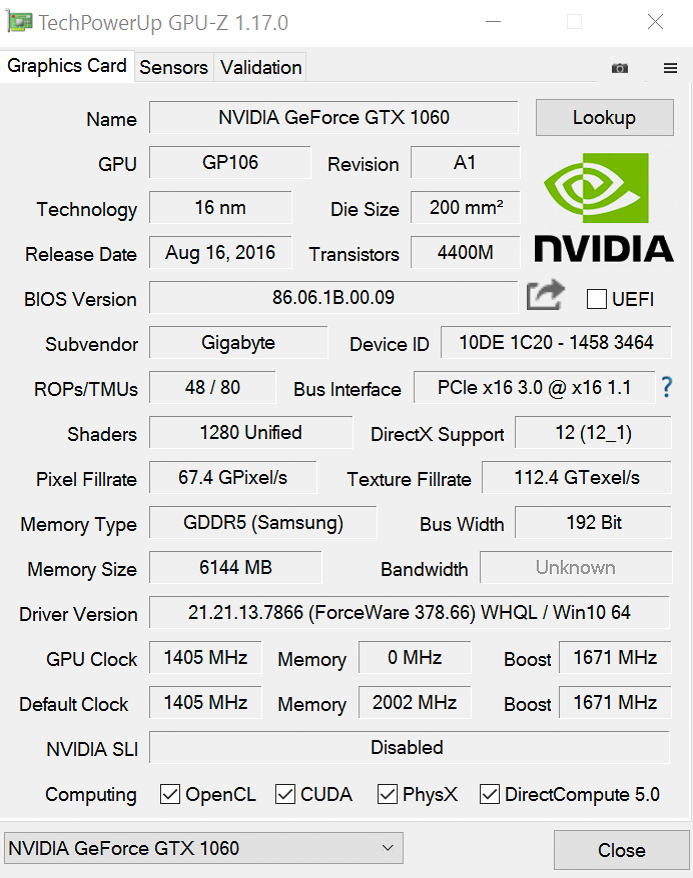
| Gigabyte Aero 14 i7-7700HQ, GeForce GTX 1060 Mobile | MSI GS43VR 6RE-006US 6700HQ, GeForce GTX 1060 Mobile | Schenker XMG P407 i7-7700HQ, GeForce GTX 1050 Ti Mobile | Razer Blade (2016) 6700HQ, GeForce GTX 1060 Mobile | |
|---|---|---|---|---|
| Power Consumption | -28% | -10% | -2% | |
| Idle Minimum * (Watt) | 8 | 12.1 -51% | 10 -25% | 9 -13% |
| Idle Average * (Watt) | 13 | 19 -46% | 15 -15% | 14 -8% |
| Idle Maximum * (Watt) | 20 | 19.5 2% | 24 -20% | 22 -10% |
| Load Average * (Watt) | 78 | 106.7 -37% | 82 -5% | 72 8% |
| Witcher 3 ultra * (Watt) | 110 | |||
| Load Maximum * (Watt) | 146 | 159 -9% | 124 15% | 124 15% |
* ... smaller is better
| Gigabyte Aero 14 i7-7700HQ, GeForce GTX 1060 Mobile, 94 Wh | MSI GS43VR 6RE-006US 6700HQ, GeForce GTX 1060 Mobile, 61 Wh | Schenker XMG P407 i7-7700HQ, GeForce GTX 1050 Ti Mobile, 45 Wh | Razer Blade (2016) 6700HQ, GeForce GTX 1060 Mobile, 70 Wh | |
|---|---|---|---|---|
| Battery runtime | -42% | -46% | -53% | |
| Reader / Idle (h) | 15.2 | 9.6 -37% | 7.4 -51% | |
| WiFi v1.3 (h) | 8.7 | 4.4 -49% | 4 -54% | 4.1 -53% |
| Load (h) | 2.2 | 1.3 -41% | 1.5 -32% | |
| H.264 (h) | 3.6 |
Pros
Cons
所以,是不是它的一切都很好呢?应该说接近。我们的缺点列表中的大部分项目都与典型的Aero 14用户无关。但是,风扇在中等转速下的啸叫声十分令人厌烦,技嘉迫切需要解决这个问题。
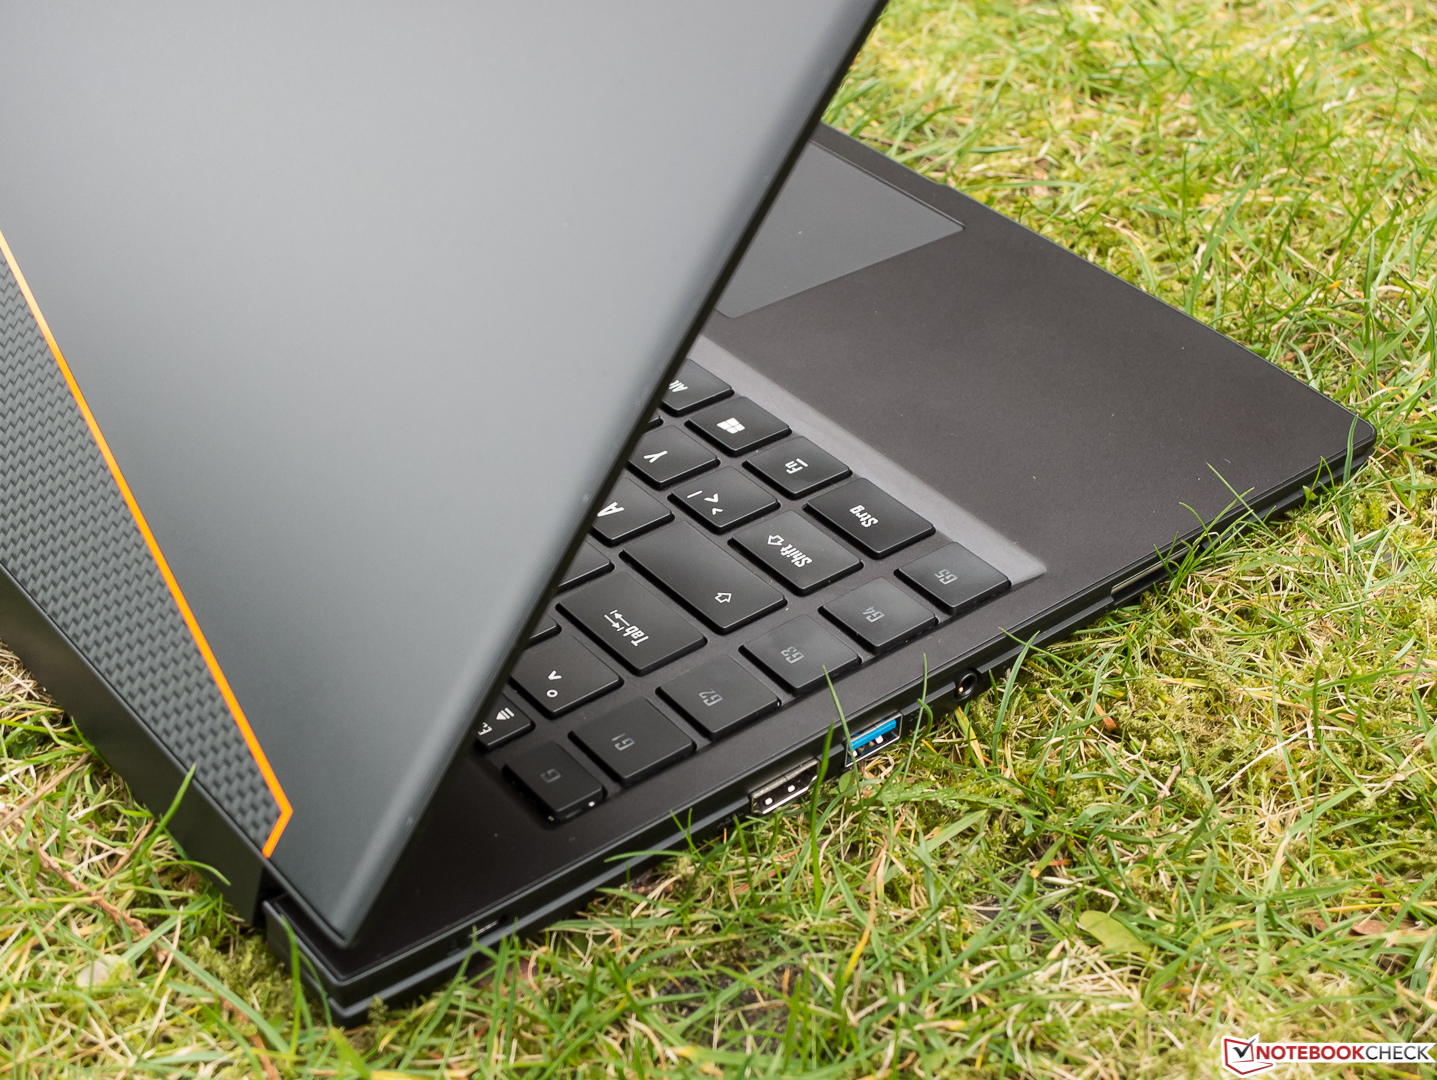
在另一方面。Aero 14整体上给我们留下了很好的印象。尽管有着容量巨大的电池,整体的铝质机身依旧轻薄。尽管键盘是为玩家设计的(带有多功能按键)非标准的键盘,其即使作为办公本其体验依旧是出色的。接口比我们想象的还要多,而且附带有USB网卡。而且,我们对它的性能感到满意。
它巨大的电池及其所带来的长电池续航时间是Aero 14区别于其他移动游戏本竞品的独一无二的特点。但它被散热风扇的高频啸叫问题所掩盖,这就是为什么我们不能推荐这台笔记本。
注:本文是基于完整评测的缩减版本,阅读完整的英文评测,请点击这里。
Gigabyte Aero 14
- 06/30/2017 v6 (old)
Sven Kloevekorn
Price comparison
