微星 GS63VR 7RF (7700HQ, 4K超高清, GTX 1060) 笔记本电脑简短评测


| SD Card Reader | |
| average JPG Copy Test (av. of 3 runs) | |
| Dell XPS 15 9560 (i7-7700HQ, UHD) | |
| Asus FX502VM-AS73 | |
| MSI GS63VR 7RF-228US | |
| maximum AS SSD Seq Read Test (1GB) | |
| Dell XPS 15 9560 (i7-7700HQ, UHD) | |
| Asus FX502VM-AS73 | |
| MSI GS63VR 7RF-228US | |
| Networking | |
| iperf3 transmit AX12 | |
| MSI GS63VR 7RF-228US | |
| Dell XPS 15 9560 (i7-7700HQ, UHD) | |
| Asus FX502VM-AS73 | |
| iperf3 receive AX12 | |
| MSI GS63VR 7RF-228US | |
| Dell XPS 15 9560 (i7-7700HQ, UHD) | |
| Asus FX502VM-AS73 | |
| |||||||||||||||||||||||||
Brightness Distribution: 92 %
Center on Battery: 274.2 cd/m²
Contrast: 623:1 (Black: 0.44 cd/m²)
ΔE ColorChecker Calman: 8 | ∀{0.5-29.43 Ø4.73}
ΔE Greyscale Calman: 9.1 | ∀{0.09-98 Ø4.97}
72.1% sRGB (Argyll 1.6.3 3D)
45.7% AdobeRGB 1998 (Argyll 1.6.3 3D)
49.81% AdobeRGB 1998 (Argyll 3D)
72.6% sRGB (Argyll 3D)
48.21% Display P3 (Argyll 3D)
Gamma: 2.24
CCT: 5020 K
| MSI GS63VR 7RF-228US IPS, 15.6", 3840x2160 | Dell XPS 15 9560 (i7-7700HQ, UHD) IGZO IPS, 15.6", 3840x2160 | Asus FX502VM-AS73 TN LED, 15.6", 1920x1080 | Alienware 15 R3 HPJGK_B156HTN (AUO51ED), TN, 15.6", 1920x1080 | Apple MacBook Pro 15 2016 (2.9 GHz, 460) Apple APPA030, IPS, 15.4", 2880x1800 | |
|---|---|---|---|---|---|
| Display | 75% | -21% | 32% | 73% | |
| Display P3 Coverage (%) | 48.21 | 89.7 86% | 38.28 -21% | 66 37% | 99 105% |
| sRGB Coverage (%) | 72.6 | 100 38% | 56.9 -22% | 90.5 25% | 100 38% |
| AdobeRGB 1998 Coverage (%) | 49.81 | 100 101% | 39.47 -21% | 66.2 33% | 87.3 75% |
| Response Times | -85% | 2% | 30% | -101% | |
| Response Time Grey 50% / Grey 80% * (ms) | 28 ? | 57.2 ? -104% | 28.4 ? -1% | 25 ? 11% | 46 ? -64% |
| Response Time Black / White * (ms) | 23.6 ? | 39.2 ? -66% | 22.4 ? 5% | 12 ? 49% | 56 ? -137% |
| PWM Frequency (Hz) | 1351 ? | 962 | 119000 ? | ||
| Screen | 39% | -11% | 15% | 56% | |
| Brightness middle (cd/m²) | 274.2 | 370.1 35% | 209.5 -24% | 386 41% | 420 53% |
| Brightness (cd/m²) | 263 | 356 35% | 205 -22% | 382 45% | 401 52% |
| Brightness Distribution (%) | 92 | 87 -5% | 92 0% | 93 1% | 90 -2% |
| Black Level * (cd/m²) | 0.44 | 0.37 16% | 0.69 -57% | 0.39 11% | 0.3 32% |
| Contrast (:1) | 623 | 1000 61% | 304 -51% | 990 59% | 1400 125% |
| Colorchecker dE 2000 * | 8 | 5.3 34% | 4.7 41% | 10.2 -27% | 3.33 58% |
| Colorchecker dE 2000 max. * | 14.6 | 9.9 32% | 19.7 -35% | 15.81 -8% | 5.11 65% |
| Greyscale dE 2000 * | 9.1 | 4.6 49% | 1.8 80% | 11.28 -24% | 2.73 70% |
| Gamma | 2.24 98% | 2.31 95% | 2.23 99% | 2.23 99% | 2.48 89% |
| CCT | 5020 129% | 6284 103% | 6975 93% | 11383 57% | 6457 101% |
| Color Space (Percent of AdobeRGB 1998) (%) | 45.7 | 88.3 93% | 36.2 -21% | 59 29% | 78.09 71% |
| Color Space (Percent of sRGB) (%) | 72.1 | 100 39% | 56.6 -21% | 90 25% | 99.97 39% |
| Total Average (Program / Settings) | 10% /
30% | -10% /
-11% | 26% /
20% | 9% /
39% |
* ... smaller is better
Display Response Times
| ↔ Response Time Black to White | ||
|---|---|---|
| 23.6 ms ... rise ↗ and fall ↘ combined | ↗ 15.2 ms rise | 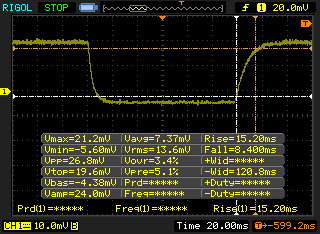 |
| ↘ 8.4 ms fall | ||
| The screen shows good response rates in our tests, but may be too slow for competitive gamers. In comparison, all tested devices range from 0.1 (minimum) to 240 (maximum) ms. » 54 % of all devices are better. This means that the measured response time is worse than the average of all tested devices (19.9 ms). | ||
| ↔ Response Time 50% Grey to 80% Grey | ||
| 28 ms ... rise ↗ and fall ↘ combined | ↗ 15.6 ms rise | 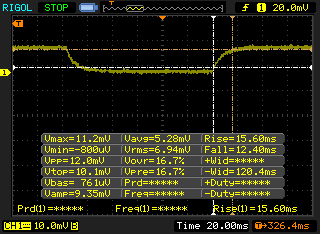 |
| ↘ 12.4 ms fall | ||
| The screen shows relatively slow response rates in our tests and may be too slow for gamers. In comparison, all tested devices range from 0.165 (minimum) to 636 (maximum) ms. » 38 % of all devices are better. This means that the measured response time is similar to the average of all tested devices (31.1 ms). | ||
Screen Flickering / PWM (Pulse-Width Modulation)
| Screen flickering / PWM detected | 1351 Hz | ≤ 39 % brightness setting | 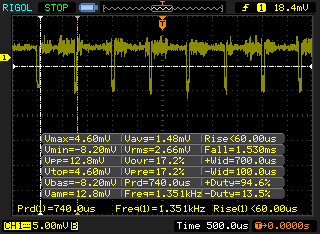 |
The display backlight flickers at 1351 Hz (worst case, e.g., utilizing PWM) Flickering detected at a brightness setting of 39 % and below. There should be no flickering or PWM above this brightness setting. The frequency of 1351 Hz is quite high, so most users sensitive to PWM should not notice any flickering. In comparison: 52 % of all tested devices do not use PWM to dim the display. If PWM was detected, an average of 7791 (minimum: 5 - maximum: 343500) Hz was measured. | |||
| Cinebench R15 | |
| CPU Single 64Bit | |
| i7-7700K Gigabyte Z270-Gaming K3 | |
| MSI GS63VR 7RF-228US | |
| Eurocom Sky X7E2 | |
| Asus Strix GL702VSK | |
| EVGA SC17 GTX 1070 | |
| MSI GP62-2QEi781FD | |
| Asus GL702VM-GC102D | |
| Lenovo IdeaPad Y50 | |
| CPU Multi 64Bit | |
| i7-7700K Gigabyte Z270-Gaming K3 | |
| Eurocom Sky X7E2 | |
| MSI GS63VR 7RF-228US | |
| Asus Strix GL702VSK | |
| EVGA SC17 GTX 1070 | |
| MSI GP62-2QEi781FD | |
| Asus GL702VM-GC102D | |
| Lenovo IdeaPad Y50 | |
| Cinebench R11.5 | |
| CPU Single 64Bit | |
| i7-7700K Gigabyte Z270-Gaming K3 | |
| Asus Strix GL702VSK | |
| MSI GS63VR 7RF-228US | |
| Eurocom Sky X7E2 | |
| EVGA SC17 GTX 1070 | |
| MSI GP62-2QEi781FD | |
| Asus GL702VM-GC102D | |
| Lenovo IdeaPad Y50 | |
| CPU Multi 64Bit | |
| i7-7700K Gigabyte Z270-Gaming K3 | |
| Eurocom Sky X7E2 | |
| MSI GS63VR 7RF-228US | |
| Asus Strix GL702VSK | |
| EVGA SC17 GTX 1070 | |
| MSI GP62-2QEi781FD | |
| Asus GL702VM-GC102D | |
| Lenovo IdeaPad Y50 | |
| Cinebench R10 | |
| Rendering Multiple CPUs 32Bit | |
| i7-7700K Gigabyte Z270-Gaming K3 | |
| Eurocom Sky X7E2 | |
| MSI GS63VR 7RF-228US | |
| Asus Strix GL702VSK | |
| EVGA SC17 GTX 1070 | |
| Asus GL702VM-GC102D | |
| MSI GP62-2QEi781FD | |
| Lenovo IdeaPad Y50 | |
| Rendering Single 32Bit | |
| i7-7700K Gigabyte Z270-Gaming K3 | |
| Eurocom Sky X7E2 | |
| Asus Strix GL702VSK | |
| MSI GS63VR 7RF-228US | |
| EVGA SC17 GTX 1070 | |
| MSI GP62-2QEi781FD | |
| Asus GL702VM-GC102D | |
| Lenovo IdeaPad Y50 | |
| wPrime 2.10 - 1024m | |
| Lenovo IdeaPad Y50 | |
| MSI GS63VR 7RF-228US | |
| Asus Strix GL702VSK | |
| EVGA SC17 GTX 1070 | |
| MSI GP62-2QEi781FD | |
| Eurocom Sky X7E2 | |
| i7-7700K Gigabyte Z270-Gaming K3 | |
| 3DMark | |
| 3840x2160 Fire Strike Ultra Physics | |
| Eurocom Sky X7E2 | |
| EVGA SC17 GTX 1070 | |
| MSI GS63VR 7RF-228US | |
| Asus GL702VM-GC102D | |
| Fire Strike Extreme Physics | |
| Eurocom Sky X7E2 | |
| MSI GP62-2QEi781FD | |
| Asus Strix GL702VSK | |
| EVGA SC17 GTX 1070 | |
| MSI GS63VR 7RF-228US | |
| Asus GL702VM-GC102D | |
| Lenovo IdeaPad Y50 | |
| 1920x1080 Fire Strike Physics | |
| i7-7700K Gigabyte Z270-Gaming K3 | |
| Eurocom Sky X7E2 | |
| MSI GP62-2QEi781FD | |
| Asus Strix GL702VSK | |
| EVGA SC17 GTX 1070 | |
| MSI GS63VR 7RF-228US | |
| Asus GL702VM-GC102D | |
| Lenovo IdeaPad Y50 | |
* ... smaller is better
| PCMark 8 | |
| Home Score Accelerated v2 | |
| Alienware 15 R3 | |
| Asus FX502VM-AS73 | |
| MSI GS63VR 7RF-228US | |
| Gigabyte P55W v7 | |
| Dell XPS 15 9560 (i7-7700HQ, UHD) | |
| Work Score Accelerated v2 | |
| Gigabyte P55W v7 | |
| Alienware 15 R3 | |
| MSI GS63VR 7RF-228US | |
| Dell XPS 15 9560 (i7-7700HQ, UHD) | |
| Asus FX502VM-AS73 | |
| Creative Score Accelerated v2 | |
| Alienware 15 R3 | |
| Asus FX502VM-AS73 | |
| MSI GS63VR 7RF-228US | |
| Dell XPS 15 9560 (i7-7700HQ, UHD) | |
| PCMark 8 Home Score Accelerated v2 | 4141 points | |
| PCMark 8 Creative Score Accelerated v2 | 5318 points | |
| PCMark 8 Work Score Accelerated v2 | 5268 points | |
Help | ||
| MSI GS63VR 7RF-228US Samsung SM961 MZVKW512HMJP m.2 PCI-e | Dell XPS 15 9560 (i7-7700HQ, UHD) Lite-On CX2-8B512-Q11 | Asus FX502VM-AS73 SK Hynix HFS256G39TND-N210A | Alienware 15 R3 | Apple MacBook Pro 15 2016 (2.9 GHz, 460) Apple SSD SM1024L | |
|---|---|---|---|---|---|
| CrystalDiskMark 3.0 | -7% | -64% | -26% | -19% | |
| Read Seq (MB/s) | 2141 | 1684 -21% | 503 -77% | 1123 -48% | 1458 -32% |
| Write Seq (MB/s) | 1621 | 1106 -32% | 138.2 -91% | 429.2 -74% | 1440 -11% |
| Read 512 (MB/s) | 499.7 | 977 96% | 343.5 -31% | 833 67% | 914 83% |
| Write 512 (MB/s) | 1531 | 1119 -27% | 137.8 -91% | 428.1 -72% | 1058 -31% |
| Read 4k (MB/s) | 54.2 | 45.14 -17% | 29.36 -46% | 37.8 -30% | 9.786 -82% |
| Write 4k (MB/s) | 158.2 | 134.1 -15% | 70.9 -55% | 122.9 -22% | 10.9 -93% |
| Read 4k QD32 (MB/s) | 632 | 509 -19% | 369.9 -41% | 542 -14% | 679 7% |
| Write 4k QD32 (MB/s) | 527 | 398.1 -24% | 99.7 -81% | 429.8 -18% | 562 7% |

| 3DMark | |
| 1920x1080 Fire Strike Graphics | |
| Asus Strix GL702VSK | |
| Asus Strix GTX 980 Ti Desktop PC | |
| Nvidia GeForce GTX 1060 Founders Edition 6 GB | |
| Asus FX502VM-AS73 | |
| MSI GS63VR 7RF-228US | |
| Razer Blade (2016) FHD | |
| Asus Strix GL502VY-DS71 | |
| Schenker XMG P407 | |
| 3840x2160 Fire Strike Ultra Graphics | |
| Asus Strix GTX 980 Ti Desktop PC | |
| Nvidia GeForce GTX 1060 Founders Edition 6 GB | |
| Asus FX502VM-AS73 | |
| MSI GS63VR 7RF-228US | |
| Razer Blade (2016) FHD | |
| Asus Strix GL502VY-DS71 | |
| Schenker XMG P407 | |
| Fire Strike Extreme Graphics | |
| Asus Strix GL702VSK | |
| Asus Strix GTX 980 Ti Desktop PC | |
| Asus FX502VM-AS73 | |
| MSI GS63VR 7RF-228US | |
| Razer Blade (2016) FHD | |
| Asus Strix GL502VY-DS71 | |
| Schenker XMG P407 | |
| 3DMark 11 | |
| 1280x720 Performance GPU | |
| Asus Strix GTX 980 Ti Desktop PC | |
| Asus Strix GL702VSK | |
| Nvidia GeForce GTX 1060 Founders Edition 6 GB | |
| Asus FX502VM-AS73 | |
| MSI GS63VR 7RF-228US | |
| Razer Blade (2016) FHD | |
| Asus Strix GL502VY-DS71 | |
| Schenker XMG P407 | |
| 1280x720 Performance Combined | |
| Asus Strix GTX 980 Ti Desktop PC | |
| Nvidia GeForce GTX 1060 Founders Edition 6 GB | |
| Asus FX502VM-AS73 | |
| MSI GS63VR 7RF-228US | |
| Asus Strix GL502VY-DS71 | |
| Razer Blade (2016) FHD | |
| Schenker XMG P407 | |
| Asus Strix GL702VSK | |
| 3DMark 11 Performance | 12530 points | |
| 3DMark Cloud Gate Standard Score | 17664 points | |
| 3DMark Fire Strike Score | 9485 points | |
| 3DMark Fire Strike Extreme Score | 5047 points | |
Help | ||
| low | med. | high | ultra | 4K | |
|---|---|---|---|---|---|
| BioShock Infinite (2013) | 100.6 | ||||
| Metro: Last Light (2013) | 78.1 | ||||
| Thief (2014) | 74.9 | ||||
| The Witcher 3 (2015) | 76 | 39.4 | 26.3 | ||
| Batman: Arkham Knight (2015) | 58 | 29 | |||
| Metal Gear Solid V (2015) | 60 | 40.8 | |||
| Fallout 4 (2015) | 64 | 26.2 | |||
| Rise of the Tomb Raider (2016) | 64.1 | 25.5 | |||
| Doom (2016) | 92.3 | 30.5 | |||
| Overwatch (2016) | 104.6 | 54.5 | |||
| Mafia 3 (2016) | 43.6 | 13.1 |
| Fallout 4 - 3840x2160 High Preset AA:T AF:16x | |
| Eurocom Tornado F5 Killer Edition | |
| Gigabyte P57X v7 | |
| Nvidia GeForce GTX 1060 Founders Edition 6 GB | |
| MSI GS63VR 7RF-228US | |
| MSI GE72 7RE-046 | |
| Dell XPS 15 9560 (i7-7700HQ, UHD) | |
| The Witcher 3 - 3840x2160 High Graphics & Postprocessing (Nvidia HairWorks Off) | |
| Eurocom Tornado F5 Killer Edition | |
| Nvidia GeForce GTX 1060 Founders Edition 6 GB | |
| MSI GS63VR 7RF-228US | |
| MSI GE72 7RE-046 | |
| Batman: Arkham Knight - 3840x2160 High / On (Interactive Smoke & Paper Debris Off) AA:SM AF:8x | |
| Eurocom Tornado F5 Killer Edition | |
| Gigabyte P57X v7 | |
| Nvidia GeForce GTX 1060 Founders Edition 6 GB | |
| MSI GS63VR 7RF-228US | |
| MSI GE72 7RE-046 | |
| Dell XPS 15 9560 (i7-7700HQ, UHD) | |
| Rise of the Tomb Raider - 3840x2160 High Preset AA:FX AF:4x | |
| Eurocom Tornado F5 Killer Edition | |
| Gigabyte P57X v7 | |
| Nvidia GeForce GTX 1060 Founders Edition 6 GB | |
| Nvidia GeForce GTX 1060 Founders Edition 6 GB | |
| MSI GS63VR 7RF-228US | |
| MSI GE72 7RE-046 | |
| Dell XPS 15 9560 (i7-7700HQ, UHD) | |
| Doom - 3840x2160 High Preset AA:FX | |
| Eurocom Tornado F5 Killer Edition | |
| Nvidia GeForce GTX 1060 Founders Edition 6 GB | |
| MSI GS63VR 7RF-228US | |
| MSI GE72 7RE-046 | |
| Dell XPS 15 9560 (i7-7700HQ, UHD) | |
| Overwatch - 3840x2160 High (Render Scale 100 %) AA:SM AF:4x | |
| Eurocom Tornado F5 Killer Edition | |
| Nvidia GeForce GTX 1060 Founders Edition 6 GB | |
| MSI GS63VR 7RF-228US | |
| MSI GE72 7RE-046 | |
| Dell XPS 15 9560 (i7-7700HQ, UHD) | |
| Mafia 3 - 3840x2160 High Preset | |
| Eurocom Tornado F5 Killer Edition | |
| MSI GS63VR 7RF-228US | |
| MSI GE72 7RE-046 | |
Noise level
| Idle |
| 33.1 / 33.1 / 34 dB(A) |
| Load |
| 37.2 / 47.1 dB(A) |
 | ||
30 dB silent 40 dB(A) audible 50 dB(A) loud |
||
min: | ||
| MSI GS63VR 7RF-228US GeForce GTX 1060 Mobile, i7-7700HQ, Samsung SM961 MZVKW512HMJP m.2 PCI-e | Dell XPS 15 9560 (i7-7700HQ, UHD) GeForce GTX 1050 Mobile, i7-7700HQ, Lite-On CX2-8B512-Q11 | Asus FX502VM-AS73 GeForce GTX 1060 Mobile, i7-7700HQ, SK Hynix HFS256G39TND-N210A | Alienware 15 R3 GeForce GTX 1070 Mobile, i7-7700HQ | Apple MacBook Pro 15 2016 (2.9 GHz, 460) Radeon Pro 460, 6920HQ, Apple SSD SM1024L | MSI GS60 6QE-002US GeForce GTX 970M, 6700HQ, Samsung SM951 MZHPV128 m.2 PCI-e | |
|---|---|---|---|---|---|---|
| Noise | -1% | -2% | -10% | 6% | -5% | |
| off / environment * (dB) | 28.8 | 28.4 1% | 28.7 -0% | 30 -4% | 29 -1% | |
| Idle Minimum * (dB) | 33.1 | 29 12% | 30.6 8% | 31 6% | 30.3 8% | 35.2 -6% |
| Idle Average * (dB) | 33.1 | 29 12% | 30.6 8% | 32 3% | 30.3 8% | 35.3 -7% |
| Idle Maximum * (dB) | 34 | 32.2 5% | 31 9% | 42 -24% | 30.3 11% | 35.5 -4% |
| Load Average * (dB) | 37.2 | 47.1 -27% | 46.2 -24% | 49 -32% | 35.1 6% | 40.4 -9% |
| Witcher 3 ultra * (dB) | 46.1 | 52 -13% | ||||
| Load Maximum * (dB) | 47.1 | 47.1 -0% | 52.3 -11% | 50 -6% | 46 2% | 47.2 -0% |
* ... smaller is better
(±) Playing The Witcher 3, the average temperature for the upper side is 35.1 °C / 95 F, compared to the device average of 33.9 °C / 93 F.
(+) The palmrests and touchpad are reaching skin temperature as a maximum (32.4 °C / 90.3 F) and are therefore not hot.
(-) The average temperature of the palmrest area of similar devices was 28.8 °C / 83.8 F (-3.6 °C / -6.5 F).
MSI GS63VR 7RF-228US audio analysis
(±) | speaker loudness is average but good (75 dB)
Bass 100 - 315 Hz
(-) | nearly no bass - on average 25.3% lower than median
(±) | linearity of bass is average (12.4% delta to prev. frequency)
Mids 400 - 2000 Hz
(+) | balanced mids - only 3.3% away from median
(±) | linearity of mids is average (7% delta to prev. frequency)
Highs 2 - 16 kHz
(±) | higher highs - on average 8.1% higher than median
(±) | linearity of highs is average (8.6% delta to prev. frequency)
Overall 100 - 16.000 Hz
(±) | linearity of overall sound is average (28.4% difference to median)
Compared to same class
» 94% of all tested devices in this class were better, 1% similar, 5% worse
» The best had a delta of 6%, average was 18%, worst was 132%
Compared to all devices tested
» 86% of all tested devices were better, 3% similar, 12% worse
» The best had a delta of 4%, average was 24%, worst was 134%
Apple MacBook 12 (Early 2016) 1.1 GHz audio analysis
(+) | speakers can play relatively loud (83.6 dB)
Bass 100 - 315 Hz
(±) | reduced bass - on average 11.3% lower than median
(±) | linearity of bass is average (14.2% delta to prev. frequency)
Mids 400 - 2000 Hz
(+) | balanced mids - only 2.4% away from median
(+) | mids are linear (5.5% delta to prev. frequency)
Highs 2 - 16 kHz
(+) | balanced highs - only 2% away from median
(+) | highs are linear (4.5% delta to prev. frequency)
Overall 100 - 16.000 Hz
(+) | overall sound is linear (10.2% difference to median)
Compared to same class
» 7% of all tested devices in this class were better, 2% similar, 91% worse
» The best had a delta of 5%, average was 18%, worst was 53%
Compared to all devices tested
» 5% of all tested devices were better, 1% similar, 94% worse
» The best had a delta of 4%, average was 24%, worst was 134%
| Off / Standby | |
| Idle | |
| Load |
|
Key:
min: | |
| MSI GS63VR 7RF-228US i7-7700HQ, GeForce GTX 1060 Mobile, Samsung SM961 MZVKW512HMJP m.2 PCI-e, IPS, 3840x2160, 15.6" | Dell XPS 15 9560 (i7-7700HQ, UHD) i7-7700HQ, GeForce GTX 1050 Mobile, Lite-On CX2-8B512-Q11, IGZO IPS, 3840x2160, 15.6" | Asus FX502VM-AS73 i7-7700HQ, GeForce GTX 1060 Mobile, SK Hynix HFS256G39TND-N210A, TN LED, 1920x1080, 15.6" | Alienware 15 R3 i7-7700HQ, GeForce GTX 1070 Mobile, , TN, 1920x1080, 15.6" | Gigabyte P55W v7 i7-7700HQ, GeForce GTX 1060 Mobile, Liteonit CV3-8D256, IPS, 1920x1080, 15.6" | MSI GS63VR-6RF16H22 Stealth Pro 6700HQ, GeForce GTX 1060 Mobile, Samsung SM951 MZVPV256HDGL m.2 PCI-e, IPS, 1920x1080, 15.6" | |
|---|---|---|---|---|---|---|
| Power Consumption | 7% | 2% | -31% | 21% | -27% | |
| Idle Minimum * (Watt) | 14.5 | 11.9 18% | 14.9 -3% | 19 -31% | 8 45% | 18 -24% |
| Idle Average * (Watt) | 17.3 | 17.1 1% | 15.1 13% | 23 -33% | 13 25% | 22 -27% |
| Idle Maximum * (Watt) | 17.4 | 17.3 1% | 15.2 13% | 29 -67% | 18 -3% | 30 -72% |
| Load Average * (Watt) | 93 | 94.7 -2% | 105.8 -14% | 85 9% | 76 18% | 77 17% |
| Witcher 3 ultra * (Watt) | 128.8 | 104.8 19% | ||||
| Load Maximum * (Watt) | 122 | 148.8 | 192 | 143 | 165 |
* ... smaller is better
| MSI GS63VR 7RF-228US i7-7700HQ, GeForce GTX 1060 Mobile, 65 Wh | Dell XPS 15 9560 (i7-7700HQ, UHD) i7-7700HQ, GeForce GTX 1050 Mobile, 97 Wh | Asus FX502VM-AS73 i7-7700HQ, GeForce GTX 1060 Mobile, 64 Wh | Alienware 15 R3 i7-7700HQ, GeForce GTX 1070 Mobile, 99 Wh | Apple MacBook Pro 15 2016 (2.9 GHz, 460) 6920HQ, Radeon Pro 460, 76 Wh | |
|---|---|---|---|---|---|
| Battery runtime | 78% | -1% | 15% | 67% | |
| Reader / Idle (h) | 6.4 | 13.9 117% | 6.1 -5% | 6.4 0% | |
| WiFi v1.3 (h) | 3.9 | 7.2 85% | 4.6 18% | 4.4 13% | 10.3 164% |
| Load (h) | 1.3 | 1.7 31% | 1.1 -15% | 1.7 31% | 0.9 -31% |
Pros
Cons

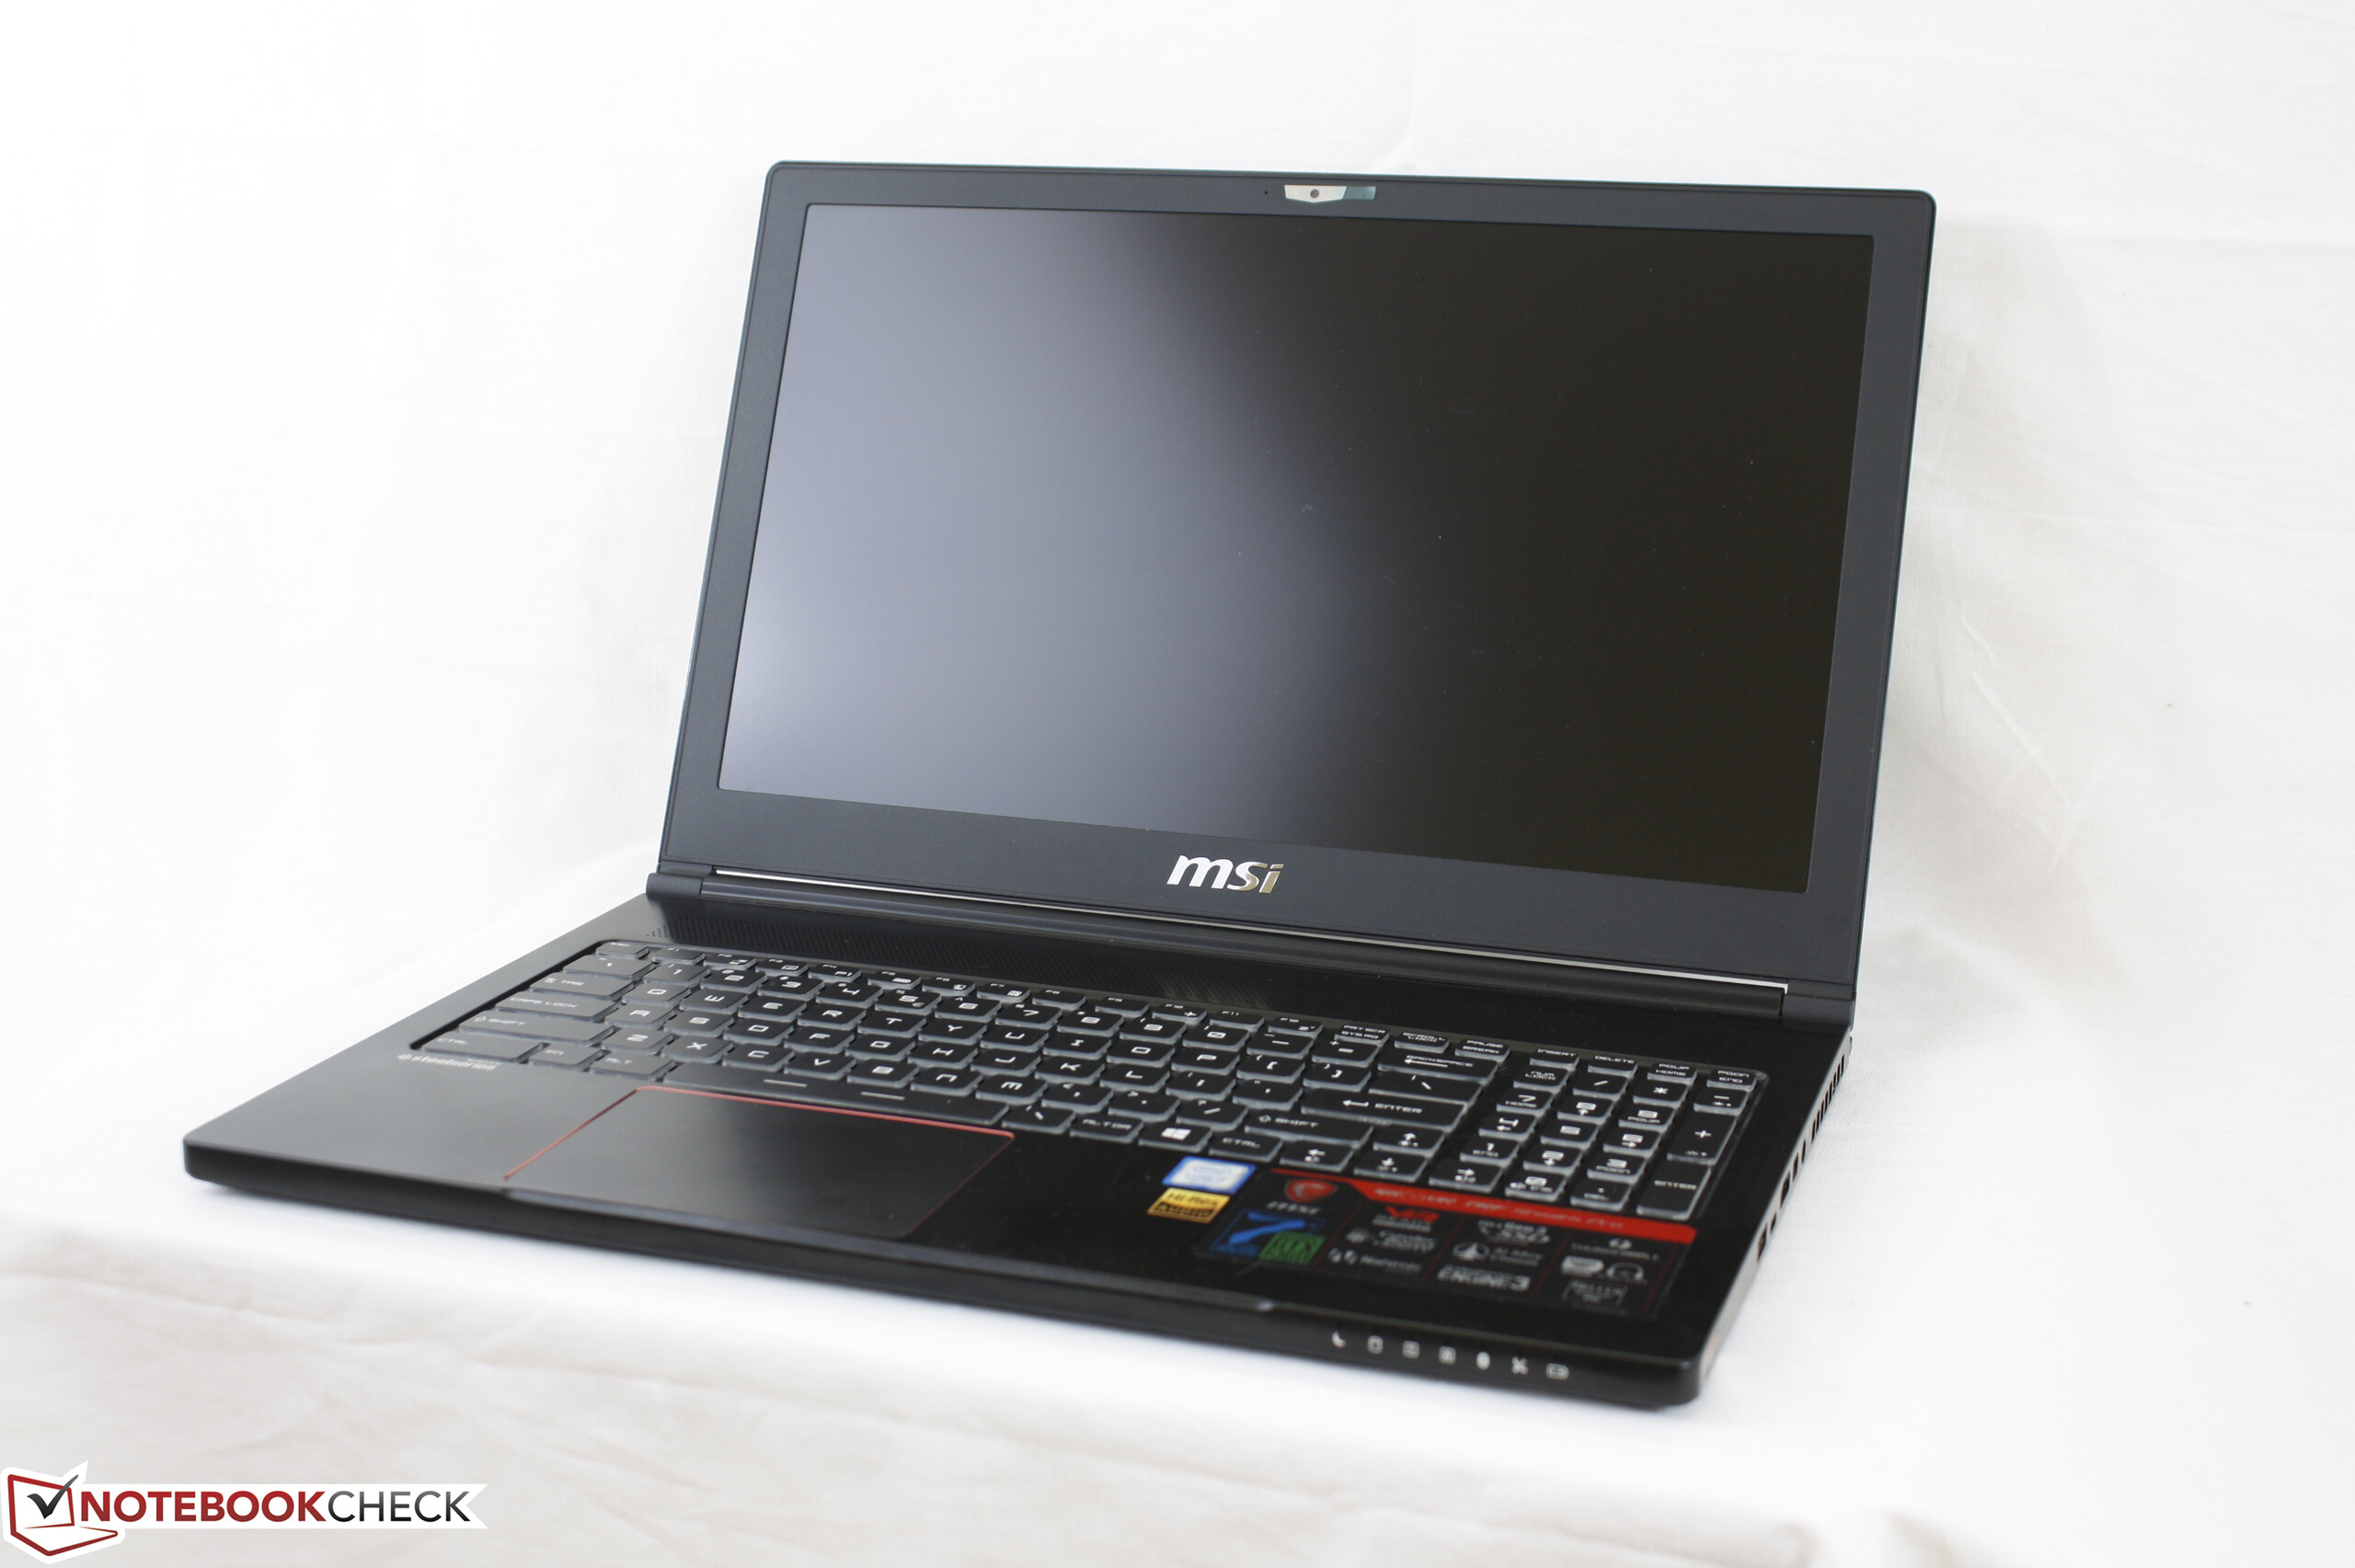
第一代的GS60有些超前于时代。超薄机身设计和4K超高清屏幕很难与Broadwell/Maxwell架构处理器和显卡很好地协同工作,尽管它的机身设计十分时尚。幸运的事,新一代的英特尔和英伟达硬件能够更好满足这种设计的需要,可以在与MacBook尺寸相似的超薄机身中提供骨灰级的游戏性能。Kaby Lake处理器和Pascal显卡在运行中没有遇到很明显的降频问题。结合便携的机身设计,用户可以得到一台同时满足上学通勤和高水平游戏需要的设备。
但是它的弱点也十分明显。GS63VR在性能上确实可以超过XPS 15,MacBook Pro 15甚至是更大尺寸的ROG G752,但用户需要接受坚固度稍差的机身和更高的风扇噪音。在电池续航、音响效果和屏幕亮度方面,它也还有改进的空间,而可以适合低负载文字处理应用的“安静模式”应该可以让它受到更多用户的喜爱。另外,在更审慎的测试后,我们发现它的处理器无法在负载下维持最高Turbo Boost时钟频率,而显卡核心温度也比大尺寸游戏本更高。
它搭配1080p屏幕的基础型号比4K超高清屏幕型号更值得推荐。除非用户认为在中低设置和无G-Sync支持下的4K分辨率仍然有吸引力的话,GTX 1060仍然是更适合1080p分辨率运行游戏的。另外,它的1080p屏幕相比4K屏幕提供了更高的对比度和更广色域覆盖,同时价位更低,这意味着选择它的4K机型的用户需要舍弃显示品质来得到更高像素密度。
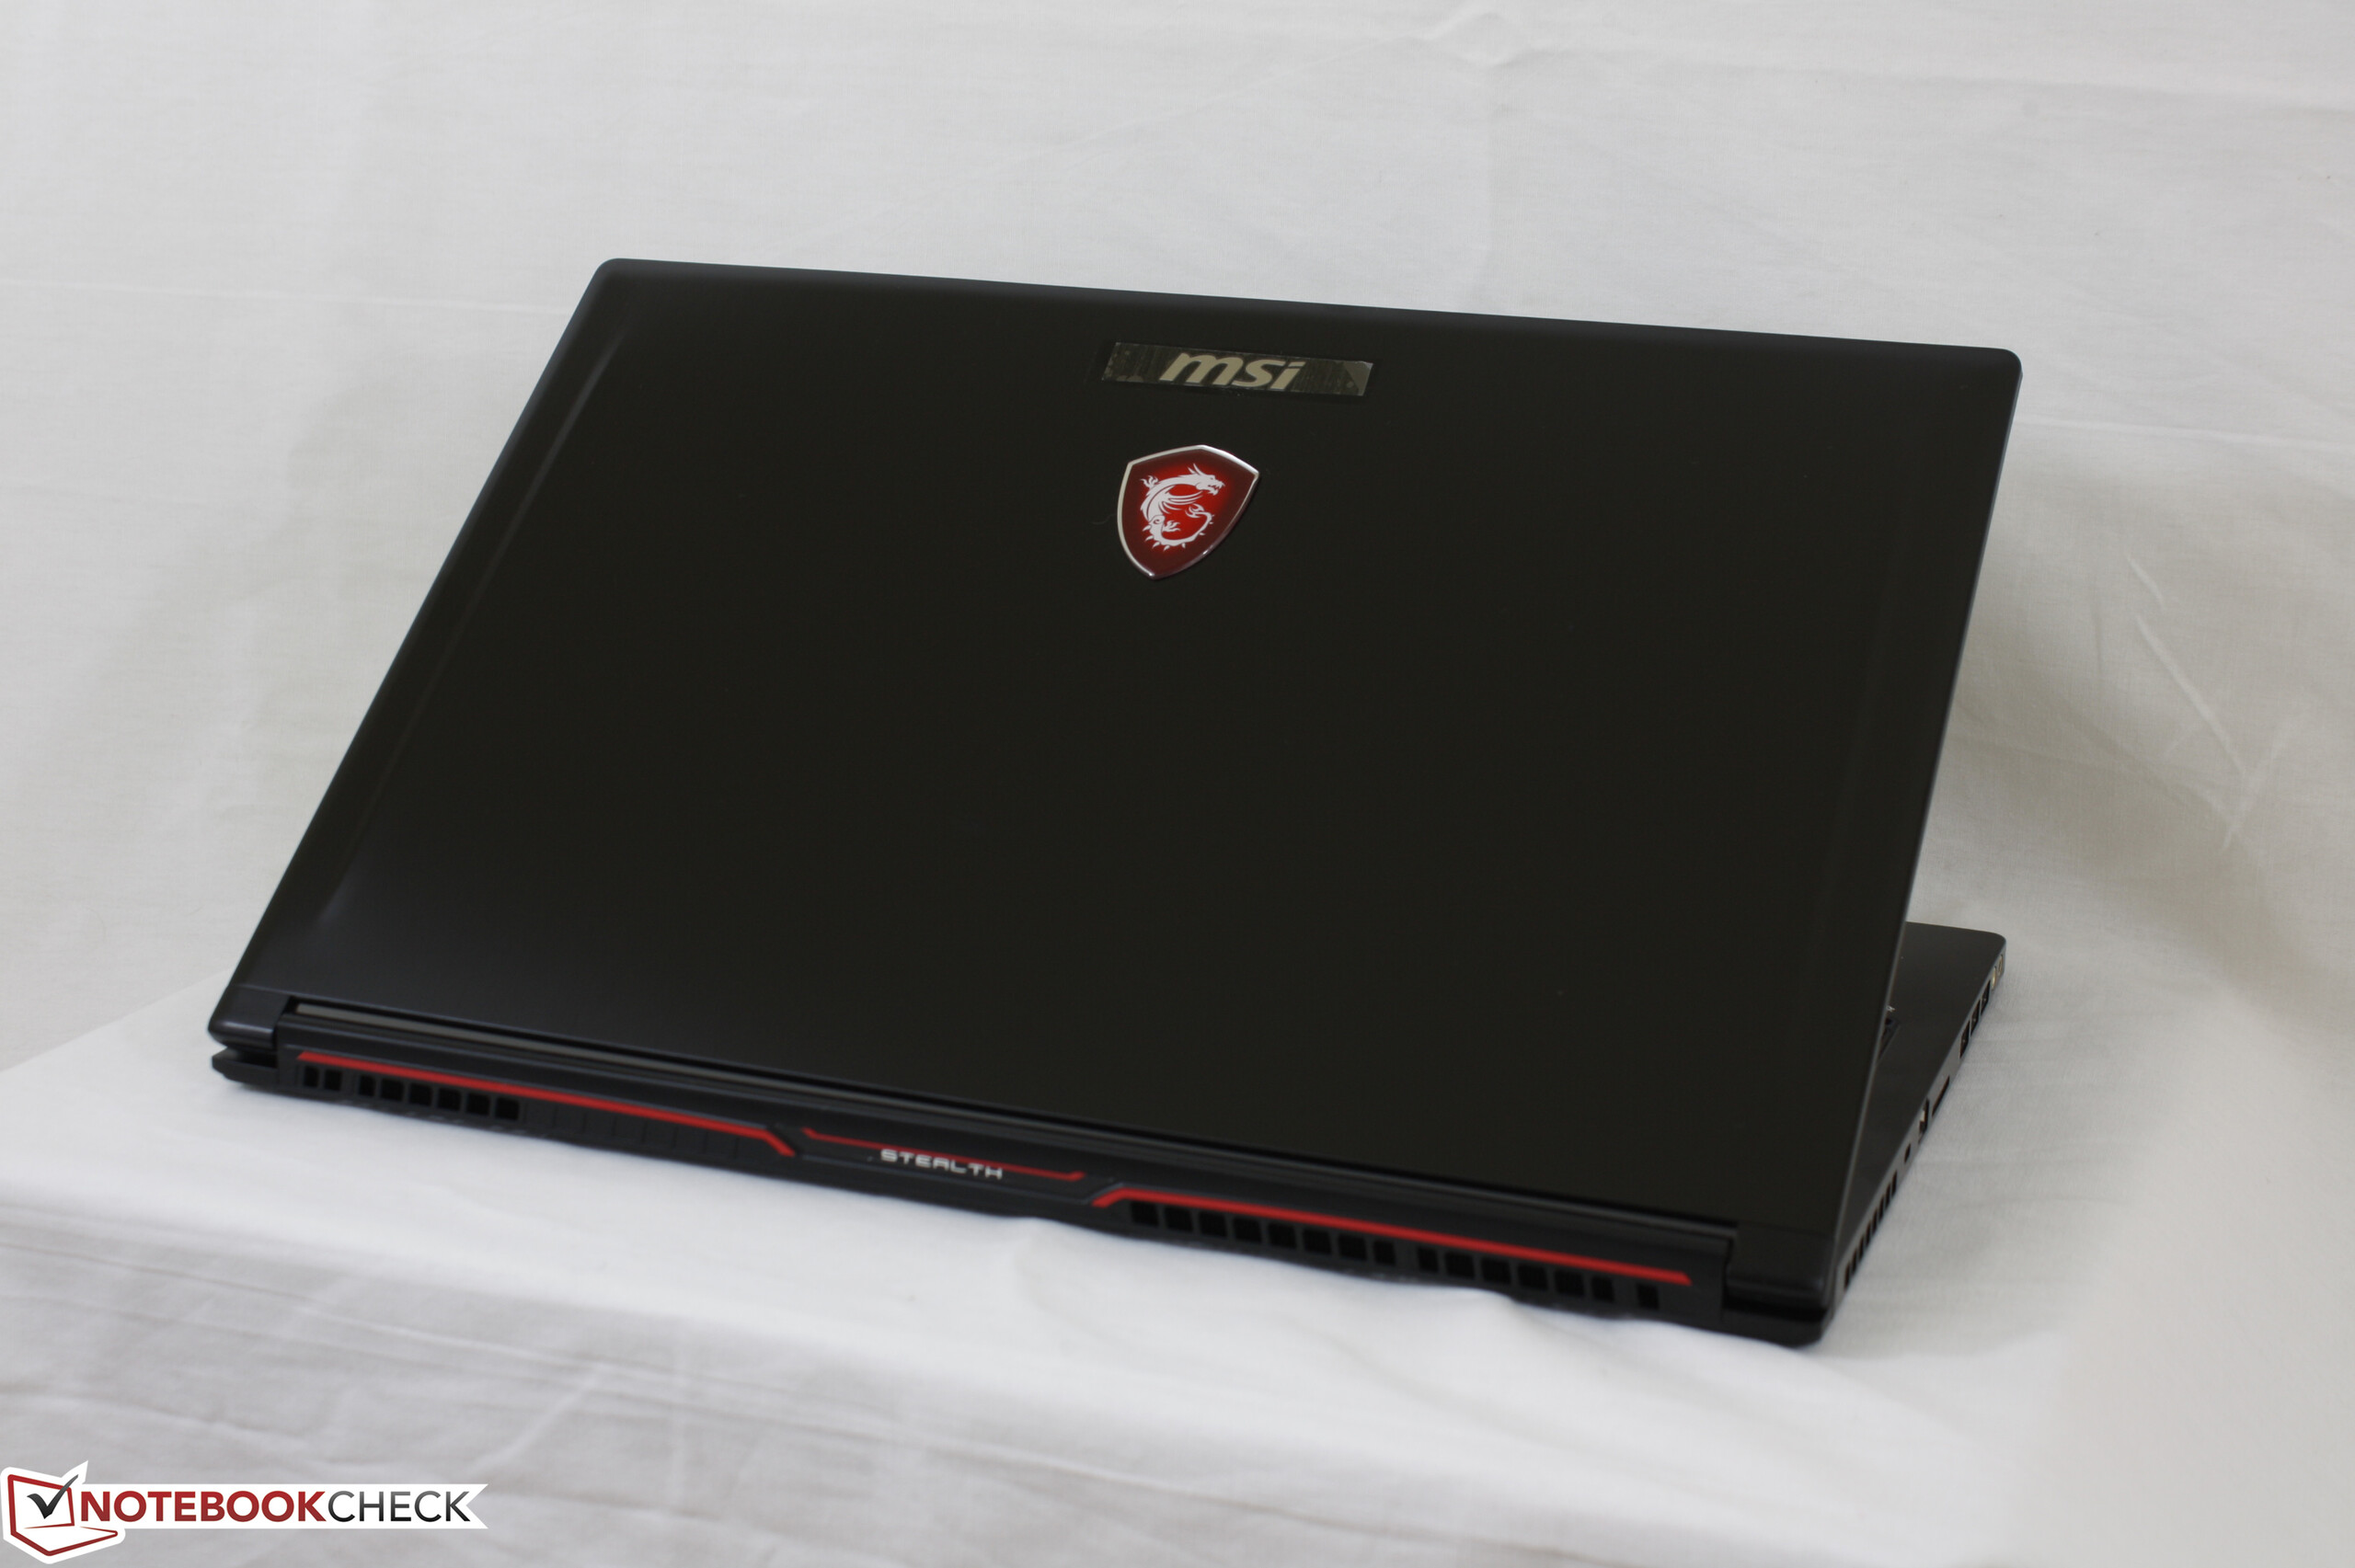
GS63VR相比GS60运行更安静,同时带来了显著的性能提升。尽管它的游戏性能不容小觑,但在屏幕品质、电池续航和机身坚固性等方面没有得到同样程度的改进。
注:本文是基于完整评测的缩减版本,阅读完整的英文评测,请点击这里。
MSI GS63VR 7RF-228US
- 03/24/2017 v6 (old)
Allen Ngo
Price comparison
