联想 Legion Y720 (7700HQ,全高清, GTX 1060) 笔记本电脑简短评测
| |||||||||||||||||||||||||
Brightness Distribution: 86 %
Center on Battery: 288 cd/m²
Contrast: 800:1 (Black: 0.36 cd/m²)
ΔE ColorChecker Calman: 5.29 | ∀{0.5-29.43 Ø4.71}
ΔE Greyscale Calman: 4.5 | ∀{0.09-98 Ø4.96}
57% sRGB (Argyll 1.6.3 3D)
37% AdobeRGB 1998 (Argyll 1.6.3 3D)
39.75% AdobeRGB 1998 (Argyll 3D)
57.5% sRGB (Argyll 3D)
38.43% Display P3 (Argyll 3D)
Gamma: 2.39
CCT: 6839 K
| Lenovo Legion Y720 80VR002XGE LG Philips LGD0533 LP156WF6-SPK3, , 1920x1080, 15.6" | MSI GS63VR 7RF-228US 3840x2160, 15.6" | Asus FX502VM-AS73 1920x1080, 15.6" | Acer Aspire VN7-593G-73HP V15 Nitro BE LG Display LP156WF6-SPP1, , 1920x1080, 15.6" | Gigabyte P55W v7 LG Philips LP156WF6 (LGD046F), , 1920x1080, 15.6" | |
|---|---|---|---|---|---|
| Display | 25% | -1% | 58% | 53% | |
| Display P3 Coverage (%) | 38.43 | 48.21 25% | 38.28 0% | 65.8 71% | 63.5 65% |
| sRGB Coverage (%) | 57.5 | 72.6 26% | 56.9 -1% | 85.1 48% | 82 43% |
| AdobeRGB 1998 Coverage (%) | 39.75 | 49.81 25% | 39.47 -1% | 62.2 56% | 59.9 51% |
| Response Times | 19% | 21% | -19% | 5% | |
| Response Time Grey 50% / Grey 80% * (ms) | 43 ? | 28 ? 35% | 28.4 ? 34% | 41 ? 5% | 37 ? 14% |
| Response Time Black / White * (ms) | 24 ? | 23.6 ? 2% | 22.4 ? 7% | 34 ? -42% | 25 ? -4% |
| PWM Frequency (Hz) | 21000 ? | 1351 ? | |||
| Screen | -20% | -23% | 19% | 16% | |
| Brightness middle (cd/m²) | 288 | 274.2 -5% | 209.5 -27% | 322 12% | 287 0% |
| Brightness (cd/m²) | 275 | 263 -4% | 205 -25% | 297 8% | 289 5% |
| Brightness Distribution (%) | 86 | 92 7% | 92 7% | 86 0% | 87 1% |
| Black Level * (cd/m²) | 0.36 | 0.44 -22% | 0.69 -92% | 0.31 14% | 0.29 19% |
| Contrast (:1) | 800 | 623 -22% | 304 -62% | 1039 30% | 990 24% |
| Colorchecker dE 2000 * | 5.29 | 8 -51% | 4.7 11% | 4.73 11% | 4.92 7% |
| Colorchecker dE 2000 max. * | 9.97 | 14.6 -46% | 19.7 -98% | 12.37 -24% | 11 -10% |
| Greyscale dE 2000 * | 4.5 | 9.1 -102% | 1.8 60% | 2.99 34% | 3.66 19% |
| Gamma | 2.39 92% | 2.24 98% | 2.23 99% | 2.32 95% | 2.32 95% |
| CCT | 6839 95% | 5020 129% | 6975 93% | 6905 94% | 6482 100% |
| Color Space (Percent of AdobeRGB 1998) (%) | 37 | 45.7 24% | 36.2 -2% | 56 51% | 54 46% |
| Color Space (Percent of sRGB) (%) | 57 | 72.1 26% | 56.6 -1% | 85 49% | 82 44% |
| Total Average (Program / Settings) | 8% /
-5% | -1% /
-13% | 19% /
22% | 25% /
22% |
* ... smaller is better
Display Response Times
| ↔ Response Time Black to White | ||
|---|---|---|
| 24 ms ... rise ↗ and fall ↘ combined | ↗ 12 ms rise | 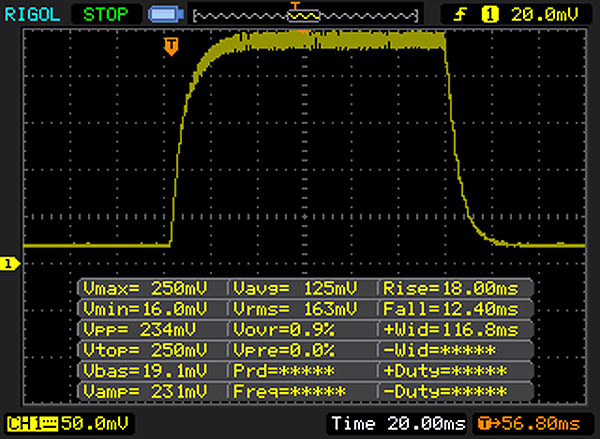 |
| ↘ 12 ms fall | ||
| The screen shows good response rates in our tests, but may be too slow for competitive gamers. In comparison, all tested devices range from 0.1 (minimum) to 240 (maximum) ms. » 54 % of all devices are better. This means that the measured response time is worse than the average of all tested devices (19.8 ms). | ||
| ↔ Response Time 50% Grey to 80% Grey | ||
| 43 ms ... rise ↗ and fall ↘ combined | ↗ 22 ms rise | 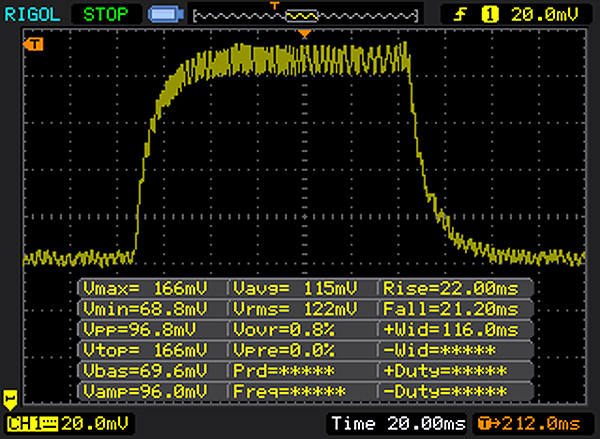 |
| ↘ 21 ms fall | ||
| The screen shows slow response rates in our tests and will be unsatisfactory for gamers. In comparison, all tested devices range from 0.165 (minimum) to 636 (maximum) ms. » 71 % of all devices are better. This means that the measured response time is worse than the average of all tested devices (31 ms). | ||
Screen Flickering / PWM (Pulse-Width Modulation)
| Screen flickering / PWM detected | 21000 Hz | ≤ 90 % brightness setting | 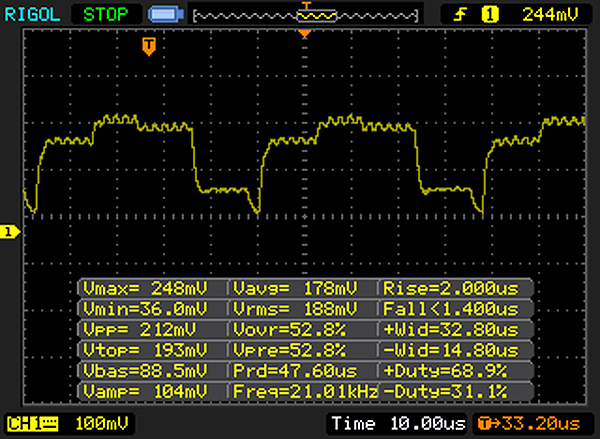 |
The display backlight flickers at 21000 Hz (worst case, e.g., utilizing PWM) Flickering detected at a brightness setting of 90 % and below. There should be no flickering or PWM above this brightness setting. The frequency of 21000 Hz is quite high, so most users sensitive to PWM should not notice any flickering. In comparison: 52 % of all tested devices do not use PWM to dim the display. If PWM was detected, an average of 7754 (minimum: 5 - maximum: 343500) Hz was measured. | |||
| PCMark 8 | |
| Home Score Accelerated v2 | |
| Asus FX502VM-AS73 | |
| MSI GS63VR 7RF-228US | |
| Lenovo Legion Y720 80VR002XGE | |
| Gigabyte P55W v7 | |
| Work Score Accelerated v2 | |
| Gigabyte P55W v7 | |
| MSI GS63VR 7RF-228US | |
| Lenovo Legion Y720 80VR002XGE | |
| Asus FX502VM-AS73 | |
| PCMark 8 Home Score Accelerated v2 | 4115 points | |
| PCMark 8 Work Score Accelerated v2 | 5083 points | |
Help | ||
| Lenovo Legion Y720 80VR002XGE Samsung PM961 MZVLW256HEHP | MSI GS63VR 7RF-228US Samsung SM961 MZVKW512HMJP m.2 PCI-e | Asus FX502VM-AS73 SK Hynix HFS256G39TND-N210A | Acer Aspire VN7-593G-73HP V15 Nitro BE Seagate Mobile HDD 1TB ST1000LM035 | Gigabyte P55W v7 Liteonit CV3-8D256 | |
|---|---|---|---|---|---|
| CrystalDiskMark 3.0 | 19% | -63% | -96% | -60% | |
| Read Seq (MB/s) | 2196 | 2141 -3% | 503 -77% | 120.9 -94% | 466.2 -79% |
| Write Seq (MB/s) | 1144 | 1621 42% | 138.2 -88% | 101.8 -91% | 261.9 -77% |
| Read 512 (MB/s) | 747 | 499.7 -33% | 343.5 -54% | 37.83 -95% | 252.5 -66% |
| Write 512 (MB/s) | 810 | 1531 89% | 137.8 -83% | 84.4 -90% | 254.8 -69% |
| Read 4k (MB/s) | 60.1 | 54.2 -10% | 29.36 -51% | 0.473 -99% | 25.4 -58% |
| Write 4k (MB/s) | 153.5 | 158.2 3% | 70.9 -54% | 0.313 -100% | 55 -64% |
| Read 4k QD32 (MB/s) | 485.4 | 632 30% | 369.9 -24% | 1.133 -100% | 358.5 -26% |
| Write 4k QD32 (MB/s) | 396.3 | 527 33% | 99.7 -75% | 0.274 -100% | 240.1 -39% |

| 3DMark 11 - 1280x720 Performance GPU | |
| Acer Aspire VN7-593G-73HP V15 Nitro BE | |
| Asus FX502VM-AS73 | |
| Gigabyte P55W v7 | |
| MSI GS63VR 7RF-228US | |
| Lenovo Legion Y720 80VR002XGE | |
| 3DMark | |
| 1280x720 Cloud Gate Standard Graphics | |
| Asus FX502VM-AS73 | |
| Acer Aspire VN7-593G-73HP V15 Nitro BE | |
| Lenovo Legion Y720 80VR002XGE | |
| Gigabyte P55W v7 | |
| MSI GS63VR 7RF-228US | |
| 1920x1080 Fire Strike Graphics | |
| Asus FX502VM-AS73 | |
| Acer Aspire VN7-593G-73HP V15 Nitro BE | |
| Gigabyte P55W v7 | |
| MSI GS63VR 7RF-228US | |
| Lenovo Legion Y720 80VR002XGE | |
| 3DMark 11 Performance | 12067 points | |
| 3DMark Cloud Gate Standard Score | 21147 points | |
| 3DMark Fire Strike Score | 9527 points | |
Help | ||
| BioShock Infinite | |
| 1920x1080 Ultra Preset, DX11 (DDOF) | |
| Asus FX502VM-AS73 | |
| MSI GS63VR 7RF-228US | |
| Lenovo Legion Y720 80VR002XGE | |
| Acer Aspire VN7-593G-73HP V15 Nitro BE | |
| 1366x768 High Preset | |
| Lenovo Legion Y720 80VR002XGE | |
| Acer Aspire VN7-593G-73HP V15 Nitro BE | |
| The Witcher 3 | |
| 1920x1080 Ultra Graphics & Postprocessing (HBAO+) | |
| MSI GS63VR 7RF-228US | |
| Gigabyte P55W v7 | |
| Acer Aspire VN7-593G-73HP V15 Nitro BE | |
| Lenovo Legion Y720 80VR002XGE | |
| 1920x1080 High Graphics & Postprocessing (Nvidia HairWorks Off) | |
| MSI GS63VR 7RF-228US | |
| Gigabyte P55W v7 | |
| Acer Aspire VN7-593G-73HP V15 Nitro BE | |
| Lenovo Legion Y720 80VR002XGE | |
| Doom | |
| 1920x1080 Ultra Preset AA:SM | |
| Asus FX502VM-AS73 | |
| Lenovo Legion Y720 80VR002XGE | |
| MSI GS63VR 7RF-228US | |
| 1920x1080 High Preset AA:FX | |
| Lenovo Legion Y720 80VR002XGE | |
| low | med. | high | ultra | |
|---|---|---|---|---|
| BioShock Infinite (2013) | 204.3 | 171.1 | 159.5 | 99.5 |
| The Witcher 3 (2015) | 182.6 | 118 | 66 | 35.5 |
| Doom (2016) | 131.7 | 125.1 | 97 | 93 |
Noise level
| Idle |
| 31 / 30.9 / 31.5 dB(A) |
| Load |
| 38.7 / 41.9 dB(A) |
 | ||
30 dB silent 40 dB(A) audible 50 dB(A) loud |
||
min: | ||
(±) The maximum temperature on the upper side is 41.6 °C / 107 F, compared to the average of 40.4 °C / 105 F, ranging from 21.2 to 68.8 °C for the class Gaming.
(+) The bottom heats up to a maximum of 37 °C / 99 F, compared to the average of 43.2 °C / 110 F
(+) In idle usage, the average temperature for the upper side is 24.2 °C / 76 F, compared to the device average of 33.9 °C / 93 F.
(±) Playing The Witcher 3, the average temperature for the upper side is 35.9 °C / 97 F, compared to the device average of 33.9 °C / 93 F.
(±) The palmrests and touchpad can get very hot to the touch with a maximum of 37 °C / 98.6 F.
(-) The average temperature of the palmrest area of similar devices was 28.8 °C / 83.8 F (-8.2 °C / -14.8 F).
Lenovo Legion Y720 80VR002XGE audio analysis
(-) | not very loud speakers (70 dB)
Bass 100 - 315 Hz
(±) | reduced bass - on average 12.6% lower than median
(±) | linearity of bass is average (12.6% delta to prev. frequency)
Mids 400 - 2000 Hz
(+) | balanced mids - only 2.8% away from median
(±) | linearity of mids is average (8.9% delta to prev. frequency)
Highs 2 - 16 kHz
(+) | balanced highs - only 3.5% away from median
(+) | highs are linear (4.5% delta to prev. frequency)
Overall 100 - 16.000 Hz
(+) | overall sound is linear (13.9% difference to median)
Compared to same class
» 22% of all tested devices in this class were better, 7% similar, 70% worse
» The best had a delta of 6%, average was 18%, worst was 132%
Compared to all devices tested
» 16% of all tested devices were better, 4% similar, 80% worse
» The best had a delta of 4%, average was 23%, worst was 134%
Apple MacBook 12 (Early 2016) 1.1 GHz audio analysis
(+) | speakers can play relatively loud (83.6 dB)
Bass 100 - 315 Hz
(±) | reduced bass - on average 11.3% lower than median
(±) | linearity of bass is average (14.2% delta to prev. frequency)
Mids 400 - 2000 Hz
(+) | balanced mids - only 2.4% away from median
(+) | mids are linear (5.5% delta to prev. frequency)
Highs 2 - 16 kHz
(+) | balanced highs - only 2% away from median
(+) | highs are linear (4.5% delta to prev. frequency)
Overall 100 - 16.000 Hz
(+) | overall sound is linear (10.2% difference to median)
Compared to same class
» 7% of all tested devices in this class were better, 2% similar, 90% worse
» The best had a delta of 5%, average was 18%, worst was 53%
Compared to all devices tested
» 5% of all tested devices were better, 1% similar, 94% worse
» The best had a delta of 4%, average was 23%, worst was 134%
| Off / Standby | |
| Idle | |
| Load |
|
Key:
min: | |
| Lenovo Legion Y720 80VR002XGE i7-7700HQ, GeForce GTX 1060 Mobile, Samsung PM961 MZVLW256HEHP, IPS, 1920x1080, 15.6" | Asus FX502VM-AS73 i7-7700HQ, GeForce GTX 1060 Mobile, SK Hynix HFS256G39TND-N210A, TN LED, 1920x1080, 15.6" | MSI GS63VR 7RF-228US i7-7700HQ, GeForce GTX 1060 Mobile, Samsung SM961 MZVKW512HMJP m.2 PCI-e, IPS, 3840x2160, 15.6" | Acer Aspire VN7-593G-73HP V15 Nitro BE i7-7700HQ, GeForce GTX 1060 Mobile, Seagate Mobile HDD 1TB ST1000LM035, AH-IPS, Normally Black, Transmissive, 1920x1080, 15.6" | Gigabyte P55W v7 i7-7700HQ, GeForce GTX 1060 Mobile, Liteonit CV3-8D256, IPS, 1920x1080, 15.6" | |
|---|---|---|---|---|---|
| Power Consumption | -41% | -49% | -11% | -16% | |
| Idle Minimum * (Watt) | 8 | 14.9 -86% | 14.5 -81% | 7.2 10% | 8 -0% |
| Idle Average * (Watt) | 10.9 | 15.1 -39% | 17.3 -59% | 10.5 4% | 13 -19% |
| Idle Maximum * (Watt) | 11.8 | 15.2 -29% | 17.4 -47% | 16 -36% | 18 -53% |
| Load Average * (Watt) | 70 | 105.8 -51% | 93 -33% | 82 -17% | 76 -9% |
| Witcher 3 ultra * (Watt) | 102 | 128.8 -26% | 124 -22% | ||
| Load Maximum * (Watt) | 148 | 148.8 -1% | 155 -5% | 143 3% |
* ... smaller is better
| Lenovo Legion Y720 80VR002XGE i7-7700HQ, GeForce GTX 1060 Mobile, 60 Wh | Asus FX502VM-AS73 i7-7700HQ, GeForce GTX 1060 Mobile, 64 Wh | MSI GS63VR 7RF-228US i7-7700HQ, GeForce GTX 1060 Mobile, 65 Wh | Acer Aspire VN7-593G-73HP V15 Nitro BE i7-7700HQ, GeForce GTX 1060 Mobile, 69 Wh | Gigabyte P55W v7 i7-7700HQ, GeForce GTX 1060 Mobile, 63 Wh | |
|---|---|---|---|---|---|
| Battery runtime | -28% | -25% | 22% | 12% | |
| Reader / Idle (h) | 11.8 | 6.1 -48% | 6.4 -46% | 8.4 -29% | 13.2 12% |
| H.264 (h) | 5.2 | ||||
| WiFi v1.3 (h) | 6.3 | 4.6 -27% | 3.9 -38% | 6 -5% | 5.8 -8% |
| Load (h) | 1.2 | 1.1 -8% | 1.3 8% | 2.4 100% | 1.6 33% |
Pros
Cons
Verdict

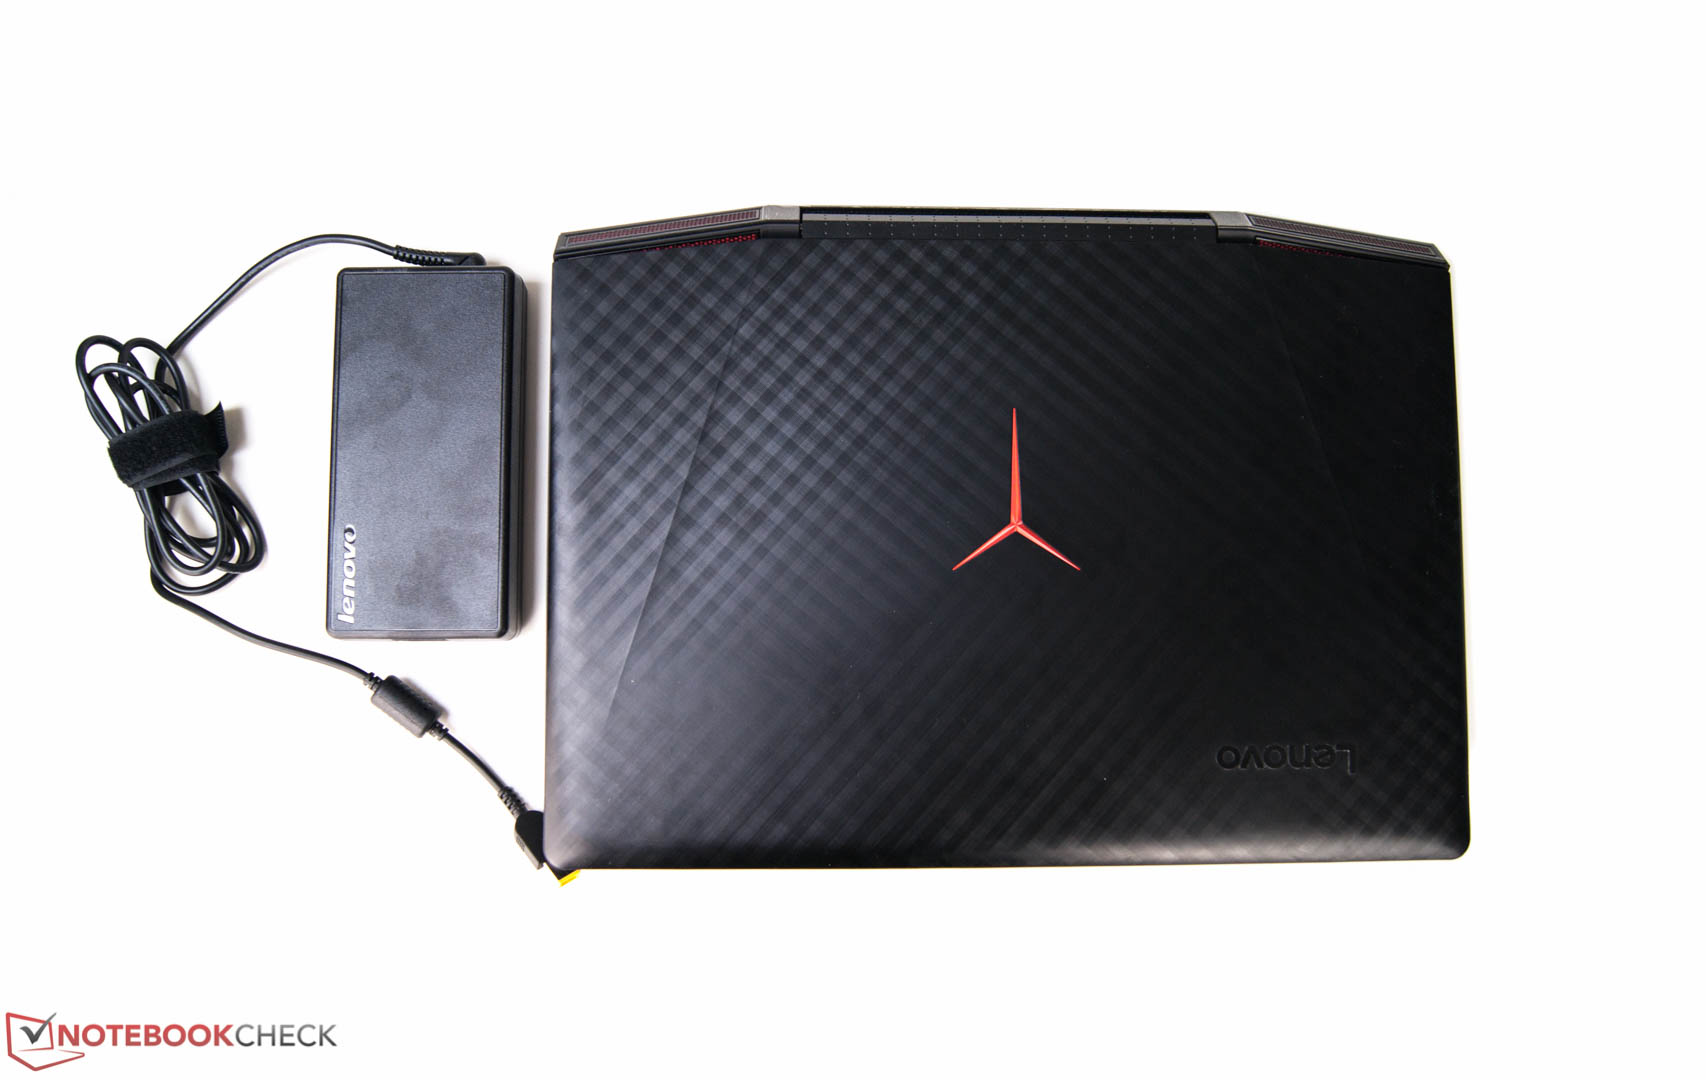
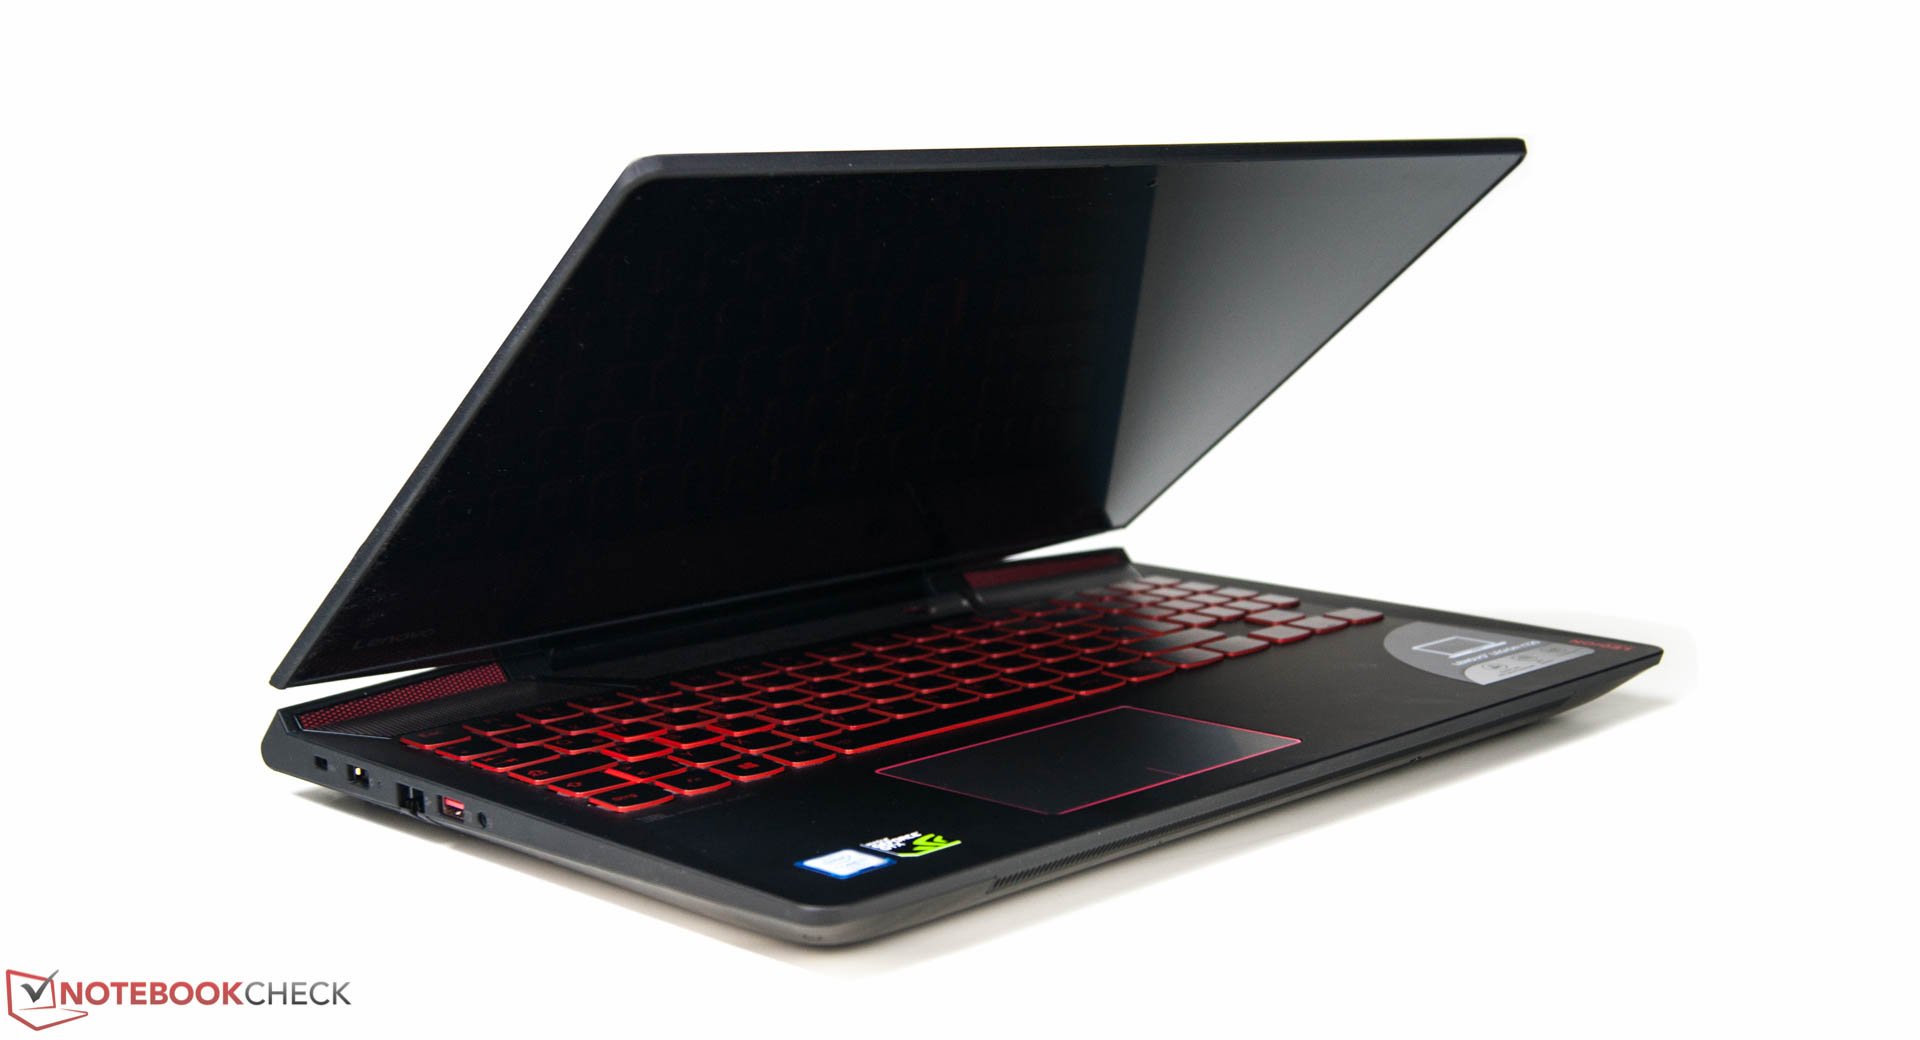
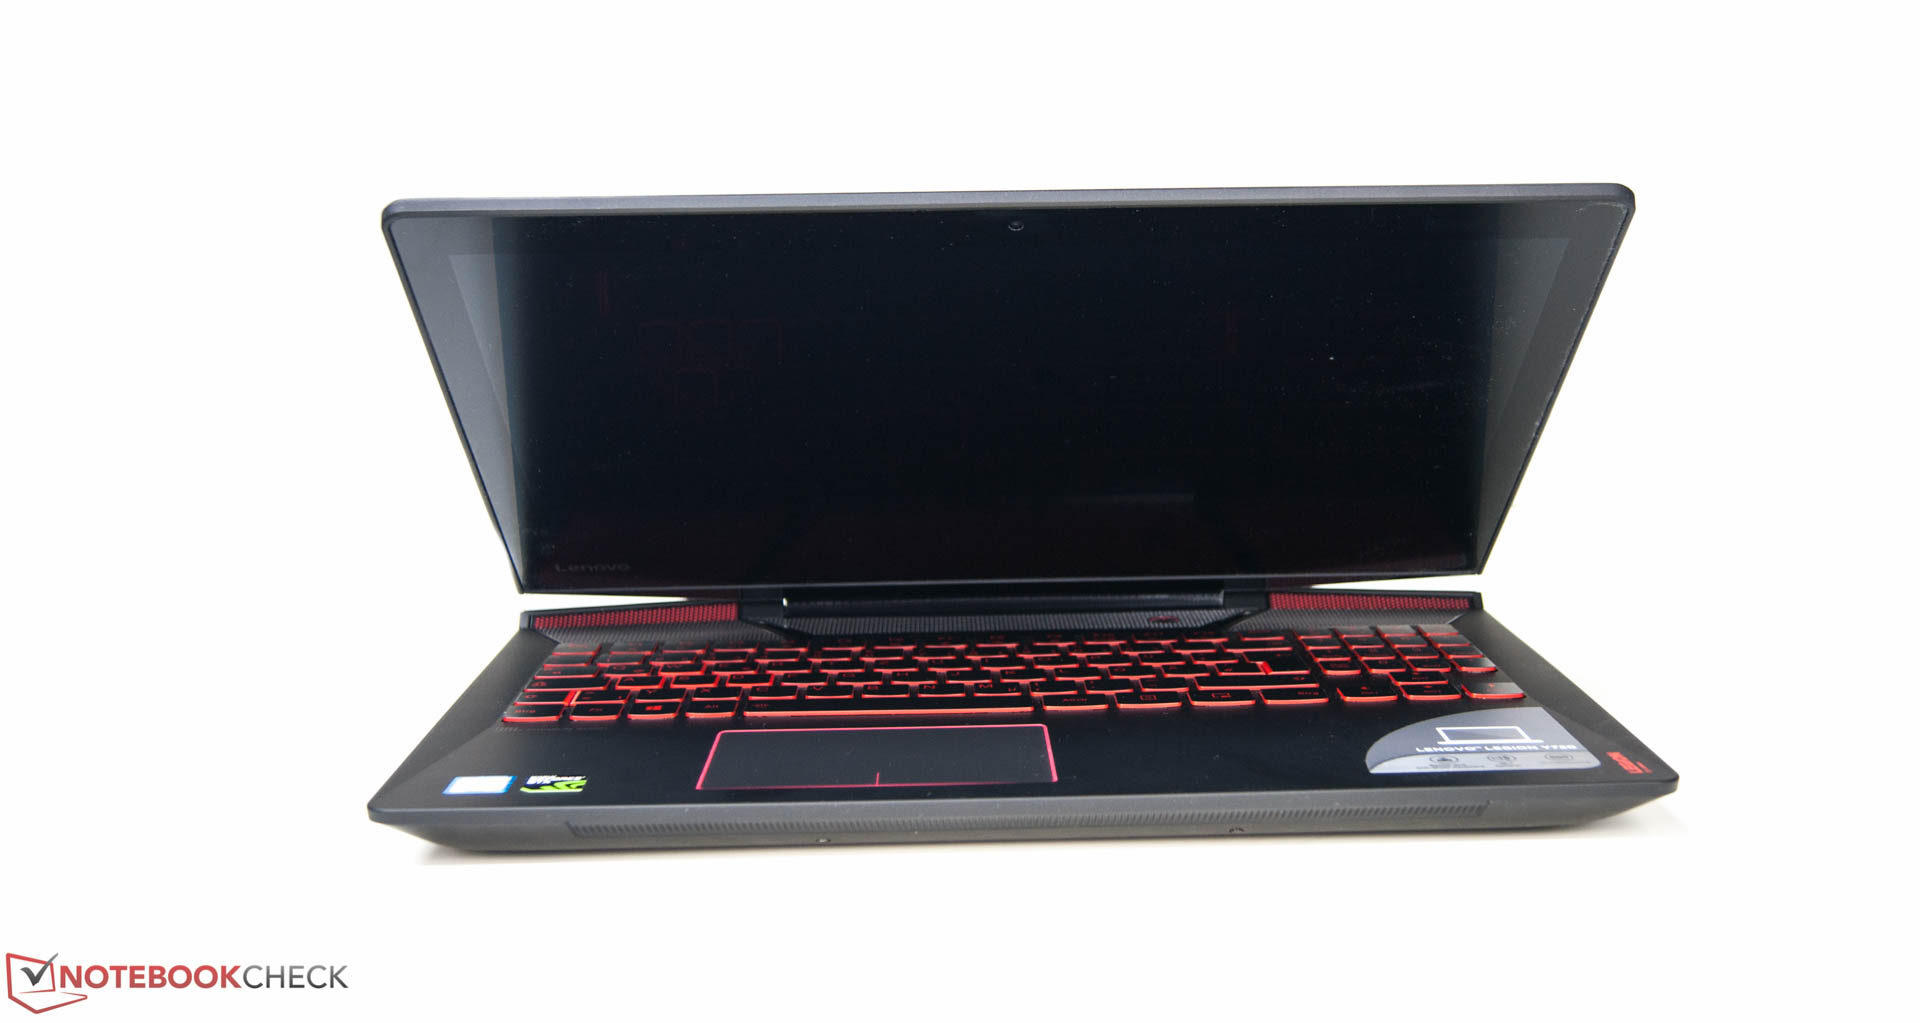
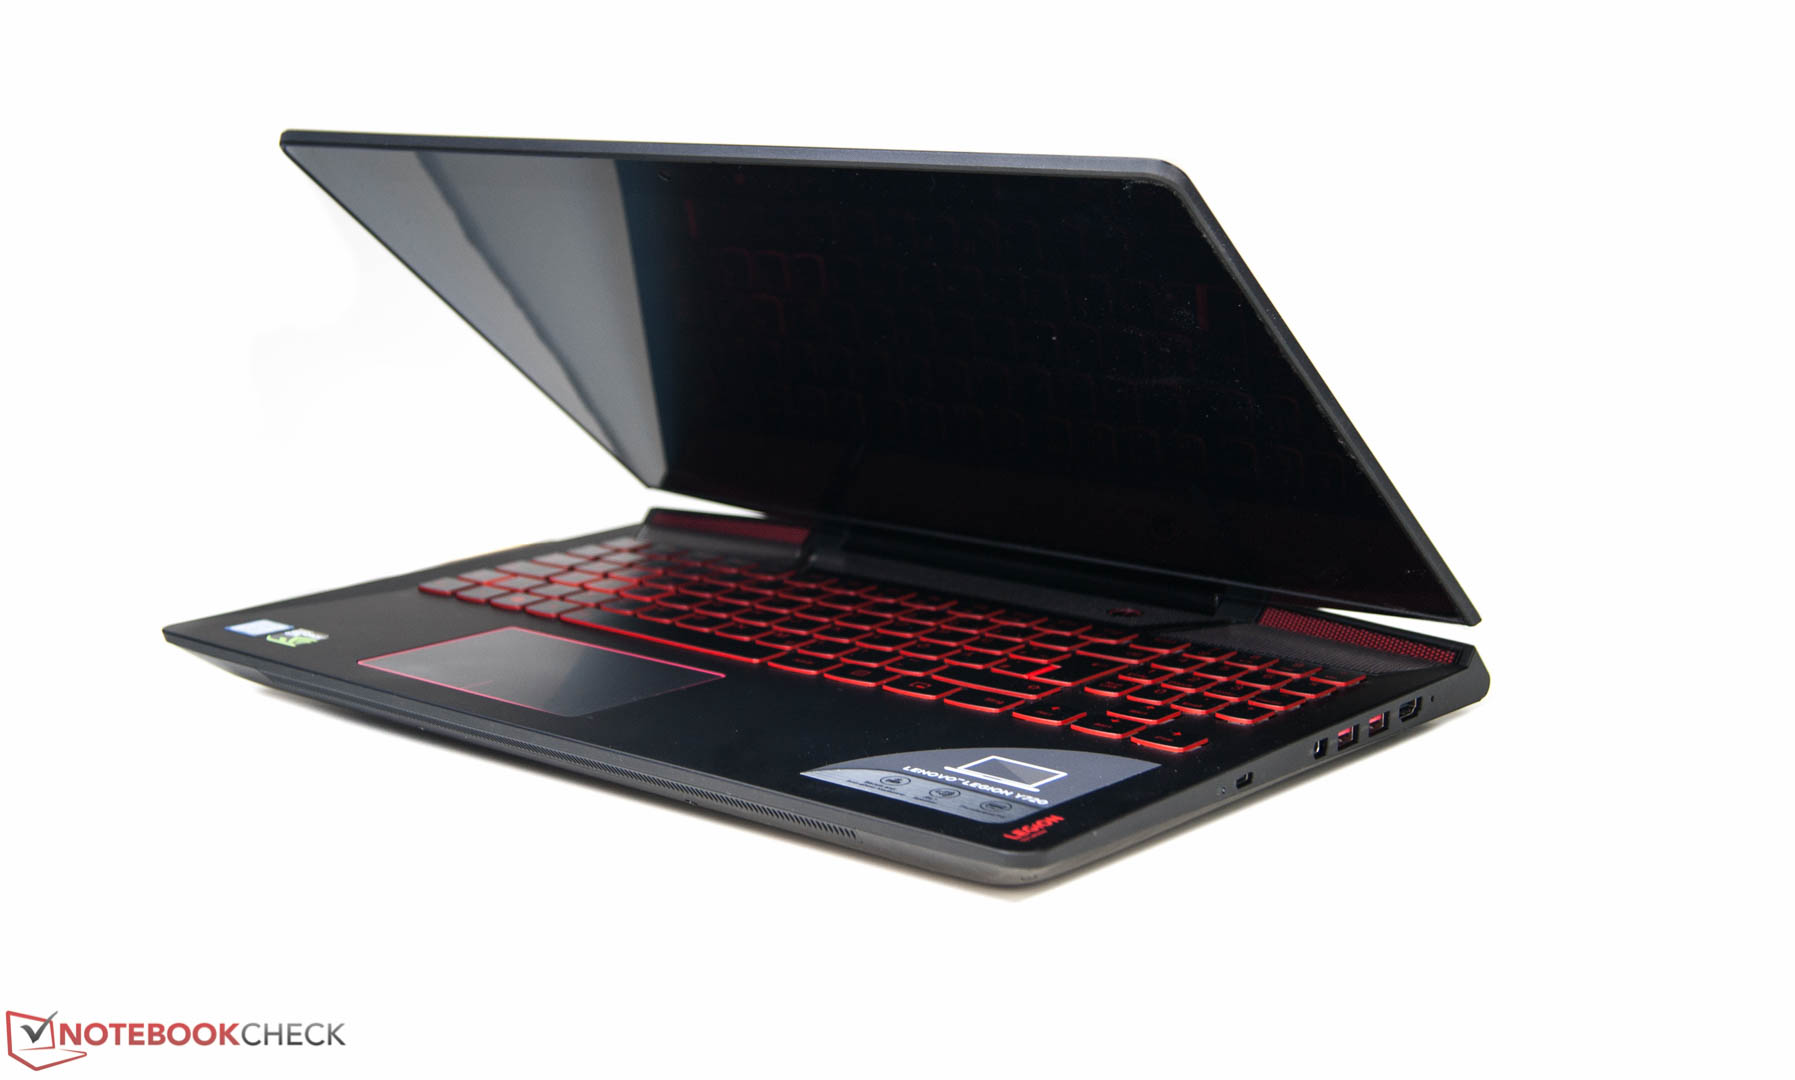
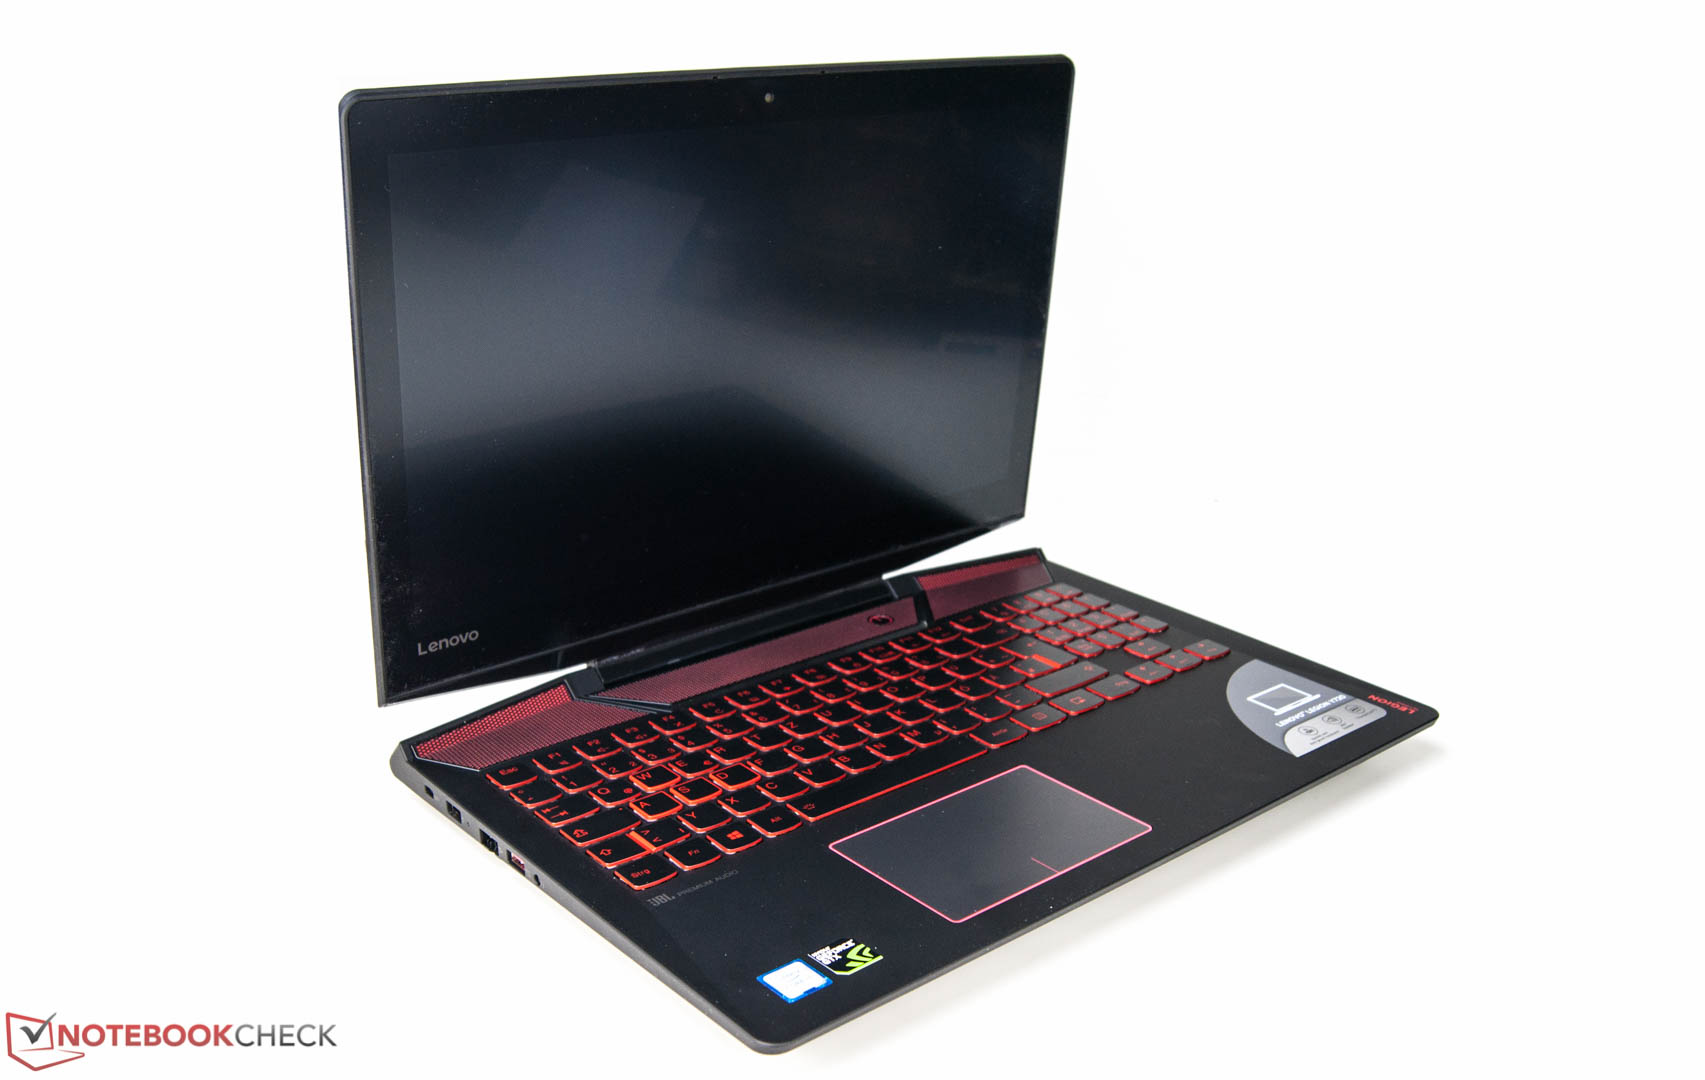
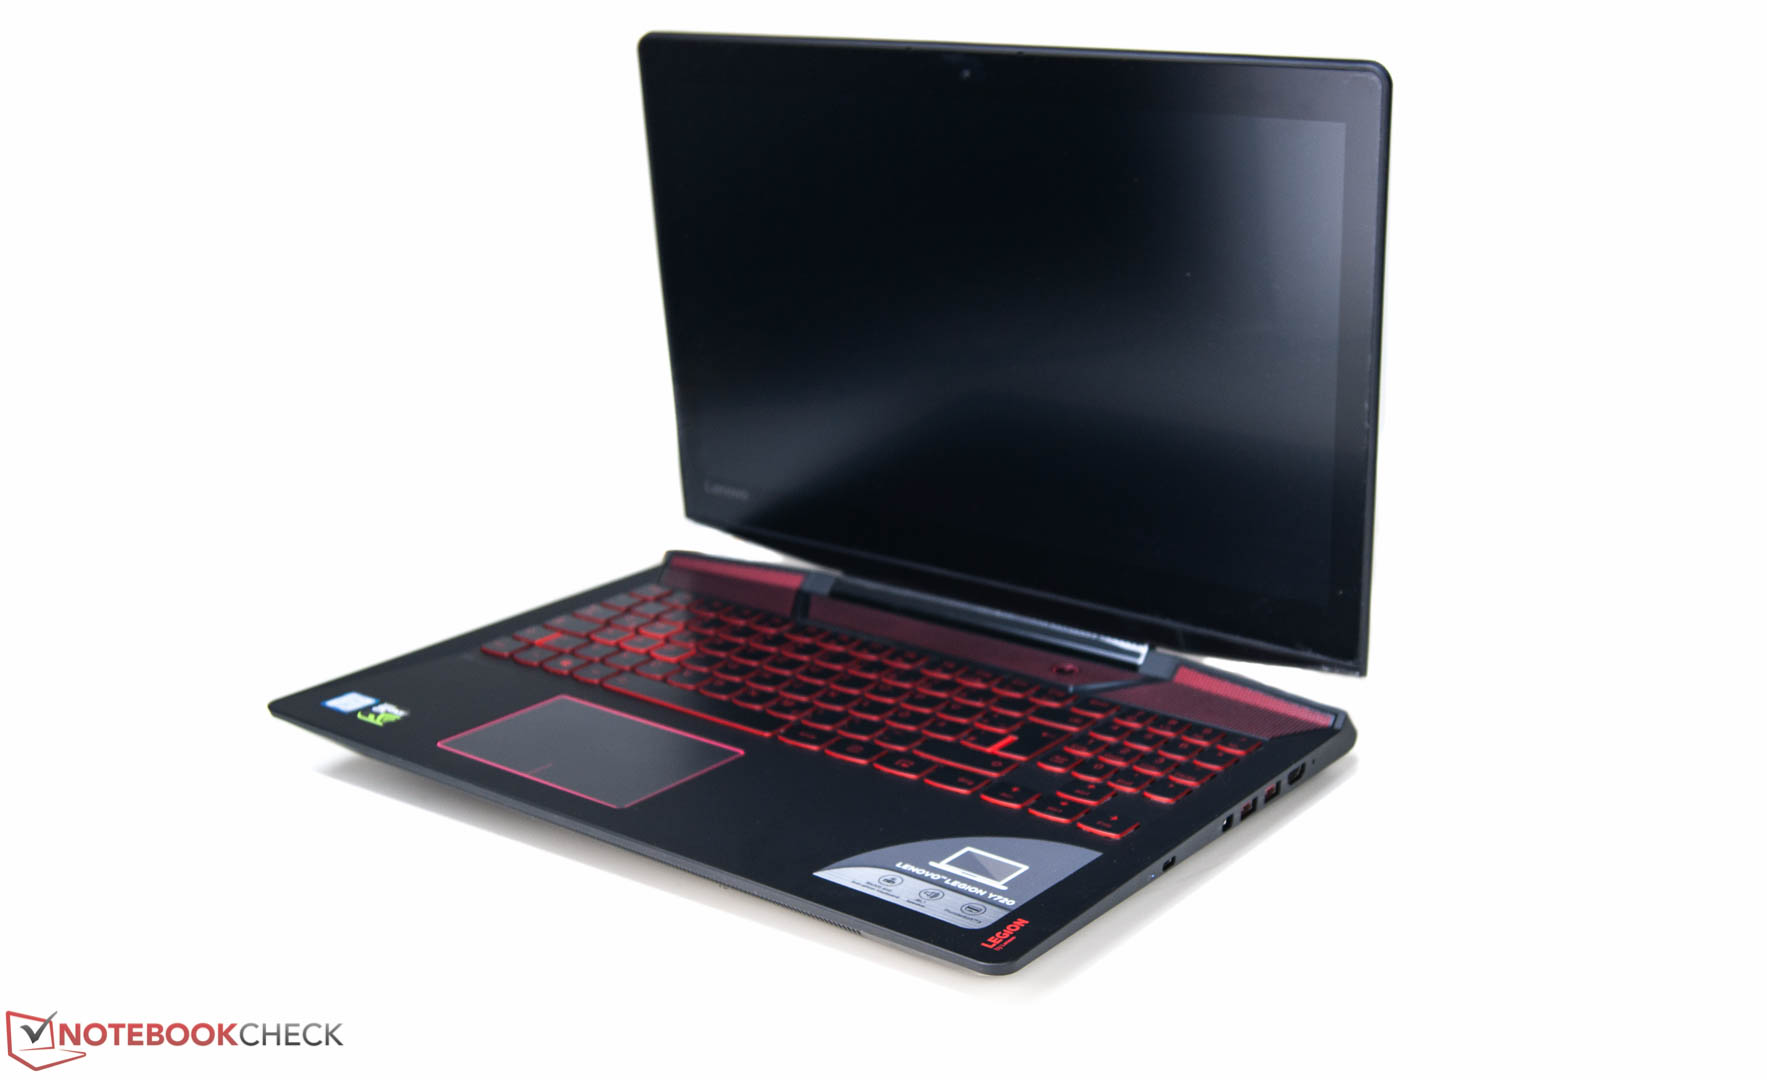
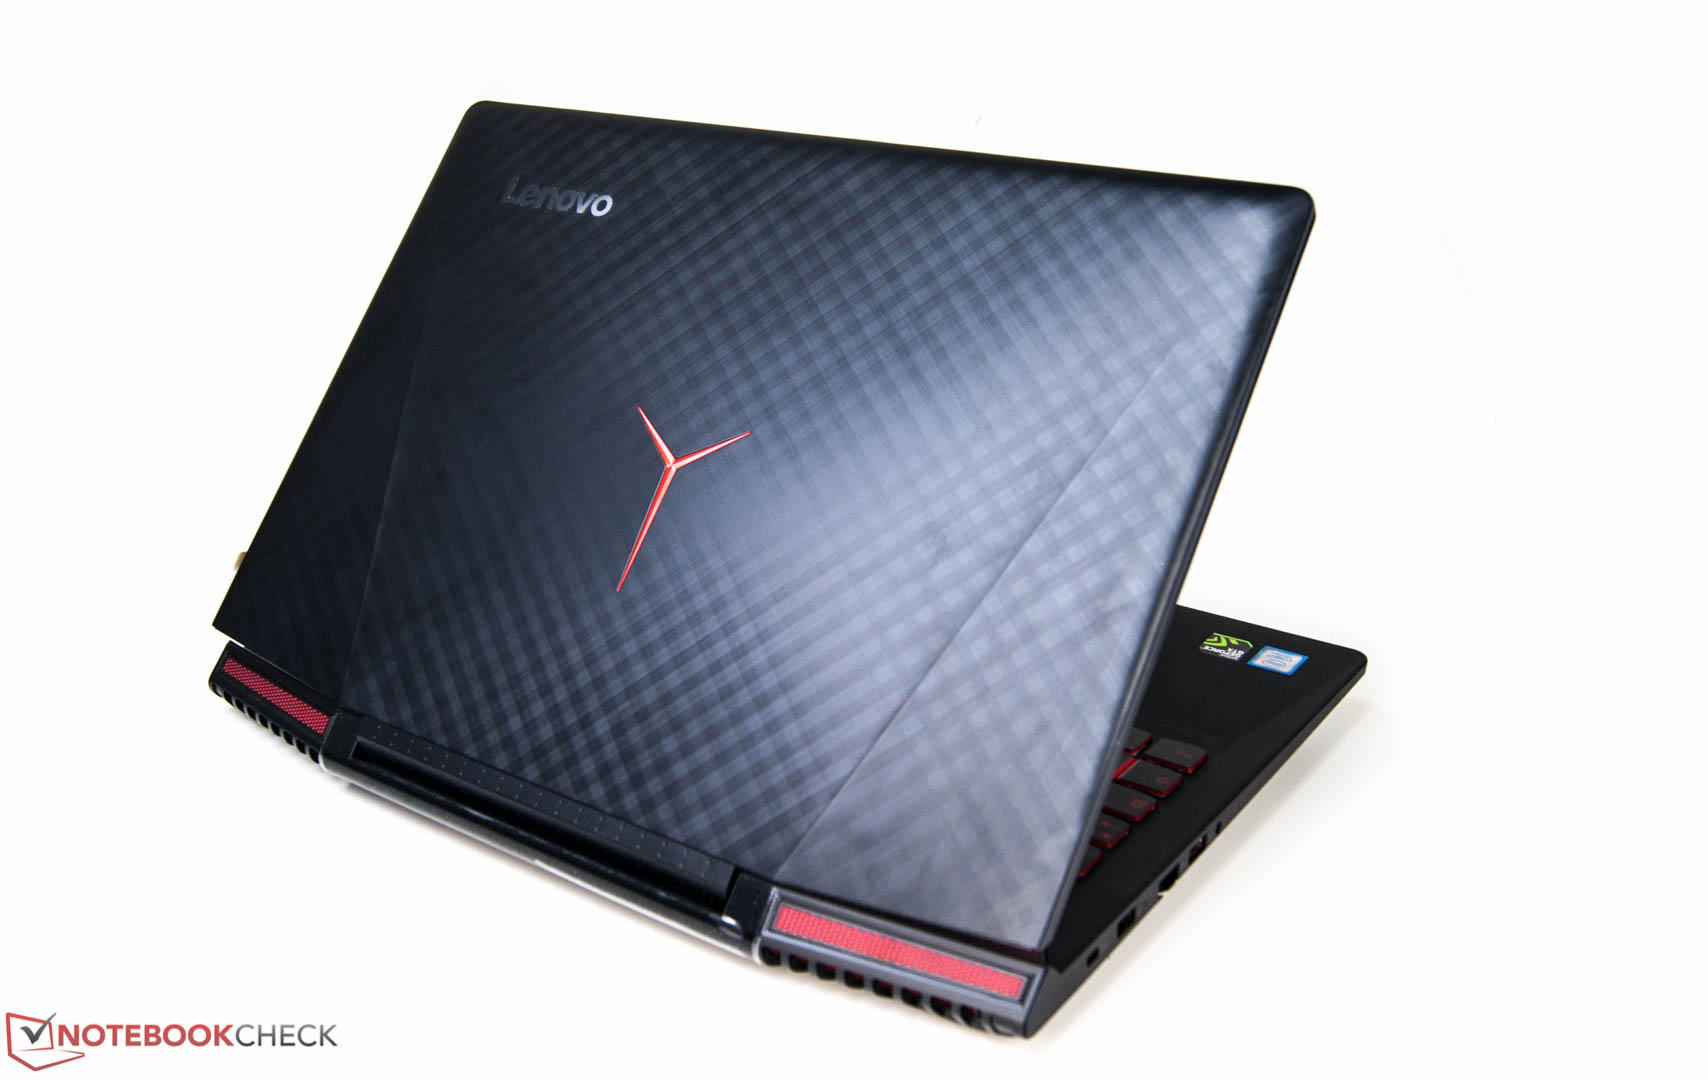
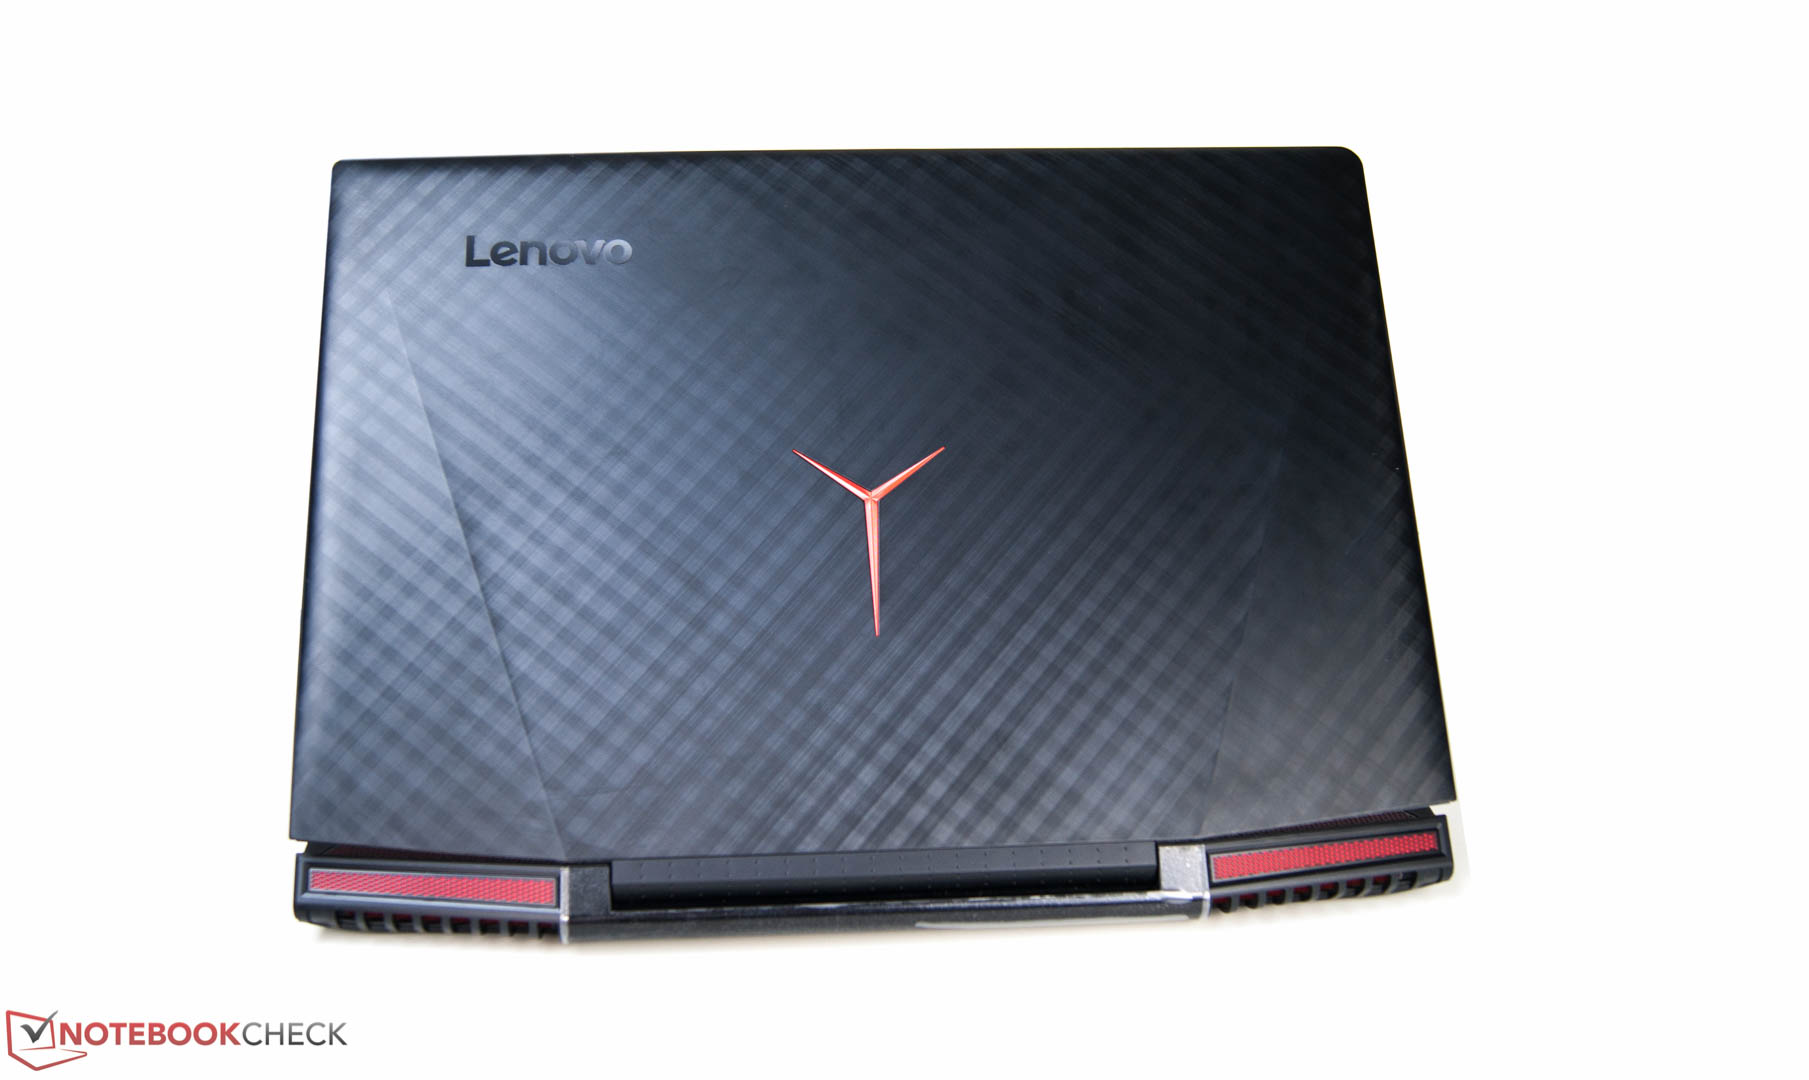
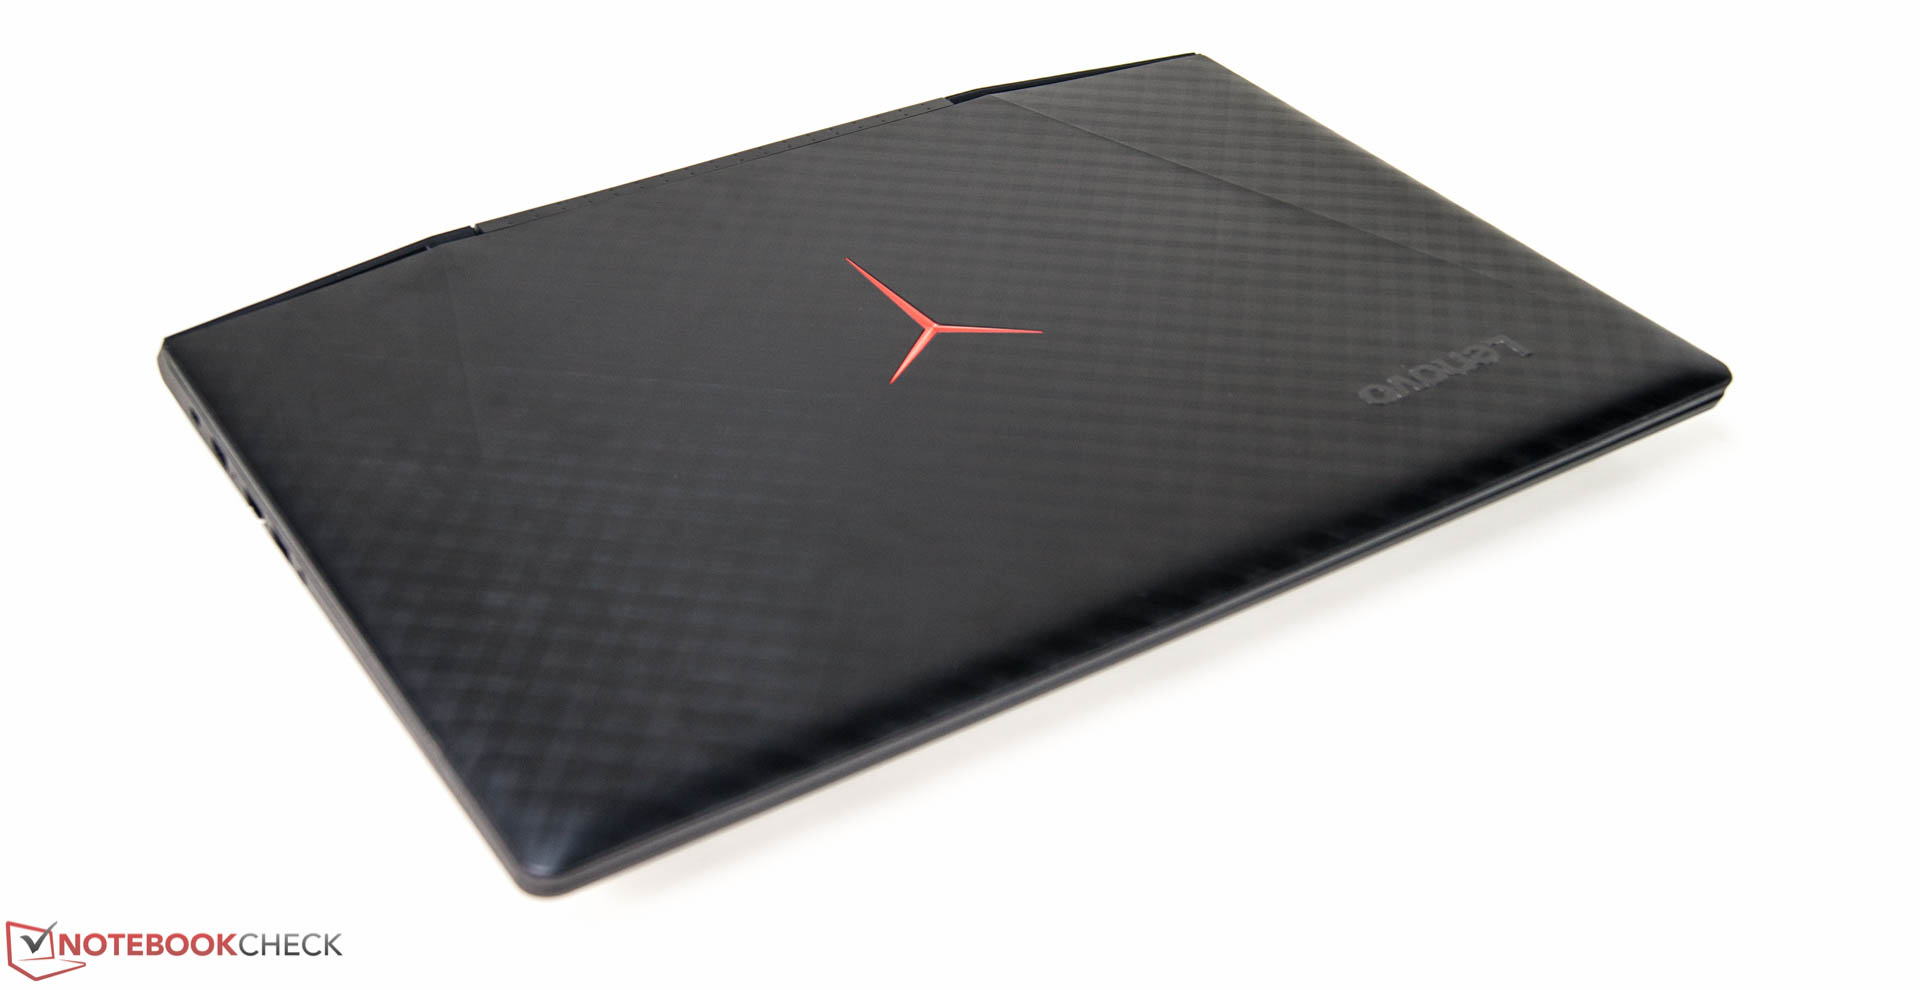
p.p1 {margin: 0.0px 0.0px 0.0px 0.0px; font: 12.0px '.PingFang SC'; color: #454545} span.s1 {font: 12.0px 'Helvetica Neue'} span.s2 {font: 12.0px 'Helvetica Neue'; text-decoration: underline ; color: #e4af0a} span.s3 {text-decoration: underline ; color: #e4af0a} span.s4 {color: #e4af0a} 联想的最新Legion Y720设计十分成功,这台游戏本具备很强的竞争力。在机身品质和外观设计两方面它都十分出色,同时机身配色也十分适合它的定位。机身方面的唯一缺陷是表面材质的选择,它十分容易沾上指纹和油污。 对于游戏设备来说输入设备十分重要,特别是键盘。它搭配的键盘按键尺寸较大,同时具备很酷的红色背光。如果说有什么不满的话,我们希望它在接下来的更新中可以改进键程和反馈。屏幕也是至关重要的一个方面。联想为这台设备采用了一块全高清IPS屏幕面板,这块屏幕整体表现属于中上水平。联想也将会推出搭配4K屏幕的机型。如果用户不希望等待太久的话,可以考虑微星的同类设备。 它的性能十分充沛:Legion Y720在负载下性能有些许下降,不过同类设备也难以避免这个问题。这台设备在机身温度和噪音方面都控制的很好,这也是Y720的优势所在。这台联想游戏本同样具备优秀的电池续航表现。 联想Leigion Y720是一台名副其实的游戏笔记本电脑。 也出于这个原因,它在其他的一些方面有所不足。联想Leigion Y720的便携性不算出色,不过作为一台不错的游戏本,它仍然十分便于转移阵地。 相比之下,微星GS63VR具备更高的便携性,也同时搭配了4K屏幕。不希望支出1700欧元(约12818人民币)高预算的用户可以考虑一下宏碁 Aspire V15 Nitro和华硕 FX502VM。 注:本文是基于完整评测的缩减版本,阅读完整的英文评测,请点击这里。
Lenovo Legion Y720 80VR002XGE
- 05/04/2017 v6 (old)
Nino Ricchizzi
Price comparison
