技嘉 P55W v6 笔记本电脑简短评测
| SD Card Reader | |
| average JPG Copy Test (av. of 3 runs) | |
| Acer Predator 15 G9-593-765Q | |
| Asus Strix GL502VM-FY039T | |
| Gigabyte P55W v6 | |
| Gigabyte P55W v5 | |
| MSI GS63VR-6RF16H22 Stealth Pro | |
| maximum AS SSD Seq Read Test (1GB) | |
| Acer Predator 15 G9-593-765Q | |
| Gigabyte P55W v6 | |
| Asus Strix GL502VM-FY039T | |
| Gigabyte P55W v5 | |
| MSI GS63VR-6RF16H22 Stealth Pro | |
| Networking | |
| iperf3 transmit AX12 | |
| Acer Predator 15 G9-593-765Q | |
| Asus Strix GL502VM-FY039T | |
| Gigabyte P55W v6 | |
| iperf3 receive AX12 | |
| Asus Strix GL502VM-FY039T | |
| Acer Predator 15 G9-593-765Q | |
| Gigabyte P55W v6 | |
| |||||||||||||||||||||||||
Brightness Distribution: 82 %
Center on Battery: 280 cd/m²
Contrast: 609:1 (Black: 0.46 cd/m²)
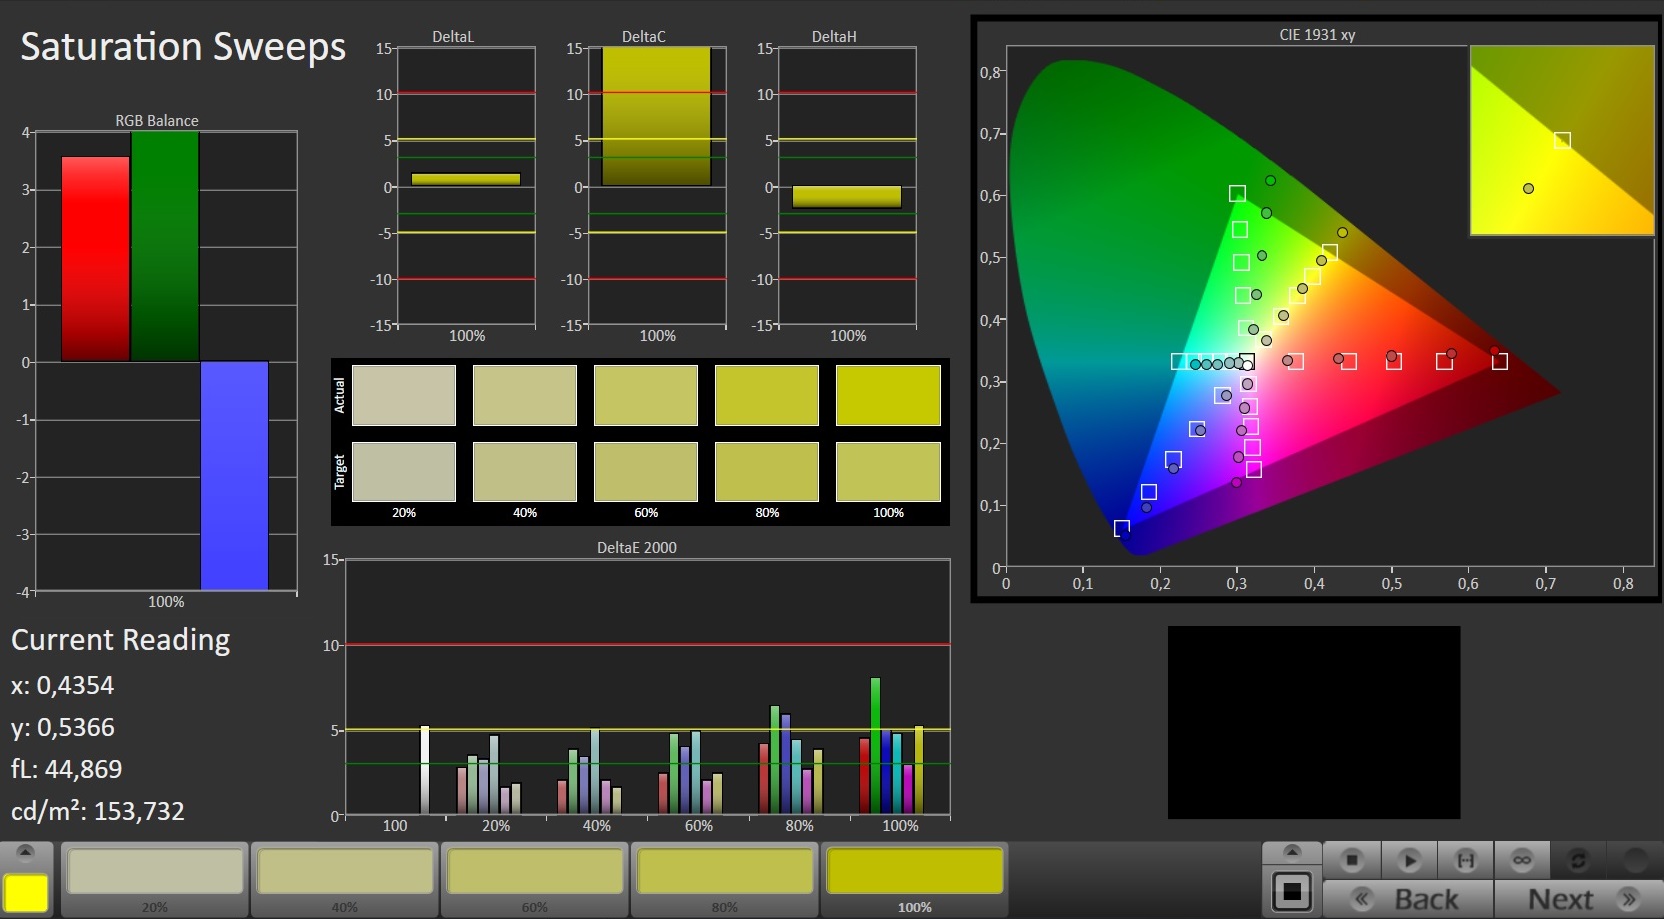
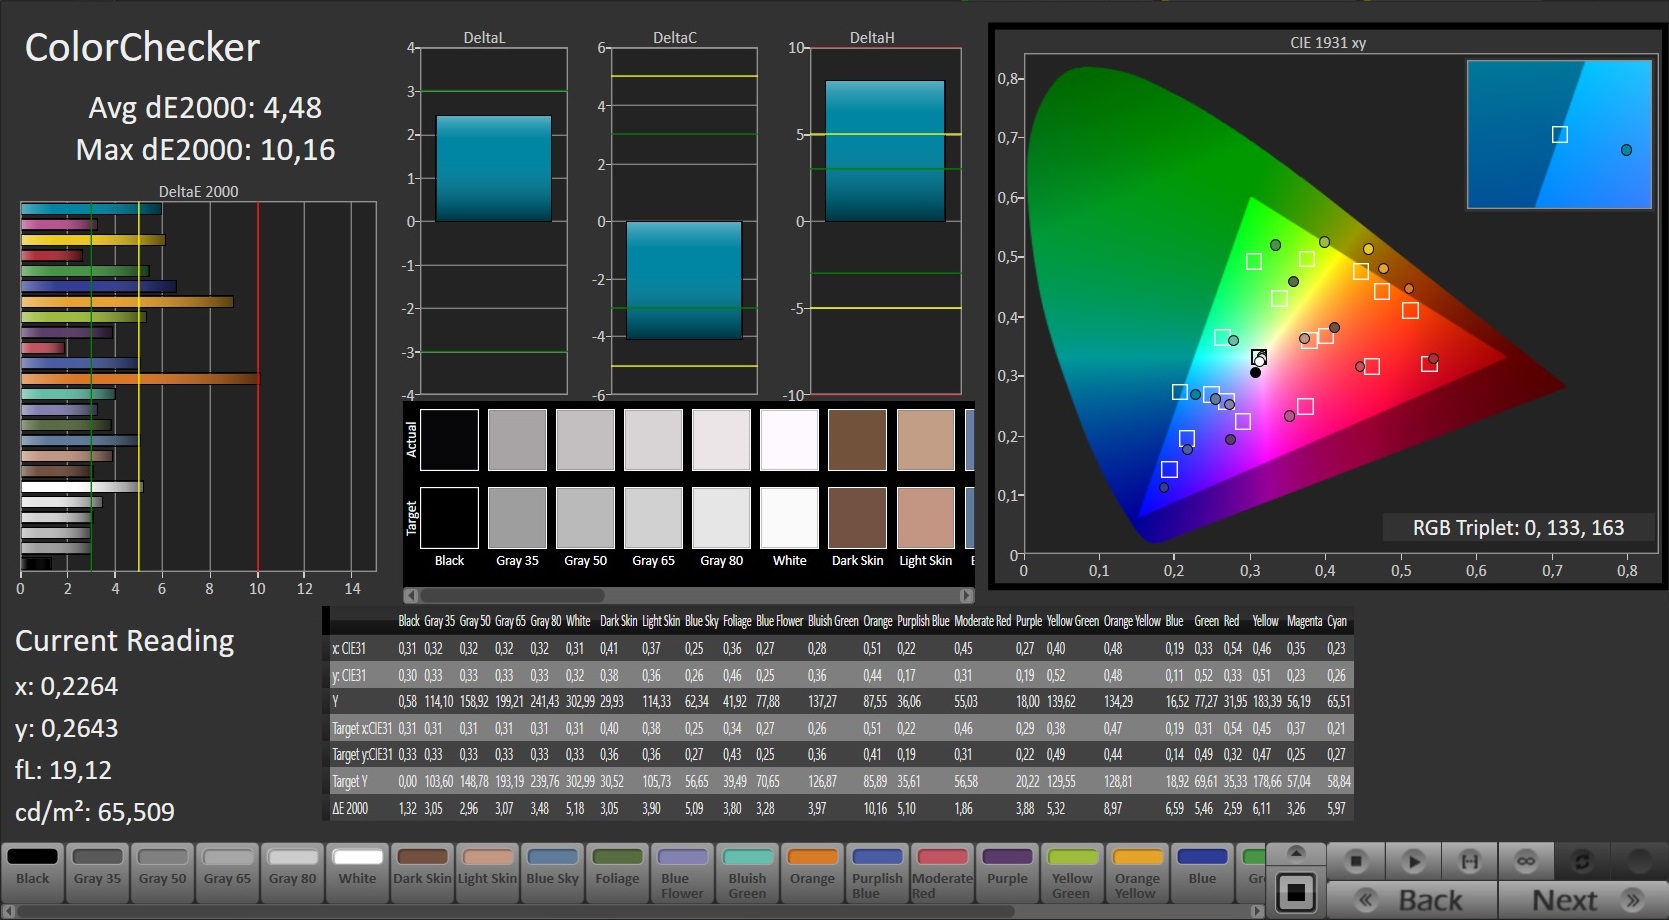
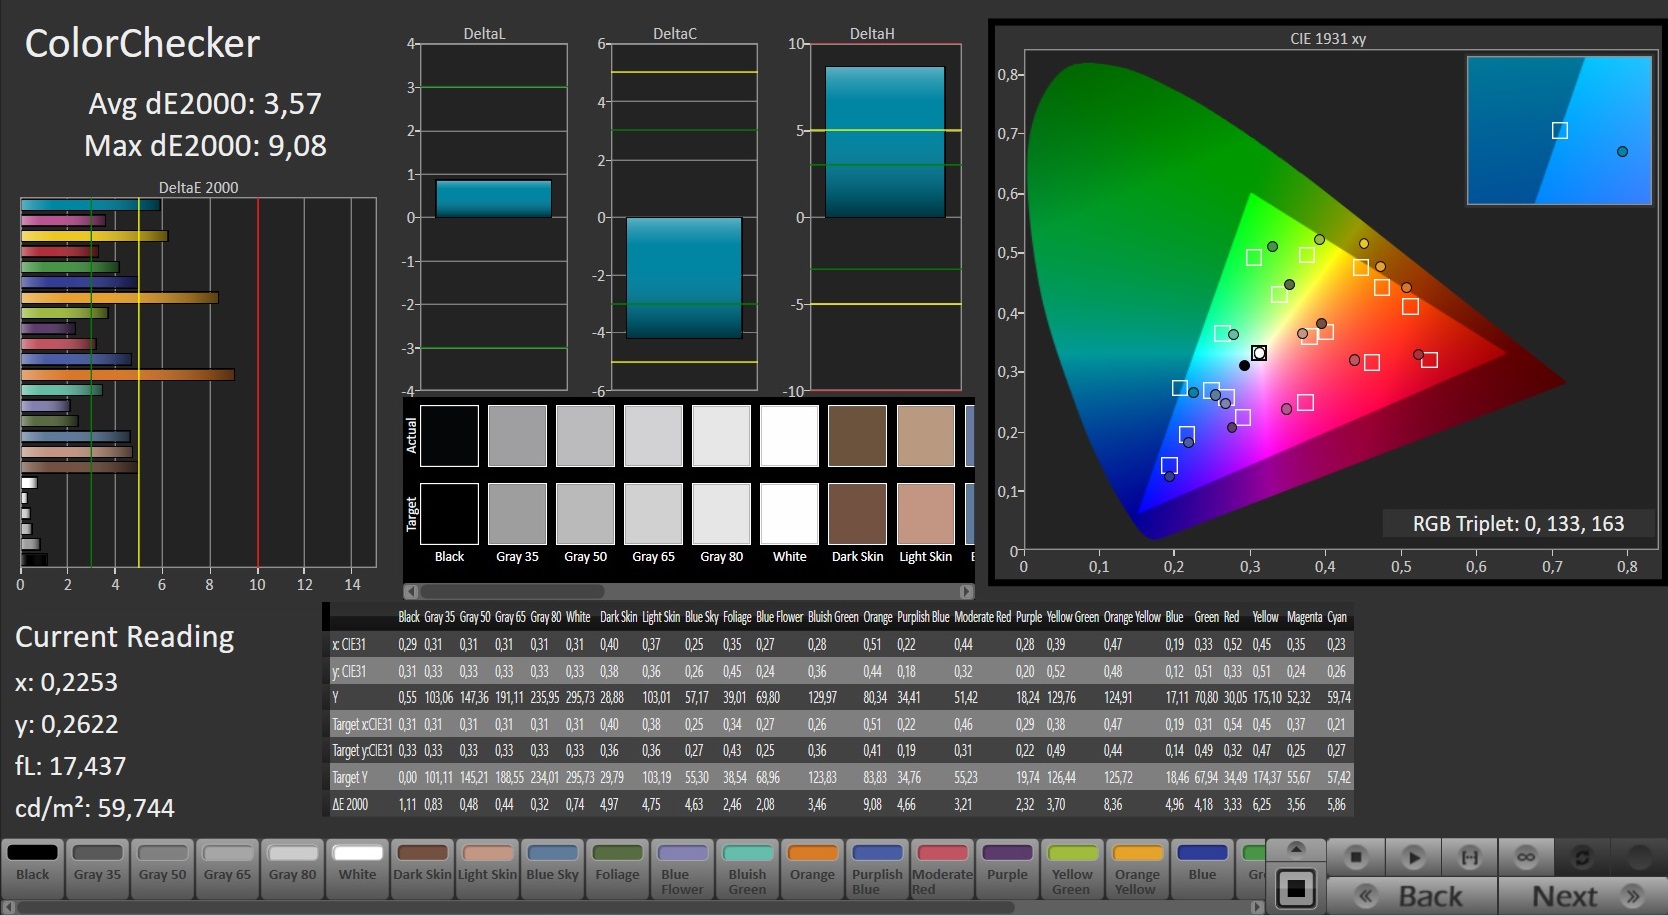
ΔE ColorChecker Calman: 4.48 | ∀{0.5-29.43 Ø4.71}
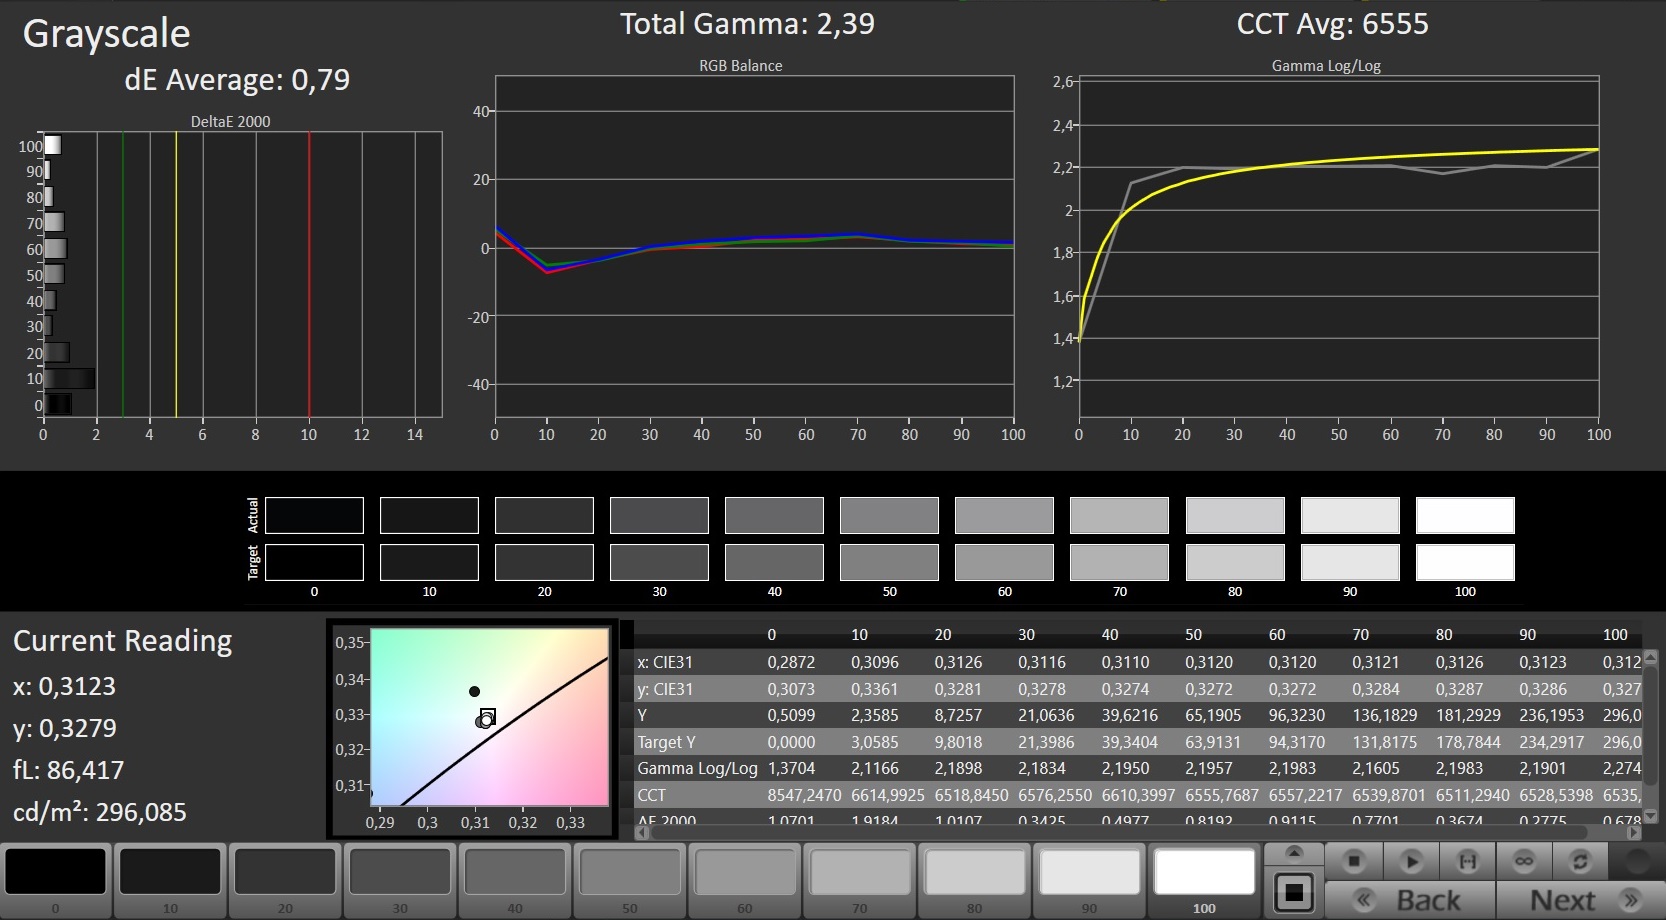
ΔE Greyscale Calman: 2.69 | ∀{0.09-98 Ø4.96}
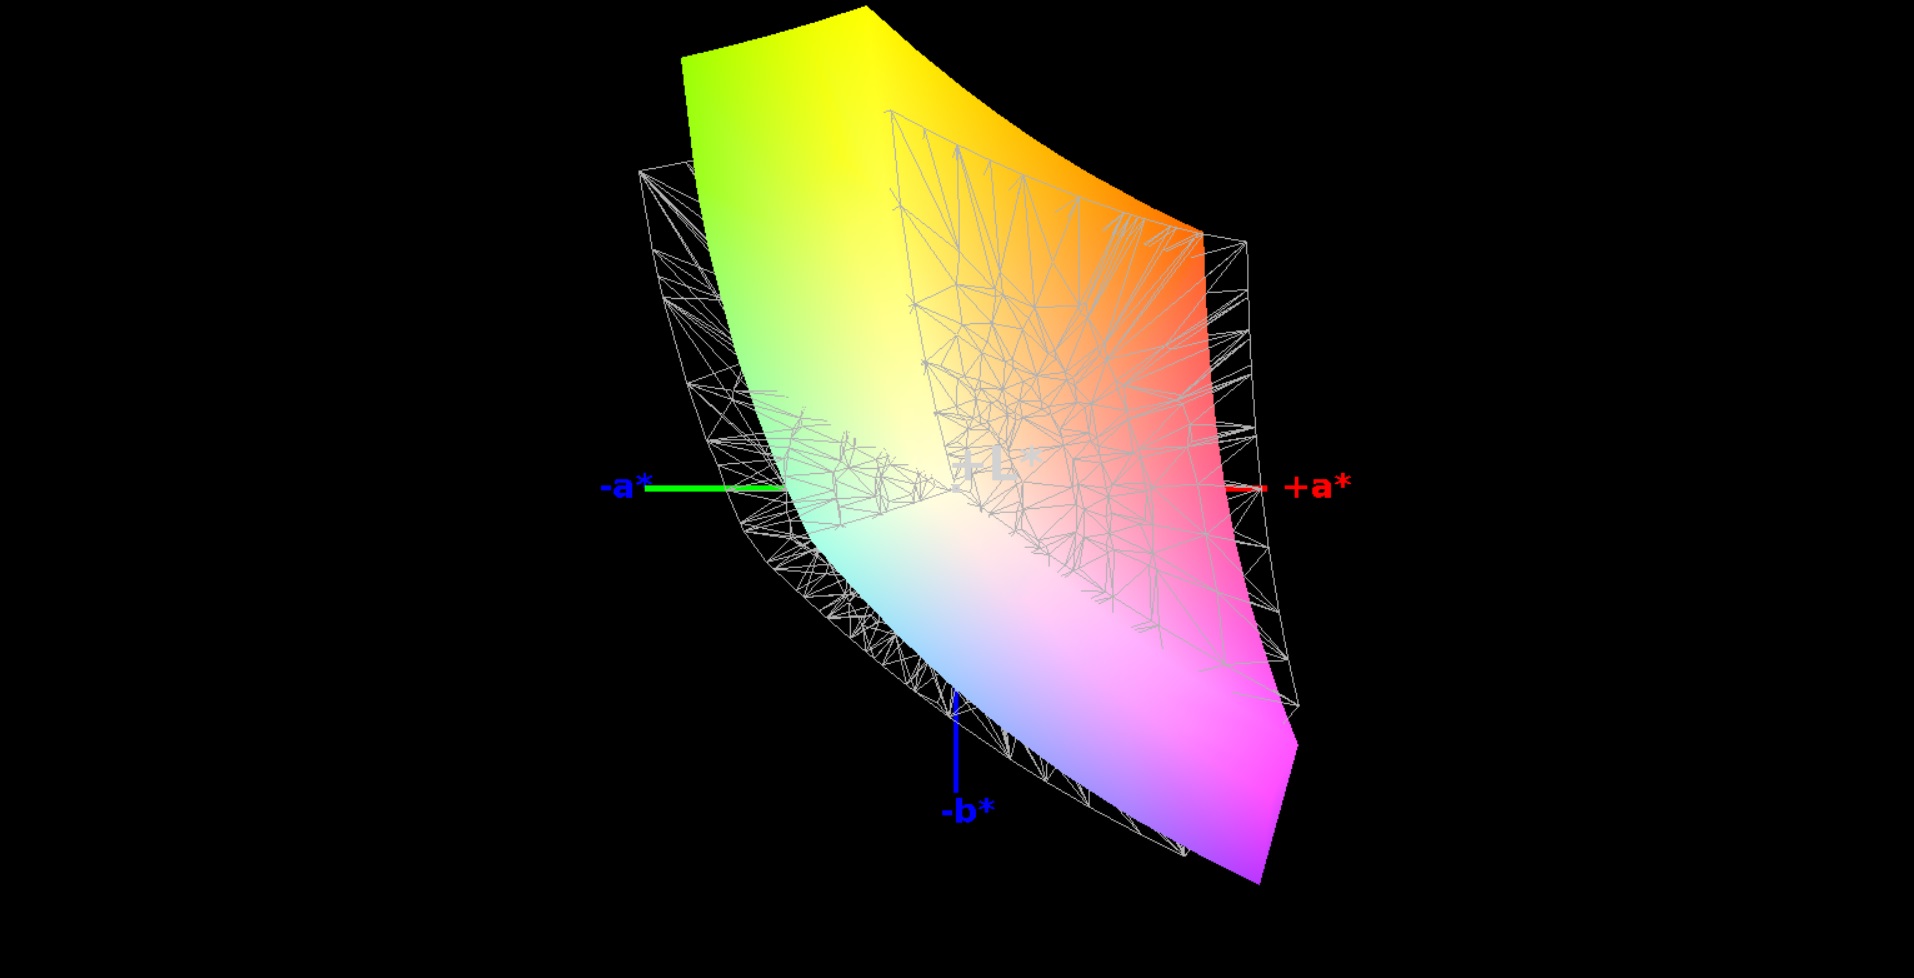
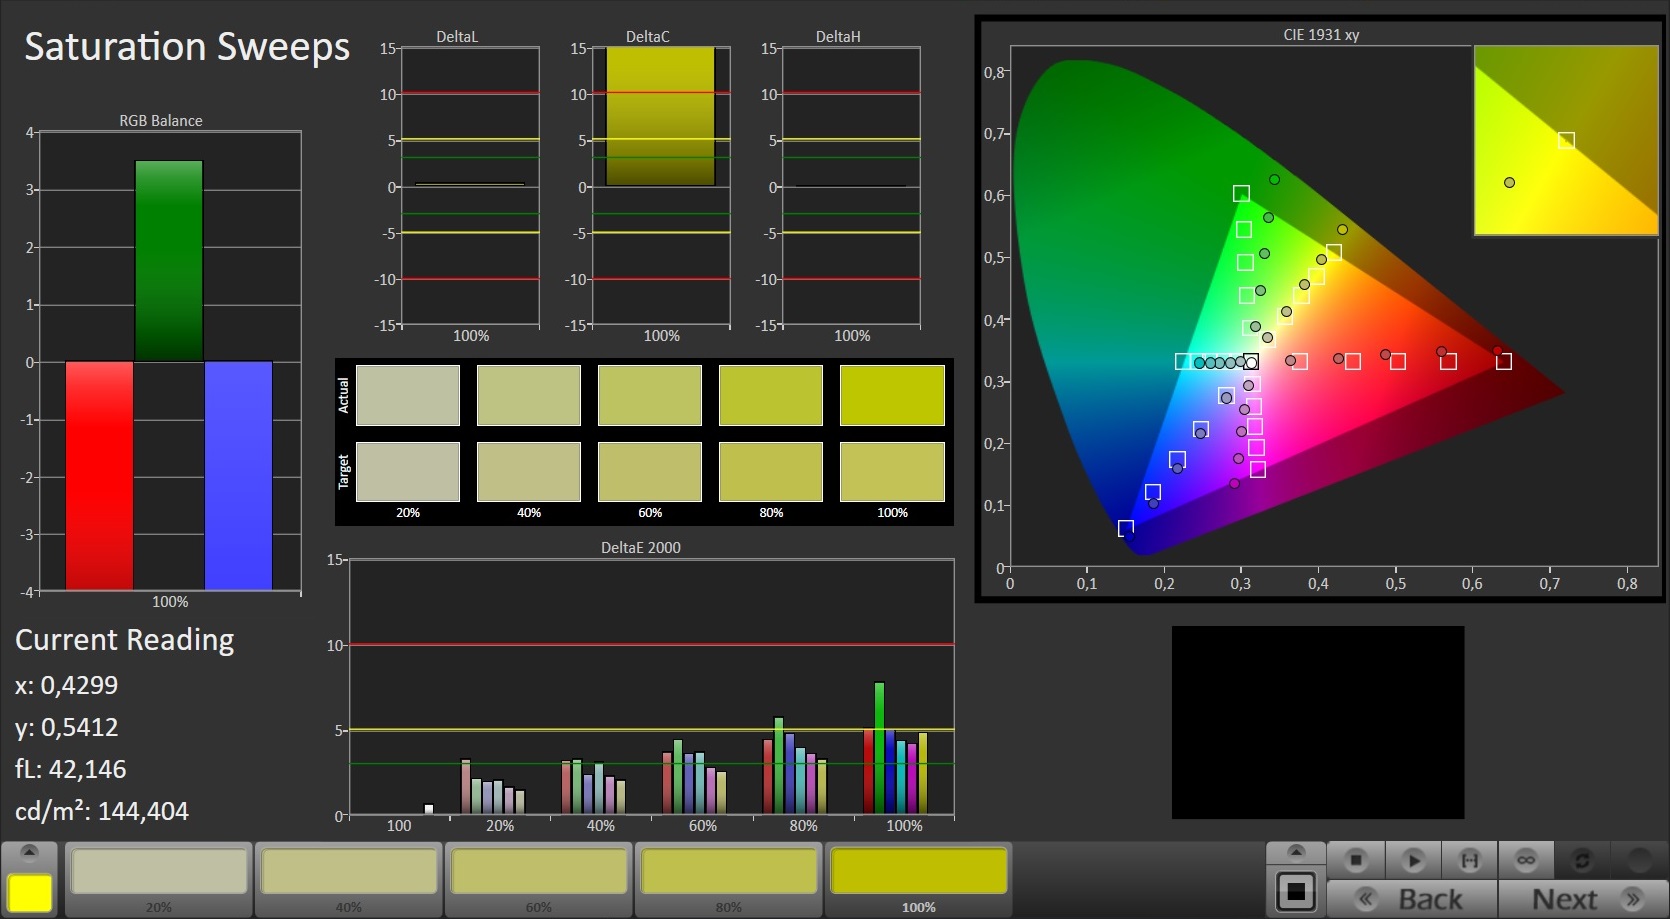
80% sRGB (Argyll 1.6.3 3D)
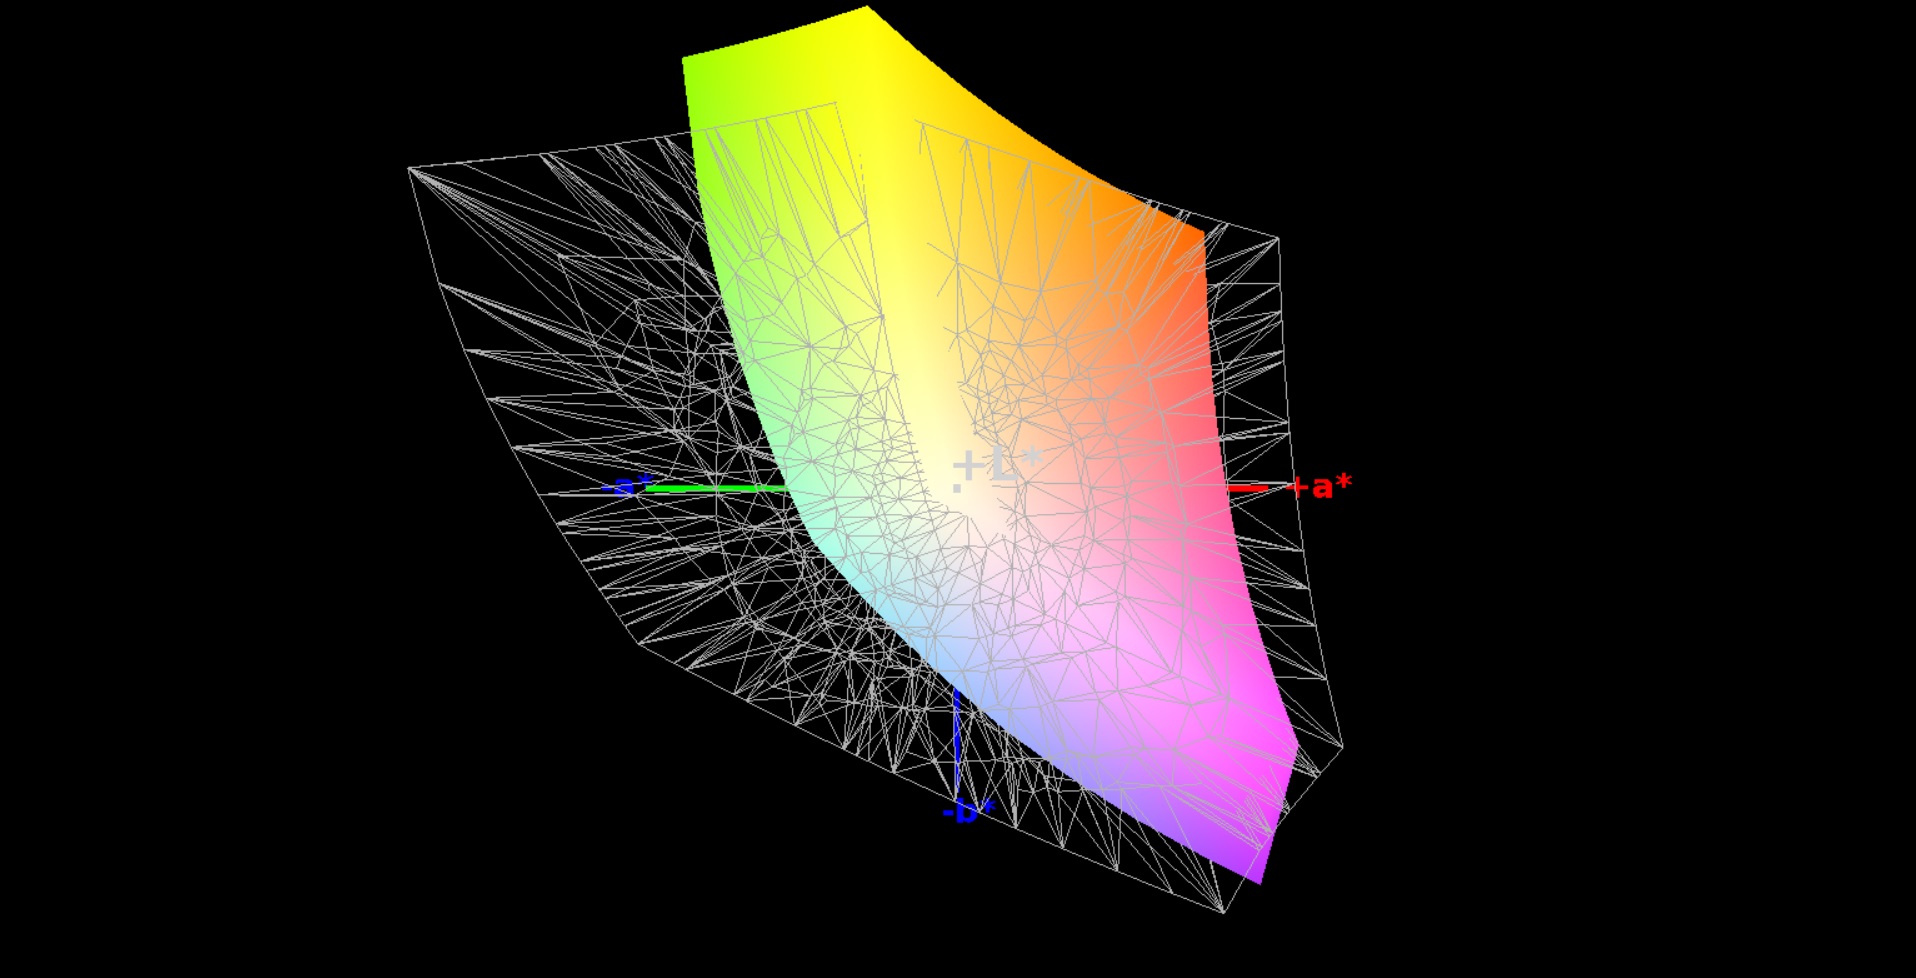
53% AdobeRGB 1998 (Argyll 1.6.3 3D)
59% AdobeRGB 1998 (Argyll 3D)
80.6% sRGB (Argyll 3D)
63.2% Display P3 (Argyll 3D)
Gamma: 2.37
CCT: 6455 K
| Gigabyte P55W v6 LG Philips LP156WF4 (LGD040E), 1920x1080 | Gigabyte P55W v5 LG Philips LP156WF4-SPH1, 1920x1080 | Asus Strix GL502VM-FY039T LG Philips LP156WF6-SPB6 (LGD046F), 1920x1080 | MSI GS63VR-6RF16H22 Stealth Pro Samsung 156HL01-104 (SDC324C) , 1920x1080 | Acer Predator 15 G9-593-765Q LG Philips LP156WF6-SPP1 (LGD04D5), 1920x1080 | |
|---|---|---|---|---|---|
| Display | -14% | 3% | 15% | 3% | |
| Display P3 Coverage (%) | 63.2 | 50.1 -21% | 64.5 2% | 67.8 7% | 63.6 1% |
| sRGB Coverage (%) | 80.6 | 73.5 -9% | 83.4 3% | 97.4 21% | 83.9 4% |
| AdobeRGB 1998 Coverage (%) | 59 | 51.2 -13% | 60.9 3% | 69.7 18% | 61.3 4% |
| Response Times | 17% | 24% | 16% | 28% | |
| Response Time Grey 50% / Grey 80% * (ms) | 56 ? | 44 ? 21% | 40 ? 29% | 35 ? 37% | |
| Response Time Black / White * (ms) | 31 ? | 27 ? 13% | 25 ? 19% | 26 ? 16% | 25 ? 19% |
| PWM Frequency (Hz) | 202 ? | ||||
| Screen | 6% | 10% | 14% | 13% | |
| Brightness middle (cd/m²) | 280 | 254 -9% | 321 15% | 293 5% | 273 -2% |
| Brightness (cd/m²) | 294 | 267 -9% | 296 1% | 279 -5% | 267 -9% |
| Brightness Distribution (%) | 82 | 89 9% | 88 7% | 84 2% | 83 1% |
| Black Level * (cd/m²) | 0.46 | 0.28 39% | 0.33 28% | 0.33 28% | 0.27 41% |
| Contrast (:1) | 609 | 907 49% | 973 60% | 888 46% | 1011 66% |
| Colorchecker dE 2000 * | 4.48 | 4.28 4% | 4.42 1% | 3.59 20% | 3.77 16% |
| Colorchecker dE 2000 max. * | 10.16 | 10.6 -4% | 9.78 4% | 5.79 43% | 10.64 -5% |
| Greyscale dE 2000 * | 2.69 | 2.77 -3% | 3.34 -24% | 3.86 -43% | 2.48 8% |
| Gamma | 2.37 93% | 2.28 96% | 2.4 92% | 2.53 87% | 2.37 93% |
| CCT | 6455 101% | 6284 103% | 6213 105% | 7229 90% | 6854 95% |
| Color Space (Percent of AdobeRGB 1998) (%) | 53 | 47 -11% | 55 4% | 63 19% | 55 4% |
| Color Space (Percent of sRGB) (%) | 80 | 73 -9% | 83 4% | 97 21% | 84 5% |
| Total Average (Program / Settings) | 3% /
3% | 12% /
10% | 15% /
14% | 15% /
13% |
* ... smaller is better

Display Response Times
| ↔ Response Time Black to White | ||
|---|---|---|
| 31 ms ... rise ↗ and fall ↘ combined | ↗ 8 ms rise | 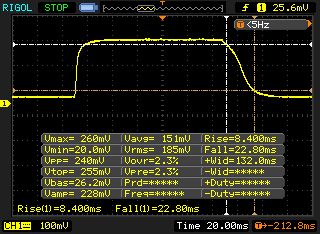 |
| ↘ 23 ms fall | ||
| The screen shows slow response rates in our tests and will be unsatisfactory for gamers. In comparison, all tested devices range from 0.1 (minimum) to 240 (maximum) ms. » 84 % of all devices are better. This means that the measured response time is worse than the average of all tested devices (19.8 ms). | ||
| ↔ Response Time 50% Grey to 80% Grey | ||
| 56 ms ... rise ↗ and fall ↘ combined | ↗ 23 ms rise | 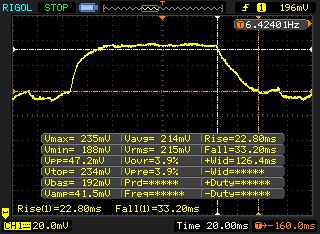 |
| ↘ 33 ms fall | ||
| The screen shows slow response rates in our tests and will be unsatisfactory for gamers. In comparison, all tested devices range from 0.165 (minimum) to 636 (maximum) ms. » 93 % of all devices are better. This means that the measured response time is worse than the average of all tested devices (31 ms). | ||
Screen Flickering / PWM (Pulse-Width Modulation)
| Screen flickering / PWM not detected | 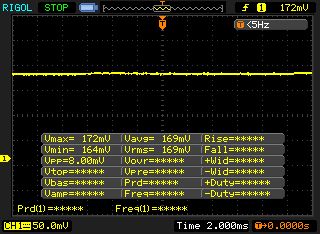 | ||
In comparison: 52 % of all tested devices do not use PWM to dim the display. If PWM was detected, an average of 7747 (minimum: 5 - maximum: 343500) Hz was measured. | |||
| PCMark 7 Score | 5715 points | |
| PCMark 8 Home Score Accelerated v2 | 4014 points | |
| PCMark 8 Creative Score Accelerated v2 | 4897 points | |
| PCMark 8 Work Score Accelerated v2 | 4784 points | |
Help | ||
| Gigabyte P55W v6 Transcend MTS800 128GB M.2 (TS128GMTS800) | Gigabyte P55W v5 Samsung SM951 MZVPV128 NVMe | Asus Strix GL502VM-FY039T Micron SSD 1100 (MTFDDAV256TBN) | MSI GS63VR-6RF16H22 Stealth Pro Samsung SM951 MZVPV256HDGL m.2 PCI-e | Acer Aspire VX5-591G-D0DD SK Hynix Canvas SC300 512GB M.2 (HFS512G39MND) | Acer Predator 15 G9-593-765Q LiteOn CV1-8B512 | |
|---|---|---|---|---|---|---|
| CrystalDiskMark 3.0 | 166% | 53% | 298% | 50% | 55% | |
| Read Seq (MB/s) | 511 | 1356 165% | 462.5 -9% | 1973 286% | 494.2 -3% | 517 1% |
| Write Seq (MB/s) | 161.1 | 657 308% | 462.7 187% | 1292 702% | 449.6 179% | 449.7 179% |
| Read 512 (MB/s) | 338 | 1044 209% | 335 -1% | 1279 278% | 348.1 3% | 355.3 5% |
| Write 512 (MB/s) | 160.8 | 642 299% | 407.1 153% | 1288 701% | 418.2 160% | 433.7 170% |
| Read 4k (MB/s) | 26.2 | 50.8 94% | 25.61 -2% | 52.3 100% | 16.97 -35% | 27.69 6% |
| Write 4k (MB/s) | 76.7 | 142.7 86% | 86.3 13% | 153.2 100% | 38.36 -50% | 72.9 -5% |
| Read 4k QD32 (MB/s) | 264.7 | 588 122% | 246.7 -7% | 464.4 75% | 394.9 49% | 290.9 10% |
| Write 4k QD32 (MB/s) | 160.3 | 236.3 47% | 301.5 88% | 384.4 140% | 317.4 98% | 273.8 71% |

| 3DMark | |
| 1280x720 Cloud Gate Standard Graphics | |
| Acer Predator 15 G9-593-765Q | |
| Asus Strix GL502VM-FY039T | |
| Gigabyte P55W v6 | |
| MSI GS63VR-6RF16H22 Stealth Pro | |
| Acer Aspire VX5-591G-D0DD | |
| Gigabyte P55W v5 | |
| 1920x1080 Fire Strike Graphics | |
| Acer Predator 15 G9-593-765Q | |
| MSI GS63VR-6RF16H22 Stealth Pro | |
| Asus Strix GL502VM-FY039T | |
| Gigabyte P55W v6 | |
| Acer Aspire VX5-591G-D0DD | |
| Gigabyte P55W v5 | |
| 3DMark 11 - 1280x720 Performance GPU | |
| Acer Predator 15 G9-593-765Q | |
| Asus Strix GL502VM-FY039T | |
| MSI GS63VR-6RF16H22 Stealth Pro | |
| Gigabyte P55W v6 | |
| Gigabyte P55W v5 | |
| Acer Aspire VX5-591G-D0DD | |
| 3DMark 11 Performance | 12433 points | |
| 3DMark Cloud Gate Standard Score | 22706 points | |
| 3DMark Fire Strike Score | 9527 points | |
| 3DMark Fire Strike Extreme Score | 4963 points | |
Help | ||
| The Witcher 3 | |
| 1920x1080 Ultra Graphics & Postprocessing (HBAO+) | |
| Acer Predator 15 G9-593-765Q | |
| MSI GS63VR-6RF16H22 Stealth Pro | |
| Gigabyte P55W v6 | |
| Acer Aspire VX5-591G-D0DD | |
| 1920x1080 High Graphics & Postprocessing (Nvidia HairWorks Off) | |
| Acer Predator 15 G9-593-765Q | |
| MSI GS63VR-6RF16H22 Stealth Pro | |
| Gigabyte P55W v6 | |
| Acer Aspire VX5-591G-D0DD | |
| Deus Ex Mankind Divided | |
| 1920x1080 High Preset AF:4x | |
| Acer Predator 15 G9-593-765Q | |
| Gigabyte P55W v6 | |
| MSI GS63VR-6RF16H22 Stealth Pro | |
| 1920x1080 Ultra Preset AA:2xMS AF:8x | |
| Acer Predator 15 G9-593-765Q | |
| Gigabyte P55W v6 | |
| MSI GS63VR-6RF16H22 Stealth Pro | |
| BioShock Infinite - 1920x1080 Ultra Preset, DX11 (DDOF) | |
| Asus Strix GL502VM-FY039T | |
| MSI GS63VR-6RF16H22 Stealth Pro | |
| Gigabyte P55W v6 | |
| Gigabyte P55W v5 | |
| low | med. | high | ultra | |
|---|---|---|---|---|
| BioShock Infinite (2013) | 189 | 176.2 | 151.7 | 99.7 |
| The Witcher 3 (2015) | 166.1 | 127.2 | 63.3 | 37.8 |
| Deus Ex Mankind Divided (2016) | 116.1 | 98.4 | 54.6 | 28 |
Noise level
| Idle |
| 35 / 36 / 37 dB(A) |
| HDD |
| 37 dB(A) |
| DVD |
| 39 / dB(A) |
| Load |
| 41 / 52 dB(A) |
 | ||
30 dB silent 40 dB(A) audible 50 dB(A) loud |
||
min: | ||
| Gigabyte P55W v6 GeForce GTX 1060 Mobile, 6700HQ | Gigabyte P55W v5 GeForce GTX 970M, 6700HQ | Asus Strix GL502VM-FY039T GeForce GTX 1060 Mobile, 6700HQ | MSI GS63VR-6RF16H22 Stealth Pro GeForce GTX 1060 Mobile, 6700HQ | Acer Predator 15 G9-593-765Q GeForce GTX 1070 Mobile, 6700HQ | |
|---|---|---|---|---|---|
| Noise | 4% | 3% | 8% | 3% | |
| off / environment * (dB) | 31 | 31 -0% | 30 3% | 30 3% | |
| Idle Minimum * (dB) | 35 | 33 6% | 32 9% | 32 9% | 31 11% |
| Idle Average * (dB) | 36 | 34 6% | 33 8% | 33 8% | 35 3% |
| Idle Maximum * (dB) | 37 | 35 5% | 34 8% | 34 8% | 38 -3% |
| Load Average * (dB) | 41 | 43 -5% | 44 -7% | 37 10% | 43 -5% |
| Load Maximum * (dB) | 52 | 49 6% | 53 -2% | 46 12% | 49 6% |
* ... smaller is better
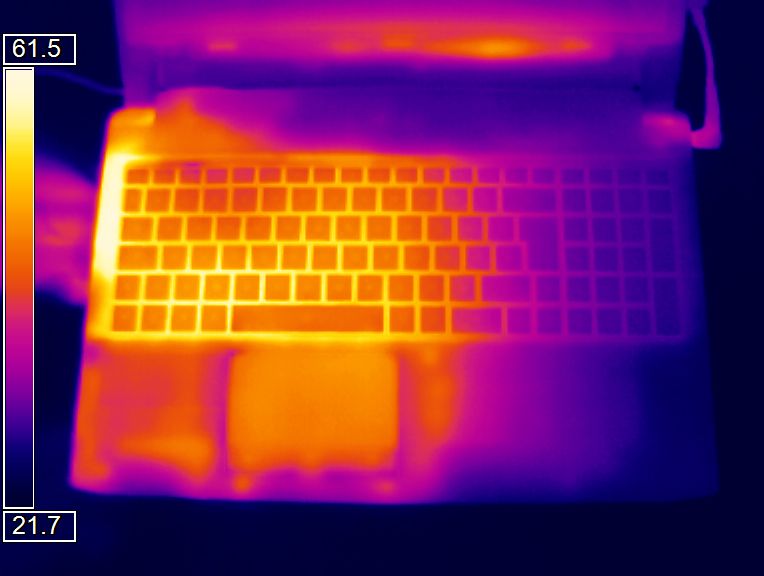
(-) The maximum temperature on the upper side is 47.7 °C / 118 F, compared to the average of 40.4 °C / 105 F, ranging from 21.2 to 68.8 °C for the class Gaming.
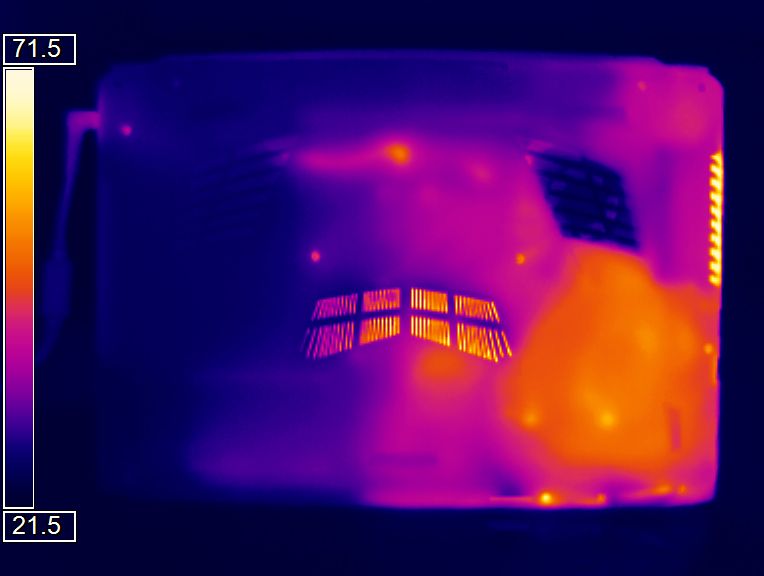
(-) The bottom heats up to a maximum of 51.2 °C / 124 F, compared to the average of 43.2 °C / 110 F
(+) In idle usage, the average temperature for the upper side is 28 °C / 82 F, compared to the device average of 33.9 °C / 93 F.
(-) The palmrests and touchpad can get very hot to the touch with a maximum of 45.2 °C / 113.4 F.
(-) The average temperature of the palmrest area of similar devices was 28.8 °C / 83.8 F (-16.4 °C / -29.6 F).
| Gigabyte P55W v6 GeForce GTX 1060 Mobile, 6700HQ | Gigabyte P55W v5 GeForce GTX 970M, 6700HQ | Asus Strix GL502VM-FY039T GeForce GTX 1060 Mobile, 6700HQ | MSI GS63VR-6RF16H22 Stealth Pro GeForce GTX 1060 Mobile, 6700HQ | Acer Predator 15 G9-593-765Q GeForce GTX 1070 Mobile, 6700HQ | |
|---|---|---|---|---|---|
| Heat | 5% | -17% | 5% | 18% | |
| Maximum Upper Side * (°C) | 47.7 | 50 -5% | 65.3 -37% | 45.3 5% | 40.5 15% |
| Maximum Bottom * (°C) | 51.2 | 57.7 -13% | 64.4 -26% | 62.6 -22% | 42 18% |
| Idle Upper Side * (°C) | 32.1 | 25.7 20% | 35.4 -10% | 25.3 21% | 28.2 12% |
| Idle Bottom * (°C) | 32.8 | 27.2 17% | 31.6 4% | 27.3 17% | 24.3 26% |
* ... smaller is better
Gigabyte P55W v6 audio analysis
(+) | speakers can play relatively loud (83 dB)
Bass 100 - 315 Hz
(-) | nearly no bass - on average 24.9% lower than median
(±) | linearity of bass is average (8.7% delta to prev. frequency)
Mids 400 - 2000 Hz
(±) | higher mids - on average 7% higher than median
(±) | linearity of mids is average (8.9% delta to prev. frequency)
Highs 2 - 16 kHz
(±) | higher highs - on average 6% higher than median
(±) | linearity of highs is average (7.8% delta to prev. frequency)
Overall 100 - 16.000 Hz
(±) | linearity of overall sound is average (25.2% difference to median)
Compared to same class
» 90% of all tested devices in this class were better, 3% similar, 7% worse
» The best had a delta of 6%, average was 18%, worst was 132%
Compared to all devices tested
» 77% of all tested devices were better, 5% similar, 18% worse
» The best had a delta of 4%, average was 23%, worst was 134%
Asus Strix GL502VM-FY039T audio analysis
(±) | speaker loudness is average but good (76 dB)
Bass 100 - 315 Hz
(-) | nearly no bass - on average 19.1% lower than median
(-) | bass is not linear (18.1% delta to prev. frequency)
Mids 400 - 2000 Hz
(+) | balanced mids - only 2.9% away from median
(+) | mids are linear (4% delta to prev. frequency)
Highs 2 - 16 kHz
(±) | higher highs - on average 5.6% higher than median
(±) | linearity of highs is average (8% delta to prev. frequency)
Overall 100 - 16.000 Hz
(±) | linearity of overall sound is average (23% difference to median)
Compared to same class
» 83% of all tested devices in this class were better, 5% similar, 12% worse
» The best had a delta of 6%, average was 18%, worst was 132%
Compared to all devices tested
» 69% of all tested devices were better, 5% similar, 26% worse
» The best had a delta of 4%, average was 23%, worst was 134%
| Off / Standby | |
| Idle | |
| Load |
|
Key:
min: | |
| Gigabyte P55W v6 GeForce GTX 1060 Mobile, 6700HQ | Gigabyte P55W v5 GeForce GTX 970M, 6700HQ | Asus Strix GL502VM-FY039T GeForce GTX 1060 Mobile, 6700HQ | MSI GS63VR-6RF16H22 Stealth Pro GeForce GTX 1060 Mobile, 6700HQ | Acer Predator 15 G9-593-765Q GeForce GTX 1070 Mobile, 6700HQ | |
|---|---|---|---|---|---|
| Power Consumption | -4% | -34% | -56% | -65% | |
| Idle Minimum * (Watt) | 8 | 9 -13% | 16 -100% | 18 -125% | 18 -125% |
| Idle Average * (Watt) | 13 | 13 -0% | 19 -46% | 22 -69% | 24 -85% |
| Idle Maximum * (Watt) | 17 | 17 -0% | 23 -35% | 30 -76% | 29 -71% |
| Load Average * (Watt) | 71 | 81 -14% | 68 4% | 77 -8% | 86 -21% |
| Load Maximum * (Watt) | 165 | 152 8% | 157 5% | 165 -0% | 201 -22% |
* ... smaller is better
| Gigabyte P55W v6 GeForce GTX 1060 Mobile, 6700HQ, 63 Wh | Gigabyte P55W v5 GeForce GTX 970M, 6700HQ, 61 Wh | Asus Strix GL502VM-FY039T GeForce GTX 1060 Mobile, 6700HQ, 64 Wh | MSI GS63VR-6RF16H22 Stealth Pro GeForce GTX 1060 Mobile, 6700HQ, 65 Wh | Acer Predator 15 G9-593-765Q GeForce GTX 1070 Mobile, 6700HQ, Wh | |
|---|---|---|---|---|---|
| Battery runtime | -1% | -30% | -30% | -4% | |
| Reader / Idle (h) | 10.2 | 10.1 -1% | 5.3 -48% | 6 -41% | |
| H.264 (h) | 5.6 | 5.5 -2% | 3.9 -30% | 4.5 -20% | 5 -11% |
| WiFi v1.3 (h) | 5.9 | 5.8 -2% | 3.7 -37% | 3.5 -41% | 4.8 -19% |
| Load (h) | 1.6 | 1.6 0% | 1.5 -6% | 1.3 -19% | 1.9 19% |
Pros
Cons
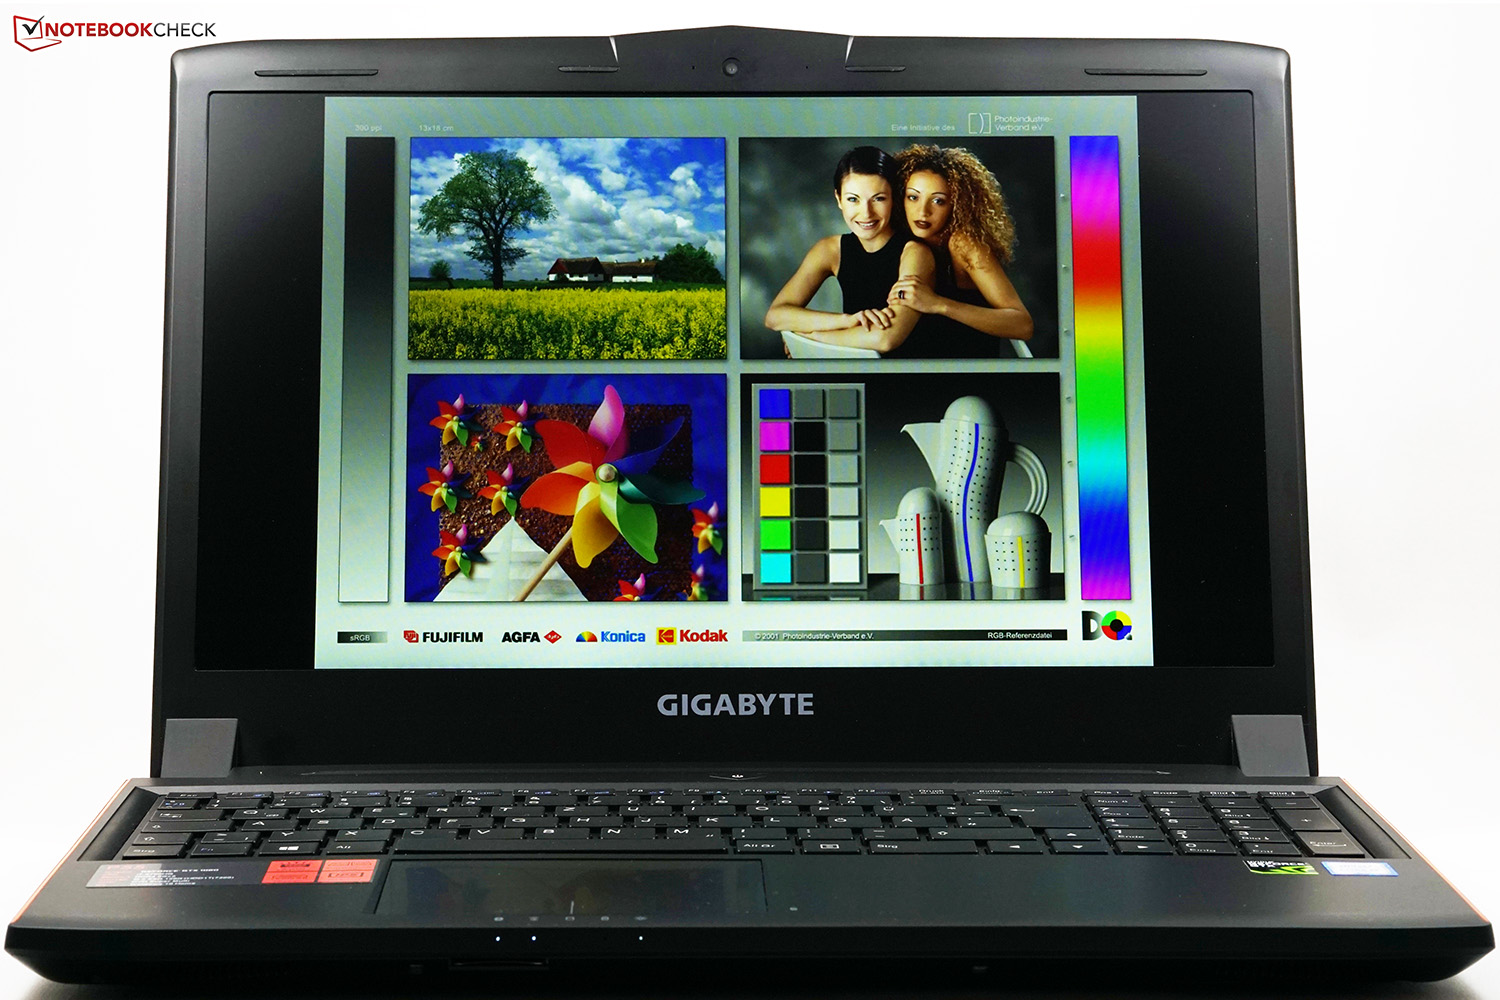
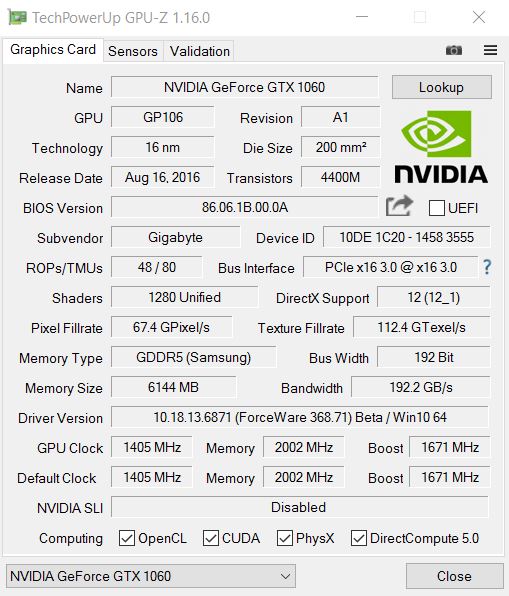
技嘉P55W的不同机型几乎都在性能和价位上实现了巧妙的平衡——这次的第六版也是如此。从GeForce GTX 970到GTX 1060的升级带来了接近50%的3D性能提升,而它的价位并没有改变(1600欧元,约11711人民币)。”低价高效“可以说是对它的完美形容。
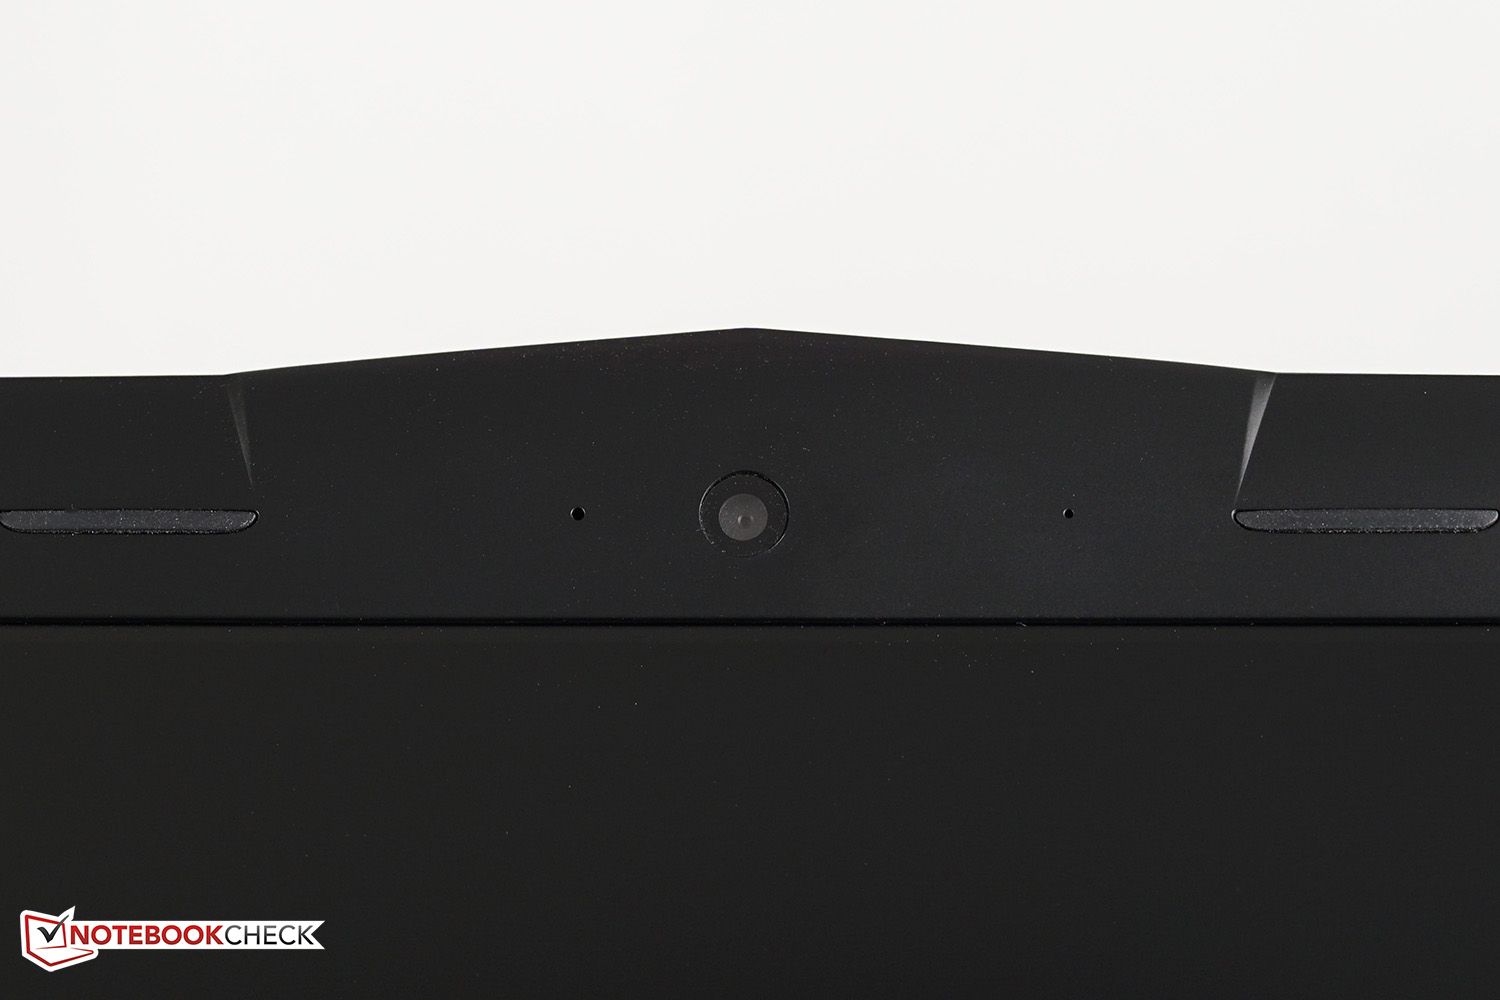
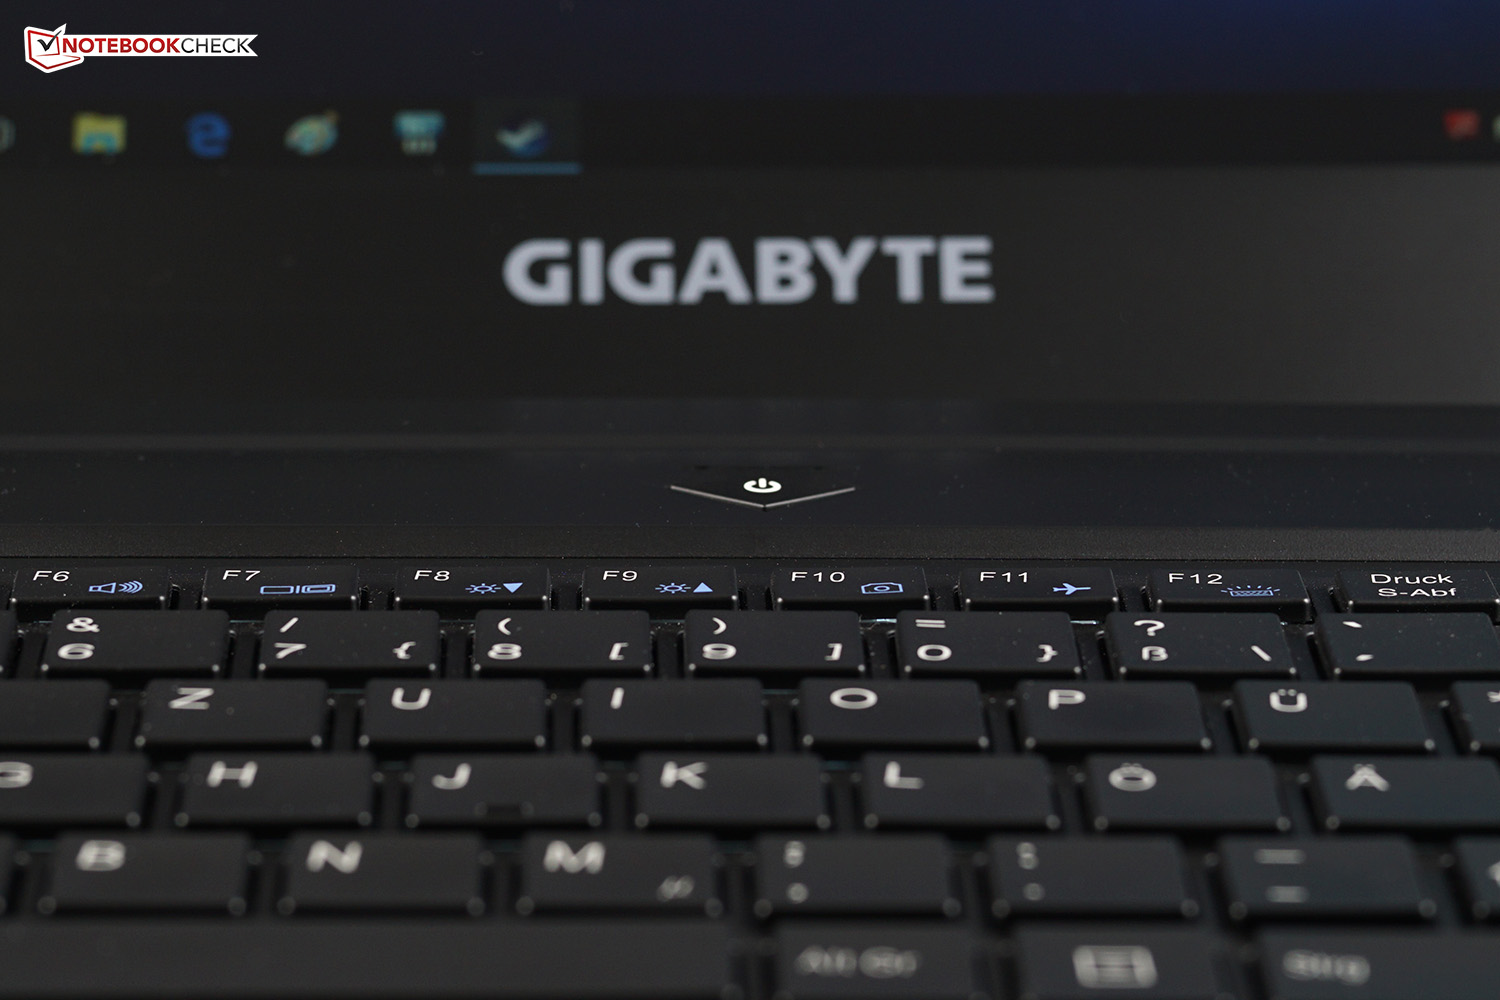
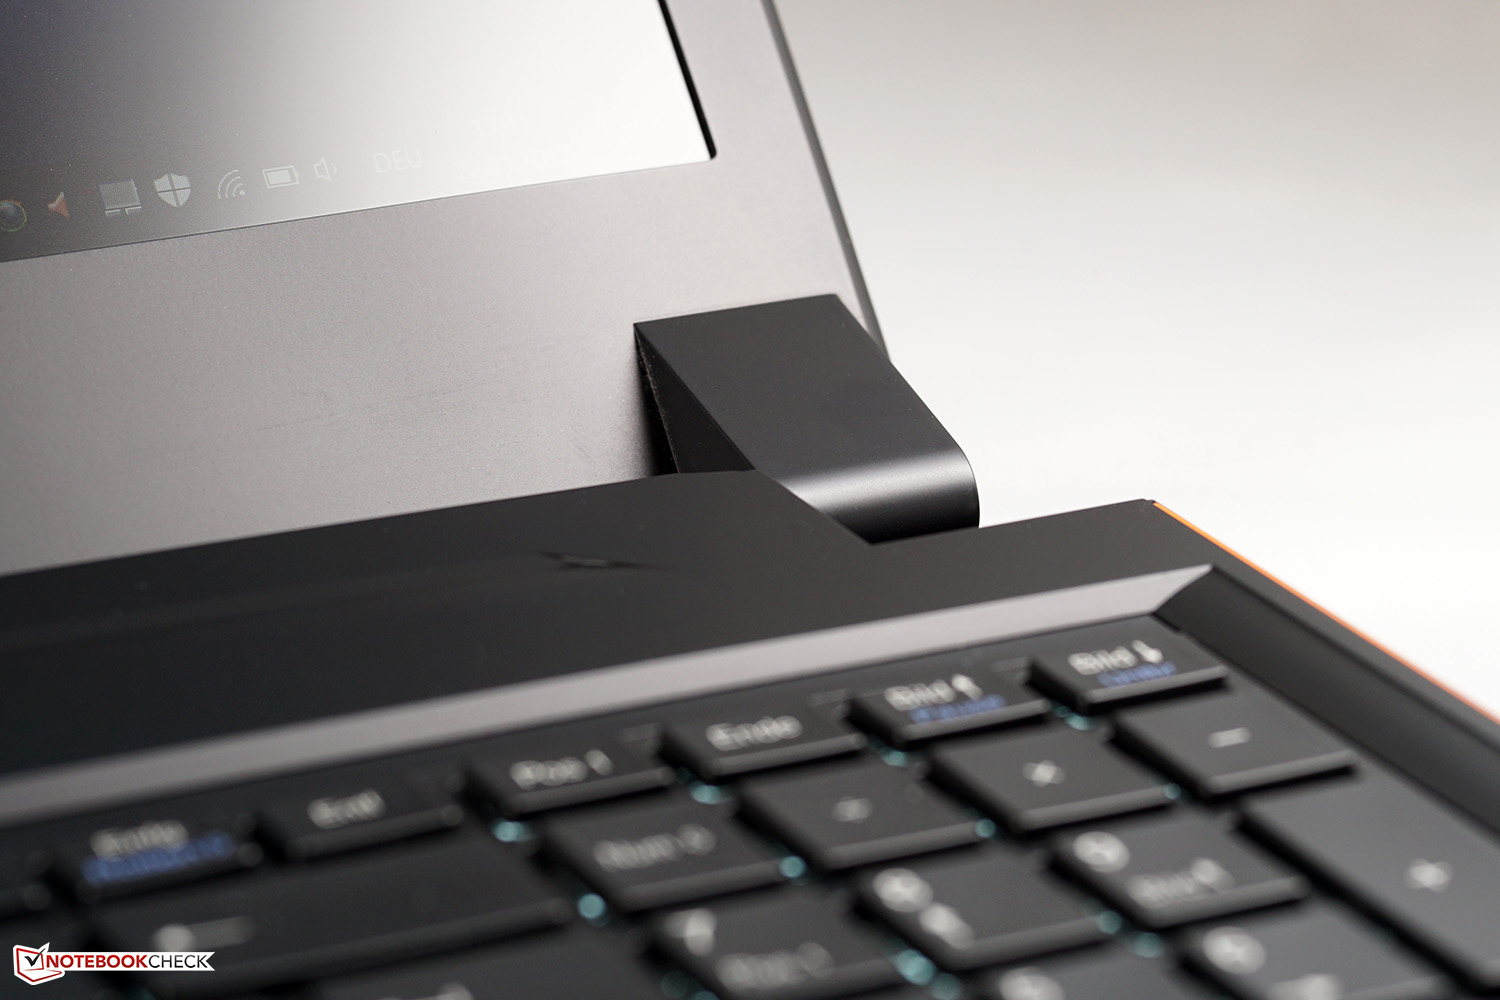
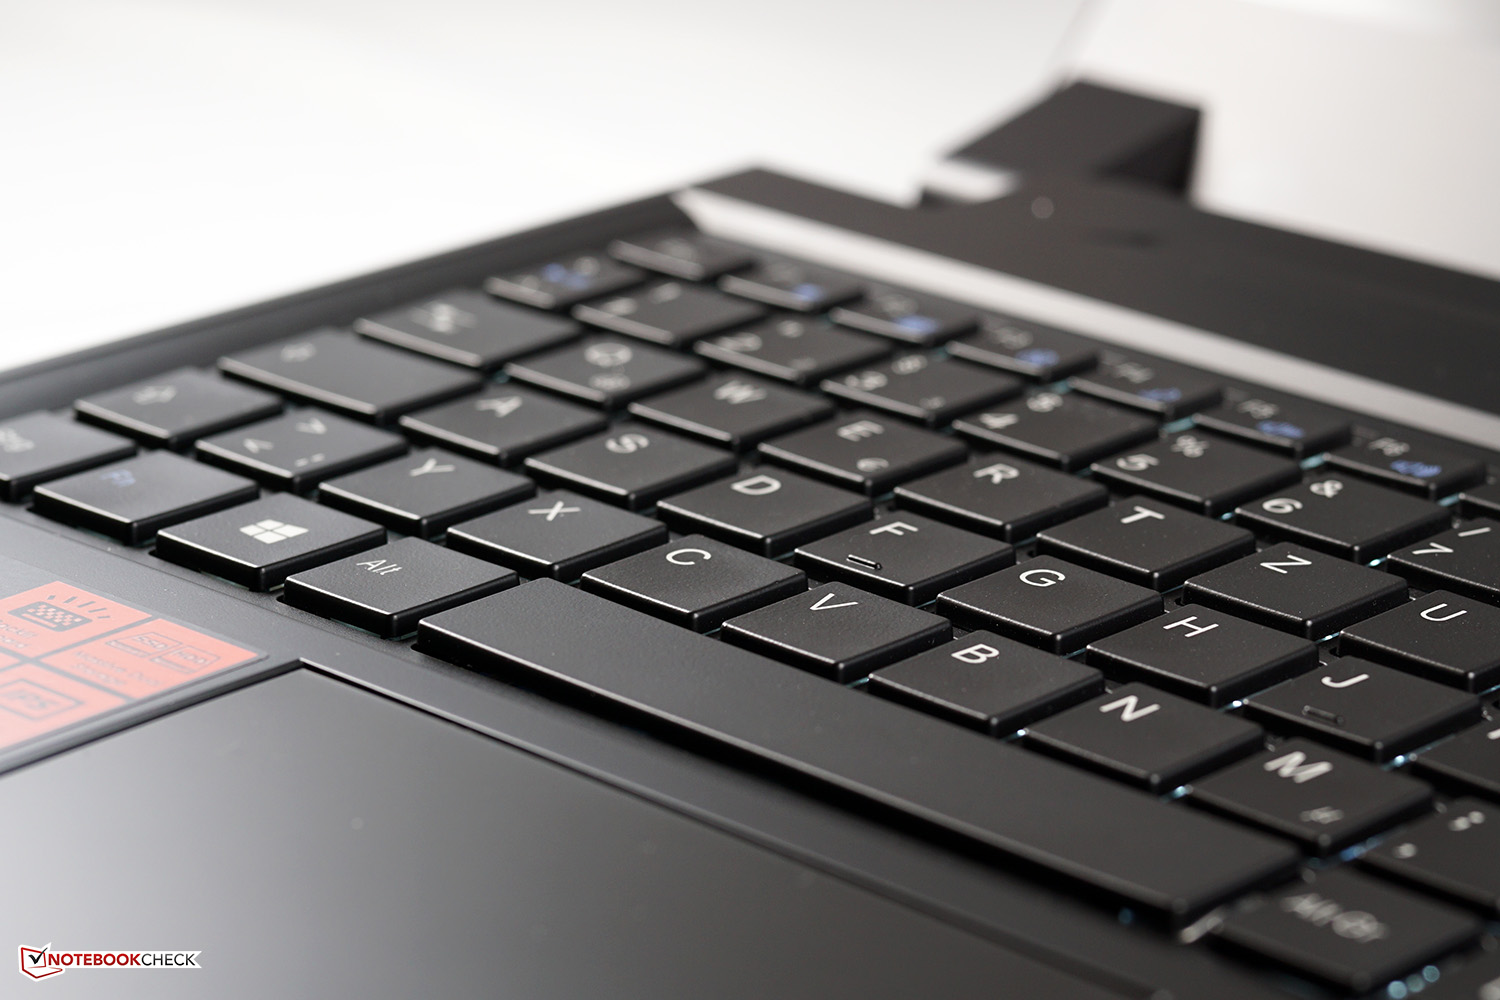
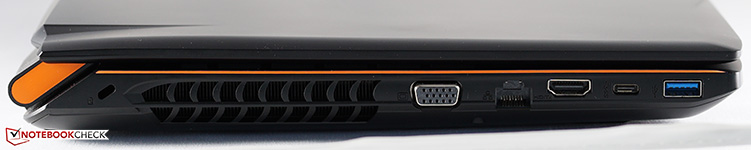
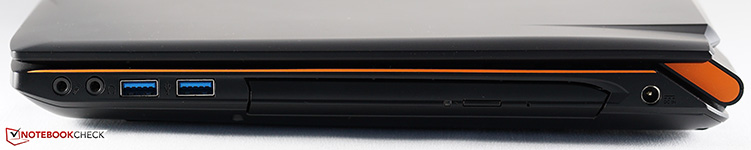
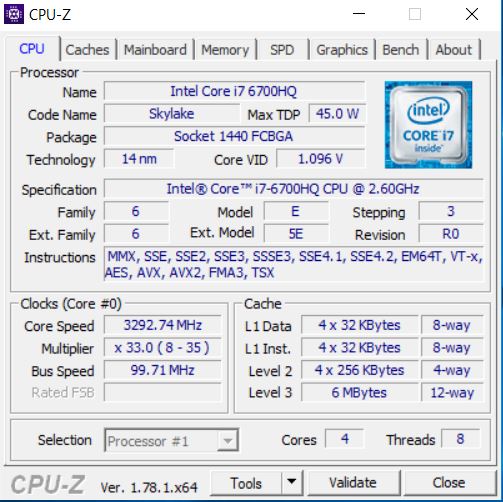
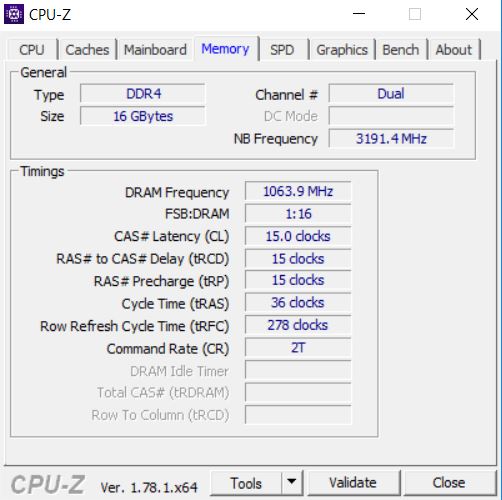
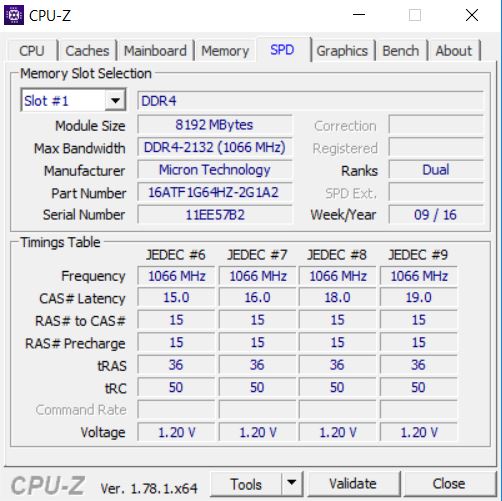
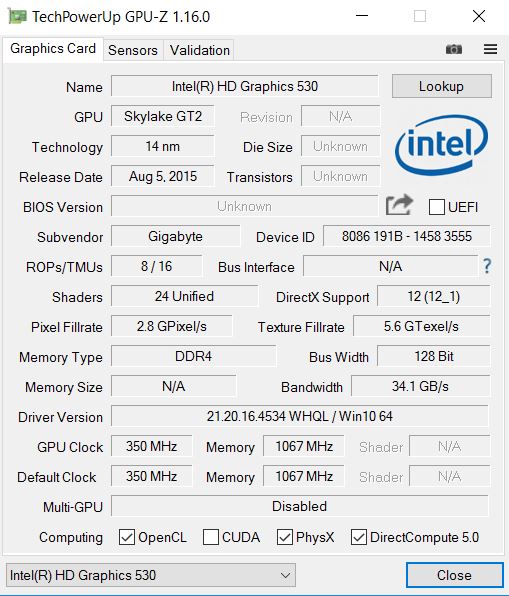
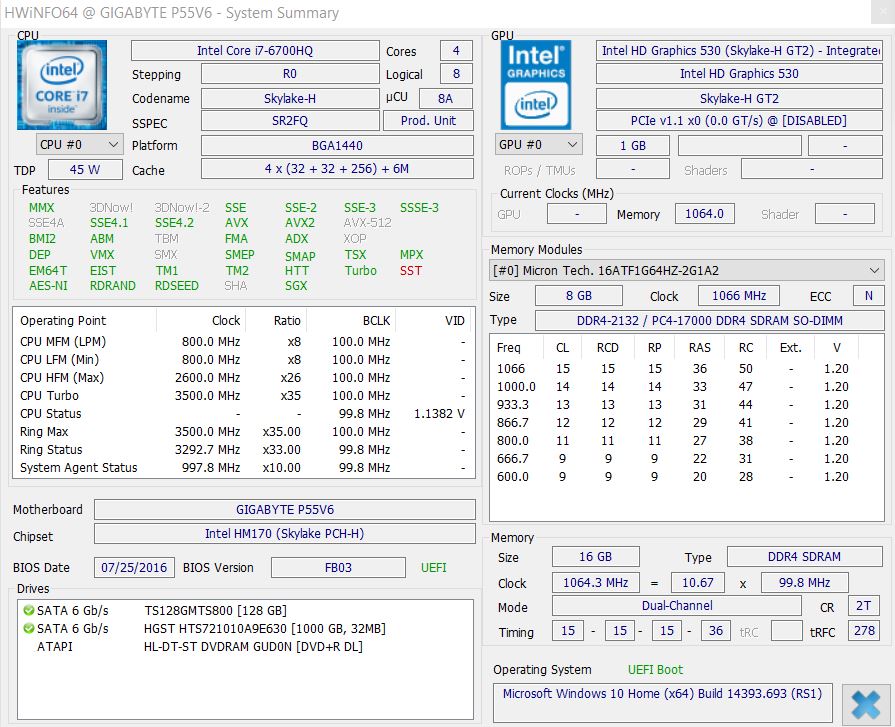
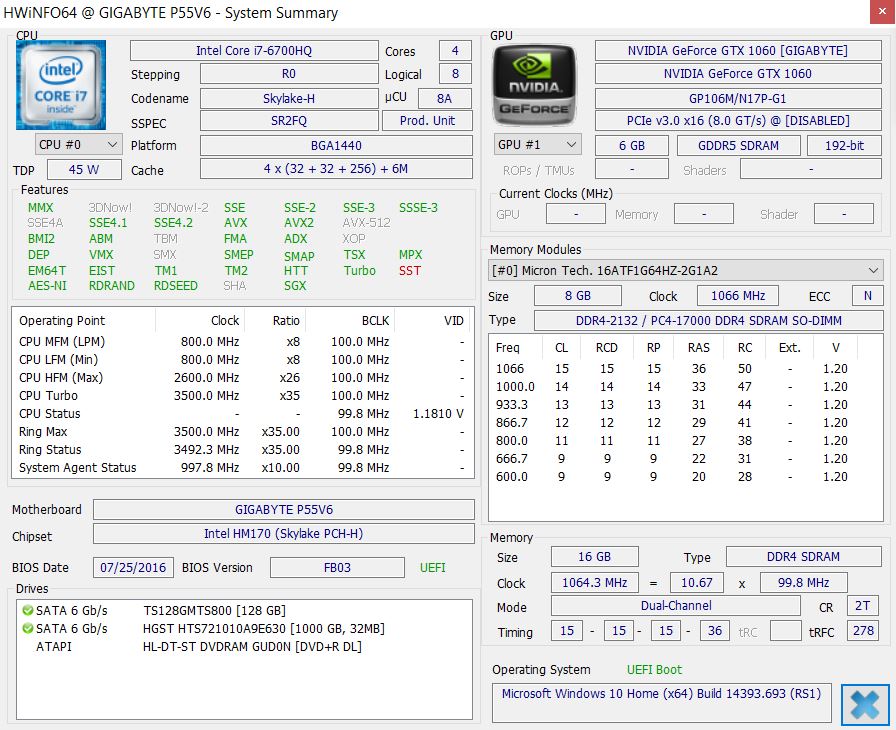
它的外观也完全没有改变——它的机身和合理的物理接口搭配,非常优秀的输入设备和中规中矩的扬声器都一如既往。这一次技嘉采用了一块Skylake处理器搭配16GB内存,因此它的系统性能足够应对大型软件。它的电池续航也没有受到什么影响。
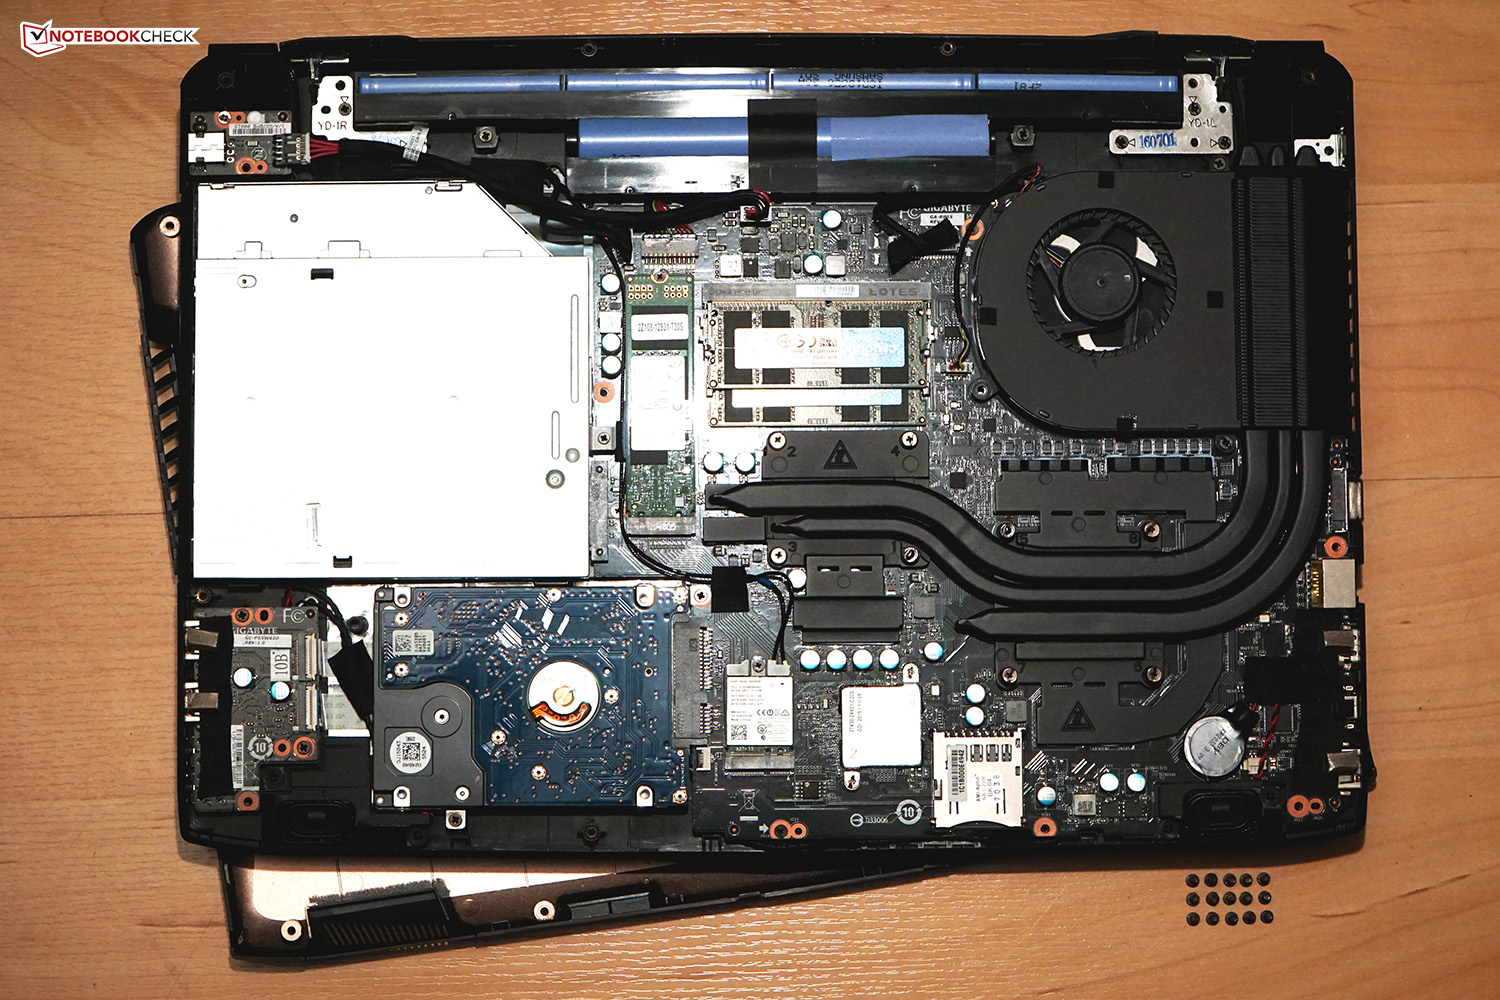
相比前代机型,这台新设备在一部分方面有所退步。它的屏幕对比度相比更低,亮度分布也不如前代机型均匀。这让我们十分惊讶,因为它的屏幕型号和类型都完全相同。P55W v5所搭配的极速三星固态硬盘也换成了速度慢了许多的创见固态硬盘。它的噪音控制也相比差了不少,特别是在最高负载下时高时低的噪音十分烦人。
综合考虑,P55W v6是基于前代机型的成功更新,它的整体表现不错——而在1600欧元(约11711人民币)的价位上用户可以得到非常不错的3D性能。配置相同的华硕Strix GL502VM是唯一在性价比上可以与它抗衡的机型。不需要这么高游戏性能的用户可以节省不少,值得参考的机型包括售价约1000欧元(约7319人民币)的宏碁Aspire VX5-591G。需要比P55W v6更高性能的游戏玩家则需要准备出更多的预算:如宏碁Predator 15 G9-593售价达到了接近2500欧元(约18298人民币)。
注:本文是基于完整评测的缩减版本,阅读完整的英文评测,请点击这里。
Gigabyte P55W v6
- 01/31/2017 v6 (old)
Oliver Moebel
Price comparison
