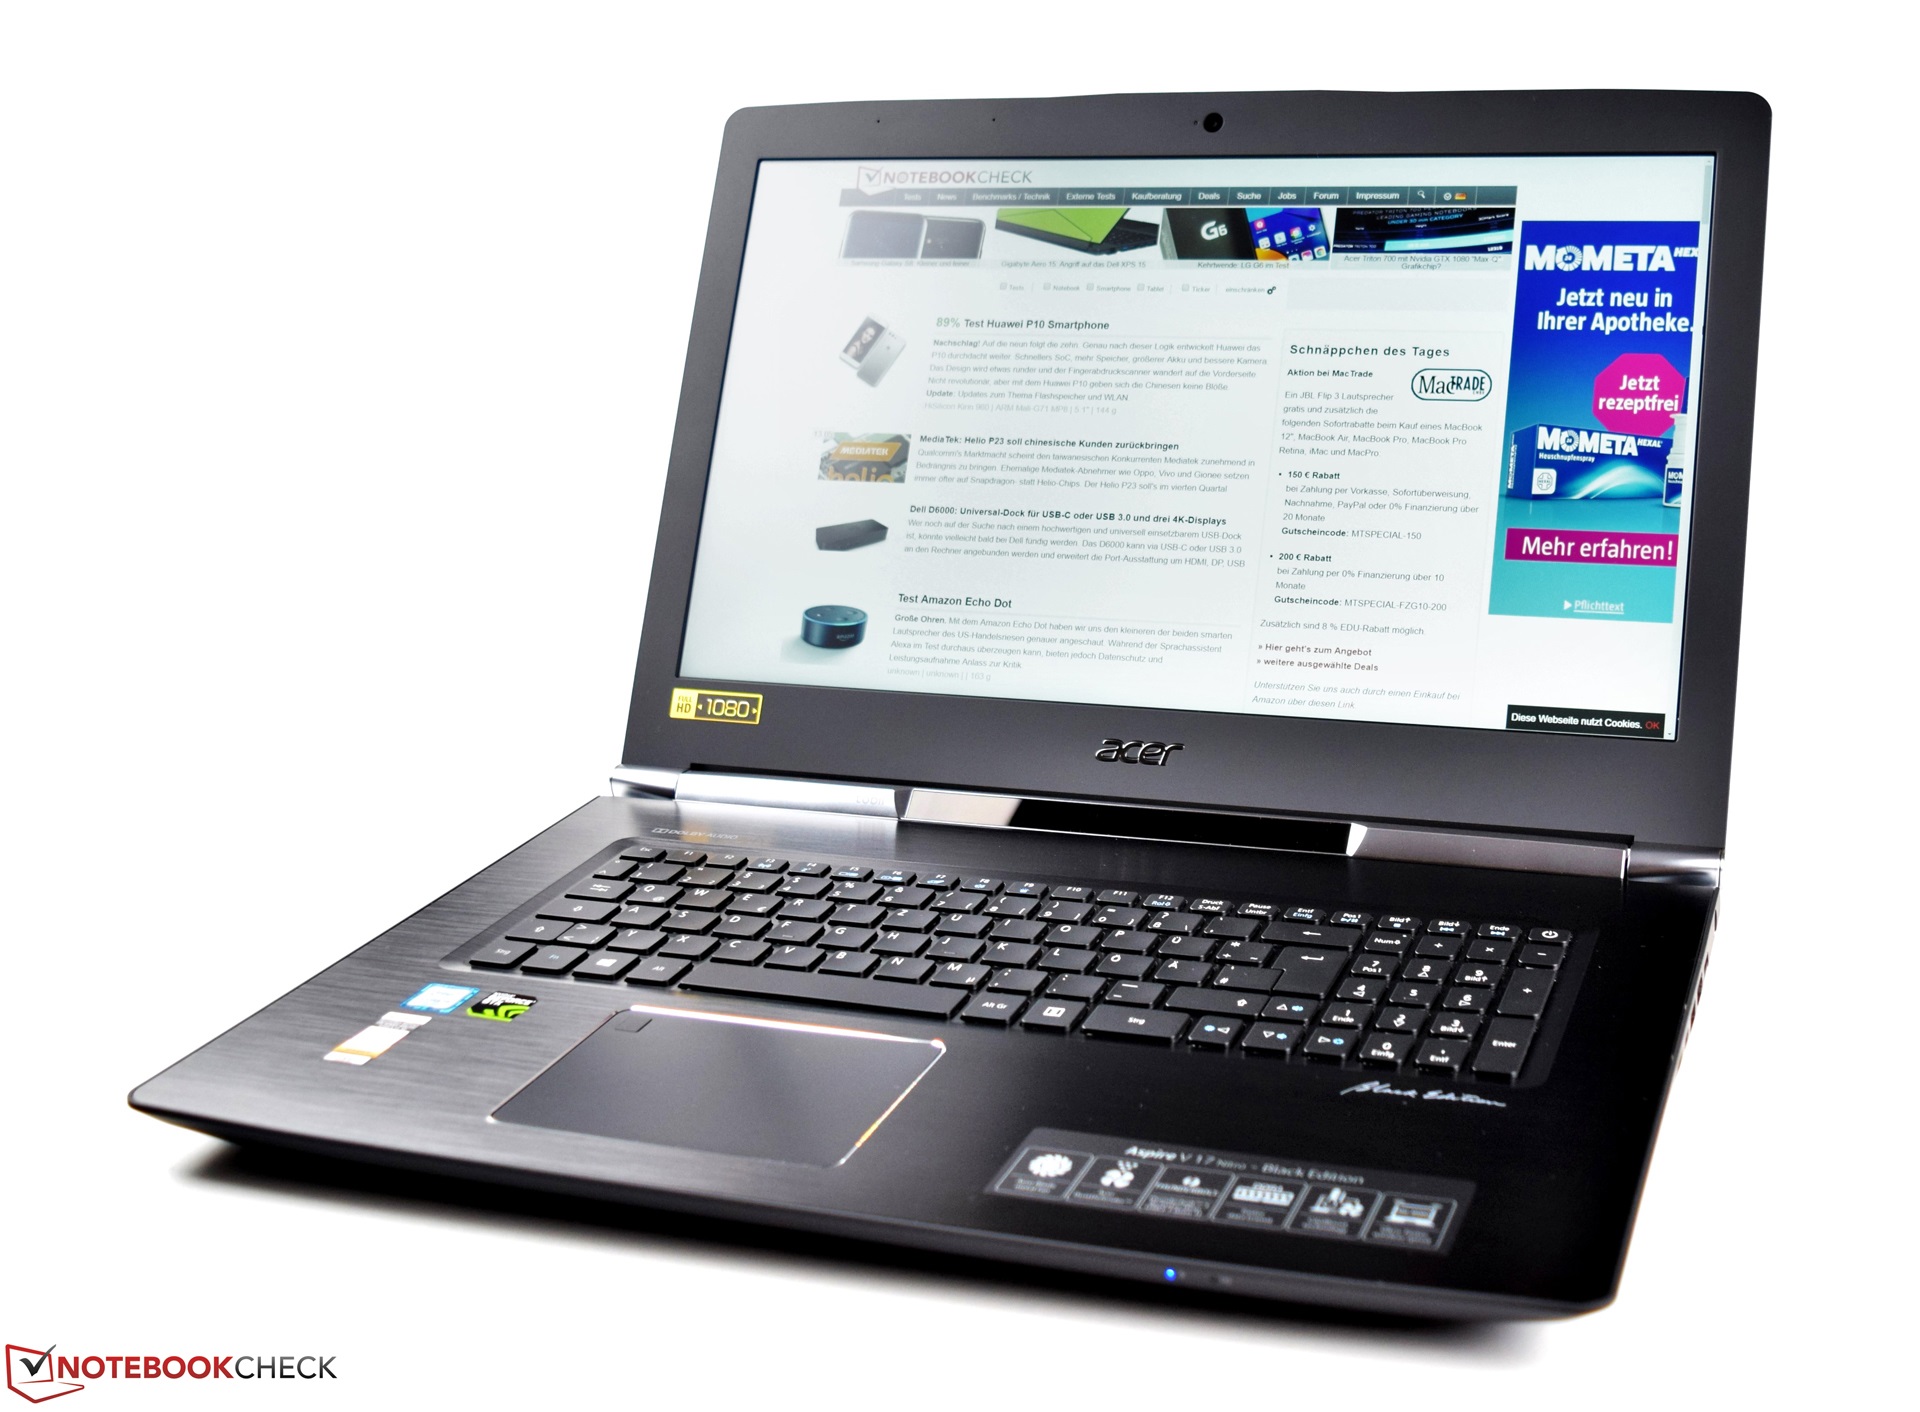
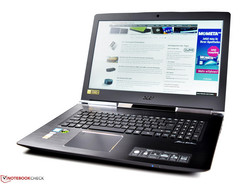
宏碁 Aspire V17 Nitro BE VN7-793G (7300HQ, GTX 1060, 全高清, 眼球追踪) 笔记本电脑简短评测
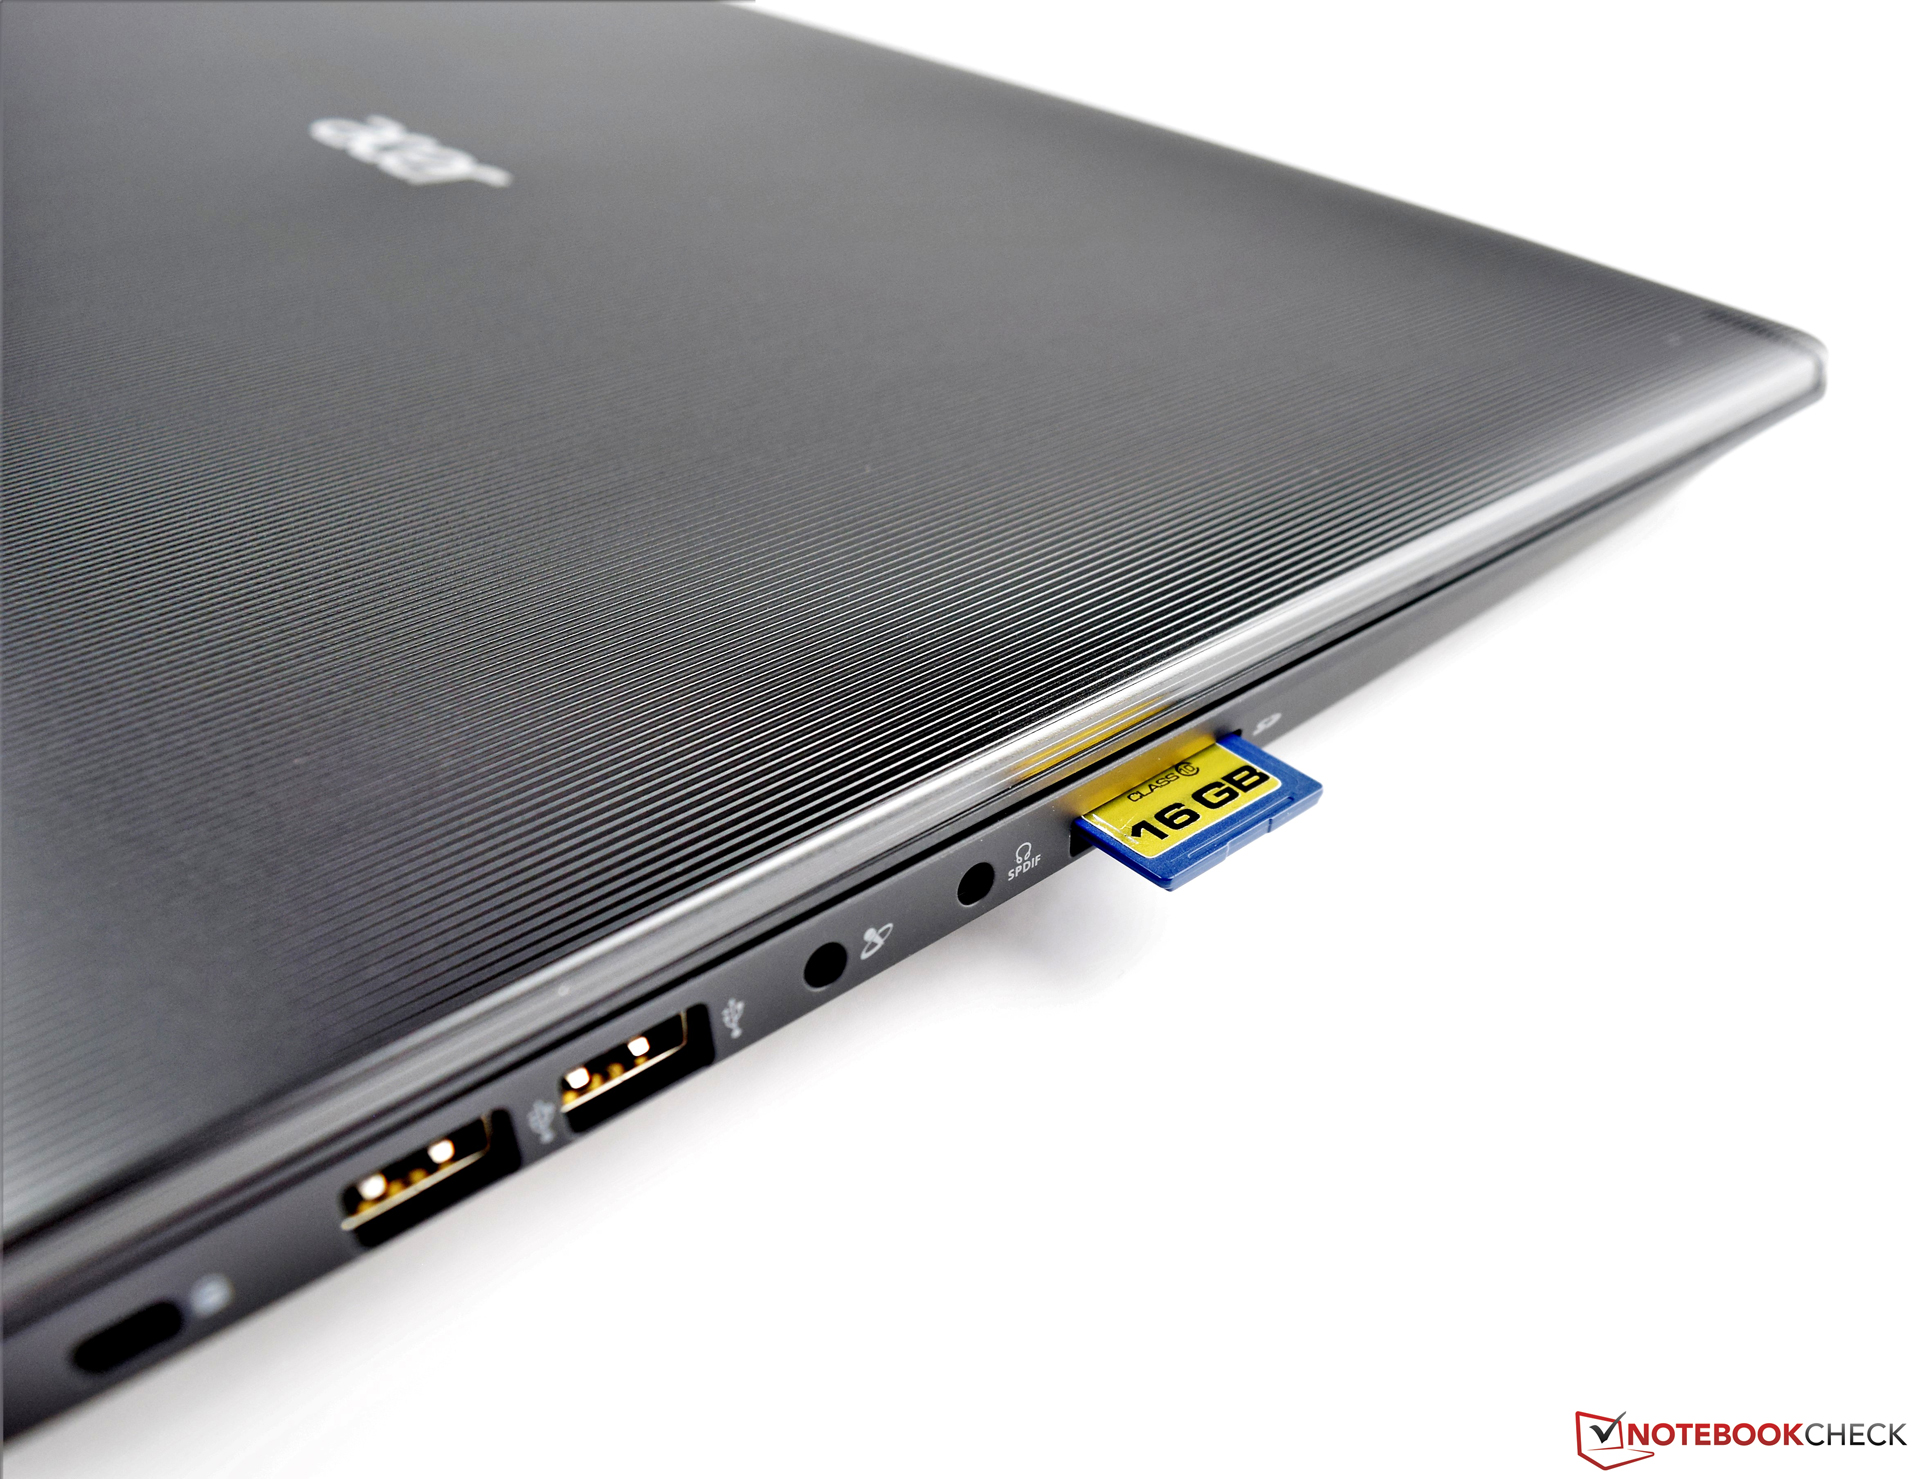
| SD Card Reader | |
| average JPG Copy Test (av. of 3 runs) | |
| MSI GT72VR 7RE-433 | |
| Gigabyte P57X v7 | |
| Asus Strix GL753VD-GC045T | |
| HP Omen 17-w100ng | |
| HP Pavilion 17t-ab200 | |
| Acer Aspire V17 Nitro BE VN7-793G-52XN | |
| maximum AS SSD Seq Read Test (1GB) | |
| MSI GT72VR 7RE-433 | |
| HP Pavilion 17t-ab200 | |
| Gigabyte P57X v7 | |
| HP Omen 17-w100ng | |
| Asus Strix GL753VD-GC045T | |
| Acer Aspire V17 Nitro BE VN7-793G-52XN | |
| |||||||||||||||||||||||||
Brightness Distribution: 84 %
Center on Battery: 346 cd/m²
Contrast: 1331:1 (Black: 0.26 cd/m²)
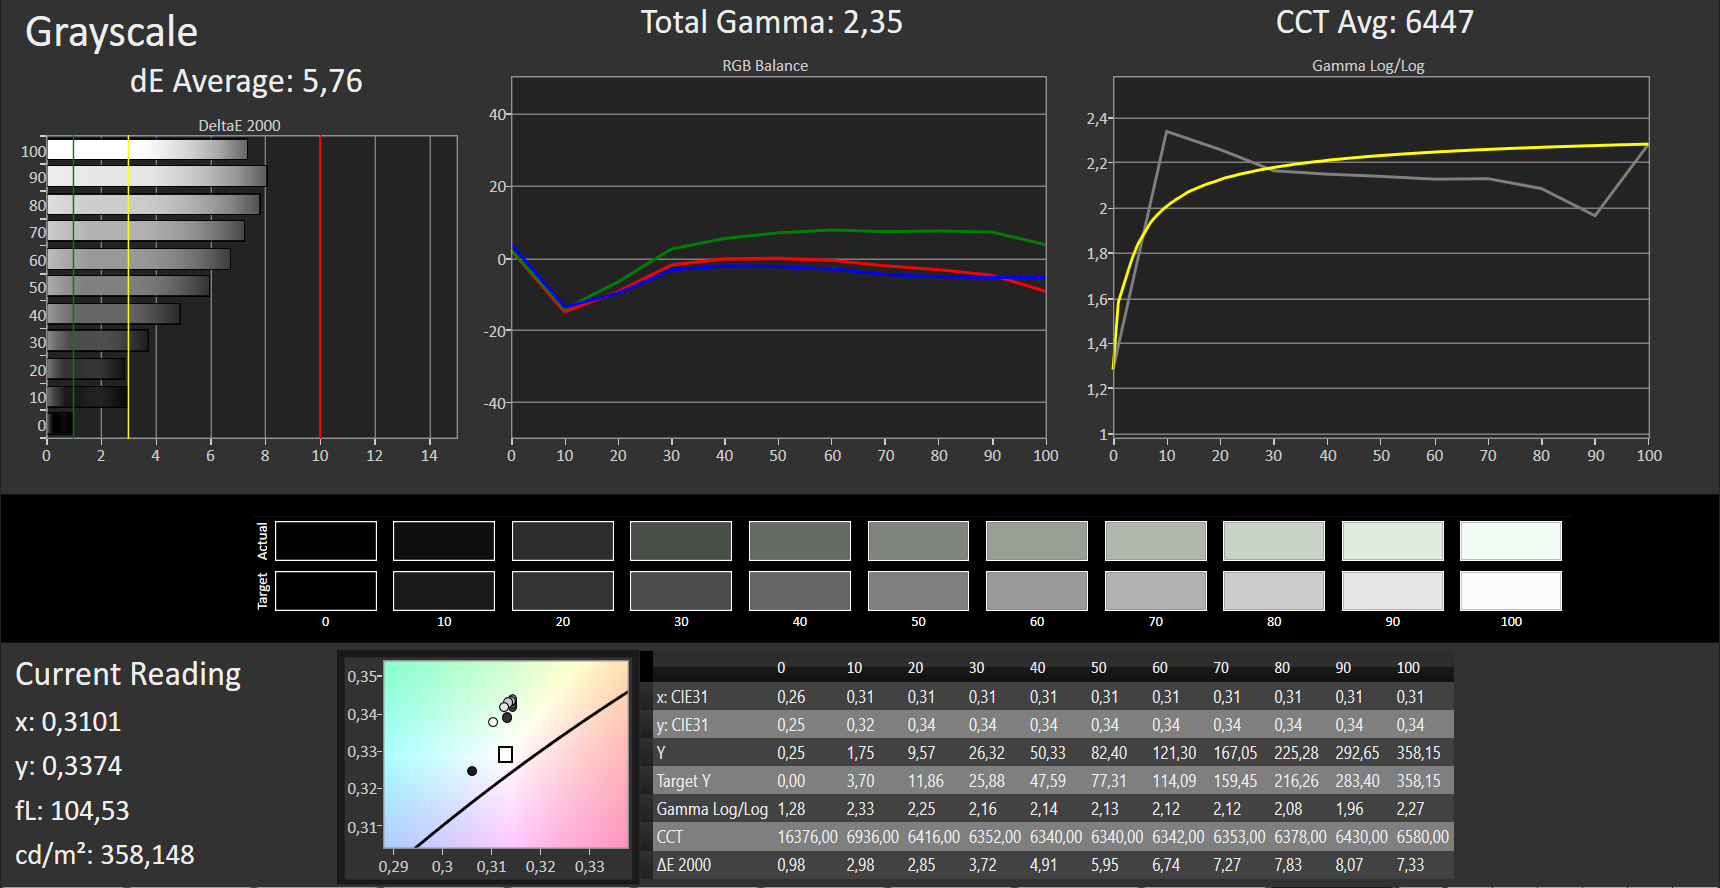
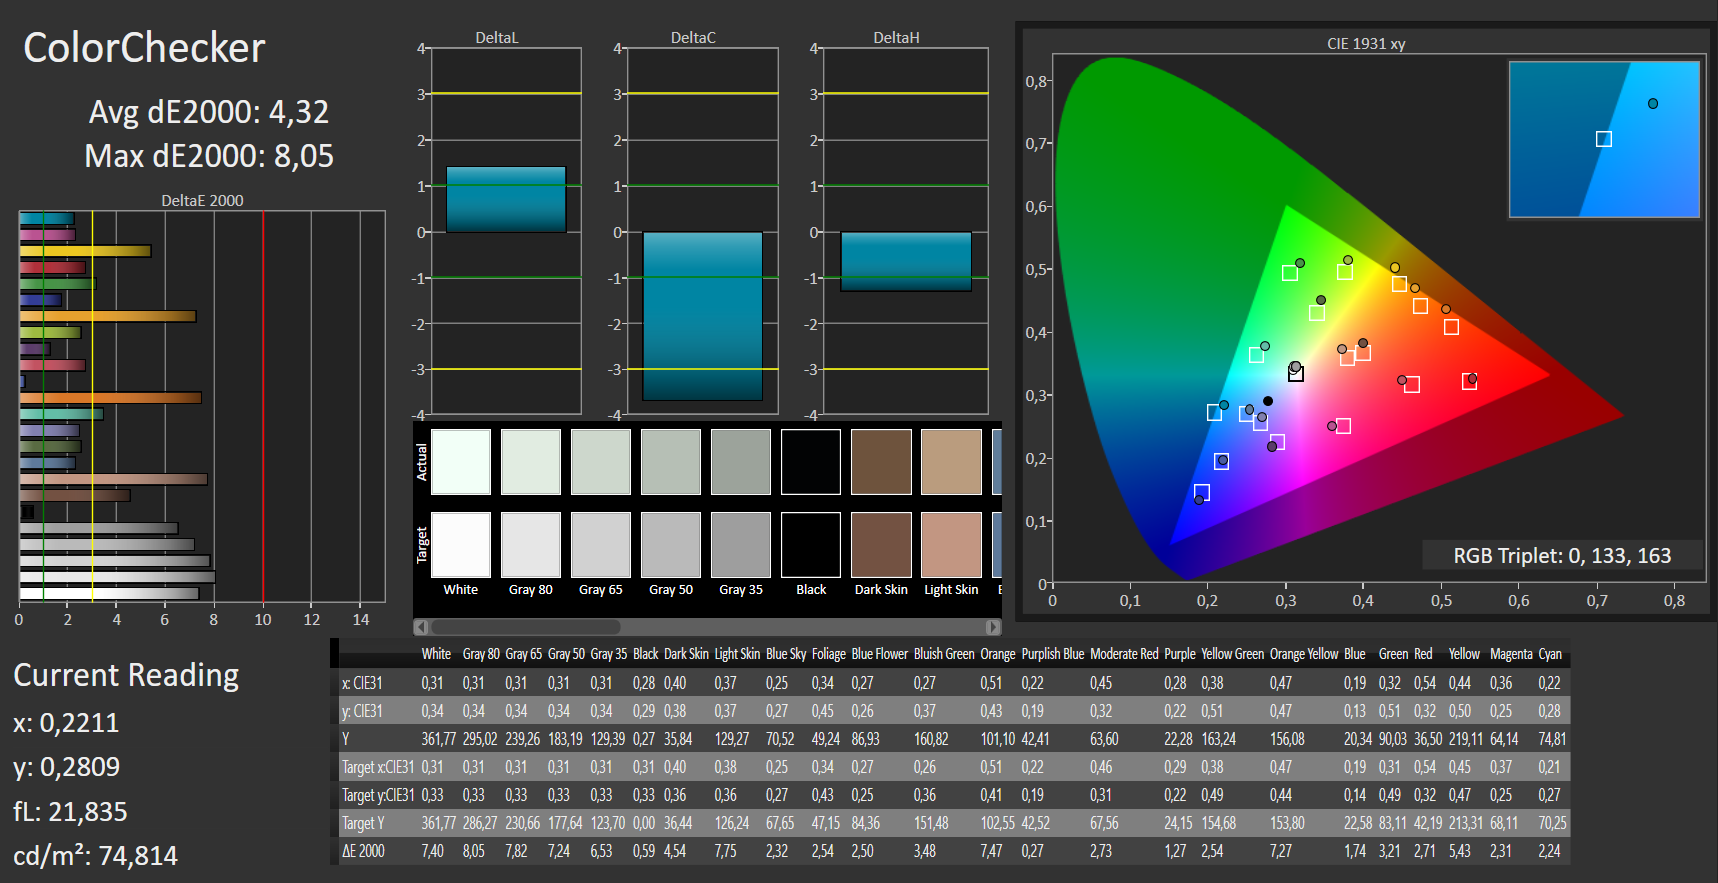
ΔE ColorChecker Calman: 4.32 | ∀{0.5-29.43 Ø4.71}
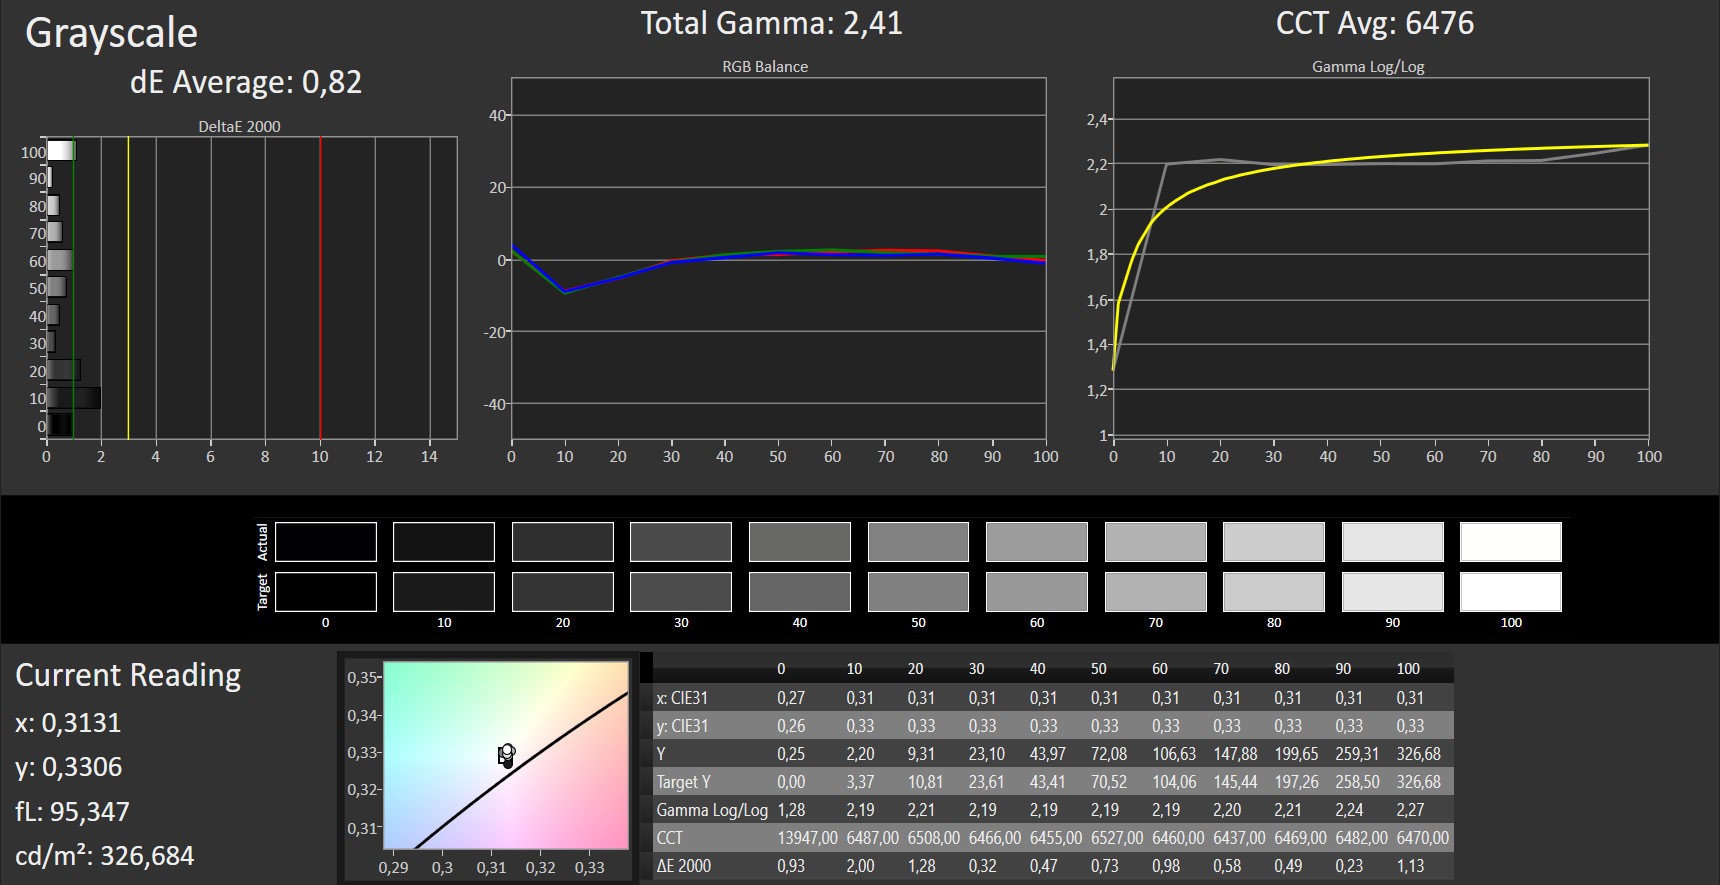
ΔE Greyscale Calman: 5.76 | ∀{0.09-98 Ø4.96}
90% sRGB (Argyll 1.6.3 3D)
59% AdobeRGB 1998 (Argyll 1.6.3 3D)
65.4% AdobeRGB 1998 (Argyll 3D)
90.2% sRGB (Argyll 3D)
64% Display P3 (Argyll 3D)
Gamma: 2.35
CCT: 6447 K
| Acer Aspire V17 Nitro BE VN7-793G-52XN a-Si TFT-LCD, WLED, 1920x1080, 17.3" | Asus Strix GL753VD-GC045T LED IPS, 1920x1080, 17.3" | MSI GT72VR 7RE-433 TN LED, 1920x1080, 17.3" | Gigabyte P57X v7 IPS, 3840x2160, 17.3" | HP Pavilion 17t-ab200 IPS, 1920x1080, 17.3" | HP Omen 17-w100ng IPS, 1920x1080, 17.3" | |
|---|---|---|---|---|---|---|
| Display | -2% | 0% | 33% | -1% | -1% | |
| Display P3 Coverage (%) | 64 | 67.1 5% | 68.3 7% | 87.8 37% | 65.2 2% | 67.2 5% |
| sRGB Coverage (%) | 90.2 | 84.8 -6% | 86.7 -4% | 100 11% | 87.6 -3% | 86.6 -4% |
| AdobeRGB 1998 Coverage (%) | 65.4 | 62 -5% | 63.4 -3% | 98.9 51% | 64.1 -2% | 63.3 -3% |
| Response Times | -2% | 46% | -67% | -5% | 4% | |
| Response Time Grey 50% / Grey 80% * (ms) | 36 ? | 33.2 ? 8% | 29 ? 19% | 55.6 ? -54% | 36.8 -2% | 35 ? 3% |
| Response Time Black / White * (ms) | 26 ? | 28.8 ? -11% | 7 ? 73% | 46.8 ? -80% | 28 -8% | 25 ? 4% |
| PWM Frequency (Hz) | 1000 ? | |||||
| Screen | -17% | -29% | 1% | -17% | -2% | |
| Brightness middle (cd/m²) | 346 | 349 1% | 299 -14% | 441.3 28% | 278.8 -19% | 342 -1% |
| Brightness (cd/m²) | 307 | 337 10% | 277 -10% | 408 33% | 265 -14% | 331 8% |
| Brightness Distribution (%) | 84 | 91 8% | 87 4% | 86 2% | 91 8% | 84 0% |
| Black Level * (cd/m²) | 0.26 | 0.58 -123% | 0.27 -4% | 0.44 -69% | 0.28 -8% | 0.32 -23% |
| Contrast (:1) | 1331 | 602 -55% | 1107 -17% | 1003 -25% | 996 -25% | 1069 -20% |
| Colorchecker dE 2000 * | 4.32 | 4.5 -4% | 9.65 -123% | 5.1 -18% | 5.8 -34% | 4.35 -1% |
| Colorchecker dE 2000 max. * | 8.05 | 10.2 -27% | 15.43 -92% | 9.8 -22% | 10.6 -32% | 9.24 -15% |
| Greyscale dE 2000 * | 5.76 | 3.3 43% | 9.68 -68% | 4.3 25% | 8.3 -44% | 3.73 35% |
| Gamma | 2.35 94% | 2.15 102% | 1.89 116% | 2.08 106% | 2.1 105% | 2.23 99% |
| CCT | 6447 101% | 6103 107% | 11652 56% | 7345 88% | 5723 114% | 6801 96% |
| Color Space (Percent of AdobeRGB 1998) (%) | 59 | 55.7 -6% | 75 27% | 87 47% | 57 -3% | 57 -3% |
| Color Space (Percent of sRGB) (%) | 90 | 75.7 -16% | 100 11% | 100 11% | 87 -3% | 86 -4% |
| Total Average (Program / Settings) | -7% /
-12% | 6% /
-13% | -11% /
-2% | -8% /
-12% | 0% /
-1% |
* ... smaller is better

Display Response Times
| ↔ Response Time Black to White | ||
|---|---|---|
| 26 ms ... rise ↗ and fall ↘ combined | ↗ 15 ms rise | 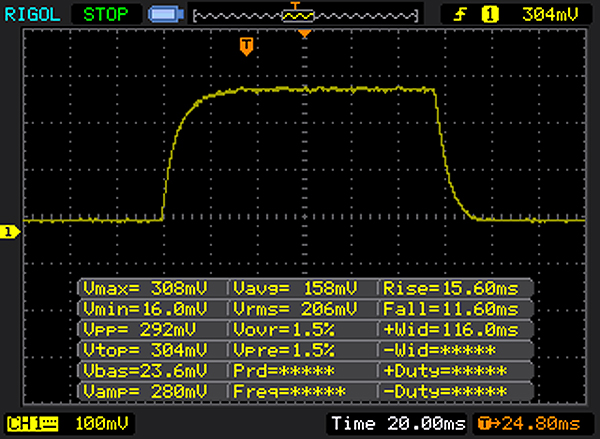 |
| ↘ 11 ms fall | ||
| The screen shows relatively slow response rates in our tests and may be too slow for gamers. In comparison, all tested devices range from 0.1 (minimum) to 240 (maximum) ms. » 63 % of all devices are better. This means that the measured response time is worse than the average of all tested devices (19.8 ms). | ||
| ↔ Response Time 50% Grey to 80% Grey | ||
| 36 ms ... rise ↗ and fall ↘ combined | ↗ 20 ms rise | 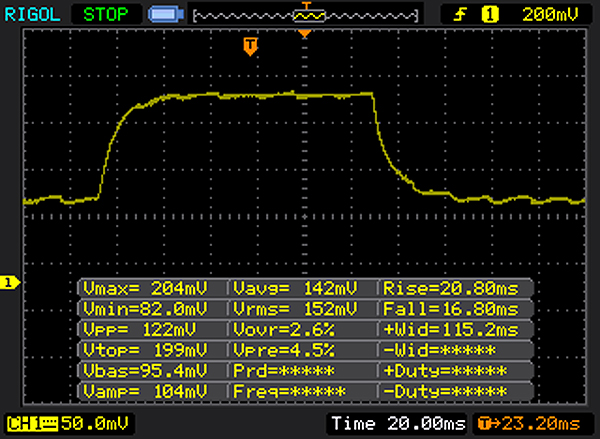 |
| ↘ 16 ms fall | ||
| The screen shows slow response rates in our tests and will be unsatisfactory for gamers. In comparison, all tested devices range from 0.165 (minimum) to 636 (maximum) ms. » 51 % of all devices are better. This means that the measured response time is worse than the average of all tested devices (31 ms). | ||
Screen Flickering / PWM (Pulse-Width Modulation)
| Screen flickering / PWM not detected | ||
In comparison: 52 % of all tested devices do not use PWM to dim the display. If PWM was detected, an average of 7754 (minimum: 5 - maximum: 343500) Hz was measured. | ||
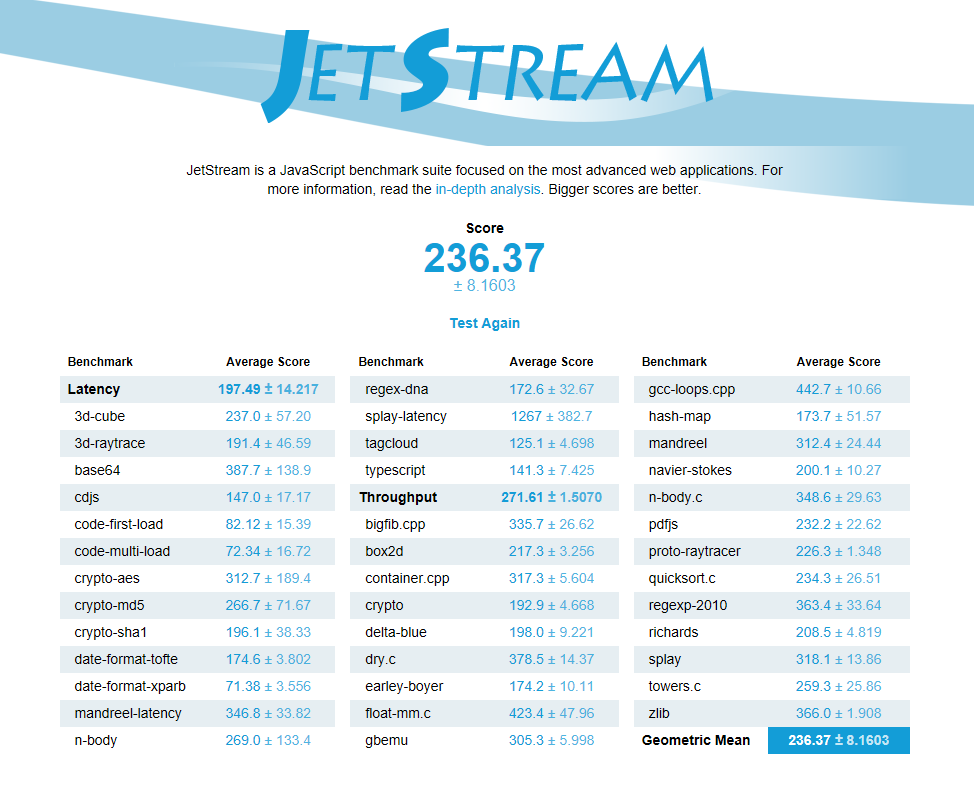
| JetStream 1.1 - 1.1 Total | |
| HP Pavilion 17t-ab200 | |
| MSI GT72VR 7RE-433 | |
| Acer Aspire V17 Nitro BE VN7-793G-52XN | |
| HP Omen 17-w100ng | |
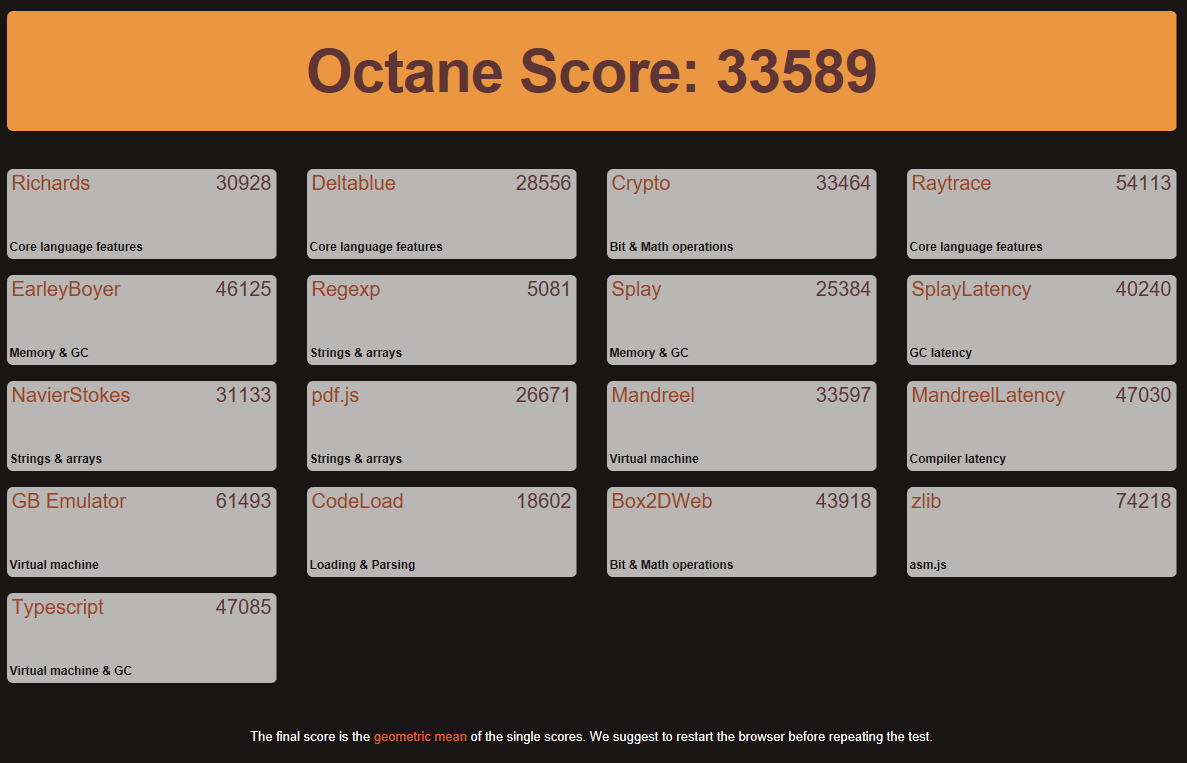
| Octane V2 - Total Score | |
| HP Pavilion 17t-ab200 | |
| MSI GT72VR 7RE-433 | |
| Acer Aspire V17 Nitro BE VN7-793G-52XN | |
| HP Omen 17-w100ng | |
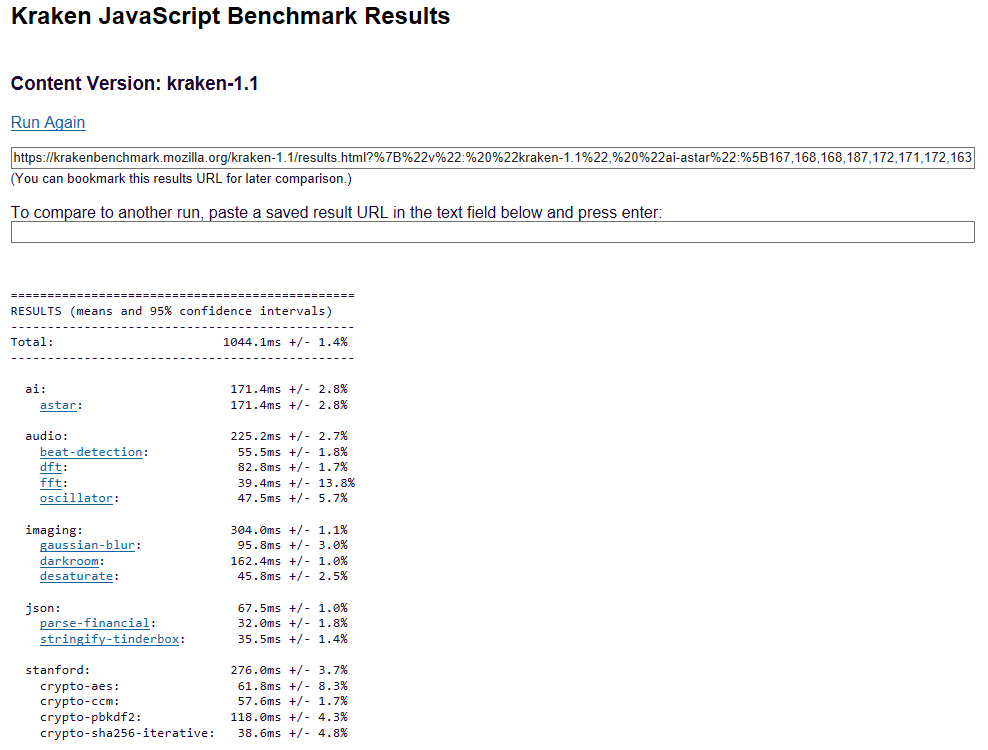
| Mozilla Kraken 1.1 - Total | |
| HP Omen 17-w100ng | |
| Acer Aspire V17 Nitro BE VN7-793G-52XN | |
| MSI GT72VR 7RE-433 | |
| HP Pavilion 17t-ab200 | |
* ... smaller is better
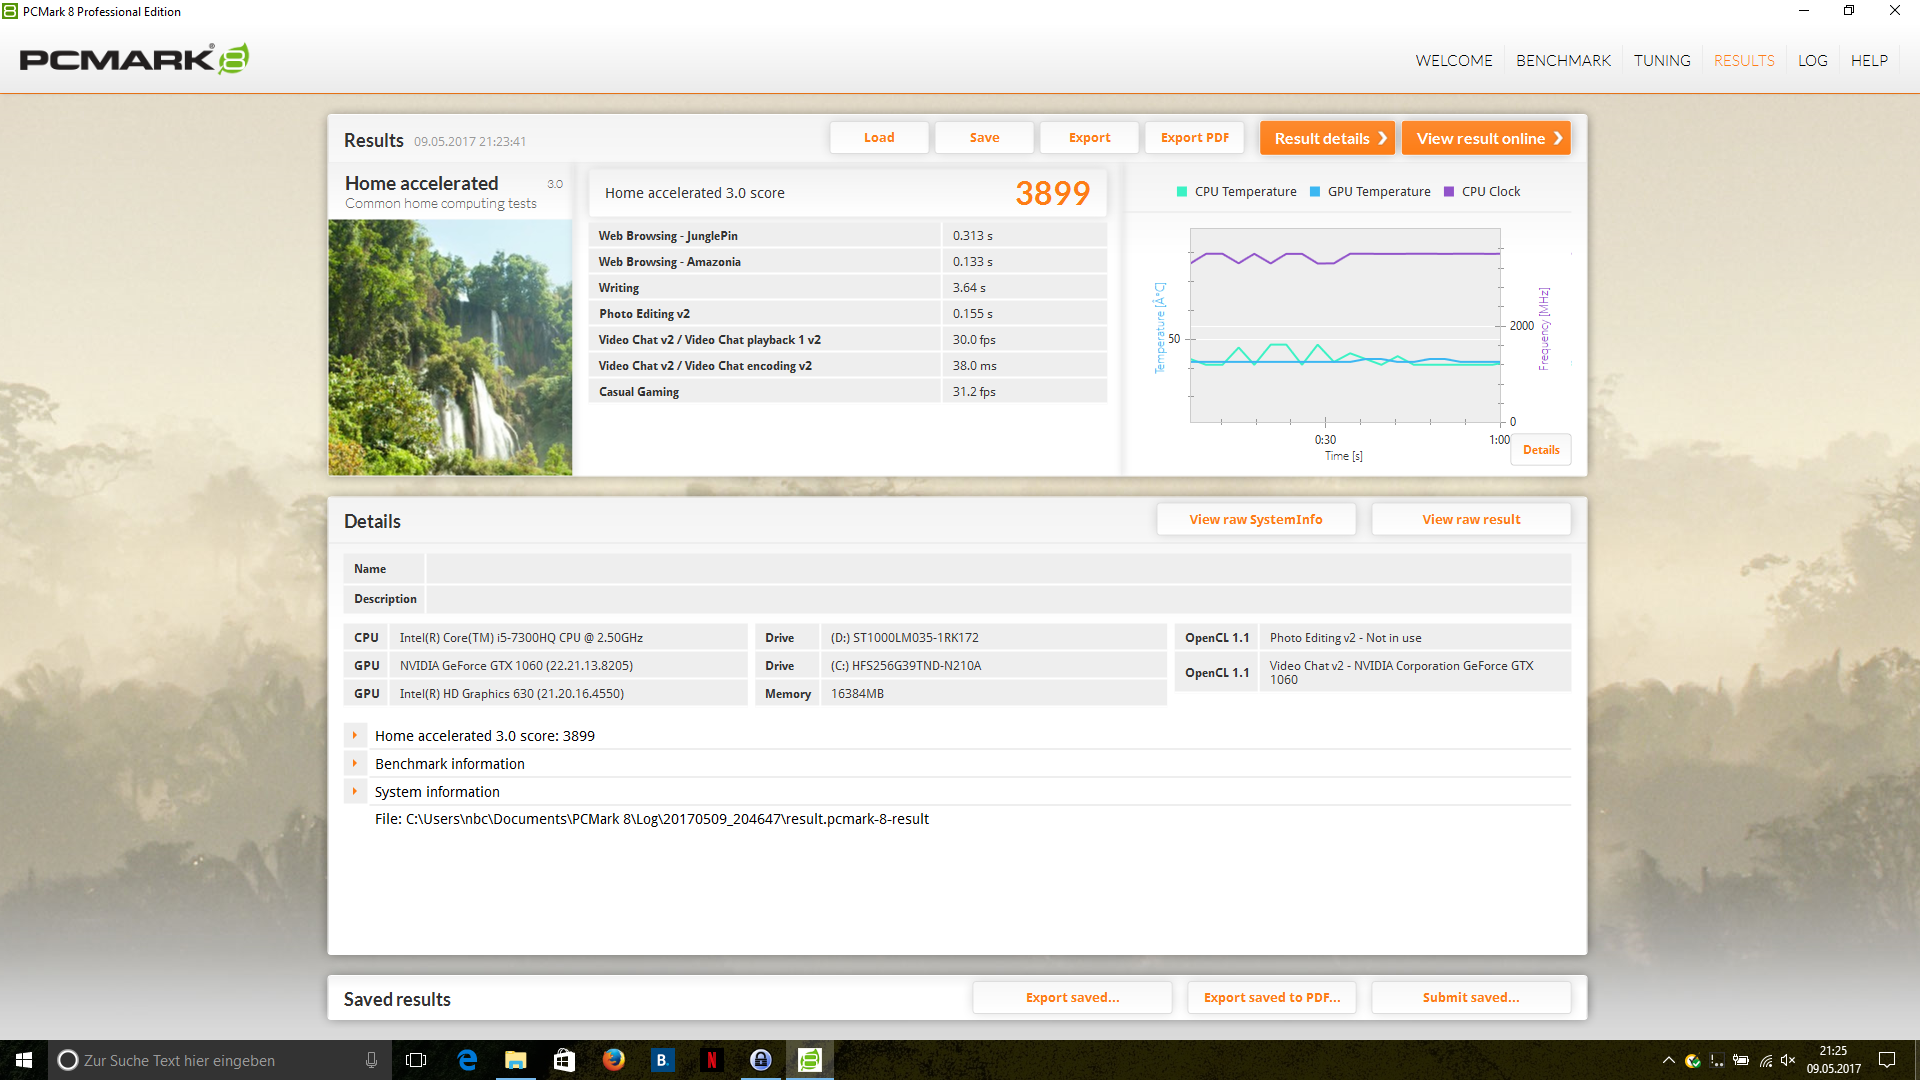
| PCMark 8 | |
| Home Score Accelerated v2 | |
| MSI GT72VR 7RE-433 | |
| HP Omen 17-w100ng | |
| HP Pavilion 17t-ab200 | |
| Asus Strix GL753VD-GC045T | |
| Acer Aspire V17 Nitro BE VN7-793G-52XN | |
| Gigabyte P57X v7 | |
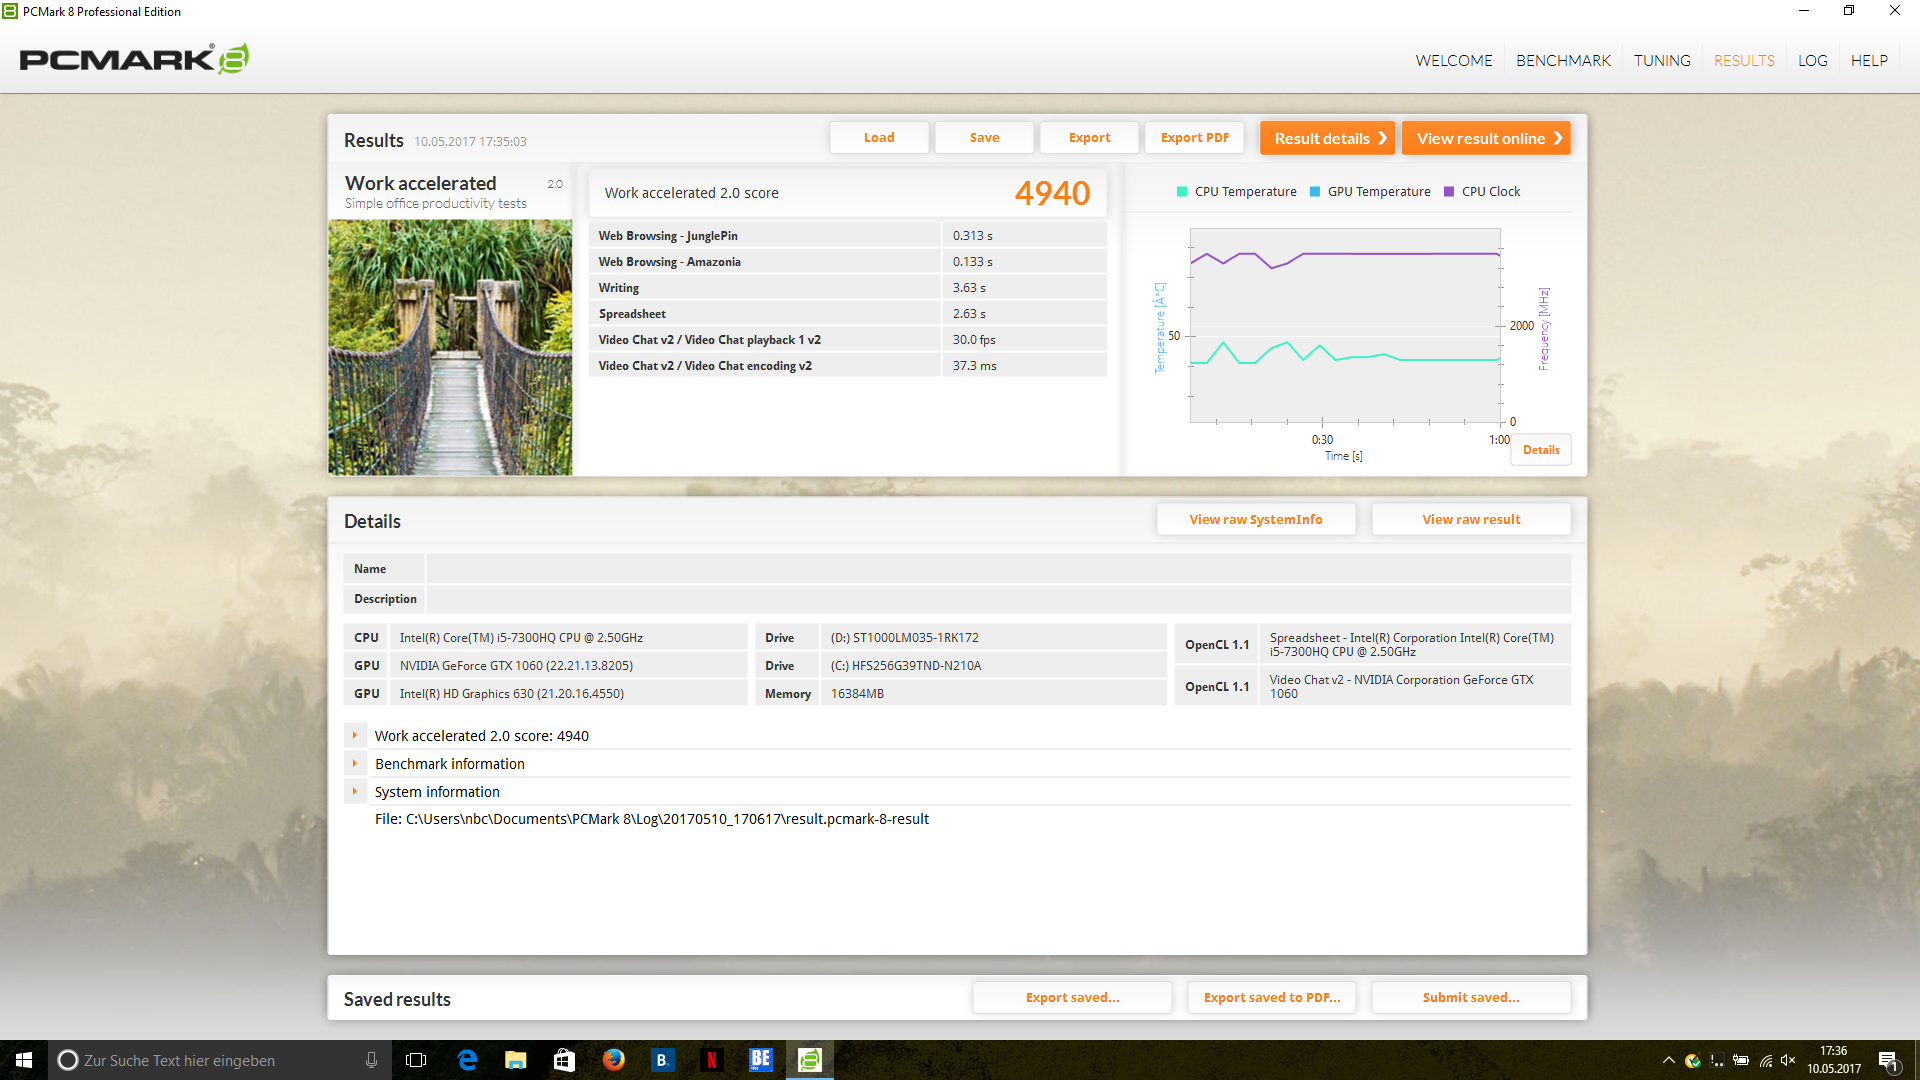
| Work Score Accelerated v2 | |
| MSI GT72VR 7RE-433 | |
| HP Omen 17-w100ng | |
| HP Pavilion 17t-ab200 | |
| Acer Aspire V17 Nitro BE VN7-793G-52XN | |
| Gigabyte P57X v7 | |
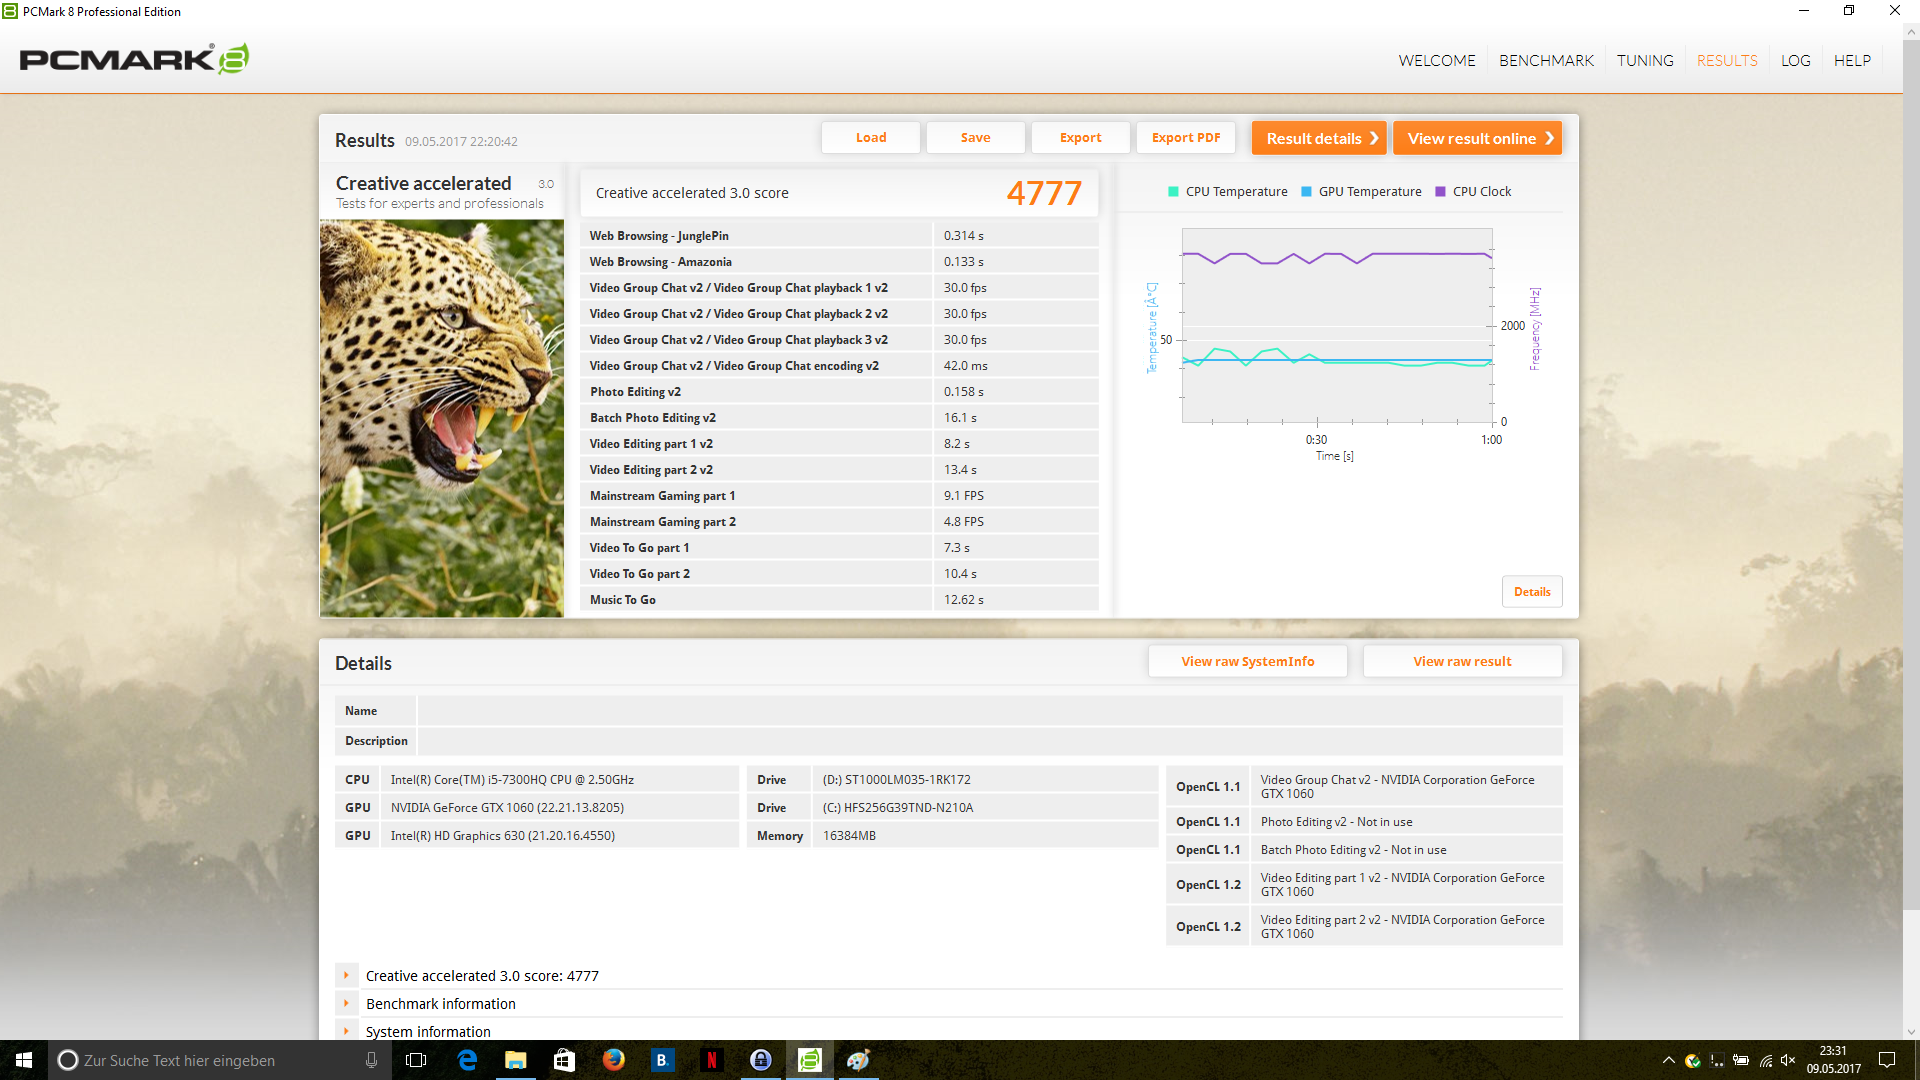
| Creative Score Accelerated v2 | |
| MSI GT72VR 7RE-433 | |
| HP Omen 17-w100ng | |
| HP Pavilion 17t-ab200 | |
| Gigabyte P57X v7 | |
| Acer Aspire V17 Nitro BE VN7-793G-52XN | |
| PCMark 7 | |
| Productivity | |
| MSI GT72VR 7RE-433 | |
| Acer Aspire V17 Nitro BE VN7-793G-52XN | |
| HP Omen 17-w100ng | |
| Score | |
| MSI GT72VR 7RE-433 | |
| HP Omen 17-w100ng | |
| Acer Aspire V17 Nitro BE VN7-793G-52XN | |
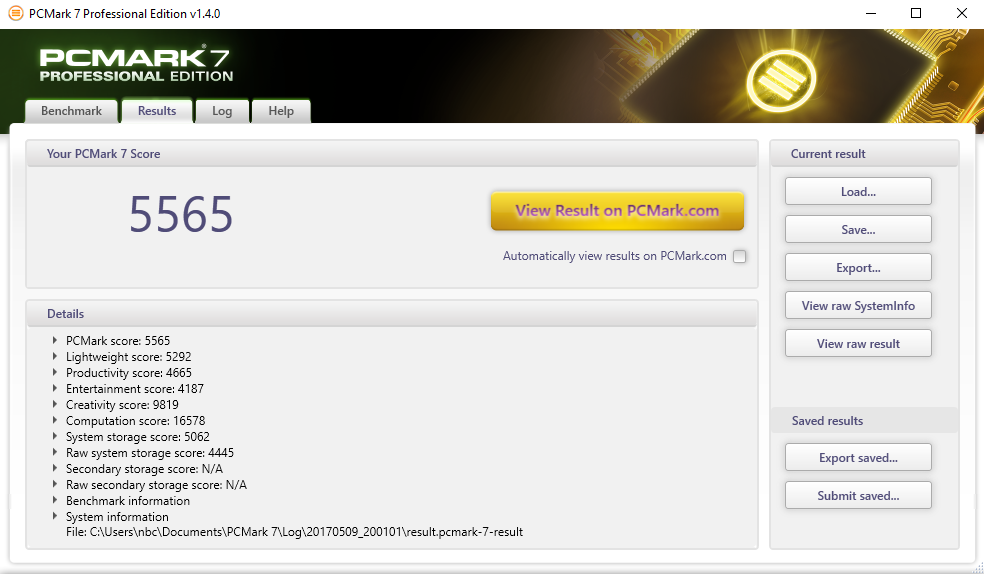
| PCMark 7 Score | 5565 points | |
| PCMark 8 Home Score Accelerated v2 | 3899 points | |
| PCMark 8 Creative Score Accelerated v2 | 4777 points | |
| PCMark 8 Work Score Accelerated v2 | 4940 points | |
Help | ||
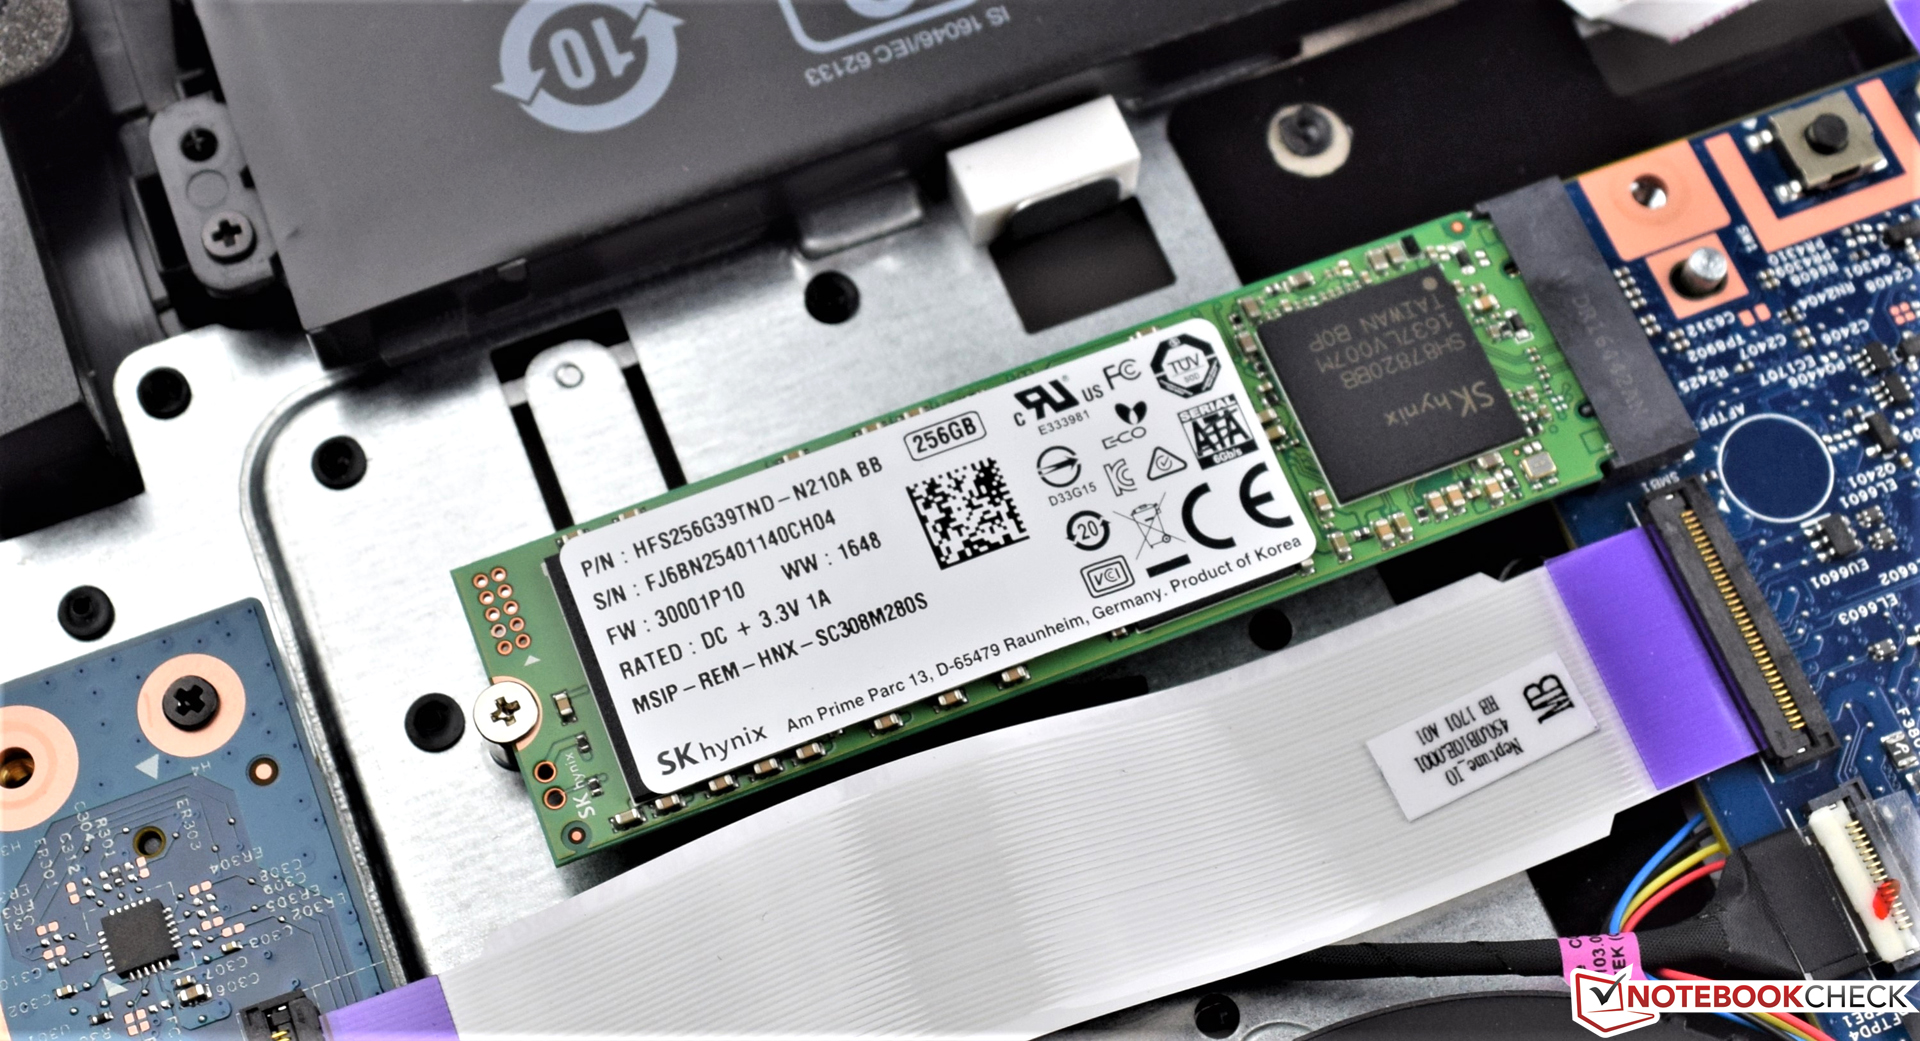
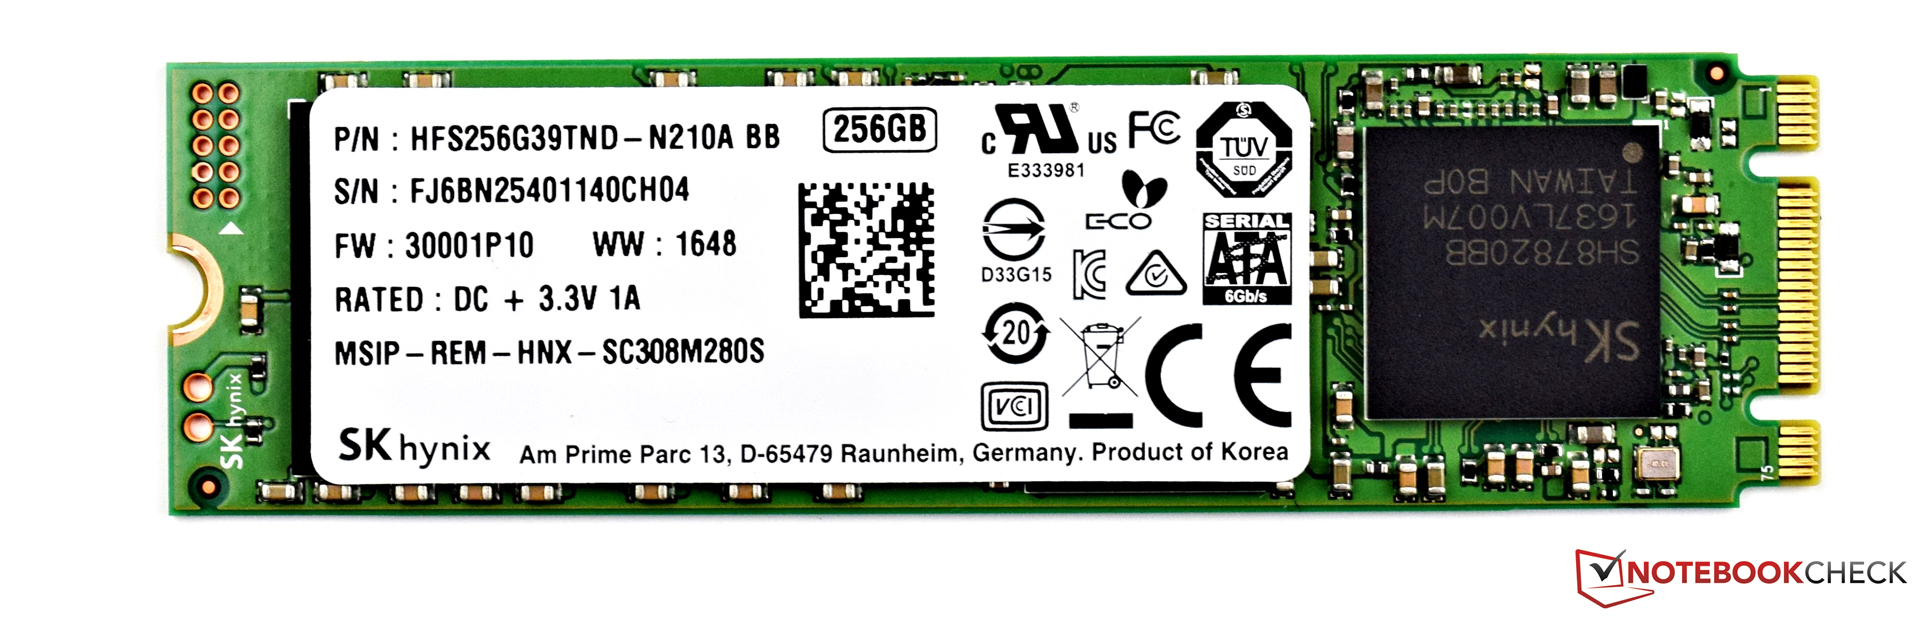
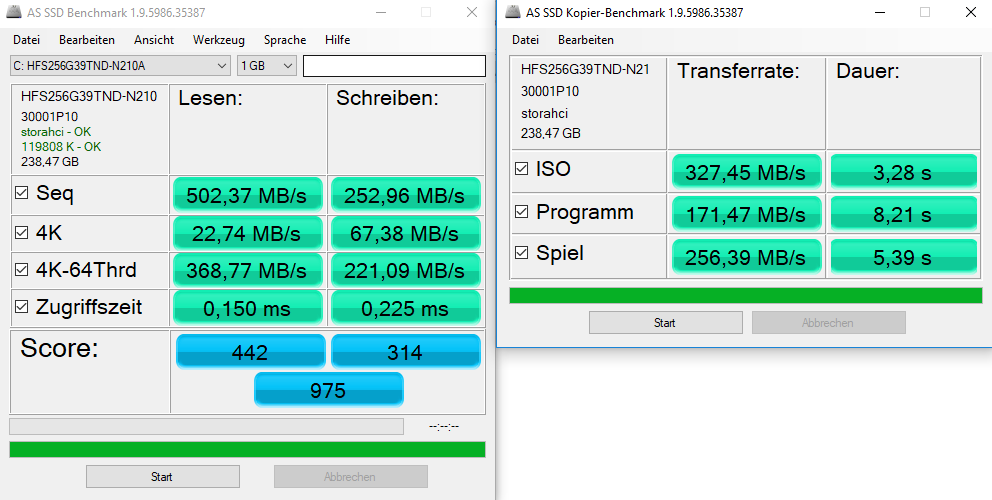
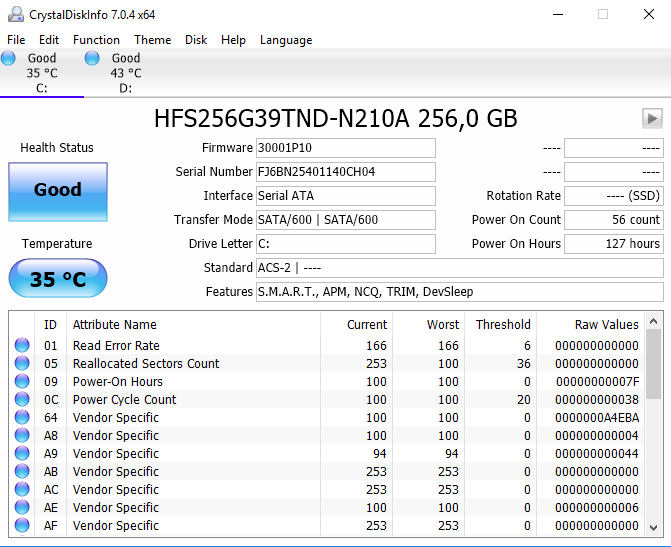
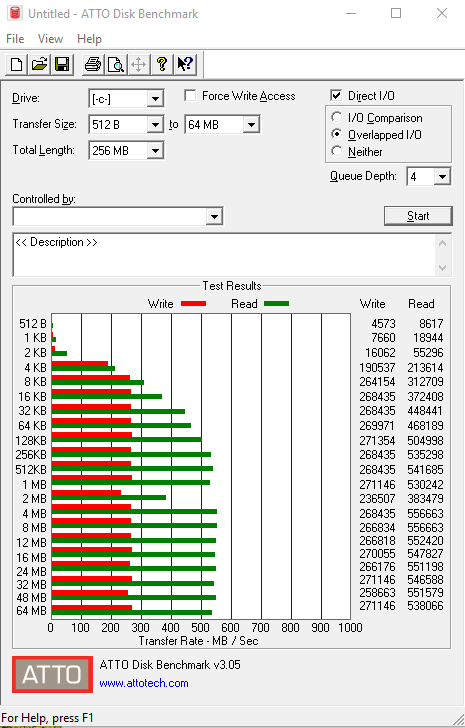
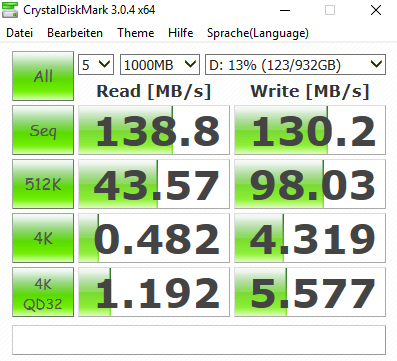
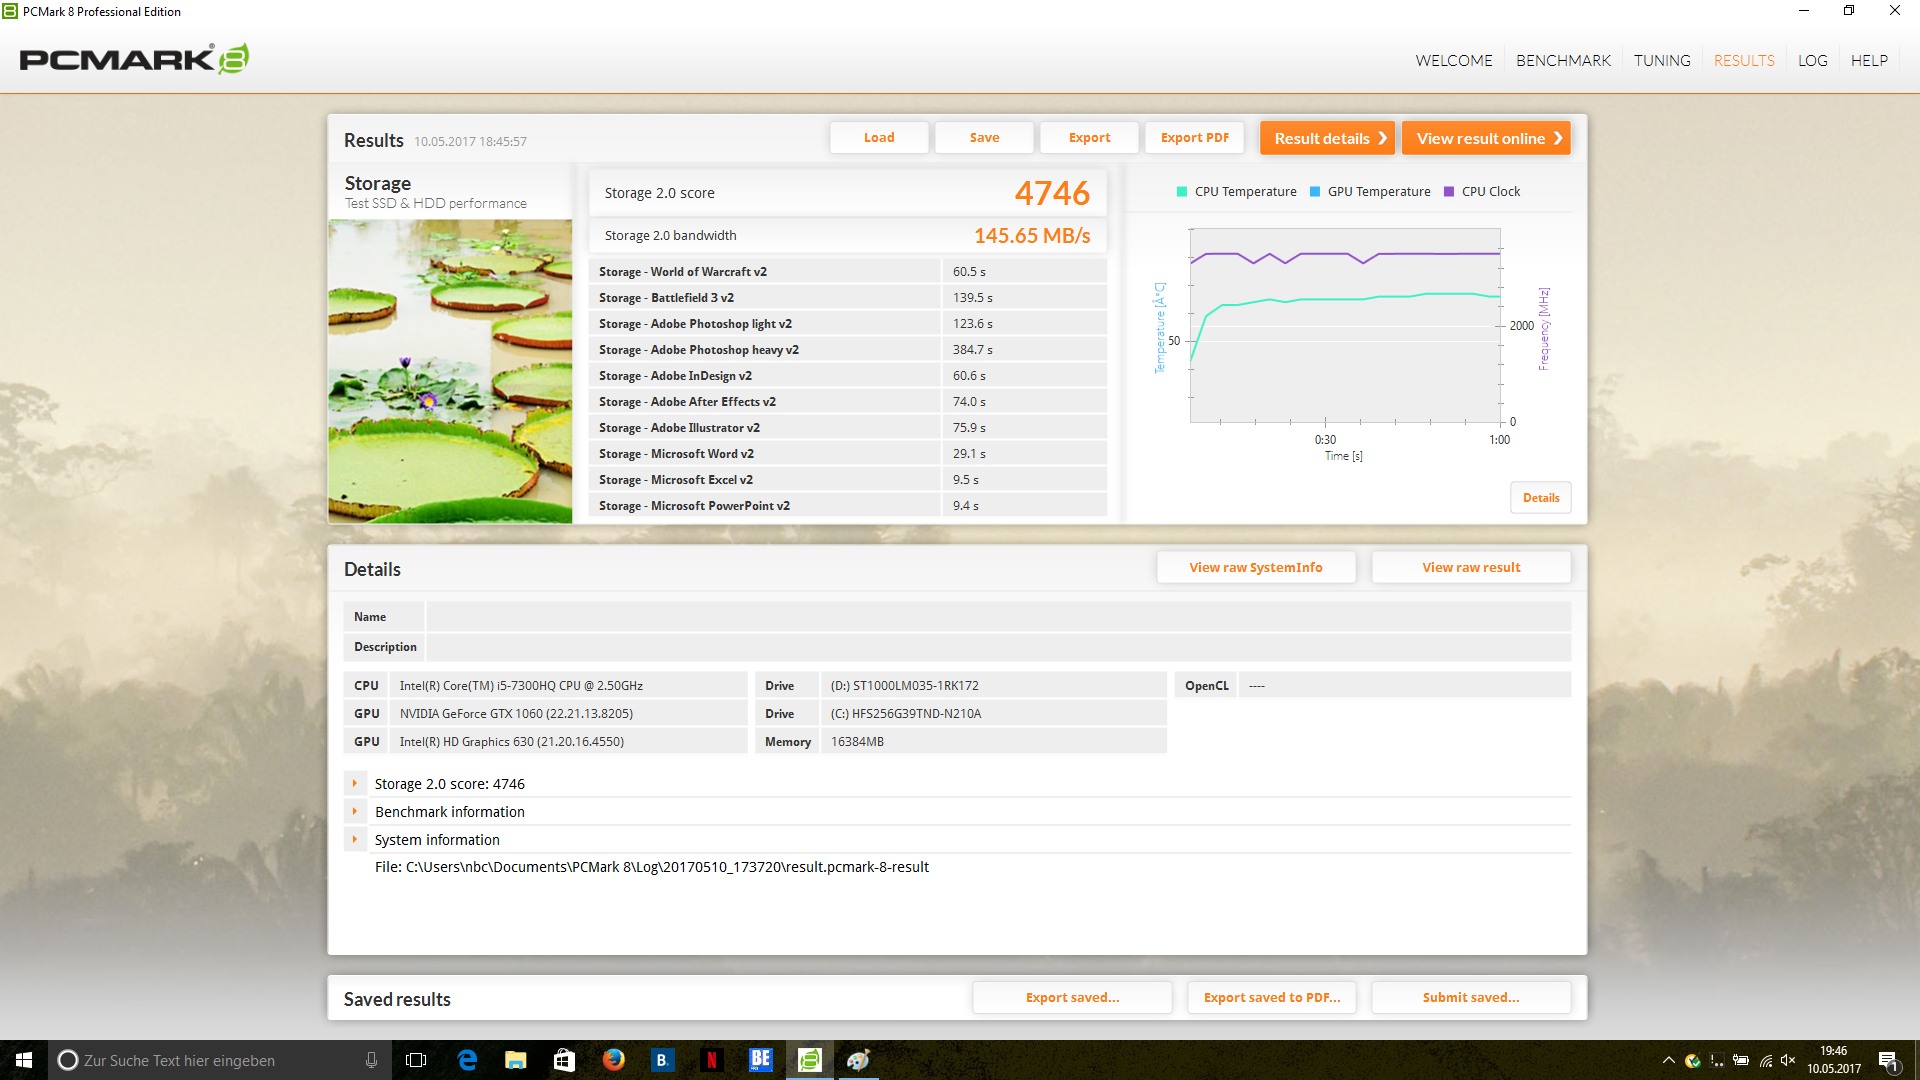
| Acer Aspire V17 Nitro BE VN7-793G-52XN SK Hynix HFS256G39TND-N210A | Asus Strix GL753VD-GC045T Micron SSD 1100 (MTFDDAV256TBN) | MSI GT72VR 7RE-433 Kingston RBU-SNS8152S3256GG5 | Gigabyte P57X v7 Transcend MTS800 256GB M.2 (TS256GMTS800) | HP Pavilion 17t-ab200 Samsung CM871a MZNTY128HDHP | HP Omen 17-w100ng SanDisk Z400s SD8SNAT-128G | |
|---|---|---|---|---|---|---|
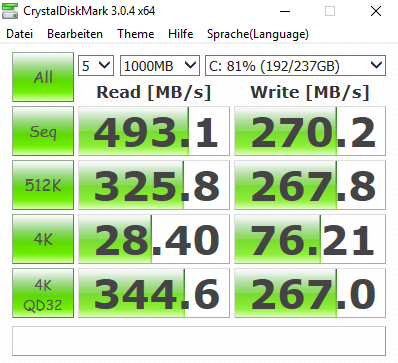
| CrystalDiskMark 3.0 | 4% | 18% | 3% | -2% | -25% | |
| Read Seq (MB/s) | 493.1 | 475.7 -4% | 521 6% | 517 5% | 520 5% | 495 0% |
| Write Seq (MB/s) | 270.2 | 419.1 55% | 311.8 15% | 305.7 13% | 353.6 31% | 180.2 -33% |
| Read 512 (MB/s) | 325.8 | 336.1 3% | 403.1 24% | 315 -3% | 376.2 15% | 315.5 -3% |
| Write 512 (MB/s) | 267.8 | 346.6 29% | 332.3 24% | 306.1 14% | 118.5 -56% | 172.4 -36% |
| Read 4k (MB/s) | 28.4 | 24.7 -13% | 33.35 17% | 26.04 -8% | 32.7 15% | 20.25 -29% |
| Write 4k (MB/s) | 76.2 | 76.8 1% | 111.1 46% | 82.3 8% | 85.3 12% | 76.1 0% |
| Read 4k QD32 (MB/s) | 344.6 | 247.6 -28% | 331.1 -4% | 281.3 -18% | 399 16% | 141.6 -59% |
| Write 4k QD32 (MB/s) | 267 | 234.9 -12% | 318.3 19% | 296 11% | 132.5 -50% | 170.8 -36% |


| 3DMark | |
| 1280x720 Cloud Gate Standard Graphics | |
| MSI GT72VR 7RE-433 | |
| Gigabyte P57X v7 | |
| HP Omen 17-w100ng | |
| Acer Aspire V17 Nitro BE VN7-793G-52XN | |
| HP Pavilion 17t-ab200 | |
| Asus Strix GL753VD-GC045T | |
| 1920x1080 Fire Strike Graphics | |
| MSI GT72VR 7RE-433 | |
| Gigabyte P57X v7 | |
| HP Omen 17-w100ng | |
| Acer Aspire V17 Nitro BE VN7-793G-52XN | |
| HP Pavilion 17t-ab200 | |
| Asus Strix GL753VD-GC045T | |
| Asus Strix GL753VD-GC045T | |
| 3DMark 11 - 1280x720 Performance GPU | |
| Gigabyte P57X v7 | |
| MSI GT72VR 7RE-433 | |
| Acer Aspire V17 Nitro BE VN7-793G-52XN | |
| HP Omen 17-w100ng | |
| HP Pavilion 17t-ab200 | |
| Asus Strix GL753VD-GC045T | |
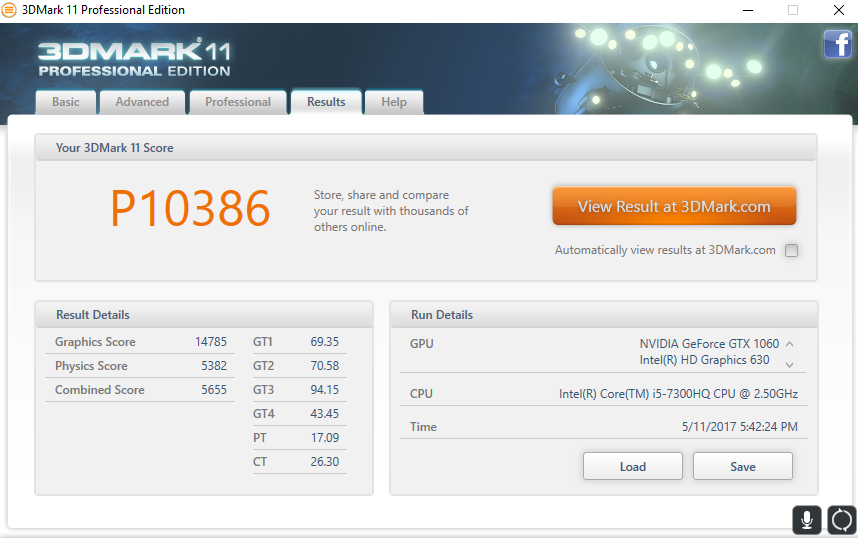
| 3DMark 11 Performance | 10386 points | |
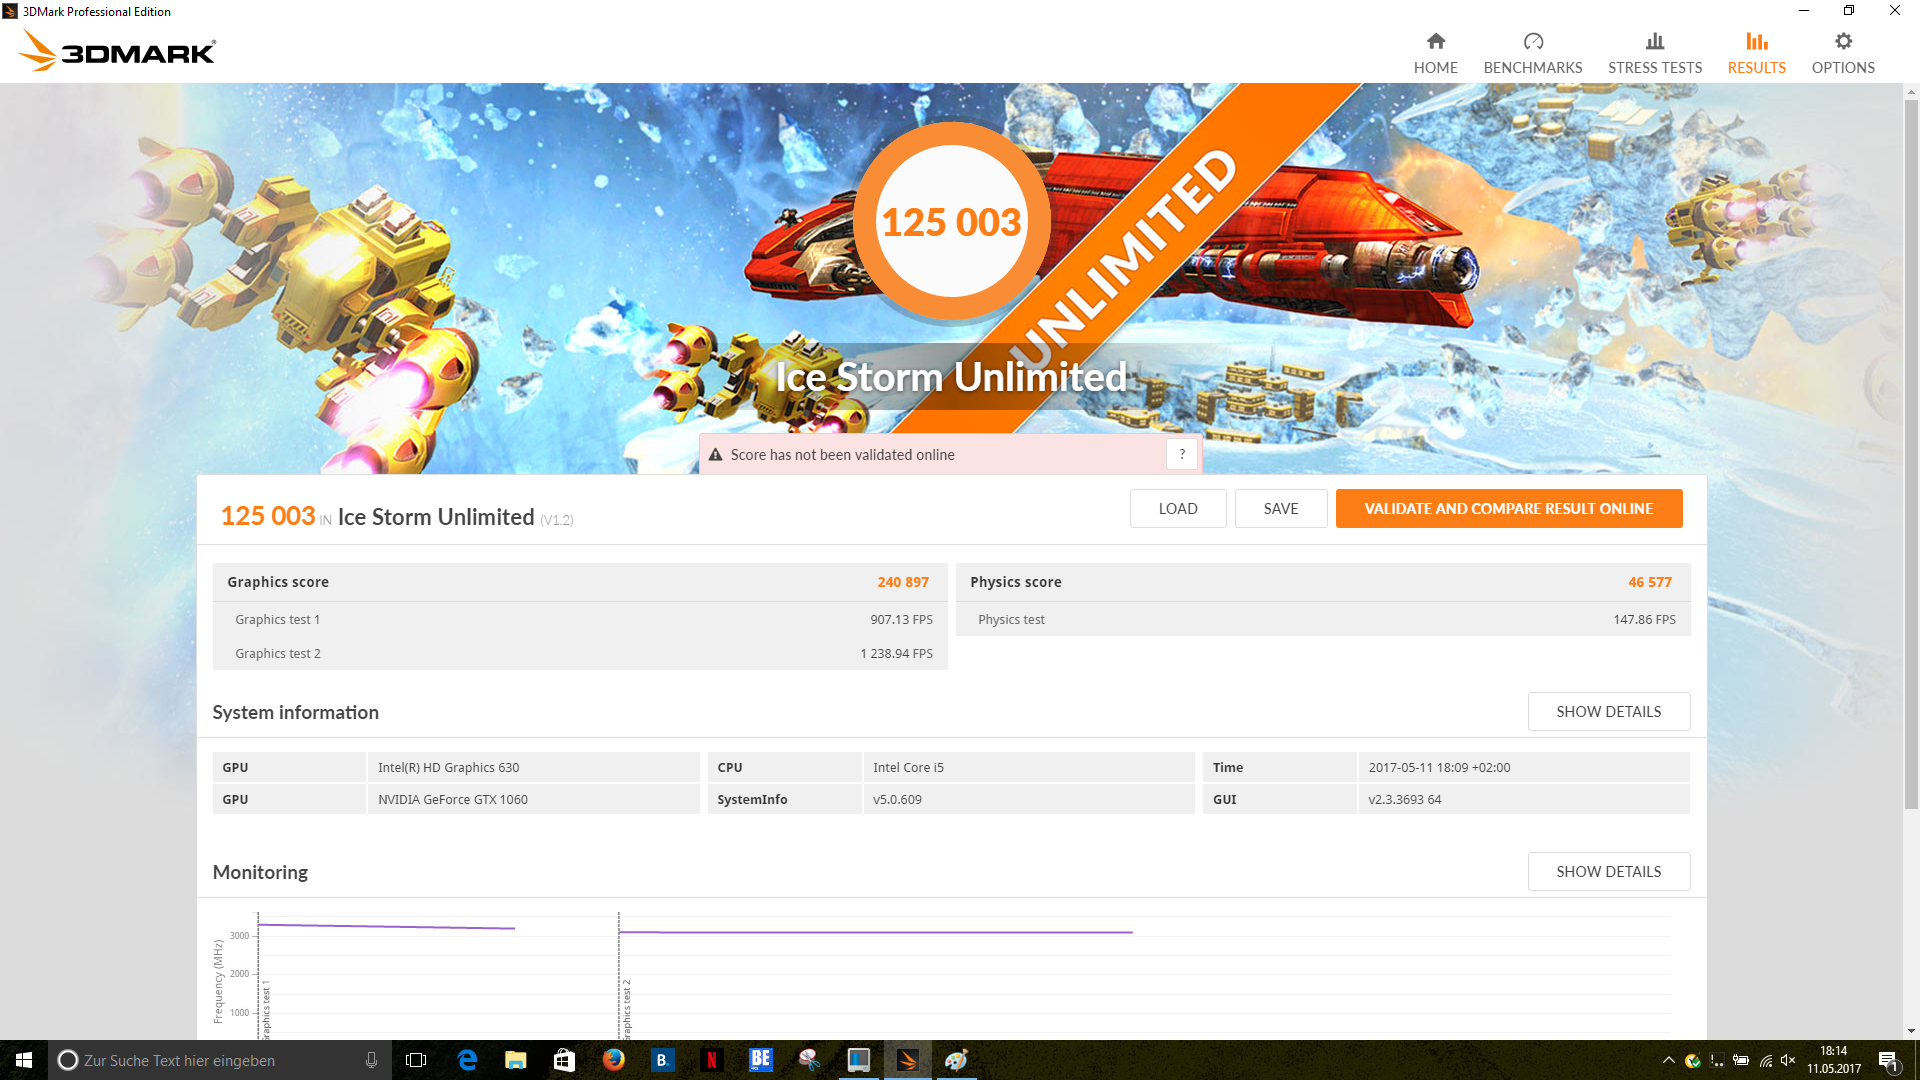
| 3DMark Ice Storm Standard Score | 64333 points | |
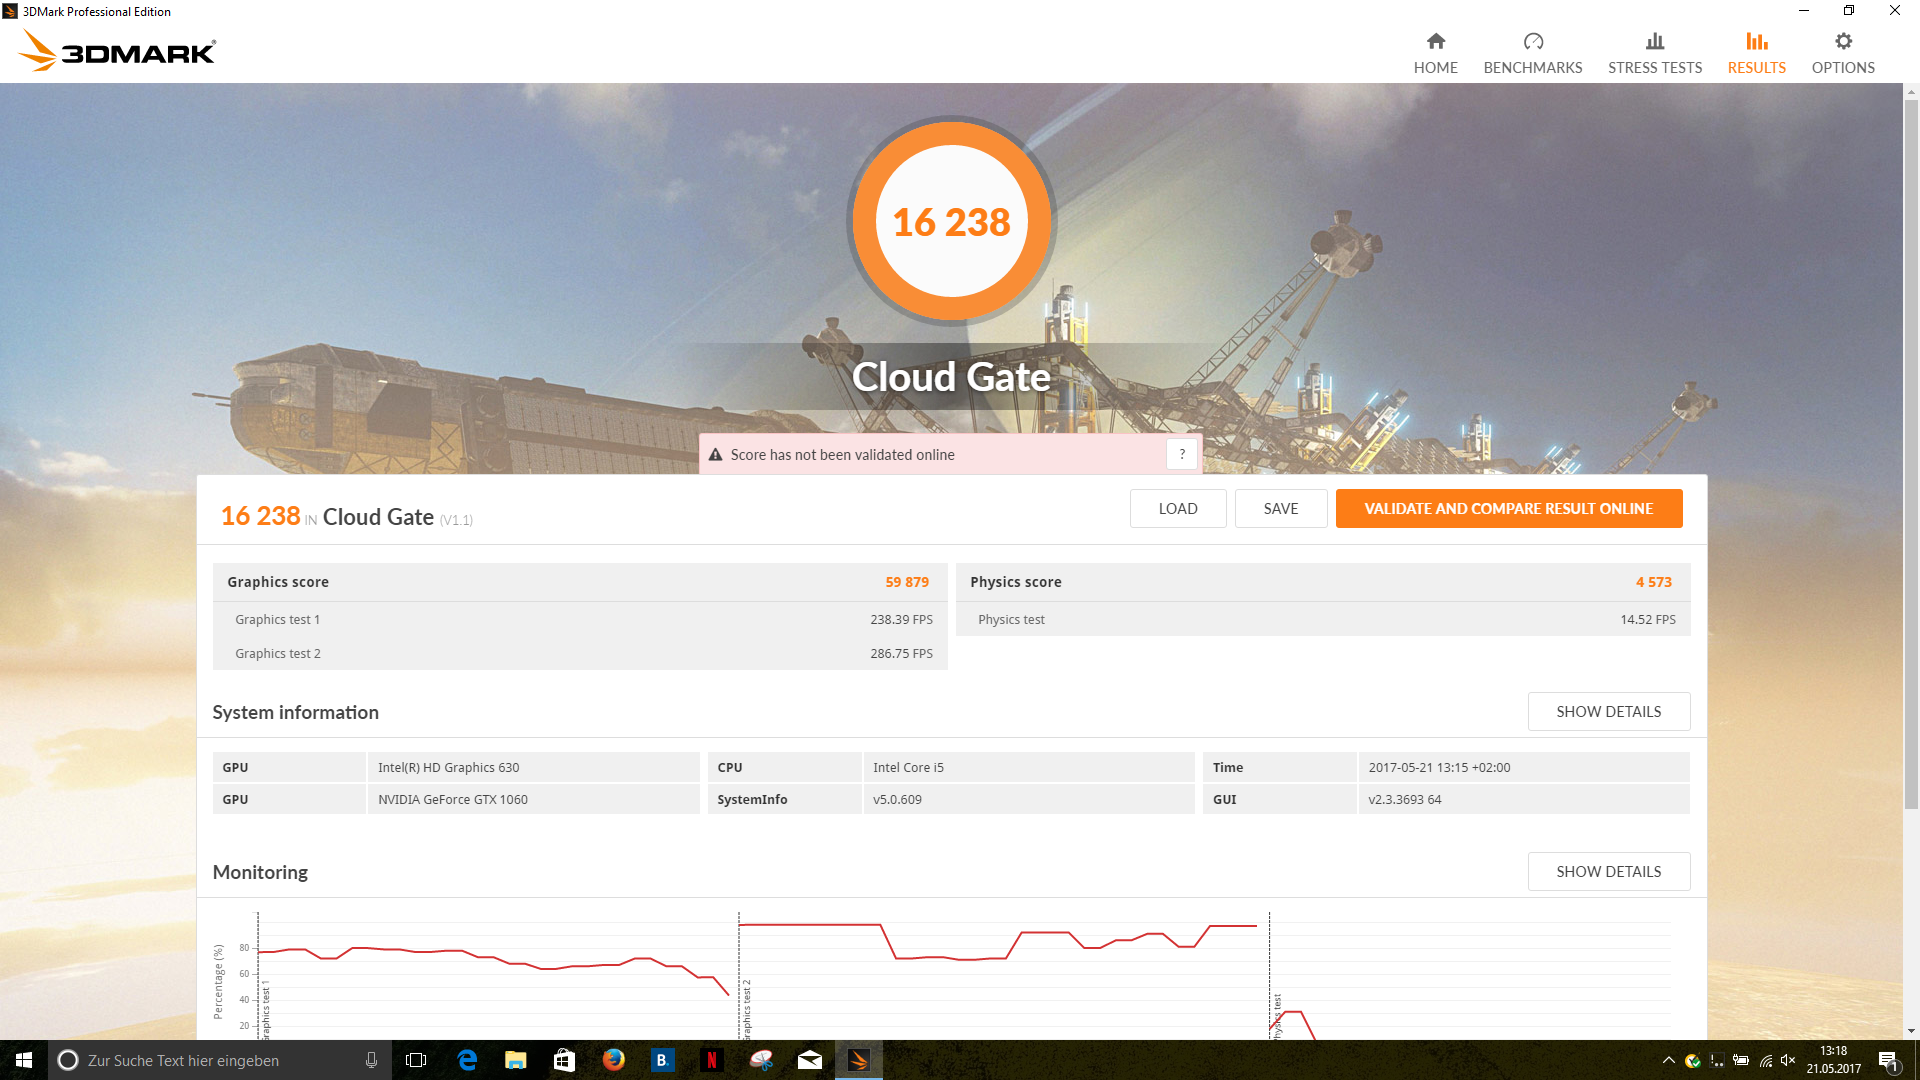
| 3DMark Cloud Gate Standard Score | 16238 points | |
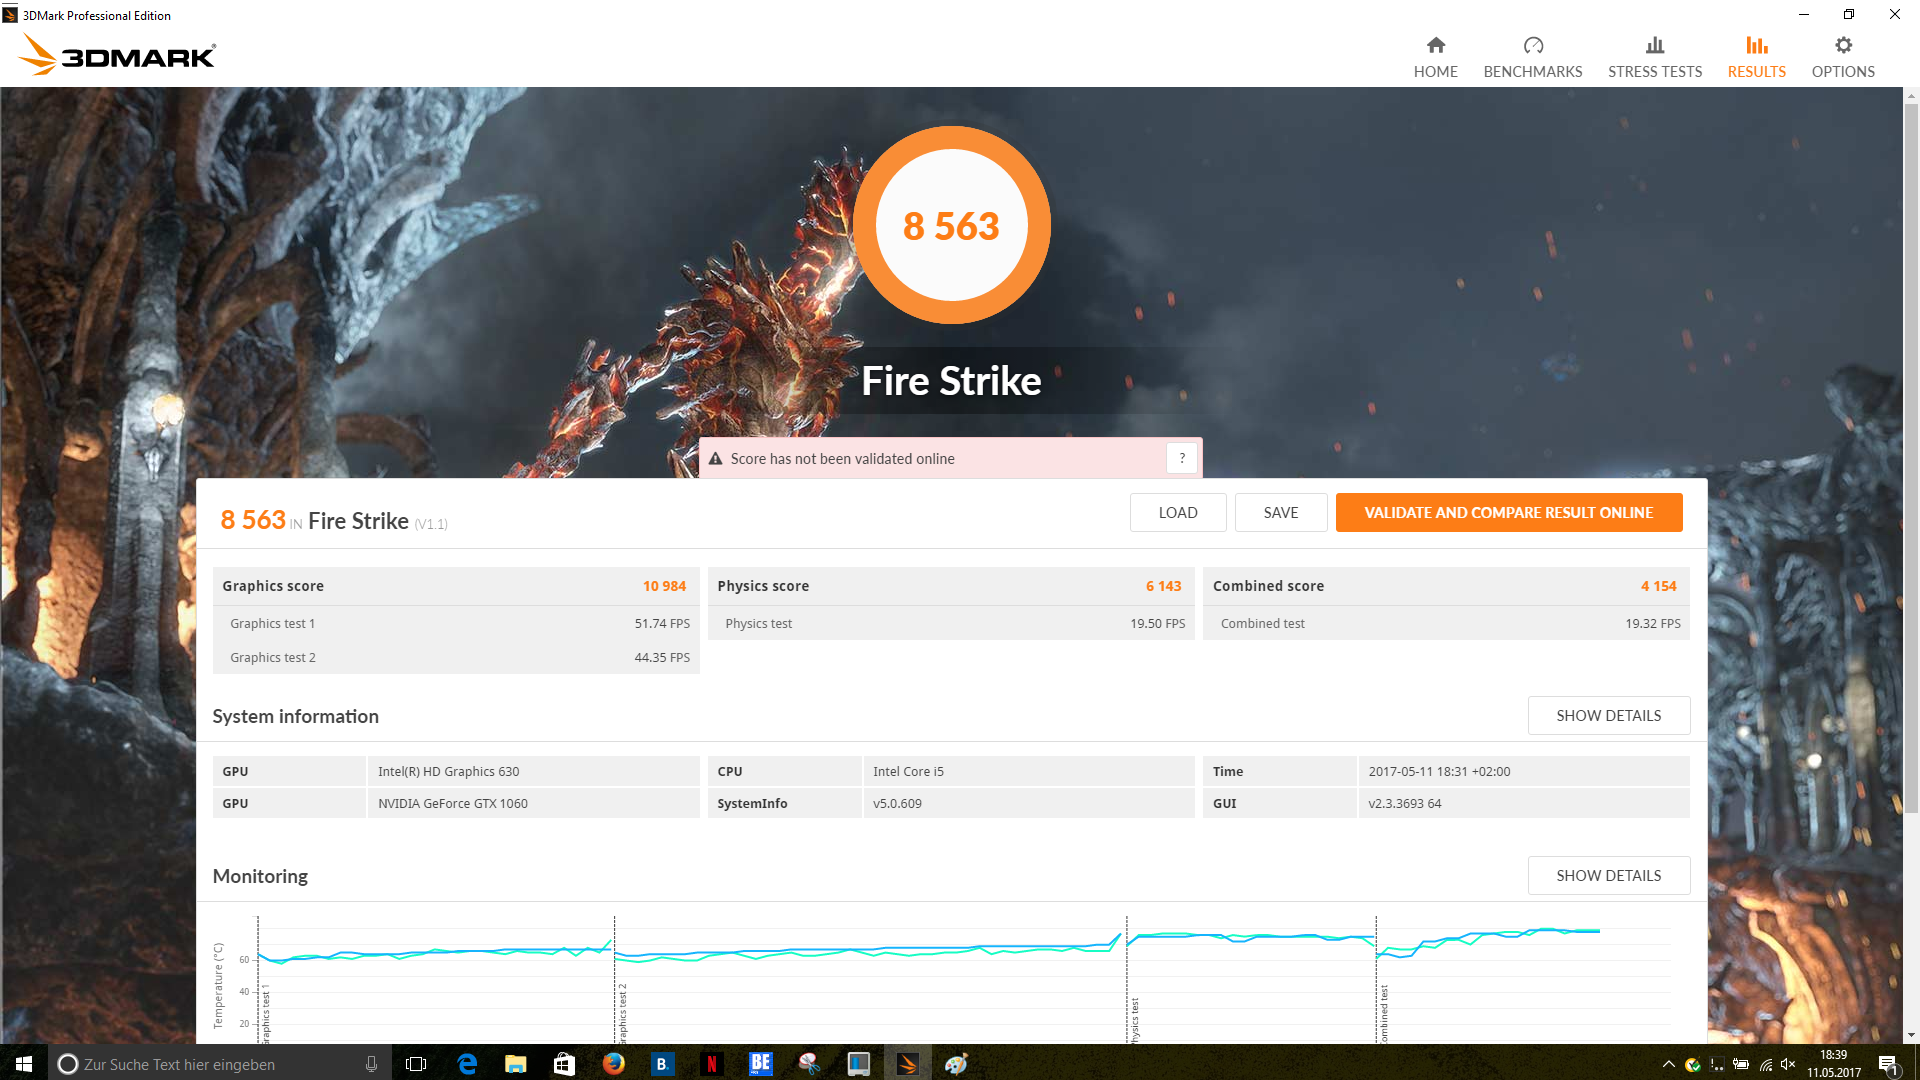
| 3DMark Fire Strike Score | 8563 points | |
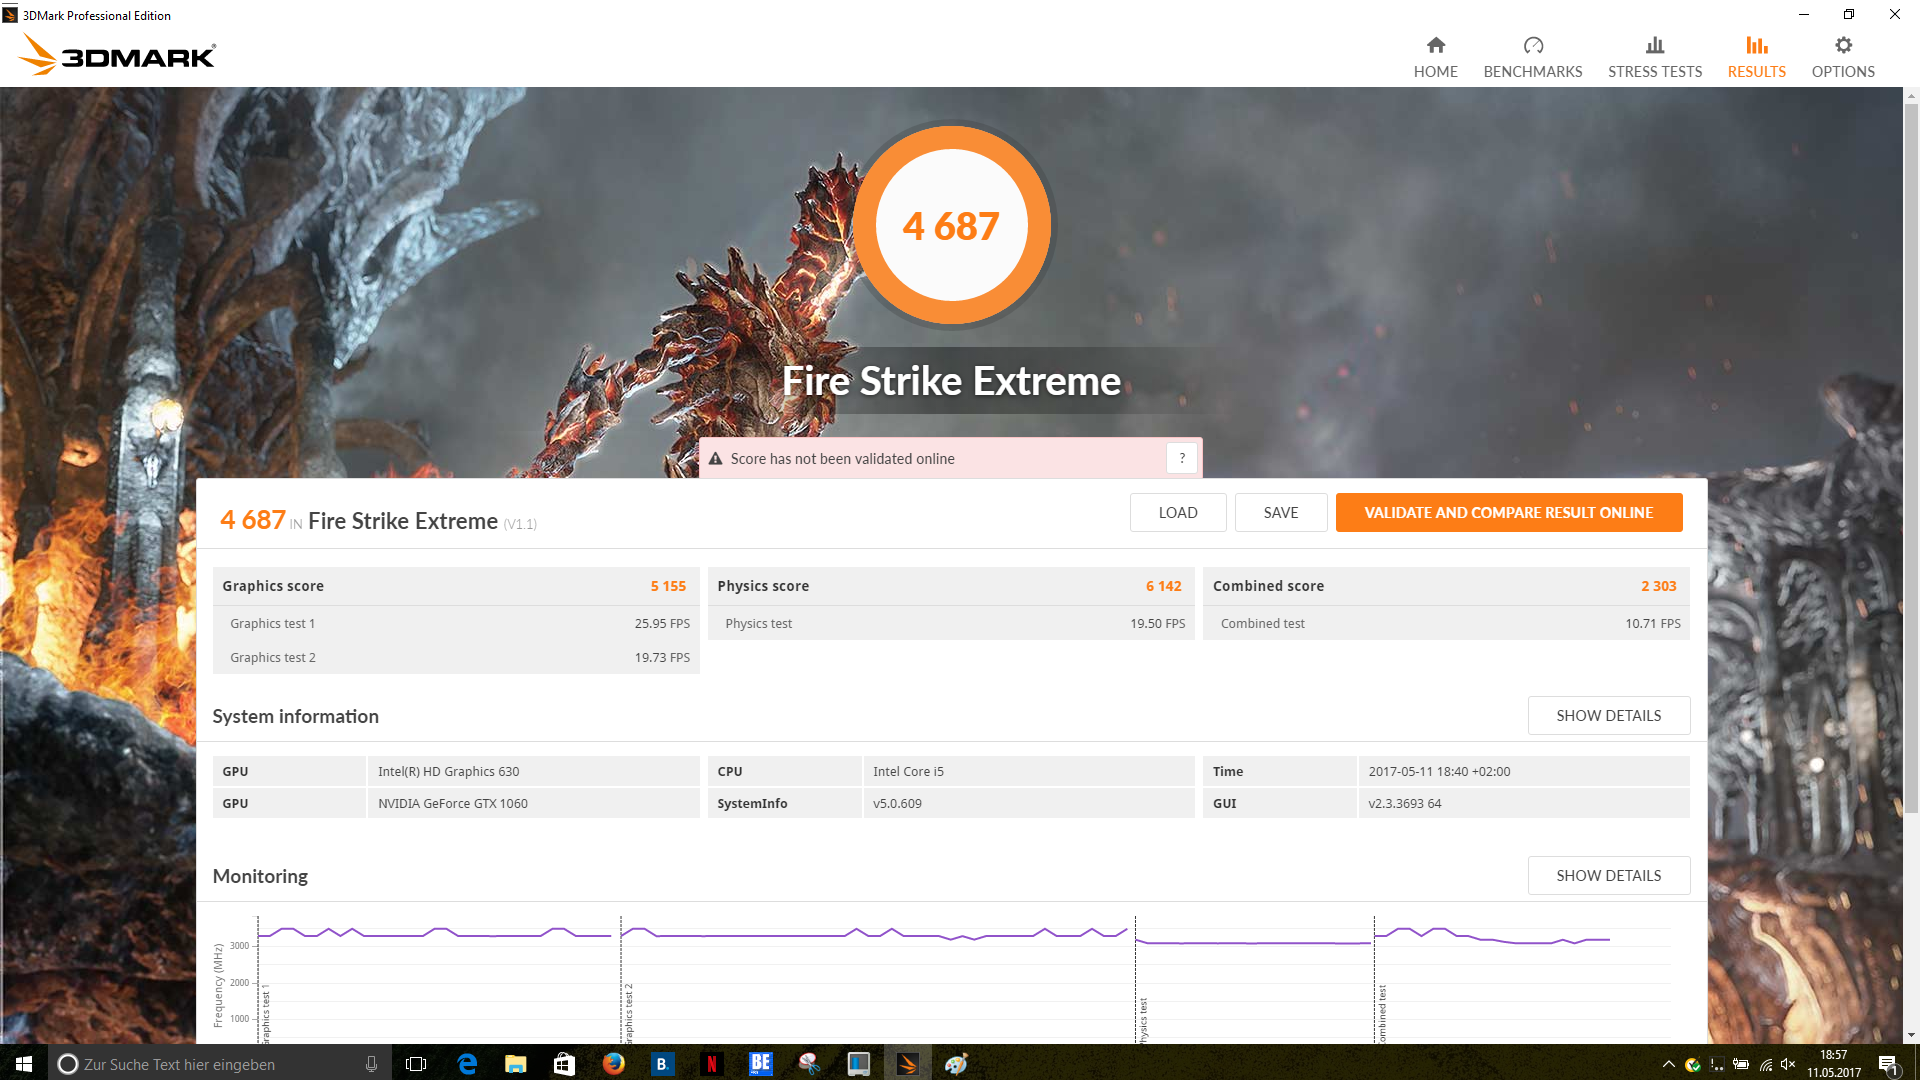
| 3DMark Fire Strike Extreme Score | 4687 points | |
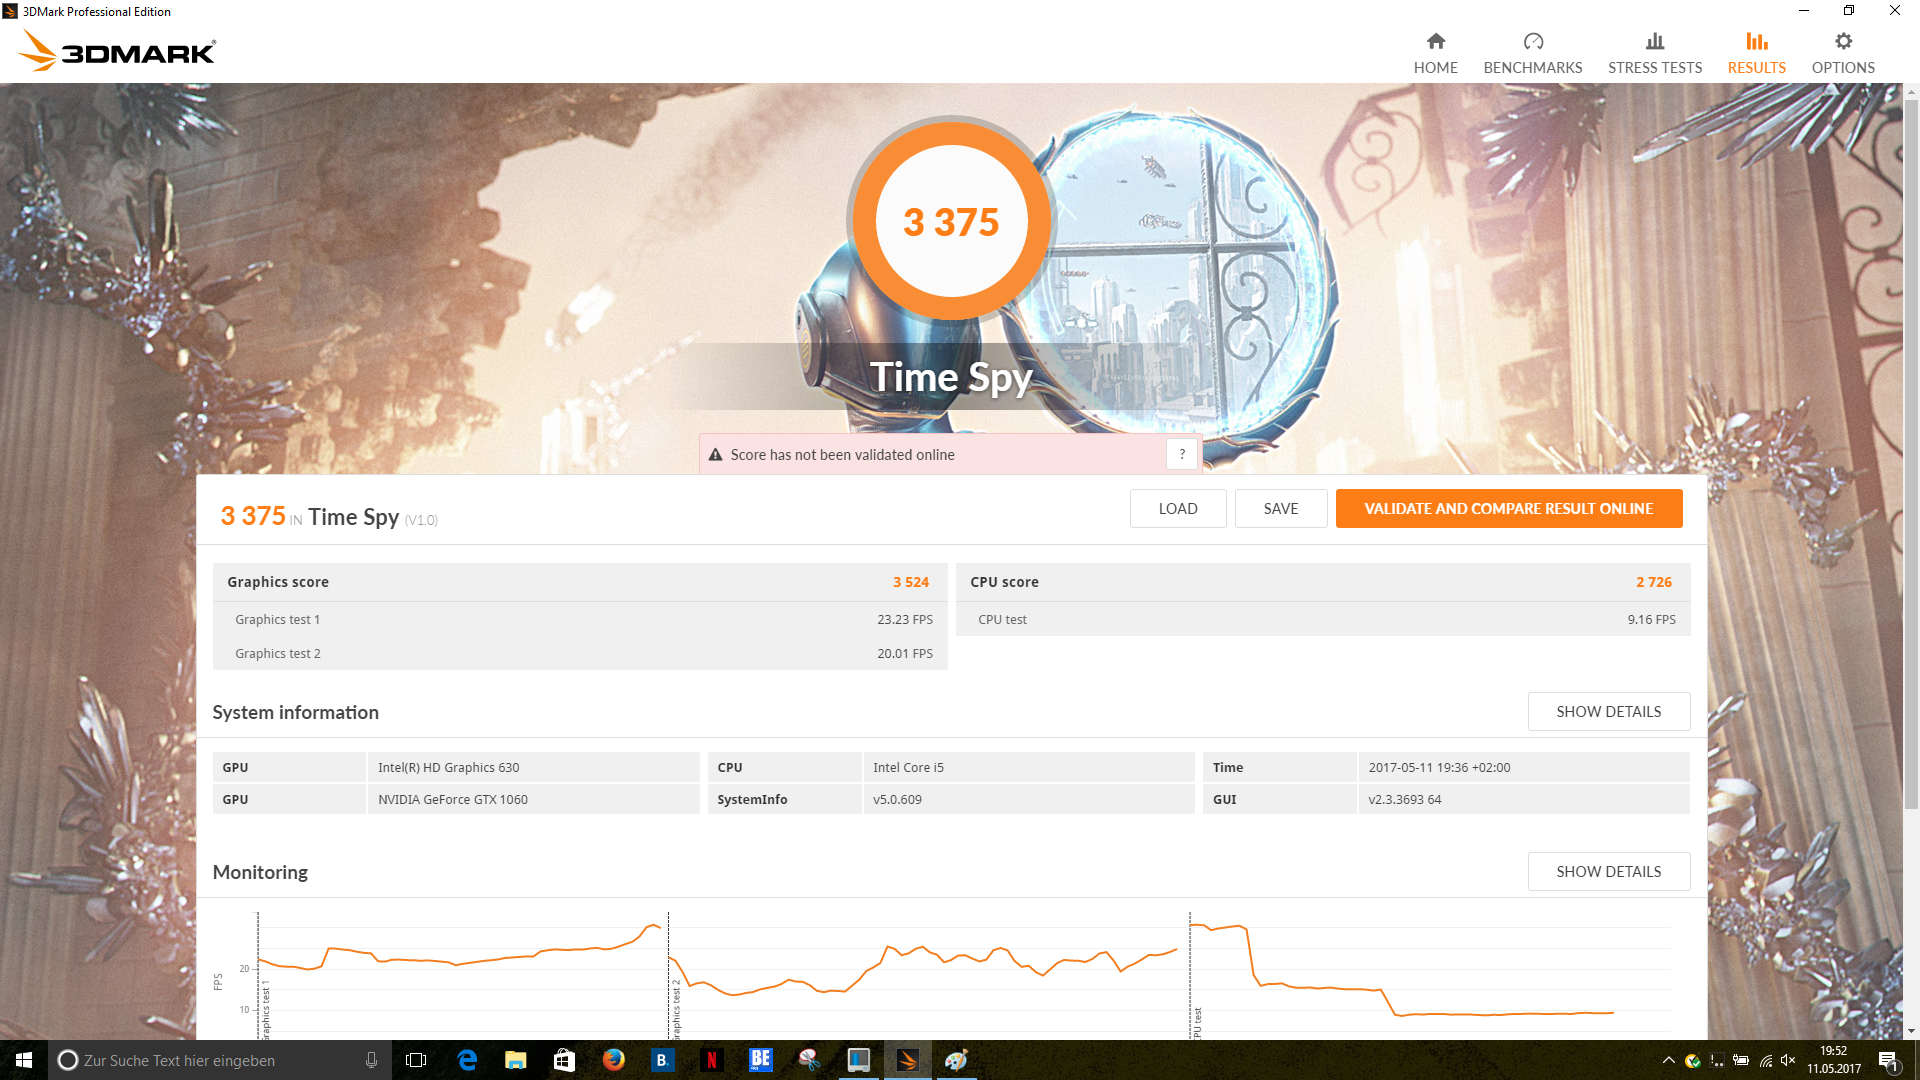
| 3DMark Time Spy Score | 3375 points | |
Help | ||
| low | med. | high | ultra | |
|---|---|---|---|---|
| BioShock Infinite (2013) | 187 | 164.6 | 154.7 | 92.5 |
| Battlefield 4 (2013) | 182.6 | 169.5 | 153.1 | 98 |
| The Witcher 3 (2015) | 130.2 | 118.1 | 65.9 | 37.5 |
| Rise of the Tomb Raider (2016) | 115.4 | 111.4 | 68.7 | 58.4 |
| BioShock Infinite - 1920x1080 Ultra Preset, DX11 (DDOF) | |
| MSI GT72VR 7RE-433 | |
| Gigabyte P57X v7 | |
| HP Omen 17-w100ng | |
| Acer Aspire V17 Nitro BE VN7-793G-52XN | |
| HP Pavilion 17t-ab200 | |
| Battlefield 4 - 1920x1080 Ultra Preset AA:4x MS | |
| MSI GT72VR 7RE-433 | |
| HP Omen 17-w100ng | |
| Acer Aspire V17 Nitro BE VN7-793G-52XN | |
| Rise of the Tomb Raider - 1920x1080 Very High Preset AA:FX AF:16x | |
| Acer Aspire V17 Nitro BE VN7-793G-52XN | |
| Asus Strix GL753VD-GC045T | |
| HP Pavilion 17t-ab200 | |
| The Witcher 3 - 1920x1080 Ultra Graphics & Postprocessing (HBAO+) | |
| Acer Aspire V17 Nitro BE VN7-793G-52XN | |
| Asus Strix GL753VD-GC045T | |
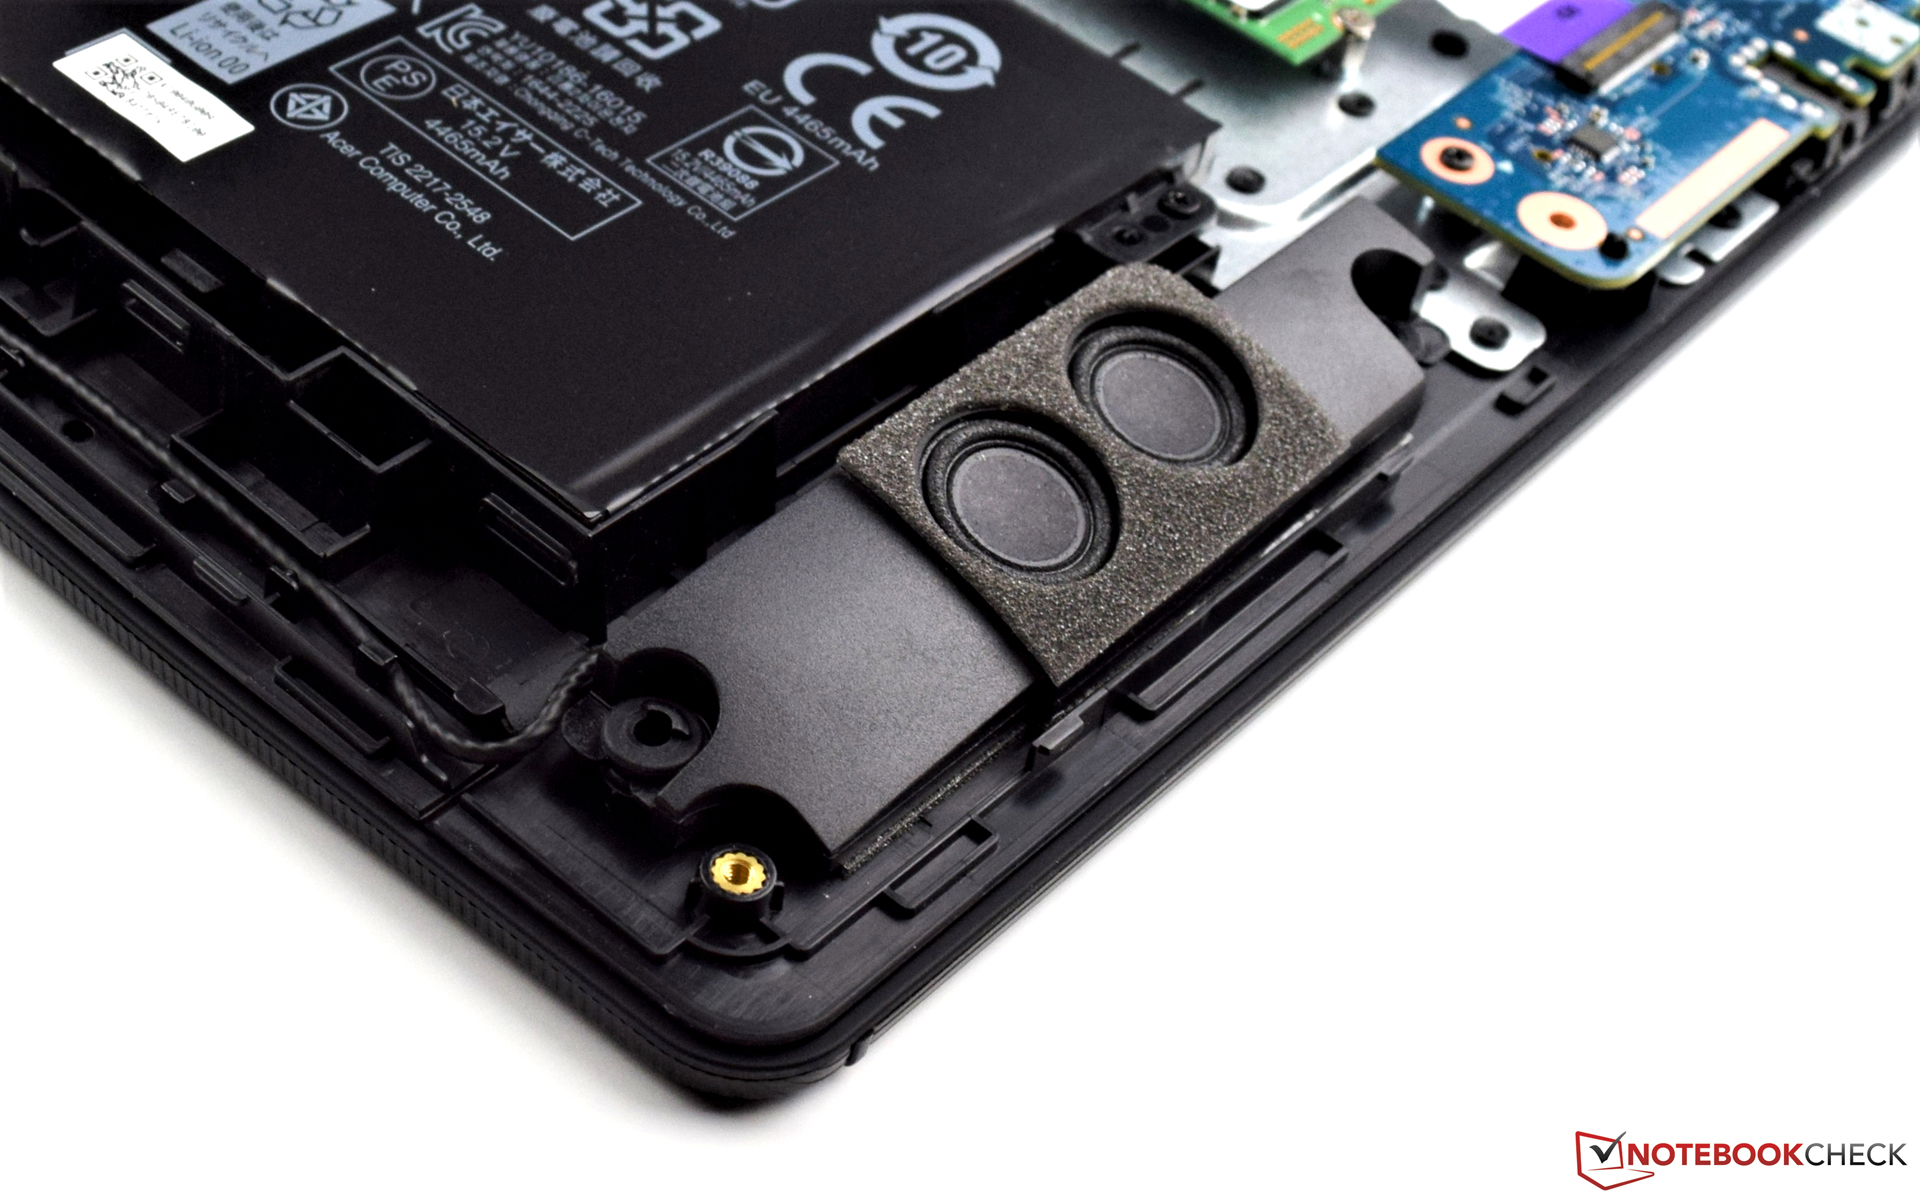
Acer Aspire V17 Nitro BE VN7-793G-52XN audio analysis
(-) | not very loud speakers (42.8 dB)
Analysis not possible as maximum curve is missing or too high
Noise level
| Idle |
| 30.7 / 30.7 / 31.4 dB(A) |
| HDD |
| 30.7 dB(A) |
| Load |
| 32.1 / 42.8 dB(A) |
 | ||
30 dB silent 40 dB(A) audible 50 dB(A) loud |
||
min: | ||
| Acer Aspire V17 Nitro BE VN7-793G-52XN i5-7300HQ, GeForce GTX 1060 Mobile | Asus Strix GL753VD-GC045T i7-7700HQ, GeForce GTX 1050 Mobile | MSI GT72VR 7RE-433 i7-7700HQ, GeForce GTX 1070 Mobile | Gigabyte P57X v7 i7-7700HQ, GeForce GTX 1070 Mobile | HP Pavilion 17t-ab200 i7-7700HQ, GeForce GTX 1050 Mobile | HP Omen 17-w100ng 6300HQ, GeForce GTX 1060 Mobile | |
|---|---|---|---|---|---|---|
| Noise | -13% | -10% | -10% | -18% | -19% | |
| off / environment * (dB) | 30.7 | 28.8 6% | 31 -1% | 29 6% | 30.8 -0% | 31 -1% |
| Idle Minimum * (dB) | 30.7 | 33.9 -10% | 34 -11% | 30.4 1% | 35.3 -15% | 35 -14% |
| Idle Average * (dB) | 30.7 | 33.9 -10% | 35 -14% | 32.1 -5% | 35.4 -15% | 36 -17% |
| Idle Maximum * (dB) | 31.4 | 37.8 -20% | 37 -18% | 32.1 -2% | 35.4 -13% | 37 -18% |
| Load Average * (dB) | 32.1 | 42.7 -33% | 37 -15% | 45.6 -42% | 48.6 -51% | 44 -37% |
| Witcher 3 ultra * (dB) | 42.8 | |||||
| Load Maximum * (dB) | 42.8 | 47.4 -11% | 44 -3% | 51.5 -20% | 49.8 -16% | 54 -26% |
* ... smaller is better
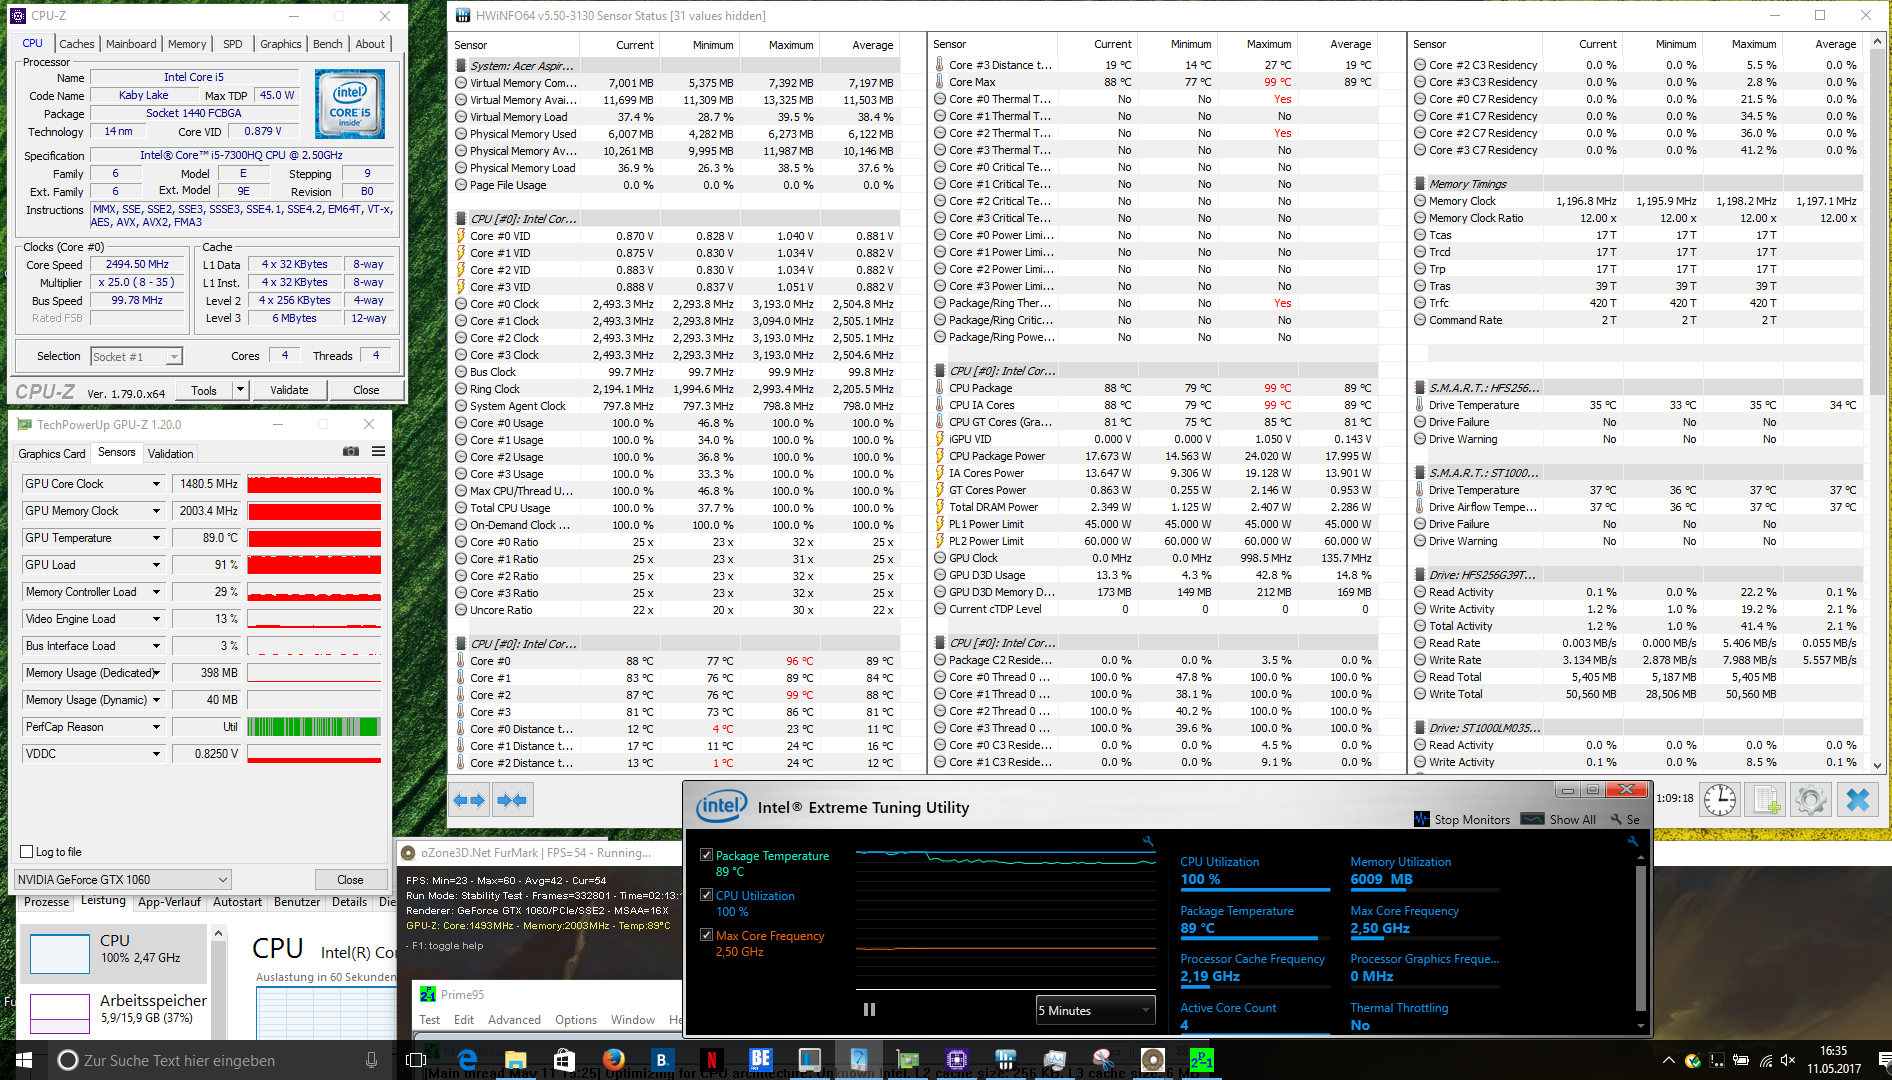
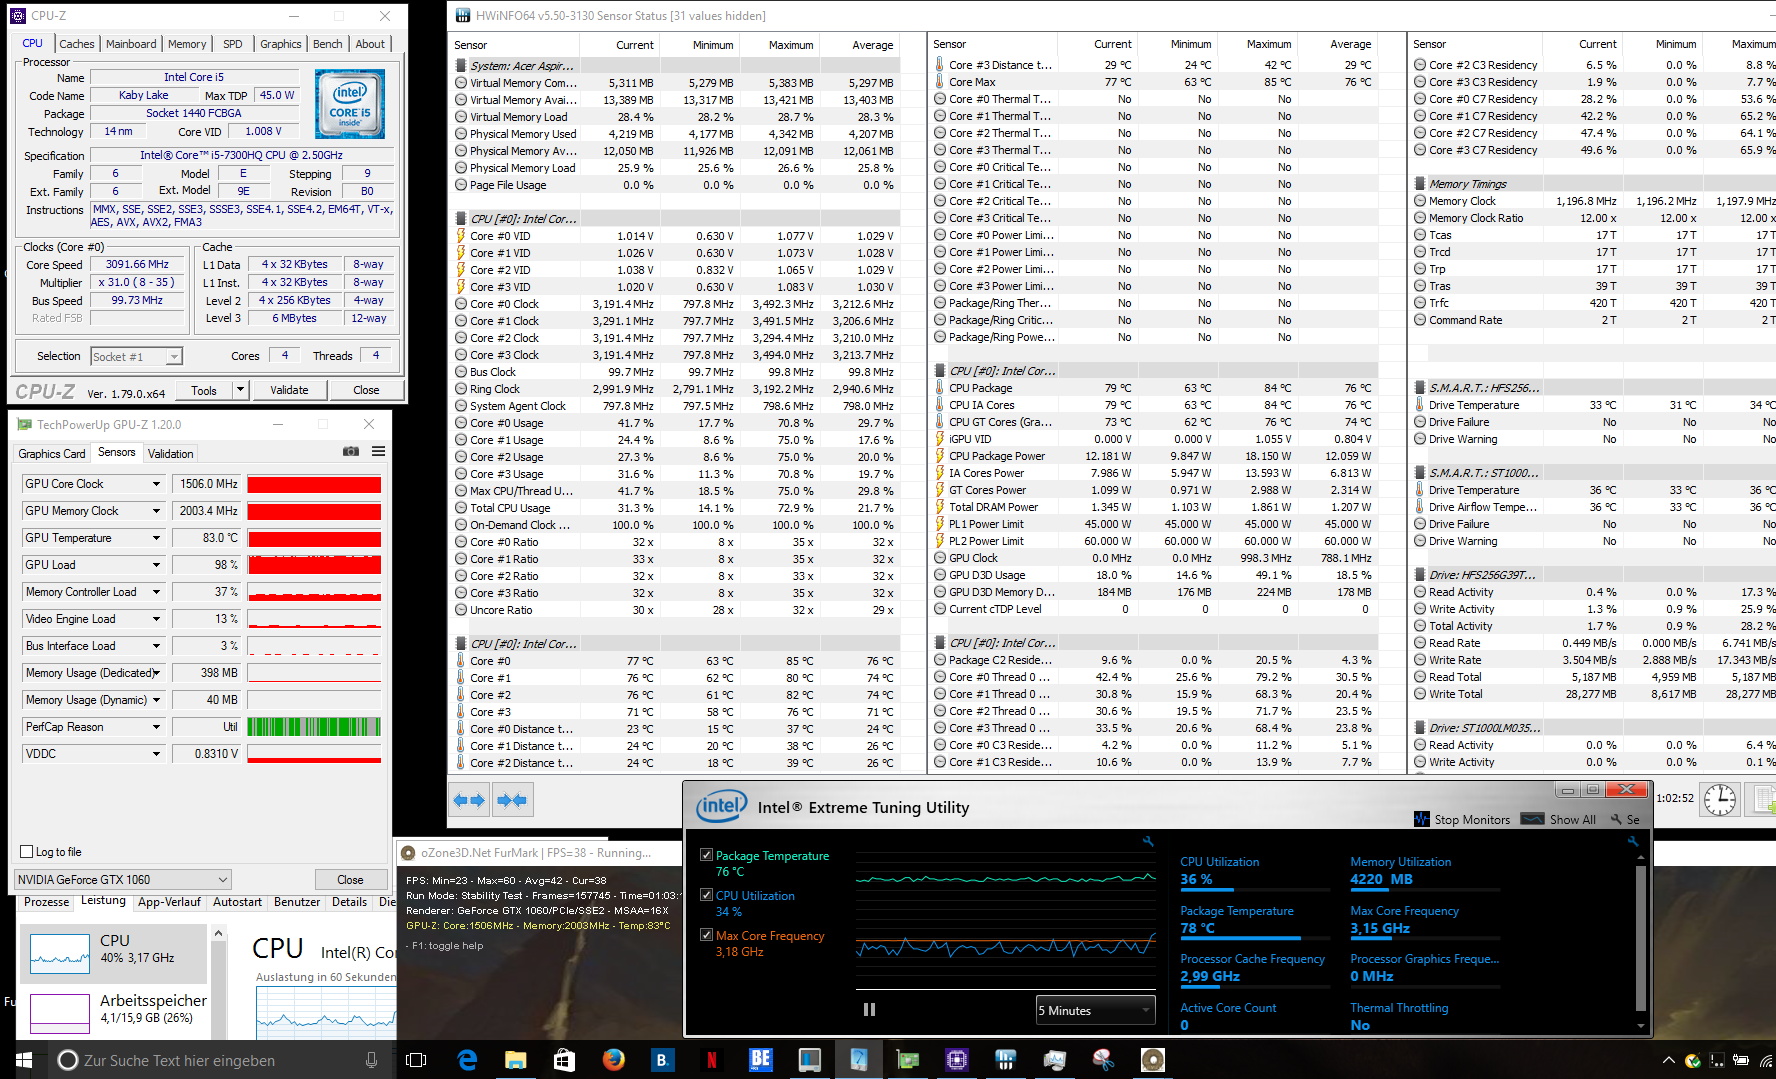
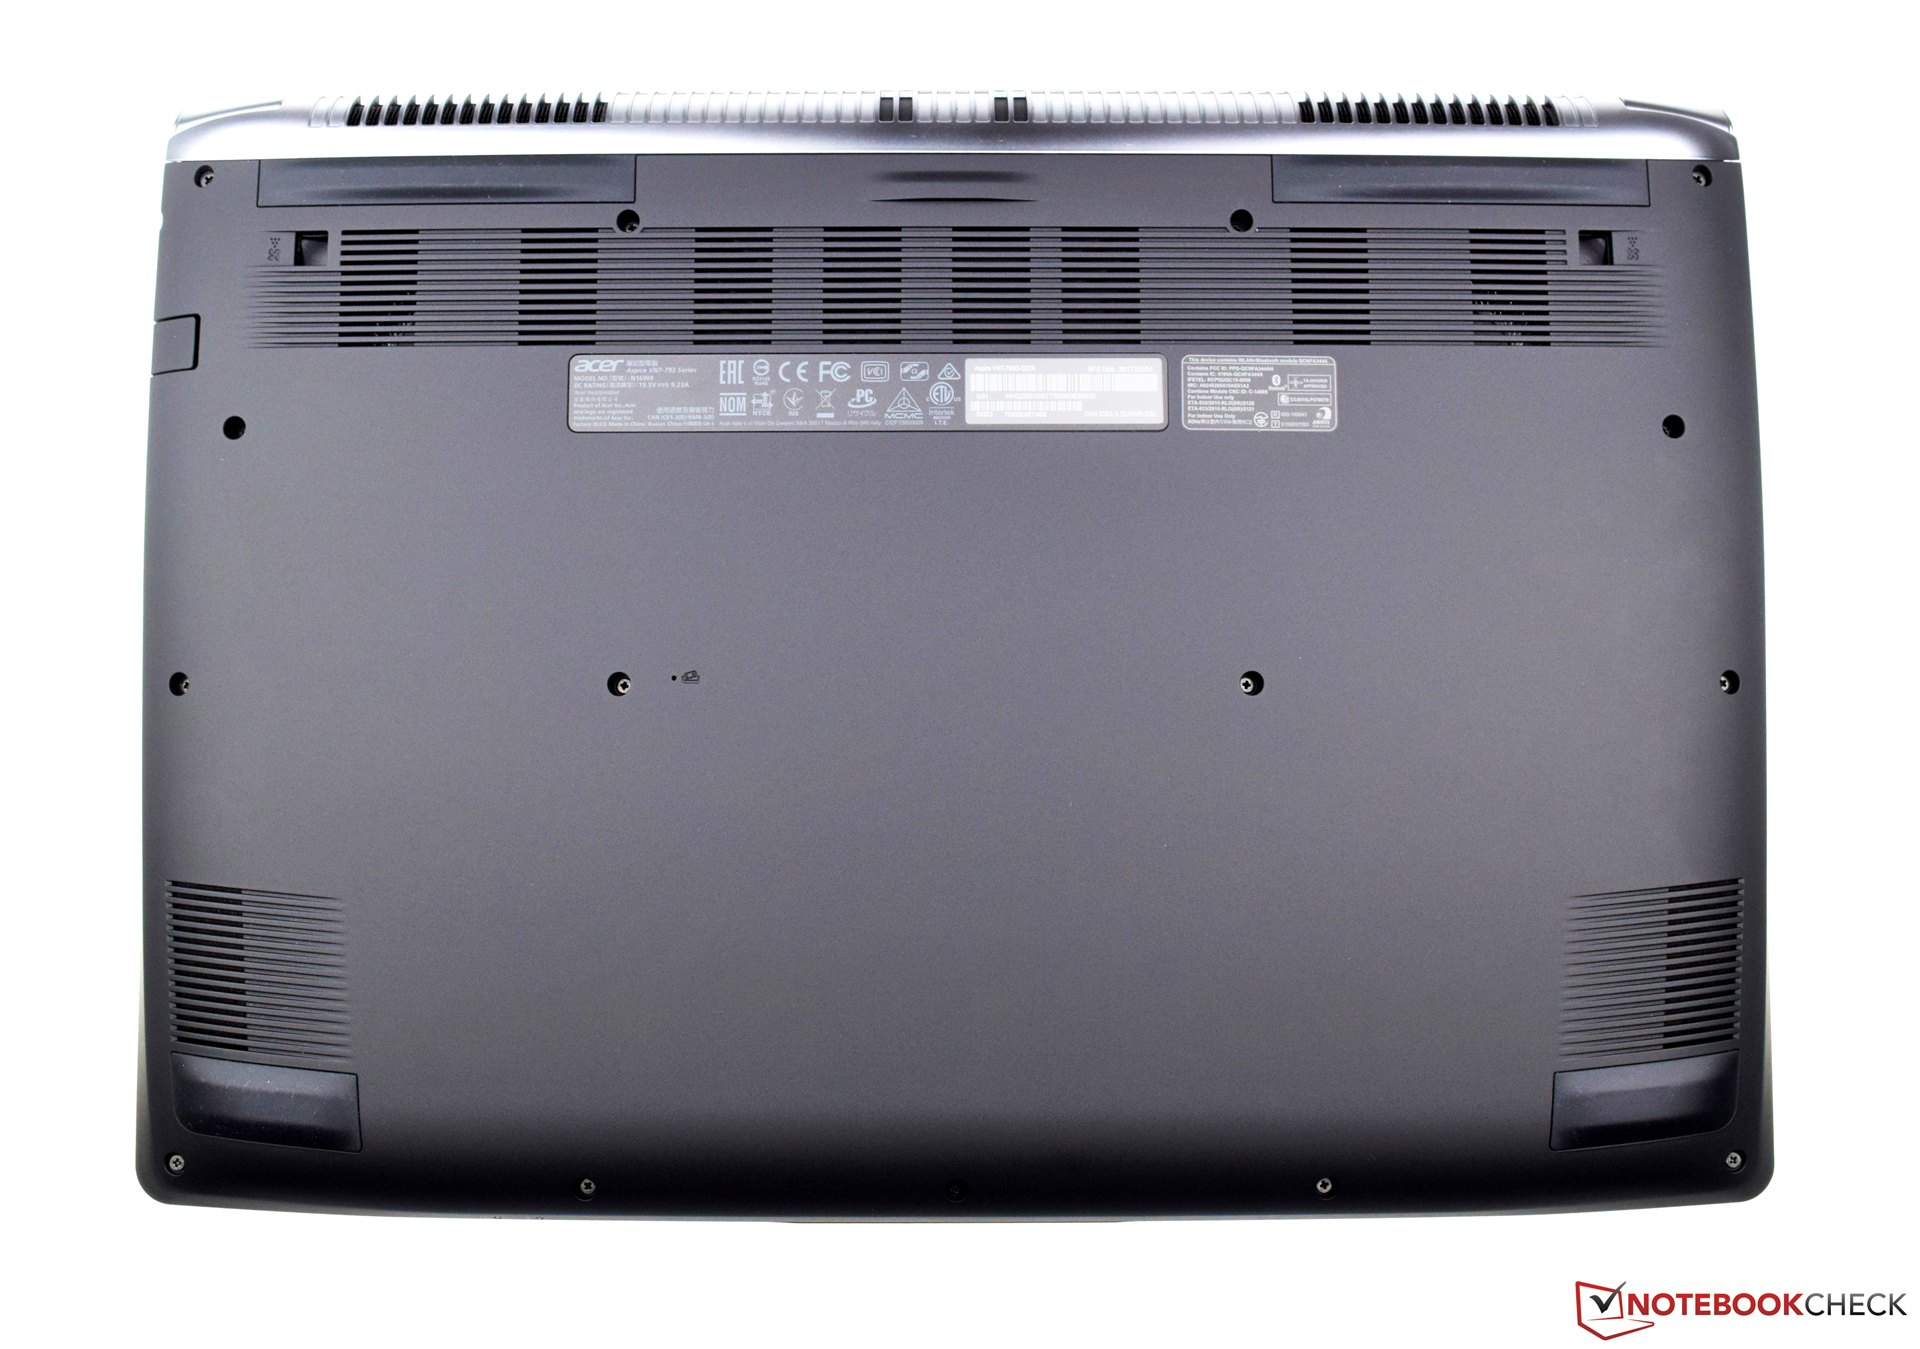
(-) The maximum temperature on the upper side is 48.4 °C / 119 F, compared to the average of 36.8 °C / 98 F, ranging from 21 to 71 °C for the class Multimedia.
(±) The bottom heats up to a maximum of 44.2 °C / 112 F, compared to the average of 39.1 °C / 102 F
(+) In idle usage, the average temperature for the upper side is 23.2 °C / 74 F, compared to the device average of 31.3 °C / 88 F.
(±) Playing The Witcher 3, the average temperature for the upper side is 36.3 °C / 97 F, compared to the device average of 31.3 °C / 88 F.
(+) The palmrests and touchpad are cooler than skin temperature with a maximum of 28.7 °C / 83.7 F and are therefore cool to the touch.
(±) The average temperature of the palmrest area of similar devices was 28.7 °C / 83.7 F (0 °C / 0 F).
| Acer Aspire V17 Nitro BE VN7-793G-52XN i5-7300HQ, GeForce GTX 1060 Mobile | Asus Strix GL753VD-GC045T i7-7700HQ, GeForce GTX 1050 Mobile | MSI GT72VR 7RE-433 i7-7700HQ, GeForce GTX 1070 Mobile | Gigabyte P57X v7 i7-7700HQ, GeForce GTX 1070 Mobile | HP Pavilion 17t-ab200 i7-7700HQ, GeForce GTX 1050 Mobile | HP Omen 17-w100ng 6300HQ, GeForce GTX 1060 Mobile | |
|---|---|---|---|---|---|---|
| Heat | 11% | -1% | -16% | 10% | -7% | |
| Maximum Upper Side * (°C) | 48.4 | 37.7 22% | 41.5 14% | 51.2 -6% | 45.8 5% | 41.5 14% |
| Maximum Bottom * (°C) | 44.2 | 36.3 18% | 50.6 -14% | 56.8 -29% | 37 16% | 45.5 -3% |
| Idle Upper Side * (°C) | 25.8 | 25.7 -0% | 26.4 -2% | 29.2 -13% | 24 7% | 31.8 -23% |
| Idle Bottom * (°C) | 25.5 | 24.4 4% | 25.4 -0% | 29.2 -15% | 23 10% | 29.6 -16% |
* ... smaller is better
Acer Aspire V17 Nitro BE VN7-793G-52XN audio analysis
(±) | speaker loudness is average but good (72 dB)
Bass 100 - 315 Hz
(±) | reduced bass - on average 5.7% lower than median
(+) | bass is linear (5% delta to prev. frequency)
Mids 400 - 2000 Hz
(+) | balanced mids - only 4.4% away from median
(+) | mids are linear (6% delta to prev. frequency)
Highs 2 - 16 kHz
(+) | balanced highs - only 3% away from median
(±) | linearity of highs is average (7.2% delta to prev. frequency)
Overall 100 - 16.000 Hz
(+) | overall sound is linear (12.5% difference to median)
Compared to same class
» 24% of all tested devices in this class were better, 3% similar, 73% worse
» The best had a delta of 5%, average was 17%, worst was 45%
Compared to all devices tested
» 11% of all tested devices were better, 2% similar, 87% worse
» The best had a delta of 4%, average was 23%, worst was 134%
Asus Strix GL753VD-GC045T audio analysis
(±) | speaker loudness is average but good (81.5 dB)
Bass 100 - 315 Hz
(-) | nearly no bass - on average 15.8% lower than median
(±) | linearity of bass is average (12.2% delta to prev. frequency)
Mids 400 - 2000 Hz
(+) | balanced mids - only 3.1% away from median
(±) | linearity of mids is average (7% delta to prev. frequency)
Highs 2 - 16 kHz
(±) | higher highs - on average 6.3% higher than median
(+) | highs are linear (5.4% delta to prev. frequency)
Overall 100 - 16.000 Hz
(±) | linearity of overall sound is average (17.2% difference to median)
Compared to same class
» 47% of all tested devices in this class were better, 11% similar, 42% worse
» The best had a delta of 6%, average was 18%, worst was 132%
Compared to all devices tested
» 32% of all tested devices were better, 8% similar, 60% worse
» The best had a delta of 4%, average was 23%, worst was 134%
| Off / Standby | |
| Idle | |
| Load |
|
Key:
min: | |
| Acer Aspire V17 Nitro BE VN7-793G-52XN i5-7300HQ, GeForce GTX 1060 Mobile, SK Hynix HFS256G39TND-N210A, a-Si TFT-LCD, WLED, 1920x1080, 17.3" | Asus Strix GL753VD-GC045T i7-7700HQ, GeForce GTX 1050 Mobile, Micron SSD 1100 (MTFDDAV256TBN), LED IPS, 1920x1080, 17.3" | MSI GT72VR 7RE-433 i7-7700HQ, GeForce GTX 1070 Mobile, Kingston RBU-SNS8152S3256GG5, TN LED, 1920x1080, 17.3" | Gigabyte P57X v7 i7-7700HQ, GeForce GTX 1070 Mobile, Transcend MTS800 256GB M.2 (TS256GMTS800), IPS, 3840x2160, 17.3" | HP Pavilion 17t-ab200 i7-7700HQ, GeForce GTX 1050 Mobile, Samsung CM871a MZNTY128HDHP, IPS, 1920x1080, 17.3" | HP Omen 17-w100ng 6300HQ, GeForce GTX 1060 Mobile, SanDisk Z400s SD8SNAT-128G, IPS, 1920x1080, 17.3" | |
|---|---|---|---|---|---|---|
| Power Consumption | 8% | -79% | -88% | 11% | -52% | |
| Idle Minimum * (Watt) | 7.8 | 6.2 21% | 20 -156% | 15.7 -101% | 8.2 -5% | 17 -118% |
| Idle Average * (Watt) | 13.3 | 12.2 8% | 27 -103% | 23.4 -76% | 11 17% | 22 -65% |
| Idle Maximum * (Watt) | 16.6 | 14.8 11% | 31 -87% | 23.5 -42% | 11.1 33% | 29 -75% |
| Load Average * (Watt) | 73 | 84.9 -16% | 86 -18% | 184.6 -153% | 77 -5% | 72 1% |
| Witcher 3 ultra * (Watt) | 118 | |||||
| Load Maximum * (Watt) | 140 | 120.7 14% | 184 -31% | 233.1 -67% | 116.9 16% | 141 -1% |
* ... smaller is better
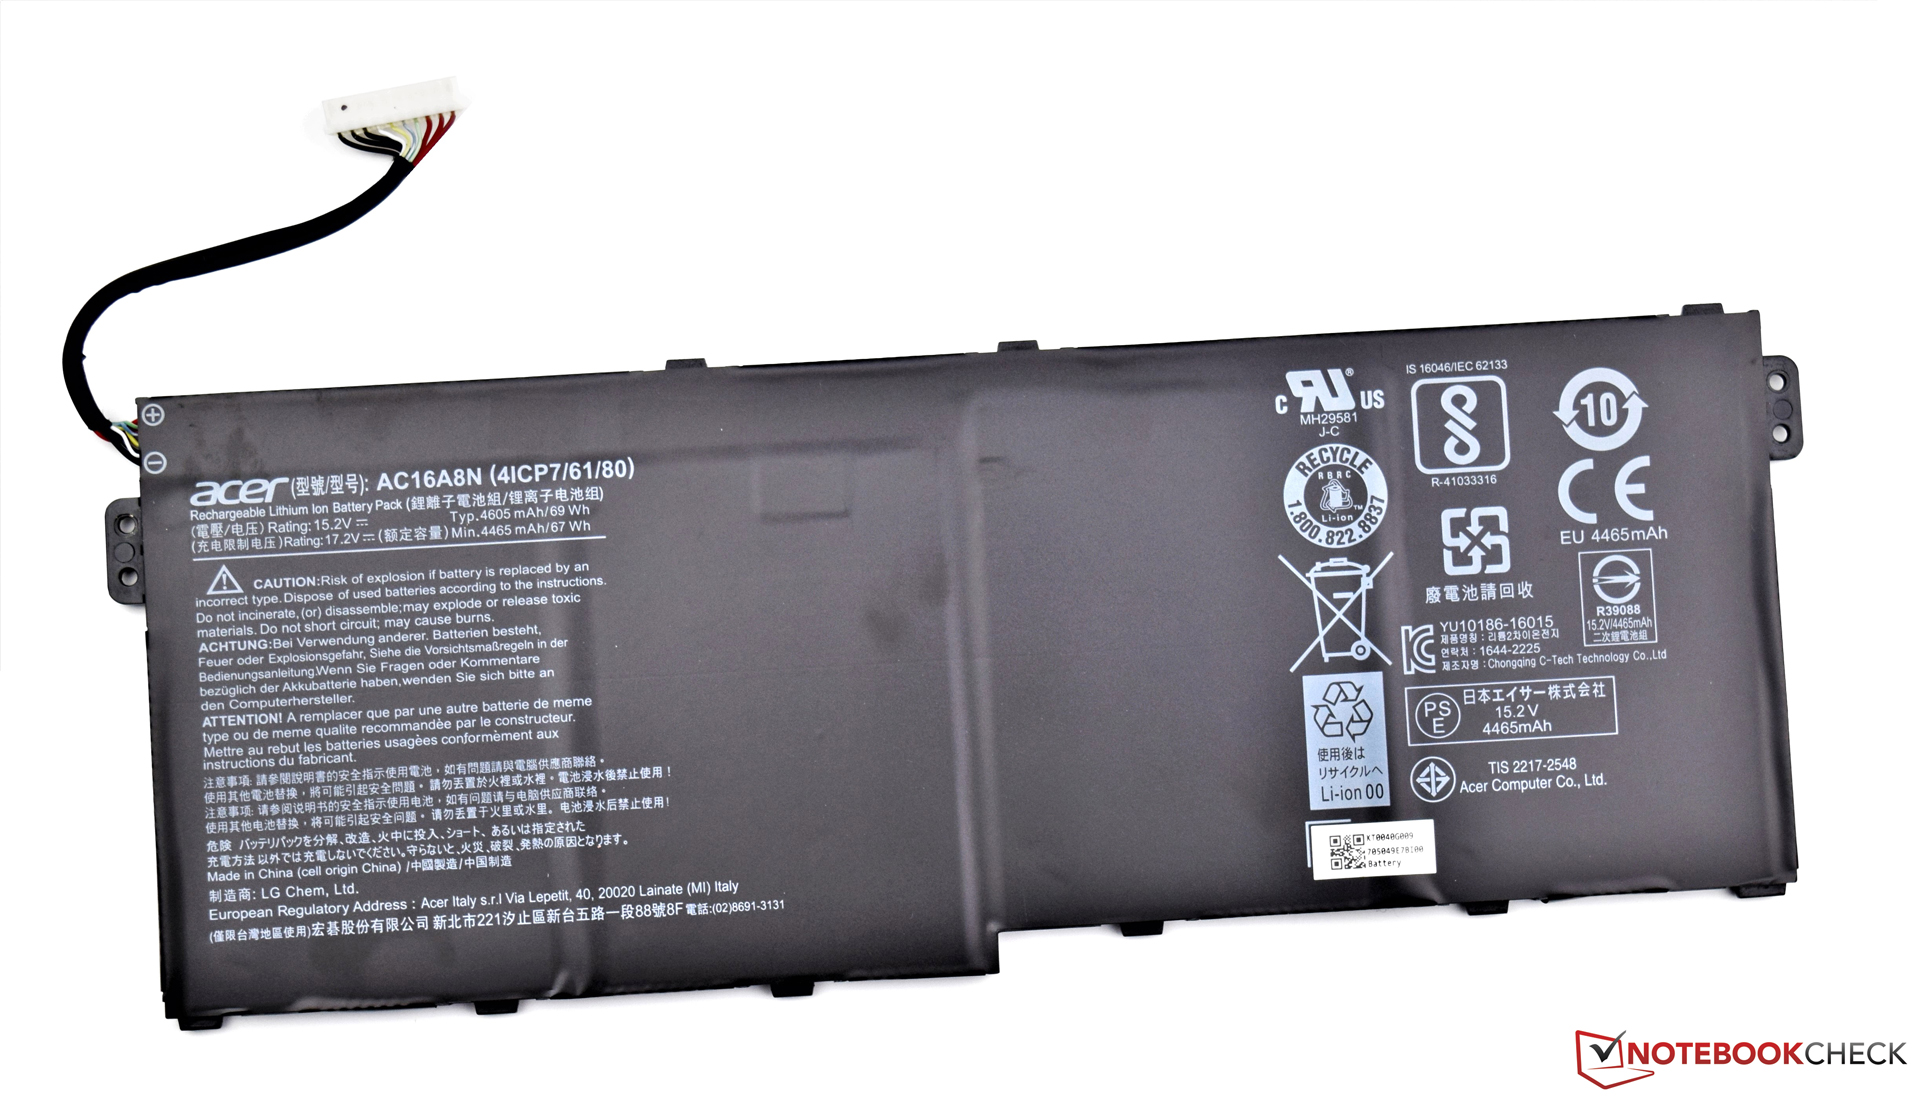
| Acer Aspire V17 Nitro BE VN7-793G-52XN i5-7300HQ, GeForce GTX 1060 Mobile, 69 Wh | Asus Strix GL753VD-GC045T i7-7700HQ, GeForce GTX 1050 Mobile, 48 Wh | MSI GT72VR 7RE-433 i7-7700HQ, GeForce GTX 1070 Mobile, 83 Wh | Gigabyte P57X v7 i7-7700HQ, GeForce GTX 1070 Mobile, 75.81 Wh | HP Pavilion 17t-ab200 i7-7700HQ, GeForce GTX 1050 Mobile, 62 Wh | HP Omen 17-w100ng 6300HQ, GeForce GTX 1060 Mobile, 95.8 Wh | |
|---|---|---|---|---|---|---|
| Battery runtime | -37% | -37% | -48% | -0% | -2% | |
| Reader / Idle (h) | 10.3 | 8.6 -17% | 5.3 -49% | 4.3 -58% | 11.5 12% | 9.1 -12% |
| H.264 (h) | 5.3 | 3.8 -28% | 5.2 -2% | |||
| WiFi v1.3 (h) | 6.2 | 4.4 -29% | 3.8 -39% | 2.6 -58% | 6.8 10% | 6.1 -2% |
| Load (h) | 2.2 | 0.8 -64% | 1.5 -32% | 1.6 -27% | 1.7 -23% | 2.4 9% |
Pros
Cons
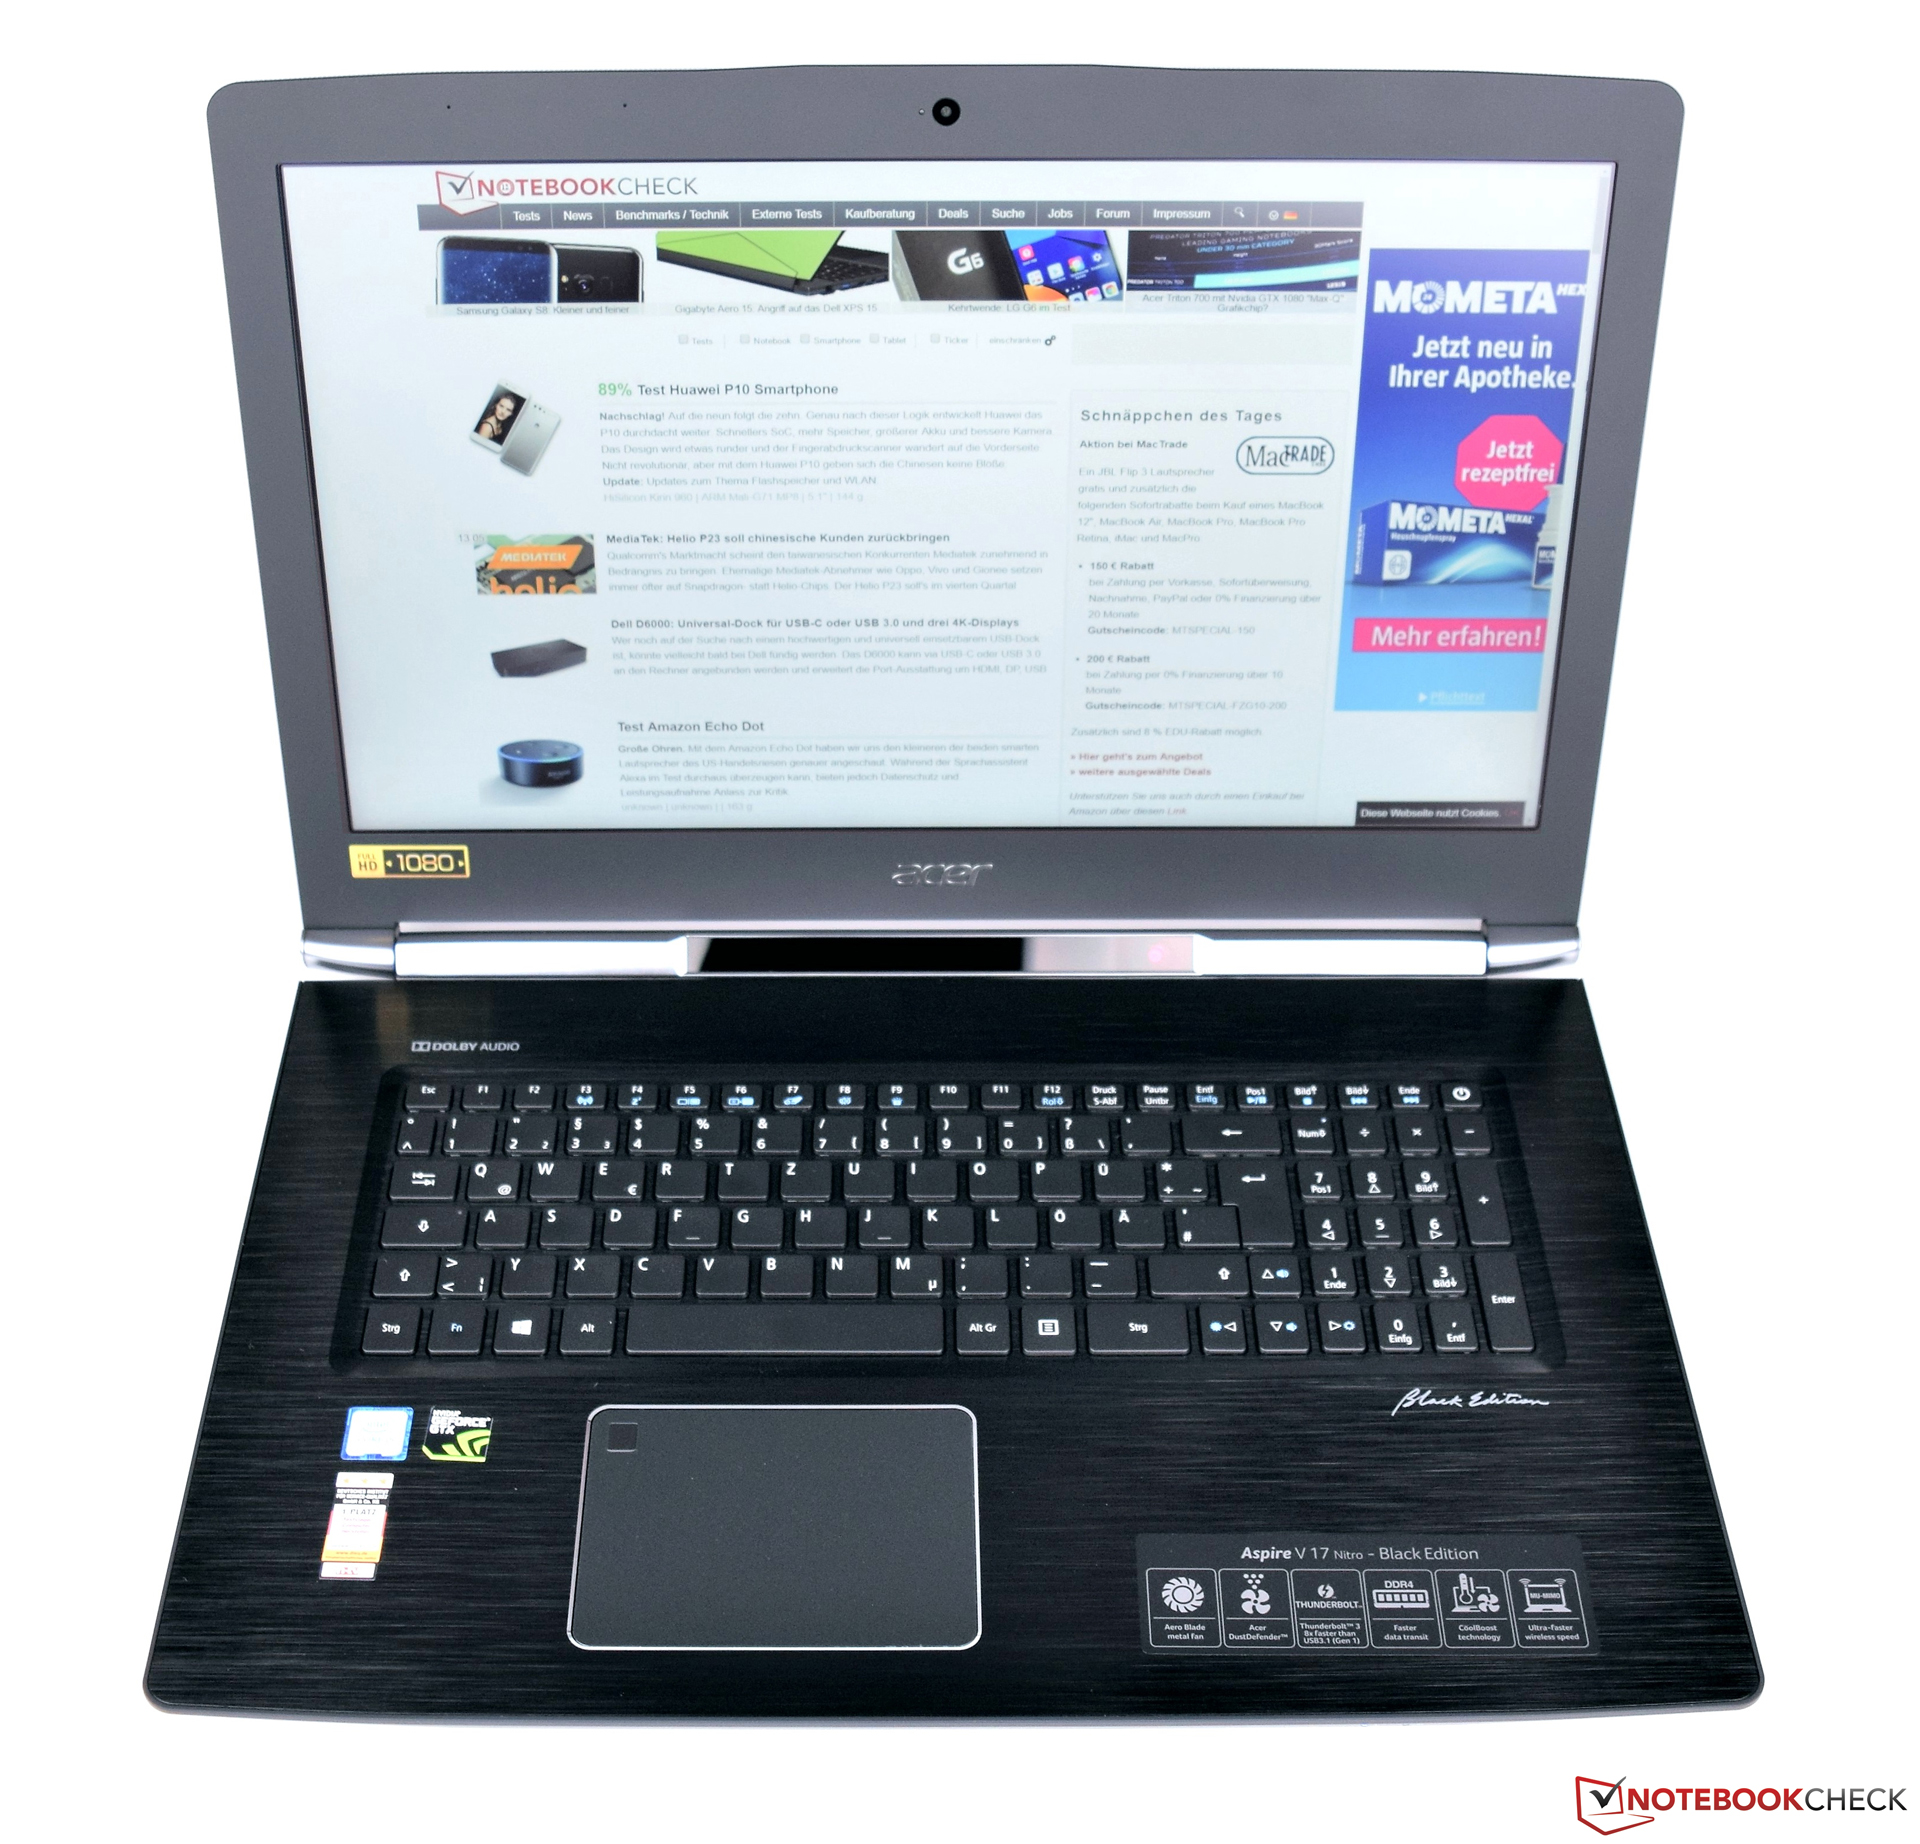
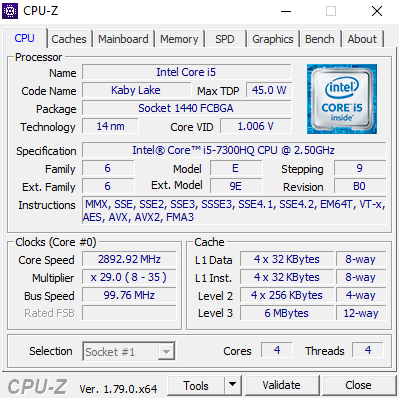
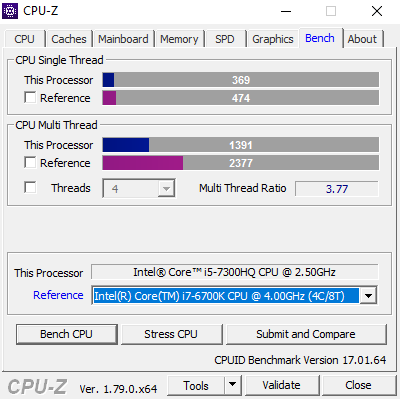
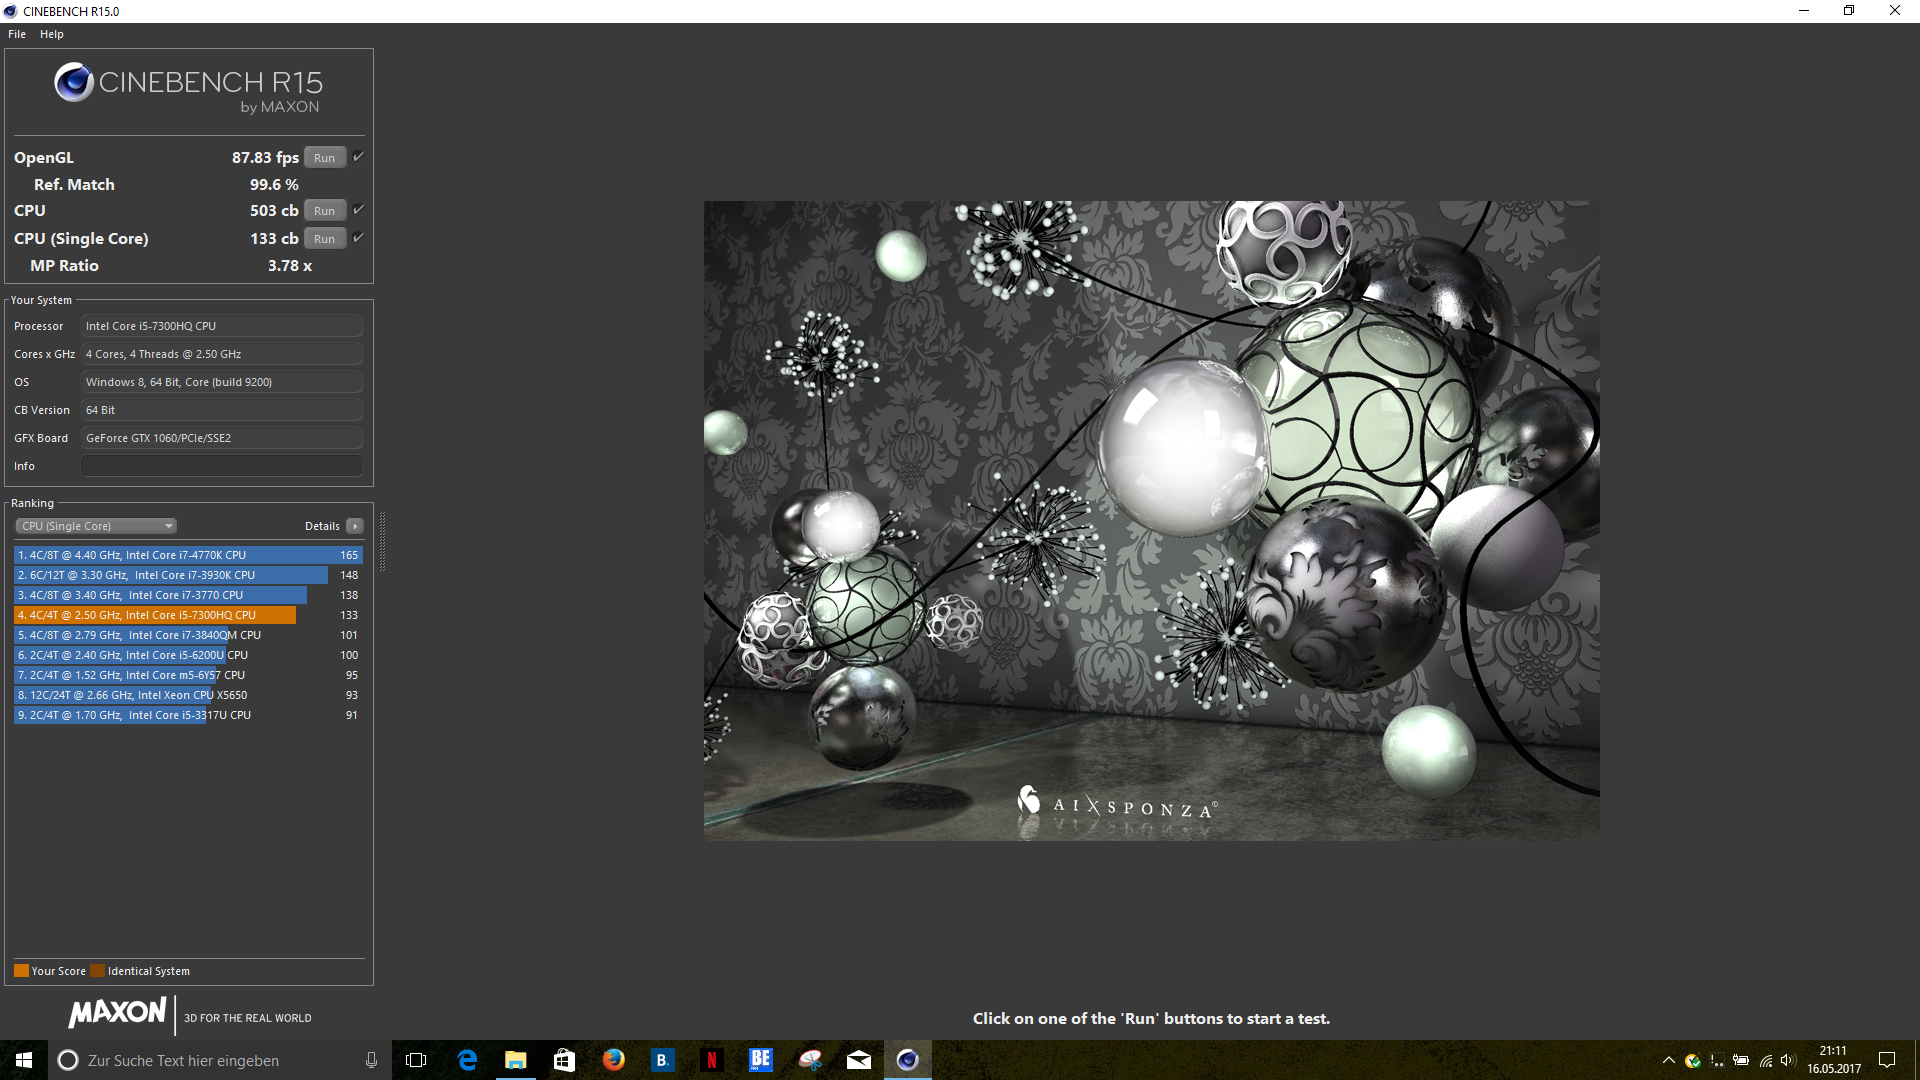
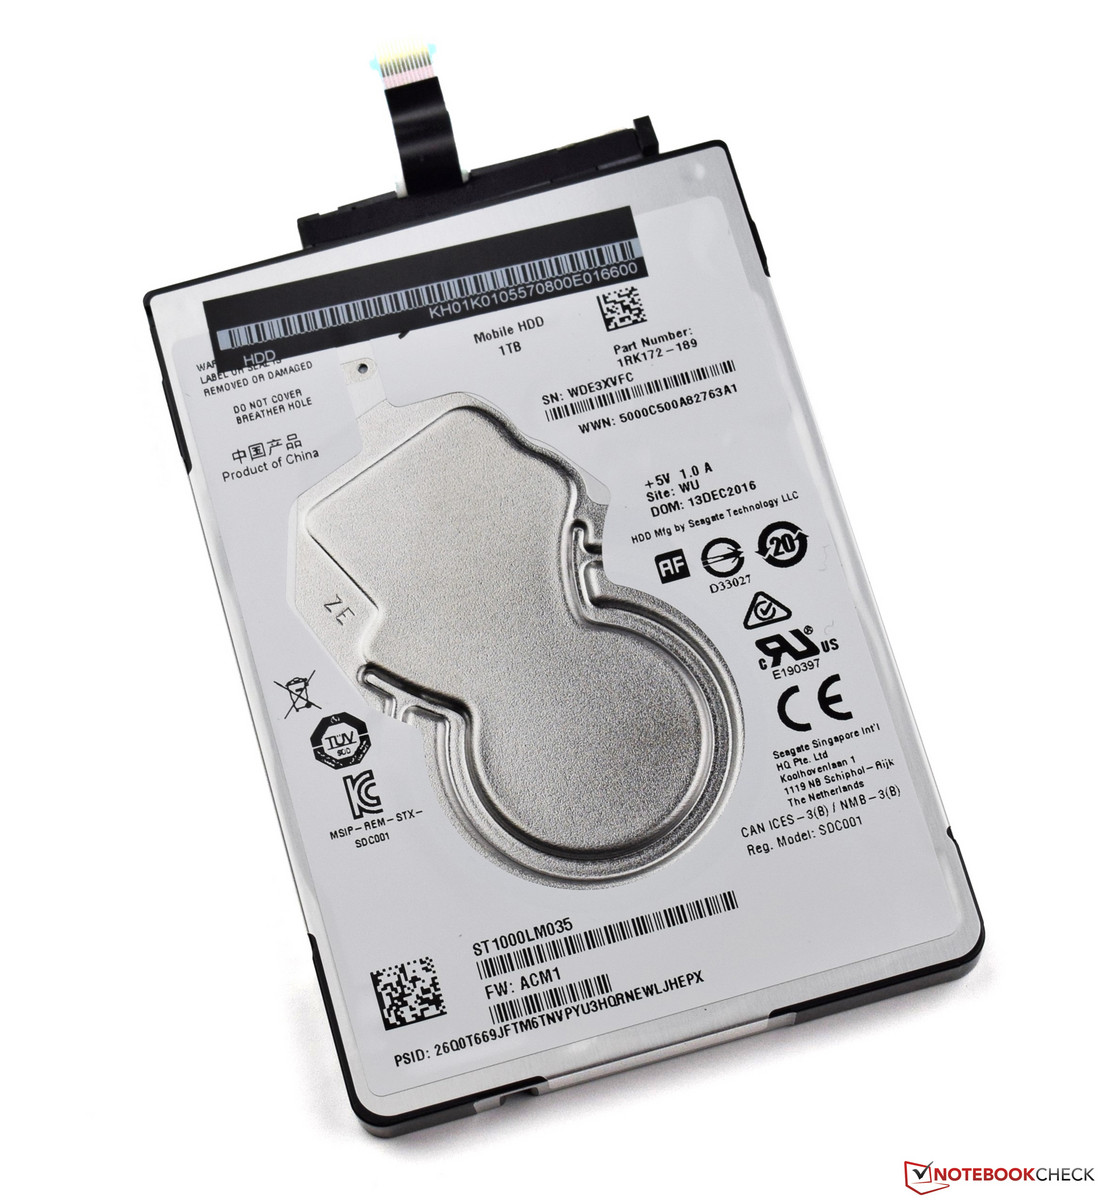
综合考虑各个方面,从游戏设备的角度来看Nitro是一台优秀的产品。宏碁用实际行动证明了酷睿i5也可以适合游戏所需,而更重要的硬件是显卡。英特尔酷睿i5-7300HQ是一颗45瓦四核处理器,并不是同功耗处理器中性能最高的。不过,结合大容量内存和合理的硬盘配备(固态硬盘+机械硬盘),这台机型提供了十分优秀的性能表现。
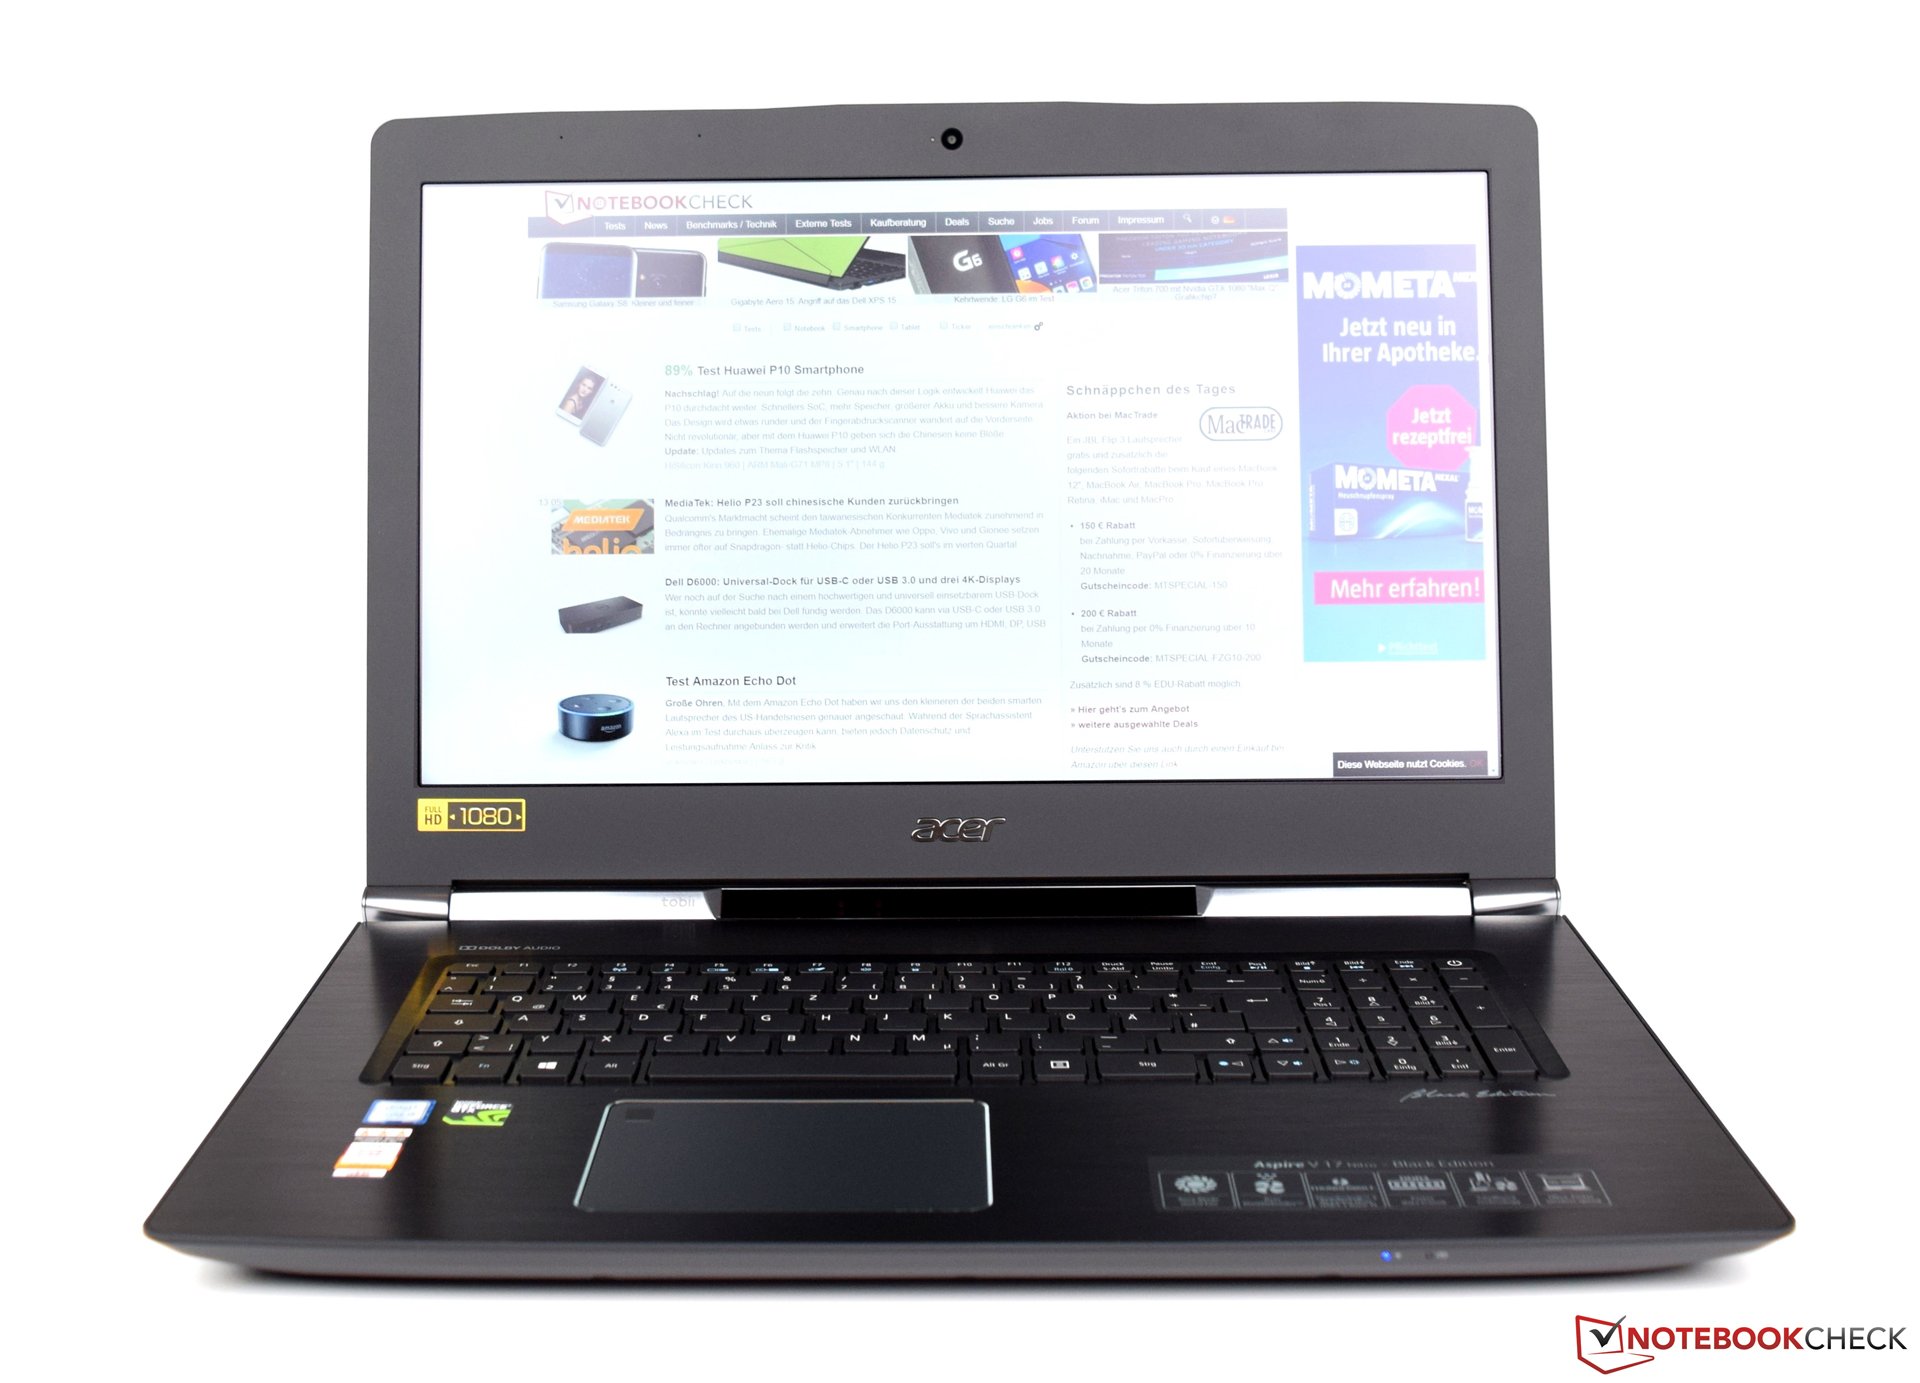
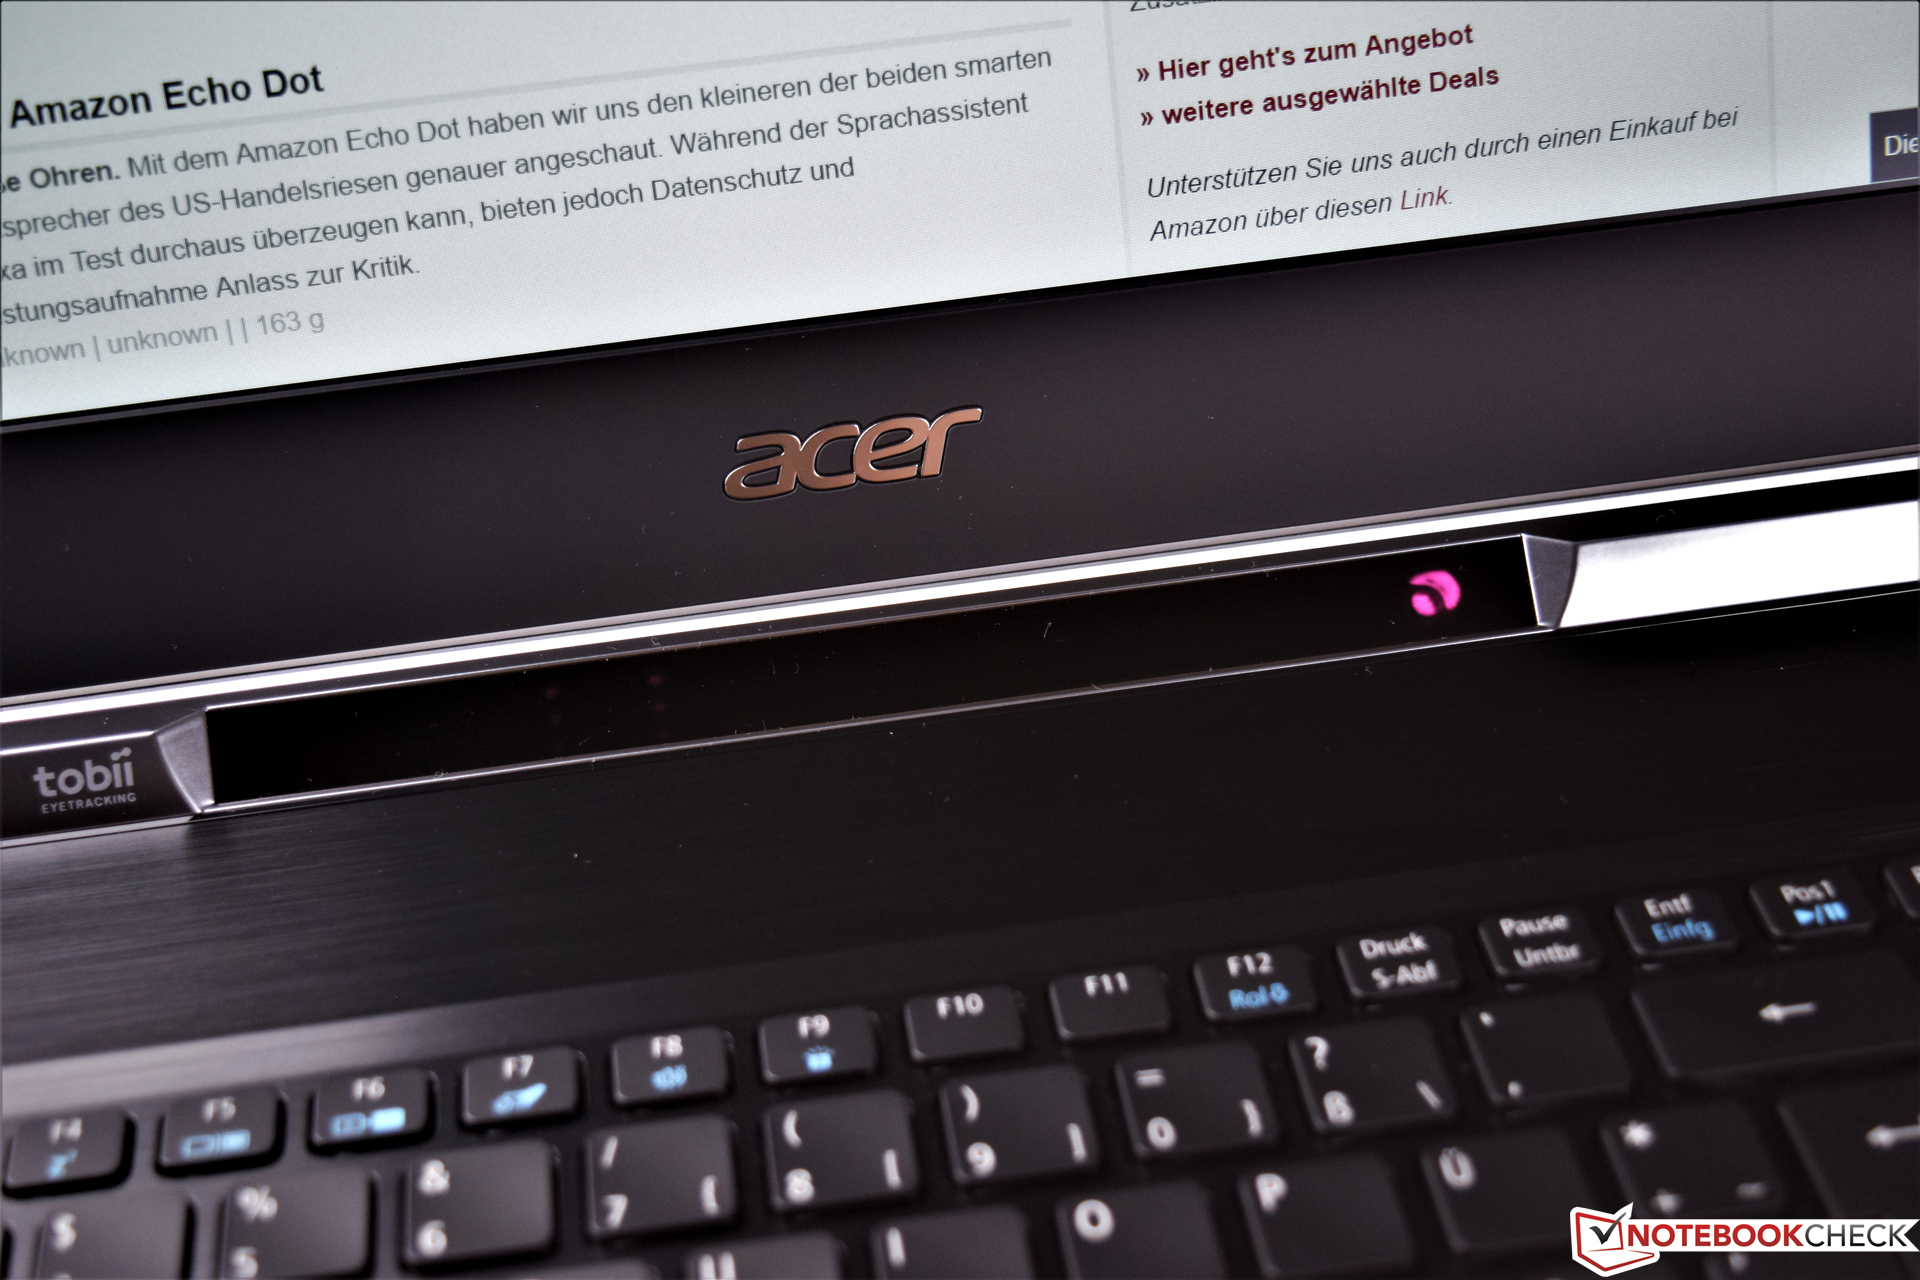
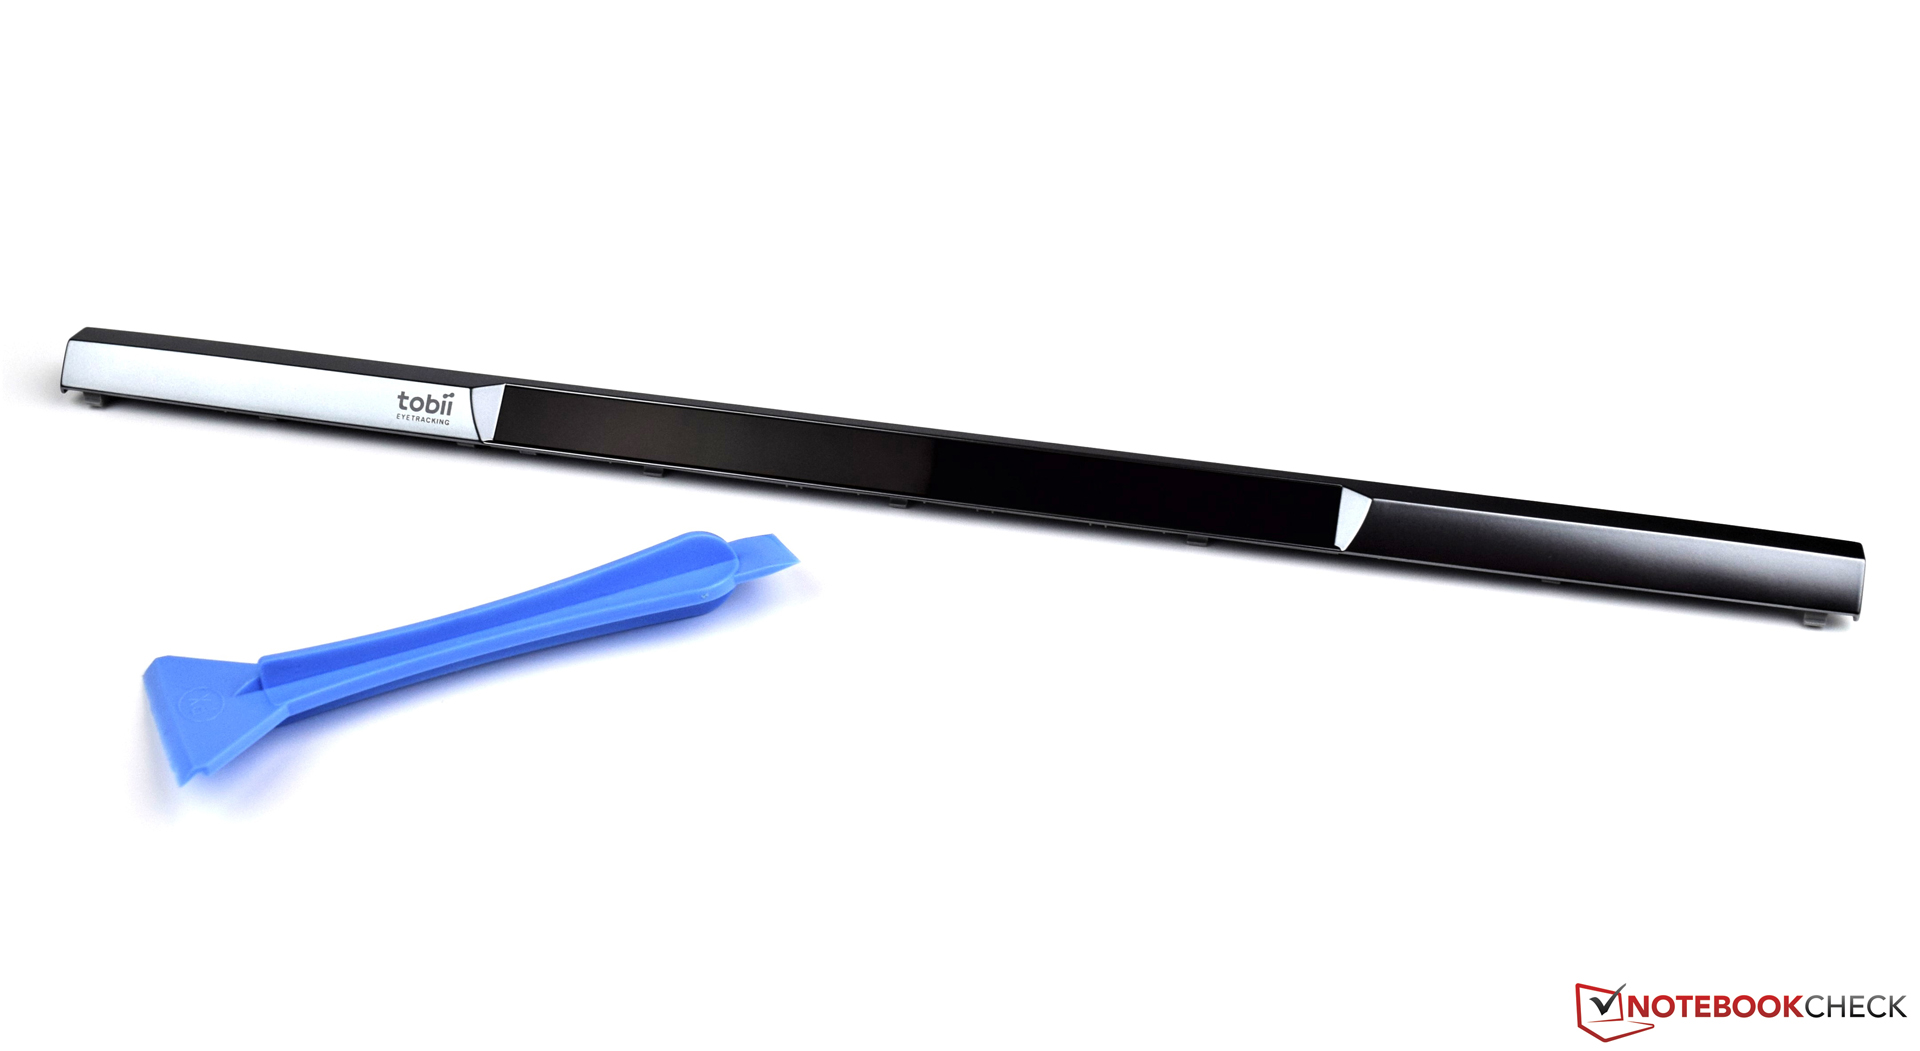
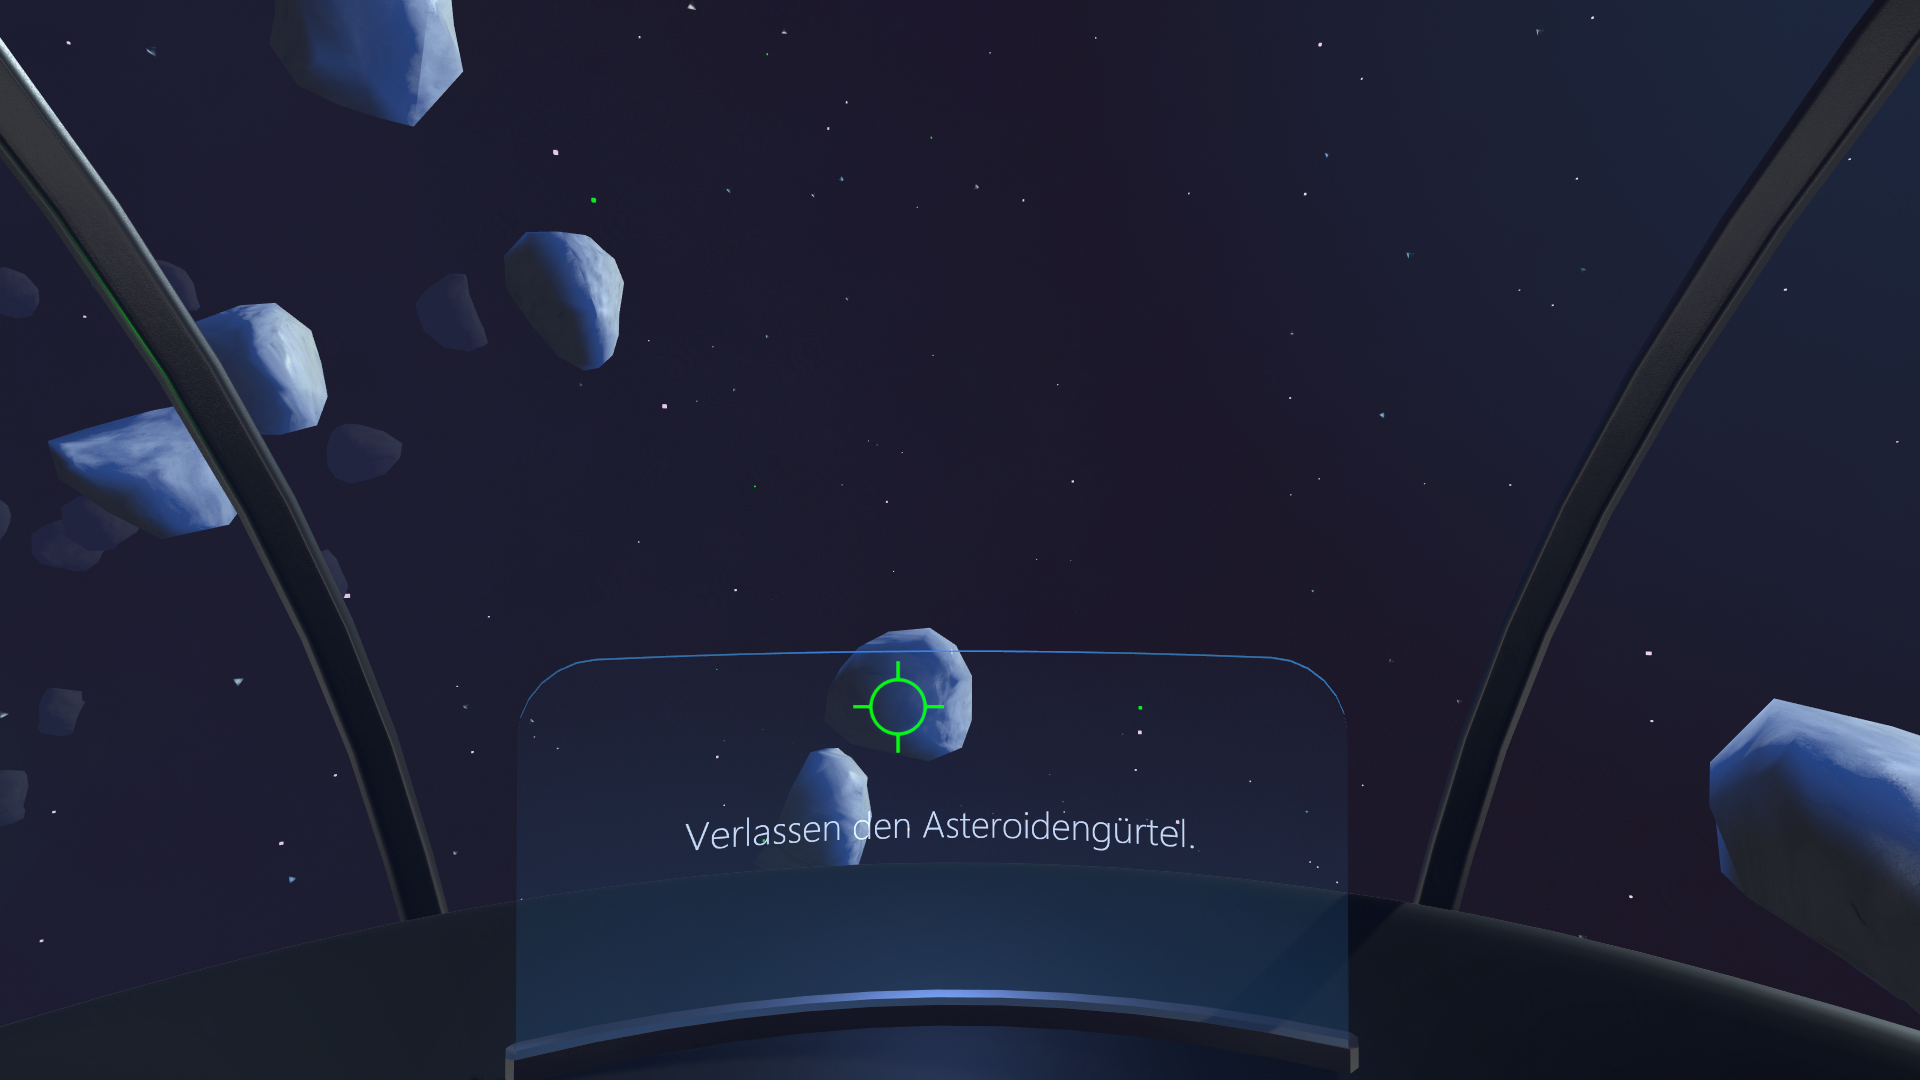
宏碁Aspire Nitro用优秀的整体性能和游戏性能证明了自己。Tobii眼球追踪也是一个不错的额外功能,它会带来更独特的游戏体验。
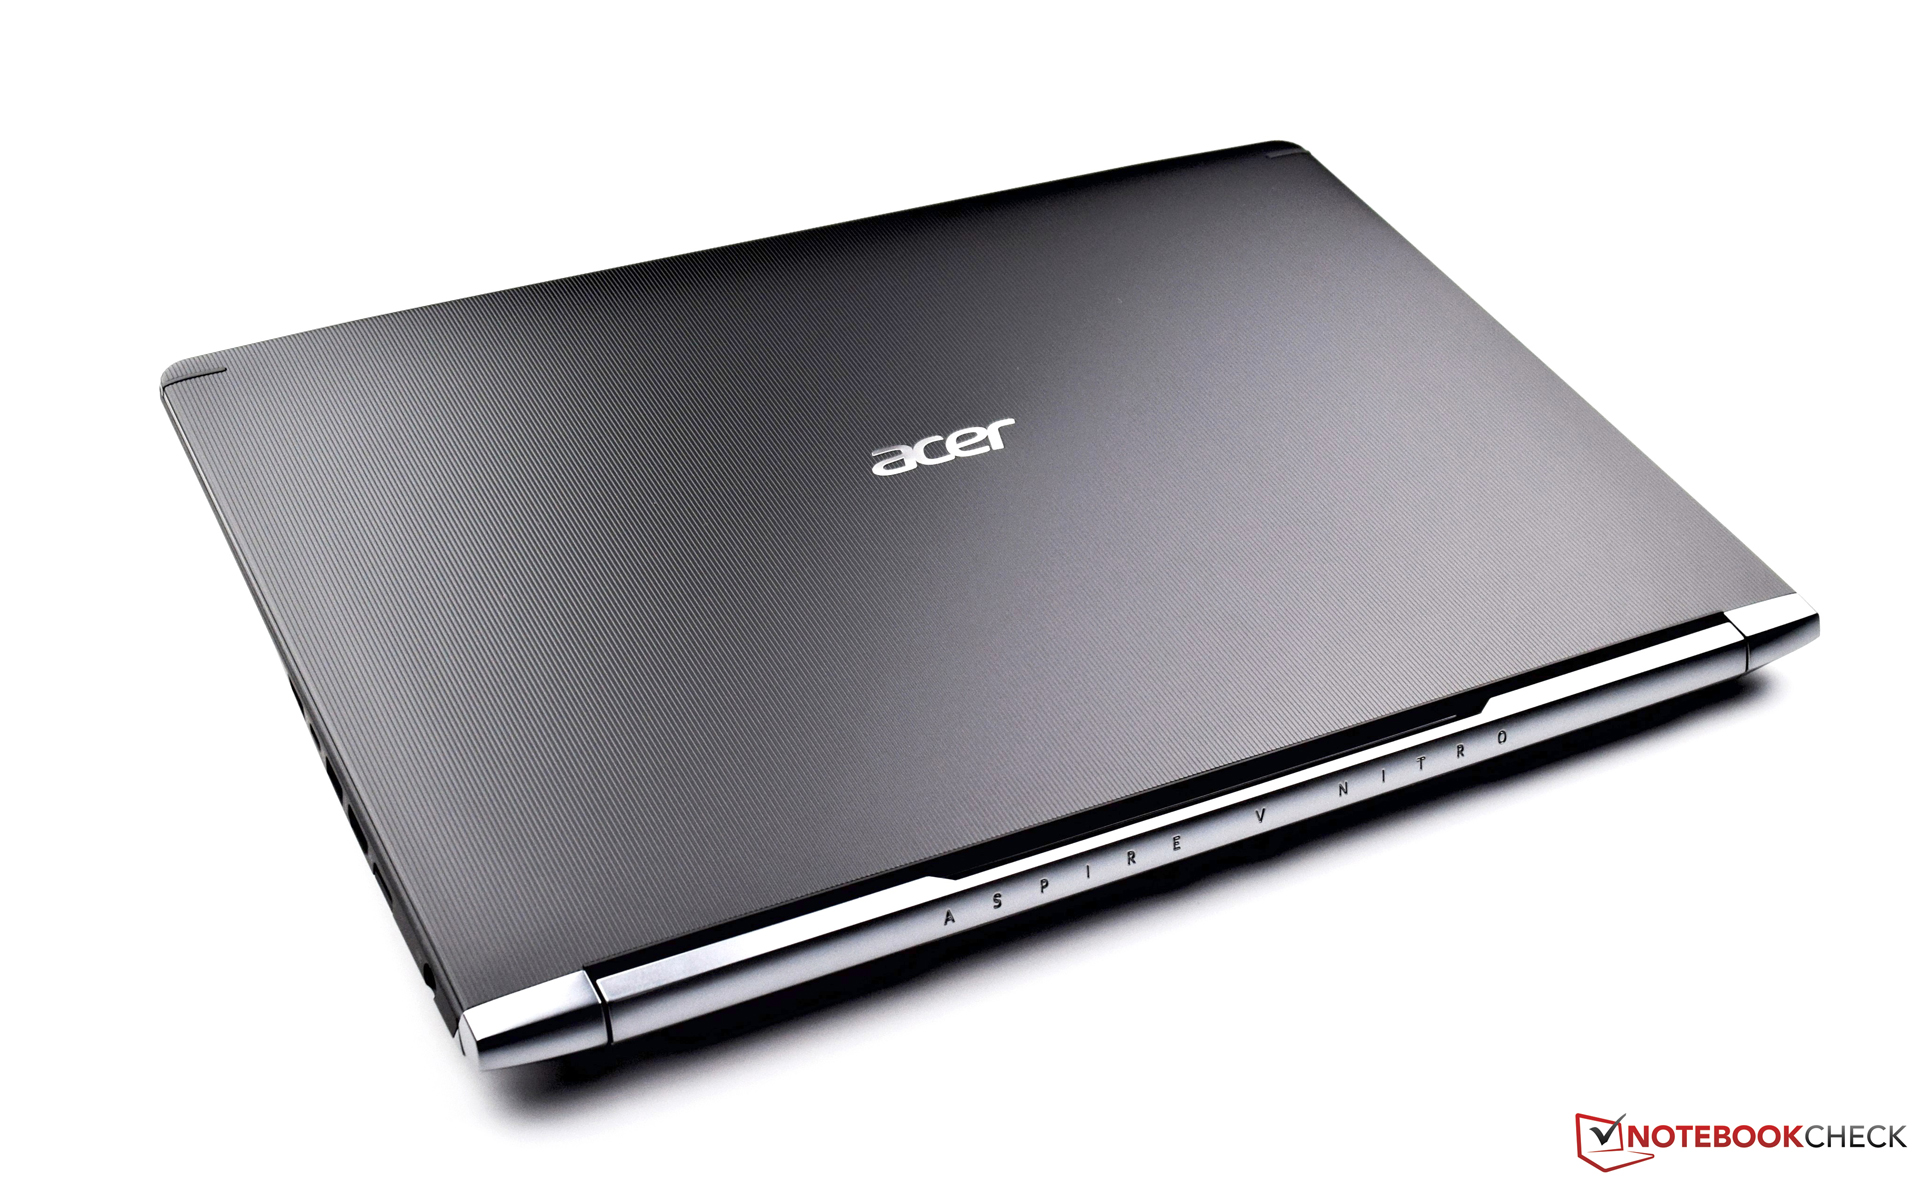
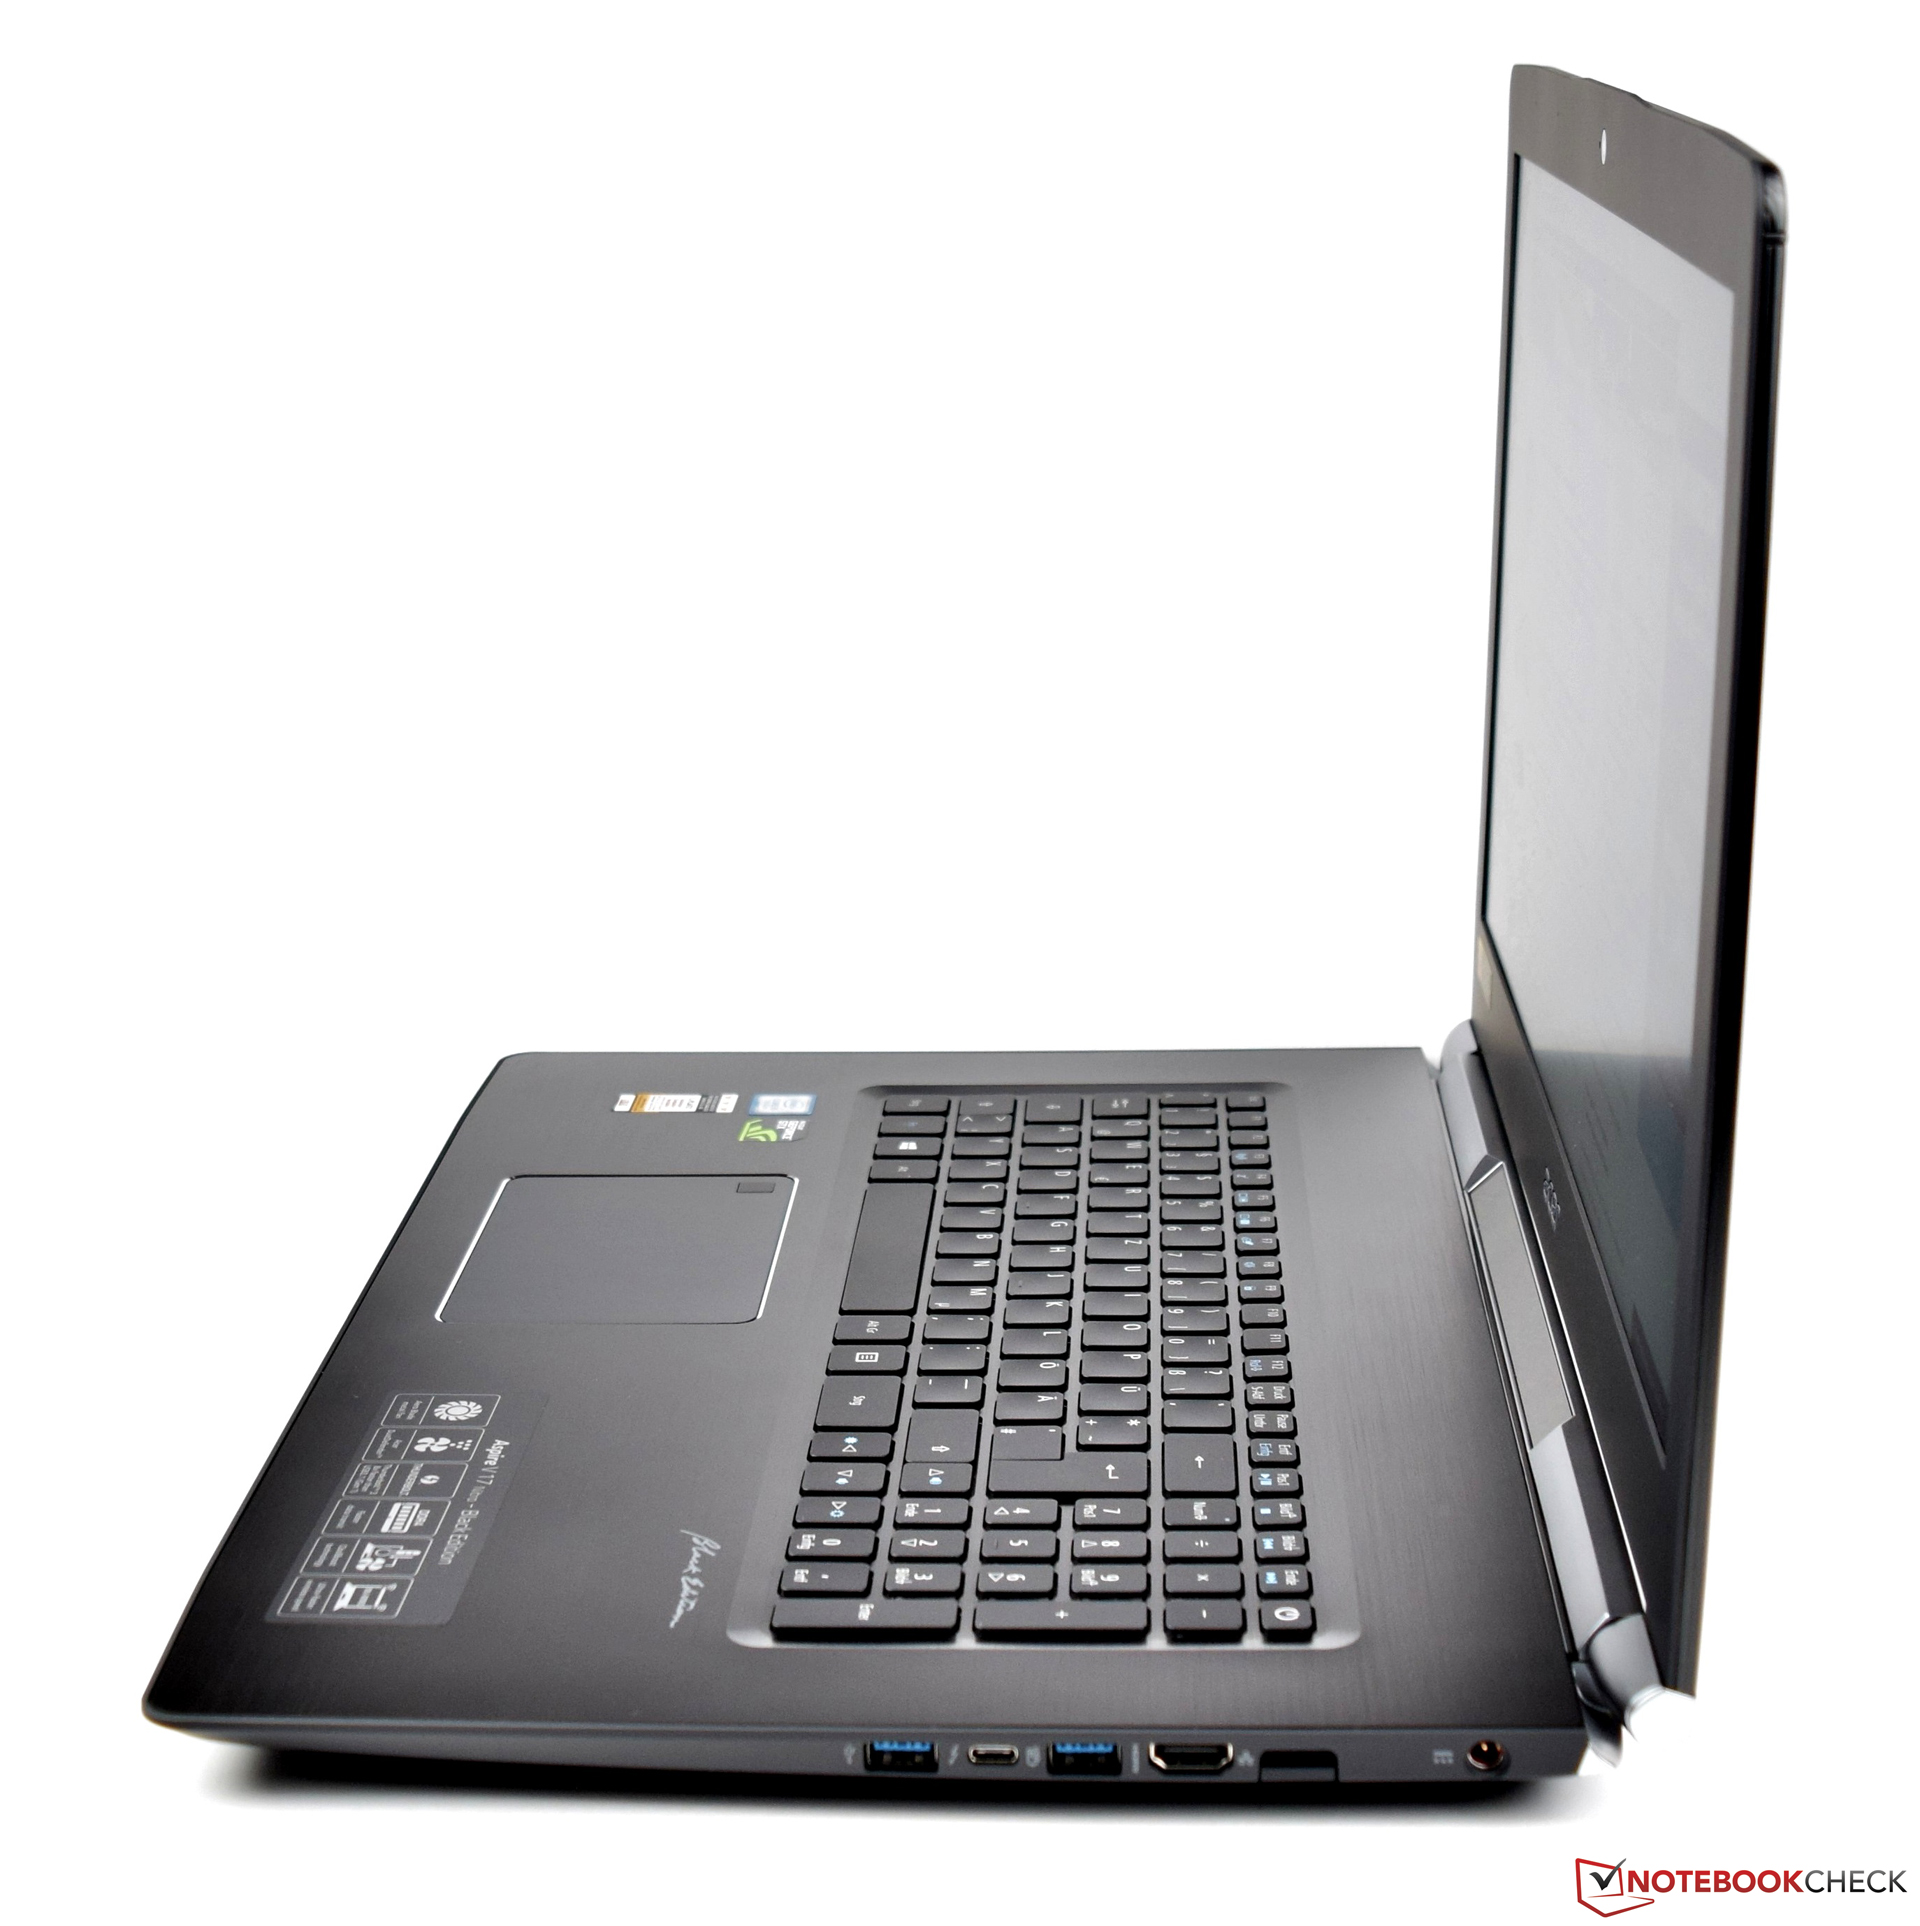
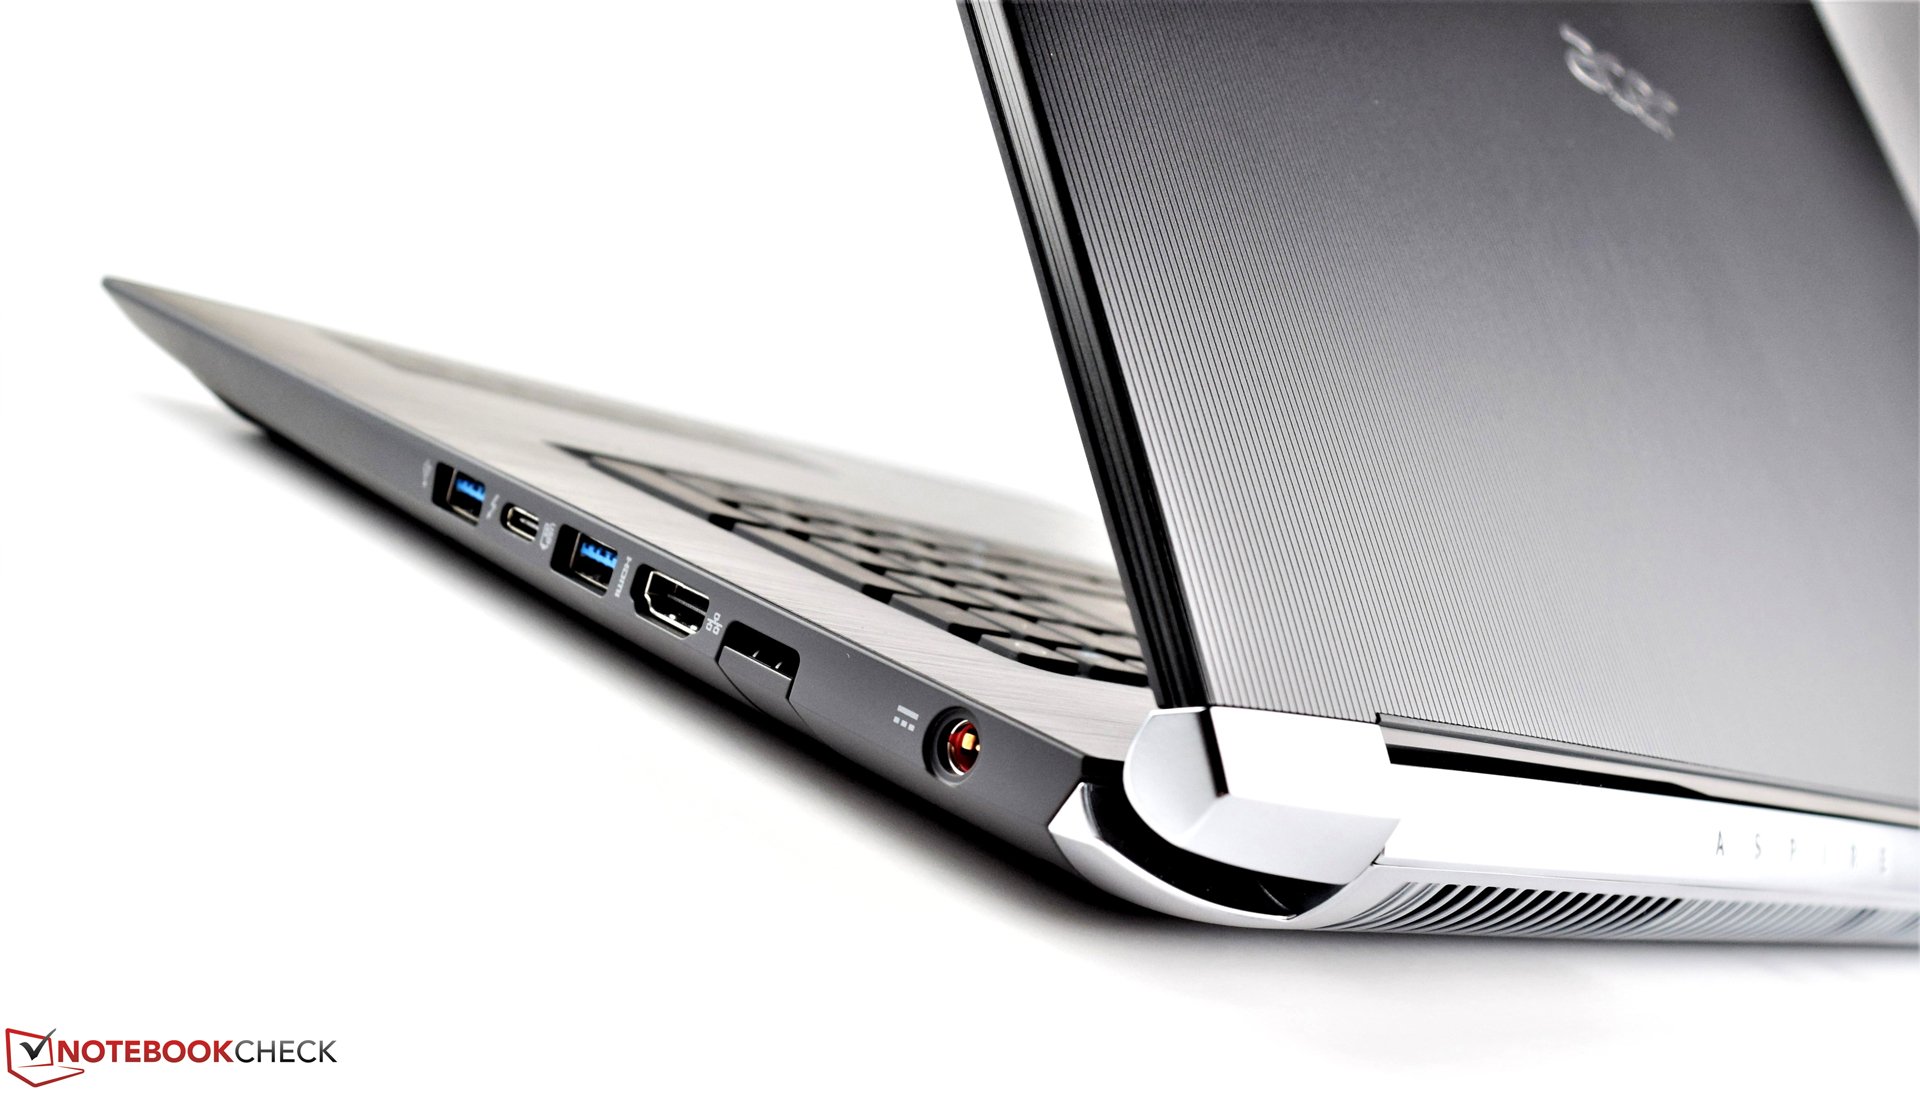
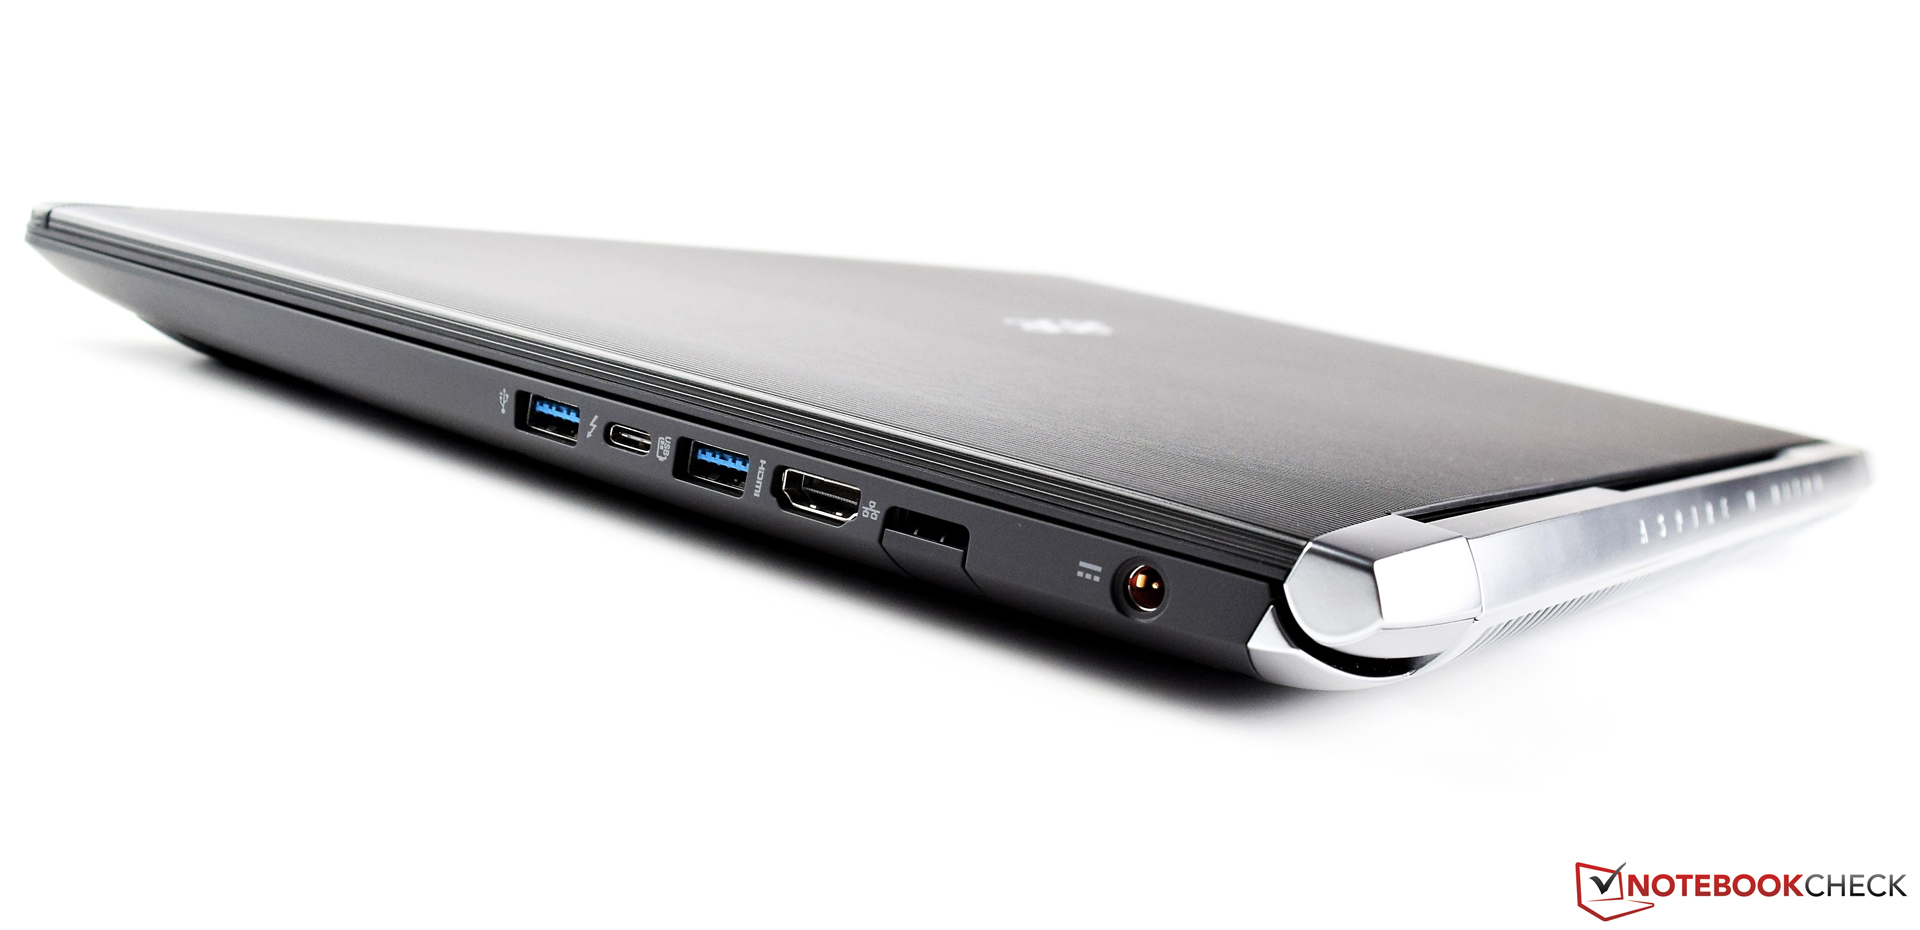
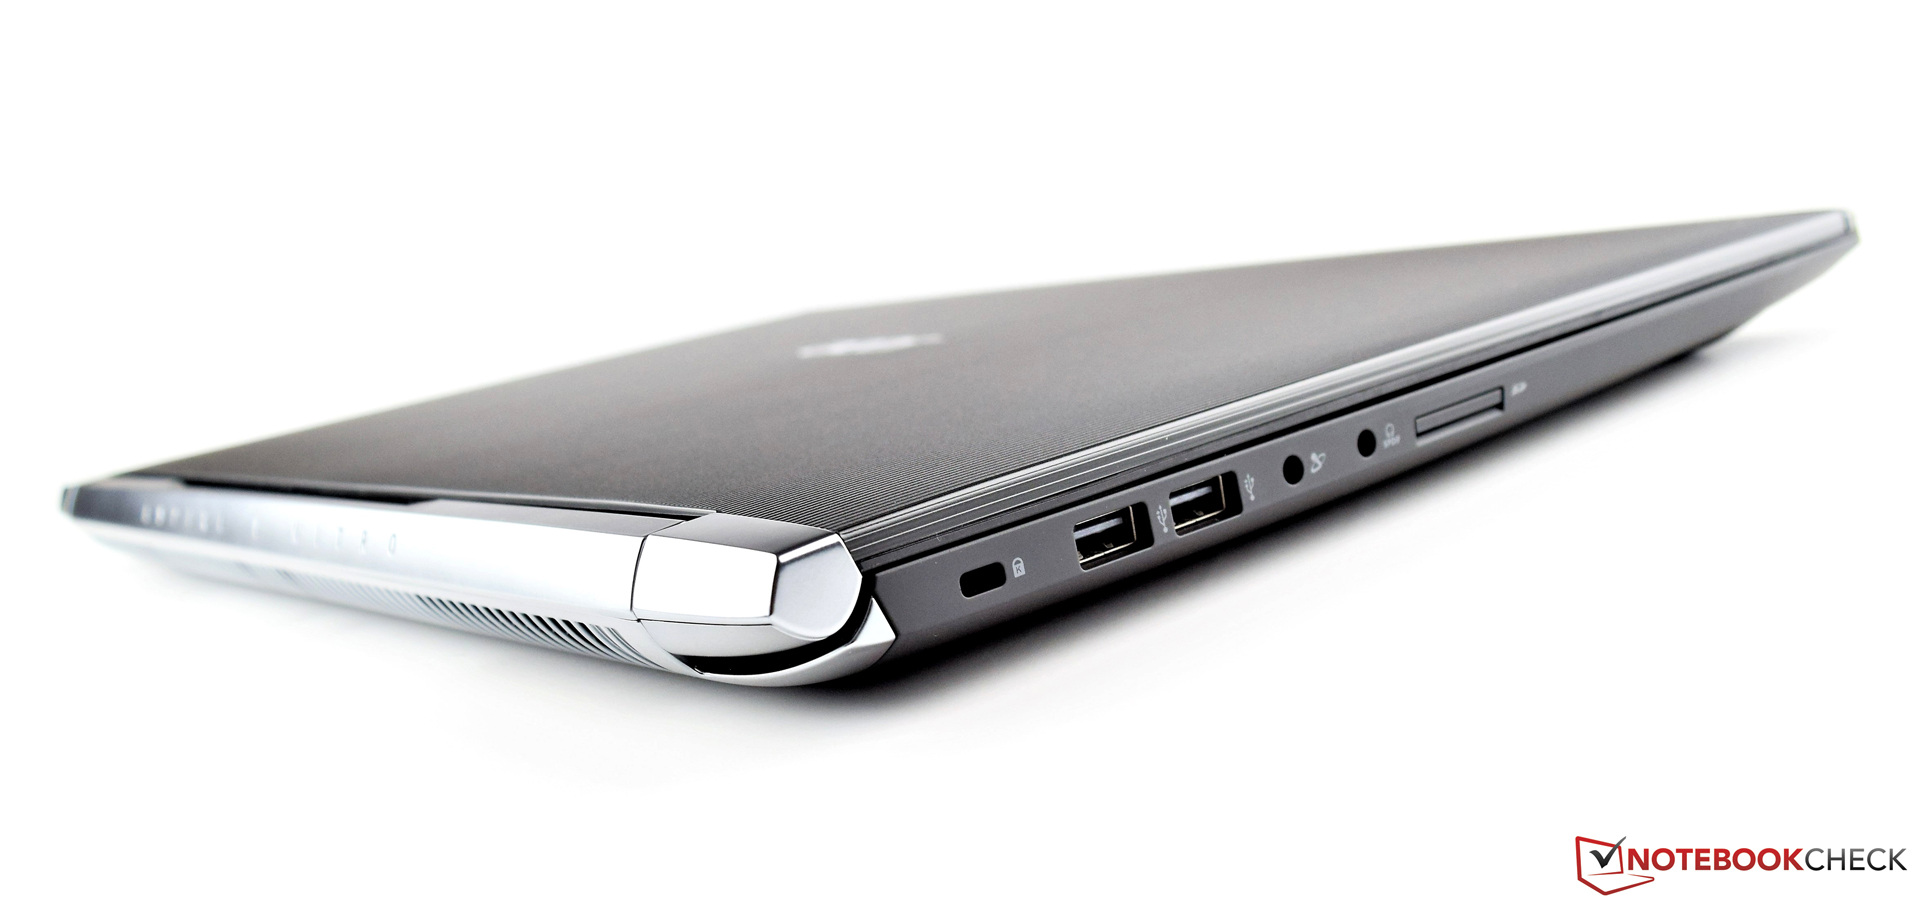
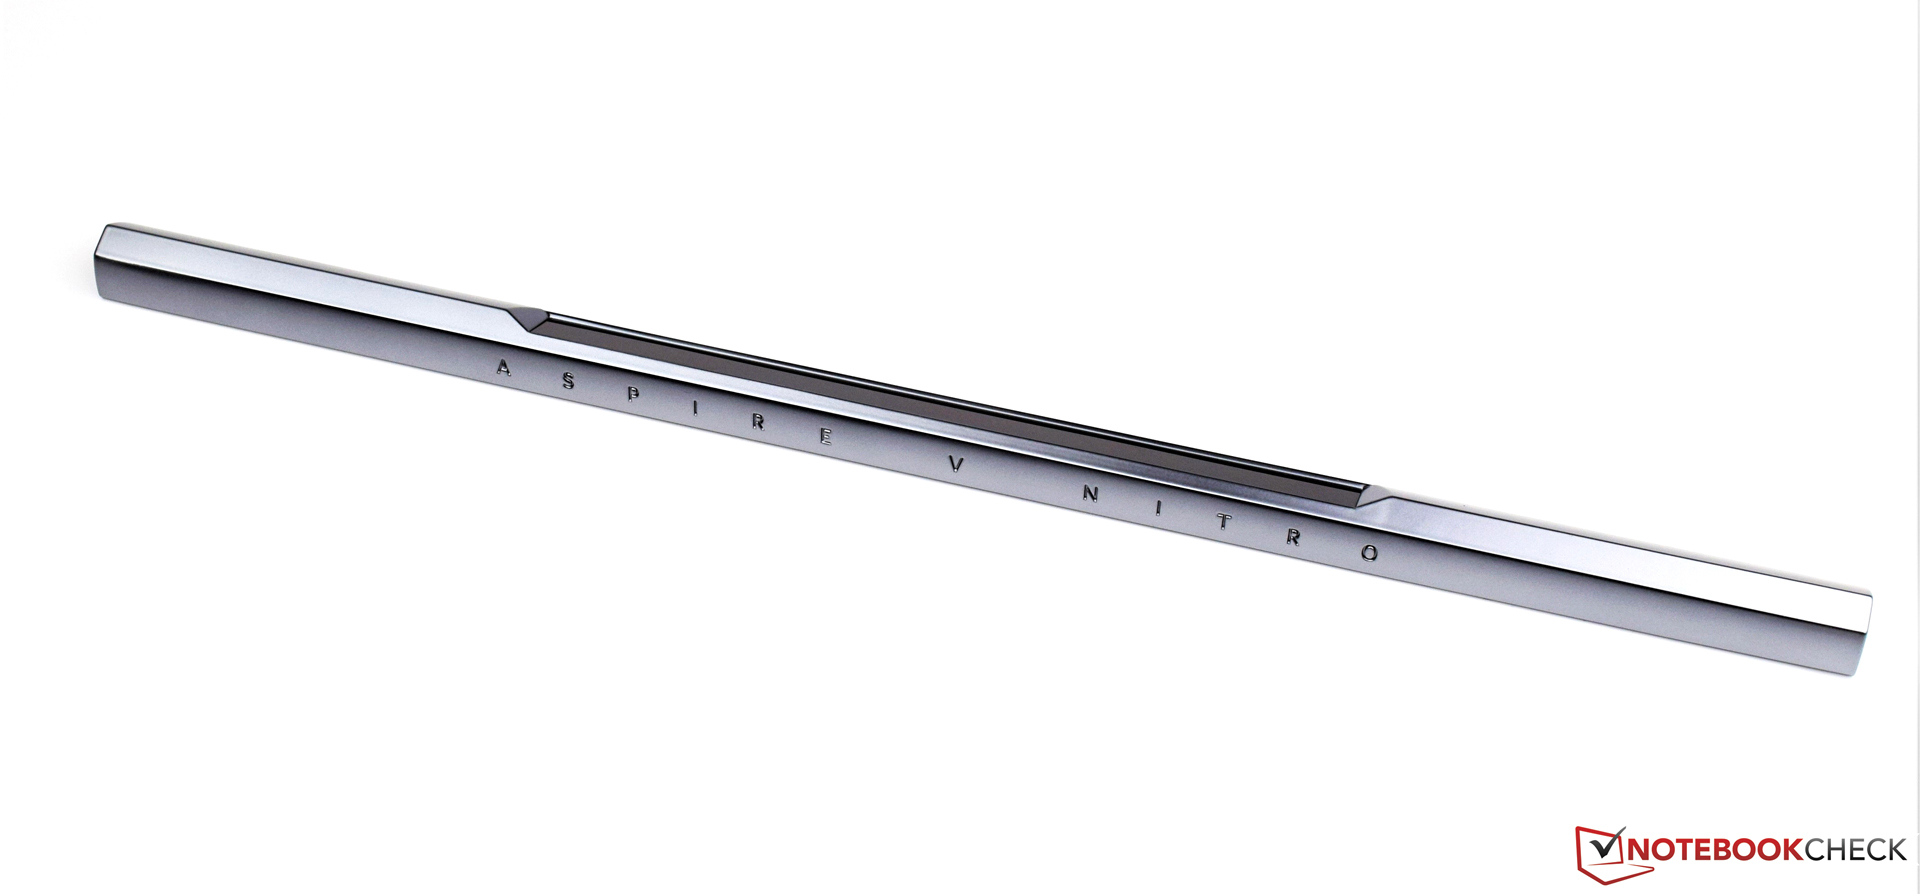
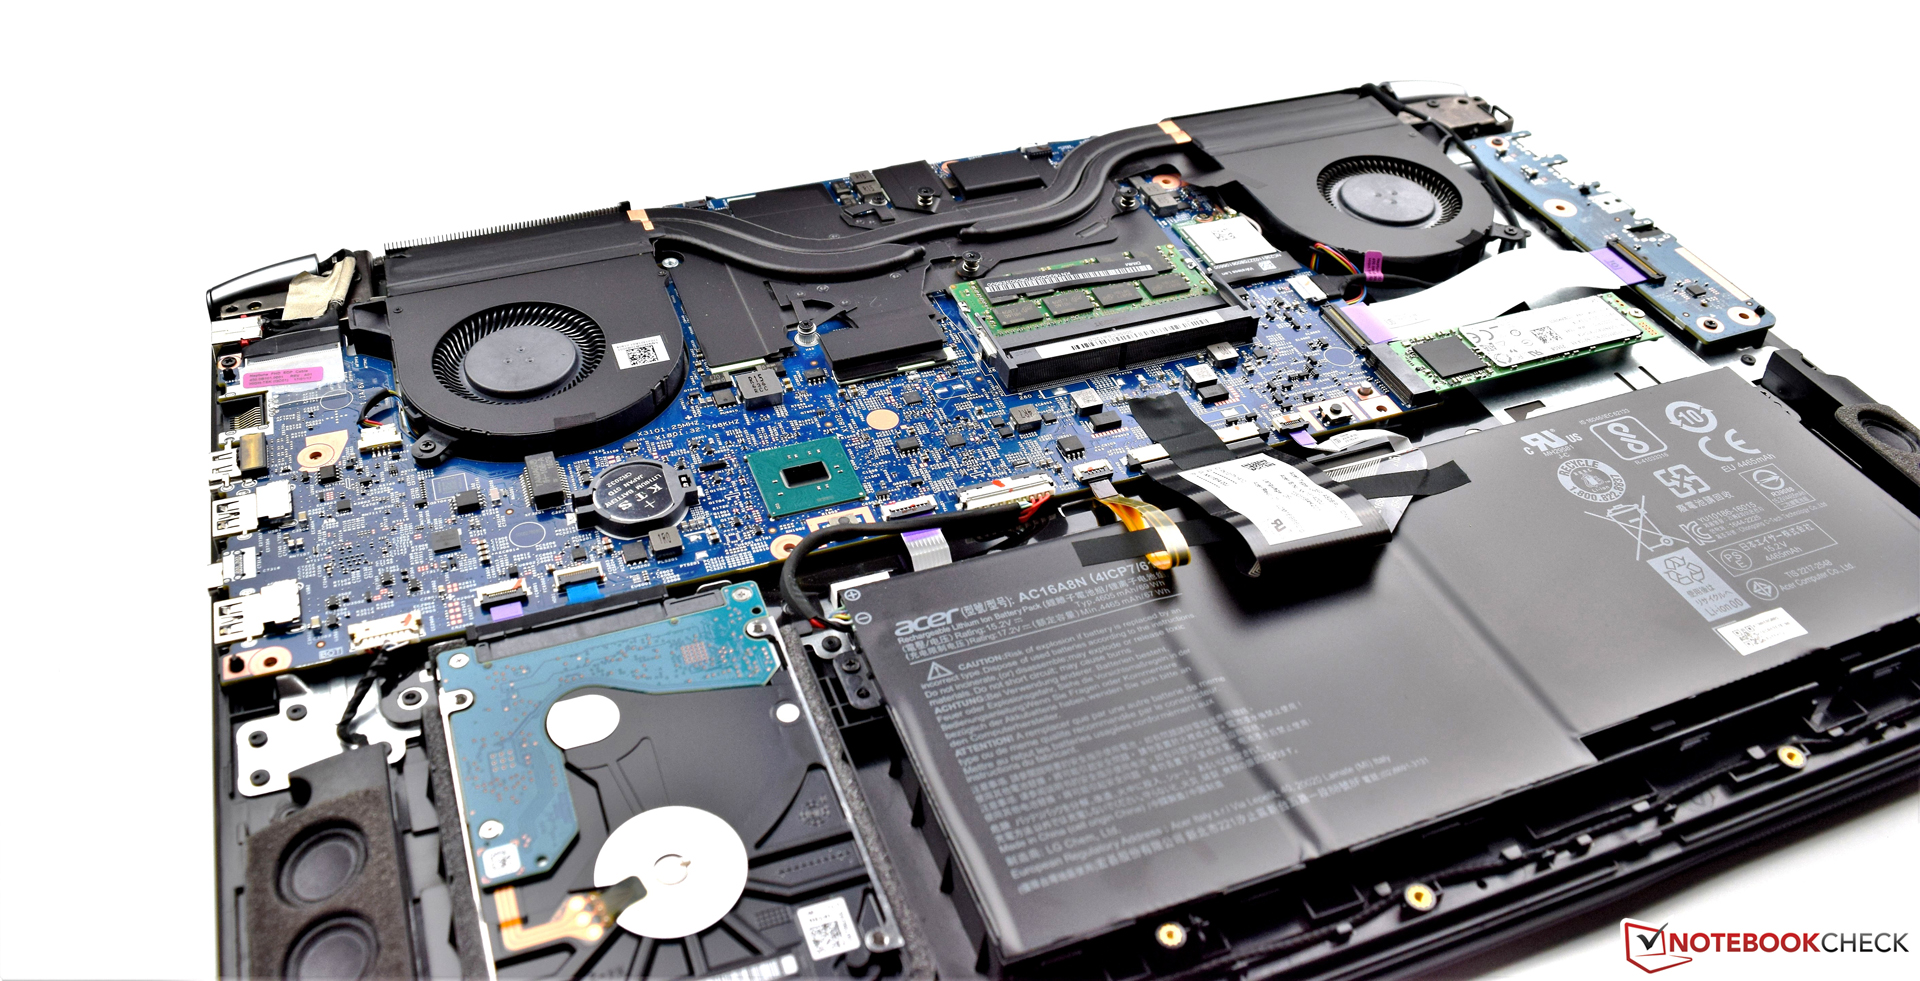
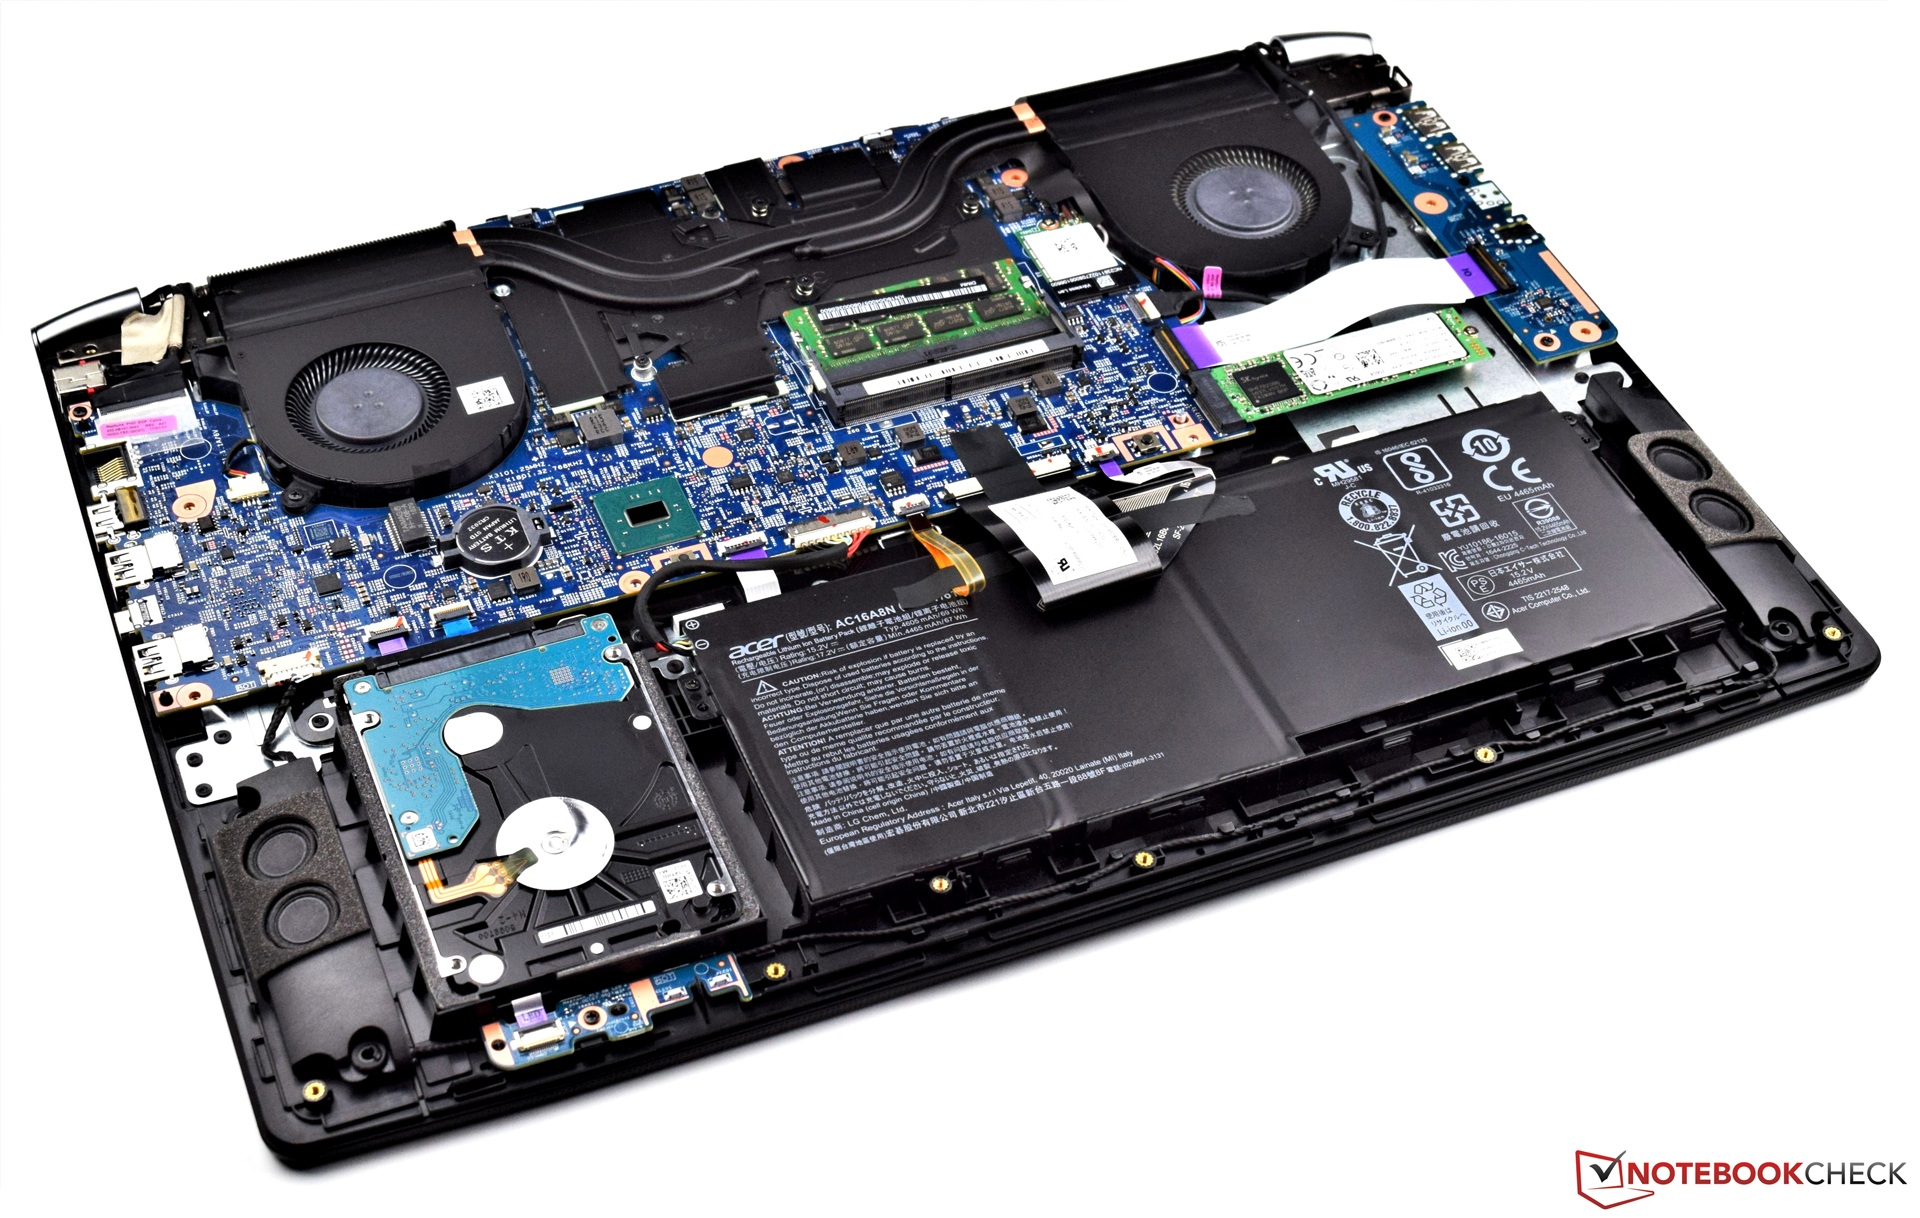
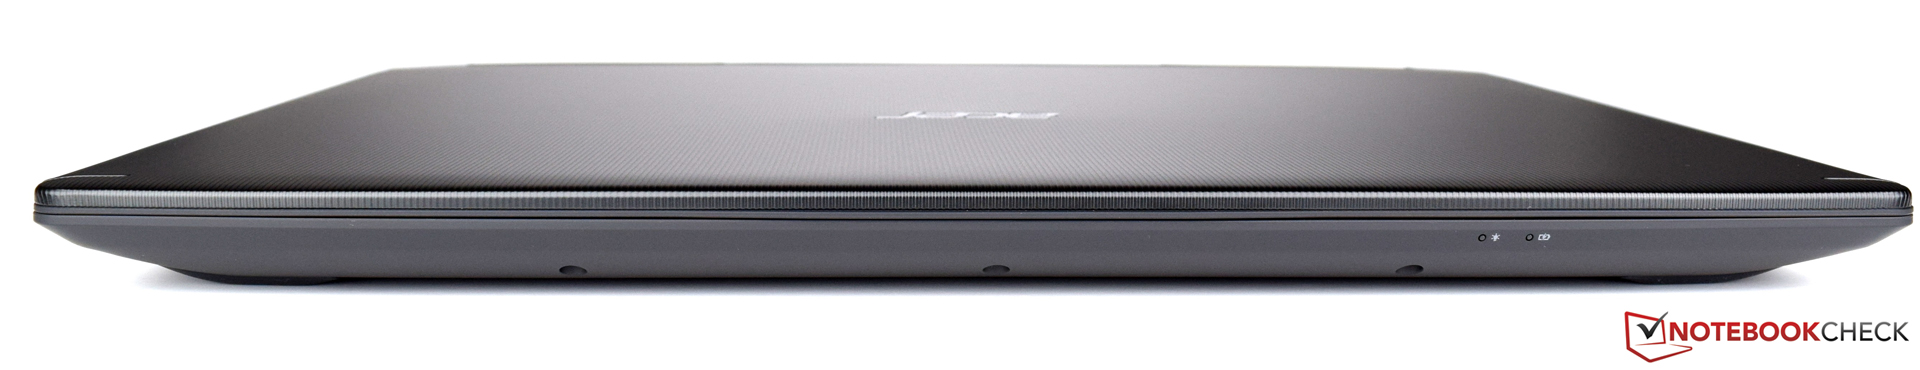
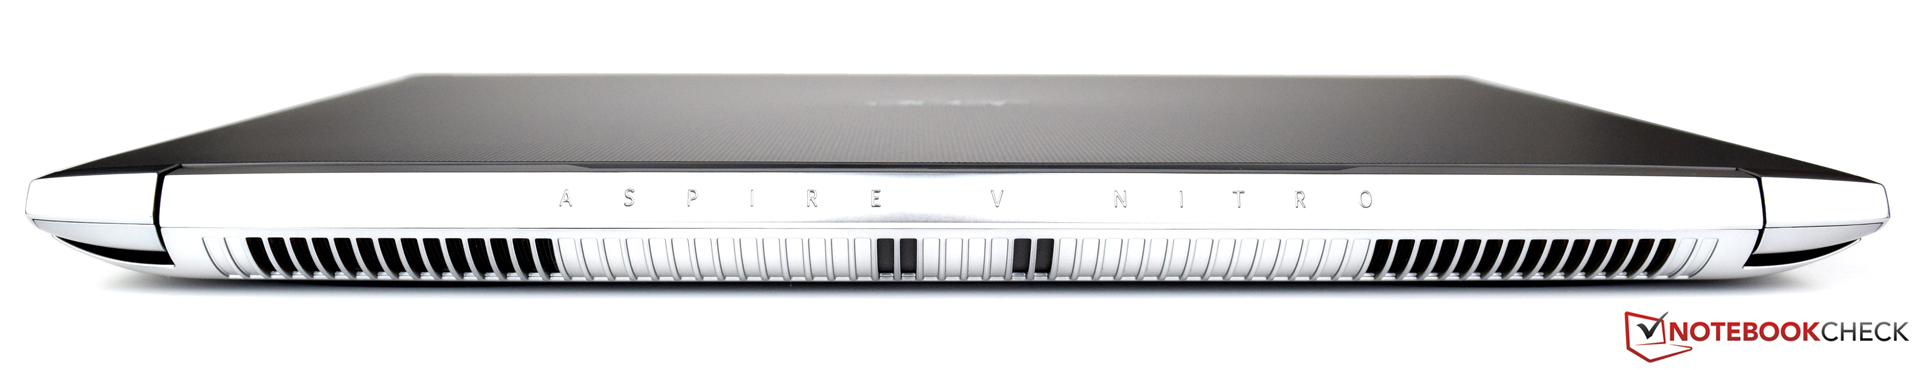
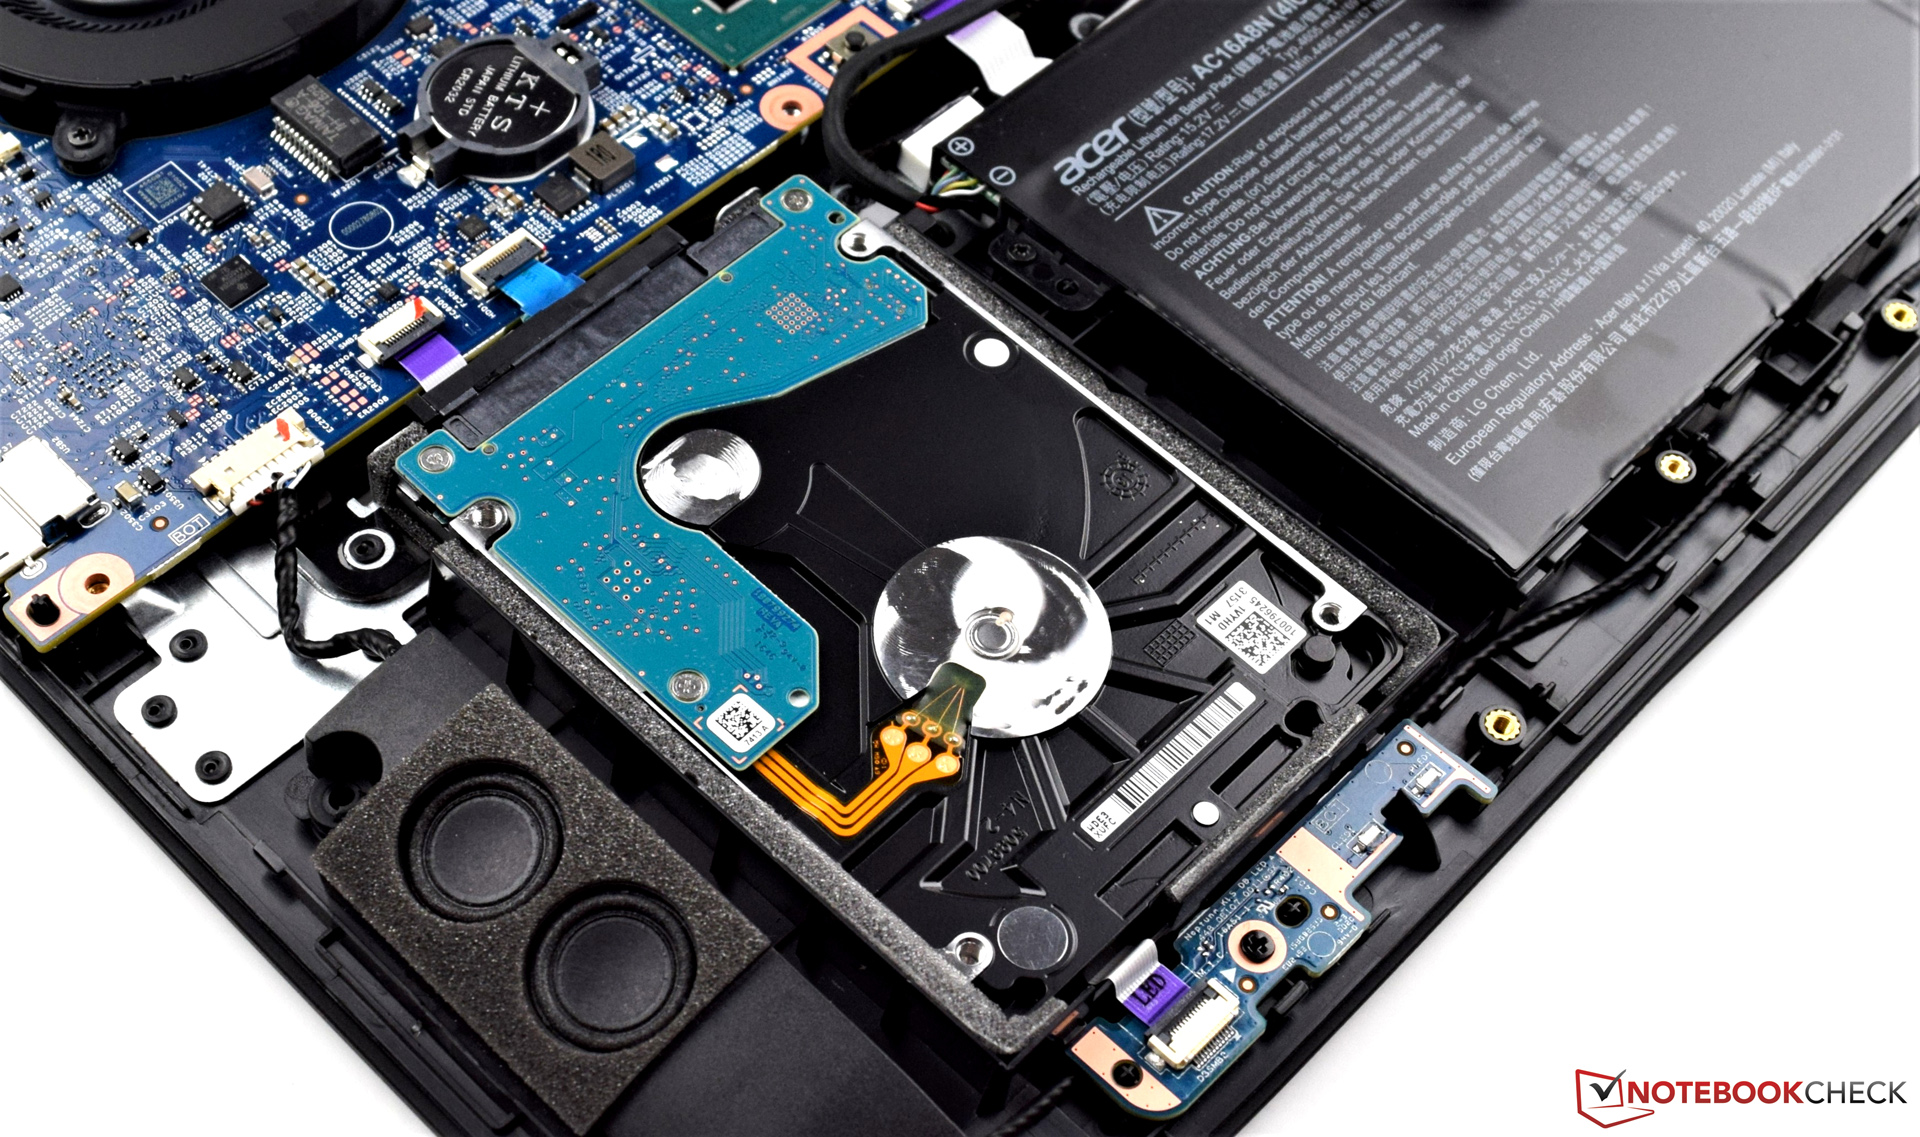
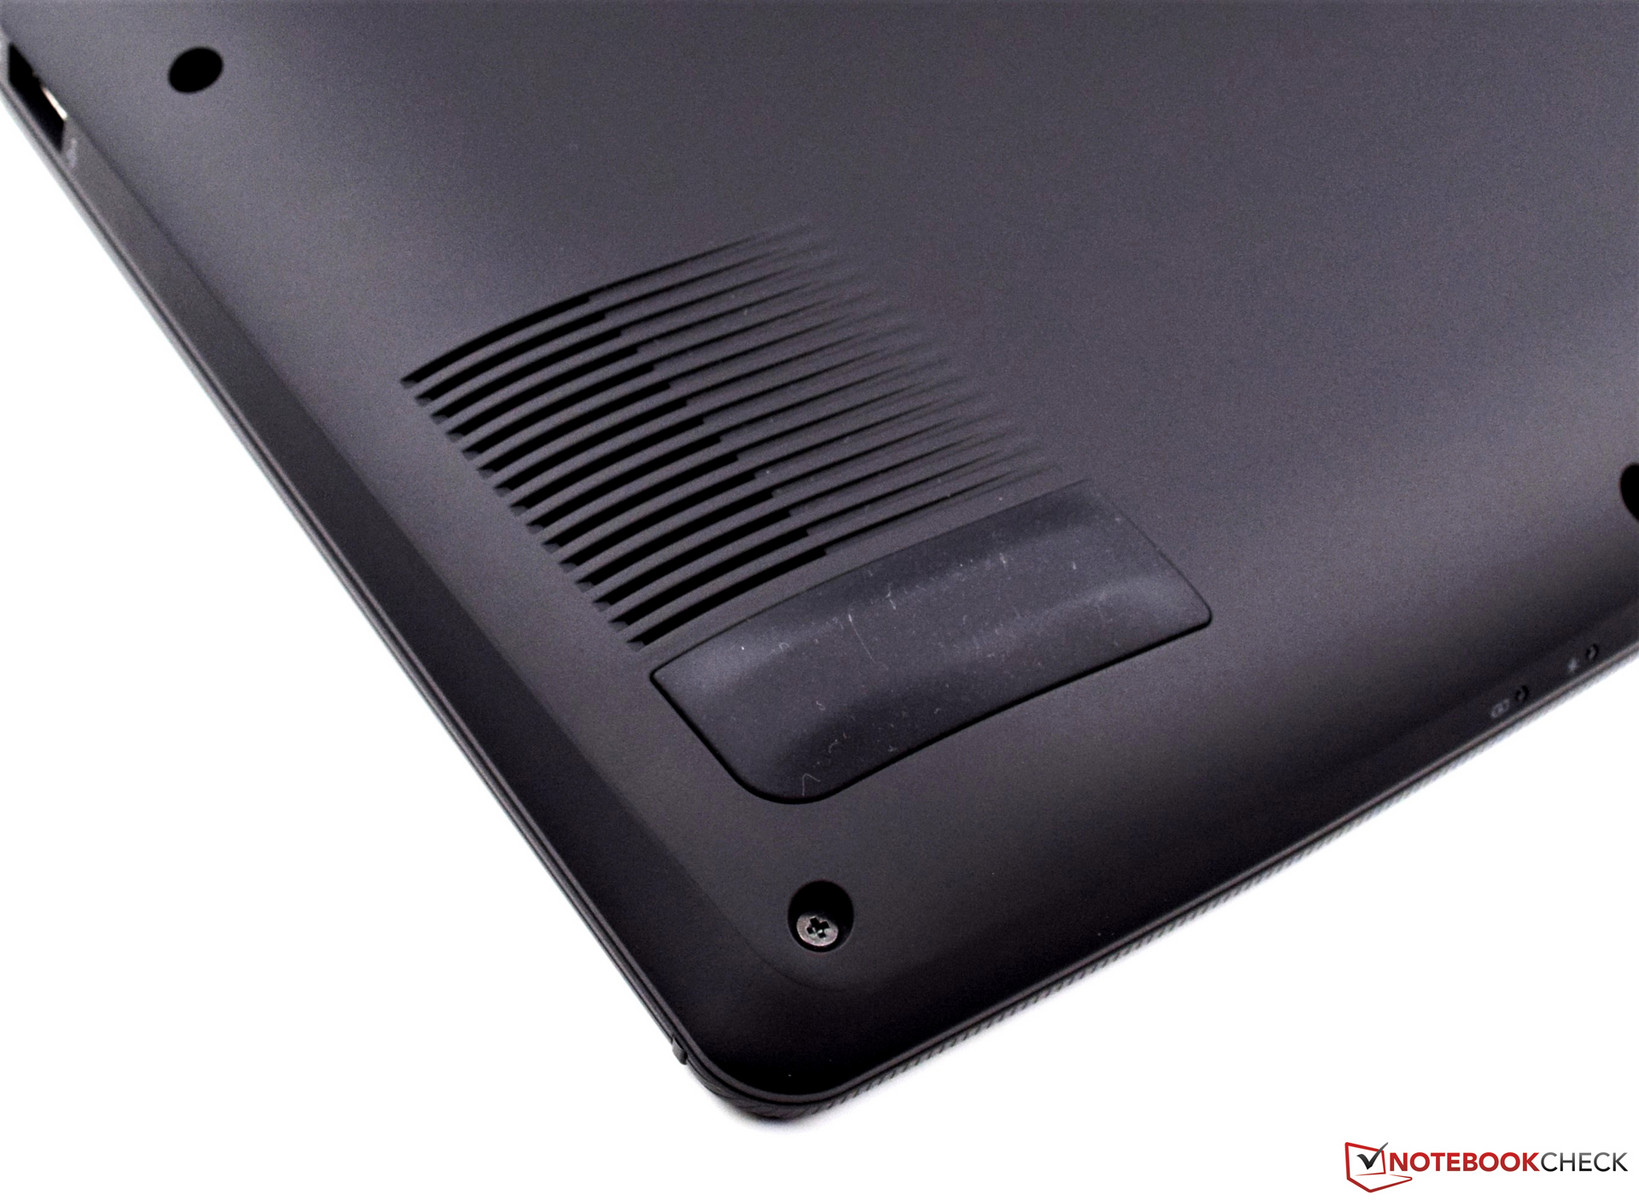
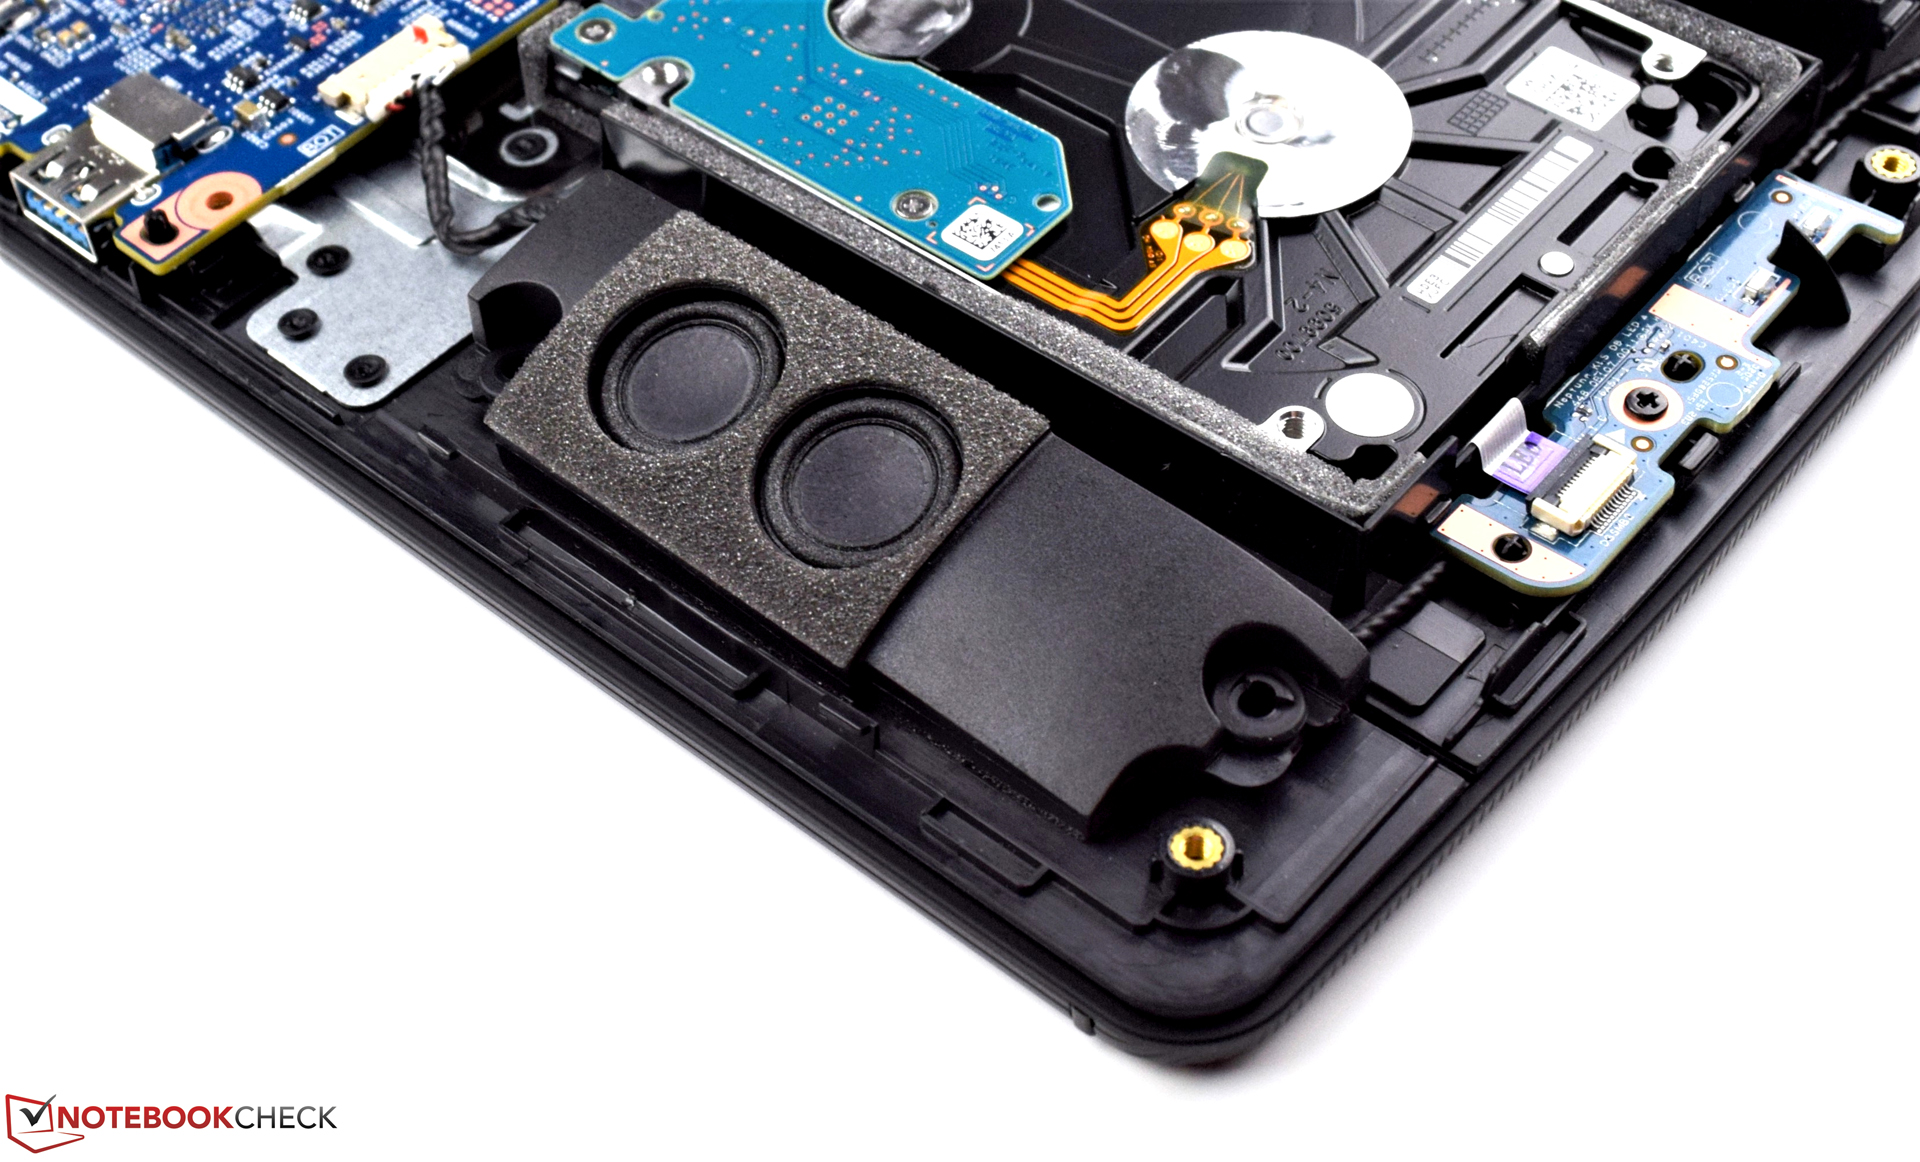
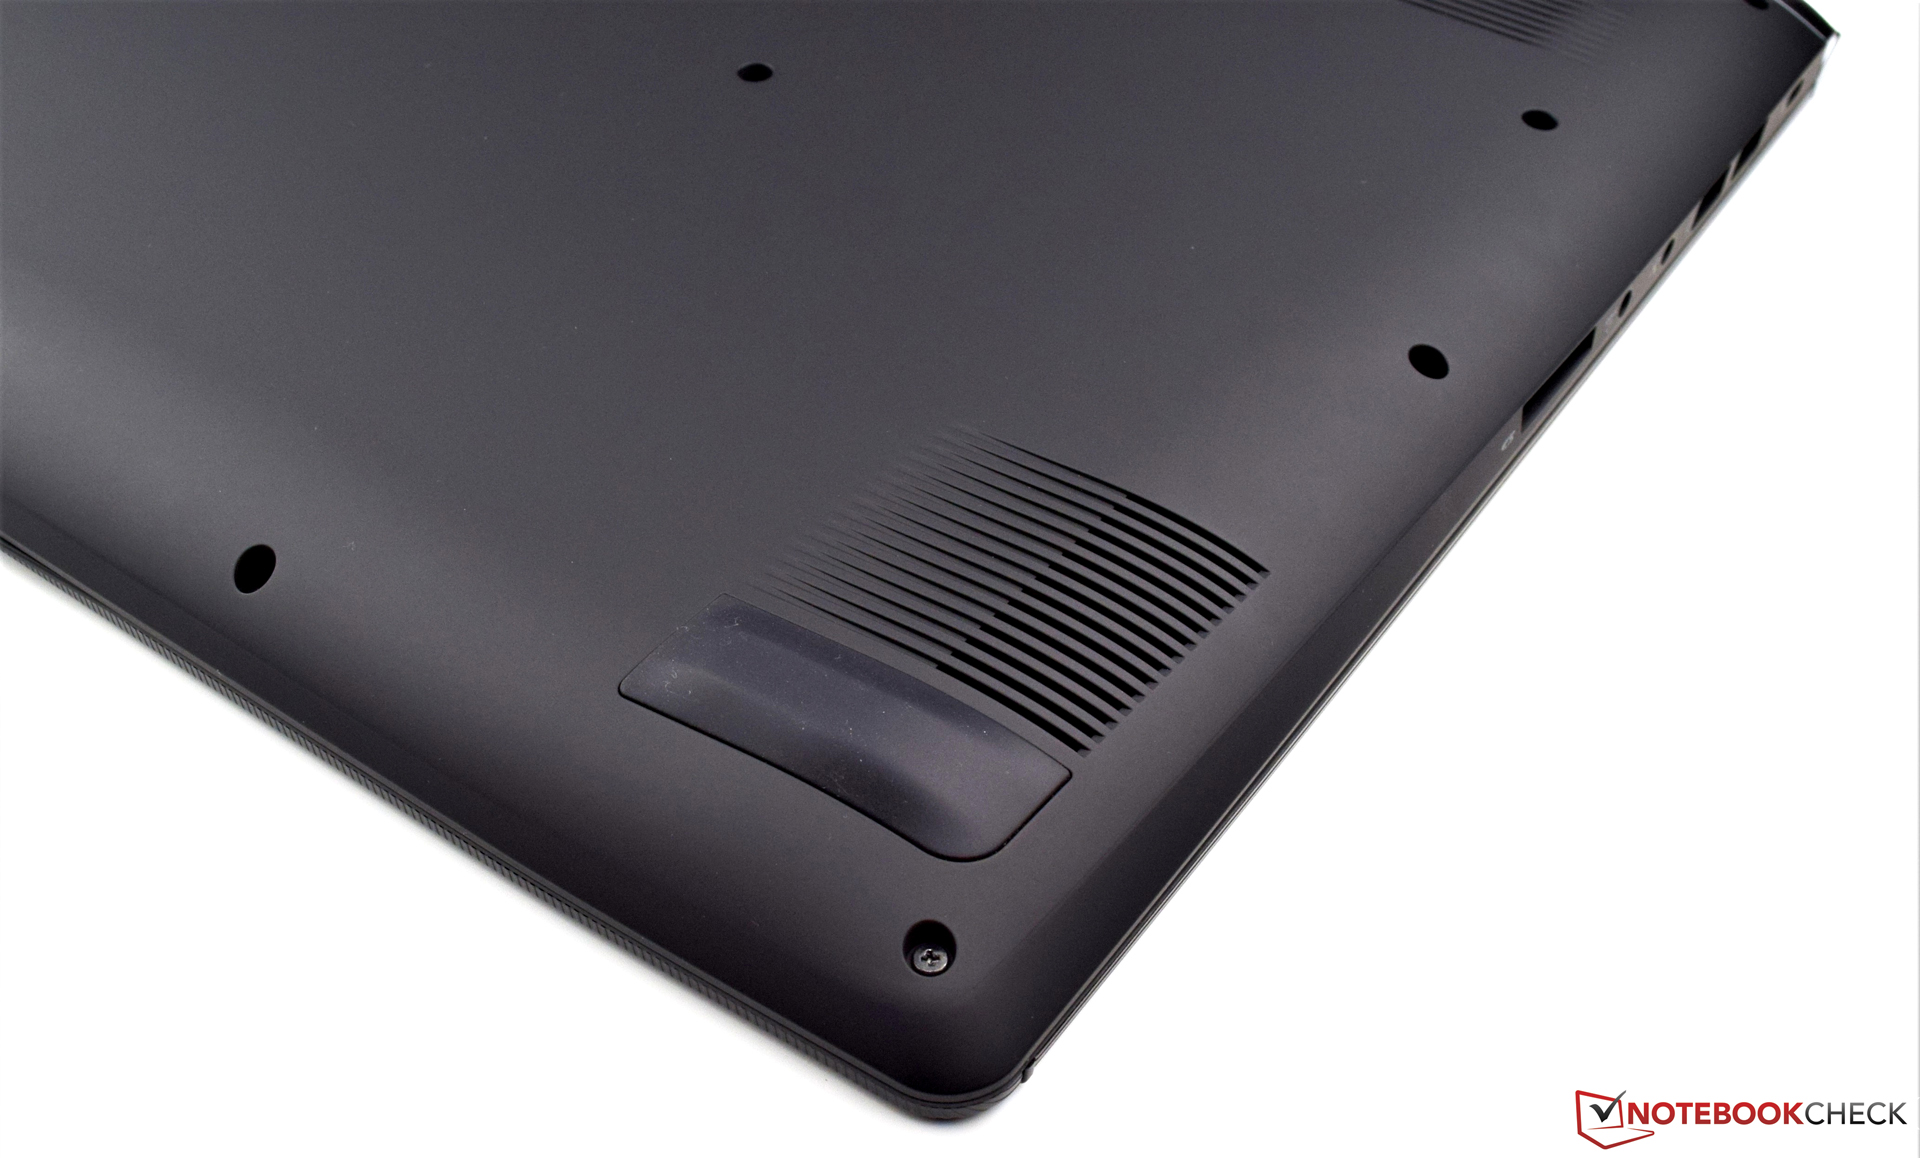
我们十分喜欢这台设备的低调设计,和潜藏其中的强劲硬件。它的高品质机身十分坚固,而无光驱省出的空间也带来了更大的电池容量。整体来看,宏碁Aspire V17 Nitro BE可以很好地实现设计定位的功能,约1800美元的售价也十分合理。
注:本文是基于完整评测的缩减版本,阅读完整的英文评测,请点击这里。
Acer Aspire V17 Nitro BE VN7-793G-52XN
- 06/30/2017 v6 (old)
Sebastian Bade
Price comparison
