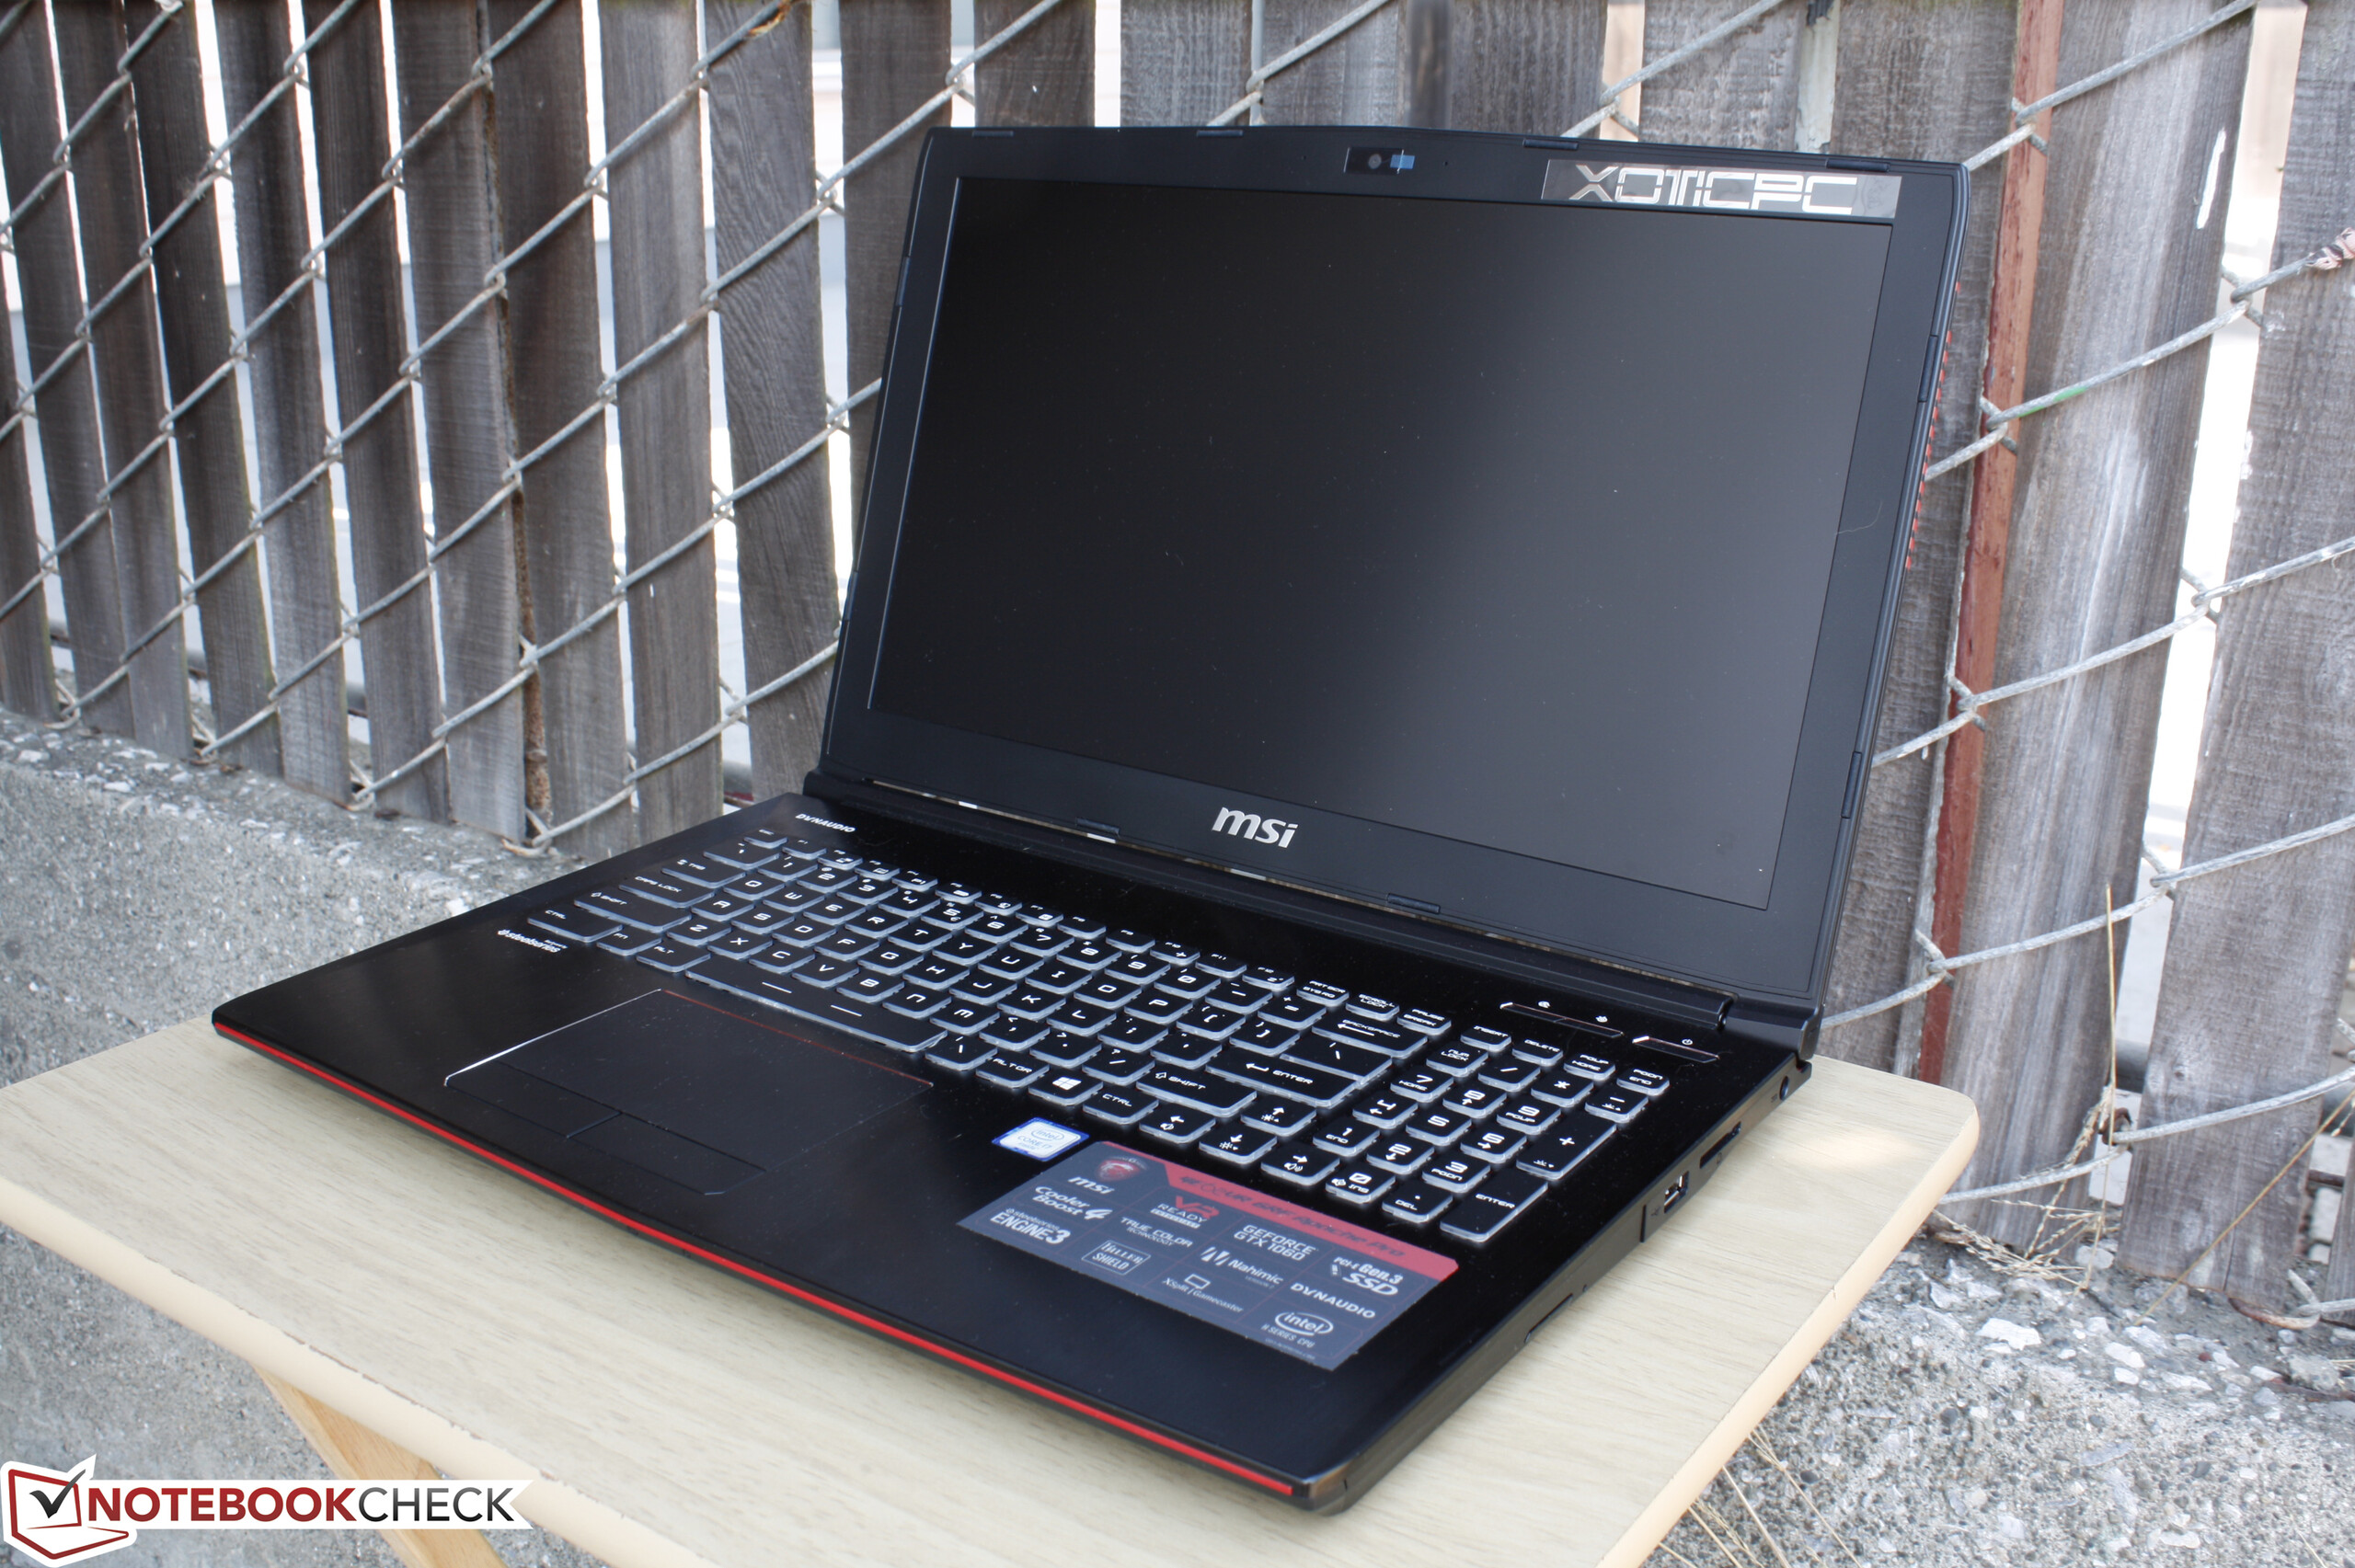
微星 GE62VR 6RF Apache Xotic PC版 笔记本电脑简短评测
| SD Card Reader | |
| average JPG Copy Test (av. of 3 runs) | |
| MSI GT72VR 6RE-015US | |
| MSI GE62VR 6RF-001US | |
| MSI GS43VR 6RE-006US | |
| maximum AS SSD Seq Read Test (1GB) | |
| MSI GT72VR 6RE-015US | |
| MSI GS43VR 6RE-006US | |
| MSI GE62VR 6RF-001US | |
| Networking | |
| iperf Server (receive) TCP 1 m 512KB | |
| MSI GE62VR 6RF-001US | |
| iperf Client (transmit) TCP 1 m 512KB | |
| MSI GE62VR 6RF-001US | |
| |||||||||||||||||||||||||
Brightness Distribution: 87 %
Center on Battery: 302 cd/m²
Contrast: 1787:1 (Black: 0.169 cd/m²)
ΔE ColorChecker Calman: 4.61 | ∀{0.5-29.43 Ø4.71}
ΔE Greyscale Calman: 3.32 | ∀{0.09-98 Ø4.96}
84.4% sRGB (Argyll 1.6.3 3D)
55.4% AdobeRGB 1998 (Argyll 1.6.3 3D)
61.7% AdobeRGB 1998 (Argyll 3D)
84.3% sRGB (Argyll 3D)
65.6% Display P3 (Argyll 3D)
Gamma: 2.24
CCT: 6358 K
| MSI GE62VR 6RF-001US IPS, 15.6", 1920x1080 | MSI GT62VR-6RE16H21 LG Philips LP156WF6 (LGD046F), IPS, 15.6", 1920x1080 | Asus Strix GL502VS-FY032T LG Philips LP156WF6-SPB6 (LGD046F), IPS, 15.6", 1920x1080 | Dell XPS 15 9550 i7 FHD IPS, 15.6", 1920x1080 | Asus ZenBook Pro UX501VW-DS71T IPS, 15.6", 3840x2160 | |
|---|---|---|---|---|---|
| Display | -1% | -1% | 11% | 4% | |
| Display P3 Coverage (%) | 65.6 | 64.6 -2% | 64.5 -2% | 68.5 4% | 64.3 -2% |
| sRGB Coverage (%) | 84.3 | 84.6 0% | 83.1 -1% | 97.2 15% | 89.9 7% |
| AdobeRGB 1998 Coverage (%) | 61.7 | 61.8 0% | 60.8 -1% | 70.4 14% | 65.4 6% |
| Response Times | 13% | 5% | -82% | -10% | |
| Response Time Grey 50% / Grey 80% * (ms) | 36.8 ? | 34 ? 8% | 38 ? -3% | 64 ? -74% | 43.2 ? -17% |
| Response Time Black / White * (ms) | 26.4 ? | 22 ? 17% | 23 ? 13% | 50 ? -89% | 27.2 ? -3% |
| PWM Frequency (Hz) | |||||
| Screen | -7% | -16% | -14% | -39% | |
| Brightness middle (cd/m²) | 302 | 273 -10% | 315 4% | 371.5 23% | 252.9 -16% |
| Brightness (cd/m²) | 303 | 278 -8% | 290 -4% | 356 17% | 250 -17% |
| Brightness Distribution (%) | 87 | 88 1% | 85 -2% | 92 6% | 89 2% |
| Black Level * (cd/m²) | 0.169 | 0.27 -60% | 0.32 -89% | 0.252 -49% | 0.5 -196% |
| Contrast (:1) | 1787 | 1011 -43% | 984 -45% | 1474 -18% | 506 -72% |
| Colorchecker dE 2000 * | 4.61 | 3.67 20% | 4.88 -6% | 5.55 -20% | 5.22 -13% |
| Colorchecker dE 2000 max. * | 9.98 | 8.33 17% | 8.88 11% | 10.95 -10% | 8.33 17% |
| Greyscale dE 2000 * | 3.32 | 2.73 18% | 4.17 -26% | 7.1 -114% | 6.74 -103% |
| Gamma | 2.24 98% | 2.49 88% | 2.53 87% | 2.1 105% | 2.45 90% |
| CCT | 6358 102% | 7029 92% | 6683 97% | 6026 108% | |
| Color Space (Percent of AdobeRGB 1998) (%) | 55.4 | 55 -1% | 55 -1% | 63.4 14% | 58.4 5% |
| Color Space (Percent of sRGB) (%) | 84.4 | 84 0% | 83 -2% | 97.9 16% | 89.7 6% |
| Total Average (Program / Settings) | 2% /
-3% | -4% /
-10% | -28% /
-18% | -15% /
-26% |
* ... smaller is better
Display Response Times
| ↔ Response Time Black to White | ||
|---|---|---|
| 26.4 ms ... rise ↗ and fall ↘ combined | ↗ 5.2 ms rise | 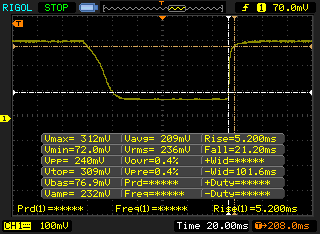 |
| ↘ 21.2 ms fall | ||
| The screen shows relatively slow response rates in our tests and may be too slow for gamers. In comparison, all tested devices range from 0.1 (minimum) to 240 (maximum) ms. » 66 % of all devices are better. This means that the measured response time is worse than the average of all tested devices (19.8 ms). | ||
| ↔ Response Time 50% Grey to 80% Grey | ||
| 36.8 ms ... rise ↗ and fall ↘ combined | ↗ 16.4 ms rise | 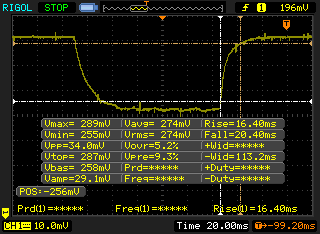 |
| ↘ 20.4 ms fall | ||
| The screen shows slow response rates in our tests and will be unsatisfactory for gamers. In comparison, all tested devices range from 0.165 (minimum) to 636 (maximum) ms. » 53 % of all devices are better. This means that the measured response time is worse than the average of all tested devices (31 ms). | ||
Screen Flickering / PWM (Pulse-Width Modulation)
| Screen flickering / PWM not detected | 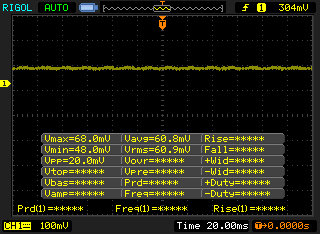 | ||
In comparison: 52 % of all tested devices do not use PWM to dim the display. If PWM was detected, an average of 7754 (minimum: 5 - maximum: 343500) Hz was measured. | |||
| Cinebench R15 | |
| CPU Single 64Bit | |
| DogHouse Systems Mobius SS | |
| MSI GT73VR-6RE16SR451 | |
| MSI GE62 2QC-468XPL | |
| Toshiba Tecra Z40-C-11F | |
| MSI GE62VR 6RF-001US | |
| Lenovo IdeaPad Y50 | |
| CPU Multi 64Bit | |
| DogHouse Systems Mobius SS | |
| MSI GT73VR-6RE16SR451 | |
| MSI GE62 2QC-468XPL | |
| MSI GE62VR 6RF-001US | |
| Lenovo IdeaPad Y50 | |
| Toshiba Tecra Z40-C-11F | |
| Cinebench R11.5 | |
| CPU Single 64Bit | |
| DogHouse Systems Mobius SS | |
| MSI GT73VR-6RE16SR451 | |
| MSI GE62 2QC-468XPL | |
| MSI GE62VR 6RF-001US | |
| Lenovo IdeaPad Y50 | |
| CPU Multi 64Bit | |
| DogHouse Systems Mobius SS | |
| MSI GT73VR-6RE16SR451 | |
| MSI GE62 2QC-468XPL | |
| MSI GE62VR 6RF-001US | |
| Lenovo IdeaPad Y50 | |
| Cinebench R10 | |
| Rendering Multiple CPUs 32Bit | |
| DogHouse Systems Mobius SS | |
| MSI GE62 2QC-468XPL | |
| MSI GE62VR 6RF-001US | |
| Lenovo IdeaPad Y50 | |
| Rendering Single 32Bit | |
| DogHouse Systems Mobius SS | |
| MSI GE62 2QC-468XPL | |
| MSI GE62VR 6RF-001US | |
| Lenovo IdeaPad Y50 | |
| wPrime 2.10 - 1024m | |
| Toshiba Tecra Z40-C-11F | |
| Lenovo IdeaPad Y50 | |
| MSI GE62VR 6RF-001US | |
| MSI GE62 2QC-468XPL | |
| DogHouse Systems Mobius SS | |
| Super Pi Mod 1.5 XS 32M - 32M | |
| MSI GE62VR 6RF-001US | |
| MSI GE62 2QC-468XPL | |
| Toshiba Tecra Z40-C-11F | |
| Lenovo IdeaPad Y50 | |
| DogHouse Systems Mobius SS | |
* ... smaller is better
| PCMark 8 | |
| Home Score Accelerated v2 | |
| Asus Strix GL502VS-FY032T | |
| MSI GE62VR 6RF-001US | |
| HP Omen 15-ax007ng | |
| Dell XPS 15 9550 i7 FHD | |
| Work Score Accelerated v2 | |
| MSI GE62VR 6RF-001US | |
| Asus Strix GL502VS-FY032T | |
| HP Omen 15-ax007ng | |
| Dell XPS 15 9550 i7 FHD | |
| Creative Score Accelerated v2 | |
| MSI GE62VR 6RF-001US | |
| HP Omen 15-ax007ng | |
| Dell XPS 15 9550 i7 FHD | |
| PCMark 8 Home Score Accelerated v2 | 4059 points | |
| PCMark 8 Creative Score Accelerated v2 | 5136 points | |
| PCMark 8 Work Score Accelerated v2 | 5046 points | |
Help | ||
| MSI GE62VR 6RF-001US Samsung SM951 MZVPV512HDGL m.2 PCI-e | Asus Strix GL502VS-FY032T SanDisk SD8SNAT256G1002 | MSI GT62VR-6RE16H21 Toshiba HG6 THNSNJ256G8NY | Dell XPS 15 9550 i7 FHD Samsung PM951 NVMe 512 GB | Asus ZenBook Pro UX501VW-DS71T Samsung SM951 MZVPV512HDGL m.2 PCI-e | |
|---|---|---|---|---|---|
| CrystalDiskMark 3.0 | -65% | -57% | -30% | -5% | |
| Read Seq (MB/s) | 1696 | 485.4 -71% | 523 -69% | 1291 -24% | 1633 -4% |
| Write Seq (MB/s) | 1584 | 312.4 -80% | 485.5 -69% | 590 -63% | 1579 0% |
| Read 512 (MB/s) | 1044 | 294.8 -72% | 444.7 -57% | 632 -39% | 1068 2% |
| Write 512 (MB/s) | 1562 | 287.8 -82% | 471.2 -70% | 588 -62% | 1570 1% |
| Read 4k (MB/s) | 50.8 | 21.44 -58% | 21.86 -57% | 41.4 -19% | 50.4 -1% |
| Write 4k (MB/s) | 139.2 | 75.7 -46% | 98.8 -29% | 132.4 -5% | 128.6 -8% |
| Read 4k QD32 (MB/s) | 591 | 149.4 -75% | 350.3 -41% | 542 -8% | 534 -10% |
| Write 4k QD32 (MB/s) | 422.8 | 256.3 -39% | 162.2 -62% | 343.8 -19% | 344 -19% |

| 3DMark 11 Performance | 12762 points | |
| 3DMark Ice Storm Standard Score | 84062 points | |
| 3DMark Cloud Gate Standard Score | 21817 points | |
| 3DMark Fire Strike Score | 9873 points | |
| 3DMark Fire Strike Extreme Score | 5261 points | |
Help | ||
| Fallout 4 - 1920x1080 Ultra Preset AA:T AF:16x | |
| MSI GT62VR-6RE16H21 | |
| Zotac ZBOX Magnus EN980-U | |
| MSI GE62VR 6RF-001US | |
| Asus Strix GL502VY-DS71 | |
| MSI GS73VR 6RF | |
| Asus Strix GL502VT-DS74 | |
| BioShock Infinite - 1920x1080 Ultra Preset, DX11 (DDOF) | |
| MSI GT62VR-6RE16H21 | |
| Zotac ZBOX Magnus EN980-U | |
| MSI GS73VR 6RF | |
| MSI GE62VR 6RF-001US | |
| Asus Strix GL502VY-DS71 | |
| Asus Strix GL502VT-DS74 | |
| Guild Wars 2 - 1920x1080 All Maximum / On AA:FX | |
| Zotac ZBOX Magnus EN980-U | |
| MSI GE62VR 6RF-001US | |
| MSI GS73VR 6RF | |
| Metro: Last Light - 1920x1080 Very High (DX11) AF:16x | |
| MSI GT62VR-6RE16H21 | |
| Zotac ZBOX Magnus EN980-U | |
| MSI GS73VR 6RF | |
| MSI GE62VR 6RF-001US | |
| Asus Strix GL502VT-DS74 | |
| Thief - 1920x1080 Very High Preset AA:FXAA & High SS AF:8x | |
| Zotac ZBOX Magnus EN980-U | |
| MSI GT62VR-6RE16H21 | |
| MSI GE62VR 6RF-001US | |
| MSI GS73VR 6RF | |
| Asus Strix GL502VY-DS71 | |
| Asus Strix GL502VT-DS74 | |
| Batman: Arkham Knight - 1920x1080 High / On AA:SM AF:16x | |
| MSI GT62VR-6RE16H21 | |
| Zotac ZBOX Magnus EN980-U | |
| MSI GS73VR 6RF | |
| MSI GE62VR 6RF-001US | |
| Asus Strix GL502VT-DS74 | |
| Metal Gear Solid V - 1920x1080 Extra High / On | |
| Asus Strix GL502VT-DS74 | |
| Asus Strix GL502VY-DS71 | |
| Zotac ZBOX Magnus EN980-U | |
| MSI GS73VR 6RF | |
| MSI GE62VR 6RF-001US | |
| Rise of the Tomb Raider - 1920x1080 Very High Preset AA:FX AF:16x | |
| MSI GT62VR-6RE16H21 | |
| Zotac ZBOX Magnus EN980-U | |
| MSI GS73VR 6RF | |
| Asus Strix GL502VY-DS71 | |
| MSI GE62VR 6RF-001US | |
| Asus Strix GL502VT-DS74 | |
| Doom - 1920x1080 Ultra Preset AA:SM | |
| MSI GT62VR-6RE16H21 | |
| MSI GE62VR 6RF-001US | |
| MSI GS73VR 6RF | |
| Asus Strix GL502VY-DS71 | |
| Overwatch - 1920x1080 Epic (Render Scale 100 %) AA:SM AF:16x | |
| MSI GT62VR-6RE16H21 | |
| Zotac ZBOX Magnus EN980-U | |
| MSI GE62VR 6RF-001US | |
| MSI GS73VR 6RF | |
| Asus Strix GL502VY-DS71 | |
| low | med. | high | ultra | |
|---|---|---|---|---|
| Guild Wars 2 (2012) | 57.4 | |||
| BioShock Infinite (2013) | 97.7 | |||
| Metro: Last Light (2013) | 68.3 | |||
| Thief (2014) | 67.9 | |||
| Batman: Arkham Knight (2015) | 83 | 45 | ||
| Metal Gear Solid V (2015) | 60 | |||
| Fallout 4 (2015) | 63.9 | |||
| Rise of the Tomb Raider (2016) | 52 | |||
| Doom (2016) | 82.1 | |||
| Overwatch (2016) | 108.5 |
Noise level
| Idle |
| 32.8 / 32.9 / 32.9 dB(A) |
| Load |
| 41.6 / 55 dB(A) |
 | ||
30 dB silent 40 dB(A) audible 50 dB(A) loud |
||
min: | ||
| MSI GE62VR 6RF-001US GeForce GTX 1060 Mobile, 6700HQ, Samsung SM951 MZVPV512HDGL m.2 PCI-e | MSI GT62VR-6RE16H21 GeForce GTX 1070 Mobile, 6700HQ, Toshiba HG6 THNSNJ256G8NY | Asus Strix GL502VS-FY032T GeForce GTX 1070 Mobile, 6700HQ, SanDisk SD8SNAT256G1002 | MSI GE62-6QD16H11 GeForce GTX 960M, 6700HQ, Samsung SSD 850 EVO M.2 250 GB | Asus ZenBook Pro UX501VW-DS71T GeForce GTX 960M, 6700HQ, Samsung SM951 MZVPV512HDGL m.2 PCI-e | |
|---|---|---|---|---|---|
| Noise | 2% | 1% | -1% | 10% | |
| off / environment * (dB) | 28.2 | 30 -6% | 30 -6% | ||
| Idle Minimum * (dB) | 32.8 | 32 2% | 32 2% | 33 -1% | 28.9 12% |
| Idle Average * (dB) | 32.9 | 33 -0% | 33 -0% | 34 -3% | 28.9 12% |
| Idle Maximum * (dB) | 32.9 | 34 -3% | 34 -3% | 38 -16% | 30.2 8% |
| Load Average * (dB) | 41.6 | 40 4% | 39 6% | 42 -1% | 41.8 -0% |
| Load Maximum * (dB) | 55 | 46 16% | 51 7% | 46 16% | 43.9 20% |
* ... smaller is better
(-) The maximum temperature on the upper side is 53.2 °C / 128 F, compared to the average of 40.4 °C / 105 F, ranging from 21.2 to 68.8 °C for the class Gaming.
(-) The bottom heats up to a maximum of 59.4 °C / 139 F, compared to the average of 43.2 °C / 110 F
(+) In idle usage, the average temperature for the upper side is 29.4 °C / 85 F, compared to the device average of 33.9 °C / 93 F.
(-) The palmrests and touchpad can get very hot to the touch with a maximum of 47.8 °C / 118 F.
(-) The average temperature of the palmrest area of similar devices was 28.8 °C / 83.8 F (-19 °C / -34.2 F).
MSI GE62VR 6RF-001US audio analysis
(±) | speaker loudness is average but good (76.9 dB)
Bass 100 - 315 Hz
(±) | reduced bass - on average 13.1% lower than median
(±) | linearity of bass is average (12% delta to prev. frequency)
Mids 400 - 2000 Hz
(+) | balanced mids - only 3% away from median
(±) | linearity of mids is average (12% delta to prev. frequency)
Highs 2 - 16 kHz
(+) | balanced highs - only 4.4% away from median
(±) | linearity of highs is average (10.1% delta to prev. frequency)
Overall 100 - 16.000 Hz
(±) | linearity of overall sound is average (18.6% difference to median)
Compared to same class
» 61% of all tested devices in this class were better, 9% similar, 31% worse
» The best had a delta of 6%, average was 18%, worst was 132%
Compared to all devices tested
» 42% of all tested devices were better, 8% similar, 50% worse
» The best had a delta of 4%, average was 23%, worst was 134%
Apple MacBook 12 (Early 2016) 1.1 GHz audio analysis
(+) | speakers can play relatively loud (83.6 dB)
Bass 100 - 315 Hz
(±) | reduced bass - on average 11.3% lower than median
(±) | linearity of bass is average (14.2% delta to prev. frequency)
Mids 400 - 2000 Hz
(+) | balanced mids - only 2.4% away from median
(+) | mids are linear (5.5% delta to prev. frequency)
Highs 2 - 16 kHz
(+) | balanced highs - only 2% away from median
(+) | highs are linear (4.5% delta to prev. frequency)
Overall 100 - 16.000 Hz
(+) | overall sound is linear (10.2% difference to median)
Compared to same class
» 7% of all tested devices in this class were better, 2% similar, 90% worse
» The best had a delta of 5%, average was 18%, worst was 53%
Compared to all devices tested
» 5% of all tested devices were better, 1% similar, 94% worse
» The best had a delta of 4%, average was 23%, worst was 134%
| Off / Standby | |
| Idle | |
| Load |
|
Key:
min: | |
| MSI GE62VR 6RF-001US 6700HQ, GeForce GTX 1060 Mobile, Samsung SM951 MZVPV512HDGL m.2 PCI-e, IPS, 1920x1080, 15.6" | MSI GT62VR-6RE16H21 6700HQ, GeForce GTX 1070 Mobile, Toshiba HG6 THNSNJ256G8NY, IPS, 1920x1080, 15.6" | Asus Strix GL502VS-FY032T 6700HQ, GeForce GTX 1070 Mobile, SanDisk SD8SNAT256G1002, IPS, 1920x1080, 15.6" | MSI GE62-6QD16H11 6700HQ, GeForce GTX 960M, Samsung SSD 850 EVO M.2 250 GB, IPS, 1920x1080, 15.6" | Asus Zenbook Pro UX501JW-FI218H 4720HQ, GeForce GTX 960M, SanDisk SD7SN3Q128G1002, IPS, 3840x2160, 15.6" | |
|---|---|---|---|---|---|
| Power Consumption | 4% | 12% | 13% | 38% | |
| Idle Minimum * (Watt) | 25.4 | 20 21% | 20 21% | 20 21% | 15.6 39% |
| Idle Average * (Watt) | 30.3 | 26 14% | 24 21% | 24 21% | 20.5 32% |
| Idle Maximum * (Watt) | 31.5 | 32 -2% | 29 8% | 30 5% | 21.2 33% |
| Load Average * (Watt) | 111.8 | 100 11% | 86 23% | 97 13% | 75.8 32% |
| Load Maximum * (Watt) | 163.2 | 202 -24% | 183 -12% | 155 5% | 72.9 55% |
* ... smaller is better
| MSI GE62VR 6RF-001US 6700HQ, GeForce GTX 1060 Mobile, 51 Wh | MSI GT62VR-6RE16H21 6700HQ, GeForce GTX 1070 Mobile, 75.24 Wh | Asus Strix GL502VS-FY032T 6700HQ, GeForce GTX 1070 Mobile, 62 Wh | MSI GE62-6QD16H11 6700HQ, GeForce GTX 960M, 53 Wh | Asus ZenBook Pro UX501VW-DS71T 6700HQ, GeForce GTX 960M, 96 Wh | |
|---|---|---|---|---|---|
| Battery runtime | 142% | 80% | 50% | 301% | |
| Reader / Idle (h) | 2.3 | 5 117% | 4.1 78% | 3.1 35% | 11.5 400% |
| WiFi v1.3 (h) | 1.7 | 4.1 141% | 3.3 94% | 2.5 47% | 6.3 271% |
| Load (h) | 0.6 | 1.6 167% | 1 67% | 1 67% | 2 233% |
Pros
Cons

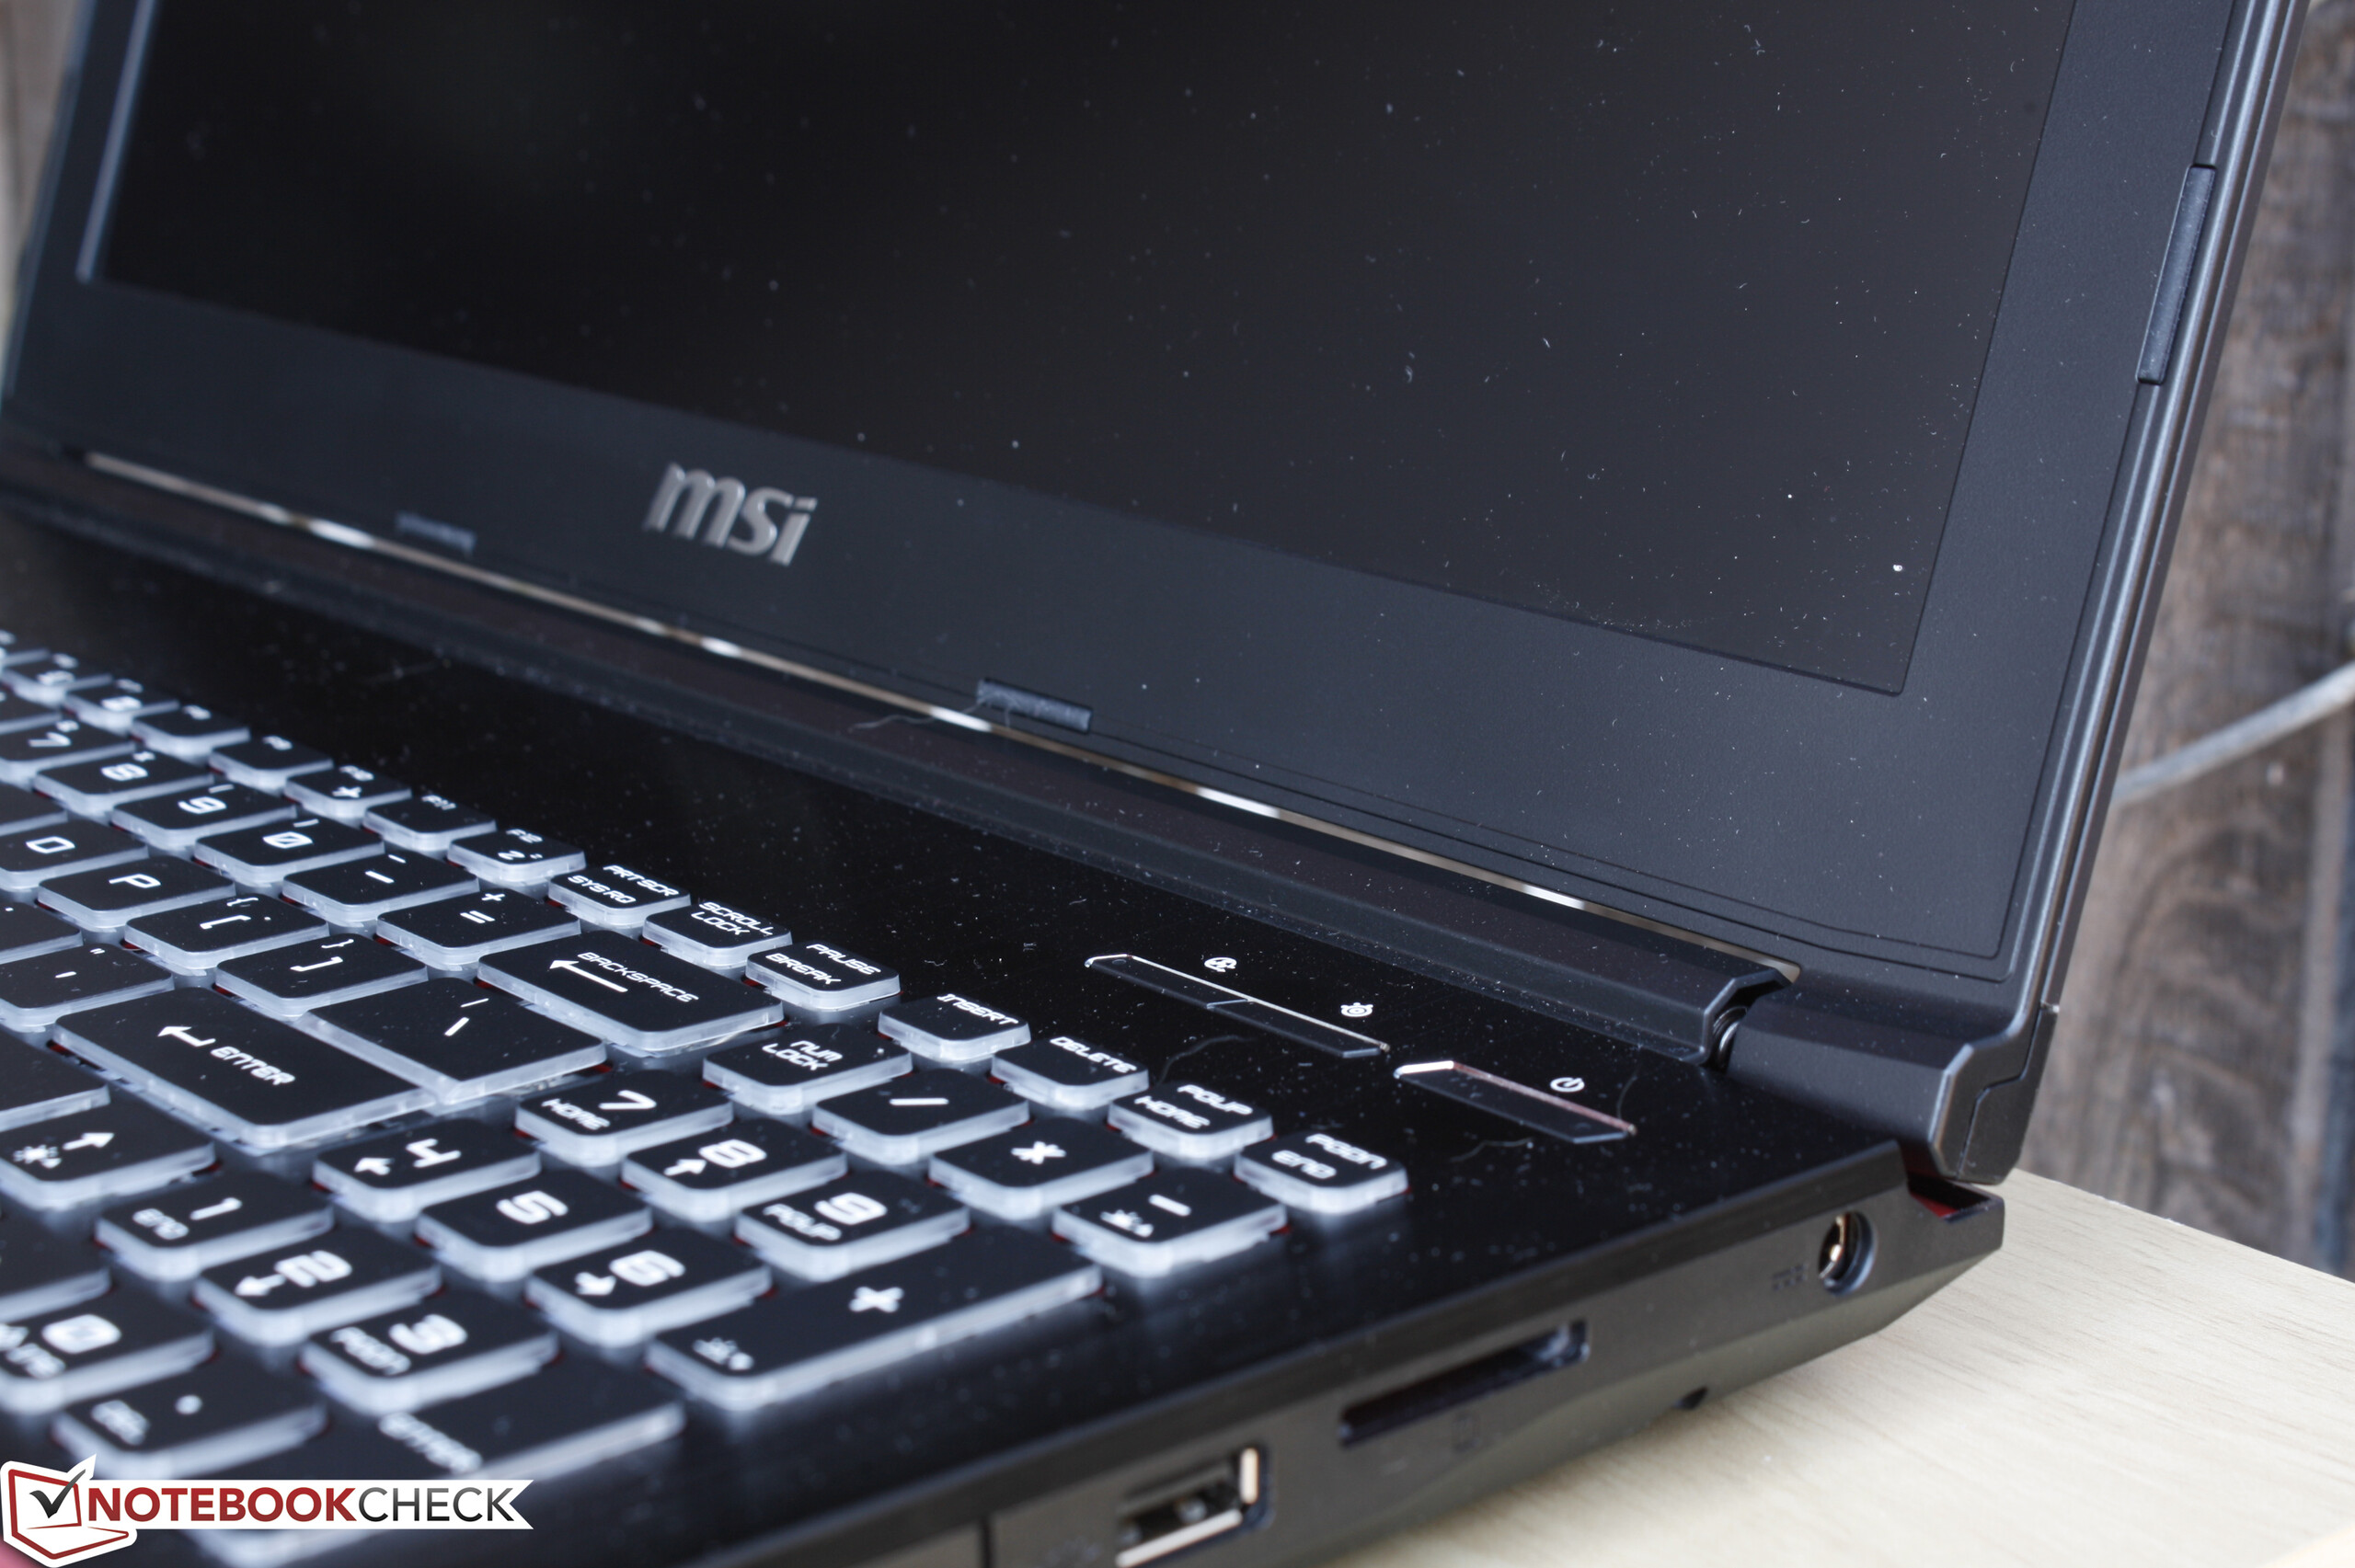
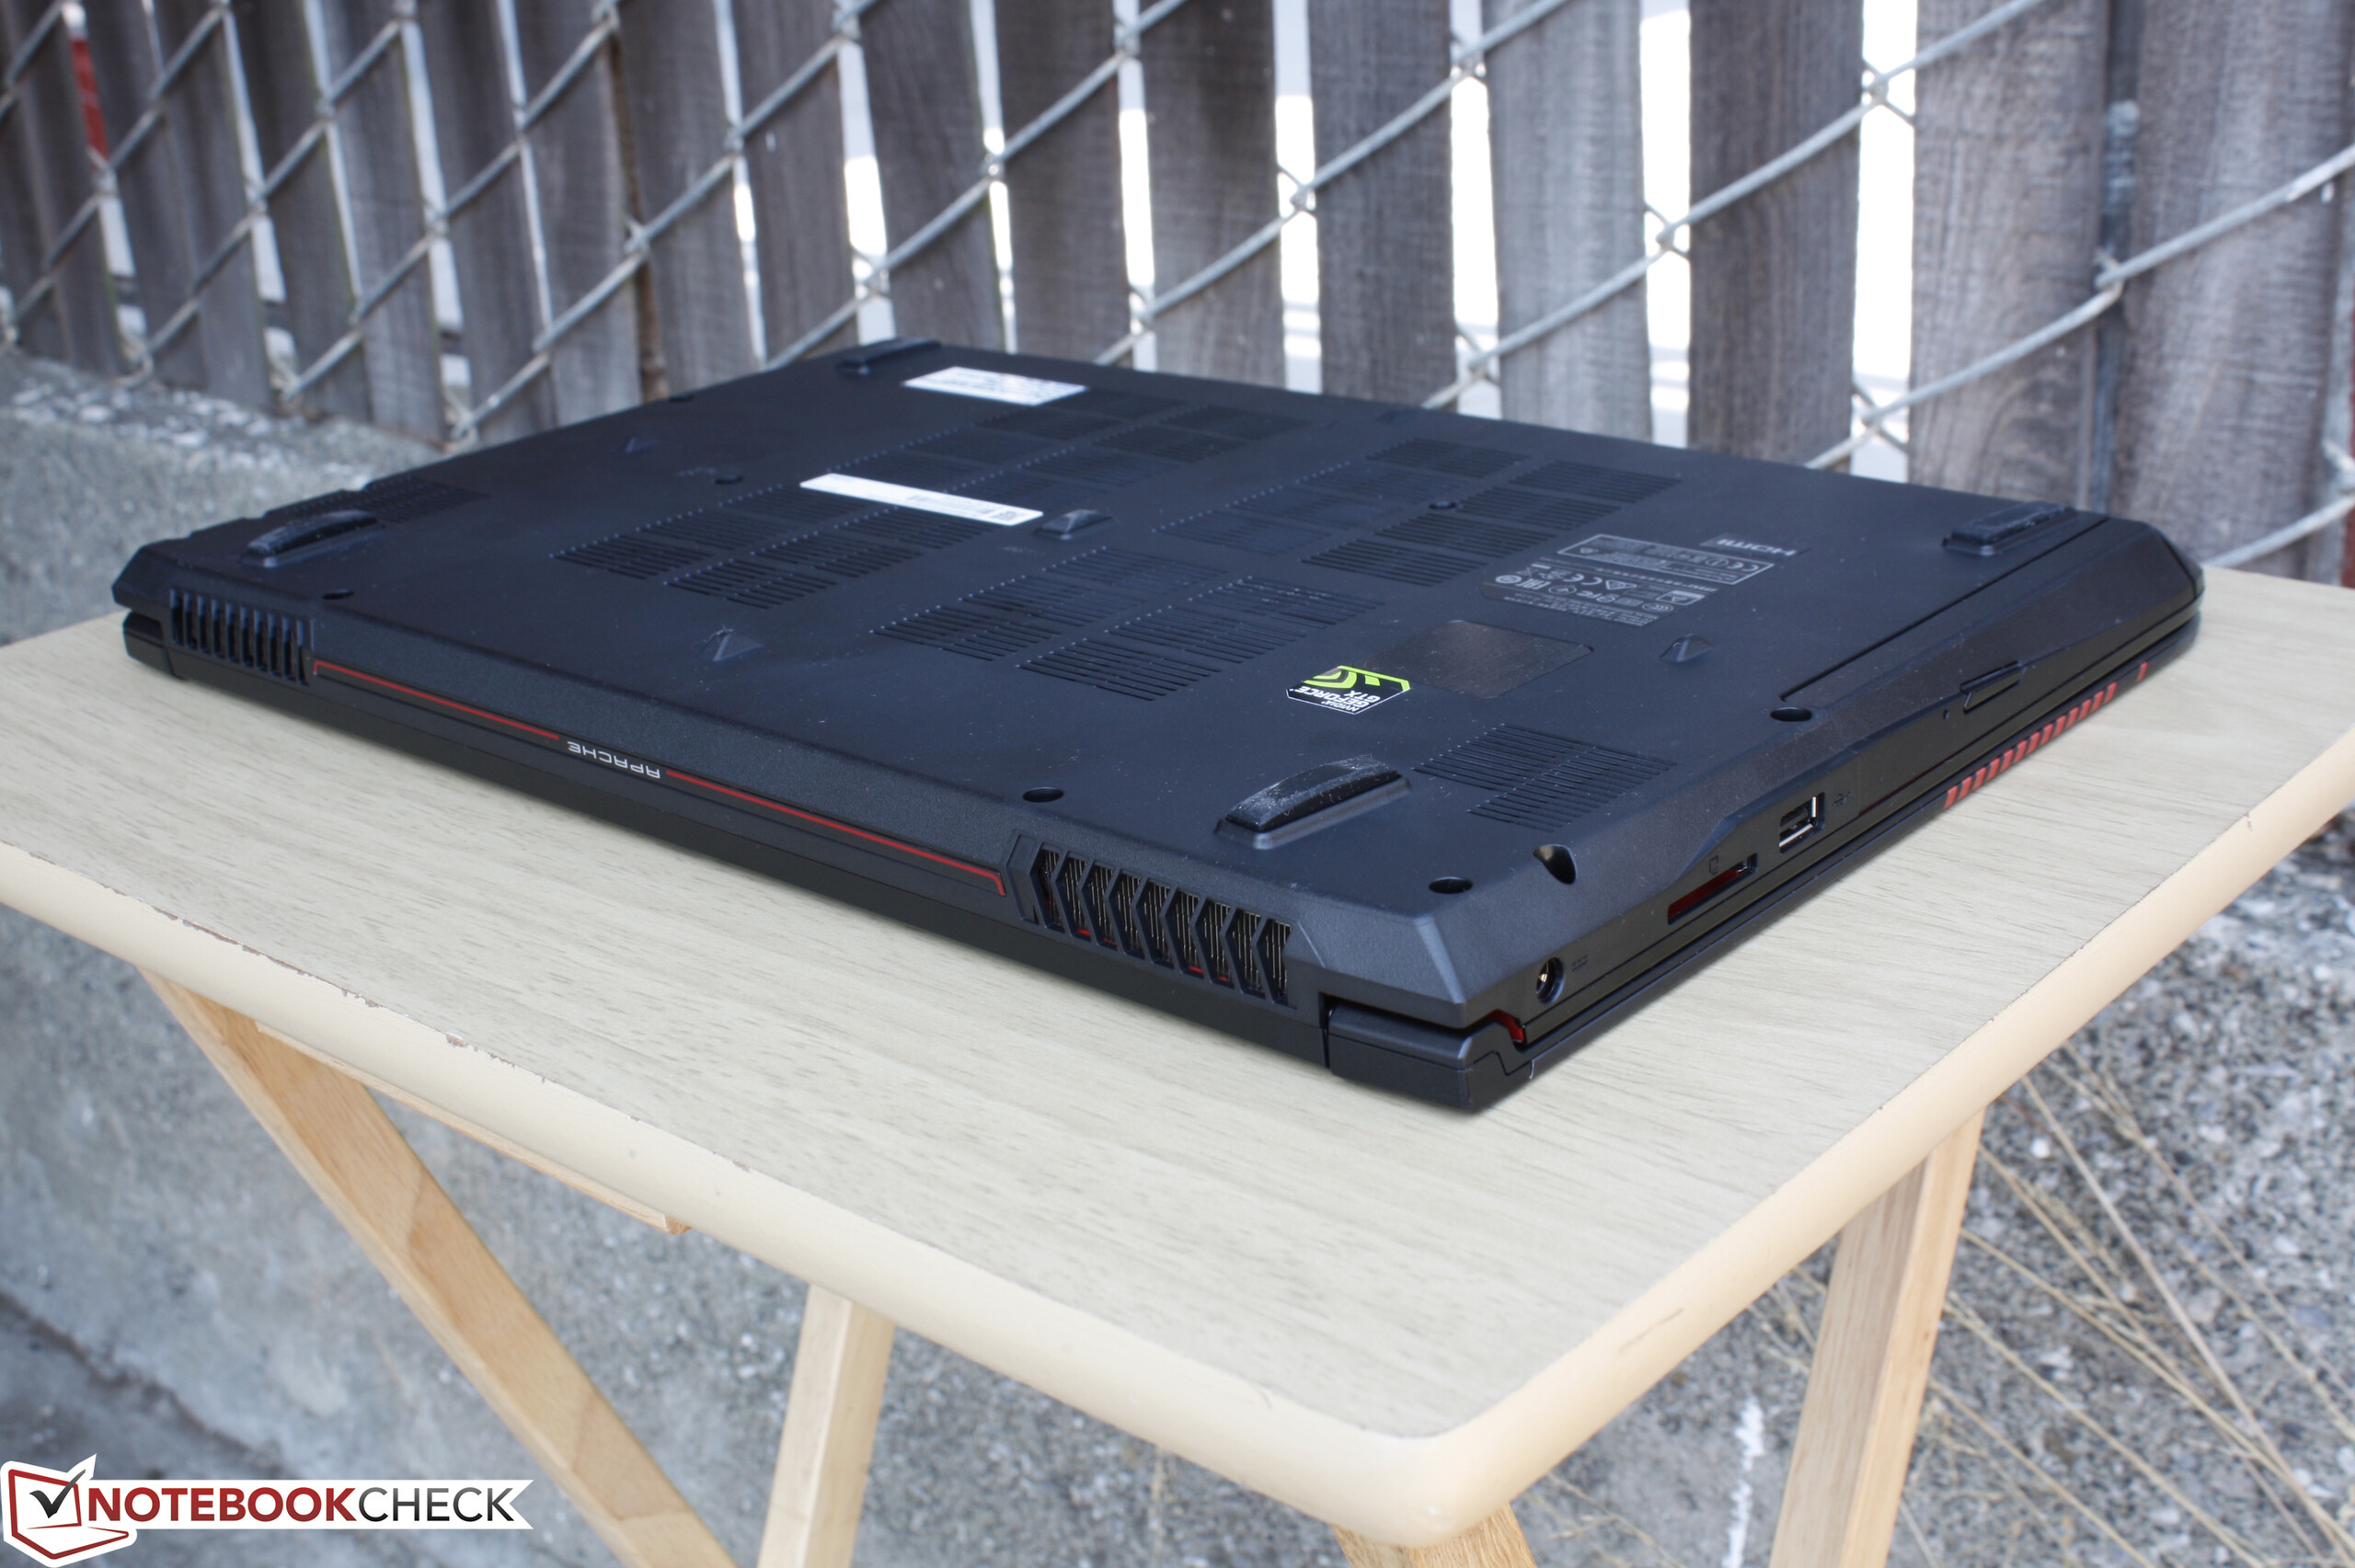
去年上市的GE62售价约1700美元(约11338人民币),搭配GTX 965M/970M显卡和Haswell处理器。在18个月后的现在,GE62VR配备了GTX 980M级别的显卡和更加高效的Skylake处理器,而售价保持不变。不像GT72到GT72VR的升级,GE62VR几乎没有减少GE62的主要功能,让它更具吸引力,考虑到搭配GTX 1070的设备通常售价高于2000美元(约13341人民币)。
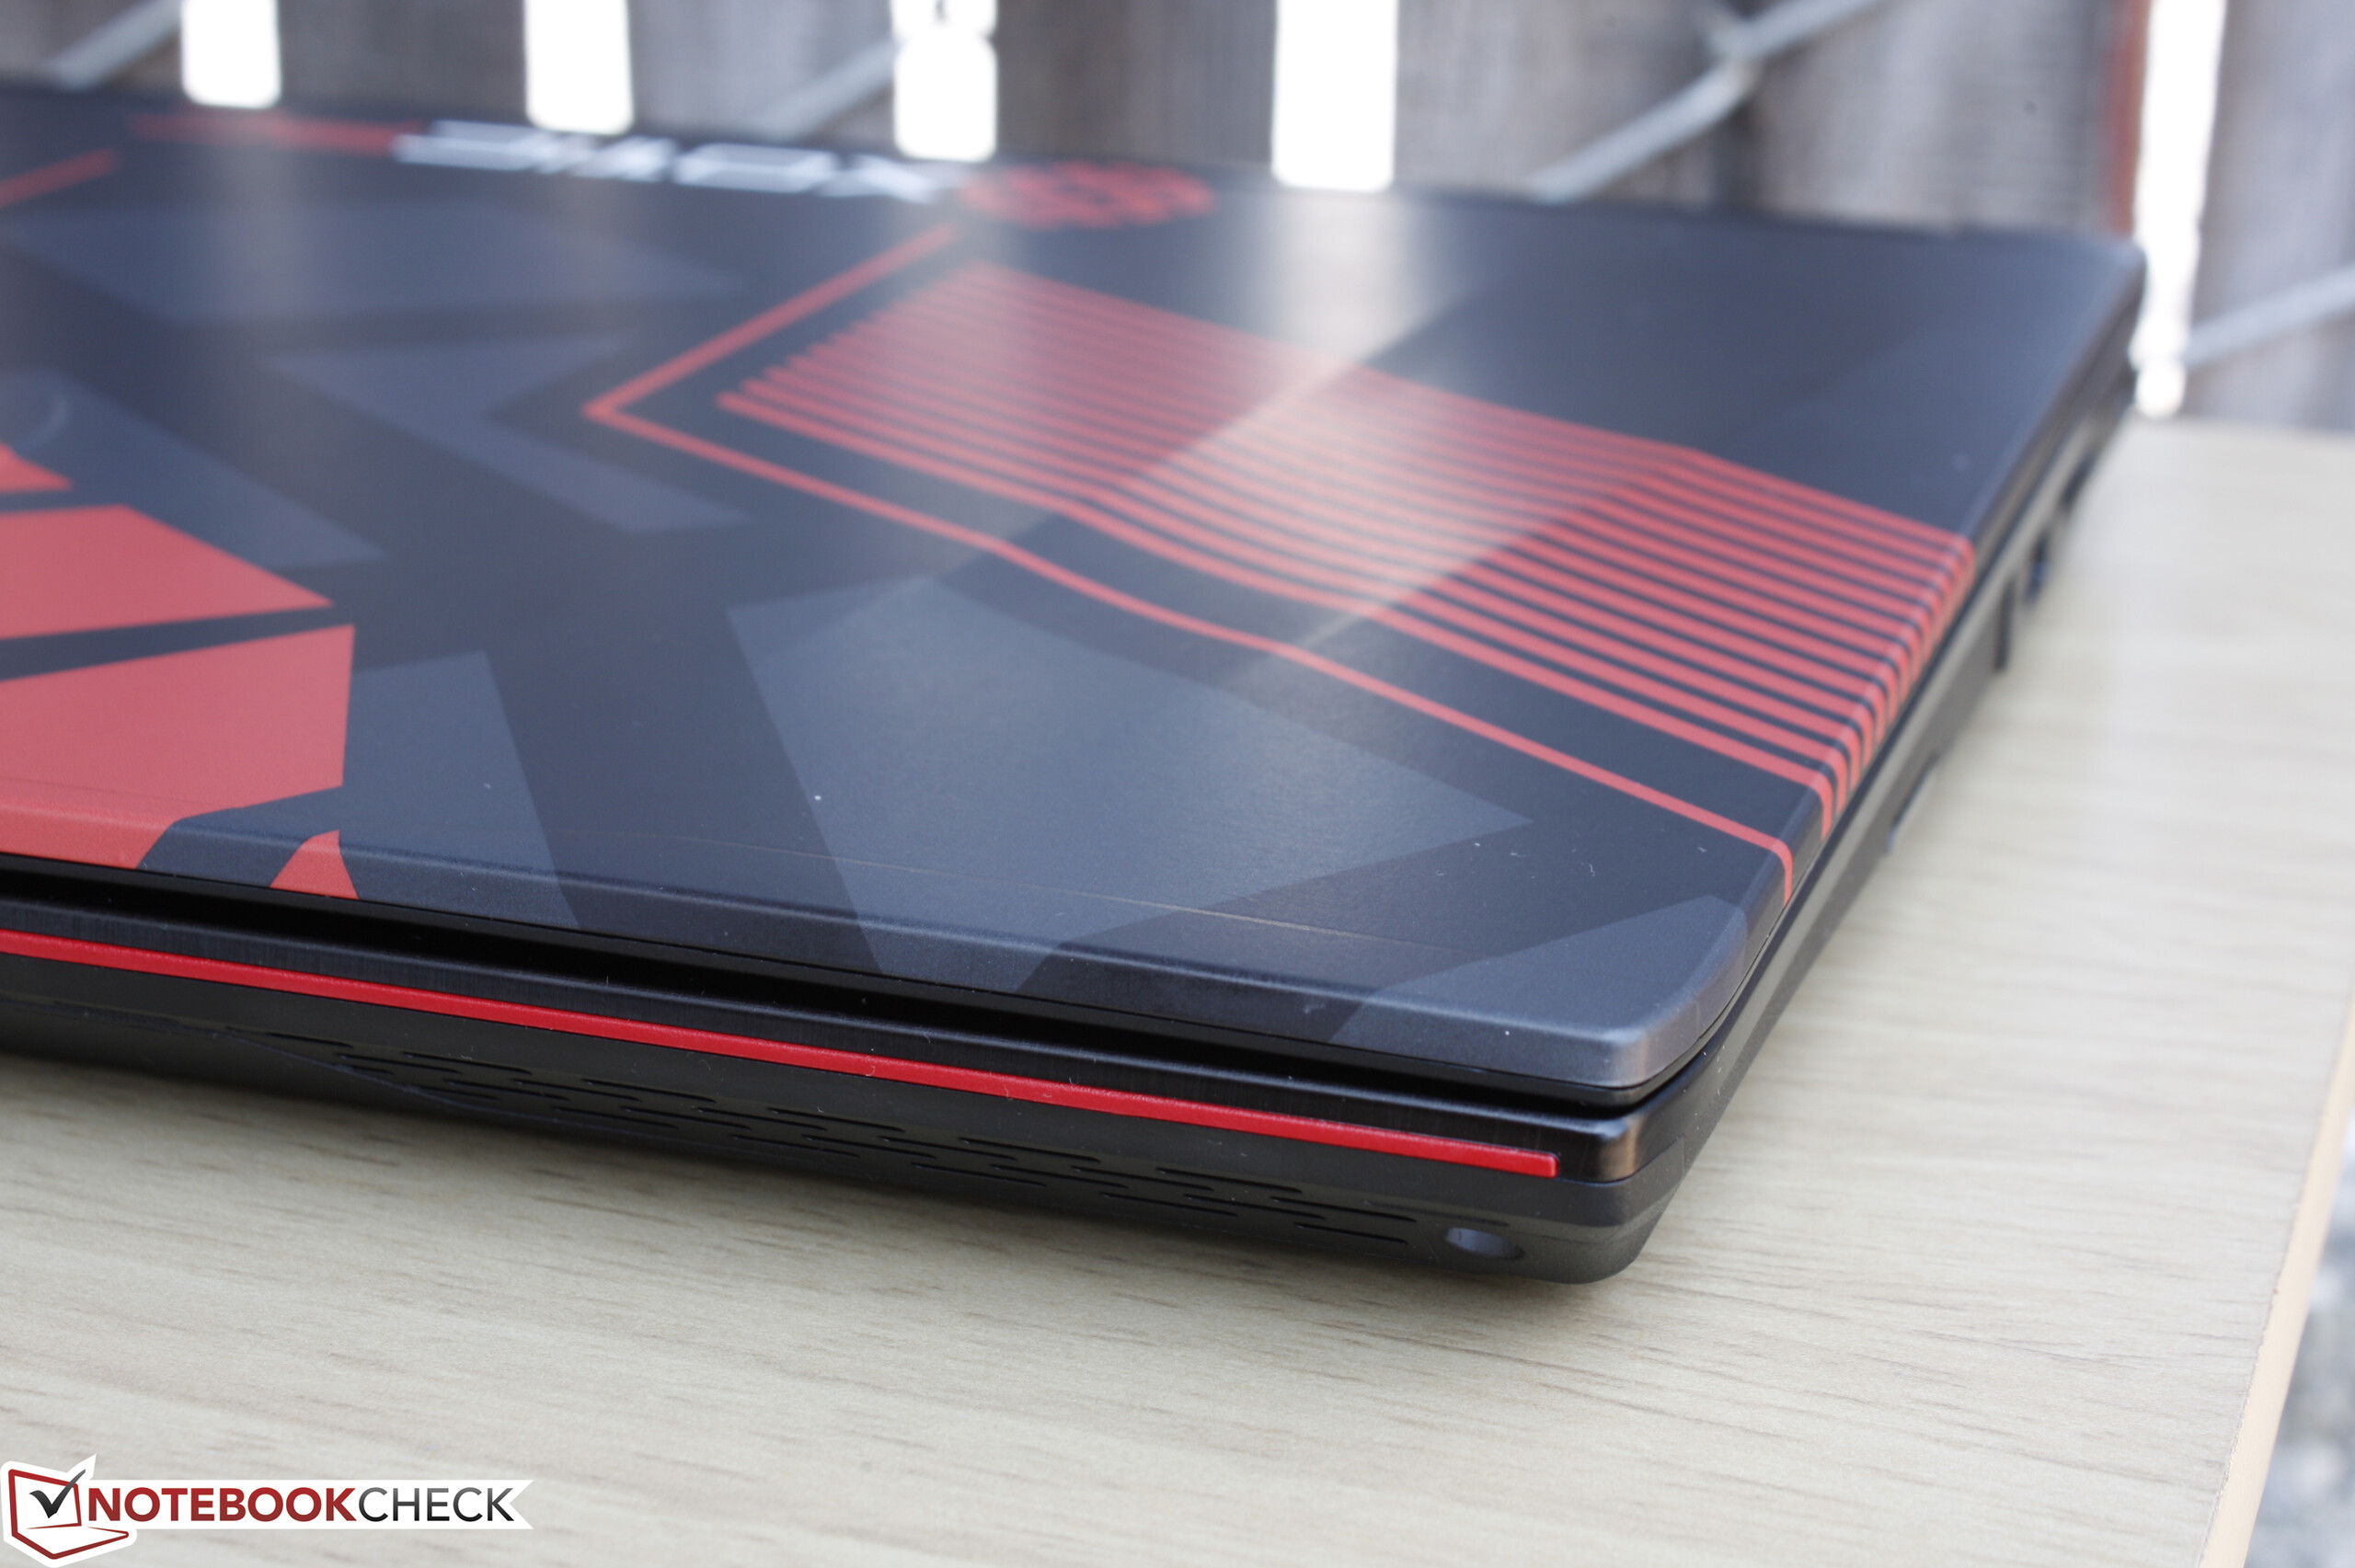
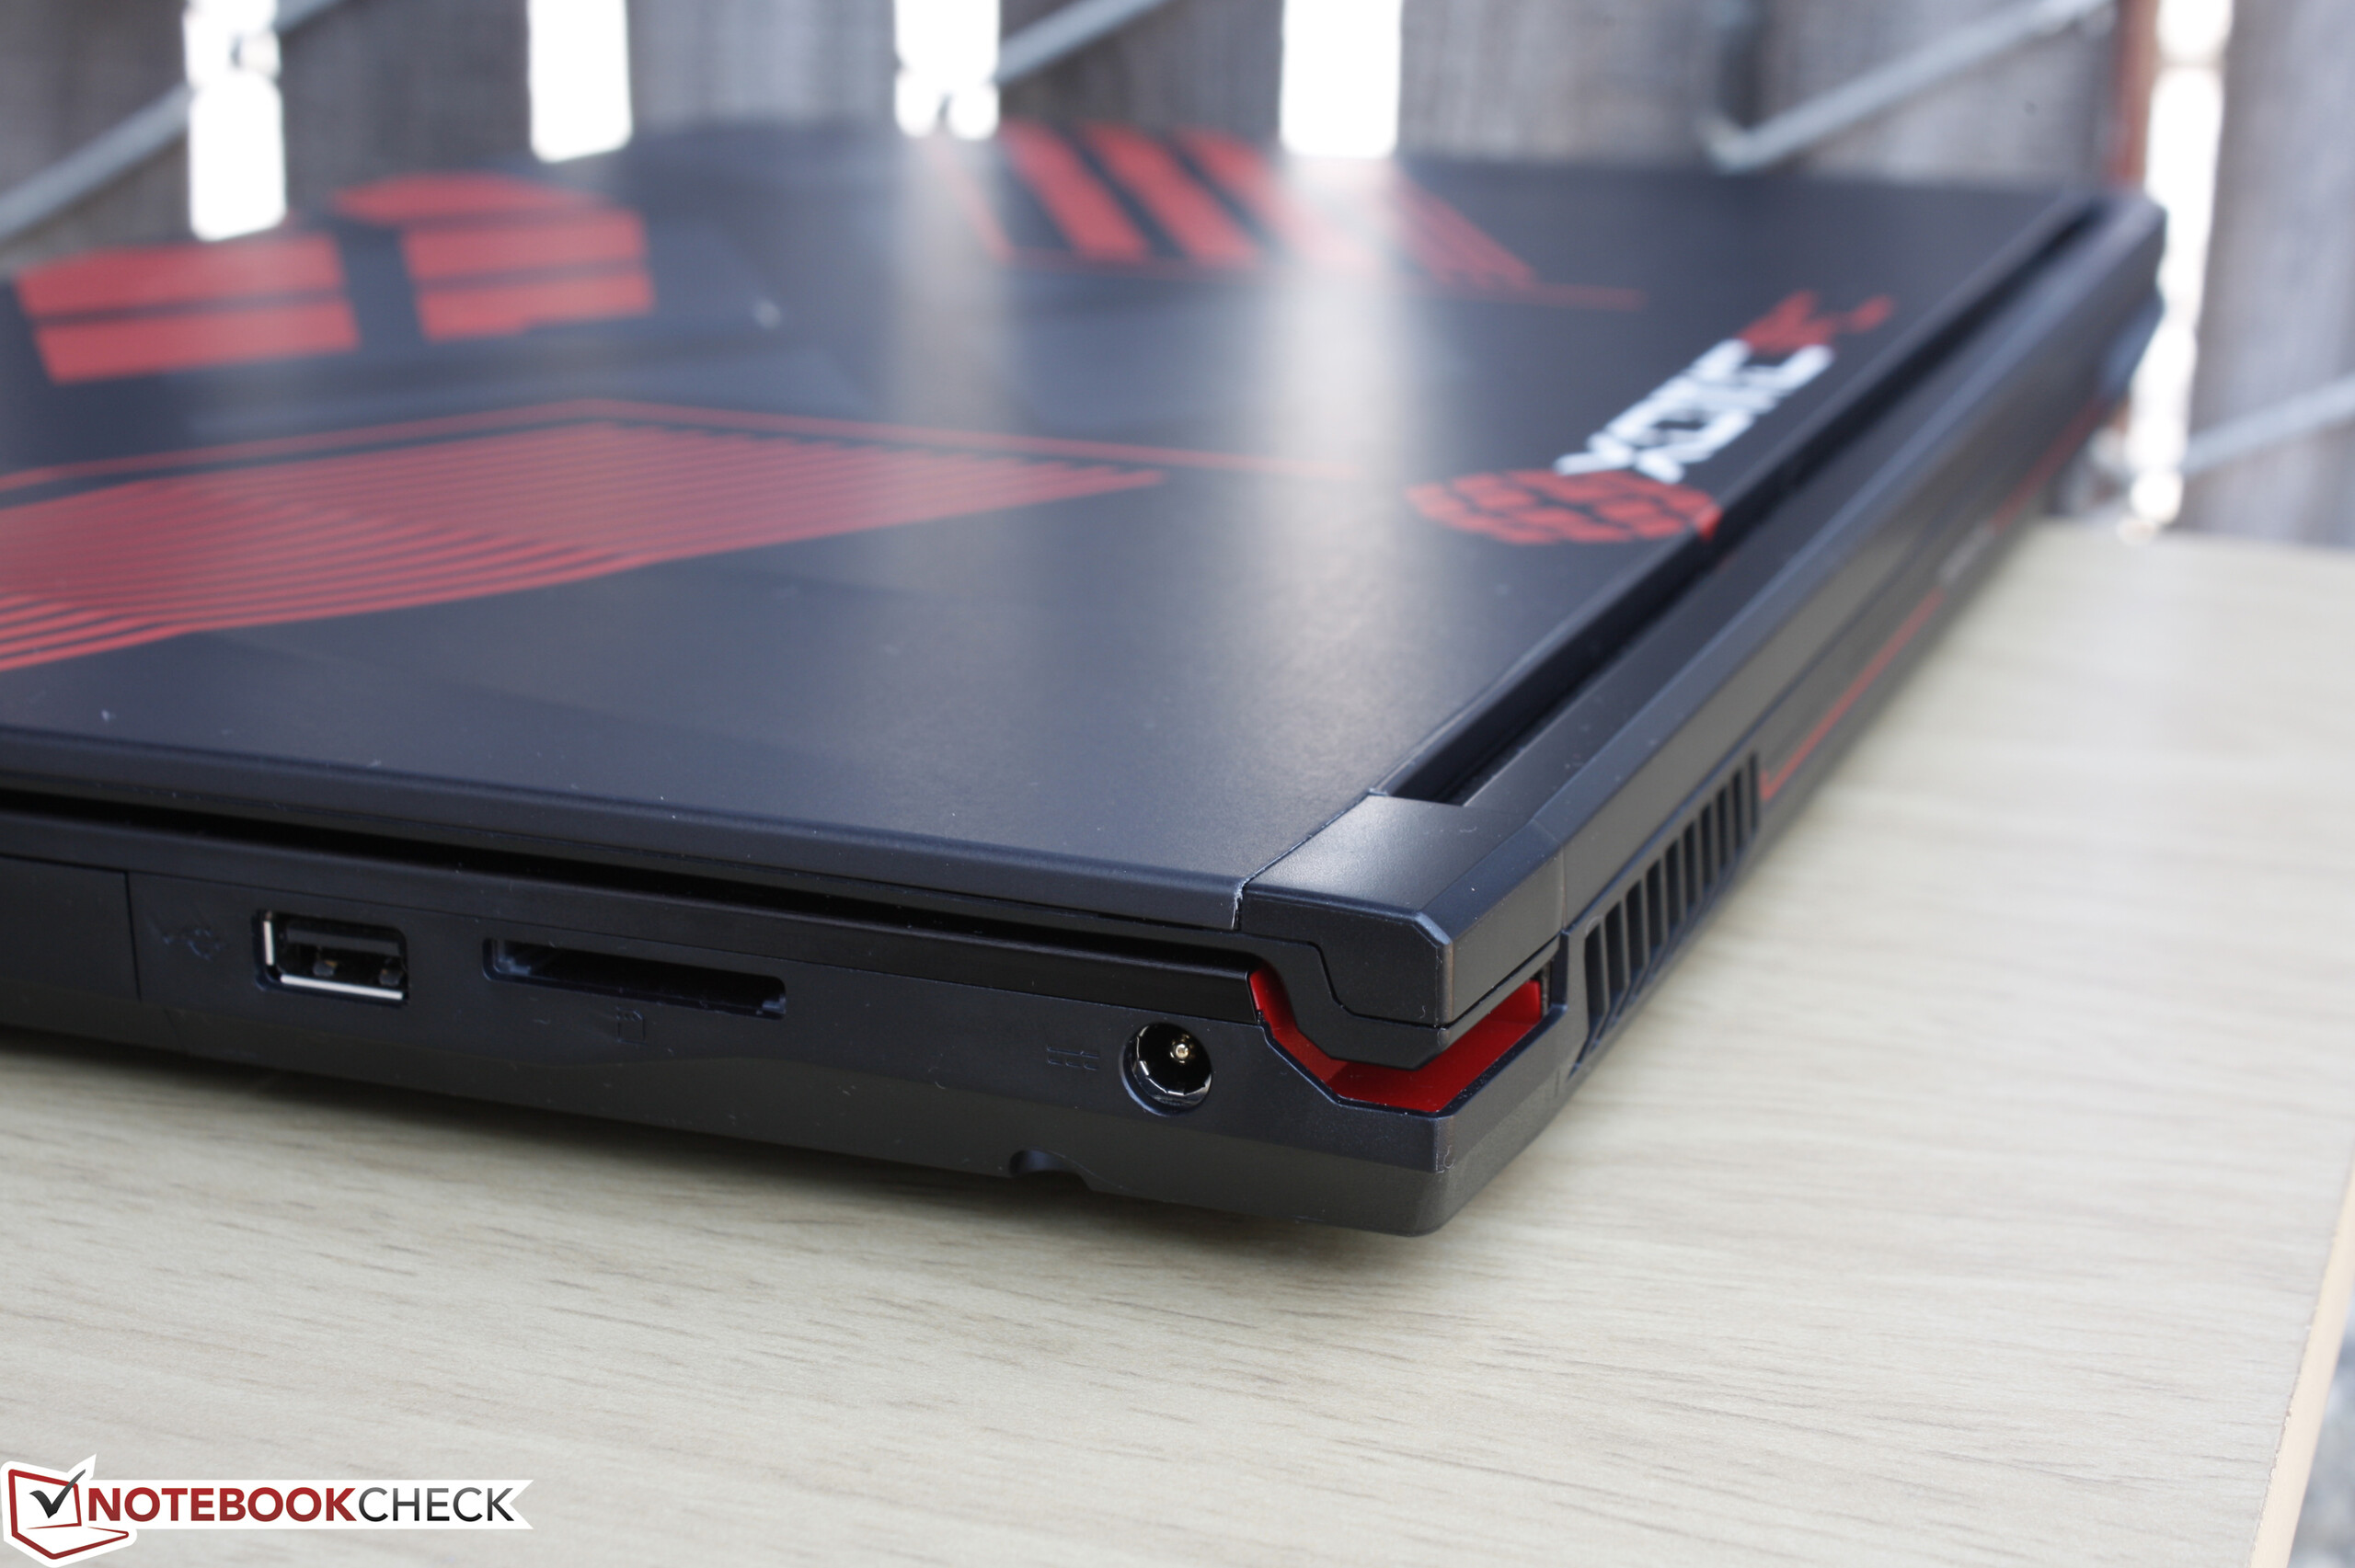
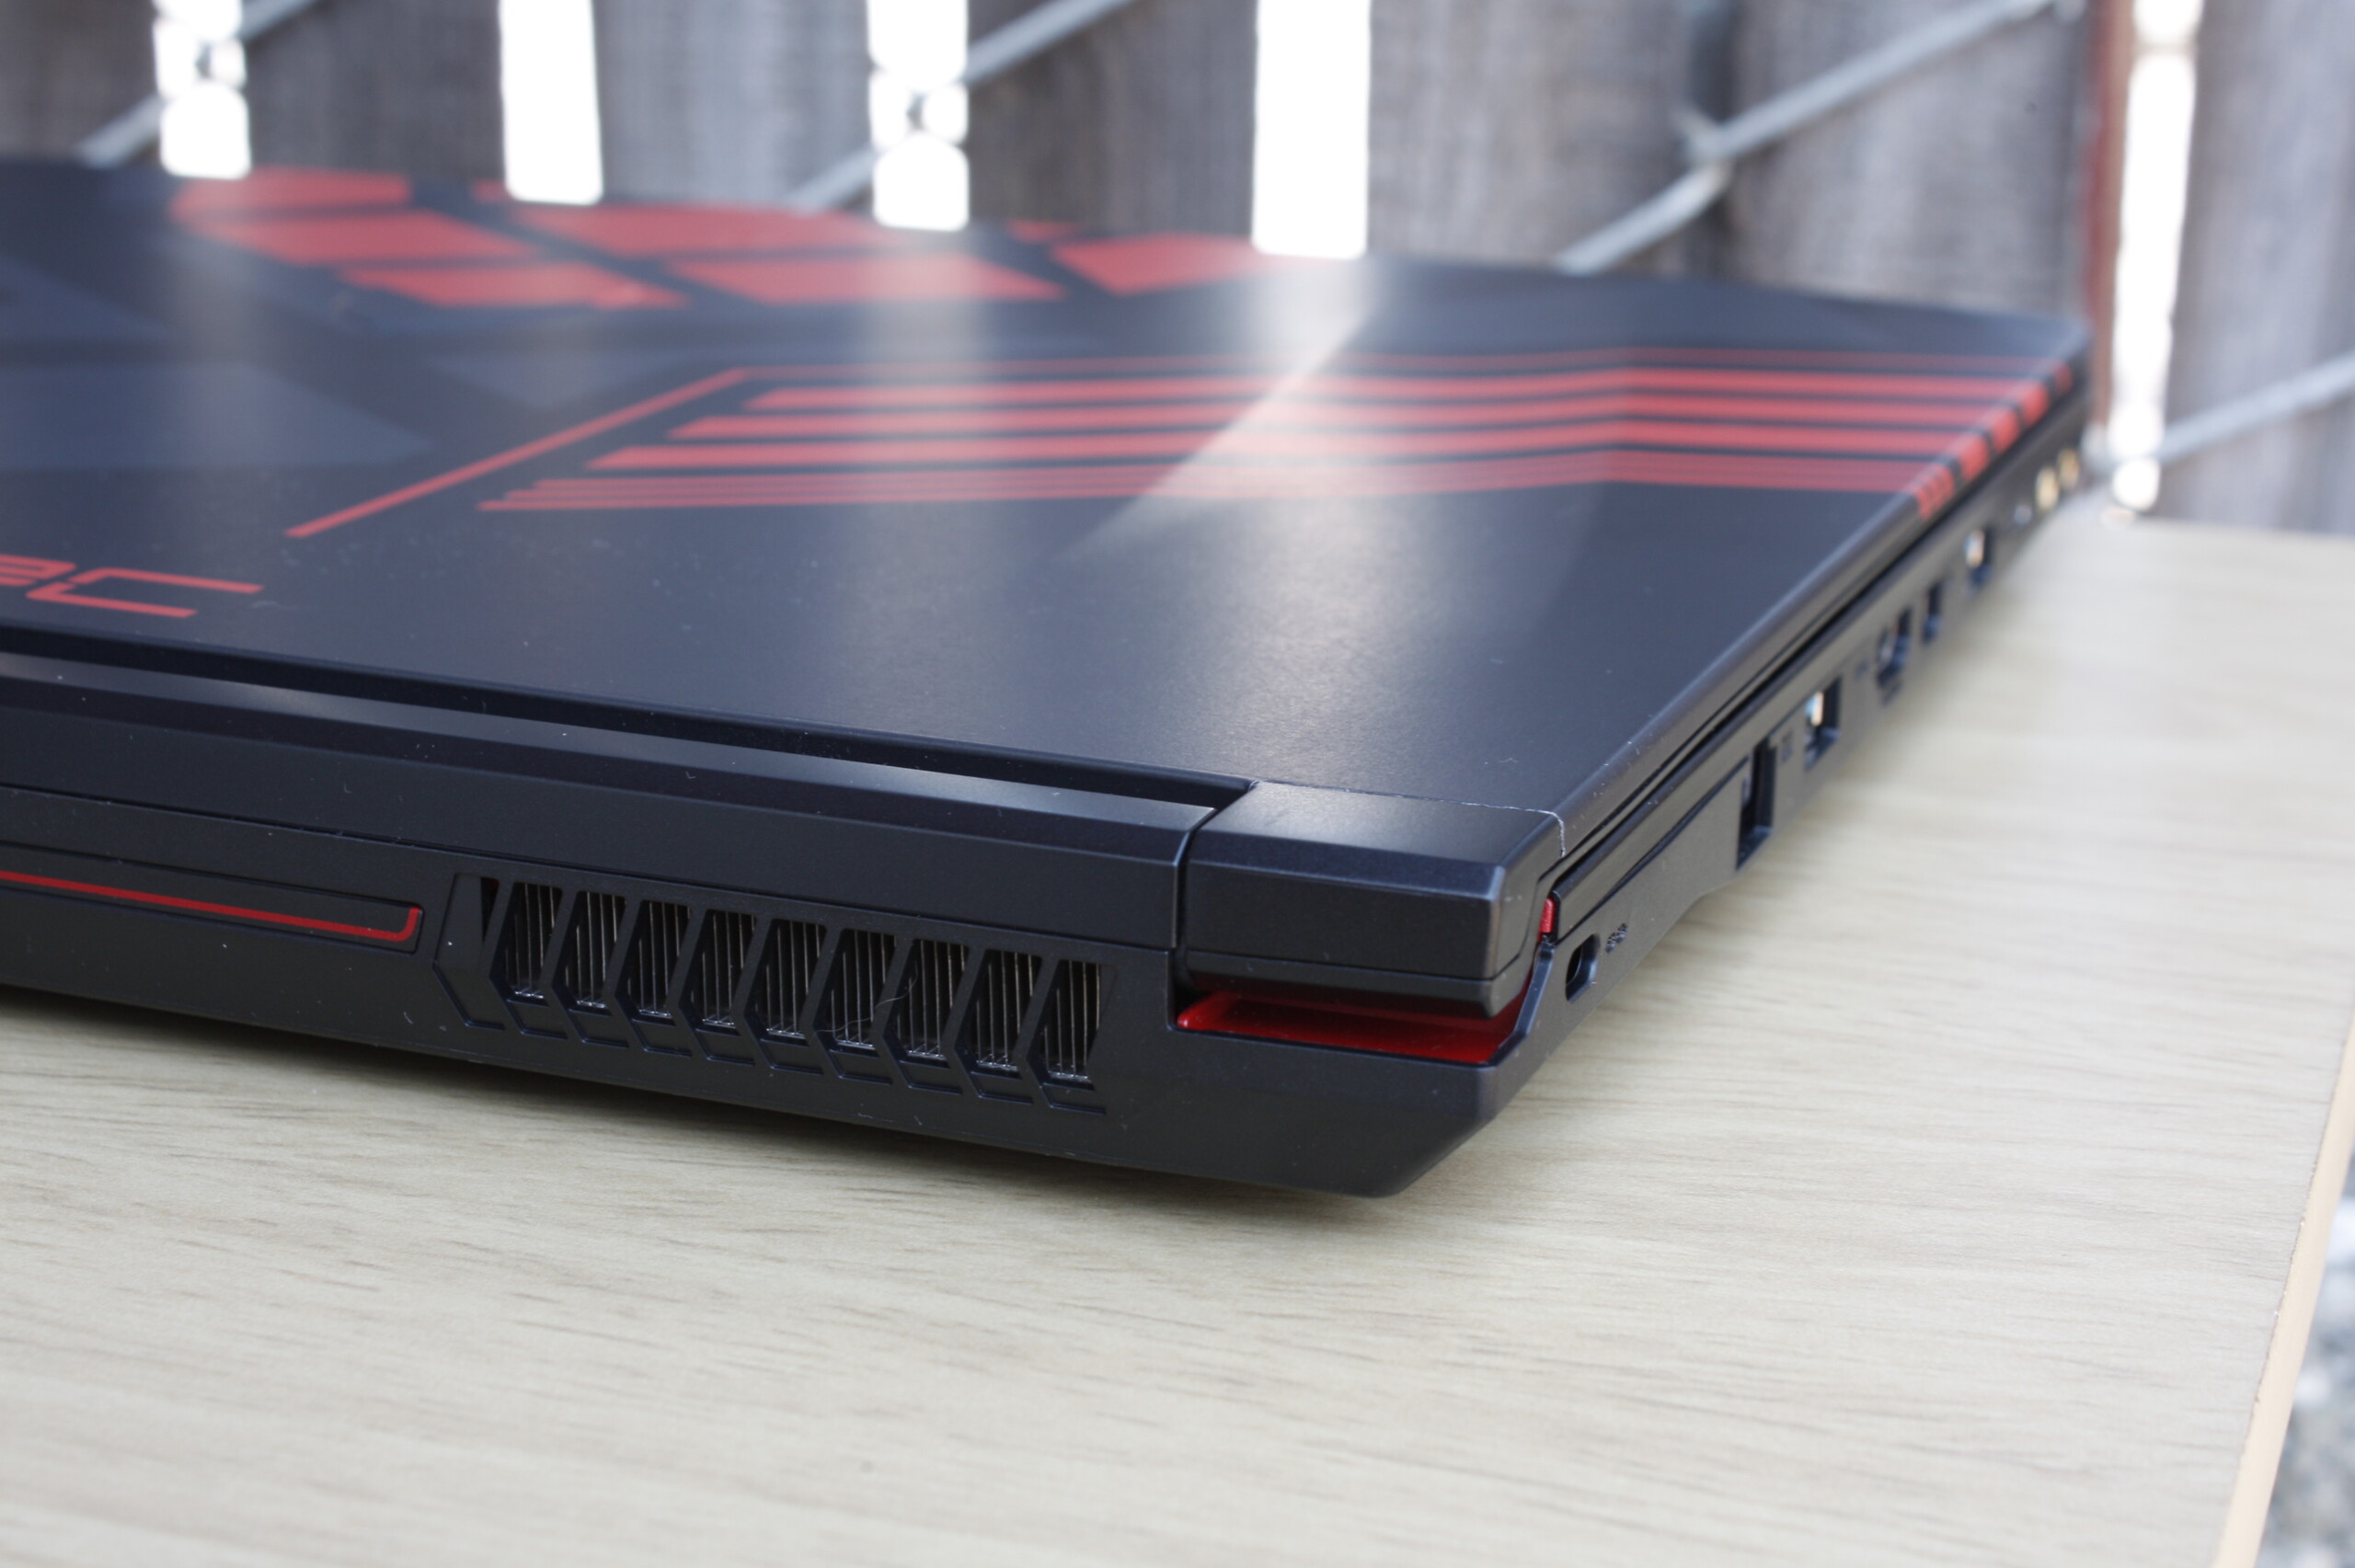
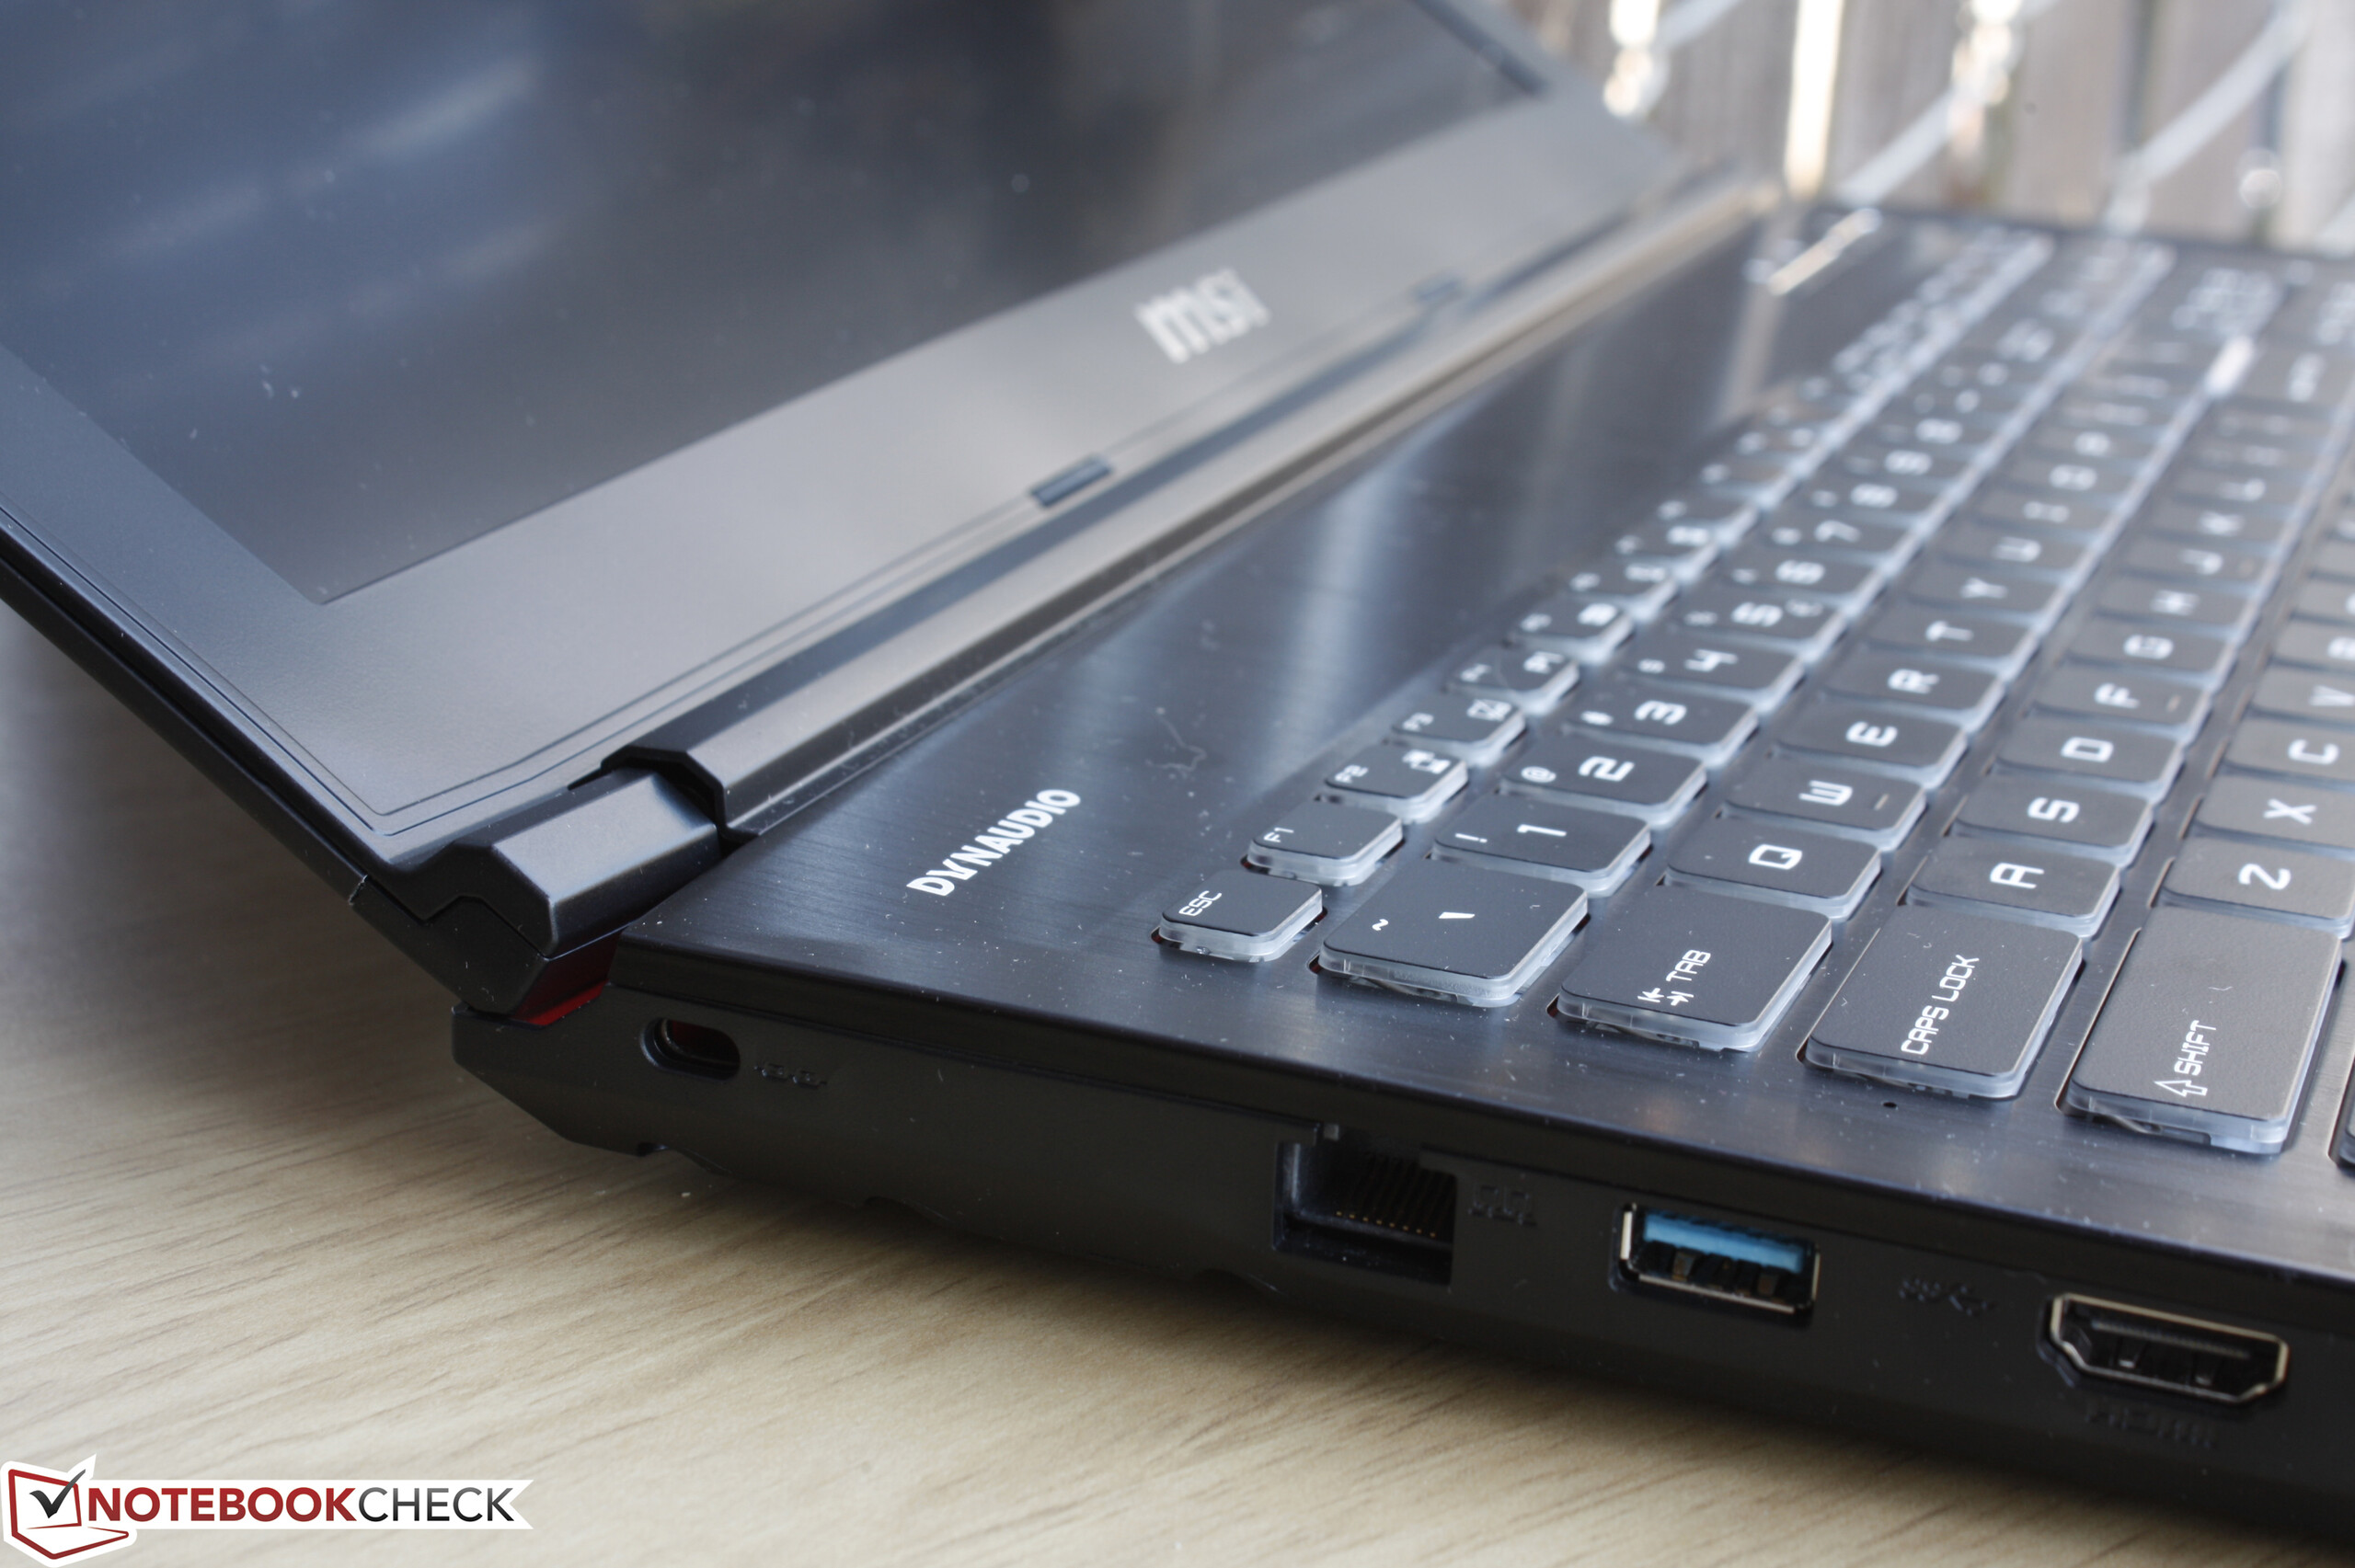
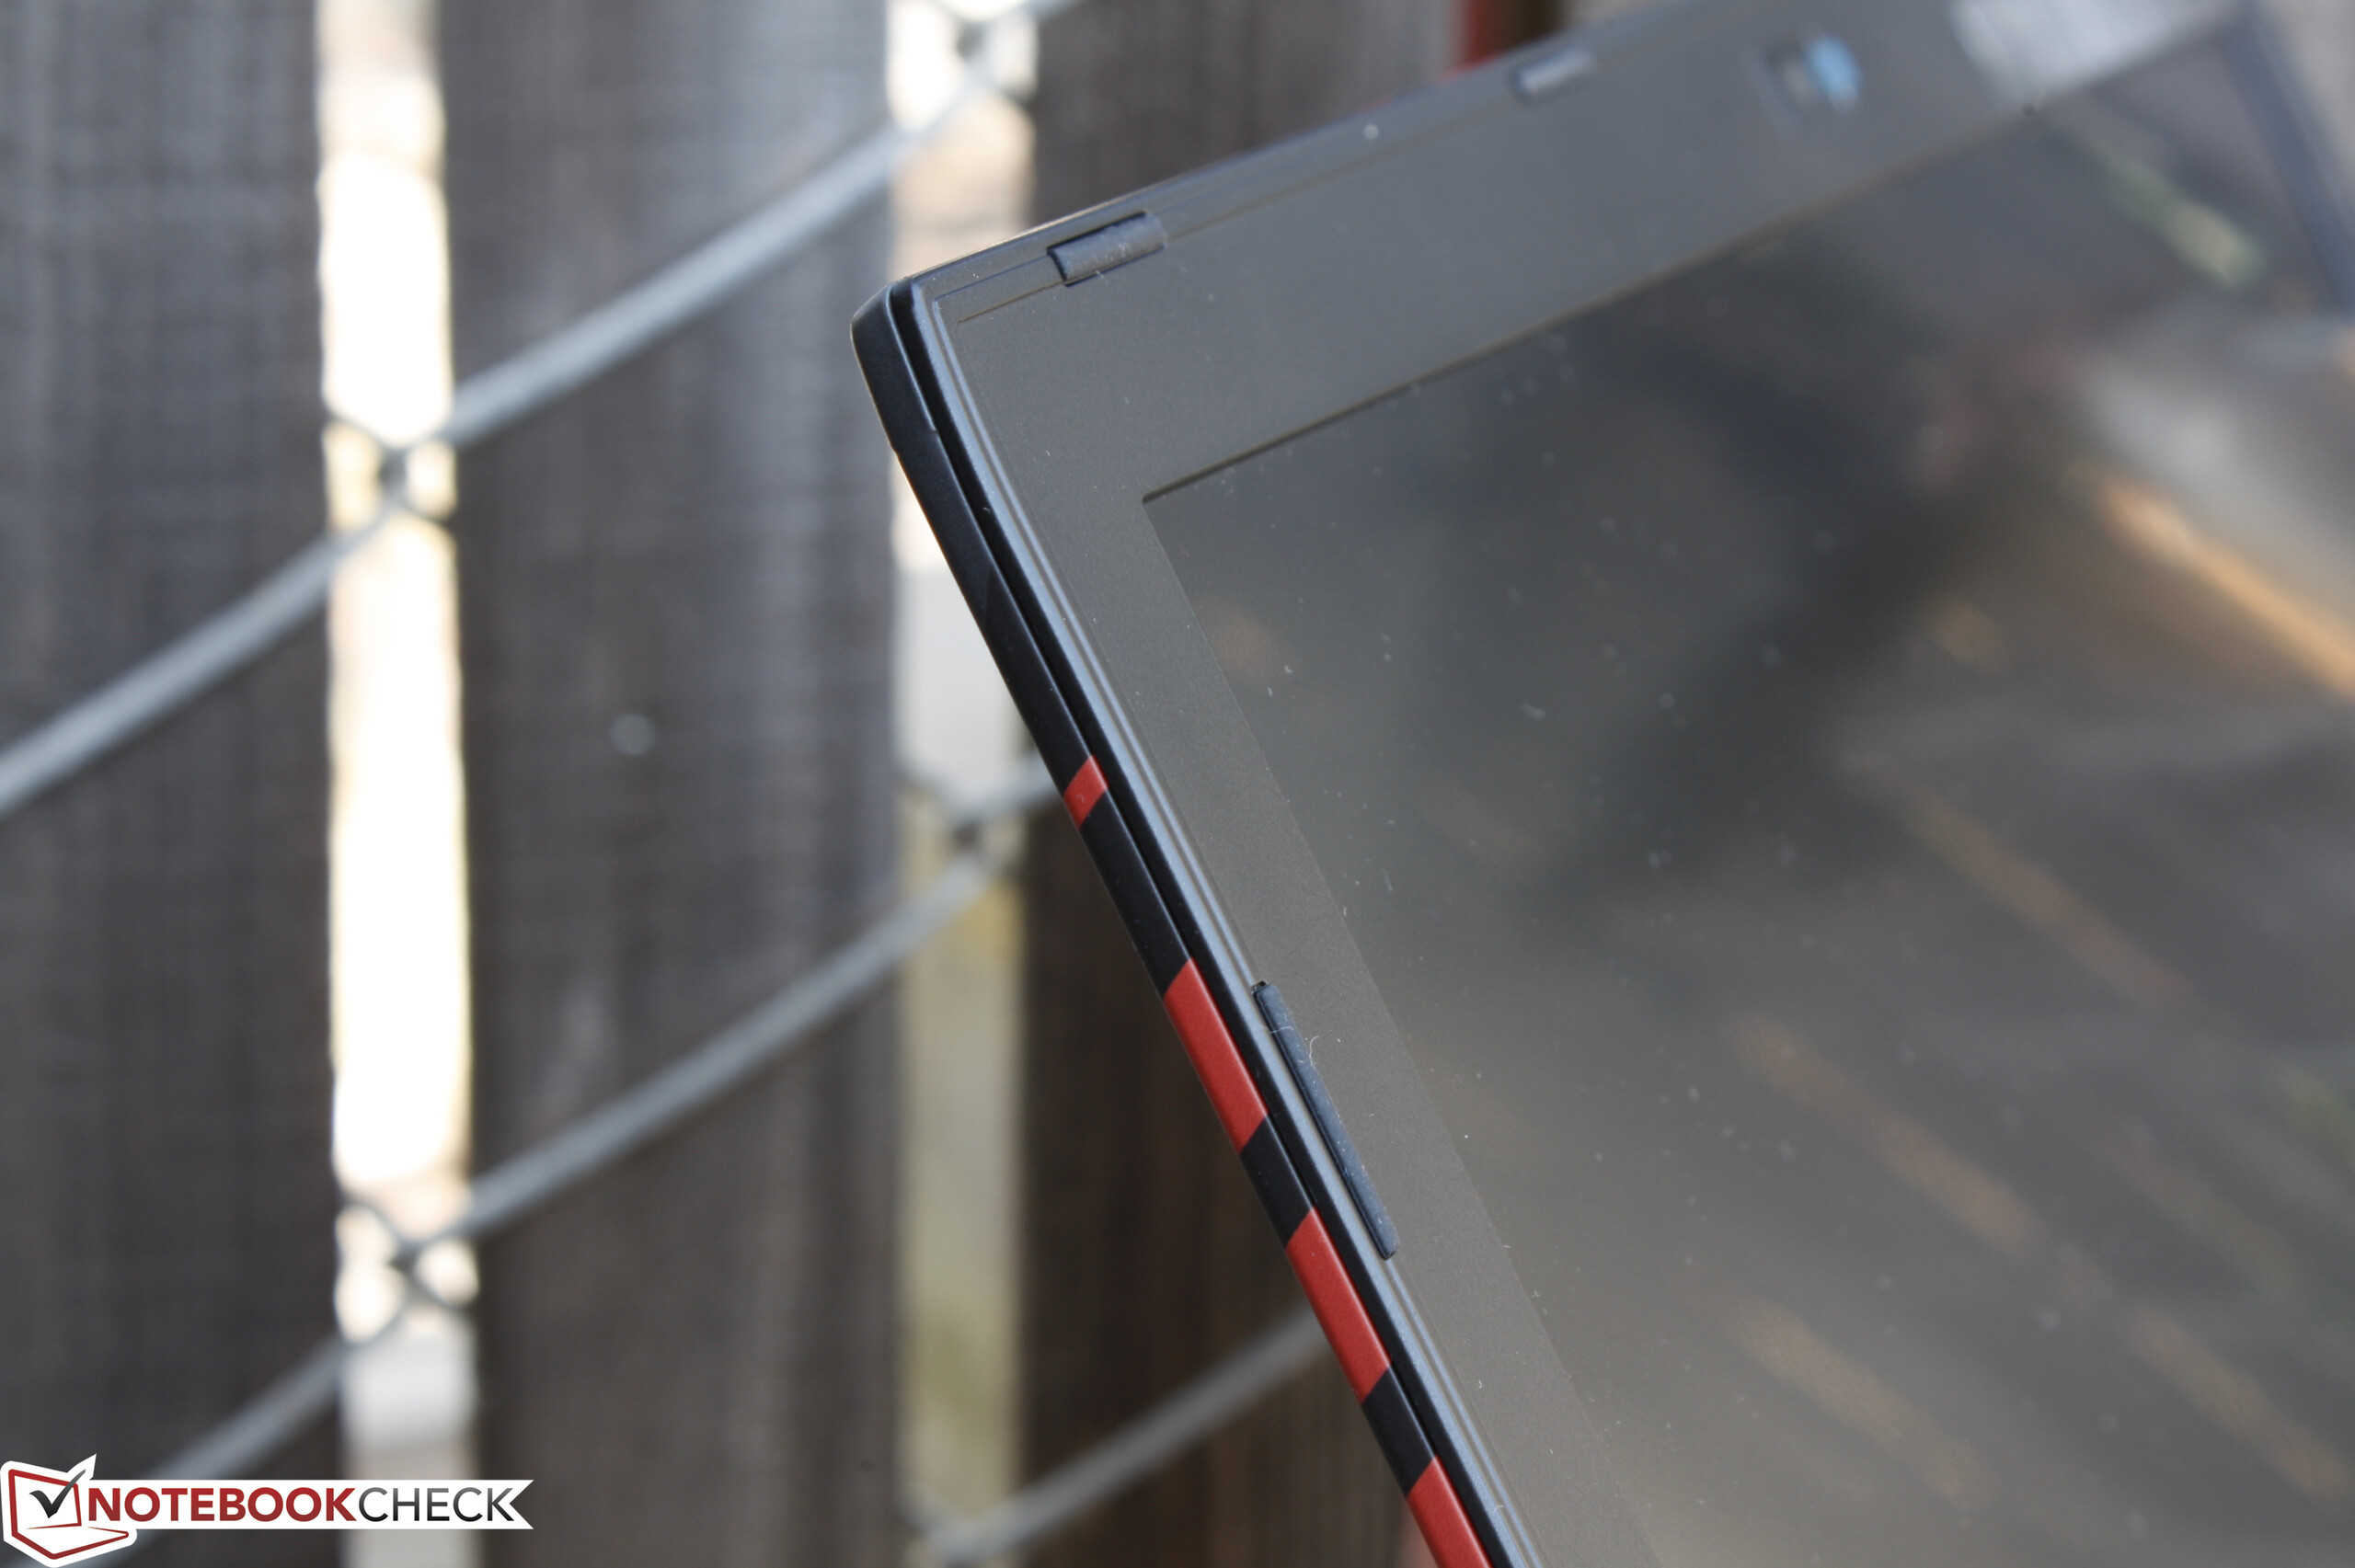
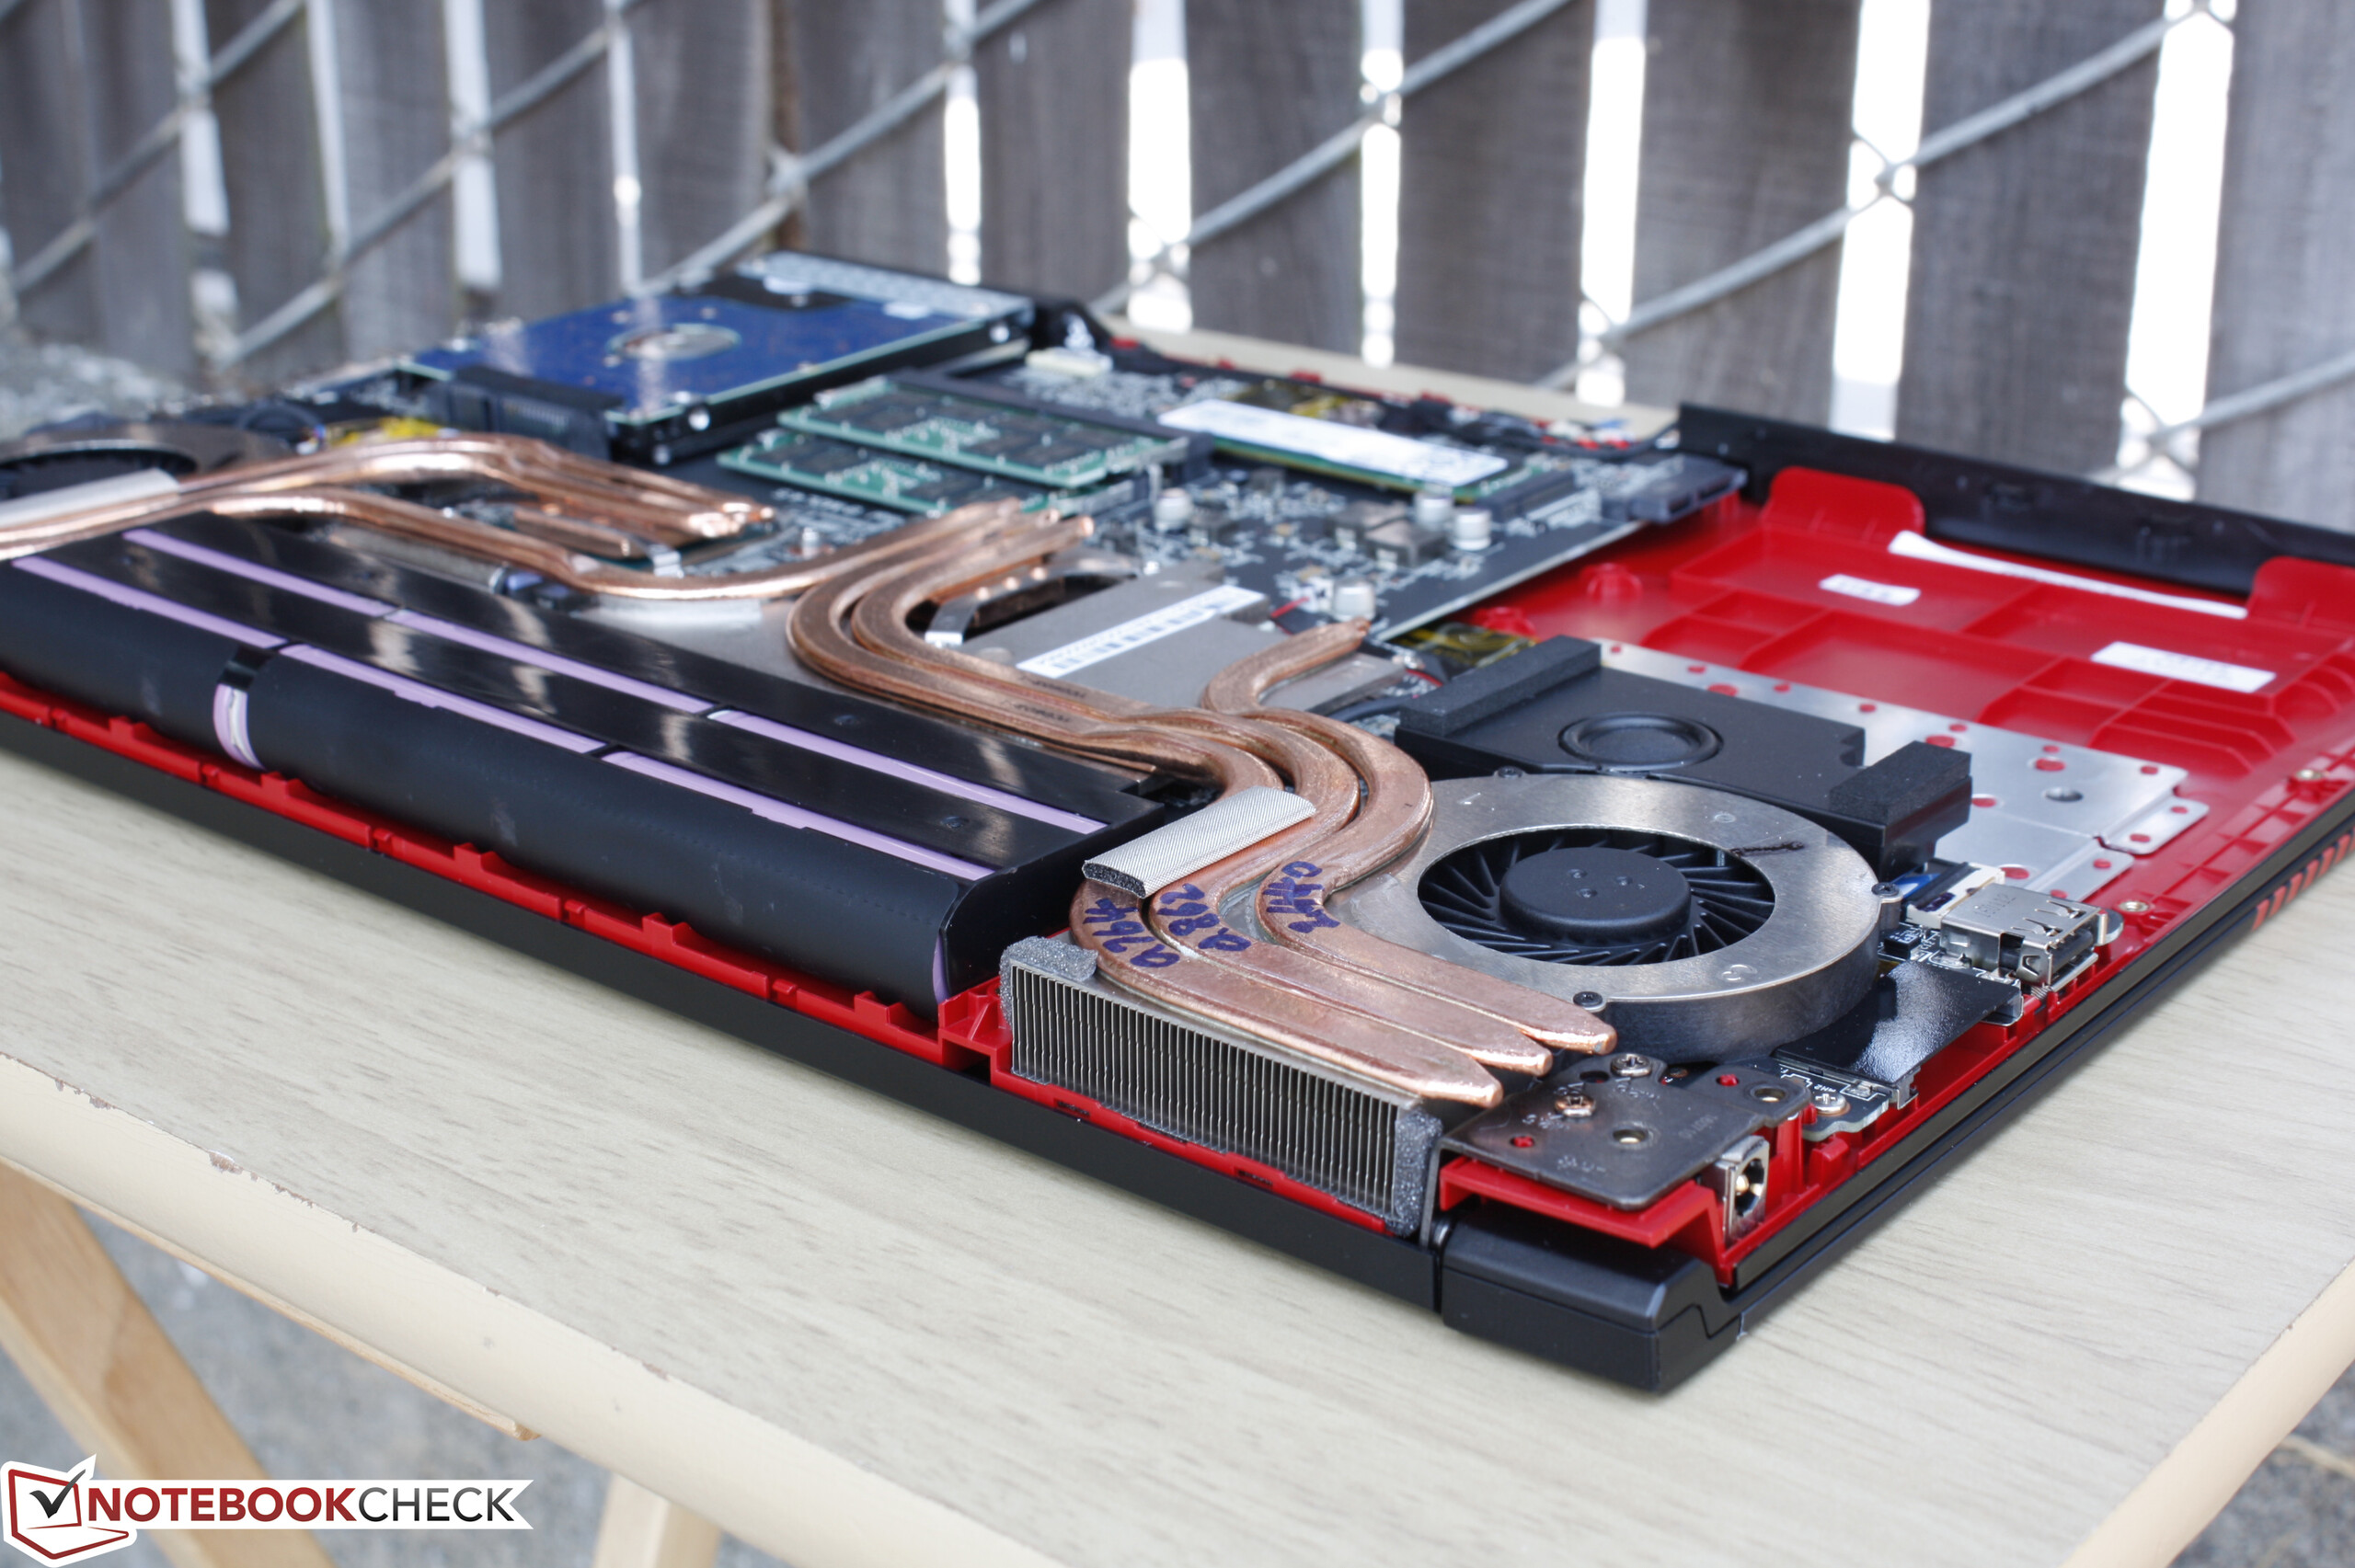
和GE62一样,它因为只是更换了一些核心组件,整体的优势和缺点都没有什么变化。它的电池续航仍然低于平均水平,屏幕上盖不够坚固,尽管采用了两个散热管,风扇噪音在各个负载强度下都清晰可闻。不均匀的屏幕背光和来自边缘的漏光液都让我们在测试中对微星的质量控制有些担忧。缺少一些功能如Thunderbolt 3,Sabre Audio DAC,和120赫兹屏幕刷新率让它继续与更高端的微星G系列保持了一定距离。
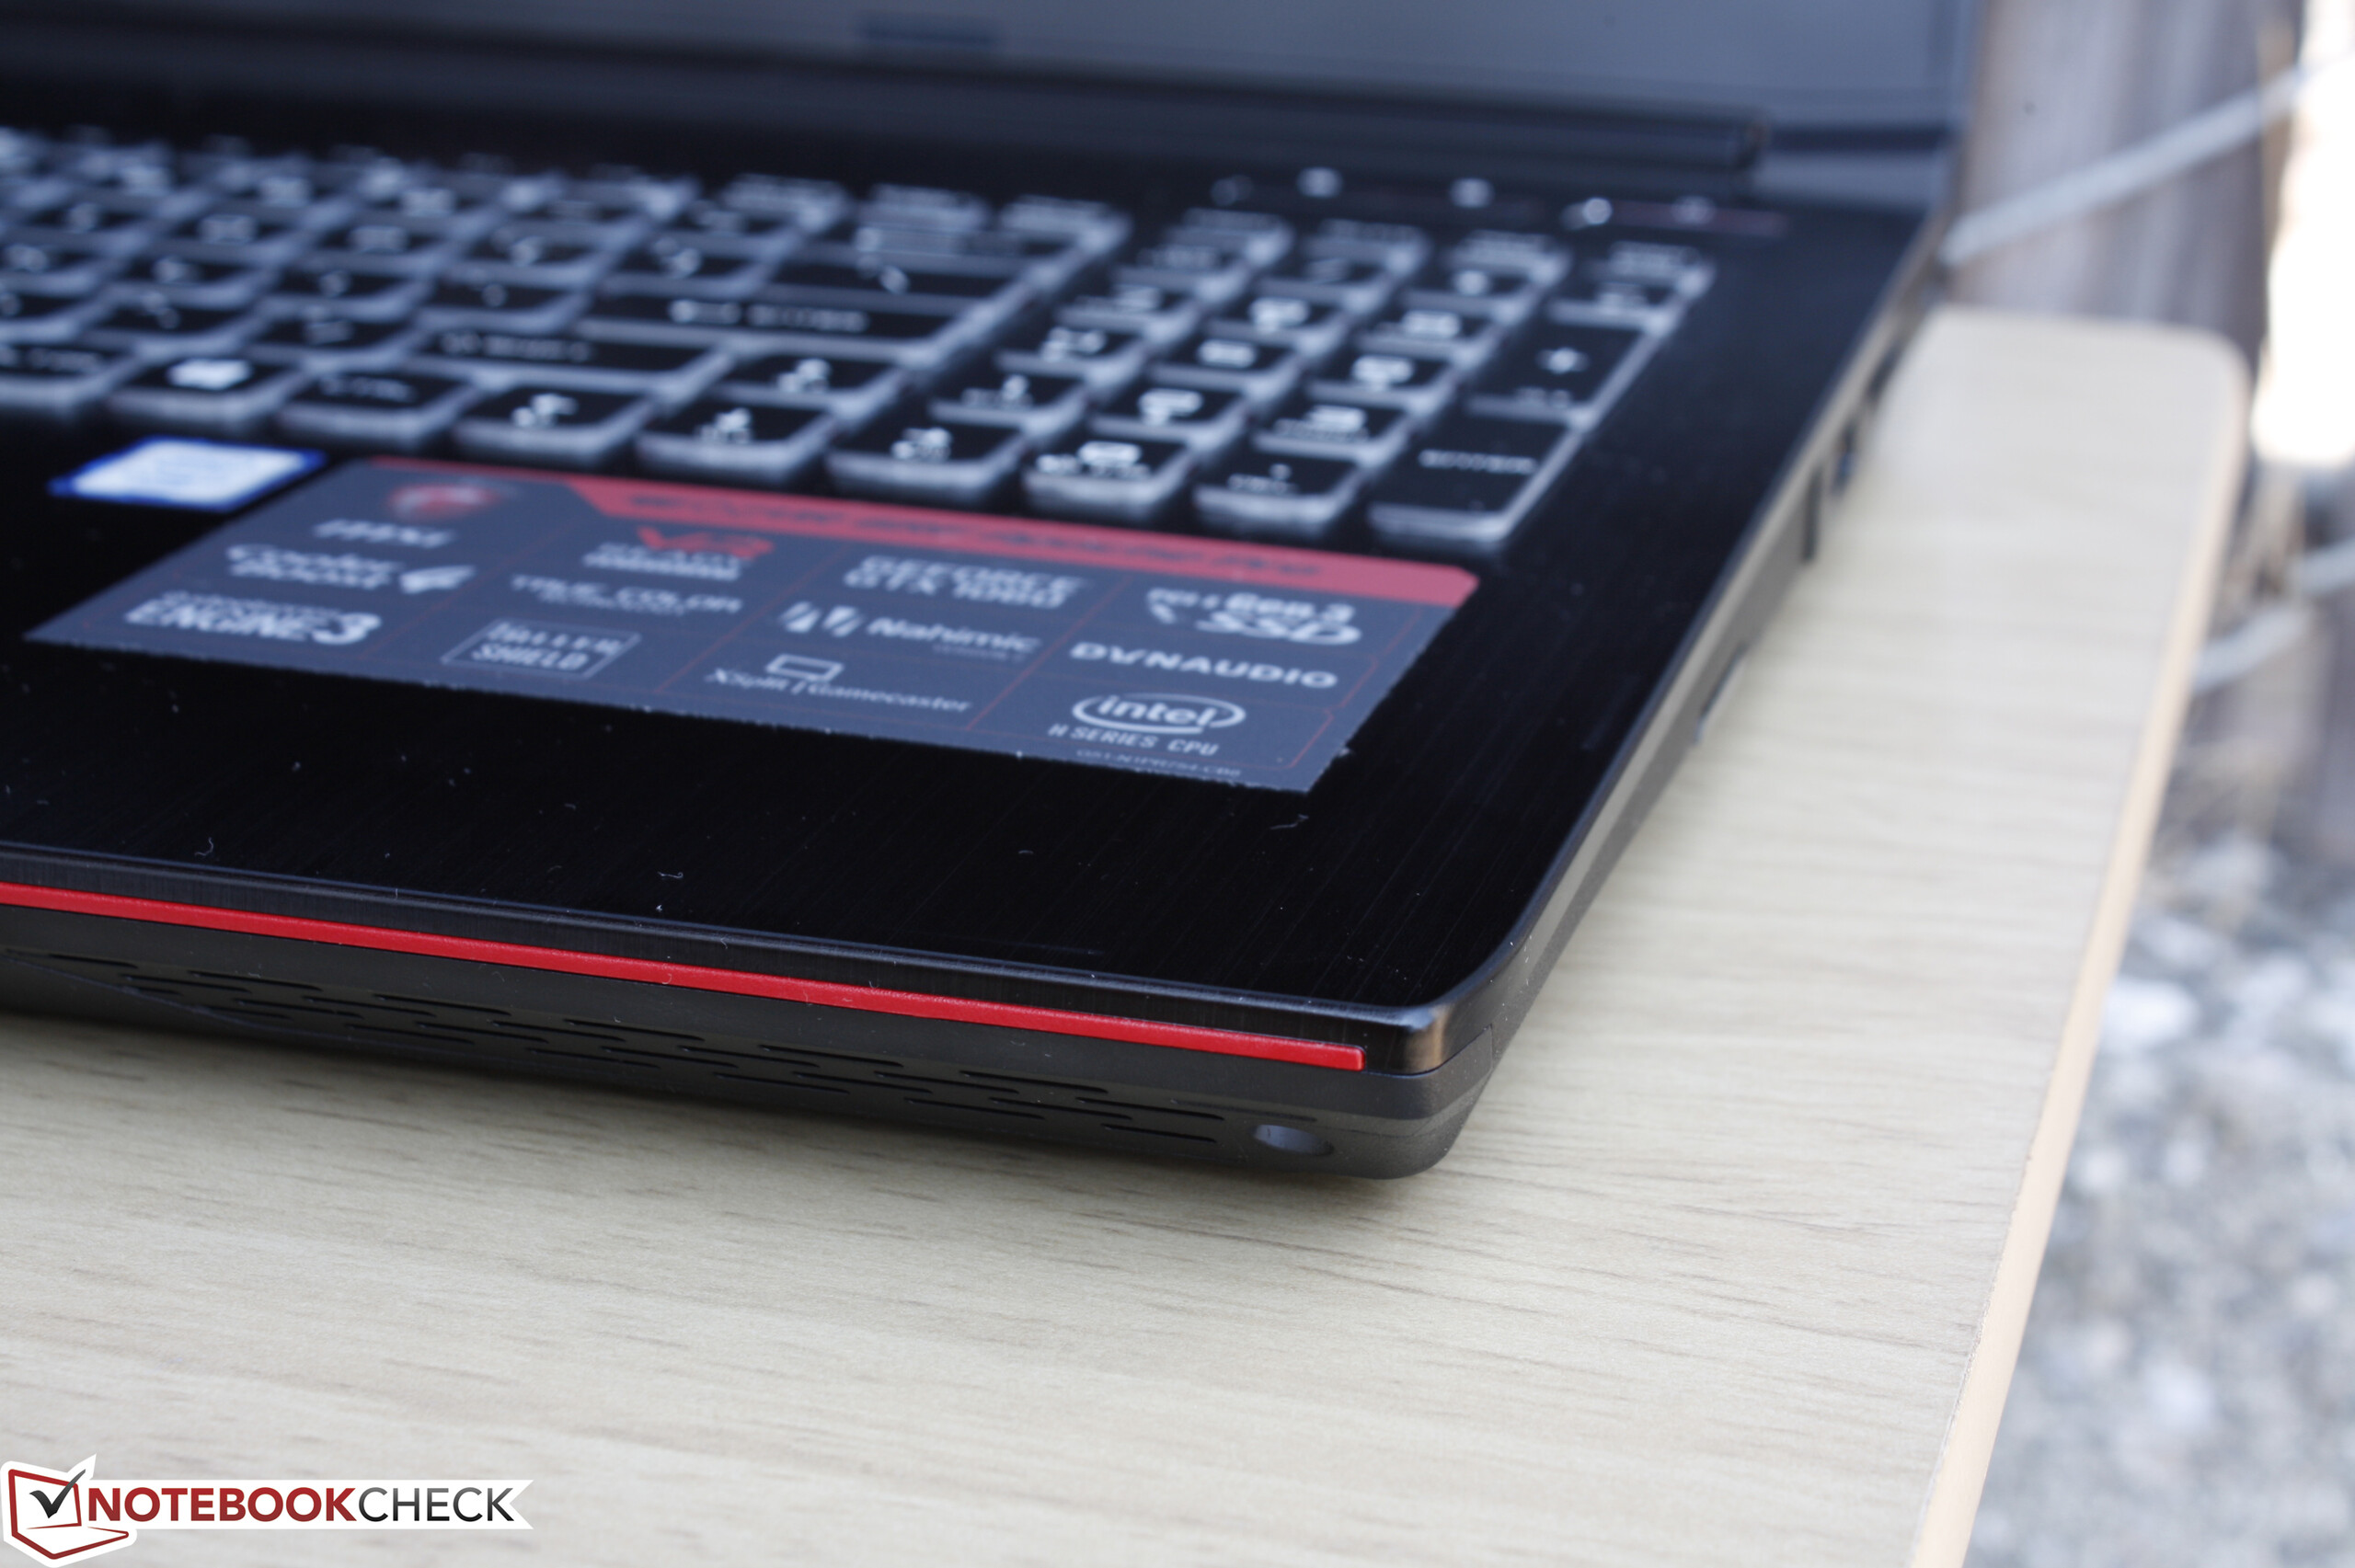
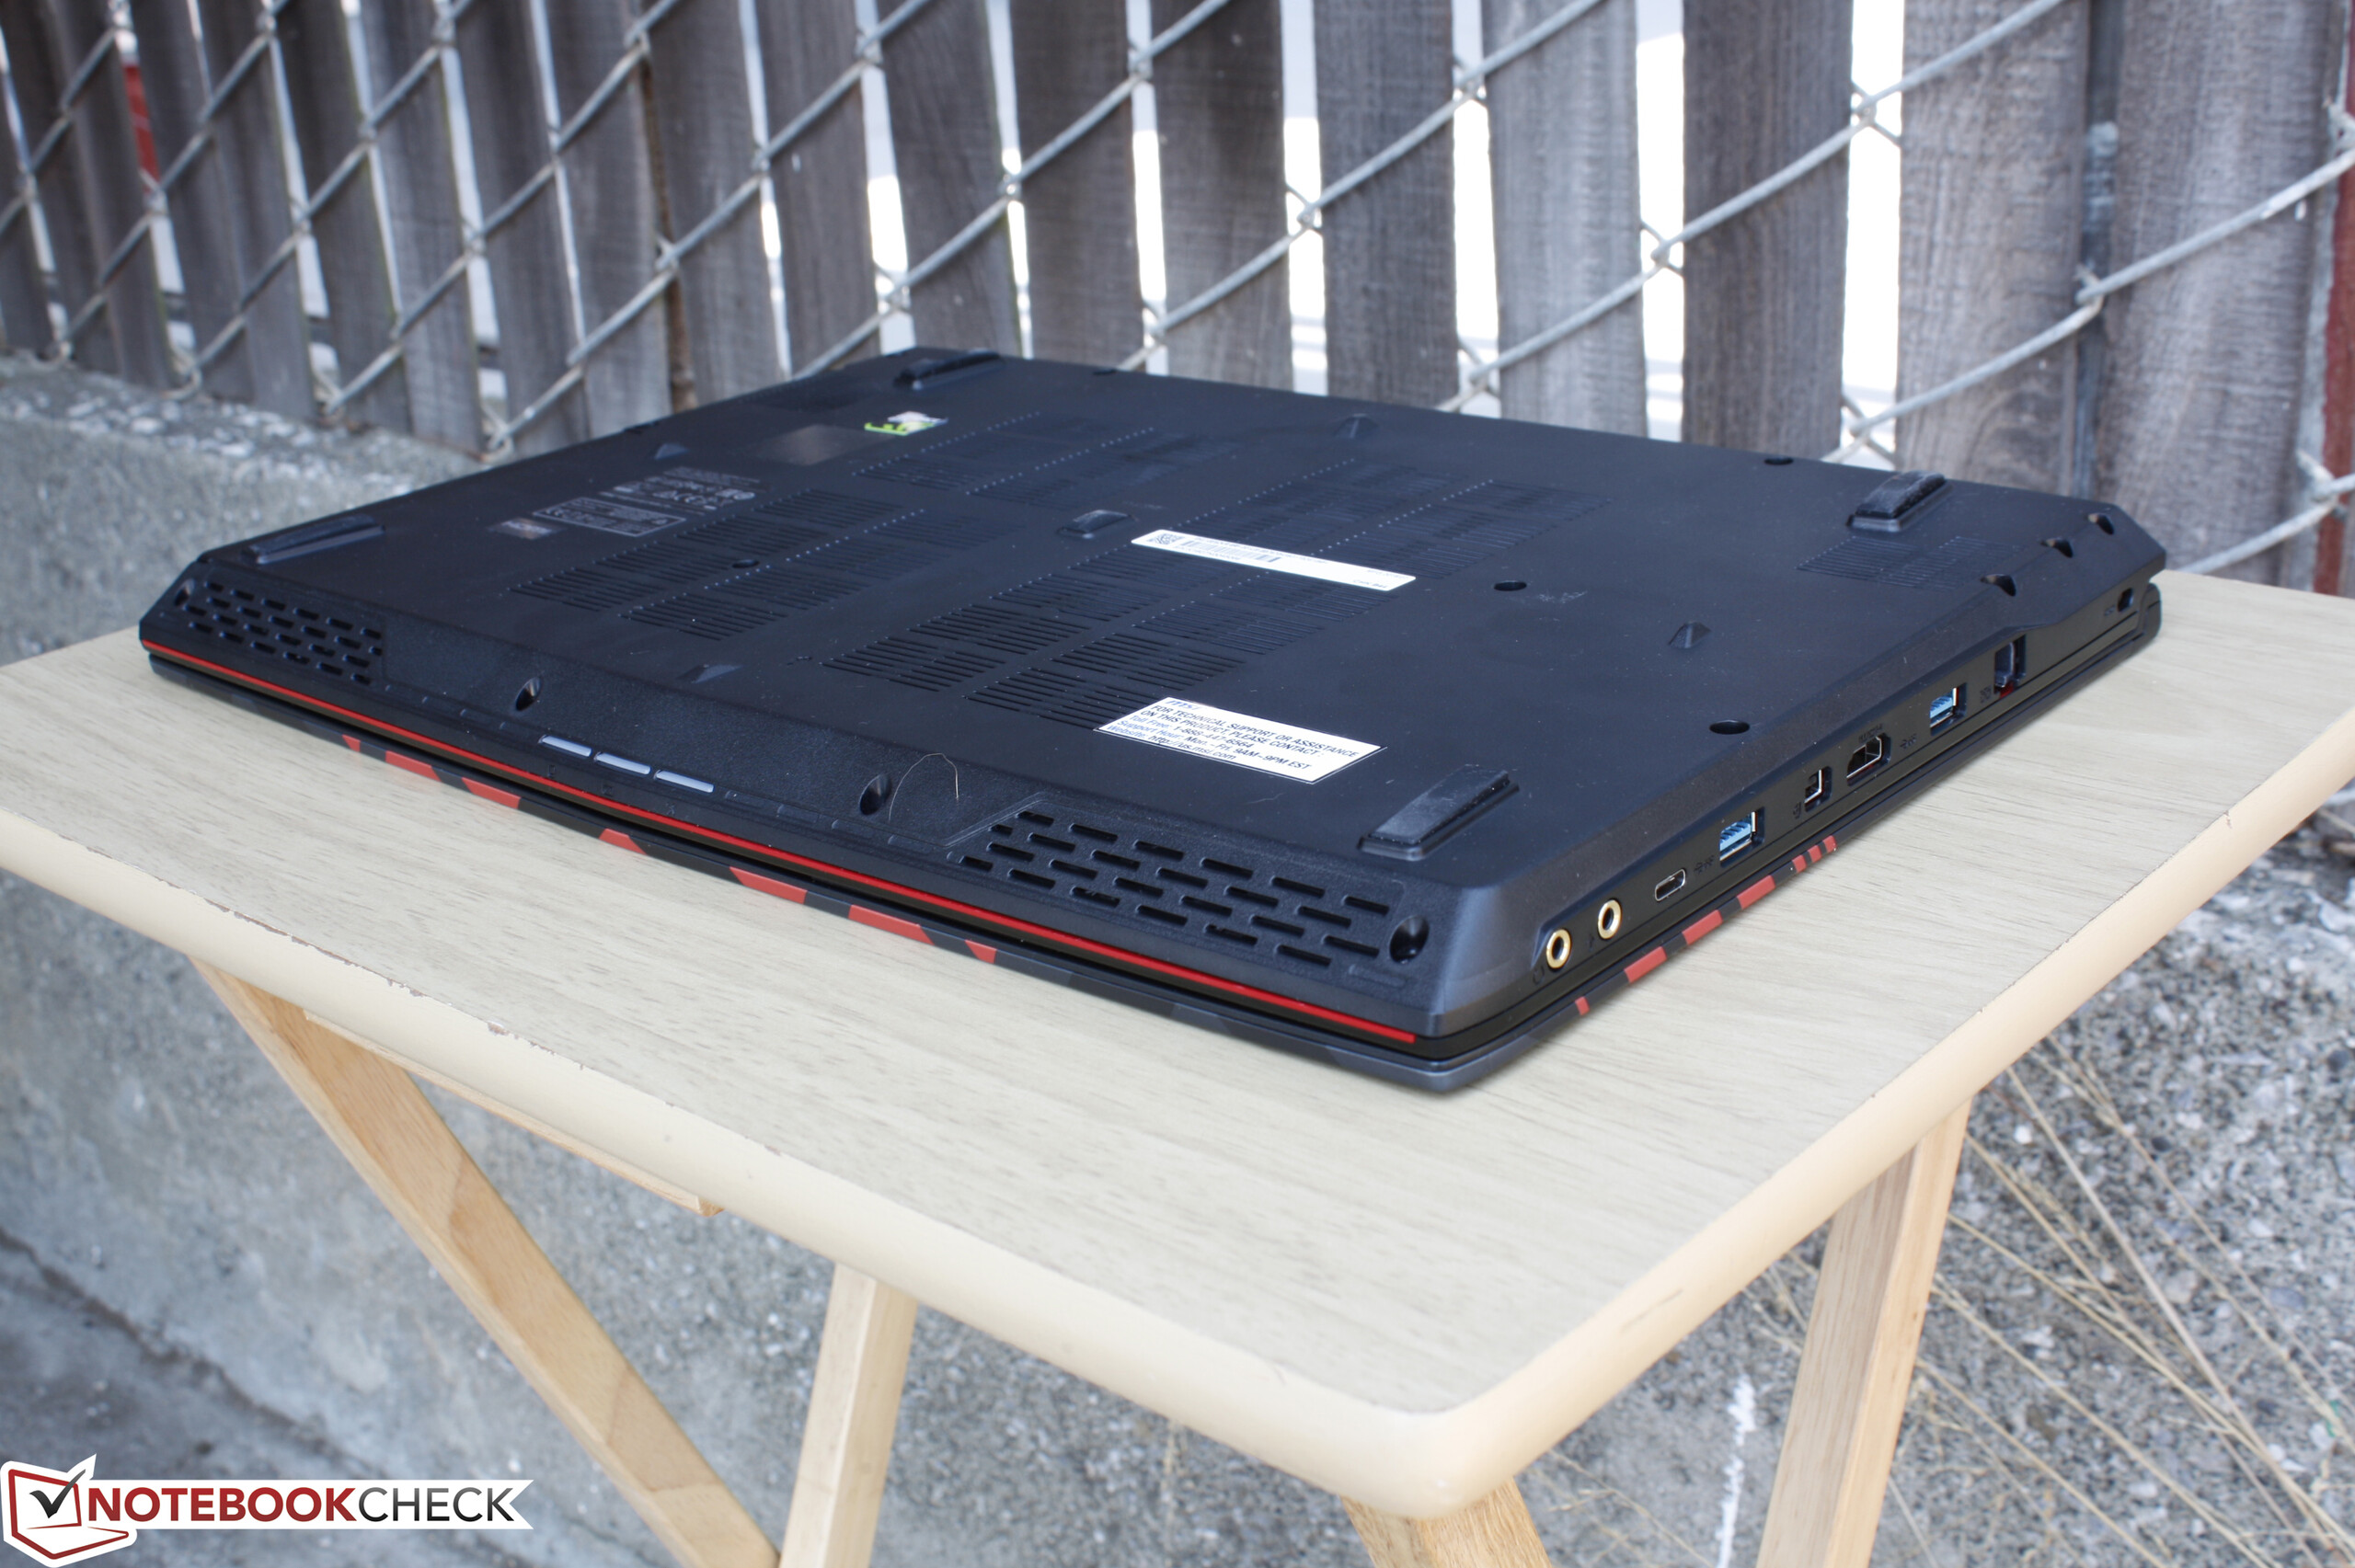
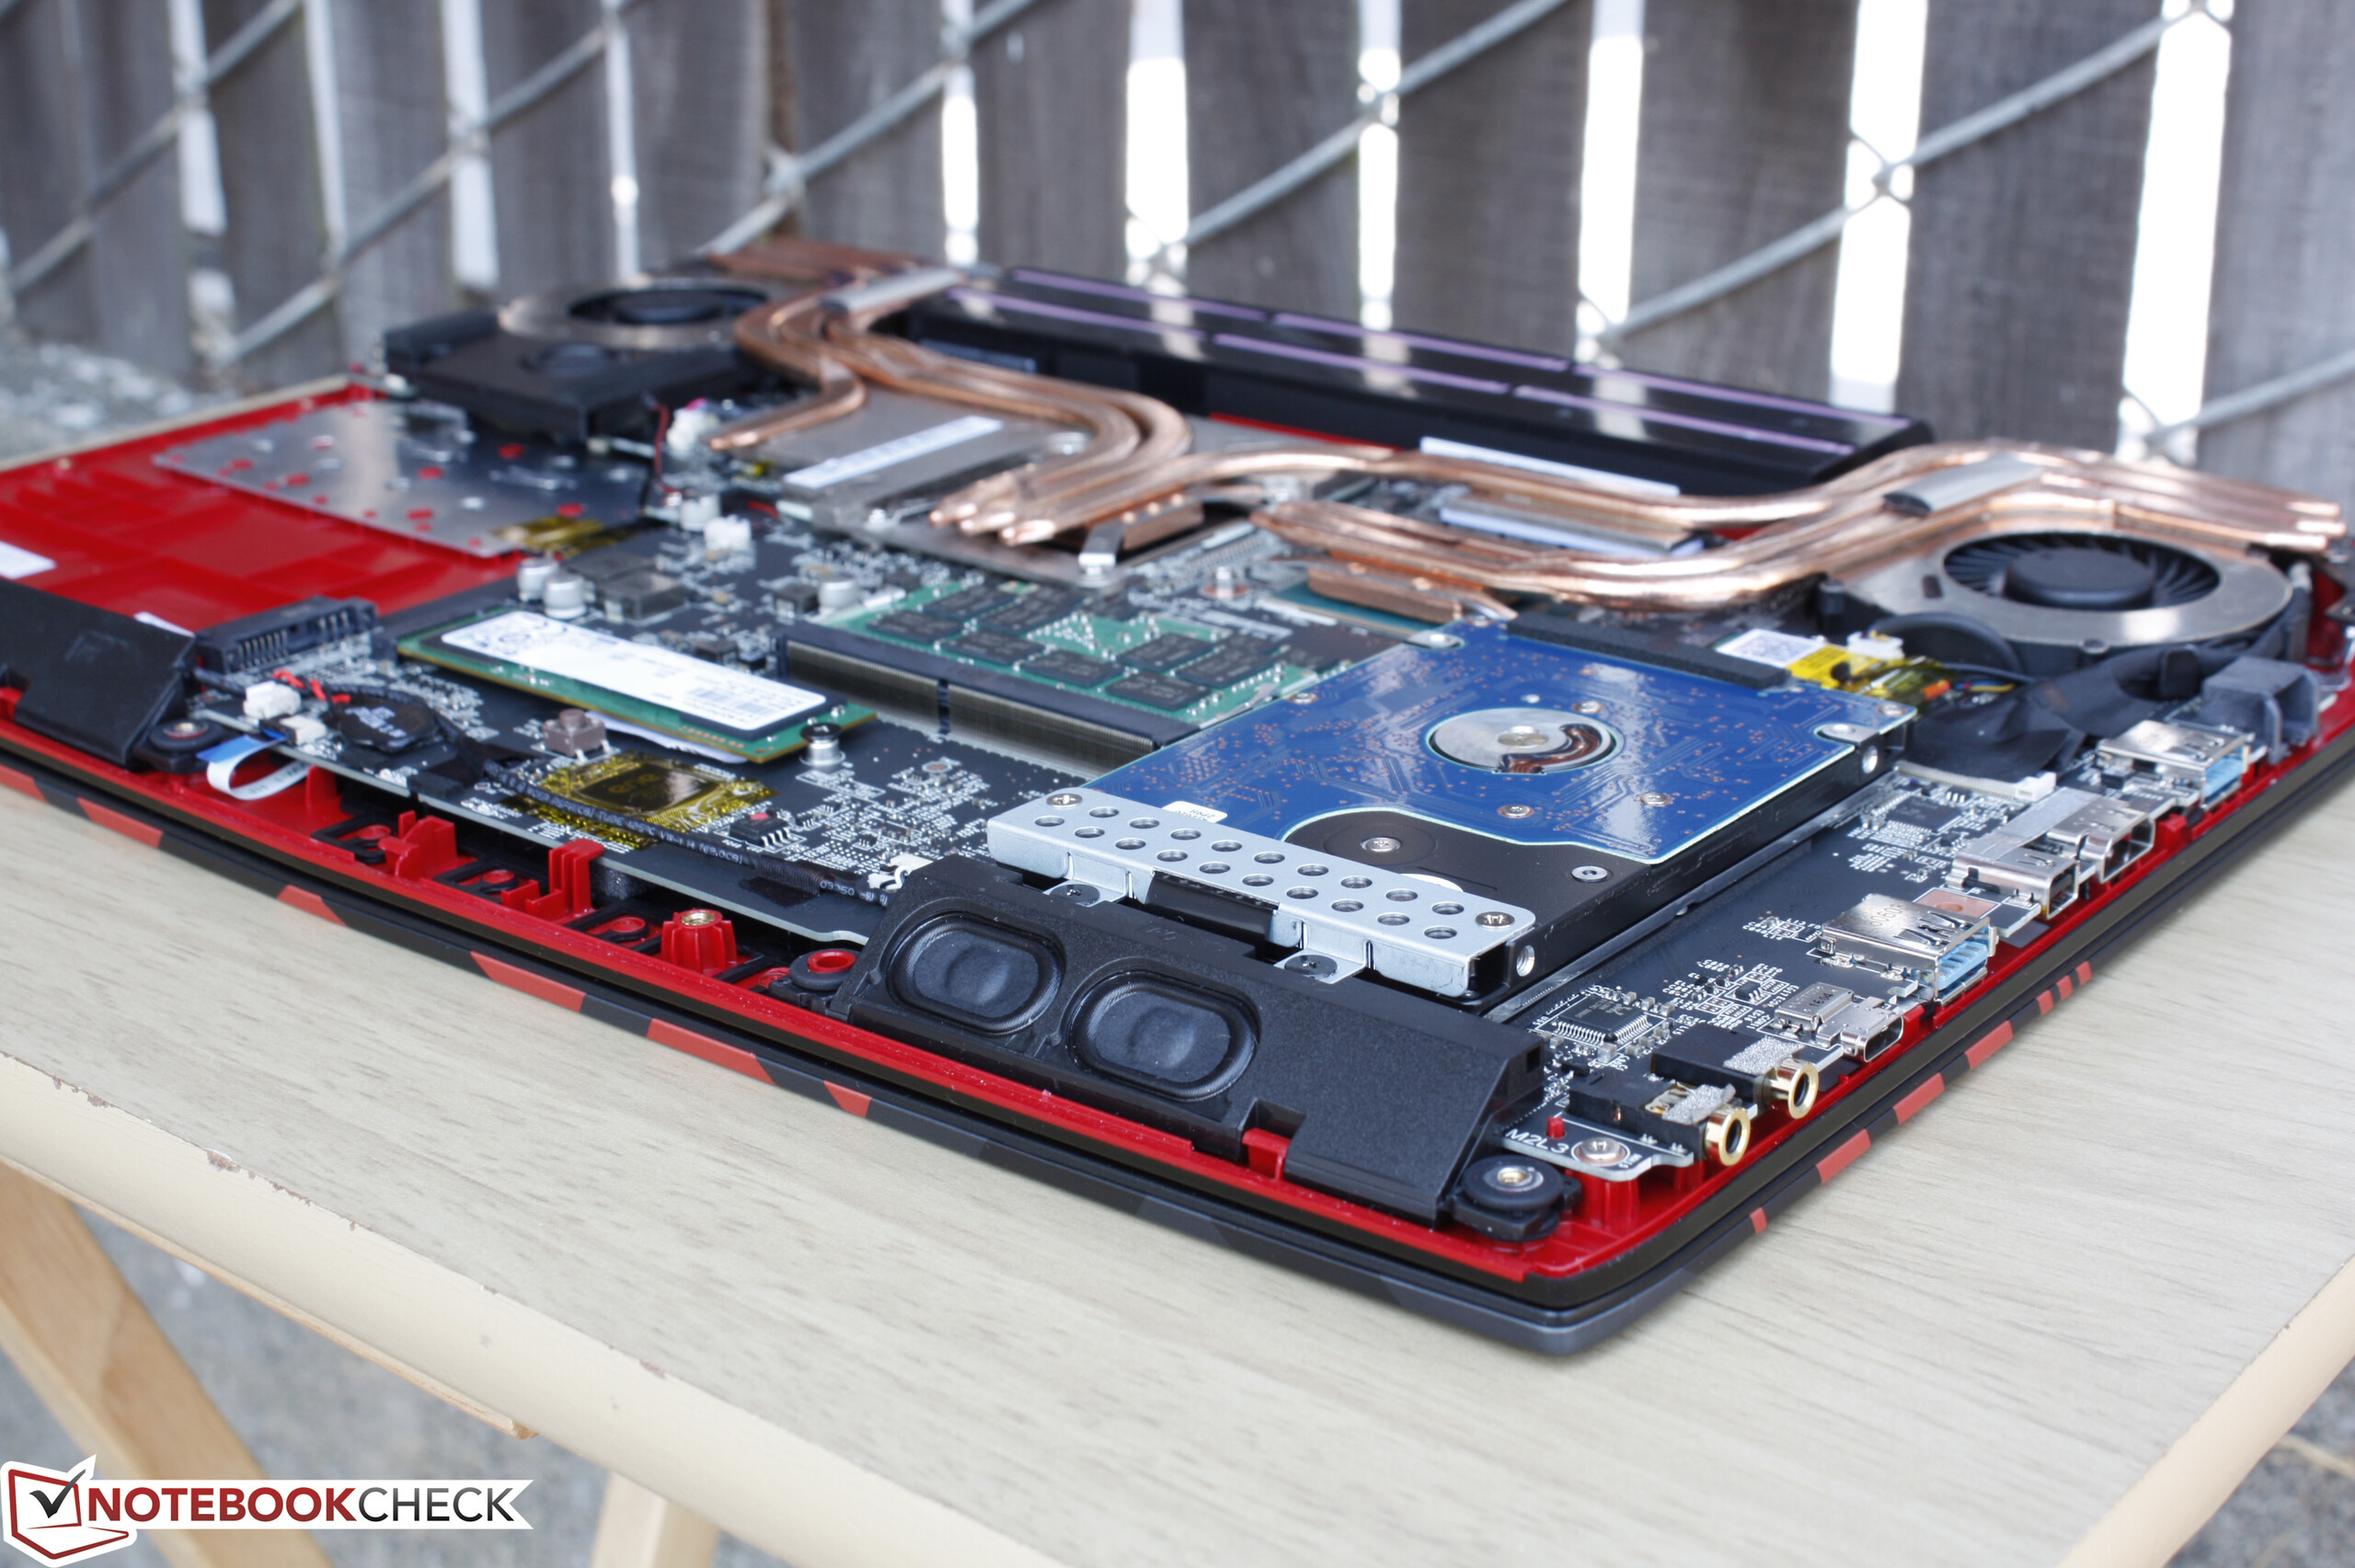
GE系列的重点是核心性能,而GE62VR在这方面做得十分不错。它几乎不会有过热降频问题,核心温度保持在了较低的水平。它依然接近于准系统给人带来的感觉,只是相比之前更清凉、更高速了。
注:本文是基于完整评测的缩减版本,阅读完整的英文评测,请点击这里。
MSI GE62VR 6RF-001US
- 09/08/2016 v5.1 (old)
Allen Ngo
Price comparison
