华硕 Strix GL502VM-DS74 Xotic PC Edition 笔记本电脑简短评测


| SD Card Reader | |
| average JPG Copy Test (av. of 3 runs) | |
| Eurocom Tornado F5 | |
| Asus Strix GL502VM-DS74 | |
| MSI GL62-6QFi781H11 | |
| maximum AS SSD Seq Read Test (1GB) | |
| Eurocom Tornado F5 | |
| Asus Strix GL502VM-DS74 | |
| MSI GL62-6QFi781H11 | |
| Networking | |
| iperf3 transmit AX12 | |
| MSI GT73VR 7RF-296 | |
| Dell XPS 13 9360 FHD i5 | |
| Asus Strix GL502VM-DS74 | |
| iperf3 receive AX12 | |
| MSI GT73VR 7RF-296 | |
| Dell XPS 13 9360 FHD i5 | |
| Asus Strix GL502VM-DS74 | |
| |||||||||||||||||||||||||
Brightness Distribution: 88 %
Center on Battery: 307.8 cd/m²
Contrast: 933:1 (Black: 0.33 cd/m²)
ΔE ColorChecker Calman: 4.5 | ∀{0.5-29.43 Ø4.71}
ΔE Greyscale Calman: 2.9 | ∀{0.09-98 Ø4.96}
84.8% sRGB (Argyll 1.6.3 3D)
55.4% AdobeRGB 1998 (Argyll 1.6.3 3D)
62% AdobeRGB 1998 (Argyll 3D)
84.9% sRGB (Argyll 3D)
64.8% Display P3 (Argyll 3D)
Gamma: 2.22
CCT: 1136 K
| Asus Strix GL502VM-DS74 IPS, 15.6", 1920x1080 | MSI GL62-6QFi781H11 CMN N156HGE-EAL (CMN15D2), TN LED, 15.6", 1920x1080 | Acer Predator 15 G9-593-765Q LG Philips LP156WF6-SPP1 (LGD04D5), IPS, 15.6", 1920x1080 | Asus Zenbook UX510UW-CN044T LG Philips LP156WF6-SPB6, IPS, 15.6", 1920x1080 | MSI GS63VR-6RF16H22 Stealth Pro Samsung 156HL01-104 (SDC324C) , IPS, 15.6", 1920x1080 | |
|---|---|---|---|---|---|
| Display | 29% | -1% | -5% | 11% | |
| Display P3 Coverage (%) | 64.8 | 85.8 32% | 63.6 -2% | 61.5 -5% | 67.8 5% |
| sRGB Coverage (%) | 84.9 | 99.8 18% | 83.9 -1% | 80.4 -5% | 97.4 15% |
| AdobeRGB 1998 Coverage (%) | 62 | 84.1 36% | 61.3 -1% | 58.8 -5% | 69.7 12% |
| Response Times | 14% | 21% | 13% | 21% | |
| Response Time Grey 50% / Grey 80% * (ms) | 42 ? | 43 ? -2% | 35 ? 17% | 40 ? 5% | |
| Response Time Black / White * (ms) | 32.8 ? | 23 ? 30% | 25 ? 24% | 26 ? 21% | 26 ? 21% |
| PWM Frequency (Hz) | 1000 ? | 202 ? | |||
| Screen | -58% | 2% | -12% | 4% | |
| Brightness middle (cd/m²) | 307.8 | 216 -30% | 273 -11% | 326 6% | 293 -5% |
| Brightness (cd/m²) | 301 | 202 -33% | 267 -11% | 316 5% | 279 -7% |
| Brightness Distribution (%) | 88 | 83 -6% | 83 -6% | 80 -9% | 84 -5% |
| Black Level * (cd/m²) | 0.33 | 0.48 -45% | 0.27 18% | 0.35 -6% | 0.33 -0% |
| Contrast (:1) | 933 | 450 -52% | 1011 8% | 931 0% | 888 -5% |
| Colorchecker dE 2000 * | 4.5 | 9.98 -122% | 3.77 16% | 5.49 -22% | 3.59 20% |
| Colorchecker dE 2000 max. * | 10 | 17.12 -71% | 10.64 -6% | 11.36 -14% | 5.79 42% |
| Greyscale dE 2000 * | 2.9 | 10.91 -276% | 2.48 14% | 4.84 -67% | 3.86 -33% |
| Gamma | 2.22 99% | 2.31 95% | 2.37 93% | 2.23 99% | 2.53 87% |
| CCT | 1136 572% | 13185 49% | 6854 95% | 5971 109% | 7229 90% |
| Color Space (Percent of AdobeRGB 1998) (%) | 55.4 | 75 35% | 55 -1% | 53 -4% | 63 14% |
| Color Space (Percent of sRGB) (%) | 84.8 | 100 18% | 84 -1% | 80 -6% | 97 14% |
| Total Average (Program / Settings) | -5% /
-31% | 7% /
4% | -1% /
-7% | 12% /
6% |
* ... smaller is better
Display Response Times
| ↔ Response Time Black to White | ||
|---|---|---|
| 32.8 ms ... rise ↗ and fall ↘ combined | ↗ 6 ms rise | 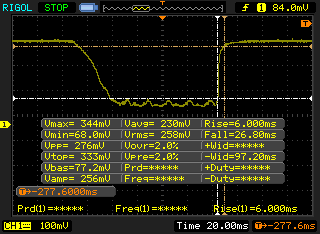 |
| ↘ 26.8 ms fall | ||
| The screen shows slow response rates in our tests and will be unsatisfactory for gamers. In comparison, all tested devices range from 0.1 (minimum) to 240 (maximum) ms. » 88 % of all devices are better. This means that the measured response time is worse than the average of all tested devices (19.8 ms). | ||
| ↔ Response Time 50% Grey to 80% Grey | ||
| 42 ms ... rise ↗ and fall ↘ combined | ↗ 19.2 ms rise | 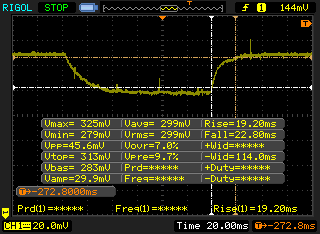 |
| ↘ 22.8 ms fall | ||
| The screen shows slow response rates in our tests and will be unsatisfactory for gamers. In comparison, all tested devices range from 0.165 (minimum) to 636 (maximum) ms. » 67 % of all devices are better. This means that the measured response time is worse than the average of all tested devices (31 ms). | ||
Screen Flickering / PWM (Pulse-Width Modulation)
| Screen flickering / PWM not detected | 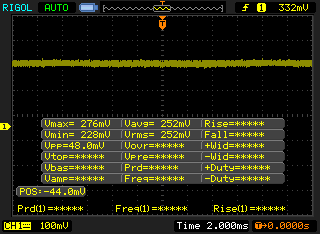 | ||
In comparison: 52 % of all tested devices do not use PWM to dim the display. If PWM was detected, an average of 7754 (minimum: 5 - maximum: 343500) Hz was measured. | |||
| Cinebench R10 | |
| Rendering Multiple CPUs 32Bit | |
| DogHouse Systems Mobius SS | |
| Asus Strix GL502VM-DS74 | |
| EVGA SC17 GTX 1070 | |
| Asus GL702VM-GC102D | |
| MSI GP62-2QEi781FD | |
| Rendering Single 32Bit | |
| DogHouse Systems Mobius SS | |
| Asus Strix GL502VM-DS74 | |
| EVGA SC17 GTX 1070 | |
| MSI GP62-2QEi781FD | |
| Asus GL702VM-GC102D | |
| wPrime 2.10 - 1024m | |
| EVGA SC17 GTX 1070 | |
| Asus Strix GL502VM-DS74 | |
| MSI GP62-2QEi781FD | |
| DogHouse Systems Mobius SS | |
| Super Pi Mod 1.5 XS 32M - 32M | |
| EVGA SC17 GTX 1070 | |
| MSI GP62-2QEi781FD | |
| Asus Strix GL502VM-DS74 | |
| DogHouse Systems Mobius SS | |
* ... smaller is better
| PCMark 8 Home Score Accelerated v2 | 4967 points | |
| PCMark 8 Creative Score Accelerated v2 | 7332 points | |
| PCMark 8 Work Score Accelerated v2 | 5447 points | |
Help | ||
| Asus Strix GL502VM-DS74 Samsung SSD 960 Evo 250GB m.2 NVMe | MSI GL62-6QFi781H11 Toshiba HG6 THNSNJ128G8NY | Eurocom Tornado F5 Samsung SSD 960 Pro 512 GB m.2 | Acer Predator 15 G9-593-765Q LiteOn CV1-8B512 | MSI GS63VR-6RF16H22 Stealth Pro Samsung SM951 MZVPV256HDGL m.2 PCI-e | |
|---|---|---|---|---|---|
| CrystalDiskMark 3.0 | -61% | 7% | -58% | -0% | |
| Read Seq (MB/s) | 1747 | 530 -70% | 2145 23% | 517 -70% | 1973 13% |
| Write Seq (MB/s) | 1477 | 442.7 -70% | 1724 17% | 449.7 -70% | 1292 -13% |
| Read 512 (MB/s) | 863 | 409.1 -53% | 715 -17% | 355.3 -59% | 1279 48% |
| Write 512 (MB/s) | 1115 | 417.3 -63% | 967 -13% | 433.7 -61% | 1288 16% |
| Read 4k (MB/s) | 56.8 | 21.81 -62% | 55.9 -2% | 27.69 -51% | 52.3 -8% |
| Write 4k (MB/s) | 152.4 | 93 -39% | 180.6 19% | 72.9 -52% | 153.2 1% |
| Read 4k QD32 (MB/s) | 652 | 257 -61% | 744 14% | 290.9 -55% | 464.4 -29% |
| Write 4k QD32 (MB/s) | 542 | 168.3 -69% | 634 17% | 273.8 -49% | 384.4 -29% |

| 3DMark | |
| 1920x1080 Fire Strike Graphics | |
| Eurocom Sky X7E2 | |
| Eurocom Tornado F5 | |
| Nvidia GeForce GTX 1060 Founders Edition 6 GB | |
| Asus Strix GL502VM-DS74 | |
| Asus Strix GL502VY-DS71 | |
| Asus Strix GL753VD-GC045T | |
| Asus Strix GL753VD-GC045T | |
| 3840x2160 Fire Strike Ultra Graphics | |
| Eurocom Sky X7E2 | |
| Eurocom Tornado F5 | |
| Nvidia GeForce GTX 1060 Founders Edition 6 GB | |
| Asus Strix GL502VM-DS74 | |
| Asus Strix GL502VY-DS71 | |
| Asus Strix GL753VD-GC045T | |
| Fire Strike Extreme Graphics | |
| Eurocom Sky X7E2 | |
| Eurocom Tornado F5 | |
| Asus Strix GL502VM-DS74 | |
| Asus Strix GL502VY-DS71 | |
| Asus Strix GL753VD-GC045T | |
| Asus Strix GL753VD-GC045T | |
| 3DMark 11 | |
| 1280x720 Performance GPU | |
| Eurocom Sky X7E2 | |
| Eurocom Tornado F5 | |
| Nvidia GeForce GTX 1060 Founders Edition 6 GB | |
| Asus Strix GL502VM-DS74 | |
| Asus Strix GL502VY-DS71 | |
| Asus Strix GL753VD-GC045T | |
| 1280x720 Performance Combined | |
| Nvidia GeForce GTX 1060 Founders Edition 6 GB | |
| Eurocom Tornado F5 | |
| Eurocom Sky X7E2 | |
| Asus Strix GL502VM-DS74 | |
| Asus Strix GL502VY-DS71 | |
| Asus Strix GL753VD-GC045T | |
| 3DMark 11 Performance | 12492 points | |
| 3DMark Ice Storm Standard Score | 123983 points | |
| 3DMark Cloud Gate Standard Score | 25389 points | |
| 3DMark Fire Strike Score | 9588 points | |
| 3DMark Fire Strike Extreme Score | 5112 points | |
Help | ||
| Rise of the Tomb Raider - 1920x1080 Very High Preset AA:FX AF:16x | |
| Eurocom Sky X7E2 | |
| Eurocom Tornado F5 | |
| Nvidia GeForce GTX 1060 Founders Edition 6 GB | |
| Nvidia GeForce GTX 1060 Founders Edition 6 GB | |
| Asus Strix GL502VM-DS74 | |
| DogHouse Systems Mobius SS | |
| Asus Strix GL753VD-GC045T | |
| BioShock Infinite - 1920x1080 Ultra Preset, DX11 (DDOF) | |
| Eurocom Sky X7E2 | |
| Eurocom Tornado F5 | |
| Asus Strix GL502VM-DS74 | |
| DogHouse Systems Mobius SS | |
| Metro: Last Light - 1920x1080 Very High (DX11) AF:16x | |
| Eurocom Sky X7E2 | |
| Eurocom Tornado F5 | |
| Asus Strix GL502VM-DS74 | |
| DogHouse Systems Mobius SS | |
| Asus Strix GL753VD-GC045T | |
| Thief - 1920x1080 Very High Preset AA:FXAA & High SS AF:8x | |
| Eurocom Sky X7E2 | |
| Asus Strix GL502VM-DS74 | |
| DogHouse Systems Mobius SS | |
| Batman: Arkham Knight - 1920x1080 High / On AA:SM AF:16x | |
| Eurocom Sky X7E2 | |
| Eurocom Tornado F5 | |
| Nvidia GeForce GTX 1060 Founders Edition 6 GB | |
| DogHouse Systems Mobius SS | |
| Asus Strix GL502VM-DS74 | |
| Fallout 4 - 1920x1080 Ultra Preset AA:T AF:16x | |
| Eurocom Sky X7E2 | |
| Eurocom Tornado F5 | |
| Nvidia GeForce GTX 1060 Founders Edition 6 GB | |
| Asus Strix GL502VM-DS74 | |
| DogHouse Systems Mobius SS | |
| Asus Strix GL753VD-GC045T | |
| Ashes of the Singularity - 1920x1080 high | |
| Eurocom Tornado F5 | |
| Asus Strix GL502VM-DS74 | |
| Asus Strix GL753VD-GC045T | |
| Doom - 1920x1080 Ultra Preset AA:SM | |
| Eurocom Sky X7E2 | |
| Eurocom Tornado F5 | |
| Asus Strix GL502VM-DS74 | |
| Nvidia GeForce GTX 1060 Founders Edition 6 GB | |
| Asus Strix GL753VD-GC045T | |
| Overwatch - 1920x1080 Epic (Render Scale 100 %) AA:SM AF:16x | |
| Eurocom Sky X7E2 | |
| Eurocom Tornado F5 | |
| Nvidia GeForce GTX 1060 Founders Edition 6 GB | |
| Asus Strix GL502VM-DS74 | |
| Asus Strix GL753VD-GC045T | |
| Mafia 3 - 1920x1080 High Preset | |
| Eurocom Tornado F5 | |
| Asus Strix GL502VM-DS74 | |
| Asus Strix GL753VD-GC045T | |
| low | med. | high | ultra | |
|---|---|---|---|---|
| BioShock Infinite (2013) | 102.8 | |||
| Metro: Last Light (2013) | 77.6 | |||
| Thief (2014) | 73.4 | |||
| Batman: Arkham Knight (2015) | 50 | |||
| Metal Gear Solid V (2015) | 60 | |||
| Fallout 4 (2015) | 70.4 | |||
| Rise of the Tomb Raider (2016) | 60.2 | |||
| Ashes of the Singularity (2016) | 55.2 | |||
| Doom (2016) | 103.3 | |||
| Overwatch (2016) | 106 | |||
| Mafia 3 (2016) | 43.7 |
Noise level
| Idle |
| 32 / 32 / 32 dB(A) |
| Load |
| 48.3 / 51.2 dB(A) |
 | ||
30 dB silent 40 dB(A) audible 50 dB(A) loud |
||
min: | ||
| Asus Strix GL502VM-DS74 GeForce GTX 1060 Mobile, i7-7700HQ, Samsung SSD 960 Evo 250GB m.2 NVMe | MSI GL62-6QFi781H11 GeForce GTX 960M, 6700HQ, Toshiba HG6 THNSNJ128G8NY | Eurocom Tornado F5 GeForce GTX 1070 Mobile, i7-7700K, Samsung SSD 960 Pro 512 GB m.2 | Acer Predator 15 G9-593-765Q GeForce GTX 1070 Mobile, 6700HQ, LiteOn CV1-8B512 | MSI GS63VR-6RF16H22 Stealth Pro GeForce GTX 1060 Mobile, 6700HQ, Samsung SM951 MZVPV256HDGL m.2 PCI-e | |
|---|---|---|---|---|---|
| Noise | -2% | -1% | -1% | 5% | |
| off / environment * (dB) | 30.8 | 30 3% | 29.4 5% | 30 3% | 30 3% |
| Idle Minimum * (dB) | 32 | 35 -9% | 33.3 -4% | 31 3% | 32 -0% |
| Idle Average * (dB) | 32 | 36 -13% | 33.5 -5% | 35 -9% | 33 -3% |
| Idle Maximum * (dB) | 32 | 37 -16% | 33.5 -5% | 38 -19% | 34 -6% |
| Load Average * (dB) | 48.3 | 41 15% | 44.2 8% | 43 11% | 37 23% |
| Load Maximum * (dB) | 51.2 | 46 10% | 52.5 -3% | 49 4% | 46 10% |
* ... smaller is better
(-) The maximum temperature on the upper side is 50.2 °C / 122 F, compared to the average of 40.4 °C / 105 F, ranging from 21.2 to 68.8 °C for the class Gaming.
(-) The bottom heats up to a maximum of 60.2 °C / 140 F, compared to the average of 43.2 °C / 110 F
(+) In idle usage, the average temperature for the upper side is 27.5 °C / 82 F, compared to the device average of 33.9 °C / 93 F.
(+) The palmrests and touchpad are cooler than skin temperature with a maximum of 25.5 °C / 77.9 F and are therefore cool to the touch.
(+) The average temperature of the palmrest area of similar devices was 28.8 °C / 83.8 F (+3.3 °C / 5.9 F).
Apple MacBook 12 (Early 2016) 1.1 GHz audio analysis
(+) | speakers can play relatively loud (83.6 dB)
Bass 100 - 315 Hz
(±) | reduced bass - on average 11.3% lower than median
(±) | linearity of bass is average (14.2% delta to prev. frequency)
Mids 400 - 2000 Hz
(+) | balanced mids - only 2.4% away from median
(+) | mids are linear (5.5% delta to prev. frequency)
Highs 2 - 16 kHz
(+) | balanced highs - only 2% away from median
(+) | highs are linear (4.5% delta to prev. frequency)
Overall 100 - 16.000 Hz
(+) | overall sound is linear (10.2% difference to median)
Compared to same class
» 7% of all tested devices in this class were better, 2% similar, 90% worse
» The best had a delta of 5%, average was 18%, worst was 53%
Compared to all devices tested
» 5% of all tested devices were better, 1% similar, 94% worse
» The best had a delta of 4%, average was 23%, worst was 134%
| Off / Standby | |
| Idle | |
| Load |
|
Key:
min: | |
| Asus Strix GL502VM-DS74 i7-7700HQ, GeForce GTX 1060 Mobile, Samsung SSD 960 Evo 250GB m.2 NVMe, IPS, 1920x1080, 15.6" | MSI GL62-6QFi781H11 6700HQ, GeForce GTX 960M, Toshiba HG6 THNSNJ128G8NY, TN LED, 1920x1080, 15.6" | Acer Predator 15 G9-593-765Q 6700HQ, GeForce GTX 1070 Mobile, LiteOn CV1-8B512, IPS, 1920x1080, 15.6" | MSI GS63VR-6RF16H22 Stealth Pro 6700HQ, GeForce GTX 1060 Mobile, Samsung SM951 MZVPV256HDGL m.2 PCI-e, IPS, 1920x1080, 15.6" | Asus Strix GL502VM-FY039T 6700HQ, GeForce GTX 1060 Mobile, Micron SSD 1100 (MTFDDAV256TBN), IPS, 1920x1080, 15.6" | |
|---|---|---|---|---|---|
| Power Consumption | 49% | 24% | 30% | 39% | |
| Idle Minimum * (Watt) | 38.3 | 10 74% | 18 53% | 18 53% | 16 58% |
| Idle Average * (Watt) | 40.5 | 14 65% | 24 41% | 22 46% | 19 53% |
| Idle Maximum * (Watt) | 42.2 | 19 55% | 29 31% | 30 29% | 23 45% |
| Load Average * (Watt) | 110.4 | 82 26% | 86 22% | 77 30% | 68 38% |
| Load Maximum * (Watt) | 155.7 | 118 24% | 201 -29% | 165 -6% | 157 -1% |
* ... smaller is better
| Asus Strix GL502VM-DS74 i7-7700HQ, GeForce GTX 1060 Mobile, 64 Wh | MSI GL62-6QFi781H11 6700HQ, GeForce GTX 960M, 41.4 Wh | Acer Predator 15 G9-593-765Q 6700HQ, GeForce GTX 1070 Mobile, Wh | MSI GS63VR-6RF16H22 Stealth Pro 6700HQ, GeForce GTX 1060 Mobile, 65 Wh | Asus Strix GL502VM-FY039T 6700HQ, GeForce GTX 1060 Mobile, 64 Wh | |
|---|---|---|---|---|---|
| Battery runtime | 109% | 155% | 139% | 136% | |
| Reader / Idle (h) | 1.7 | 5.7 235% | 6 253% | 5.3 212% | |
| WiFi v1.3 (h) | 1.5 | 2.6 73% | 4.8 220% | 3.5 133% | 3.7 147% |
| Load (h) | 1 | 1.2 20% | 1.9 90% | 1.3 30% | 1.5 50% |
Pros
Cons

类似于我们在Skylake XPS 13 9350和Kaby Lake XPS 13 9360之间的结论,Skylake GL502VM和Kaby Lake GL502VM本质上是可以互换的。甚至游戏玩家将很难从Kaby Lake更新中找到任何真实的性能优势,尤其是考虑到大多数现代游戏都是显卡绑定,并且不太依赖于原始处理器性能。如果Kaby Lake GL502VM 由于其全新的处理器而获得更长的运行时间,更低的温度,更低的功耗以及更安静的风扇噪音,我们将更愿意推荐它。不幸的是,我们的测量没有显示出这种情况。
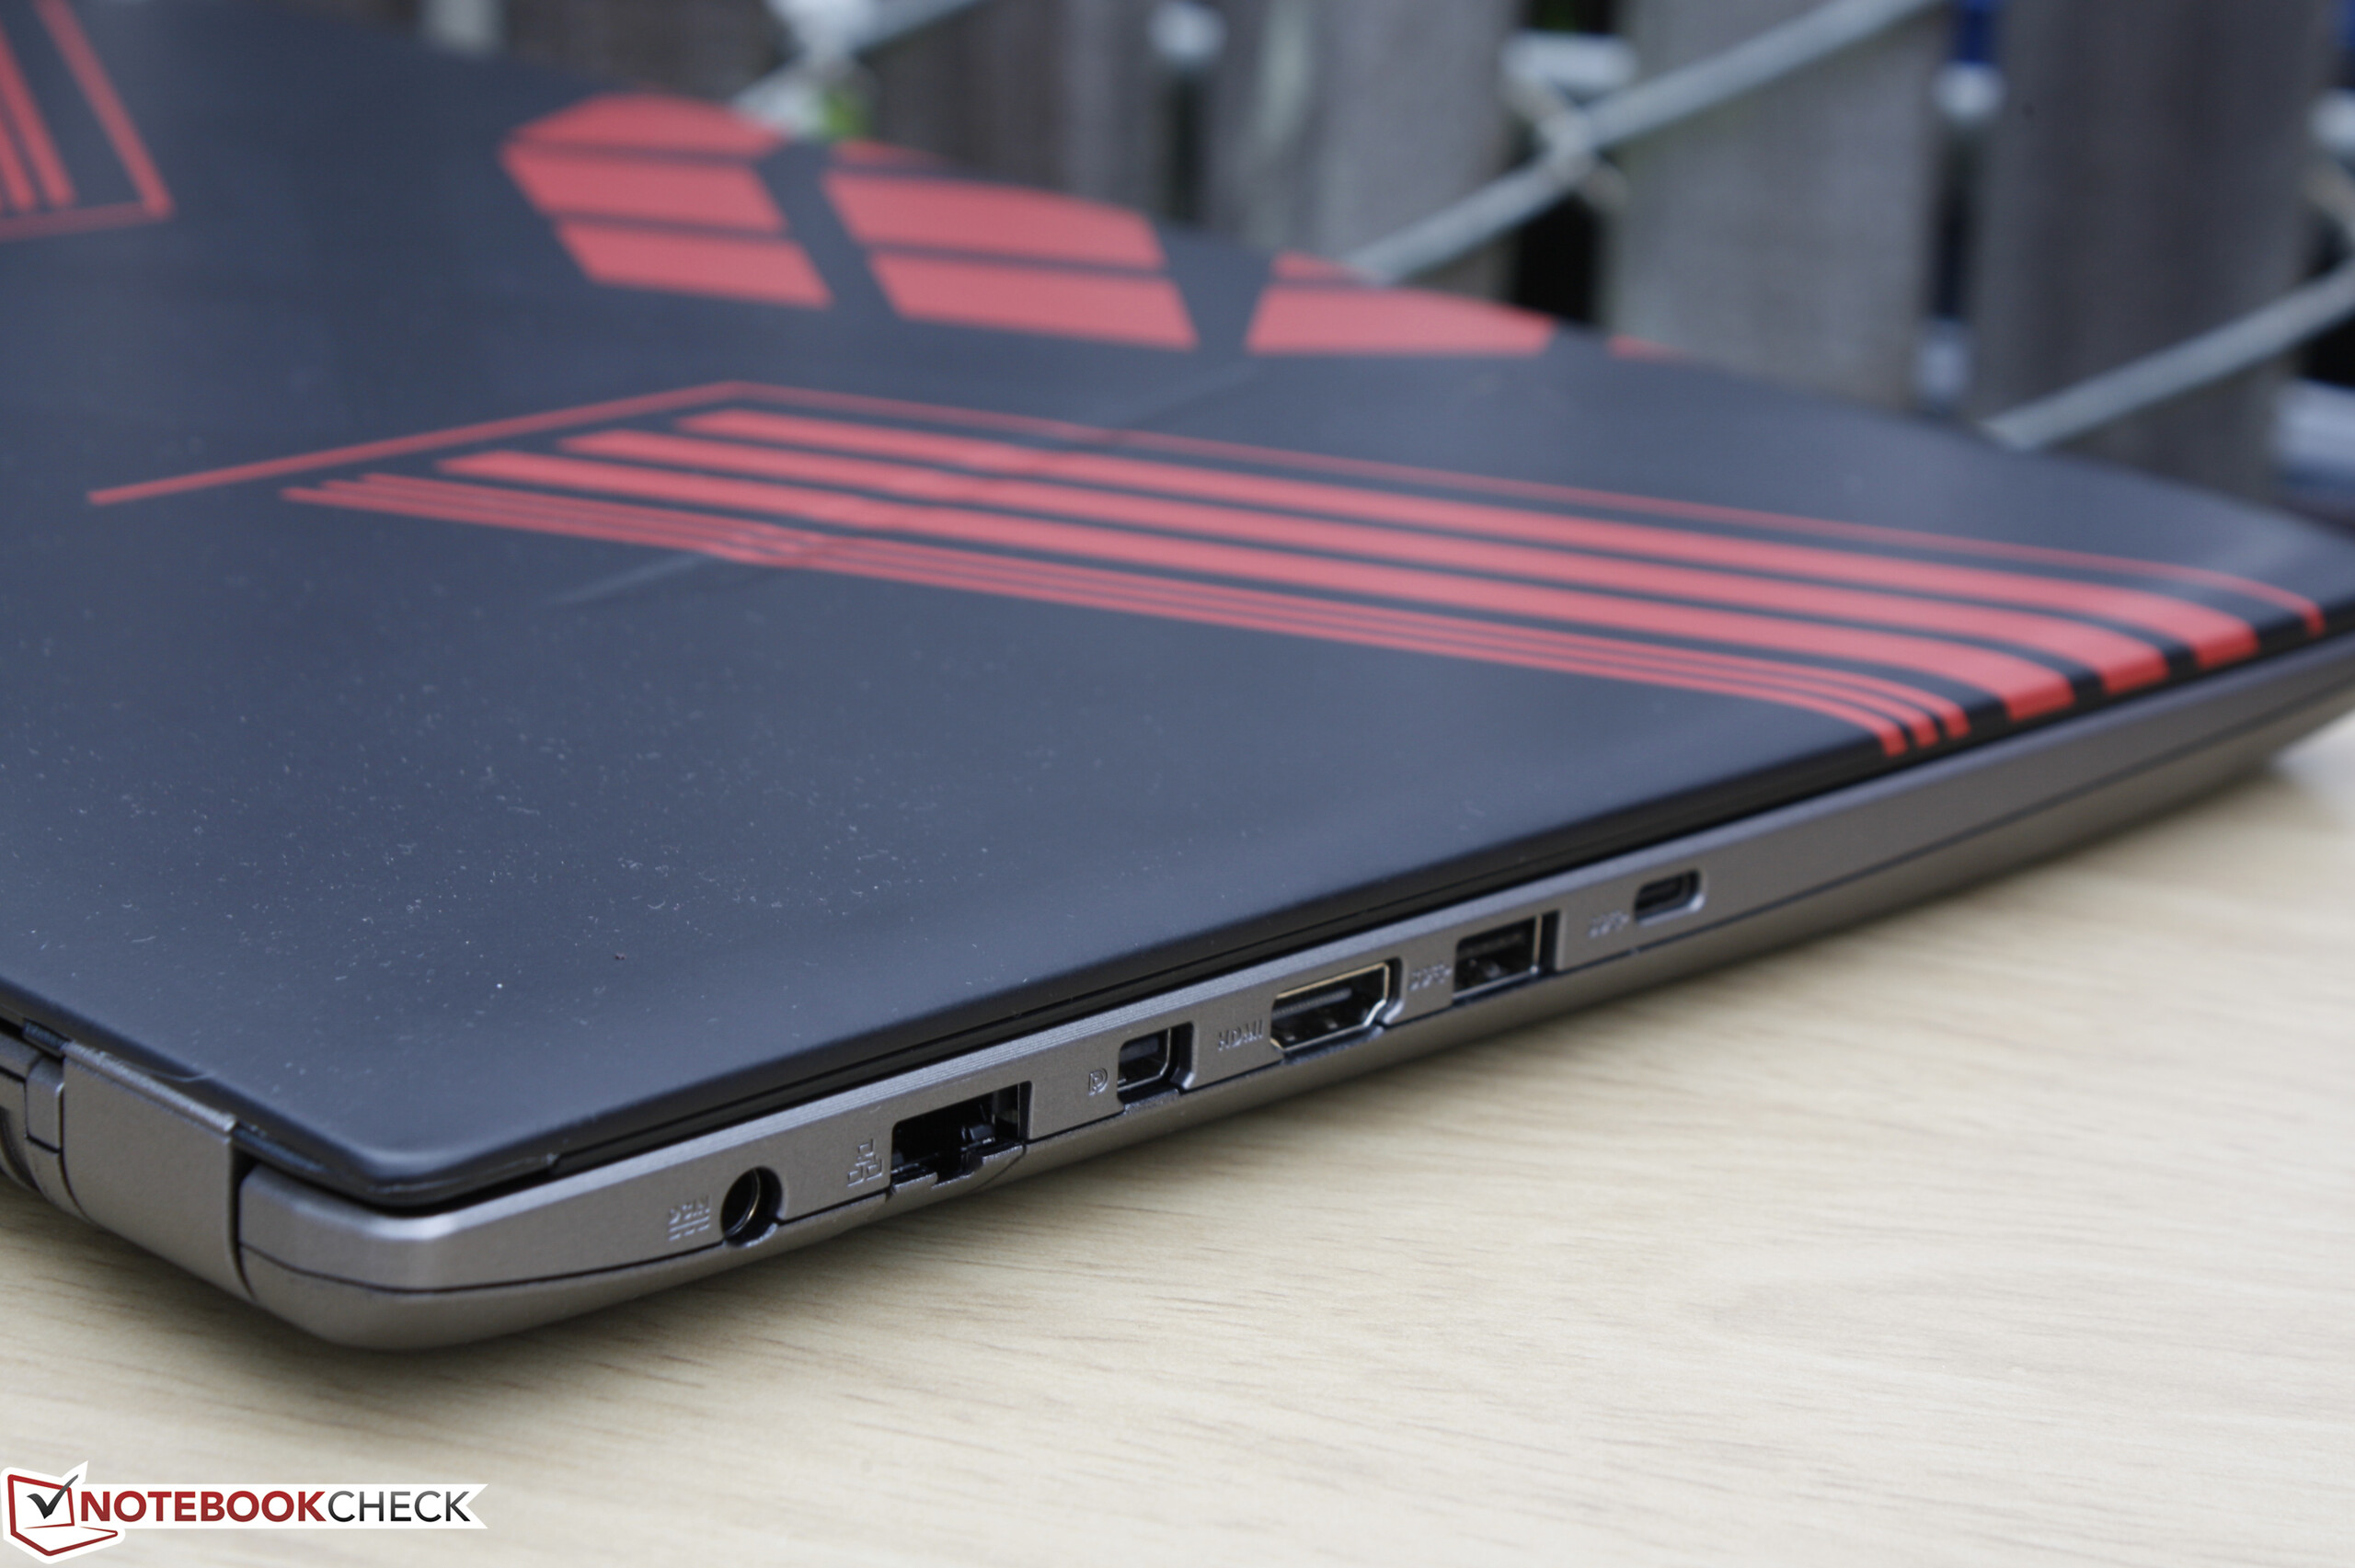
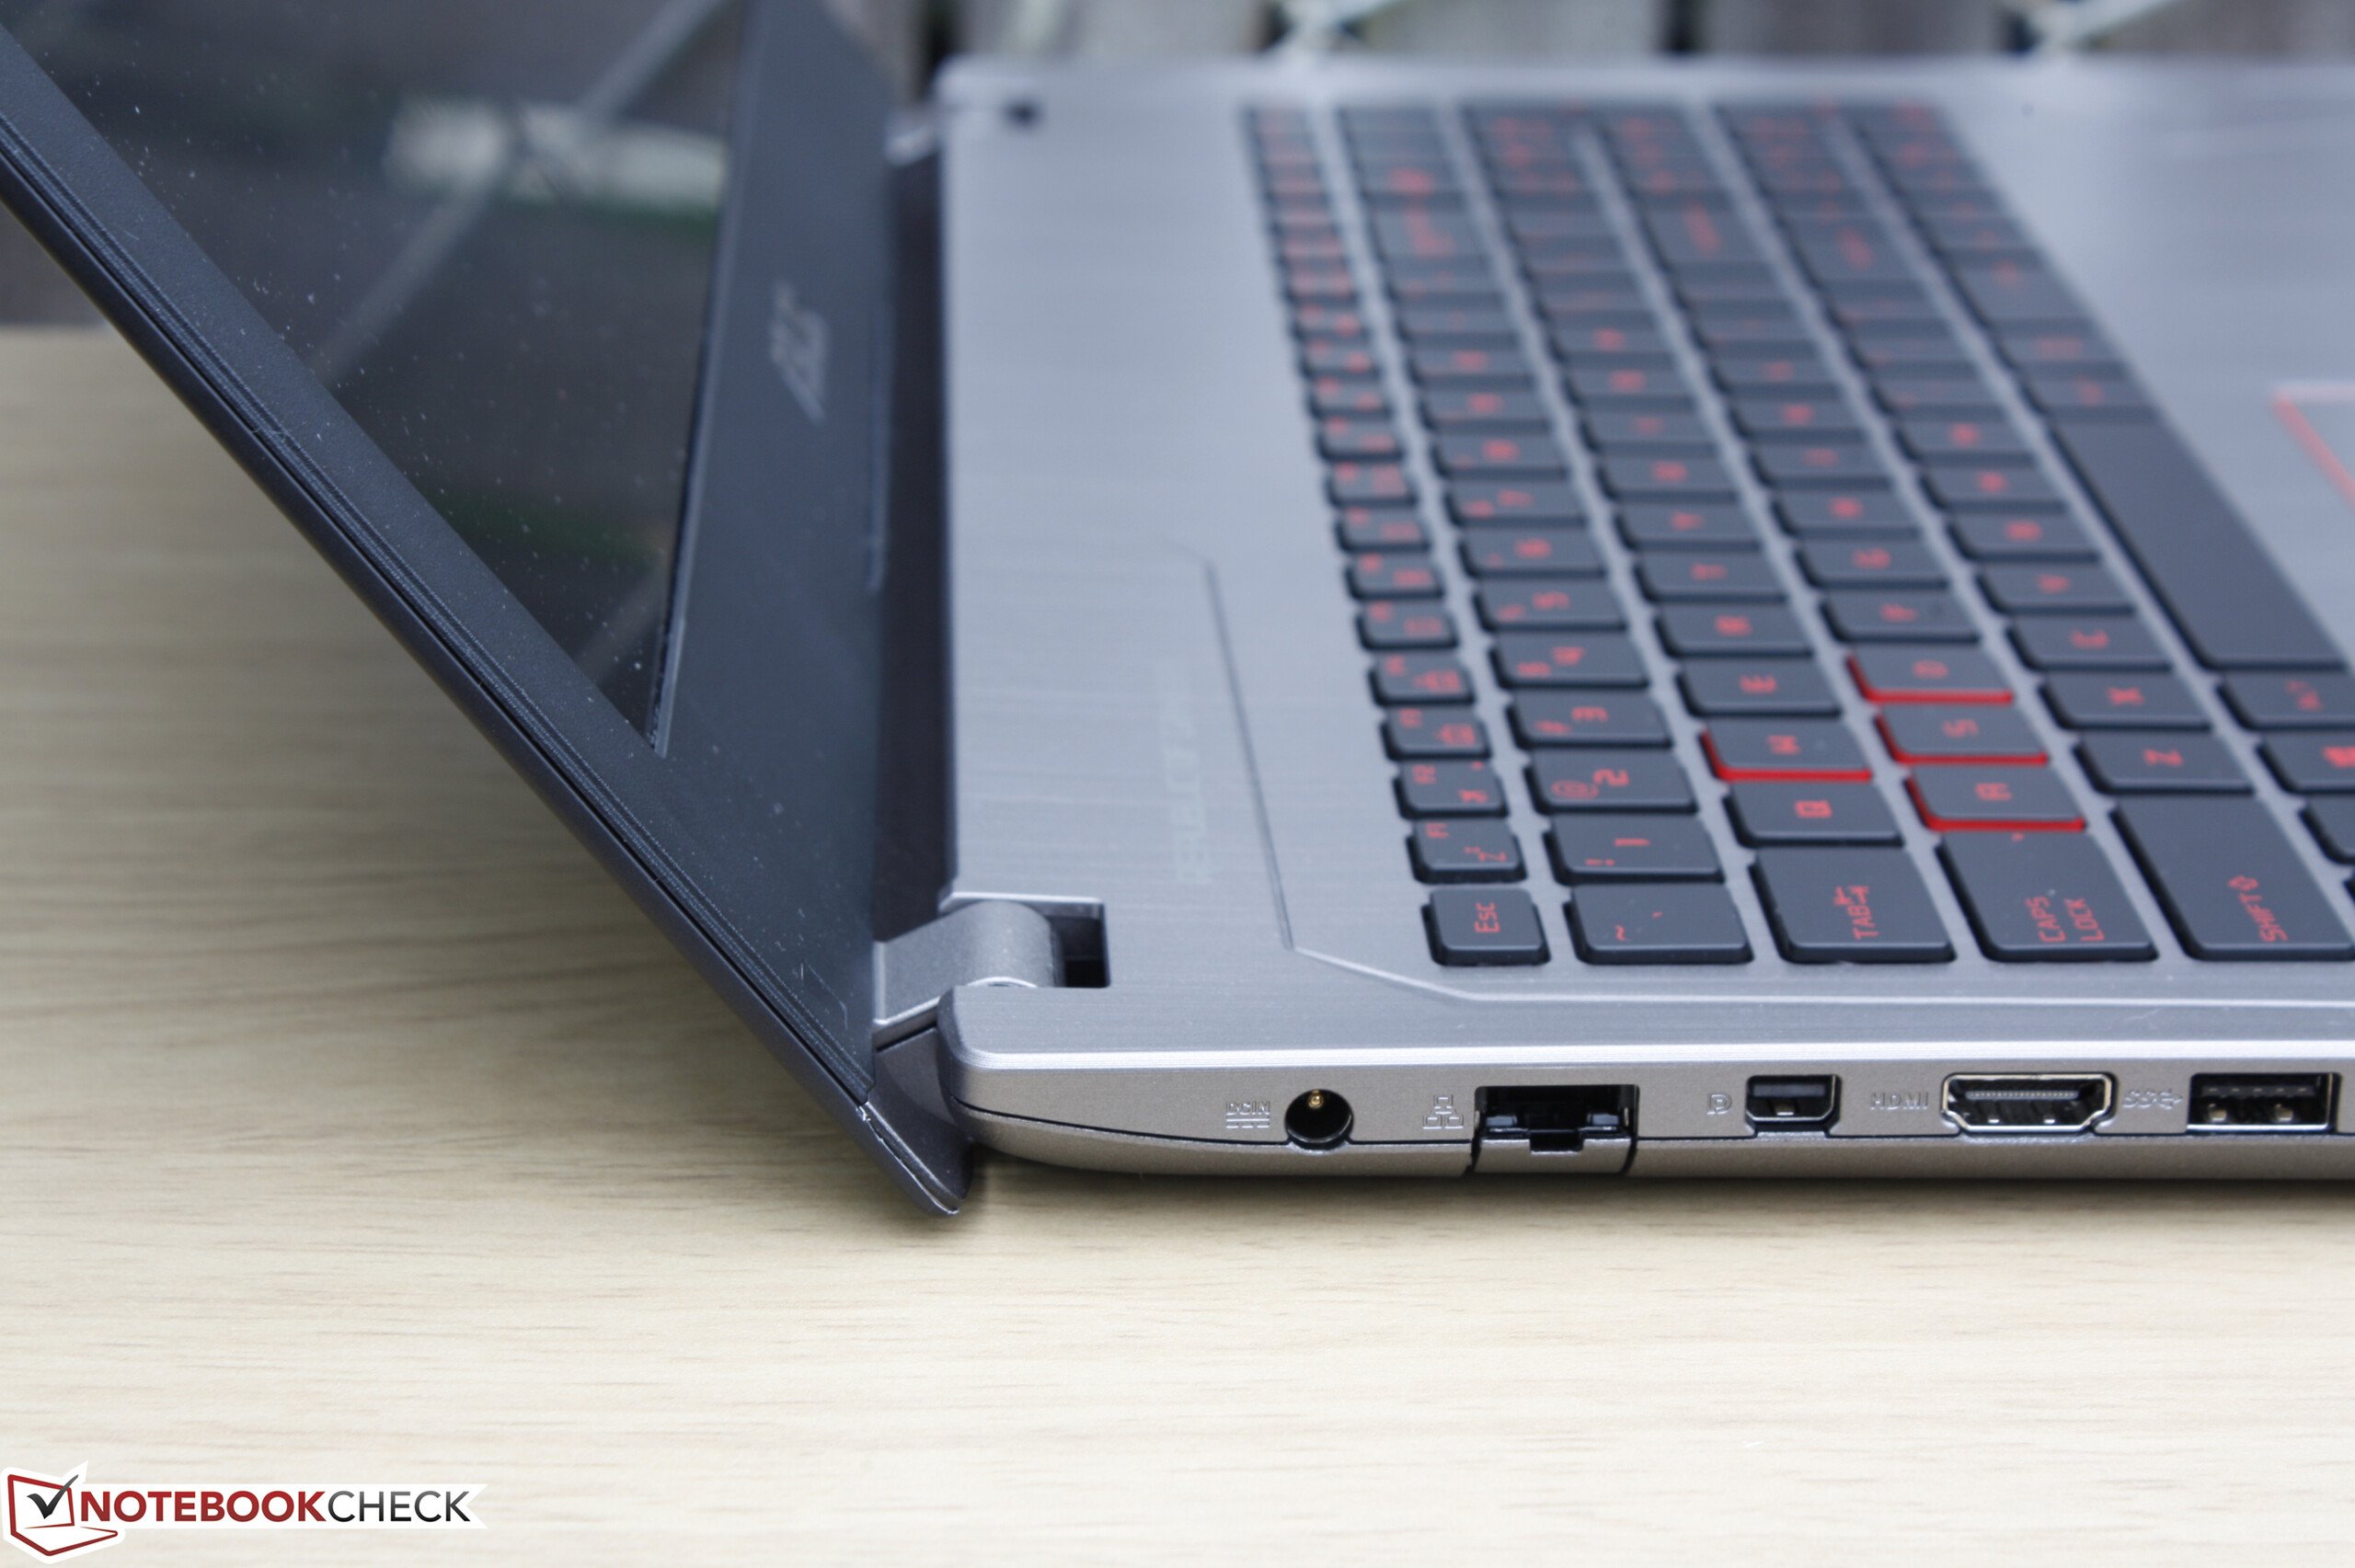
对于可能还在考虑MSI GE / GS系列,惠普Omen系列,联想Y系列或Dell Inspiron Gaming系列的玩家来说,GL502系列仍然是一个强大的主流解决方案。希望华硕会在GL502系列中添加更多的功能,在未来的更新中做更多,而不只在这里所做的简单处理器更新。诸如Thunderbolt 3或120Hz/5ms等选项,甚至带有更好的风扇控制和电源设置软件的更新,它们都可为GL502VM带来巨大的进步。
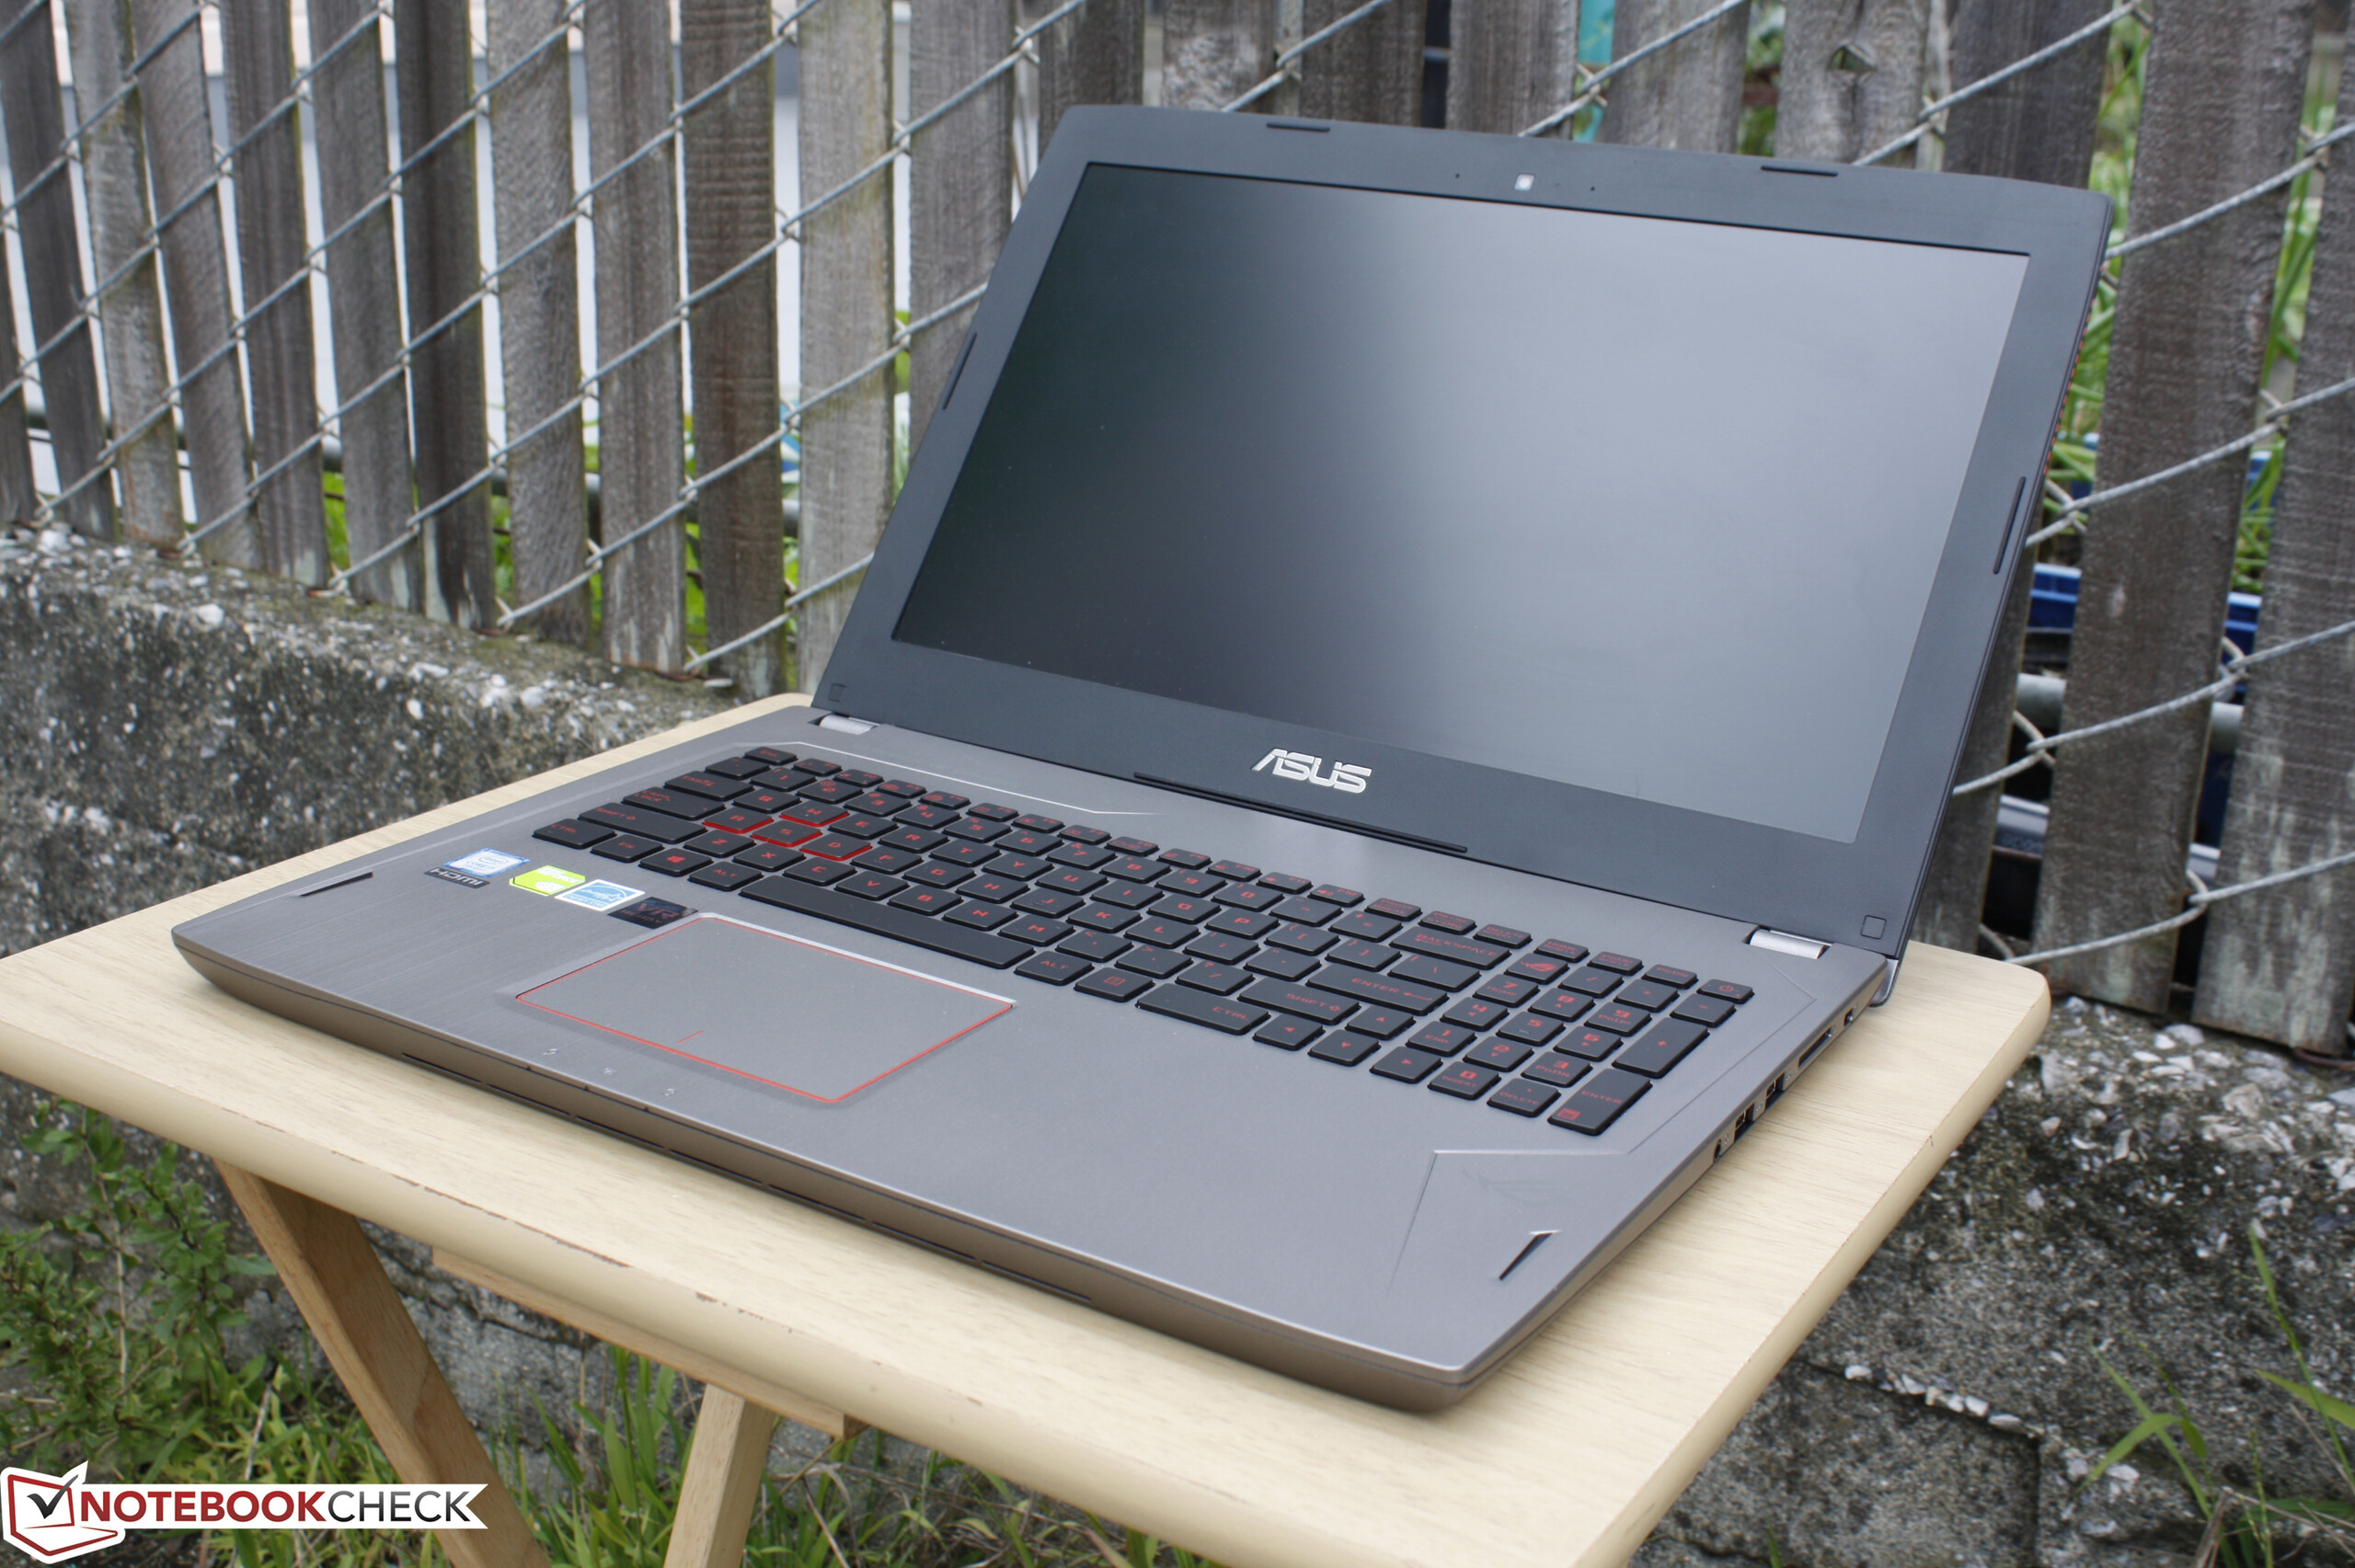
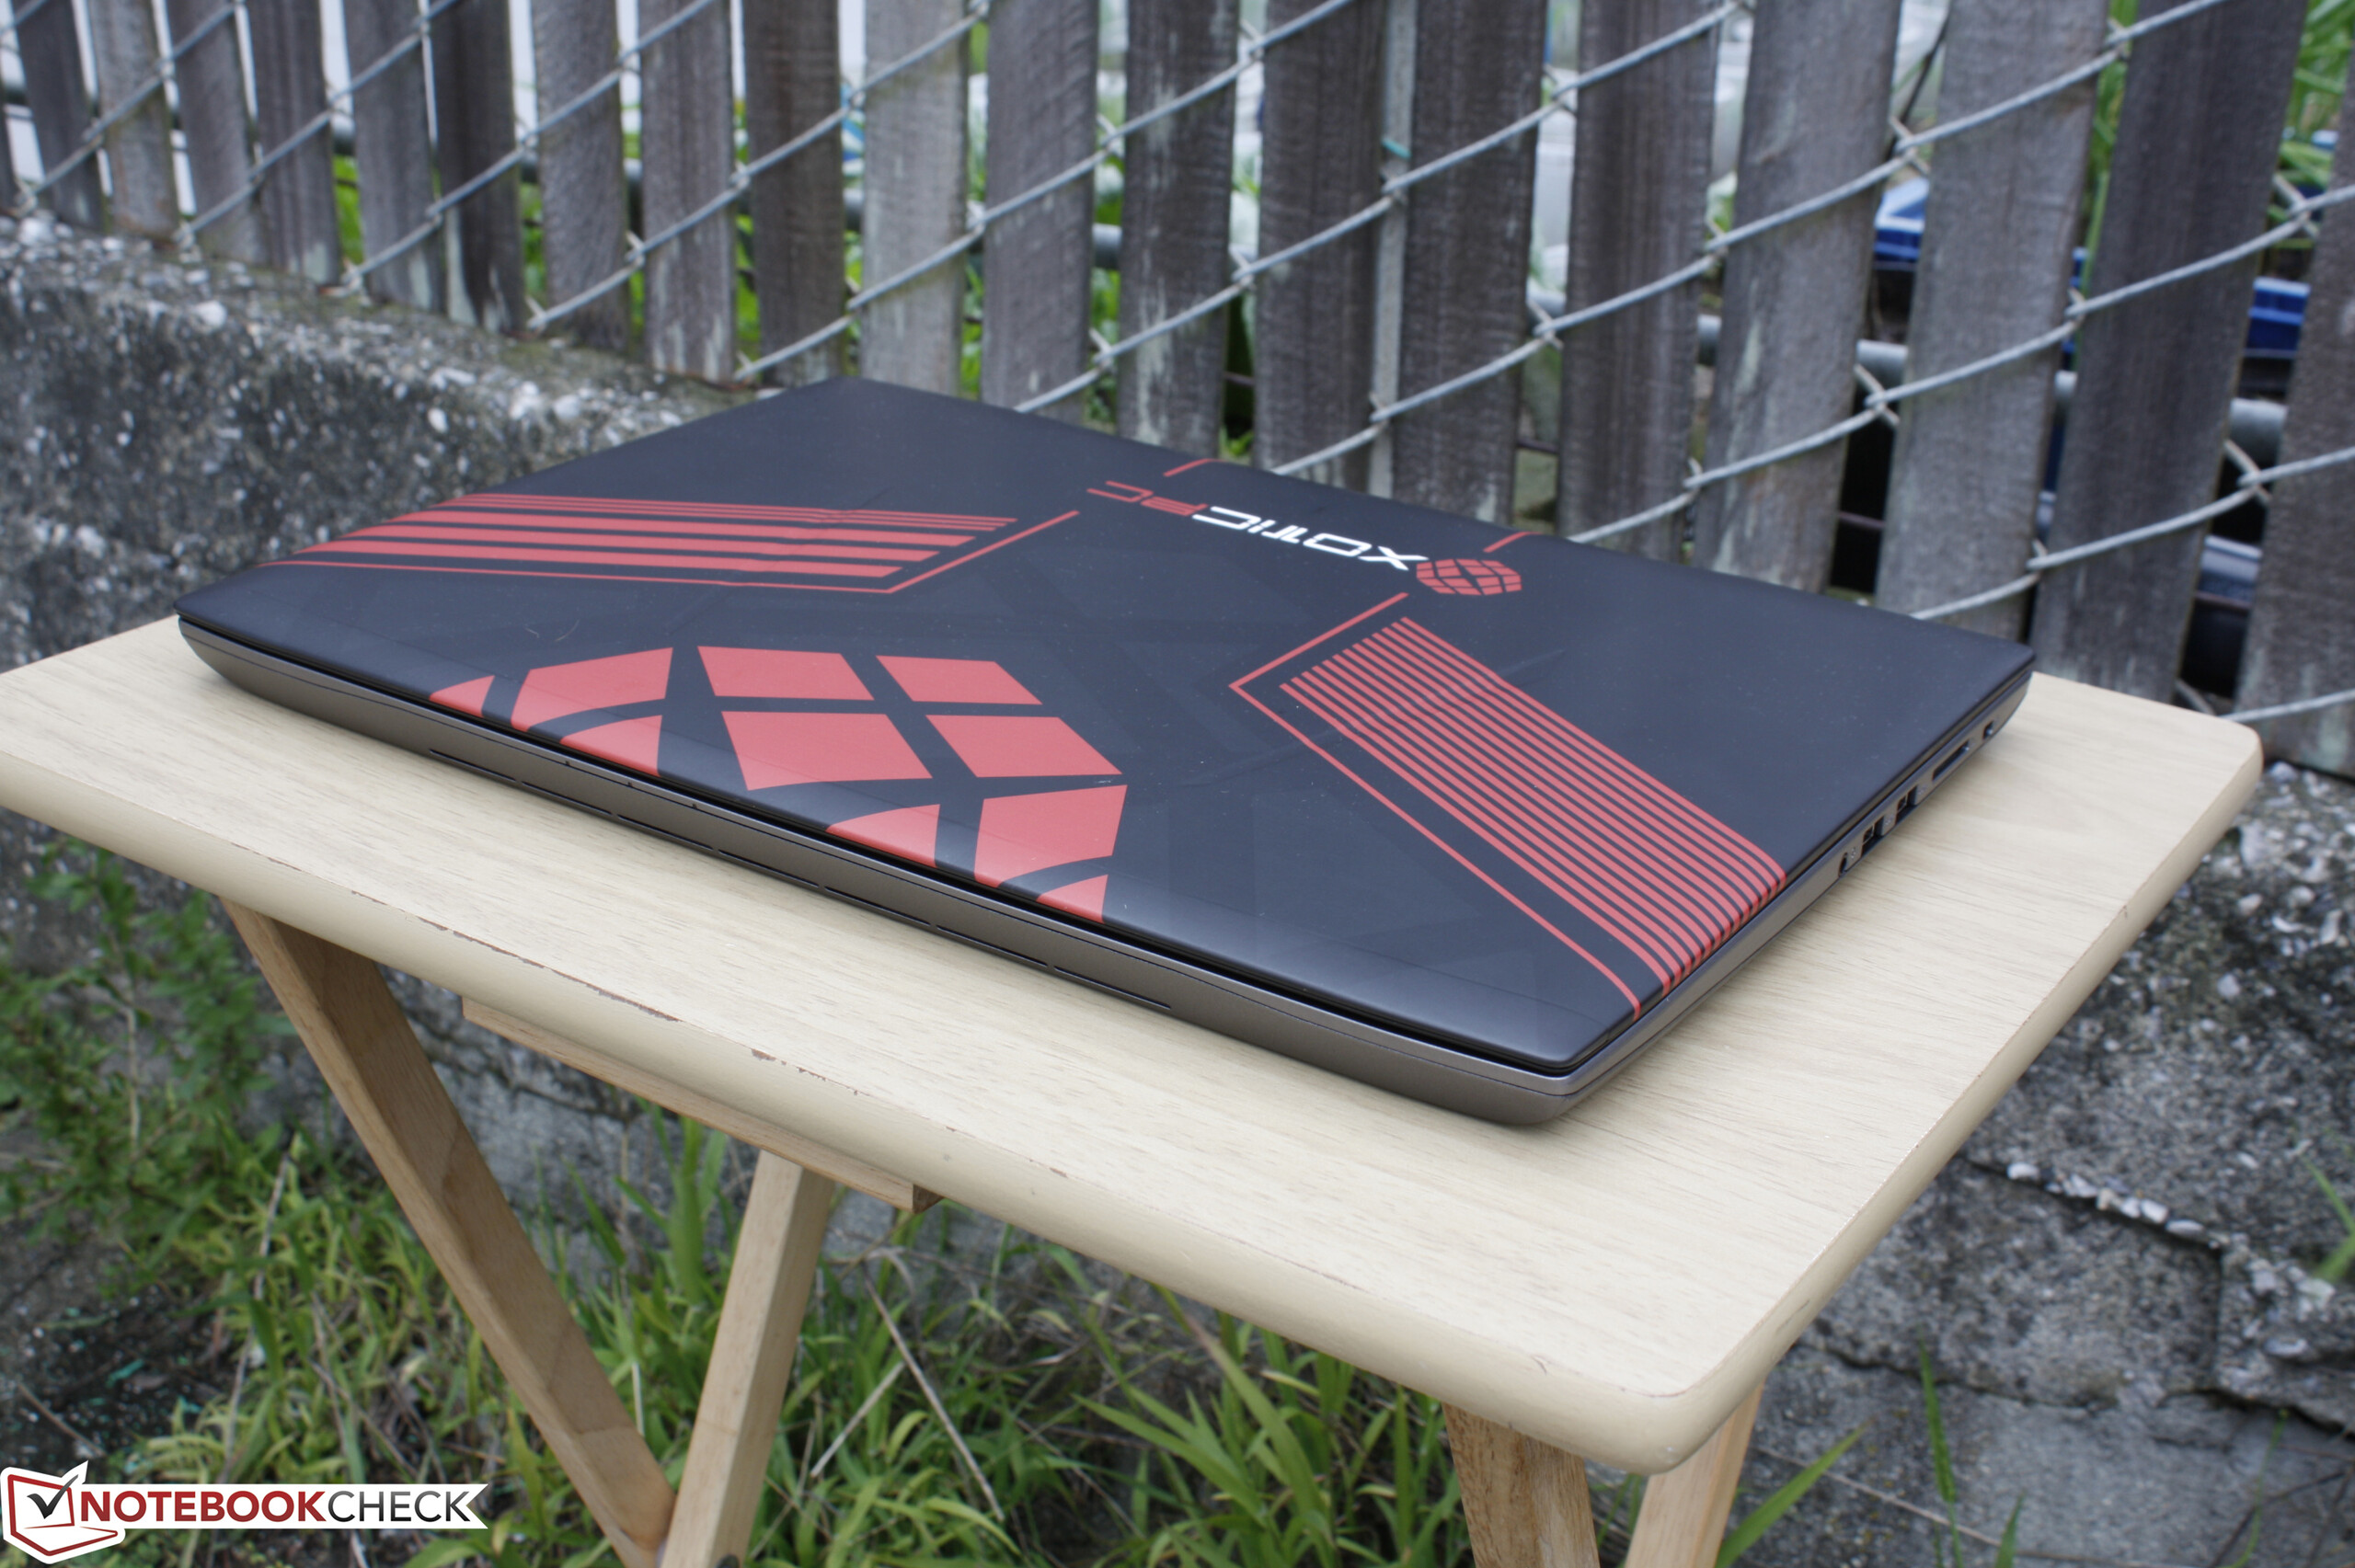
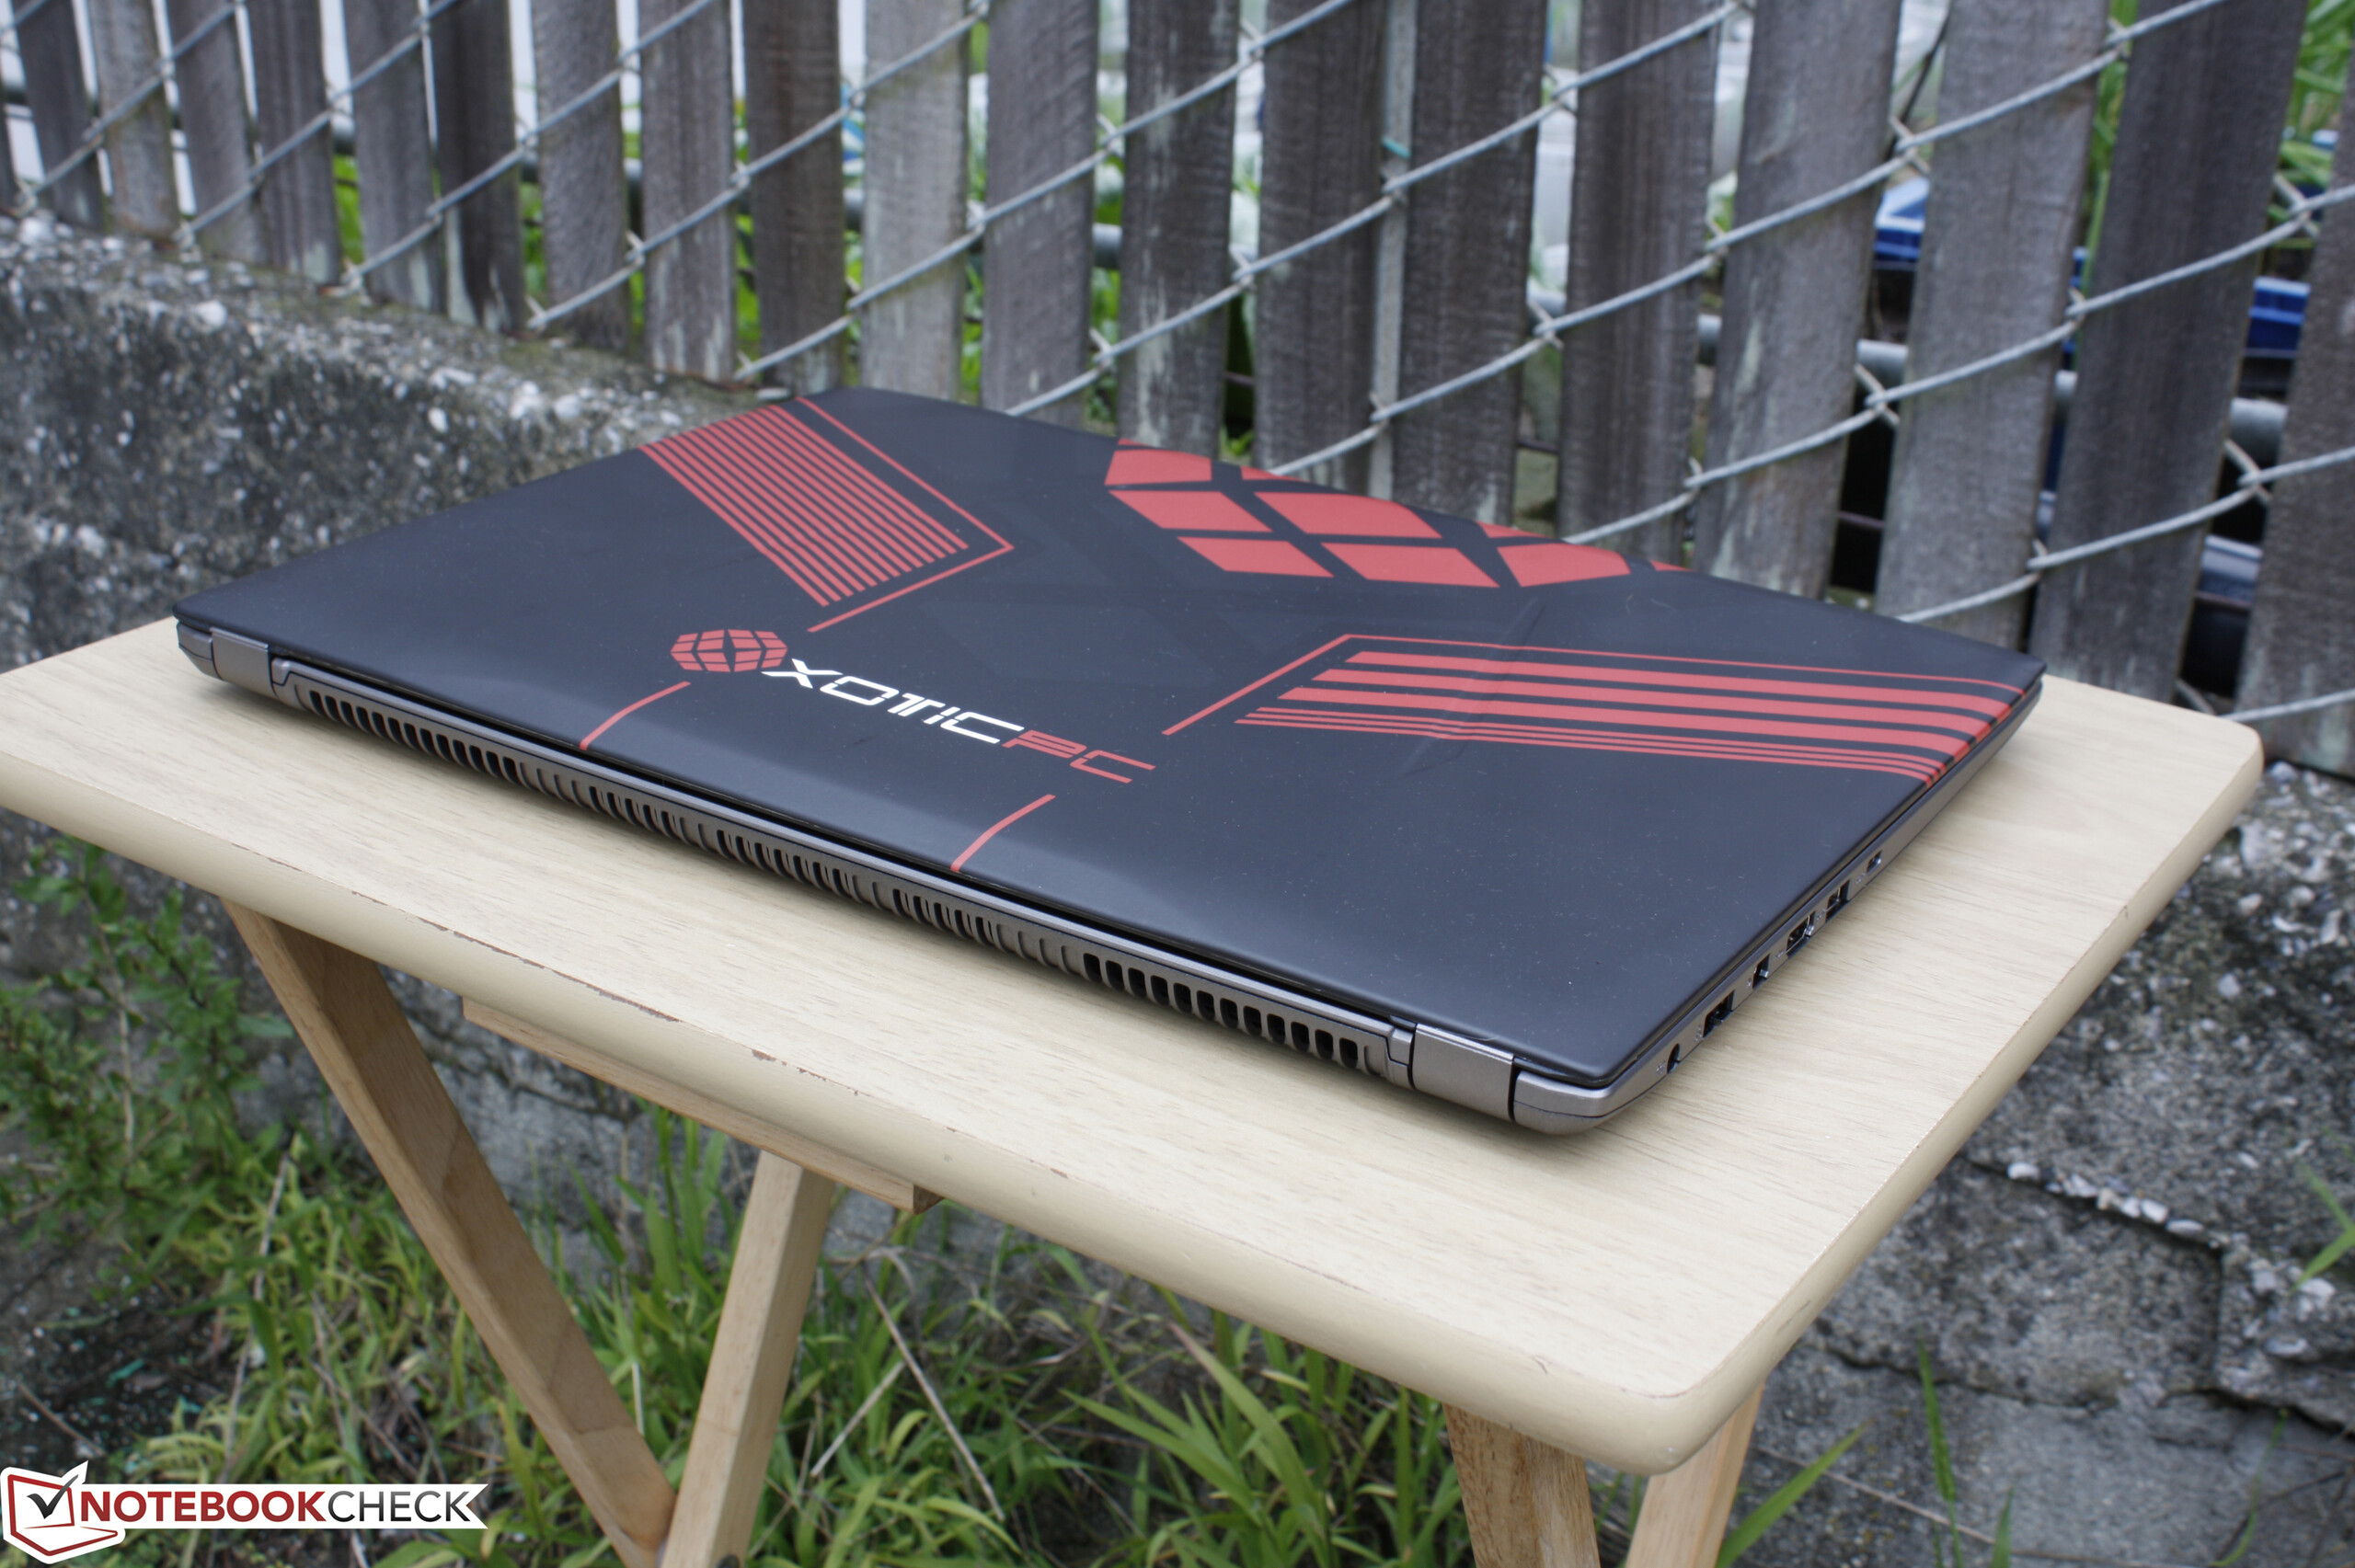
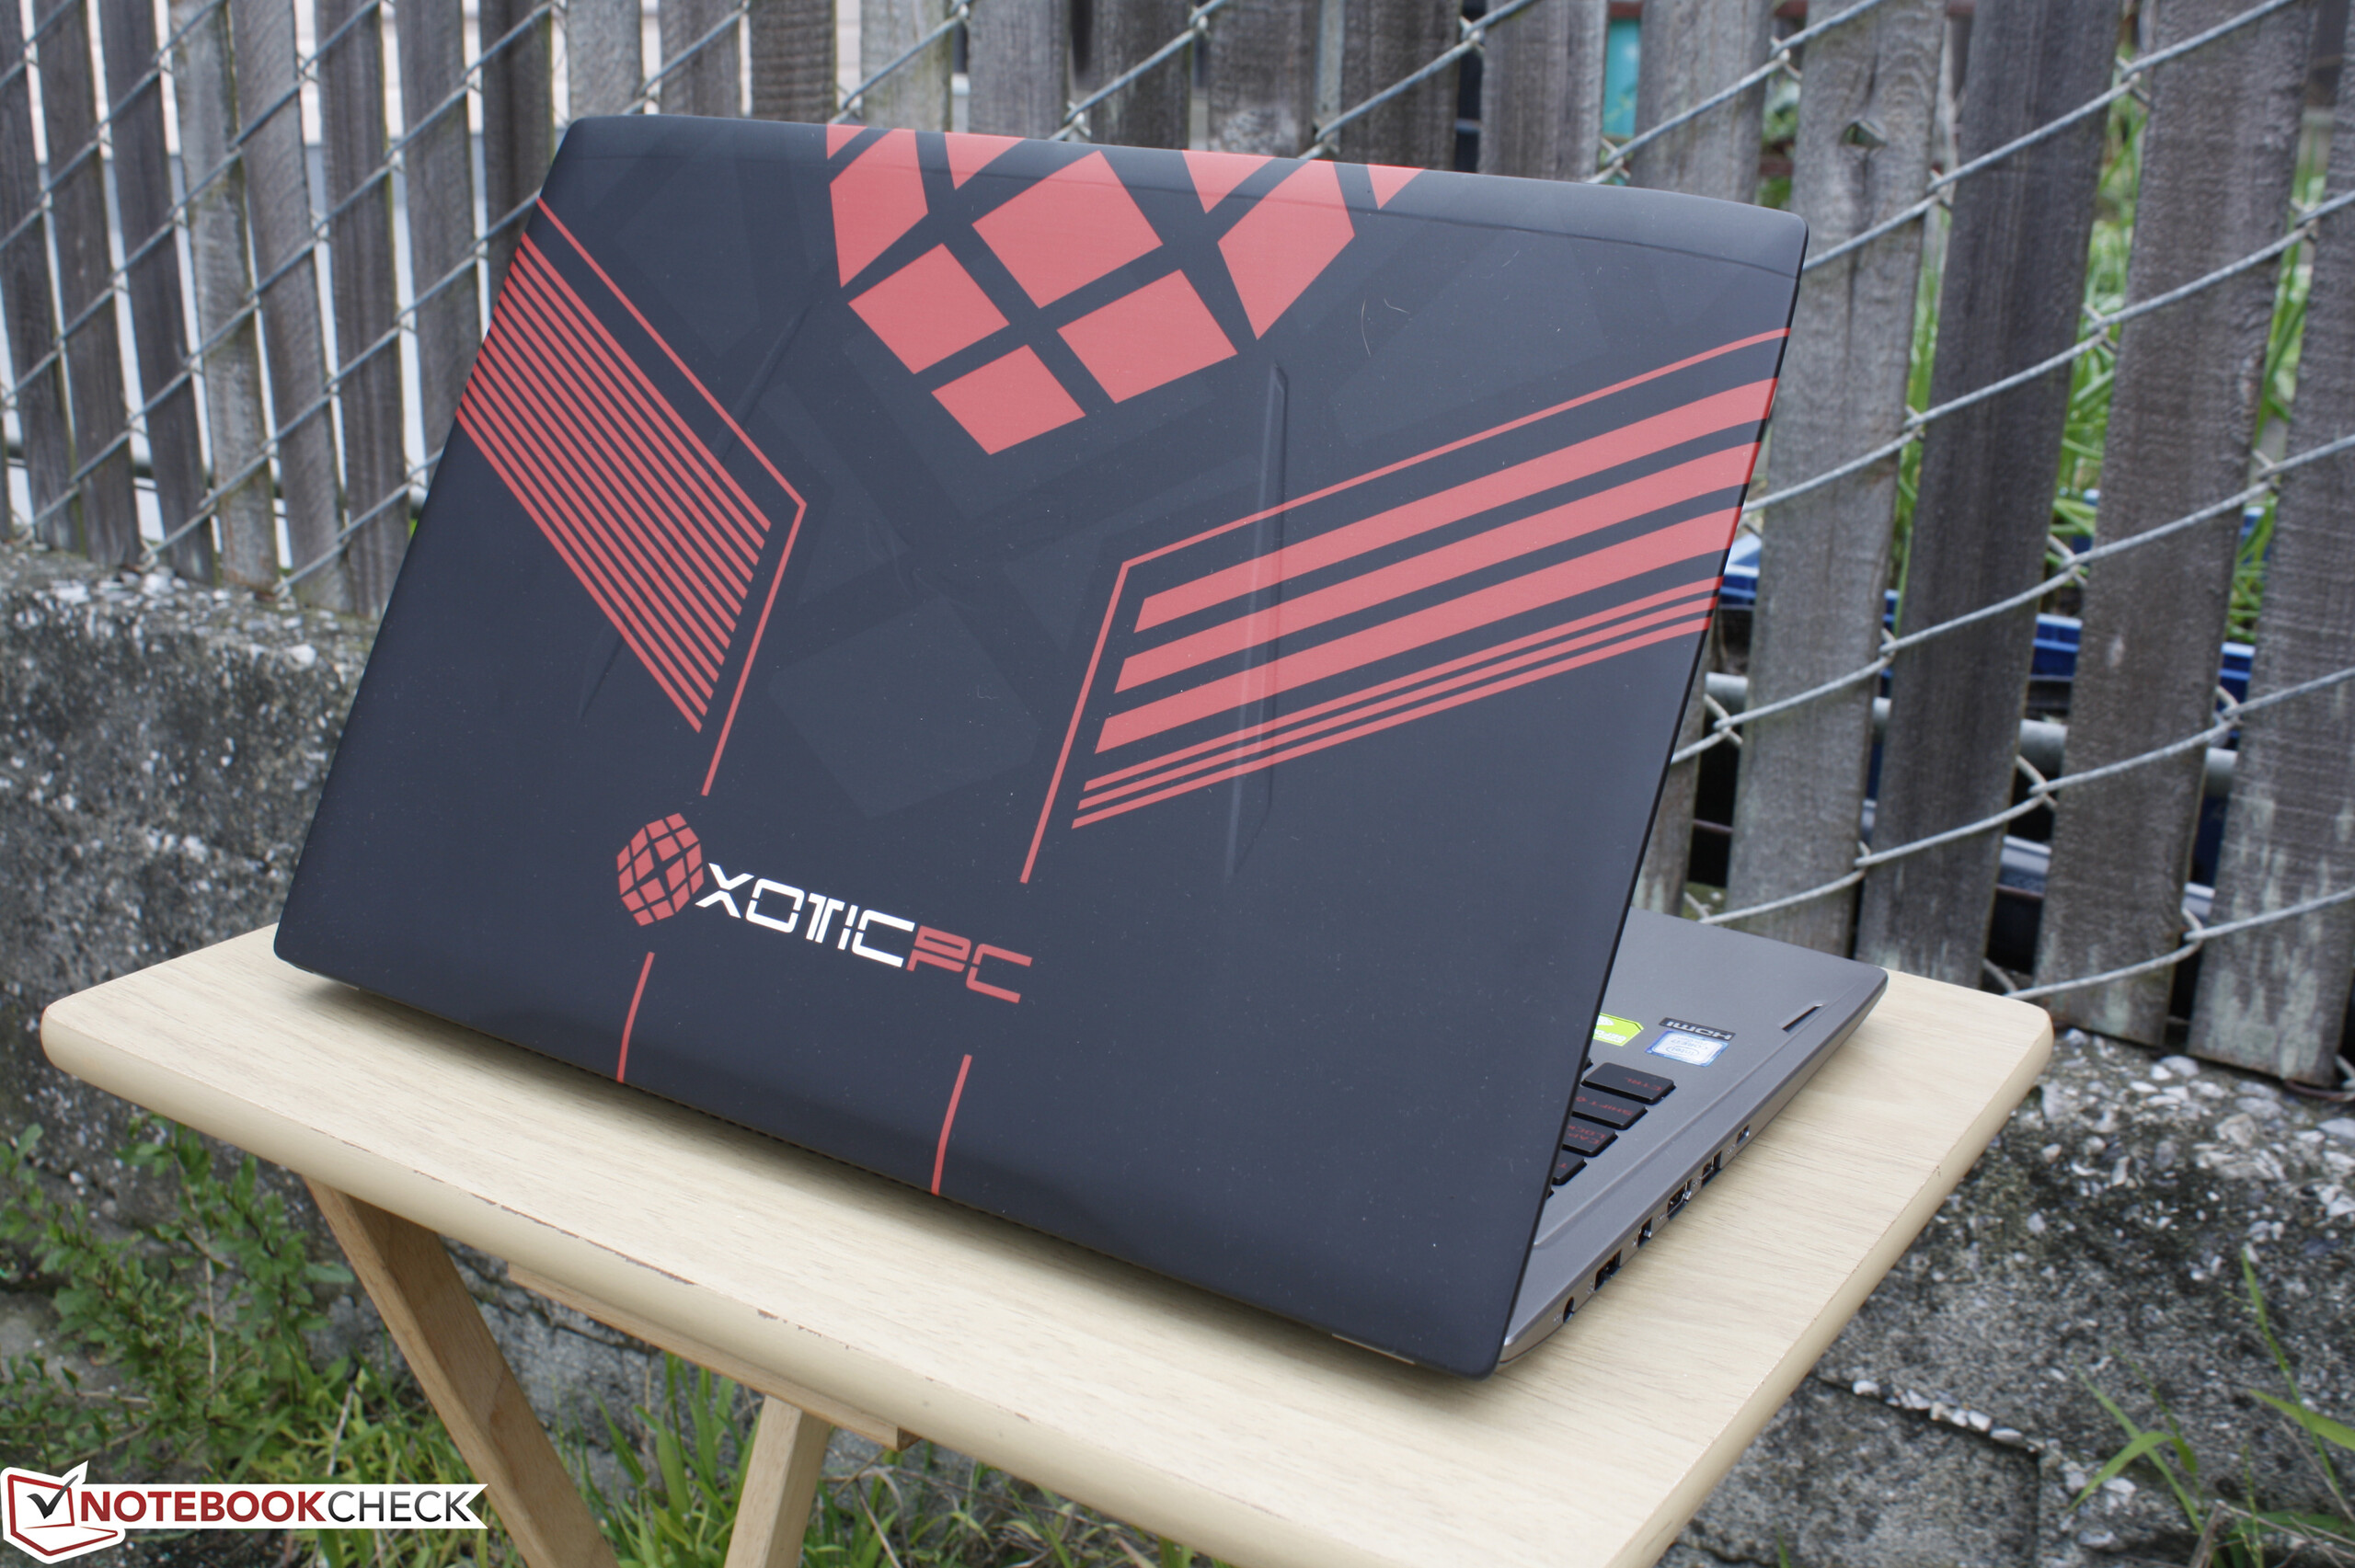
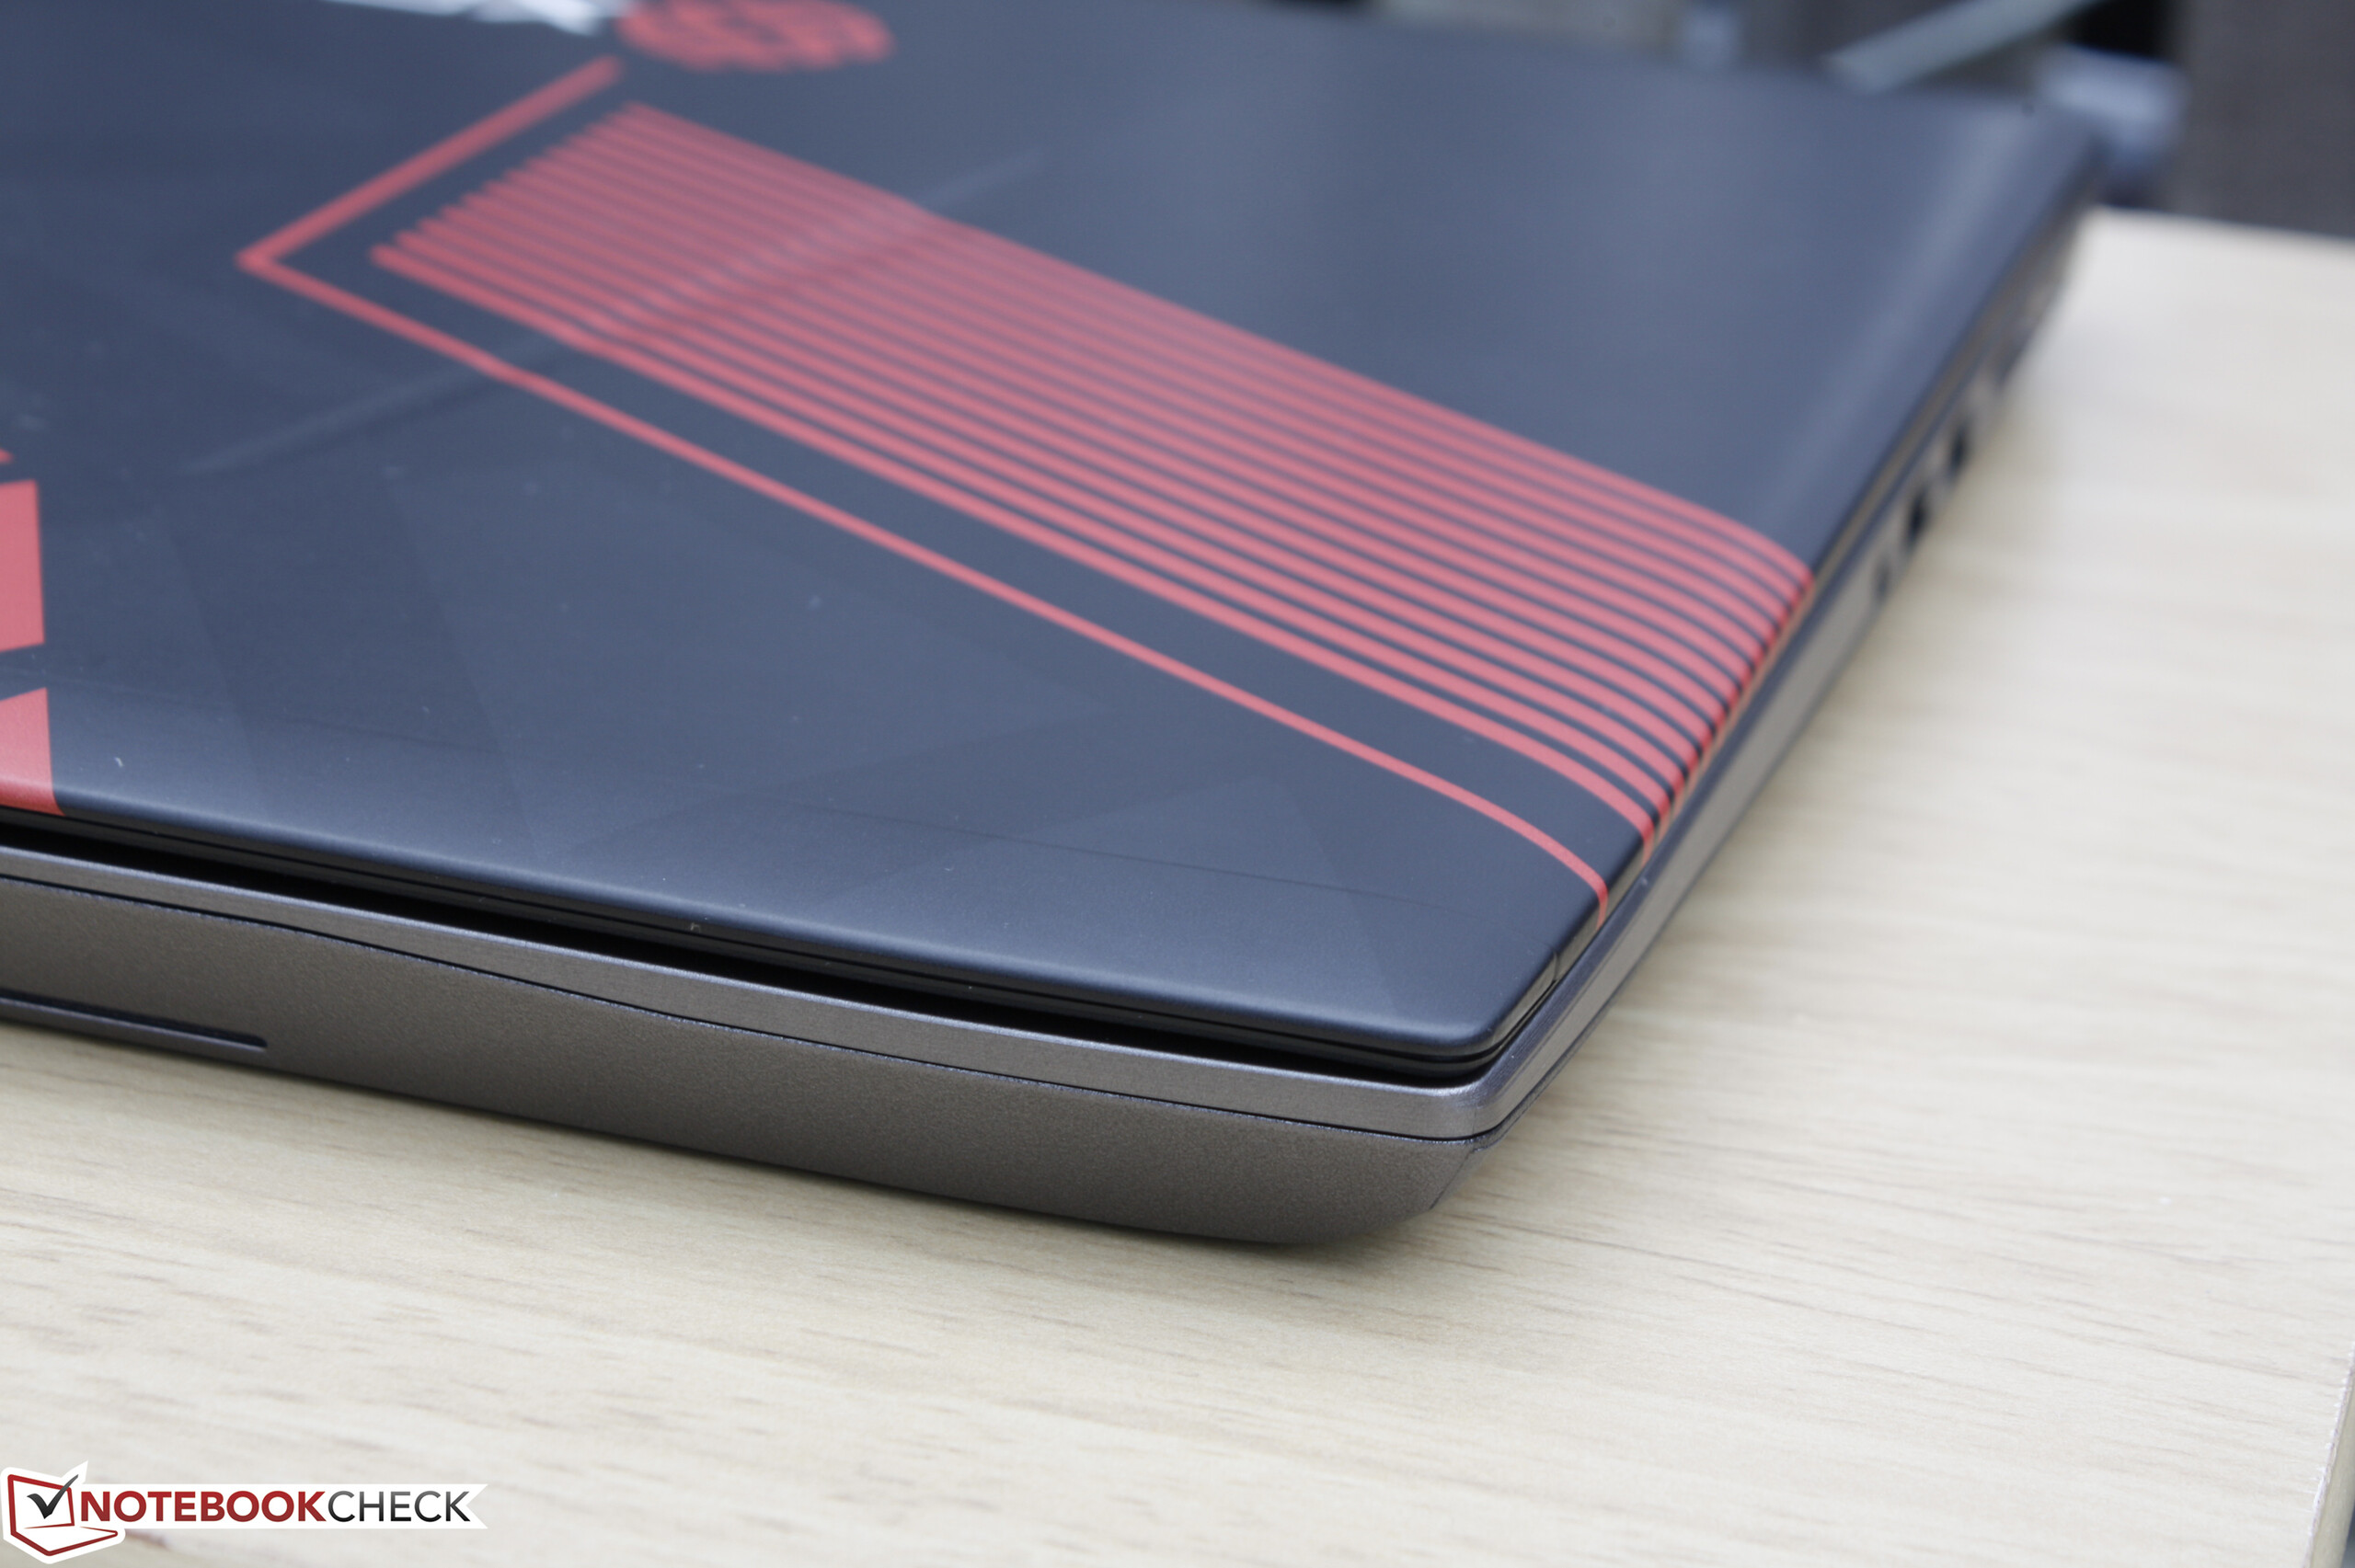
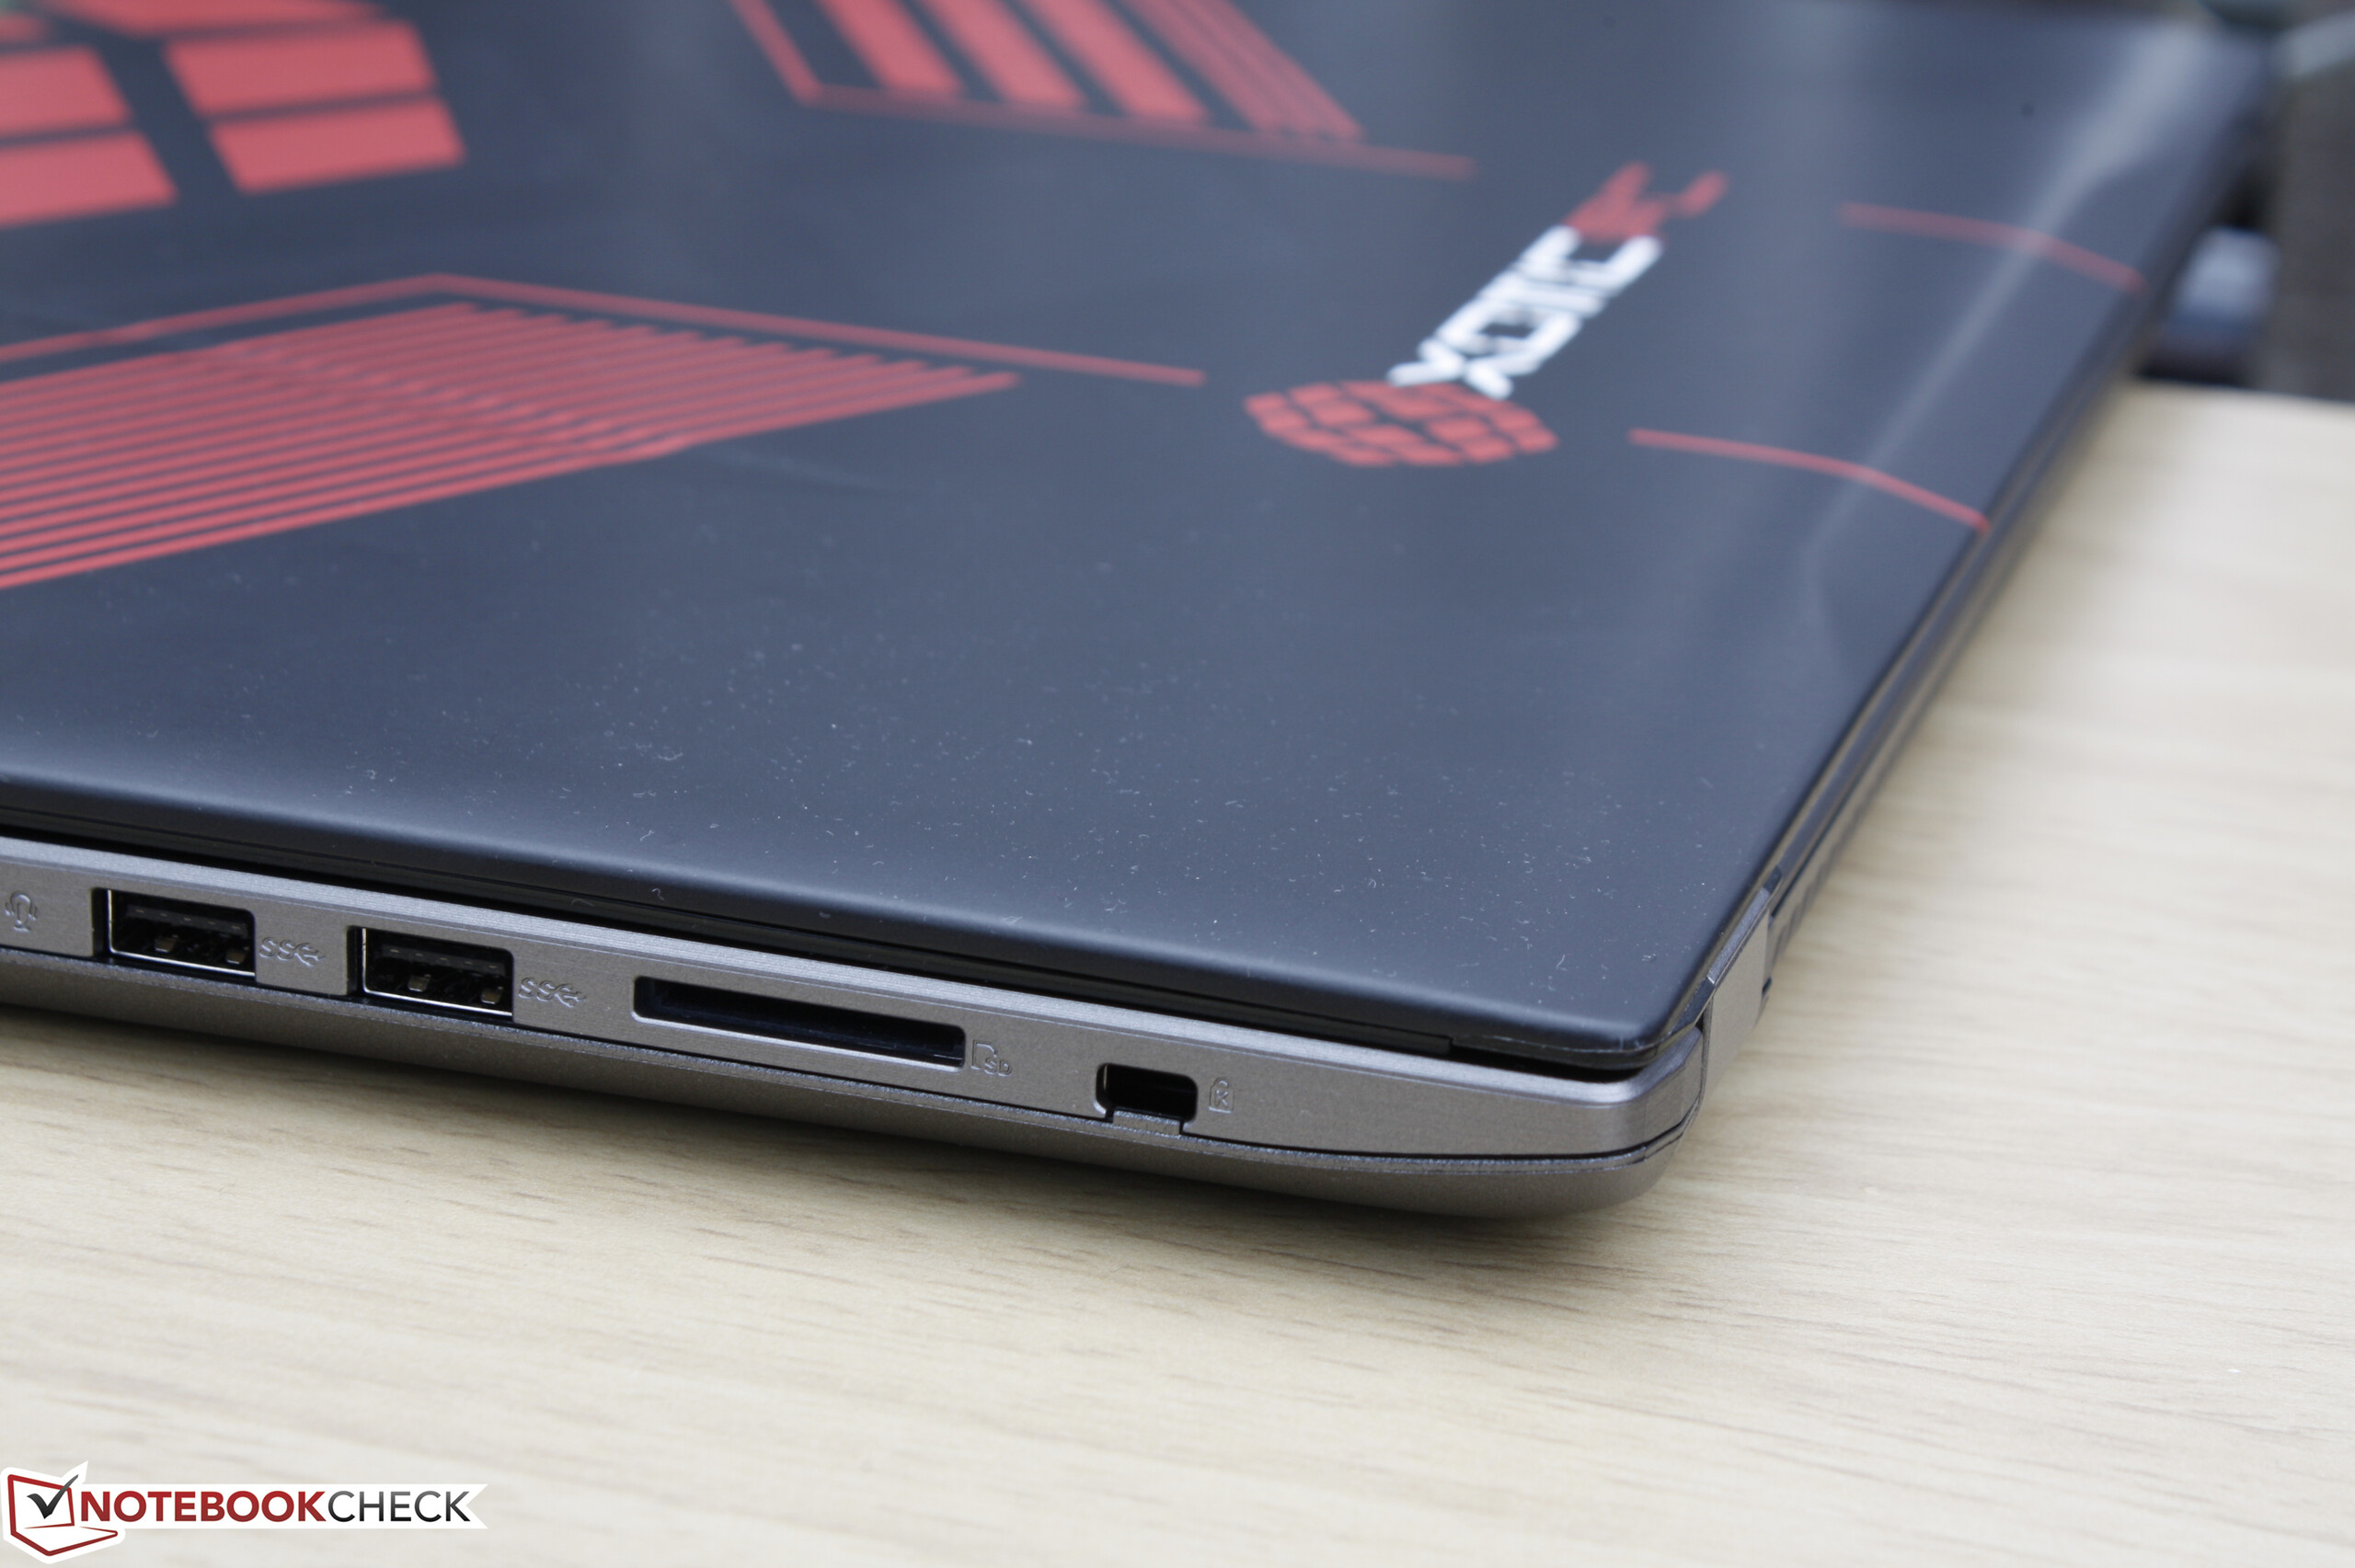
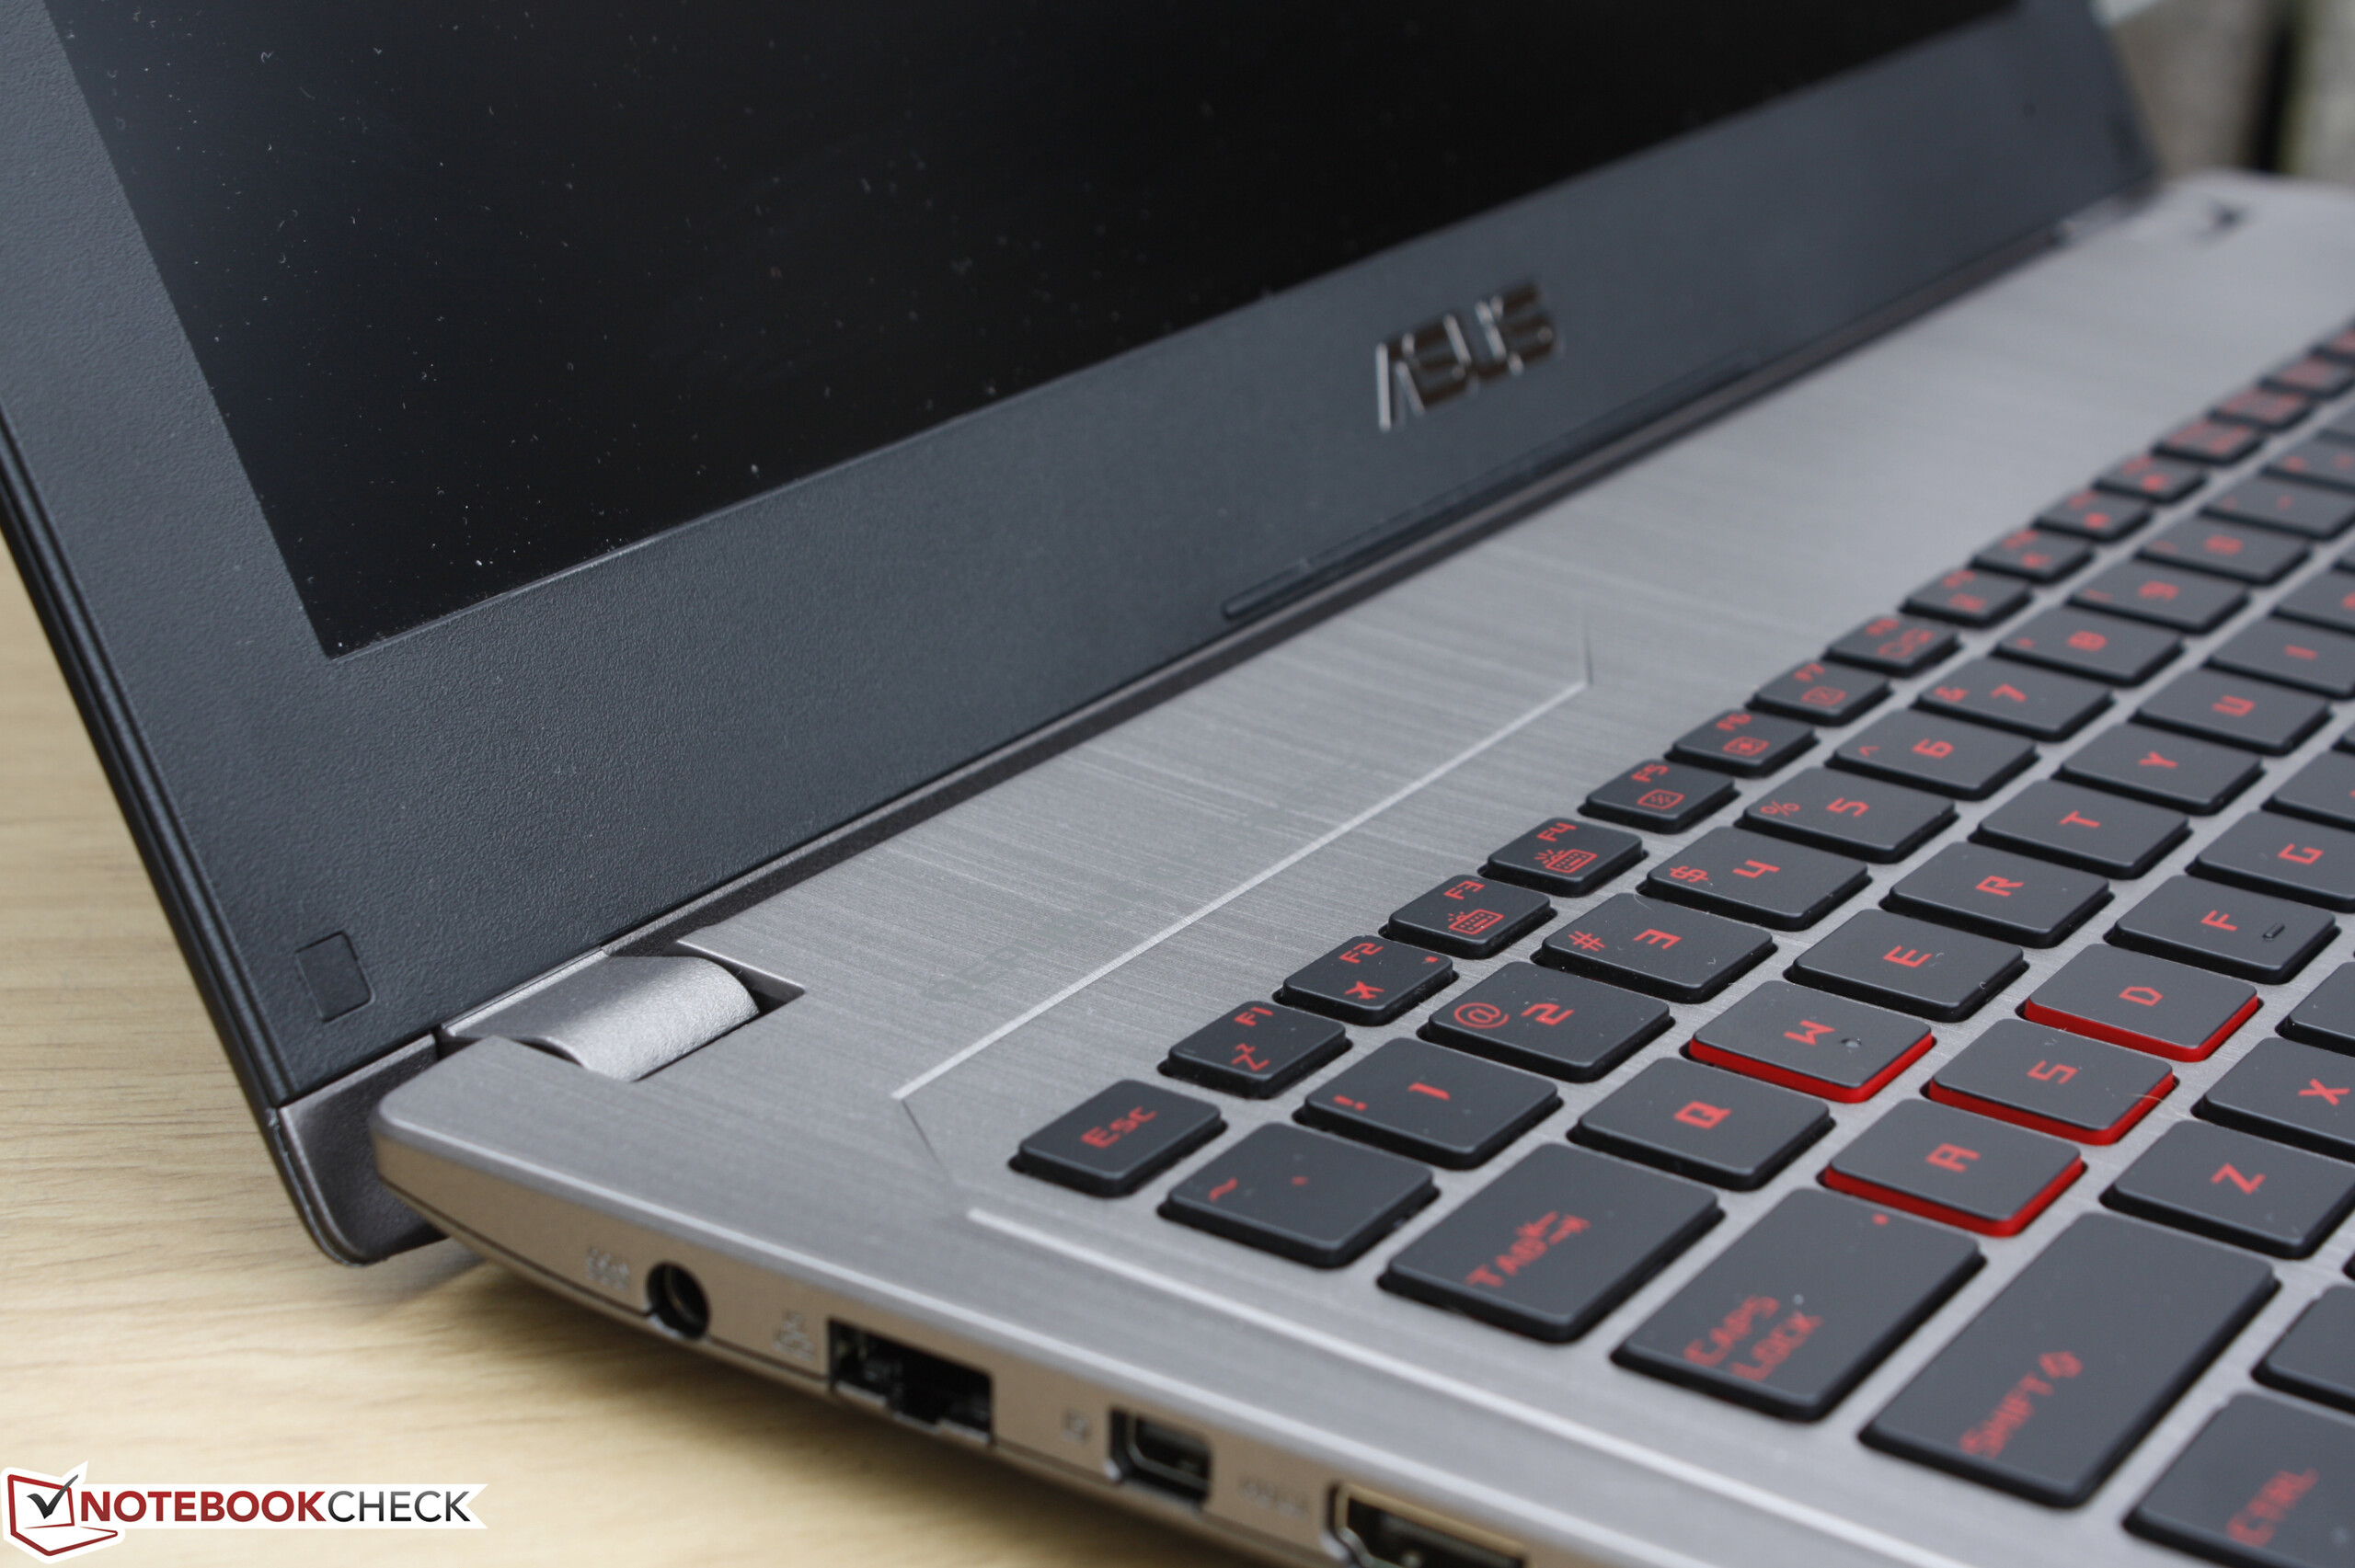
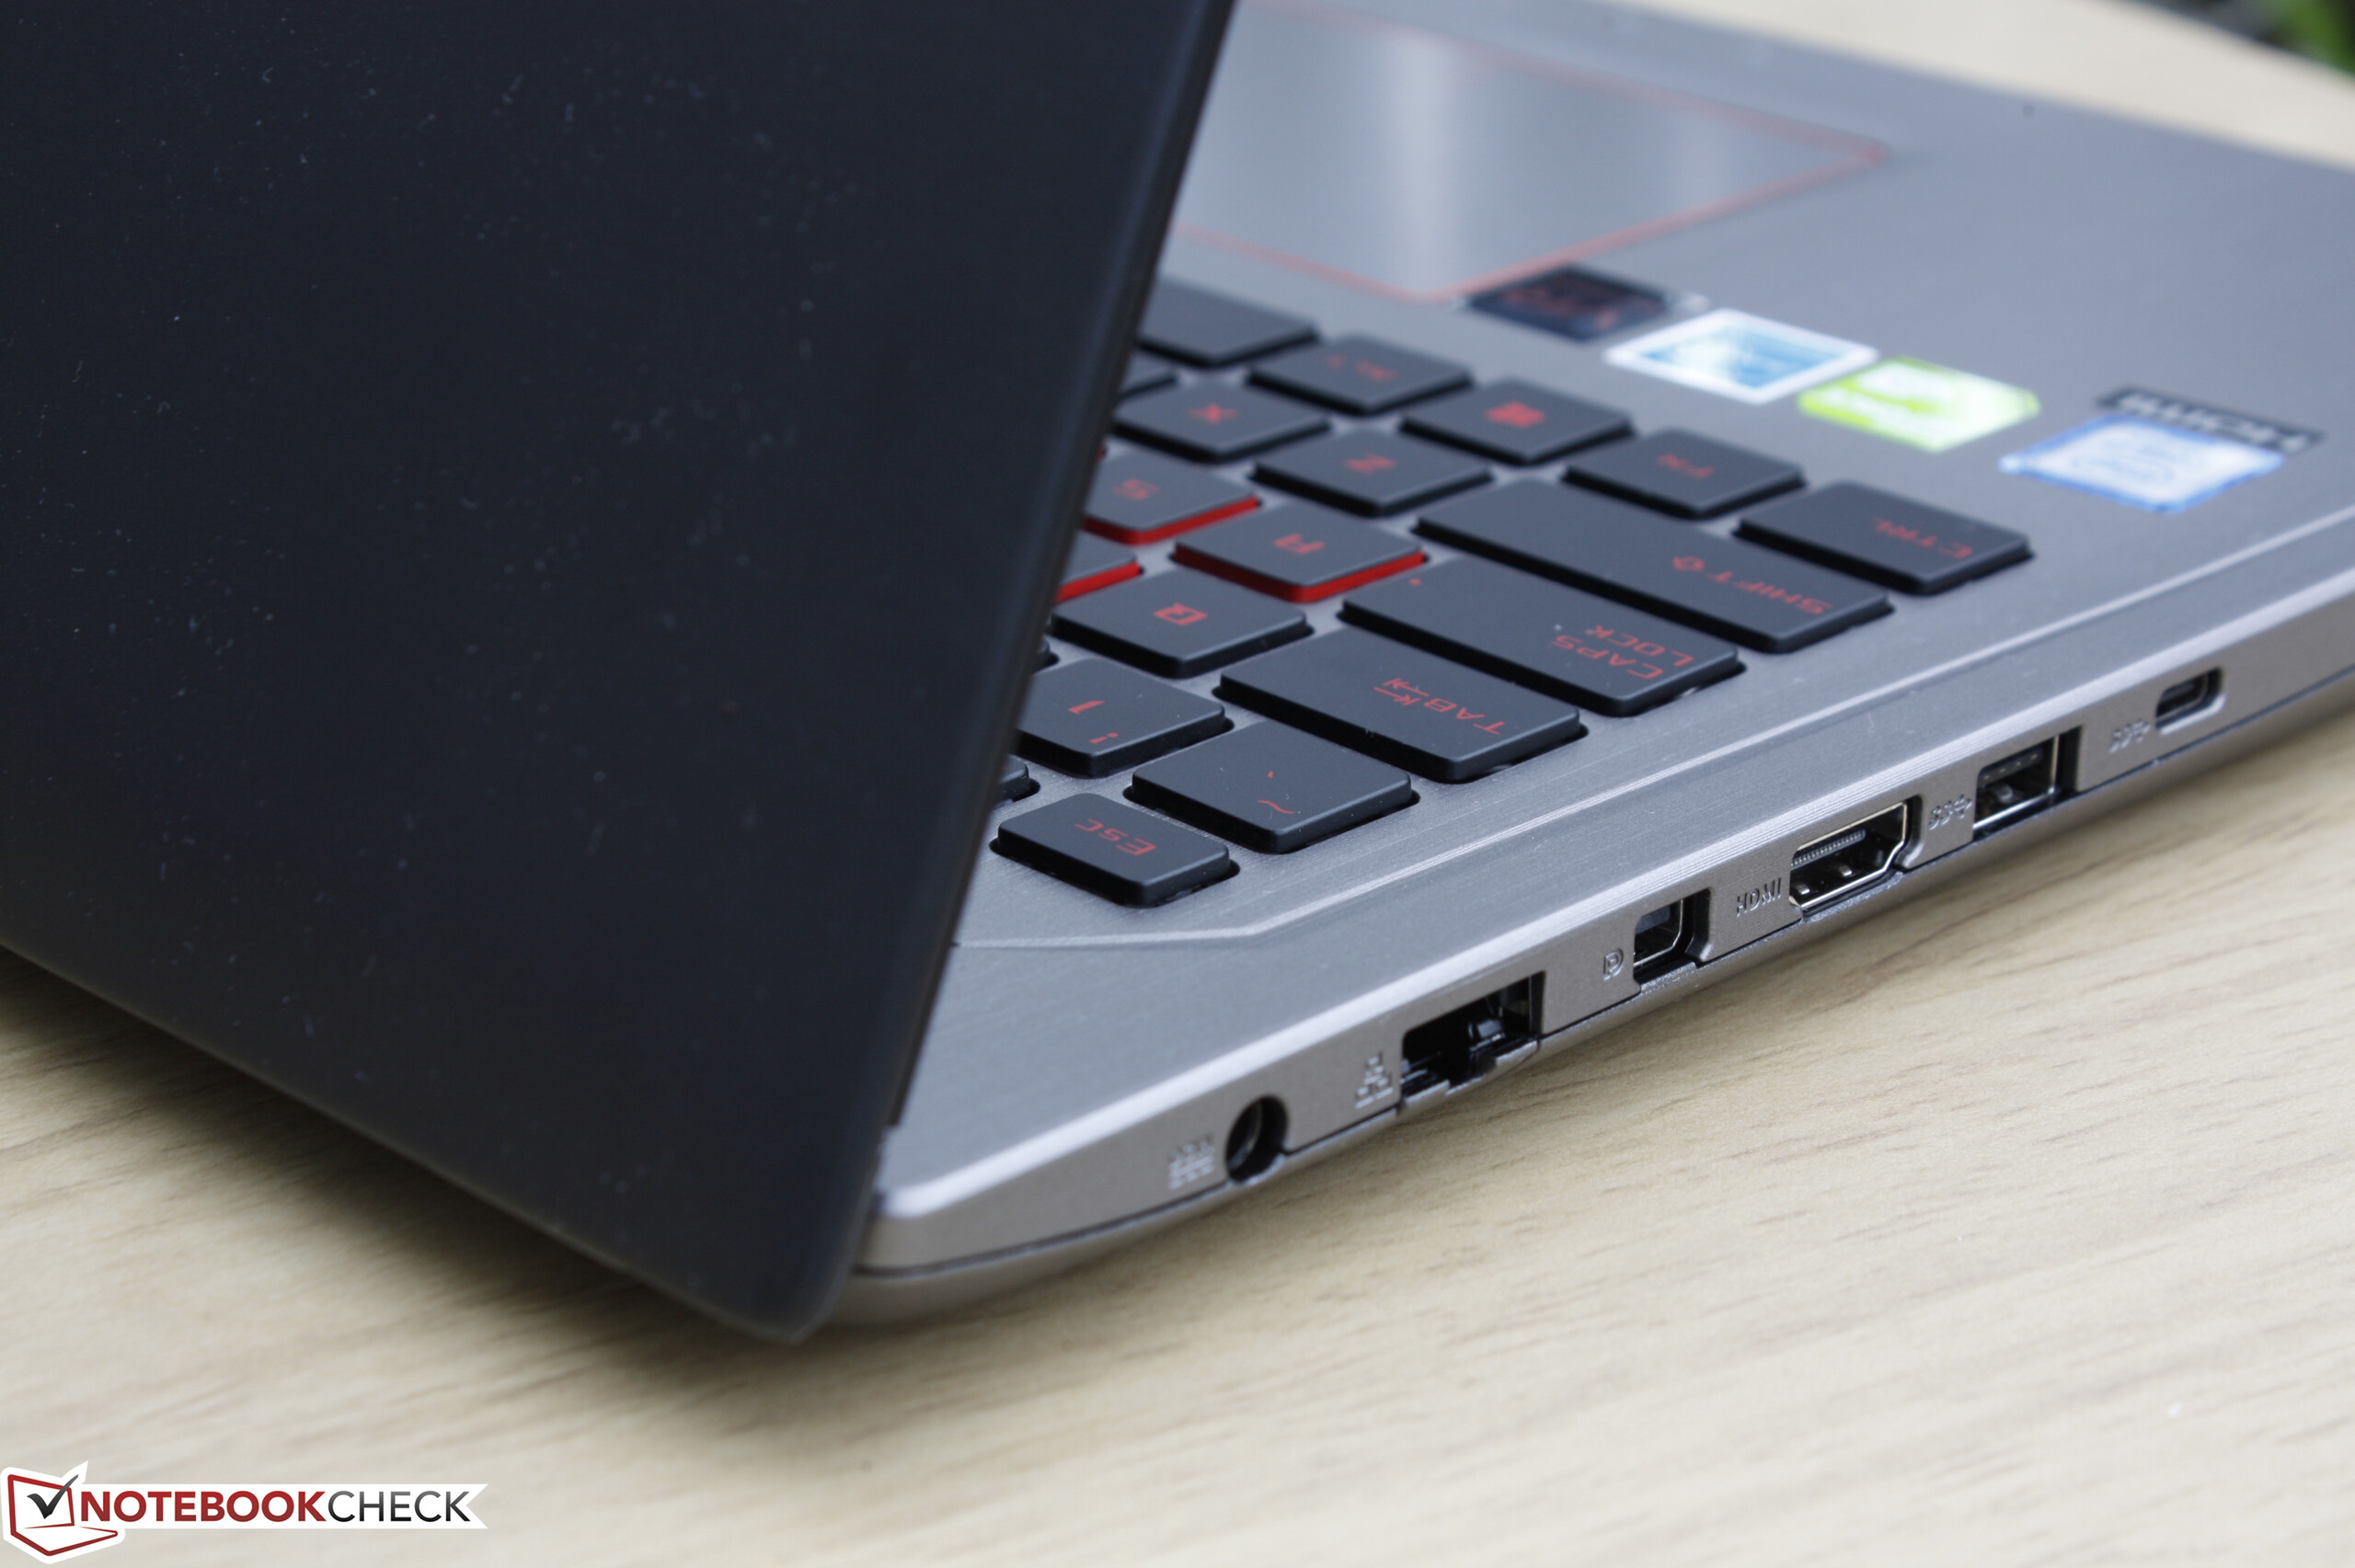
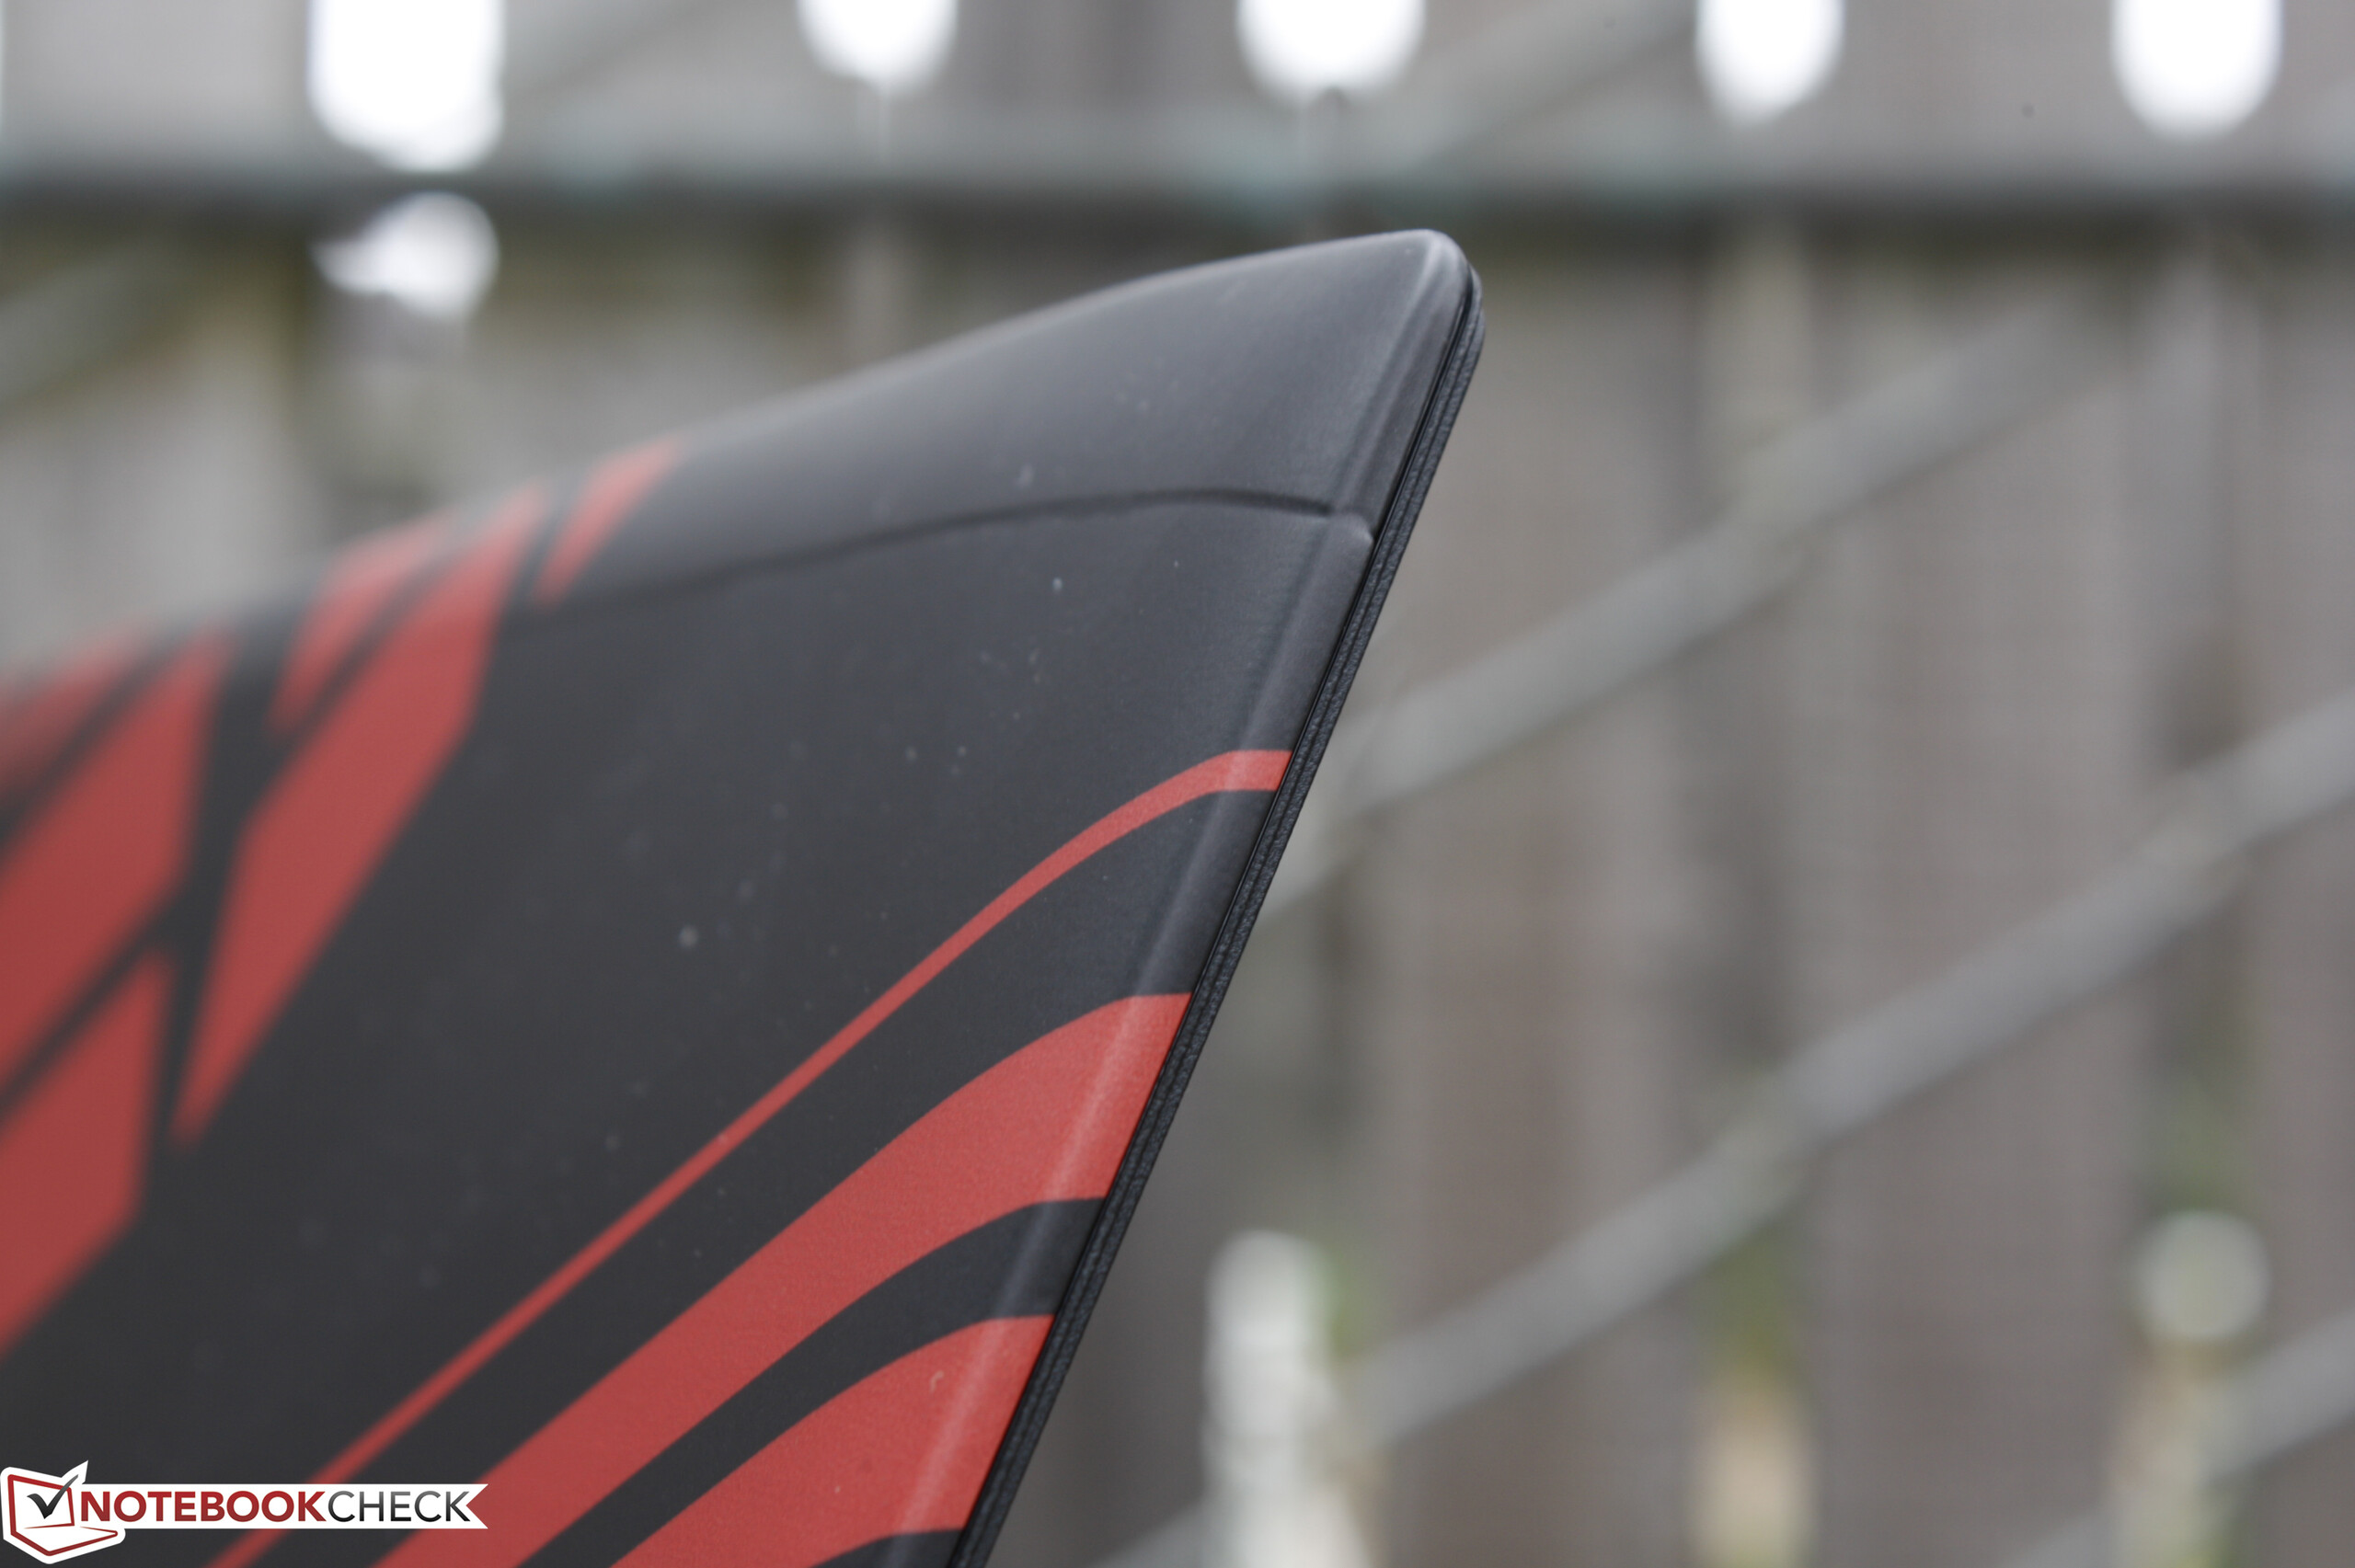
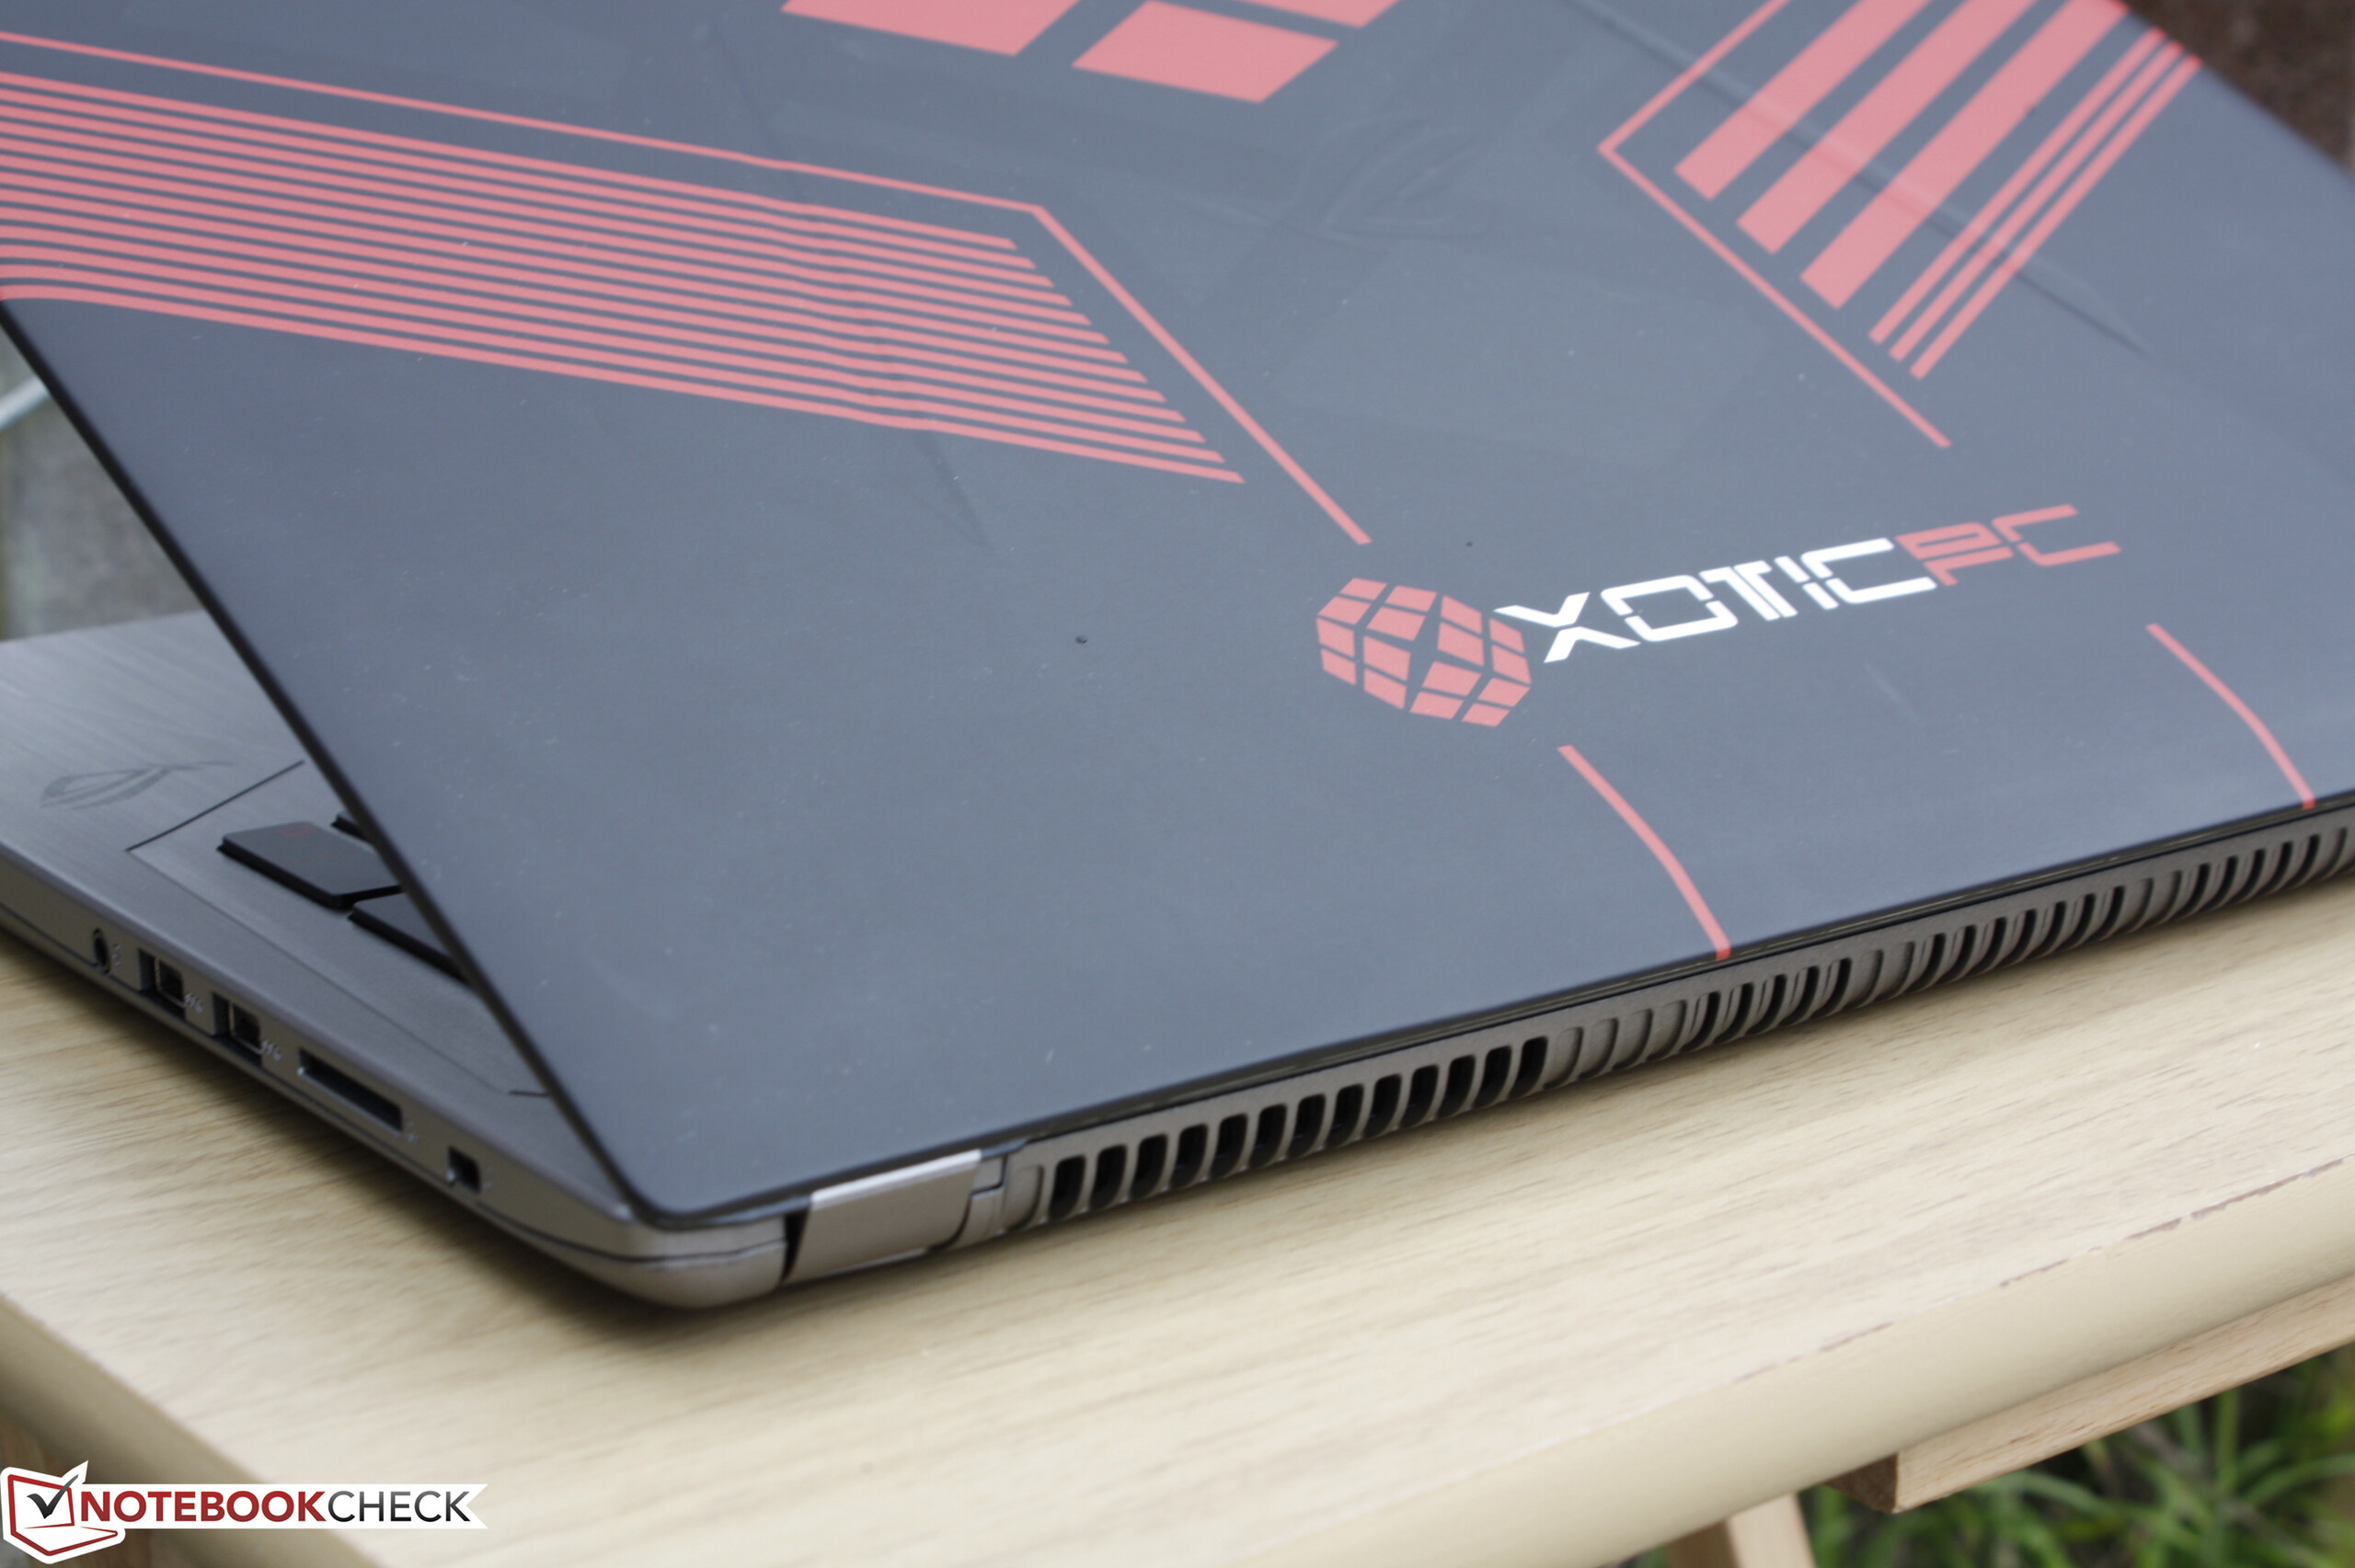
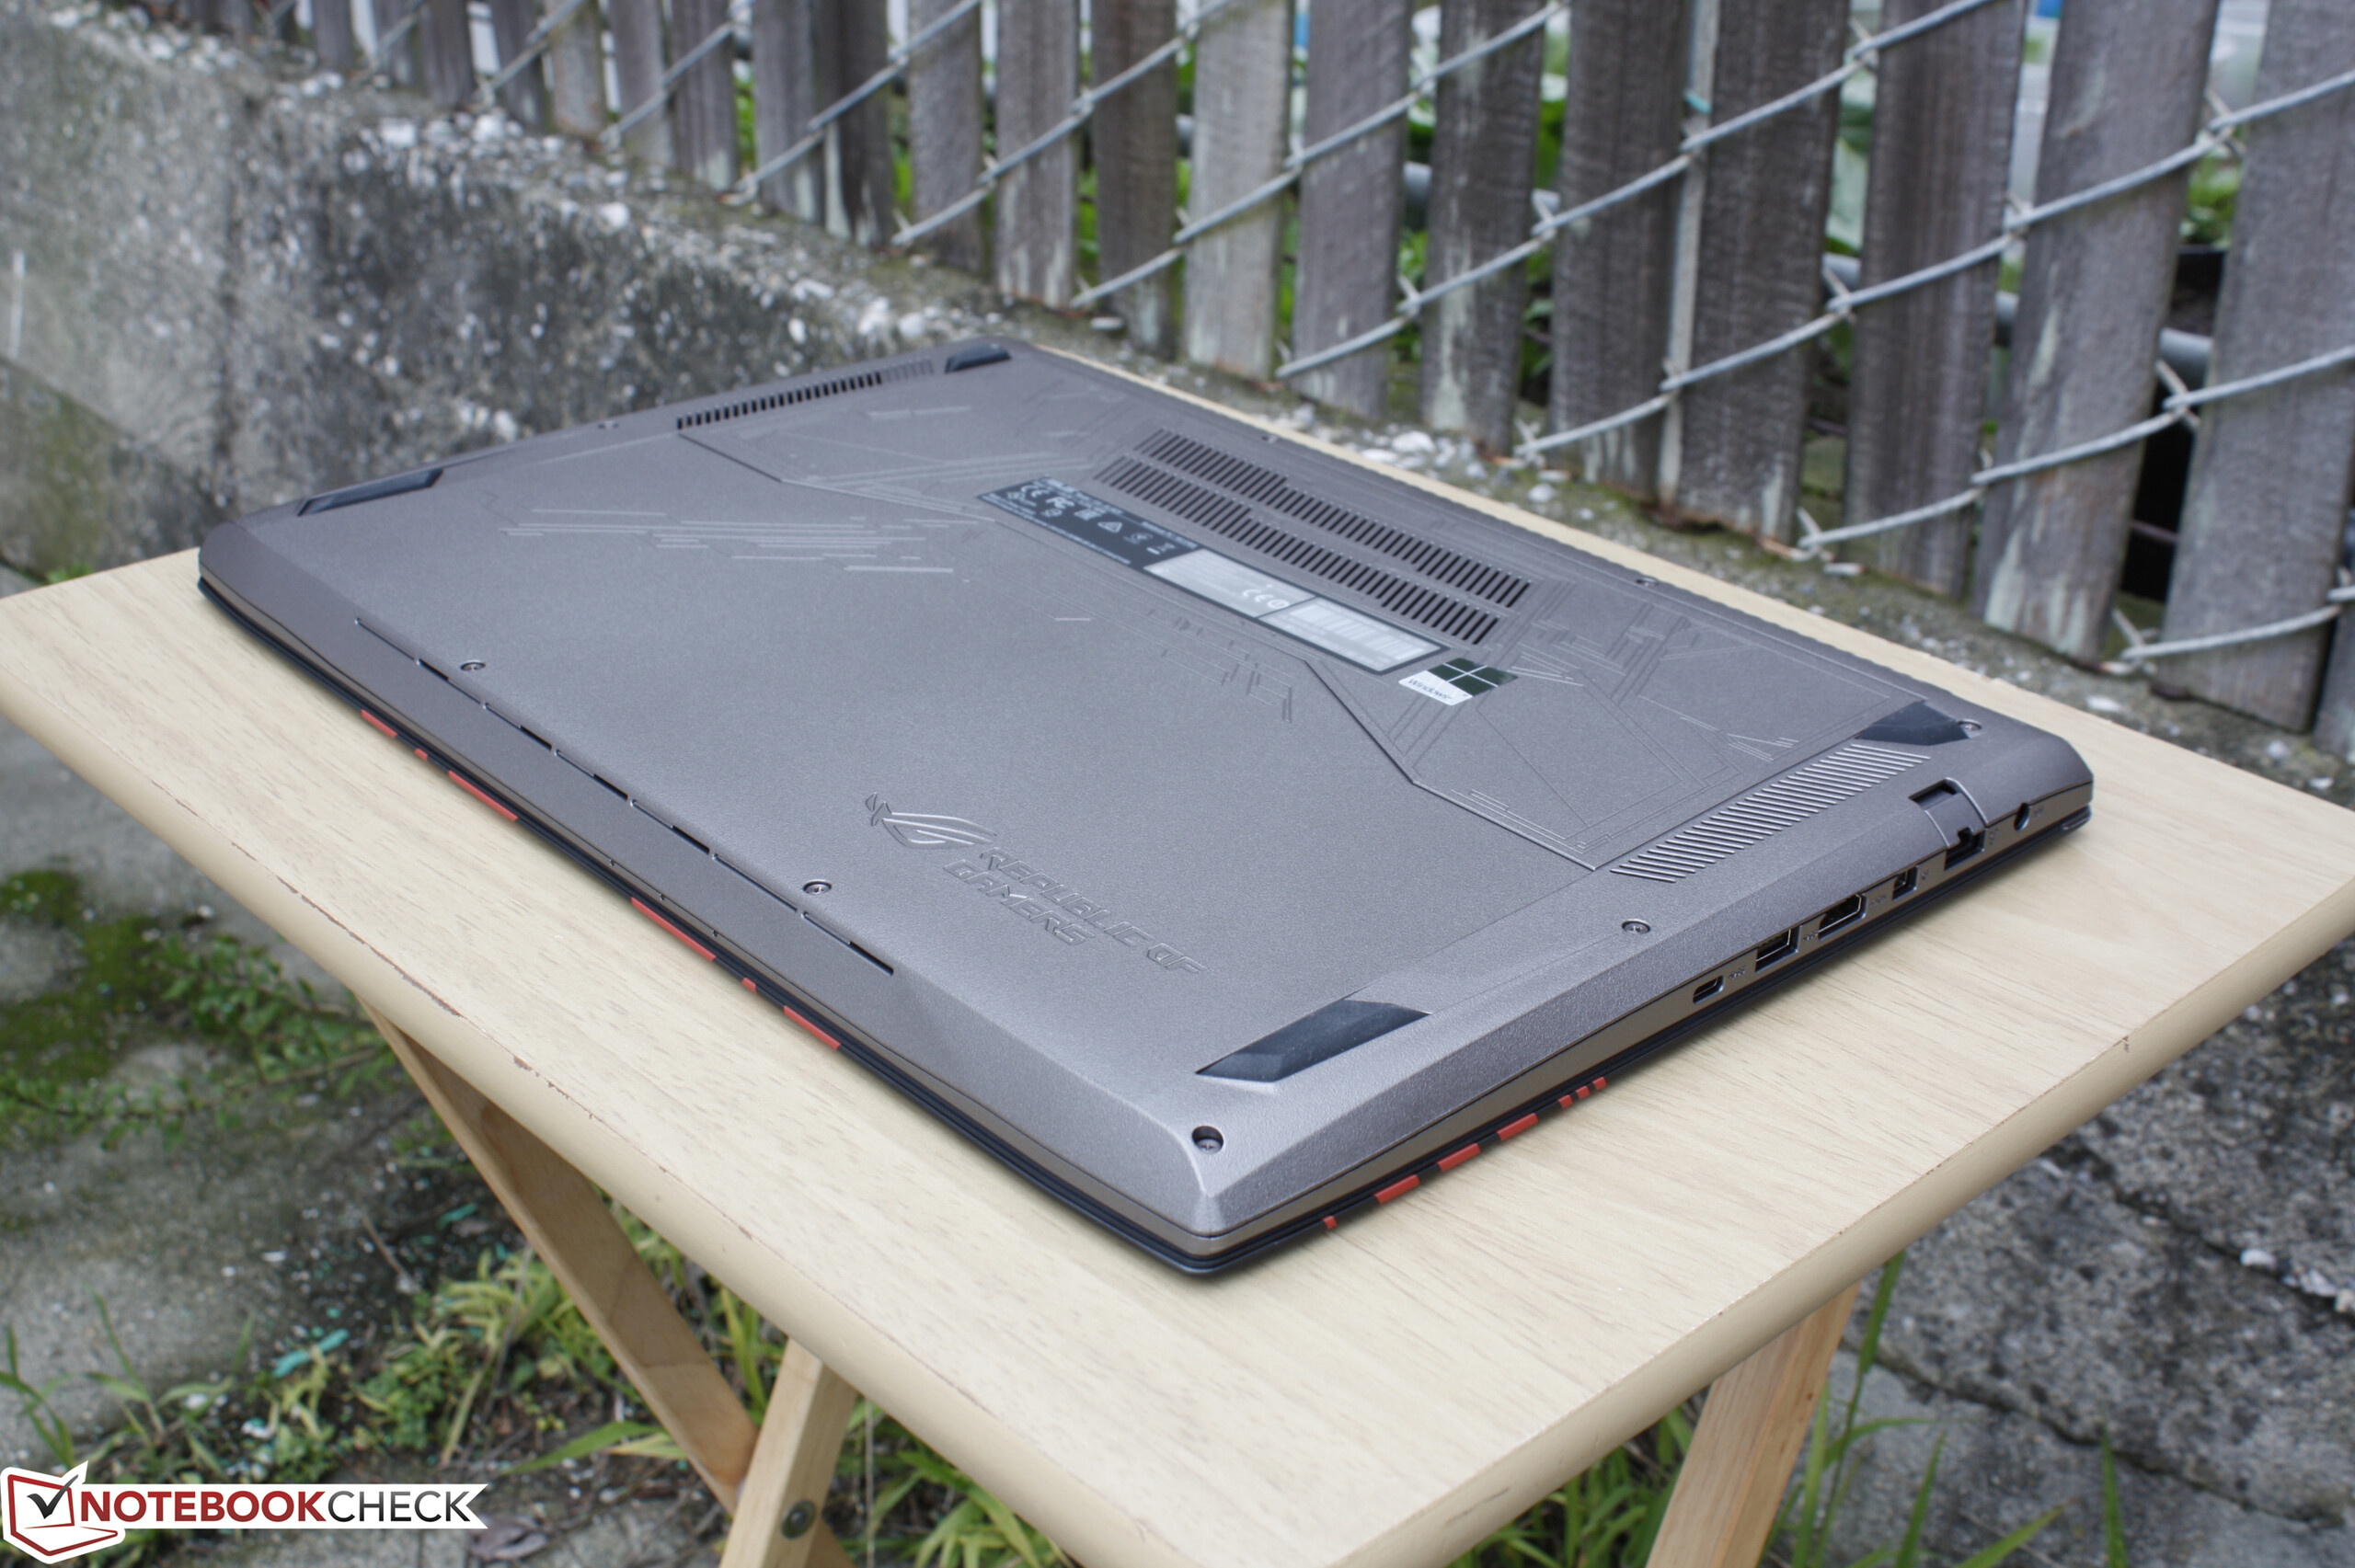
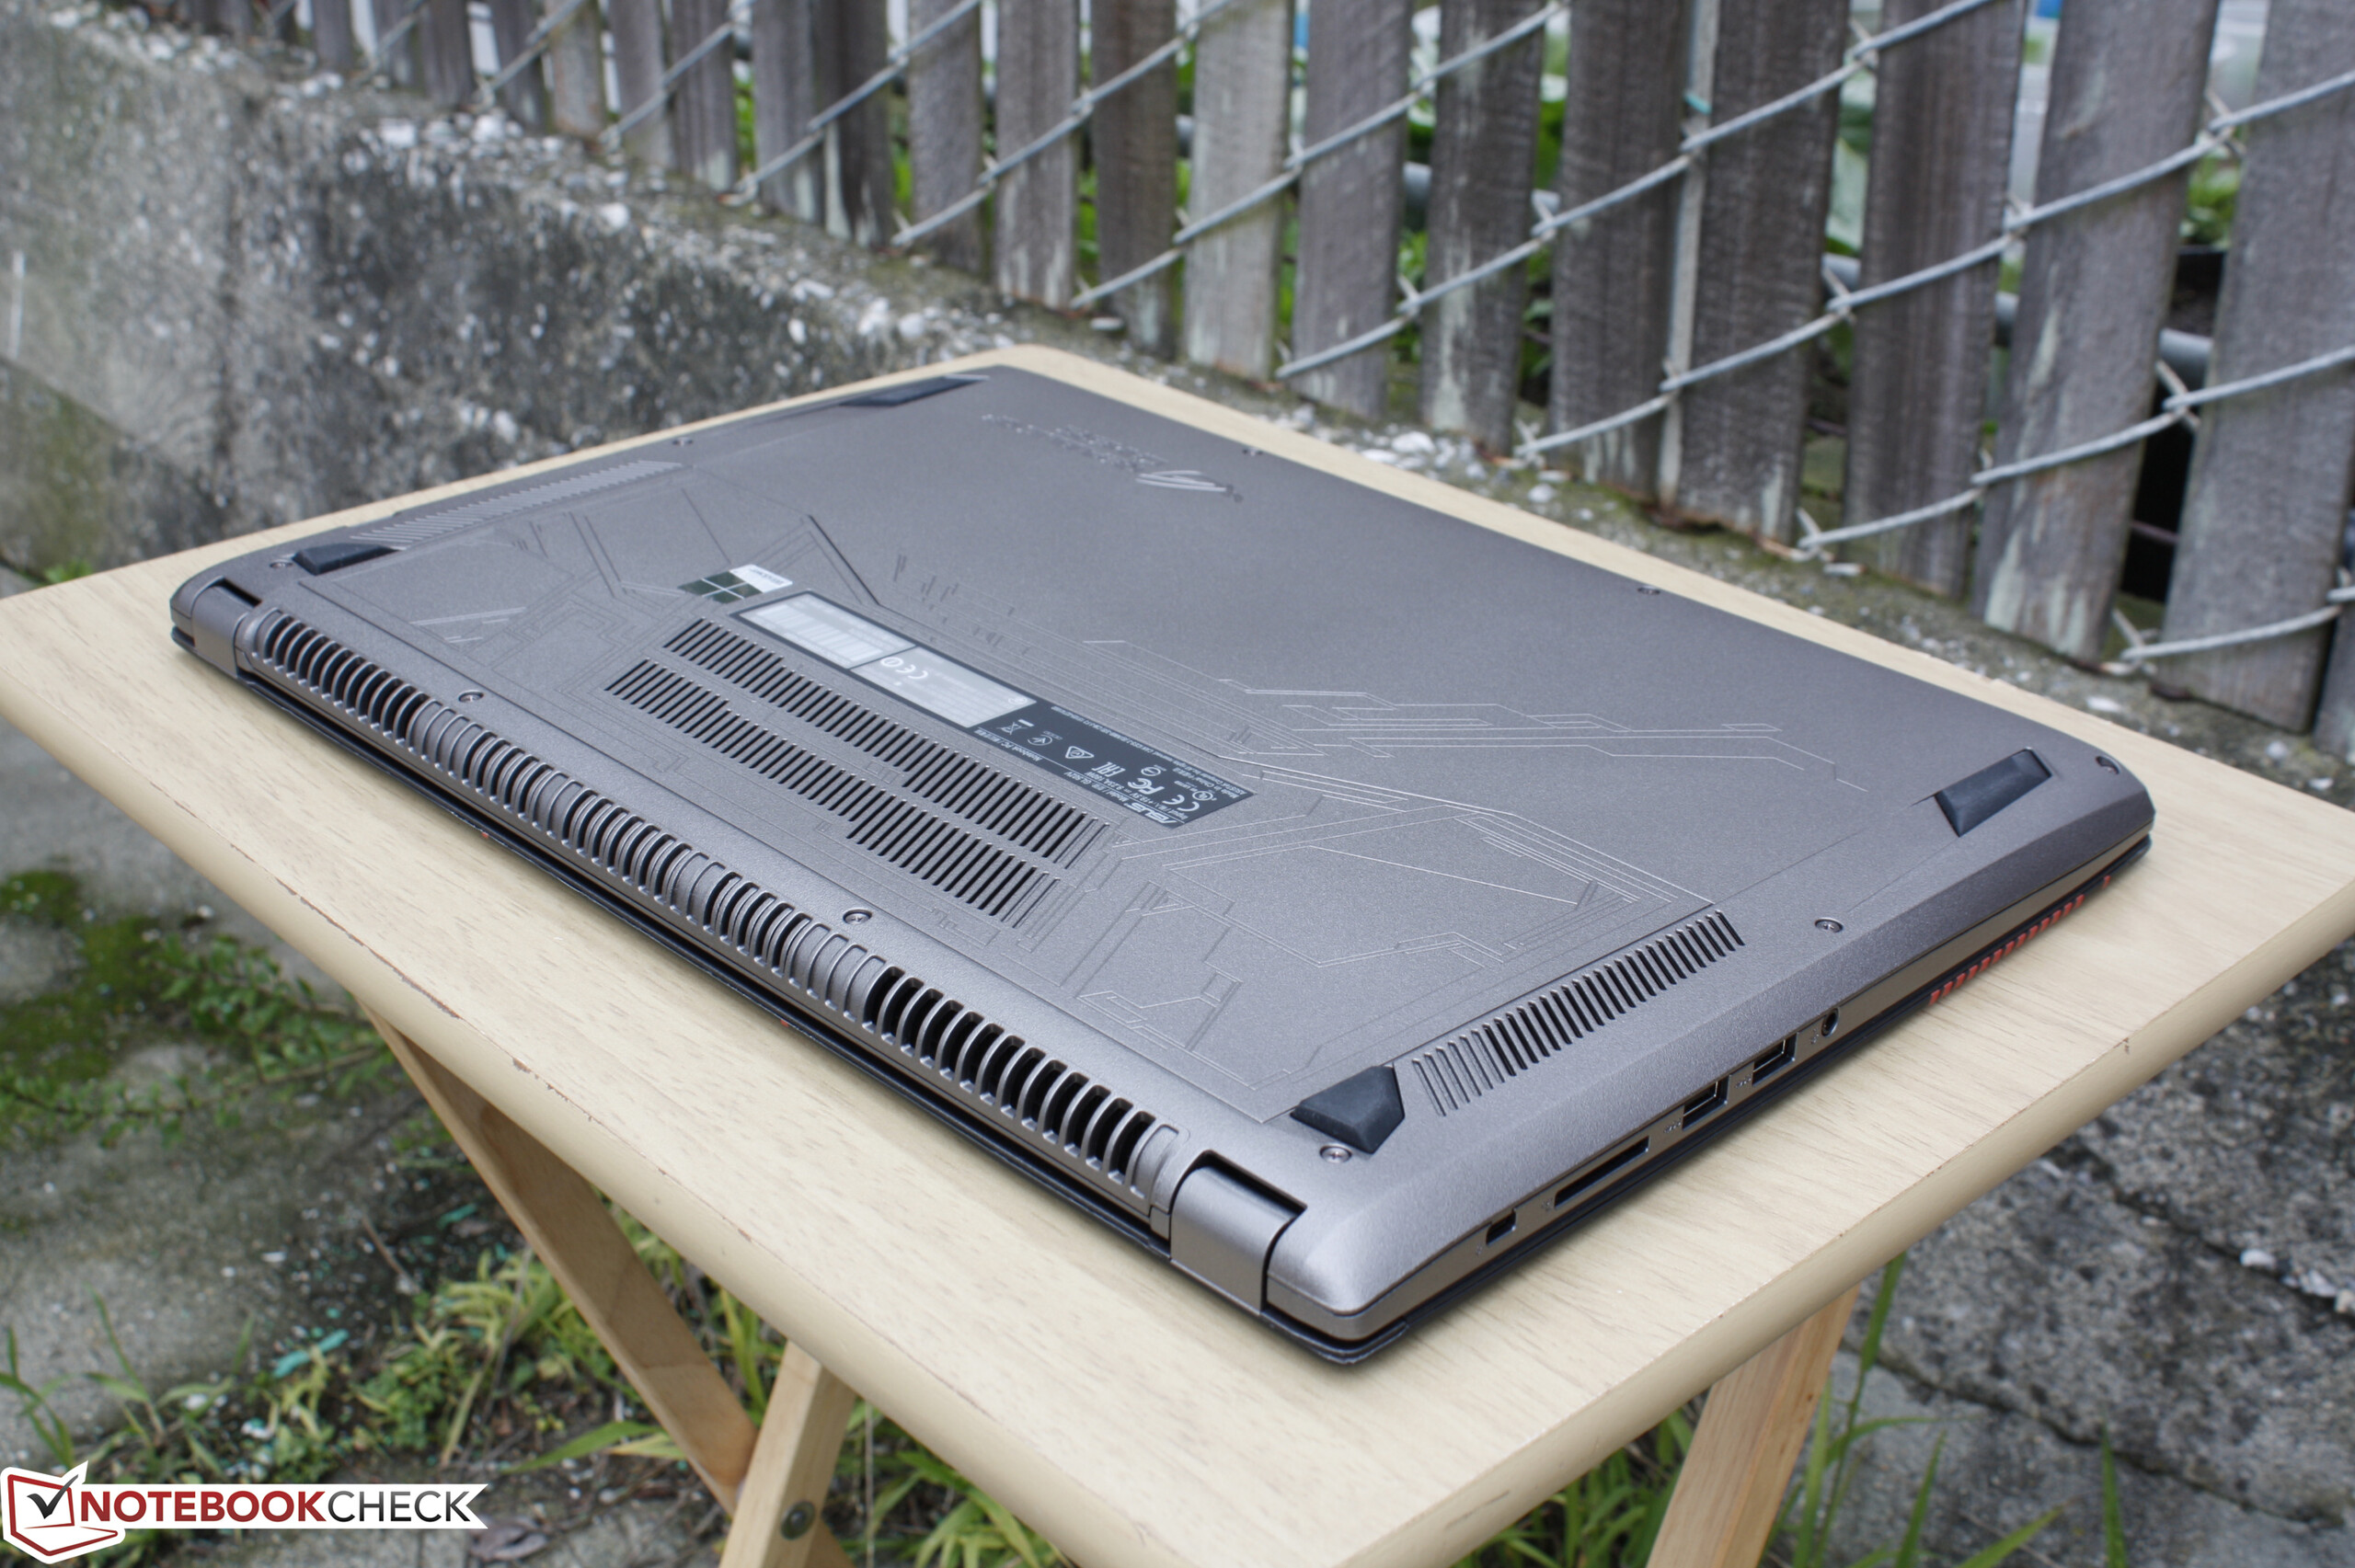
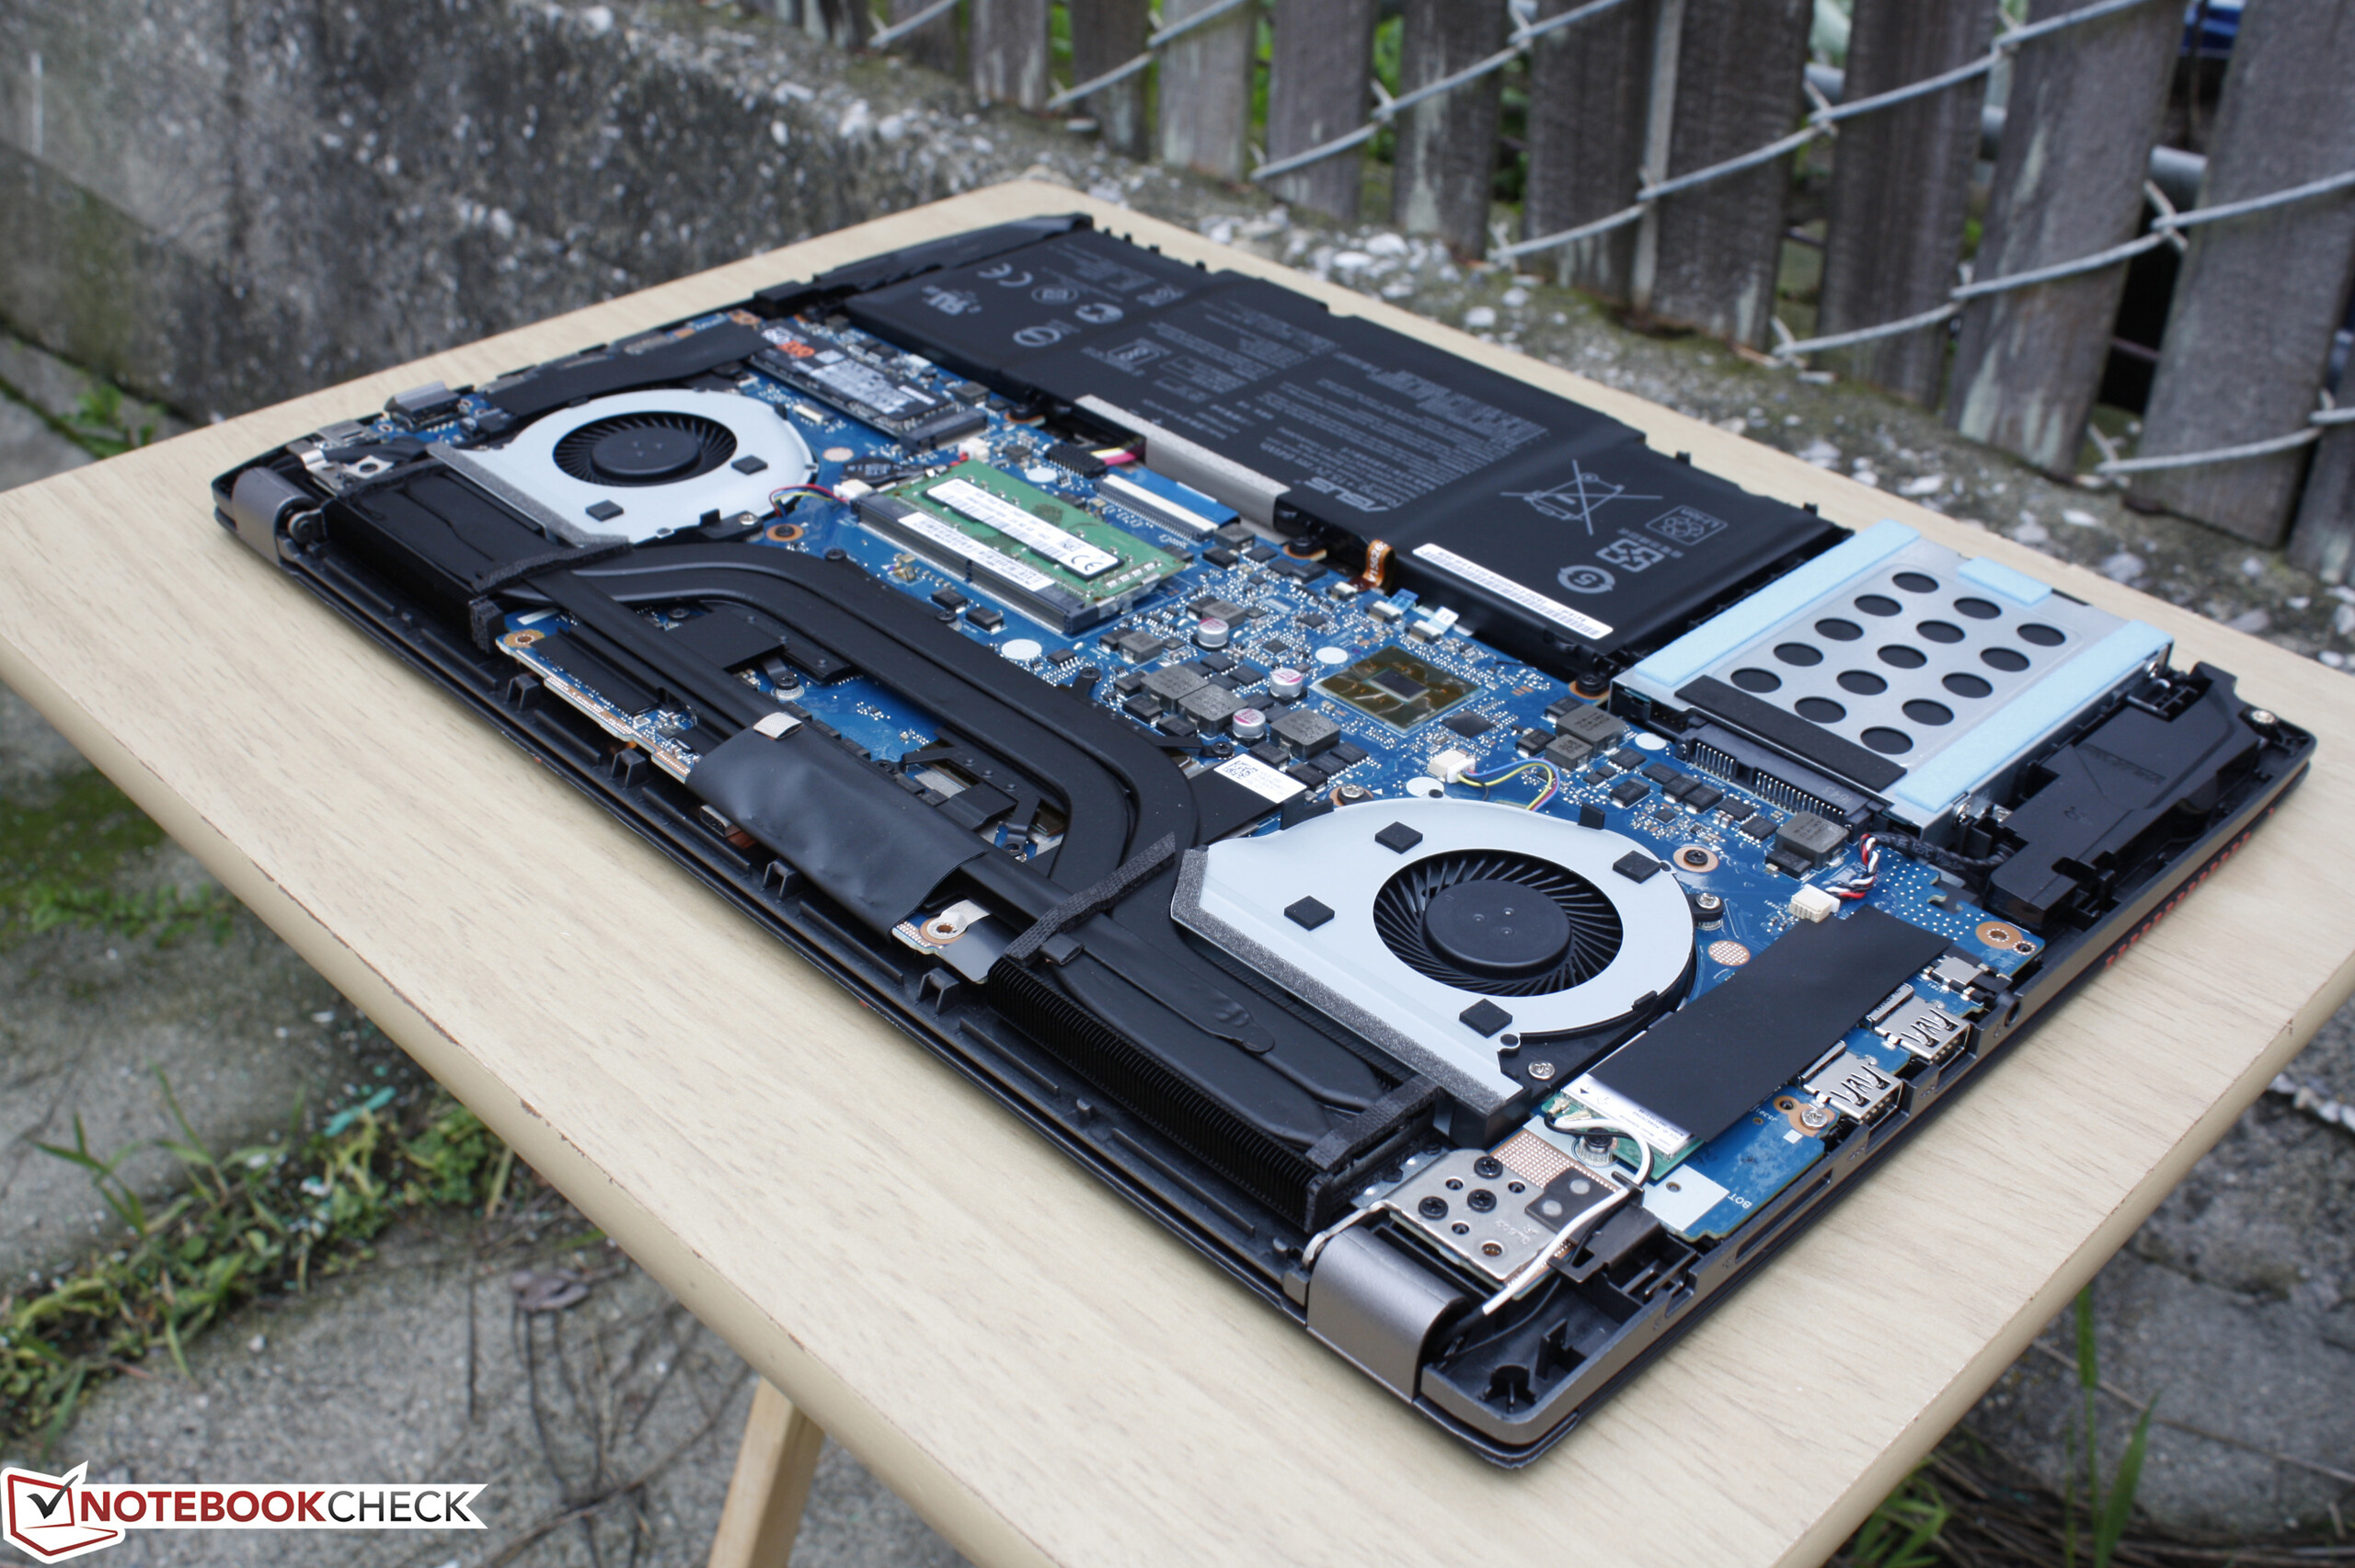
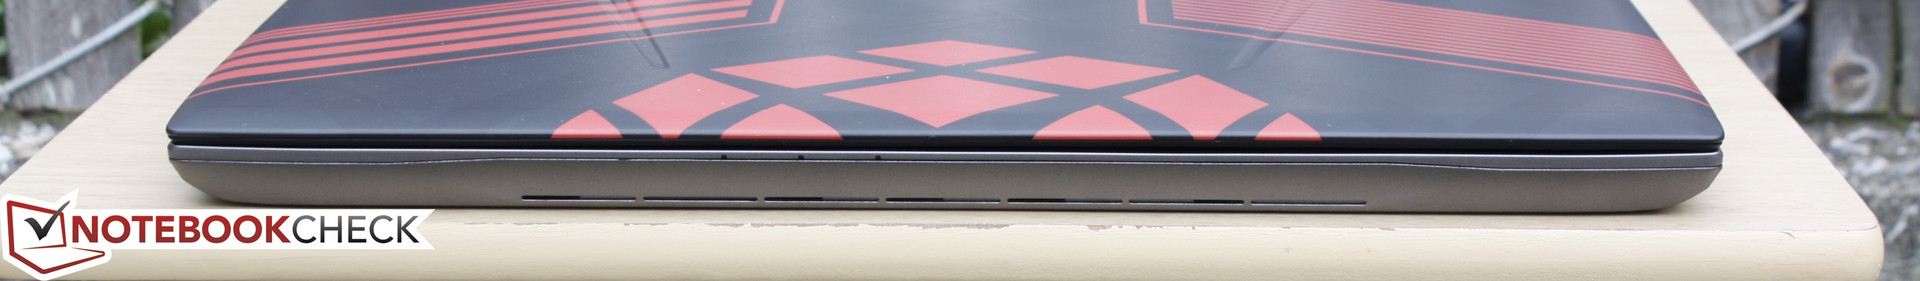
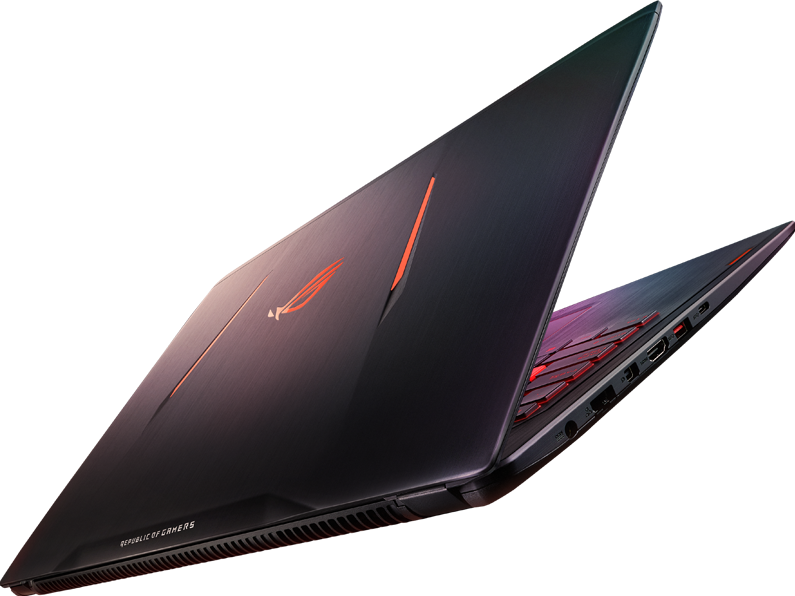
GL502VM具有相对轻巧坚固的外壳。但是,与竞争对手相比,它的硬件选择更有限。风扇噪音和电池寿命在我们的Xotic PC测试单元特别令人失望,新的Kaby Lake 处理器几乎没有在游戏的优势上超过Skylake SKU。
注:本文是基于完整评测的缩减版本,阅读完整的英文评测,请点击这里。
Asus Strix GL502VM-DS74
- 01/24/2017 v6 (old)
Allen Ngo
Price comparison
