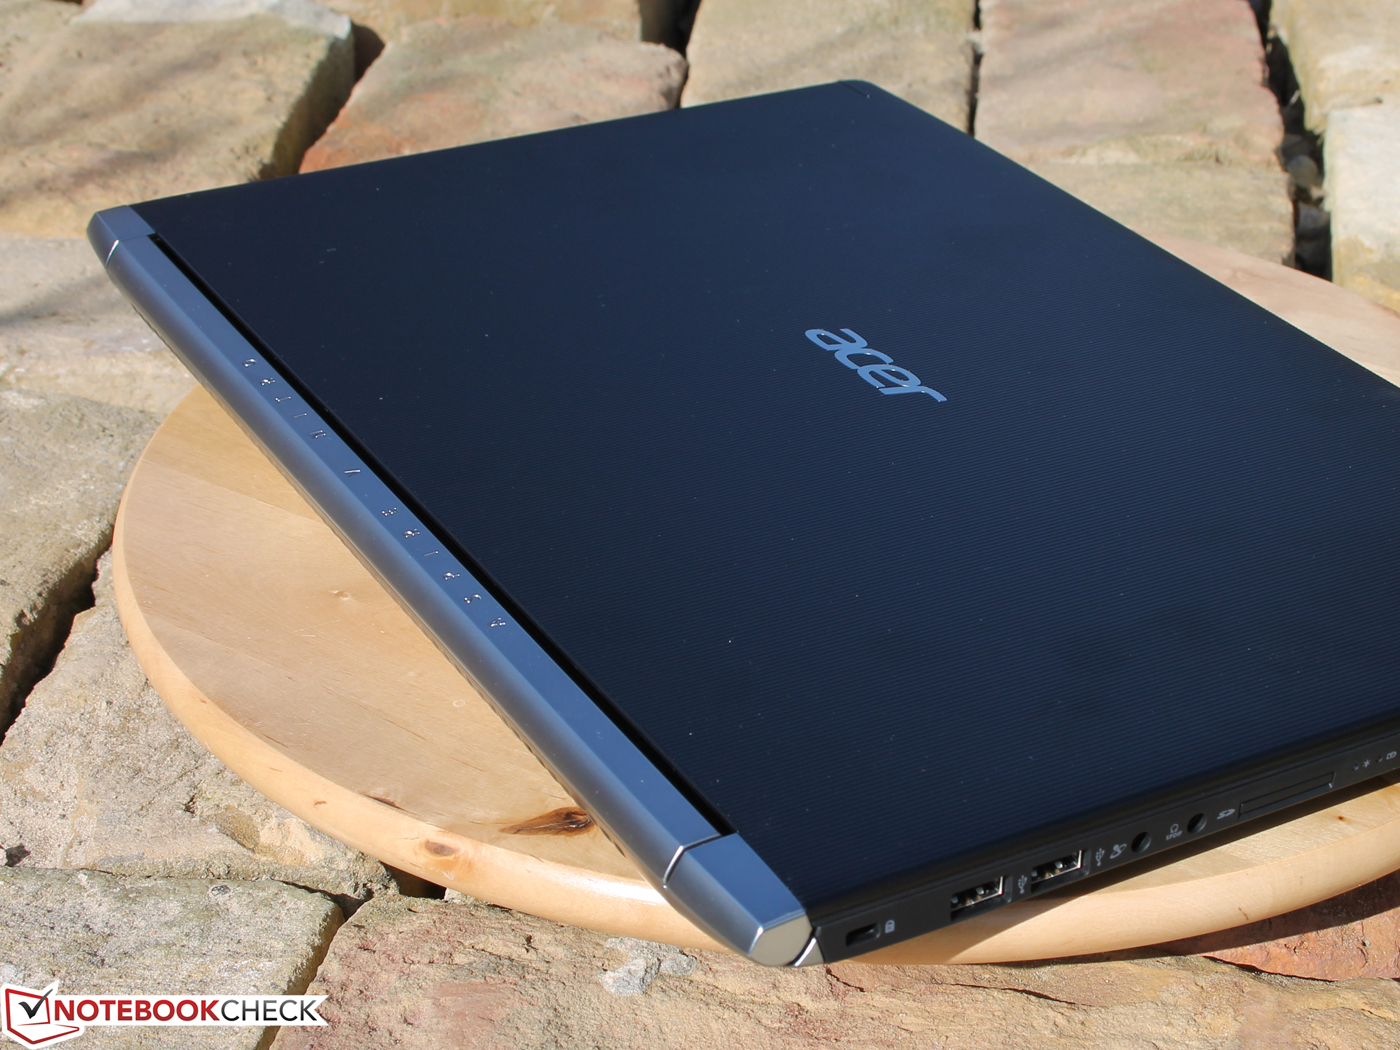
宏碁 Aspire V15 Nitro BE VN7-593G (7700HQ, GTX 1060) 笔记本电脑简短评测


| |||||||||||||||||||||||||
Brightness Distribution: 86 %
Center on Battery: 322 cd/m²
Contrast: 1039:1 (Black: 0.31 cd/m²)
ΔE ColorChecker Calman: 4.73 | ∀{0.5-29.43 Ø4.72}
ΔE Greyscale Calman: 2.99 | ∀{0.09-98 Ø4.97}
85% sRGB (Argyll 1.6.3 3D)
56% AdobeRGB 1998 (Argyll 1.6.3 3D)
62.2% AdobeRGB 1998 (Argyll 3D)
85.1% sRGB (Argyll 3D)
65.8% Display P3 (Argyll 3D)
Gamma: 2.32
CCT: 6905 K
| Acer Aspire VN7-593G-73HP V15 Nitro BE LG Display LP156WF6-SPP1, , 1920x1080, 15.6" | Acer Aspire V15 Nitro BE VN7-592G-79DV Sharp LQ156D1JW02D, , 3840x2160, 15.6" | Asus Strix GL502VM-FY039T LG Philips LP156WF6-SPB6 (LGD046F), , 1920x1080, 15.6" | MSI GT62VR 7RE-223 LG Philips LP156WF6 (LGD046F), , 1920x1080, 15.6" | Gigabyte P55W v7 LG Philips LP156WF6 (LGD046F), , 1920x1080, 15.6" | Dell XPS 15 2017 9560 (7300HQ, Full-HD) Sharp SHP1453 LQ156M1, , 1920x1080, 15.6" | Acer Aspire VX5-591G-75C4 VX15 LG Philips LGD0550 / LP156WF6-SPK4, , 1920x1080, 15.6" | Dell Inspiron 15 7000 7567 AU Optronics AUO38ED B156HTN 28H80, , 1920x1080, 15.6" | MSI GL62M 7RD-077 Chi Mei N156HGE-EAL, , 1920x1080, 15.6" | |
|---|---|---|---|---|---|---|---|---|---|
| Display | 36% | -2% | -2% | -4% | 12% | -36% | -40% | 28% | |
| Display P3 Coverage (%) | 65.8 | 86.2 31% | 64.5 -2% | 63.9 -3% | 63.5 -3% | 68.9 5% | 38.88 -41% | 36.42 -45% | 85.4 30% |
| sRGB Coverage (%) | 85.1 | 100 18% | 83.4 -2% | 83.1 -2% | 82 -4% | 98.9 16% | 58.2 -32% | 54.9 -35% | 100 18% |
| AdobeRGB 1998 Coverage (%) | 62.2 | 99.5 60% | 60.9 -2% | 60.8 -2% | 59.9 -4% | 70.9 14% | 40.2 -35% | 37.62 -40% | 83.8 35% |
| Response Times | 3% | 14% | 18% | 18% | -43% | 39% | 3% | 4% | |
| Response Time Grey 50% / Grey 80% * (ms) | 41 ? | 49 ? -20% | 40 ? 2% | 37 ? 10% | 37 ? 10% | 54 ? -32% | 22 ? 46% | 36 ? 12% | 44 ? -7% |
| Response Time Black / White * (ms) | 34 ? | 25 ? 26% | 25 ? 26% | 25 ? 26% | 25 ? 26% | 52.4 ? -54% | 23 ? 32% | 36 ? -6% | 29 ? 15% |
| PWM Frequency (Hz) | 1000 ? | 198 ? | |||||||
| Screen | 26% | 0% | -2% | -4% | 2% | -15% | -86% | -54% | |
| Brightness middle (cd/m²) | 322 | 303 -6% | 321 0% | 310 -4% | 287 -11% | 400 24% | 281 -13% | 246 -24% | 258 -20% |
| Brightness (cd/m²) | 297 | 291 -2% | 296 0% | 311 5% | 289 -3% | 392 32% | 257 -13% | 235 -21% | 234 -21% |
| Brightness Distribution (%) | 86 | 83 -3% | 88 2% | 85 -1% | 87 1% | 89 3% | 85 -1% | 75 -13% | 79 -8% |
| Black Level * (cd/m²) | 0.31 | 0.22 29% | 0.33 -6% | 0.3 3% | 0.29 6% | 0.26 16% | 0.32 -3% | 0.55 -77% | 0.54 -74% |
| Contrast (:1) | 1039 | 1377 33% | 973 -6% | 1033 -1% | 990 -5% | 1538 48% | 878 -15% | 447 -57% | 478 -54% |
| Colorchecker dE 2000 * | 4.73 | 3.47 27% | 4.42 7% | 4.82 -2% | 4.92 -4% | 4.9 -4% | 5.16 -9% | 10.97 -132% | 9.74 -106% |
| Colorchecker dE 2000 max. * | 12.37 | 6.79 45% | 9.78 21% | 10.14 18% | 11 11% | 11 11% | 9.09 27% | 14.6 -18% | |
| Greyscale dE 2000 * | 2.99 | 1.17 61% | 3.34 -12% | 3.94 -32% | 3.66 -22% | 7.2 -141% | 4.57 -53% | 14.25 -377% | 11.59 -288% |
| Gamma | 2.32 95% | 2.35 94% | 2.4 92% | 2.45 90% | 2.32 95% | 2.11 104% | 2.59 85% | 1.83 120% | 2.19 100% |
| CCT | 6905 94% | 6658 98% | 6213 105% | 6877 95% | 6482 100% | 6911 94% | 6931 94% | 11200 58% | 11851 55% |
| Color Space (Percent of AdobeRGB 1998) (%) | 56 | 86 54% | 55 -2% | 54 -4% | 54 -4% | 64.2 15% | 37 -34% | 35 -37% | 76 36% |
| Color Space (Percent of sRGB) (%) | 85 | 100 18% | 83 -2% | 83 -2% | 82 -4% | 98.9 16% | 58 -32% | 55 -35% | 100 18% |
| Total Average (Program / Settings) | 22% /
25% | 4% /
2% | 5% /
1% | 3% /
-1% | -10% /
-2% | -4% /
-12% | -41% /
-63% | -7% /
-30% |
* ... smaller is better
Display Response Times
| ↔ Response Time Black to White | ||
|---|---|---|
| 34 ms ... rise ↗ and fall ↘ combined | ↗ 21 ms rise | 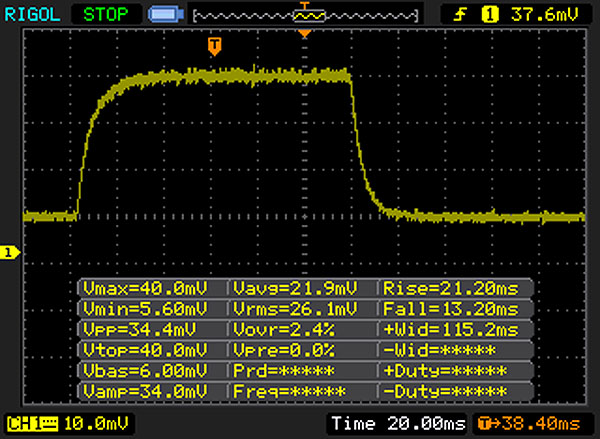 |
| ↘ 13 ms fall | ||
| The screen shows slow response rates in our tests and will be unsatisfactory for gamers. In comparison, all tested devices range from 0.1 (minimum) to 240 (maximum) ms. » 91 % of all devices are better. This means that the measured response time is worse than the average of all tested devices (19.8 ms). | ||
| ↔ Response Time 50% Grey to 80% Grey | ||
| 41 ms ... rise ↗ and fall ↘ combined | ↗ 21 ms rise | 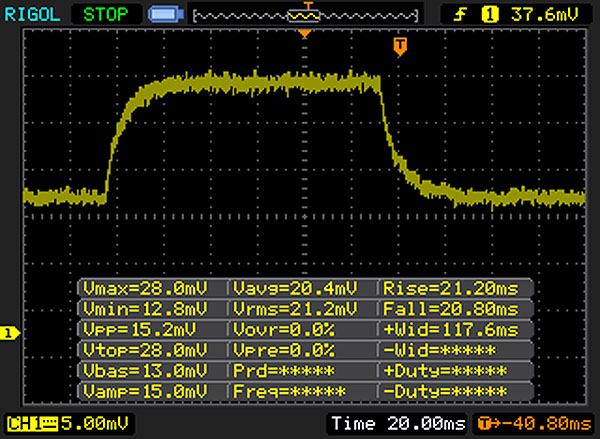 |
| ↘ 20 ms fall | ||
| The screen shows slow response rates in our tests and will be unsatisfactory for gamers. In comparison, all tested devices range from 0.165 (minimum) to 636 (maximum) ms. » 65 % of all devices are better. This means that the measured response time is worse than the average of all tested devices (31 ms). | ||
Screen Flickering / PWM (Pulse-Width Modulation)
| Screen flickering / PWM not detected | 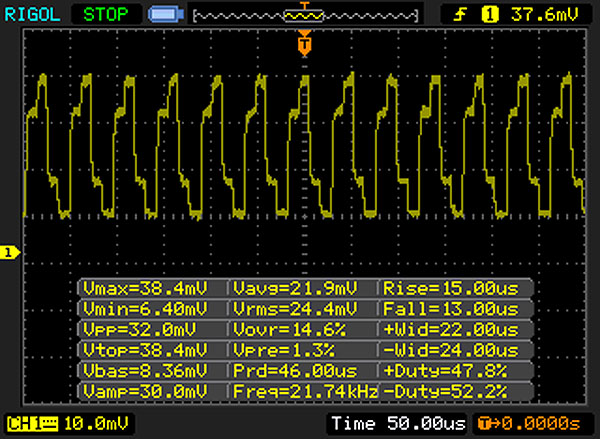 | ||
In comparison: 52 % of all tested devices do not use PWM to dim the display. If PWM was detected, an average of 7781 (minimum: 5 - maximum: 343500) Hz was measured. | |||
| Acer Aspire VN7-593G-73HP V15 Nitro BE Seagate Mobile HDD 1TB ST1000LM035 | Acer Aspire V15 Nitro BE VN7-592G-79DV Lite-On CV1-8B512 M.2 512 GB | Asus Strix GL502VM-FY039T Micron SSD 1100 (MTFDDAV256TBN) | MSI GL62M 7RD-077 HGST Travelstar 7K1000 HTS721010A9E630 | |
|---|---|---|---|---|
| CrystalDiskMark 3.0 | 18615% | 20775% | 74% | |
| Read Seq (MB/s) | 120.9 | 531 339% | 462.5 283% | 112.4 -7% |
| Write Seq (MB/s) | 101.8 | 415.6 308% | 462.7 355% | 107.3 5% |
| Read 512 (MB/s) | 37.83 | 338.9 796% | 335 786% | 43.19 14% |
| Write 512 (MB/s) | 84.4 | 415.6 392% | 407.1 382% | 57 -32% |
| Read 4k (MB/s) | 0.473 | 24.77 5137% | 25.61 5314% | 0.494 4% |
| Write 4k (MB/s) | 0.313 | 78.4 24948% | 86.3 27472% | 1.122 258% |
| Read 4k QD32 (MB/s) | 1.133 | 278.8 24507% | 246.7 21674% | 1.088 -4% |
| Write 4k QD32 (MB/s) | 0.274 | 253.7 92491% | 301.5 109936% | 1.234 350% |

| 3DMark 11 Performance | 12181 points | |
| 3DMark Cloud Gate Standard Score | 23269 points | |
| 3DMark Fire Strike Score | 9621 points | |
| 3DMark Time Spy Score | 3594 points | |
Help | ||
| BioShock Infinite - 1920x1080 Ultra Preset, DX11 (DDOF) | |
| MSI GT62VR 7RE-223 | |
| Asus Strix GL502VM-FY039T | |
| HP Omen 17-w100ng | |
| Acer Aspire VN7-593G-73HP V15 Nitro BE | |
| Dell Inspiron 15 7000 7567 | |
| MSI GL62M 7RD-077 | |
| Acer Aspire V15 Nitro BE VN7-592G-79DV | |
| Thief - 1920x1080 Very High Preset AA:FXAA & High SS AF:8x | |
| Acer Aspire VN7-593G-73HP V15 Nitro BE | |
| MSI GL62M 7RD-077 | |
| The Witcher 3 - 1920x1080 Ultra Graphics & Postprocessing (HBAO+) | |
| Gigabyte P55W v7 | |
| Acer Aspire VN7-593G-73HP V15 Nitro BE | |
| Acer Aspire VX5-591G-75C4 VX15 | |
| Dell XPS 15 2017 9560 (7300HQ, Full-HD) | |
| Rise of the Tomb Raider - 1920x1080 Very High Preset AA:FX AF:16x | |
| Gigabyte P55W v7 | |
| Acer Aspire VN7-593G-73HP V15 Nitro BE | |
| Dell Inspiron 15 7000 7567 | |
| MSI GL62M 7RD-077 | |
| Acer Aspire V15 Nitro BE VN7-592G-79DV | |
| Deus Ex Mankind Divided - 1920x1080 Ultra Preset AA:2xMS AF:8x | |
| MSI GT62VR 7RE-223 | |
| Acer Aspire VN7-593G-73HP V15 Nitro BE | |
| HP Omen 17-w100ng | |
| MSI GL62M 7RD-077 | |
| Battlefield 1 - 1920x1080 Ultra Preset AA:T | |
| MSI GT62VR 7RE-223 | |
| HP Omen 17-w100ng | |
| Gigabyte P55W v7 | |
| Acer Aspire VN7-593G-73HP V15 Nitro BE | |
| Dell Inspiron 15 7000 7567 | |
| Dell XPS 15 2017 9560 (7300HQ, Full-HD) | |
| MSI GL62M 7RD-077 | |
| Titanfall 2 - 1920x1080 Very High (Insane Texture Quality) / Enabled AA:TS AF:16x | |
| MSI GT62VR 7RE-223 | |
| Acer Aspire VN7-593G-73HP V15 Nitro BE | |
| HP Omen 17-w100ng | |
| Asus Strix GL502VM-FY039T | |
| Dell Inspiron 15 7000 7567 | |
| Dell XPS 15 2017 9560 (7300HQ, Full-HD) | |
| MSI GL62M 7RD-077 | |
| Dishonored 2 - 1920x1080 Ultra Preset AA:TX | |
| Asus Strix GL502VM-FY039T | |
| Acer Aspire VN7-593G-73HP V15 Nitro BE | |
| Gigabyte P55W v7 | |
| Dell Inspiron 15 7000 7567 | |
| low | med. | high | ultra | |
|---|---|---|---|---|
| BioShock Infinite (2013) | 142 | 128 | 88 | |
| Thief (2014) | 63.8 | |||
| The Witcher 3 (2015) | 68 | 38.3 | ||
| Rise of the Tomb Raider (2016) | 74.5 | 60.7 | ||
| Deus Ex Mankind Divided (2016) | 55.9 | 29.4 | ||
| Battlefield 1 (2016) | 60 | 57 | ||
| Titanfall 2 (2016) | 143.5 | 124.2 | 99.4 | |
| Dishonored 2 (2016) | 60.5 | 53.9 |
Noise level
| Idle |
| 30.9 / 30.9 / 31.5 dB(A) |
| HDD |
| 32.3 dB(A) |
| Load |
| 40.7 / 43.9 dB(A) |
 | ||
30 dB silent 40 dB(A) audible 50 dB(A) loud |
||
min: | ||
(-) The maximum temperature on the upper side is 51.9 °C / 125 F, compared to the average of 36.8 °C / 98 F, ranging from 21 to 71 °C for the class Multimedia.
(-) The bottom heats up to a maximum of 54.6 °C / 130 F, compared to the average of 39.1 °C / 102 F
(+) In idle usage, the average temperature for the upper side is 26.3 °C / 79 F, compared to the device average of 31.3 °C / 88 F.
(-) Playing The Witcher 3, the average temperature for the upper side is 39.4 °C / 103 F, compared to the device average of 31.3 °C / 88 F.
(+) The palmrests and touchpad are reaching skin temperature as a maximum (34 °C / 93.2 F) and are therefore not hot.
(-) The average temperature of the palmrest area of similar devices was 28.7 °C / 83.7 F (-5.3 °C / -9.5 F).
Acer Aspire VN7-593G-73HP V15 Nitro BE audio analysis
(±) | speaker loudness is average but good (80 dB)
Bass 100 - 315 Hz
(±) | reduced bass - on average 11.8% lower than median
(±) | linearity of bass is average (13.5% delta to prev. frequency)
Mids 400 - 2000 Hz
(±) | higher mids - on average 5.5% higher than median
(+) | mids are linear (6.6% delta to prev. frequency)
Highs 2 - 16 kHz
(+) | balanced highs - only 1.1% away from median
(+) | highs are linear (4% delta to prev. frequency)
Overall 100 - 16.000 Hz
(+) | overall sound is linear (14.6% difference to median)
Compared to same class
» 35% of all tested devices in this class were better, 4% similar, 61% worse
» The best had a delta of 5%, average was 17%, worst was 45%
Compared to all devices tested
» 19% of all tested devices were better, 4% similar, 77% worse
» The best had a delta of 4%, average was 24%, worst was 134%
Asus Strix GL502VM-FY039T audio analysis
(±) | speaker loudness is average but good (76 dB)
Bass 100 - 315 Hz
(-) | nearly no bass - on average 19.1% lower than median
(-) | bass is not linear (18.1% delta to prev. frequency)
Mids 400 - 2000 Hz
(+) | balanced mids - only 2.9% away from median
(+) | mids are linear (4% delta to prev. frequency)
Highs 2 - 16 kHz
(±) | higher highs - on average 5.6% higher than median
(±) | linearity of highs is average (8% delta to prev. frequency)
Overall 100 - 16.000 Hz
(±) | linearity of overall sound is average (23% difference to median)
Compared to same class
» 83% of all tested devices in this class were better, 5% similar, 12% worse
» The best had a delta of 6%, average was 18%, worst was 132%
Compared to all devices tested
» 69% of all tested devices were better, 5% similar, 26% worse
» The best had a delta of 4%, average was 24%, worst was 134%
| Off / Standby | |
| Idle | |
| Load |
|
Key:
min: | |
| Acer Aspire VN7-593G-73HP V15 Nitro BE i7-7700HQ, GeForce GTX 1060 Mobile, Seagate Mobile HDD 1TB ST1000LM035, AH-IPS, Normally Black, Transmissive, 1920x1080, 15.6" | Acer Aspire V15 Nitro BE VN7-592G-79DV 6700HQ, GeForce GTX 960M, Lite-On CV1-8B512 M.2 512 GB, IPS, 3840x2160, 15.6" | Asus Strix GL502VM-FY039T 6700HQ, GeForce GTX 1060 Mobile, Micron SSD 1100 (MTFDDAV256TBN), IPS, 1920x1080, 15.6" | MSI GT62VR 7RE-223 i7-7700HQ, GeForce GTX 1070 Mobile, Samsung SSD PM871a MZNLN256HMHQ, IPS, 1920x1080, 15.6" | Gigabyte P55W v7 i7-7700HQ, GeForce GTX 1060 Mobile, Liteonit CV3-8D256, IPS, 1920x1080, 15.6" | Dell XPS 15 2017 9560 (7300HQ, Full-HD) i5-7300HQ, GeForce GTX 1050 Mobile, WDC WD10SPCX-75KHST0 + SanDisk Z400s M.2 2242 32 GB Cache, LED IGZO IPS InfinityEdge, 1920x1080, 15.6" | Acer Aspire VX5-591G-75C4 VX15 i7-7700HQ, GeForce GTX 1050 Ti Mobile, Toshiba MQ01ABD100, IPS, 1920x1080, 15.6" | Dell Inspiron 15 7000 7567 i7-7700HQ, GeForce GTX 1050 Ti Mobile, Intel SSDSCKKF256H6, TN, 1920x1080, 15.6" | MSI GL62M 7RD-077 i7-7700HQ, GeForce GTX 1050 Mobile, HGST Travelstar 7K1000 HTS721010A9E630, TN LED, 1920x1080, 15.6" | |
|---|---|---|---|---|---|---|---|---|---|
| Power Consumption | -8% | -46% | -83% | -7% | 15% | 8% | 28% | -15% | |
| Idle Minimum * (Watt) | 7.2 | 8.9 -24% | 16 -122% | 20 -178% | 8 -11% | 6.6 8% | 7 3% | 4.4 39% | 10.6 -47% |
| Idle Average * (Watt) | 10.5 | 13.9 -32% | 19 -81% | 24 -129% | 13 -24% | 9 14% | 10.2 3% | 6.8 35% | 14.5 -38% |
| Idle Maximum * (Watt) | 16 | 15.6 2% | 23 -44% | 29 -81% | 18 -13% | 10.7 33% | 14 12% | 8.3 48% | 15 6% |
| Load Average * (Watt) | 82 | 89 -9% | 68 17% | 82 -0% | 76 7% | 77.5 5% | 78 5% | 81 1% | 90 -10% |
| Witcher 3 ultra * (Watt) | 124 | ||||||||
| Load Maximum * (Watt) | 155 | 118 24% | 157 -1% | 193 -25% | 143 8% | 130 16% | 127 18% | 127 18% | 135 13% |
* ... smaller is better
| Acer Aspire VN7-593G-73HP V15 Nitro BE i7-7700HQ, GeForce GTX 1060 Mobile, 69 Wh | Acer Aspire V15 Nitro BE VN7-592G-79DV 6700HQ, GeForce GTX 960M, 52 Wh | Asus Strix GL502VM-FY039T 6700HQ, GeForce GTX 1060 Mobile, 64 Wh | MSI GT62VR 7RE-223 i7-7700HQ, GeForce GTX 1070 Mobile, 75 Wh | Gigabyte P55W v7 i7-7700HQ, GeForce GTX 1060 Mobile, 63 Wh | Dell XPS 15 2017 9560 (7300HQ, Full-HD) i5-7300HQ, GeForce GTX 1050 Mobile, 56 Wh | Acer Aspire VX5-591G-75C4 VX15 i7-7700HQ, GeForce GTX 1050 Ti Mobile, 52.5 Wh | Dell Inspiron 15 7000 7567 i7-7700HQ, GeForce GTX 1050 Ti Mobile, 74 Wh | MSI GL62M 7RD-077 i7-7700HQ, GeForce GTX 1050 Mobile, 41 Wh | |
|---|---|---|---|---|---|---|---|---|---|
| Battery runtime | -27% | -37% | -30% | 7% | -12% | -32% | 55% | -44% | |
| Reader / Idle (h) | 8.4 | 8.8 5% | 5.3 -37% | 6.3 -25% | 13.2 57% | 9.4 12% | 5.4 -36% | 19.6 133% | 6.5 -23% |
| WiFi v1.3 (h) | 6 | 3.6 -40% | 3.7 -38% | 4.1 -32% | 5.8 -3% | 5.6 -7% | 5 -17% | 10.4 73% | 3.8 -37% |
| Load (h) | 2.4 | 1.3 -46% | 1.5 -37% | 1.6 -33% | 1.6 -33% | 1.4 -42% | 1.4 -42% | 1.4 -42% | 0.7 -71% |
| H.264 (h) | 3.9 | 3.9 | 4.2 | 7.6 | 3.6 |
Pros
Cons
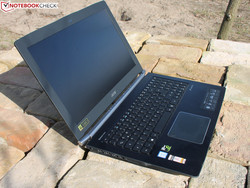
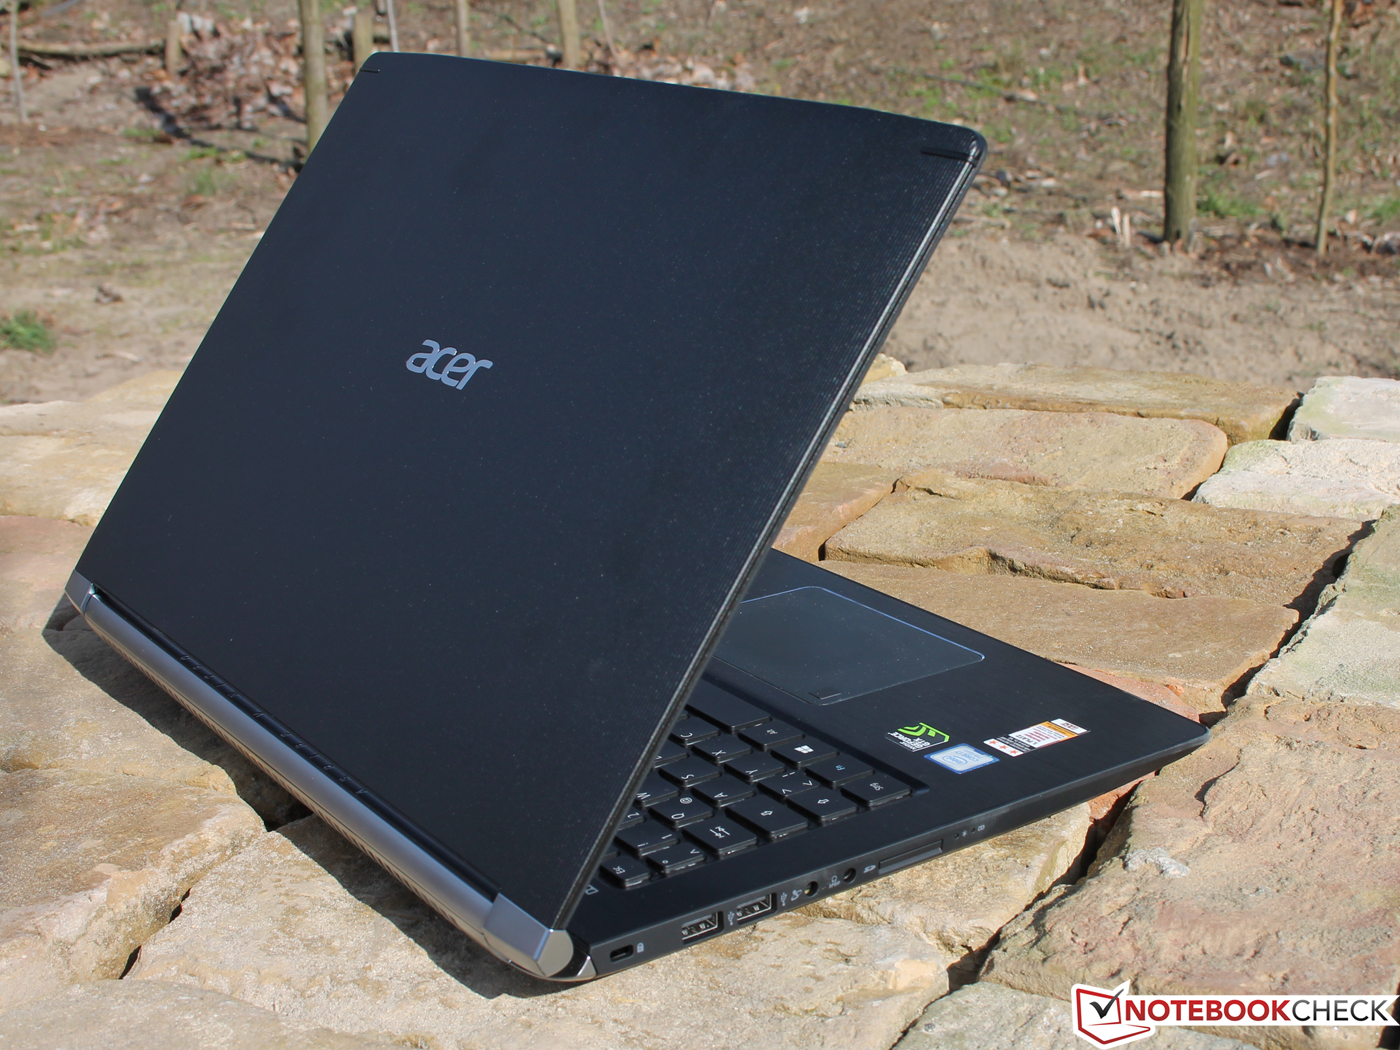
宏碁再次证明了它的设计才能,这台15寸设备不仅适合游戏,也能够满足家庭娱乐或工作的需要。让我们从最重要的方面看起。
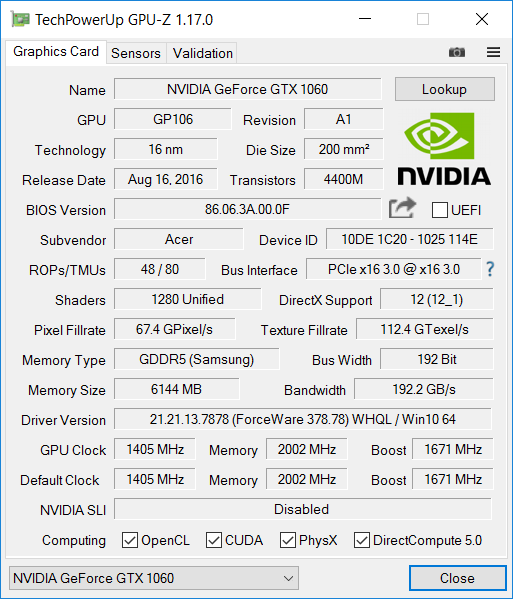
性能明显是它的最大优势。由于搭配了GeForce GTX 1060显卡,最新游戏可以在高设定下流畅运行。两个风扇构成的散热系统可以保证在游戏中持续的高帧率。我们建议追求高性价比游戏本的玩家考虑GTX 1060显卡。
2017年的Aspire V15 Nitro Black Edition将完整的游戏性能带到了桌面上。
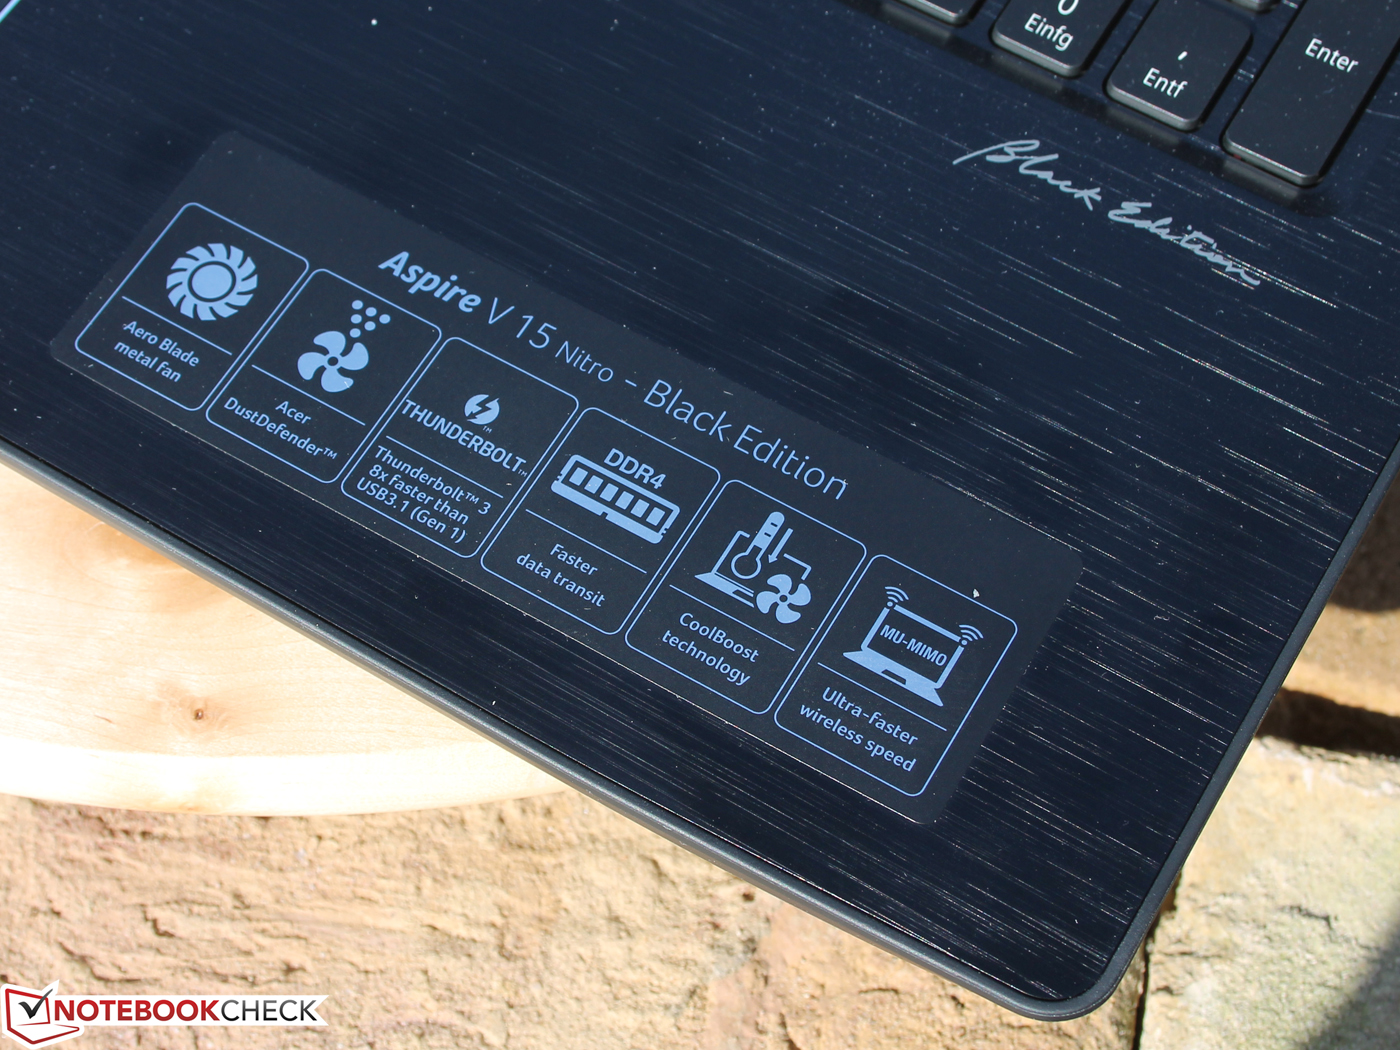
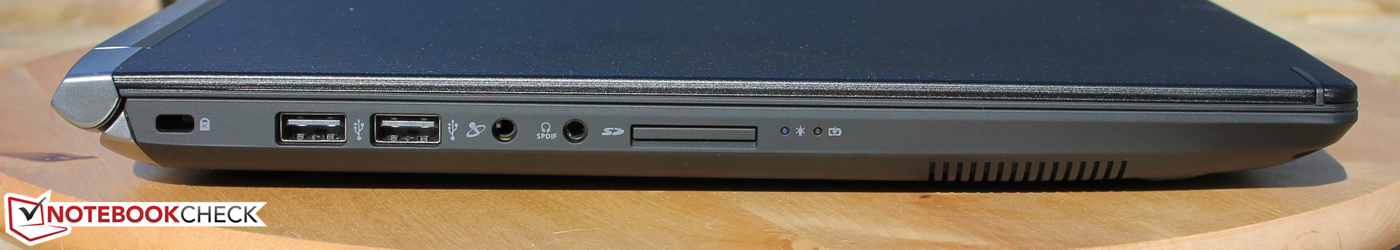
尽管V15在待机时几乎不会发出噪音,但它在游戏中十分吵。不过高低音全面的优秀扬声器可以轻松盖过噪音。它的输入设备也相对优秀,维护升级空间几乎可以称为其他设备的典范。一块雾面的高对比IPS屏幕更为它锦上添花,尽管这块屏幕的色域覆盖一般,但是它没有使用闪烁亮度控制。
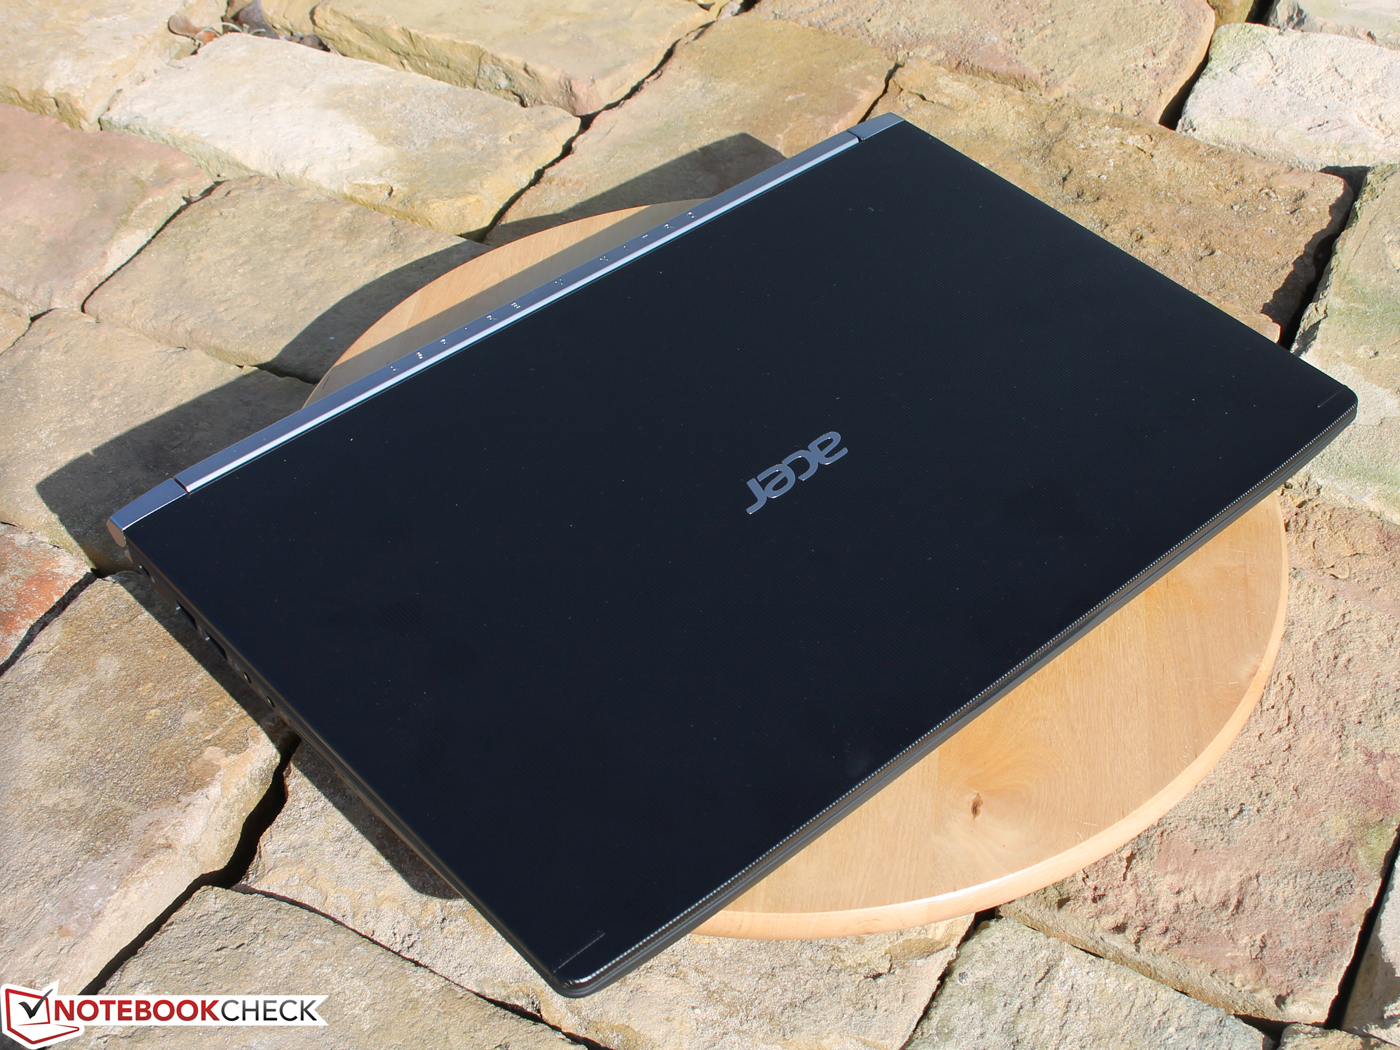
它脆弱的屏幕上盖让我们感觉有些不够稳定。另外它的摄像头品质较弱,同时硬盘速度较慢还会发出较大的噪音。后面一个问题可以通过选择搭配固态硬盘的V15机型解决。
尽管它的机身采用了全新的铝合金材质,但是仍然在一些部位不够坚固。不过它的维护设计却前所未有的方便。
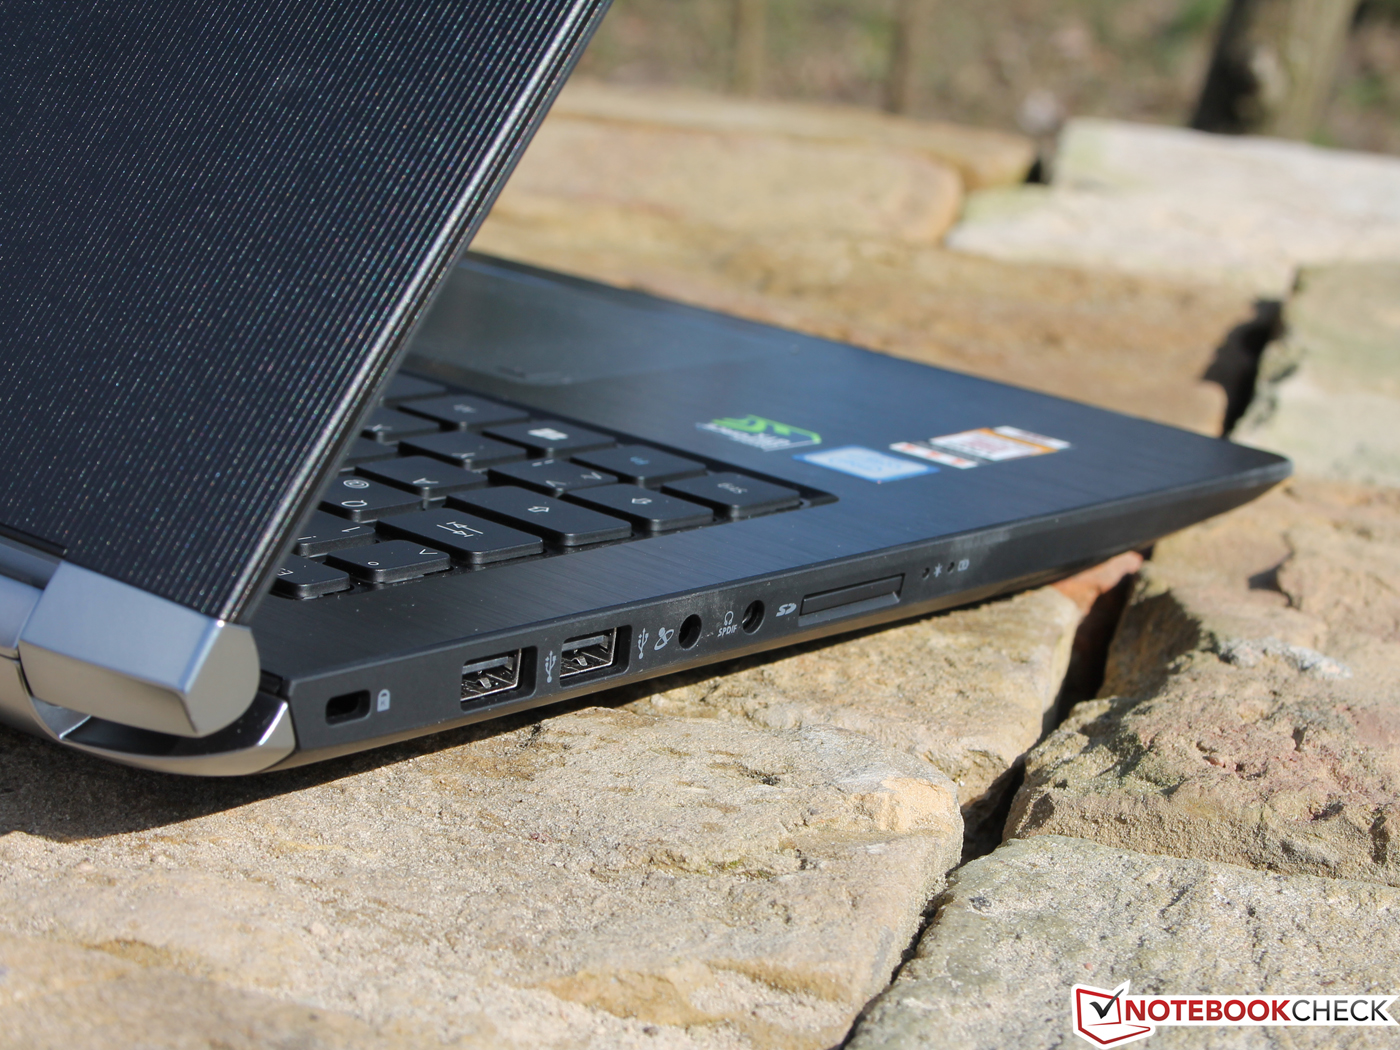
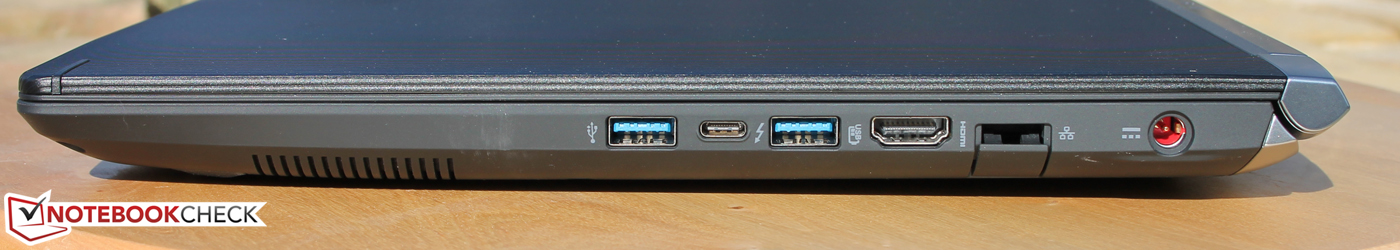
游戏玩家也可以同时参考一下华硕 Strix GL502VM作为备选。尽管这台设备仍然搭配了Broadwell四核处理器,不过与我们评测的Aspire VN7-593G-73HP售价相同,而搭配了固态硬盘(1400欧元,约10404人民币)。它也不是在各方面都有优势:Strix GL502VM没有提供对Thunderbolt 3的支持,仅支持标准USB-C 3.0。
注:本文是基于完整评测的缩减版本,阅读完整的英文评测,请点击这里。 .
Acer Aspire VN7-593G-73HP V15 Nitro BE
- 03/18/2017 v6 (old)
Sebastian Jentsch