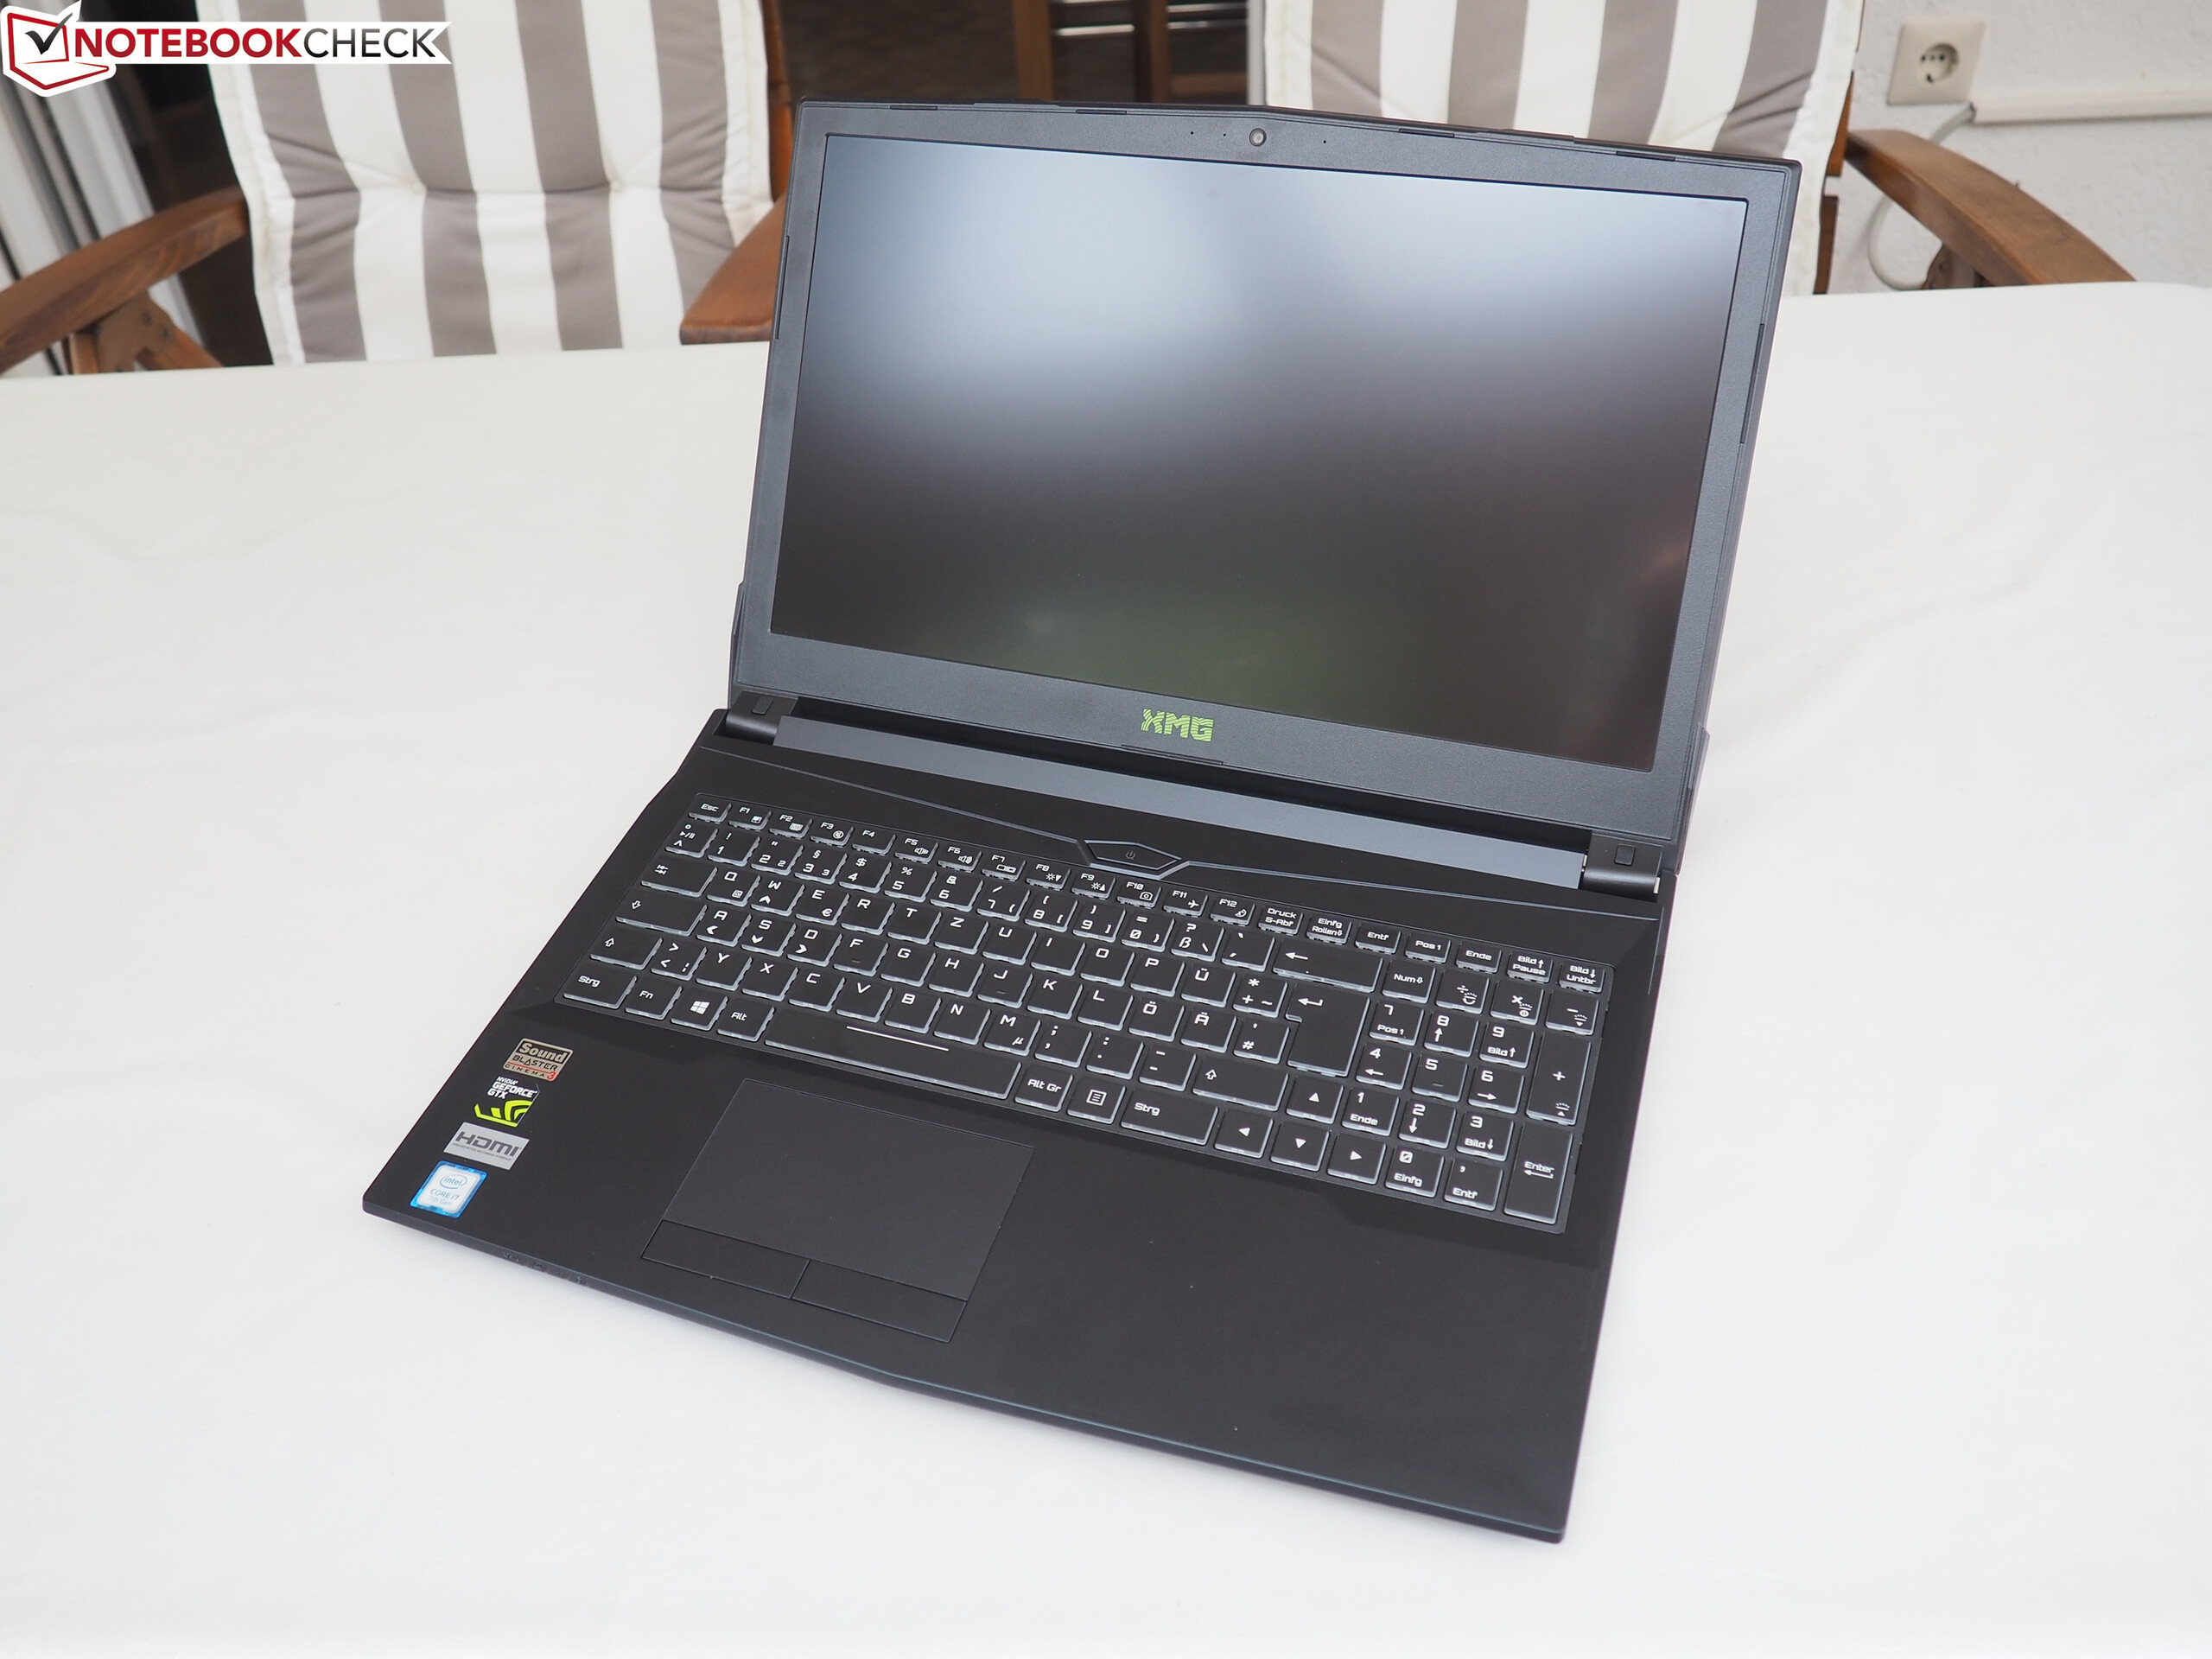
Schenker Technologies XMG A517 (Clevo N850HP6) 笔记本电脑简短评测
| SD Card Reader | |
| average JPG Copy Test (av. of 3 runs) | |
| MSI GT62VR 7RE-223 (Toshiba Exceria Pro SDXC 64 GB UHS-II) | |
| Gigabyte Aero 15 (Toshiba Exceria Pro SDXC 64 GB UHS-II) | |
| Schenker XMG A517 (Toshiba Exceria Pro SDXC 64 GB UHS-II) | |
| Acer Aspire VX5-591G-75C4 VX15 | |
| maximum AS SSD Seq Read Test (1GB) | |
| MSI GT62VR 7RE-223 (Toshiba Exceria Pro SDXC 64 GB UHS-II) | |
| Gigabyte Aero 15 (Toshiba Exceria Pro SDXC 64 GB UHS-II) | |
| Schenker XMG A517 (Toshiba Exceria Pro SDXC 64 GB UHS-II) | |
| Acer Aspire VX5-591G-75C4 VX15 | |
| Networking | |
| iperf3 transmit AX12 | |
| Acer Aspire VX5-591G-75C4 VX15 | |
| Schenker XMG A517 | |
| MSI GT62VR 7RE-223 | |
| Alienware 15 R3 | |
| Gigabyte Aero 15 | |
| iperf3 receive AX12 | |
| Schenker XMG A517 | |
| Alienware 15 R3 | |
| Gigabyte Aero 15 | |
| MSI GT62VR 7RE-223 | |
| Acer Aspire VX5-591G-75C4 VX15 | |
| |||||||||||||||||||||||||
Brightness Distribution: 90 %
Center on Battery: 320 cd/m²
Contrast: 889:1 (Black: 0.36 cd/m²)
ΔE ColorChecker Calman: 5.08 | ∀{0.5-29.43 Ø4.71}
ΔE Greyscale Calman: 4.04 | ∀{0.09-98 Ø4.96}
85% sRGB (Argyll 1.6.3 3D)
56% AdobeRGB 1998 (Argyll 1.6.3 3D)
62.2% AdobeRGB 1998 (Argyll 3D)
85.1% sRGB (Argyll 3D)
65% Display P3 (Argyll 3D)
Gamma: 2.34
CCT: 7029 K
| Schenker XMG A517 LG Philips LP156WF6 (LGD046F), 1920x1080 | Alienware 15 R3 HPJGK_B156HTN (AUO51ED), 1920x1080 | MSI GT62VR 7RE-223 LG Philips LP156WF6 (LGD046F), 1920x1080 | Gigabyte Aero 15 N156HCA-EA1 (CMN15D7), 1920x1080 | Acer Aspire VX5-591G-75C4 VX15 LG Philips LGD0550 / LP156WF6-SPK4, 1920x1080 | |
|---|---|---|---|---|---|
| Display | 5% | -2% | 5% | -36% | |
| Display P3 Coverage (%) | 65 | 66 2% | 63.9 -2% | 65.2 0% | 38.88 -40% |
| sRGB Coverage (%) | 85.1 | 90.5 6% | 83.1 -2% | 92.5 9% | 58.2 -32% |
| AdobeRGB 1998 Coverage (%) | 62.2 | 66.2 6% | 60.8 -2% | 66.5 7% | 40.2 -35% |
| Response Times | 41% | -4% | -26% | 22% | |
| Response Time Grey 50% / Grey 80% * (ms) | 36 ? | 25 ? 31% | 37 ? -3% | 42.8 ? -19% | 22 ? 39% |
| Response Time Black / White * (ms) | 24 ? | 12 ? 50% | 25 ? -4% | 32 ? -33% | 23 ? 4% |
| PWM Frequency (Hz) | 21000 ? | 26000 ? | |||
| Screen | -27% | 3% | -1% | -9% | |
| Brightness middle (cd/m²) | 320 | 386 21% | 310 -3% | 320 0% | 281 -12% |
| Brightness (cd/m²) | 311 | 382 23% | 311 0% | 316 2% | 257 -17% |
| Brightness Distribution (%) | 90 | 93 3% | 85 -6% | 90 0% | 85 -6% |
| Black Level * (cd/m²) | 0.36 | 0.39 -8% | 0.3 17% | 0.36 -0% | 0.32 11% |
| Contrast (:1) | 889 | 990 11% | 1033 16% | 889 0% | 878 -1% |
| Colorchecker dE 2000 * | 5.08 | 10.2 -101% | 4.82 5% | 4.62 9% | 5.16 -2% |
| Colorchecker dE 2000 max. * | 10.73 | 15.81 -47% | 10.14 5% | 9.75 9% | 9.09 15% |
| Greyscale dE 2000 * | 4.04 | 11.28 -179% | 3.94 2% | 6 -49% | 4.57 -13% |
| Gamma | 2.34 94% | 2.23 99% | 2.45 90% | 2.46 89% | 2.59 85% |
| CCT | 7029 92% | 11383 57% | 6877 95% | 6761 96% | 6931 94% |
| Color Space (Percent of AdobeRGB 1998) (%) | 56 | 59 5% | 54 -4% | 60 7% | 37 -34% |
| Color Space (Percent of sRGB) (%) | 85 | 90 6% | 83 -2% | 92 8% | 58 -32% |
| Total Average (Program / Settings) | 6% /
-11% | -1% /
1% | -7% /
-3% | -8% /
-10% |
* ... smaller is better
Display Response Times
| ↔ Response Time Black to White | ||
|---|---|---|
| 24 ms ... rise ↗ and fall ↘ combined | ↗ 12.4 ms rise | 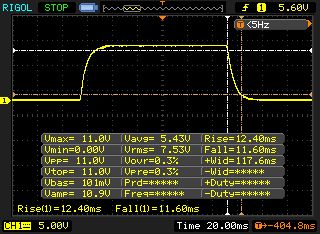 |
| ↘ 11.6 ms fall | ||
| The screen shows good response rates in our tests, but may be too slow for competitive gamers. In comparison, all tested devices range from 0.1 (minimum) to 240 (maximum) ms. » 54 % of all devices are better. This means that the measured response time is worse than the average of all tested devices (19.8 ms). | ||
| ↔ Response Time 50% Grey to 80% Grey | ||
| 36 ms ... rise ↗ and fall ↘ combined | ↗ 18 ms rise | 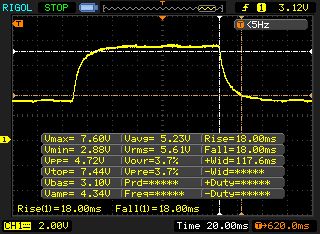 |
| ↘ 18 ms fall | ||
| The screen shows slow response rates in our tests and will be unsatisfactory for gamers. In comparison, all tested devices range from 0.165 (minimum) to 636 (maximum) ms. » 51 % of all devices are better. This means that the measured response time is worse than the average of all tested devices (31 ms). | ||
Screen Flickering / PWM (Pulse-Width Modulation)
| Screen flickering / PWM detected | 21000 Hz | ≤ 95 % brightness setting | 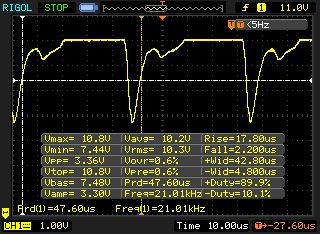 |
The display backlight flickers at 21000 Hz (worst case, e.g., utilizing PWM) Flickering detected at a brightness setting of 95 % and below. There should be no flickering or PWM above this brightness setting. The frequency of 21000 Hz is quite high, so most users sensitive to PWM should not notice any flickering. In comparison: 52 % of all tested devices do not use PWM to dim the display. If PWM was detected, an average of 7757 (minimum: 5 - maximum: 343500) Hz was measured. | |||
| Cinebench R11.5 | |
| CPU Single 64Bit | |
| Gigabyte Aero 15 | |
| Alienware 15 R3 | |
| MSI GT62VR 7RE-223 | |
| Schenker XMG A517 | |
| CPU Multi 64Bit | |
| Gigabyte Aero 15 | |
| Alienware 15 R3 | |
| MSI GT62VR 7RE-223 | |
| Schenker XMG A517 | |
| PCMark 8 | |
| Home Score Accelerated v2 | |
| MSI GT62VR 7RE-223 | |
| Alienware 15 R3 | |
| Gigabyte Aero 15 | |
| Schenker XMG A517 | |
| Acer Aspire VX5-591G-75C4 VX15 | |
| Work Score Accelerated v2 | |
| MSI GT62VR 7RE-223 | |
| Alienware 15 R3 | |
| Gigabyte Aero 15 | |
| Schenker XMG A517 | |
| Acer Aspire VX5-591G-75C4 VX15 | |
| PCMark 10 - Score | |
| Schenker XMG A517 | |
| PCMark 8 Home Score Accelerated v2 | 4187 points | |
| PCMark 8 Work Score Accelerated v2 | 5198 points | |
| PCMark 10 Score | 4866 points | |
Help | ||
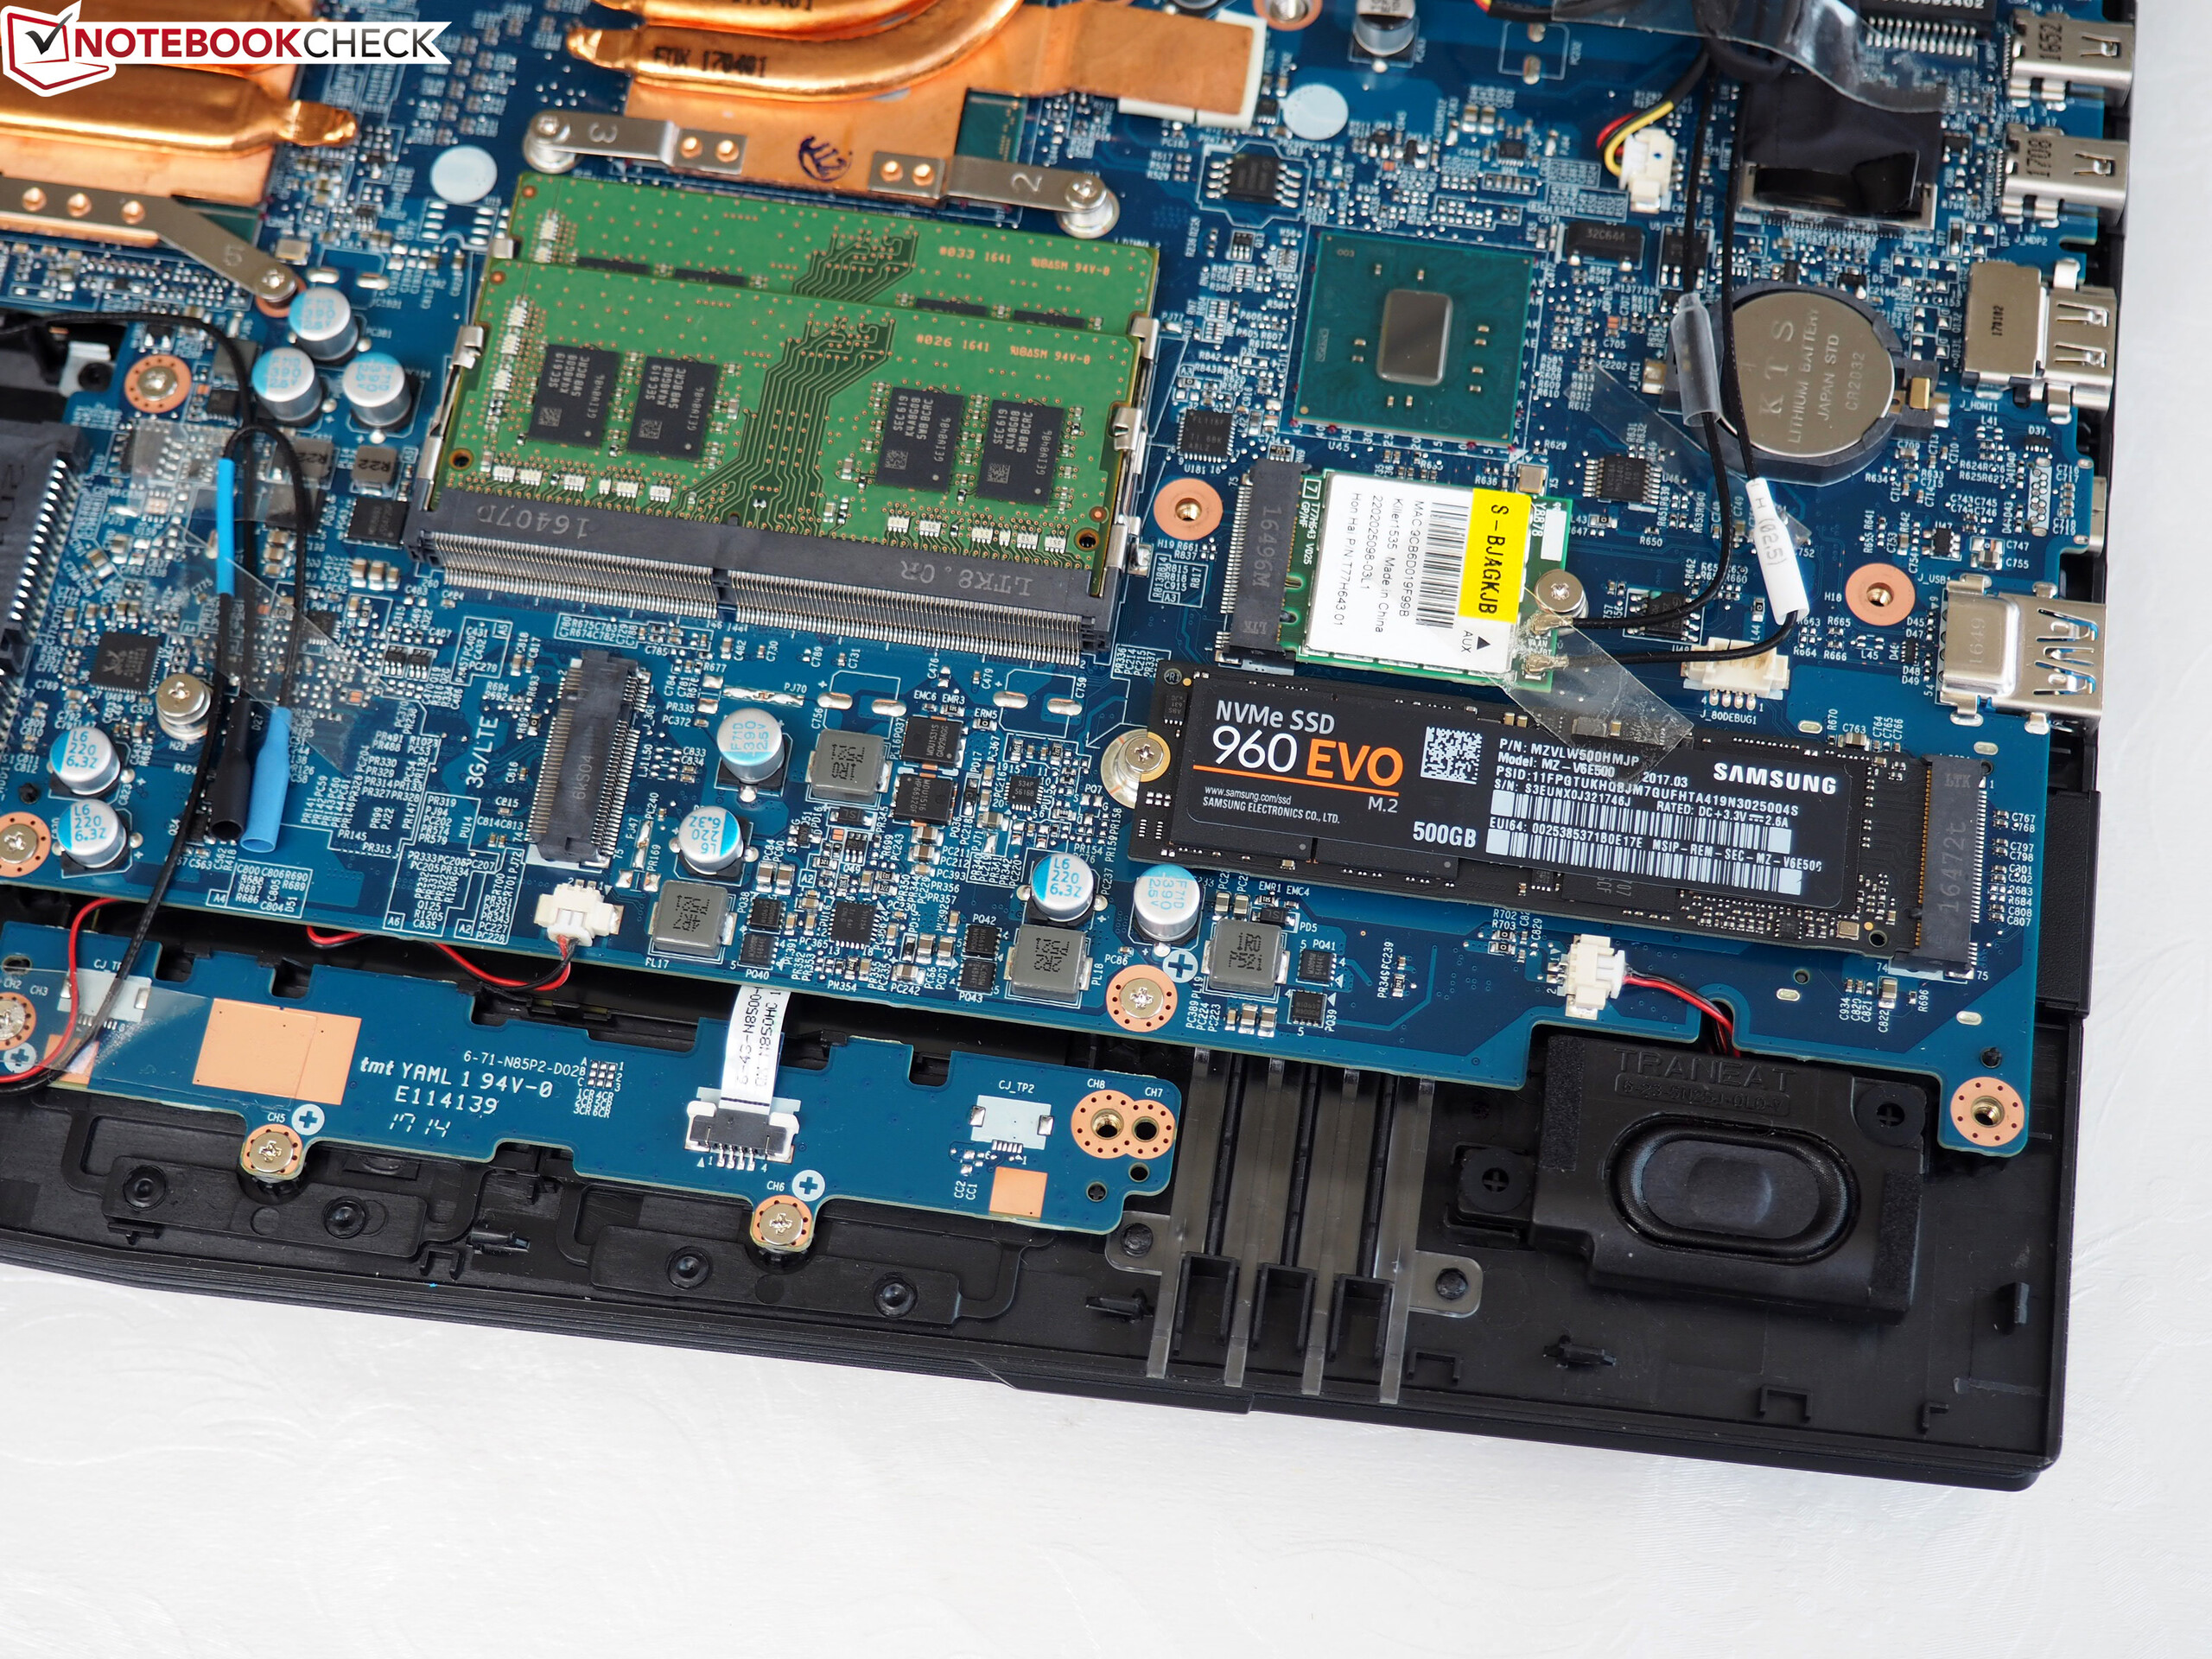
| Schenker XMG A517 Samsung SSD 960 Evo 500GB m.2 NVMe | Alienware 15 R3 | MSI GT62VR 7RE-223 Samsung SSD PM871a MZNLN256HMHQ | Gigabyte Aero 15 Lite-On CX2-8B512-Q11 | Acer Aspire VX5-591G-75C4 VX15 Toshiba MQ01ABD100 | |
|---|---|---|---|---|---|
| AS SSD | -58% | ||||
| Seq Read (MB/s) | 2694 | 510 -81% | |||
| Seq Write (MB/s) | 1662 | 288.2 -83% | |||
| 4K Read (MB/s) | 48 | 37.2 -22% | |||
| 4K Write (MB/s) | 147 | 104 -29% | |||
| Score Total (Points) | 4063 | 1019 -75% |

| 3DMark - 1920x1080 Fire Strike Graphics | |
| Alienware 15 R3 | |
| MSI GT62VR 7RE-223 | |
| Schenker XMG A517 | |
| Gigabyte Aero 15 | |
| Acer Aspire VX5-591G-75C4 VX15 | |
| 3DMark 11 - 1280x720 Performance GPU | |
| Alienware 15 R3 | |
| MSI GT62VR 7RE-223 | |
| Schenker XMG A517 | |
| Gigabyte Aero 15 | |
| Acer Aspire VX5-591G-75C4 VX15 | |
| 3DMark 11 Performance | 12575 points | |
| 3DMark Ice Storm Standard Score | 128763 points | |
| 3DMark Cloud Gate Standard Score | 25679 points | |
| 3DMark Fire Strike Score | 9727 points | |
Help | ||
| low | med. | high | ultra | |
|---|---|---|---|---|
| The Witcher 3 (2015) | 70.9 | 39.2 | ||
| Mass Effect Andromeda (2017) | 52.4 | 47.4 | ||
| Warhammer 40.000: Dawn of War III (2017) | 73.3 | 68.3 | ||
| Prey (2017) | 115 | 97.1 | ||
| Rocket League (2017) | 168 | |||
| Dirt 4 (2017) | 90.1 | 55.3 |
Noise level
| Idle |
| 30 / 35 / 40 dB(A) |
| Load |
| 43 / 49 dB(A) |
 | ||
30 dB silent 40 dB(A) audible 50 dB(A) loud |
||
min: | ||
| Schenker XMG A517 i7-7700HQ, GeForce GTX 1060 Mobile | Alienware 15 R3 i7-7700HQ, GeForce GTX 1070 Mobile | MSI GT62VR 7RE-223 i7-7700HQ, GeForce GTX 1070 Mobile | Gigabyte Aero 15 i7-7700HQ, GeForce GTX 1060 Mobile | Acer Aspire VX5-591G-75C4 VX15 i7-7700HQ, GeForce GTX 1050 Ti Mobile | |
|---|---|---|---|---|---|
| Noise | -3% | 2% | 3% | 9% | |
| off / environment * (dB) | 30 | 30 -0% | 30 -0% | 31 -3% | 30.4 -1% |
| Idle Minimum * (dB) | 30 | 31 -3% | 34 -13% | 32 -7% | 31.4 -5% |
| Idle Average * (dB) | 35 | 32 9% | 35 -0% | 33 6% | 31.4 10% |
| Idle Maximum * (dB) | 40 | 42 -5% | 36 10% | 34 15% | 31.4 22% |
| Load Average * (dB) | 43 | 49 -14% | 40 7% | 39 9% | 36.8 14% |
| Witcher 3 ultra * (dB) | 43 | 43 -0% | |||
| Load Maximum * (dB) | 49 | 50 -2% | 46 6% | 50 -2% | 41.3 16% |
* ... smaller is better
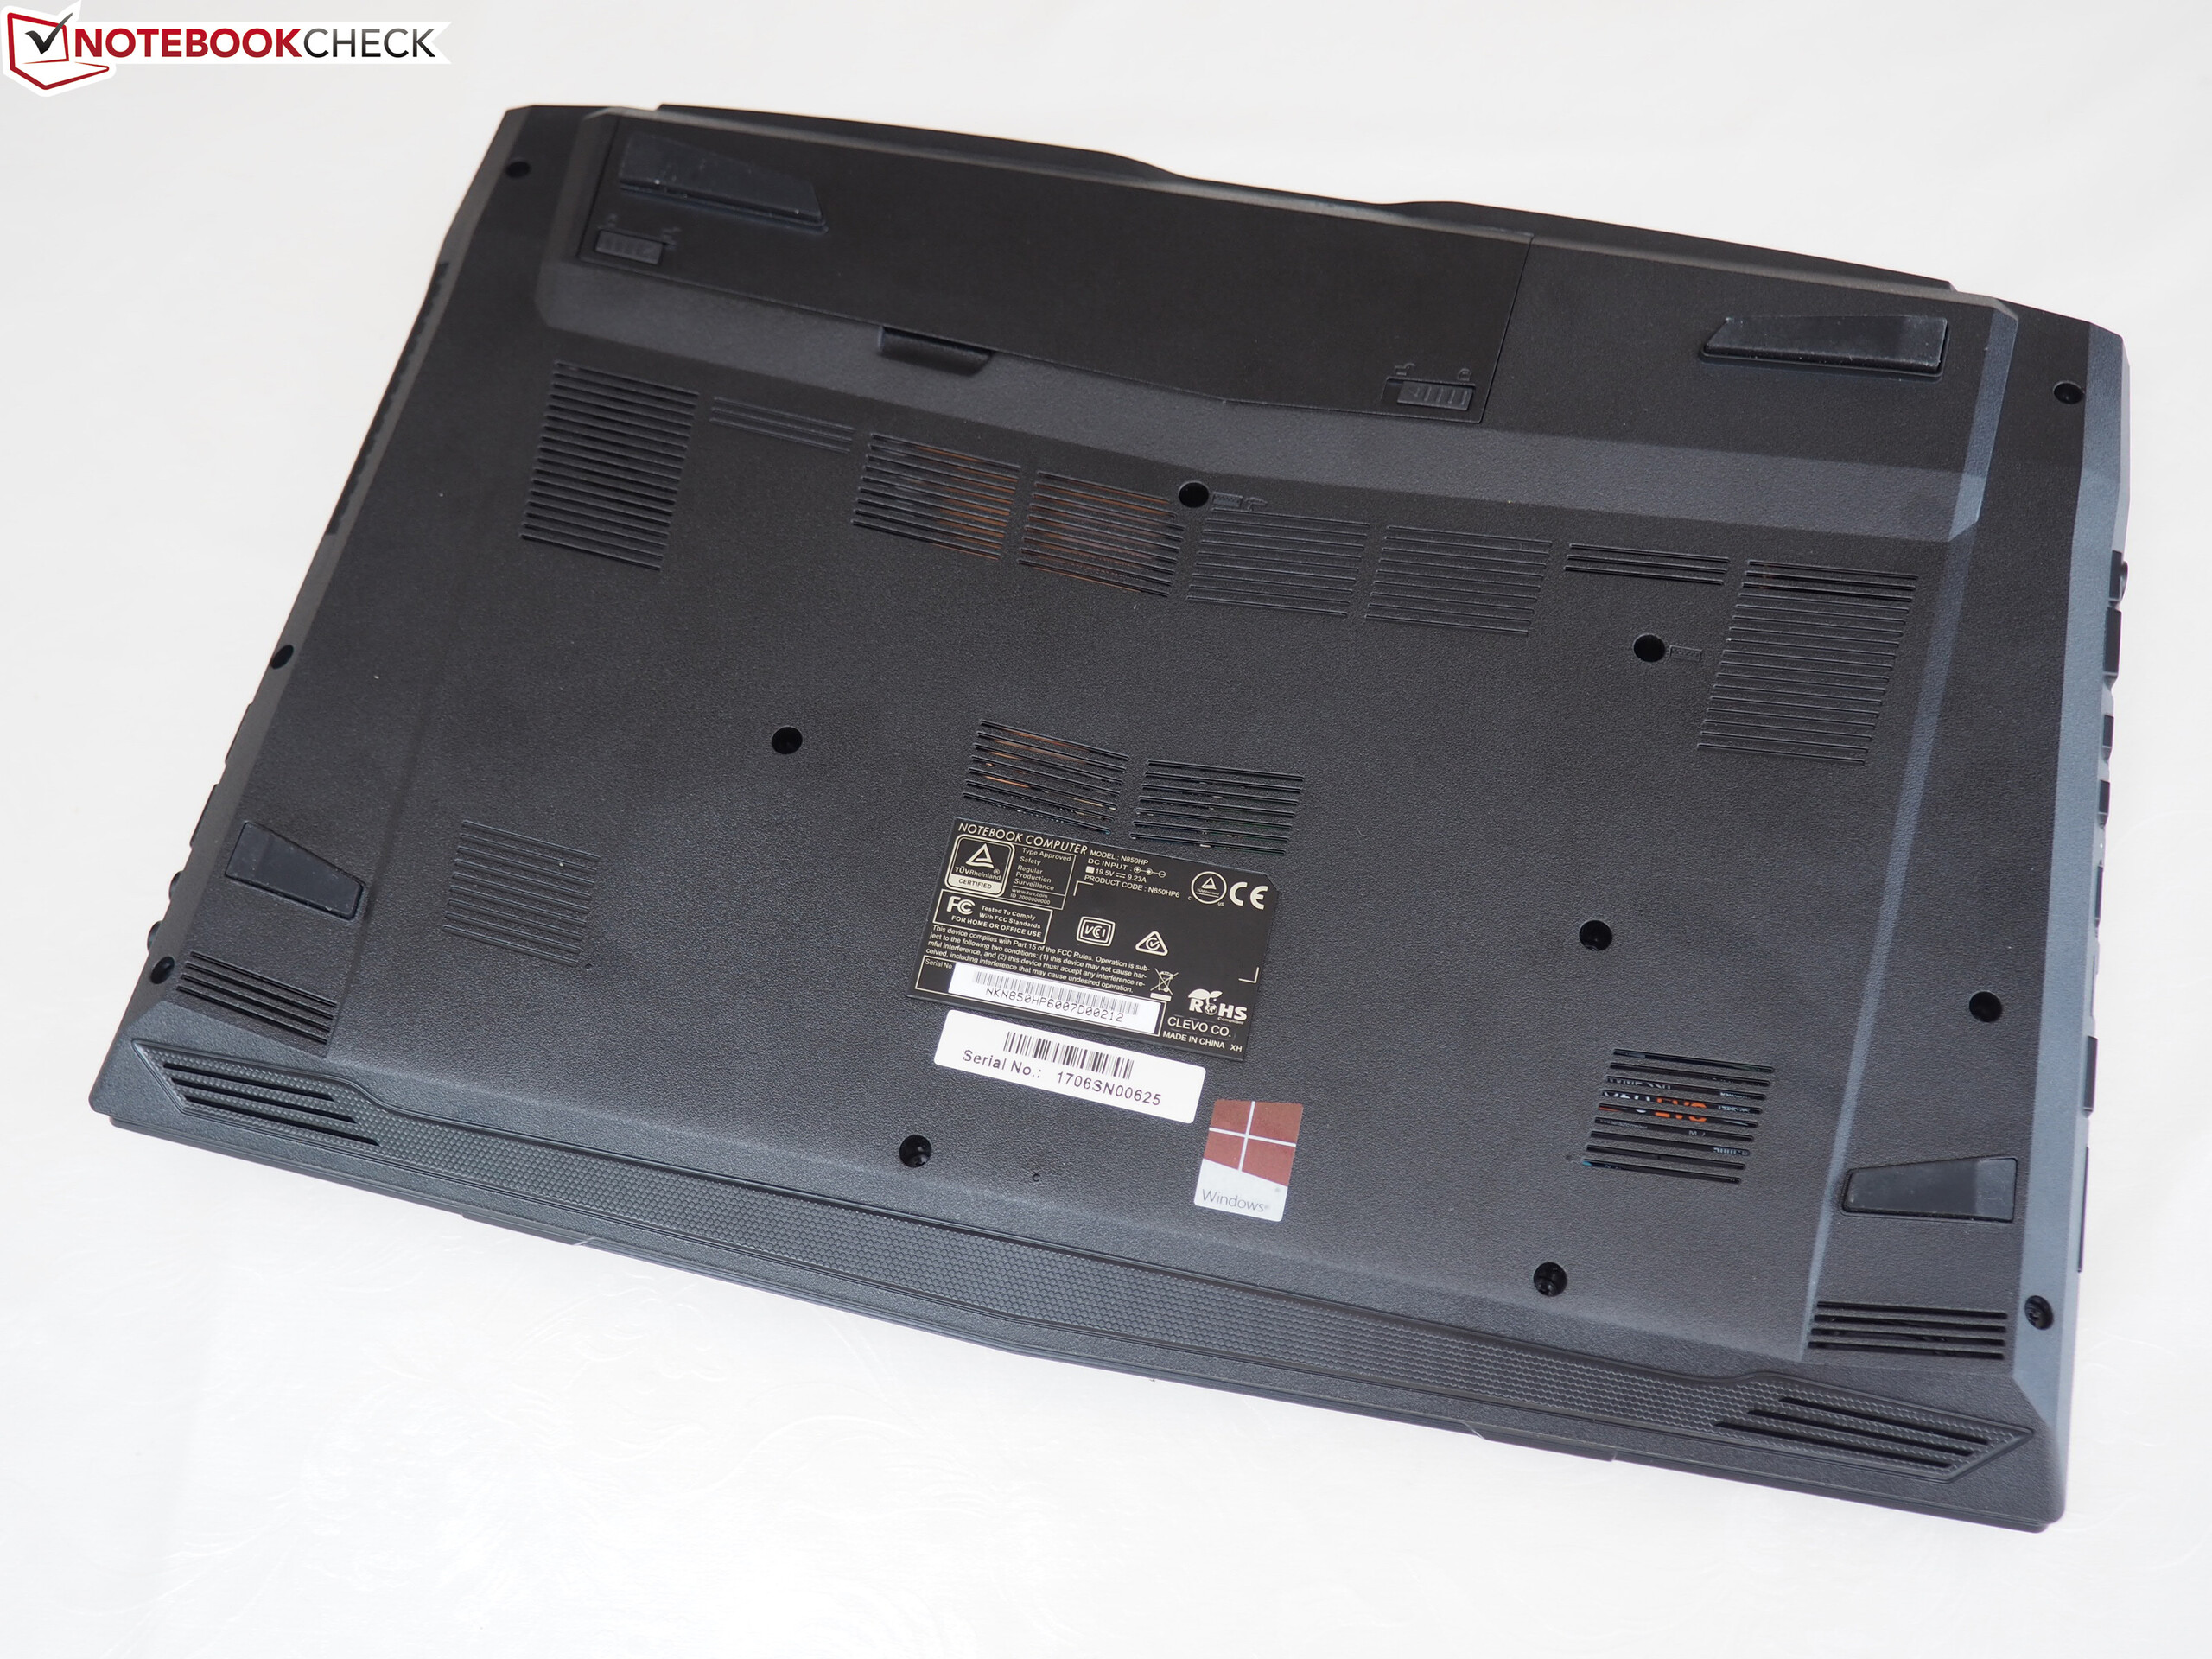
(-) The maximum temperature on the upper side is 53 °C / 127 F, compared to the average of 40.4 °C / 105 F, ranging from 21.2 to 68.8 °C for the class Gaming.
(-) The bottom heats up to a maximum of 49 °C / 120 F, compared to the average of 43.2 °C / 110 F
(+) In idle usage, the average temperature for the upper side is 29.6 °C / 85 F, compared to the device average of 33.9 °C / 93 F.
(-) Playing The Witcher 3, the average temperature for the upper side is 45.4 °C / 114 F, compared to the device average of 33.9 °C / 93 F.
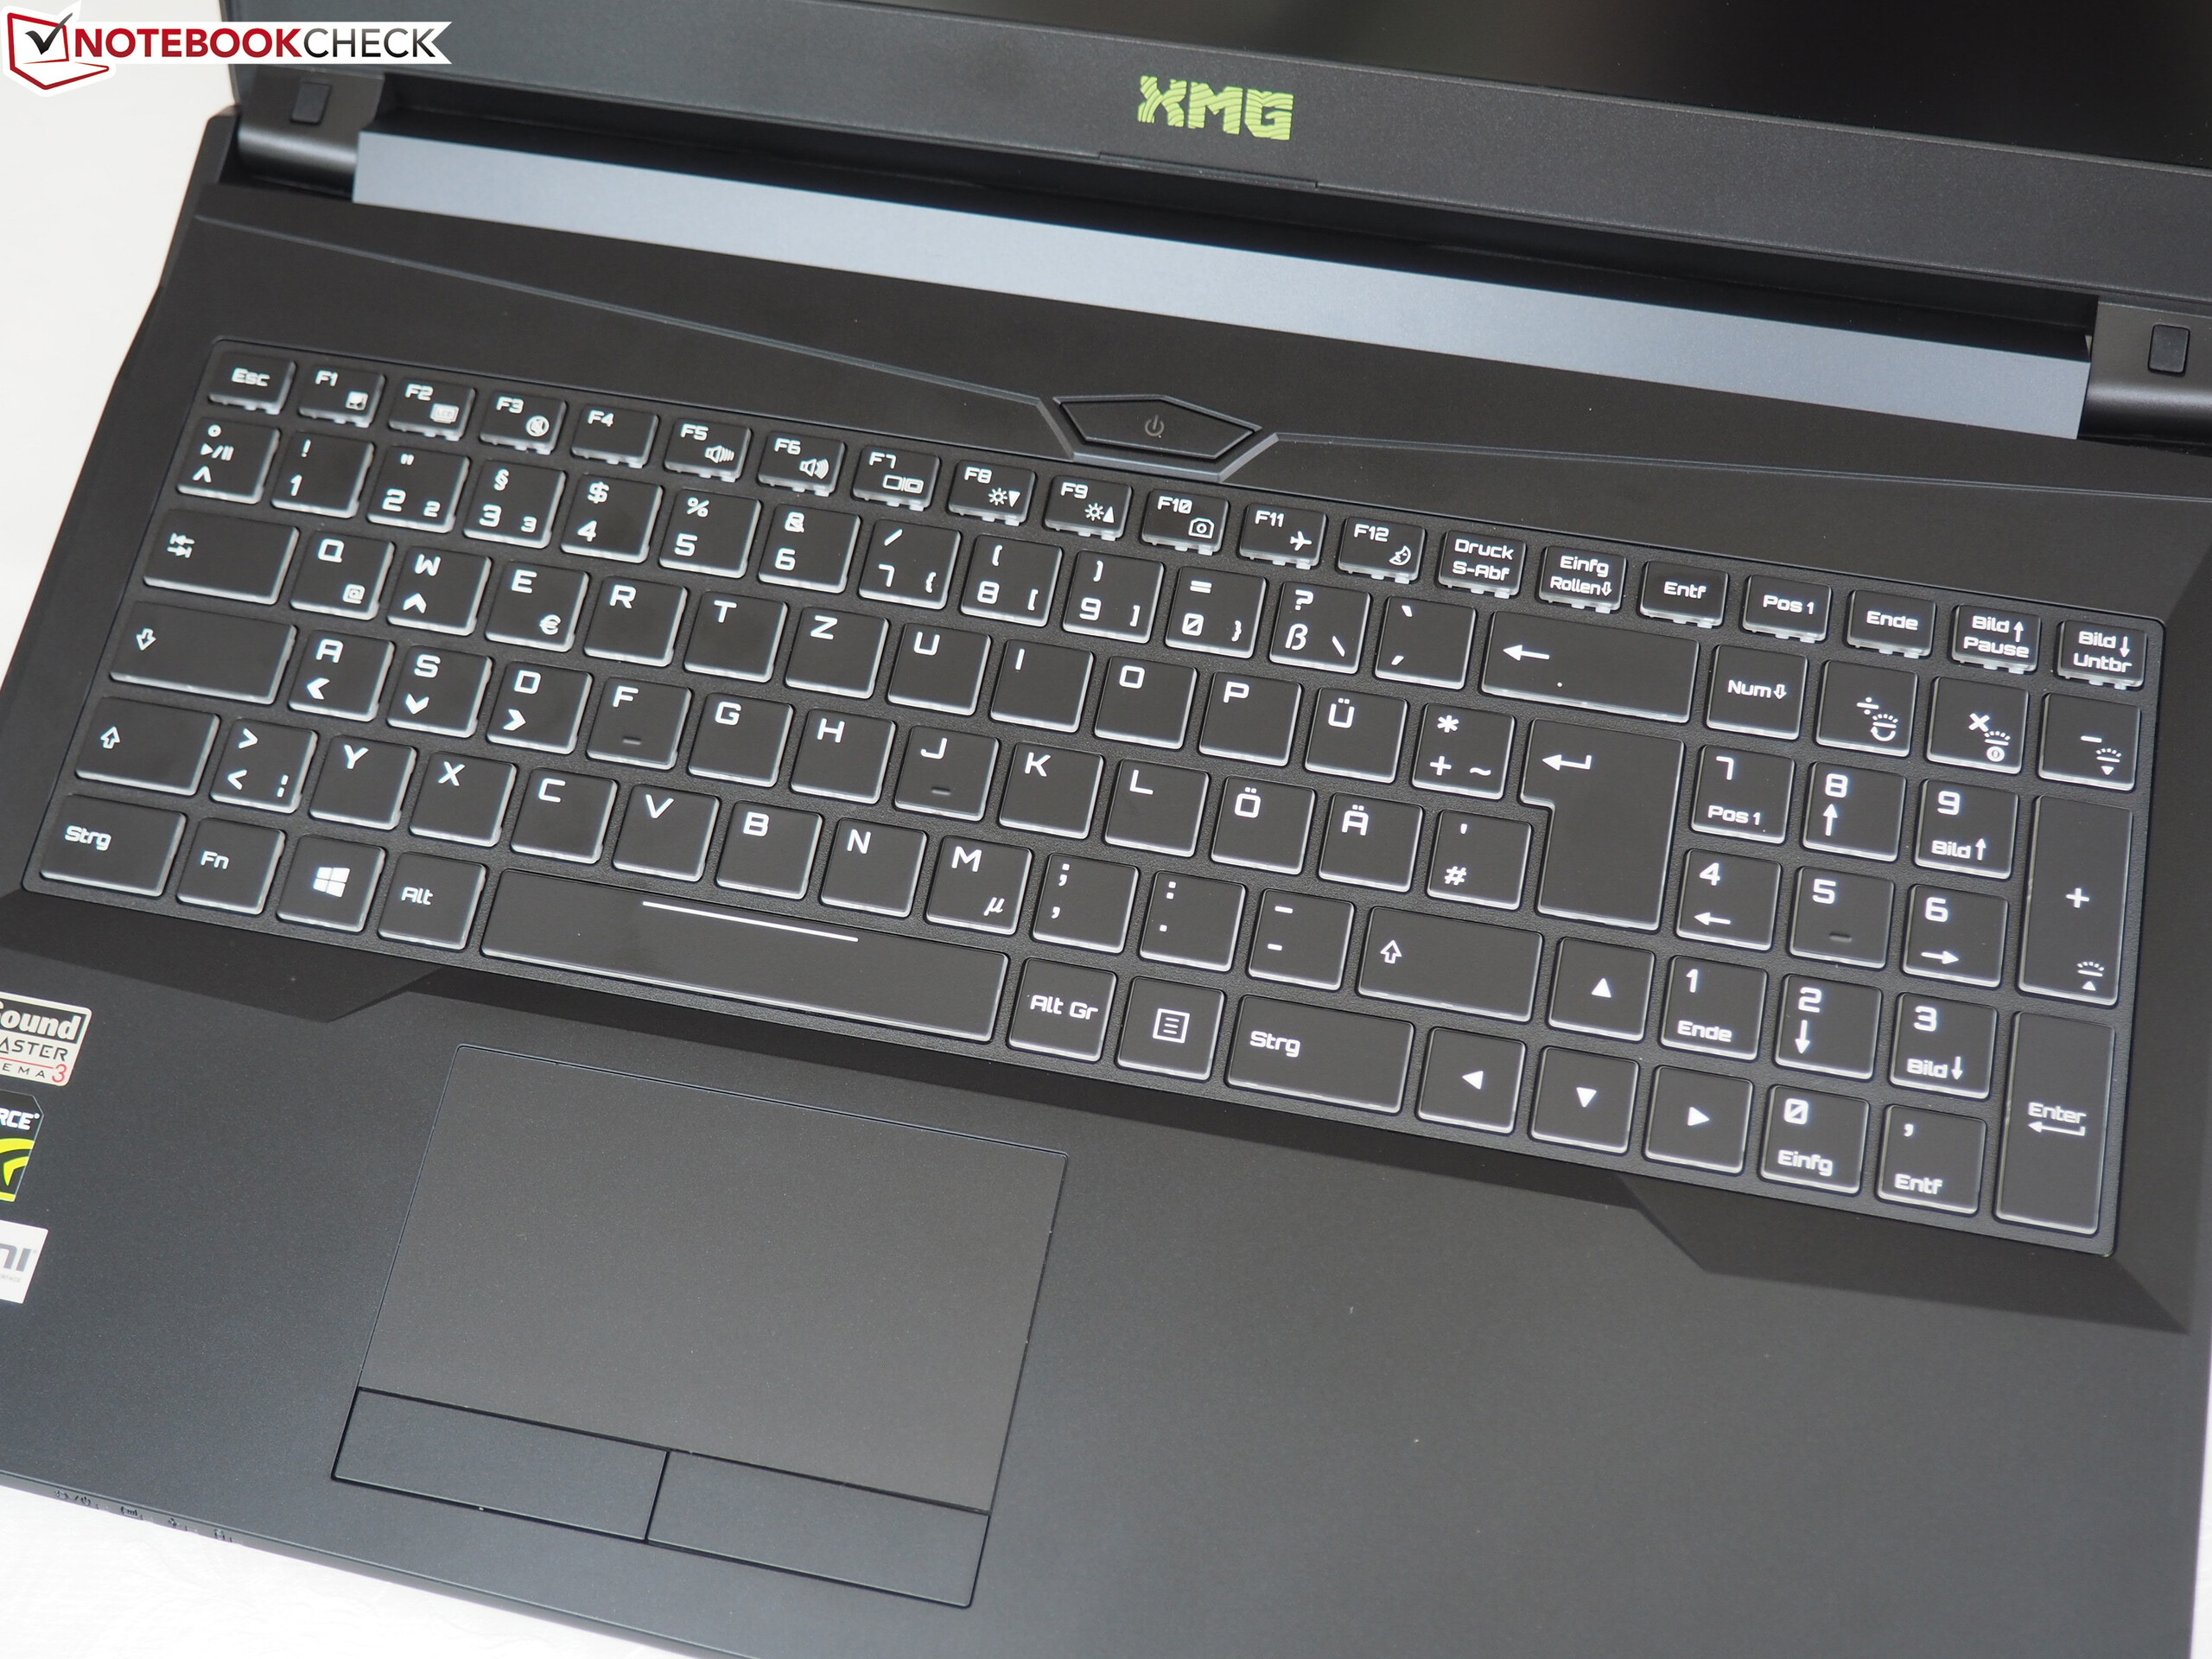
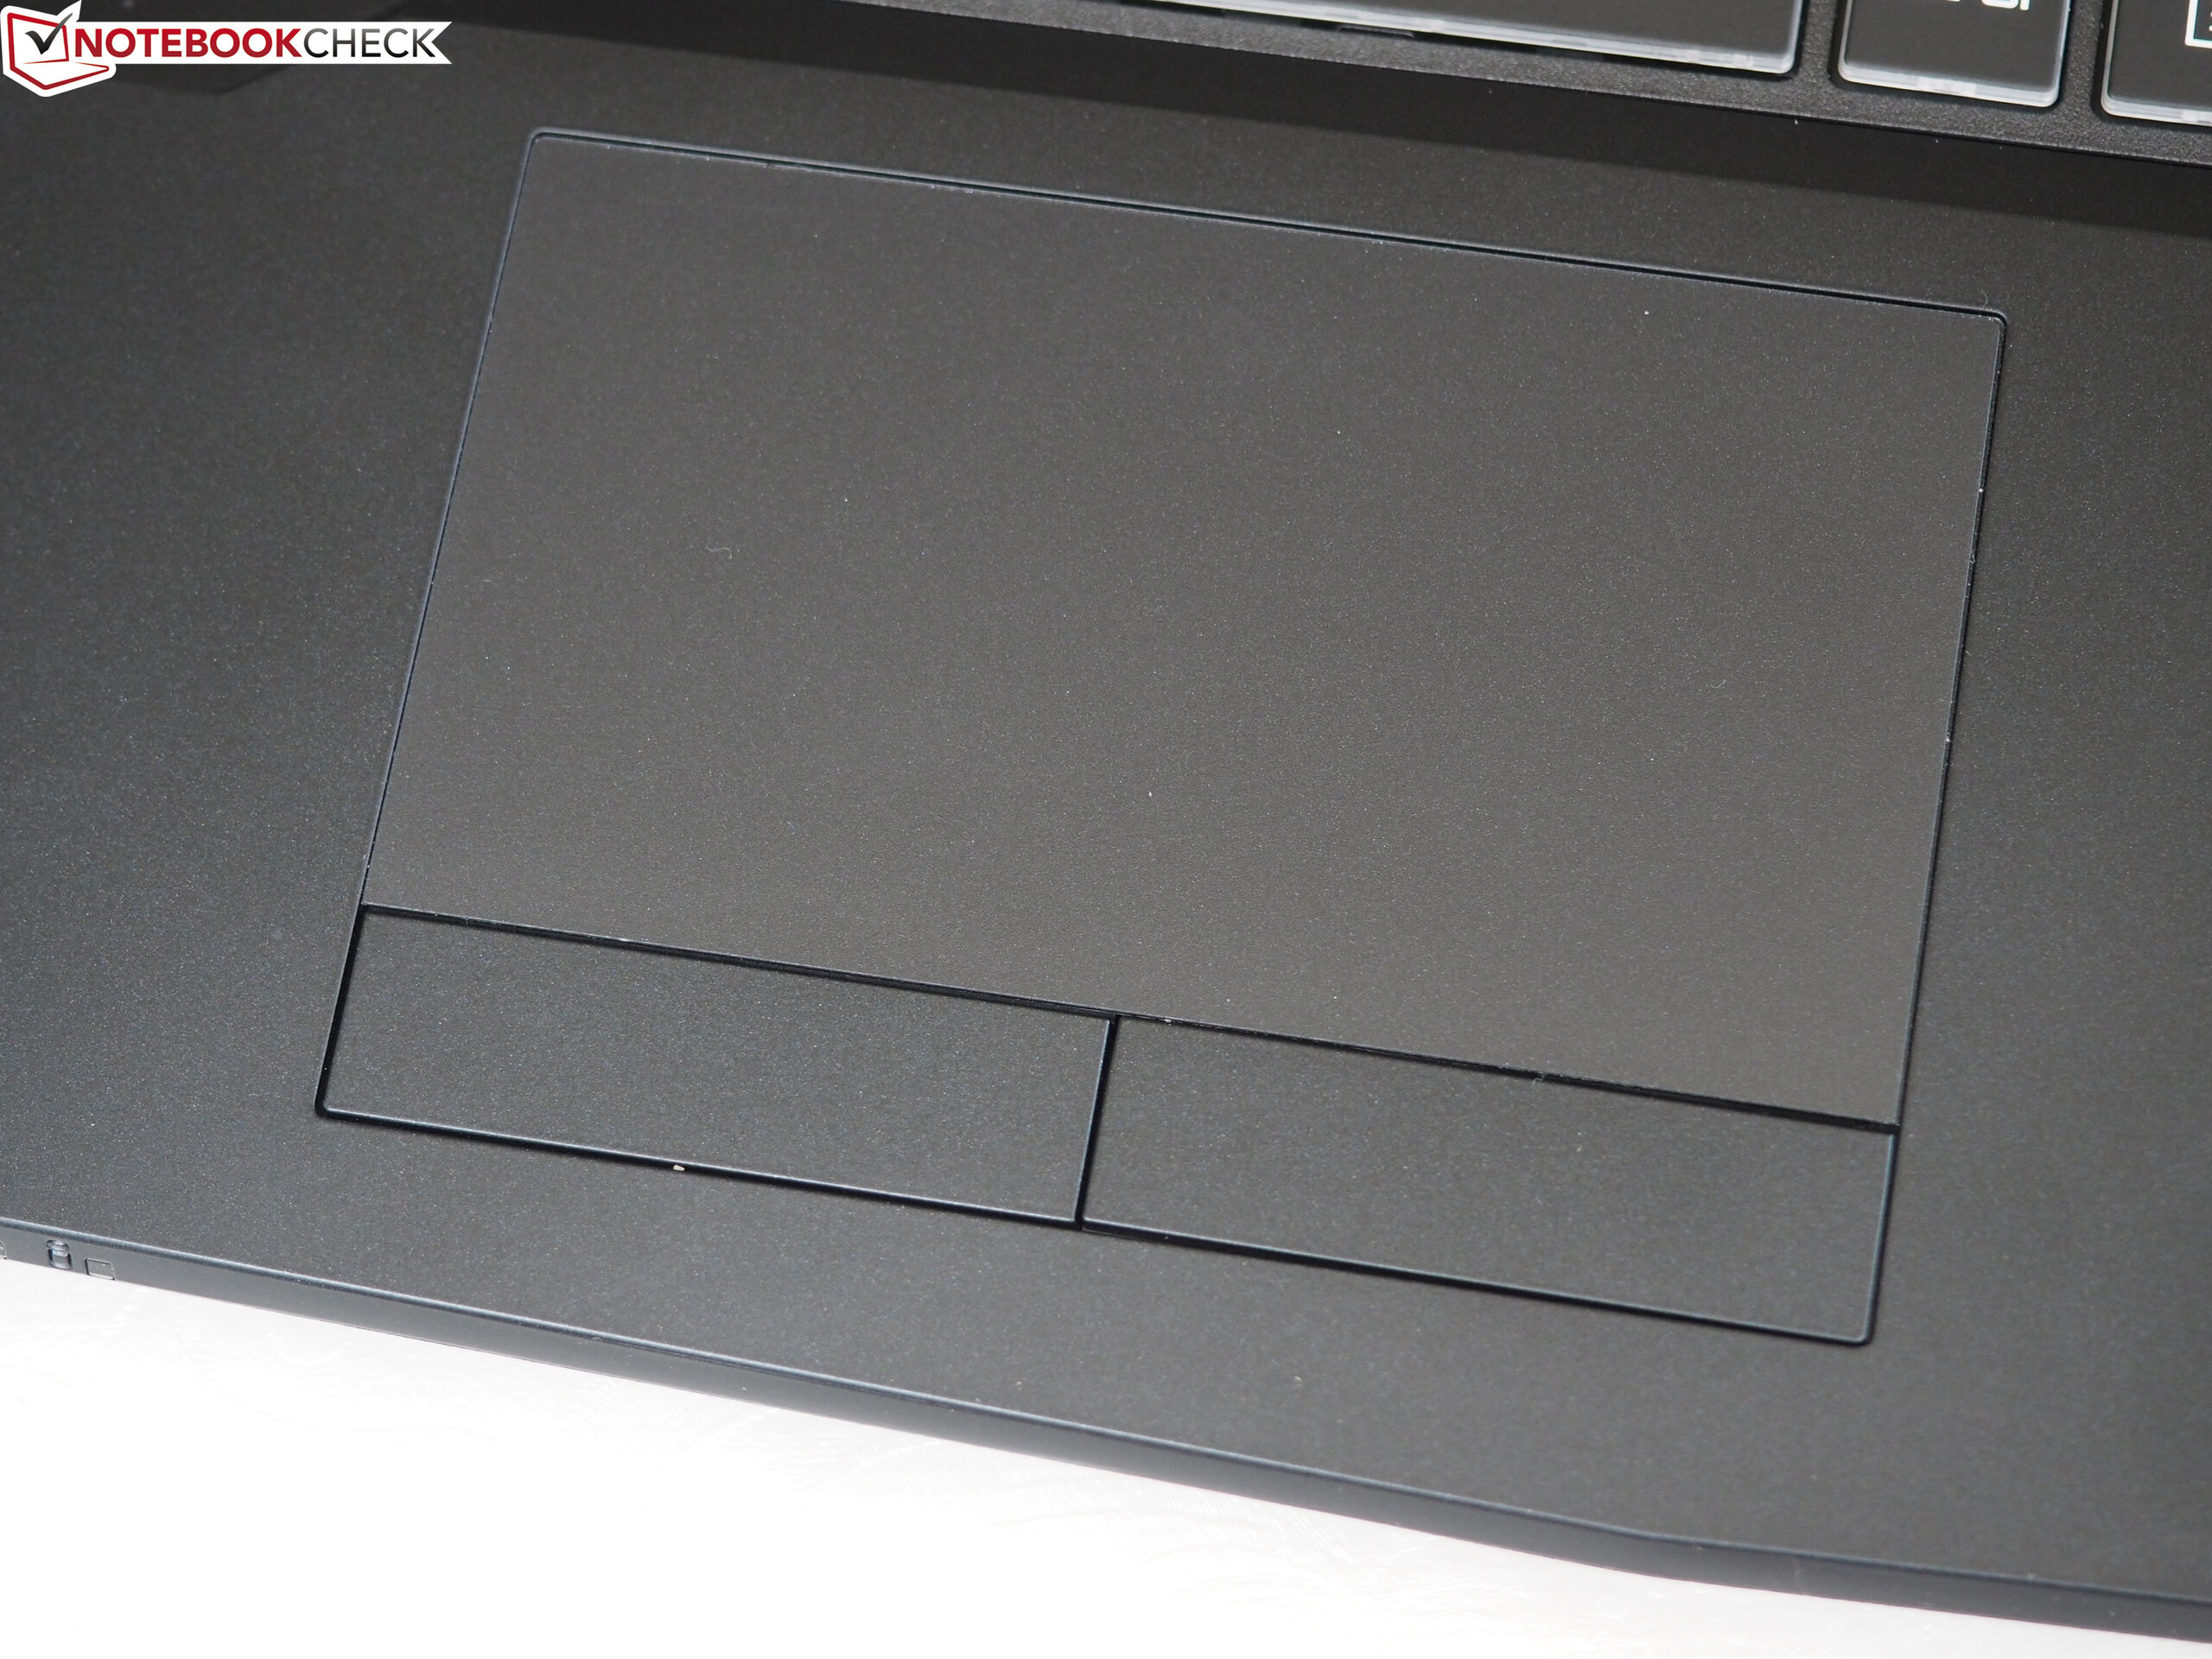
(-) The palmrests and touchpad can get very hot to the touch with a maximum of 49 °C / 120.2 F.
(-) The average temperature of the palmrest area of similar devices was 28.8 °C / 83.8 F (-20.2 °C / -36.4 F).
| Schenker XMG A517 i7-7700HQ, GeForce GTX 1060 Mobile | Alienware 15 R3 i7-7700HQ, GeForce GTX 1070 Mobile | MSI GT62VR 7RE-223 i7-7700HQ, GeForce GTX 1070 Mobile | Gigabyte Aero 15 i7-7700HQ, GeForce GTX 1060 Mobile | Acer Aspire VX5-591G-75C4 VX15 i7-7700HQ, GeForce GTX 1050 Ti Mobile | |
|---|---|---|---|---|---|
| Heat | -8% | 14% | 4% | 10% | |
| Maximum Upper Side * (°C) | 53 | 46 13% | 40.6 23% | 56 -6% | 47 11% |
| Maximum Bottom * (°C) | 49 | 51.8 -6% | 48.4 1% | 61 -24% | 47 4% |
| Idle Upper Side * (°C) | 33 | 36.5 -11% | 26.8 19% | 25 24% | 28.4 14% |
| Idle Bottom * (°C) | 30 | 38.2 -27% | 26.4 12% | 24 20% | 27.1 10% |
* ... smaller is better
Schenker XMG A517 audio analysis
(±) | speaker loudness is average but good (80 dB)
Bass 100 - 315 Hz
(-) | nearly no bass - on average 24.1% lower than median
(±) | linearity of bass is average (12.1% delta to prev. frequency)
Mids 400 - 2000 Hz
(±) | higher mids - on average 7.3% higher than median
(±) | linearity of mids is average (9.4% delta to prev. frequency)
Highs 2 - 16 kHz
(±) | higher highs - on average 7.7% higher than median
(±) | linearity of highs is average (10.1% delta to prev. frequency)
Overall 100 - 16.000 Hz
(±) | linearity of overall sound is average (29.4% difference to median)
Compared to same class
» 95% of all tested devices in this class were better, 2% similar, 3% worse
» The best had a delta of 6%, average was 18%, worst was 132%
Compared to all devices tested
» 87% of all tested devices were better, 3% similar, 10% worse
» The best had a delta of 4%, average was 23%, worst was 134%
Gigabyte Aero 15 audio analysis
(±) | speaker loudness is average but good (79 dB)
Bass 100 - 315 Hz
(-) | nearly no bass - on average 23.3% lower than median
(±) | linearity of bass is average (10.7% delta to prev. frequency)
Mids 400 - 2000 Hz
(+) | balanced mids - only 1.8% away from median
(+) | mids are linear (4.1% delta to prev. frequency)
Highs 2 - 16 kHz
(+) | balanced highs - only 2.6% away from median
(+) | highs are linear (5.1% delta to prev. frequency)
Overall 100 - 16.000 Hz
(±) | linearity of overall sound is average (18.3% difference to median)
Compared to same class
» 56% of all tested devices in this class were better, 7% similar, 38% worse
» The best had a delta of 5%, average was 17%, worst was 45%
Compared to all devices tested
» 40% of all tested devices were better, 8% similar, 52% worse
» The best had a delta of 4%, average was 23%, worst was 134%
| Off / Standby | |
| Idle | |
| Load |
|
Key:
min: | |
| Schenker XMG A517 i7-7700HQ, GeForce GTX 1060 Mobile | Alienware 15 R3 i7-7700HQ, GeForce GTX 1070 Mobile | MSI GT62VR 7RE-223 i7-7700HQ, GeForce GTX 1070 Mobile | Gigabyte Aero 15 i7-7700HQ, GeForce GTX 1060 Mobile | Acer Aspire VX5-591G-75C4 VX15 i7-7700HQ, GeForce GTX 1050 Ti Mobile | |
|---|---|---|---|---|---|
| Power Consumption | -51% | -54% | -7% | 22% | |
| Idle Minimum * (Watt) | 8 | 19 -138% | 20 -150% | 12 -50% | 7 12% |
| Idle Average * (Watt) | 12 | 23 -92% | 24 -100% | 15 -25% | 10.2 15% |
| Idle Maximum * (Watt) | 25 | 29 -16% | 29 -16% | 20 20% | 14 44% |
| Load Average * (Watt) | 85 | 85 -0% | 82 4% | 82 4% | 78 8% |
| Witcher 3 ultra * (Watt) | 110 | 111 -1% | |||
| Load Maximum * (Watt) | 180 | 192 -7% | 193 -7% | 161 11% | 127 29% |
* ... smaller is better
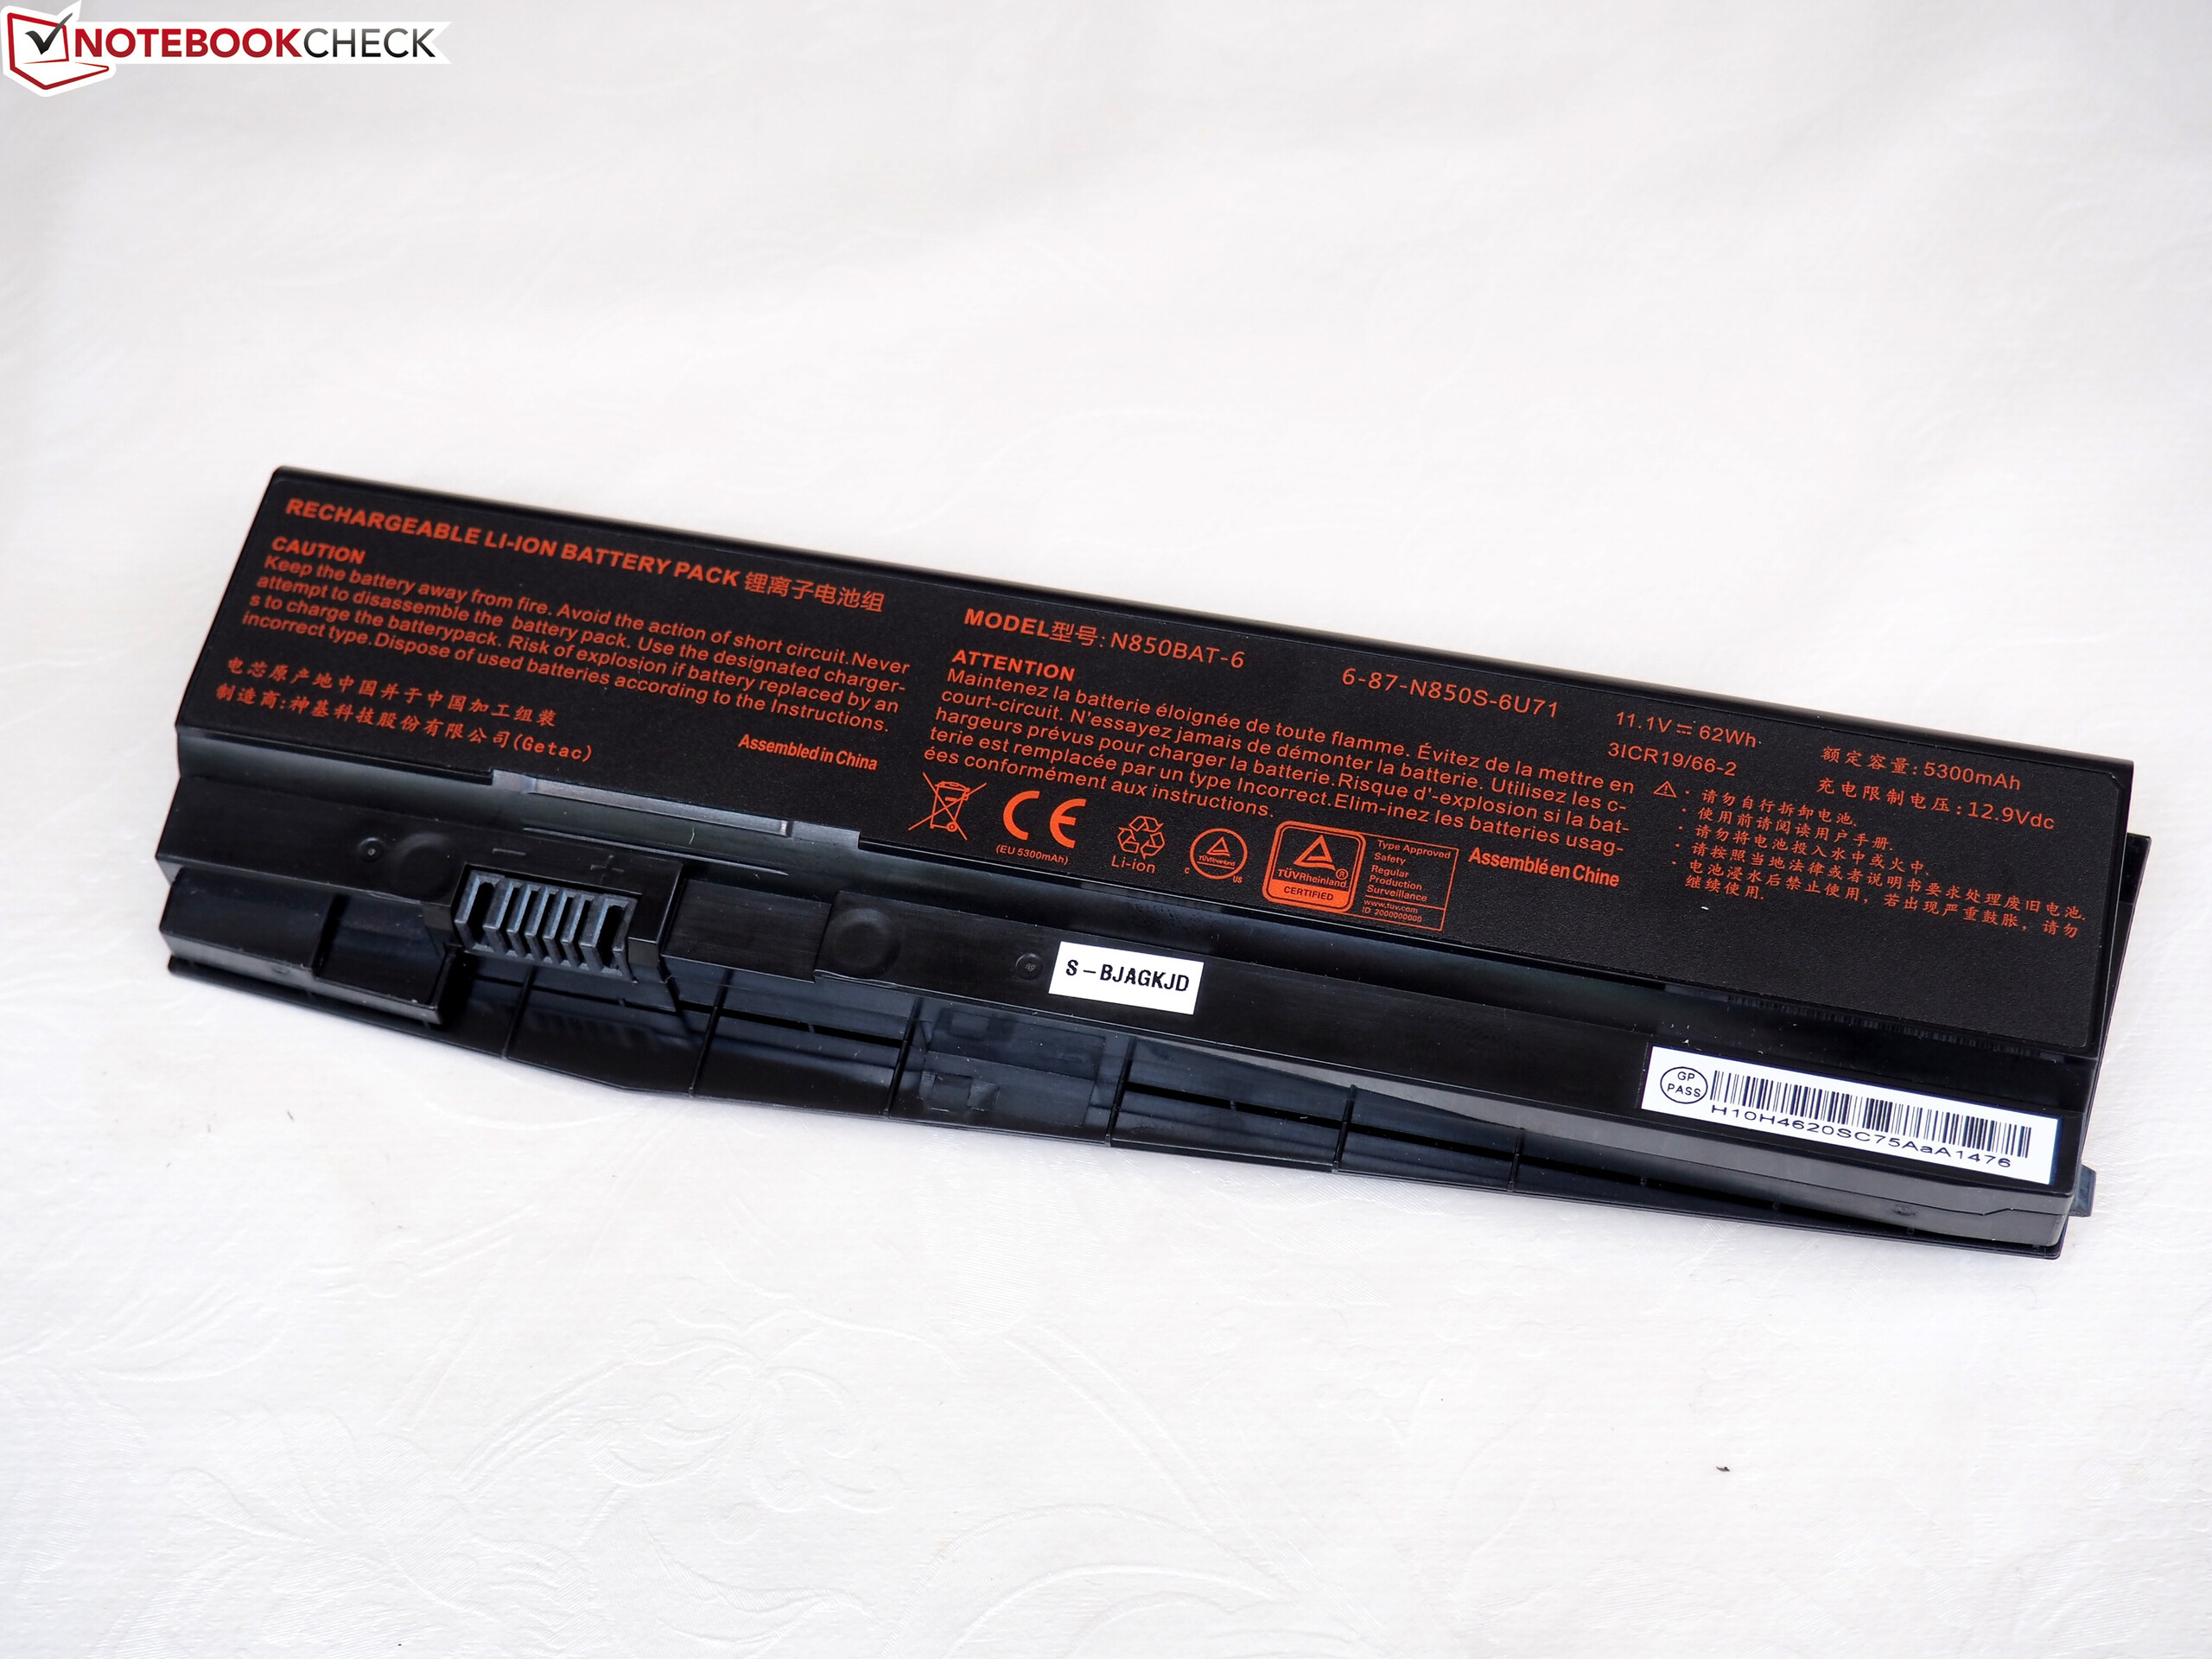
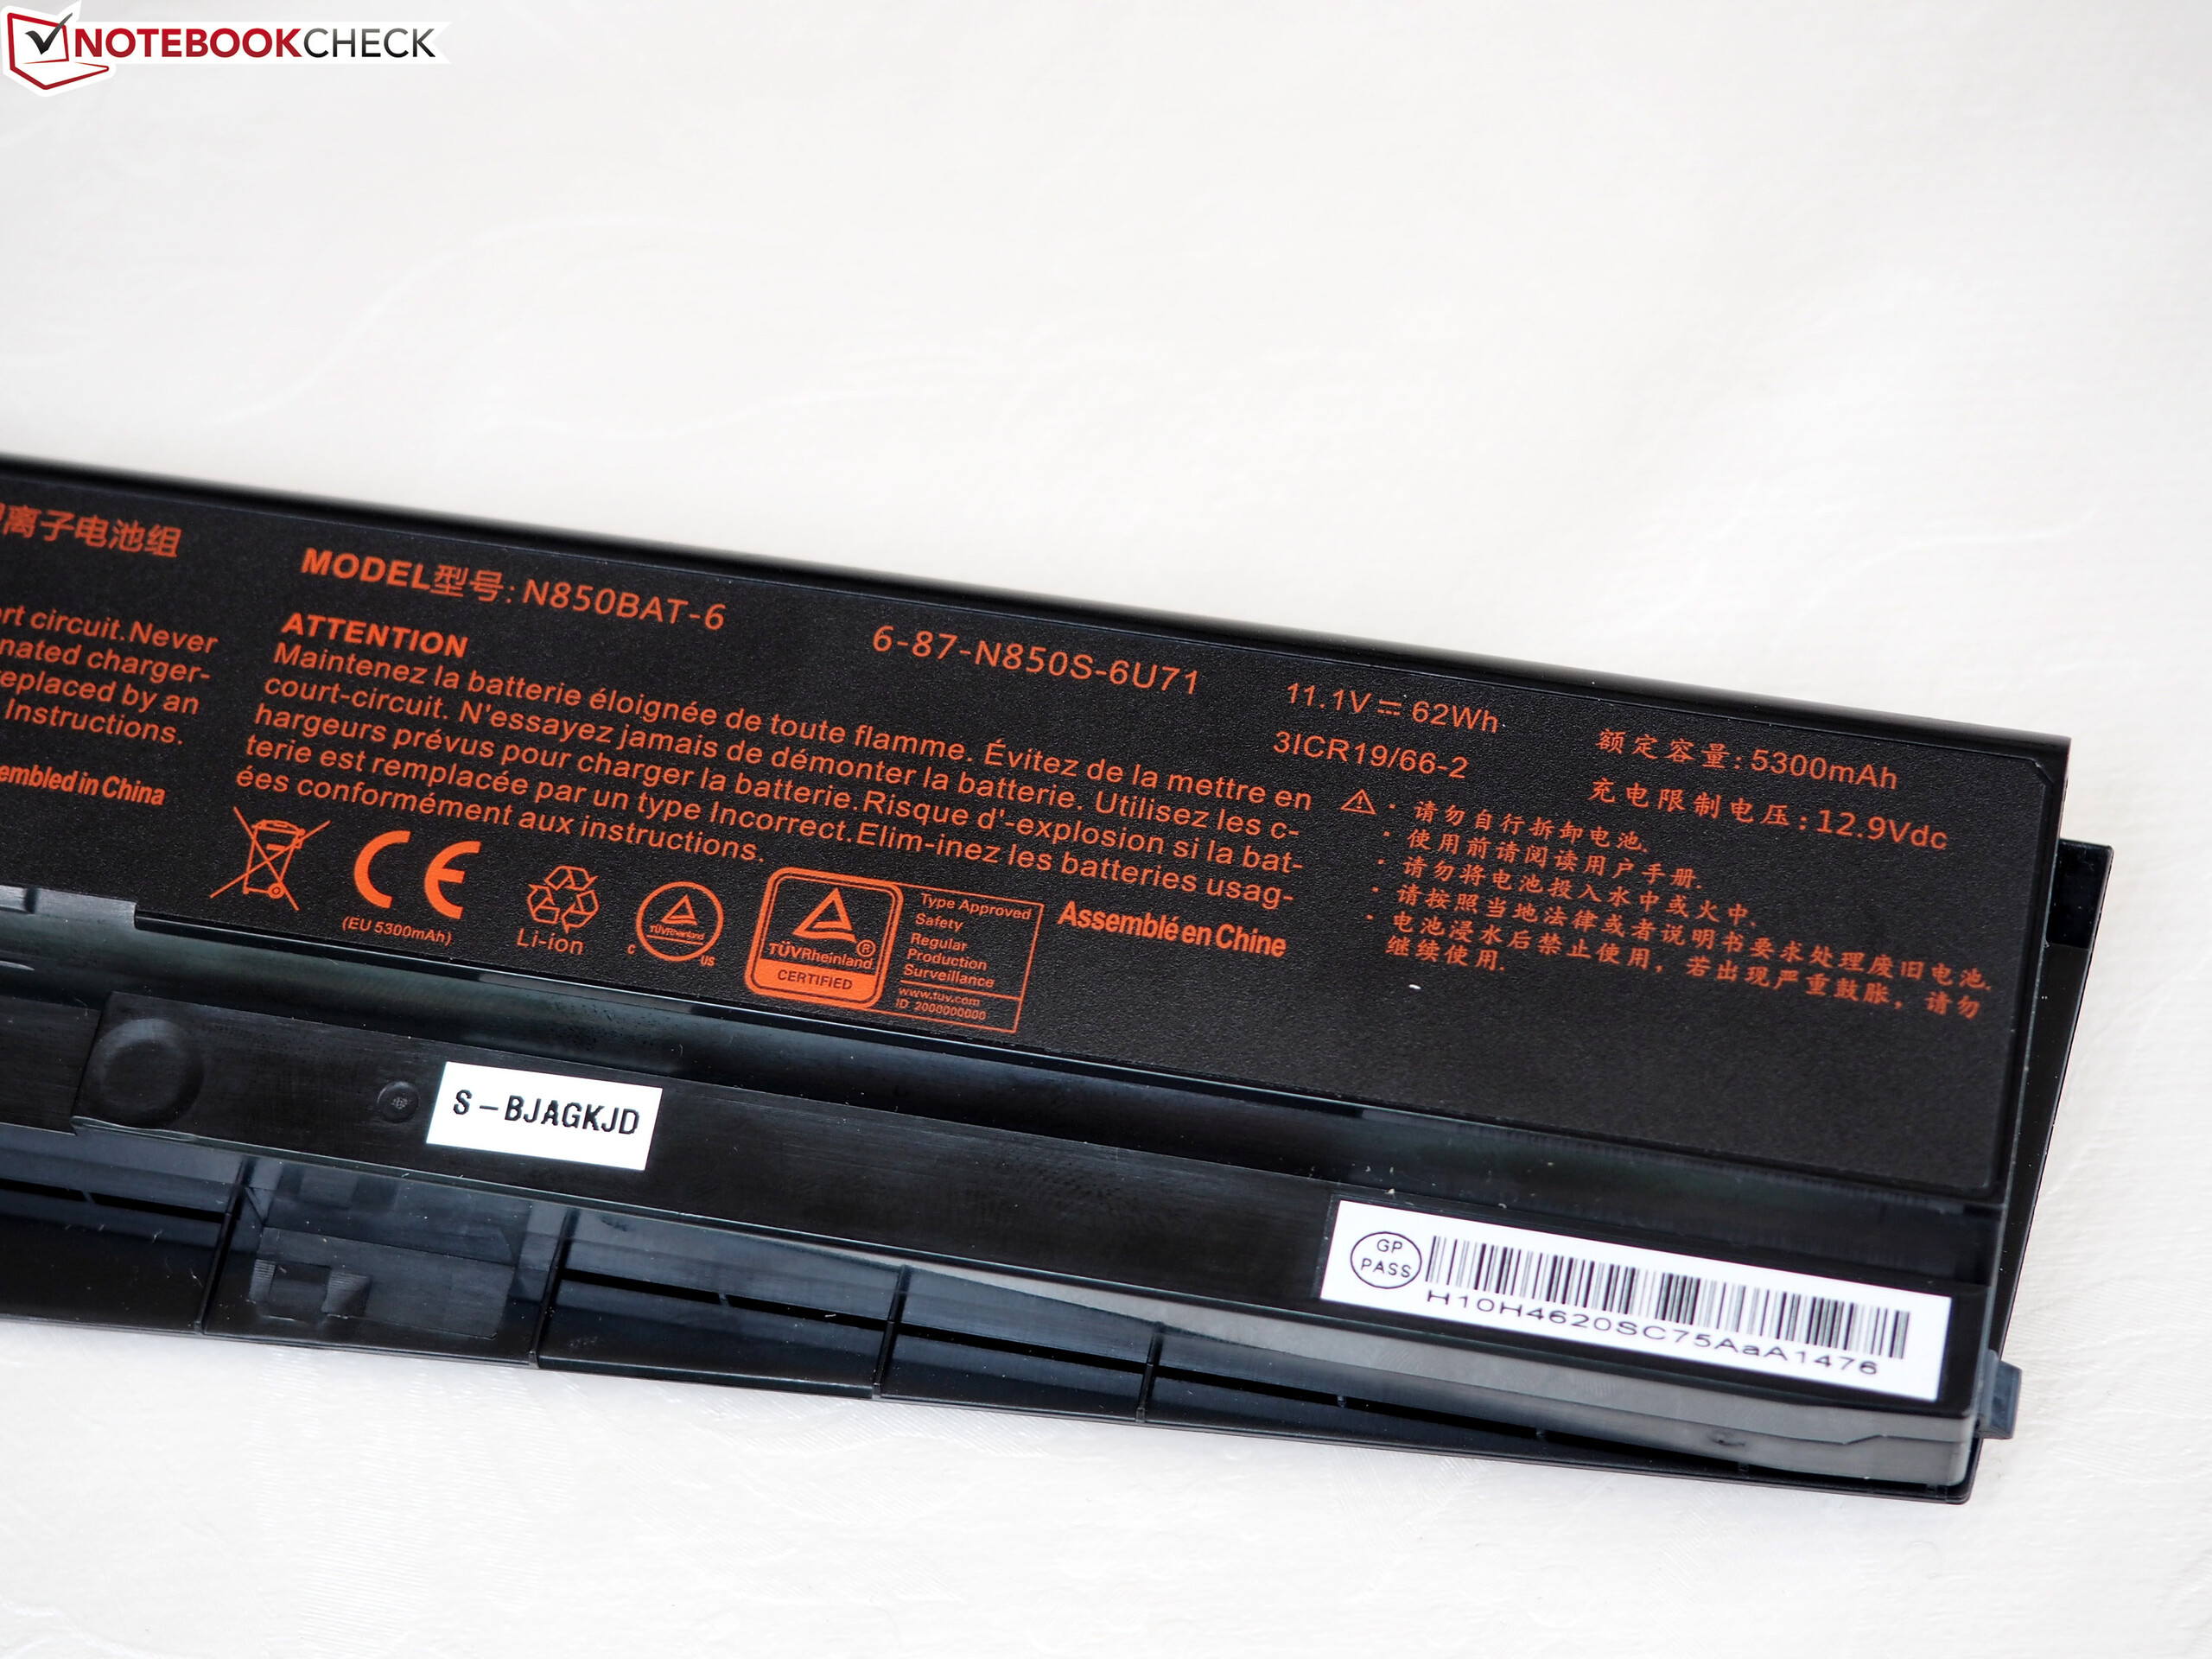
| Schenker XMG A517 i7-7700HQ, GeForce GTX 1060 Mobile, 62 Wh | Alienware 15 R3 i7-7700HQ, GeForce GTX 1070 Mobile, 99 Wh | MSI GT62VR 7RE-223 i7-7700HQ, GeForce GTX 1070 Mobile, 75 Wh | Gigabyte Aero 15 i7-7700HQ, GeForce GTX 1060 Mobile, 94.24 Wh | Acer Aspire VX5-591G-75C4 VX15 i7-7700HQ, GeForce GTX 1050 Ti Mobile, 52.5 Wh | |
|---|---|---|---|---|---|
| Battery runtime | -11% | -15% | 35% | -15% | |
| Reader / Idle (h) | 7.5 | 6.4 -15% | 6.3 -16% | 10.6 41% | 5.4 -28% |
| H.264 (h) | 5.2 | 4.4 -15% | 4.2 -19% | 7.7 48% | |
| WiFi v1.3 (h) | 5 | 4.4 -12% | 4.1 -18% | 7 40% | 5 0% |
| Load (h) | 1.7 | 1.7 0% | 1.6 -6% | 1.9 12% | 1.4 -18% |
Pros
Cons
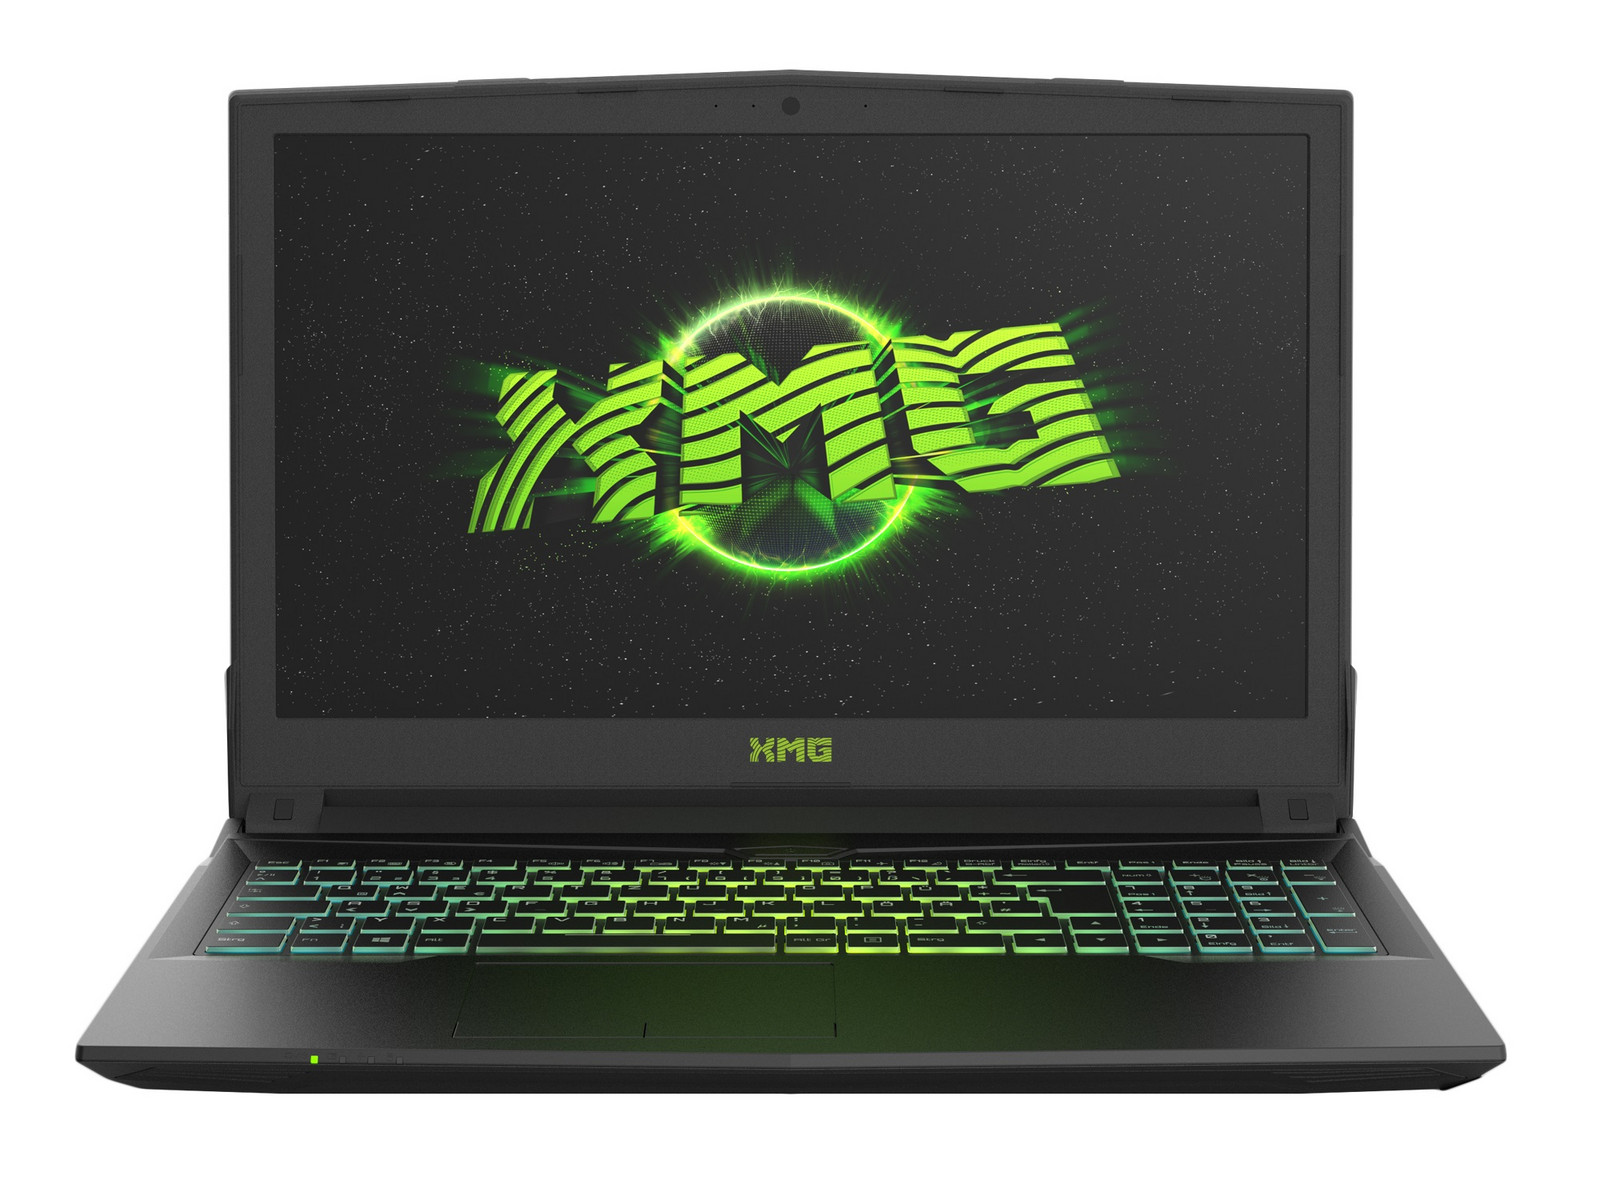
XMG A517在与来自宏碁、外星人、技嘉和微星的最新游戏笔记本电脑的竞争中遇到了一些困难。它的机身,扬声器和散热噪音控制无法与它1200欧元(约1378美元)的价位相配。很多的其他游戏本都做得更好。
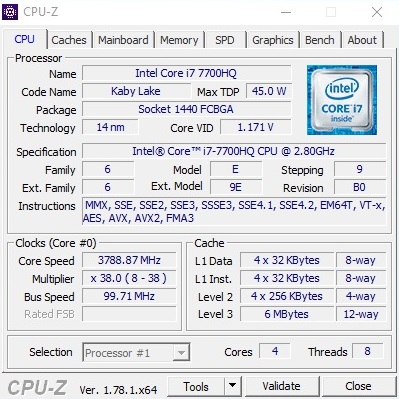
不过,对于这台设备的性能我们并没有太多不满的地方。尽管它的处理器睿频利用率在多核负载下还有待改善,这台15寸笔记本电脑提供了全面的出色性能,可以在1920x1080像素分辨率下流畅运行最新游戏。
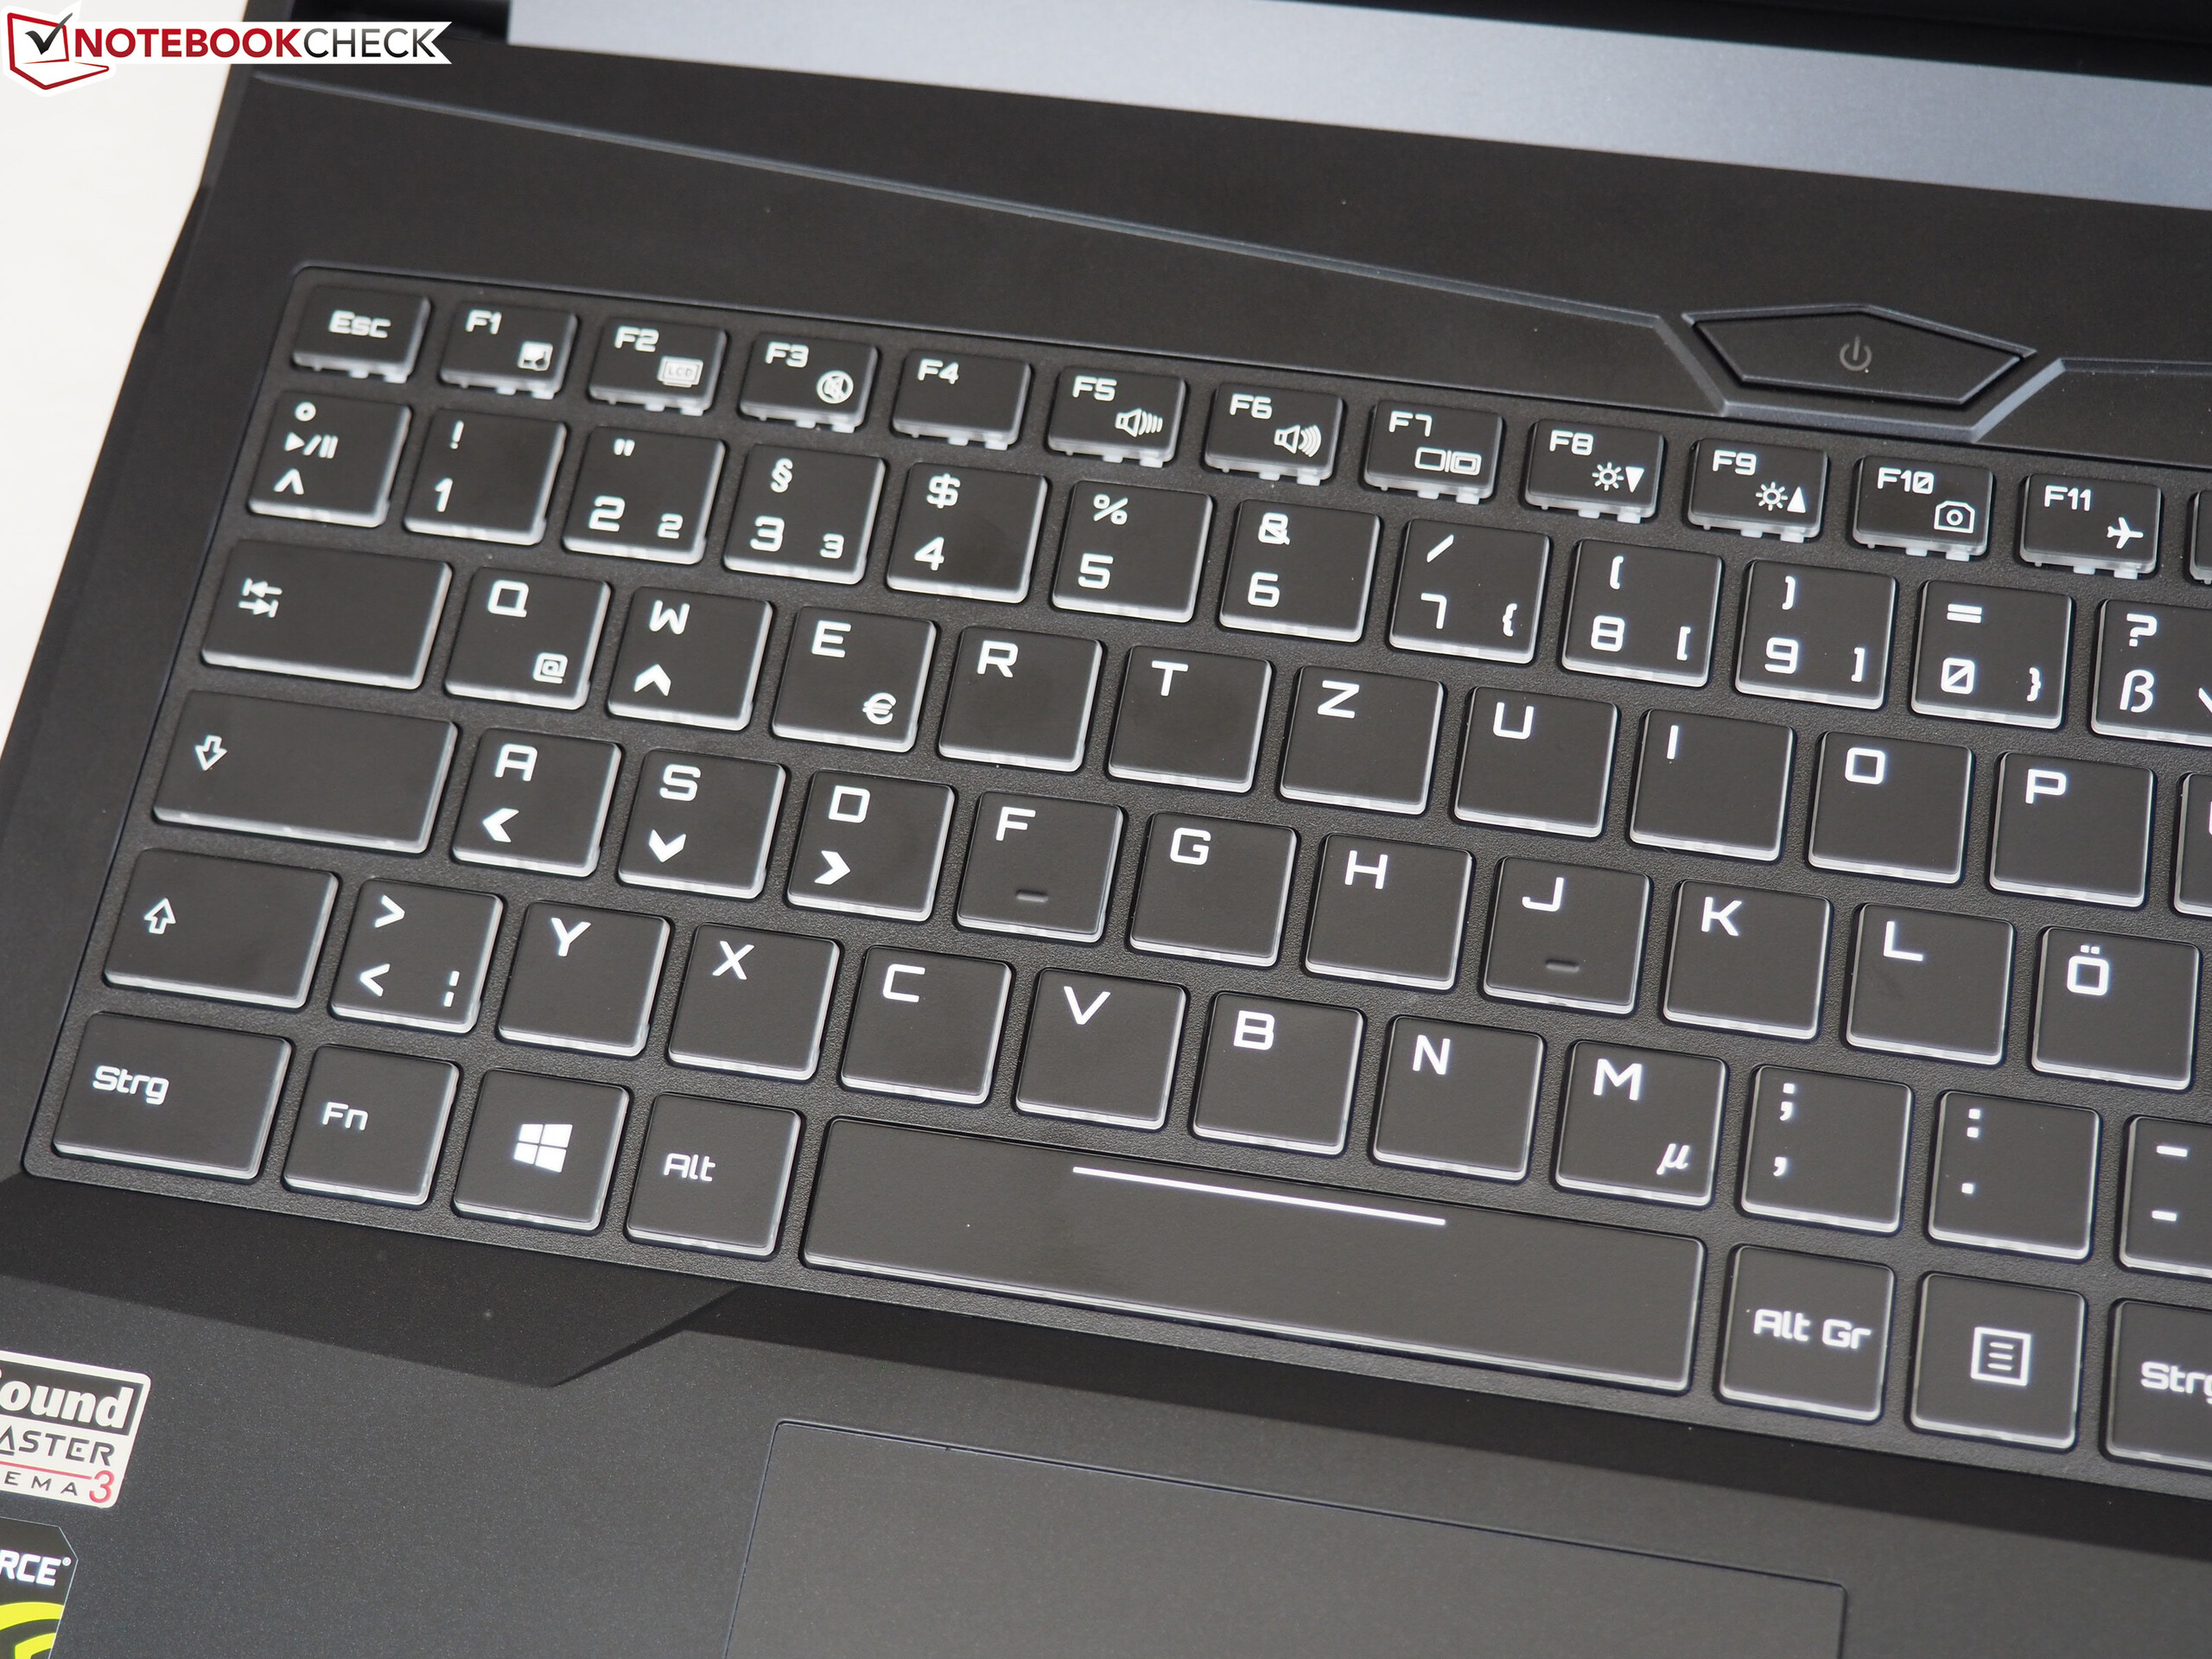
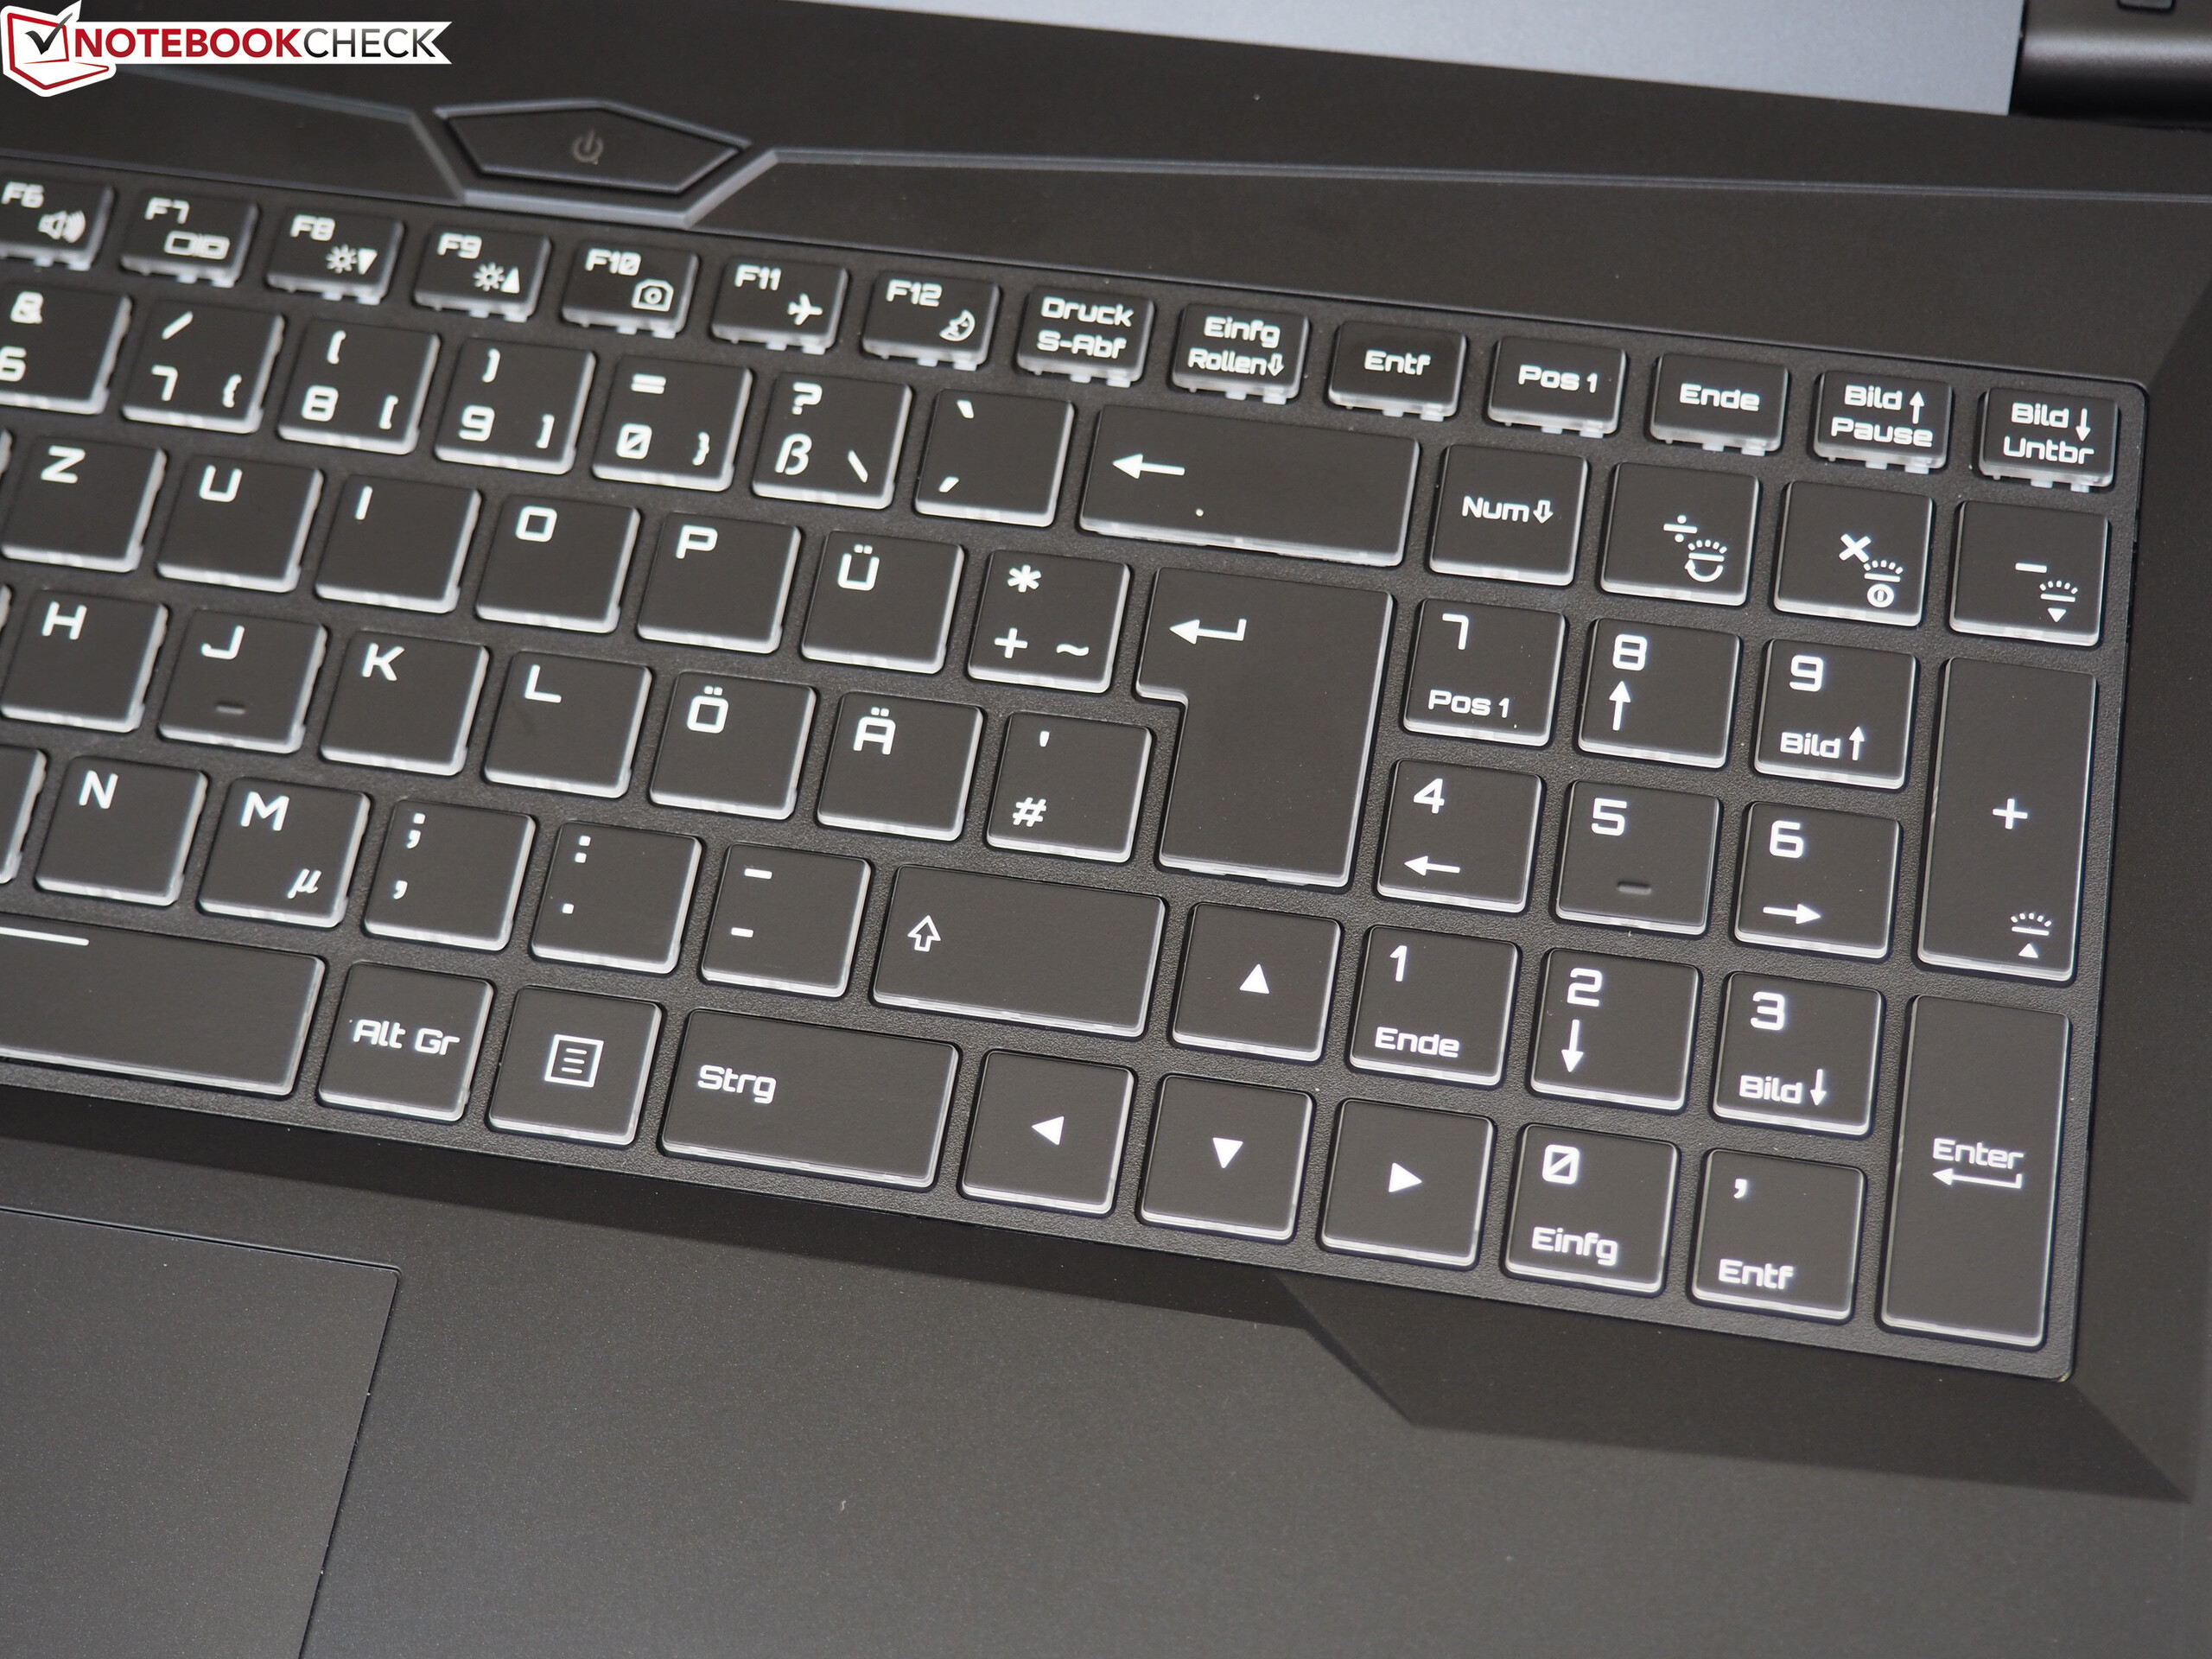
如果你不需要120赫兹刷新率和G-Sync,那么可能会对它的IPS屏幕十分满意。其他的优势还有品质优秀的RGB背光键盘,出人意料的超长电池续航和可以接受的2.4千克重量。
由于支持个性化配置,XMG A517可以轻松满足不同用户的需要(内存容量,存储设备,操作系统等)。
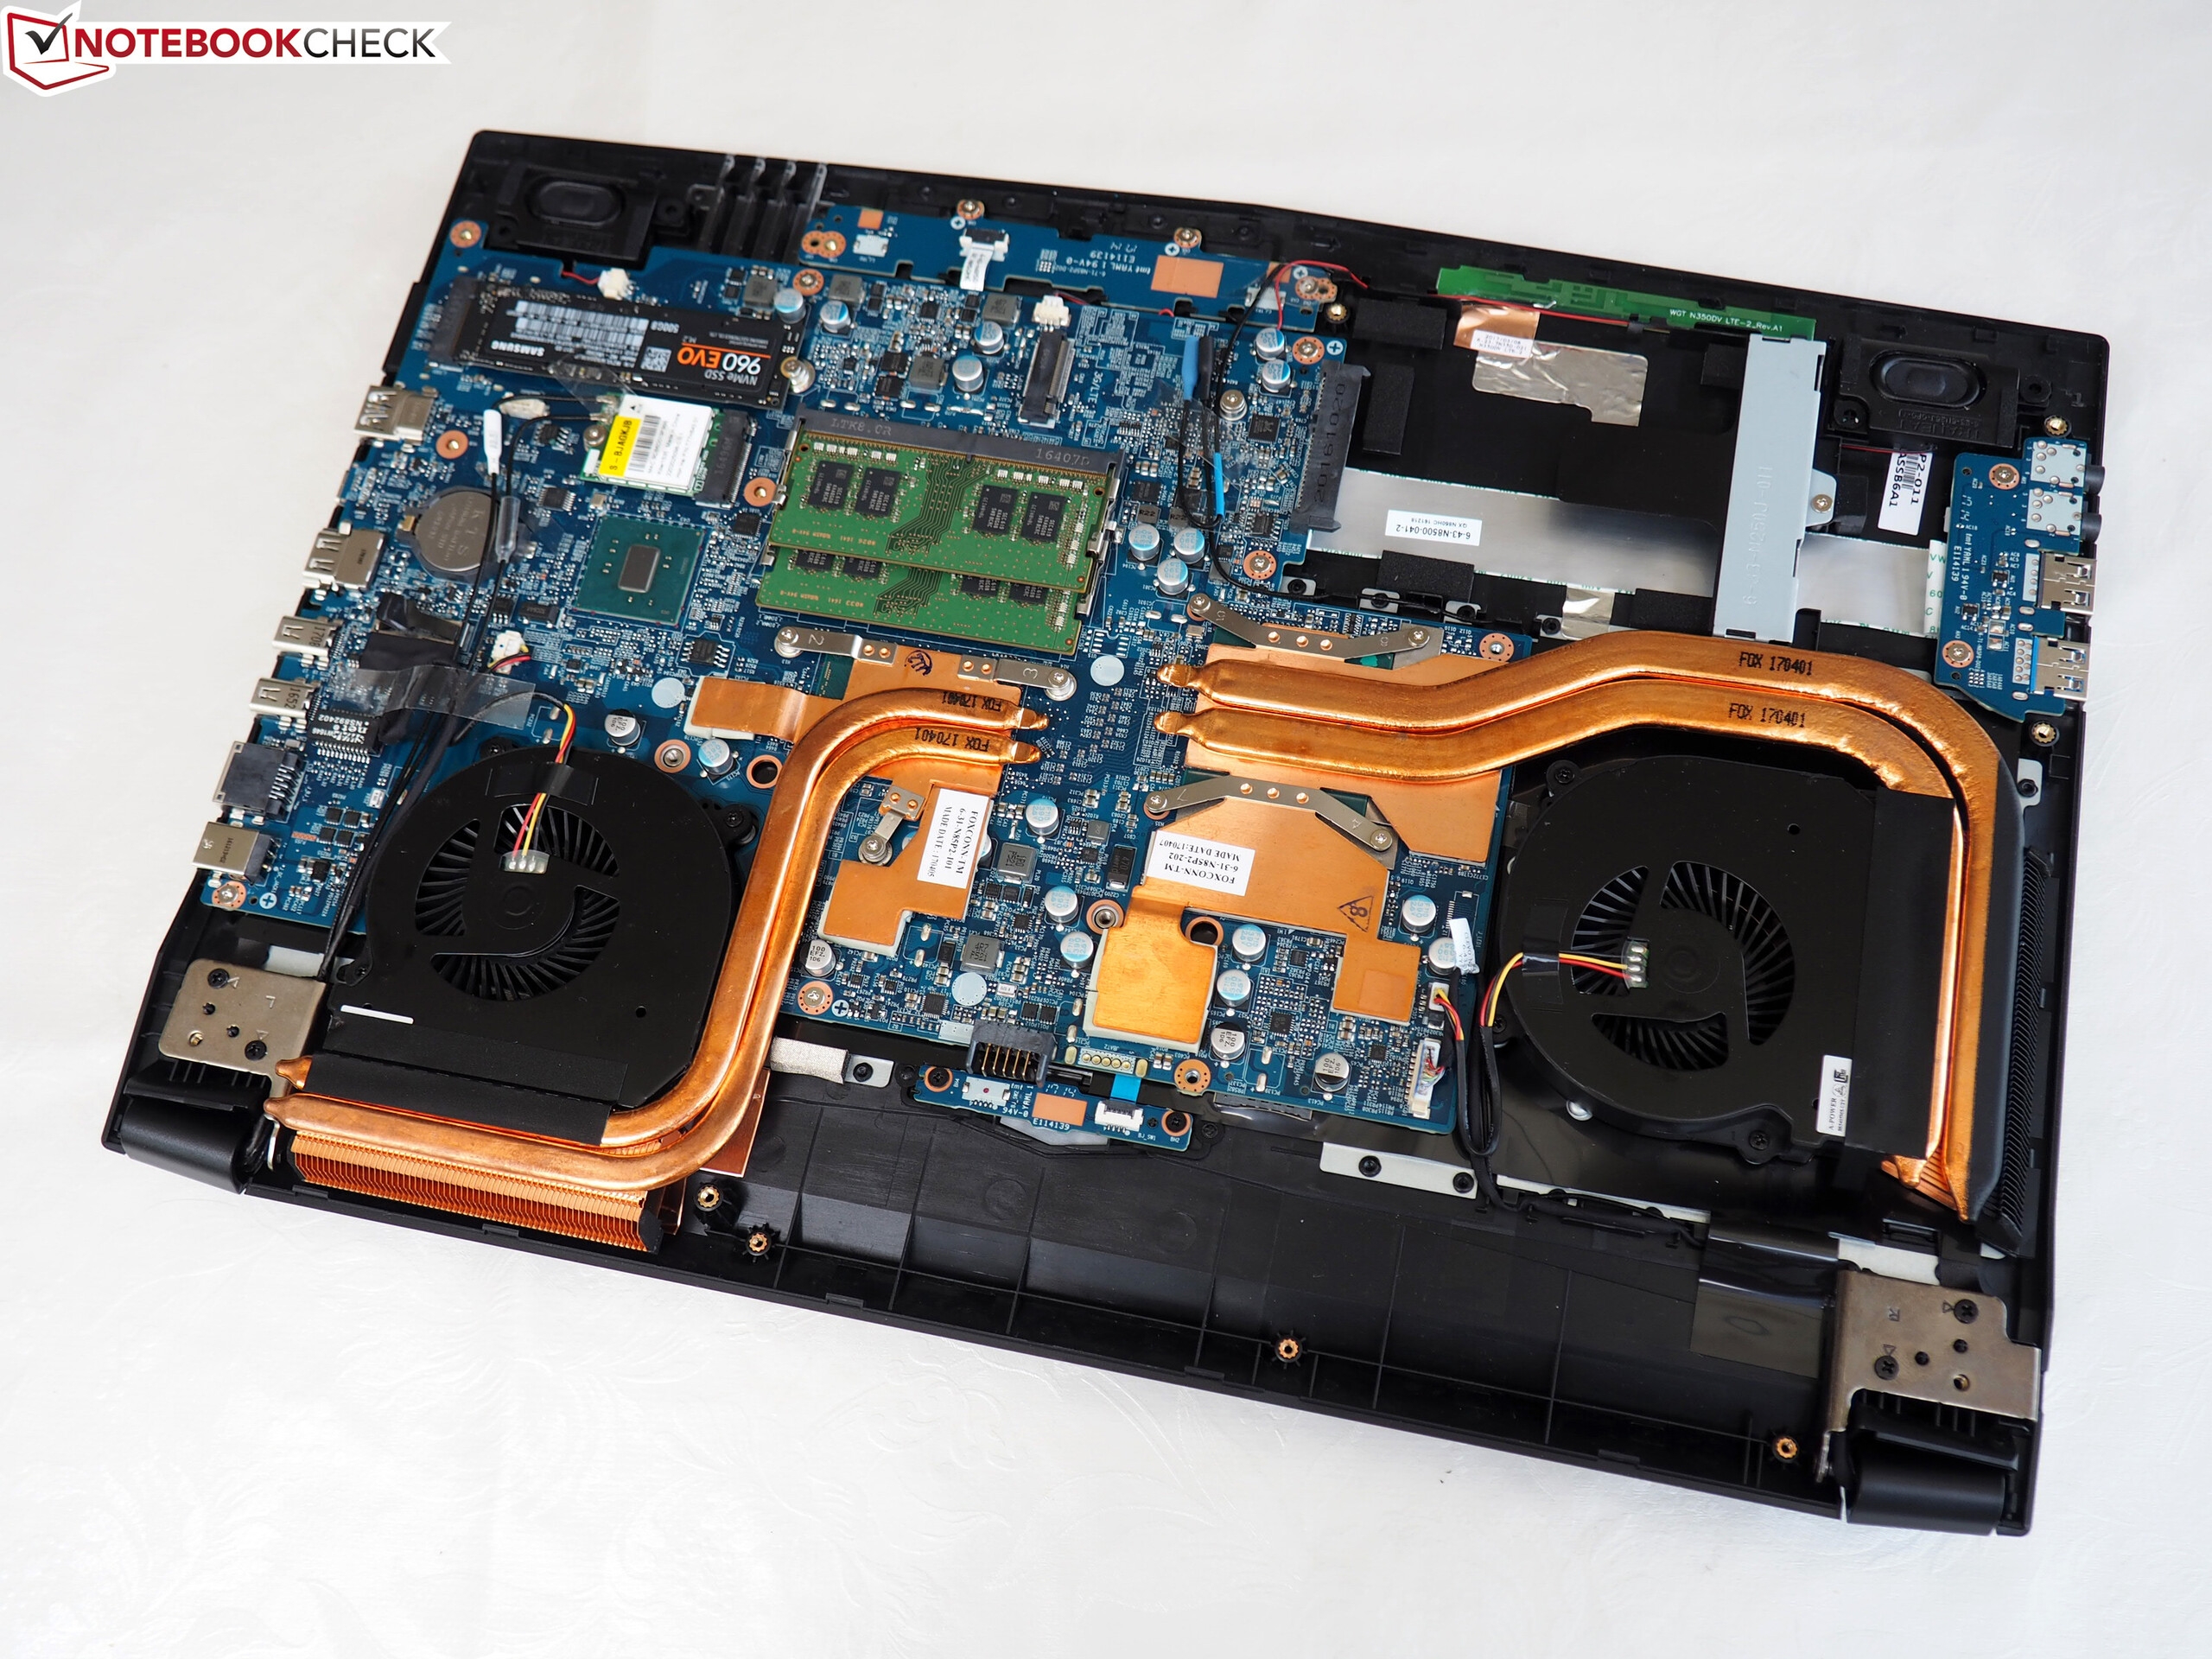
整体上,如果你可以接受我们之前提到的问题的话,这款设备值得考虑。不过我们无法建议读者购买这台15寸设备,由于准系统生产商蓝天犯下了太多的错误(特别是散热系统和相应控制程序)。
注:本文是基于完整评测的缩减版本,阅读完整的英文评测,请点击这里。
Schenker XMG A517
- 06/19/2018 v6 (old)
Florian Glaser
Price comparison