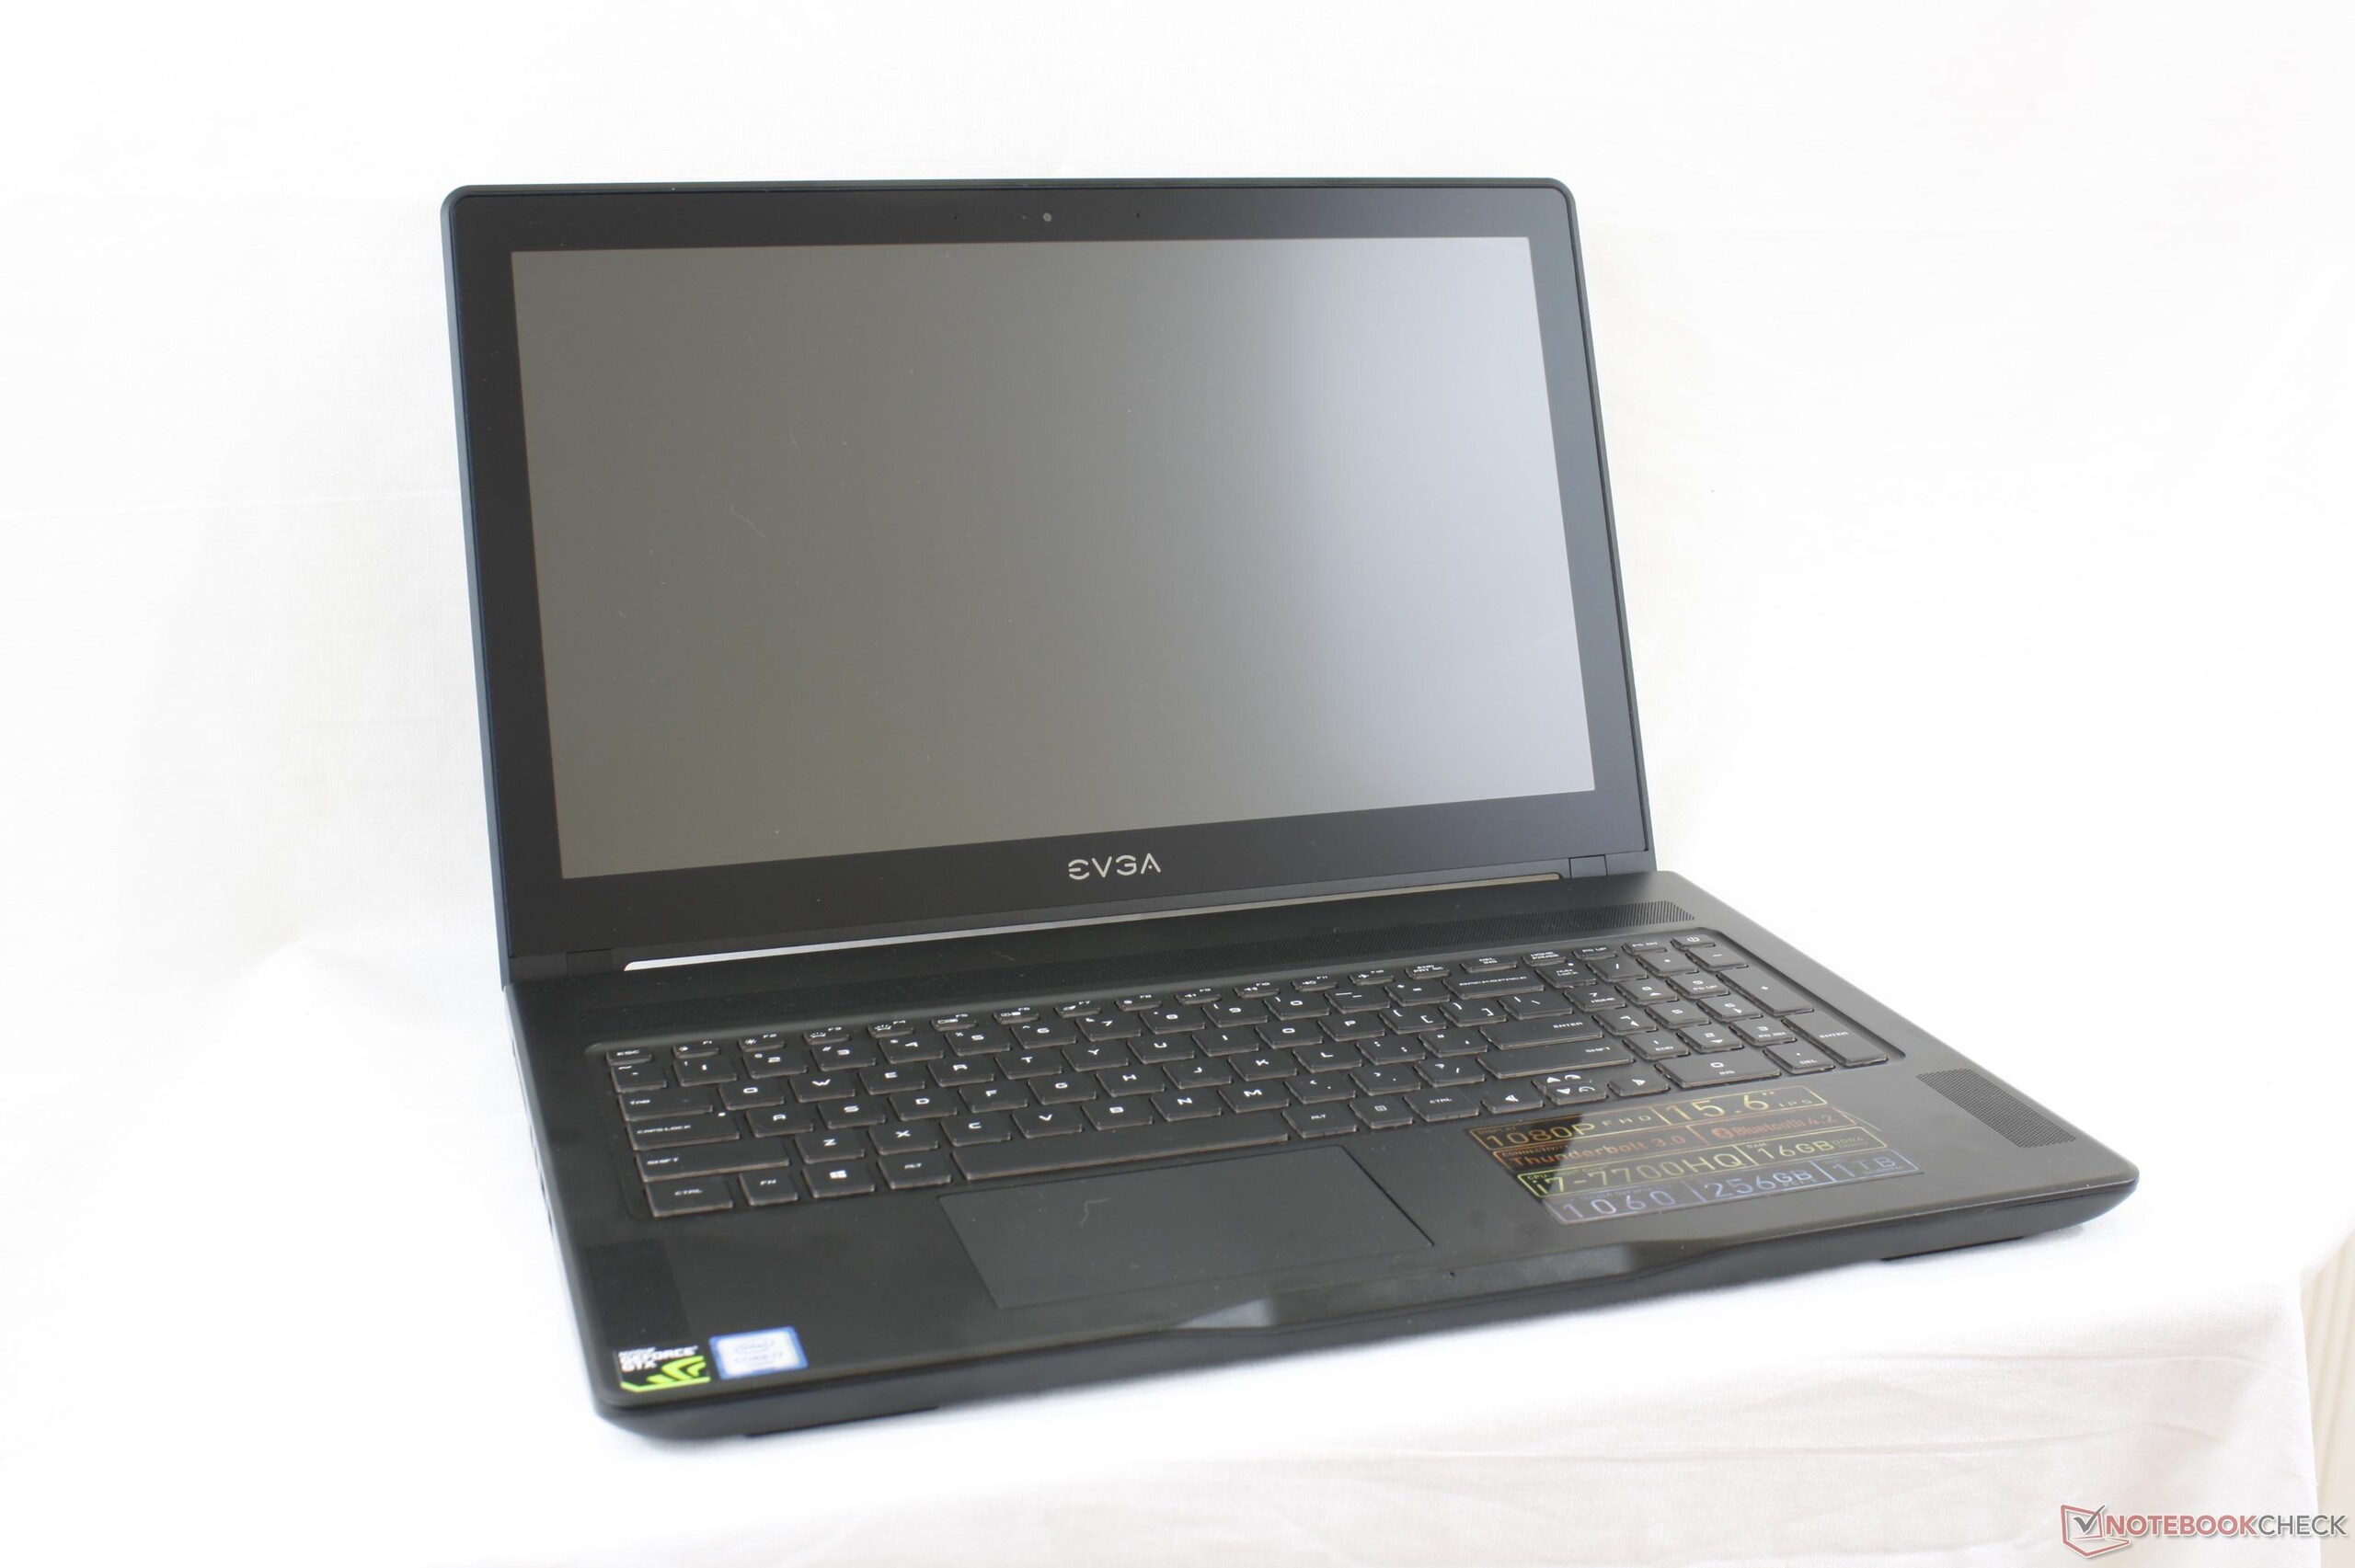
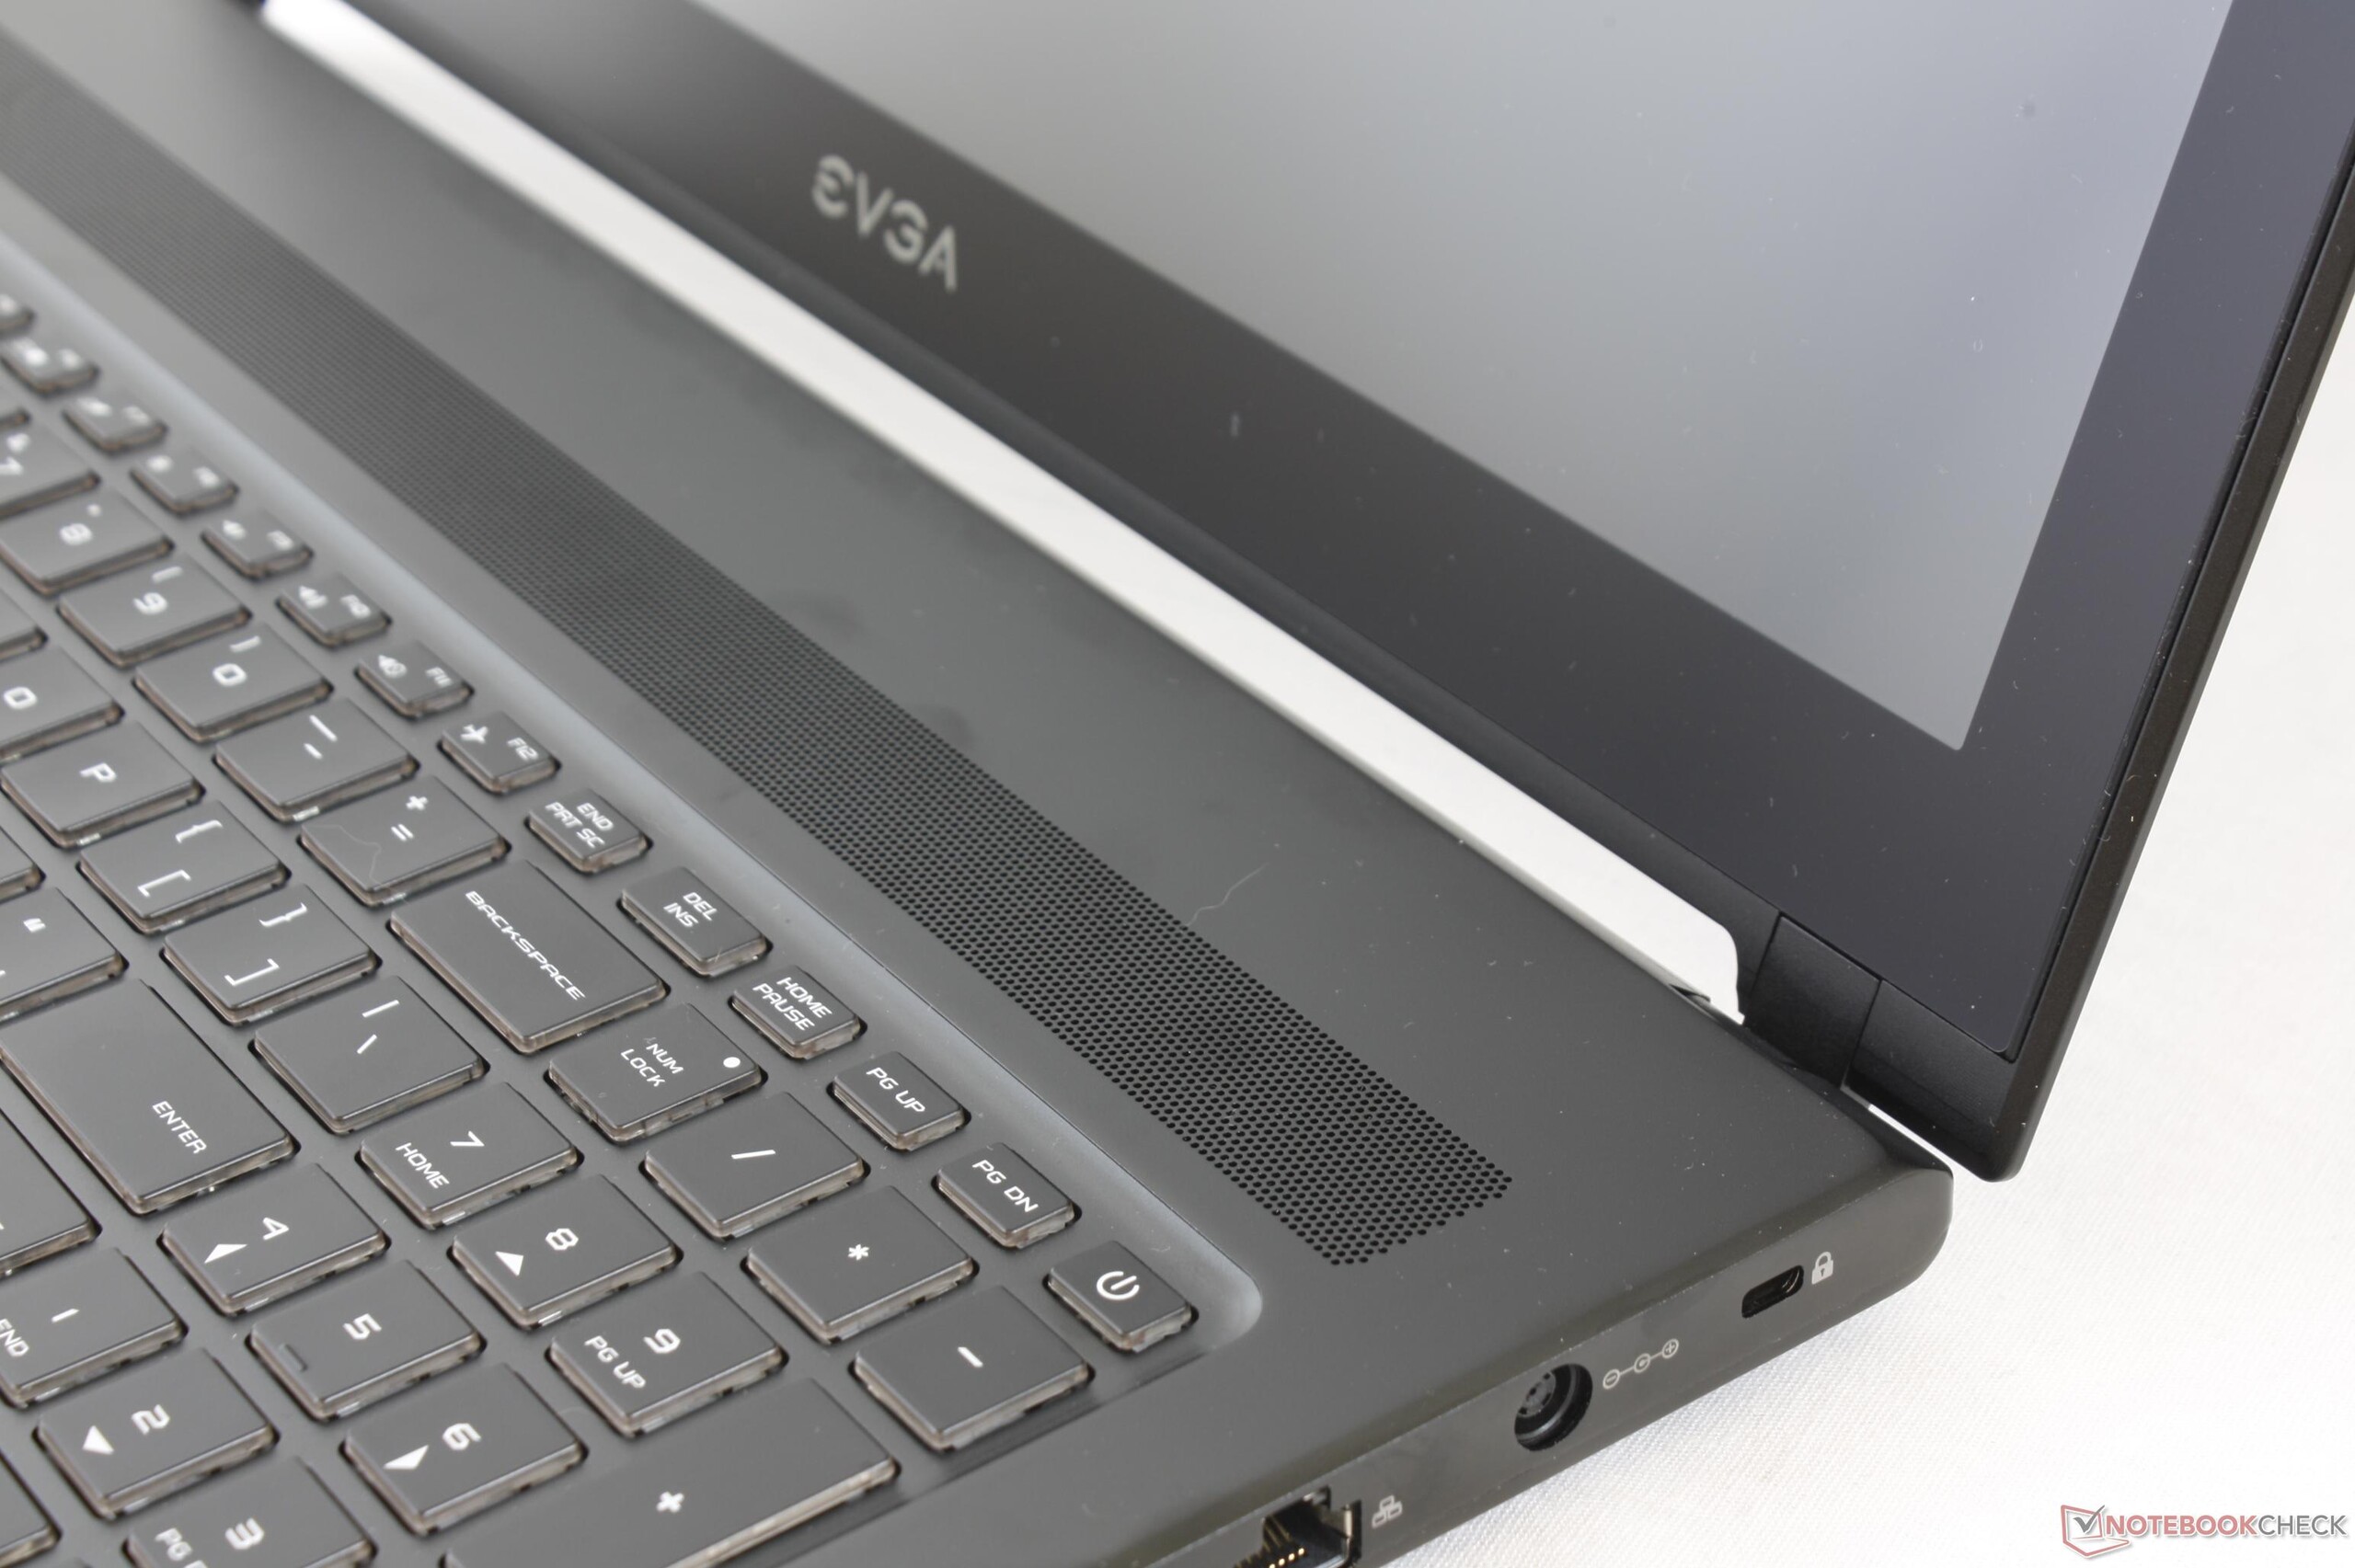
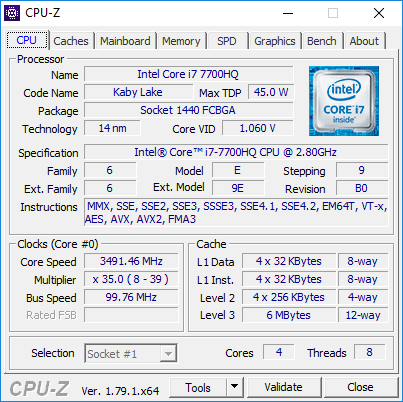
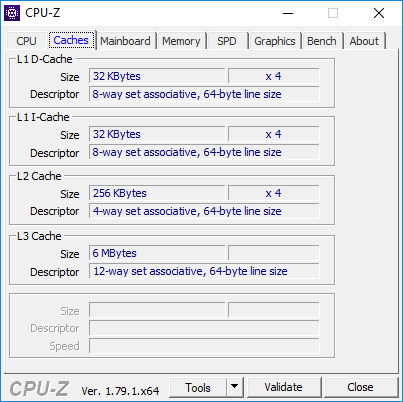
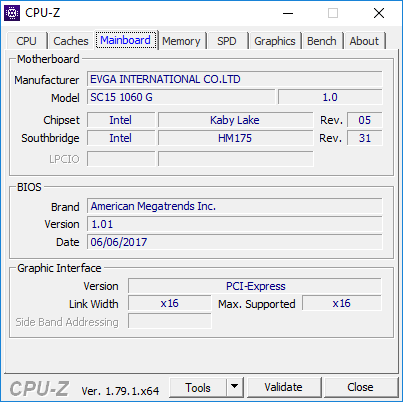
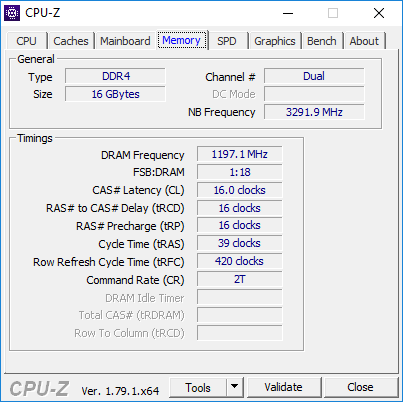
EVGA SC15 (i7-7700HQ, GTX 1060) 笔记本电脑简短评测
| Networking | |
| iperf3 transmit AX12 | |
| MSI GS63VR 7RF-228US | |
| Dell XPS 15 9560 (i7-7700HQ, UHD) | |
| EVGA SC15 | |
| iperf3 receive AX12 | |
| MSI GS63VR 7RF-228US | |
| EVGA SC15 | |
| Dell XPS 15 9560 (i7-7700HQ, UHD) | |
| |||||||||||||||||||||||||
Brightness Distribution: 73 %
Center on Battery: 281.5 cd/m²
Contrast: 1043:1 (Black: 0.27 cd/m²)
ΔE ColorChecker Calman: 3.9 | ∀{0.5-29.43 Ø4.71}
ΔE Greyscale Calman: 3.8 | ∀{0.09-98 Ø4.96}
89.3% sRGB (Argyll 1.6.3 3D)
57.8% AdobeRGB 1998 (Argyll 1.6.3 3D)
63.6% AdobeRGB 1998 (Argyll 3D)
89.6% sRGB (Argyll 3D)
62.3% Display P3 (Argyll 3D)
Gamma: 2.27
CCT: 7322 K
| EVGA SC15 ID: AUO42ED, Name: AU Optronics B156HAN04.2, , 15.6", 1920x1080 | Asus Zephyrus GX501 AUO B156HAN04.2 (AUO42ED), IPS, 15.6", 1920x1080 | Apple MacBook Pro 15 2017 (2.8 GHz, 555) APPA031, IPS, 15.4", 2880x1800 | Gigabyte Aero 15 N156HCA-EA1 (CMN15D7), IPS, 15.6", 1920x1080 | Aorus X5 v6 IPS, 15.6", 2880x1620 | MSI GS63VR 7RF-228US IPS, 15.6", 3840x2160 | |
|---|---|---|---|---|---|---|
| Display | 3% | 34% | 4% | -2% | -21% | |
| Display P3 Coverage (%) | 62.3 | 64.8 4% | 97.9 57% | 65.2 5% | 62.5 0% | 48.21 -23% |
| sRGB Coverage (%) | 89.6 | 91.8 2% | 99.9 11% | 92.5 3% | 86.2 -4% | 72.6 -19% |
| AdobeRGB 1998 Coverage (%) | 63.6 | 65.9 4% | 85.9 35% | 66.5 5% | 62.5 -2% | 49.81 -22% |
| Response Times | 13% | -13% | -4% | 7% | 28% | |
| Response Time Grey 50% / Grey 80% * (ms) | 41.6 ? | 40.4 ? 3% | 48 ? -15% | 42.8 ? -3% | 34 ? 18% | 28 ? 33% |
| Response Time Black / White * (ms) | 30.8 ? | 24 ? 22% | 33.8 ? -10% | 32 ? -4% | 32 ? -4% | 23.6 ? 23% |
| PWM Frequency (Hz) | 119000 ? | 26000 ? | 198.4 | 1351 ? | ||
| Screen | -7% | 41% | -9% | -5% | -47% | |
| Brightness middle (cd/m²) | 281.5 | 328 17% | 545 94% | 320 14% | 280.4 0% | 274.2 -3% |
| Brightness (cd/m²) | 253 | 305 21% | 523 107% | 316 25% | 271 7% | 263 4% |
| Brightness Distribution (%) | 73 | 83 14% | 86 18% | 90 23% | 83 14% | 92 26% |
| Black Level * (cd/m²) | 0.27 | 0.25 7% | 0.44 -63% | 0.36 -33% | 0.249 8% | 0.44 -63% |
| Contrast (:1) | 1043 | 1312 26% | 1239 19% | 889 -15% | 1126 8% | 623 -40% |
| Colorchecker dE 2000 * | 3.9 | 6.02 -54% | 1.6 59% | 4.62 -18% | 4.94 -27% | 8 -105% |
| Colorchecker dE 2000 max. * | 7.1 | 10.14 -43% | 3.8 46% | 9.75 -37% | 8.13 -15% | 14.6 -106% |
| Greyscale dE 2000 * | 3.8 | 6.32 -66% | 1.9 50% | 6 -58% | 5.13 -35% | 9.1 -139% |
| Gamma | 2.27 97% | 2.28 96% | 2.26 97% | 2.46 89% | 2.26 97% | 2.24 98% |
| CCT | 7322 89% | 8194 79% | 6834 95% | 6761 96% | 7433 87% | 5020 129% |
| Color Space (Percent of AdobeRGB 1998) (%) | 57.8 | 60 4% | 60 4% | 55.9 -3% | 45.7 -21% | |
| Color Space (Percent of sRGB) (%) | 89.3 | 92 3% | 92 3% | 85.9 -4% | 72.1 -19% | |
| Total Average (Program / Settings) | 3% /
-2% | 21% /
31% | -3% /
-6% | 0% /
-3% | -13% /
-32% |
* ... smaller is better
Display Response Times
| ↔ Response Time Black to White | ||
|---|---|---|
| 30.8 ms ... rise ↗ and fall ↘ combined | ↗ 17.6 ms rise | 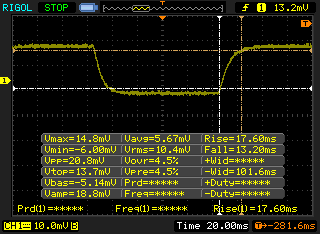 |
| ↘ 13.2 ms fall | ||
| The screen shows slow response rates in our tests and will be unsatisfactory for gamers. In comparison, all tested devices range from 0.1 (minimum) to 240 (maximum) ms. » 83 % of all devices are better. This means that the measured response time is worse than the average of all tested devices (19.8 ms). | ||
| ↔ Response Time 50% Grey to 80% Grey | ||
| 41.6 ms ... rise ↗ and fall ↘ combined | ↗ 21.6 ms rise | 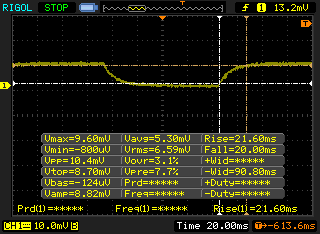 |
| ↘ 20 ms fall | ||
| The screen shows slow response rates in our tests and will be unsatisfactory for gamers. In comparison, all tested devices range from 0.165 (minimum) to 636 (maximum) ms. » 67 % of all devices are better. This means that the measured response time is worse than the average of all tested devices (30.9 ms). | ||
Screen Flickering / PWM (Pulse-Width Modulation)
| Screen flickering / PWM not detected | 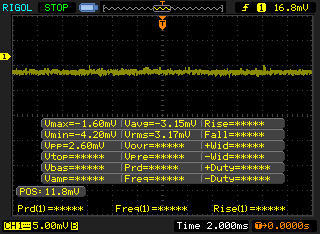 | ||
In comparison: 52 % of all tested devices do not use PWM to dim the display. If PWM was detected, an average of 7744 (minimum: 5 - maximum: 343500) Hz was measured. | |||
| Cinebench R15 | |
| CPU Single 64Bit | |
| Eurocom Tornado F5 | |
| EVGA SC15 | |
| Eurocom Sky MX5 R3 | |
| Samsung Odyssey NP800G5M-X01US | |
| EVGA SC17 GTX 1070 | |
| MSI GP62-2QEi781FD | |
| Acer Aspire Nitro BE VN7-793G-5811 | |
| MSI GE72VR-6RF16H21 | |
| Toshiba Satellite S70-B-106 | |
| CPU Multi 64Bit | |
| Eurocom Tornado F5 | |
| Eurocom Sky MX5 R3 | |
| Samsung Odyssey NP800G5M-X01US | |
| EVGA SC15 | |
| EVGA SC17 GTX 1070 | |
| MSI GP62-2QEi781FD | |
| MSI GE72VR-6RF16H21 | |
| Toshiba Satellite S70-B-106 | |
| Acer Aspire Nitro BE VN7-793G-5811 | |
| Cinebench R10 | |
| Rendering Multiple CPUs 32Bit | |
| Eurocom Tornado F5 | |
| Eurocom Sky MX5 R3 | |
| Samsung Odyssey NP800G5M-X01US | |
| EVGA SC15 | |
| EVGA SC17 GTX 1070 | |
| MSI GE72VR-6RF16H21 | |
| MSI GP62-2QEi781FD | |
| Acer Aspire Nitro BE VN7-793G-5811 | |
| Rendering Single 32Bit | |
| Eurocom Tornado F5 | |
| Eurocom Sky MX5 R3 | |
| EVGA SC15 | |
| Samsung Odyssey NP800G5M-X01US | |
| EVGA SC17 GTX 1070 | |
| Acer Aspire Nitro BE VN7-793G-5811 | |
| MSI GP62-2QEi781FD | |
| MSI GE72VR-6RF16H21 | |
| wPrime 2.10 - 1024m | |
| EVGA SC17 GTX 1070 | |
| Eurocom Sky MX5 R3 | |
| EVGA SC15 | |
| Samsung Odyssey NP800G5M-X01US | |
| MSI GP62-2QEi781FD | |
| Eurocom Tornado F5 | |
* ... smaller is better
| PCMark 8 | |
| Home Score Accelerated v2 | |
| EVGA SC15 | |
| Aorus X5 v6 | |
| Apple MacBook Pro 15 2017 (2.8 GHz, 555) | |
| Work Score Accelerated v2 | |
| EVGA SC15 | |
| Aorus X5 v6 | |
| Apple MacBook Pro 15 2017 (2.8 GHz, 555) | |
| Creative Score Accelerated v2 | |
| Aorus X5 v6 | |
| EVGA SC15 | |
| Apple MacBook Pro 15 2017 (2.8 GHz, 555) | |
| PCMark 8 Home Score Accelerated v2 | 5085 points | |
| PCMark 8 Creative Score Accelerated v2 | 7505 points | |
| PCMark 8 Work Score Accelerated v2 | 5400 points | |
Help | ||
| EVGA SC15 Toshiba NVMe THNSN5256GPU7 | MSI GS63VR 7RF-228US Samsung SM961 MZVKW512HMJP m.2 PCI-e | Aorus X5 v6 Samsung SM951 MZVPV256 m.2 | Dell XPS 15 9560 (i7-7700HQ, UHD) Lite-On CX2-8B512-Q11 | Aorus X7 DT v6 Samsung SM951 MZVPV512HDGL m.2 PCI-e | |
|---|---|---|---|---|---|
| AS SSD | 37% | -56% | 9% | 17% | |
| Copy Game MB/s (MB/s) | 977 | 1082 11% | 1073 10% | 540 -45% | 1134 16% |
| Copy Program MB/s (MB/s) | 442.3 | 401.9 -9% | 351.5 -21% | 411.5 -7% | 502 13% |
| Copy ISO MB/s (MB/s) | 1071 | 1666 56% | 351.1 -67% | 1272 19% | 1482 38% |
| Score Total (Points) | 2474 | 3756 52% | 1630 -34% | 2810 14% | 2695 9% |
| Score Write (Points) | 896 | 1468 64% | 514 -43% | 1022 14% | 665 -26% |
| Score Read (Points) | 1081 | 1549 43% | 756 -30% | 1206 12% | 1353 25% |
| Access Time Write * (ms) | 0.035 | 0.029 17% | 0.025 29% | 0.034 3% | 0.025 29% |
| Access Time Read * (ms) | 0.054 | 0.041 24% | 0.367 -580% | 0.034 37% | 0.047 13% |
| 4K-64 Write (MB/s) | 706 | 1185 68% | 272.5 -61% | 789 12% | 366.9 -48% |
| 4K-64 Read (MB/s) | 822 | 1229 50% | 521 -37% | 962 17% | 1107 35% |
| 4K Write (MB/s) | 95.5 | 127.6 34% | 131.3 37% | 112.2 17% | 149.1 56% |
| 4K Read (MB/s) | 39.13 | 48.01 23% | 44.6 14% | 41.34 6% | 48.93 25% |
| Seq Write (MB/s) | 943 | 1550 64% | 1099 17% | 1207 28% | 1494 58% |
| Seq Read (MB/s) | 2203 | 2719 23% | 1904 -14% | 2026 -8% | 1971 -11% |
* ... smaller is better

| 3DMark | |
| 1920x1080 Fire Strike Graphics | |
| Eurocom Sky X7E2 | |
| Eurocom Sky MX5 R3 | |
| Asus Zephyrus GX501 | |
| Nvidia GeForce GTX 1060 Founders Edition 6 GB | |
| EVGA SC15 | |
| Lenovo Legion Y720 80VR002XGE | |
| Asus Strix GL502VT-DS74 | |
| HP Pavilion 15 Power 1GK62AV | |
| Asus Zenbook UX510UW-CN044T | |
| Fire Strike Extreme Graphics | |
| Eurocom Sky X7E2 | |
| Eurocom Sky MX5 R3 | |
| EVGA SC15 | |
| Asus Strix GL502VT-DS74 | |
| HP Pavilion 15 Power 1GK62AV | |
| Asus Zenbook UX510UW-CN044T | |
| 3840x2160 Fire Strike Ultra Graphics | |
| Eurocom Sky X7E2 | |
| Eurocom Sky MX5 R3 | |
| Asus Zephyrus GX501 | |
| Nvidia GeForce GTX 1060 Founders Edition 6 GB | |
| EVGA SC15 | |
| HP Pavilion 15 Power 1GK62AV | |
| 3DMark 11 | |
| 1280x720 Performance GPU | |
| Eurocom Sky X7E2 | |
| Asus Zephyrus GX501 | |
| Eurocom Sky MX5 R3 | |
| Nvidia GeForce GTX 1060 Founders Edition 6 GB | |
| EVGA SC15 | |
| Lenovo Legion Y720 80VR002XGE | |
| Asus Strix GL502VT-DS74 | |
| HP Pavilion 15 Power 1GK62AV | |
| Asus Zenbook UX510UW-CN044T | |
| 1280x720 Performance Combined | |
| Nvidia GeForce GTX 1060 Founders Edition 6 GB | |
| Eurocom Sky X7E2 | |
| Eurocom Sky MX5 R3 | |
| Asus Zephyrus GX501 | |
| EVGA SC15 | |
| Asus Strix GL502VT-DS74 | |
| HP Pavilion 15 Power 1GK62AV | |
| Asus Zenbook UX510UW-CN044T | |
| 3DMark 11 Performance | 13148 points | |
| 3DMark Ice Storm Standard Score | 110194 points | |
| 3DMark Cloud Gate Standard Score | 24201 points | |
| 3DMark Fire Strike Score | 9750 points | |
| 3DMark Fire Strike Extreme Score | 5165 points | |
Help | ||
| low | med. | high | ultra | |
|---|---|---|---|---|
| BioShock Infinite (2013) | 110 | |||
| Metro: Last Light (2013) | 82.7 | |||
| Thief (2014) | 79 | |||
| The Witcher 3 (2015) | 66 | 39.6 | ||
| Batman: Arkham Knight (2015) | 89 | 62 | ||
| Metal Gear Solid V (2015) | 60 | |||
| Dota 2 Reborn (2015) | 117.9 | |||
| Fallout 4 (2015) | 70.8 | |||
| Rise of the Tomb Raider (2016) | 66.8 | |||
| Ashes of the Singularity (2016) | 63.7 | 59.2 | ||
| Doom (2016) | 98.4 | |||
| Overwatch (2016) | 103.9 | |||
| Mafia 3 (2016) | 41 | |||
| Prey (2017) | 110.3 |
| Rise of the Tomb Raider - 1920x1080 Very High Preset AA:FX AF:16x | |
| EVGA SC17 GTX 1070 | |
| Nvidia GeForce GTX 1060 Founders Edition 6 GB | |
| Nvidia GeForce GTX 1060 Founders Edition 6 GB | |
| EVGA SC15 | |
| Aorus x3 Plus v7 | |
| EVGA SC17 | |
| Asus Strix GL502VT-DS74 | |
| HP Omen 15-ax213ng | |
| HP Pavilion 17 FHD V3A33AV | |
Noise level
| Idle |
| 31.9 / 32 / 32 dB(A) |
| Load |
| 36.5 / 53.4 dB(A) |
 | ||
30 dB silent 40 dB(A) audible 50 dB(A) loud |
||
min: | ||
| EVGA SC15 GeForce GTX 1060 Mobile, i7-7700HQ, Toshiba NVMe THNSN5256GPU7 | Asus Zephyrus GX501 GeForce GTX 1080 Max-Q, i7-7700HQ, Samsung SSD SM961 1TB M.2 MZVKW1T0HMLH | Apple MacBook Pro 15 2017 (2.8 GHz, 555) Radeon Pro 555, i7-7700HQ, Apple SSD SM0256L | MSI GS63VR 7RF-228US GeForce GTX 1060 Mobile, i7-7700HQ, Samsung SM961 MZVKW512HMJP m.2 PCI-e | Gigabyte Aero 15 GeForce GTX 1060 Mobile, i7-7700HQ, Lite-On CX2-8B512-Q11 | Aorus X5 v6 GeForce GTX 1070 Mobile, 6820HK, Samsung SM951 MZVPV256 m.2 | |
|---|---|---|---|---|---|---|
| Noise | -2% | 1% | -3% | -4% | -14% | |
| off / environment * (dB) | 28 | 31 -11% | 30.9 -10% | 28.8 -3% | 31 -11% | 29.3 -5% |
| Idle Minimum * (dB) | 31.9 | 32 -0% | 31.3 2% | 33.1 -4% | 32 -0% | 33.4 -5% |
| Idle Average * (dB) | 32 | 33 -3% | 31.3 2% | 33.1 -3% | 33 -3% | 35.2 -10% |
| Idle Maximum * (dB) | 32 | 34 -6% | 31.7 1% | 34 -6% | 34 -6% | 35.2 -10% |
| Load Average * (dB) | 36.5 | 39 -7% | 39.7 -9% | 37.2 -2% | 39 -7% | 53.3 -46% |
| Witcher 3 ultra * (dB) | 40.3 | 42 -4% | 35.5 12% | 46.1 -14% | 43 -7% | |
| Load Maximum * (dB) | 53.4 | 46 14% | 48.6 9% | 47.1 12% | 50 6% | 57.6 -8% |
* ... smaller is better
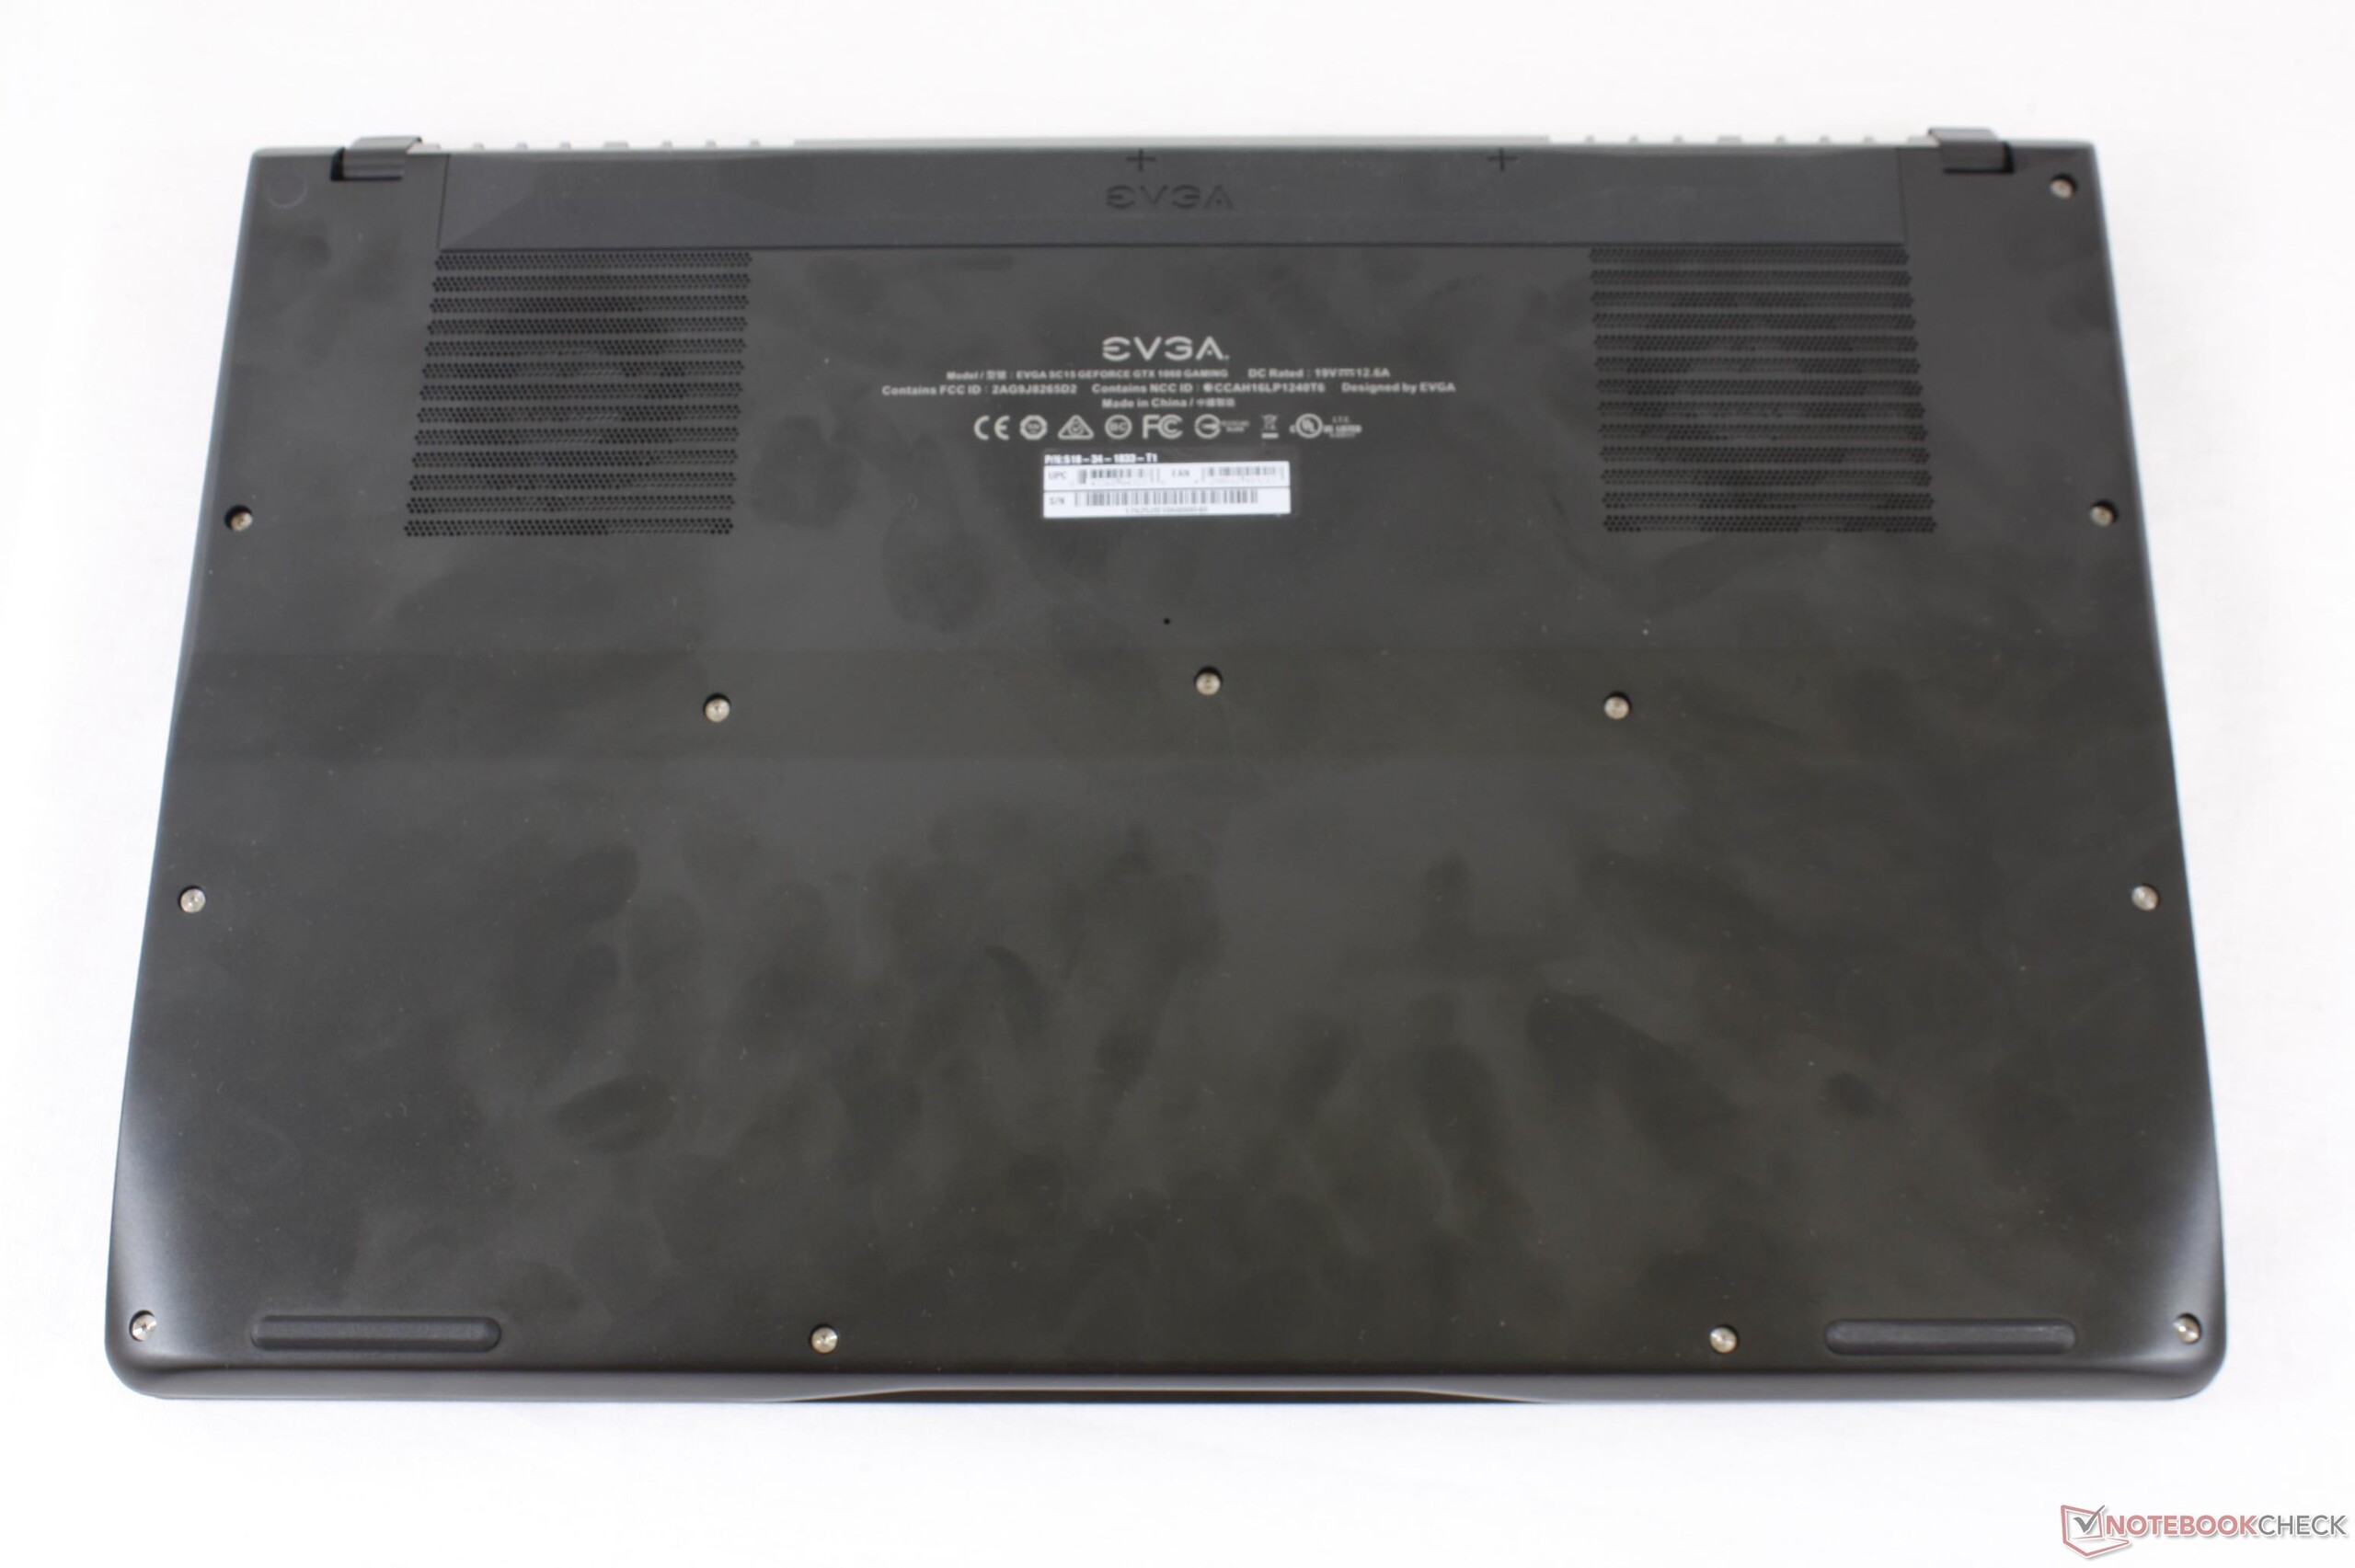
(-) The maximum temperature on the upper side is 49.2 °C / 121 F, compared to the average of 40.4 °C / 105 F, ranging from 21.2 to 68.8 °C for the class Gaming.
(-) The bottom heats up to a maximum of 45.2 °C / 113 F, compared to the average of 43.2 °C / 110 F
(+) In idle usage, the average temperature for the upper side is 26.8 °C / 80 F, compared to the device average of 33.9 °C / 93 F.
(±) Playing The Witcher 3, the average temperature for the upper side is 32 °C / 90 F, compared to the device average of 33.9 °C / 93 F.
(+) The palmrests and touchpad are cooler than skin temperature with a maximum of 29.8 °C / 85.6 F and are therefore cool to the touch.
(±) The average temperature of the palmrest area of similar devices was 28.8 °C / 83.8 F (-1 °C / -1.8 F).
EVGA SC15 audio analysis
(-) | not very loud speakers (61.2 dB)
Bass 100 - 315 Hz
(-) | nearly no bass - on average 15.8% lower than median
(±) | linearity of bass is average (7.3% delta to prev. frequency)
Mids 400 - 2000 Hz
(±) | higher mids - on average 6.8% higher than median
(±) | linearity of mids is average (14.5% delta to prev. frequency)
Highs 2 - 16 kHz
(+) | balanced highs - only 2.5% away from median
(±) | linearity of highs is average (8% delta to prev. frequency)
Overall 100 - 16.000 Hz
(-) | overall sound is not linear (34.7% difference to median)
Compared to same class
» 99% of all tested devices in this class were better, 1% similar, 1% worse
» The best had a delta of 6%, average was 18%, worst was 132%
Compared to all devices tested
» 93% of all tested devices were better, 1% similar, 6% worse
» The best had a delta of 4%, average was 23%, worst was 134%
Apple MacBook 12 (Early 2016) 1.1 GHz audio analysis
(+) | speakers can play relatively loud (83.6 dB)
Bass 100 - 315 Hz
(±) | reduced bass - on average 11.3% lower than median
(±) | linearity of bass is average (14.2% delta to prev. frequency)
Mids 400 - 2000 Hz
(+) | balanced mids - only 2.4% away from median
(+) | mids are linear (5.5% delta to prev. frequency)
Highs 2 - 16 kHz
(+) | balanced highs - only 2% away from median
(+) | highs are linear (4.5% delta to prev. frequency)
Overall 100 - 16.000 Hz
(+) | overall sound is linear (10.2% difference to median)
Compared to same class
» 7% of all tested devices in this class were better, 2% similar, 90% worse
» The best had a delta of 5%, average was 18%, worst was 53%
Compared to all devices tested
» 5% of all tested devices were better, 1% similar, 94% worse
» The best had a delta of 4%, average was 23%, worst was 134%
| Off / Standby | |
| Idle | |
| Load |
|
Key:
min: | |
| EVGA SC15 i7-7700HQ, GeForce GTX 1060 Mobile, Toshiba NVMe THNSN5256GPU7, , 1920x1080, 15.6" | Asus Zephyrus GX501 i7-7700HQ, GeForce GTX 1080 Max-Q, Samsung SSD SM961 1TB M.2 MZVKW1T0HMLH, IPS, 1920x1080, 15.6" | Apple MacBook Pro 15 2017 (2.8 GHz, 555) i7-7700HQ, Radeon Pro 555, Apple SSD SM0256L, IPS, 2880x1800, 15.4" | Gigabyte Aero 15 i7-7700HQ, GeForce GTX 1060 Mobile, Lite-On CX2-8B512-Q11, IPS, 1920x1080, 15.6" | Aorus X5 v6 6820HK, GeForce GTX 1070 Mobile, Samsung SM951 MZVPV256 m.2, IPS, 2880x1620, 15.6" | |
|---|---|---|---|---|---|
| Power Consumption | -3% | 46% | 21% | -33% | |
| Idle Minimum * (Watt) | 25.8 | 18 30% | 3.4 87% | 12 53% | 25 3% |
| Idle Average * (Watt) | 26.6 | 23 14% | 13.9 48% | 15 44% | 28.9 -9% |
| Idle Maximum * (Watt) | 26.7 | 31 -16% | 17.6 34% | 20 25% | 30.1 -13% |
| Load Average * (Watt) | 80.3 | 79 2% | 71.1 11% | 82 -2% | 167.3 -108% |
| Witcher 3 ultra * (Watt) | 121.2 | 148 -22% | 57.9 52% | 111 8% | |
| Load Maximum * (Watt) | 159.3 | 196 -23% | 88.5 44% | 161 -1% | 222.6 -40% |
* ... smaller is better
| EVGA SC15 i7-7700HQ, GeForce GTX 1060 Mobile, 62 Wh | Asus Zephyrus GX501 i7-7700HQ, GeForce GTX 1080 Max-Q, 50 Wh | Apple MacBook Pro 15 2017 (2.8 GHz, 555) i7-7700HQ, Radeon Pro 555, 76 Wh | MSI GS63VR 7RF-228US i7-7700HQ, GeForce GTX 1060 Mobile, 65 Wh | Gigabyte Aero 15 i7-7700HQ, GeForce GTX 1060 Mobile, 94.24 Wh | Aorus X5 v6 6820HK, GeForce GTX 1070 Mobile, 94.24 Wh | |
|---|---|---|---|---|---|---|
| Battery runtime | -29% | 127% | 35% | 124% | 14% | |
| Reader / Idle (h) | 3.7 | 3.1 -16% | 6.4 73% | 10.6 186% | 4.2 14% | |
| WiFi v1.3 (h) | 2.8 | 2.2 -21% | 10.7 282% | 3.9 39% | 7 150% | 3 7% |
| Load (h) | 1.4 | 0.7 -50% | 1 -29% | 1.3 -7% | 1.9 36% | 1.7 21% |
| Witcher 3 ultra (h) | 1.5 |
Pros
Cons
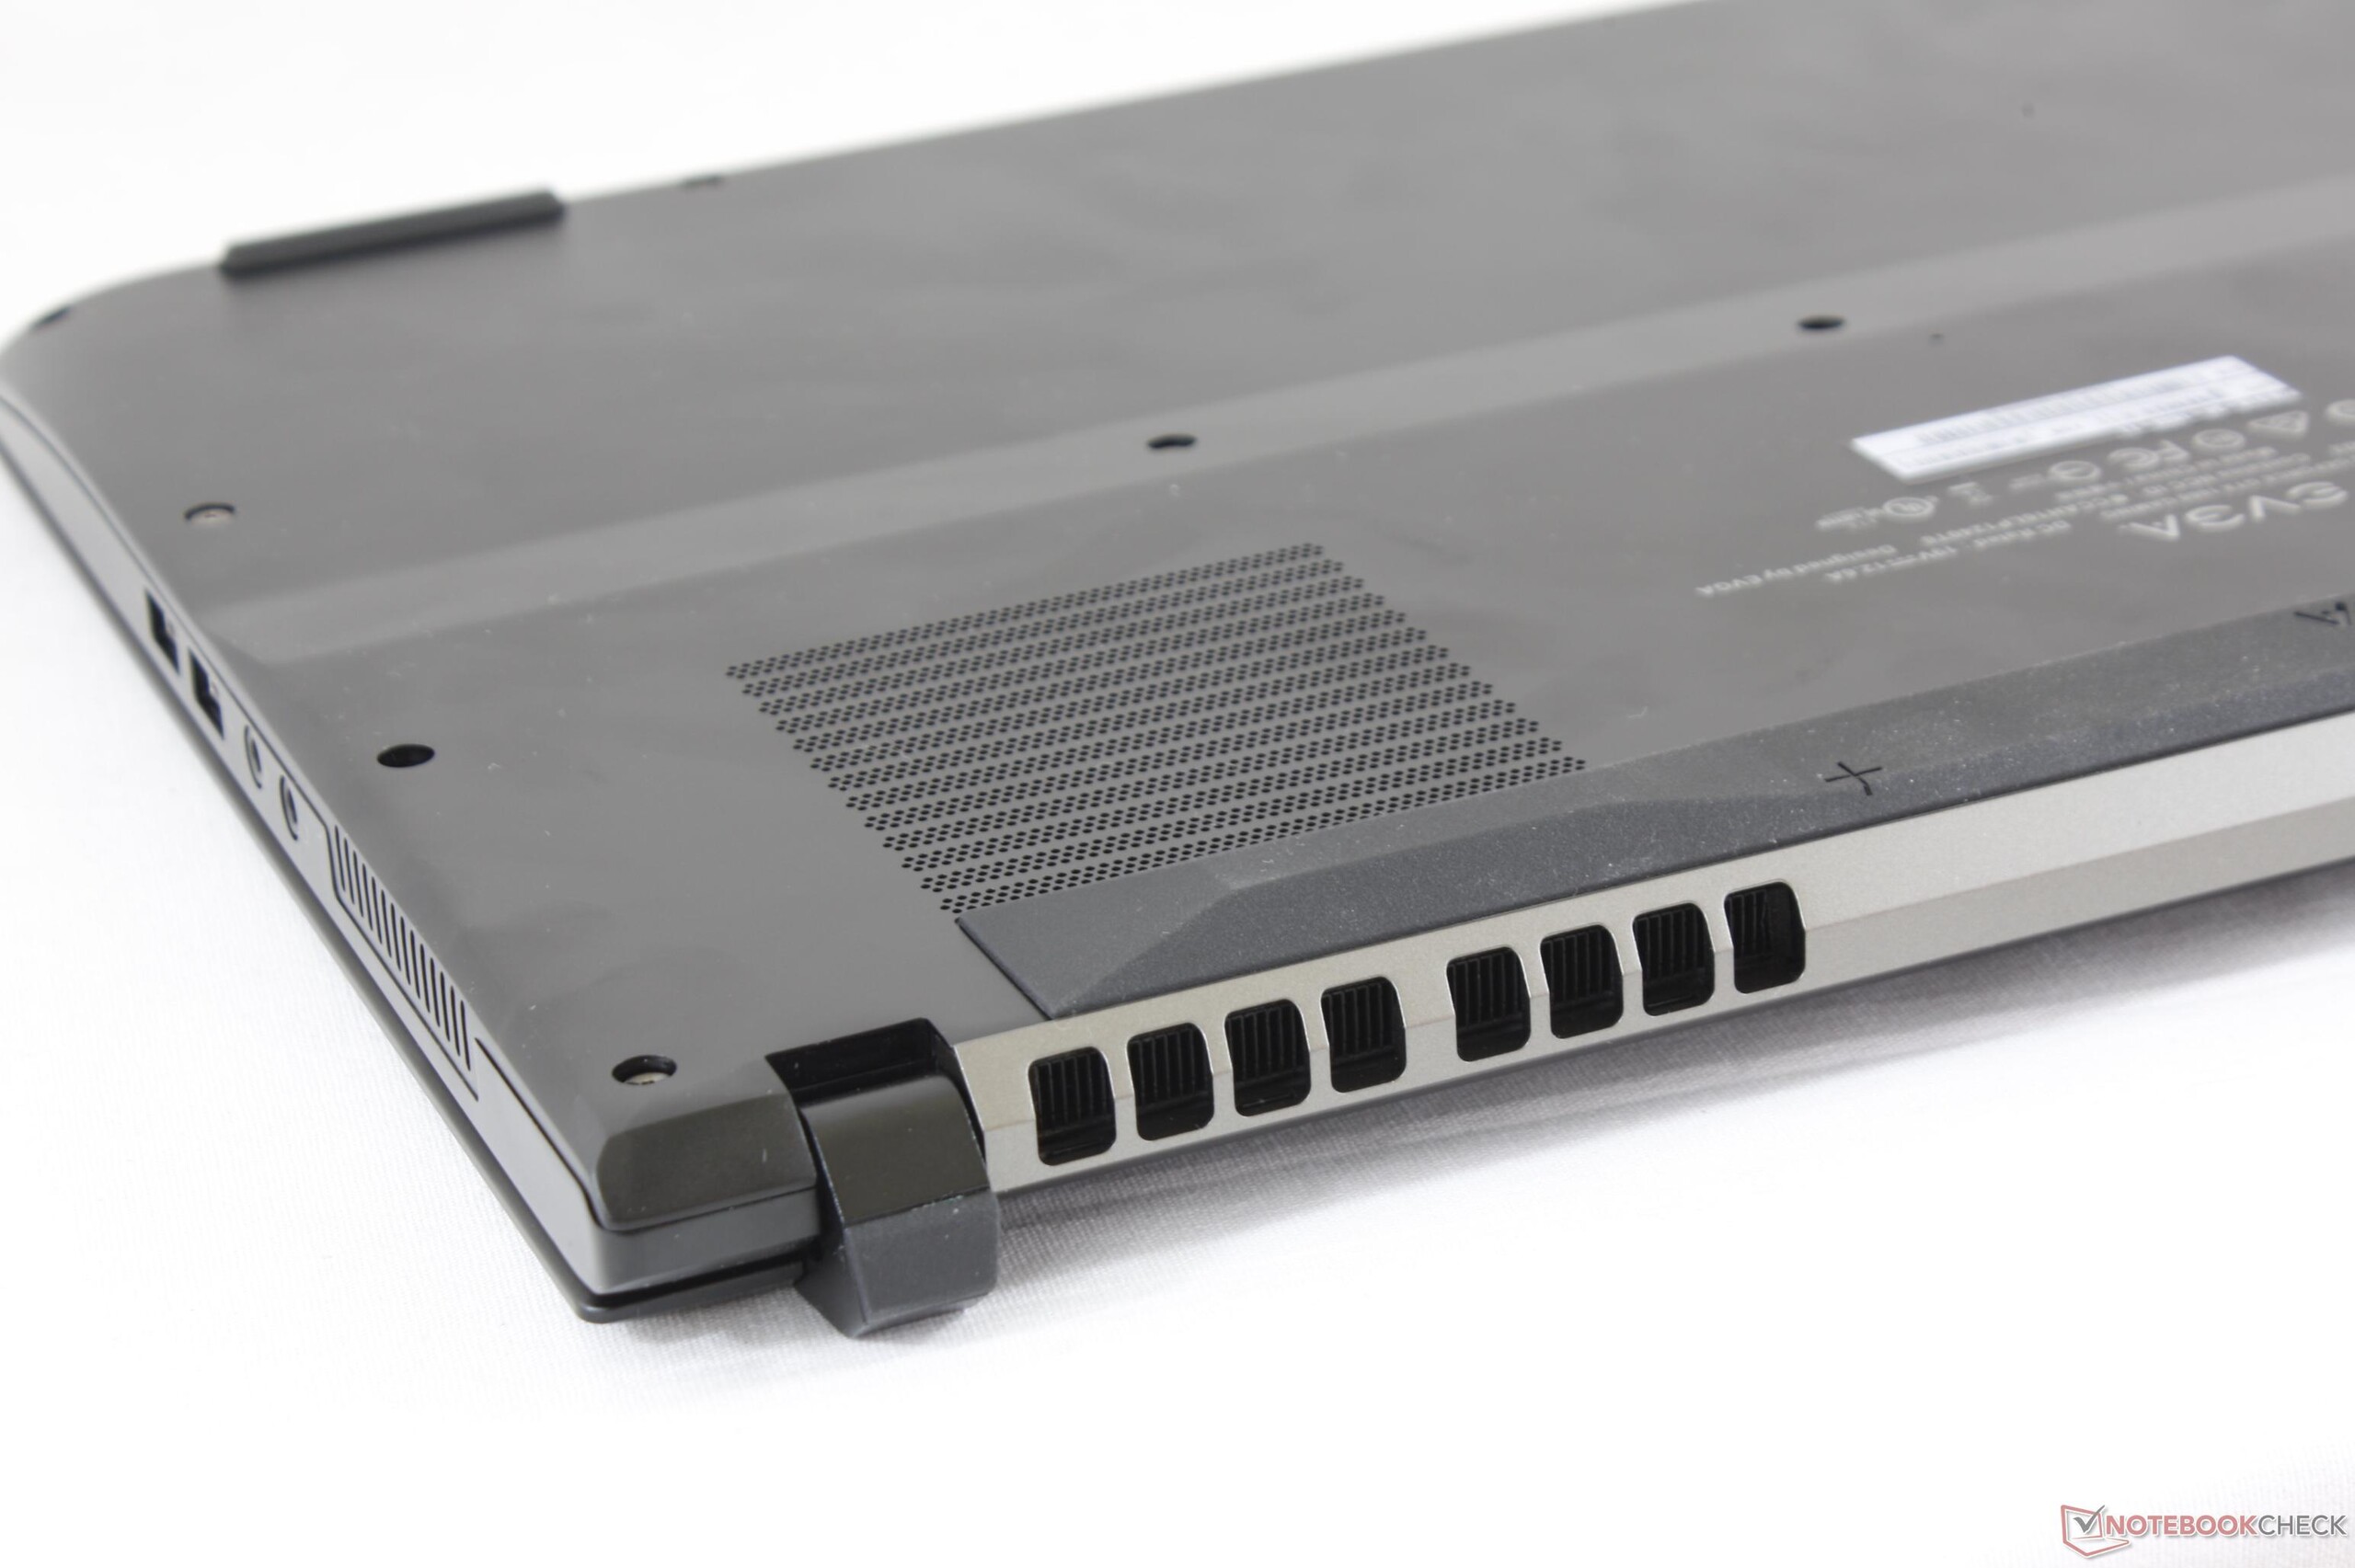
SC15满足了我们对一个平衡的GTX 1060 游戏本的所有期望。机身外壳质量很高,风扇声音不是很嘈杂,中央处理器性能表现稳定,G-Sync 和120 Hz 刷新率都合乎标准。那些正在考虑 GS63VR, Omen 15, Gigabyte P55, Asus GL552/FX502, Aorus X5, 或者其他15英寸游戏本的用户,将会发现EVGA不仅仅只是表面上的更加坚固耐用,而且也更加安静低温。如果续航时间,温度和噪声水平是第一考虑要素,那么大概没有更好的其他选择了。
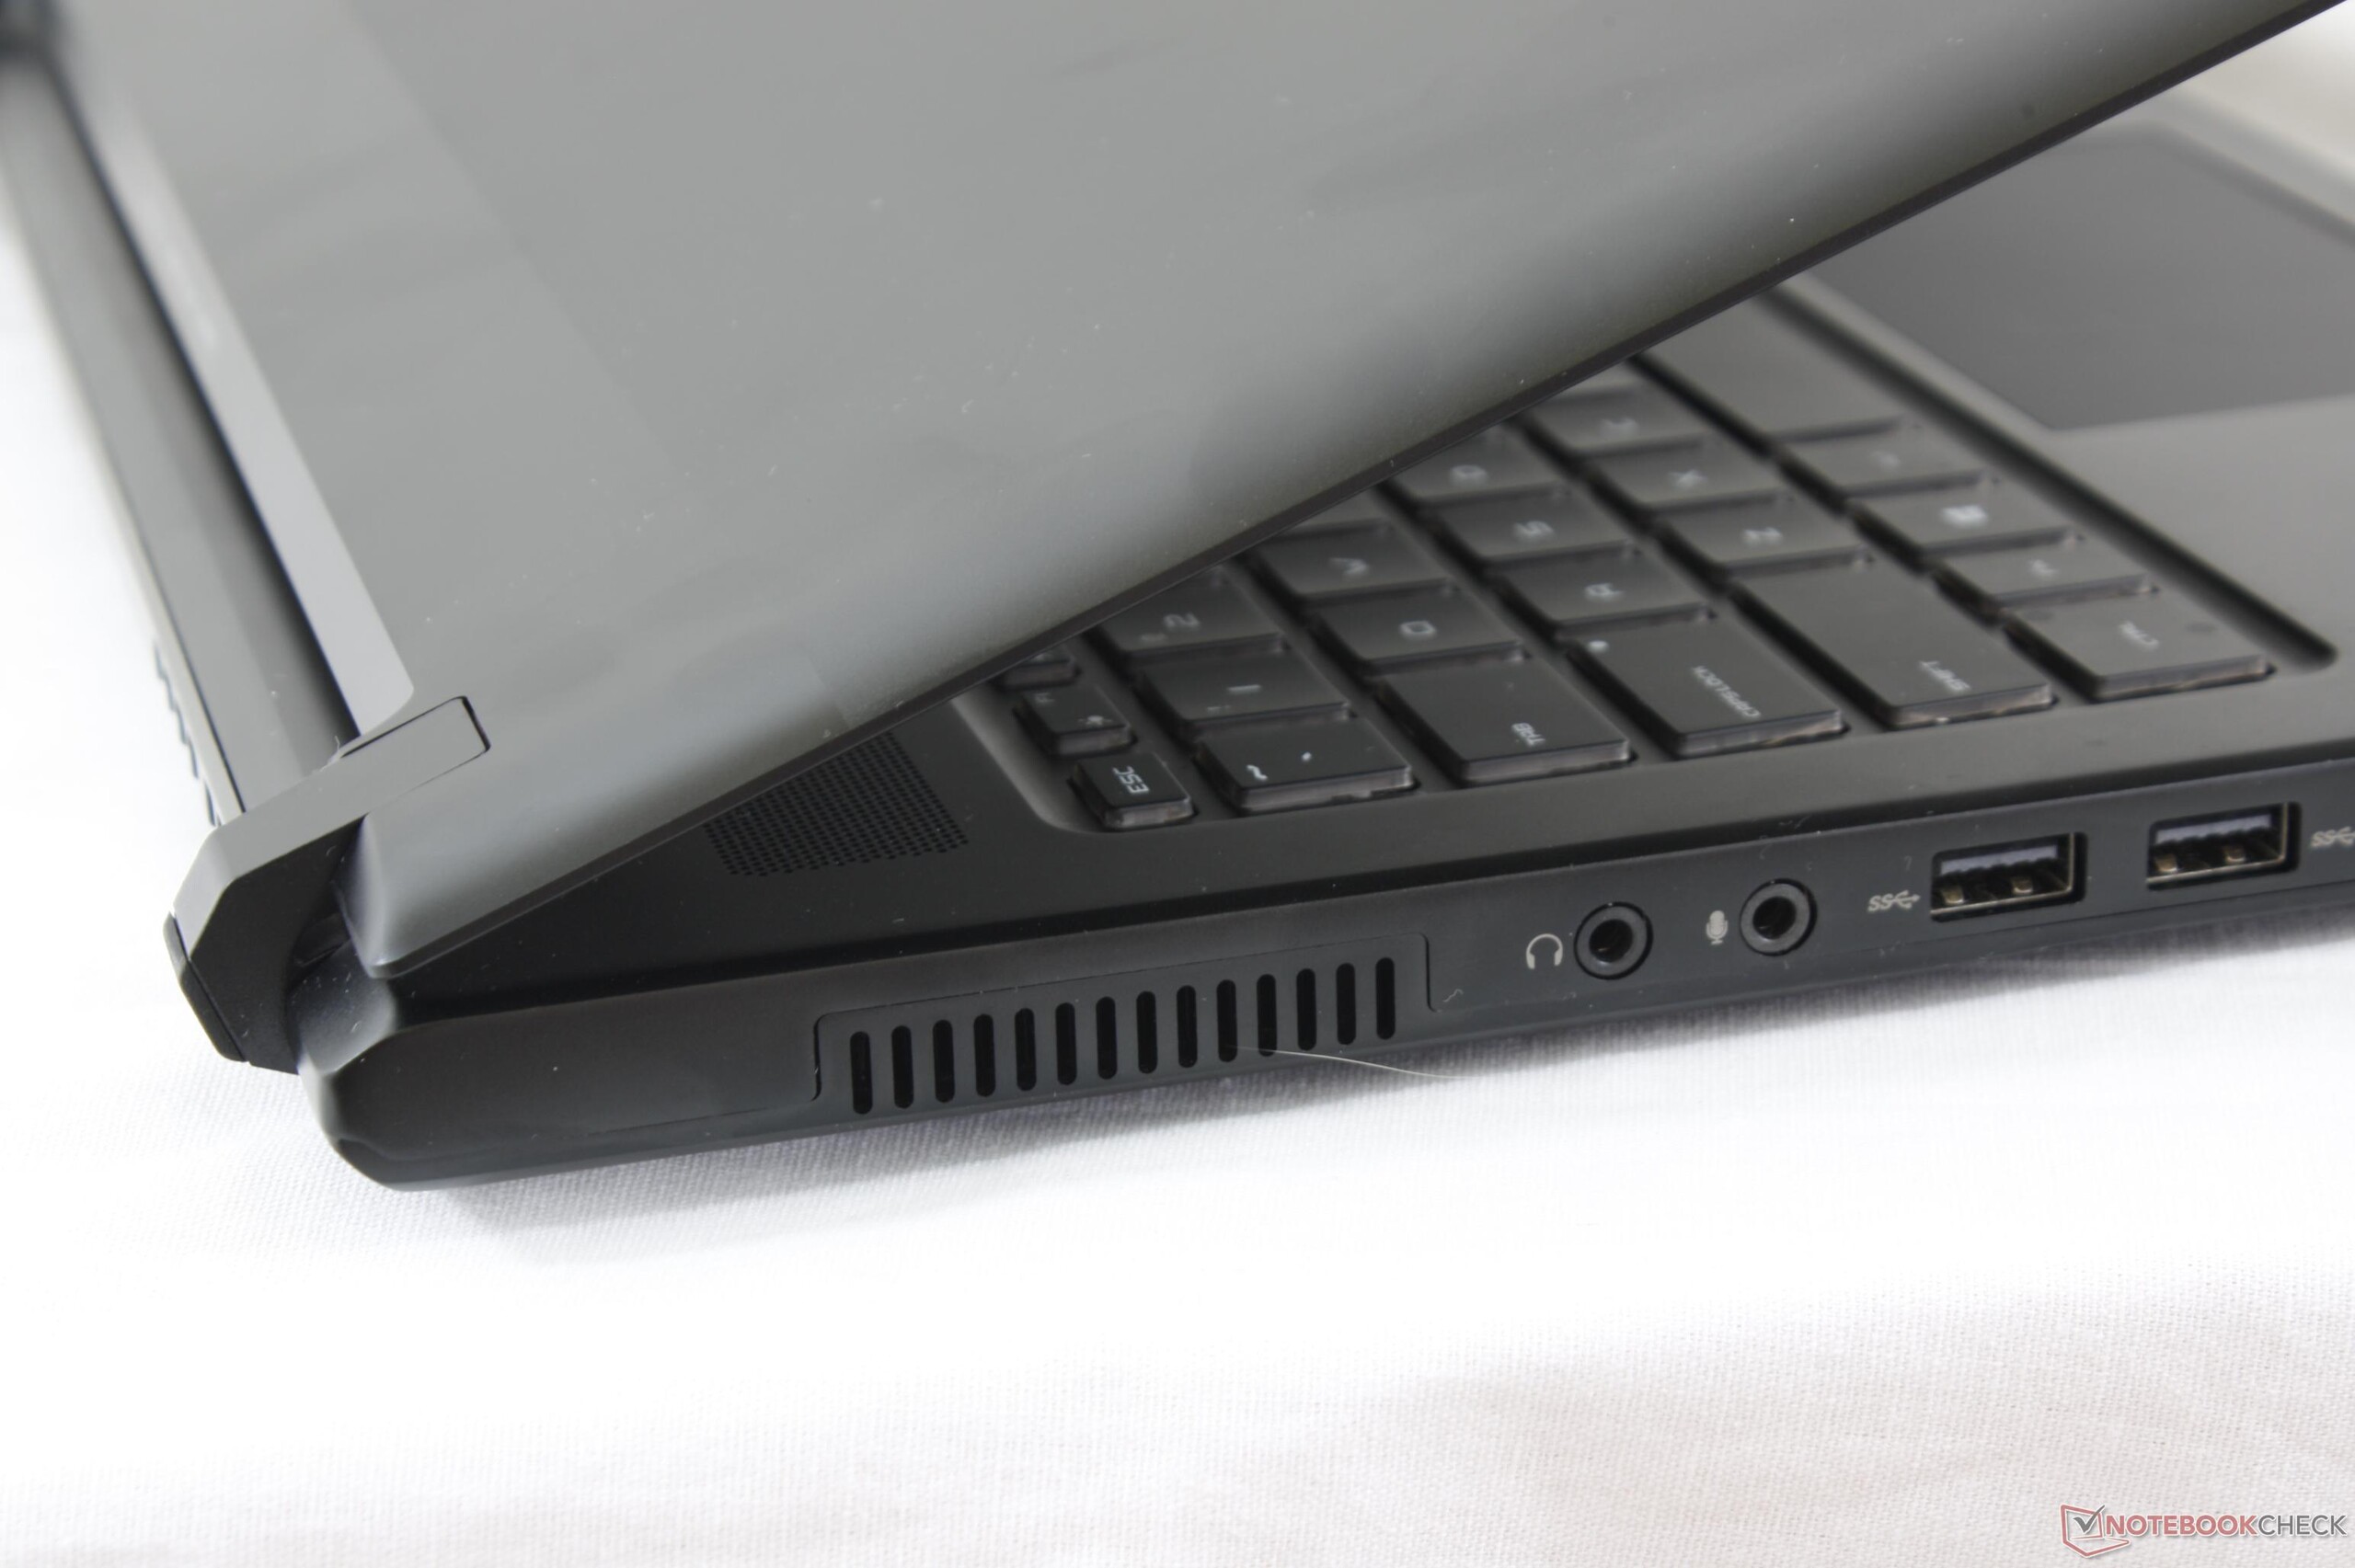
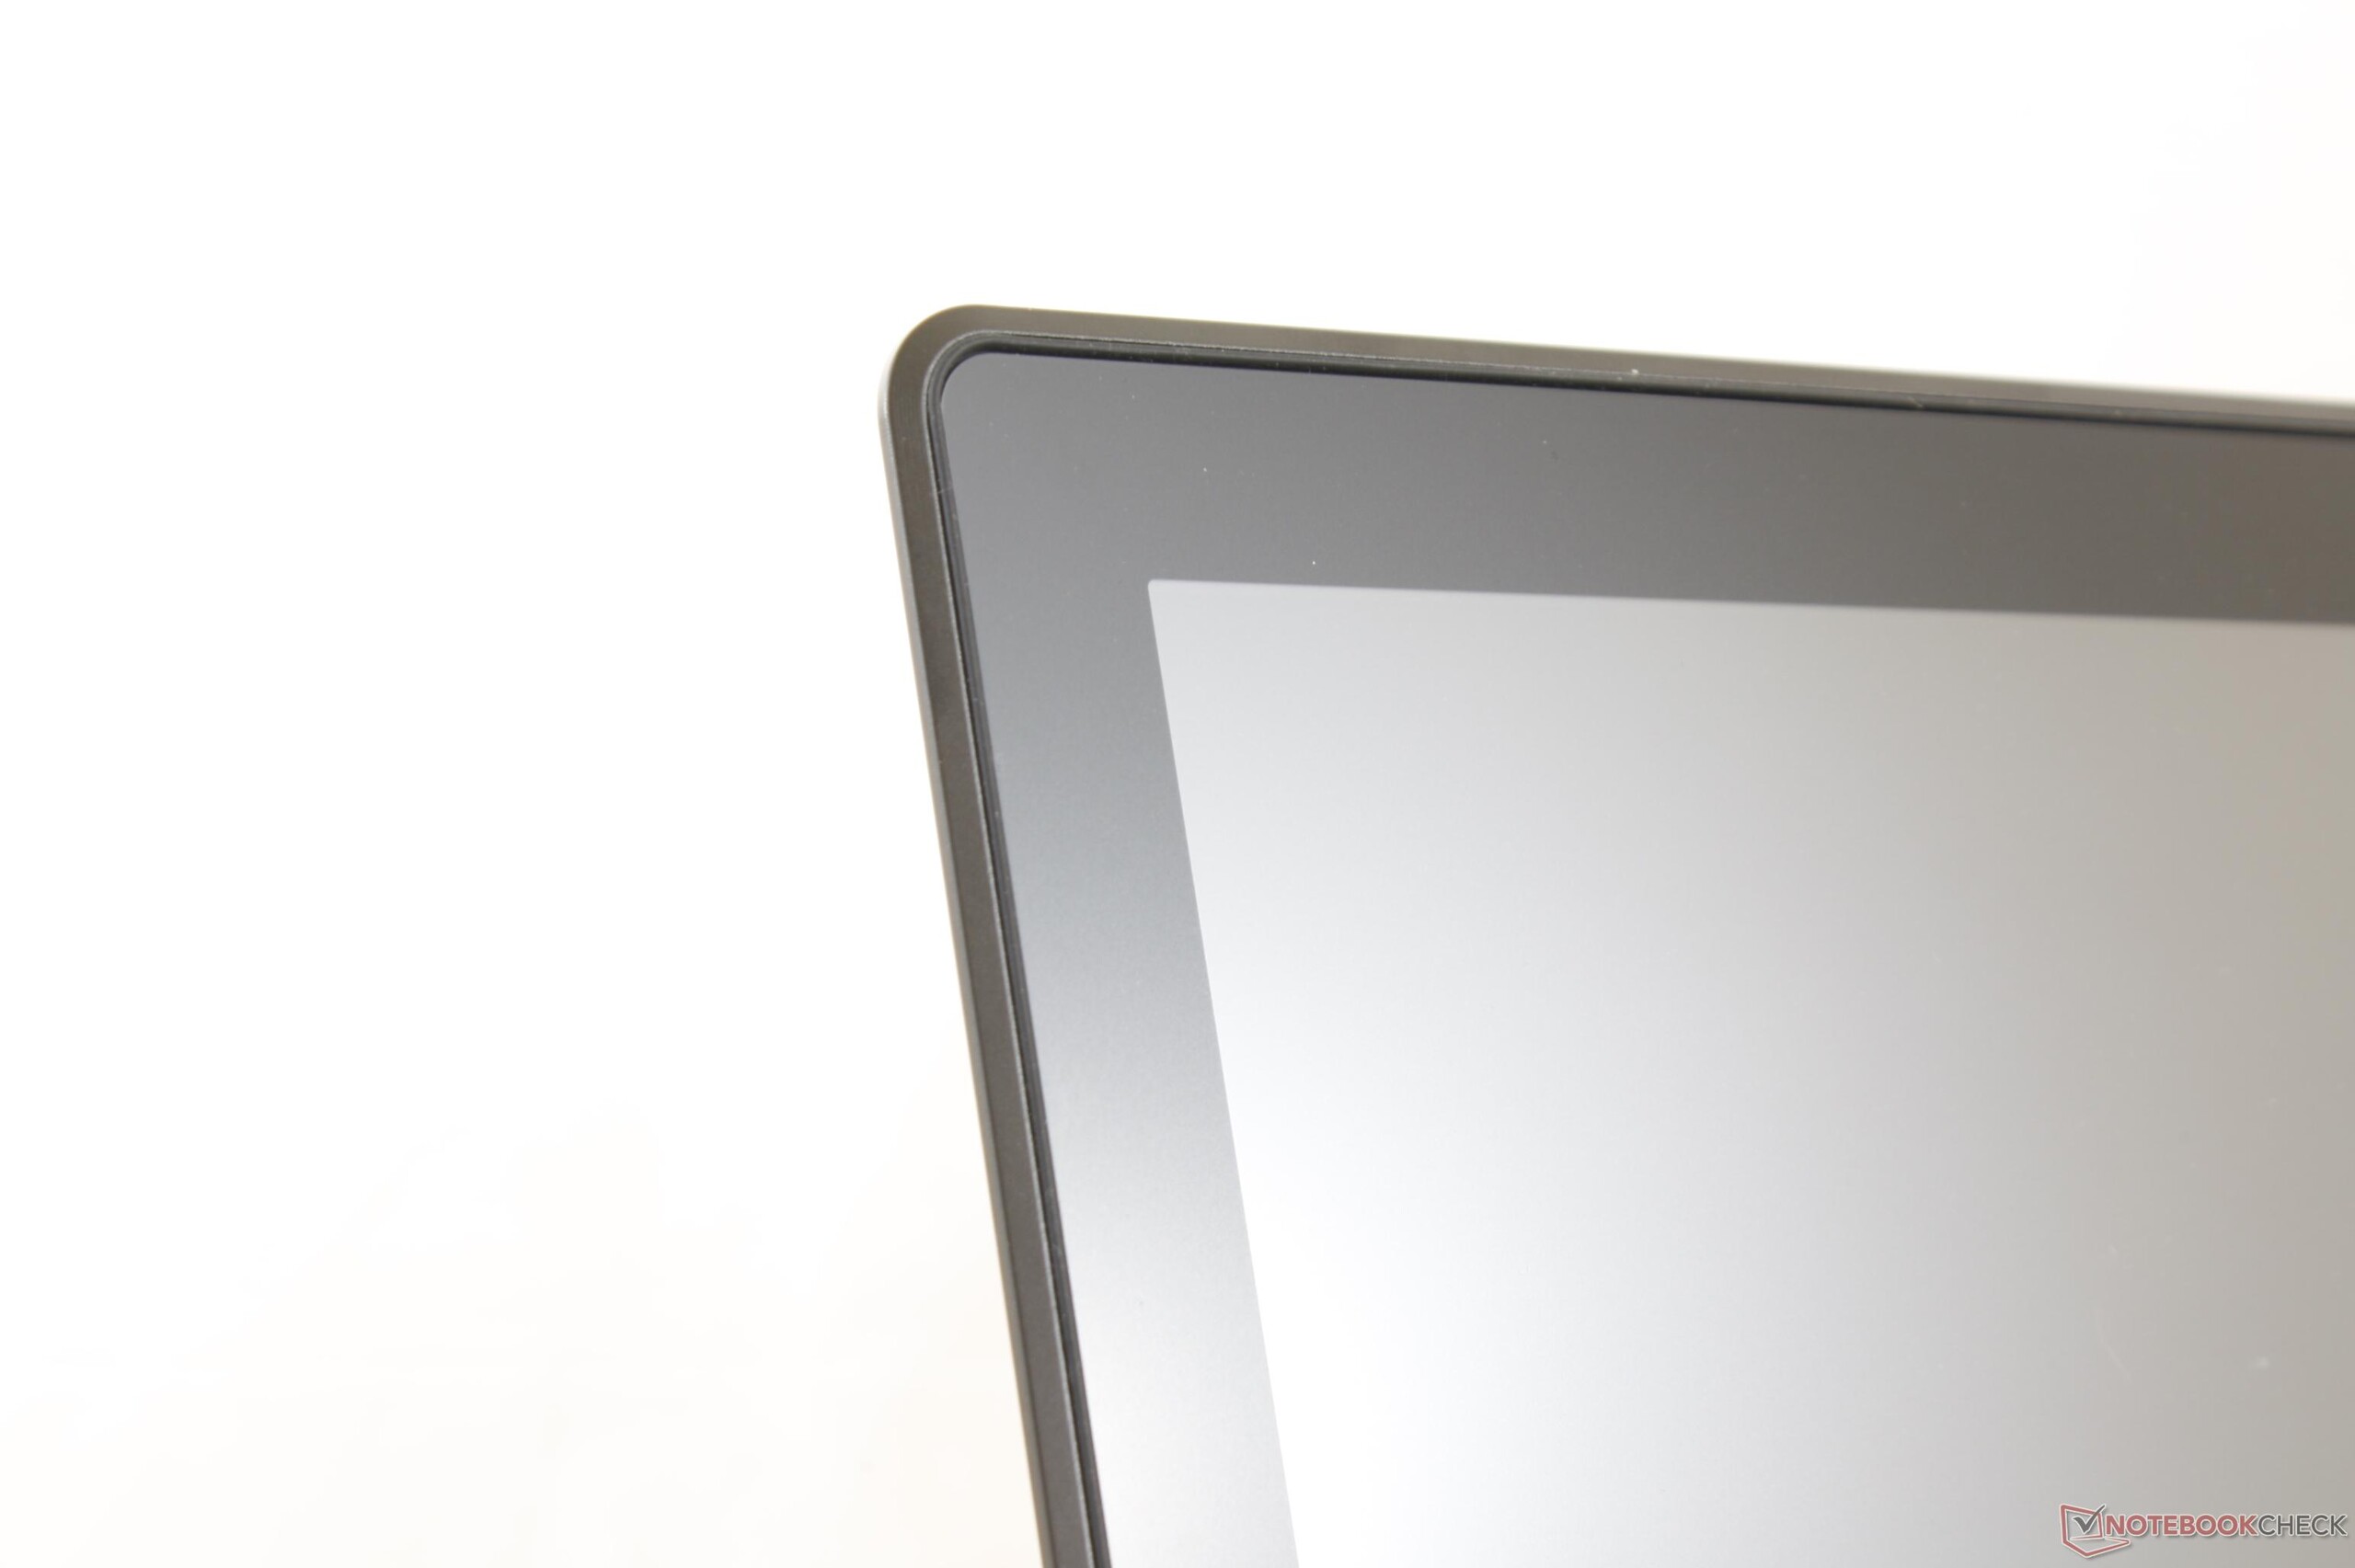
SC15也有一些缺点,如果把它作为一个15英寸GTX 1060游戏笔记本电脑来看的话,也许最大的缺点是:缺少任何其他显示屏幕可选方案。微星和Aorus提供了5 毫秒和3 毫秒的响应时间的面板,与EVGA上的18 毫秒(黑白)相比,显着减少了重影。较高的120 Hz的刷新率是不错,但是它的优点被较低的响应速度拖累,并且需要更强大的图形处理器来达到这样高的帧速率,进而来实现快速输入的延迟。一个120 Hz / 5 ms的屏幕兴许会是SC15最好的选择,即便是TN面板损失了IPS应该有的宽视角。
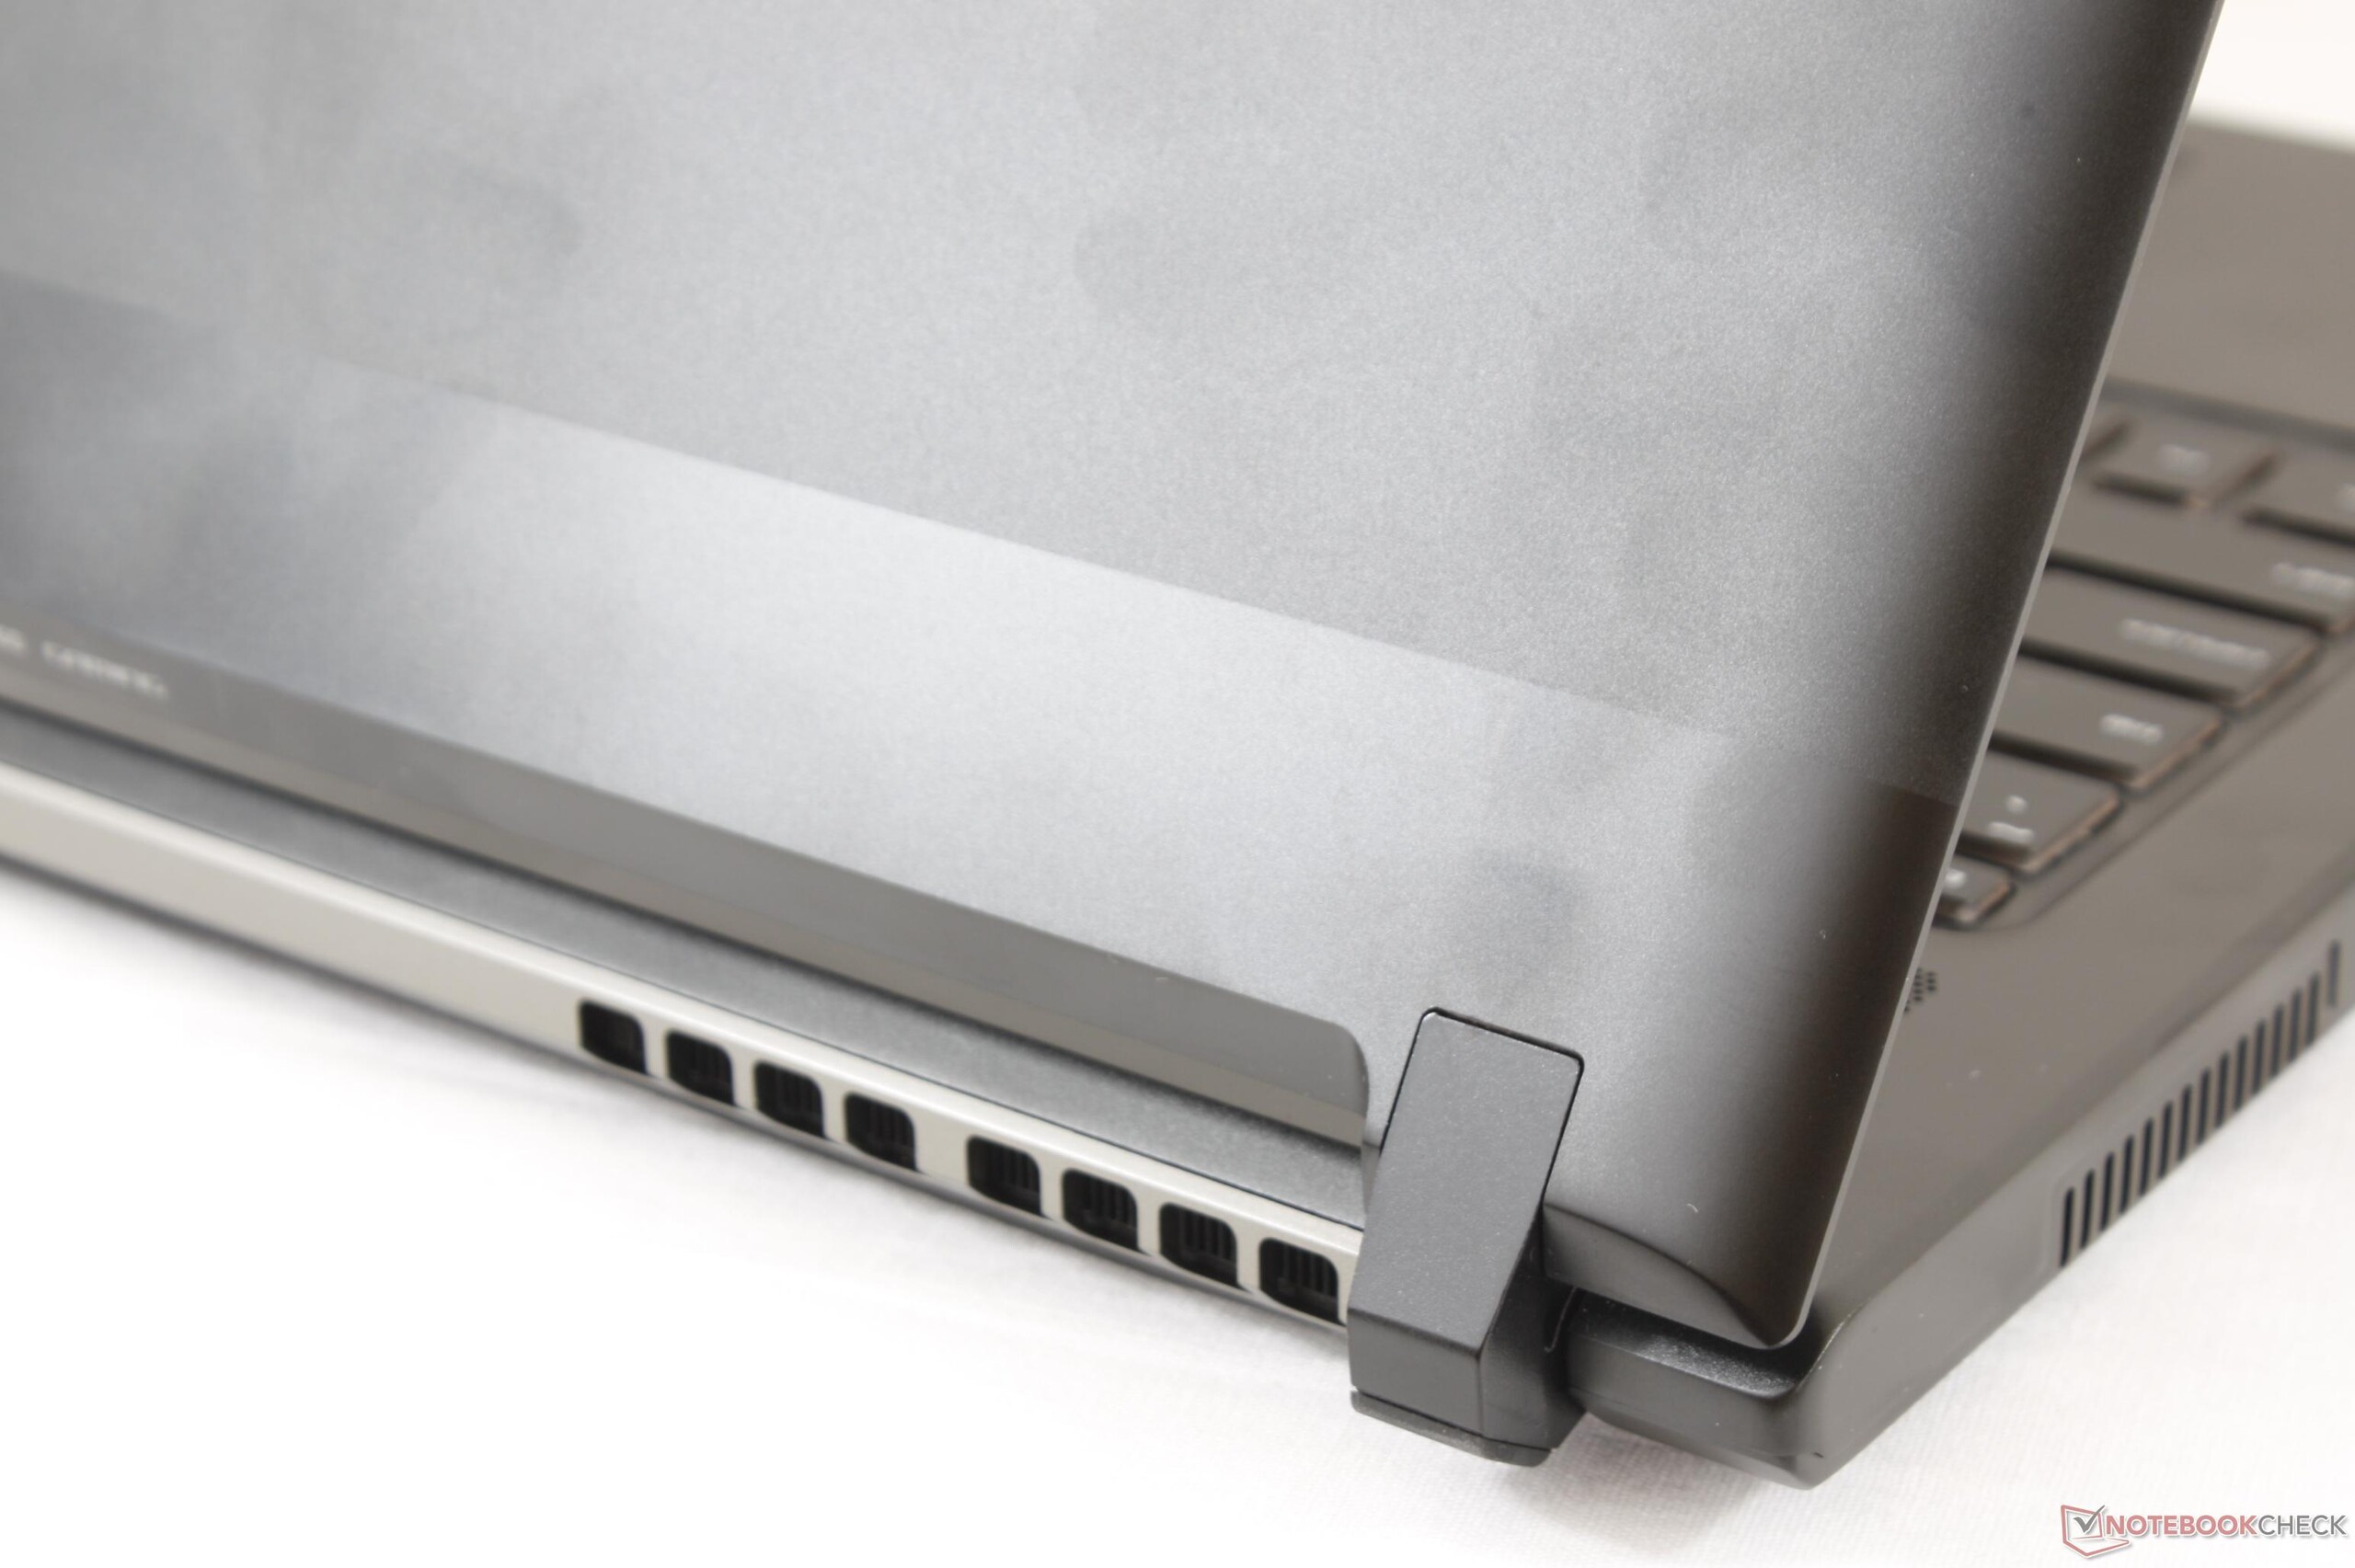
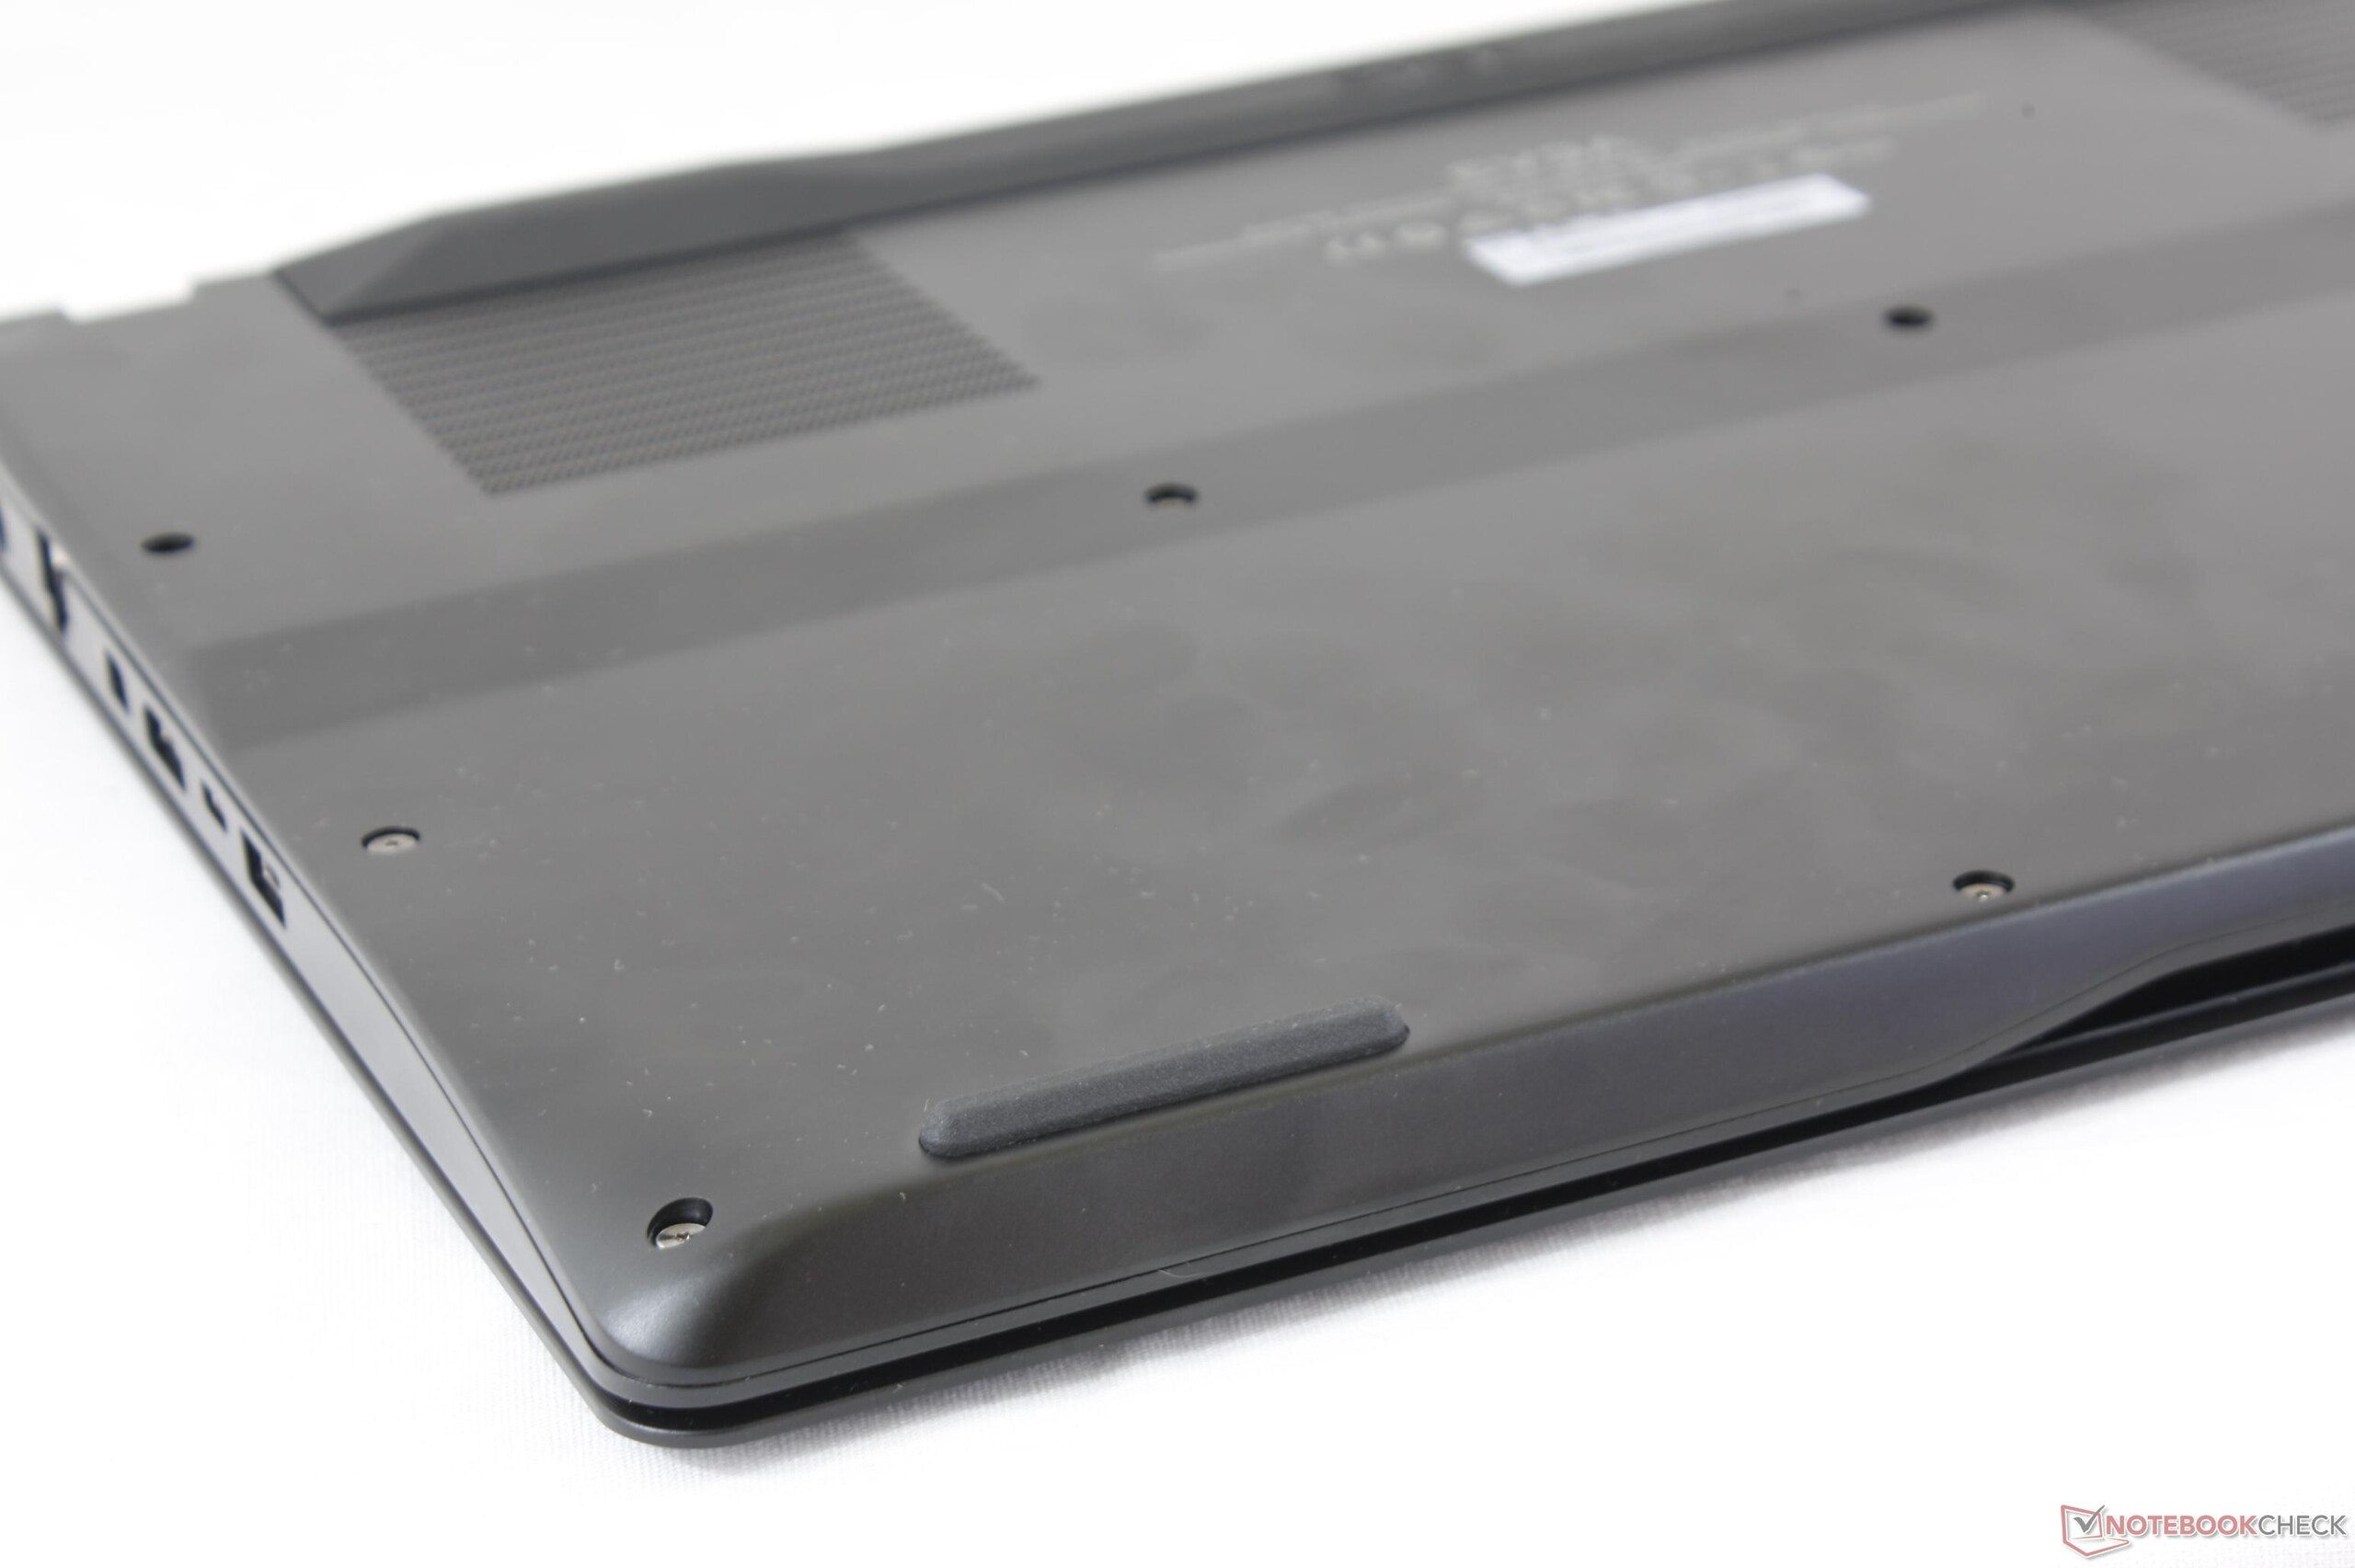
对于屏幕的抱怨远没有结束,亚光面板蛮厚的,虽然这样子盖子可以更加坚固灵活,但是使得显示内容增加了颗粒感。
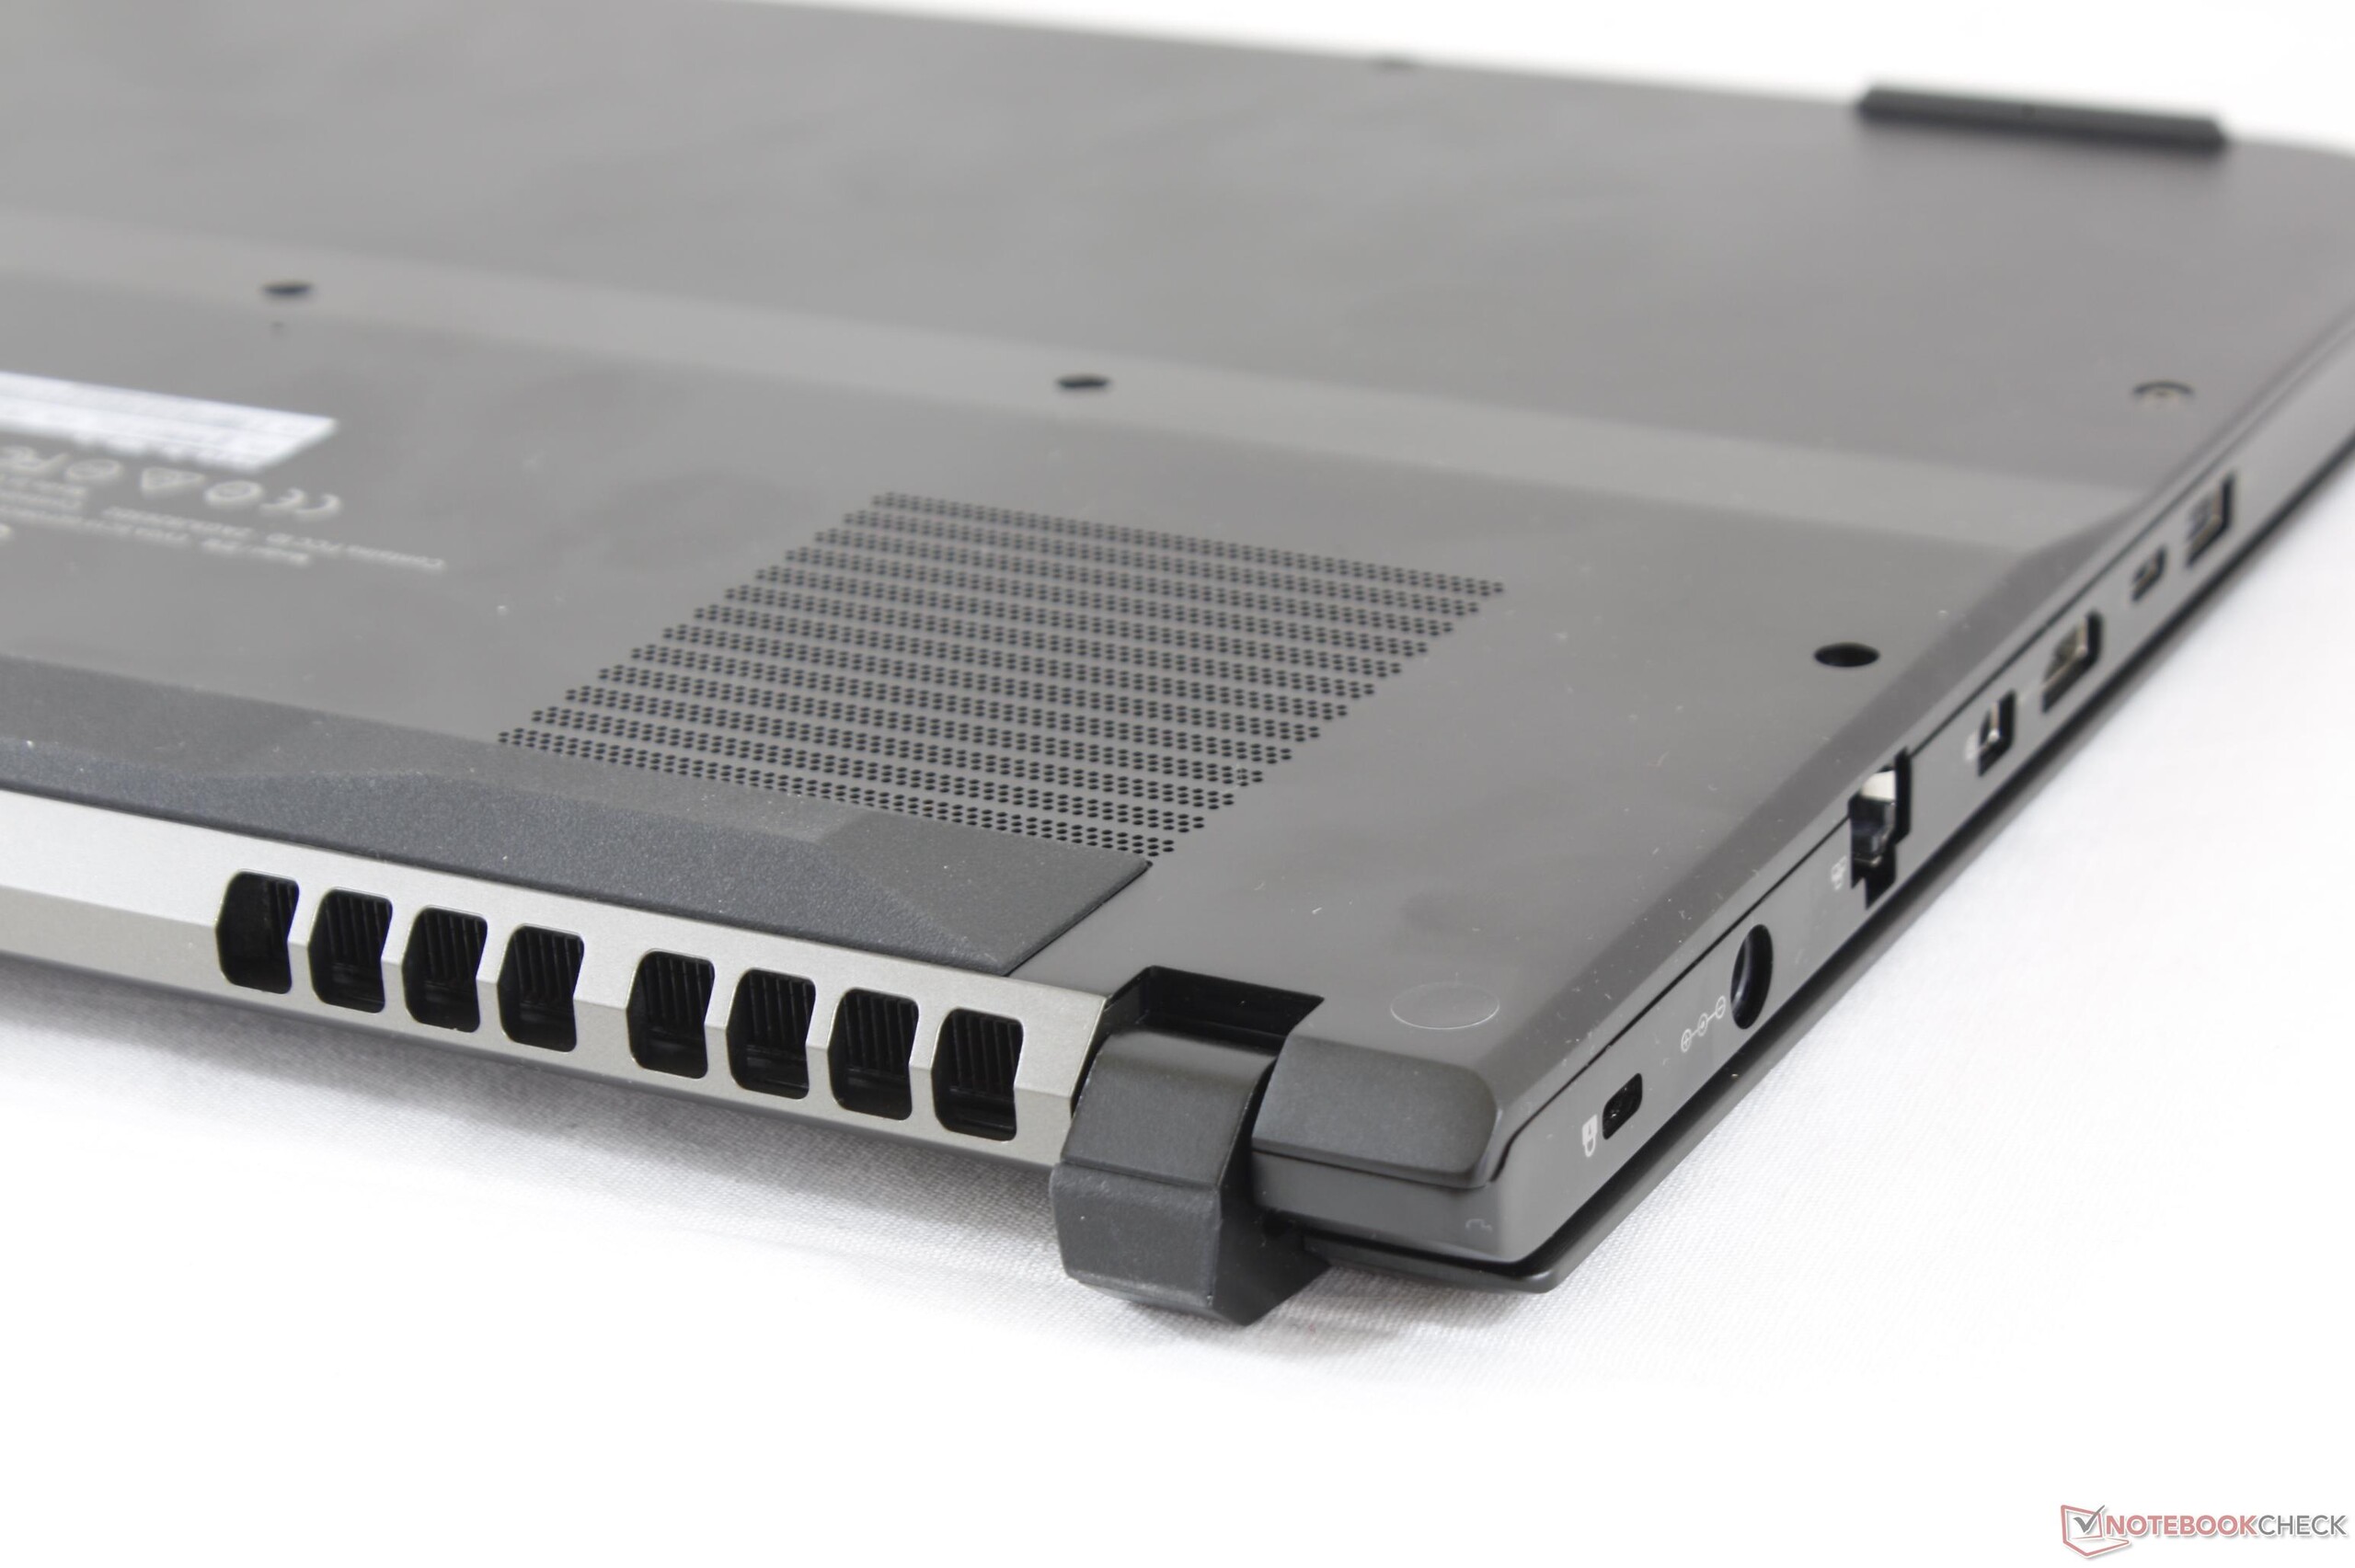
其他的一些缺陷很小,虽然让情况更糟了。薄弱的扬声器;集合的SD读卡器的缺失;短的续航时间;高的待机电源消耗;重量上,可能让一部分玩家不满。像大多数Apple电话一样,价格高不代表性能强大,而是代表合乎预期的整体质量。
SC15比其他同等大小的游戏本更坚固,更安静,更多彩。它较低的显示反应时间,和可选型号的缺失,拉低了原本有的质量。
EVGA SC15
- 07/05/2017 v6 (old)
Allen Ngo
Price comparison
