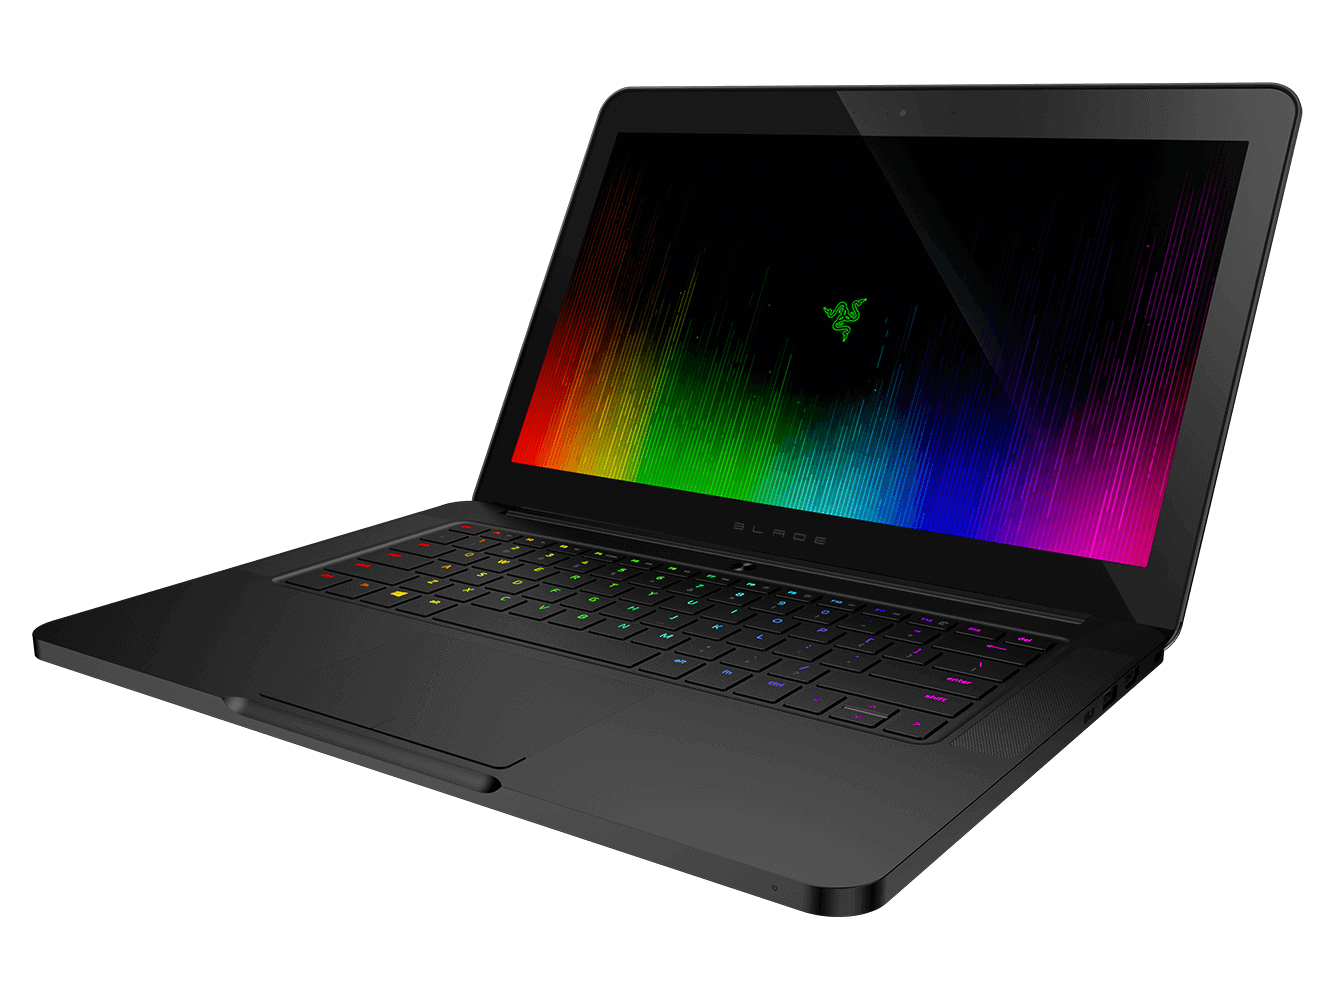
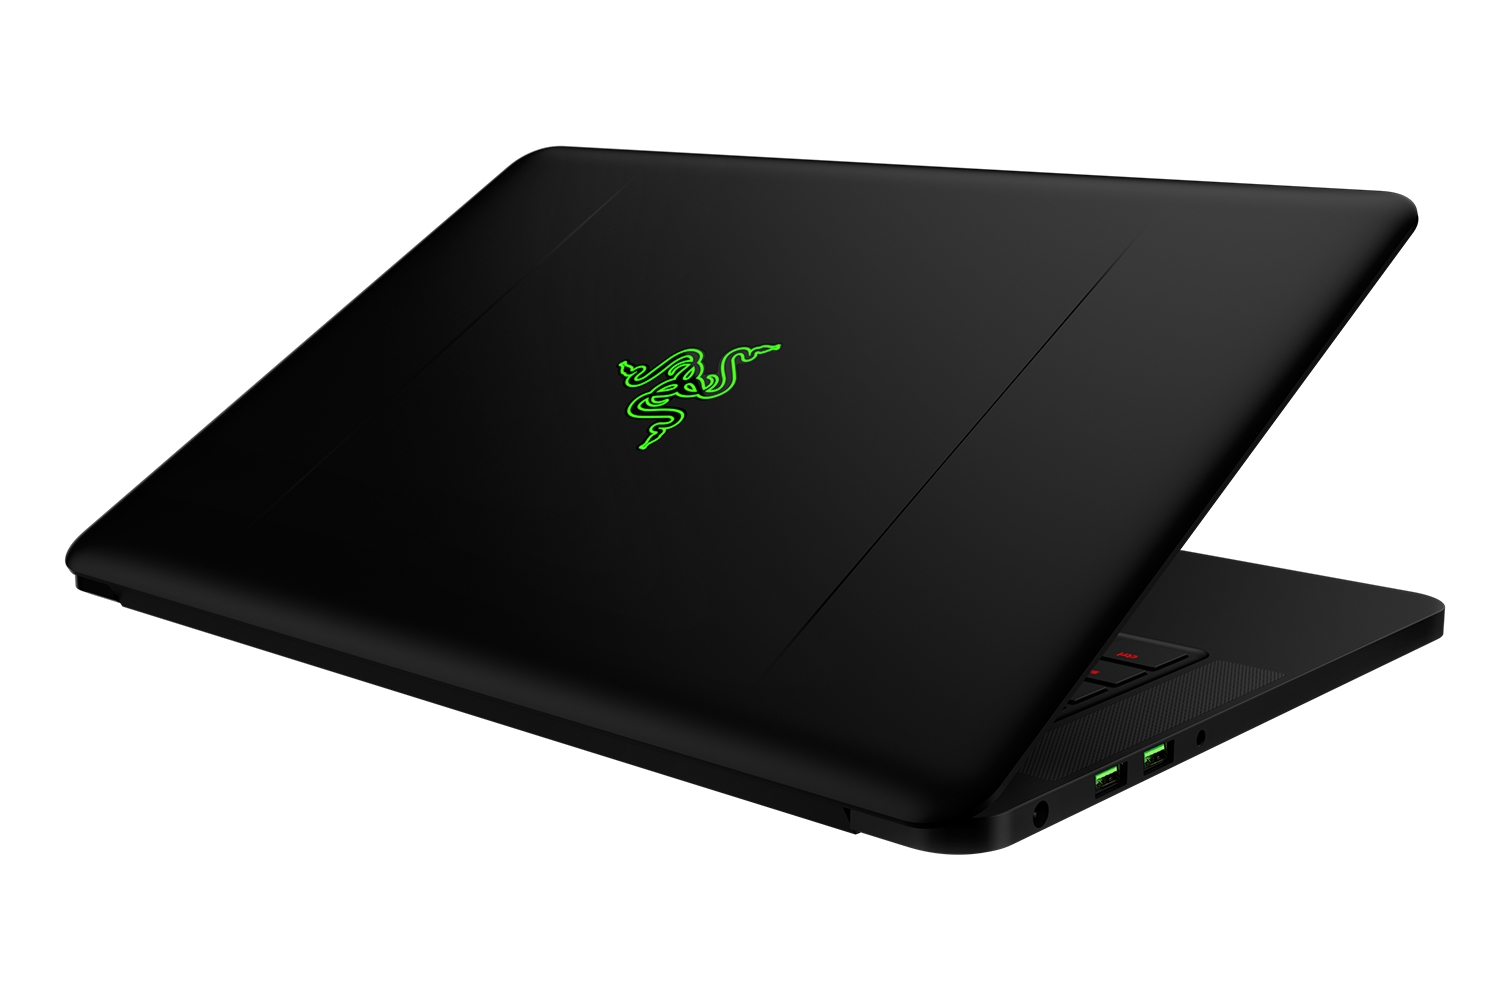
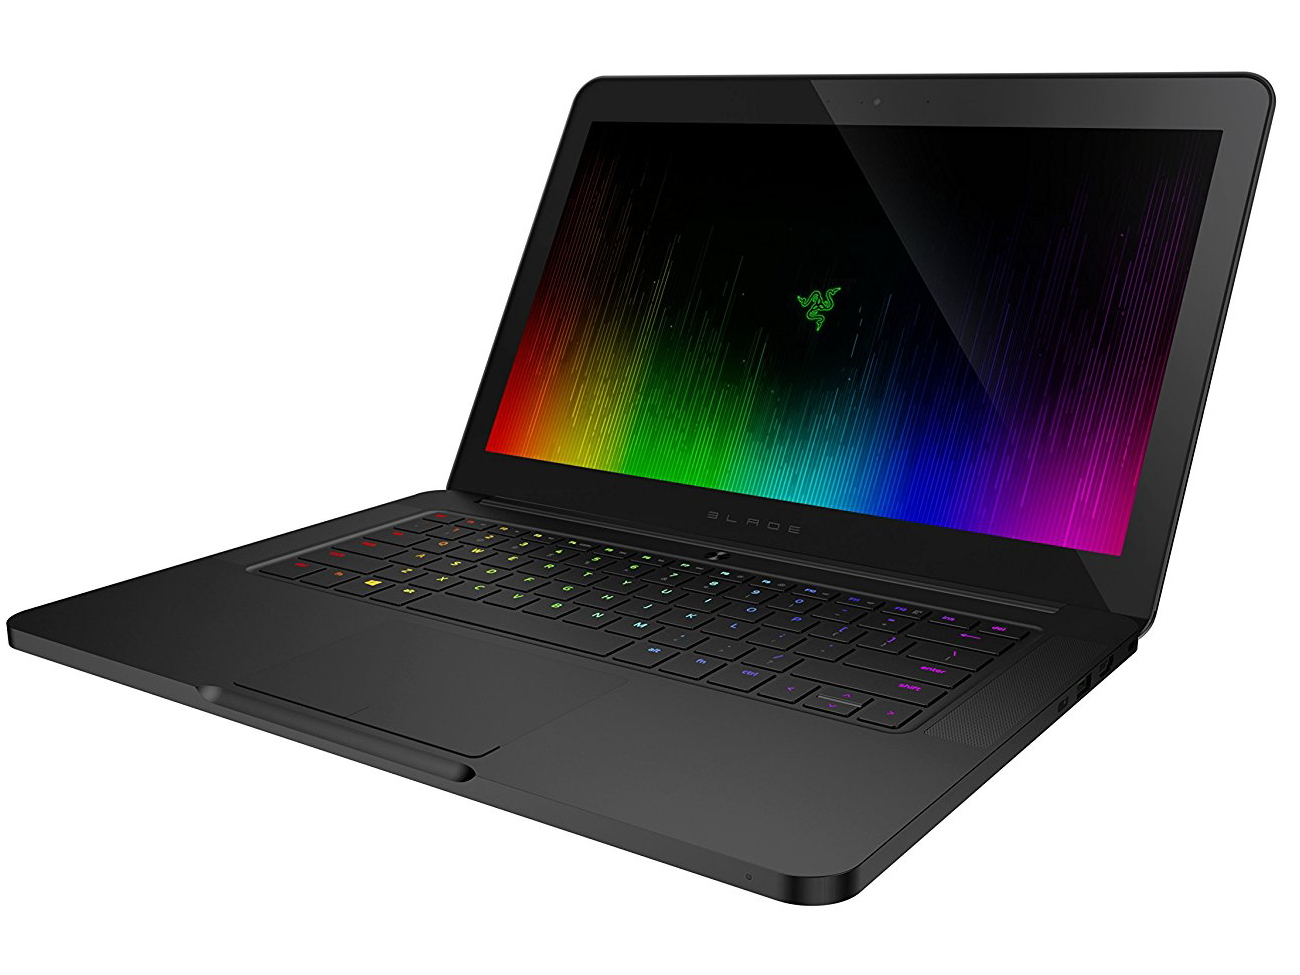
雷蛇 灵刃(2016) FHD 笔记本电脑简短评测
| Networking | |
| iperf3 transmit AX12 | |
| Razer Blade (2016) | |
| Razer Blade (2016) FHD | |
| Asus Strix GL502VM-FY039T | |
| iperf3 receive AX12 | |
| Asus Strix GL502VM-FY039T | |
| Razer Blade (2016) | |
| Razer Blade (2016) FHD | |
Display
| |||||||||||||||||||||||||
Brightness Distribution: 84 %
Center on Battery: 272 cd/m²
Contrast: 1046:1 (Black: 0.26 cd/m²)
ΔE ColorChecker Calman: 4.59 | ∀{0.5-29.43 Ø4.71}
ΔE Greyscale Calman: 4.28 | ∀{0.09-98 Ø4.96}
83% sRGB (Argyll 1.6.3 3D)
55% AdobeRGB 1998 (Argyll 1.6.3 3D)
60.9% AdobeRGB 1998 (Argyll 3D)
83.4% sRGB (Argyll 3D)
65.2% Display P3 (Argyll 3D)
Gamma: 2.23
CCT: 6848 K
| Razer Blade (2016) FHD LG Philips LP140WF3-SPD1 (LGD046D), 1920x1080 | Razer Blade (2016) Sharp LQ140Z1JW01 (SHP1401), 3200x1800 | MSI GS43VR 6RE-006US Name: LG Philips LP140WF3-SPD1, ID: LGD046D, 1920x1080 | Gigabyte P34W v5 2560x1440 | Schenker XMG P406 LG Philips 140WF1 (LGD040A), 1920x1080 | Asus Strix GL502VM-FY039T LG Philips LP156WF6-SPB6 (LGD046F), 1920x1080 | |
|---|---|---|---|---|---|---|
| Display | 10% | 3% | -14% | 0% | -0% | |
| Display P3 Coverage (%) | 65.2 | 66.9 3% | 65.5 0% | 51.4 -21% | 66.2 2% | 64.5 -1% |
| sRGB Coverage (%) | 83.4 | 96.8 16% | 86.4 4% | 76.6 -8% | 82.8 -1% | 83.4 0% |
| AdobeRGB 1998 Coverage (%) | 60.9 | 68.2 12% | 63.1 4% | 52.8 -13% | 60.5 -1% | 60.9 0% |
| Response Times | -15% | 20% | 7% | -17% | 10% | |
| Response Time Grey 50% / Grey 80% * (ms) | 47 ? | 41 ? 13% | 31.6 ? 33% | 41.2 ? 12% | 56 ? -19% | 40 ? 15% |
| Response Time Black / White * (ms) | 26 ? | 37 ? -42% | 24.4 ? 6% | 25.4 ? 2% | 30 ? -15% | 25 ? 4% |
| PWM Frequency (Hz) | 200 ? | |||||
| Screen | 29% | 9% | 3% | 1% | 1% | |
| Brightness middle (cd/m²) | 272 | 328 21% | 288.4 6% | 277.8 2% | 282 4% | 321 18% |
| Brightness (cd/m²) | 277 | 328 18% | 282 2% | 270 -3% | 266 -4% | 296 7% |
| Brightness Distribution (%) | 84 | 69 -18% | 83 -1% | 83 -1% | 81 -4% | 88 5% |
| Black Level * (cd/m²) | 0.26 | 0.22 15% | 0.35 -35% | 0.38 -46% | 0.22 15% | 0.33 -27% |
| Contrast (:1) | 1046 | 1491 43% | 824 -21% | 731 -30% | 1282 23% | 973 -7% |
| Colorchecker dE 2000 * | 4.59 | 1.91 58% | 2.61 43% | 2.71 41% | 4.98 -8% | 4.42 4% |
| Colorchecker dE 2000 max. * | 8.49 | 3.23 62% | 7.34 14% | 5.47 36% | 10.2 -20% | 9.78 -15% |
| Greyscale dE 2000 * | 4.28 | 1.69 61% | 1.18 72% | 2.11 51% | 4.08 5% | 3.34 22% |
| Gamma | 2.23 99% | 2.3 96% | 2.24 98% | 2.19 100% | 2.51 88% | 2.4 92% |
| CCT | 6848 95% | 6418 101% | 6506 100% | 6314 103% | 5877 111% | 6213 105% |
| Color Space (Percent of AdobeRGB 1998) (%) | 55 | 63 15% | 56.4 3% | 48.5 -12% | 54 -2% | 55 0% |
| Color Space (Percent of sRGB) (%) | 83 | 97 17% | 86.4 4% | 76.9 -7% | 83 0% | 83 0% |
| Total Average (Program / Settings) | 8% /
20% | 11% /
9% | -1% /
0% | -5% /
-2% | 4% /
2% |
* ... smaller is better
Screen Flickering / PWM (Pulse-Width Modulation)
| Screen flickering / PWM not detected |  | ||
In comparison: 52 % of all tested devices do not use PWM to dim the display. If PWM was detected, an average of 7741 (minimum: 5 - maximum: 343500) Hz was measured. | |||
Display Response Times
| ↔ Response Time Black to White | ||
|---|---|---|
| 26 ms ... rise ↗ and fall ↘ combined | ↗ 6 ms rise | 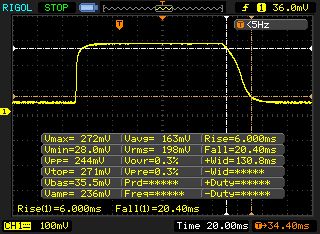 |
| ↘ 20 ms fall | ||
| The screen shows relatively slow response rates in our tests and may be too slow for gamers. In comparison, all tested devices range from 0.1 (minimum) to 240 (maximum) ms. » 63 % of all devices are better. This means that the measured response time is worse than the average of all tested devices (19.8 ms). | ||
| ↔ Response Time 50% Grey to 80% Grey | ||
| 47 ms ... rise ↗ and fall ↘ combined | ↗ 14 ms rise | 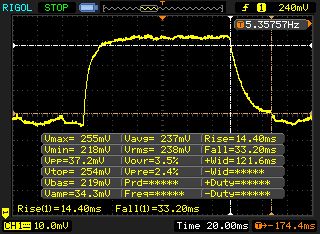 |
| ↘ 33 ms fall | ||
| The screen shows slow response rates in our tests and will be unsatisfactory for gamers. In comparison, all tested devices range from 0.165 (minimum) to 636 (maximum) ms. » 81 % of all devices are better. This means that the measured response time is worse than the average of all tested devices (30.9 ms). | ||
Performance
| Cinebench R10 | |
| Rendering Multiple CPUs 32Bit | |
| Razer Blade (2016) FHD | |
| Asus Strix GL502VM-FY039T | |
| Schenker XMG P406 | |
| Gigabyte P34W v5 | |
| MSI GS43VR 6RE-006US | |
| Rendering Single 32Bit | |
| Razer Blade (2016) FHD | |
| Asus Strix GL502VM-FY039T | |
| Gigabyte P34W v5 | |
| Schenker XMG P406 | |
| MSI GS43VR 6RE-006US | |
| Geekbench 3 | |
| 32 Bit Single-Core Score | |
| Razer Blade (2016) FHD | |
| Asus Strix GL502VM-FY039T | |
| 32 Bit Multi-Core Score | |
| Razer Blade (2016) FHD | |
| Asus Strix GL502VM-FY039T | |
| Geekbench 4.0 | |
| 64 Bit Single-Core Score | |
| Razer Blade (2016) FHD | |
| Asus Strix GL502VM-FY039T | |
| 64 Bit Multi-Core Score | |
| Razer Blade (2016) FHD | |
| Asus Strix GL502VM-FY039T | |
| JetStream 1.1 - 1.1 Total | |
| Asus Strix GL502VM-FY039T | |
| Razer Blade (2016) FHD | |
| MSI GS43VR 6RE-006US | |
| PCMark 7 Score | 5874 points | |
| PCMark 8 Home Score Accelerated v2 | 4010 points | |
| PCMark 8 Creative Score Accelerated v2 | 4942 points | |
| PCMark 8 Work Score Accelerated v2 | 4920 points | |
Help | ||
| PCMark 8 | |
| Home Score Accelerated v2 | |
| Asus Strix GL502VM-FY039T | |
| MSI GS43VR 6RE-006US | |
| Razer Blade (2016) FHD | |
| Gigabyte P34W v5 | |
| Razer Blade (2016) | |
| Schenker XMG P406 | |
| Work Score Accelerated v2 | |
| Asus Strix GL502VM-FY039T | |
| Schenker XMG P406 | |
| Razer Blade (2016) FHD | |
| MSI GS43VR 6RE-006US | |
| Gigabyte P34W v5 | |
| Razer Blade (2016) | |

| Razer Blade (2016) FHD | Razer Blade (2016) Samsung PM951 NVMe MZVLV512 | MSI GS43VR 6RE-006US SanDisk SD8SN8U1T001122 | Gigabyte P34W v5 Samsung SSD 950 Pro 512GB m.2 NVMe | Schenker XMG P406 Samsung SM951 MZHPV256HDGL m.2 PCI-e | Asus Strix GL502VM-FY039T Micron SSD 1100 (MTFDDAV256TBN) | |
|---|---|---|---|---|---|---|
| CrystalDiskMark 3.0 | -25% | -73% | 8% | -14% | -58% | |
| Read Seq (MB/s) | 1977 | 1296 -34% | 335.3 -83% | 2269 15% | 1634 -17% | 462.5 -77% |
| Write Seq (MB/s) | 1668 | 603 -64% | 299 -82% | 1524 -9% | 1290 -23% | 462.7 -72% |
| Read 512 (MB/s) | 800 | 655 -18% | 223 -72% | 937 17% | 1149 44% | 335 -58% |
| Write 512 (MB/s) | 1030 | 604 -41% | 246.7 -76% | 1483 44% | 1285 25% | 407.1 -60% |
| Read 4k (MB/s) | 58.1 | 42.22 -27% | 17.68 -70% | 53.8 -7% | 43.82 -25% | 25.61 -56% |
| Write 4k (MB/s) | 145.6 | 139.6 -4% | 35.31 -76% | 167.3 15% | 110.3 -24% | 86.3 -41% |
| Read 4k QD32 (MB/s) | 592 | 573 -3% | 247.4 -58% | 622 5% | 320.5 -46% | 246.7 -58% |
| Write 4k QD32 (MB/s) | 508 | 480 -6% | 156.3 -69% | 418.9 -18% | 287.3 -43% | 301.5 -41% |
| 3DMark 06 Standard Score | 25367 points | |
| 3DMark 11 Performance | 11616 points | |
| 3DMark Ice Storm Standard Score | 78946 points | |
| 3DMark Cloud Gate Standard Score | 21402 points | |
| 3DMark Fire Strike Score | 9117 points | |
| 3DMark Fire Strike Extreme Score | 4873 points | |
| 3DMark Time Spy Score | 3443 points | |
Help | ||
| 3DMark | |
| 2560x1440 Time Spy Graphics | |
| Asus Strix GL502VM-FY039T | |
| Razer Blade (2016) FHD | |
| 1920x1080 Fire Strike Graphics | |
| MSI GS43VR 6RE-006US | |
| Asus Strix GL502VM-FY039T | |
| Razer Blade (2016) | |
| Razer Blade (2016) FHD | |
| Gigabyte P34W v5 | |
| Schenker XMG P406 | |
| 3DMark 11 - 1280x720 Performance GPU | |
| Asus Strix GL502VM-FY039T | |
| MSI GS43VR 6RE-006US | |
| Razer Blade (2016) | |
| Razer Blade (2016) FHD | |
| Gigabyte P34W v5 | |
| Schenker XMG P406 | |
| BioShock Infinite - 1920x1080 Ultra Preset, DX11 (DDOF) | |
| Asus Strix GL502VM-FY039T | |
| MSI GS43VR 6RE-006US | |
| Razer Blade (2016) FHD | |
| Gigabyte P34W v5 | |
| Battlefield 4 - 1920x1080 Ultra Preset AA:4x MS | |
| Asus Strix GL502VM-FY039T | |
| Razer Blade (2016) FHD | |
| Schenker XMG P406 | |
| low | med. | high | ultra | |
|---|---|---|---|---|
| Tomb Raider (2013) | 347.4 | 312.1 | 261.9 | 131.7 |
| BioShock Infinite (2013) | 184.5 | 164.6 | 148.3 | 94 |
| Battlefield 4 (2013) | 168.1 | 167.8 | 154.1 | 94 |
| Anno 2205 (2015) | 110.4 | 103.3 | 79.2 | 28.6 |
| XCOM 2 (2016) | 85.5 | 62.8 | 52.8 | 27.8 |
| The Division (2016) | 184.6 | 120.7 | 61.2 | 48.2 |
| Ashes of the Singularity (2016) | 67.9 | 54.8 | 49.4 | |
| Deus Ex Mankind Divided (2016) | 114.4 | 93.8 | 52.4 | 28.1 |
Emissions
Noise level
| Idle |
| 35 / 36 / 37 dB(A) |
| Load |
| 43 / 57 dB(A) |
 | ||
30 dB silent 40 dB(A) audible 50 dB(A) loud |
||
min: | ||
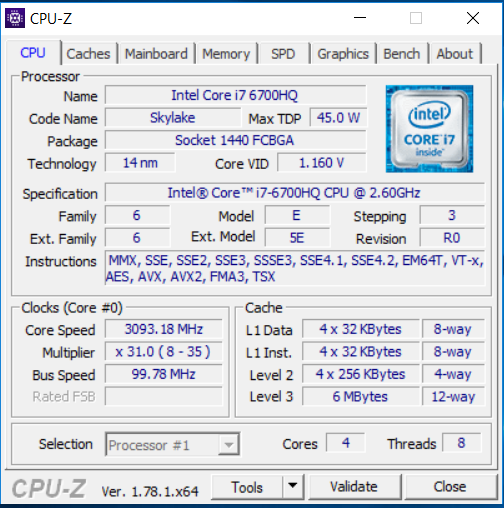
| Razer Blade (2016) FHD 6700HQ, GeForce GTX 1060 Mobile | Razer Blade (2016) 6700HQ, GeForce GTX 1060 Mobile | MSI GS43VR 6RE-006US 6700HQ, GeForce GTX 1060 Mobile | Gigabyte P34W v5 6700HQ, GeForce GTX 970M | Schenker XMG P406 6700HQ, GeForce GTX 970M | Asus Strix GL502VM-FY039T 6700HQ, GeForce GTX 1060 Mobile | |
|---|---|---|---|---|---|---|
| Noise | 8% | 5% | 7% | 4% | 5% | |
| off / environment * (dB) | 31 | 30 3% | 29.1 6% | 31 -0% | ||
| Idle Minimum * (dB) | 35 | 31 11% | 32 9% | 31.6 10% | 30 14% | 32 9% |
| Idle Average * (dB) | 36 | 33 8% | 32 11% | 31.6 12% | 32 11% | 33 8% |
| Idle Maximum * (dB) | 37 | 35 5% | 33.5 9% | 32.5 12% | 40 -8% | 34 8% |
| Load Average * (dB) | 43 | 39 9% | 50 -16% | 46.5 -8% | 47 -9% | 44 -2% |
| Load Maximum * (dB) | 57 | 51 11% | 51.5 10% | 52.5 8% | 51 11% | 53 7% |
* ... smaller is better
(-) The maximum temperature on the upper side is 54 °C / 129 F, compared to the average of 40.4 °C / 105 F, ranging from 21.2 to 68.8 °C for the class Gaming.
(-) The bottom heats up to a maximum of 49.4 °C / 121 F, compared to the average of 43.2 °C / 110 F
(+) In idle usage, the average temperature for the upper side is 26.3 °C / 79 F, compared to the device average of 33.9 °C / 93 F.
(±) The palmrests and touchpad can get very hot to the touch with a maximum of 39.9 °C / 103.8 F.
(-) The average temperature of the palmrest area of similar devices was 28.8 °C / 83.8 F (-11.1 °C / -20 F).
| Razer Blade (2016) FHD 6700HQ, GeForce GTX 1060 Mobile | Razer Blade (2016) 6700HQ, GeForce GTX 1060 Mobile | MSI GS43VR 6RE-006US 6700HQ, GeForce GTX 1060 Mobile | Gigabyte P34W v5 6700HQ, GeForce GTX 970M | Schenker XMG P406 6700HQ, GeForce GTX 970M | Asus Strix GL502VM-FY039T 6700HQ, GeForce GTX 1060 Mobile | |
|---|---|---|---|---|---|---|
| Heat | -2% | -22% | -11% | -27% | -24% | |
| Maximum Upper Side * (°C) | 54 | 52.7 2% | 55.6 -3% | 59.3 -10% | 55 -2% | 65.3 -21% |
| Maximum Bottom * (°C) | 49.4 | 48.4 2% | 62.4 -26% | 56.5 -14% | 58.7 -19% | 64.4 -30% |
| Idle Upper Side * (°C) | 28 | 29.3 -5% | 33.2 -19% | 27.8 1% | 36.9 -32% | 35.4 -26% |
| Idle Bottom * (°C) | 26.8 | 28.4 -6% | 37.2 -39% | 31.8 -19% | 41.7 -56% | 31.6 -18% |
* ... smaller is better
Speakers
Razer Blade (2016) FHD audio analysis
(±) | speaker loudness is average but good (79 dB)
Bass 100 - 315 Hz
(±) | reduced bass - on average 10.6% lower than median
(±) | linearity of bass is average (12.4% delta to prev. frequency)
Mids 400 - 2000 Hz
(+) | balanced mids - only 4.3% away from median
(+) | mids are linear (3.9% delta to prev. frequency)
Highs 2 - 16 kHz
(+) | balanced highs - only 3.4% away from median
(+) | highs are linear (5.7% delta to prev. frequency)
Overall 100 - 16.000 Hz
(±) | linearity of overall sound is average (17.3% difference to median)
Compared to same class
» 47% of all tested devices in this class were better, 12% similar, 41% worse
» The best had a delta of 6%, average was 18%, worst was 132%
Compared to all devices tested
» 33% of all tested devices were better, 8% similar, 59% worse
» The best had a delta of 4%, average was 23%, worst was 134%
MSI GS43VR 6RE-006US audio analysis
(±) | speaker loudness is average but good (76.7 dB)
Bass 100 - 315 Hz
(-) | nearly no bass - on average 17.5% lower than median
(±) | linearity of bass is average (12% delta to prev. frequency)
Mids 400 - 2000 Hz
(+) | balanced mids - only 3.9% away from median
(±) | linearity of mids is average (9.5% delta to prev. frequency)
Highs 2 - 16 kHz
(±) | higher highs - on average 6.4% higher than median
(±) | linearity of highs is average (8.5% delta to prev. frequency)
Overall 100 - 16.000 Hz
(±) | linearity of overall sound is average (28.9% difference to median)
Compared to same class
» 95% of all tested devices in this class were better, 2% similar, 4% worse
» The best had a delta of 6%, average was 18%, worst was 132%
Compared to all devices tested
» 87% of all tested devices were better, 2% similar, 11% worse
» The best had a delta of 4%, average was 23%, worst was 134%
Frequency Comparison (Checkboxes select/deselectable!)
Energy Management
| Off / Standby | |
| Idle | |
| Load |
|
Key:
min: | |
| Razer Blade (2016) FHD 6700HQ, GeForce GTX 1060 Mobile | Razer Blade (2016) 6700HQ, GeForce GTX 1060 Mobile | MSI GS43VR 6RE-006US 6700HQ, GeForce GTX 1060 Mobile | Schenker XMG P406 6700HQ, GeForce GTX 970M | Asus Strix GL502VM-FY039T 6700HQ, GeForce GTX 1060 Mobile | |
|---|---|---|---|---|---|
| Power Consumption | 13% | -9% | -5% | -7% | |
| Idle Minimum * (Watt) | 14 | 9 36% | 12.1 14% | 12 14% | 16 -14% |
| Idle Average * (Watt) | 18 | 14 22% | 19 -6% | 16 11% | 19 -6% |
| Idle Maximum * (Watt) | 21 | 22 -5% | 19.5 7% | 22 -5% | 23 -10% |
| Load Average * (Watt) | 70 | 72 -3% | 106.7 -52% | 90 -29% | 68 3% |
| Load Maximum * (Watt) | 146 | 124 15% | 159 -9% | 170 -16% | 157 -8% |
* ... smaller is better
| Razer Blade (2016) FHD 6700HQ, GeForce GTX 1060 Mobile, 70 Wh | Razer Blade (2016) 6700HQ, GeForce GTX 1060 Mobile, 70 Wh | MSI GS43VR 6RE-006US 6700HQ, GeForce GTX 1060 Mobile, 61 Wh | Gigabyte P34W v5 6700HQ, GeForce GTX 970M, 61 Wh | Schenker XMG P406 6700HQ, GeForce GTX 970M, 45 Wh | Asus Strix GL502VM-FY039T 6700HQ, GeForce GTX 1060 Mobile, 64 Wh | |
|---|---|---|---|---|---|---|
| Battery runtime | -42% | -11% | -38% | -33% | -20% | |
| Reader / Idle (h) | 12.7 | 9.6 -24% | 6.5 -49% | 4.6 -64% | 5.3 -58% | |
| H.264 (h) | 5.2 | 3.9 -25% | ||||
| WiFi v1.3 (h) | 7.1 | 4.1 -42% | 4.4 -38% | 3.9 -45% | 3.3 -54% | 3.7 -48% |
| Load (h) | 1 | 1.3 30% | 0.8 -20% | 1.2 20% | 1.5 50% |
Pros
Cons
Verdict
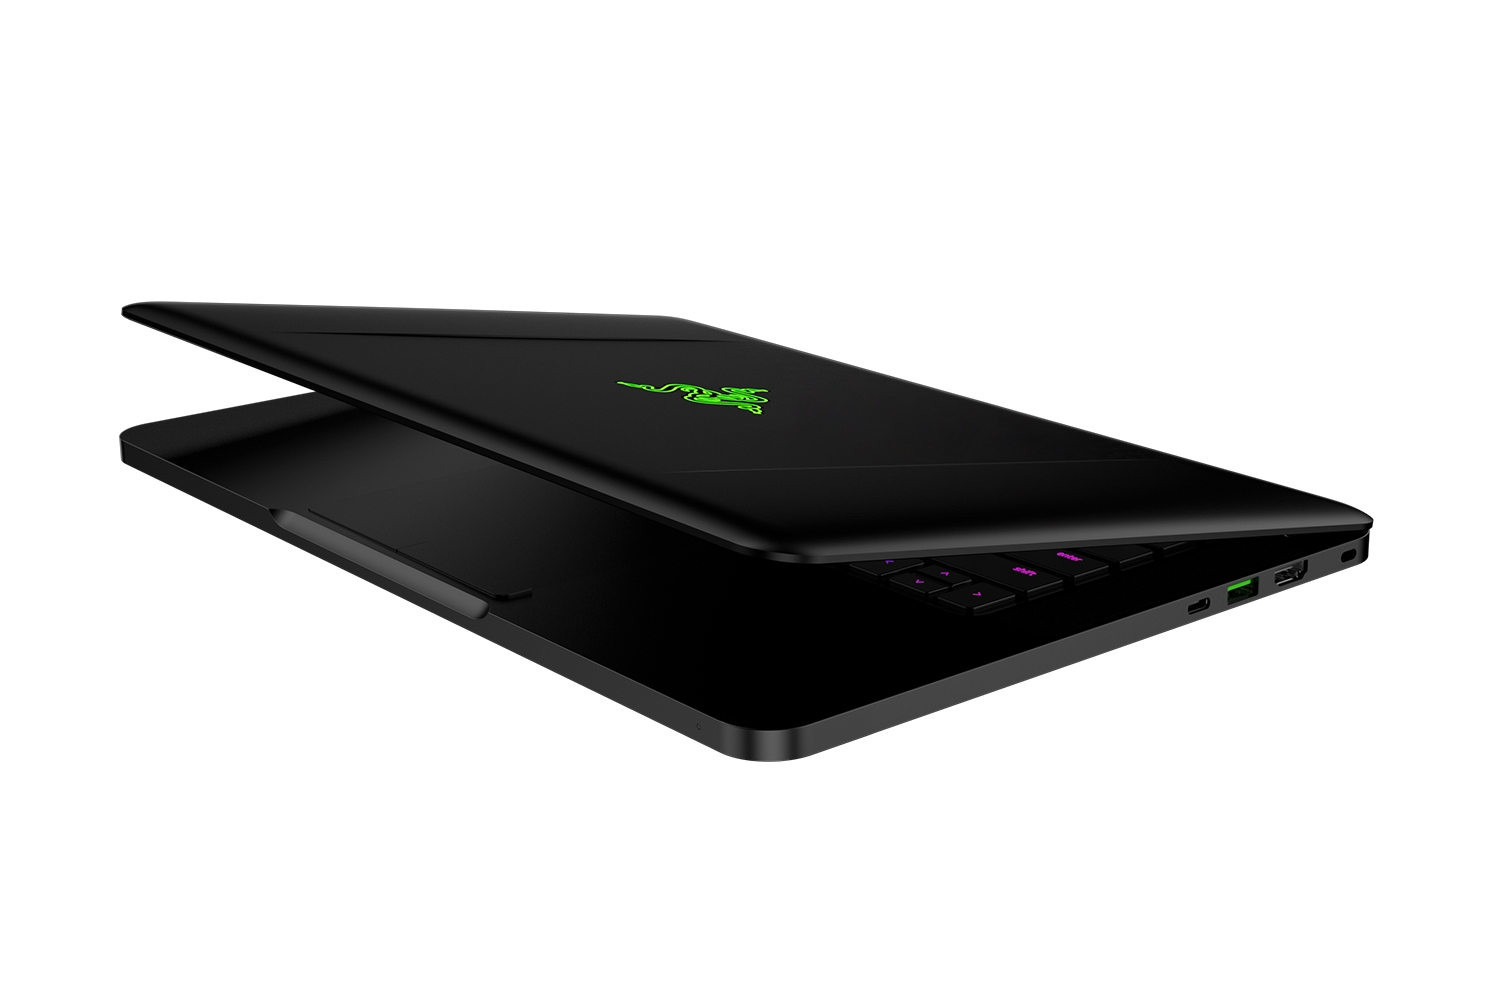
雷蛇将强大的性能融入到极富吸引力的超薄机身中。该设备可以应对当今所有的游戏,但与体积更大的其他竞争对手相比,帧速有点低。因为机身小,散热能力有限,所以影响了图形处理器核心的频率。这是从来没有正在安静下来的笔记本电脑——但我们没有预料到这一点。当然,这些噪音是可以接受的。快速固态硬盘保证了系统响应速度。底部面板的拆卸不存在任何问题,这款笔记本电脑的端口是面向未来的。千兆以太网端口的缺失,如有必要,可以通过USB适配器来解决。
全高清版灵刃,是一个整体性能更强的设备。
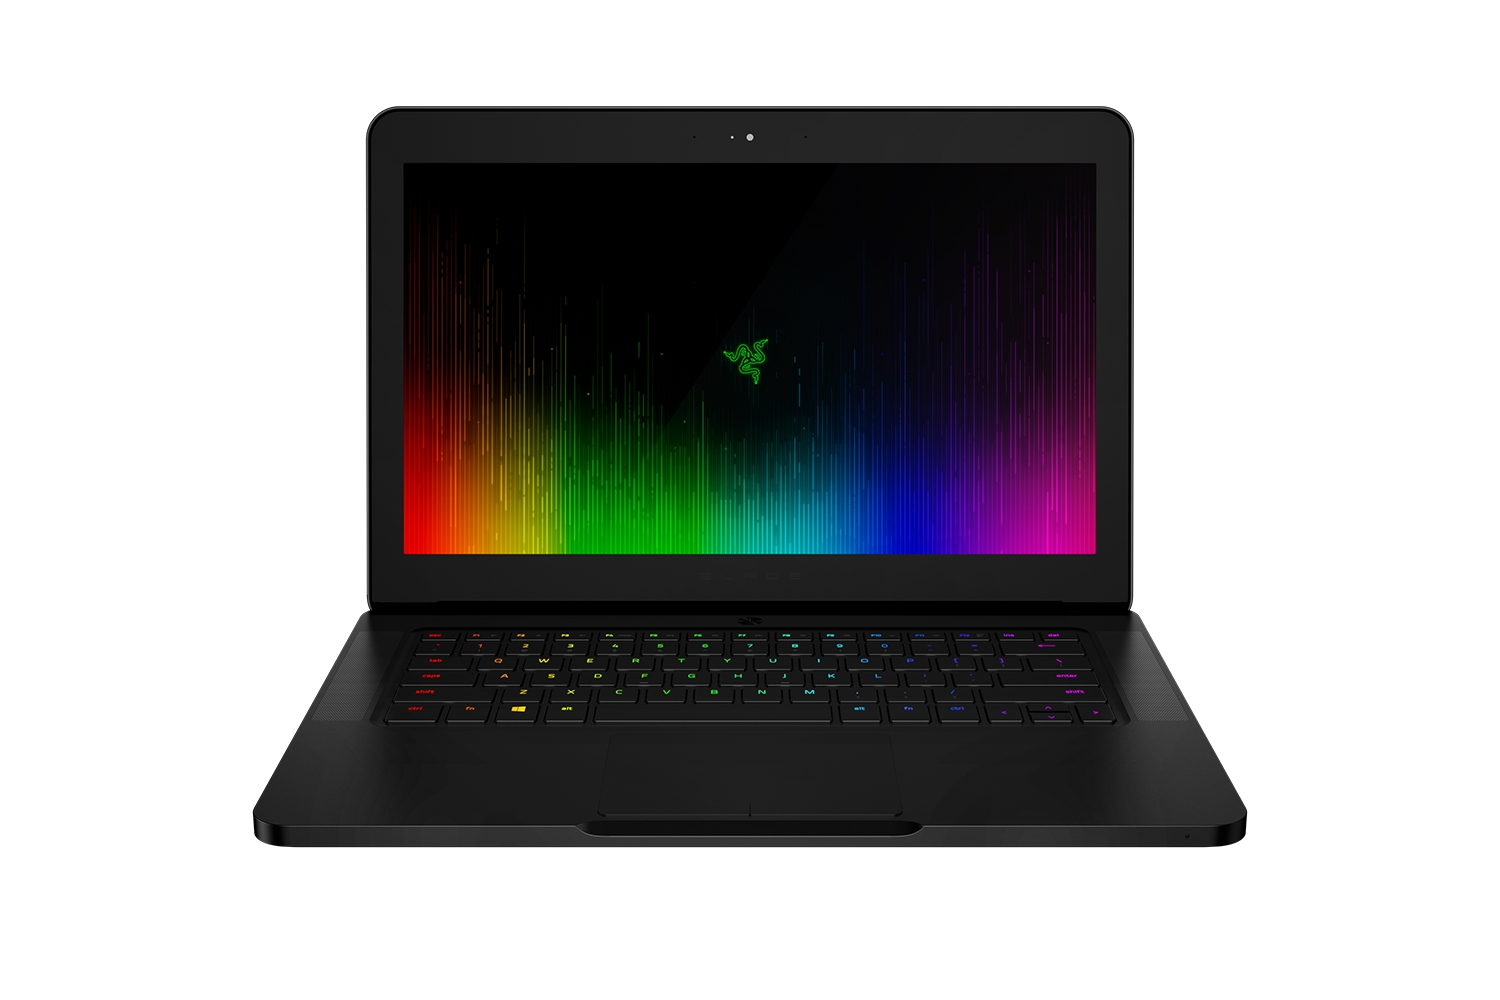
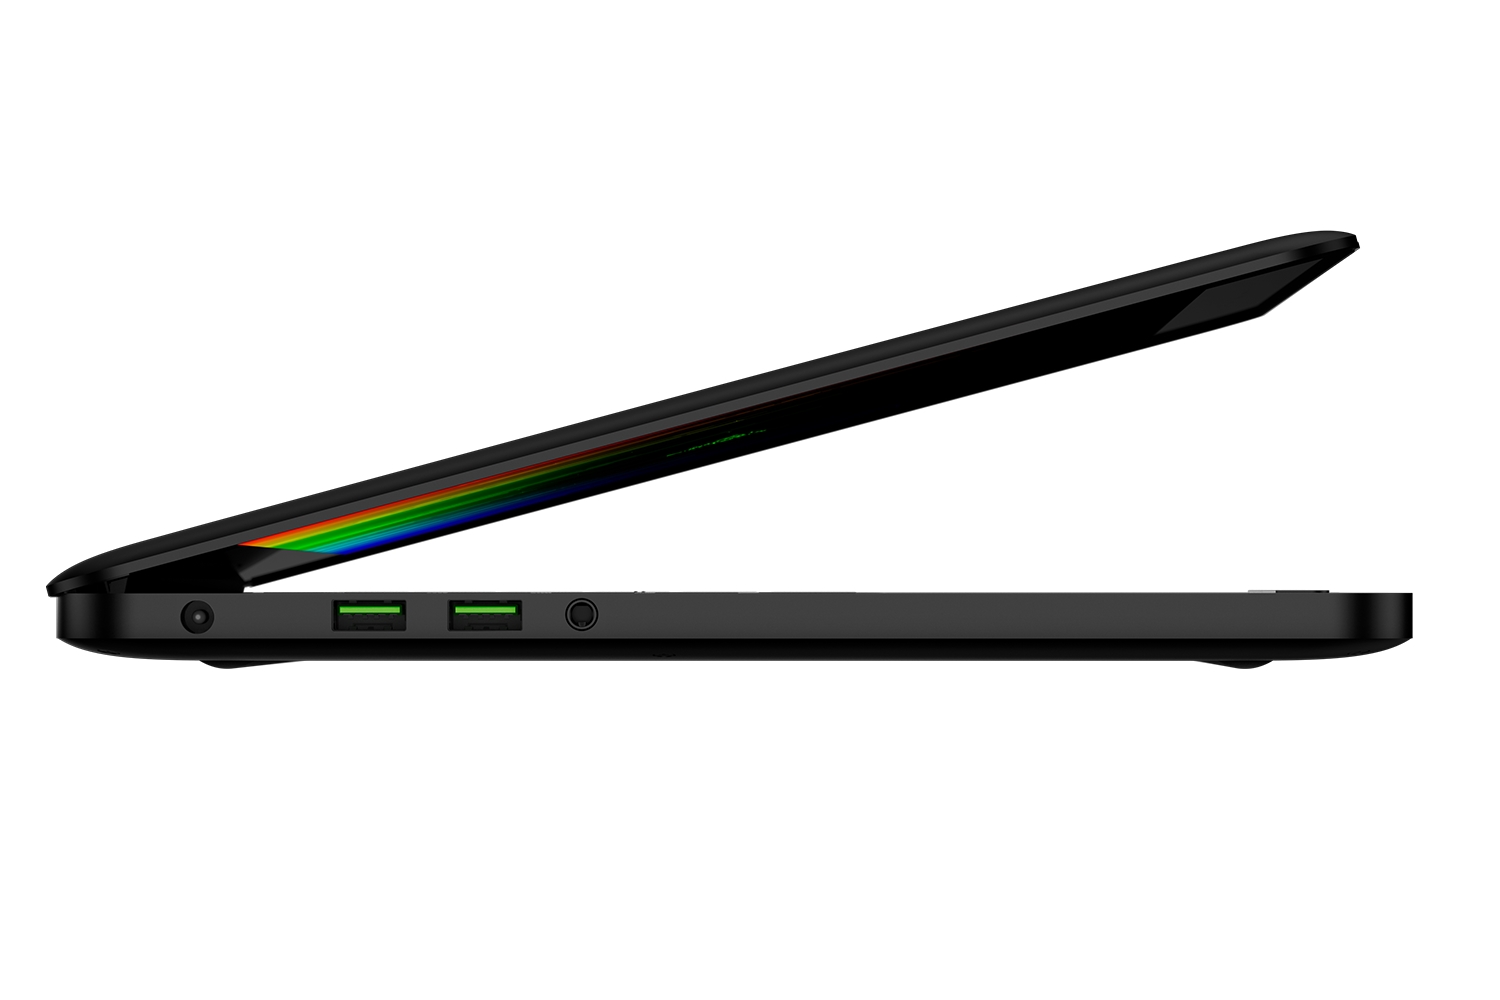
与以前测评过的灵刃对比,新版本的最大的区别是屏幕。 广角的IPS全高清屏幕,拥有适宜的亮度和良好的对比度。 优势:与QHD +屏幕的同系列笔电相比,我们无法发现,该机型全高清屏幕上的任何闪烁。 该屏幕也比QHD+触摸屏更高效,拥有更长的电池续航时间。
注:本文是基于完整评测的缩减版本,阅读完整的英文评测,请点击这里。
Razer Blade (2016) FHD
- 12/25/2016 v6 (old)
Sascha Mölck
Price comparison
