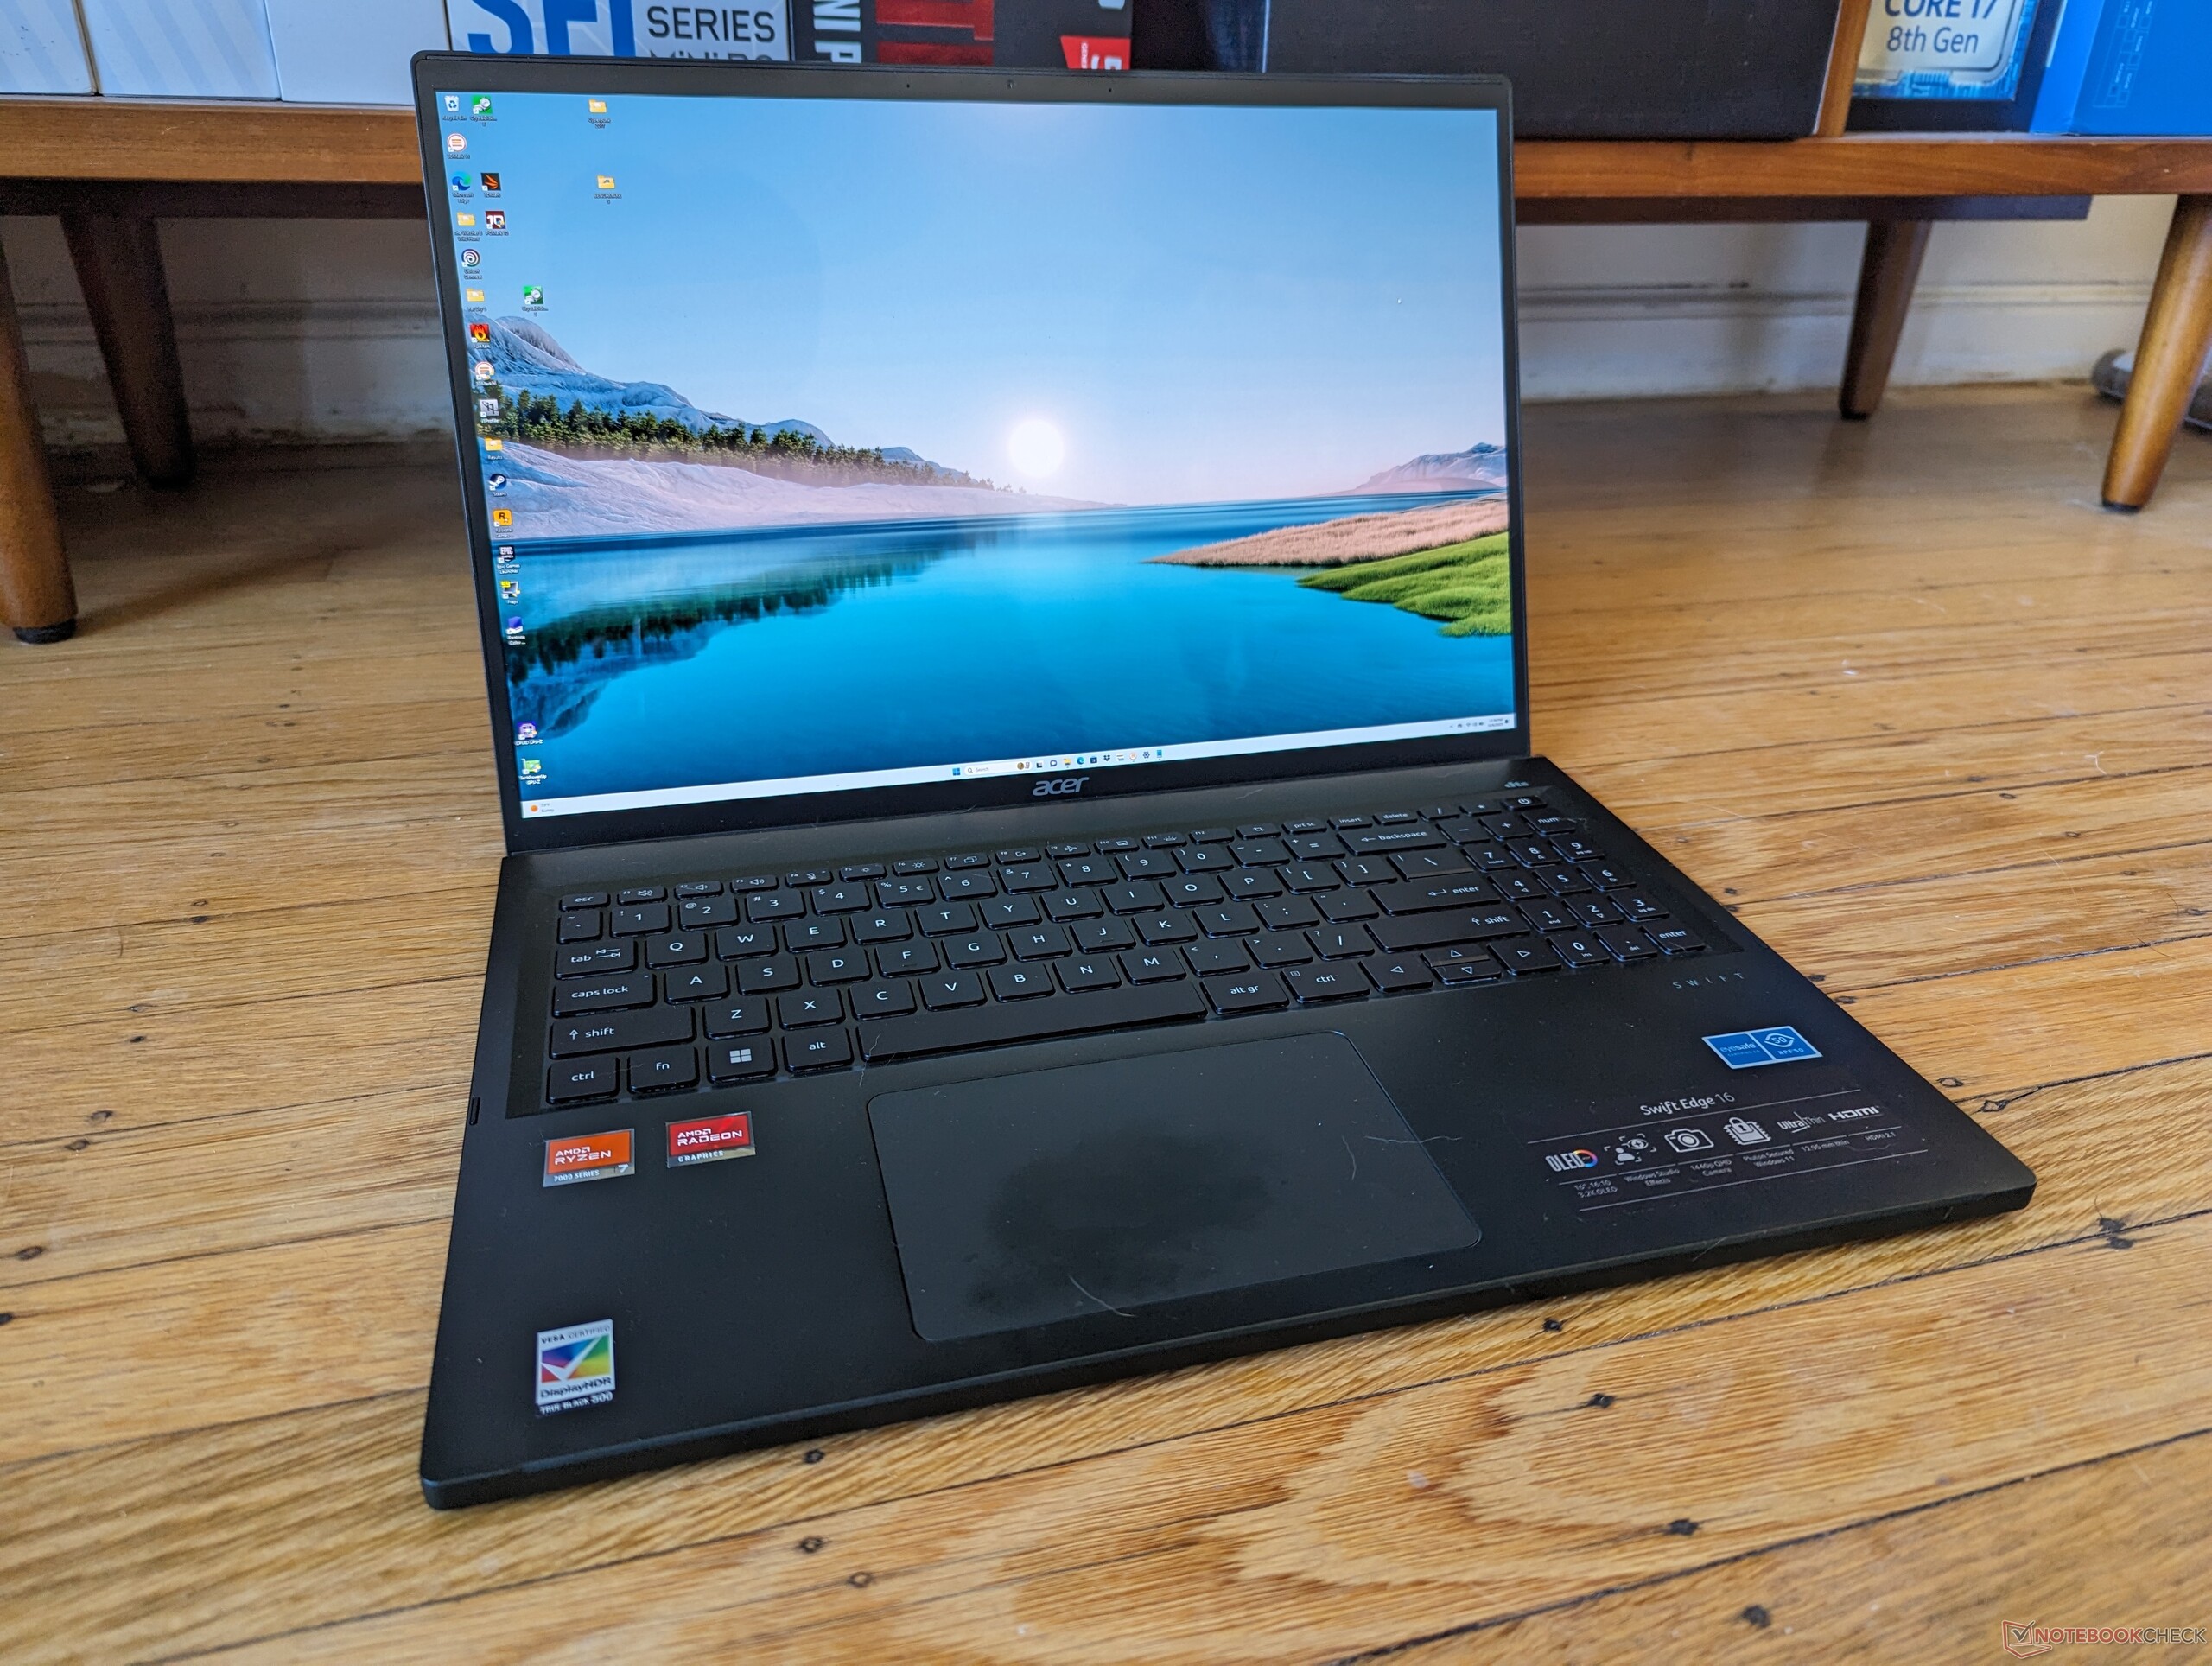
宏碁 Swift Edge 16 Ryzen 7 7840U 笔记本电脑评测:Zen 4 CPU 和 3.2K 120 Hz OLED 提升

宏碁 Swift Edge SFE16 在本季进行了更新,从几个月前发布的 Zen 3+ Ryzen 7 7735U 升级到支持新的 Zen 4 Ryzen 7 7840U CPU。更新后的机型还采用了新的 120 Hz 3.2K 三星 OLED 面板,而不是 Zen 3+ 配置上的 4K 60 Hz 面板。
除了上述 CPU 和 GPU 的差异之外,Swift Edge SFE16 Zen 4 和 Swift Edge SFE16 Zen 3+ 都采用了类似的机箱设计,但也有一些不同之处,我们将在本次评测中加以说明。不过,主板内部的许多方面都发生了变化。我们建议您查看 我们对 Swift Edge SFE16 Zen 3+ 的评测了解该机型的更多物理特性。
Swift Edge 的替代产品包括其他轻型 16 英寸超极本,如 LG Gram 16, 三星Galaxy Book3 Pro 16,华硕 VivoBook 16或华为 MateBook 16s.
Swift Edge 16 不应与Swift X 16 混淆,后者是一款更厚的笔记本电脑,配备更快的 H 系列 CPU 和专用GeForce RTX 显卡。
更多宏碁评论:
潜在的竞争对手比较
Rating | Date | Model | Weight | Height | Size | Resolution | Price |
|---|---|---|---|---|---|---|---|
| 88.6 % v7 (old) | 10 / 2023 | Acer Swift Edge SFE16 Ryzen 7 7840U R7 7840U, Radeon 780M | 1.2 kg | 13 mm | 16.00" | 3200x2000 | |
| 87.5 % v7 (old) | 06 / 2023 | Acer Swift Edge SFE16-42-R1GM R7 7735U, Radeon 680M | 1.2 kg | 13.95 mm | 16.00" | 3840x2400 | |
| 88 % v7 (old) | 08 / 2023 | Lenovo Slim Pro 9i 16IRP8 i9-13905H, GeForce RTX 4050 Laptop GPU | 2.2 kg | 18.2 mm | 16.00" | 3200x2000 | |
| 86.3 % v7 (old) | 05 / 2023 | Asus VivoBook Pro 16 i7-12700H, GeForce RTX 3050 Ti Laptop GPU | 1.9 kg | 20 mm | 16.00" | 2560x1600 | |
| 89.4 % v7 (old) | 04 / 2023 | Samsung Galaxy Book3 Ultra 16 i7-13700H, GeForce RTX 4050 Laptop GPU | 1.8 kg | 16.5 mm | 16.00" | 2880x1800 | |
| 86.4 % v7 (old) | 07 / 2022 | Huawei MateBook 16s i7 i7-12700H, Iris Xe G7 96EUs | 2 kg | 17.8 mm | 16.00" | 2520x1680 |
案例
Swift Edge 16 Zen 4 乍一看可能与 Swift Edge 16 Zen 3+ 毫无二致,但仔细观察就会发现外观上的变化。首先,新版本集成了数字键盘,而 Zen 3+ 版本则没有。其次,第一排键盘按键上方的通风栅现在没有了,正面边缘现在是连续的,没有切口。后者是一个奇怪的变化,因为它导致盖子更难打开。
除此之外,该机型采用了同样光滑的镁合金和铝合金机身材料、同样的端口和位置,以及同样大小的点击式键盘。这次的尺寸只是稍宽一些,甚至更薄一些,但在实际使用中很难发现差异。
SD 读卡器
宏碁增加了一个 MicroSD 读卡器,而 Ryzen 7 7735U 配置中缺少这一功能。不过,传输速率比同类机型(如华硕 VivoBook Pro 16或三星Galaxy Book3 Ultra 16 等竞争机型的 SD 卡读卡器慢 3 倍左右。
| SD Card Reader | |
| average JPG Copy Test (av. of 3 runs) | |
| Lenovo Slim Pro 9i 16IRP8 (PNY EliteX-Pro60 V60 256 GB) | |
| Samsung Galaxy Book3 Ultra 16 (AV PRO microSD 128 GB V60) | |
| Asus VivoBook Pro 16 (AV Pro SD microSD 128 GB V60) | |
| Acer Swift Edge SFE16 Ryzen 7 7840U (AV Pro V60) | |
| maximum AS SSD Seq Read Test (1GB) | |
| Lenovo Slim Pro 9i 16IRP8 (PNY EliteX-Pro60 V60 256 GB) | |
| Samsung Galaxy Book3 Ultra 16 (AV PRO microSD 128 GB V60) | |
| Asus VivoBook Pro 16 (AV Pro SD microSD 128 GB V60) | |
| Acer Swift Edge SFE16 Ryzen 7 7840U (AV Pro V60) | |
交流
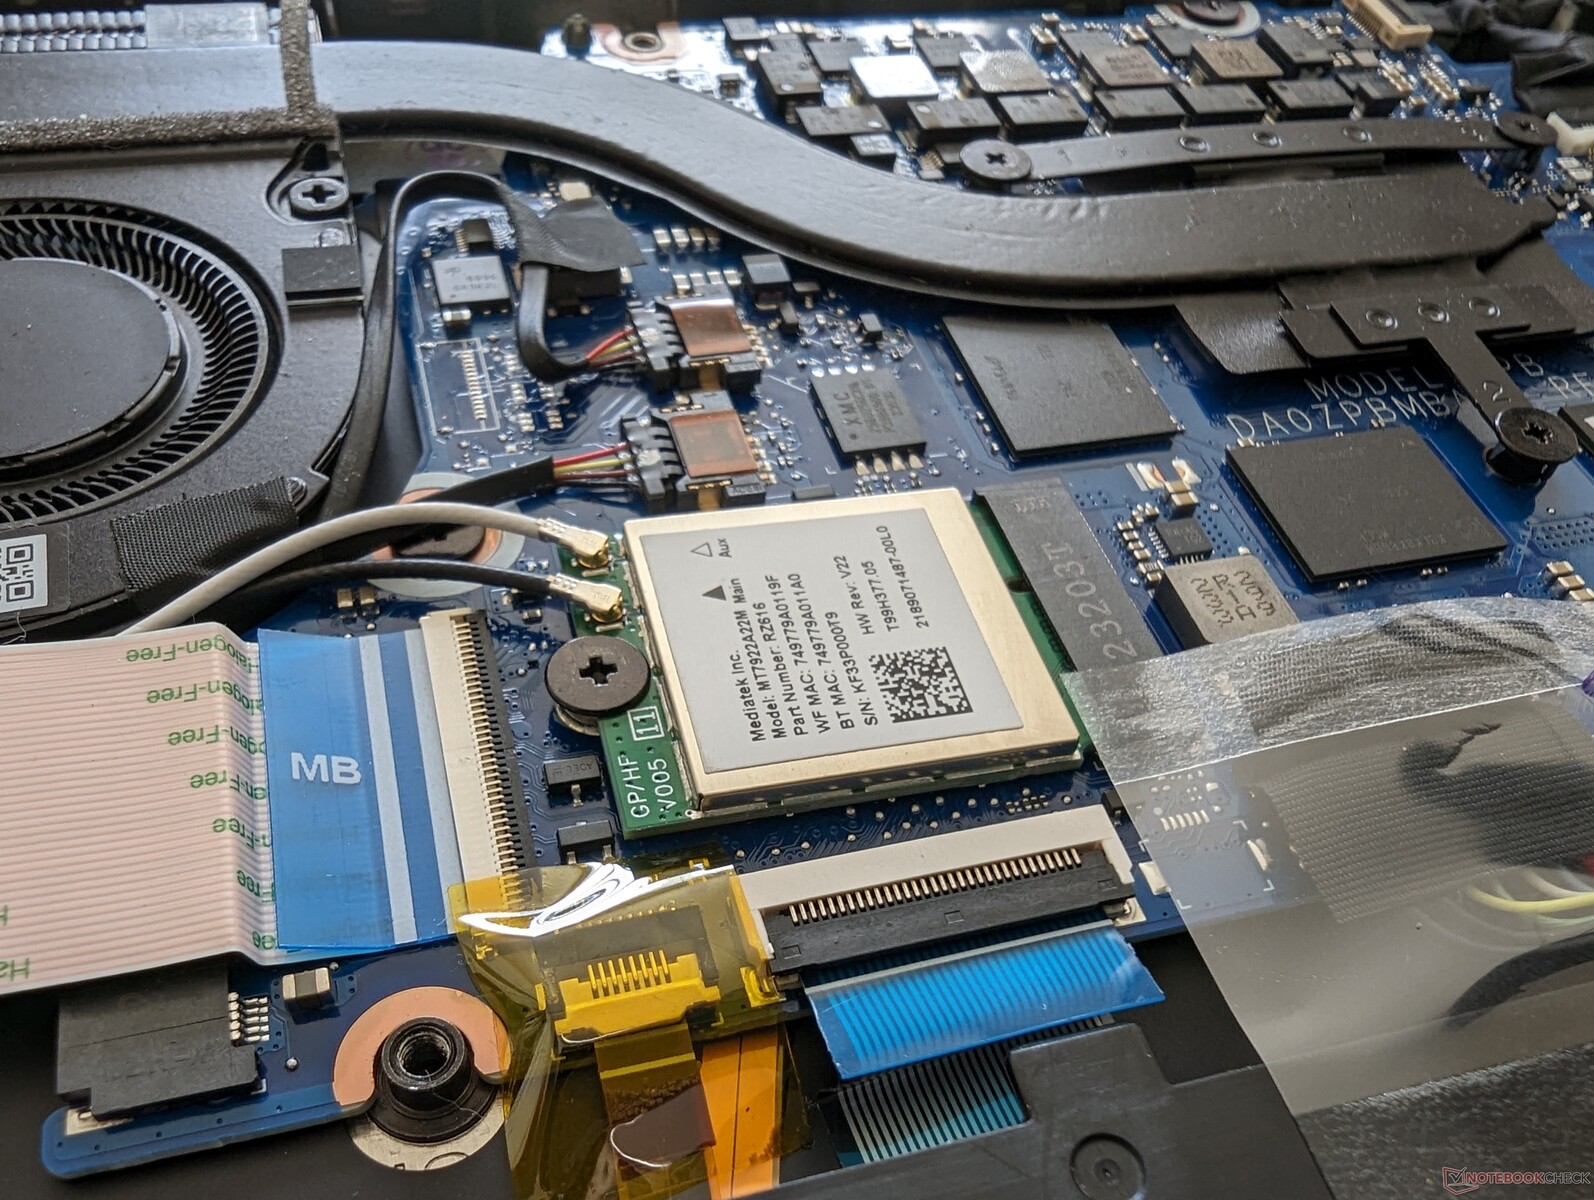
使用 Wi-Fi 6 时,联发科模块的传输速度异常缓慢,这与我们在 Zen 3+ 配置上观察到的情况类似。与华硕 AXE11000 6 GHz 网络配对时,Wi-Fi 6E 的速度则非常出色。
网络摄像头
网络摄像头的有效像素为 370 万像素,最高可录制 1440p30 的画面,比 Zen 3+ 配置的 210 万像素和 1080p30 的录制画面要高,画面清晰度略高。
但仍然没有内置网络摄像头隐私快门,也不支持红外功能。


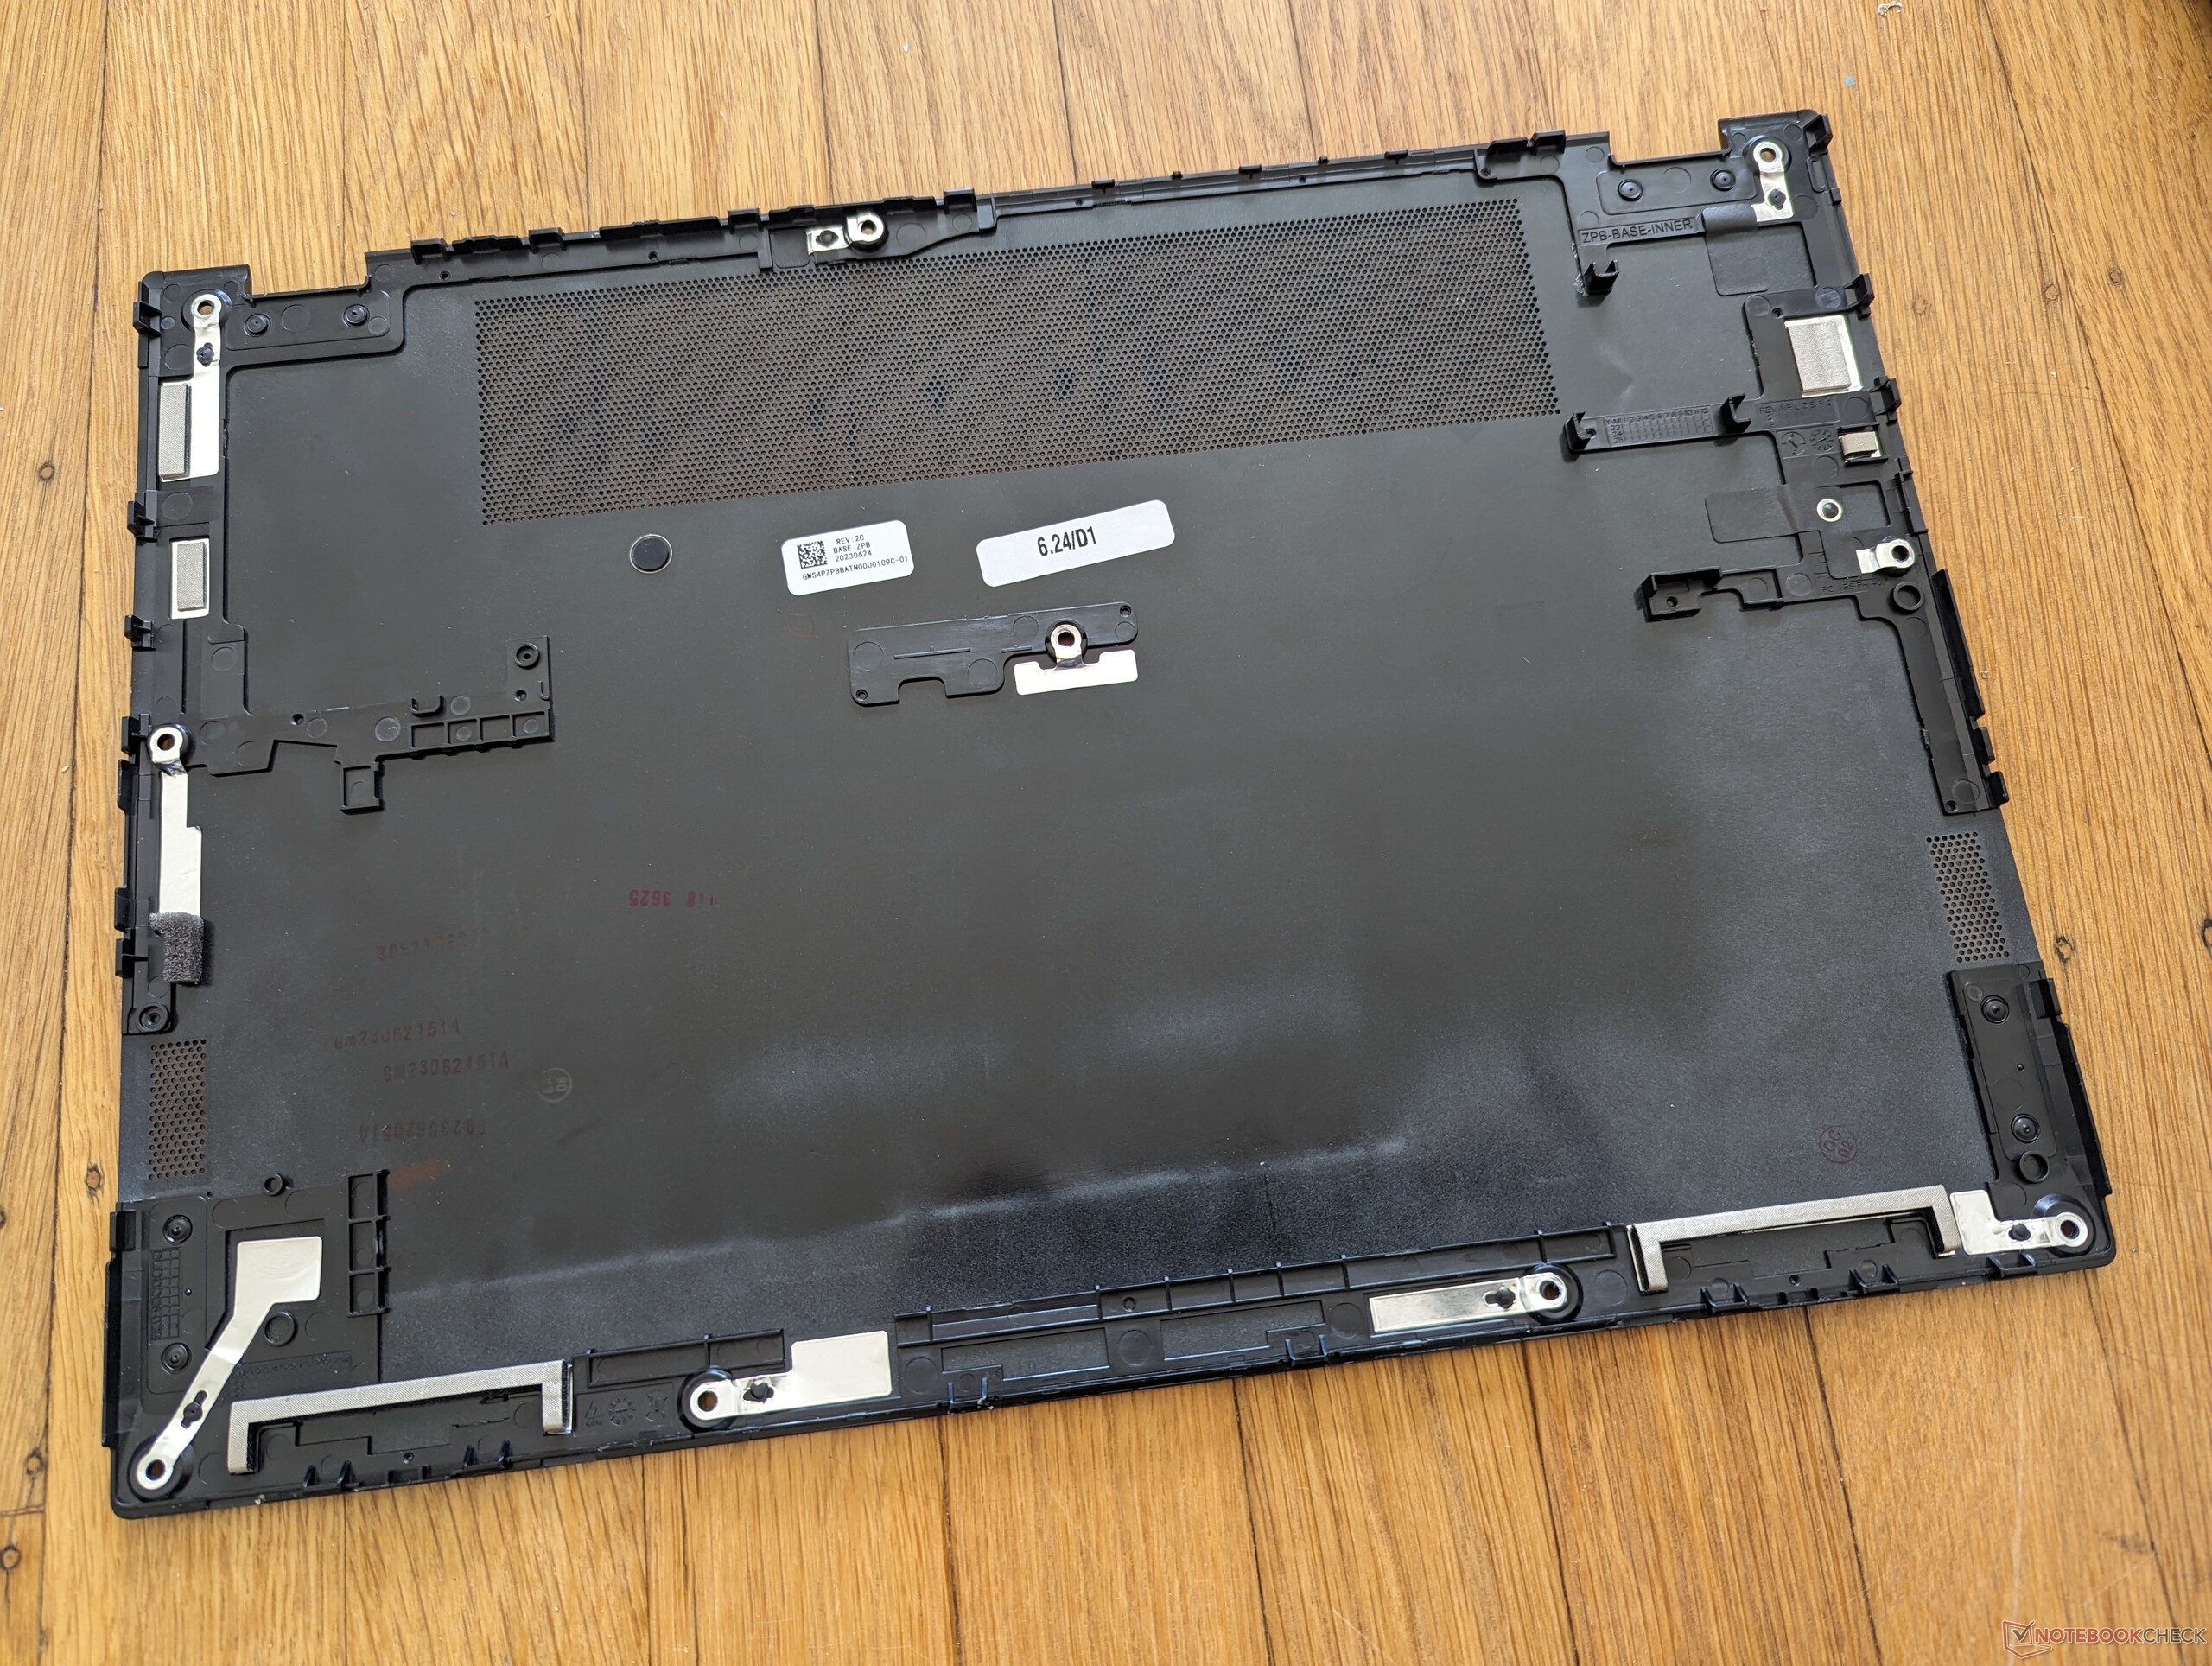
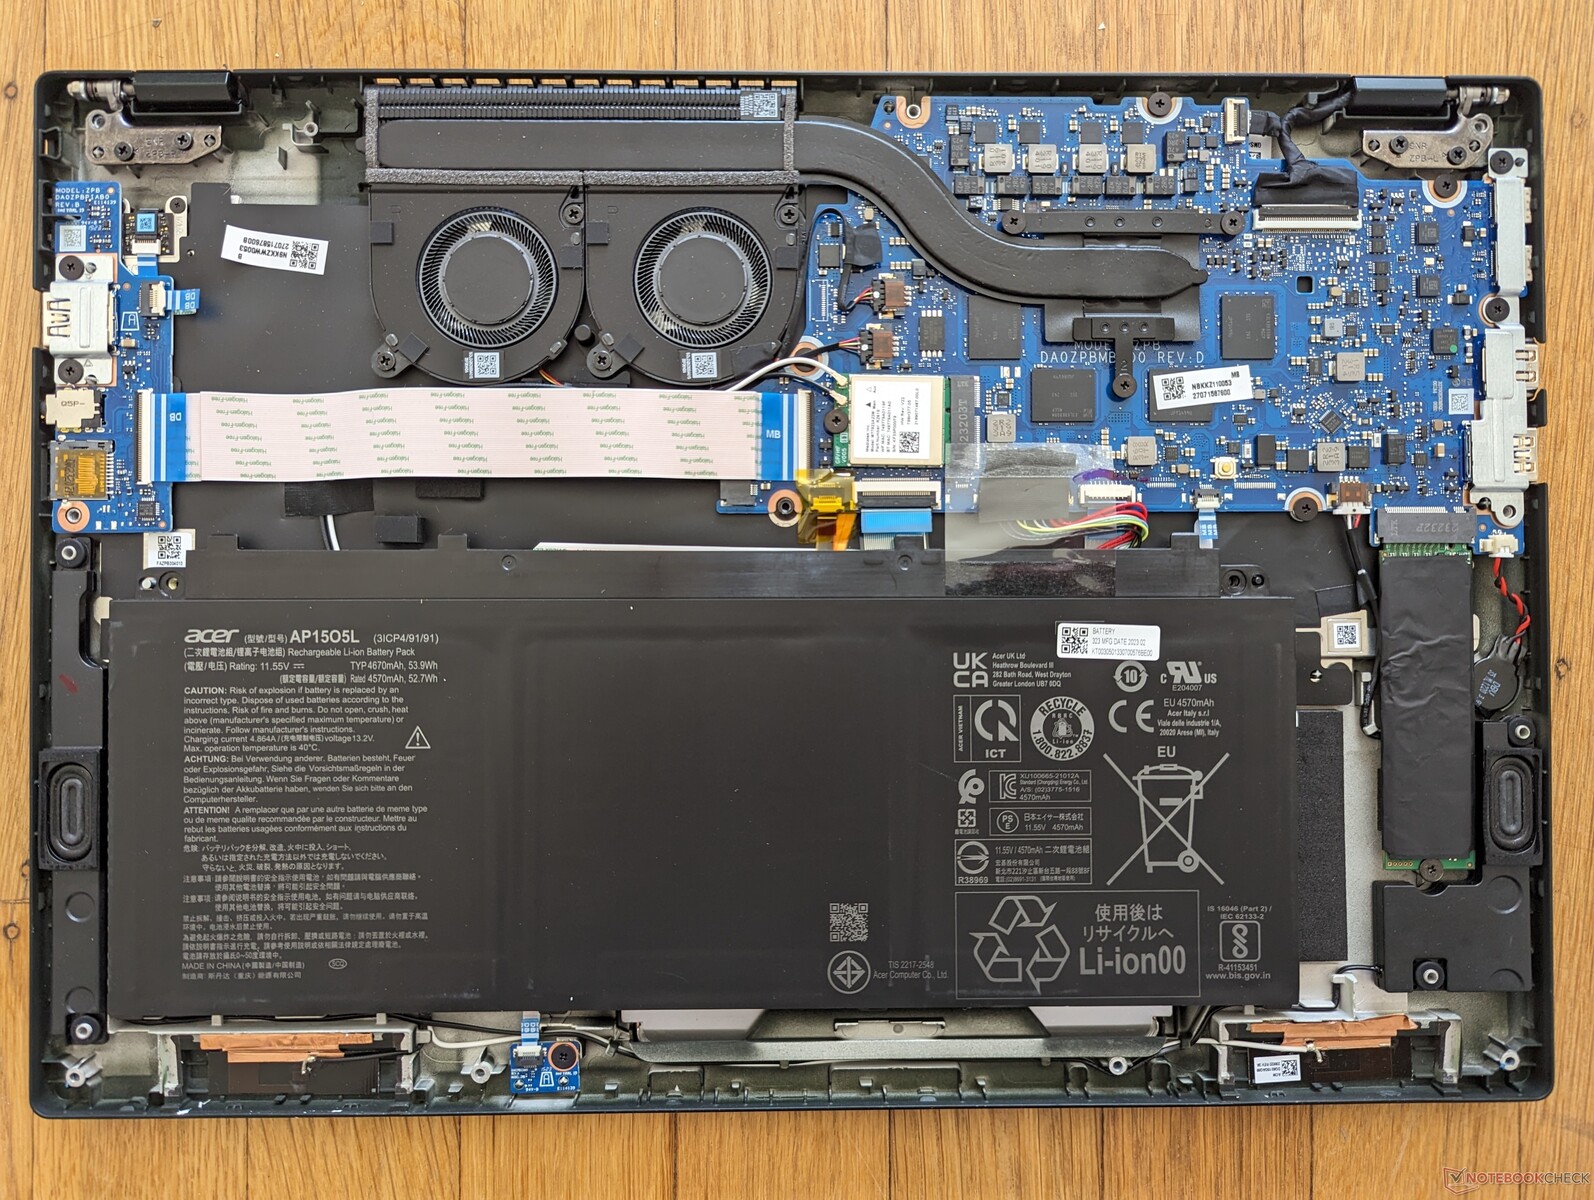
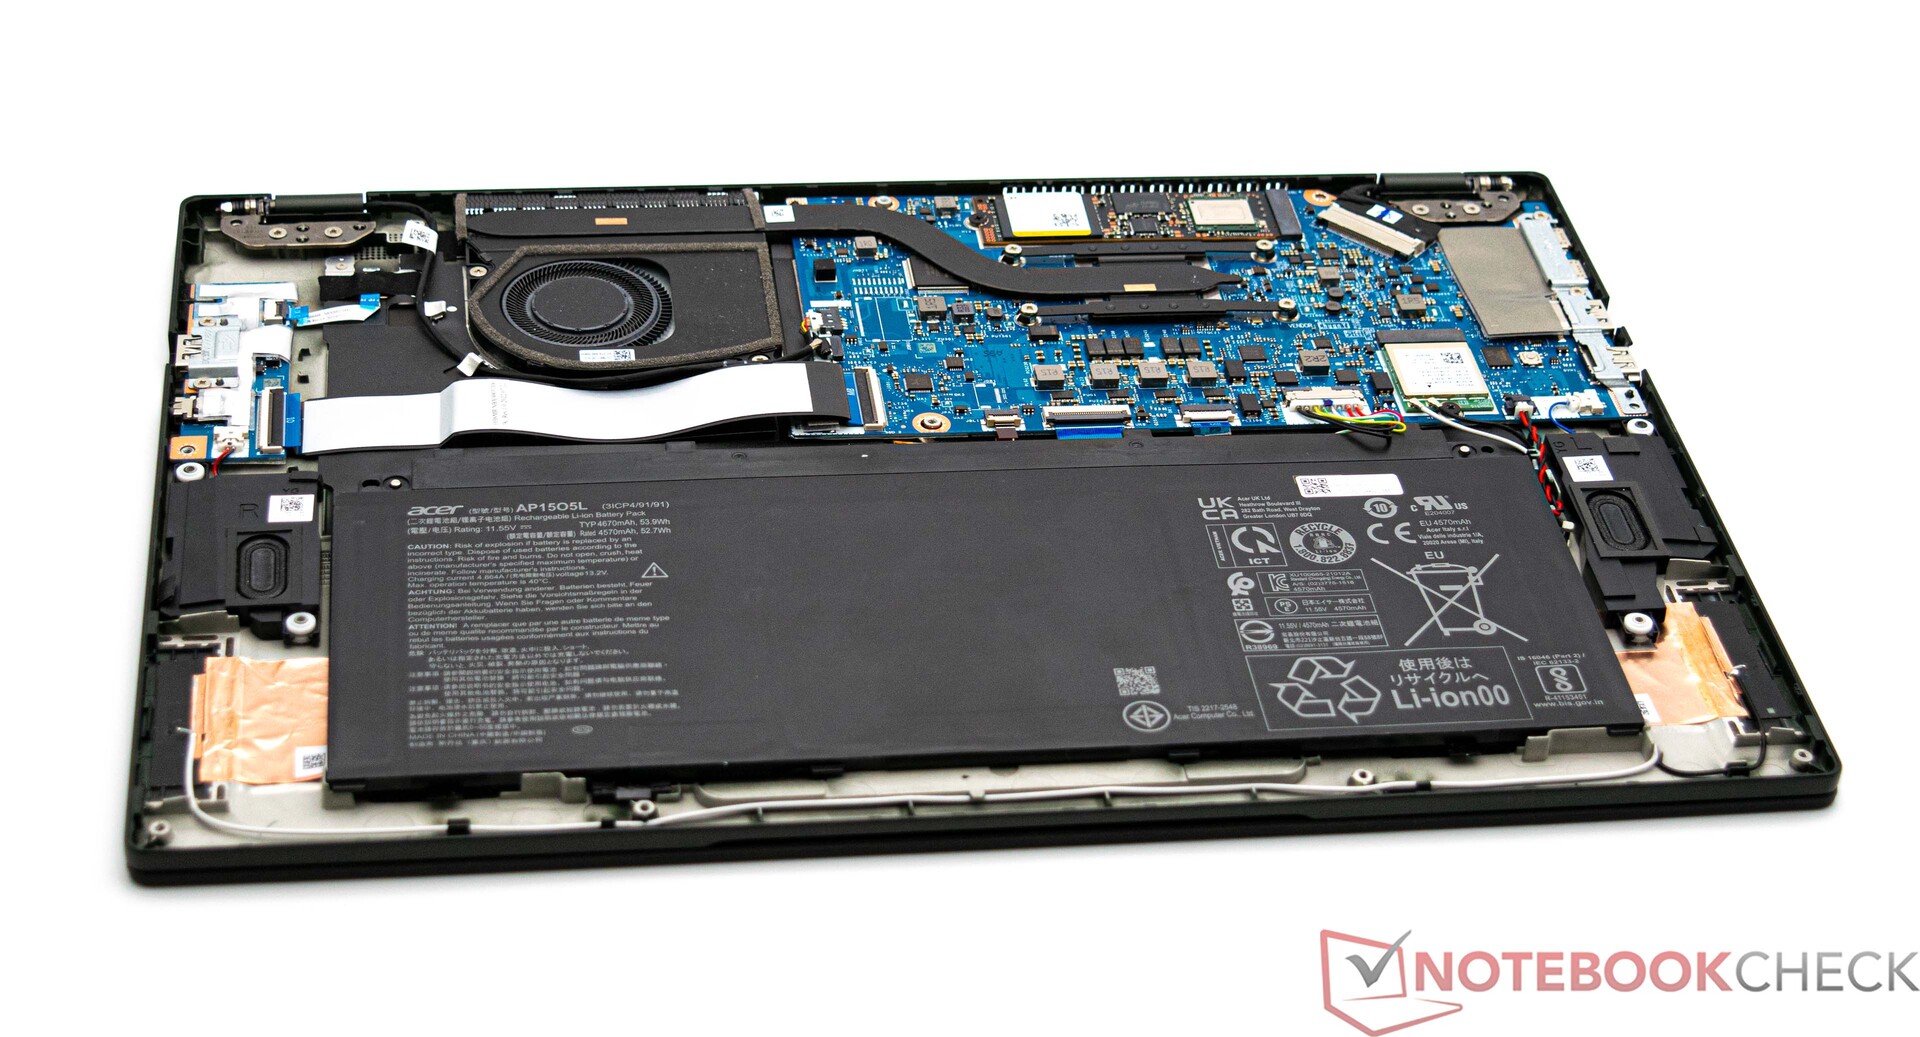
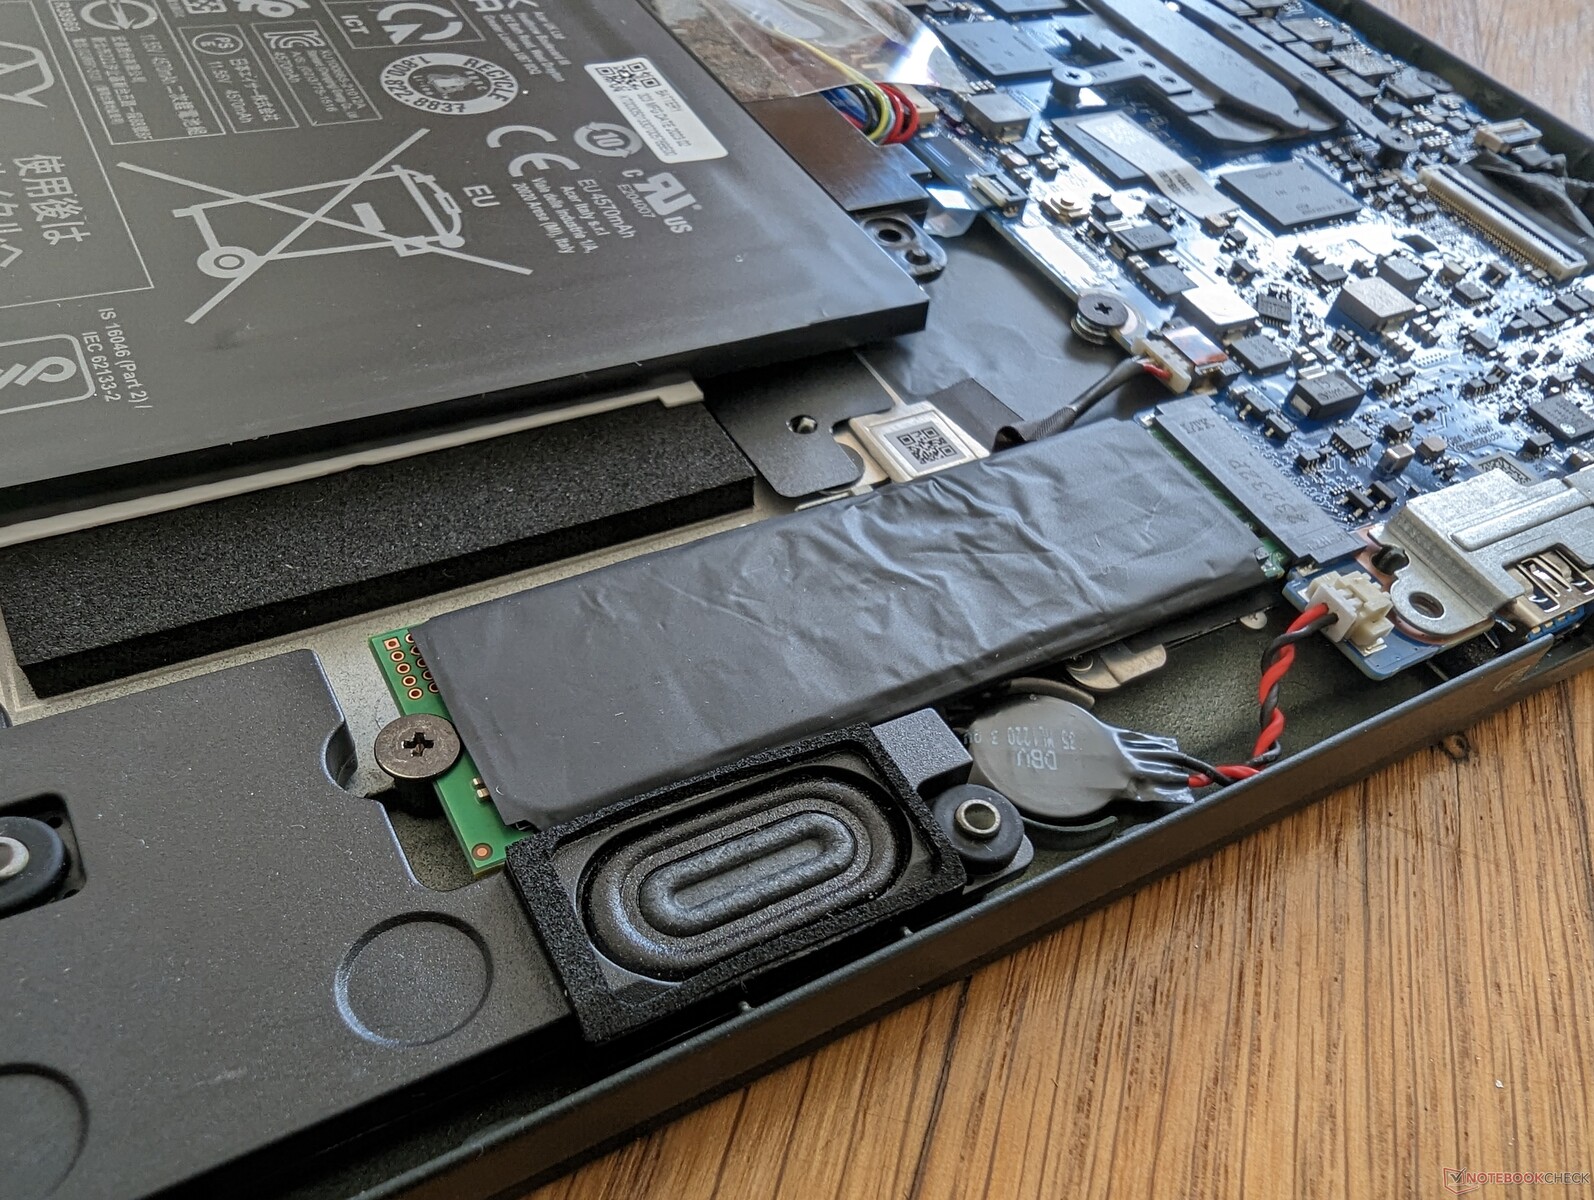
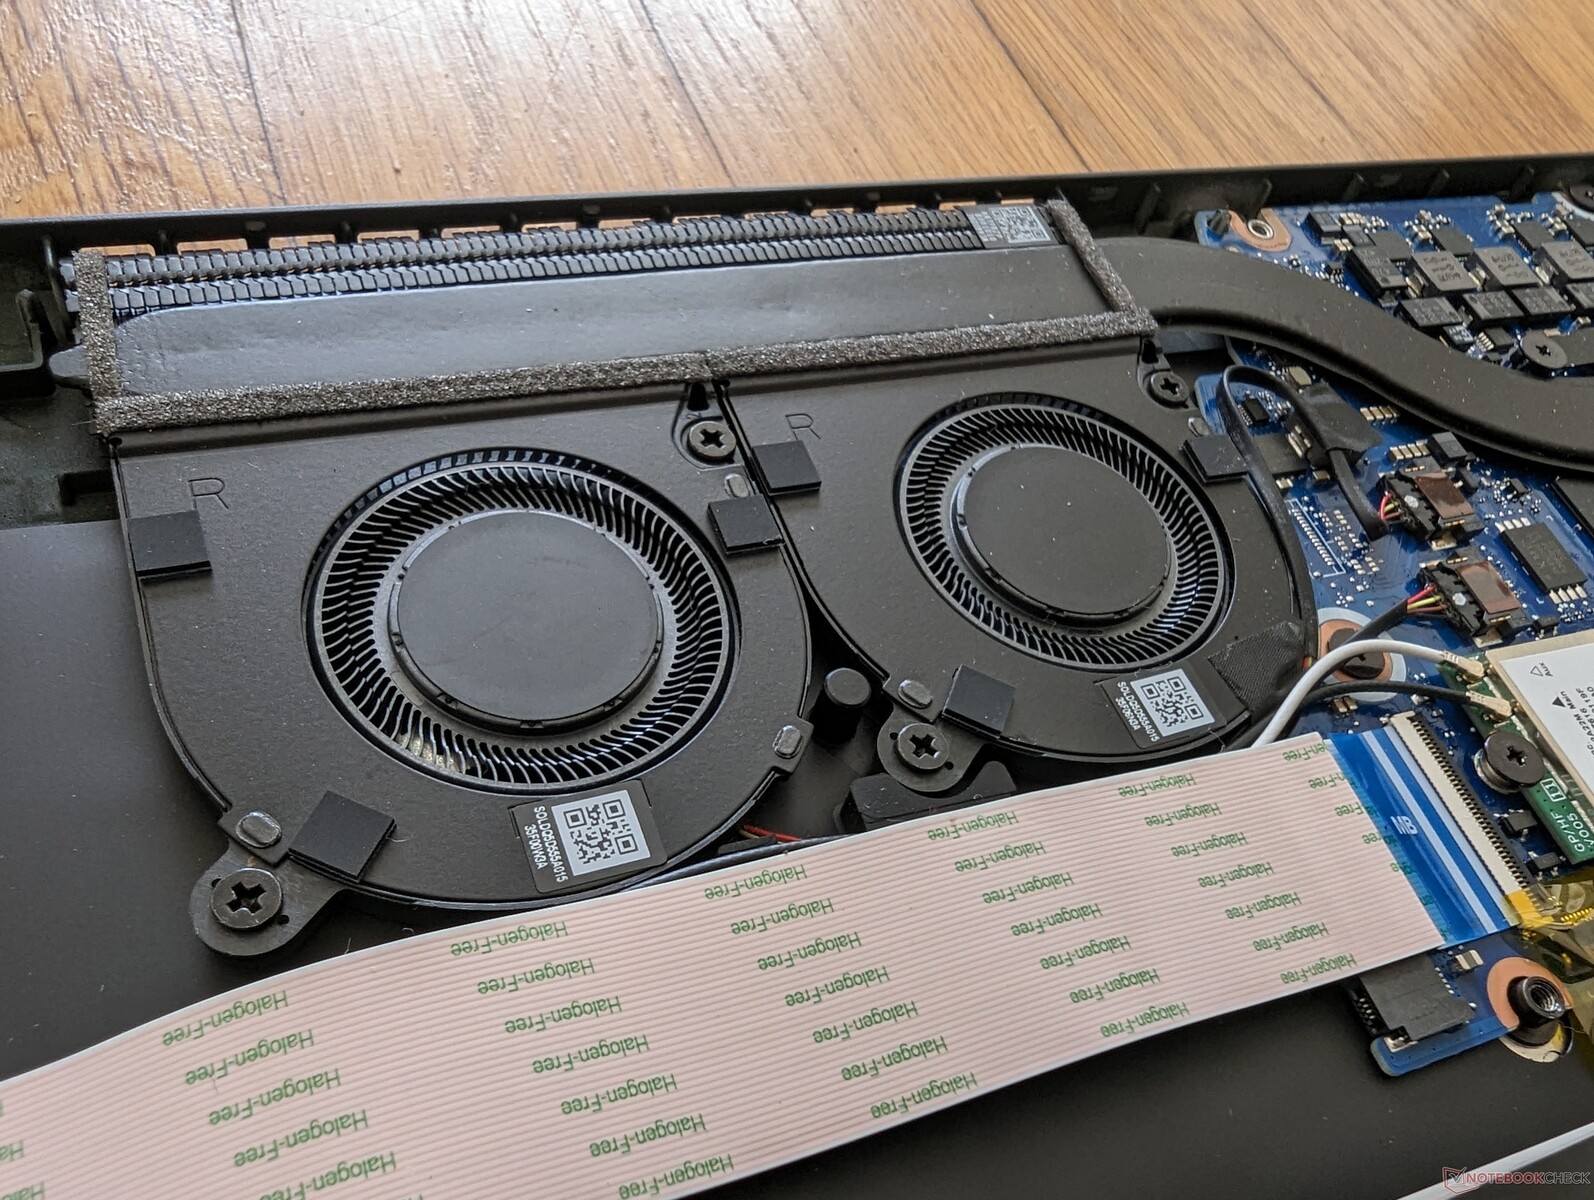
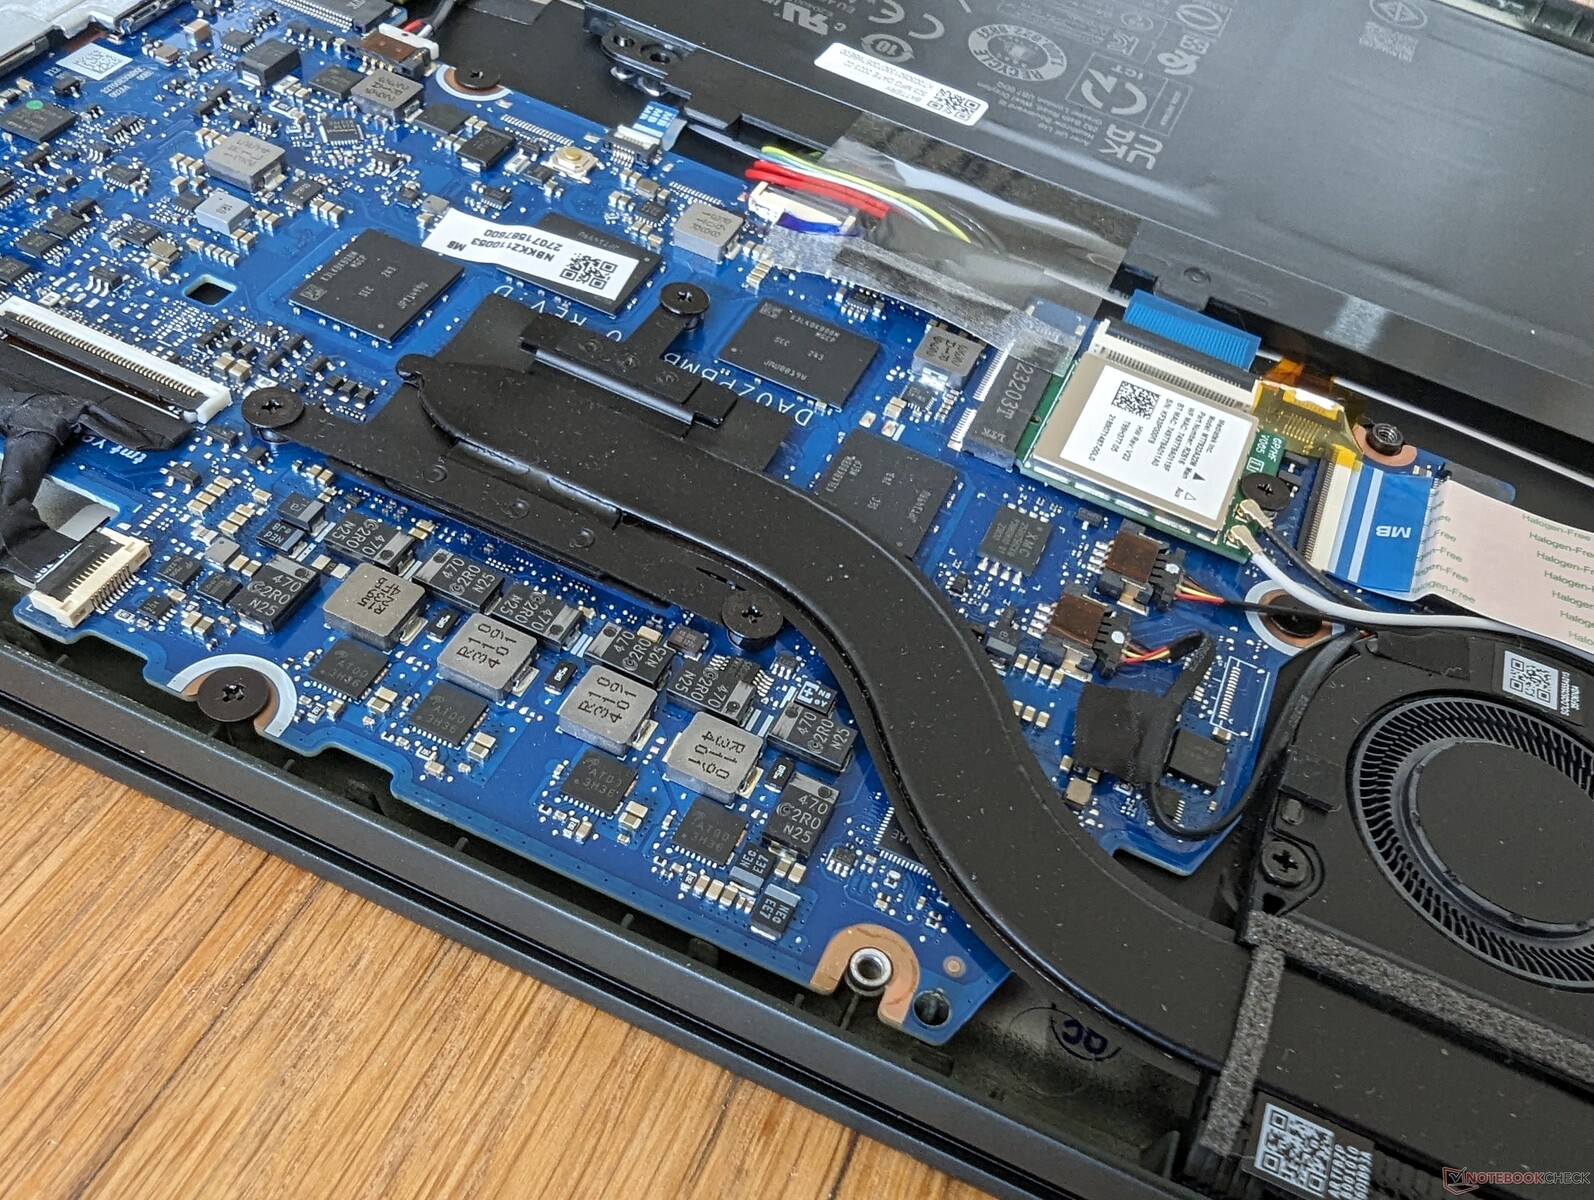
维护
使用梅花扳手可以轻松打开底部面板。如下图所示,Zen 3+ 和 Zen 4 两款机型的风扇和主板发生了很大变化。例如,固态硬盘现在位于电池组旁边。
配件和保修
包装盒内除了文件和交流适配器外没有其他附件。如果在美国购买,制造商提供一年有限保修。
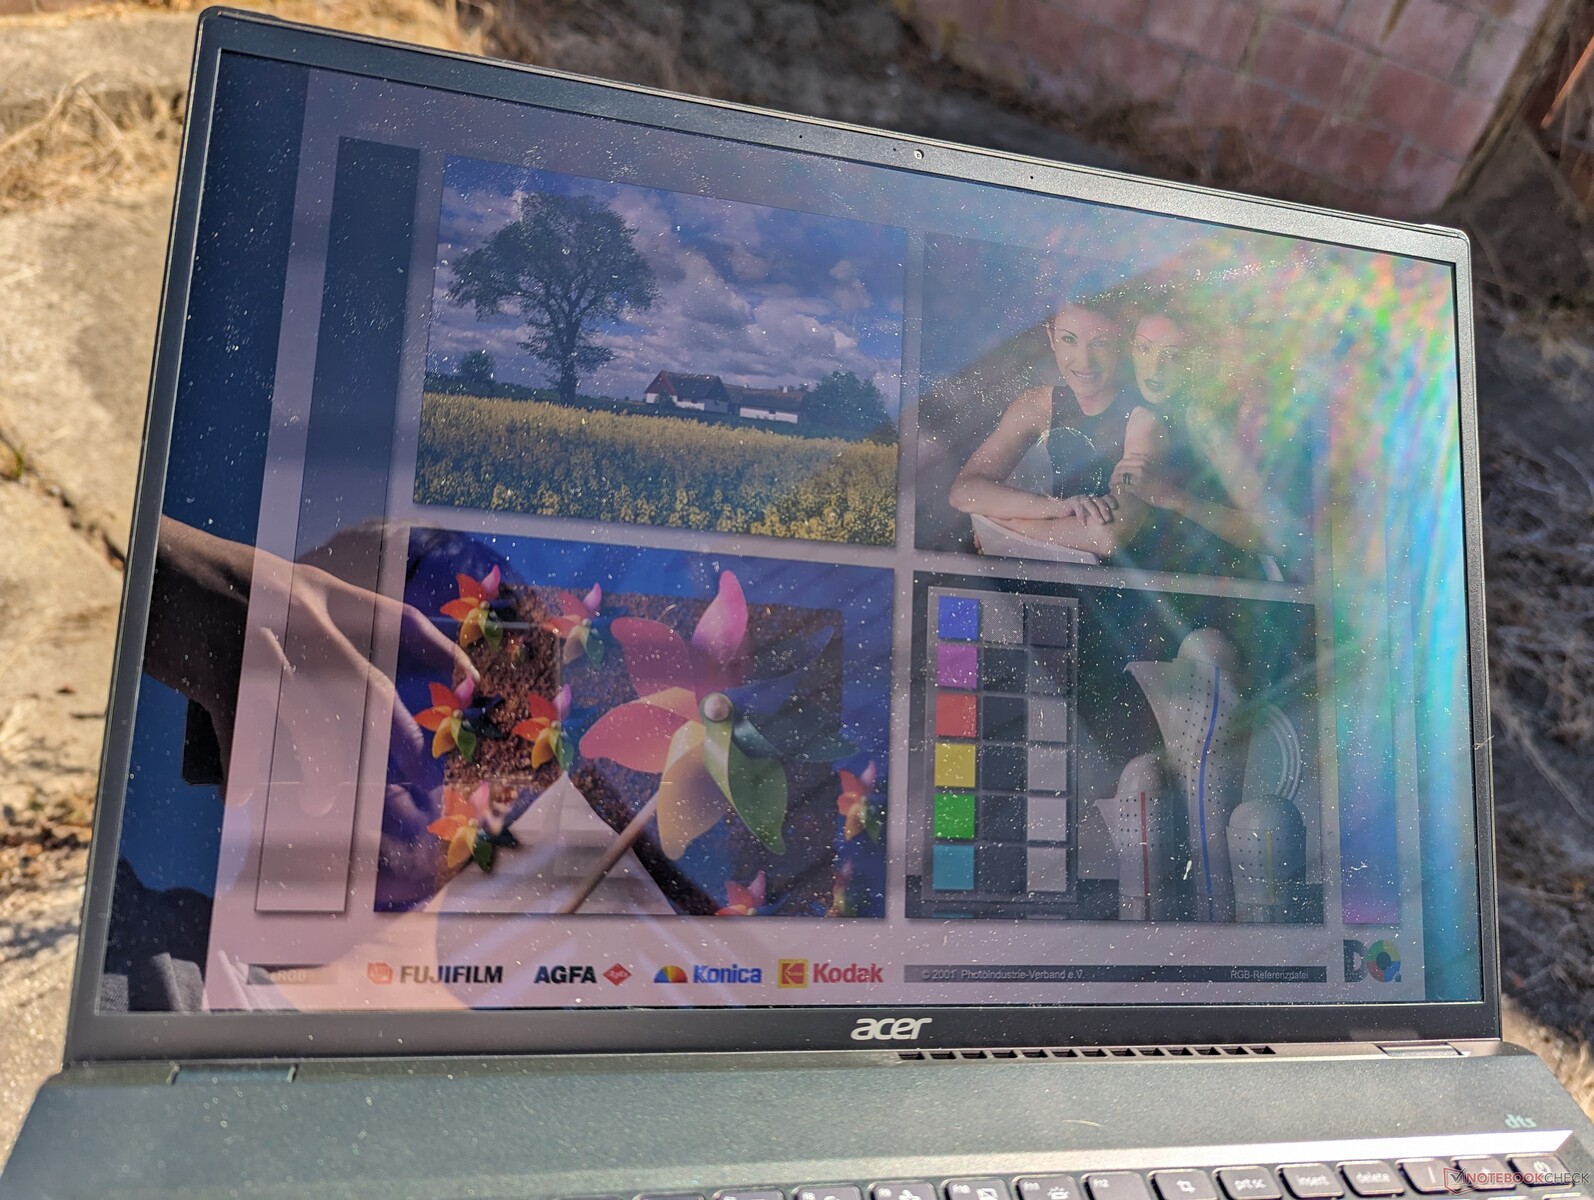
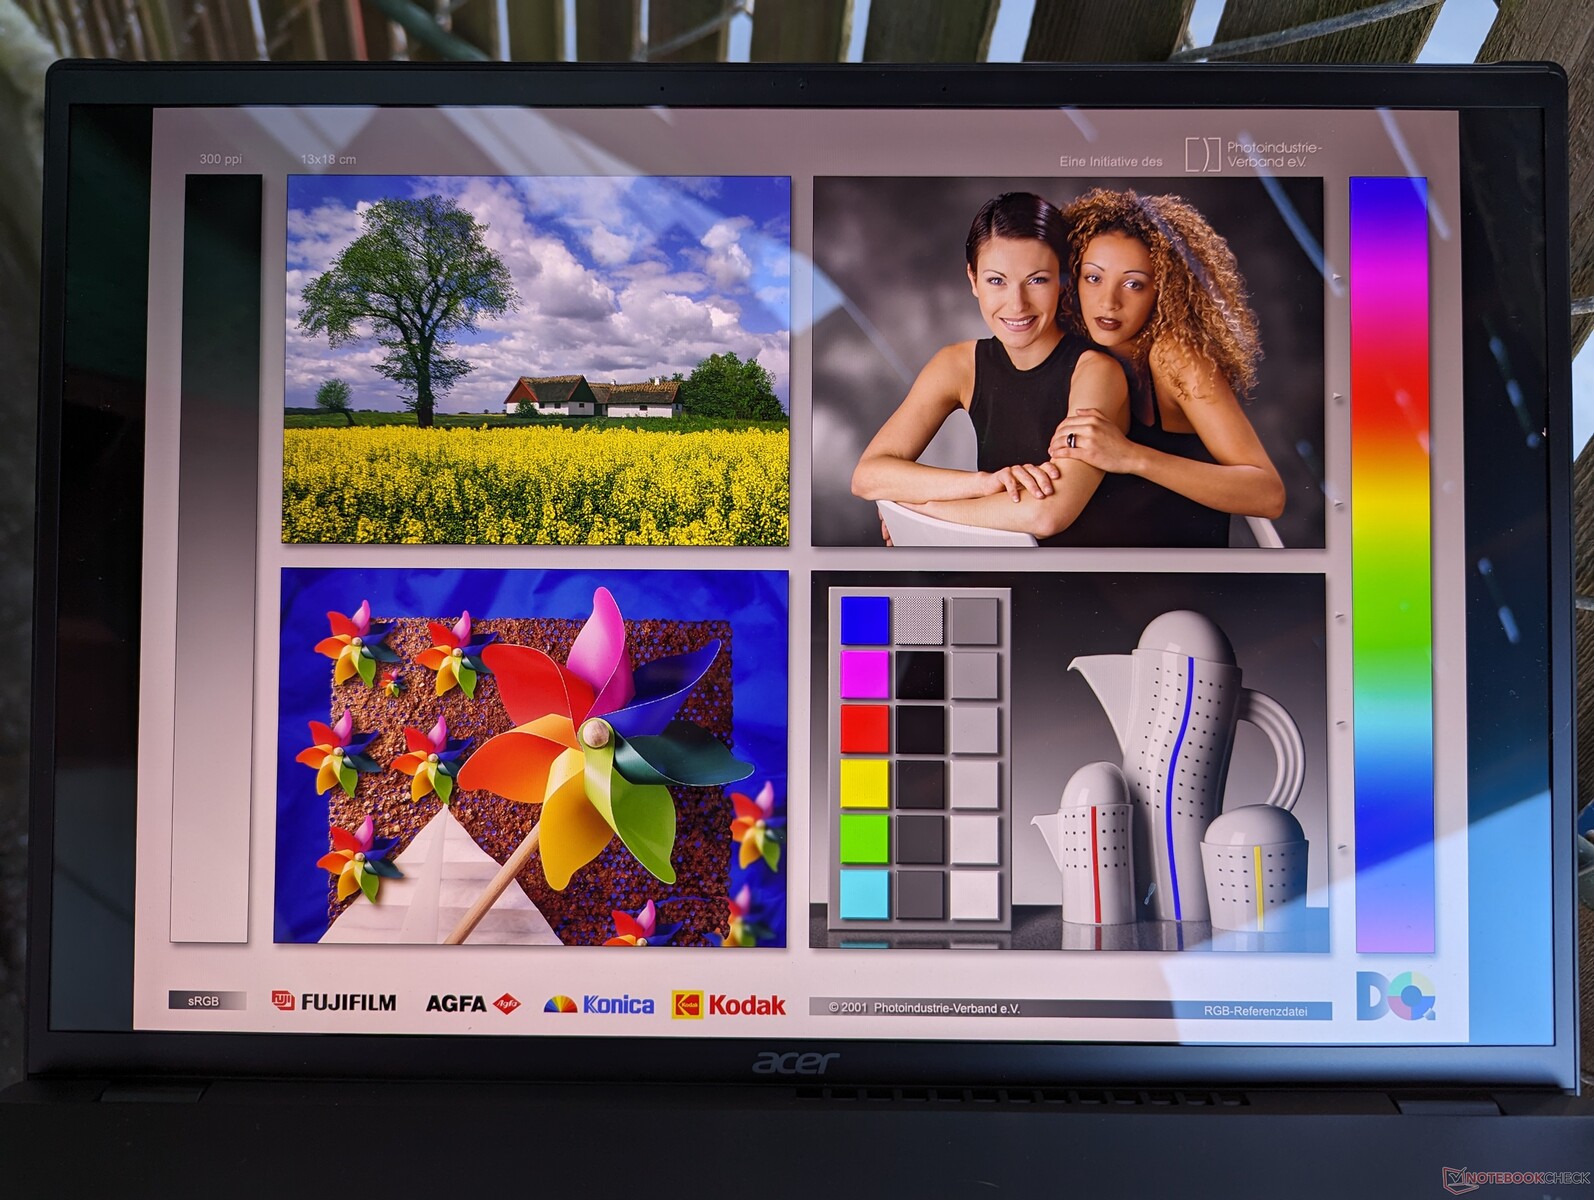
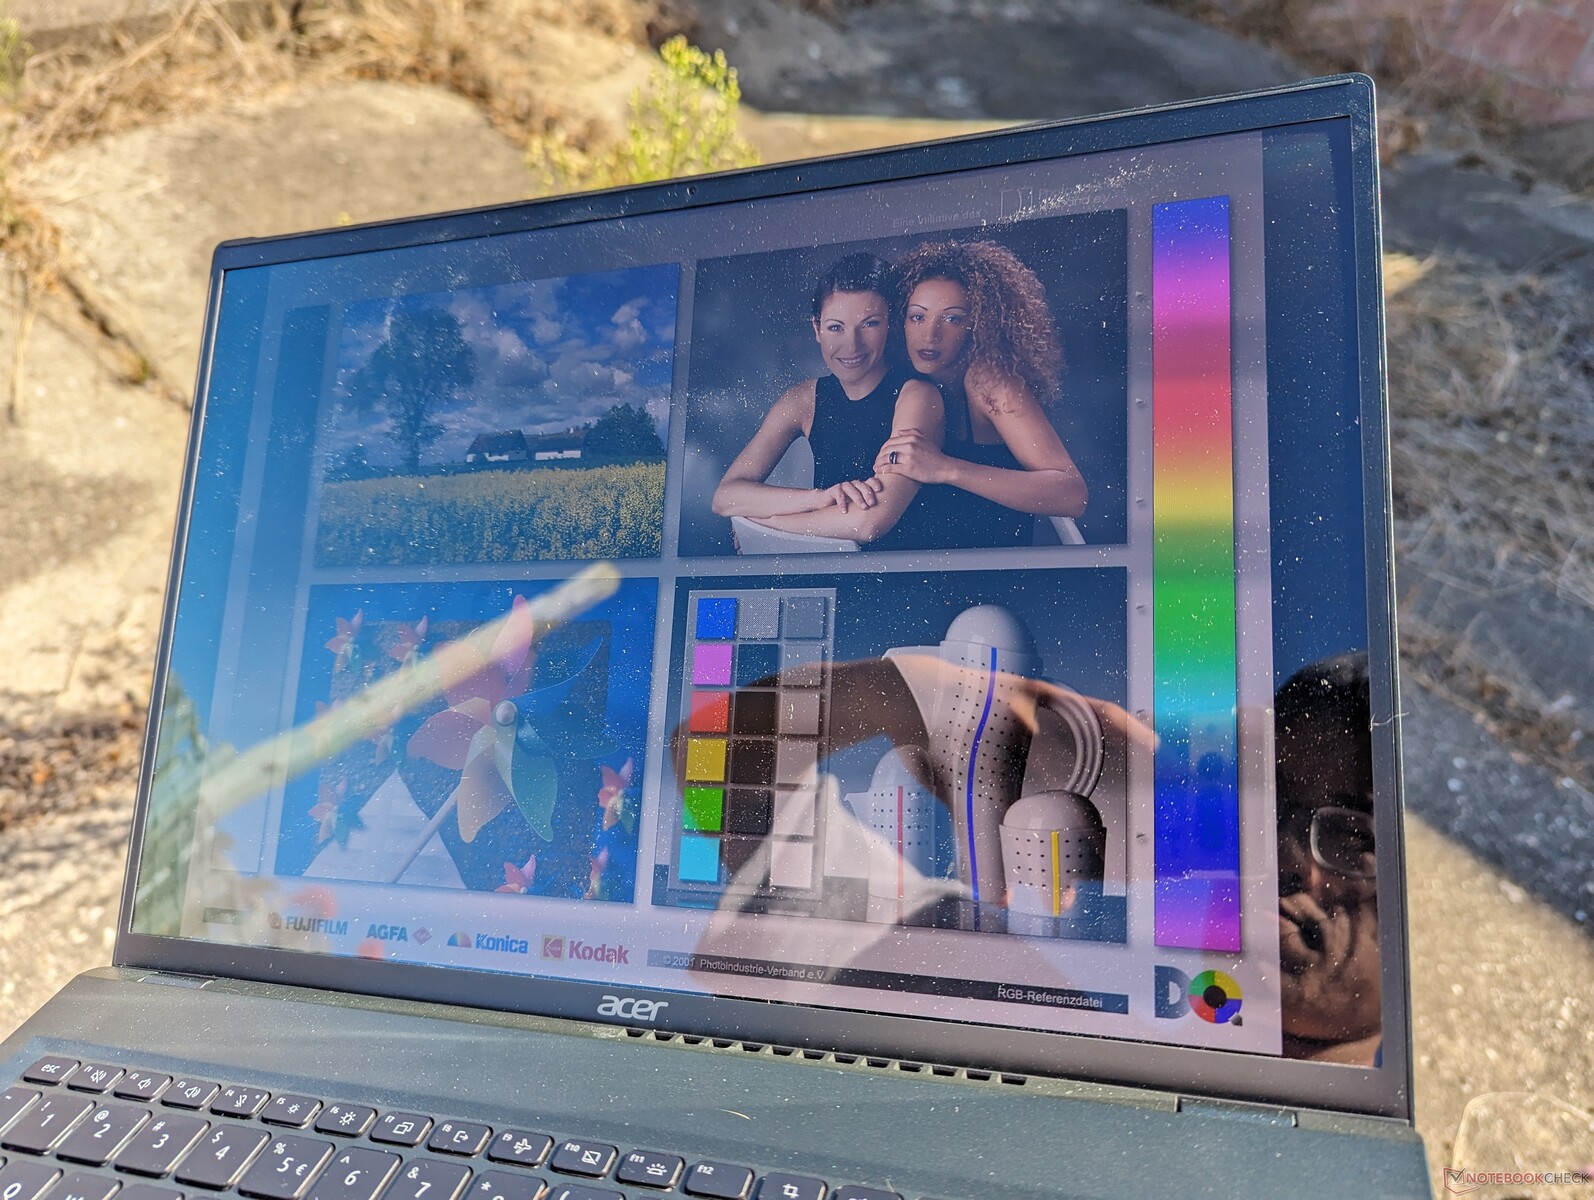
显示屏
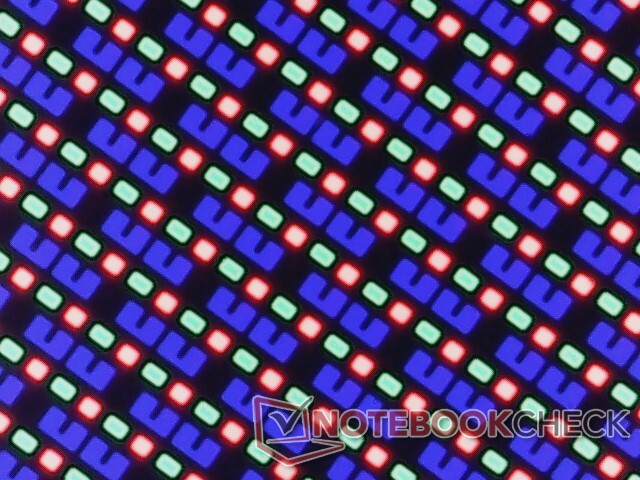
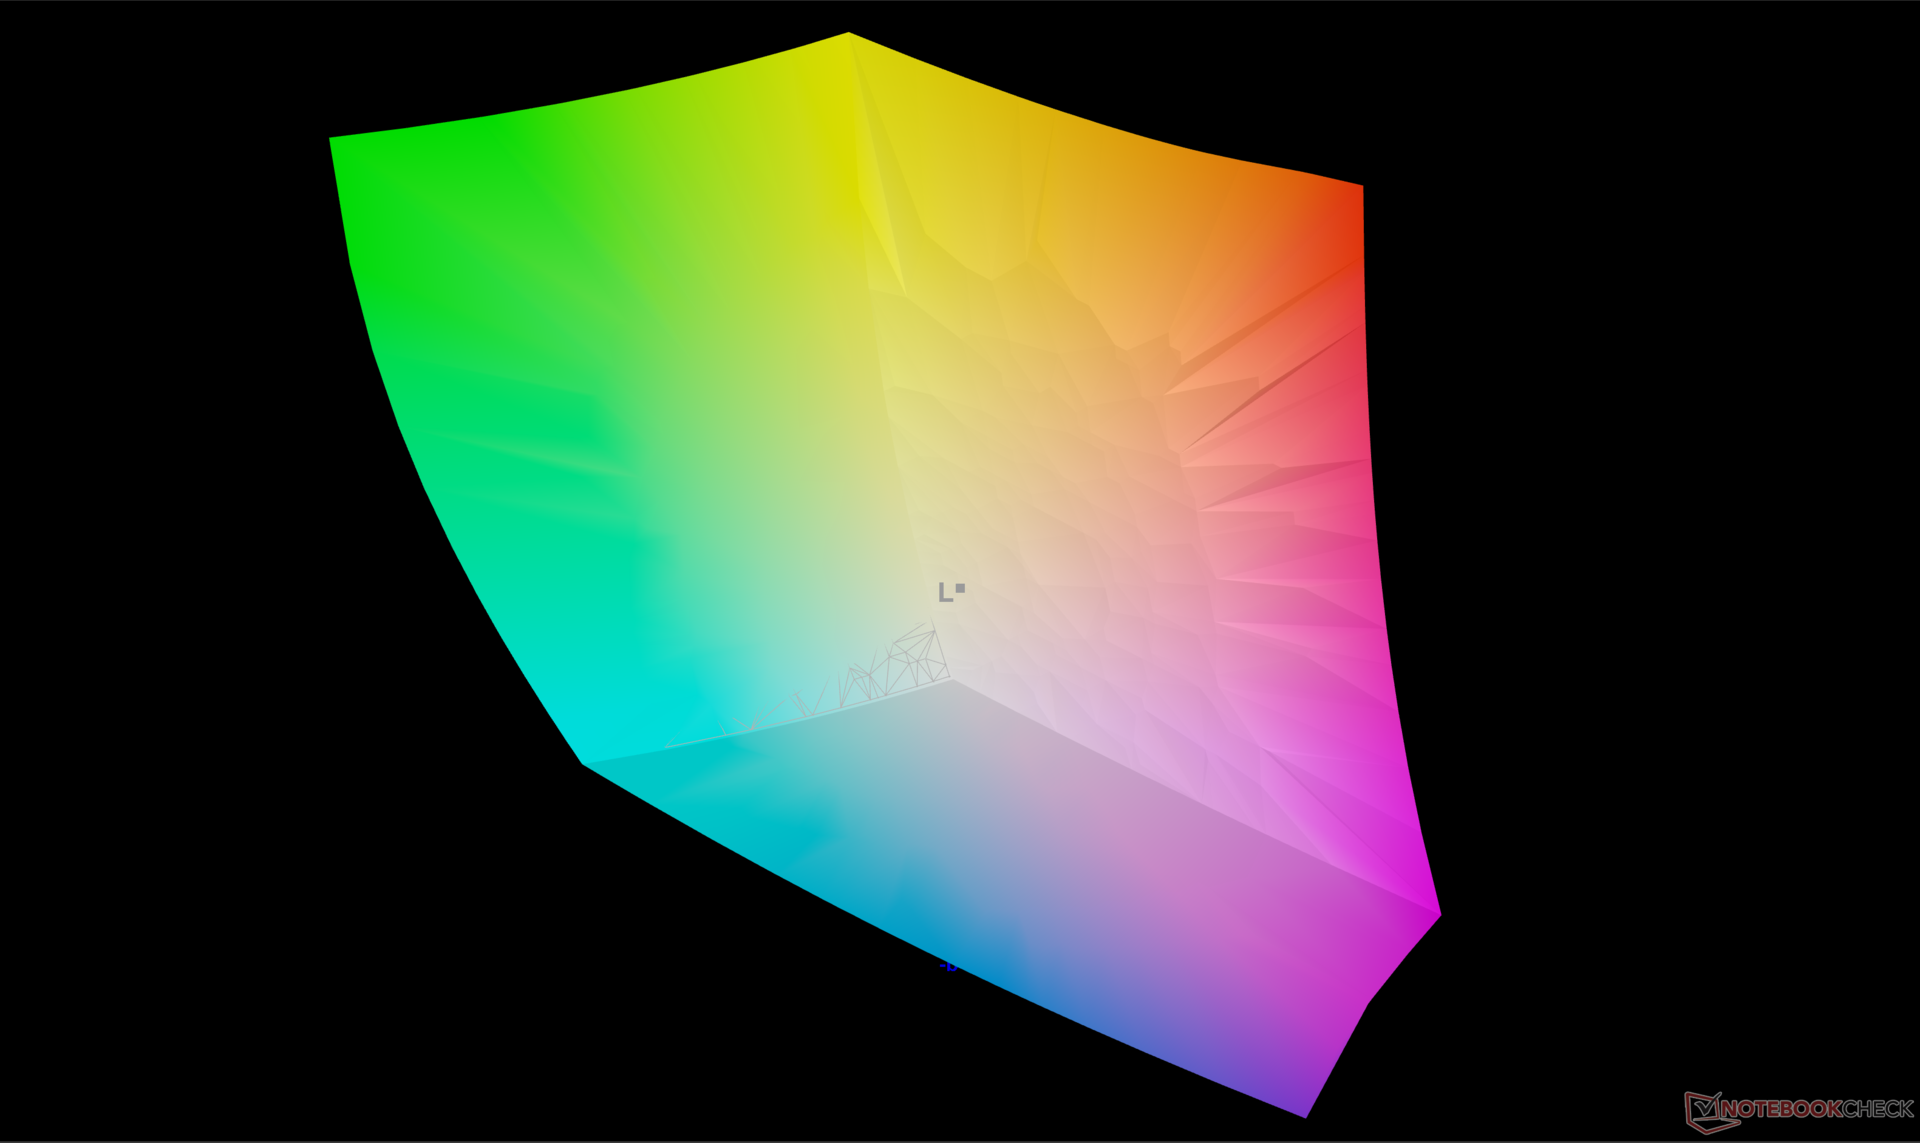
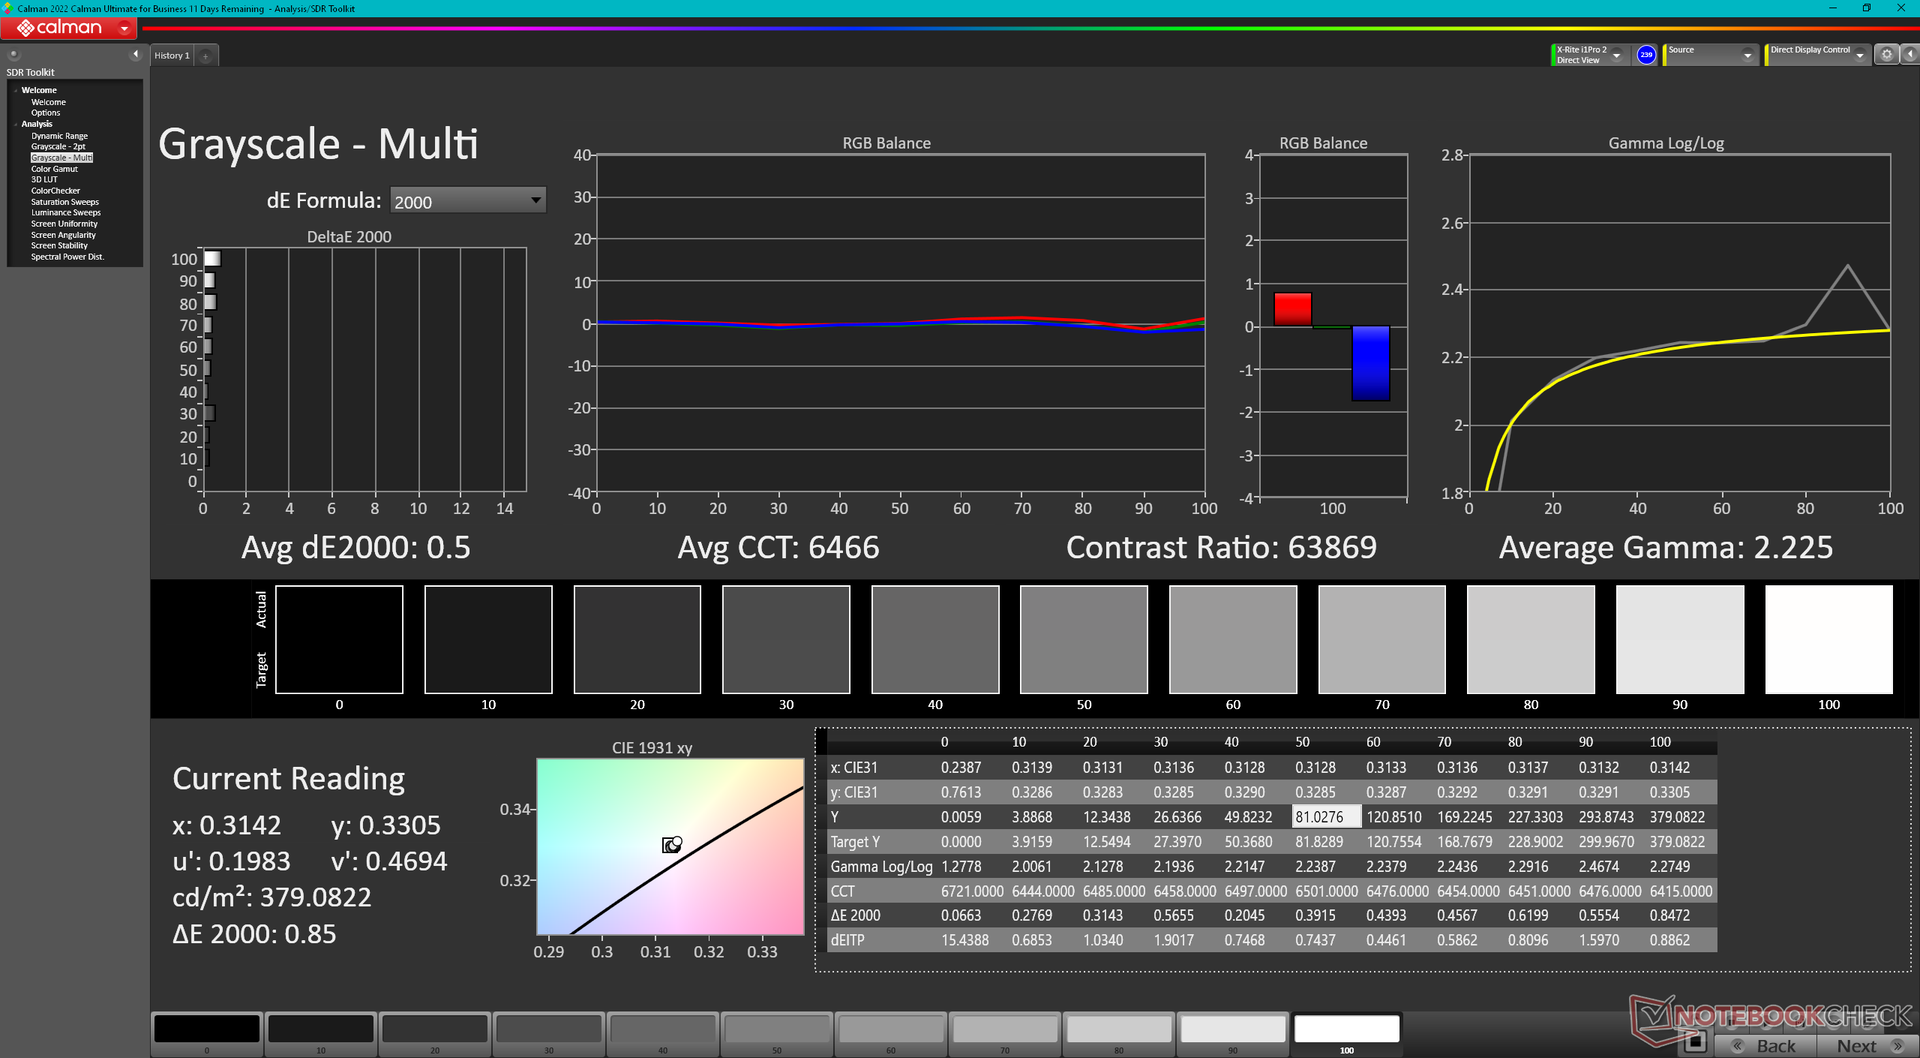
我们的设备配备的是 3200 x 2000 120 Hz OLED 显示屏,而不是我们之前评测的 Zen 3+ Swift Edge 16 上的 3840 x 2400 60 Hz OLED 显示屏。这两款三星面板的色彩覆盖率、亮度、黑度和响应时间都非常接近。对于 Excel 或并排多任务窗口等某些应用来说,高分辨率可能更有用,但一旦习惯了低分辨率 3.2K 显示屏更快的 120 Hz 刷新率,就很难再使用 60 Hz 显示屏了。对于游戏而言,120 Hz 显示屏意味着你可以将目标锁定在 40 FPS 而不是 30 FPS,而无需担心屏幕撕裂。
| |||||||||||||||||||||||||
Brightness Distribution: 98 %
Center on Battery: 379.8 cd/m²
Contrast: ∞:1 (Black: 0 cd/m²)
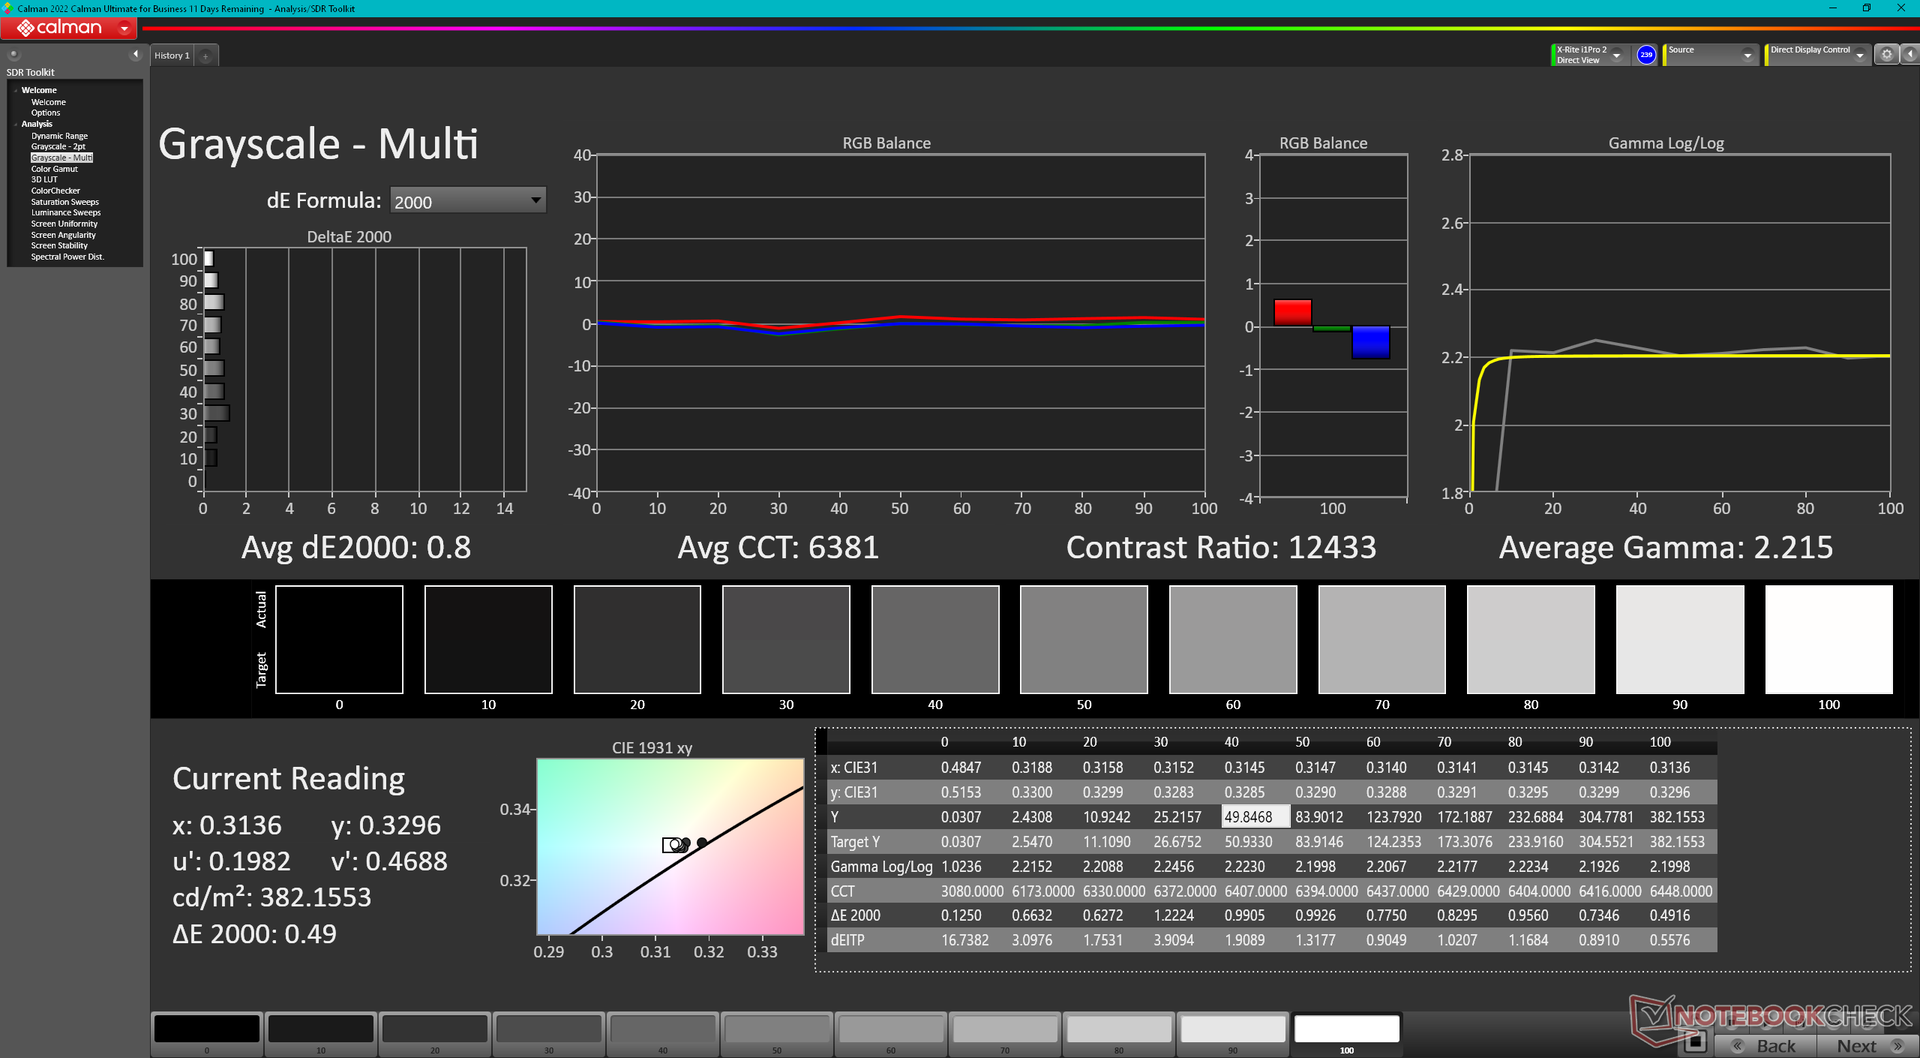
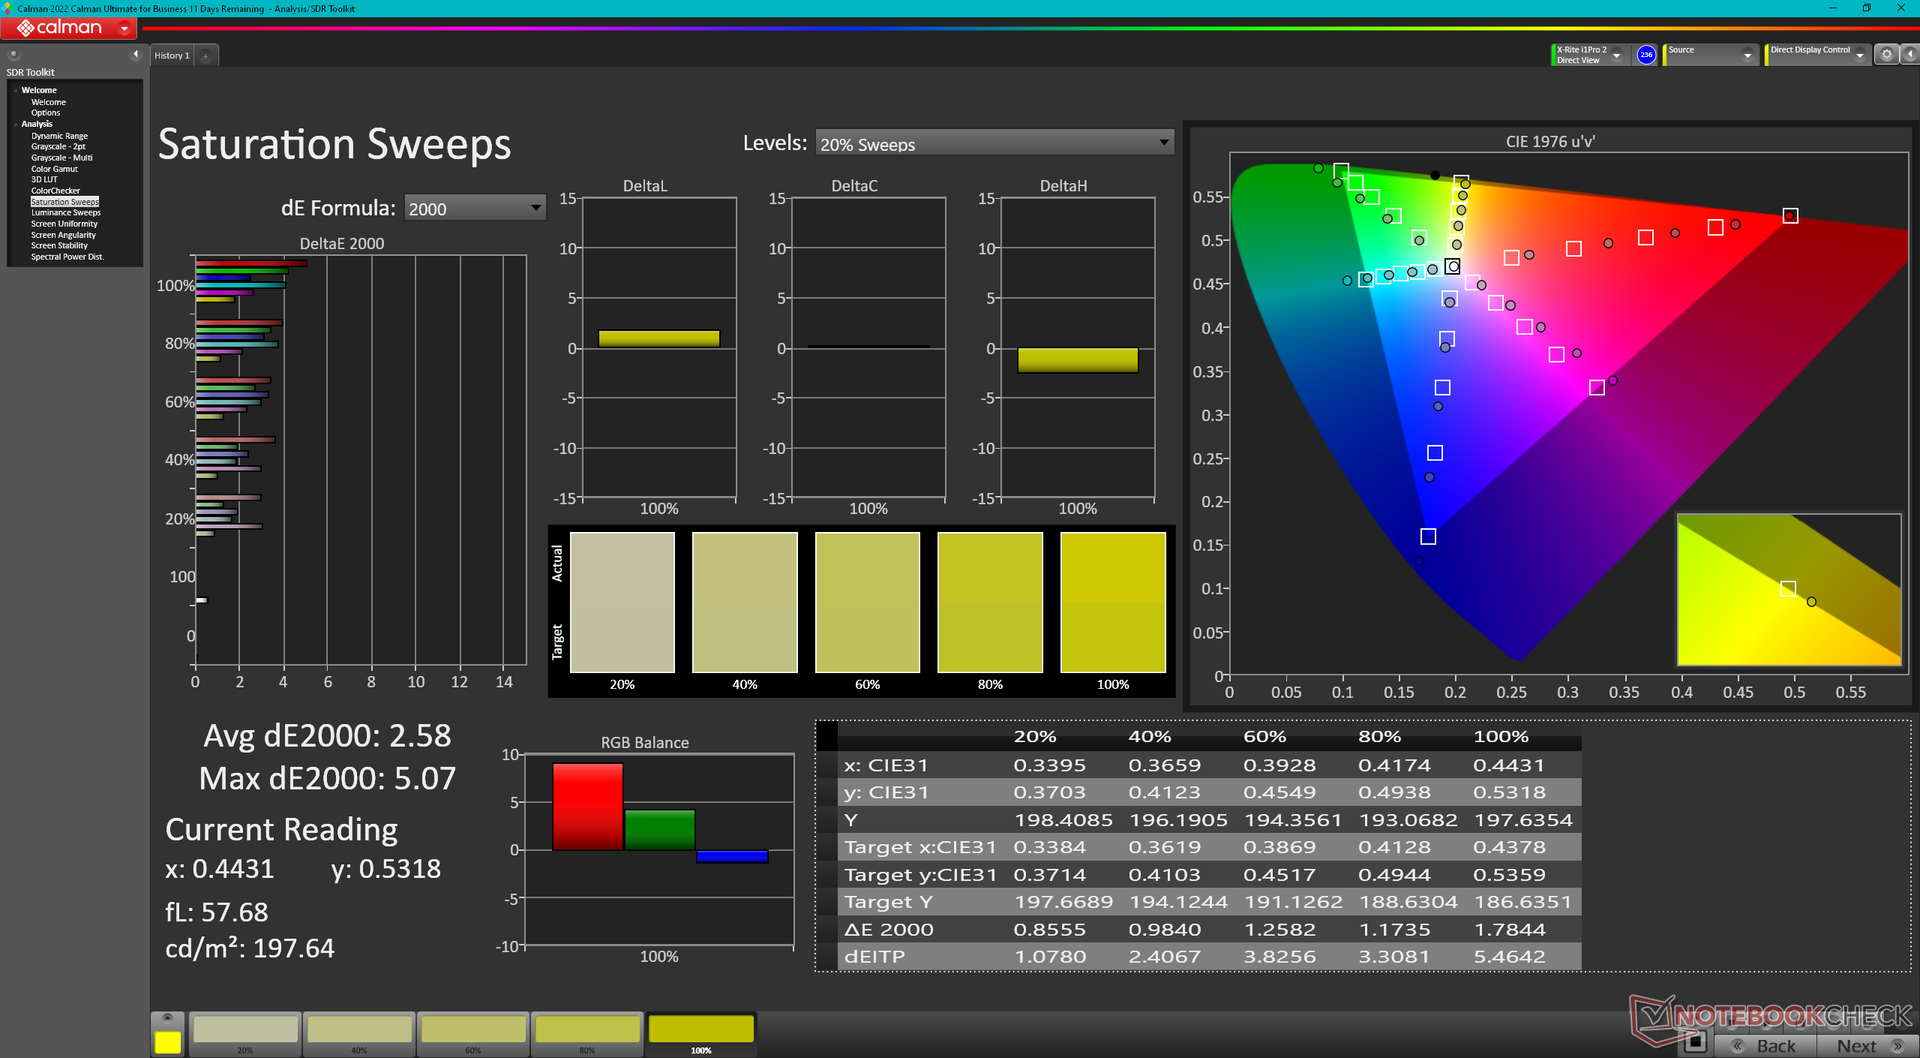
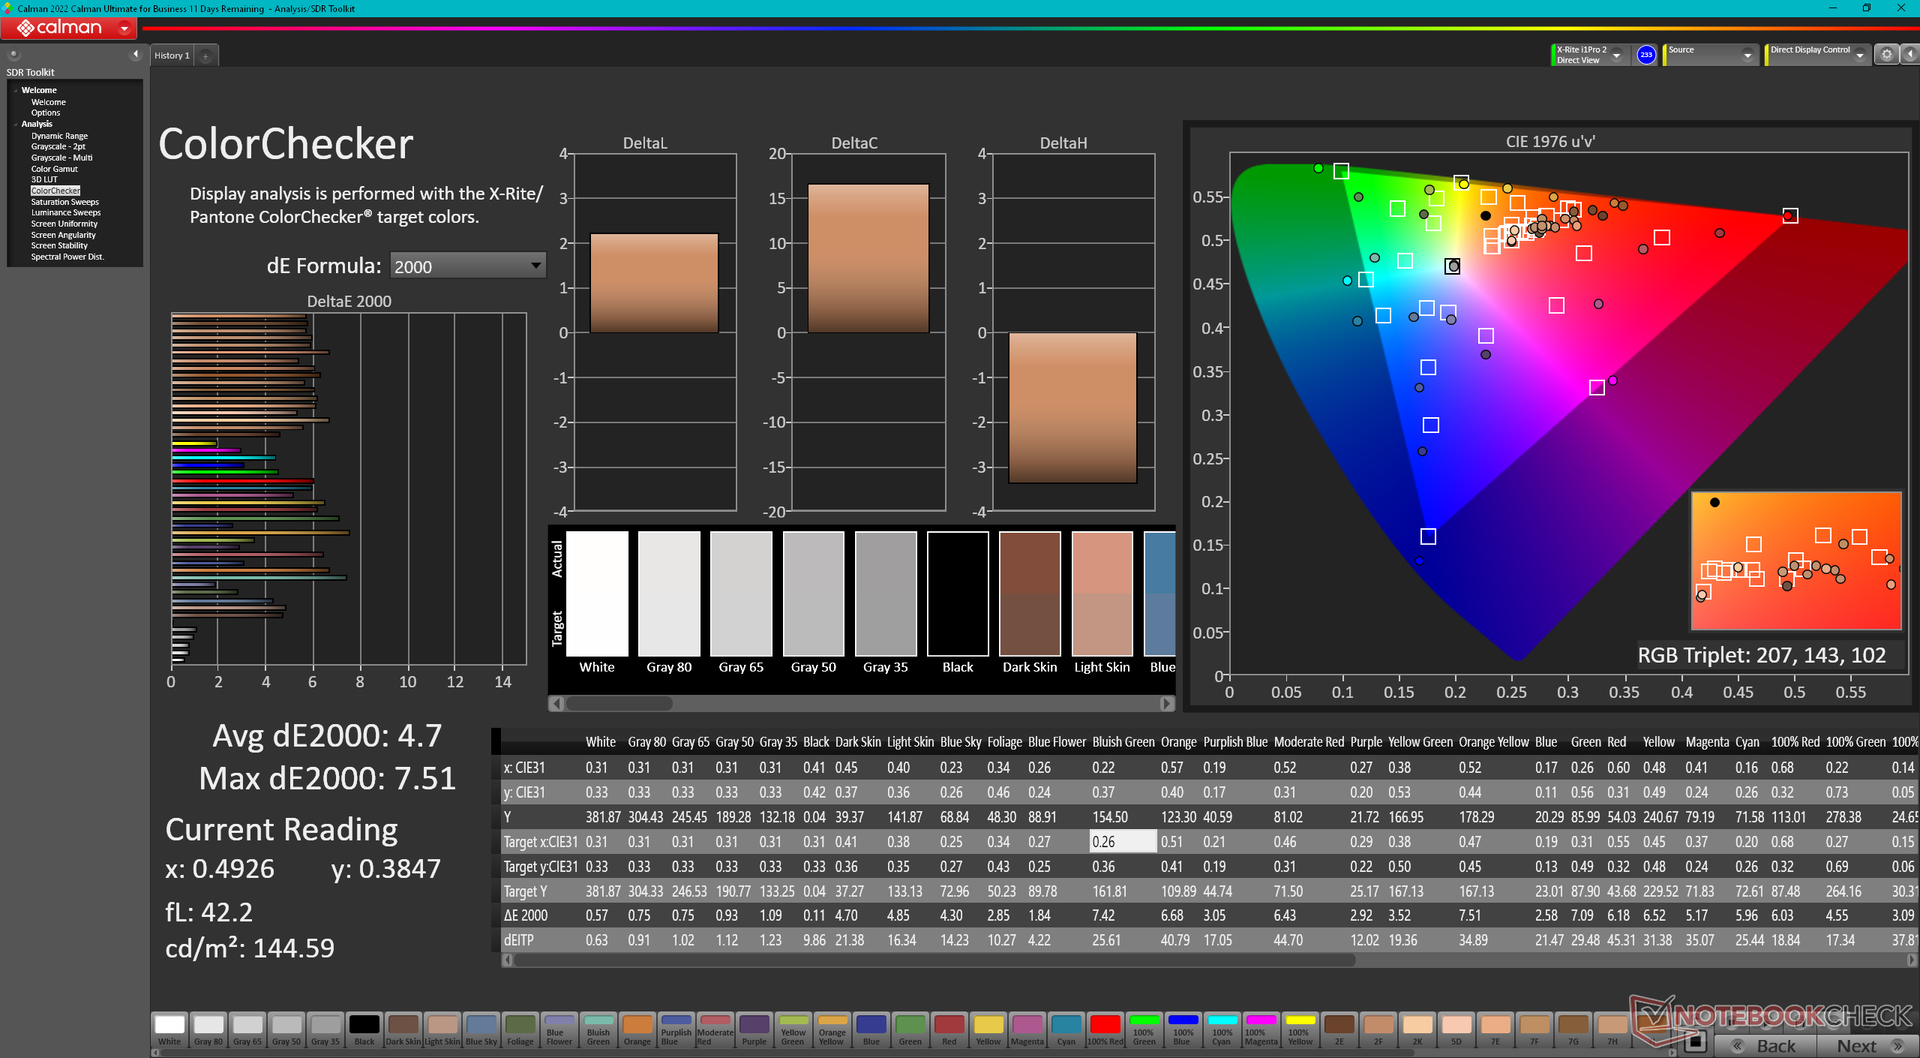
ΔE ColorChecker Calman: 4.7 | ∀{0.5-29.43 Ø4.71}
calibrated: 0.55
ΔE Greyscale Calman: 0.8 | ∀{0.09-98 Ø4.96}
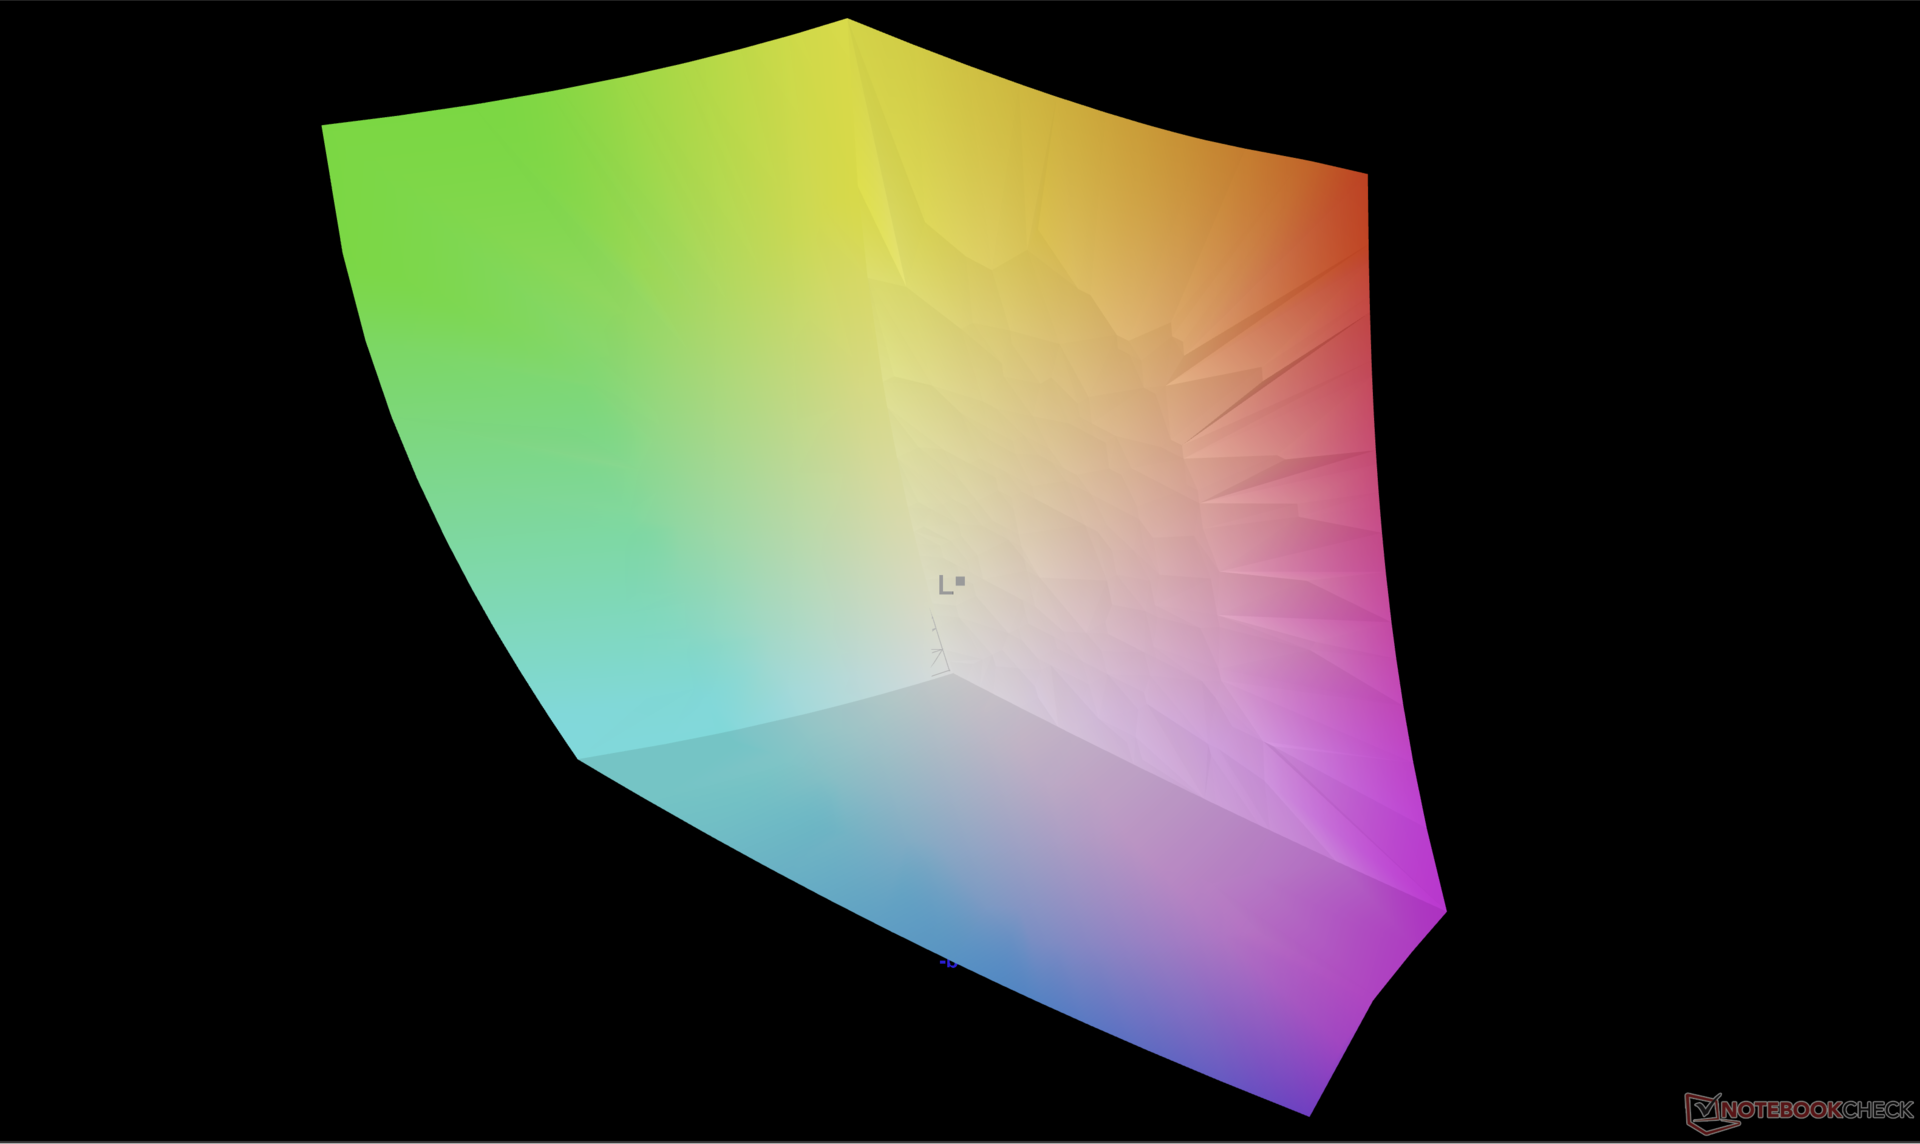
100% AdobeRGB 1998 (Argyll 3D)
100% sRGB (Argyll 3D)
99.9% Display P3 (Argyll 3D)
Gamma: 2.22
CCT: 6381 K
| Acer Swift Edge SFE16 Ryzen 7 7840U Samsung ATNA60BX03-0, OLED, 3200x2000, 16" | Acer Swift Edge SFE16-42-R1GM Samsung SDC4168, OLED, 3840x2400, 16" | Lenovo Slim Pro 9i 16IRP8 LEN160-3.2K, Mini-LED, 3200x2000, 16" | Asus VivoBook Pro 16 Au Optronics B160QAN02.L, IPS, 2560x1600, 16" | Samsung Galaxy Book3 Ultra 16 Samsung ATNA60CL03-0, AMOLED, 2880x1800, 16" | Huawei MateBook 16s i7 BOE XS TV160DKT-NH0, IPS, 2520x1680, 16" | |
|---|---|---|---|---|---|---|
| Display | -1% | -7% | -5% | -1% | -24% | |
| Display P3 Coverage (%) | 99.9 | 99.7 0% | 95.1 -5% | 98.5 -1% | 99.9 0% | 64.5 -35% |
| sRGB Coverage (%) | 100 | 100 0% | 99.9 0% | 99.9 0% | 100 0% | 96.7 -3% |
| AdobeRGB 1998 Coverage (%) | 100 | 97.2 -3% | 84.6 -15% | 86.1 -14% | 96.3 -4% | 66.6 -33% |
| Response Times | -226% | -1588% | -476% | 25% | -4192% | |
| Response Time Grey 50% / Grey 80% * (ms) | 0.57 ? | 2 ? -251% | 14 ? -2356% | 2 ? -251% | 0.49 ? 14% | 35.7 ? -6163% |
| Response Time Black / White * (ms) | 1 ? | 3 ? -200% | 9.2 ? -820% | 8 ? -700% | 0.65 ? 35% | 23.2 ? -2220% |
| PWM Frequency (Hz) | 238.8 | 239 ? | 5784 ? | 240 ? | ||
| Screen | -66% | -198% | -42% | -49% | -3% | |
| Brightness middle (cd/m²) | 379.8 | 369 -3% | 627.4 65% | 504 33% | 400 5% | 311 -18% |
| Brightness (cd/m²) | 383 | 371 -3% | 618 61% | 465 21% | 399 4% | 319 -17% |
| Brightness Distribution (%) | 98 | 97 -1% | 95 -3% | 87 -11% | 93 -5% | 91 -7% |
| Black Level * (cd/m²) | 0.19 | 0.35 | 0.03 | 0.17 | ||
| Colorchecker dE 2000 * | 4.7 | 2.3 51% | 5.84 -24% | 1.83 61% | 2.3 51% | 1 79% |
| Colorchecker dE 2000 max. * | 7.51 | 4.37 42% | 10.22 -36% | 5.51 27% | 4.15 45% | 1.7 77% |
| Colorchecker dE 2000 calibrated * | 0.55 | 2.87 -422% | 4.45 -709% | 1.34 -144% | 1.66 -202% | 0.8 -45% |
| Greyscale dE 2000 * | 0.8 | 1.83 -129% | 6.7 -738% | 3.02 -278% | 2.7 -238% | 1.5 -88% |
| Gamma | 2.22 99% | 2.39 92% | 2.77 79% | 2.39 92% | 2.266 97% | 2.15 102% |
| CCT | 6381 102% | 6392 102% | 5795 112% | 6688 97% | 7047 92% | 6432 101% |
| Contrast (:1) | 3302 | 1440 | 13333 | 1829 | ||
| Total Average (Program / Settings) | -98% /
-77% | -598% /
-382% | -174% /
-105% | -8% /
-25% | -1406% /
-706% |
* ... smaller is better
Display Response Times
| ↔ Response Time Black to White | ||
|---|---|---|
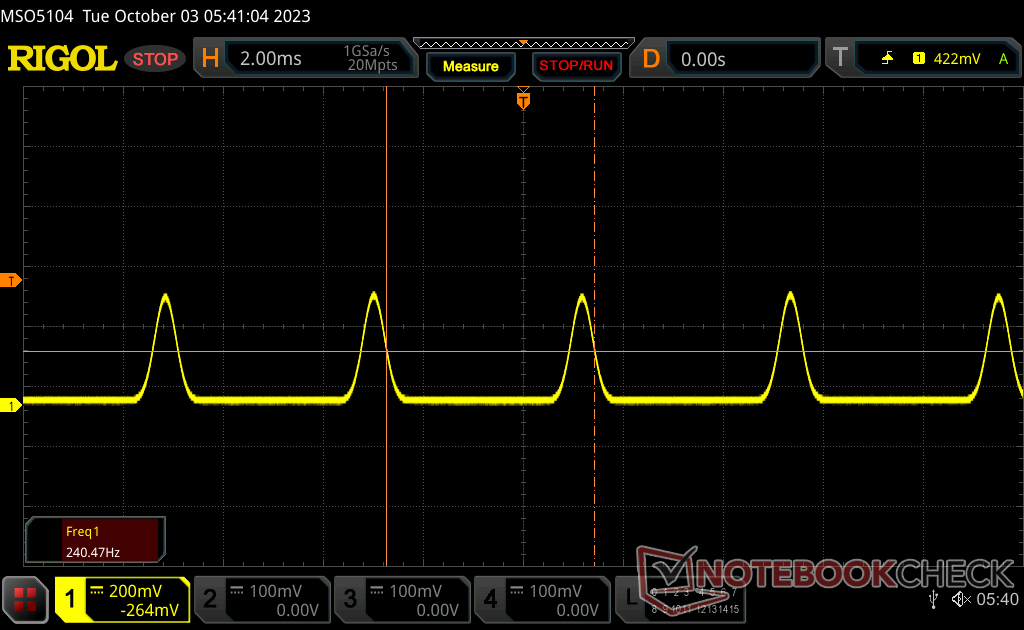
| 1 ms ... rise ↗ and fall ↘ combined | ↗ 0.55 ms rise | 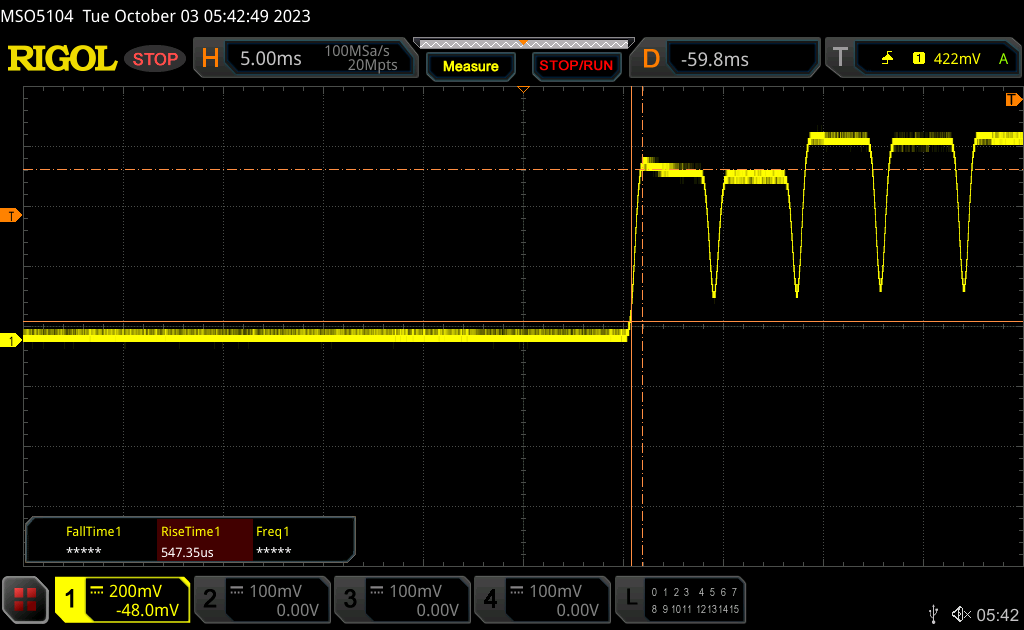 |
| ↘ 0.45 ms fall | ||
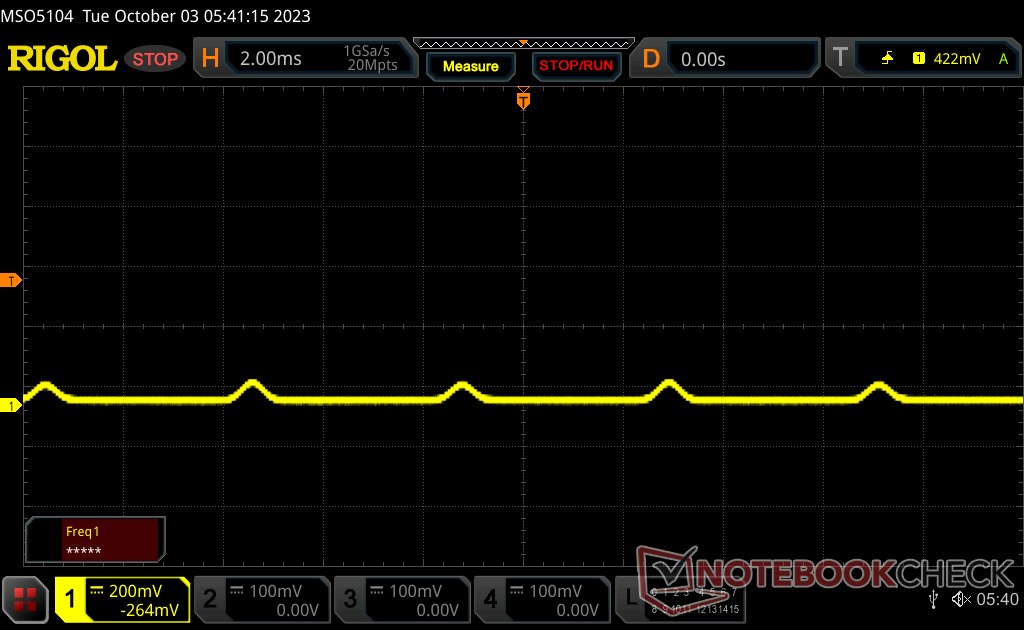
| The screen shows very fast response rates in our tests and should be very well suited for fast-paced gaming. In comparison, all tested devices range from 0.1 (minimum) to 240 (maximum) ms. » 4 % of all devices are better. This means that the measured response time is better than the average of all tested devices (19.8 ms). | ||
| ↔ Response Time 50% Grey to 80% Grey | ||
| 0.57 ms ... rise ↗ and fall ↘ combined | ↗ 0.28 ms rise | 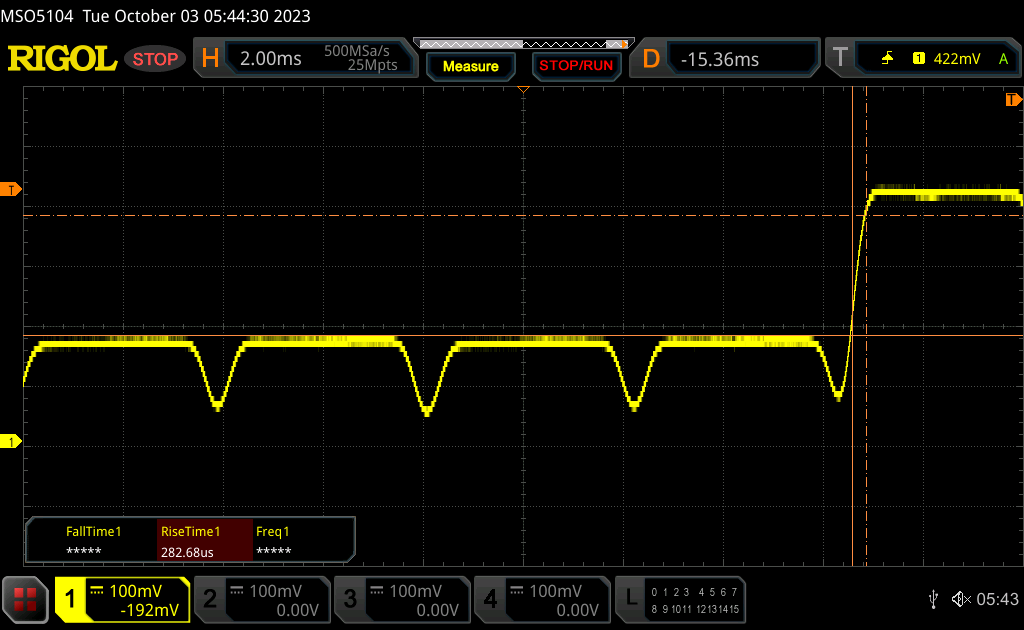 |
| ↘ 0.29 ms fall | ||
| The screen shows very fast response rates in our tests and should be very well suited for fast-paced gaming. In comparison, all tested devices range from 0.165 (minimum) to 636 (maximum) ms. » 1 % of all devices are better. This means that the measured response time is better than the average of all tested devices (31 ms). | ||
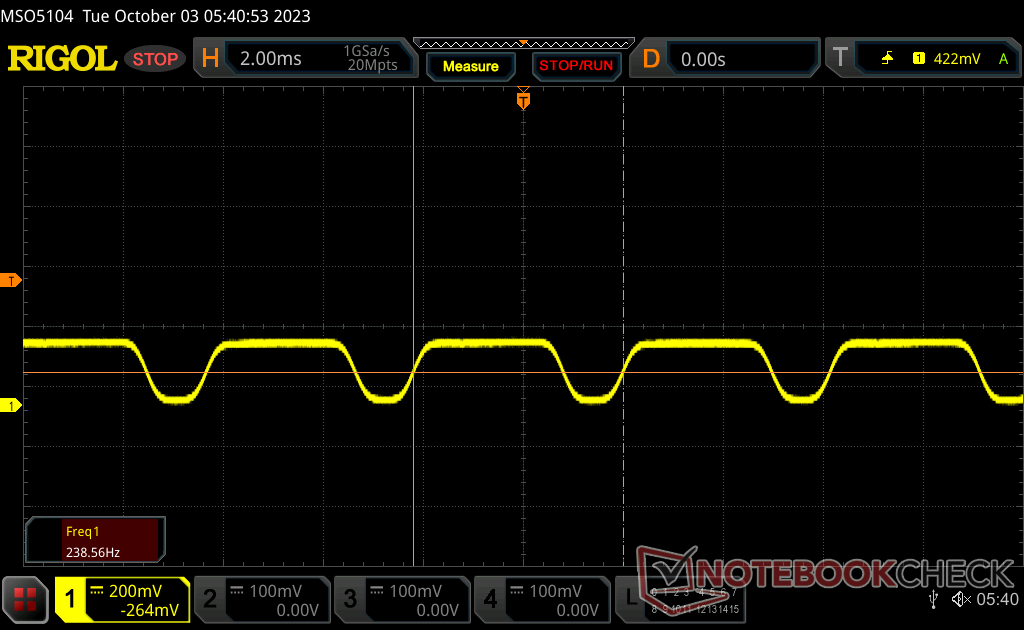
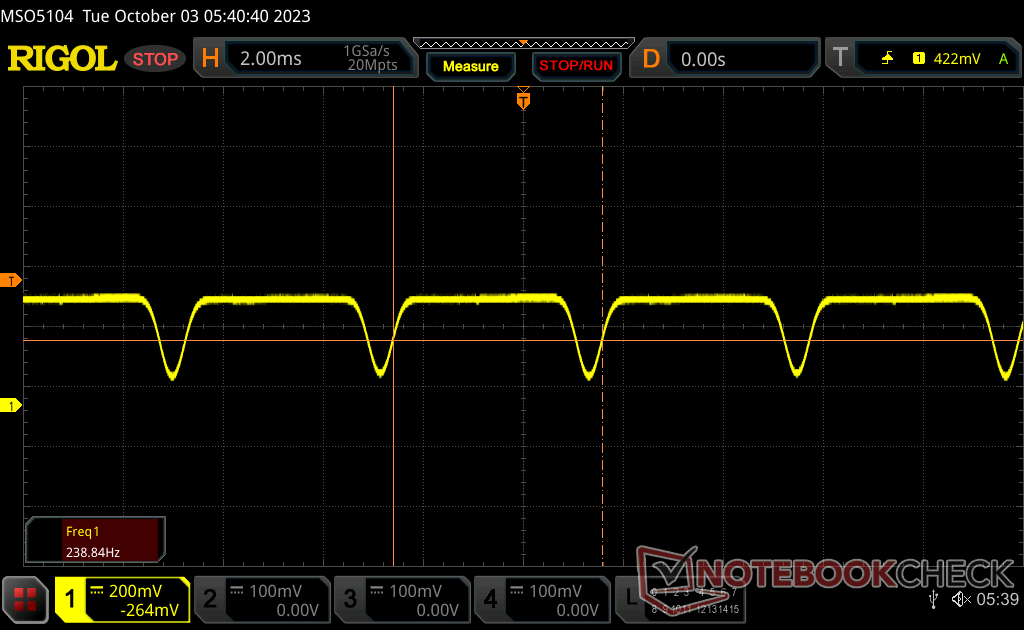
Screen Flickering / PWM (Pulse-Width Modulation)
| Screen flickering / PWM detected | 238.8 Hz | 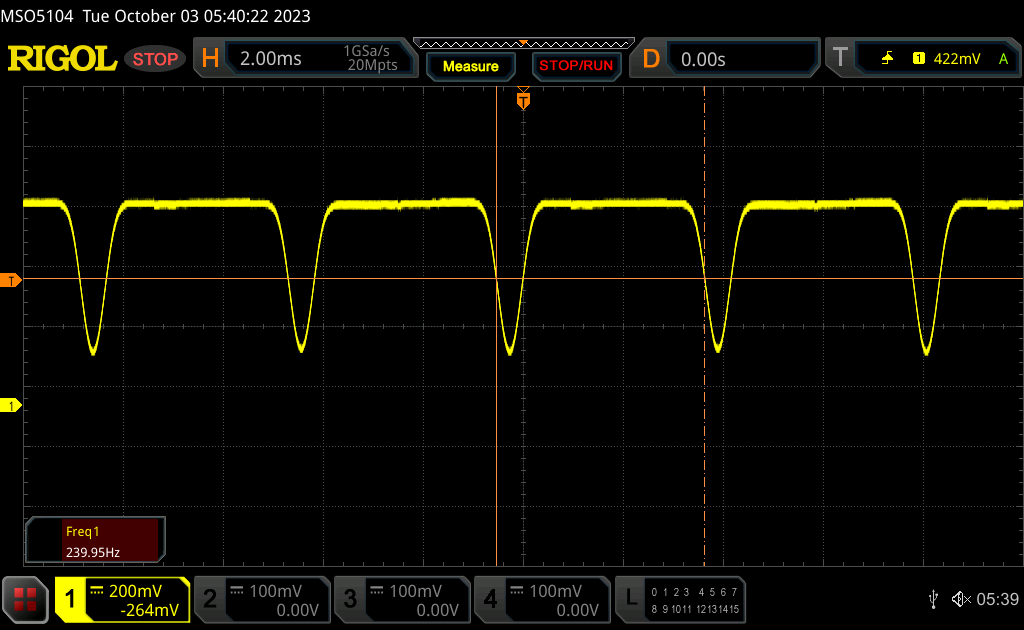 | |
The display backlight flickers at 238.8 Hz (worst case, e.g., utilizing PWM) . The frequency of 238.8 Hz is relatively low, so sensitive users will likely notice flickering and experience eyestrain at the stated brightness setting and below. In comparison: 52 % of all tested devices do not use PWM to dim the display. If PWM was detected, an average of 7754 (minimum: 5 - maximum: 343500) Hz was measured. | |||
238 Hz 的恒定脉宽调制出现在所有亮度级别上,甚至包括最大设置。这种现象在从智能手机到笔记本电脑的 OLED 显示屏上都很常见。
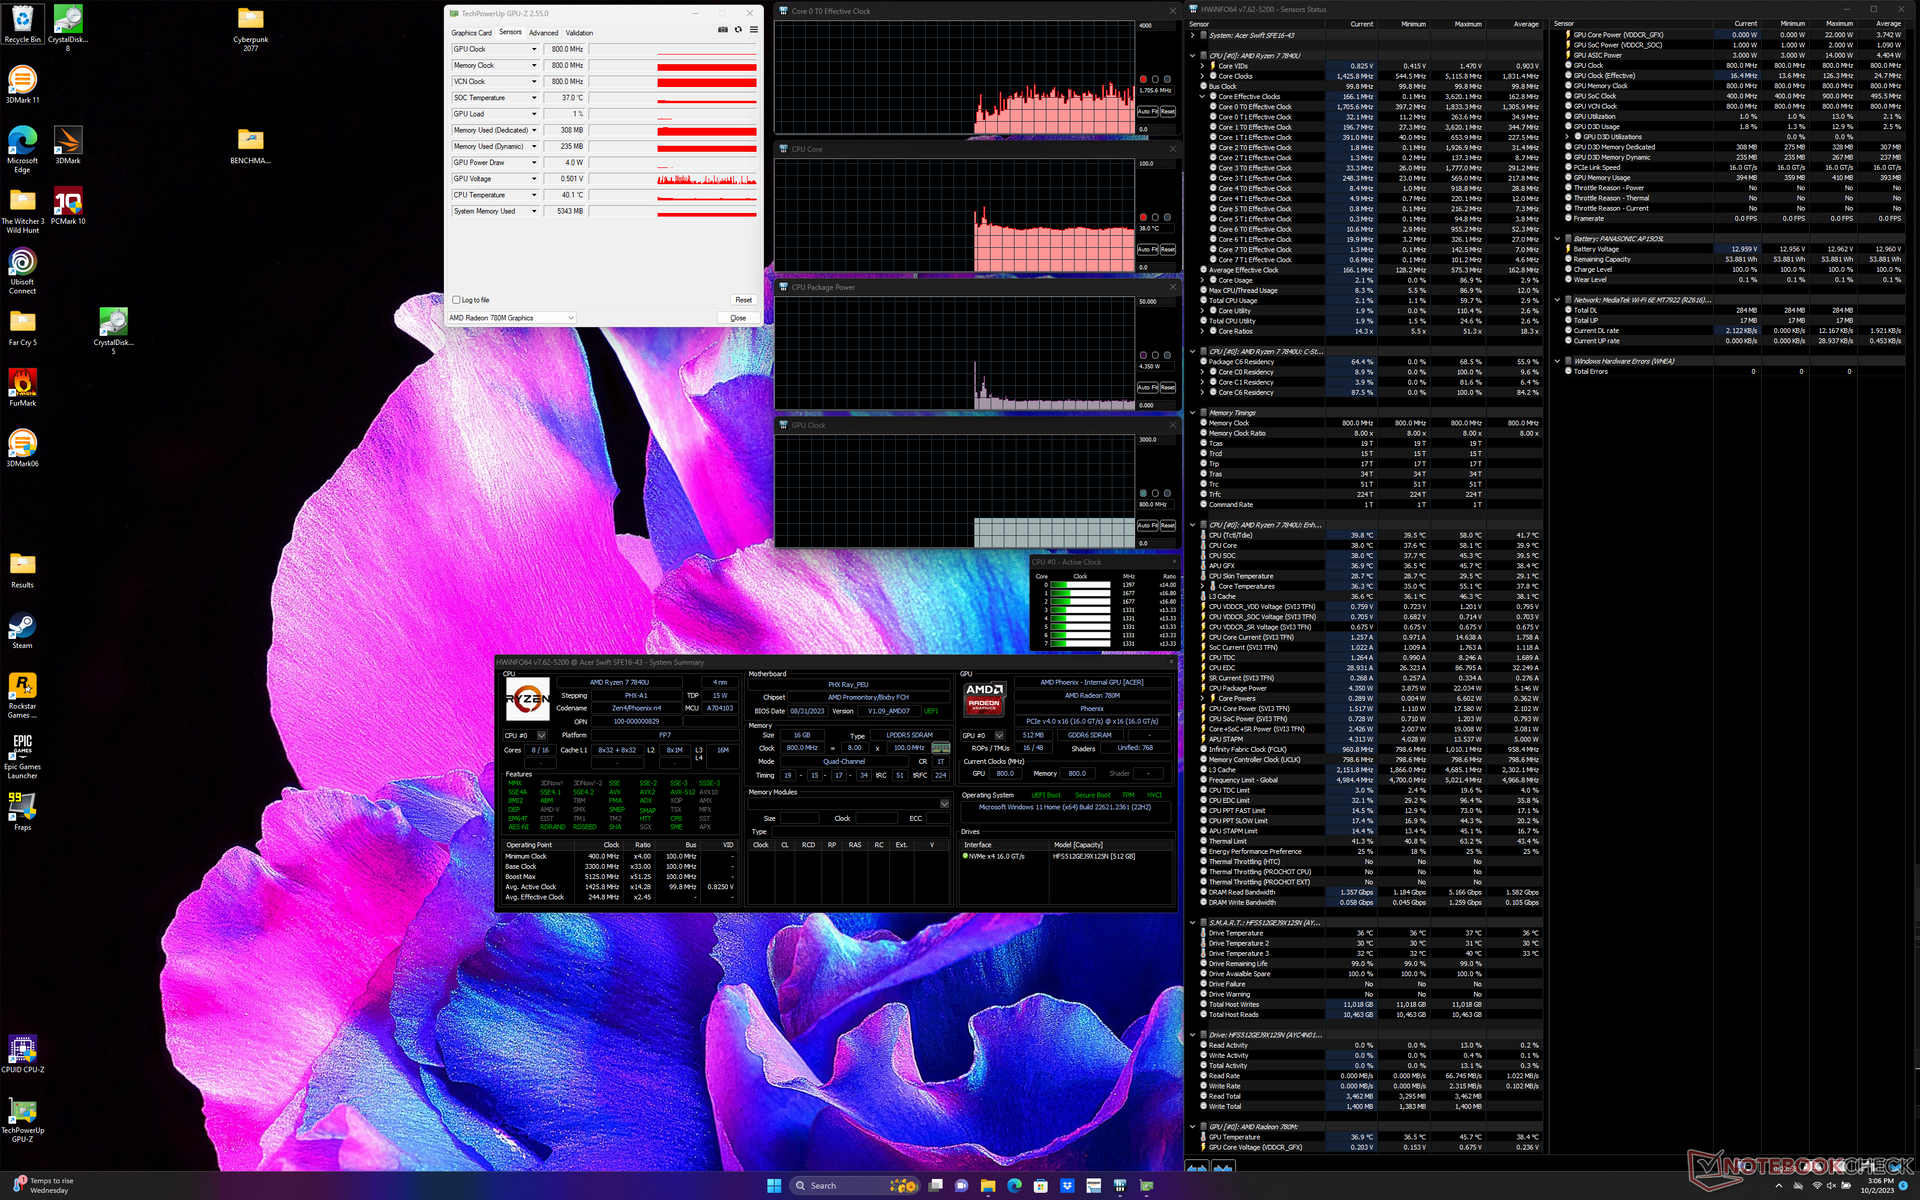
性能
测试条件
在运行下面的基准测试之前,我们将 Windows 设置为性能模式。与华硕 VivoBook 系列不同,宏碁没有为性能或显示屏调整提供专门的软件。
内置显示屏不支持 FreeSync。
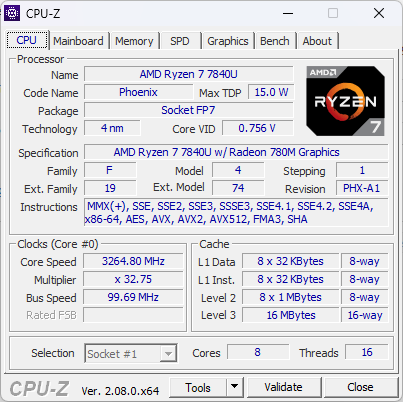
处理器
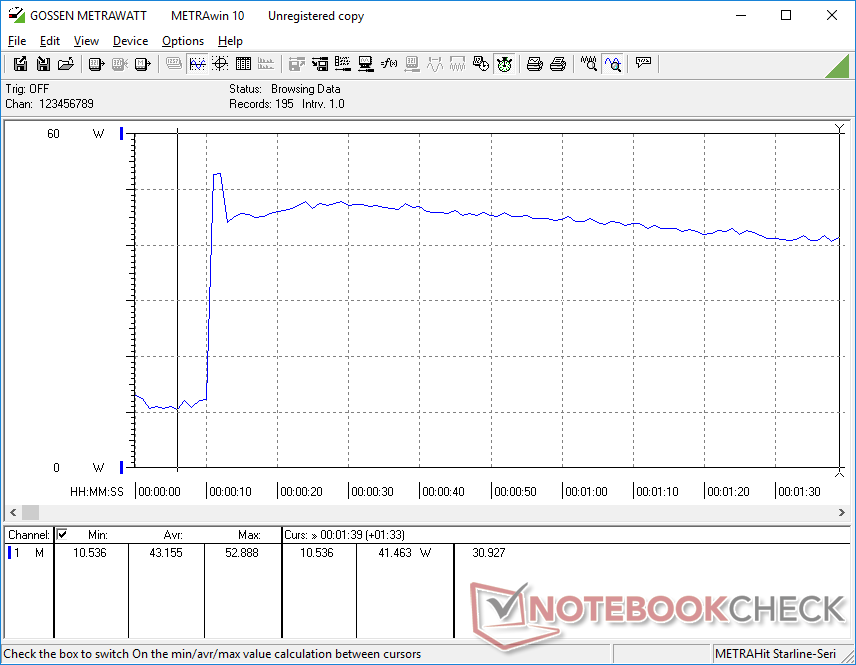
多线程性能略微落后于大多数其他笔记本电脑,但始终保持在同一水平。 Ryzen 7 7840U.最近的 AMD Framework 13.5 笔记本电脑的多线程性能要快 15%。造成这种差异的原因是,相对于 16 英寸的大屏幕尺寸,宏碁笔记本电脑 CPU 的散热解决方案较小,因此其 Turbo Core 潜能较弱。如下图所示,随着时间的推移,CineBench R15 xT 分数将下降 21%。
总体性能仍比 Zen 3+ 快 Ryzen 7 7735U在单线程和多线程负载中,尽管有节流,但总体性能仍比旧款宏碁 Swift Edge SFE16-42-R1GM 中的 Zen 3+ Ryzen 7735U 快约 15%。
Cinebench R15 Multi Loop
Cinebench R23: Multi Core | Single Core
Cinebench R20: CPU (Multi Core) | CPU (Single Core)
Cinebench R15: CPU Multi 64Bit | CPU Single 64Bit
Blender: v2.79 BMW27 CPU
7-Zip 18.03: 7z b 4 | 7z b 4 -mmt1
Geekbench 5.5: Multi-Core | Single-Core
HWBOT x265 Benchmark v2.2: 4k Preset
LibreOffice : 20 Documents To PDF
R Benchmark 2.5: Overall mean
* ... smaller is better
AIDA64: FP32 Ray-Trace | FPU Julia | CPU SHA3 | CPU Queen | FPU SinJulia | FPU Mandel | CPU AES | CPU ZLib | FP64 Ray-Trace | CPU PhotoWorxx
| Performance rating | |
| Lenovo Slim Pro 9i 16IRP8 | |
| Average AMD Ryzen 7 7840U | |
| Acer Swift Edge SFE16 Ryzen 7 7840U | |
| Samsung Galaxy Book3 Ultra 16 | |
| Asus VivoBook Pro 16 | |
| Acer Swift Edge SFE16-42-R1GM | |
| Huawei MateBook 16s i7 | |
| AIDA64 / FP32 Ray-Trace | |
| Average AMD Ryzen 7 7840U (17924 - 25901, n=11) | |
| Lenovo Slim Pro 9i 16IRP8 | |
| Acer Swift Edge SFE16 Ryzen 7 7840U | |
| Asus VivoBook Pro 16 | |
| Samsung Galaxy Book3 Ultra 16 | |
| Acer Swift Edge SFE16-42-R1GM | |
| Huawei MateBook 16s i7 | |
| AIDA64 / FPU Julia | |
| Lenovo Slim Pro 9i 16IRP8 | |
| Average AMD Ryzen 7 7840U (78360 - 109745, n=11) | |
| Acer Swift Edge SFE16 Ryzen 7 7840U | |
| Asus VivoBook Pro 16 | |
| Acer Swift Edge SFE16-42-R1GM | |
| Samsung Galaxy Book3 Ultra 16 | |
| Huawei MateBook 16s i7 | |
| AIDA64 / CPU SHA3 | |
| Lenovo Slim Pro 9i 16IRP8 | |
| Average AMD Ryzen 7 7840U (3519 - 4847, n=11) | |
| Acer Swift Edge SFE16 Ryzen 7 7840U | |
| Asus VivoBook Pro 16 | |
| Samsung Galaxy Book3 Ultra 16 | |
| Acer Swift Edge SFE16-42-R1GM | |
| Huawei MateBook 16s i7 | |
| AIDA64 / CPU Queen | |
| Lenovo Slim Pro 9i 16IRP8 | |
| Asus VivoBook Pro 16 | |
| Samsung Galaxy Book3 Ultra 16 | |
| Average AMD Ryzen 7 7840U (83206 - 114294, n=10) | |
| Acer Swift Edge SFE16 Ryzen 7 7840U | |
| Huawei MateBook 16s i7 | |
| Acer Swift Edge SFE16-42-R1GM | |
| AIDA64 / FPU SinJulia | |
| Average AMD Ryzen 7 7840U (11969 - 14822, n=11) | |
| Acer Swift Edge SFE16 Ryzen 7 7840U | |
| Lenovo Slim Pro 9i 16IRP8 | |
| Acer Swift Edge SFE16-42-R1GM | |
| Samsung Galaxy Book3 Ultra 16 | |
| Asus VivoBook Pro 16 | |
| Huawei MateBook 16s i7 | |
| AIDA64 / FPU Mandel | |
| Average AMD Ryzen 7 7840U (40720 - 58482, n=11) | |
| Lenovo Slim Pro 9i 16IRP8 | |
| Acer Swift Edge SFE16 Ryzen 7 7840U | |
| Acer Swift Edge SFE16-42-R1GM | |
| Asus VivoBook Pro 16 | |
| Samsung Galaxy Book3 Ultra 16 | |
| Huawei MateBook 16s i7 | |
| AIDA64 / CPU AES | |
| Average AMD Ryzen 7 7840U (53018 - 166333, n=11) | |
| Lenovo Slim Pro 9i 16IRP8 | |
| Huawei MateBook 16s i7 | |
| Samsung Galaxy Book3 Ultra 16 | |
| Asus VivoBook Pro 16 | |
| Acer Swift Edge SFE16 Ryzen 7 7840U | |
| Acer Swift Edge SFE16-42-R1GM | |
| AIDA64 / CPU ZLib | |
| Lenovo Slim Pro 9i 16IRP8 | |
| Samsung Galaxy Book3 Ultra 16 | |
| Asus VivoBook Pro 16 | |
| Average AMD Ryzen 7 7840U (801 - 1047, n=11) | |
| Acer Swift Edge SFE16 Ryzen 7 7840U | |
| Huawei MateBook 16s i7 | |
| Acer Swift Edge SFE16-42-R1GM | |
| AIDA64 / FP64 Ray-Trace | |
| Average AMD Ryzen 7 7840U (9347 - 13846, n=11) | |
| Lenovo Slim Pro 9i 16IRP8 | |
| Acer Swift Edge SFE16 Ryzen 7 7840U | |
| Asus VivoBook Pro 16 | |
| Samsung Galaxy Book3 Ultra 16 | |
| Acer Swift Edge SFE16-42-R1GM | |
| Huawei MateBook 16s i7 | |
| AIDA64 / CPU PhotoWorxx | |
| Lenovo Slim Pro 9i 16IRP8 | |
| Samsung Galaxy Book3 Ultra 16 | |
| Huawei MateBook 16s i7 | |
| Average AMD Ryzen 7 7840U (26206 - 38173, n=11) | |
| Acer Swift Edge SFE16 Ryzen 7 7840U | |
| Acer Swift Edge SFE16-42-R1GM | |
| Asus VivoBook Pro 16 | |
系统性能
CrossMark: Overall | Productivity | Creativity | Responsiveness
| PCMark 10 / Score | |
| Lenovo Slim Pro 9i 16IRP8 | |
| Acer Swift Edge SFE16 Ryzen 7 7840U | |
| Samsung Galaxy Book3 Ultra 16 | |
| Asus VivoBook Pro 16 | |
| Average AMD Ryzen 7 7840U, AMD Radeon 780M (5866 - 7157, n=10) | |
| Huawei MateBook 16s i7 | |
| Acer Swift Edge SFE16-42-R1GM | |
| PCMark 10 / Essentials | |
| Huawei MateBook 16s i7 | |
| Lenovo Slim Pro 9i 16IRP8 | |
| Acer Swift Edge SFE16 Ryzen 7 7840U | |
| Samsung Galaxy Book3 Ultra 16 | |
| Average AMD Ryzen 7 7840U, AMD Radeon 780M (9068 - 11081, n=10) | |
| Asus VivoBook Pro 16 | |
| Acer Swift Edge SFE16-42-R1GM | |
| PCMark 10 / Productivity | |
| Acer Swift Edge SFE16 Ryzen 7 7840U | |
| Lenovo Slim Pro 9i 16IRP8 | |
| Acer Swift Edge SFE16-42-R1GM | |
| Asus VivoBook Pro 16 | |
| Average AMD Ryzen 7 7840U, AMD Radeon 780M (7323 - 10099, n=10) | |
| Samsung Galaxy Book3 Ultra 16 | |
| Huawei MateBook 16s i7 | |
| PCMark 10 / Digital Content Creation | |
| Lenovo Slim Pro 9i 16IRP8 | |
| Samsung Galaxy Book3 Ultra 16 | |
| Asus VivoBook Pro 16 | |
| Acer Swift Edge SFE16 Ryzen 7 7840U | |
| Average AMD Ryzen 7 7840U, AMD Radeon 780M (7204 - 8987, n=10) | |
| Acer Swift Edge SFE16-42-R1GM | |
| Huawei MateBook 16s i7 | |
| CrossMark / Overall | |
| Huawei MateBook 16s i7 | |
| Acer Swift Edge SFE16 Ryzen 7 7840U | |
| Lenovo Slim Pro 9i 16IRP8 | |
| Asus VivoBook Pro 16 | |
| Samsung Galaxy Book3 Ultra 16 | |
| Average AMD Ryzen 7 7840U, AMD Radeon 780M (1256 - 1804, n=10) | |
| Acer Swift Edge SFE16-42-R1GM | |
| CrossMark / Productivity | |
| Huawei MateBook 16s i7 | |
| Acer Swift Edge SFE16 Ryzen 7 7840U | |
| Asus VivoBook Pro 16 | |
| Lenovo Slim Pro 9i 16IRP8 | |
| Average AMD Ryzen 7 7840U, AMD Radeon 780M (1261 - 1798, n=10) | |
| Samsung Galaxy Book3 Ultra 16 | |
| Acer Swift Edge SFE16-42-R1GM | |
| CrossMark / Creativity | |
| Lenovo Slim Pro 9i 16IRP8 | |
| Huawei MateBook 16s i7 | |
| Acer Swift Edge SFE16 Ryzen 7 7840U | |
| Asus VivoBook Pro 16 | |
| Samsung Galaxy Book3 Ultra 16 | |
| Average AMD Ryzen 7 7840U, AMD Radeon 780M (1251 - 1835, n=10) | |
| Acer Swift Edge SFE16-42-R1GM | |
| CrossMark / Responsiveness | |
| Huawei MateBook 16s i7 | |
| Acer Swift Edge SFE16 Ryzen 7 7840U | |
| Asus VivoBook Pro 16 | |
| Samsung Galaxy Book3 Ultra 16 | |
| Lenovo Slim Pro 9i 16IRP8 | |
| Average AMD Ryzen 7 7840U, AMD Radeon 780M (1082 - 1775, n=10) | |
| Acer Swift Edge SFE16-42-R1GM | |
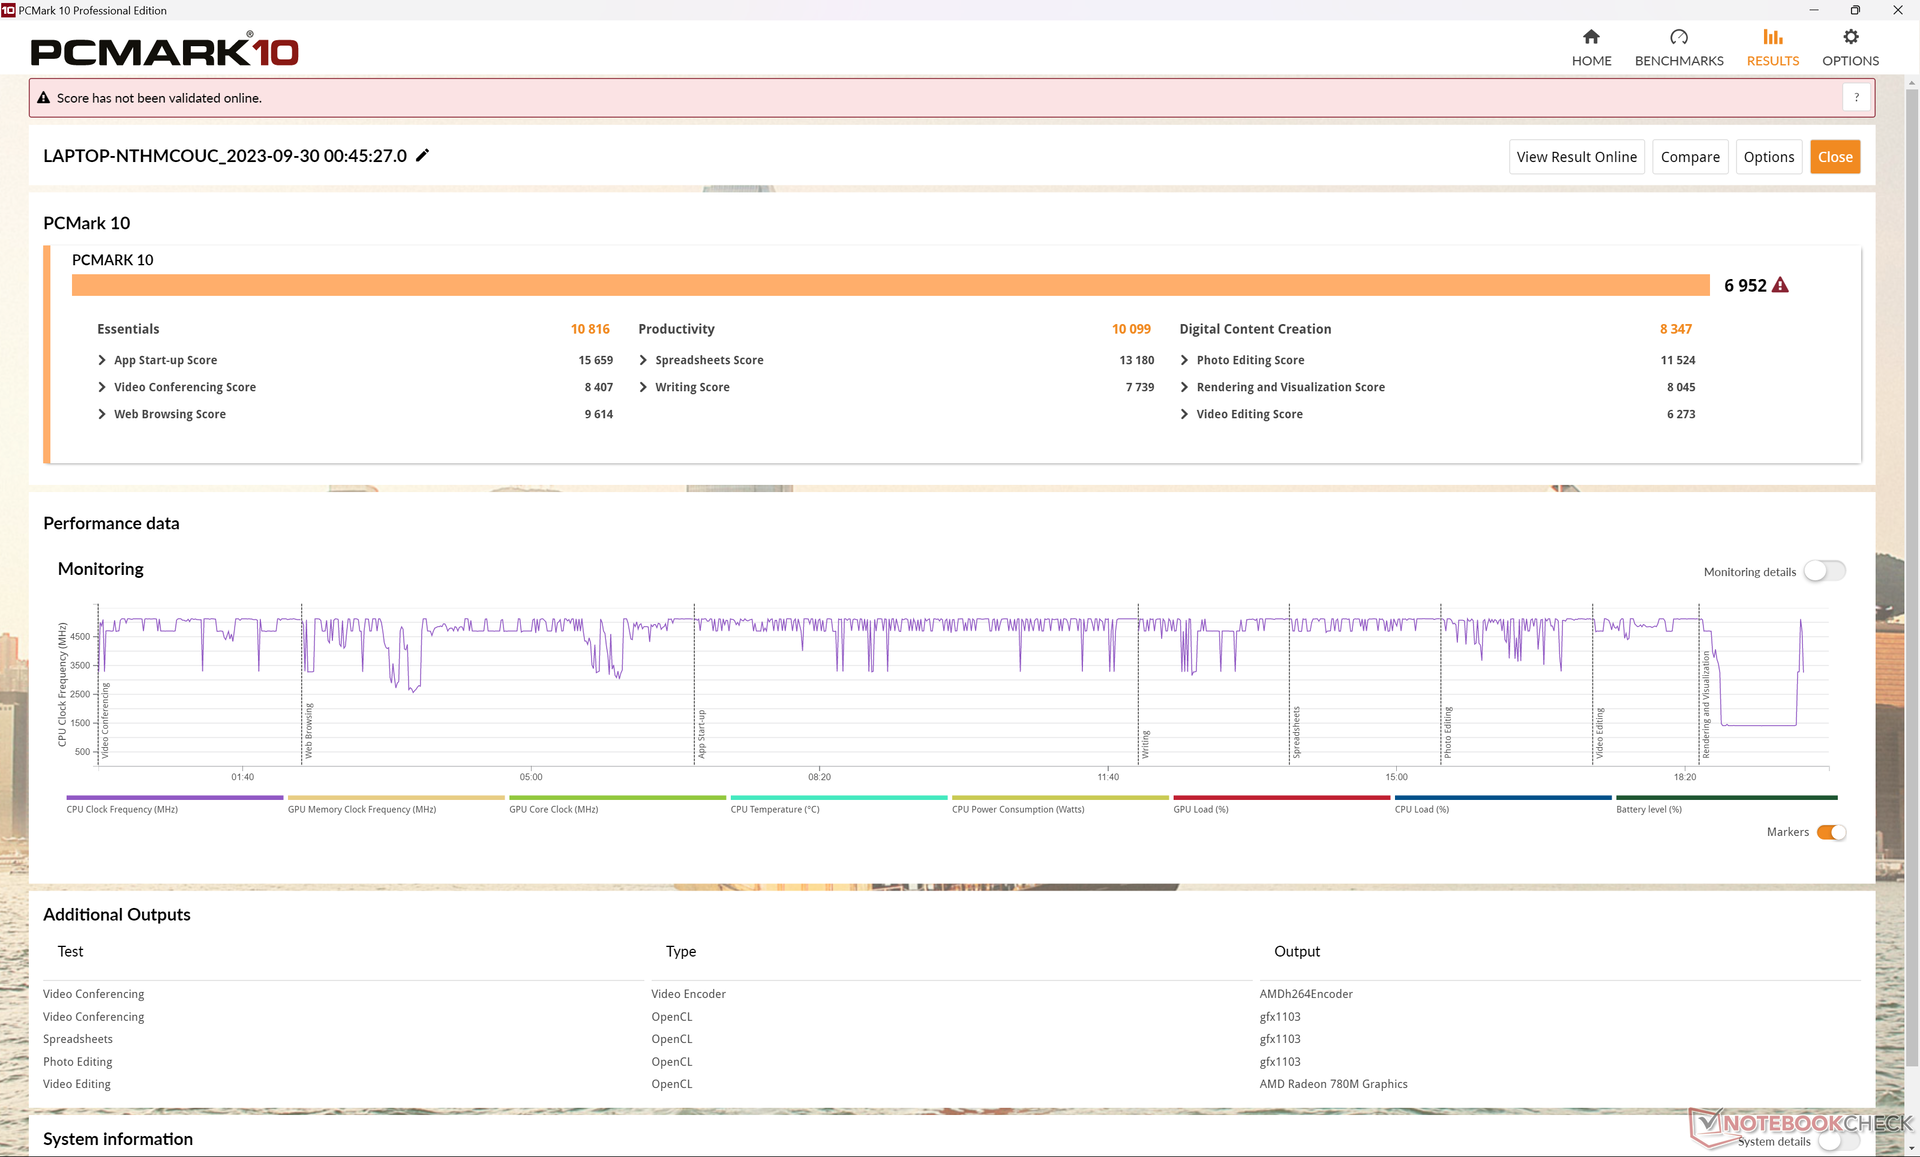
| PCMark 10 Score | 6952 points | |
Help | ||
| AIDA64 / Memory Copy | |
| Lenovo Slim Pro 9i 16IRP8 | |
| Samsung Galaxy Book3 Ultra 16 | |
| Huawei MateBook 16s i7 | |
| Acer Swift Edge SFE16 Ryzen 7 7840U | |
| Average AMD Ryzen 7 7840U (43255 - 70532, n=12) | |
| Acer Swift Edge SFE16-42-R1GM | |
| Asus VivoBook Pro 16 | |
| AIDA64 / Memory Read | |
| Lenovo Slim Pro 9i 16IRP8 | |
| Samsung Galaxy Book3 Ultra 16 | |
| Huawei MateBook 16s i7 | |
| Acer Swift Edge SFE16 Ryzen 7 7840U | |
| Average AMD Ryzen 7 7840U (37399 - 61602, n=11) | |
| Acer Swift Edge SFE16-42-R1GM | |
| Asus VivoBook Pro 16 | |
| AIDA64 / Memory Write | |
| Acer Swift Edge SFE16 Ryzen 7 7840U | |
| Lenovo Slim Pro 9i 16IRP8 | |
| Samsung Galaxy Book3 Ultra 16 | |
| Average AMD Ryzen 7 7840U (46797 - 92289, n=13) | |
| Huawei MateBook 16s i7 | |
| Acer Swift Edge SFE16-42-R1GM | |
| Asus VivoBook Pro 16 | |
| AIDA64 / Memory Latency | |
| Average AMD Ryzen 7 7840U (90 - 137.2, n=12) | |
| Acer Swift Edge SFE16 Ryzen 7 7840U | |
| Huawei MateBook 16s i7 | |
| Lenovo Slim Pro 9i 16IRP8 | |
| Acer Swift Edge SFE16-42-R1GM | |
| Samsung Galaxy Book3 Ultra 16 | |
| Asus VivoBook Pro 16 | |
* ... smaller is better
DPC 延迟
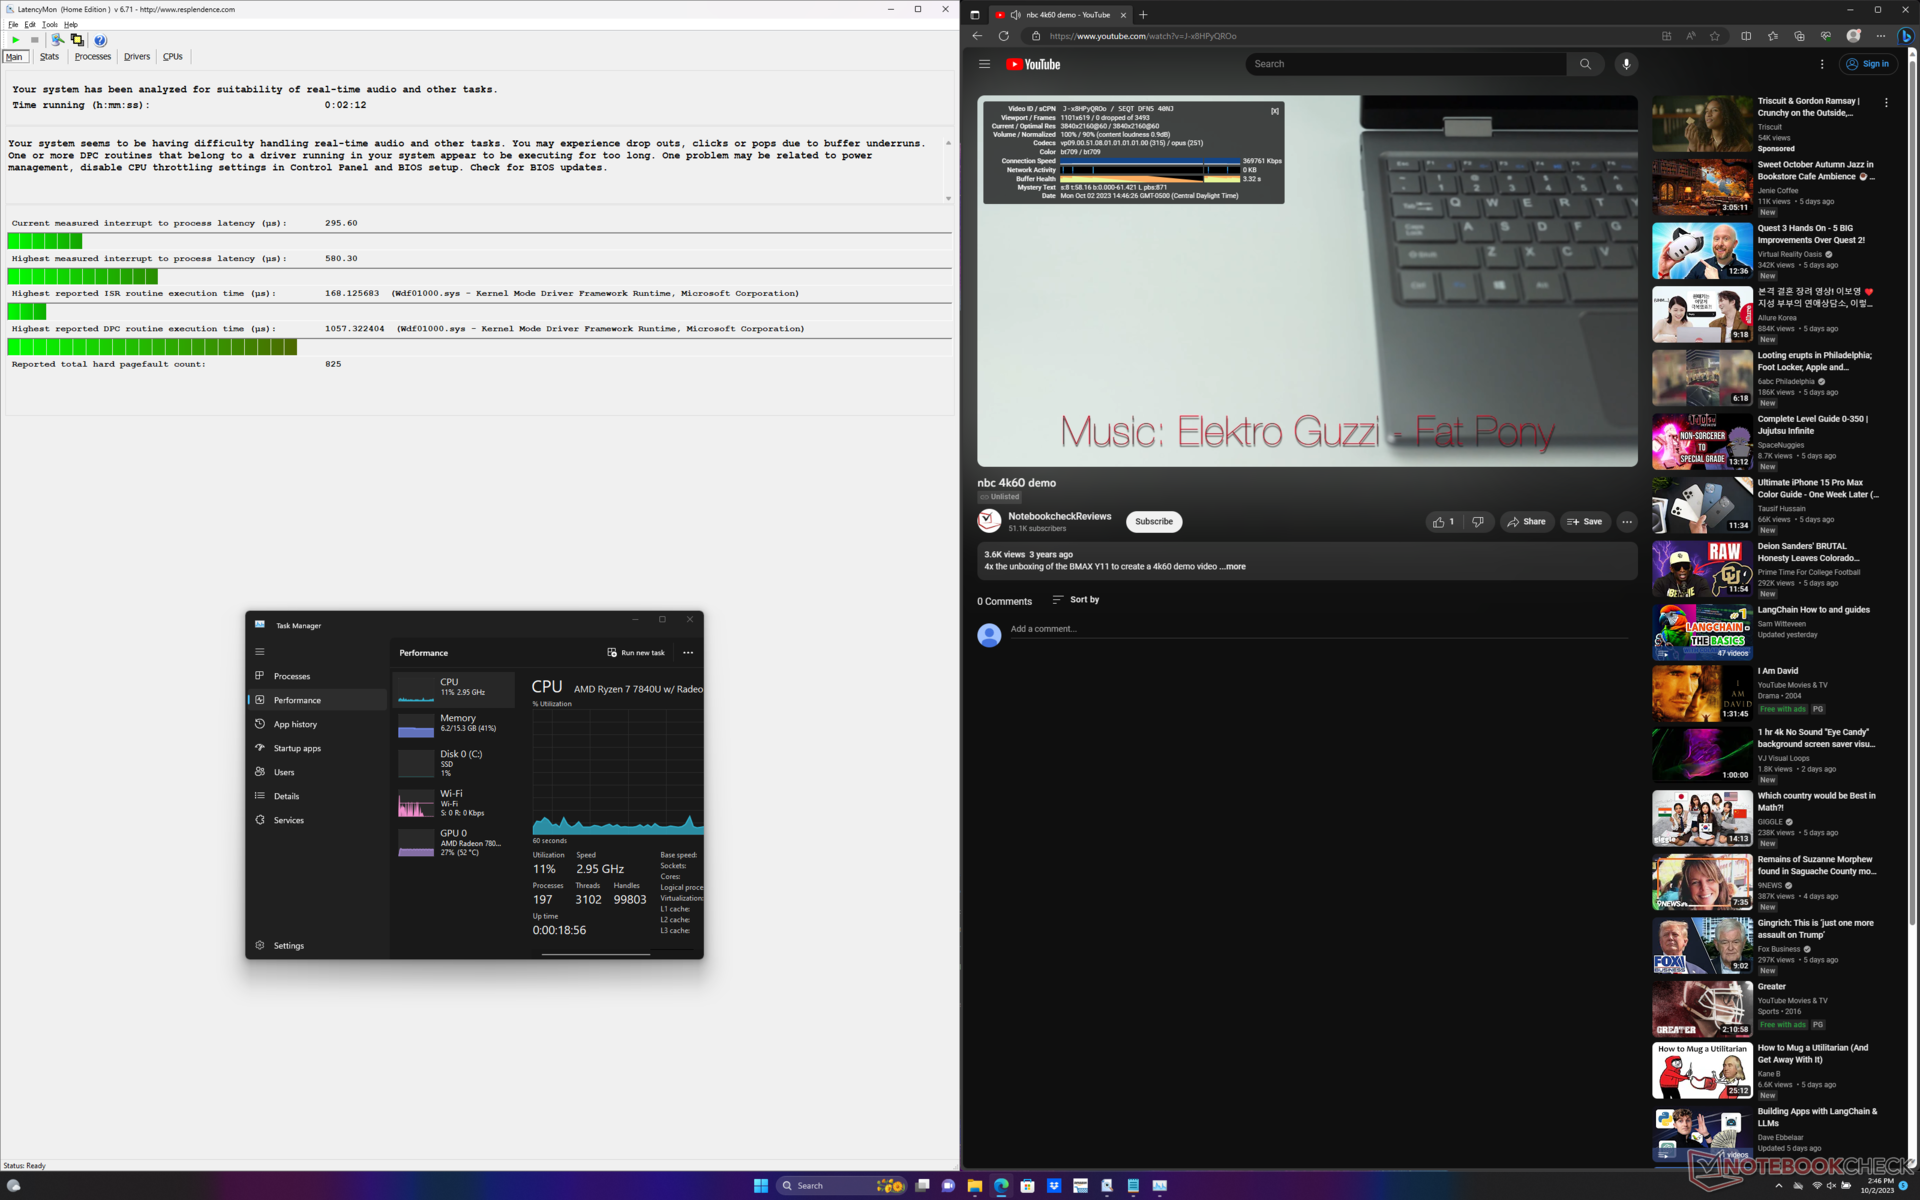
在打开主页的多个浏览器标签页时,LatencyMon 没有发现重大的 DPC 问题。60 FPS 的 4K 视频播放也非常完美,没有任何掉帧记录。
| DPC Latencies / LatencyMon - interrupt to process latency (max), Web, Youtube, Prime95 | |
| Samsung Galaxy Book3 Ultra 16 | |
| Acer Swift Edge SFE16-42-R1GM | |
| Asus VivoBook Pro 16 | |
| Lenovo Slim Pro 9i 16IRP8 | |
| Acer Swift Edge SFE16 Ryzen 7 7840U | |
* ... smaller is better
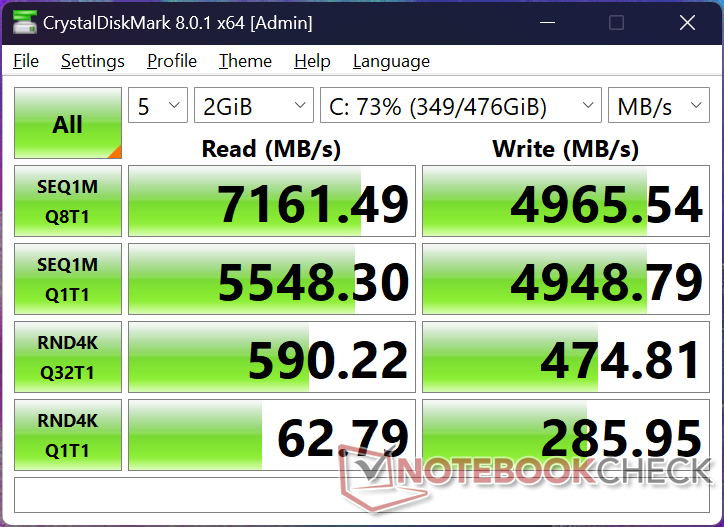
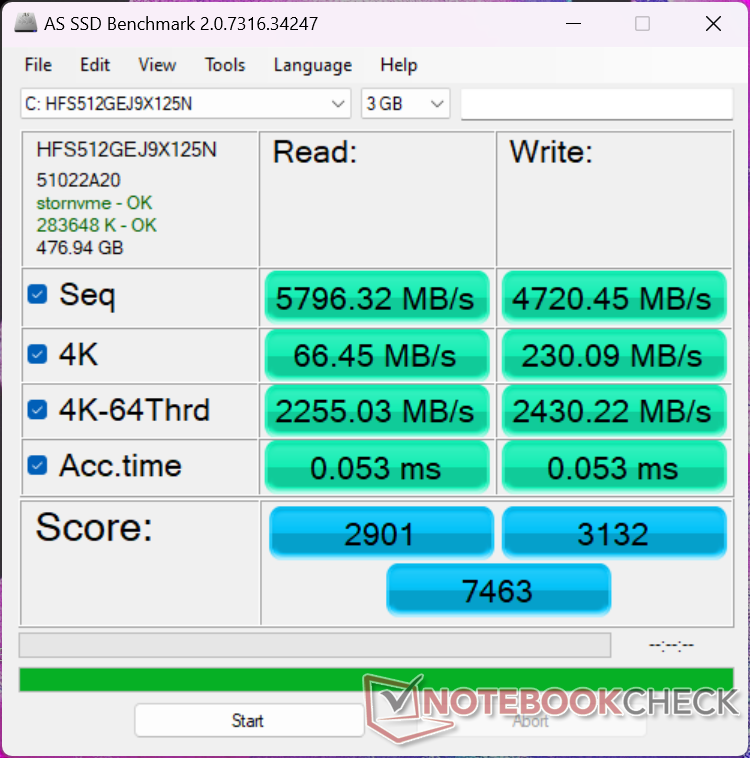
存储设备
我们的测试设备配备了 SK hynix HFS512GEJ9X125N这在纸面上可与三星 PM9A1 相媲美。但实际上,如下图所示,在几分钟的压力下,我们设备上的硬盘速度就会降到 3500 MB/s。我们在旧款 Swift Edge 16 上也观察到了这种现象,这表明硬盘存在冷却或散热不足的问题。

| Drive Performance rating - Percent | |
| Acer Swift Edge SFE16 Ryzen 7 7840U | |
| Samsung Galaxy Book3 Ultra 16 | |
| Acer Swift Edge SFE16-42-R1GM | |
| Lenovo Slim Pro 9i 16IRP8 | |
| Huawei MateBook 16s i7 | |
| Asus VivoBook Pro 16 | |
* ... smaller is better
Disk Throttling: DiskSpd Read Loop, Queue Depth 8
图形处理器性能
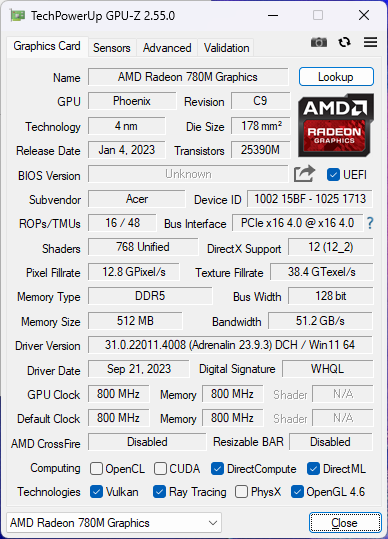
2022 年 Radeon 680M已经比早期的 RX Vega 系列有了大幅提升,因此 2023 年的 Radeon 780M更像是一次小更新,只有微不足道的改进。在这种情况下,我们宏碁的 Radeon 780M 只比 Zen 3+ 配置中的 680M 快几个百分点。
将系统设置为平衡模式而不是性能模式,或者使用电池供电都会影响整体性能,如下表Fire Strike 所示。
| 电源配置文件 | 图形分数 | 物理得分 | 综合得分 |
| 性能模式 | 7156 | 20127 | 2511 |
| 均衡模式 | 4682 (-37%) | 15022 (-25%) | 1726 (-31%) |
| 电池电量 | 4982 (-33%) | 14856 (-26%) | 1734 (-31%) |
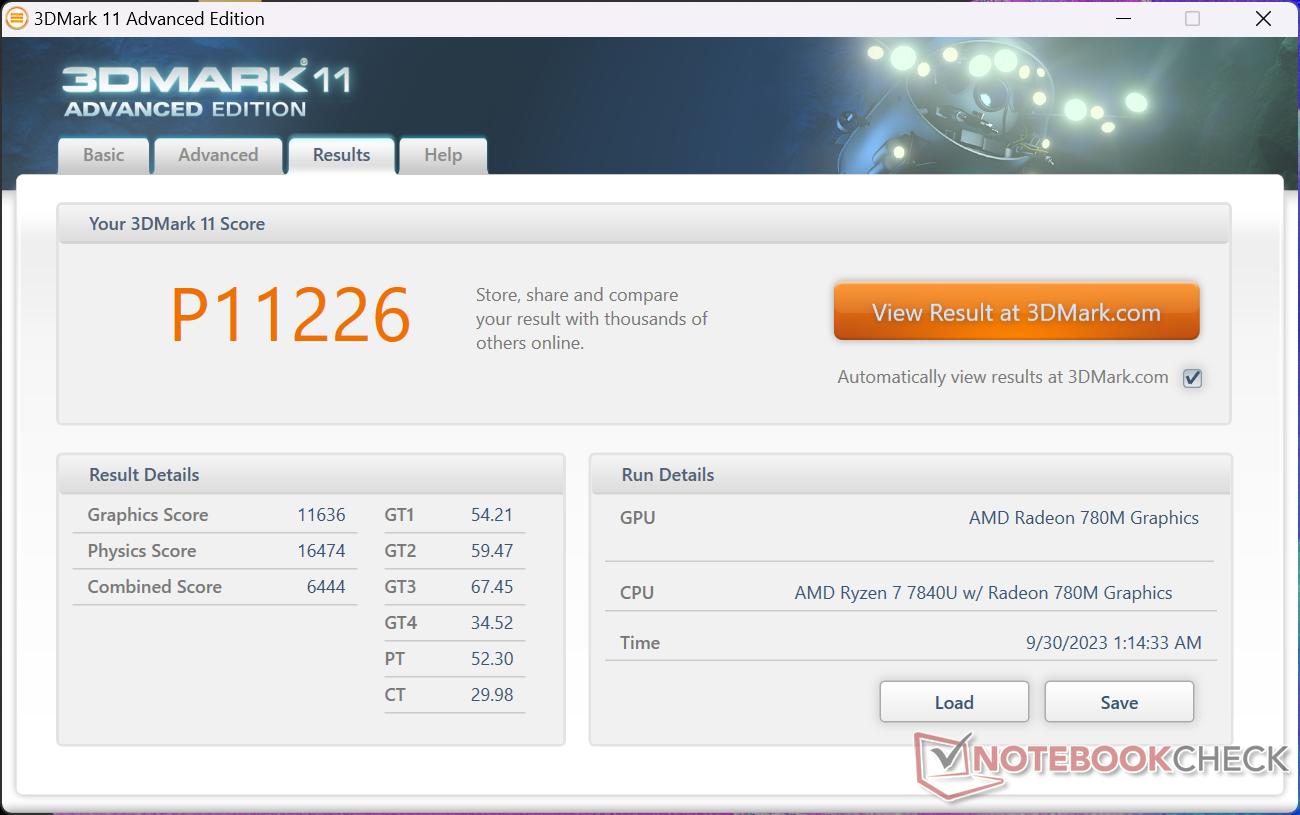
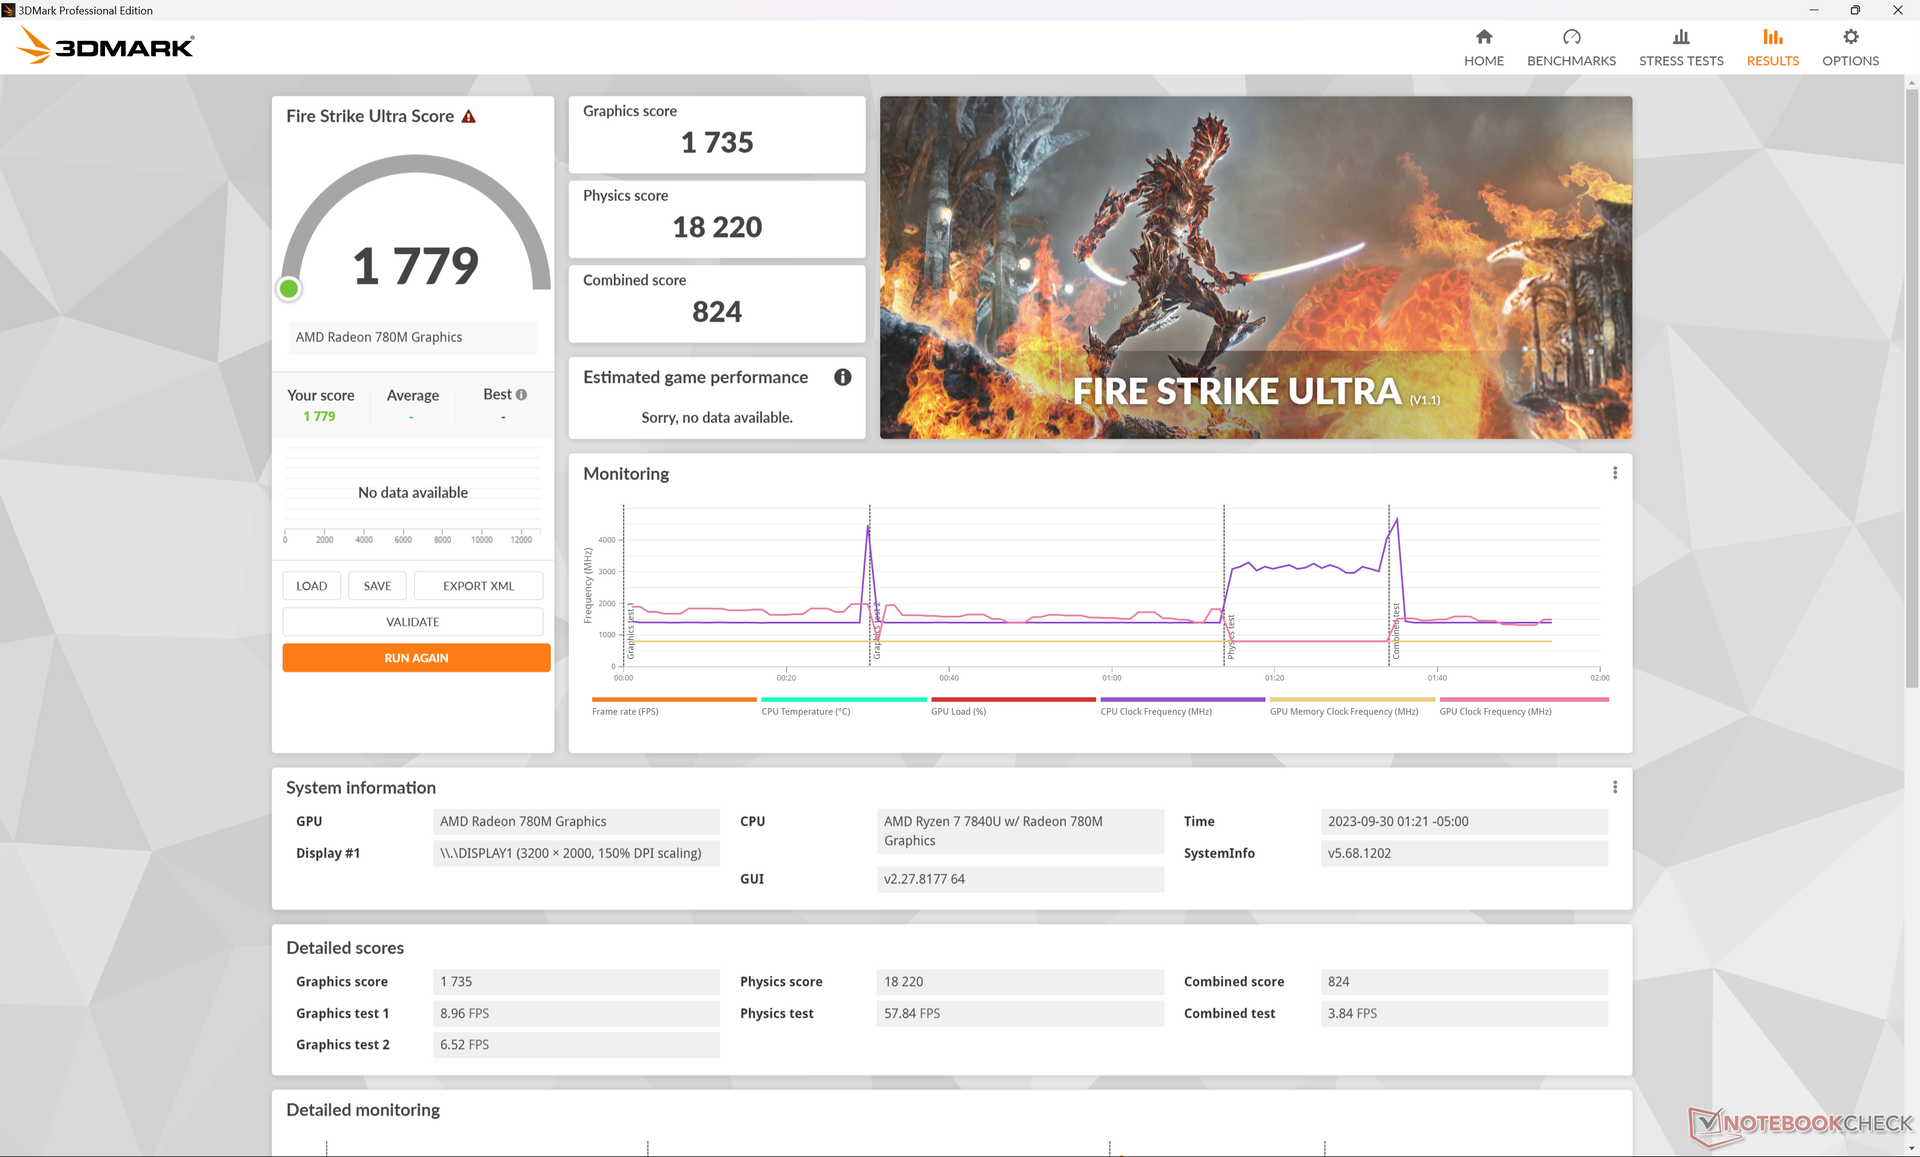
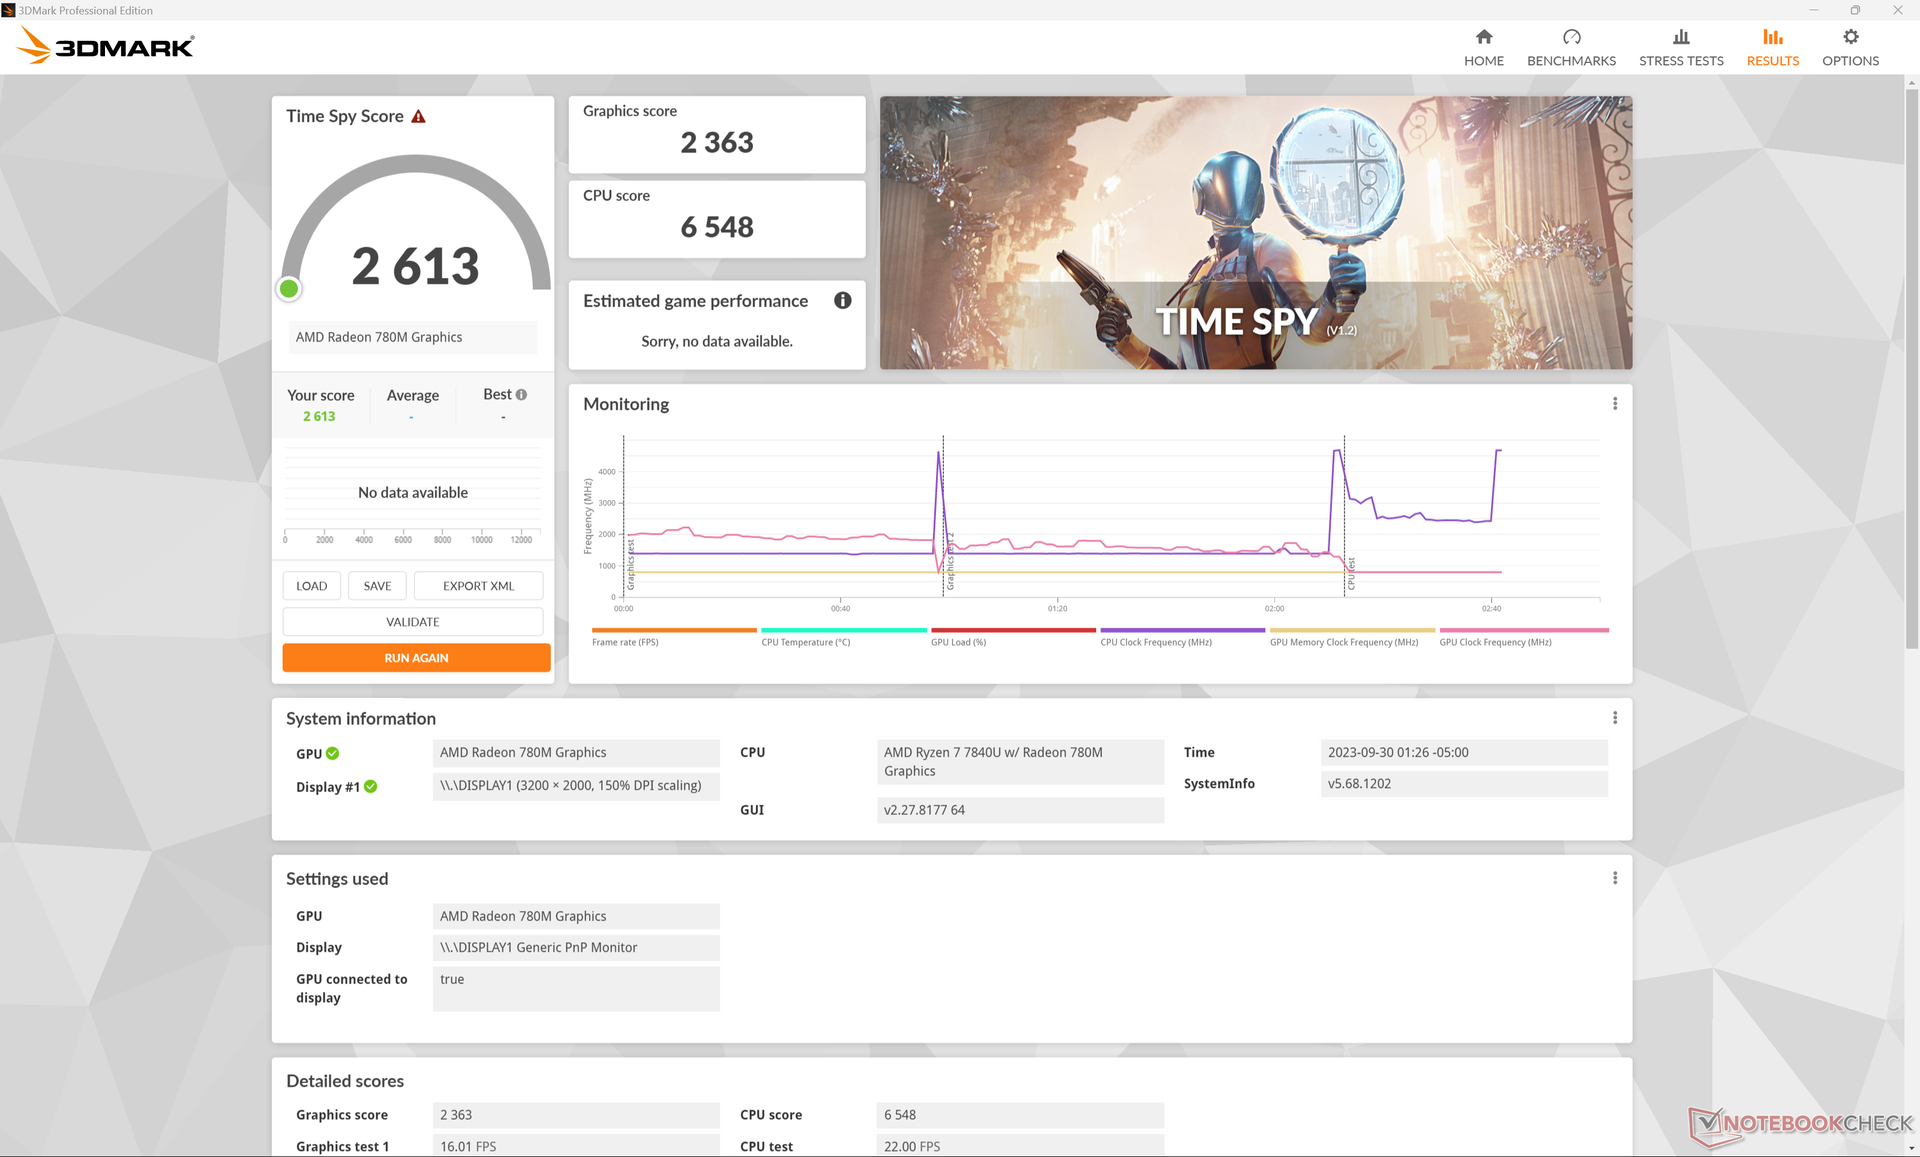
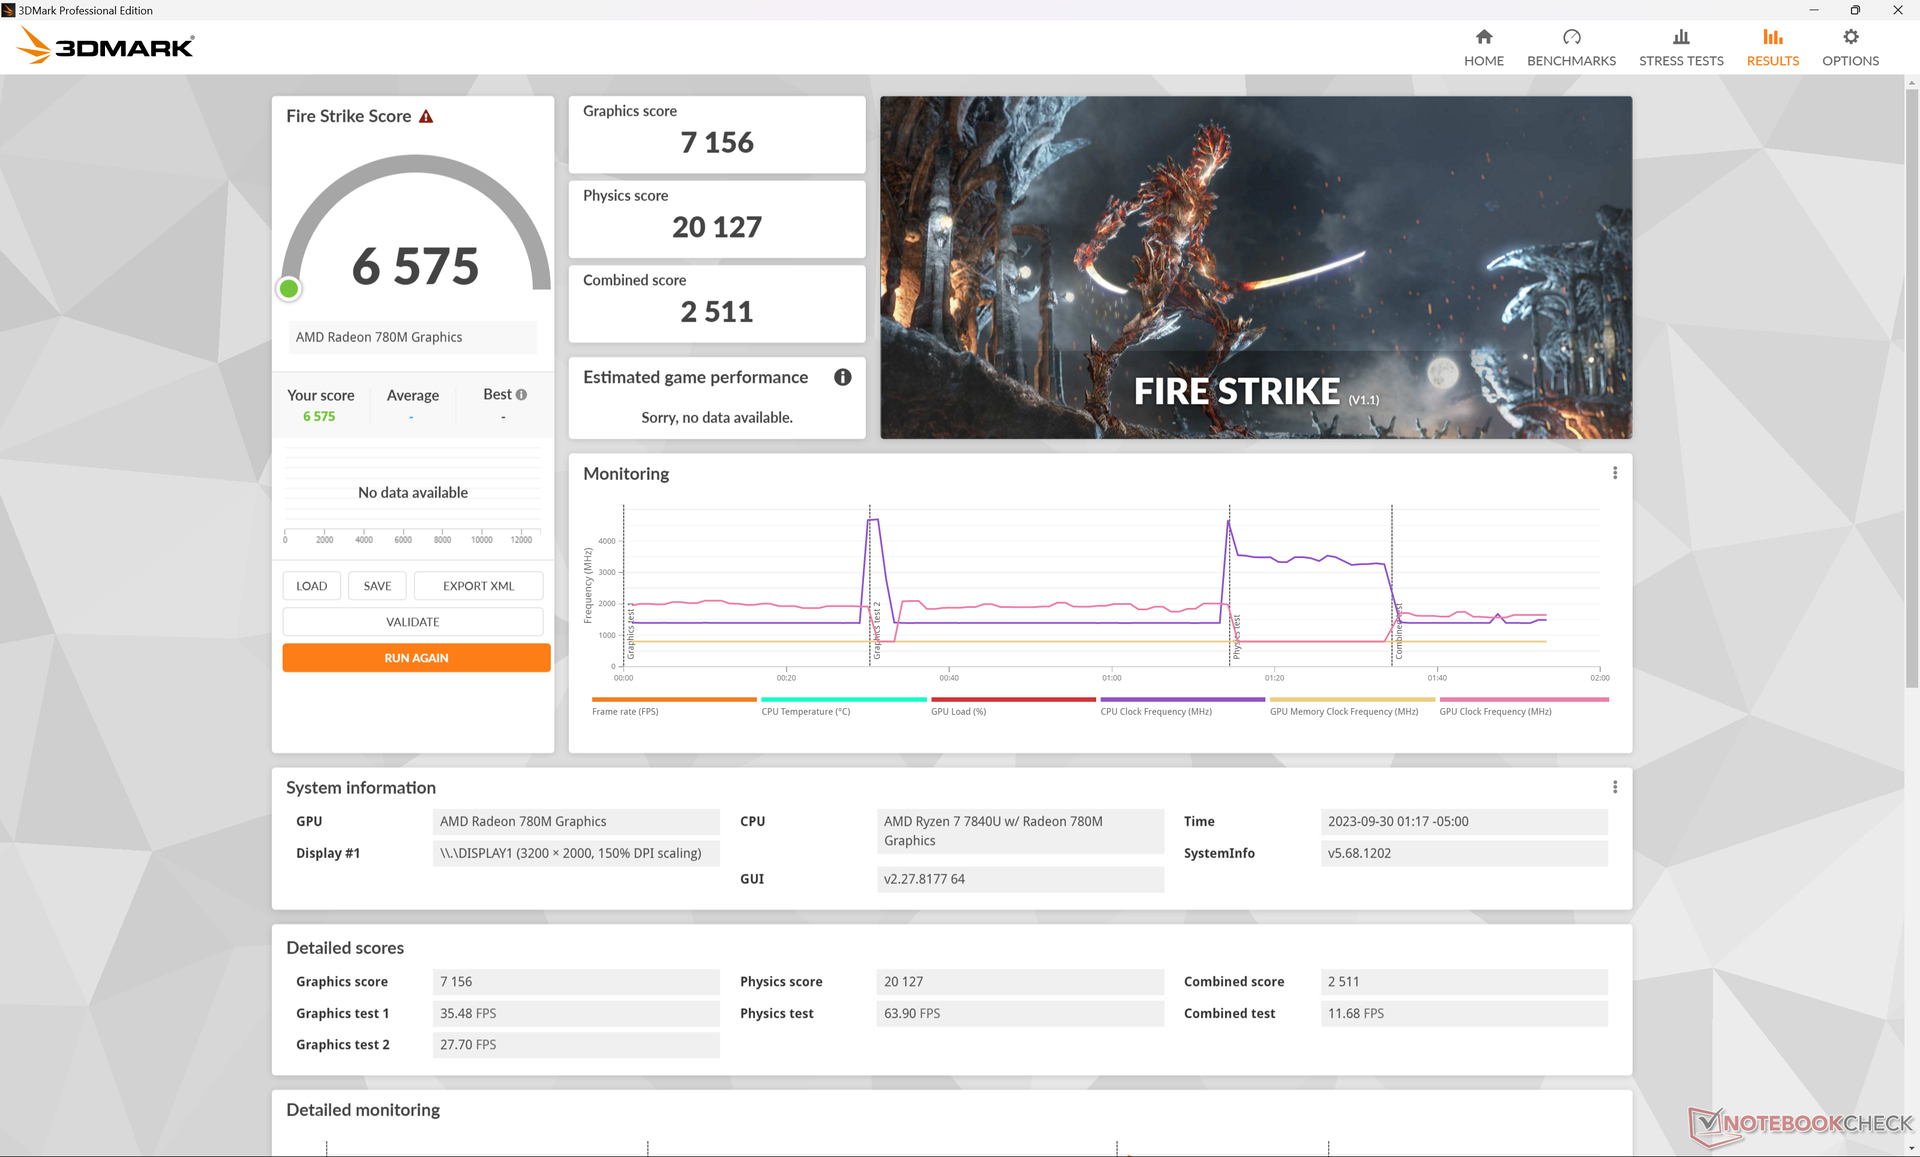
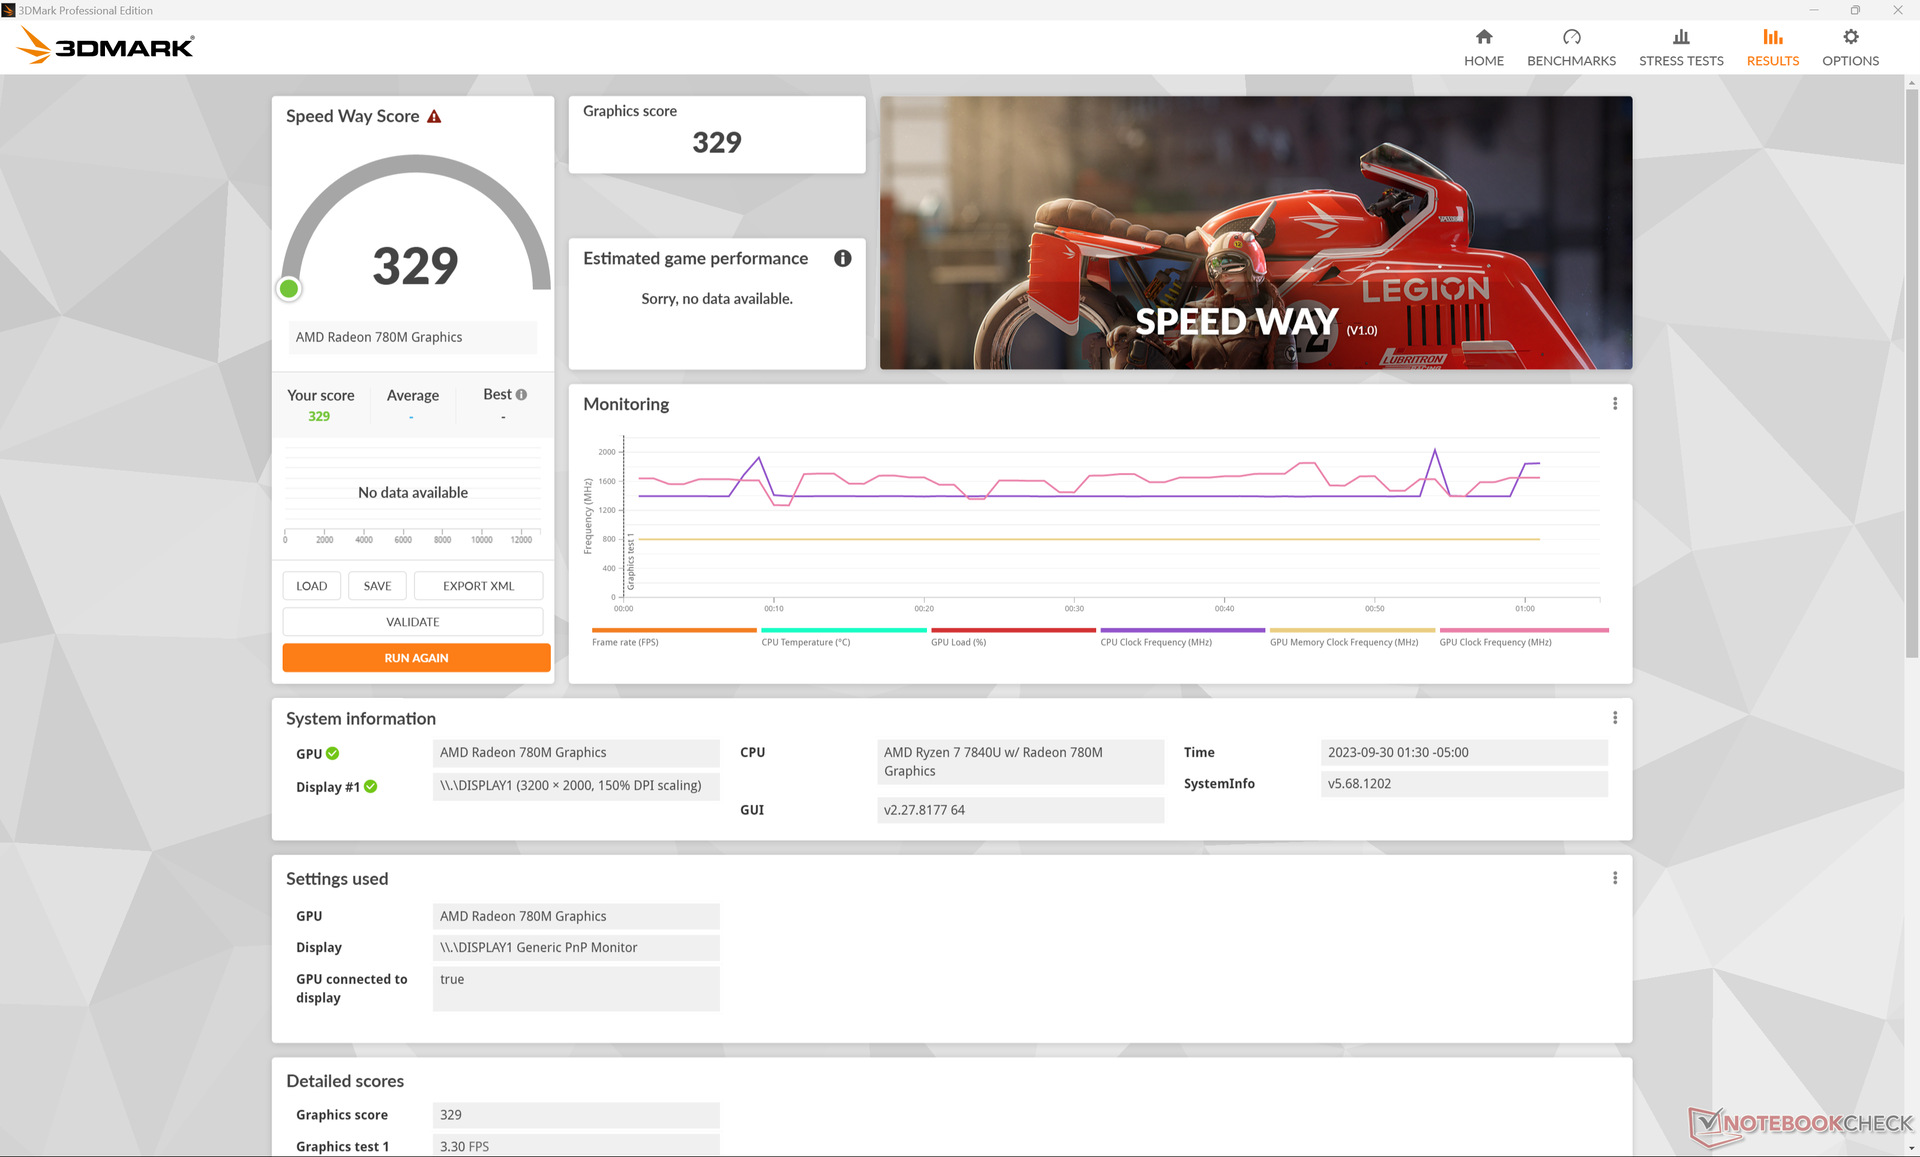
| 3DMark 11 Performance | 11226 points | |
| 3DMark Fire Strike Score | 6575 points | |
| 3DMark Time Spy Score | 2613 points | |
Help | ||
* ... smaller is better
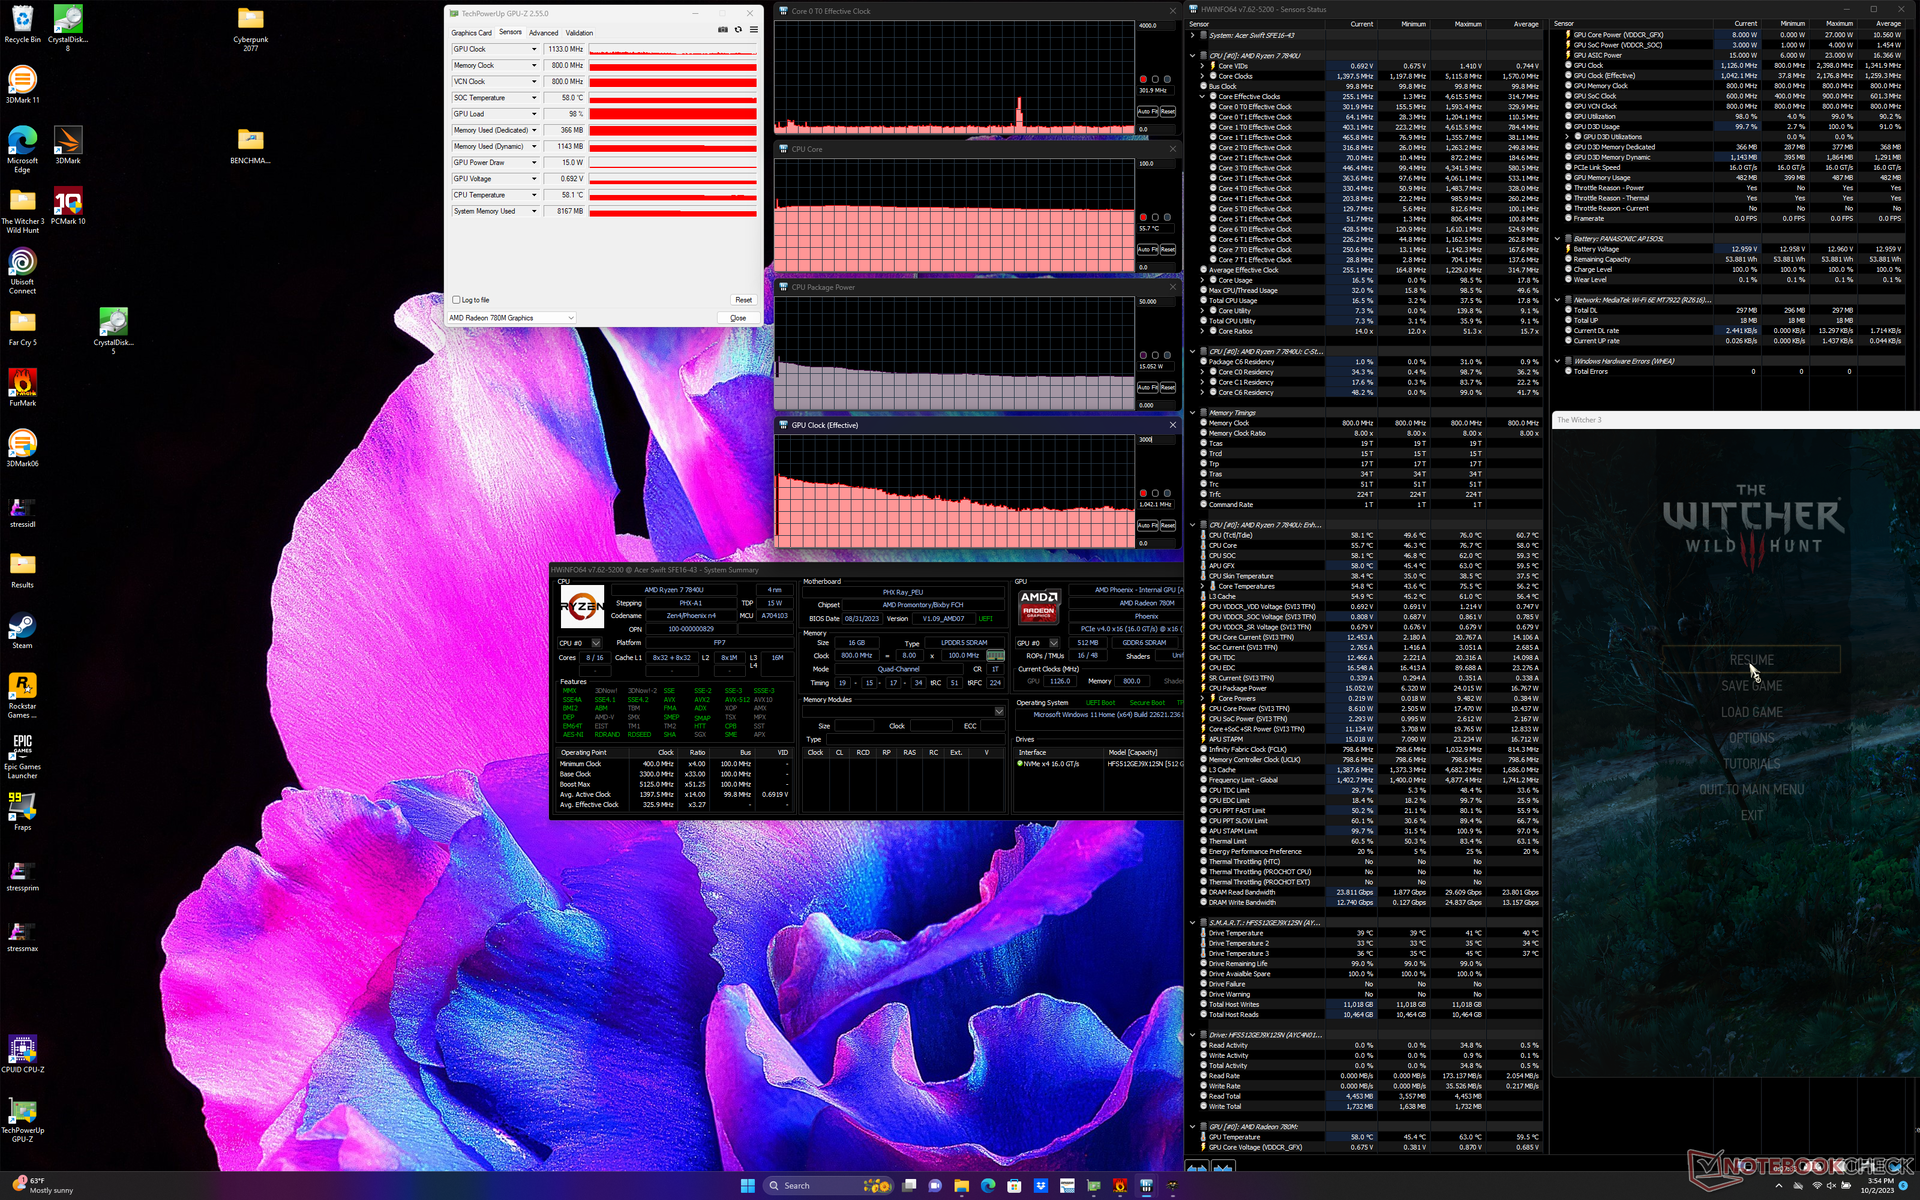
GPU 性能也会随着时间的推移而减弱,这与我们在运行上述 CineBench R15 xT 循环测试时观察到的情况类似。例如,当在 Witcher 3时,帧速率会从 45 FPS 的高帧率开始,最终放缓并稳定在 30 FPS 的低帧率范围内。
Witcher 3 FPS Chart
| low | med. | high | ultra | |
|---|---|---|---|---|
| GTA V (2015) | 139.3 | 53.9 | 21 | |
| The Witcher 3 (2015) | 109.8 | 36.1 | 20.4 | |
| Dota 2 Reborn (2015) | 128.1 | 101.5 | 66.8 | 61.4 |
| Final Fantasy XV Benchmark (2018) | 50.5 | 27.4 | 21.2 | |
| X-Plane 11.11 (2018) | 49.1 | 37 | 30.3 | |
| Far Cry 5 (2018) | 53 | 28 | 26 | 24 |
| Strange Brigade (2018) | 139.8 | 60.6 | 49.5 | 41.3 |
| Cyberpunk 2077 1.6 (2022) | 26.7 | 20.8 | 17.3 | 15.9 |
| Tiny Tina's Wonderlands (2022) | 34.3 | 28.4 | 18.6 | 16.5 |
| F1 22 (2022) | 65.4 | 62.1 | 42.6 | 9.92 |
排放量
系统噪音
尽管风扇的数量有所变化,但风扇噪音与 Zen 3+ 的配置相比并没有什么变化。这是令人遗憾的,因为我们的 Zen 3+ 测试机中的风扇会在引入较重负载时发出频繁而响亮的脉冲,我们的 Zen 4 测试机也不例外。在浏览网页或流媒体时,风扇噪音经常徘徊在 28 分贝(A)左右,而安静的背景噪音为 24 分贝(A)。
Noise level
| Idle |
| 24.1 / 24.3 / 28 dB(A) |
| Load |
| 41 / 40.9 dB(A) |
 | ||
30 dB silent 40 dB(A) audible 50 dB(A) loud |
||
min: | ||
| Acer Swift Edge SFE16 Ryzen 7 7840U Radeon 780M, R7 7840U, SK hynix HFS512GEJ9X125N | Acer Swift Edge SFE16-42-R1GM Radeon 680M, R7 7735U, Micron 3400 1TB MTFDKBA1T0TFH | Lenovo Slim Pro 9i 16IRP8 GeForce RTX 4050 Laptop GPU, i9-13905H, Samsung PM9A1 MZVL21T0HCLR | Asus VivoBook Pro 16 GeForce RTX 3050 Ti Laptop GPU, i7-12700H, Intel SSD 670p SSDPEKNU010TZ | Samsung Galaxy Book3 Ultra 16 GeForce RTX 4050 Laptop GPU, i7-13700H, Samsung PM9A1 MZVL2512HCJQ | Huawei MateBook 16s i7 Iris Xe G7 96EUs, i7-12700H, Silicon Motion PCIe-8 SSD | |
|---|---|---|---|---|---|---|
| Noise | -7% | -1% | -15% | -3% | 4% | |
| off / environment * (dB) | 23.4 | 25.7 -10% | 22.7 3% | 25.2 -8% | 25 -7% | 24 -3% |
| Idle Minimum * (dB) | 24.1 | 25.7 -7% | 22.7 6% | 25.2 -5% | 26 -8% | 24 -0% |
| Idle Average * (dB) | 24.3 | 27 -11% | 22.7 7% | 25.2 -4% | 27 -11% | 25.2 -4% |
| Idle Maximum * (dB) | 28 | 29.3 -5% | 27.5 2% | 25.2 10% | 28 -0% | 27.2 3% |
| Load Average * (dB) | 41 | 42.3 -3% | 28.9 30% | 55.1 -34% | 40 2% | 34.8 15% |
| Witcher 3 ultra * (dB) | 40.9 | 52.6 -29% | 39 5% | 34.8 15% | ||
| Load Maximum * (dB) | 40.9 | 42.7 -4% | 52.5 -28% | 61.5 -50% | 41 -0% | 39 5% |
* ... smaller is better
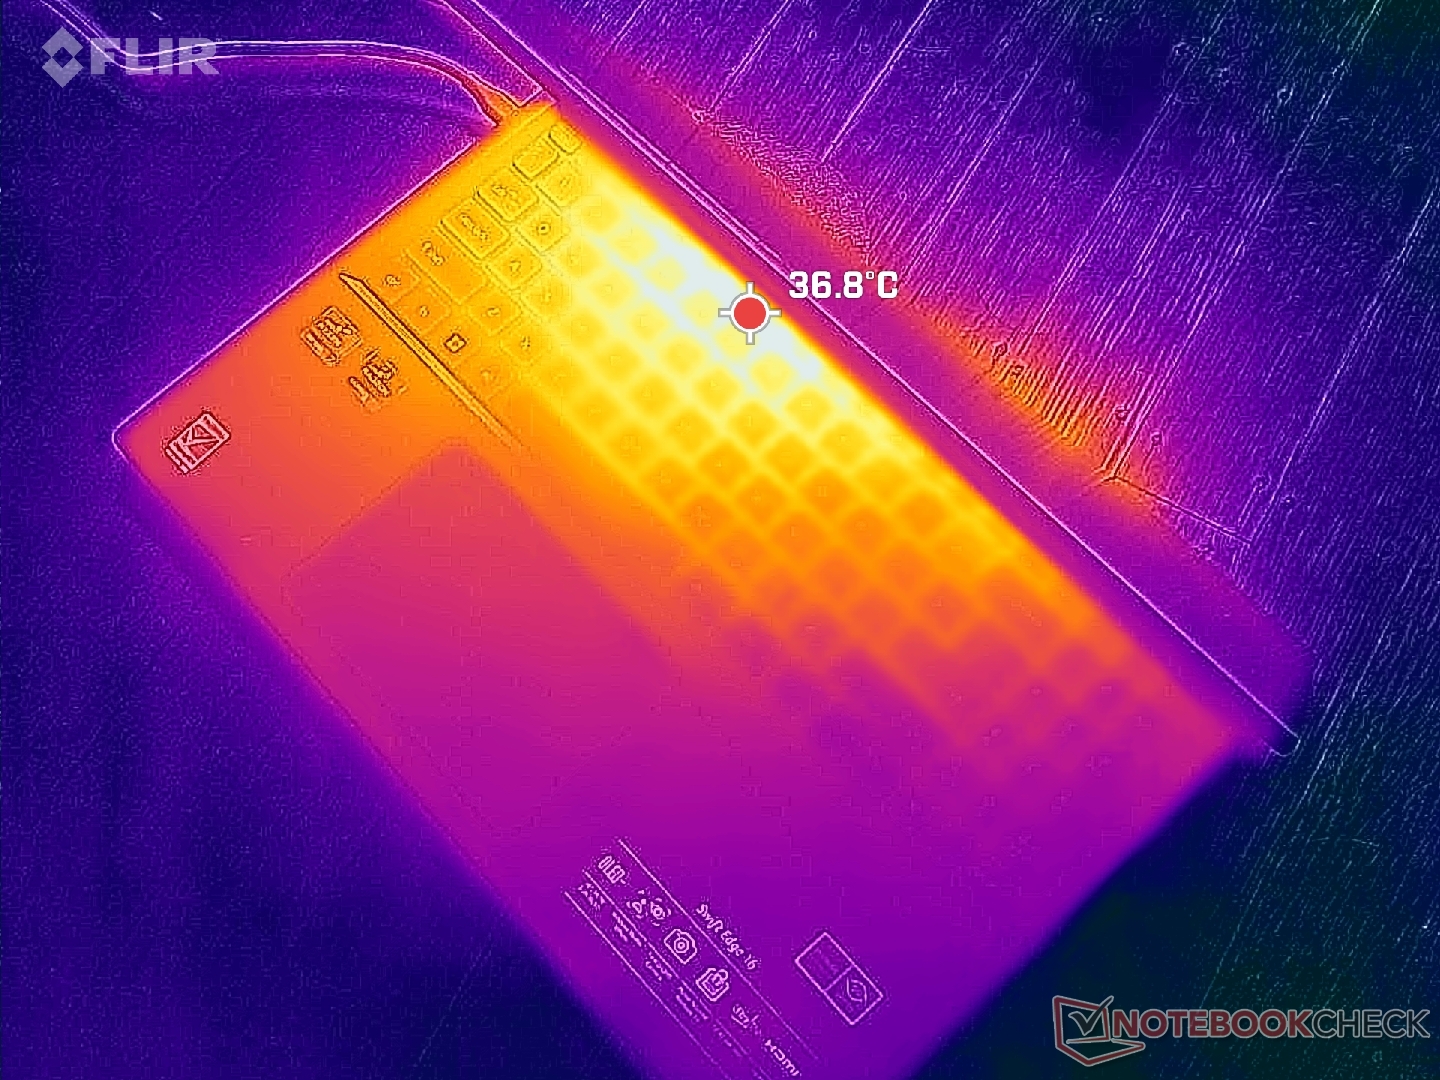
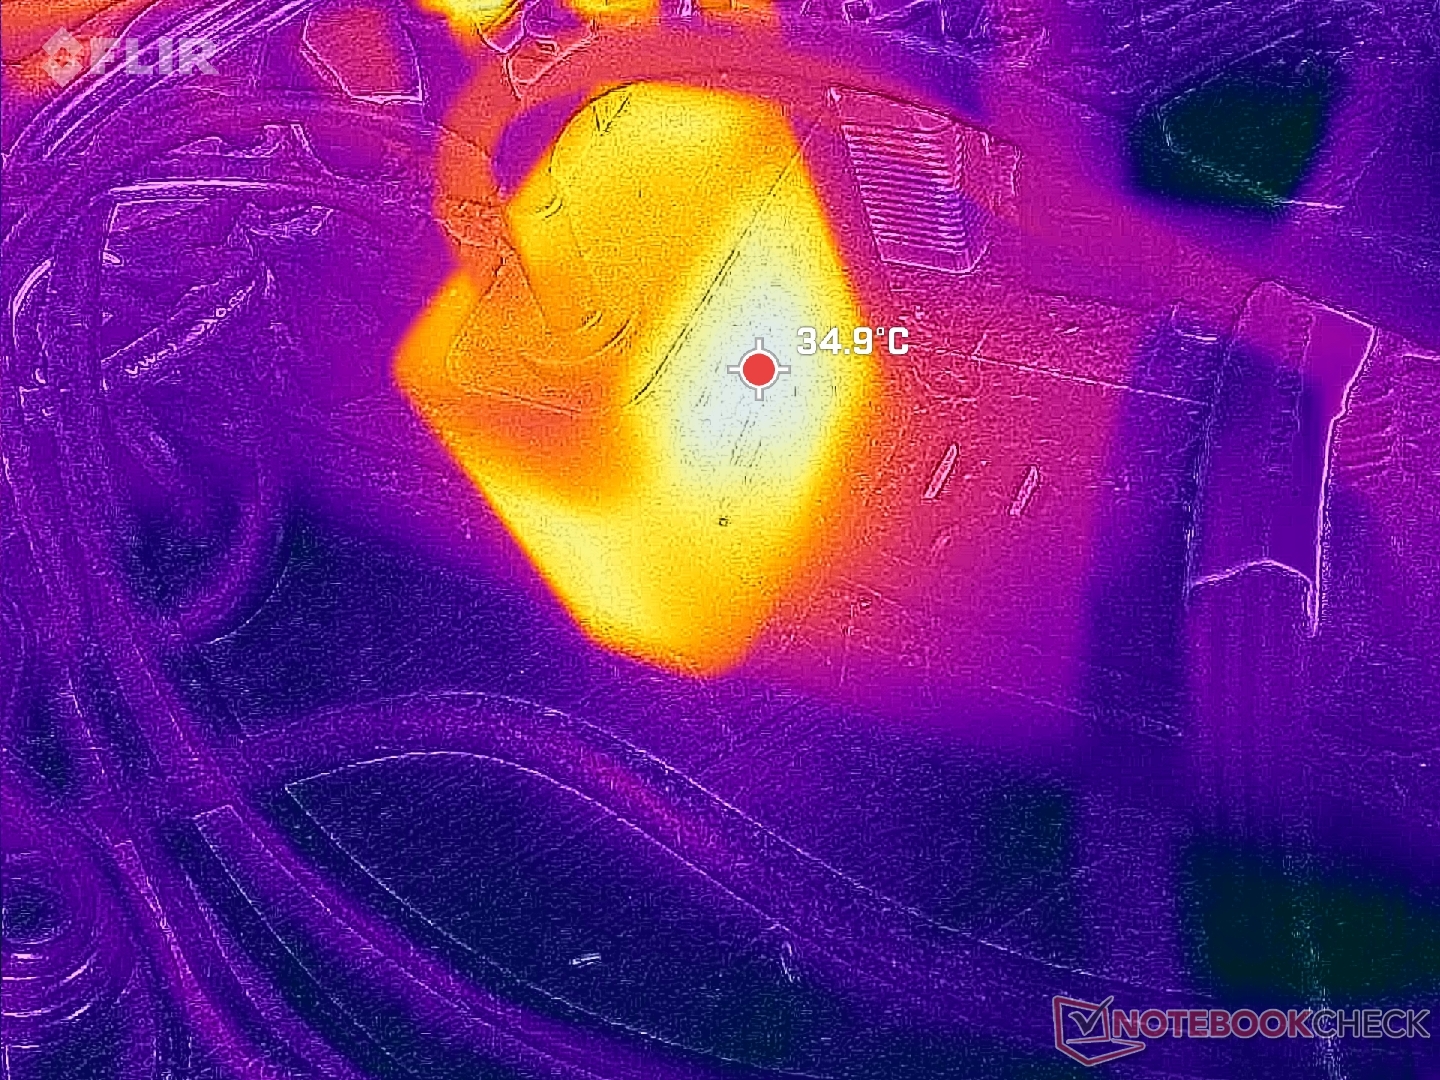
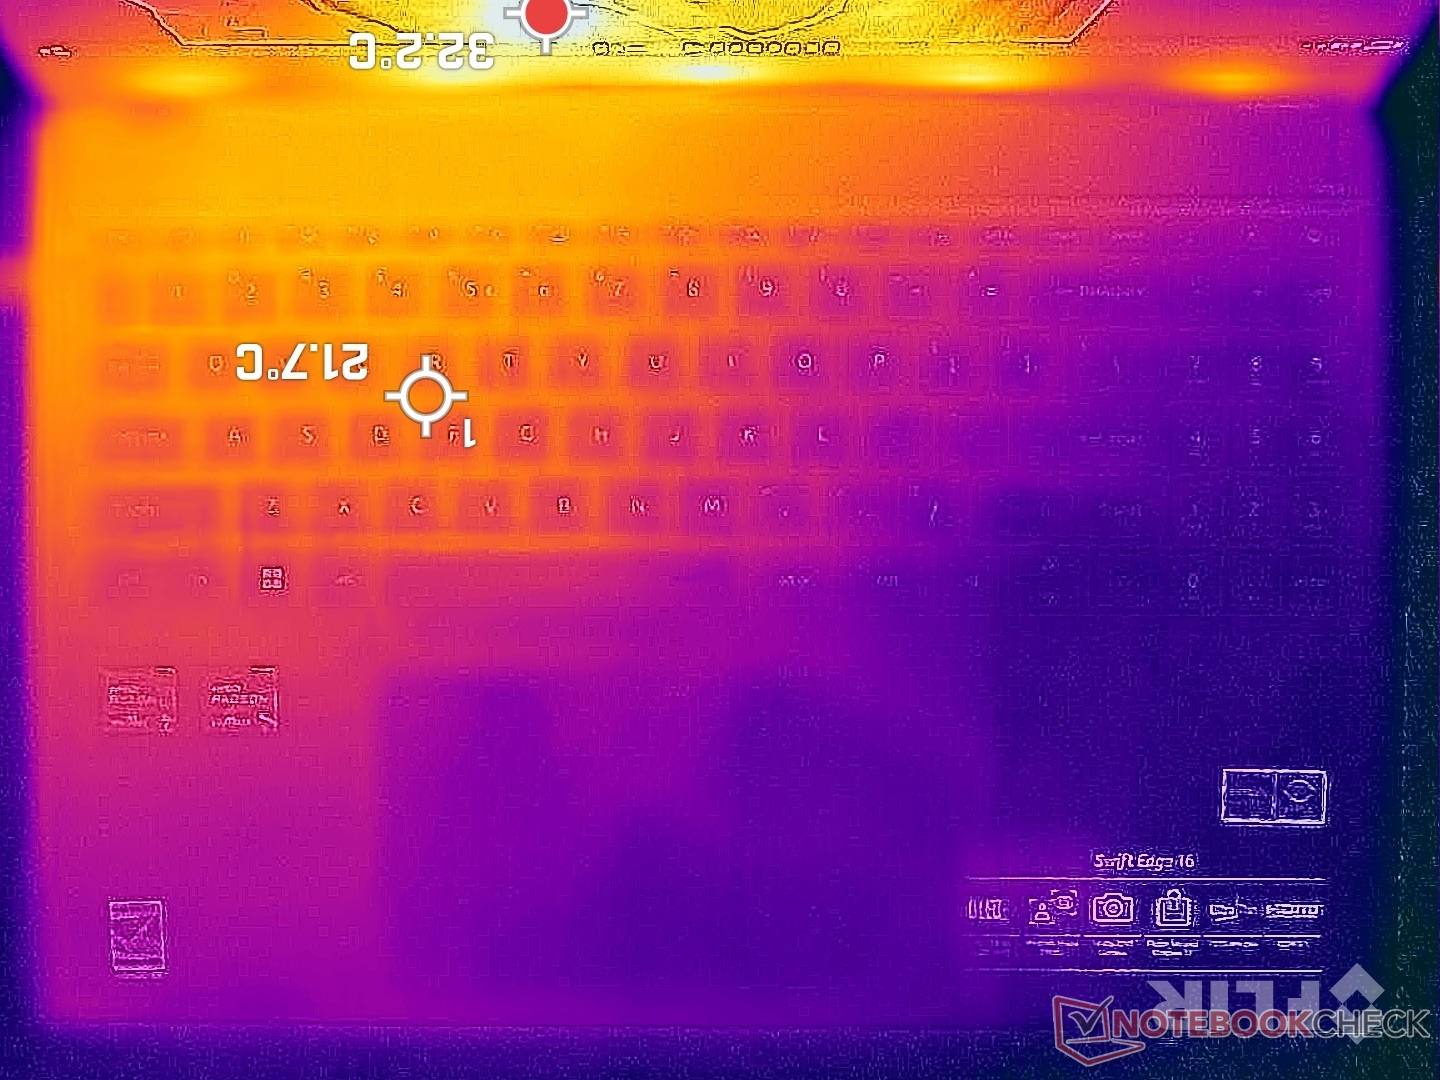
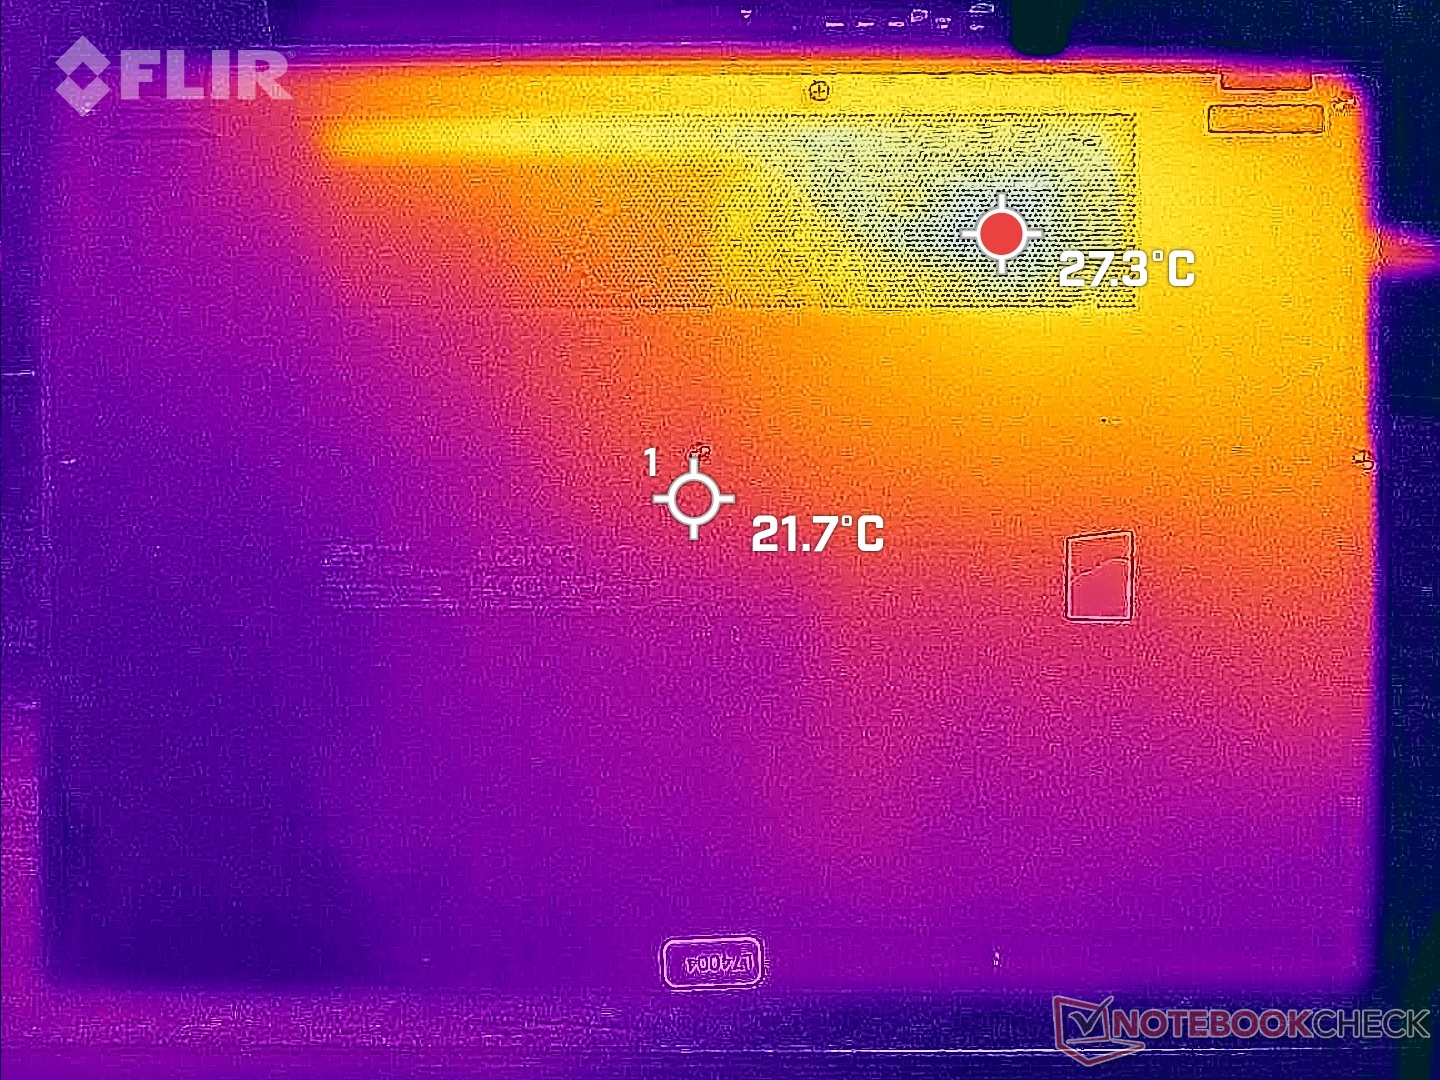
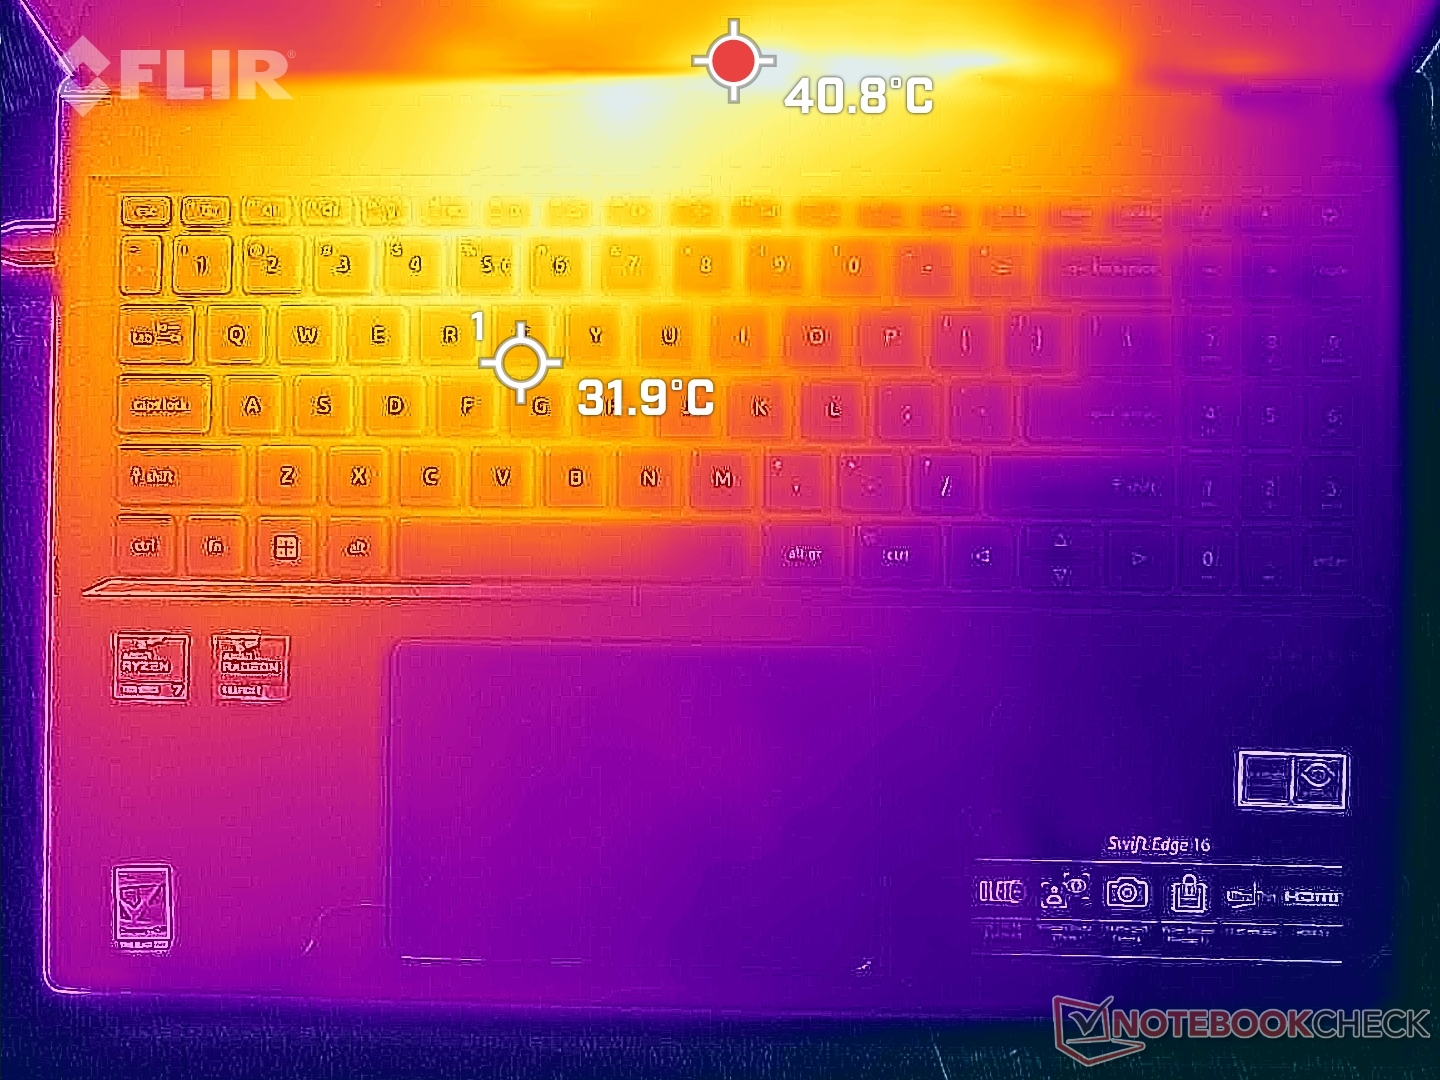
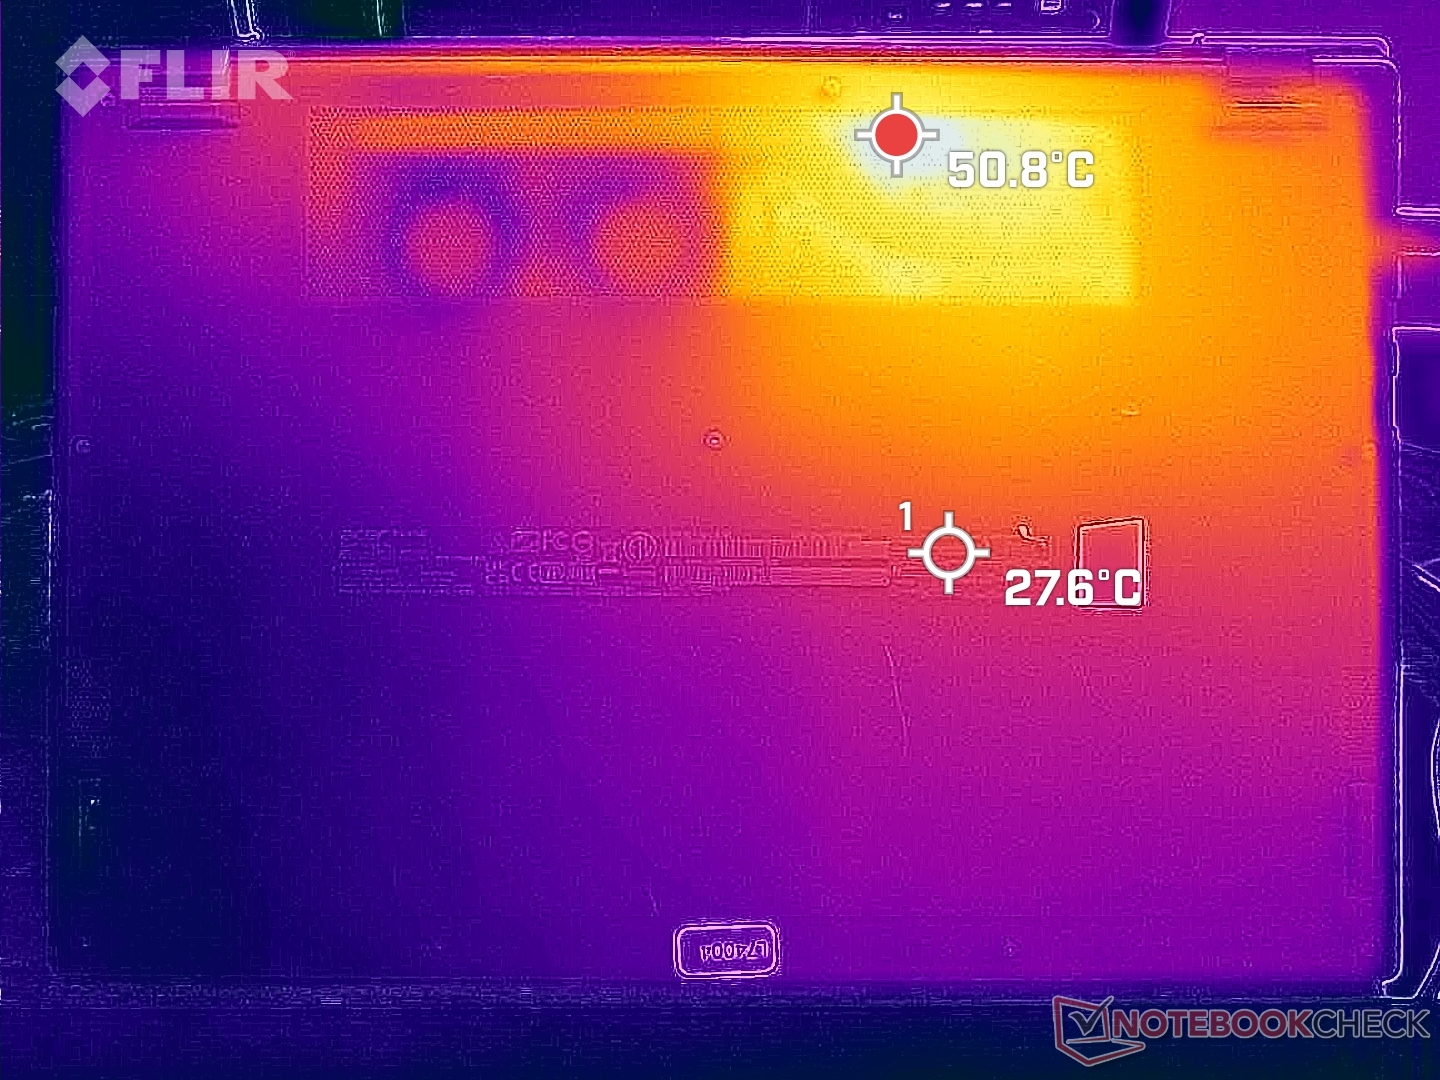
温度
表面温度并不比我们在 Ryzen 7 7735U 配置.底部通风口附近的热点温度仍然高达 50 摄氏度以上,而顶部铰链附近的表面温度则根据盖子的角度从 40 摄氏度到 50 摄氏度不等。玩游戏时,手不太可能长时间接触这些发热区域。
(±) The maximum temperature on the upper side is 41.6 °C / 107 F, compared to the average of 34.3 °C / 94 F, ranging from 21.2 to 62.5 °C for the class Office.
(-) The bottom heats up to a maximum of 46.6 °C / 116 F, compared to the average of 36.8 °C / 98 F
(+) In idle usage, the average temperature for the upper side is 27 °C / 81 F, compared to the device average of 29.5 °C / 85 F.
(+) The palmrests and touchpad are cooler than skin temperature with a maximum of 26.6 °C / 79.9 F and are therefore cool to the touch.
(±) The average temperature of the palmrest area of similar devices was 27.5 °C / 81.5 F (+0.9 °C / 1.6 F).
| Acer Swift Edge SFE16 Ryzen 7 7840U AMD Ryzen 7 7840U, AMD Radeon 780M | Acer Swift Edge SFE16-42-R1GM AMD Ryzen 7 7735U, AMD Radeon 680M | Lenovo Slim Pro 9i 16IRP8 Intel Core i9-13905H, NVIDIA GeForce RTX 4050 Laptop GPU | Asus VivoBook Pro 16 Intel Core i7-12700H, NVIDIA GeForce RTX 3050 Ti Laptop GPU | Samsung Galaxy Book3 Ultra 16 Intel Core i7-13700H, NVIDIA GeForce RTX 4050 Laptop GPU | Huawei MateBook 16s i7 Intel Core i7-12700H, Intel Iris Xe Graphics G7 96EUs | |
|---|---|---|---|---|---|---|
| Heat | -7% | 3% | -13% | 12% | 1% | |
| Maximum Upper Side * (°C) | 41.6 | 49.4 -19% | 37.8 9% | 44.2 -6% | 41 1% | 40.9 2% |
| Maximum Bottom * (°C) | 46.6 | 44.7 4% | 44.8 4% | 53 -14% | 44 6% | 48.3 -4% |
| Idle Upper Side * (°C) | 30.4 | 34 -12% | 30.6 -1% | 32.1 -6% | 23 24% | 29.2 4% |
| Idle Bottom * (°C) | 31 | 31.6 -2% | 31 -0% | 38.4 -24% | 26 16% | 30.4 2% |
* ... smaller is better
压力测试
在进行基准压力测试时,可以观察到宏碁的 Turbo Core 潜力有限。在启动 Prime95 压力测试时,时钟频率和主板功耗分别升至 3.5 GHz 和 30 W,然后在接下来的一分钟内稳步降至 2.3 GHz 和 18 W。核心温度也稳定在相对较低的 64 C。 AMD 框架笔记本 13.5笔记本电脑上重复这项测试,CPU 的频率、功耗和温度都会有所提高,分别为 3.2 GHz、35 W 和 85 C。
运行时的核心温度 Witcher 3将稳定在 56 摄氏度,比上述 Framework 低约 15 摄氏度。很明显,系统优先考虑的是较低的表面温度,而不是较高的性能。
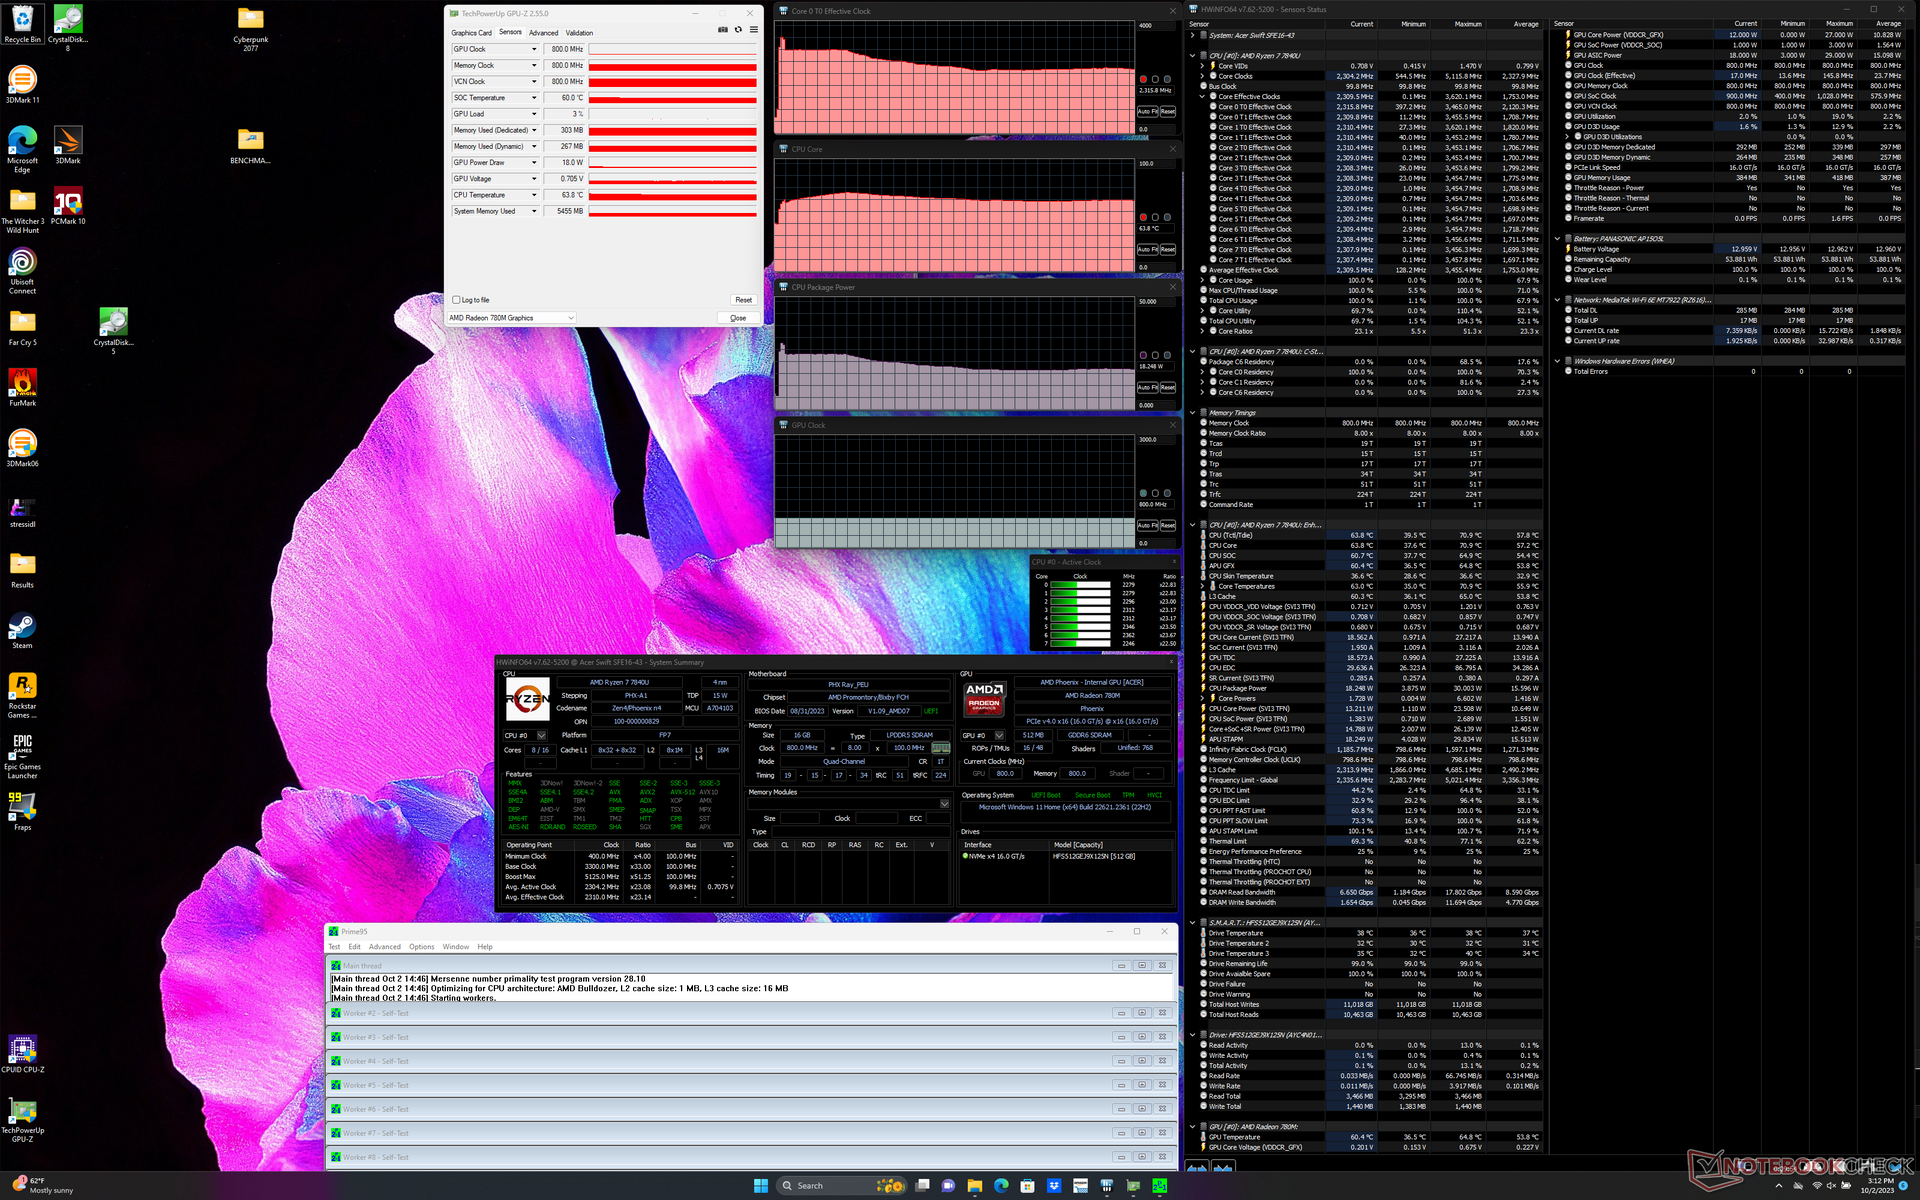
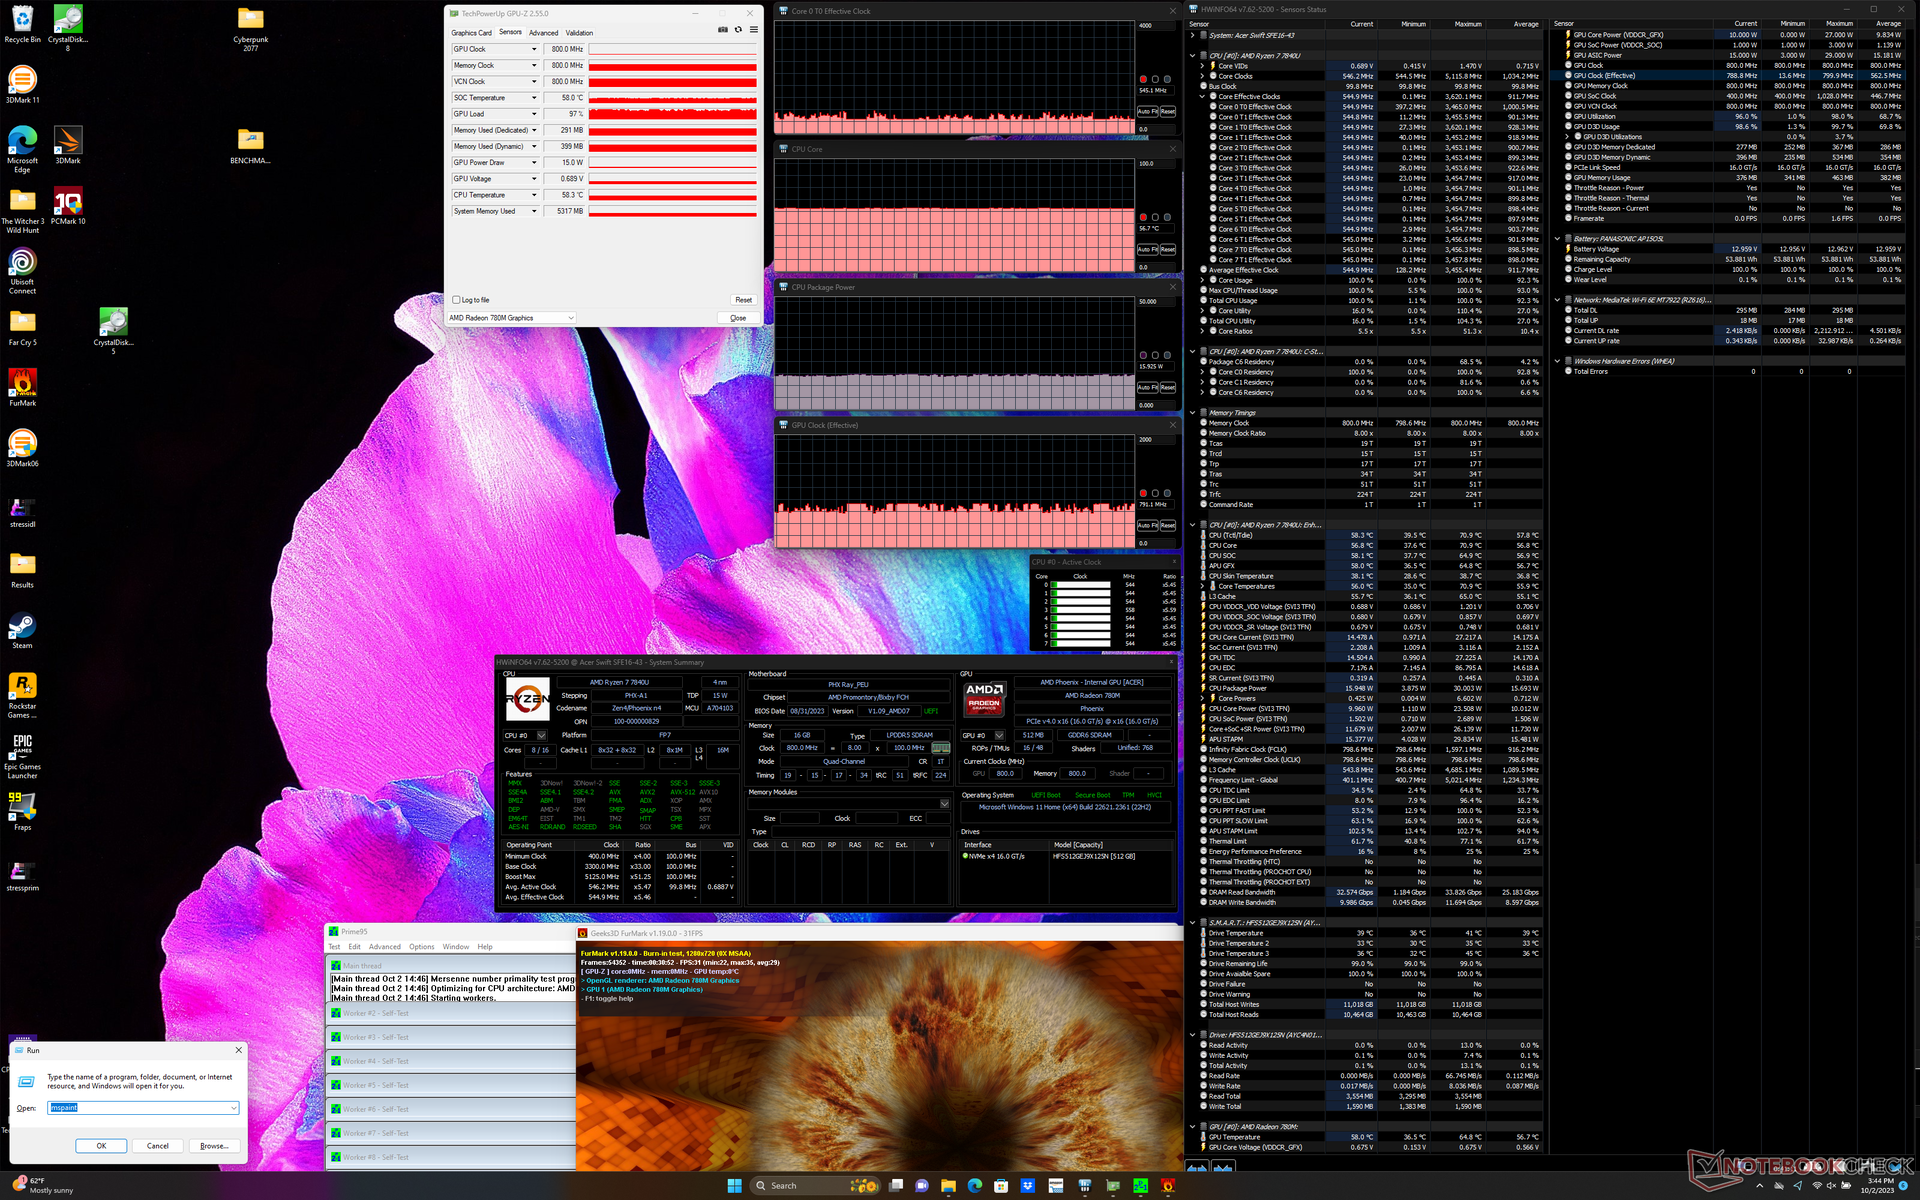
| CPU 时钟 (GHz) | GPU 时钟 (MHz) | CPU 平均温度 (°C) | |
| 系统闲置 | -- | -- | 38 |
| Prime95 压力 | 2.3 | -- | 64 |
| Prime95 + FurMark 压力 | 0.5 | 791 | 57 |
| Witcher 3 压力 | 0.3 | 1042 | 56 |
发言人
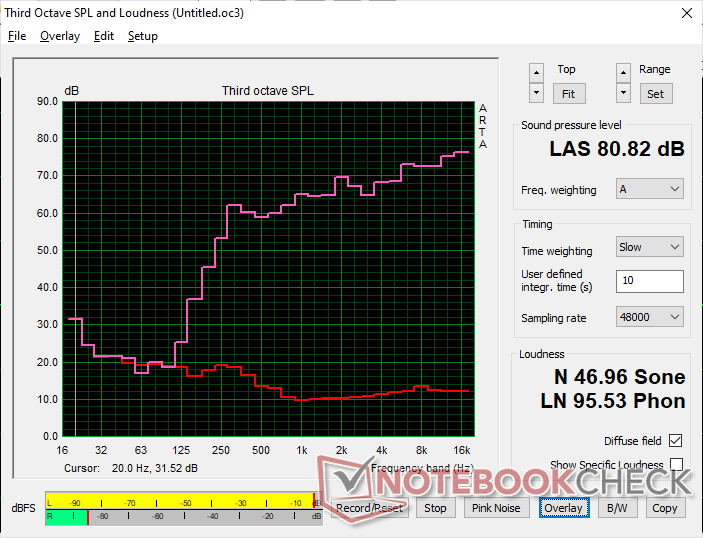
Acer Swift Edge SFE16 Ryzen 7 7840U audio analysis
(±) | speaker loudness is average but good (80.8 dB)
Bass 100 - 315 Hz
(-) | nearly no bass - on average 24.5% lower than median
(±) | linearity of bass is average (14.2% delta to prev. frequency)
Mids 400 - 2000 Hz
(+) | balanced mids - only 2.9% away from median
(+) | mids are linear (3.5% delta to prev. frequency)
Highs 2 - 16 kHz
(+) | balanced highs - only 4.8% away from median
(+) | highs are linear (3.7% delta to prev. frequency)
Overall 100 - 16.000 Hz
(±) | linearity of overall sound is average (19.8% difference to median)
Compared to same class
» 41% of all tested devices in this class were better, 9% similar, 50% worse
» The best had a delta of 7%, average was 21%, worst was 53%
Compared to all devices tested
» 51% of all tested devices were better, 7% similar, 42% worse
» The best had a delta of 4%, average was 23%, worst was 134%
Apple MacBook Pro 16 2021 M1 Pro audio analysis
(+) | speakers can play relatively loud (84.7 dB)
Bass 100 - 315 Hz
(+) | good bass - only 3.8% away from median
(+) | bass is linear (5.2% delta to prev. frequency)
Mids 400 - 2000 Hz
(+) | balanced mids - only 1.3% away from median
(+) | mids are linear (2.1% delta to prev. frequency)
Highs 2 - 16 kHz
(+) | balanced highs - only 1.9% away from median
(+) | highs are linear (2.7% delta to prev. frequency)
Overall 100 - 16.000 Hz
(+) | overall sound is linear (4.6% difference to median)
Compared to same class
» 0% of all tested devices in this class were better, 0% similar, 100% worse
» The best had a delta of 5%, average was 17%, worst was 45%
Compared to all devices tested
» 0% of all tested devices were better, 0% similar, 100% worse
» The best had a delta of 4%, average was 23%, worst was 134%
能源管理
耗电量
由于宏碁配置的 OLED 面板具有 120 Hz 的高刷新率,比通常的 60 Hz IPS 更耗电,因此空闲时的功耗比其他大多数集成 GPU 的笔记本电脑都要高。以 120 Hz 显示全白图像的功耗高达 19 W,而 Framework Laptop 13.5 的功耗不到一半。
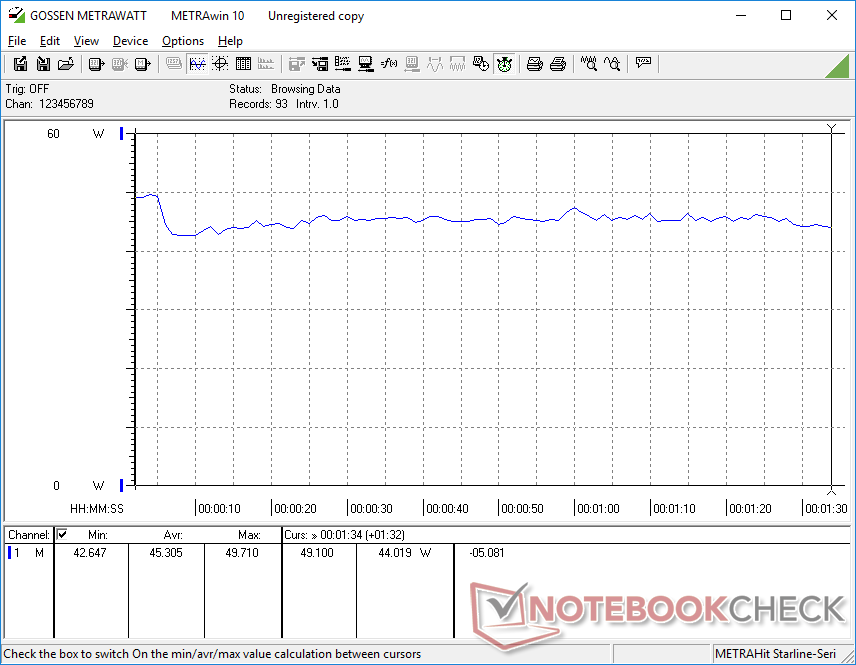
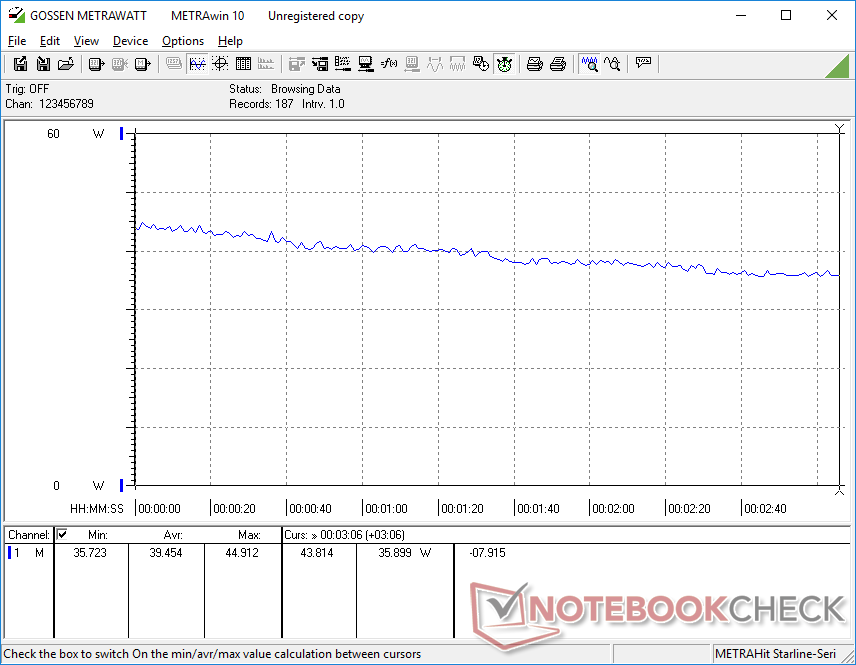
相反,由于处理器的节流倾向,游戏时的功耗会低于预期。在测试开始时,功耗会很高,然后随着时间的推移稳步下降,如下图所示,这表明性能节流。
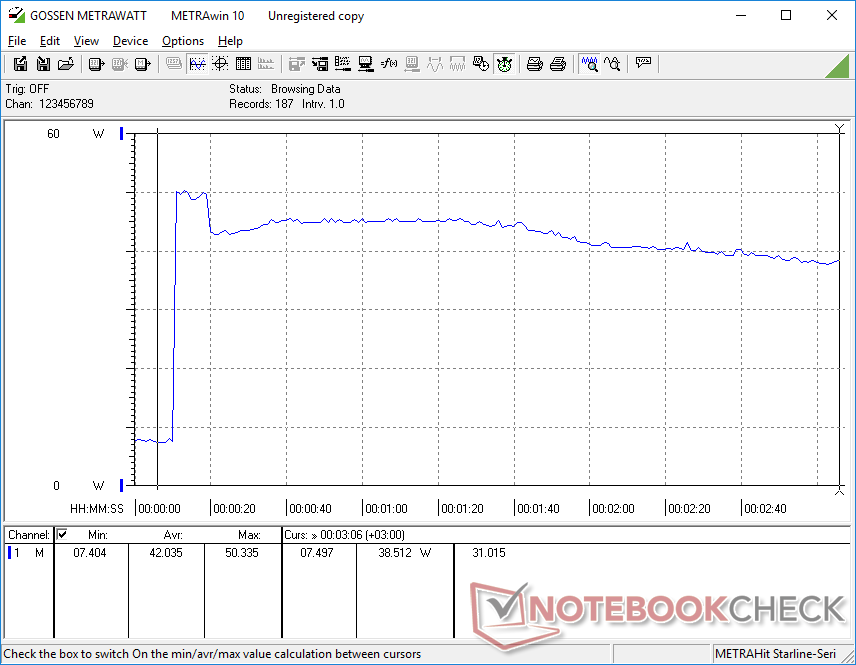
| Off / Standby | |
| Idle | |
| Load |
|
Key:
min: | |
| Acer Swift Edge SFE16 Ryzen 7 7840U R7 7840U, Radeon 780M, SK hynix HFS512GEJ9X125N, OLED, 3200x2000, 16" | Acer Swift Edge SFE16-42-R1GM R7 7735U, Radeon 680M, Micron 3400 1TB MTFDKBA1T0TFH, OLED, 3840x2400, 16" | Lenovo Slim Pro 9i 16IRP8 i9-13905H, GeForce RTX 4050 Laptop GPU, Samsung PM9A1 MZVL21T0HCLR, Mini-LED, 3200x2000, 16" | Asus VivoBook Pro 16 i7-12700H, GeForce RTX 3050 Ti Laptop GPU, Intel SSD 670p SSDPEKNU010TZ, IPS, 2560x1600, 16" | Samsung Galaxy Book3 Ultra 16 i7-13700H, GeForce RTX 4050 Laptop GPU, Samsung PM9A1 MZVL2512HCJQ, AMOLED, 2880x1800, 16" | Huawei MateBook 16s i7 i7-12700H, Iris Xe G7 96EUs, Silicon Motion PCIe-8 SSD, IPS, 2520x1680, 16" | |
|---|---|---|---|---|---|---|
| Power Consumption | 4% | -166% | -102% | -15% | -30% | |
| Idle Minimum * (Watt) | 7.1 | 8.6 -21% | 16 -125% | 8.7 -23% | 3 58% | 6.8 4% |
| Idle Average * (Watt) | 10.1 | 7.7 24% | 30 -197% | 13.1 -30% | 5 50% | 13.2 -31% |
| Idle Maximum * (Watt) | 18.6 | 9.3 50% | 30.4 -63% | 18.3 2% | 11 41% | 13.8 26% |
| Load Average * (Watt) | 45.3 | 47.9 -6% | 78.9 -74% | 116 -156% | 72 -59% | 75.2 -66% |
| Witcher 3 ultra * (Watt) | 39.5 | 46.3 -17% | 155.3 -293% | 117.6 -198% | 69.7 -76% | 56.1 -42% |
| Load Maximum * (Watt) | 52.9 | 56 -6% | 180.4 -241% | 162 -206% | 108 -104% | 90.6 -71% |
* ... smaller is better
Power Consumption Witcher 3 / Stresstest
Power Consumption external Monitor
电池寿命
即使在相同的电源配置文件设置和浏览器条件下,无线局域网的运行时间也比我们在前一台设备上记录的时间短了近两个小时。120 Hz 的刷新率可能是造成电池寿命差异的一个因素。
| Acer Swift Edge SFE16 Ryzen 7 7840U R7 7840U, Radeon 780M, 54 Wh | Acer Swift Edge SFE16-42-R1GM R7 7735U, Radeon 680M, 54 Wh | Lenovo Slim Pro 9i 16IRP8 i9-13905H, GeForce RTX 4050 Laptop GPU, 75 Wh | Asus VivoBook Pro 16 i7-12700H, GeForce RTX 3050 Ti Laptop GPU, 70 Wh | Samsung Galaxy Book3 Ultra 16 i7-13700H, GeForce RTX 4050 Laptop GPU, 76 Wh | Huawei MateBook 16s i7 i7-12700H, Iris Xe G7 96EUs, 84 Wh | |
|---|---|---|---|---|---|---|
| Battery runtime | 30% | 18% | 30% | 71% | 45% | |
| WiFi v1.3 (h) | 5.6 | 7.3 30% | 6.6 18% | 7.3 30% | 9.6 71% | 8.1 45% |
| Reader / Idle (h) | 10.9 | 18.2 | ||||
| H.264 (h) | 8.6 | 13.4 | 9.3 | |||
| Load (h) | 1.5 | 1.8 | 1.9 |
Pros
Cons
结论:微小但显著的升级
禅 3+ Swift Edge 16 Zen 3+ Swift Edge 16Zen 3+ Swift Edge 16 已经是我们最喜欢的 16 英寸笔记本电脑之一,更新后的 Zen 4 配置更坚定了我们的立场。考虑到低重量和轻薄的外形,它的 CPU 性能,尤其是 GPU 性能非常强大。同时,3.2K 120 Hz OLED 显示屏是我们所见过的多媒体笔记本电脑中最好的显示屏之一,适用于文字处理、编辑、浏览、视频甚至游戏。如果你想在尽可能减轻重量的同时最大限度地提高性能和显示质量,那么 Swift Edge 16 确实能满足你的要求。
Ryzen 7 7840U 的性能比已经非常出色的 Ryzen 7 735U Swift Edge 16 配置有了相当大的提升。用户会喜欢 120 Hz OLED 显示屏和轻巧的机身,但一般的电池续航时间和性能节流可能会让高级用户不爽。
除了 CPU 和显示屏之外,还有其他不足之处。由于这款笔记本电脑的尺寸非常轻巧,因此不得不取消或减少某些功能,如较小的散热解决方案、较小的电池容量,以及不采用大猩猩玻璃或触摸屏,以保持较低的重量。因此,CPU 运行速度比预期稍慢,电池续航能力一般,固态硬盘在压力下会跳动,显示屏比我们希望的更容易扭曲和晃动。由于内存是焊接的,而且只支持一个内部固态硬盘,因此扩展性也受到了限制。
如果你绝对需要 H 系列 CPU 和GeForce RTX GPU 的强大性能,那么你可能需要考虑更重的 Swift X 16, 华硕 VivoBook Pro 16或Galaxy Book3 Ultra 16相反。经常旅行的人会更喜欢 Swift Edge 16,因为他们可以更经常地利用系统的低重量,而不会牺牲显示质量或太多性能。
价格和供应情况
宏碁的 Swift Edge SFE16(评测机型为 Ryzen 7 7840U)目前在百思买有售,售价 1300 美元。
Acer Swift Edge SFE16 Ryzen 7 7840U
- 10/06/2023 v7 (old)
Allen Ngo
Transparency
The selection of devices to be reviewed is made by our editorial team. The test sample was provided to the author as a loan by the manufacturer or retailer for the purpose of this review. The lender had no influence on this review, nor did the manufacturer receive a copy of this review before publication. There was no obligation to publish this review. As an independent media company, Notebookcheck is not subjected to the authority of manufacturers, retailers or publishers.
This is how Notebookcheck is testing
Every year, Notebookcheck independently reviews hundreds of laptops and smartphones using standardized procedures to ensure that all results are comparable. We have continuously developed our test methods for around 20 years and set industry standards in the process. In our test labs, high-quality measuring equipment is utilized by experienced technicians and editors. These tests involve a multi-stage validation process. Our complex rating system is based on hundreds of well-founded measurements and benchmarks, which maintains objectivity. Further information on our test methods can be found here.
Price comparison

