框架笔记本 13.5 Ryzen 7 7840U 评测:比英特尔版本好太多

自 2021 年推出适合 DIY 的框架笔记本电脑(Framework Laptop)以来,用户对 AMD 版本的框架笔记本电脑一直呼声很高。随着 Ryzen CPU 与英特尔的竞争逐年加剧,现在正是推出首款 AMD Framework Laptop 的大好时机。
我们的评测机是搭载 Ryzen 7 7840U 的高端配置,售价不到 1500 美元,而搭载 Ryzen 5 7640U 的低端配置可供选择。框架笔记本 13.5 是市场上首批搭载 Ryzen 7 7840U 的产品之一。
我们建议您查看我们的 现有评论和视频,了解其物理特性的更多细节,因为其设计保持不变。
框架笔记本 13.5 的竞争对手包括其他旗舰级子笔记本,如联想 ThinkPad X1 Nano Gen 3, 惠普蜻蜓 G4,戴尔 XPS 13 Plus 9320或 华硕 ZenBook S13.
更多框架评论:
潜在的竞争对手比较
Rating | Date | Model | Weight | Height | Size | Resolution | Price |
|---|---|---|---|---|---|---|---|
| 87.5 % v7 (old) | 10 / 2023 | Framework Laptop 13.5 Ryzen 7 7840U R7 7840U, Radeon 780M | 1.3 kg | 15.85 mm | 13.50" | 2256x1504 | |
| 85.4 % v7 (old) | 08 / 2021 | Framework Laptop 13.5 i7-1165G7, Iris Xe G7 96EUs | 1.3 kg | 15.85 mm | 13.50" | 2256x1504 | |
| 89.5 % v7 (old) | 08 / 2023 | Lenovo ThinkPad X1 Nano Gen 3 i7-1360P, Iris Xe G7 96EUs | 989 g | 14.8 mm | 13.00" | 2160x1350 | |
| 91.9 % v7 (old) | 07 / 2023 | HP Dragonfly G4 i7-1365U, Iris Xe G7 96EUs | 1.1 kg | 16.3 mm | 13.50" | 1920x1280 | |
| 87.4 % v7 (old) | 07 / 2023 | Dell XPS 13 Plus 9320 Core i7-1360P i7-1360P, Iris Xe G7 96EUs | 1.3 kg | 15.3 mm | 13.40" | 3456x2160 | |
| 85.4 % v7 (old) | 05 / 2023 | Asus ZenBook S13 OLED UX5304 i7-1355U, Iris Xe G7 96EUs | 1 kg | 11.8 mm | 13.30" | 2880x1800 |
案例
连接性
虽然四个 USB-C 端口依然存在,但由于 AMD PC 对 Thunderbolt 的支持较为模糊,因此细节方面比较复杂。只有后部的两个端口支持 USB4,而左下方的端口仅支持 USB-C 3.2,右下方的端口支持 USB-C 3.2 和 DisplayPort。我们可以亲自证实这一点,因为我们的外接显示器只能在四个 USB-C 端口中的三个上工作。此外,还可以使用四个端口中的任何一个进行充电。
后两个 USB-C 端口支持 Thunderbolt 设备。
交流
AMD 机型配备了联发科 RZ616,支持 Wi-Fi 6E 和蓝牙 5.2,而不是常见的英特尔 AX210 或 AX211。尽管如此,传输速率仍然非常出色,但还可以再稳定一些。
| Networking | |
| iperf3 transmit AX12 | |
| Framework Laptop 13.5 | |
| iperf3 receive AX12 | |
| Framework Laptop 13.5 | |
| iperf3 transmit AXE11000 | |
| Asus ZenBook S13 OLED UX5304 | |
| Framework Laptop 13.5 Ryzen 7 7840U | |
| Lenovo ThinkPad X1 Nano Gen 3 | |
| Dell XPS 13 Plus 9320 Core i7-1360P | |
| HP Dragonfly G4 | |
| iperf3 receive AXE11000 | |
| Asus ZenBook S13 OLED UX5304 | |
| Framework Laptop 13.5 Ryzen 7 7840U | |
| Lenovo ThinkPad X1 Nano Gen 3 | |
| Dell XPS 13 Plus 9320 Core i7-1360P | |
| HP Dragonfly G4 | |
| iperf3 transmit AXE11000 6GHz | |
| Framework Laptop 13.5 Ryzen 7 7840U | |
| Lenovo ThinkPad X1 Nano Gen 3 | |
| HP Dragonfly G4 | |
| Dell XPS 13 Plus 9320 Core i7-1360P | |
| iperf3 receive AXE11000 6GHz | |
| Lenovo ThinkPad X1 Nano Gen 3 | |
| Framework Laptop 13.5 Ryzen 7 7840U | |
| HP Dragonfly G4 | |
| Dell XPS 13 Plus 9320 Core i7-1360P | |
网络摄像头


维护
在维修和升级方面,该框架对用户非常友好,详见我们的 现有评论.
配件和保修
AMD 版采用了与英特尔版相同的端口扩展卡,包括经过改进的 HDMI 和 DP 卡。需要注意的是,没有免费的扩展卡,因此强烈建议在购买笔记本电脑时至少配备一到两张扩展卡。
如果在美国购买,将享受标准的一年有限保修服务。
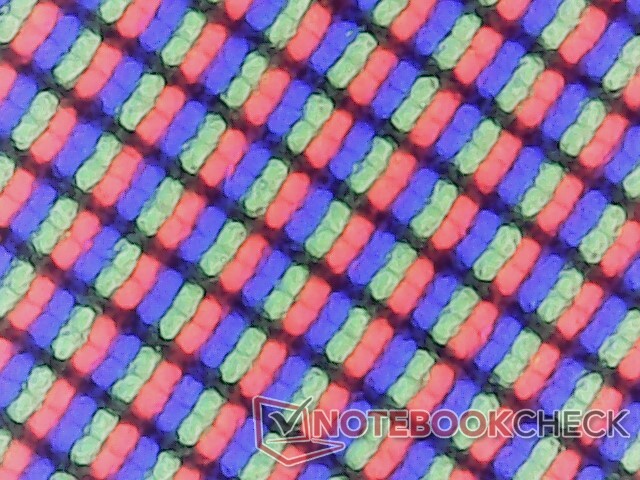
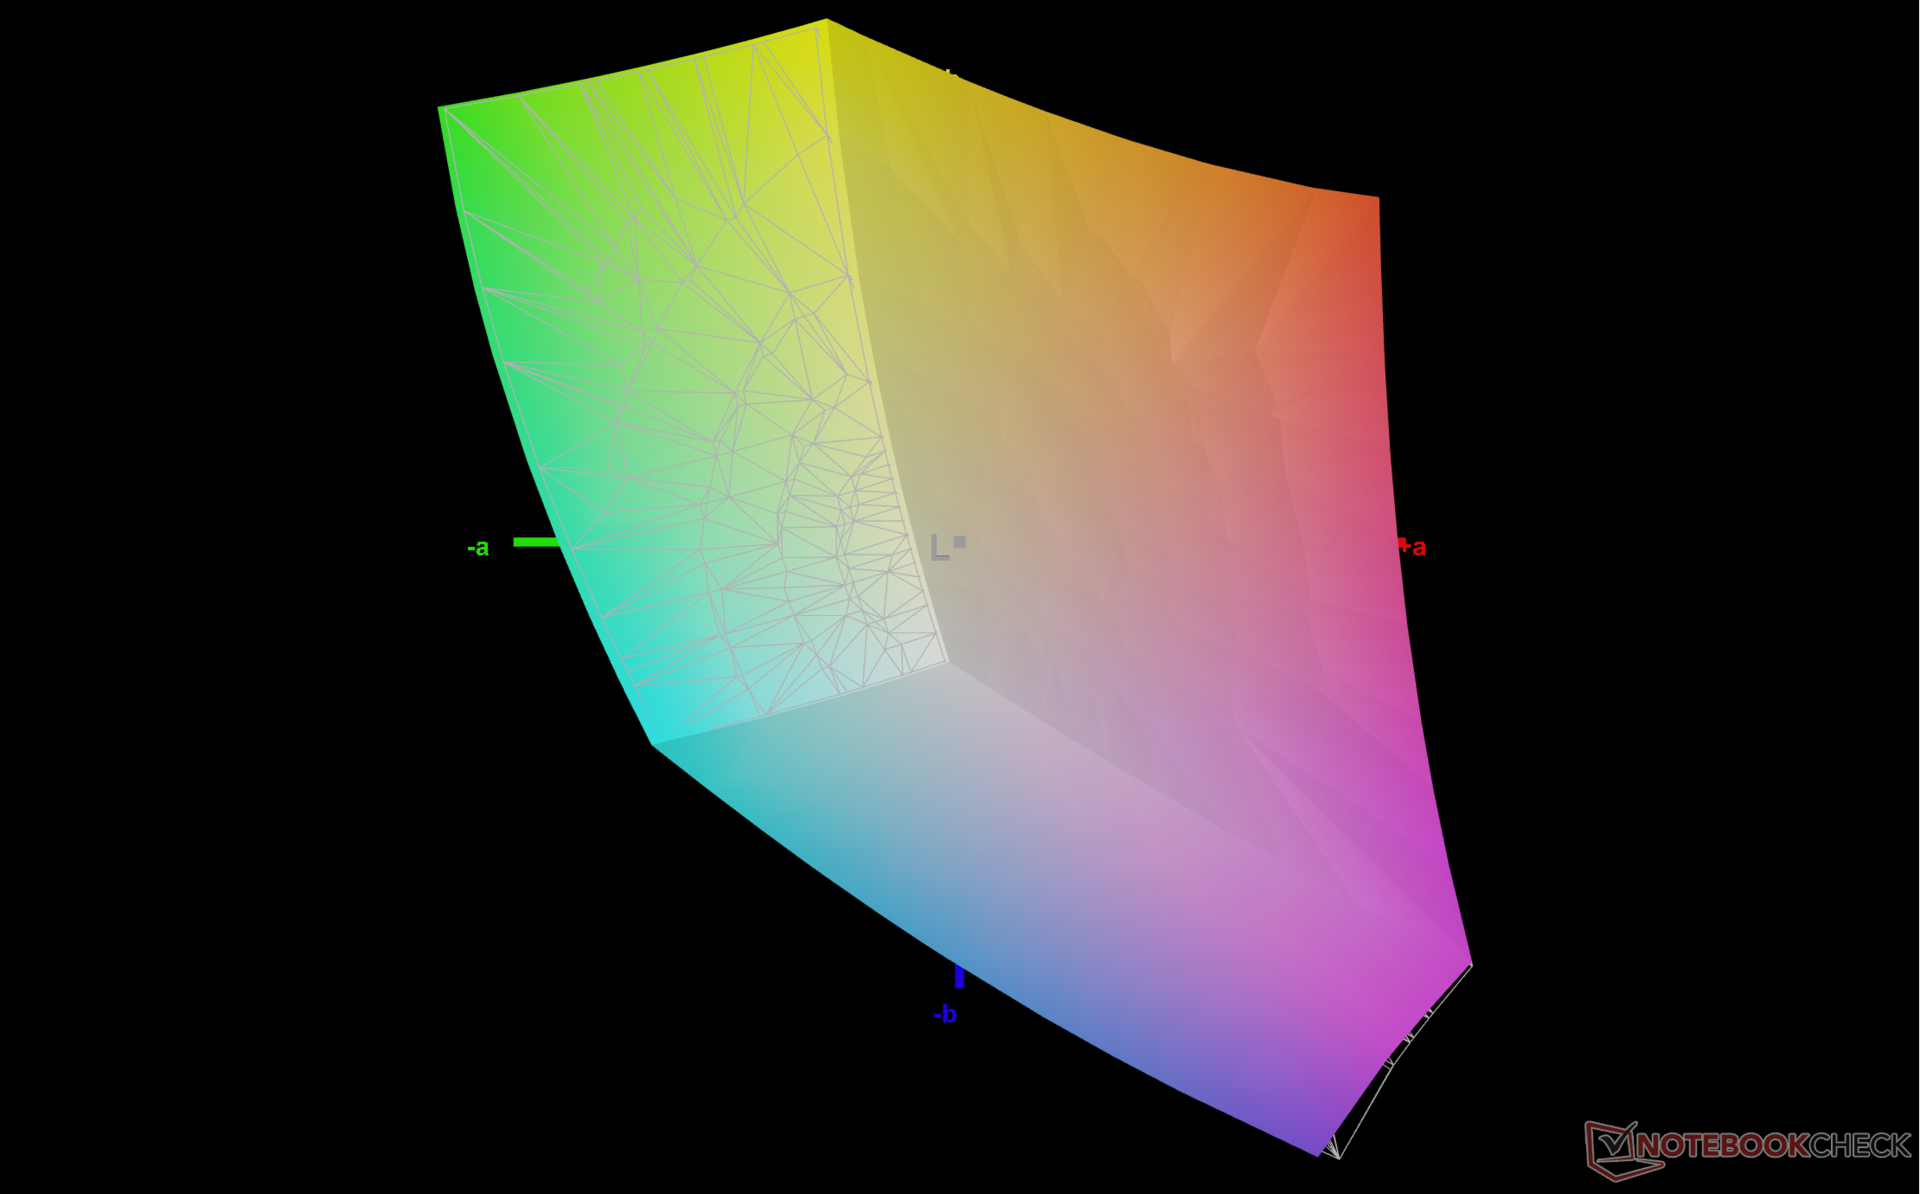
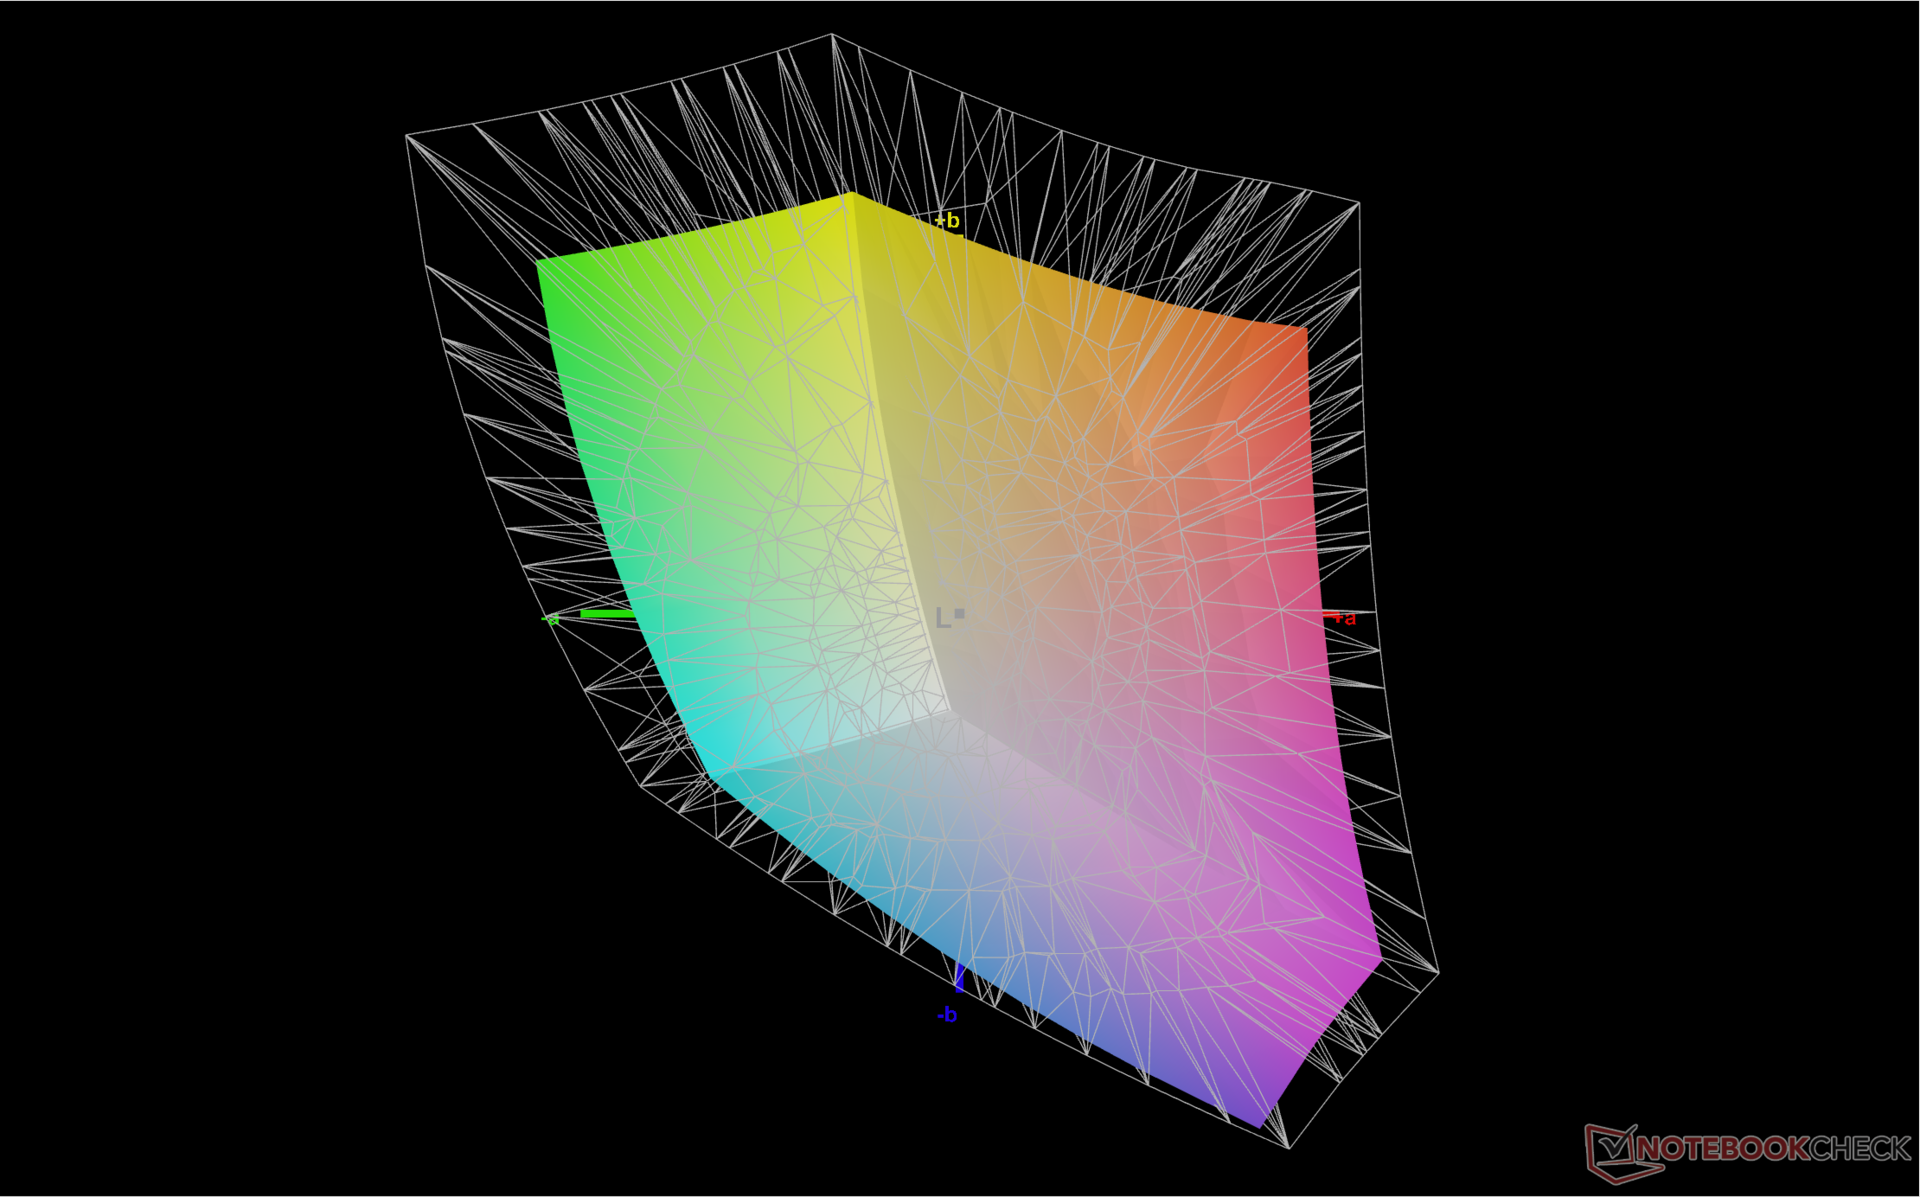
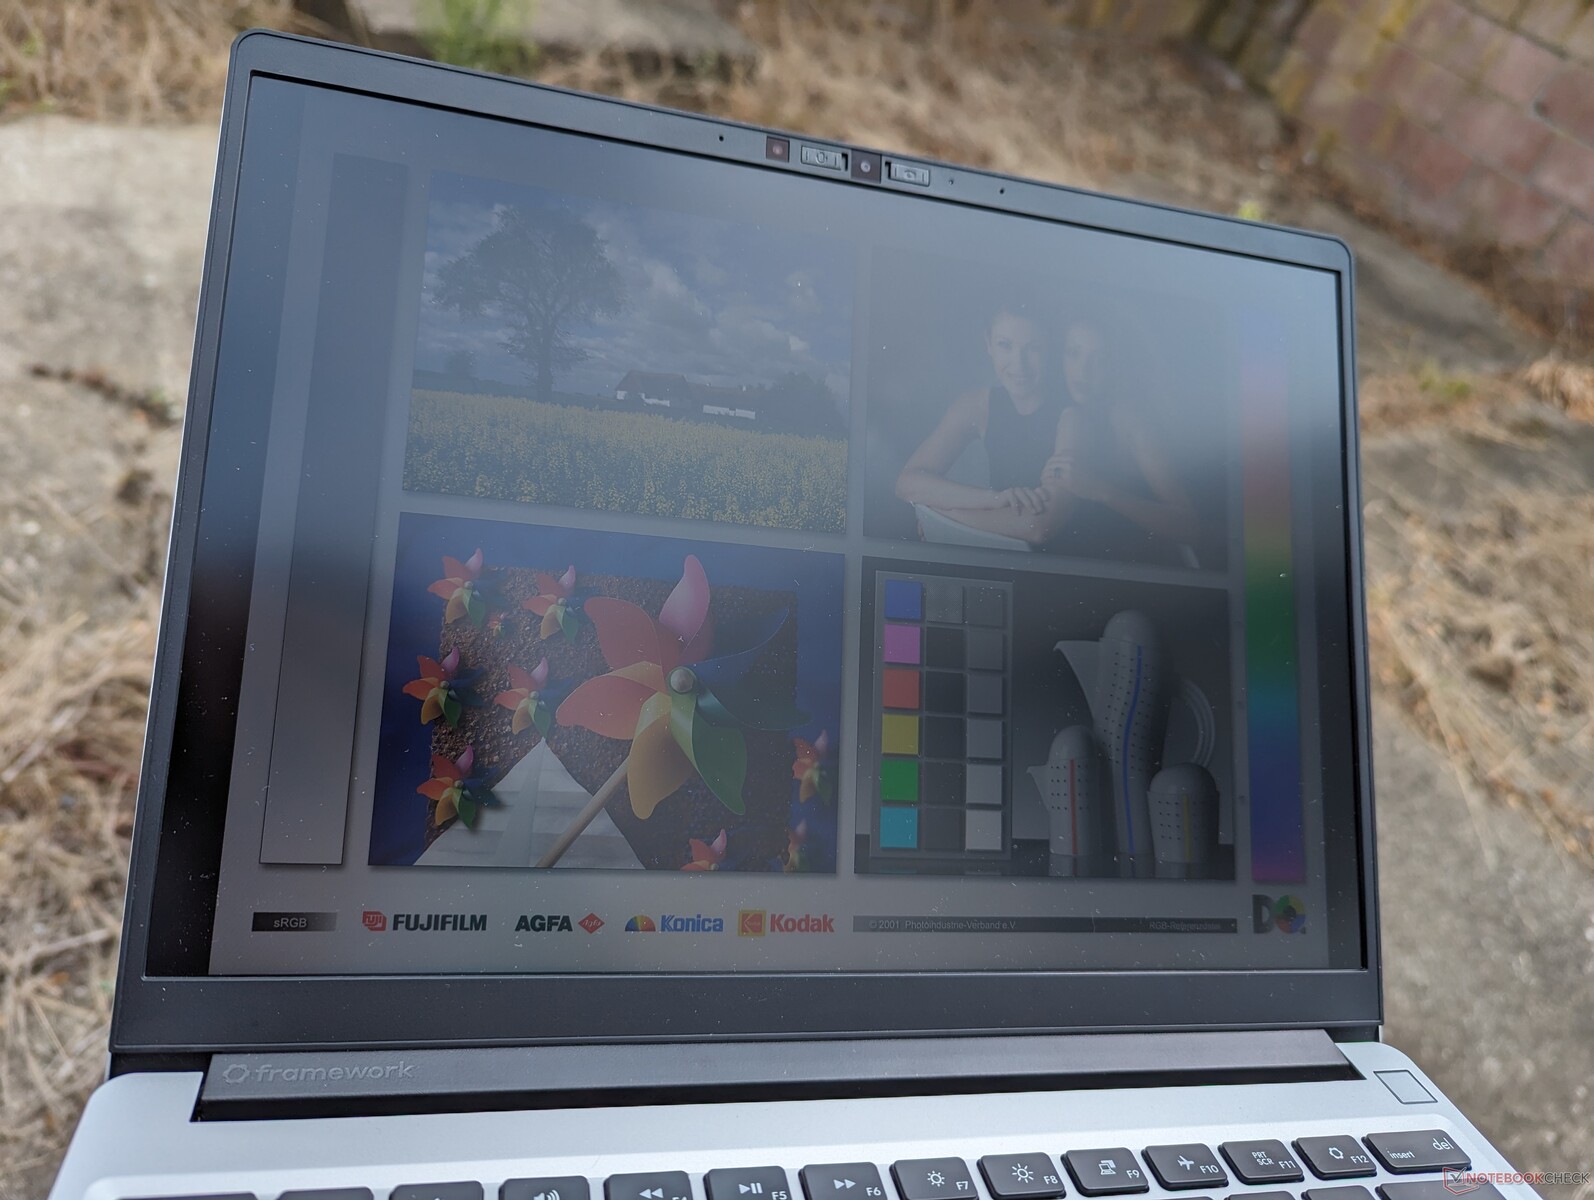
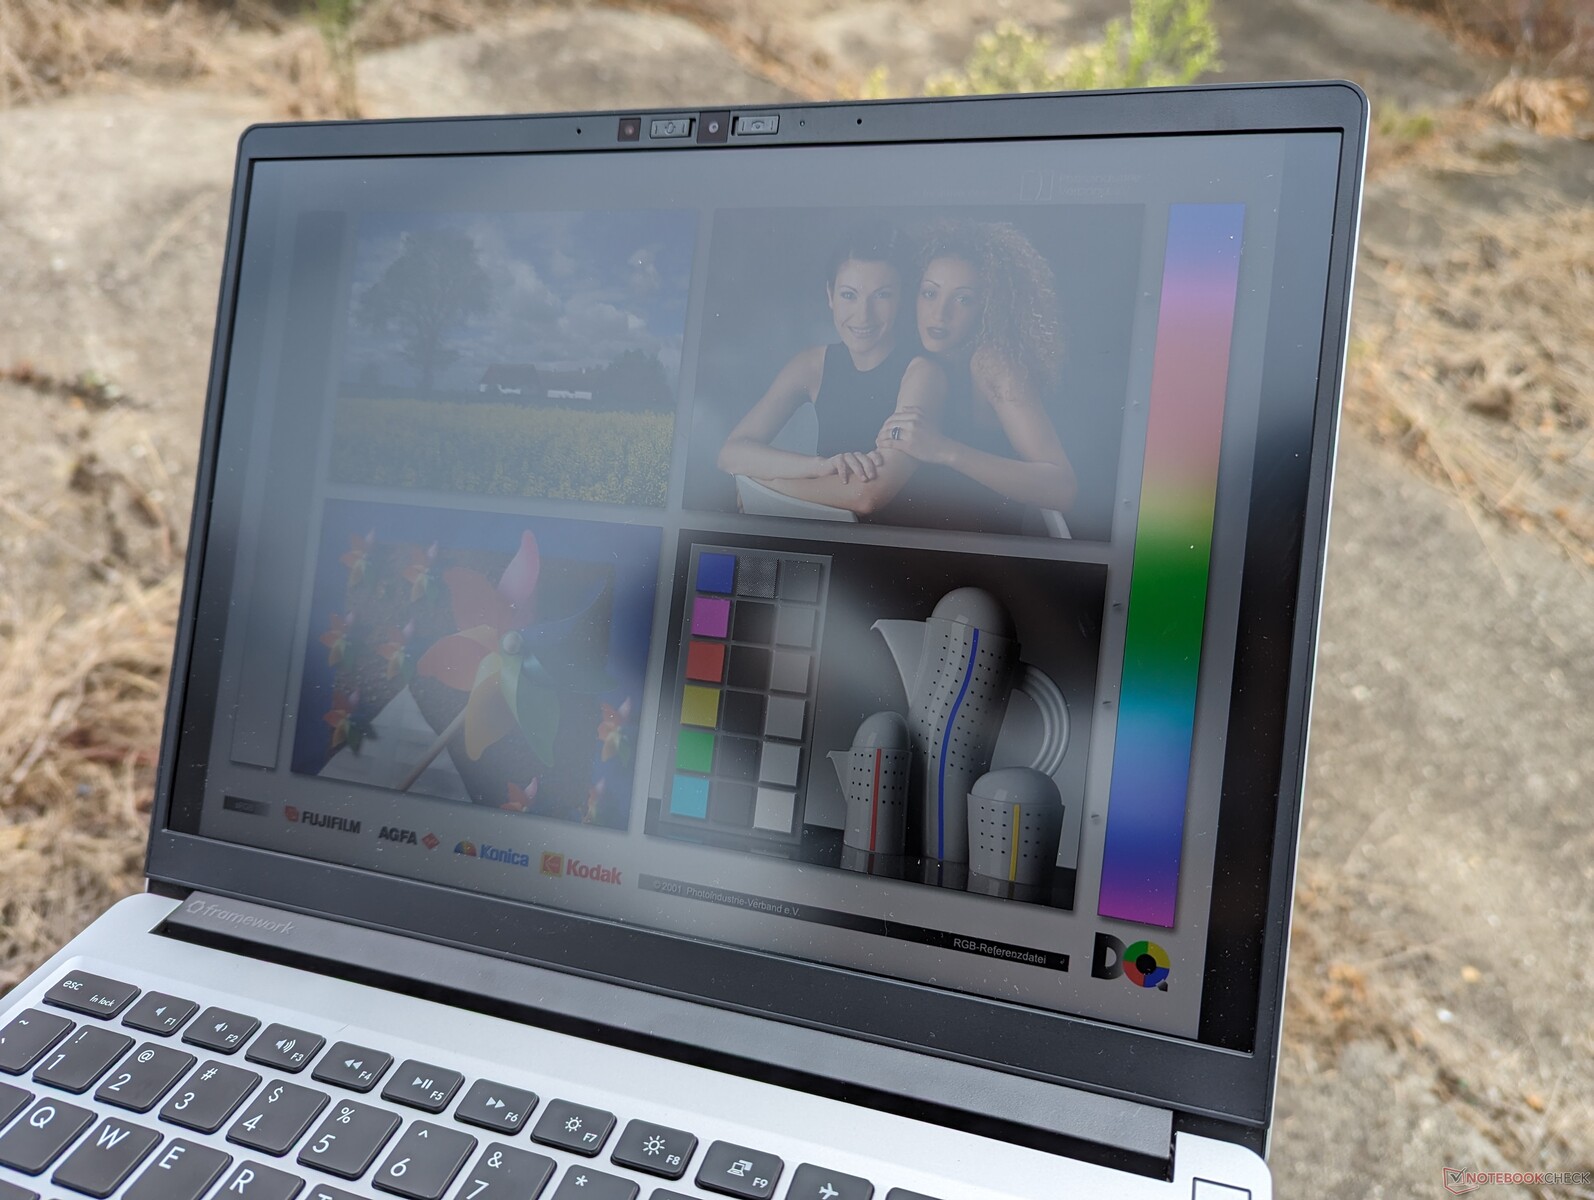
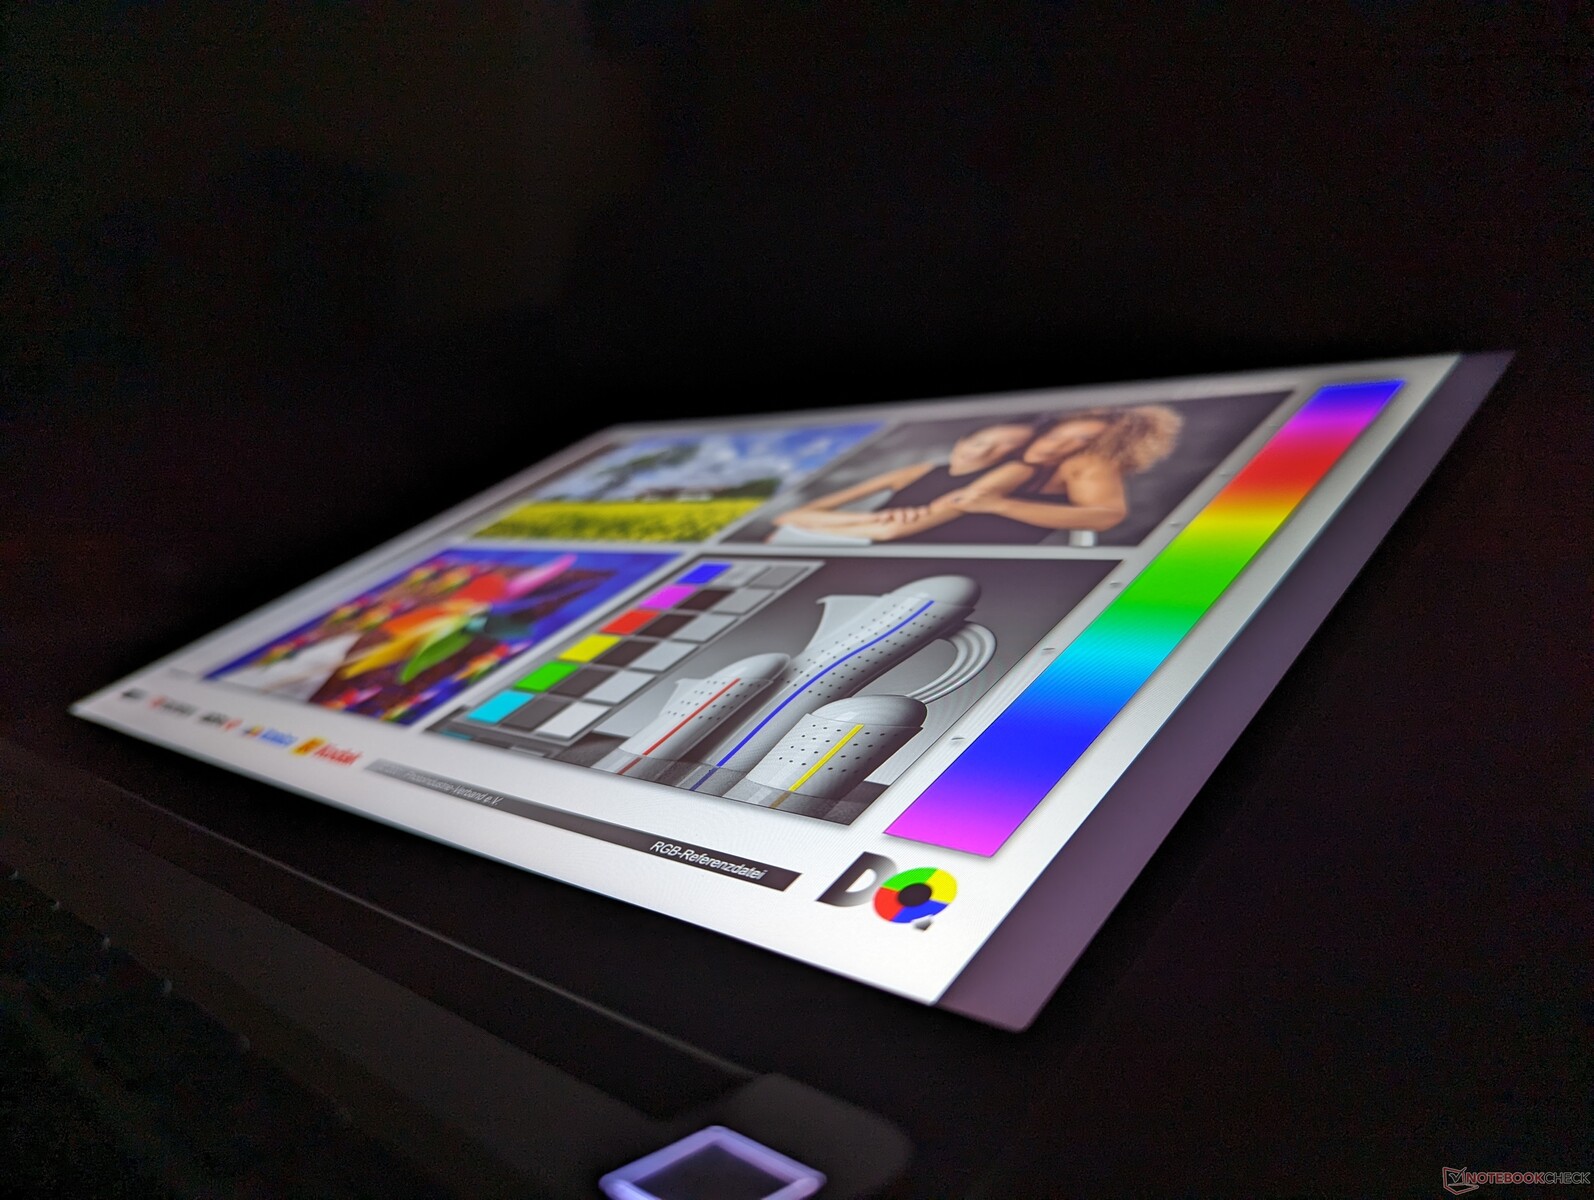
显示屏
2256 x 1504 的京东方 CQ NE135FBM-N41 IPS 显示屏自最初的 2021 Framework 笔记本电脑发布以来就没有改变过。目前,Framework 还没有提供采用 OLED、迷你 LED、>60 Hz 刷新率或更快响应时间等更新或更好技术的其他显示屏选项。
| |||||||||||||||||||||||||
Brightness Distribution: 89 %
Center on Battery: 436 cd/m²
Contrast: 1211:1 (Black: 0.36 cd/m²)
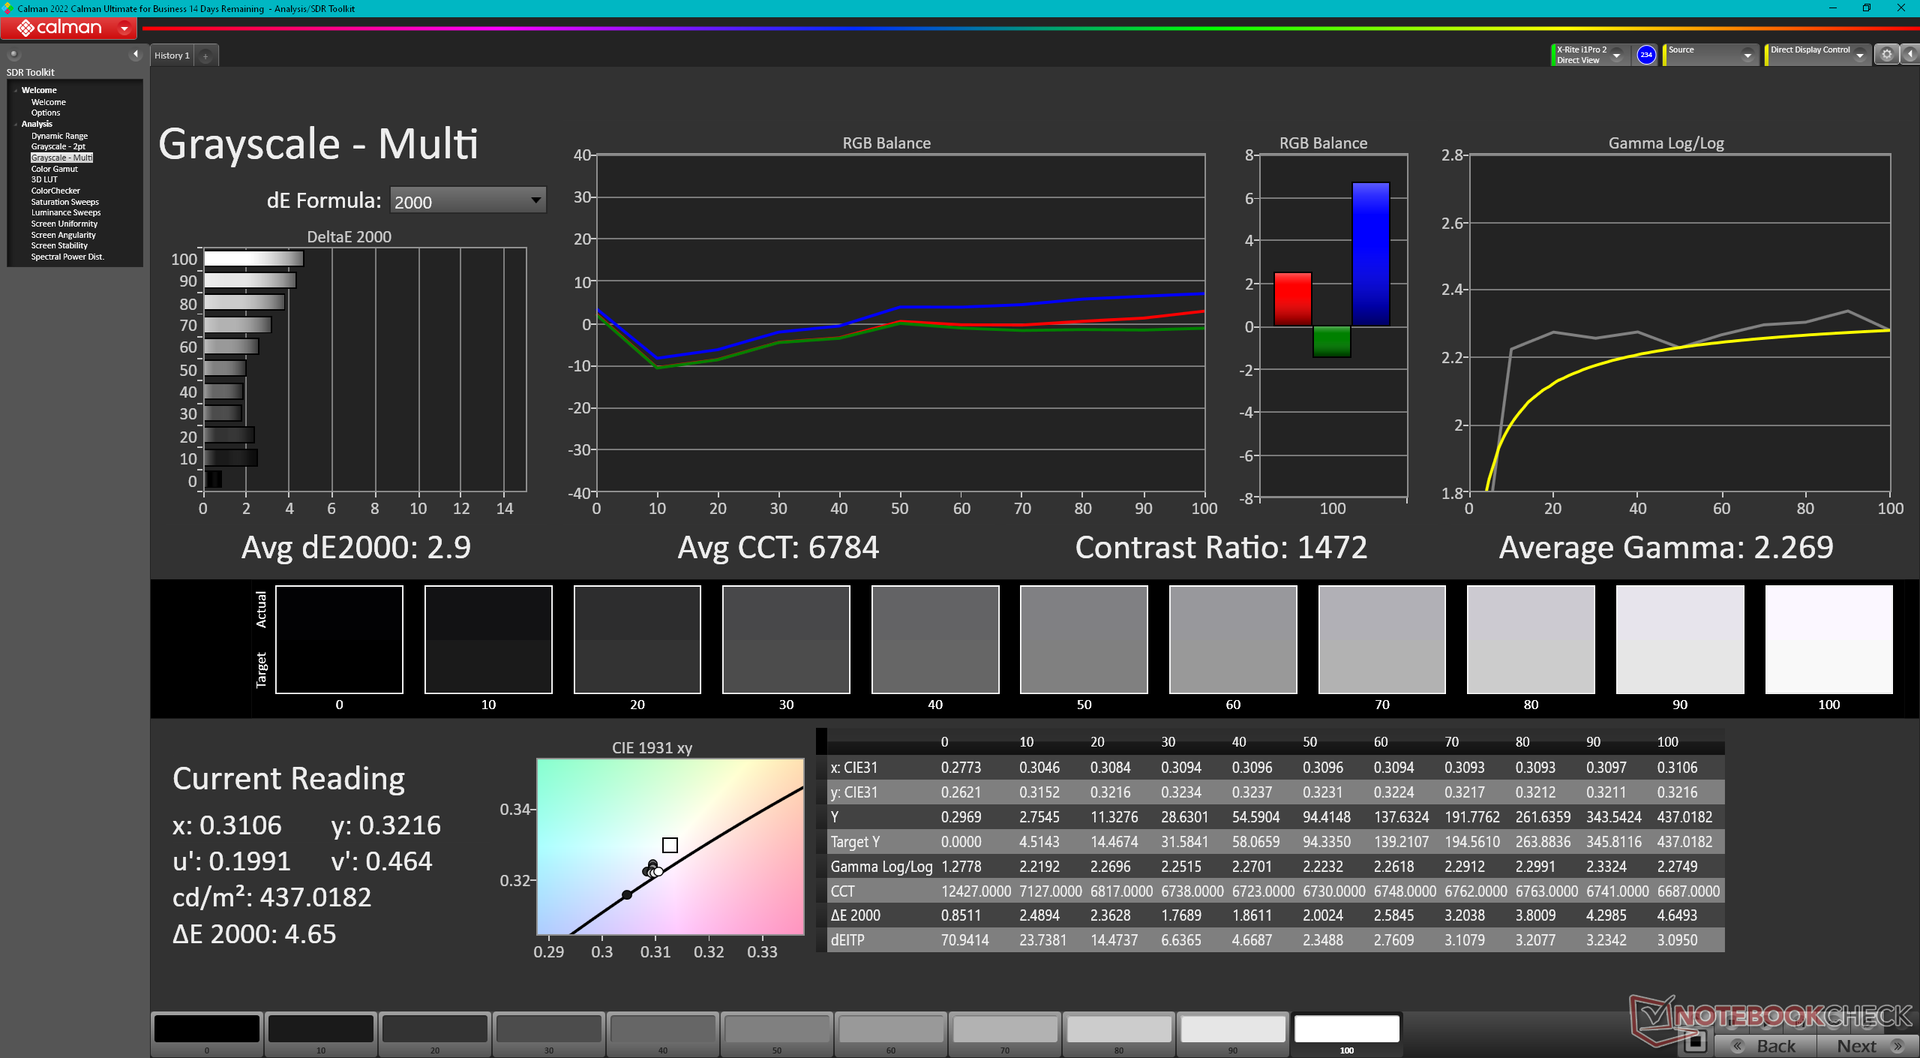
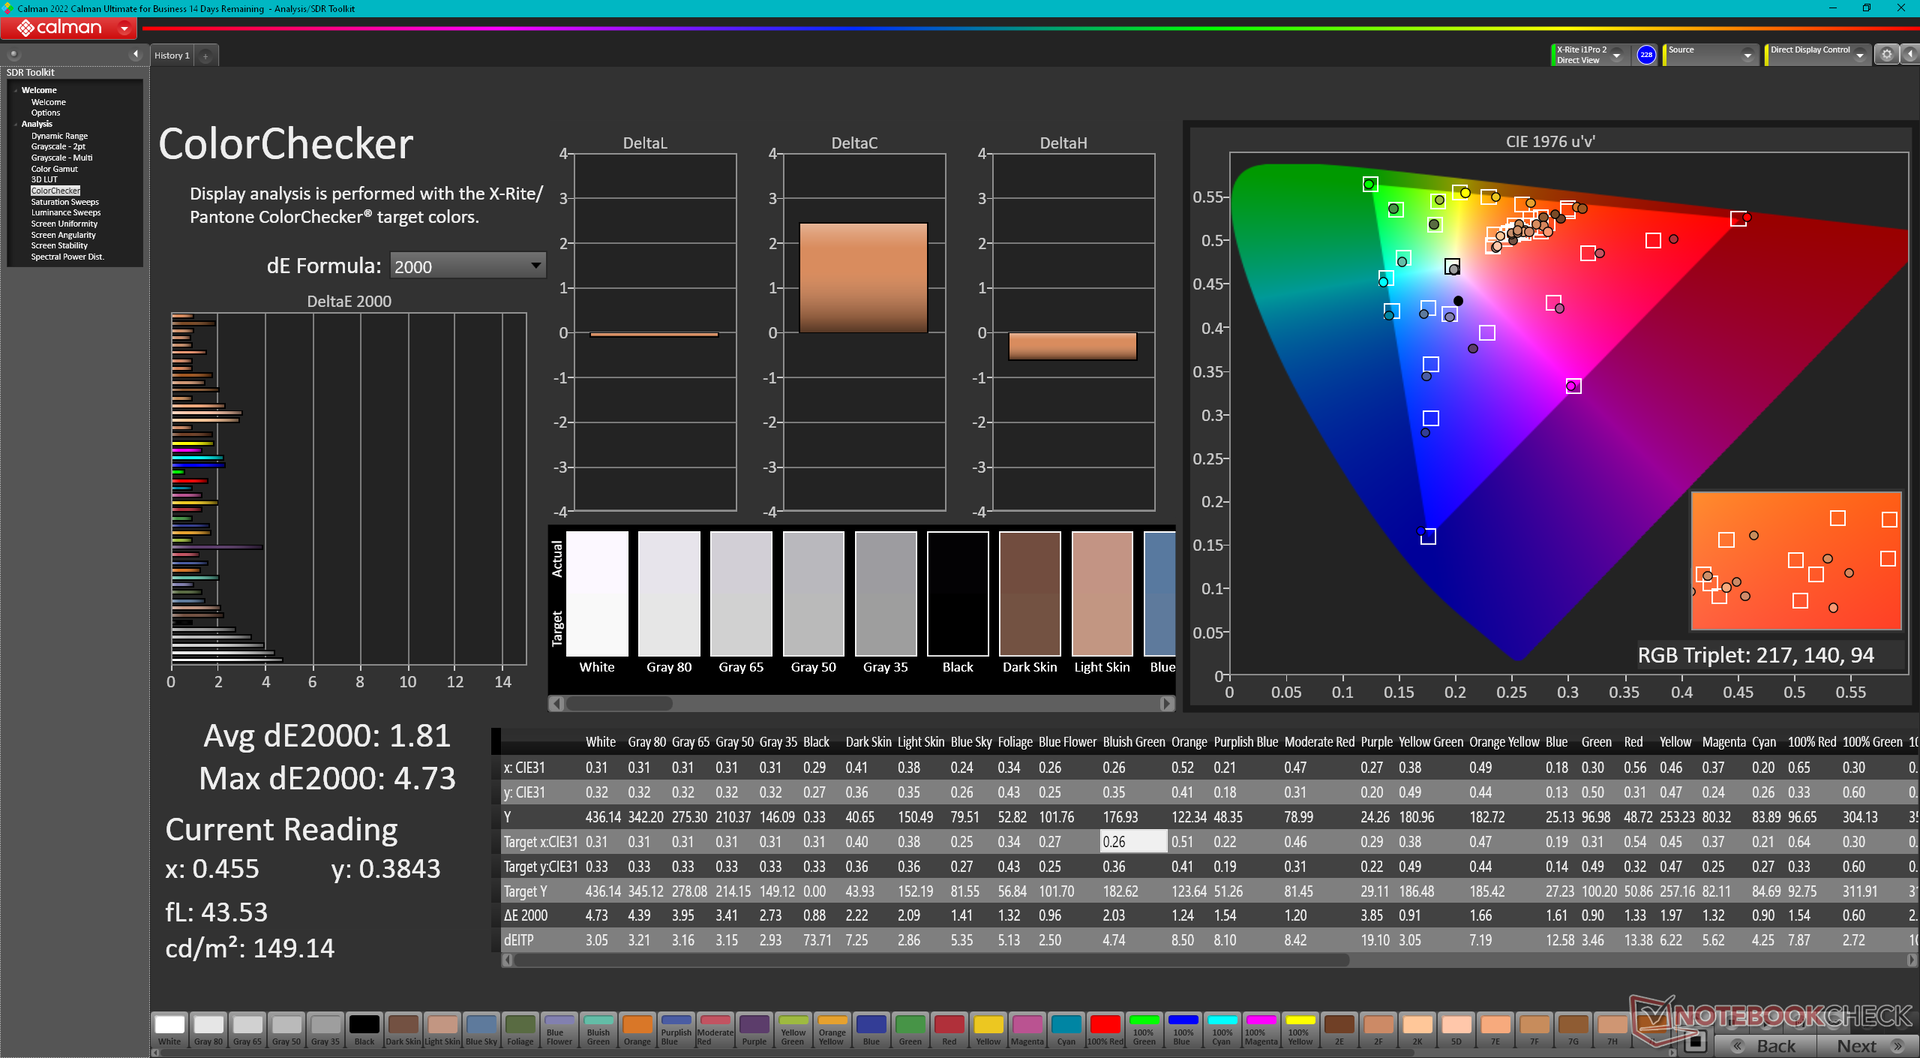
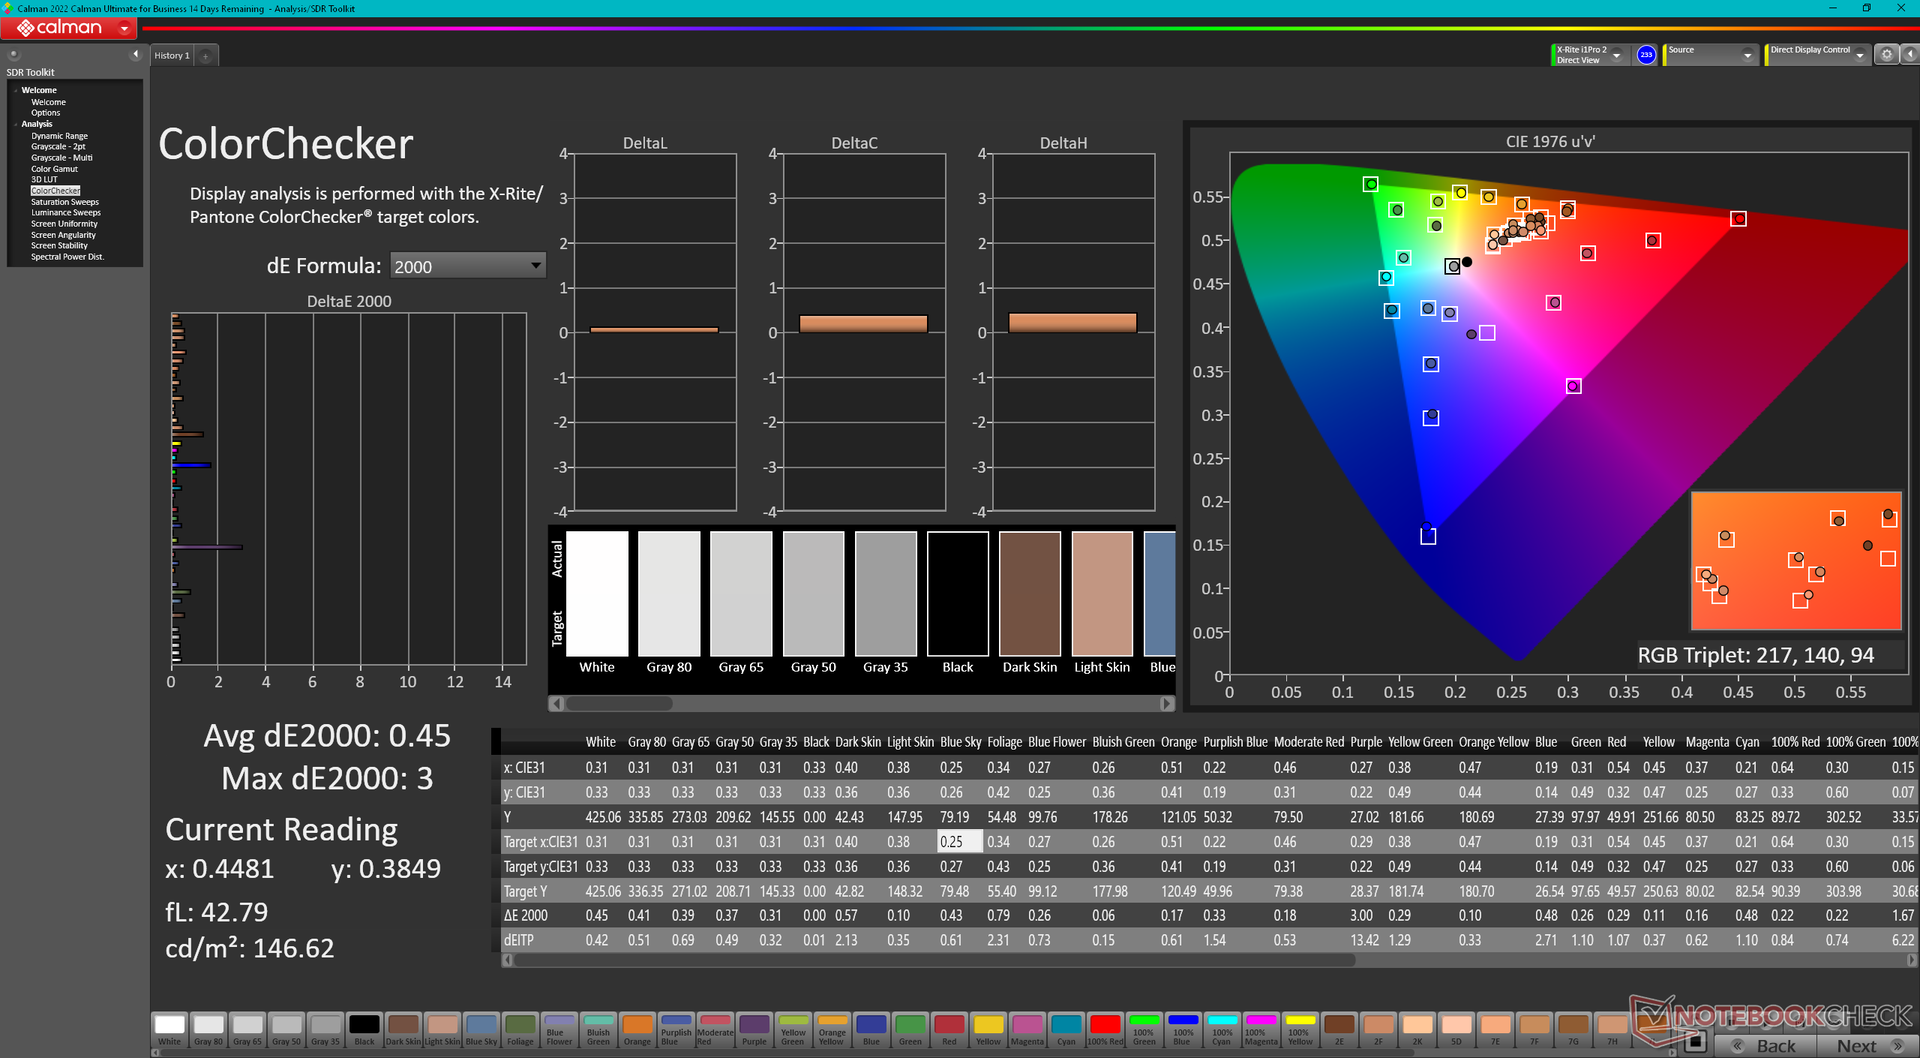
ΔE ColorChecker Calman: 1.81 | ∀{0.5-29.43 Ø4.71}
calibrated: 0.45
ΔE Greyscale Calman: 2.9 | ∀{0.09-98 Ø4.96}
71.1% AdobeRGB 1998 (Argyll 3D)
99.1% sRGB (Argyll 3D)
69% Display P3 (Argyll 3D)
Gamma: 2.27
CCT: 6784 K
| Framework Laptop 13.5 Ryzen 7 7840U BOE CQ NE135FBM-N41, IPS, 2256x1504, 13.5" | Framework Laptop 13.5 13th Gen Intel BOE CQ NE135FBM-N41, IPS, 2256x1504, 13.5" | Framework Laptop 13.5 12th Gen Intel BOE CQ NE135FBM-N41, IPS, 2256x1504, 13.5" | Framework Laptop 13.5 BOE CQ NE135FBM-N41, IPS, 2256x1504, 13.5" | Lenovo ThinkPad X1 Nano Gen 3 MND007ZA1-3, IPS, 2160x1350, 13" | HP Dragonfly G4 Chi Mei CMN13C0, IPS, 1920x1280, 13.5" | |
|---|---|---|---|---|---|---|
| Display | -1% | 0% | -0% | -1% | -1% | |
| Display P3 Coverage (%) | 69 | 68.9 0% | 69.9 1% | 69 0% | 68.5 -1% | 68.4 -1% |
| sRGB Coverage (%) | 99.1 | 97.5 -2% | 99.4 0% | 99.3 0% | 99.5 0% | 98.3 -1% |
| AdobeRGB 1998 Coverage (%) | 71.1 | 71.1 0% | 71.1 0% | 70.3 -1% | 69.7 -2% | 70.4 -1% |
| Response Times | -8% | 22% | -12% | 20% | 2% | |
| Response Time Grey 50% / Grey 80% * (ms) | 50.4 ? | 54.9 ? -9% | 34.7 ? 31% | 55.6 ? -10% | 39.9 ? 21% | 48.8 ? 3% |
| Response Time Black / White * (ms) | 31.5 ? | 33.5 ? -6% | 27.5 ? 13% | 36 ? -14% | 25.8 ? 18% | 31.3 ? 1% |
| PWM Frequency (Hz) | ||||||
| Screen | -37% | -21% | -28% | 13% | 0% | |
| Brightness middle (cd/m²) | 436 | 503 15% | 449.6 3% | 449 3% | 461.2 6% | 408.8 -6% |
| Brightness (cd/m²) | 416 | 472 13% | 431 4% | 435 5% | 428 3% | 399 -4% |
| Brightness Distribution (%) | 89 | 87 -2% | 90 1% | 93 4% | 86 -3% | 90 1% |
| Black Level * (cd/m²) | 0.36 | 0.36 -0% | 0.31 14% | 0.39 -8% | 0.29 19% | 0.32 11% |
| Contrast (:1) | 1211 | 1397 15% | 1450 20% | 1151 -5% | 1590 31% | 1278 6% |
| Colorchecker dE 2000 * | 1.81 | 3.38 -87% | 2.76 -52% | 2.34 -29% | 1.79 1% | 2.02 -12% |
| Colorchecker dE 2000 max. * | 4.73 | 7.08 -50% | 7.96 -68% | 7.07 -49% | 3.3 30% | 3.84 19% |
| Colorchecker dE 2000 calibrated * | 0.45 | 1.21 -169% | 0.58 -29% | 0.96 -113% | 0.47 -4% | 0.61 -36% |
| Greyscale dE 2000 * | 2.9 | 4.8 -66% | 5.2 -79% | 4.7 -62% | 1.8 38% | 2.3 21% |
| Gamma | 2.27 97% | 2.13 103% | 2.23 99% | 2.29 96% | 2.24 98% | 2.2 100% |
| CCT | 6784 96% | 6235 104% | 6475 100% | 6760 96% | 6588 99% | 6203 105% |
| Total Average (Program / Settings) | -15% /
-25% | 0% /
-10% | -13% /
-20% | 11% /
11% | 0% /
0% |
* ... smaller is better

Display Response Times
| ↔ Response Time Black to White | ||
|---|---|---|
| 31.5 ms ... rise ↗ and fall ↘ combined | ↗ 17.7 ms rise | 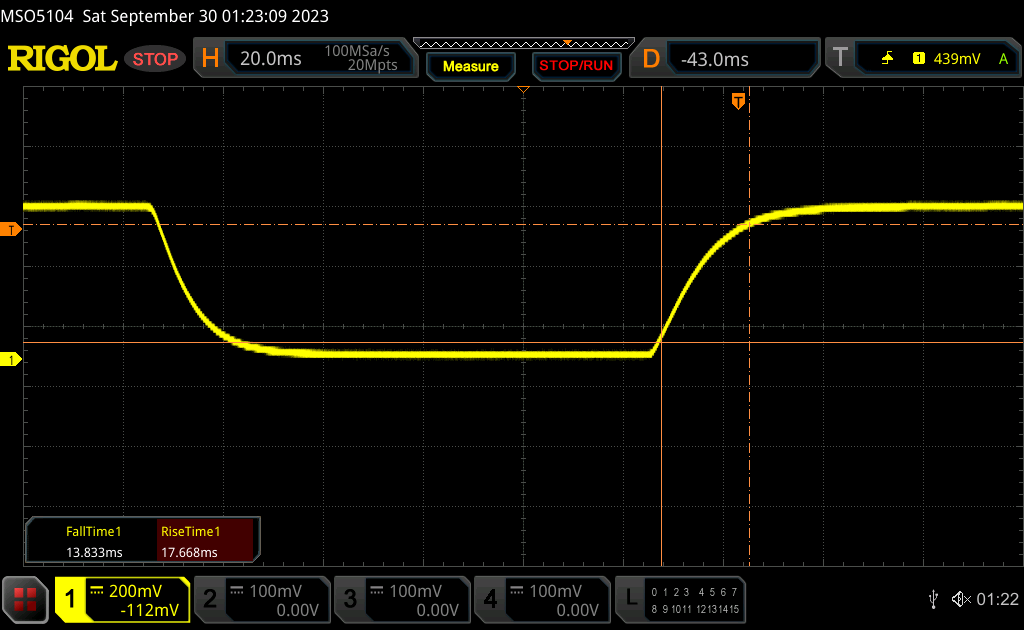 |
| ↘ 13.8 ms fall | ||
| The screen shows slow response rates in our tests and will be unsatisfactory for gamers. In comparison, all tested devices range from 0.1 (minimum) to 240 (maximum) ms. » 85 % of all devices are better. This means that the measured response time is worse than the average of all tested devices (19.8 ms). | ||
| ↔ Response Time 50% Grey to 80% Grey | ||
| 50.4 ms ... rise ↗ and fall ↘ combined | ↗ 23.8 ms rise | 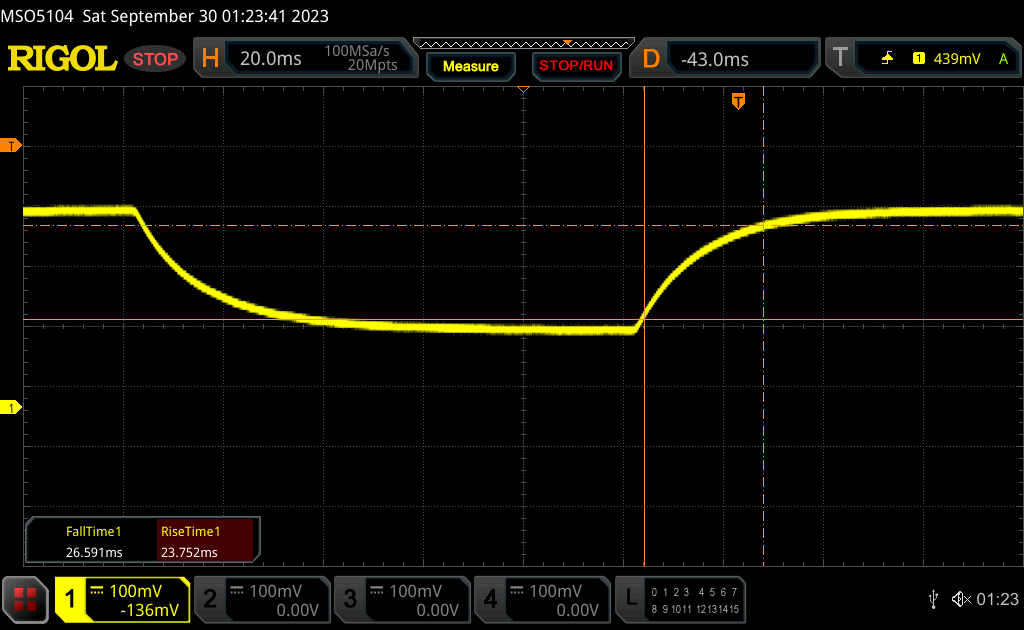 |
| ↘ 26.6 ms fall | ||
| The screen shows slow response rates in our tests and will be unsatisfactory for gamers. In comparison, all tested devices range from 0.165 (minimum) to 636 (maximum) ms. » 87 % of all devices are better. This means that the measured response time is worse than the average of all tested devices (31 ms). | ||
Screen Flickering / PWM (Pulse-Width Modulation)
| Screen flickering / PWM not detected | 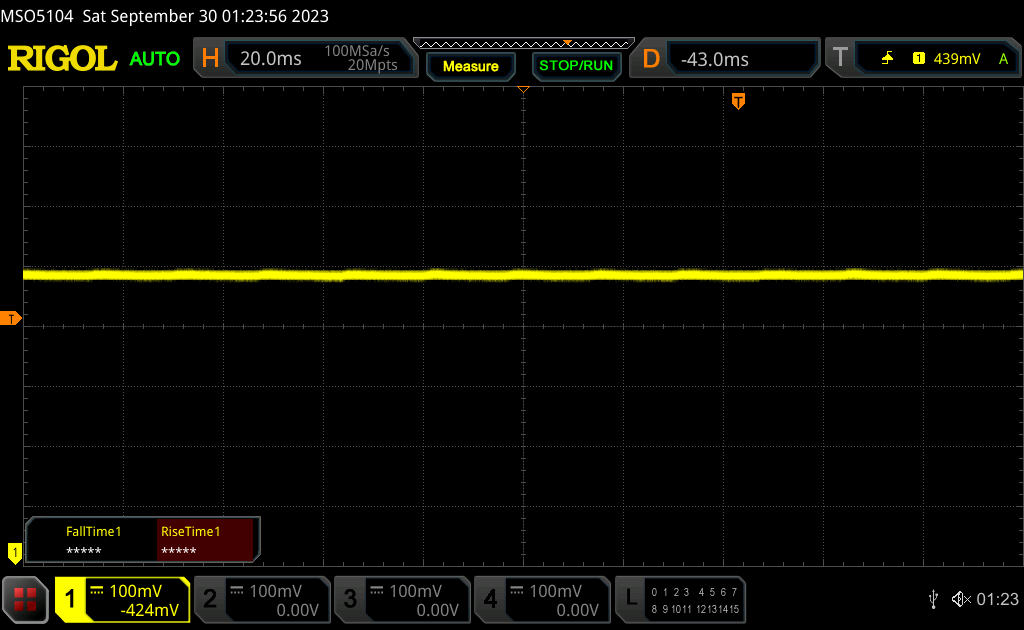 | ||
In comparison: 52 % of all tested devices do not use PWM to dim the display. If PWM was detected, an average of 7751 (minimum: 5 - maximum: 343500) Hz was measured. | |||

性能
测试条件
在运行以下基准测试之前,我们将 Windows 设置为性能模式。Framework 没有预装控制中心类型的软件来调整任何专用功能,但我们建议安装 AMD Adrenalin,以便更好地控制集成 GPU。
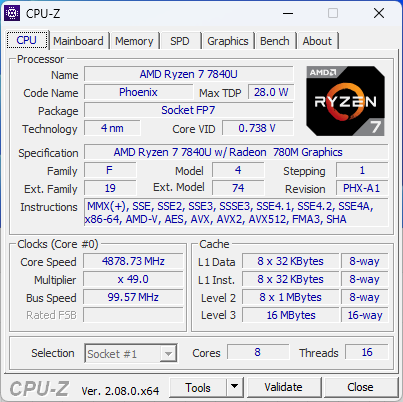
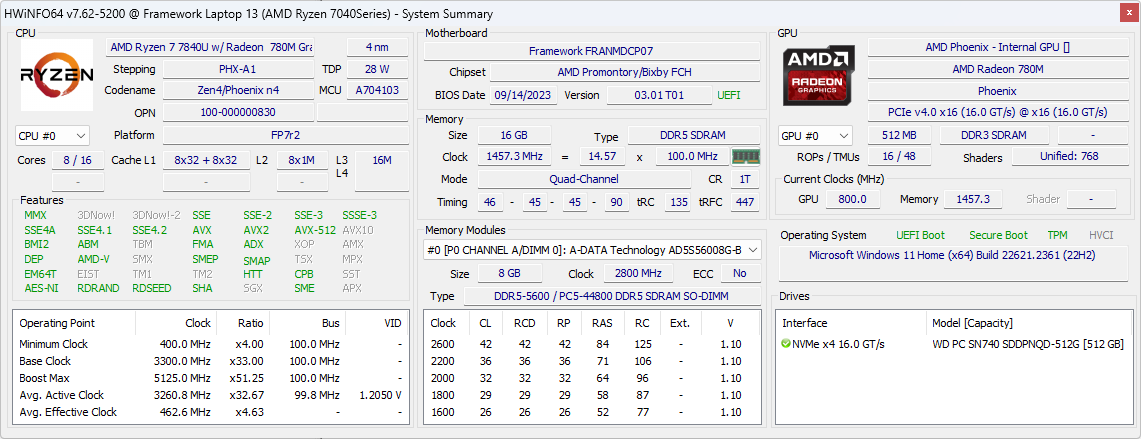
处理器
在令人失望的 Zen 3 Ryzen 7 7730U之后,我们终于开始看到更多的笔记本电脑采用 Zen 4 Ryzen 7 7840U的笔记本电脑开始上市。这款期待已久的 U 系列 CPU 可与 H 系列的 酷睿 i7-12700H不相上下,而所需功耗仅为后者的一小部分。它的性能还略微超过了第 13 代 酷睿 i7-1370P在多线程工作负载中也略胜一筹。
不过,单线程性能比酷睿 i7-1370P 慢了约 15%,与英特尔第 12 代 CPU(如酷睿 i7-1260P )更接近。鉴于 AMD CPU 在这方面通常会略微落后,因此这种差距并不令人感到意外。
我们尚未对 Ryzen 5 7640U 笔记本电脑进行内部测试,因此我们无法确定从 Ryzen 7 7840U 降级到 Ryzen 5 7640U 时会有多少性能损失。
Cinebench R15 Multi Loop
Cinebench R23: Multi Core | Single Core
Cinebench R20: CPU (Multi Core) | CPU (Single Core)
Cinebench R15: CPU Multi 64Bit | CPU Single 64Bit
Blender: v2.79 BMW27 CPU
7-Zip 18.03: 7z b 4 | 7z b 4 -mmt1
Geekbench 5.5: Multi-Core | Single-Core
HWBOT x265 Benchmark v2.2: 4k Preset
LibreOffice : 20 Documents To PDF
R Benchmark 2.5: Overall mean
* ... smaller is better
AIDA64: FP32 Ray-Trace | FPU Julia | CPU SHA3 | CPU Queen | FPU SinJulia | FPU Mandel | CPU AES | CPU ZLib | FP64 Ray-Trace | CPU PhotoWorxx
AIDA64: FP32 Ray-Trace | FPU Julia | CPU SHA3 | CPU Queen | FPU SinJulia | FPU Mandel | CPU AES | CPU ZLib | FP64 Ray-Trace | CPU PhotoWorxx
系统性能
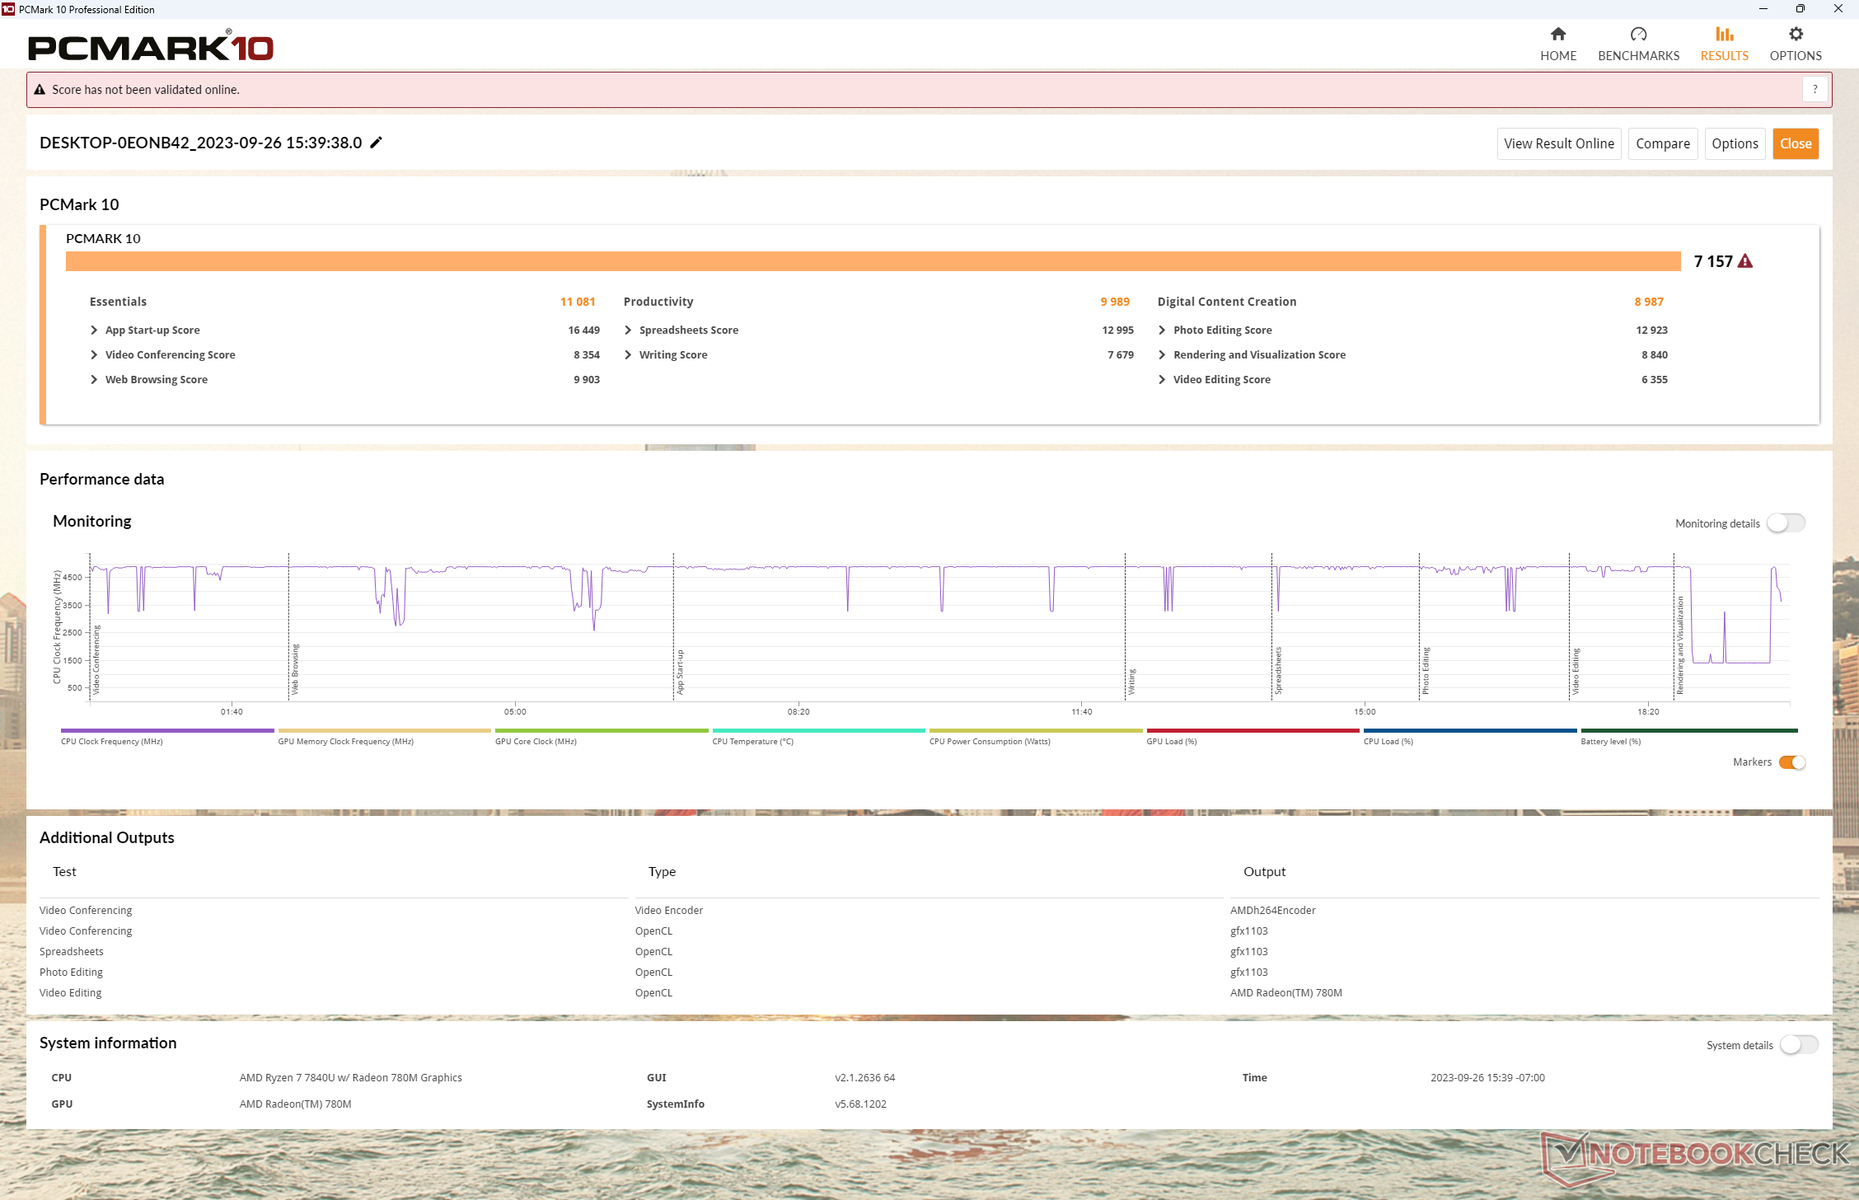
CrossMark: Overall | Productivity | Creativity | Responsiveness
| PCMark 10 / Score | |
| Framework Laptop 13.5 Ryzen 7 7840U | |
| Average AMD Ryzen 7 7840U, AMD Radeon 780M (5866 - 7157, n=10) | |
| Dell XPS 13 Plus 9320 Core i7-1360P | |
| Lenovo ThinkPad X1 Nano Gen 3 | |
| HP Dragonfly G4 | |
| Asus ZenBook S13 OLED UX5304 | |
| Framework Laptop 13.5 | |
| PCMark 10 / Essentials | |
| Dell XPS 13 Plus 9320 Core i7-1360P | |
| Framework Laptop 13.5 Ryzen 7 7840U | |
| HP Dragonfly G4 | |
| Lenovo ThinkPad X1 Nano Gen 3 | |
| Asus ZenBook S13 OLED UX5304 | |
| Framework Laptop 13.5 | |
| Average AMD Ryzen 7 7840U, AMD Radeon 780M (9068 - 11081, n=10) | |
| PCMark 10 / Productivity | |
| Framework Laptop 13.5 Ryzen 7 7840U | |
| Average AMD Ryzen 7 7840U, AMD Radeon 780M (7323 - 10099, n=10) | |
| Lenovo ThinkPad X1 Nano Gen 3 | |
| Dell XPS 13 Plus 9320 Core i7-1360P | |
| HP Dragonfly G4 | |
| Asus ZenBook S13 OLED UX5304 | |
| Framework Laptop 13.5 | |
| PCMark 10 / Digital Content Creation | |
| Framework Laptop 13.5 Ryzen 7 7840U | |
| Average AMD Ryzen 7 7840U, AMD Radeon 780M (7204 - 8987, n=10) | |
| Dell XPS 13 Plus 9320 Core i7-1360P | |
| Lenovo ThinkPad X1 Nano Gen 3 | |
| HP Dragonfly G4 | |
| Asus ZenBook S13 OLED UX5304 | |
| Framework Laptop 13.5 | |
| CrossMark / Overall | |
| Dell XPS 13 Plus 9320 Core i7-1360P | |
| Lenovo ThinkPad X1 Nano Gen 3 | |
| Framework Laptop 13.5 Ryzen 7 7840U | |
| HP Dragonfly G4 | |
| Asus ZenBook S13 OLED UX5304 | |
| Average AMD Ryzen 7 7840U, AMD Radeon 780M (1256 - 1804, n=10) | |
| CrossMark / Productivity | |
| Lenovo ThinkPad X1 Nano Gen 3 | |
| Dell XPS 13 Plus 9320 Core i7-1360P | |
| Framework Laptop 13.5 Ryzen 7 7840U | |
| HP Dragonfly G4 | |
| Asus ZenBook S13 OLED UX5304 | |
| Average AMD Ryzen 7 7840U, AMD Radeon 780M (1261 - 1798, n=10) | |
| CrossMark / Creativity | |
| Dell XPS 13 Plus 9320 Core i7-1360P | |
| Lenovo ThinkPad X1 Nano Gen 3 | |
| Framework Laptop 13.5 Ryzen 7 7840U | |
| HP Dragonfly G4 | |
| Asus ZenBook S13 OLED UX5304 | |
| Average AMD Ryzen 7 7840U, AMD Radeon 780M (1251 - 1835, n=10) | |
| CrossMark / Responsiveness | |
| Dell XPS 13 Plus 9320 Core i7-1360P | |
| Lenovo ThinkPad X1 Nano Gen 3 | |
| Framework Laptop 13.5 Ryzen 7 7840U | |
| Asus ZenBook S13 OLED UX5304 | |
| HP Dragonfly G4 | |
| Average AMD Ryzen 7 7840U, AMD Radeon 780M (1082 - 1775, n=10) | |
| PCMark 10 Score | 7157 points | |
Help | ||
| AIDA64 / Memory Copy | |
| Dell XPS 13 Plus 9320 Core i7-1360P | |
| Lenovo ThinkPad X1 Nano Gen 3 | |
| Framework Laptop 13.5 Ryzen 7 7840U | |
| Asus ZenBook S13 OLED UX5304 | |
| HP Dragonfly G4 | |
| Average AMD Ryzen 7 7840U (43255 - 70532, n=12) | |
| Framework Laptop 13.5 | |
| AIDA64 / Memory Read | |
| Dell XPS 13 Plus 9320 Core i7-1360P | |
| Lenovo ThinkPad X1 Nano Gen 3 | |
| Framework Laptop 13.5 Ryzen 7 7840U | |
| Asus ZenBook S13 OLED UX5304 | |
| HP Dragonfly G4 | |
| Average AMD Ryzen 7 7840U (37399 - 61602, n=11) | |
| Framework Laptop 13.5 | |
| AIDA64 / Memory Write | |
| Lenovo ThinkPad X1 Nano Gen 3 | |
| Dell XPS 13 Plus 9320 Core i7-1360P | |
| Framework Laptop 13.5 Ryzen 7 7840U | |
| Asus ZenBook S13 OLED UX5304 | |
| HP Dragonfly G4 | |
| Average AMD Ryzen 7 7840U (46797 - 92289, n=13) | |
| Framework Laptop 13.5 | |
| AIDA64 / Memory Latency | |
| Average AMD Ryzen 7 7840U (90 - 137.2, n=12) | |
| Dell XPS 13 Plus 9320 Core i7-1360P | |
| Lenovo ThinkPad X1 Nano Gen 3 | |
| HP Dragonfly G4 | |
| Asus ZenBook S13 OLED UX5304 | |
| Framework Laptop 13.5 Ryzen 7 7840U | |
| Framework Laptop 13.5 | |
* ... smaller is better
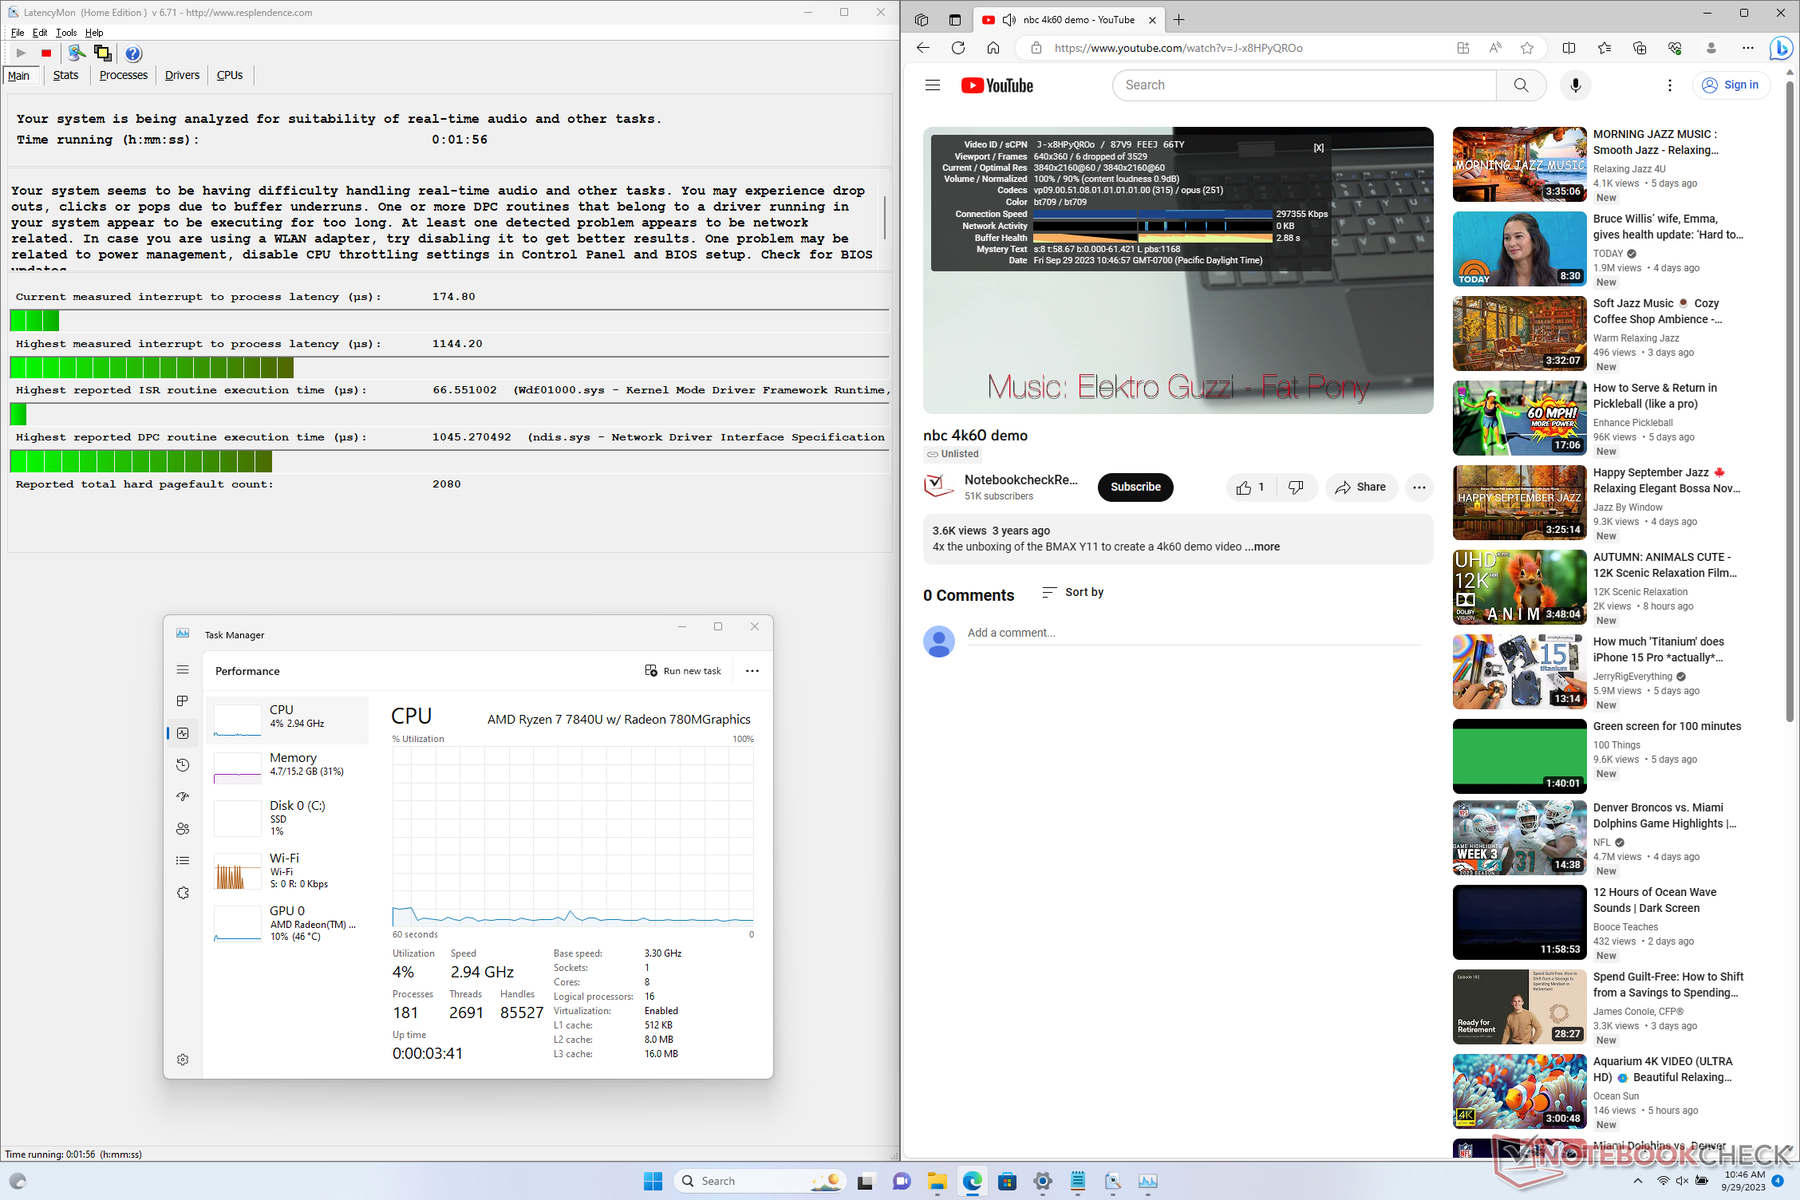
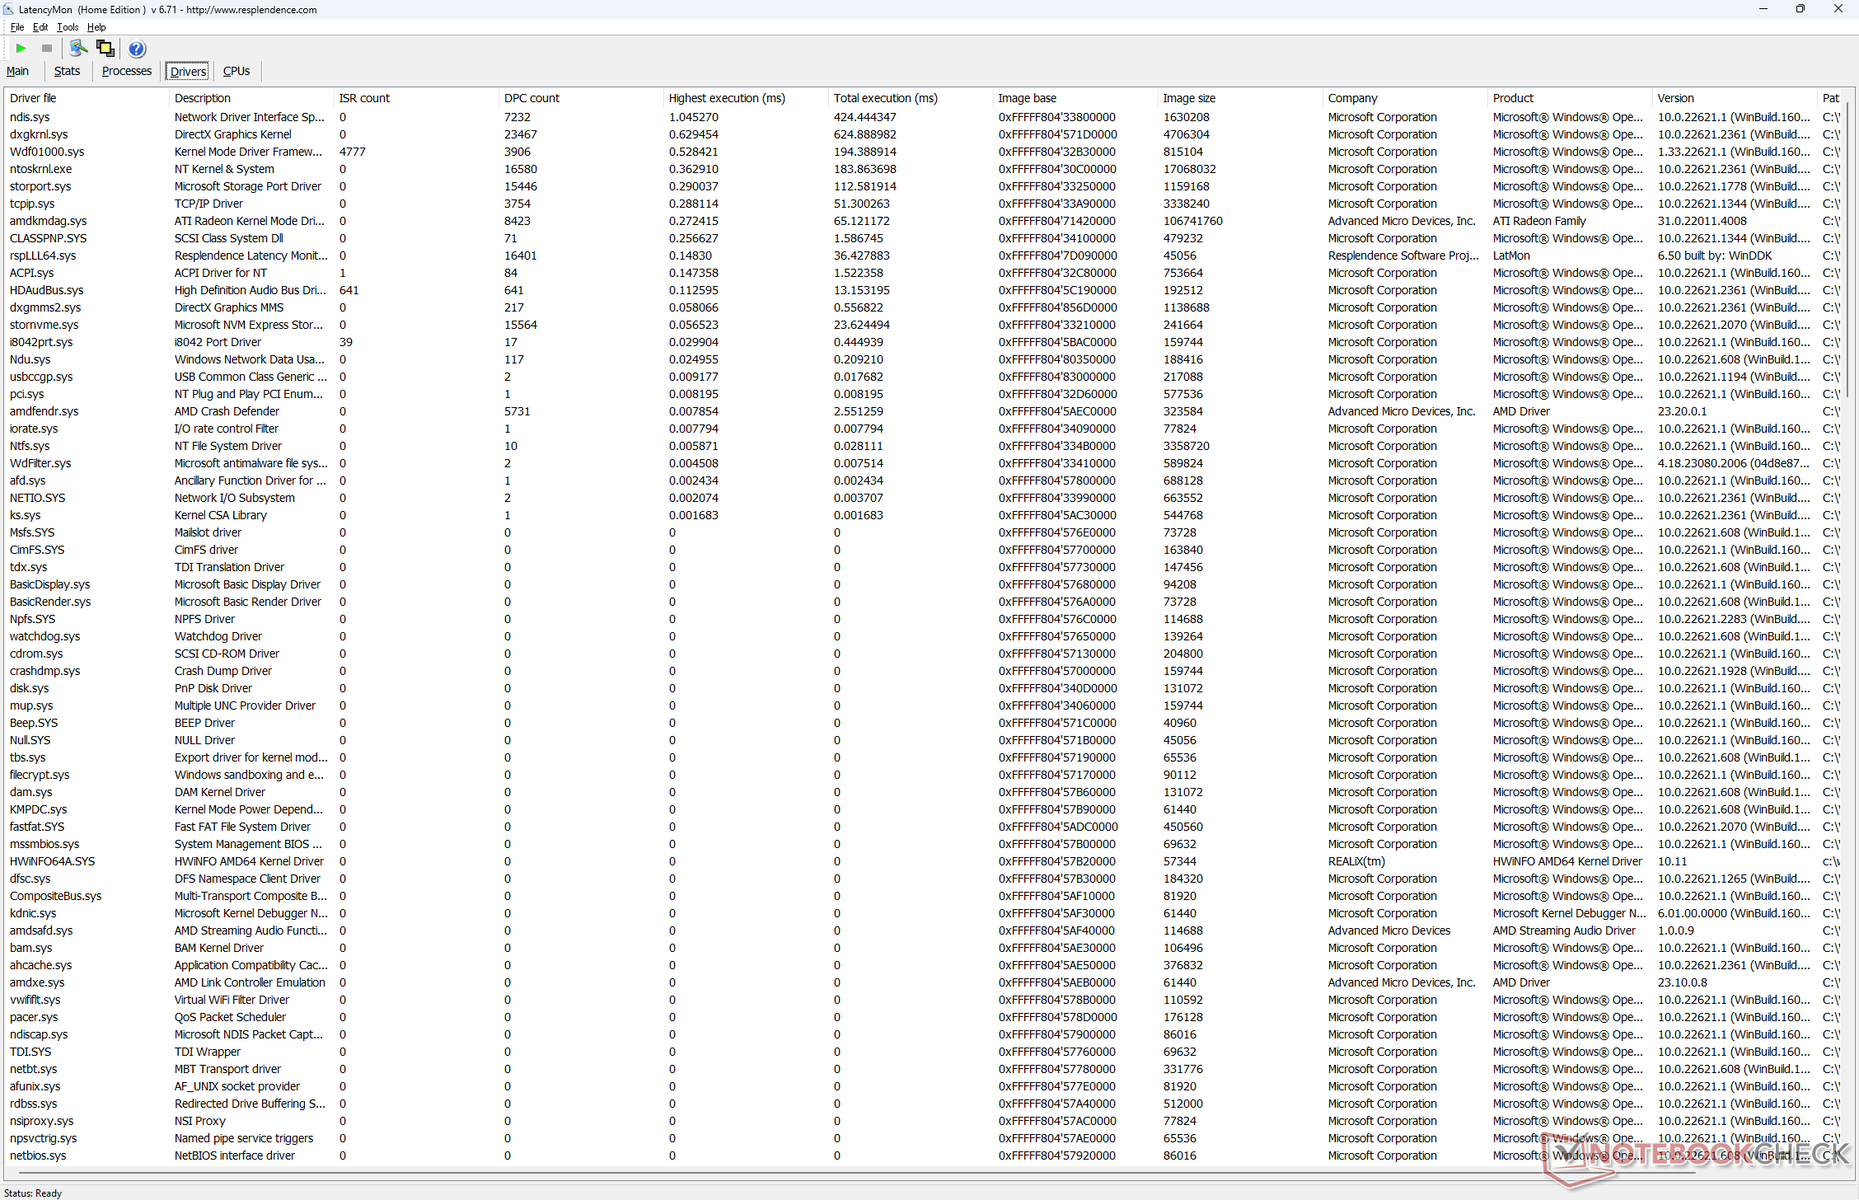
DPC 延迟
LatencyMon 仅在打开主页的多个标签页时显示出轻微的 DPC 问题。60 FPS 的 4K 视频回放并不完美,一分钟内记录到 6 次跳帧。AMD 系统(如Legion Slim 5 14 或 Aokzoe A1)最近出现的跳帧问题似乎比英特尔更多。
| DPC Latencies / LatencyMon - interrupt to process latency (max), Web, Youtube, Prime95 | |
| Dell XPS 13 Plus 9320 Core i7-1360P | |
| Lenovo ThinkPad X1 Nano Gen 3 | |
| Framework Laptop 13.5 | |
| Asus ZenBook S13 OLED UX5304 | |
| HP Dragonfly G4 | |
| Framework Laptop 13.5 Ryzen 7 7840U | |
* ... smaller is better
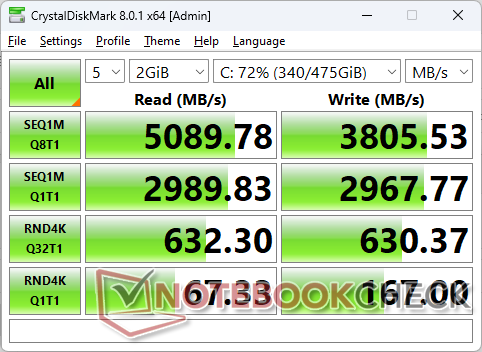
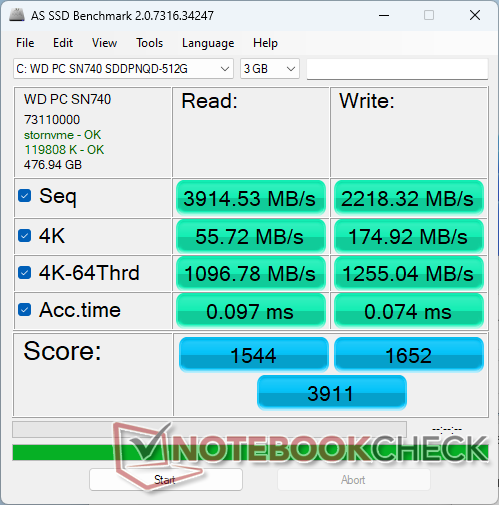
存储设备
框架仅提供 西部数据硬盘这很可能是因为与这家固态硬盘制造商达成了独家协议。当然,用户也可以很容易地安装自己的硬盘来代替所需的硬盘。

* ... smaller is better
Disk Throttling: DiskSpd Read Loop, Queue Depth 8
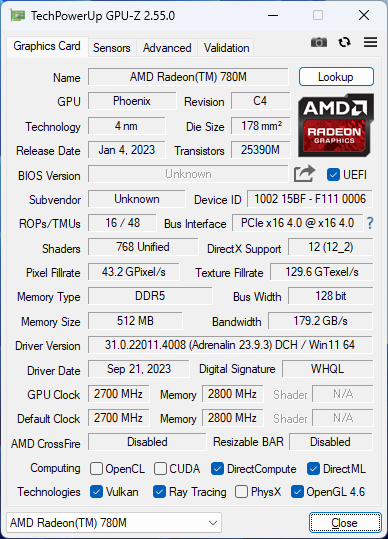
图形处理器性能
去年的 Radeon 680M已经比英特尔的任何集成解决方案都要快,而今年的 Radeon 780M进一步巩固了 AMD 的领先地位。原始图形性能比Iris Xe 96 EUs快 30%至 50%。在支持 DX12 的应用程序中,性能优势更加明显。
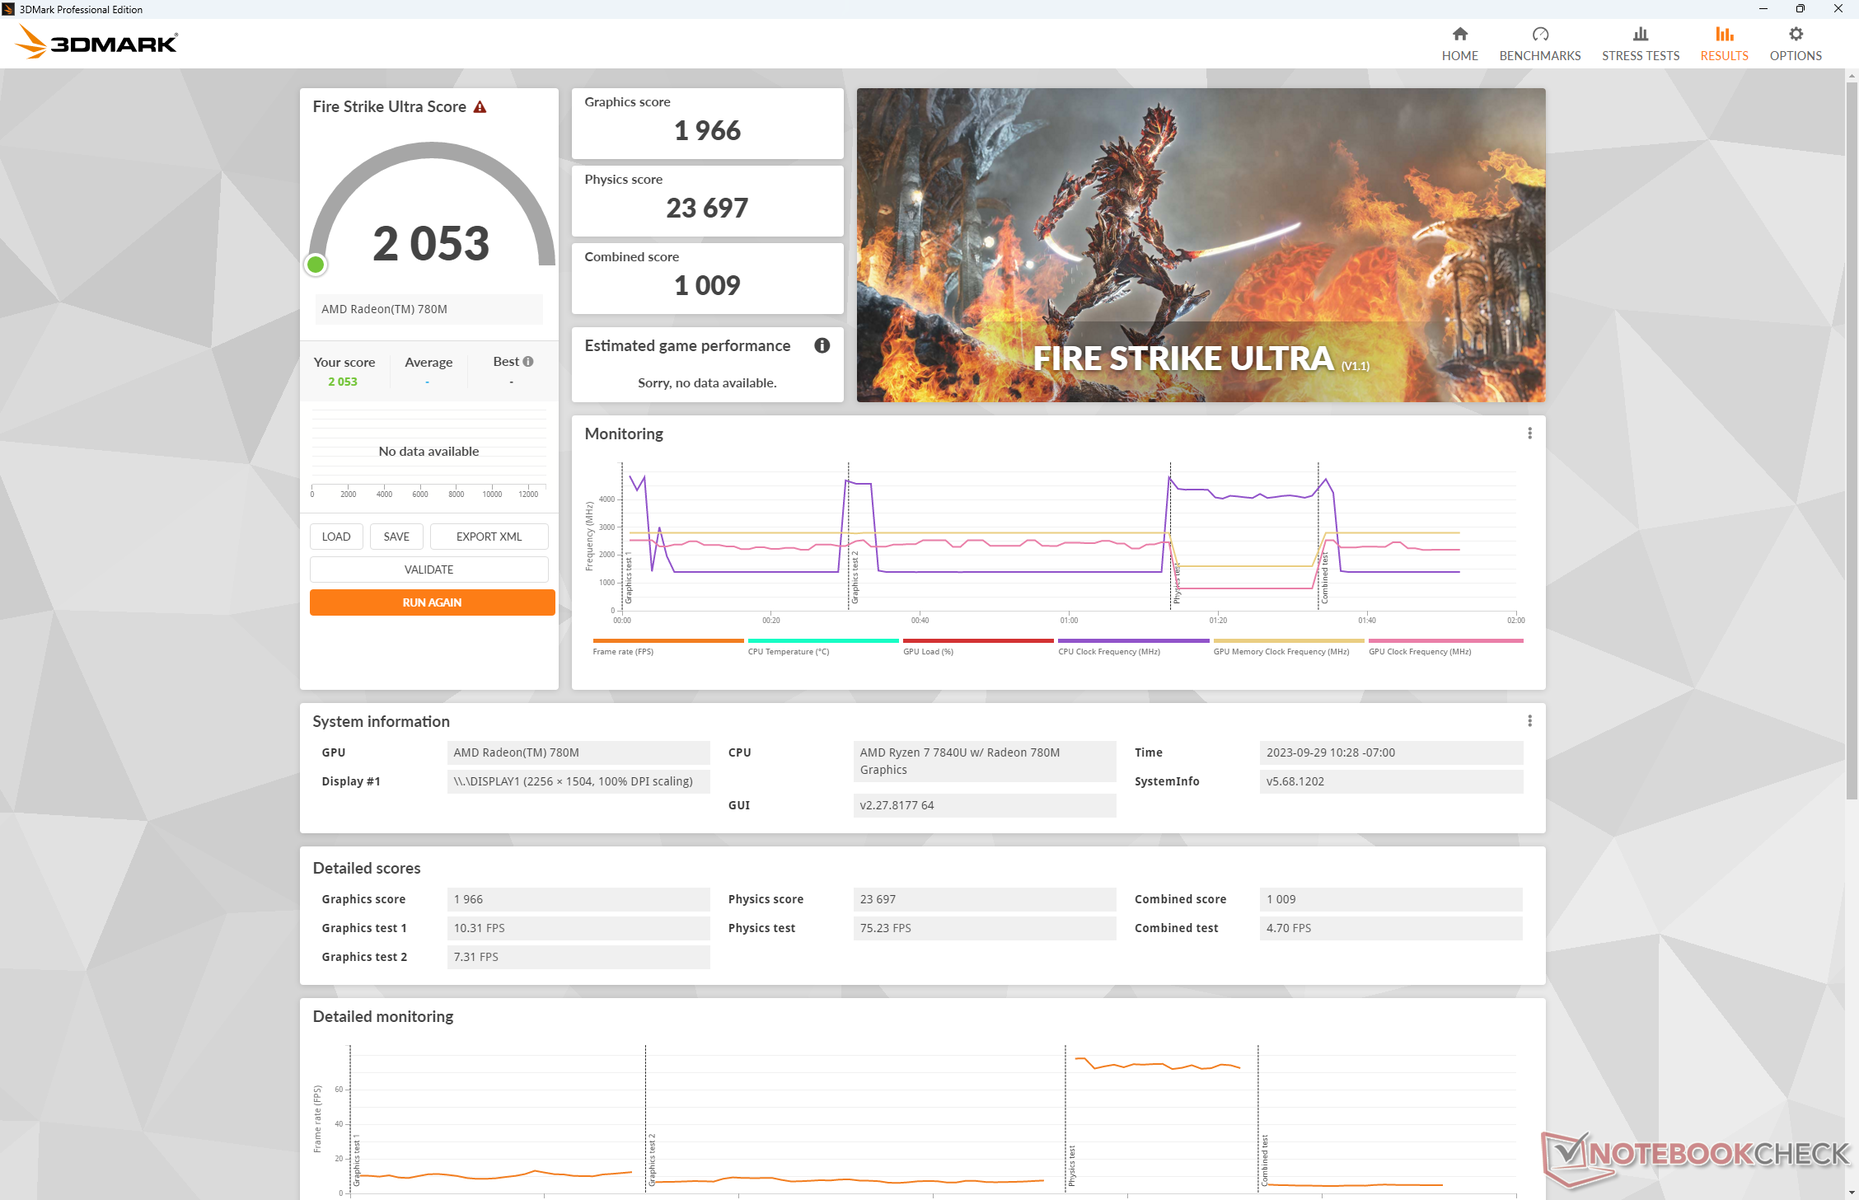
| 电源配置文件 | 图形得分 | 物理得分 | 综合得分 |
| 性能模式 | 7455 | 24735 | 2646 |
| 平衡模式 | 7426 (-0%) | 24403 (-1%) | 2646 (-0%) |
| 电池电量 | 6591 (-12%) | 24183 (-2%) | 2223 (-16%) |
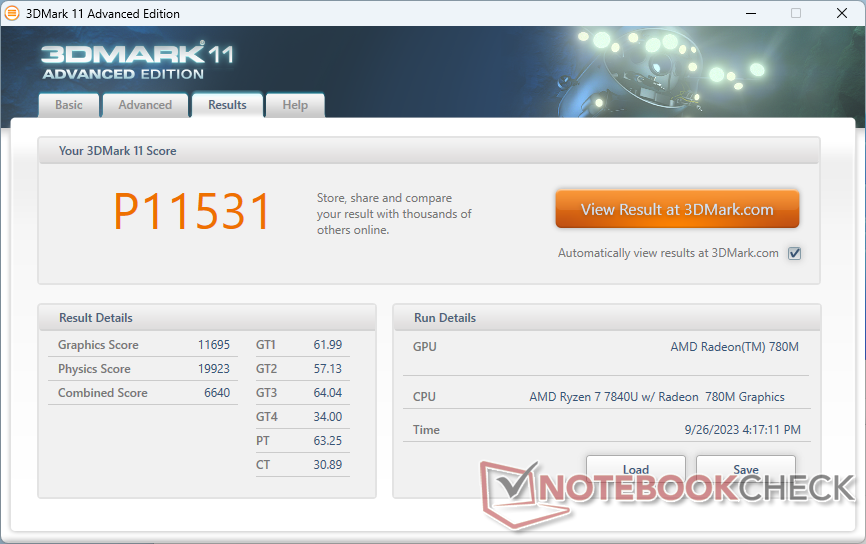
| 3DMark 11 Performance | 11531 points | |
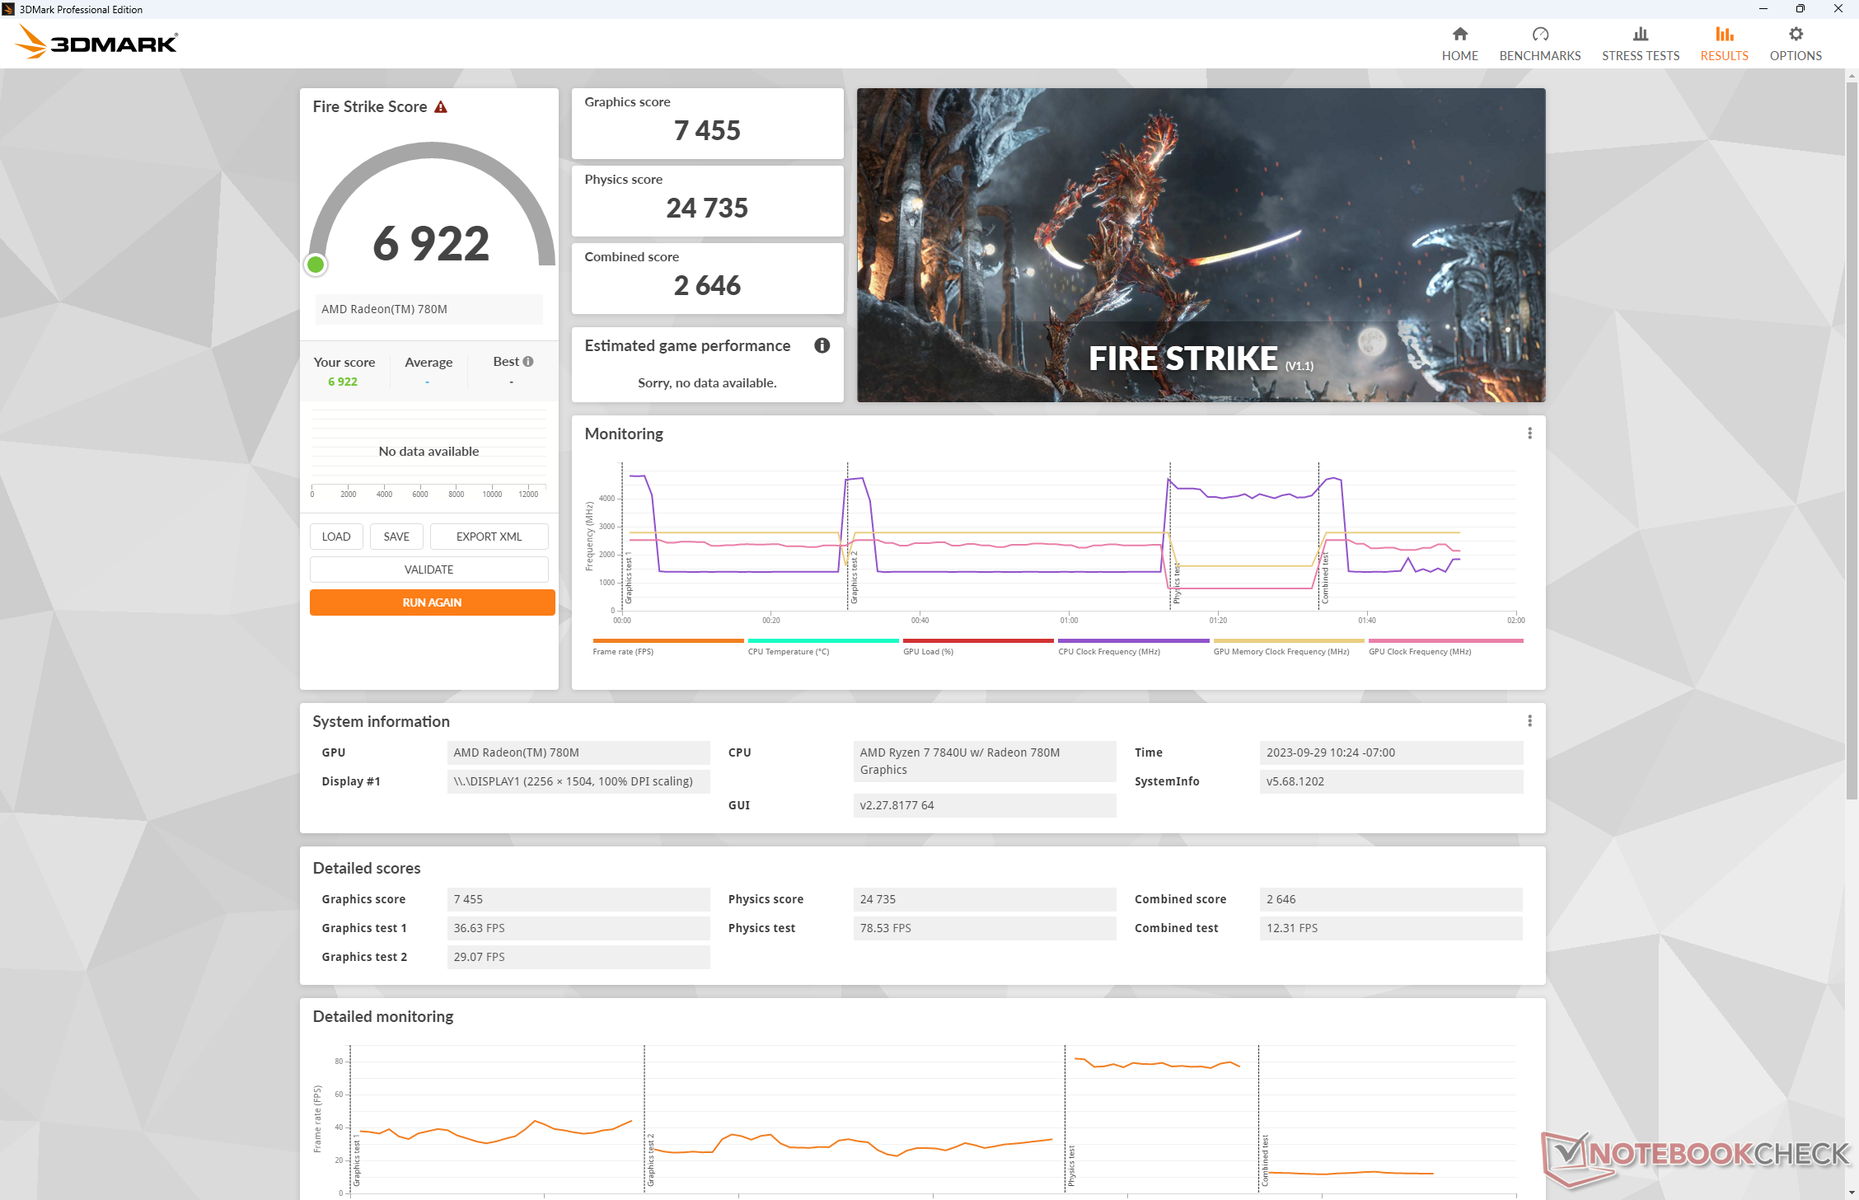
| 3DMark Fire Strike Score | 6922 points | |
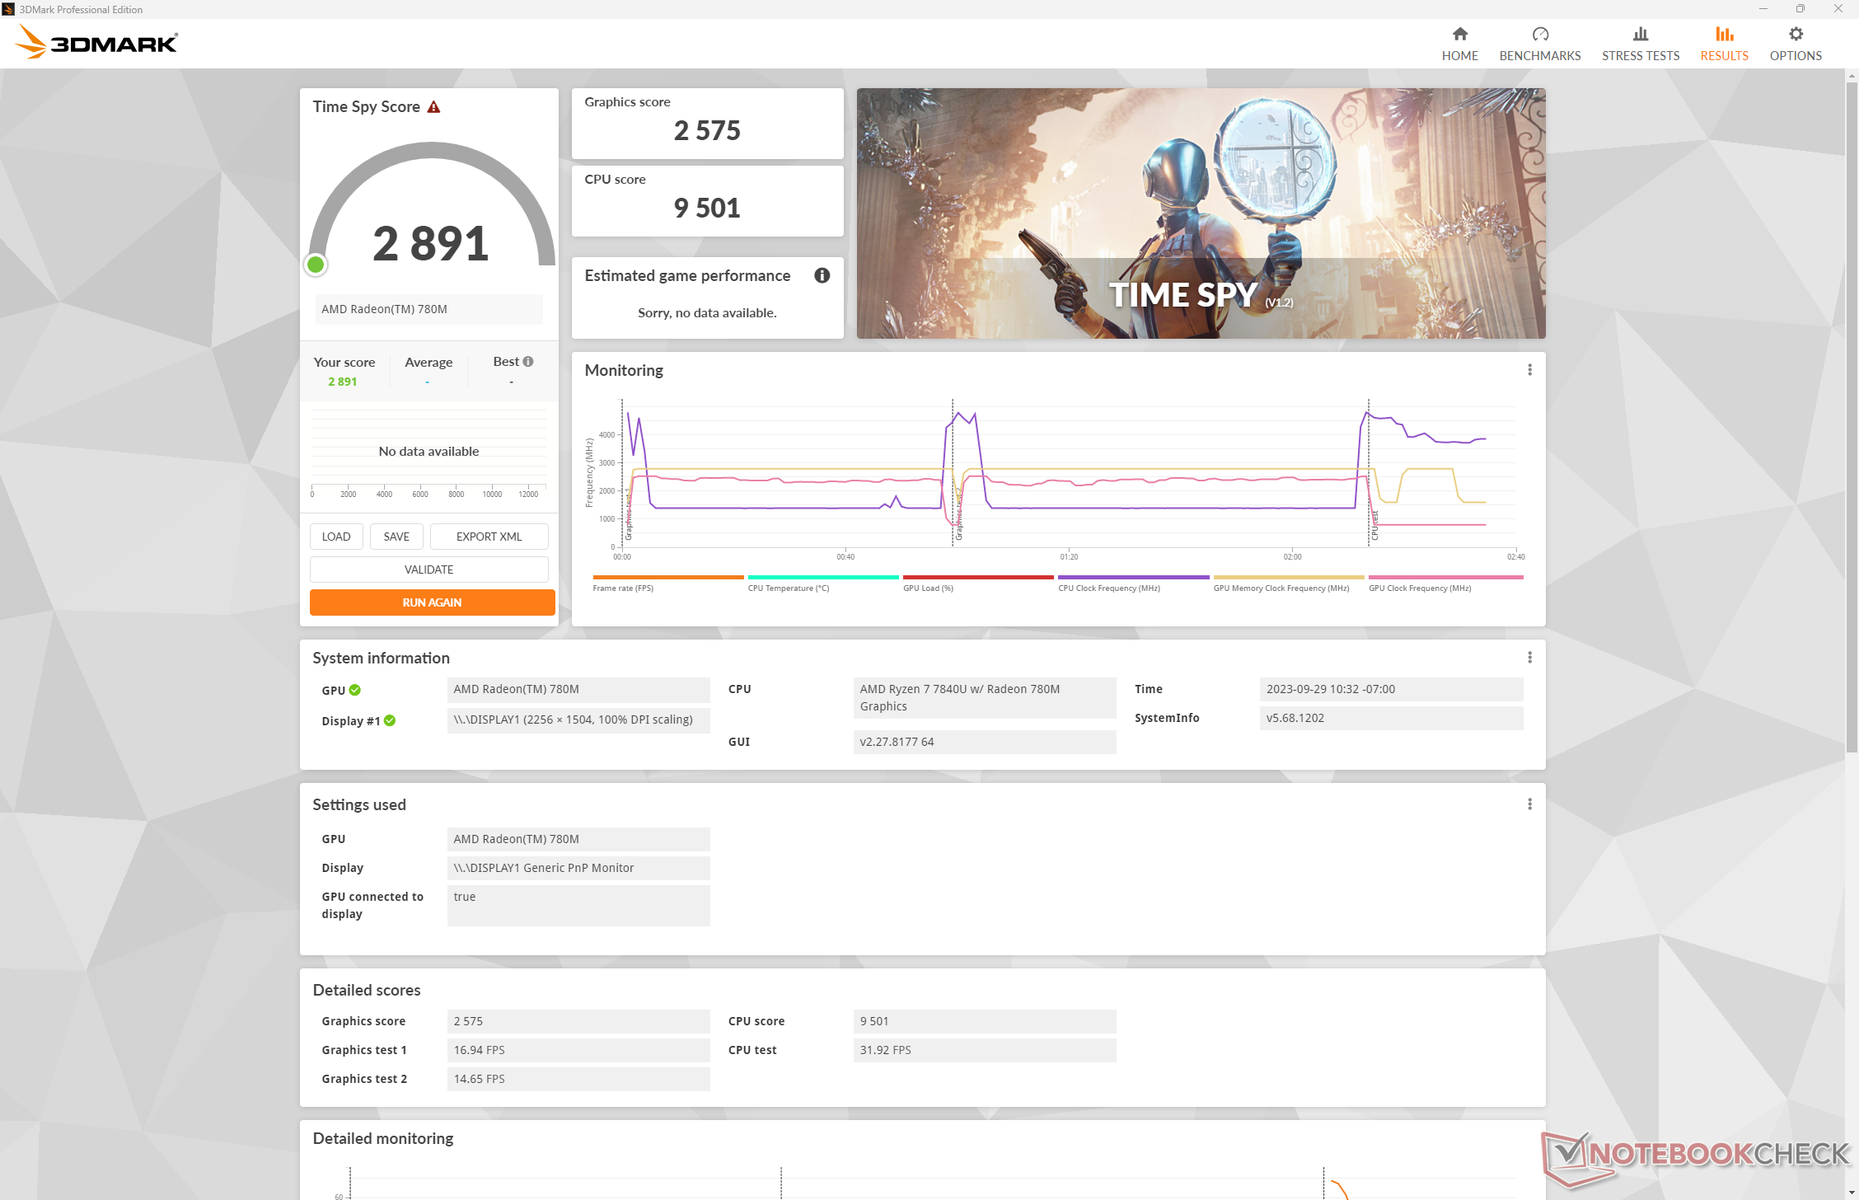
| 3DMark Time Spy Score | 2891 points | |
Help | ||
* ... smaller is better
游戏性能
Framework Laptop 13.5 并不是一款游戏机,但其 Zen 4 CPU 仍能在 1080p 下运行大多数游戏,甚至包括《赛博朋克 2077》。尽管如此,我们在运行《F1 22》和《Ratchet and Clank Rift Apart》等几款游戏时还是遇到了死机现象。
Witcher 3 FPS Chart
| low | med. | high | ultra | |
|---|---|---|---|---|
| The Witcher 3 (2015) | 136.2 | 45.9 | 28.7 | |
| Dota 2 Reborn (2015) | 154.1 | 119.3 | 76.2 | 71.2 |
| Final Fantasy XV Benchmark (2018) | 66.6 | 34.4 | 25.7 | |
| X-Plane 11.11 (2018) | 60 | 44.4 | 37.5 | |
| Far Cry 5 (2018) | 74 | 39 | 37 | 35 |
| Strange Brigade (2018) | 139.8 | 59.7 | 50.5 | 43 |
| Cyberpunk 2077 1.6 (2022) | 39.5 | 30.9 | 24.6 | 23 |
| Tiny Tina's Wonderlands (2022) | 60.4 | 44.8 | 30.4 | 25.2 |
| F1 22 (2022) | 80.6 | 72.5 | 54.2 |
排放量
系统噪音
运行高负载时的风扇噪音与我们在英特尔酷睿-P 配置上记录到的噪音基本相同。与其他大多数子笔记本的 40 分贝(A)相比,Framework 在 46 至 49 分贝(A)的范围内仍然是最吵闹的子笔记本之一。我们还注意到风扇的脉动也更加频繁。
值得称赞的是,AMD 配置的风扇噪音上升时间相对较慢且稳定,这意味着系统在运行要求不高的负载(如浏览或视频流)时能够保持相对安静。
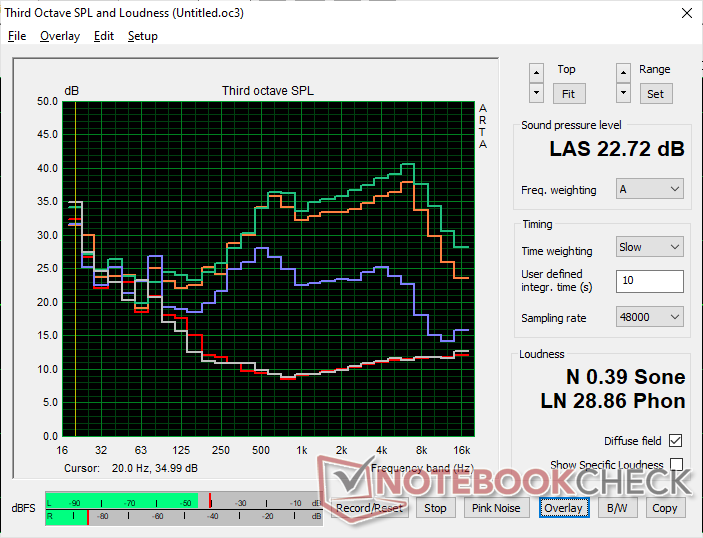
Noise level
| Idle |
| 22.6 / 22.6 / 24.2 dB(A) |
| Load |
| 35.8 / 48.9 dB(A) |
 | ||
30 dB silent 40 dB(A) audible 50 dB(A) loud |
||
min: | ||
| Framework Laptop 13.5 Ryzen 7 7840U Radeon 780M, R7 7840U, WD PC SN740 512GB SDDPNQD-512G | Framework Laptop 13.5 Iris Xe G7 96EUs, i7-1165G7, Western Digital WD_BLACK SN850 WDS100T1X0E | Lenovo ThinkPad X1 Nano Gen 3 Iris Xe G7 96EUs, i7-1360P, Lenovo UMIS AM6A0 RPJTJ512MKP1QDQ | HP Dragonfly G4 Iris Xe G7 96EUs, i7-1365U, Micron 3400 MTFDKBA512TFH 512GB | Dell XPS 13 Plus 9320 Core i7-1360P Iris Xe G7 96EUs, i7-1360P, Samsung PM9A1 MZVL2512HCJQ | Asus ZenBook S13 OLED UX5304 Iris Xe G7 96EUs, i7-1355U, Samsung PM9A1 MZVL21T0HCLR | |
|---|---|---|---|---|---|---|
| Noise | -6% | 8% | 9% | 0% | 3% | |
| off / environment * (dB) | 22.6 | 23.9 -6% | 22.9 -1% | 23.3 -3% | 23.7 -5% | 23.3 -3% |
| Idle Minimum * (dB) | 22.6 | 23.9 -6% | 23 -2% | 23.5 -4% | 24 -6% | 23.3 -3% |
| Idle Average * (dB) | 22.6 | 23.9 -6% | 23 -2% | 23.5 -4% | 24 -6% | 23.3 -3% |
| Idle Maximum * (dB) | 24.2 | 23.9 1% | 23 5% | 26.8 -11% | 24.4 -1% | 23.3 4% |
| Load Average * (dB) | 35.8 | 45.6 -27% | 32.8 8% | 27.2 24% | 37 -3% | 37.7 -5% |
| Witcher 3 ultra * (dB) | 46.5 | 47.1 -1% | 36.9 21% | 32.7 30% | 42.1 9% | 40.1 14% |
| Load Maximum * (dB) | 48.9 | 47.9 2% | 36.9 25% | 35 28% | 42 14% | 40.1 18% |
* ... smaller is better
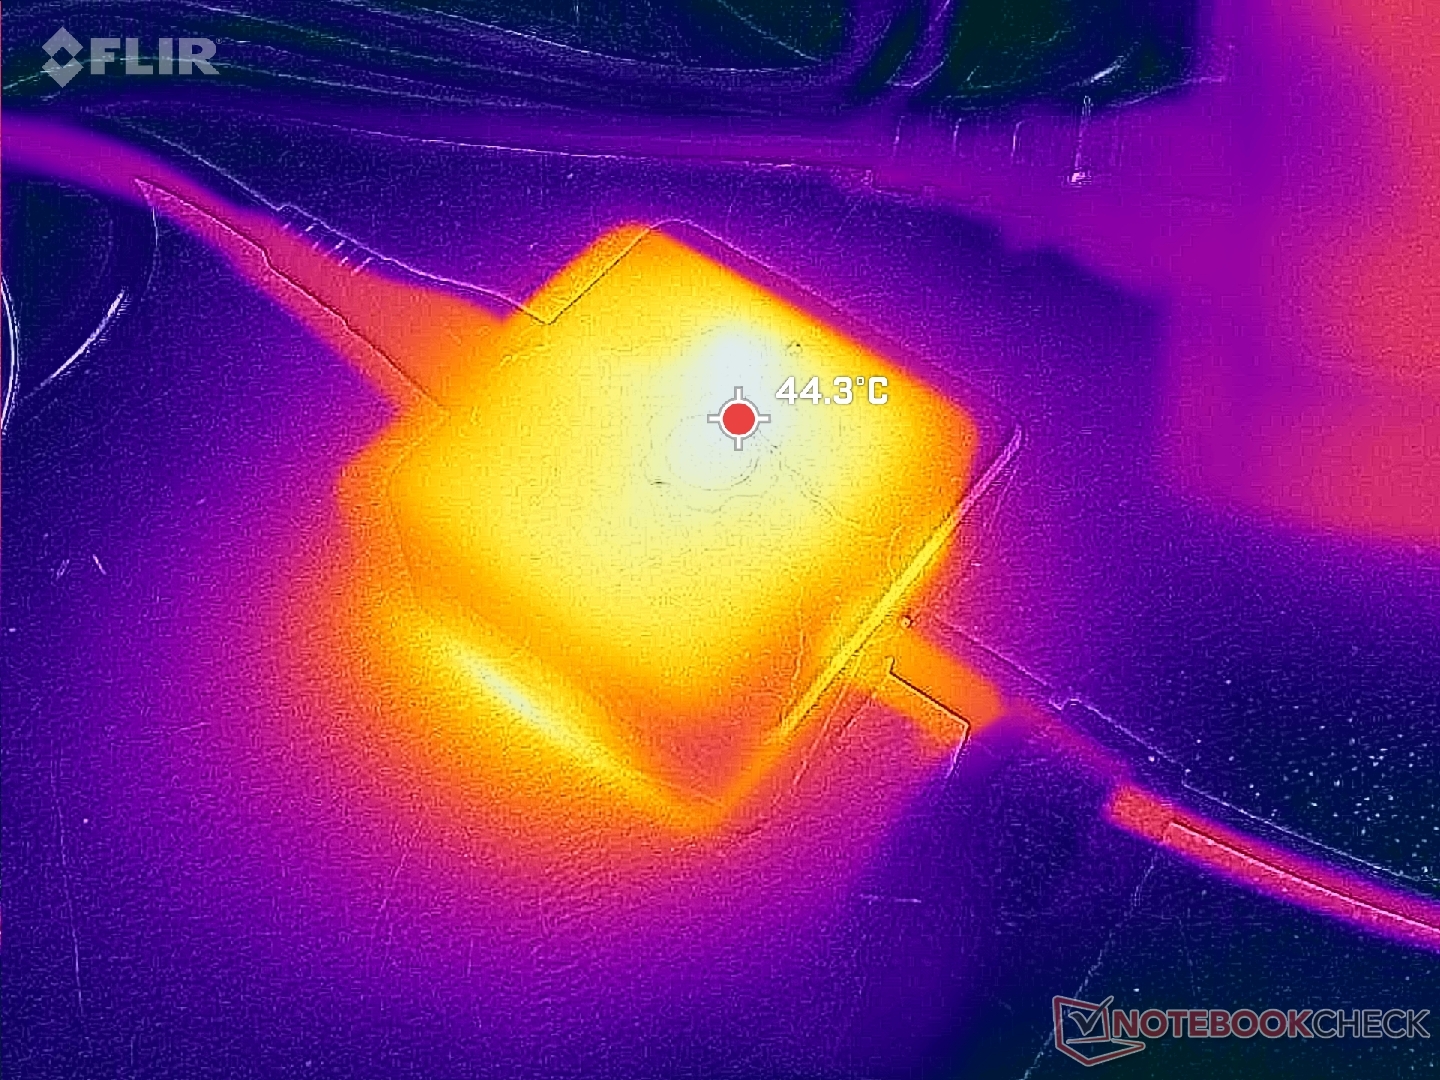
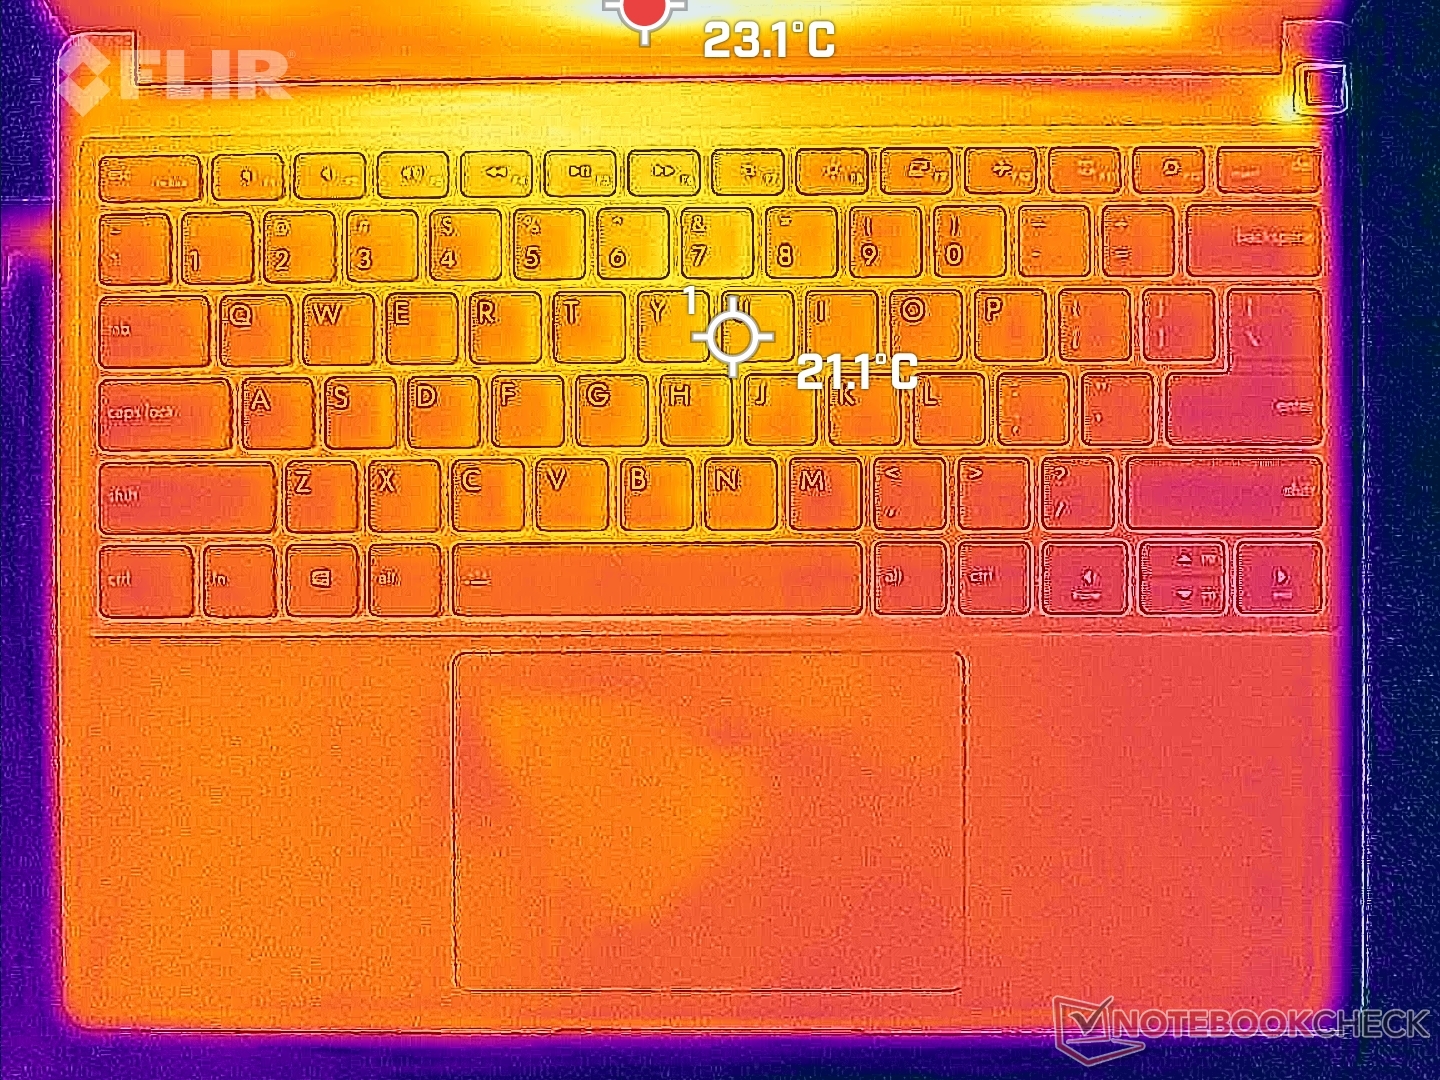
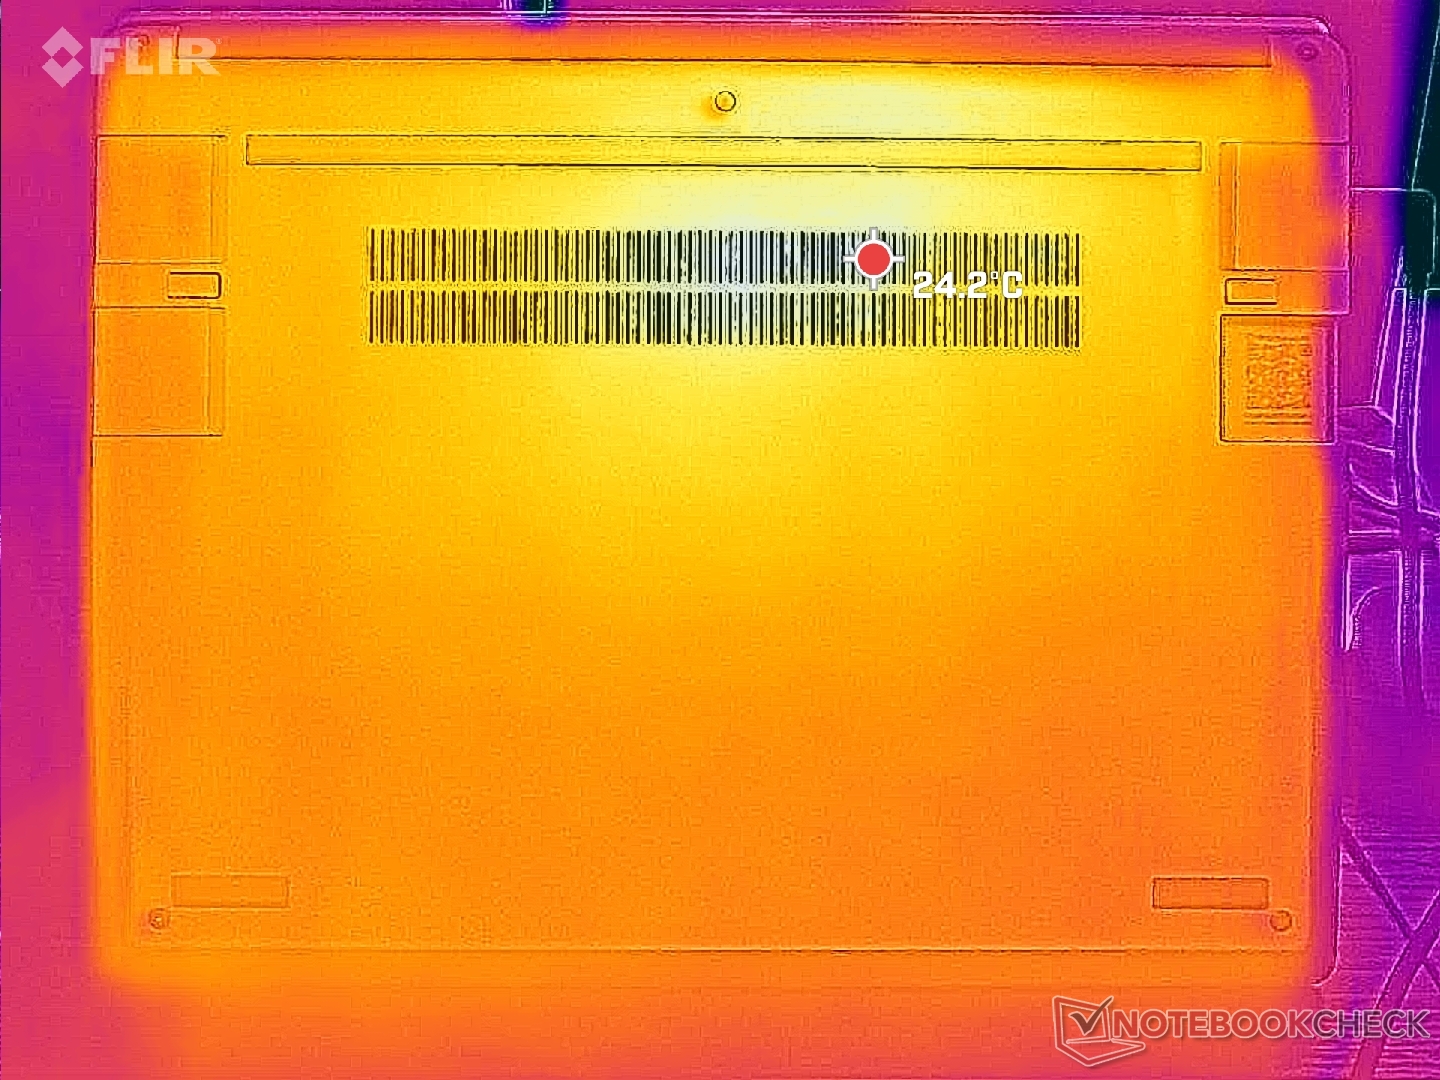
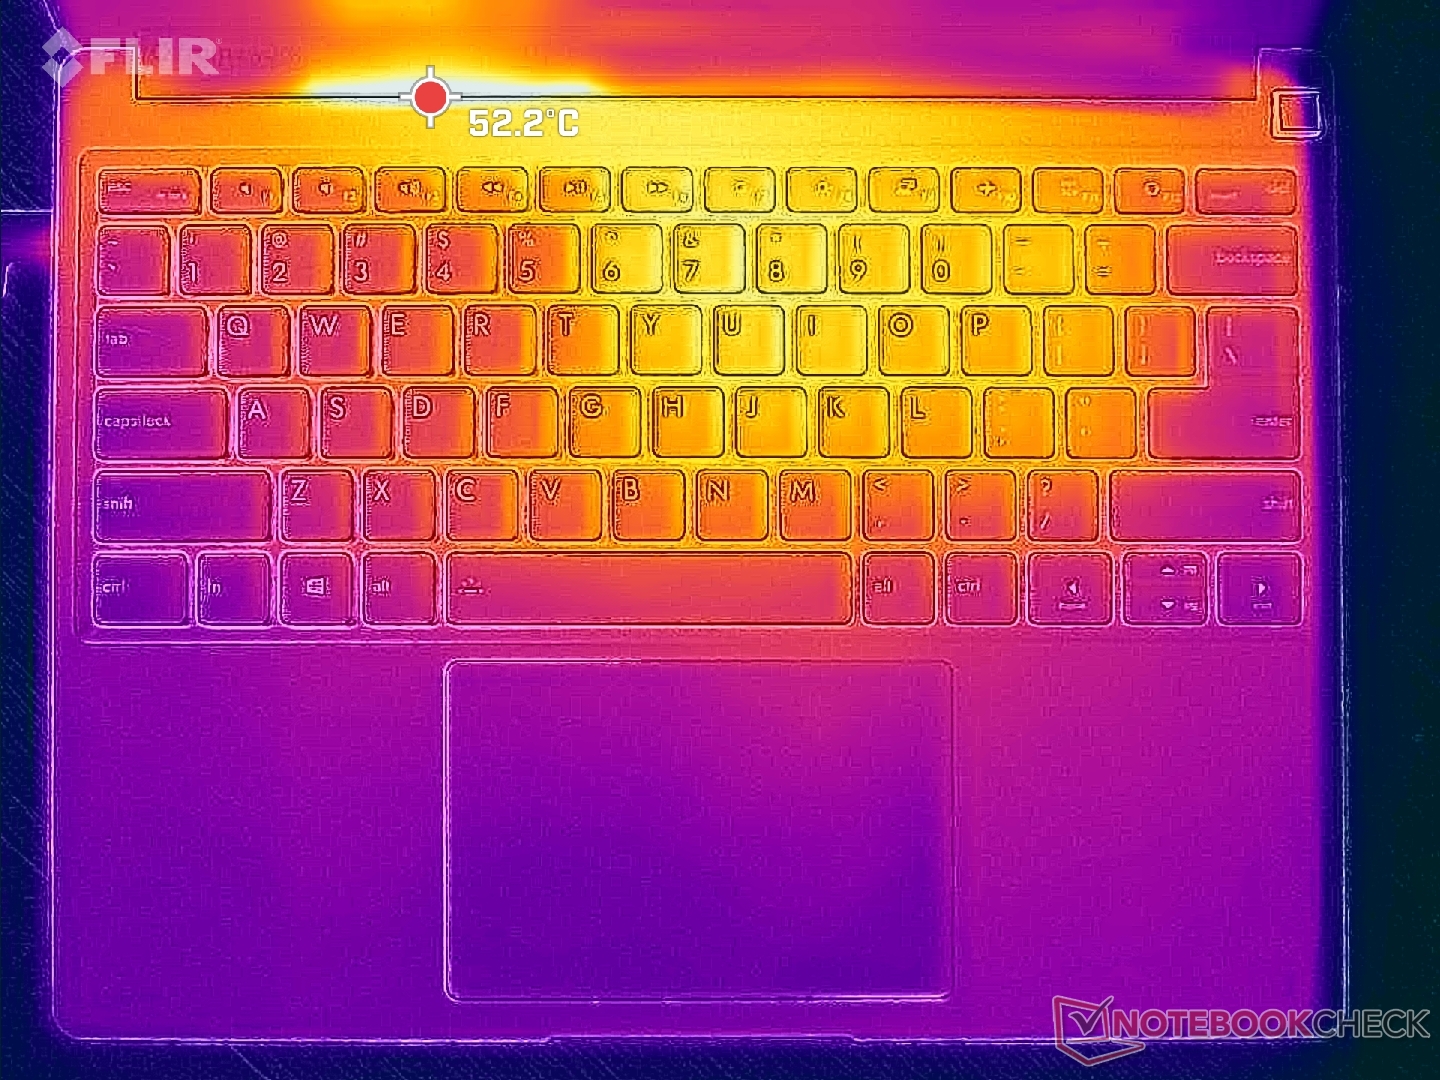
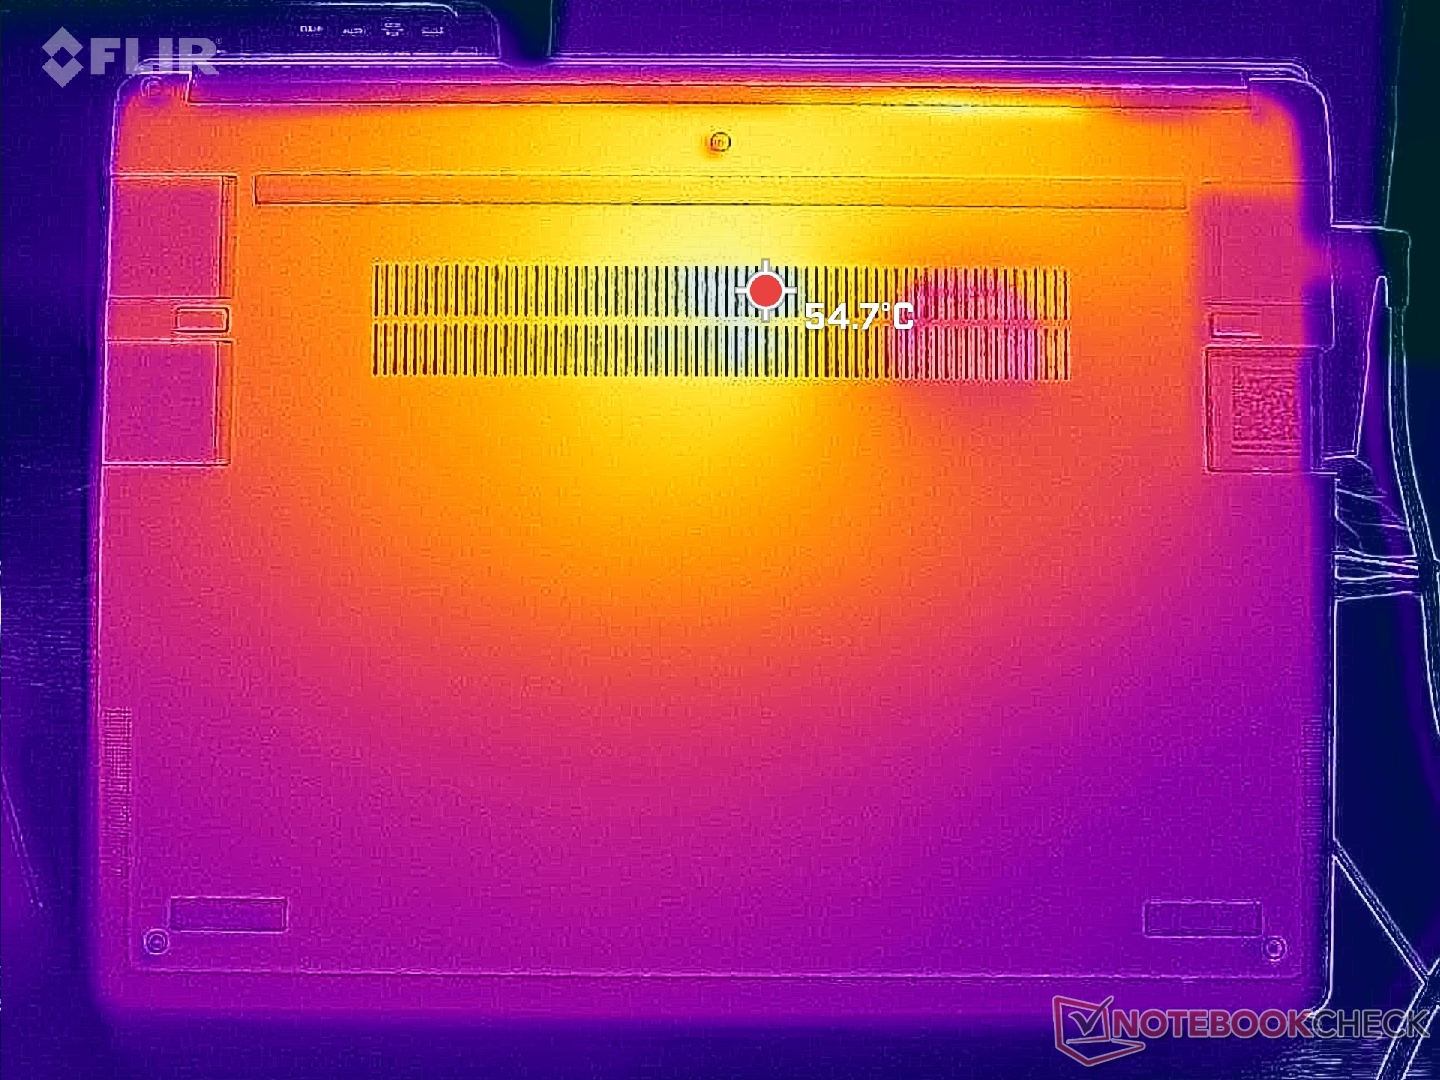
温度
表面温度并不比英特尔版本低,甚至可能更高。我们的 AMD 系统上下两面的平均温度要高出几摄氏度,但也不能完全排除背景温度的差异。采用较慢 CPU 的替代产品,如惠普 Spectre x360 13.5运行温度更低。
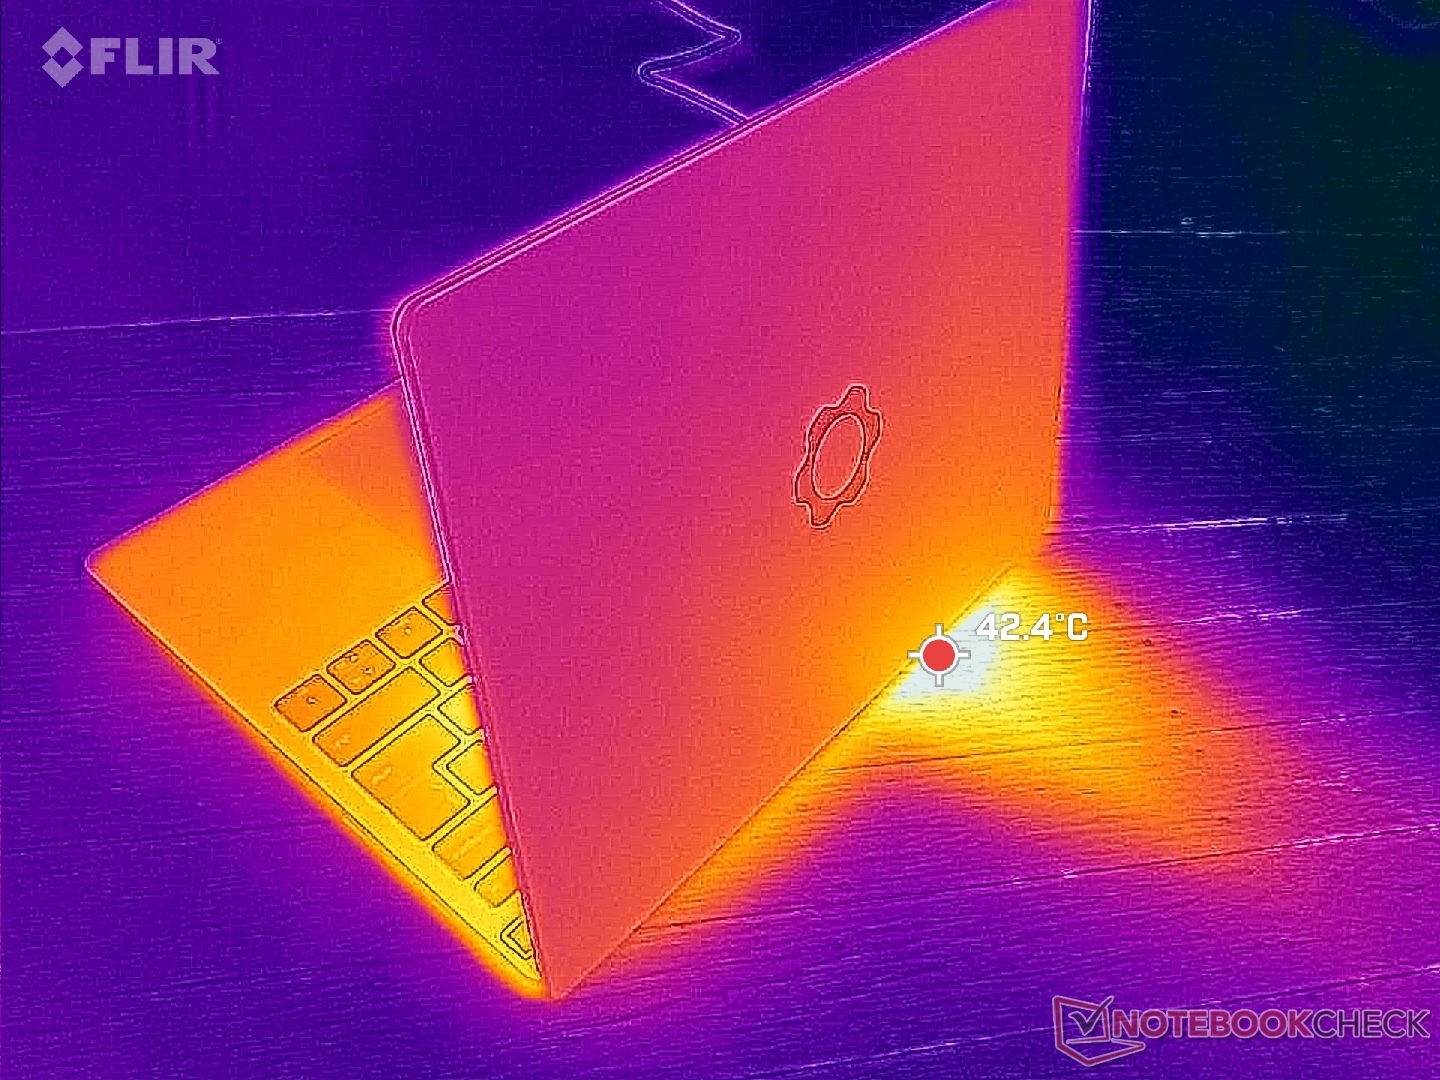
(±) The maximum temperature on the upper side is 42 °C / 108 F, compared to the average of 34.3 °C / 94 F, ranging from 21.2 to 62.5 °C for the class Office.
(-) The bottom heats up to a maximum of 47.4 °C / 117 F, compared to the average of 36.8 °C / 98 F
(+) In idle usage, the average temperature for the upper side is 27.5 °C / 82 F, compared to the device average of 29.5 °C / 85 F.
(+) The palmrests and touchpad are cooler than skin temperature with a maximum of 27.8 °C / 82 F and are therefore cool to the touch.
(±) The average temperature of the palmrest area of similar devices was 27.5 °C / 81.5 F (-0.3 °C / -0.5 F).
| Framework Laptop 13.5 Ryzen 7 7840U AMD Ryzen 7 7840U, AMD Radeon 780M | Framework Laptop 13.5 Intel Core i7-1165G7, Intel Iris Xe Graphics G7 96EUs | Lenovo ThinkPad X1 Nano Gen 3 Intel Core i7-1360P, Intel Iris Xe Graphics G7 96EUs | HP Dragonfly G4 Intel Core i7-1365U, Intel Iris Xe Graphics G7 96EUs | Dell XPS 13 Plus 9320 Core i7-1360P Intel Core i7-1360P, Intel Iris Xe Graphics G7 96EUs | Asus ZenBook S13 OLED UX5304 Intel Core i7-1355U, Intel Iris Xe Graphics G7 96EUs | |
|---|---|---|---|---|---|---|
| Heat | 6% | 7% | 7% | 9% | 3% | |
| Maximum Upper Side * (°C) | 42 | 47.2 -12% | 44 -5% | 38.6 8% | 43.8 -4% | 43.1 -3% |
| Maximum Bottom * (°C) | 47.4 | 39.4 17% | 43.2 9% | 40.4 15% | 44.4 6% | 45 5% |
| Idle Upper Side * (°C) | 28.8 | 25.2 12% | 25.6 11% | 28.2 2% | 24 17% | 27.3 5% |
| Idle Bottom * (°C) | 29.6 | 27.8 6% | 25.6 14% | 29 2% | 25.2 15% | 27.8 6% |
* ... smaller is better
压力测试
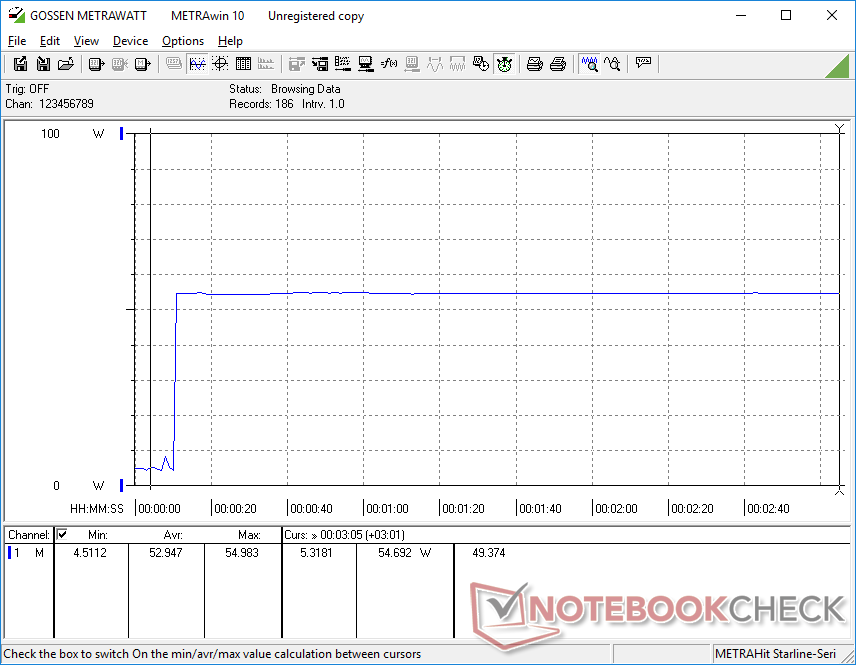
CPU 时钟频率和主板功耗分别飙升至 4 GHz 和 51 W,最多持续几秒钟,然后稳定在 3.2 GHz、35 W 和 85 C。
当运行 Witcher 3时,尽管 Radeon 780M 比 Iris Xe 快很多,但核心温度仅稳定在 71 摄氏度,而英特尔版本则为 93 摄氏度。
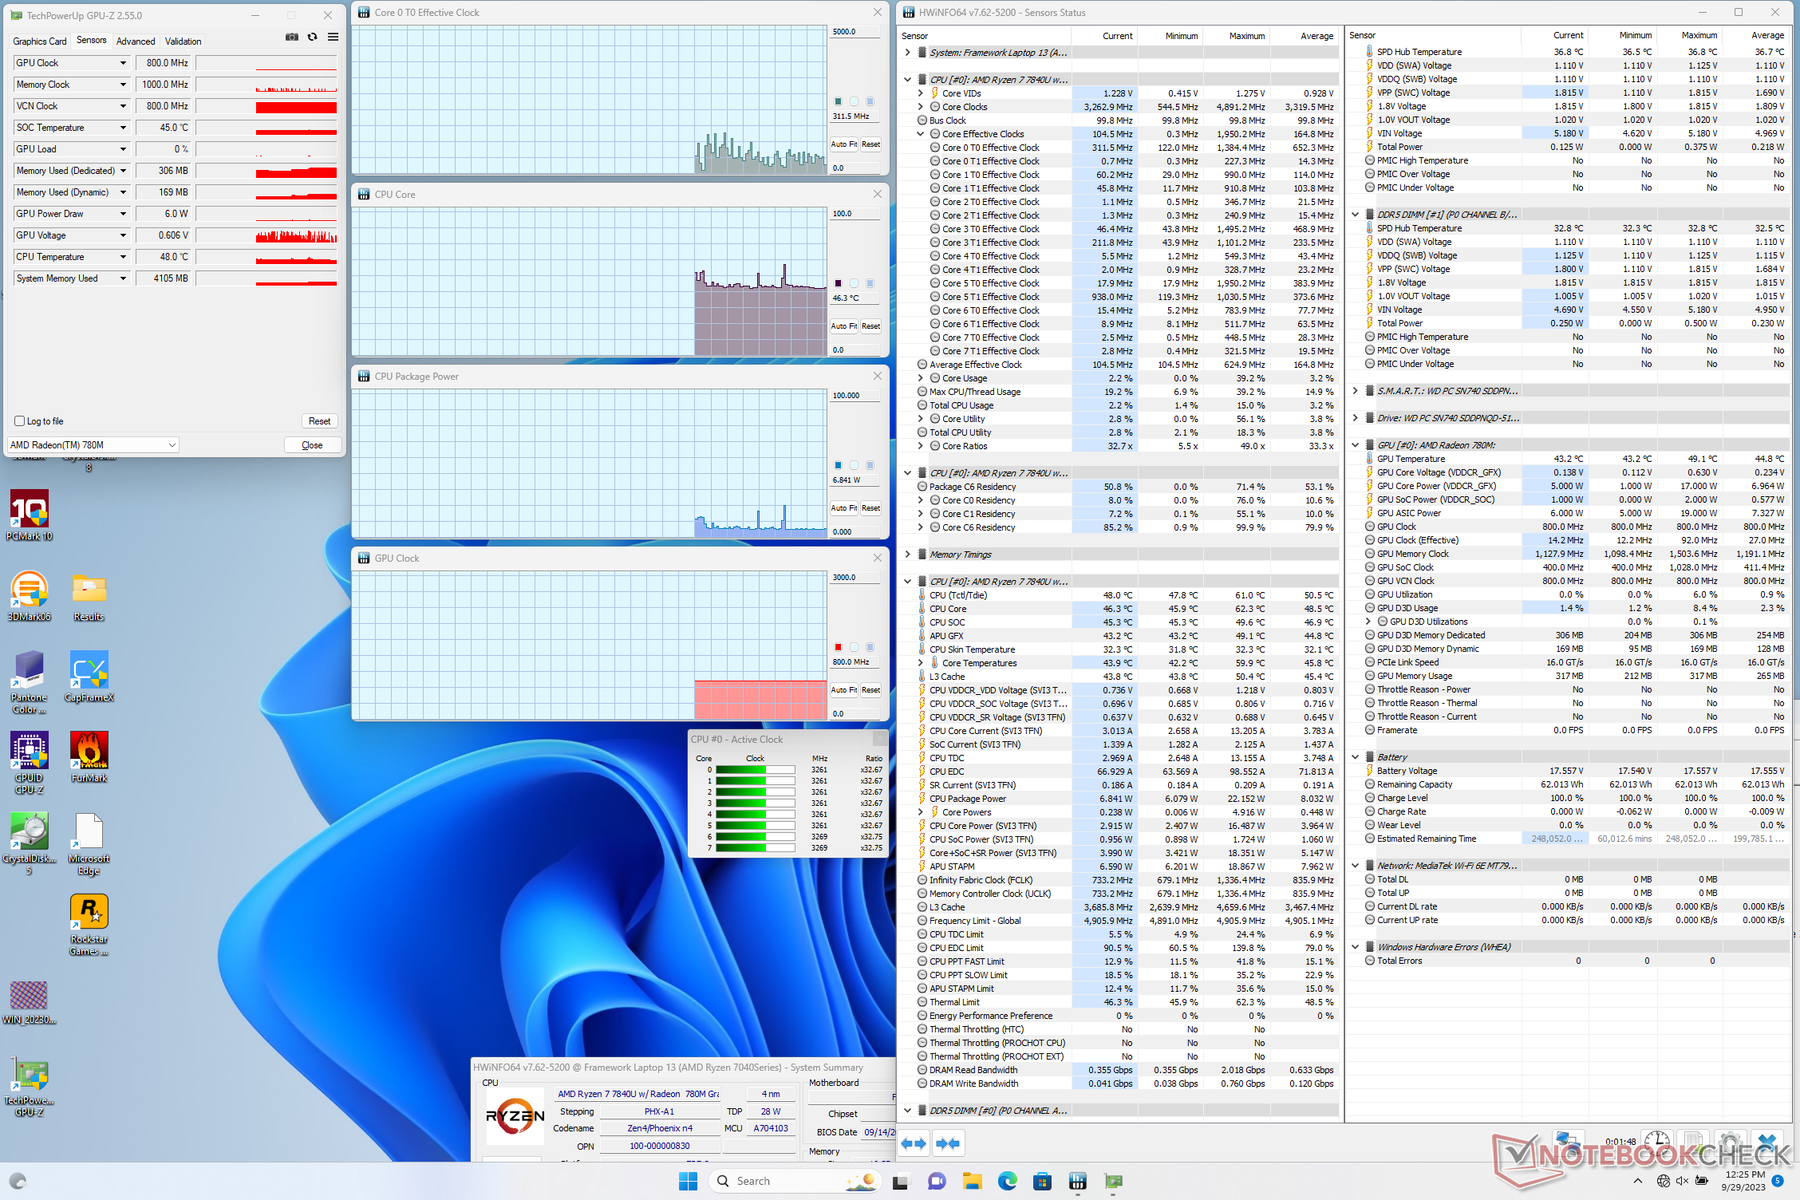

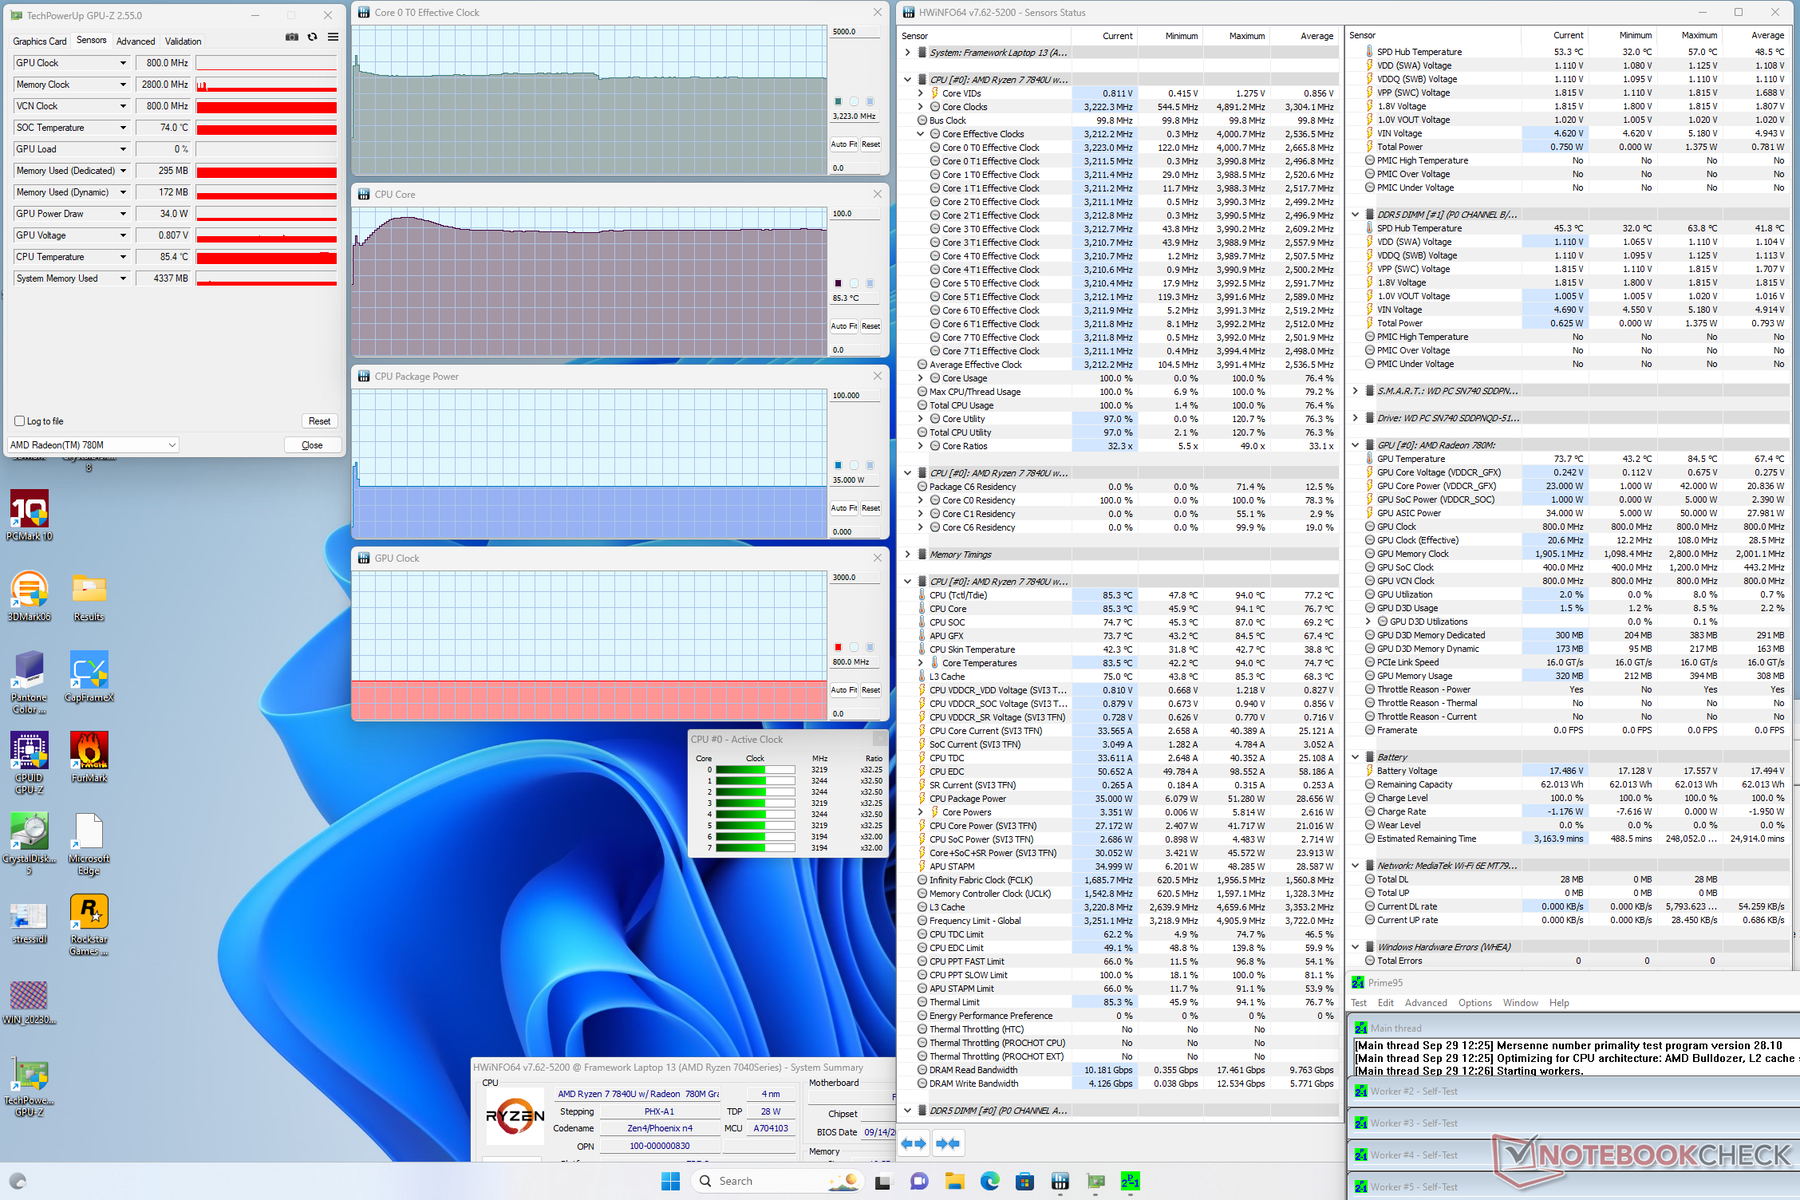
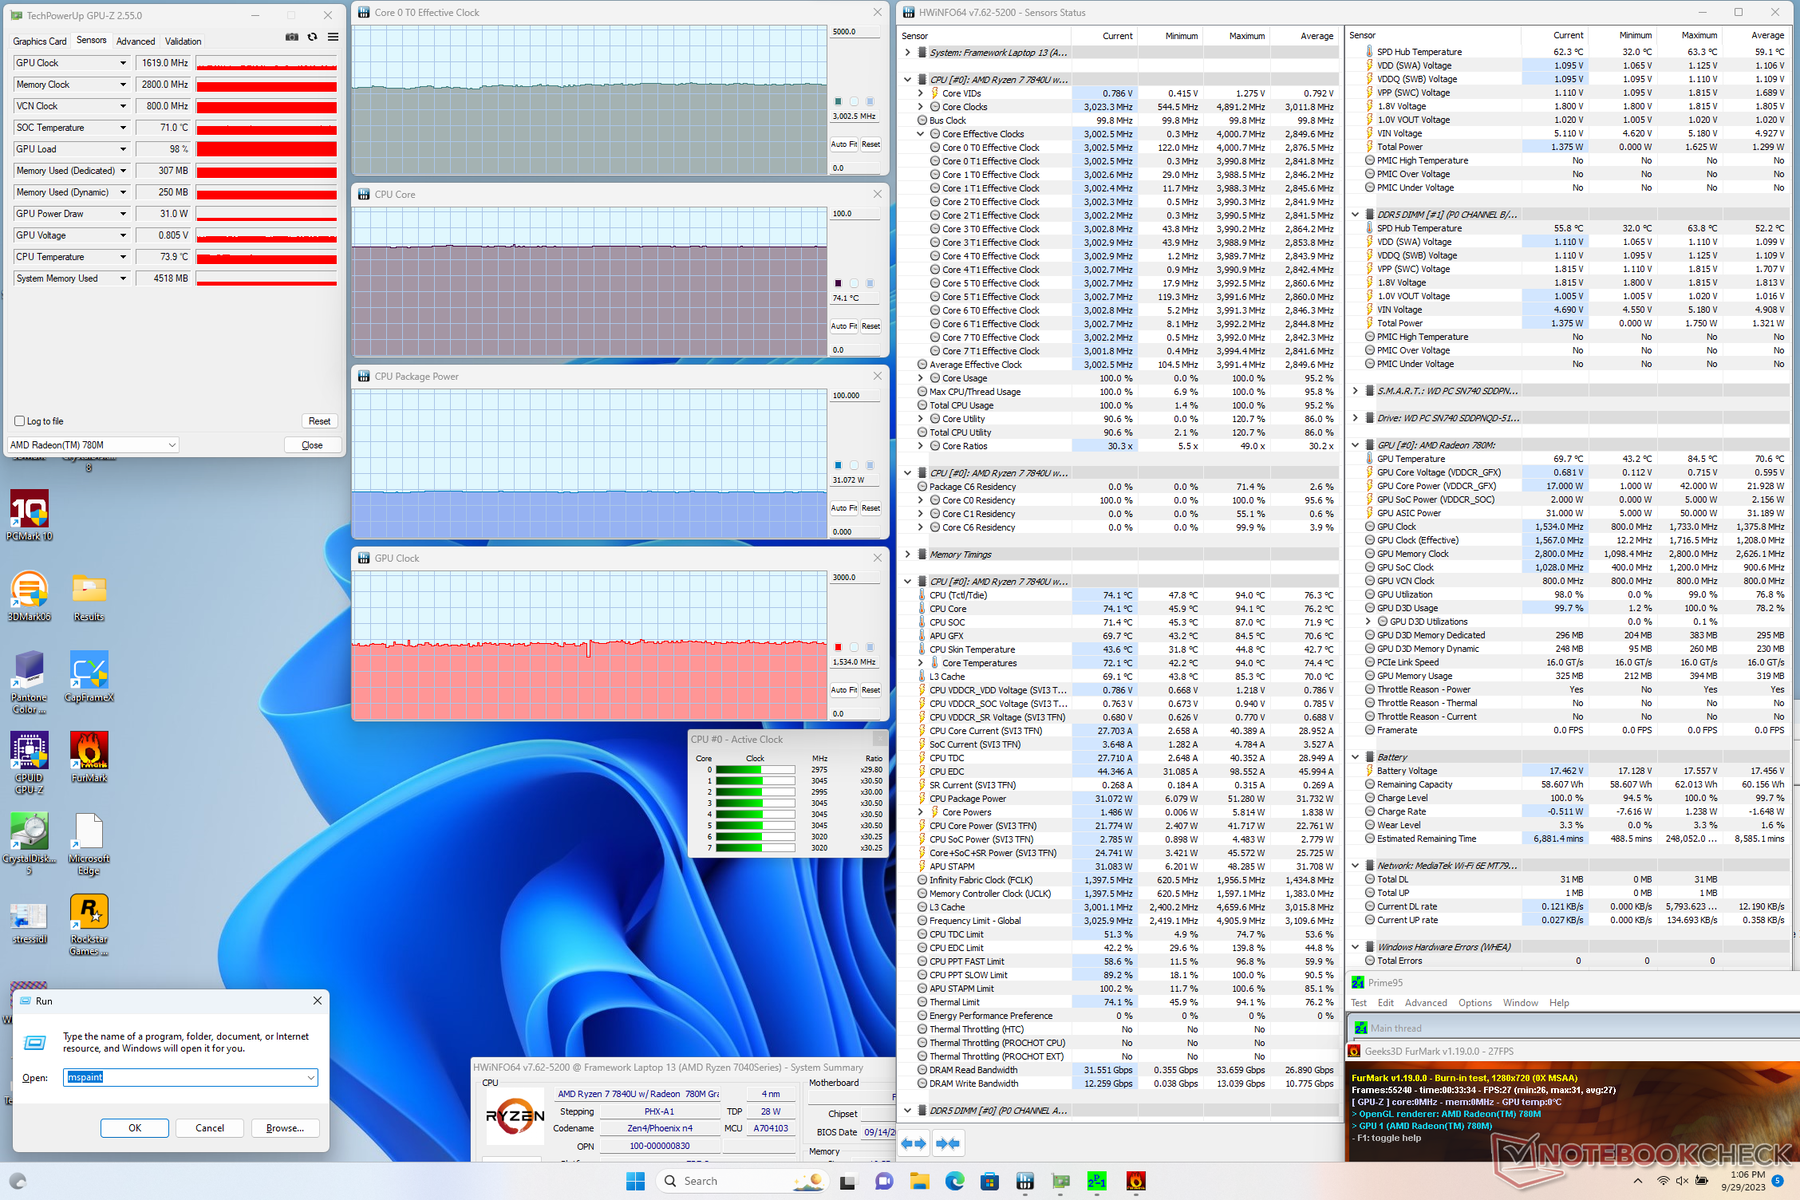
| CPU 时钟 (GHz) | GPU 时钟 (MHz) | CPU 平均温度 (°C) | |
| 系统闲置 | -- | -- | 46 |
| Prime95 压力 | 3.2 | -- | 85 |
| Prime95 + FurMark Stress | 3.0 | 1534 | 74 |
| Witcher 3 压力 | ~0.3 | 2176 | 71 |
发言人
Framework Laptop 13.5 Ryzen 7 7840U audio analysis
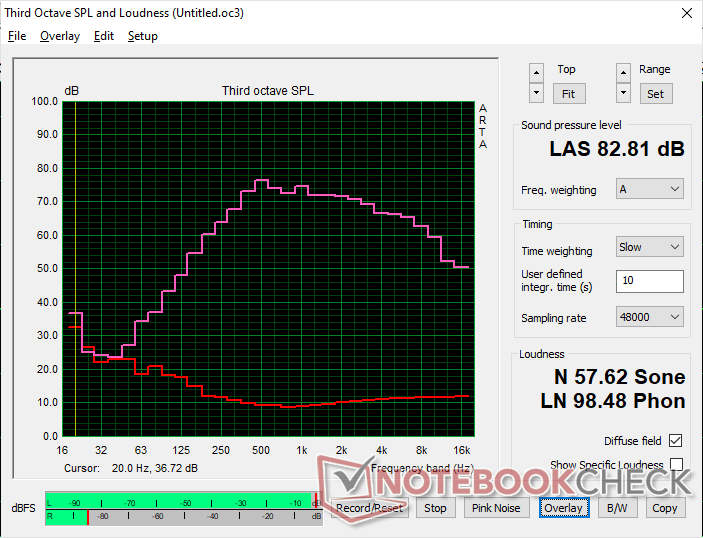
(+) | speakers can play relatively loud (82.8 dB)
Bass 100 - 315 Hz
(±) | reduced bass - on average 10.7% lower than median
(±) | linearity of bass is average (9.2% delta to prev. frequency)
Mids 400 - 2000 Hz
(±) | higher mids - on average 6.7% higher than median
(+) | mids are linear (3.9% delta to prev. frequency)
Highs 2 - 16 kHz
(+) | balanced highs - only 2.8% away from median
(+) | highs are linear (3.2% delta to prev. frequency)
Overall 100 - 16.000 Hz
(+) | overall sound is linear (13.9% difference to median)
Compared to same class
» 9% of all tested devices in this class were better, 4% similar, 87% worse
» The best had a delta of 7%, average was 21%, worst was 53%
Compared to all devices tested
» 16% of all tested devices were better, 4% similar, 80% worse
» The best had a delta of 4%, average was 23%, worst was 134%
Apple MacBook Pro 16 2021 M1 Pro audio analysis
(+) | speakers can play relatively loud (84.7 dB)
Bass 100 - 315 Hz
(+) | good bass - only 3.8% away from median
(+) | bass is linear (5.2% delta to prev. frequency)
Mids 400 - 2000 Hz
(+) | balanced mids - only 1.3% away from median
(+) | mids are linear (2.1% delta to prev. frequency)
Highs 2 - 16 kHz
(+) | balanced highs - only 1.9% away from median
(+) | highs are linear (2.7% delta to prev. frequency)
Overall 100 - 16.000 Hz
(+) | overall sound is linear (4.6% difference to median)
Compared to same class
» 0% of all tested devices in this class were better, 0% similar, 100% worse
» The best had a delta of 5%, average was 17%, worst was 45%
Compared to all devices tested
» 0% of all tested devices were better, 0% similar, 100% worse
» The best had a delta of 4%, average was 23%, worst was 134%
能源管理
耗电量
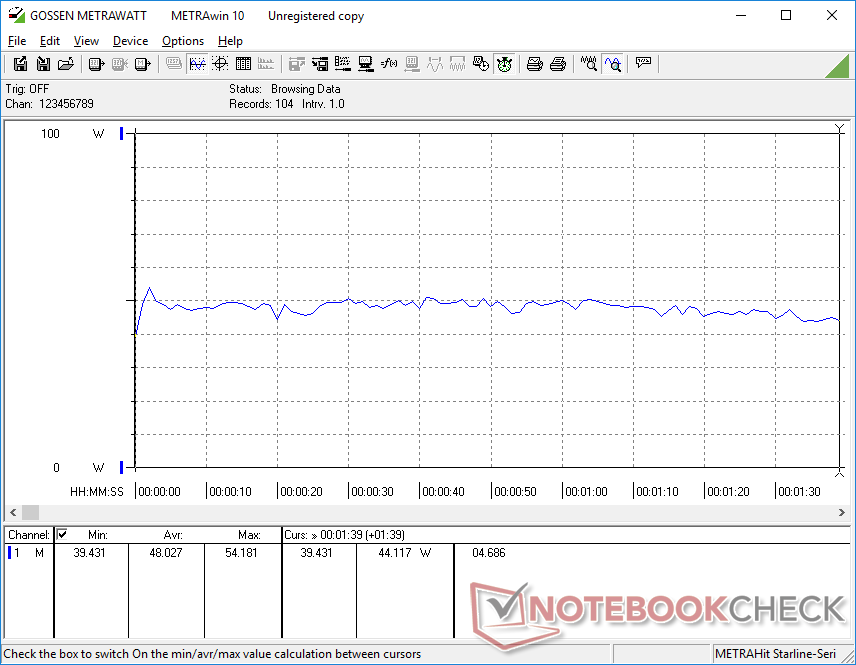
功耗始终低于我们在酷睿 i7-1370P 配置上记录的所有功耗。此外,Ryzen 7 7840U 在大多数应用中的性能都优于英特尔 CPU。在台式机上空转只需要 4 到 7 瓦,而英特尔版本则需要 3 到 10 瓦。
运行Witcher 3 来表示典型的游戏负载,其功耗比酷睿 i7-1370P 配置低约 8%,而原始图形性能却提高了 30% 至 50%。因此,Radeon 780M 不仅比 Iris Xe 96 EU 更快,而且功耗更低,每瓦性能更高。
小型(约 5.8 x 5.8 x 2.6 厘米)60 W GaN USB-C AC 充电器在所有配置中都是一样的,与 CPU 选项无关。


| Off / Standby | |
| Idle | |
| Load |
|
Key:
min: | |
| Framework Laptop 13.5 Ryzen 7 7840U R7 7840U, Radeon 780M, WD PC SN740 512GB SDDPNQD-512G, IPS, 2256x1504, 13.5" | Framework Laptop 13.5 13th Gen Intel i7-1370P, Iris Xe G7 96EUs, WD PC SN740 SDDPNQD-1T00, IPS, 2256x1504, 13.5" | Framework Laptop 13.5 12th Gen Intel i7-1260P, Iris Xe G7 96EUs, WDC PC SN730 SDBPNTY-512G, IPS, 2256x1504, 13.5" | Framework Laptop 13.5 i7-1165G7, Iris Xe G7 96EUs, Western Digital WD_BLACK SN850 WDS100T1X0E, IPS, 2256x1504, 13.5" | Lenovo ThinkPad X1 Nano Gen 3 i7-1360P, Iris Xe G7 96EUs, Lenovo UMIS AM6A0 RPJTJ512MKP1QDQ, IPS, 2160x1350, 13" | HP Dragonfly G4 i7-1365U, Iris Xe G7 96EUs, Micron 3400 MTFDKBA512TFH 512GB, IPS, 1920x1280, 13.5" | |
|---|---|---|---|---|---|---|
| Power Consumption | -9% | -25% | -8% | 9% | -1% | |
| Idle Minimum * (Watt) | 4 | 2.9 27% | 5.3 -33% | 4.3 -8% | 3.3 17% | 4.1 -2% |
| Idle Average * (Watt) | 6.5 | 6.3 3% | 8.4 -29% | 8.2 -26% | 6.5 -0% | 7.5 -15% |
| Idle Maximum * (Watt) | 6.8 | 9.9 -46% | 11.2 -65% | 8.7 -28% | 7.1 -4% | 8.2 -21% |
| Load Average * (Watt) | 48 | 56.2 -17% | 57.4 -20% | 43.5 9% | 40.7 15% | 35.5 26% |
| Witcher 3 ultra * (Watt) | 52.3 | 56.6 -8% | 46.7 11% | 43.5 17% | 37 29% | 37.5 28% |
| Load Maximum * (Watt) | 55.2 | 60.8 -10% | 61.2 -11% | 61.8 -12% | 58.6 -6% | 66.5 -20% |
* ... smaller is better
Power Consumption Witcher 3 / Stresstest
Power Consumption external Monitor
电池寿命
由于上述较低的功耗水平,运行时间比基于英特尔的配置要长很多。当两者都设置为平衡模式和 150 nit 亮度时,我们在 AMD 机型上浏览网页的时间比酷睿 i7-1370P 机型长 3 个多小时。这并不是说使用英特尔配置时电池寿命很差,但 AMD 在这方面具有明显的优势。
请注意,基本 Ryzen 5 配置仅配备 55 Wh 电池,而我们的 Ryzen 7 7840U 配置则配备 61 Wh 电池。
| Framework Laptop 13.5 Ryzen 7 7840U R7 7840U, Radeon 780M, 61 Wh | Framework Laptop 13.5 13th Gen Intel i7-1370P, Iris Xe G7 96EUs, 61 Wh | Framework Laptop 13.5 12th Gen Intel i7-1260P, Iris Xe G7 96EUs, 55 Wh | Framework Laptop 13.5 i7-1165G7, Iris Xe G7 96EUs, 55 Wh | Lenovo ThinkPad X1 Nano Gen 3 i7-1360P, Iris Xe G7 96EUs, 49.5 Wh | HP Dragonfly G4 i7-1365U, Iris Xe G7 96EUs, 68 Wh | |
|---|---|---|---|---|---|---|
| Battery runtime | -27% | -38% | -34% | -36% | 31% | |
| WiFi v1.3 (h) | 12.1 | 8.8 -27% | 7.5 -38% | 8 -34% | 7.8 -36% | 15.9 31% |
| Reader / Idle (h) | 42.5 | |||||
| Load (h) | 3.2 |
Pros
Cons
结论 - 图形性能比英特尔快两倍
如果你看重多线程性能和图形处理能力,那么 AMD 配置无疑是优于英特尔的选择。Ryzen 7 7840U 和 Radeon 780M 比任何第 13 代英特尔酷睿-U 或酷睿-P 处理器都要快,尤其是在每瓦性能和电池续航时间方面。Ryzen 7 和酷睿 i7 配置的价格差不多,都是 1500 美元,这只会让 AMD 版本更有吸引力。
除非你绝对需要 Ryzen PRO 或英特尔 vPro,否则基于 AMD 的 Framework Laptop 13.5 会比英特尔更快、更容易推荐,尤其是因为它们的价格差不多。
目前,选择英特尔仍有几个理由。首先,Framework 尚未推出 Zen 4 Ryzen PRO CPU,因此英特尔 vPro 是唯一的选择。其次,在单线程性能方面,Core-P 系列仍略胜 AMD 一筹。最后,在功能和兼容性方面,英特尔型号的 USB-C 端口是统一的。在这三个不同点中,第一个可以说是最有价值的,尤其是对于需要额外的硬件安全层的企业或用户来说。除此之外,在价格相同的情况下,更长的电池续航时间和两倍的图形处理性能也是很难让人拒绝的。
价格和供应情况
该制造商目前正在出货其 AMD 版 Framework Laptop 13.5 的基本 Ryzen 5 配置起价为 1050 美元,如果完全配置 Ryzen 7 7840U 则售价超过 1600 美元。
Framework Laptop 13.5 Ryzen 7 7840U
- 10/02/2023 v7 (old)
Allen Ngo
Transparency
The selection of devices to be reviewed is made by our editorial team. The test sample was provided to the author as a loan by the manufacturer or retailer for the purpose of this review. The lender had no influence on this review, nor did the manufacturer receive a copy of this review before publication. There was no obligation to publish this review. As an independent media company, Notebookcheck is not subjected to the authority of manufacturers, retailers or publishers.
This is how Notebookcheck is testing
Every year, Notebookcheck independently reviews hundreds of laptops and smartphones using standardized procedures to ensure that all results are comparable. We have continuously developed our test methods for around 20 years and set industry standards in the process. In our test labs, high-quality measuring equipment is utilized by experienced technicians and editors. These tests involve a multi-stage validation process. Our complex rating system is based on hundreds of well-founded measurements and benchmarks, which maintains objectivity. Further information on our test methods can be found here.
Price comparison

