华硕ROG Ally Z1 Extreme评测--拥有120赫兹显示屏和AMD Zen4的游戏掌机
当华硕在4月1日预告新的ROG Ally游戏掌机时,这似乎是一个愚人节玩笑,但该制造商真的进入了这个领域。去年Valve通过Steam Deck复兴了这一设备领域,现在似乎所有其他大厂商也想分一杯羹。
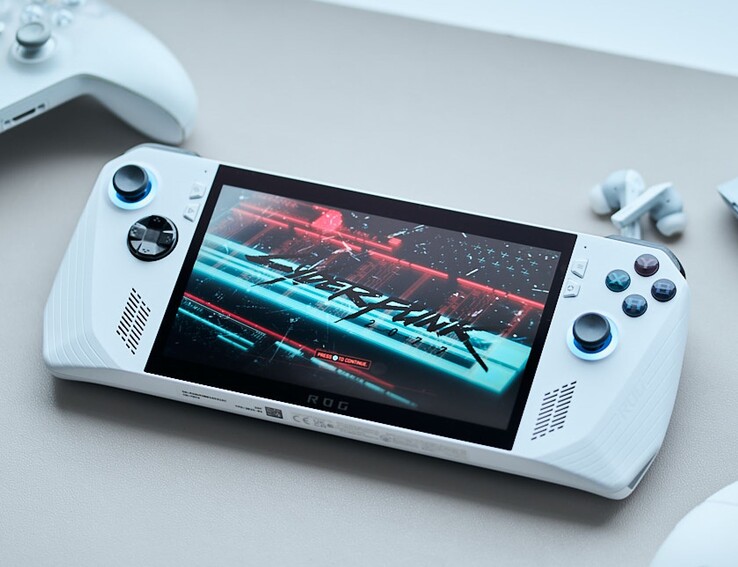
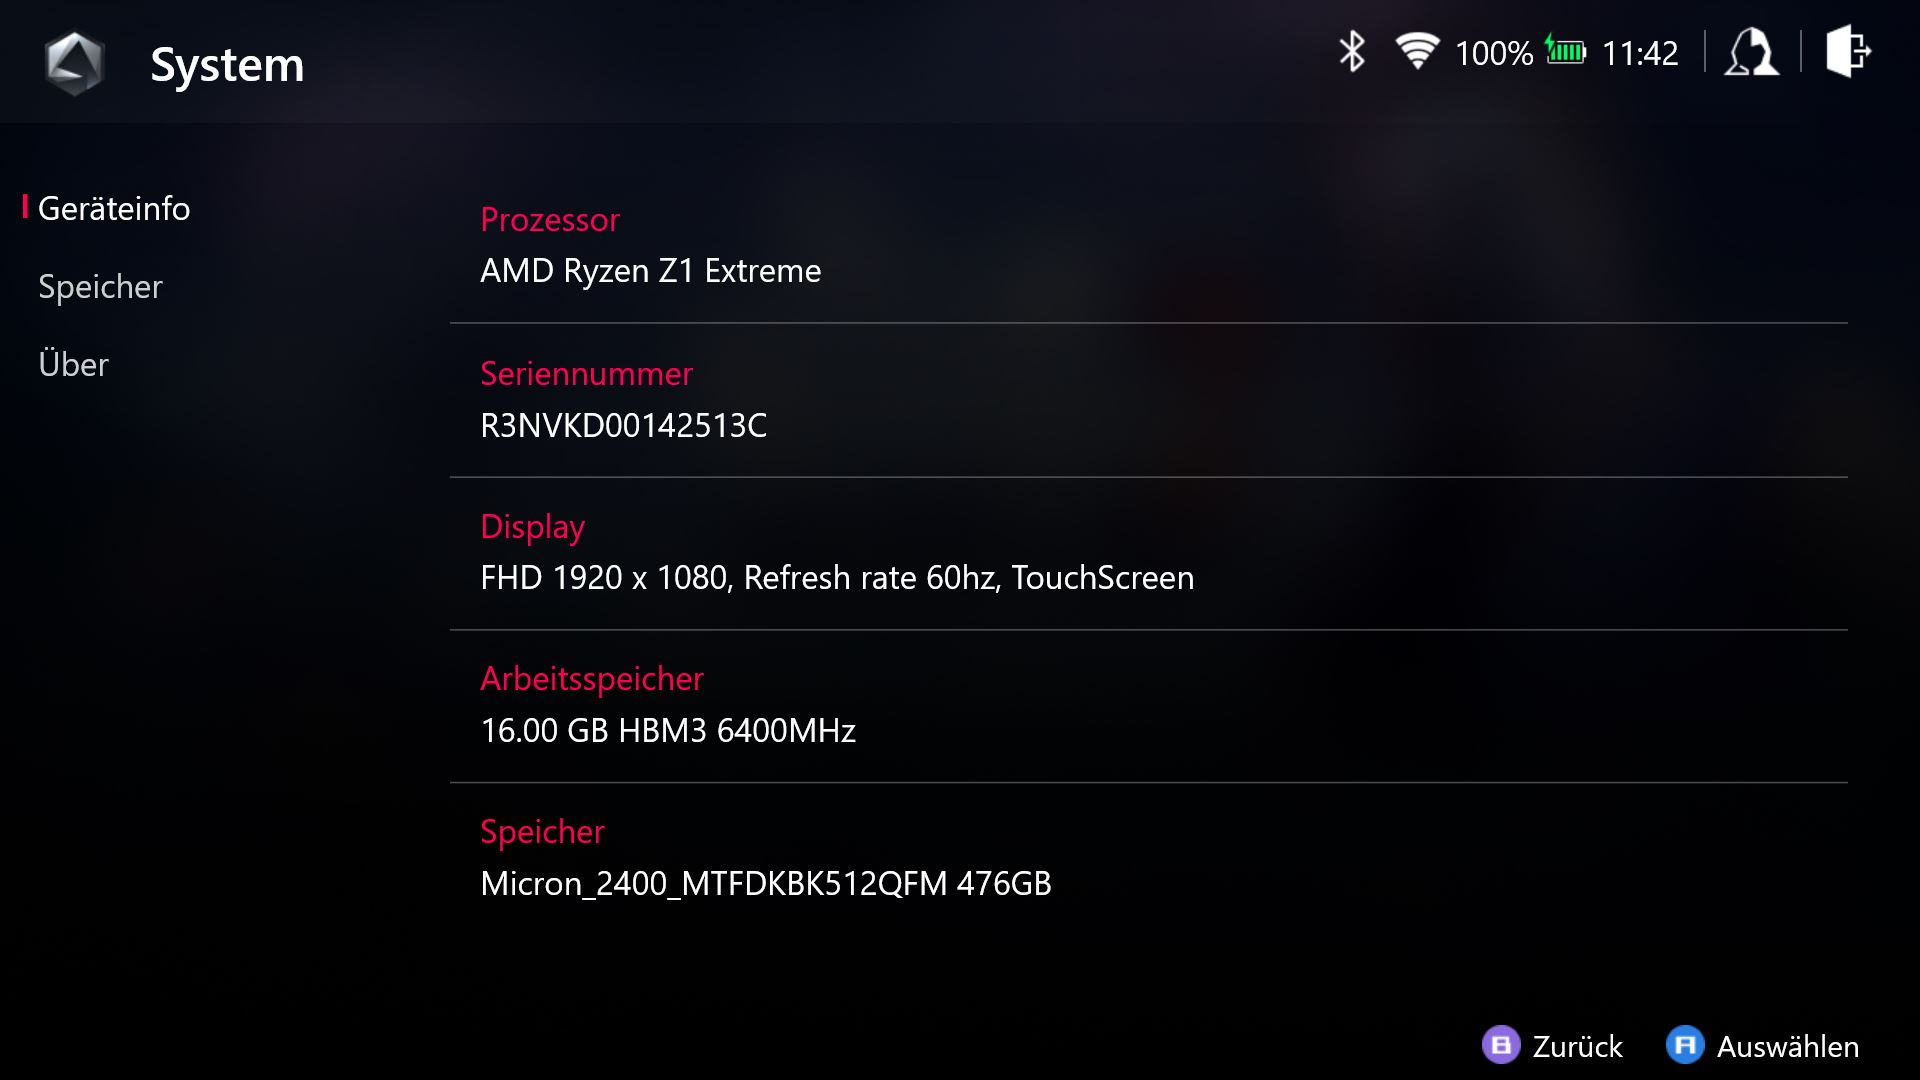
华硕在ROG Ally上使用了最新和最伟大的AMD Ryzen移动处理器。它们分别被称为Z1和Z1 Extreme,而Z1 Extreme在我们的审查单元中几乎是新的Ryzen 7 7840U(AMD Phoenix,4纳米,Zen4),但稍后会有更多关于这一点。这意味着与Steam Deck相比,应该有相当大的性能优势。否则,ROG Ally配备了16GB内存,512GB NVM-SSD存储(可更换)和7英寸1080p IPS屏幕,120赫兹,500尼特亮度。Ally Z1 Extreme的德国零售价为799欧元,功能较弱的Ally Z1为699欧元。
| ROG Ally Z1 Extreme | ROG Ally Z1 | |
|---|---|---|
| CPU | AMD Ryzen Z1 Extreme 8个Zen4核心(4纳米) 高达5.1 GHz |
AMD Ryzen Z1 6个Zen4核心(4纳米) 高达4.9 GHz |
| GPU | AMD Radeon Graphics RDNA 3 & 4 GB RAM/8.6 TFlops 12 CUs / up to 2.7 GHz |
AMD Radeon Graphics RDNA 3 & 4 GB RAM/2.8 TFlops 4 CUs / up to 2.5 GHz |
| RAM | 16 GB LPDDR5-6400 (双通道) | 16 GB LPDDR5-6400 (双通道) |
| SSD | 512 GB NVMe PCIe 4.0 / M.2-2230 |
256 GB NVMe PCIe 4.0 / M.2-2230 |
| 显示器 | 7 Zoll IPS, 120 Hz, 500 nits FreeSync Premium, sRGB |
7 Zoll IPS, 120 Hz, 500 nits FreeSync Premium, sRGB |
| 价格 | 799欧元 | 699欧元 |
你甚至可以将XG Mobile外置显卡连接到ROG Ally手持设备上,因此你可以将Ally与GeForce RTX 4090 笔记本电脑在家。我们的XG Mobile样品没有及时到达,但我们将在几天后添加与4090的游戏基准测试。当你使用Turbo模式时,这个组合应该工作得很好,因为CPU性能与最近审查的ROG Zephyrus G14(稍后会有更多介绍)。
潜在的竞争对手比较
Rating | Date | Model | Weight | Height | Size | Resolution | Price |
|---|---|---|---|---|---|---|---|
| 87.5 % v7 (old) | 05 / 2023 | Asus ROG Ally Z1 Extreme Z1 Extreme, Radeon 780M | 611 g | 21.22 mm | 7.00" | 1920x1080 | |
v (old) | 09 / 2025 | Valve Steam Deck 512 GB LCD | 669 g | 49 mm | 7.00" | 1280x800 | |
| 80.3 % v7 (old) | 03 / 2023 | GPD Win 4 R7 6800U, Radeon 680M | 607 g | 28 mm | 6.00" | 1920x1080 | |
| 84.5 % v7 (old) | 07 / 2022 | GPD Win Max 2 i7-1260P, Iris Xe G7 96EUs | 1 kg | 23 mm | 10.10" | 2560x1600 |
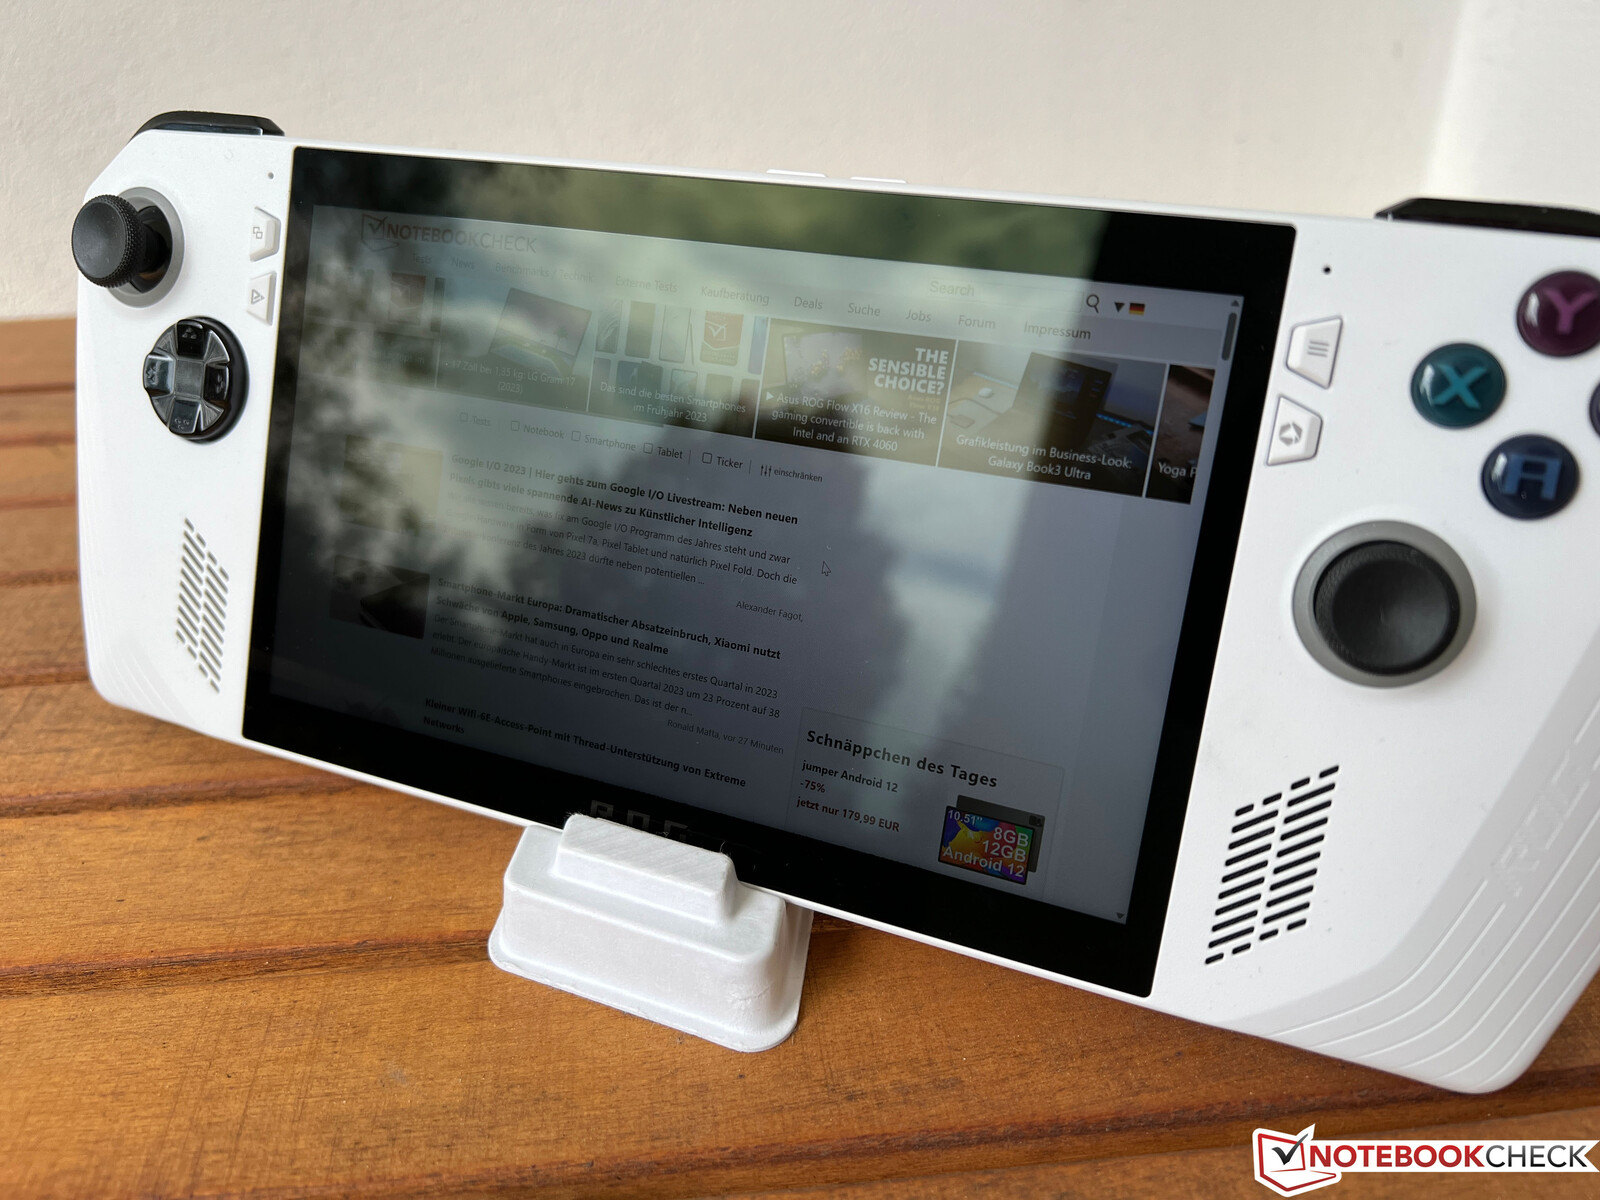
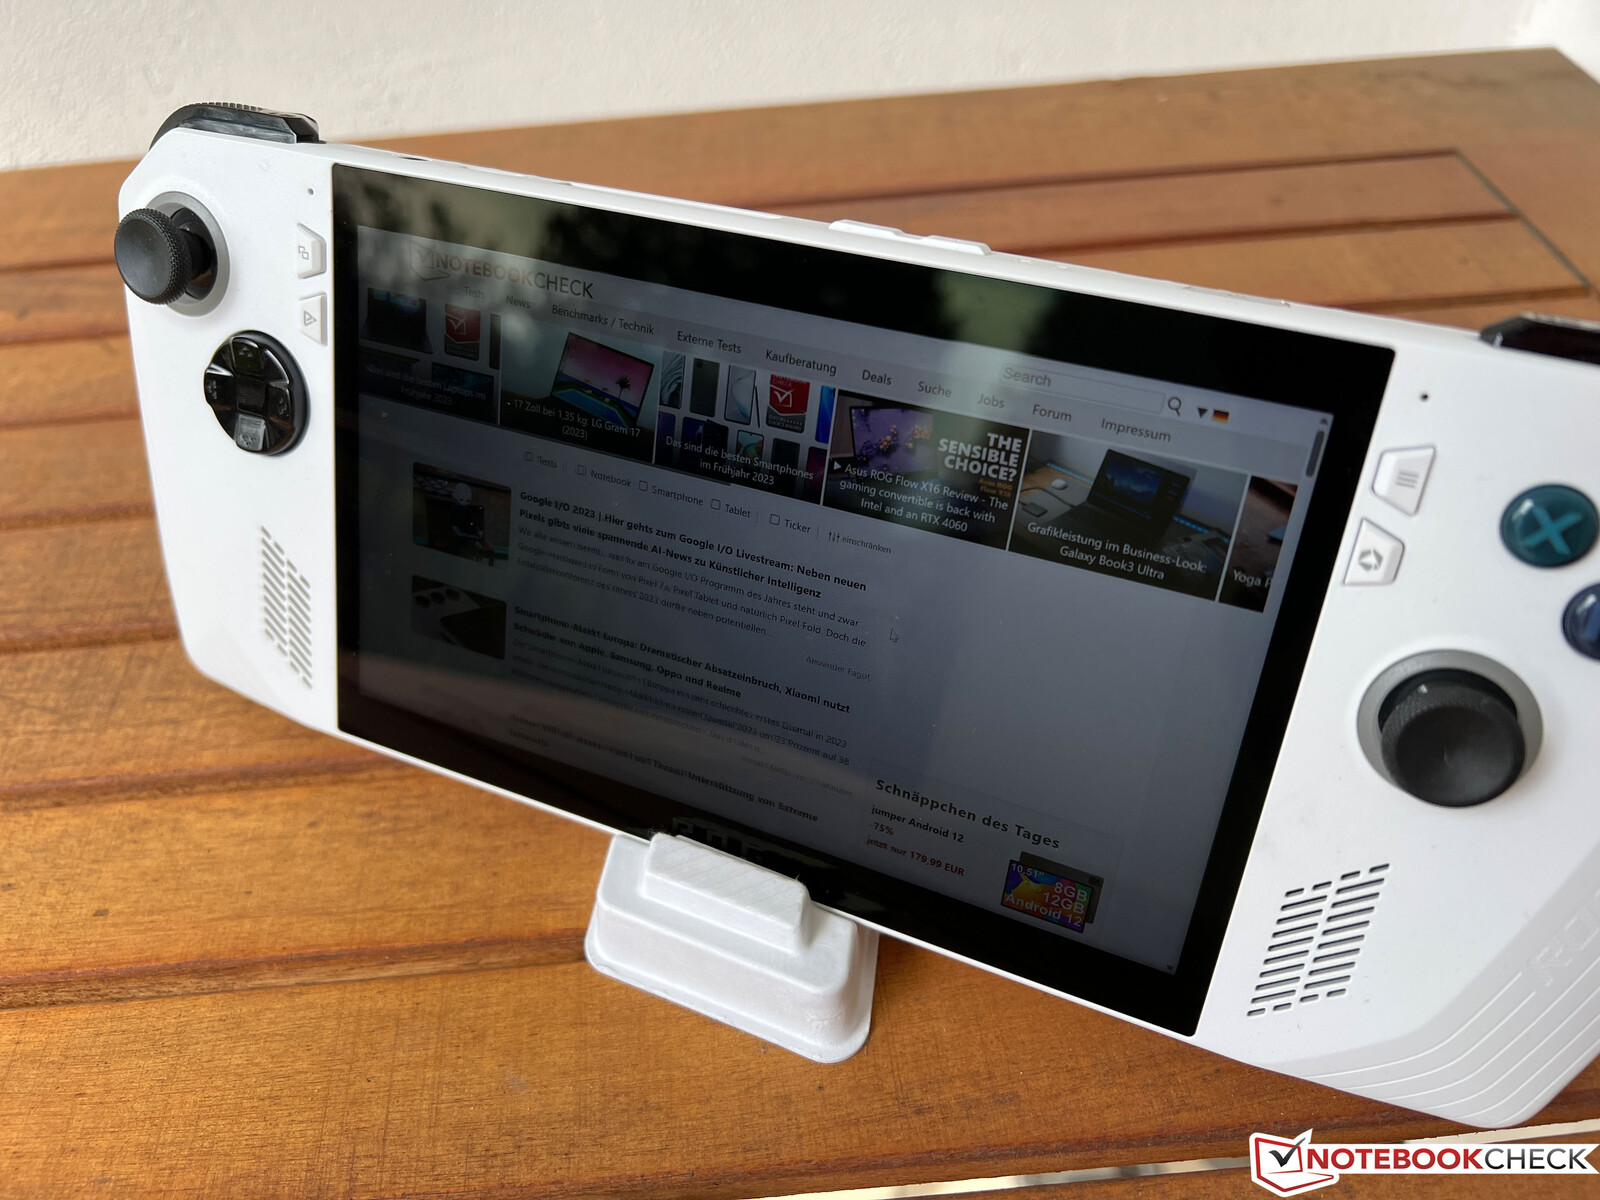
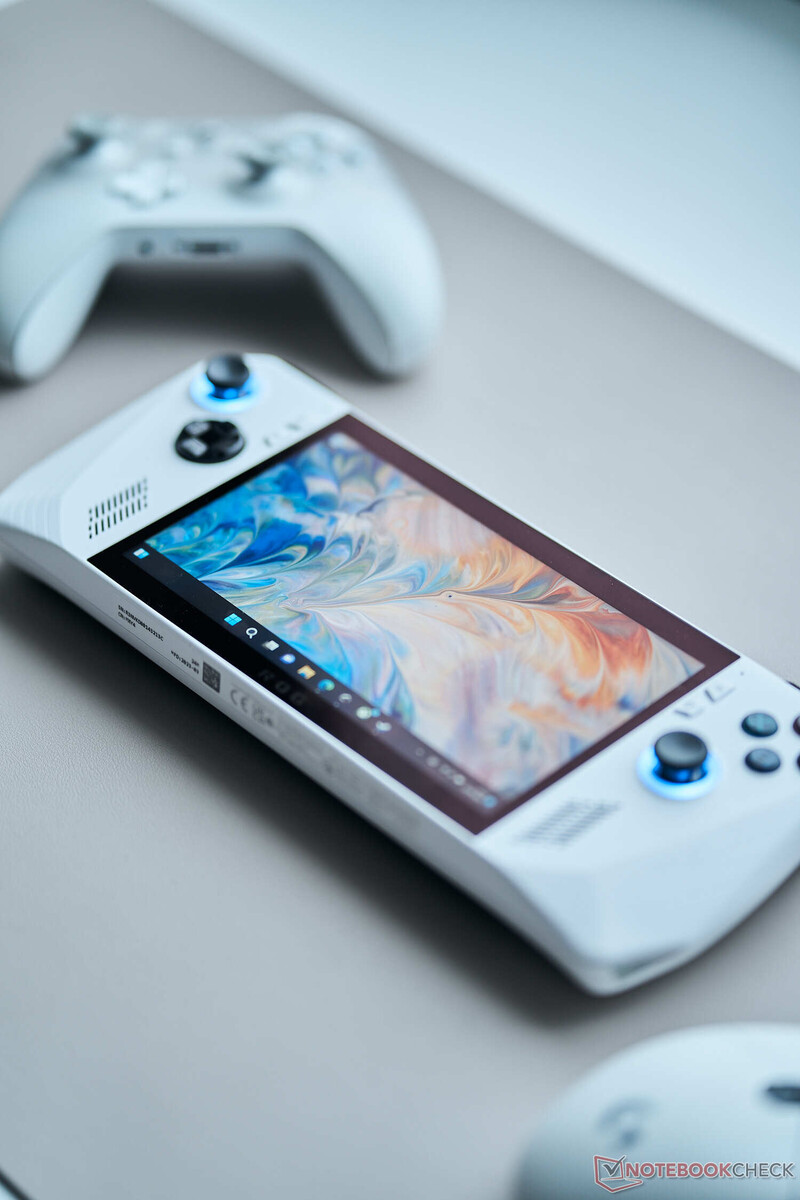
外壳 - 功能性塑料设计
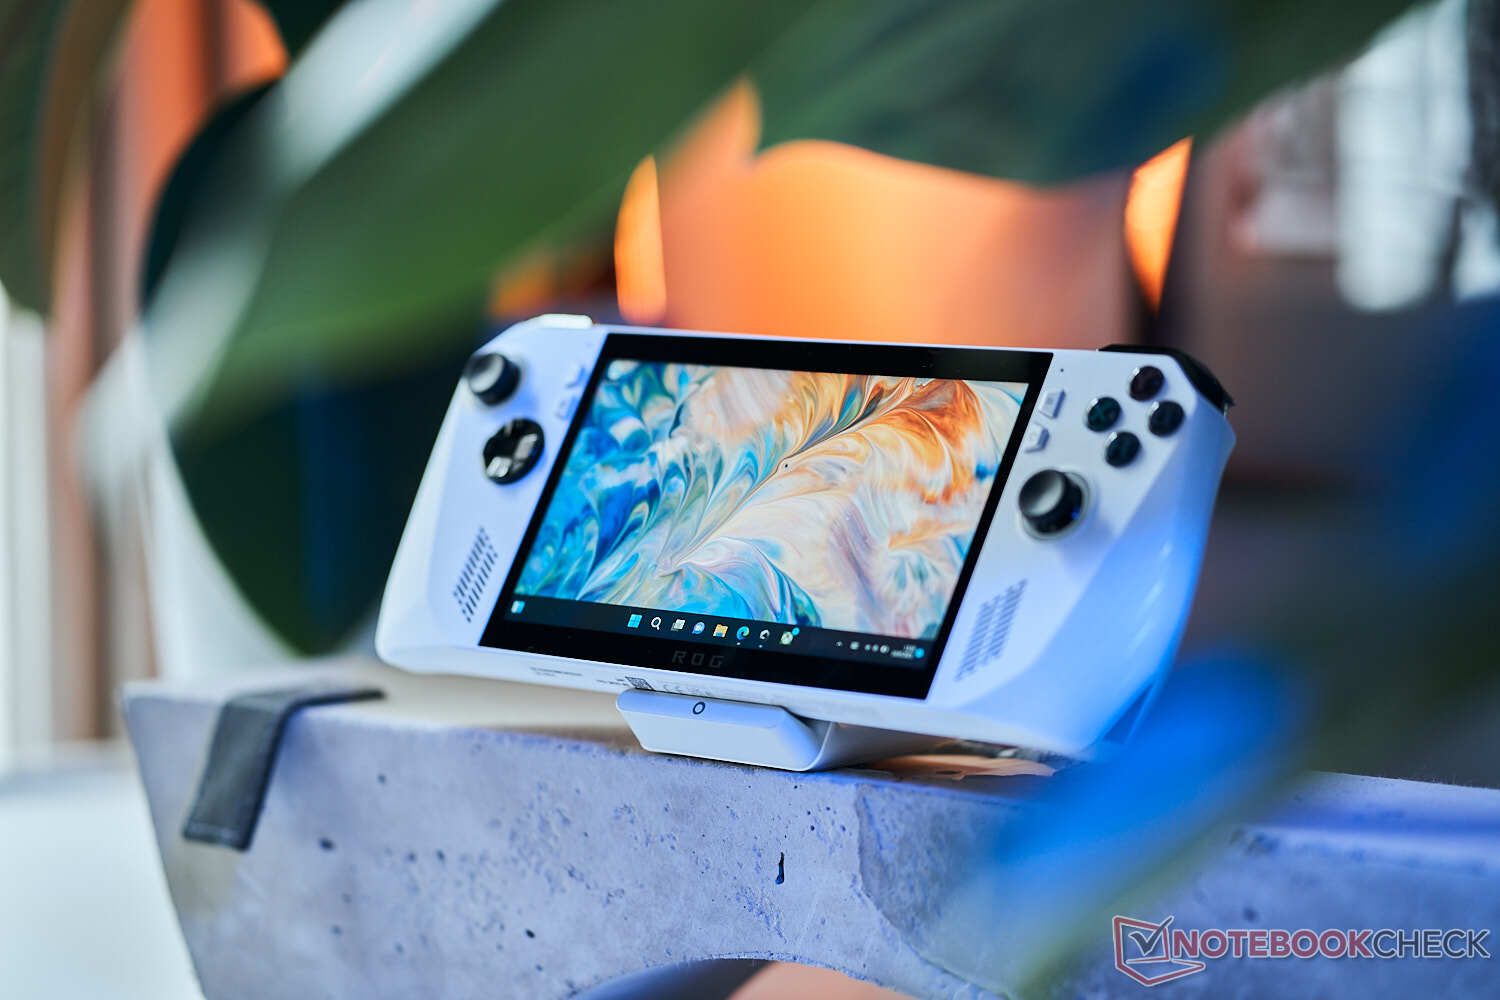
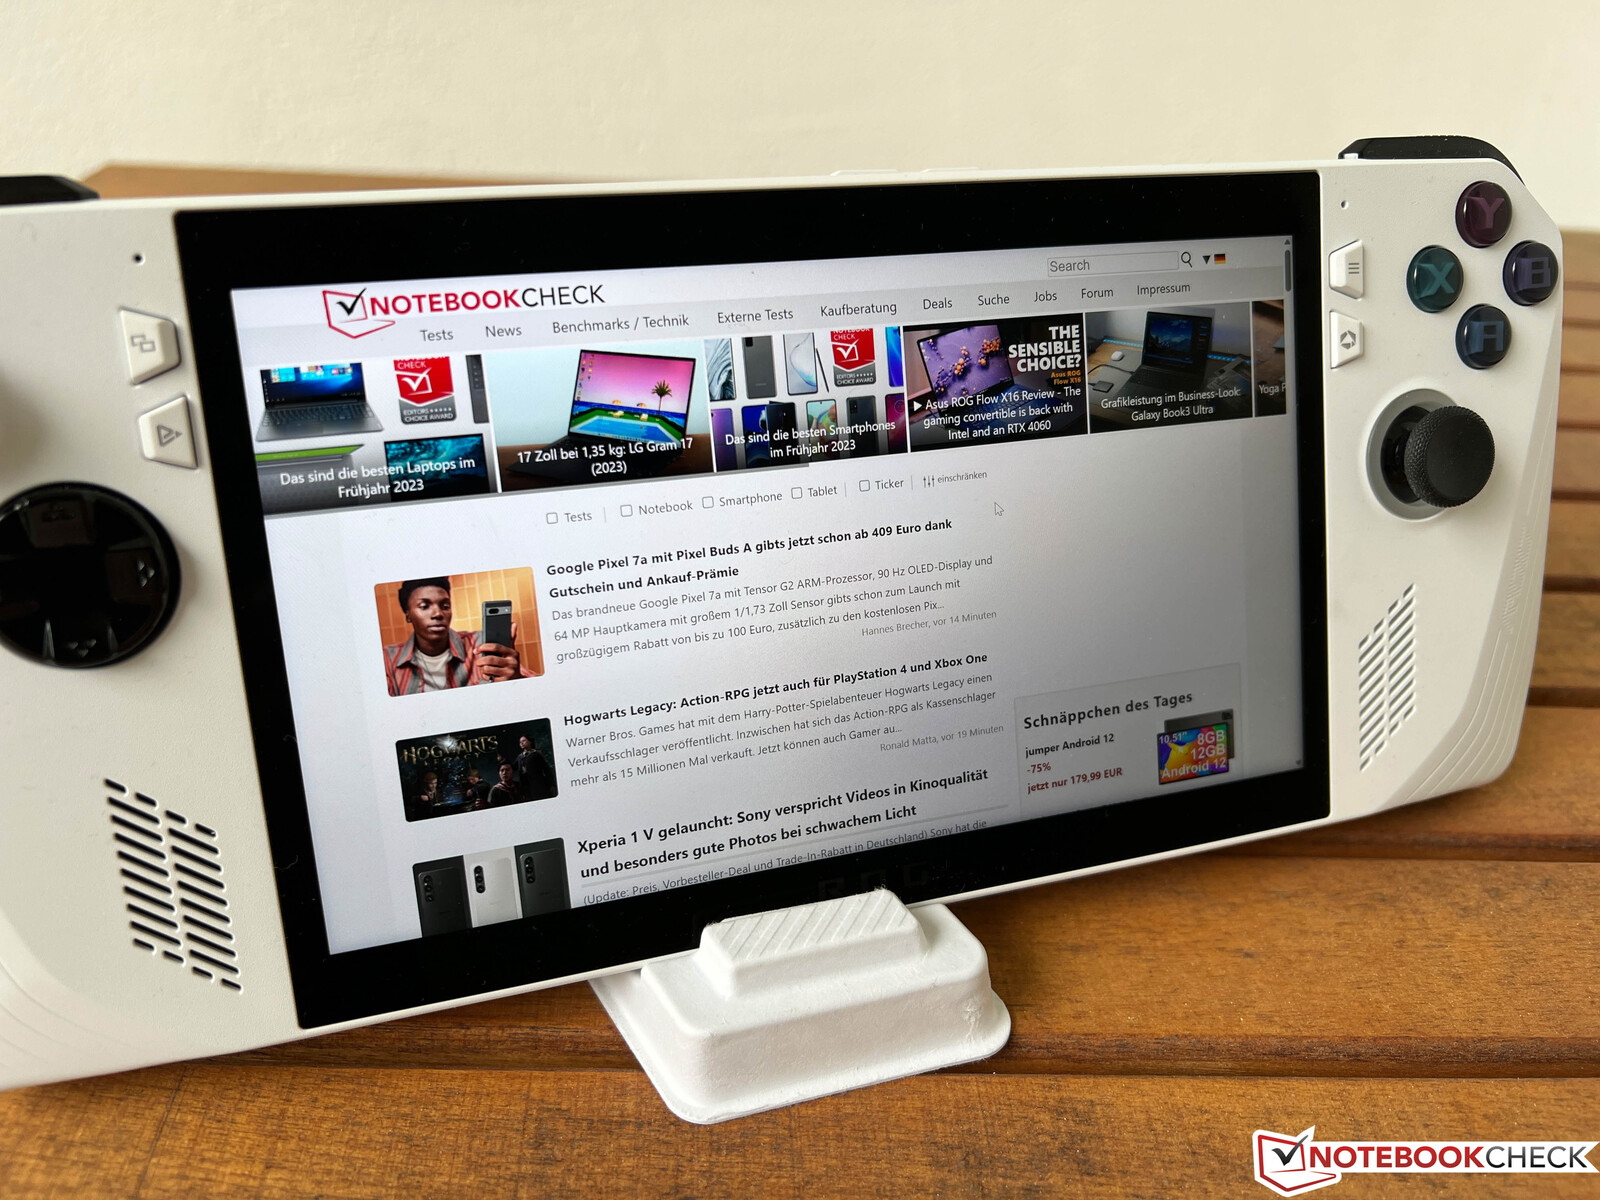
ROG Ally使用白色塑料底盘,有不同的设计元素。握把处的表面有纹理,以便更好地抓握(前面是条纹,后面是三角形图案)。这样做效果很好,Ally握起来非常舒服。与Steam Deck相比,Ally更紧凑,更密集,因为重量相当。然而,Steam Deck的手柄更厚,这对人体工程学更有利。两台设备的机箱质量相当。
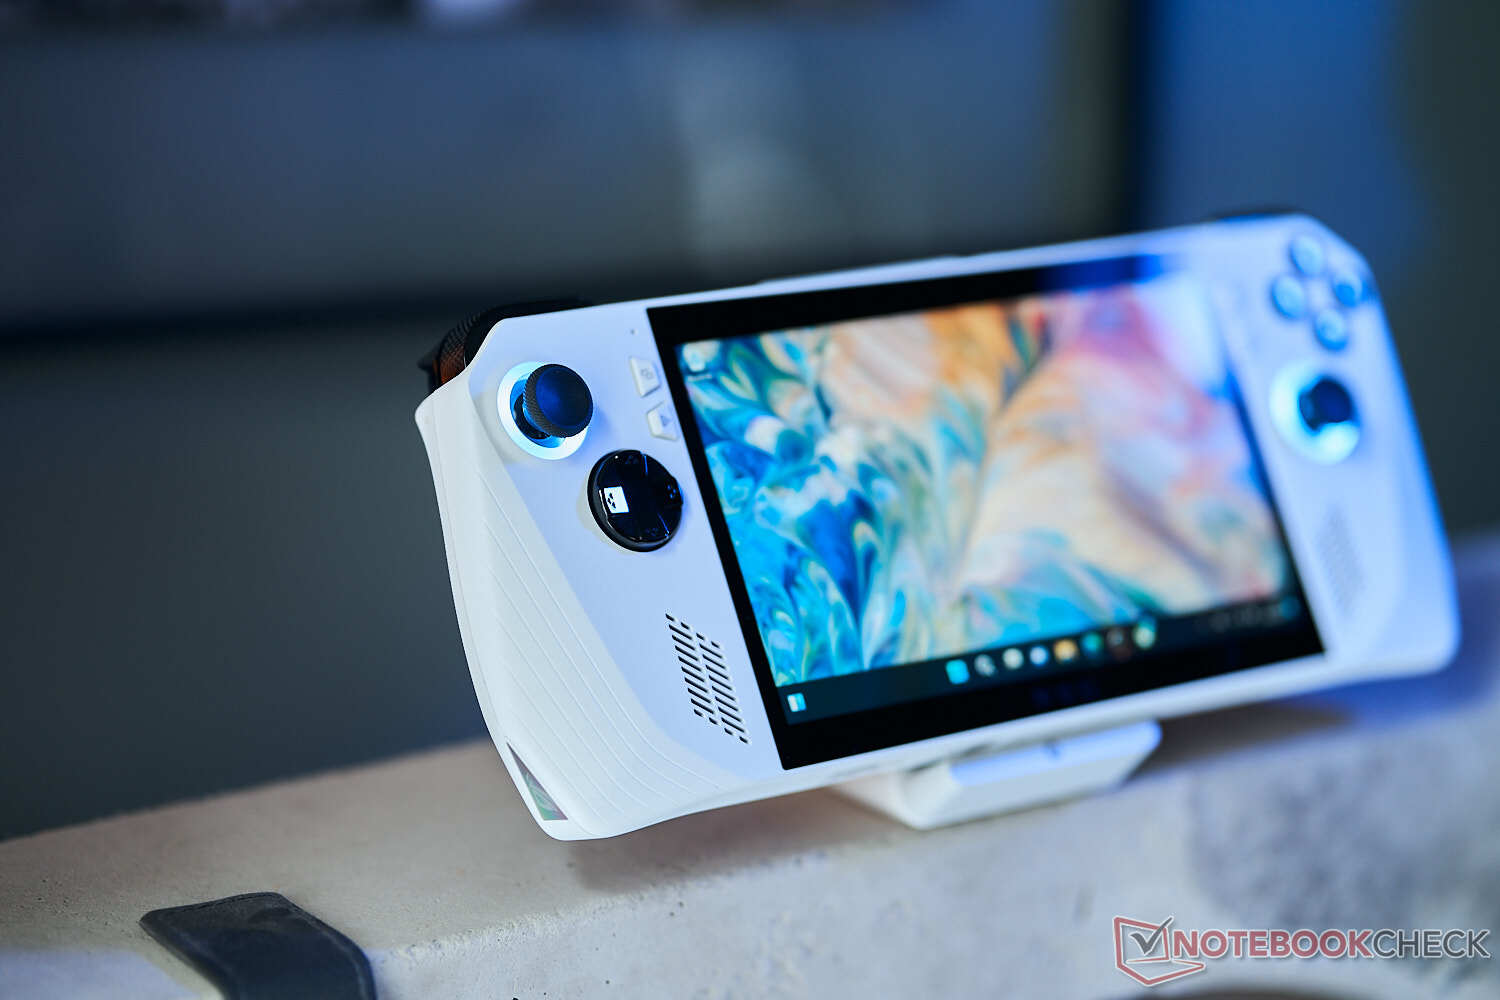
ROG Ally的建造质量非常好,你无法扭曲或凹陷机箱。在我们的评测单元上,我们也没能激起吱吱嘎嘎的声音。没有内置脚架,这可能是一个问题。有一个白色的小支架(由纸板制成),包括ROG字样,它是功能性的,看起来很好。
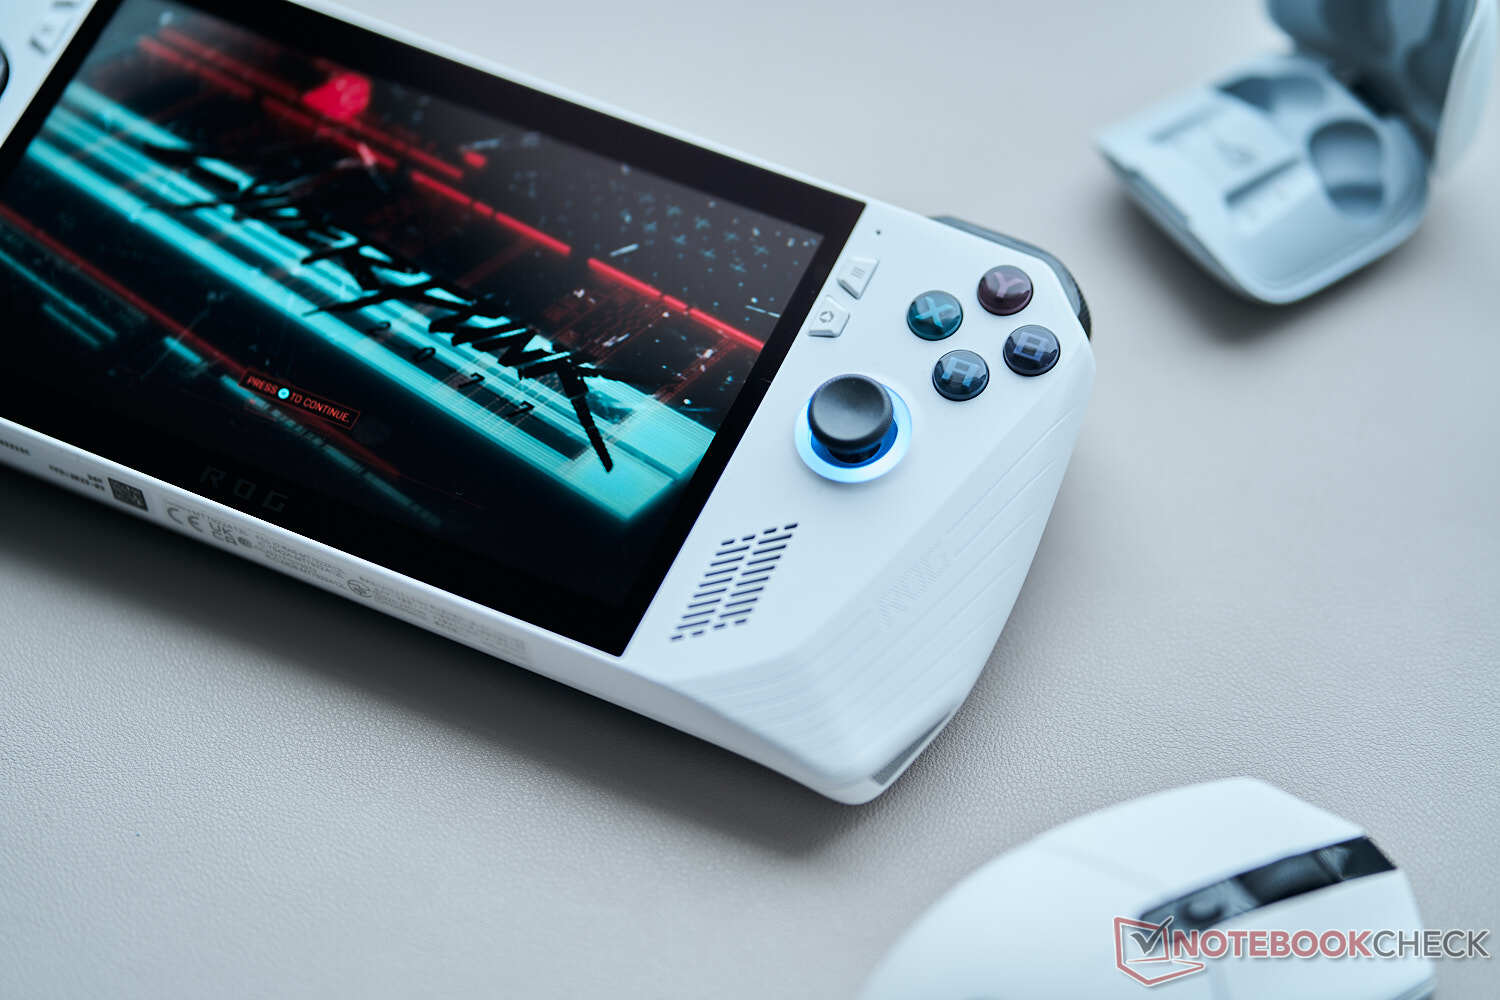
我们喜欢整体设计,黑色的按钮以及黑色的边框形成了一个很好的对比。Aura Sync技术的粉丝们会对拇指杆周围的照明圆圈感到高兴。
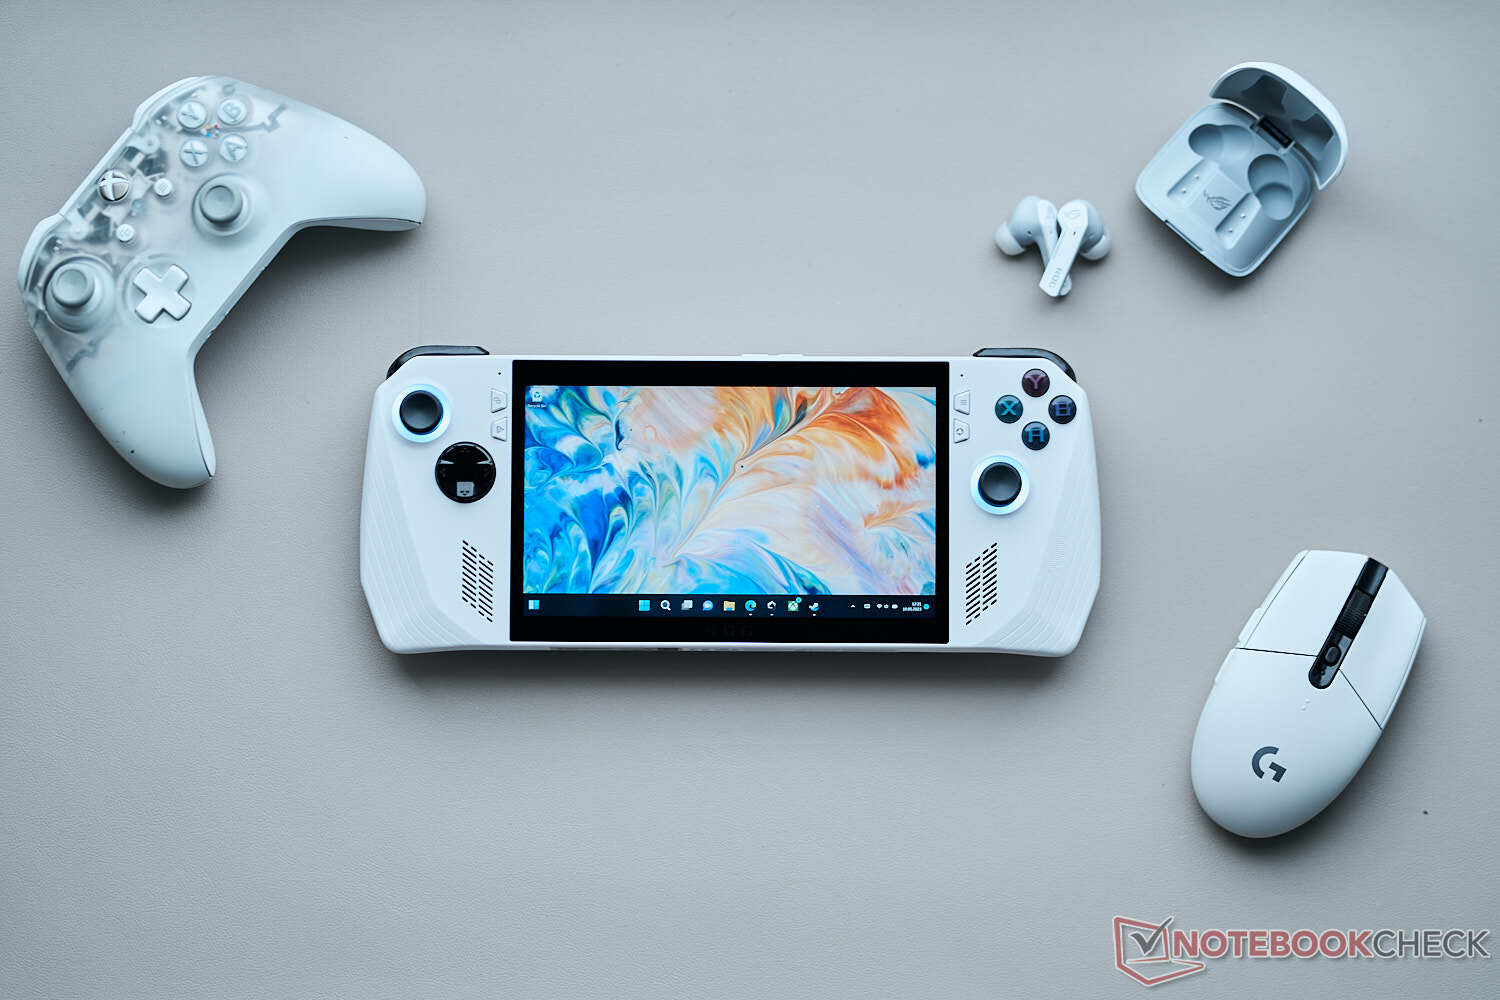
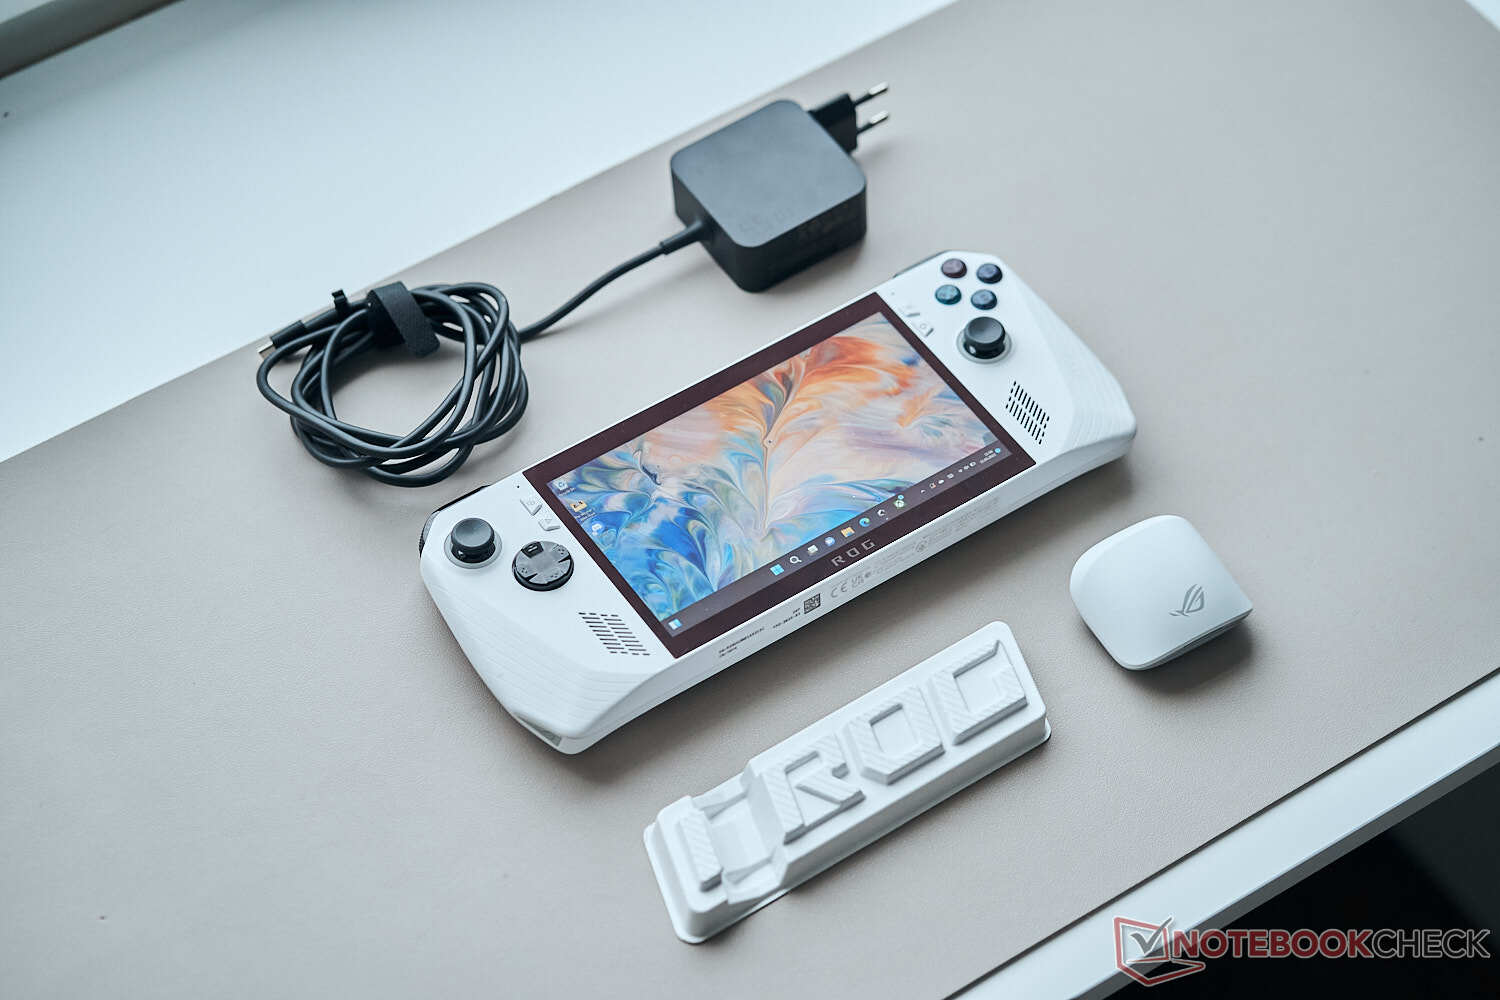
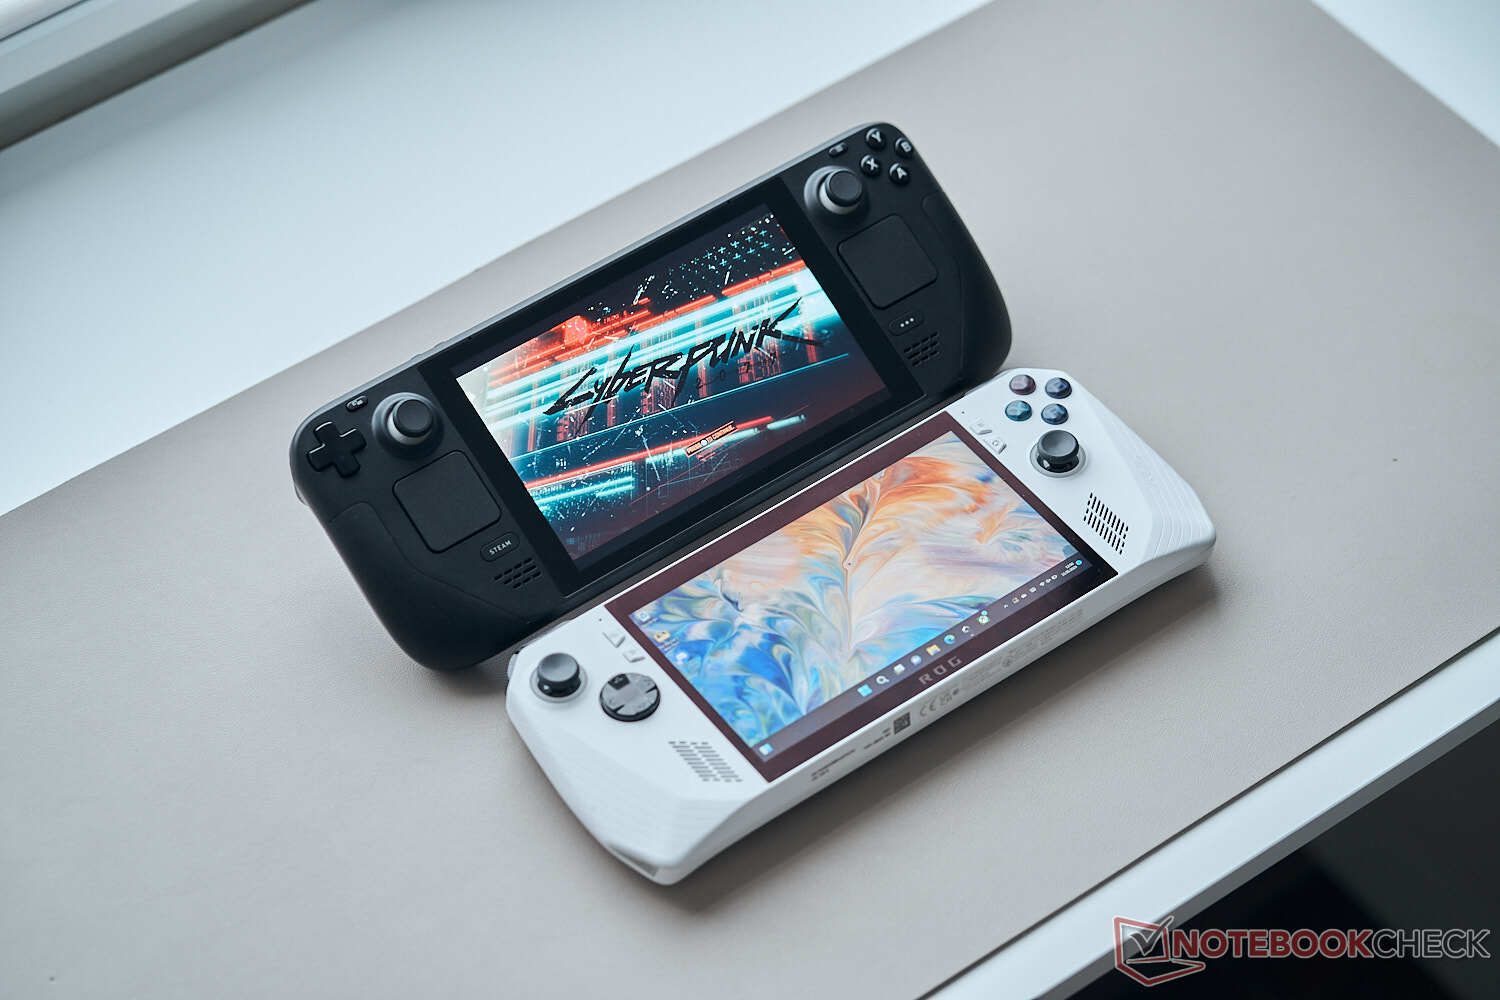
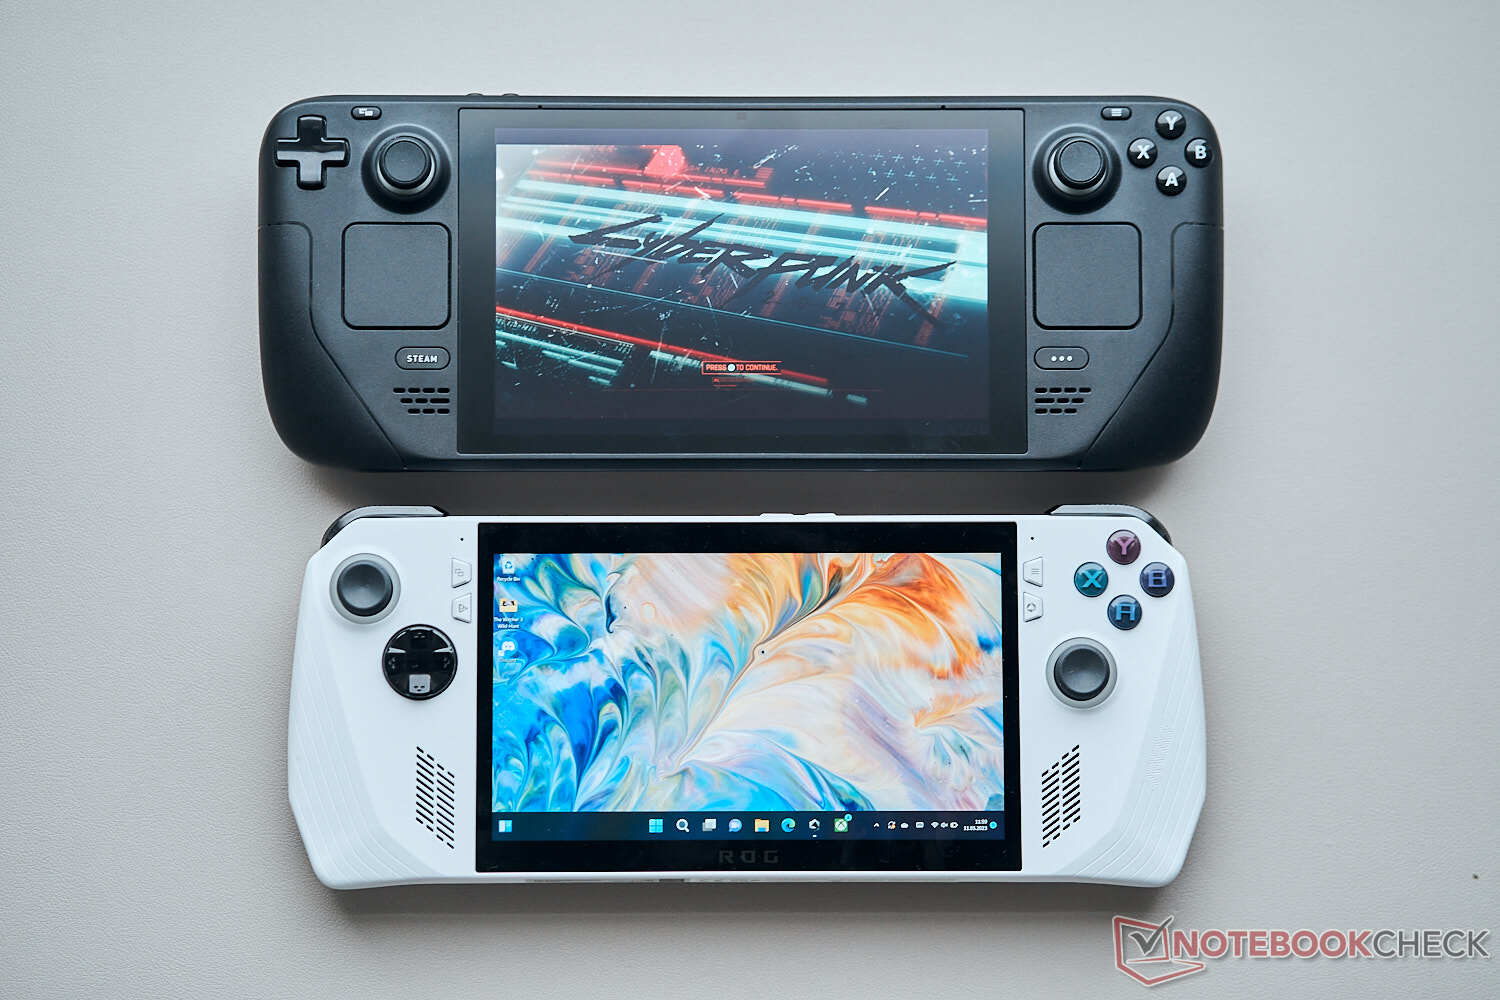

与Steam Deck相比,ROG Ally明显更加紧凑,尽管两者的重量基本相同,略高于600克。另一方面,GPD Win 4的6英寸屏幕甚至更小。华硕为ROG Ally配备了一个65W的电源适配器。
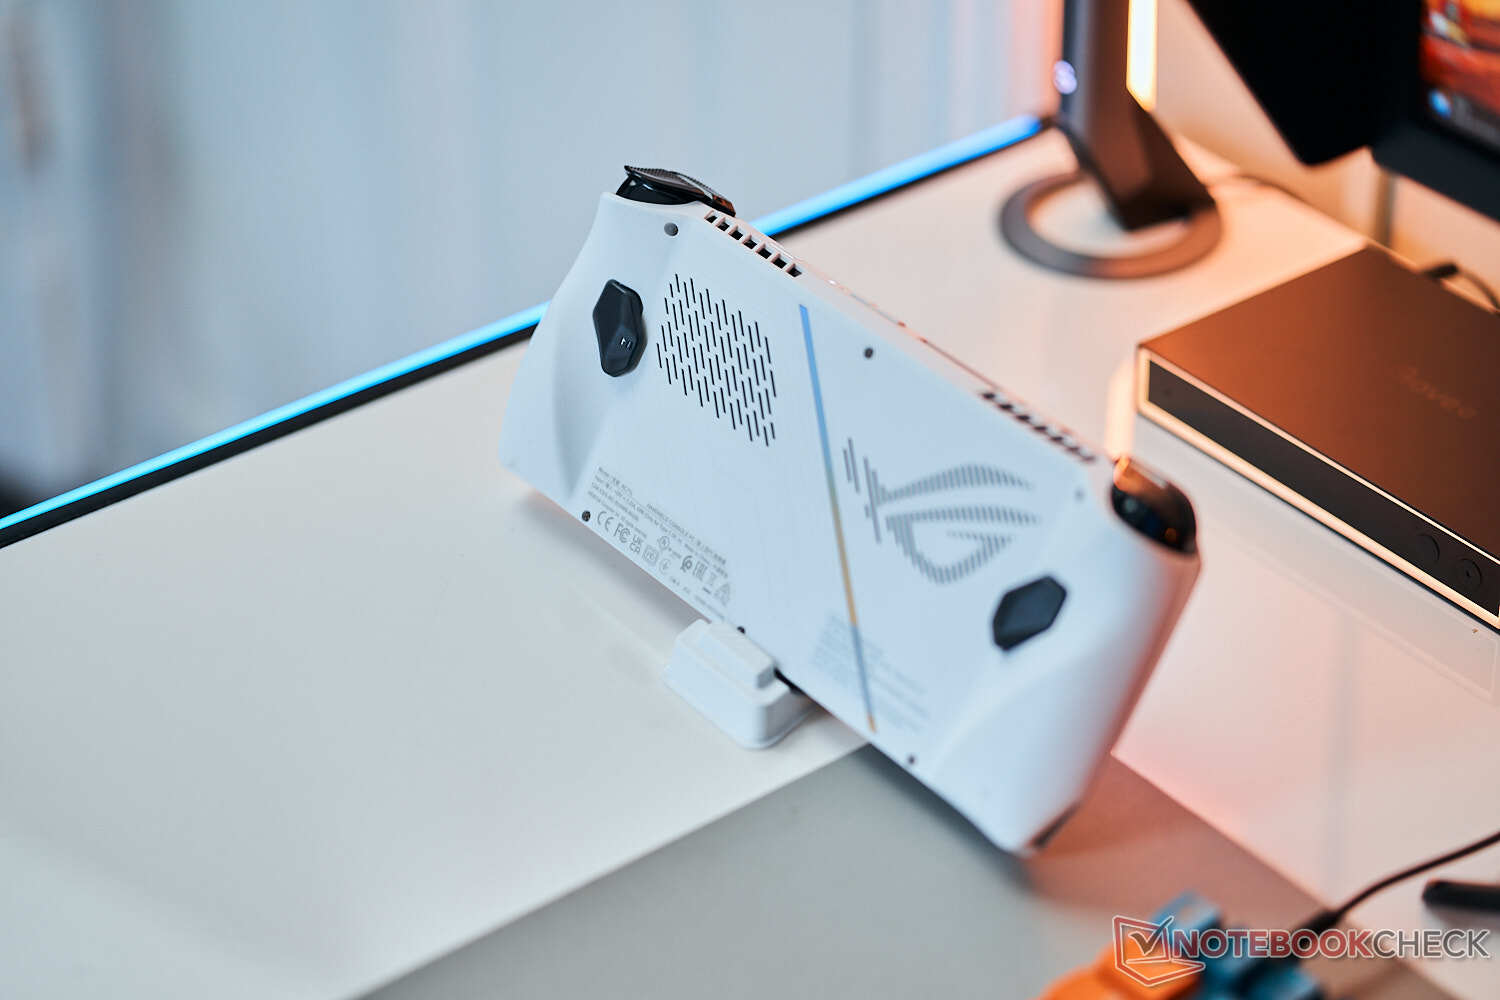
连接性 - XG Mobile和microSD
你在端口方面非常有限,因为只有一个USB-C端口或XG移动eGPU的连接器,分别。这意味着,例如,当你想连接外部硬盘时,你必须拆除电源适配器。华硕没有包括USB 4.0,但底部缺乏一个额外的端口(用于简单的扩展坞),在实践中是一个更大的问题。没有网络摄像头,但电源按钮上有一个指纹扫描仪。由于表面积小,设置起来需要更长的时间,但一旦指纹被注册,它就能完美无缺地工作。
USB-C端口支持通过DisplayPort进行视频输出,我们使用ROG Ally通过USB-C(包括USB集线器)连接到我们的Eizo 2795屏幕没有问题,因此我们可以使用屏幕的输入设备、网络连接和连接的扬声器。尽管这绝对不是主要的使用情况,但ROG Ally几乎可以像其他装有Windows 11的笔记本电脑一样工作,也可以用于生产性工作。
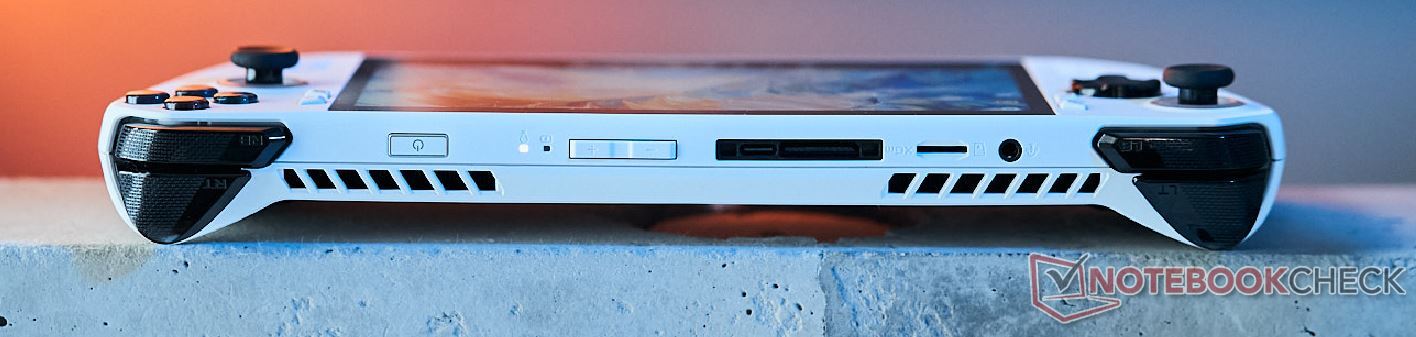
SD卡阅读器
与Steam Deck和GPD Win 4相比,顶部的microSD读卡器的速度要快得多。我们结合参考卡(Angelbird AV Pro V60)的传输速率超过了260 MB/s,这意味着你也可以在快速的microSD卡上存储游戏。
| SD Card Reader | |
| average JPG Copy Test (av. of 3 runs) | |
| GPD Win Max 2 (Toshiba Exceria Pro SDXC 64 GB UHS-II) | |
| Asus ROG Ally Z1 Extreme (Angelbird AV Pro V60) | |
| Average of class Multimedia (23 - 531, n=37, last 2 years) | |
| GPD Win 4 (AV Pro SD microSD 128 GB V60) | |
| Valve Steam Deck 512 GB LCD (Angelbird AV Pro V60) | |
| maximum AS SSD Seq Read Test (1GB) | |
| Asus ROG Ally Z1 Extreme (Angelbird AV Pro V60) | |
| GPD Win Max 2 (Toshiba Exceria Pro SDXC 64 GB UHS-II) | |
| Average of class Multimedia (37.3 - 1455, n=36, last 2 years) | |
| GPD Win 4 (AV Pro SD microSD 128 GB V60) | |
沟通
华硕为ROG Ally配备了RealTek公司目前的MT9722 Wi-Fi模块,它支持蓝牙5.2以及最新的Wi-Fi 6E标准。在我们的测试中,我们无法连接到华硕参考路由器的相应6GHz网络,但5GHz的性能令人印象深刻,传输速度快且稳定,Ally不必躲在全尺寸笔记本电脑后面。如果你想使用Xbox Game Pass等游戏的流媒体服务,这是个好消息。
| Networking | |
| Asus ROG Ally Z1 Extreme | |
| iperf3 transmit AXE11000 | |
| iperf3 receive AXE11000 | |
| GPD Win 4 | |
| iperf3 transmit AXE11000 | |
| iperf3 receive AXE11000 | |
| iperf3 transmit AXE11000 6GHz | |
| iperf3 receive AXE11000 6GHz | |
| GPD Win Max 2 | |
| iperf3 transmit AXE11000 6GHz | |
| iperf3 receive AXE11000 6GHz | |
辅料
我们已经提到,盒子里包括一个小纸板支架,但华硕提供额外的配件,如保护套或耳机。还有外置显卡XG Mobile与GeForce RTX 4090笔记本电脑,尽管这是一个非常昂贵的投资,为2500欧元。
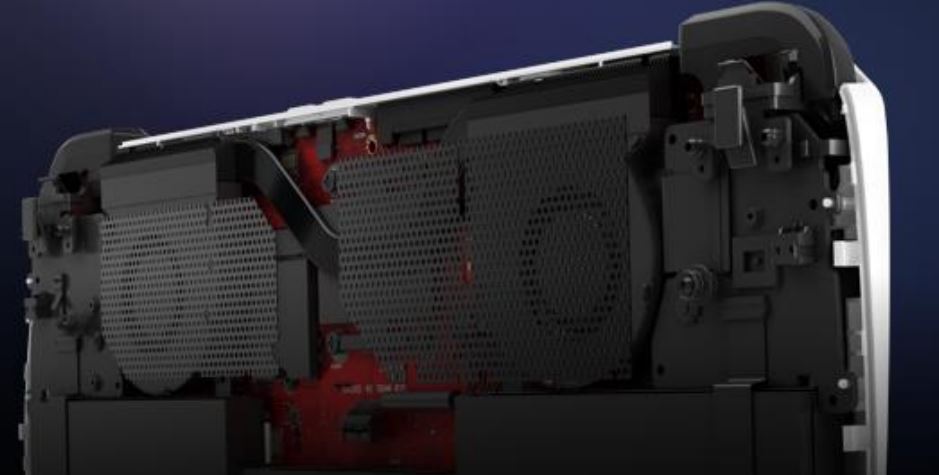
维护
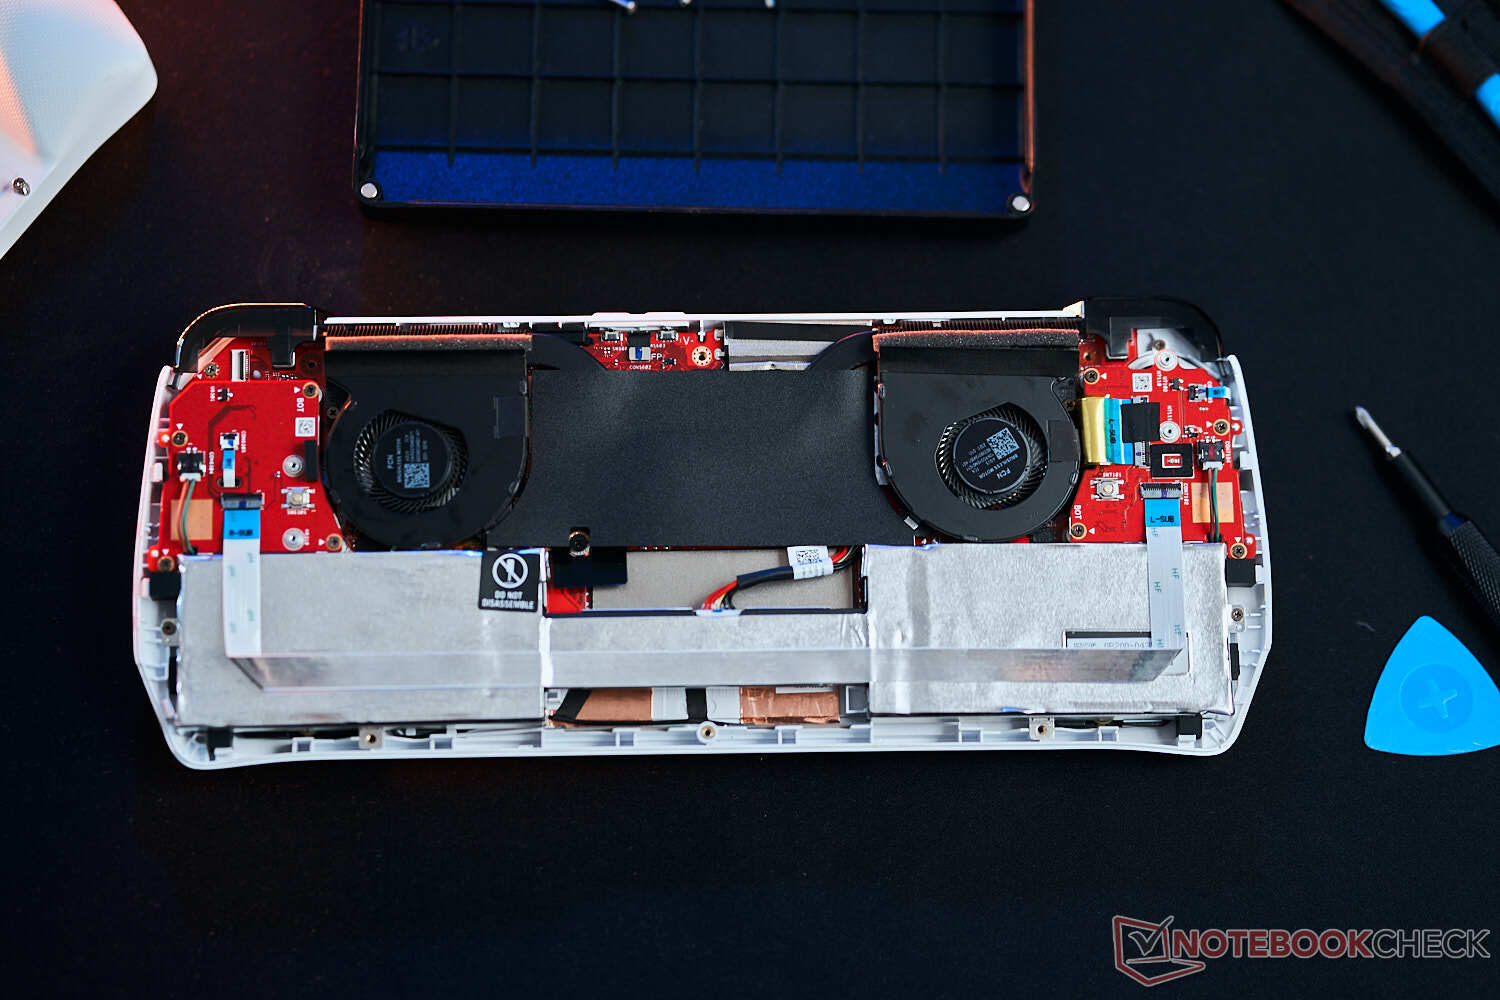
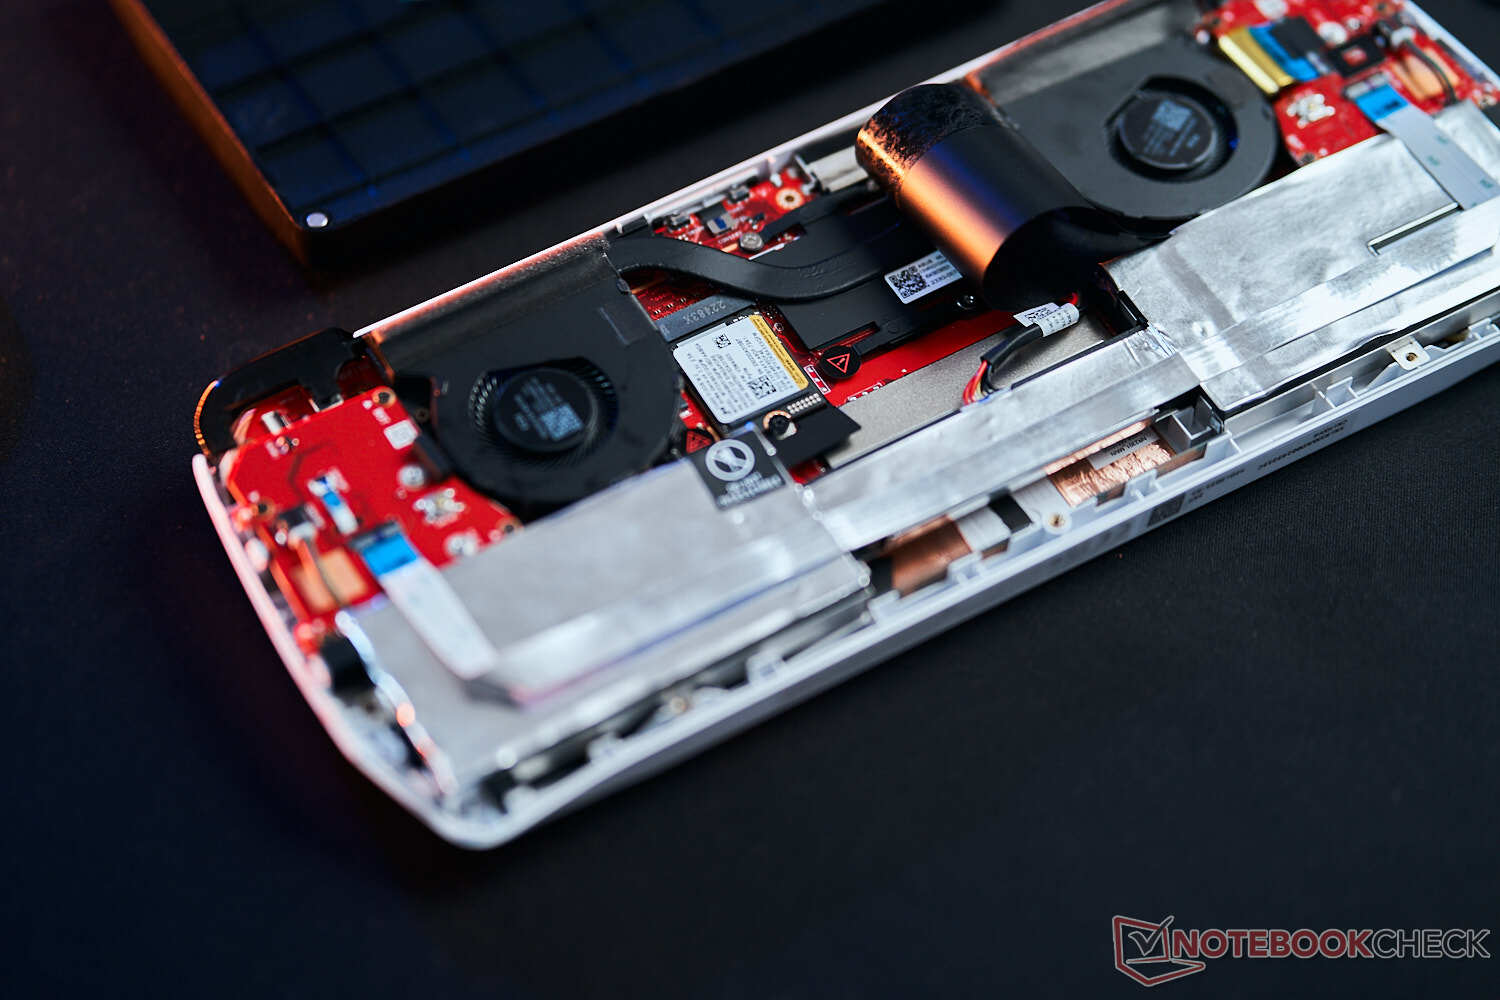
后面板由几颗飞利浦螺钉固定,可以非常容易地取下。在里面你可以接触到两个风扇、电池以及紧凑的M.2-2230固态硬盘(PCIe 4.0),它可以被替换。根据我们的信息,制造商计划在未来提供替换零件,如ne拇指棒,所以有经验的用户可以更换零件,因此不必送去维修。
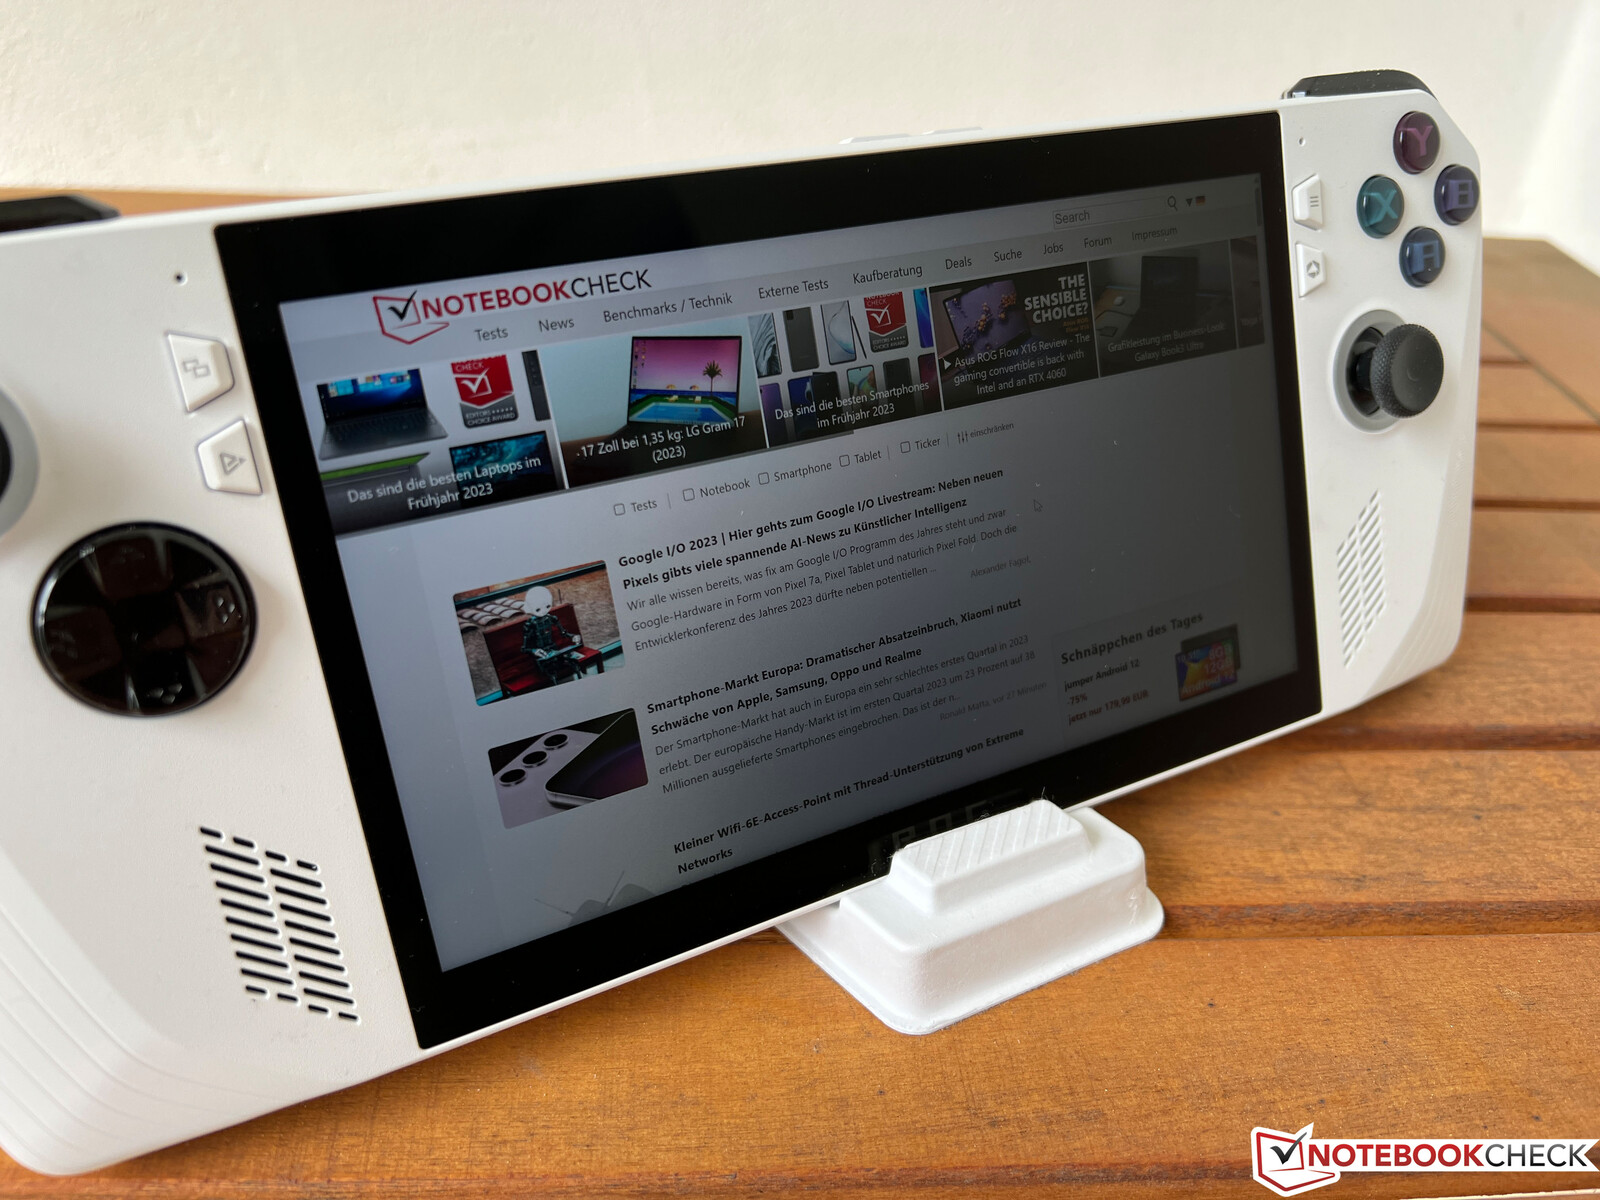
输入设备和处理
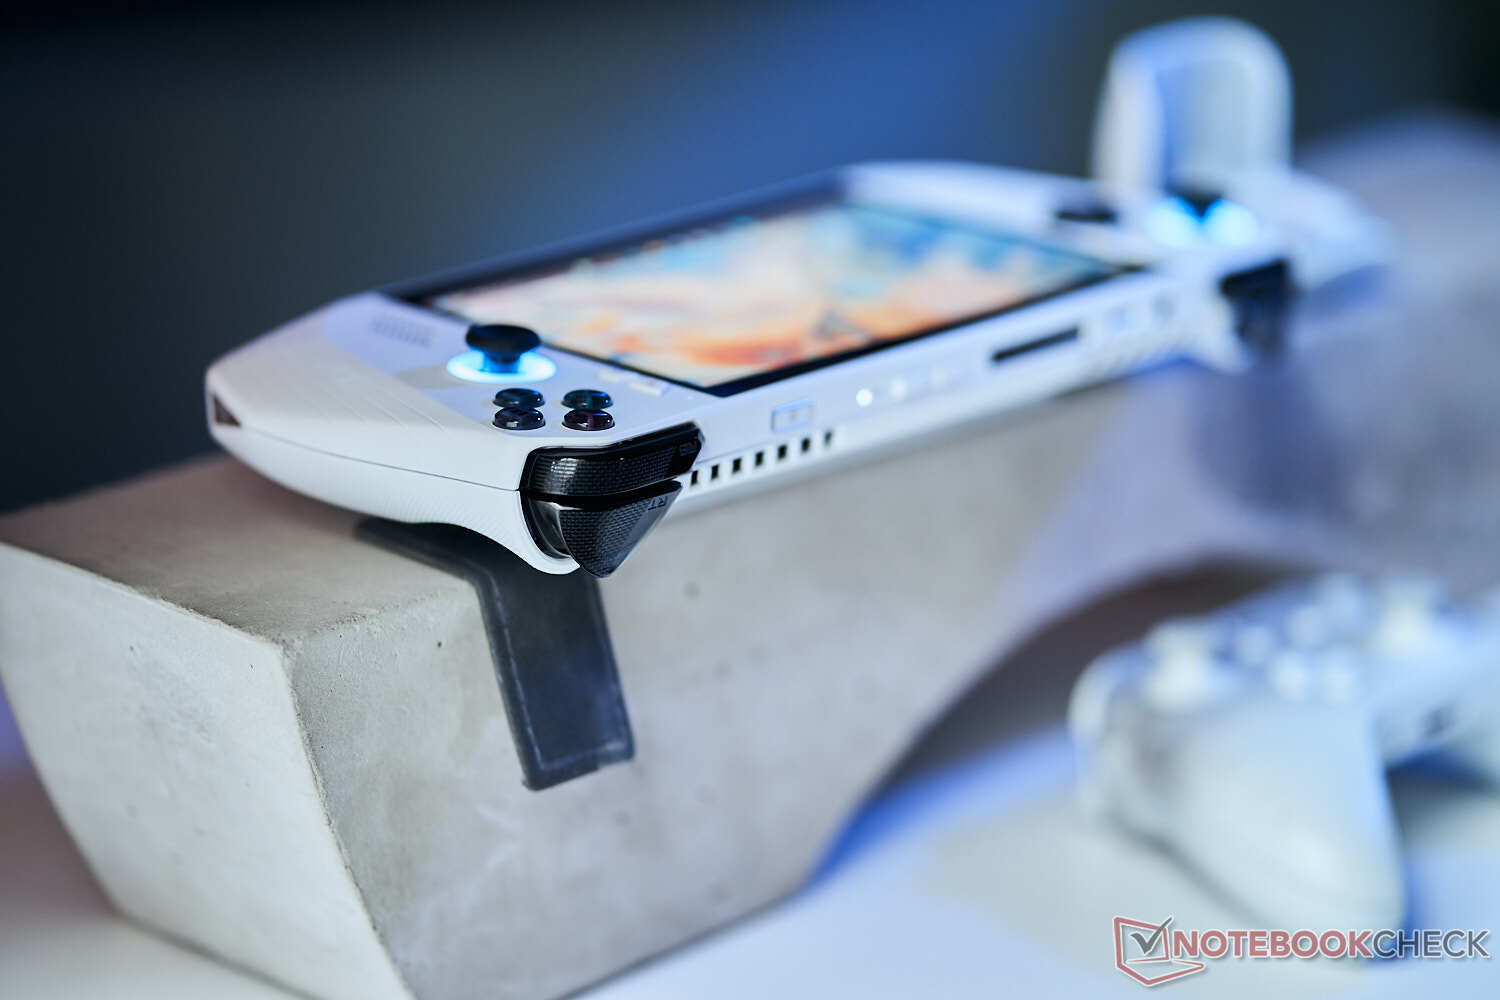
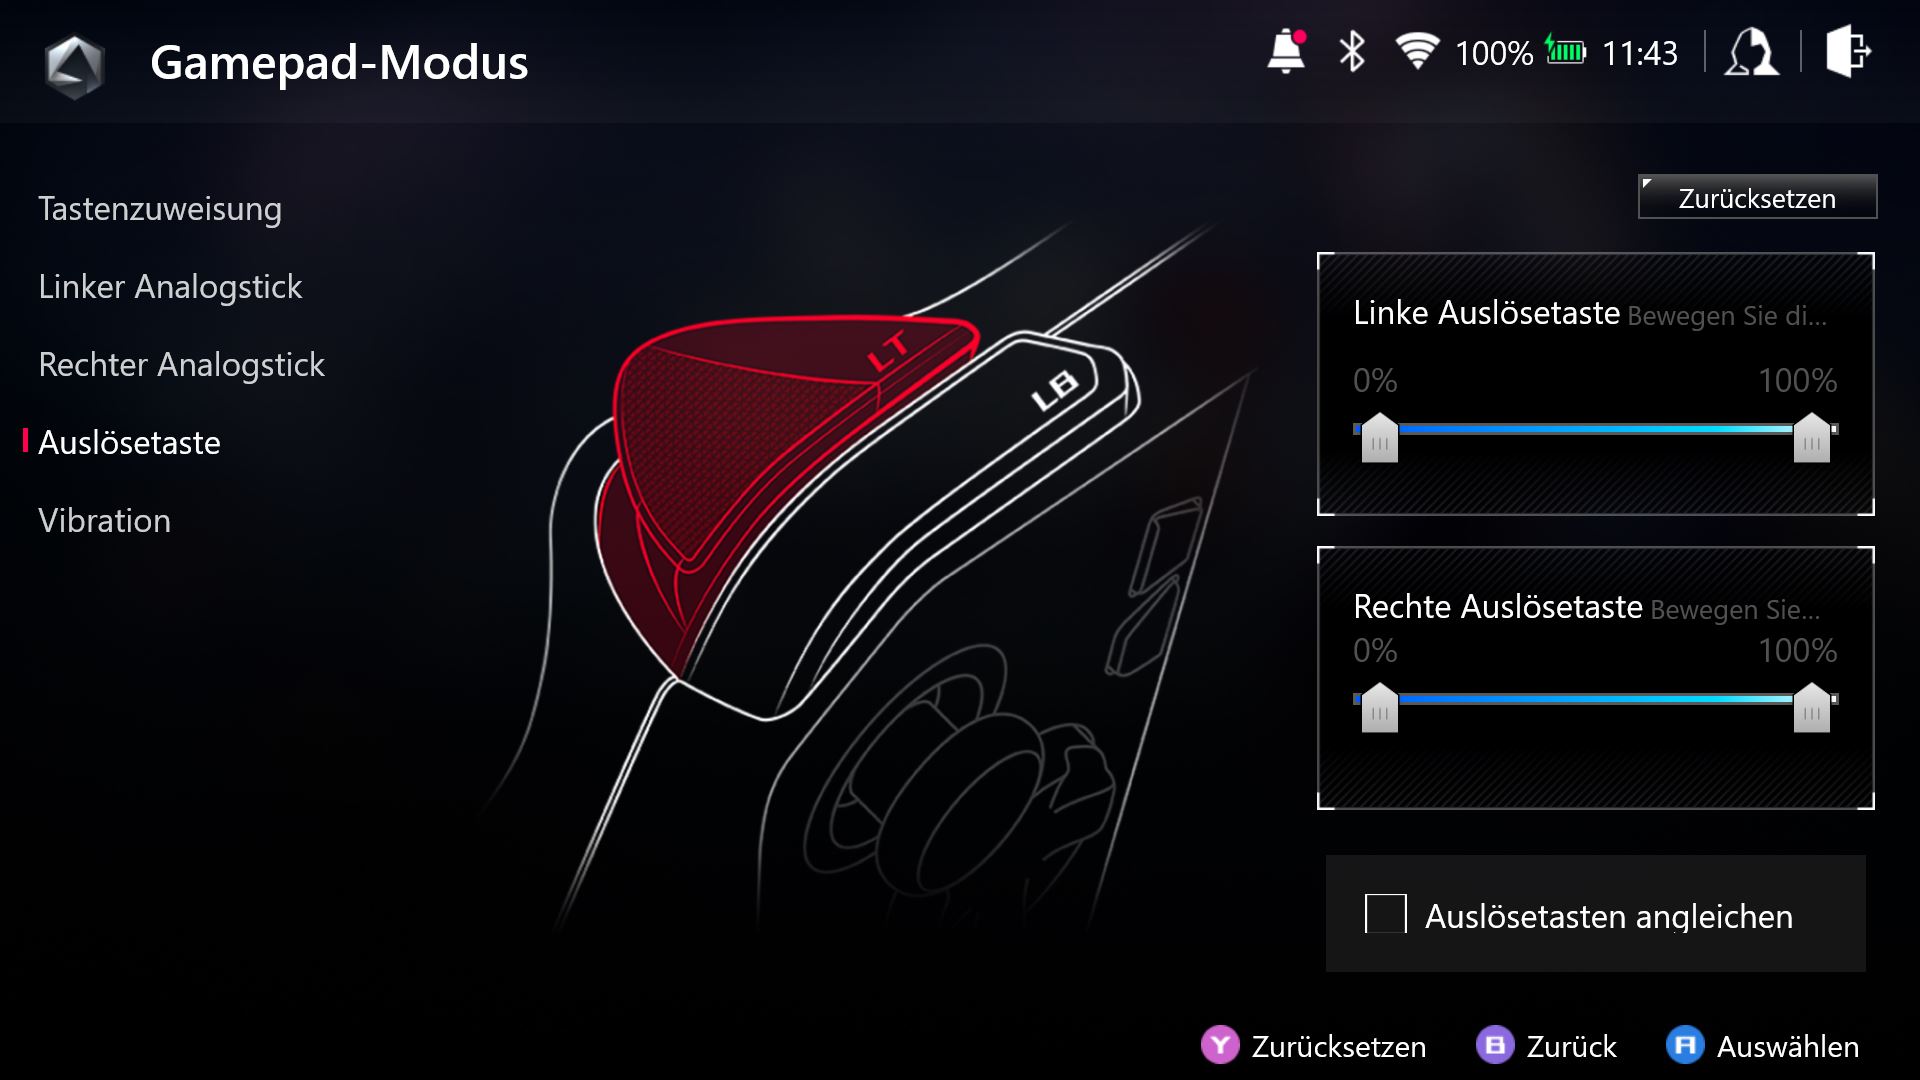
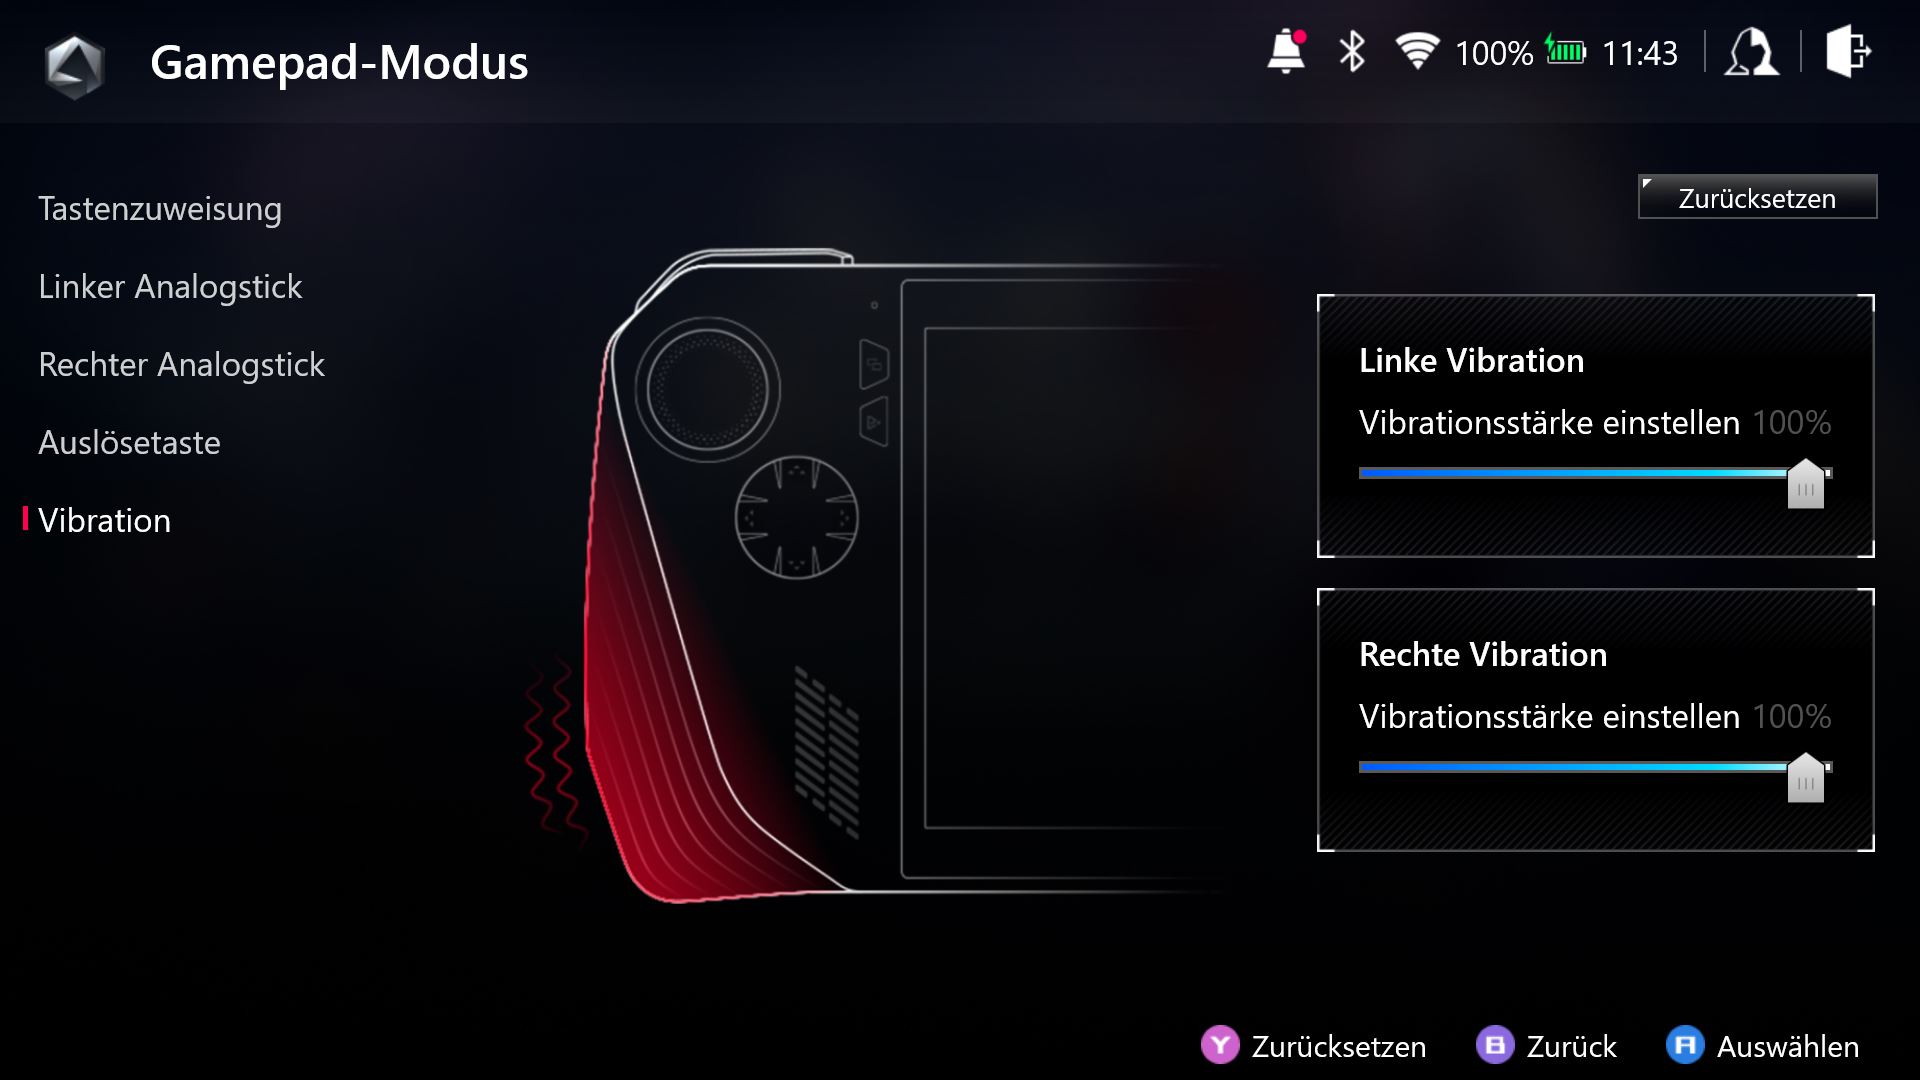
现在我们来看看最重要的方面之一,输入设备和操作。首先,很明显,有康宁大猩猩玻璃Victus的电容式触摸屏,它的工作原理和你所期望的一样。但也有大量的按钮,一个D-pad和两个大棍子,类似于Xbox控制器的布局。顶部的触发器使用了霍尔传感器,所以手柄没有霍尔传感器(也是为了减少成本)。

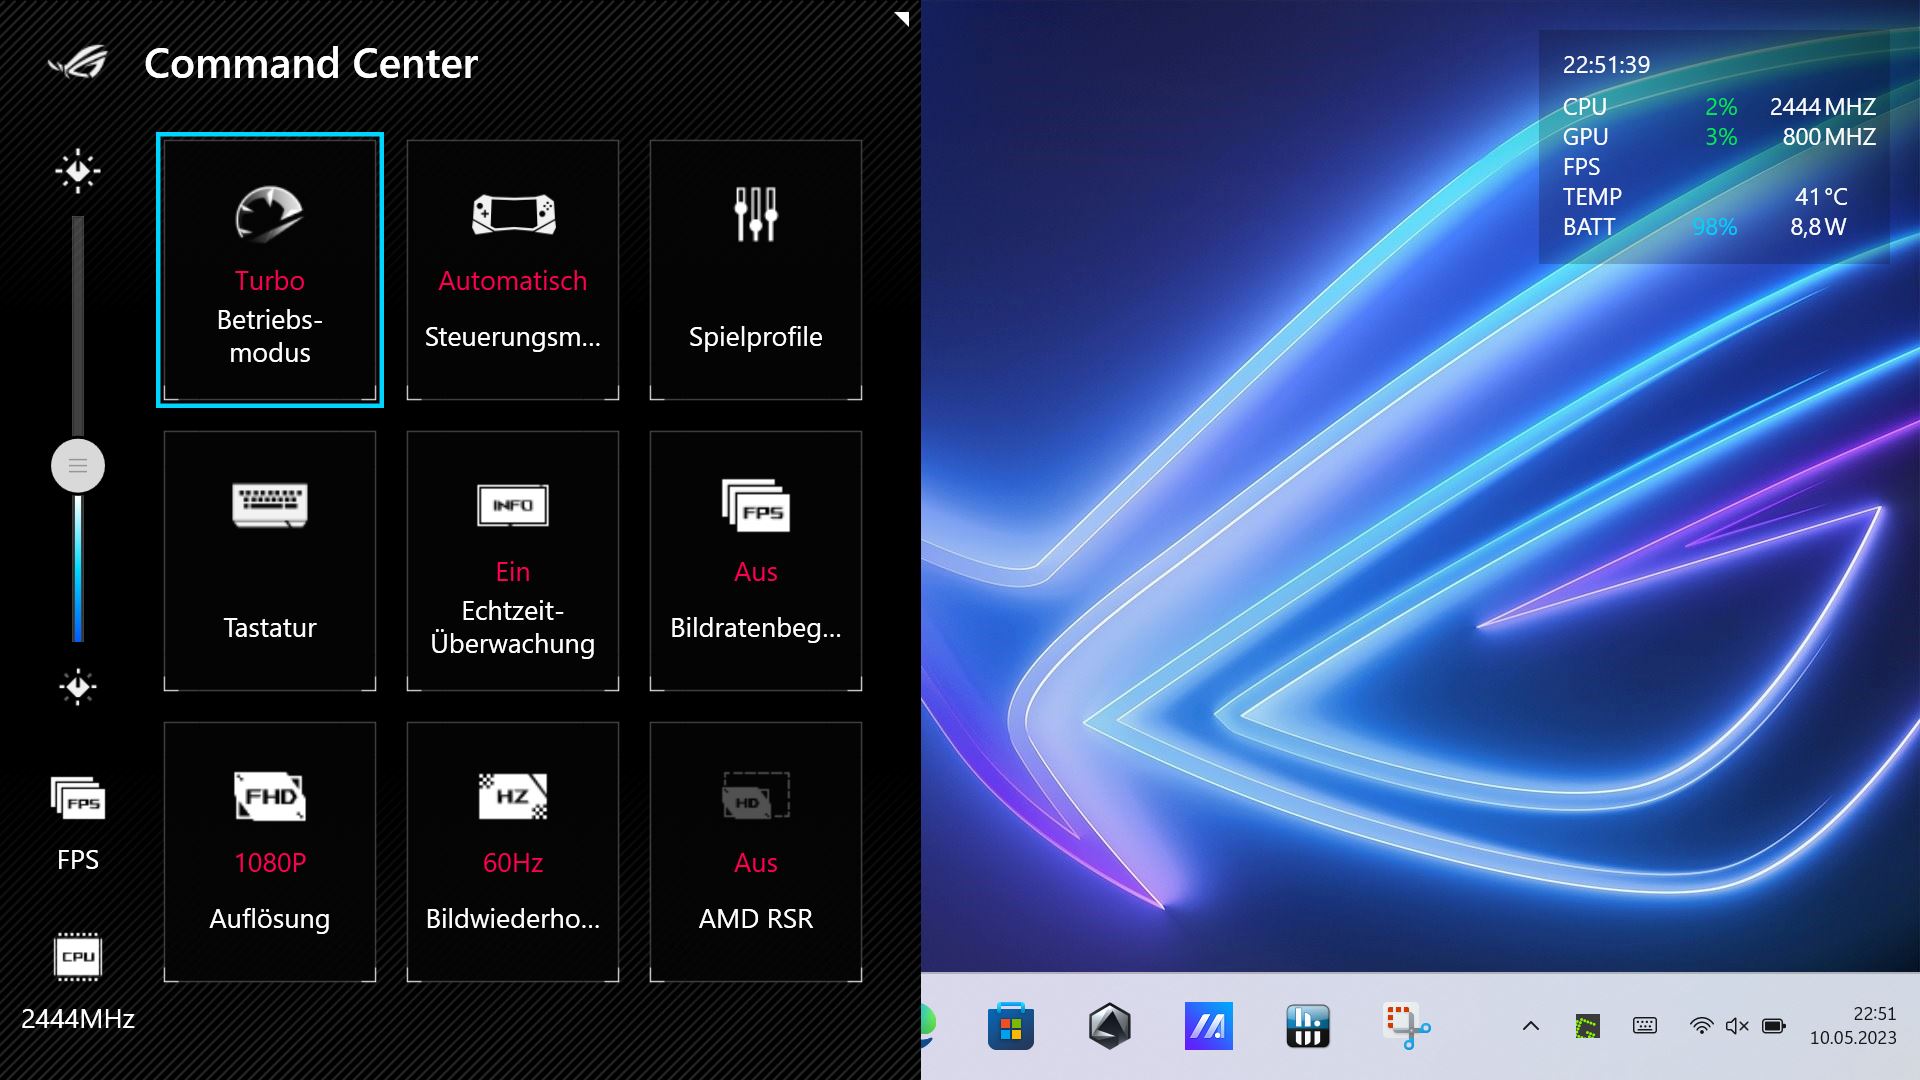
然后沿着屏幕有四个小按钮,其中一个打开了极其方便的命令中心。华硕还在后部实施了两个宏按钮,作为Fn键的一种,允许用其他键进行快速操作,如启动屏幕键盘、任务管理器或进行屏幕截图。这里肯定有一个学习曲线,但一旦你习惯了,即使是标准的Windows控制也能很好地工作。
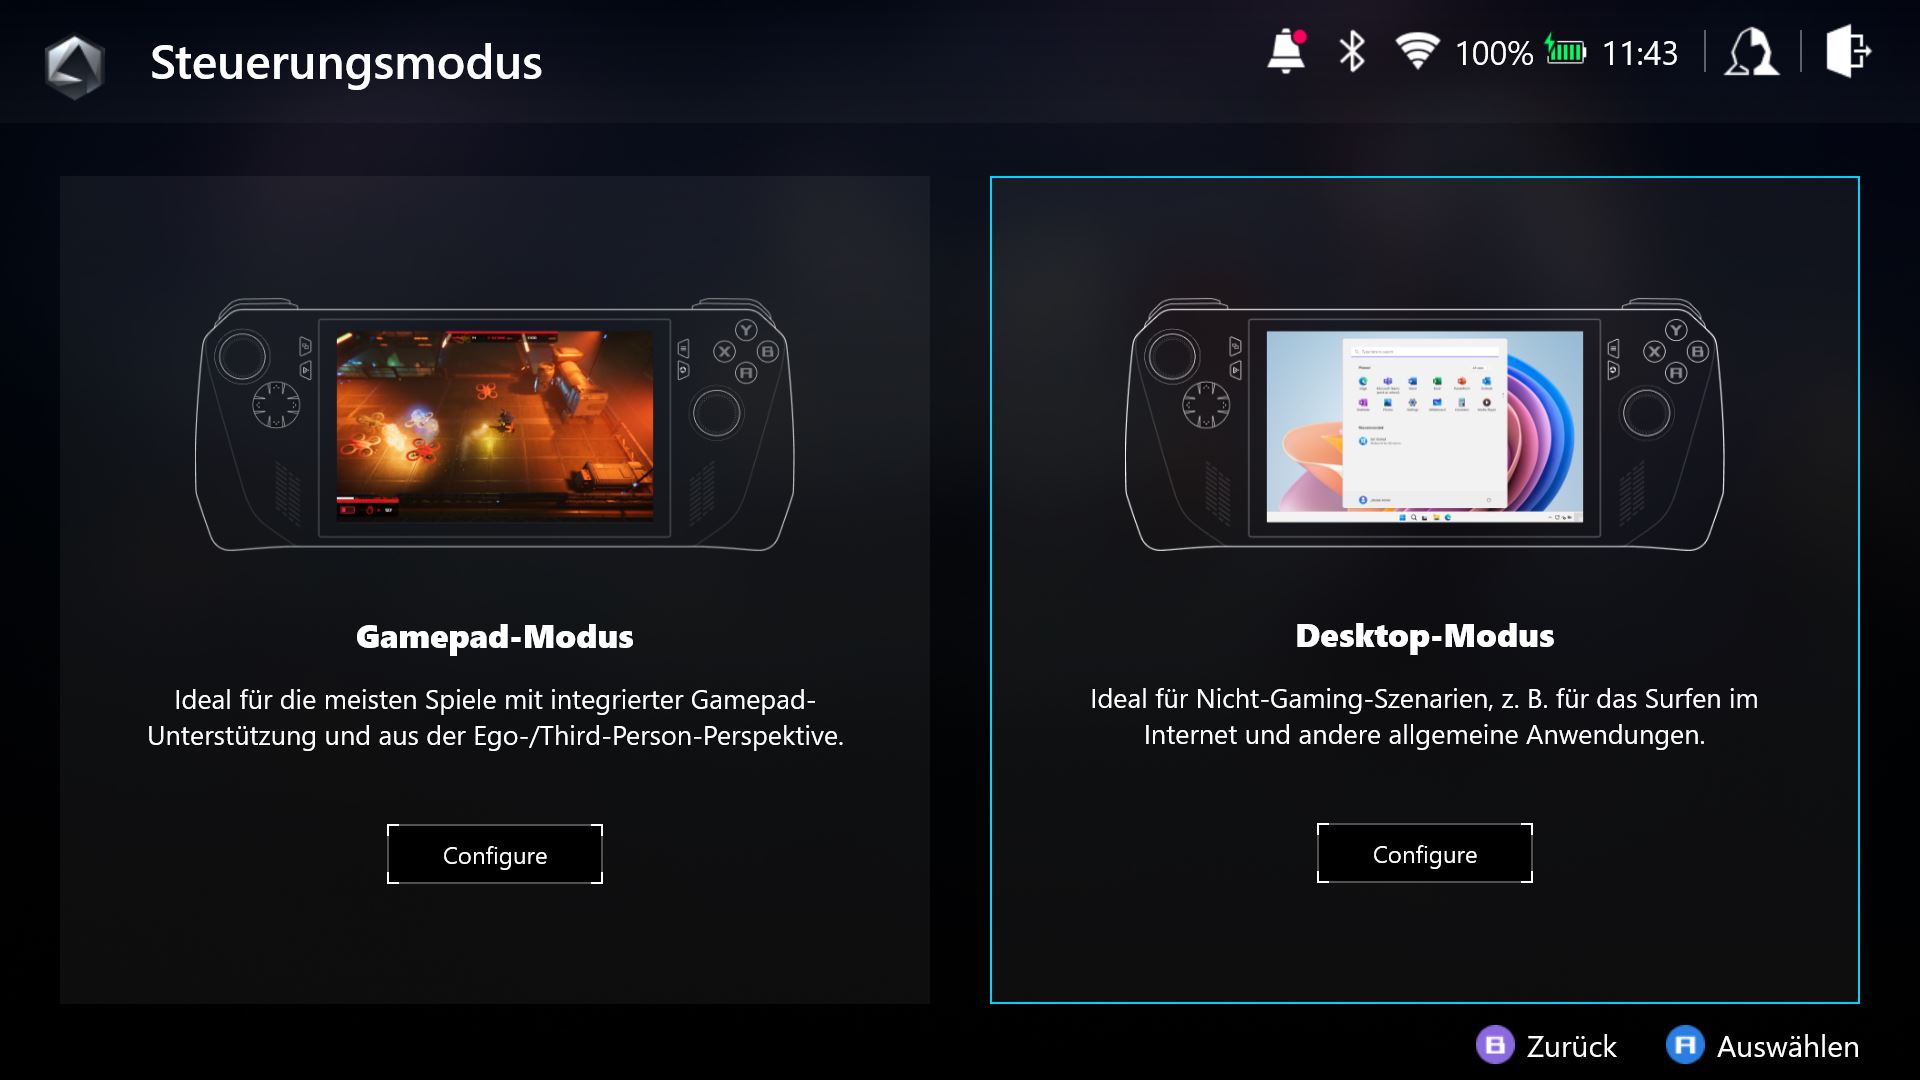
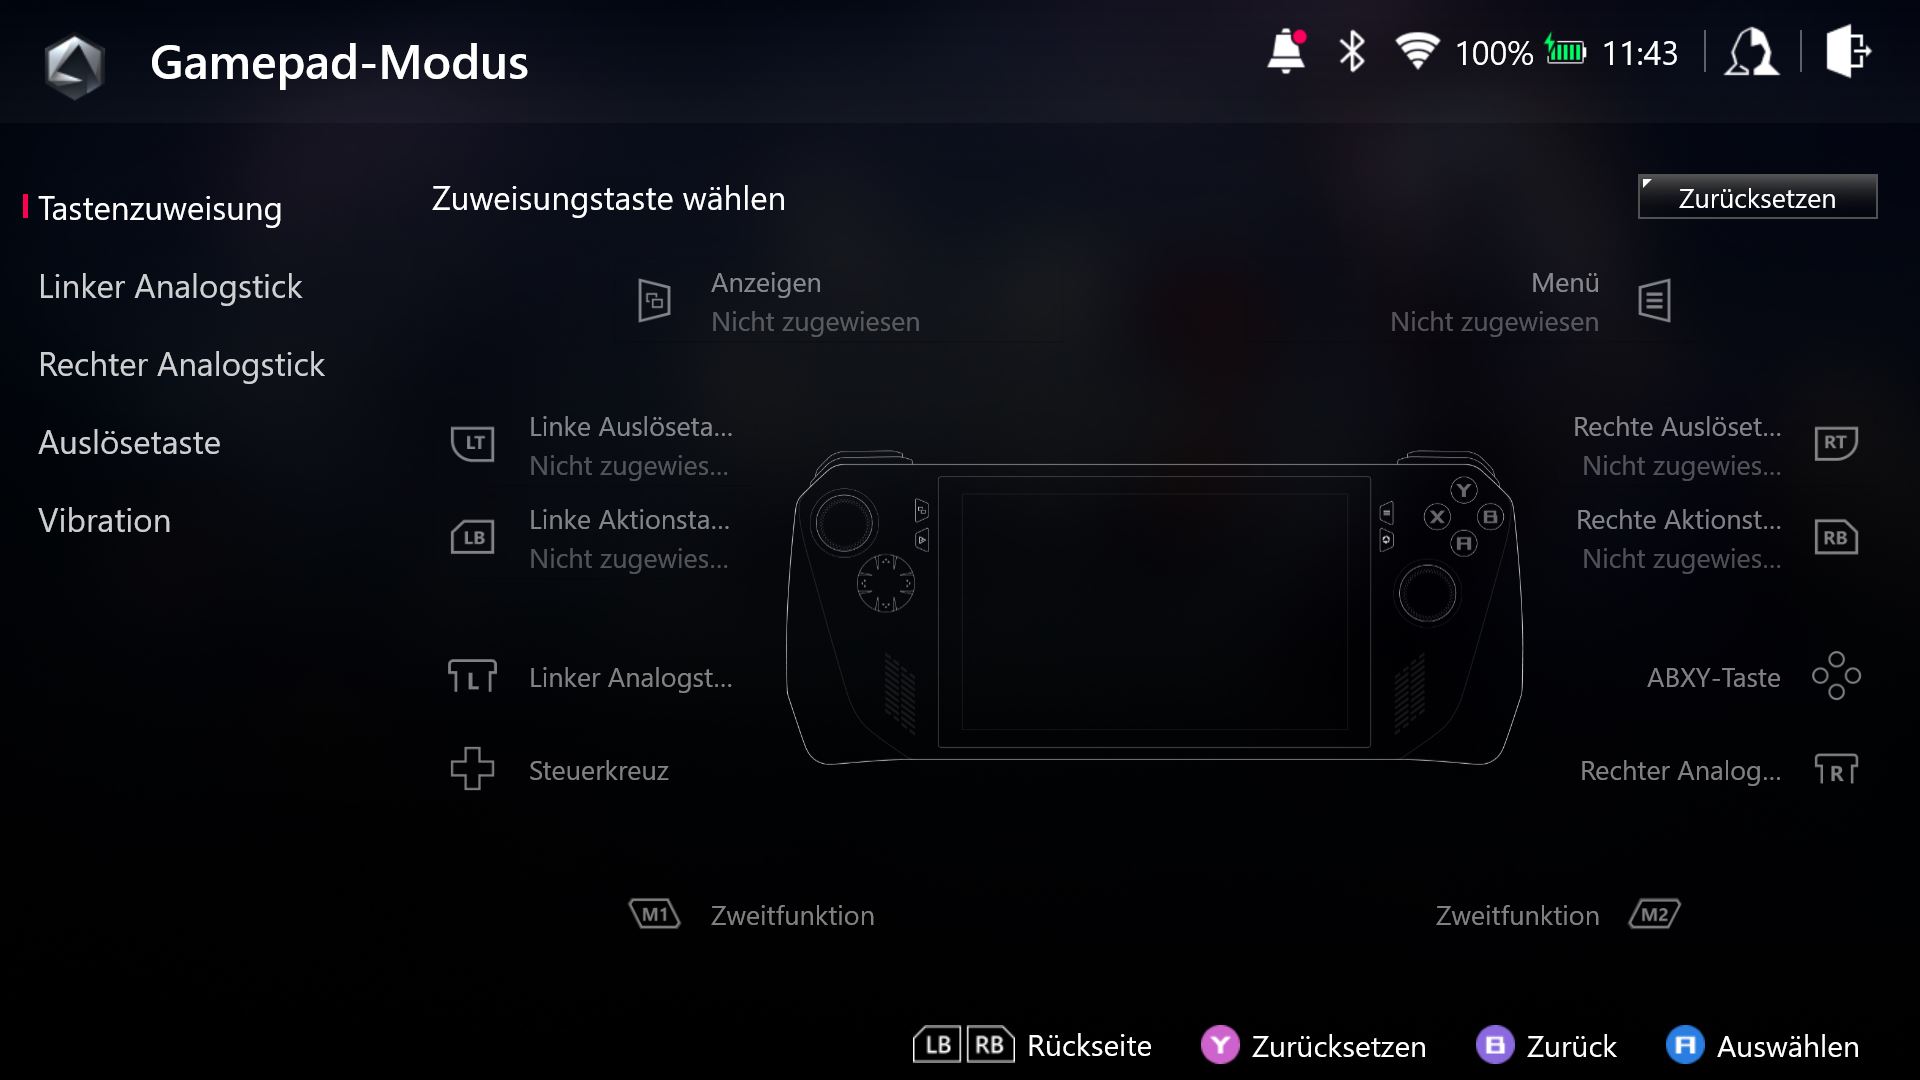
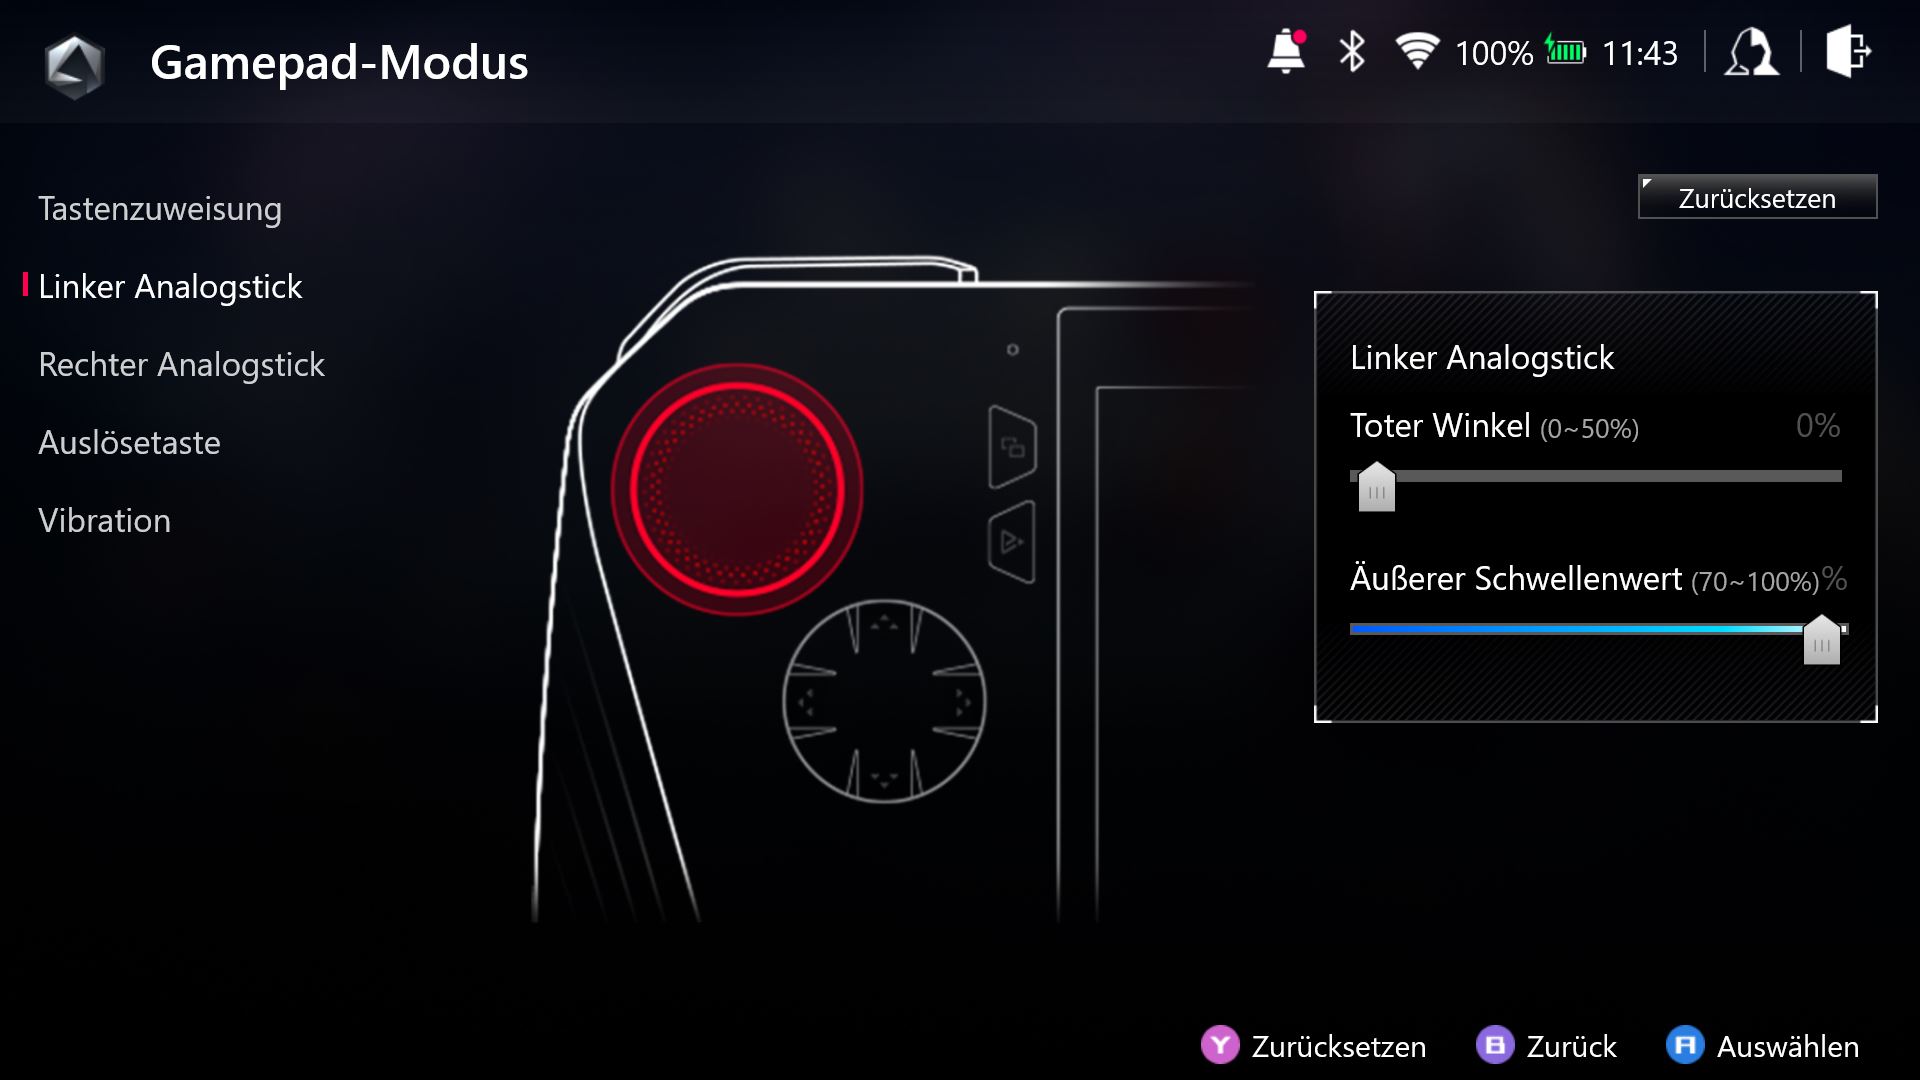
按钮和摇杆的质量也让我们想起了目前的Xbox控制器,这也意味着按钮的声音相当大。摇杆和扳机的配置选项非常好,你可以为每个游戏单独创建自定义按钮布局。华硕在这方面确实花了一些心思,在我们使用该设备的过程中,它的效果非常好。手柄上也有触觉反馈,你也可以调整振动的强度。也可以用ROG Ally使用其他游戏手柄或控制器(例如,当它连接到电视上时),因为它是一个普通的Windows设备。
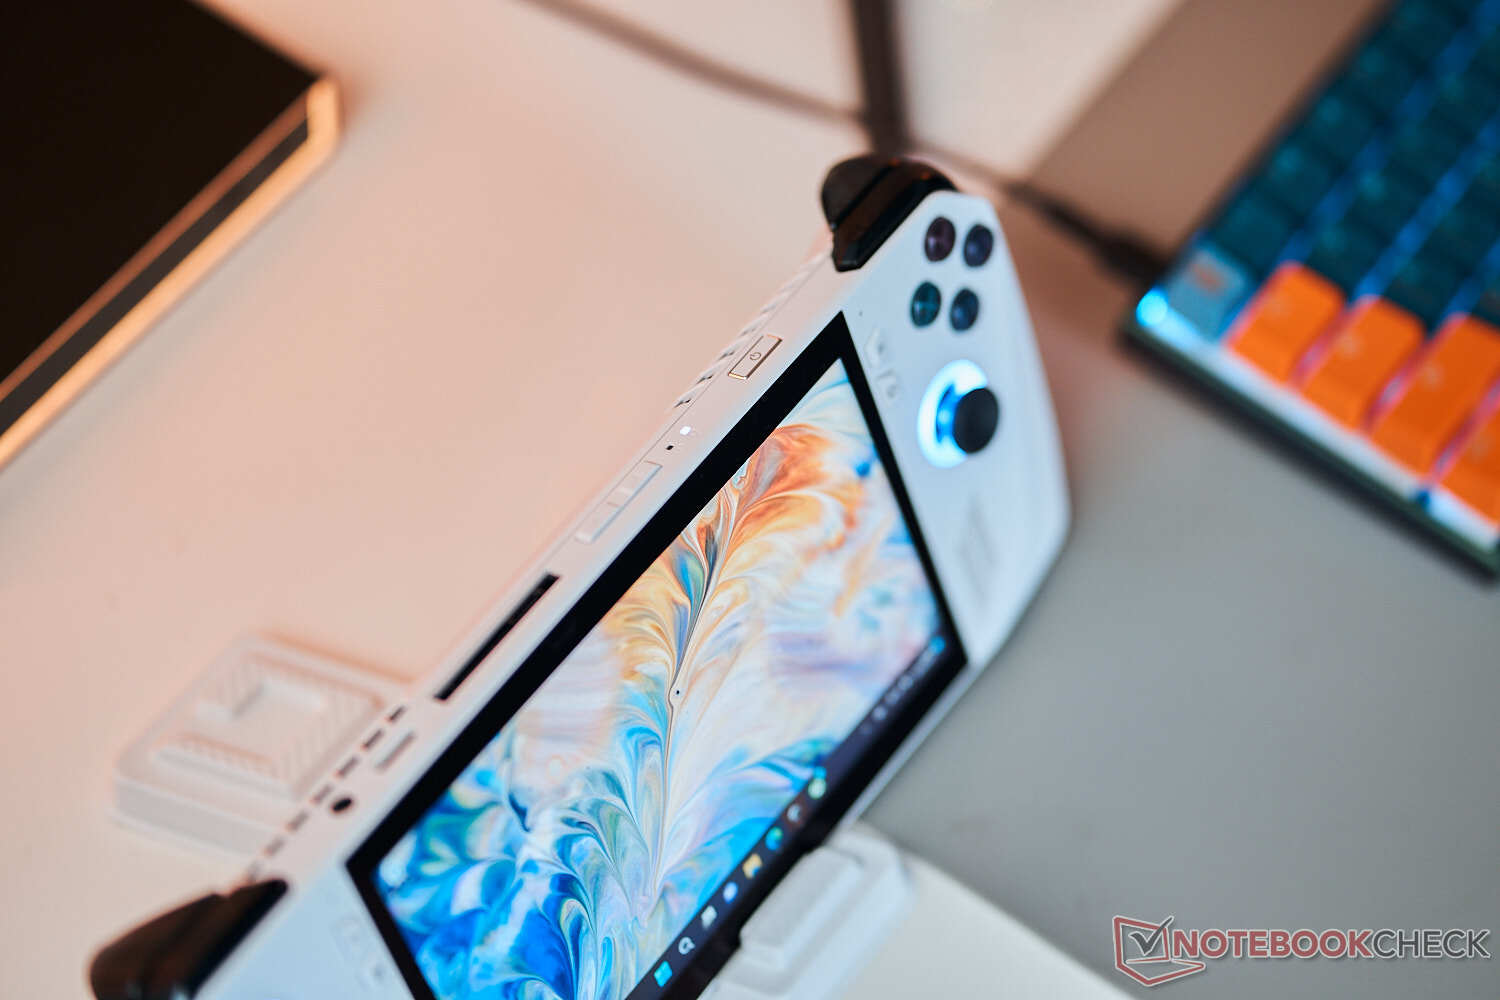
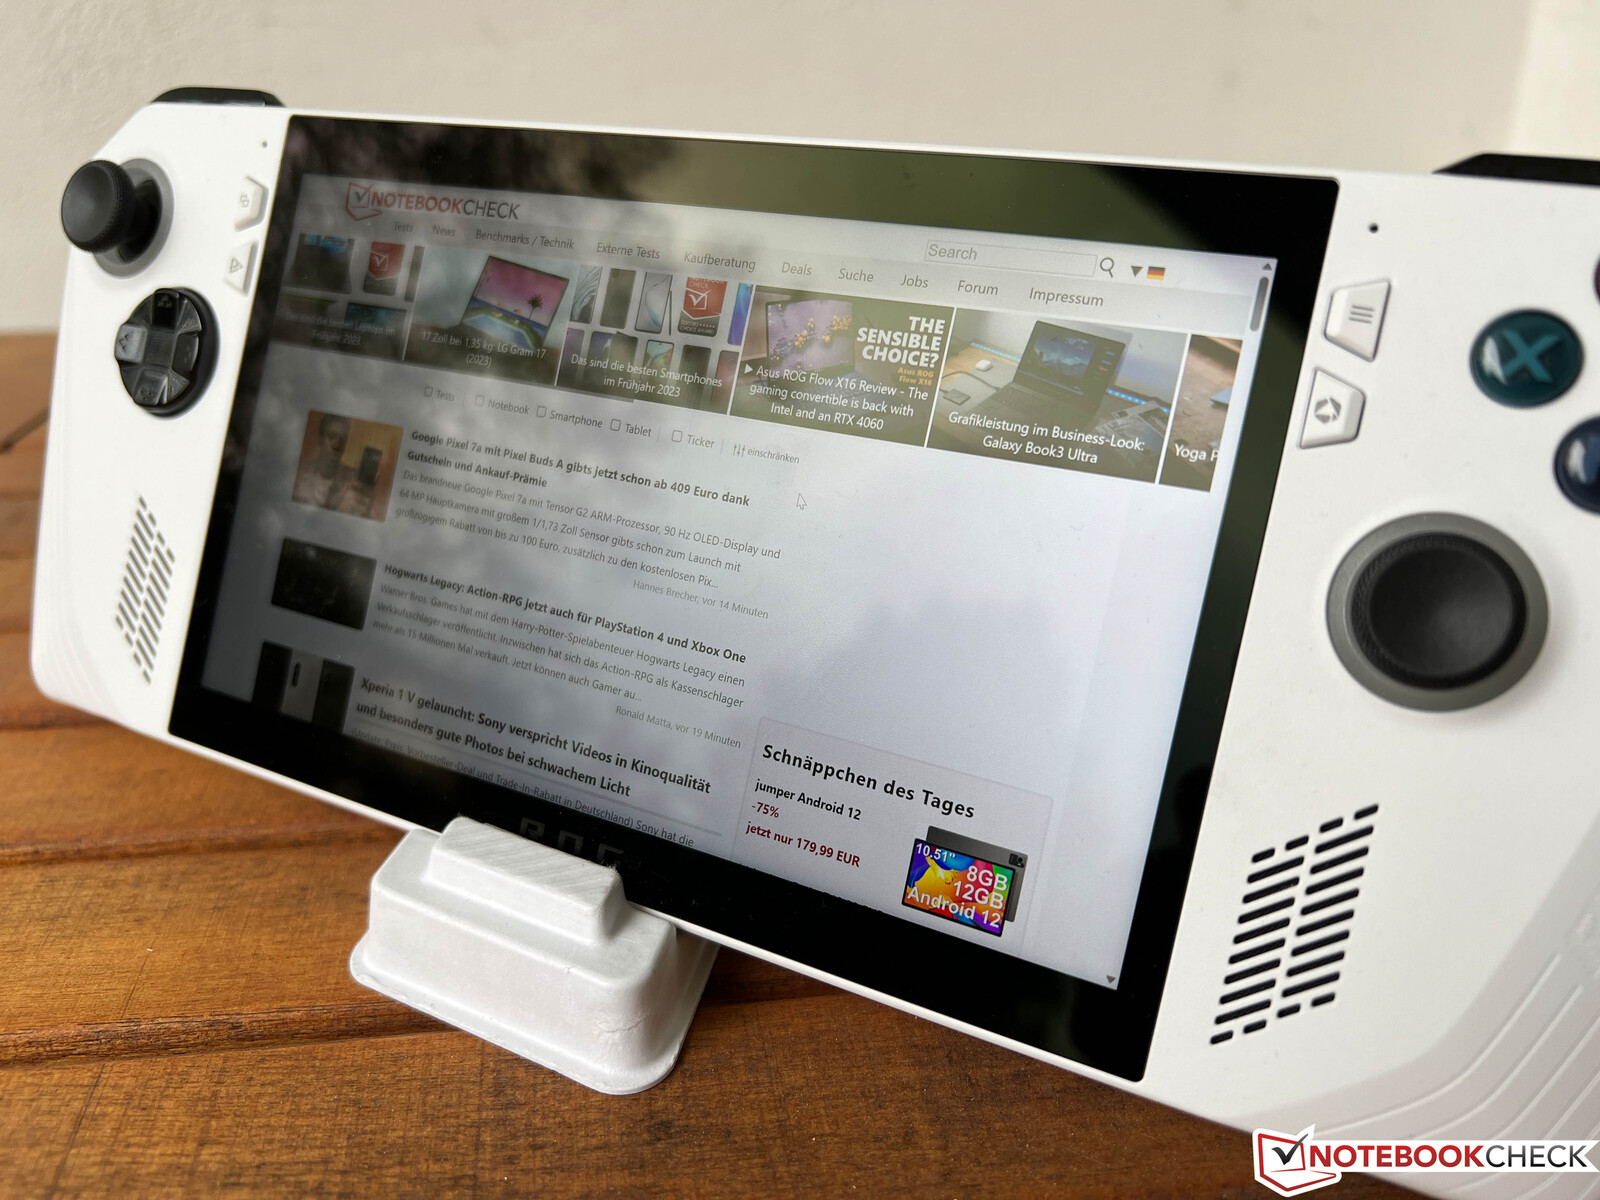
显示器 - 120赫兹IPS面板

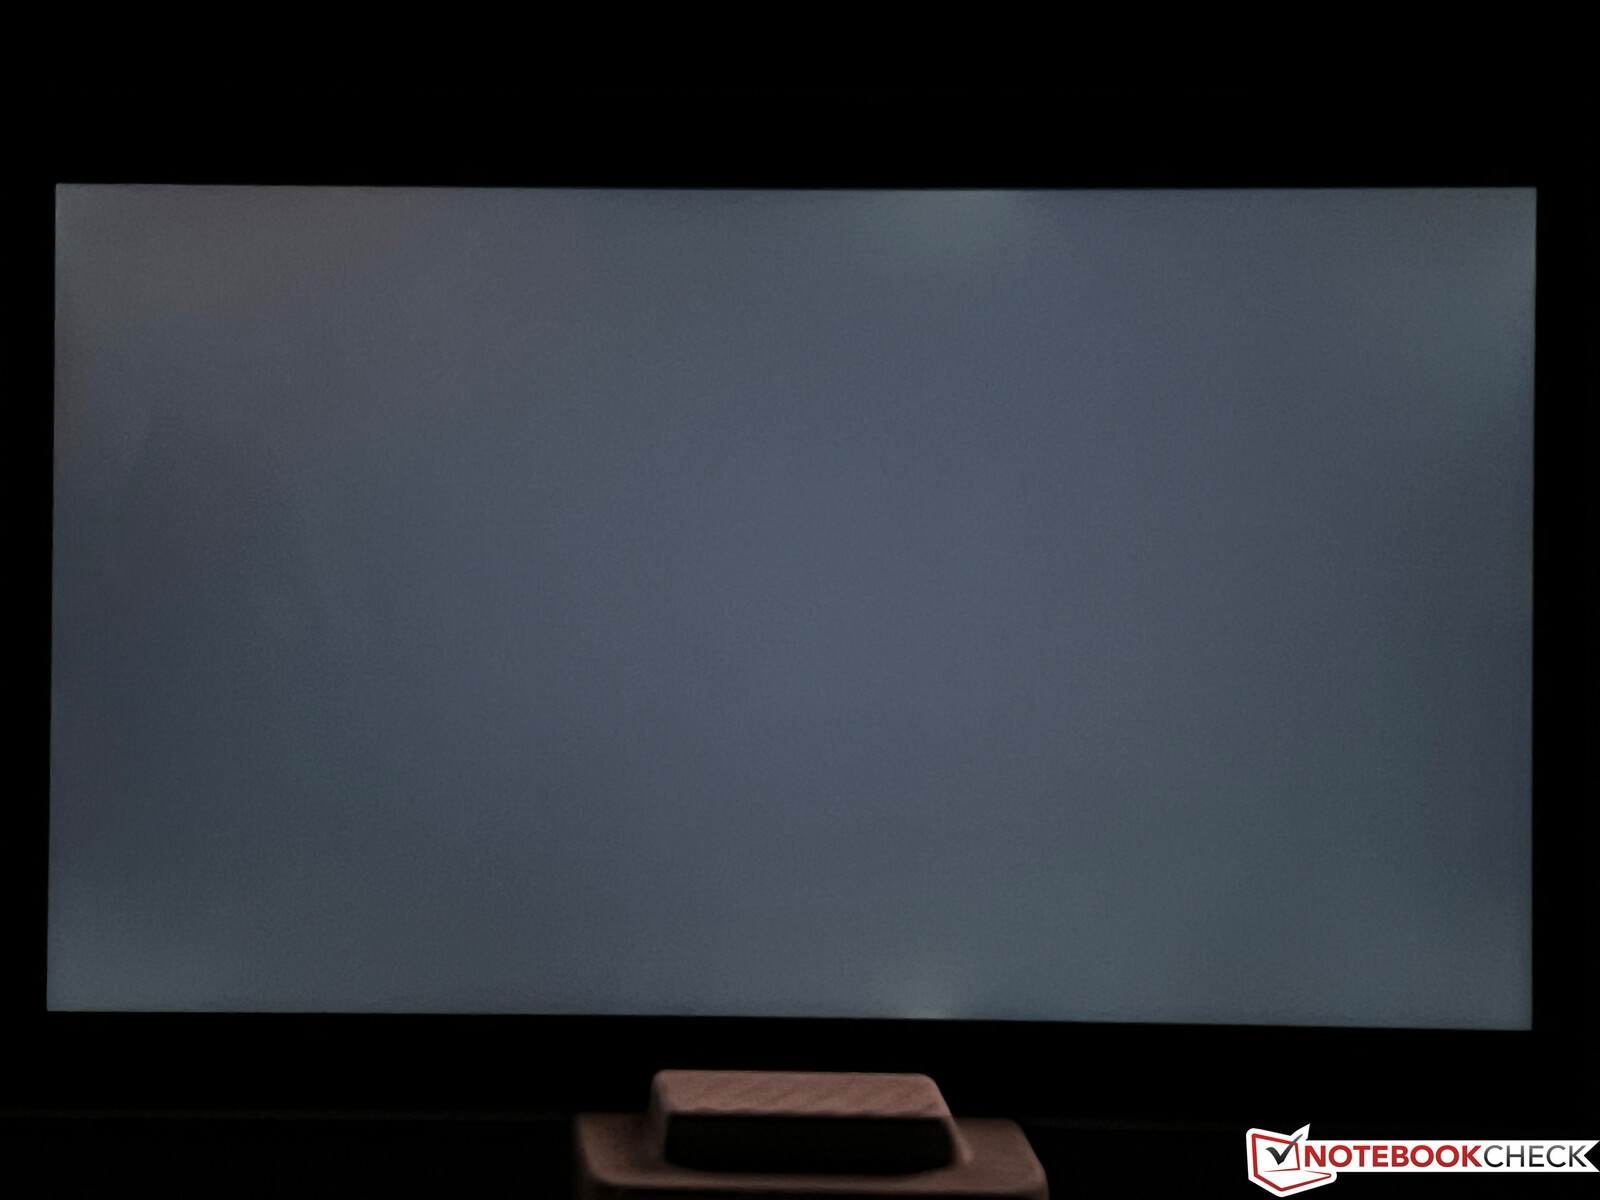
华硕使用7英寸IPS屏幕,全高清分辨率(1920 x 1080像素,16:9)。主观的画面印象非常好,但由于触摸屏层的原因,明亮的表面看起来有点颗粒感。然而,这是一个小小的不便,它并没有真正困扰我们,你必须非常接近才能看到它。由于120赫兹的刷新率,移动非常顺畅,你还可以从快速响应时间以及游戏期间的FreeSync Premium中受益。没有PWM闪烁,背光渗漏几乎不存在。
华硕宣传的亮度为500尼特,我们在屏幕中央的评测单元证实了这一点。平均结果是475尼特,这意味着爱丽并不像Steam Deck那样明亮(它提供的功能较少)。明亮的IPS面板的缺点是0.38cd/m²的黑色数值略有提高。由此产生的超过1300:1的对比度仍然很好,但黑色内容更加暗灰,特别是与OLED屏幕相比。
| |||||||||||||||||||||||||
Brightness Distribution: 84 %
Center on Battery: 512 cd/m²
Contrast: 1350:1 (Black: 0.38 cd/m²)
ΔE ColorChecker Calman: 3.7 | ∀{0.5-29.43 Ø4.71}
ΔE Greyscale Calman: 5.1 | ∀{0.09-98 Ø4.96}
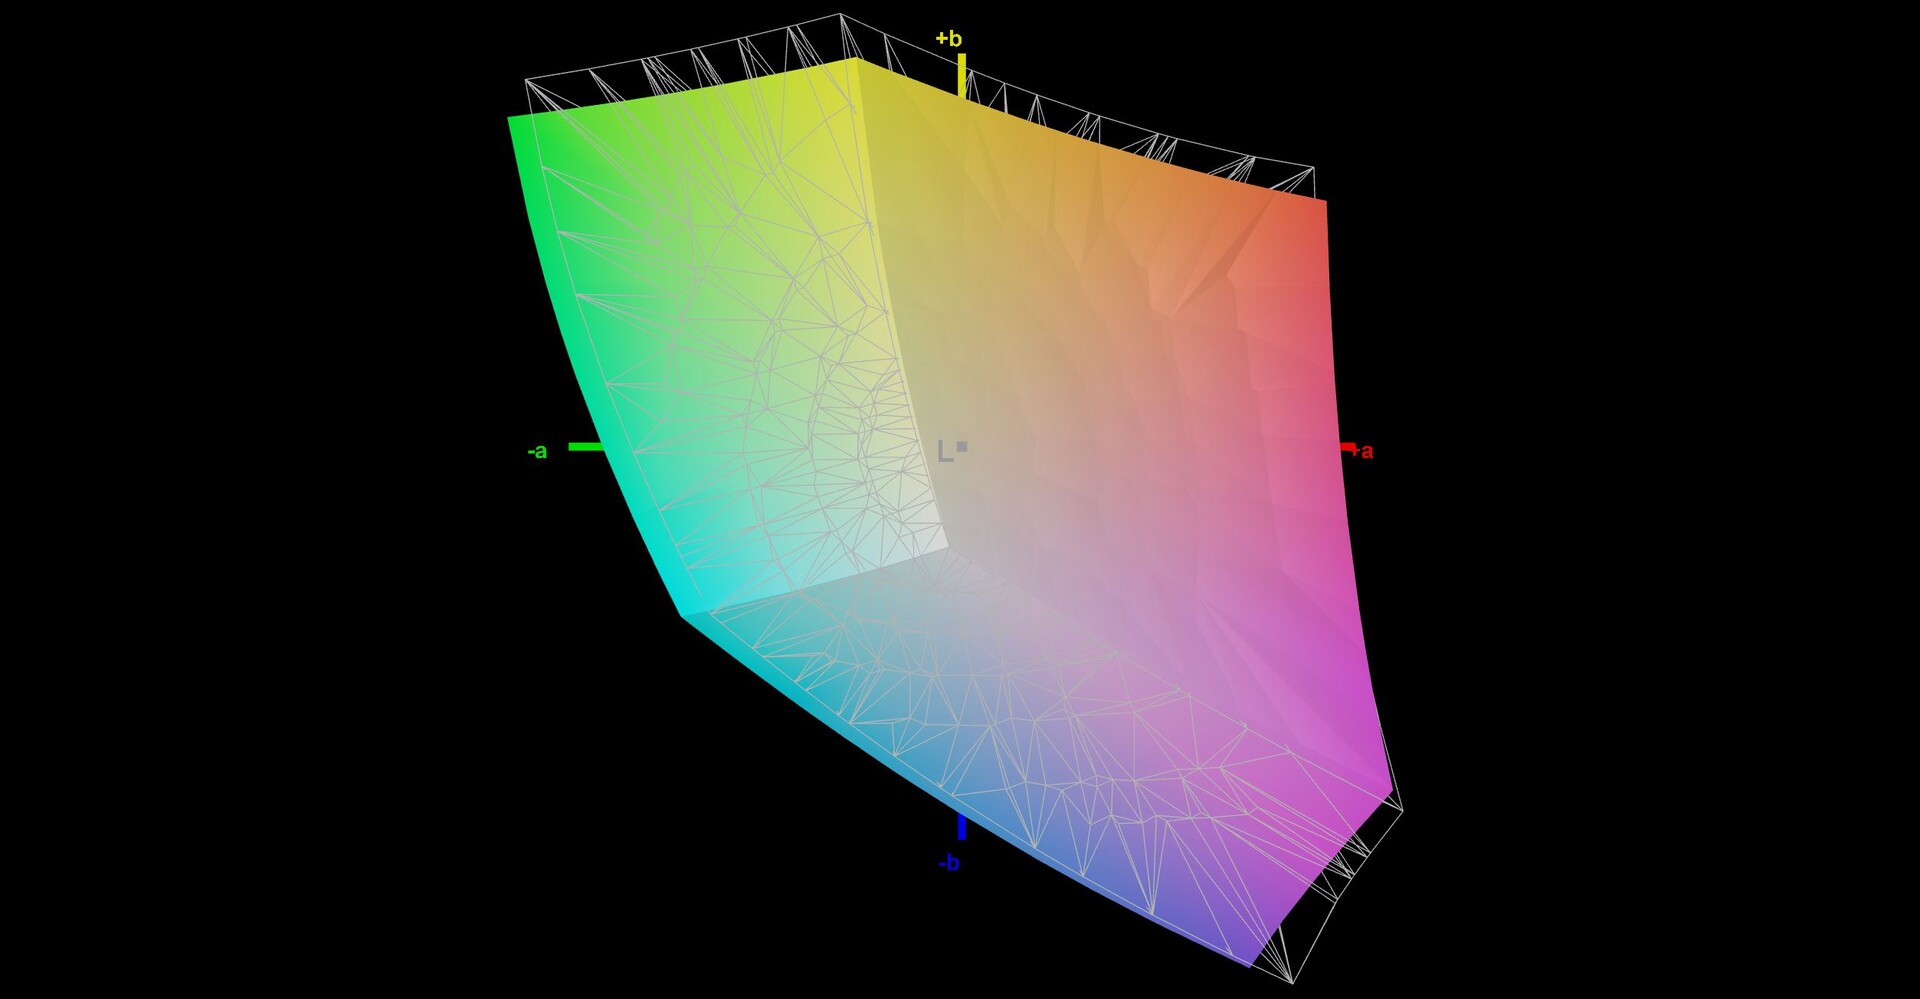
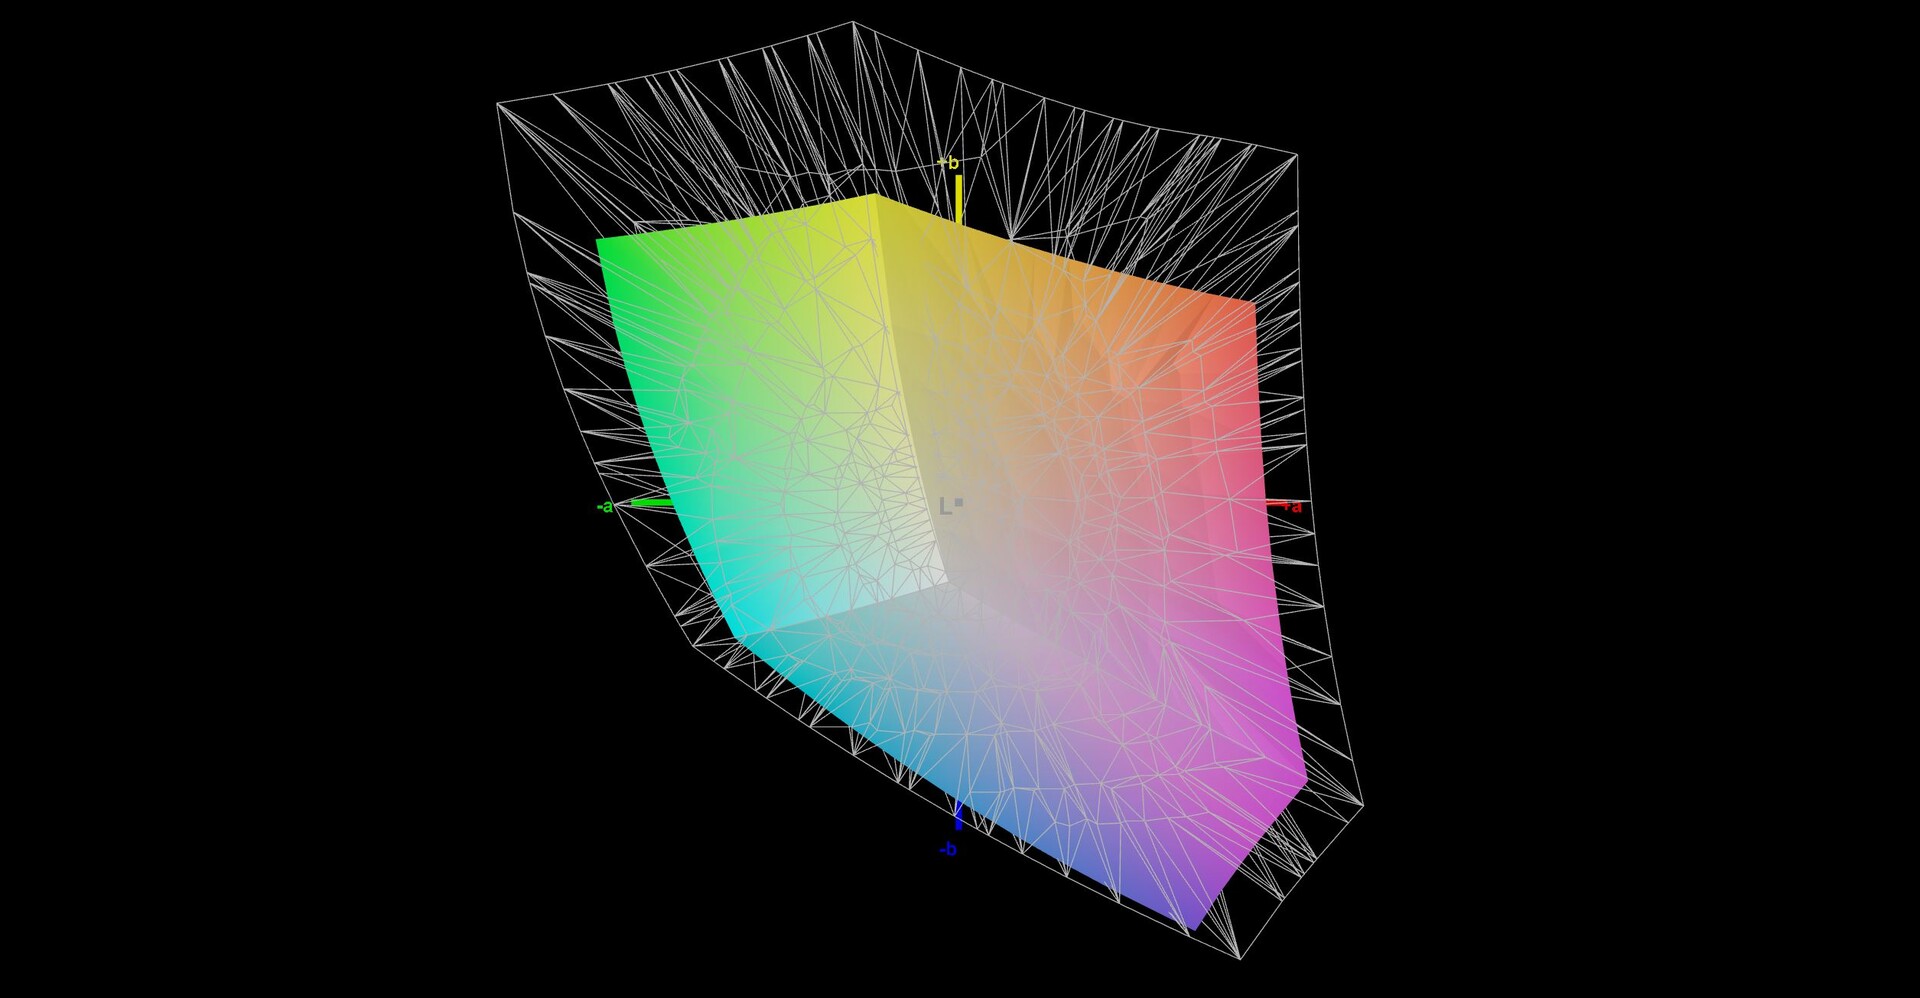
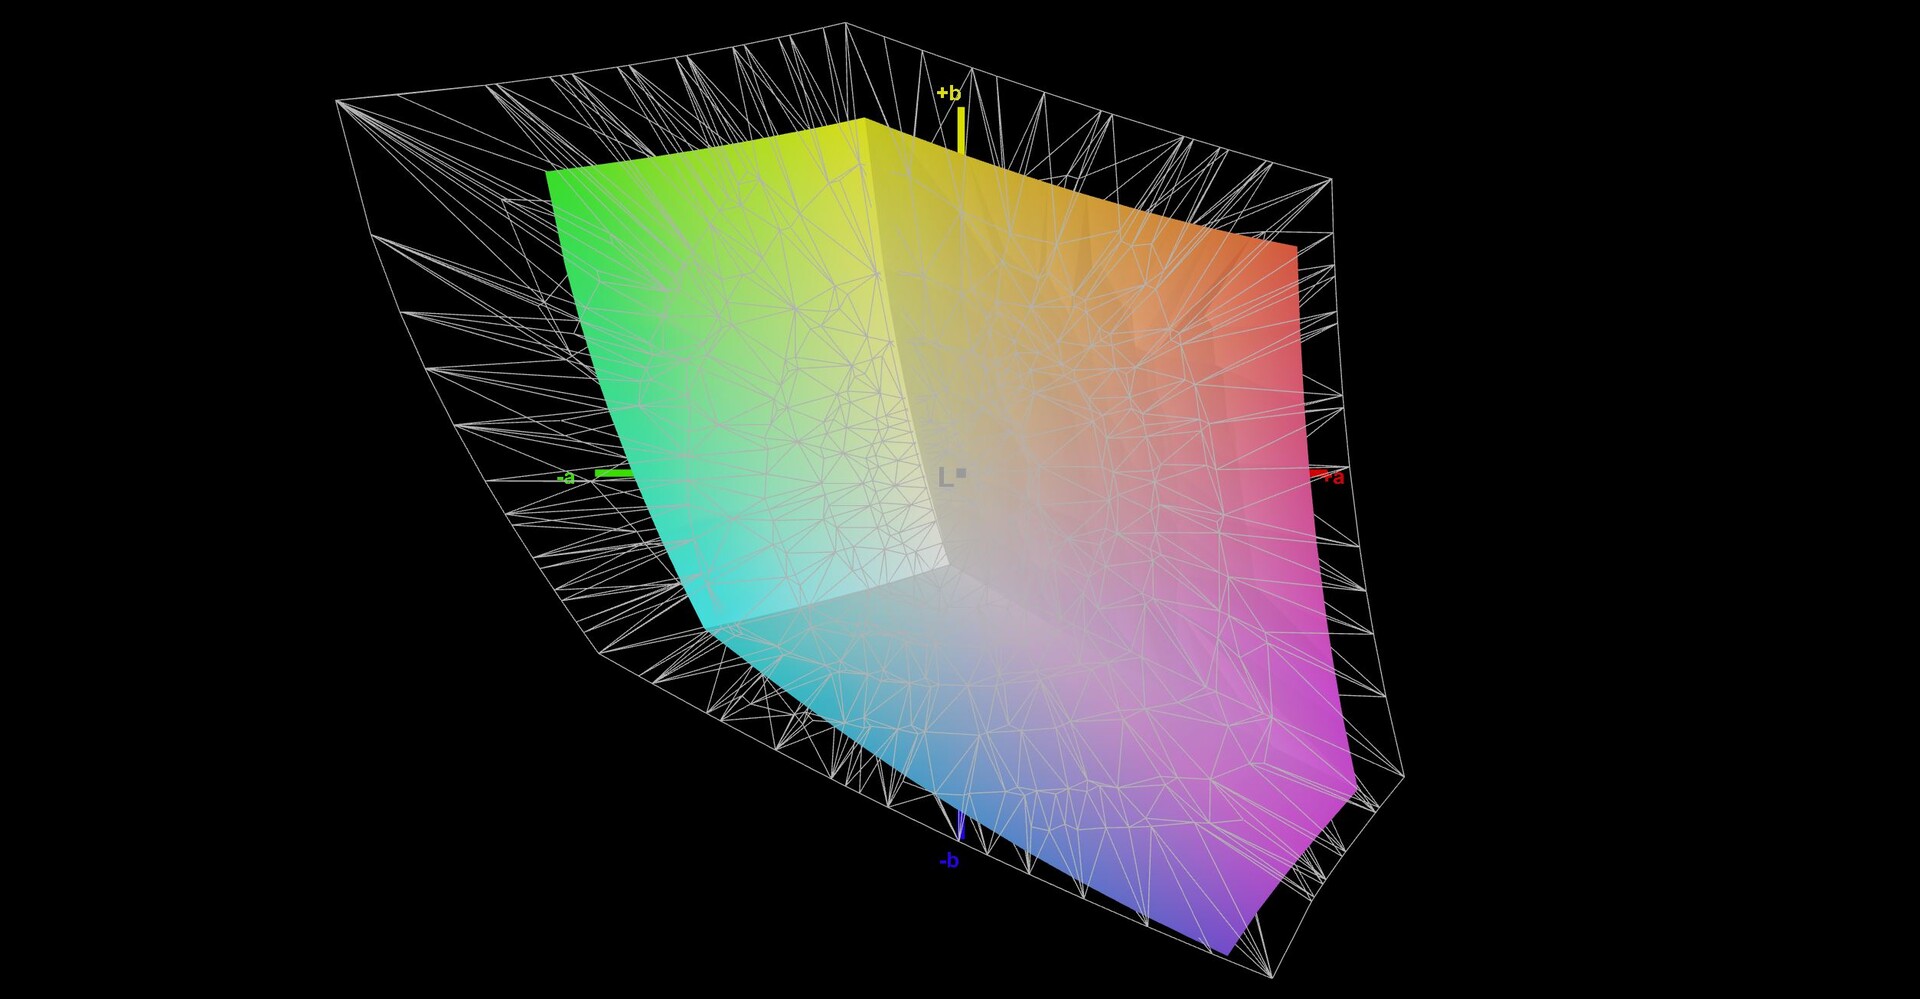
67.9% AdobeRGB 1998 (Argyll 3D)
92.1% sRGB (Argyll 3D)
65.6% Display P3 (Argyll 3D)
Gamma: 2.14
CCT: 7732 K
| Asus ROG Ally Z1 Extreme TL070FVSX01-0, IPS, 1920x1080, 7" | Valve Steam Deck 512 GB LCD 1280x800, 7" | GPD Win 4 G1618-04, IPS, 1920x1080, 6" | GPD Win Max 2 Toshiba HX_10.1_LCD, IPS, 2560x1600, 10.1" | |
|---|---|---|---|---|
| Display | -3% | 1% | ||
| Display P3 Coverage (%) | 65.6 | 63.1 -4% | 69.8 6% | |
| sRGB Coverage (%) | 92.1 | 92 0% | 91 -1% | |
| AdobeRGB 1998 Coverage (%) | 67.9 | 64.6 -5% | 66.6 -2% | |
| Response Times | -165% | -202% | -157% | |
| Response Time Grey 50% / Grey 80% * (ms) | 10.5 ? | 30.1 ? -187% | 26.8 ? -155% | 21.2 ? -102% |
| Response Time Black / White * (ms) | 6 ? | 14.5 ? -142% | 20.9 ? -248% | 18.7 ? -212% |
| PWM Frequency (Hz) | 1080 ? | |||
| Screen | -14% | -39% | -19% | |
| Brightness middle (cd/m²) | 513 | 517 1% | 413.1 -19% | 396.7 -23% |
| Brightness (cd/m²) | 474 | 524 11% | 407 -14% | 381 -20% |
| Brightness Distribution (%) | 84 | 97 15% | 81 -4% | 89 6% |
| Black Level * (cd/m²) | 0.38 | 0.47 -24% | 0.39 -3% | 0.36 5% |
| Contrast (:1) | 1350 | 1100 -19% | 1059 -22% | 1102 -18% |
| Colorchecker dE 2000 * | 3.7 | 5.7 -54% | 6.97 -88% | 6.31 -71% |
| Colorchecker dE 2000 max. * | 8.3 | 10.5 -27% | 14.11 -70% | 10.23 -23% |
| Greyscale dE 2000 * | 5.1 | 5.7 -12% | 9.9 -94% | 5.5 -8% |
| Gamma | 2.14 103% | 2.18 101% | 2.04 108% | 2.17 101% |
| CCT | 7732 84% | 7733 84% | 9571 68% | 7502 87% |
| Colorchecker dE 2000 calibrated * | 1.24 | 1.44 | ||
| Total Average (Program / Settings) | -90% /
-44% | -81% /
-56% | -58% /
-36% |
* ... smaller is better
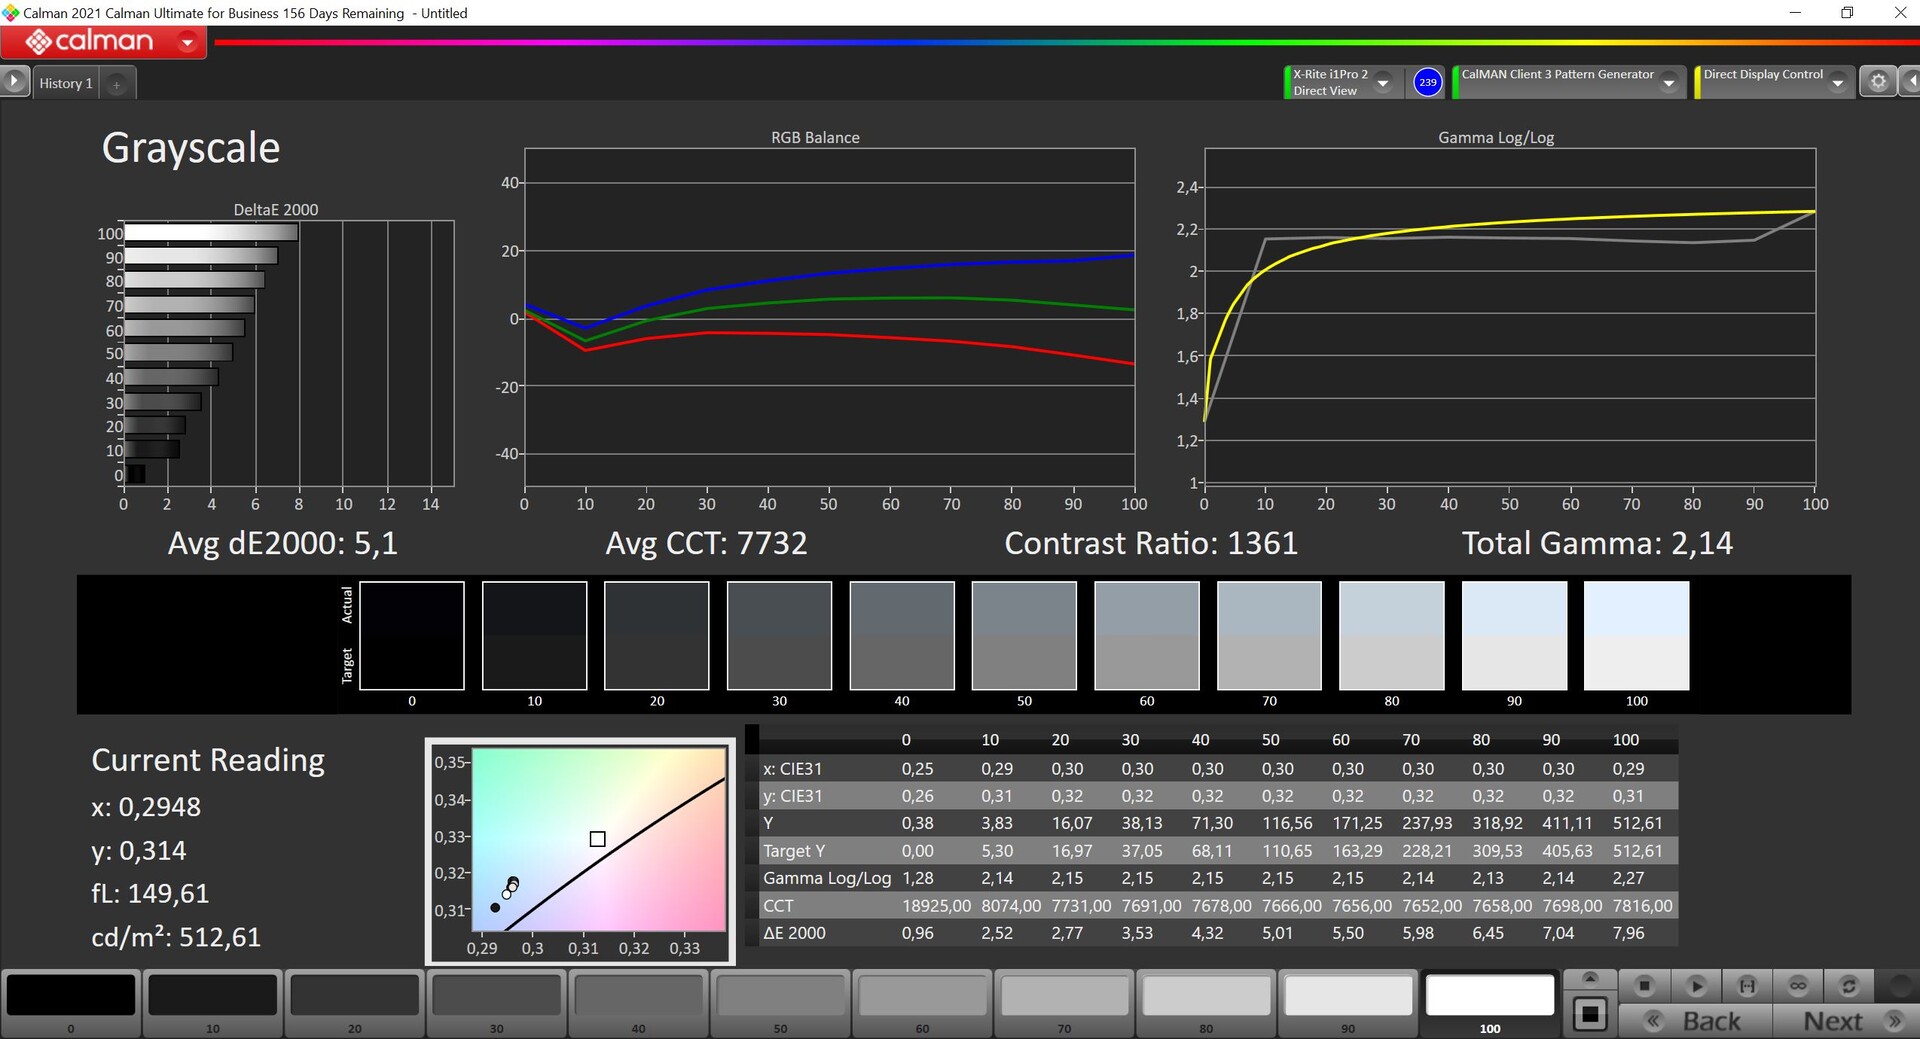
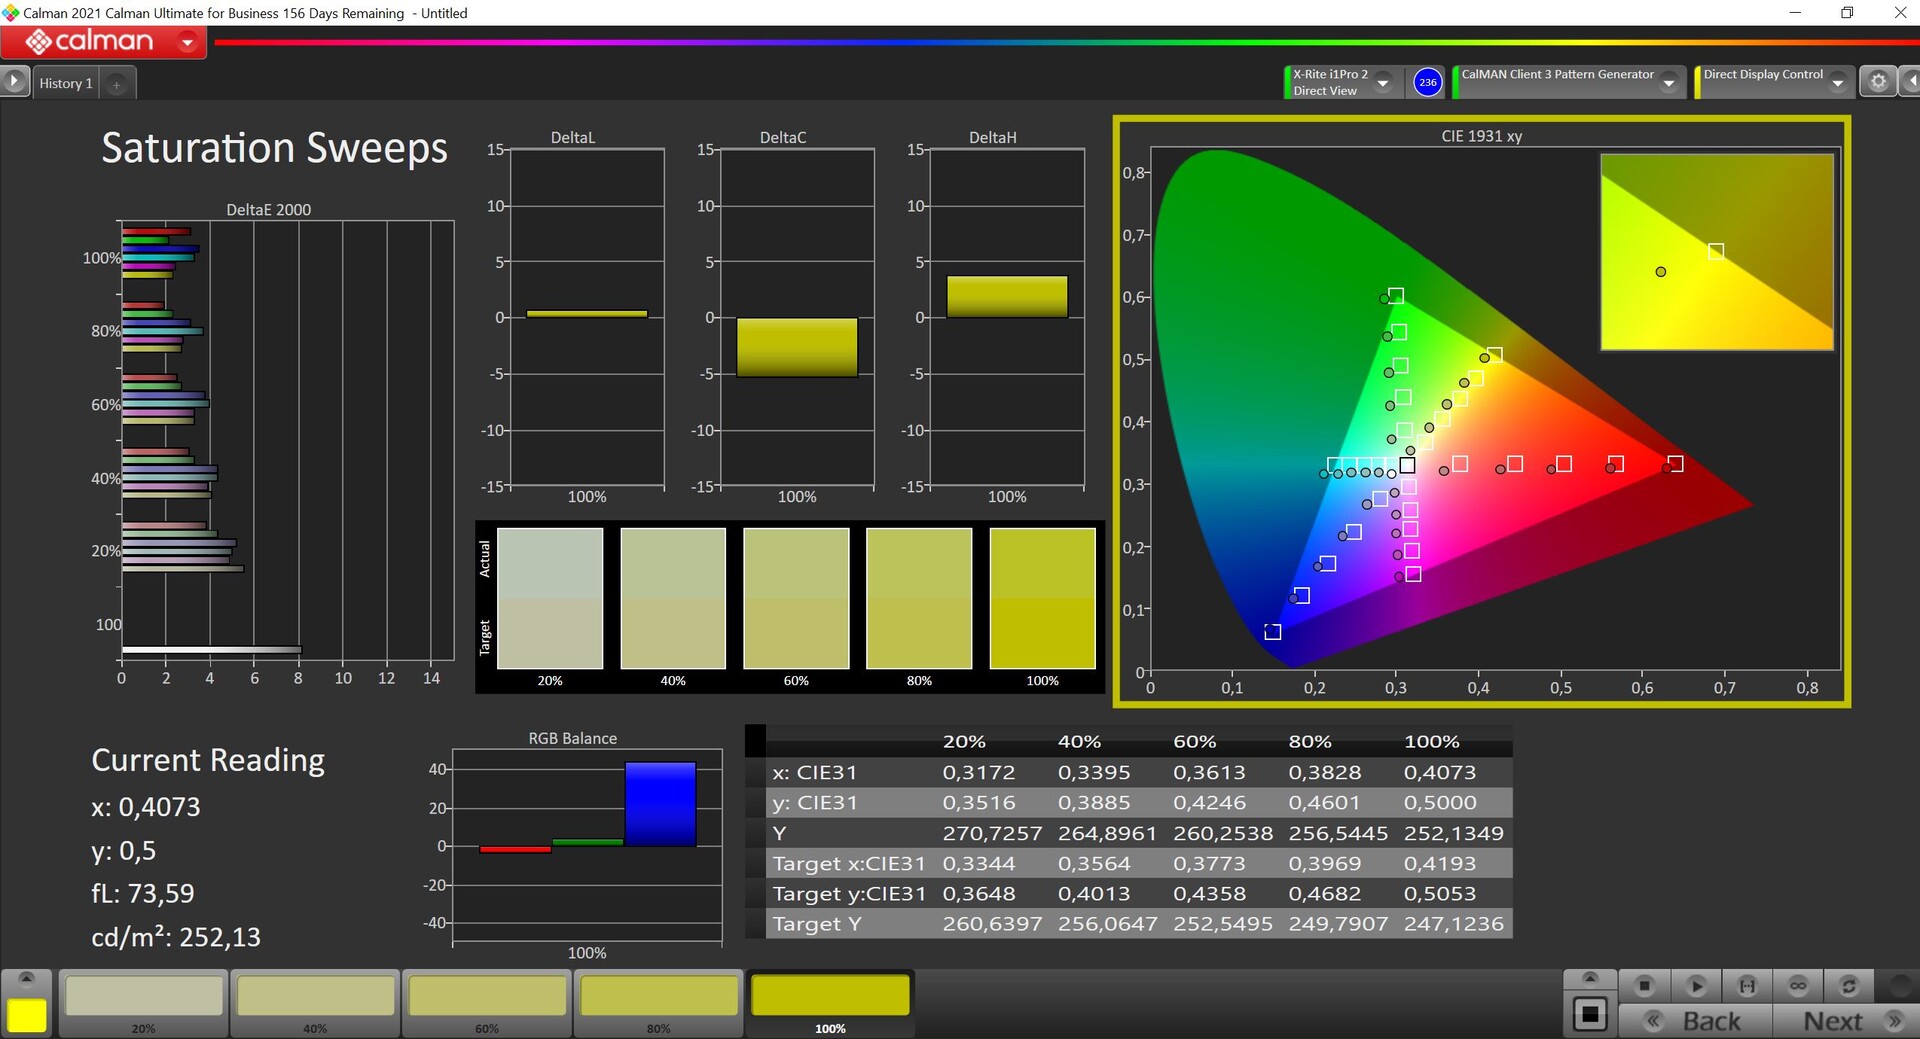
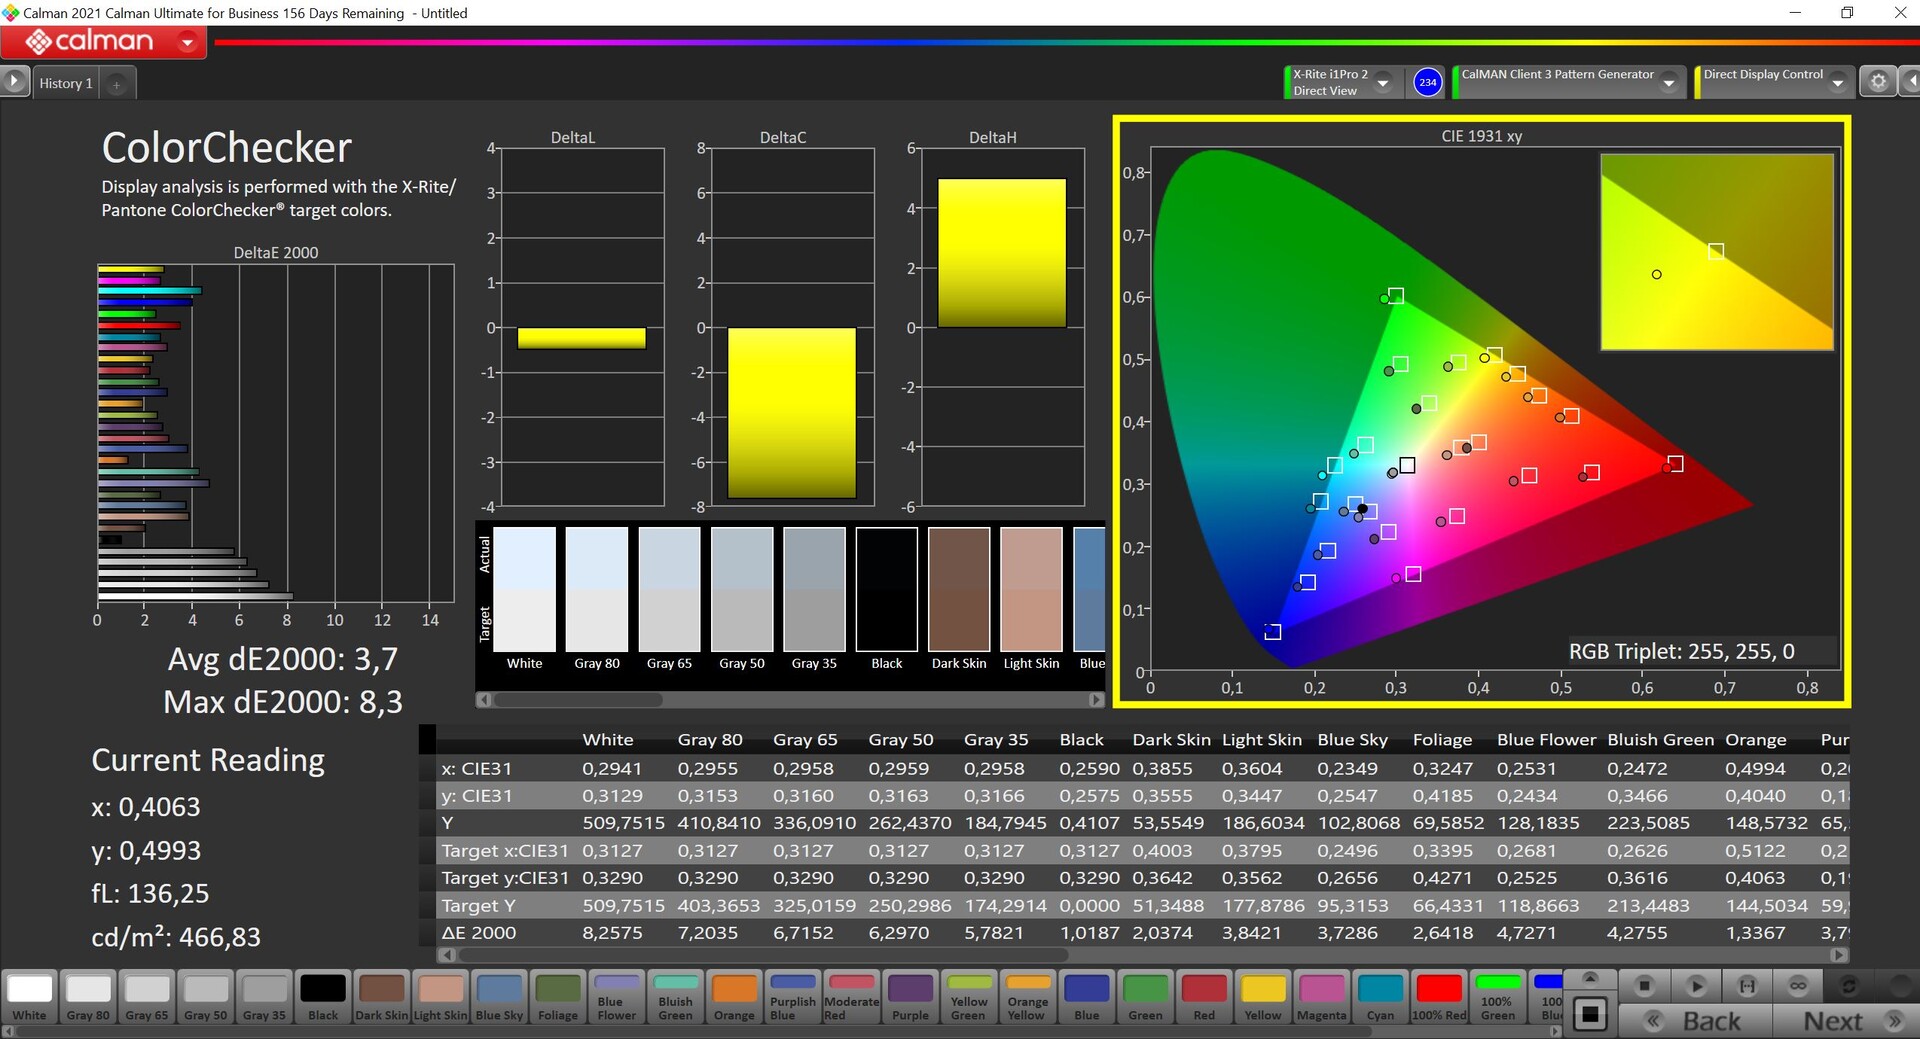
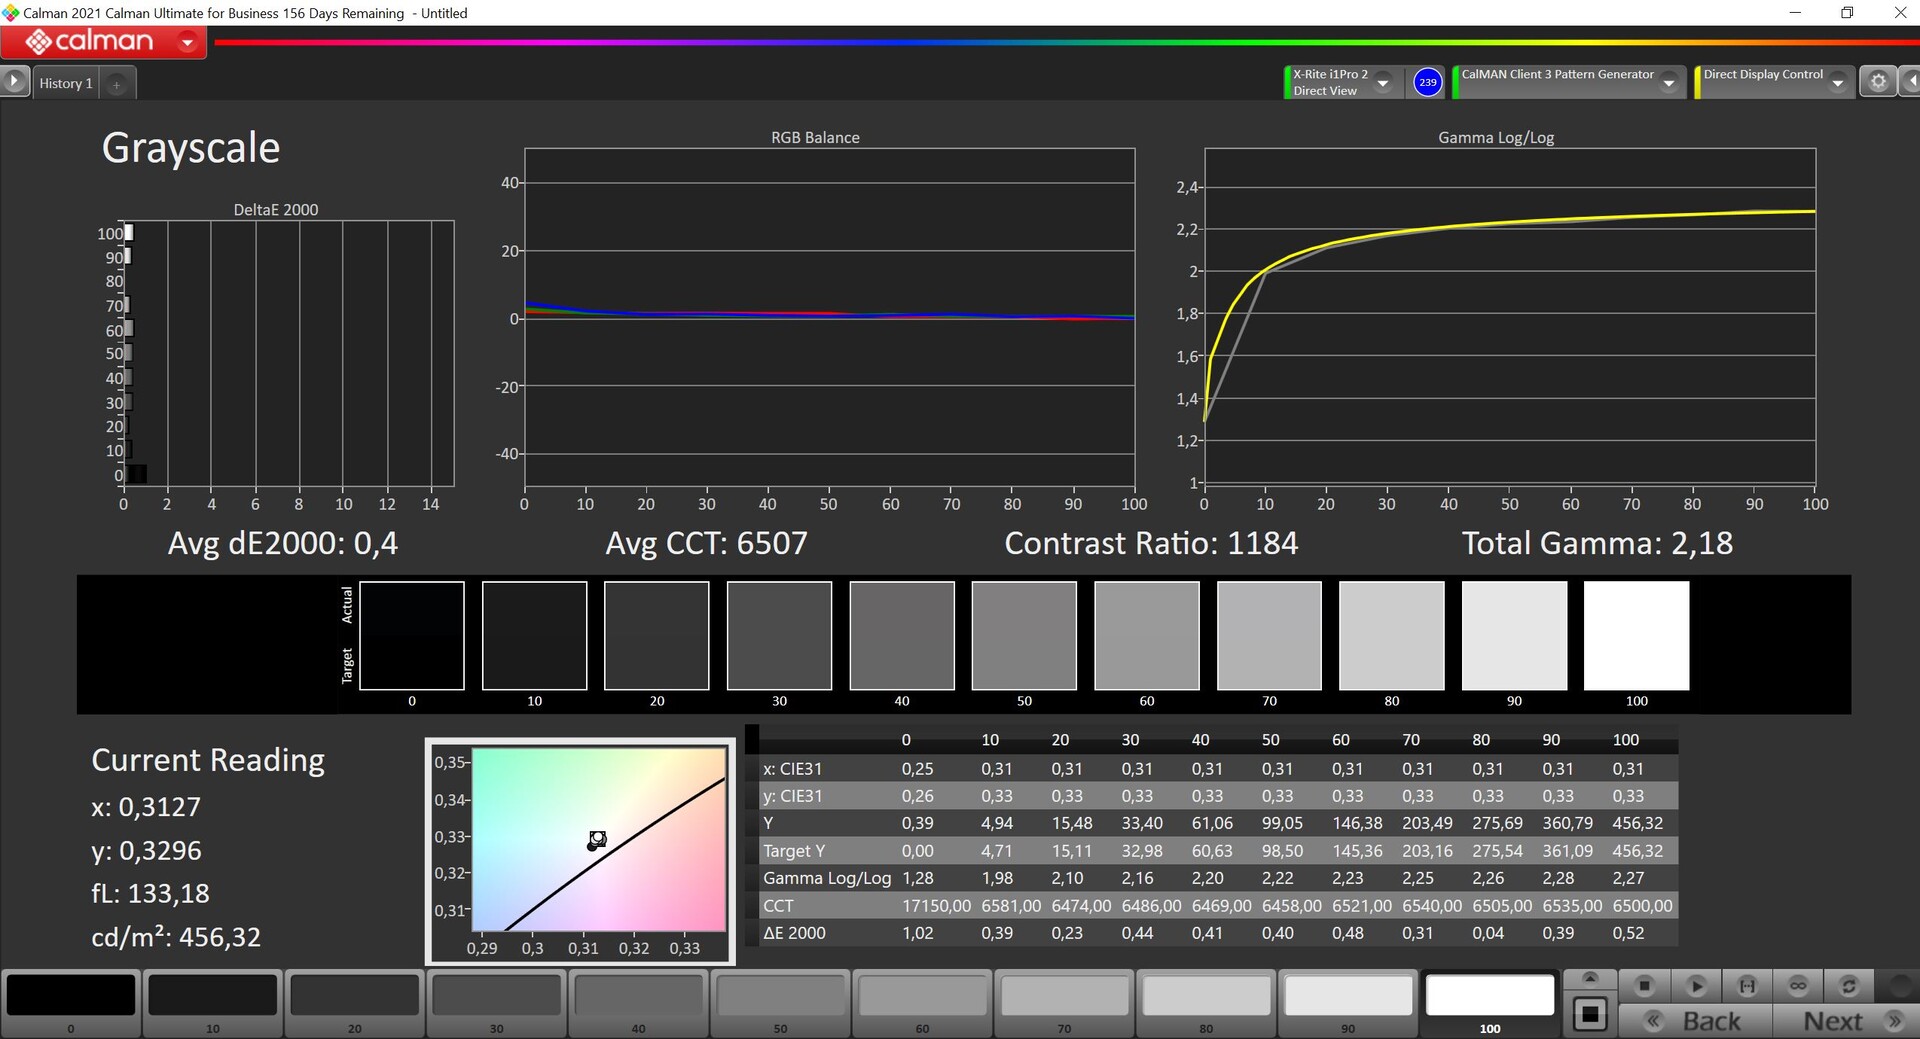
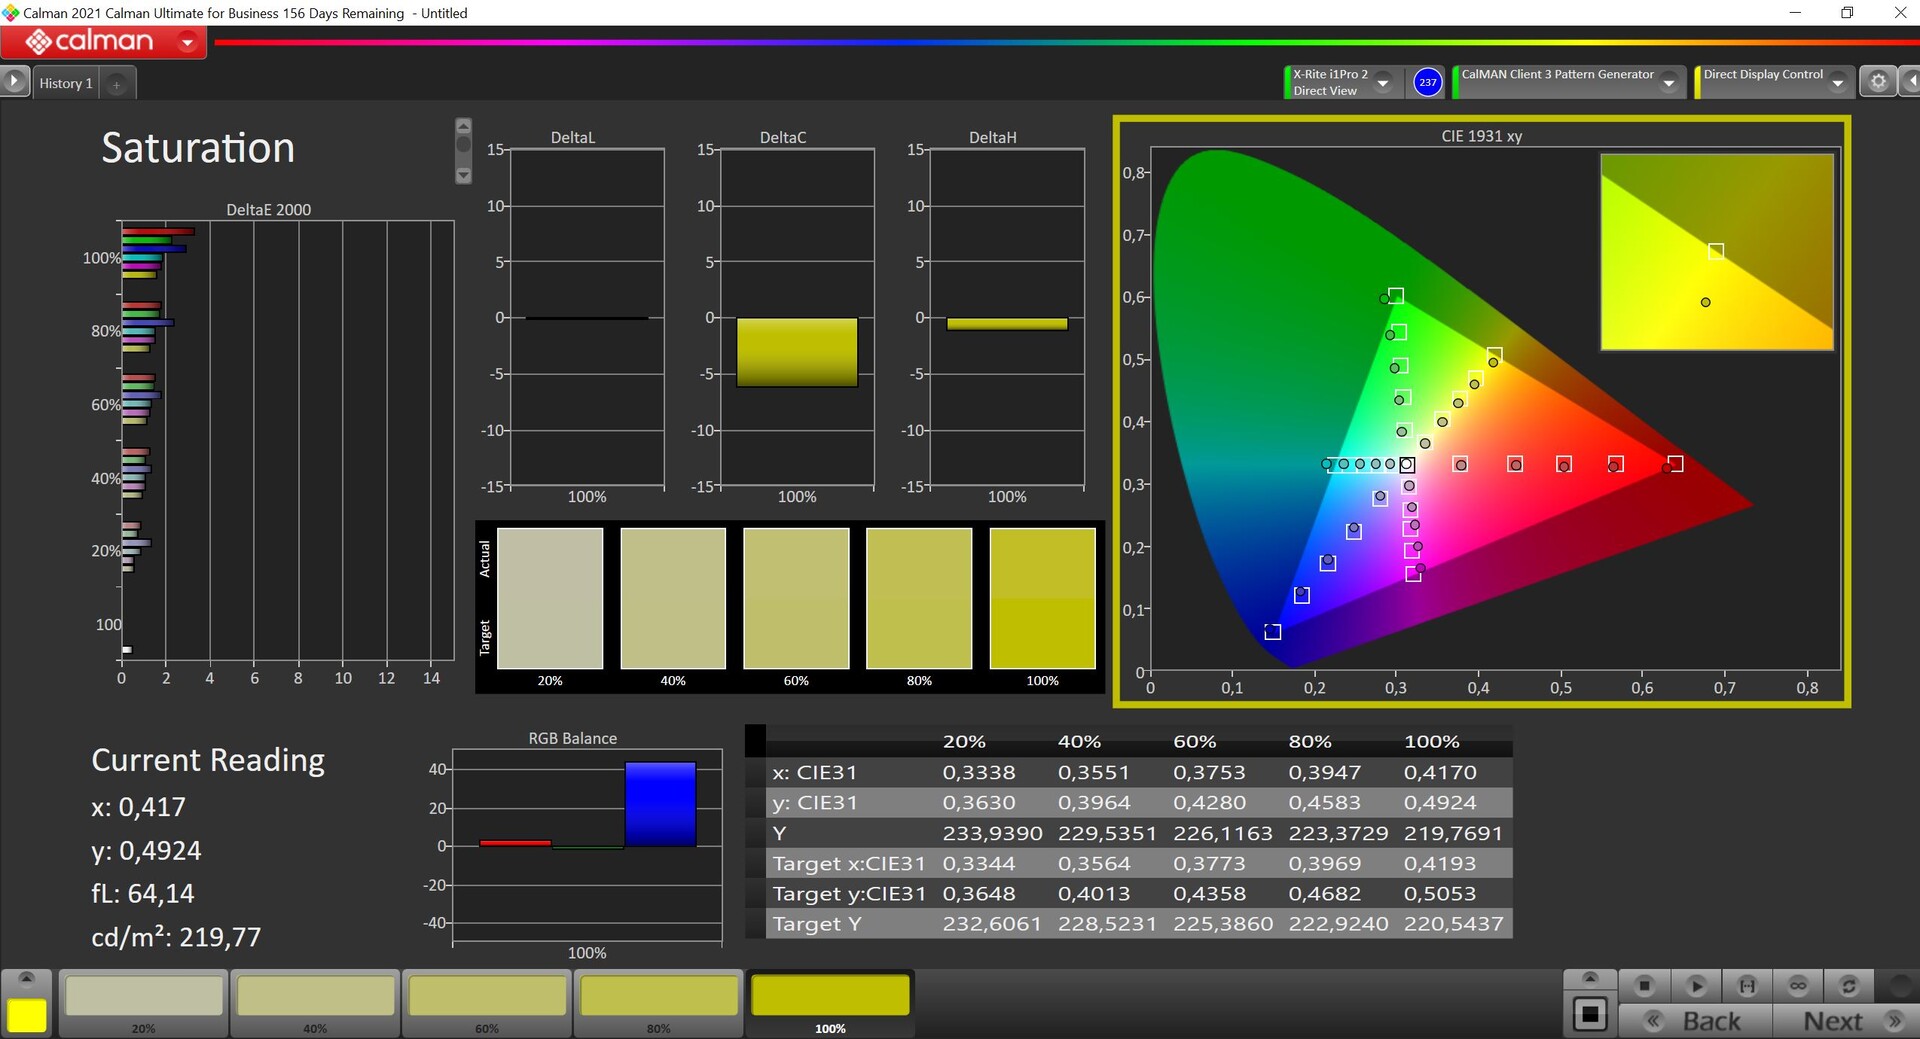
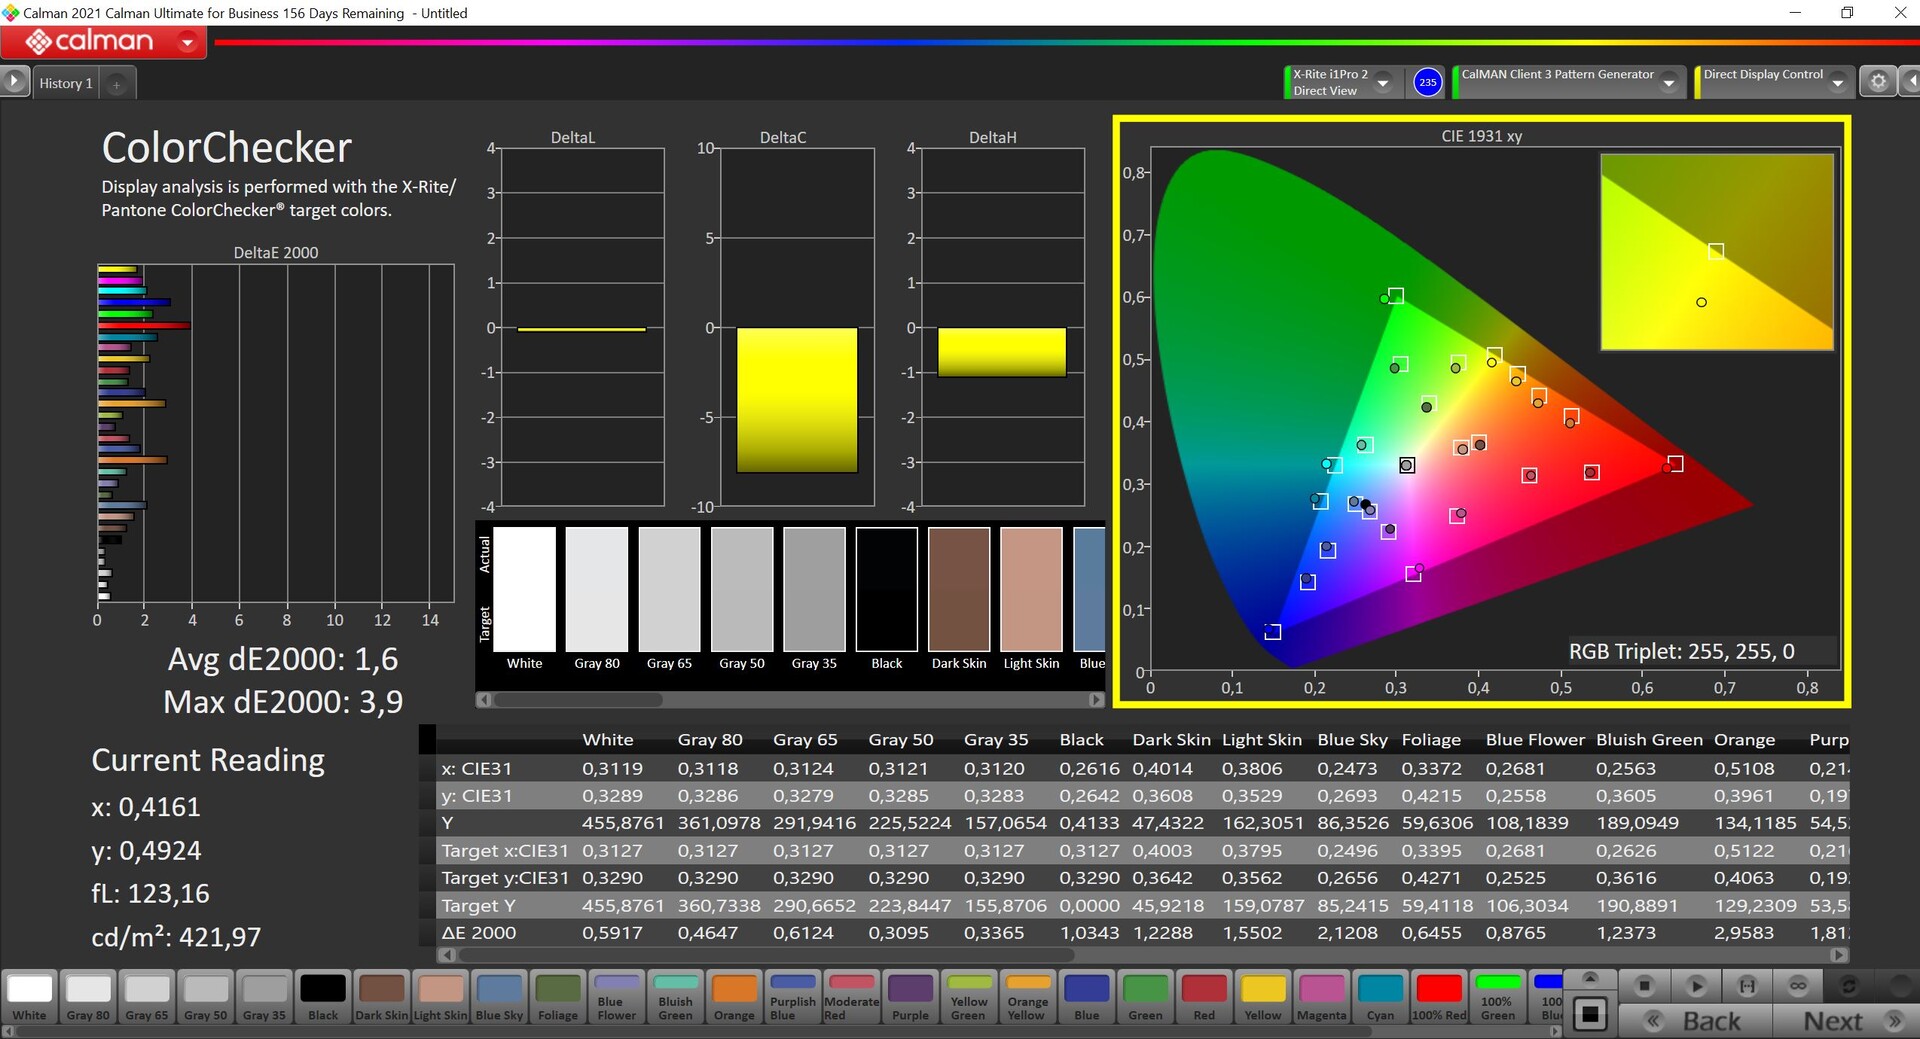
Armoury Crate SE软件为显示器提供了不同的预设(如具有较高饱和度的vivid或减少蓝光的EyeCare)。我们用专业的CalMAN软件分析时使用了默认预设。对于一个游戏设备来说,颜色偏差还可以,但画面明显太冷,而且有明显的蓝光。这种校准的优点是最大亮度较高,在我们自己校准后,亮度下降了约50尼特。但结果是灰度表现出色,我们也设法提高了色彩准确性。小的sRGB参考值覆盖了92%,这对于游戏手持设备来说是完全足够的。我们不相信任何用户会使用爱丽进行严肃的图片/视频编辑。
Display Response Times
| ↔ Response Time Black to White | ||
|---|---|---|
| 6 ms ... rise ↗ and fall ↘ combined | ↗ 2.7 ms rise | 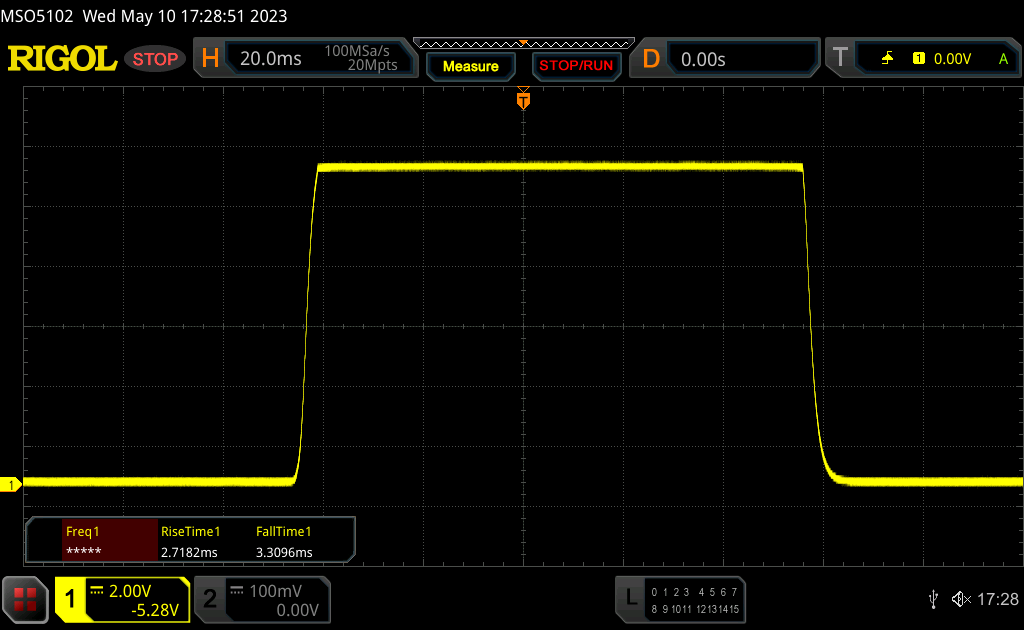 |
| ↘ 3.3 ms fall | ||
| The screen shows very fast response rates in our tests and should be very well suited for fast-paced gaming. In comparison, all tested devices range from 0.1 (minimum) to 240 (maximum) ms. » 19 % of all devices are better. This means that the measured response time is better than the average of all tested devices (19.8 ms). | ||
| ↔ Response Time 50% Grey to 80% Grey | ||
| 10.5 ms ... rise ↗ and fall ↘ combined | ↗ 5 ms rise | 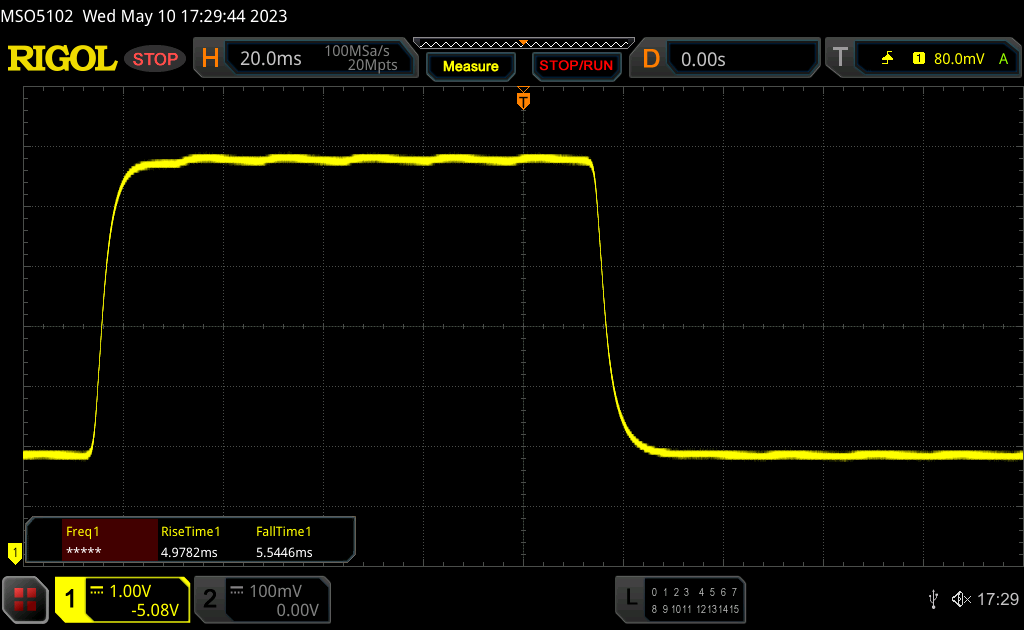 |
| ↘ 5.5 ms fall | ||
| The screen shows good response rates in our tests, but may be too slow for competitive gamers. In comparison, all tested devices range from 0.165 (minimum) to 636 (maximum) ms. » 24 % of all devices are better. This means that the measured response time is better than the average of all tested devices (31 ms). | ||
Screen Flickering / PWM (Pulse-Width Modulation)
| Screen flickering / PWM not detected | 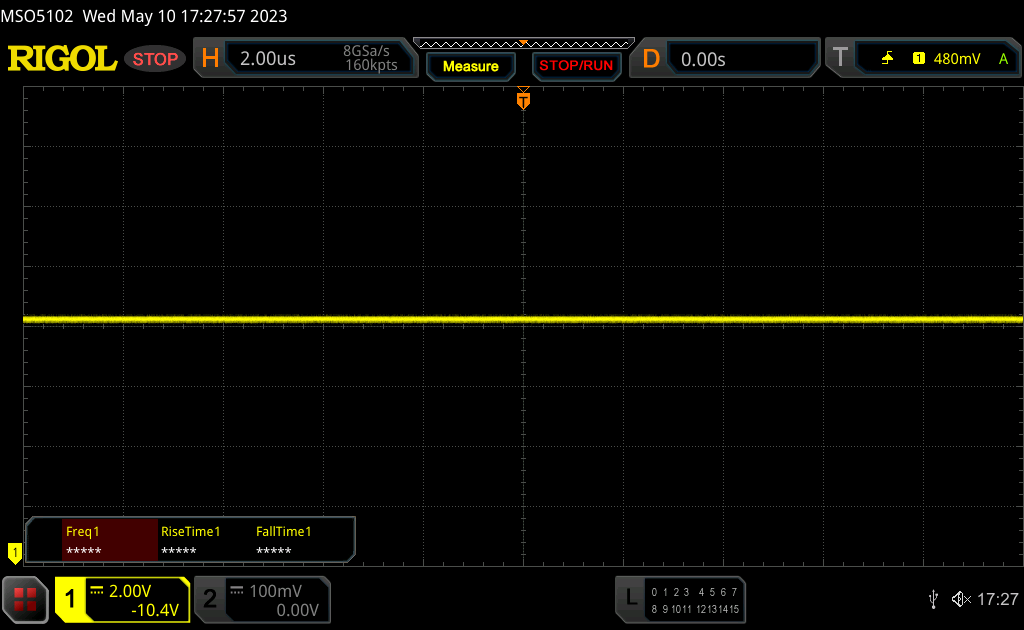 | ||
In comparison: 52 % of all tested devices do not use PWM to dim the display. If PWM was detected, an average of 7754 (minimum: 5 - maximum: 343500) Hz was measured. | |||
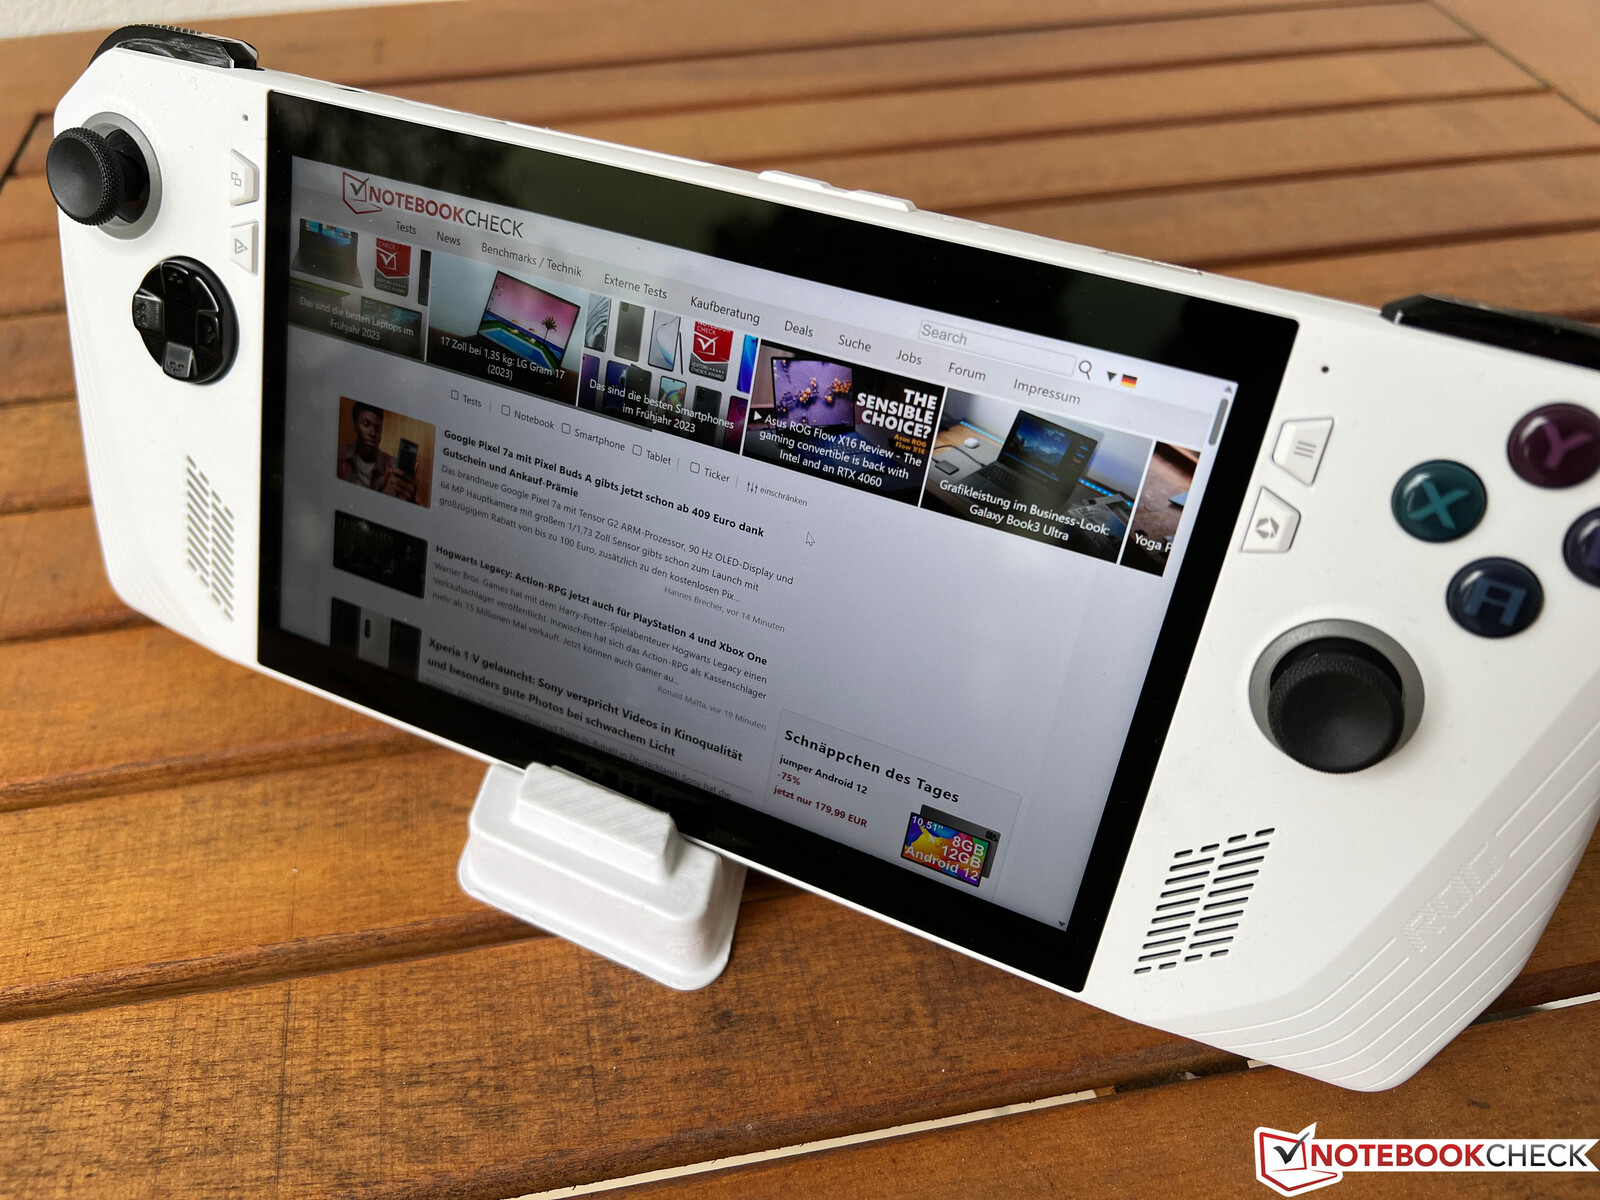
为了减少触摸屏的反射,华硕还使用了康宁大猩猩玻璃DXC涂层。这一点做得相当好,屏幕不像其他许多触摸屏那样有反射。即使在明亮的阳光下,你仍然可以合理地看到图片内容,尽管你必须使用全面板亮度。视角的稳定性很好。

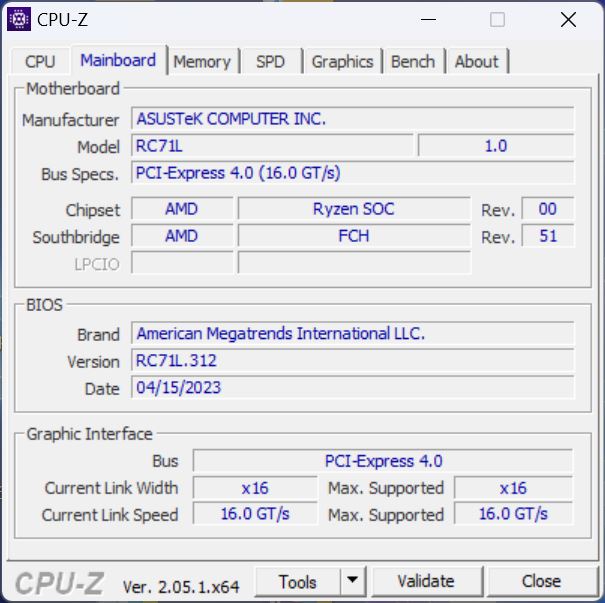
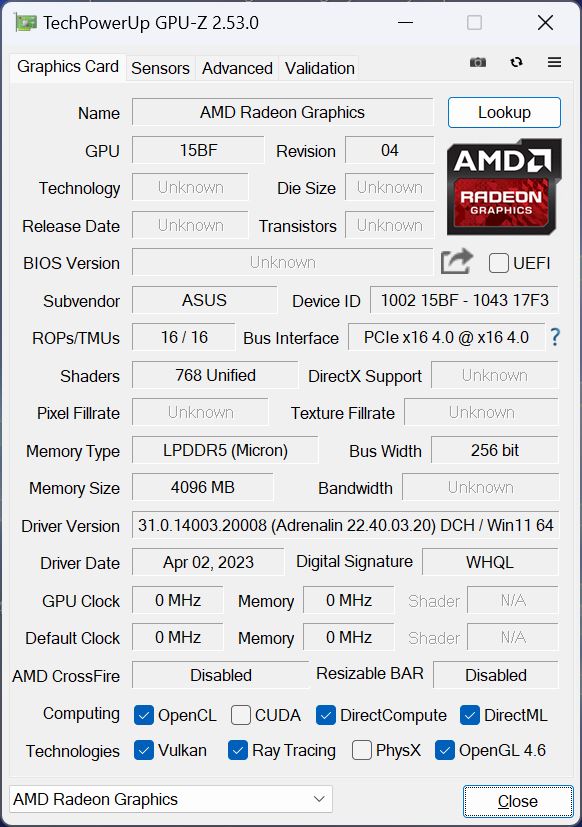
性能 - Ryzen Z1 Extreme/Ryzen 7 7840U的首次亮相
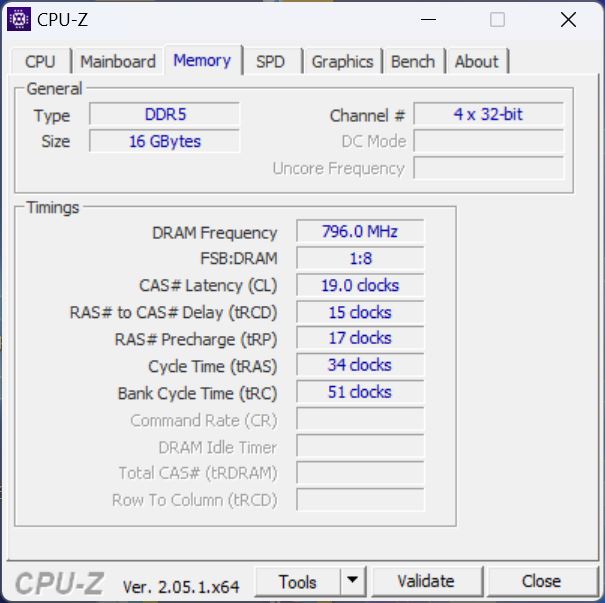
我们已经列出了两个不同的ROG Ally SKU的规格,其中价格较低的型号配有AMD Ryzen Z1在GPU性能方面应该明显较慢,因为它只使用4个而不是12个CU。这款Z1 Extreme在我们的评测单元中,其规格与新的Ryzen 7 7840U但Z1 Extreme可以在9瓦的较低TDP下运行(7840U:15瓦)。普通Ryzen Z1的CPU核心也少了两个。两种型号都配备了16GB LPDDR5-6400内存的双通道配置,并获得256GB或512GB SSD存储(M.2-2230)。
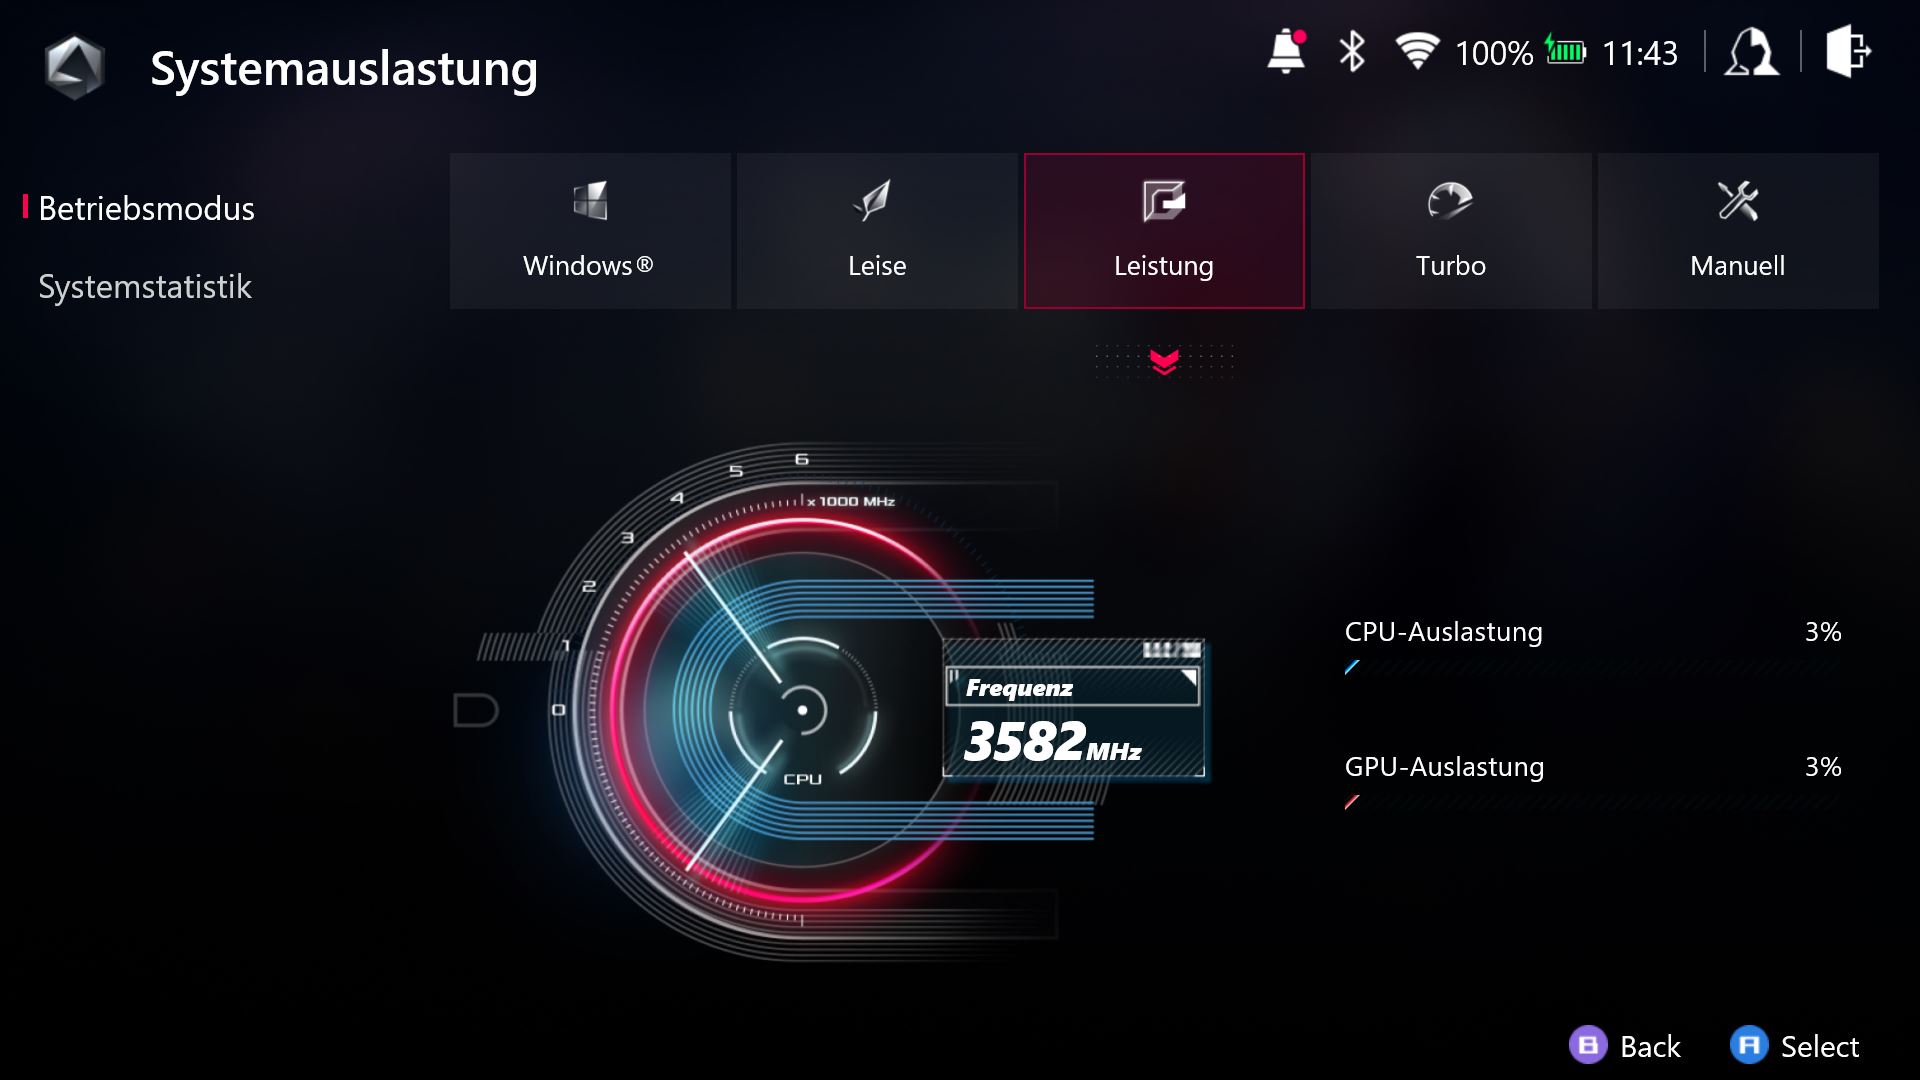
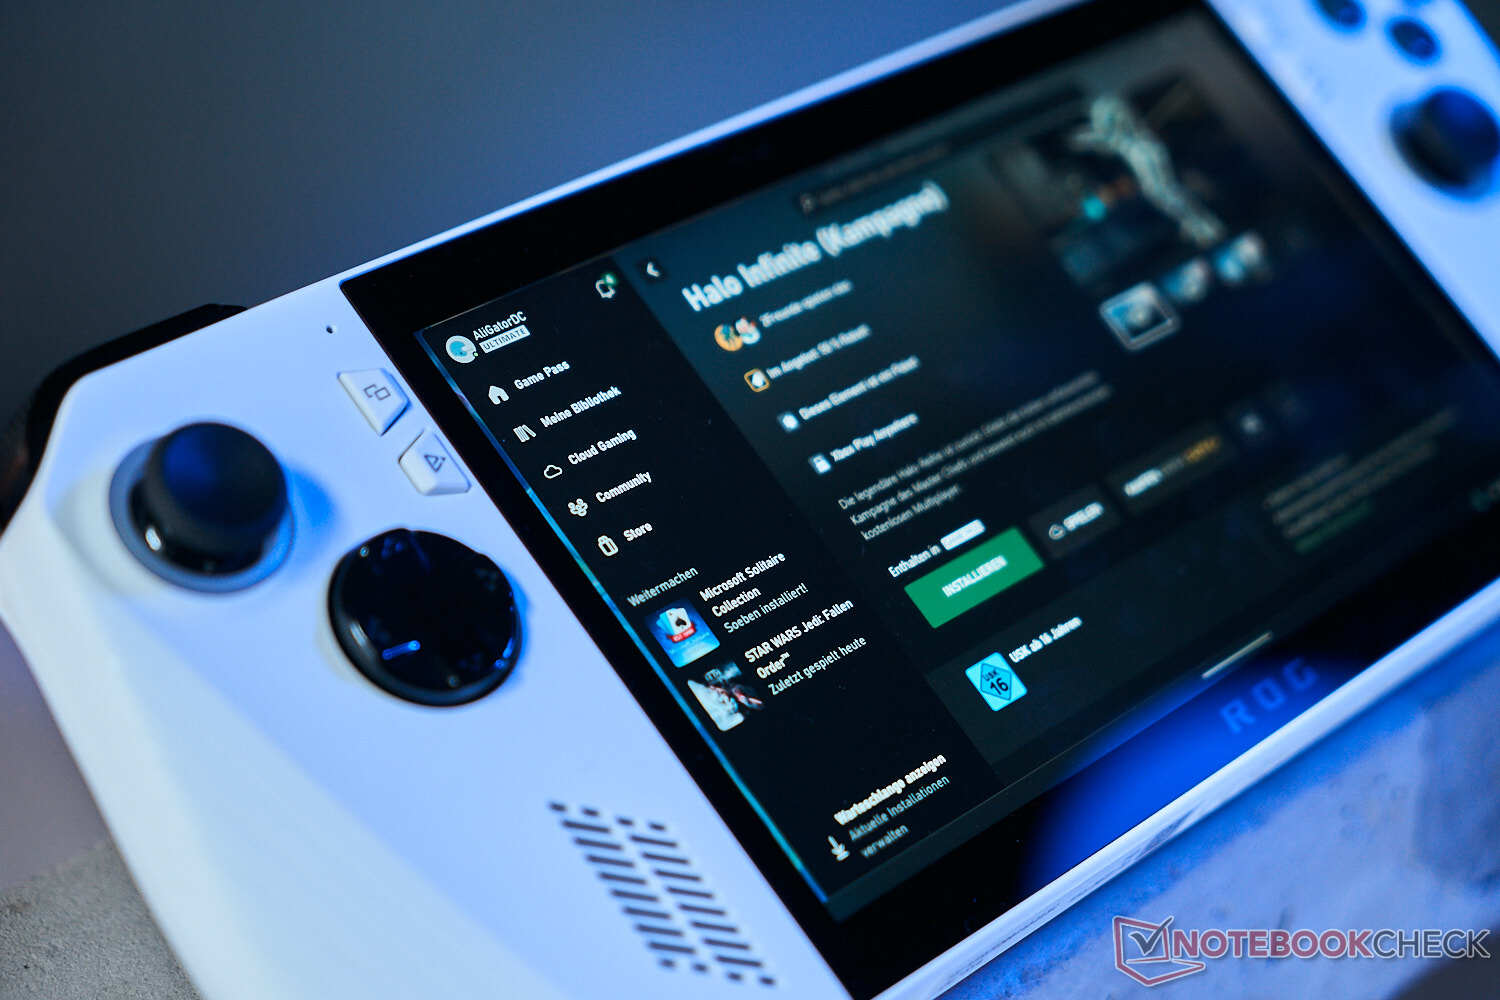
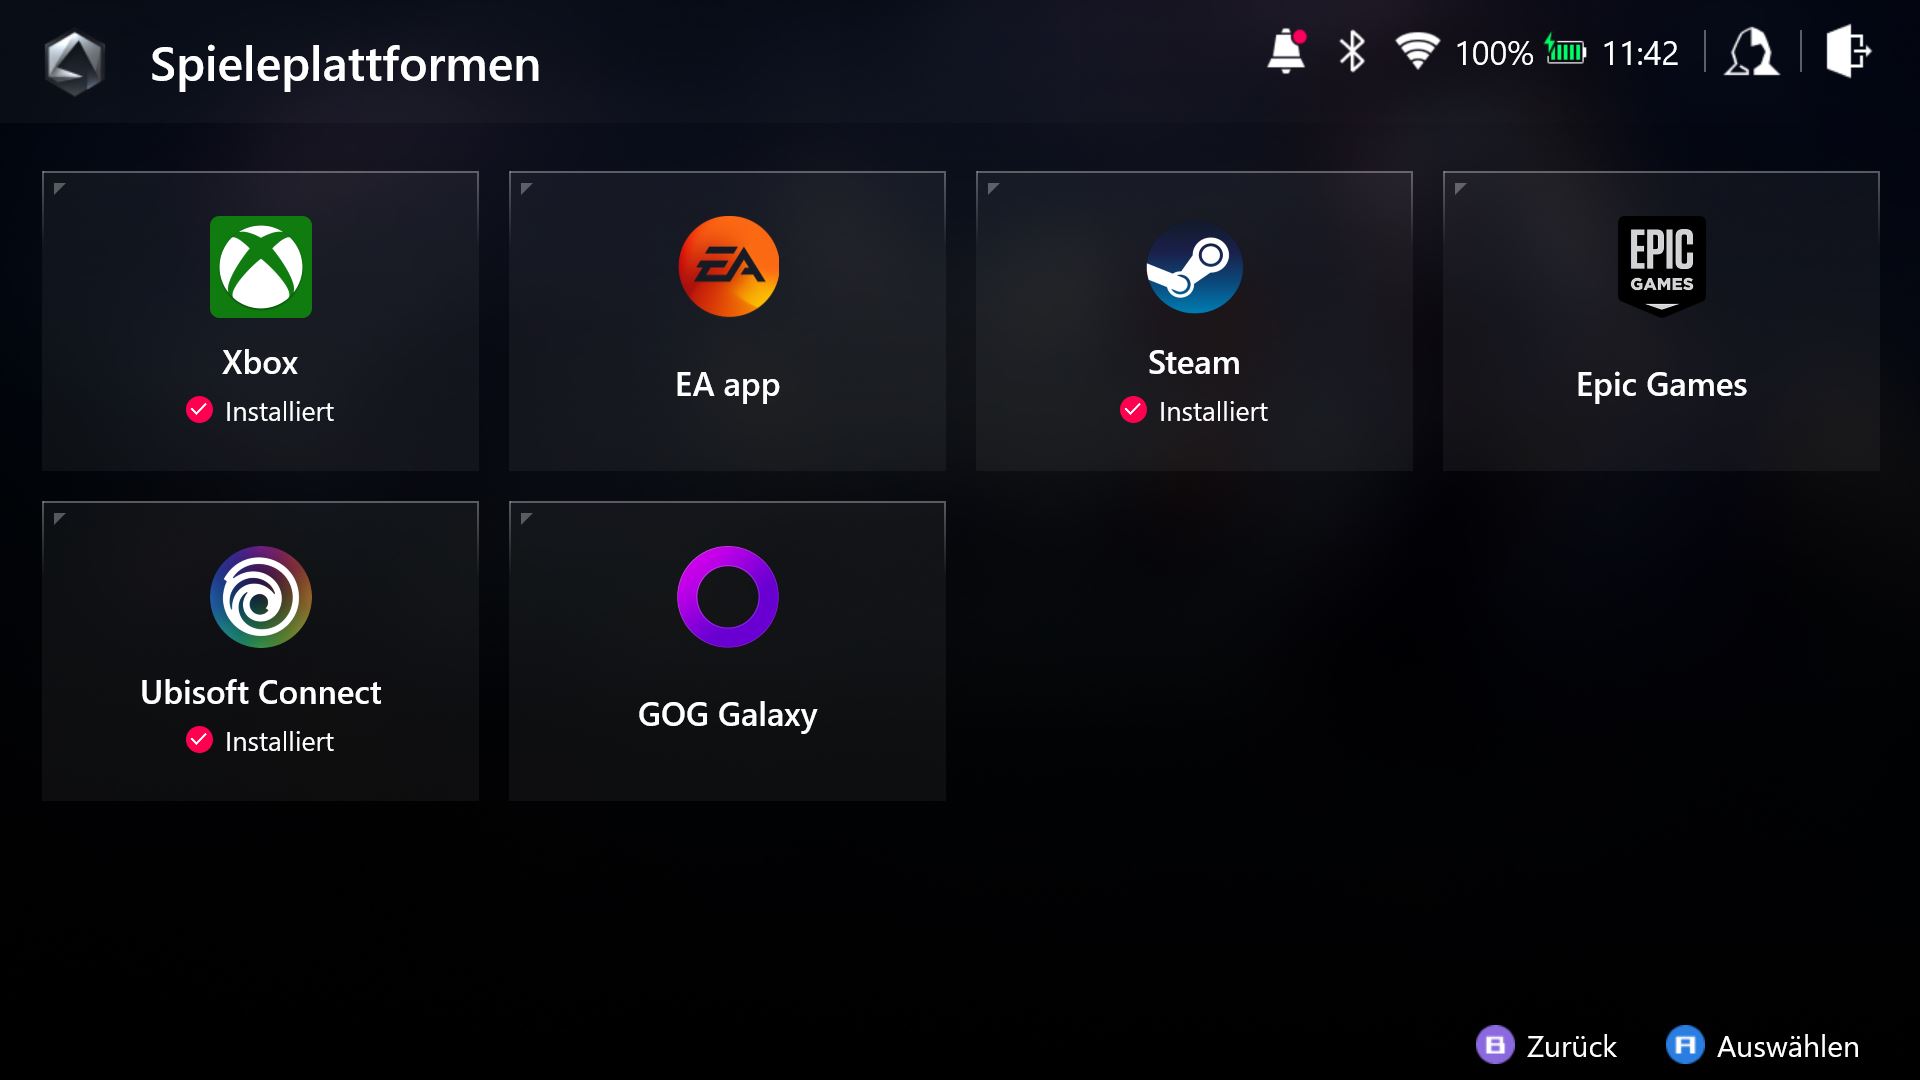
ROG Ally使用标准的Windows 11安装,所以我们在执行标准的基准测试套件时没有问题。当你启动设备时,Ally会自动启动Armoury Crate SE软件,让你直接访问最重要的系统设置以及游戏服务(如Steam、Origin等)和安装的游戏。这意味着,如果你不想的话,你真的不需要过多地摆弄Windows。

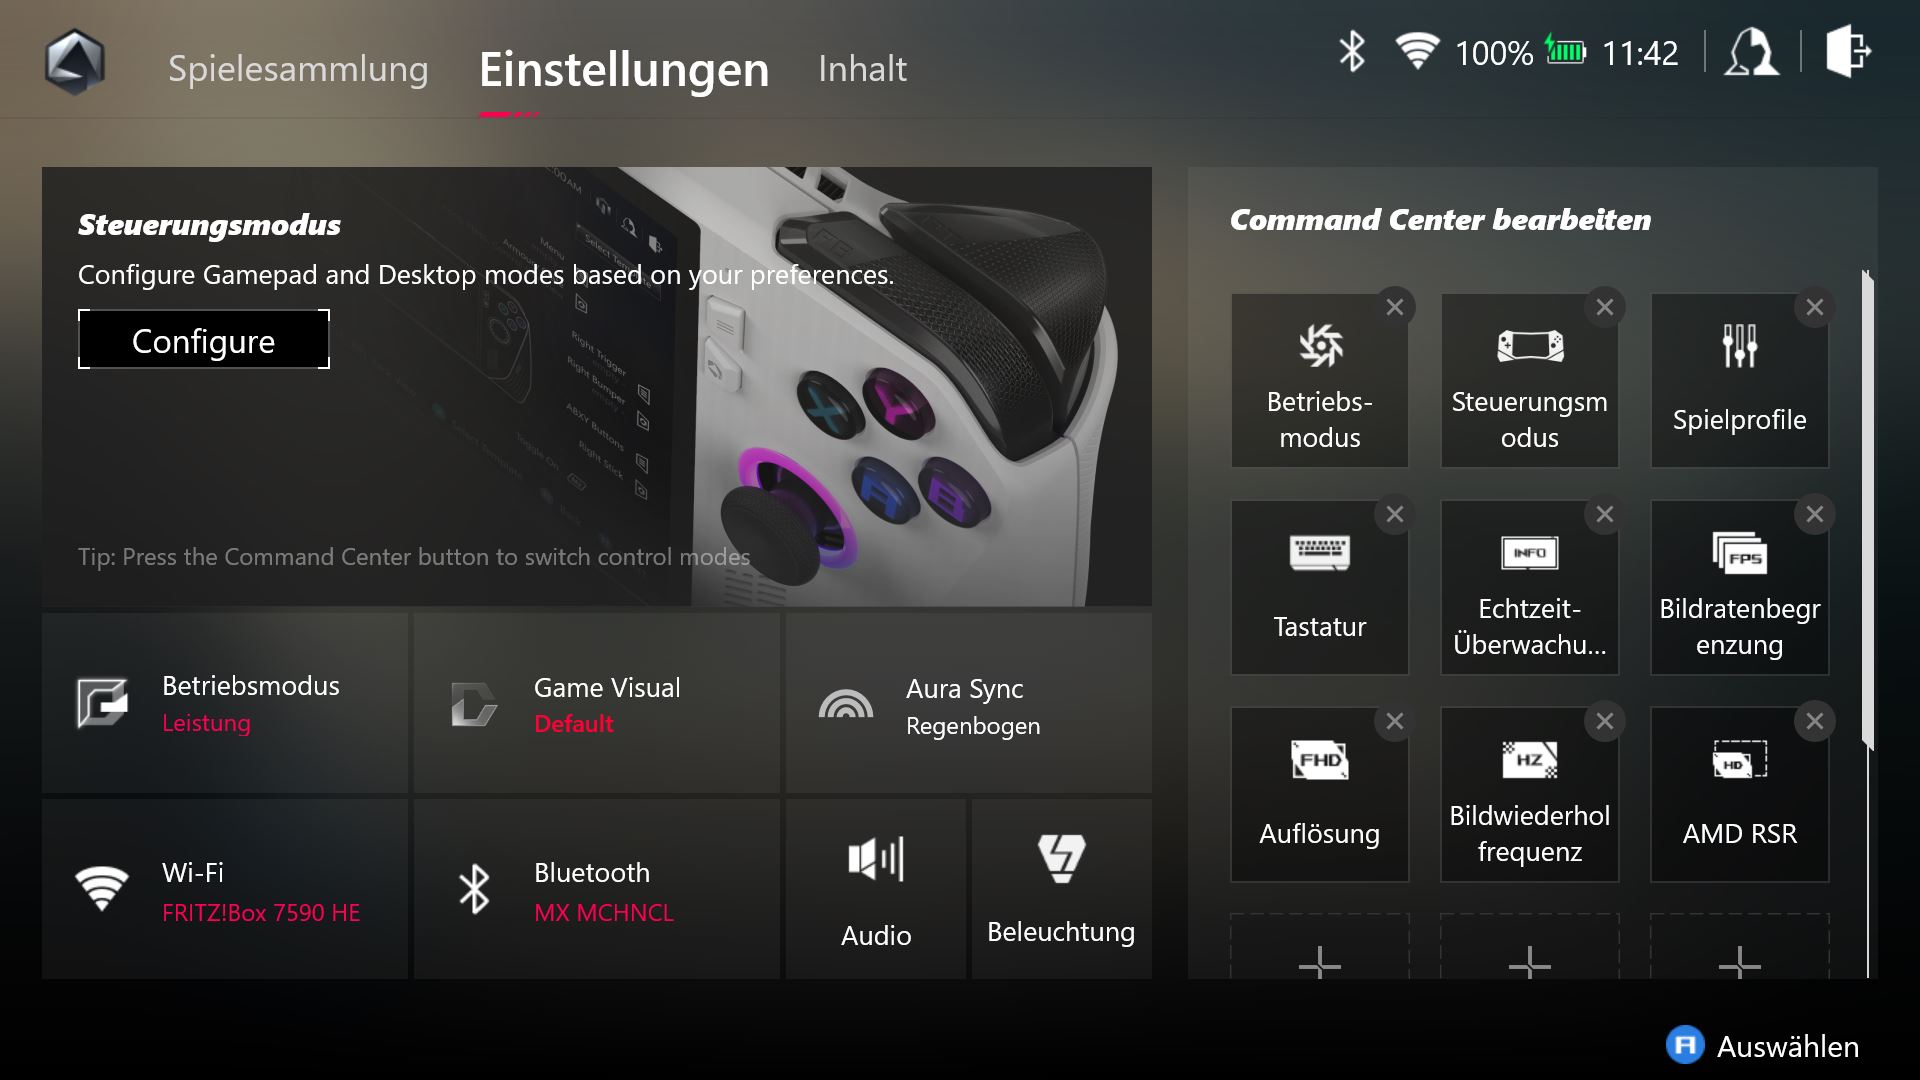
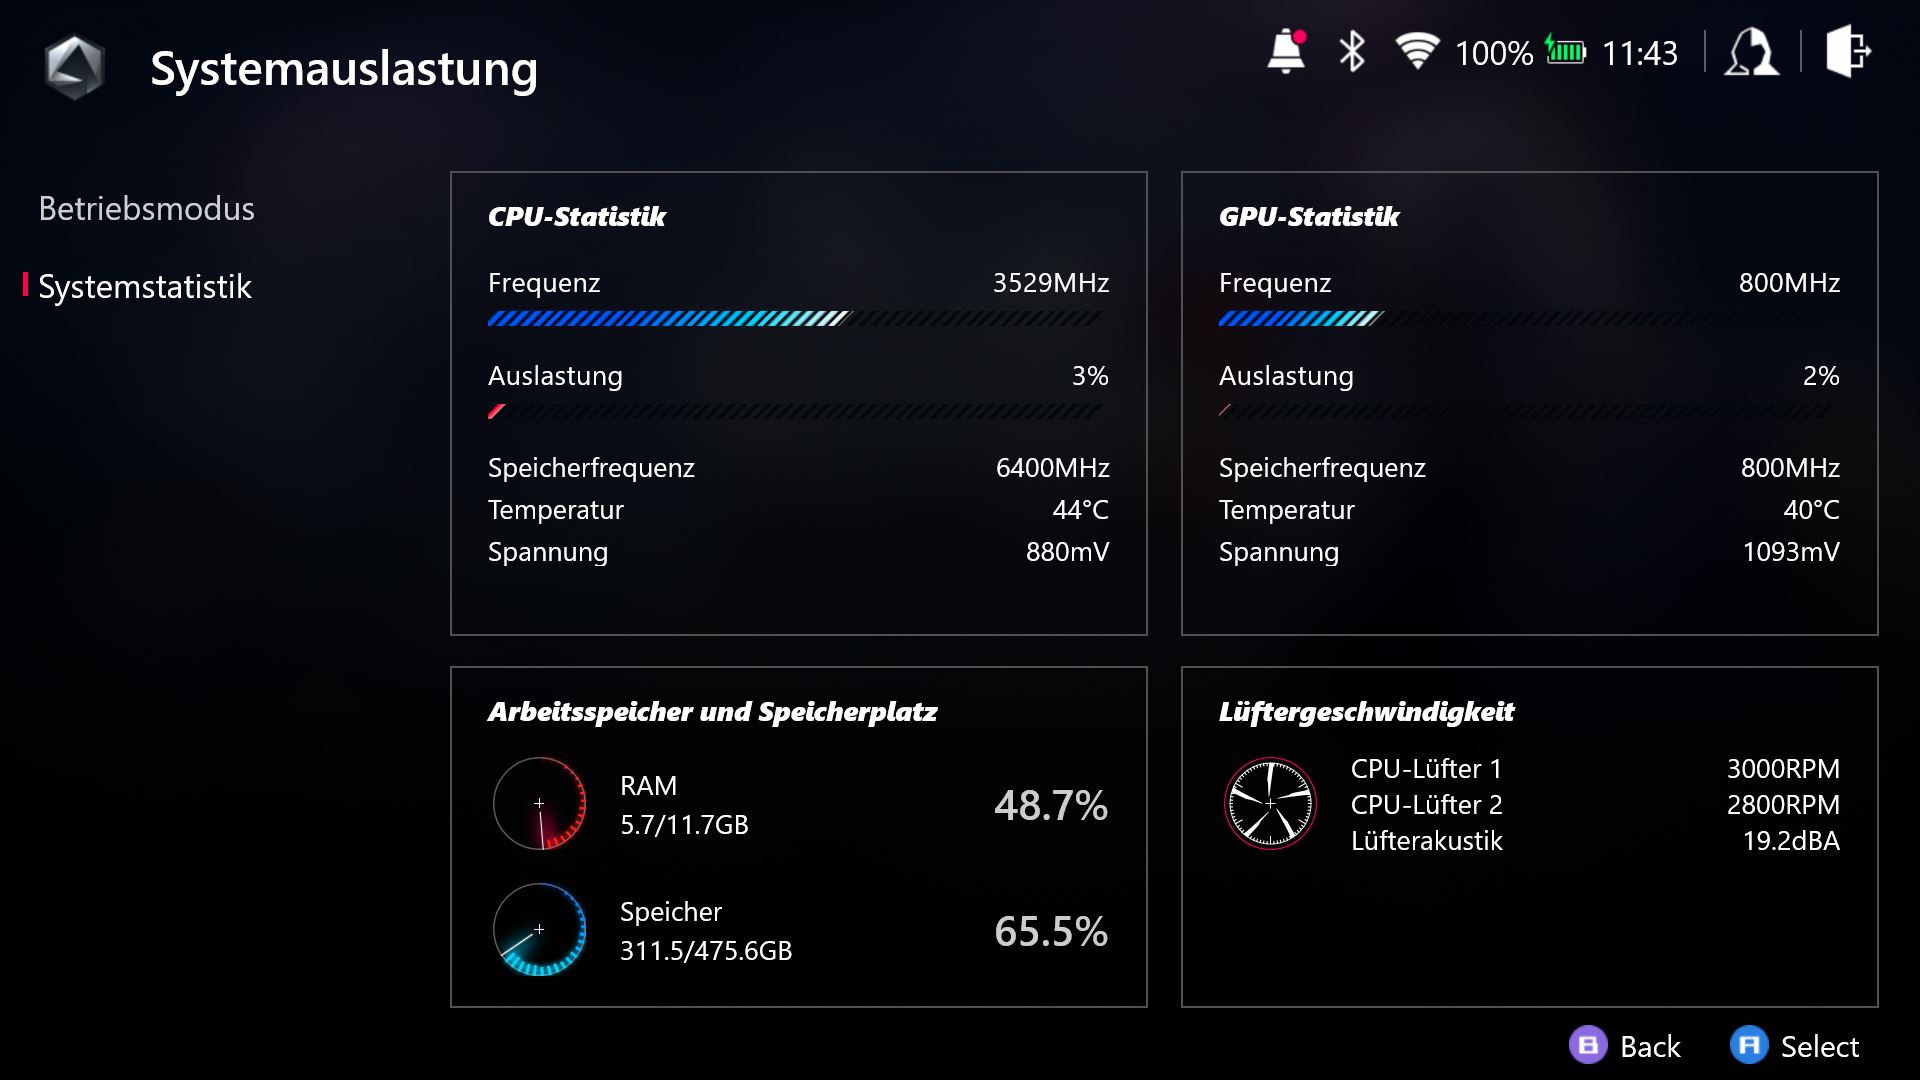
华硕的软件包括一个非常方便的实时监控工具,可以显示CPU和GPU的负载、当前的帧数以及当前的电池电量消耗,这非常有用。我们的评测单位仍然是用Armoury Crate SE软件的预览版发货的,最终的零售单位会得到一些小的改进(比如电源模式的实际TDP值)。你还会得到一个为期90天的Xbox Game Pass Ultimate免费试用版,在我们的评测中它运行得非常好(尽管它主要取决于你的网络连接)。
审查设置
你可以通过命令中心快速改变电源模式,这显然也可以通过Armoury Crate软件实现。甚至还有一个手动模式,你可以为Ryzen Z1 Extreme调整TDP值。我们用涡轮动力模式进行了以下基准测试和测量,因为这是获得最大功率的唯一途径。性能电源模式在游戏过程中已经明显变慢,考虑到有限的iGPU性能,这往往是现代游戏中流畅游戏和停滞之间的区别。我们在下表中列出了不同电源模式的TDP值:
| 功率模式 | 静音 | 性能 | 涡轮增压/带PSU | 手动/带PSU |
|---|---|---|---|---|
| SoC SPL (= PL1) | 9瓦特 | 15瓦特 | 25 / 30瓦特 | 15 / 30瓦特 |
| SoC sPPT (= PL2) | 14 瓦特 | 20 瓦特 | 30 / 43 瓦特 | 20 / 43 瓦特 |
| SoC fPPT (= PL4) | 17 瓦特 | 25 瓦特 | 35 / 53 瓦特 | 25 / 53 瓦特 |
我们还用性能电源模式重复了所有的游戏基准测试,因此你可以直接比较结果。电池供电的TDP要低一些,但我们的游戏结果只慢了1-2帧。安静的电源模式不适合游戏,因为性能实在太低。
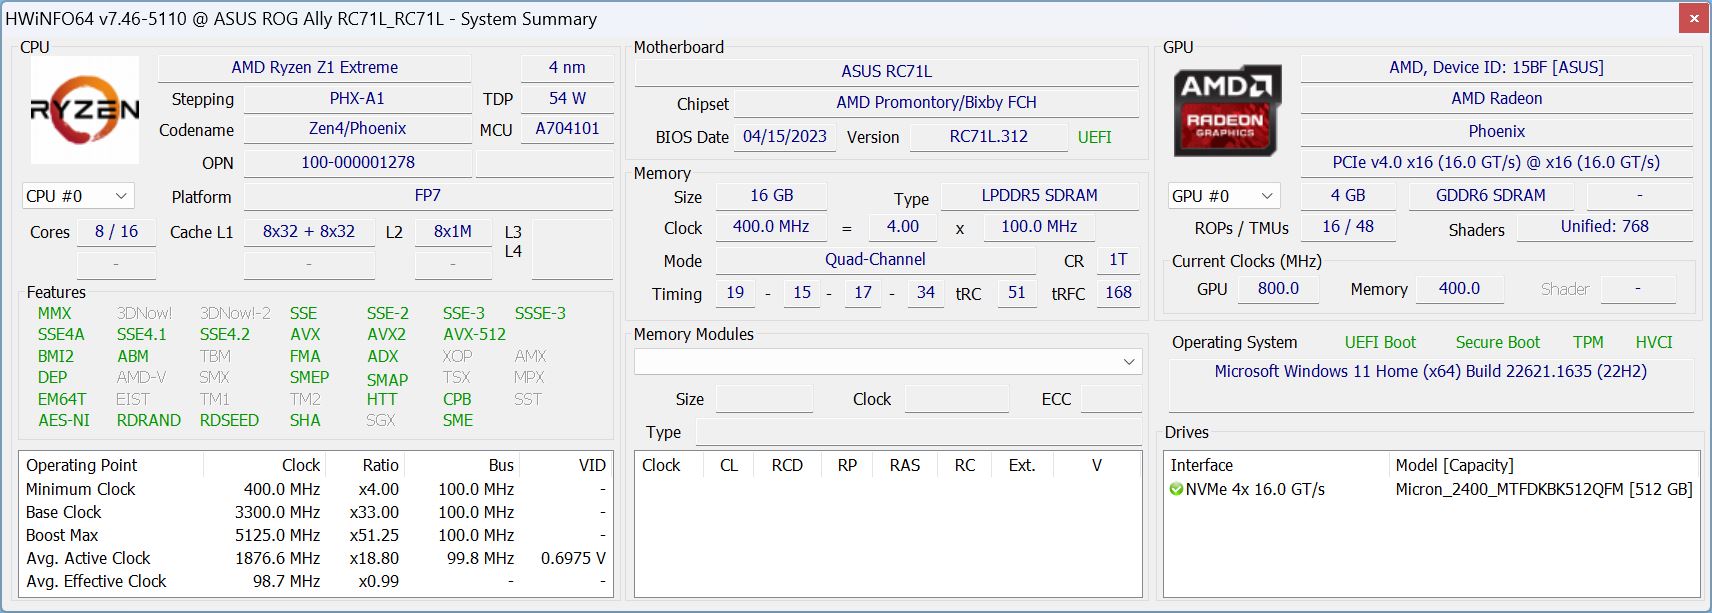
处理器 - 带有Zen4 Phoenix的Ryzen Z1 Extreme
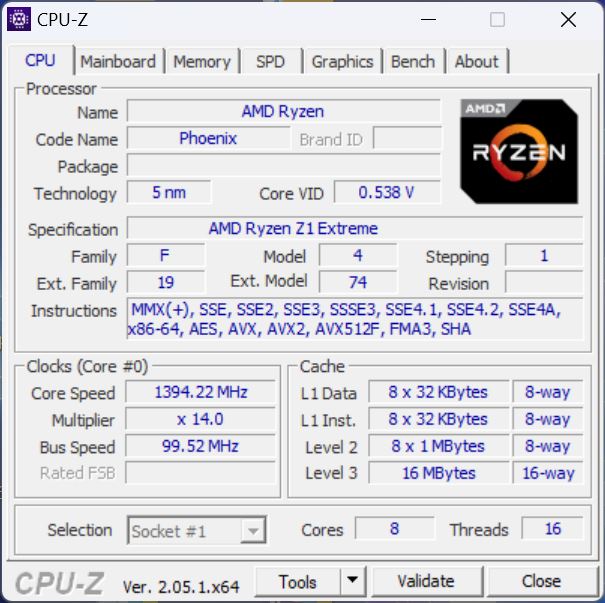
华硕在CPU方面并不吝啬,为ROG Ally配备了全新的装备了全新的AMD Ryzen Z1 Extreme这实际上是新的Ryzen 7 7840U.我们仍在等待相应的笔记本电脑型号,但这个紧凑的游戏掌机已经让我们有机会检查AMD最新U系列移动处理器的性能。
Ryzen Z1 Extreme使用八个Zen4核心,并采用现代4纳米工艺制造。它可以同时执行16个线程,最高时钟为5.1GHz。我们对基准测试结果相当惊讶,因为考虑到小机箱的尺寸,CPU的性能非常好。在第一次CB R15运行时,Z1 Extreme在Turbo模式下可以短暂地消耗53瓦特,然后在几分钟内平息在40瓦特左右,最终在我们的循环结束时下降到30瓦特左右。在40瓦特的情况下,Z1 Extreme与目前的Raptor Lake擦身而过。酷睿i7-1360P运行在38W (联想Yoga 9 14)的多核基准测试中。它在30瓦时甚至快得多,与旧的Ryzen 7 6800U相比也有明显的优势。新的Ryzen 9 7940HS(65瓦)是我们比较组中唯一具有更好的多核性能的芯片(但不是很多)。
Cinebench R15 Multi Loop
25/15瓦的多核性能更令人印象深刻,因为Ryzen Z1 Extreme仍然比目前的Raptor Lake更快酷睿i7-1355U在50/25瓦特时更快。我们将在我们的 "Zen4分析 "中对新的Ryzen Z1 Extreme/Ryzen 7 7840U的性能进行仔细研究。禅4分析文章中,并且还包括不同功率限制的结果。
| 安静 | 性能 | Turbo | Turbo电池 | |
|---|---|---|---|---|
| CB R15 Multi | 1180分 | 1727分 | 2397分 | 2153分 |
| CB R15 Single | 222分 | 280分 | 280分 | 280分 |
AMD成功地提高了新Zen4芯片的单核性能(比Ryzen 7 6800U快20%左右)。Ryzen 7 6800U).英特尔在这方面仍有优势,他们的性能核心,但差距不再那么大了。更多的CPU基准测试可在我们的 技术部分.
Cinebench R23: Multi Core | Single Core
Cinebench R20: CPU (Multi Core) | CPU (Single Core)
Cinebench R15: CPU Multi 64Bit | CPU Single 64Bit
Blender: v2.79 BMW27 CPU
7-Zip 18.03: 7z b 4 | 7z b 4 -mmt1
Geekbench 5.5: Multi-Core | Single-Core
HWBOT x265 Benchmark v2.2: 4k Preset
LibreOffice : 20 Documents To PDF
R Benchmark 2.5: Overall mean
| CPU Performance rating | |
| Asus ROG Zephyrus G14 GA402XY -2! | |
| Average of class Multimedia | |
| Asus ROG Ally Z1 Extreme | |
| Average AMD Ryzen Z1 Extreme | |
| Lenovo Yoga 9 14IRP G8 | |
| Lenovo Yoga 7 16IRL8 | |
| GPD Win 4 | |
| Asus Zenbook S 13 OLED | |
| GPD Win Max 2 | |
| Cinebench R23 / Multi Core | |
| Asus ROG Zephyrus G14 GA402XY | |
| Average of class Multimedia (4861 - 33362, n=74, last 2 years) | |
| Asus ROG Ally Z1 Extreme | |
| Average AMD Ryzen Z1 Extreme (13004 - 15120, n=3) | |
| Lenovo Yoga 9 14IRP G8 | |
| GPD Win 4 | |
| Asus Zenbook S 13 OLED | |
| Lenovo Yoga 7 16IRL8 | |
| GPD Win Max 2 | |
| Cinebench R23 / Single Core | |
| Average of class Multimedia (1128 - 2459, n=66, last 2 years) | |
| Lenovo Yoga 9 14IRP G8 | |
| Lenovo Yoga 7 16IRL8 | |
| GPD Win Max 2 | |
| Asus ROG Zephyrus G14 GA402XY | |
| Asus ROG Ally Z1 Extreme | |
| Average AMD Ryzen Z1 Extreme (1733 - 1779, n=3) | |
| GPD Win 4 | |
| Asus Zenbook S 13 OLED | |
| Cinebench R20 / CPU (Multi Core) | |
| Asus ROG Zephyrus G14 GA402XY | |
| Average of class Multimedia (1887 - 12912, n=57, last 2 years) | |
| Asus ROG Ally Z1 Extreme | |
| Average AMD Ryzen Z1 Extreme (5109 - 5825, n=3) | |
| Lenovo Yoga 9 14IRP G8 | |
| GPD Win 4 | |
| Asus Zenbook S 13 OLED | |
| Lenovo Yoga 7 16IRL8 | |
| GPD Win Max 2 | |
| Cinebench R20 / CPU (Single Core) | |
| Average of class Multimedia (425 - 853, n=57, last 2 years) | |
| Lenovo Yoga 9 14IRP G8 | |
| Lenovo Yoga 7 16IRL8 | |
| Asus ROG Zephyrus G14 GA402XY | |
| Asus ROG Ally Z1 Extreme | |
| GPD Win Max 2 | |
| Average AMD Ryzen Z1 Extreme (672 - 692, n=3) | |
| GPD Win 4 | |
| Asus Zenbook S 13 OLED | |
| Cinebench R15 / CPU Multi 64Bit | |
| Asus ROG Zephyrus G14 GA402XY | |
| Average of class Multimedia (856 - 5224, n=61, last 2 years) | |
| Asus ROG Ally Z1 Extreme | |
| Average AMD Ryzen Z1 Extreme (2050 - 2397, n=3) | |
| Lenovo Yoga 9 14IRP G8 | |
| GPD Win 4 | |
| Asus Zenbook S 13 OLED | |
| Lenovo Yoga 7 16IRL8 | |
| GPD Win Max 2 | |
| Cinebench R15 / CPU Single 64Bit | |
| Asus ROG Zephyrus G14 GA402XY | |
| Average of class Multimedia (184.8 - 326, n=59, last 2 years) | |
| Asus ROG Ally Z1 Extreme | |
| Lenovo Yoga 9 14IRP G8 | |
| Average AMD Ryzen Z1 Extreme (262 - 280, n=3) | |
| Lenovo Yoga 7 16IRL8 | |
| GPD Win Max 2 | |
| GPD Win 4 | |
| Asus Zenbook S 13 OLED | |
| Blender / v2.79 BMW27 CPU | |
| GPD Win Max 2 | |
| Lenovo Yoga 7 16IRL8 | |
| Asus Zenbook S 13 OLED | |
| GPD Win 4 | |
| Lenovo Yoga 9 14IRP G8 | |
| Average of class Multimedia (100 - 557, n=58, last 2 years) | |
| Average AMD Ryzen Z1 Extreme (213 - 214, n=2) | |
| Asus ROG Ally Z1 Extreme | |
| 7-Zip 18.03 / 7z b 4 | |
| Asus ROG Zephyrus G14 GA402XY | |
| Asus ROG Ally Z1 Extreme | |
| Average AMD Ryzen Z1 Extreme (56966 - 64454, n=3) | |
| Average of class Multimedia (26062 - 130368, n=55, last 2 years) | |
| GPD Win 4 | |
| Lenovo Yoga 9 14IRP G8 | |
| Asus Zenbook S 13 OLED | |
| Lenovo Yoga 7 16IRL8 | |
| GPD Win Max 2 | |
| 7-Zip 18.03 / 7z b 4 -mmt1 | |
| Asus ROG Zephyrus G14 GA402XY | |
| Asus ROG Ally Z1 Extreme | |
| Average AMD Ryzen Z1 Extreme (6077 - 6316, n=2) | |
| Average of class Multimedia (3666 - 7545, n=56, last 2 years) | |
| Lenovo Yoga 9 14IRP G8 | |
| Lenovo Yoga 7 16IRL8 | |
| GPD Win Max 2 | |
| GPD Win 4 | |
| Asus Zenbook S 13 OLED | |
| Geekbench 5.5 / Multi-Core | |
| Average of class Multimedia (4652 - 20422, n=56, last 2 years) | |
| Asus ROG Zephyrus G14 GA402XY | |
| Asus ROG Ally Z1 Extreme | |
| Lenovo Yoga 9 14IRP G8 | |
| Average AMD Ryzen Z1 Extreme (9589 - 10917, n=4) | |
| Lenovo Yoga 7 16IRL8 | |
| GPD Win 4 | |
| Asus Zenbook S 13 OLED | |
| GPD Win Max 2 | |
| Geekbench 5.5 / Single-Core | |
| Asus ROG Zephyrus G14 GA402XY | |
| Average of class Multimedia (805 - 2974, n=56, last 2 years) | |
| Asus ROG Ally Z1 Extreme | |
| Average AMD Ryzen Z1 Extreme (1896 - 1956, n=4) | |
| Lenovo Yoga 9 14IRP G8 | |
| Lenovo Yoga 7 16IRL8 | |
| GPD Win Max 2 | |
| GPD Win 4 | |
| Asus Zenbook S 13 OLED | |
| HWBOT x265 Benchmark v2.2 / 4k Preset | |
| Average of class Multimedia (5.26 - 36.1, n=56, last 2 years) | |
| Asus ROG Ally Z1 Extreme | |
| Average AMD Ryzen Z1 Extreme (16.3 - 18.7, n=3) | |
| Lenovo Yoga 9 14IRP G8 | |
| GPD Win 4 | |
| Asus Zenbook S 13 OLED | |
| Lenovo Yoga 7 16IRL8 | |
| GPD Win Max 2 | |
| LibreOffice / 20 Documents To PDF | |
| Asus Zenbook S 13 OLED | |
| GPD Win 4 | |
| Average of class Multimedia (23.9 - 146.7, n=57, last 2 years) | |
| Average AMD Ryzen Z1 Extreme (43 - 52.3, n=3) | |
| Lenovo Yoga 9 14IRP G8 | |
| Lenovo Yoga 7 16IRL8 | |
| GPD Win Max 2 | |
| Asus ROG Ally Z1 Extreme | |
| Asus ROG Zephyrus G14 GA402XY | |
| R Benchmark 2.5 / Overall mean | |
| Asus Zenbook S 13 OLED | |
| GPD Win 4 | |
| Average of class Multimedia (0.3604 - 0.947, n=56, last 2 years) | |
| GPD Win Max 2 | |
| Lenovo Yoga 9 14IRP G8 | |
| Lenovo Yoga 7 16IRL8 | |
| Average AMD Ryzen Z1 Extreme (0.4447 - 0.4662, n=3) | |
| Asus ROG Ally Z1 Extreme | |
| Asus ROG Zephyrus G14 GA402XY | |
* ... smaller is better
AIDA64: FP32 Ray-Trace | FPU Julia | CPU SHA3 | CPU Queen | FPU SinJulia | FPU Mandel | CPU AES | CPU ZLib | FP64 Ray-Trace | CPU PhotoWorxx
| Performance rating | |
| Asus ROG Ally Z1 Extreme | |
| Average AMD Ryzen Z1 Extreme | |
| Average of class Multimedia | |
| GPD Win 4 | |
| Asus Zenbook S 13 OLED | |
| Lenovo Yoga 9 14IRP G8 | |
| Lenovo Yoga 7 16IRL8 | |
| GPD Win Max 2 | |
| AIDA64 / FP32 Ray-Trace | |
| Asus ROG Ally Z1 Extreme | |
| Average AMD Ryzen Z1 Extreme (20714 - 24519, n=3) | |
| Average of class Multimedia (2214 - 50388, n=53, last 2 years) | |
| GPD Win 4 | |
| Asus Zenbook S 13 OLED | |
| Lenovo Yoga 9 14IRP G8 | |
| Lenovo Yoga 7 16IRL8 | |
| GPD Win Max 2 | |
| AIDA64 / FPU Julia | |
| Asus ROG Ally Z1 Extreme | |
| Average AMD Ryzen Z1 Extreme (86738 - 103637, n=3) | |
| Average of class Multimedia (12867 - 201874, n=54, last 2 years) | |
| GPD Win 4 | |
| Asus Zenbook S 13 OLED | |
| Lenovo Yoga 9 14IRP G8 | |
| Lenovo Yoga 7 16IRL8 | |
| GPD Win Max 2 | |
| AIDA64 / CPU SHA3 | |
| Asus ROG Ally Z1 Extreme | |
| Average AMD Ryzen Z1 Extreme (3854 - 4465, n=3) | |
| Average of class Multimedia (626 - 8623, n=54, last 2 years) | |
| GPD Win 4 | |
| Asus Zenbook S 13 OLED | |
| Lenovo Yoga 9 14IRP G8 | |
| Lenovo Yoga 7 16IRL8 | |
| GPD Win Max 2 | |
| AIDA64 / CPU Queen | |
| Asus ROG Ally Z1 Extreme | |
| Average AMD Ryzen Z1 Extreme (95153 - 107867, n=3) | |
| Lenovo Yoga 9 14IRP G8 | |
| GPD Win 4 | |
| Asus Zenbook S 13 OLED | |
| Average of class Multimedia (13483 - 181505, n=41, last 2 years) | |
| GPD Win Max 2 | |
| Lenovo Yoga 7 16IRL8 | |
| AIDA64 / FPU SinJulia | |
| Asus ROG Ally Z1 Extreme | |
| Average AMD Ryzen Z1 Extreme (12936 - 14281, n=3) | |
| GPD Win 4 | |
| Asus Zenbook S 13 OLED | |
| Average of class Multimedia (886 - 28794, n=54, last 2 years) | |
| Lenovo Yoga 9 14IRP G8 | |
| GPD Win Max 2 | |
| Lenovo Yoga 7 16IRL8 | |
| AIDA64 / FPU Mandel | |
| Asus ROG Ally Z1 Extreme | |
| Average AMD Ryzen Z1 Extreme (46180 - 55457, n=3) | |
| Average of class Multimedia (6395 - 105740, n=53, last 2 years) | |
| GPD Win 4 | |
| Asus Zenbook S 13 OLED | |
| Lenovo Yoga 9 14IRP G8 | |
| Lenovo Yoga 7 16IRL8 | |
| GPD Win Max 2 | |
| AIDA64 / CPU AES | |
| GPD Win 4 | |
| Asus Zenbook S 13 OLED | |
| Asus ROG Ally Z1 Extreme | |
| Average AMD Ryzen Z1 Extreme (57678 - 80158, n=3) | |
| Average of class Multimedia (8171 - 126790, n=54, last 2 years) | |
| GPD Win Max 2 | |
| Lenovo Yoga 9 14IRP G8 | |
| Lenovo Yoga 7 16IRL8 | |
| AIDA64 / CPU ZLib | |
| Average of class Multimedia (143.8 - 2022, n=54, last 2 years) | |
| Asus ROG Ally Z1 Extreme | |
| Average AMD Ryzen Z1 Extreme (687 - 987, n=3) | |
| Lenovo Yoga 9 14IRP G8 | |
| Lenovo Yoga 7 16IRL8 | |
| GPD Win 4 | |
| Asus Zenbook S 13 OLED | |
| GPD Win Max 2 | |
| AIDA64 / FP64 Ray-Trace | |
| Asus ROG Ally Z1 Extreme | |
| Average AMD Ryzen Z1 Extreme (10740 - 13049, n=3) | |
| Average of class Multimedia (1014 - 26875, n=54, last 2 years) | |
| GPD Win 4 | |
| Asus Zenbook S 13 OLED | |
| Lenovo Yoga 9 14IRP G8 | |
| Lenovo Yoga 7 16IRL8 | |
| GPD Win Max 2 | |
| AIDA64 / CPU PhotoWorxx | |
| Average of class Multimedia (8187 - 88154, n=54, last 2 years) | |
| Lenovo Yoga 7 16IRL8 | |
| Lenovo Yoga 9 14IRP G8 | |
| Asus ROG Ally Z1 Extreme | |
| Average AMD Ryzen Z1 Extreme (34764 - 39932, n=3) | |
| GPD Win Max 2 | |
| GPD Win 4 | |
| Asus Zenbook S 13 OLED | |
系统性能
系统性能非常好,考虑到强大的组件,这并不令人惊讶。与Steam Deck相比,性能优势非常明显,ROG Ally在任何情况下都更加迅捷和快速。我们的合成基准分数也很好,在审查期间我们没有发现任何问题。
CrossMark: Overall | Productivity | Creativity | Responsiveness
| PCMark 10 / Score | |
| Average of class Multimedia (4325 - 10386, n=52, last 2 years) | |
| Asus ROG Ally Z1 Extreme | |
| Average AMD Ryzen Z1 Extreme, AMD Radeon 780M (6439 - 7149, n=3) | |
| GPD Win 4 | |
| Asus Zenbook S 13 OLED | |
| Lenovo Yoga 9 14IRP G8 | |
| Lenovo Yoga 7 16IRL8 | |
| GPD Win Max 2 | |
| PCMark 10 / Essentials | |
| Lenovo Yoga 9 14IRP G8 | |
| Lenovo Yoga 7 16IRL8 | |
| GPD Win Max 2 | |
| Asus Zenbook S 13 OLED | |
| Average of class Multimedia (8025 - 11664, n=51, last 2 years) | |
| Average AMD Ryzen Z1 Extreme, AMD Radeon 780M (10081 - 10633, n=3) | |
| Asus ROG Ally Z1 Extreme | |
| GPD Win 4 | |
| PCMark 10 / Productivity | |
| Average of class Multimedia (7323 - 18233, n=51, last 2 years) | |
| Asus ROG Ally Z1 Extreme | |
| Average AMD Ryzen Z1 Extreme, AMD Radeon 780M (8996 - 10074, n=3) | |
| GPD Win 4 | |
| Asus Zenbook S 13 OLED | |
| GPD Win Max 2 | |
| Lenovo Yoga 7 16IRL8 | |
| Lenovo Yoga 9 14IRP G8 | |
| PCMark 10 / Digital Content Creation | |
| Average of class Multimedia (3651 - 16240, n=51, last 2 years) | |
| Average AMD Ryzen Z1 Extreme, AMD Radeon 780M (7990 - 9408, n=3) | |
| Asus ROG Ally Z1 Extreme | |
| GPD Win 4 | |
| Lenovo Yoga 9 14IRP G8 | |
| Asus Zenbook S 13 OLED | |
| Lenovo Yoga 7 16IRL8 | |
| GPD Win Max 2 | |
| CrossMark / Overall | |
| Average of class Multimedia (866 - 2728, n=60, last 2 years) | |
| Lenovo Yoga 9 14IRP G8 | |
| Asus ROG Ally Z1 Extreme | |
| Average AMD Ryzen Z1 Extreme, AMD Radeon 780M (1693 - 1718, n=2) | |
| GPD Win Max 2 | |
| Lenovo Yoga 7 16IRL8 | |
| GPD Win 4 | |
| Asus Zenbook S 13 OLED | |
| CrossMark / Productivity | |
| Average of class Multimedia (931 - 2489, n=60, last 2 years) | |
| Lenovo Yoga 9 14IRP G8 | |
| Asus ROG Ally Z1 Extreme | |
| GPD Win Max 2 | |
| Average AMD Ryzen Z1 Extreme, AMD Radeon 780M (1639 - 1662, n=2) | |
| GPD Win 4 | |
| Lenovo Yoga 7 16IRL8 | |
| Asus Zenbook S 13 OLED | |
| CrossMark / Creativity | |
| Average of class Multimedia (907 - 3465, n=60, last 2 years) | |
| Lenovo Yoga 9 14IRP G8 | |
| Asus ROG Ally Z1 Extreme | |
| Average AMD Ryzen Z1 Extreme, AMD Radeon 780M (1868 - 1878, n=2) | |
| Lenovo Yoga 7 16IRL8 | |
| GPD Win Max 2 | |
| GPD Win 4 | |
| Asus Zenbook S 13 OLED | |
| CrossMark / Responsiveness | |
| GPD Win Max 2 | |
| Average of class Multimedia (605 - 2024, n=60, last 2 years) | |
| Lenovo Yoga 9 14IRP G8 | |
| GPD Win 4 | |
| Asus ROG Ally Z1 Extreme | |
| Average AMD Ryzen Z1 Extreme, AMD Radeon 780M (1392 - 1451, n=2) | |
| Lenovo Yoga 7 16IRL8 | |
| Asus Zenbook S 13 OLED | |
| PCMark 10 Score | 6907 points | |
Help | ||
| AIDA64 / Memory Copy | |
| Asus ROG Ally Z1 Extreme | |
| Average of class Multimedia (11299 - 132135, n=54, last 2 years) | |
| Average AMD Ryzen Z1 Extreme (74414 - 92447, n=3) | |
| Lenovo Yoga 9 14IRP G8 | |
| Lenovo Yoga 7 16IRL8 | |
| GPD Win Max 2 | |
| GPD Win 4 | |
| Asus Zenbook S 13 OLED | |
| AIDA64 / Memory Read | |
| Average of class Multimedia (11624 - 174586, n=54, last 2 years) | |
| GPD Win Max 2 | |
| Lenovo Yoga 7 16IRL8 | |
| Lenovo Yoga 9 14IRP G8 | |
| Average AMD Ryzen Z1 Extreme (50337 - 58713, n=3) | |
| Asus ROG Ally Z1 Extreme | |
| GPD Win 4 | |
| Asus Zenbook S 13 OLED | |
| AIDA64 / Memory Write | |
| Average AMD Ryzen Z1 Extreme (92869 - 108872, n=3) | |
| Asus ROG Ally Z1 Extreme | |
| Average of class Multimedia (11755 - 134998, n=54, last 2 years) | |
| Lenovo Yoga 7 16IRL8 | |
| Lenovo Yoga 9 14IRP G8 | |
| GPD Win Max 2 | |
| GPD Win 4 | |
| Asus Zenbook S 13 OLED | |
| AIDA64 / Memory Latency | |
| Average of class Multimedia (7 - 535, n=53, last 2 years) | |
| Asus Zenbook S 13 OLED | |
| Average AMD Ryzen Z1 Extreme (113.7 - 122.1, n=3) | |
| Asus ROG Ally Z1 Extreme | |
| GPD Win 4 | |
| GPD Win Max 2 | |
| Lenovo Yoga 9 14IRP G8 | |
| Lenovo Yoga 7 16IRL8 | |
* ... smaller is better
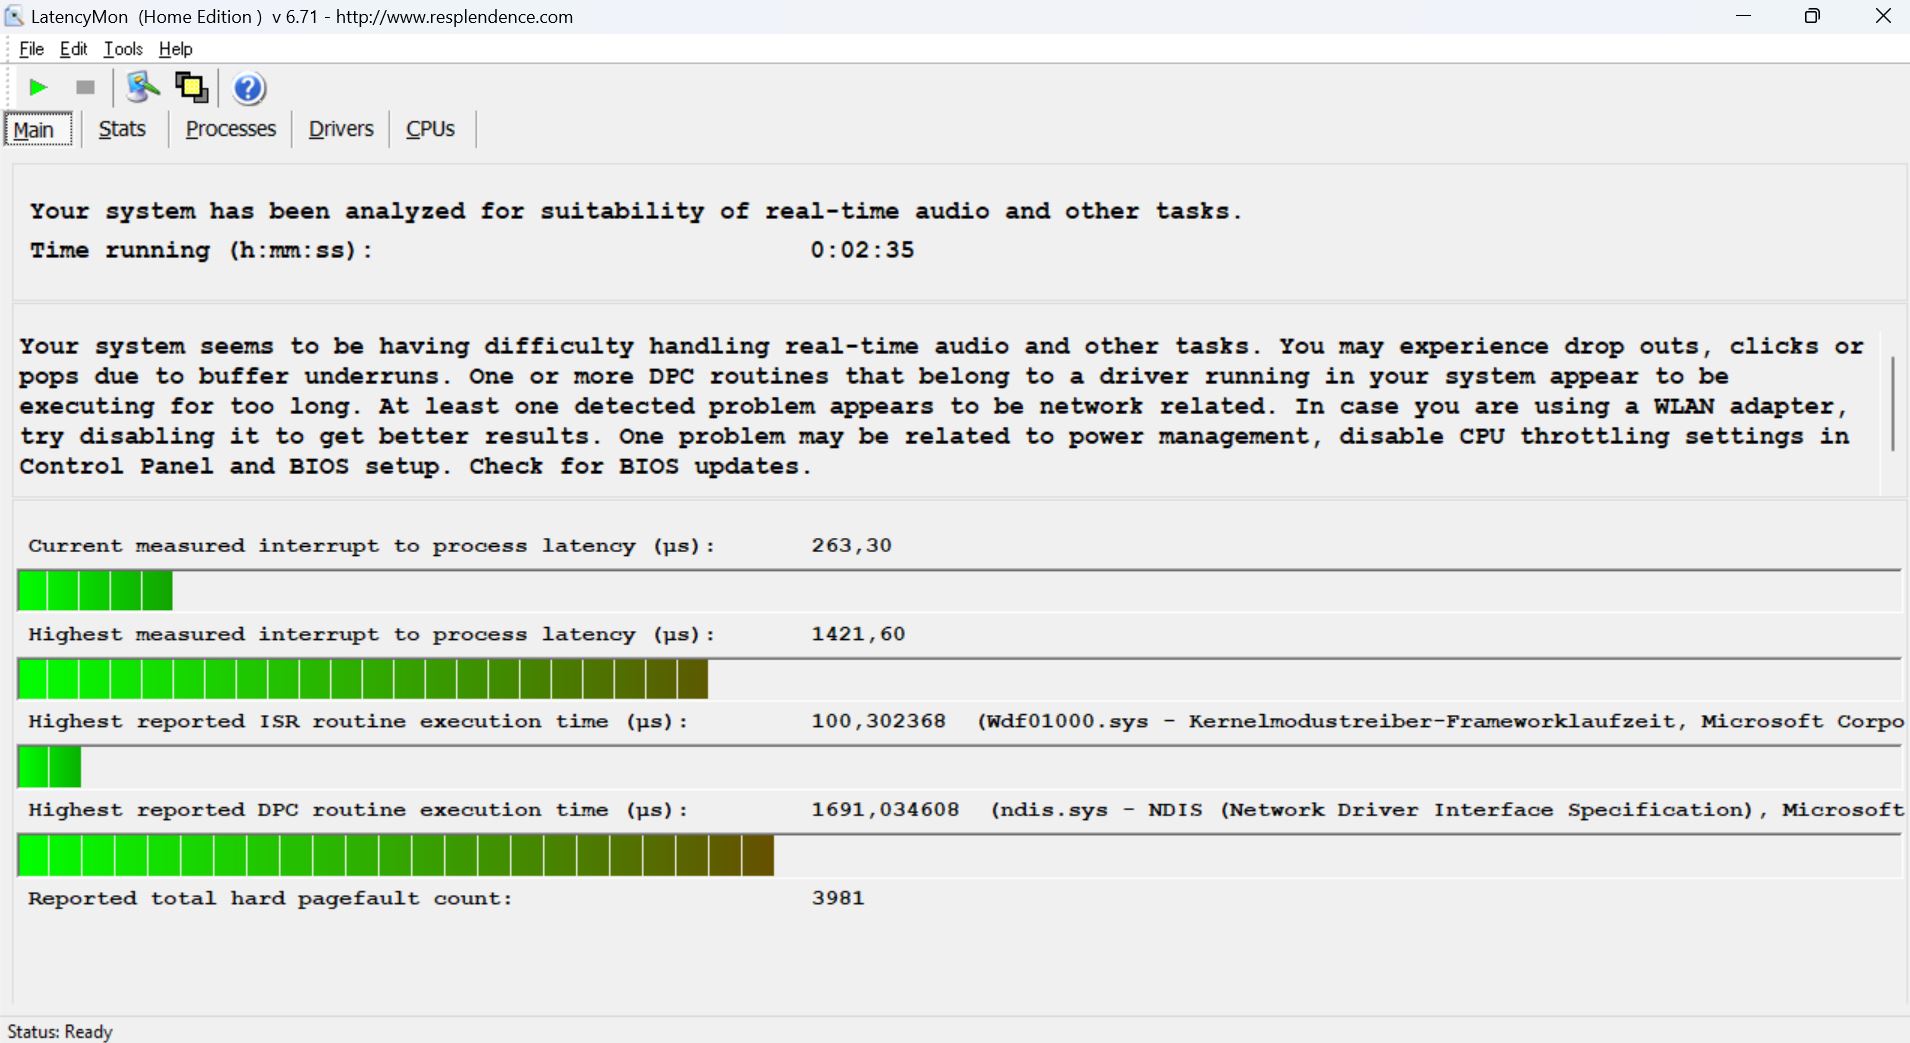
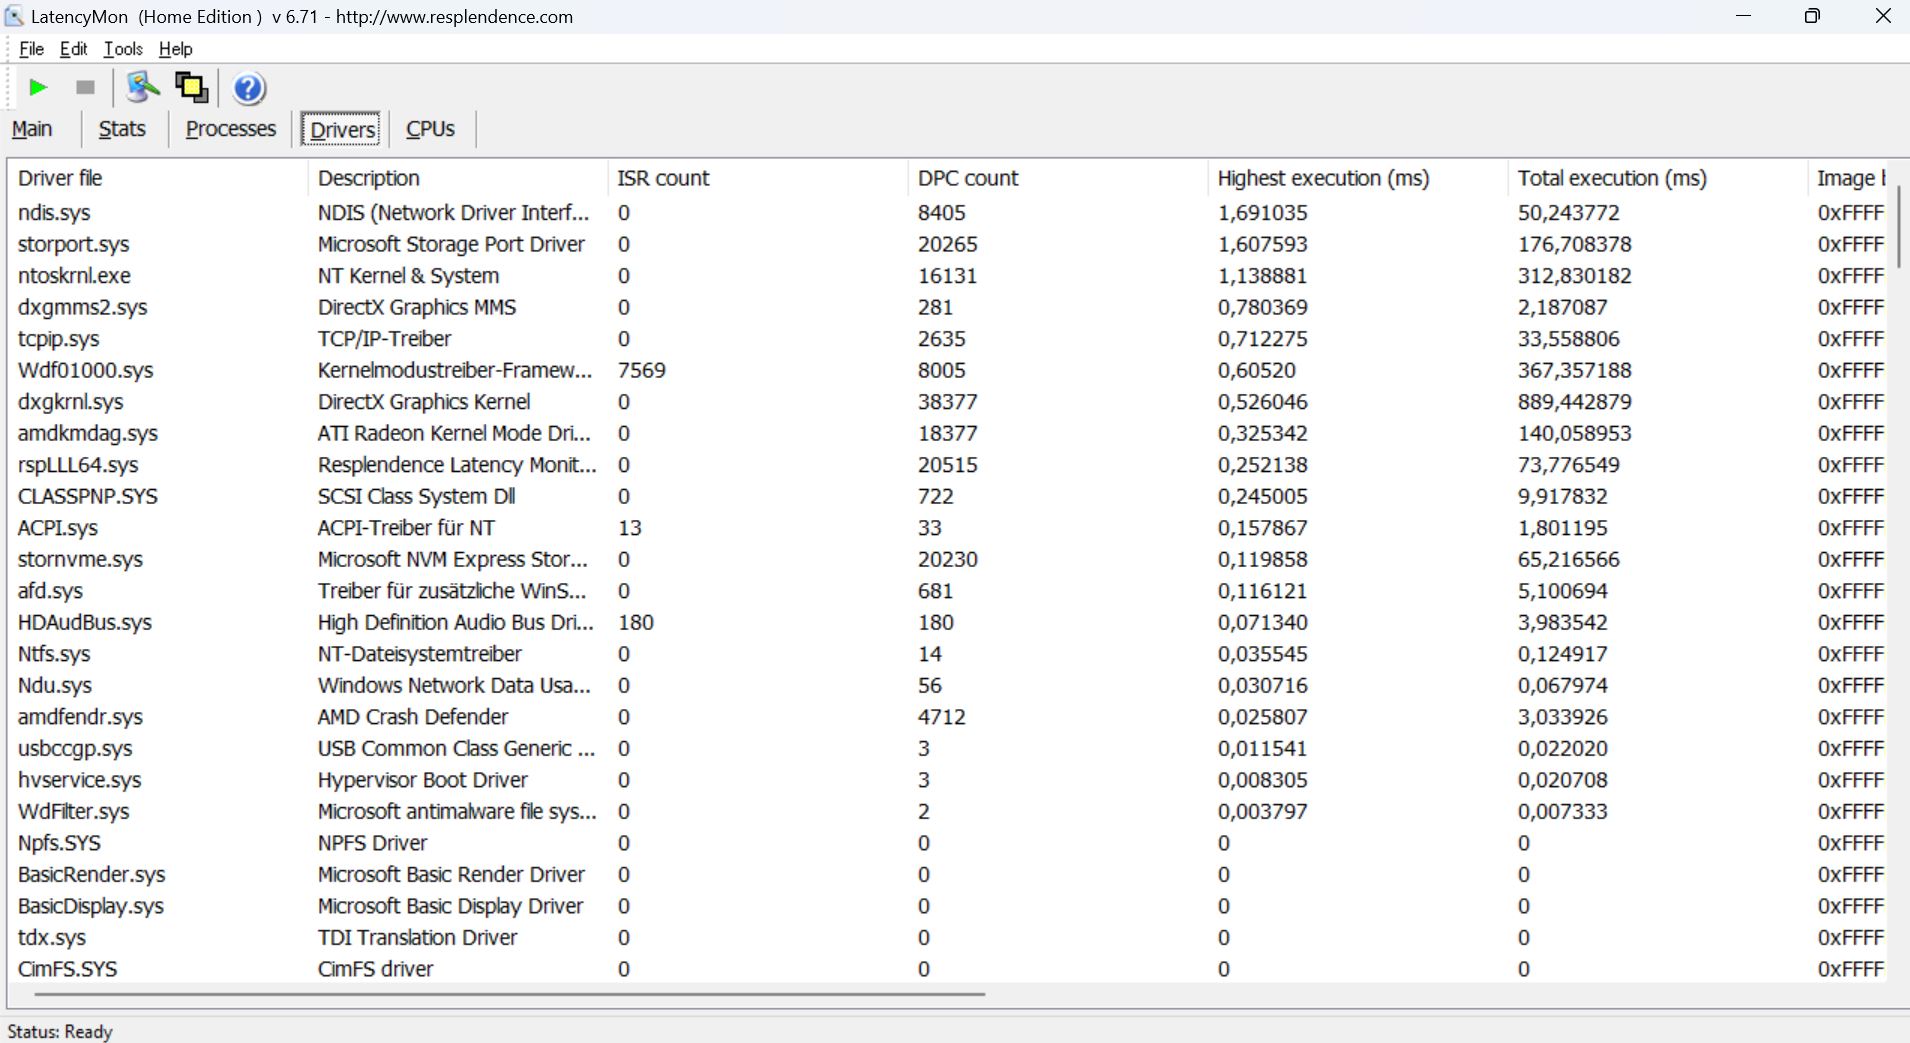
DPC延时
我们的标准化延迟测试(网页浏览、4K YouTube播放、CPU负载)显示,当你想使用实时音频应用程序时,当前BIOS版本的评测单元有一些限制。
| DPC Latencies / LatencyMon - interrupt to process latency (max), Web, Youtube, Prime95 | |
| Lenovo Yoga 9 14IRP G8 | |
| Asus ROG Ally Z1 Extreme | |
| Lenovo Yoga 7 16IRL8 | |
| GPD Win 4 | |
| Asus Zenbook S 13 OLED | |
| GPD Win Max 2 | |
* ... smaller is better
存储设备
紧凑的M.2-2230固态硬盘通过PCIe 4.0连接,根据华硕的说法,最大传输速率达到4.5GB/s。我们的评测单元配备了512GB的美光2400,在初始设置之后,你可以使用428GB的文件来存放自己的文件。我们的基准测试显示最大传输率超过4.2 GB/s,整体性能良好,尽管市场上有更大的M.2-2280硬盘,传输率更高。我们注意到,在持续工作几分钟后,有一些小的性能下降,但这在实践中是不明显的。更多的SSD基准测试被列在 这里.

* ... smaller is better
Disk Throttling: DiskSpd Read Loop, Queue Depth 8
GPU性能
我们已经第一次看到了新的集成式锐龙780M在我们对华硕ROG Zephyrus G14但这个强大的iGPU与缓慢的DDR5-4800内存相结合。另一方面,ROG Ally将Radeon 780M与16GB LPDDR5-6400内存(双通道)结合起来,但性能实际上并没有好多少。Ally只比使用较慢内存的780M快3%到9%。
这意味着Radeon 780M显然要比Iris Xe Graphics G7快得多,而且大致上与GeForce GTX 1650 Mobile的速度,但仍落后于GeForce RTX 2050.与旧的Radeon 680M相比,我们可以看到在功率水平相似的情况下,新的780M大约有10%的优势。当你使用高性能电源模式时,GPU的性能并没有慢多少(见下表),但对游戏性能的影响更大,因为CPU的性能也更低。
| 安静 | 性能 | Turbo | Turbo电池 | |
|---|---|---|---|---|
| Time Spy 图形 | 1073分 | 2565分 | 2854分 | 2706分 |
在持续的工作负荷下,GPU性能几乎完全稳定,Ally以97.7%的成绩通过了苛刻的Time Spy 压力测试。电池供电的性能略有下降,但我们仍然确定Time Spy 图形分数为2706分,这只是5%的赤字。请参阅我们的 技术部分了解更多GPU基准测试。
| 3DMark 11 Performance | 12465 points | |
| 3DMark Fire Strike Score | 7353 points | |
| 3DMark Time Spy Score | 3191 points | |
Help | ||
| Blender / v3.3 Classroom HIP/AMD | |
| GPD Win 4 | |
| Blender / v3.3 Classroom CPU | |
| Lenovo Yoga 7 16IRL8 | |
| GPD Win 4 | |
| Lenovo Yoga 9 14IRP G8 | |
| Average of class Multimedia (134.5 - 1042, n=62, last 2 years) | |
| Average AMD Radeon 780M (300 - 664, n=76) | |
| Asus ROG Ally Z1 Extreme | |
| Asus ROG Zephyrus G14 GA402XY | |
* ... smaller is better
游戏性能
我们终于到了一个Gamin g手持设备最重要的方面--游戏性能。你必须记住,这仍然是一个集成的GPU,但Radeon 780M足够强大,可以在1080p下流畅地运行现代游戏,至少在低度或中度细节方面。虽然在3DMark测试中,纯粹的GPU性能是相似的,但我们可以看到在游戏过程中,Turbo和Performance电源模式之间的差异更大。我们默认的一组游戏测试显示,ROG Ally比它的直接对手更快,可以击败GeForce GTX 1050 Max-Q,但它仍然被MX550,GTX 1650手机, 和RTX 2050移动版.
Witcher 3 FPS Chart
电池运行时间对于一个游戏掌机来说显然很重要。ROG Ally提供了许多功能,包括升频和帧数限制。限制帧率而不是功率限制肯定更有意义,因为在要求很高的游戏场景中可能会导致帧数下降。我们对所有这些设置进行了相当多的摆弄,但对实际功耗的影响相当小。唯一真正的区别是在涡轮和性能电源模式之间。该系统在Turbo模式下消耗约40-42瓦,考虑到40瓦的电池,其运行时间大约为一个小时。我们在150尼特下进行的Witcher 3 电池测试证实了这一点,运行时间仅为57分钟。然而,如果你选择性能模式,消耗量就会下降到22-24瓦特左右,因此你可以期待一个大约1小时45分钟的运行时间。
有可能用一个大的电源箱来改善运行时间。我们用一个99Wh的模型进行了测试(尽管它是旧的,我们非常肯定它不再提供额定容量),并将Witcher 3 ,在涡轮模式下的运行时间从57分钟提高到几乎3小时。我们非常确定,使用新的电源箱,你可以在涡轮模式下获得接近4小时,在性能模式下获得6-7小时。
显然,你可以摆弄一下设置和分辨率,以减少一些消耗(1-2瓦特应该是可能的),但我们绝对建议在电池上使用性能电源模式,然后调整设置,以便你可以享受流畅的游戏。更多游戏基准测试可在 这里.
Gaming Benchmarks Turbo mode
| low | med. | high | ultra | |
|---|---|---|---|---|
| GTA V (2015) | 126.9 | 122.2 | 59.5 | 25.7 |
| The Witcher 3 (2015) | 47.2 | 27.5 | ||
| Dota 2 Reborn (2015) | 127.2 | 105.8 | 85.6 | 75.5 |
| Final Fantasy XV Benchmark (2018) | 75.2 | 37.4 | 27.7 | |
| X-Plane 11.11 (2018) | 50.8 | 37.3 | 29.9 | |
| Far Cry 5 (2018) | 73 | 43 | 40 | 37 |
| Strange Brigade (2018) | 147.6 | 64.8 | 54.8 | 46.3 |
| Shadow of the Tomb Raider (2018) | 97 | 43 | 38 | 33 |
| Horizon Zero Dawn (2020) | 37 | |||
| F1 2021 (2021) | 190.3 | 96.2 | 75.4 | 31.5 |
| Far Cry 6 (2021) | 80 | 48 | 41 | 30 |
| Forza Horizon 5 (2021) | 100 | 65 | 56 | 0 () |
| Cyberpunk 2077 1.6 (2022) | 38.6 | 31.2 | 24.4 | 23.3 |
| F1 22 (2022) | 86.6 | 77.9 | 57.9 | 15.1 |
| Hogwarts Legacy (2023) | 37.8 | 24.8 | 19.5 | 14.8 |
| Baldur's Gate 3 (2023) | 39.6 | 30.8 | 25.1 | 24 |
| Cyberpunk 2077 (2023) | 39.1 | 29.9 | 23.8 | 20.3 |
| Ghost of Tsushima (2024) | 32.5 | 25.6 | 21.8 | 0 () |
Gaming Benchmarks Performance mode
排放 - 温度和风扇噪音是可以接受的
系统噪音
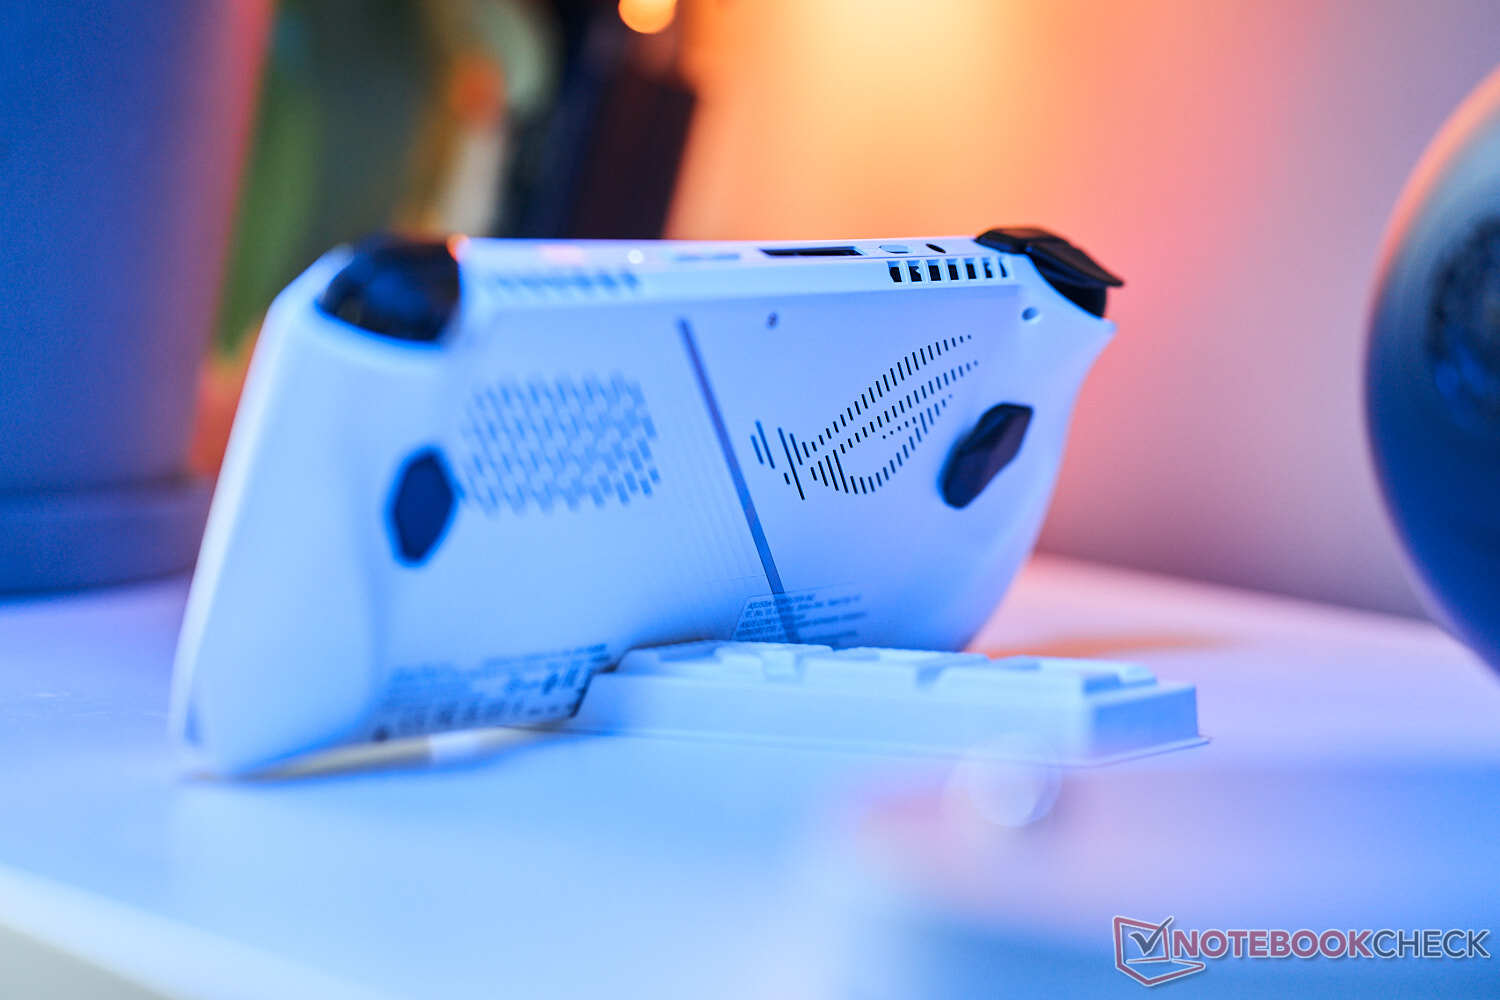
华硕使用了一个带有两个风扇的冷却解决方案,在每个倾斜角度都能工作(制造商称其为零重力冷却)。新鲜空气从后面吸进来,暖空气通过设备顶部的风扇排气口散去。在进气口处有一个防尘罩,以防止风扇变脏。看一下这些小风扇可能会引起对高亢的风扇噪音的担忧,但幸运的是,情况并非如此。
这两个风扇对一般的负载变化相当敏感(与电源模式无关),在轻度工作负荷时也是如此。这并不是一个真正的问题,因为风扇的噪音非常小,大约为27 dB(A),但它表明由于空间有限,被动冷却性能非常低。负载下的风扇噪音只取决于电源模式,所有测试中涡轮模式下为39.2 dB(A),性能模式下为31.2 dB(A)。这种差异非常明显,但在涡轮模式下性能也明显更好。我们没能得到更高的风扇噪音,也没有电子噪音(如线圈啸叫)。
Noise level
| Idle |
| 23.3 / 23.3 / 27.3 dB(A) |
| Load |
| 39.2 / 39.2 dB(A) |
 | ||
30 dB silent 40 dB(A) audible 50 dB(A) loud |
||
min: | ||
| Asus ROG Ally Z1 Extreme Radeon 780M, Z1 Extreme, Micron 2400 MTFDKBK512QFM | Valve Steam Deck 512 GB LCD , | GPD Win 4 Radeon 680M, R7 6800U, BiWin CE480Y2D100-1TB | GPD Win Max 2 Iris Xe G7 96EUs, i7-1260P, BiWin NQ200 1TB CNF82GS1D00-1TB | Asus Zenbook S 13 OLED Radeon 680M, R7 6800U, Samsung PM9A1 MZVL21T0HCLR | Lenovo Yoga 9 14IRP G8 Iris Xe G7 96EUs, i7-1360P, SK hynix PC801 HFS512GEJ9X101N BF | Lenovo Yoga 7 16IRL8 Iris Xe G7 96EUs, i7-1355U, WD PC SN740 512GB SDDPMQD-512G-1101 | |
|---|---|---|---|---|---|---|---|
| Noise | -5% | -23% | -0% | 1% | -5% | -2% | |
| off / environment * (dB) | 23.3 | 24.3 -4% | 24 -3% | 22.6 3% | 24 -3% | 23.6 -1% | 22.8 2% |
| Idle Minimum * (dB) | 23.3 | 24.3 -4% | 31.2 -34% | 23.7 -2% | 24 -3% | 23.6 -1% | 22.9 2% |
| Idle Average * (dB) | 23.3 | 24.3 -4% | 31.2 -34% | 23.7 -2% | 24 -3% | 23.6 -1% | 22.9 2% |
| Idle Maximum * (dB) | 27.3 | 30 -10% | 33.5 -23% | 28.5 -4% | 24 12% | 24.6 10% | 26.9 1% |
| Load Average * (dB) | 39.2 | 45.5 -16% | 36.5 7% | 33.1 16% | 45 -15% | 41.7 -6% | |
| Witcher 3 ultra * (dB) | 39.2 | 40.7 -4% | 48.6 -24% | 39.8 -2% | 40.2 -3% | 45 -15% | 41.5 -6% |
| Load Maximum * (dB) | 39.2 | 40.7 -4% | 49 -25% | 40.5 -3% | 41.7 -6% | 45 -15% | 43.6 -11% |
* ... smaller is better
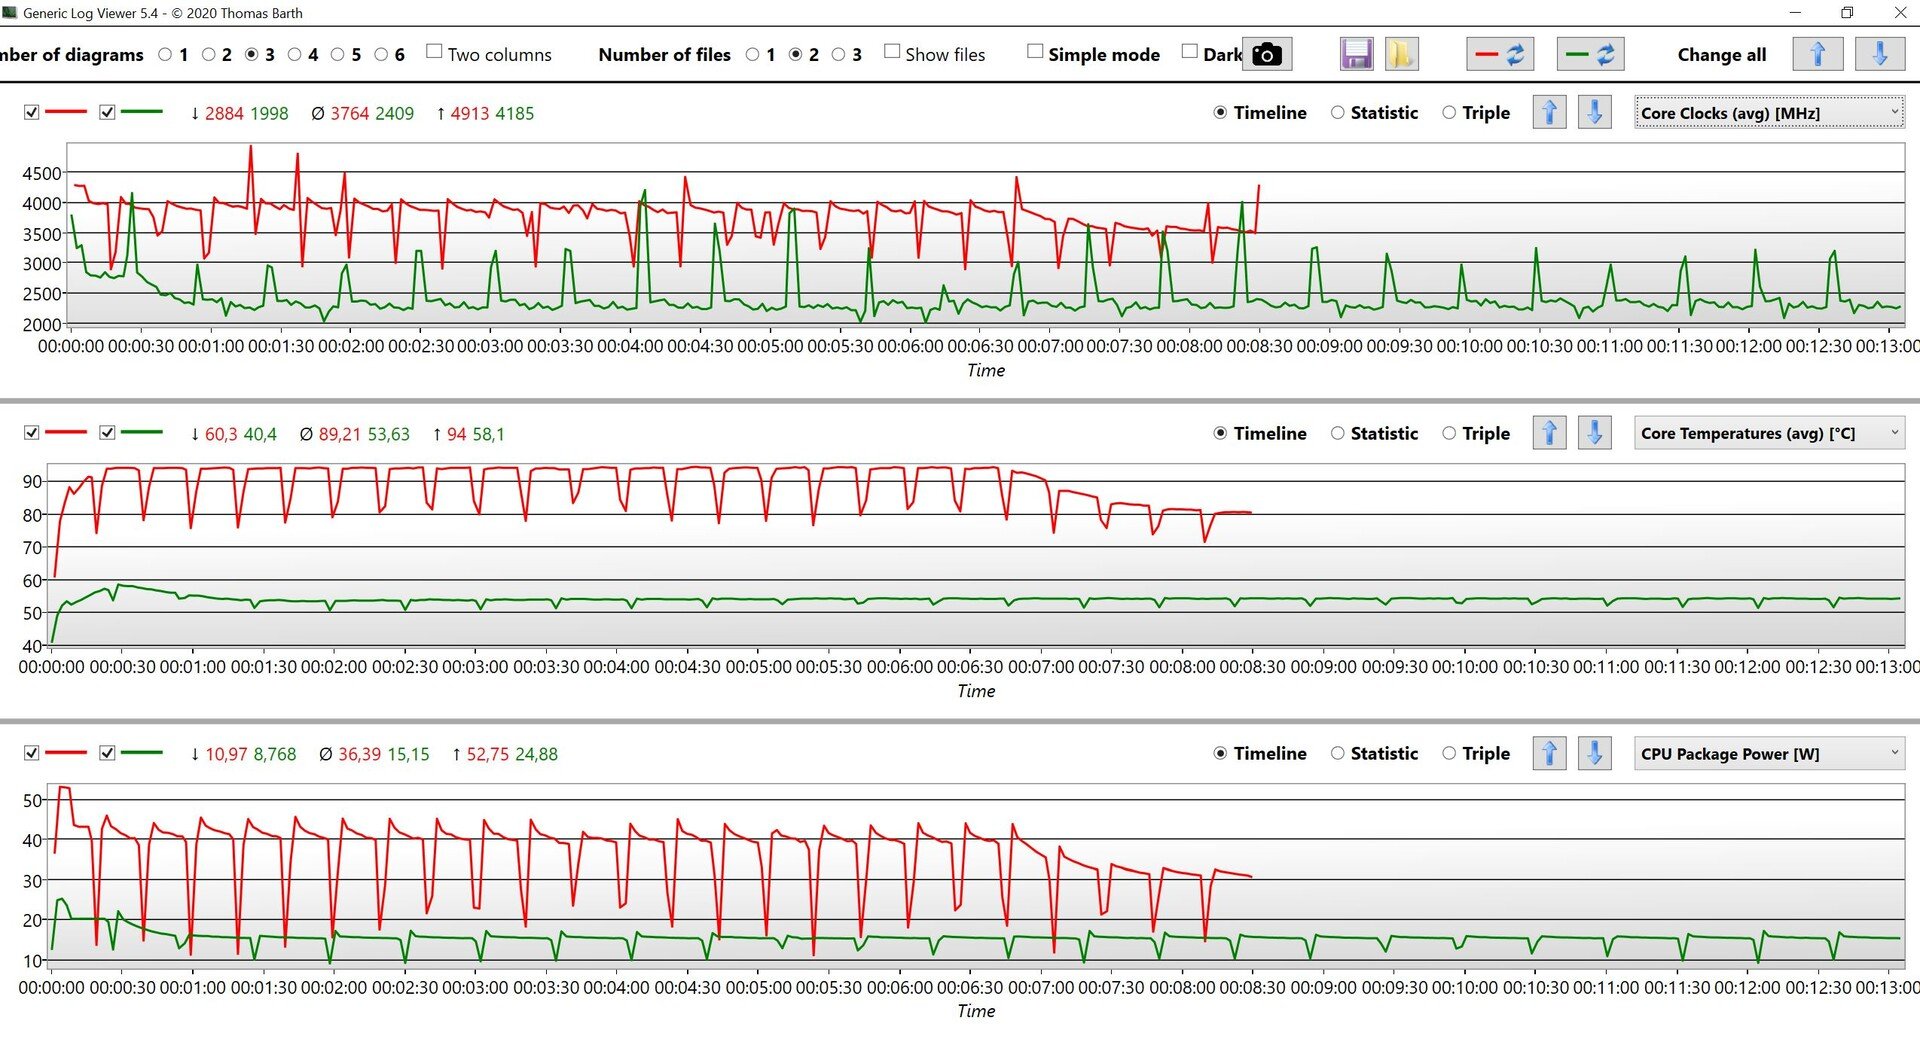
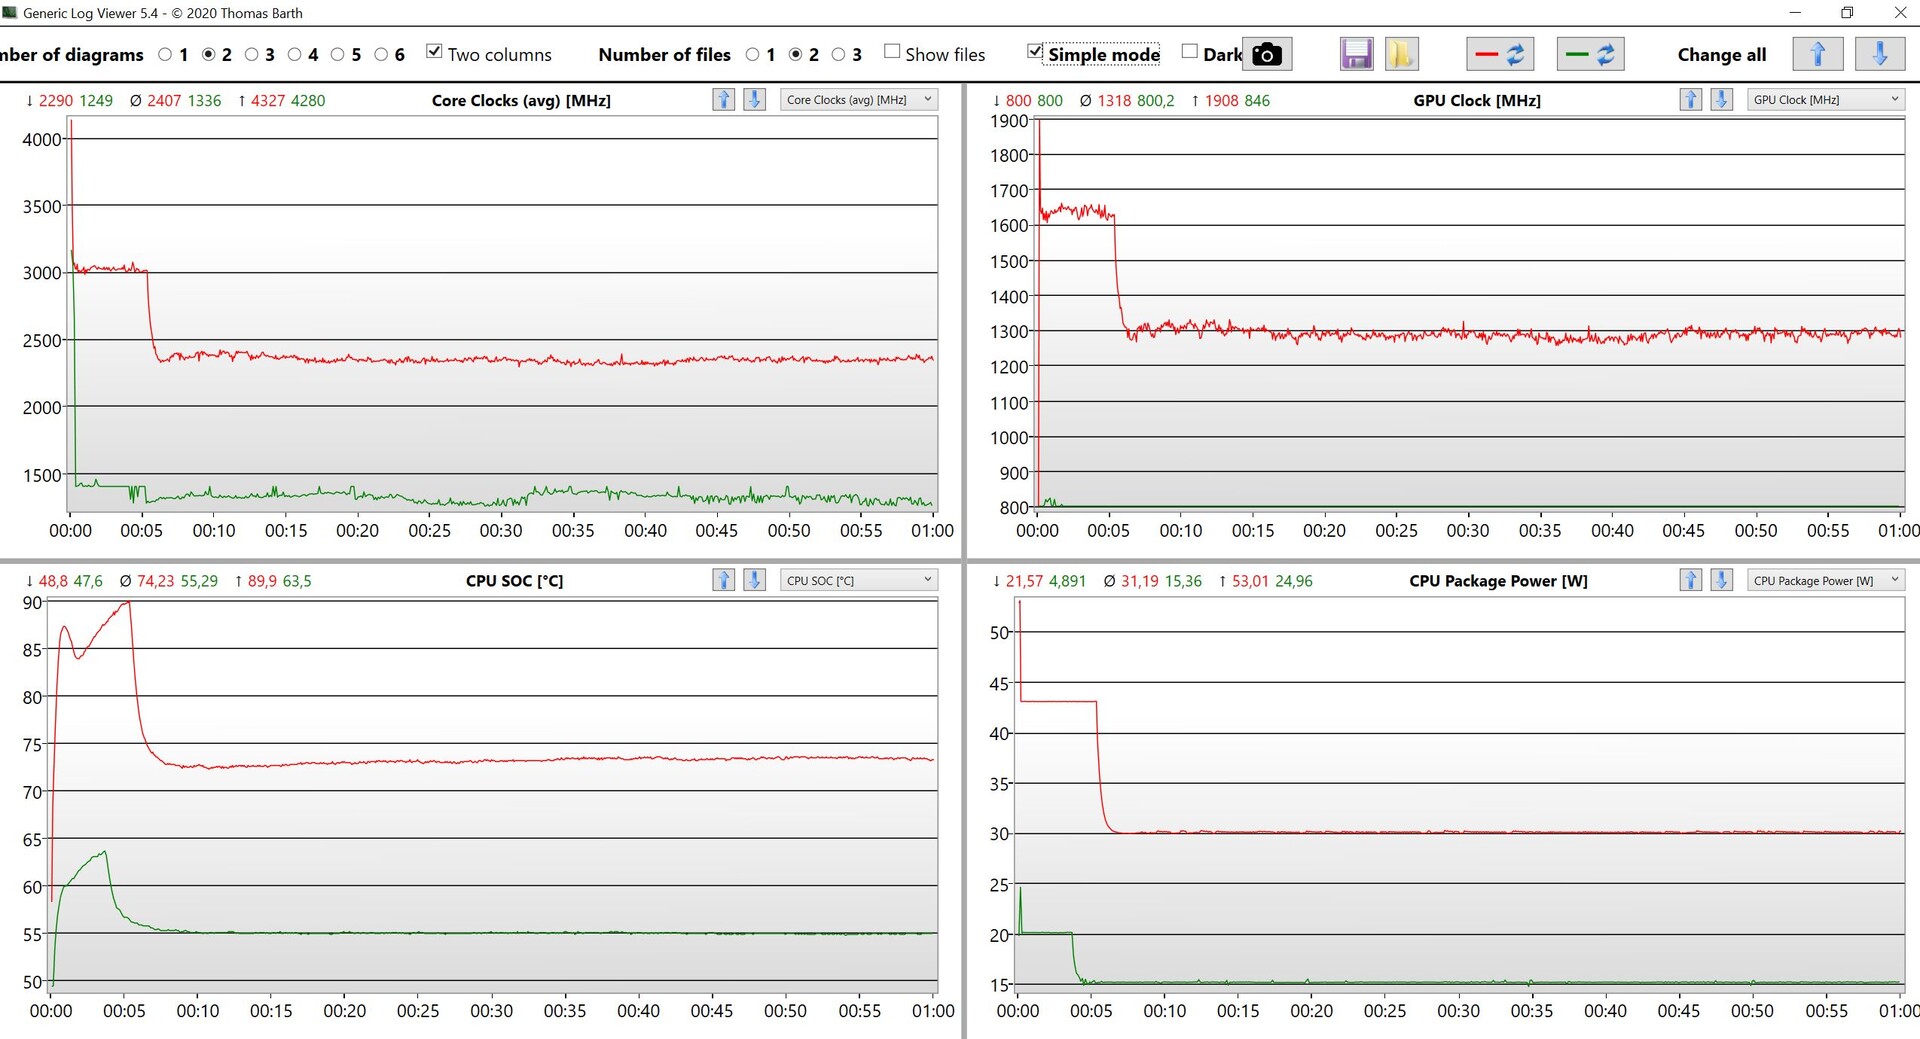
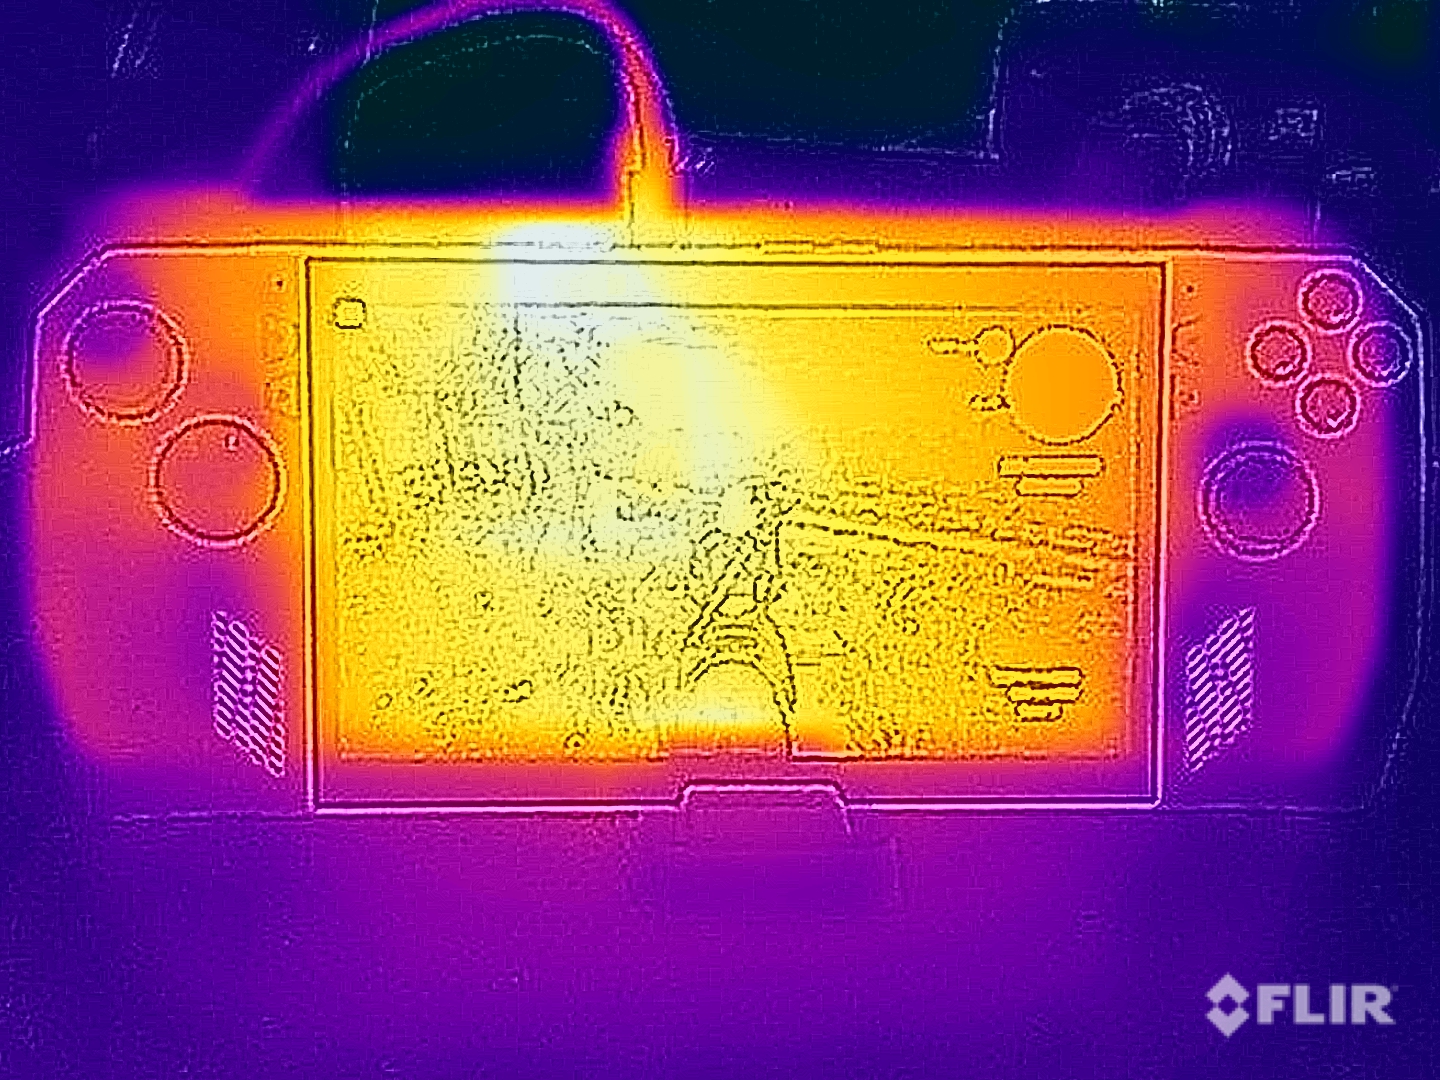
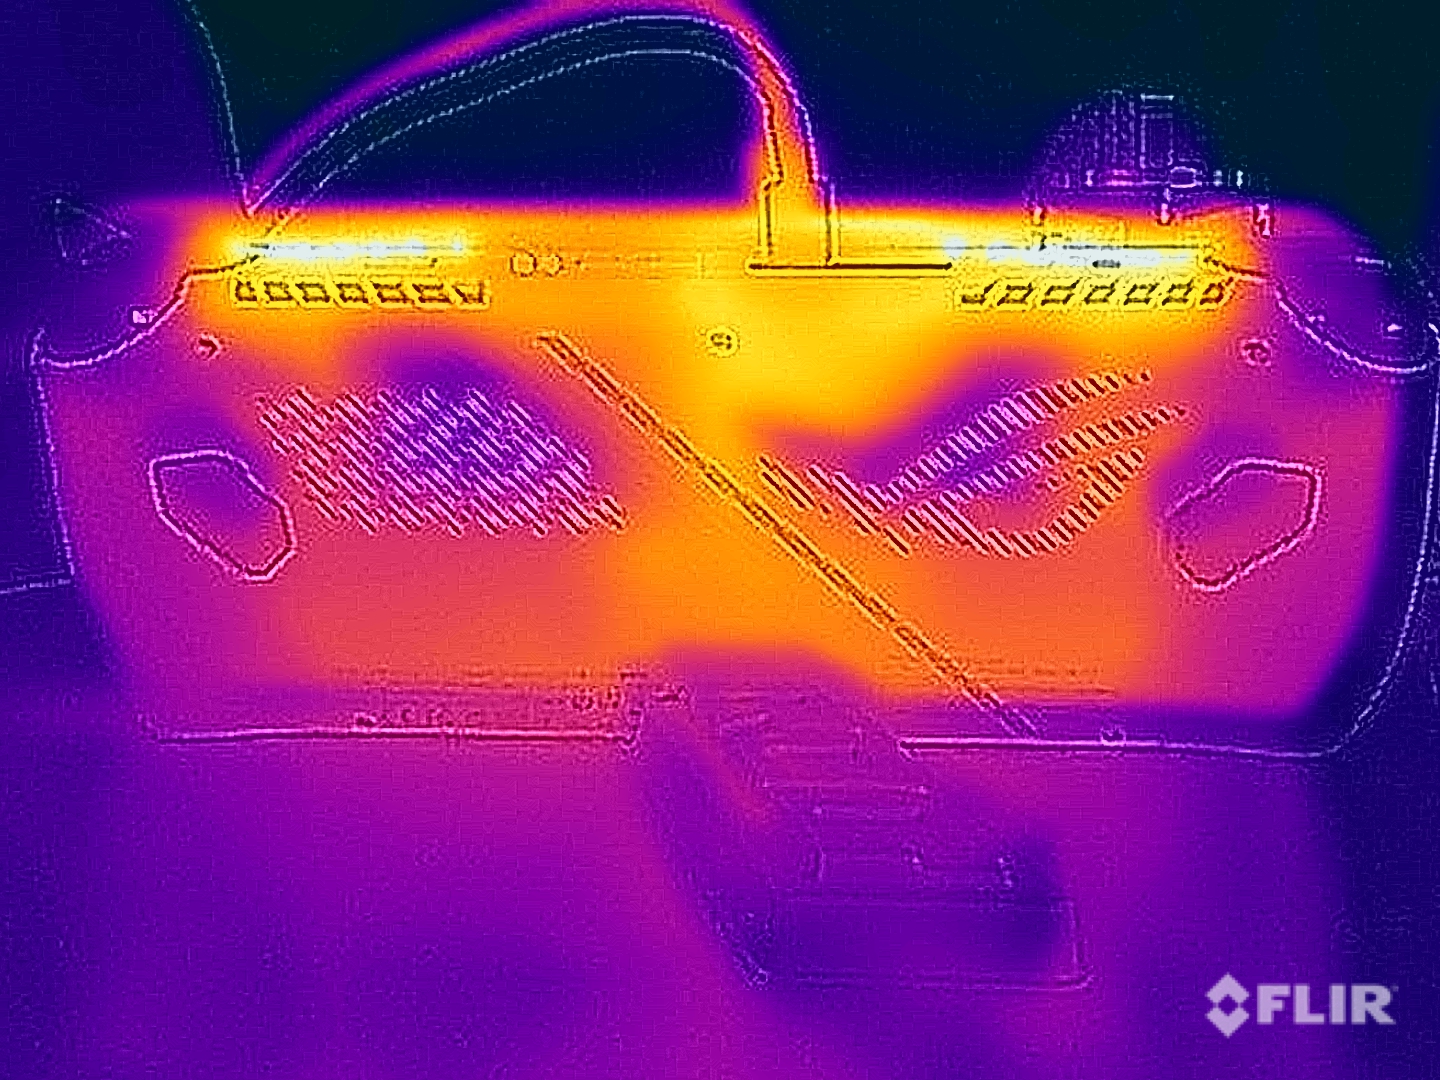
温度
尽管性能很高,但表面温度没有问题,因为两个手柄总是舒适的凉爽(这在下面的热成像中也得到了很好的说明)。背板显然升温不少,热点是顶部的风扇排气口周围的区域,在涡轮模式下高达49℃。然而,这些区域通常没有皮肤接触,当你把爱丽放在身体前面时,暖空气会被引导到远离用户的地方。在轻度工作负荷下,表面温度保持在30℃以下,所以没有任何限制。
我们的压力测试再次显示了涡轮和性能电源模式之间的巨大差异。几分钟后,SoC将分别在宣传的30瓦特和15瓦特处趋于平稳,并在测试的其余部分保持在这个水平。这是一个非常好的结果,一些紧凑型笔记本电脑无法做到。压力测试后,性能不会立即降低。
Surface temperatures Turbo mode
(±) The maximum temperature on the upper side is 44.4 °C / 112 F, compared to the average of 36.8 °C / 98 F, ranging from 21 to 71 °C for the class Multimedia.
(+) The bottom heats up to a maximum of 37.9 °C / 100 F, compared to the average of 39.1 °C / 102 F
(+) In idle usage, the average temperature for the upper side is 29 °C / 84 F, compared to the device average of 31.3 °C / 88 F.
(-) Playing The Witcher 3, the average temperature for the upper side is 41.9 °C / 107 F, compared to the device average of 31.3 °C / 88 F.
(-) The palmrests and touchpad can get very hot to the touch with a maximum of 43.3 °C / 109.9 F.
(-) The average temperature of the palmrest area of similar devices was 28.7 °C / 83.7 F (-14.6 °C / -26.2 F).
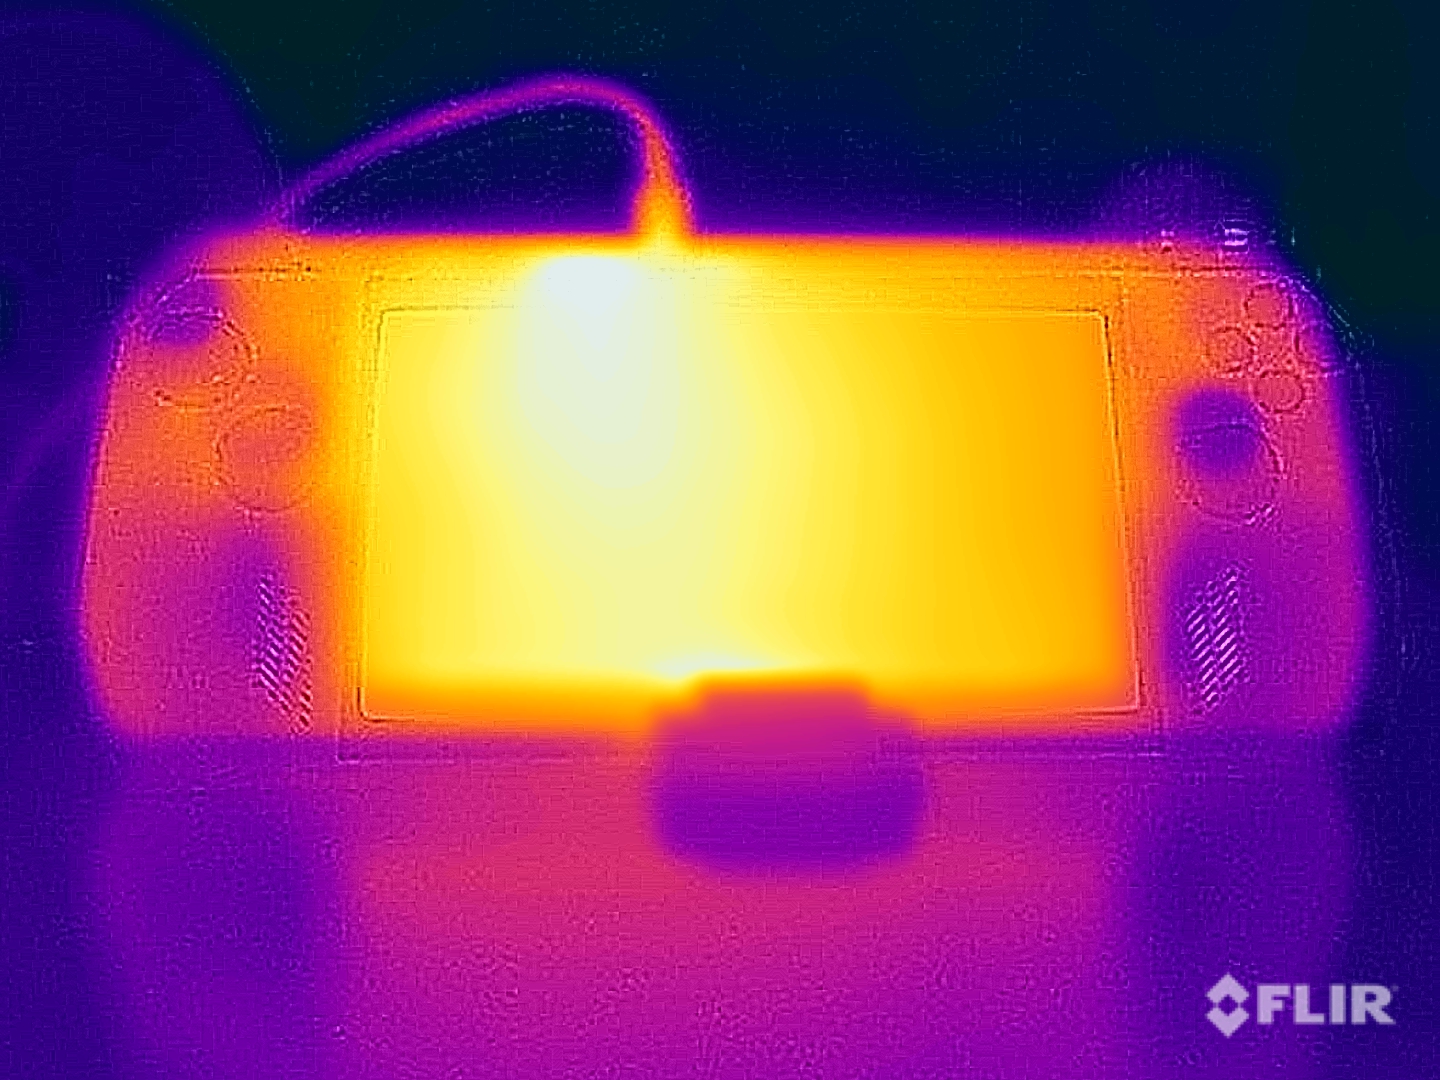
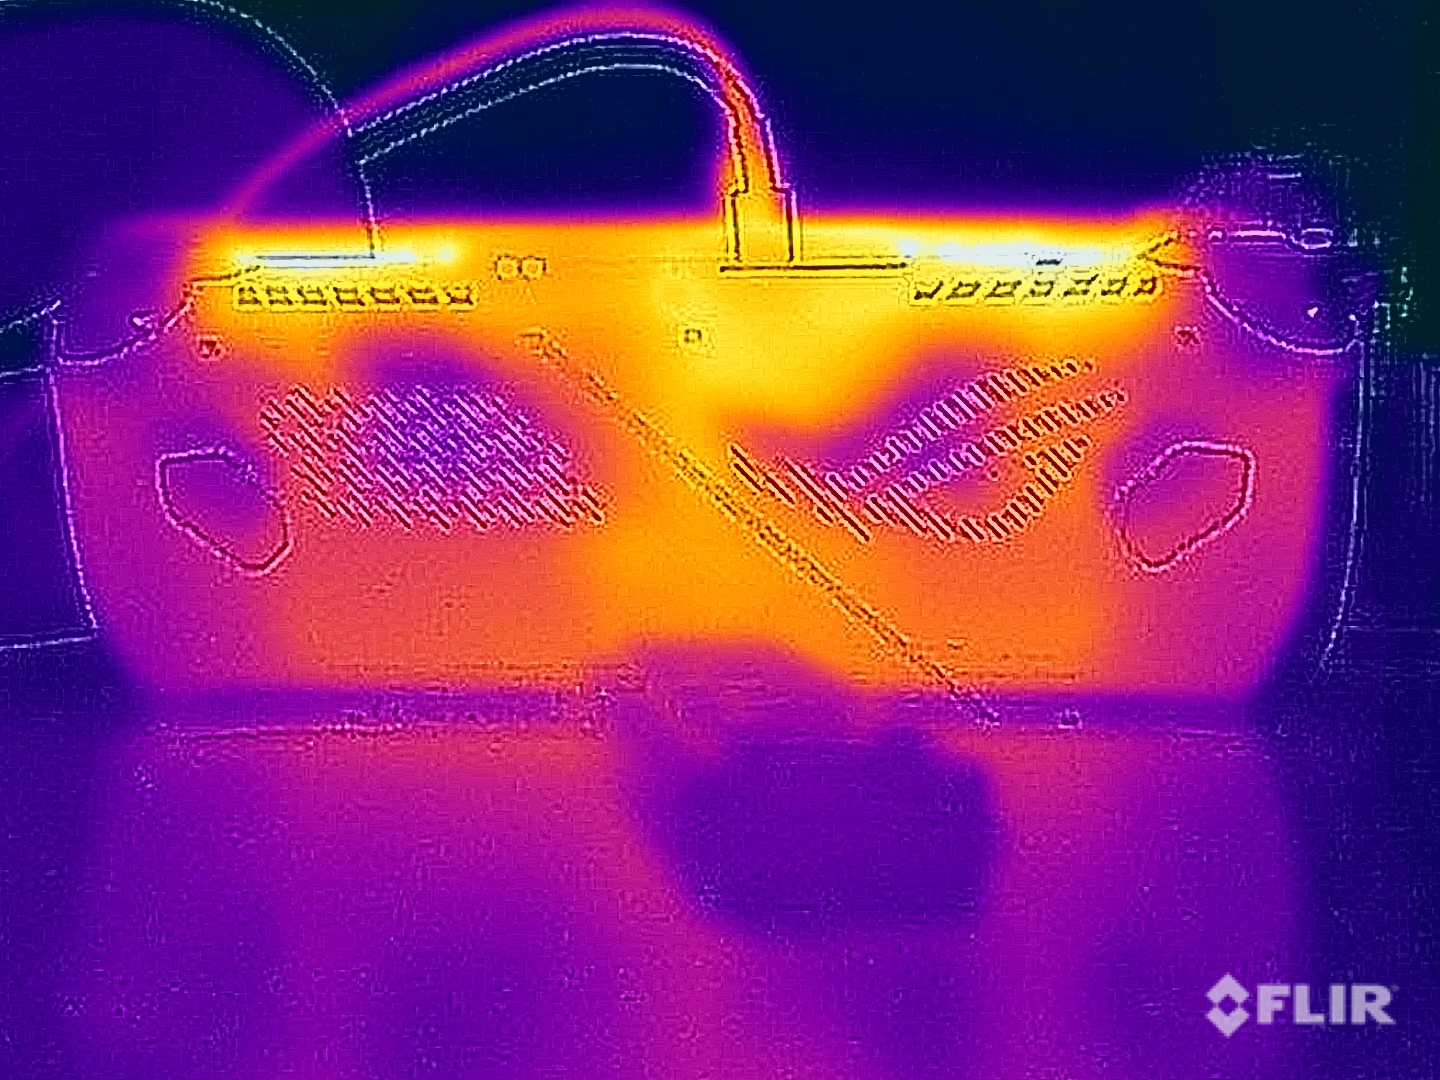
Surface temperatures Performance mode
(±) The maximum temperature on the upper side is 40.7 °C / 105 F, compared to the average of 36.8 °C / 98 F, ranging from 21 to 71 °C for the class Multimedia.
(+) The bottom heats up to a maximum of 30.1 °C / 86 F, compared to the average of 39.1 °C / 102 F
(-) Playing The Witcher 3, the average temperature for the upper side is 40 °C / 104 F, compared to the device average of 31.3 °C / 88 F.
(-) The palmrests and touchpad can get very hot to the touch with a maximum of 41.8 °C / 107.2 F.
(-) The average temperature of the palmrest area of similar devices was 28.7 °C / 83.7 F (-13.1 °C / -23.5 F).
| Asus ROG Ally Z1 Extreme AMD Ryzen Z1 Extreme, AMD Radeon 780M | GPD Win 4 AMD Ryzen 7 6800U, AMD Radeon 680M | GPD Win Max 2 Intel Core i7-1260P, Intel Iris Xe Graphics G7 96EUs | |
|---|---|---|---|
| Heat | 17% | 17% | |
| Maximum Upper Side * (°C) | 44.4 | 35 21% | 28.6 36% |
| Maximum Bottom * (°C) | 37.9 | 26.8 29% | 33 13% |
| Idle Upper Side * (°C) | 29.9 | 28.4 5% | 24.6 18% |
| Idle Bottom * (°C) | 28.3 | 25 12% | 27.6 2% |
* ... smaller is better
发言人
在设备前面有两个立体声扬声器(每个1W),因此声音是朝向用户的。这些模块能够管理好音量,整体质量也不错,但声音缺乏冲击力,尽管这对一个小型设备来说并不令人惊讶。我们的分析还表明,与Steam Deck相比,整体质量更好。
当你在性能电源模式下游戏时,你实际上可以将扬声器用于游戏音效。否则,有一个3.5毫米的立体声插孔用于耳机或外部扬声器。
Asus ROG Ally Z1 Extreme audio analysis
(+) | speakers can play relatively loud (82.1 dB)
Bass 100 - 315 Hz
(-) | nearly no bass - on average 15.5% lower than median
(±) | linearity of bass is average (8.4% delta to prev. frequency)
Mids 400 - 2000 Hz
(+) | balanced mids - only 3.1% away from median
(+) | mids are linear (3% delta to prev. frequency)
Highs 2 - 16 kHz
(+) | balanced highs - only 1.9% away from median
(+) | highs are linear (2.3% delta to prev. frequency)
Overall 100 - 16.000 Hz
(+) | overall sound is linear (13.5% difference to median)
Compared to same class
» 29% of all tested devices in this class were better, 4% similar, 67% worse
» The best had a delta of 5%, average was 17%, worst was 45%
Compared to all devices tested
» 14% of all tested devices were better, 4% similar, 82% worse
» The best had a delta of 4%, average was 23%, worst was 134%
Valve Steam Deck 512 GB LCD audio analysis
(±) | speaker loudness is average but good (79.2 dB)
Bass 100 - 315 Hz
(-) | nearly no bass - on average 21.6% lower than median
(±) | linearity of bass is average (12% delta to prev. frequency)
Mids 400 - 2000 Hz
(+) | balanced mids - only 3.3% away from median
(+) | mids are linear (6.1% delta to prev. frequency)
Highs 2 - 16 kHz
(+) | balanced highs - only 3.4% away from median
(+) | highs are linear (5.4% delta to prev. frequency)
Overall 100 - 16.000 Hz
(±) | linearity of overall sound is average (17.9% difference to median)
Compared to same class
» 46% of all tested devices in this class were better, 17% similar, 38% worse
» The best had a delta of 12%, average was 17%, worst was 23%
Compared to all devices tested
» 37% of all tested devices were better, 8% similar, 55% worse
» The best had a delta of 4%, average was 23%, worst was 134%
能源管理--电池运行时间有限的盟友
消耗功率
ROG Ally的最低空闲功耗为4.2瓦,效率不高。有一些拥有较大屏幕的笔记本电脑能够管理类似甚至更好的结果。在最大亮度下,该值增加到6.3瓦。负载结果与普通的AMD供电的次笔记本非常相似,在游戏期间和我们的压力测试中,几分钟后的负载结果为50瓦特左右。我们测量了65瓦的电源适配器的最大消耗量为67瓦,但电池并没有被耗尽。
| Off / Standby | |
| Idle | |
| Load |
|
Key:
min: | |
| Asus ROG Ally Z1 Extreme Z1 Extreme, Radeon 780M, Micron 2400 MTFDKBK512QFM, IPS, 1920x1080, 7" | Valve Steam Deck 512 GB LCD 1280x800, 7" | GPD Win 4 R7 6800U, Radeon 680M, BiWin CE480Y2D100-1TB, IPS, 1920x1080, 6" | GPD Win Max 2 i7-1260P, Iris Xe G7 96EUs, BiWin NQ200 1TB CNF82GS1D00-1TB, IPS, 2560x1600, 10.1" | Average of class Multimedia | |
|---|---|---|---|---|---|
| Power Consumption | -7% | -37% | -26% | -57% | |
| Idle Minimum * (Watt) | 4.2 | 5.4 -29% | 7.5 -79% | 5.8 -38% | 5.66 ? -35% |
| Idle Average * (Watt) | 6.1 | 7.6 -25% | 12.4 -103% | 10.2 -67% | 10.2 ? -67% |
| Idle Maximum * (Watt) | 6.3 | 7.8 -24% | 13 -106% | 11.5 -83% | 12.5 ? -98% |
| Load Average * (Watt) | 56.6 | 46 19% | 47.7 16% | 65.2 ? -15% | |
| Witcher 3 ultra * (Watt) | 64.1 | 31.1 51% | 45.2 29% | 45.6 29% | |
| Load Maximum * (Watt) | 67.2 | 56 17% | 76.8 -14% | 113.5 ? -69% |
* ... smaller is better
Power consumption Witcher 3 / Stress test
电池运行时间
我们已经谈到了游戏期间的电池运行时间,根据电源模式的不同,你可以期待1小时到1小时45分钟。如果你使用该设备进行视频播放或网页浏览,40瓦特的电池可以管理更长的运行时间。在150尼特的调整亮度下(占我们评测设备最大亮度的40%),我们的视频测试运行了约9.5小时。在Wi-Fi测试中,我们在60和120赫兹下测试了不同的亮度水平,结果在6到8小时之间:
| 亮度 | 60 Hz | 120 Hz |
|---|---|---|
| 150尼特 | 465分钟 | 444分钟 |
| 最大 | 397分钟 | 355分钟 |
当设备开机时,充满电需要90分钟。当电池电量达到60%时,充电速度下降,需要34分钟(大约50分钟后可获得0%的容量。
| Asus ROG Ally Z1 Extreme Z1 Extreme, Radeon 780M, 40 Wh | GPD Win 4 R7 6800U, Radeon 680M, 46 Wh | GPD Win Max 2 i7-1260P, Iris Xe G7 96EUs, 70 Wh | Average of class Multimedia | |
|---|---|---|---|---|
| Battery runtime | -4% | 12% | 68% | |
| H.264 (h) | 9.5 | 17.1 ? 80% | ||
| WiFi v1.3 (h) | 7.8 | 7.5 -4% | 8.7 12% | 12.2 ? 56% |
| Witcher 3 ultra (h) | 1 | |||
| Reader / Idle (h) | 9.7 | 15.4 | 24.9 ? | |
| Load (h) | 1.3 | 1.7 | 1.664 ? |
Pros
Cons
结论 - ROG Ally是一款非常好的游戏掌机
新的华硕ROG Ally是非常成功的游戏掌机的第一次尝试。不仅硬件非常有说服力,而且以游戏体验为重点的出色控制和操作也给我们留下了深刻印象。专门设计的Armoury Crate SE软件是经过深思熟虑(并针对触摸进行了优化)的用户界面,也是所有游戏的控制中心,在你启动ROG Ally时默认启动。你可以舒适地在一个地方管理你的所有游戏,甚至为每个单独的游戏创建自定义控制方案。指挥中心可以通过触摸一个按钮随时访问(并且可以配置),这也是非常方便的,甚至包括实时硬件监控。有人真的在这些方面花了一些心思。Armoury Crate SE仍然只是一个单一的应用程序,带有完全库存的Windows 11操作系统,所以你只需将Ally连接到你的USB-C屏幕或扩展坞上,就能发挥其作用。
华硕在硬件方面也没有做出任何妥协,你可以用799欧元获得最新、最棒的AMD移动处理器。这其实是第一款设备,我们还在等待配备这些CPU的笔记本电脑。的AMD Ryzen Z1 Extreme实际上是新的Ryzen 7 7840U,有8个强大的Zen4核心(4纳米,凤凰),包括新的Radeon 780M iGPU.在Turbo模式下的CPU性能特别令人印象深刻,在多核性能方面,这个紧凑的手持设备很容易击败大多数紧凑的笔记本电脑。我们已经非常渴望用外部的Ally进行测试。GeForce RTX 4090笔记本电脑我们将在几天后添加基准测试结果。我们怀疑CPU不会成为游戏性能的一个巨大瓶颈,当你考虑到华硕ROG Zephyrus G14,其中Ryzen 9 7940HS在游戏期间也被限制在45瓦特。
华硕ROG Ally是一款优秀的游戏掌机。由于强大的AMD Zen4处理器和快速的iGPU,这个紧凑的设备即使在现代游戏中也能管理流畅的帧率,你可以享受1080p屏幕的快速响应时间和120 Hz。ROG Ally唯一真正的缺点是玩游戏时电池运行时间有限,因为电池在1.5小时左右就会耗尽。
华硕使用的是塑料机箱,但整体质量完全没问题,建造质量以及稳定性都很好。你可以更换紧凑的M.2-2230固态硬盘,清洁风扇,并通过快速的microSD读卡器扩大存储容量。7英寸的IPS屏幕具有快速的响应时间和自适应同步,对于游戏来说是非常好的,而且也有足够的亮度,接近500尼特。
我们最大的批评是缺乏网络摄像头,以及当你真正玩游戏时电池运行时间短。如果你在Turbo模式下使用最高性能,最多一个小时后电池就会耗尽。在性能模式下,你可以将运行时间延长到1:45小时,但这几乎是最大的运行时间。否则,不容易找到缺点。一个内置的脚架在旅途中会很好,我们希望在底部有一个对接端口,这样电缆就不会从顶部伸出来。
注:我们在多媒体类别中对该设备进行了评级,因为我们还没有一个游戏掌上电脑的类别。当我们能够审查更多的设备时,我们将添加一个相应的类别。
价格和可用性
与Steam Deck相比,新的ROG Ally在几乎所有方面都更胜一筹,除了价格(Steam Deck配备16GB内存和512GB SSD的建议零售价为679欧元)。我们目前还在审查配备AMD Ryzen 7 6800U和更大的8.4英寸屏幕的One X Player 2,但它也更贵(1099欧元),配备16/512 GB。该GPD Win 4配有6800U,更加紧凑,但也更加昂贵。由于iGPU功能较弱,ROG Ally的低价SKU在游戏过程中会慢得多,所以我们想等待一个结论。游戏掌机领域似乎正在复苏,我们期待在未来几个月内有更多来自大厂商的设备。在那之前,新的华硕ROG Ally是你目前能得到的最好的游戏掌机。
Asus ROG Ally Z1 Extreme
- 05/11/2023 v7 (old)
Andreas Osthoff
Transparency
The selection of devices to be reviewed is made by our editorial team. The test sample was provided to the author as a loan by the manufacturer or retailer for the purpose of this review. The lender had no influence on this review, nor did the manufacturer receive a copy of this review before publication. There was no obligation to publish this review. As an independent media company, Notebookcheck is not subjected to the authority of manufacturers, retailers or publishers.
This is how Notebookcheck is testing
Every year, Notebookcheck independently reviews hundreds of laptops and smartphones using standardized procedures to ensure that all results are comparable. We have continuously developed our test methods for around 20 years and set industry standards in the process. In our test labs, high-quality measuring equipment is utilized by experienced technicians and editors. These tests involve a multi-stage validation process. Our complex rating system is based on hundreds of well-founded measurements and benchmarks, which maintains objectivity. Further information on our test methods can be found here.
Price comparison

