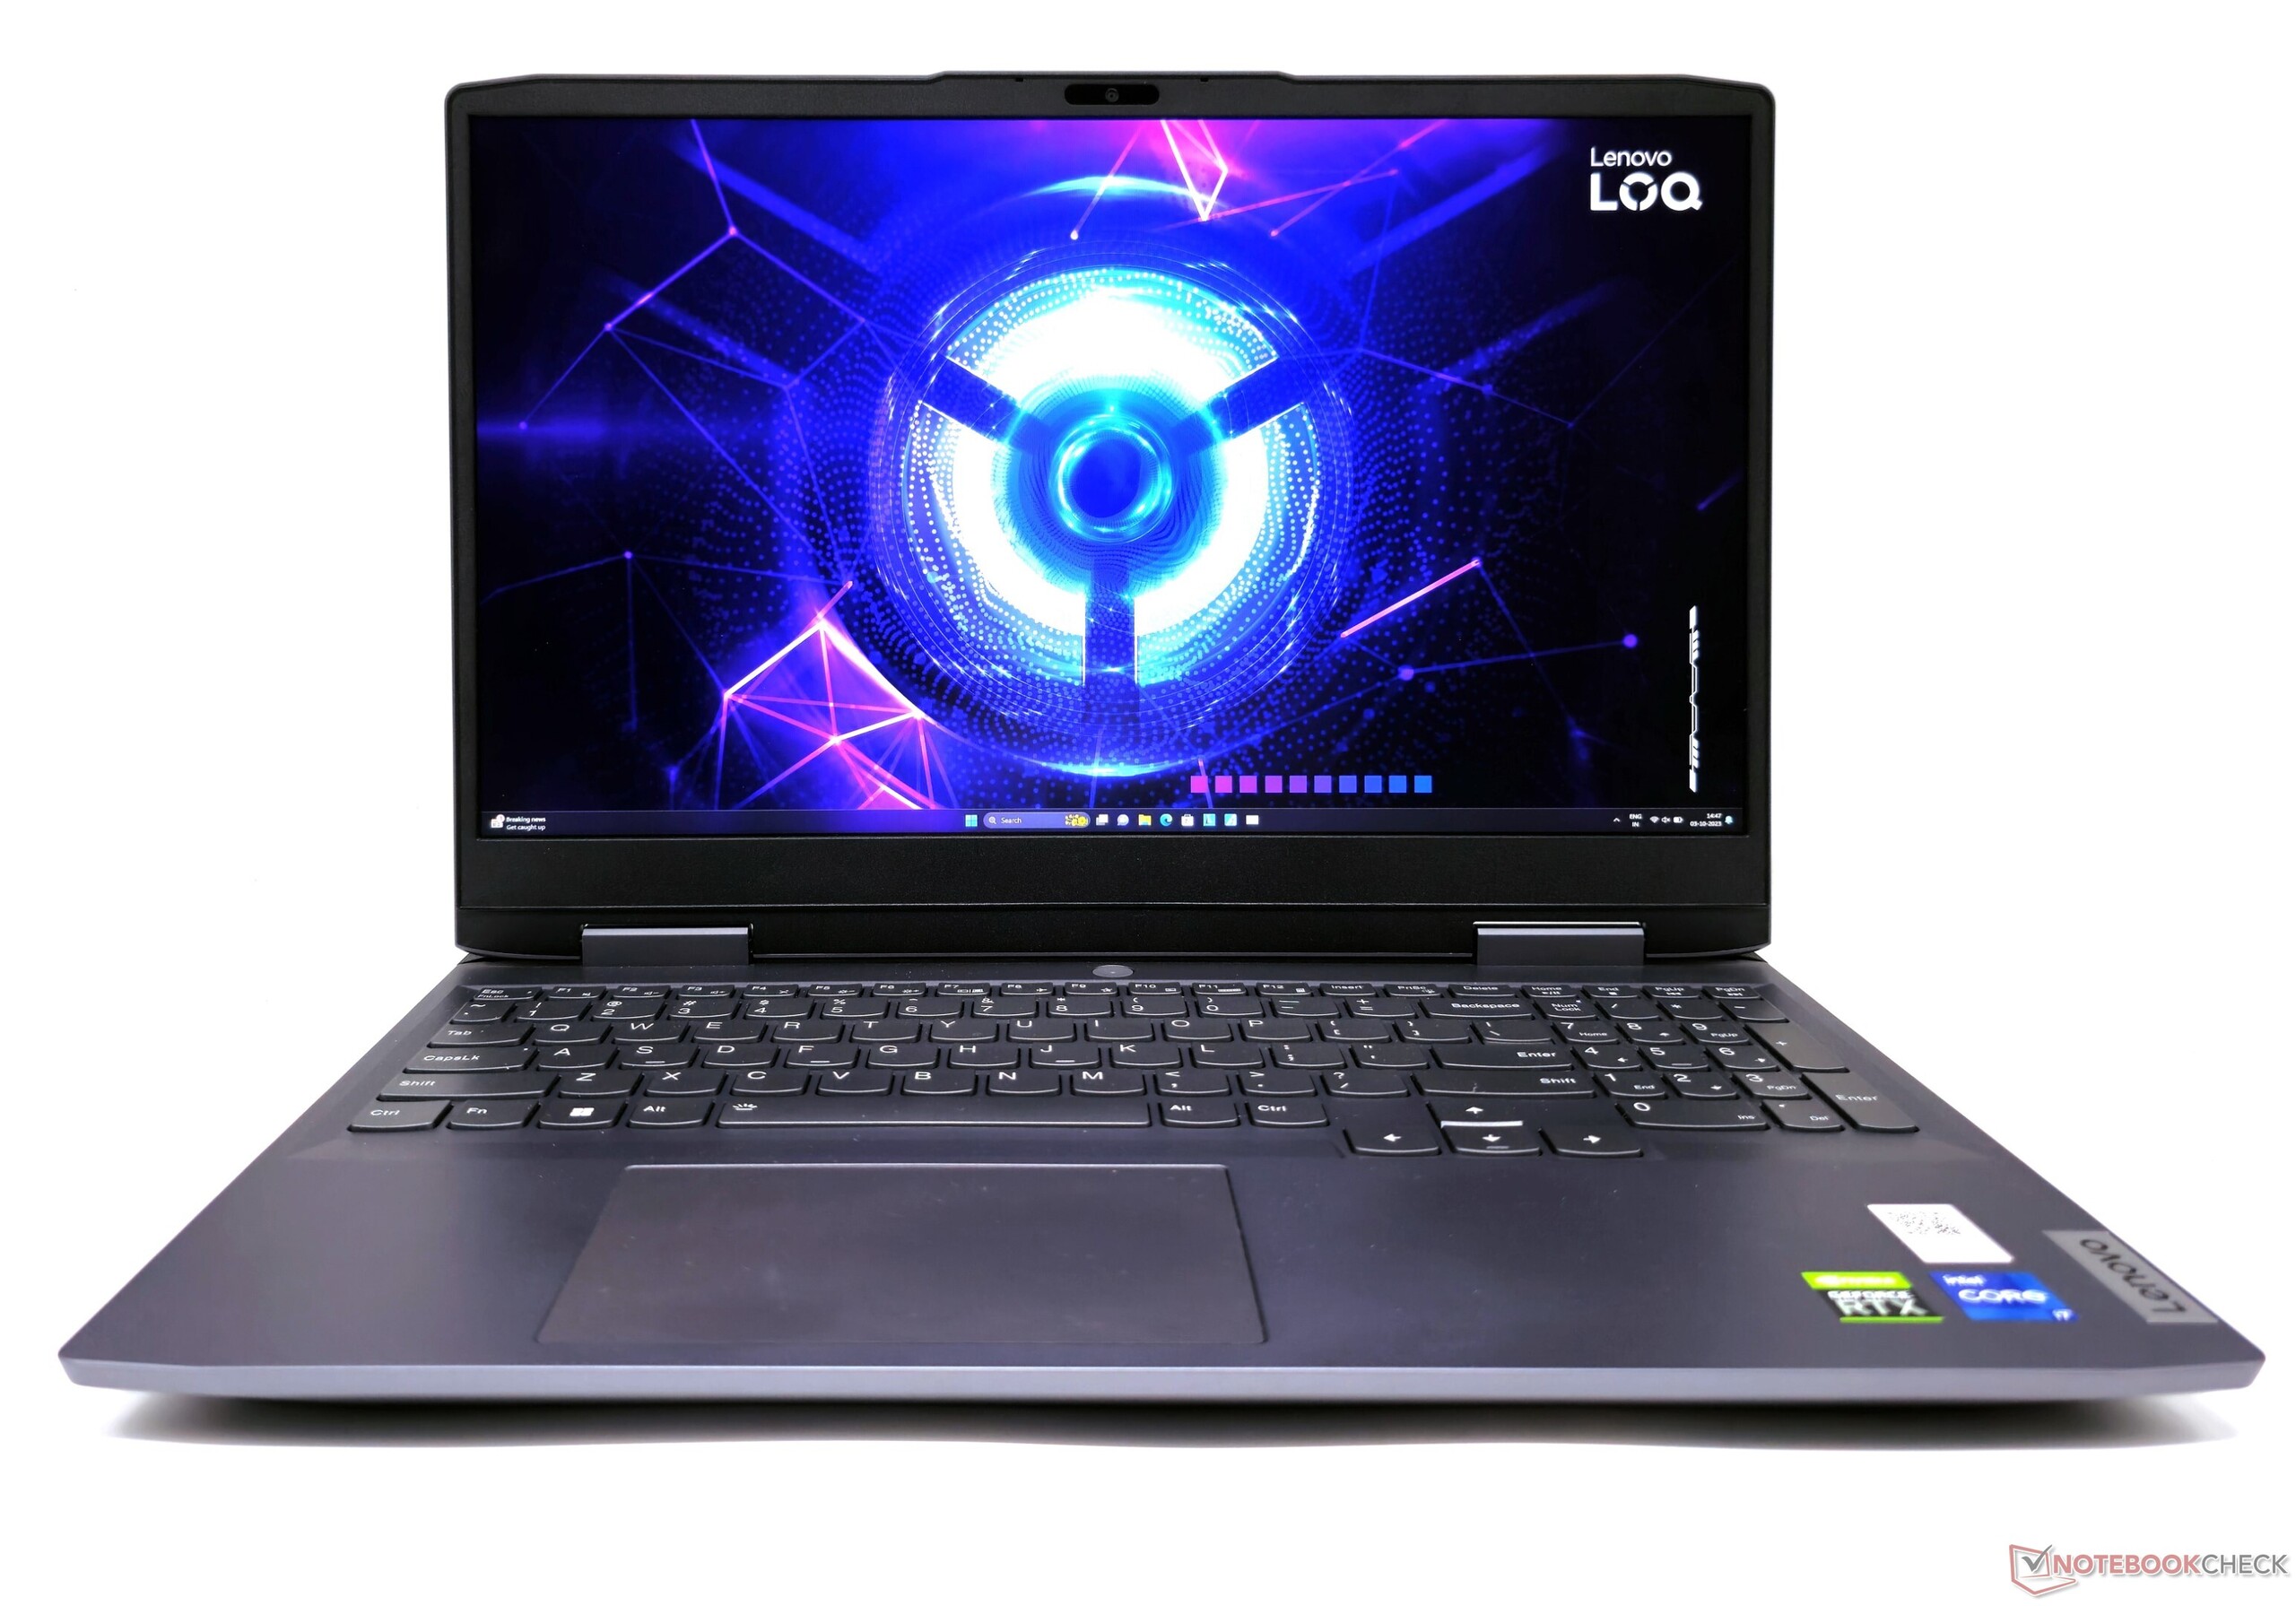
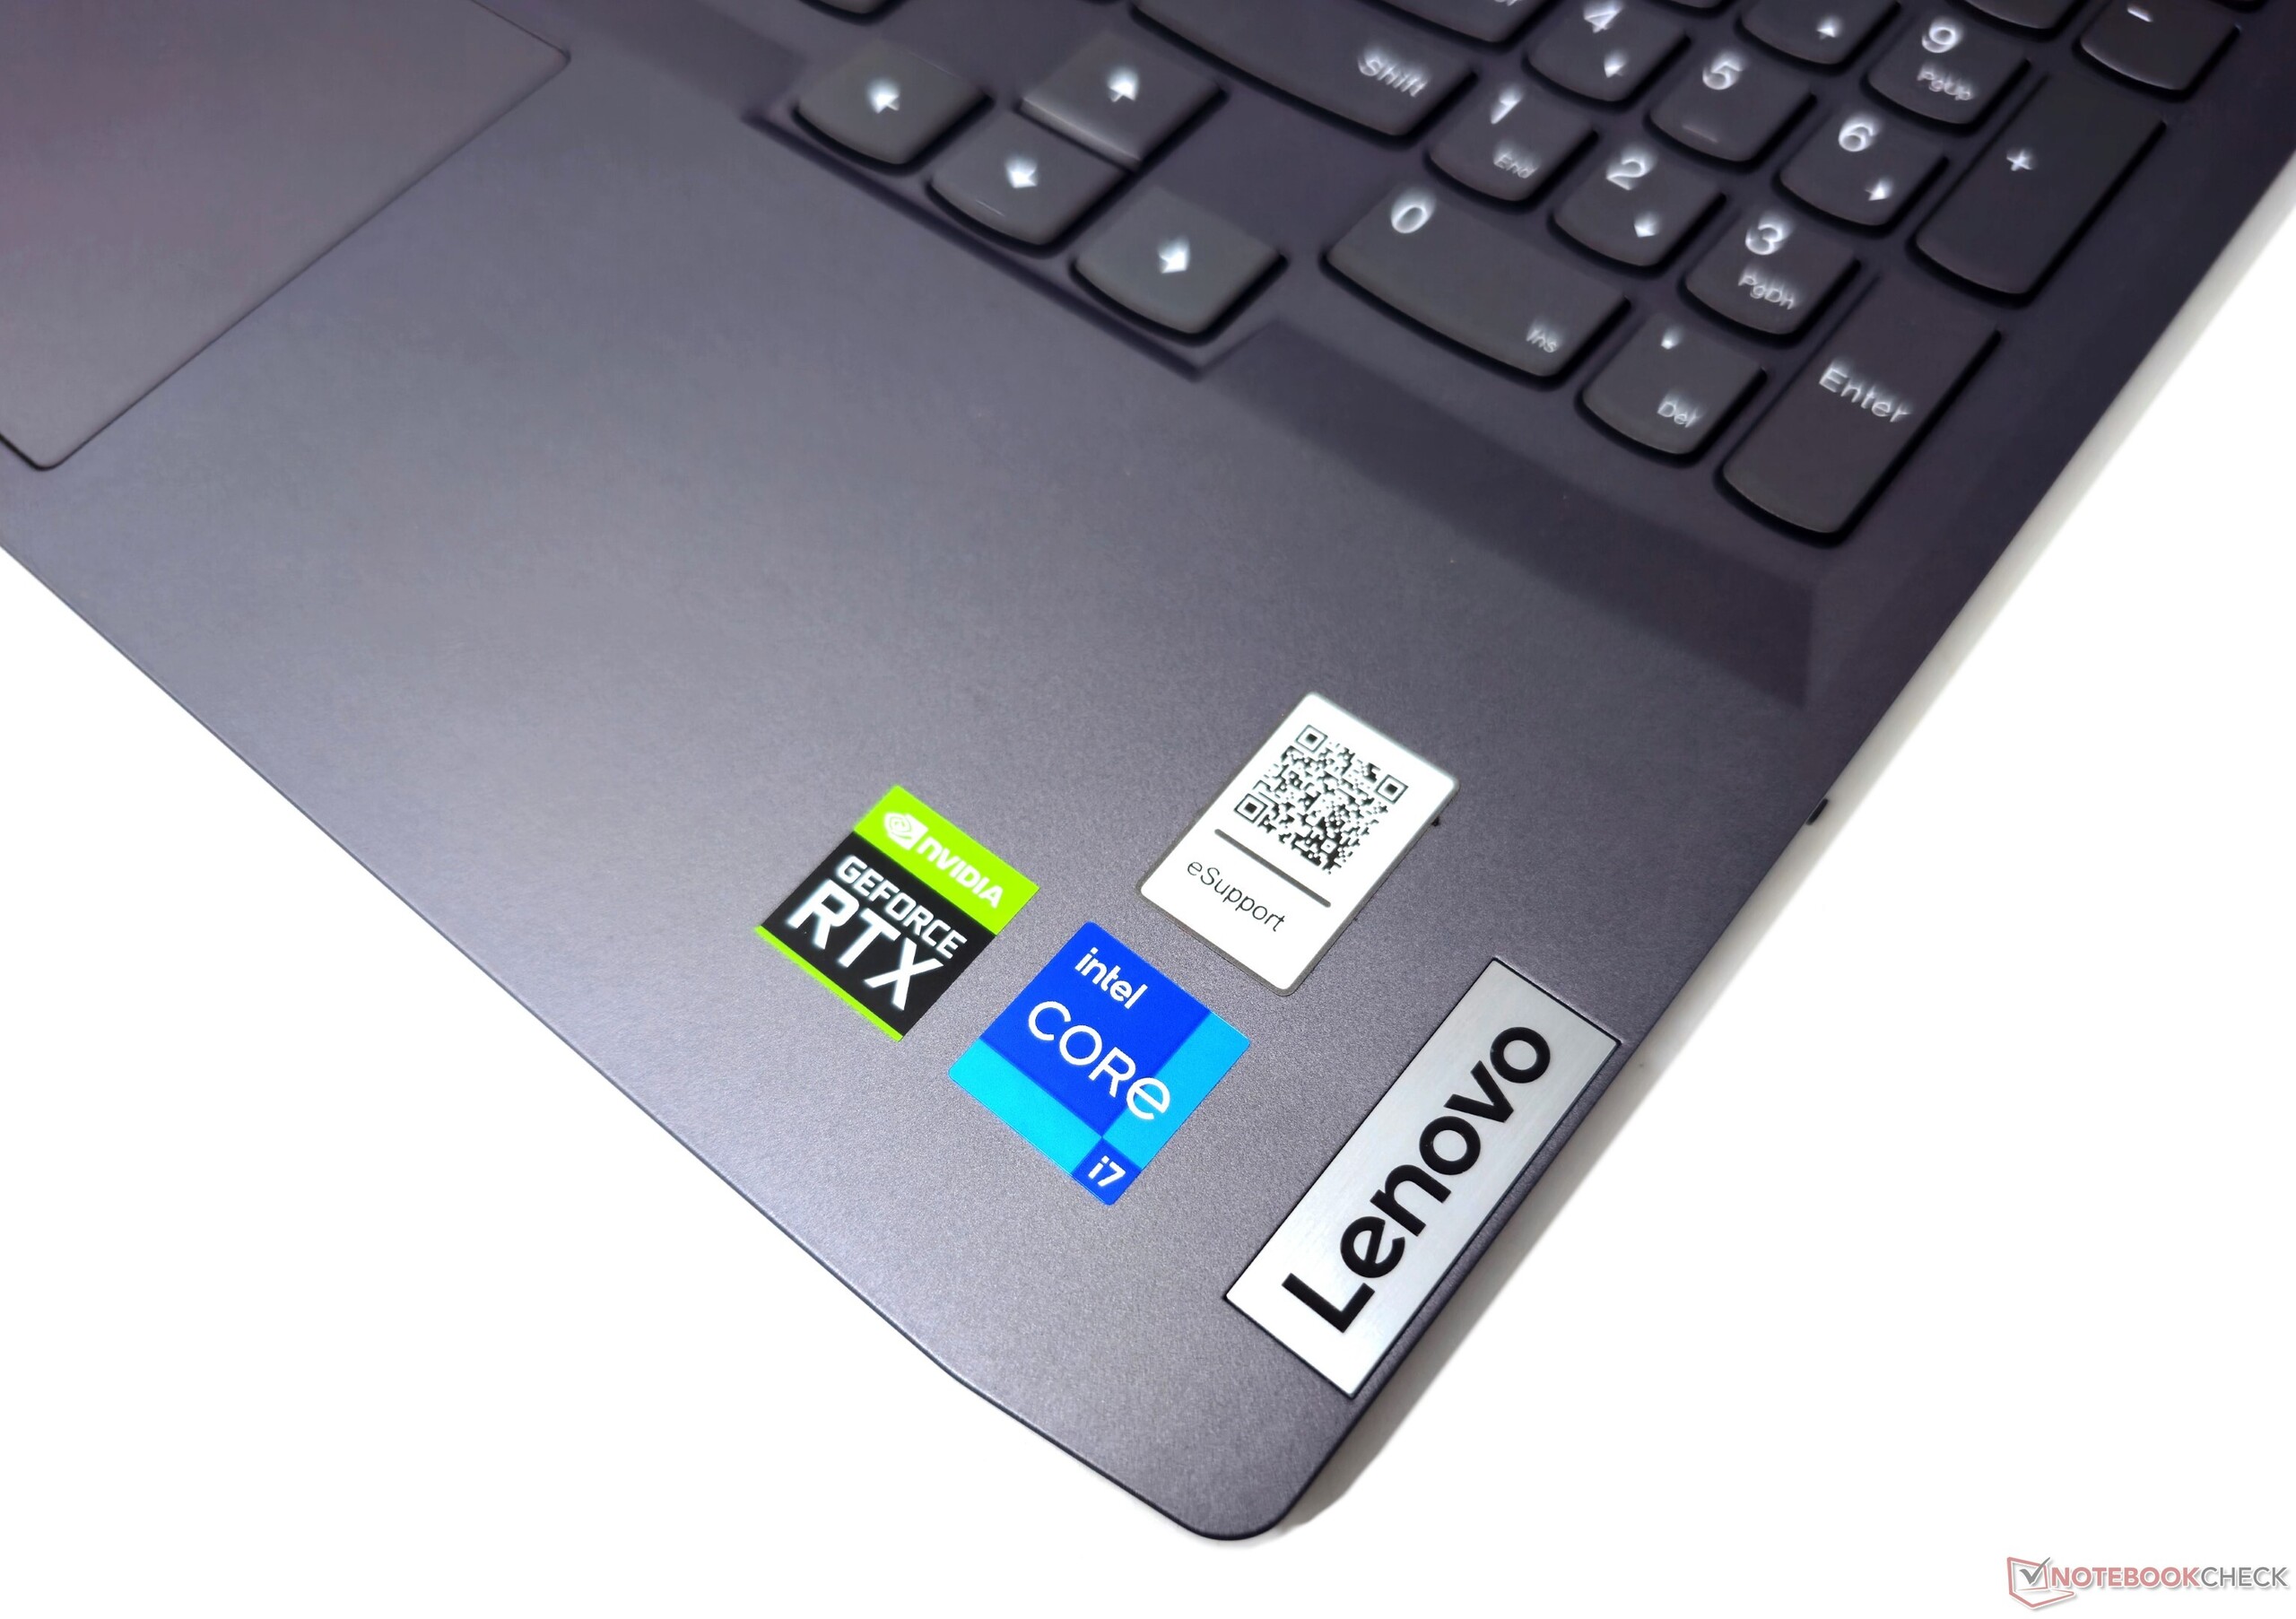
联想LOQ 15酷睿i7评测:经济实惠的Legion 替代品,带来英特尔与 AMD 的难题

联想 LOQ 系列面向经济型入门级游戏玩家,类似于戴尔 G 系列、惠普 Victus、华硕 TUF、微星 Katana 和宏碁 Nitro 系列。我们最近评测了配备AMD Ryzen 7 7840HS和Nvidia RTX 4050 笔记本电脑 GPU.这款 LOQ 16IRH8同样结合了英特尔和 Nvidia 的芯片,配备了 酷睿 i7-13620H与 RTX 4060显卡。
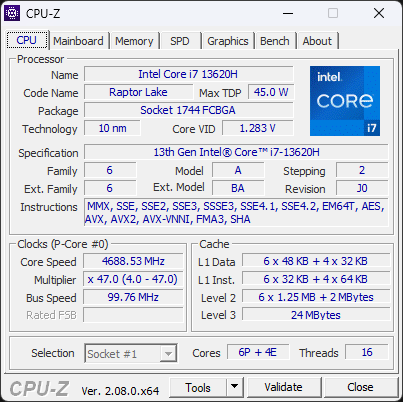
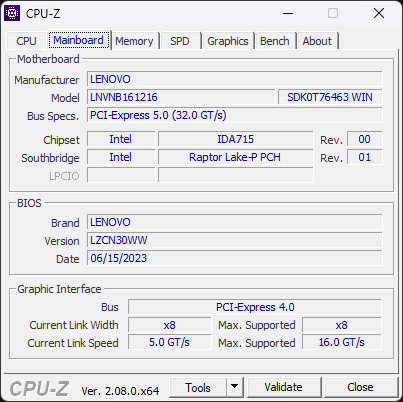
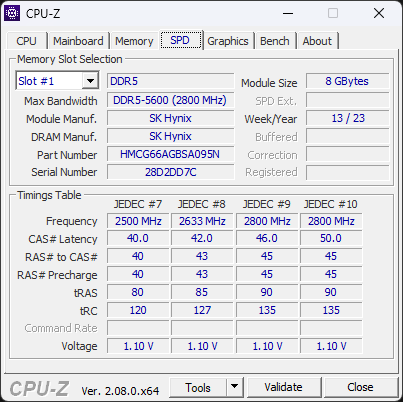
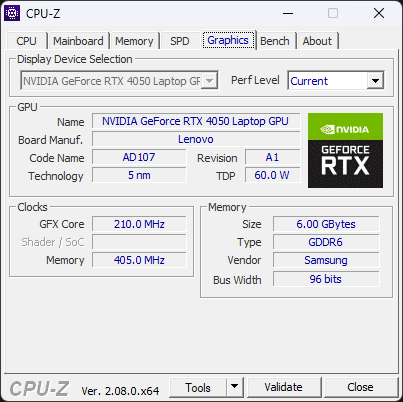
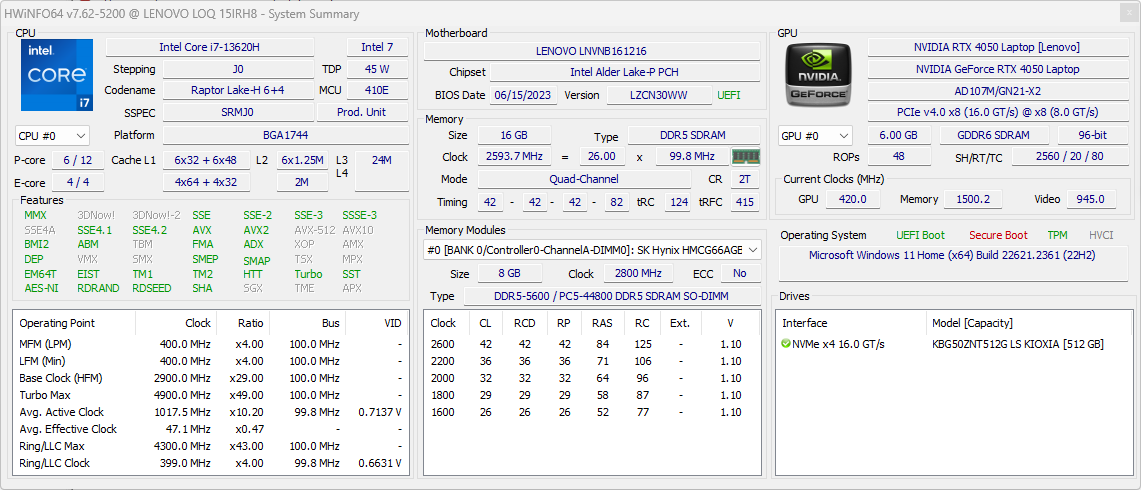
现在我们实验室里的是 15 英寸的 LOQ 15IRH8,采用酷睿 i7-13620H 和 RTX 4050。我们的测试机型还配备了 16 GB DDR5-5200 内存、512 GB PCIe Gen4 NVMe SSD 和 165 Hz QHD G-Sync 显示屏。
这款中高端配置在印度的售价为 1,01,988 ₹(1,224 美元),而 1080p 144Hz 版本的售价为 97,790 ₹(1,050 美元)。
潜在的竞争对手比较
Rating | Date | Model | Weight | Height | Size | Resolution | Price |
|---|---|---|---|---|---|---|---|
| 85.9 % v7 (old) | 10 / 2023 | Lenovo LOQ 15IRH8 Core i7 i7-13620H, GeForce RTX 4050 Laptop GPU | 2.4 kg | 25.2 mm | 15.60" | 2560x1440 | |
| 87.3 % v7 (old) | 09 / 2023 | Lenovo LOQ 16IRH8 i7-13620H, GeForce RTX 4060 Laptop GPU | 2.7 kg | 25.9 mm | 16.00" | 2560x1600 | |
| 85.7 % v7 (old) | 07 / 2023 | Lenovo LOQ 15APH8 R7 7840HS, GeForce RTX 4050 Laptop GPU | 2.5 kg | 25.2 mm | 15.60" | 1920x1080 | |
| 82.1 % v7 (old) | 02 / 2023 | MSI Katana 17 B13VFK i7-13620H, GeForce RTX 4060 Laptop GPU | 2.8 kg | 25.2 mm | 17.30" | 1920x1080 | |
| 89 % v7 (old) | 08 / 2023 | Lenovo Legion Pro 5 16ARX8 (R5 7645HX, RTX 4050) R5 7645HX, GeForce RTX 4050 Laptop GPU | 2.5 kg | 27.3 mm | 16.00" | 2560x1600 | |
| 85.1 % v7 (old) | 09 / 2023 | HP Victus 16-r0077ng i7-13700H, GeForce RTX 4070 Laptop GPU | 2.4 kg | 24 mm | 16.10" | 1920x1080 | |
| 84.2 % v7 (old) | 06 / 2023 | Dell G15 5530 i7-13650HX, GeForce RTX 4060 Laptop GPU | 3 kg | 26.95 mm | 15.60" | 1920x1080 | |
| 86.9 % v7 (old) | 06 / 2023 | Asus TUF Gaming A16 FA617XS R9 7940HS, Radeon RX 7600S | 2.2 kg | 22.1 mm | 16.00" | 1920x1200 |
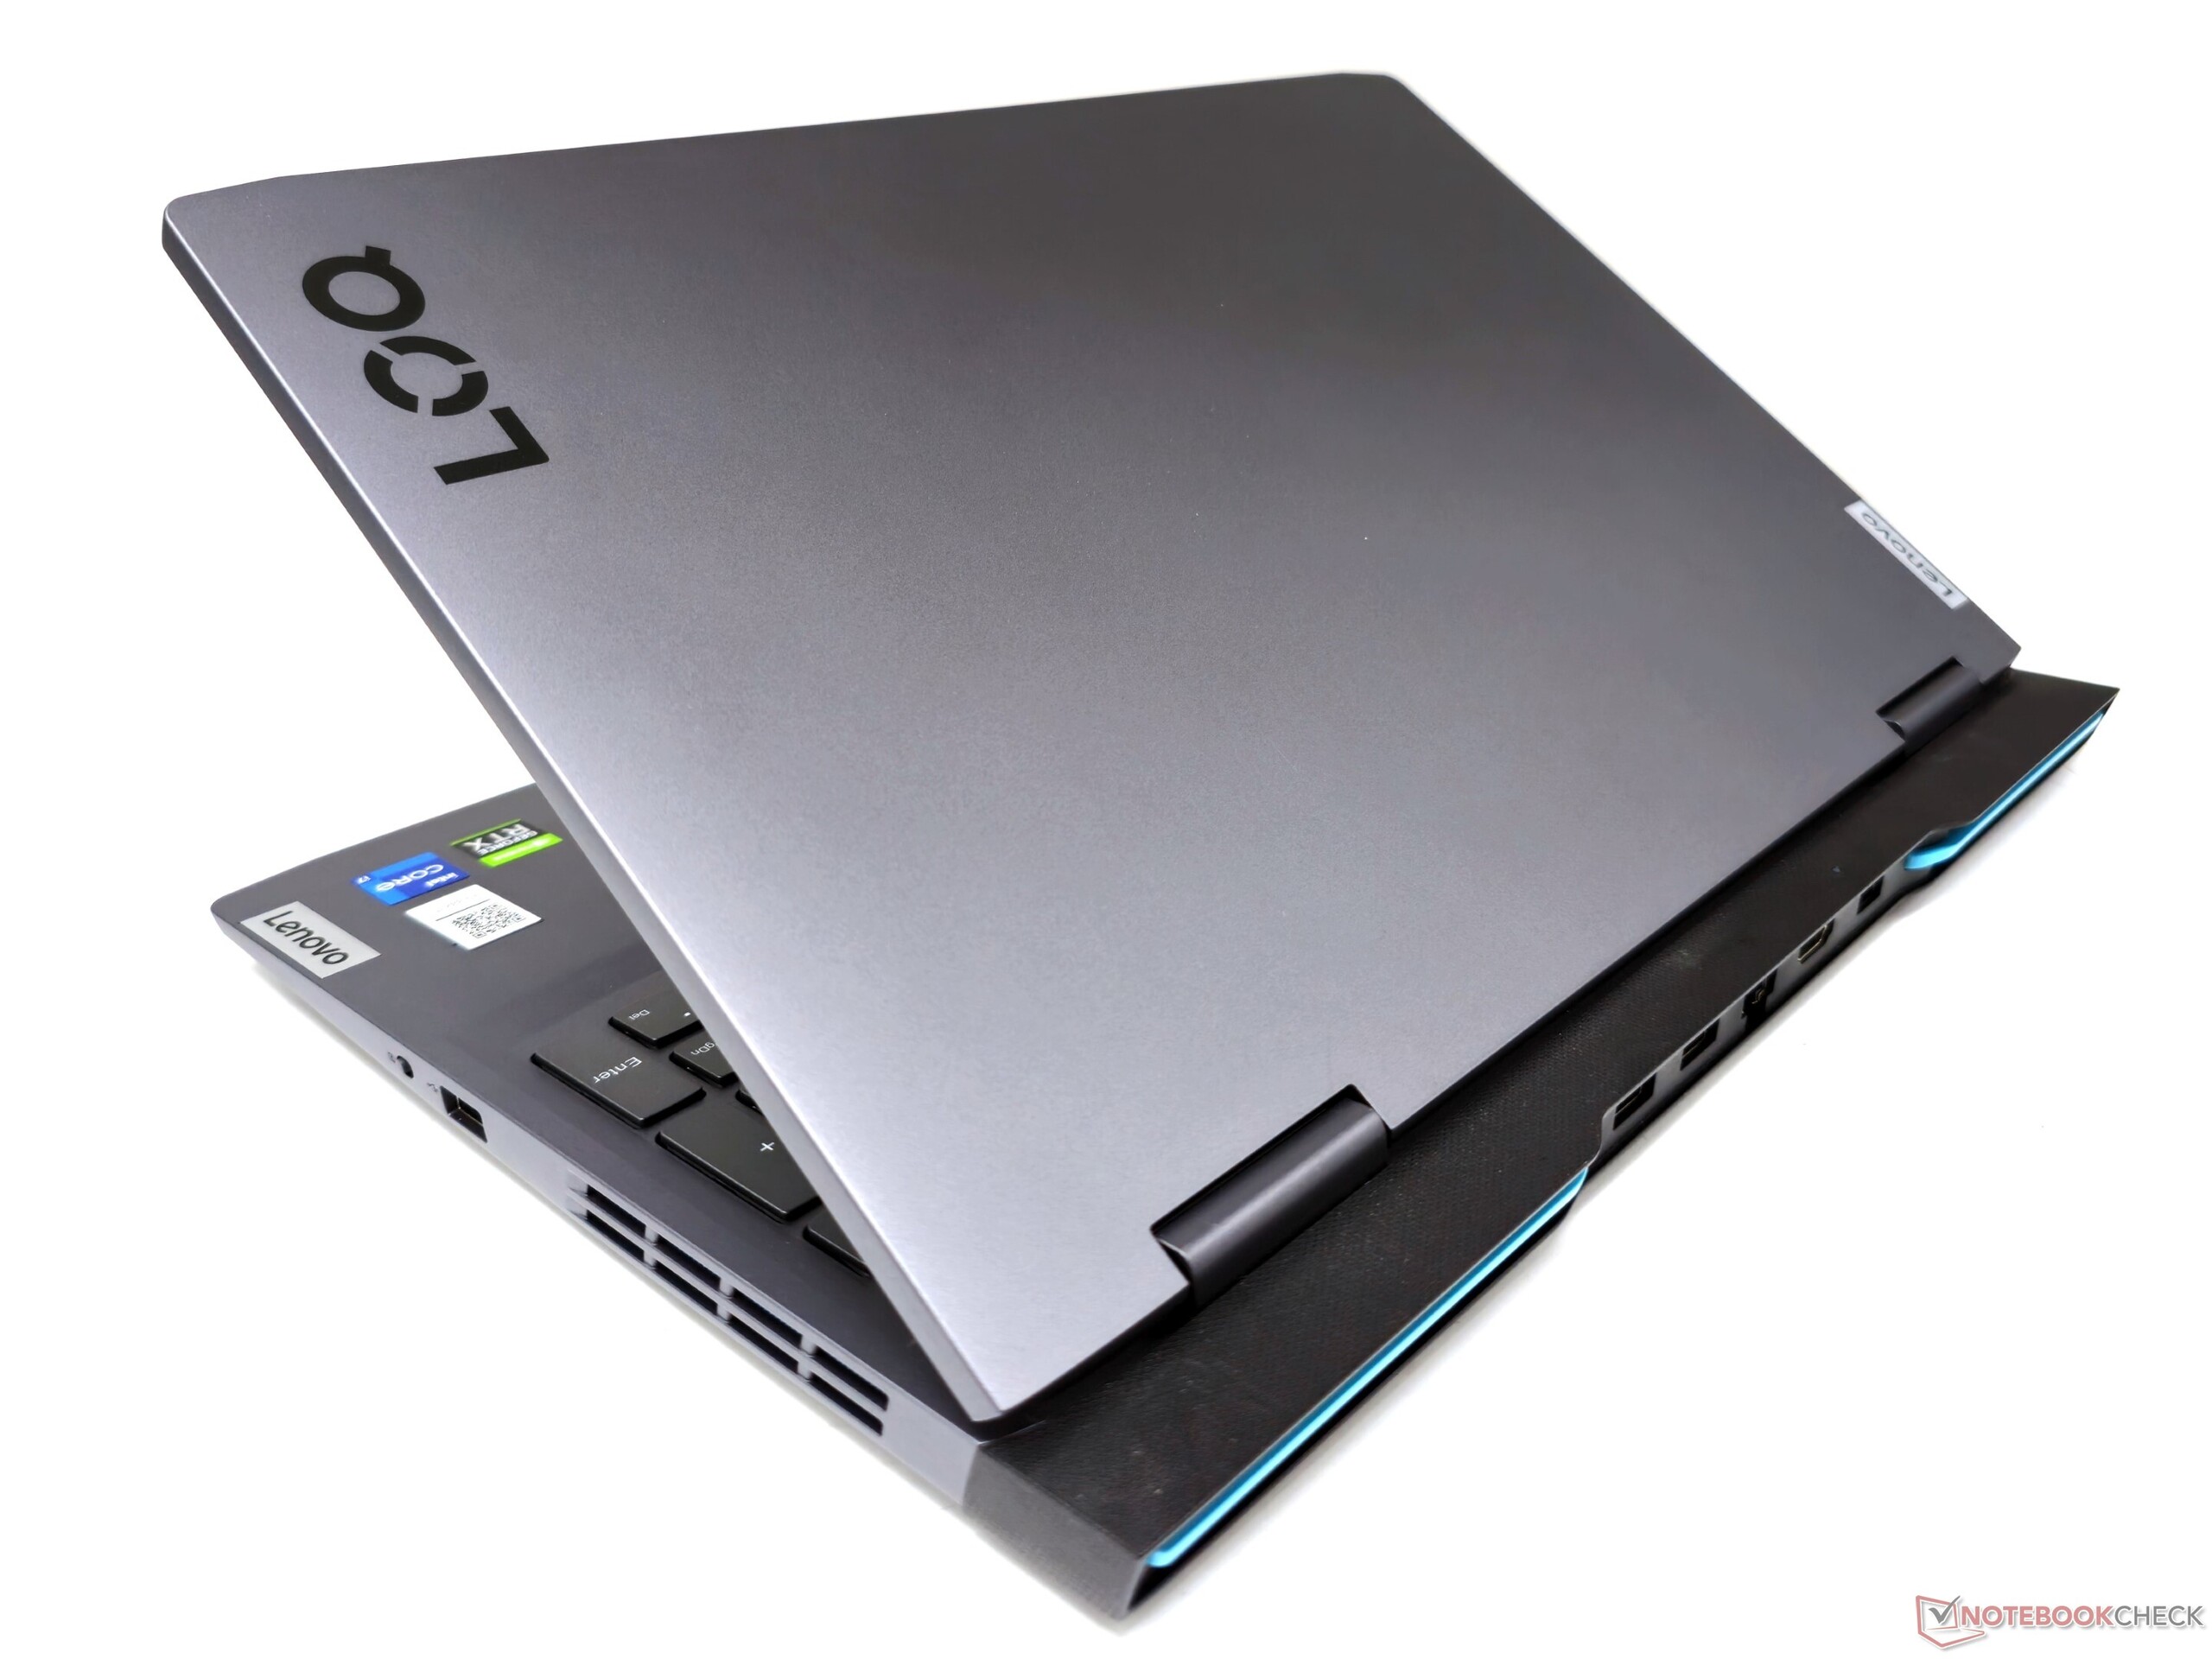
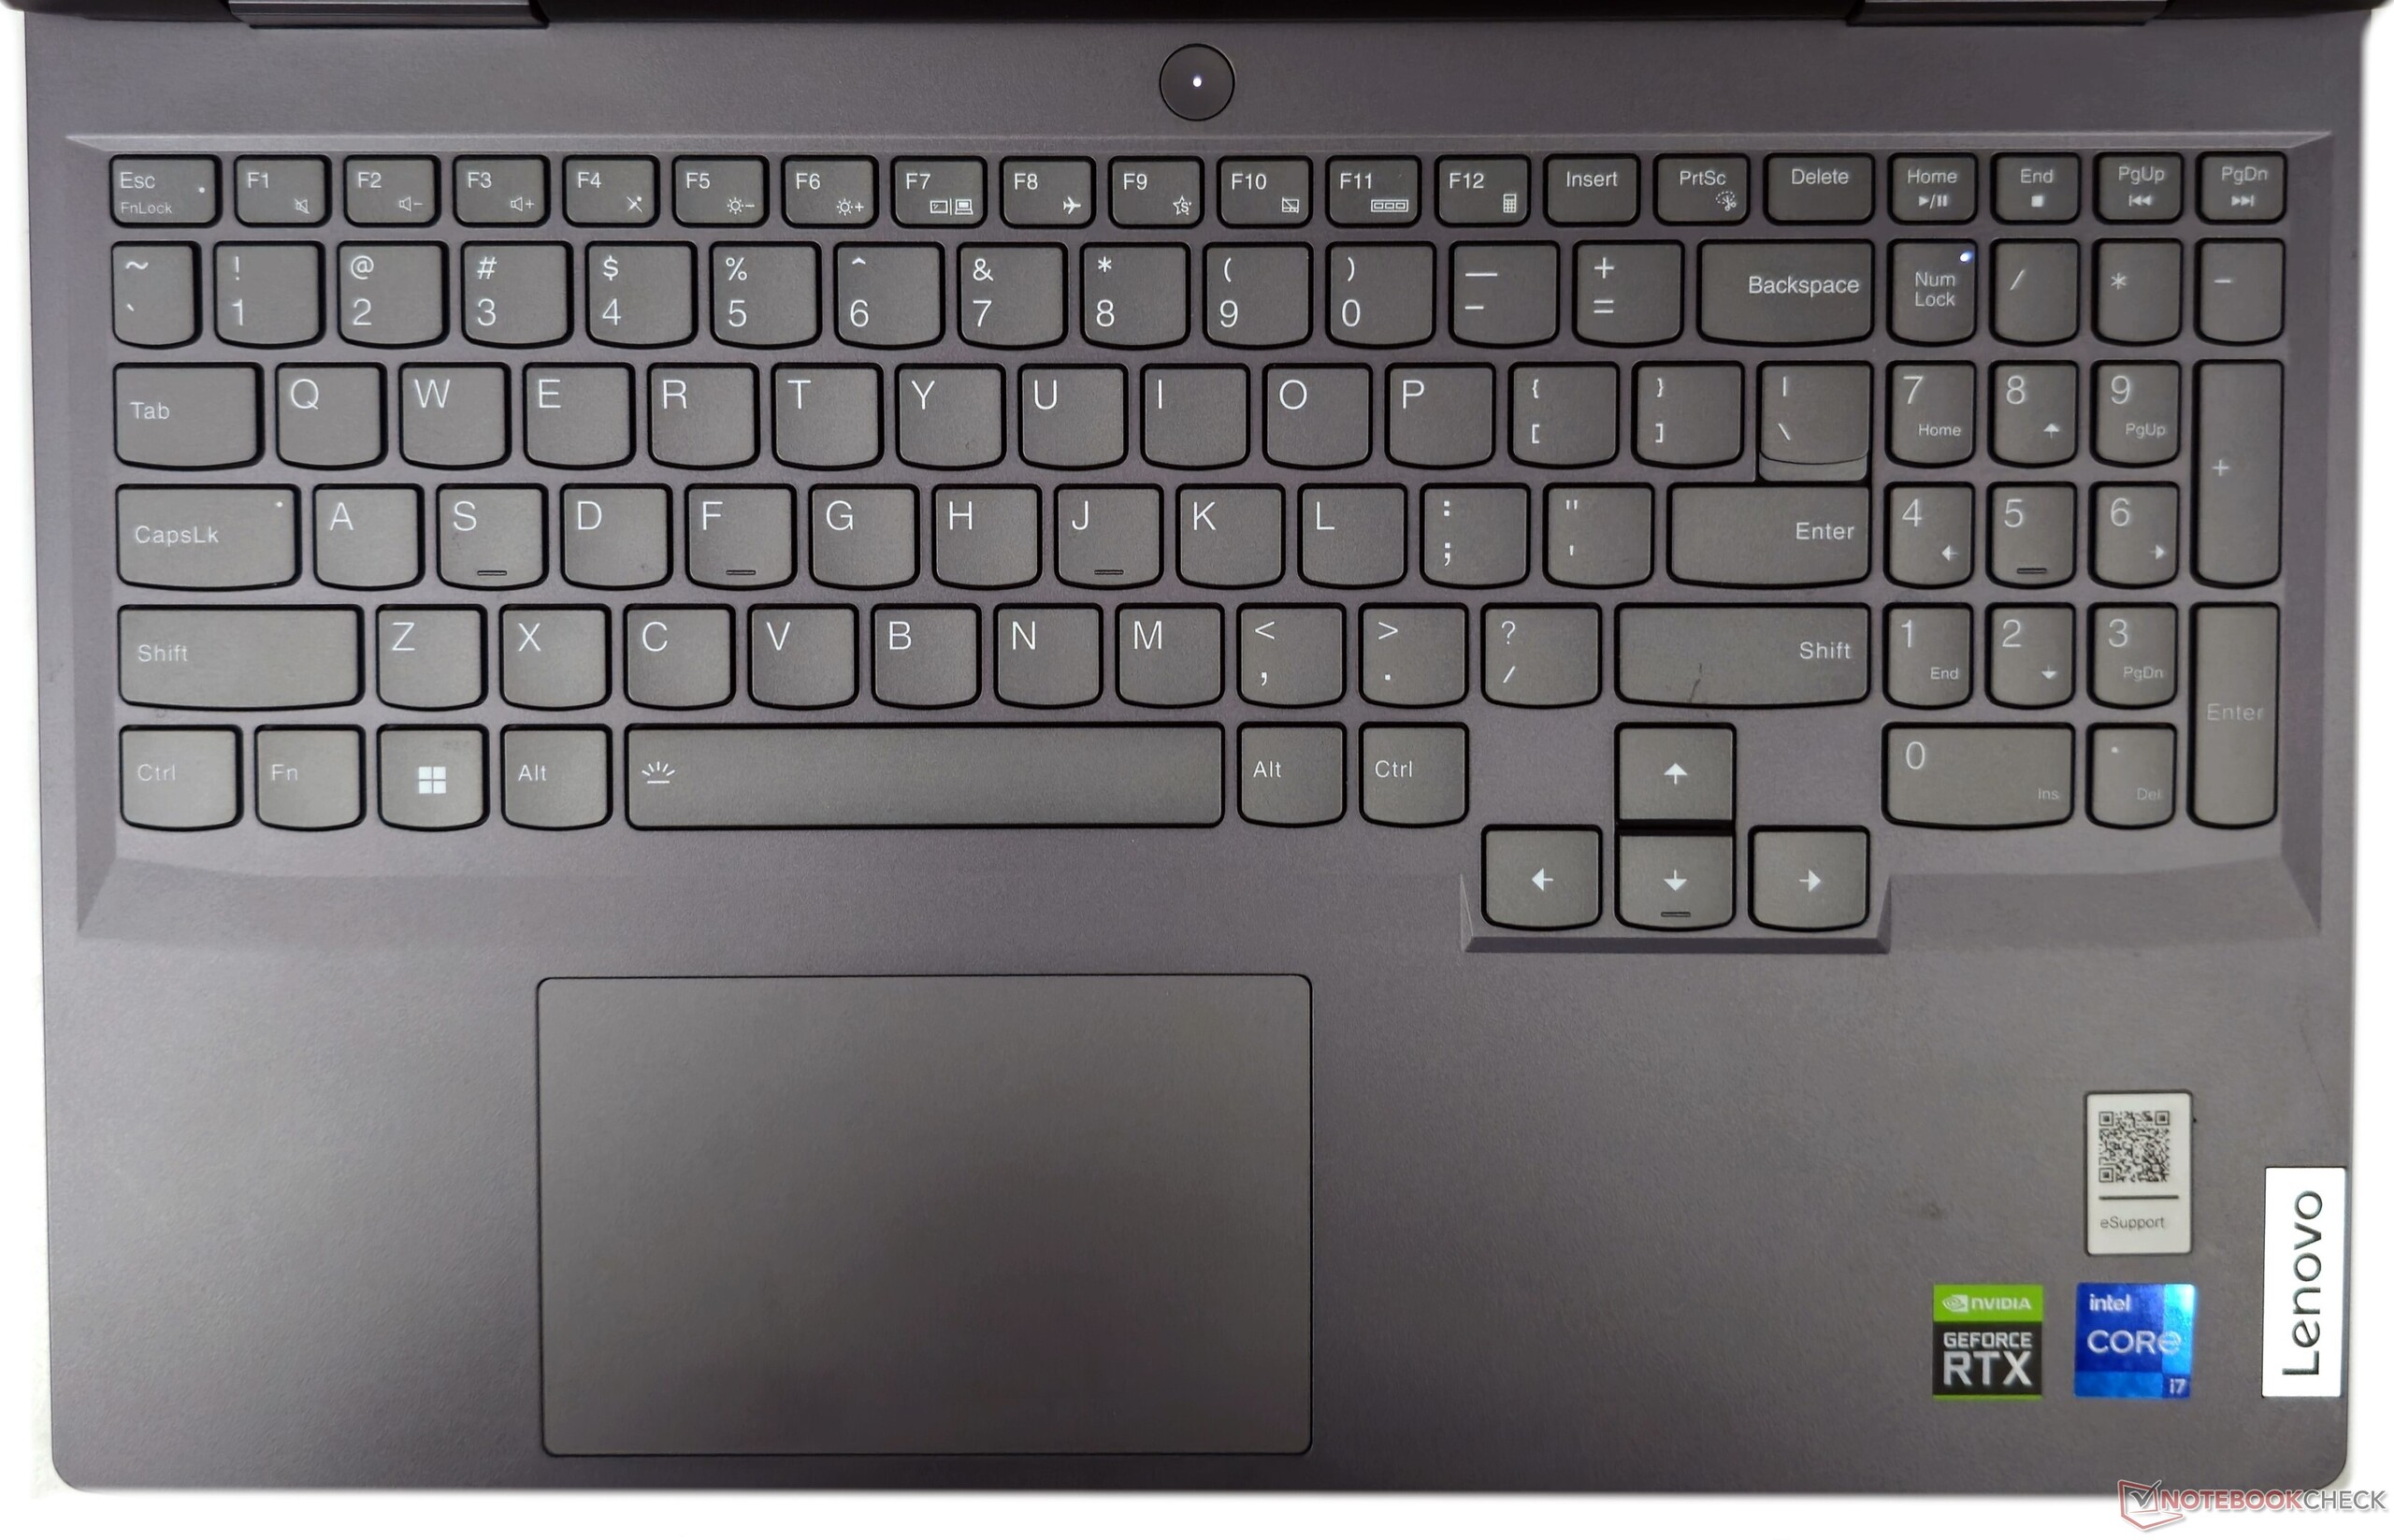
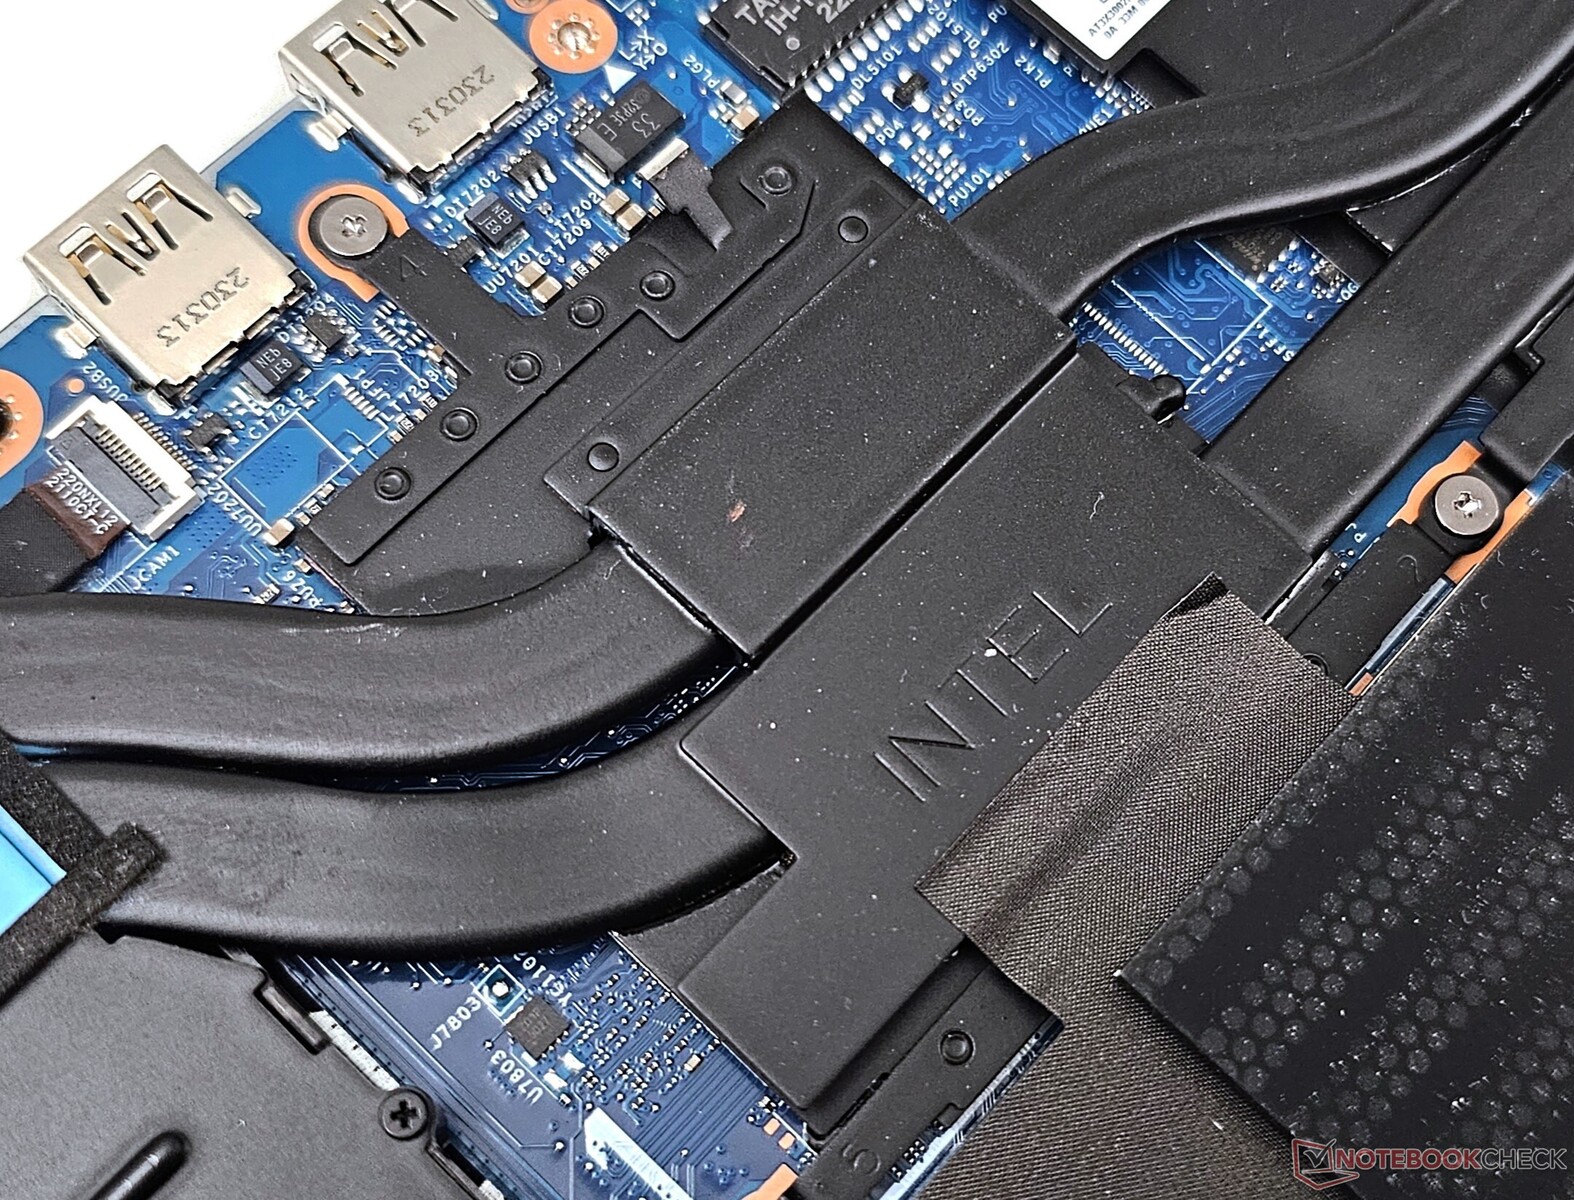
机箱和输入设备与 AMD 机型相同的塑料结构
有关联想 LOQ 15IRH8 机箱、维护和输入设备的更多详情,请参阅我们的 LOQ 15APH8 评测- 这些方面在联想基于英特尔和 AMD 的 LOQ 笔记本电脑中是相同的。
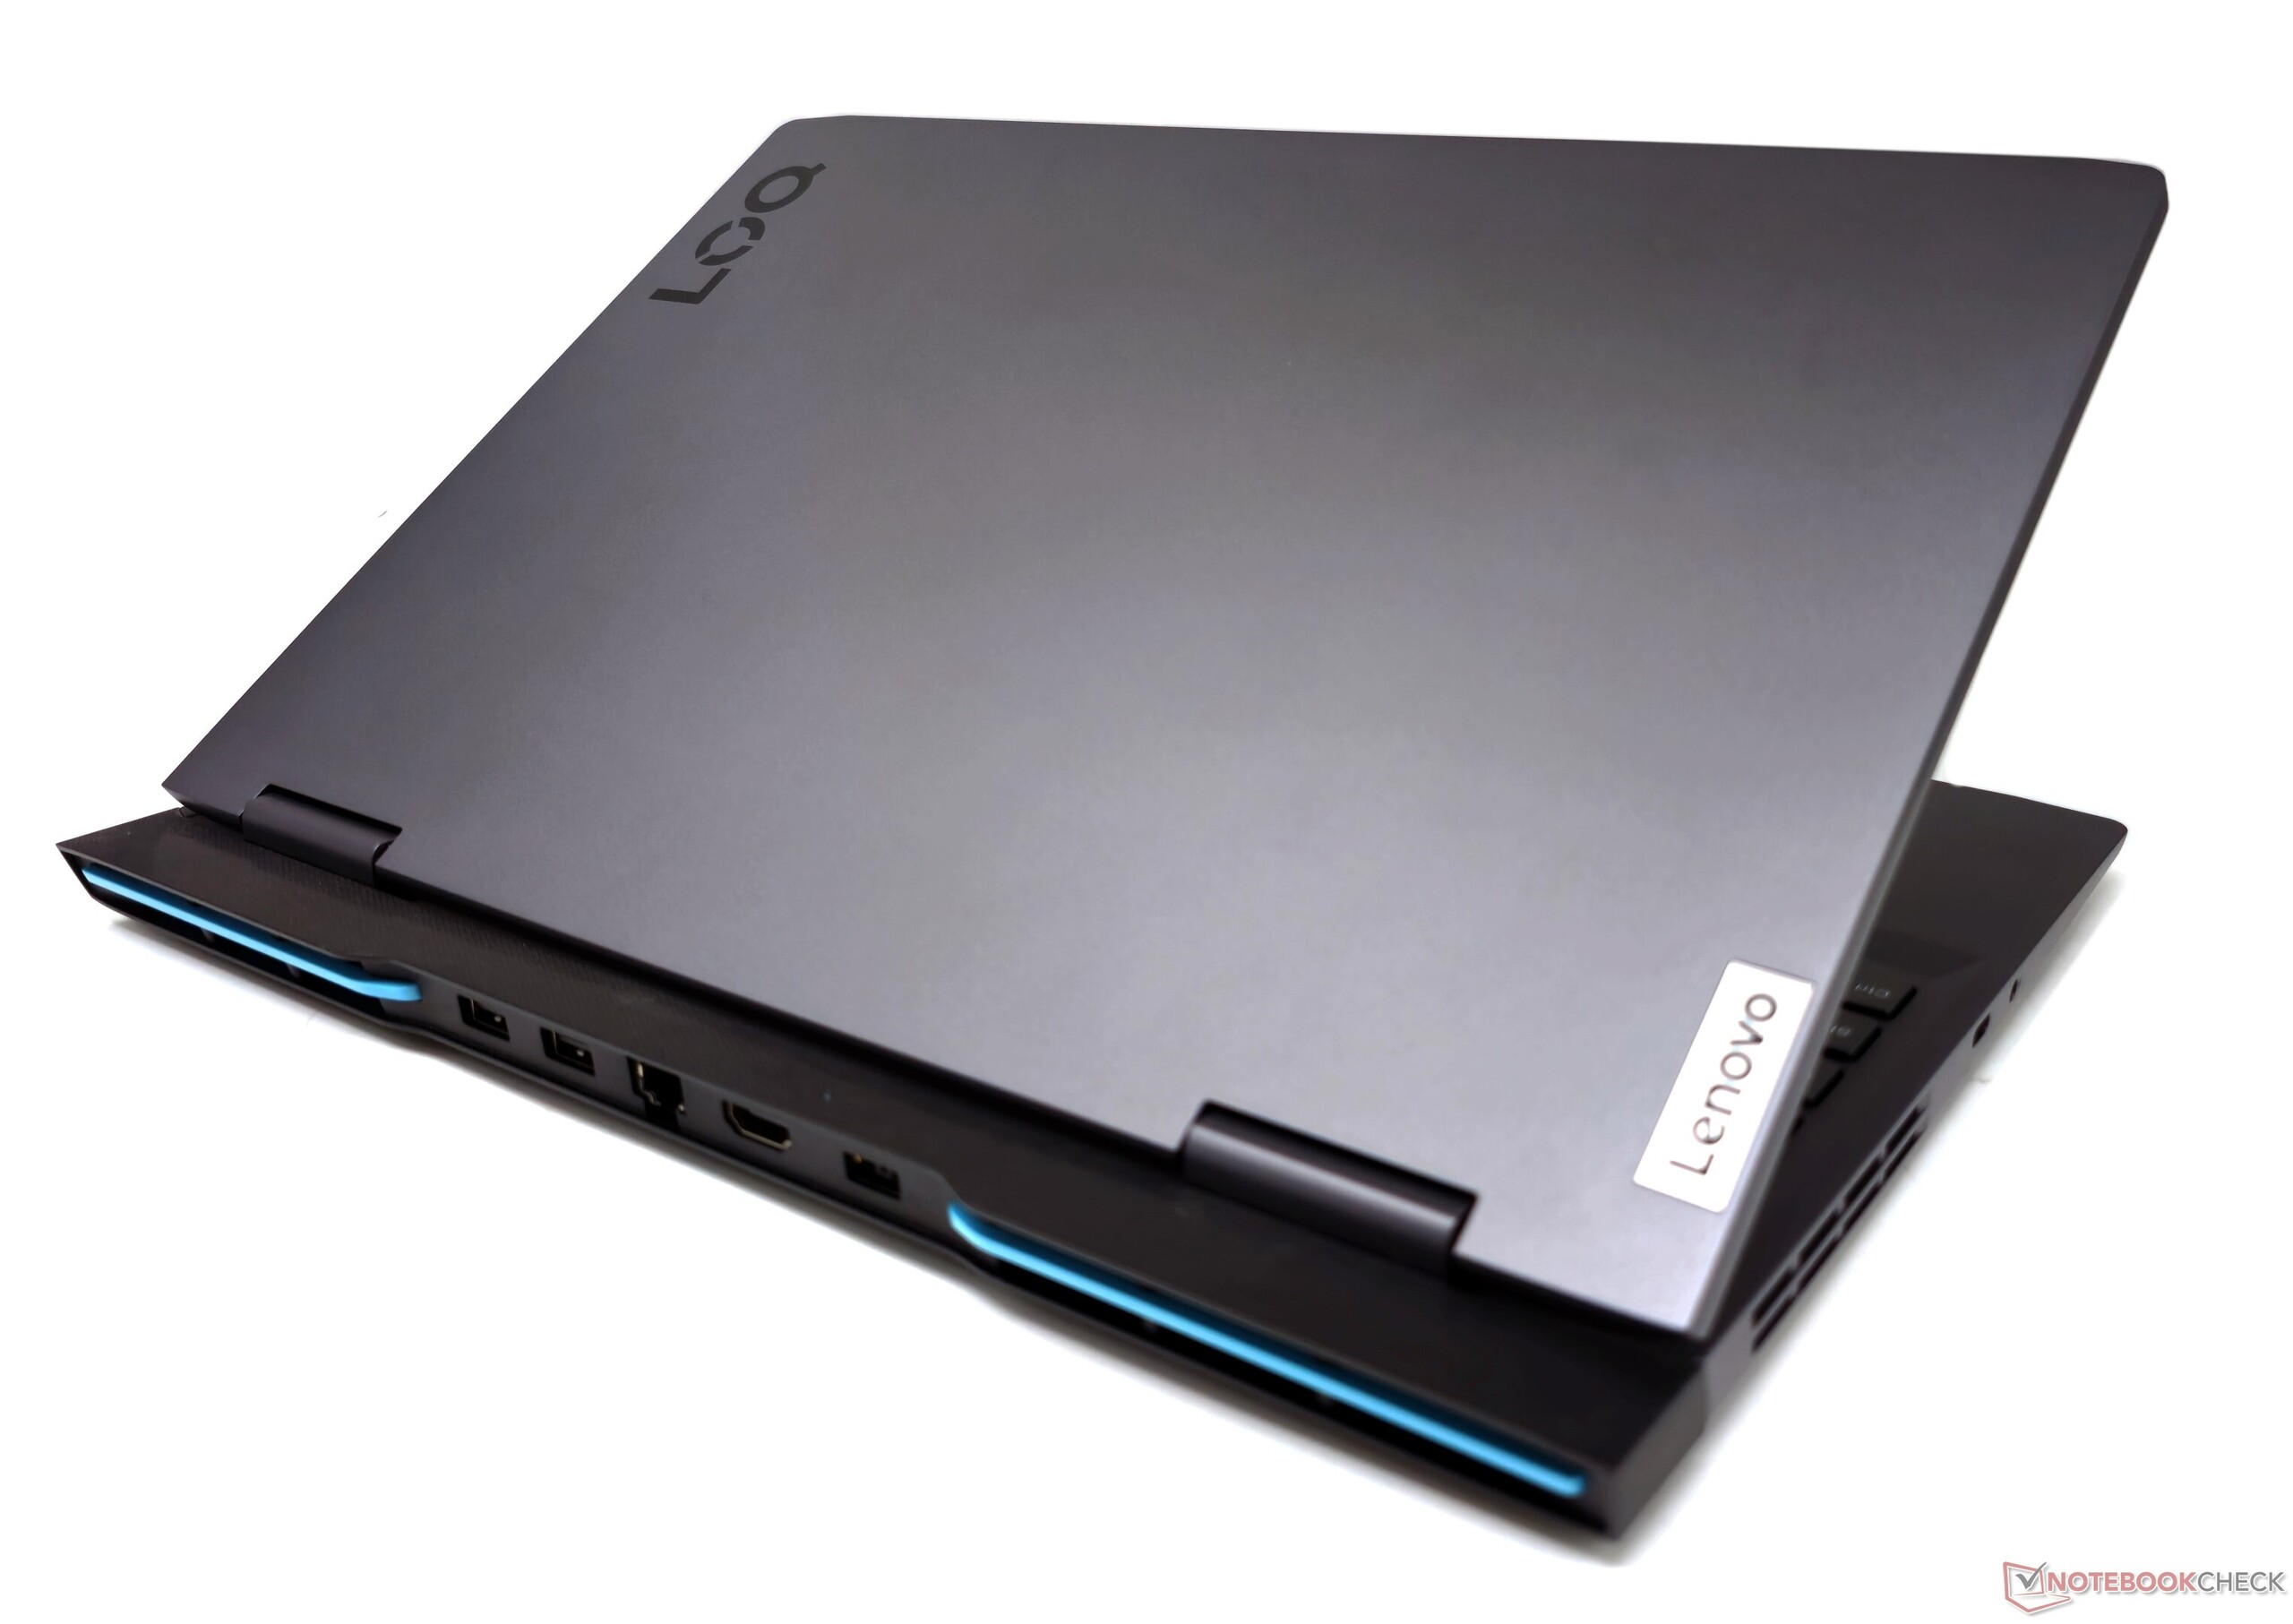
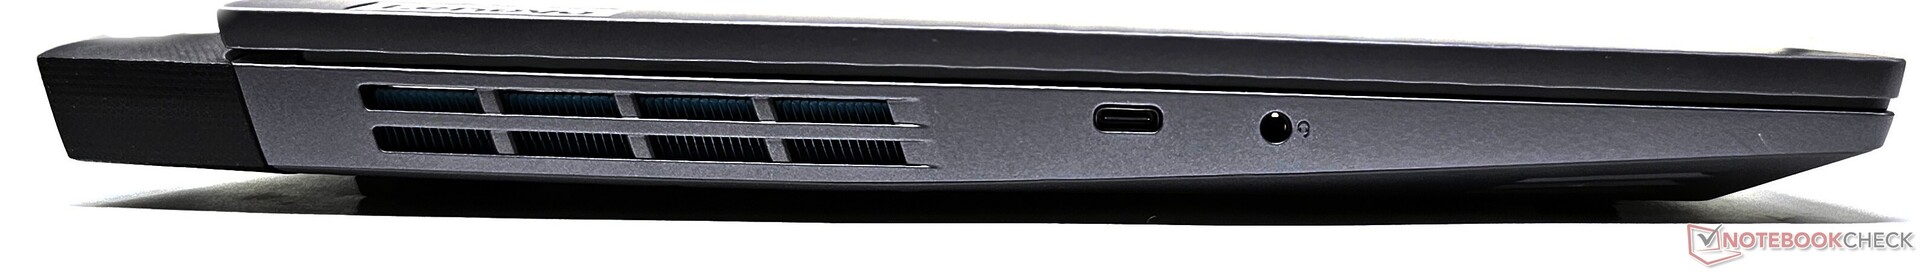
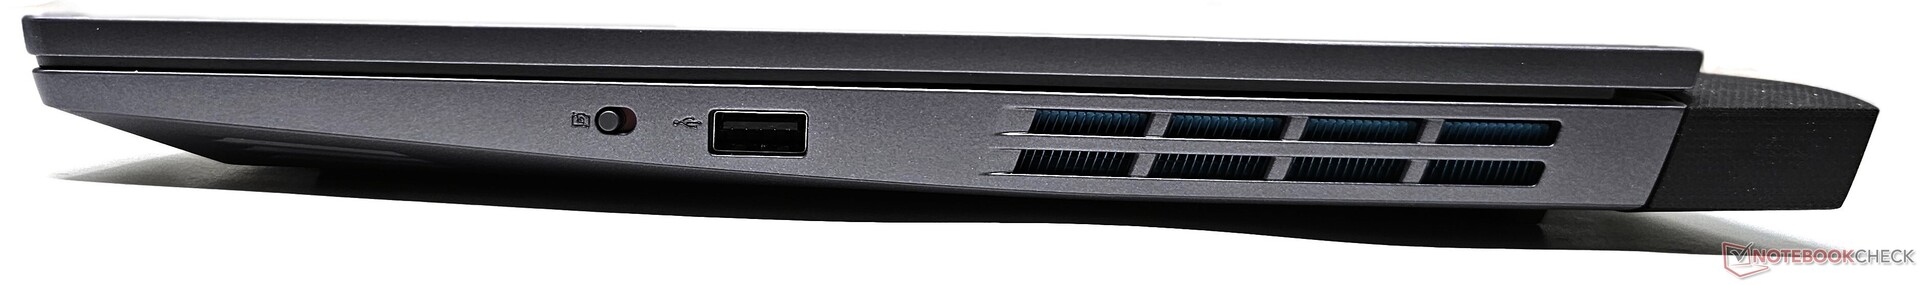
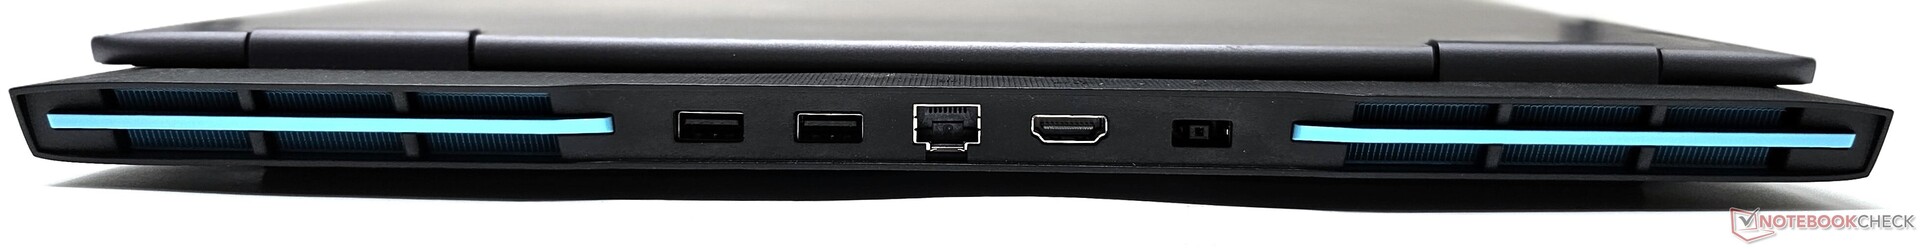
连接性:140 W USB-C 供电,但无雷电 4
端口的选择和位置与基于英特尔的 LOQ 16 完全相同。与 LOQ 15APH8 在其他 USB 3.2 端口中使用一个 USB 2.0 端口不同,英特尔版本完全采用 USB 3.2 连接标准。
据联想称,唯一的 USB 3.2 Gen2 Type-C 端口能够提供 140 W 的功率。没有提供 USB4 或 Thunderbolt 4 选项。
交流
无线性能符合 Realtek Wi-Fi 6 模块的预期。与华硕 ROG Rapture GT-AXE11000 路由器一起测试时,发射和接收测试均显示出稳定的吞吐量。
| Networking / iperf3 transmit AXE11000 | |
| Lenovo Legion Pro 5 16ARX8 (R5 7645HX, RTX 4050) | |
| Dell G15 5530 | |
| MSI Katana 17 B13VFK | |
| Average of class Gaming (560 - 1862, n=88, last 2 years) | |
| Lenovo LOQ 15IRH8 Core i7 | |
| Lenovo LOQ 15APH8 | |
| Average Realtek RTL8852BE (536 - 943, n=71) | |
| Asus TUF Gaming A16 FA617XS | |
| Lenovo LOQ 16IRH8 | |
| HP Victus 16-r0077ng | |
| Networking / iperf3 receive AXE11000 | |
| MSI Katana 17 B13VFK | |
| Lenovo Legion Pro 5 16ARX8 (R5 7645HX, RTX 4050) | |
| Dell G15 5530 | |
| Average of class Gaming (680 - 1745, n=88, last 2 years) | |
| Lenovo LOQ 15IRH8 Core i7 | |
| Asus TUF Gaming A16 FA617XS | |
| Average Realtek RTL8852BE (455 - 985, n=72) | |
| Lenovo LOQ 16IRH8 | |
| Lenovo LOQ 15APH8 | |
| HP Victus 16-r0077ng | |
网络摄像头
1080p 网络摄像头在除白色以外的所有颜色上都显示出较高的偏差。在环境光线良好的情况下,图像质量仍可用于视频通话。设备右侧设有电子摄像头快门开关。


保修
在印度,联想为 LOQ 15 提供标准的一年现场保修服务。此外,买家还可以选择多种保修升级和意外损坏保护选项,。.
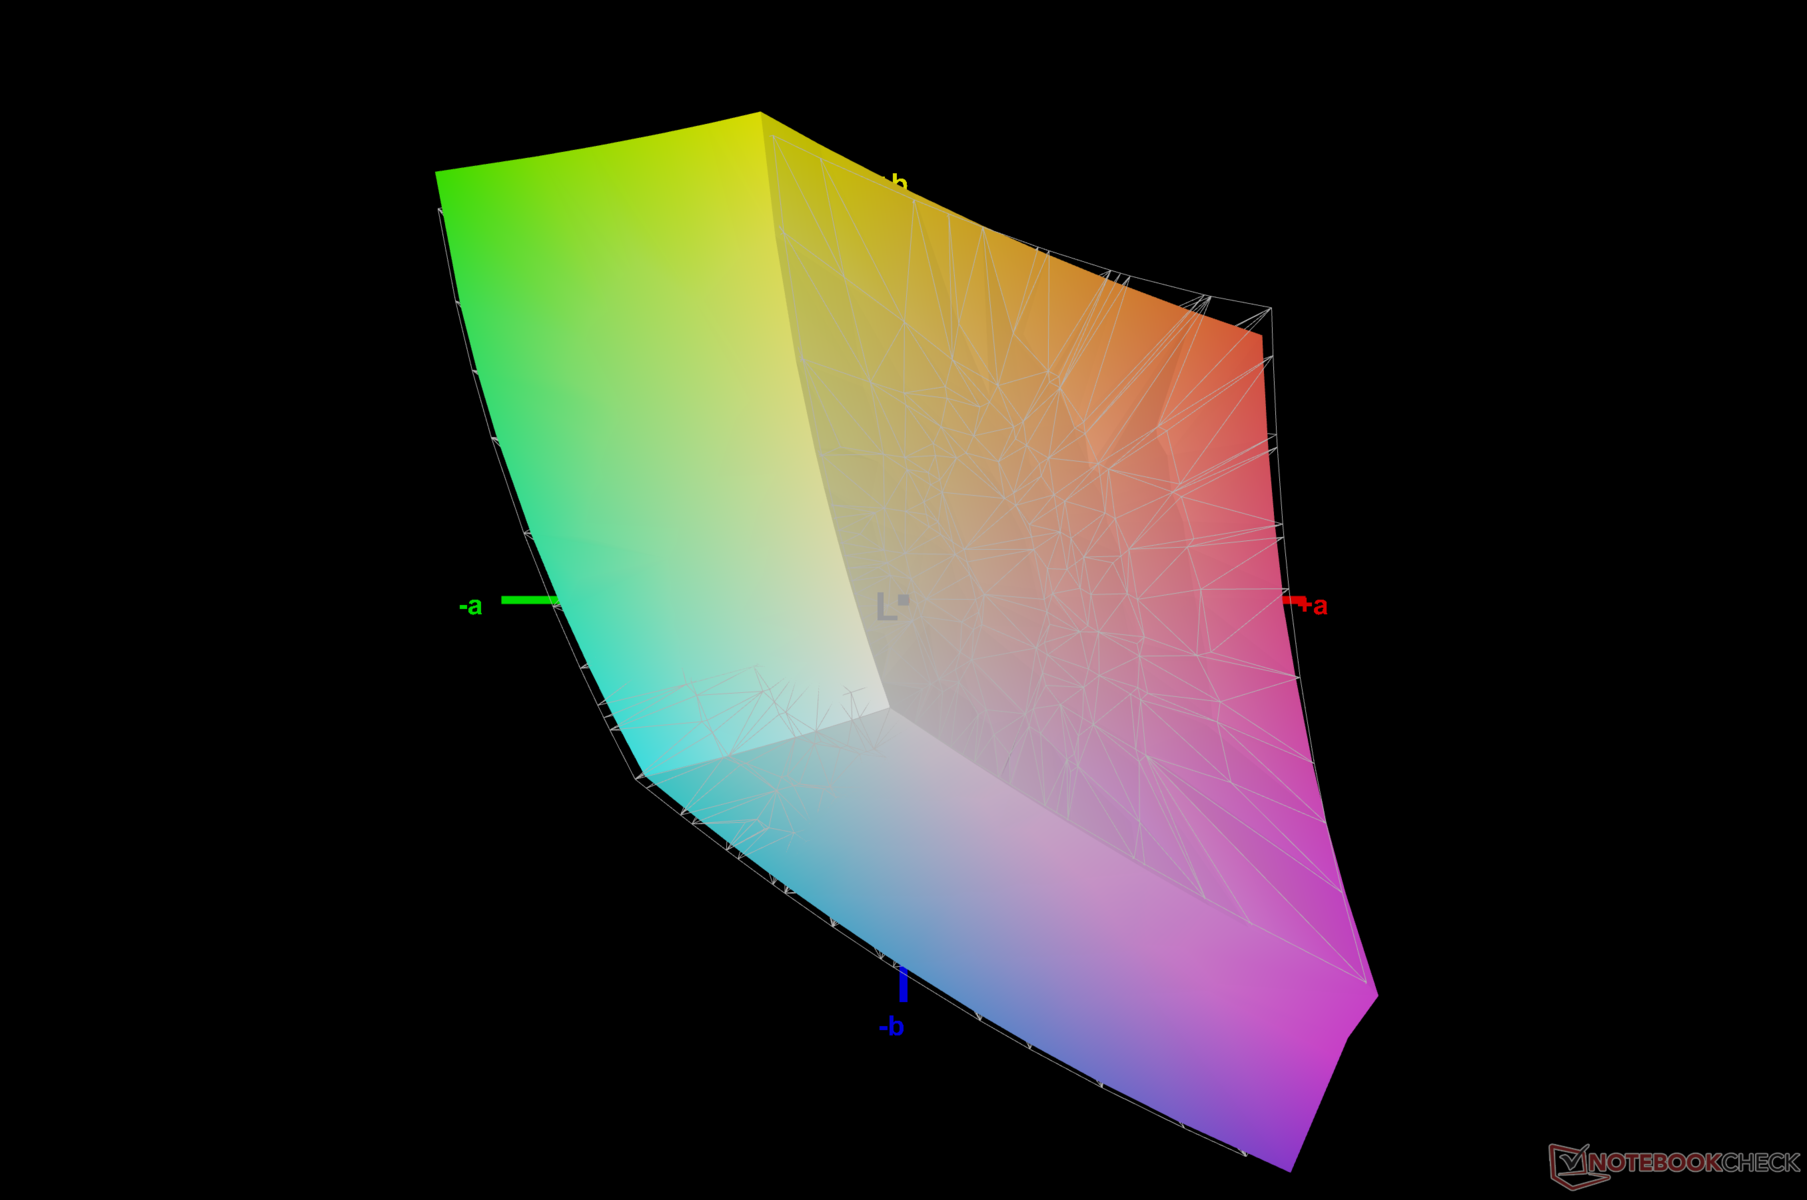
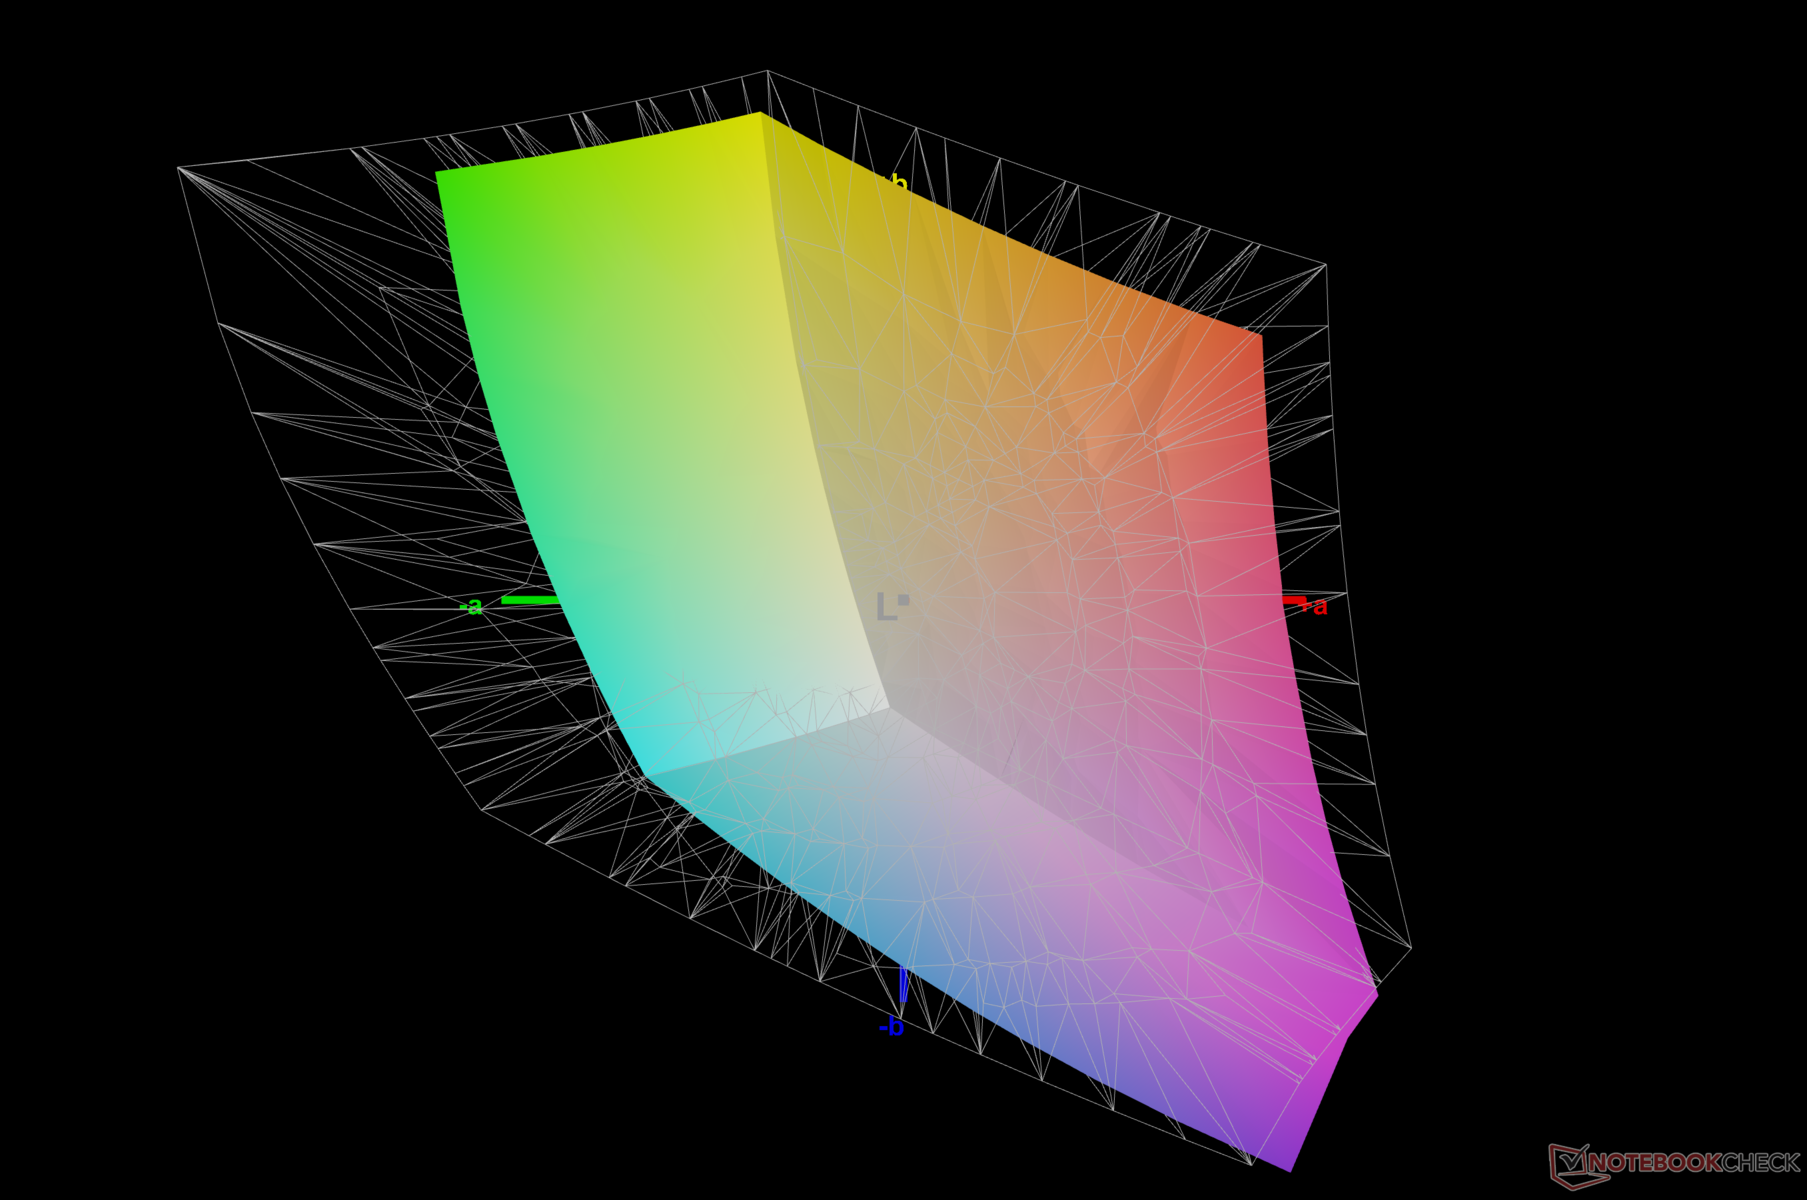
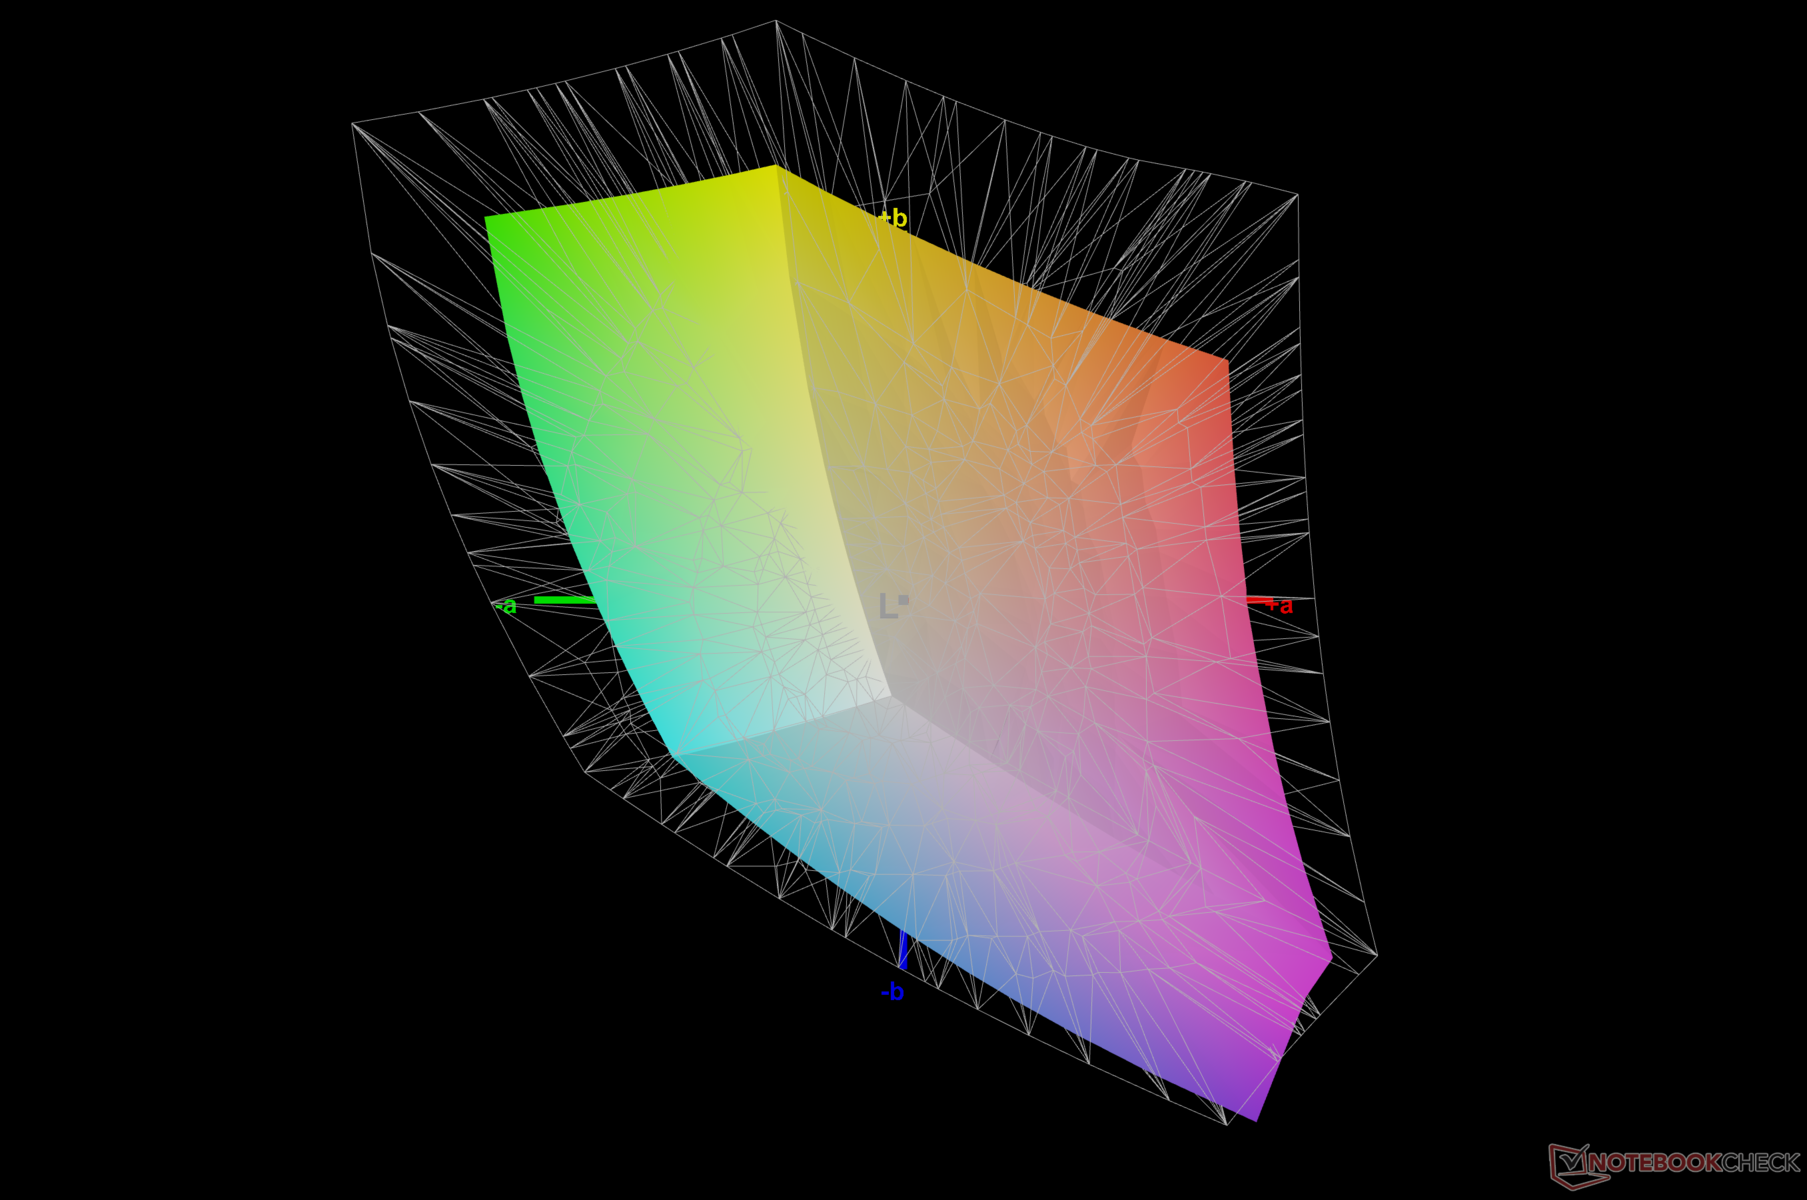
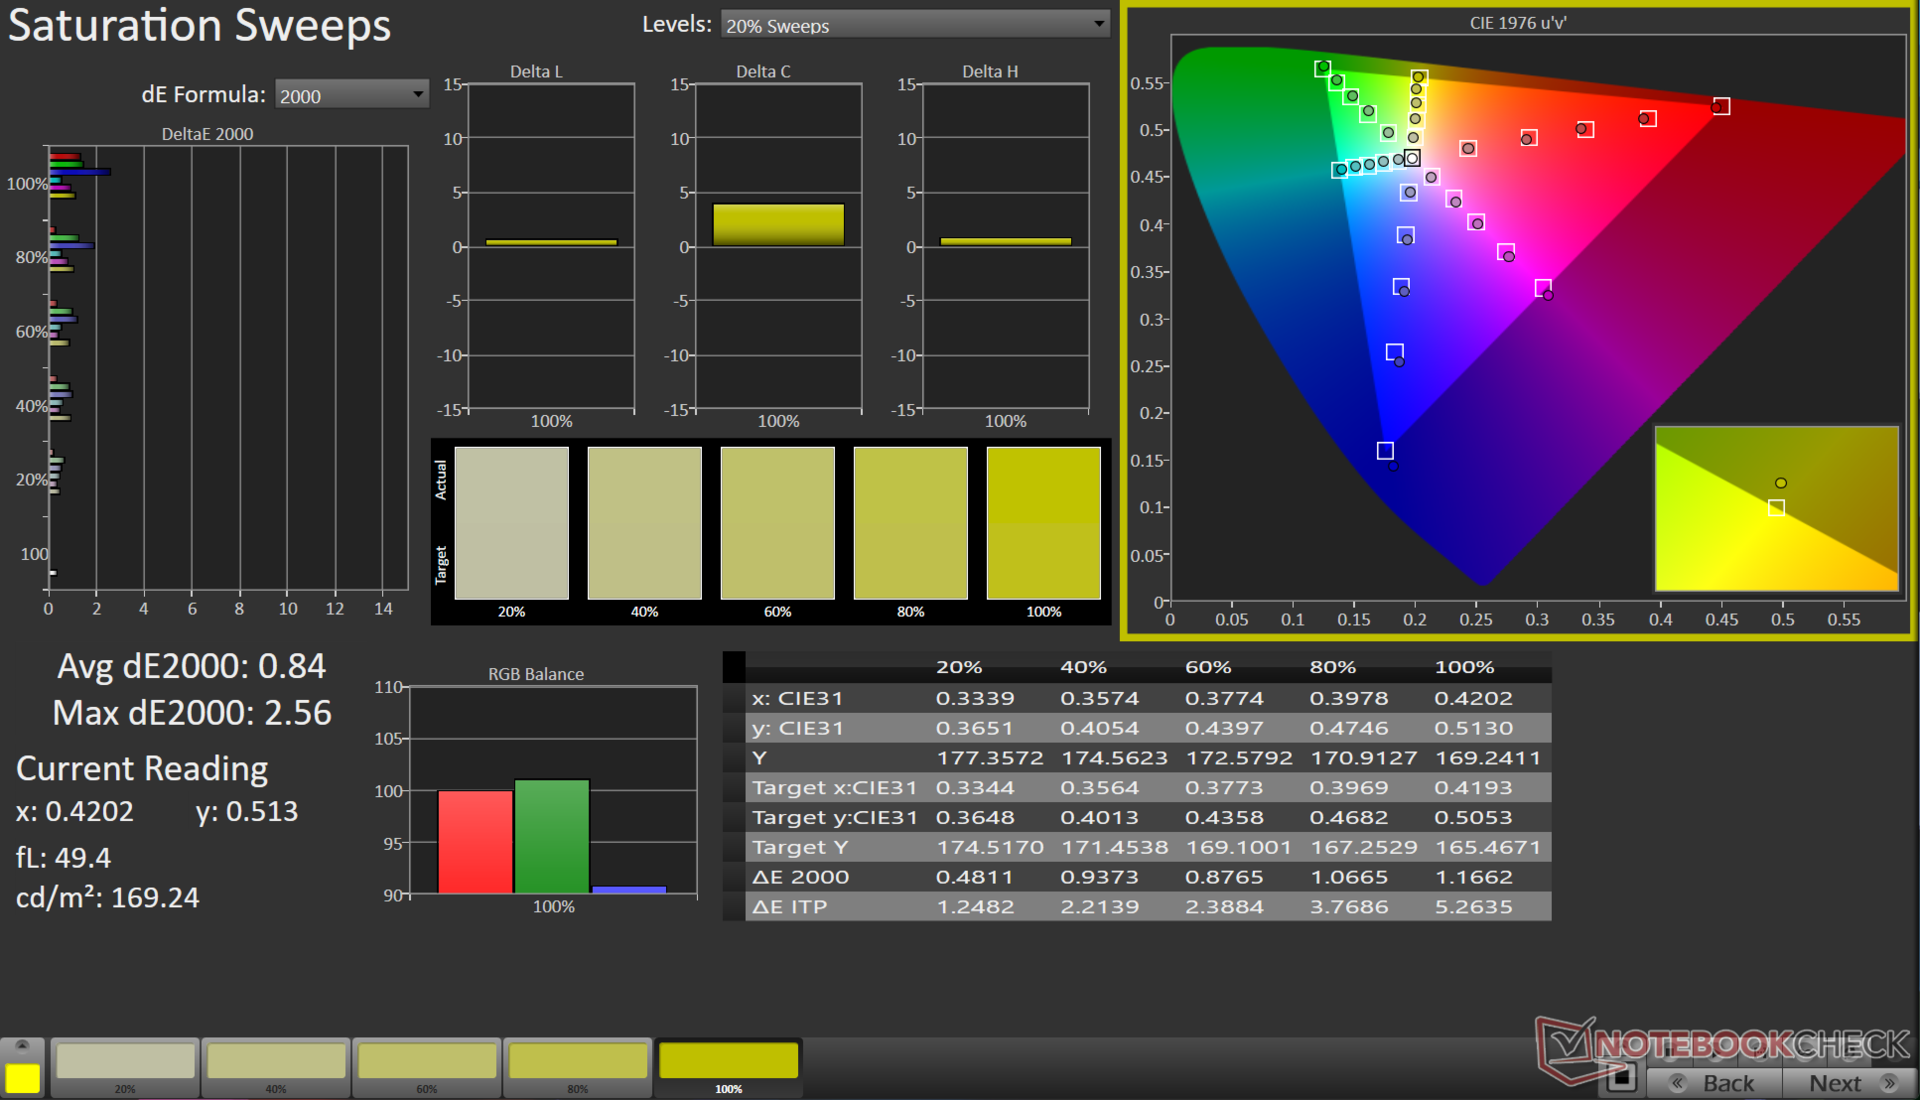
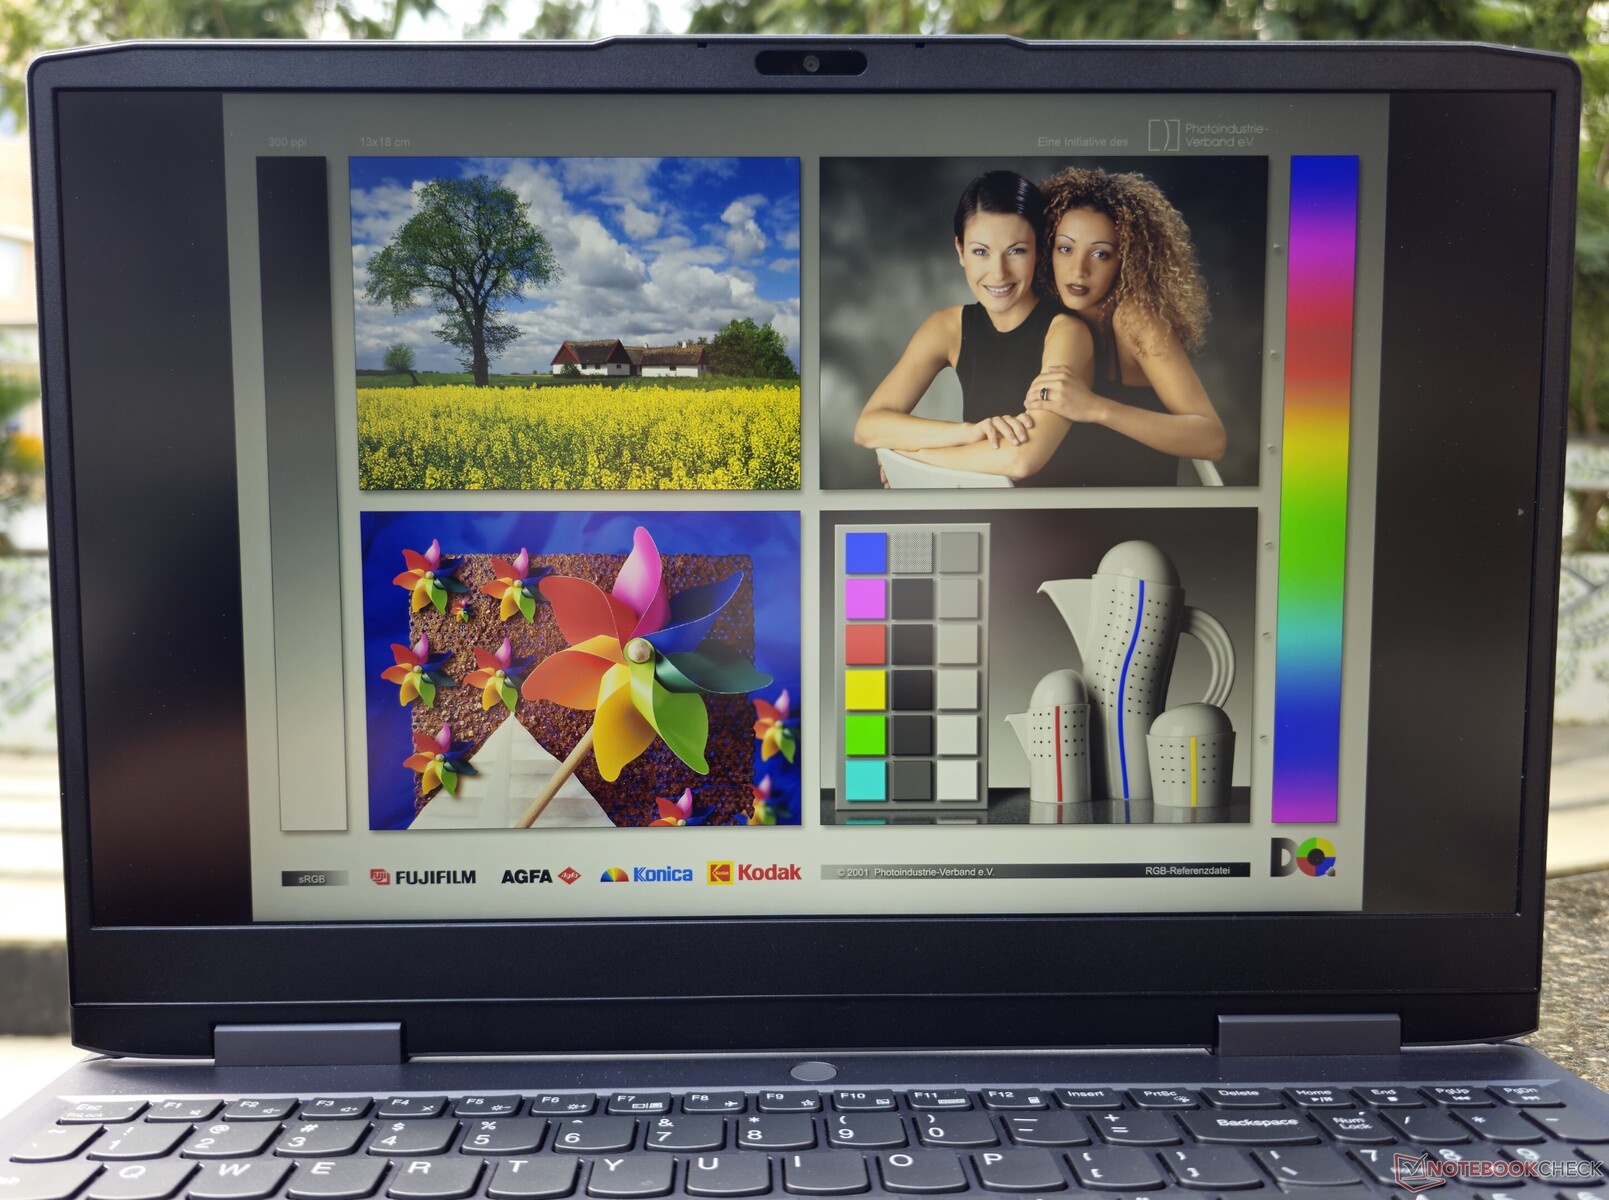
显示屏165 Hz QHD G-Sync 面板是一个重要的升级选项
我们的 LOQ 15 配备了京东方 QHD 面板,刷新率为 165 Hz。该面板在独立 GPU 模式下支持 Nvidia G-Sync。 联想将亮度设定为 350 尼特,但我们在显示屏最亮处记录到的亮度高达 383 尼特。
边角有背光渗出,但整体亮度均匀性良好,达到 90%。黑色水平和对比度均优于 LOQ 16IRH8 的友达 QHD+ 面板。
| |||||||||||||||||||||||||
Brightness Distribution: 90 %
Center on Battery: 372 cd/m²
Contrast: 1130:1 (Black: 0.33 cd/m²)
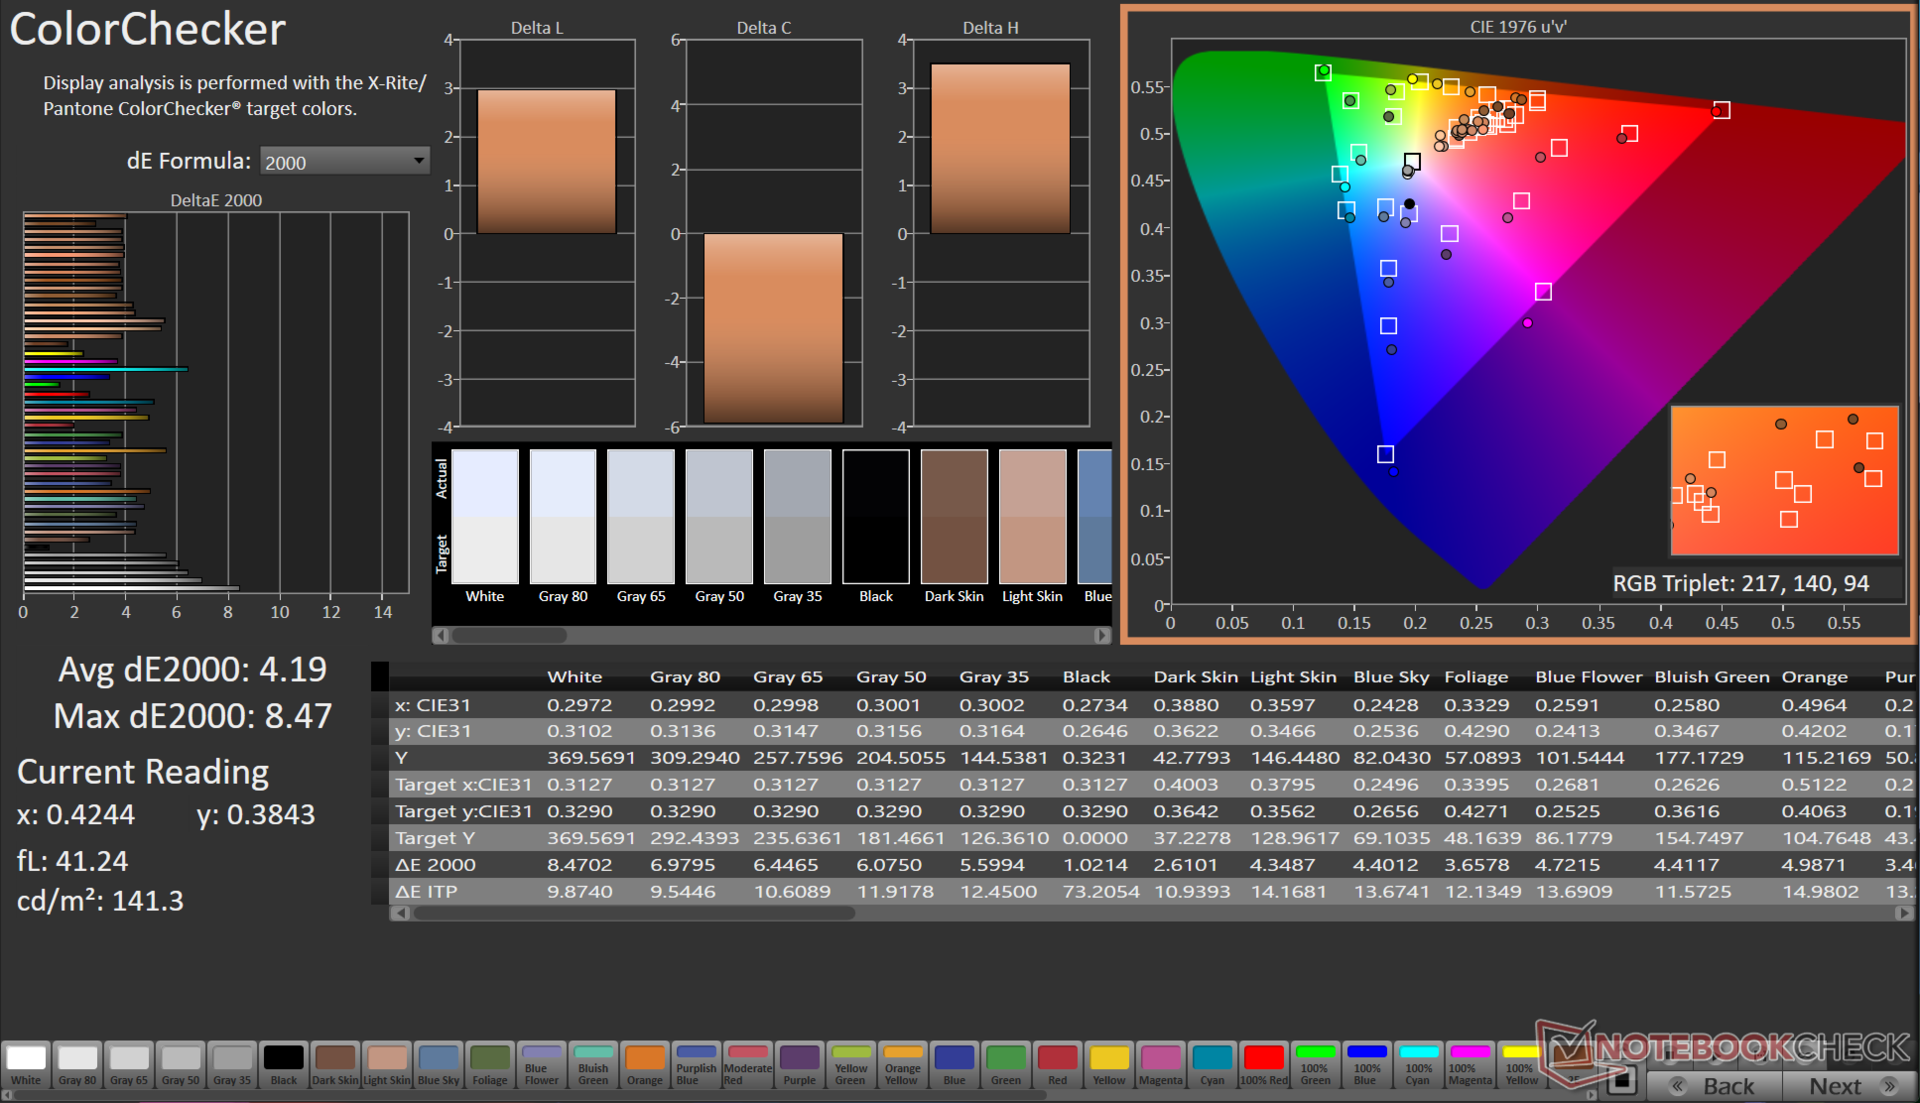
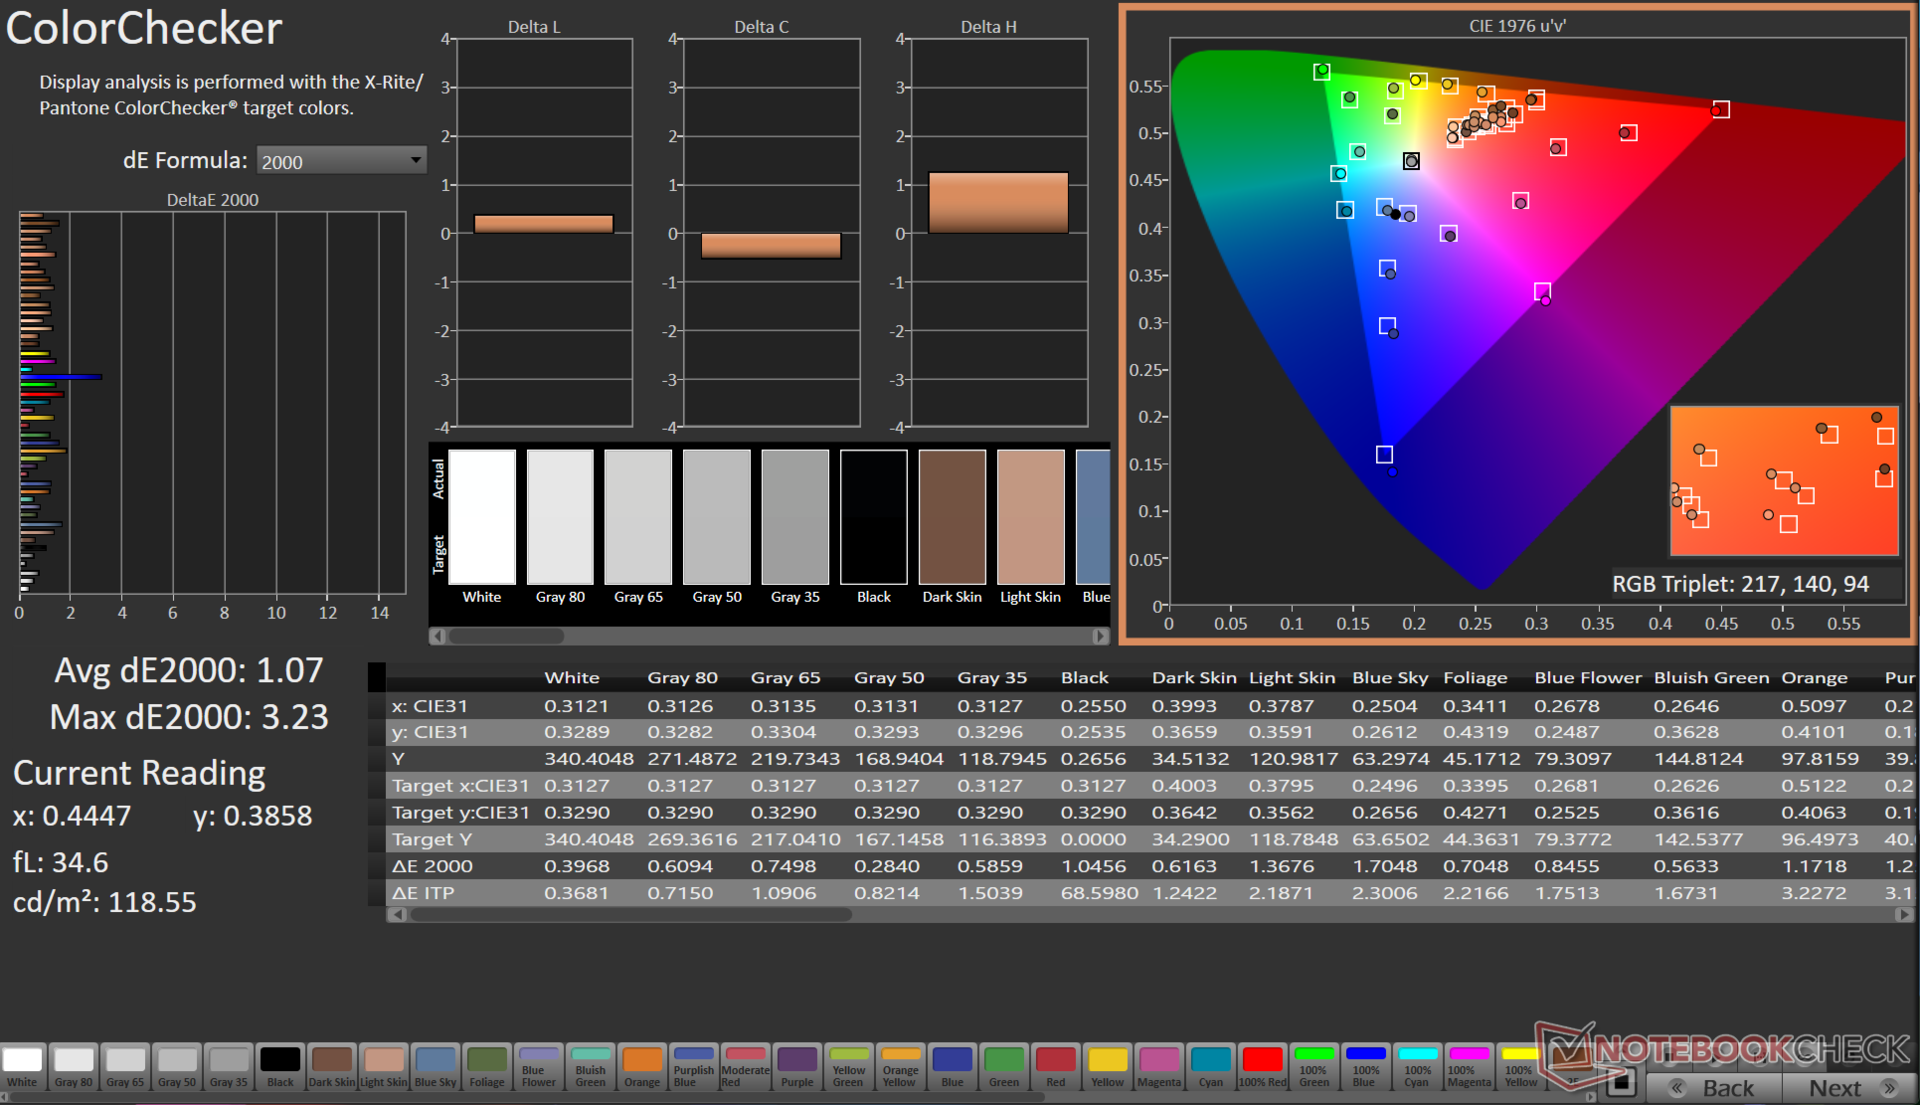
ΔE ColorChecker Calman: 4.19 | ∀{0.5-29.43 Ø4.71}
calibrated: 1.07
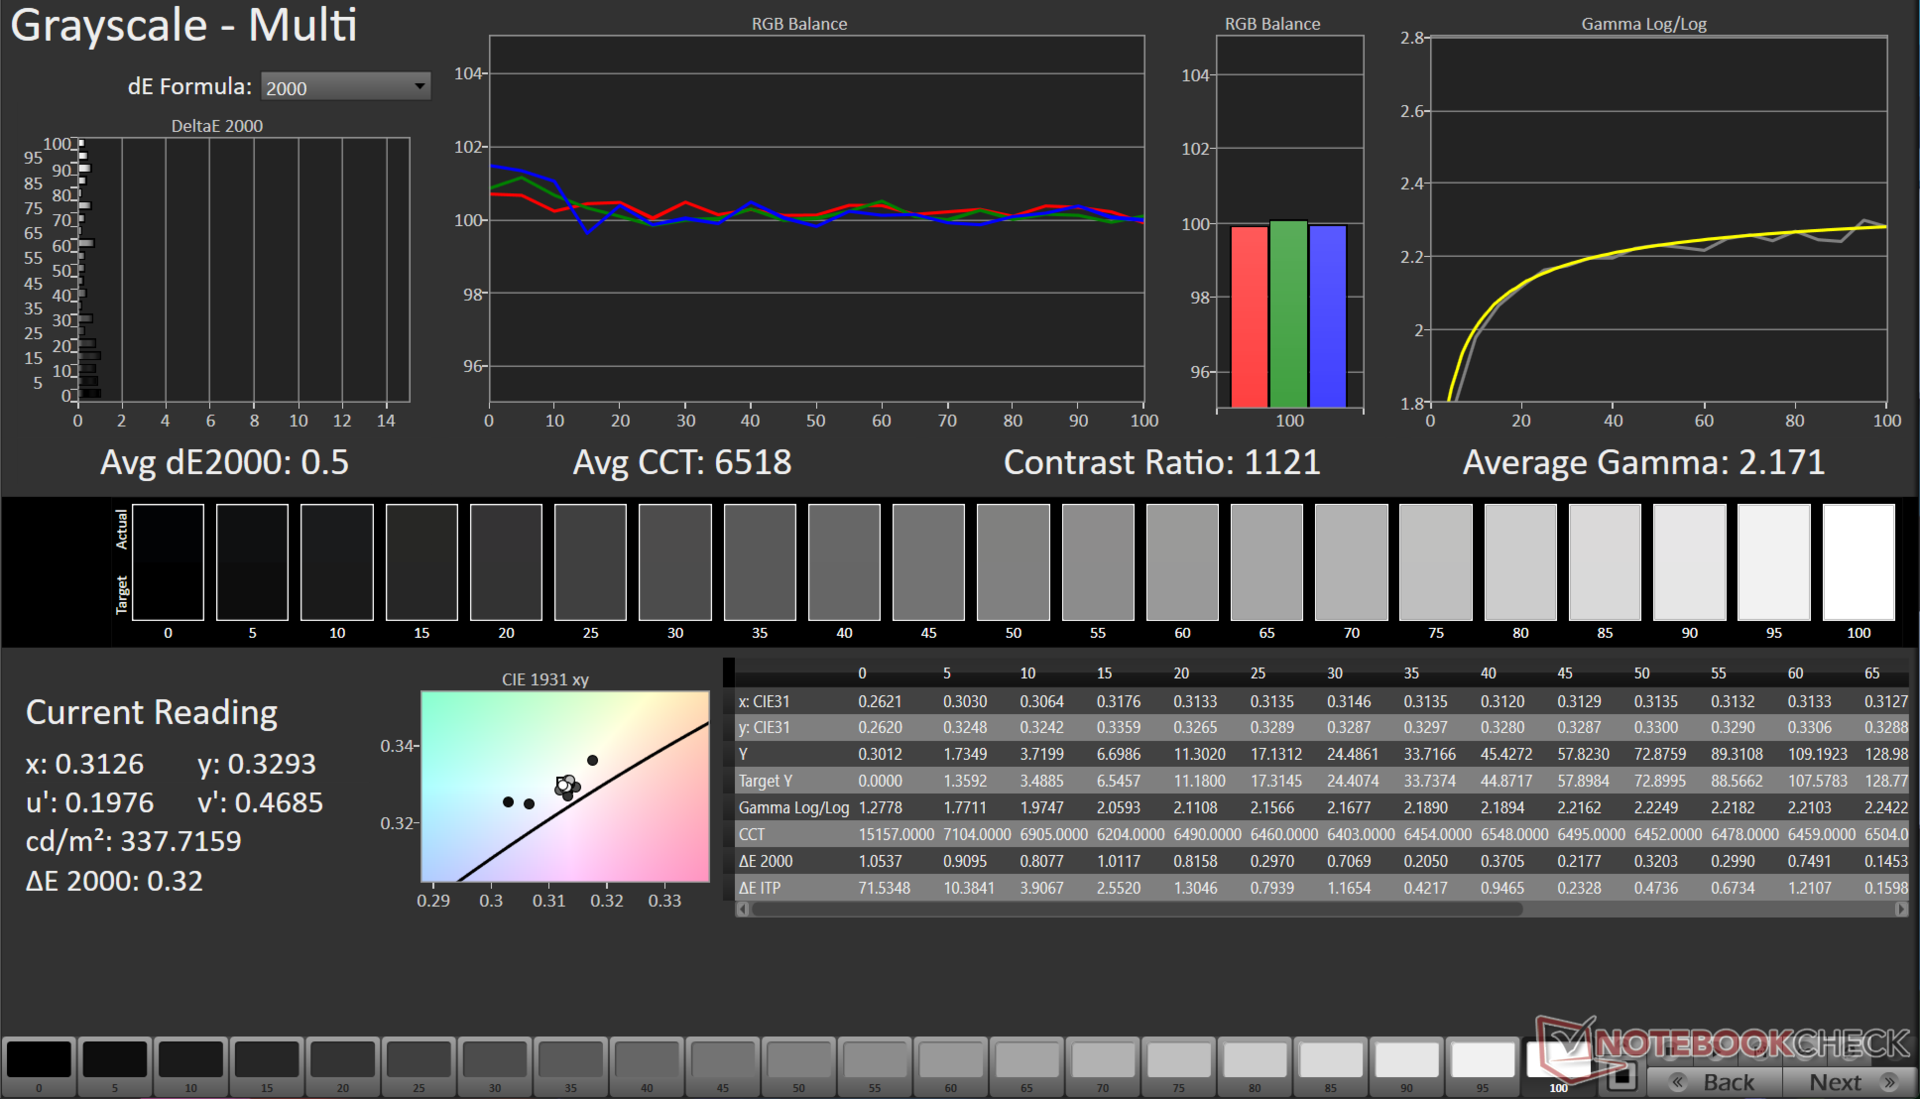
ΔE Greyscale Calman: 5 | ∀{0.09-98 Ø4.96}
67.7% AdobeRGB 1998 (Argyll 3D)
96.6% sRGB (Argyll 3D)
66.3% Display P3 (Argyll 3D)
Gamma: 1.93
CCT: 7520 K
| Lenovo LOQ 15IRH8 Core i7 BOE CQ NE156QHM-NY4, IPS, 2560x1440, 15.6" | Lenovo LOQ 16IRH8 AUOC1A5 (B160QAN03.L), IPS, 2560x1600, 16" | Lenovo LOQ 15APH8 BOE NJ NE156FHM-NX3, IPS, 1920x1080, 15.6" | MSI Katana 17 B13VFK B173HAN04.9, IPS LED, 1920x1080, 17.3" | Lenovo Legion Pro 5 16ARX8 (R5 7645HX, RTX 4050) CSOT T3 MNG007DA2-2, IPS, 2560x1600, 16" | HP Victus 16-r0077ng CMN162D, IPS, 1920x1080, 16.1" | Dell G15 5530 AUO B156HAN, IPS, 1920x1080, 15.6" | Asus TUF Gaming A16 FA617XS BOE NE160WUM-NX2, IPS, 1920x1200, 16" | |
|---|---|---|---|---|---|---|---|---|
| Display | 5% | -39% | -38% | 6% | 1% | 7% | 3% | |
| Display P3 Coverage (%) | 66.3 | 70.5 6% | 40.2 -39% | 40.8 -38% | 71.6 8% | 66.7 1% | 73.1 10% | 69.3 5% |
| sRGB Coverage (%) | 96.6 | 98.9 2% | 60.2 -38% | 61 -37% | 99.8 3% | 98 1% | 98.4 2% | 97.3 1% |
| AdobeRGB 1998 Coverage (%) | 67.7 | 72.6 7% | 41.5 -39% | 42.2 -38% | 72.9 8% | 69 2% | 74.4 10% | 70.7 4% |
| Response Times | -16% | -473% | -385% | -51% | -82% | 34% | -116% | |
| Response Time Grey 50% / Grey 80% * (ms) | 5 ? | 7.2 ? -44% | 42.7 ? -754% | 33 ? -560% | 12 ? -140% | 13.3 ? -166% | 3.39 ? 32% | 15.6 ? -212% |
| Response Time Black / White * (ms) | 8.41 ? | 7.4 ? 12% | 24.5 ? -191% | 26 ? -209% | 5.2 ? 38% | 8.2 ? 2% | 5.35 ? 36% | 10 ? -19% |
| PWM Frequency (Hz) | 21620 ? | |||||||
| Screen | 17% | -17% | -46% | 20% | 23% | -5% | 20% | |
| Brightness middle (cd/m²) | 373 | 407 9% | 346.2 -7% | 267 -28% | 543 46% | 308 -17% | 320 -14% | 301 -19% |
| Brightness (cd/m²) | 365 | 369 1% | 329 -10% | 256 -30% | 516 41% | 285 -22% | 316 -13% | 294 -19% |
| Brightness Distribution (%) | 90 | 85 -6% | 81 -10% | 93 3% | 87 -3% | 85 -6% | 94 4% | 94 4% |
| Black Level * (cd/m²) | 0.33 | 0.45 -36% | 0.31 6% | 0.21 36% | 0.58 -76% | 0.25 24% | 0.21 36% | 0.21 36% |
| Contrast (:1) | 1130 | 904 -20% | 1117 -1% | 1271 12% | 936 -17% | 1232 9% | 1524 35% | 1433 27% |
| Colorchecker dE 2000 * | 4.19 | 1.43 66% | 4.19 -0% | 4.7 -12% | 1.35 68% | 1.3 69% | 4.55 -9% | 1.79 57% |
| Colorchecker dE 2000 max. * | 8.47 | 3.58 58% | 19.19 -127% | 20.4 -141% | 3.22 62% | 2.76 67% | 9.83 -16% | 3.48 59% |
| Colorchecker dE 2000 calibrated * | 1.07 | 1.07 -0% | 1.66 -55% | 4.5 -321% | 1.31 -22% | 0.92 14% | 1.51 -41% | 1.2 -12% |
| Greyscale dE 2000 * | 5 | 1.13 77% | 2.6 48% | 1.5 70% | 1.03 79% | 1.7 66% | 6.2 -24% | 2.5 50% |
| Gamma | 1.93 114% | 2.5 88% | 2.19 100% | 2.12 104% | 2.38 92% | 2.167 102% | 2.07 106% | 2.265 97% |
| CCT | 7520 86% | 6526 100% | 6749 96% | 6552 99% | 6452 101% | 6767 96% | 6479 100% | 6157 106% |
| Total Average (Program / Settings) | 2% /
9% | -176% /
-87% | -156% /
-92% | -8% /
7% | -19% /
3% | 12% /
3% | -31% /
-3% |
* ... smaller is better
该显示屏覆盖了近 97% 的 sRGB 色域,对于大多数游戏和网页内容来说已经足够了。不过,Adobe RGB 和 Display P3 的覆盖率只能算一般。
尽管如此,与采用 AMD 技术的 LOQ 15APH8 的 1080p 144 Hz 面板相比,LOQ 15IRH8 的 QHD 面板具有更好的色彩特性。
开箱即用的色彩偏差很大,但我们使用肖像显示器公司提供的 X-Rite i1Basic Pro 3 分光光度计和 Calman Ultimate 软件进行的校准程序显示,灰度和 ColorChecker Delta E 值都有显著改善。
该面板在准确再现光谱的 100% 蓝色部分方面仍然存在问题。
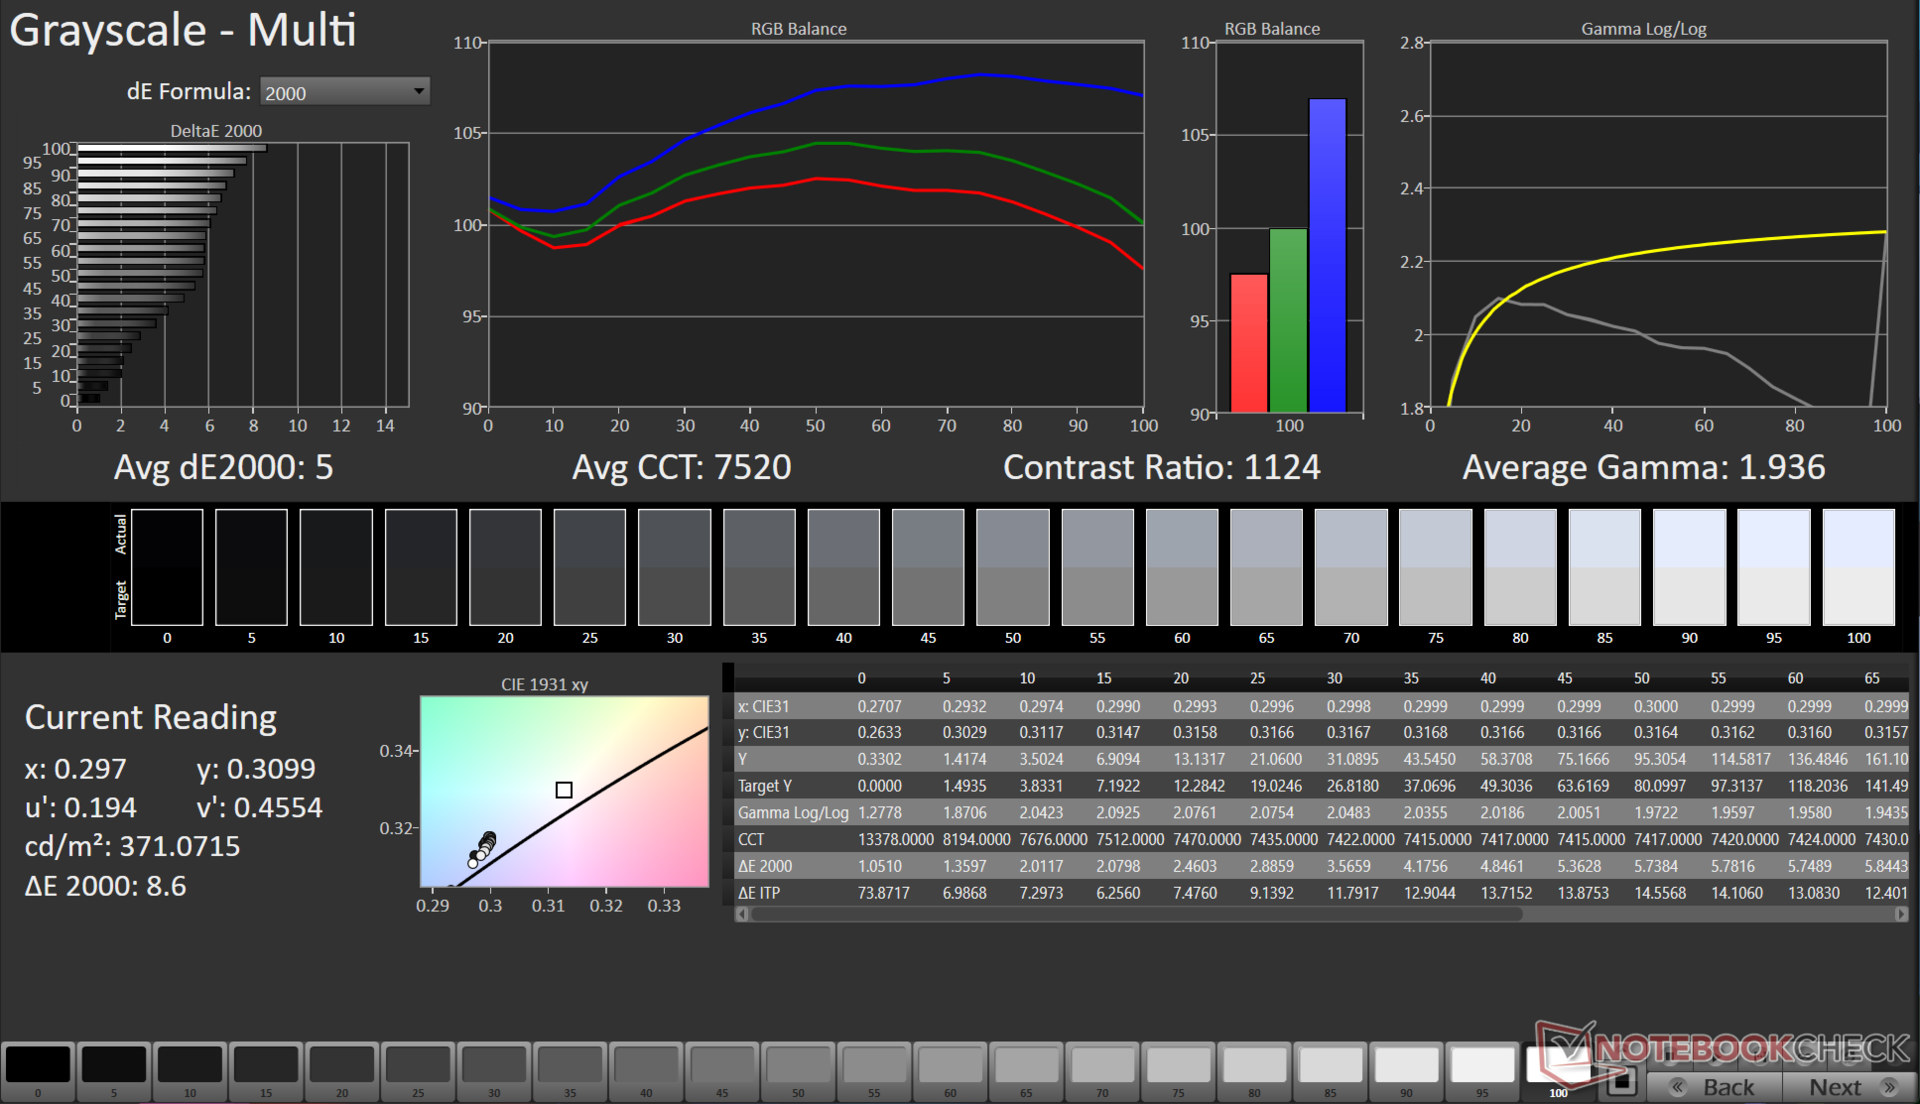
我们的校准 ICC 文件可从上面的链接下载。
Display Response Times
| ↔ Response Time Black to White | ||
|---|---|---|
| 8.41 ms ... rise ↗ and fall ↘ combined | ↗ 3.96 ms rise | 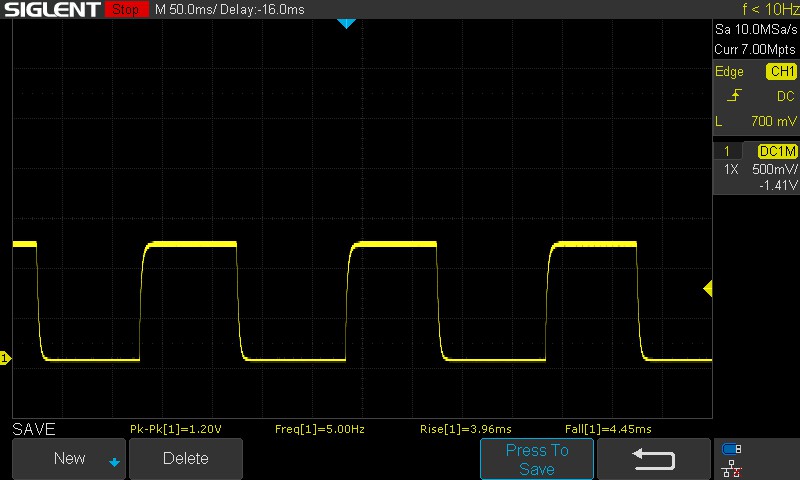 |
| ↘ 4.45 ms fall | ||
| The screen shows fast response rates in our tests and should be suited for gaming. In comparison, all tested devices range from 0.1 (minimum) to 240 (maximum) ms. » 24 % of all devices are better. This means that the measured response time is better than the average of all tested devices (19.8 ms). | ||
| ↔ Response Time 50% Grey to 80% Grey | ||
| 5 ms ... rise ↗ and fall ↘ combined | ↗ 2.16 ms rise | 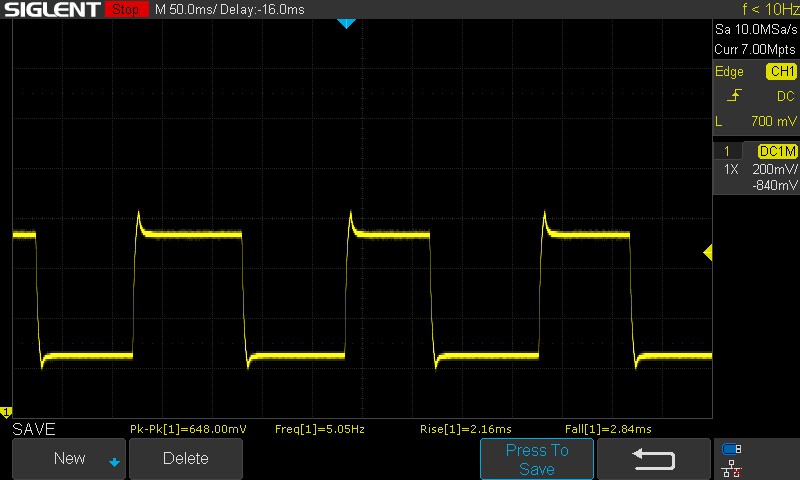 |
| ↘ 2.84 ms fall | ||
| The screen shows very fast response rates in our tests and should be very well suited for fast-paced gaming. In comparison, all tested devices range from 0.165 (minimum) to 636 (maximum) ms. » 17 % of all devices are better. This means that the measured response time is better than the average of all tested devices (31 ms). | ||
与 LOQ 15APH8 的 1080p 面板相比,响应时间大大缩短。该面板默认使用超驱动,这有助于实现从 50% 灰到 80% 灰的快速 5 毫秒过渡。从联想 Vantage 应用程序中禁用超驱动后,50% 灰到 80% 灰的综合响应时间增加到 11 毫秒。
在所有测试的亮度水平下,面板都不会出现 PWM 闪烁。更多信息,请参阅我们的文章"为什么 PWM 如此令人头痛"以及我们的 PWM 排名表对所有评测设备的 PWM 测量值进行比较。
Screen Flickering / PWM (Pulse-Width Modulation)
| Screen flickering / PWM not detected | ≤ 100 % brightness setting |  | |
In comparison: 52 % of all tested devices do not use PWM to dim the display. If PWM was detected, an average of 7757 (minimum: 5 - maximum: 343500) Hz was measured. | |||
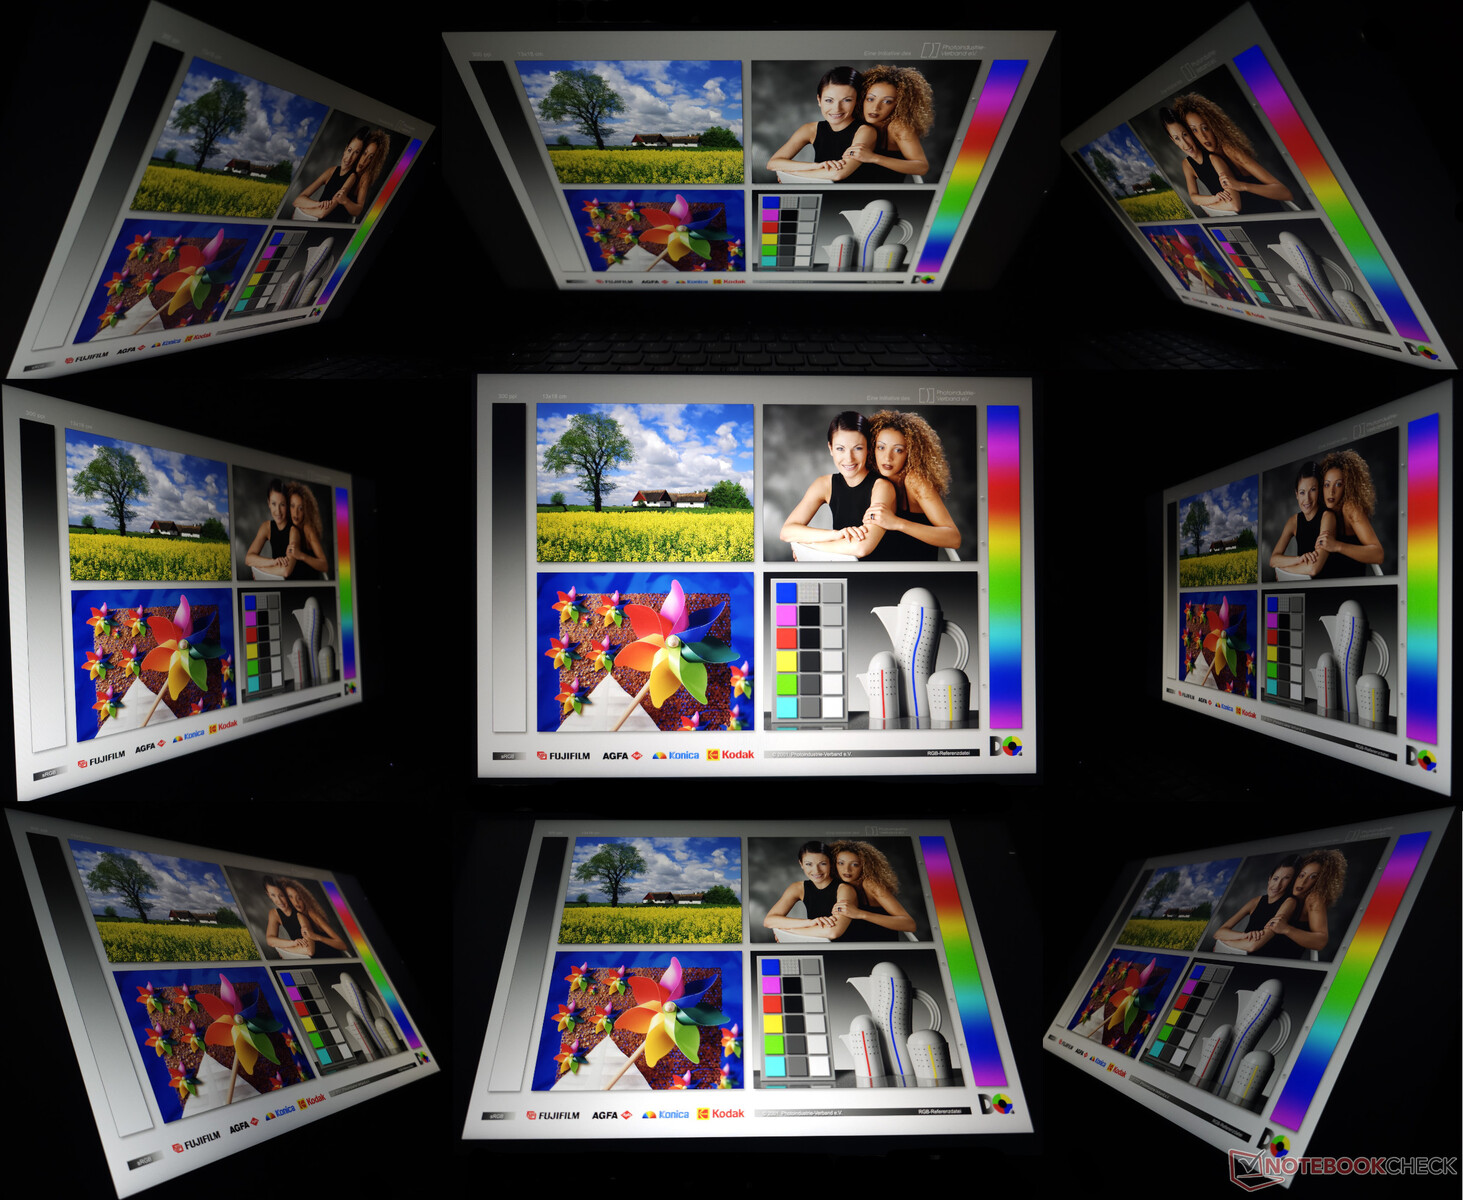
虽然 350 尼特的面板在阳光特别充足的日子里会显得格外刺眼,但室外可视性在一般使用情况下还是没问题的。可视角度相对稳定,在极端情况下亮度和色彩损失极小。
性能酷睿 i7-13620H 难以发挥稳定的性能
在印度,联想提供了配备英特尔和 AMD 处理器的多种 LOQ 15 配置选项。基于英特尔处理器的机型可选择 酷睿i5-12450H和 酷睿i7-13620HCPU 之间进行选择,而 AMD 机型则配备了 Ryzen 5 7640HS或 Ryzen 7 7840HS部件。在图形处理器方面,客户可以选择笔记本电脑版本的 RTX 2050, RTX 3050, RTX 4050或 RTX 4060图形处理器。
在美国市场,联想为 LOQ 15 配置了 酷睿 i7-13700H搭配 RTX 4050 或 酷睿 i5-13420H搭配 RTX 2050。
测试条件
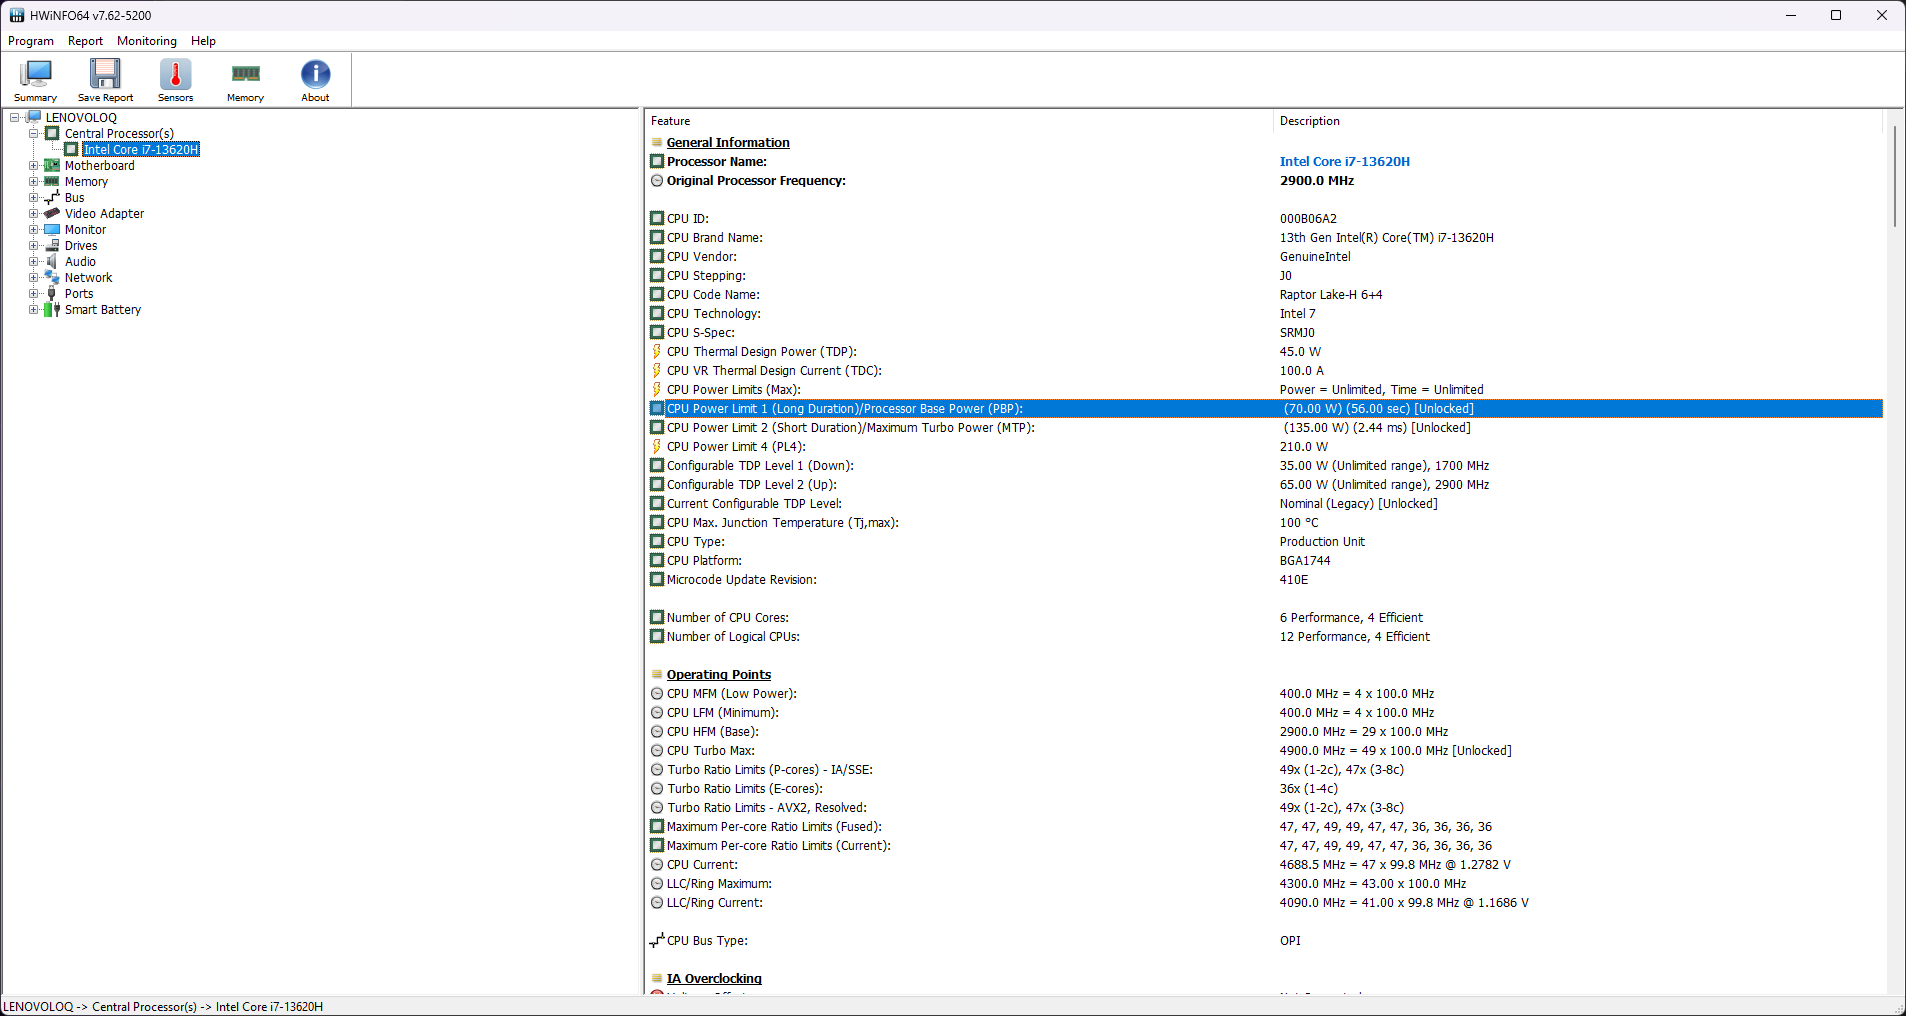
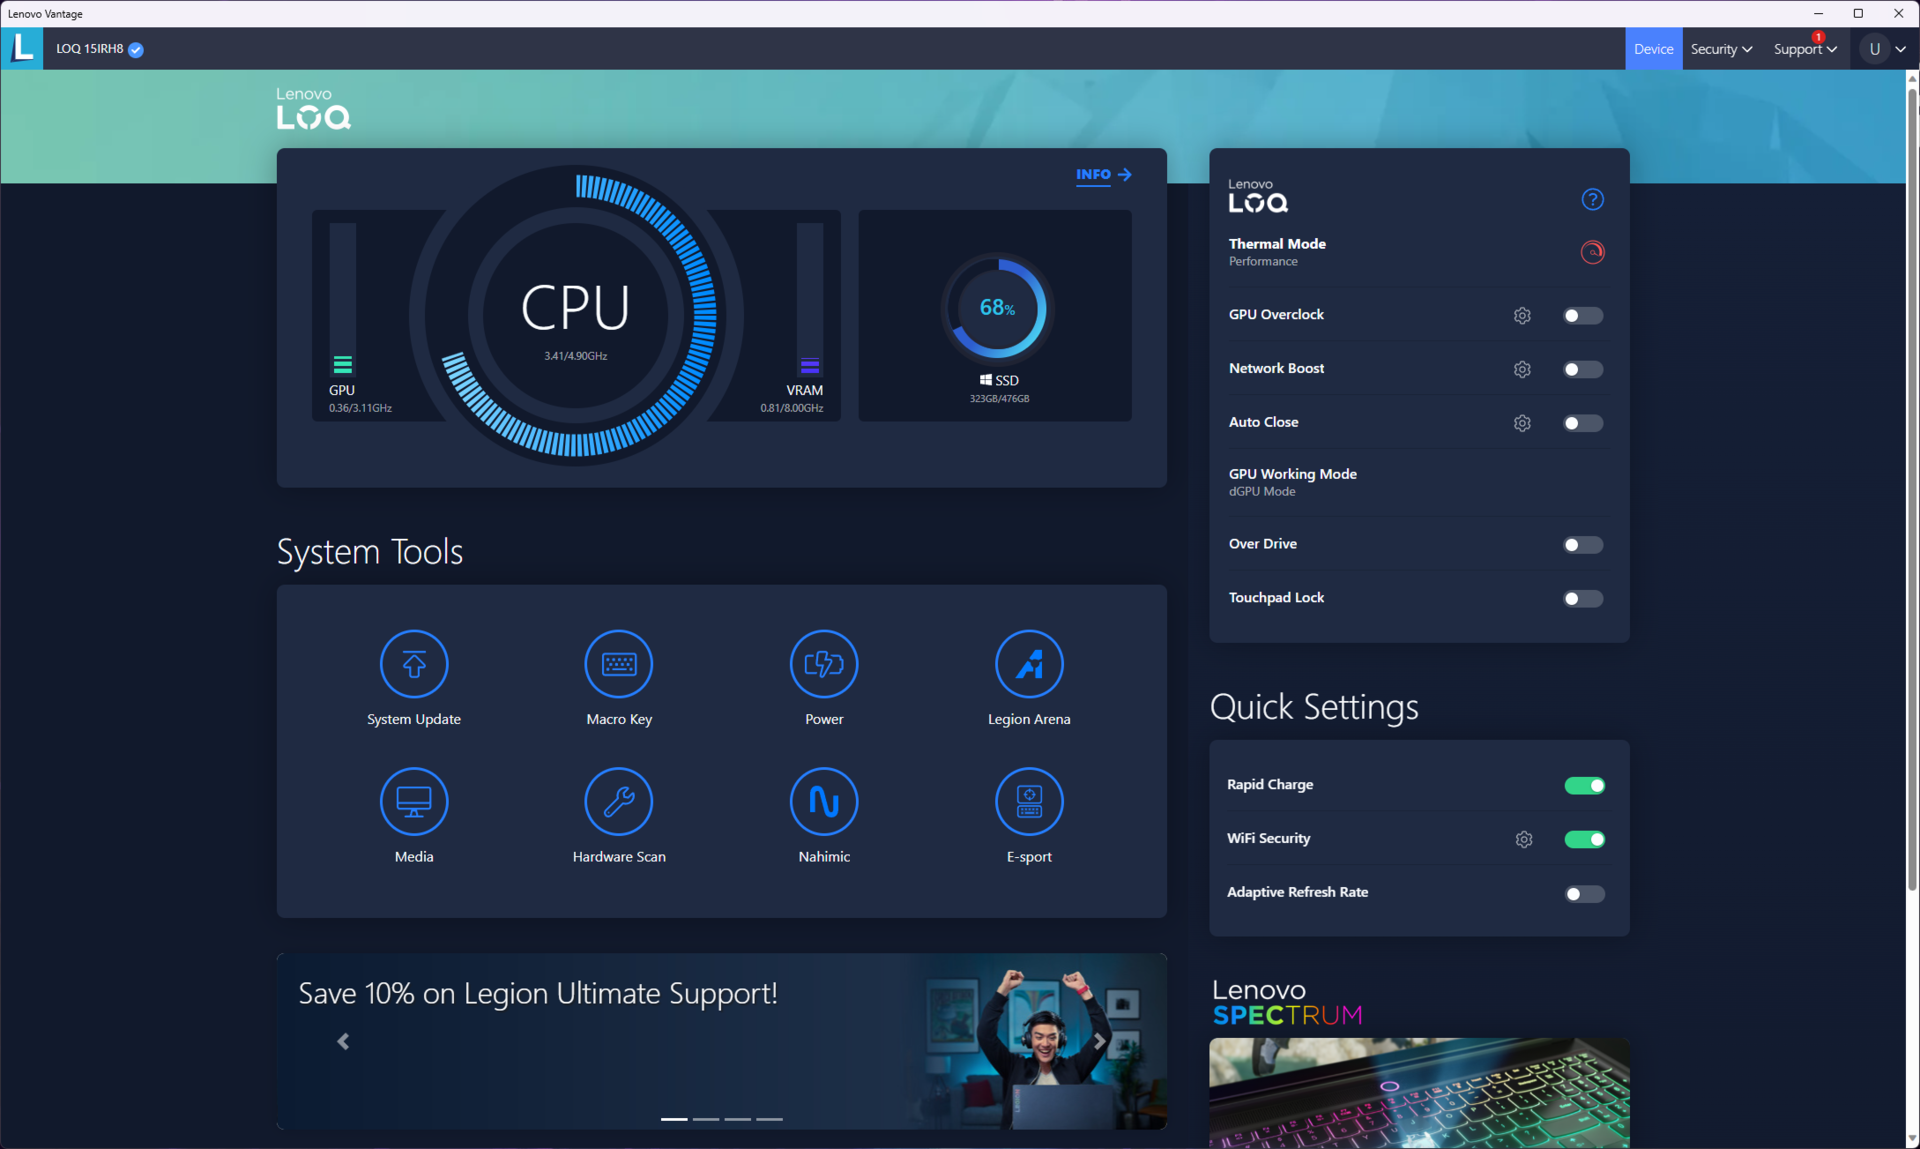
联想 Vantage 可以轻松更改 LOQ 15 的电源配置文件、RGB 效果和其他属性。该应用程序还允许有经验的用户根据需要设置自己的 CPU 功耗限制、持续时间、GPU TDP、GPU 到 CPU 的动态提升和温度限制。
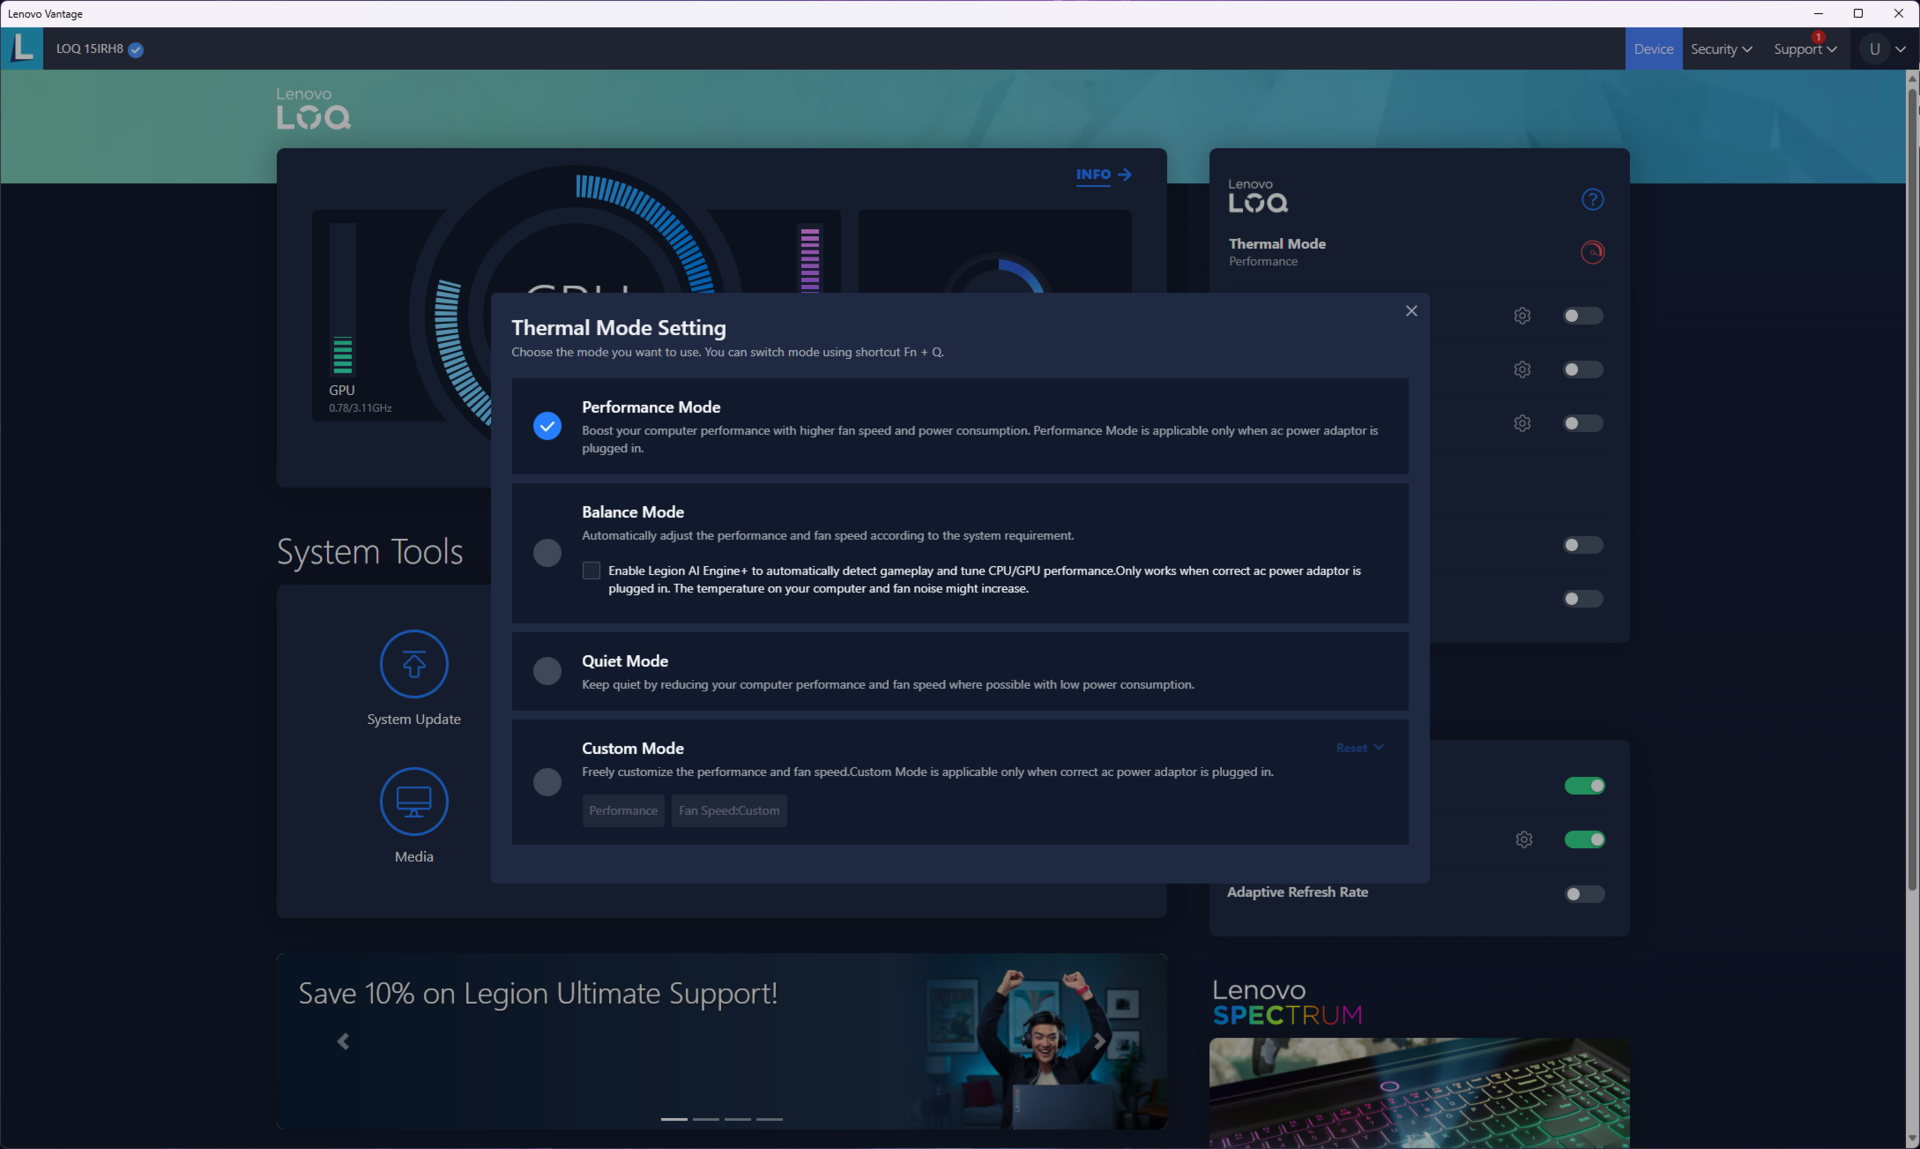
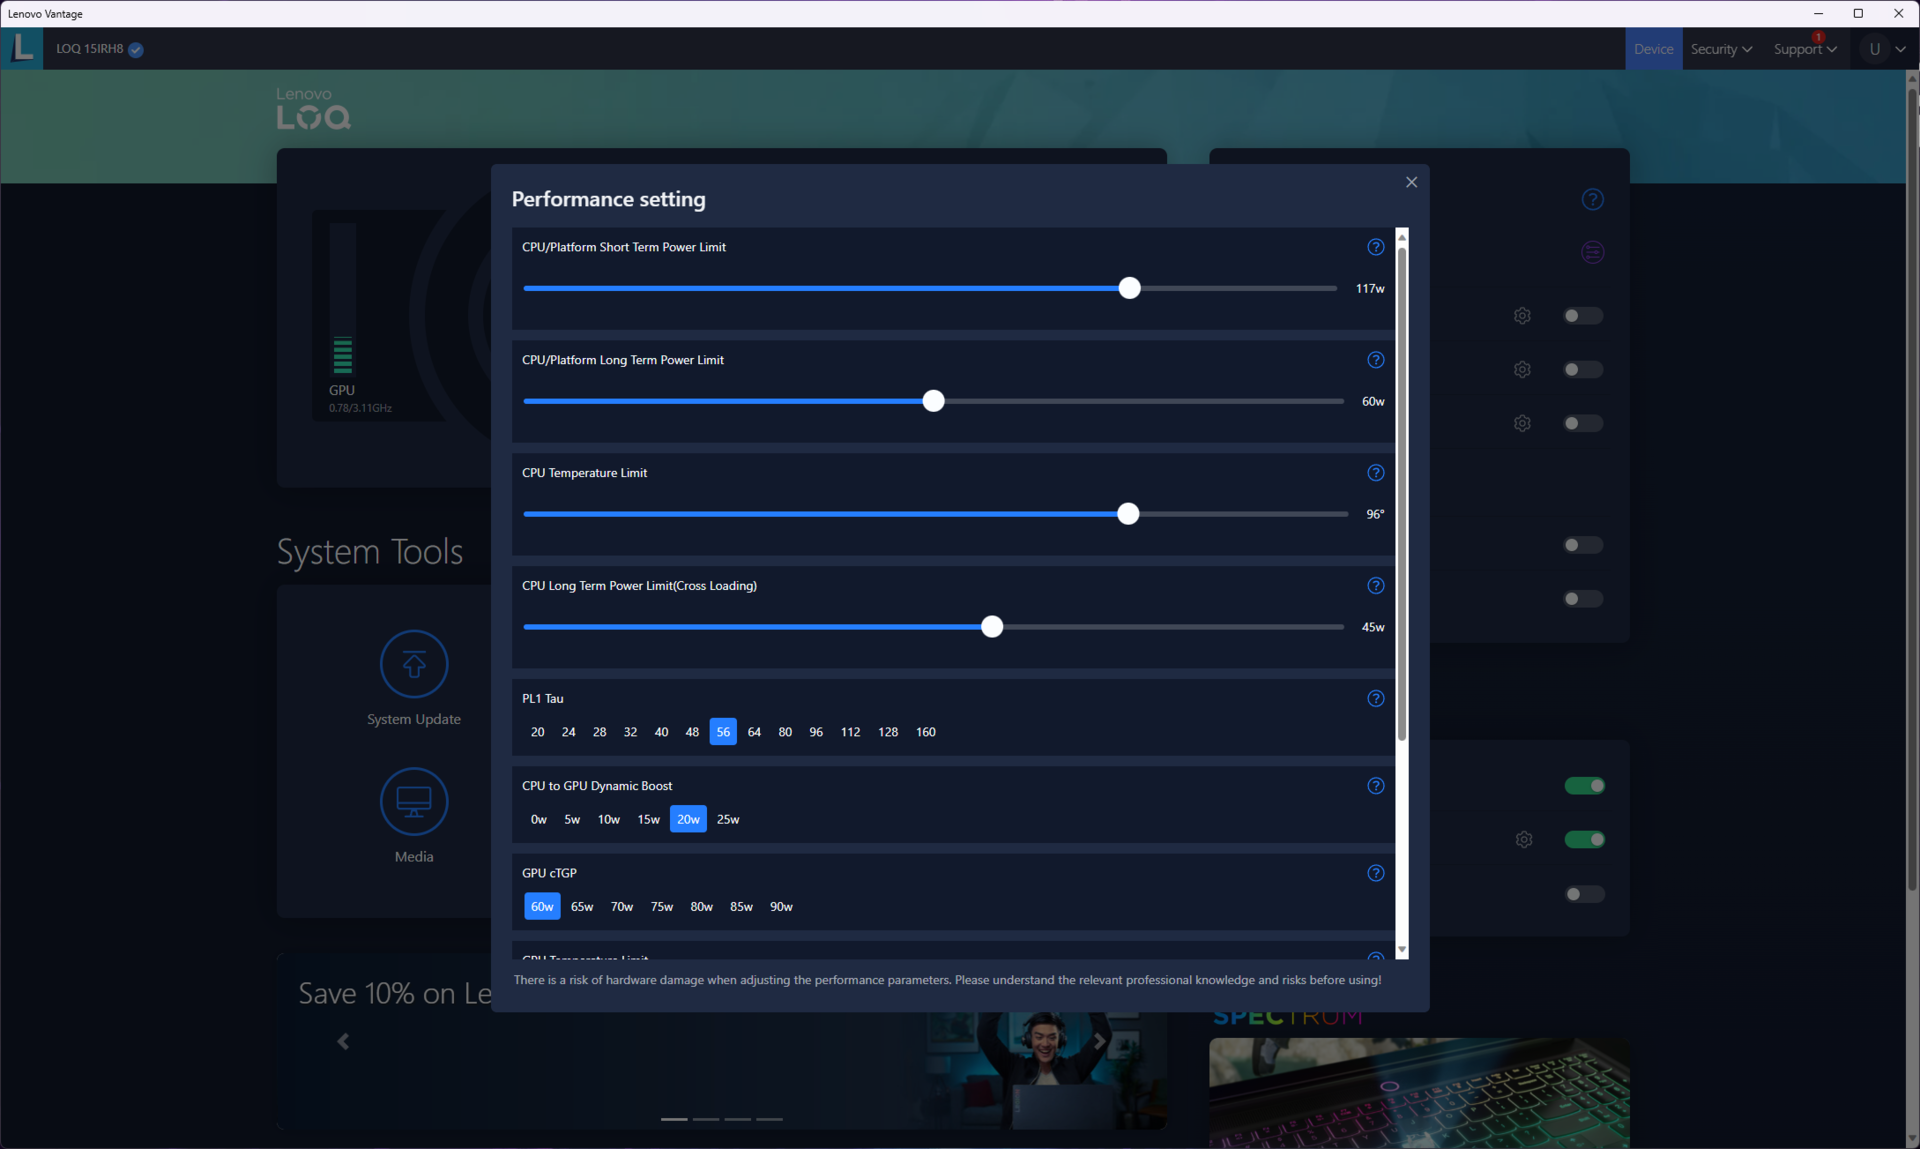
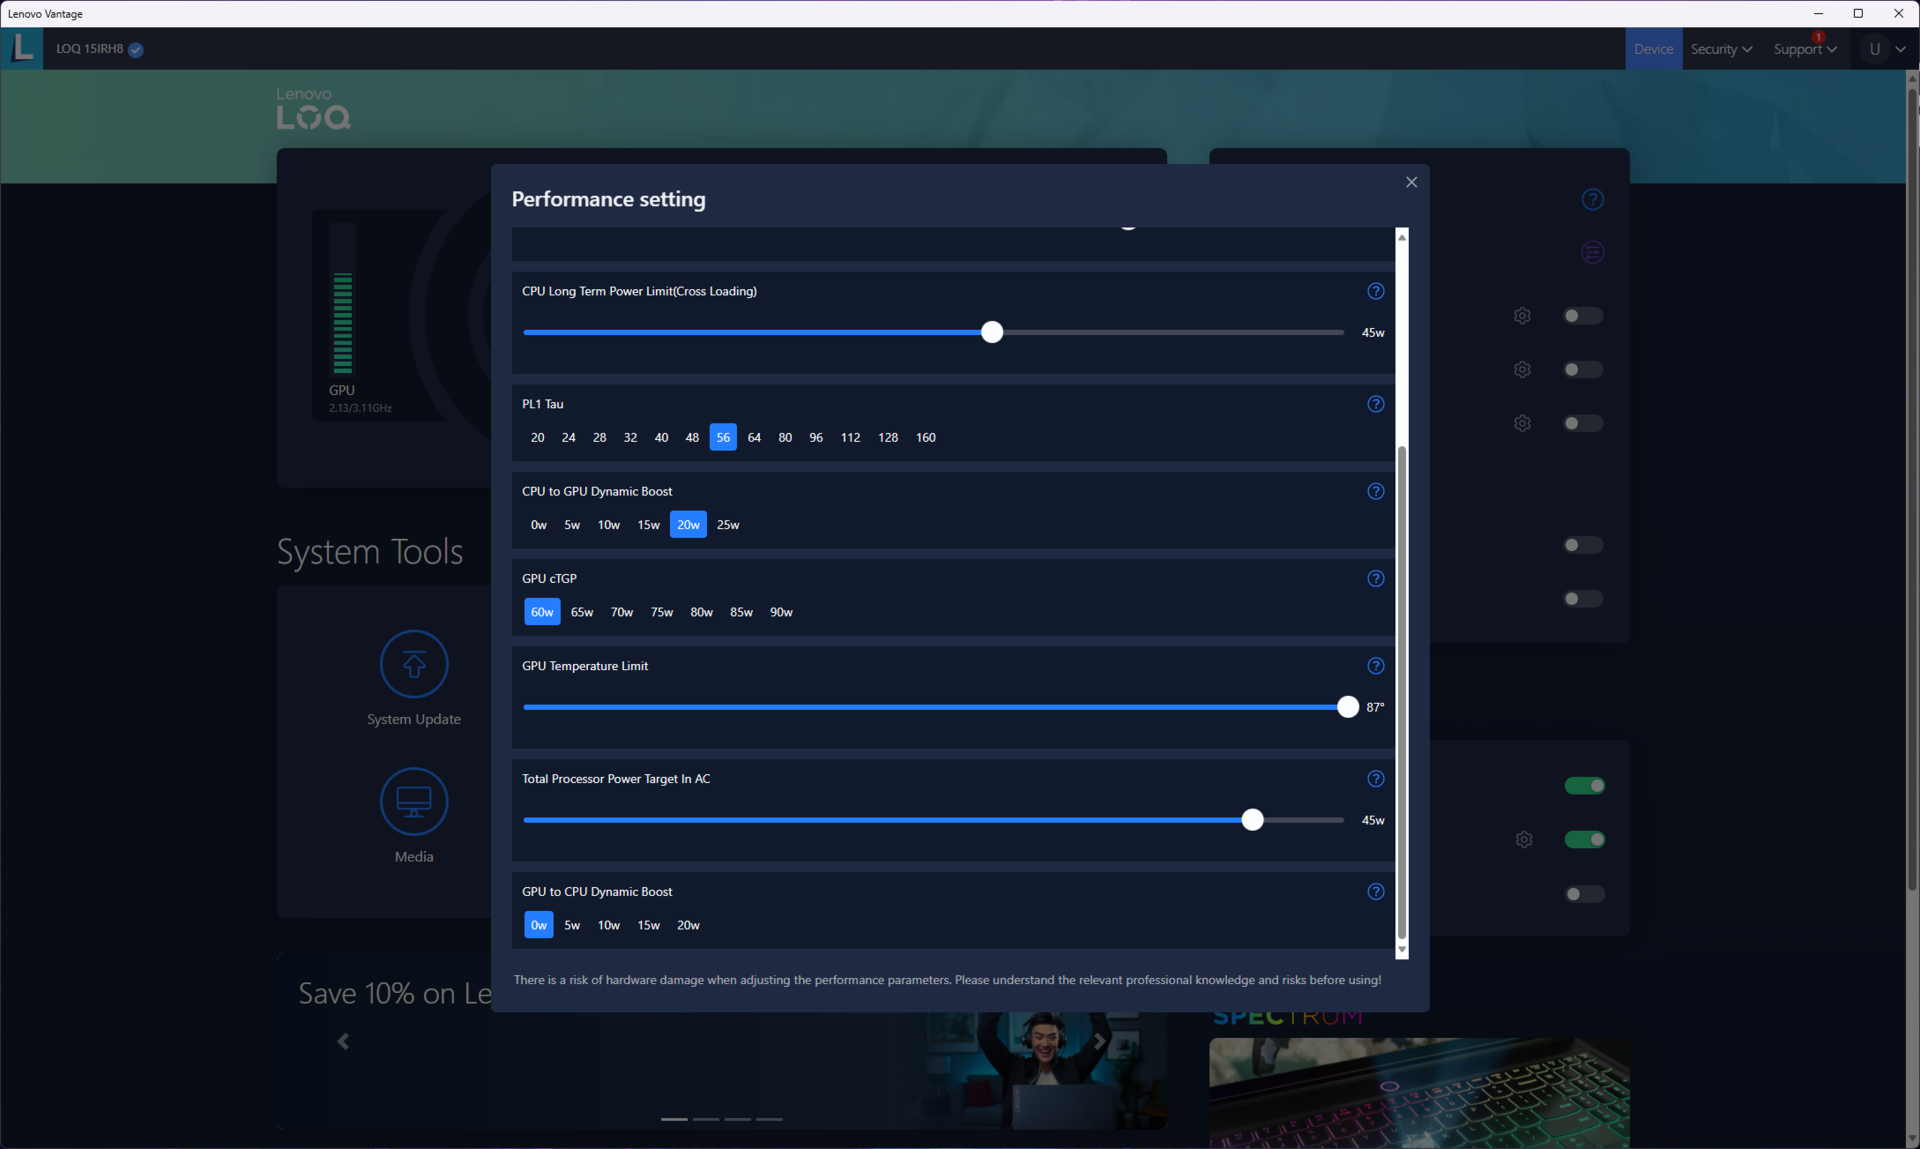
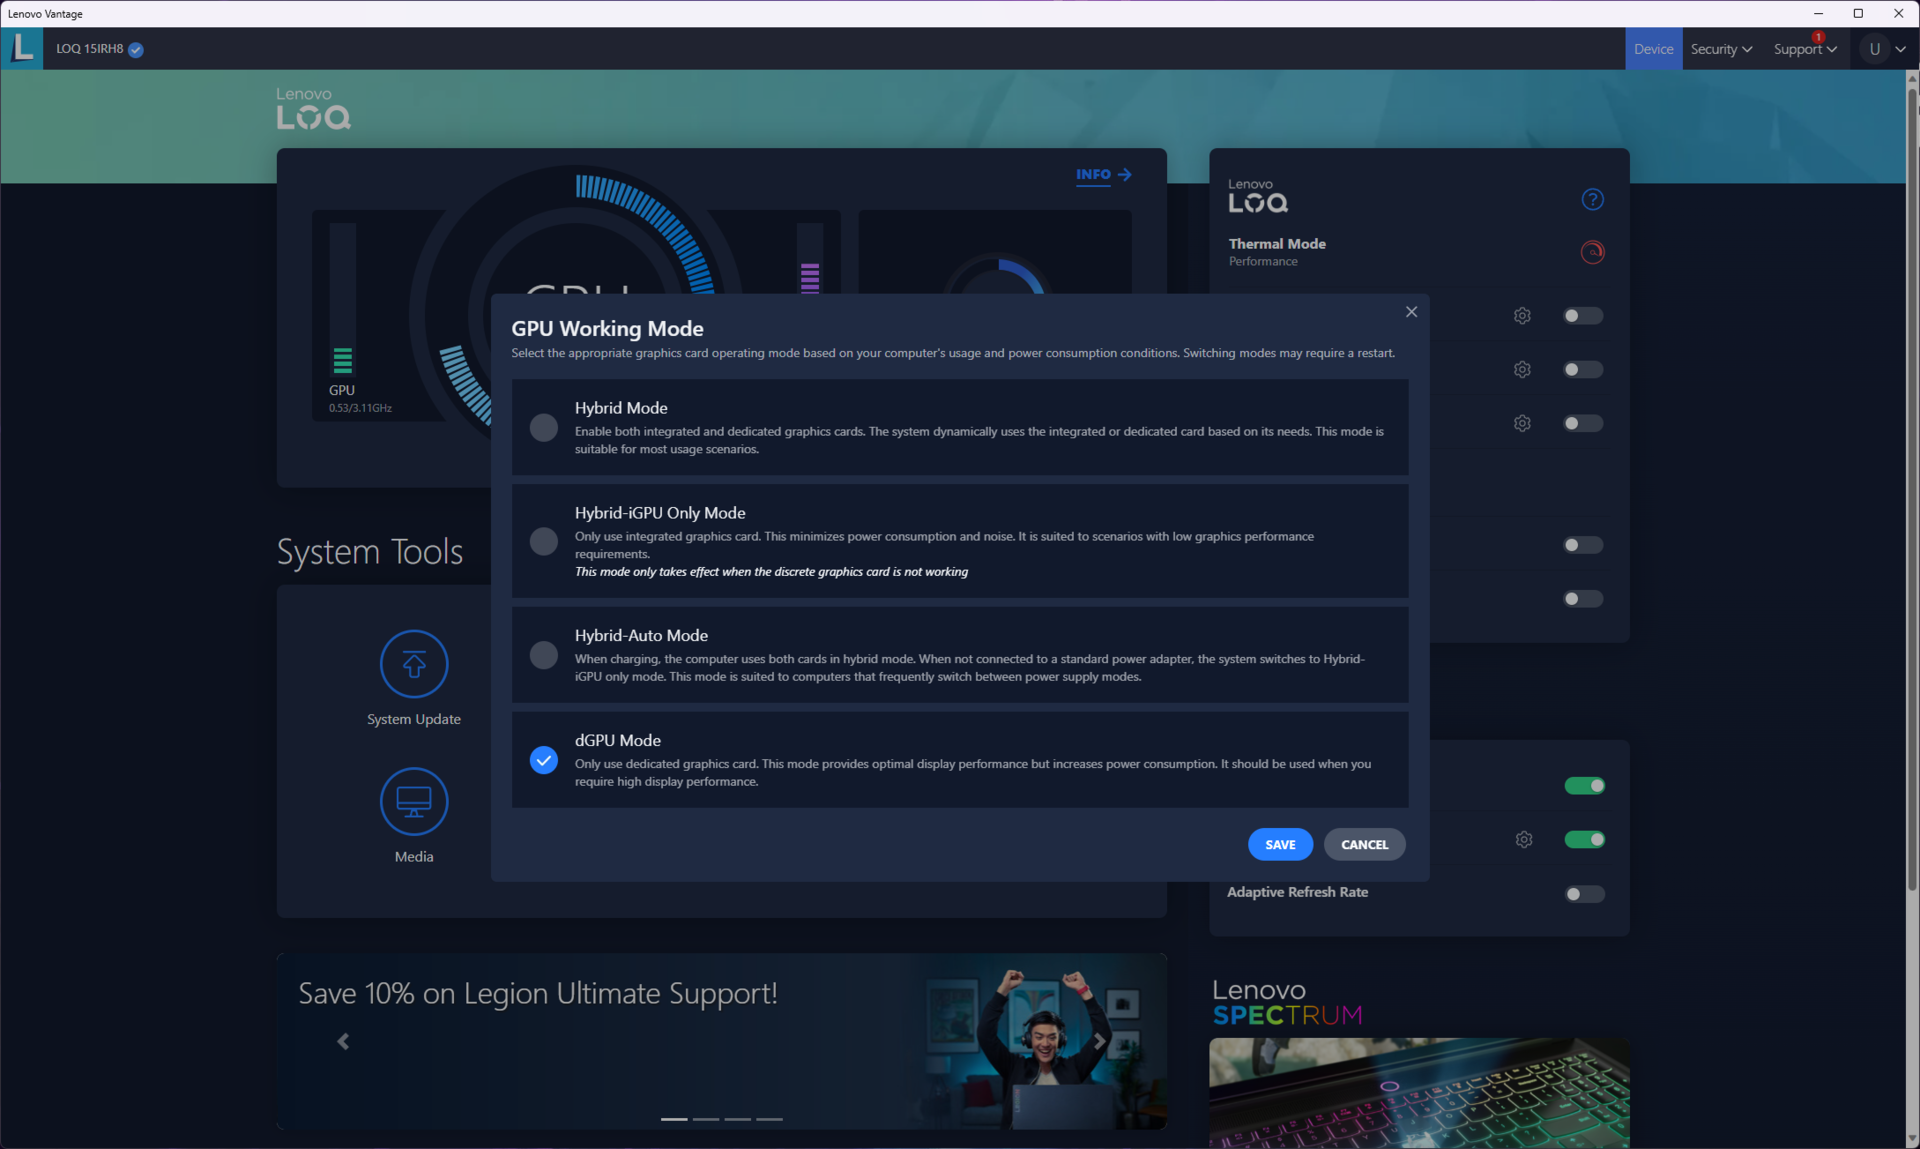
下表显示了默认电源配置文件对处理器 PL1 和 PL2 的影响。在测试中,我们使用了 "性能 "配置文件并启动了 dGPU 模式,让酷睿 i7-13620H 和 RTX 4050 充分发挥其性能。电池测试在安静模式下进行,GPU 设置为混合模式。
| 性能模式 | PL1 (PBP) / Tau | PL2 (MTP) / Tau | PL4 | Cinebench R15 Multi score | Cinebench R15 Multi score (30 loops) |
|---|---|---|---|---|---|
| 安静 | 45 瓦 / 56 秒 | 55 瓦 / 2.44 毫秒 | 210 瓦 | 1,879 (-17.98%) | 1,412 (-26.34%) |
| 平衡 | 60 瓦 / 56 秒 | 117 瓦 / 2.44 毫秒 | 210 瓦 | 2,178 (-4.93%) | 1,657 (-13.56%) |
| 性能 | 70 W / 56 s | 135 W / 2.44 ms | 210 W | 2,291 (100%) | 1,917 (100%) |
处理器
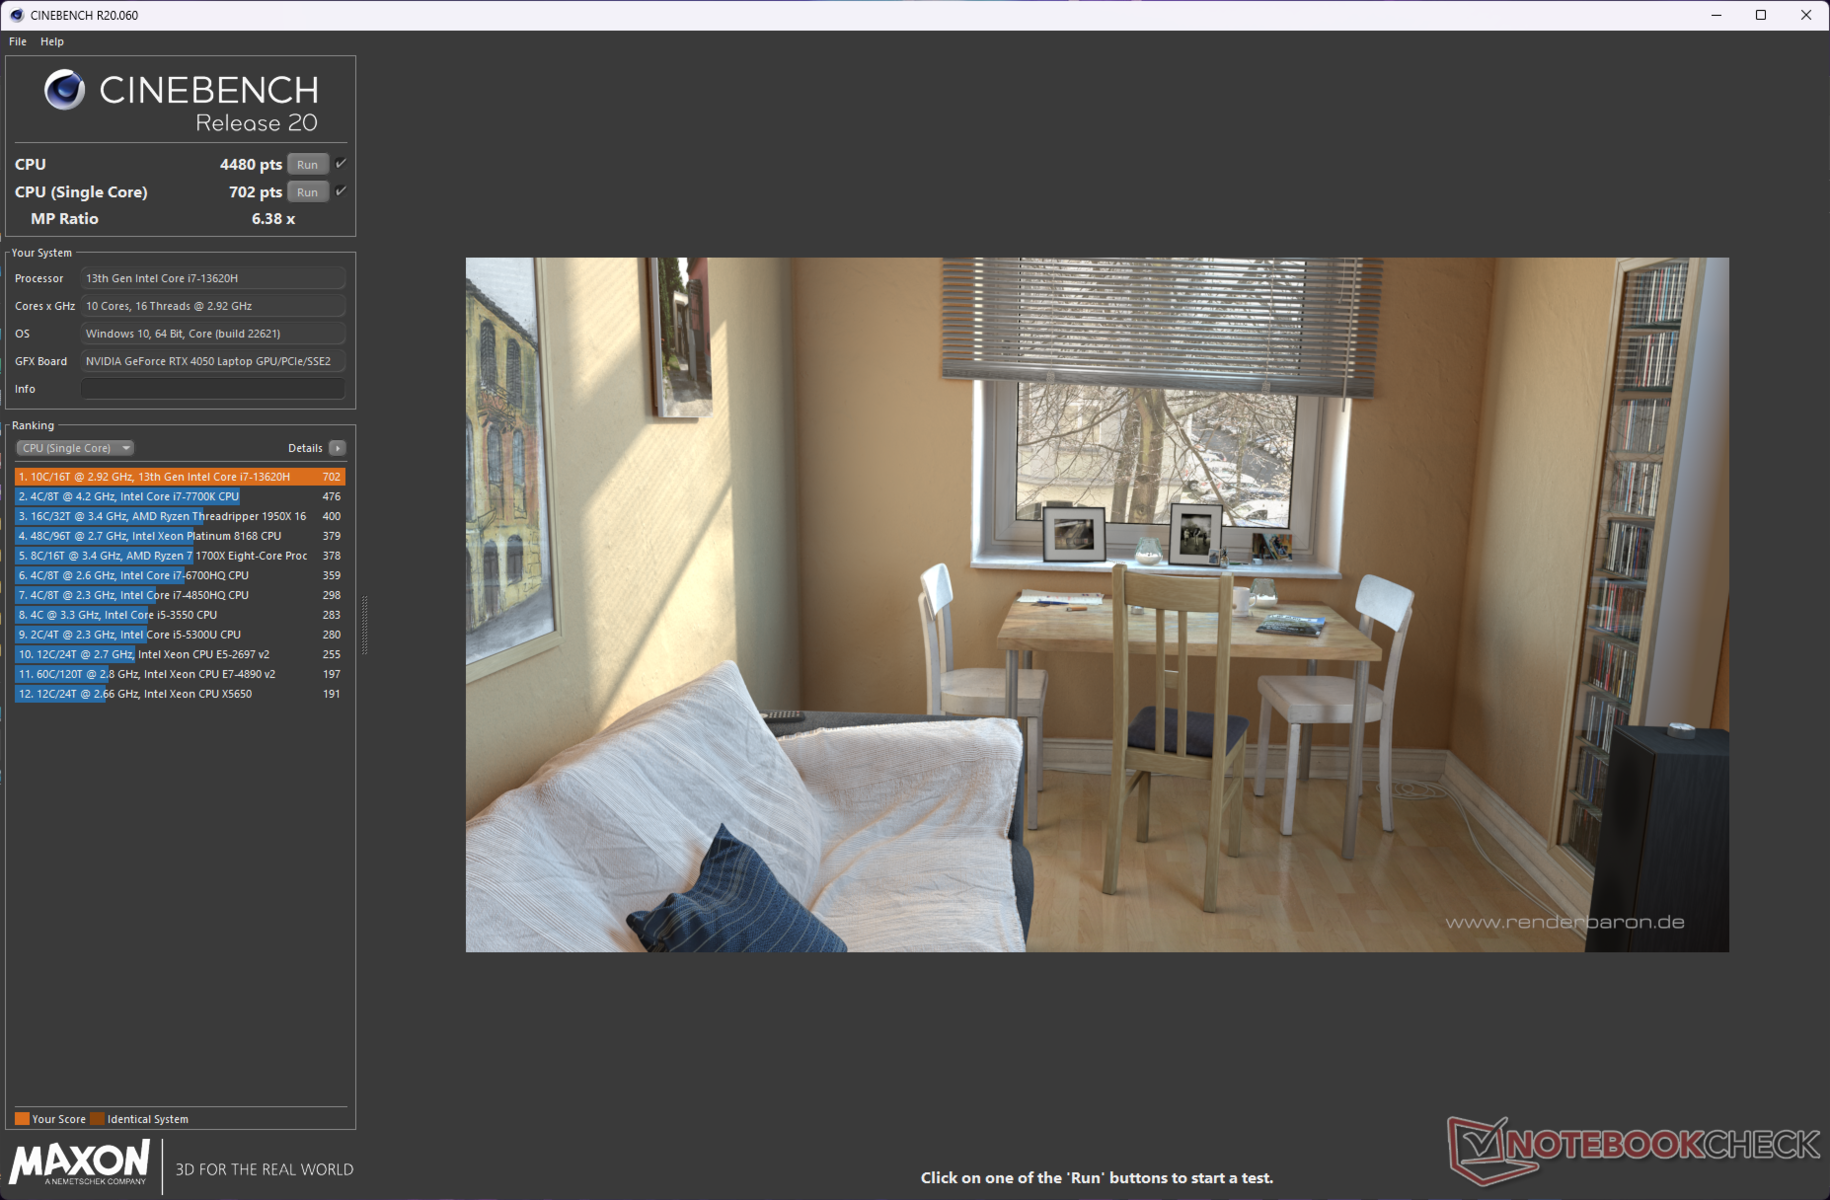
LOQ 15IRH8 的酷睿 i7-13620H 在 Cinebench 多核测试中落后于搭载 Ryzen 7 7840HS 的 LOQ 15APH8 多达 16%,尽管线程数相同,这可能是由于后者的时钟频率更高。不过,我们在 Geekbench 多核测试中看到了角色的逆转。英特尔芯片在大多数单核基准测试中也表现出色。
在 Cinebench R15 多核循环测试中,LOQ 15IRH8 的机箱和散热似乎难以正常维持。酷睿 i7-13620H 在 LOQ 16IRH8 中的表现则更为出色,性能非常稳定。
Cinebench R15 Multi Loop
Cinebench R23: Multi Core | Single Core
Cinebench R20: CPU (Multi Core) | CPU (Single Core)
Cinebench R15: CPU Multi 64Bit | CPU Single 64Bit
Blender: v2.79 BMW27 CPU
7-Zip 18.03: 7z b 4 | 7z b 4 -mmt1
Geekbench 5.5: Multi-Core | Single-Core
HWBOT x265 Benchmark v2.2: 4k Preset
LibreOffice : 20 Documents To PDF
R Benchmark 2.5: Overall mean
| CPU Performance rating | |
| Average of class Gaming | |
| Dell G15 5530 | |
| Asus TUF Gaming A16 FA617XS | |
| Lenovo LOQ 15APH8 | |
| Lenovo LOQ 16IRH8 | |
| Lenovo Legion Pro 5 16ARX8 (R5 7645HX, RTX 4050) | |
| Lenovo LOQ 15IRH8 Core i7 | |
| MSI Katana 17 B13VFK | |
| Average Intel Core i7-13620H | |
| HP Victus 16-r0077ng | |
| Cinebench R23 / Multi Core | |
| Average of class Gaming (10488 - 42661, n=107, last 2 years) | |
| Dell G15 5530 | |
| Lenovo LOQ 15APH8 | |
| Asus TUF Gaming A16 FA617XS | |
| MSI Katana 17 B13VFK | |
| HP Victus 16-r0077ng | |
| Lenovo LOQ 16IRH8 | |
| Lenovo LOQ 15IRH8 Core i7 | |
| Average Intel Core i7-13620H (10819 - 15496, n=7) | |
| Lenovo Legion Pro 5 16ARX8 (R5 7645HX, RTX 4050) | |
| Cinebench R23 / Single Core | |
| Average of class Gaming (1166 - 2415, n=107, last 2 years) | |
| Lenovo LOQ 16IRH8 | |
| Lenovo LOQ 15IRH8 Core i7 | |
| Dell G15 5530 | |
| Average Intel Core i7-13620H (1716 - 1871, n=7) | |
| Lenovo Legion Pro 5 16ARX8 (R5 7645HX, RTX 4050) | |
| MSI Katana 17 B13VFK | |
| Asus TUF Gaming A16 FA617XS | |
| Lenovo LOQ 15APH8 | |
| HP Victus 16-r0077ng | |
| Cinebench R20 / CPU (Multi Core) | |
| Average of class Gaming (4029 - 16433, n=106, last 2 years) | |
| Dell G15 5530 | |
| Lenovo LOQ 15APH8 | |
| Asus TUF Gaming A16 FA617XS | |
| MSI Katana 17 B13VFK | |
| HP Victus 16-r0077ng | |
| Lenovo LOQ 15IRH8 Core i7 | |
| Lenovo LOQ 16IRH8 | |
| Lenovo Legion Pro 5 16ARX8 (R5 7645HX, RTX 4050) | |
| Average Intel Core i7-13620H (4214 - 5905, n=7) | |
| Cinebench R20 / CPU (Single Core) | |
| Average of class Gaming (442 - 913, n=106, last 2 years) | |
| Lenovo LOQ 15IRH8 Core i7 | |
| Dell G15 5530 | |
| Lenovo LOQ 16IRH8 | |
| Asus TUF Gaming A16 FA617XS | |
| Lenovo Legion Pro 5 16ARX8 (R5 7645HX, RTX 4050) | |
| Average Intel Core i7-13620H (657 - 719, n=7) | |
| Lenovo LOQ 15APH8 | |
| MSI Katana 17 B13VFK | |
| HP Victus 16-r0077ng | |
| Cinebench R15 / CPU Multi 64Bit | |
| Average of class Gaming (1578 - 6330, n=105, last 2 years) | |
| Dell G15 5530 | |
| Lenovo LOQ 15APH8 | |
| Asus TUF Gaming A16 FA617XS | |
| Lenovo LOQ 16IRH8 | |
| MSI Katana 17 B13VFK | |
| HP Victus 16-r0077ng | |
| Lenovo LOQ 15IRH8 Core i7 | |
| Lenovo Legion Pro 5 16ARX8 (R5 7645HX, RTX 4050) | |
| Average Intel Core i7-13620H (1681 - 2492, n=7) | |
| Cinebench R15 / CPU Single 64Bit | |
| Average of class Gaming (188.8 - 350, n=106, last 2 years) | |
| Lenovo Legion Pro 5 16ARX8 (R5 7645HX, RTX 4050) | |
| Asus TUF Gaming A16 FA617XS | |
| Lenovo LOQ 15APH8 | |
| Dell G15 5530 | |
| Lenovo LOQ 16IRH8 | |
| Lenovo LOQ 15IRH8 Core i7 | |
| Average Intel Core i7-13620H (250 - 269, n=7) | |
| MSI Katana 17 B13VFK | |
| HP Victus 16-r0077ng | |
| Blender / v2.79 BMW27 CPU | |
| Lenovo LOQ 15IRH8 Core i7 | |
| Average Intel Core i7-13620H (215 - 297, n=7) | |
| Lenovo Legion Pro 5 16ARX8 (R5 7645HX, RTX 4050) | |
| Lenovo LOQ 16IRH8 | |
| MSI Katana 17 B13VFK | |
| HP Victus 16-r0077ng | |
| Asus TUF Gaming A16 FA617XS | |
| Lenovo LOQ 15APH8 | |
| Dell G15 5530 | |
| Average of class Gaming (79 - 330, n=104, last 2 years) | |
| 7-Zip 18.03 / 7z b 4 | |
| Average of class Gaming (33491 - 148086, n=105, last 2 years) | |
| Dell G15 5530 | |
| Asus TUF Gaming A16 FA617XS | |
| HP Victus 16-r0077ng | |
| MSI Katana 17 B13VFK | |
| Lenovo Legion Pro 5 16ARX8 (R5 7645HX, RTX 4050) | |
| Lenovo LOQ 15APH8 | |
| Lenovo LOQ 16IRH8 | |
| Lenovo LOQ 15IRH8 Core i7 | |
| Average Intel Core i7-13620H (45092 - 62324, n=7) | |
| 7-Zip 18.03 / 7z b 4 -mmt1 | |
| Lenovo Legion Pro 5 16ARX8 (R5 7645HX, RTX 4050) | |
| Asus TUF Gaming A16 FA617XS | |
| Average of class Gaming (4199 - 7436, n=105, last 2 years) | |
| Lenovo LOQ 15APH8 | |
| Average Intel Core i7-13620H (5648 - 6326, n=7) | |
| Lenovo LOQ 15IRH8 Core i7 | |
| Lenovo LOQ 16IRH8 | |
| Dell G15 5530 | |
| MSI Katana 17 B13VFK | |
| HP Victus 16-r0077ng | |
| Geekbench 5.5 / Multi-Core | |
| Average of class Gaming (6460 - 28263, n=105, last 2 years) | |
| Dell G15 5530 | |
| Lenovo LOQ 16IRH8 | |
| Asus TUF Gaming A16 FA617XS | |
| HP Victus 16-r0077ng | |
| Lenovo LOQ 15IRH8 Core i7 | |
| MSI Katana 17 B13VFK | |
| Average Intel Core i7-13620H (8112 - 12223, n=7) | |
| Lenovo Legion Pro 5 16ARX8 (R5 7645HX, RTX 4050) | |
| Lenovo LOQ 15APH8 | |
| Geekbench 5.5 / Single-Core | |
| Average of class Gaming (986 - 2474, n=105, last 2 years) | |
| Asus TUF Gaming A16 FA617XS | |
| Lenovo Legion Pro 5 16ARX8 (R5 7645HX, RTX 4050) | |
| Lenovo LOQ 15IRH8 Core i7 | |
| Dell G15 5530 | |
| Lenovo LOQ 15APH8 | |
| Lenovo LOQ 16IRH8 | |
| Average Intel Core i7-13620H (1703 - 1865, n=7) | |
| MSI Katana 17 B13VFK | |
| HP Victus 16-r0077ng | |
| HWBOT x265 Benchmark v2.2 / 4k Preset | |
| Average of class Gaming (11.5 - 44.4, n=105, last 2 years) | |
| Dell G15 5530 | |
| Asus TUF Gaming A16 FA617XS | |
| Lenovo Legion Pro 5 16ARX8 (R5 7645HX, RTX 4050) | |
| Lenovo LOQ 15APH8 | |
| MSI Katana 17 B13VFK | |
| Lenovo LOQ 16IRH8 | |
| Lenovo LOQ 15IRH8 Core i7 | |
| HP Victus 16-r0077ng | |
| Average Intel Core i7-13620H (12.2 - 17.7, n=7) | |
| LibreOffice / 20 Documents To PDF | |
| HP Victus 16-r0077ng | |
| MSI Katana 17 B13VFK | |
| Lenovo Legion Pro 5 16ARX8 (R5 7645HX, RTX 4050) | |
| Average Intel Core i7-13620H (41.5 - 78.9, n=7) | |
| Average of class Gaming (33.2 - 88.8, n=105, last 2 years) | |
| Dell G15 5530 | |
| Lenovo LOQ 16IRH8 | |
| Lenovo LOQ 15IRH8 Core i7 | |
| Asus TUF Gaming A16 FA617XS | |
| Lenovo LOQ 15APH8 | |
| R Benchmark 2.5 / Overall mean | |
| HP Victus 16-r0077ng | |
| Average Intel Core i7-13620H (0.4438 - 0.4762, n=7) | |
| Lenovo LOQ 15IRH8 Core i7 | |
| Lenovo LOQ 15APH8 | |
| Lenovo LOQ 16IRH8 | |
| MSI Katana 17 B13VFK | |
| Lenovo Legion Pro 5 16ARX8 (R5 7645HX, RTX 4050) | |
| Average of class Gaming (0.3439 - 0.759, n=106, last 2 years) | |
| Dell G15 5530 | |
| Asus TUF Gaming A16 FA617XS | |
* ... smaller is better
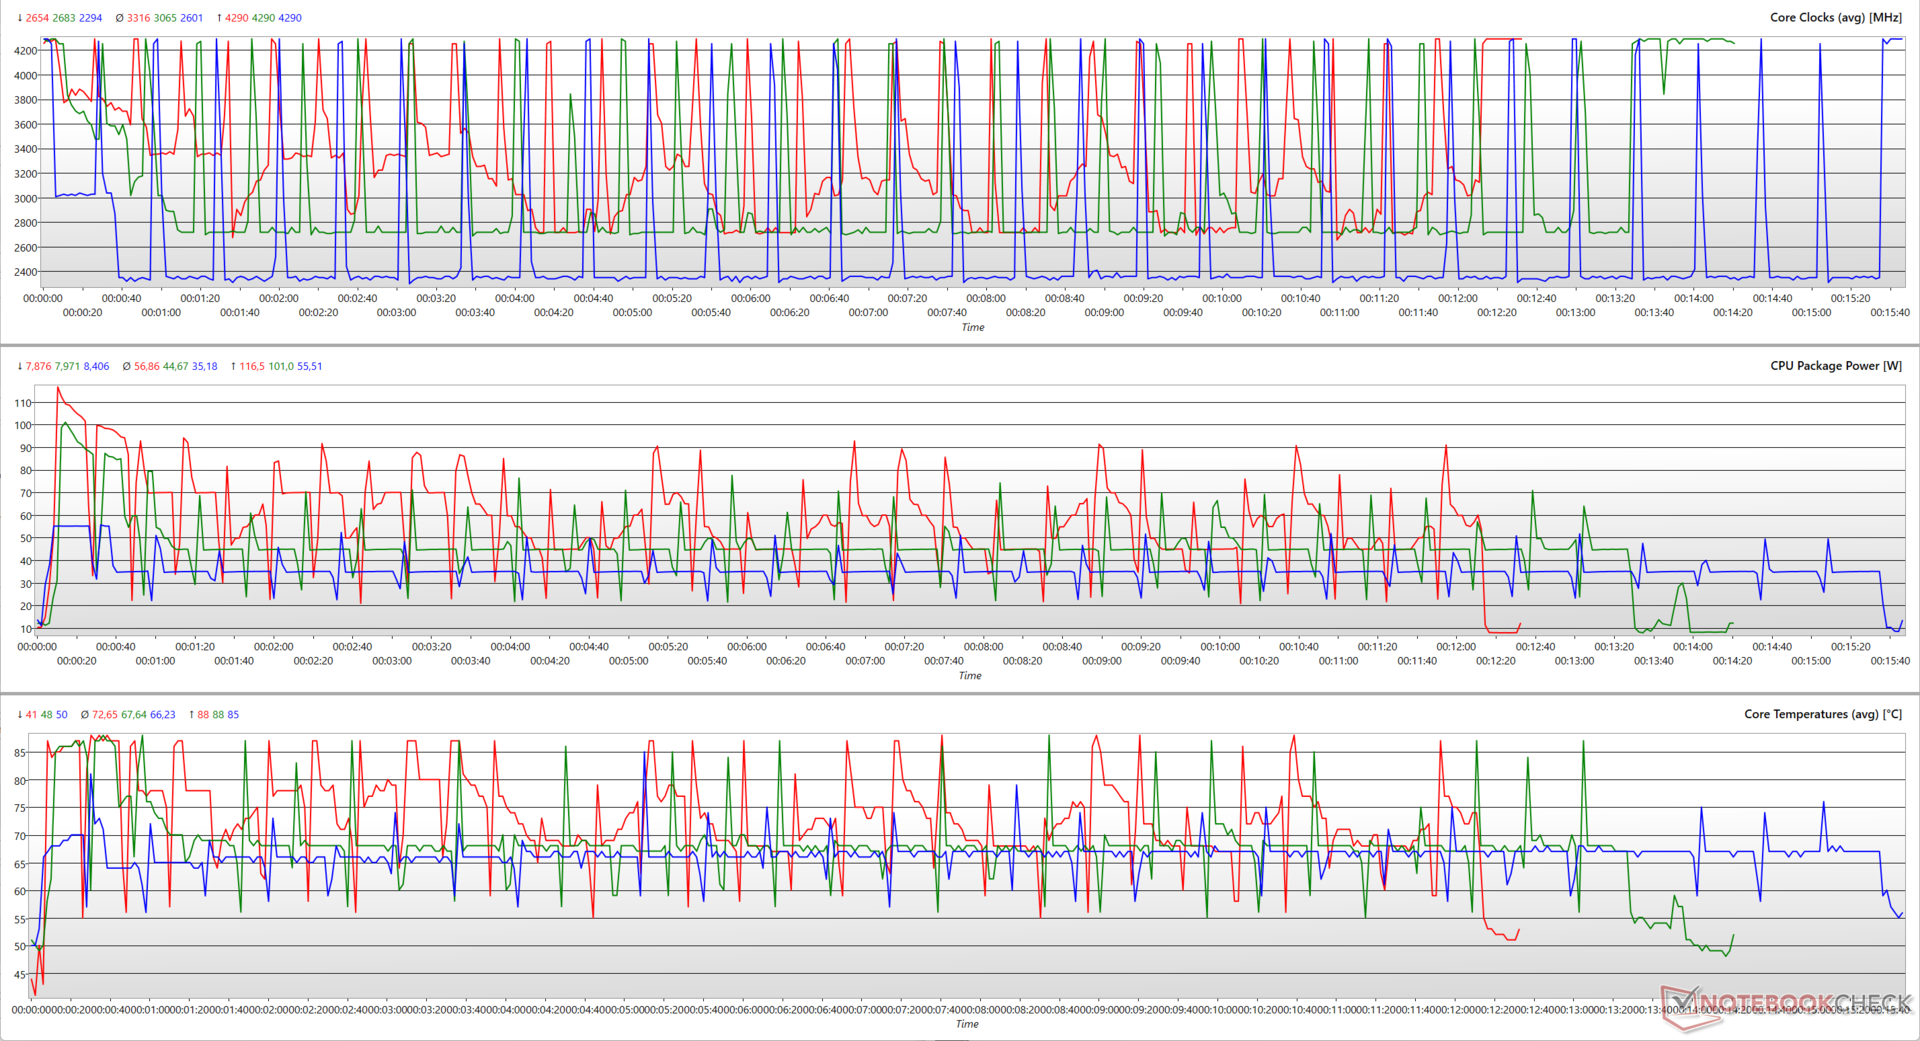
对 Cinebench R15 多核循环测试的分析表明了内置功耗曲线对 CPU 各项参数的影响。
虽然 "性能 "模式应该允许处理器使用高达 135 W 的 PL2,但我们看到它的最大值仅为 116.5 W。"平衡 "模式似乎也可以使用比可能更低的封装功率(101 W 对 117 W),但与 "性能 "模式相比,我们在这里看到了更稳定的运行。
可能是 LOQ 15IRH8 的散热系统在功耗限制超过 116 W 时就会出现问题,这也是该基准测试中性能持续性较差的原因。
Cinebench R20 多核跑分在电池供电情况下下降了 23%,不过单核性能只受到轻微影响。
AIDA64: FP32 Ray-Trace | FPU Julia | CPU SHA3 | CPU Queen | FPU SinJulia | FPU Mandel | CPU AES | CPU ZLib | FP64 Ray-Trace | CPU PhotoWorxx
| Performance rating | |
| Average of class Gaming | |
| Asus TUF Gaming A16 FA617XS | |
| Lenovo LOQ 15APH8 | |
| Dell G15 5530 | |
| Lenovo Legion Pro 5 16ARX8 (R5 7645HX, RTX 4050) | |
| HP Victus 16-r0077ng | |
| MSI Katana 17 B13VFK | |
| Lenovo LOQ 16IRH8 | |
| Lenovo LOQ 15IRH8 Core i7 | |
| Average Intel Core i7-13620H | |
| AIDA64 / FP32 Ray-Trace | |
| Average of class Gaming (10227 - 85542, n=105, last 2 years) | |
| Lenovo LOQ 15APH8 | |
| Asus TUF Gaming A16 FA617XS | |
| Lenovo Legion Pro 5 16ARX8 (R5 7645HX, RTX 4050) | |
| Dell G15 5530 | |
| HP Victus 16-r0077ng | |
| MSI Katana 17 B13VFK | |
| Lenovo LOQ 16IRH8 | |
| Average Intel Core i7-13620H (10779 - 13601, n=7) | |
| Lenovo LOQ 15IRH8 Core i7 | |
| AIDA64 / FPU Julia | |
| Average of class Gaming (51376 - 238426, n=105, last 2 years) | |
| Lenovo LOQ 15APH8 | |
| Asus TUF Gaming A16 FA617XS | |
| Lenovo Legion Pro 5 16ARX8 (R5 7645HX, RTX 4050) | |
| Dell G15 5530 | |
| HP Victus 16-r0077ng | |
| MSI Katana 17 B13VFK | |
| Lenovo LOQ 16IRH8 | |
| Lenovo LOQ 15IRH8 Core i7 | |
| Average Intel Core i7-13620H (54287 - 67187, n=7) | |
| AIDA64 / CPU SHA3 | |
| Average of class Gaming (2180 - 10115, n=105, last 2 years) | |
| Lenovo LOQ 15APH8 | |
| Asus TUF Gaming A16 FA617XS | |
| Dell G15 5530 | |
| Lenovo Legion Pro 5 16ARX8 (R5 7645HX, RTX 4050) | |
| HP Victus 16-r0077ng | |
| MSI Katana 17 B13VFK | |
| Lenovo LOQ 16IRH8 | |
| Average Intel Core i7-13620H (2327 - 2773, n=7) | |
| Lenovo LOQ 15IRH8 Core i7 | |
| AIDA64 / CPU Queen | |
| Asus TUF Gaming A16 FA617XS | |
| Lenovo LOQ 15APH8 | |
| Average of class Gaming (49785 - 173351, n=90, last 2 years) | |
| Dell G15 5530 | |
| Lenovo Legion Pro 5 16ARX8 (R5 7645HX, RTX 4050) | |
| HP Victus 16-r0077ng | |
| Lenovo LOQ 15IRH8 Core i7 | |
| Lenovo LOQ 16IRH8 | |
| MSI Katana 17 B13VFK | |
| Average Intel Core i7-13620H (66885 - 78867, n=7) | |
| AIDA64 / FPU SinJulia | |
| Asus TUF Gaming A16 FA617XS | |
| Lenovo LOQ 15APH8 | |
| Average of class Gaming (4424 - 33636, n=105, last 2 years) | |
| Lenovo Legion Pro 5 16ARX8 (R5 7645HX, RTX 4050) | |
| Dell G15 5530 | |
| HP Victus 16-r0077ng | |
| MSI Katana 17 B13VFK | |
| Lenovo LOQ 16IRH8 | |
| Average Intel Core i7-13620H (6737 - 8421, n=7) | |
| Lenovo LOQ 15IRH8 Core i7 | |
| AIDA64 / FPU Mandel | |
| Average of class Gaming (25115 - 128721, n=105, last 2 years) | |
| Lenovo LOQ 15APH8 | |
| Asus TUF Gaming A16 FA617XS | |
| Lenovo Legion Pro 5 16ARX8 (R5 7645HX, RTX 4050) | |
| Dell G15 5530 | |
| HP Victus 16-r0077ng | |
| MSI Katana 17 B13VFK | |
| Lenovo LOQ 16IRH8 | |
| Lenovo LOQ 15IRH8 Core i7 | |
| Average Intel Core i7-13620H (27242 - 32787, n=7) | |
| AIDA64 / CPU AES | |
| Average of class Gaming (39258 - 247074, n=105, last 2 years) | |
| Asus TUF Gaming A16 FA617XS | |
| Dell G15 5530 | |
| Lenovo LOQ 15APH8 | |
| HP Victus 16-r0077ng | |
| Average Intel Core i7-13620H (48646 - 85895, n=7) | |
| MSI Katana 17 B13VFK | |
| Lenovo LOQ 16IRH8 | |
| Lenovo Legion Pro 5 16ARX8 (R5 7645HX, RTX 4050) | |
| Lenovo LOQ 15IRH8 Core i7 | |
| AIDA64 / CPU ZLib | |
| Average of class Gaming (574 - 2531, n=105, last 2 years) | |
| Dell G15 5530 | |
| Lenovo LOQ 15APH8 | |
| Asus TUF Gaming A16 FA617XS | |
| HP Victus 16-r0077ng | |
| Lenovo Legion Pro 5 16ARX8 (R5 7645HX, RTX 4050) | |
| Lenovo LOQ 16IRH8 | |
| MSI Katana 17 B13VFK | |
| Average Intel Core i7-13620H (688 - 835, n=7) | |
| Lenovo LOQ 15IRH8 Core i7 | |
| AIDA64 / FP64 Ray-Trace | |
| Average of class Gaming (5509 - 45446, n=105, last 2 years) | |
| Lenovo LOQ 15APH8 | |
| Asus TUF Gaming A16 FA617XS | |
| Lenovo Legion Pro 5 16ARX8 (R5 7645HX, RTX 4050) | |
| Dell G15 5530 | |
| HP Victus 16-r0077ng | |
| MSI Katana 17 B13VFK | |
| Lenovo LOQ 16IRH8 | |
| Average Intel Core i7-13620H (5919 - 7364, n=7) | |
| Lenovo LOQ 15IRH8 Core i7 | |
| AIDA64 / CPU PhotoWorxx | |
| Average of class Gaming (12271 - 89891, n=105, last 2 years) | |
| HP Victus 16-r0077ng | |
| Dell G15 5530 | |
| MSI Katana 17 B13VFK | |
| Lenovo LOQ 15IRH8 Core i7 | |
| Lenovo LOQ 16IRH8 | |
| Asus TUF Gaming A16 FA617XS | |
| Lenovo Legion Pro 5 16ARX8 (R5 7645HX, RTX 4050) | |
| Average Intel Core i7-13620H (19421 - 34544, n=7) | |
| Lenovo LOQ 15APH8 | |
查看我们的专用 英特尔酷睿 i7-13620H页面,了解更多信息和性能比较。
系统性能
在 CrossMark 中,LOQ 15IRH8 领先其 AMD 版 LOQ 15APH8 19%,但在 PCMark 中,这两款设备几乎打成平手。在日常工作和游戏任务中,我们没有发现系统性能出现任何问题。
CrossMark: Overall | Productivity | Creativity | Responsiveness
AIDA64: Memory Copy | Memory Read | Memory Write | Memory Latency
| PCMark 10 / Score | |
| Average of class Gaming (5828 - 12414, n=93, last 2 years) | |
| Lenovo Legion Pro 5 16ARX8 (R5 7645HX, RTX 4050) | |
| Asus TUF Gaming A16 FA617XS | |
| Lenovo LOQ 15APH8 | |
| Lenovo LOQ 15IRH8 Core i7 | |
| Average Intel Core i7-13620H, NVIDIA GeForce RTX 4050 Laptop GPU (n=1) | |
| MSI Katana 17 B13VFK | |
| HP Victus 16-r0077ng | |
| Dell G15 5530 | |
| Lenovo LOQ 16IRH8 | |
| PCMark 10 / Essentials | |
| Lenovo Legion Pro 5 16ARX8 (R5 7645HX, RTX 4050) | |
| Dell G15 5530 | |
| Lenovo LOQ 15IRH8 Core i7 | |
| Average Intel Core i7-13620H, NVIDIA GeForce RTX 4050 Laptop GPU (n=1) | |
| Asus TUF Gaming A16 FA617XS | |
| MSI Katana 17 B13VFK | |
| HP Victus 16-r0077ng | |
| Average of class Gaming (8810 - 11935, n=97, last 2 years) | |
| Lenovo LOQ 15APH8 | |
| Lenovo LOQ 16IRH8 | |
| PCMark 10 / Productivity | |
| Average of class Gaming (6845 - 25323, n=95, last 2 years) | |
| Lenovo Legion Pro 5 16ARX8 (R5 7645HX, RTX 4050) | |
| Asus TUF Gaming A16 FA617XS | |
| Dell G15 5530 | |
| Lenovo LOQ 15APH8 | |
| Lenovo LOQ 15IRH8 Core i7 | |
| Average Intel Core i7-13620H, NVIDIA GeForce RTX 4050 Laptop GPU (n=1) | |
| MSI Katana 17 B13VFK | |
| HP Victus 16-r0077ng | |
| Lenovo LOQ 16IRH8 | |
| PCMark 10 / Digital Content Creation | |
| Average of class Gaming (7602 - 19954, n=95, last 2 years) | |
| Asus TUF Gaming A16 FA617XS | |
| Lenovo LOQ 15APH8 | |
| Lenovo LOQ 15IRH8 Core i7 | |
| Average Intel Core i7-13620H, NVIDIA GeForce RTX 4050 Laptop GPU (n=1) | |
| Lenovo Legion Pro 5 16ARX8 (R5 7645HX, RTX 4050) | |
| HP Victus 16-r0077ng | |
| MSI Katana 17 B13VFK | |
| Lenovo LOQ 16IRH8 | |
| Dell G15 5530 | |
| CrossMark / Overall | |
| Average of class Gaming (1366 - 2409, n=94, last 2 years) | |
| Lenovo LOQ 16IRH8 | |
| Lenovo Legion Pro 5 16ARX8 (R5 7645HX, RTX 4050) | |
| Lenovo LOQ 15IRH8 Core i7 | |
| Average Intel Core i7-13620H, NVIDIA GeForce RTX 4050 Laptop GPU (n=1) | |
| MSI Katana 17 B13VFK | |
| Dell G15 5530 | |
| Asus TUF Gaming A16 FA617XS | |
| Lenovo LOQ 15APH8 | |
| CrossMark / Productivity | |
| Lenovo Legion Pro 5 16ARX8 (R5 7645HX, RTX 4050) | |
| Lenovo LOQ 16IRH8 | |
| Average of class Gaming (1386 - 2254, n=94, last 2 years) | |
| Lenovo LOQ 15IRH8 Core i7 | |
| Average Intel Core i7-13620H, NVIDIA GeForce RTX 4050 Laptop GPU (n=1) | |
| MSI Katana 17 B13VFK | |
| Dell G15 5530 | |
| Asus TUF Gaming A16 FA617XS | |
| Lenovo LOQ 15APH8 | |
| CrossMark / Creativity | |
| Average of class Gaming (1343 - 2786, n=94, last 2 years) | |
| Dell G15 5530 | |
| Lenovo LOQ 16IRH8 | |
| Lenovo Legion Pro 5 16ARX8 (R5 7645HX, RTX 4050) | |
| MSI Katana 17 B13VFK | |
| Lenovo LOQ 15IRH8 Core i7 | |
| Average Intel Core i7-13620H, NVIDIA GeForce RTX 4050 Laptop GPU (n=1) | |
| Asus TUF Gaming A16 FA617XS | |
| Lenovo LOQ 15APH8 | |
| CrossMark / Responsiveness | |
| Lenovo LOQ 16IRH8 | |
| Lenovo Legion Pro 5 16ARX8 (R5 7645HX, RTX 4050) | |
| Lenovo LOQ 15IRH8 Core i7 | |
| Average Intel Core i7-13620H, NVIDIA GeForce RTX 4050 Laptop GPU (n=1) | |
| MSI Katana 17 B13VFK | |
| Average of class Gaming (1226 - 2334, n=94, last 2 years) | |
| Dell G15 5530 | |
| Asus TUF Gaming A16 FA617XS | |
| Lenovo LOQ 15APH8 | |
| AIDA64 / Memory Copy | |
| Average of class Gaming (21750 - 129946, n=105, last 2 years) | |
| HP Victus 16-r0077ng | |
| Asus TUF Gaming A16 FA617XS | |
| Dell G15 5530 | |
| Lenovo LOQ 15IRH8 Core i7 | |
| Average Intel Core i7-13620H, NVIDIA GeForce RTX 4050 Laptop GPU (n=1) | |
| Lenovo LOQ 16IRH8 | |
| MSI Katana 17 B13VFK | |
| Lenovo Legion Pro 5 16ARX8 (R5 7645HX, RTX 4050) | |
| Lenovo LOQ 15APH8 | |
| AIDA64 / Memory Read | |
| Average of class Gaming (22956 - 118858, n=105, last 2 years) | |
| HP Victus 16-r0077ng | |
| Dell G15 5530 | |
| Lenovo LOQ 16IRH8 | |
| Lenovo LOQ 15IRH8 Core i7 | |
| Average Intel Core i7-13620H, NVIDIA GeForce RTX 4050 Laptop GPU (n=1) | |
| MSI Katana 17 B13VFK | |
| Asus TUF Gaming A16 FA617XS | |
| Lenovo Legion Pro 5 16ARX8 (R5 7645HX, RTX 4050) | |
| Lenovo LOQ 15APH8 | |
| AIDA64 / Memory Write | |
| Average of class Gaming (22297 - 135096, n=105, last 2 years) | |
| Asus TUF Gaming A16 FA617XS | |
| HP Victus 16-r0077ng | |
| Dell G15 5530 | |
| Lenovo LOQ 15IRH8 Core i7 | |
| Average Intel Core i7-13620H, NVIDIA GeForce RTX 4050 Laptop GPU (n=1) | |
| Lenovo LOQ 16IRH8 | |
| Lenovo Legion Pro 5 16ARX8 (R5 7645HX, RTX 4050) | |
| MSI Katana 17 B13VFK | |
| Lenovo LOQ 15APH8 | |
| AIDA64 / Memory Latency | |
| Lenovo LOQ 15IRH8 Core i7 | |
| Average Intel Core i7-13620H, NVIDIA GeForce RTX 4050 Laptop GPU (n=1) | |
| Lenovo LOQ 16IRH8 | |
| Average of class Gaming (75.3 - 259, n=105, last 2 years) | |
| MSI Katana 17 B13VFK | |
| Lenovo LOQ 15APH8 | |
| HP Victus 16-r0077ng | |
| Dell G15 5530 | |
| Asus TUF Gaming A16 FA617XS | |
| Lenovo Legion Pro 5 16ARX8 (R5 7645HX, RTX 4050) | |
* ... smaller is better
| PCMark 8 Home Score Accelerated v2 | 5795 points | |
| PCMark 8 Work Score Accelerated v2 | 6177 points | |
| PCMark 10 Score | 7656 points | |
Help | ||
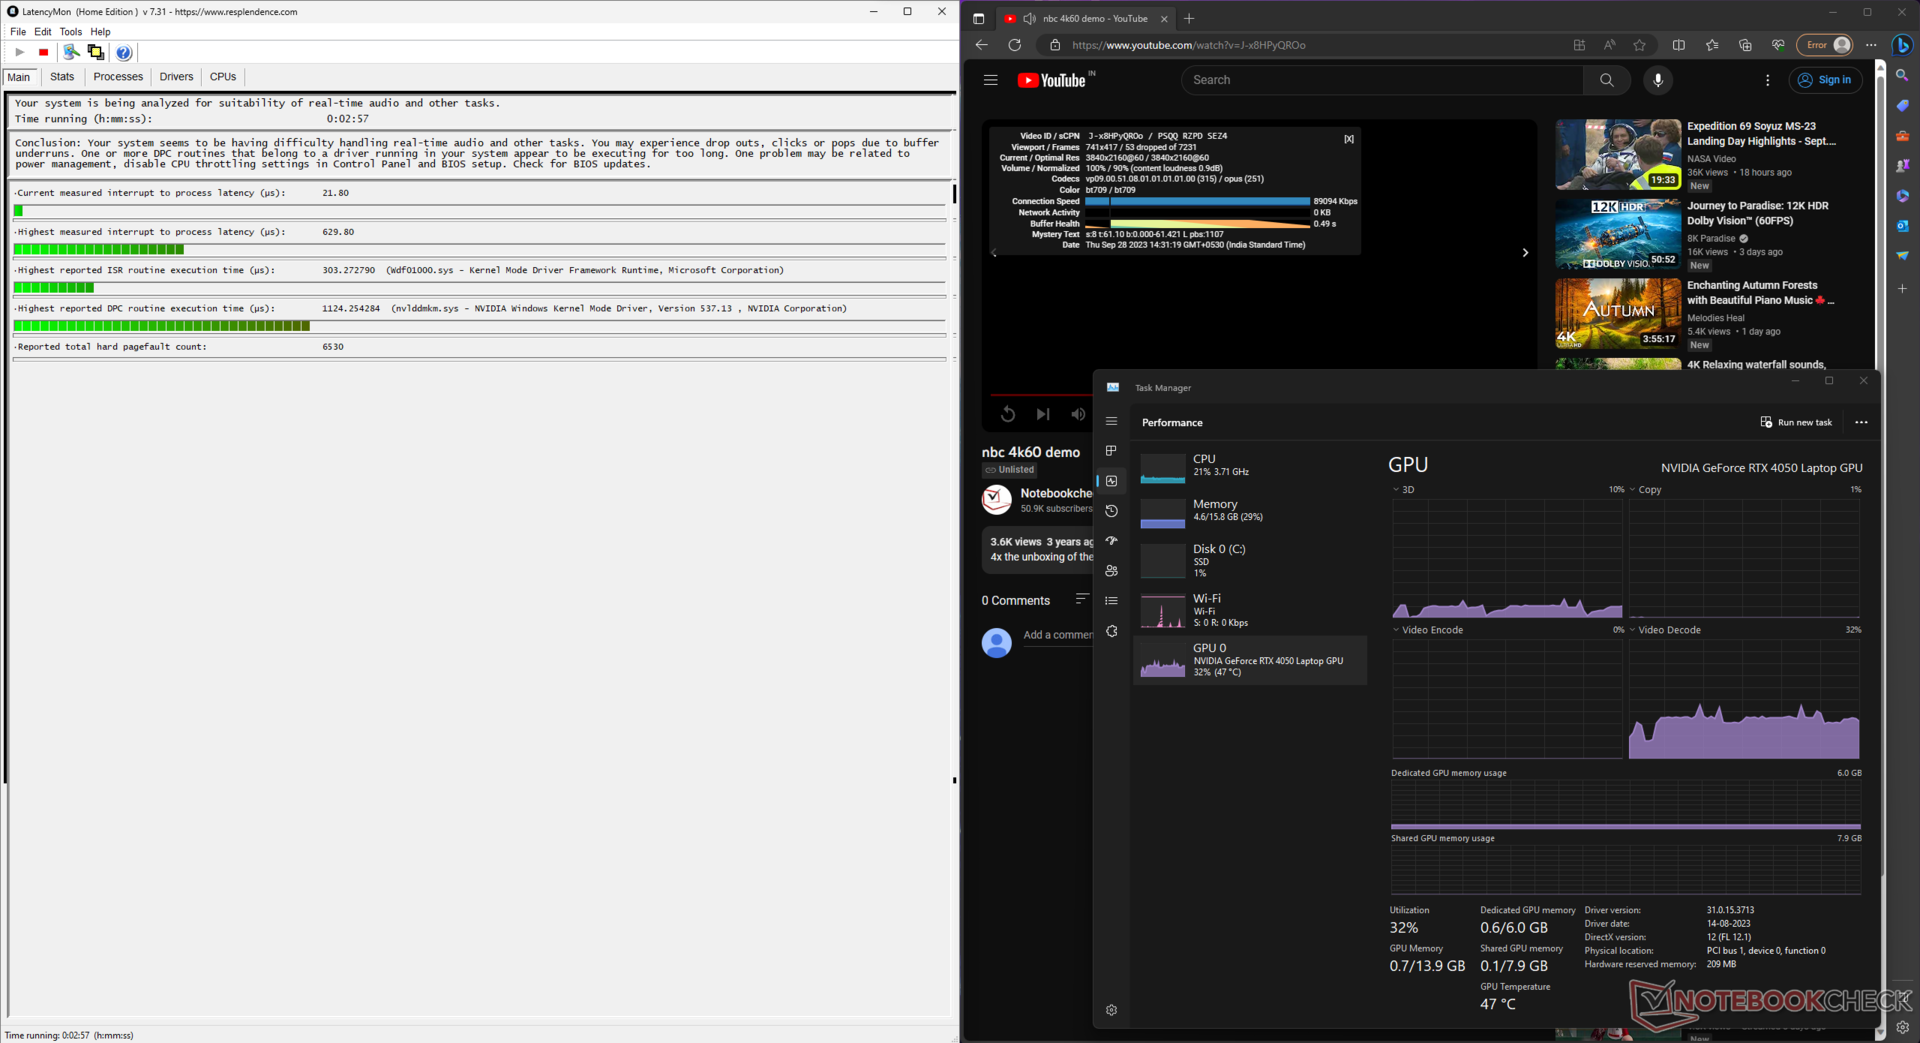
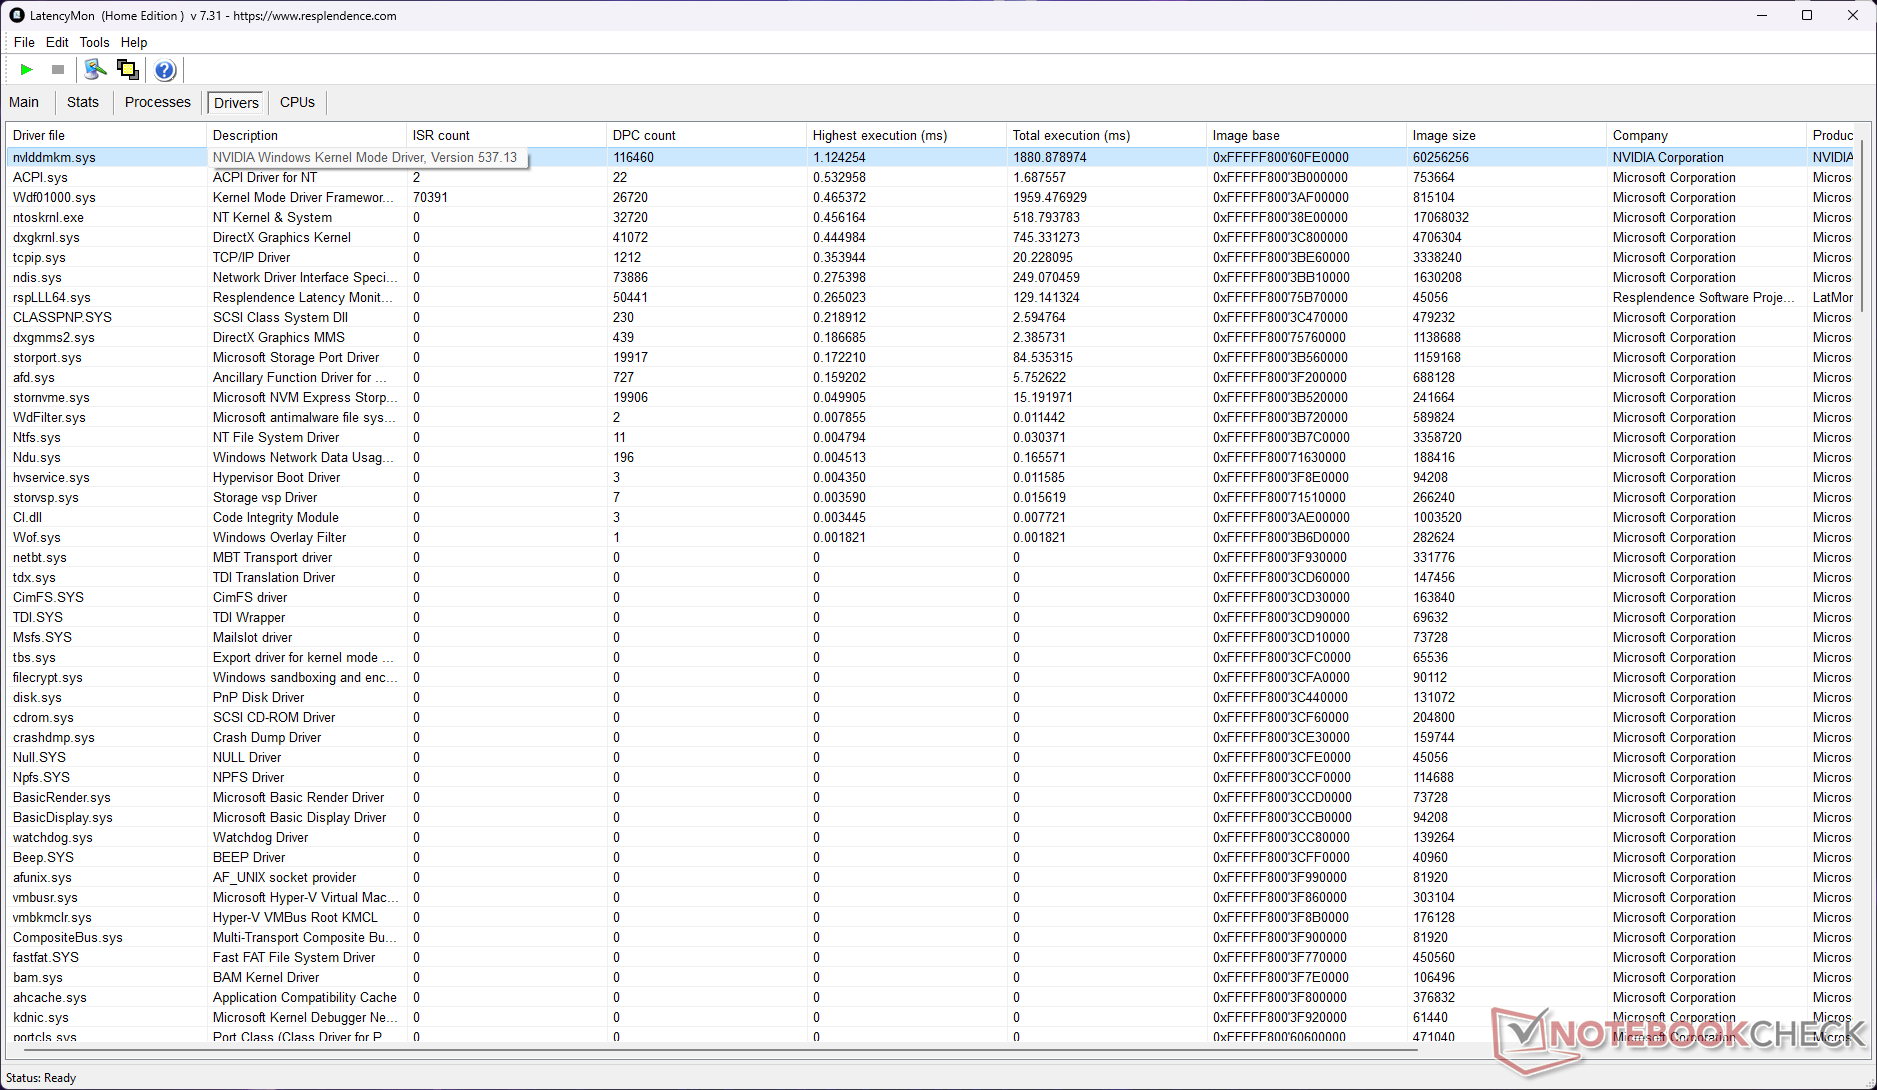
DPC 延迟
DPC 延迟稍高,但 LOQ 15 酷睿 i7 在测试中的表现要比同类产品好很多。
| DPC Latencies / LatencyMon - interrupt to process latency (max), Web, Youtube, Prime95 | |
| Dell G15 5530 | |
| MSI Katana 17 B13VFK | |
| HP Victus 16-r0077ng | |
| Lenovo LOQ 15APH8 | |
| Lenovo LOQ 16IRH8 | |
| Asus TUF Gaming A16 FA617XS | |
| Lenovo Legion Pro 5 16ARX8 (R5 7645HX, RTX 4050) | |
| Lenovo LOQ 15IRH8 Core i7 | |
* ... smaller is better
我们的 DPC 延迟排名页面提供了经评测设备的测量延迟概览。
存储设备
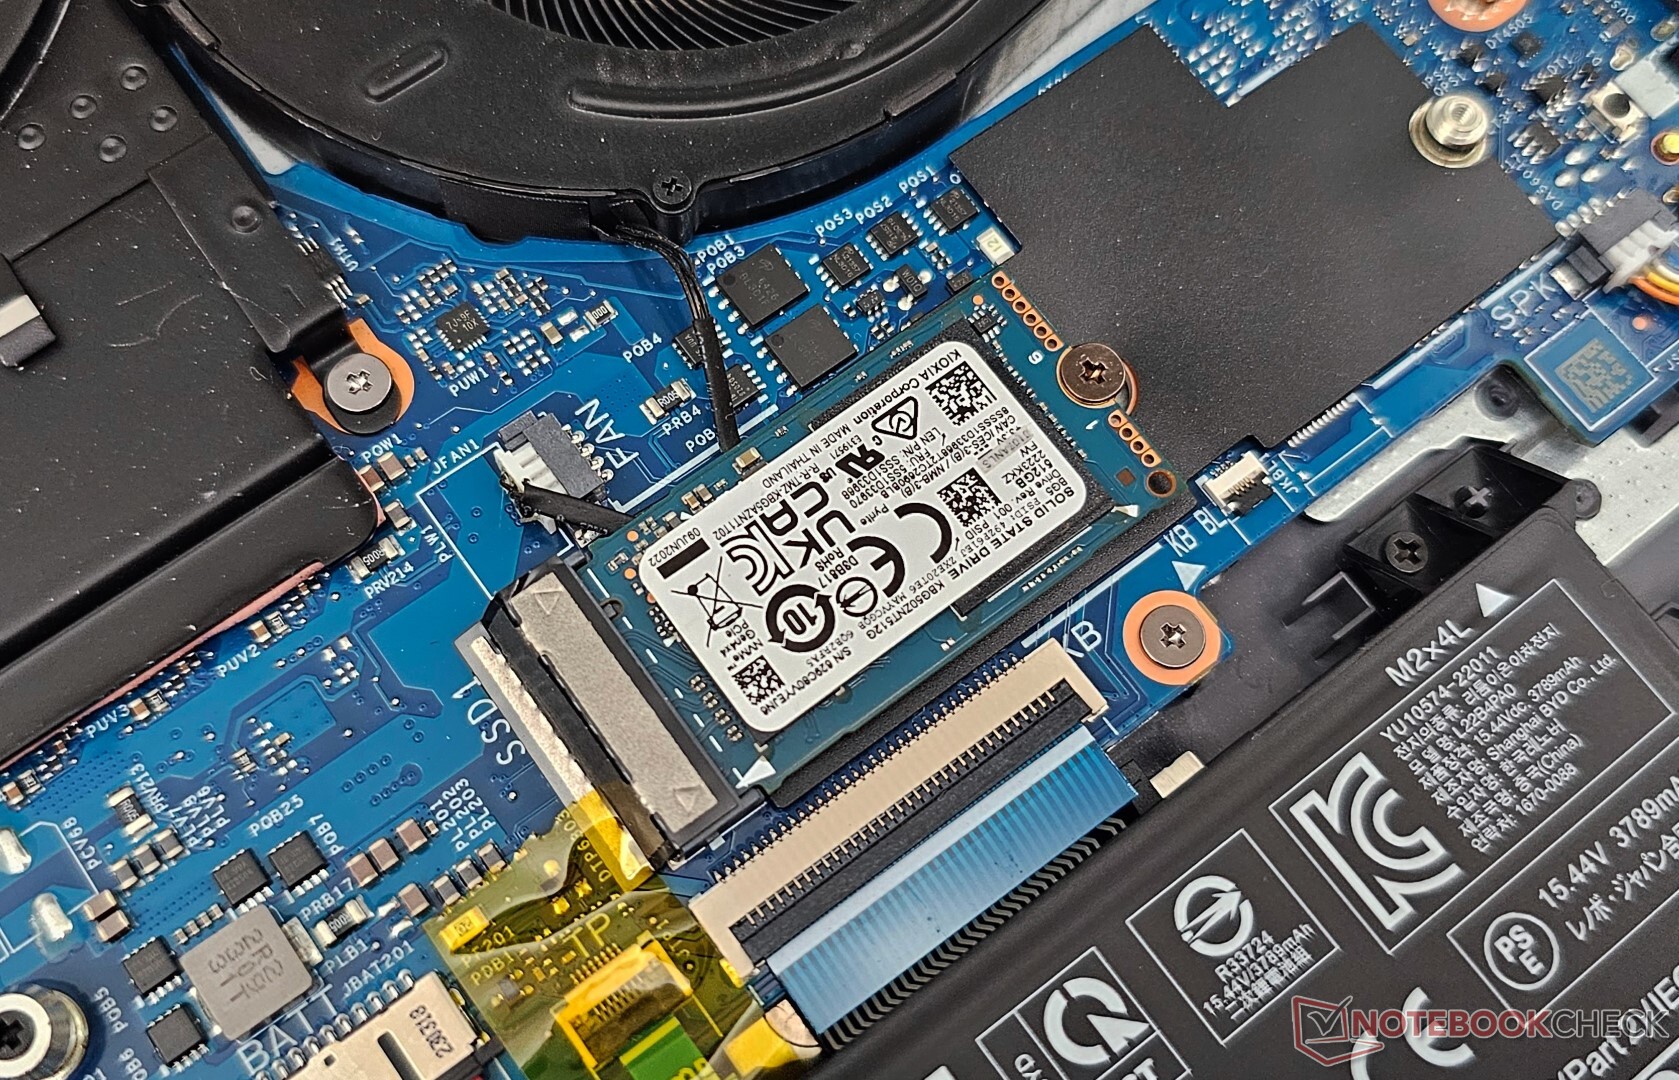
我们的 LOQ 15IRH8 配备了 Kioxia 512 GB M.2 2230 PCIe Gen4 NVMe SSD。如果需要,你可以用更大容量的 M.2280 硬盘来替换它。此外,还有一个空闲的 M.2 2280 插槽可用于存储扩展。
硬盘的整体性能落后于 Kioxia 1 TB 硬盘。 惠普 Victus 16.在队列深度为 8 的 DiskSpd 读取循环测试中,我们在第 25 次运行后发现性能下降,因此该固态硬盘在保持稳定的读取速度方面也很吃力。

* ... smaller is better
Disk Throttling: DiskSpd Read Loop, Queue Depth 8
更多信息和性能比较,请参阅我们的 硬盘和固态硬盘基准页面。
图形处理器性能
LOQ 15IRH8 中的 RTX 4050 笔记本电脑 GPU 额定 TGP 为 95 W,但它在压力下有利用更多功率的余地。我们看到,LOQ 15APH8 中的相同 GPU 在 3DMark 测试中的累计速度要快 6%。
有趣的是,这款 95 W RTX 4050 只比联想 Pro 5 中的 140 W 型号稍逊一筹。 联想Legion Pro 5.不过,后者在 Blender CUDA 基准测试中弥补了这一不足。
| 3DMark 11 Performance | 27474 points | |
| 3DMark Ice Storm Standard Score | 229274 points | |
| 3DMark Cloud Gate Standard Score | 49040 points | |
| 3DMark Fire Strike Score | 19230 points | |
| 3DMark Fire Strike Extreme Score | 9873 points | |
| 3DMark Time Spy Score | 8701 points | |
Help | ||
| Blender / v3.3 Classroom OPTIX/RTX | |
| Average NVIDIA GeForce RTX 4050 Laptop GPU (25 - 37, n=40) | |
| Lenovo Legion Pro 5 16ARX8 (R5 7645HX, RTX 4050) | |
| Lenovo LOQ 15IRH8 Core i7 | |
| MSI Katana 17 B13VFK | |
| Lenovo LOQ 15APH8 | |
| HP Victus 16-r0077ng | |
| Lenovo LOQ 16IRH8 | |
| Dell G15 5530 | |
| Average of class Gaming (9 - 32, n=106, last 2 years) | |
| Blender / v3.3 Classroom CUDA | |
| Average NVIDIA GeForce RTX 4050 Laptop GPU (47 - 68, n=39) | |
| Lenovo LOQ 15IRH8 Core i7 | |
| Lenovo LOQ 15APH8 | |
| Lenovo Legion Pro 5 16ARX8 (R5 7645HX, RTX 4050) | |
| MSI Katana 17 B13VFK | |
| Lenovo LOQ 16IRH8 | |
| Dell G15 5530 | |
| HP Victus 16-r0077ng | |
| Average of class Gaming (15 - 228, n=106, last 2 years) | |
| Blender / v3.3 Classroom CPU | |
| Lenovo LOQ 15IRH8 Core i7 | |
| Average NVIDIA GeForce RTX 4050 Laptop GPU (243 - 907, n=40) | |
| Lenovo LOQ 16IRH8 | |
| HP Victus 16-r0077ng | |
| Lenovo Legion Pro 5 16ARX8 (R5 7645HX, RTX 4050) | |
| MSI Katana 17 B13VFK | |
| Asus TUF Gaming A16 FA617XS | |
| Lenovo LOQ 15APH8 | |
| Dell G15 5530 | |
| Average of class Gaming (122 - 565, n=102, last 2 years) | |
* ... smaller is better
游戏性能
在游戏基准测试中也可以看到类似的趋势。LOQ 15 的 95 瓦 RTX 4050 和Legion Pro 5 的 140 瓦 RTX 4050 在累积 1080p Ultra 游戏测试中的表现几乎相同,但后者的高瓦数使其在 QHD Ultra 中明显领先。
LOQ 15IRH8 本质上是一款 1080p 超高清游戏机。在 QHD Ultra 下,一些较老的游戏也能达到可玩的帧率。如果玩家希望在 QHD 或 4K 下获得更高的帧数,则不可避免地要使用 AMD FSR、Nvidia DLSS 或 Intel XeSS 等升频技术,具体取决于游戏的内容。
| The Witcher 3 - 1920x1080 Ultra Graphics & Postprocessing (HBAO+) | |
| Average of class Gaming (104.7 - 240, n=7, last 2 years) | |
| HP Victus 16-r0077ng | |
| MSI Katana 17 B13VFK | |
| Dell G15 5530 | |
| Lenovo LOQ 16IRH8 | |
| Asus TUF Gaming A16 FA617XS | |
| Lenovo Legion Pro 5 16ARX8 (R5 7645HX, RTX 4050) | |
| Lenovo LOQ 15IRH8 Core i7 | |
| Lenovo LOQ 15APH8 | |
| The Witcher 3 - 2560x1440 Ultra Graphics & Postprocessing (HBAO+) | |
| Average of class Gaming (130 - 199.1, n=5, last 2 years) | |
| Lenovo LOQ 16IRH8 | |
| Lenovo LOQ 15IRH8 Core i7 | |
| Average NVIDIA GeForce RTX 4050 Laptop GPU (39 - 61.3, n=8) | |
| Cyberpunk 2077 1.6 | |
| 1920x1080 Ultra Preset | |
| Dell G15 5530 | |
| MSI Katana 17 B13VFK | |
| Lenovo LOQ 15APH8 | |
| Lenovo LOQ 15IRH8 Core i7 | |
| Average NVIDIA GeForce RTX 4050 Laptop GPU (44.4 - 79.4, n=14) | |
| 2560x1440 Ultra Preset | |
| MSI Katana 17 B13VFK | |
| Lenovo LOQ 15IRH8 Core i7 | |
| Average NVIDIA GeForce RTX 4050 Laptop GPU (27.2 - 43.1, n=10) | |
| 1920x1080 Ray Tracing Ultra Preset (DLSS off) | |
| Dell G15 5530 | |
| Average NVIDIA GeForce RTX 4050 Laptop GPU (15.8 - 65.6, n=5) | |
| MSI Katana 17 B13VFK | |
| Lenovo LOQ 15IRH8 Core i7 | |
| F1 22 | |
| 1920x1080 Ultra High Preset AA:T AF:16x | |
| Average of class Gaming (40.1 - 121.2, n=4, last 2 years) | |
| Dell G15 5530 | |
| MSI Katana 17 B13VFK | |
| Lenovo LOQ 15IRH8 Core i7 | |
| Asus TUF Gaming A16 FA617XS | |
| Average NVIDIA GeForce RTX 4050 Laptop GPU (10.9 - 56.4, n=24) | |
| 2560x1440 Ultra High Preset AA:T AF:16x | |
| Average of class Gaming (42 - 77.8, n=3, last 2 years) | |
| MSI Katana 17 B13VFK | |
| Lenovo LOQ 15IRH8 Core i7 | |
| Average NVIDIA GeForce RTX 4050 Laptop GPU (6.58 - 34, n=14) | |
| F1 23 | |
| 1920x1080 Ultra High Preset AA:T AF:16x | |
| Lenovo Legion Pro 5 16ARX8 (R5 7645HX, RTX 4050) | |
| Lenovo LOQ 15IRH8 Core i7 | |
| Average NVIDIA GeForce RTX 4050 Laptop GPU (25.7 - 60.8, n=14) | |
| 2560x1440 Ultra High Preset AA:T AF:16x | |
| Lenovo Legion Pro 5 16ARX8 (R5 7645HX, RTX 4050) | |
| Lenovo LOQ 15IRH8 Core i7 | |
| Average NVIDIA GeForce RTX 4050 Laptop GPU (16.7 - 40.8, n=11) | |
Witcher 3 FPS 图表
虽然 LOQ 15 的 CPU 持续性能(或缺乏持续性能)令人瞠目结舌,但这款笔记本电脑的散热似乎足以满足 RTX 4050 Laptop GPU 的需求,这一点从TheWitcher 3 1080p Ultra 下相对稳定的帧数中可以看出。
| low | med. | high | ultra | QHD | |
|---|---|---|---|---|---|
| GTA V (2015) | 185.9 | 179.7 | 168.9 | 93.2 | 66 |
| The Witcher 3 (2015) | 390 | 286 | 167.6 | 85.6 | 61.3 |
| Dota 2 Reborn (2015) | 196.3 | 178.3 | 171.1 | 162.2 | |
| Final Fantasy XV Benchmark (2018) | 192.9 | 121.2 | 84 | 60.9 | |
| X-Plane 11.11 (2018) | 159.9 | 139.8 | 110.2 | ||
| Far Cry 5 (2018) | 156 | 135 | 128 | 121 | 83 |
| Strange Brigade (2018) | 475 | 211 | 171.8 | 149.2 | 95.5 |
| Cyberpunk 2077 1.6 (2022) | 103.3 | 85.5 | 72.9 | 67.8 | 41 |
| F1 22 (2022) | 233 | 224 | 172.3 | 55 | 33.9 |
| F1 23 (2023) | 228 | 222 | 158.4 | 44.1 | 34.1 |
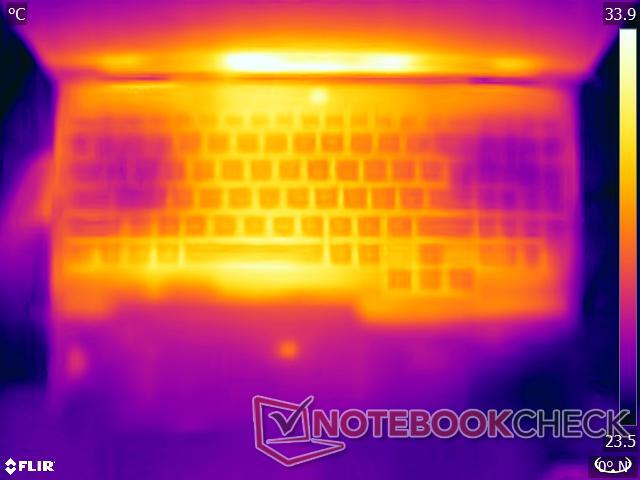
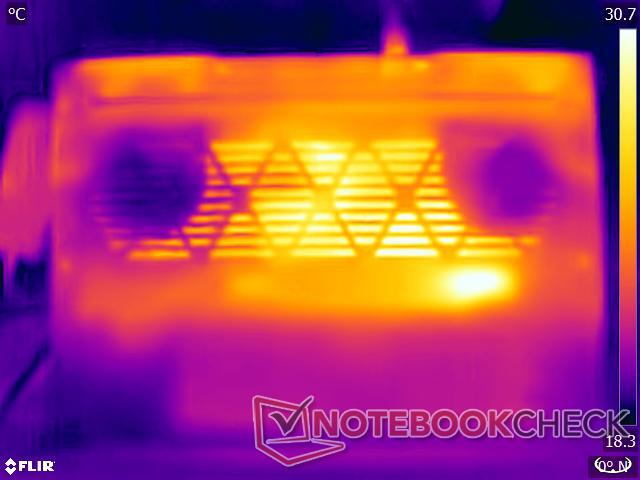
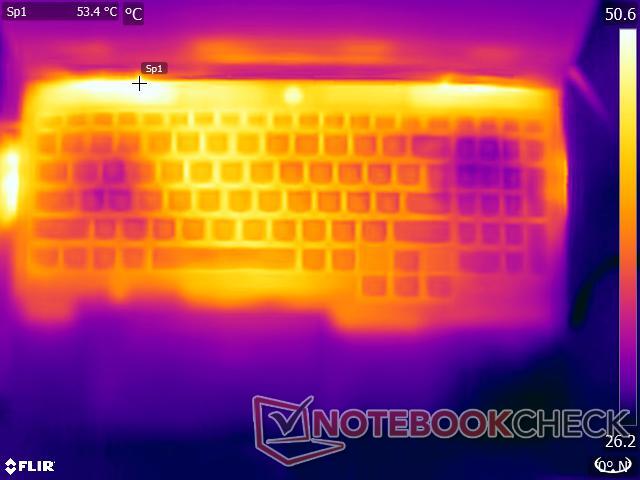
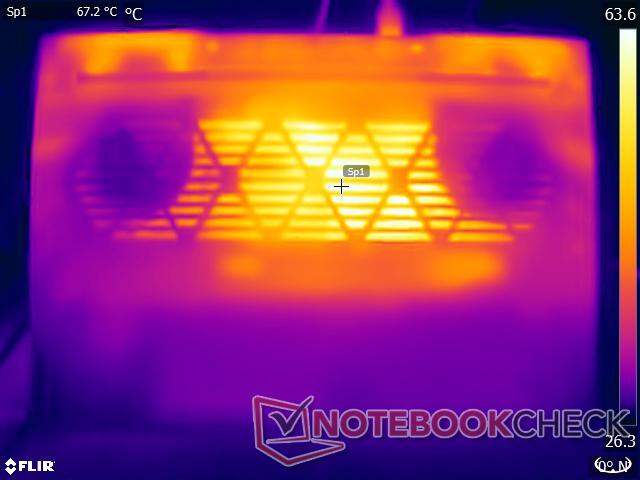
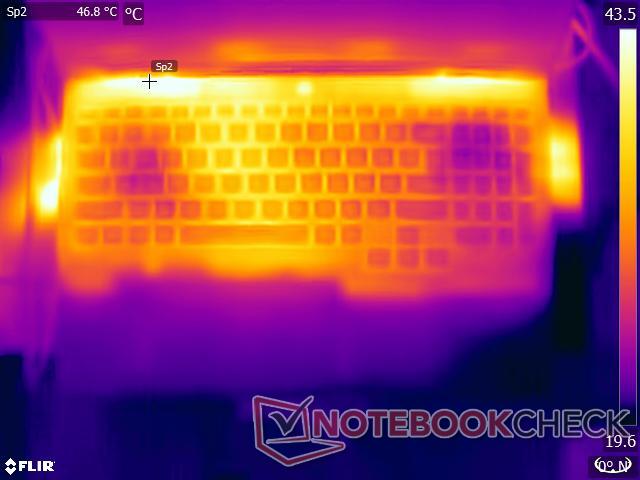
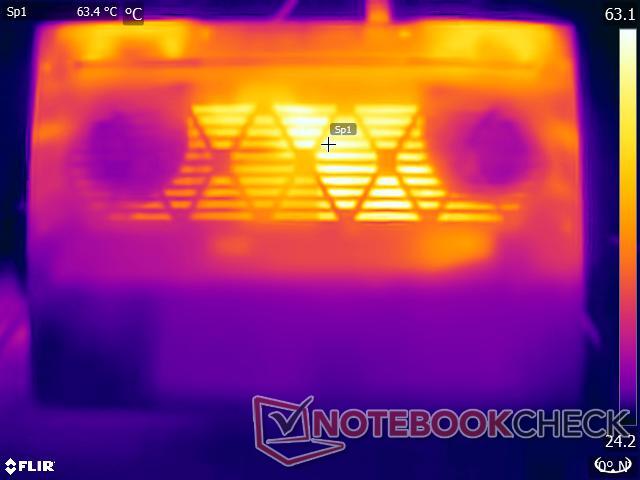
排放物:负载时表面温度过高
系统噪音
LOQ 15IRH8 在空闲时的风扇噪音与我们在 LOQ 15 AMD 机型上看到的噪音基本相似,但后者的风扇噪音在满载情况下要大 7%左右。 从下表中可以看出,联想根据所选的电源配置文件,将风扇噪音水平限制在了一定的阈值之下。
在负载情况下,"性能 "模式的噪音仅低于 50 分贝(A)。虽然 "静音 "模式会对 CPU 性能造成很大影响,但与 "性能 "模式相比,游戏还是比较适合的。
Noise level
| Idle |
| 29.03 / 29.03 / 29.03 dB(A) |
| Load |
| 48.7 / 48.7 dB(A) |
 | ||
30 dB silent 40 dB(A) audible 50 dB(A) loud |
||
min: | ||
| 性能模式 | 怠速 dB(A) | 负载平均 dB(A) | 负载最大 dB(A) | Witcher 3 1080p Ultra dB(A) |
|---|---|---|---|---|
| 安静 | 25.28 | 33.09 | 36.07 | 36.69 / 78 fps |
| 平衡 | 25.28 | 40.40 | 45.15 | 45.42 / 83 帧/秒 |
| 性能 | 29.03 | 48.72 | 48.71 | 48.52 / 85 帧/秒 |
| Lenovo LOQ 15IRH8 Core i7 i7-13620H, GeForce RTX 4050 Laptop GPU | Lenovo LOQ 16IRH8 i7-13620H, GeForce RTX 4060 Laptop GPU | Lenovo LOQ 15APH8 R7 7840HS, GeForce RTX 4050 Laptop GPU | MSI Katana 17 B13VFK i7-13620H, GeForce RTX 4060 Laptop GPU | Lenovo Legion Pro 5 16ARX8 (R5 7645HX, RTX 4050) R5 7645HX, GeForce RTX 4050 Laptop GPU | HP Victus 16-r0077ng i7-13700H, GeForce RTX 4070 Laptop GPU | Dell G15 5530 i7-13650HX, GeForce RTX 4060 Laptop GPU | Asus TUF Gaming A16 FA617XS R9 7940HS, Radeon RX 7600S | |
|---|---|---|---|---|---|---|---|---|
| Noise | 3% | 9% | -6% | 14% | 2% | 12% | 3% | |
| off / environment * (dB) | 23.69 | 23 3% | 23.1 2% | 24.5 -3% | 23 3% | 25 -6% | 20.41 14% | 25 -6% |
| Idle Minimum * (dB) | 29.03 | 23 21% | 23.1 20% | 24.5 16% | 23 21% | 28 4% | 26.85 8% | 25 14% |
| Idle Average * (dB) | 29.03 | 23 21% | 23.1 20% | 24.5 16% | 23 21% | 29 -0% | 26.85 8% | 26 10% |
| Idle Maximum * (dB) | 29.03 | 27.66 5% | 25.2 13% | 40 -38% | 24.42 16% | 30 -3% | 26.85 8% | 28 4% |
| Load Average * (dB) | 48.7 | 53.62 -10% | 44.3 9% | 48.3 1% | 34.94 28% | 43 12% | 27.65 43% | 43 12% |
| Witcher 3 ultra * (dB) | 48.5 | 53.5 -10% | 45.8 6% | 56 -15% | 43.79 10% | 46 5% | 47.9 1% | 51 -5% |
| Load Maximum * (dB) | 48.7 | 53.5 -10% | 52 -7% | 59.1 -21% | 50 -3% | 48 1% | 47.86 2% | 53 -9% |
* ... smaller is better
温度
在性能配置文件中进行压力测试时,表面温度会变得相当高,尤其是机箱底部。虽然我们的压力测试是在极端情况下进行的,但我们不建议将该设备放在腿上使用,除非是轻度使用。
(-) The maximum temperature on the upper side is 46.4 °C / 116 F, compared to the average of 40.4 °C / 105 F, ranging from 21.2 to 68.8 °C for the class Gaming.
(-) The bottom heats up to a maximum of 59.2 °C / 139 F, compared to the average of 43.2 °C / 110 F
(±) In idle usage, the average temperature for the upper side is 32.7 °C / 91 F, compared to the device average of 33.9 °C / 93 F.
(-) Playing The Witcher 3, the average temperature for the upper side is 39.4 °C / 103 F, compared to the device average of 33.9 °C / 93 F.
(+) The palmrests and touchpad are reaching skin temperature as a maximum (34 °C / 93.2 F) and are therefore not hot.
(-) The average temperature of the palmrest area of similar devices was 28.8 °C / 83.8 F (-5.2 °C / -9.4 F).
| Lenovo LOQ 15IRH8 Core i7 Intel Core i7-13620H, NVIDIA GeForce RTX 4050 Laptop GPU | Lenovo LOQ 16IRH8 Intel Core i7-13620H, NVIDIA GeForce RTX 4060 Laptop GPU | Lenovo LOQ 15APH8 AMD Ryzen 7 7840HS, NVIDIA GeForce RTX 4050 Laptop GPU | MSI Katana 17 B13VFK Intel Core i7-13620H, NVIDIA GeForce RTX 4060 Laptop GPU | Lenovo Legion Pro 5 16ARX8 (R5 7645HX, RTX 4050) AMD Ryzen 5 7645HX, NVIDIA GeForce RTX 4050 Laptop GPU | HP Victus 16-r0077ng Intel Core i7-13700H, NVIDIA GeForce RTX 4070 Laptop GPU | Dell G15 5530 Intel Core i7-13650HX, NVIDIA GeForce RTX 4060 Laptop GPU | Asus TUF Gaming A16 FA617XS AMD Ryzen 9 7940HS, AMD Radeon RX 7600S | |
|---|---|---|---|---|---|---|---|---|
| Heat | 10% | 13% | 11% | 1% | 3% | -3% | 9% | |
| Maximum Upper Side * (°C) | 46.4 | 48 -3% | 44.4 4% | 41.6 10% | 45 3% | 51 -10% | 54 -16% | 53 -14% |
| Maximum Bottom * (°C) | 59.2 | 59 -0% | 52 12% | 43.1 27% | 54 9% | 54 9% | 62.2 -5% | 48 19% |
| Idle Upper Side * (°C) | 34.4 | 28 19% | 28 19% | 32 7% | 36 -5% | 37 -8% | 33.4 3% | 30 13% |
| Idle Bottom * (°C) | 36.2 | 28 23% | 29.6 18% | 35.8 1% | 38 -5% | 29 20% | 33.4 8% | 30 17% |
* ... smaller is better
压力测试
与我们之前在 Cinebench R15 多核循环测试中看到的情况不同,在使用 Prime95 就地大型 FFT 对 LOQ 15 进行压力测试时,酷睿 i7-13620H 的最大时钟频率为 4.27 GHz,功耗最终达到 133 W。
Prime95 和 FurMark 的综合压力测试表明,RTX 4050 的最大时钟频率为 2,565 MHz,功耗高达 117 W。由于酷睿 i7-13620H 必须与 RTX 4050 共享散热和功耗空间,因此其峰值提升必须达到 3.6 GHz。
| 压力测试 | CPU 时钟 (GHz) | GPU 时钟 (MHz) | CPU 平均温度 (°C) | GPU 平均温度(°C) |
| 系统空闲 | 4.3 | 210 | 37 | 38.4 |
| Prime95 | 4.8 | 210 | 75 | 54.2 |
| Prime95 + FurMark | 3.2 | 2,220 | 77 | 79.7 |
| Witcher 3 1080p Ultra | 4.8 | 2,535 | 76 | 80.5 |
在 Witcher 3 1080p Ultra 压力测试中,RTX 4050 能够达到相同的 2,565 MHz 时钟,但最大 TGP 却低得多,仅为 103 W。这为酷 睿i7-13620H 提供了一些喘息空间,使其能够利用高达 42 W 的功耗,实现 4.26 GHz 的最大提升。
发言人
LOQ 15IRH8 的扬声器音量适中。低音不是很深,但中高音重现得很充分。用户可以通过有线扬声器或蓝牙 5.2 获得更好的音频输出。
Lenovo LOQ 15IRH8 Core i7 audio analysis
(±) | speaker loudness is average but good (75.9 dB)
Bass 100 - 315 Hz
(-) | nearly no bass - on average 18.6% lower than median
(±) | linearity of bass is average (10.2% delta to prev. frequency)
Mids 400 - 2000 Hz
(+) | balanced mids - only 2.2% away from median
(+) | mids are linear (3.1% delta to prev. frequency)
Highs 2 - 16 kHz
(+) | balanced highs - only 2.3% away from median
(+) | highs are linear (4.4% delta to prev. frequency)
Overall 100 - 16.000 Hz
(+) | overall sound is linear (13.7% difference to median)
Compared to same class
» 21% of all tested devices in this class were better, 7% similar, 72% worse
» The best had a delta of 6%, average was 18%, worst was 132%
Compared to all devices tested
» 15% of all tested devices were better, 4% similar, 81% worse
» The best had a delta of 4%, average was 23%, worst was 134%
Apple MacBook Pro 16 2021 M1 Pro audio analysis
(+) | speakers can play relatively loud (84.7 dB)
Bass 100 - 315 Hz
(+) | good bass - only 3.8% away from median
(+) | bass is linear (5.2% delta to prev. frequency)
Mids 400 - 2000 Hz
(+) | balanced mids - only 1.3% away from median
(+) | mids are linear (2.1% delta to prev. frequency)
Highs 2 - 16 kHz
(+) | balanced highs - only 1.9% away from median
(+) | highs are linear (2.7% delta to prev. frequency)
Overall 100 - 16.000 Hz
(+) | overall sound is linear (4.6% difference to median)
Compared to same class
» 0% of all tested devices in this class were better, 0% similar, 100% worse
» The best had a delta of 5%, average was 17%, worst was 45%
Compared to all devices tested
» 0% of all tested devices were better, 0% similar, 100% worse
» The best had a delta of 4%, average was 23%, worst was 134%
能源管理:AMD 变体看起来更经济
耗电量
与同类产品相比,Ryzen 7 7840HS驱动的LOQ 15APH8在负载情况下的功耗普遍偏低。 尽管显示屏存在差异,但Ryzen 7 7840HS驱动的LOQ 15APH8在总体功耗上要比英特尔驱动的LOQ 15IRH8节省约18%。
全 AMD 华硕 TUF GAMING A16是最省钱的,但负载功耗也在 LOQ 15IRH8 的可比范围之内。最大负载下的功耗超过了所提供充电器的 170 W 额定功率。
| Off / Standby | |
| Idle | |
| Load |
|
Key:
min: | |
| Lenovo LOQ 15IRH8 Core i7 i7-13620H, GeForce RTX 4050 Laptop GPU, IPS, 2560x1440, 15.6" | Lenovo LOQ 16IRH8 i7-13620H, GeForce RTX 4060 Laptop GPU, IPS, 2560x1600, 16" | Lenovo LOQ 15APH8 R7 7840HS, GeForce RTX 4050 Laptop GPU, IPS, 1920x1080, 15.6" | MSI Katana 17 B13VFK i7-13620H, GeForce RTX 4060 Laptop GPU, IPS LED, 1920x1080, 17.3" | Lenovo Legion Pro 5 16ARX8 (R5 7645HX, RTX 4050) R5 7645HX, GeForce RTX 4050 Laptop GPU, IPS, 2560x1600, 16" | HP Victus 16-r0077ng i7-13700H, GeForce RTX 4070 Laptop GPU, IPS, 1920x1080, 16.1" | Dell G15 5530 i7-13650HX, GeForce RTX 4060 Laptop GPU, IPS, 1920x1080, 15.6" | Asus TUF Gaming A16 FA617XS R9 7940HS, Radeon RX 7600S, IPS, 1920x1200, 16" | Average NVIDIA GeForce RTX 4050 Laptop GPU | Average of class Gaming | |
|---|---|---|---|---|---|---|---|---|---|---|
| Power Consumption | 6% | 18% | 19% | 15% | 20% | 12% | 31% | 25% | 2% | |
| Idle Minimum * (Watt) | 18.52 | 17.2 7% | 15 19% | 12.2 34% | 13 30% | 8 57% | 8.4 55% | 7 62% | 9.95 ? 46% | 13 ? 30% |
| Idle Average * (Watt) | 22.54 | 19.3 14% | 17.7 21% | 14.9 34% | 17.4 23% | 13 42% | 14.98 34% | 10 56% | 15.8 ? 30% | 18.7 ? 17% |
| Idle Maximum * (Watt) | 29.79 | 21.2 29% | 21.5 28% | 15.8 47% | 21.8 27% | 22 26% | 15.56 48% | 15 50% | 20.1 ? 33% | 24.3 ? 18% |
| Load Average * (Watt) | 94.5 | 90 5% | 73.5 22% | 85.22 10% | 96.4 -2% | 86 9% | 96.8 -2% | 86 9% | 88 ? 7% | 110.2 ? -17% |
| Witcher 3 ultra * (Watt) | 154.4 | 168 -9% | 138.6 10% | 151.1 2% | 125 19% | 141.8 8% | 186 -20% | 160.6 -4% | ||
| Load Maximum * (Watt) | 190.4 | 211 -11% | 176.5 7% | 212.8 -12% | 204 -7% | 233 -22% | 271.42 -43% | 172 10% | 176.3 ? 7% | 258 ? -36% |
* ... smaller is better
Power Consumption: The Witcher 3 / Stress test
Power Consumption: External Monitor
电池寿命
电池运行时间与我们在 LOQ 16IRH8 上观察到的情况类似。与LOQ 15IRH8相比,LOQ 15APH8的功耗降低使电池寿命延长了25%。
随附的 170 W 电源适配器支持快速充电(Rapid Charge),可在联想 Vantage 应用程序中启用。这可以让设备在大约 45 分钟内从零充至 100% 电量。
| Lenovo LOQ 15IRH8 Core i7 i7-13620H, GeForce RTX 4050 Laptop GPU, 60 Wh | Lenovo LOQ 16IRH8 i7-13620H, GeForce RTX 4060 Laptop GPU, 80 Wh | Lenovo LOQ 15APH8 R7 7840HS, GeForce RTX 4050 Laptop GPU, 60 Wh | MSI Katana 17 B13VFK i7-13620H, GeForce RTX 4060 Laptop GPU, 53.5 Wh | Lenovo Legion Pro 5 16ARX8 (R5 7645HX, RTX 4050) R5 7645HX, GeForce RTX 4050 Laptop GPU, 80 Wh | HP Victus 16-r0077ng i7-13700H, GeForce RTX 4070 Laptop GPU, 83 Wh | Dell G15 5530 i7-13650HX, GeForce RTX 4060 Laptop GPU, 86 Wh | Asus TUF Gaming A16 FA617XS R9 7940HS, Radeon RX 7600S, 90 Wh | Average of class Gaming | |
|---|---|---|---|---|---|---|---|---|---|
| Battery runtime | 6% | 25% | -51% | -8% | 20% | 11% | 107% | 29% | |
| H.264 (h) | 6.1 | 6.4 5% | 5.4 -11% | 6.8 11% | 12.4 103% | 8.32 ? 36% | |||
| WiFi v1.3 (h) | 5.9 | 6.3 7% | 7.4 25% | 2.9 -51% | 5.6 -5% | 7.1 20% | 6.5 10% | 12.4 110% | 7.11 ? 21% |
| Load (h) | 1.5 | 1.1 | 1 | 0.8 | 0.9 | 1.502 ? | |||
| Reader / Idle (h) | 9.8 | 20.3 | 8.16 ? | ||||||
| Witcher 3 ultra (h) | 0.8 | 0.8 |
Pros
Cons
评语:1080p 超高清游戏,不花一分钱
尽管成本低廉,LOQ 15 Core i7 却配备了 165 Hz QHD G-Sync 显示屏和 1080p 网络摄像头。与全高清 144 Hz 显示屏相比,QHD 面板的色彩和响应时间都有明显改善,尤其令人印象深刻。
可以理解的是,该产品的制造质量受到大量塑料的影响。更令人担忧的是,LOQ 15IRH8 的酷睿 i7-13620H 难以维持其性能,这与我们在基于 AMD Ryzen 7 7840HS 的 LOQ 15APH8甚至 LOQ 16IRH8.
不过,由于采用了英特尔 i7-13620H 处理器和 RTX 4050 显卡,其性能足以流畅地运行 1080p 游戏,其 TGP 可超过额定值。
联想 LOQ 15 酷睿 i7 符合大多数标准,如果您正在寻找一款价格在 1,200 美元或 1,00,00 美元左右的 1080p 游戏笔记本电脑,联想 LOQ 15 酷睿 i7 值得高度考虑。不过,在制造质量和发热量方面,需要降低期望值"。
基于英特尔处理器的 LOQ 15 另一个令人失望的地方是发热量。相反,风扇噪音水平是可控的,即使在较低的功率配置下,也能以 1080p 的速度充分玩游戏。
在英特尔和 AMD 处理器的 LOQ 15 SKU 之间做出选择取决于优先级。英特尔版本在 1080p 下的游戏性能更好,负载下的风扇噪音更低。但 AMD 版本在 CPU 整体性能方面更具优势,运行时温度更低、更省电、电池续航时间更长。
尽管如此,与 Pro 5 16 相比,LOQ 15 的两个变体都具有很高的性价比。 Legion Pro 5 16.笔记本电脑,如 惠普 Victus 16和 微星卡塔纳 17在排行榜上的表现明显要好一些,但与 LOQ 15 相比,它们的价格似乎与硬件配置不相称。
价格和供应情况
LOQ 15 Core i7 的 FHD 144 Hz 版本起价为 97,790 英镑,可直接从Lenovo India 购买。.该网站目前没有列出测试的 QHD 版本。
亚马逊印度网站目前没有大多数 LOQ 15 机型的现货,只有配备酷睿 i7-13700H 和 RTX 4060 的 LOQ 16IRH8 机型有货,售价为 2,25,766 美元。
联想美国公司也有大量英特尔第 13 代 LOQ 15,并有多种 Nvidia GPU 可供选择。百思买(Best Buy)提供了一款搭载酷睿 i5-13420H 和 RTX 3050 显卡的 LOQ 15,售价为 650 美元。美国亚马逊有一款配备 RTX 4050 的机型,售价 1,227 美元。百思买还提供配备 RTX 4050 的 Ryzen 7 7840HS,售价为 1,240 美元。
Lenovo LOQ 15IRH8 Core i7
- 10/13/2023 v7 (old)
Vaidyanathan Subramaniam
Transparency
The selection of devices to be reviewed is made by our editorial team. The test sample was provided to the author as a loan by the manufacturer or retailer for the purpose of this review. The lender had no influence on this review, nor did the manufacturer receive a copy of this review before publication. There was no obligation to publish this review. As an independent media company, Notebookcheck is not subjected to the authority of manufacturers, retailers or publishers.
This is how Notebookcheck is testing
Every year, Notebookcheck independently reviews hundreds of laptops and smartphones using standardized procedures to ensure that all results are comparable. We have continuously developed our test methods for around 20 years and set industry standards in the process. In our test labs, high-quality measuring equipment is utilized by experienced technicians and editors. These tests involve a multi-stage validation process. Our complex rating system is based on hundreds of well-founded measurements and benchmarks, which maintains objectivity. Further information on our test methods can be found here.
Price comparison

