掠夺者 Helios Neo 16 笔记本电脑评测:宏碁创造了游戏奇美拉
从原理上讲,宏碁的中端游戏笔记本电脑 Predator Helios Neo 16 是 Predator Helios 16 的瘦身版。掠夺者 Helios 16(非 Neo)的缩小版。它保留了经典的 Helio 机型的一些功能,这意味着它可以从宏碁的入门级 Nitro 系列中脱颖而出。 入门级的 Nitro 系列。
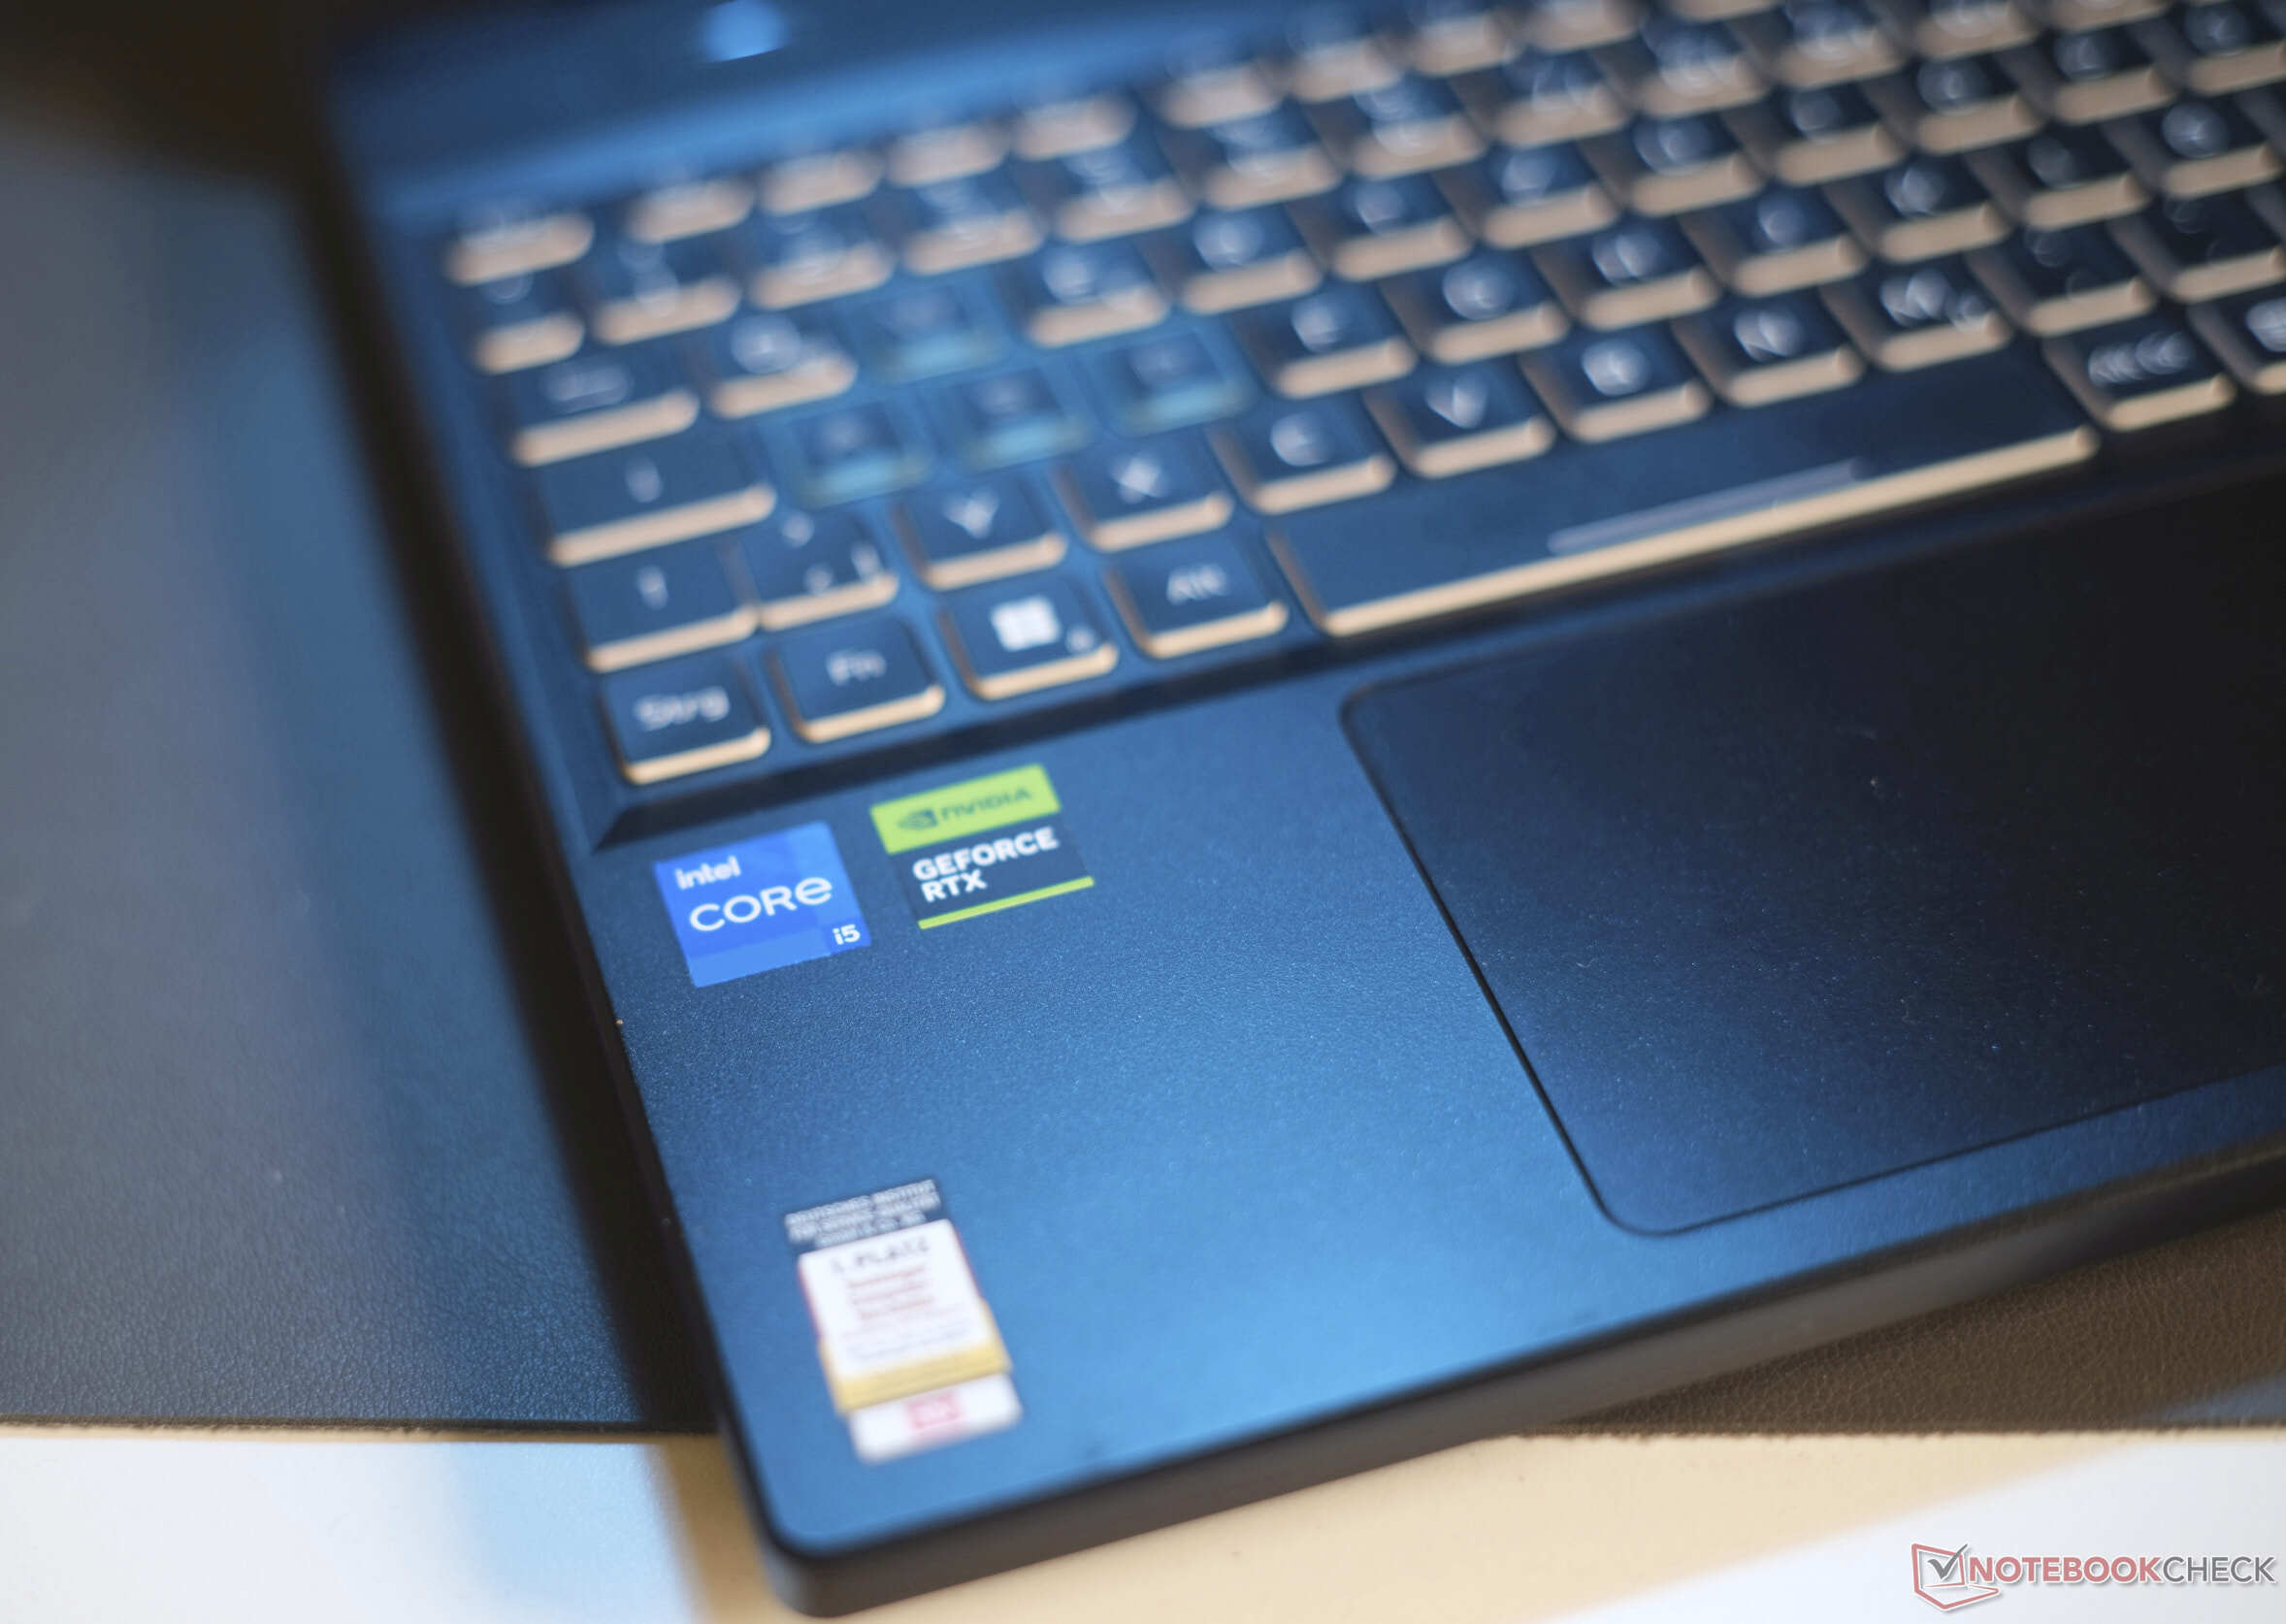
即便如此,它的一些方面仍可被归类为入门级功能,比如它安装的RTX 4050 --售价 1069 美元,这就有点值得商榷了。不过,这款笔记本电脑的英特尔酷睿 i5-13500HX 是一款功能强大的台式机级 CPU,功耗仅为 55 瓦。这一点及其他一些功能通常不会出现在真正的经济型笔记本电脑中。此外,还有配备RTX 4060 或RTX 4070 的型号。
在本次评测过程中,我们将分析这些功能是否足以让这款笔记本物有所值。它的主要竞争对手是联想的Legion Pro 5 ,但其他竞争对手包括惠普Victus 16 、XMGApex 15 和戴尔 G15 。
潜在的竞争对手比较
Rating | Date | Model | Weight | Height | Size | Resolution | Price |
|---|---|---|---|---|---|---|---|
| 86.6 % v7 (old) | 11 / 2023 | Acer Predator Helios Neo 16 NH.QLTEG.002 i5-13500HX, GeForce RTX 4050 Laptop GPU | 2.6 kg | 28.25 mm | 16.00" | 1920x1200 | |
| 89 % v7 (old) | 08 / 2023 | Lenovo Legion Pro 5 16ARX8 (R5 7645HX, RTX 4050) R5 7645HX, GeForce RTX 4050 Laptop GPU | 2.5 kg | 27.3 mm | 16.00" | 2560x1600 | |
| 87.3 % v7 (old) | 09 / 2023 | Lenovo LOQ 16IRH8 i7-13620H, GeForce RTX 4060 Laptop GPU | 2.7 kg | 25.9 mm | 16.00" | 2560x1600 | |
| 86.2 % v7 (old) | 10 / 2023 | Schenker XMG Apex 15 (Late 23) R7 7840HS, GeForce RTX 4050 Laptop GPU | 2.2 kg | 26.7 mm | 15.60" | 2560x1440 | |
| 85.6 % v7 (old) | 09 / 2023 | HP Victus 16-r0076TX i5-13500HX, GeForce RTX 4050 Laptop GPU | 2.3 kg | 22.9 mm | 16.10" | 1920x1080 | |
| 84.2 % v7 (old) | 06 / 2023 | Dell G15 5530 i7-13650HX, GeForce RTX 4060 Laptop GPU | 3 kg | 26.95 mm | 15.60" | 1920x1080 |
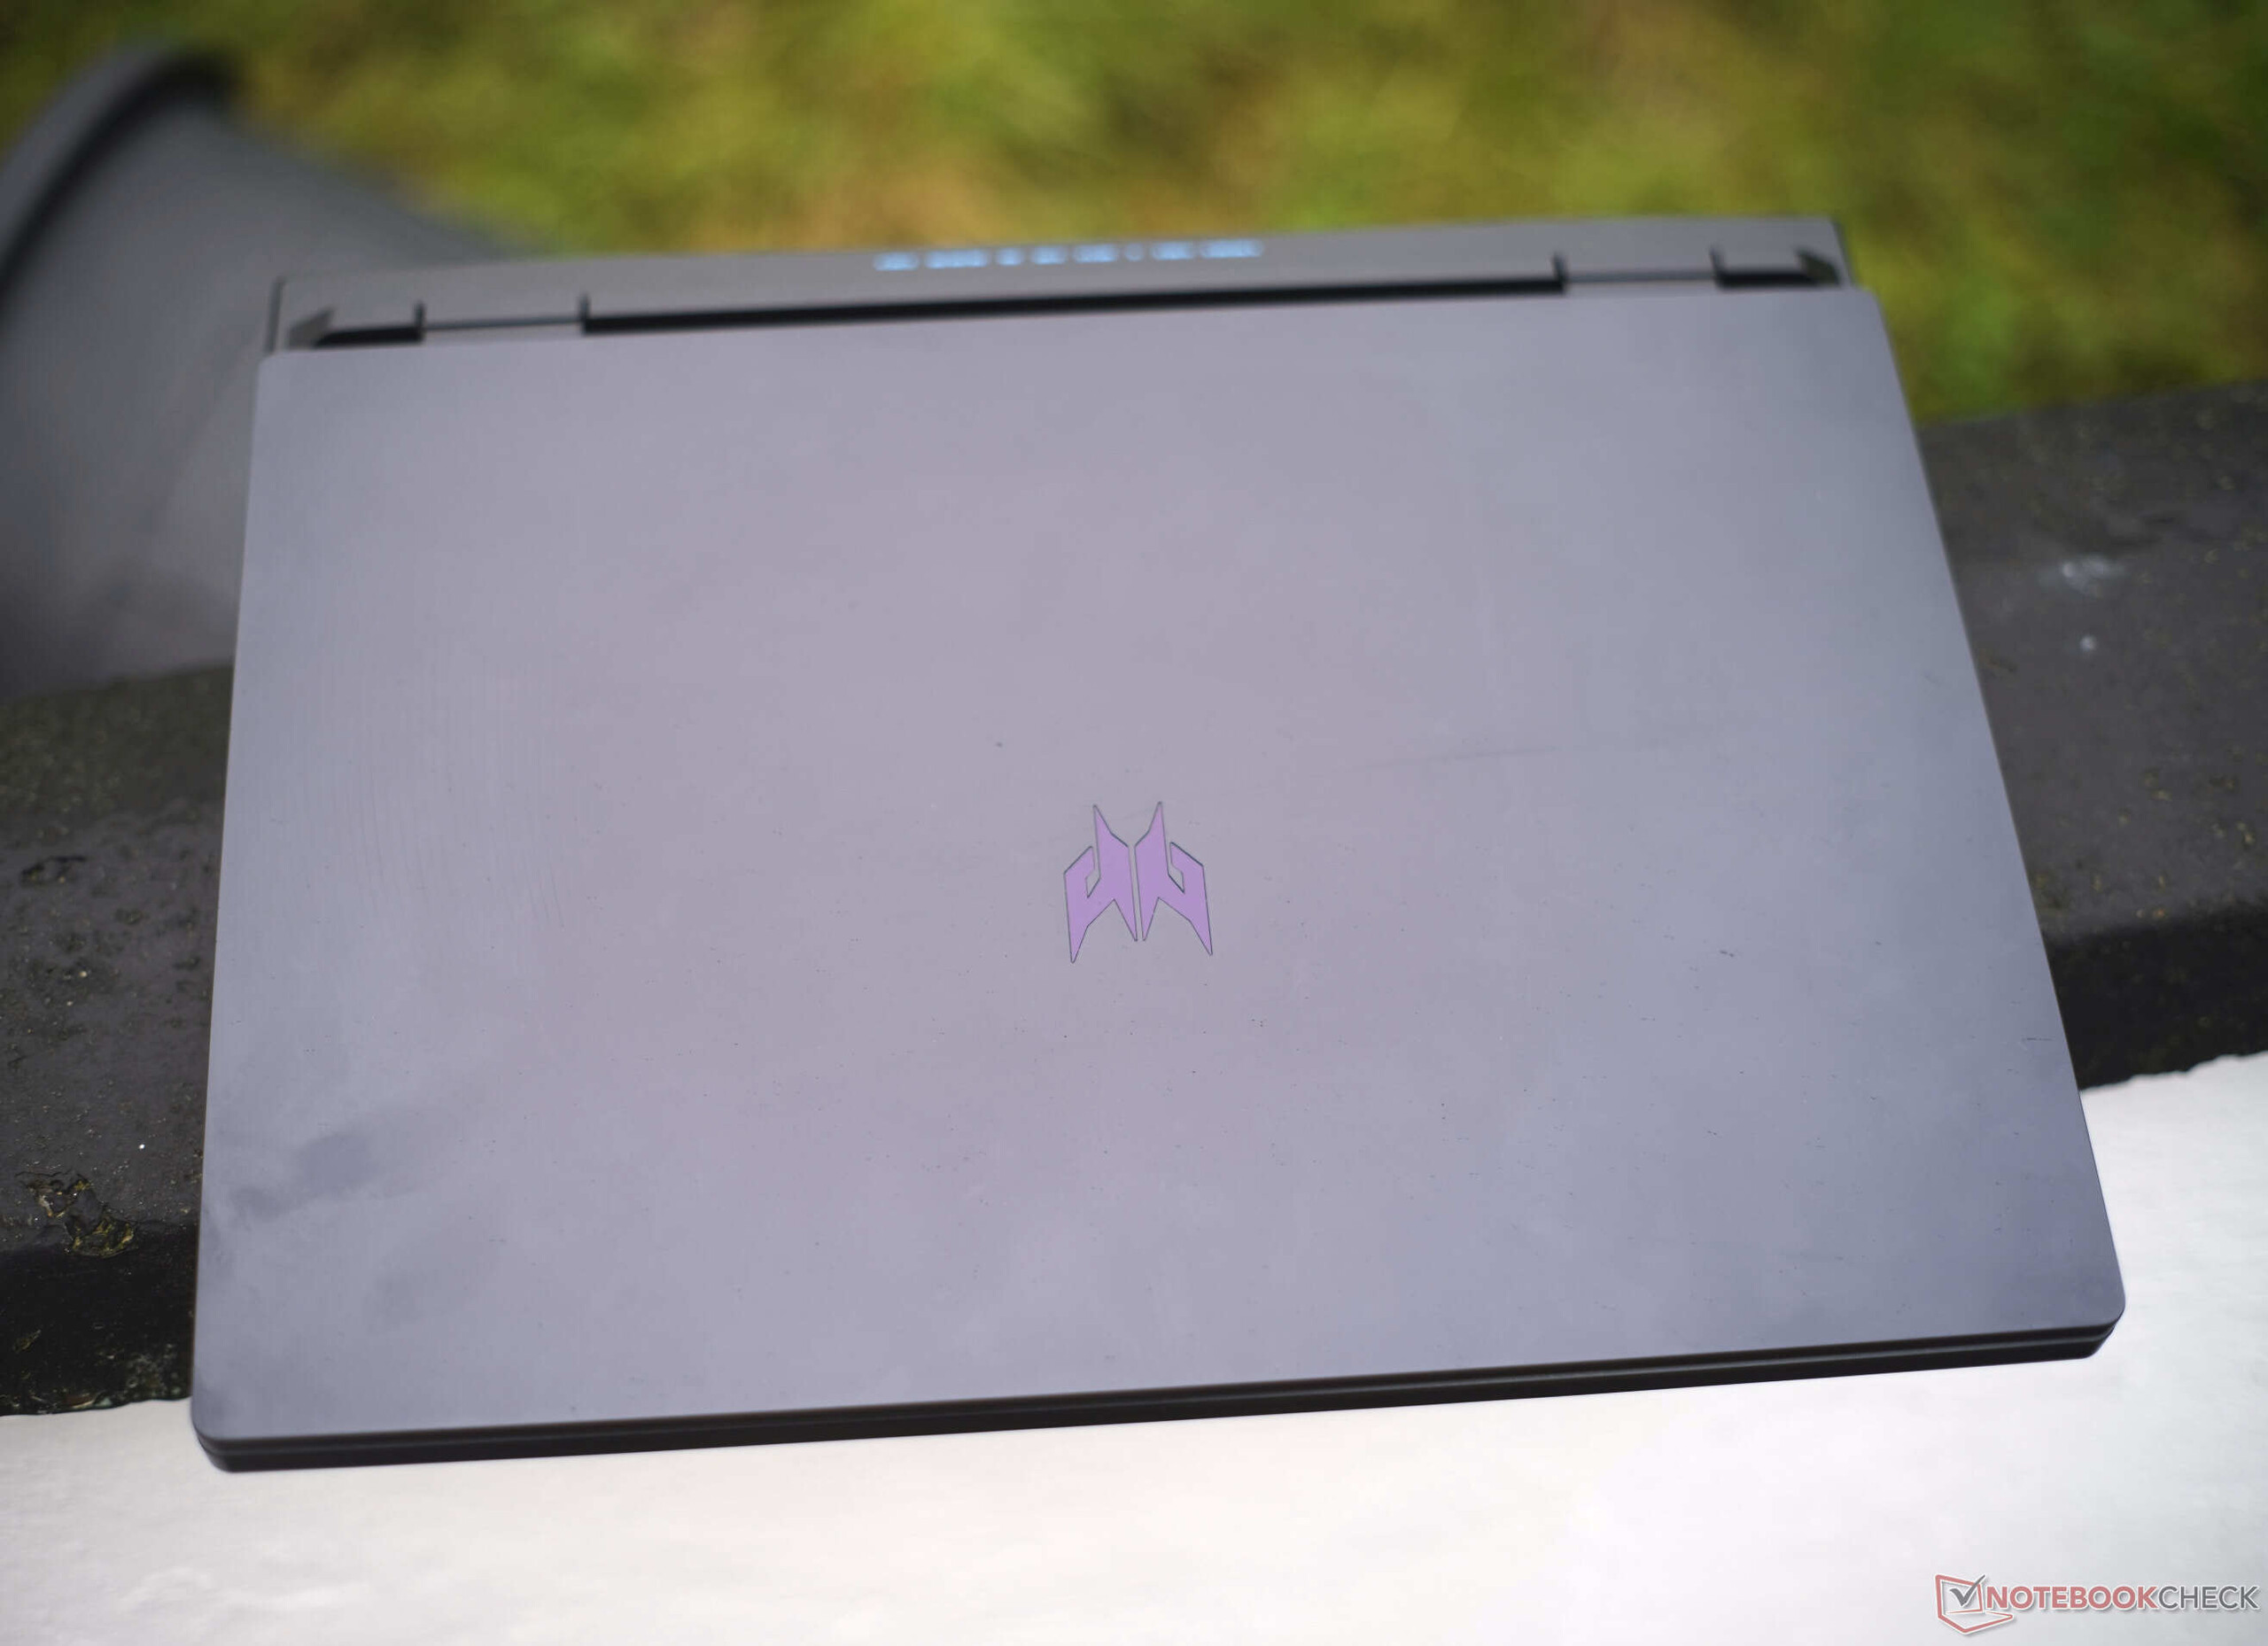
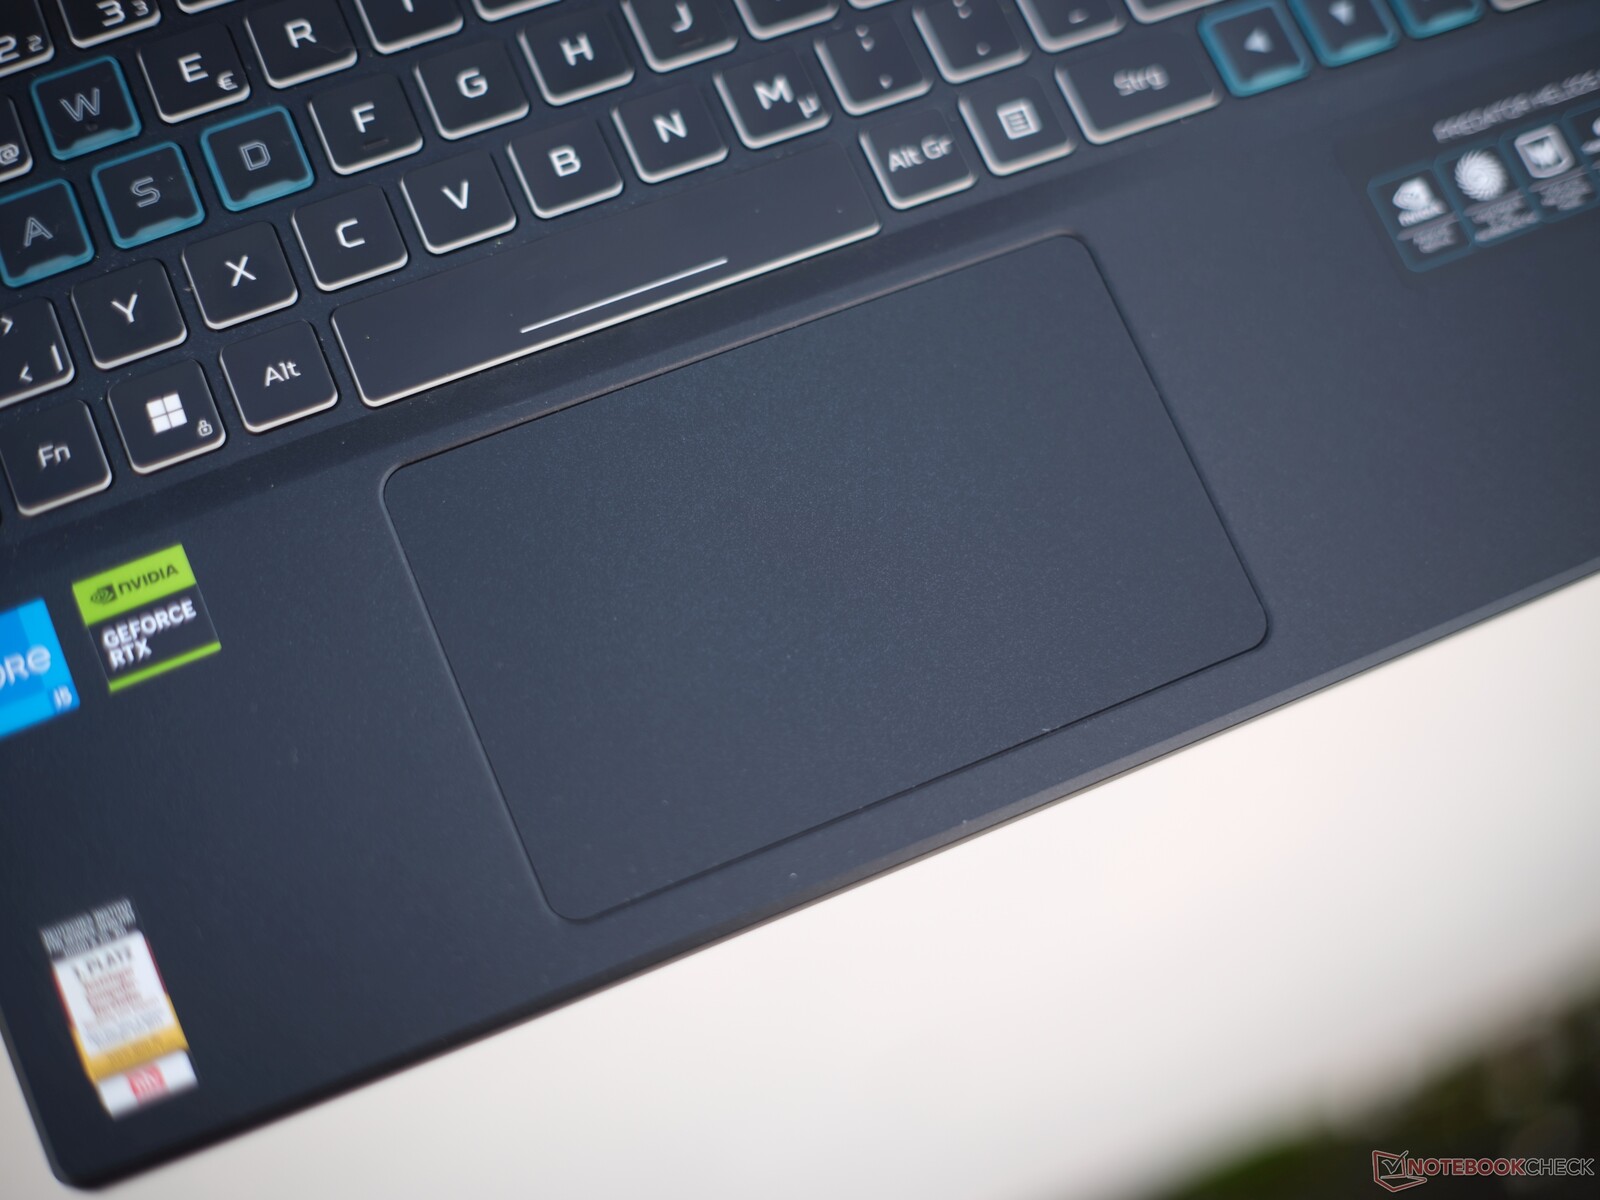
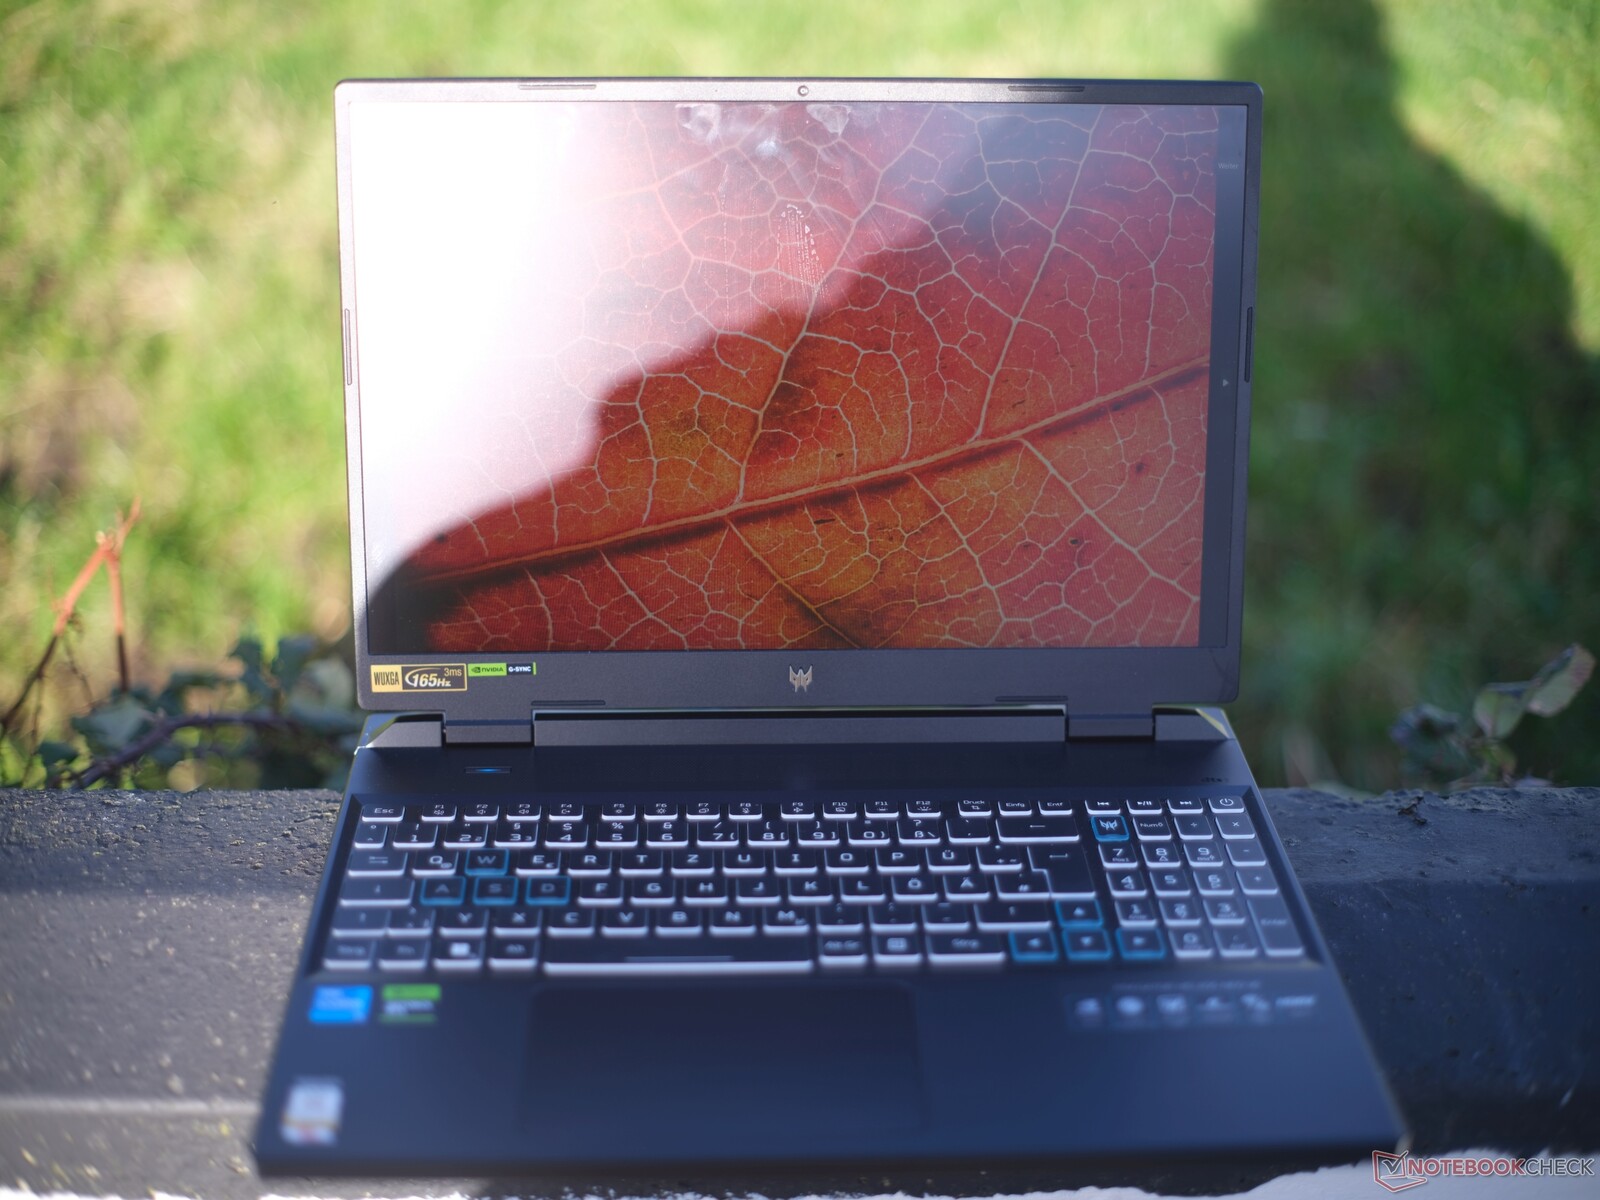
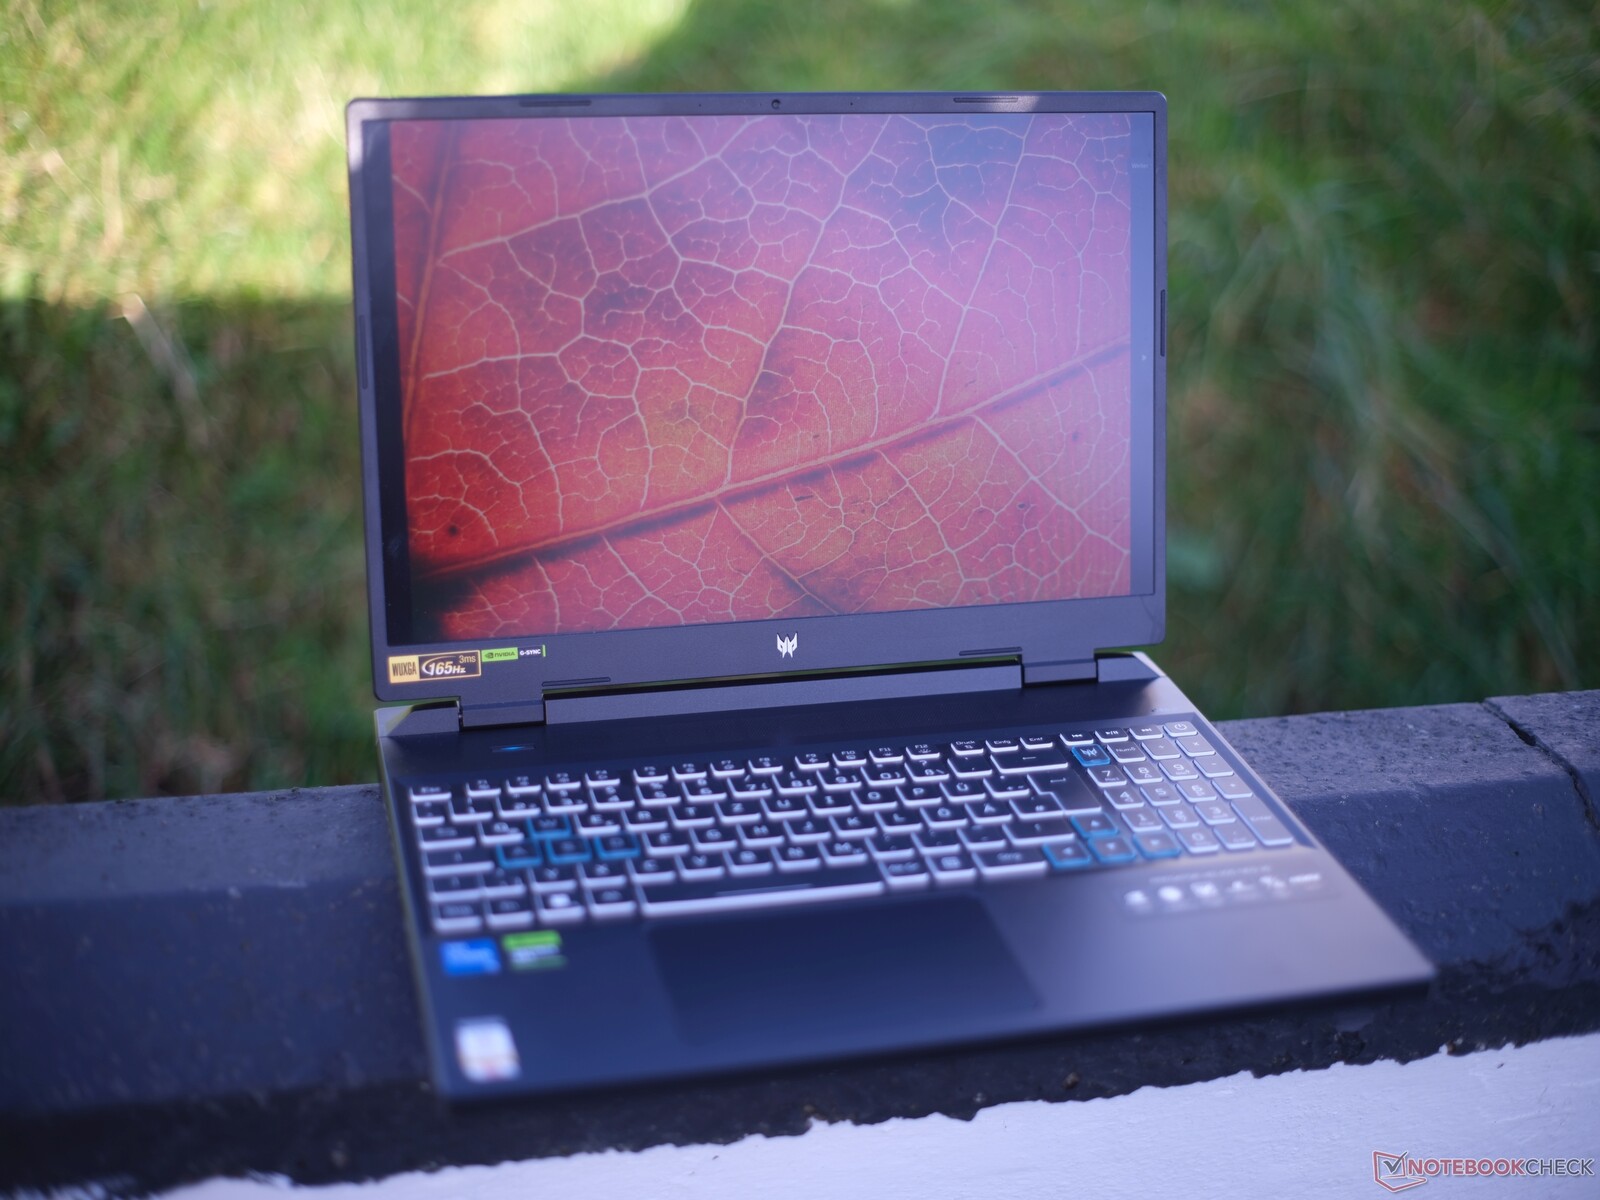
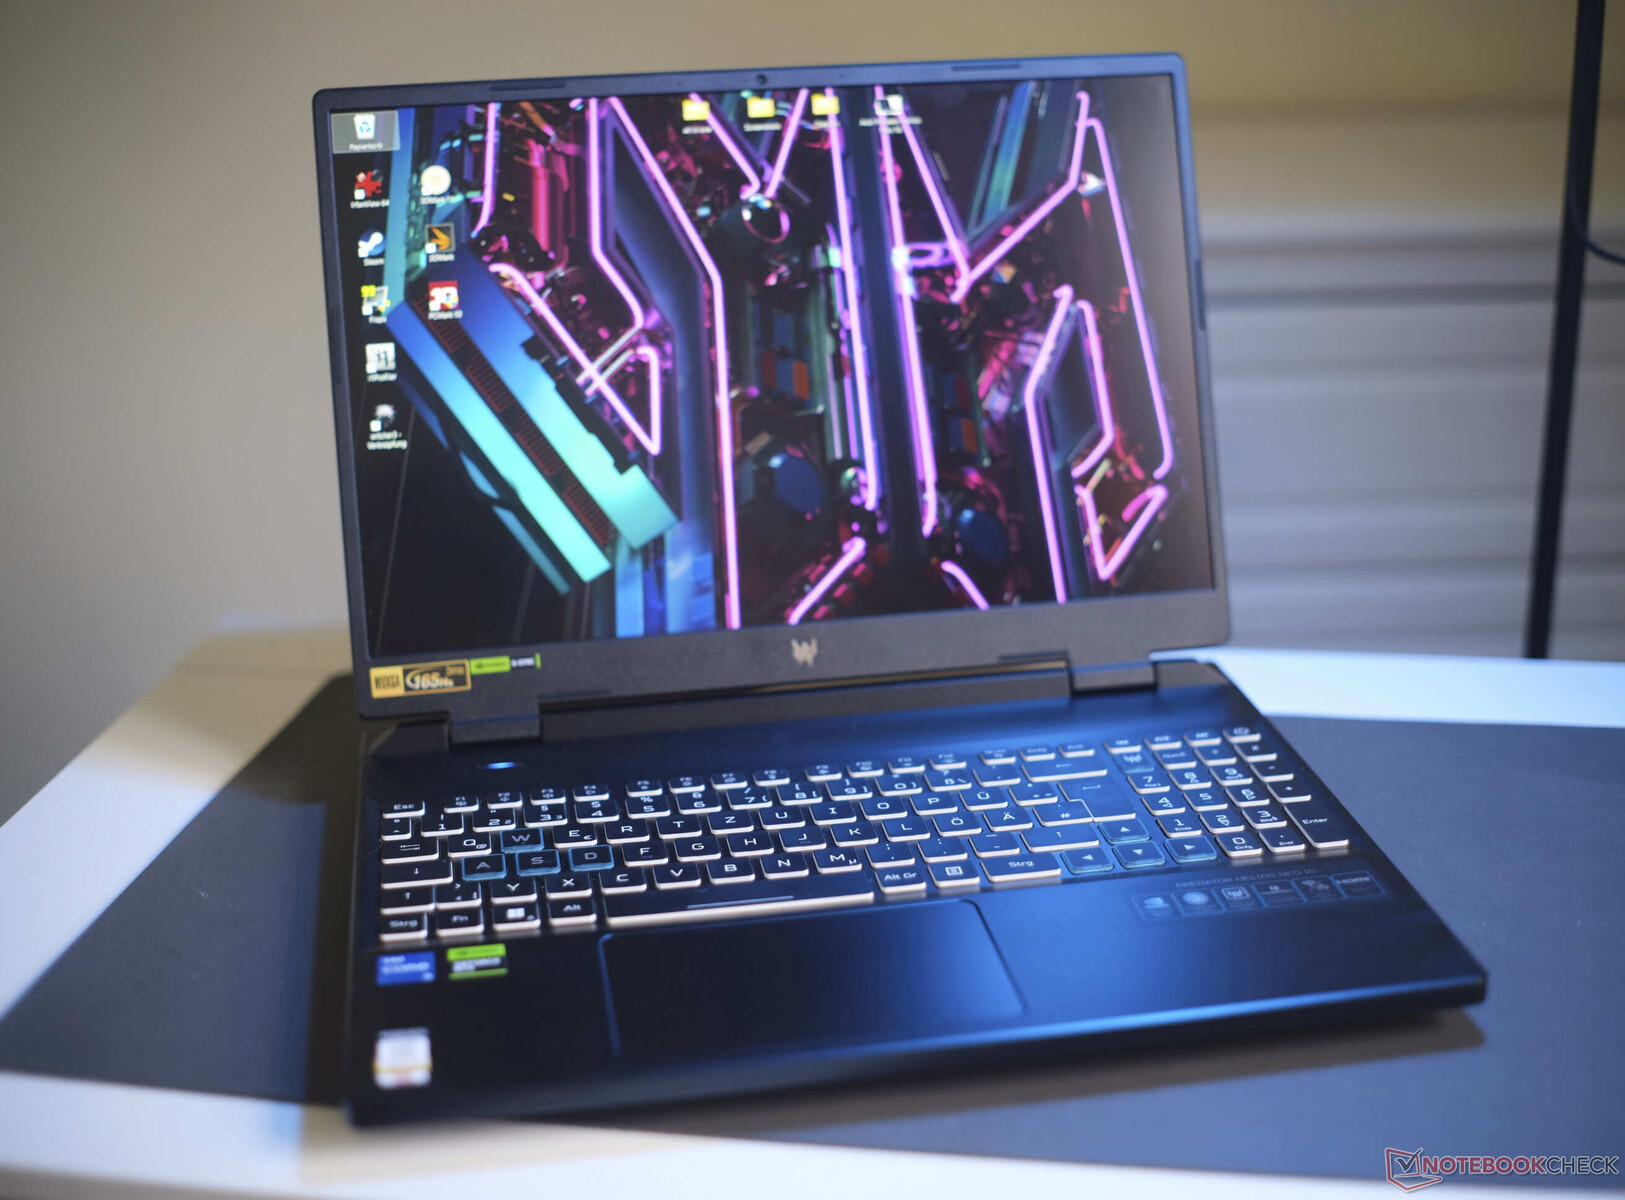
外壳:Helios Neo 16 凭借其坚固耐用的外观脱颖而出
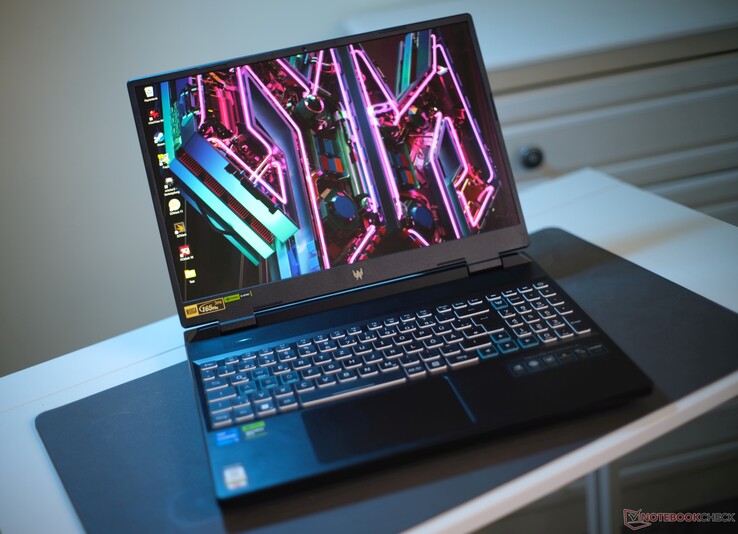
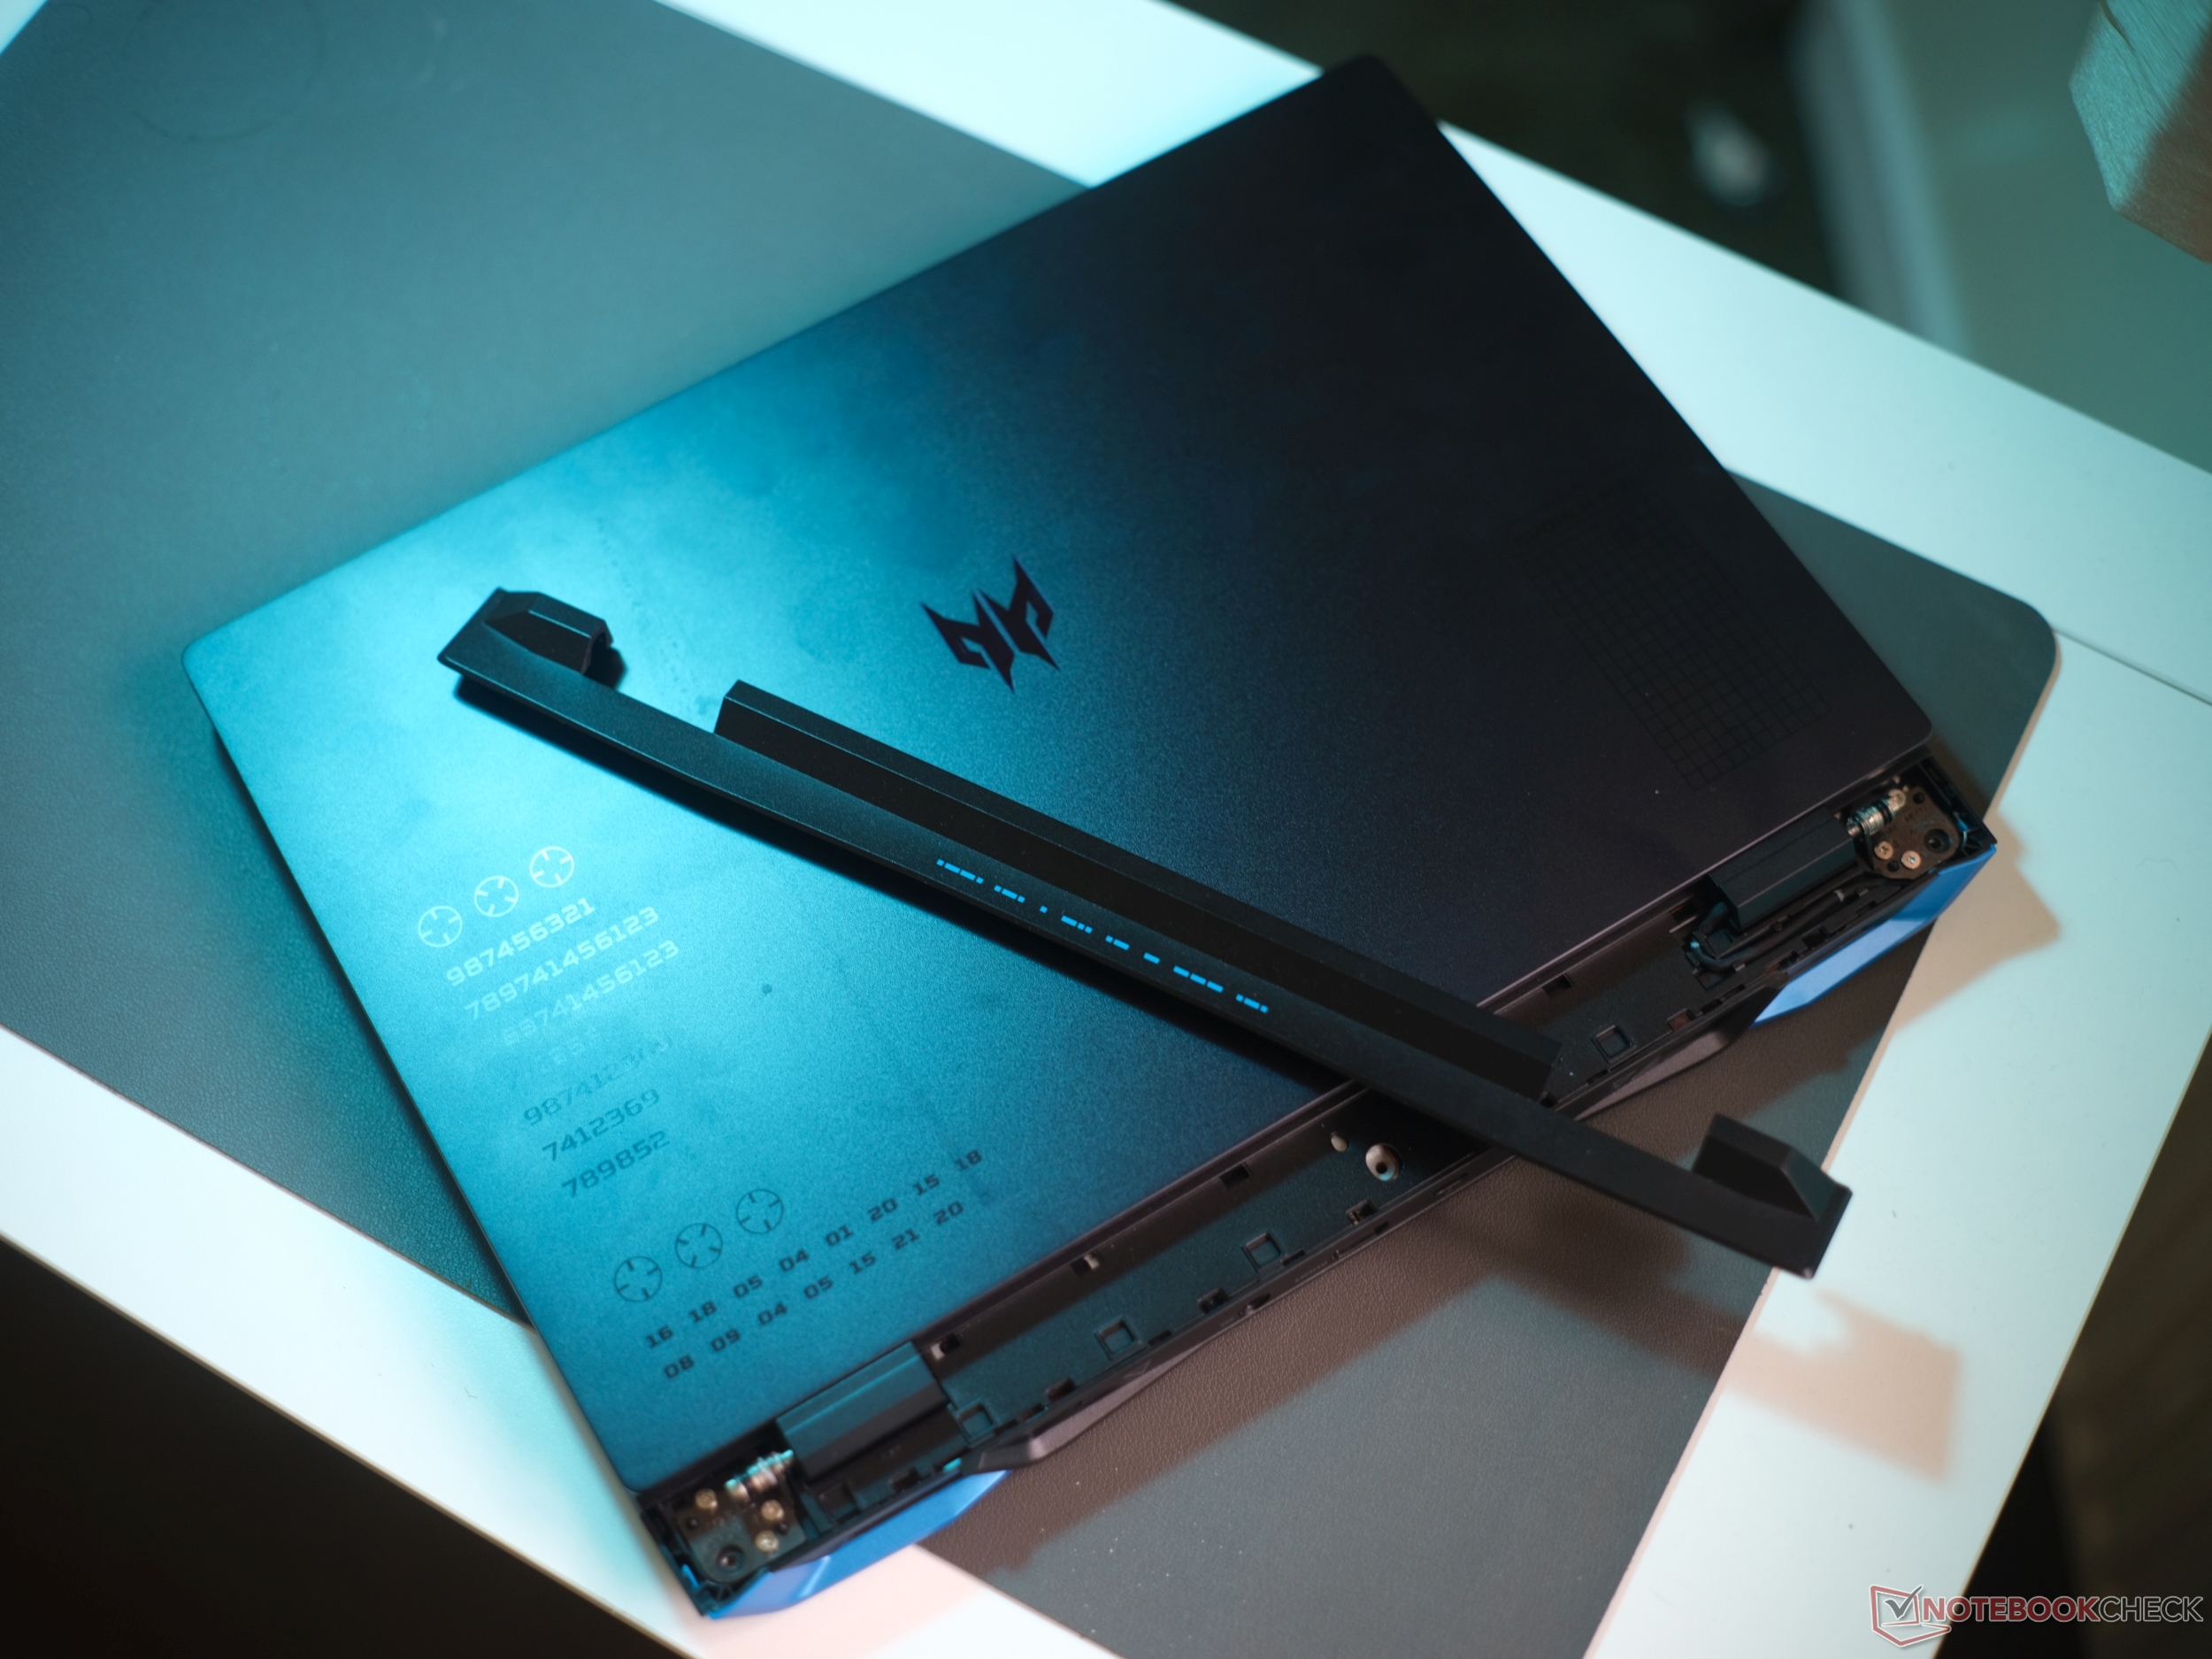
Predator Helios Neo 的机箱稳定性很好,这使它有别于许多经济型游戏机。Almuninum 机箱盖和塑料底座均为深黑色(曜石黑),并带有微妙的深蓝色光泽。
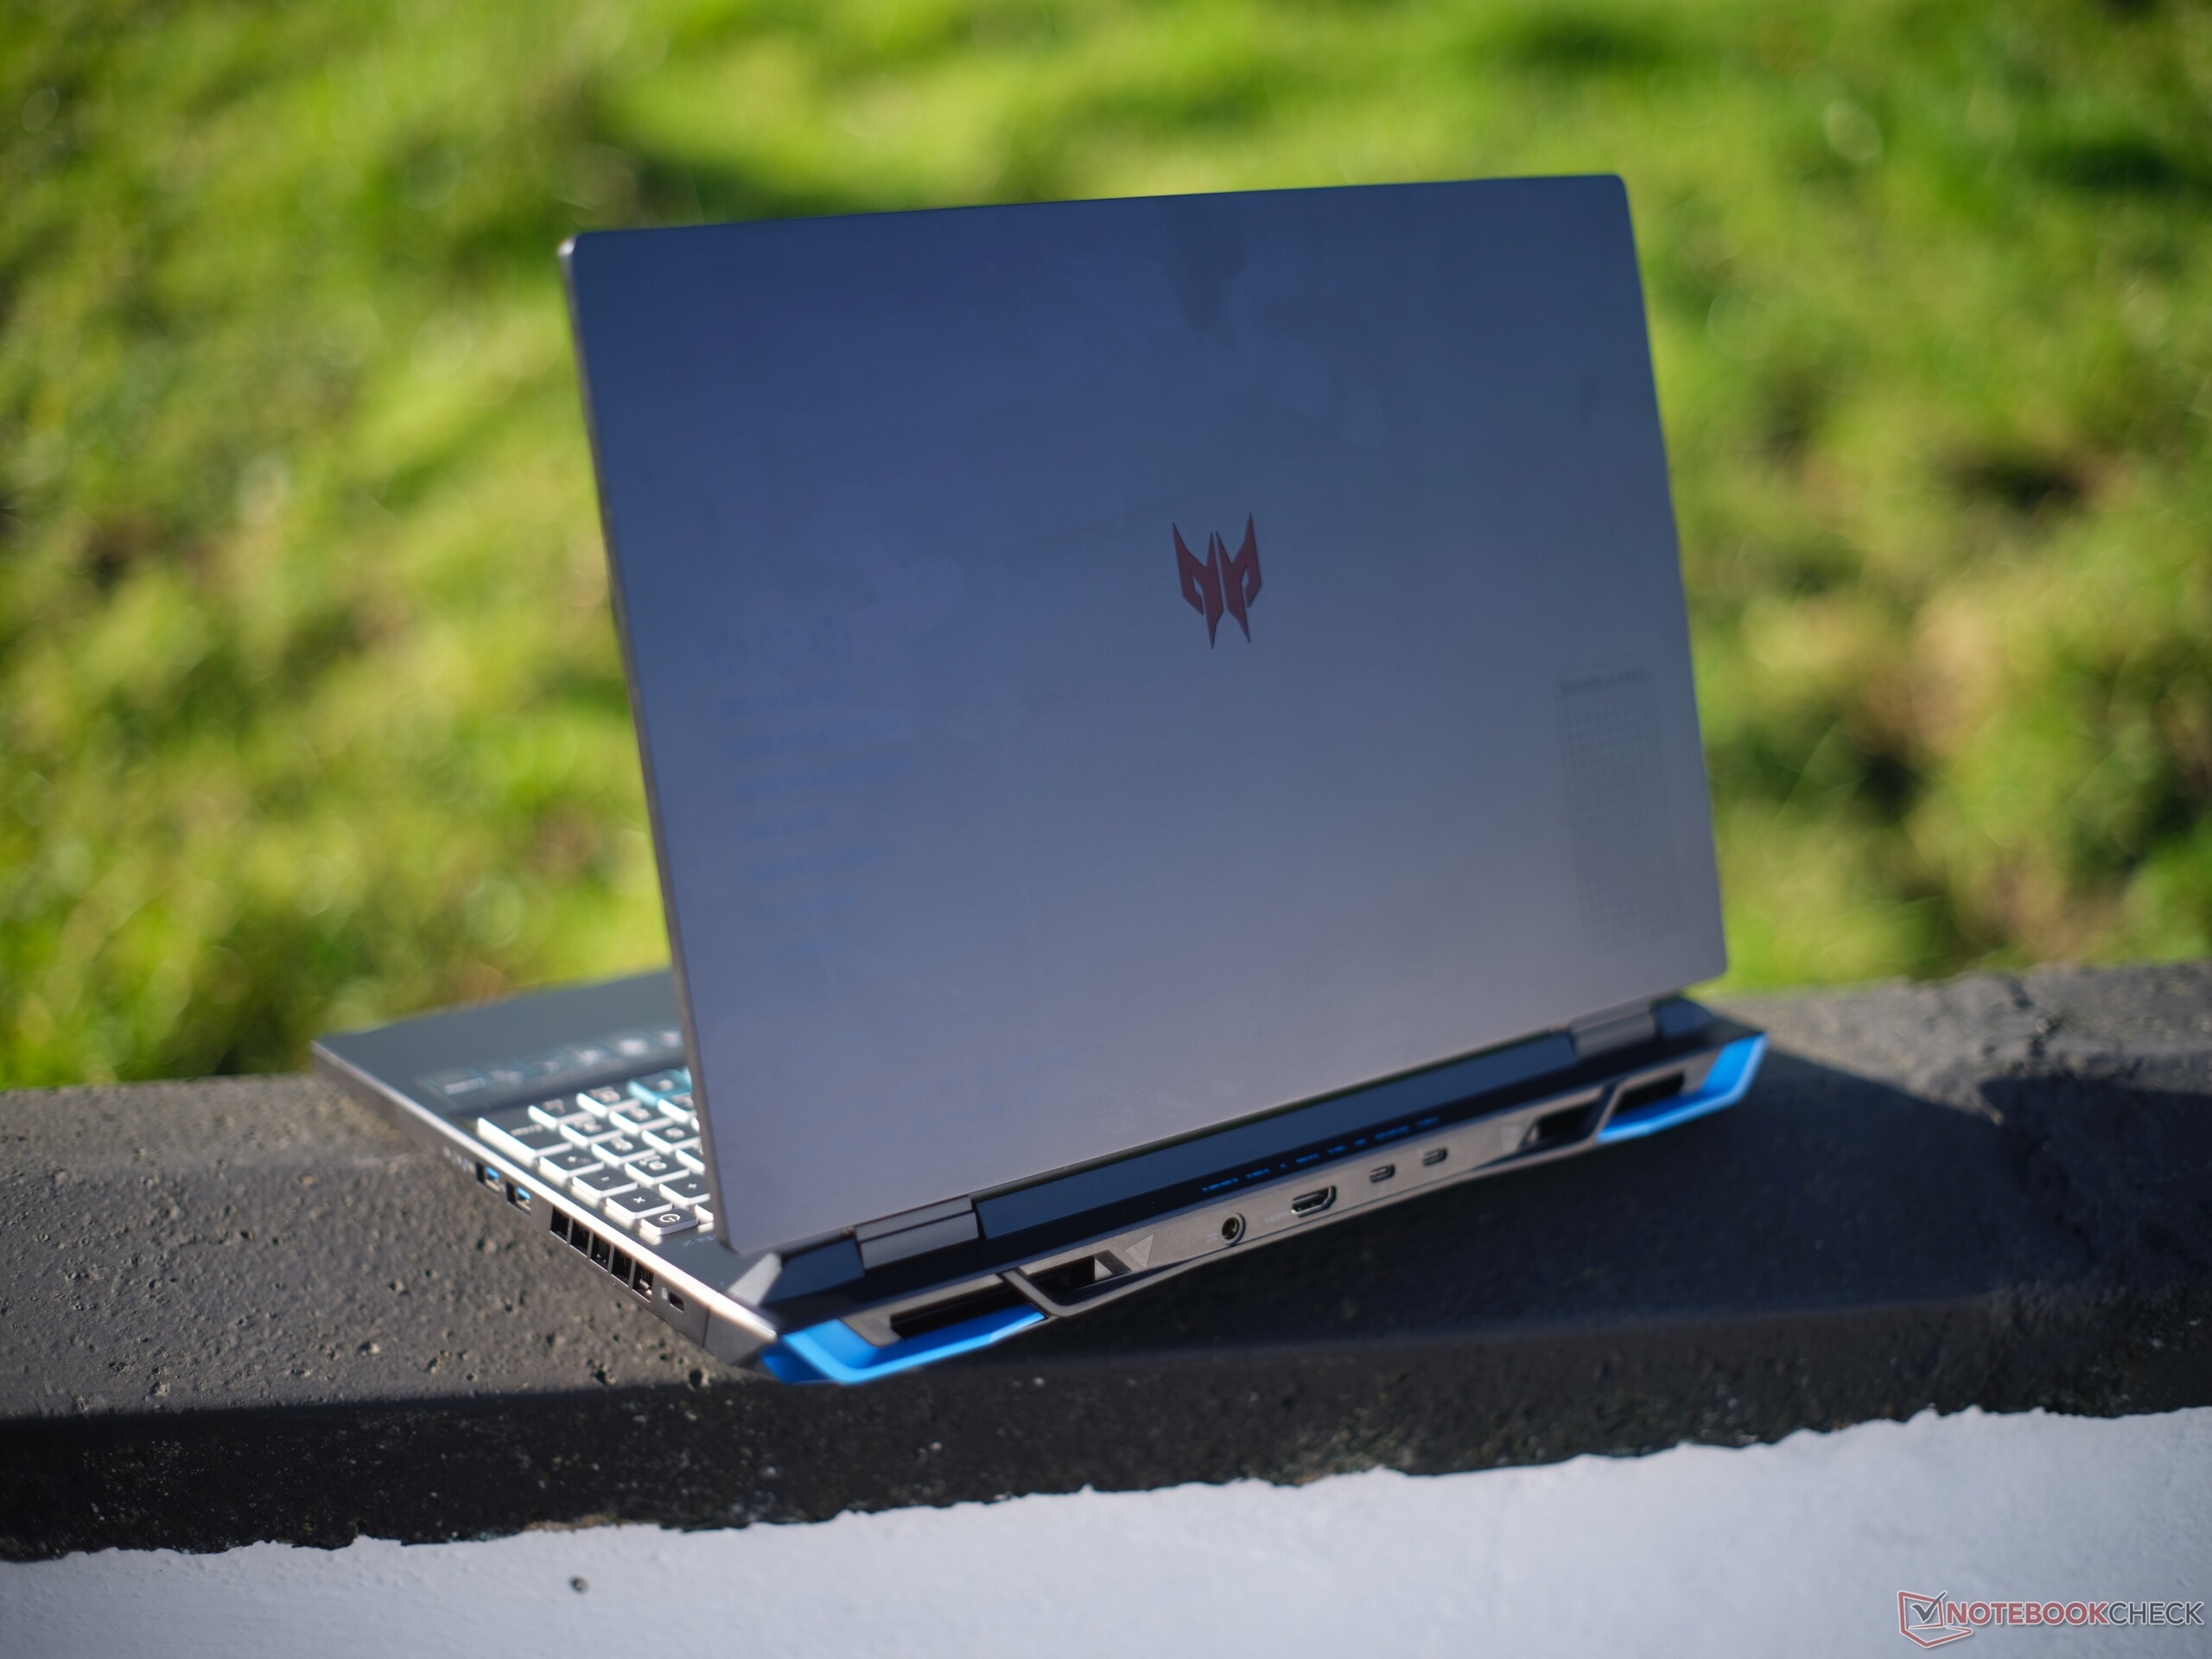
盖子上有一些雕刻元素,再加上背面的蓝色风扇格栅,使设备的外观非常有趣,同时也降低了 "隐形效果"。一个明显的缺点是其表面非常容易沾染指纹。
盖子可以单手打开,最大角度可达约 150°--同时,铰链相当坚硬,这意味着在定位时几乎不会晃动。遗憾的是,它很容易被扭曲(即使这不会导致任何图像错误),但反过来,底座单元却非常稳定。总而言之,Helios Neo 16 给我们留下了非常好的印象,就像非 Neo 变体 给我们留下的印象一样。唯一不同的是,这款产品没有照明背板或可更换的散热格栅。

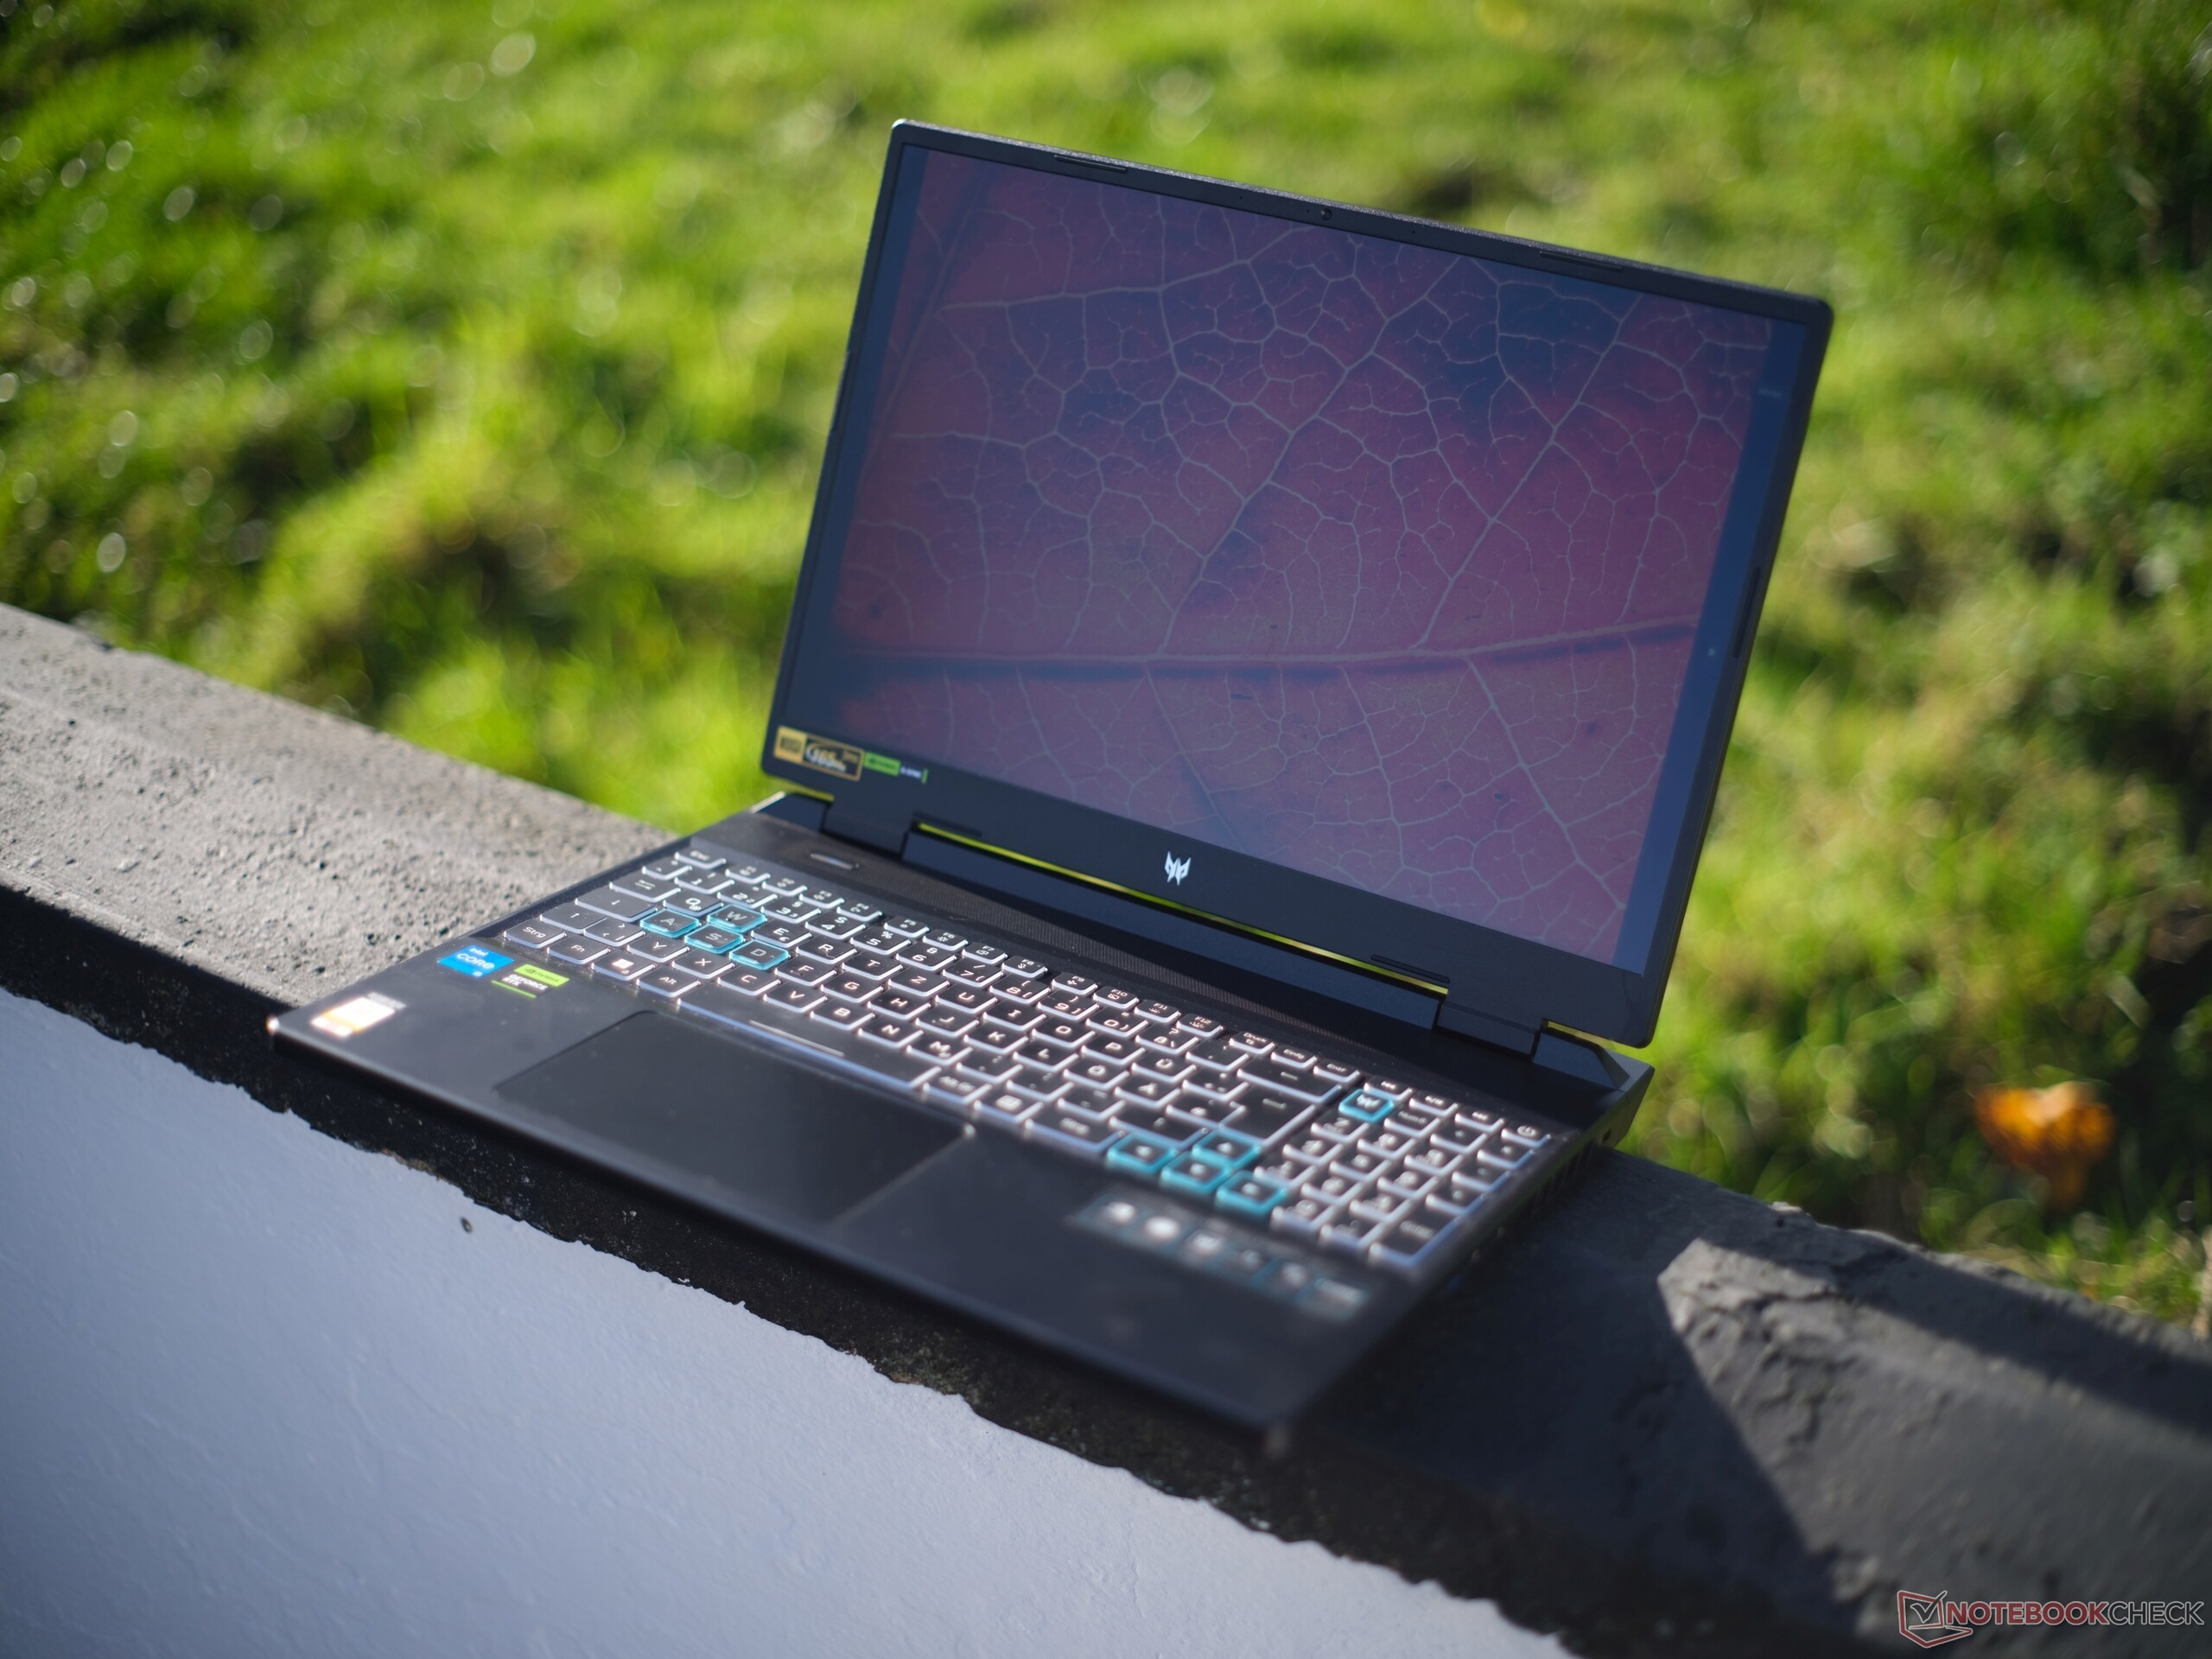
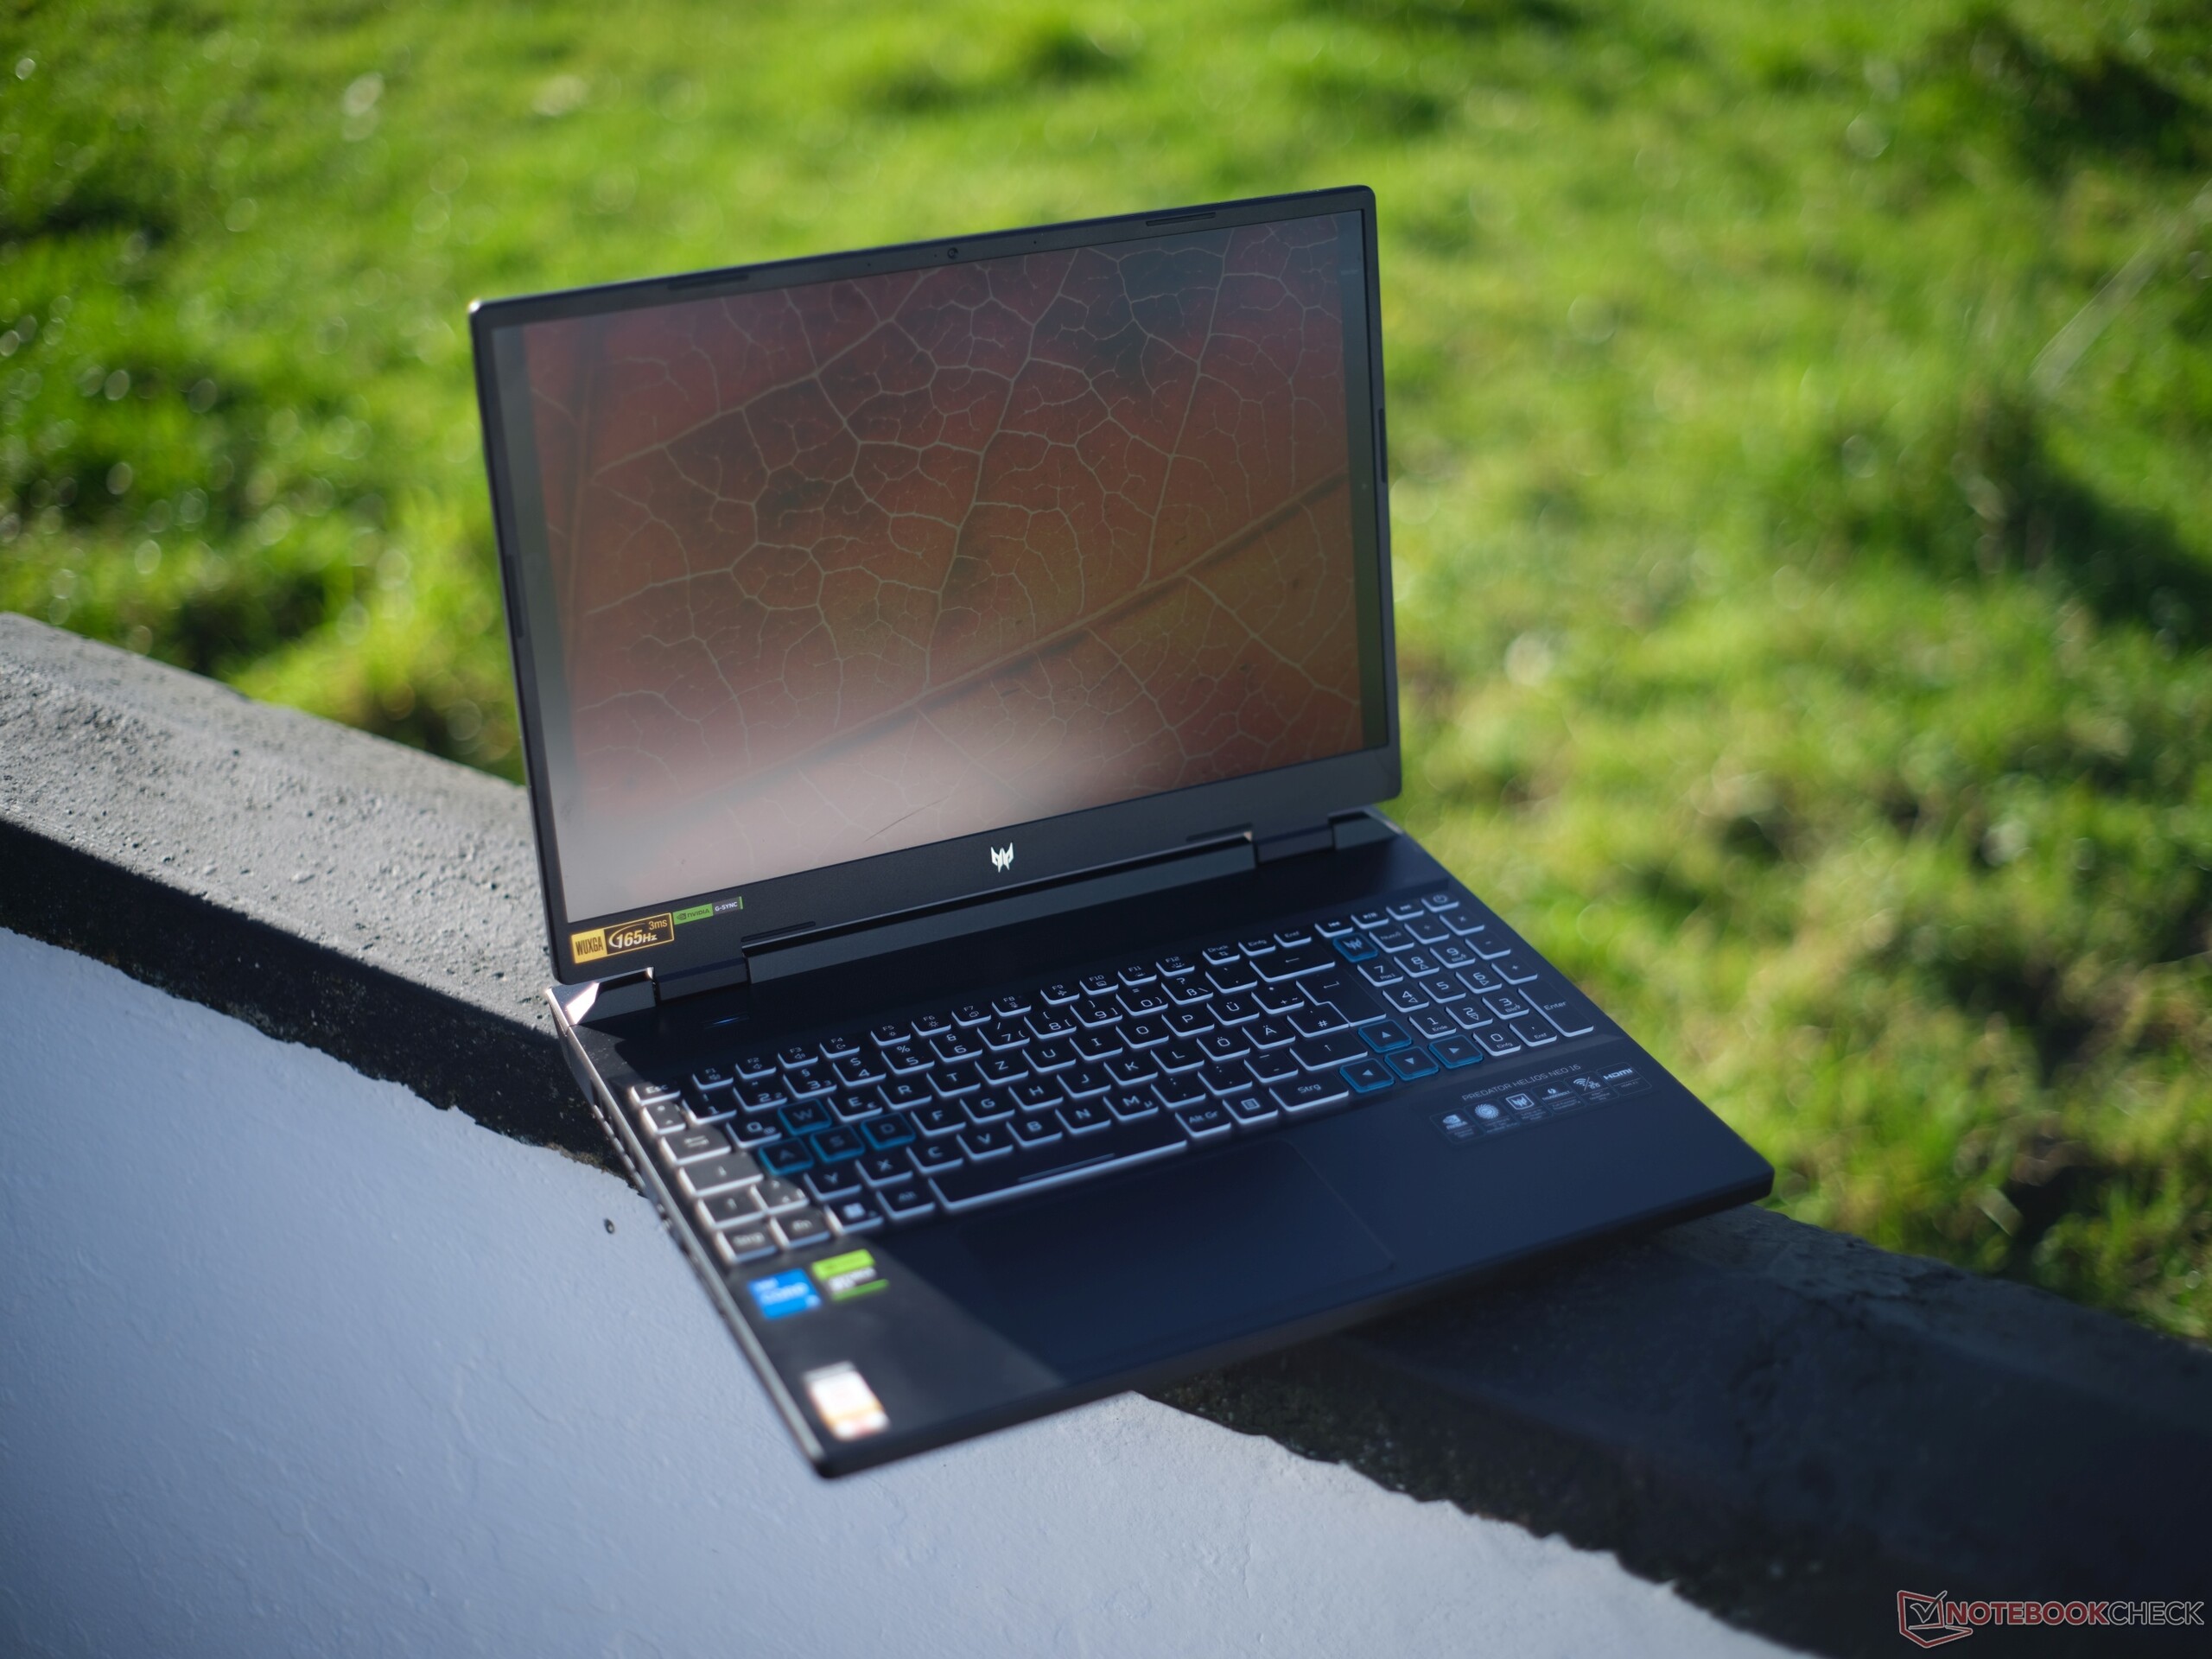
Helios Neo 的重量为 2.6 千克,厚度为 28.25 毫米,符合 16 英寸游戏笔记本电脑的平均水平。在我们的对比中,只有惠普 Victus 16重量为 2.3 千克,厚度为 22.9 毫米。15.6 英寸的 XMG Apex 15 也要轻一些。
连接性连接众多,但 WiFi 和 Power Delivery 速度较慢
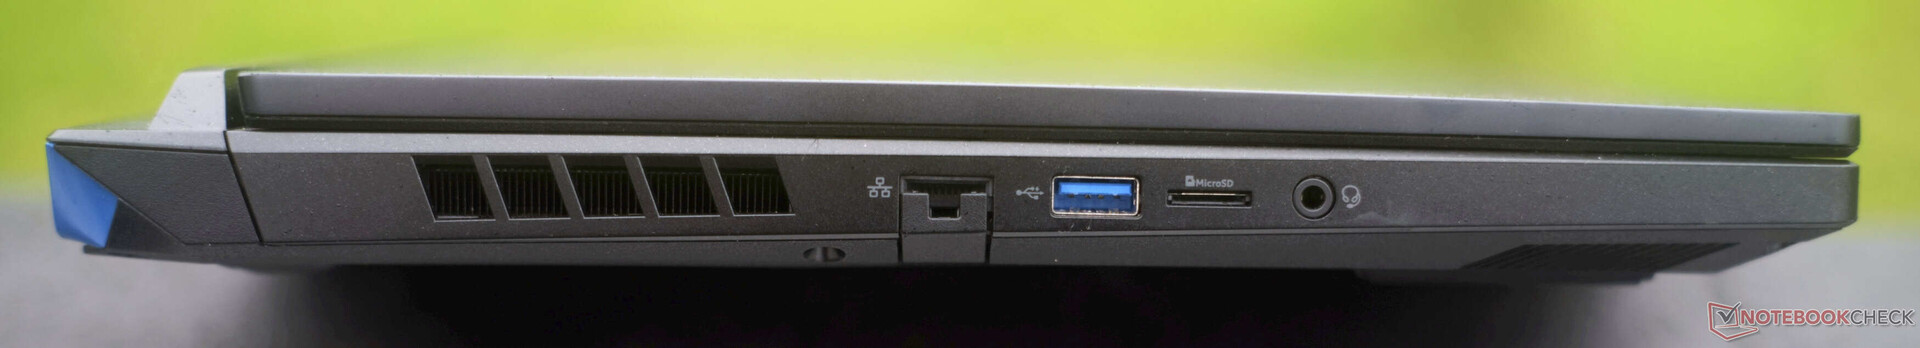
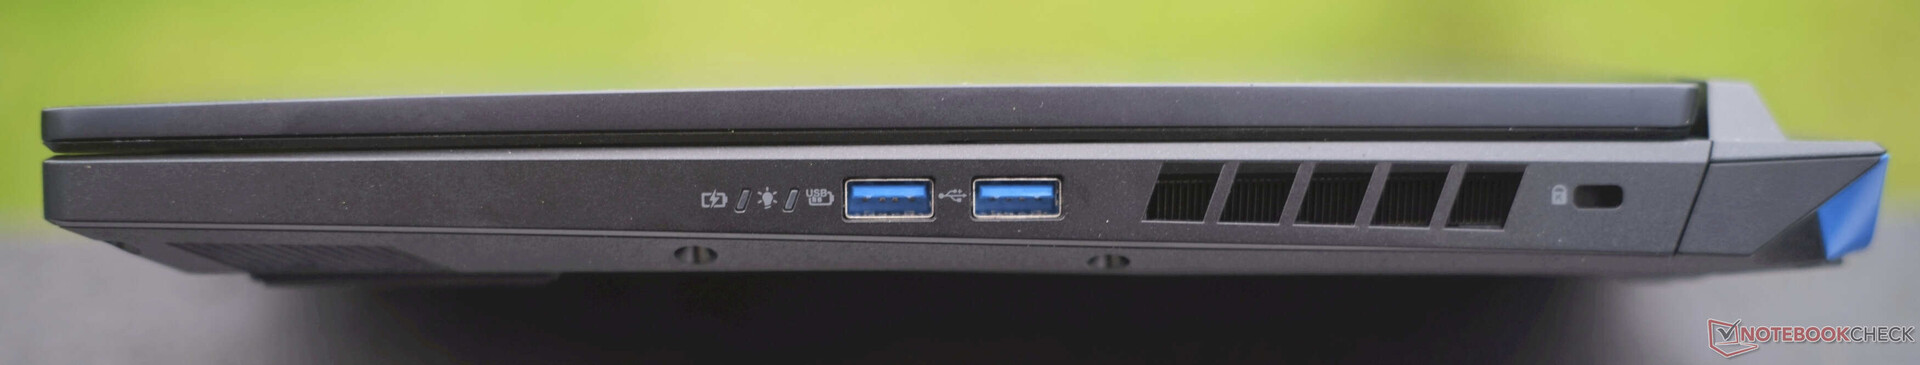
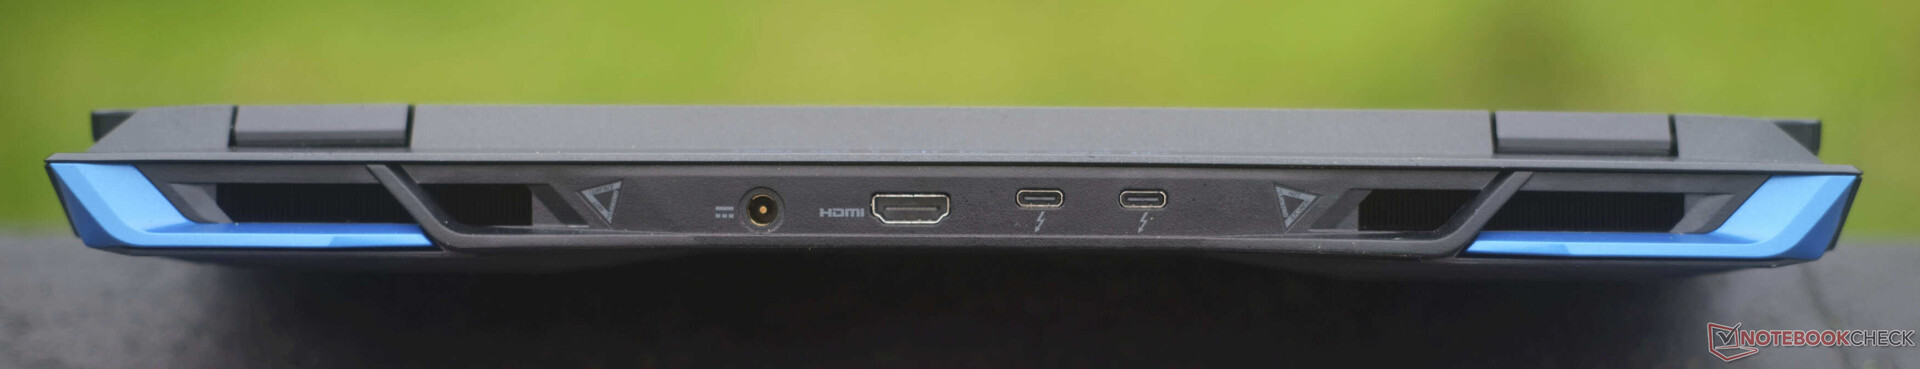
宏碁的这款游戏笔记本电脑背面配备了 1x USB-A 3.1(5 GBit/s)、2x USB-A 3.2(10 GBit/s)以及 2x Thunderbolt 4(包括 DisplayPort 1.4)和 Power Delivery(65 瓦)。此外,背面还有千兆位 RJ45、microSD 读卡器、3.5 毫米音频插孔、Kensington 锁、电源连接以及一个直接连接到 dGPU 的 HDMI 2.1 端口,该端口支持 120 Hz 的 4K 速率,并同时支持 G-Sync。
归根结底,Predator Helios Neo 与价格更高的同类产品宏碁Predator Helios 16笔记本电脑评测:一款拥有众多优势的安静游戏笔记本电脑 相比,除了 PD 性能较低之外,没有任何劣势。
SD 读卡器
与 AV PRO microSD 128 GB V60 参考卡一起使用时,microSD 读卡器的传输速率一般。读卡器Legion 超薄 5,宏碁 Nitro 16,XMG Focus 15和技嘉 G5读取和复制数据的传输速率都差不多。但是XMG 的 Apex 15慢了两倍多,而Alienware 的 m16 R1则快两倍。
| SD Card Reader | |
| average JPG Copy Test (av. of 3 runs) | |
| Alienware m16 R1 Intel (AV PRO microSD 128 GB V60) | |
| Average of class Gaming (20.9 - 210, n=54, last 2 years) | |
| Lenovo Legion Slim 5 14APH8 (Toshiba Exceria Pro SDXC 64 GB UHS-II) | |
| Acer Nitro 16 AN16-41-R7YE (AV PRO microSD 128 GB V60) | |
| Acer Predator Helios Neo 16 NH.QLTEG.002 | |
| Gigabyte G5 KF | |
| Schenker XMG Apex 15 (Late 23) (AV PRO microSD 128 GB V60) | |
| maximum AS SSD Seq Read Test (1GB) | |
| Alienware m16 R1 Intel (AV PRO microSD 128 GB V60) | |
| Average of class Gaming (25.5 - 261, n=51, last 2 years) | |
| Schenker XMG Focus 15 (E23) | |
| Gigabyte G5 KF | |
| Acer Predator Helios Neo 16 NH.QLTEG.002 | |
| Acer Nitro 16 AN16-41-R7YE (AV PRO microSD 128 GB V60) | |
| Lenovo Legion Slim 5 14APH8 (Toshiba Exceria Pro SDXC 64 GB UHS-II) | |
| Schenker XMG Apex 15 (Late 23) (AV PRO microSD 128 GB V60) | |
交流
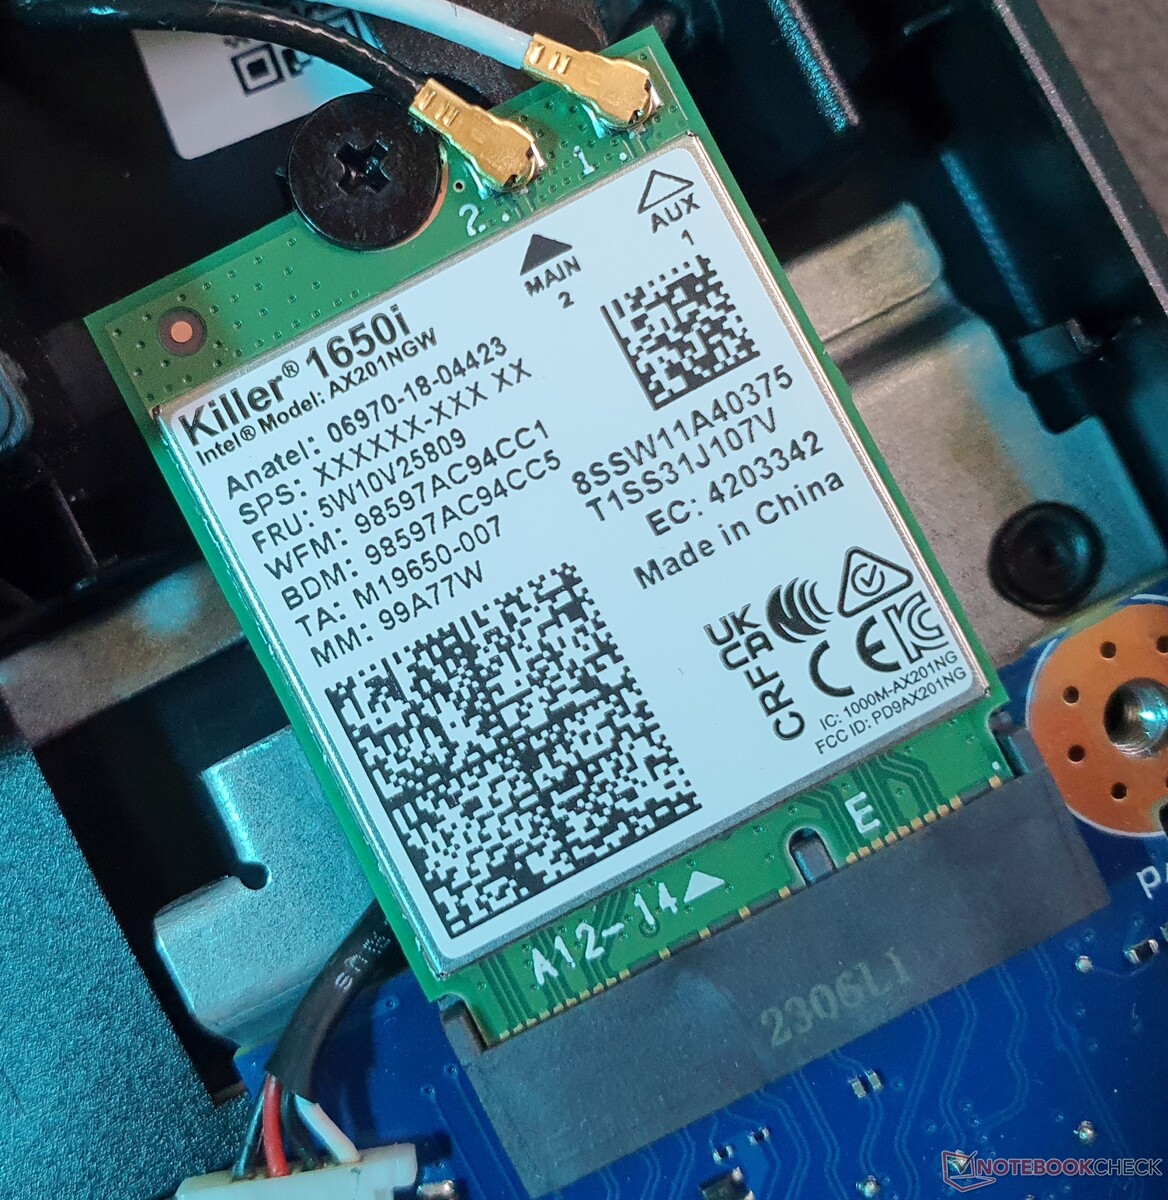
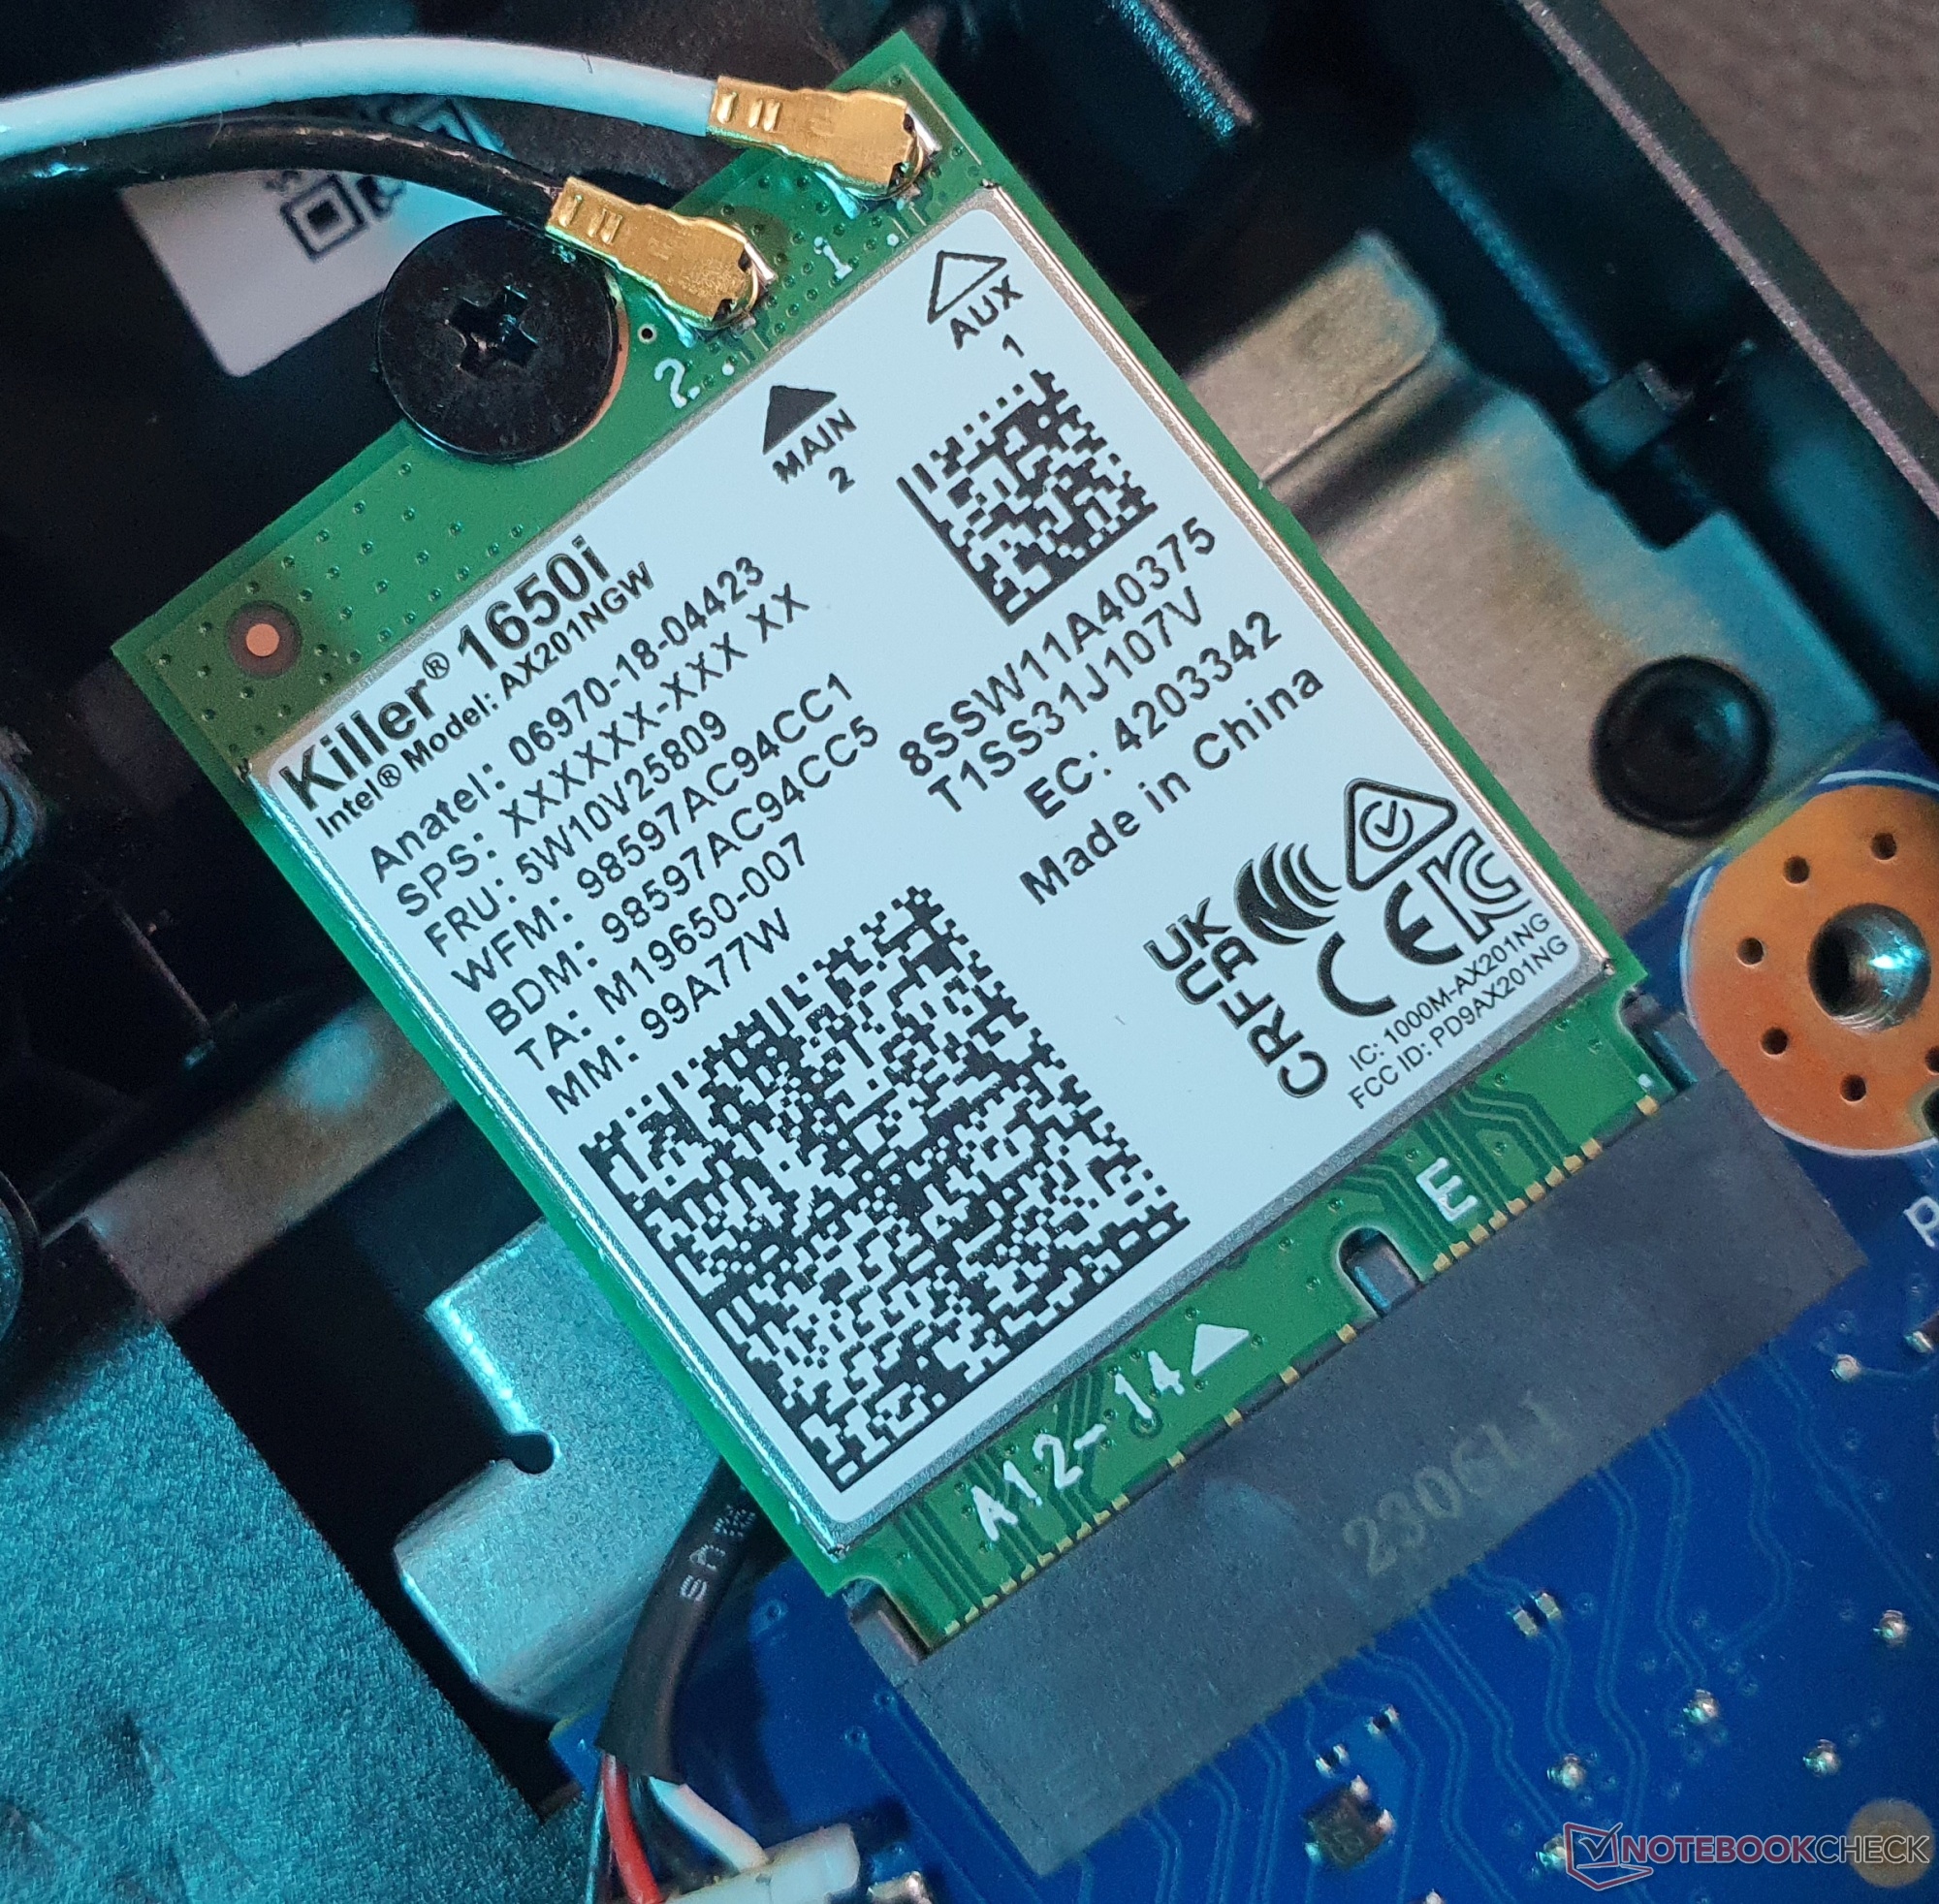
笔记本电脑安装的英特尔 Killer AX1650i WLAN 模块符合较早的 WiFi 6 标准,传输速率约为 900 MBit/s,与笔记本电脑内的 Realtek 芯片速度相近。 联想 LOQ 16.
联想 Helios 16则使用英特尔 Killer AX1675i(WiFi 6E)实现了高达 1.6 GBit/s 的传输速率,而Legion Pro 5 16在我们的比较中以微弱优势名列前茅。英特尔 Killer E2600 千兆控制器负责有线连接,同时还支持蓝牙 5.2。
网络摄像头
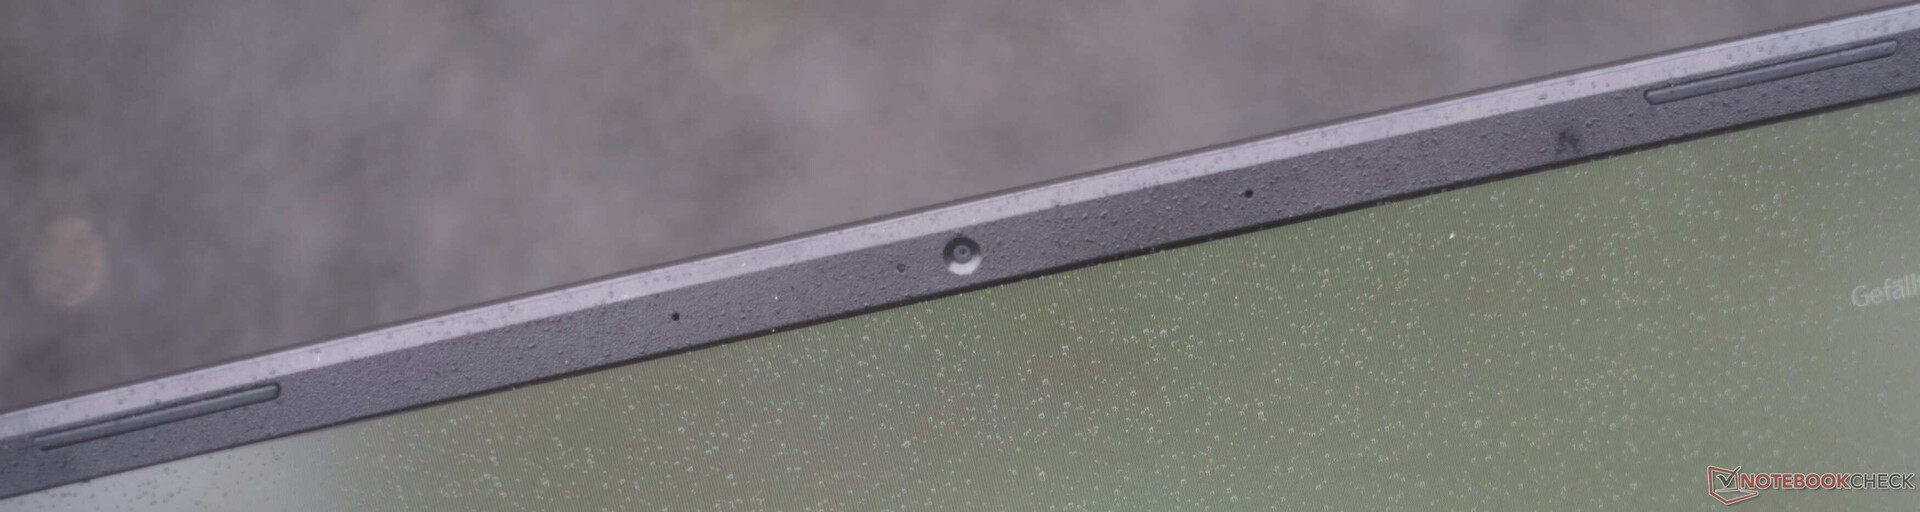

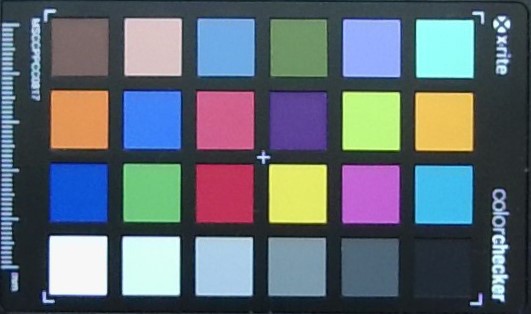
与之形成鲜明对比的是 掠夺者 Helios 16相比之下,宏碁只在 Neo 上安装了一个 720p 网络摄像头,考虑到它的价格,我们觉得这实在是太可惜了。因此,即使在最佳条件下,图像质量也还有待提高。此外,该机还不支持 Windows Hello。不过,双阵列麦克风提供了不错的音质。


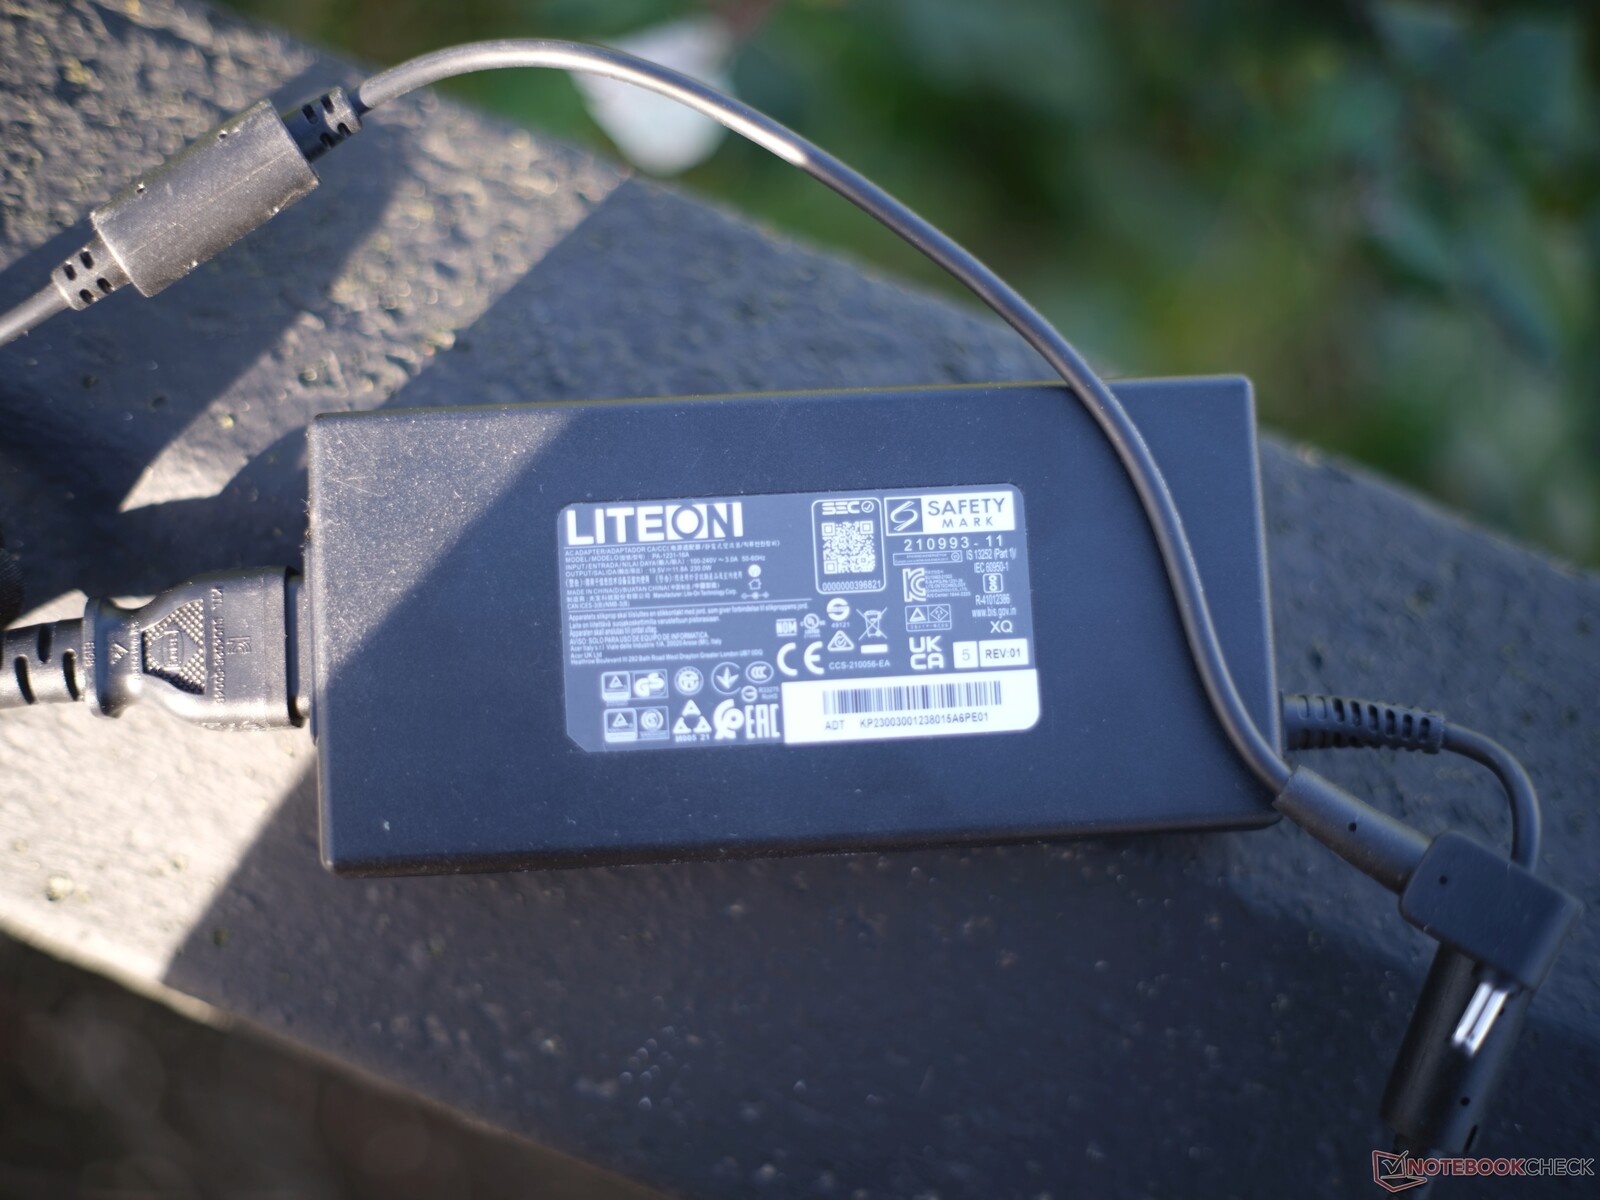
配件
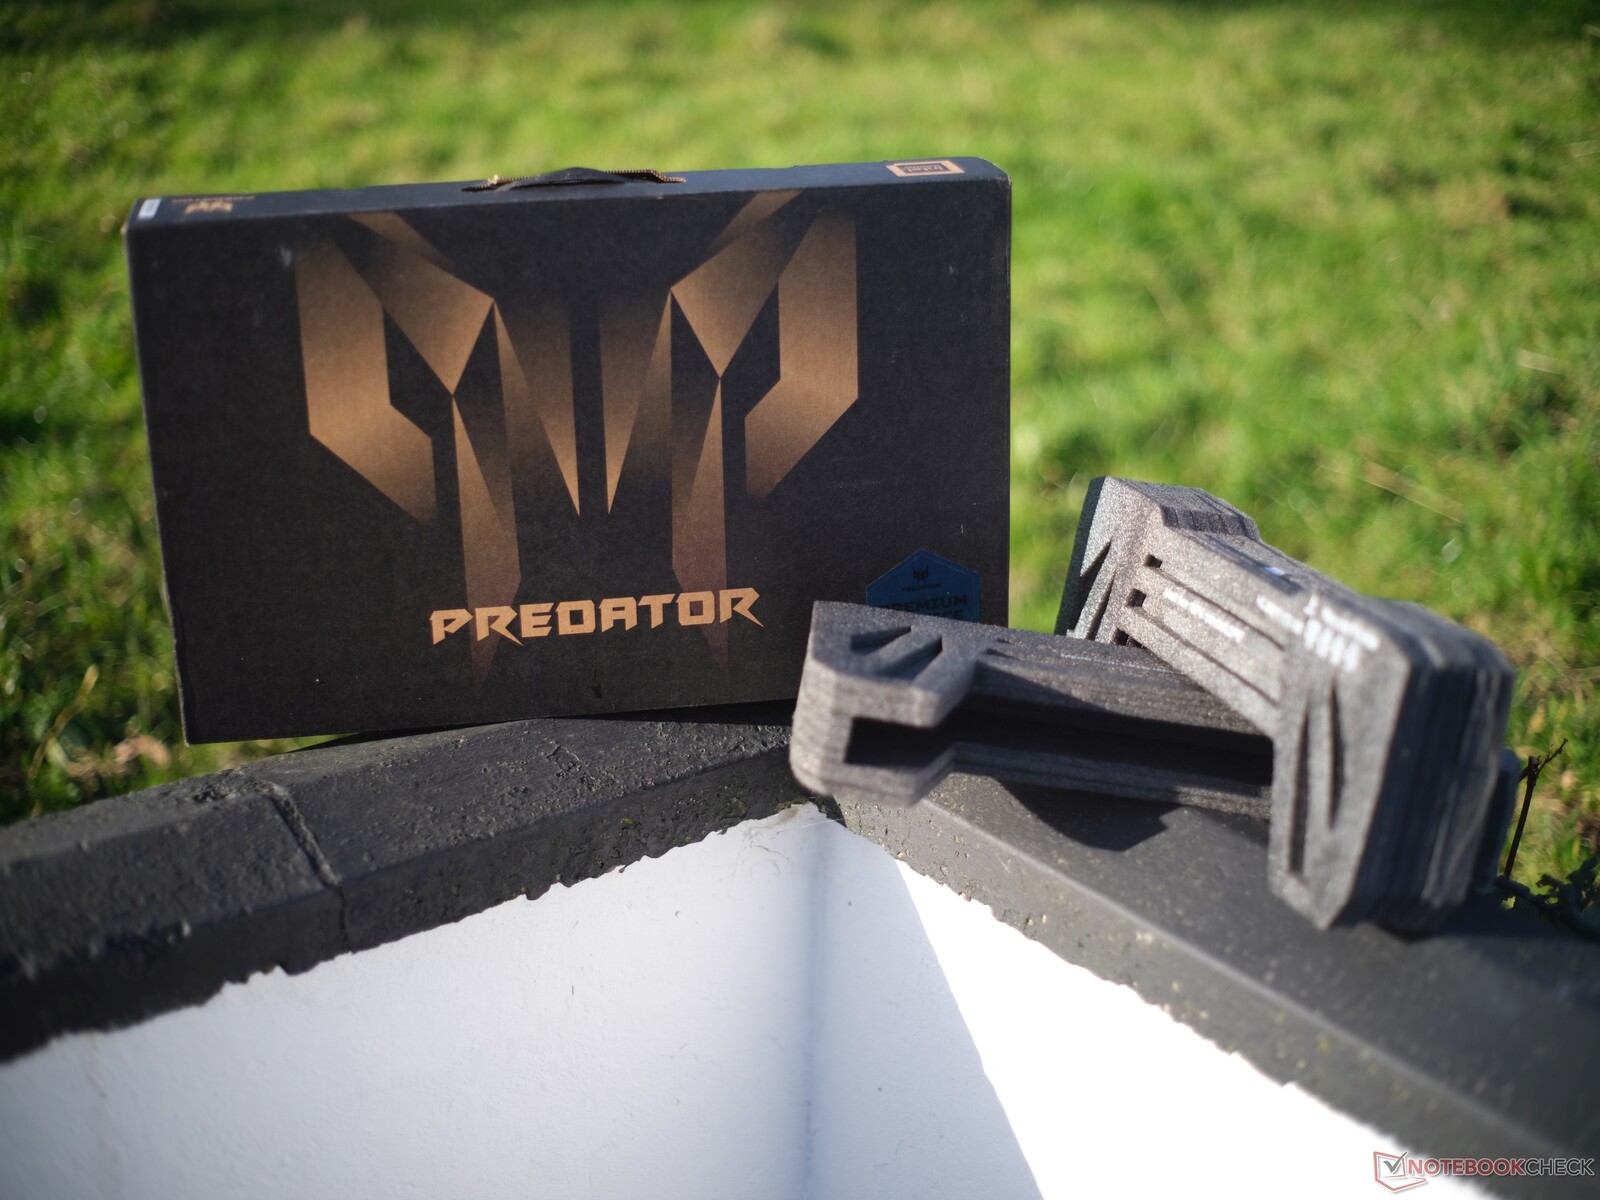
除了设备本身,笔记本电脑的供货范围只包括一个 230 瓦的电源。总的来说,我们希望看到使用更环保的包装,不使用任何塑料--不过,所使用的材料至少是可回收的。
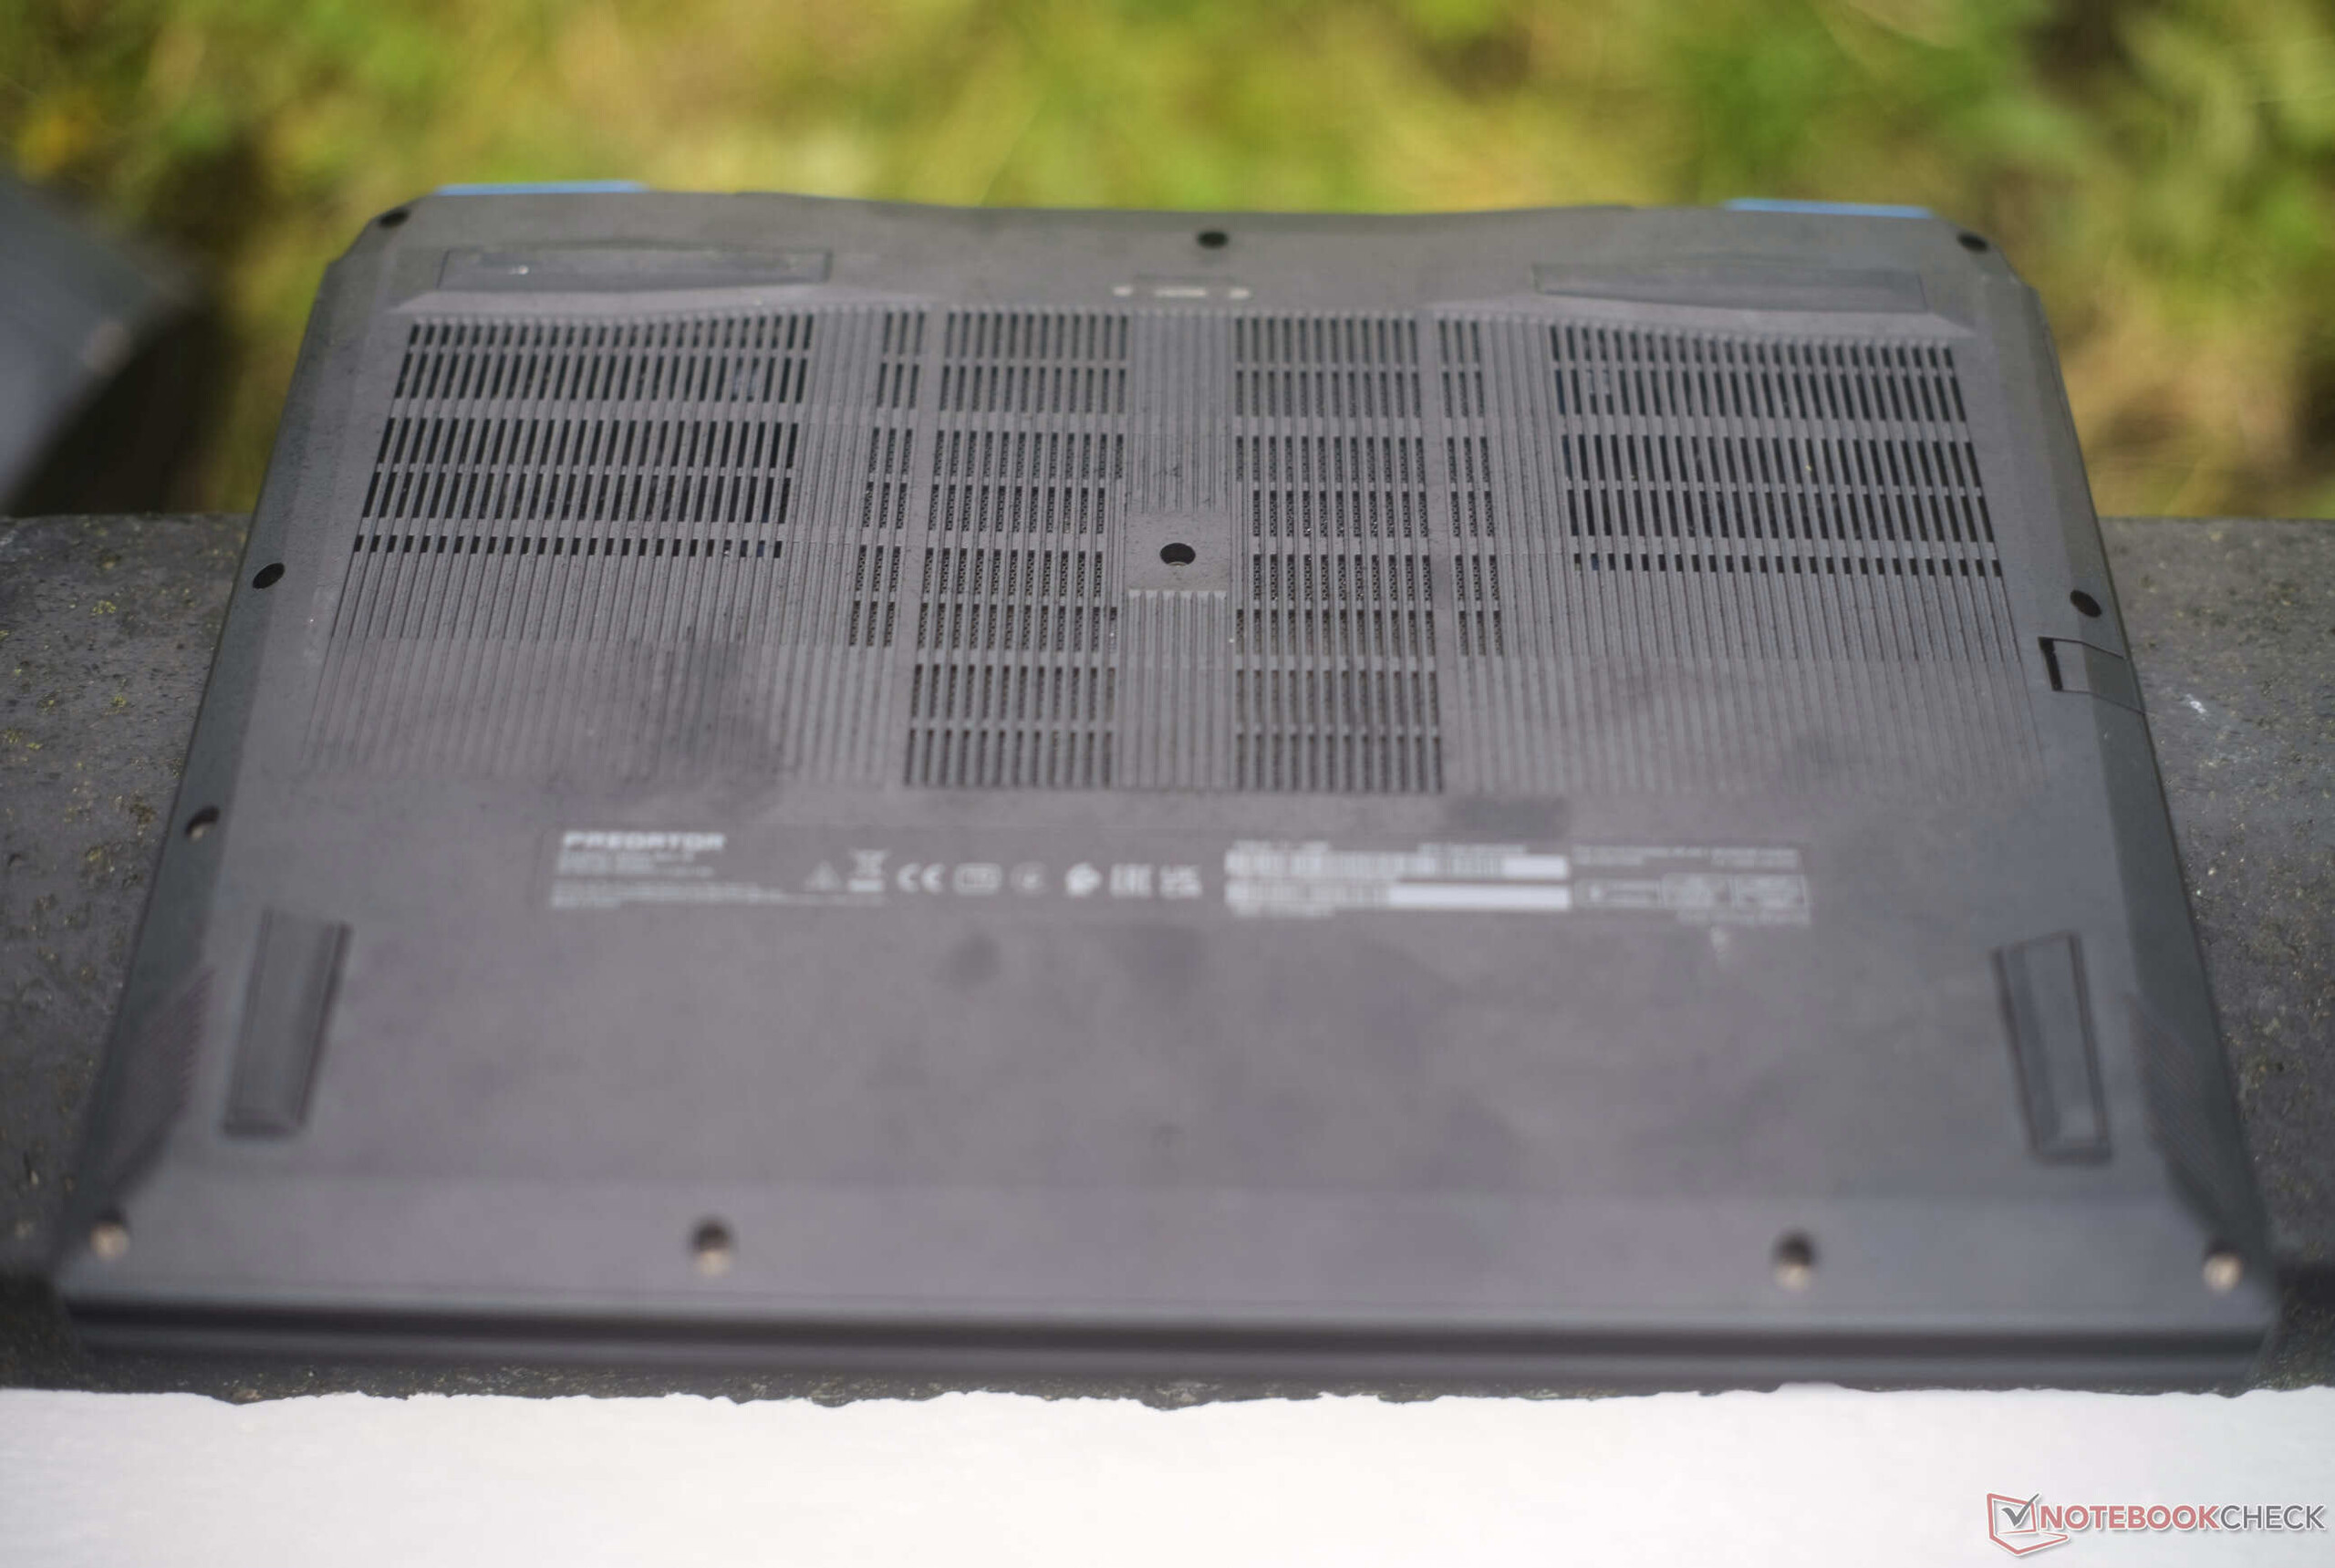
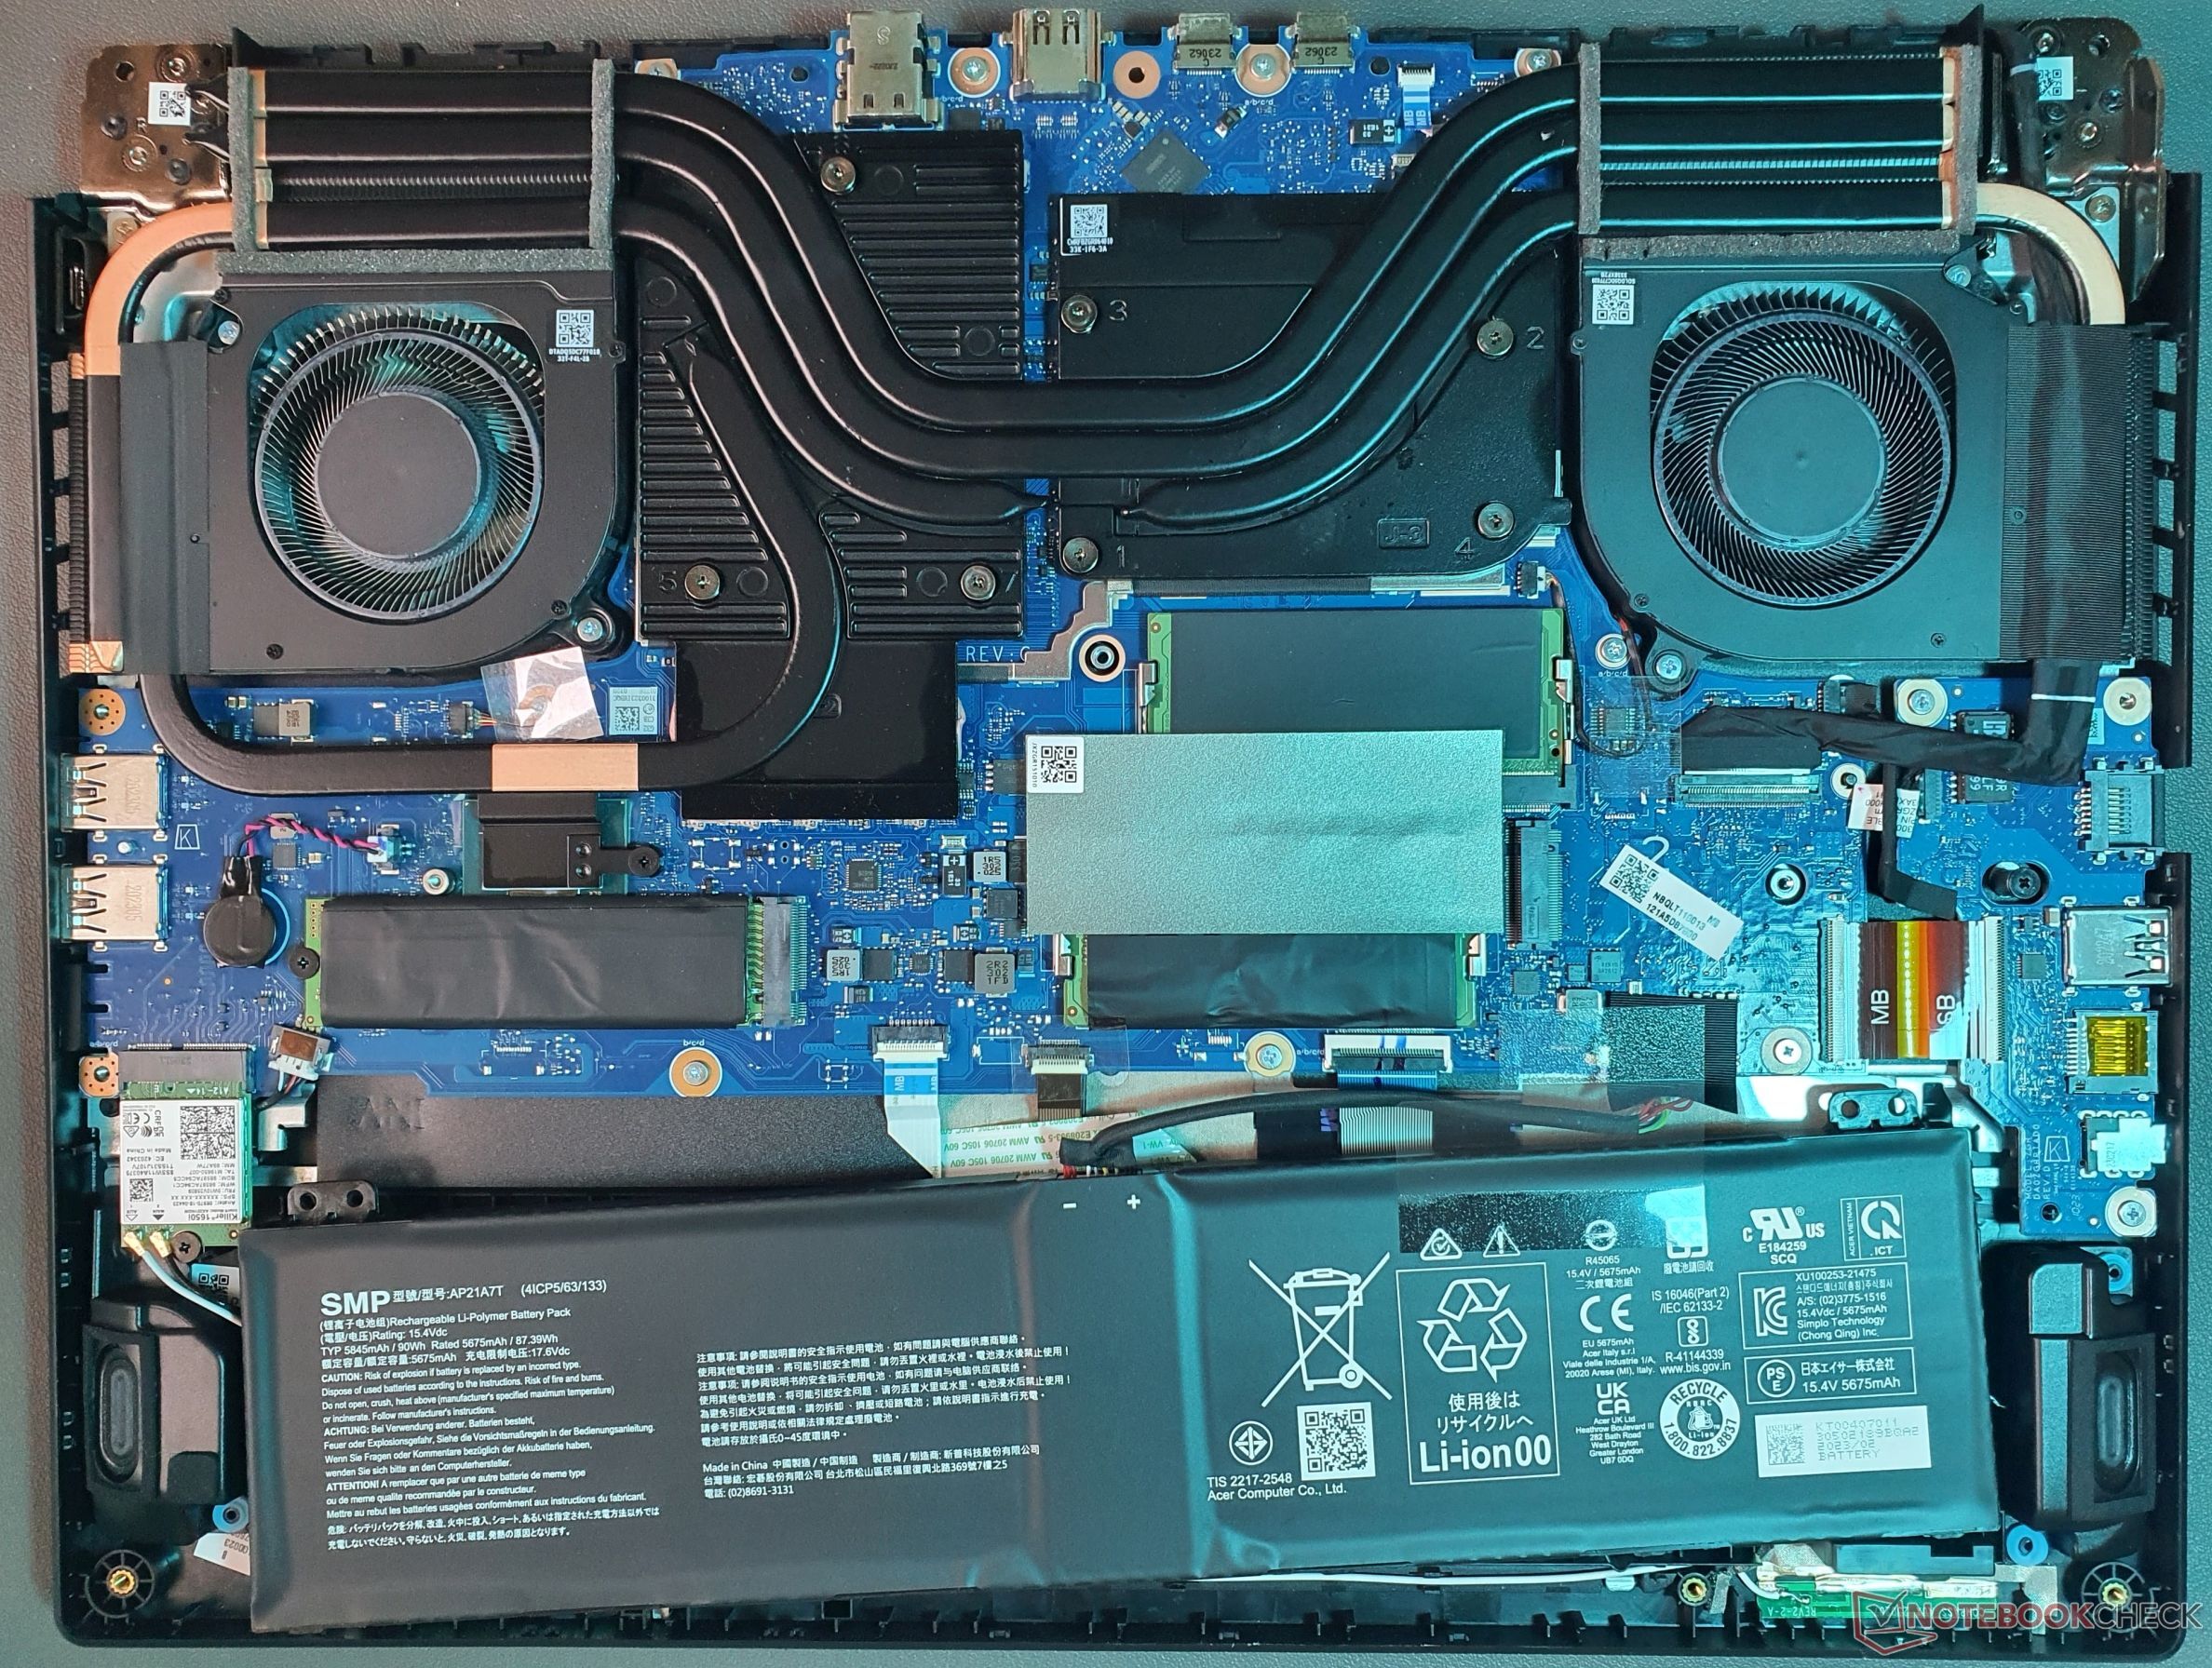
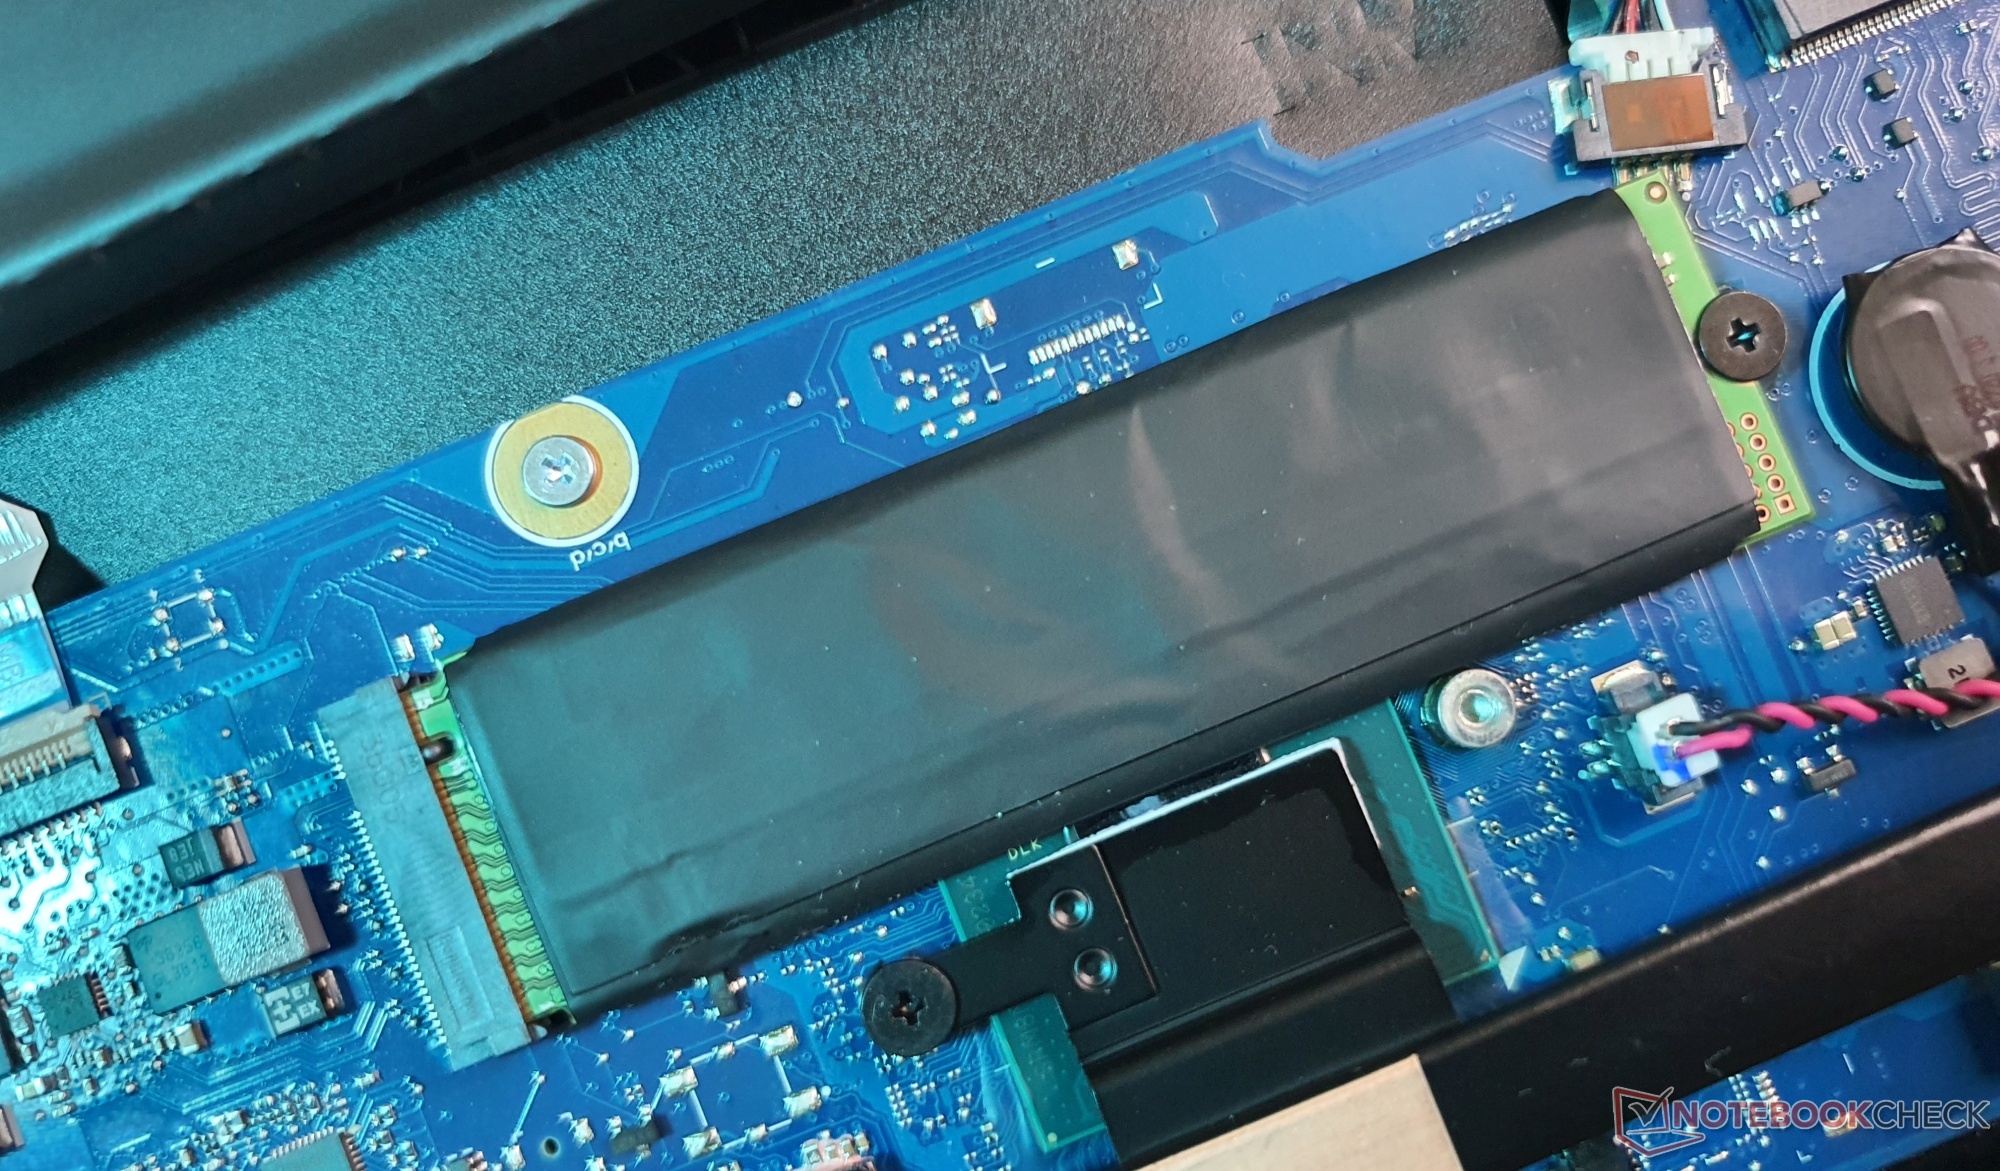
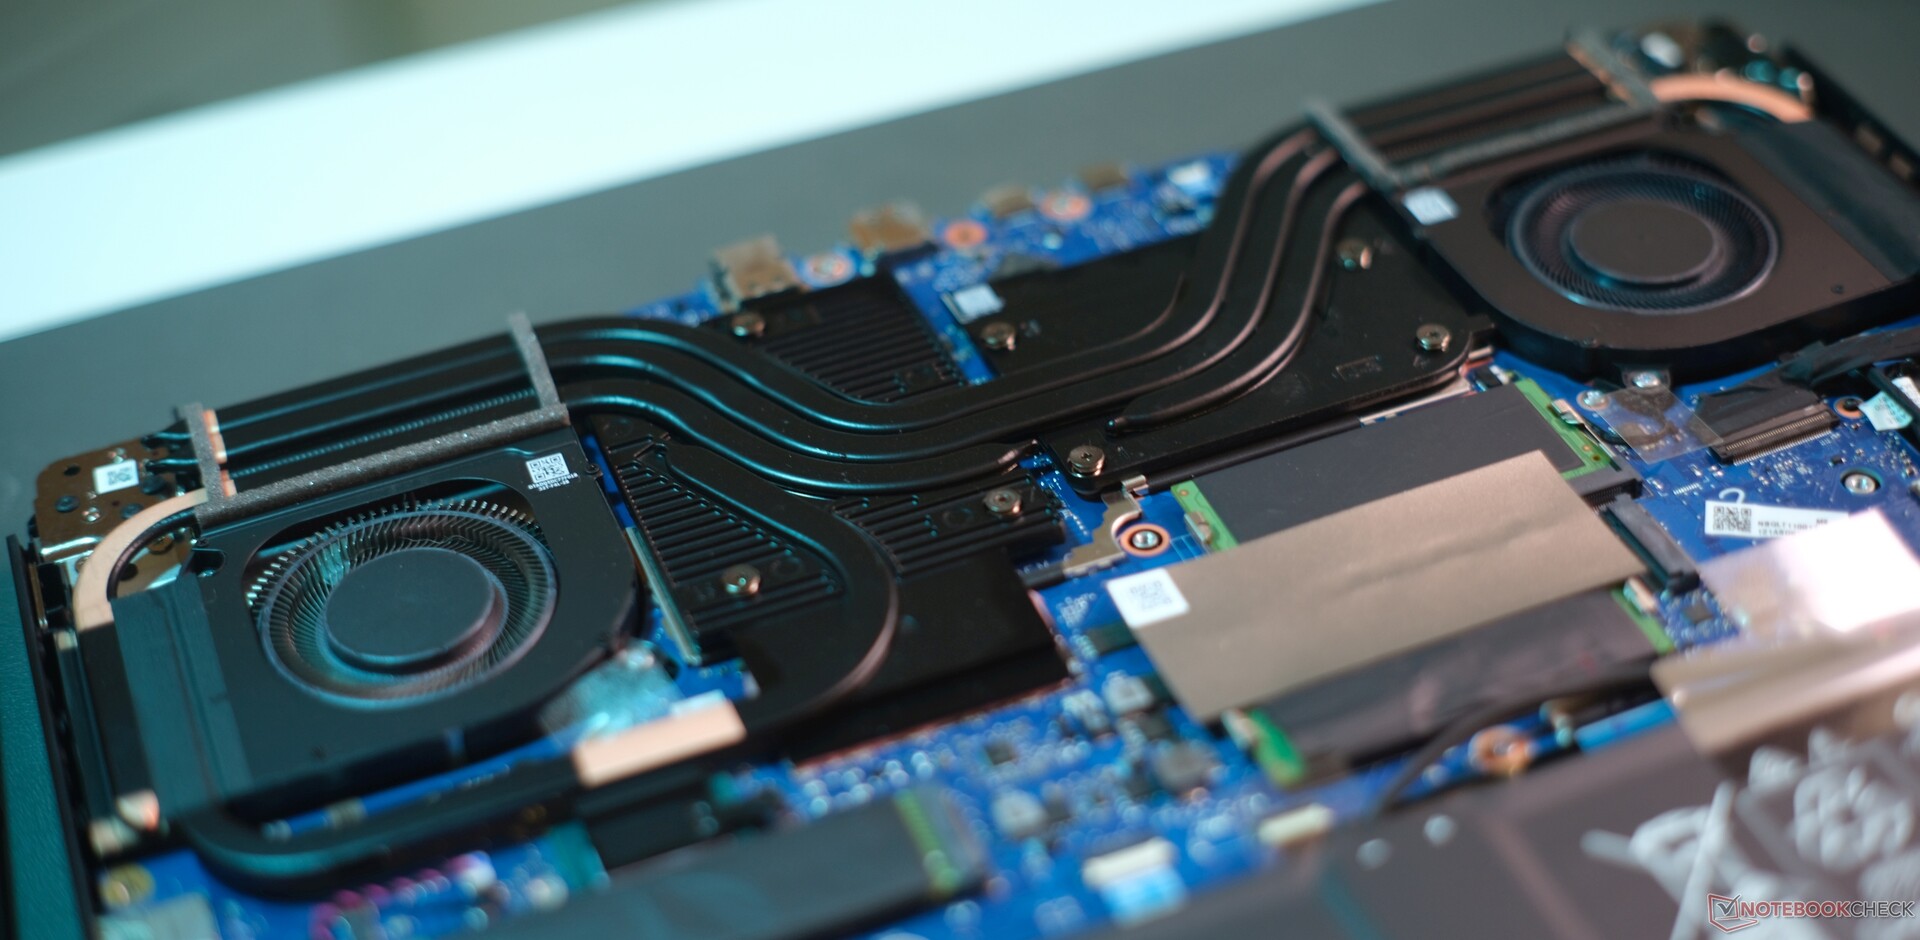
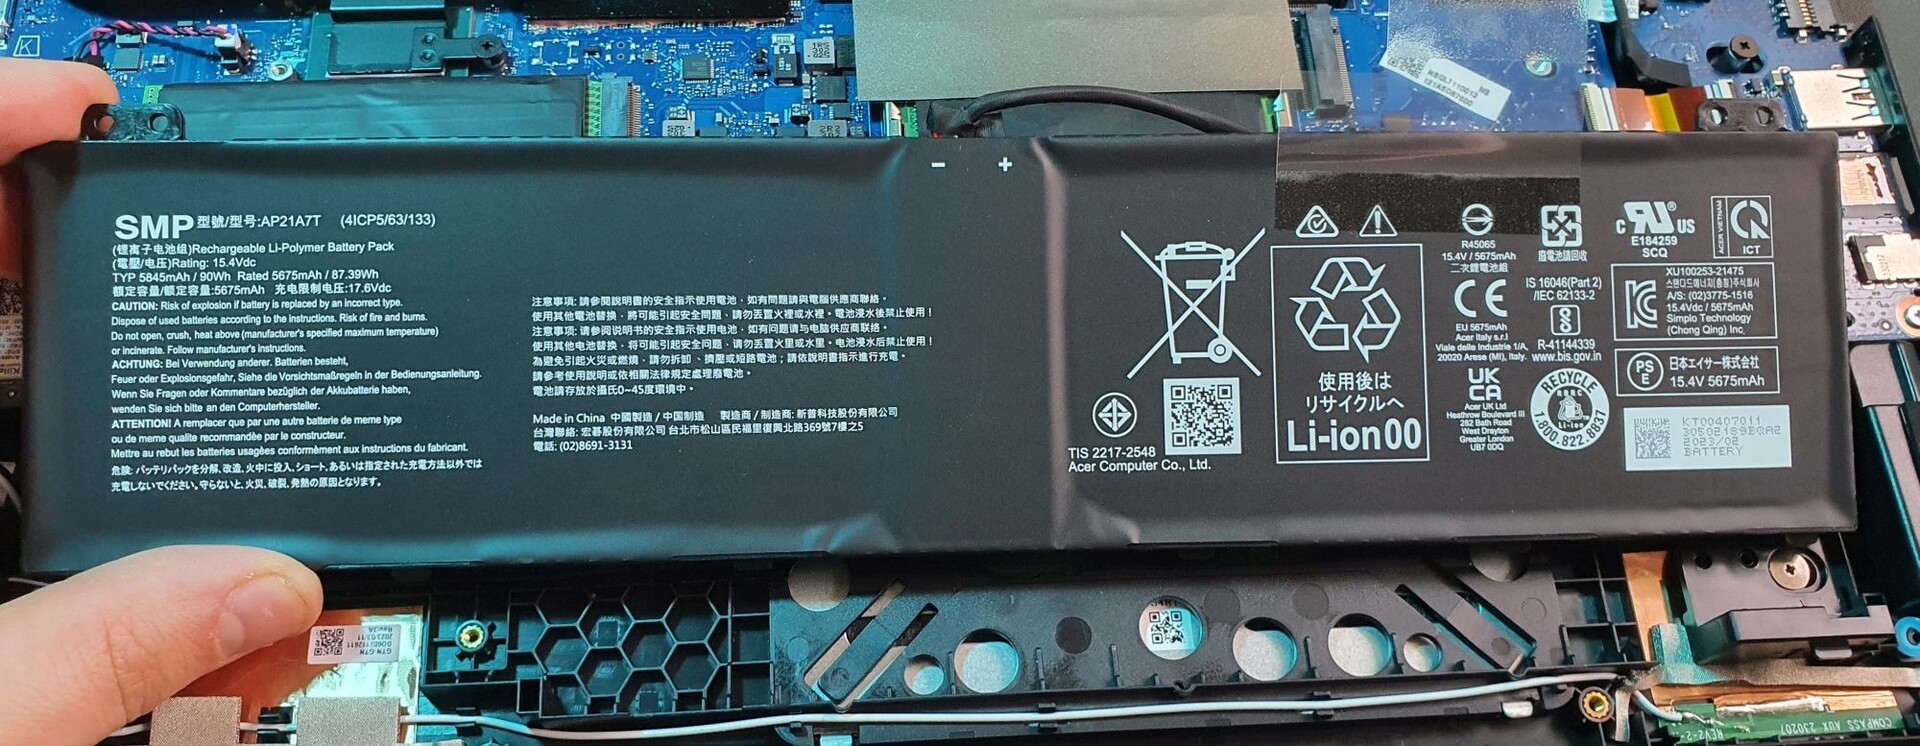
维护
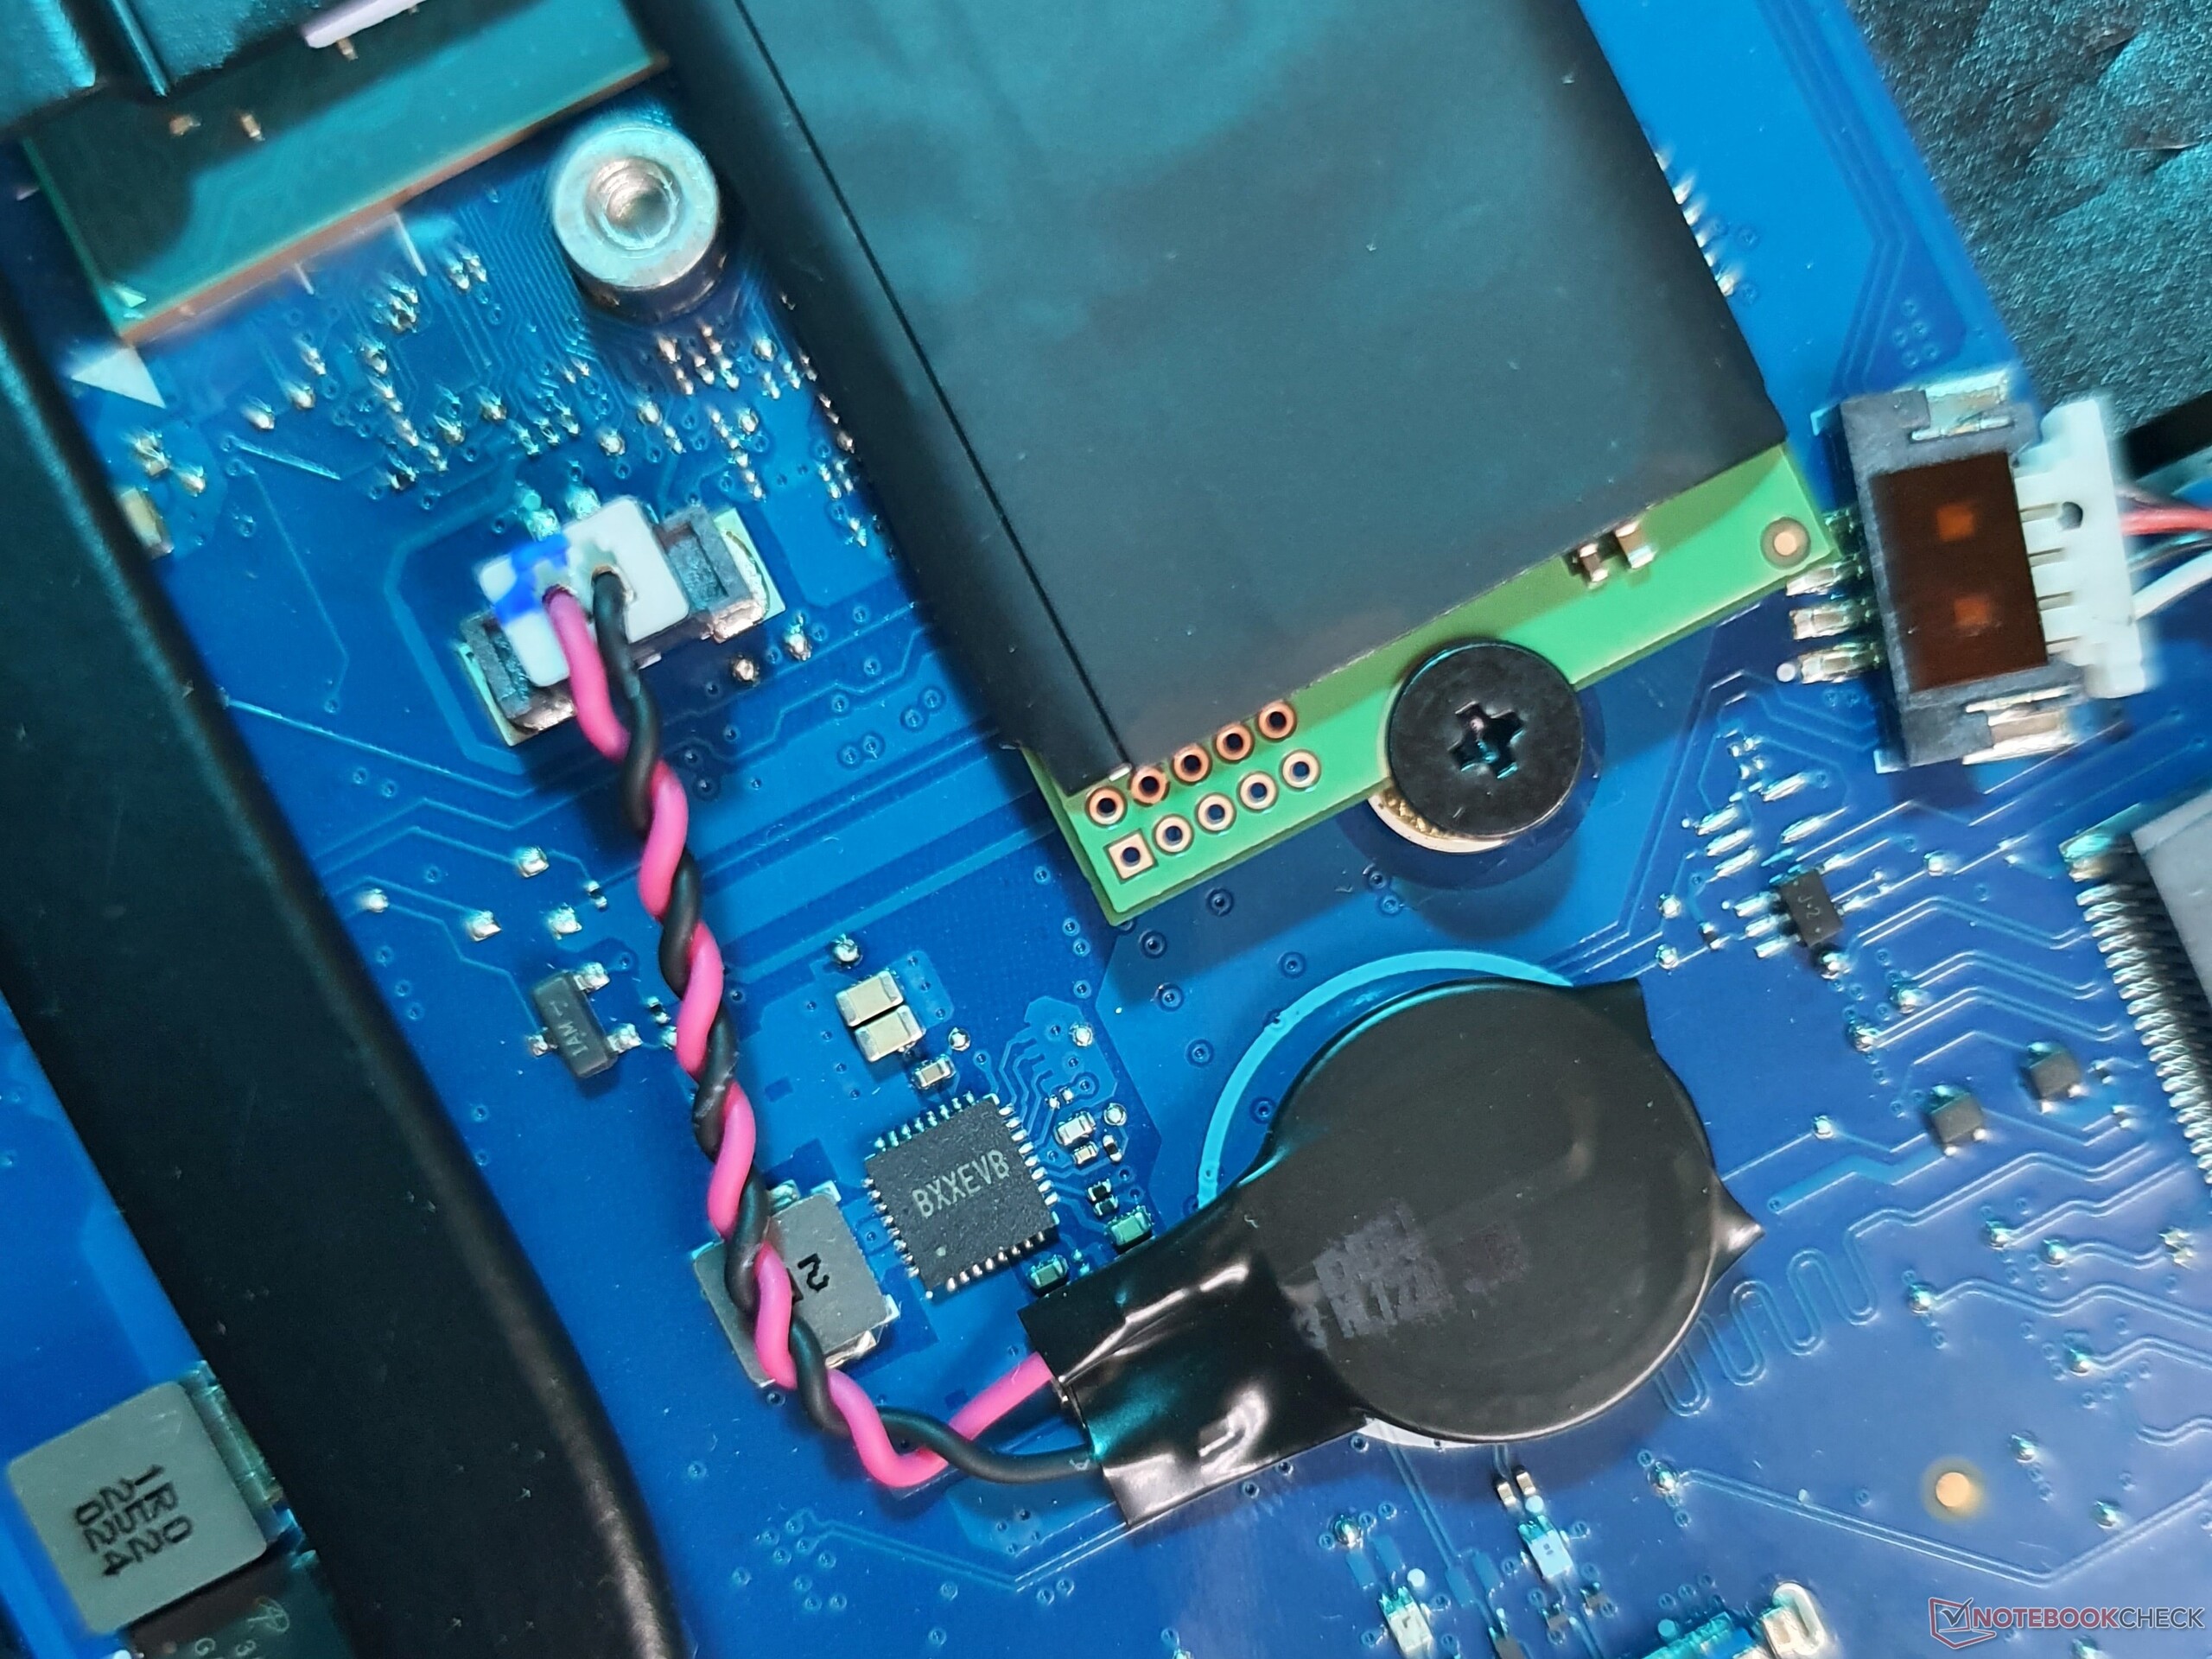
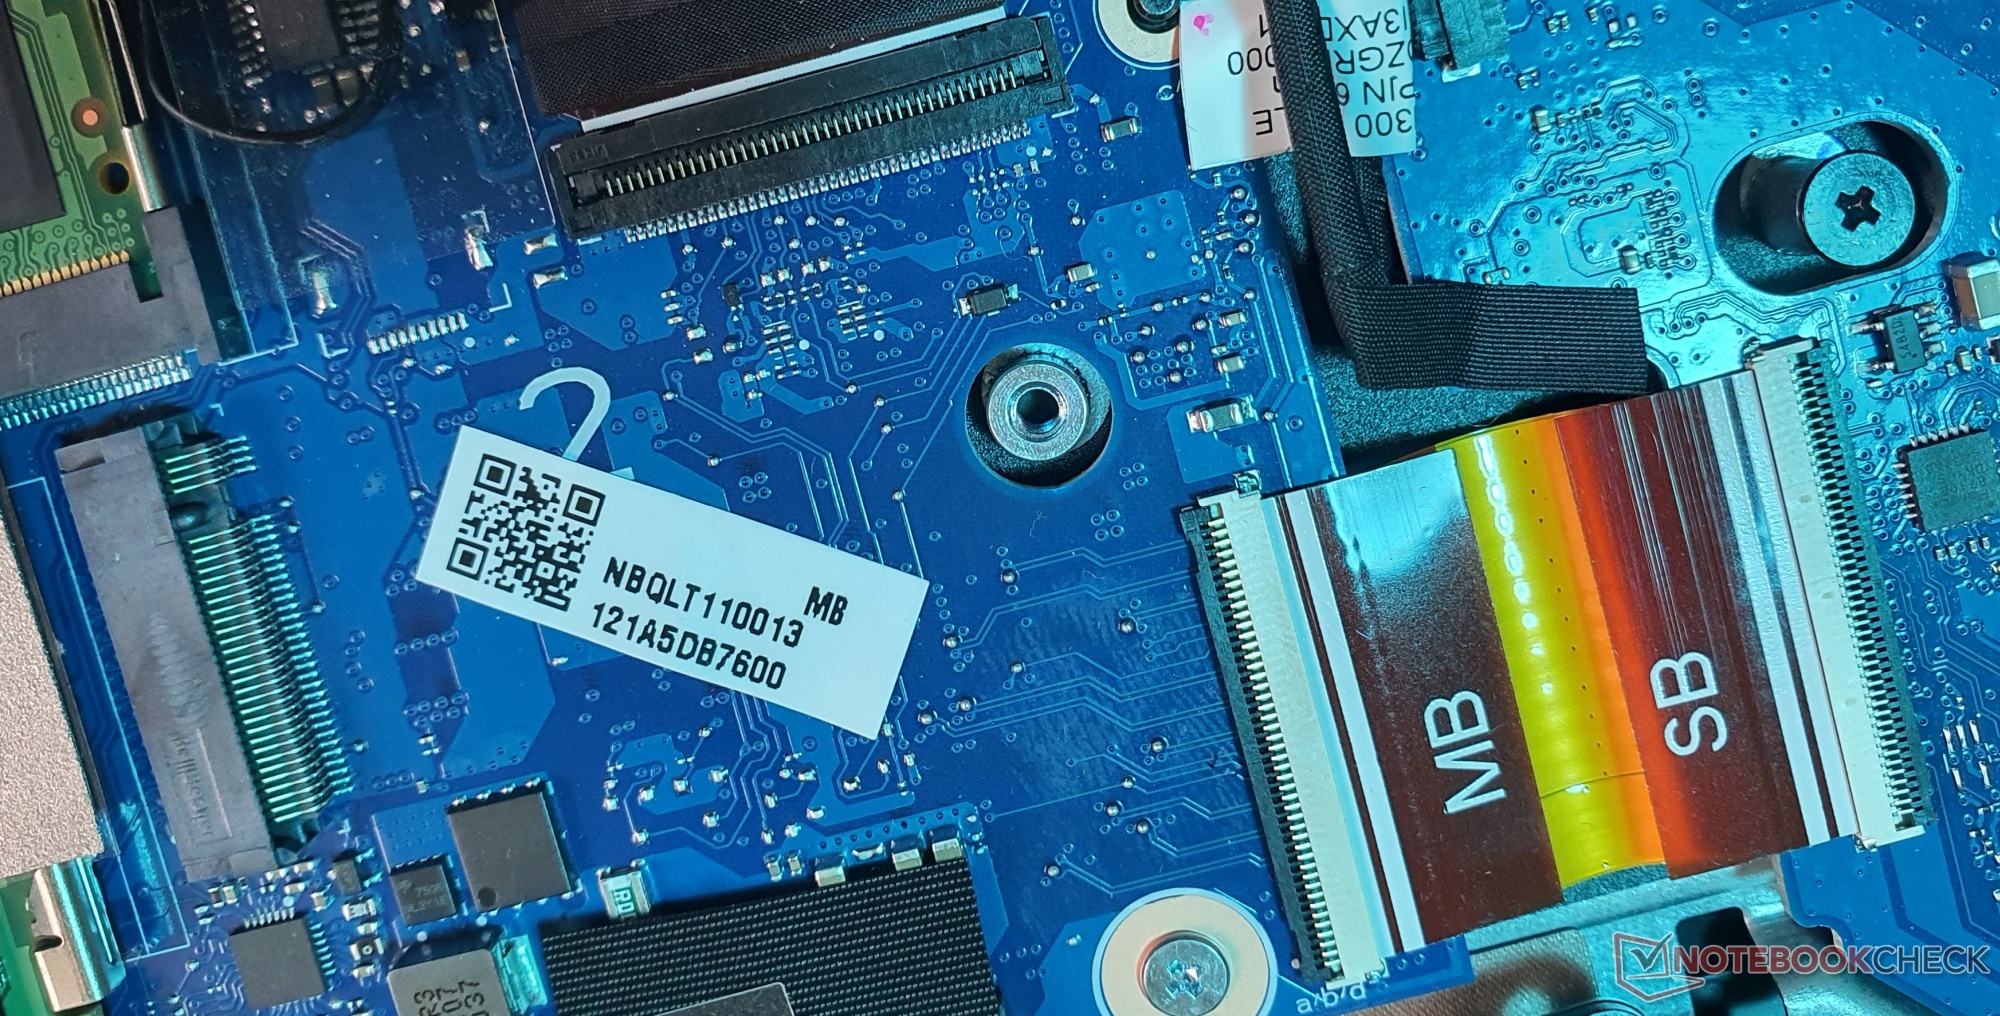
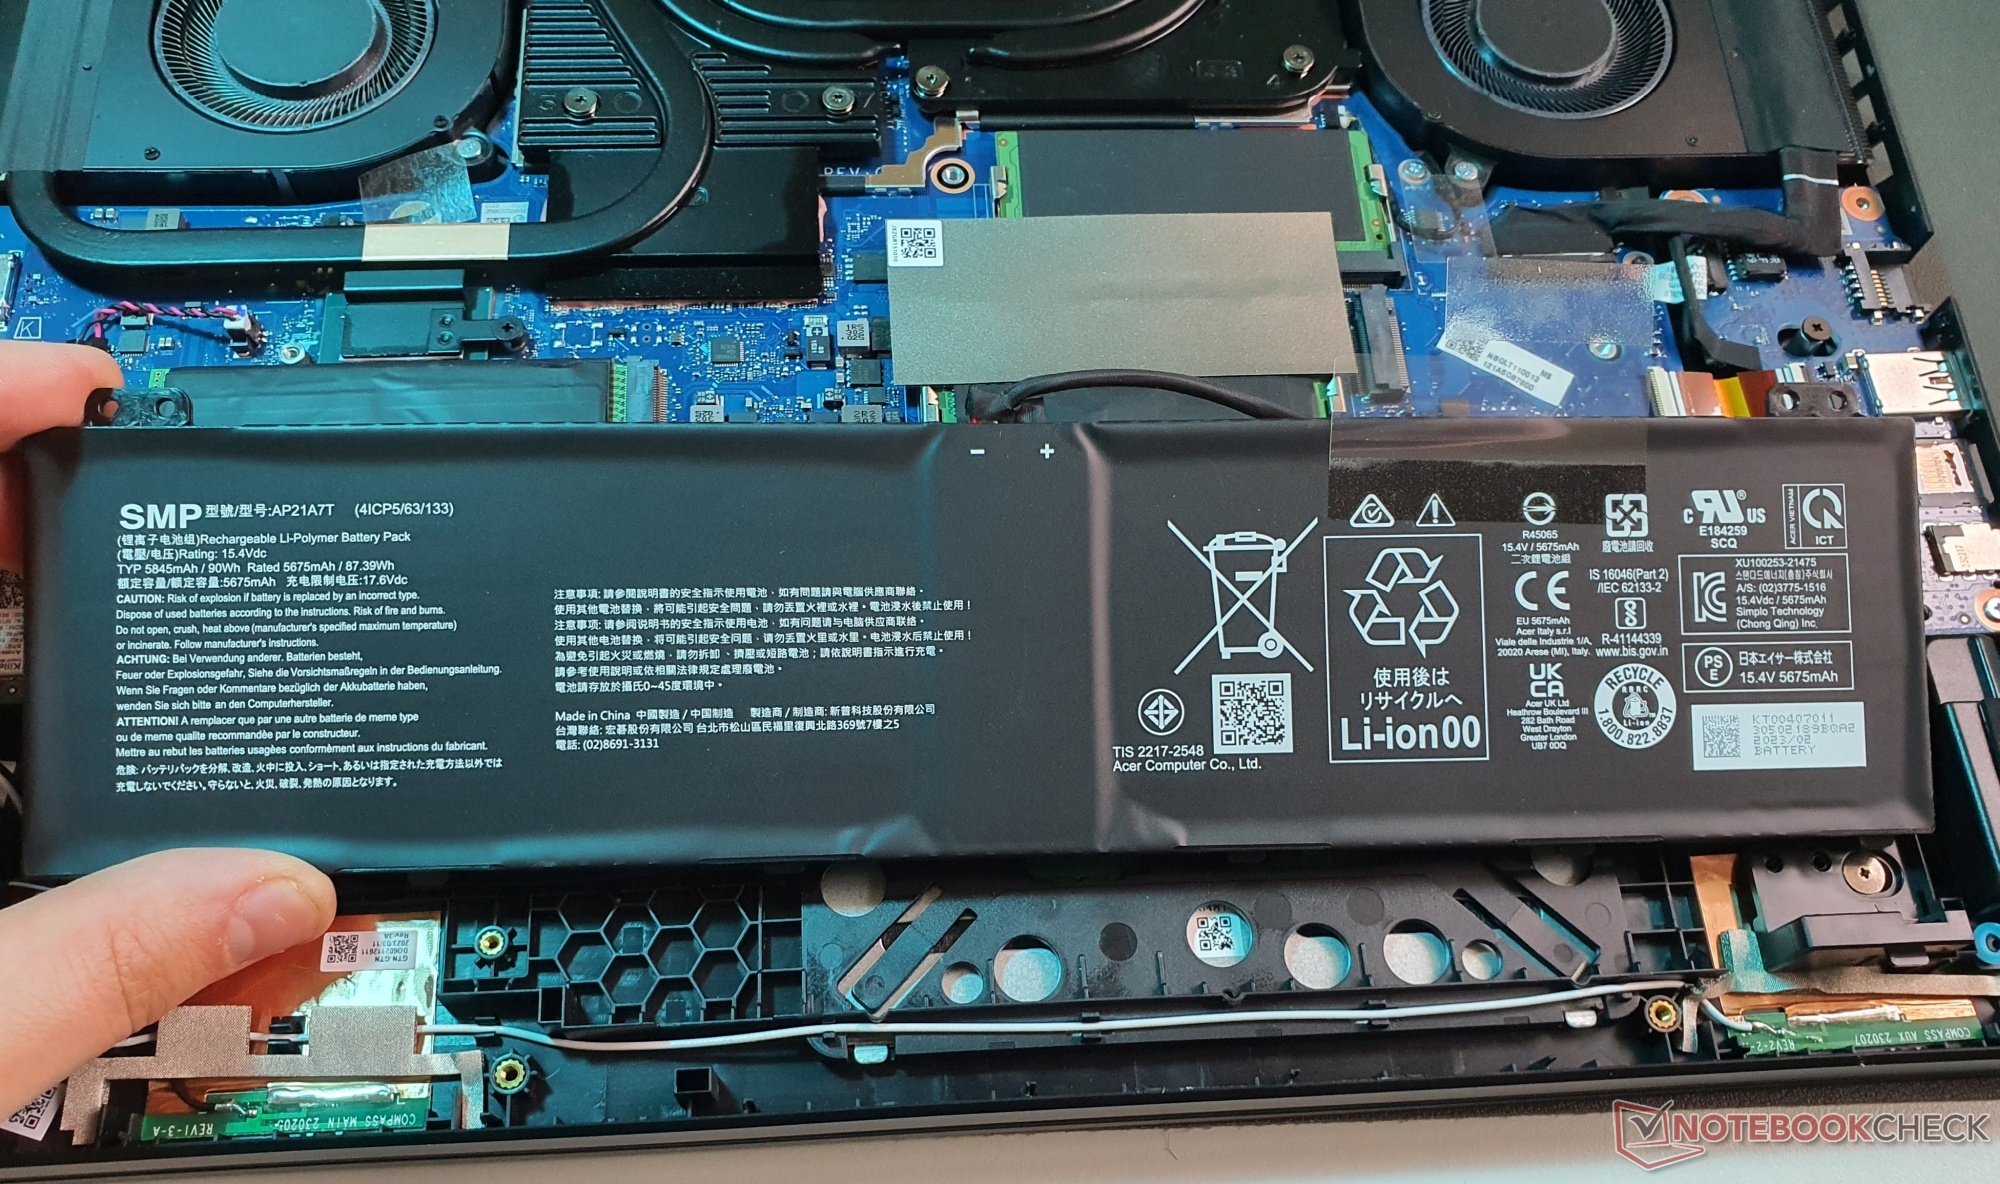
卸下 11 颗十字螺丝后,就可以轻松进入机箱内部。机箱内有两个内存组和两个 M.2-2280 插槽,两侧还安装了固态硬盘。还可以更换 WiFi 芯片和 BIOS 电池。电池由机箱螺丝和底壳固定,因此最初看起来就像松散地放在机箱中。
保修
宏碁为这款笔记本电脑提供为期一年的有限保修服务,并可通过Acer Care Plus 提供扩展服务计划。.
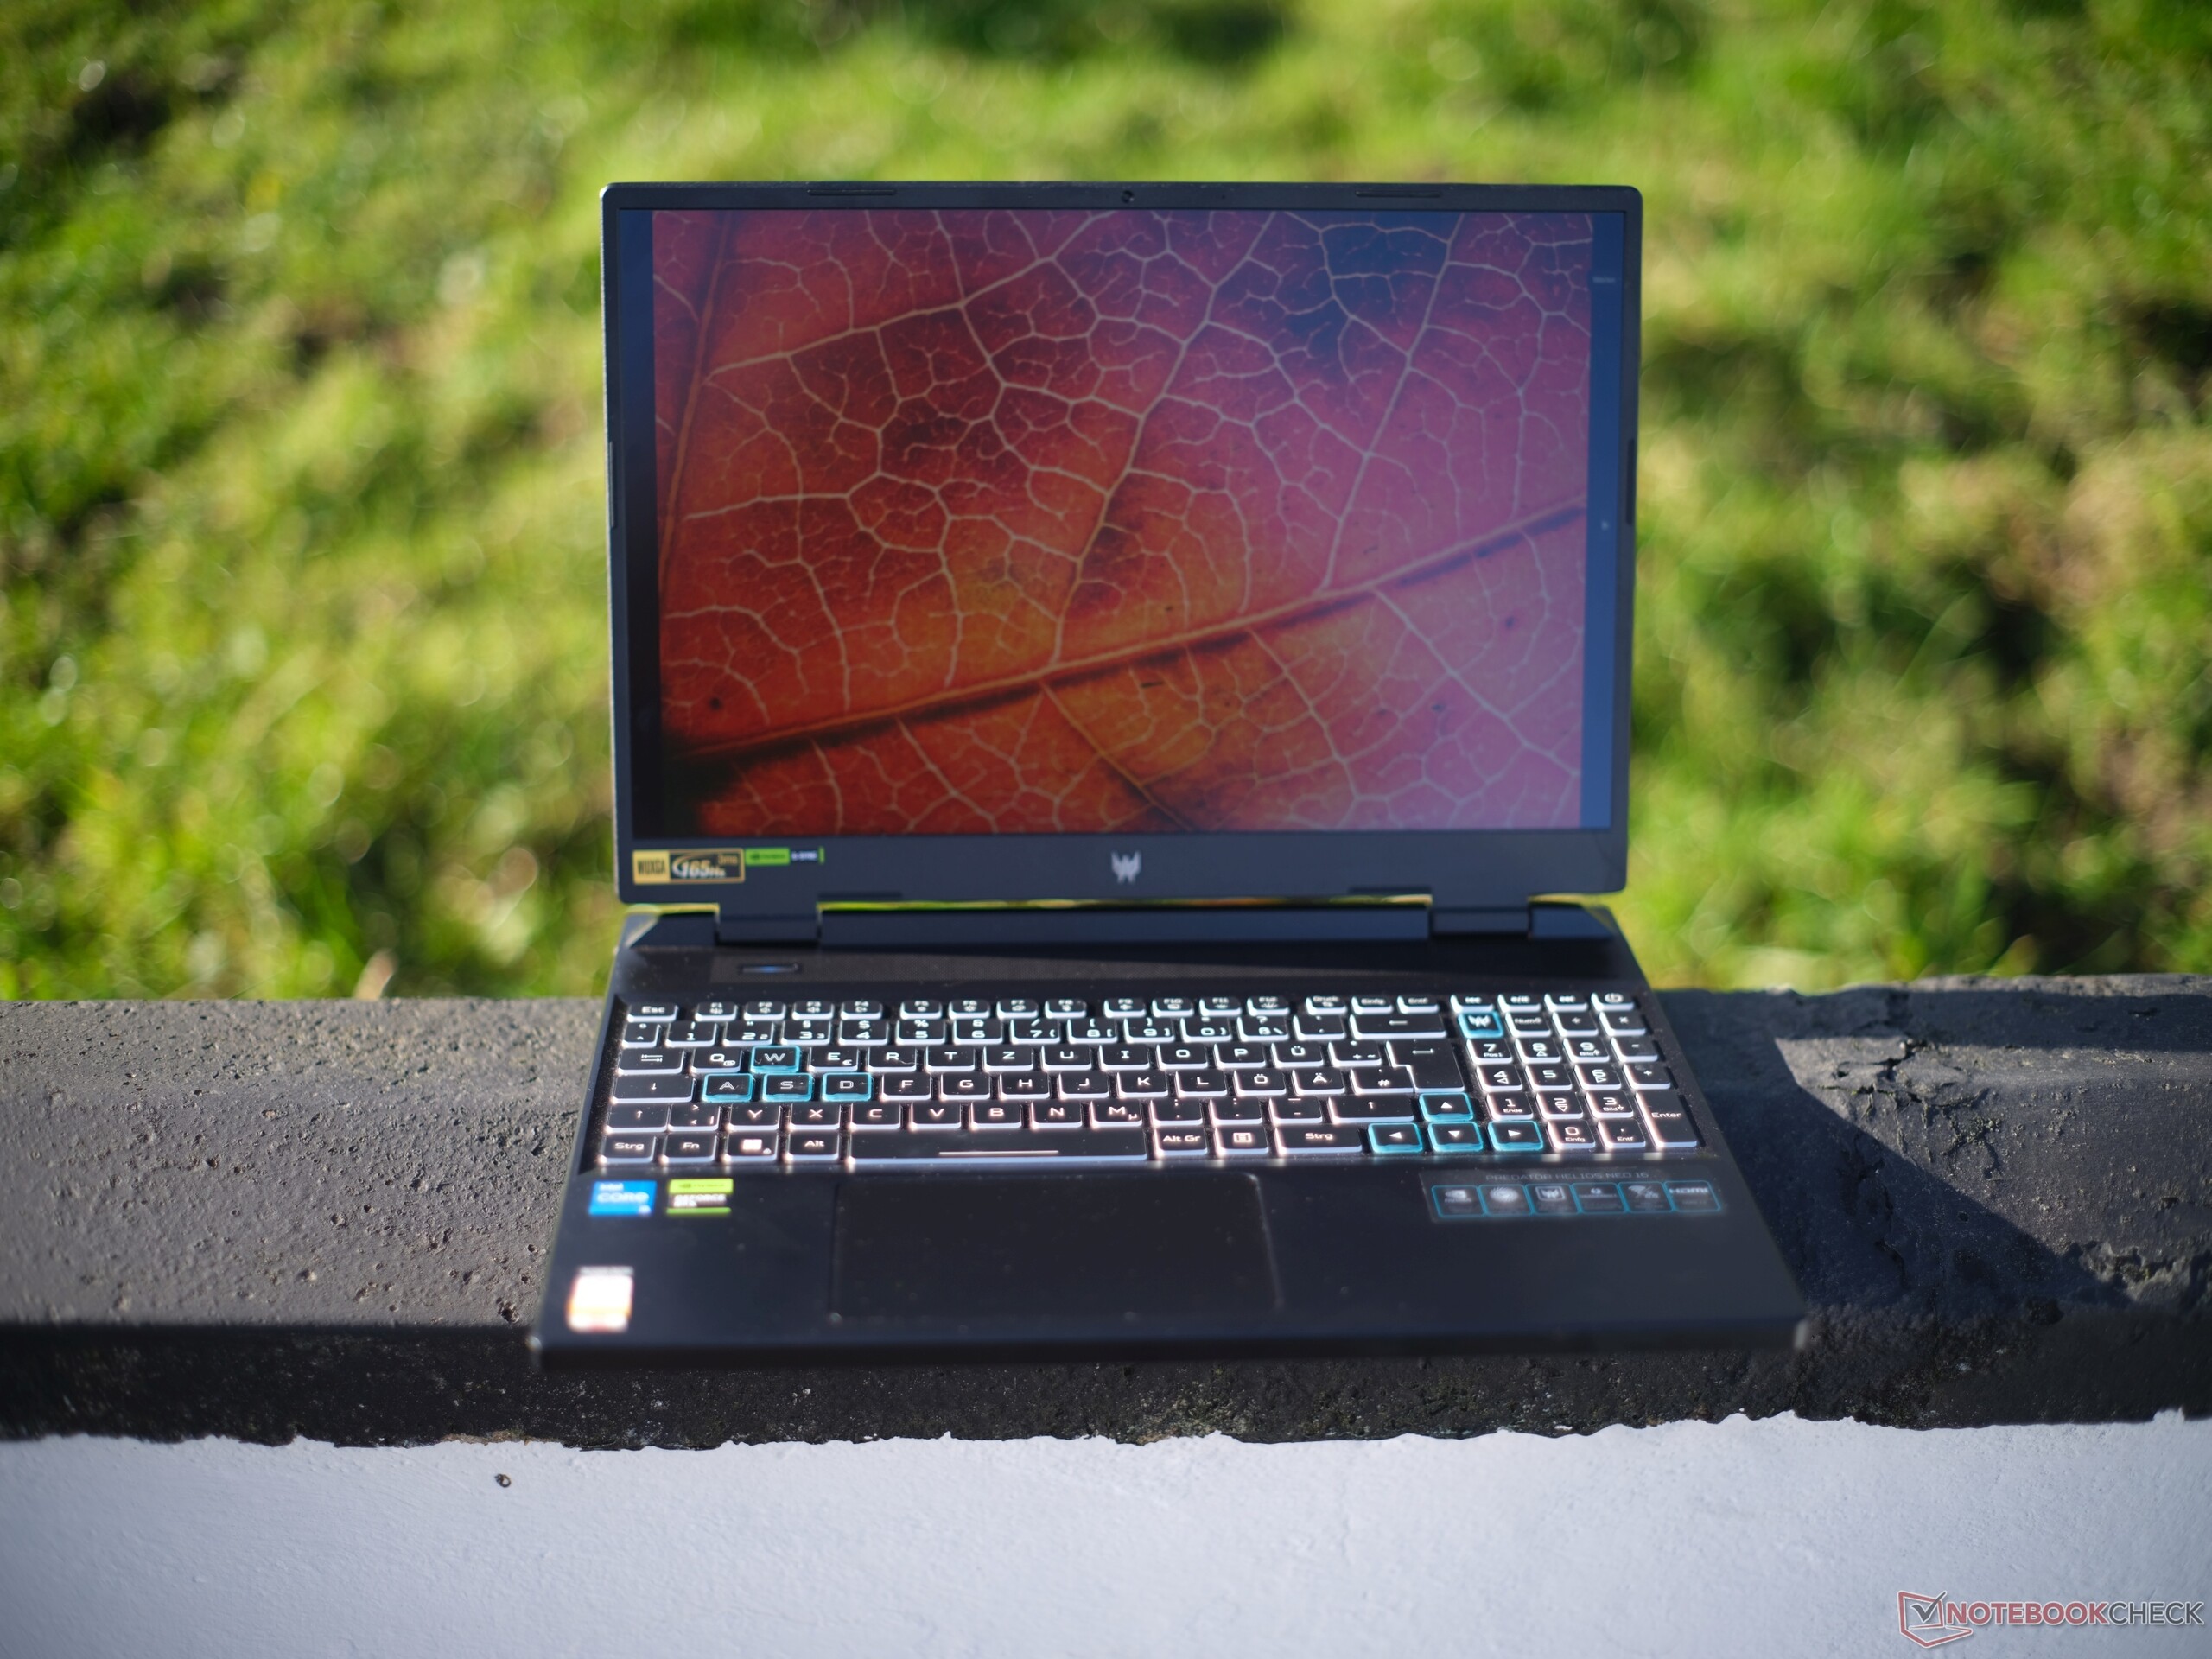
Input devices: Solid standard features with four-zone RGB lighting
键盘
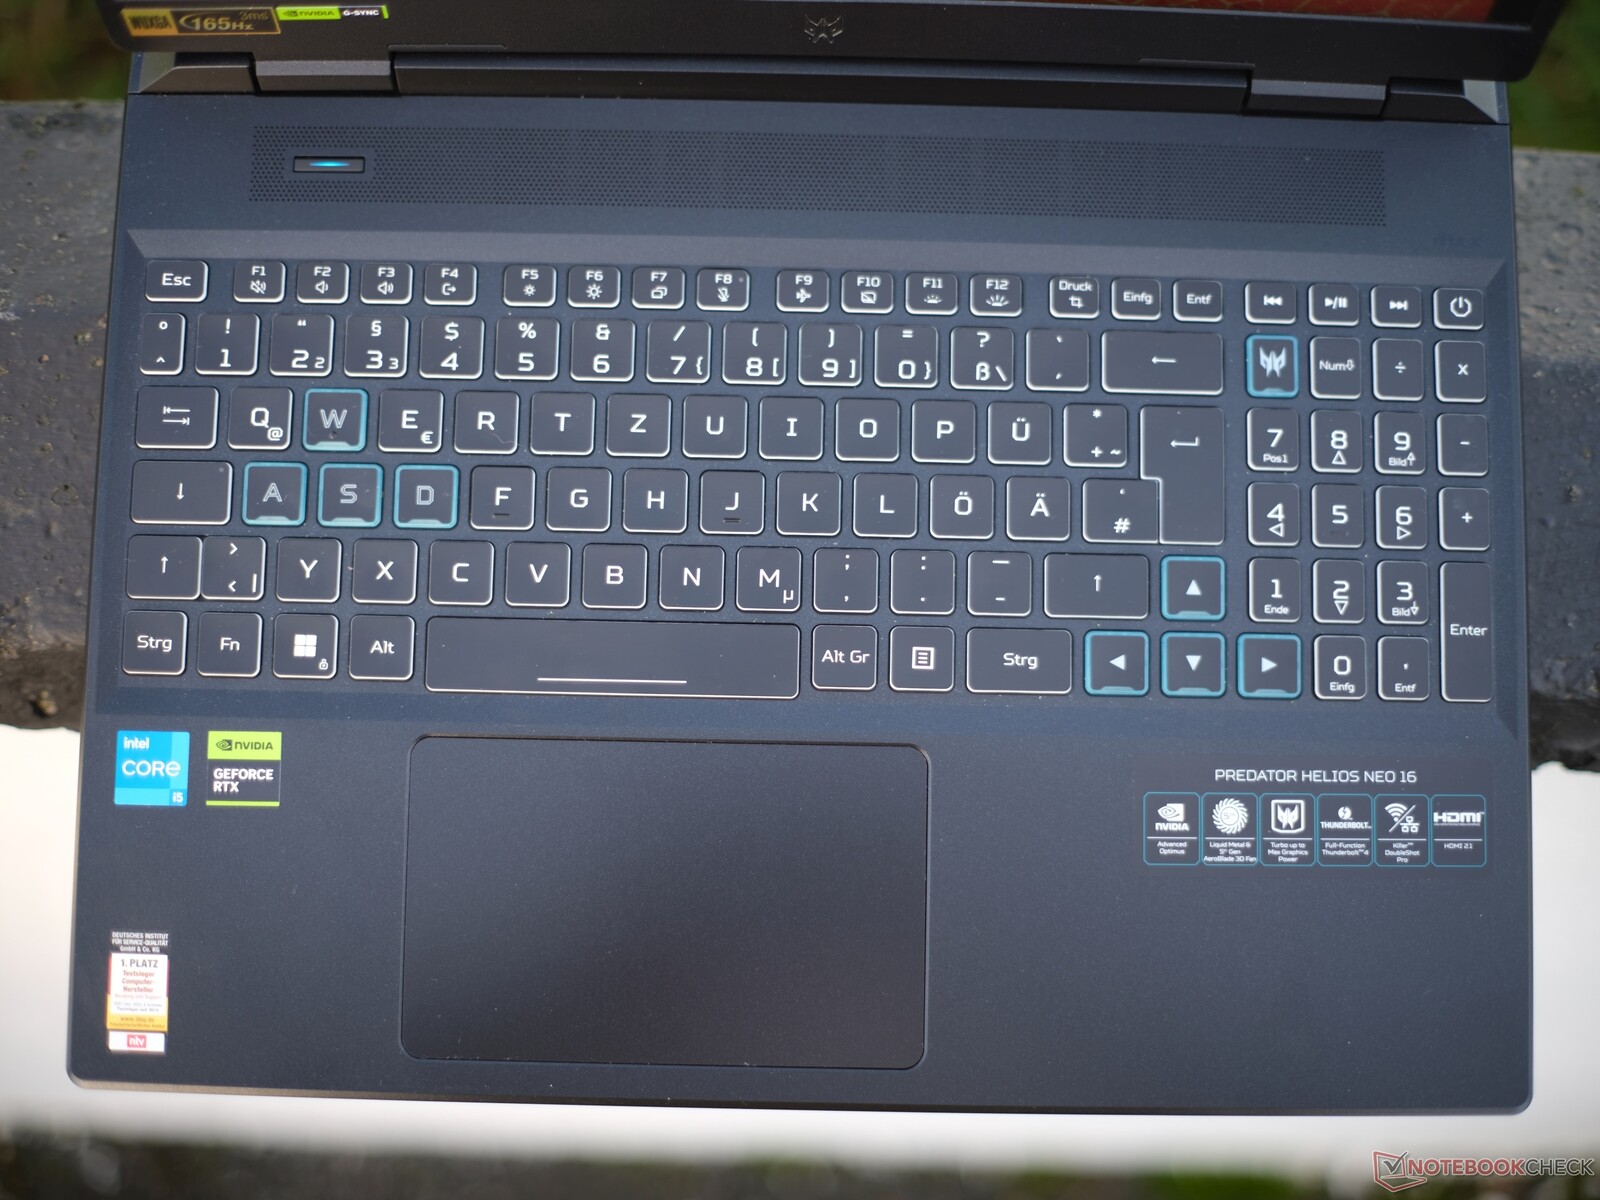
宏碁在这款设备上安装了一个 6 排 Chiclet 键盘,按键和间距都足够大。它与 Helios 16 的键盘几乎没有任何共同之处,但在机械结构和外观上与许多廉价游戏笔记本电脑的键盘相似,例如XMG Apex 15,技嘉 G5或Captiva 高级游戏笔记本电脑.它与 宏碁 Nitro 16.
1.5 毫米的按键提升幅度很大,同时还有一个明显的压力点。不过,按键的阻力还不够明显。键盘在打字时会有轻微翘起(顺便说一句,打字时非常安静),但这在日常使用中不成问题。键盘的布局其实很不错,但右边的 shift 键有点太小,因为方向键是普通大小的,而左边的 shift 键更小。
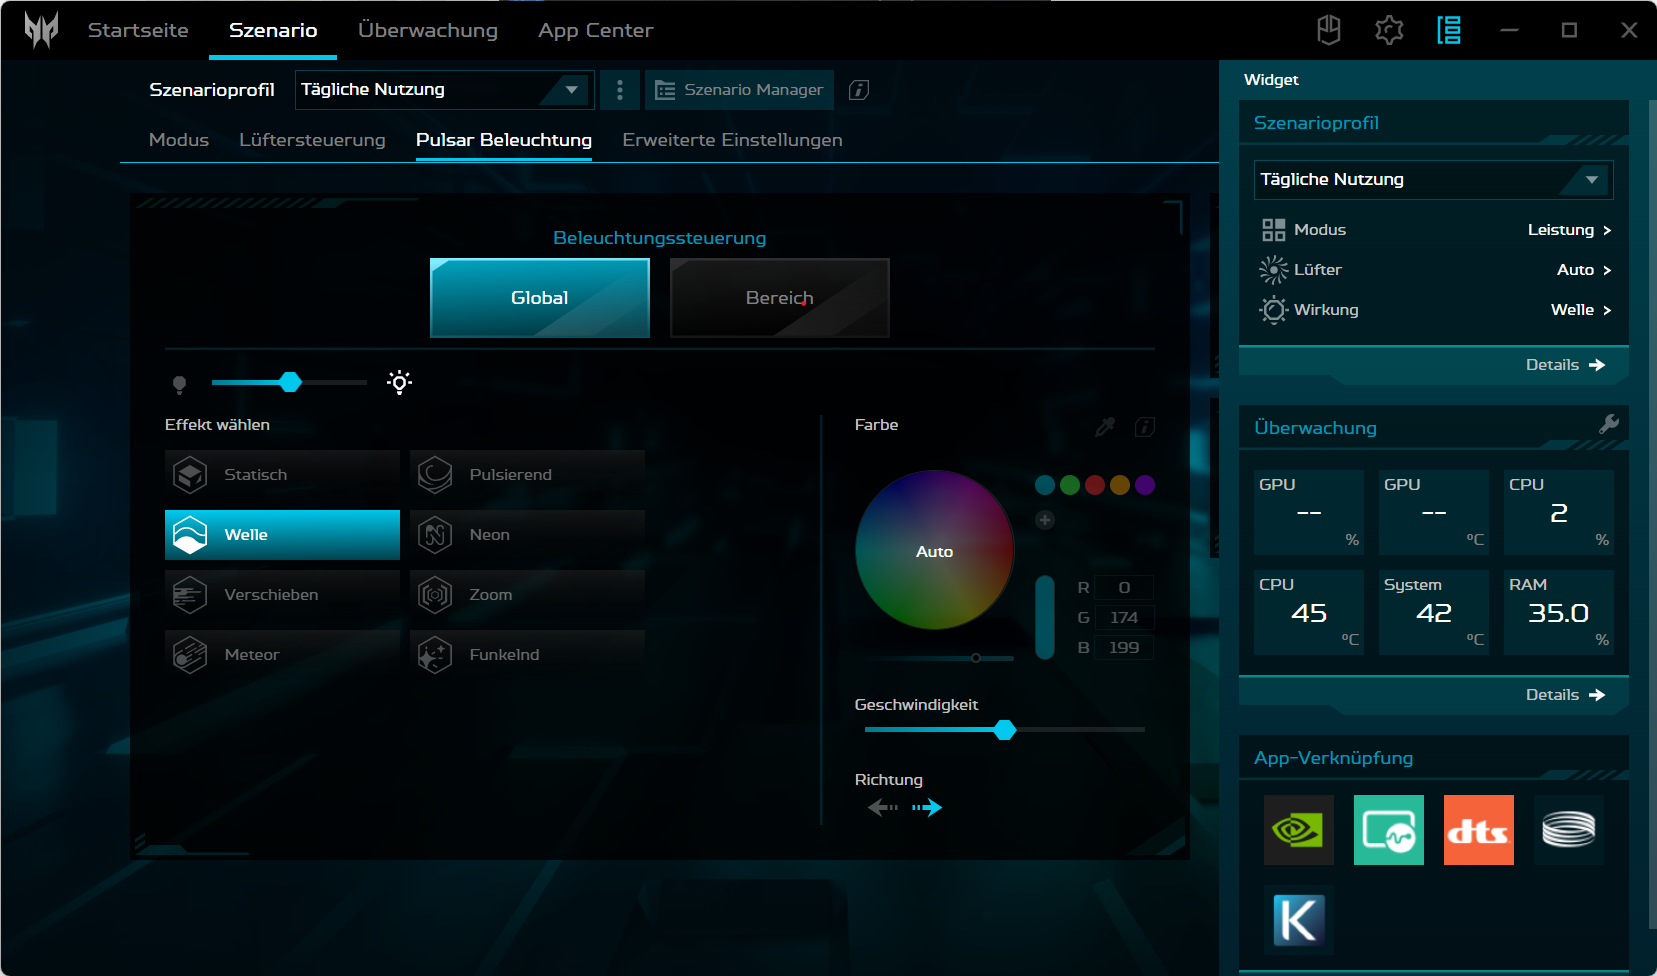
宏碁为这款键盘配备了具有四个强度级别的四区 RGB 照明,而非 Neo 版本则采用了特别均匀的 micro-LED 照明。数字键盘上的徽标按钮可启动 Predator Sense 应用程序,而左上方的长亮按钮则用于在性能模式之间切换。
触摸板
12.6 x 8.3 毫米的触摸板工作非常精确,而且光滑漂亮,尽管它是由塑料制成,而不是像 Helios 16 那样由玻璃制成。Helios 16的玻璃材质。滚动和执行多点触控手势都很方便。集成的点击按钮抬起时间很短,点击感令人满意。
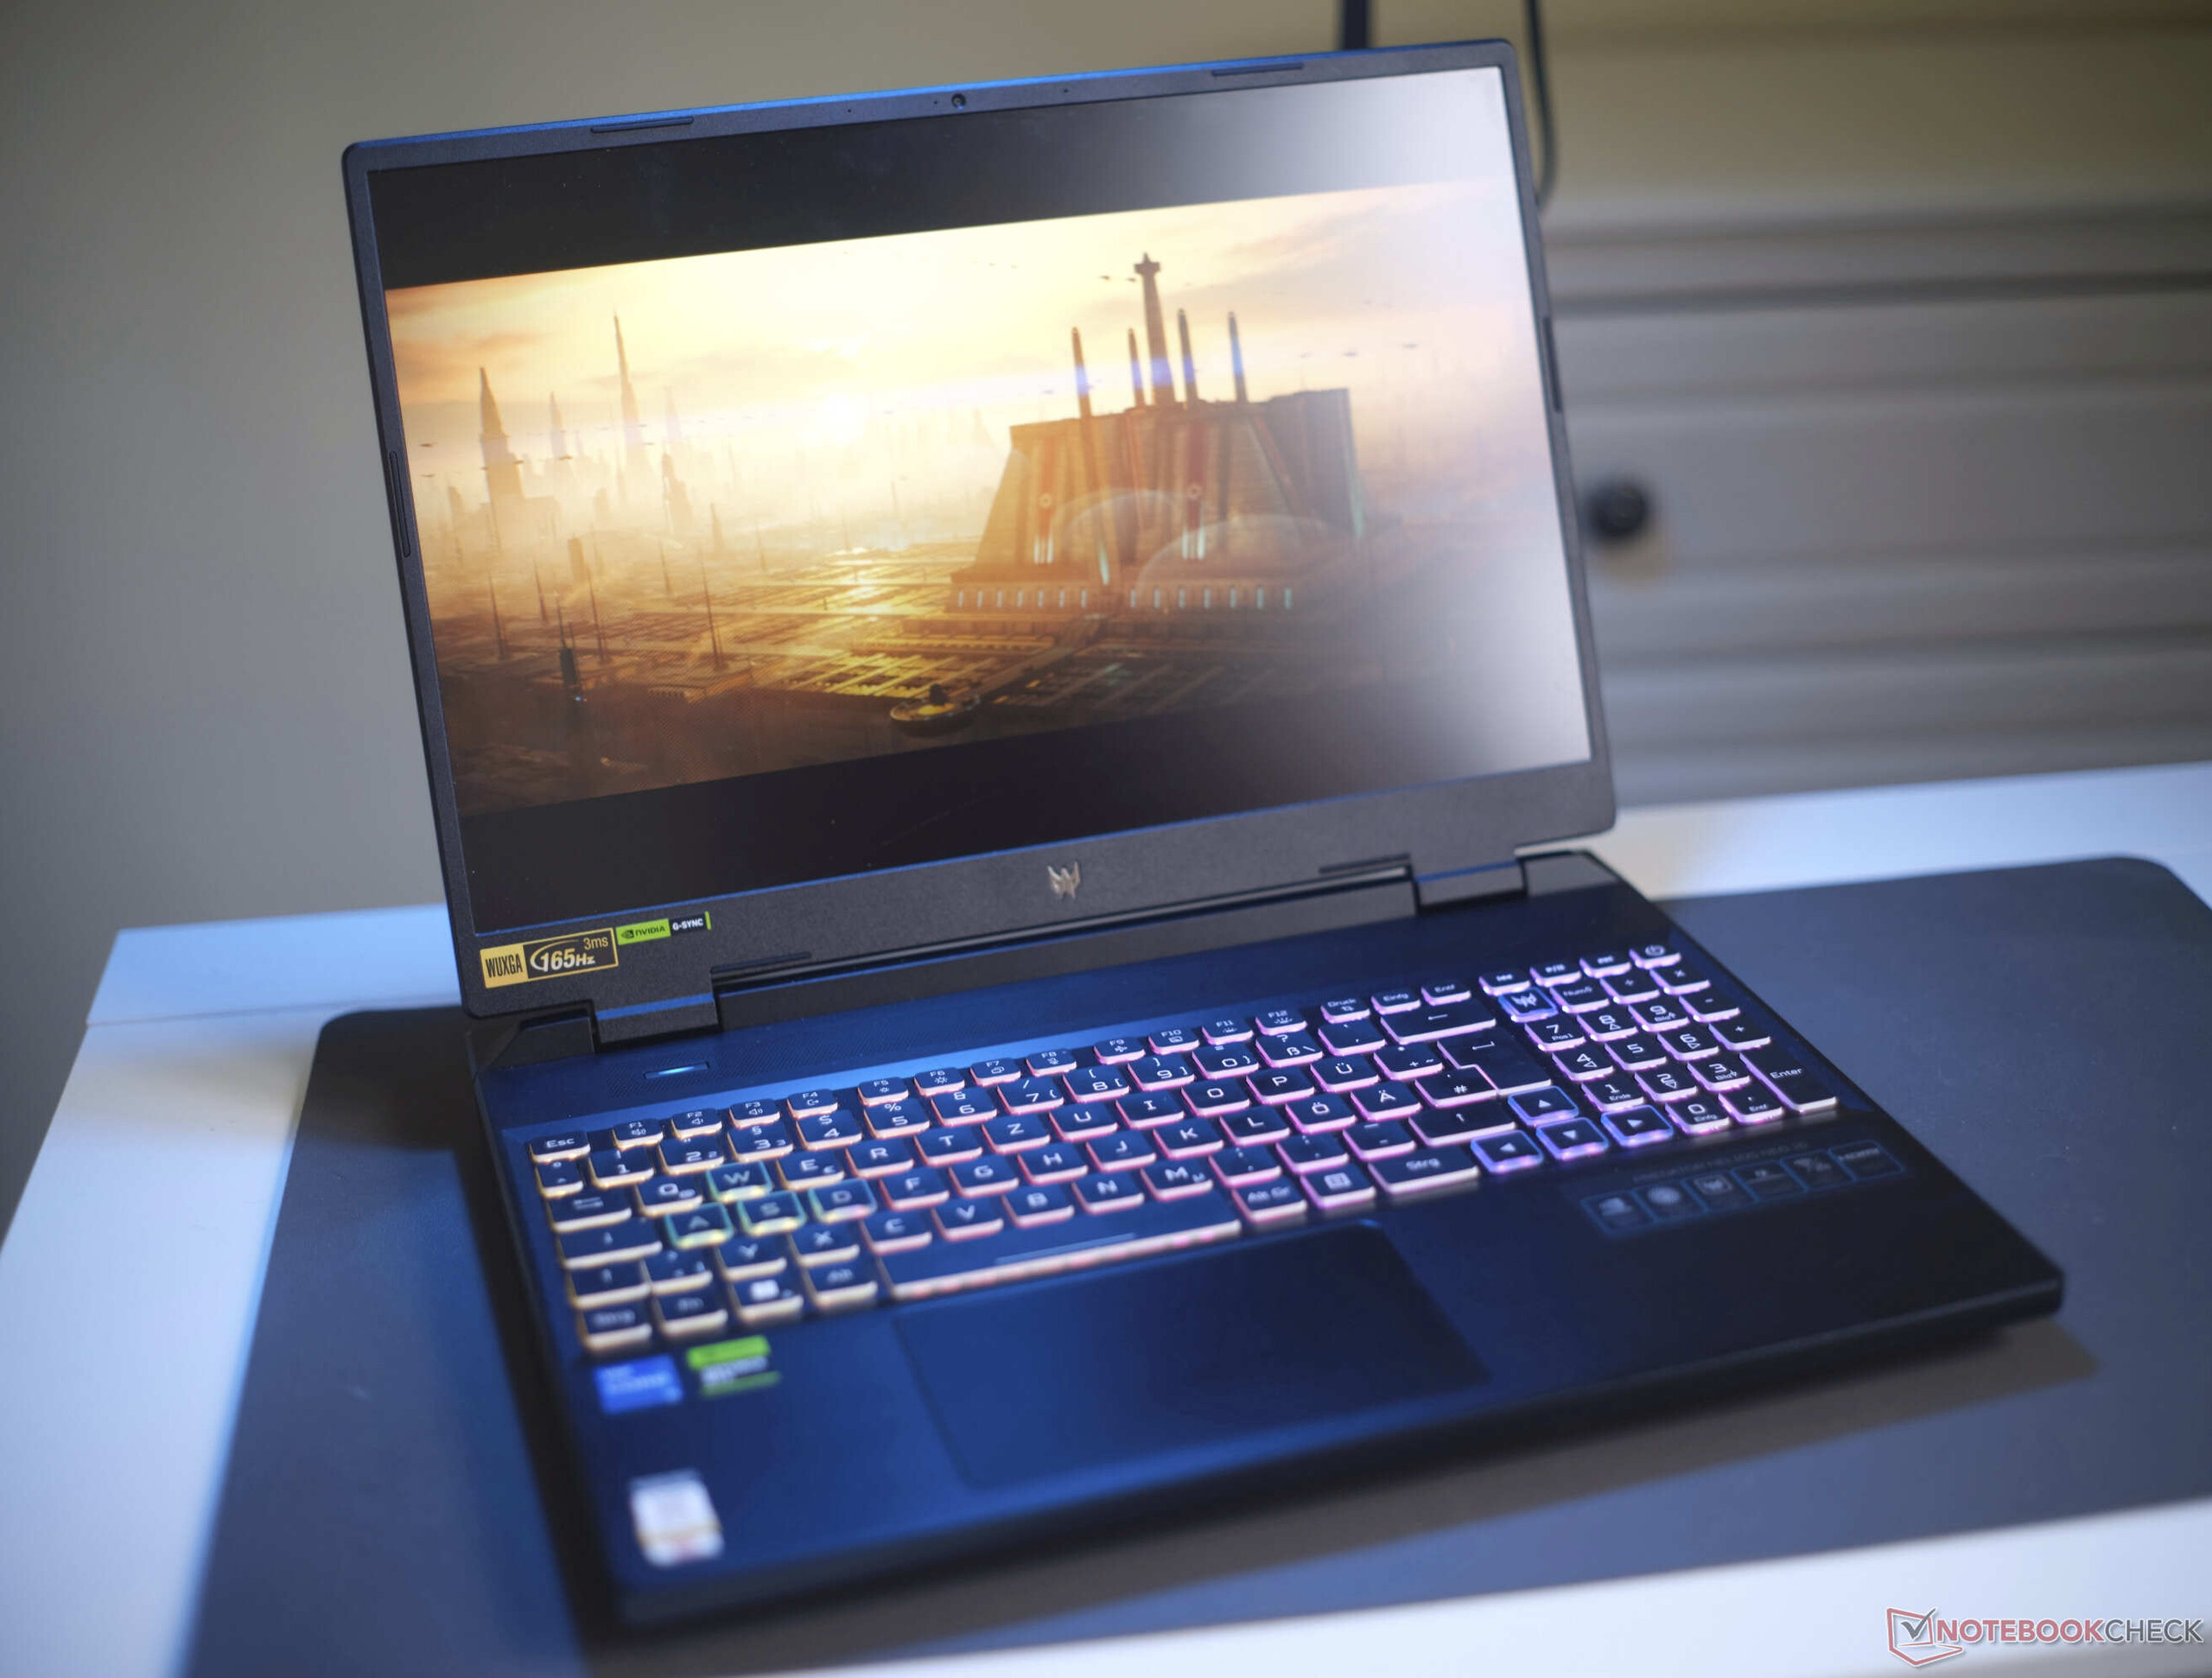
显示屏Helios Neo 16 配备了全高清游戏显示屏


我们的测试设备配备了长宽比为 16:10 的 WUXGA IPS 雾面显示屏(FHD+),而其他型号则提供 QHD 显示屏。两种面板的刷新率均为 165 Hz。
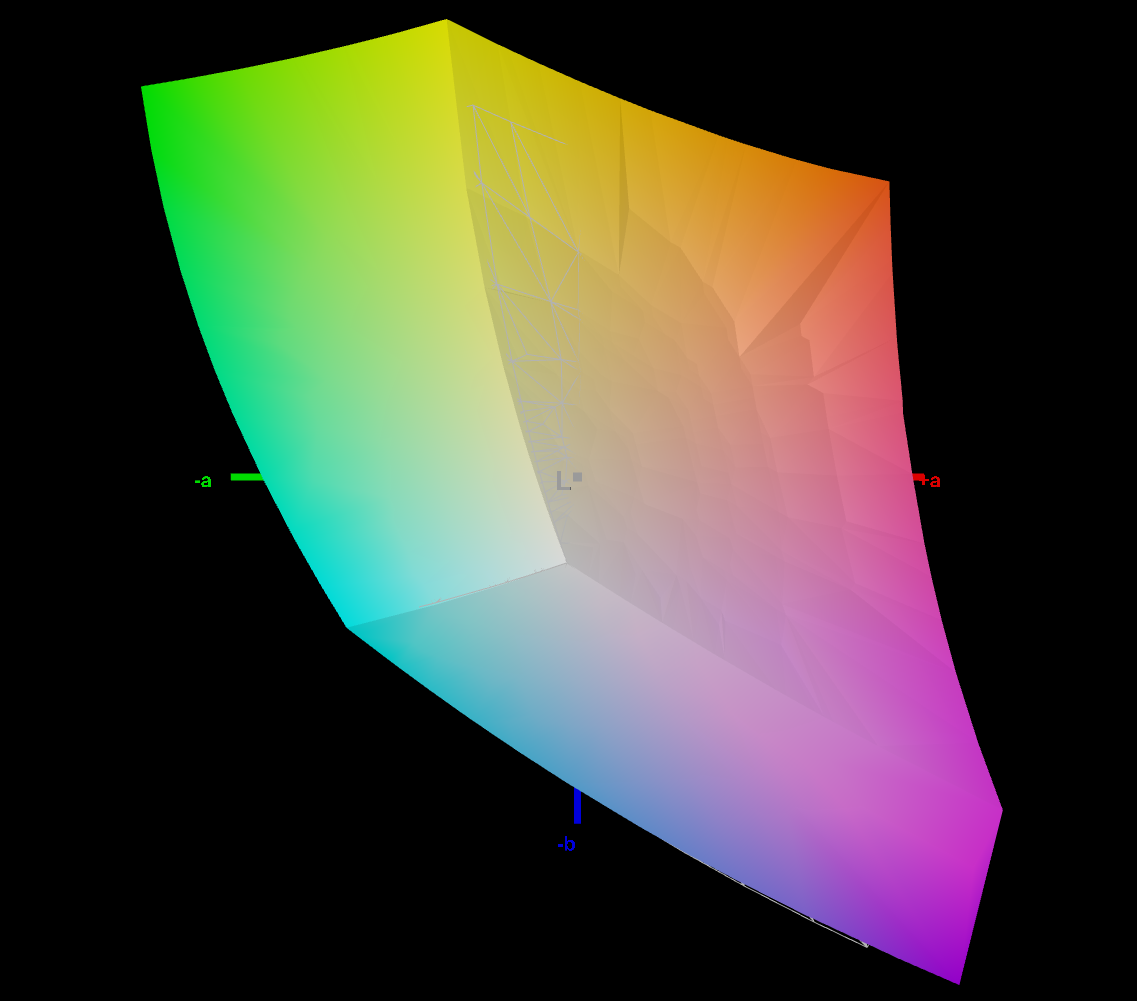
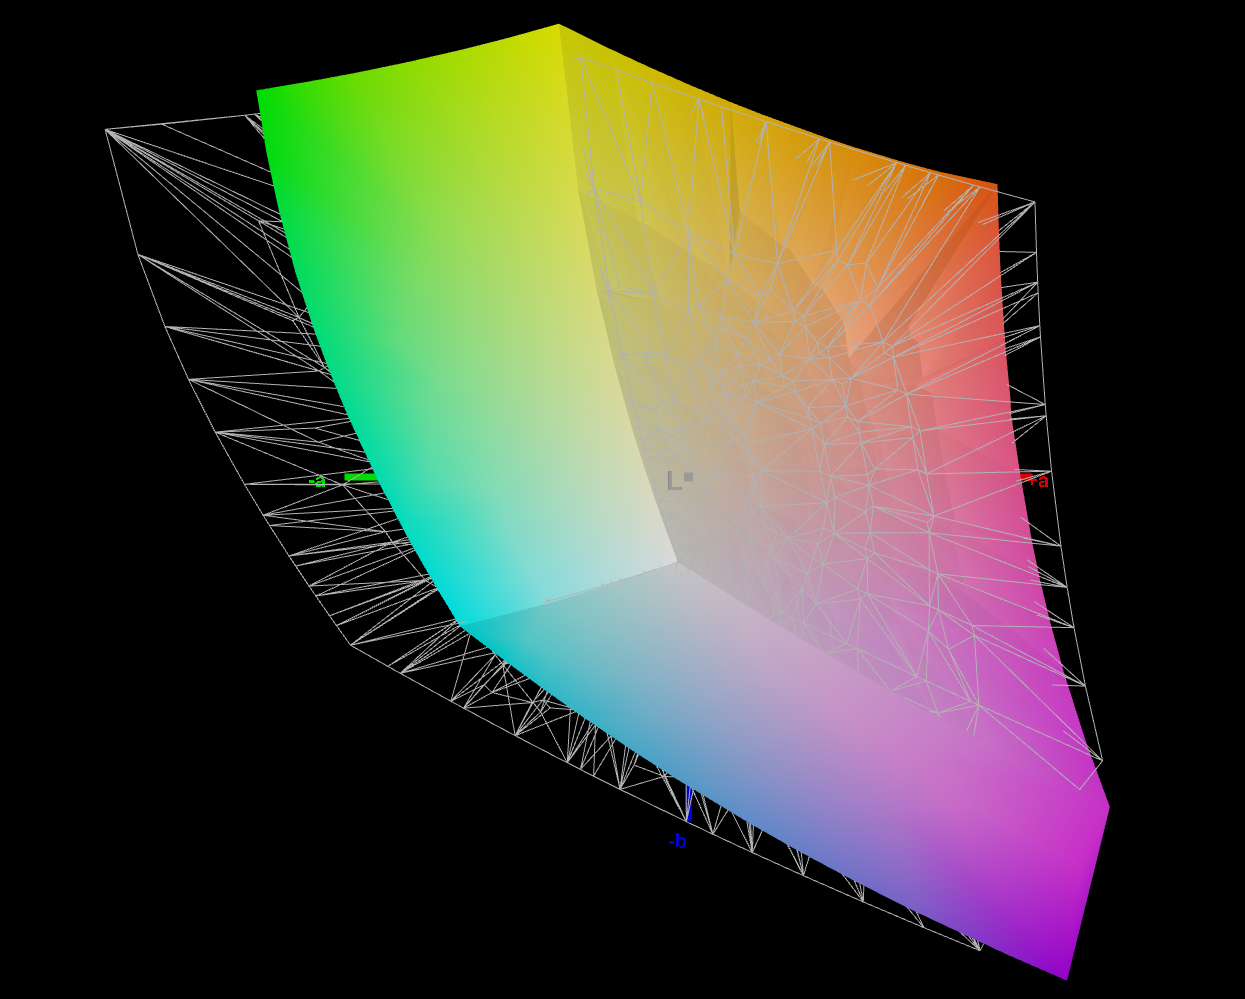
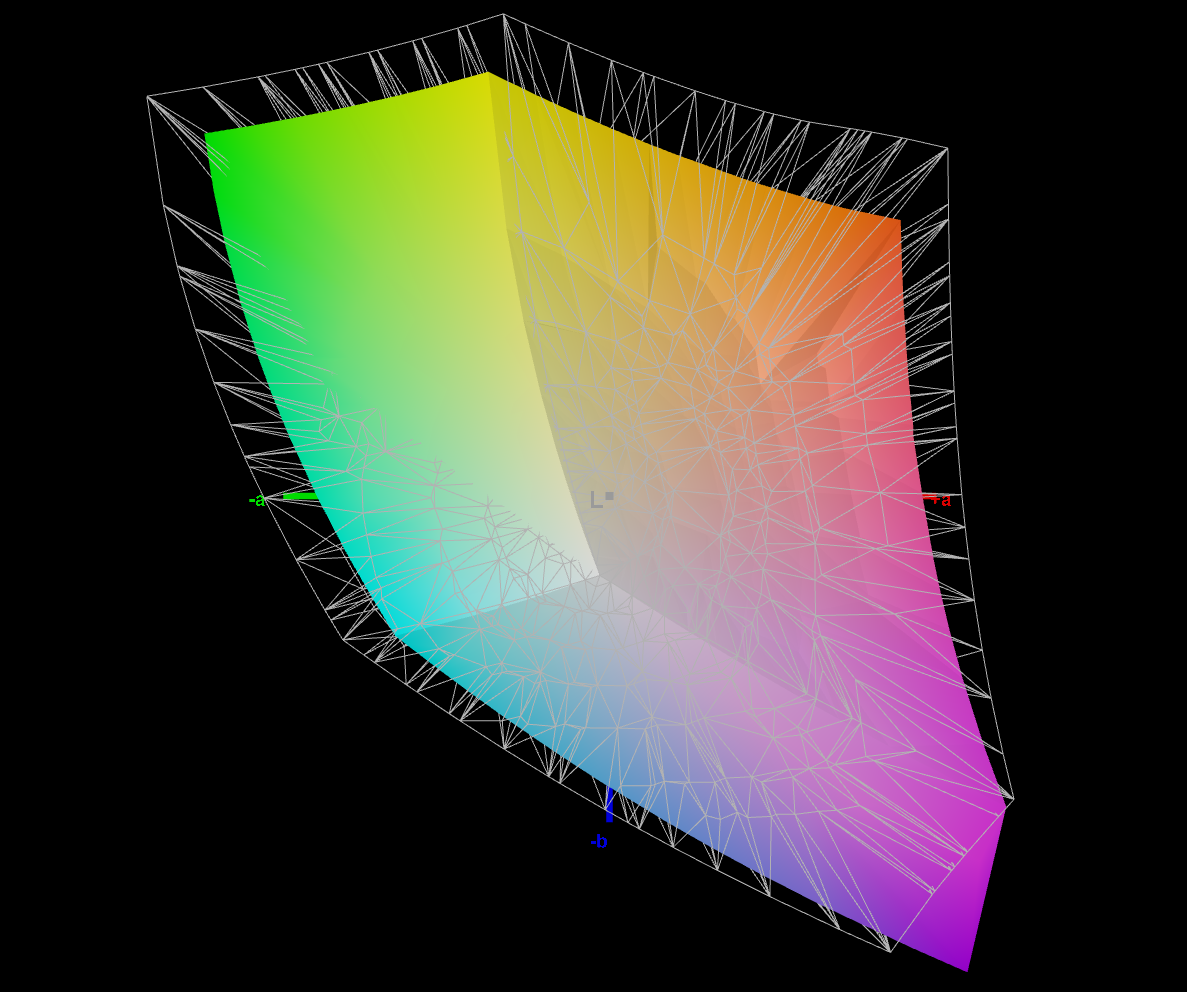
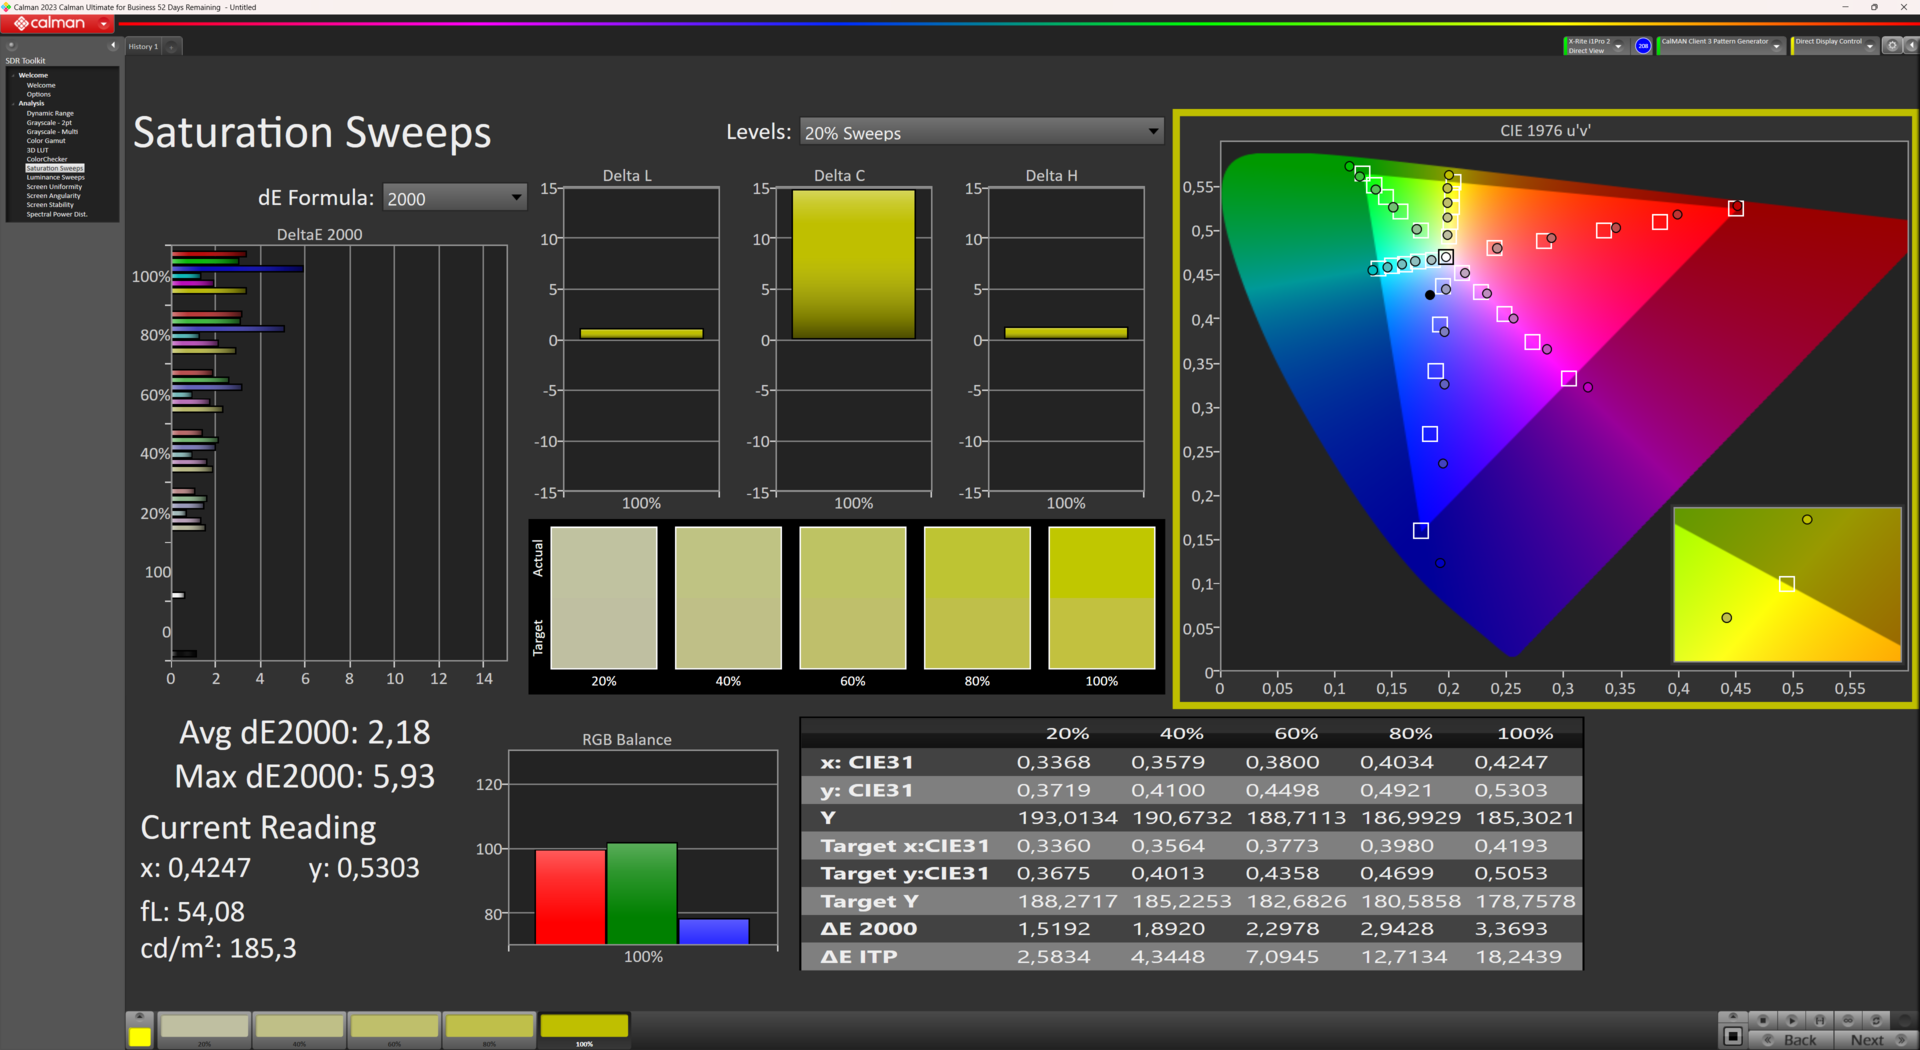
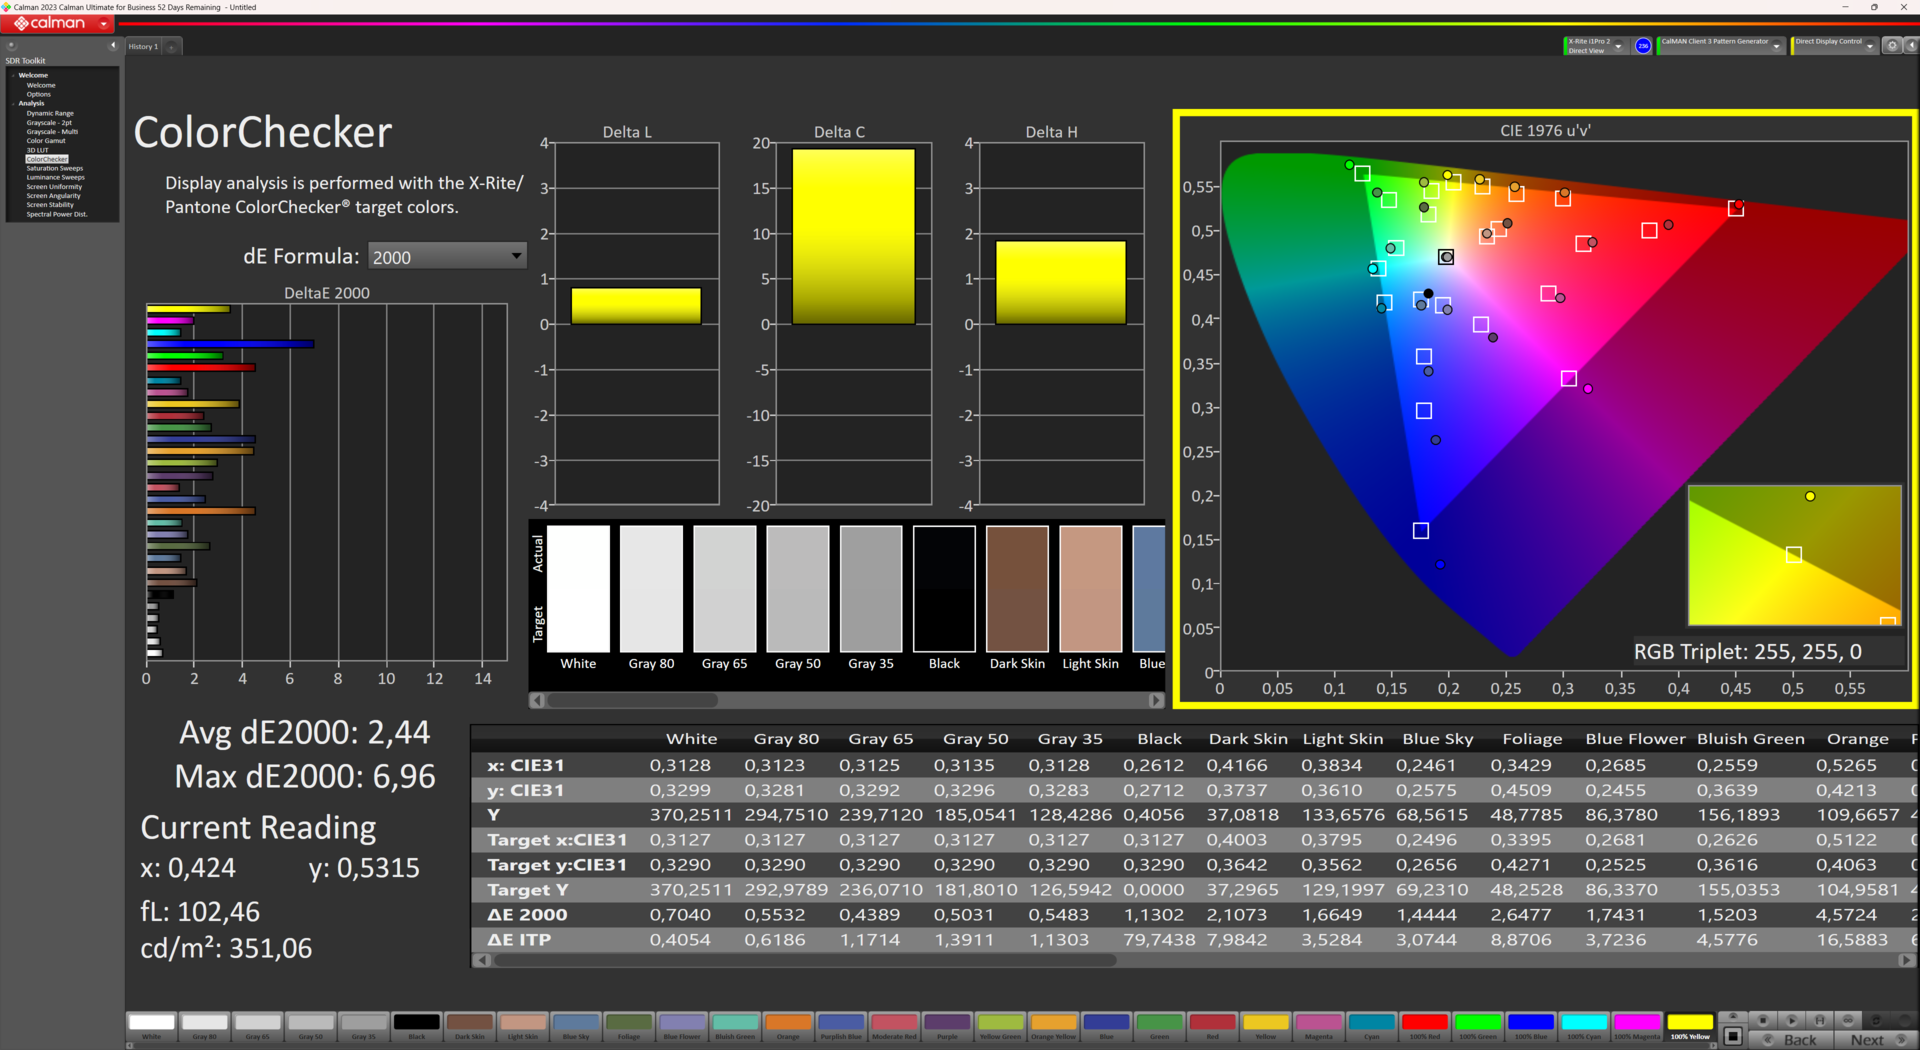
与 Predator Helios 16 不同的是,QHD 选项并不涵盖 DCI-P3 色彩空间,而是与我们测试的 FHD+ 版本一样,仅限于 100% sRGB。373 cd/m² 的亮度已经足够--在我们的对比中,只有Legion Pro 5更亮,达到了 516 cd/m²,此外,它还以类似的价格提供了更高的分辨率(正如LOQ 16和 XMG Apex 15).
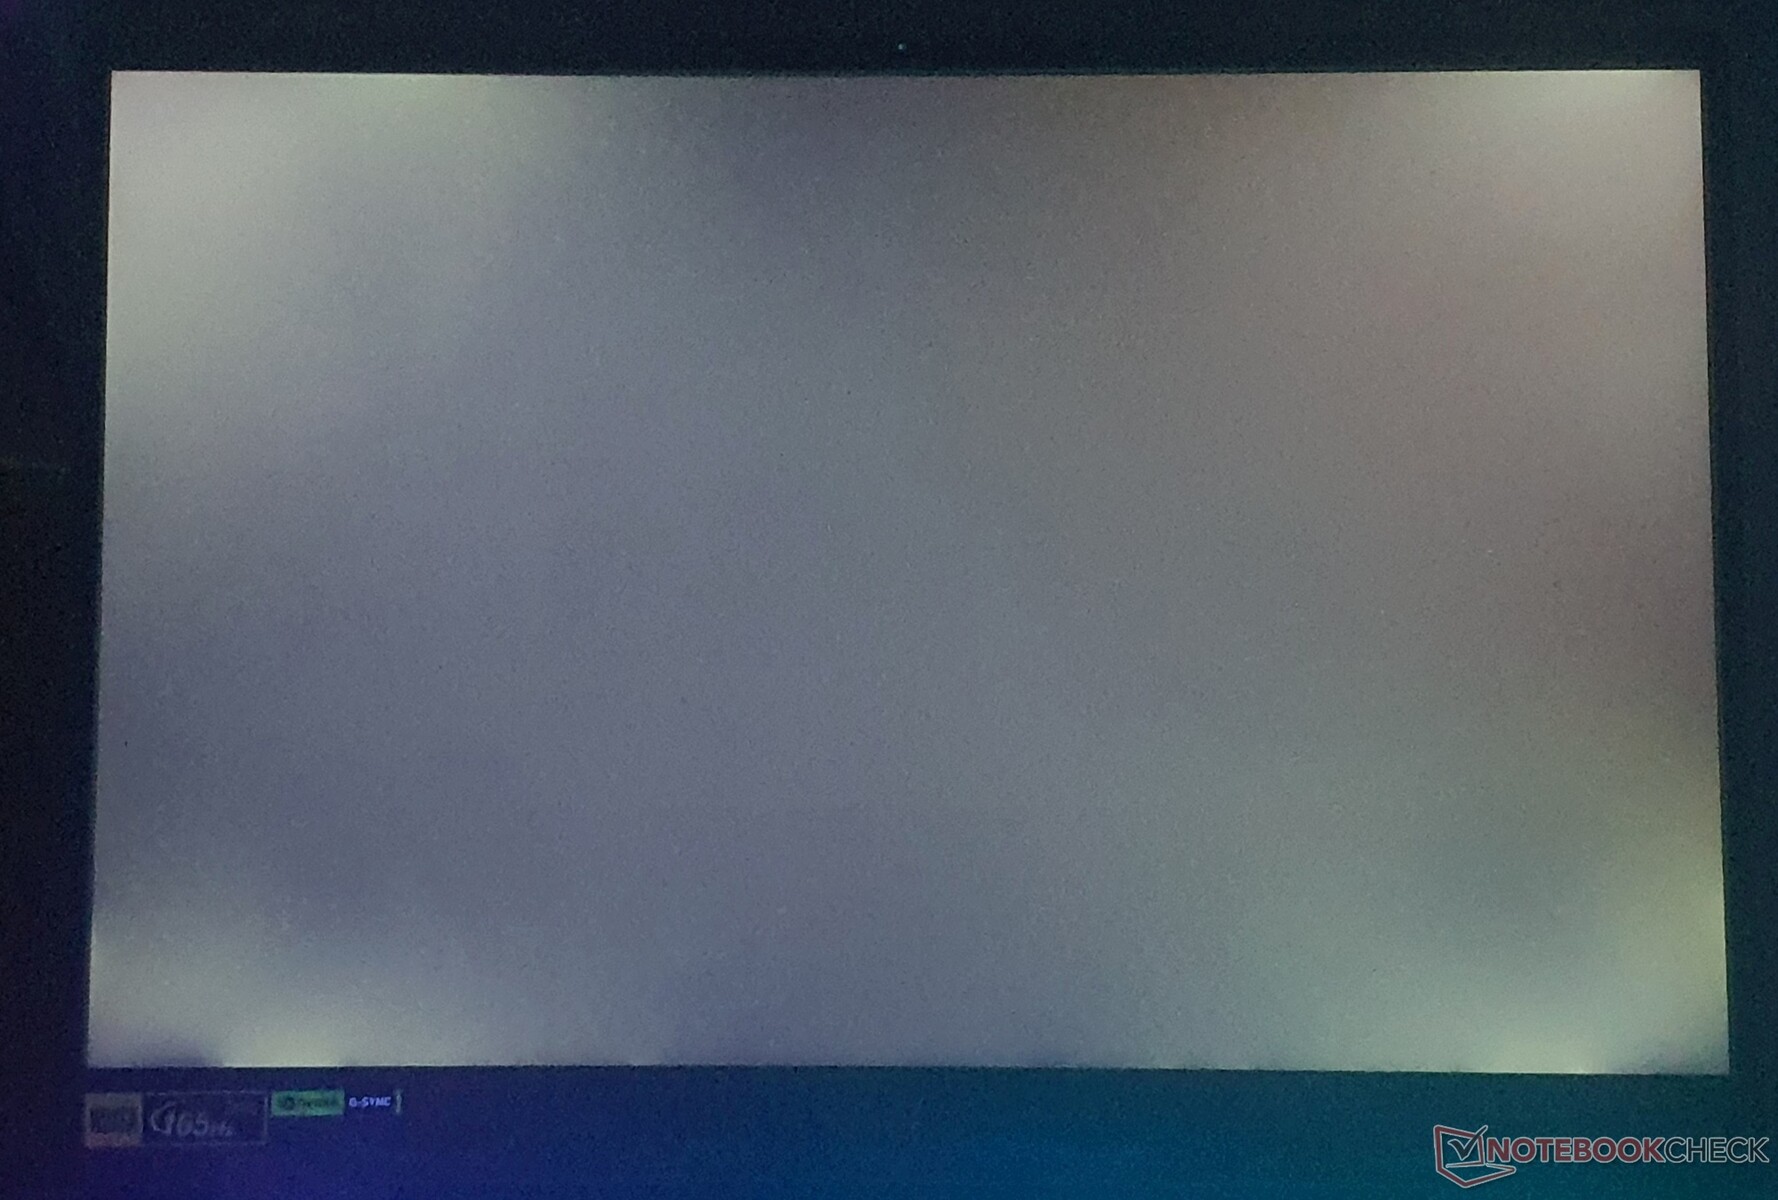
它的平均对比度为 1,025:1,而 86% 的照度并不十分均匀,我们注意到一些明显的光晕。PWM 有可能导致眼睛不适或头痛,但至少在这款设备上没有使用。
屏幕的响应时间为 8 毫秒(灰到灰)和 8 毫秒(黑到白),时间较短,只有戴尔 G15 5530 的响应时间为 8 毫秒(灰到灰)和 8 毫秒(黑到白)。戴尔 G15 5530的响应时间仅为 3.4 毫秒(灰度到灰度)。此外,还支持 Nvidia G-Sync。总体而言,该显示器看起来漂亮且色彩丰富,这可能要归功于其至少 80% 的 DCI-P3 色彩空间覆盖率。
| |||||||||||||||||||||||||
Brightness Distribution: 86 %
Center on Battery: 422.2 cd/m²
Contrast: 1025:1 (Black: 0.41 cd/m²)
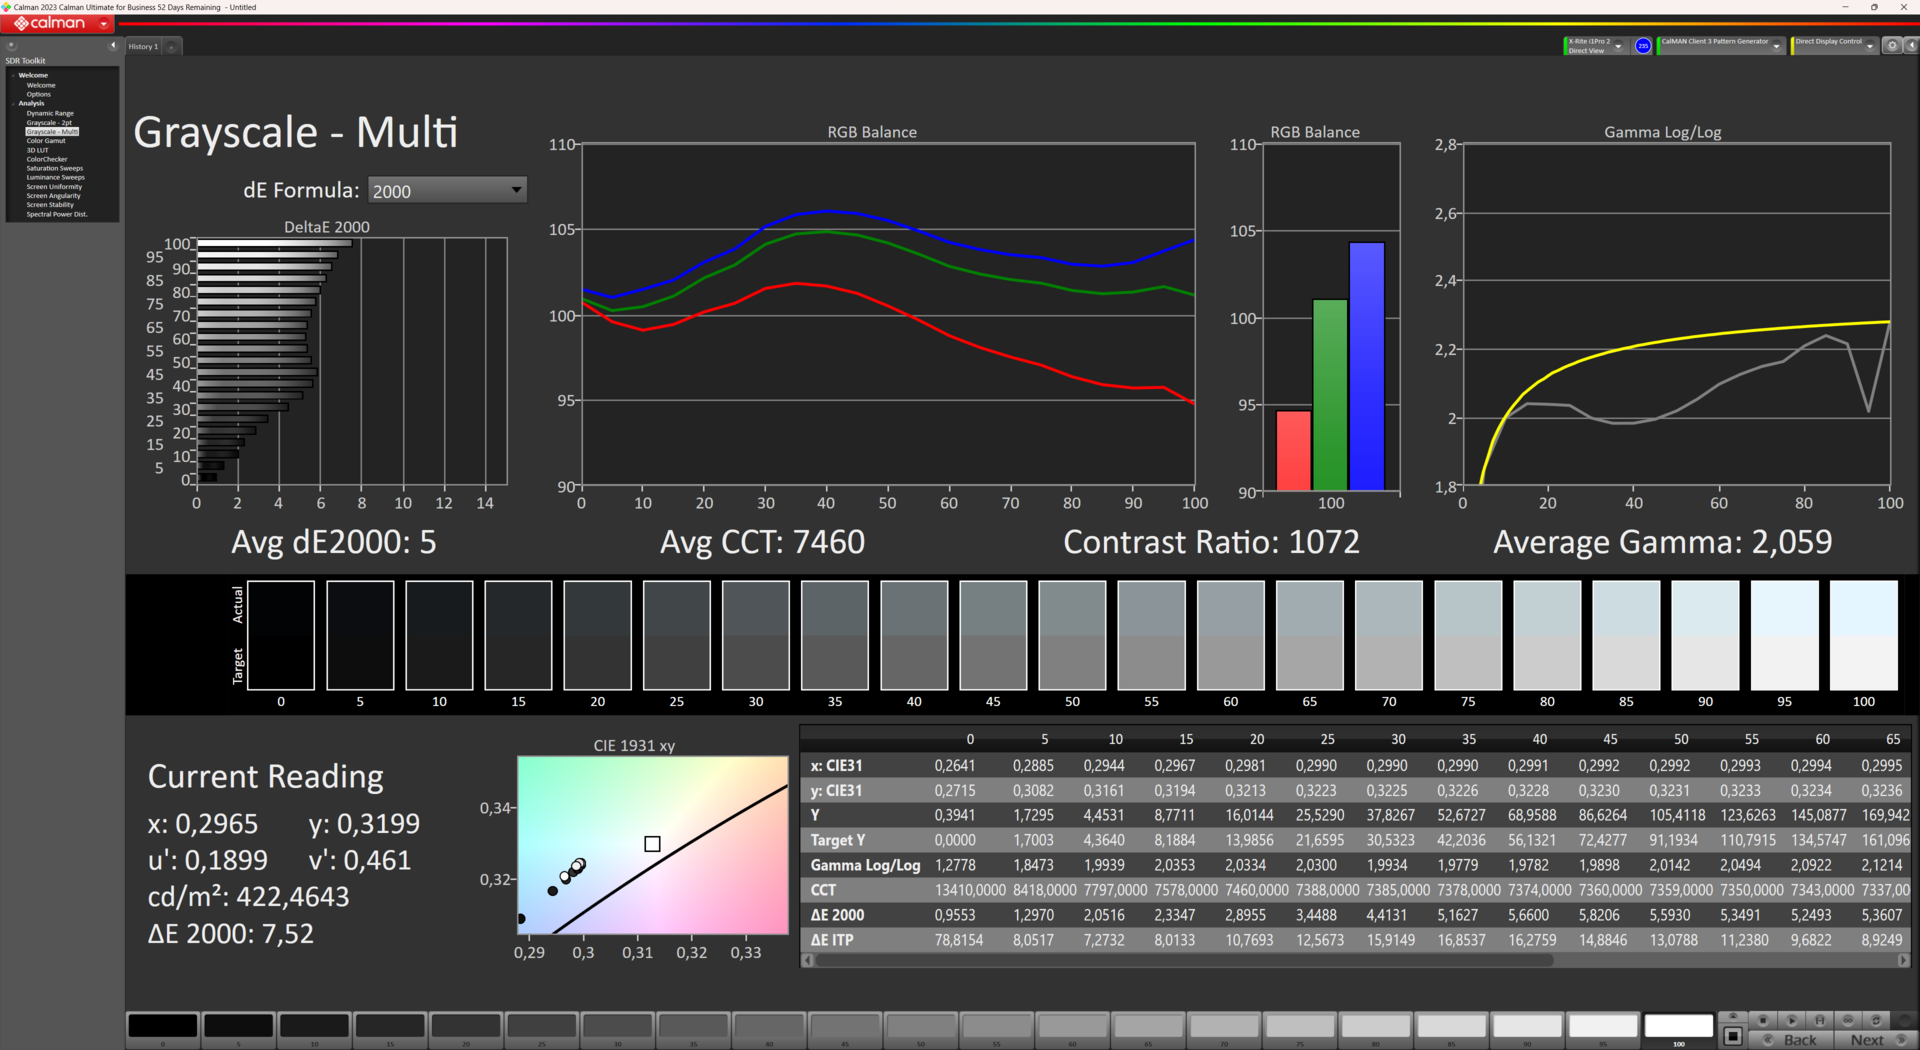
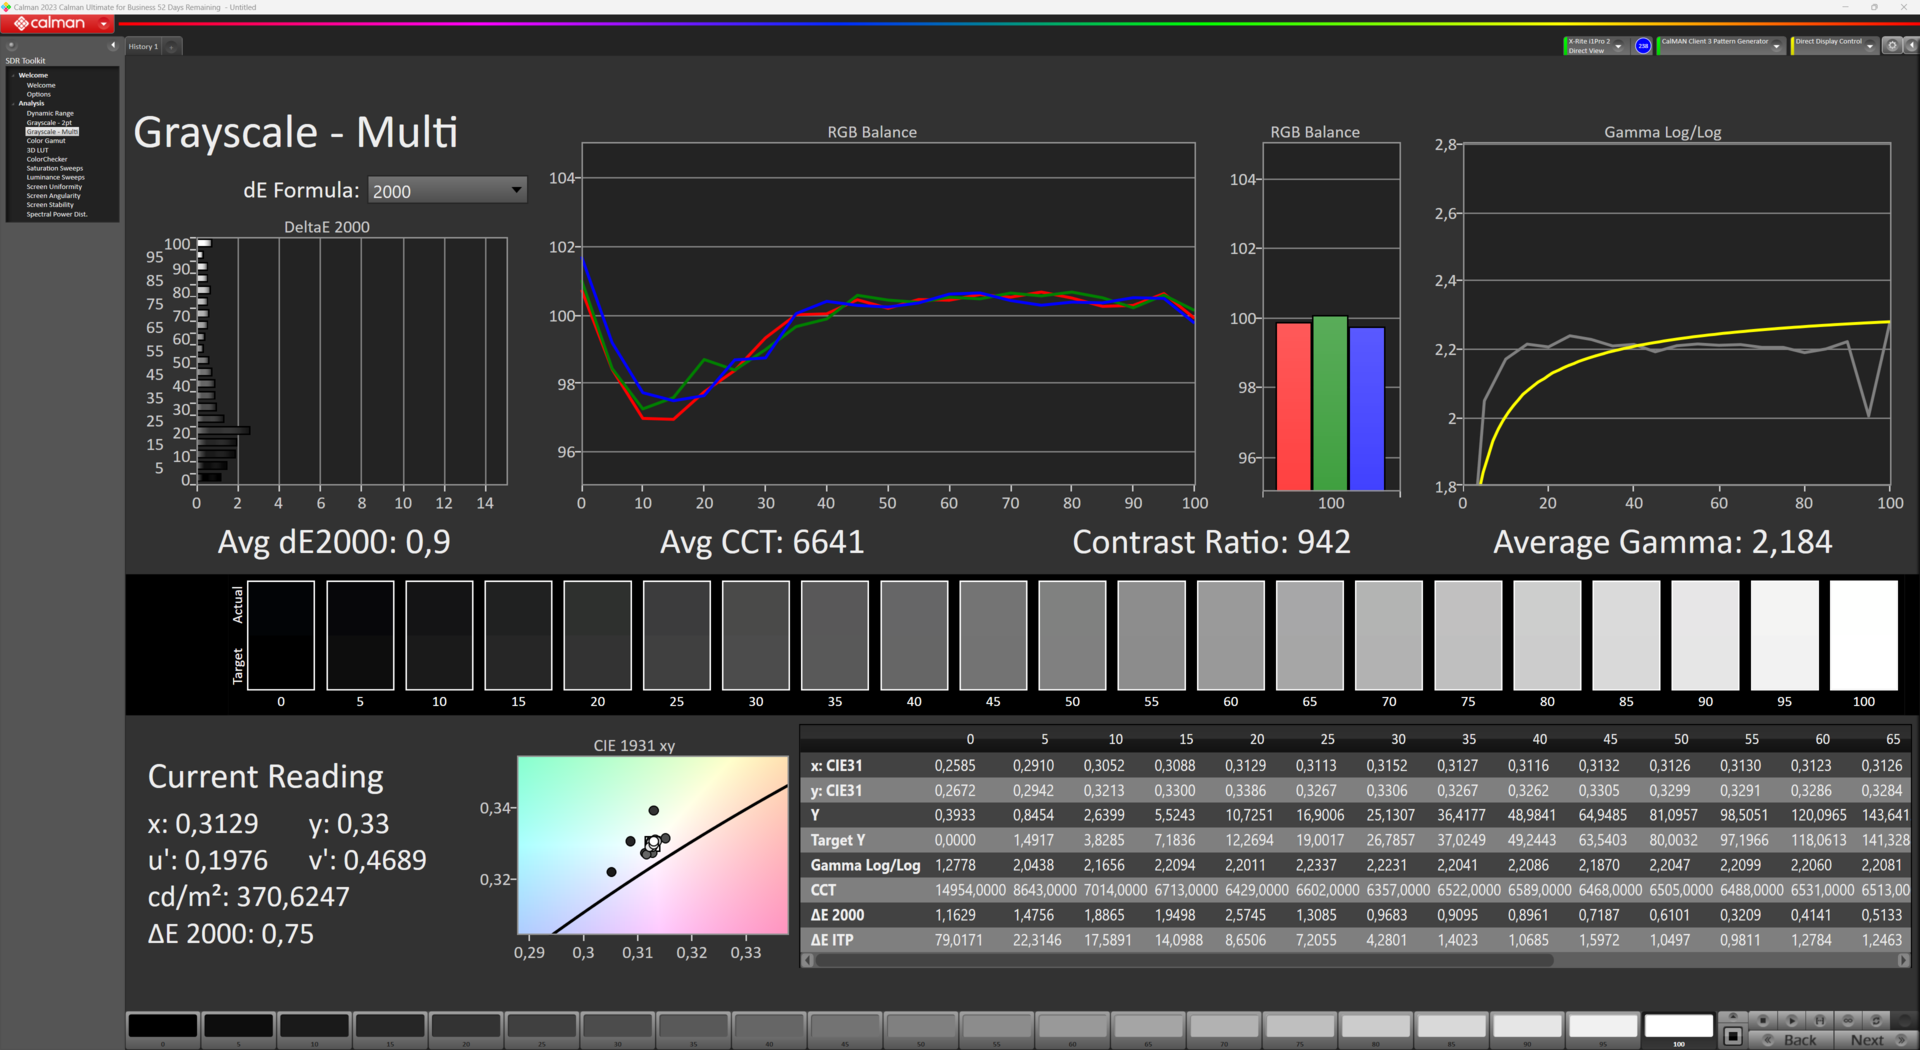
ΔE ColorChecker Calman: 4.67 | ∀{0.5-29.43 Ø4.71}
calibrated: 2.44
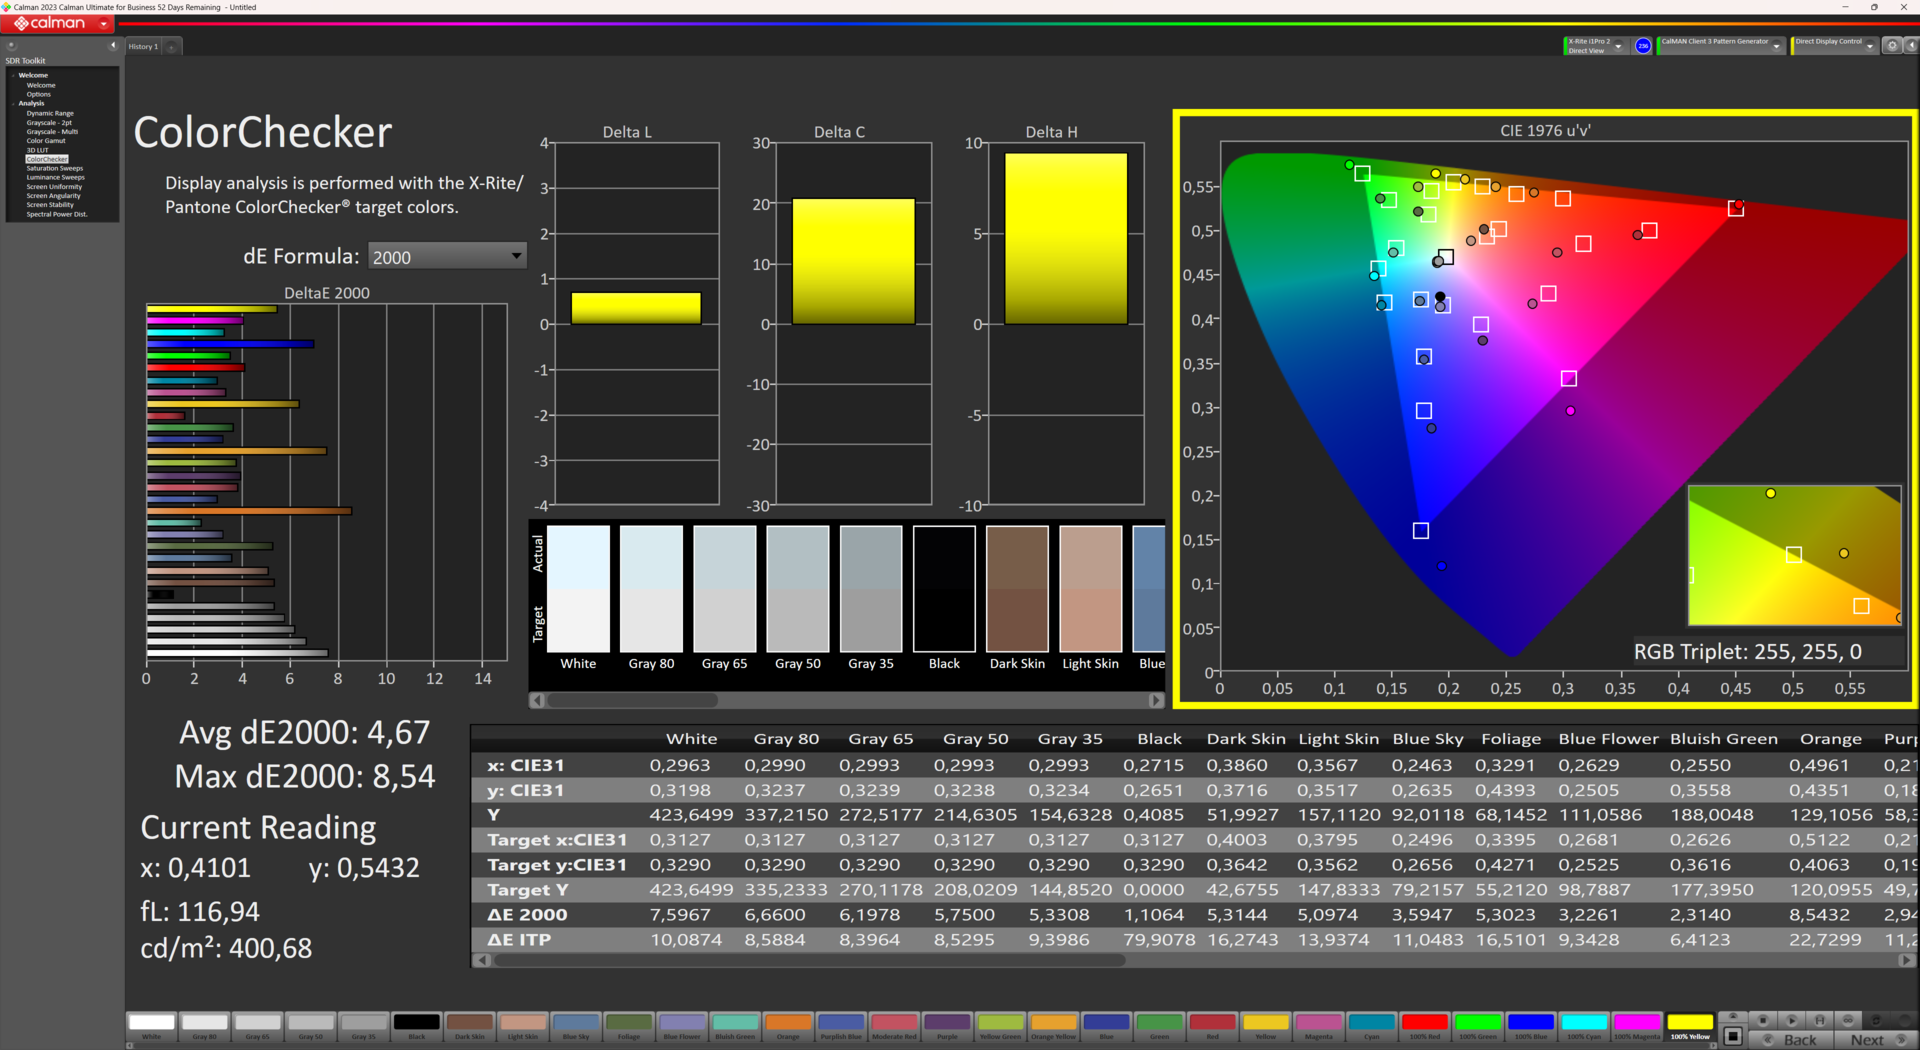
ΔE Greyscale Calman: 7.52 | ∀{0.09-98 Ø4.96}
71.36% AdobeRGB 1998 (Argyll 3D)
99.16% sRGB (Argyll 3D)
79.56% Display P3 (Argyll 3D)
Gamma: 2.184
CCT: 6641 K
| Acer Predator Helios Neo 16 NH.QLTEG.002 B160UAN01.Q, IPS, 1920x1200, 16" | Lenovo Legion Pro 5 16ARX8 (R5 7645HX, RTX 4050) CSOT T3 MNG007DA2-2, IPS, 2560x1600, 16" | Lenovo LOQ 16IRH8 AUOC1A5 (B160QAN03.L), IPS, 2560x1600, 16" | Schenker XMG Apex 15 (Late 23) BOE CQ NE156QHM-NY2, IPS, 2560x1440, 15.6" | HP Victus 16-r0076TX Chi Mei CMN1629, IPS, 1920x1080, 16.1" | Dell G15 5530 AUO B156HAN, IPS, 1920x1080, 15.6" | |
|---|---|---|---|---|---|---|
| Display | -2% | -3% | -7% | -6% | -2% | |
| Display P3 Coverage (%) | 79.56 | 71.6 -10% | 70.5 -11% | 67.5 -15% | 67.5 -15% | 73.1 -8% |
| sRGB Coverage (%) | 99.16 | 99.8 1% | 98.9 0% | 97.6 -2% | 97.5 -2% | 98.4 -1% |
| AdobeRGB 1998 Coverage (%) | 71.36 | 72.9 2% | 72.6 2% | 68.9 -3% | 69.7 -2% | 74.4 4% |
| Response Times | -8% | 9% | -38% | 14% | 46% | |
| Response Time Grey 50% / Grey 80% * (ms) | 8 ? | 12 ? -50% | 7.2 ? 10% | 13.2 ? -65% | 6.18 ? 23% | 3.39 ? 58% |
| Response Time Black / White * (ms) | 8 ? | 5.2 ? 35% | 7.4 ? 7% | 8.8 ? -10% | 7.62 ? 5% | 5.35 ? 33% |
| PWM Frequency (Hz) | 21620 ? | |||||
| Screen | 31% | 27% | 18% | 32% | 12% | |
| Brightness middle (cd/m²) | 420.2 | 543 29% | 407 -3% | 336 -20% | 290 -31% | 320 -24% |
| Brightness (cd/m²) | 373 | 516 38% | 369 -1% | 307 -18% | 275 -26% | 316 -15% |
| Brightness Distribution (%) | 86 | 87 1% | 85 -1% | 77 -10% | 82 -5% | 94 9% |
| Black Level * (cd/m²) | 0.41 | 0.58 -41% | 0.45 -10% | 0.38 7% | 0.21 49% | 0.21 49% |
| Contrast (:1) | 1025 | 936 -9% | 904 -12% | 884 -14% | 1381 35% | 1524 49% |
| Colorchecker dE 2000 * | 4.67 | 1.35 71% | 1.43 69% | 1.96 58% | 1.7 64% | 4.55 3% |
| Colorchecker dE 2000 max. * | 8.54 | 3.22 62% | 3.58 58% | 5.07 41% | 3.57 58% | 9.83 -15% |
| Colorchecker dE 2000 calibrated * | 2.44 | 1.31 46% | 1.07 56% | 1.27 48% | 0.93 62% | 1.51 38% |
| Greyscale dE 2000 * | 7.52 | 1.03 86% | 1.13 85% | 2.3 69% | 1.5 80% | 6.2 18% |
| Gamma | 2.184 101% | 2.38 92% | 2.5 88% | 2.017 109% | 2.1 105% | 2.07 106% |
| CCT | 6641 98% | 6452 101% | 6526 100% | 6644 98% | 6538 99% | 6479 100% |
| Total Average (Program / Settings) | 7% /
19% | 11% /
18% | -9% /
5% | 13% /
21% | 19% /
14% |
* ... smaller is better
由于它完全覆盖了 sRGB 色彩空间,因此当然可以进行依赖精确色彩的专业图像和视频编辑,前提是它相当低的 FHD+ 分辨率不会影响这些用途。
在我们的对比范围内,除了戴尔 G15 5530 之外,Helios Neo 16 是唯一超过 DeltaE 3 临界值(人眼能感知的色彩偏差)的笔记本电脑,开箱即达 4.67。
幸运的是,经过校准后,它的 DeltaE 值降至 2.44,但蓝色色调仍然偏差很大,达到了 7。校准后的色彩配置文件可从以下链接下载 这里.

Display Response Times
| ↔ Response Time Black to White | ||
|---|---|---|
| 8 ms ... rise ↗ and fall ↘ combined | ↗ 4.5 ms rise |  |
| ↘ 3.5 ms fall | ||
| The screen shows fast response rates in our tests and should be suited for gaming. In comparison, all tested devices range from 0.1 (minimum) to 240 (maximum) ms. » 22 % of all devices are better. This means that the measured response time is better than the average of all tested devices (19.8 ms). | ||
| ↔ Response Time 50% Grey to 80% Grey | ||
| 8 ms ... rise ↗ and fall ↘ combined | ↗ 4.5 ms rise |  |
| ↘ 3.5 ms fall | ||
| The screen shows fast response rates in our tests and should be suited for gaming. In comparison, all tested devices range from 0.165 (minimum) to 636 (maximum) ms. » 21 % of all devices are better. This means that the measured response time is better than the average of all tested devices (31 ms). | ||
Screen Flickering / PWM (Pulse-Width Modulation)
| Screen flickering / PWM not detected |  | ||
In comparison: 52 % of all tested devices do not use PWM to dim the display. If PWM was detected, an average of 7754 (minimum: 5 - maximum: 343500) Hz was measured. | |||
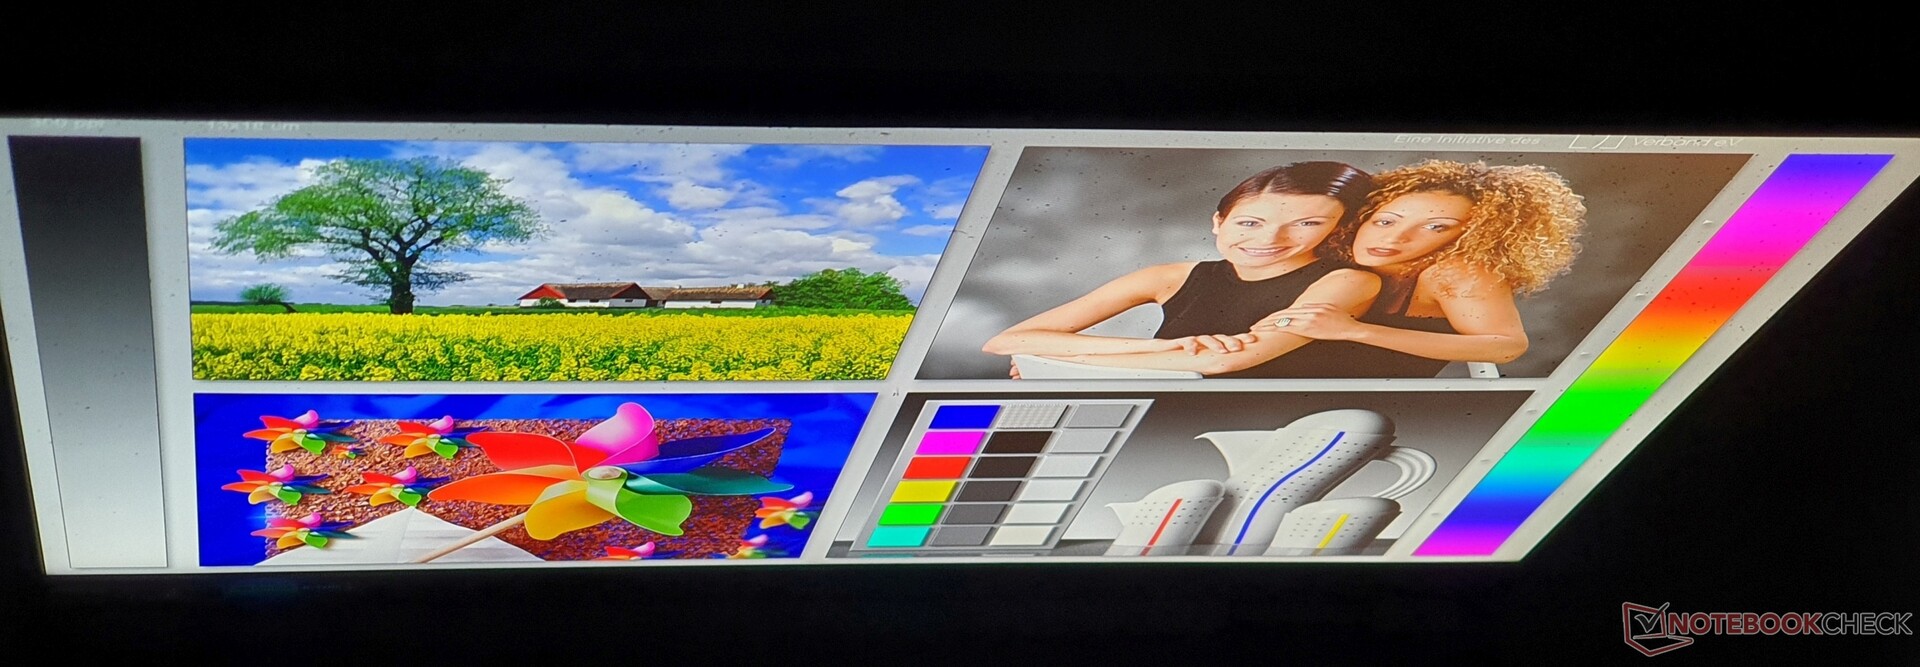
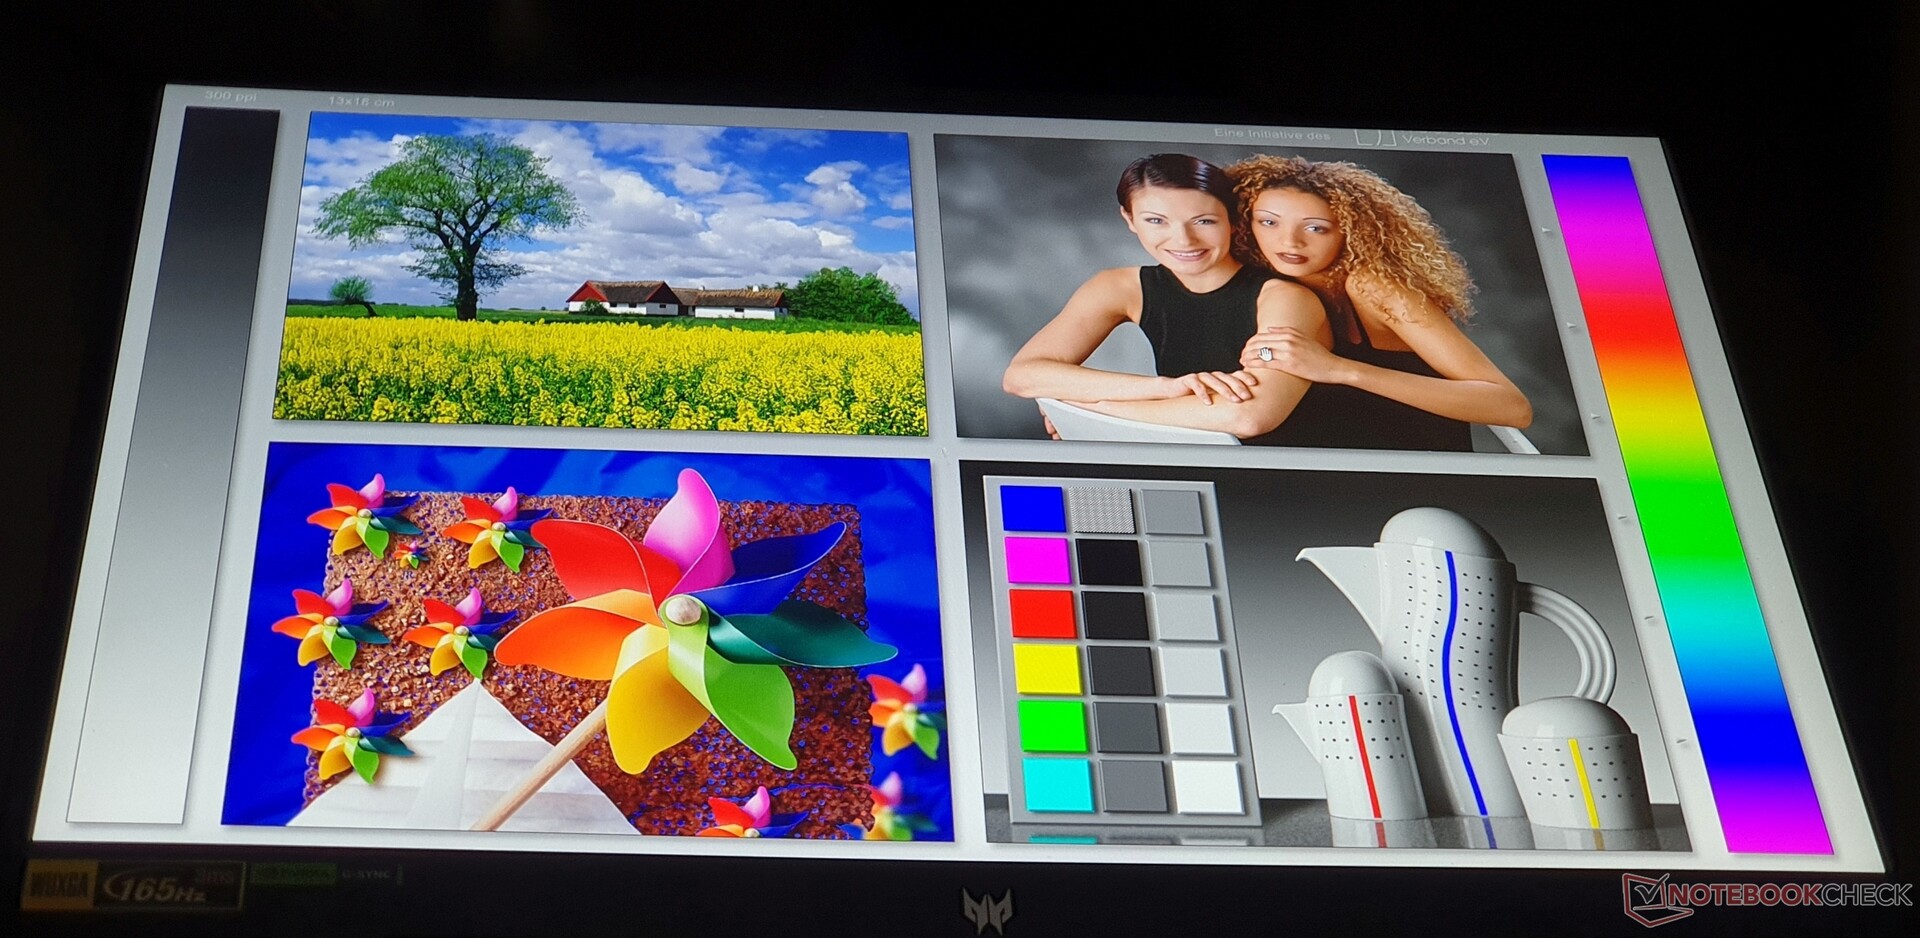
得益于该设备的哑光显示屏表面和 373 cd/m² 的亮度,只要不坐在阳光直射的地方,屏幕在户外依然清晰可辨。
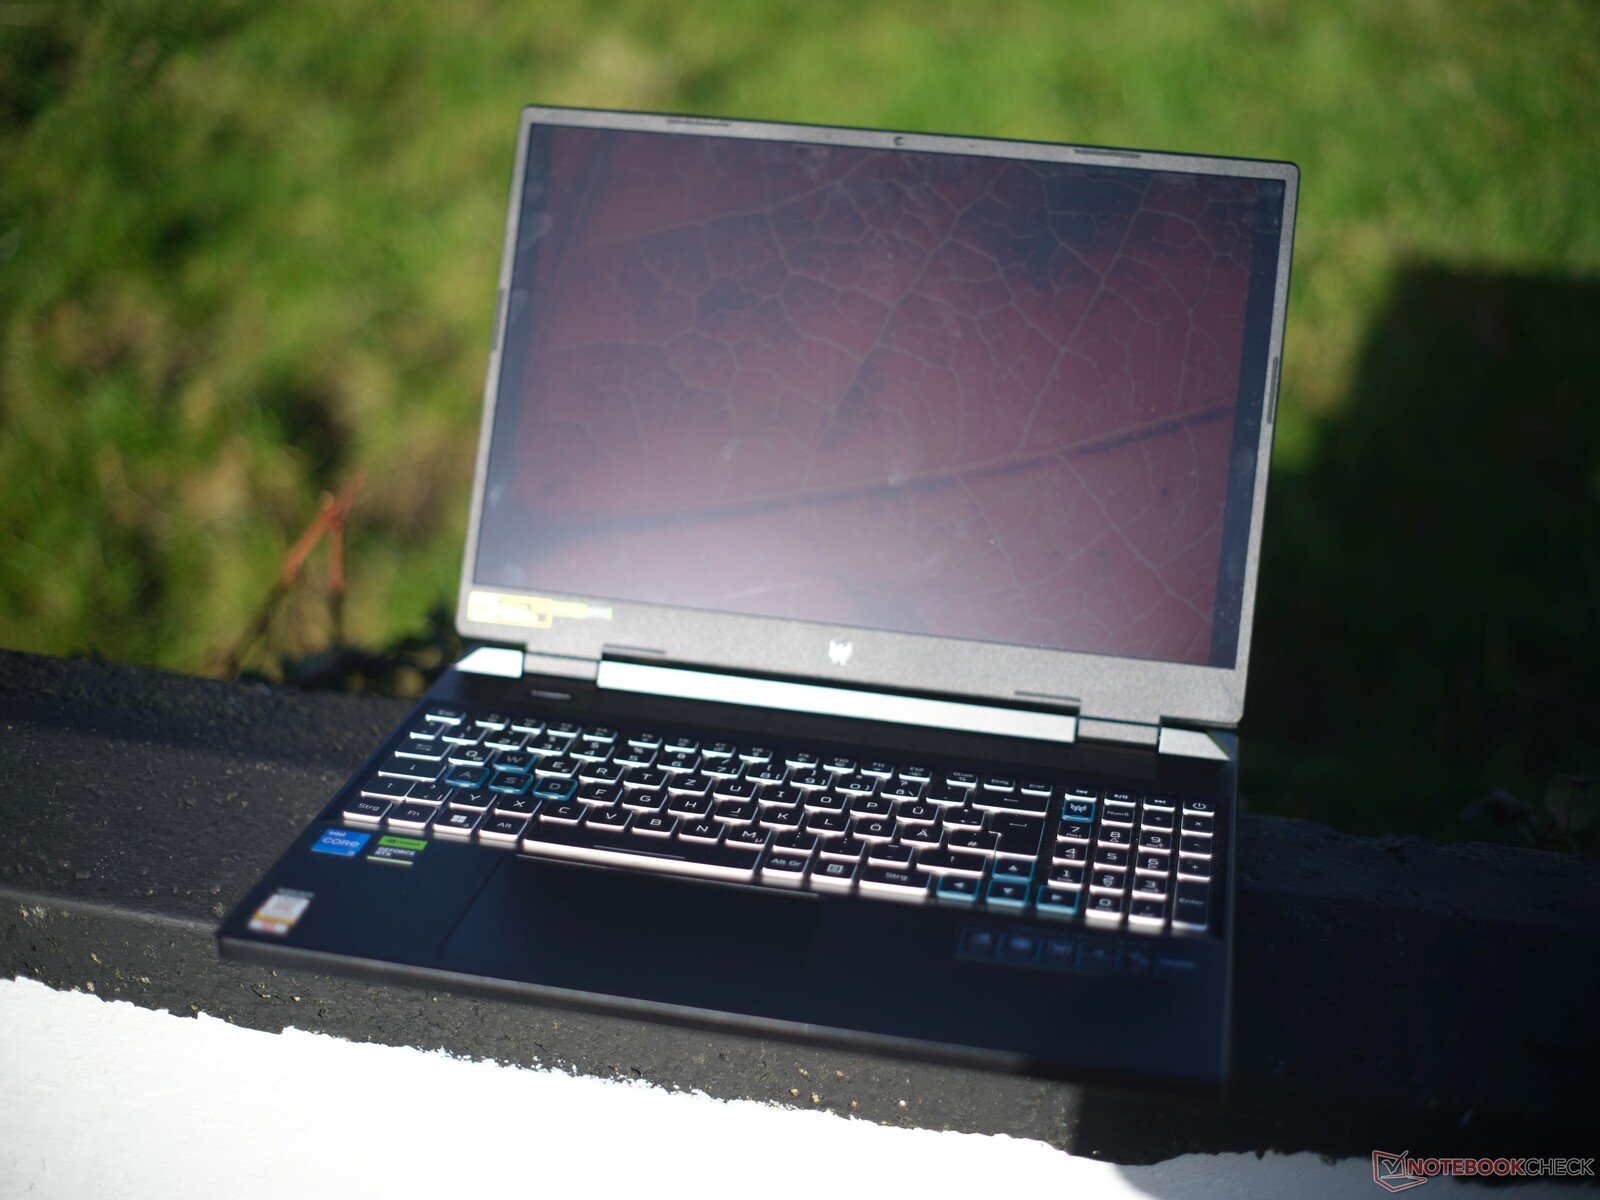
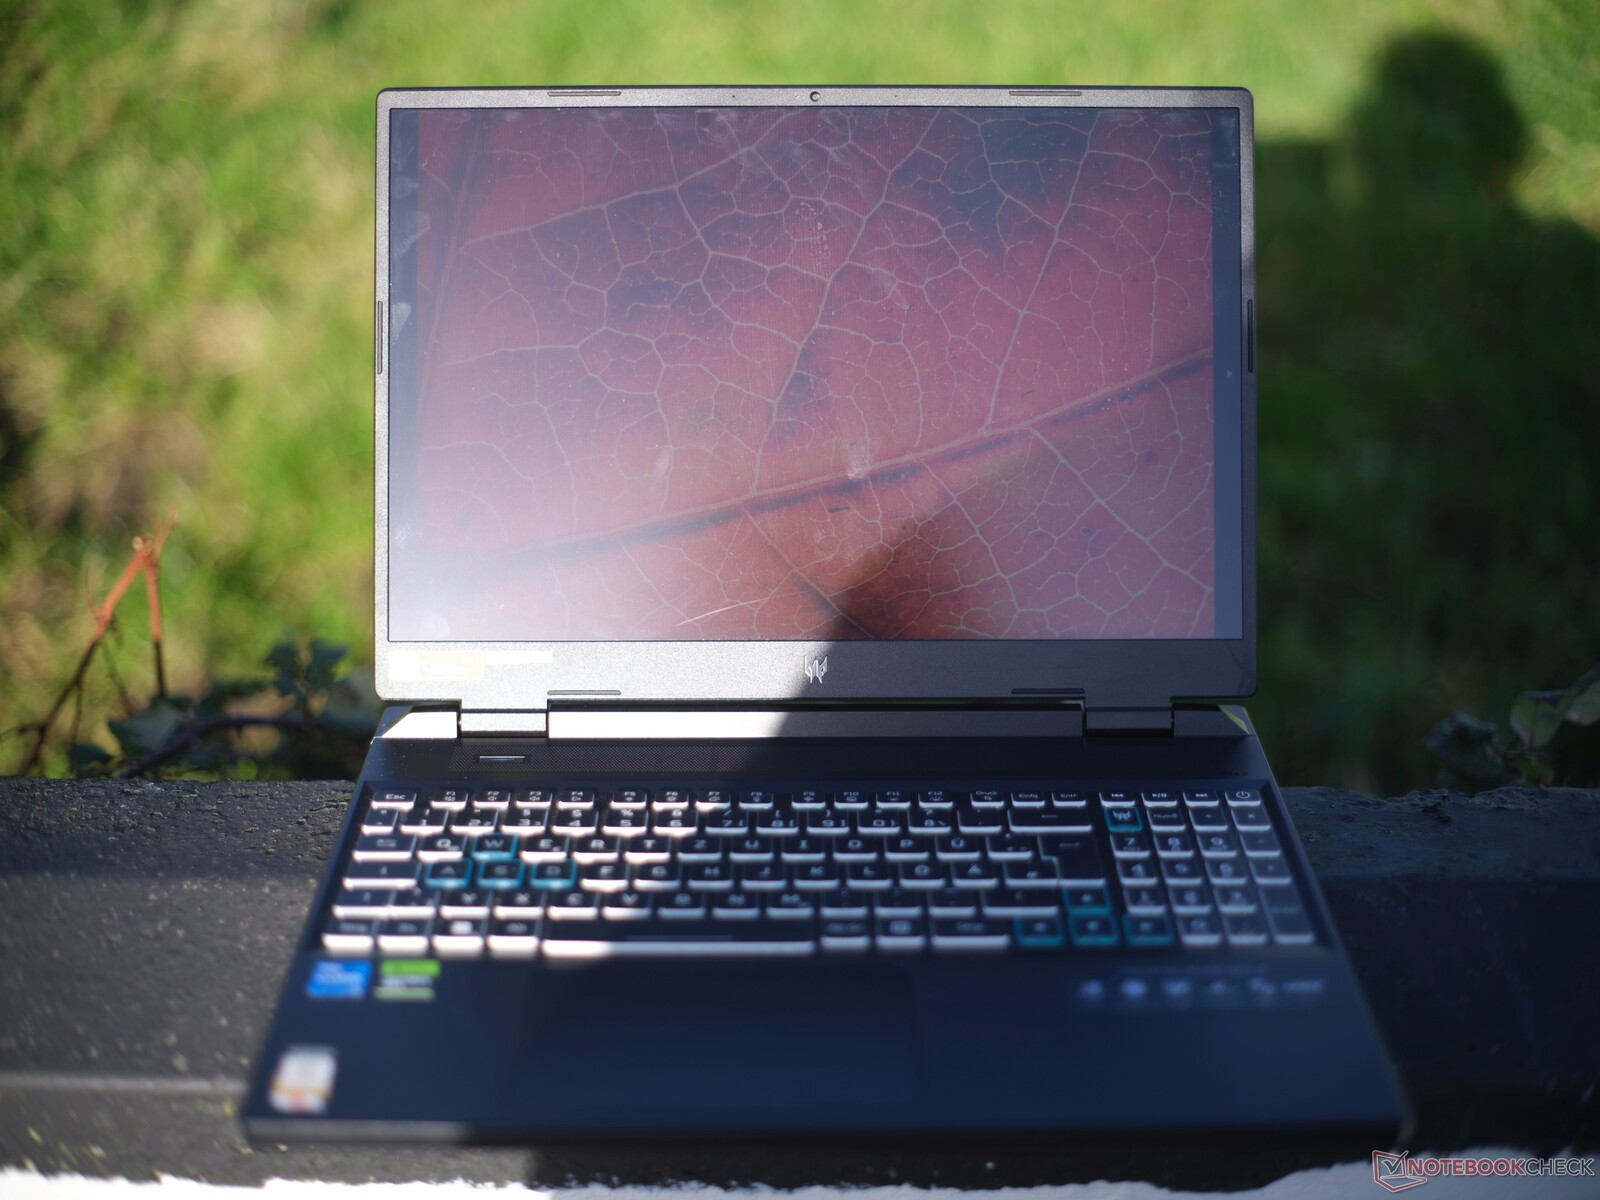
与 IPS 屏幕的典型特点一样,即使在极端视角下也能保持清晰可读。


性能中端游戏笔记本电脑中的台式机级 CPU
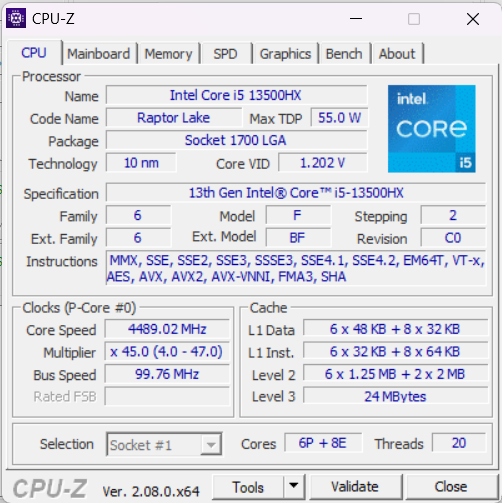
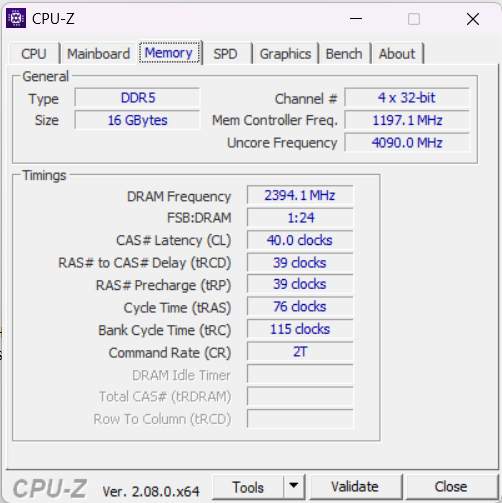
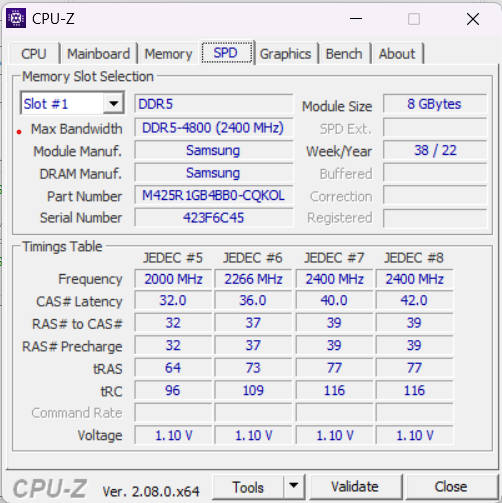
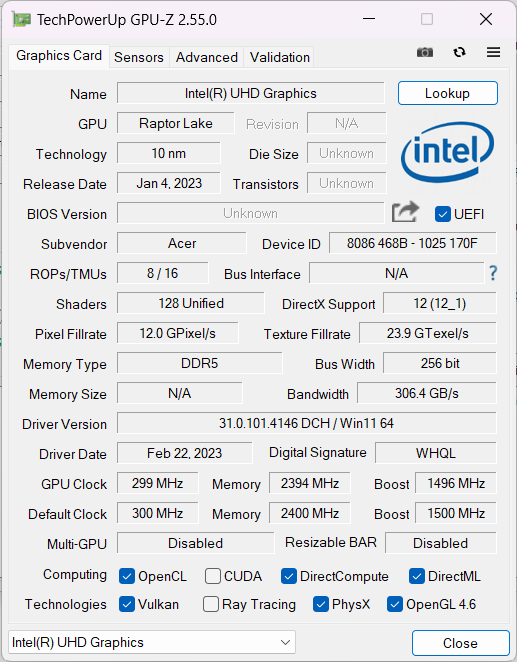
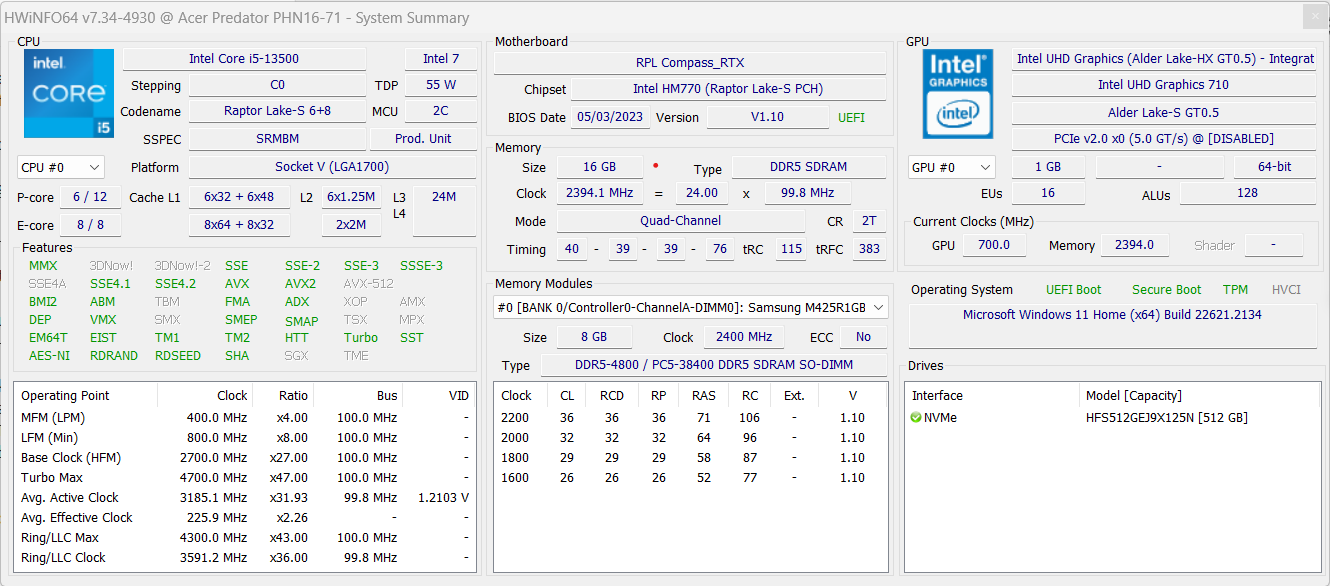
我们测试的宏碁掠夺者 Helios Neo 16 配备了英特尔酷睿 i5-13500HX(6 个 P 核心 + 8 个 E 核心)、16 GB DDR5-4800 内存、512 GB SSD 和 NvidiaGeForce RTX 4050配备 130 瓦 TGP。还可以找到更多的变体,这些变体最多可配备酷睿 i9-13900HX(8 个 P 核心 + 16 个 E 核心)和 NvidiaGeForce RTX 4070.
我们测试的这一版本的目标市场包括希望以原生 FHD+ 分辨率玩新游戏的玩家,但他们也会对两位数的 FPS 速率感到满意。 Helios Neo 16 的这一入门级型号也可以完成其他图形任务,不过 8 GB 而不是 6 GB VRAM 尤其适合 4K 视频编辑。
测试条件
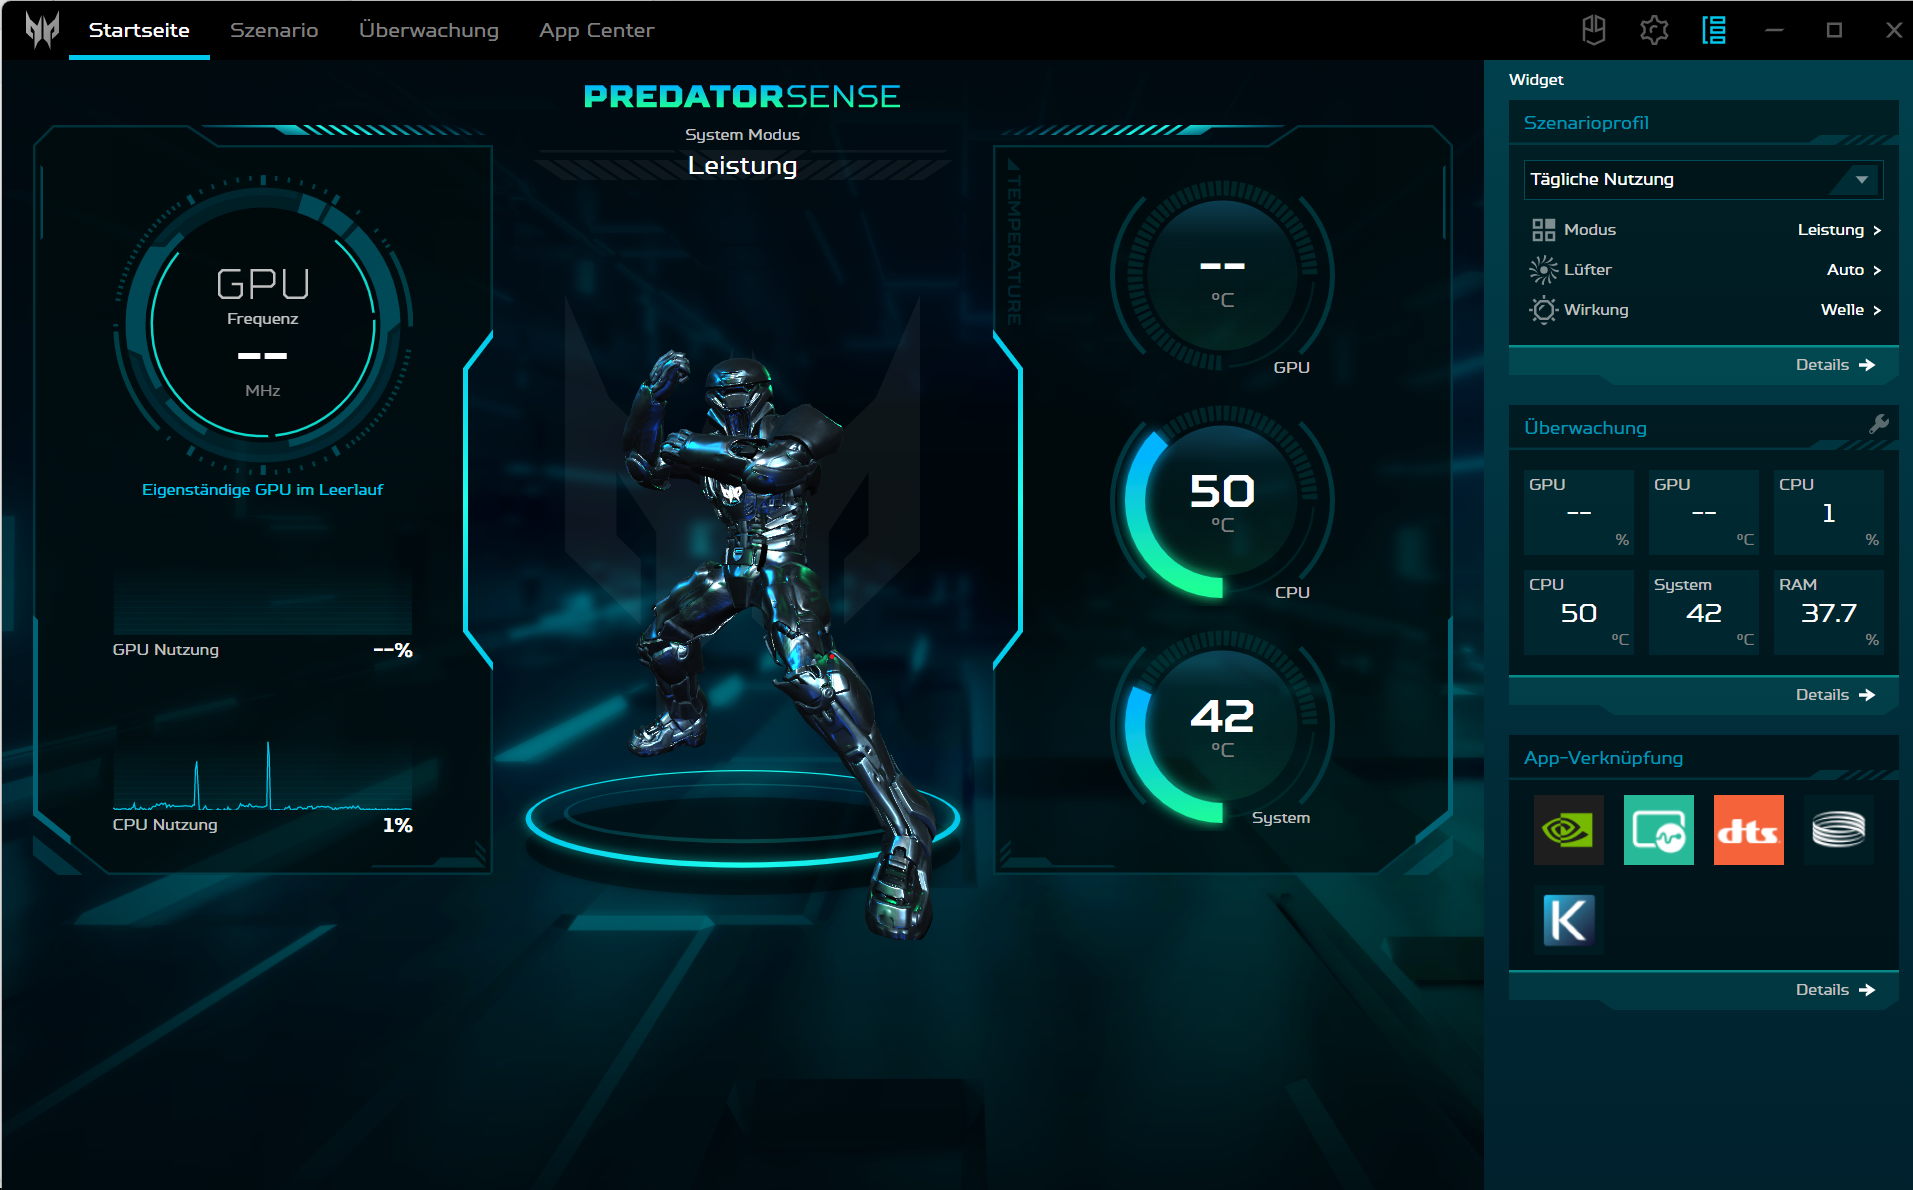
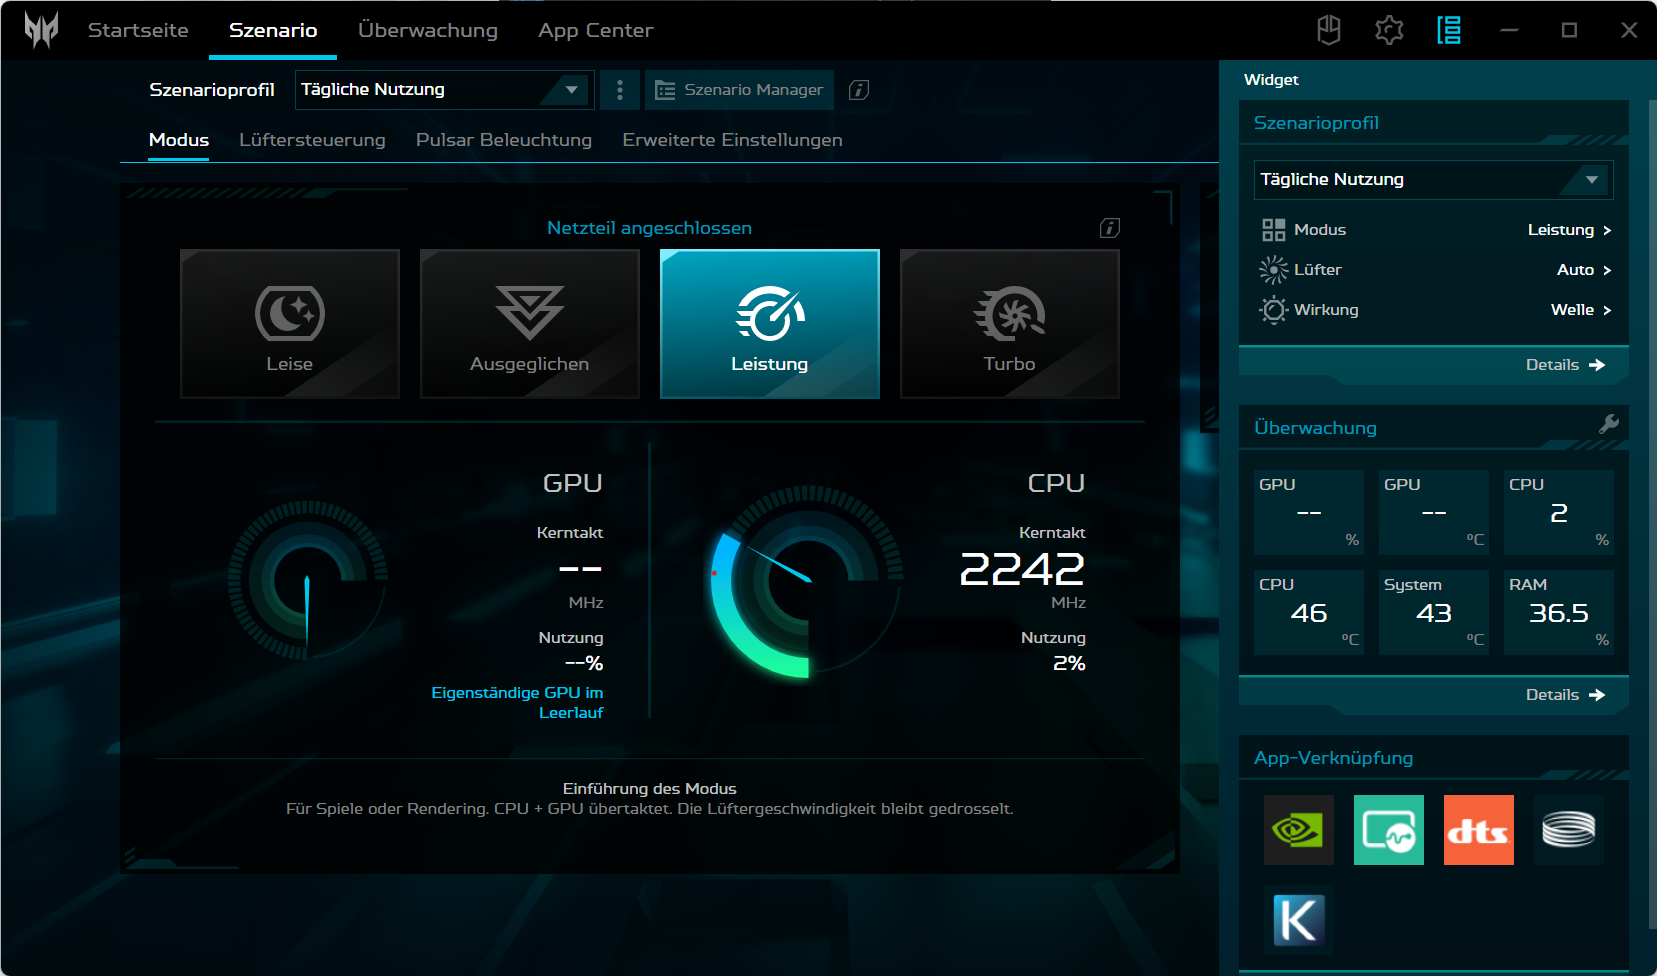
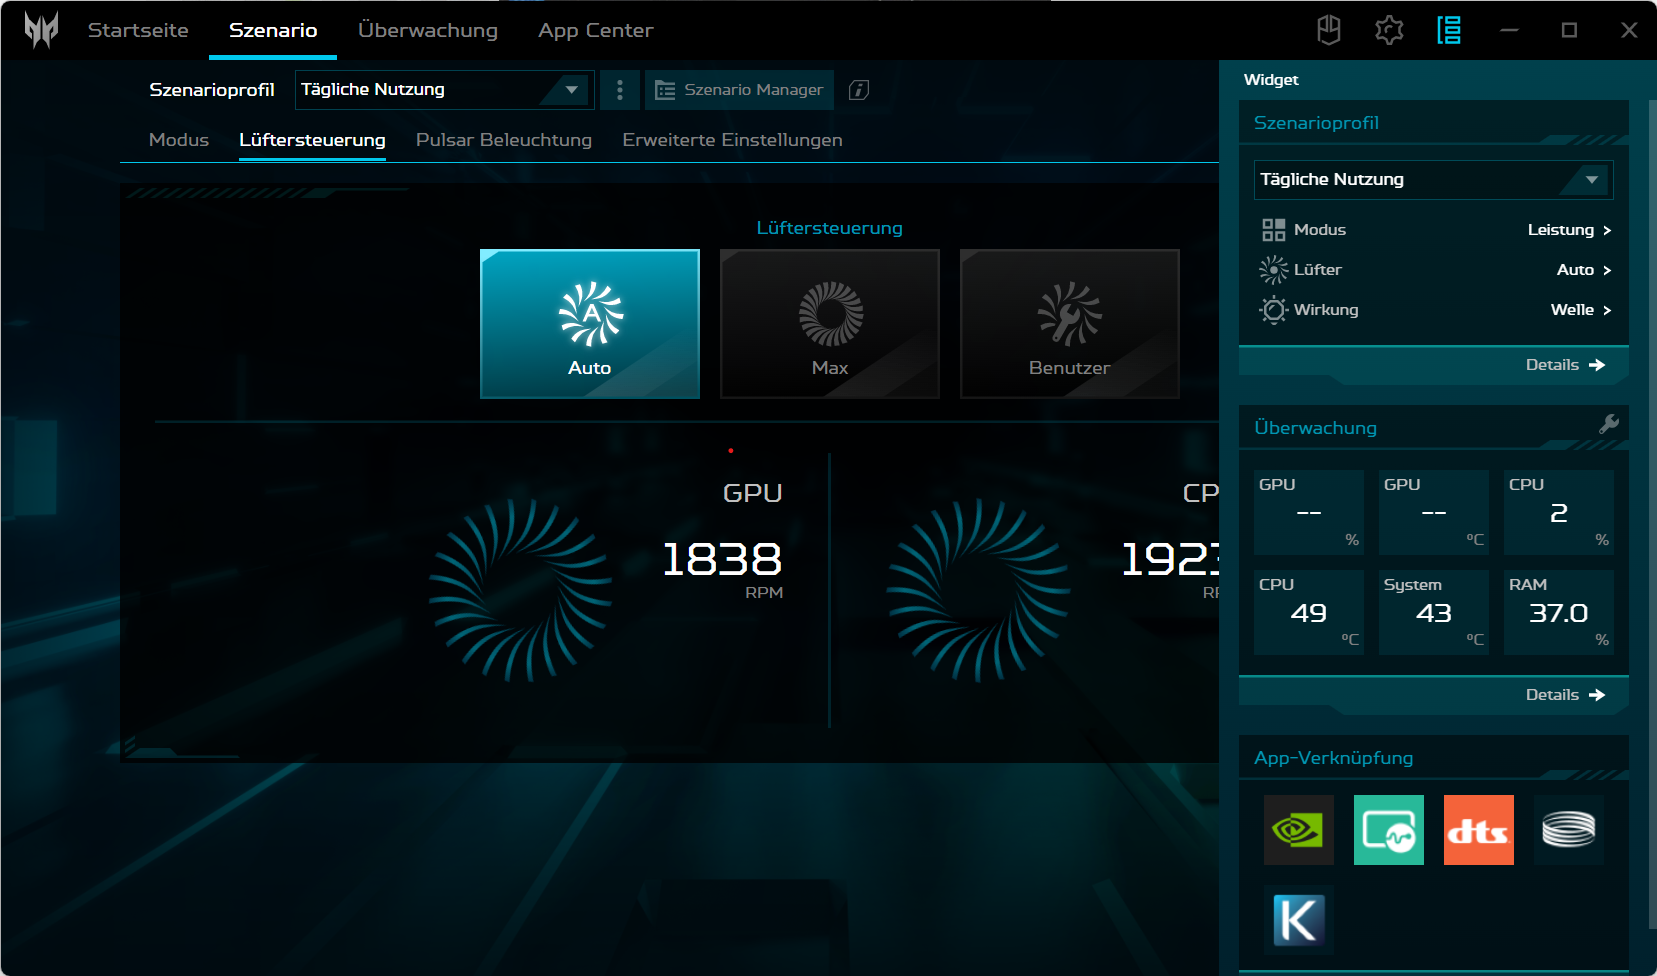
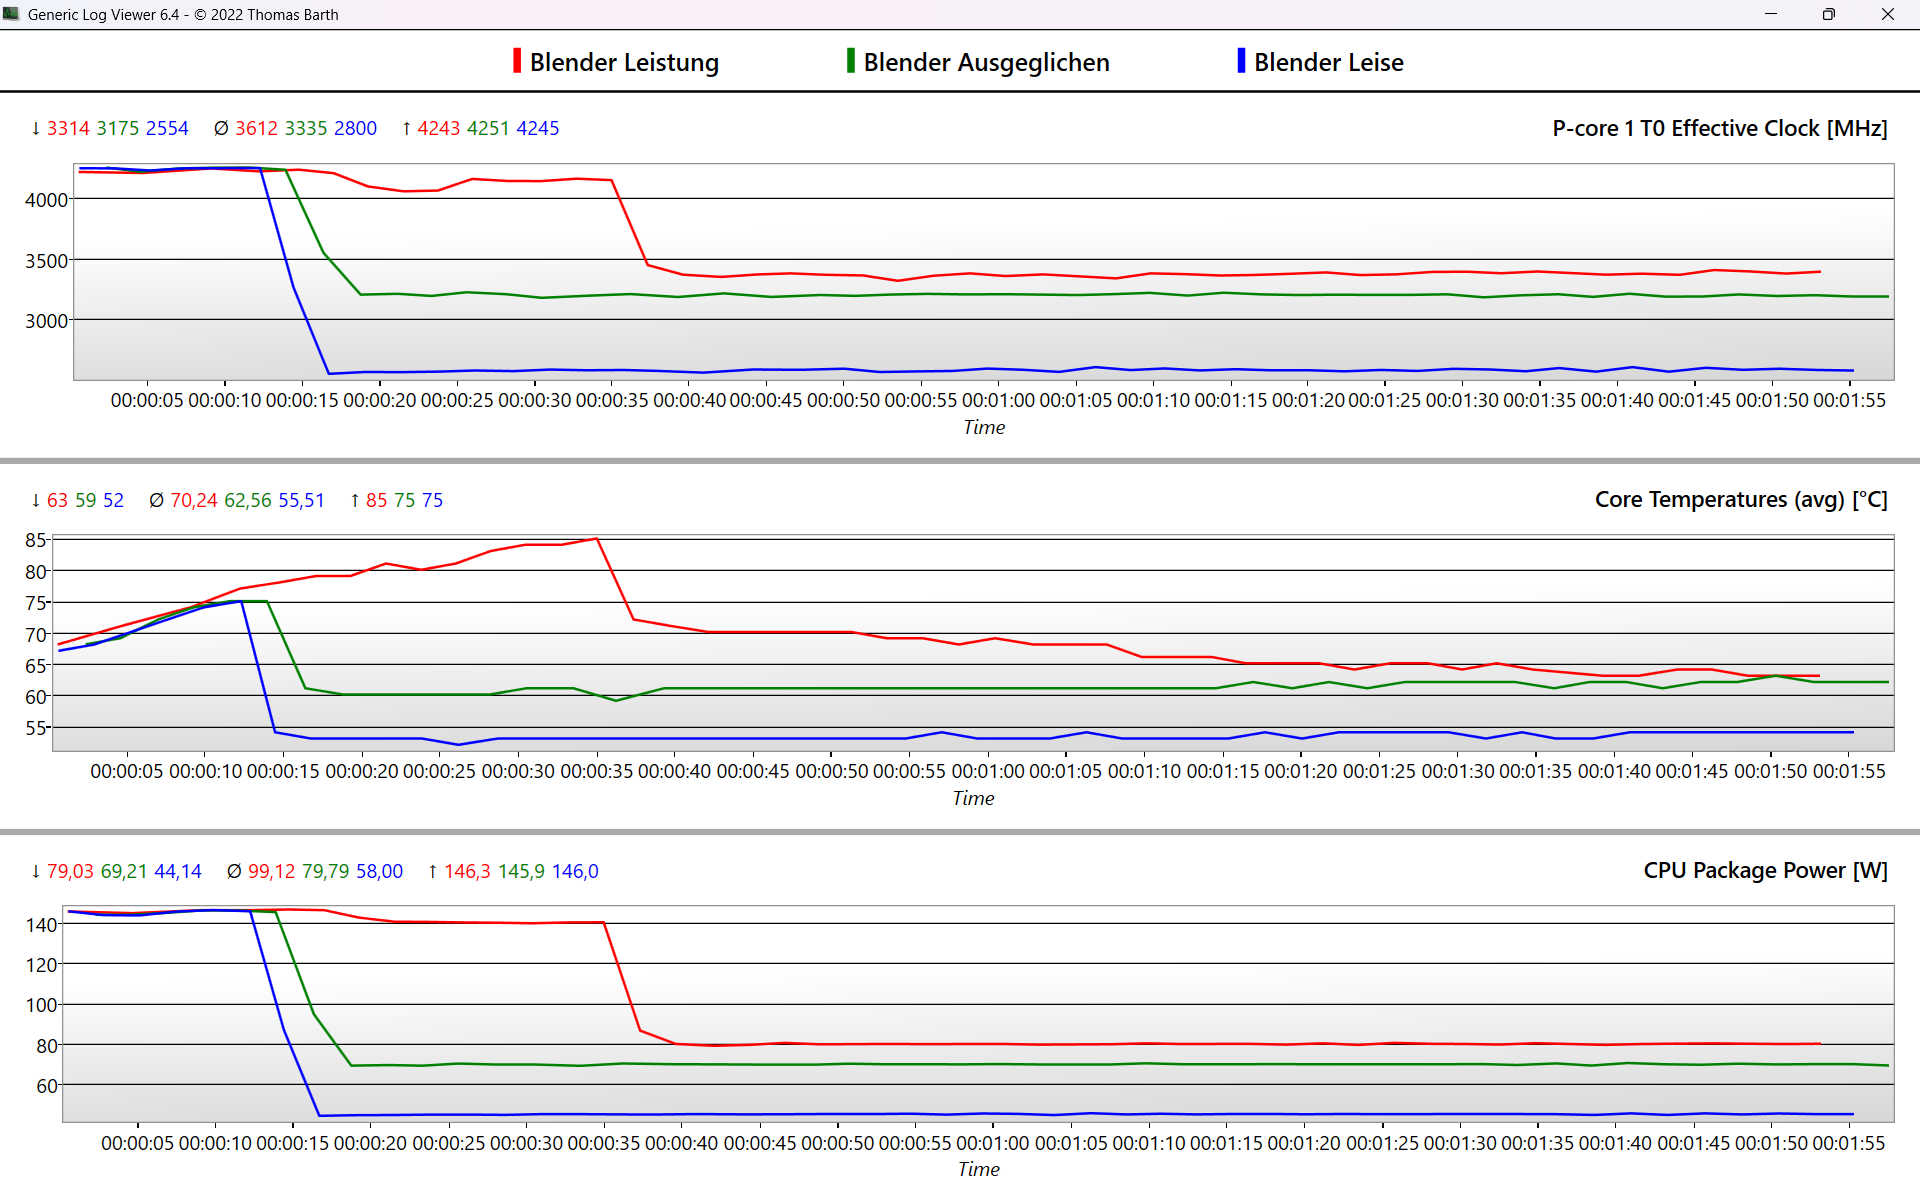
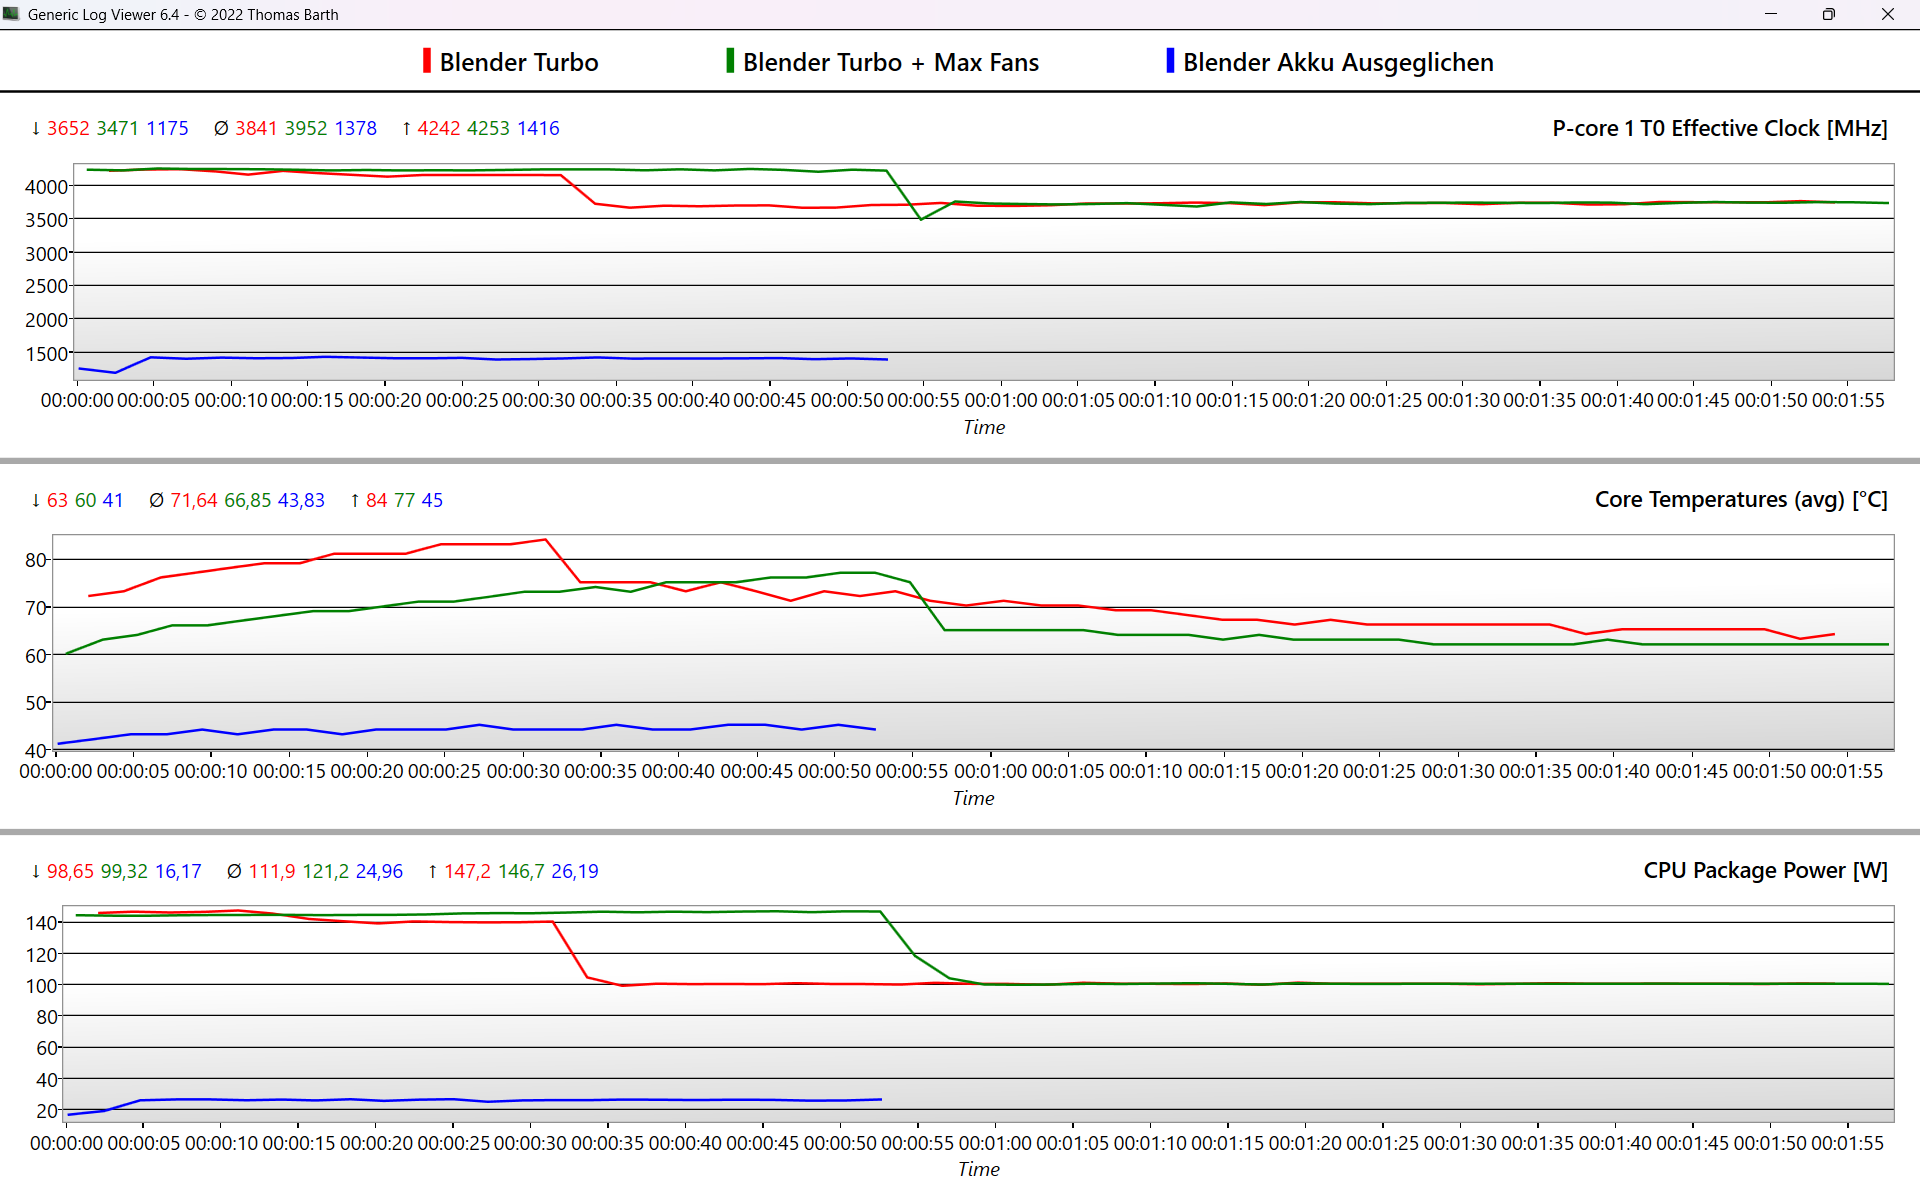
宏碁控制中心软件 "Predator Sense "提供四种性能模式,可通过键盘上方左侧的按钮进行切换。我们在 "性能 "模式下进行了与性能相关的基准测试,而在电池模式下系统会自动切换到 "平衡 "模式。Predator Helios Neo 16 的电量必须至少达到 40%,才能控制性能模式。
下表显示,在平衡模式下,GPU 性能损失很小,而风扇几乎保持了令人愉悦的安静。而涡轮增压模式的噪音则大得令人难以忍受,因此只适用于长时间的视频渲染或类似情况。
| 方案 | Turbo | Performance | Balanced | Silent | Battery |
|---|---|---|---|---|---|
| CPU PL2 | 147 W | 147 W | 147 W | 147 W | 27 W |
| CPU PL1 | 100 W | 80 W | 70 W | 45 W | 27 W |
| GPU @ TheWitcher 3 | 88 W | 86 W | 86 W | 56 W | 43 W |
| GPU @FurMark | 130 W | 130 W | 105 W | 80 W | 13 W |
| 性能(Witcher 3 @FHD/Ultra) | 81 FPS | 79 FPS | 79 FPS | 46 FPS | 30 FPS |
处理器
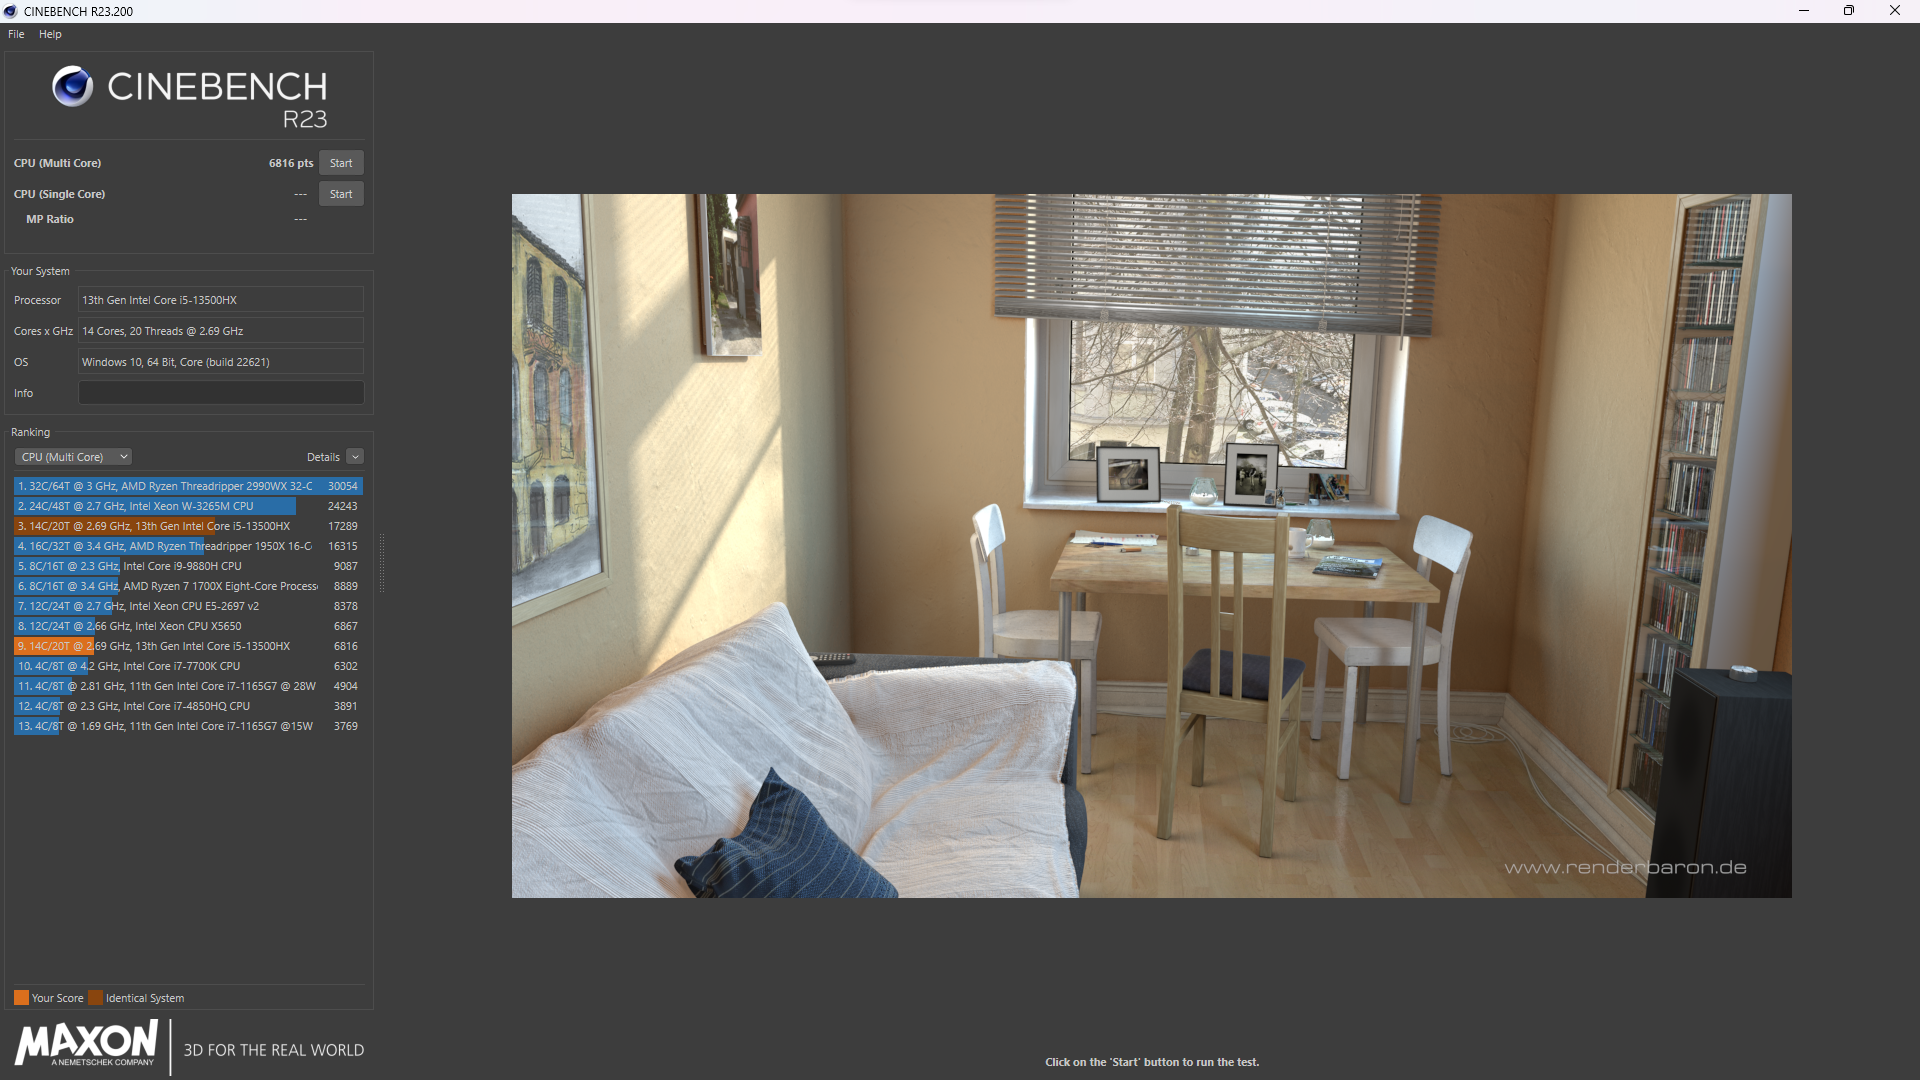
笔记本电脑安装的英特尔酷睿 i5-13500HX是一款台式机级处理器,拥有 14 个内核、20 个线程(6 个 P 内核 + 8 个 E 内核),TDP 为 55 瓦。P 核心的初始时钟频率约为 4.2 GHz,因此与 4.5 GHz 的最大 Turbo 值相差无几。大约 30 秒后,时钟频率略微降至 3.8 GHz(Turbo 模式)或 3.4 GHz(性能模式)。
在多核性能方面,Helios Neo 落后于戴尔 G15 5530 10%。戴尔 G15 5530处理器i7-13650HX和Helios 16的 15 i7-13700HX.酷睿i7-12700H的直接前身 掠夺者 Helios 300的性能要高出 12 %,而八核 AMDRyzen 7 7840HS的性能XMG Apex 15的性能超出整整 20%。
从第五次运行 Cinebench R15 开始,它的性能下降了约 17%,但通过激活响亮的 Turbo 模式几乎可以避免这种情况。可选的酷睿i9-13900HX拥有完整的 24 个内核,在多核任务中的运行速度提高了 60%。 Helios 18.在电池模式下,其 TDP 限制在令人失望的 27 瓦,导致性能下降近 60%。


Cinebench R15 Multi continuous test
Cinebench R23: Multi Core | Single Core
Cinebench R20: CPU (Multi Core) | CPU (Single Core)
Cinebench R15: CPU Multi 64Bit | CPU Single 64Bit
Blender: v2.79 BMW27 CPU
7-Zip 18.03: 7z b 4 | 7z b 4 -mmt1
Geekbench 5.5: Multi-Core | Single-Core
HWBOT x265 Benchmark v2.2: 4k Preset
LibreOffice : 20 Documents To PDF
R Benchmark 2.5: Overall mean
| CPU Performance rating | |
| Acer Predator Helios 18 N23Q2 | |
| Average of class Gaming | |
| Acer Predator Helios 16 PH16-71-731Q | |
| Dell G15 5530 | |
| Acer Predator Helios Neo 16 NH.QLTEG.002 | |
| Schenker XMG Apex 15 (Late 23) | |
| Average Intel Core i5-13500HX | |
| Lenovo Legion Pro 5 16ARX8 (R5 7645HX, RTX 4050) | |
| Lenovo LOQ 16IRH8 | |
| Acer Predator Helios 300 (i7-12700H, RTX 3070 Ti) | |
| Acer Nitro 16 AN16-41-R7YE | |
| Cinebench R23 / Multi Core | |
| Acer Predator Helios 18 N23Q2 | |
| Average of class Gaming (10488 - 42661, n=107, last 2 years) | |
| Acer Predator Helios 16 PH16-71-731Q | |
| Dell G15 5530 | |
| Acer Predator Helios Neo 16 NH.QLTEG.002 | |
| Average Intel Core i5-13500HX (18235 - 19176, n=3) | |
| Acer Predator Helios 300 (i7-12700H, RTX 3070 Ti) | |
| Schenker XMG Apex 15 (Late 23) | |
| Lenovo LOQ 16IRH8 | |
| Lenovo Legion Pro 5 16ARX8 (R5 7645HX, RTX 4050) | |
| Acer Nitro 16 AN16-41-R7YE | |
| Cinebench R23 / Single Core | |
| Acer Predator Helios 18 N23Q2 | |
| Average of class Gaming (1166 - 2415, n=107, last 2 years) | |
| Acer Predator Helios 16 PH16-71-731Q | |
| Lenovo LOQ 16IRH8 | |
| Dell G15 5530 | |
| Lenovo Legion Pro 5 16ARX8 (R5 7645HX, RTX 4050) | |
| Acer Predator Helios Neo 16 NH.QLTEG.002 | |
| Schenker XMG Apex 15 (Late 23) | |
| Acer Predator Helios 300 (i7-12700H, RTX 3070 Ti) | |
| Average Intel Core i5-13500HX (1689 - 1772, n=2) | |
| Acer Nitro 16 AN16-41-R7YE | |
| Cinebench R20 / CPU (Multi Core) | |
| Acer Predator Helios 18 N23Q2 | |
| Average of class Gaming (4029 - 16433, n=106, last 2 years) | |
| Acer Predator Helios 16 PH16-71-731Q | |
| Dell G15 5530 | |
| Acer Predator Helios Neo 16 NH.QLTEG.002 | |
| Average Intel Core i5-13500HX (6978 - 7371, n=3) | |
| Schenker XMG Apex 15 (Late 23) | |
| Acer Predator Helios 300 (i7-12700H, RTX 3070 Ti) | |
| Lenovo LOQ 16IRH8 | |
| Lenovo Legion Pro 5 16ARX8 (R5 7645HX, RTX 4050) | |
| Acer Nitro 16 AN16-41-R7YE | |
| Cinebench R20 / CPU (Single Core) | |
| Acer Predator Helios 18 N23Q2 | |
| Average of class Gaming (442 - 913, n=106, last 2 years) | |
| Acer Predator Helios 16 PH16-71-731Q | |
| Dell G15 5530 | |
| Lenovo LOQ 16IRH8 | |
| Lenovo Legion Pro 5 16ARX8 (R5 7645HX, RTX 4050) | |
| Acer Predator Helios 300 (i7-12700H, RTX 3070 Ti) | |
| Schenker XMG Apex 15 (Late 23) | |
| Acer Predator Helios Neo 16 NH.QLTEG.002 | |
| Average Intel Core i5-13500HX (648 - 695, n=3) | |
| Acer Nitro 16 AN16-41-R7YE | |
| Cinebench R15 / CPU Single 64Bit | |
| Average of class Gaming (188.8 - 350, n=106, last 2 years) | |
| Acer Predator Helios 18 N23Q2 | |
| Lenovo Legion Pro 5 16ARX8 (R5 7645HX, RTX 4050) | |
| Schenker XMG Apex 15 (Late 23) | |
| Dell G15 5530 | |
| Acer Predator Helios 16 PH16-71-731Q | |
| Lenovo LOQ 16IRH8 | |
| Acer Predator Helios 300 (i7-12700H, RTX 3070 Ti) | |
| Acer Predator Helios Neo 16 NH.QLTEG.002 | |
| Average Intel Core i5-13500HX (242 - 263, n=3) | |
| Acer Nitro 16 AN16-41-R7YE | |
| Blender / v2.79 BMW27 CPU | |
| Acer Nitro 16 AN16-41-R7YE | |
| Lenovo Legion Pro 5 16ARX8 (R5 7645HX, RTX 4050) | |
| Lenovo LOQ 16IRH8 | |
| Acer Predator Helios 300 (i7-12700H, RTX 3070 Ti) | |
| Schenker XMG Apex 15 (Late 23) | |
| Acer Predator Helios Neo 16 NH.QLTEG.002 | |
| Average Intel Core i5-13500HX (178 - 193, n=3) | |
| Dell G15 5530 | |
| Acer Predator Helios 16 PH16-71-731Q | |
| Average of class Gaming (79 - 330, n=104, last 2 years) | |
| Acer Predator Helios 18 N23Q2 | |
| 7-Zip 18.03 / 7z b 4 -mmt1 | |
| Lenovo Legion Pro 5 16ARX8 (R5 7645HX, RTX 4050) | |
| Acer Predator Helios 18 N23Q2 | |
| Schenker XMG Apex 15 (Late 23) | |
| Average of class Gaming (4199 - 7436, n=105, last 2 years) | |
| Acer Predator Helios 16 PH16-71-731Q | |
| Lenovo LOQ 16IRH8 | |
| Dell G15 5530 | |
| Acer Predator Helios 300 (i7-12700H, RTX 3070 Ti) | |
| Acer Predator Helios Neo 16 NH.QLTEG.002 | |
| Acer Nitro 16 AN16-41-R7YE | |
| Average Intel Core i5-13500HX (5377 - 5850, n=3) | |
| Geekbench 5.5 / Multi-Core | |
| Acer Predator Helios 18 N23Q2 | |
| Average of class Gaming (6460 - 28263, n=105, last 2 years) | |
| Acer Predator Helios 16 PH16-71-731Q | |
| Dell G15 5530 | |
| Acer Predator Helios Neo 16 NH.QLTEG.002 | |
| Acer Predator Helios 300 (i7-12700H, RTX 3070 Ti) | |
| Average Intel Core i5-13500HX (12683 - 13767, n=3) | |
| Lenovo LOQ 16IRH8 | |
| Schenker XMG Apex 15 (Late 23) | |
| Lenovo Legion Pro 5 16ARX8 (R5 7645HX, RTX 4050) | |
| Acer Nitro 16 AN16-41-R7YE | |
| Geekbench 5.5 / Single-Core | |
| Average of class Gaming (986 - 2474, n=105, last 2 years) | |
| Acer Predator Helios 18 N23Q2 | |
| Lenovo Legion Pro 5 16ARX8 (R5 7645HX, RTX 4050) | |
| Schenker XMG Apex 15 (Late 23) | |
| Acer Predator Helios 16 PH16-71-731Q | |
| Dell G15 5530 | |
| Lenovo LOQ 16IRH8 | |
| Average Intel Core i5-13500HX (1688 - 1779, n=3) | |
| Acer Predator Helios Neo 16 NH.QLTEG.002 | |
| Acer Predator Helios 300 (i7-12700H, RTX 3070 Ti) | |
| Acer Nitro 16 AN16-41-R7YE | |
| HWBOT x265 Benchmark v2.2 / 4k Preset | |
| Acer Predator Helios 18 N23Q2 | |
| Average of class Gaming (11.5 - 44.4, n=105, last 2 years) | |
| Acer Predator Helios 16 PH16-71-731Q | |
| Dell G15 5530 | |
| Average Intel Core i5-13500HX (20.3 - 20.9, n=3) | |
| Acer Predator Helios Neo 16 NH.QLTEG.002 | |
| Schenker XMG Apex 15 (Late 23) | |
| Lenovo Legion Pro 5 16ARX8 (R5 7645HX, RTX 4050) | |
| Lenovo LOQ 16IRH8 | |
| Acer Predator Helios 300 (i7-12700H, RTX 3070 Ti) | |
| Acer Nitro 16 AN16-41-R7YE | |
| LibreOffice / 20 Documents To PDF | |
| Acer Predator Helios 300 (i7-12700H, RTX 3070 Ti) | |
| Lenovo Legion Pro 5 16ARX8 (R5 7645HX, RTX 4050) | |
| Average of class Gaming (33.2 - 88.8, n=105, last 2 years) | |
| Acer Predator Helios 18 N23Q2 | |
| Dell G15 5530 | |
| Acer Nitro 16 AN16-41-R7YE | |
| Lenovo LOQ 16IRH8 | |
| Acer Predator Helios Neo 16 NH.QLTEG.002 | |
| Schenker XMG Apex 15 (Late 23) | |
| Average Intel Core i5-13500HX (42.5 - 45, n=2) | |
| Acer Predator Helios 16 PH16-71-731Q | |
| R Benchmark 2.5 / Overall mean | |
| Acer Nitro 16 AN16-41-R7YE | |
| Average Intel Core i5-13500HX (0.4512 - 0.4891, n=3) | |
| Acer Predator Helios Neo 16 NH.QLTEG.002 | |
| Acer Predator Helios 300 (i7-12700H, RTX 3070 Ti) | |
| Lenovo LOQ 16IRH8 | |
| Schenker XMG Apex 15 (Late 23) | |
| Lenovo Legion Pro 5 16ARX8 (R5 7645HX, RTX 4050) | |
| Average of class Gaming (0.3439 - 0.759, n=106, last 2 years) | |
| Acer Predator Helios 16 PH16-71-731Q | |
| Dell G15 5530 | |
| Acer Predator Helios 18 N23Q2 | |
* ... smaller is better
AIDA64: FP32 Ray-Trace | FPU Julia | CPU SHA3 | CPU Queen | FPU SinJulia | FPU Mandel | CPU AES | CPU ZLib | FP64 Ray-Trace | CPU PhotoWorxx
| Performance rating | |
| Average of class Gaming | |
| Schenker XMG Apex 15 (Late 23) | |
| Dell G15 5530 | |
| Acer Predator Helios Neo 16 NH.QLTEG.002 | |
| Average Intel Core i5-13500HX | |
| Lenovo Legion Pro 5 16ARX8 (R5 7645HX, RTX 4050) | |
| HP Victus 16-r0076TX | |
| Lenovo LOQ 16IRH8 | |
| AIDA64 / FP32 Ray-Trace | |
| Average of class Gaming (10227 - 85542, n=105, last 2 years) | |
| Schenker XMG Apex 15 (Late 23) | |
| Lenovo Legion Pro 5 16ARX8 (R5 7645HX, RTX 4050) | |
| Dell G15 5530 | |
| Average Intel Core i5-13500HX (15888 - 16544, n=3) | |
| Acer Predator Helios Neo 16 NH.QLTEG.002 | |
| HP Victus 16-r0076TX | |
| Lenovo LOQ 16IRH8 | |
| AIDA64 / FPU Julia | |
| Average of class Gaming (51376 - 238426, n=105, last 2 years) | |
| Schenker XMG Apex 15 (Late 23) | |
| Lenovo Legion Pro 5 16ARX8 (R5 7645HX, RTX 4050) | |
| Dell G15 5530 | |
| HP Victus 16-r0076TX | |
| Average Intel Core i5-13500HX (80761 - 85623, n=3) | |
| Acer Predator Helios Neo 16 NH.QLTEG.002 | |
| Lenovo LOQ 16IRH8 | |
| AIDA64 / CPU SHA3 | |
| Average of class Gaming (2180 - 10115, n=105, last 2 years) | |
| Dell G15 5530 | |
| Schenker XMG Apex 15 (Late 23) | |
| Average Intel Core i5-13500HX (3868 - 4017, n=3) | |
| HP Victus 16-r0076TX | |
| Acer Predator Helios Neo 16 NH.QLTEG.002 | |
| Lenovo Legion Pro 5 16ARX8 (R5 7645HX, RTX 4050) | |
| Lenovo LOQ 16IRH8 | |
| AIDA64 / CPU Queen | |
| Average of class Gaming (49785 - 173351, n=90, last 2 years) | |
| Dell G15 5530 | |
| Acer Predator Helios Neo 16 NH.QLTEG.002 | |
| Average Intel Core i5-13500HX (105168 - 107075, n=3) | |
| Schenker XMG Apex 15 (Late 23) | |
| HP Victus 16-r0076TX | |
| Lenovo Legion Pro 5 16ARX8 (R5 7645HX, RTX 4050) | |
| Lenovo LOQ 16IRH8 | |
| AIDA64 / FPU SinJulia | |
| Schenker XMG Apex 15 (Late 23) | |
| Average of class Gaming (4424 - 33636, n=105, last 2 years) | |
| Lenovo Legion Pro 5 16ARX8 (R5 7645HX, RTX 4050) | |
| Dell G15 5530 | |
| Average Intel Core i5-13500HX (10334 - 10793, n=3) | |
| Acer Predator Helios Neo 16 NH.QLTEG.002 | |
| HP Victus 16-r0076TX | |
| Lenovo LOQ 16IRH8 | |
| AIDA64 / FPU Mandel | |
| Average of class Gaming (25115 - 128721, n=105, last 2 years) | |
| Schenker XMG Apex 15 (Late 23) | |
| Lenovo Legion Pro 5 16ARX8 (R5 7645HX, RTX 4050) | |
| Dell G15 5530 | |
| Average Intel Core i5-13500HX (39805 - 41418, n=3) | |
| Acer Predator Helios Neo 16 NH.QLTEG.002 | |
| HP Victus 16-r0076TX | |
| Lenovo LOQ 16IRH8 | |
| AIDA64 / CPU AES | |
| Schenker XMG Apex 15 (Late 23) | |
| Acer Predator Helios Neo 16 NH.QLTEG.002 | |
| Average of class Gaming (39258 - 247074, n=105, last 2 years) | |
| Average Intel Core i5-13500HX (79903 - 154368, n=3) | |
| Dell G15 5530 | |
| HP Victus 16-r0076TX | |
| Lenovo LOQ 16IRH8 | |
| Lenovo Legion Pro 5 16ARX8 (R5 7645HX, RTX 4050) | |
| AIDA64 / CPU ZLib | |
| Average of class Gaming (574 - 2531, n=105, last 2 years) | |
| Dell G15 5530 | |
| Acer Predator Helios Neo 16 NH.QLTEG.002 | |
| Average Intel Core i5-13500HX (1104 - 1233, n=3) | |
| HP Victus 16-r0076TX | |
| Schenker XMG Apex 15 (Late 23) | |
| Lenovo Legion Pro 5 16ARX8 (R5 7645HX, RTX 4050) | |
| Lenovo LOQ 16IRH8 | |
| AIDA64 / FP64 Ray-Trace | |
| Average of class Gaming (5509 - 45446, n=105, last 2 years) | |
| Schenker XMG Apex 15 (Late 23) | |
| Lenovo Legion Pro 5 16ARX8 (R5 7645HX, RTX 4050) | |
| Dell G15 5530 | |
| Average Intel Core i5-13500HX (8587 - 9008, n=3) | |
| Acer Predator Helios Neo 16 NH.QLTEG.002 | |
| HP Victus 16-r0076TX | |
| Lenovo LOQ 16IRH8 | |
| AIDA64 / CPU PhotoWorxx | |
| Average of class Gaming (12271 - 89891, n=105, last 2 years) | |
| Average Intel Core i5-13500HX (36861 - 42683, n=3) | |
| Dell G15 5530 | |
| HP Victus 16-r0076TX | |
| Acer Predator Helios Neo 16 NH.QLTEG.002 | |
| Schenker XMG Apex 15 (Late 23) | |
| Lenovo LOQ 16IRH8 | |
| Lenovo Legion Pro 5 16ARX8 (R5 7645HX, RTX 4050) | |
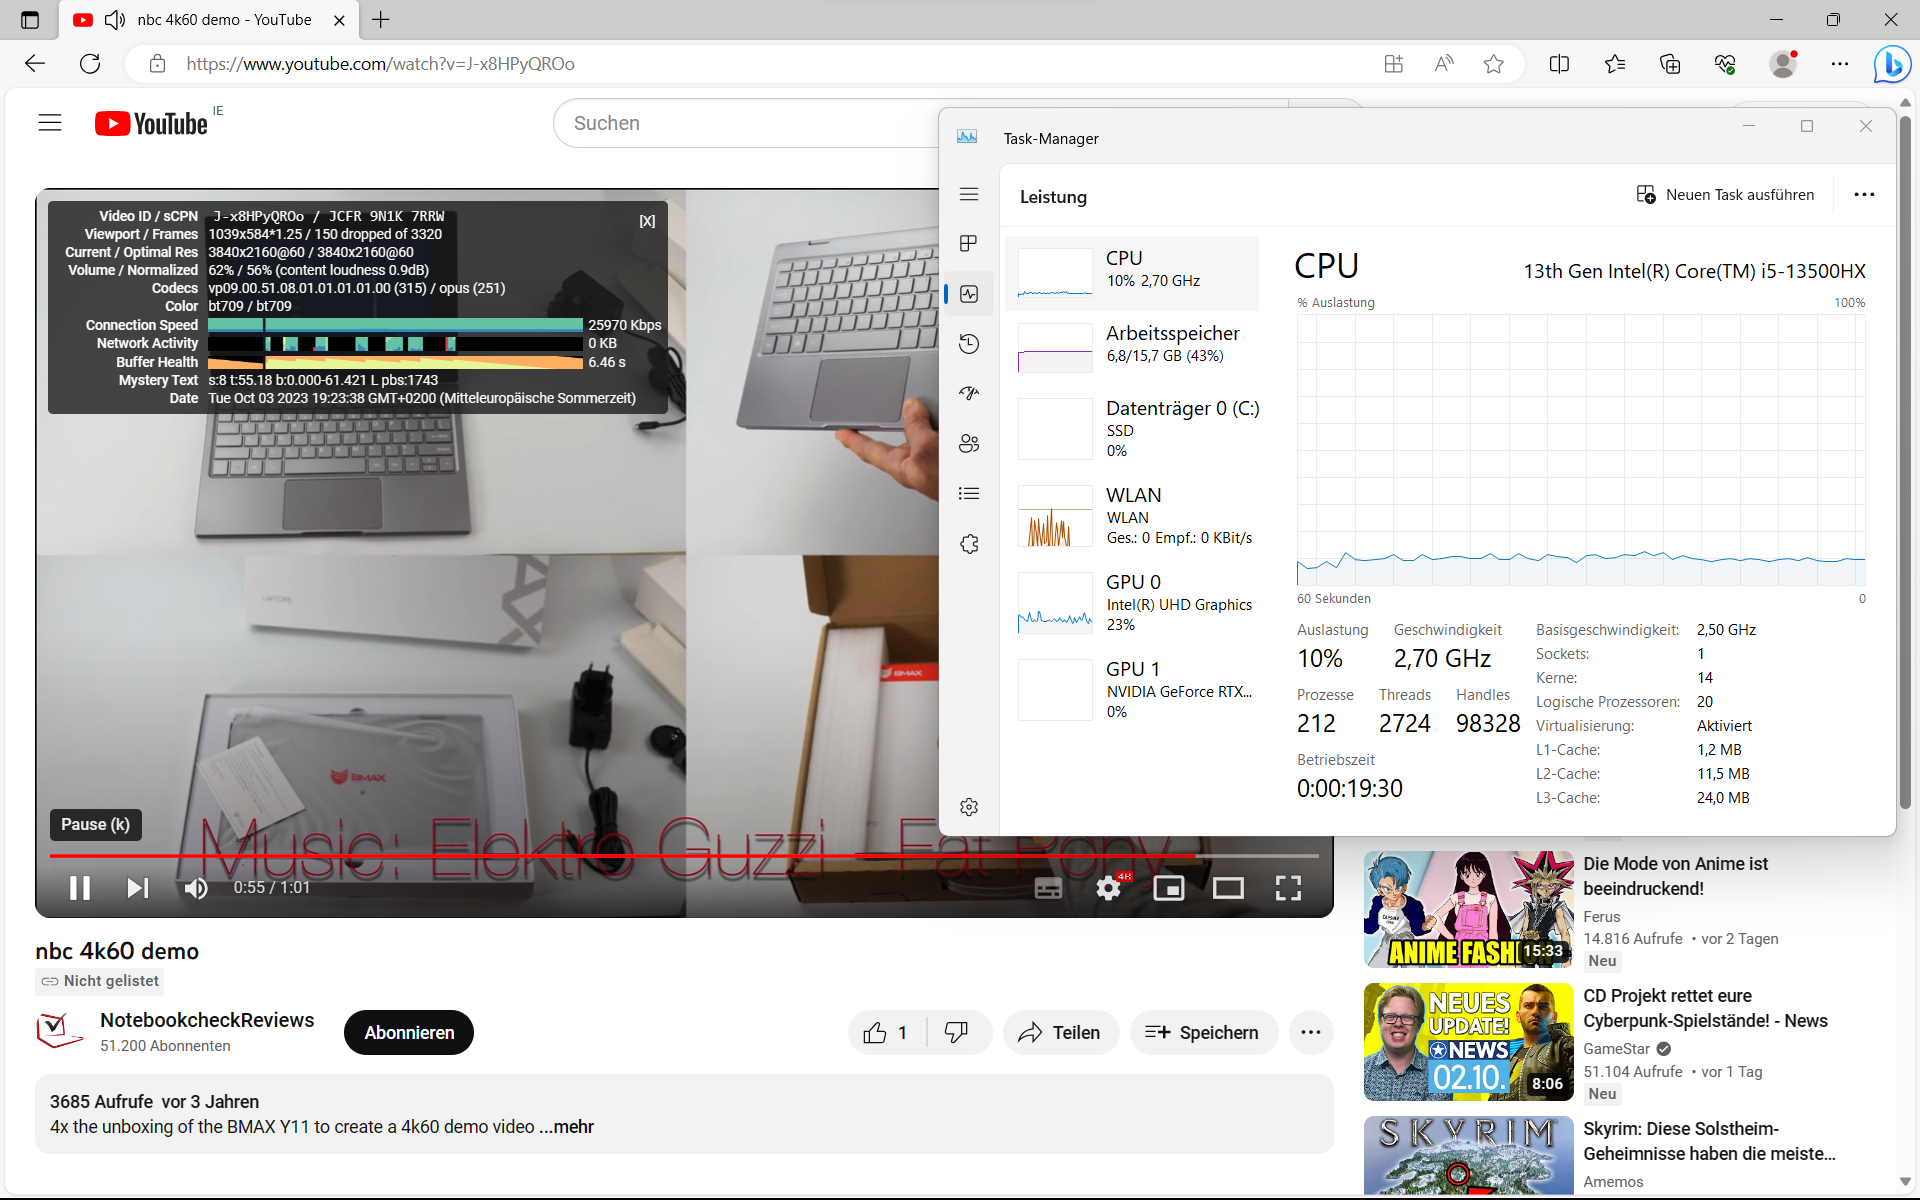
系统性能
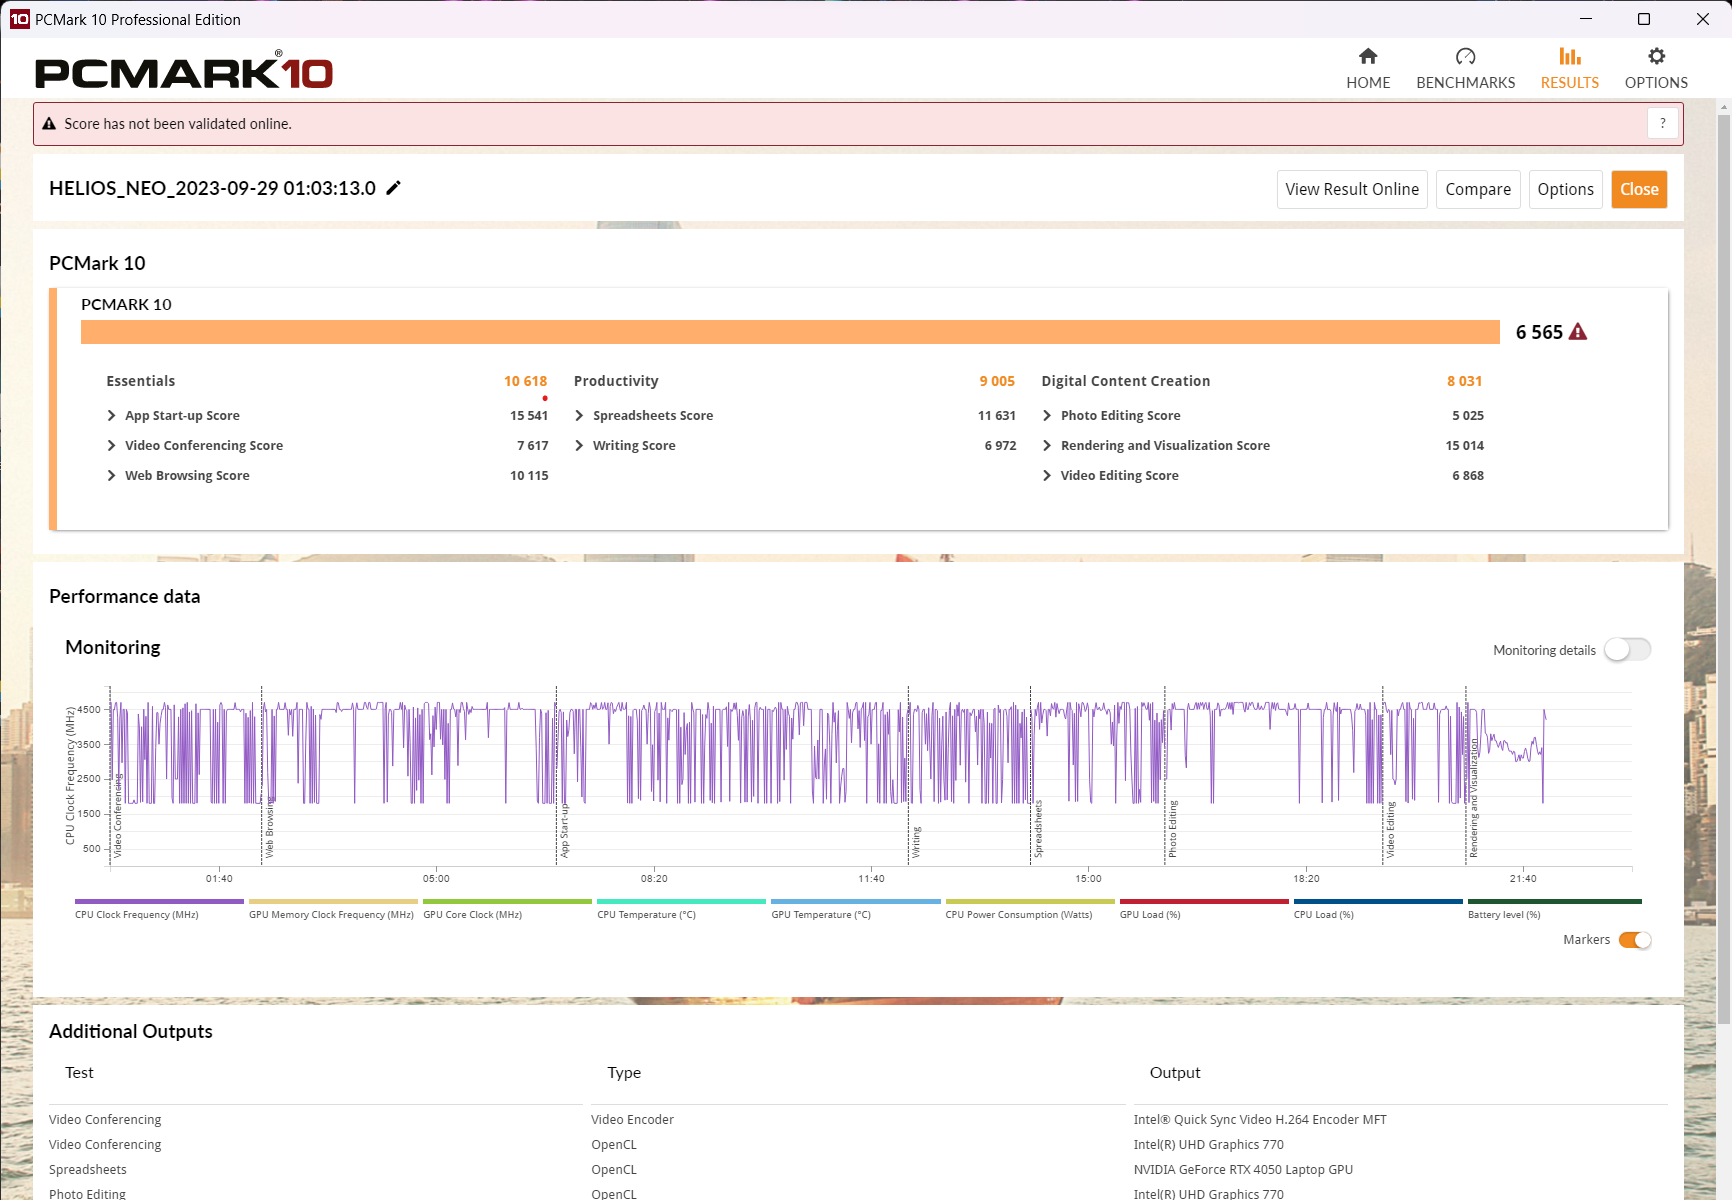
宏碁游戏笔记本电脑在执行日常任务时反应非常灵敏。对于英特尔 HX 系统来说,在播放 4K YouTube 的同时上网冲浪就像是在度假。在 PCMark 10 基准测试中,Predator Helios Neo 落后于 AMD 系统的联想Legion Pro 5和申克XMG Apex 15落后约 30%,尤其是在内容创建方面。不过,在 Crossmark 测试中,Neo 几乎达到了最高水平。
在使用 Mozilla Kraken 1.1 和 WebXPRT 进行的网页浏览性能测试中,Neo 的表现非常出色,这要归功于笔记本电脑强大的单核性能,但与Legion Pro 5 相比,Neo 的表现还差得远。
CrossMark: Overall | Productivity | Creativity | Responsiveness
Mozilla Kraken 1.1: Total
Octane V2: Total Score
Speedometer 2.0: Result 2.0
Jetstream 2: 2.0 Total
WebXPRT 3: Overall
WebXPRT 4: Overall
| PCMark 10 / Score | |
| Average of class Gaming (5828 - 12414, n=93, last 2 years) | |
| Lenovo Legion Pro 5 16ARX8 (R5 7645HX, RTX 4050) | |
| Schenker XMG Apex 15 (Late 23) | |
| Dell G15 5530 | |
| Lenovo LOQ 16IRH8 | |
| Acer Predator Helios Neo 16 NH.QLTEG.002 | |
| Average Intel Core i5-13500HX, NVIDIA GeForce RTX 4050 Laptop GPU (6125 - 6565, n=2) | |
| HP Victus 16-r0076TX | |
| PCMark 10 / Essentials | |
| Lenovo Legion Pro 5 16ARX8 (R5 7645HX, RTX 4050) | |
| Dell G15 5530 | |
| Schenker XMG Apex 15 (Late 23) | |
| Average of class Gaming (8810 - 11935, n=97, last 2 years) | |
| Acer Predator Helios Neo 16 NH.QLTEG.002 | |
| Average Intel Core i5-13500HX, NVIDIA GeForce RTX 4050 Laptop GPU (9625 - 10618, n=2) | |
| Lenovo LOQ 16IRH8 | |
| HP Victus 16-r0076TX | |
| PCMark 10 / Productivity | |
| Average of class Gaming (6845 - 25323, n=95, last 2 years) | |
| Lenovo Legion Pro 5 16ARX8 (R5 7645HX, RTX 4050) | |
| Schenker XMG Apex 15 (Late 23) | |
| Dell G15 5530 | |
| Acer Predator Helios Neo 16 NH.QLTEG.002 | |
| Average Intel Core i5-13500HX, NVIDIA GeForce RTX 4050 Laptop GPU (8471 - 9005, n=2) | |
| Lenovo LOQ 16IRH8 | |
| HP Victus 16-r0076TX | |
| PCMark 10 / Digital Content Creation | |
| Average of class Gaming (7602 - 19954, n=95, last 2 years) | |
| Schenker XMG Apex 15 (Late 23) | |
| Lenovo Legion Pro 5 16ARX8 (R5 7645HX, RTX 4050) | |
| Lenovo LOQ 16IRH8 | |
| Dell G15 5530 | |
| Acer Predator Helios Neo 16 NH.QLTEG.002 | |
| Average Intel Core i5-13500HX, NVIDIA GeForce RTX 4050 Laptop GPU (7649 - 8031, n=2) | |
| HP Victus 16-r0076TX | |
| CrossMark / Overall | |
| Average of class Gaming (1366 - 2409, n=94, last 2 years) | |
| Acer Predator Helios Neo 16 NH.QLTEG.002 | |
| Lenovo LOQ 16IRH8 | |
| Lenovo Legion Pro 5 16ARX8 (R5 7645HX, RTX 4050) | |
| Dell G15 5530 | |
| Average Intel Core i5-13500HX, NVIDIA GeForce RTX 4050 Laptop GPU (1701 - 1964, n=2) | |
| Schenker XMG Apex 15 (Late 23) | |
| HP Victus 16-r0076TX | |
| CrossMark / Productivity | |
| Lenovo Legion Pro 5 16ARX8 (R5 7645HX, RTX 4050) | |
| Acer Predator Helios Neo 16 NH.QLTEG.002 | |
| Lenovo LOQ 16IRH8 | |
| Average of class Gaming (1386 - 2254, n=94, last 2 years) | |
| Dell G15 5530 | |
| Average Intel Core i5-13500HX, NVIDIA GeForce RTX 4050 Laptop GPU (1585 - 1878, n=2) | |
| Schenker XMG Apex 15 (Late 23) | |
| HP Victus 16-r0076TX | |
| CrossMark / Creativity | |
| Average of class Gaming (1343 - 2786, n=94, last 2 years) | |
| Dell G15 5530 | |
| Lenovo LOQ 16IRH8 | |
| Lenovo Legion Pro 5 16ARX8 (R5 7645HX, RTX 4050) | |
| Acer Predator Helios Neo 16 NH.QLTEG.002 | |
| Average Intel Core i5-13500HX, NVIDIA GeForce RTX 4050 Laptop GPU (1912 - 2022, n=2) | |
| Schenker XMG Apex 15 (Late 23) | |
| HP Victus 16-r0076TX | |
| CrossMark / Responsiveness | |
| Acer Predator Helios Neo 16 NH.QLTEG.002 | |
| Lenovo LOQ 16IRH8 | |
| Lenovo Legion Pro 5 16ARX8 (R5 7645HX, RTX 4050) | |
| Average Intel Core i5-13500HX, NVIDIA GeForce RTX 4050 Laptop GPU (1478 - 2053, n=2) | |
| Average of class Gaming (1226 - 2334, n=94, last 2 years) | |
| Dell G15 5530 | |
| Schenker XMG Apex 15 (Late 23) | |
| HP Victus 16-r0076TX | |
| Mozilla Kraken 1.1 / Total | |
| HP Victus 16-r0076TX | |
| Average Intel Core i5-13500HX, NVIDIA GeForce RTX 4050 Laptop GPU (521 - 550, n=3) | |
| Acer Predator Helios Neo 16 NH.QLTEG.002 | |
| Schenker XMG Apex 15 (Late 23) | |
| Dell G15 5530 | |
| Lenovo LOQ 16IRH8 | |
| Lenovo LOQ 16IRH8 | |
| Lenovo Legion Pro 5 16ARX8 (R5 7645HX, RTX 4050) | |
| Average of class Gaming (391 - 590, n=100, last 2 years) | |
| Octane V2 / Total Score | |
| Average of class Gaming (93292 - 139447, n=27, last 2 years) | |
| Schenker XMG Apex 15 (Late 23) | |
| Acer Predator Helios Neo 16 NH.QLTEG.002 | |
| Average Intel Core i5-13500HX, NVIDIA GeForce RTX 4050 Laptop GPU (n=1) | |
| Lenovo Legion Pro 5 16ARX8 (R5 7645HX, RTX 4050) | |
| Speedometer 2.0 / Result 2.0 | |
| Average of class Gaming (29 - 736, n=27, last 2 years) | |
| Average Intel Core i5-13500HX, NVIDIA GeForce RTX 4050 Laptop GPU (n=1) | |
| Acer Predator Helios Neo 16 NH.QLTEG.002 | |
| Schenker XMG Apex 15 (Late 23) | |
| Jetstream 2 / 2.0 Total | |
| Average of class Gaming (334 - 516, n=27, last 2 years) | |
| Acer Predator Helios Neo 16 NH.QLTEG.002 | |
| Average Intel Core i5-13500HX, NVIDIA GeForce RTX 4050 Laptop GPU (n=1) | |
| Schenker XMG Apex 15 (Late 23) | |
| Lenovo Legion Pro 5 16ARX8 (R5 7645HX, RTX 4050) | |
| WebXPRT 3 / Overall | |
| Lenovo Legion Pro 5 16ARX8 (R5 7645HX, RTX 4050) | |
| Lenovo LOQ 16IRH8 | |
| Lenovo LOQ 16IRH8 | |
| Average of class Gaming (220 - 532, n=98, last 2 years) | |
| Schenker XMG Apex 15 (Late 23) | |
| Acer Predator Helios Neo 16 NH.QLTEG.002 | |
| Dell G15 5530 | |
| Average Intel Core i5-13500HX, NVIDIA GeForce RTX 4050 Laptop GPU (255 - 294, n=3) | |
| HP Victus 16-r0076TX | |
| WebXPRT 4 / Overall | |
| Average of class Gaming (165 - 354, n=98, last 2 years) | |
| Dell G15 5530 | |
| Lenovo Legion Pro 5 16ARX8 (R5 7645HX, RTX 4050) | |
| Average Intel Core i5-13500HX, NVIDIA GeForce RTX 4050 Laptop GPU (240 - 257, n=3) | |
| HP Victus 16-r0076TX | |
| Acer Predator Helios Neo 16 NH.QLTEG.002 | |
* ... smaller is better
| PCMark 10 Score | 6565 points | |
Help | ||
* ... smaller is better
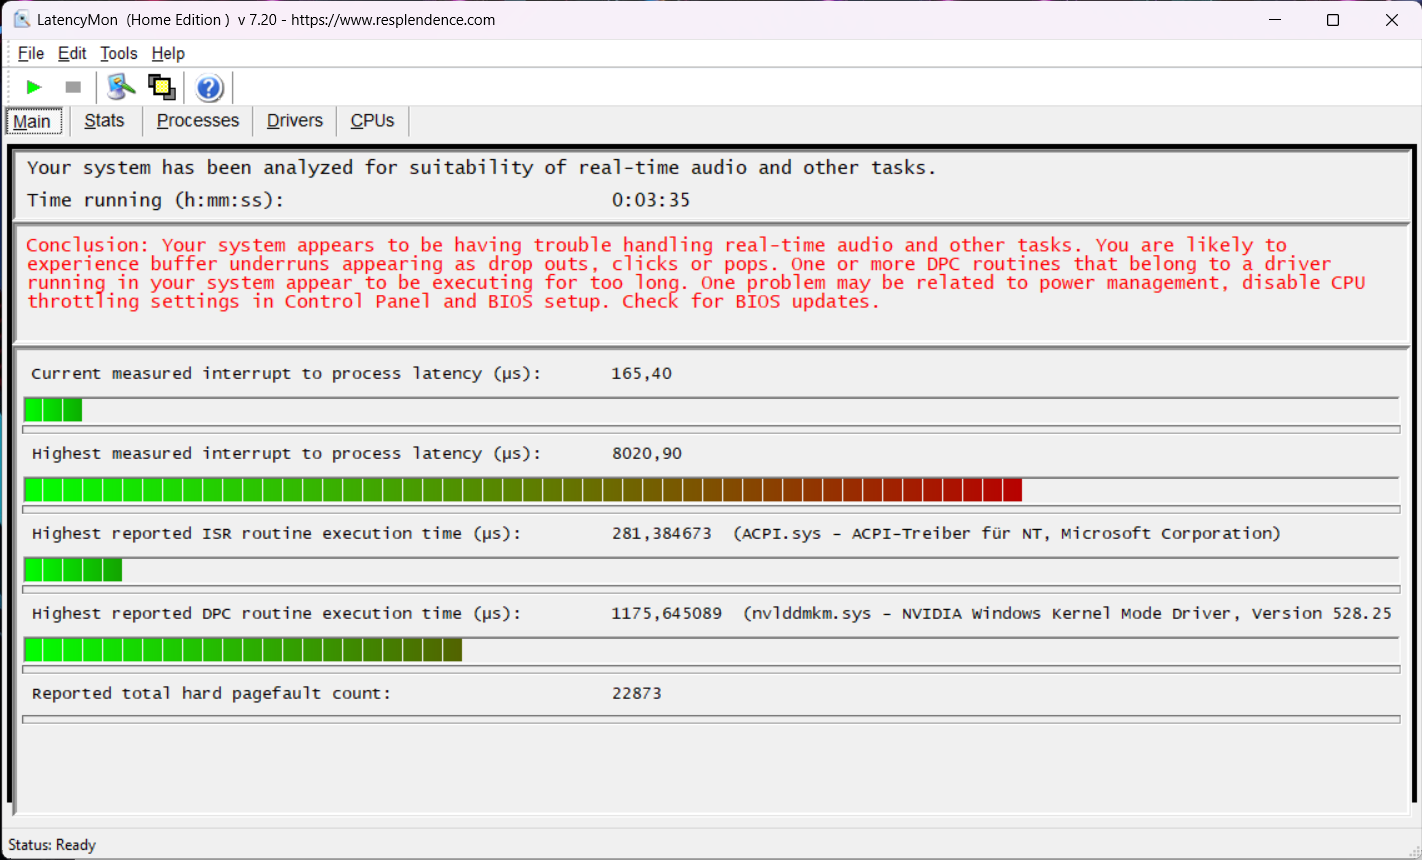
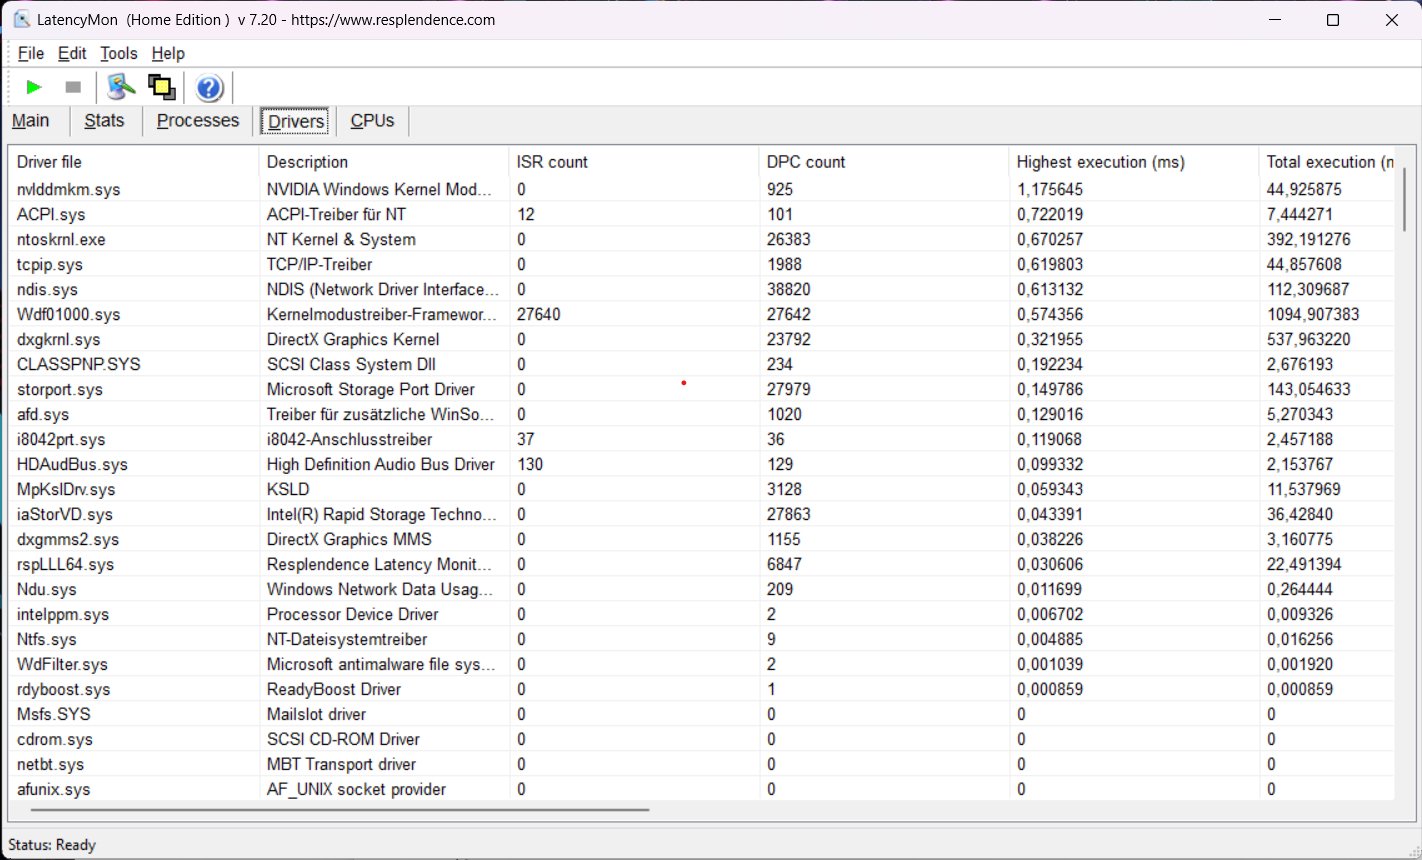
DPC 延迟
宏碁设备的 DPC 延迟时间高达 8,021 µs(多次测试),导致无法使用实时多媒体软件。其主要原因在于 Nvidia 图形驱动程序。驱动程序和 BIOS 更新可改善或恶化这一结果。
| DPC Latencies / LatencyMon - interrupt to process latency (max), Web, Youtube, Prime95 | |
| Acer Predator Helios Neo 16 NH.QLTEG.002 | |
| Dell G15 5530 | |
| HP Victus 16-r0076TX | |
| Lenovo LOQ 16IRH8 | |
| Lenovo Legion Pro 5 16ARX8 (R5 7645HX, RTX 4050) | |
| Schenker XMG Apex 15 (Late 23) | |
* ... smaller is better
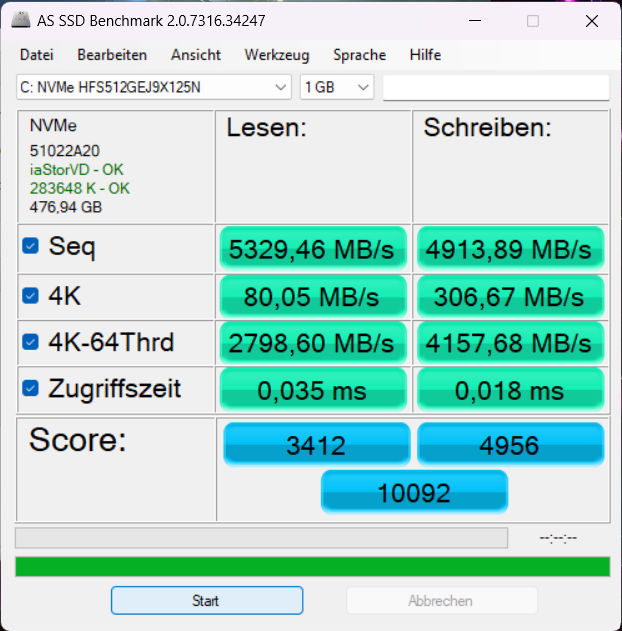
存储设备
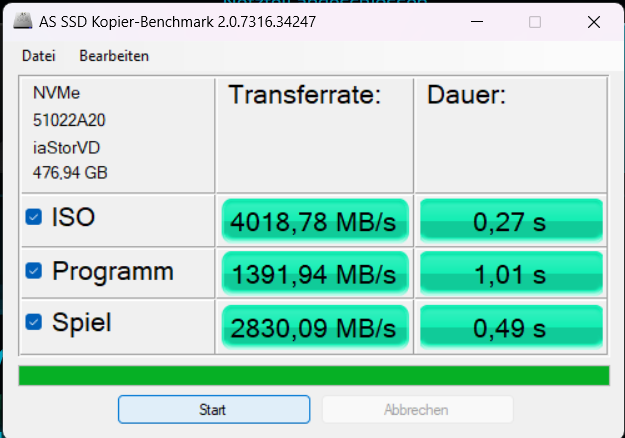
安装的 SK Hynix PCIe 4.0 固态硬盘容量为 512 GB。其传输速率高达 5,330 MB/s(连续读取),写入速率和 4K 值也很高。这使得 Helios Neo 16 在我们的性能评级中位居对比设备的首位。
不过,在一段时间后,会出现由热引起的周期性节流,如下图 "DiskSpd 读取循环 "所示。最多支持两个内部 M.2 固态硬盘(也是双面)。
| Acer Predator Helios Neo 16 NH.QLTEG.002 SK hynix HFS512GEJ9X125N | Lenovo Legion Pro 5 16ARX8 (R5 7645HX, RTX 4050) SK hynix PC801 HFS512GEJ9X115N | Lenovo LOQ 16IRH8 Solidigm SSDPFINW512GZL | Schenker XMG Apex 15 (Late 23) Samsung 990 Pro 1 TB | HP Victus 16-r0076TX SK hynix PC801 HFS512GEJ9X101N BF | Dell G15 5530 SSTC CL4-3D512-Q11 | |
|---|---|---|---|---|---|---|
| AS SSD | -11% | -59% | -18% | -27% | -142% | |
| Seq Read (MB/s) | 5329.5 | 5872 10% | 2603 -51% | 5586.1 5% | 5149.98 -3% | 2603.73 -51% |
| Seq Write (MB/s) | 4913.9 | 4253 -13% | 1427 -71% | 5512.25 12% | 3064.93 -38% | 494.63 -90% |
| 4K Read (MB/s) | 80.05 | 70.52 -12% | 64.4 -20% | 65.32 -18% | 62.73 -22% | 36.37 -55% |
| 4K Write (MB/s) | 306.67 | 251.8 -18% | 237 -23% | 193.71 -37% | 219.1 -29% | 188.64 -38% |
| 4K-64 Read (MB/s) | 2798.6 | 2755 -2% | 451 -84% | 2970.82 6% | 902.17 -68% | 932.26 -67% |
| 4K-64 Write (MB/s) | 4157.7 | 2647 -36% | 1265 -70% | 3872.46 -7% | 2901.89 -30% | 276.64 -93% |
| Access Time Read * (ms) | 0.035 | 0.039 -11% | 0.055 -57% | 0.038 -9% | 0.036 -3% | 0.103 -194% |
| Access Time Write * (ms) | 0.018 | 0.017 6% | 0.036 -100% | 0.02 -11% | 0.018 -0% | 0.182 -911% |
| Score Read (Points) | 3412 | 3413 0% | 776 -77% | 3595 5% | 1480 -57% | 1229 -64% |
| Score Write (Points) | 4956 | 3324 -33% | 1645 -67% | 4617 -7% | 3427 -31% | 515 -90% |
| Score Total (Points) | 10092 | 8397 -17% | 2782 -72% | 10039 -1% | 5574 -45% | 2271 -77% |
| Copy ISO MB/s (MB/s) | 4018.8 | 2397.08 -40% | 1100.94 -73% | 3765 -6% | 488.98 -88% | |
| Copy Program MB/s (MB/s) | 1391.9 | 751.31 -46% | 579.88 -58% | 1030 -26% | 296.26 -79% | |
| Copy Game MB/s (MB/s) | 2830.1 | 1329.99 -53% | 1006.61 -64% | 2124 -25% | 452.22 -84% | |
| DiskSpd | -1% | -48% | 5% | -29% | -64% | |
| seq read (MB/s) | 3283 | 4770 45% | 2171 -34% | 3181 -3% | 4378 33% | 2726 -17% |
| seq write (MB/s) | 4923 | 4938 0% | 1640 -67% | 5612 14% | 3325 -32% | 535 -89% |
| seq q8 t1 read (MB/s) | 6309 | 7328 16% | 3507 -44% | 7148 13% | 7109 13% | 2985 -53% |
| seq q8 t1 write (MB/s) | 4968 | 4936 -1% | 1645 -67% | 6887 39% | 5027 1% | 539 -89% |
| 4k q1 t1 read (MB/s) | 78.3 | 75.5 -4% | 82.1 5% | 68 -13% | 61.5 -21% | 34 -57% |
| 4k q1 t1 write (MB/s) | 393 | 296 -25% | 288 -27% | 231 -41% | 157.3 -60% | 224 -43% |
| 4k q32 t16 read (MB/s) | 4255 | 3794 -11% | 478 -89% | 4920 16% | 954 -78% | 1054 -75% |
| 4k q32 t16 write (MB/s) | 3869 | 2679 -31% | 1631 -58% | 4336 12% | 527 -86% | 507 -87% |
| Total Average (Program / Settings) | -6% /
-7% | -54% /
-55% | -7% /
-10% | -28% /
-28% | -103% /
-113% |
* ... smaller is better
* ... smaller is better
Reading continuous performance: DiskSpd Read Loop, Queue Depth 8
图形卡
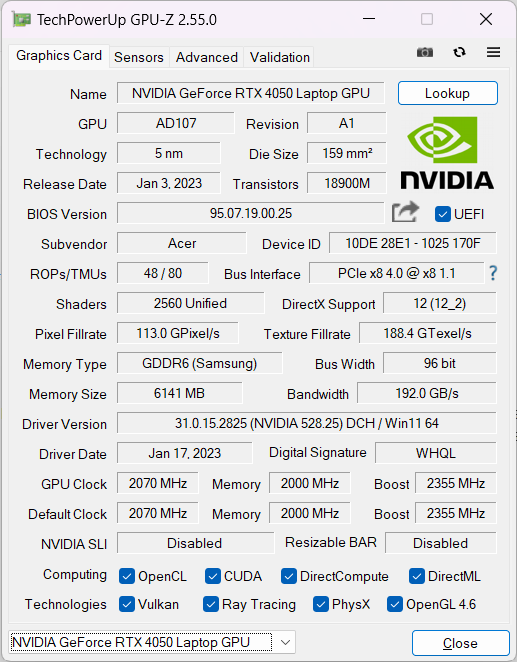
英伟达GeForce RTX 4050RTX 4050 是一款入门级 GPU,拥有 6GB VRAM,在 Helios Neo 16 中的最大功耗为 130 瓦(115 瓦+15 瓦动态提升功耗)。不过,其最大时钟频率为 2,570 MHz,已达到 85 瓦至 90 瓦。只有在 FurMark 压力测试中才能用足 130 瓦,而在运行游戏时,笔记本电脑 GPU 所需的功率永远不会超过 88 瓦。
这使得该设备的性能与采用相同 GPU 的其他游戏笔记本电脑相当,如Legion Pro 5 16,申克XMG Apex 15和惠普 Victus 16.在合成基准测试中RTX 4060也取得了类似的成绩(领先 10%),例如在联想 LOQ 16和Helios 16(非 Neo)。在电池模式下,其合成基准测试结果只有一半。
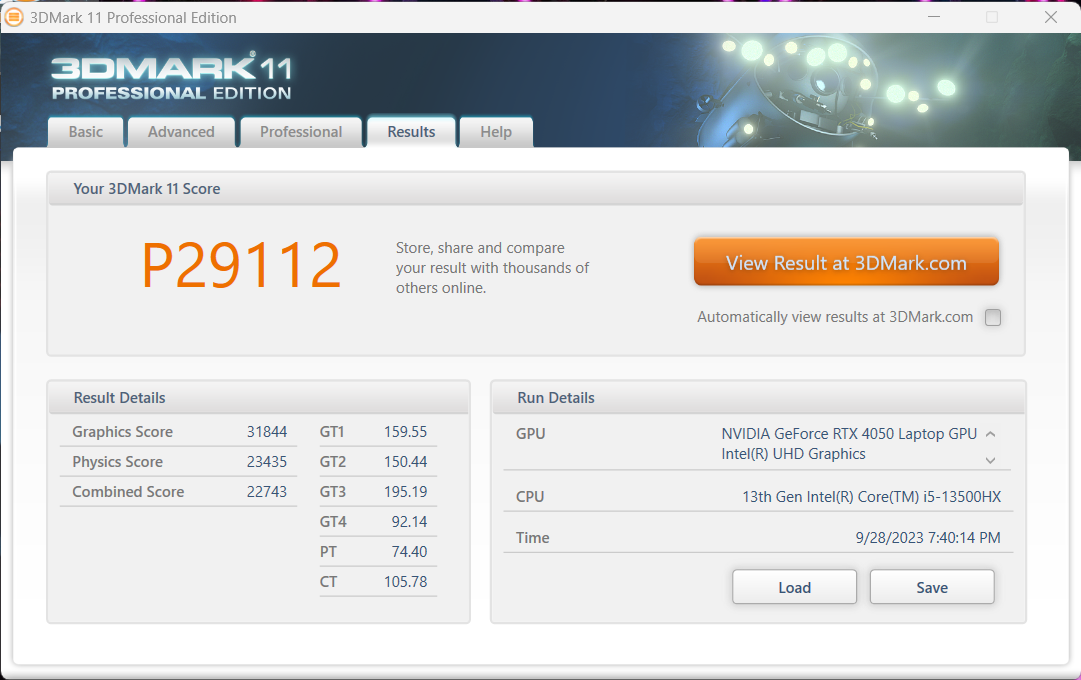
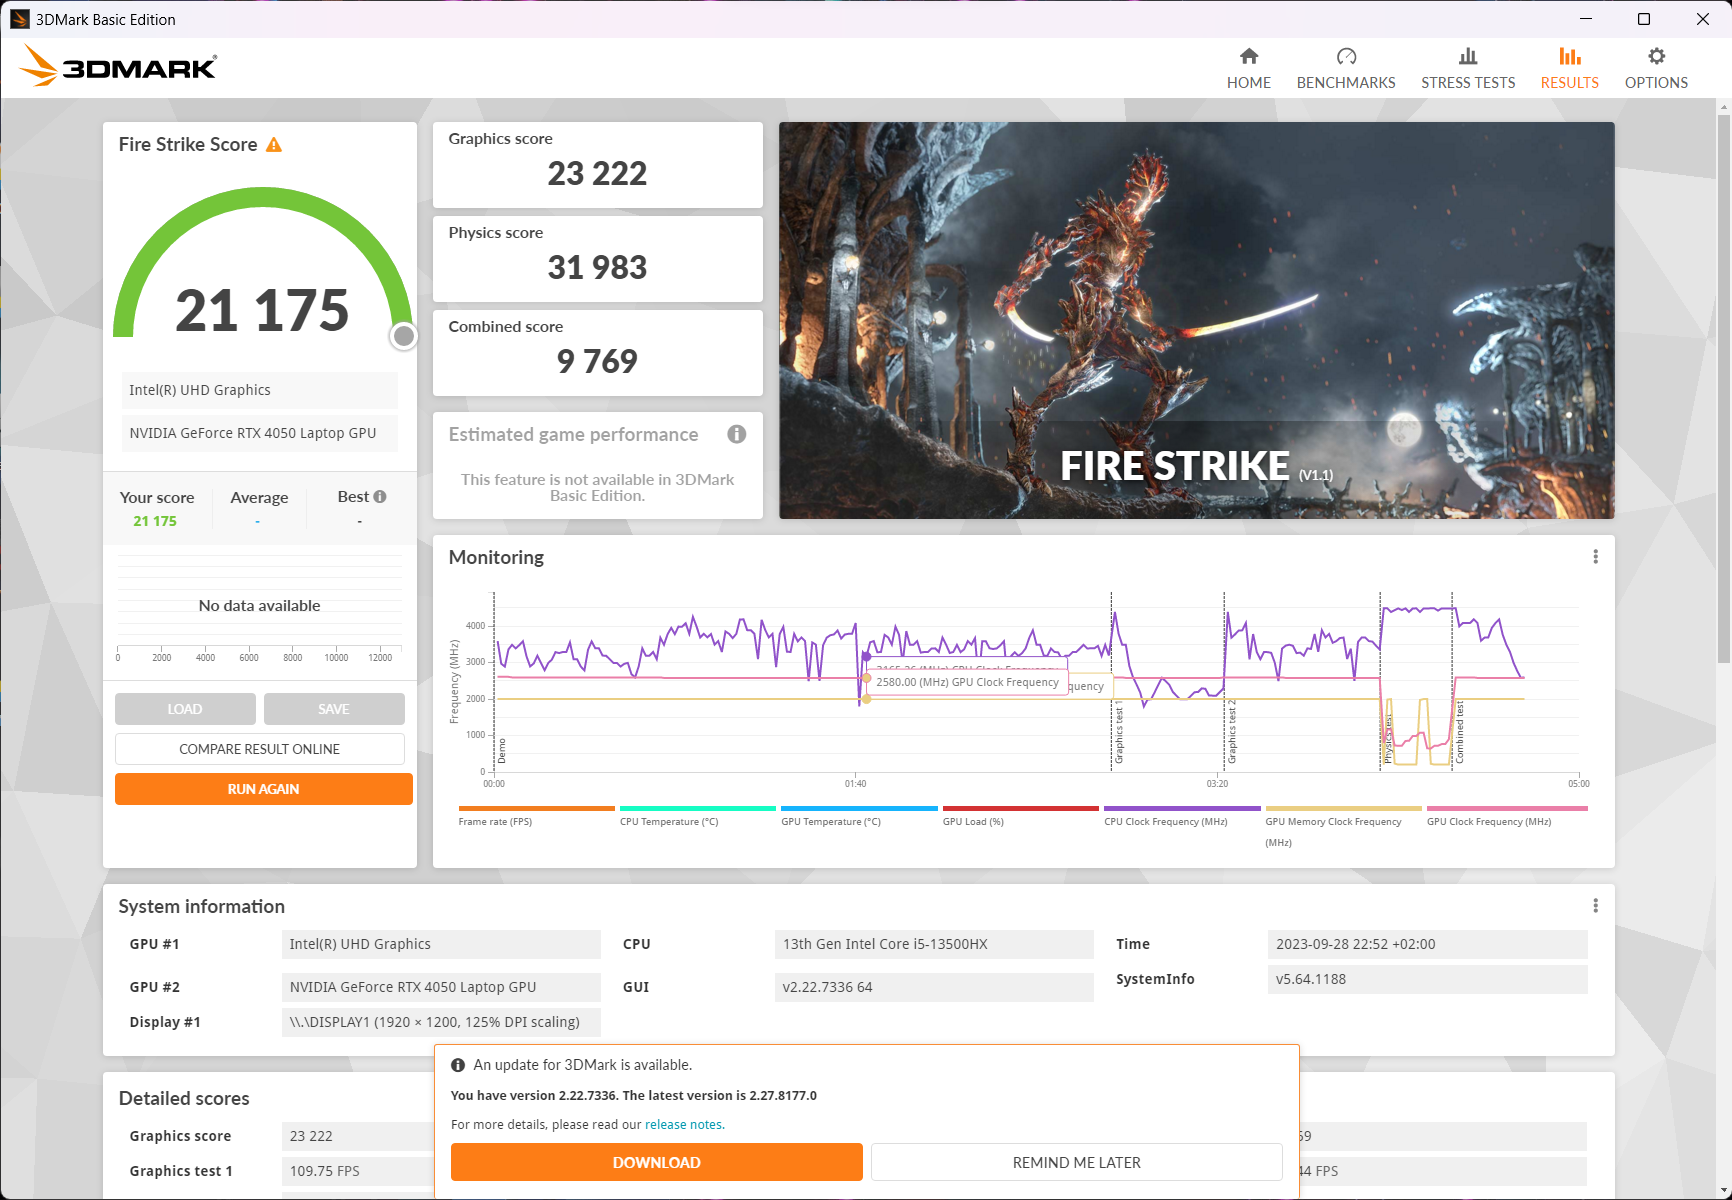
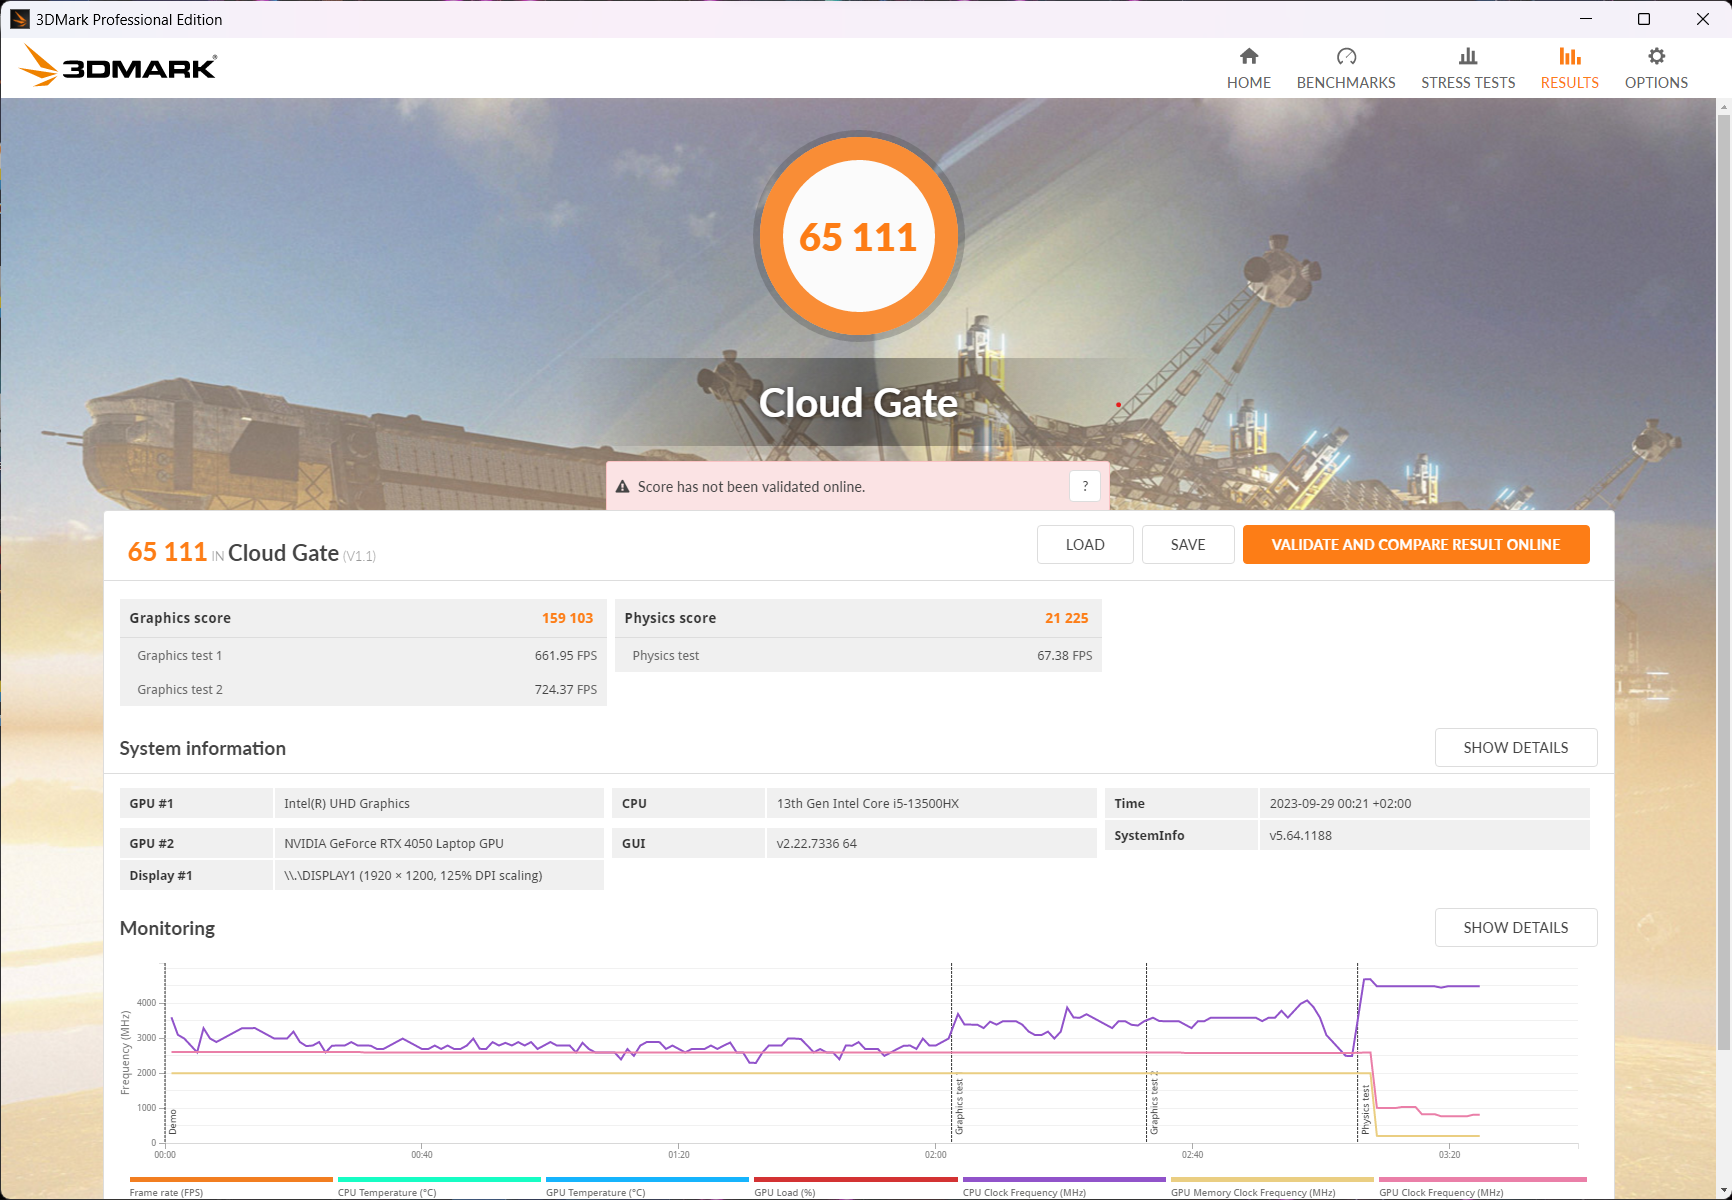
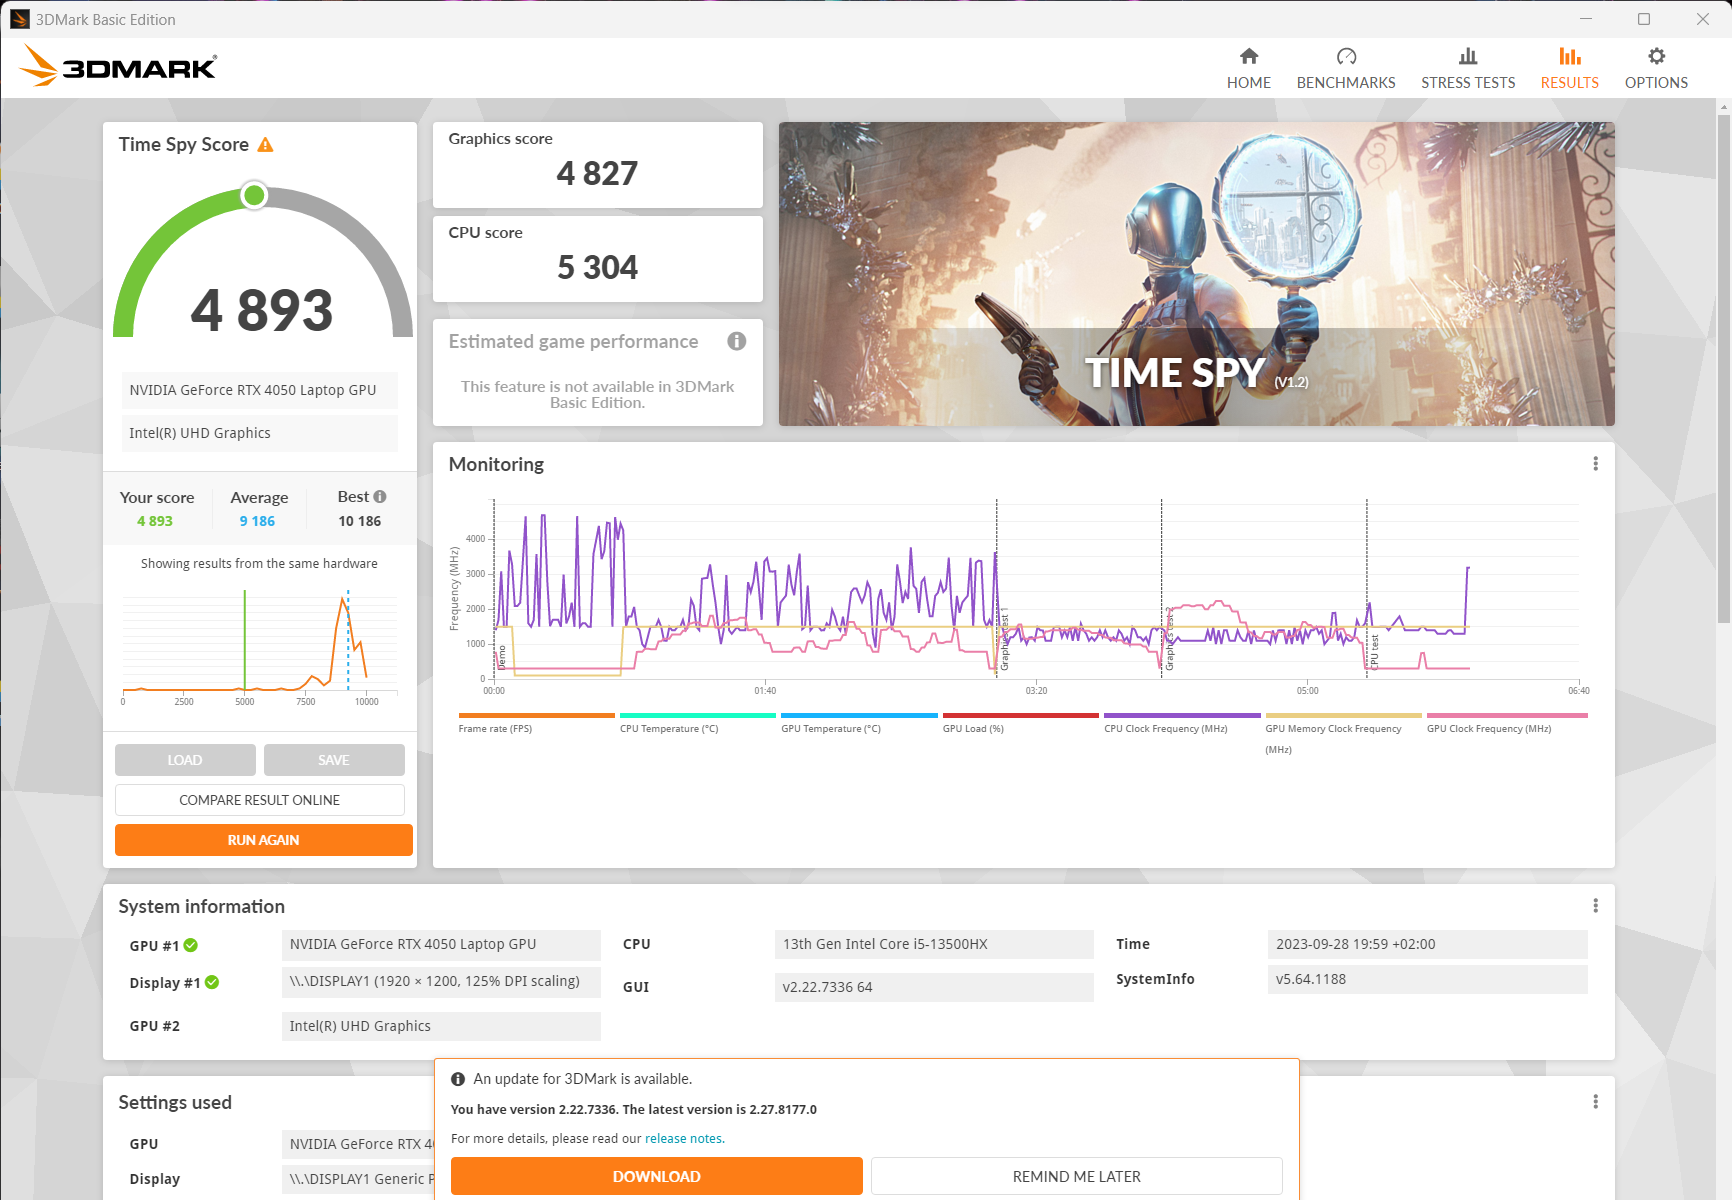
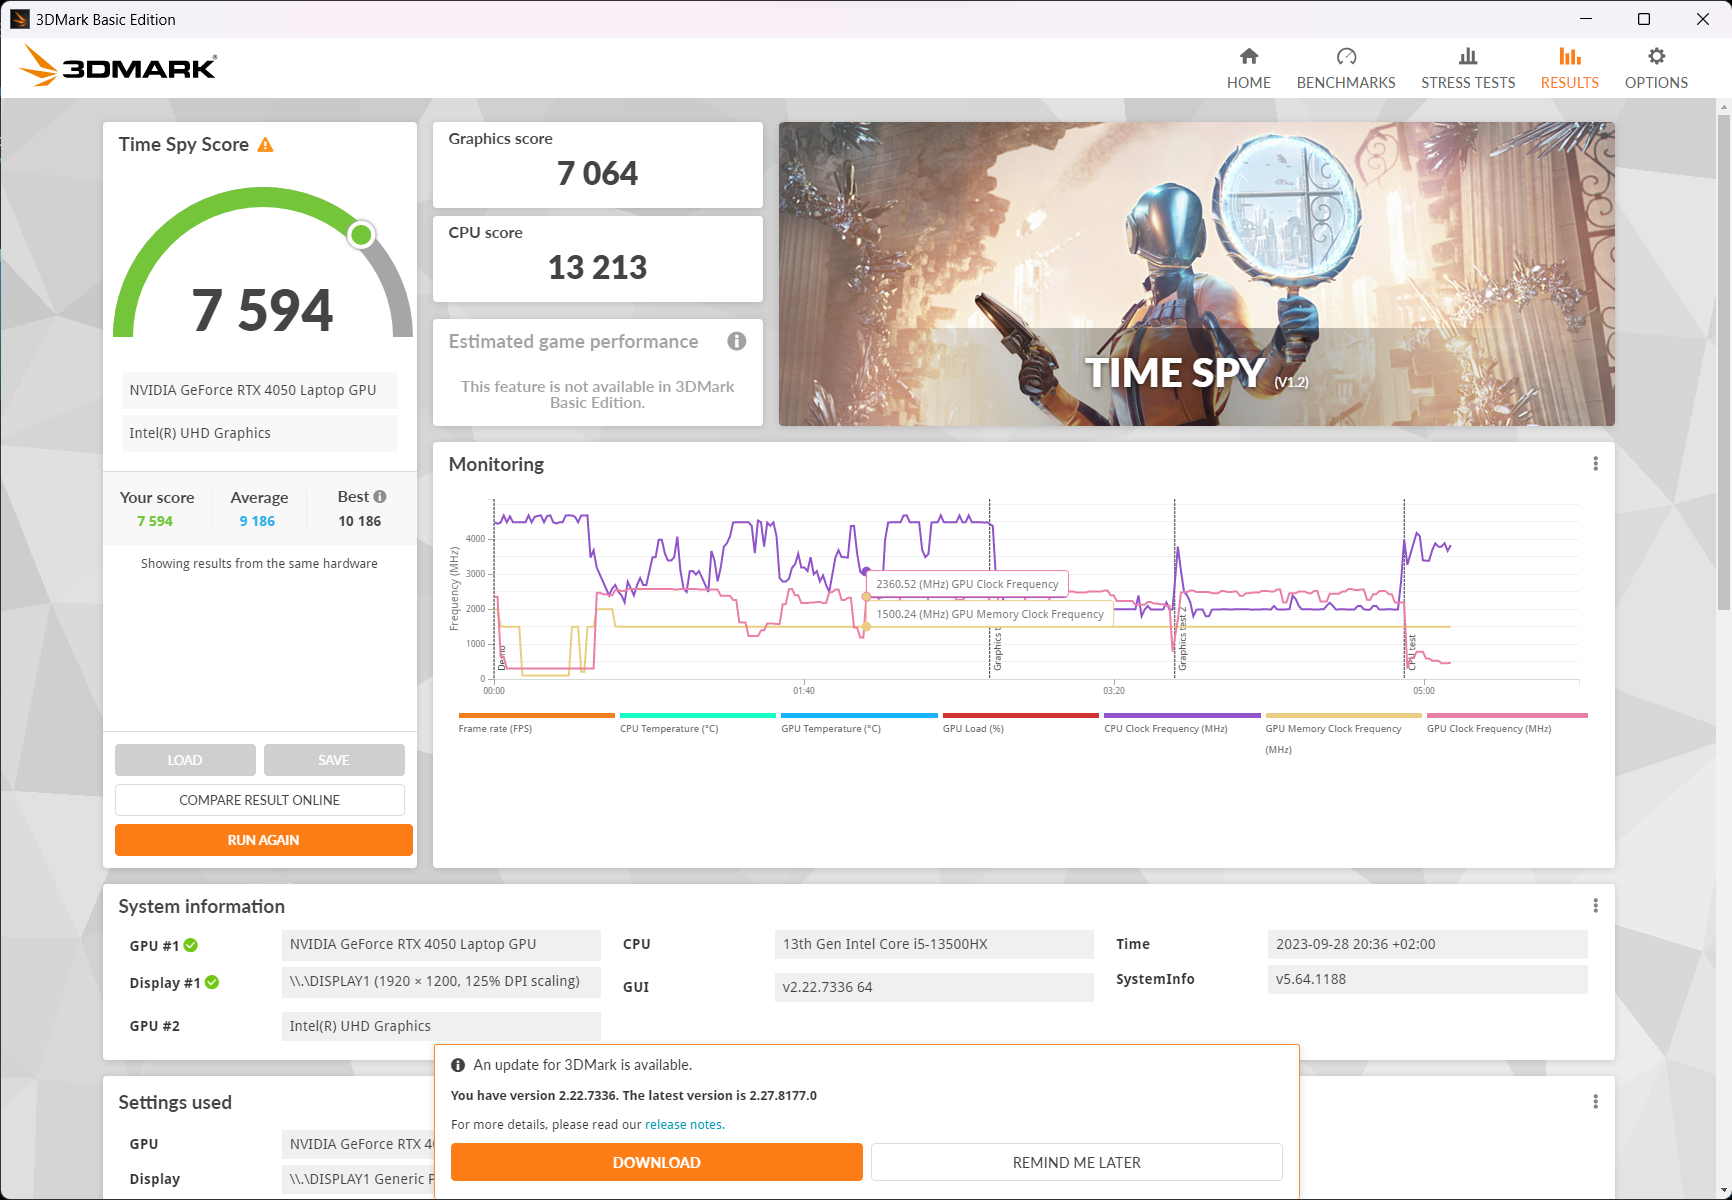
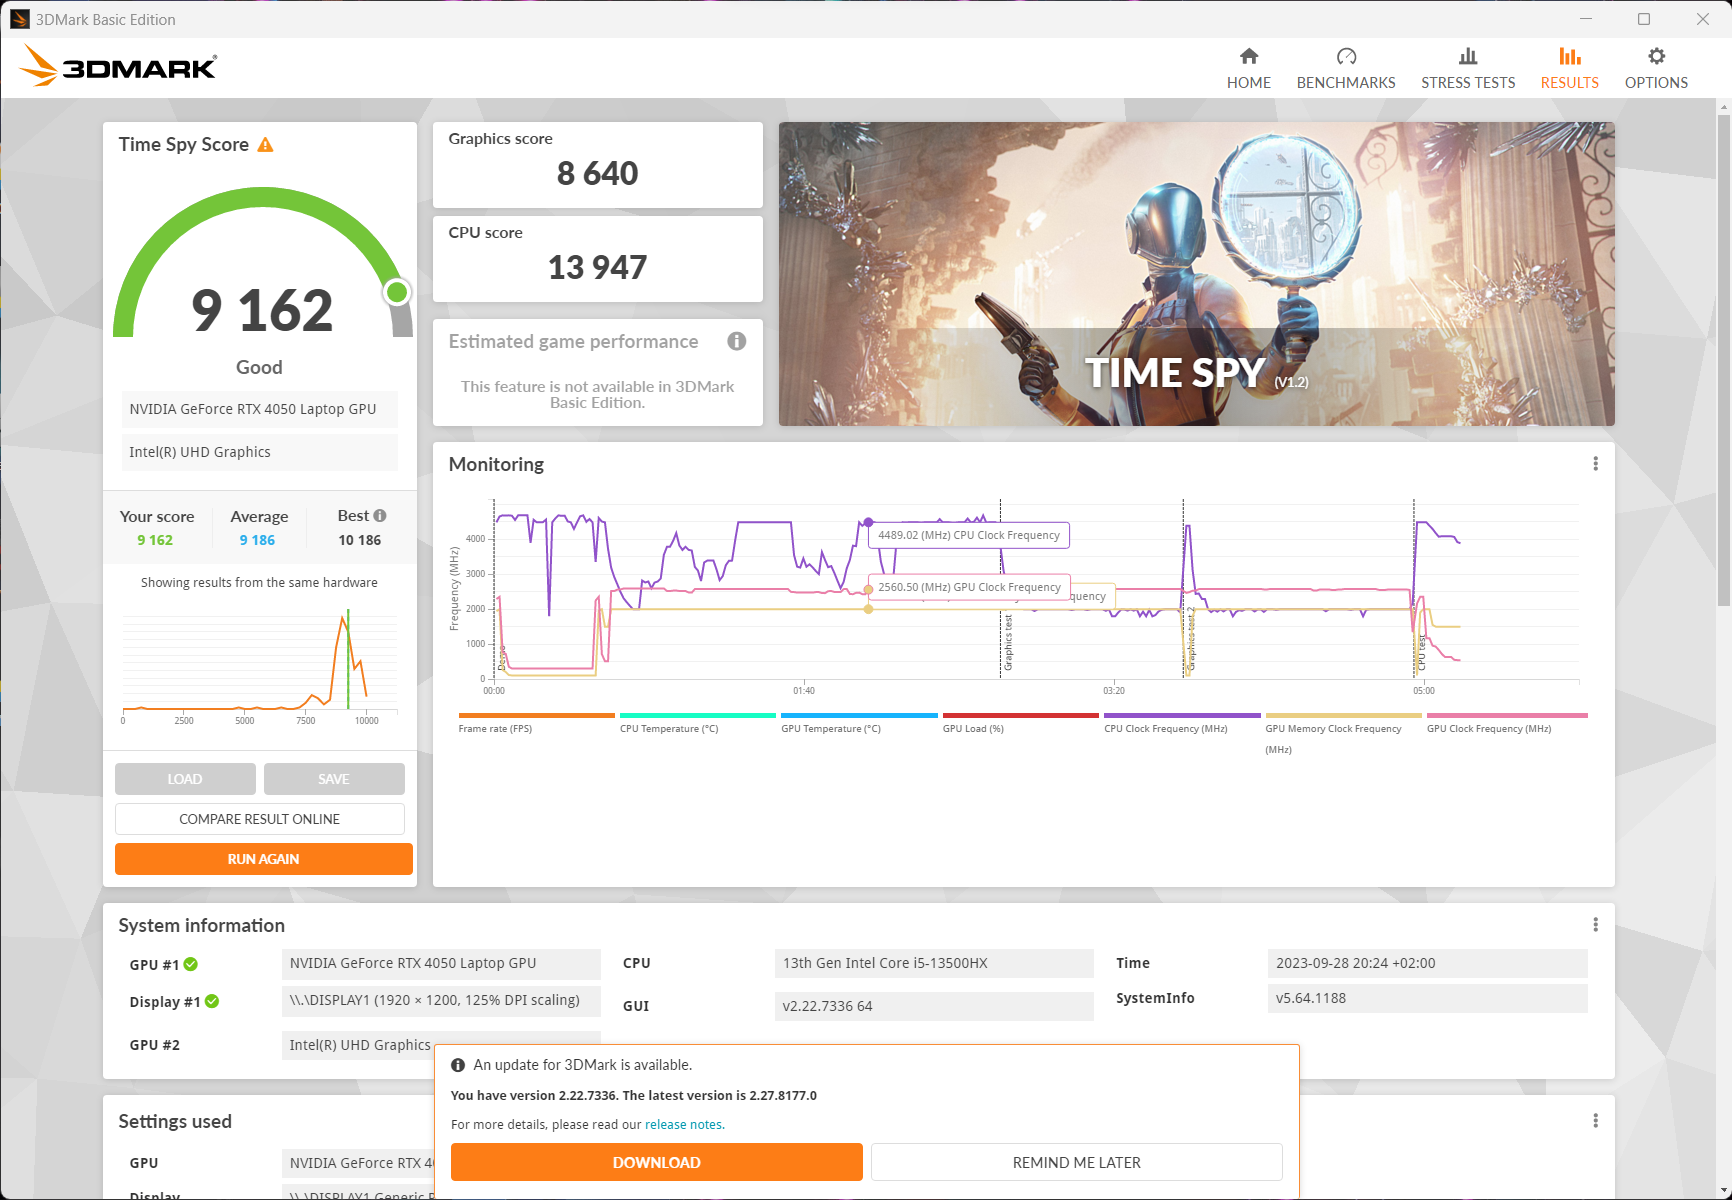
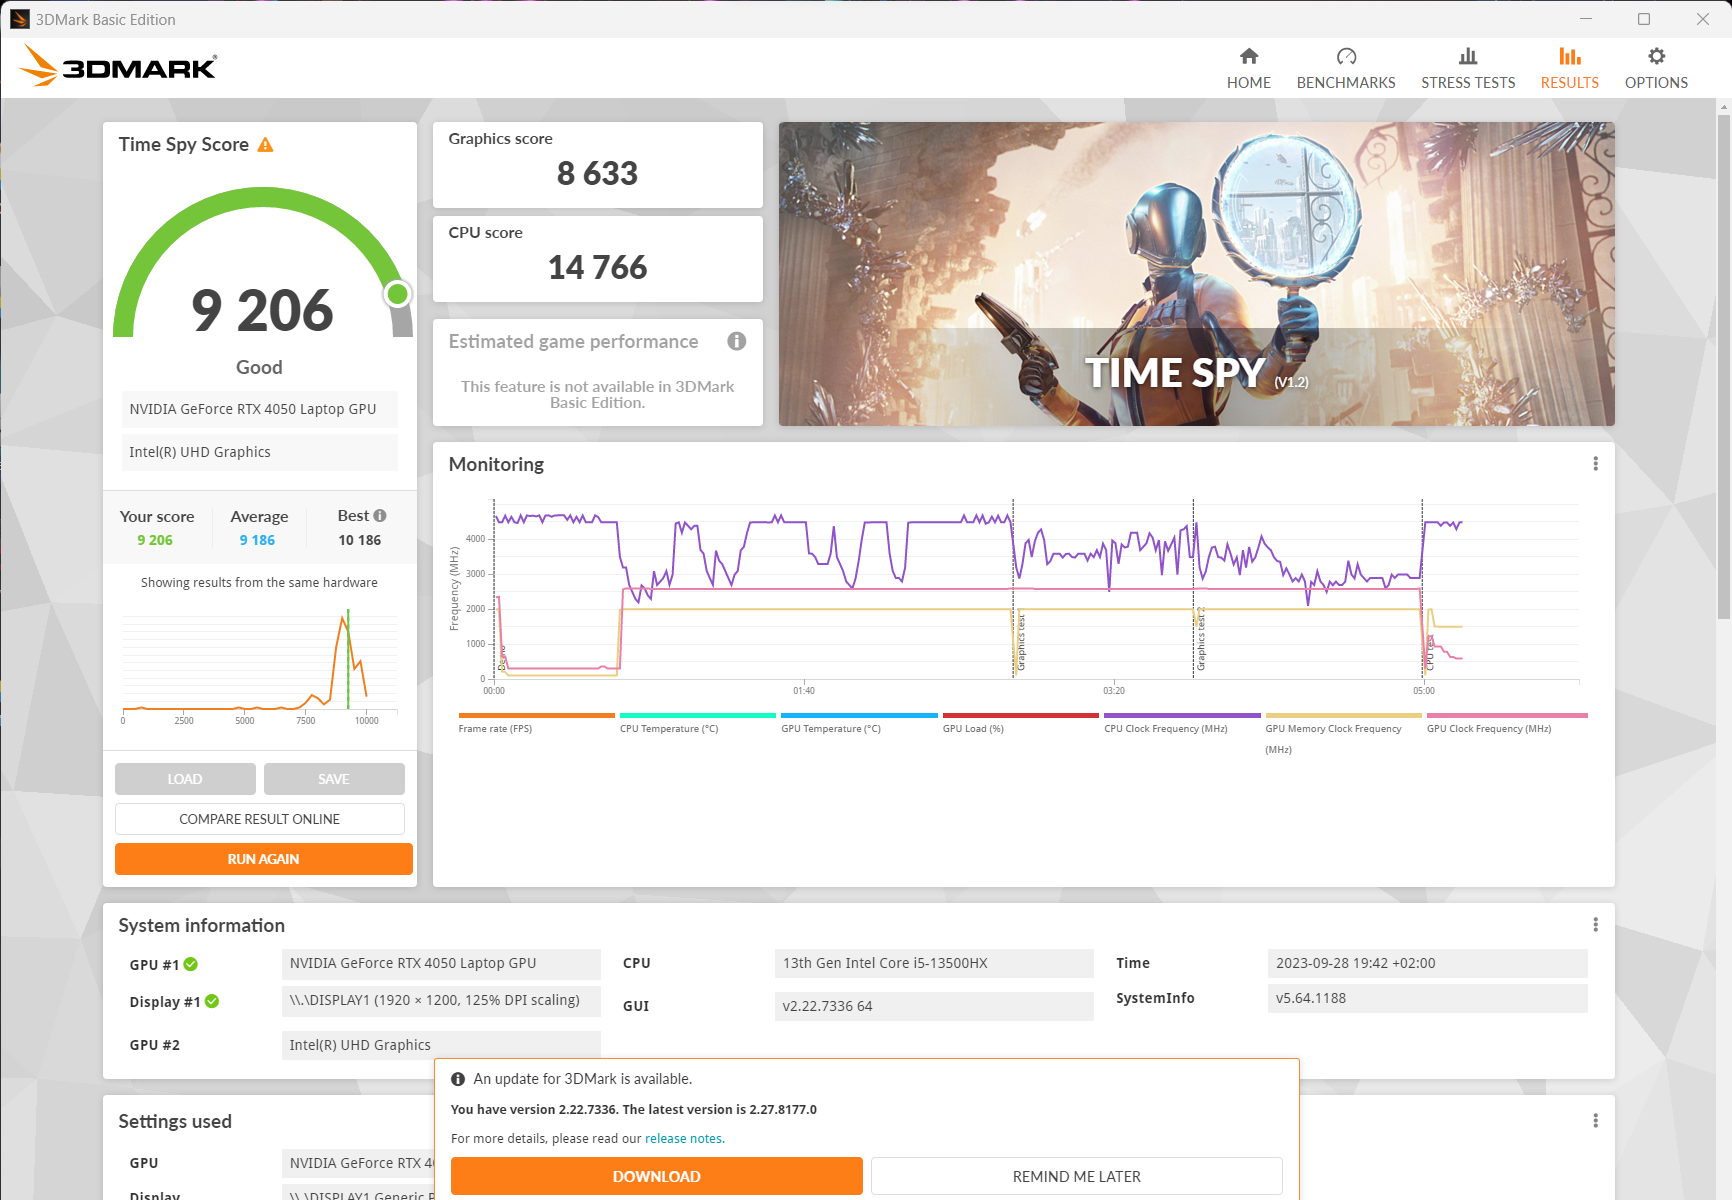
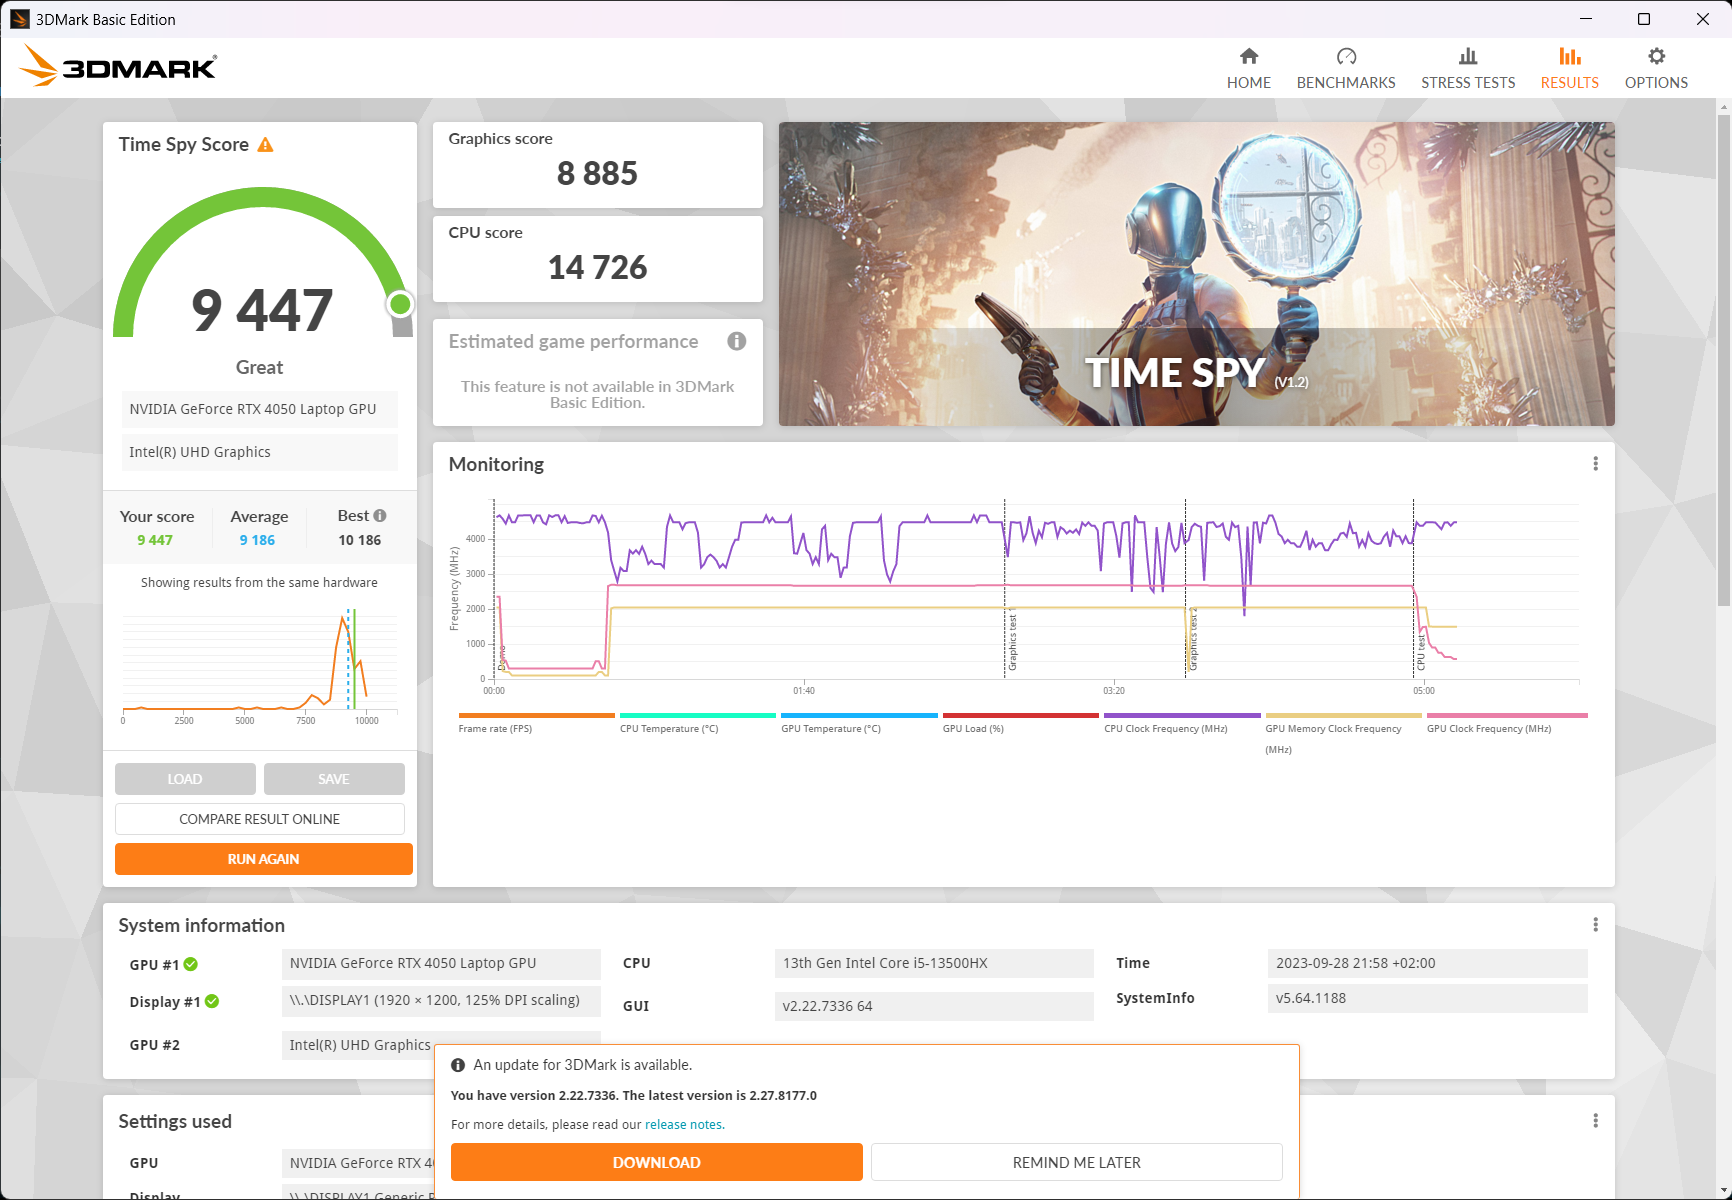
| 3DMark 11 Performance | 29112 points | |
| 3DMark Cloud Gate Standard Score | 65111 points | |
| 3DMark Fire Strike Score | 21175 points | |
| 3DMark Time Spy Score | 9206 points | |
Help | ||
* ... smaller is better
游戏性能
在我们的性能排名中Legion Pro 5 16比 Helios Neo 16 高出约 7%,而戴尔 G15 5530戴尔 G15 5530和联想LOQ 16和联想LOQ 16在配备RTX 4060.根据游戏的不同,与RTX 4060的差距有所扩大--《战神》为30%,《霍格沃茨传奇》为20%。
我们建议使用平衡模式,因为只损失 2-3 % 的 3D 性能,风扇噪音也明显降低。在电池模式下,它的性能只有三分之一。
| Sons of the Forest | |
| 1920x1080 Ultra Preset AA:T | |
| Lenovo Legion Pro 5 16ARX8 (R5 7645HX, RTX 4050) | |
| Average NVIDIA GeForce RTX 4050 Laptop GPU (61.9 - 76, n=4) | |
| Acer Predator Helios Neo 16 NH.QLTEG.002 | |
| 1920x1080 High Preset AA:T | |
| Lenovo Legion Pro 5 16ARX8 (R5 7645HX, RTX 4050) | |
| Acer Predator Helios Neo 16 NH.QLTEG.002 | |
| Average NVIDIA GeForce RTX 4050 Laptop GPU (63.5 - 76, n=4) | |
Witcher 3 FPS diagram
| low | med. | high | ultra | |
|---|---|---|---|---|
| GTA V (2015) | 186.7 | 185.1 | 176.3 | 96.5 |
| The Witcher 3 (2015) | 286 | 154.4 | 81 | |
| Dota 2 Reborn (2015) | 180.9 | 167.9 | 156.4 | 147 |
| Final Fantasy XV Benchmark (2018) | 215 | 118.6 | 84.6 | |
| X-Plane 11.11 (2018) | 152.4 | 134.7 | 106.1 | |
| Strange Brigade (2018) | 476 | 211 | 171.9 | 149.4 |
| F1 2021 (2021) | 291 | 222 | 119.5 | |
| God of War (2022) | 86.8 | 71.1 | 50.1 | |
| Hogwarts Legacy (2023) | 64 | 53.1 | 51.1 | |
| Sons of the Forest (2023) | 78.8 | 74.5 | 70 | |
| Star Wars Jedi Survivor (2023) | 58 | 53.6 | 50.7 | |
| F1 23 (2023) | 262 | 208 | 150.7 | 44.5 |
排放物:中端产品 Helios Neo 16 内部的液态金属
噪音排放
宏碁掠夺者 Helios Neo 16 在各种性能模式下基本都保持安静--不仅在空闲模式下,而且在上网冲浪和执行简单的办公任务时也是如此,尽管风扇总是发出悄无声息的呼呼声。
在纯 CPU 负载情况下,噪音水平会上升到 37.7 dB(A),但仍不会过于恼人。建议在玩游戏时使用平衡模式--使用该模式时,笔记本电脑的噪音几乎是令人愉悦的。笔记本电脑 Legion Pro 5 16则仅达到 43.8 dB(A),但在游戏时仍能正常工作。戴尔 G15 5530 也相当安静,尤其是在中等负载情况下。我们无法在我们的机型中检测到任何电子噪音。
Noise level
| Idle |
| 25.9 / 25.9 / 29.3 dB(A) |
| Load |
| 37.7 / 62.7 dB(A) |
 | ||
30 dB silent 40 dB(A) audible 50 dB(A) loud |
||
min: | ||
| Acer Predator Helios Neo 16 NH.QLTEG.002 GeForce RTX 4050 Laptop GPU, i5-13500HX, SK hynix HFS512GEJ9X125N | Lenovo Legion Pro 5 16ARX8 (R5 7645HX, RTX 4050) GeForce RTX 4050 Laptop GPU, R5 7645HX, SK hynix PC801 HFS512GEJ9X115N | Lenovo LOQ 16IRH8 GeForce RTX 4060 Laptop GPU, i7-13620H, Solidigm SSDPFINW512GZL | HP Victus 16-r0076TX GeForce RTX 4050 Laptop GPU, i5-13500HX, SK hynix PC801 HFS512GEJ9X101N BF | Dell G15 5530 GeForce RTX 4060 Laptop GPU, i7-13650HX, SSTC CL4-3D512-Q11 | Schenker XMG Apex 15 (Late 23) GeForce RTX 4050 Laptop GPU, R7 7840HS, Samsung 990 Pro 1 TB | |
|---|---|---|---|---|---|---|
| Noise | 13% | 2% | 10% | 12% | 1% | |
| off / environment * (dB) | 25.9 | 23 11% | 23 11% | 21.57 17% | 20.41 21% | 24 7% |
| Idle Minimum * (dB) | 25.9 | 23 11% | 23 11% | 23.68 9% | 26.85 -4% | 25 3% |
| Idle Average * (dB) | 25.9 | 23 11% | 23 11% | 23.68 9% | 26.85 -4% | 29 -12% |
| Idle Maximum * (dB) | 29.3 | 24.42 17% | 27.66 6% | 23.68 19% | 26.85 8% | 33 -13% |
| Load Average * (dB) | 37.7 | 34.94 7% | 53.62 -42% | 39.44 -5% | 27.65 27% | 36 5% |
| Load Maximum * (dB) | 62.7 | 50 20% | 53.5 15% | 55.37 12% | 47.86 24% | 53 15% |
| Witcher 3 ultra * (dB) | 43.79 | 53.5 | 55.4 | 47.9 | 48 |
* ... smaller is better
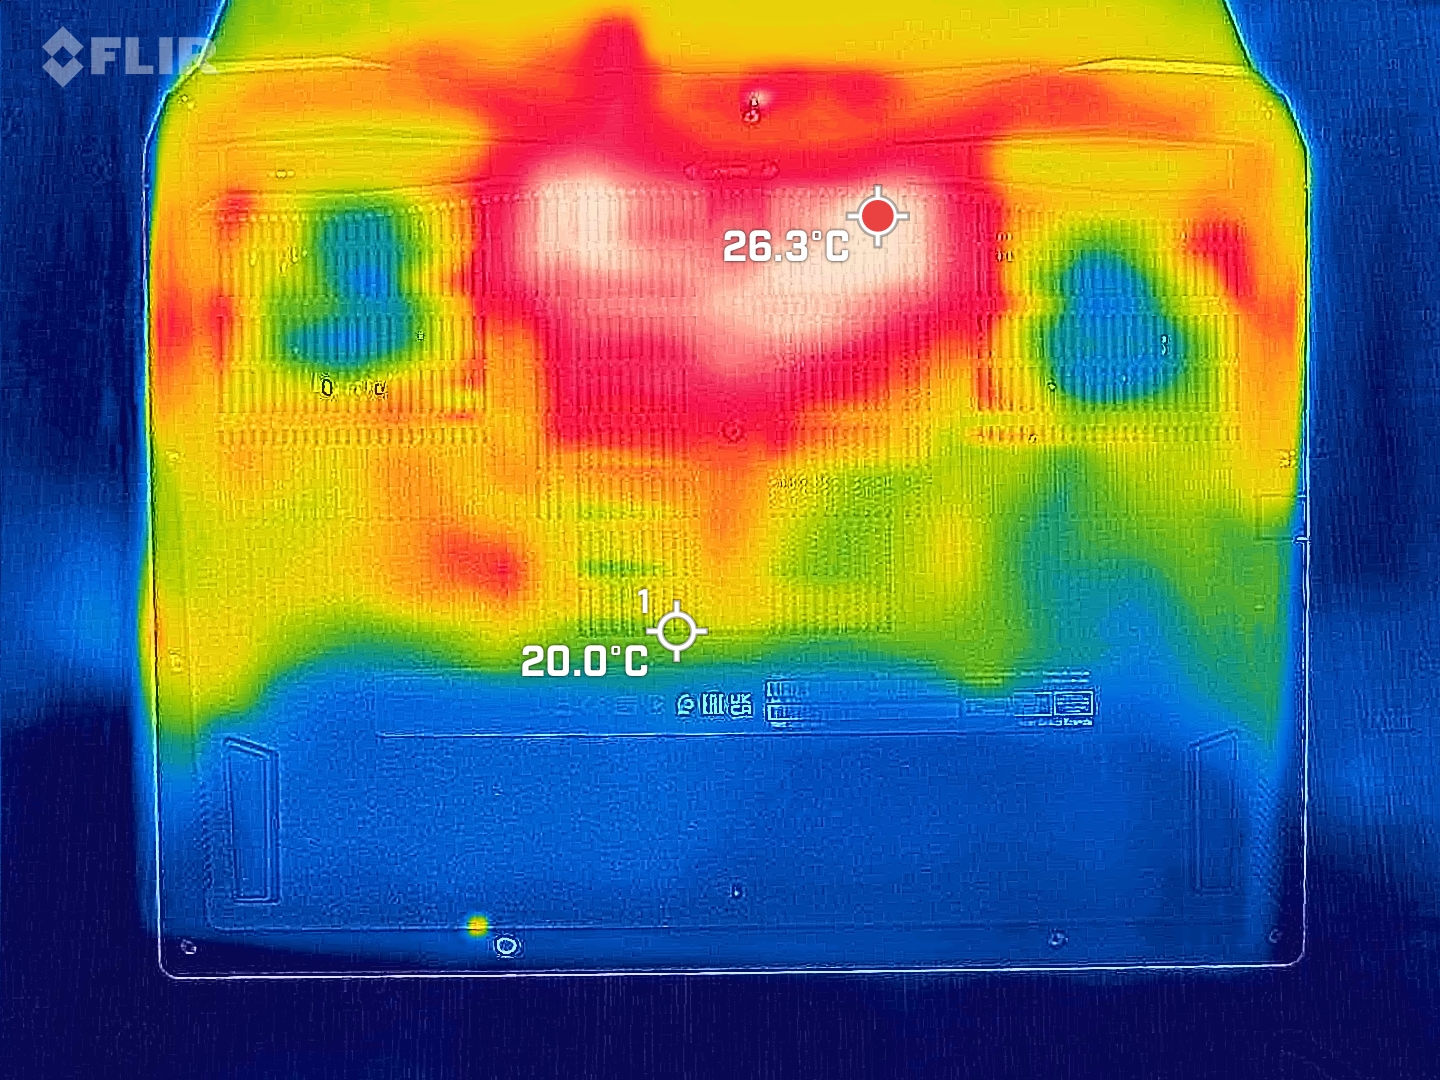
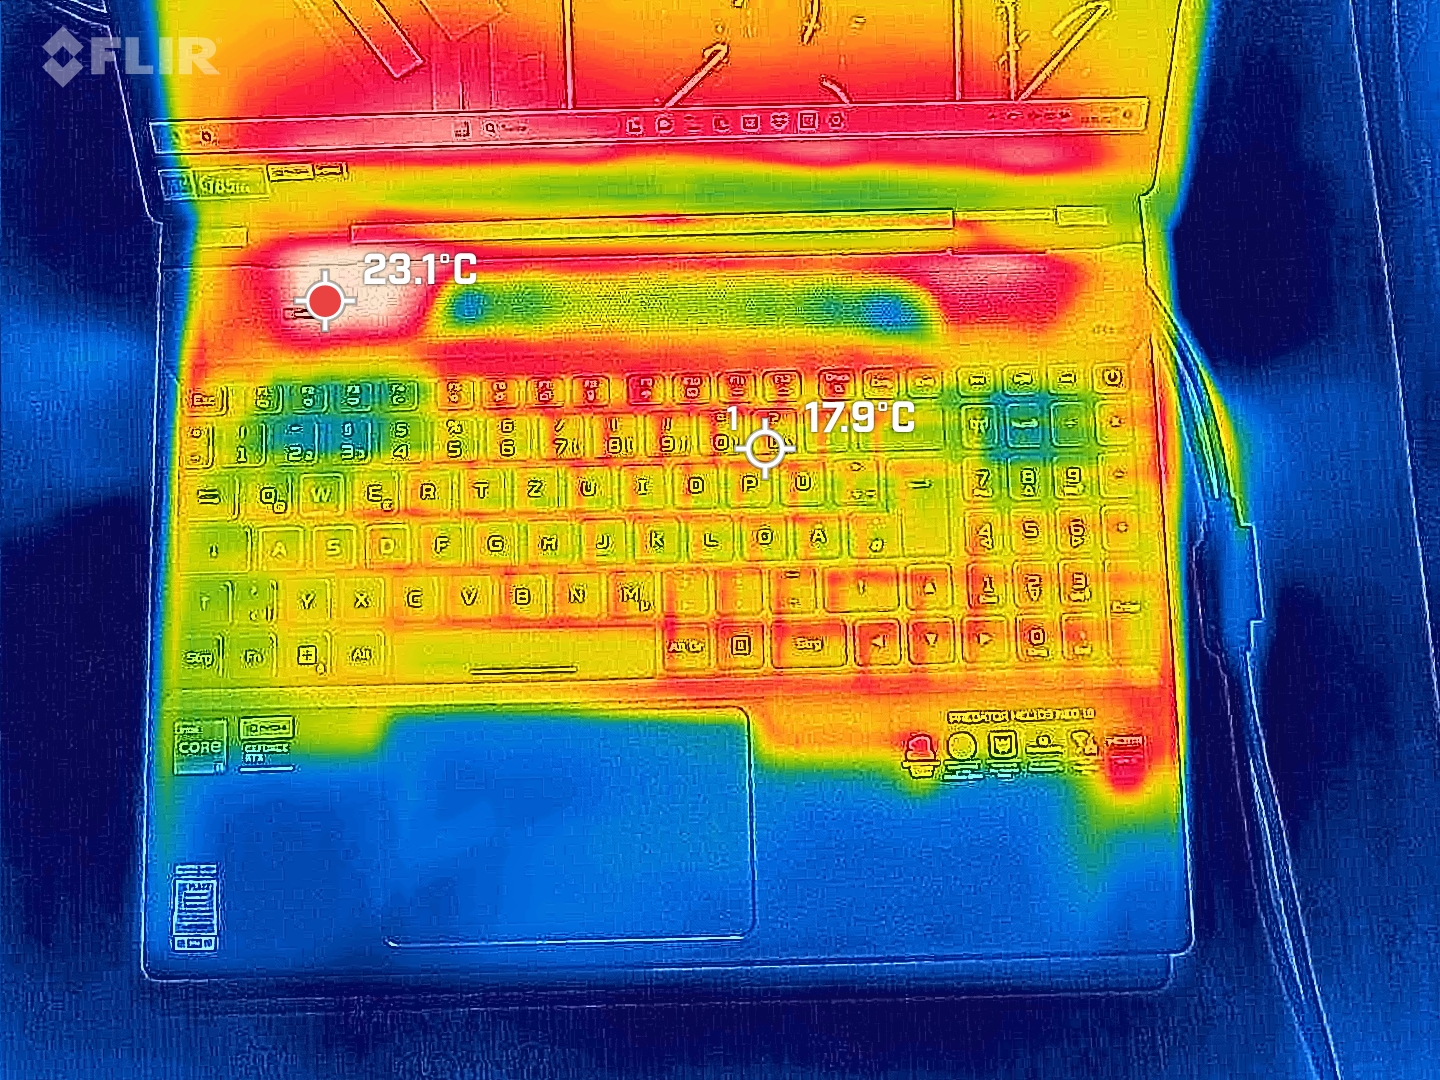
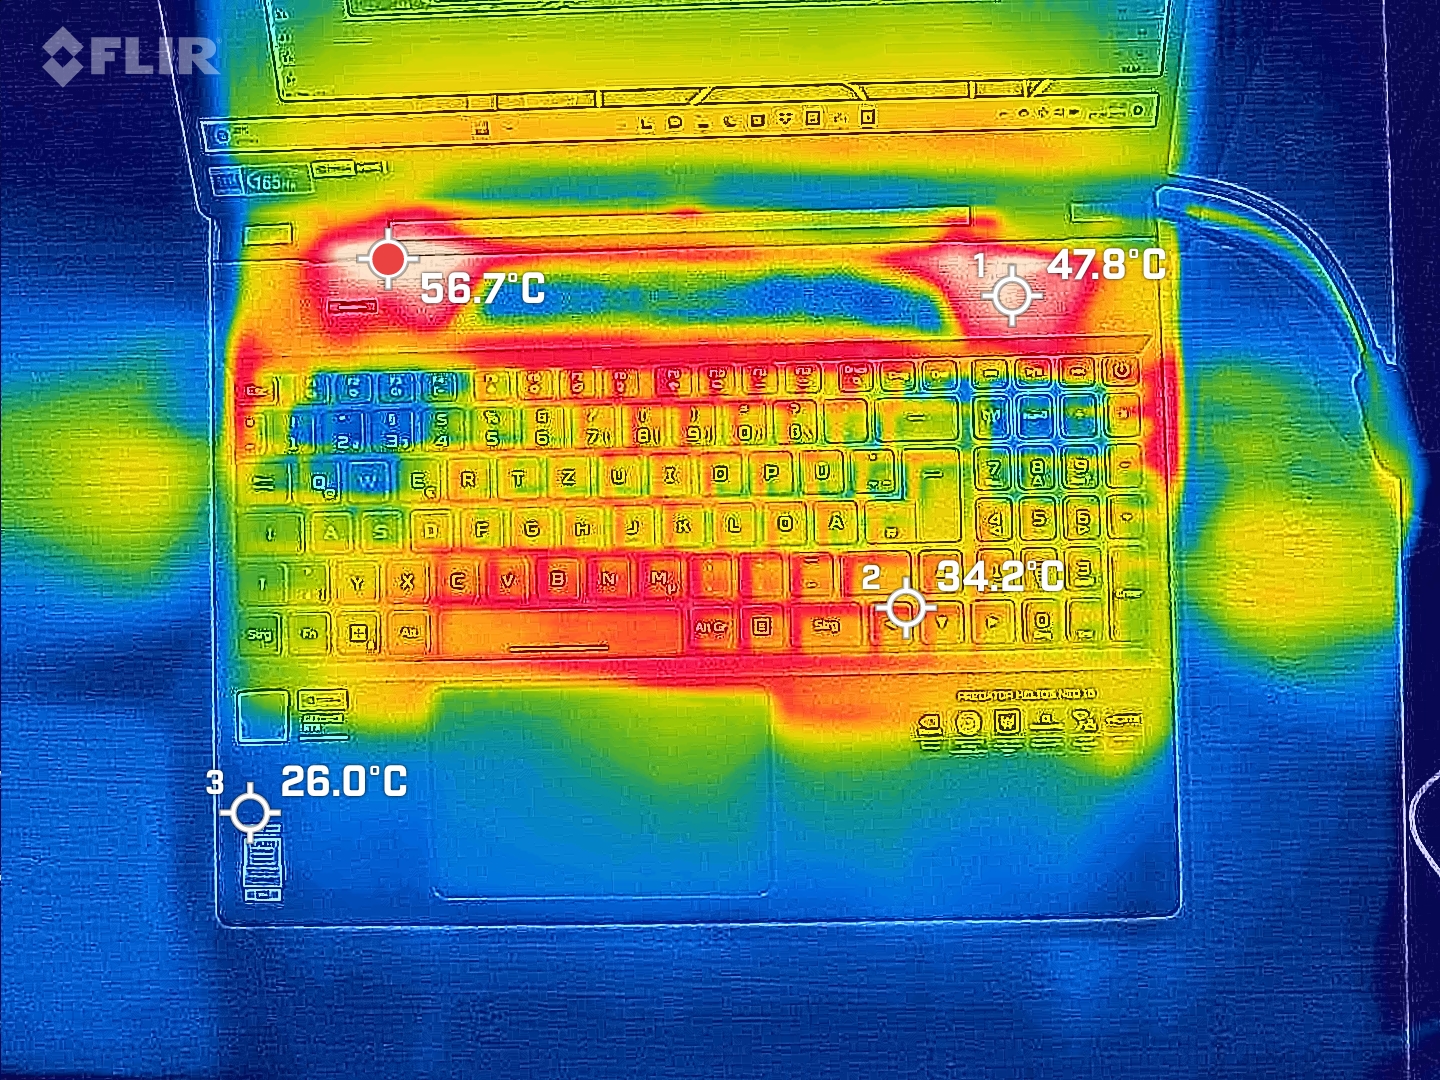
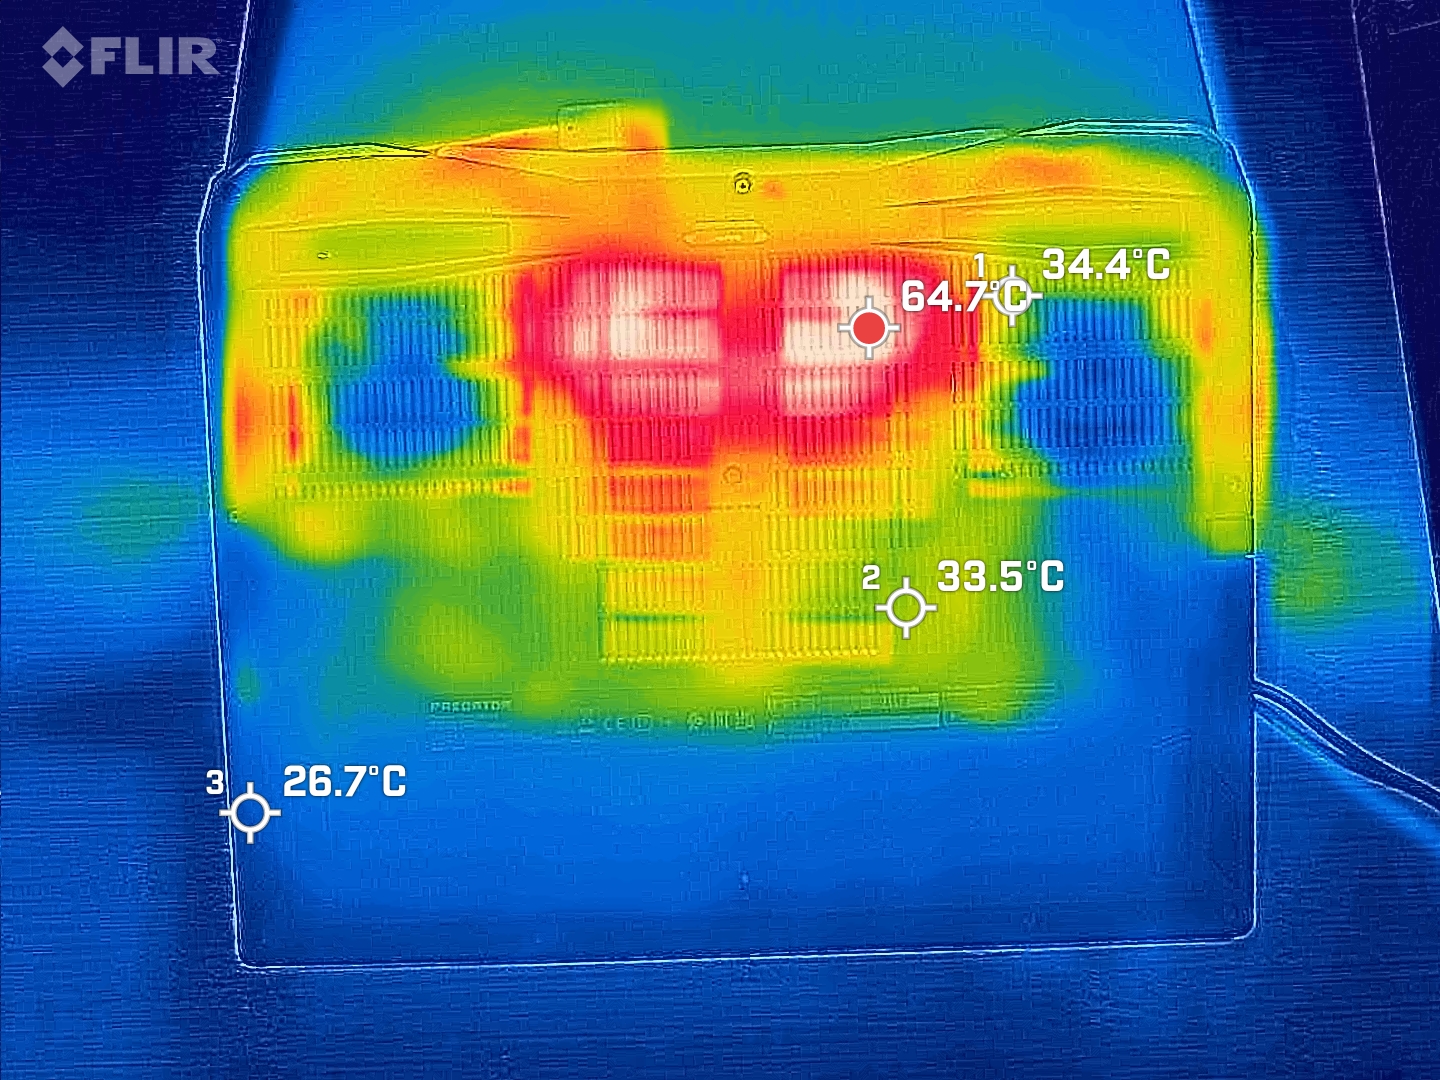
温度
总体而言,宏碁游戏笔记本电脑的温度相当低,在满载情况下,其表面温度大多仅为 25 至 35 °C。不过,我们注意到一些温度高达 56 ℃ 的热点:键盘上方左侧和背面中央顶部。例如,把笔记本放在膝盖上玩游戏时,后者可能会让人感到不舒服。
(-) The maximum temperature on the upper side is 55.7 °C / 132 F, compared to the average of 40.4 °C / 105 F, ranging from 21.2 to 68.8 °C for the class Gaming.
(-) The bottom heats up to a maximum of 55 °C / 131 F, compared to the average of 43.2 °C / 110 F
(+) In idle usage, the average temperature for the upper side is 24.1 °C / 75 F, compared to the device average of 33.9 °C / 93 F.
(+) The palmrests and touchpad are cooler than skin temperature with a maximum of 26.1 °C / 79 F and are therefore cool to the touch.
(+) The average temperature of the palmrest area of similar devices was 28.8 °C / 83.8 F (+2.7 °C / 4.8 F).
| Acer Predator Helios Neo 16 NH.QLTEG.002 Intel Core i5-13500HX, NVIDIA GeForce RTX 4050 Laptop GPU | Lenovo Legion Pro 5 16ARX8 (R5 7645HX, RTX 4050) AMD Ryzen 5 7645HX, NVIDIA GeForce RTX 4050 Laptop GPU | Lenovo LOQ 16IRH8 Intel Core i7-13620H, NVIDIA GeForce RTX 4060 Laptop GPU | Schenker XMG Apex 15 (Late 23) AMD Ryzen 7 7840HS, NVIDIA GeForce RTX 4050 Laptop GPU | HP Victus 16-r0076TX Intel Core i5-13500HX, NVIDIA GeForce RTX 4050 Laptop GPU | Dell G15 5530 Intel Core i7-13650HX, NVIDIA GeForce RTX 4060 Laptop GPU | |
|---|---|---|---|---|---|---|
| Heat | -15% | -2% | -7% | -0% | -16% | |
| Maximum Upper Side * (°C) | 55.7 | 45 19% | 48 14% | 52 7% | 48 14% | 54 3% |
| Maximum Bottom * (°C) | 55 | 54 2% | 59 -7% | 47 15% | 48 13% | 62.2 -13% |
| Idle Upper Side * (°C) | 26 | 36 -38% | 28 -8% | 33 -27% | 29.6 -14% | 33.4 -28% |
| Idle Bottom * (°C) | 26.6 | 38 -43% | 28 -5% | 33 -24% | 30.2 -14% | 33.4 -26% |
* ... smaller is better
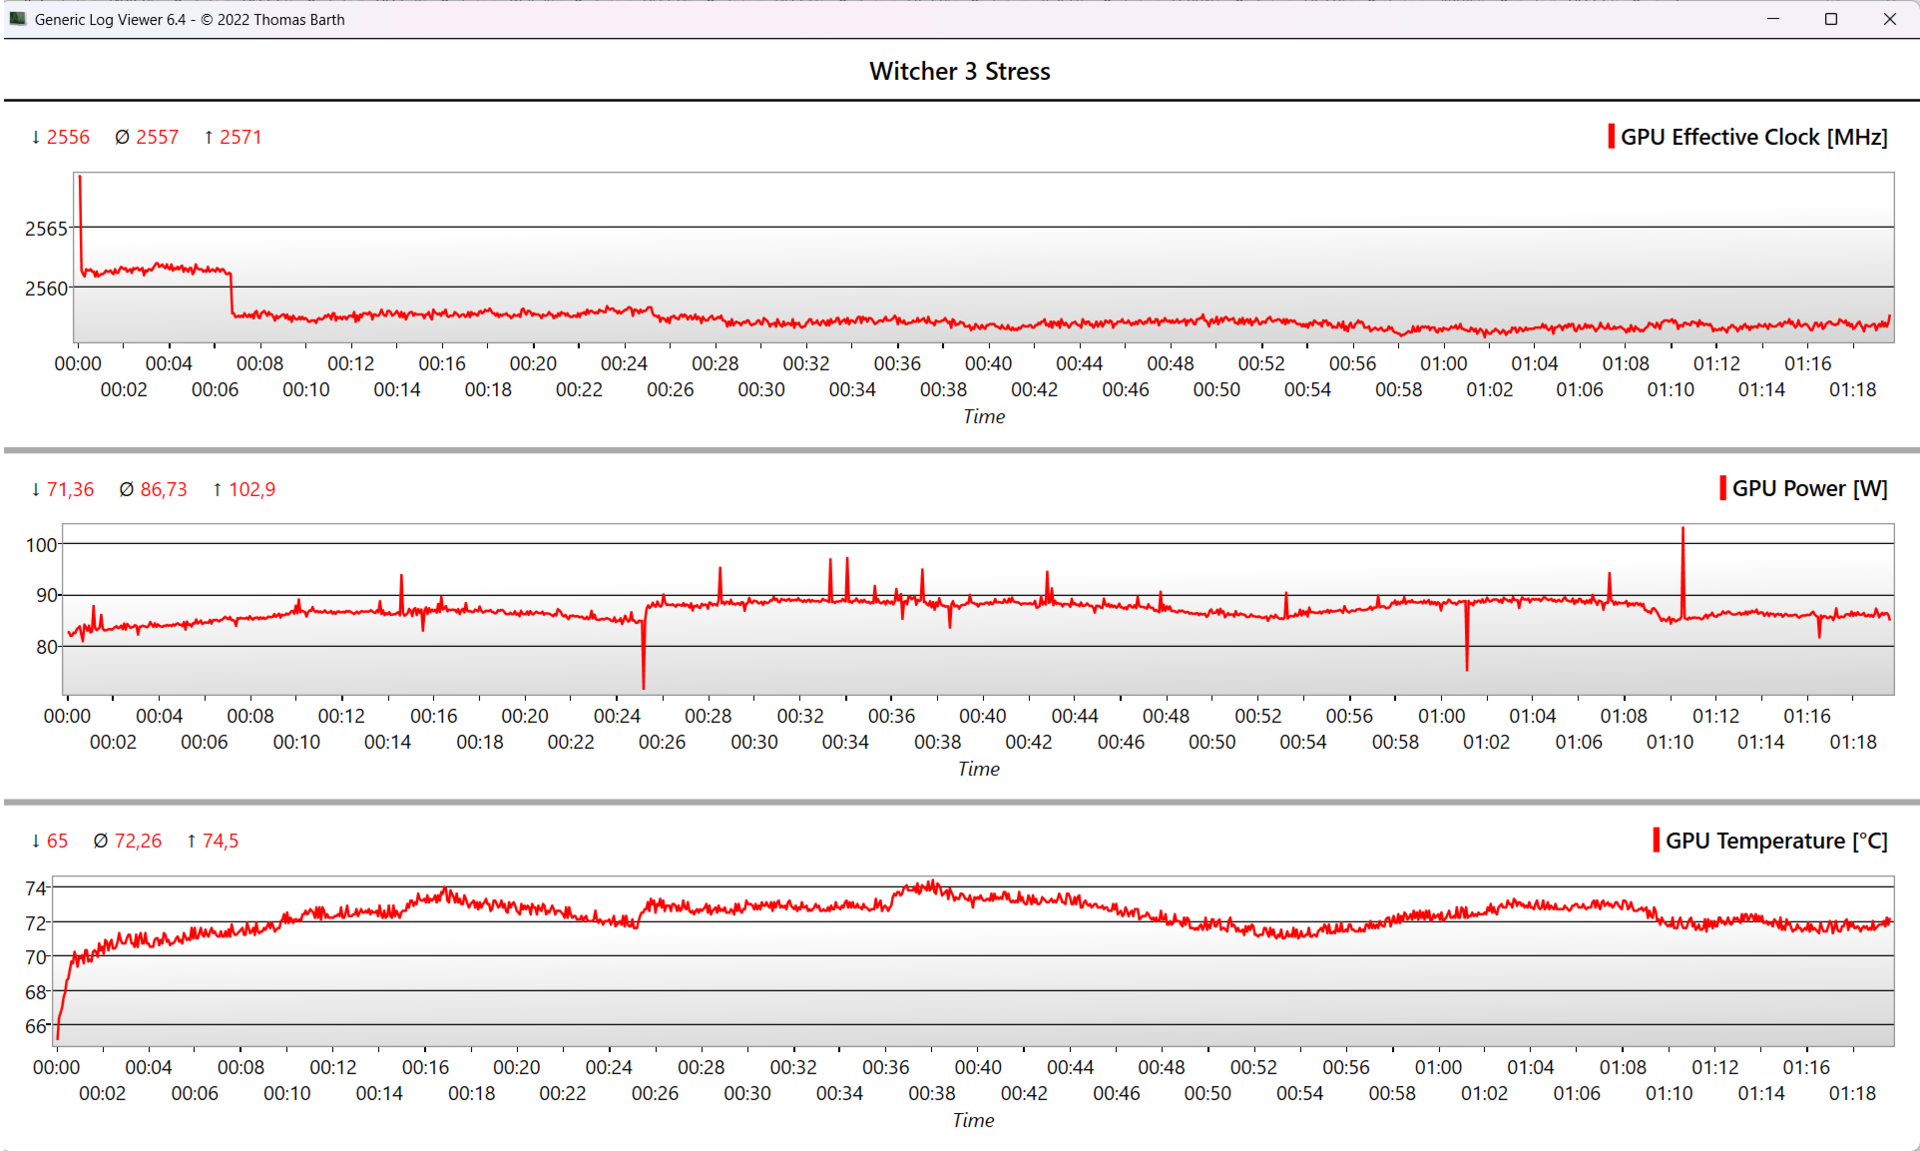
压力测试
在我们的综合压力测试(FurMark + Prime95)中,P 核心的时钟频率在一分钟后从 4 GHz 降至 2 GHz,并从第 5 分钟开始在 2.25 GHz 左右波动,高于 1.8 GHz 的基本时钟频率。
CPU 的最高温度达到 92 °C,但波动非常大,即使在一个小时后,偶尔仍会低于 80 °C。它的平均功耗为 58 瓦,而Helios 16(非 Neo)的i7-13700HX尽管散热系统(几乎)相同,但功耗却高达 100 瓦。GPU 的时钟频率很快从 2,560 MHz(最高时钟频率)降至 2,350 MHz 左右,温度最高达到 87 °C。
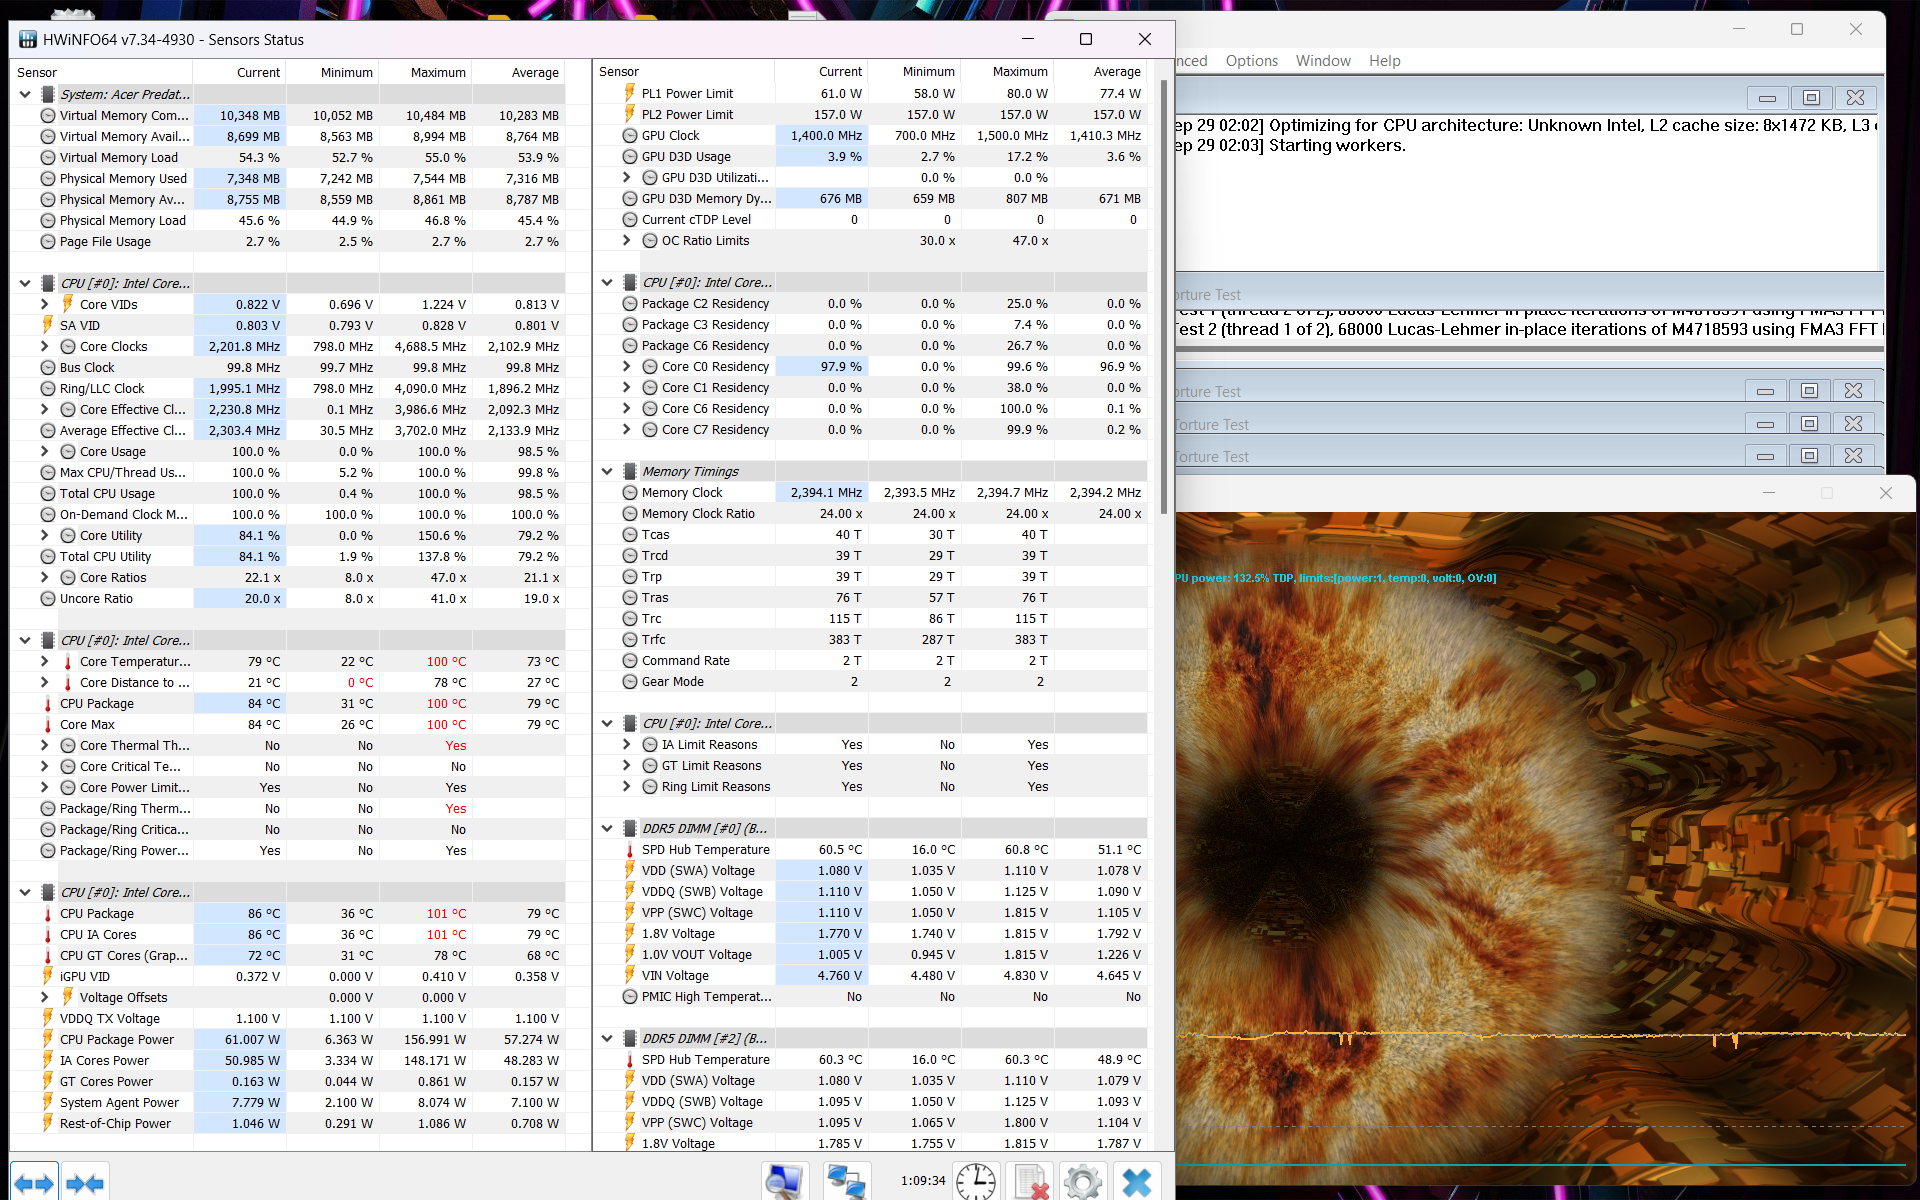
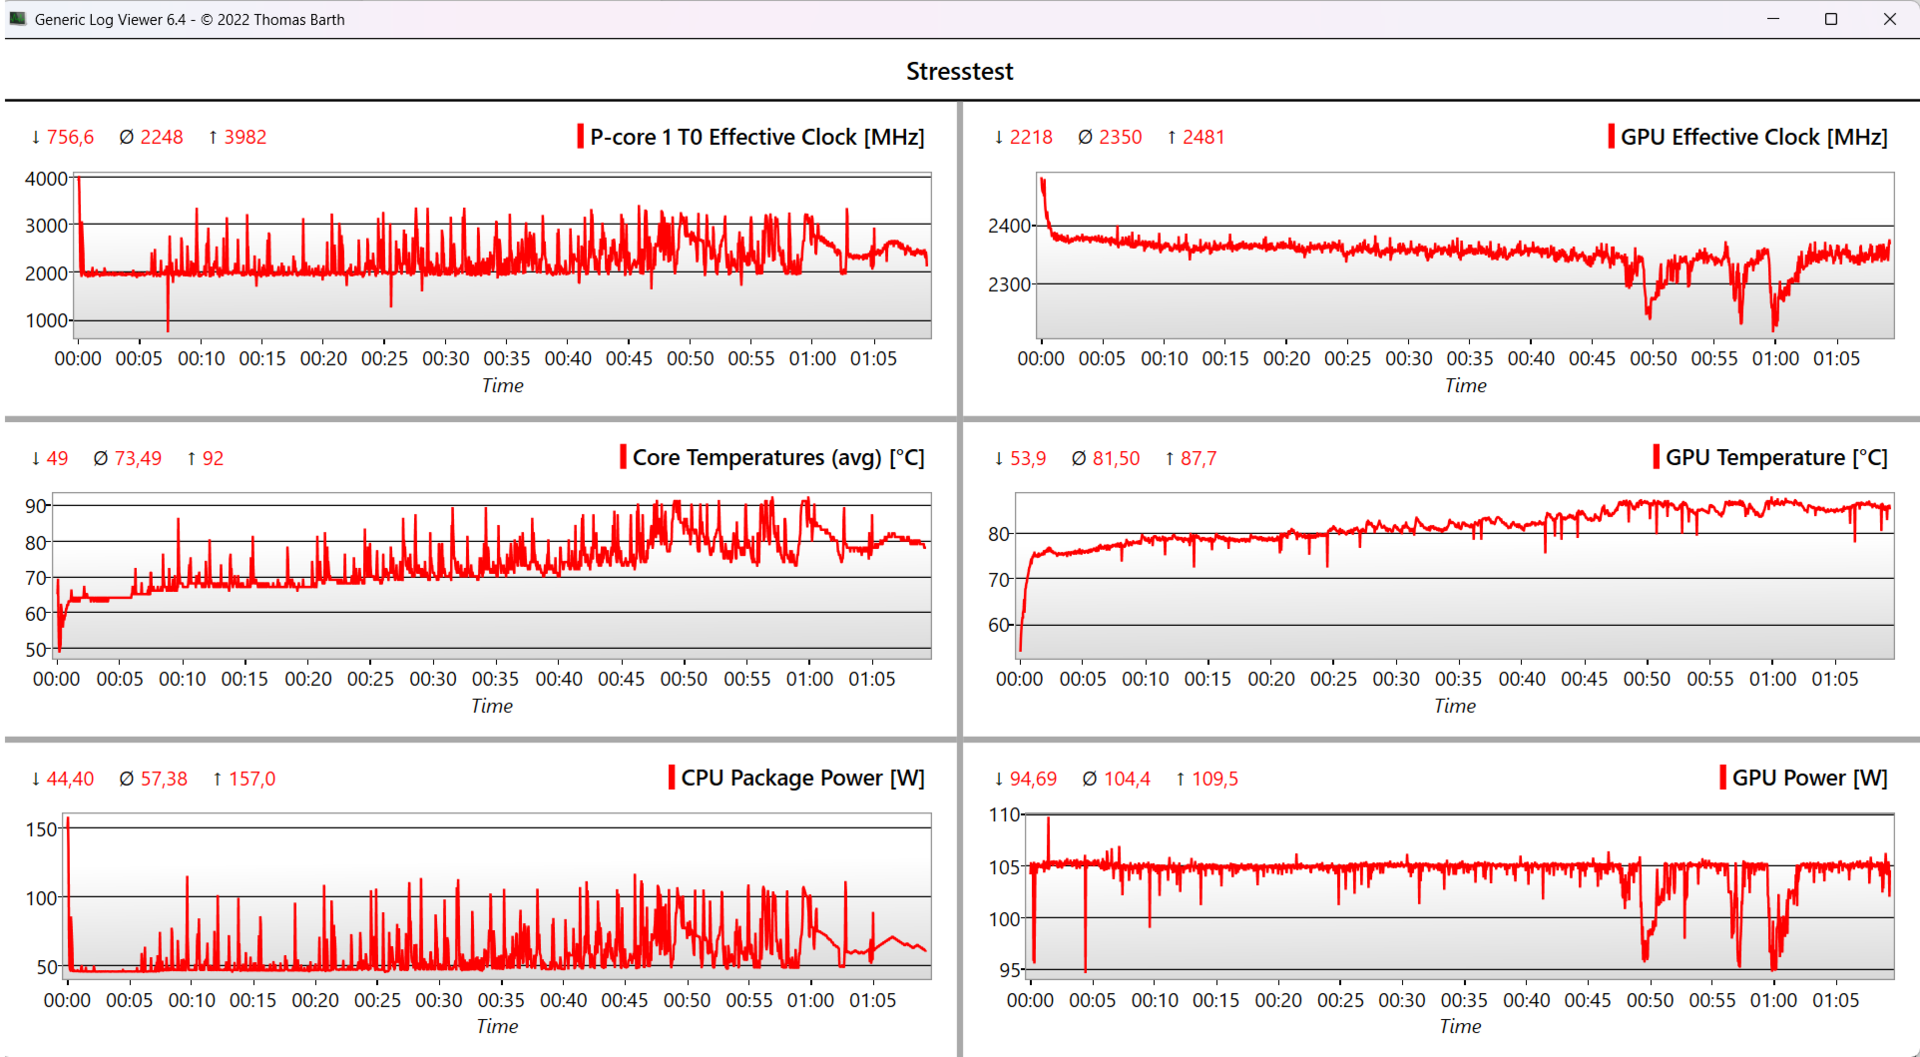
| CPU 时钟 (GHz) | GPU 时钟 (MHz) | CPU 平均温度 (°C) | GPU 平均温度(°C) | |
| Prime95+FurMark | 2,25 | 2.350 | 74 | 82 |
发言人
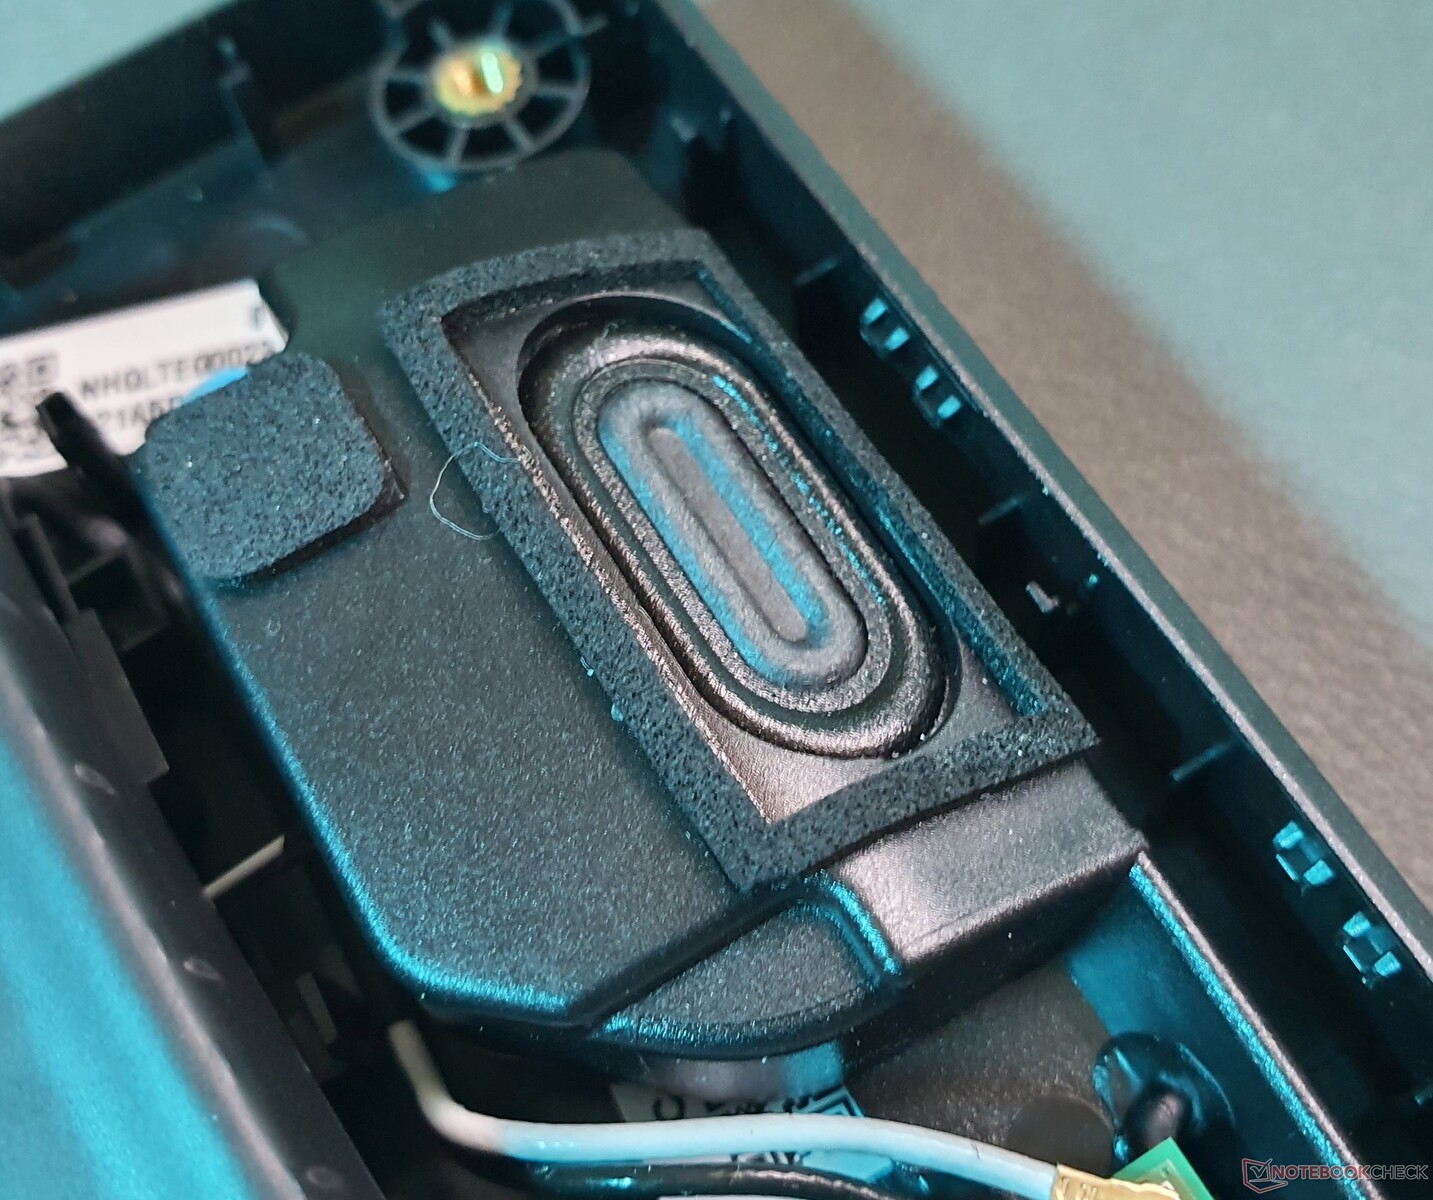
该设备的向下 2 瓦立体声扬声器可产生均衡的中高音,但几乎完全没有低音。78.5 dB(A) 的最大音量也很一般。我们对比的游戏笔记本电脑也没有提供更好的音效。
因此,建议通过音频插孔或蓝牙连接耳机或音响系统,以获得身临其境的音效体验。
Acer Predator Helios Neo 16 NH.QLTEG.002 audio analysis
(±) | speaker loudness is average but good (78.5 dB)
Bass 100 - 315 Hz
(-) | nearly no bass - on average 24.6% lower than median
(±) | linearity of bass is average (12.3% delta to prev. frequency)
Mids 400 - 2000 Hz
(+) | balanced mids - only 2.4% away from median
(+) | mids are linear (5.7% delta to prev. frequency)
Highs 2 - 16 kHz
(+) | balanced highs - only 1.9% away from median
(+) | highs are linear (3.3% delta to prev. frequency)
Overall 100 - 16.000 Hz
(±) | linearity of overall sound is average (17.4% difference to median)
Compared to same class
» 48% of all tested devices in this class were better, 12% similar, 40% worse
» The best had a delta of 6%, average was 18%, worst was 132%
Compared to all devices tested
» 33% of all tested devices were better, 8% similar, 58% worse
» The best had a delta of 4%, average was 23%, worst was 134%
Lenovo Legion Pro 5 16ARX8 (R5 7645HX, RTX 4050) audio analysis
(±) | speaker loudness is average but good (78.06 dB)
Bass 100 - 315 Hz
(-) | nearly no bass - on average 20.9% lower than median
(±) | linearity of bass is average (11.7% delta to prev. frequency)
Mids 400 - 2000 Hz
(±) | higher mids - on average 6.8% higher than median
(+) | mids are linear (5.7% delta to prev. frequency)
Highs 2 - 16 kHz
(+) | balanced highs - only 2.8% away from median
(±) | linearity of highs is average (7.5% delta to prev. frequency)
Overall 100 - 16.000 Hz
(±) | linearity of overall sound is average (21.5% difference to median)
Compared to same class
» 77% of all tested devices in this class were better, 5% similar, 18% worse
» The best had a delta of 6%, average was 18%, worst was 132%
Compared to all devices tested
» 61% of all tested devices were better, 7% similar, 32% worse
» The best had a delta of 4%, average was 23%, worst was 134%
电源管理:台式机级 CPU 对游戏笔记本电脑的影响
耗电量
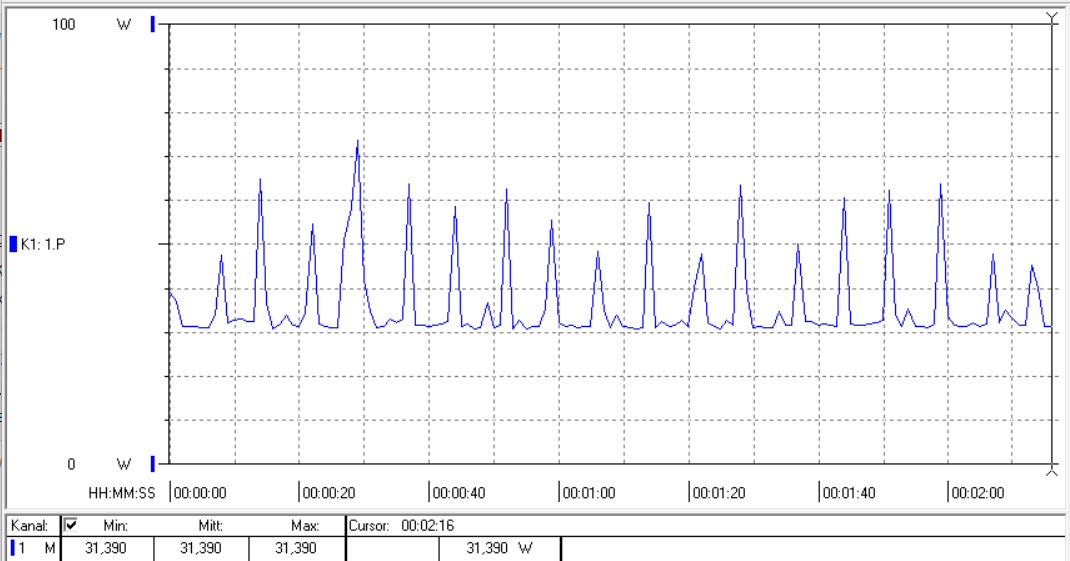
这款游戏笔记本电脑的闲置功耗为 15.5 瓦,这并不奇怪,因为它安装了台式机级 CPU。其他 HX 系统(55 瓦 TDP),无论是英特尔还是 AMD,功耗通常高达 20 瓦。AMD HS 系统(35 瓦 TDP),如XMG Apex 15(空闲模式下功耗仅为 10 瓦)通常具有相应的优势。
游戏时 145 瓦的功耗相对较低,但如果考虑到RTX 4050的最大时钟频率已达到约 87 瓦时,就不是这样了。只有在非日常压力测试中,它才会达到高达 239 瓦的峰值,而 230 瓦的电源仍然可以应付。
| Off / Standby | |
| Idle | |
| Load |
|
Key:
min: | |
| Acer Predator Helios Neo 16 NH.QLTEG.002 i5-13500HX, GeForce RTX 4050 Laptop GPU, SK hynix HFS512GEJ9X125N, IPS, 1920x1200, 16" | Lenovo Legion Pro 5 16ARX8 (R5 7645HX, RTX 4050) R5 7645HX, GeForce RTX 4050 Laptop GPU, SK hynix PC801 HFS512GEJ9X115N, IPS, 2560x1600, 16" | Lenovo LOQ 16IRH8 i7-13620H, GeForce RTX 4060 Laptop GPU, Solidigm SSDPFINW512GZL, IPS, 2560x1600, 16" | Schenker XMG Apex 15 (Late 23) R7 7840HS, GeForce RTX 4050 Laptop GPU, Samsung 990 Pro 1 TB, IPS, 2560x1440, 15.6" | HP Victus 16-r0076TX i5-13500HX, GeForce RTX 4050 Laptop GPU, SK hynix PC801 HFS512GEJ9X101N BF, IPS, 1920x1080, 16.1" | Dell G15 5530 i7-13650HX, GeForce RTX 4060 Laptop GPU, SSTC CL4-3D512-Q11, IPS, 1920x1080, 15.6" | Average NVIDIA GeForce RTX 4050 Laptop GPU | Average of class Gaming | |
|---|---|---|---|---|---|---|---|---|
| Power Consumption | 4% | -6% | 31% | -9% | 7% | 15% | -10% | |
| Idle Minimum * (Watt) | 11.95 | 13 -9% | 17.2 -44% | 6 50% | 16.12 -35% | 8.4 30% | 9.95 ? 17% | 13 ? -9% |
| Idle Average * (Watt) | 32 | 17.4 46% | 19.3 40% | 11 66% | 20.47 36% | 14.98 53% | 15.8 ? 51% | 19 ? 41% |
| Idle Maximum * (Watt) | 15.5 | 21.8 -41% | 21.2 -37% | 14 10% | 22.11 -43% | 15.56 -0% | 20.1 ? -30% | 24.6 ? -59% |
| Load Average * (Watt) | 97.5 | 96.4 1% | 90 8% | 65 33% | 94.8 3% | 96.8 1% | 88 ? 10% | 110.7 ? -14% |
| Witcher 3 ultra * (Watt) | 144.9 | 125 14% | 168 -16% | 136.5 6% | 166.9 -15% | 186 -28% | ||
| Load Maximum * (Watt) | 239 | 204 15% | 211 12% | 195 18% | 237 1% | 271.42 -14% | 176.3 ? 26% | 259 ? -8% |
* ... smaller is better
Power consumption Witcher 3 / stress test
Power consumption with external monitor
运行时间
Helios Neo 16 的运行时间为 4 小时 16 分钟,即使在游戏设备中,它的续航时间也不算太长。它的刷新率可在 83 Hz 和 120 Hz 之间自动调节。
惠普惠普 Victus 16(9 小时)和 AMDXMG Apex 15
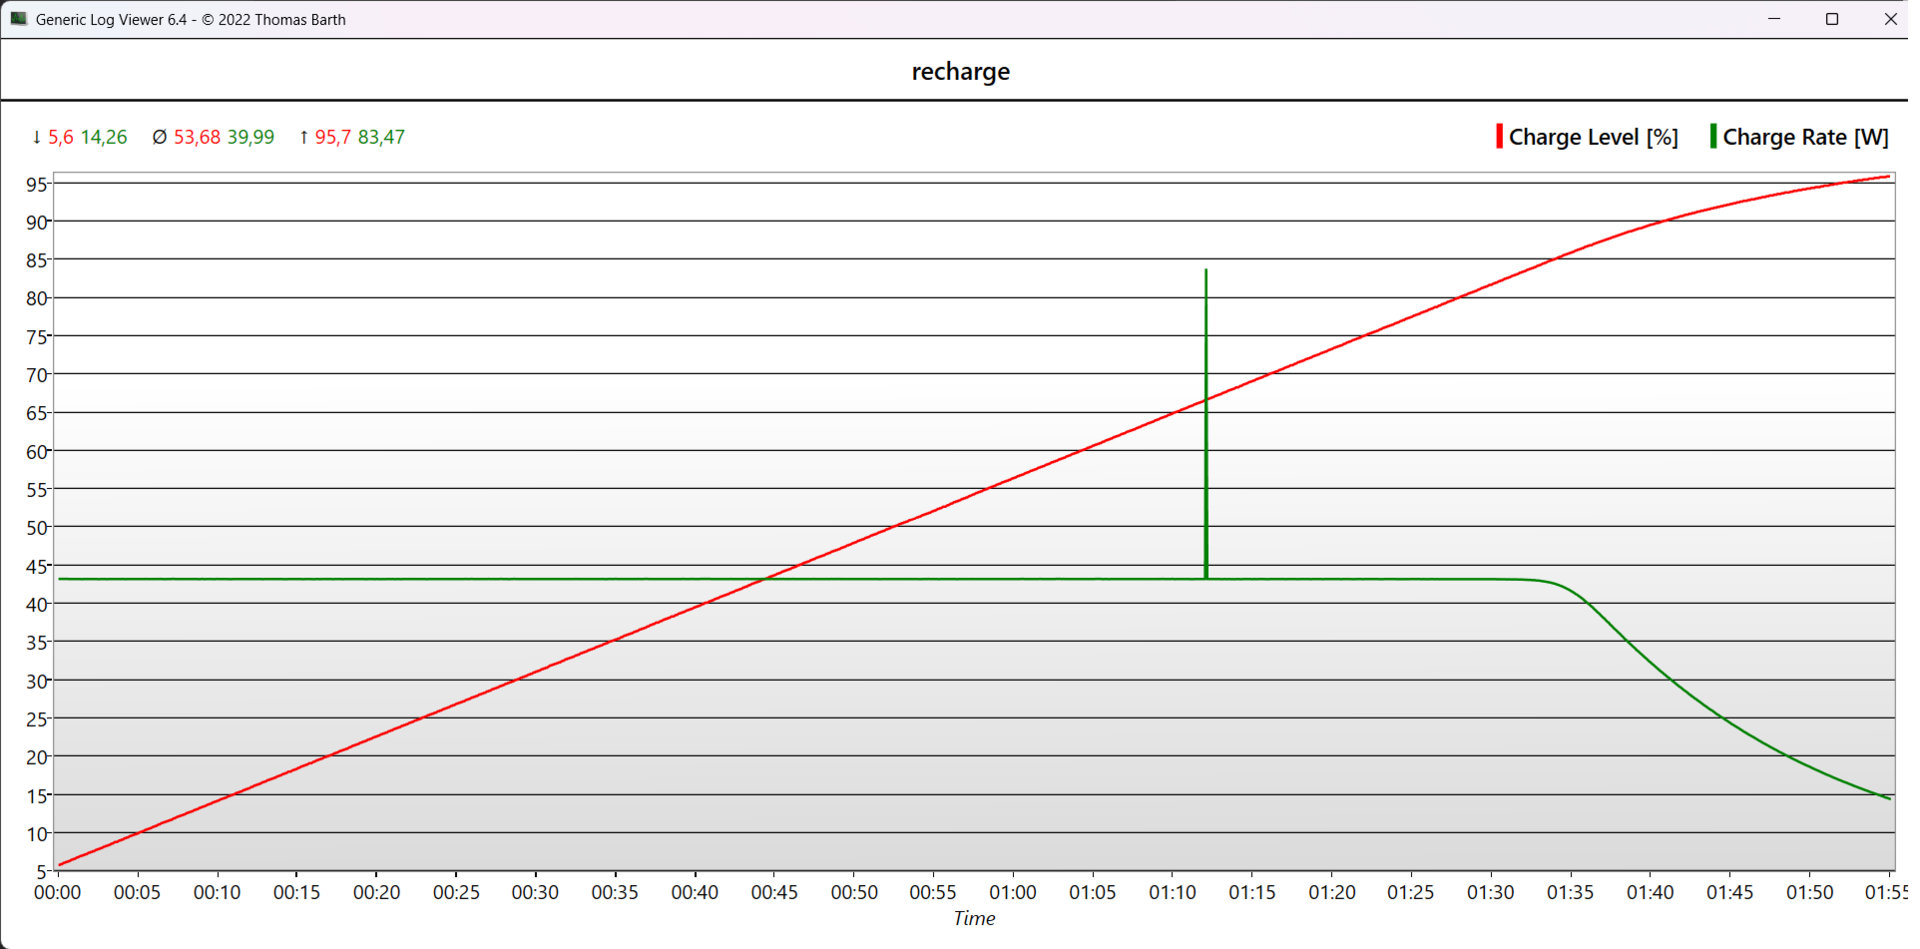
要将电池电量充至 50%,需要整整一个小时,而充满电则需要两个小时。通过 USB-C 充电则需要更长的时间。
| Acer Predator Helios Neo 16 NH.QLTEG.002 i5-13500HX, GeForce RTX 4050 Laptop GPU, 90 Wh | Lenovo Legion Pro 5 16ARX8 (R5 7645HX, RTX 4050) R5 7645HX, GeForce RTX 4050 Laptop GPU, 80 Wh | Acer Predator Helios 16 PH16-71-731Q i7-13700HX, GeForce RTX 4060 Laptop GPU, 90 Wh | Lenovo LOQ 16IRH8 i7-13620H, GeForce RTX 4060 Laptop GPU, 80 Wh | Schenker XMG Apex 15 (Late 23) R7 7840HS, GeForce RTX 4050 Laptop GPU, 62.32 Wh | HP Victus 16-r0076TX i5-13500HX, GeForce RTX 4050 Laptop GPU, 83 Wh | Dell G15 5530 i7-13650HX, GeForce RTX 4060 Laptop GPU, 86 Wh | Average of class Gaming | |
|---|---|---|---|---|---|---|---|---|
| Battery runtime | 3% | -7% | 6% | 23% | 27% | -4% | 21% | |
| H.264 (h) | 7.2 | 5.4 -25% | 4.8 -33% | 6.4 -11% | 8.3 15% | 7.7 7% | 6.8 -6% | 8.32 ? 16% |
| WiFi v1.3 (h) | 4.3 | 5.6 30% | 5.6 30% | 6.3 47% | 7.1 65% | 8.9 107% | 6.5 51% | 7.11 ? 65% |
| Load (h) | 1.8 | 1.5 -17% | 1.5 -17% | 1.6 -11% | 1.2 -33% | 0.8 -56% | 1.502 ? -17% | |
| Witcher 3 ultra (h) | 0.8 | 1.5 | 1.5 | 0.8 |
Pros
Cons
结论:配备 RTX 4050 的中端游戏玩家并不乐观
宏碁的 Predator Helios Neo 16 是一个由坚实的中端游戏笔记本电脑和大量入门级功能组成的嵌合体。特别是,后者包括RTX 4050我们的测试设备安装了 RTX 4050,但它的全高清面板可能会带来不错的性能,但也是相当标准的。它的键盘也是如此,在许多其他经济型游戏笔记本电脑中也能找到。
宏碁为所有这些配备了强大的台式机级英特尔酷睿i5-13500HX处理器,包括液态金属冷却解决方案、时尚坚固的精巧机箱以及大量连接选项,其中包括真正的 HDMI 2.1 连接到 dGPU 和两个 Thunderbolt 4 端口。此外,还有高级优化和 G-Sync 技术。
遗憾的是,我们并不完全确定这一组合(MRSP 为 1,069 美元)能否找到目标市场。它需要RTX 4060或RTX 4070才能让它物有所值,而这通常只能在 Neo 16 中找到,并且需要额外收费。与普通Helios 16该机型没有 i9-13900HX、100% sRGB 覆盖率的 QHD 面板或 Mini LED 选项。此外,它的 720p 网络摄像头也是一个很大的区别,考虑到笔记本电脑的价格,这确实是一个值得批评的理由。它的运行时间只有 4 个半小时,也不是最好的。
宏碁掠夺者 Helios Neo 16 是坚固的 Helios 16 的瘦身版。从理论上讲,这是个好主意,但前提是两者之间的价格差距不能太小。
其强大的散热系统几乎以 1:1 的比例采用了 Helios 16 的散热系统,从而实现了低内部温度和低噪音(最迟在使用平衡模式时),而这并不是以牺牲任何性能为代价的。另一方面,在电池模式下对 GPU 和 CPU 功耗的限制有点过分。
同样的价格却能买到配置相同但功能更多的普通版 Helios 16,这让我们感到非常奇怪。或者,您也可以考虑一下Legion Pro 5 16(英特尔),它的价格稍高,但拥有 240 Hz QHD 面板、更强大的 RTX 4060、舒适的键盘以及玩游戏时更安静的散热效果。另一方面,如果你正在寻找一款真正的经济型游戏机,那么你最好看看联想 LOQ 16,它采用了廉价的 AMDRyzen 9 7940HSQHD 面板和 RTX 4050(1200 美元)或 RTX 4060(1400 美元)。
价格和供应情况
我们测试的宏碁掠夺者 Helios 16 版本配备了英特尔酷睿 i5-13500HX、RTX 4050 和 FHD+ 显示屏,在亚马逊上的售价为 1,069 美元。
Acer Predator Helios Neo 16 NH.QLTEG.002
- 11/02/2023 v7 (old)
Marvin Gollor
Transparency
The selection of devices to be reviewed is made by our editorial team. The test sample was provided to the author as a loan by the manufacturer or retailer for the purpose of this review. The lender had no influence on this review, nor did the manufacturer receive a copy of this review before publication. There was no obligation to publish this review. As an independent media company, Notebookcheck is not subjected to the authority of manufacturers, retailers or publishers.
This is how Notebookcheck is testing
Every year, Notebookcheck independently reviews hundreds of laptops and smartphones using standardized procedures to ensure that all results are comparable. We have continuously developed our test methods for around 20 years and set industry standards in the process. In our test labs, high-quality measuring equipment is utilized by experienced technicians and editors. These tests involve a multi-stage validation process. Our complex rating system is based on hundreds of well-founded measurements and benchmarks, which maintains objectivity. Further information on our test methods can be found here.
Price comparison

