申克 XMG Focus 15 (E23) 经济型游戏笔记本电脑评测:比Pro 15性能更强,价格更低

我们首先测试了XMG Focus 15早在2021年底。Focus 15是一款将当时全新的RTX 3050 Ti 笔记本电脑 GPU达到了极限。尽管采用了散热技术,但XMG Focus 15在高温下的性能仅高于平均水平。
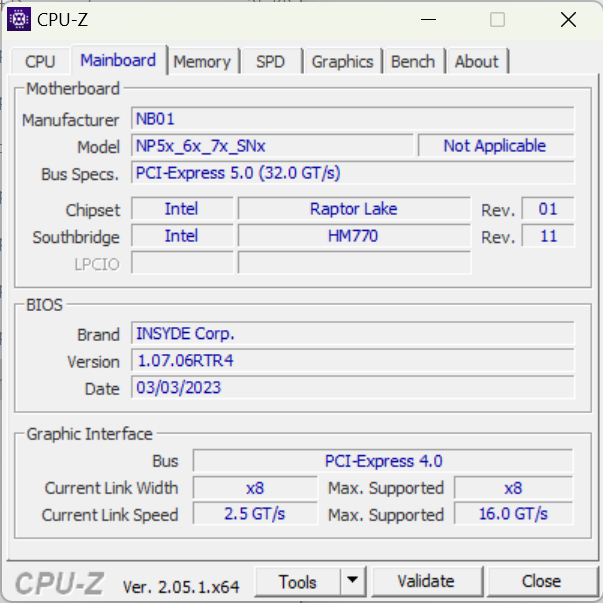
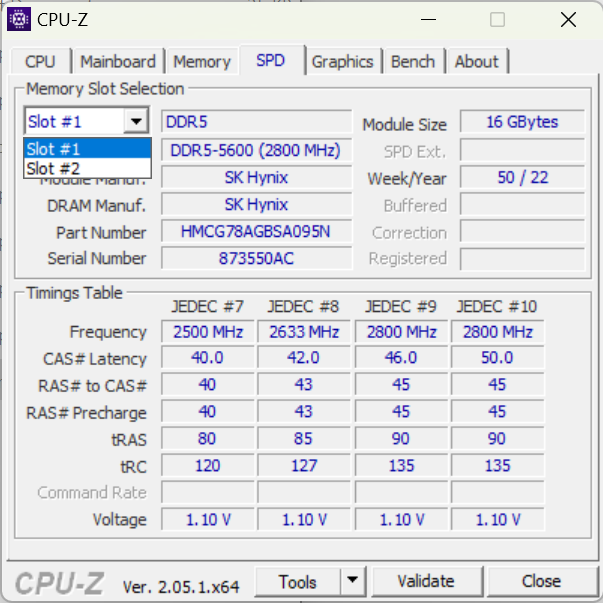
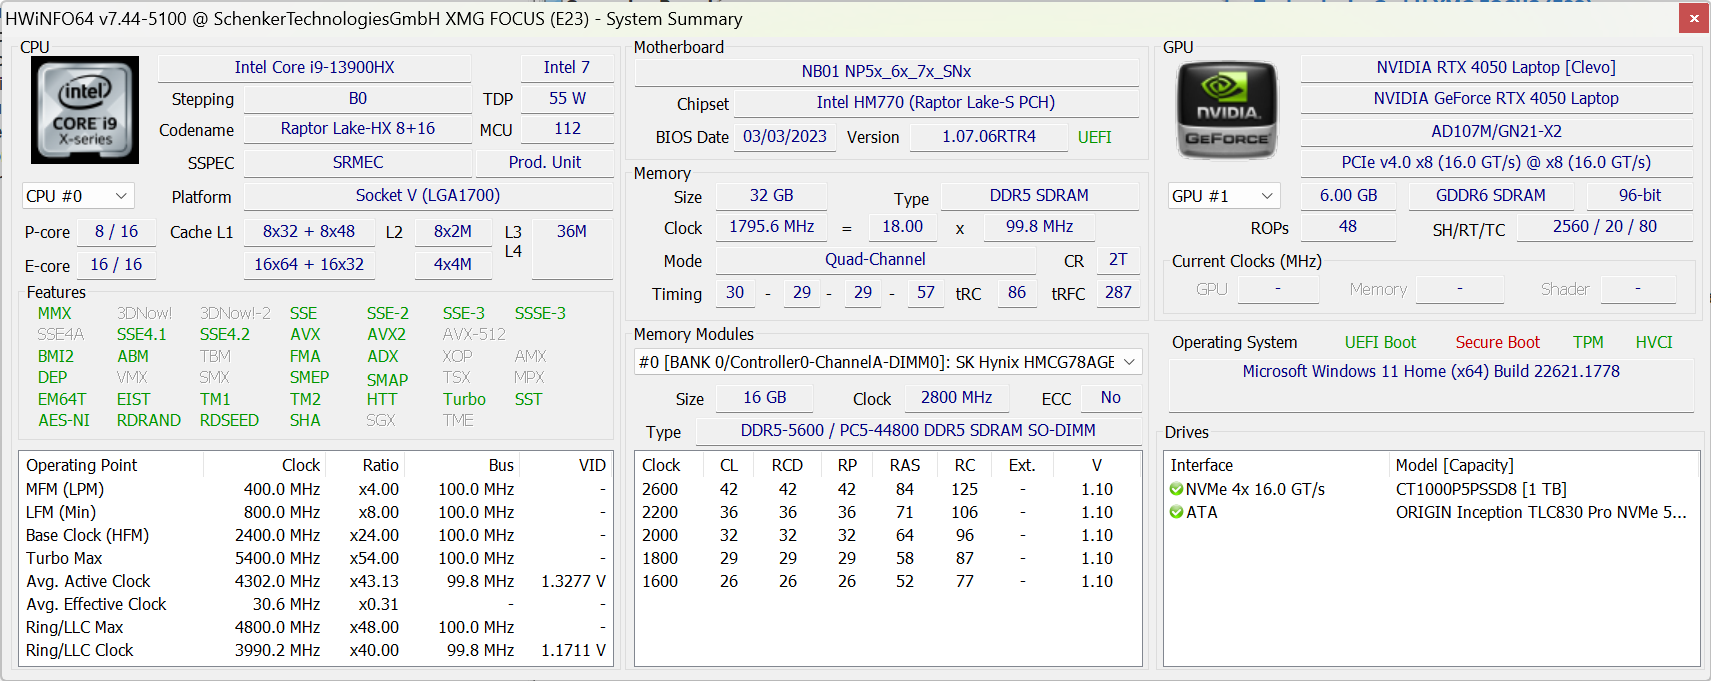
目前的Focus 15再次采用了Clevo的裸机,这次是NP50SNC机箱。与最近测试的XMG Pro 15类似,我们发现英特尔酷睿i9-13900HX处理器。
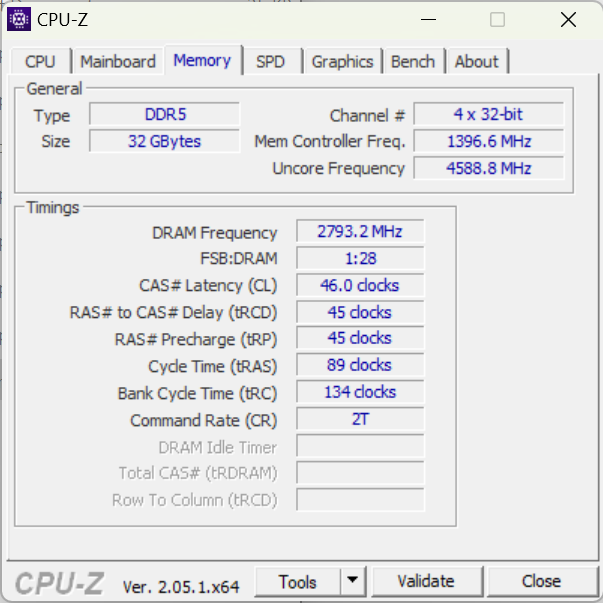
Focus 15的高端处理器辅以入门级GPU--Nvidia RTX 4050笔记本GPU。NvidiaGeForce RTX 4050笔记本电脑GPU32GB工作内存和1TB Crucial NVMe固态硬盘。
像往常一样,申克提供了广泛的配置选项。买家还可以为Focus 15配置RTX 4060笔记本GPU或RTX 4070笔记本GPU以及额外的内存选项。
由于我们的评测样品采用了入门级图形处理器,因此我们将XMG Pro 15归类为入门级游戏笔记本电脑。然而,入门级游戏笔记本电脑通常没有如此高性能的处理器和不超过16GB的工作内存,因此我们也在高端多媒体笔记本电脑中寻找相应的对比设备。
其中包括微星卡塔纳15或华硕TUF A15游戏笔记本和三星Galaxy Book3 Ultra 16或宏碁Swift X SFX14-71G作为多媒体笔记本电脑。笔记本电脑XMG Pro 15XMG Pro 15也在此次比较中占有一席之地--申克的这款更昂贵的笔记本电脑与其更便宜的同类产品仅在几个方面有所不同。
潜在的竞争对手比较
Rating | Date | Model | Weight | Height | Size | Resolution | Price |
|---|---|---|---|---|---|---|---|
| 85.1 % v7 (old) | 07 / 2023 | Schenker XMG Focus 15 (E23) i9-13900HX, GeForce RTX 4050 Laptop GPU | 2.4 kg | 26.9 mm | 15.60" | 2569x1440 | |
| 86.2 % v7 (old) | 07 / 2023 | Schenker XMG Pro 15 (E23) i9-13900HX, GeForce RTX 4060 Laptop GPU | 2.4 kg | 24.9 mm | 15.60" | 2560x1440 | |
| 86.3 % v7 (old) | 06 / 2023 | Asus TUF A15 FA507 R7 7735HS, GeForce RTX 4050 Laptop GPU | 2.2 kg | 24.9 mm | 15.60" | 1920x1080 | |
| 82.9 % v7 (old) | 03 / 2023 | MSI Katana 15 B12VEK i7-12650H, GeForce RTX 4050 Laptop GPU | 2.3 kg | 24.9 mm | 15.60" | 1920x1080 | |
| 86.3 % v7 (old) | 07 / 2023 | Acer Swift X SFX14-71G i7-13700H, GeForce RTX 4050 Laptop GPU | 1.5 kg | 17.9 mm | 14.50" | 2880x1800 | |
| 89.4 % v7 (old) | 04 / 2023 | Samsung Galaxy Book3 Ultra 16 i7-13700H, GeForce RTX 4050 Laptop GPU | 1.8 kg | 16.5 mm | 16.00" | 2880x1800 | |
| 89.4 % v7 (old) | 05 / 2023 | Gigabyte Aero 14 OLED BMF i7-13700H, GeForce RTX 4050 Laptop GPU | 1.4 kg | 17 mm | 14.00" | 2880x1800 |
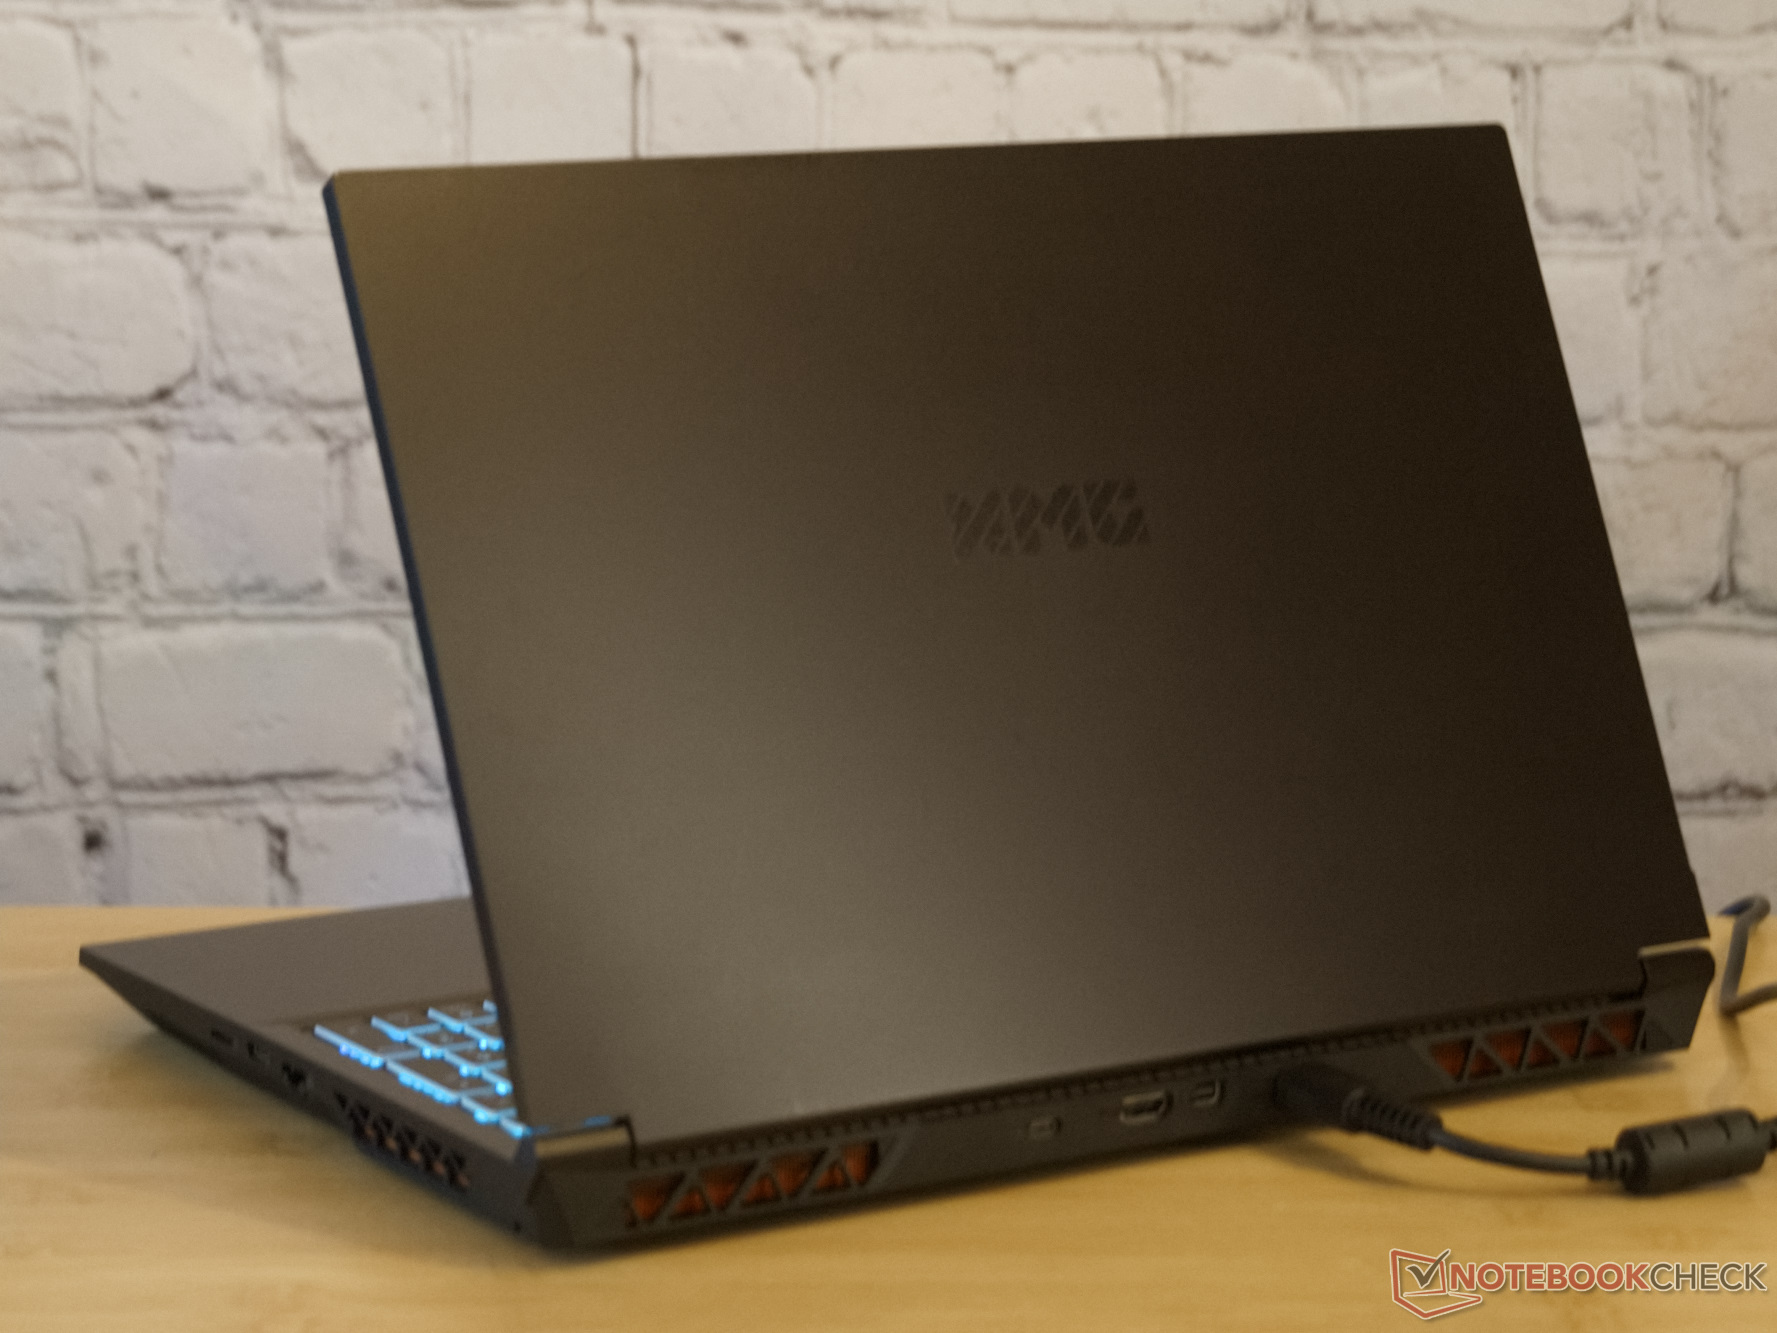
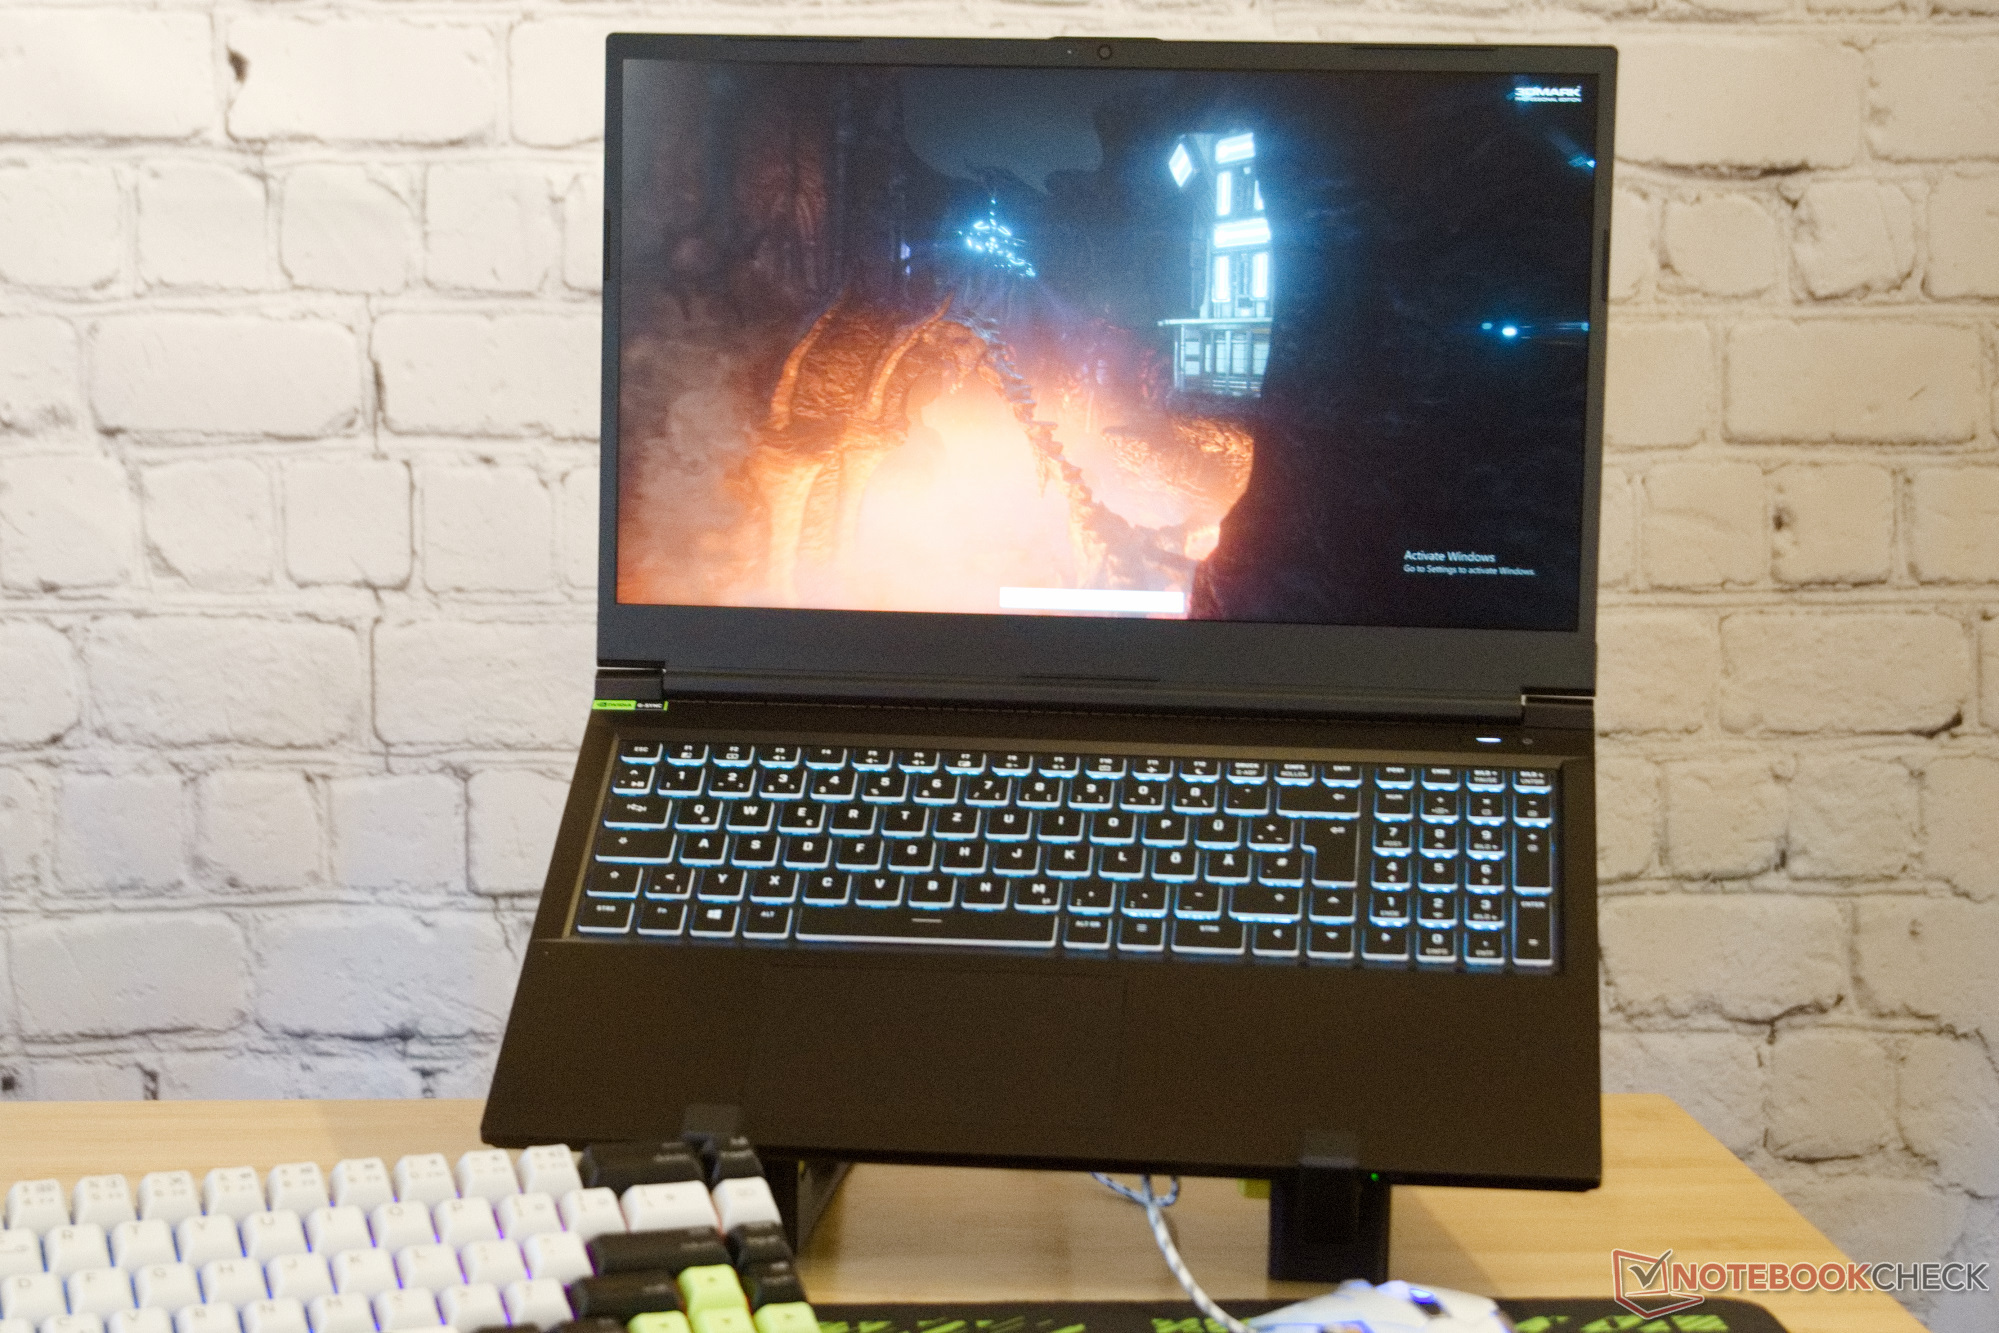
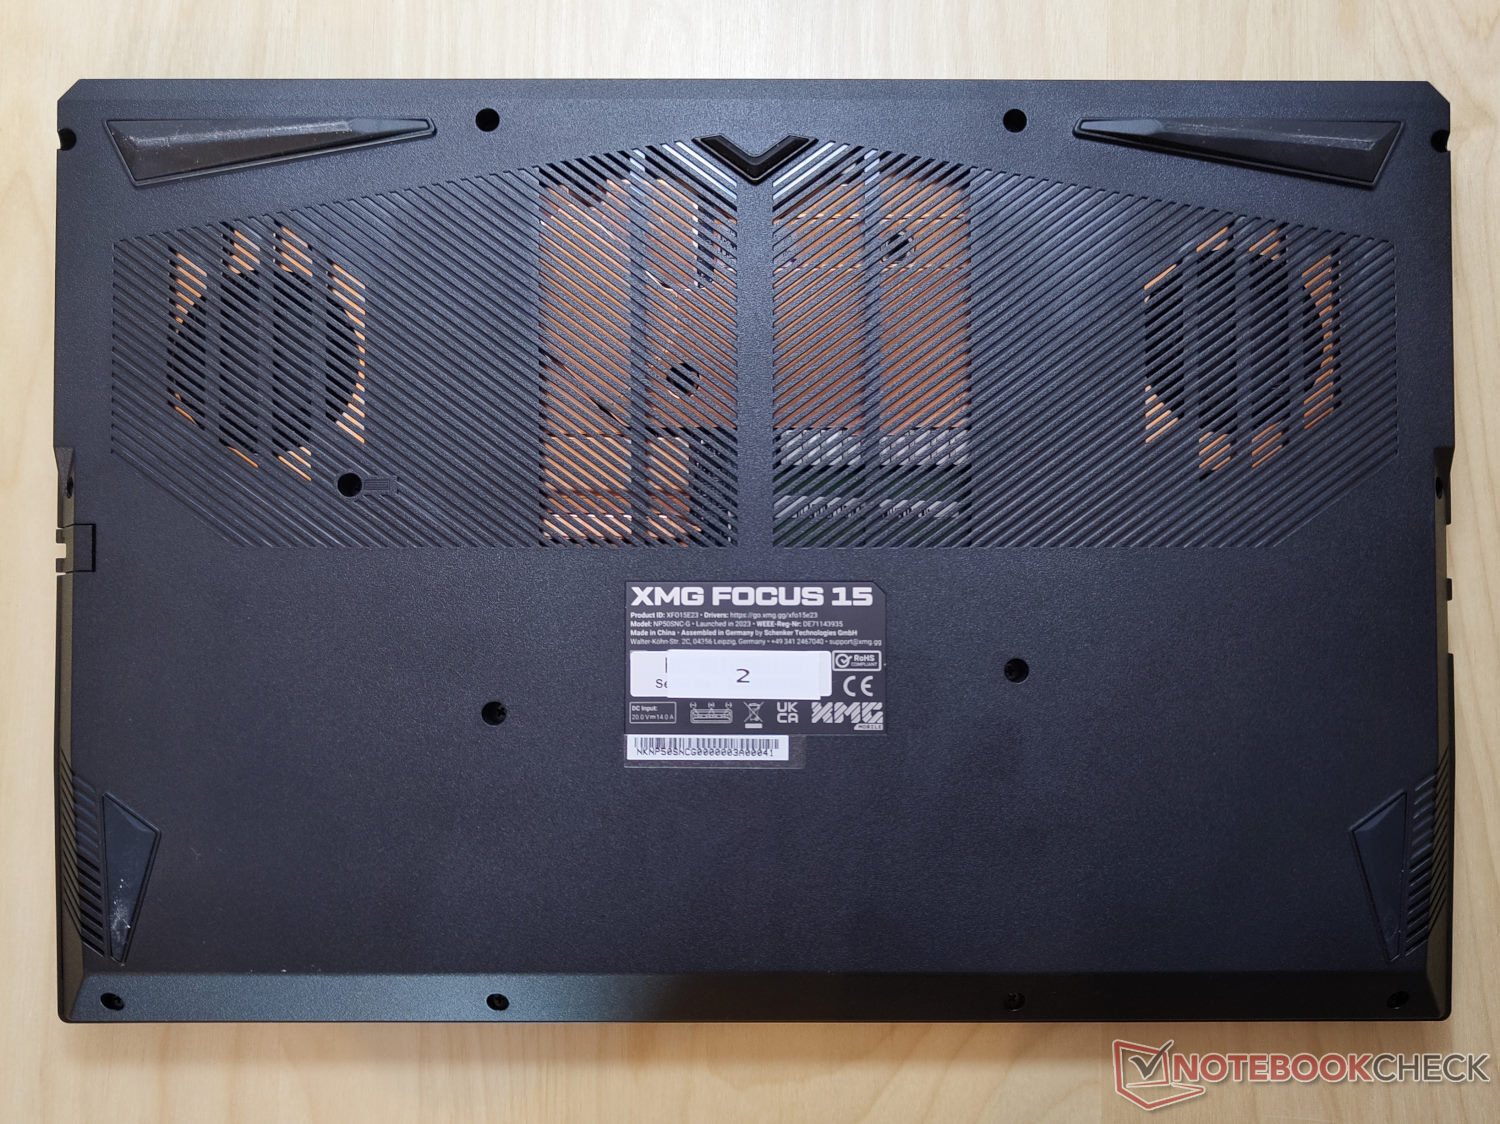
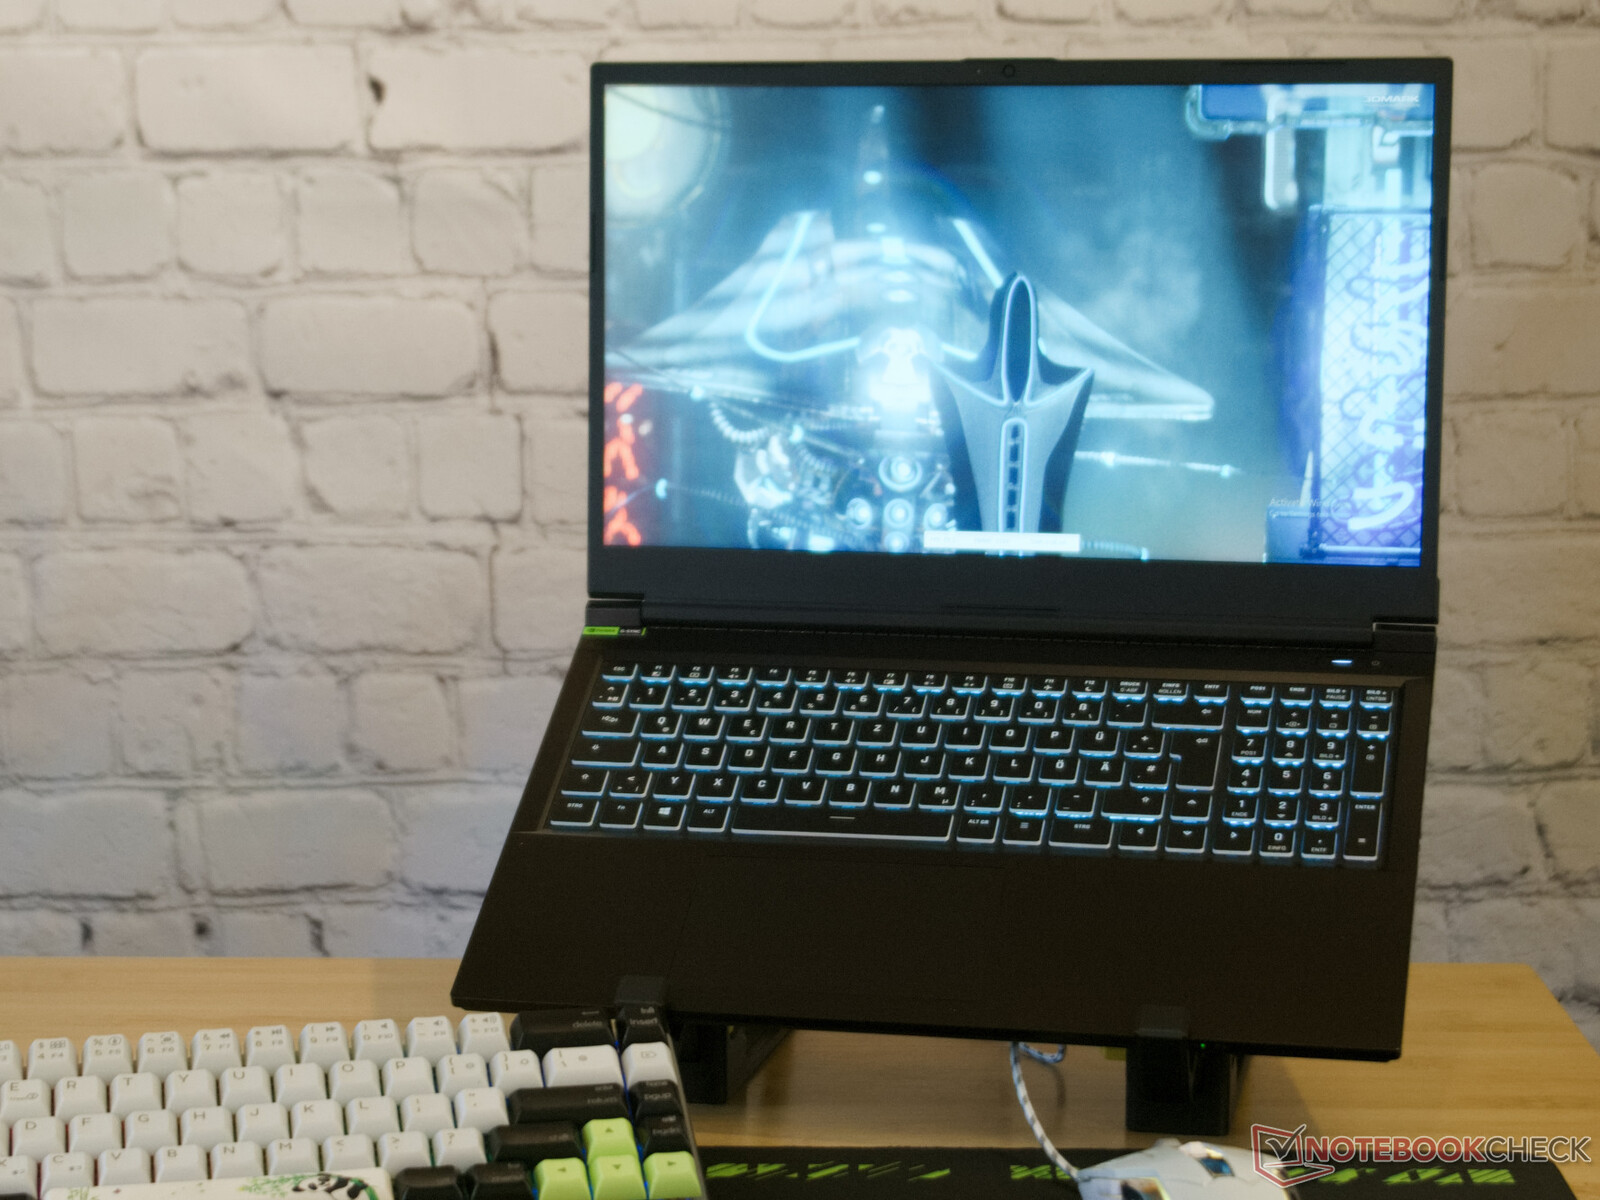
底盘坚固的塑料
这款笔记本电脑的外壳完全由坚固的塑料制成,只有在散热片的格栅后面才能看到金属。Clevo和Schenker保持了相当简洁的设计。品牌标志仅以黑底XMG标志的形式出现。
尽管外壳主要由塑料制成,但我们并没有发现质量方面的任何弱点。笔记本电脑在各方面都很坚固,扭动时不会发出嘎吱声,缝隙非常窄且均匀。单手即可将显示屏盖打开约140°,并始终保持其位置。
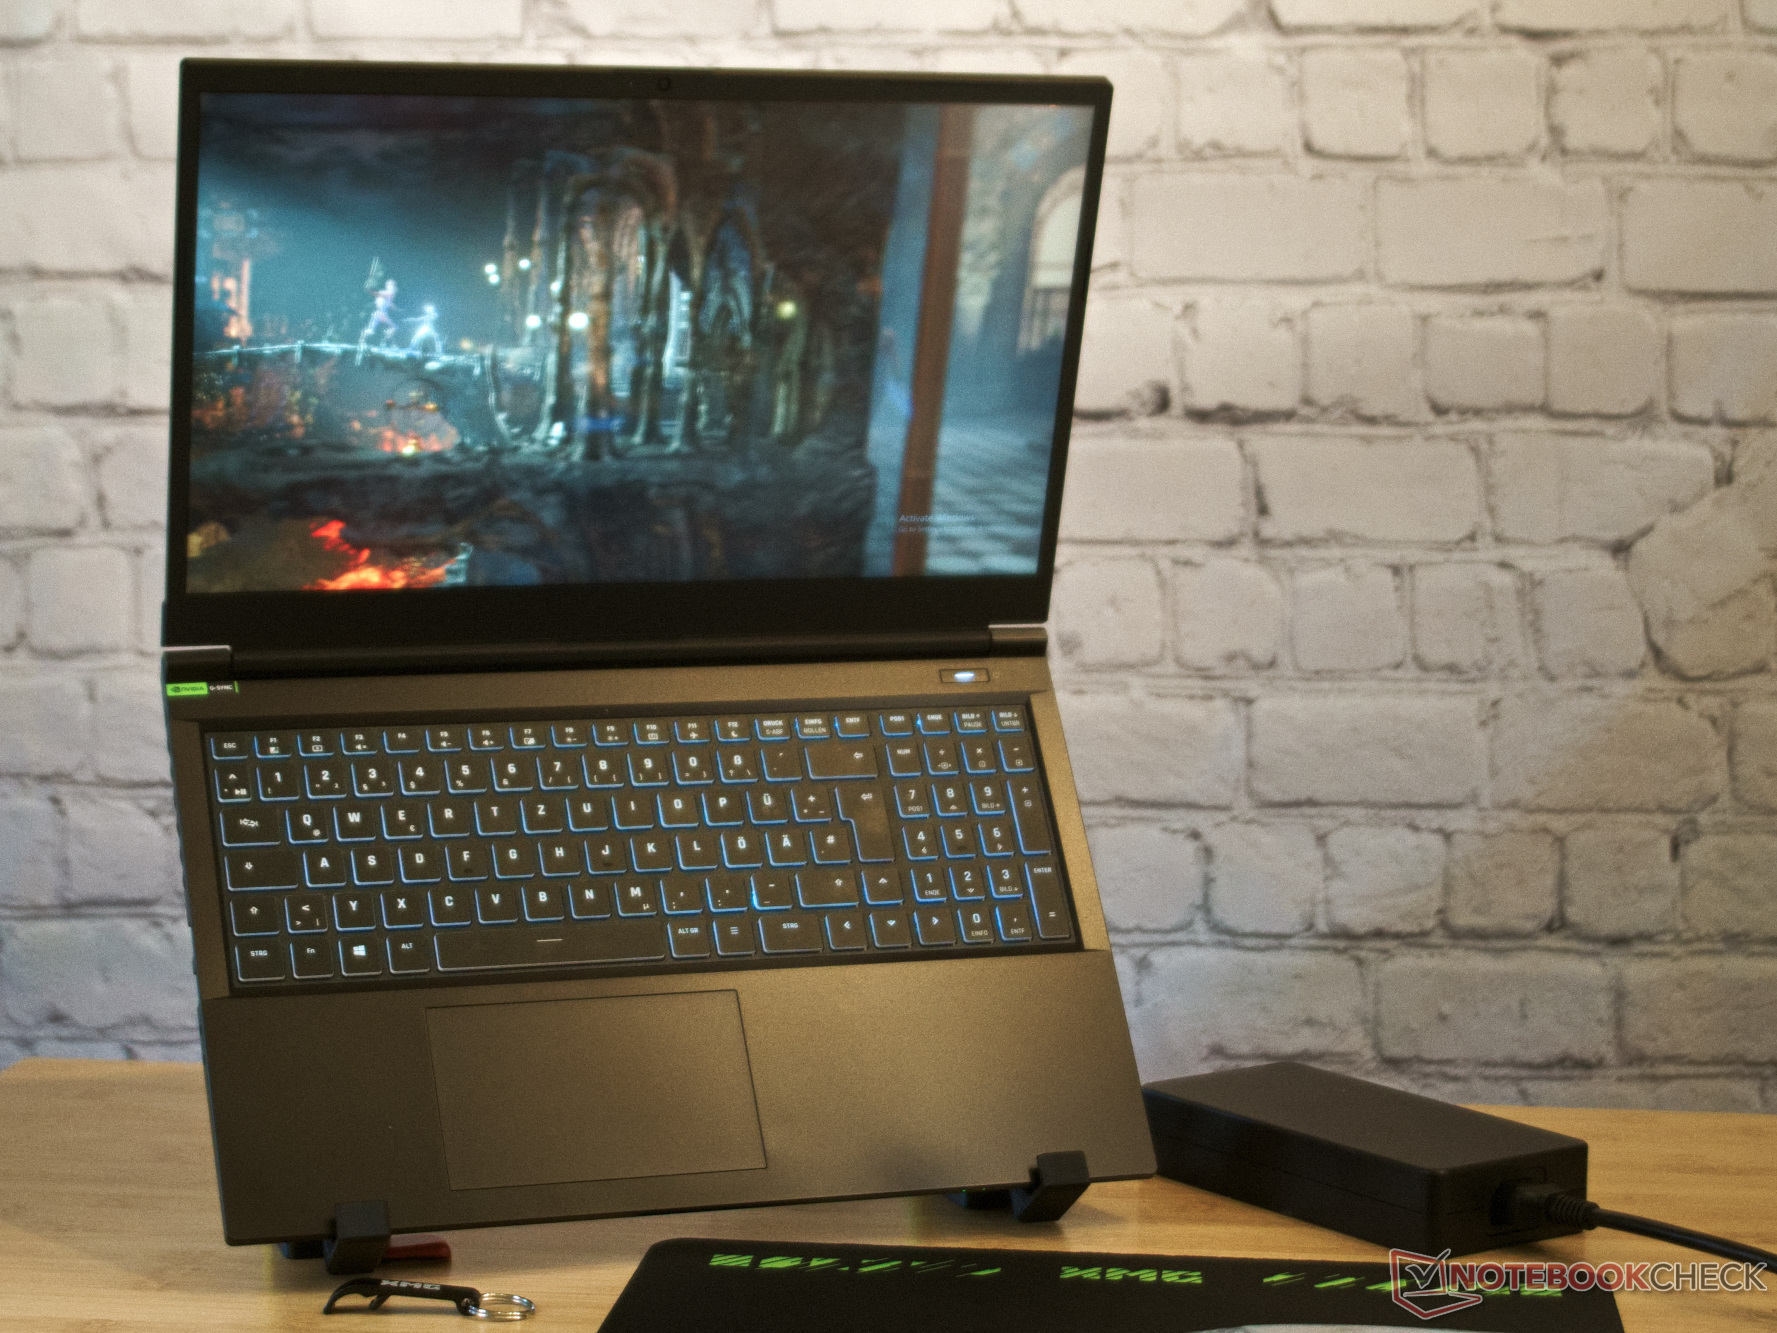
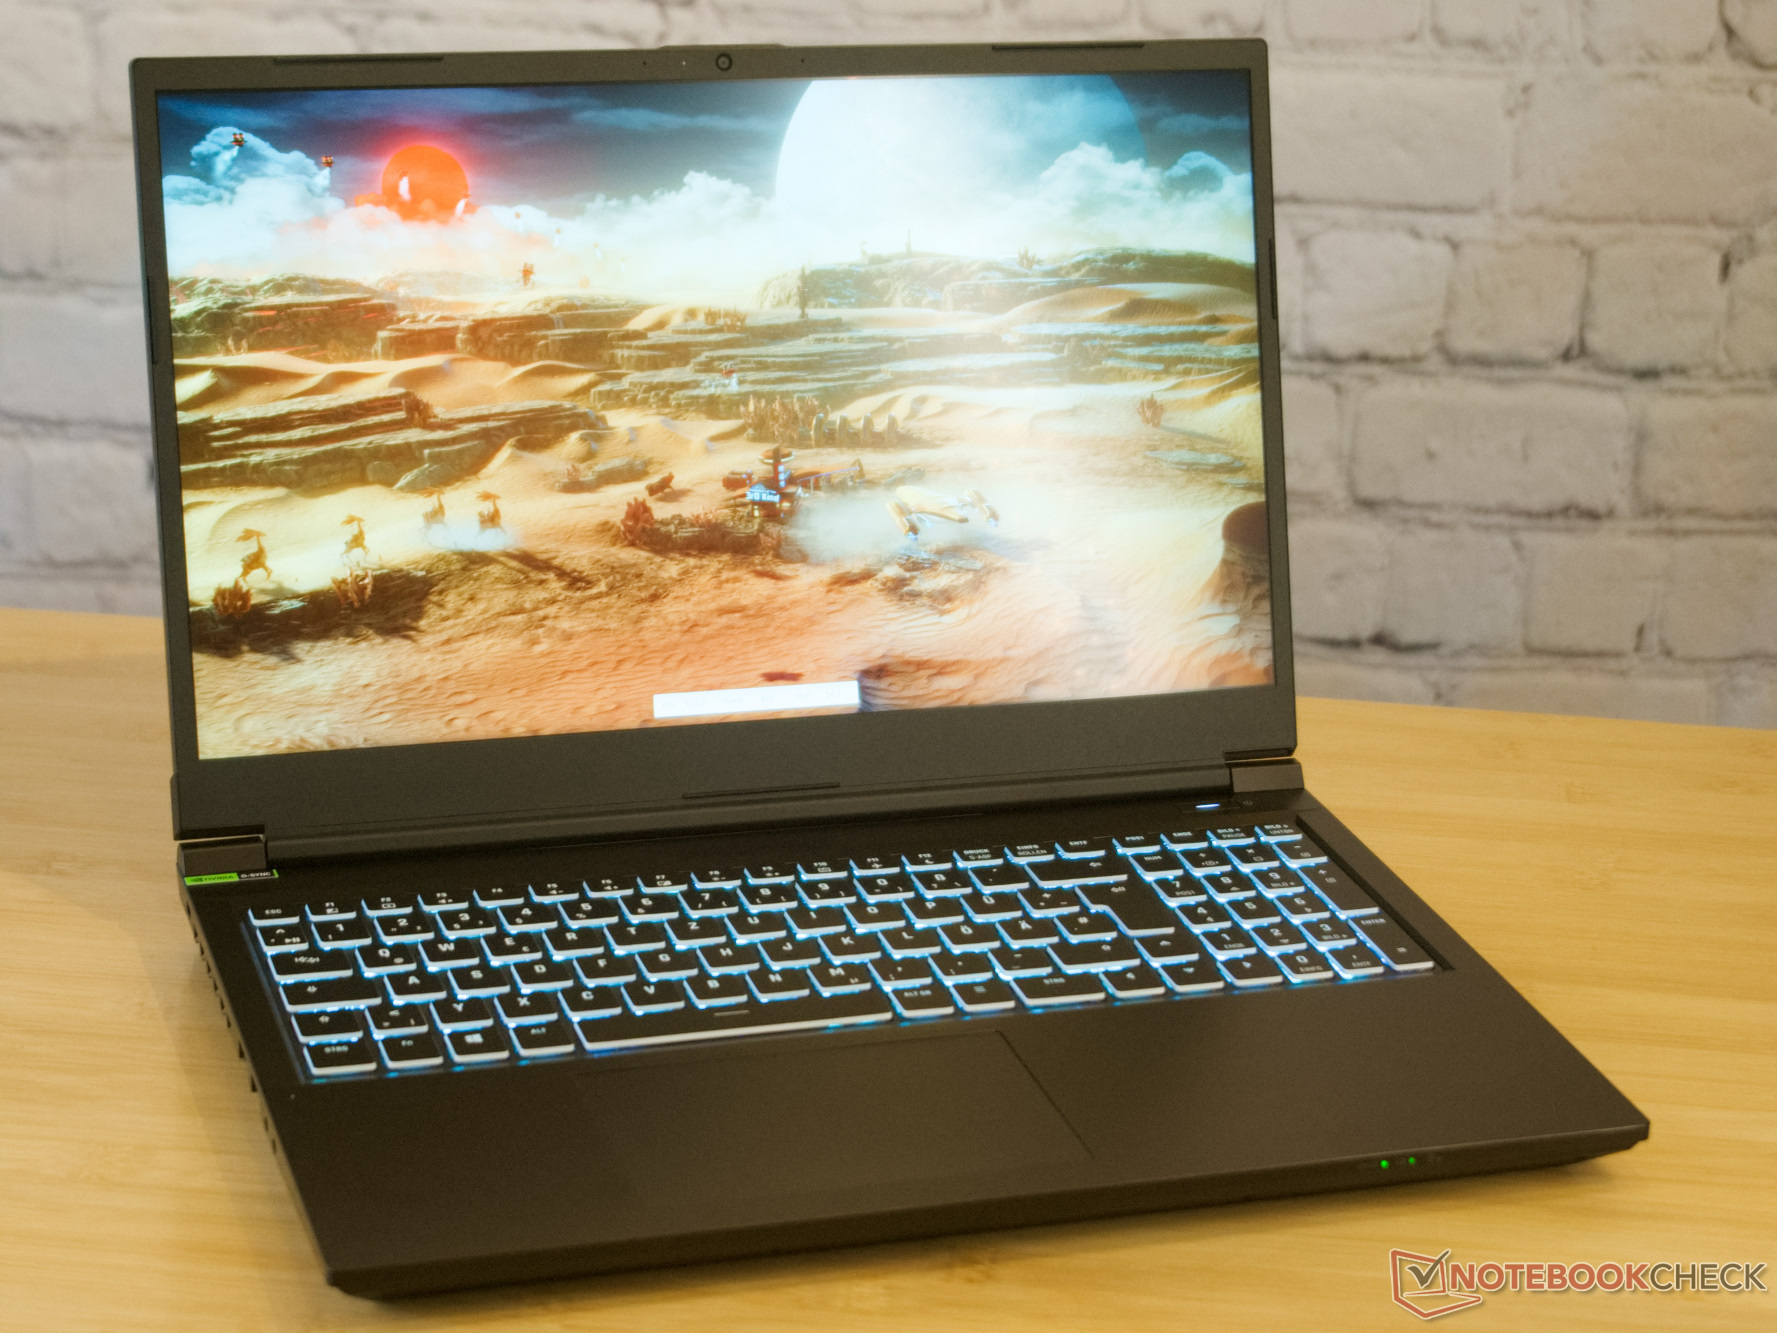
对于一款16:10格式的15.6英寸游戏笔记本电脑来说,重量和厚度都不算典型。不过,与其他多媒体笔记本电脑相比,硬件相似的笔记本电脑也可能会更轻薄一些。
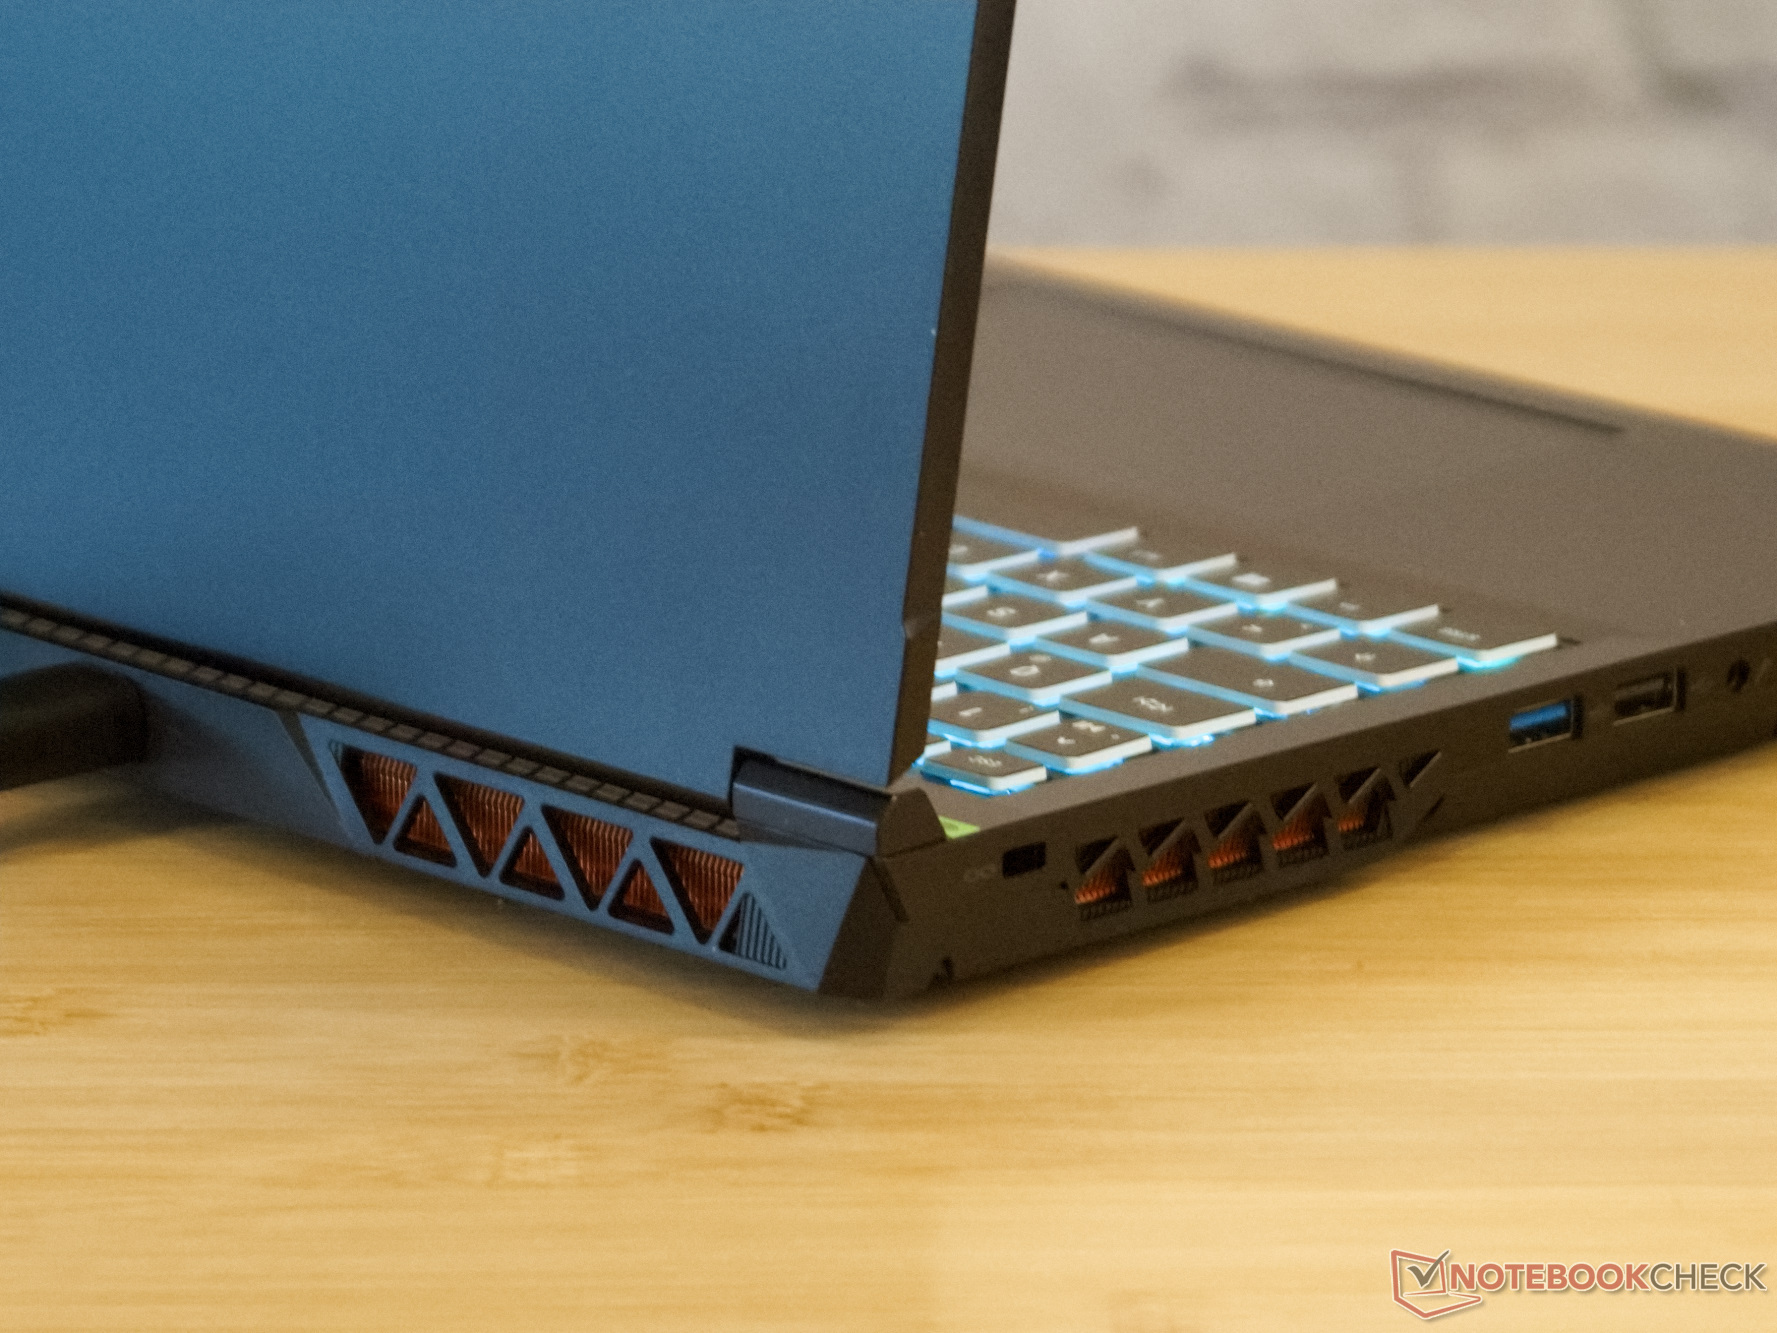
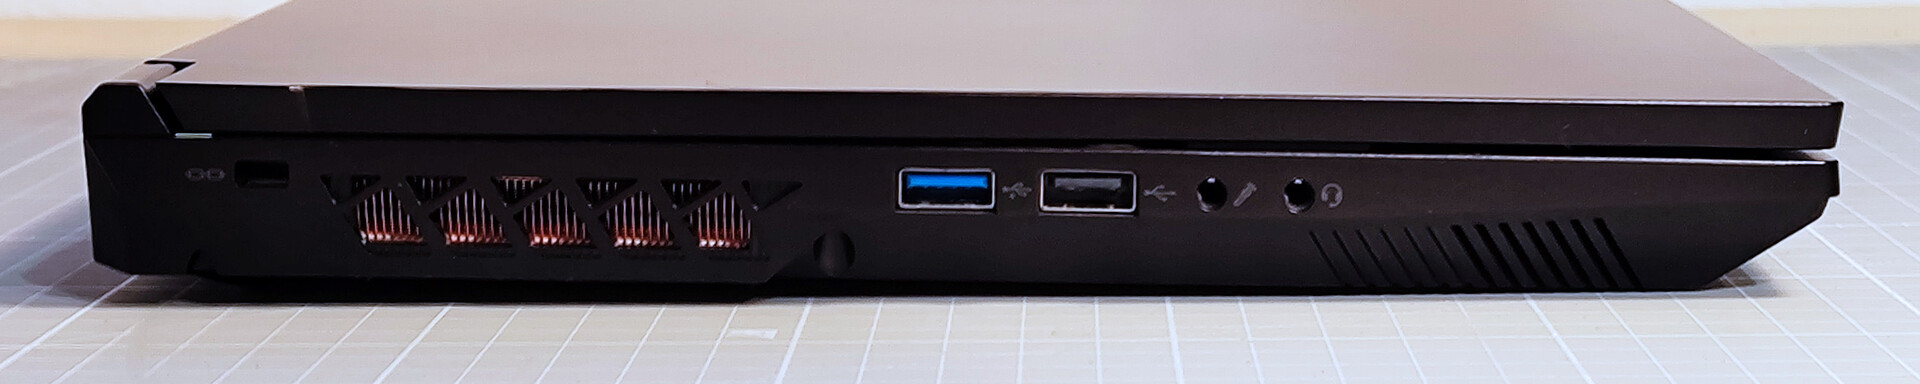
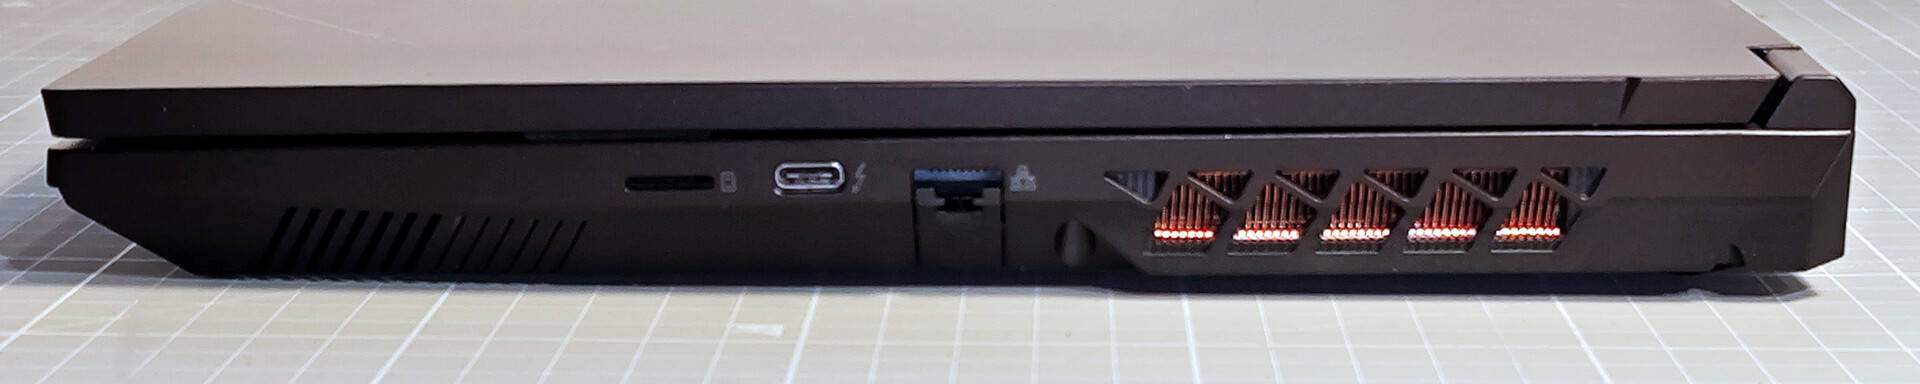
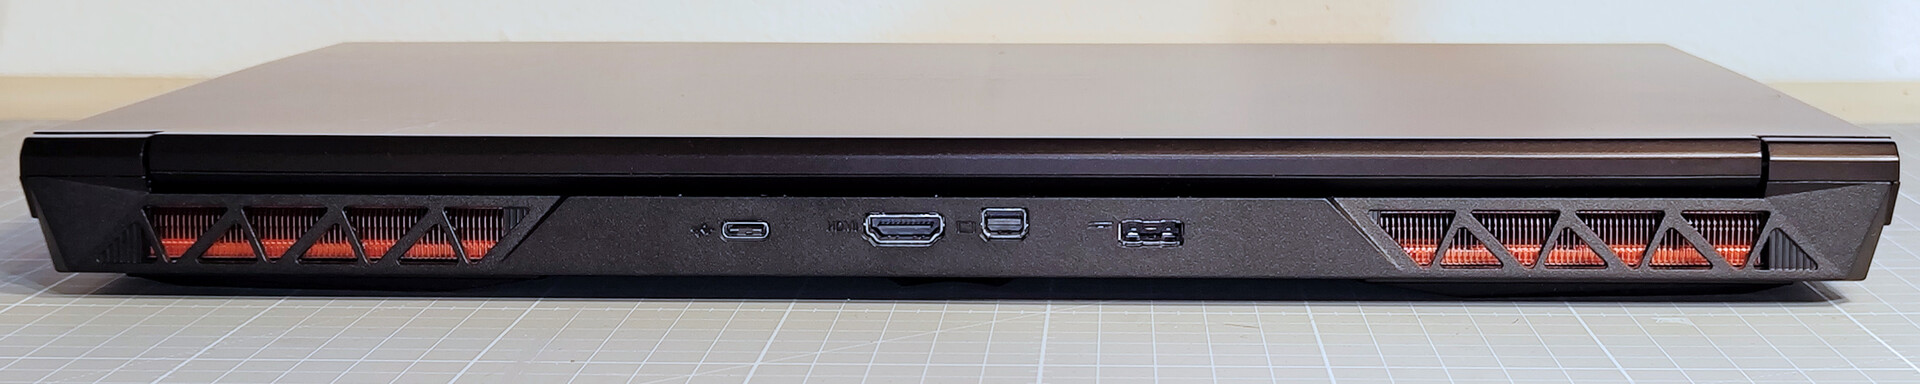
设备:三面USB接口
自上次评测以来,XMG Focus 15的连接方面几乎没有变化。唯一新增加的是另一个USB-C端口,但SD读卡器已减少为microSD格式。
两个USB Type-C接口都不提供电源。因此,您可能需要随身携带近1公斤重的电源适配器。
SD卡读卡器
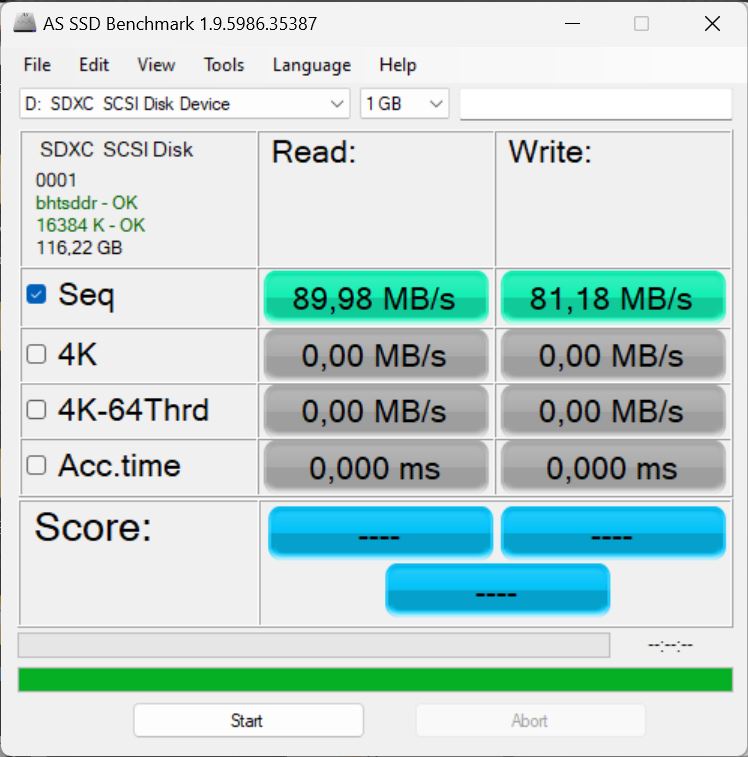
在我们的测试设备上使用AV PRO microSD 128 GB V60或Pro 15 GB V60,SD卡传输速率良好。 Pro 15尽管并不出众。
我们比较的另外两款游戏笔记本电脑没有读卡器。
| SD Card Reader - maximum AS SSD Seq Read Test (1GB) | |
| Gigabyte Aero 14 OLED BMF | |
| Average of class Gaming (25.5 - 261, n=51, last 2 years) | |
| Schenker XMG Focus 15 (E23) | |
| Acer Swift X SFX14-71G (Angelbird AV Pro V60) | |
| Samsung Galaxy Book3 Ultra 16 (AV PRO microSD 128 GB V60) | |
通讯
Focus 15中的英特尔AX211 Wi-Fi模块在Wi-Fi 6E网络中与我们参考的华硕ROG Rapture AXE-GT11000路由器一起提供了很高的传输速度。
另一方面,在相同的测试设置下,5 GHz Wi-Fi 6网络的传输速度似乎低于平均水平。
网络摄像头
新款Focus 15的全高清网络摄像头仅能完美聚焦于图像中心。因此,中心部分清晰且对比度高,而边缘部分则显得有些暗淡。
摄像头的高色彩偏差令人恼火,尤其是肤色还原不佳。

 GeForce RTX 4050 Laptop GPU, i9-13900HX, Crucial P5 Plus 1TB CT1000P5PSSD8")
 GeForce RTX 4050 Laptop GPU, i9-13900HX, Crucial P5 Plus 1TB CT1000P5PSSD8")
安全性
Focus 15没有生物识别认证选项。Kensington安全插槽可提供物理防盗保护。
TPM 2.0和SecureBoot可防止未经授权的数据访问。
配件
在包装盒中,除了电源和文档外,我们还发现了一个内容丰富的配件包。您会得到一个印有XMG标志的大鼠标垫和一个配套的开瓶器,以及一张安装光盘和一个U盘,U盘中包含Windows系统的配套程序和驱动程序。
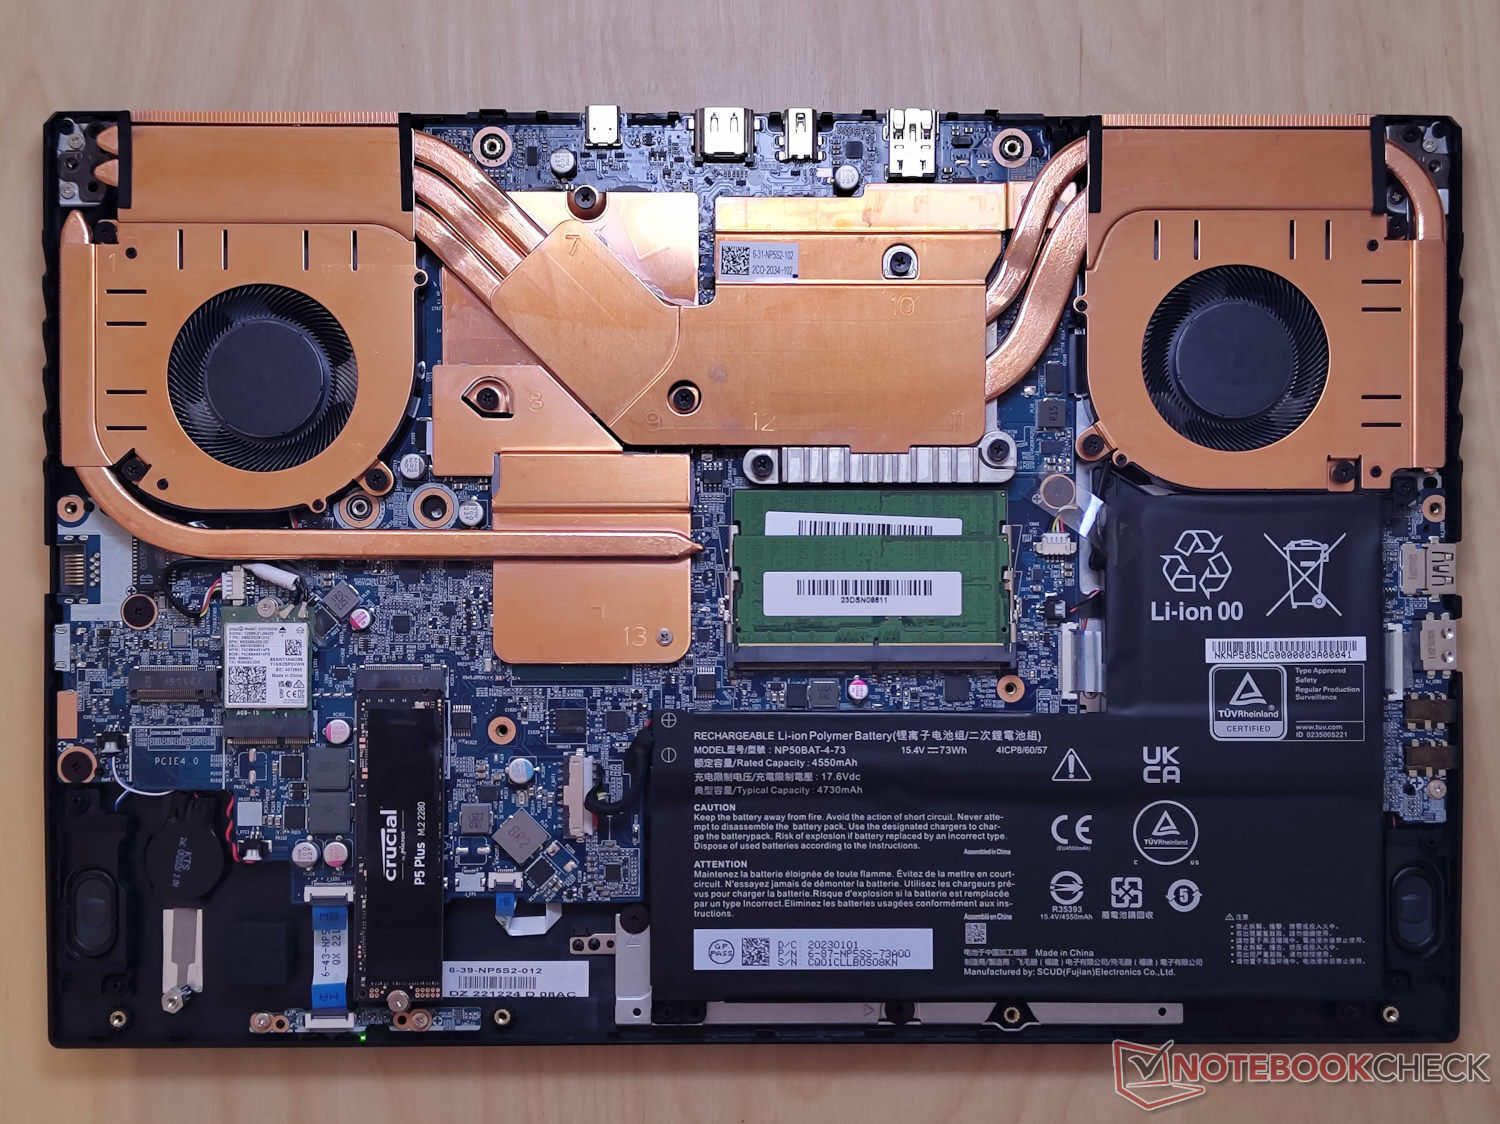
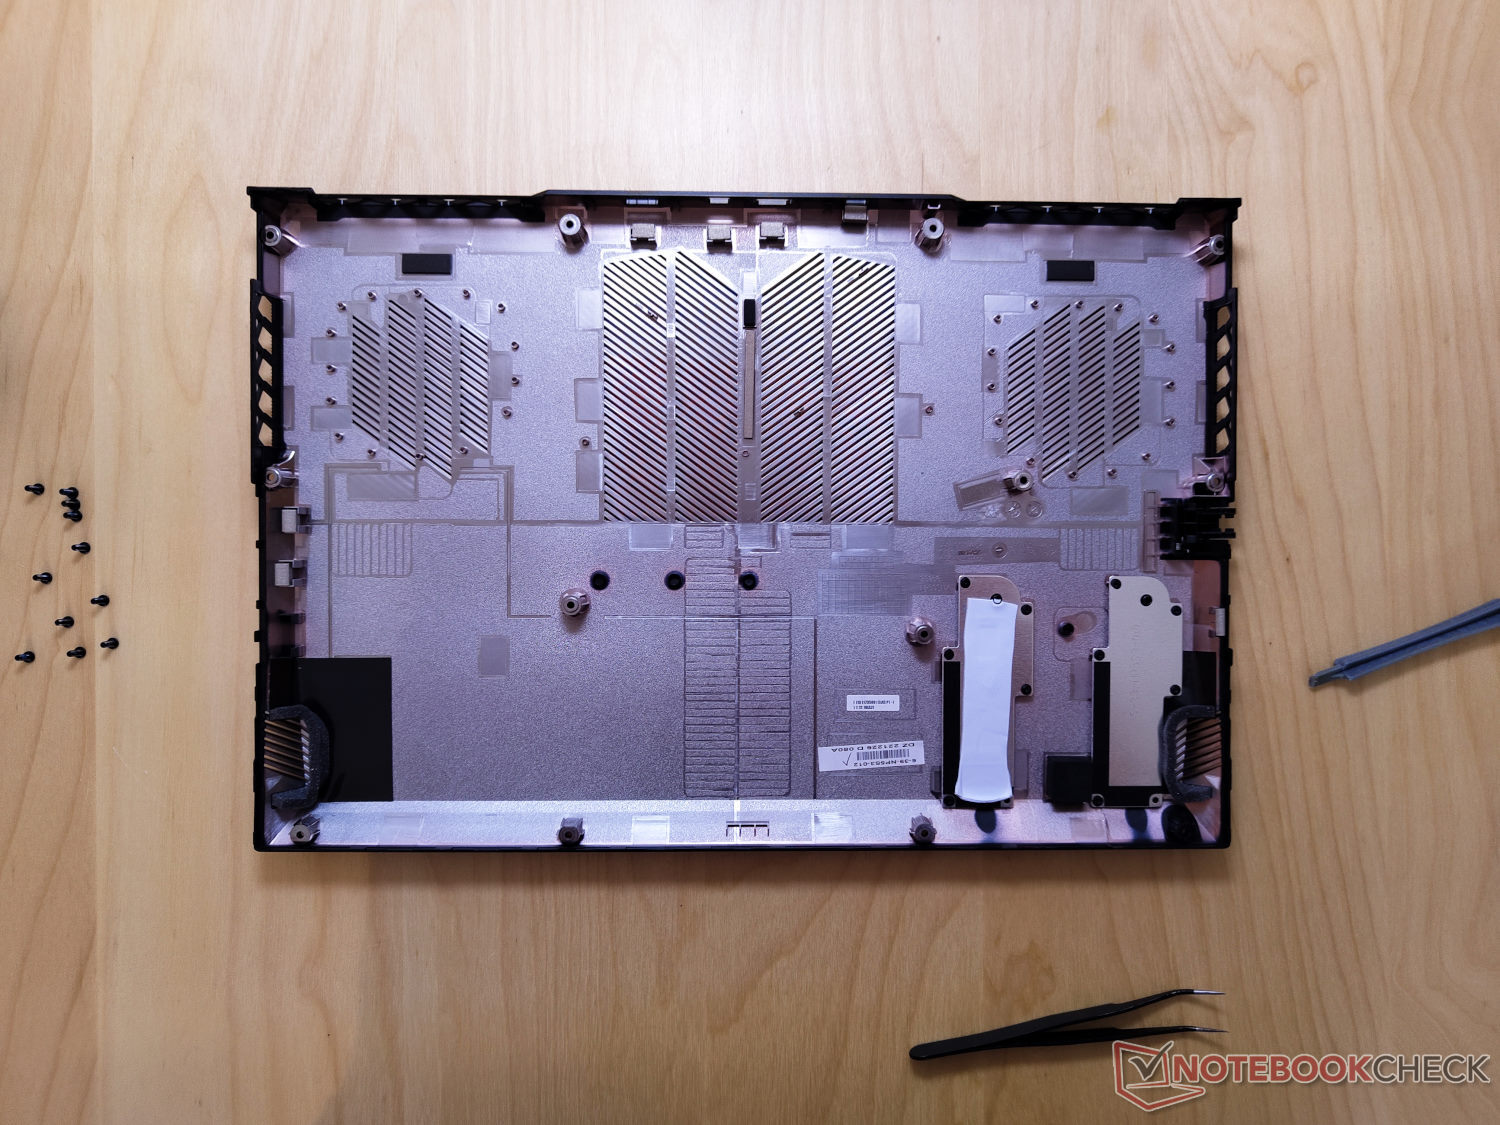
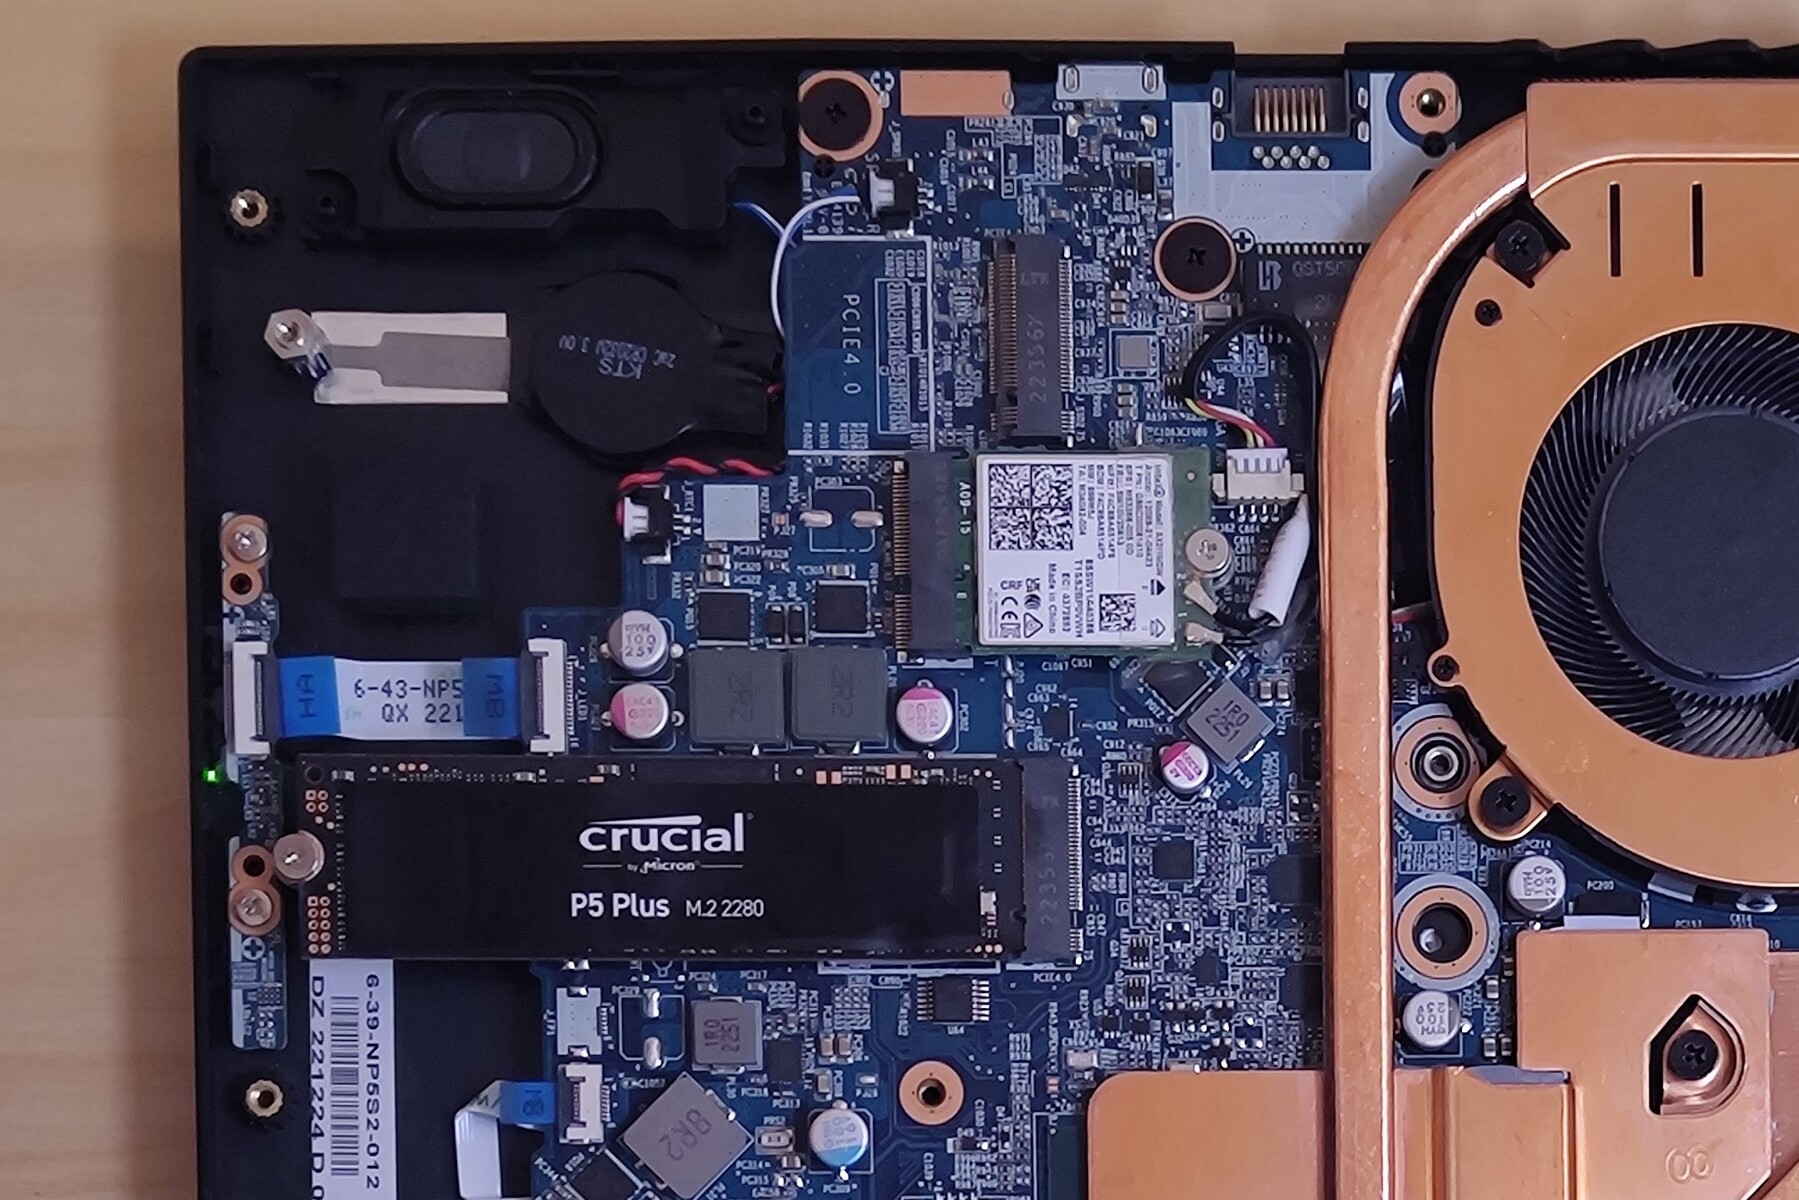
维护
XMG Focus 15的固态硬盘、工作内存和WLAN模块均可更换。在我们的测试设备中,有一个空闲的M.2 PCIe 4.0插槽。
笔记本电脑的整个底板由11颗PH0螺钉固定,可以很容易地拆卸下来,以接触相应的组件。拧松螺丝后,盖子可以顺利掀开。
质保
申克公司为笔记本电脑提供24个月的免费基本保修服务。您还可以在结账时通过Bestware添加更多保修选项。
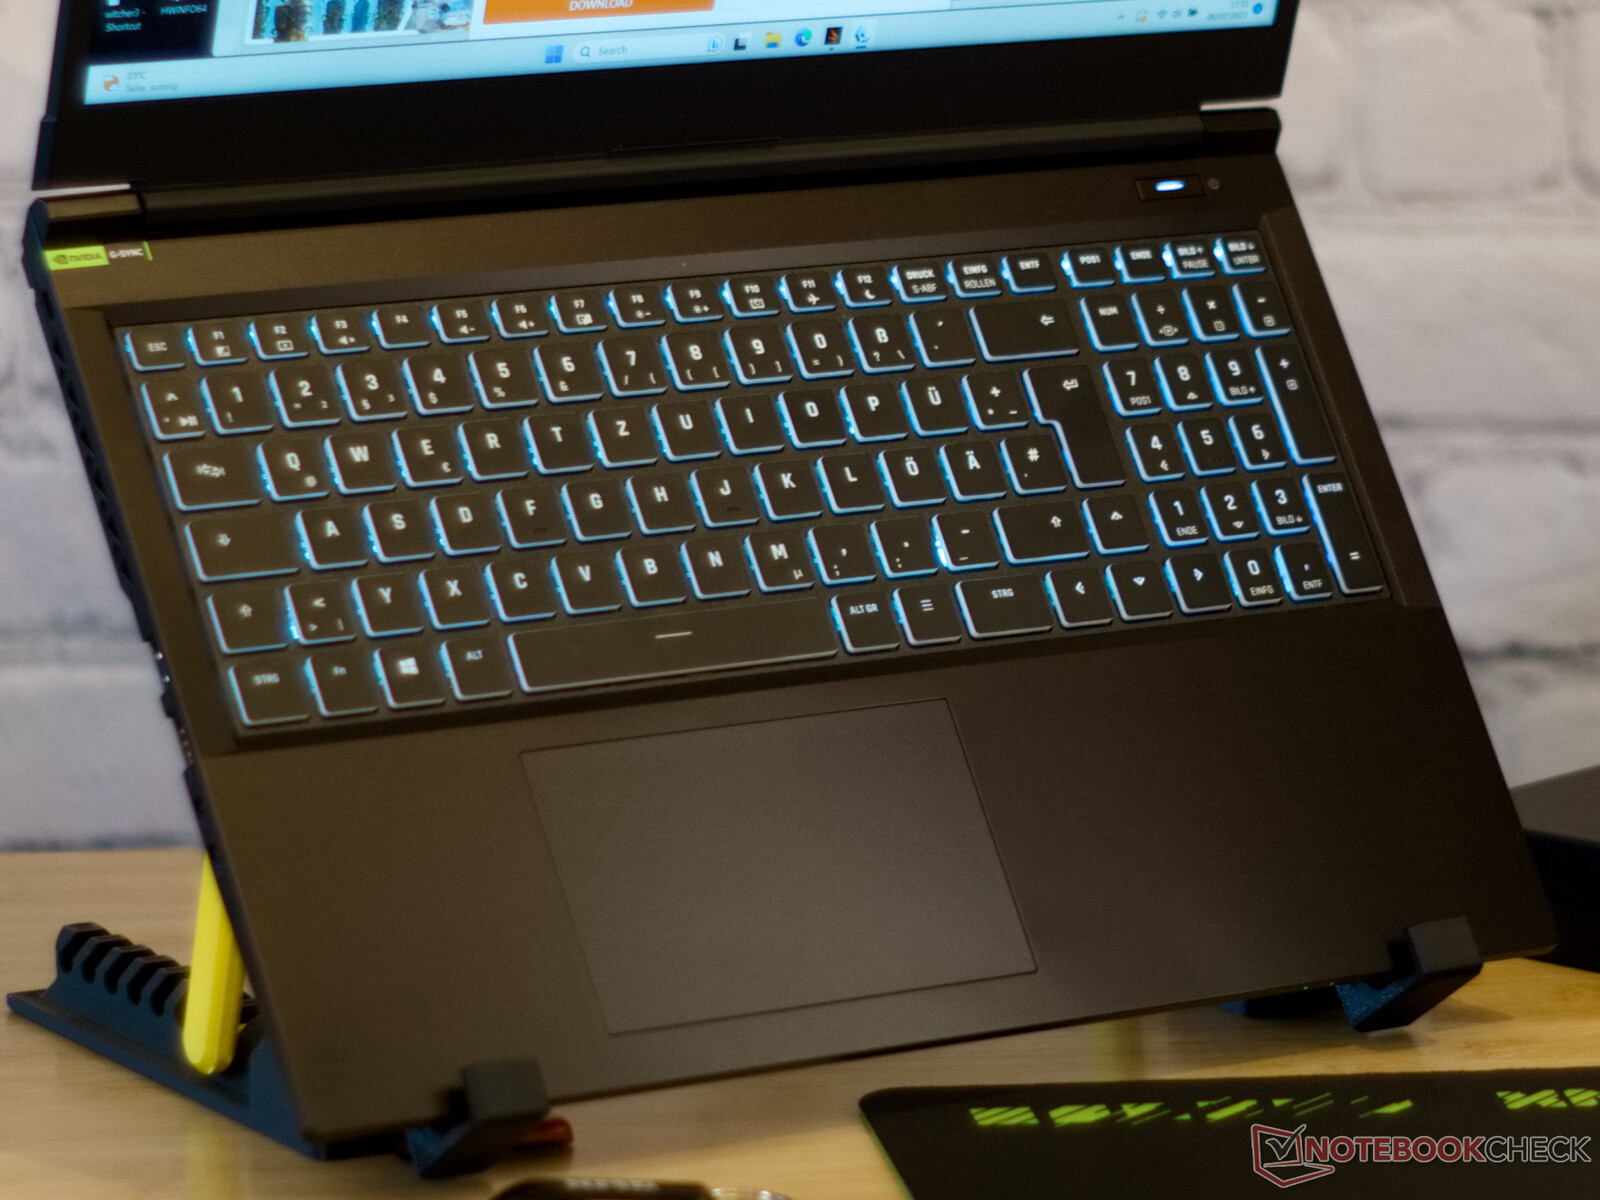
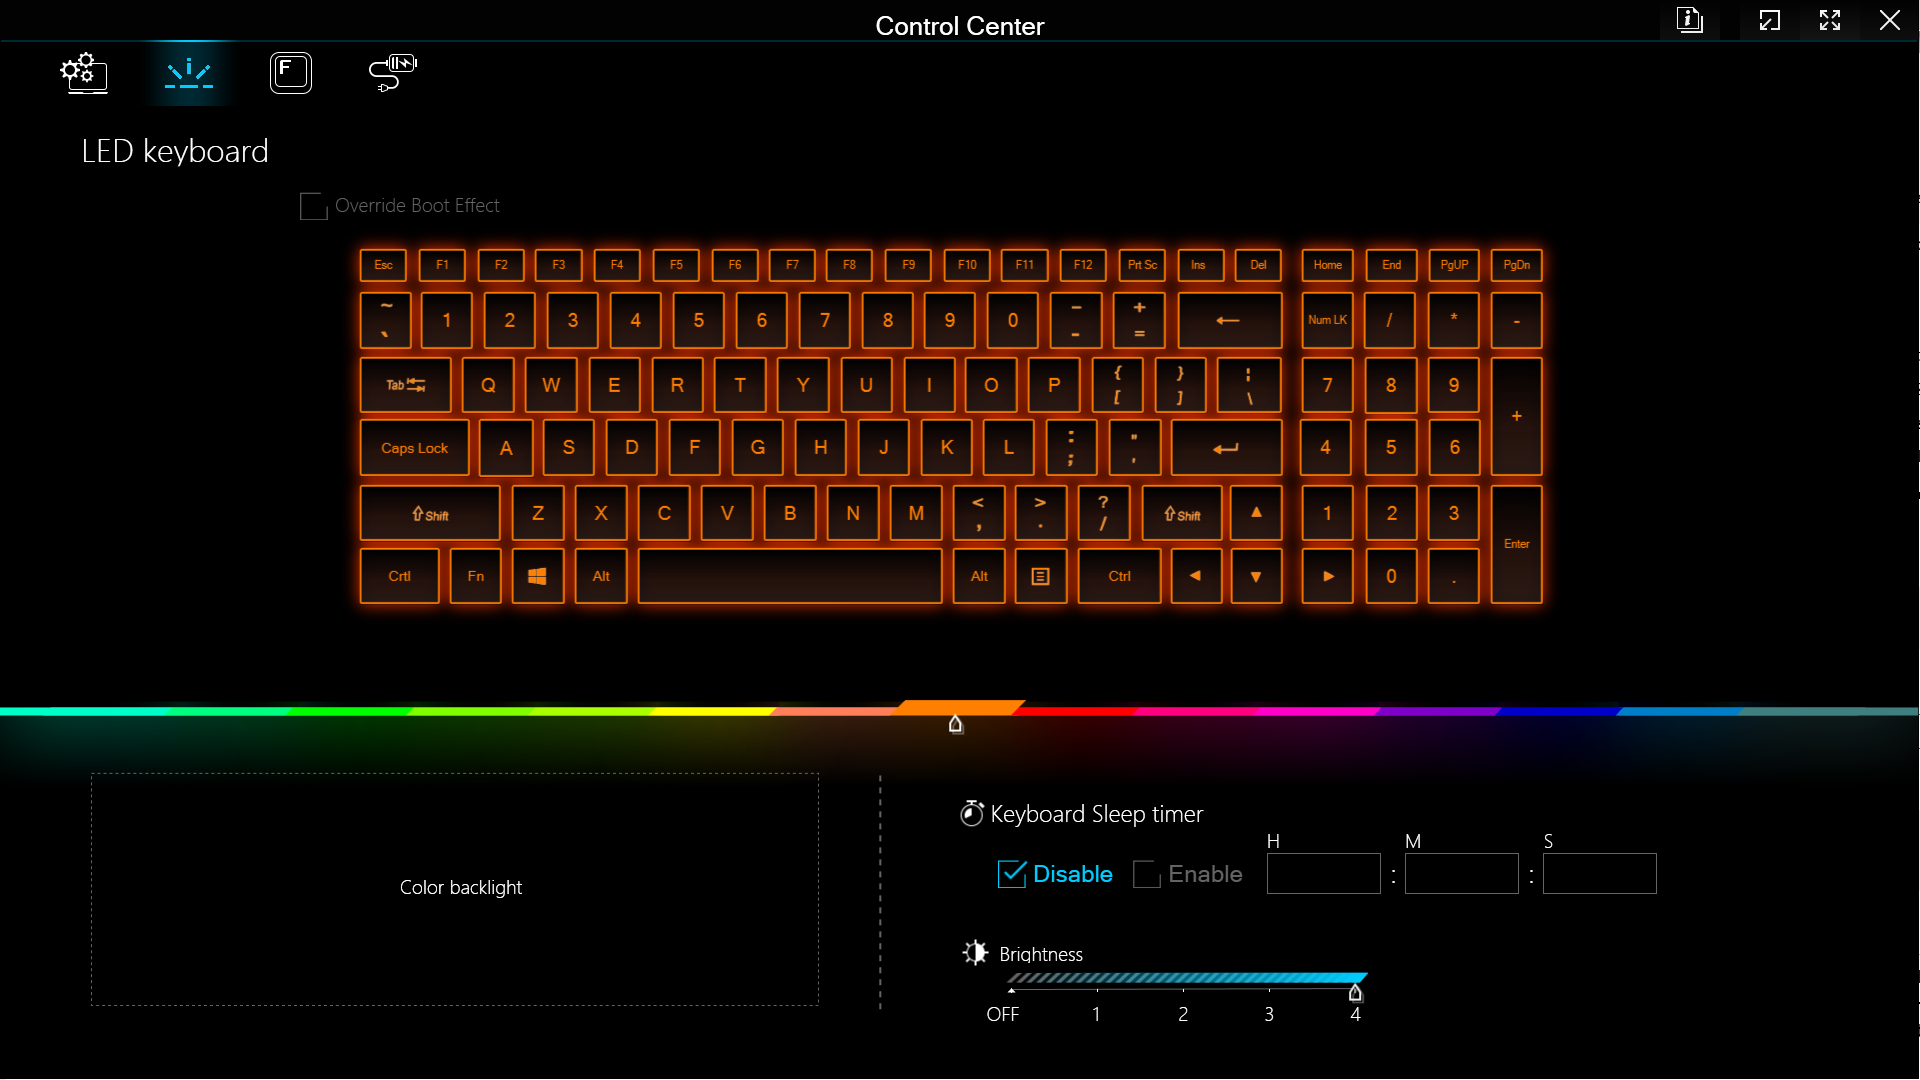
Input devices: RGB keyboard
键盘
在笔记本电脑的黑色键盘面板上输入白字按键,强烈的触觉反馈和1.5毫米的键程带来了良好的打字体验。申克公司可根据要求在黑色键盘表面激光蚀刻出所有可以想象到的语言布局。RGB灯光让键盘呈现出所需的颜色。
触摸板
Focus 15的触摸板尺寸约为7厘米×12厘米,小于大多数游戏笔记本电脑。不过,它足够大,可以舒适地用多个手指在整个屏幕上导航,并执行所有可能的多点触控手势。
触摸板的位置和大小还提供了足够的空间,避免手跟部的错误输入。光滑的表面和舒适的点击使鼠标输入更加流畅。
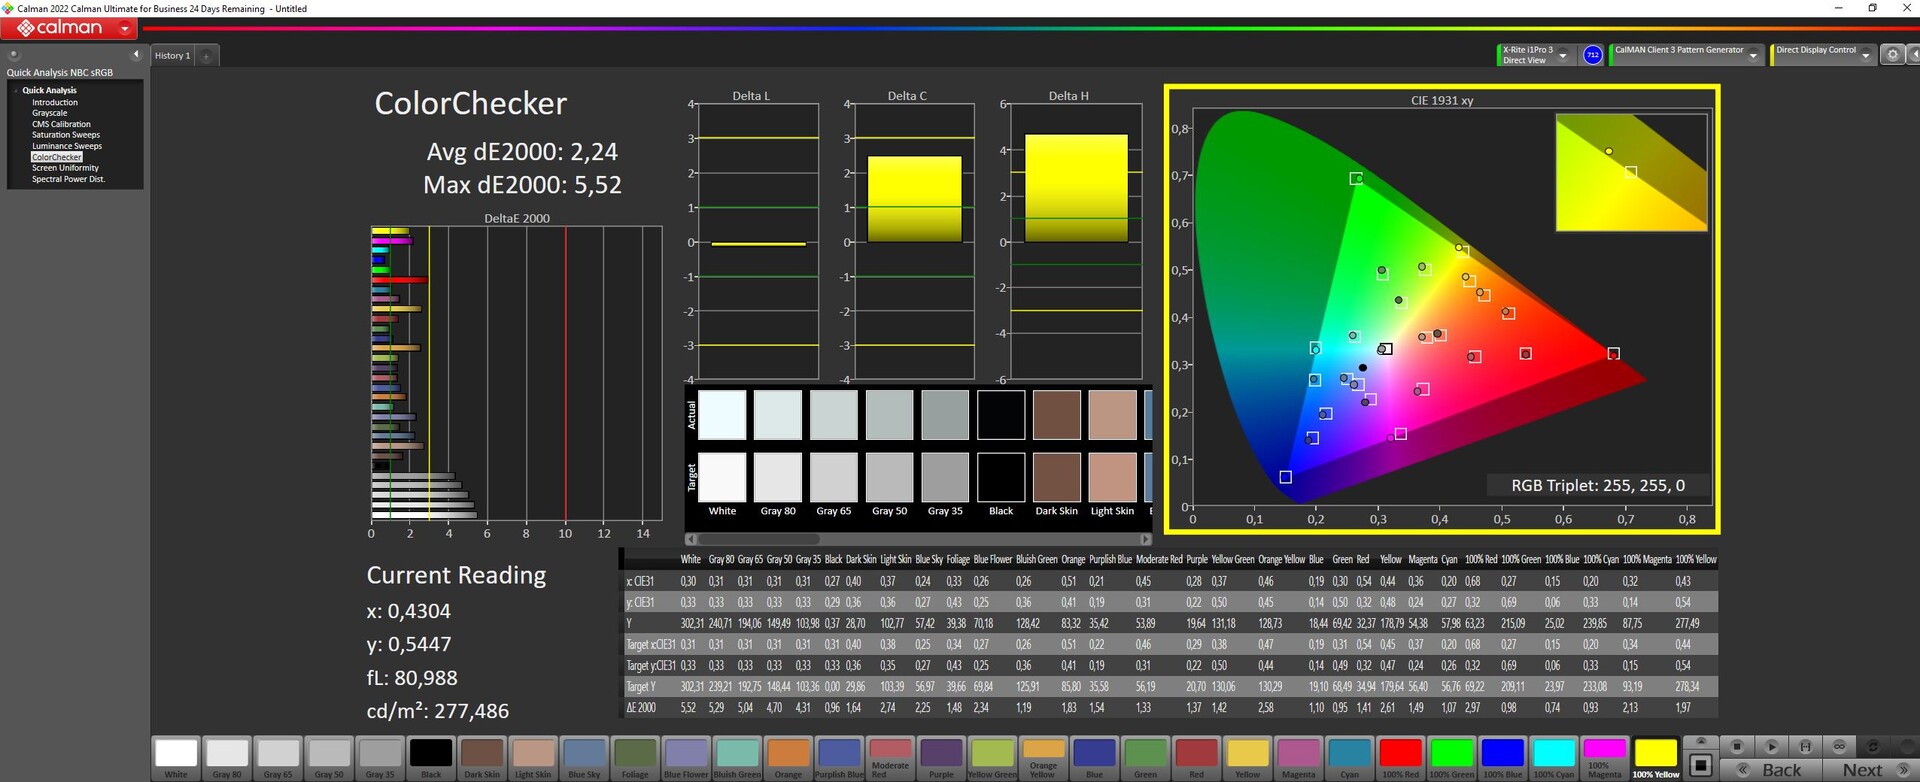
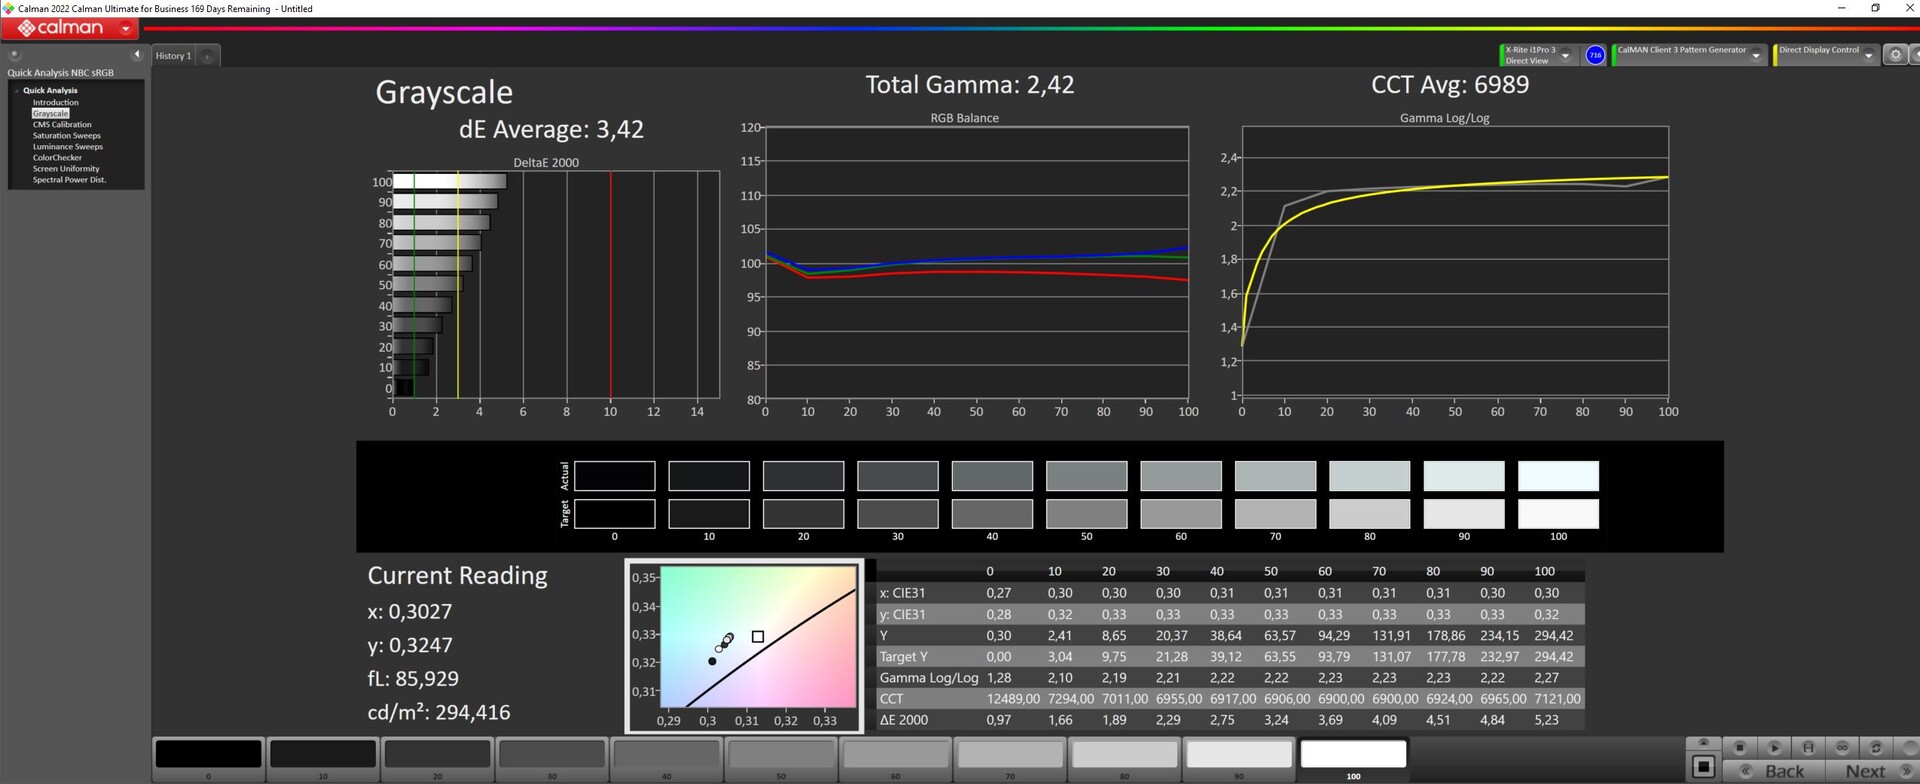
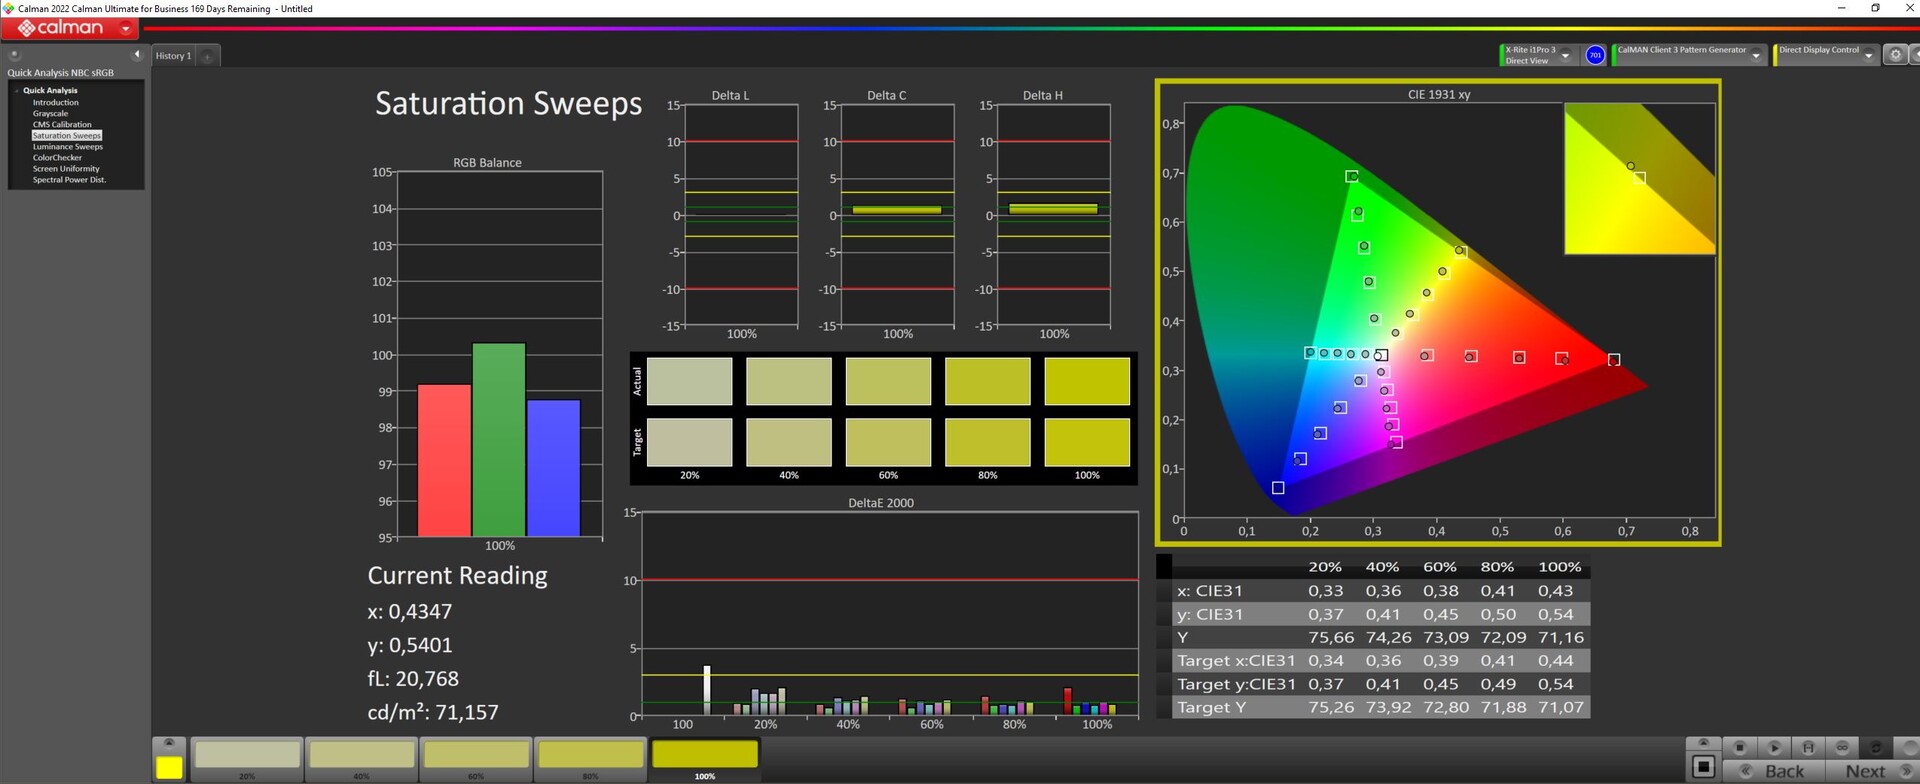
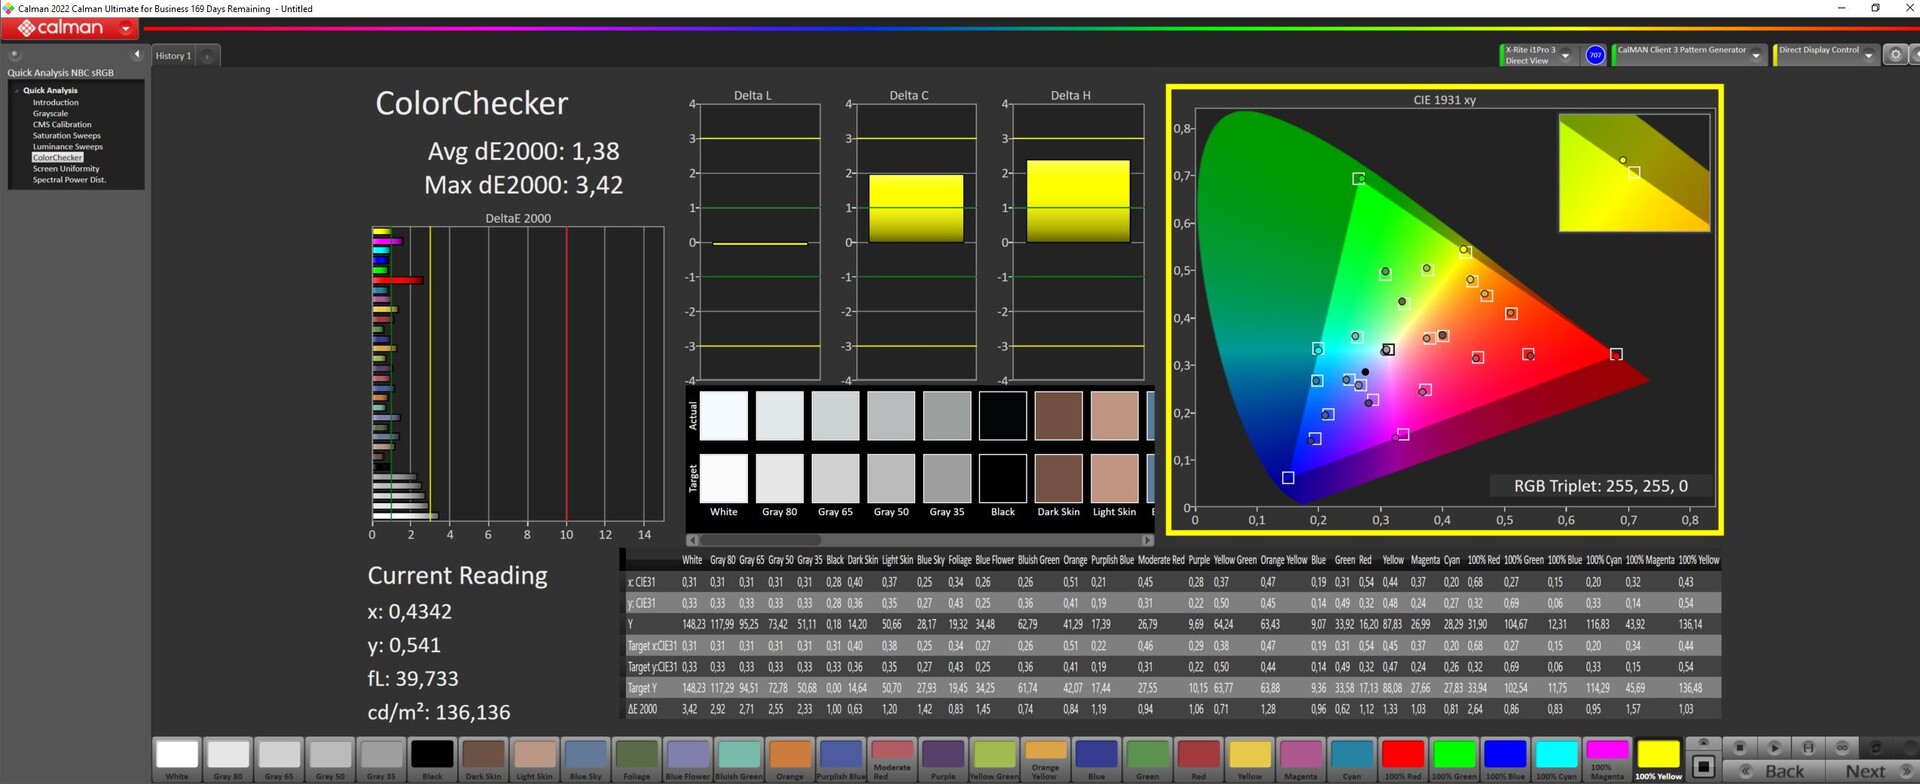
显示屏QHD,240赫兹
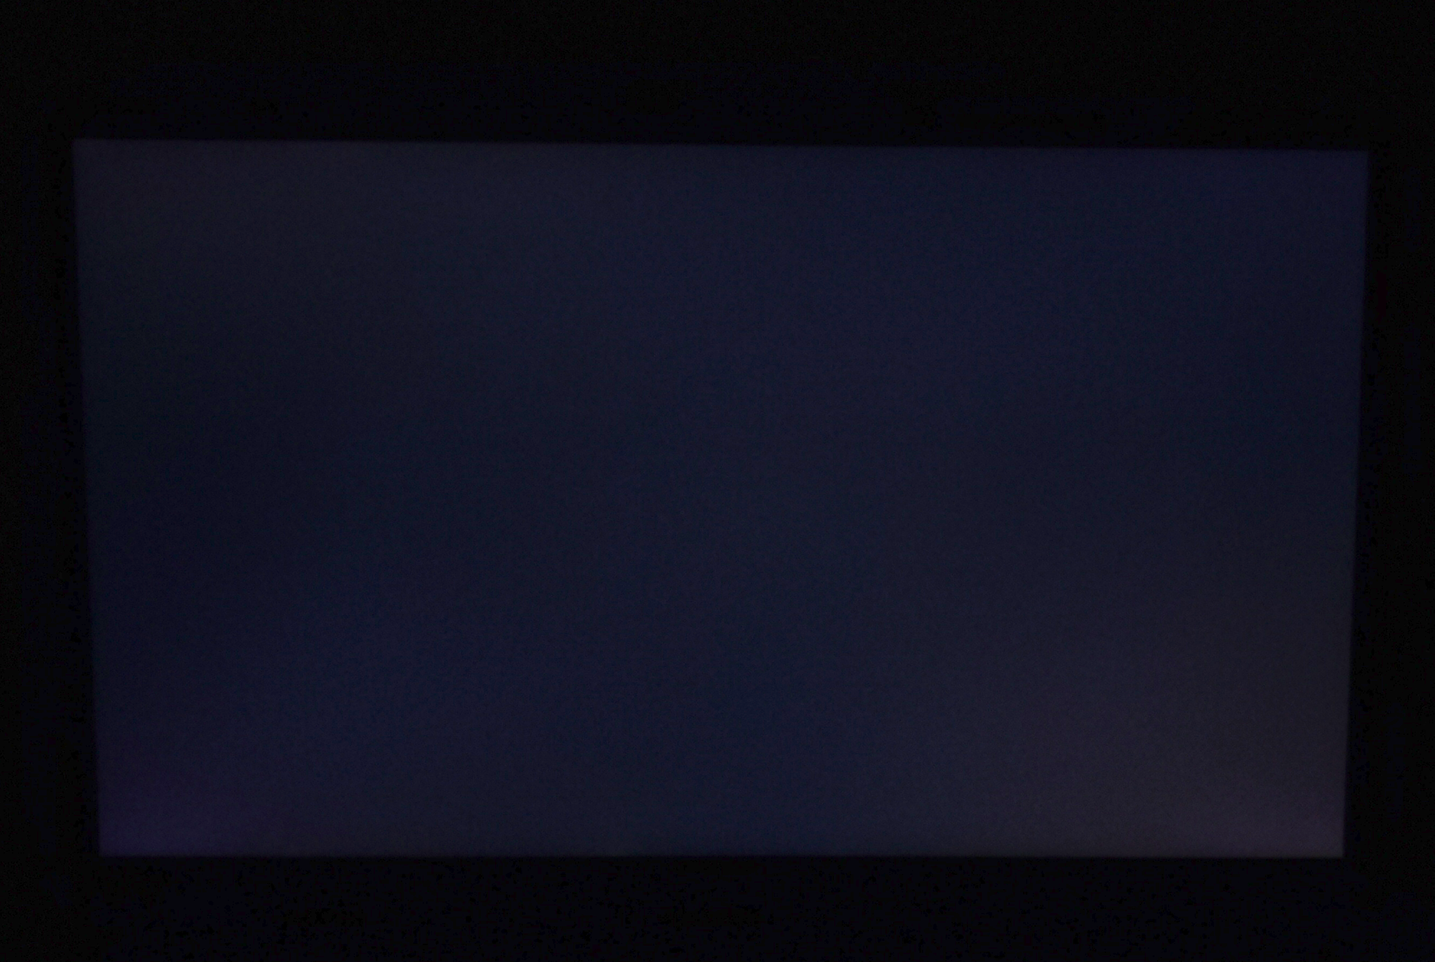
Focus 15采用了与XMG Pro 15相同的高品质IPS面板。不过,在我们的评测样本中,它的平均亮度为302 cd/m²,比Pro 15略暗。屏幕刷新率为240赫兹,分辨率为2560×1440。
哑光显示屏的黑色值和对比度均可接受,亮度也不错。屏幕上几乎看不到背光出血现象。
除了QHD显示屏,申克还为XMG Focus 15提供了全高清显示屏。不过,两种显示屏都支持G-Sync。
那些将笔记本电脑作为纯游戏设备购买并希望将其与 RTX 4050的用户应考虑选择全高清显示屏,价格便宜约80欧元。无论如何,大多数游戏只支持sRGB色彩空间,与RTX 4050结合使用可充分利用显示器的功能。
入门级Nvidia显卡只能在有限的范围内实现QHD或4K游戏。
| |||||||||||||||||||||||||
Brightness Distribution: 85 %
Center on Battery: 302 cd/m²
Contrast: 839:1 (Black: 0.36 cd/m²)
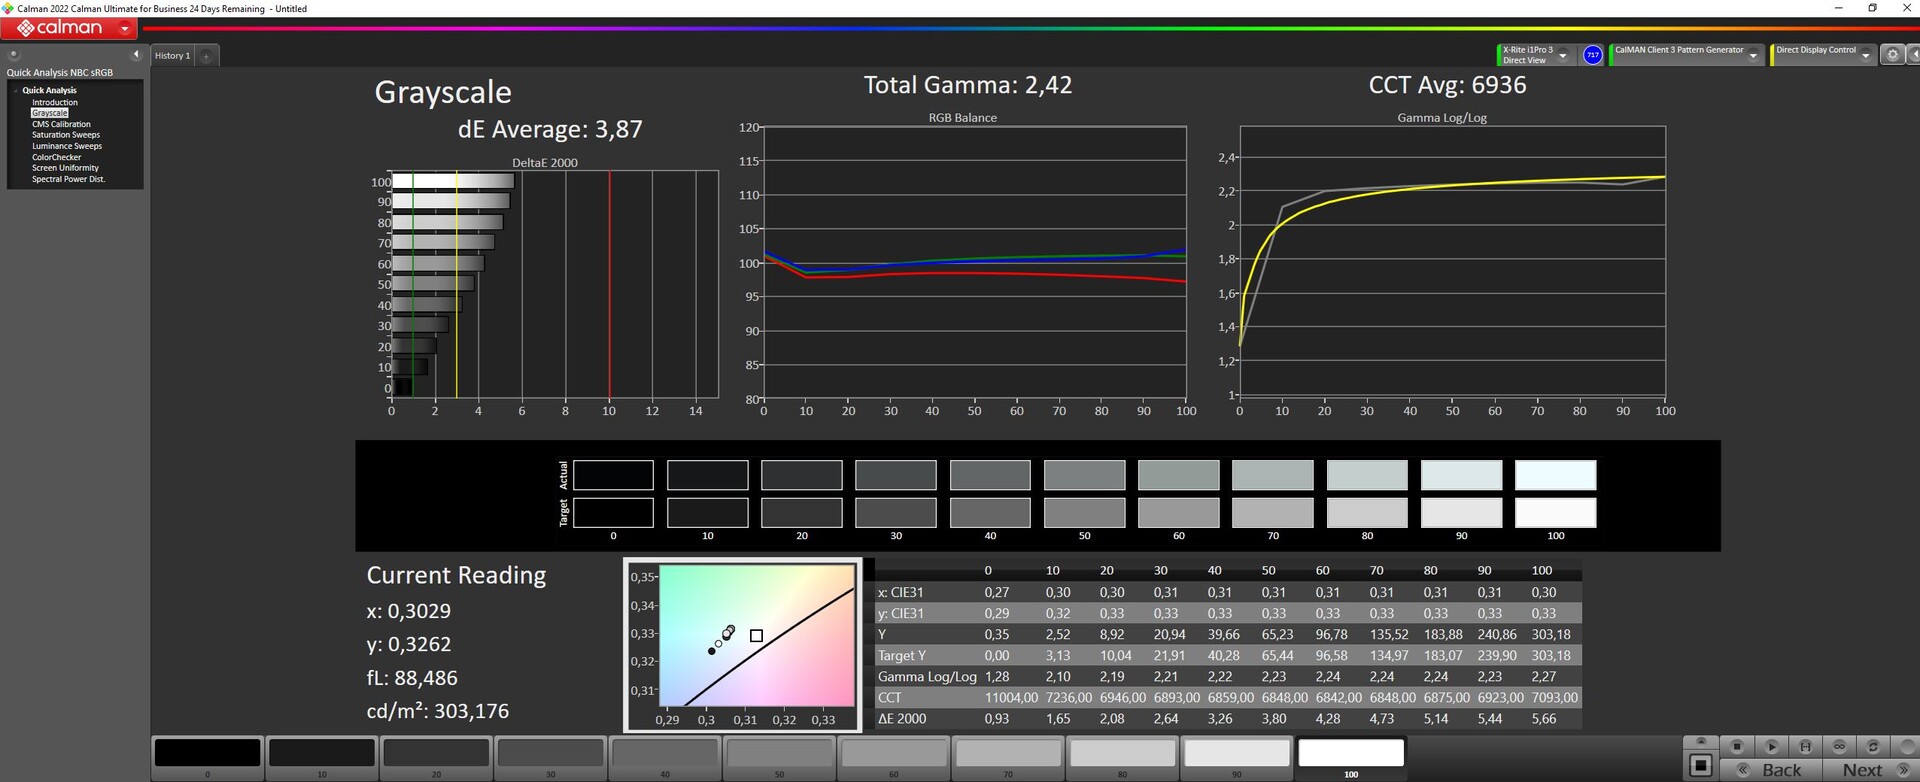
ΔE ColorChecker Calman: 2.24 | ∀{0.5-29.43 Ø4.71}
ΔE Greyscale Calman: 3.87 | ∀{0.09-98 Ø4.96}
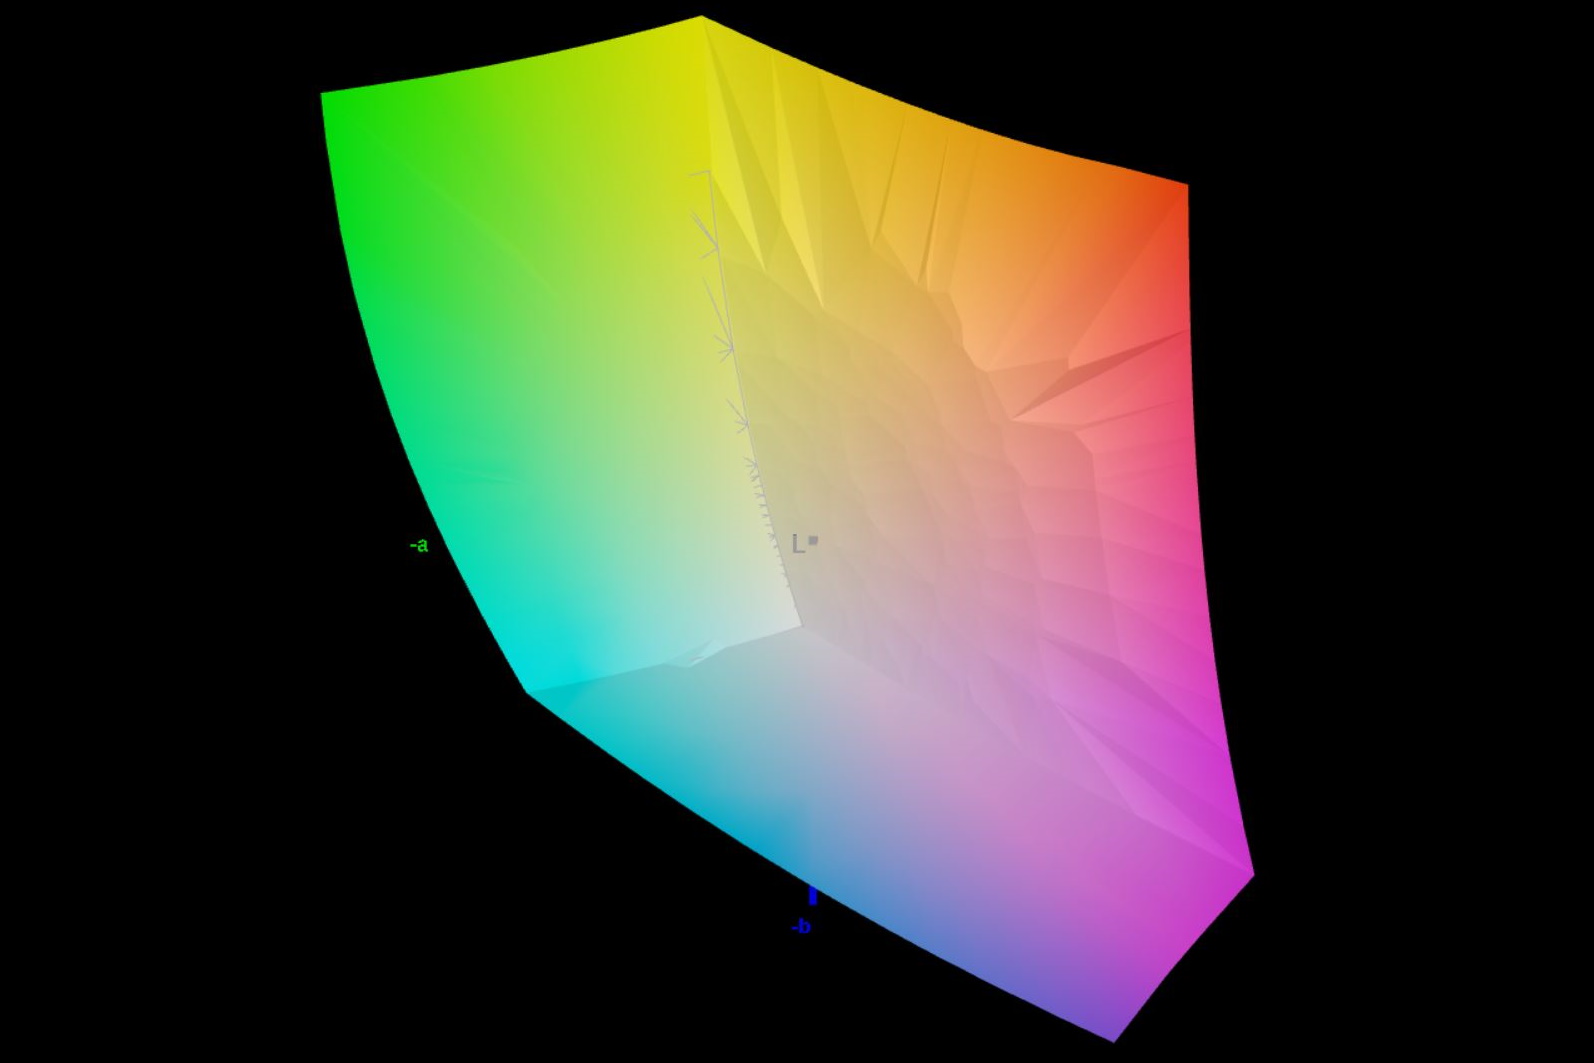
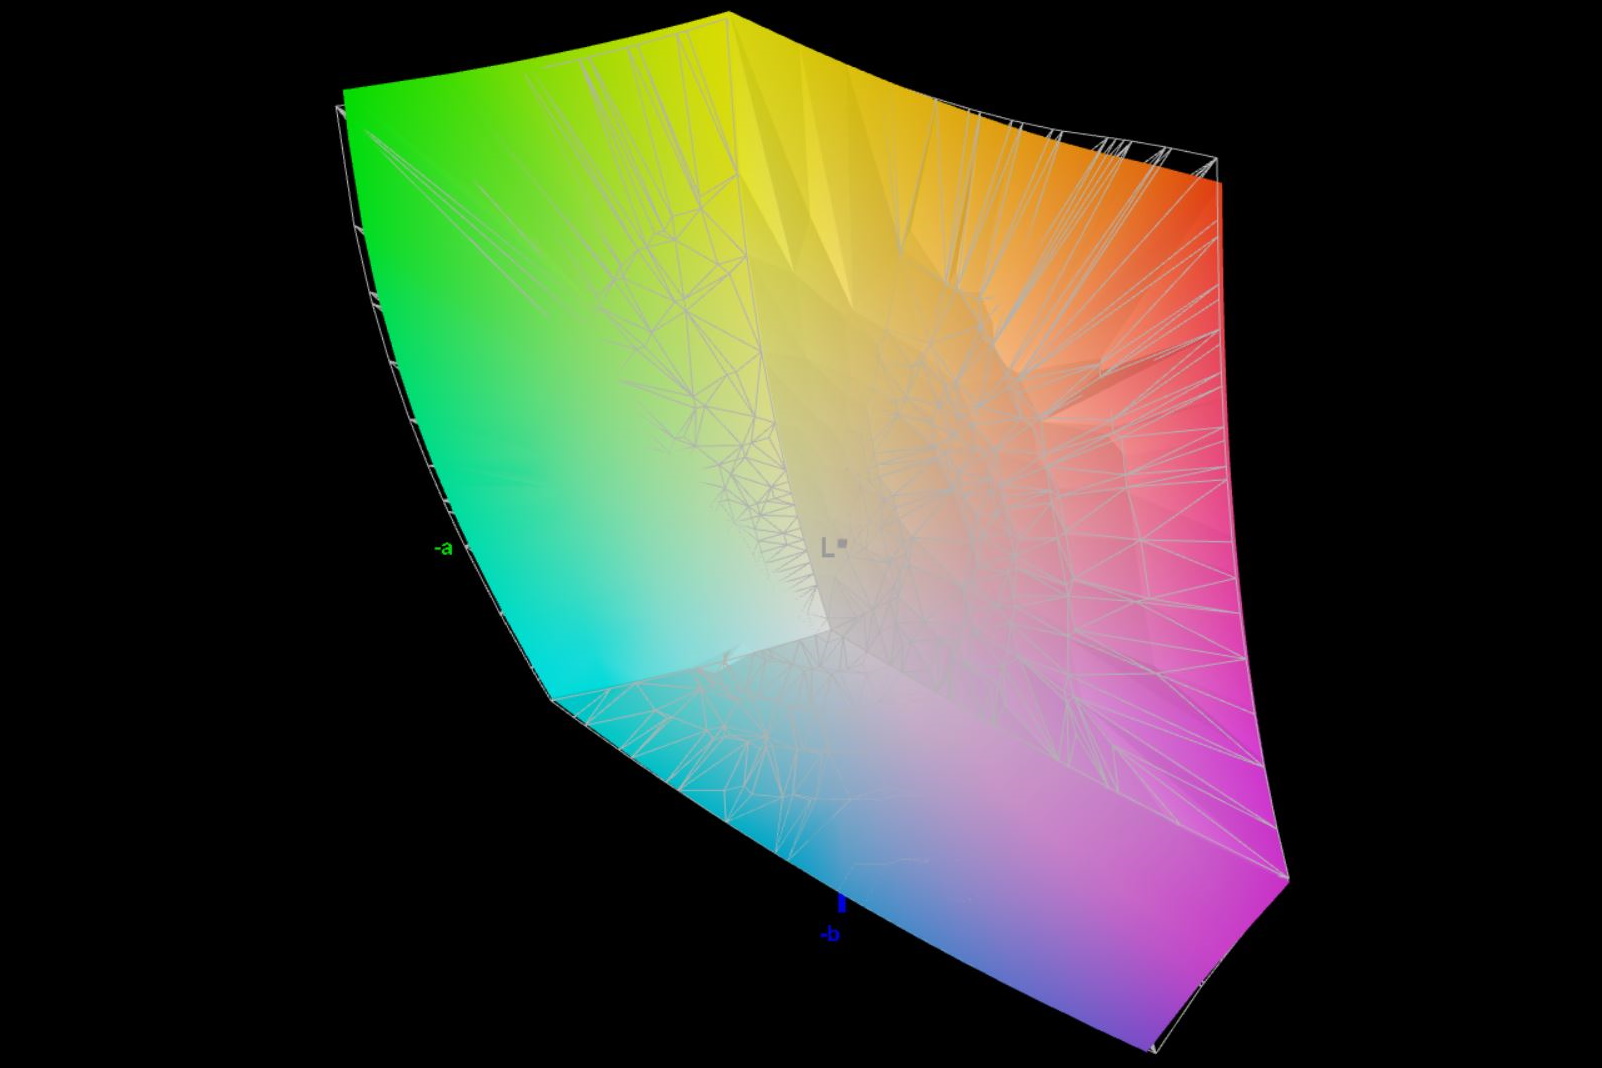
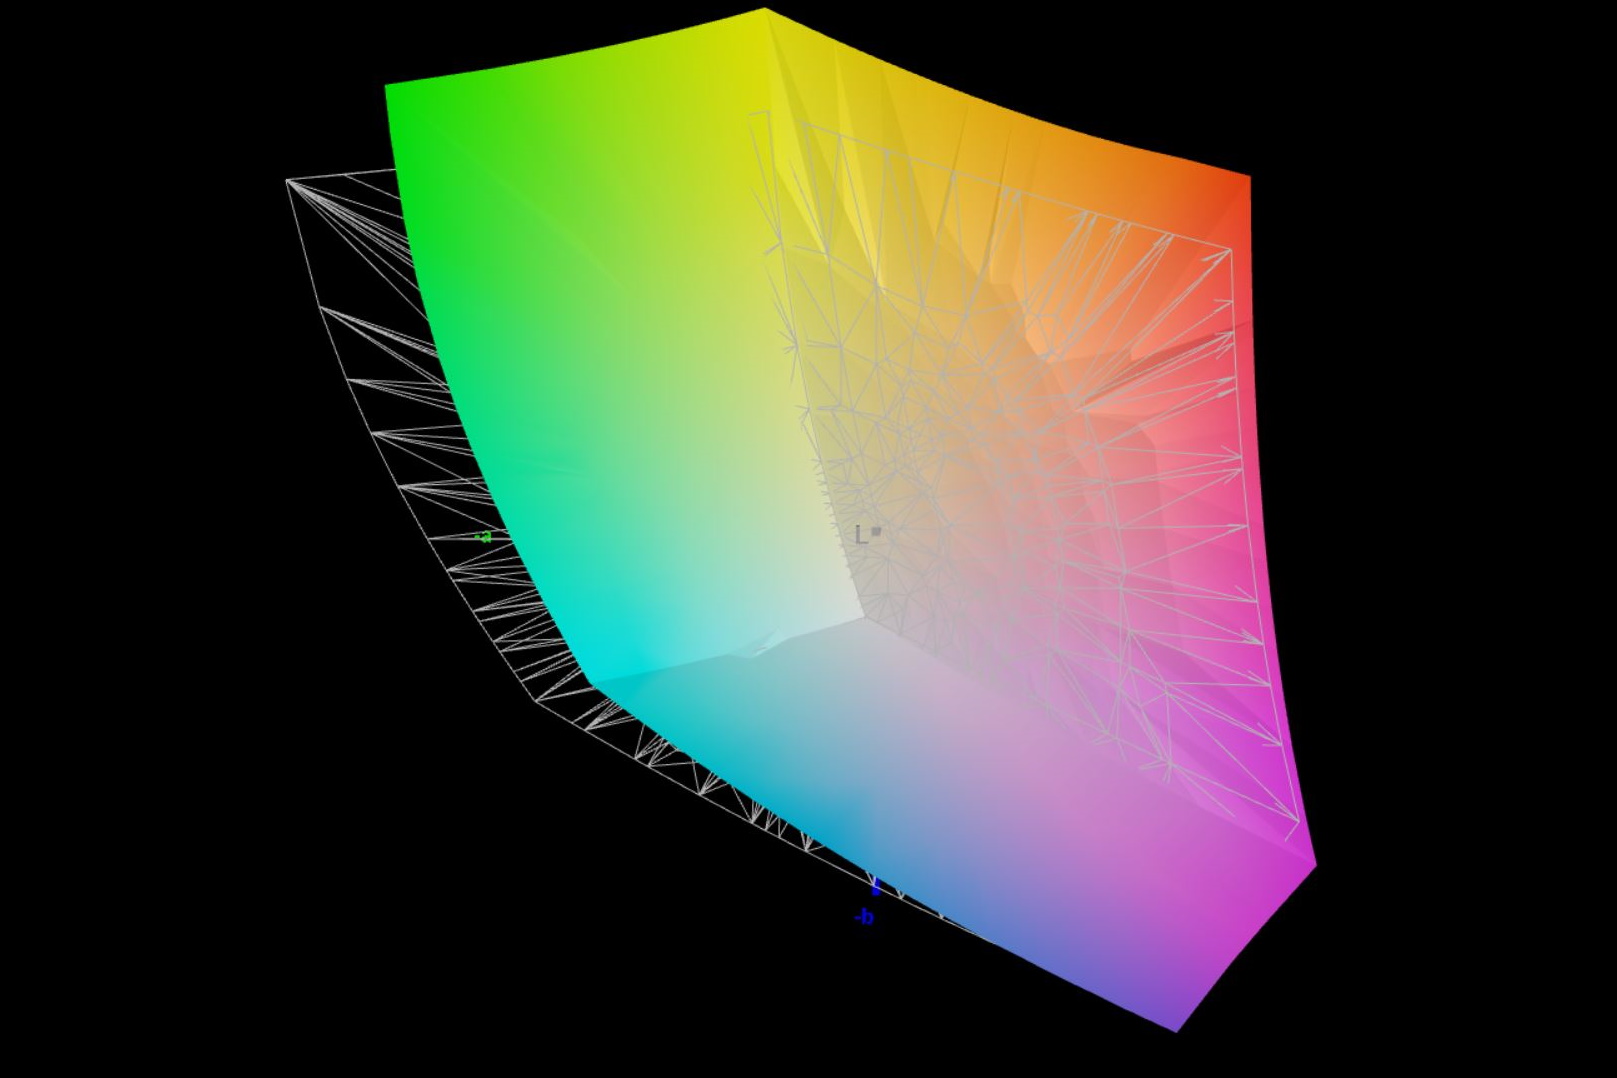
86.3% AdobeRGB 1998 (Argyll 3D)
99.9% sRGB (Argyll 3D)
98.6% Display P3 (Argyll 3D)
Gamma: 2.42
CCT: 6936 K
| Schenker XMG Focus 15 (E23) BOE0AD1, IPS, 2569x1440, 15.6" | Schenker XMG Pro 15 (E23) BOE0AD1, IPS, 2560x1440, 15.6" | Asus TUF A15 FA507 N156HMA-GA1, IPS, 1920x1080, 15.6" | MSI Katana 15 B12VEK AUOAF90 (B156HAN08.4), IPS, 1920x1080, 15.6" | Acer Swift X SFX14-71G ATNA45AF03-0, OLED, 2880x1800, 14.5" | Samsung Galaxy Book3 Ultra 16 Samsung ATNA60CL03-0, AMOLED, 2880x1800, 16" | Gigabyte Aero 14 OLED BMF Samsung SDC4192 (ATNA40YK14-0), OLED, 2880x1800, 14" | |
|---|---|---|---|---|---|---|---|
| Display | -1% | -20% | -53% | 4% | 4% | 1% | |
| Display P3 Coverage (%) | 98.6 | 97.8 -1% | 64.9 -34% | 38.1 -61% | 99.9 1% | 99.9 1% | 99.8 1% |
| sRGB Coverage (%) | 99.9 | 99.9 0% | 96.5 -3% | 56.8 -43% | 99.9 0% | 100 0% | 100 0% |
| AdobeRGB 1998 Coverage (%) | 86.3 | 85.4 -1% | 66.6 -23% | 39.3 -54% | 96.2 11% | 96.3 12% | 88.7 3% |
| Response Times | 14% | -87% | -140% | 96% | 96% | 82% | |
| Response Time Grey 50% / Grey 80% * (ms) | 15.6 ? | 14 ? 10% | 30.4 ? -95% | 38.8 ? -149% | 0.4 ? 97% | 0.49 ? 97% | 2.4 ? 85% |
| Response Time Black / White * (ms) | 11.6 ? | 9.6 ? 17% | 20.8 ? -79% | 26.8 ? -131% | 0.6 ? 95% | 0.65 ? 94% | 2.4 ? 79% |
| PWM Frequency (Hz) | 240 ? | 240 ? | 300 | ||||
| Screen | 10% | 30% | -38% | 30% | 215% | 103% | |
| Brightness middle (cd/m²) | 302 | 322 7% | 288 -5% | 261 -14% | 388 28% | 400 32% | 423 40% |
| Brightness (cd/m²) | 278 | 301 8% | 271 -3% | 258 -7% | 390 40% | 399 44% | 427 54% |
| Brightness Distribution (%) | 85 | 85 0% | 91 7% | 92 8% | 98 15% | 93 9% | 98 15% |
| Black Level * (cd/m²) | 0.36 | 0.36 -0% | 0.17 53% | 0.19 47% | 0.03 92% | 0.1 72% | |
| Contrast (:1) | 839 | 894 7% | 1694 102% | 1374 64% | 13333 1489% | 4230 404% | |
| Colorchecker dE 2000 * | 2.24 | 1.98 12% | 1.9 15% | 5.57 -149% | 2.2 2% | 2.3 -3% | 0.55 75% |
| Colorchecker dE 2000 max. * | 5.52 | 5.24 5% | 3.3 40% | 20.6 -273% | 3.9 29% | 4.15 25% | 1.15 79% |
| Greyscale dE 2000 * | 3.87 | 2.44 37% | 2.7 30% | 3.19 18% | 1.4 64% | 2.7 30% | 0.69 82% |
| Gamma | 2.42 91% | 2.42 91% | 2.32 95% | 2.45 90% | 2.22 99% | 2.266 97% | 2.42 91% |
| CCT | 6936 94% | 6984 93% | 6535 99% | 6146 106% | 6380 102% | 7047 92% | 6479 100% |
| Colorchecker dE 2000 calibrated * | 1.98 | 0.9 | 4.63 | 1.9 | 1.66 | 1.15 | |
| Total Average (Program / Settings) | 8% /
8% | -26% /
0% | -77% /
-57% | 43% /
35% | 105% /
148% | 62% /
76% |
* ... smaller is better
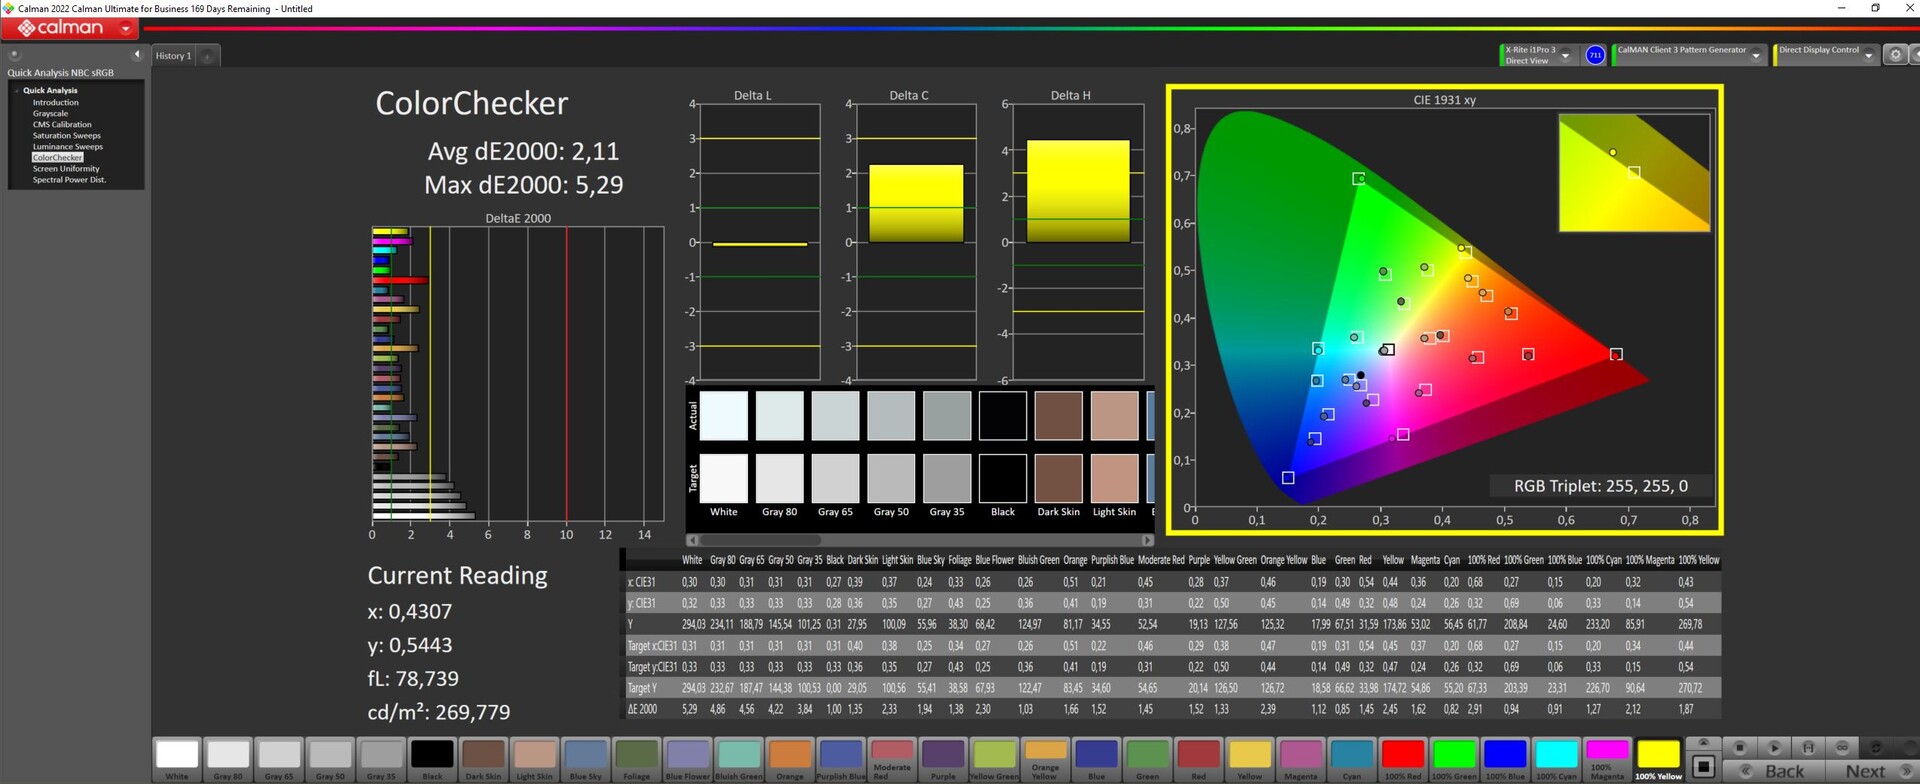
对于摄像师和内容创作者来说,XMG Focus 15近乎完整的Display P3色彩空间覆盖范围应该是一个优势。AdobeRGB色彩空间对于照片编辑和打印更为重要,而Focus 15只能再现88%的色彩空间。
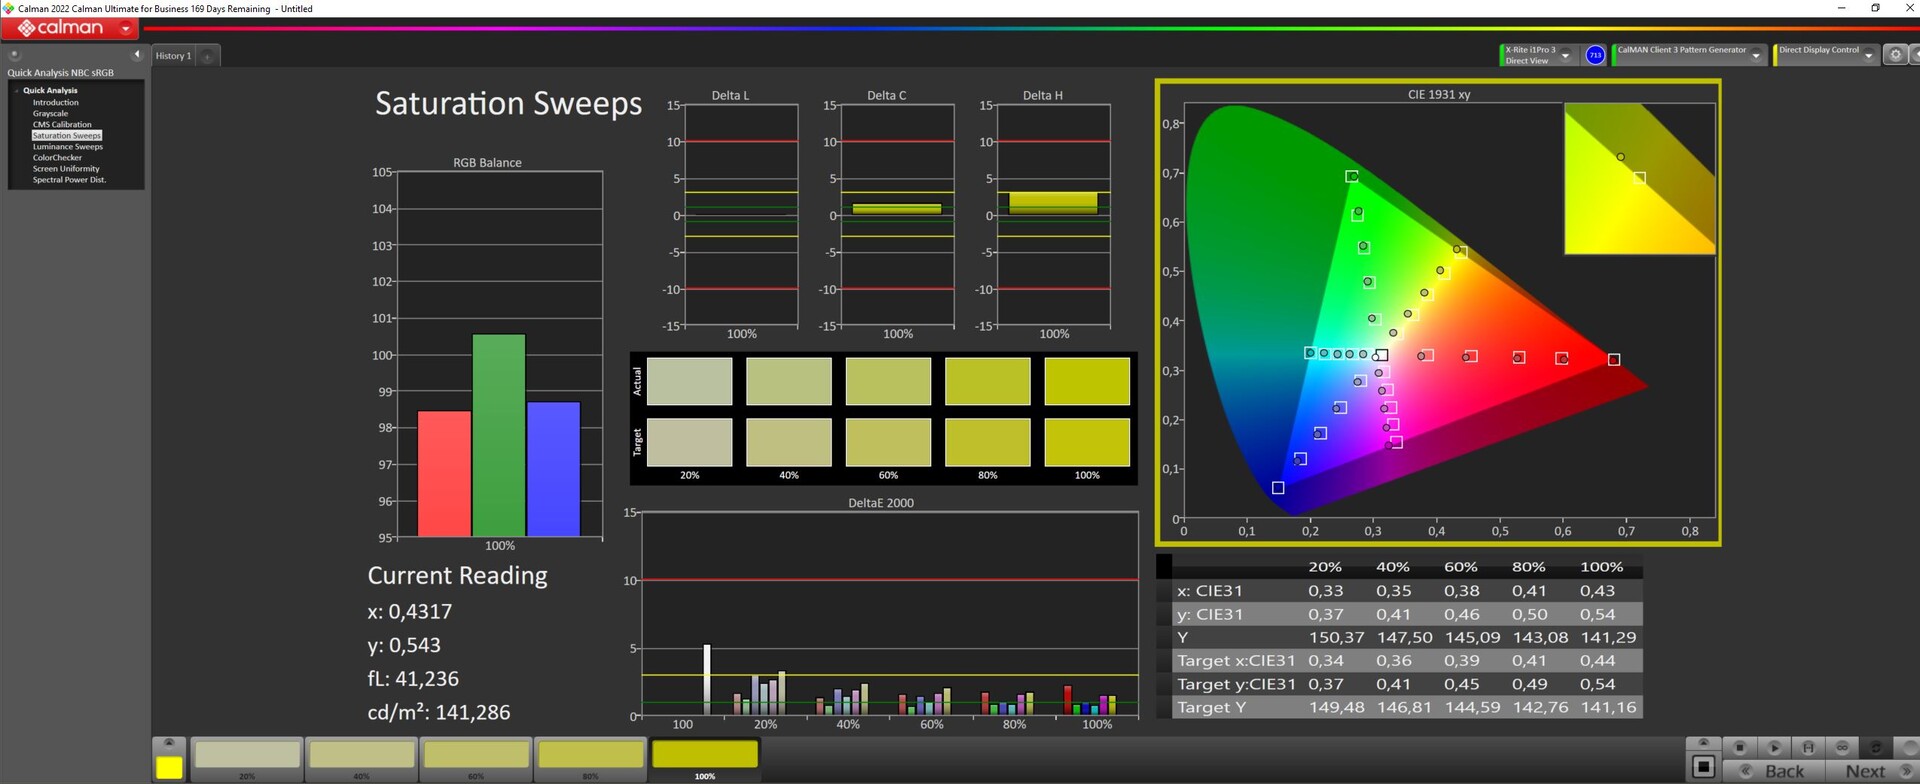
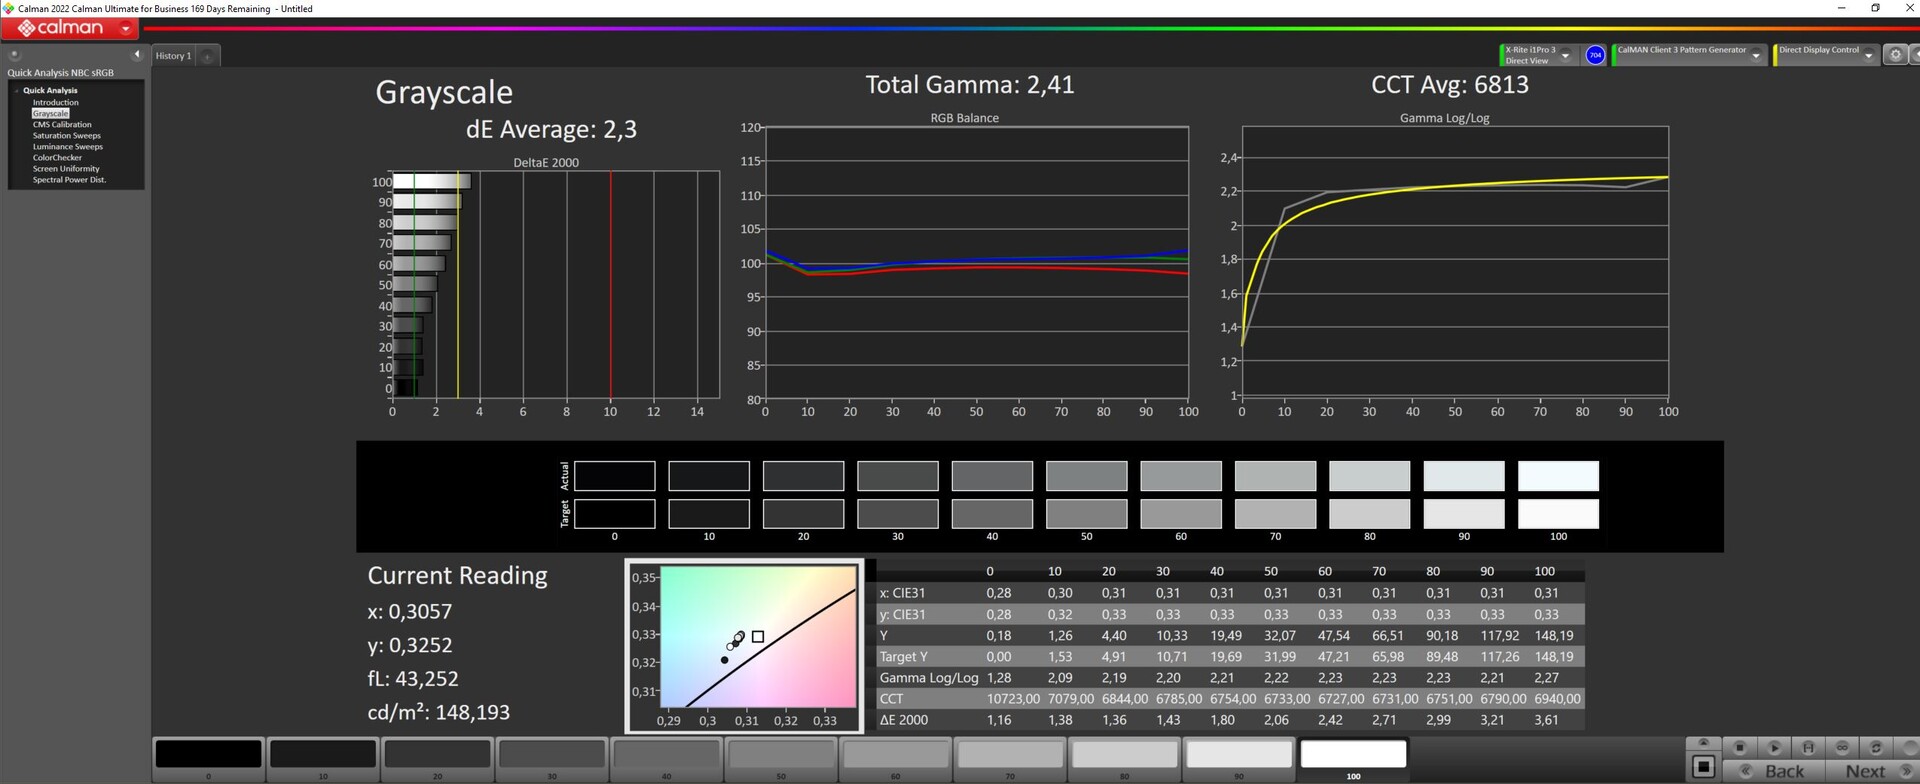
我们测试设备的屏幕具有良好的色彩还原性,平均色彩偏差为ΔΕ 2.24(出厂值)。校准后,该值会进一步改善。
我们发现,当照明度设置为150尼特时,色彩还原性也会得到改善。

Display Response Times
| ↔ Response Time Black to White | ||
|---|---|---|
| 11.6 ms ... rise ↗ and fall ↘ combined | ↗ 5.8 ms rise | 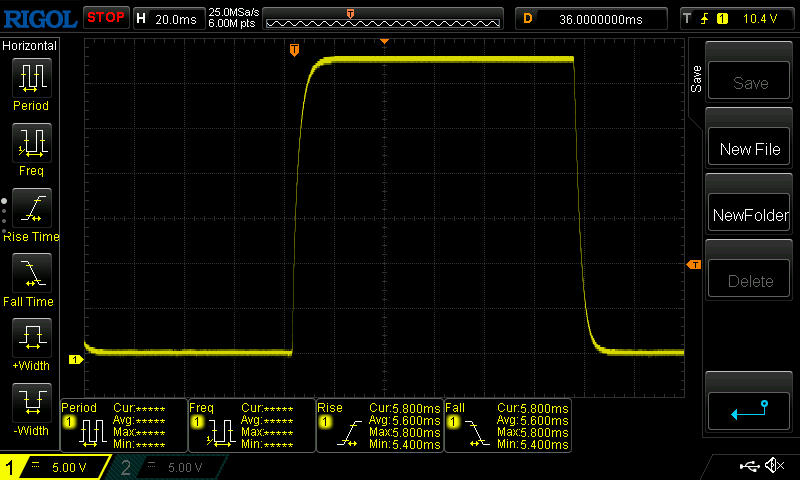 |
| ↘ 5.8 ms fall | ||
| The screen shows good response rates in our tests, but may be too slow for competitive gamers. In comparison, all tested devices range from 0.1 (minimum) to 240 (maximum) ms. » 31 % of all devices are better. This means that the measured response time is better than the average of all tested devices (19.8 ms). | ||
| ↔ Response Time 50% Grey to 80% Grey | ||
| 15.6 ms ... rise ↗ and fall ↘ combined | ↗ 7.4 ms rise | 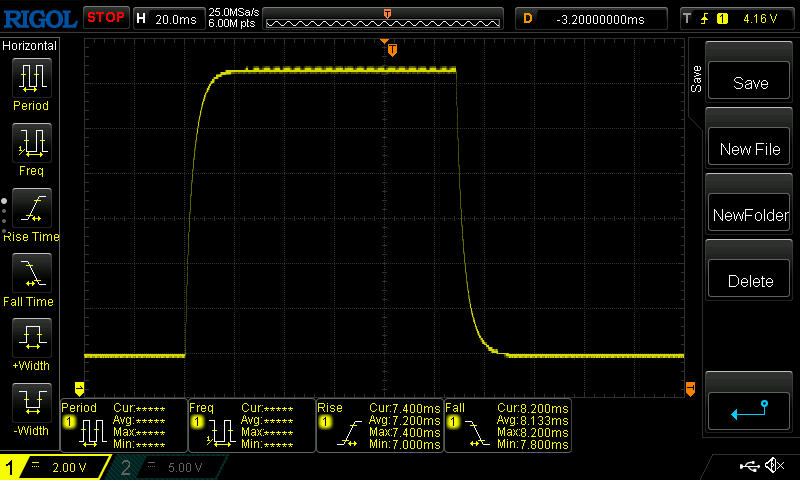 |
| ↘ 8.2 ms fall | ||
| The screen shows good response rates in our tests, but may be too slow for competitive gamers. In comparison, all tested devices range from 0.165 (minimum) to 636 (maximum) ms. » 30 % of all devices are better. This means that the measured response time is better than the average of all tested devices (31 ms). | ||
Screen Flickering / PWM (Pulse-Width Modulation)
| Screen flickering / PWM not detected |  | ||
In comparison: 52 % of all tested devices do not use PWM to dim the display. If PWM was detected, an average of 7754 (minimum: 5 - maximum: 343500) Hz was measured. | |||
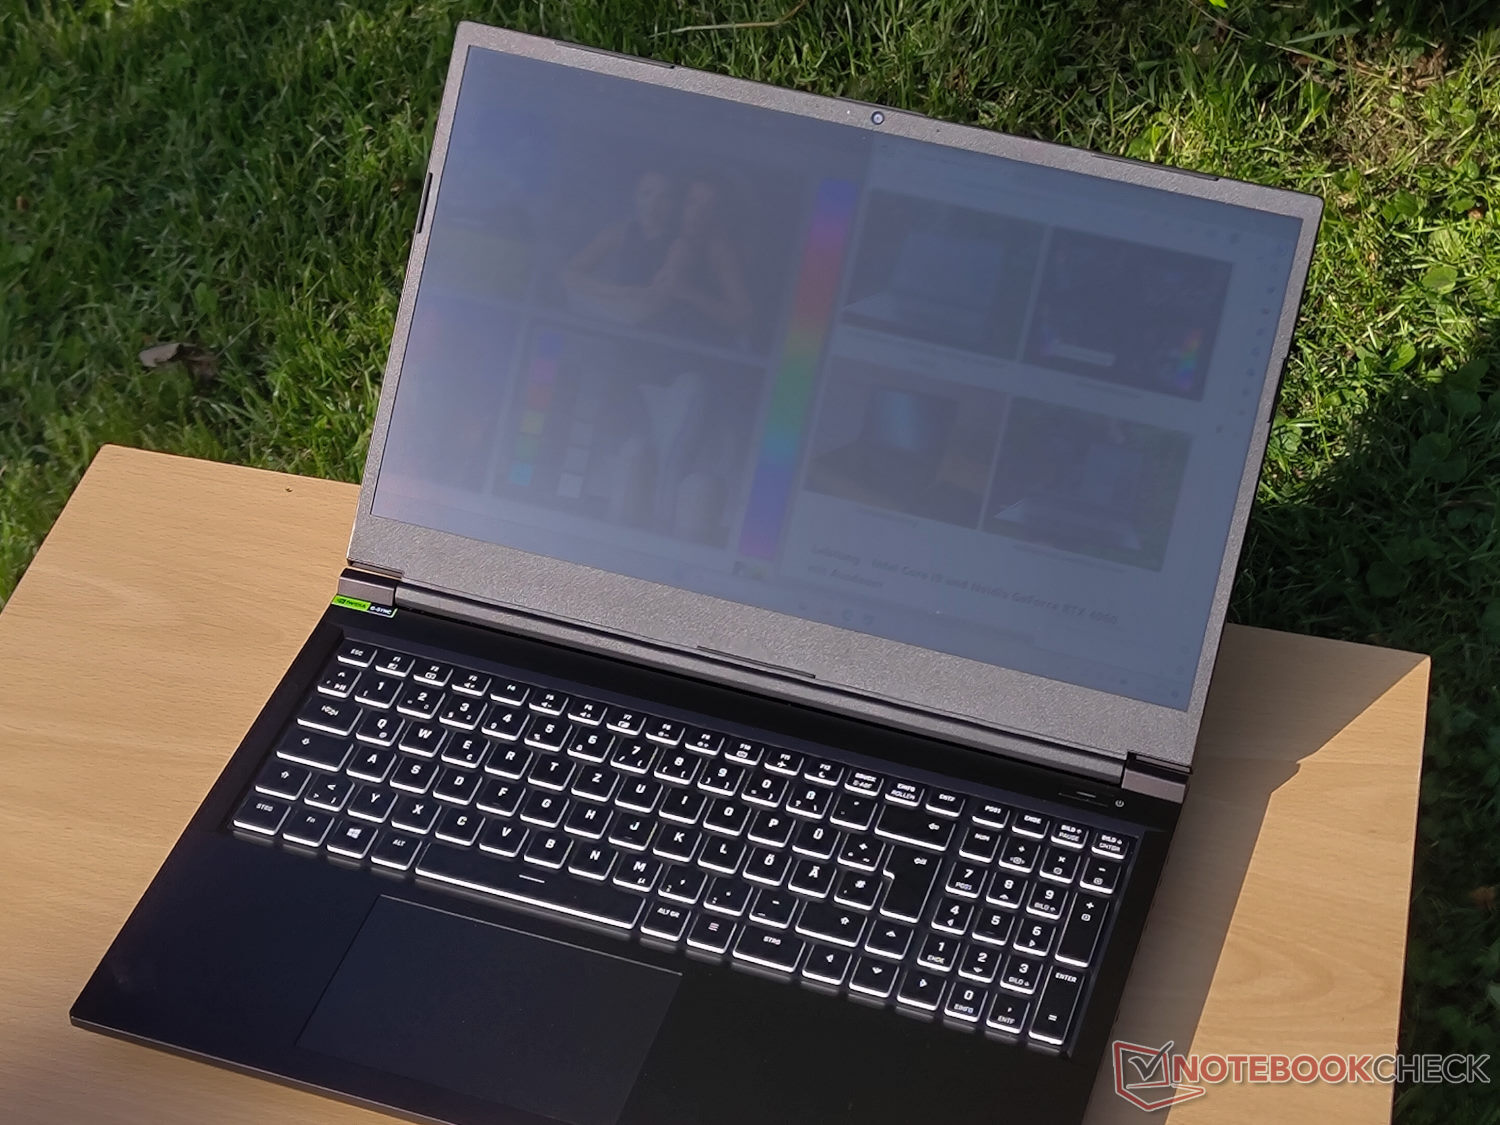
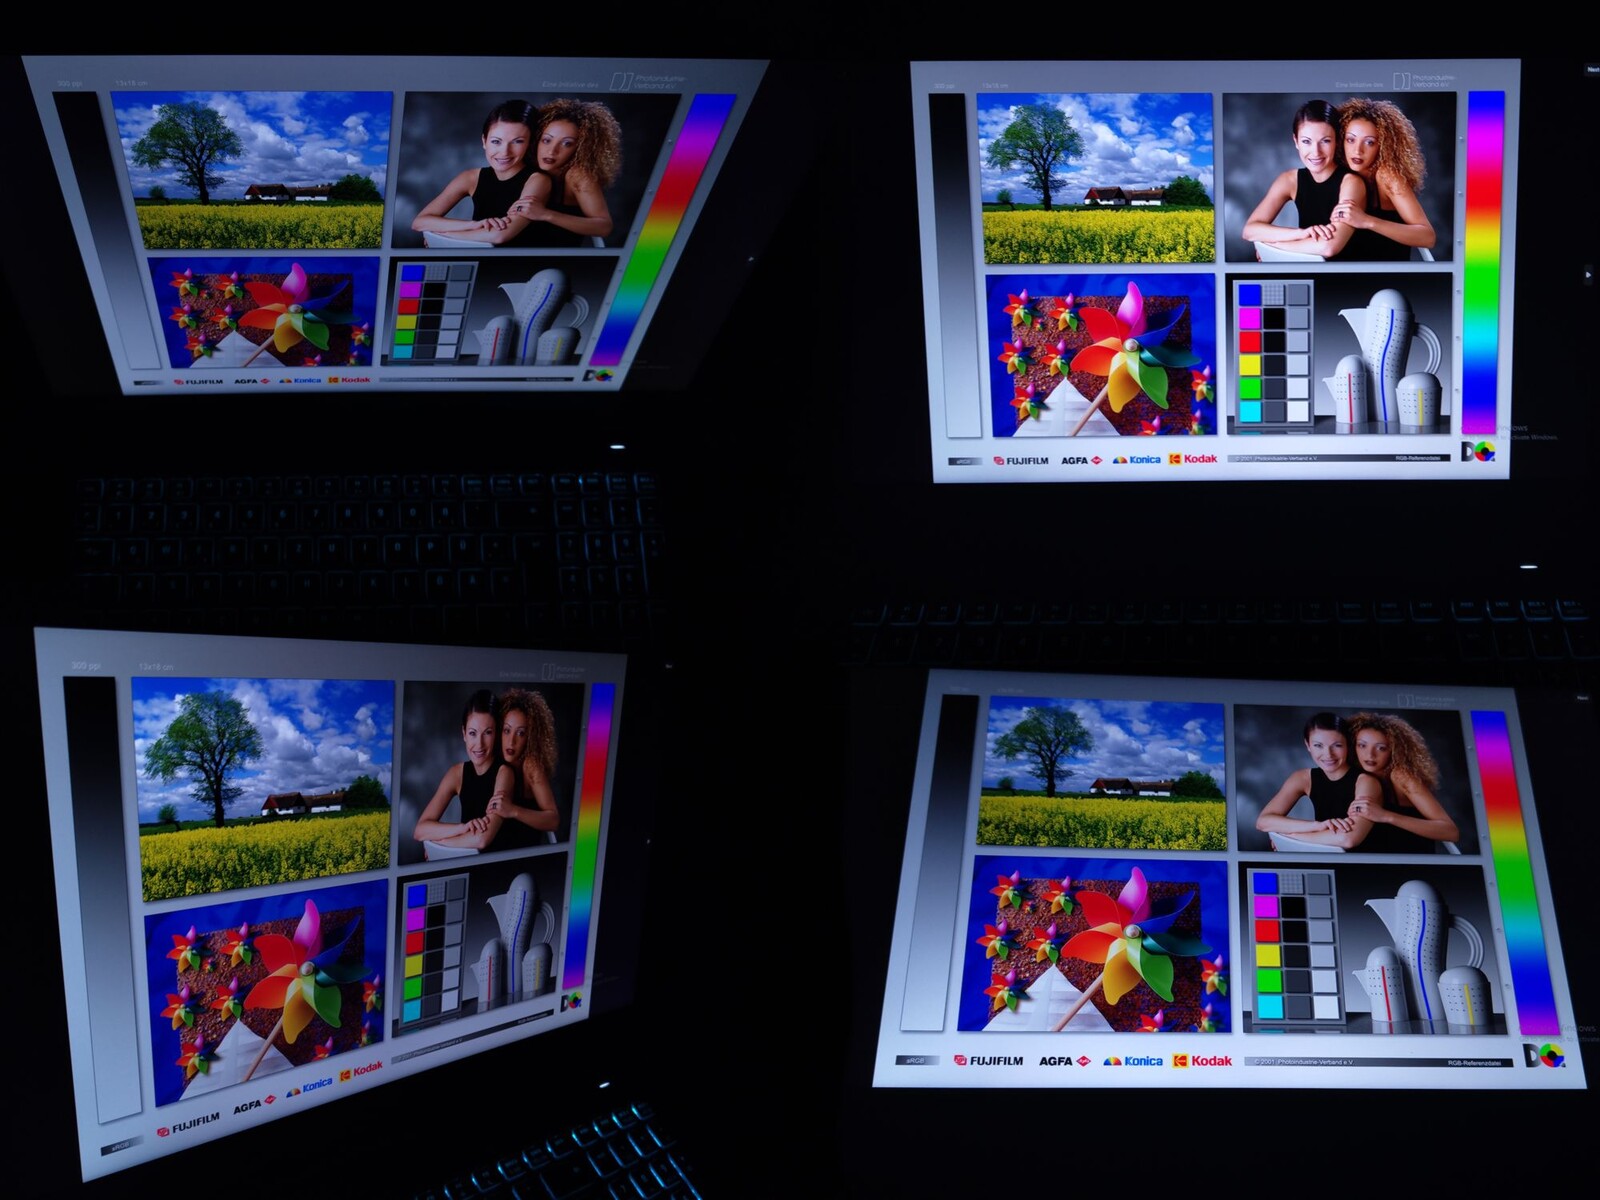
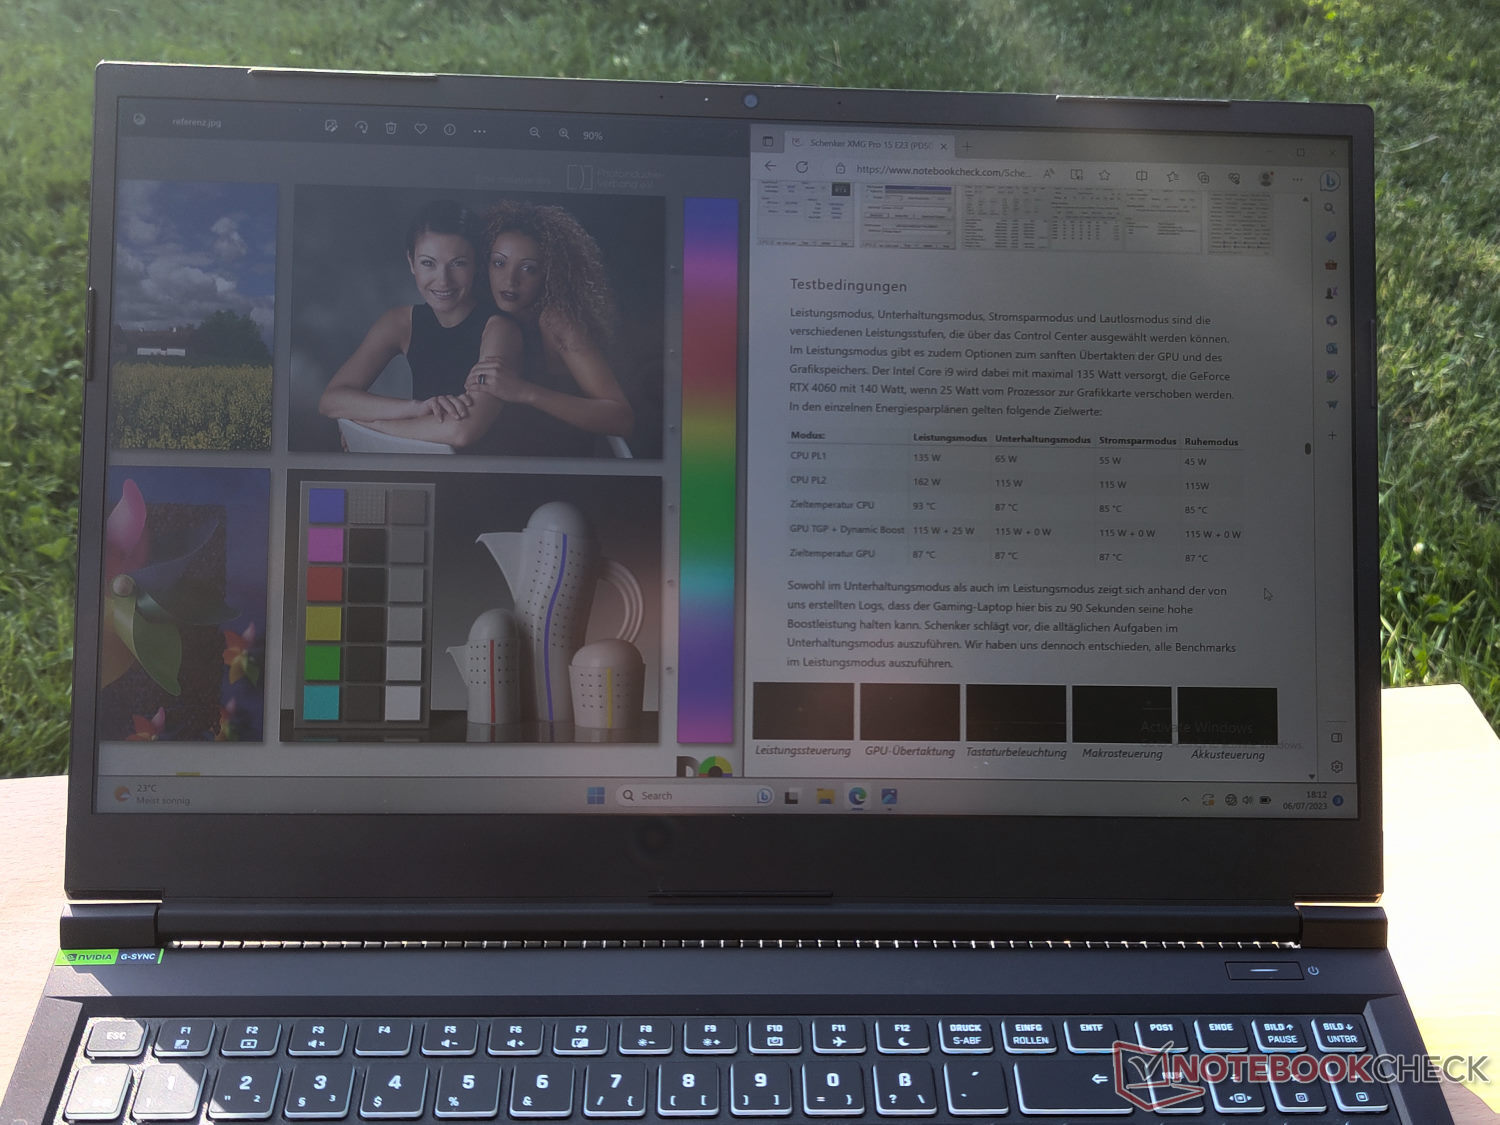
由于采用了哑光表面,只要注意位置和与阳光的角度,亮度适中的显示屏在户外也可以使用。幸运的是,由于屏幕的视角相当稳定,因此通常可以找到一个有利的位置。
性能:极致性能的酷睿i9处理器
德铁信可为 XMG Focus 15 提供多种配置选项。所有配置的处理器均为 英特尔酷睿i9-13900HX.支持该处理器的英伟达芯片为 GeForce RTX 4050, RTX 4060或 RTX 4070在Bestware的配置过程中提供了多种内存选项。
我们的测试设备配备了NvidiaGeForce RTX 4050笔记本GPU和32GB工作内存。凭借Ada Lovelace一代最低的图形芯片,该笔记本电脑能够流畅地玩许多当前的游戏,尽管如果您想利用显示屏的全QHD分辨率,可能需要限制质量设置。
测试条件
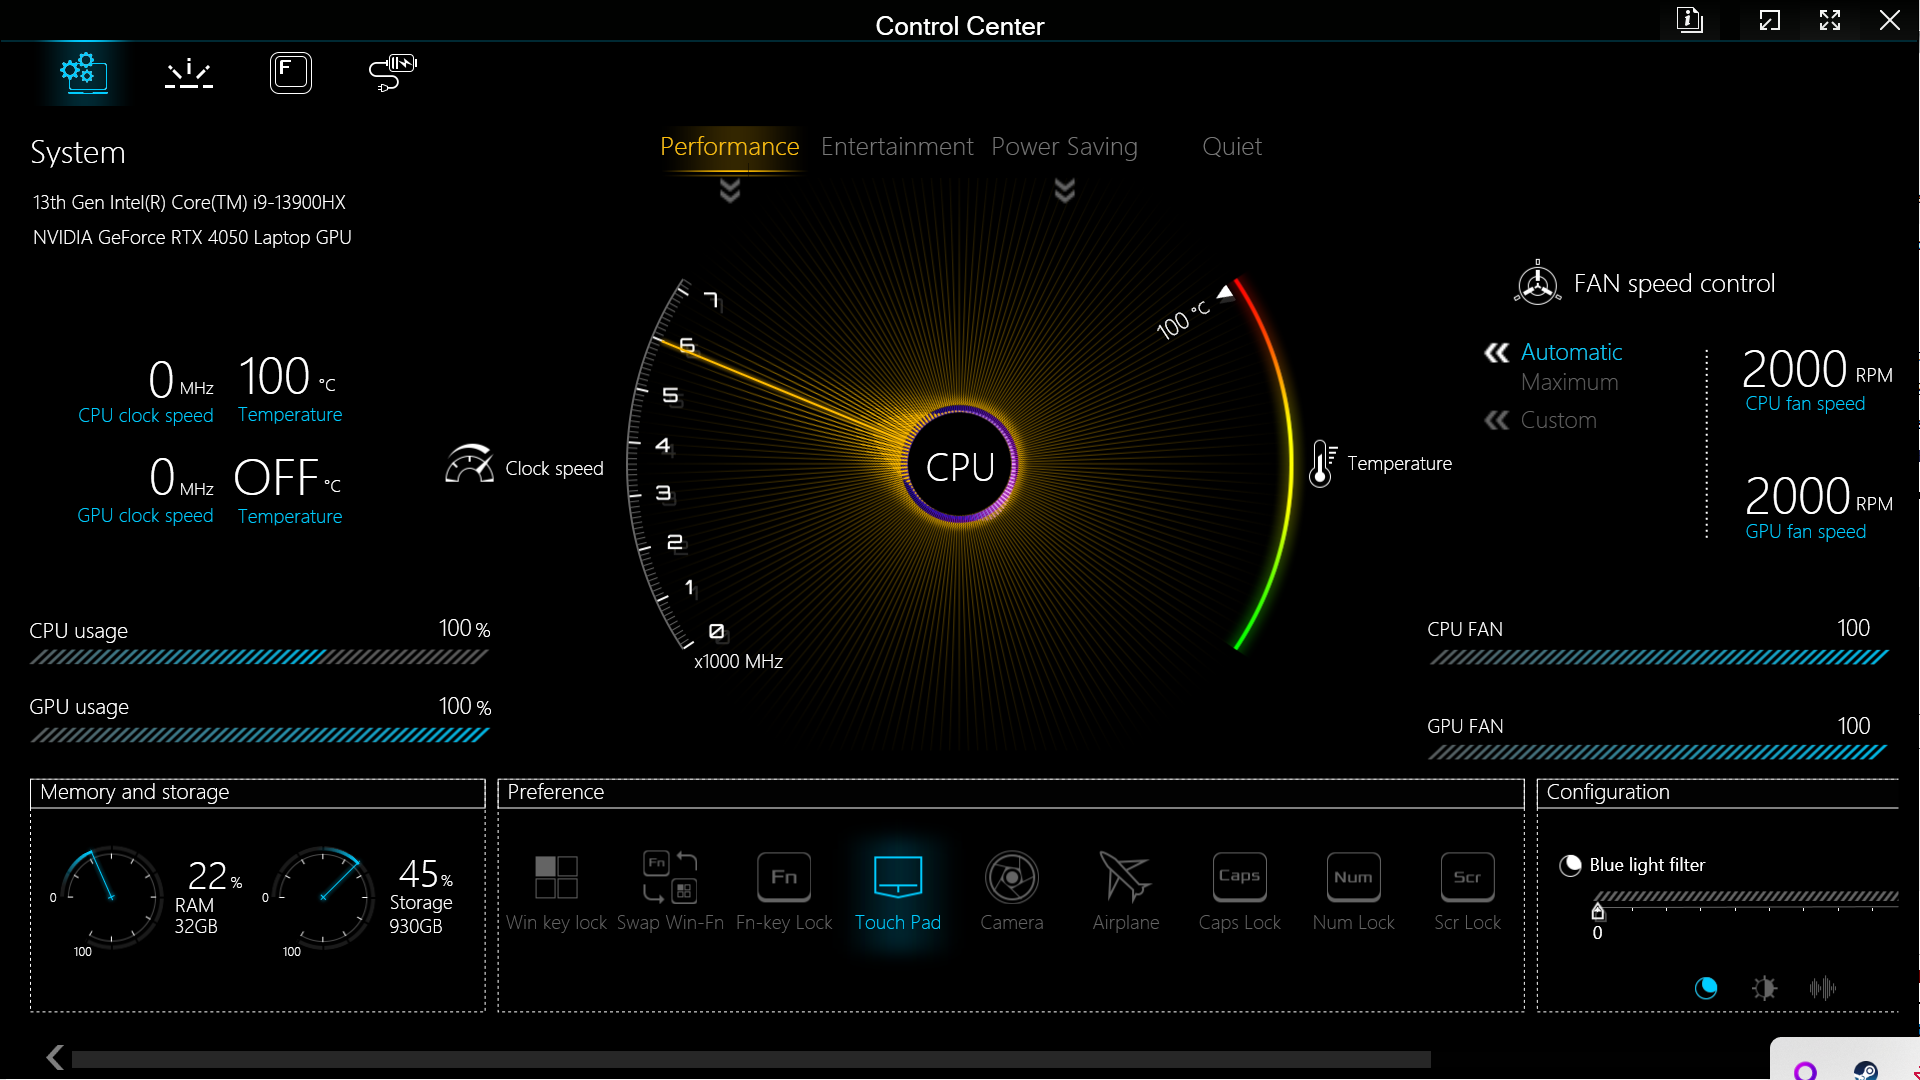
通过申克的控制中心可以访问四种不同的性能方案。虽然省电模式和睡眠模式明显限制了测试设备的性能,但当长时间需要笔记本电脑提供大量性能时,性能模式和娱乐模式的基准往往非常接近。
尽管如此,处理器的提升阶段在性能模式下持续的时间要长得多。在近1.5分钟的提升阶段,处理器可以轻松通过Cinebench R23或Blender等基准测试。各个模式下的功率限制如下:
| 模式: | 电源模式 | 娱乐模式 | 省电模式 |
|---|---|---|---|
| CPU PL1 | 135 W | 55 W | 15 W |
| CPU PL2 | 162 W | 130 W | 30 W |
| 目标温度 CPU | 93 °C | 87 °C | 85 °C |
| GPU TGP + Dynamic Boost | 115 W + 25 W | 115 W + 0 W | 115 W + 0 W |
| 目标温度 GPU | 87 °C | 87 °C | 87 °C |
在我们的测试中,笔记本电脑可以达到性能模式的高目标速率。这些数值与申克的 XMG Pro 15.因此,两款处理器在Focus和Pro中的性能几乎完全相同。
为了更好地比较这两款设备,我们最终决定也在XMG Focus 15的性能模式下运行所有基准测试。
处理器
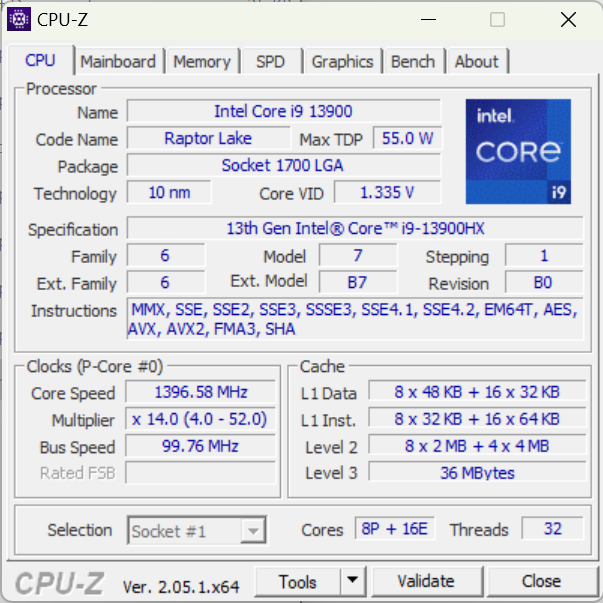
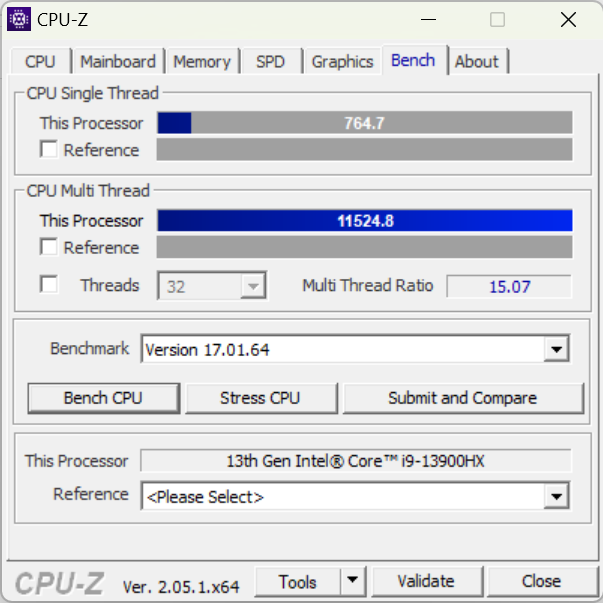
配备 英特尔酷睿i9-13900HXXMG Focus 15采用了英特尔酷睿i9-13900HX处理器,这是Raptor Lake-HX一代最高端的笔记本处理器之一。该处理器的速度甚至比 Pro 15.
在现代处理器的流畅运行方面,差异更加明显。该处理器拥有8个P-cores和16个E-cores,32个线程,可提供极强的多任务处理能力。Focus 15和 Pro 15在对比设备中名列前茅。
Cinebench R15 Multi Loop Test
Cinebench R23: Multi Core | Single Core
Cinebench R20: CPU (Multi Core) | CPU (Single Core)
Cinebench R15: CPU Multi 64Bit | CPU Single 64Bit
Blender: v2.79 BMW27 CPU
7-Zip 18.03: 7z b 4 | 7z b 4 -mmt1
Geekbench 5.5: Multi-Core | Single-Core
HWBOT x265 Benchmark v2.2: 4k Preset
LibreOffice : 20 Documents To PDF
R Benchmark 2.5: Overall mean
| CPU Performance rating | |
| Average Intel Core i9-13900HX | |
| Average of class Gaming | |
| Schenker XMG Focus 15 (E23) | |
| Schenker XMG Pro 15 (E23) | |
| Gigabyte Aero 14 OLED BMF | |
| Acer Swift X SFX14-71G | |
| Samsung Galaxy Book3 Ultra 16 | |
| MSI Katana 15 B12VEK | |
| Asus TUF A15 FA507 | |
| Cinebench R23 / Multi Core | |
| Average Intel Core i9-13900HX (24270 - 32623, n=23) | |
| Average of class Gaming (10488 - 42661, n=107, last 2 years) | |
| Schenker XMG Pro 15 (E23) | |
| Schenker XMG Focus 15 (E23) | |
| Acer Swift X SFX14-71G | |
| MSI Katana 15 B12VEK | |
| Samsung Galaxy Book3 Ultra 16 | |
| Gigabyte Aero 14 OLED BMF | |
| Asus TUF A15 FA507 | |
| Cinebench R23 / Single Core | |
| Average Intel Core i9-13900HX (1867 - 2105, n=20) | |
| Average of class Gaming (1166 - 2415, n=107, last 2 years) | |
| Schenker XMG Focus 15 (E23) | |
| Acer Swift X SFX14-71G | |
| Schenker XMG Pro 15 (E23) | |
| Gigabyte Aero 14 OLED BMF | |
| Samsung Galaxy Book3 Ultra 16 | |
| MSI Katana 15 B12VEK | |
| Asus TUF A15 FA507 | |
| Cinebench R20 / CPU (Multi Core) | |
| Average Intel Core i9-13900HX (9152 - 12541, n=21) | |
| Average of class Gaming (4029 - 16433, n=106, last 2 years) | |
| Schenker XMG Pro 15 (E23) | |
| Schenker XMG Focus 15 (E23) | |
| Acer Swift X SFX14-71G | |
| MSI Katana 15 B12VEK | |
| Samsung Galaxy Book3 Ultra 16 | |
| Gigabyte Aero 14 OLED BMF | |
| Asus TUF A15 FA507 | |
| Cinebench R20 / CPU (Single Core) | |
| Average Intel Core i9-13900HX (722 - 810, n=21) | |
| Average of class Gaming (442 - 913, n=106, last 2 years) | |
| Schenker XMG Focus 15 (E23) | |
| Acer Swift X SFX14-71G | |
| Schenker XMG Pro 15 (E23) | |
| Gigabyte Aero 14 OLED BMF | |
| Samsung Galaxy Book3 Ultra 16 | |
| MSI Katana 15 B12VEK | |
| Asus TUF A15 FA507 | |
| Cinebench R15 / CPU Multi 64Bit | |
| Average Intel Core i9-13900HX (3913 - 4970, n=22) | |
| Schenker XMG Focus 15 (E23) | |
| Average of class Gaming (1578 - 6330, n=105, last 2 years) | |
| Schenker XMG Pro 15 (E23) | |
| Samsung Galaxy Book3 Ultra 16 | |
| Gigabyte Aero 14 OLED BMF | |
| Acer Swift X SFX14-71G | |
| Asus TUF A15 FA507 | |
| MSI Katana 15 B12VEK | |
| Cinebench R15 / CPU Single 64Bit | |
| Average of class Gaming (188.8 - 350, n=106, last 2 years) | |
| Average Intel Core i9-13900HX (247 - 304, n=22) | |
| Acer Swift X SFX14-71G | |
| Schenker XMG Focus 15 (E23) | |
| Gigabyte Aero 14 OLED BMF | |
| Asus TUF A15 FA507 | |
| MSI Katana 15 B12VEK | |
| Schenker XMG Pro 15 (E23) | |
| Samsung Galaxy Book3 Ultra 16 | |
| Blender / v2.79 BMW27 CPU | |
| Acer Swift X SFX14-71G | |
| MSI Katana 15 B12VEK | |
| Gigabyte Aero 14 OLED BMF | |
| Asus TUF A15 FA507 | |
| Samsung Galaxy Book3 Ultra 16 | |
| Average of class Gaming (79 - 330, n=104, last 2 years) | |
| Schenker XMG Pro 15 (E23) | |
| Schenker XMG Focus 15 (E23) | |
| Average Intel Core i9-13900HX (101 - 153, n=22) | |
| 7-Zip 18.03 / 7z b 4 | |
| Average Intel Core i9-13900HX (90675 - 127283, n=21) | |
| Schenker XMG Focus 15 (E23) | |
| Schenker XMG Pro 15 (E23) | |
| Average of class Gaming (33491 - 148086, n=105, last 2 years) | |
| Samsung Galaxy Book3 Ultra 16 | |
| Asus TUF A15 FA507 | |
| MSI Katana 15 B12VEK | |
| Gigabyte Aero 14 OLED BMF | |
| Acer Swift X SFX14-71G | |
| 7-Zip 18.03 / 7z b 4 -mmt1 | |
| Average Intel Core i9-13900HX (6340 - 7177, n=21) | |
| Average of class Gaming (4199 - 7436, n=105, last 2 years) | |
| Schenker XMG Focus 15 (E23) | |
| Schenker XMG Pro 15 (E23) | |
| Acer Swift X SFX14-71G | |
| Gigabyte Aero 14 OLED BMF | |
| Asus TUF A15 FA507 | |
| MSI Katana 15 B12VEK | |
| Samsung Galaxy Book3 Ultra 16 | |
| Geekbench 5.5 / Multi-Core | |
| Average Intel Core i9-13900HX (17614 - 21075, n=22) | |
| Schenker XMG Focus 15 (E23) | |
| Schenker XMG Pro 15 (E23) | |
| Average of class Gaming (6460 - 28263, n=105, last 2 years) | |
| Acer Swift X SFX14-71G | |
| Samsung Galaxy Book3 Ultra 16 | |
| MSI Katana 15 B12VEK | |
| Gigabyte Aero 14 OLED BMF | |
| Asus TUF A15 FA507 | |
| Geekbench 5.5 / Single-Core | |
| Average of class Gaming (986 - 2474, n=105, last 2 years) | |
| Average Intel Core i9-13900HX (1345 - 2093, n=22) | |
| Gigabyte Aero 14 OLED BMF | |
| Acer Swift X SFX14-71G | |
| Schenker XMG Pro 15 (E23) | |
| Samsung Galaxy Book3 Ultra 16 | |
| MSI Katana 15 B12VEK | |
| Asus TUF A15 FA507 | |
| Schenker XMG Focus 15 (E23) | |
| HWBOT x265 Benchmark v2.2 / 4k Preset | |
| Average Intel Core i9-13900HX (23.5 - 34.4, n=22) | |
| Average of class Gaming (11.5 - 44.4, n=105, last 2 years) | |
| Schenker XMG Focus 15 (E23) | |
| Schenker XMG Pro 15 (E23) | |
| MSI Katana 15 B12VEK | |
| Asus TUF A15 FA507 | |
| Samsung Galaxy Book3 Ultra 16 | |
| Gigabyte Aero 14 OLED BMF | |
| Acer Swift X SFX14-71G | |
| LibreOffice / 20 Documents To PDF | |
| Schenker XMG Pro 15 (E23) | |
| Asus TUF A15 FA507 | |
| Average of class Gaming (33.2 - 88.8, n=105, last 2 years) | |
| Samsung Galaxy Book3 Ultra 16 | |
| MSI Katana 15 B12VEK | |
| Average Intel Core i9-13900HX (32.8 - 51.1, n=21) | |
| Gigabyte Aero 14 OLED BMF | |
| Acer Swift X SFX14-71G | |
| Schenker XMG Focus 15 (E23) | |
| R Benchmark 2.5 / Overall mean | |
| Asus TUF A15 FA507 | |
| MSI Katana 15 B12VEK | |
| Samsung Galaxy Book3 Ultra 16 | |
| Schenker XMG Pro 15 (E23) | |
| Gigabyte Aero 14 OLED BMF | |
| Acer Swift X SFX14-71G | |
| Schenker XMG Focus 15 (E23) | |
| Average of class Gaming (0.3439 - 0.759, n=106, last 2 years) | |
| Average Intel Core i9-13900HX (0.375 - 0.4564, n=22) | |
* ... smaller is better
AIDA64: FP32 Ray-Trace | FPU Julia | CPU SHA3 | CPU Queen | FPU SinJulia | FPU Mandel | CPU AES | CPU ZLib | FP64 Ray-Trace | CPU PhotoWorxx
| Performance rating | |
| Average of class Gaming | |
| Average Intel Core i9-13900HX | |
| Schenker XMG Focus 15 (E23) | |
| Schenker XMG Pro 15 (E23) | |
| Asus TUF A15 FA507 | |
| Gigabyte Aero 14 OLED BMF | |
| Samsung Galaxy Book3 Ultra 16 | |
| MSI Katana 15 B12VEK | |
| Acer Swift X SFX14-71G | |
| AIDA64 / FP32 Ray-Trace | |
| Average of class Gaming (10227 - 85542, n=105, last 2 years) | |
| Average Intel Core i9-13900HX (17589 - 27615, n=22) | |
| Schenker XMG Focus 15 (E23) | |
| Schenker XMG Pro 15 (E23) | |
| Asus TUF A15 FA507 | |
| MSI Katana 15 B12VEK | |
| Samsung Galaxy Book3 Ultra 16 | |
| Gigabyte Aero 14 OLED BMF | |
| Acer Swift X SFX14-71G | |
| AIDA64 / FPU Julia | |
| Average of class Gaming (51376 - 238426, n=105, last 2 years) | |
| Average Intel Core i9-13900HX (88686 - 137015, n=22) | |
| Schenker XMG Focus 15 (E23) | |
| Asus TUF A15 FA507 | |
| Schenker XMG Pro 15 (E23) | |
| MSI Katana 15 B12VEK | |
| Samsung Galaxy Book3 Ultra 16 | |
| Gigabyte Aero 14 OLED BMF | |
| Acer Swift X SFX14-71G | |
| AIDA64 / CPU SHA3 | |
| Average of class Gaming (2180 - 10115, n=105, last 2 years) | |
| Average Intel Core i9-13900HX (4362 - 7029, n=22) | |
| Schenker XMG Focus 15 (E23) | |
| Schenker XMG Pro 15 (E23) | |
| Asus TUF A15 FA507 | |
| Samsung Galaxy Book3 Ultra 16 | |
| MSI Katana 15 B12VEK | |
| Gigabyte Aero 14 OLED BMF | |
| Acer Swift X SFX14-71G | |
| AIDA64 / CPU Queen | |
| Schenker XMG Focus 15 (E23) | |
| Average Intel Core i9-13900HX (125644 - 141385, n=22) | |
| Schenker XMG Pro 15 (E23) | |
| Average of class Gaming (49785 - 173351, n=90, last 2 years) | |
| Gigabyte Aero 14 OLED BMF | |
| Acer Swift X SFX14-71G | |
| Asus TUF A15 FA507 | |
| Samsung Galaxy Book3 Ultra 16 | |
| MSI Katana 15 B12VEK | |
| AIDA64 / FPU SinJulia | |
| Average Intel Core i9-13900HX (12334 - 17179, n=22) | |
| Average of class Gaming (4424 - 33636, n=105, last 2 years) | |
| Schenker XMG Focus 15 (E23) | |
| Asus TUF A15 FA507 | |
| Schenker XMG Pro 15 (E23) | |
| Samsung Galaxy Book3 Ultra 16 | |
| Gigabyte Aero 14 OLED BMF | |
| MSI Katana 15 B12VEK | |
| Acer Swift X SFX14-71G | |
| AIDA64 / FPU Mandel | |
| Average of class Gaming (25115 - 128721, n=105, last 2 years) | |
| Average Intel Core i9-13900HX (43850 - 69202, n=22) | |
| Asus TUF A15 FA507 | |
| Schenker XMG Focus 15 (E23) | |
| Schenker XMG Pro 15 (E23) | |
| MSI Katana 15 B12VEK | |
| Samsung Galaxy Book3 Ultra 16 | |
| Gigabyte Aero 14 OLED BMF | |
| Acer Swift X SFX14-71G | |
| AIDA64 / CPU AES | |
| Average Intel Core i9-13900HX (89413 - 237881, n=22) | |
| Gigabyte Aero 14 OLED BMF | |
| Average of class Gaming (39258 - 247074, n=105, last 2 years) | |
| Schenker XMG Focus 15 (E23) | |
| Schenker XMG Pro 15 (E23) | |
| Acer Swift X SFX14-71G | |
| Samsung Galaxy Book3 Ultra 16 | |
| MSI Katana 15 B12VEK | |
| Asus TUF A15 FA507 | |
| AIDA64 / CPU ZLib | |
| Average Intel Core i9-13900HX (1284 - 1958, n=22) | |
| Schenker XMG Focus 15 (E23) | |
| Average of class Gaming (574 - 2531, n=105, last 2 years) | |
| Schenker XMG Pro 15 (E23) | |
| Samsung Galaxy Book3 Ultra 16 | |
| MSI Katana 15 B12VEK | |
| Gigabyte Aero 14 OLED BMF | |
| Acer Swift X SFX14-71G | |
| Asus TUF A15 FA507 | |
| AIDA64 / FP64 Ray-Trace | |
| Average of class Gaming (5509 - 45446, n=105, last 2 years) | |
| Average Intel Core i9-13900HX (9481 - 15279, n=22) | |
| Schenker XMG Focus 15 (E23) | |
| Schenker XMG Pro 15 (E23) | |
| Asus TUF A15 FA507 | |
| MSI Katana 15 B12VEK | |
| Samsung Galaxy Book3 Ultra 16 | |
| Gigabyte Aero 14 OLED BMF | |
| Acer Swift X SFX14-71G | |
| AIDA64 / CPU PhotoWorxx | |
| Gigabyte Aero 14 OLED BMF | |
| Schenker XMG Focus 15 (E23) | |
| Schenker XMG Pro 15 (E23) | |
| Average Intel Core i9-13900HX (42994 - 51994, n=22) | |
| Samsung Galaxy Book3 Ultra 16 | |
| Average of class Gaming (12271 - 89891, n=105, last 2 years) | |
| Acer Swift X SFX14-71G | |
| MSI Katana 15 B12VEK | |
| Asus TUF A15 FA507 | |
系统性能
英伟达入门级GPU GeForce RTX 4050在PCMark 10基准测试中,Focus的得分不及Pro 15的得分。 Pro 15.尽管如此,Focus 15仍能跟上其他对比设备的步伐。
在CrossMark基准测试中,Focus 15的处理器速度稍快,这一点也很明显。评测样本的得分略高于Pro 15。CrossMark对显卡性能的考量远低于PCMark。
CrossMark: Overall | Productivity | Creativity | Responsiveness
| PCMark 10 / Score | |
| Average of class Gaming (5828 - 12414, n=93, last 2 years) | |
| Schenker XMG Pro 15 (E23) | |
| Gigabyte Aero 14 OLED BMF | |
| Acer Swift X SFX14-71G | |
| Asus TUF A15 FA507 | |
| Schenker XMG Focus 15 (E23) | |
| Average Intel Core i9-13900HX, NVIDIA GeForce RTX 4050 Laptop GPU (n=1) | |
| MSI Katana 15 B12VEK | |
| Samsung Galaxy Book3 Ultra 16 | |
| PCMark 10 / Essentials | |
| Gigabyte Aero 14 OLED BMF | |
| Schenker XMG Pro 15 (E23) | |
| Acer Swift X SFX14-71G | |
| Average of class Gaming (8810 - 11935, n=97, last 2 years) | |
| Asus TUF A15 FA507 | |
| Samsung Galaxy Book3 Ultra 16 | |
| MSI Katana 15 B12VEK | |
| Schenker XMG Focus 15 (E23) | |
| Average Intel Core i9-13900HX, NVIDIA GeForce RTX 4050 Laptop GPU (n=1) | |
| PCMark 10 / Productivity | |
| Average of class Gaming (6845 - 25323, n=95, last 2 years) | |
| Schenker XMG Pro 15 (E23) | |
| MSI Katana 15 B12VEK | |
| Schenker XMG Focus 15 (E23) | |
| Average Intel Core i9-13900HX, NVIDIA GeForce RTX 4050 Laptop GPU (n=1) | |
| Acer Swift X SFX14-71G | |
| Gigabyte Aero 14 OLED BMF | |
| Asus TUF A15 FA507 | |
| Samsung Galaxy Book3 Ultra 16 | |
| PCMark 10 / Digital Content Creation | |
| Average of class Gaming (7602 - 19954, n=95, last 2 years) | |
| Asus TUF A15 FA507 | |
| Acer Swift X SFX14-71G | |
| Gigabyte Aero 14 OLED BMF | |
| Schenker XMG Pro 15 (E23) | |
| Schenker XMG Focus 15 (E23) | |
| Average Intel Core i9-13900HX, NVIDIA GeForce RTX 4050 Laptop GPU (n=1) | |
| Samsung Galaxy Book3 Ultra 16 | |
| MSI Katana 15 B12VEK | |
| CrossMark / Overall | |
| Schenker XMG Focus 15 (E23) | |
| Average Intel Core i9-13900HX, NVIDIA GeForce RTX 4050 Laptop GPU (n=1) | |
| Average of class Gaming (1366 - 2409, n=94, last 2 years) | |
| Schenker XMG Pro 15 (E23) | |
| Acer Swift X SFX14-71G | |
| Gigabyte Aero 14 OLED BMF | |
| MSI Katana 15 B12VEK | |
| Samsung Galaxy Book3 Ultra 16 | |
| Asus TUF A15 FA507 | |
| CrossMark / Productivity | |
| Schenker XMG Focus 15 (E23) | |
| Average Intel Core i9-13900HX, NVIDIA GeForce RTX 4050 Laptop GPU (n=1) | |
| Acer Swift X SFX14-71G | |
| Average of class Gaming (1386 - 2254, n=94, last 2 years) | |
| Schenker XMG Pro 15 (E23) | |
| Gigabyte Aero 14 OLED BMF | |
| MSI Katana 15 B12VEK | |
| Asus TUF A15 FA507 | |
| Samsung Galaxy Book3 Ultra 16 | |
| CrossMark / Creativity | |
| Schenker XMG Focus 15 (E23) | |
| Average Intel Core i9-13900HX, NVIDIA GeForce RTX 4050 Laptop GPU (n=1) | |
| Average of class Gaming (1343 - 2786, n=94, last 2 years) | |
| Schenker XMG Pro 15 (E23) | |
| Acer Swift X SFX14-71G | |
| Gigabyte Aero 14 OLED BMF | |
| MSI Katana 15 B12VEK | |
| Asus TUF A15 FA507 | |
| Samsung Galaxy Book3 Ultra 16 | |
| CrossMark / Responsiveness | |
| Acer Swift X SFX14-71G | |
| Schenker XMG Focus 15 (E23) | |
| Average Intel Core i9-13900HX, NVIDIA GeForce RTX 4050 Laptop GPU (n=1) | |
| Schenker XMG Pro 15 (E23) | |
| Gigabyte Aero 14 OLED BMF | |
| Average of class Gaming (1226 - 2334, n=94, last 2 years) | |
| MSI Katana 15 B12VEK | |
| Samsung Galaxy Book3 Ultra 16 | |
| Asus TUF A15 FA507 | |
| PCMark 10 Score | 6926 points | |
Help | ||
| AIDA64 / Memory Copy | |
| Gigabyte Aero 14 OLED BMF | |
| Schenker XMG Focus 15 (E23) | |
| Schenker XMG Pro 15 (E23) | |
| Average Intel Core i9-13900HX (67716 - 79193, n=22) | |
| Average of class Gaming (21750 - 129946, n=105, last 2 years) | |
| Samsung Galaxy Book3 Ultra 16 | |
| Acer Swift X SFX14-71G | |
| MSI Katana 15 B12VEK | |
| Asus TUF A15 FA507 | |
| AIDA64 / Memory Read | |
| Schenker XMG Focus 15 (E23) | |
| Schenker XMG Pro 15 (E23) | |
| Average Intel Core i9-13900HX (73998 - 88462, n=22) | |
| Gigabyte Aero 14 OLED BMF | |
| Average of class Gaming (22956 - 118858, n=105, last 2 years) | |
| Samsung Galaxy Book3 Ultra 16 | |
| MSI Katana 15 B12VEK | |
| Acer Swift X SFX14-71G | |
| Asus TUF A15 FA507 | |
| AIDA64 / Memory Write | |
| Gigabyte Aero 14 OLED BMF | |
| Samsung Galaxy Book3 Ultra 16 | |
| Schenker XMG Focus 15 (E23) | |
| Average of class Gaming (22297 - 135096, n=105, last 2 years) | |
| Schenker XMG Pro 15 (E23) | |
| Average Intel Core i9-13900HX (65472 - 77045, n=22) | |
| Acer Swift X SFX14-71G | |
| MSI Katana 15 B12VEK | |
| Asus TUF A15 FA507 | |
| AIDA64 / Memory Latency | |
| Average of class Gaming (75.3 - 259, n=105, last 2 years) | |
| Acer Swift X SFX14-71G | |
| Samsung Galaxy Book3 Ultra 16 | |
| MSI Katana 15 B12VEK | |
| Gigabyte Aero 14 OLED BMF | |
| Average Intel Core i9-13900HX (75.3 - 91.1, n=22) | |
| Schenker XMG Focus 15 (E23) | |
| Schenker XMG Pro 15 (E23) | |
| Asus TUF A15 FA507 | |
* ... smaller is better
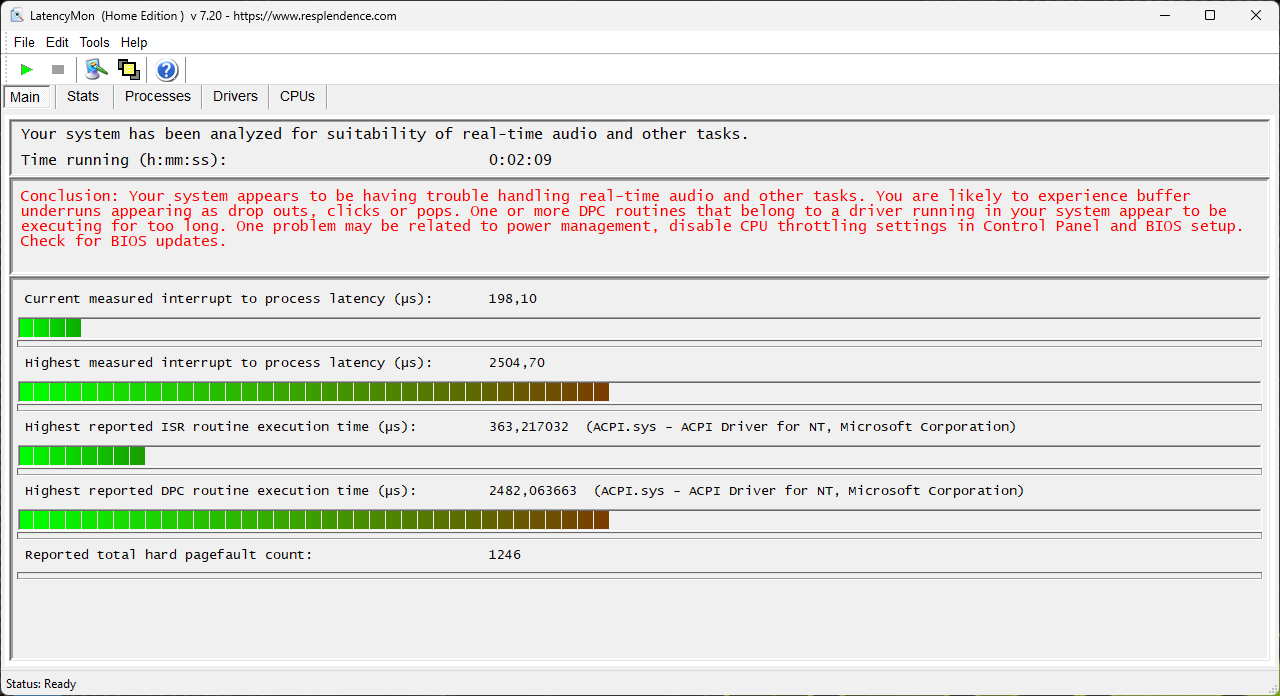
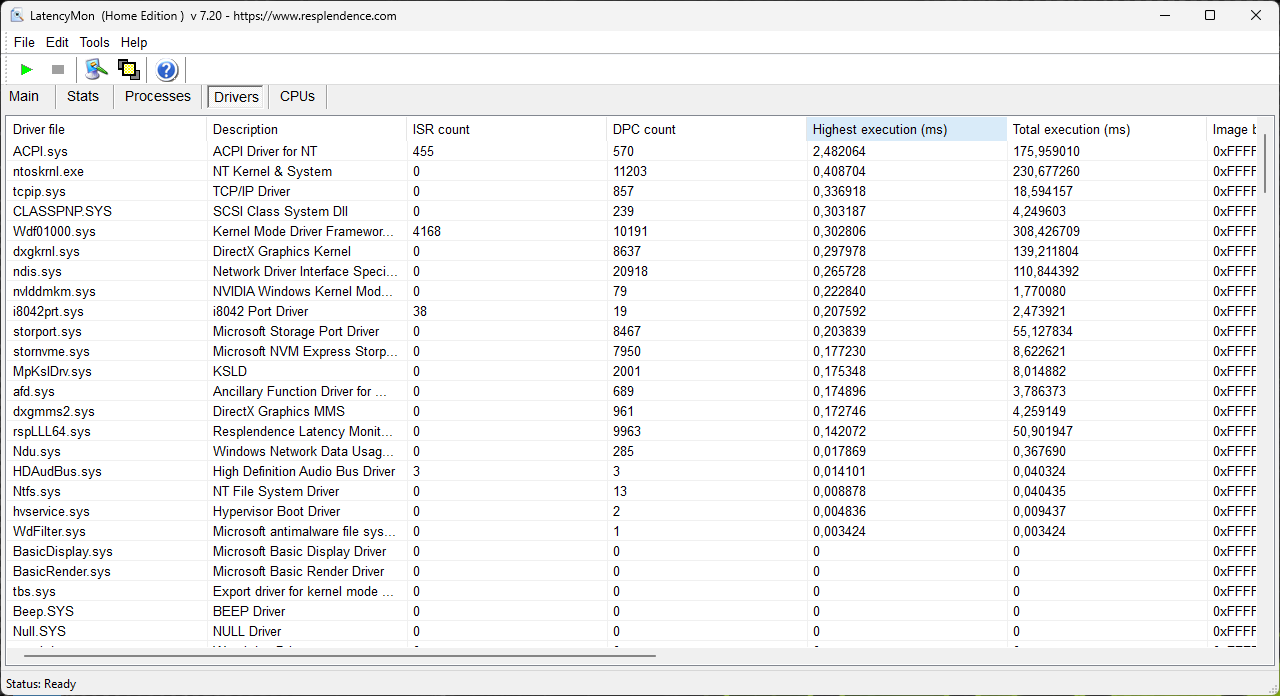
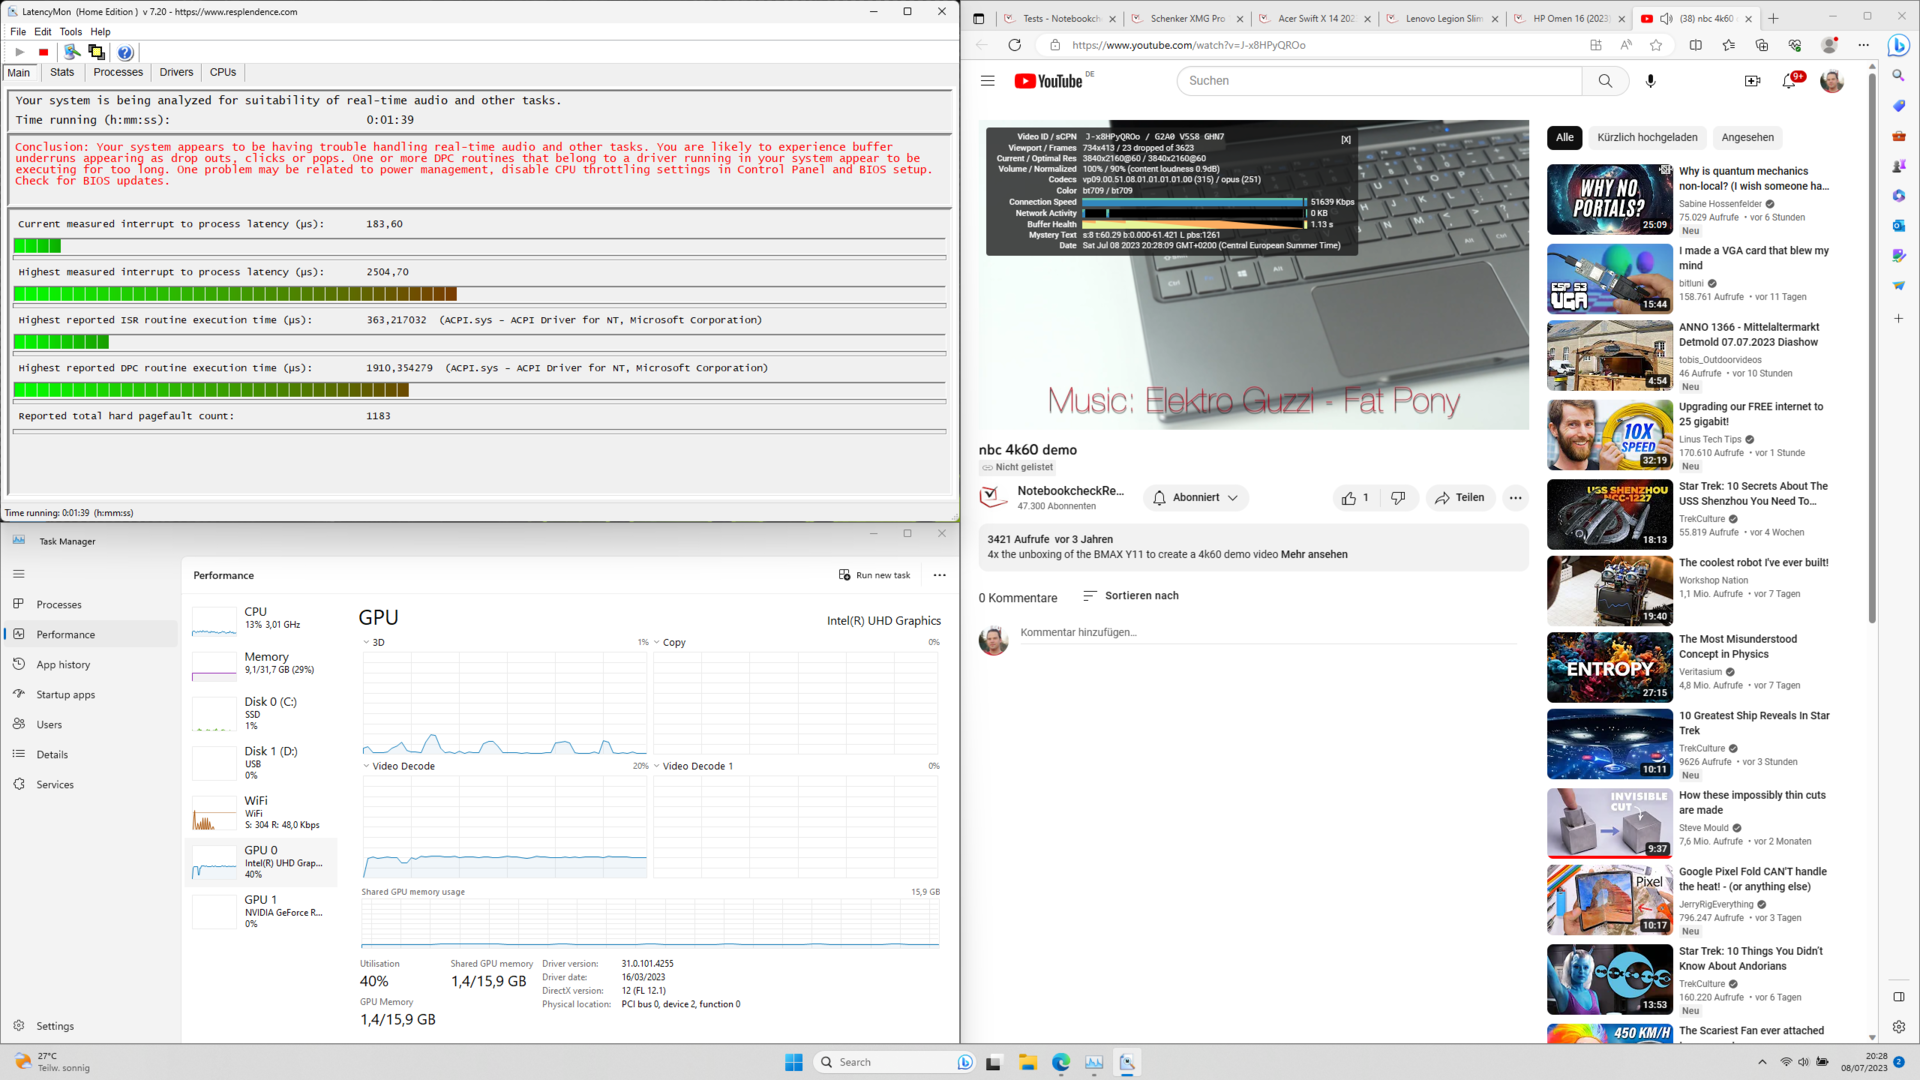
DPC延迟
我们通过各种浏览器标签、YouTube播放和Prime95进行的延迟测试表明,这款游戏笔记本的DPC延迟非常高。
在BIOS/UEFI和Windows之间建立连接的ACPI驱动程序在这里非常明显。UEFI更新并没有改善这一问题。
| DPC Latencies / LatencyMon - interrupt to process latency (max), Web, Youtube, Prime95 | |
| MSI Katana 15 B12VEK | |
| Acer Swift X SFX14-71G | |
| Samsung Galaxy Book3 Ultra 16 | |
| Schenker XMG Focus 15 (E23) | |
| Gigabyte Aero 14 OLED BMF | |
| Schenker XMG Pro 15 (E23) | |
* ... smaller is better
大容量存储器
冽测试设备中的Crucial P5 Plus测试设备中的Crucial P5 Plus提供了良好的传输速度。然而,在长时间负载时,它显然会过热。
在我们对写入速度的长期测试中,NVMe固态硬盘的性能在一段时间后明显下降。

* ... smaller is better
Disk throttling: DiskSpd Read Loop, Queue Depth 8
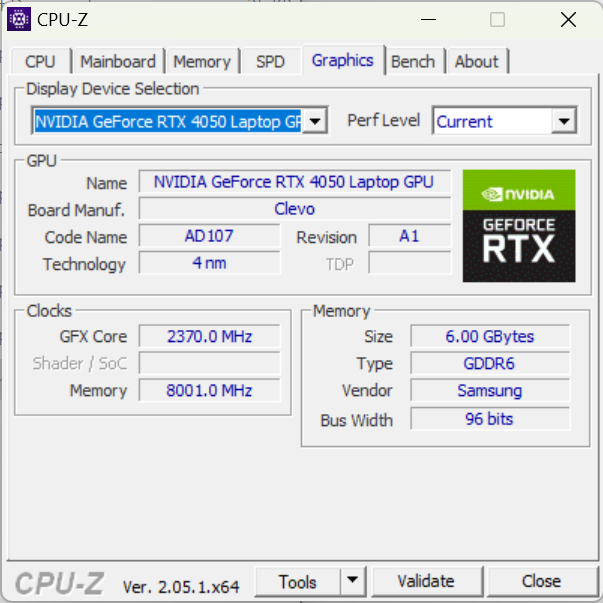
显卡
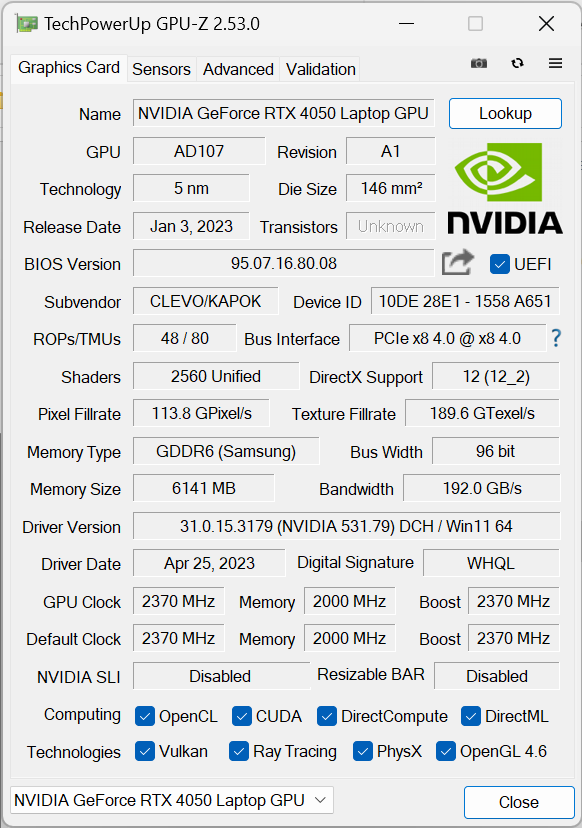
在我们的Focus 15样品中,该图形芯片的性能比RTX 4060低约15%至20%。RTX 4060在 专业版15.看看 Aorus 15X ASF还显示了Focus 15与RTX 4070组合的性能。 RTX 4070的性能。由于三款笔记本电脑的TGP值相当,因此当笔记本电脑配备相同的图形芯片时,性能应该相当。
Nvidia RTX 4050 GPU的额定TGP值高达140 W。该值处于Nvidia推荐的TGP配置的顶端。然而,这并没有给显卡带来任何 在每项基准测试中都比其他游戏笔记本电脑更具优势。.
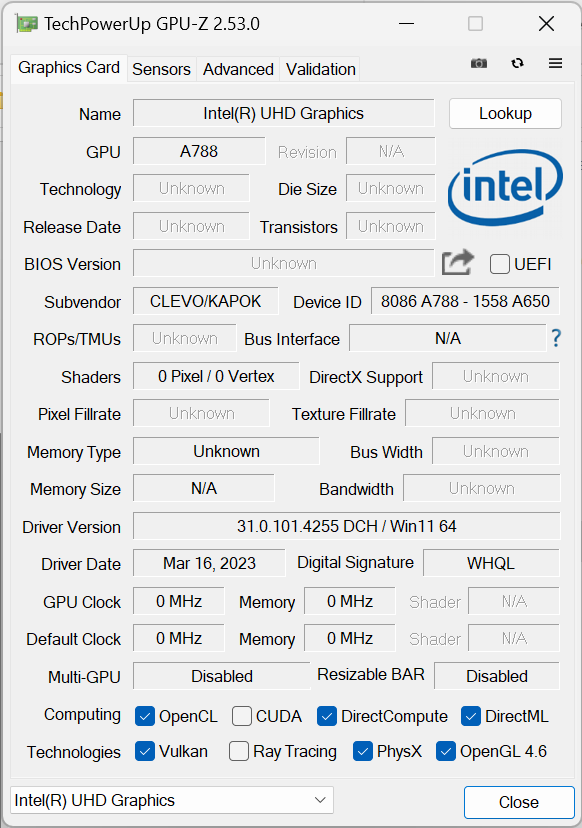
Focus 15可以通过Optimus和MUX开关直接选择图形芯片--酷睿i9的iGPU也可以使用。也就是说 英特尔UHD Graphics 770配备32个EU在 13900HX是英特尔在当前处理器中提供的较弱的图形选项之一。因此,它只能执行基本任务。
| 3DMark 11 Performance | 27613 points | |
| 3DMark Ice Storm Standard Score | 134251 points | |
| 3DMark Cloud Gate Standard Score | 52615 points | |
| 3DMark Fire Strike Score | 20964 points | |
| 3DMark Time Spy Score | 9236 points | |
Help | ||
| Geekbench 6.7 - GPU OpenCL | |
| Average of class Gaming (67235 - 253130, n=103, last 2 years) | |
| Schenker XMG Focus 15 (E23) | |
| Average NVIDIA GeForce RTX 4050 Laptop GPU (60815 - 86892, n=21) | |
* ... smaller is better
游戏性能
如前所述,图形处理器可由英特尔芯片或 Nvidia® RTX 4050 处理。 英伟达GeForce RTX 4050.实际上,我们希望在所有基准测试中使用自动切换的双GPU模式。但是,自动选择并不是在所有情况下都能很好地工作。因此,我们的游戏基准测试仅在dGPU模式下运行。
在搭载RTX 4050的对比设备中,Focus 15的游戏性能最佳。除了TheWitcher 3 之外,RTX 4050在这里的帧数比平时略高。结果Dota 2 Reborn和 X-Plane 11可能看起来很明显。Focus 15在这两款游戏中的帧数均高于专业版15更强的 RTX 4060.
然而,这两款游戏现在更多受到CPU性能而非GPU性能的限制。当您比较 Galaxy Book3 Ultra 16与 宏碁Swift Go.这两款设备均采用英特尔酷睿i7-13700H这两款设备均采用英特尔酷睿i7-13700H处理器,TDP值相近,在《Dota2重生》中的帧数也相近。
| The Witcher 3 - 1920x1080 Ultra Graphics & Postprocessing (HBAO+) | |
| Average of class Gaming (104.7 - 240, n=7, last 2 years) | |
| Schenker XMG Pro 15 (E23) | |
| MSI Katana 15 B12VEK | |
| Asus TUF A15 FA507 | |
| Gigabyte Aero 14 OLED BMF | |
| Gigabyte Aero 14 OLED BMF | |
| Schenker XMG Focus 15 (E23) | |
| Samsung Galaxy Book3 Ultra 16 | |
| Acer Swift X SFX14-71G | |
| Acer Swift Go SFG16-71 | |
| Final Fantasy XV Benchmark - 1920x1080 High Quality | |
| Average of class Gaming (41 - 215, n=95, last 2 years) | |
| Schenker XMG Focus 15 (E23) | |
| MSI Katana 15 B12VEK | |
| Asus TUF A15 FA507 | |
| Acer Swift X SFX14-71G | |
| Gigabyte Aero 14 OLED BMF | |
| Samsung Galaxy Book3 Ultra 16 | |
| Acer Swift Go SFG16-71 | |
| low | med. | high | ultra | QHD | 4K | |
|---|---|---|---|---|---|---|
| GTA V (2015) | 185.6 | 175.8 | 93.7 | |||
| The Witcher 3 (2015) | 64 | |||||
| Dota 2 Reborn (2015) | 193.2 | 181.6 | 175.8 | 160.7 | 106.6 | |
| Final Fantasy XV Benchmark (2018) | 114.1 | 85 | 58.5 | |||
| X-Plane 11.11 (2018) | 165.2 | 144.9 | 117 | 108.6 | ||
| Far Cry 5 (2018) | 141 | 131 | 123 | 86 | ||
| Strange Brigade (2018) | 417 | 218 | 175.4 | 151.2 | ||
| F1 22 (2022) | 244 | 234 | 174.7 | 55.7 | ||
| F1 23 (2023) | 259 | 235 | 164.5 | 45.3 | 36.9 |
排放:温暖的右掌托
噪声排放
Focus 15的风扇噪音水平与游戏笔记本电脑相当。在15厘米距离处测得的噪音高达55 dB(A),测试设备在性能模式下有时会发出令人不悦的噪音。
娱乐模式下的噪音值约为50 dB(A)。您还可以在睡眠模式下几乎无声地运行笔记本电脑,但会损失大量计算能力。
Noise level
| Idle |
| 24 / 25.14 / 35.14 dB(A) |
| Load |
| 55.93 / 56.34 dB(A) |
 | ||
30 dB silent 40 dB(A) audible 50 dB(A) loud |
||
min: | ||
| Schenker XMG Focus 15 (E23) GeForce RTX 4050 Laptop GPU, i9-13900HX, Crucial P5 Plus 1TB CT1000P5PSSD8 | Schenker XMG Pro 15 (E23) GeForce RTX 4060 Laptop GPU, i9-13900HX, Crucial P5 Plus 1TB CT1000P5PSSD8 | Asus TUF A15 FA507 GeForce RTX 4050 Laptop GPU, R7 7735HS, Micron 2400 MTFDKBA512QFM | MSI Katana 15 B12VEK GeForce RTX 4050 Laptop GPU, i7-12650H, Micron 2400 MTFDKBA1T0QFM | Acer Swift X SFX14-71G GeForce RTX 4050 Laptop GPU, i7-13700H, Samsung PM9A1 MZVL21T0HCLR | Samsung Galaxy Book3 Ultra 16 GeForce RTX 4050 Laptop GPU, i7-13700H, Samsung PM9A1 MZVL2512HCJQ | Gigabyte Aero 14 OLED BMF GeForce RTX 4050 Laptop GPU, i7-13700H, Gigabyte AG470S1TB-SI B10 | |
|---|---|---|---|---|---|---|---|
| Noise | 7% | 20% | 13% | 1% | 12% | 6% | |
| off / environment * (dB) | 24 | 24 -0% | 23.3 3% | 24 -0% | 24.8 -3% | 25 -4% | 24 -0% |
| Idle Minimum * (dB) | 24 | 24 -0% | 23.3 3% | 24 -0% | 28.2 -18% | 26 -8% | 24 -0% |
| Idle Average * (dB) | 25.14 | 24 5% | 23.3 7% | 24 5% | 31.8 -26% | 27 -7% | 24 5% |
| Idle Maximum * (dB) | 35.14 | 24 32% | 23.3 34% | 24 32% | 31.8 10% | 28 20% | 35.71 -2% |
| Load Average * (dB) | 55.93 | 53.65 4% | 29.6 47% | 37.71 33% | 38.2 32% | 40 28% | |
| Witcher 3 ultra * (dB) | 54.62 | 53.53 2% | 43 21% | 45.75 16% | 50 8% | 39 29% | 40.22 26% |
| Load Maximum * (dB) | 56.34 | 53.65 5% | 43 24% | 54.55 3% | 52.2 7% | 41 27% | 51.93 8% |
* ... smaller is better
温度
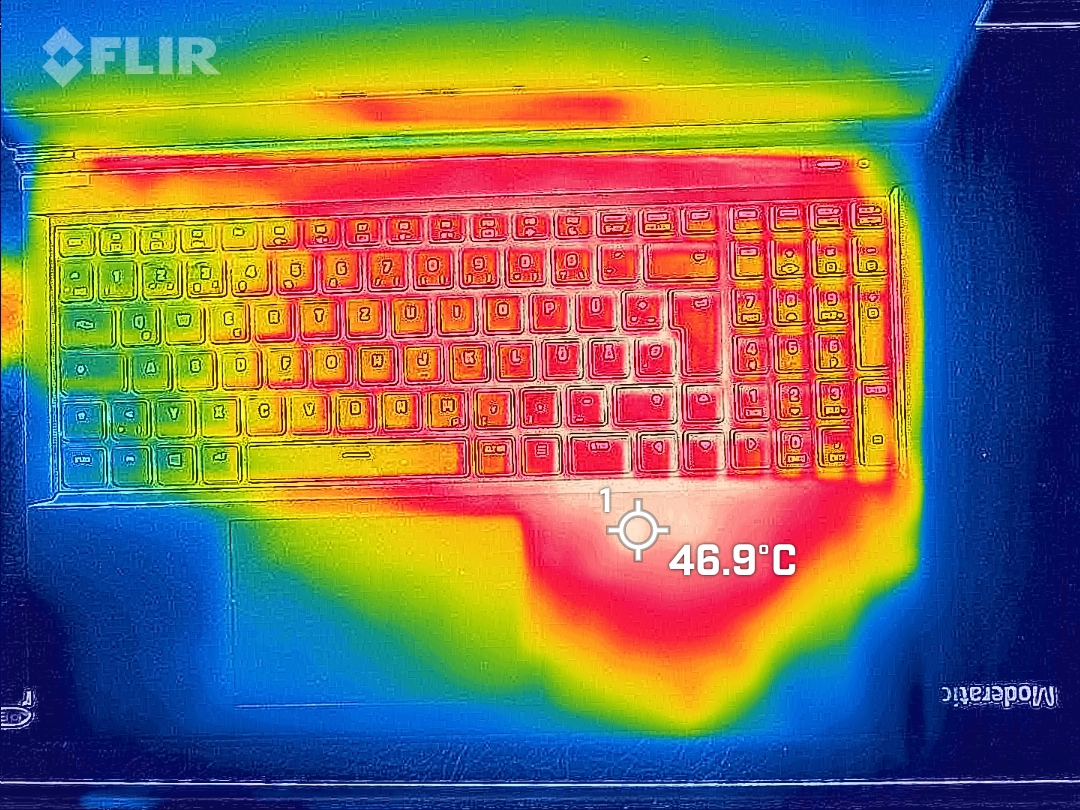
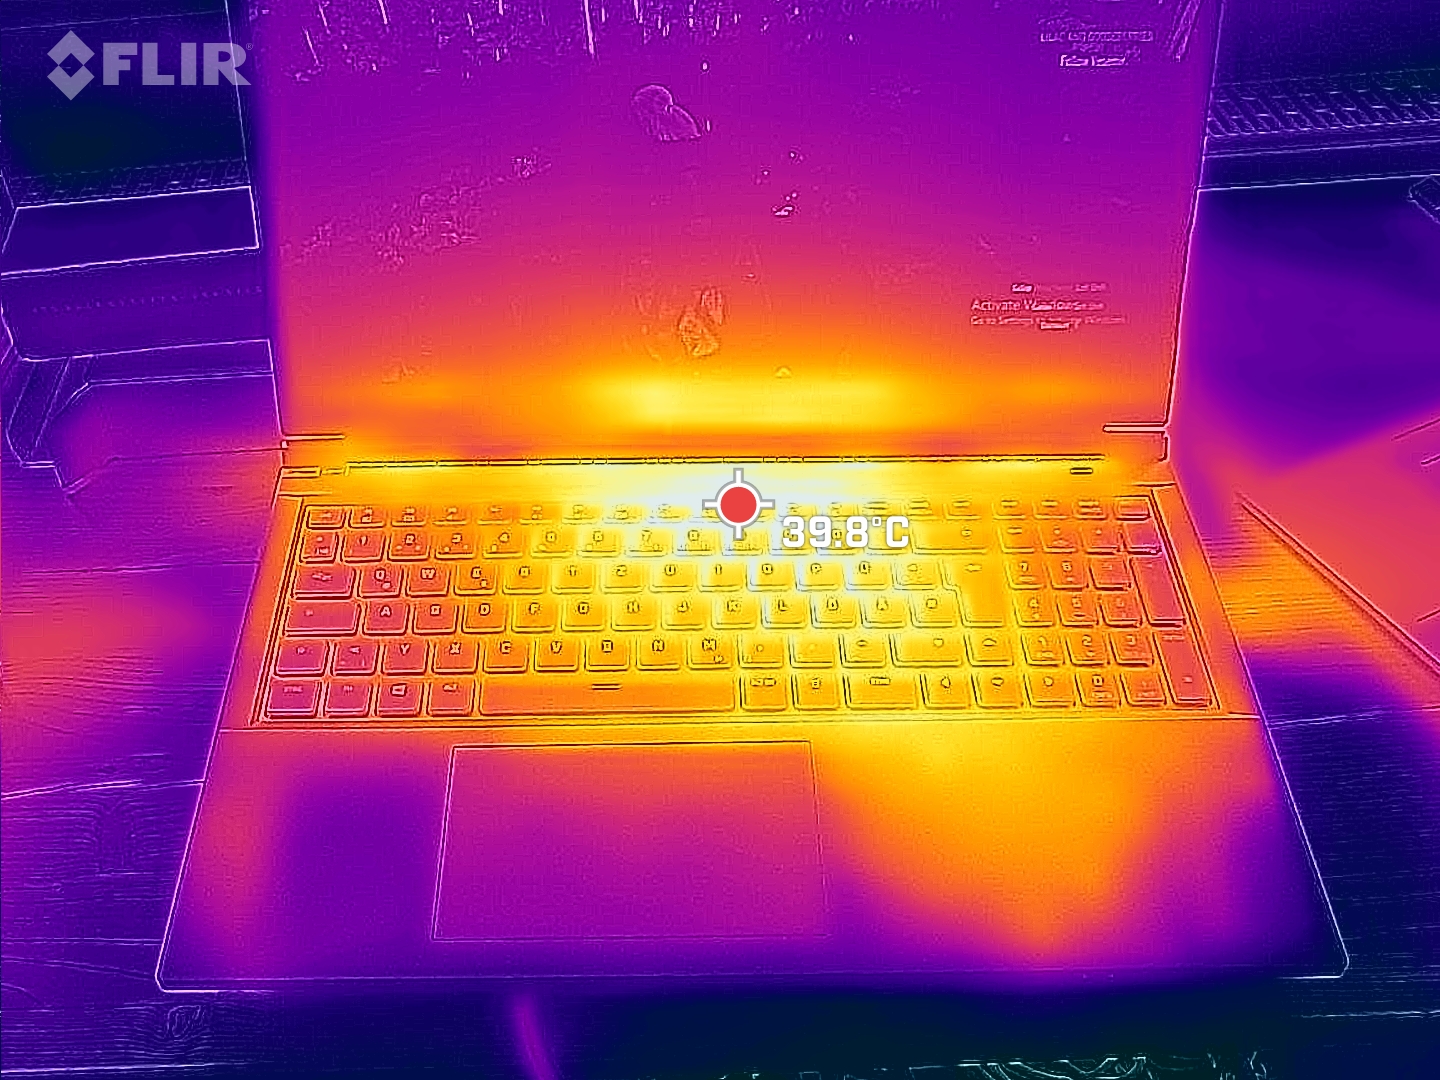
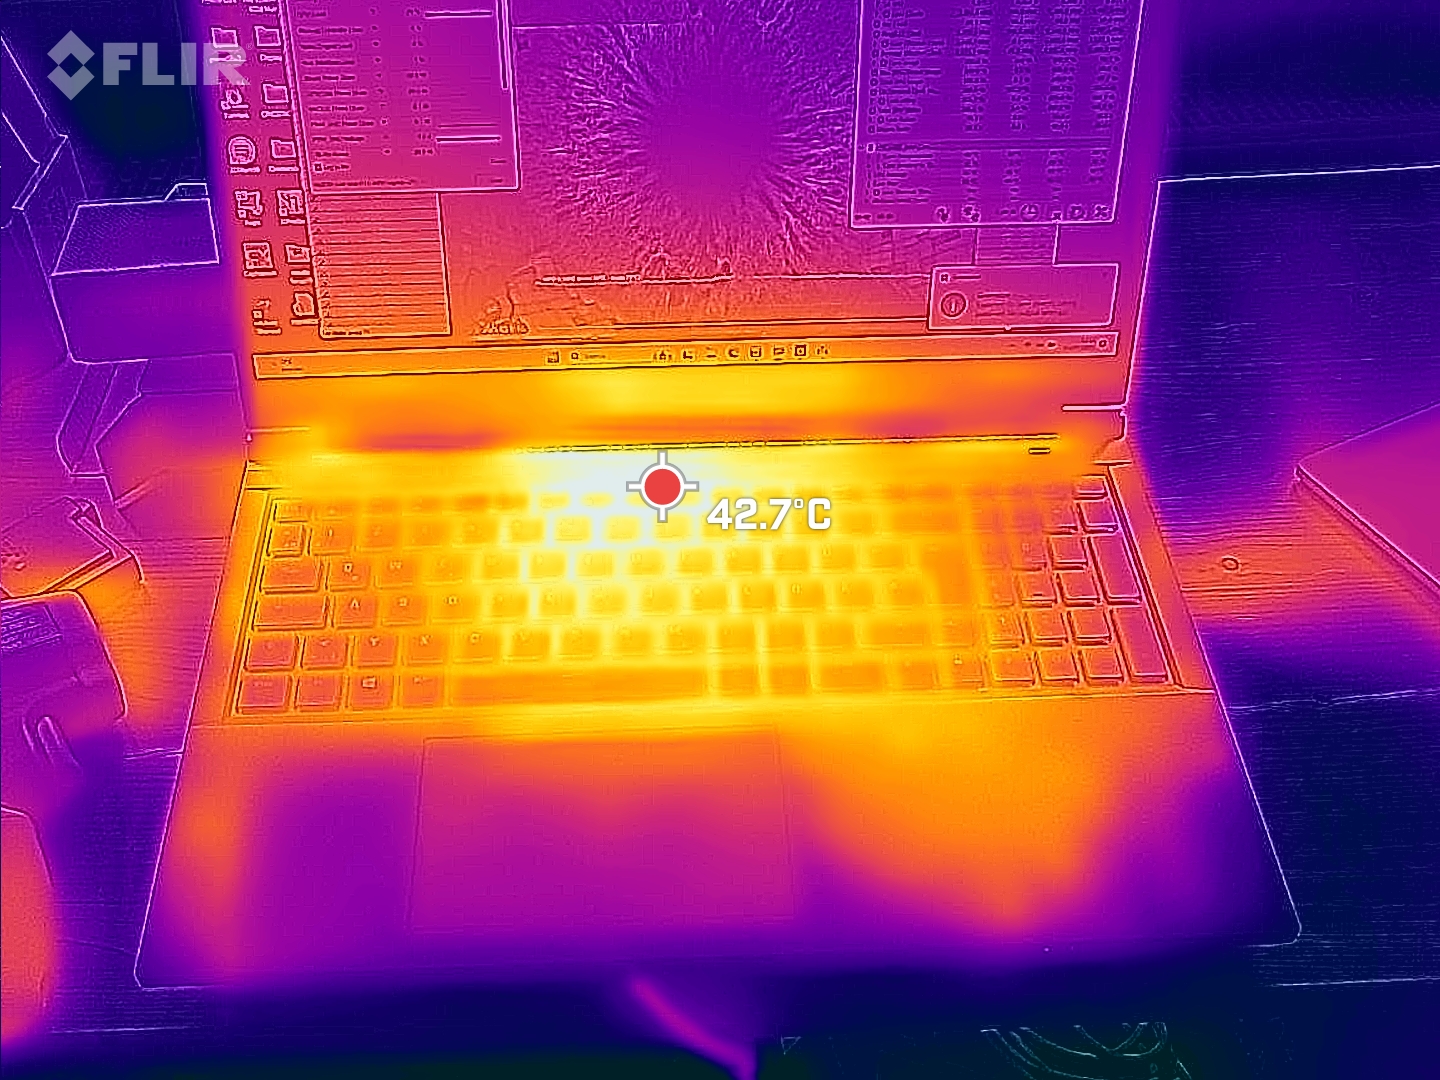
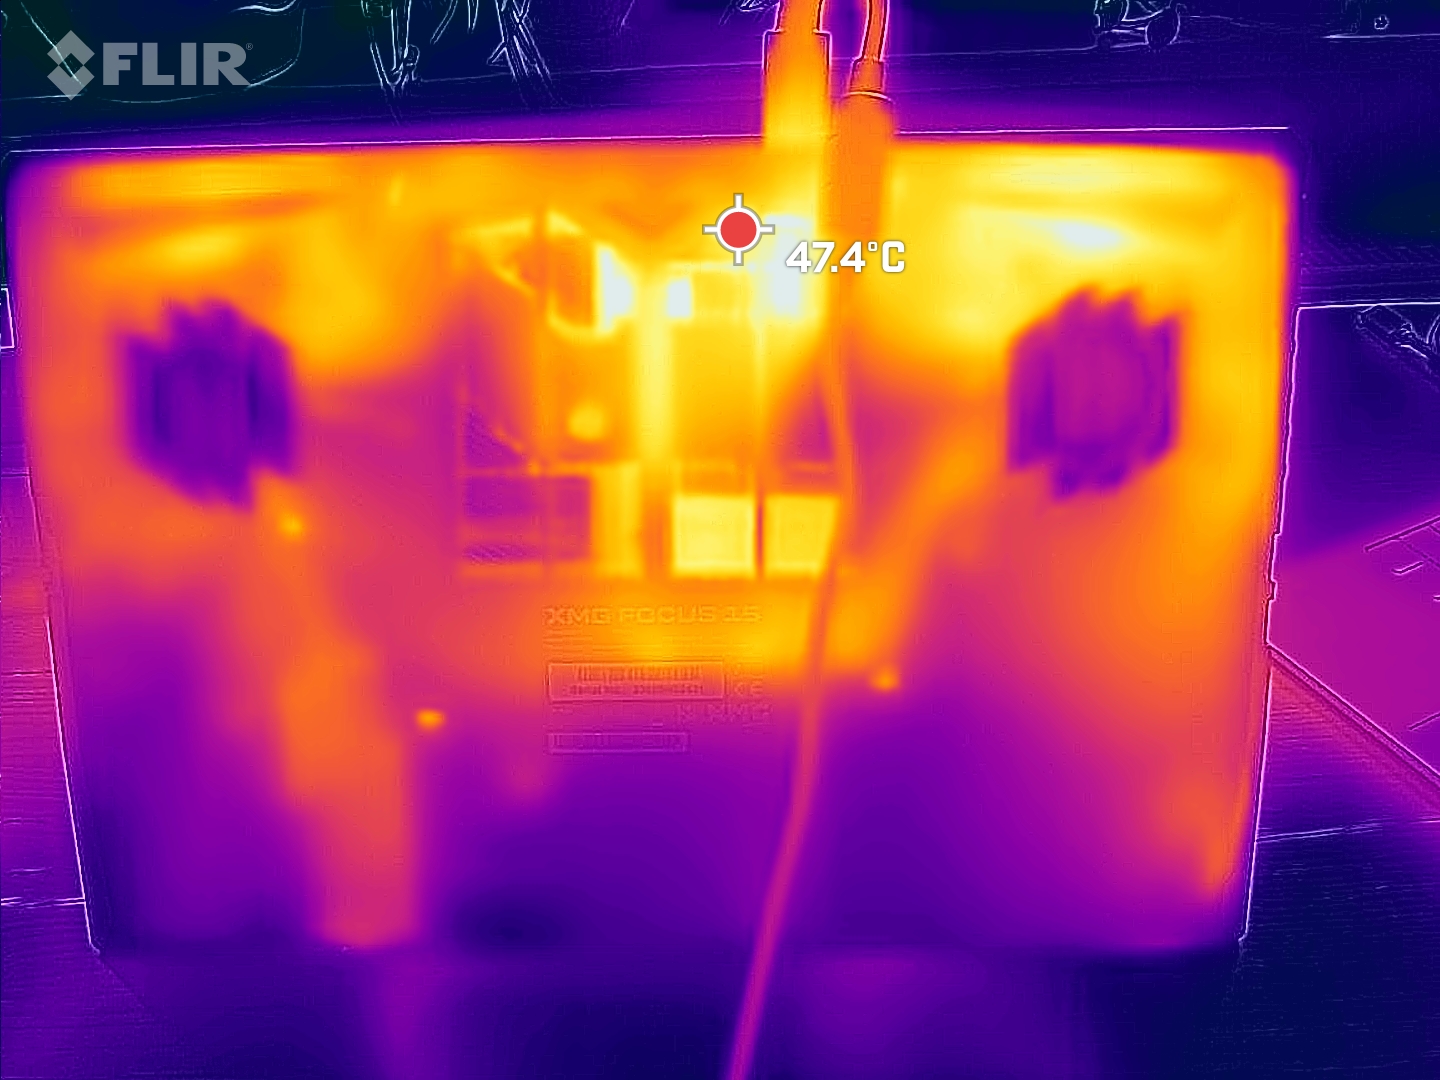
这款游戏笔记本电脑的表面温度一点也不低。我们测得的热点温度为51 °C,但幸运的是,这些热点远离通常的触摸点。
不过,在使用过程中,笔记本电脑右侧掌托的温度也很高。由于您通常使用外接鼠标进行游戏,这对右手使用者来说可能不是什么大问题。左侧掌托和W、A、S、D键则保持凉爽。
即使安装的NVMe固态硬盘负载较长,似乎也足以使掌托的温度显著升高。当我们安装测试游戏时,掌托温度几乎达到46 °C。
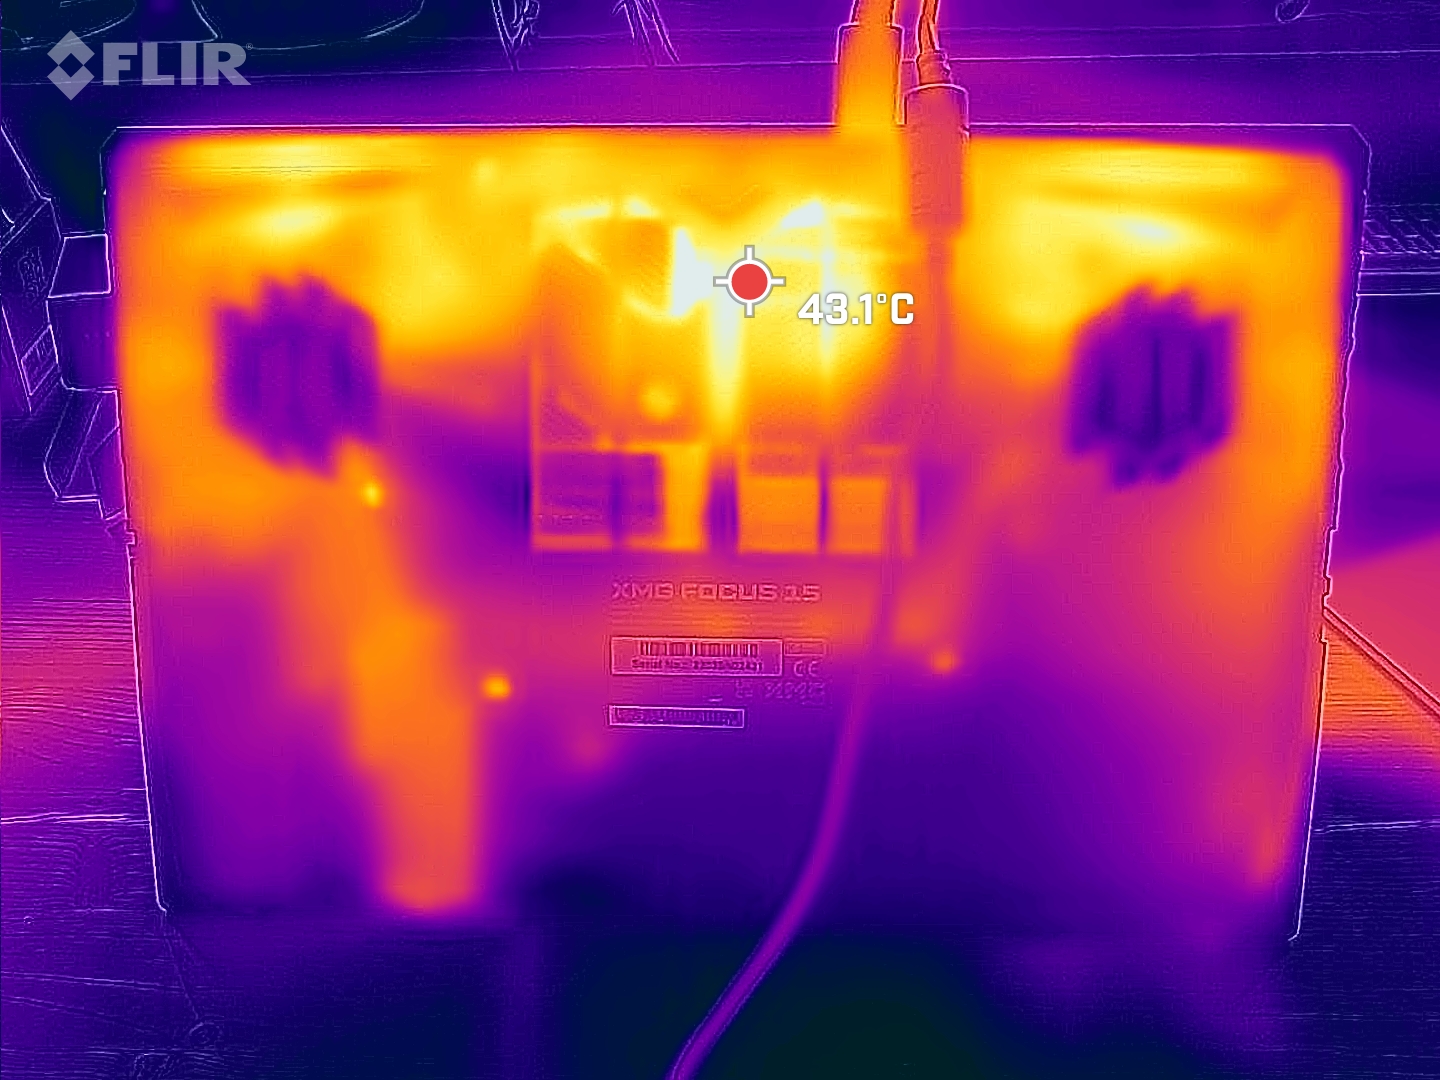
(-) The maximum temperature on the upper side is 51 °C / 124 F, compared to the average of 40.4 °C / 105 F, ranging from 21.2 to 68.8 °C for the class Gaming.
(-) The bottom heats up to a maximum of 53 °C / 127 F, compared to the average of 43.2 °C / 110 F
(+) In idle usage, the average temperature for the upper side is 25.8 °C / 78 F, compared to the device average of 33.9 °C / 93 F.
(±) Playing The Witcher 3, the average temperature for the upper side is 36.2 °C / 97 F, compared to the device average of 33.9 °C / 93 F.
(±) The palmrests and touchpad can get very hot to the touch with a maximum of 36 °C / 96.8 F.
(-) The average temperature of the palmrest area of similar devices was 28.8 °C / 83.8 F (-7.2 °C / -13 F).
| Schenker XMG Focus 15 (E23) Intel Core i9-13900HX, NVIDIA GeForce RTX 4050 Laptop GPU | Schenker XMG Pro 15 (E23) Intel Core i9-13900HX, NVIDIA GeForce RTX 4060 Laptop GPU | Asus TUF A15 FA507 AMD Ryzen 7 7735HS, NVIDIA GeForce RTX 4050 Laptop GPU | MSI Katana 15 B12VEK Intel Core i7-12650H, NVIDIA GeForce RTX 4050 Laptop GPU | Acer Swift X SFX14-71G Intel Core i7-13700H, NVIDIA GeForce RTX 4050 Laptop GPU | Samsung Galaxy Book3 Ultra 16 Intel Core i7-13700H, NVIDIA GeForce RTX 4050 Laptop GPU | Gigabyte Aero 14 OLED BMF Intel Core i7-13700H, NVIDIA GeForce RTX 4050 Laptop GPU | |
|---|---|---|---|---|---|---|---|
| Heat | -3% | 9% | -8% | 9% | 18% | 10% | |
| Maximum Upper Side * (°C) | 51 | 50 2% | 48.9 4% | 47 8% | 46.4 9% | 41 20% | 42 18% |
| Maximum Bottom * (°C) | 53 | 50 6% | 44.6 16% | 48 9% | 49 8% | 44 17% | 52 2% |
| Idle Upper Side * (°C) | 29 | 33 -14% | 27.1 7% | 35 -21% | 26.5 9% | 23 21% | 26 10% |
| Idle Bottom * (°C) | 30 | 32 -7% | 27.5 8% | 38 -27% | 26.6 11% | 26 13% | 27 10% |
* ... smaller is better
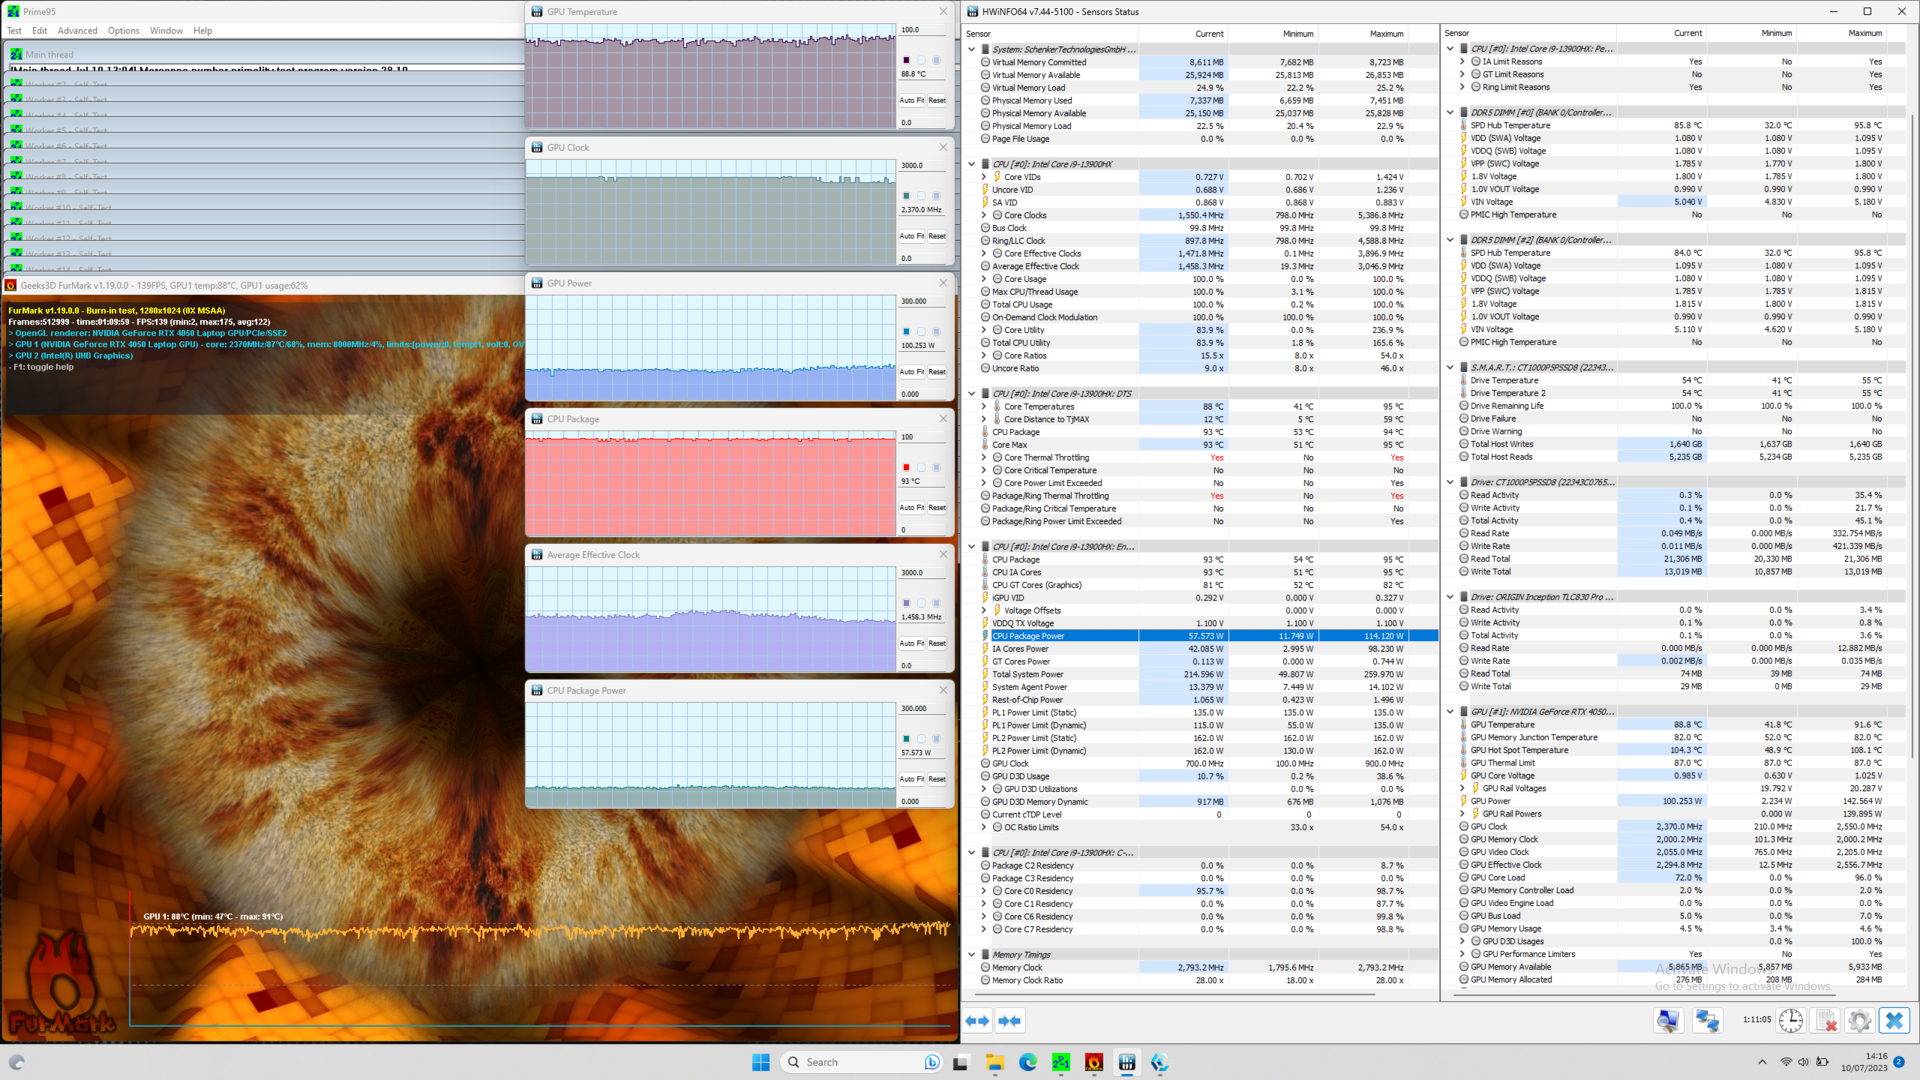
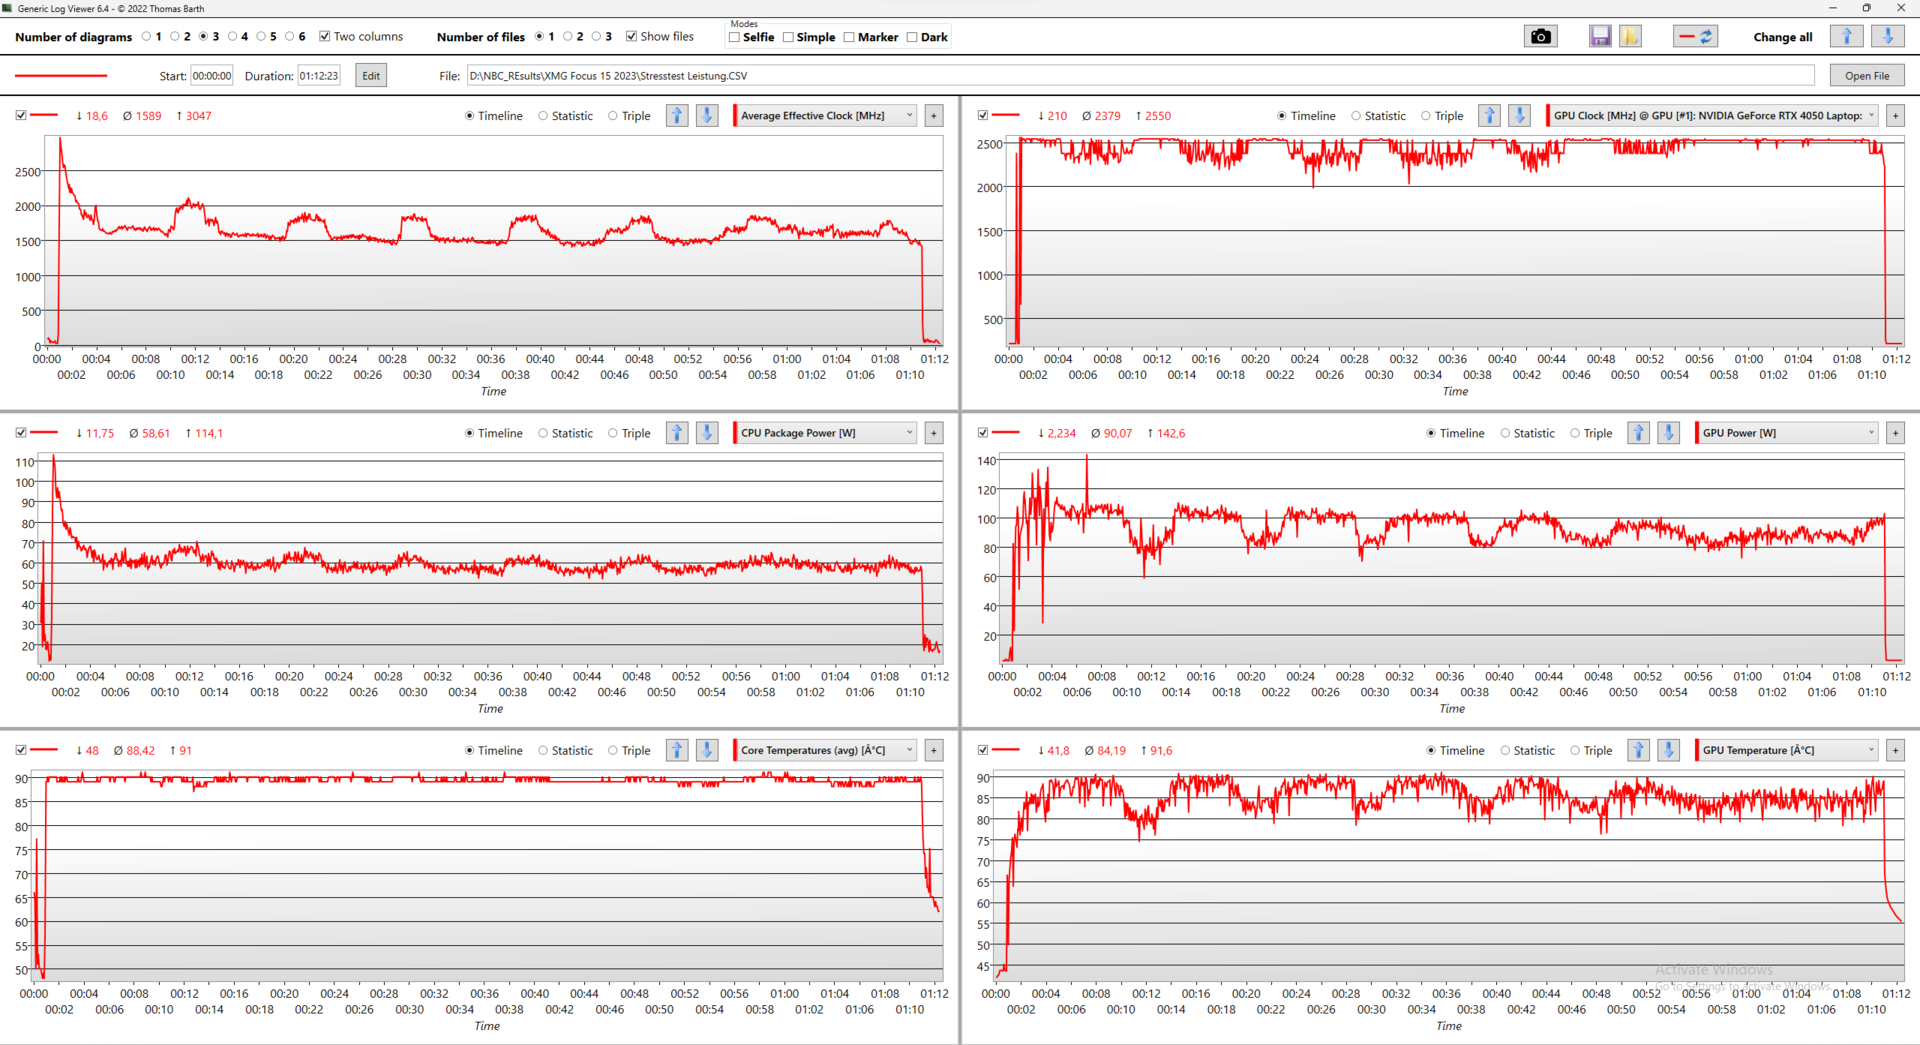
压力测试
XMG Focus 15在高温下通过了Prime95和Furmark的压力测试,性能保持稳定。在升压阶段之后,我们无法确定CPU或GPU时钟是否下降。
相反,Core i9的温度相对较高,约为90 °C。然而,从压力测试的日志来看,我们不得不注意到申克所说的数值并没有长期保持。
在压力测试进行了大约10分钟后,CPU性能稳定在60 W左右,GPU功耗为100 W。
扬声器
Focus 15的扬声器能够较好地呈现中音和高音,但几乎没有低音。因此,Focus 15的音质要比Pro 15好一些。
如果板载扬声器似乎不够用,您可以使用通过蓝牙或3.5毫米插孔连接的外部设备。
Schenker XMG Focus 15 (E23) audio analysis
(±) | speaker loudness is average but good (77.39 dB)
Bass 100 - 315 Hz
(-) | nearly no bass - on average 29% lower than median
(±) | linearity of bass is average (9.5% delta to prev. frequency)
Mids 400 - 2000 Hz
(±) | higher mids - on average 5.2% higher than median
(±) | linearity of mids is average (7.2% delta to prev. frequency)
Highs 2 - 16 kHz
(±) | higher highs - on average 5.4% higher than median
(+) | highs are linear (3.4% delta to prev. frequency)
Overall 100 - 16.000 Hz
(±) | linearity of overall sound is average (24.9% difference to median)
Compared to same class
» 89% of all tested devices in this class were better, 3% similar, 7% worse
» The best had a delta of 6%, average was 18%, worst was 132%
Compared to all devices tested
» 76% of all tested devices were better, 5% similar, 19% worse
» The best had a delta of 4%, average was 23%, worst was 134%
Schenker XMG Pro 15 (E23) audio analysis
(±) | speaker loudness is average but good (72.52 dB)
Bass 100 - 315 Hz
(±) | reduced bass - on average 12.9% lower than median
(±) | linearity of bass is average (7.2% delta to prev. frequency)
Mids 400 - 2000 Hz
(±) | higher mids - on average 6.2% higher than median
(±) | linearity of mids is average (7.8% delta to prev. frequency)
Highs 2 - 16 kHz
(+) | balanced highs - only 2.5% away from median
(+) | highs are linear (4.6% delta to prev. frequency)
Overall 100 - 16.000 Hz
(±) | linearity of overall sound is average (18% difference to median)
Compared to same class
» 56% of all tested devices in this class were better, 9% similar, 36% worse
» The best had a delta of 6%, average was 18%, worst was 132%
Compared to all devices tested
» 38% of all tested devices were better, 8% similar, 54% worse
» The best had a delta of 4%, average was 23%, worst was 134%
电源管理高能耗游戏笔记本电脑
能源消耗
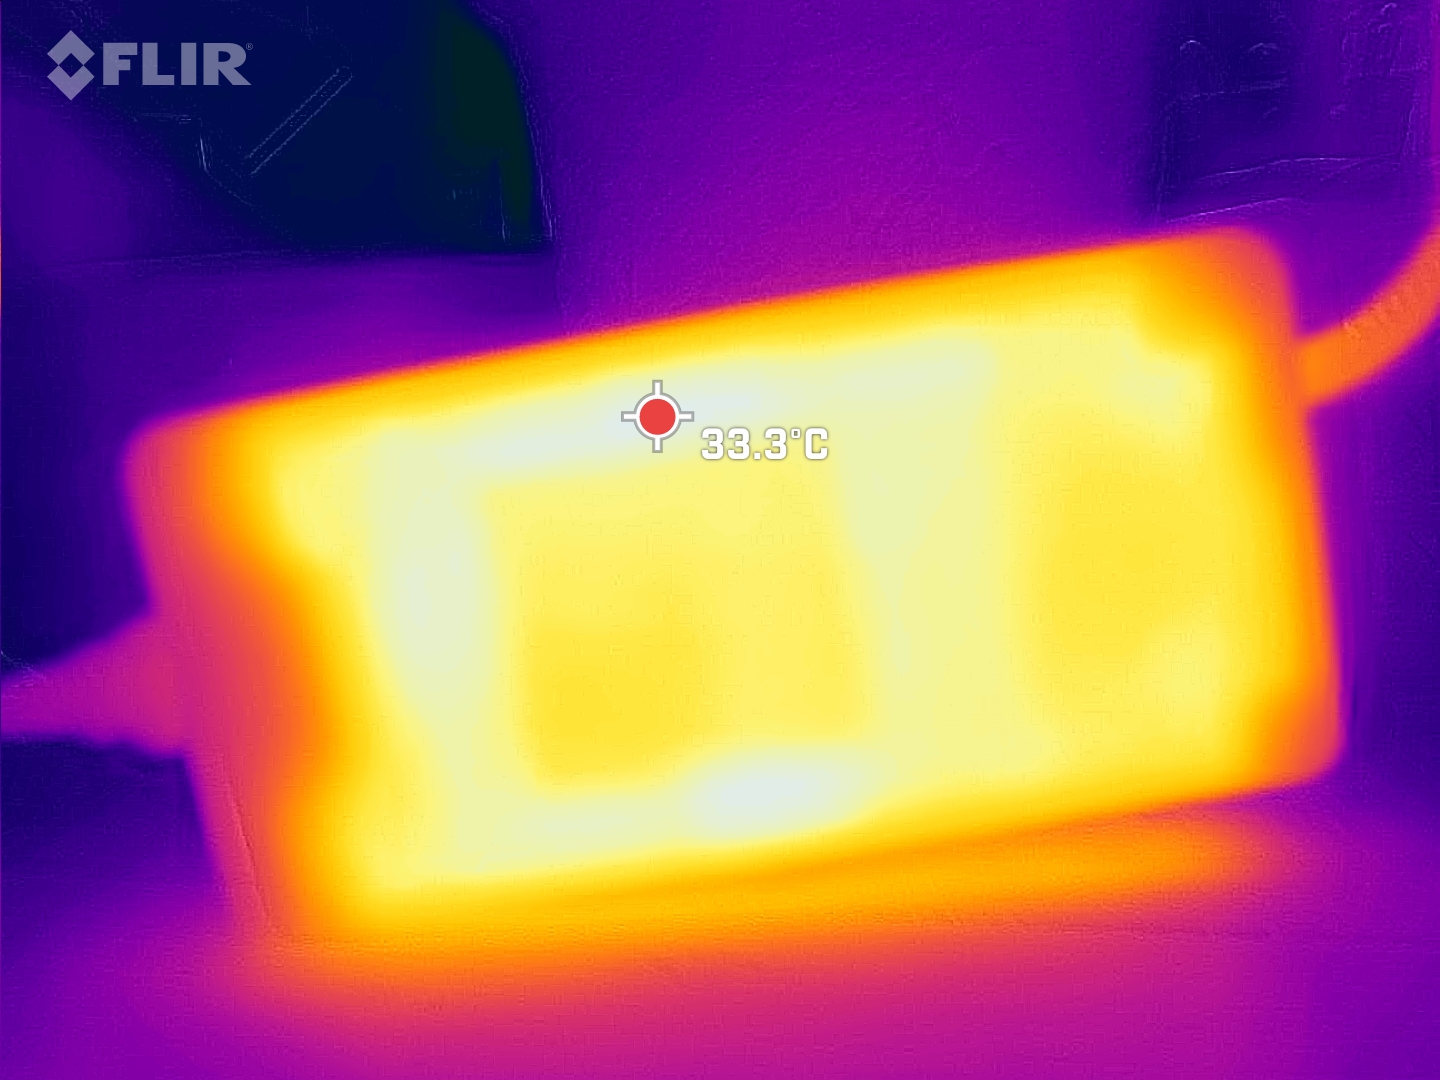
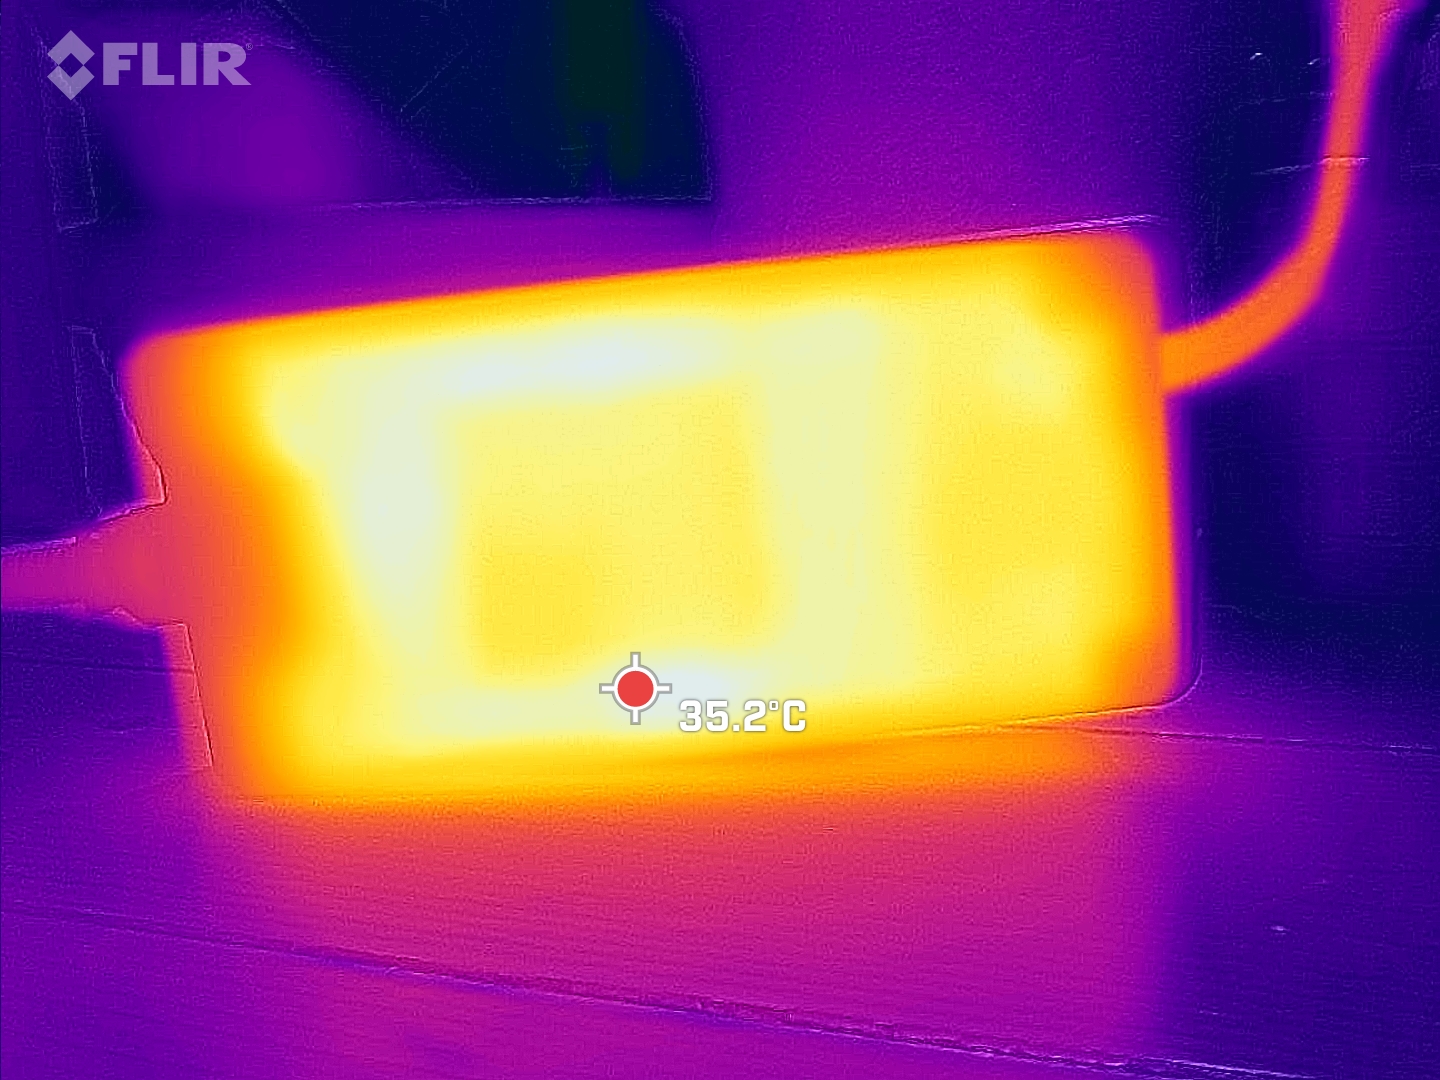
申克XMG Focus 15对能量的渴求堪称一流。它配备了一个功率高达280 W的大型电源。
有趣的是,Focus 15的峰值负载消耗要高于Pro 15,因此电源的输出功率也得到了充分利用。
在外接显示器上运行时,笔记本电脑在压力测试中的能耗甚至稳定在280 W以上。使用内置显示器时,能耗在短时间内略有下降。
| Off / Standby | |
| Idle | |
| Load |
|
Key:
min: | |
| Schenker XMG Focus 15 (E23) i9-13900HX, GeForce RTX 4050 Laptop GPU, Crucial P5 Plus 1TB CT1000P5PSSD8, IPS, 2569x1440, 15.6" | Schenker XMG Pro 15 (E23) i9-13900HX, GeForce RTX 4060 Laptop GPU, Crucial P5 Plus 1TB CT1000P5PSSD8, IPS, 2560x1440, 15.6" | Asus TUF A15 FA507 R7 7735HS, GeForce RTX 4050 Laptop GPU, Micron 2400 MTFDKBA512QFM, IPS, 1920x1080, 15.6" | MSI Katana 15 B12VEK i7-12650H, GeForce RTX 4050 Laptop GPU, Micron 2400 MTFDKBA1T0QFM, IPS, 1920x1080, 15.6" | Acer Swift X SFX14-71G i7-13700H, GeForce RTX 4050 Laptop GPU, Samsung PM9A1 MZVL21T0HCLR, OLED, 2880x1800, 14.5" | Samsung Galaxy Book3 Ultra 16 i7-13700H, GeForce RTX 4050 Laptop GPU, Samsung PM9A1 MZVL2512HCJQ, AMOLED, 2880x1800, 16" | Gigabyte Aero 14 OLED BMF i7-13700H, GeForce RTX 4050 Laptop GPU, Gigabyte AG470S1TB-SI B10, OLED, 2880x1800, 14" | Average NVIDIA GeForce RTX 4050 Laptop GPU | Average of class Gaming | |
|---|---|---|---|---|---|---|---|---|---|
| Power Consumption | -39% | 40% | 41% | 47% | 64% | 54% | 23% | 1% | |
| Idle Minimum * (Watt) | 11.4 | 21.6 -89% | 8 30% | 8.5 25% | 8.4 26% | 3 74% | 7.4 35% | 9.95 ? 13% | 13 ? -14% |
| Idle Average * (Watt) | 16.7 | 29 -74% | 12.1 28% | 10.2 39% | 11.5 31% | 5 70% | 8.3 50% | 15.8 ? 5% | 19 ? -14% |
| Idle Maximum * (Watt) | 25.8 | 42.7 -66% | 12.5 52% | 11.3 56% | 11.9 54% | 11 57% | 8.7 66% | 20.1 ? 22% | 24.6 ? 5% |
| Load Average * (Watt) | 139 | 190 -37% | 74.9 46% | 84 40% | 84.9 39% | 72 48% | 76 45% | 88 ? 37% | 110.7 ? 20% |
| Witcher 3 ultra * (Watt) | 265 | 189 29% | 136.6 48% | 128 52% | 83.6 68% | 69.7 74% | 70 74% | ||
| Load Maximum * (Watt) | 280 | 269 4% | 185 34% | 189 32% | 104.2 63% | 108 61% | 132 53% | 176.3 ? 37% | 259 ? 7% |
* ... smaller is better
Power consumption: The Witcher 3 / Stress test
Power consumption: External Monitor
电池寿命
在实际的Wi-Fi网上冲浪测试中,我们确定了近6小时的运行时间。因此,测试设备仅比普通游戏笔记本电脑少两分钟。
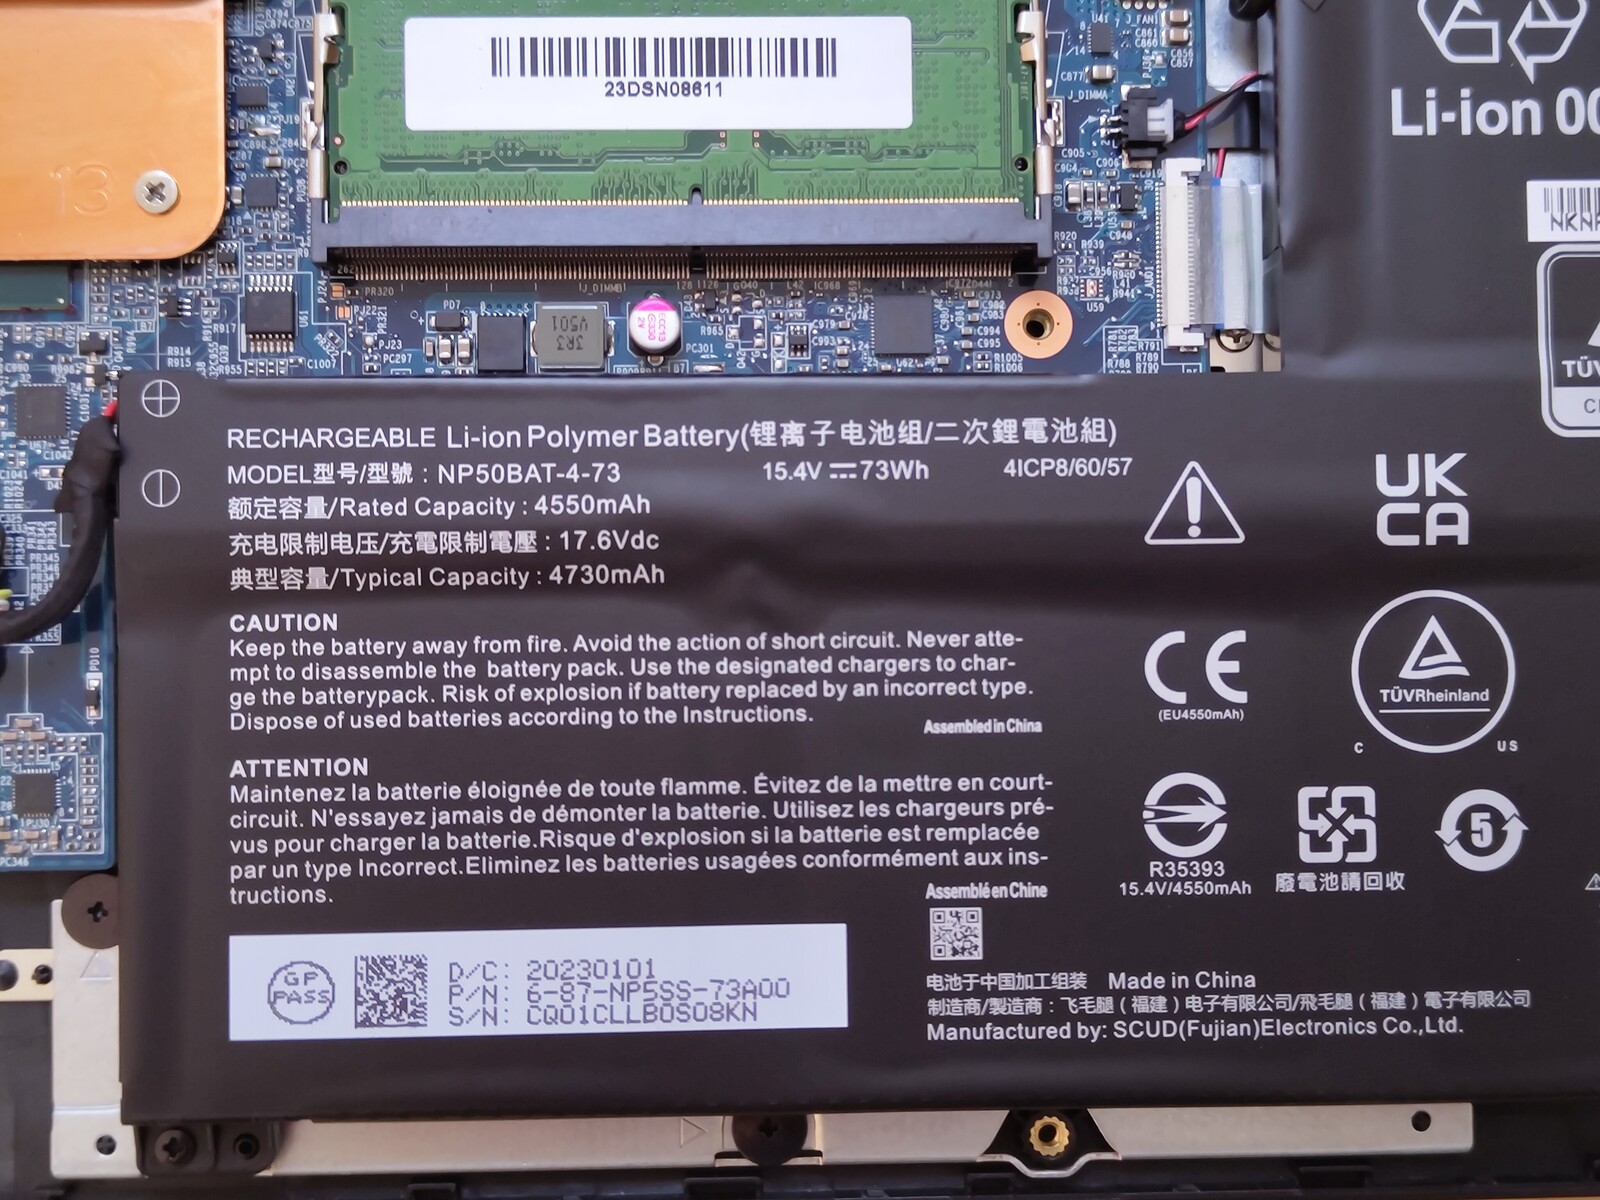
同时,游戏玩家可以在电池模式下获得更长的运行时间。不过,73 Wh的电池容量很快就会耗尽。
| Schenker XMG Focus 15 (E23) i9-13900HX, GeForce RTX 4050 Laptop GPU, 73 Wh | Schenker XMG Pro 15 (E23) i9-13900HX, GeForce RTX 4060 Laptop GPU, 80 Wh | Asus TUF A15 FA507 R7 7735HS, GeForce RTX 4050 Laptop GPU, 90 Wh | MSI Katana 15 B12VEK i7-12650H, GeForce RTX 4050 Laptop GPU, 53.5 Wh | Acer Swift X SFX14-71G i7-13700H, GeForce RTX 4050 Laptop GPU, 76 Wh | Samsung Galaxy Book3 Ultra 16 i7-13700H, GeForce RTX 4050 Laptop GPU, 76 Wh | Gigabyte Aero 14 OLED BMF i7-13700H, GeForce RTX 4050 Laptop GPU, 63 Wh | Average of class Gaming | |
|---|---|---|---|---|---|---|---|---|
| Battery runtime | 22% | 38% | -6% | -8% | 51% | 22% | 19% | |
| WiFi v1.3 (h) | 5.9 | 5.7 -3% | 11.7 98% | 4.3 -27% | 7.7 31% | 9.6 63% | 7.6 29% | 7.11 ? 21% |
| Load (h) | 1.3 | 1.9 46% | 1 -23% | 1.5 15% | 0.7 -46% | 1.8 38% | 1.5 15% | 1.502 ? 16% |
| H.264 (h) | 12.5 | 4.4 | 9.5 | 13.4 | 8.32 ? | |||
| Reader / Idle (h) | 18.2 | 11.3 | 8.27 ? |
Pros
Cons
结论:XMG抓住了游戏的本质
如果您想要一台15.6英寸的笔记本电脑,并配备申克或XMG当前的Nvidia GPU,您可以选择XMG Apex 15 Max和Focus以及Schenker Key和Media。冽 XMG Pro 15和XMG Focus 15在测试中的表现非常接近。
Focus 15侧重于基本功能。这款游戏笔记本电脑主要以高性能计算硬件取胜。英特尔英特尔酷睿i9-13900HX和 英伟达GeForce RTX 4050工作在非常高的性能水平上。虽然这在基准测试中获得了很高的分数,但同时也导致了较高的表面温度、较响的风扇声以及较短的电池运行时间。 华硕TUF A15.
至于机箱是否必须像Pro 15那样配备大量金属,或者是否可以由塑料制成,则是一个品味问题。从外观上看,Pro 15和Focus 15非常相似。不过,评测样品提供的连接性较差,缺少带Power Delivery的USB Type-C端口。
XMG Focus 15满足了游戏笔记本电脑的基本要求。由于配置选项众多,它可以满足用户的需求。
与Pro 15一样,Focus 15的缺点也不多。这是因为该笔记本电脑显示的所有缺点都是其价格和性能级别的典型缺点。
与其他廉价游戏笔记本电脑相比,如华硕 TUF A15 或微星 Katana 15 ,XMG Focus 极其强劲的酷睿 i9-13900HX 和良好的 QHD 屏幕都具有积极的意义。
价格和供货情况
XMG Focus 15可以在Bestware自由配置。有两种显示器可供选择,三种GPU可供选择,多种内存组合可供选择。在绝对基本的配置中,只有8GB工作内存,没有固态硬盘或Windows,入门级价格约为1,440欧元(约合1,618美元)。
对于配备全高清显示屏、16GB工作内存和1TB三星固态硬盘的配置,Bestware的价格约为1560欧元。我们的测试配置价格高出约300欧元。如果您打算全力以赴,选择最昂贵的组件,预计这款笔记本电脑的价格将超过3500欧元。
Schenker XMG Focus 15 (E23)
- 07/10/2023 v7 (old)
Marc Herter
Transparency
The selection of devices to be reviewed is made by our editorial team. The test sample was provided to the author as a loan by the manufacturer or retailer for the purpose of this review. The lender had no influence on this review, nor did the manufacturer receive a copy of this review before publication. There was no obligation to publish this review. As an independent media company, Notebookcheck is not subjected to the authority of manufacturers, retailers or publishers.
This is how Notebookcheck is testing
Every year, Notebookcheck independently reviews hundreds of laptops and smartphones using standardized procedures to ensure that all results are comparable. We have continuously developed our test methods for around 20 years and set industry standards in the process. In our test labs, high-quality measuring equipment is utilized by experienced technicians and editors. These tests involve a multi-stage validation process. Our complex rating system is based on hundreds of well-founded measurements and benchmarks, which maintains objectivity. Further information on our test methods can be found here.
Price comparison
