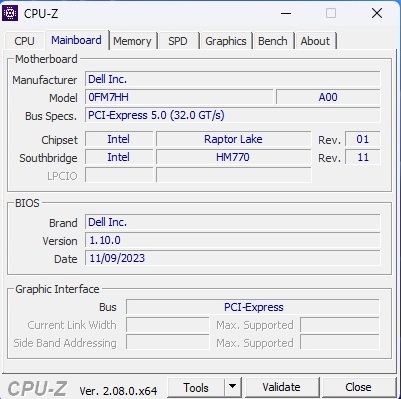
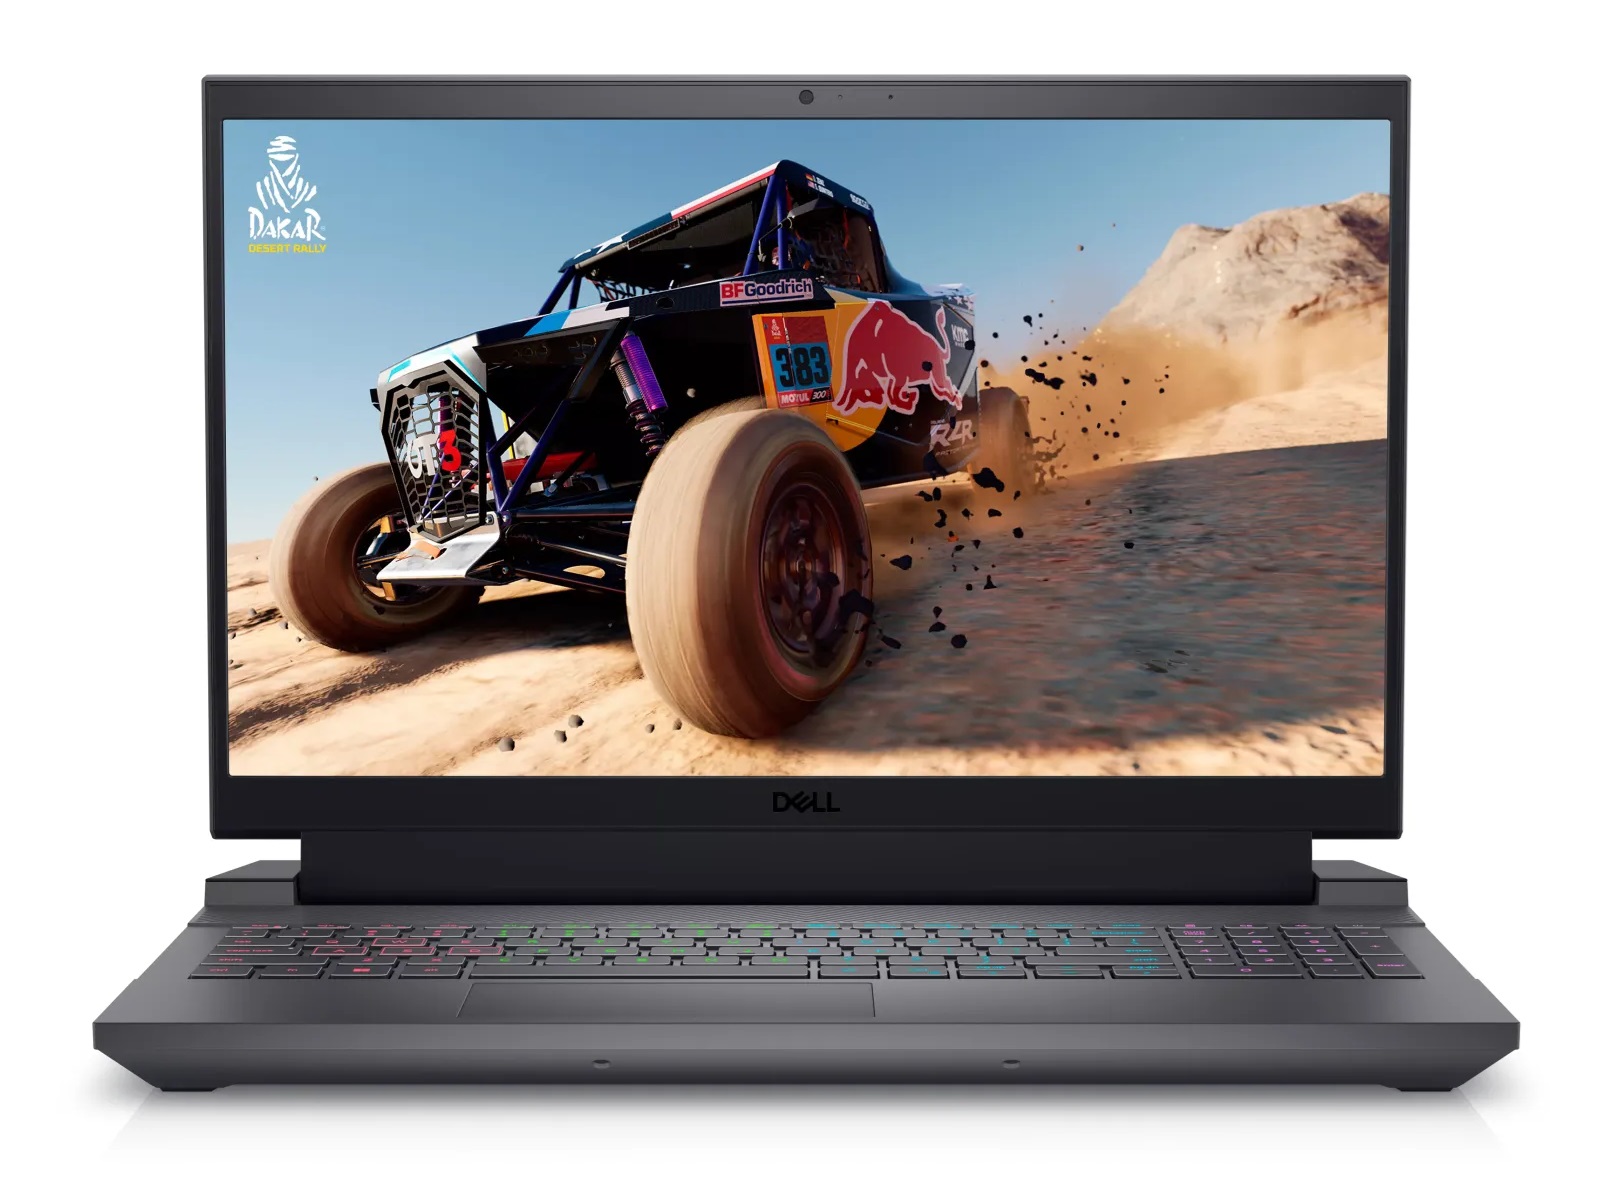
戴尔 G15 5530 评测:暗影灰色 RTX 4050 游戏笔记本电脑

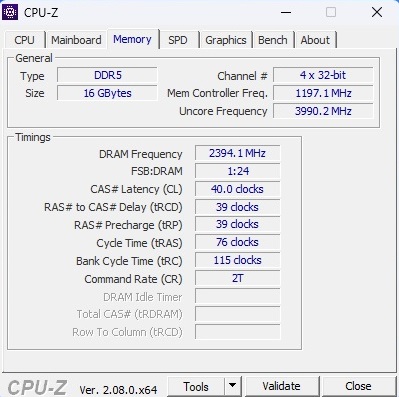
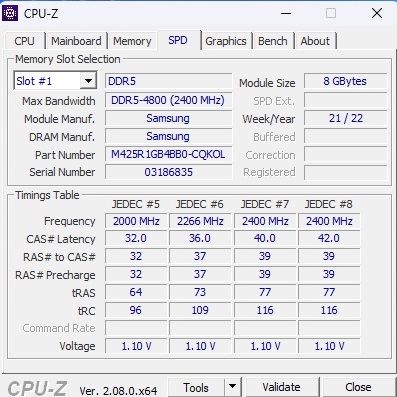
在对配备 酷睿 i7-13650HX和 GeForce RTX 4060几个月前(见 文章),现在我们来看看成本更低的版本(几百欧元),配备了 酷睿 i5-13450HX和 GeForce RTX 4050.该机型同样配备了 16 GB DDR-4800 内存、512 GB 硬盘和 165Hz IPS 显示屏,不过这些组件偶尔会使用不同的型号。最后是 Windows 11 Home 64 位操作系统。
G15 的竞争对手是其他基于 RTX 4050 的 15 英寸游戏笔记本电脑,如 Medion Erazer Crawler E40以及 联想 LOQ 15IRH8和 华硕 TUF A15 FA507所有这些产品都出现在下表中,以便进行比较。
由于机箱与 G15除了配色(灰色而非白色)和键盘语言外,机箱与我们之前评测过的 G15 完全相同,因此本文仅简要介绍机箱、规格和输入设备。
潜在的竞争对手比较
Rating | Date | Model | Weight | Height | Size | Resolution | Price |
|---|---|---|---|---|---|---|---|
| 84.7 % v7 (old) | 01 / 2024 | Dell G15 5530, i5-13450HX RTX 4050 i5-13450HX, GeForce RTX 4050 Laptop GPU | 2.7 kg | 27 mm | 15.60" | 1920x1080 | |
| 85.4 % v7 (old) | 12 / 2023 | Medion Erazer Crawler E40 - MD 62518 i5-13500H, GeForce RTX 4050 Laptop GPU | 2.3 kg | 28 mm | 15.60" | 1920x1080 | |
| 85.9 % v7 (old) | 10 / 2023 | Lenovo LOQ 15IRH8 Core i7 i7-13620H, GeForce RTX 4050 Laptop GPU | 2.4 kg | 25.2 mm | 15.60" | 2560x1440 | |
| 86.3 % v7 (old) | 06 / 2023 | Asus TUF A15 FA507 R7 7735HS, GeForce RTX 4050 Laptop GPU | 2.2 kg | 24.9 mm | 15.60" | 1920x1080 | |
| 84.2 % v7 (old) | 06 / 2023 | Dell G15 5530 i7-13650HX, GeForce RTX 4060 Laptop GPU | 3 kg | 26.95 mm | 15.60" | 1920x1080 |
案例
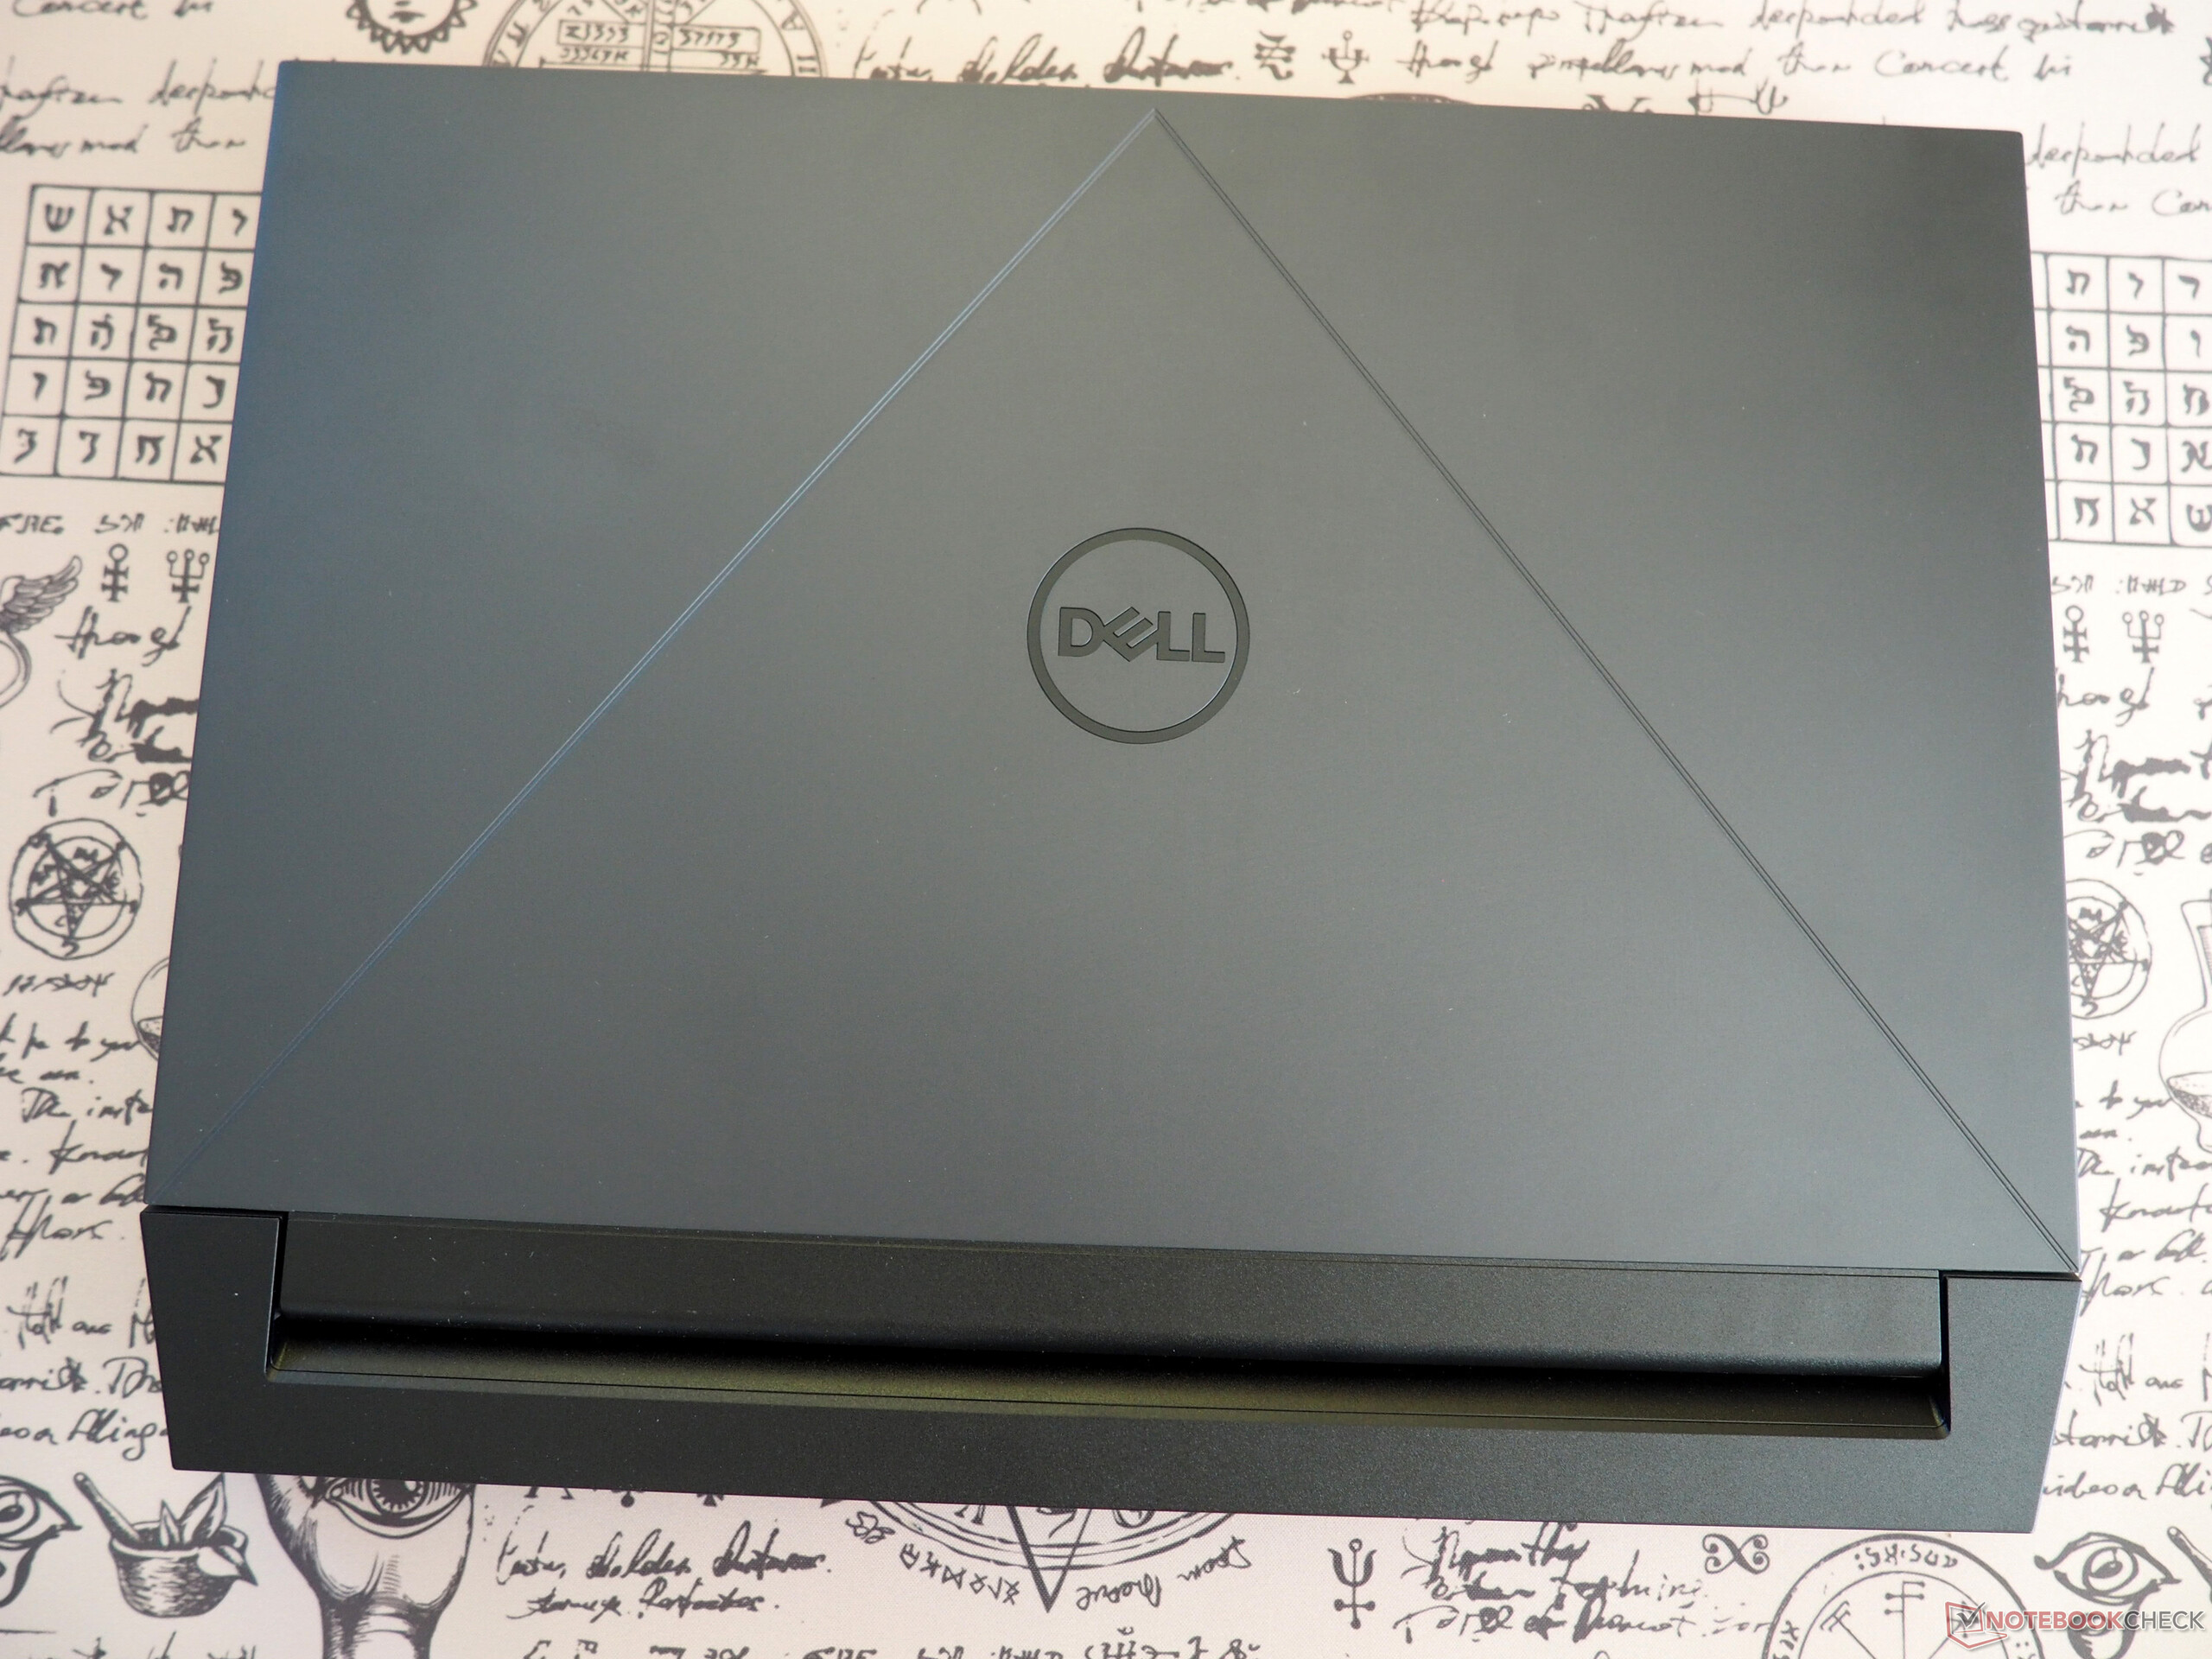
G15 是一款采用经典构造的笔记本电脑,这意味着它既不非常薄(2.7 厘米或 1.06 英寸),也不特别轻(2.7 千克或 5.95 磅)。竞争对手提供了更现代的设计,但这并不一定是好事(关键词:排放)。在美学方面,这款笔记本电脑的设计特别引人注目,但与许多其他同价位的制造商一样,戴尔选择了全塑料外观,在某些地方容易发出响声。相比之下,戴尔笔记本的装配和外观质量还是不错的。铰链装置做得不错,单手就能轻松打开笔记本电脑。
规格
接口
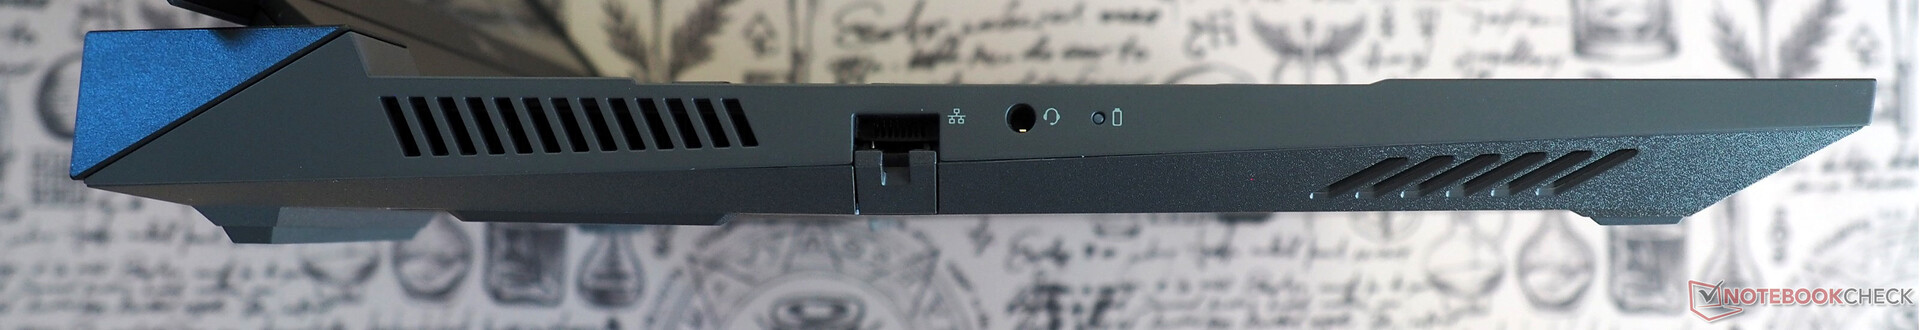
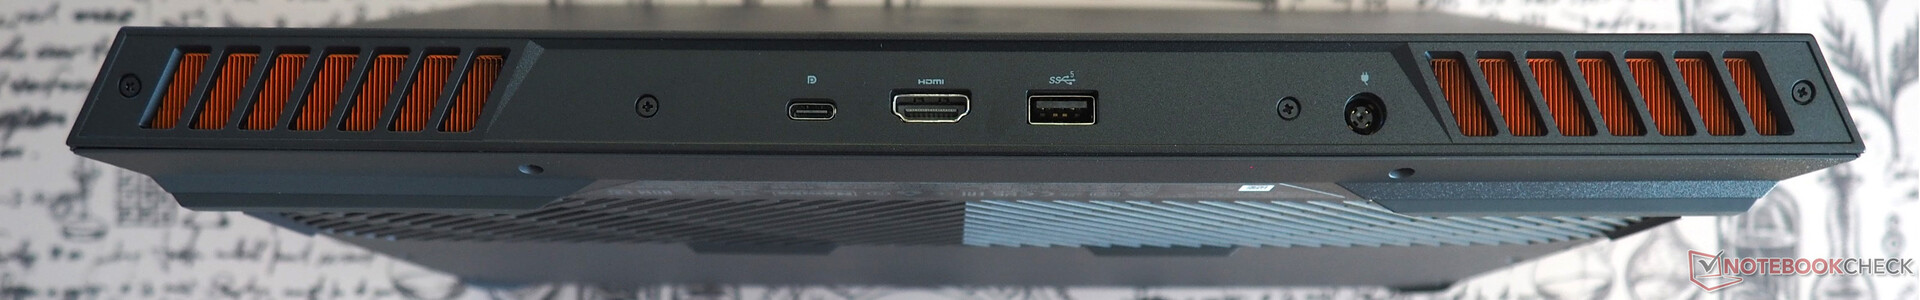
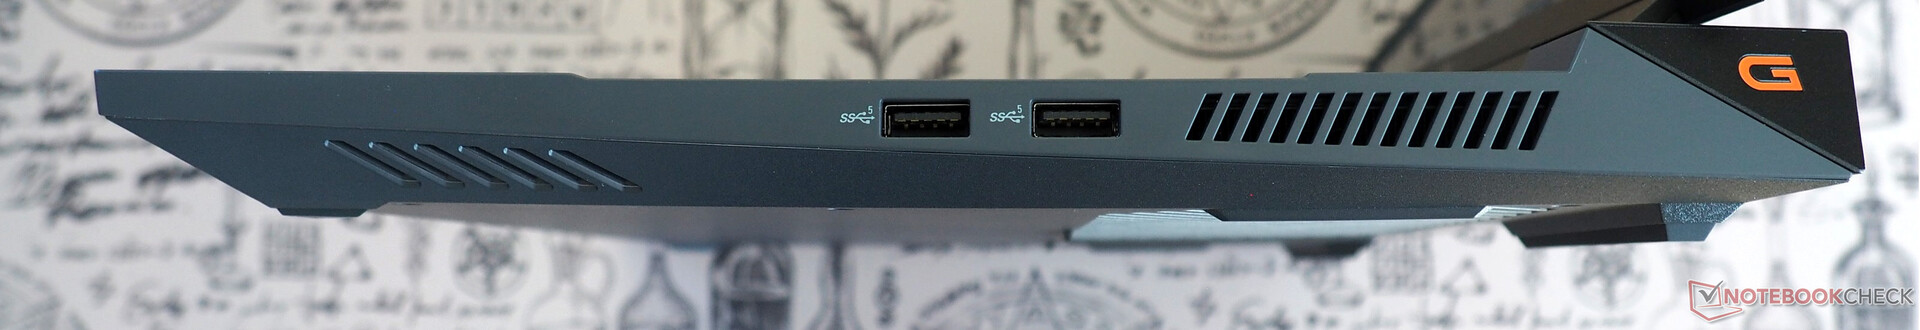
端口选择非常过时和稀少。例如,该设备上没有一个 USB4 端口。相反,它只有一个 USB 2 Gen 2(Type C)端口和三个 USB 3.2 Gen 1(Type A)端口。 3.2 Gen 2(Type C)和三个 USB 3.2 Gen 1(Type A)端口。用户还将不得不放弃读卡器和 Kensington 插槽。但至少该设备有一个 HDMI 2.1 输出、一个以太网端口和一个音频插孔。
连接性
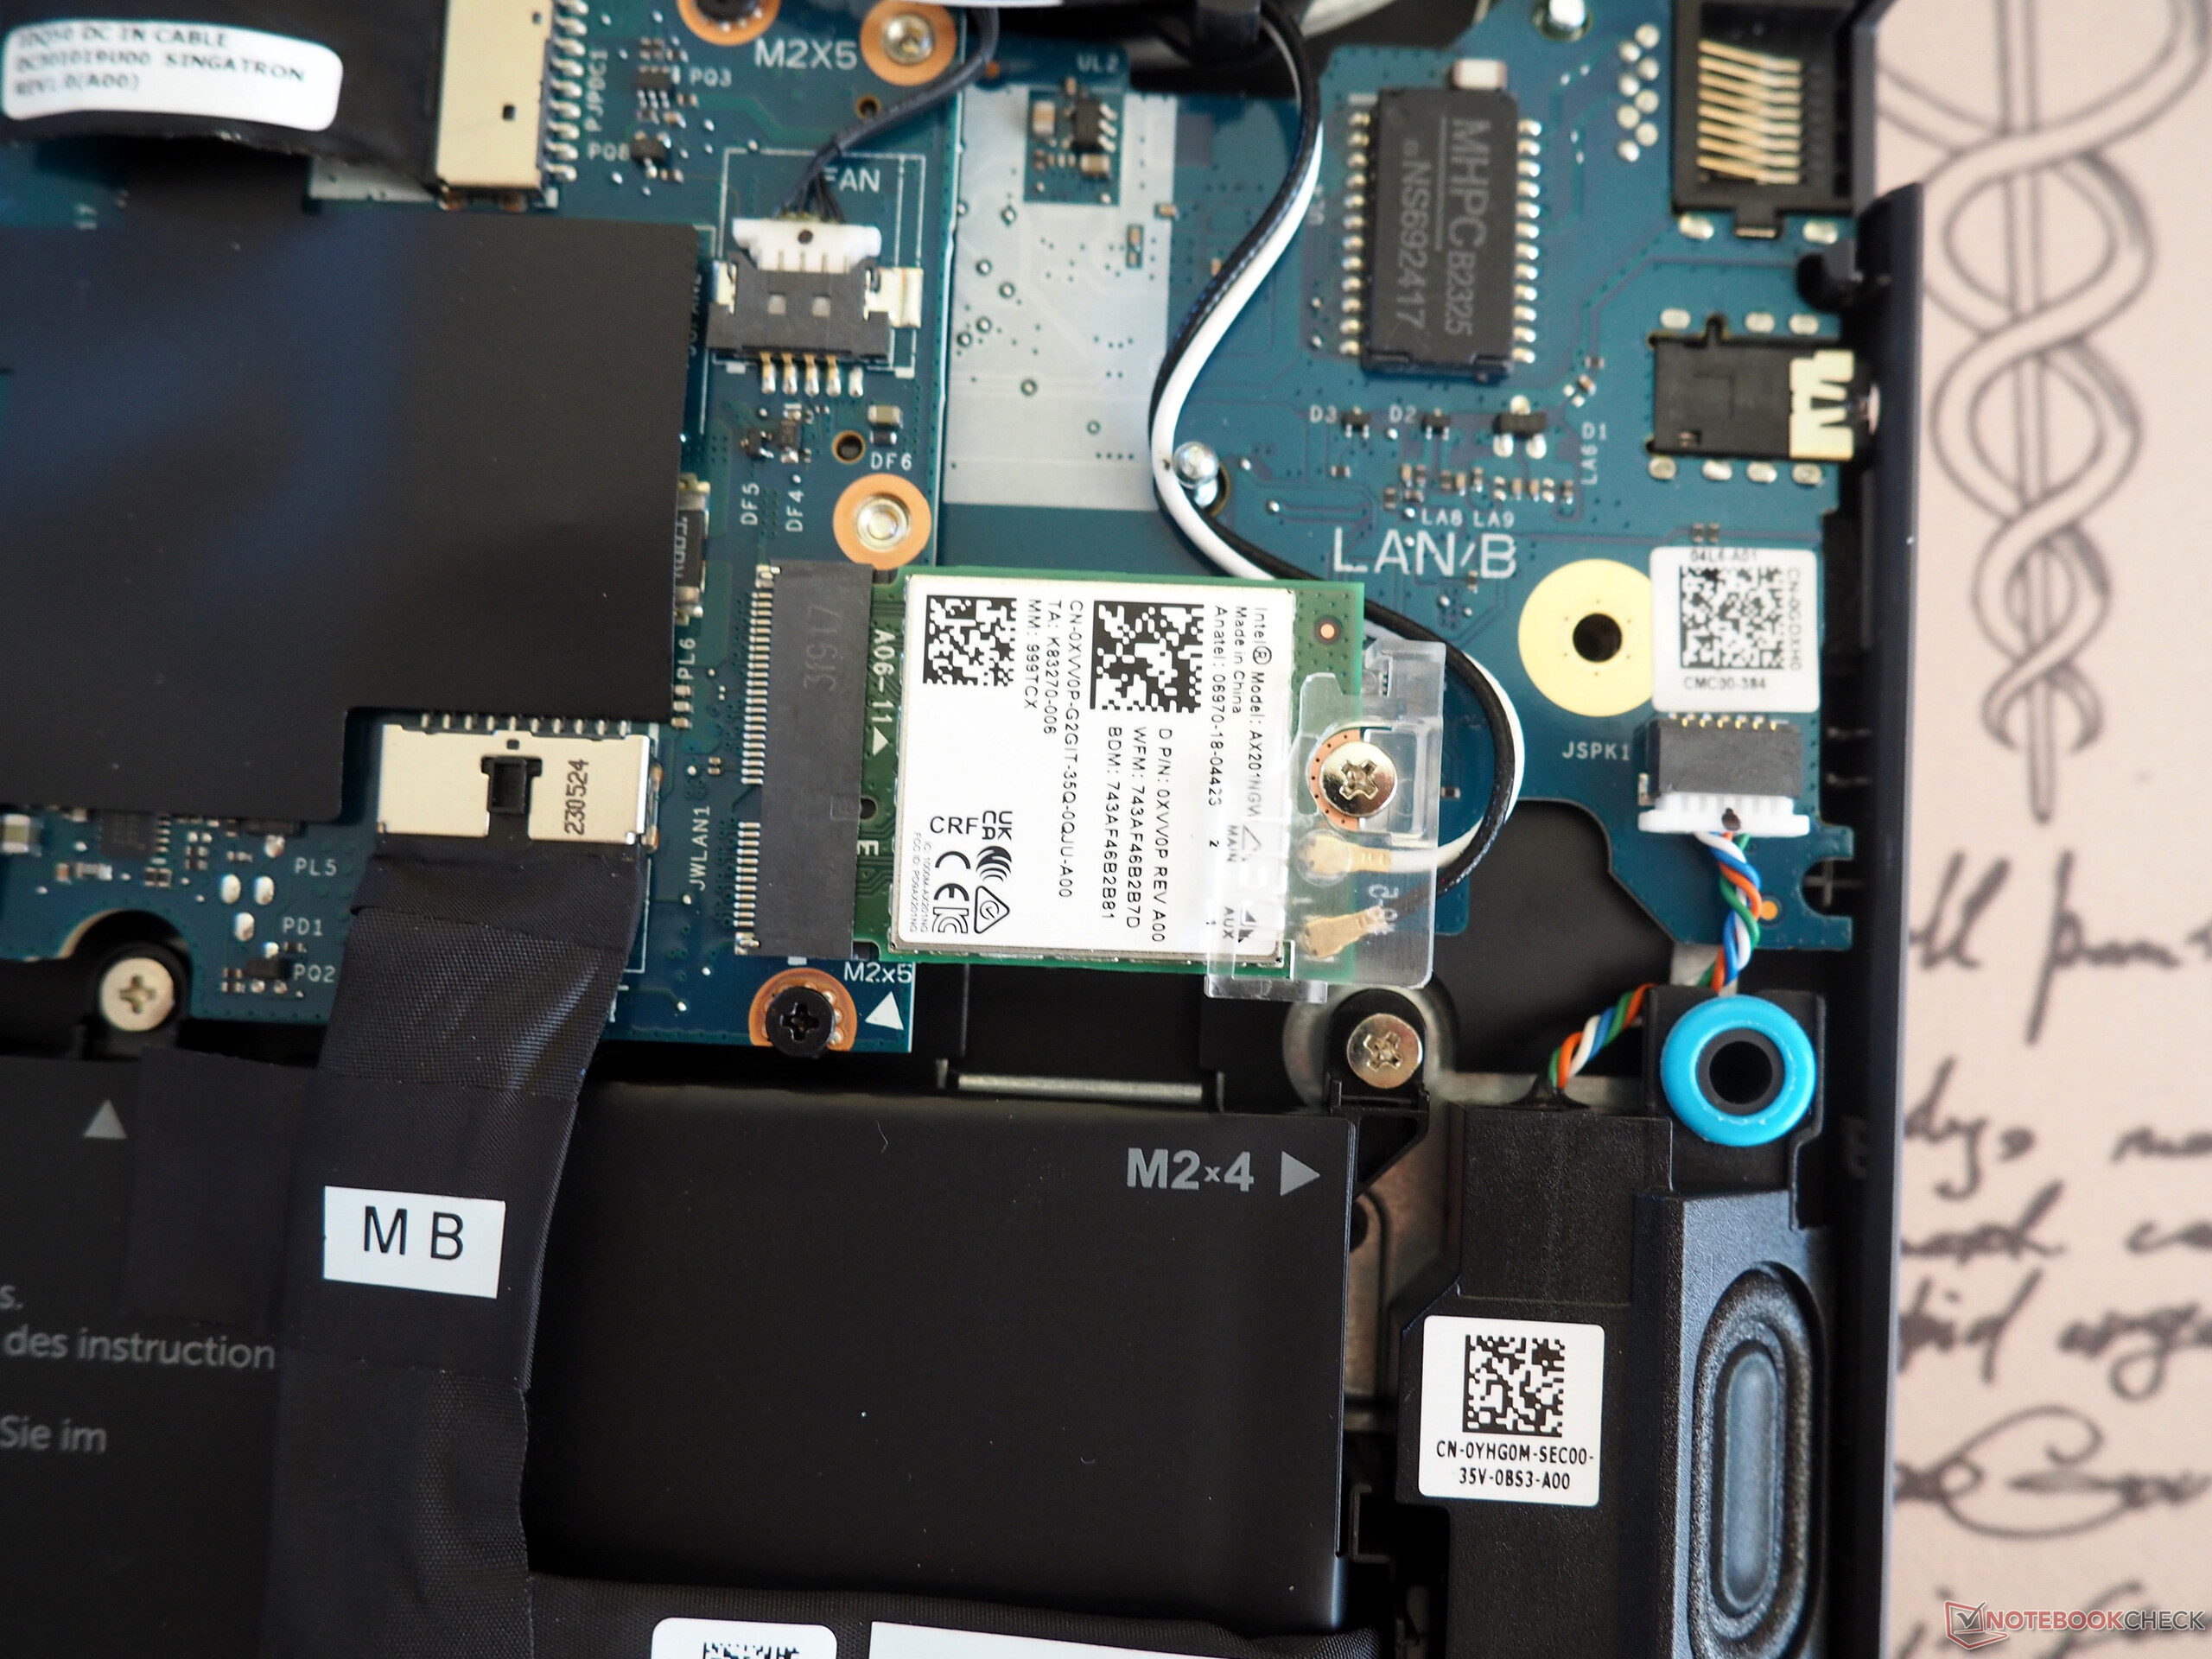
G15 的无线性能与我们目前所见的同类笔记本电脑的平均水平相当(发送)或高于平均水平(接收)。内置无线网卡由英特尔制造(Wi-Fi 6 AX201)。
网络摄像头
网络摄像头的质量相当一般。在色彩准确度和图像清晰度方面仍有改进的余地。


配件
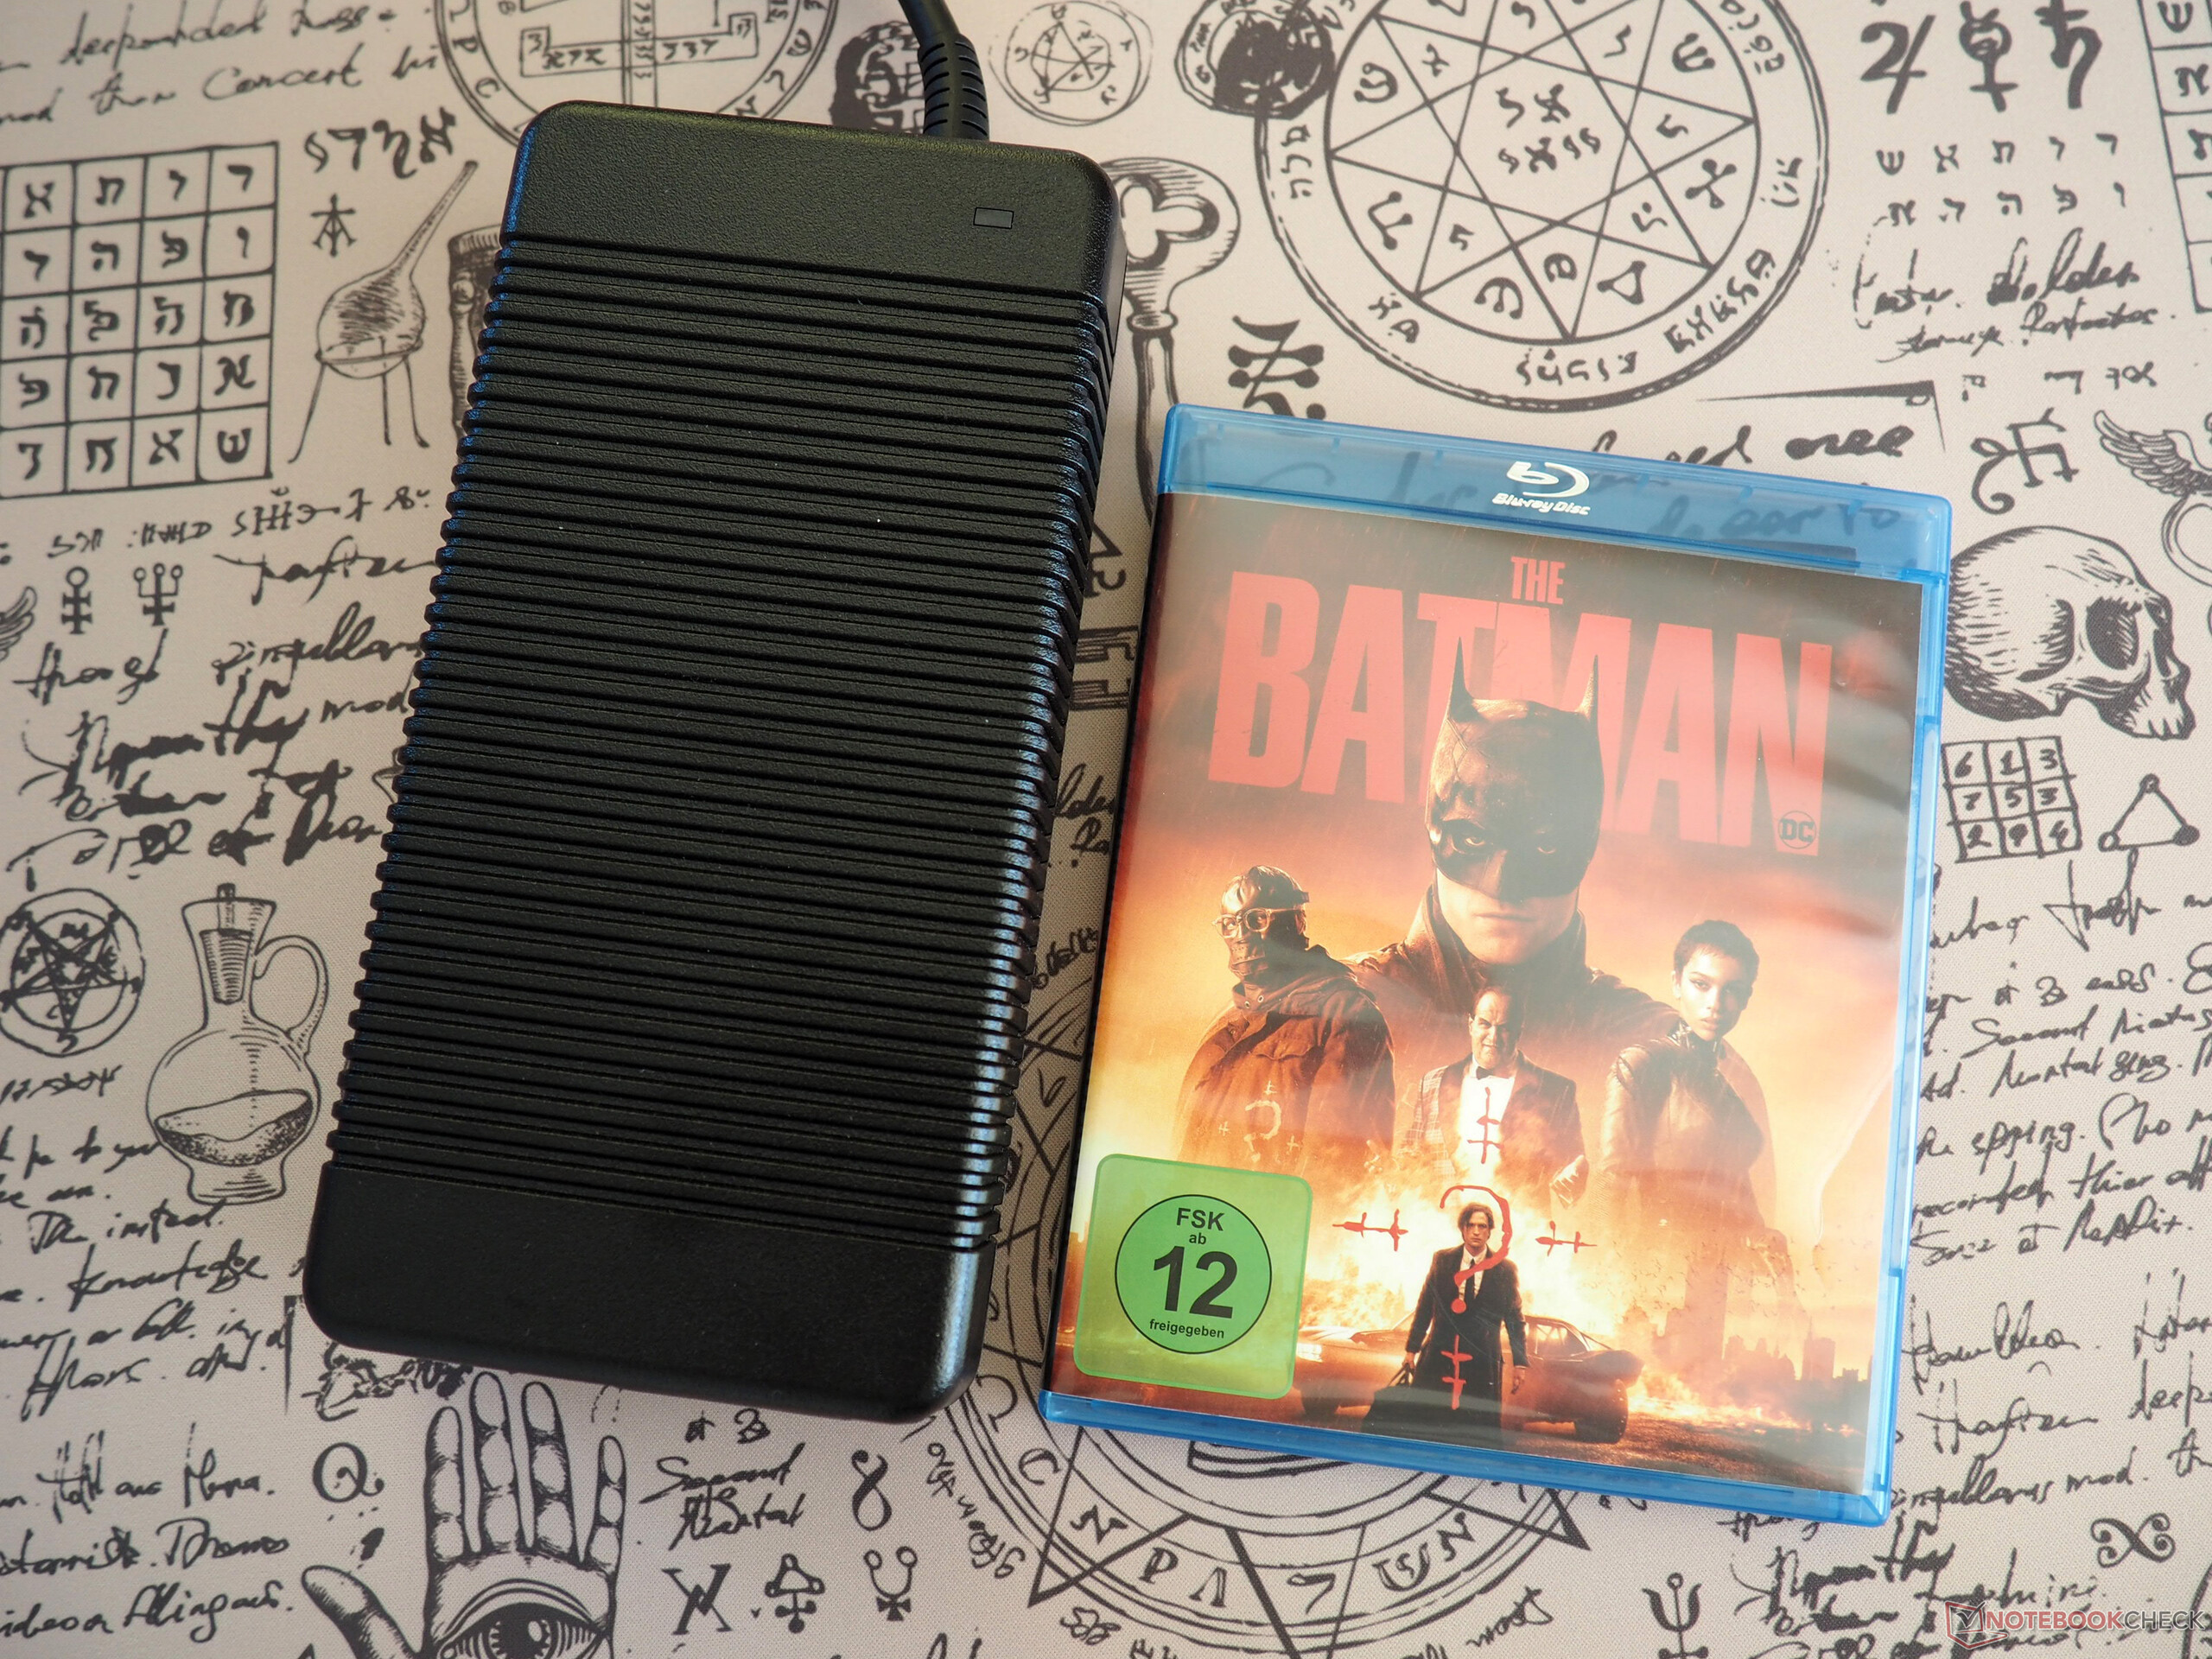
鉴于其性能水平,G15 随附的电源适配器又大又重(含线缆 1.5 千克,约合 3.3 磅)。
维护
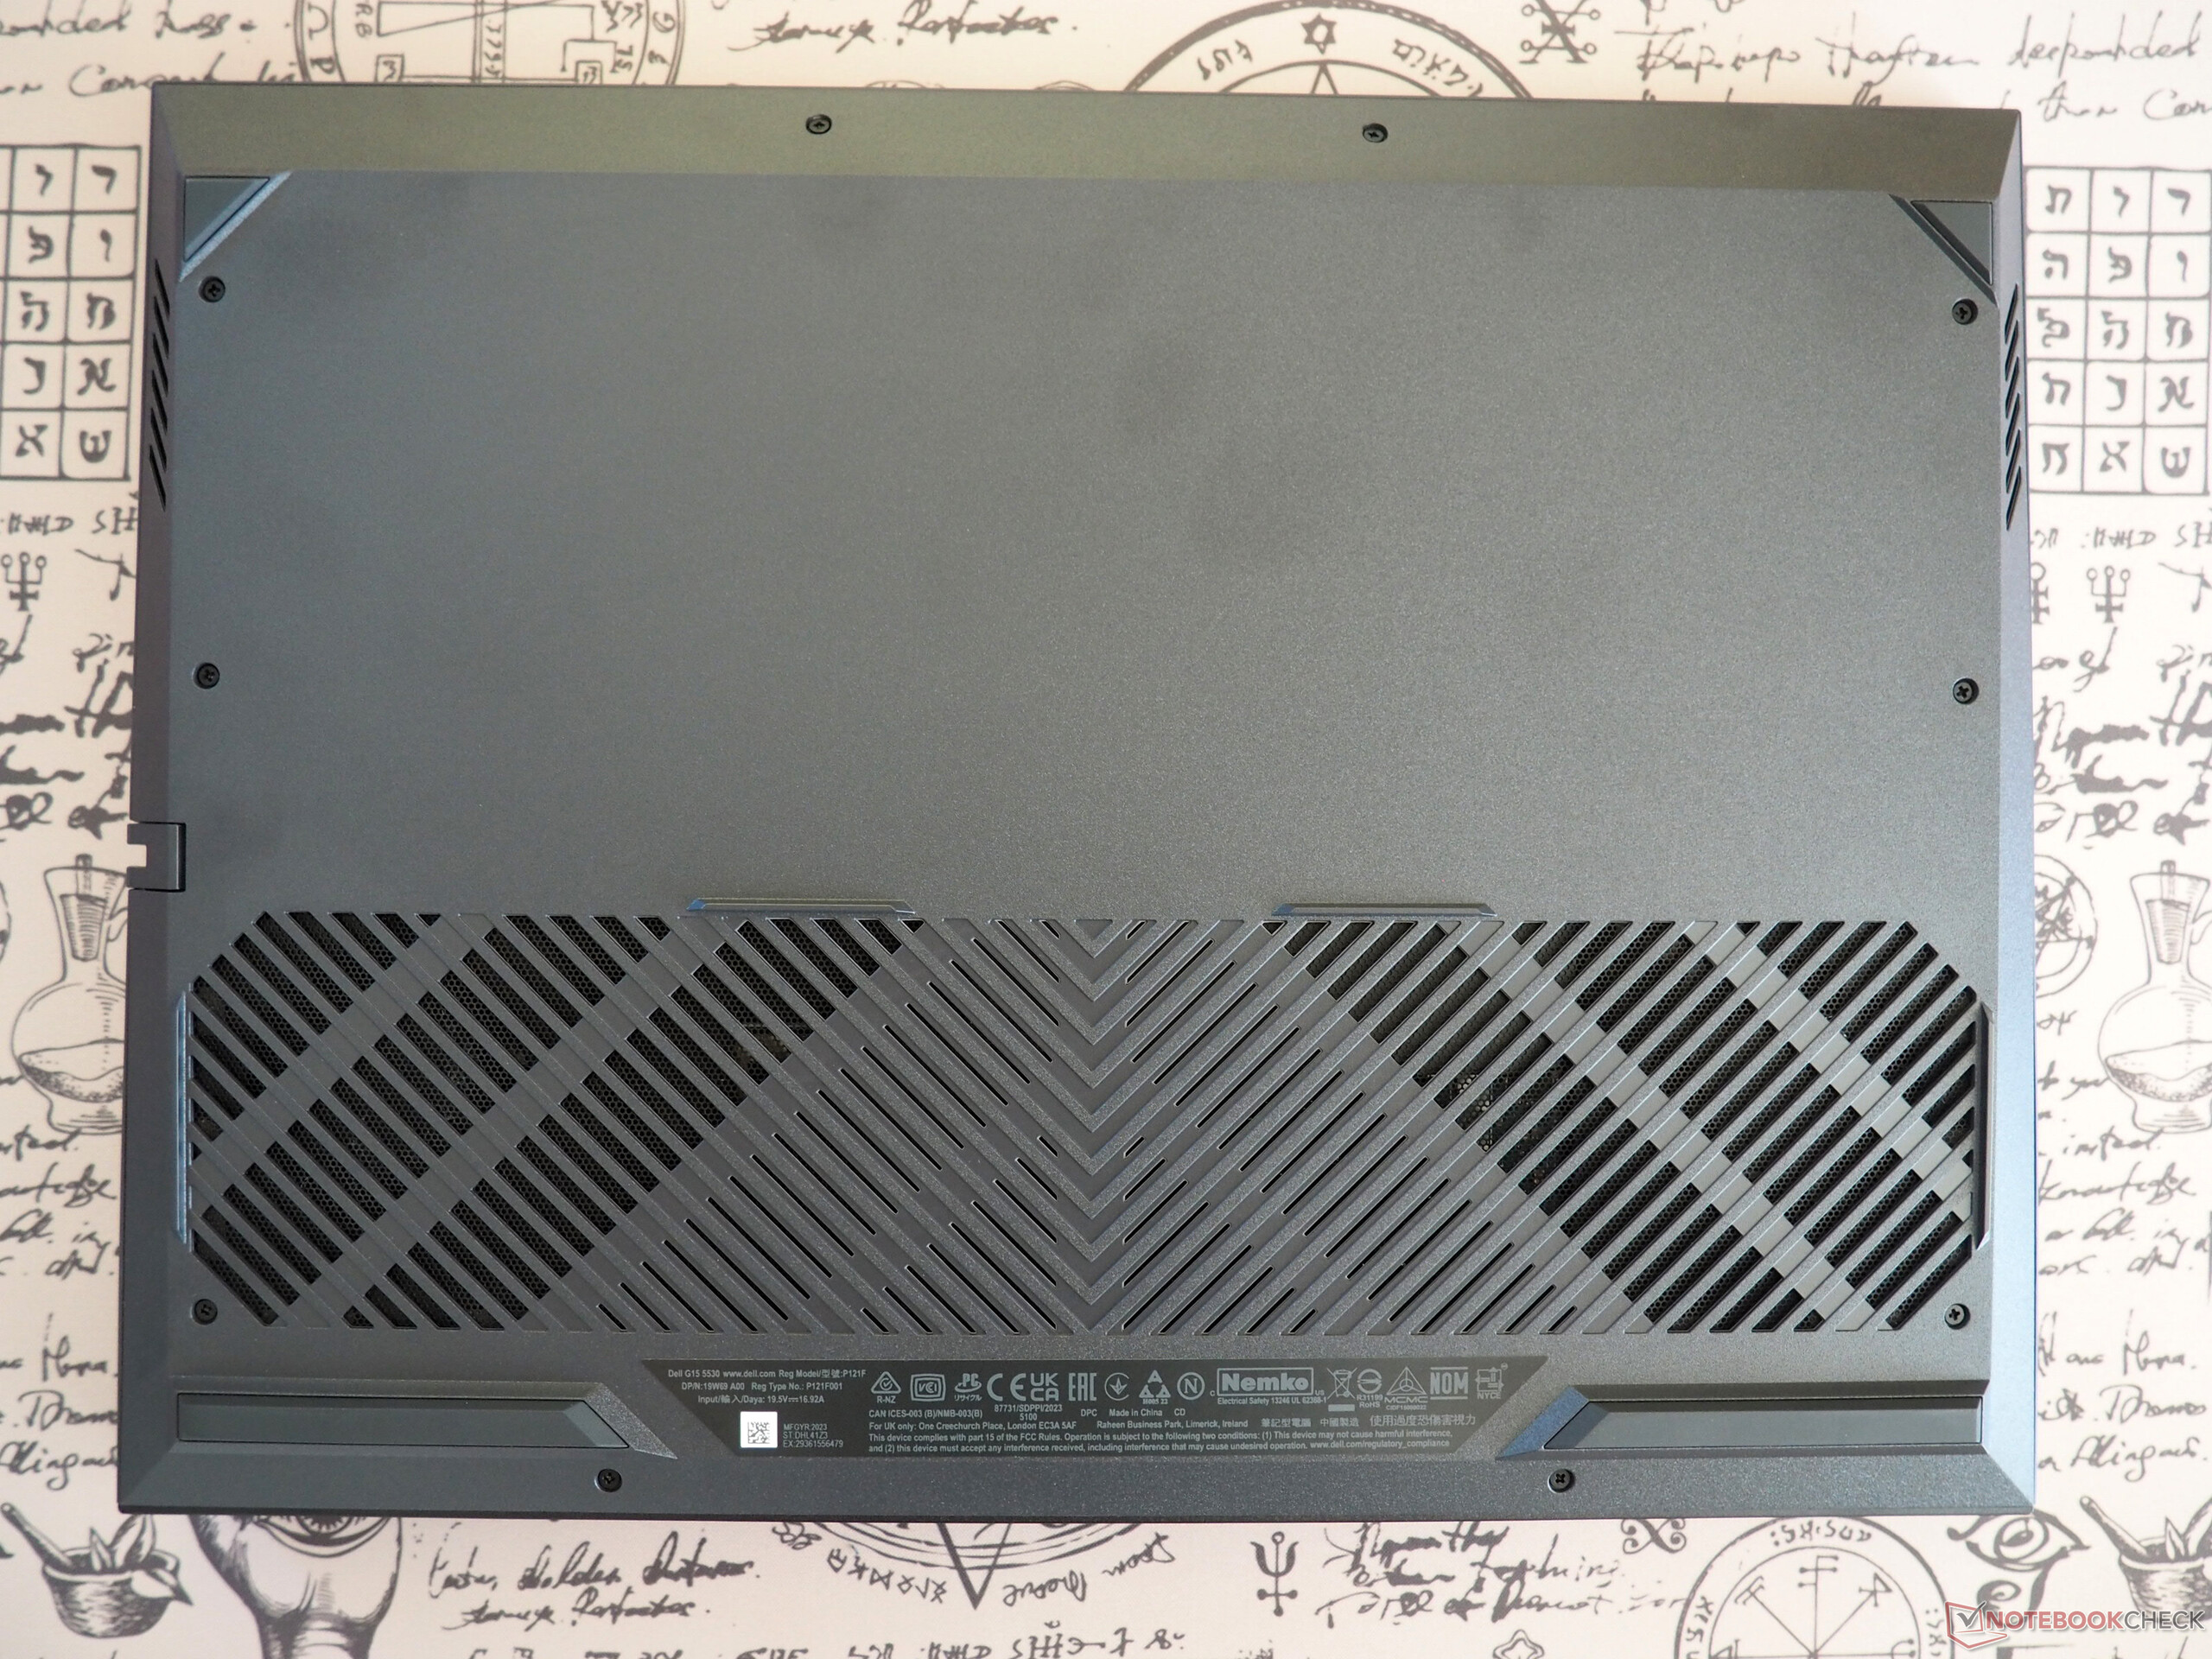
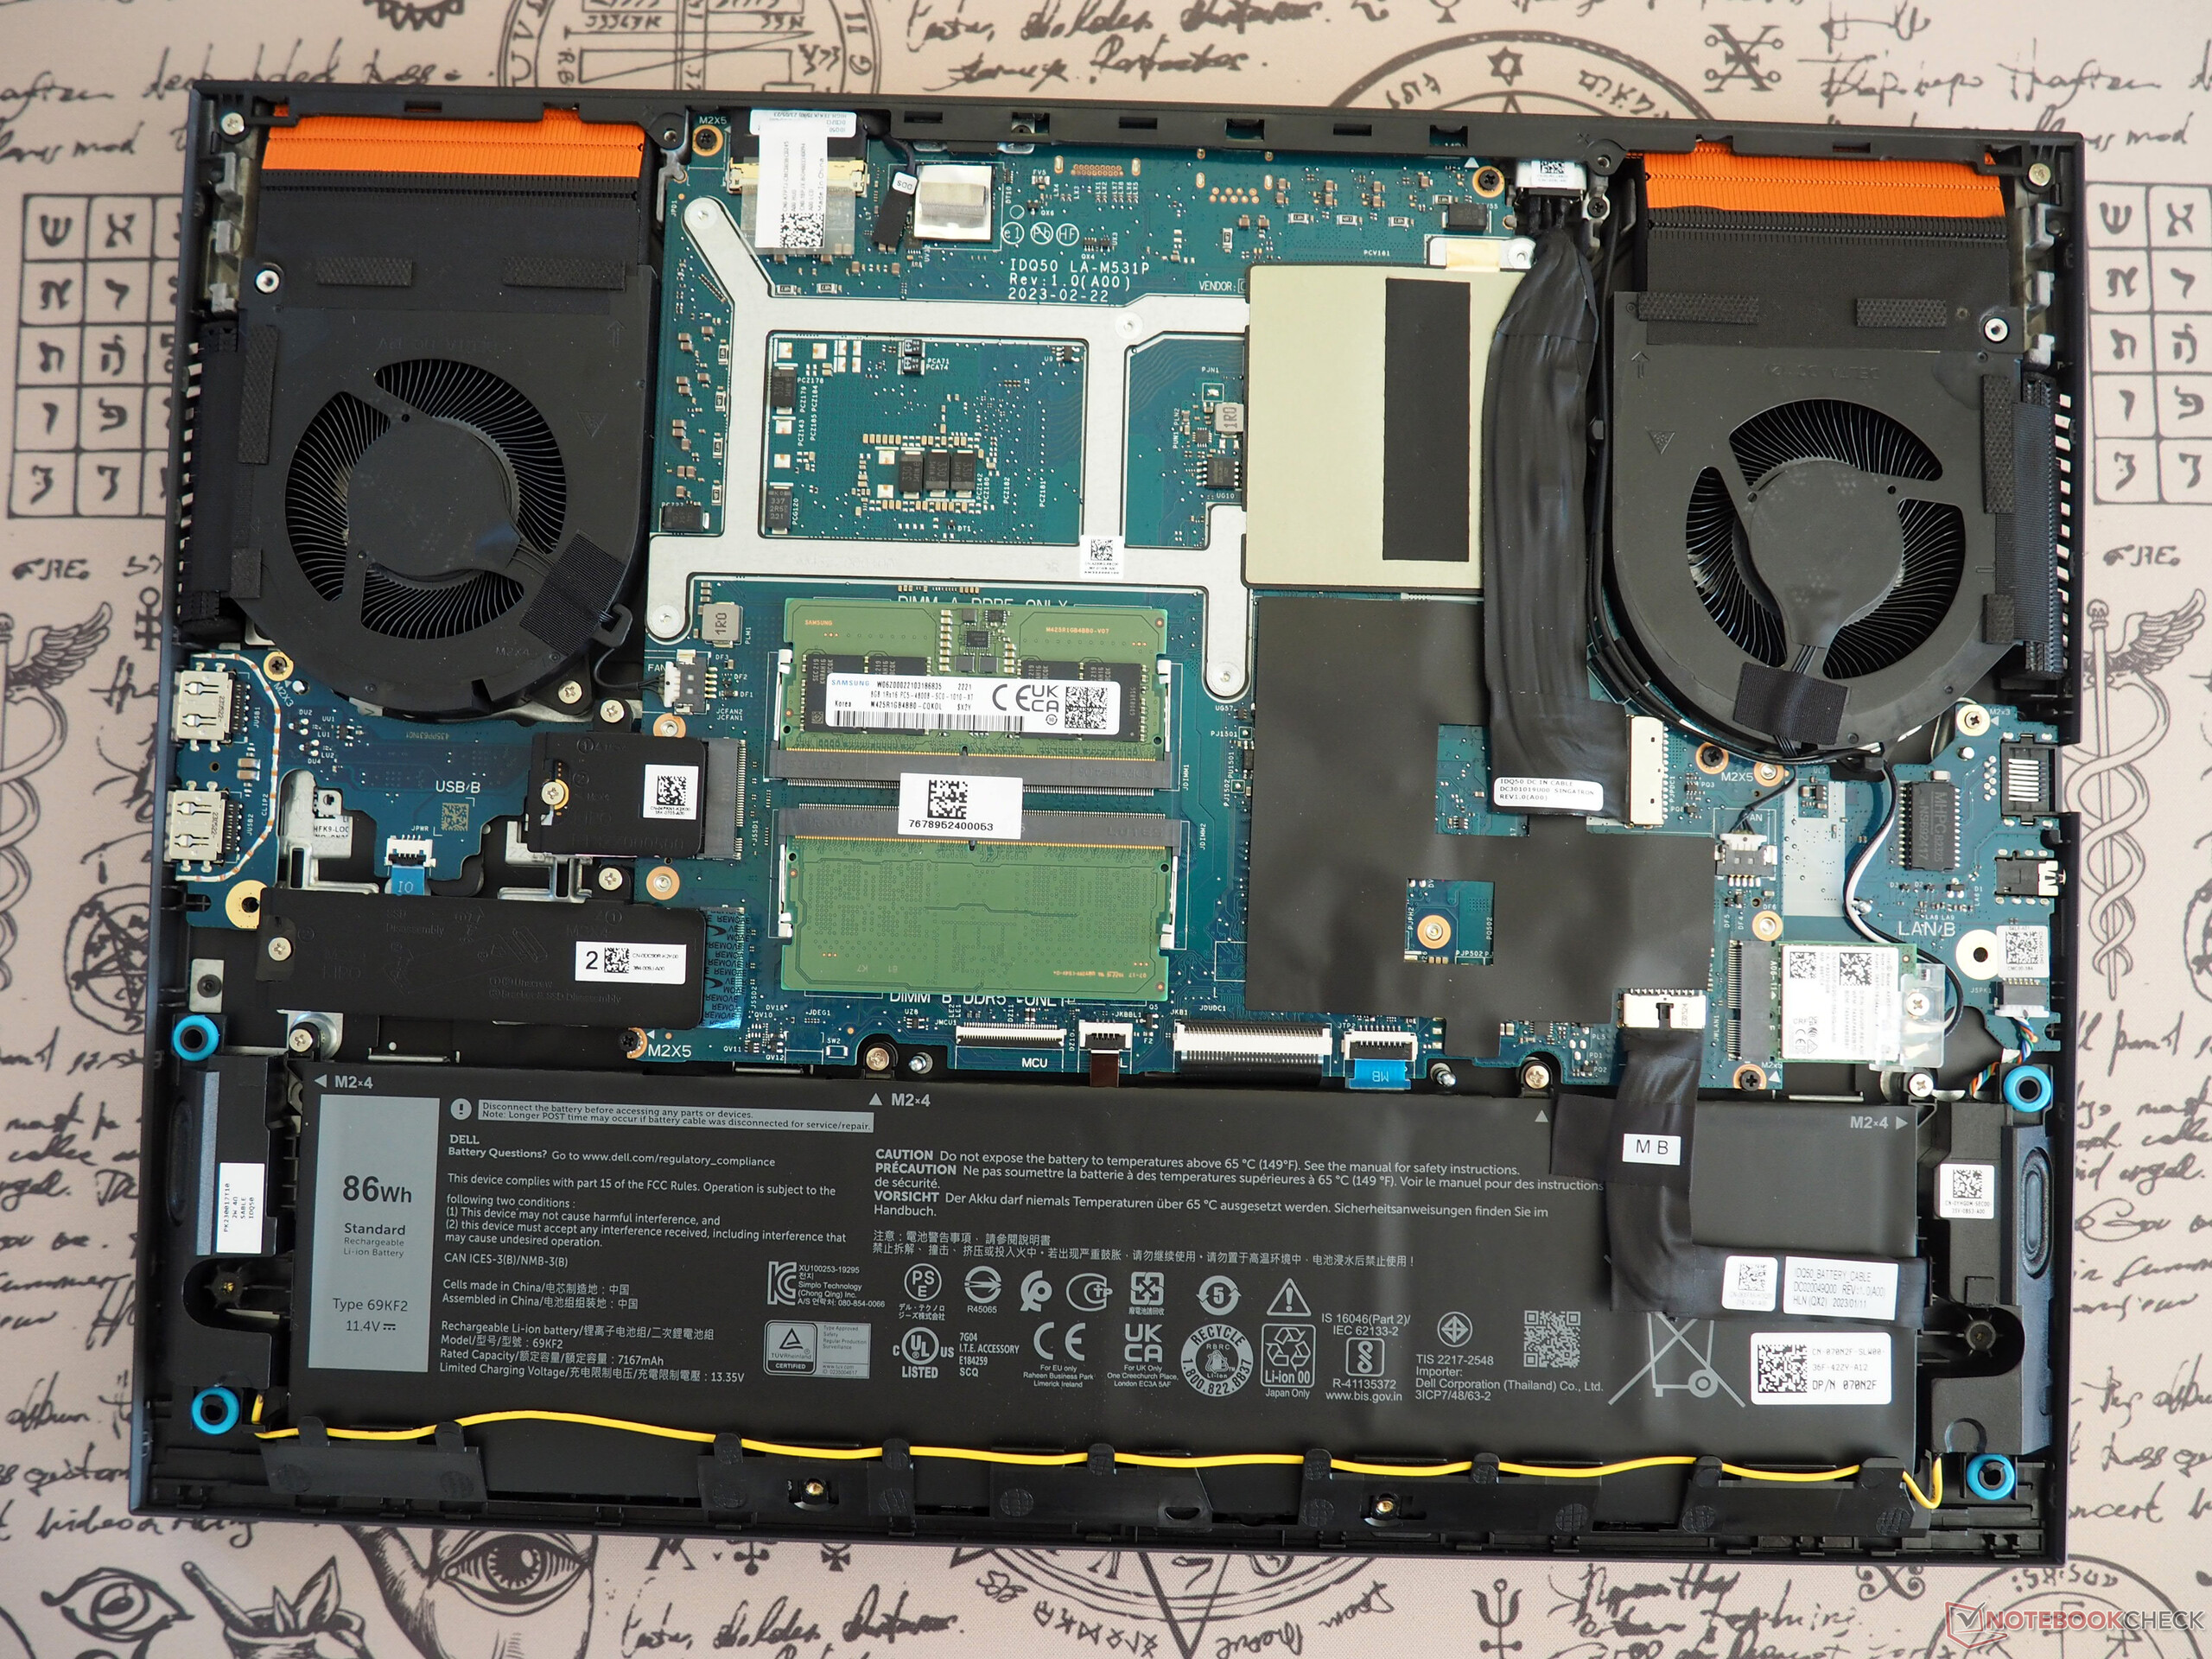
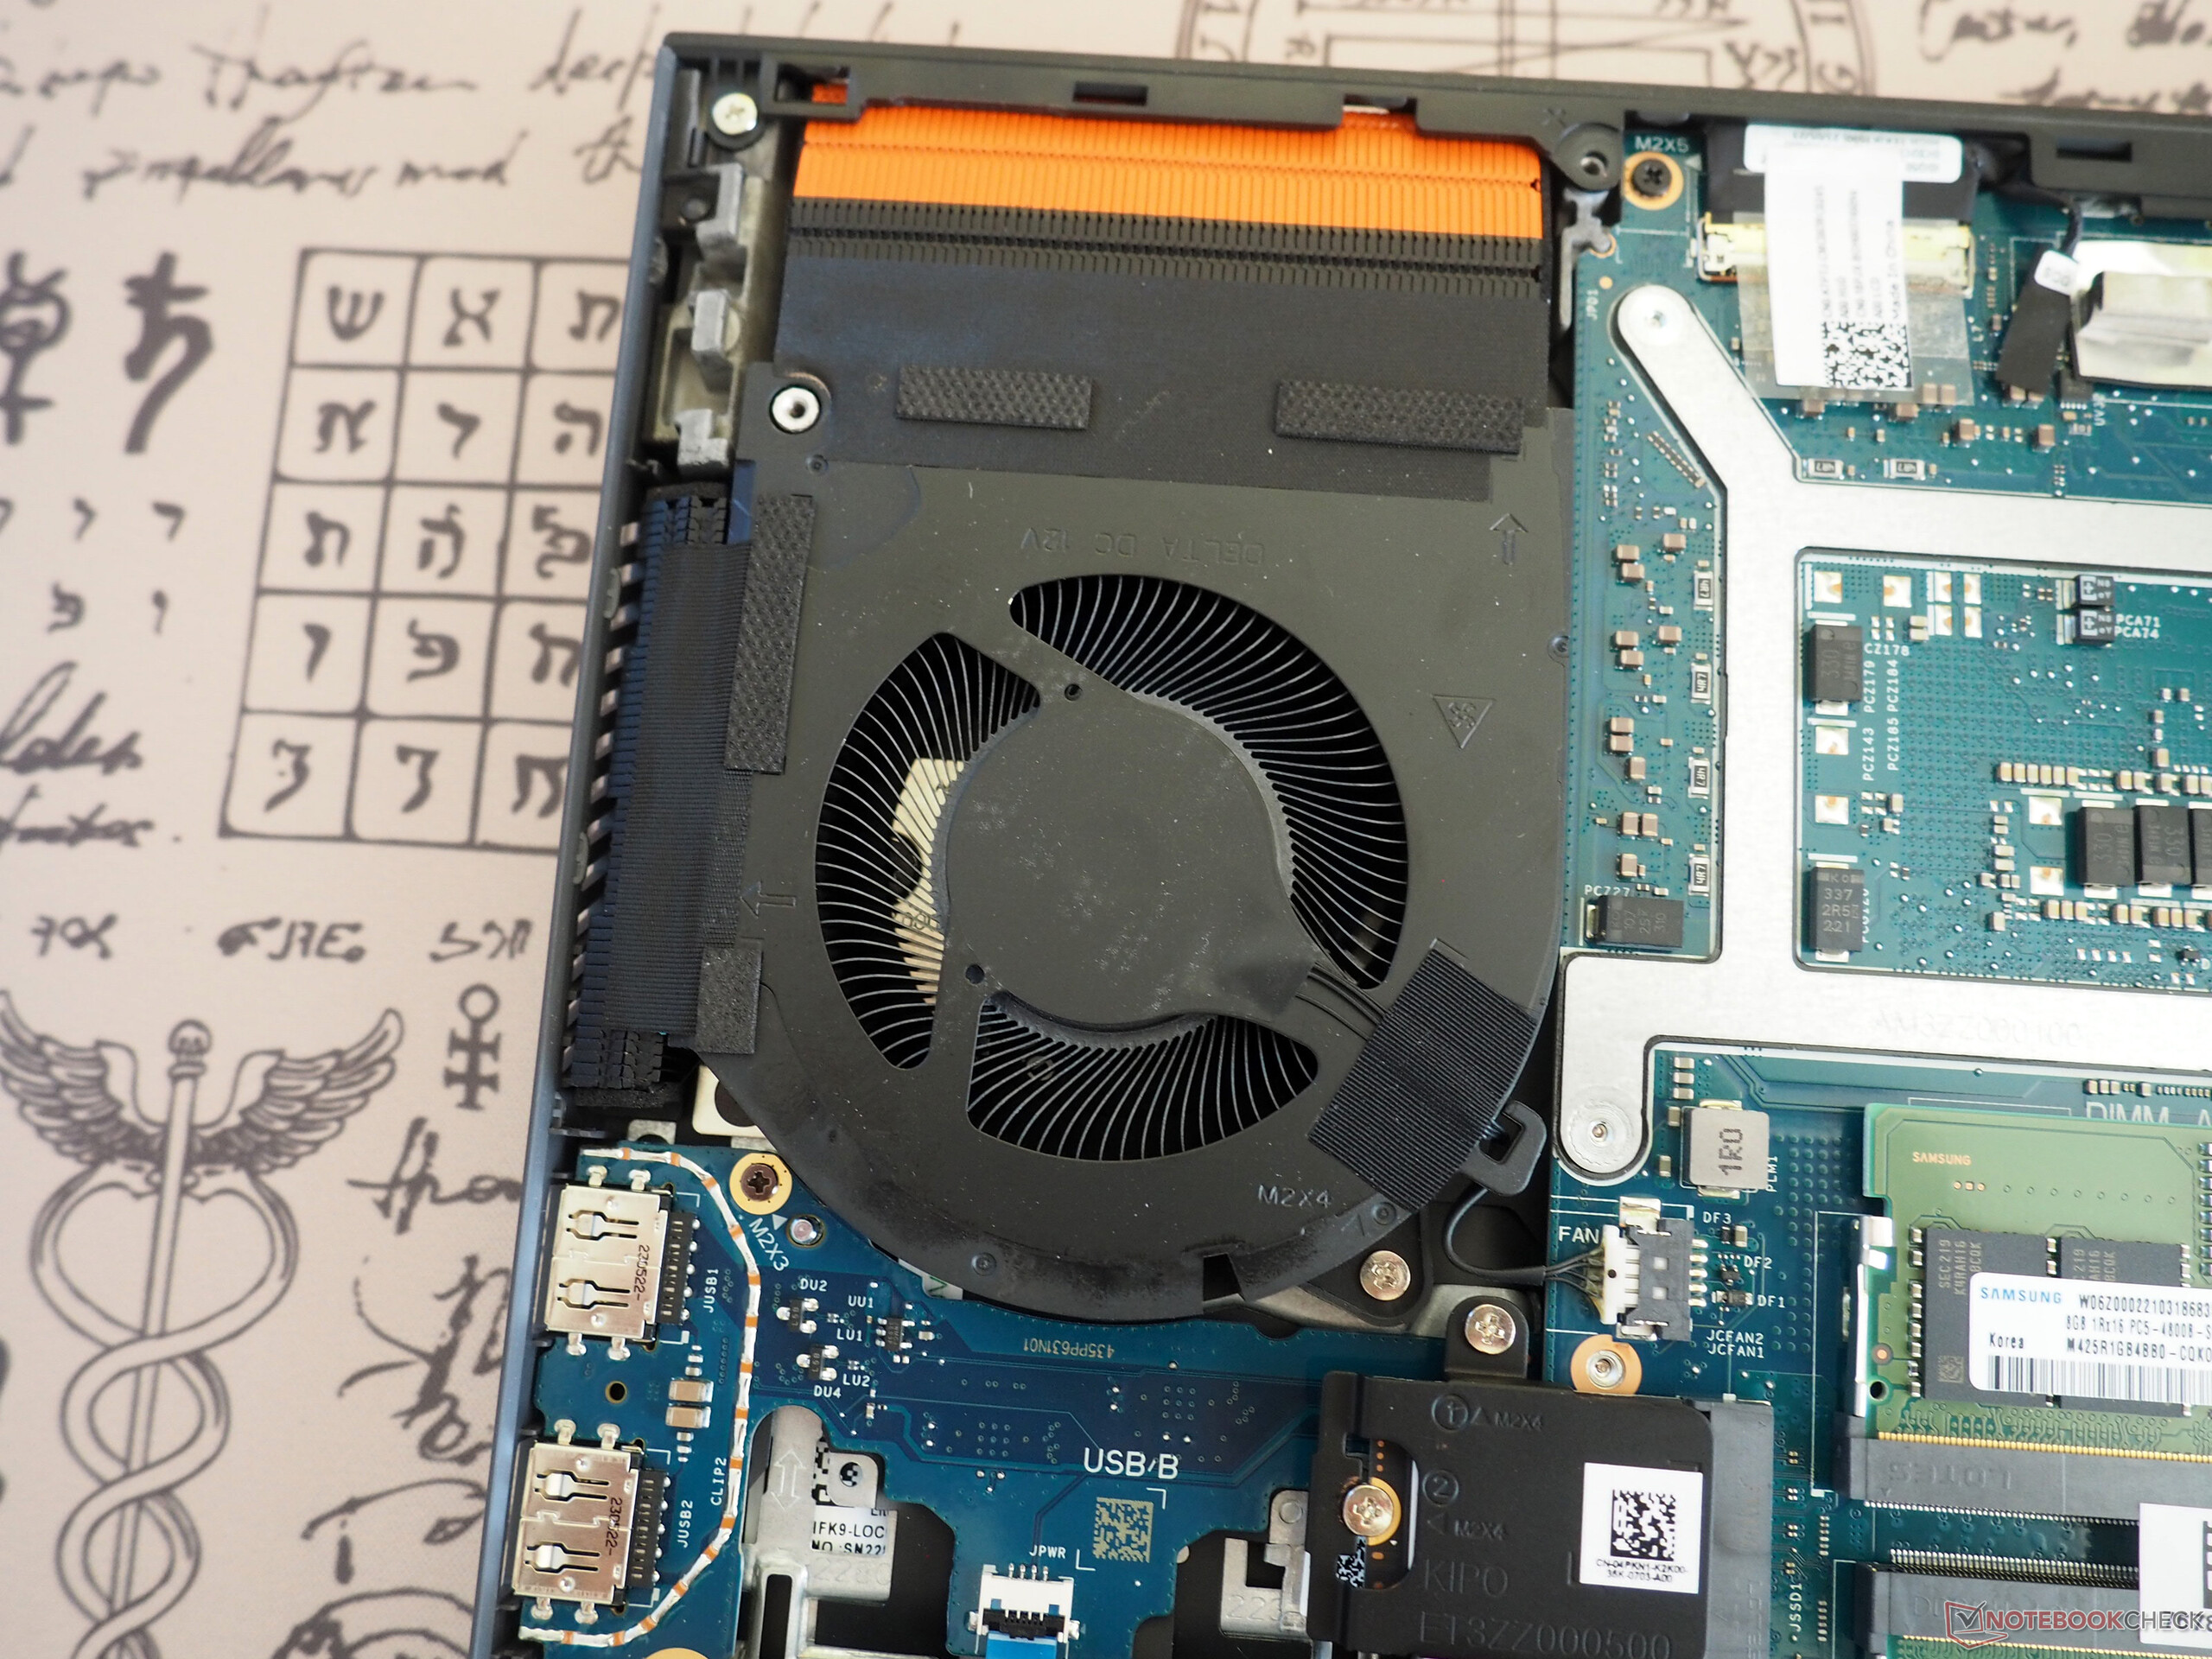
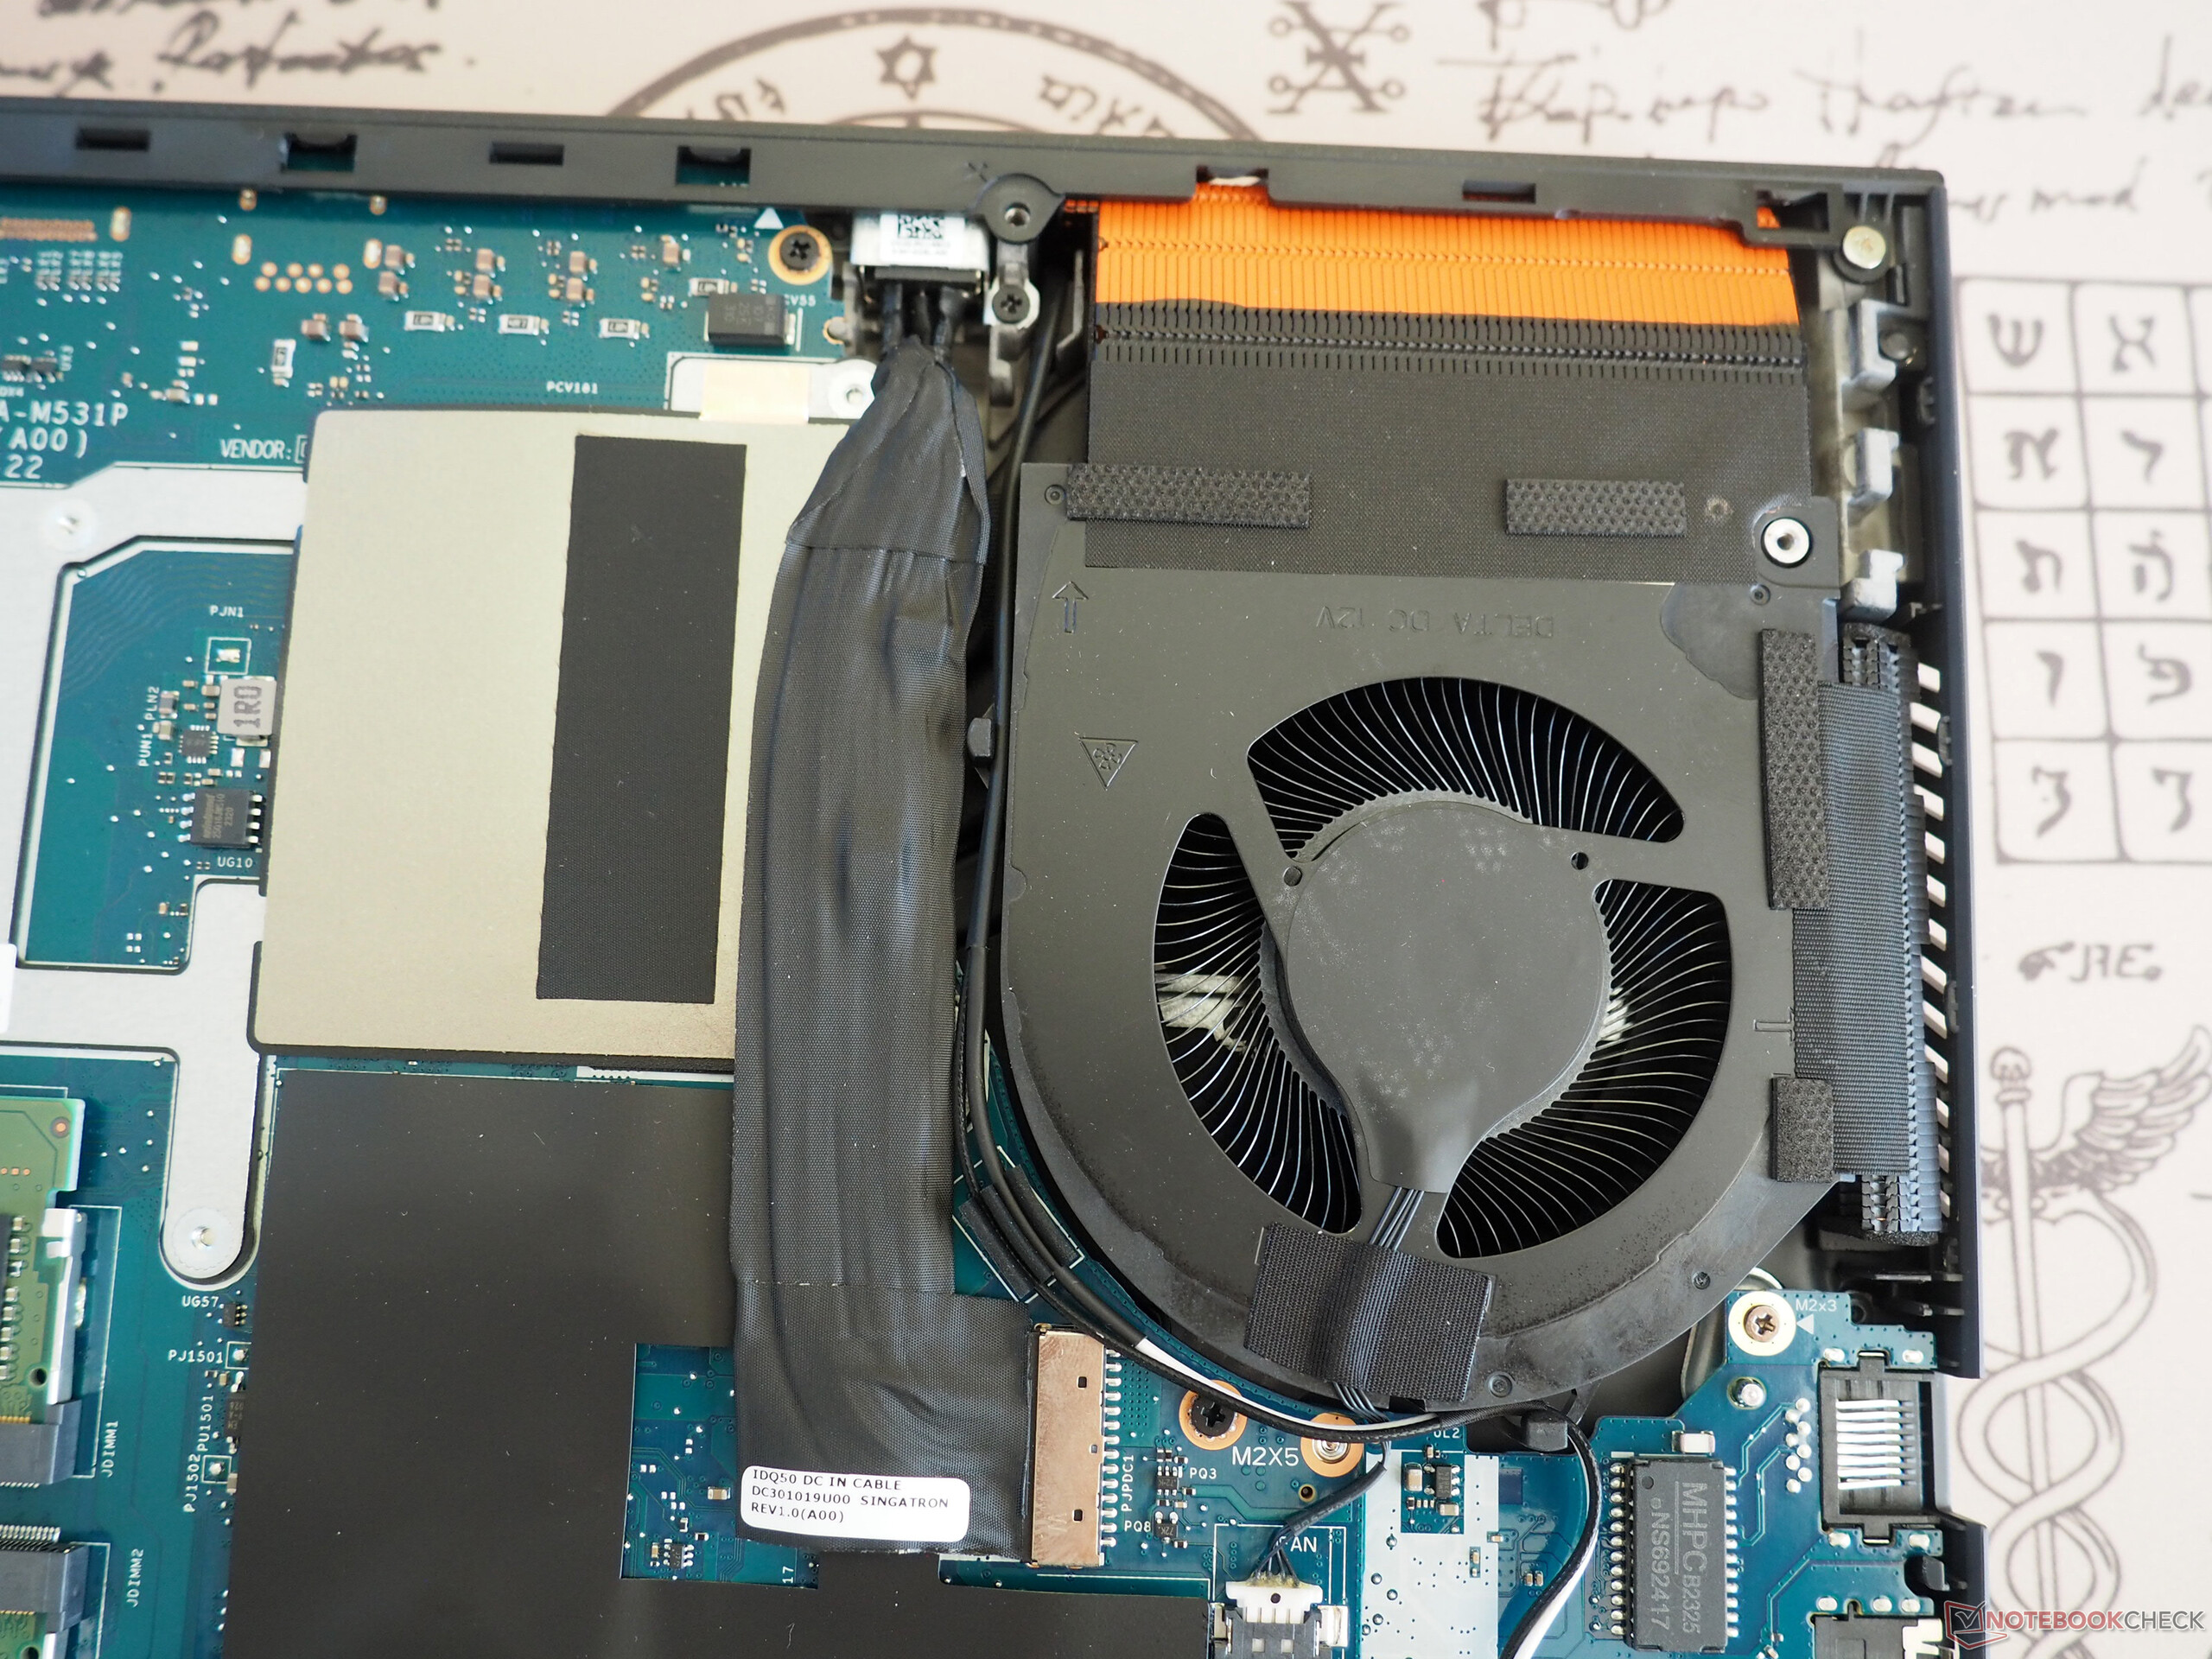
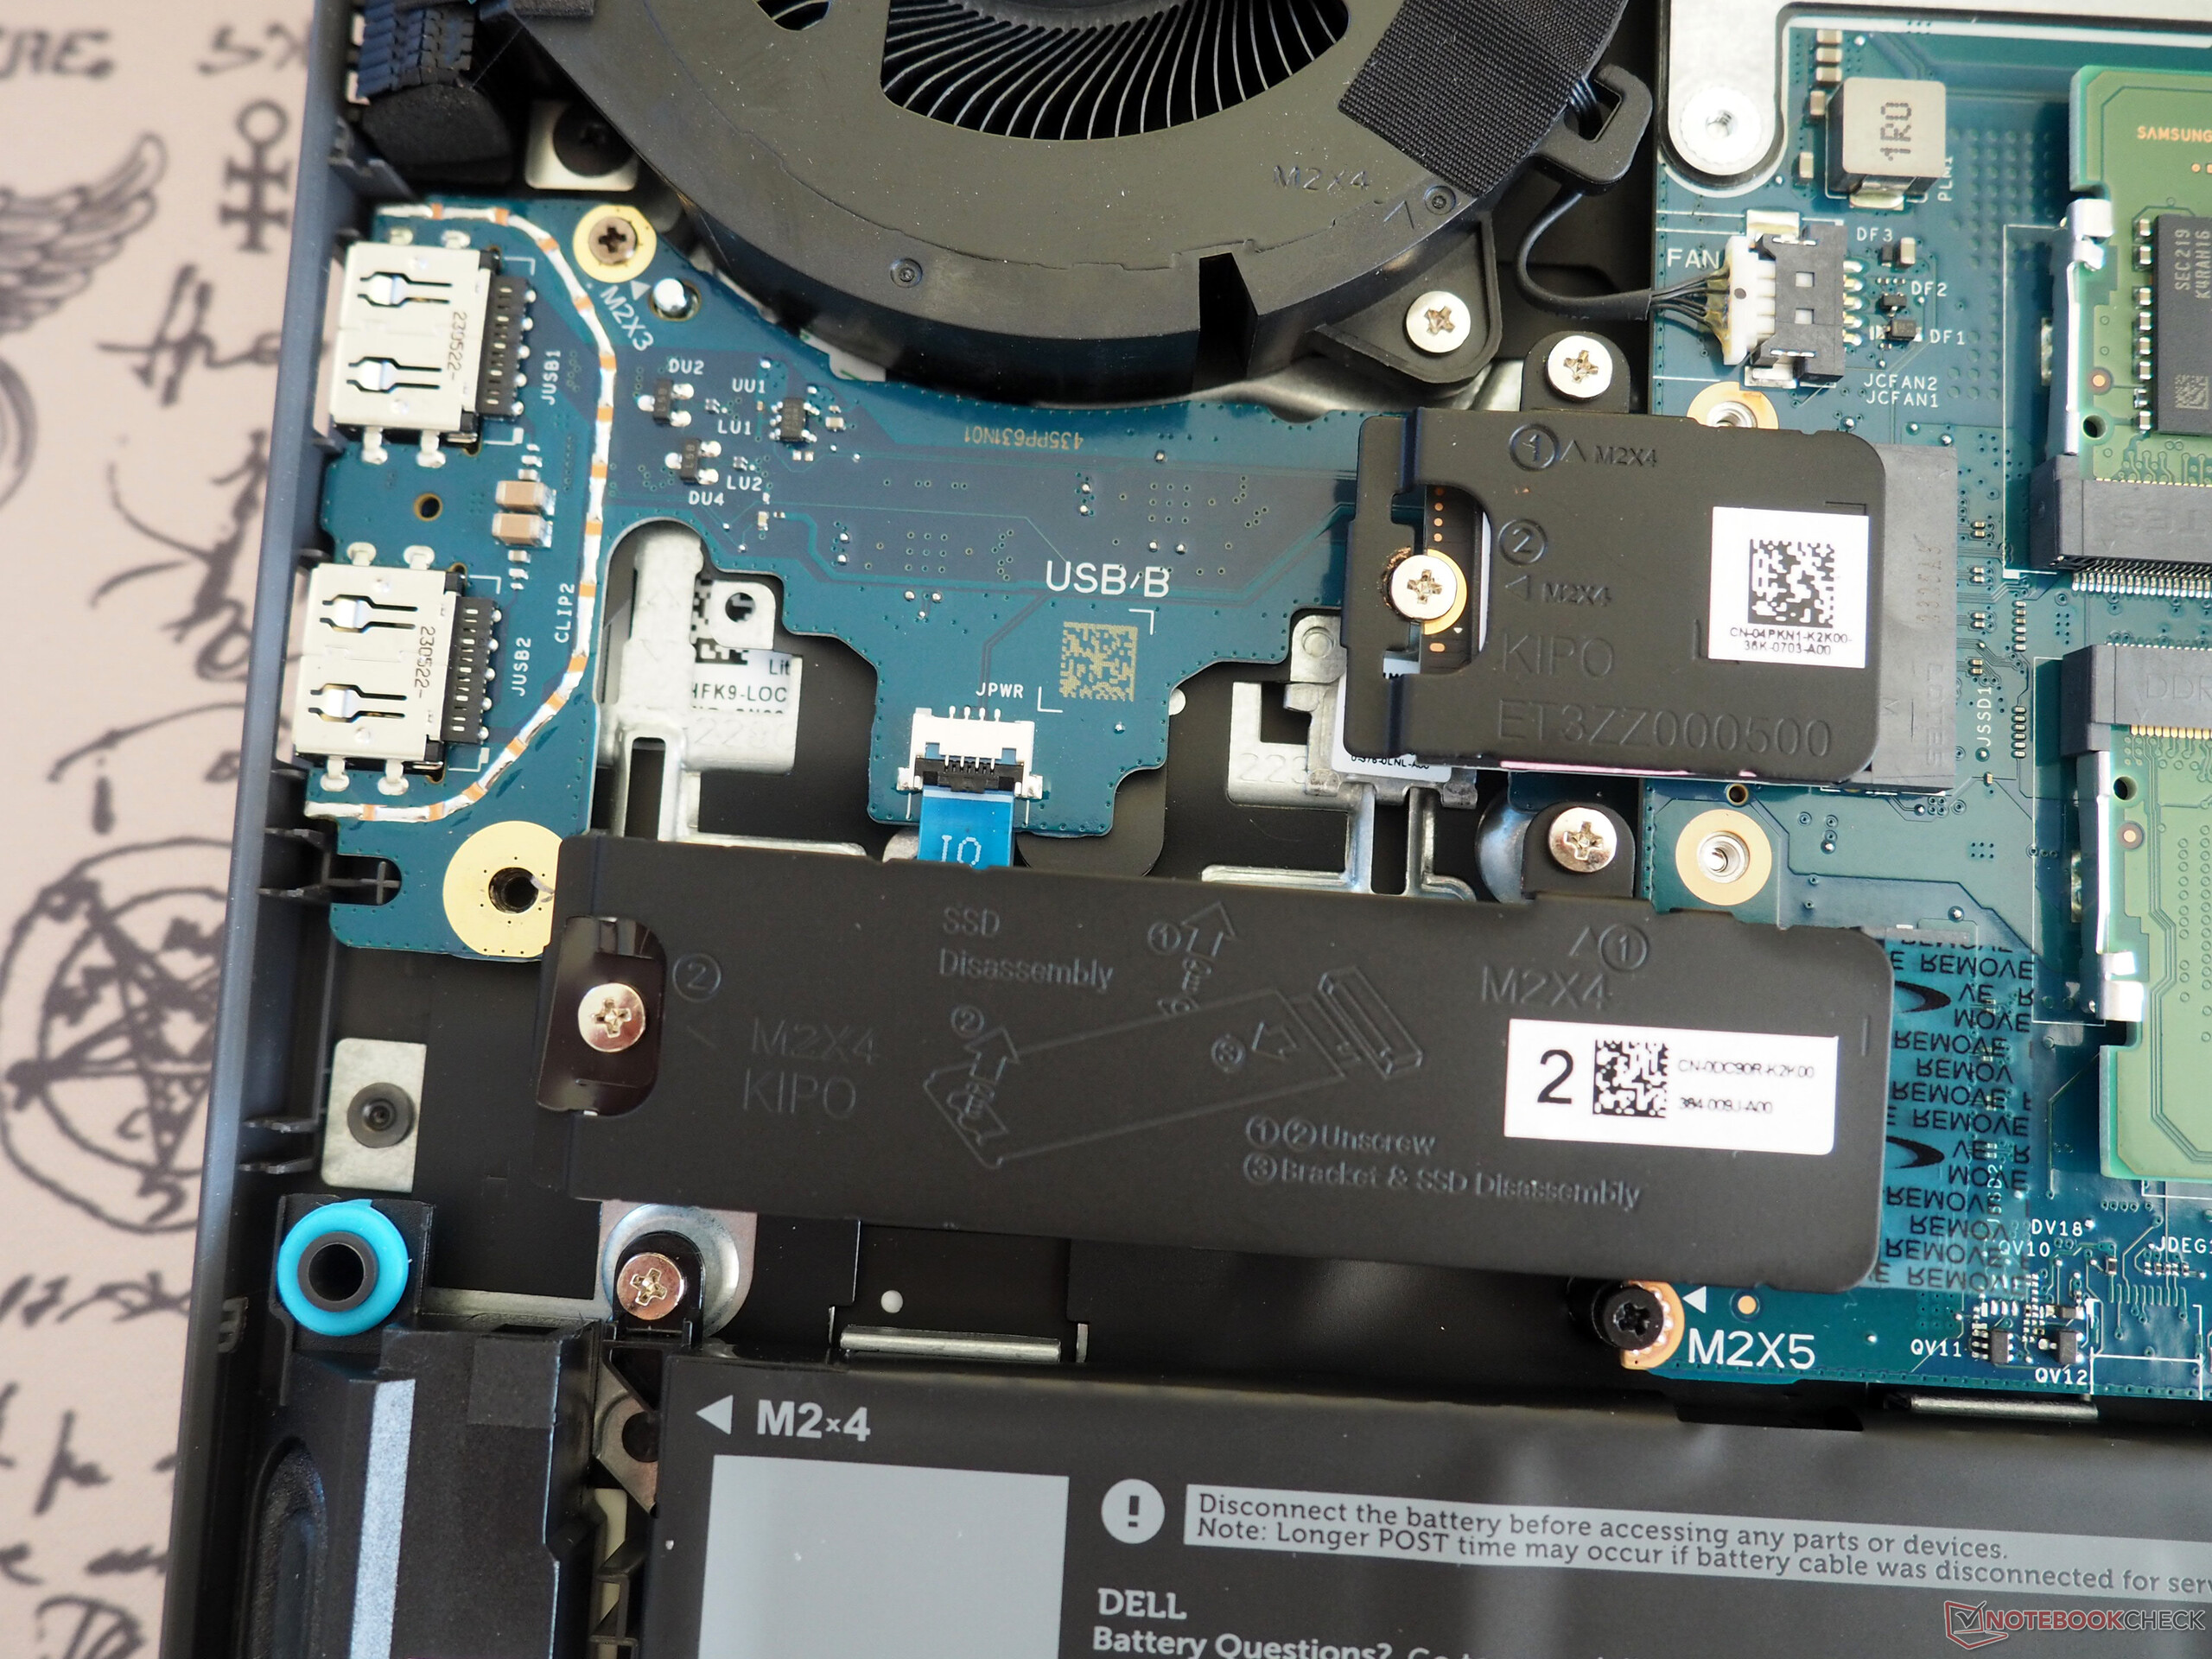
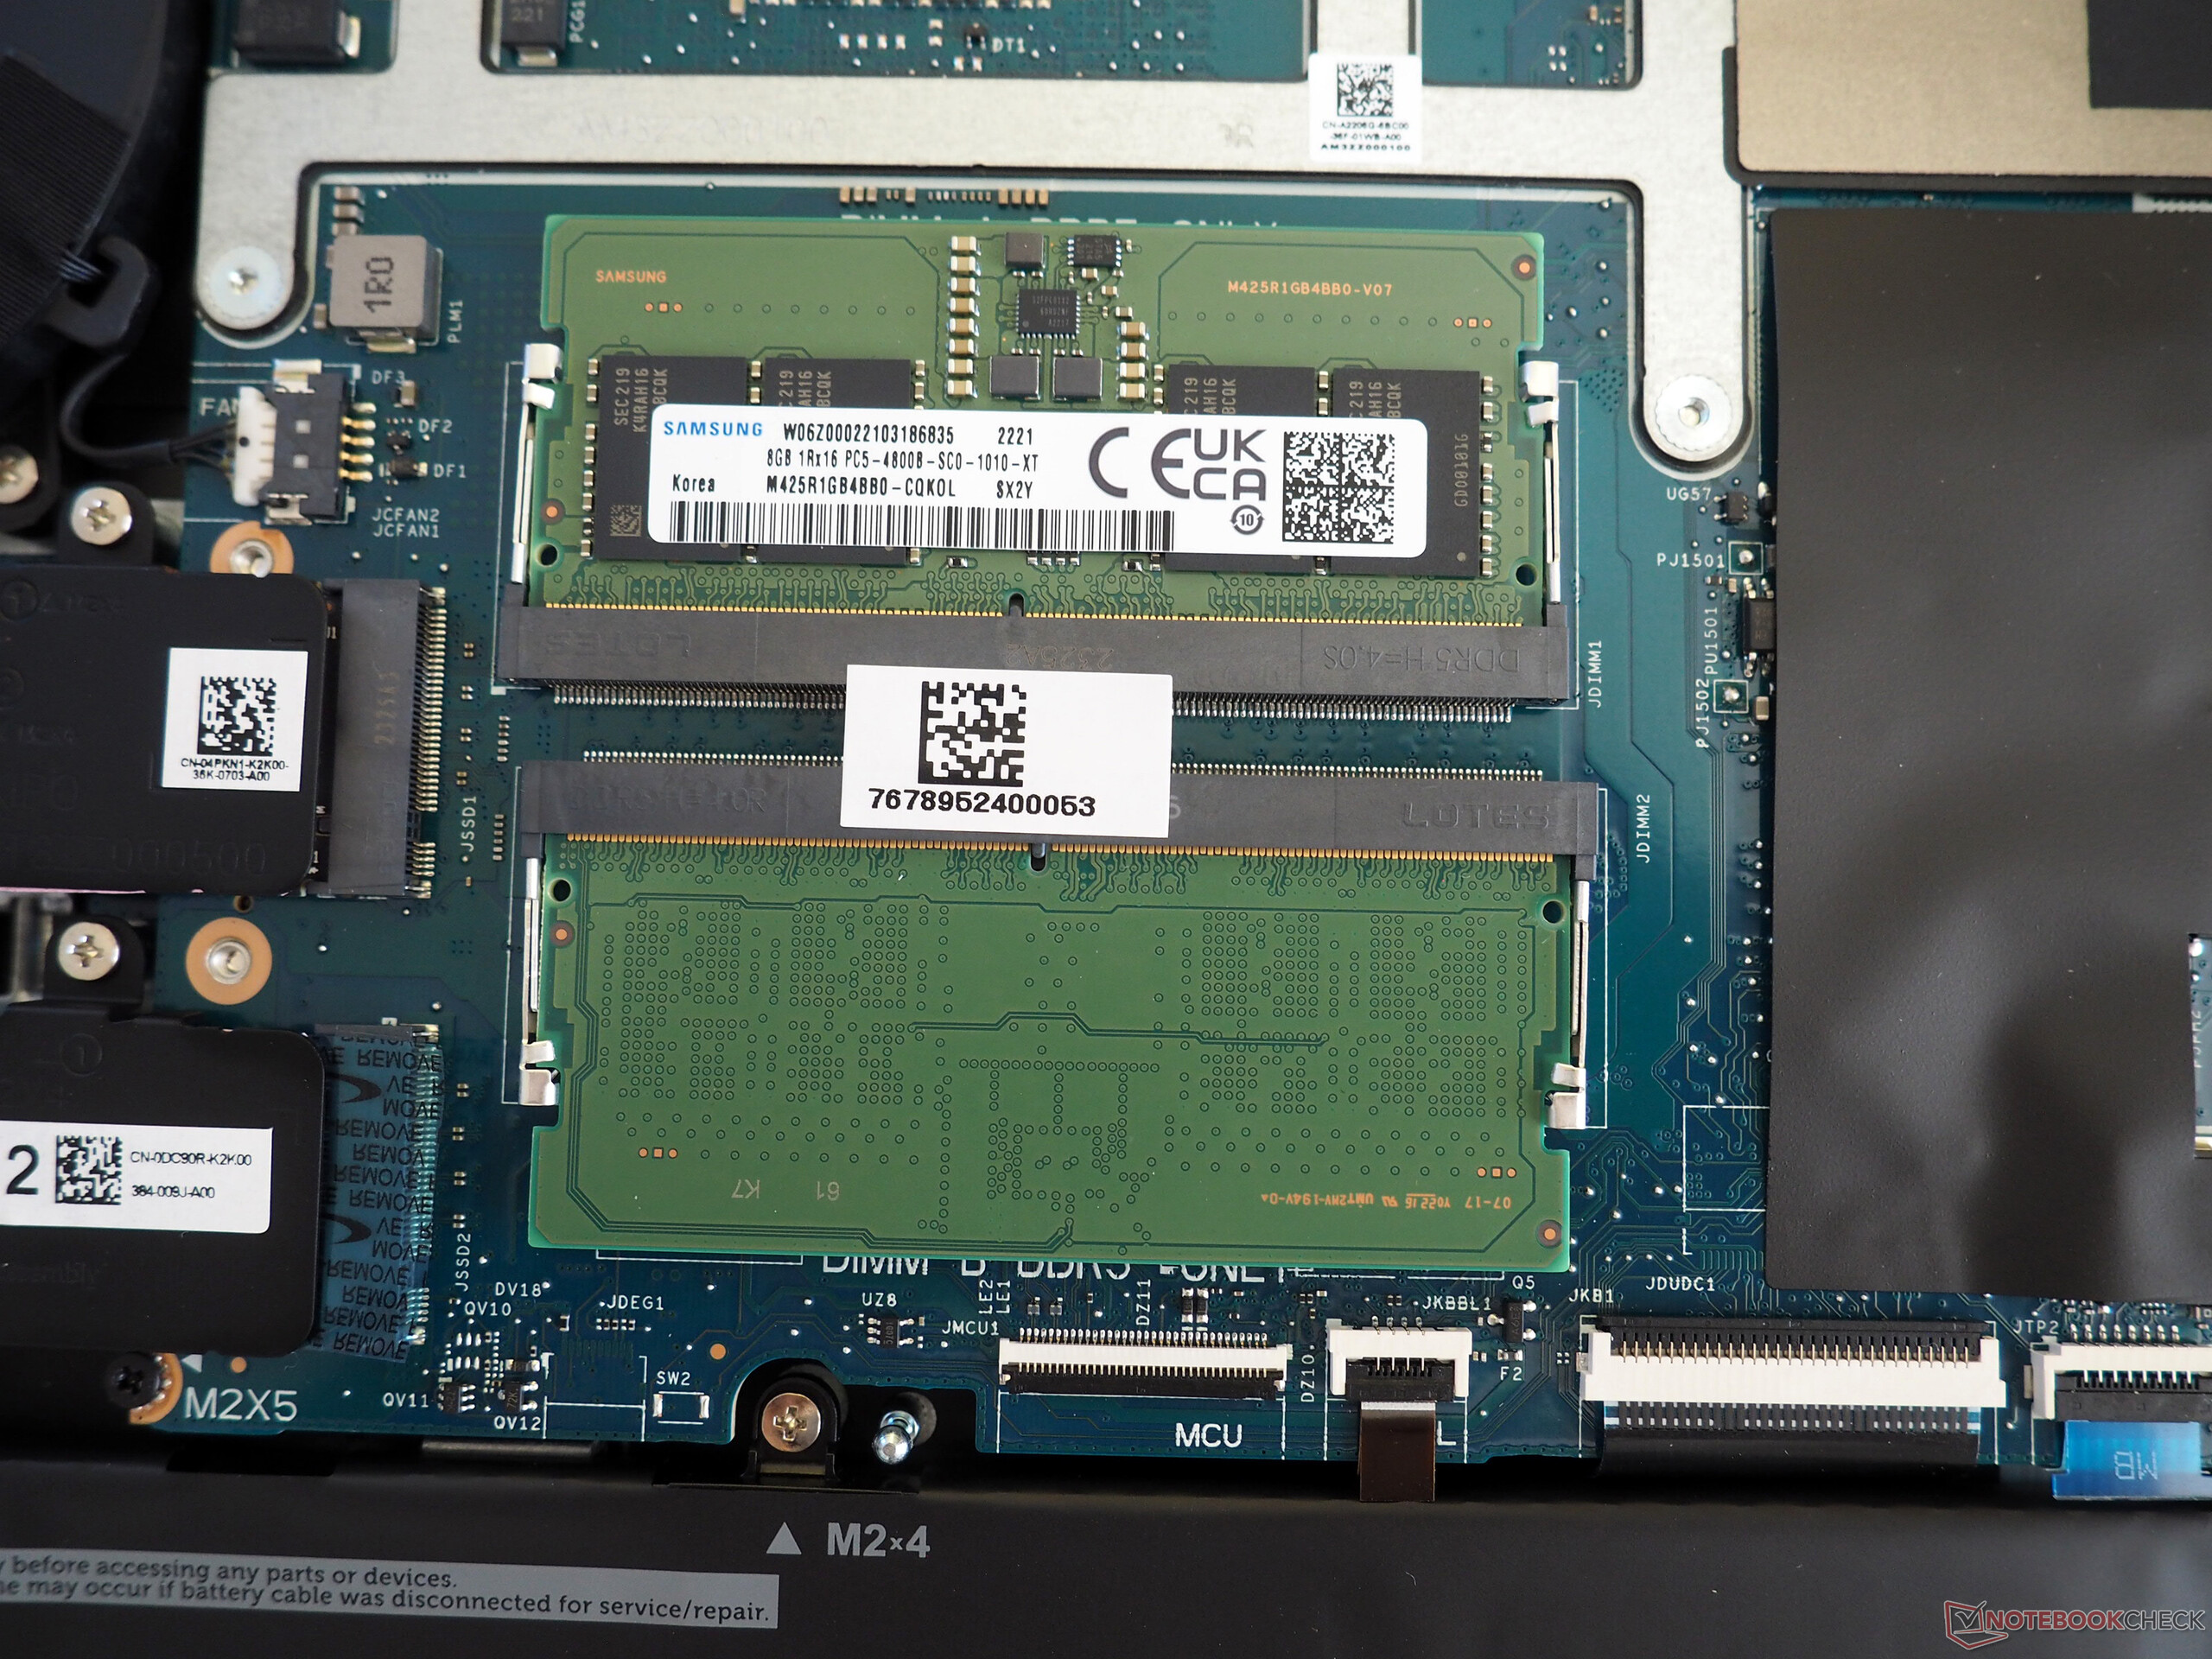
即使是普通用户也能轻松打开机箱。卸下 10 颗十字头螺丝后,就能将底板从固定器中抬起。在机箱盖下等待您的是散热装置、电池、Wi-Fi 模块、两个占用的内存插槽、一个正在使用的 M.2 2230 插槽和一个空闲的 M.2 2280 插槽(用于存储升级)。
保修
戴尔在德国默认只提供 12 个月的保修。但保修期可能因地区而异。
输入设备
键盘
输入设备性能稳定,但并不出众。尽管方向键很小,但我们尤其喜欢德文键盘的布局,它基本保持了标准的排列方式,并提供了一个全尺寸的数字键盘。键入手感比较一般,我们认为还可以更硬一些。白色背光有两个亮度级别,便于在黑暗环境中打字。
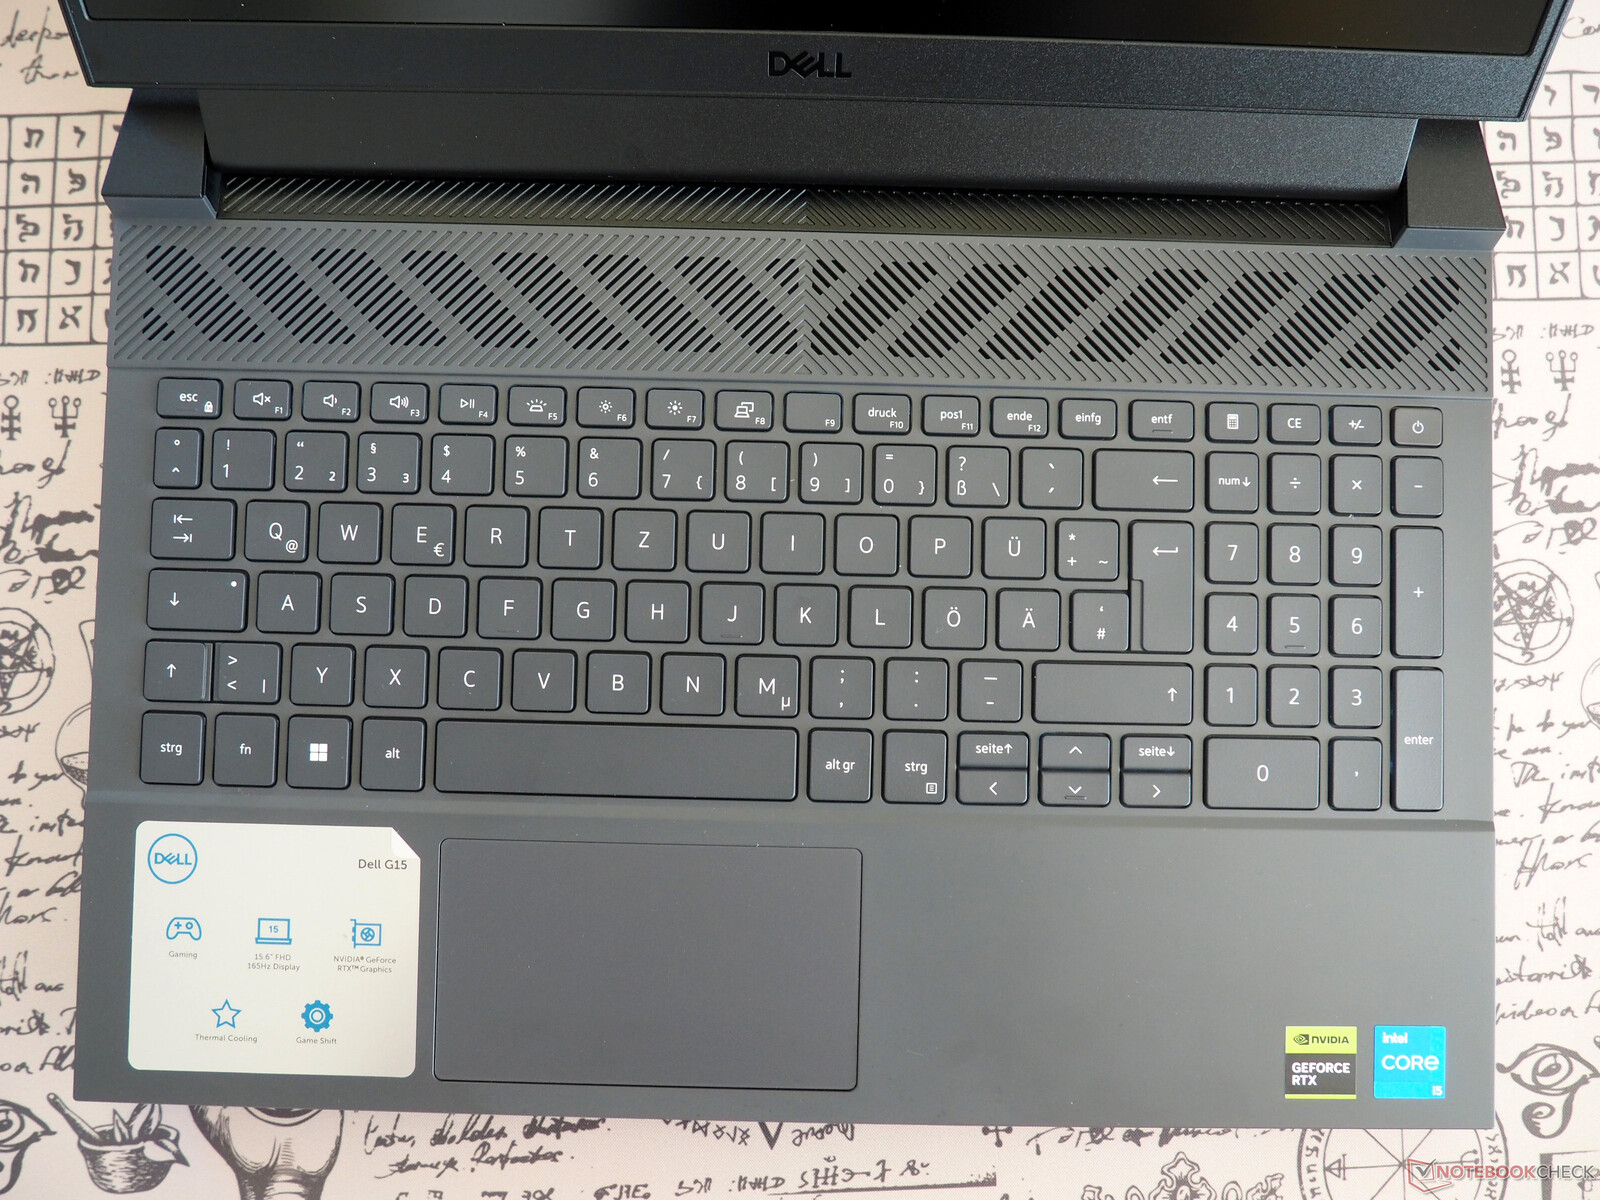
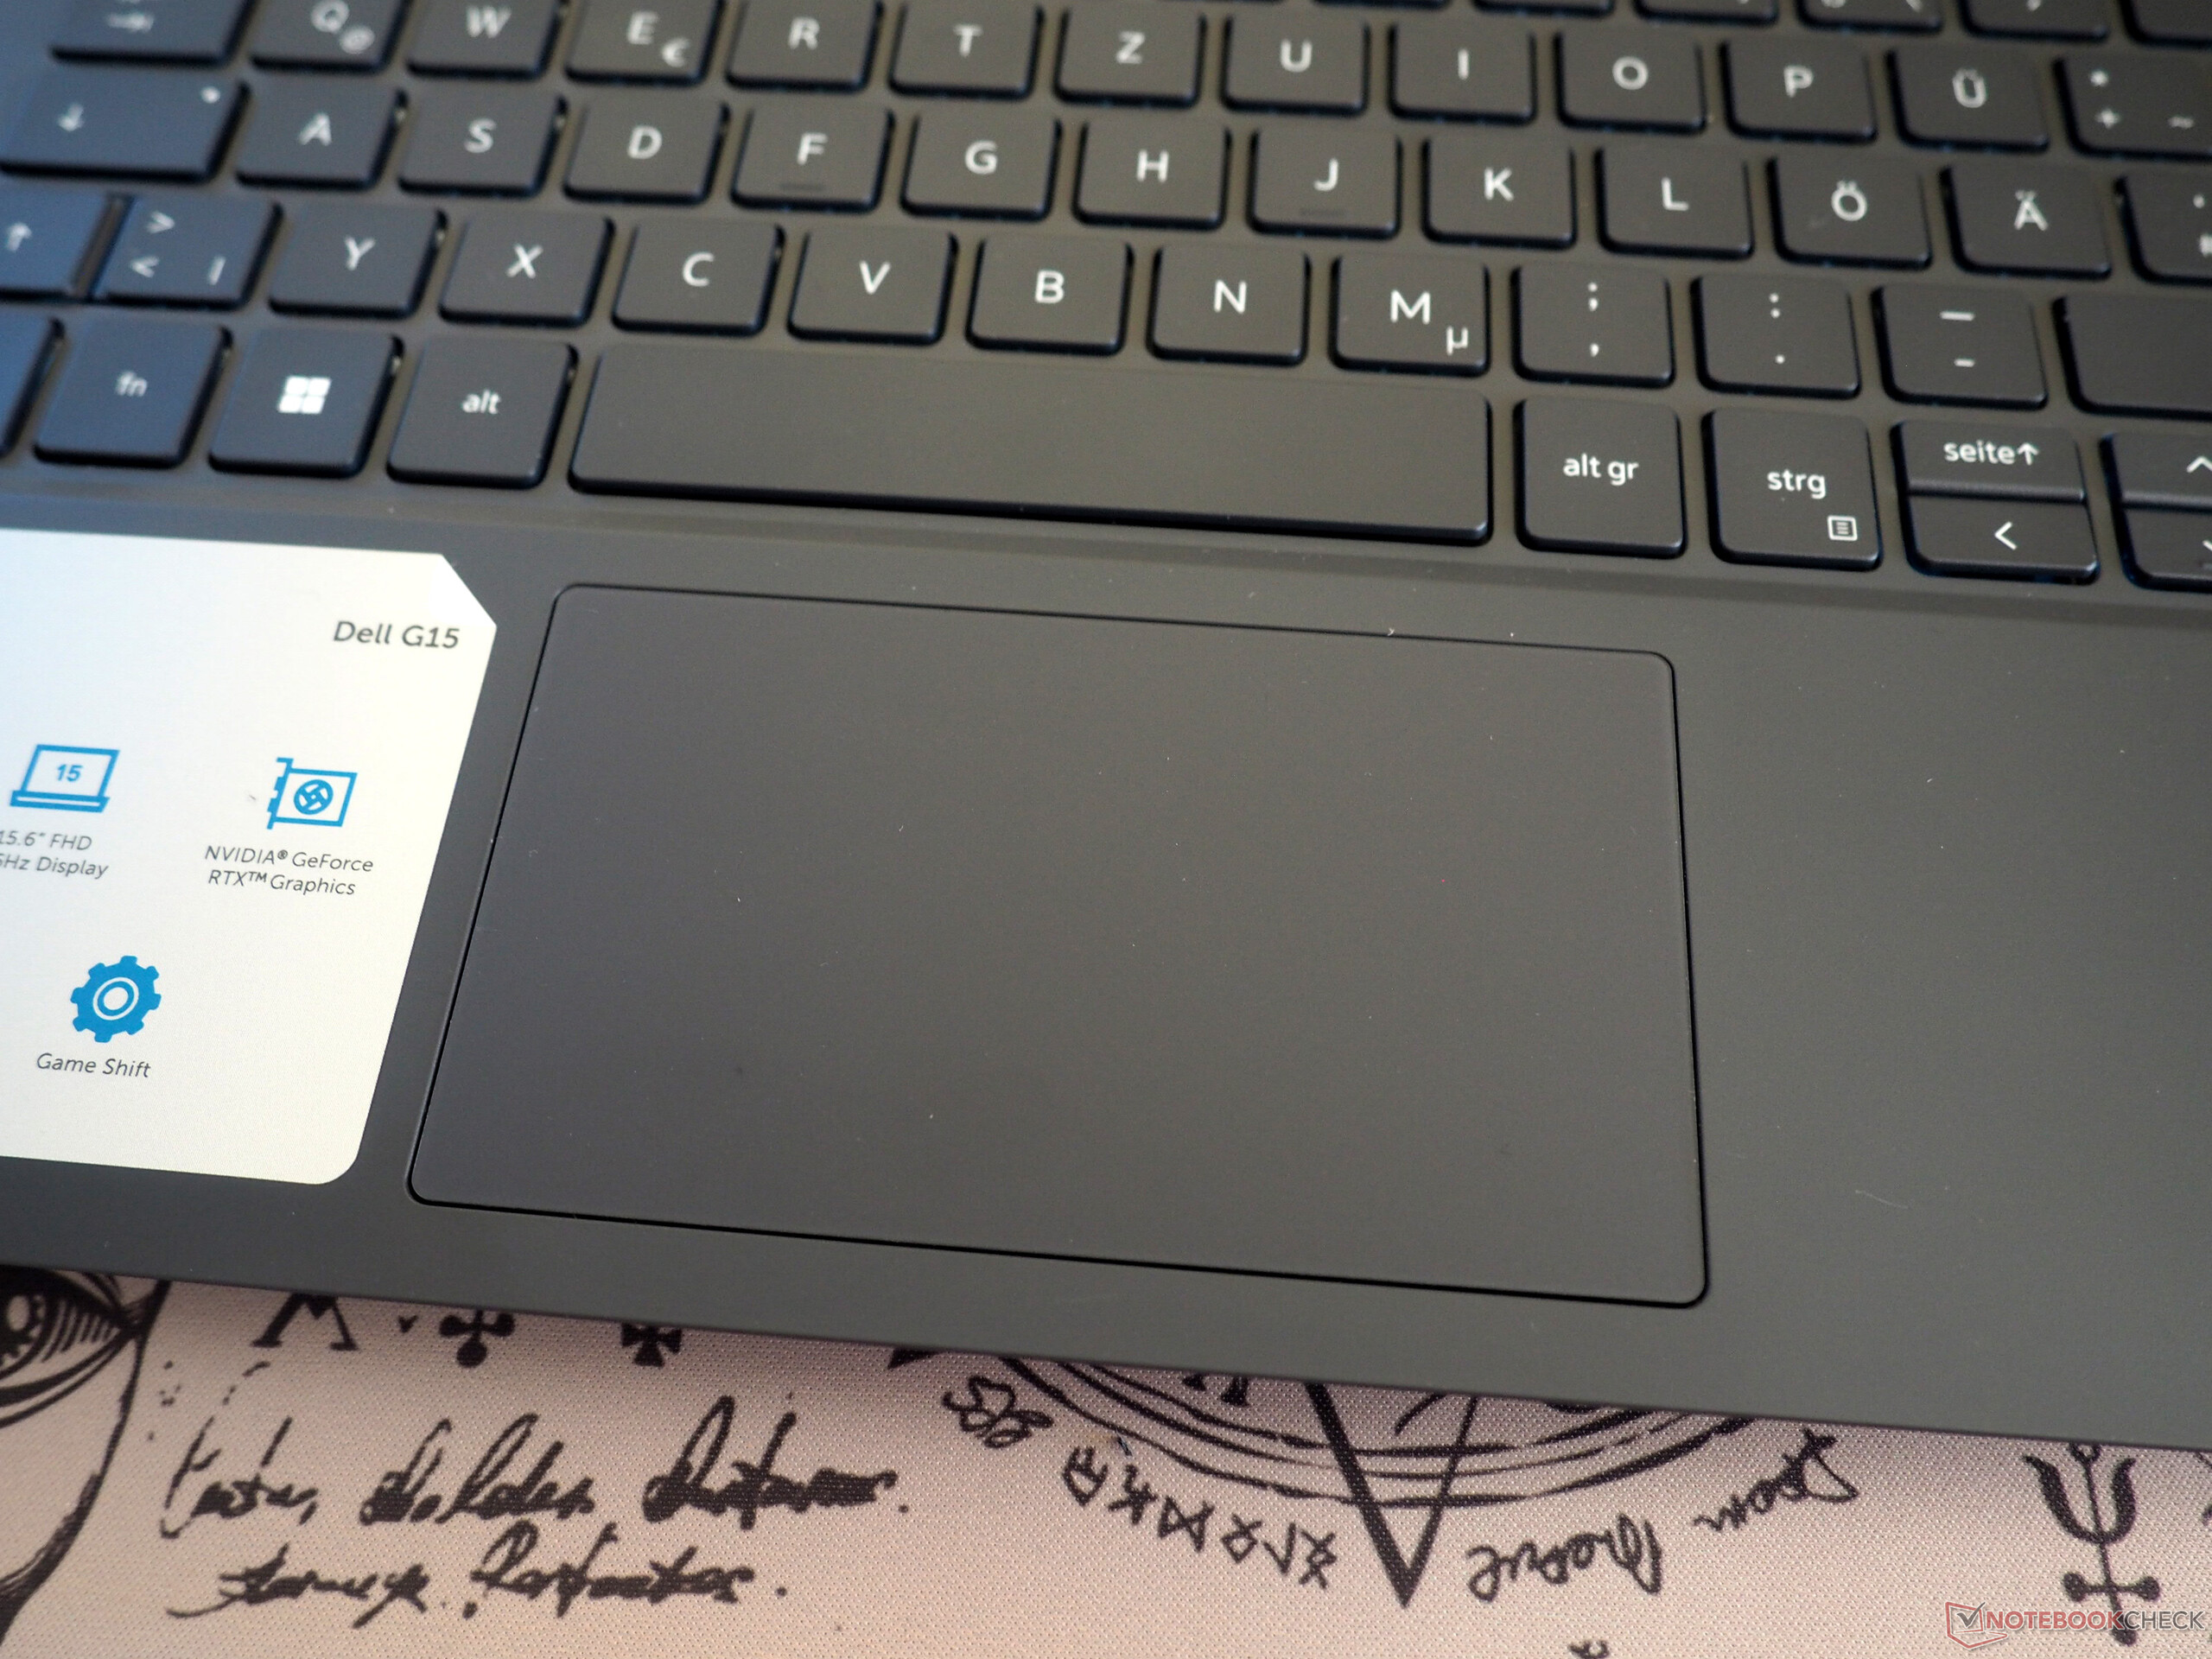
触摸板
戴尔还需要在触摸板上下功夫。例如,除了尺寸有点小(约 10.5 x 6 厘米,4.1 x 2.4 英寸)外,我们还对非常松散的表面感到不满。尽管如此,触摸板的平滑度和精确度还是可以接受的。
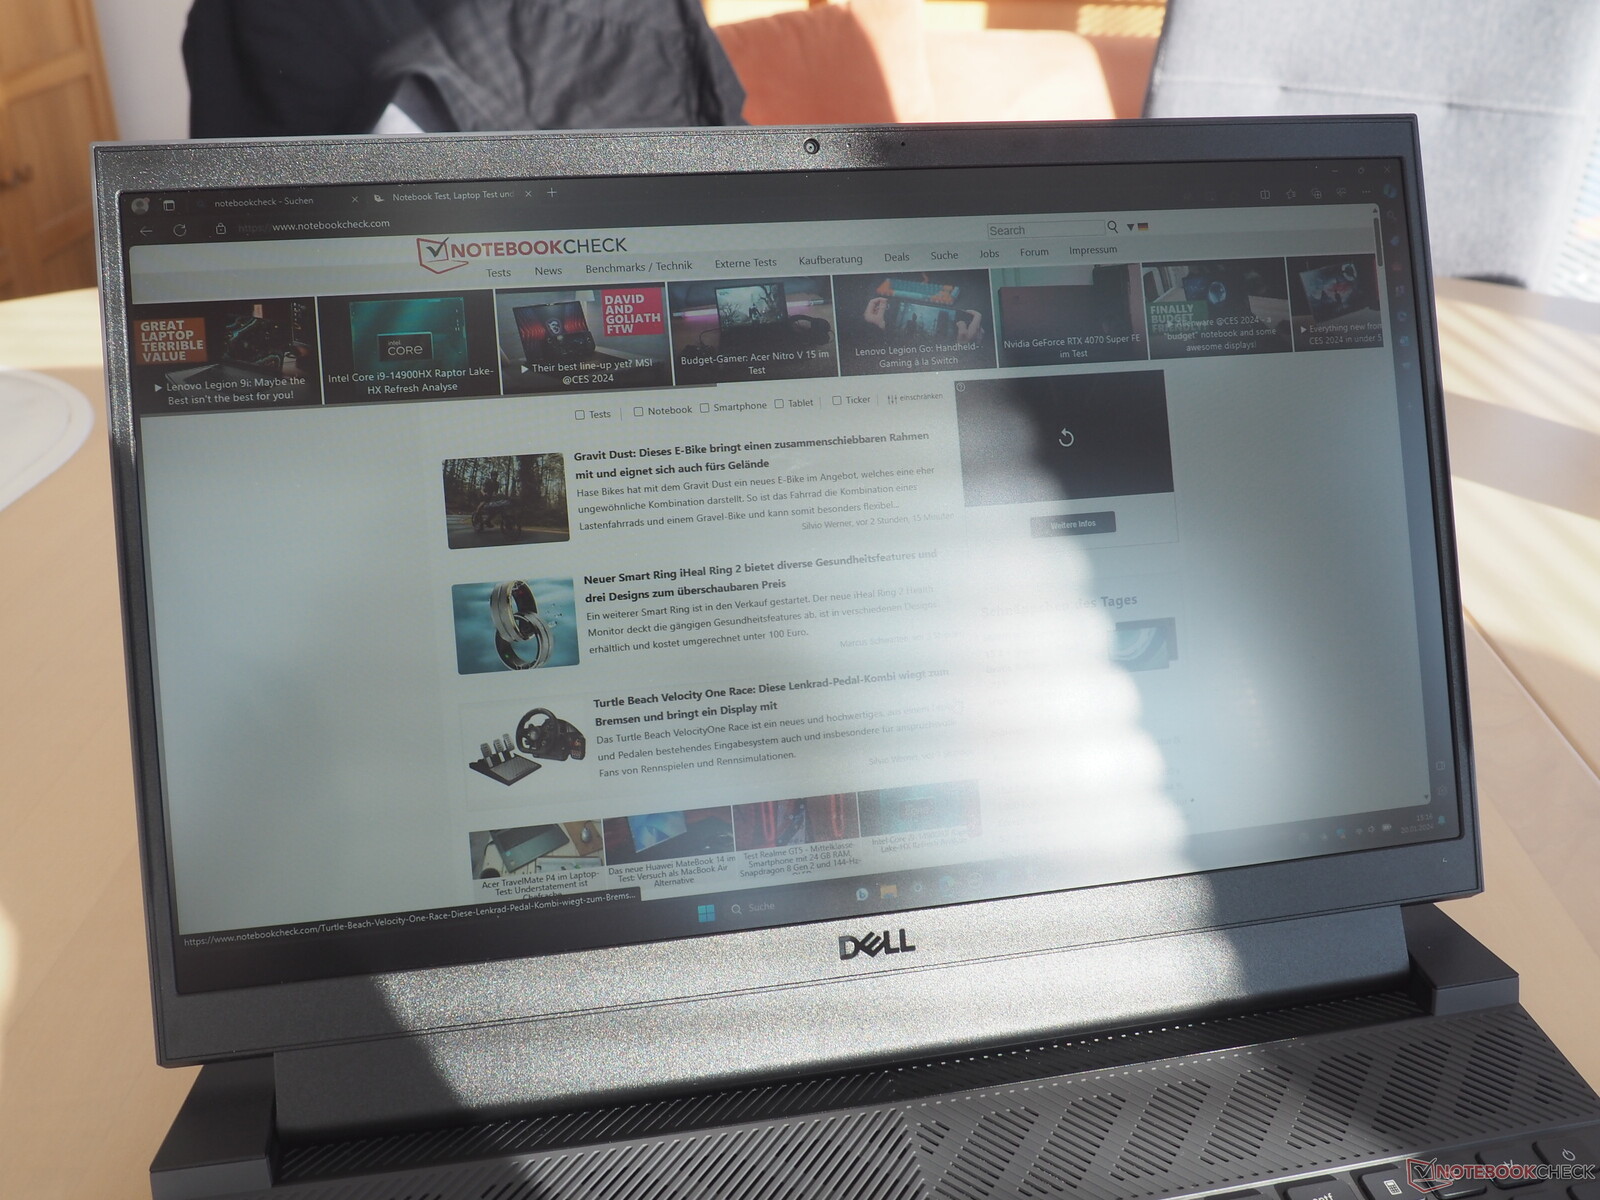
显示屏
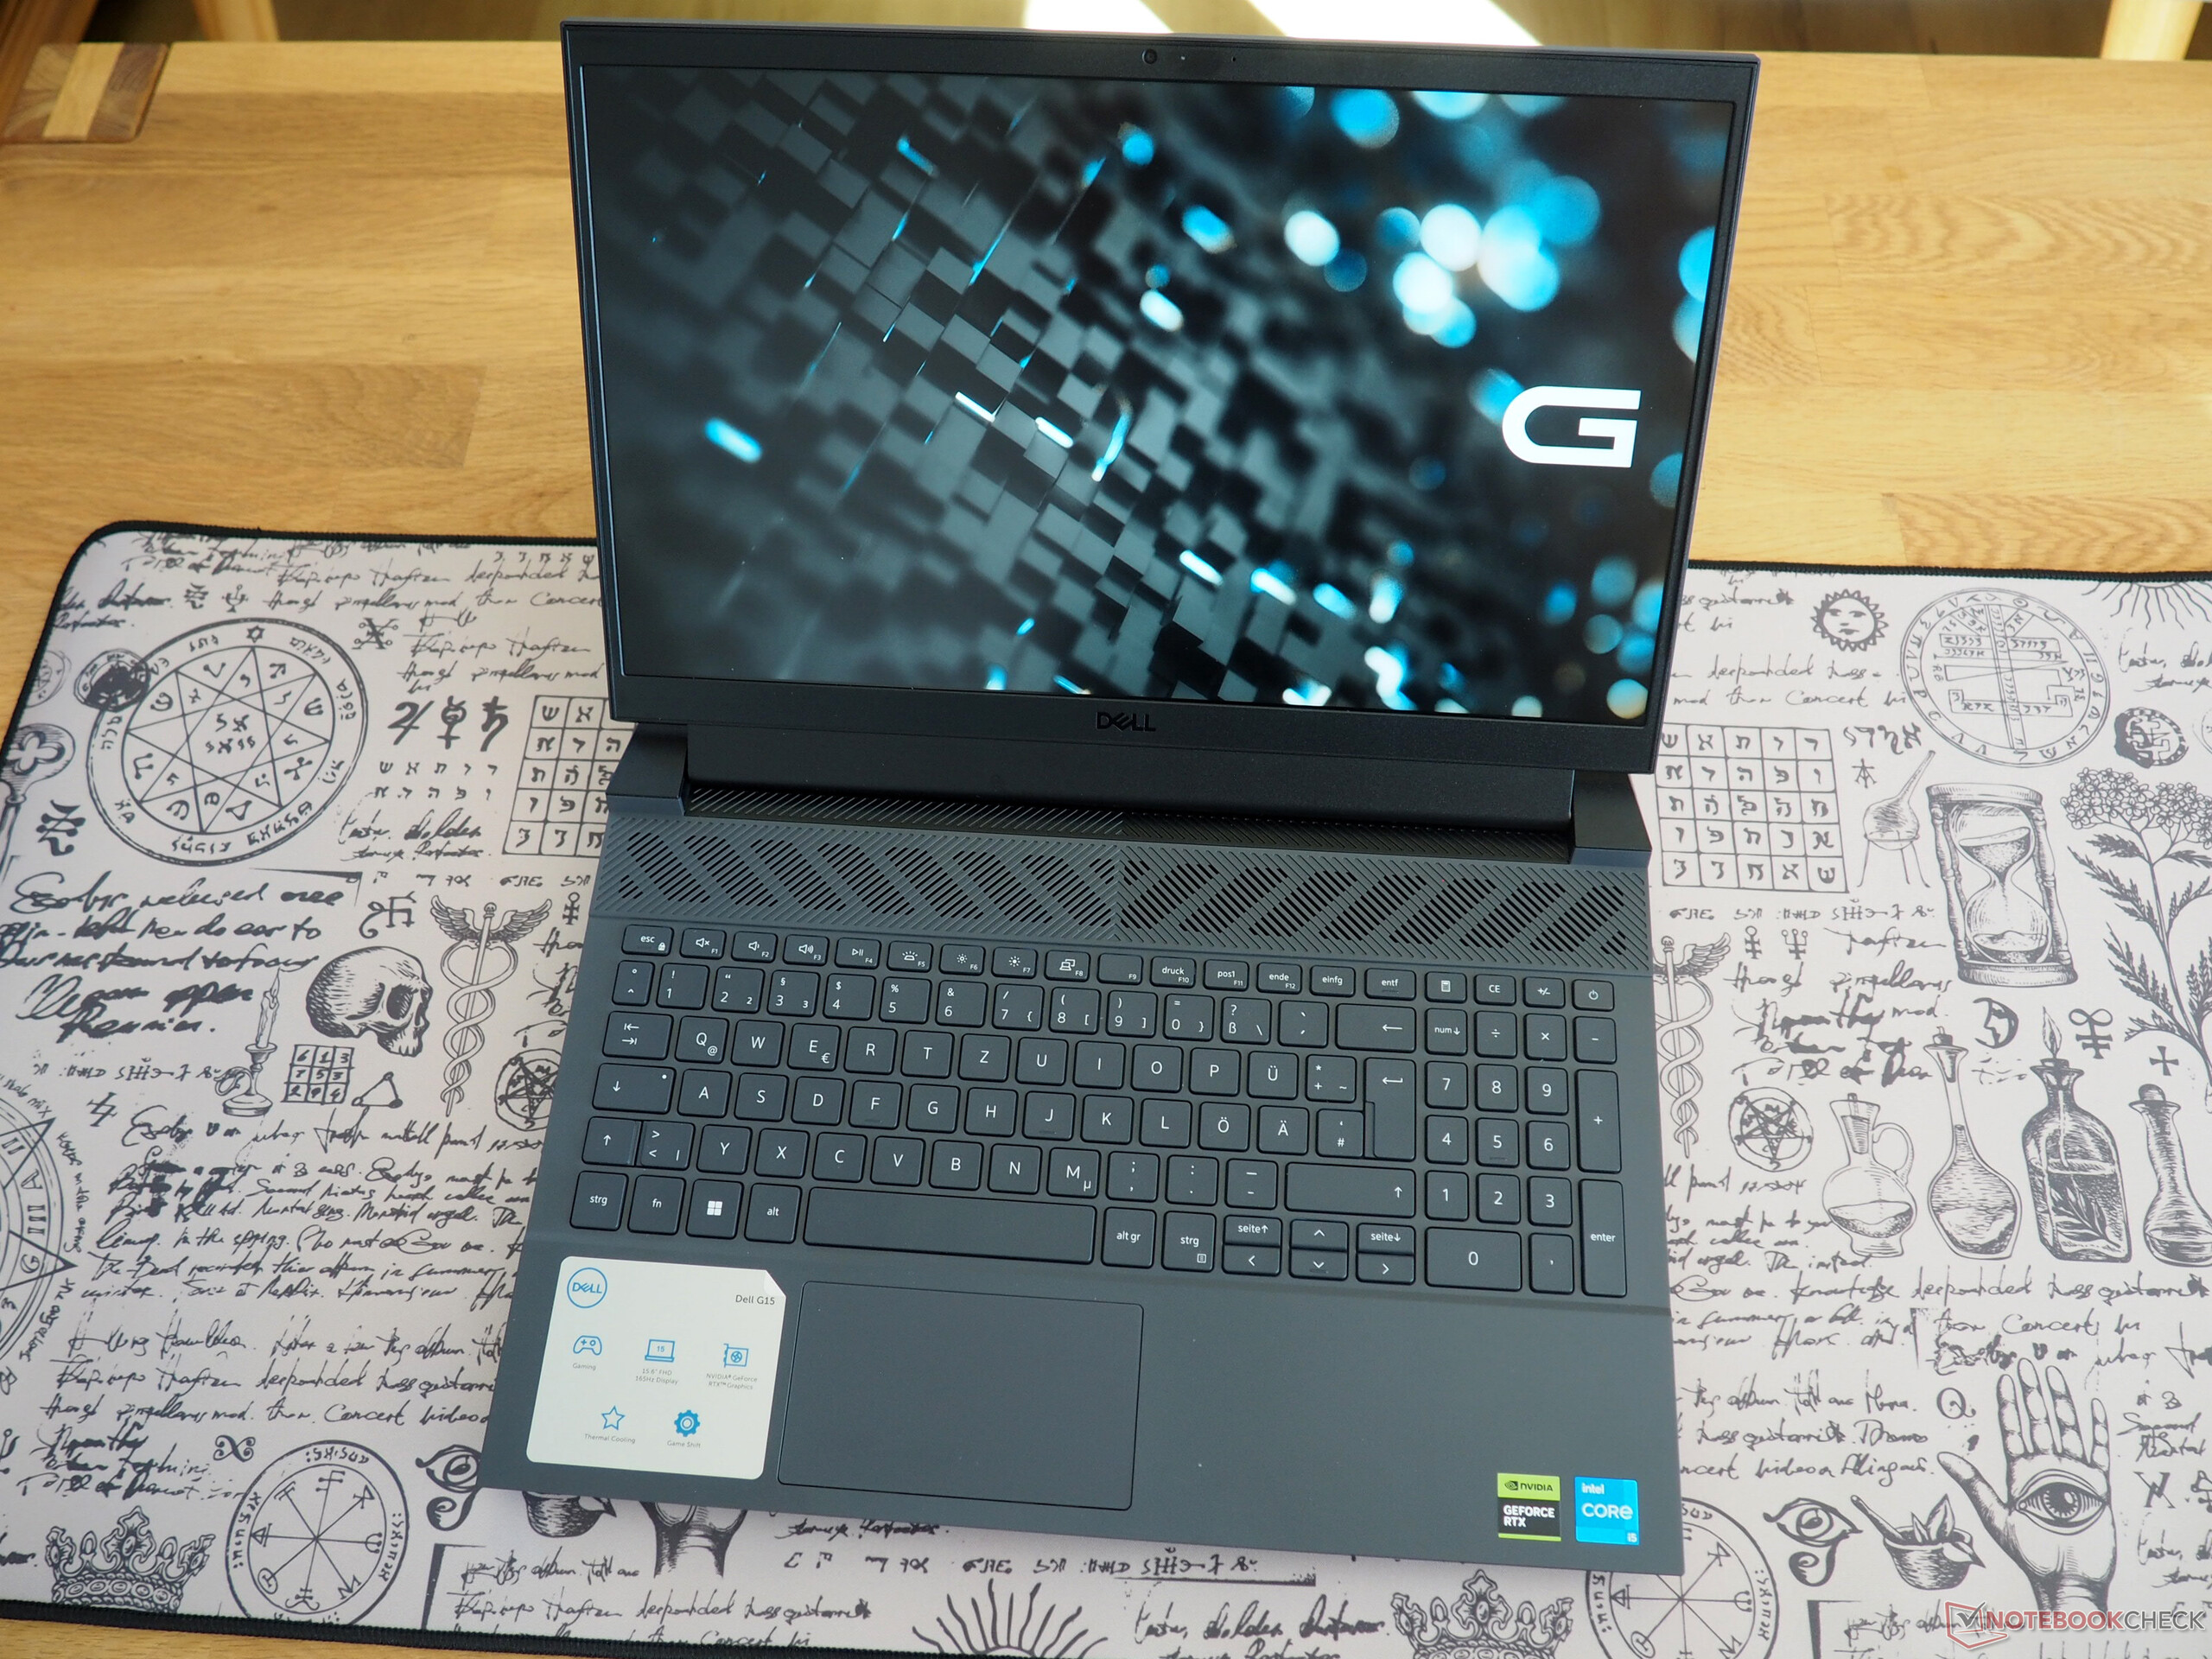
这款笔记本电脑还配备了 165Hz 显示屏。不过,该面板与 G15所使用的面板不同(见表)。这也解释了为什么两款显示屏的某些测试结果有所不同。
| |||||||||||||||||||||||||
Brightness Distribution: 89 %
Center on Battery: 389 cd/m²
Contrast: 1111:1 (Black: 0.35 cd/m²)
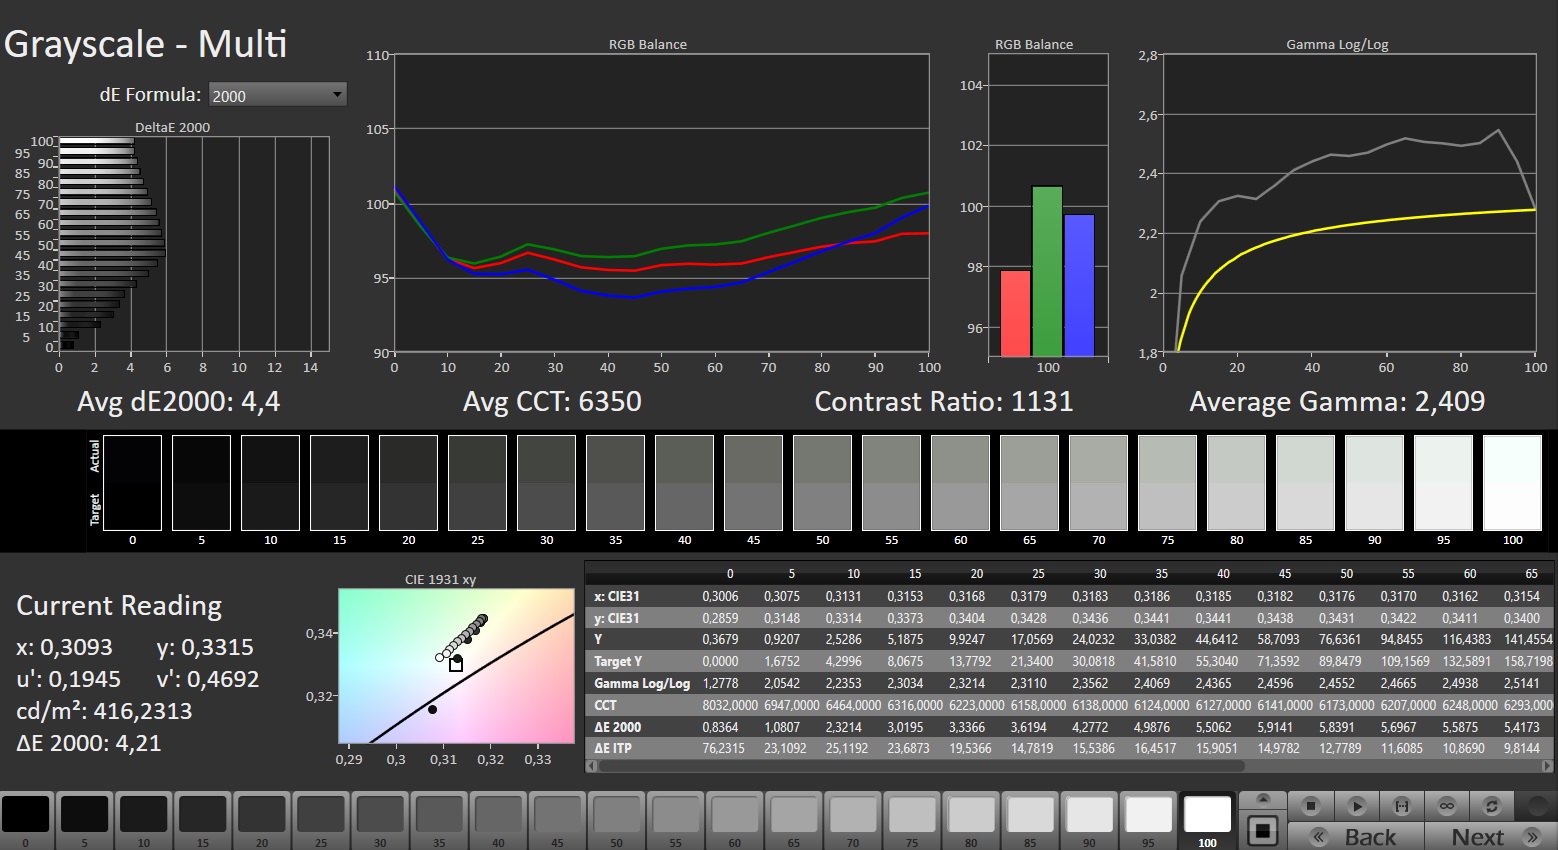
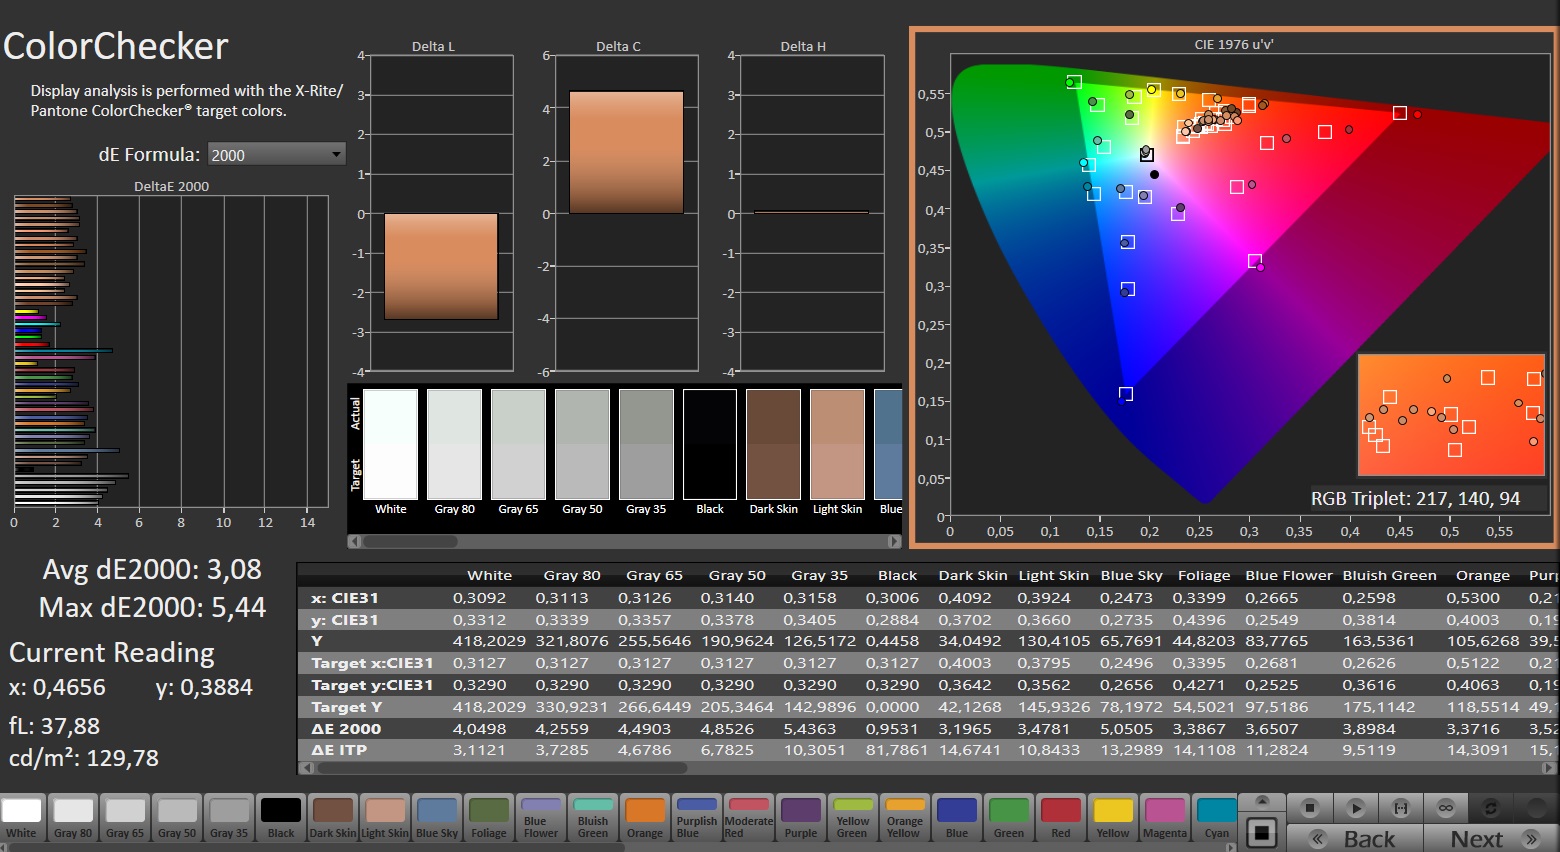
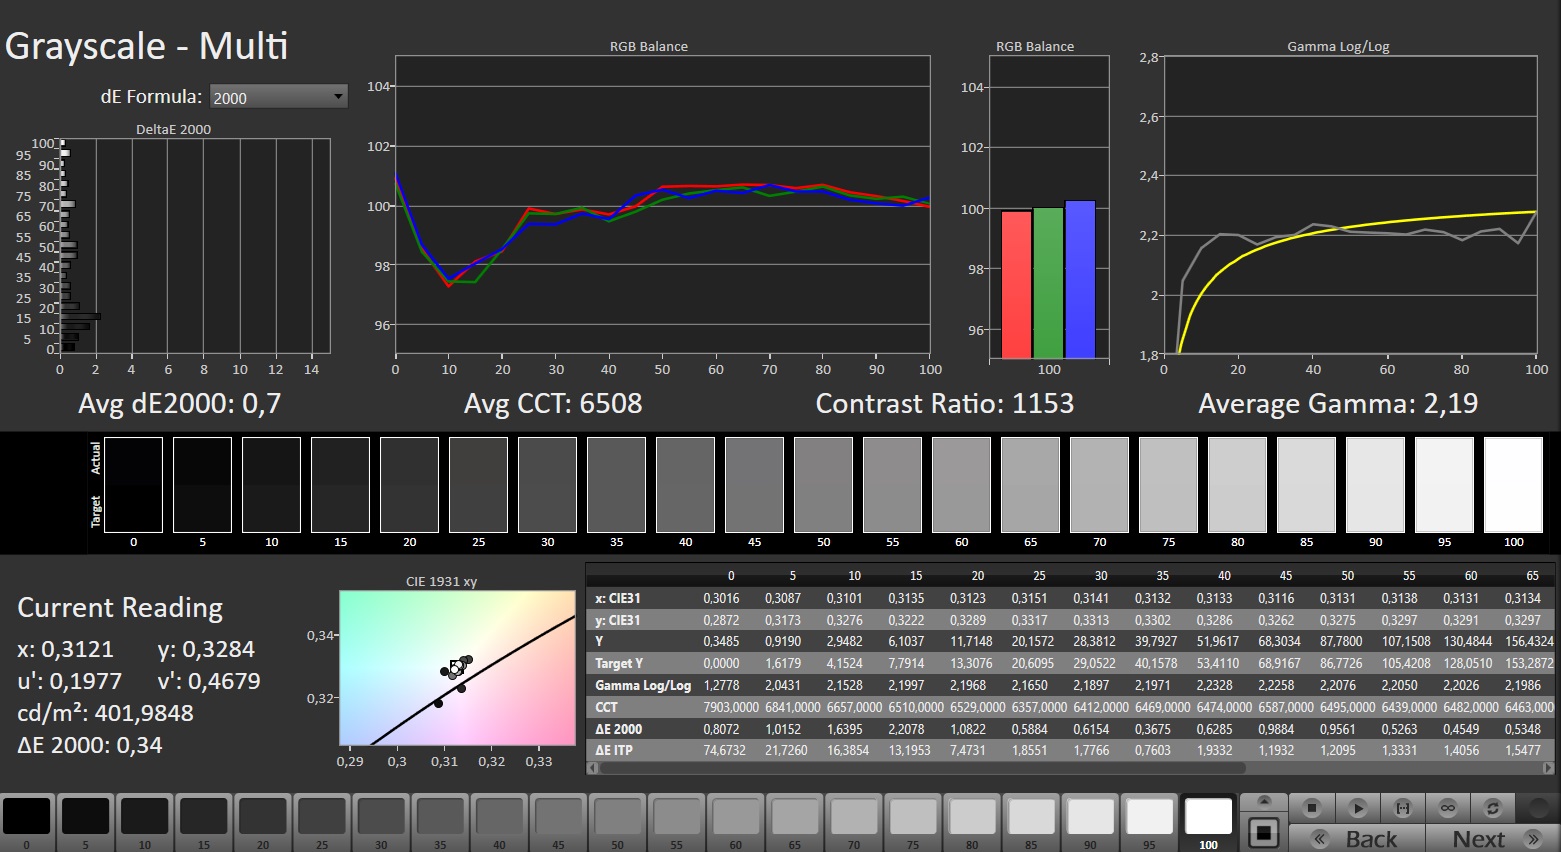
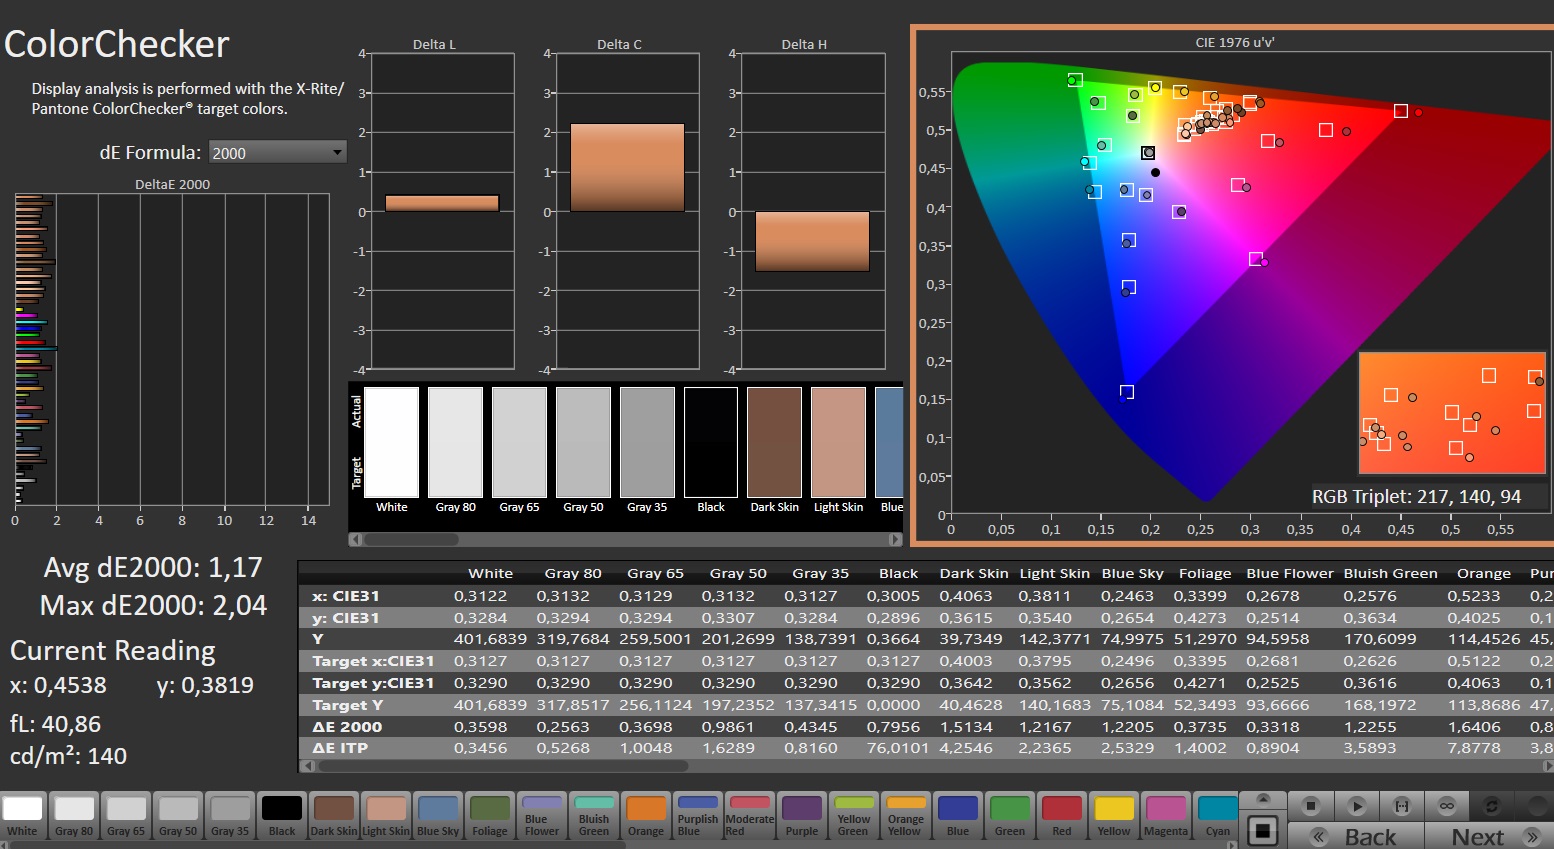
ΔE ColorChecker Calman: 3.08 | ∀{0.5-29.43 Ø4.71}
calibrated: 1.17
ΔE Greyscale Calman: 4.4 | ∀{0.09-98 Ø4.96}
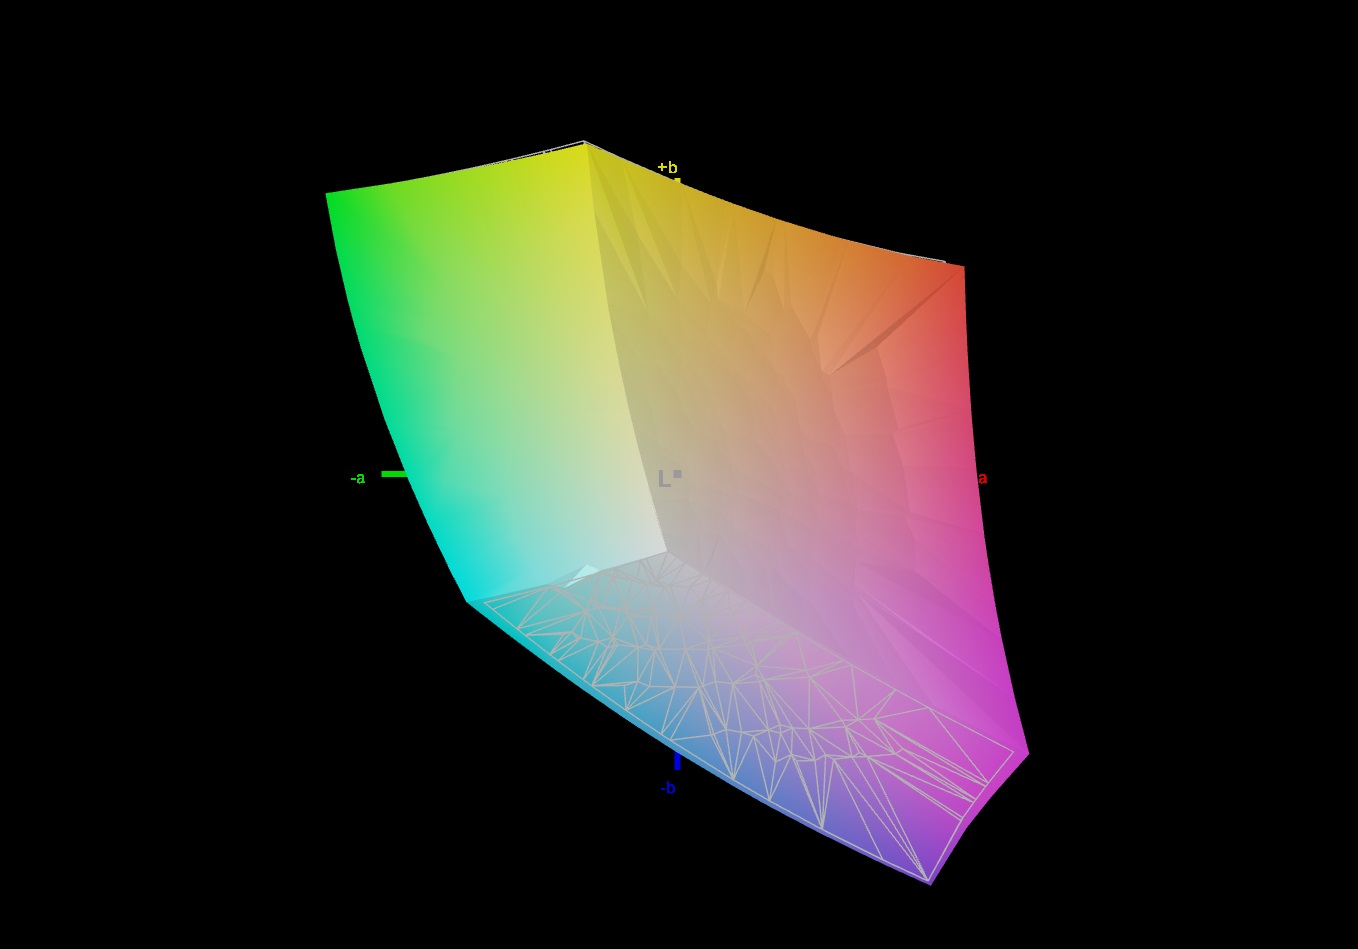
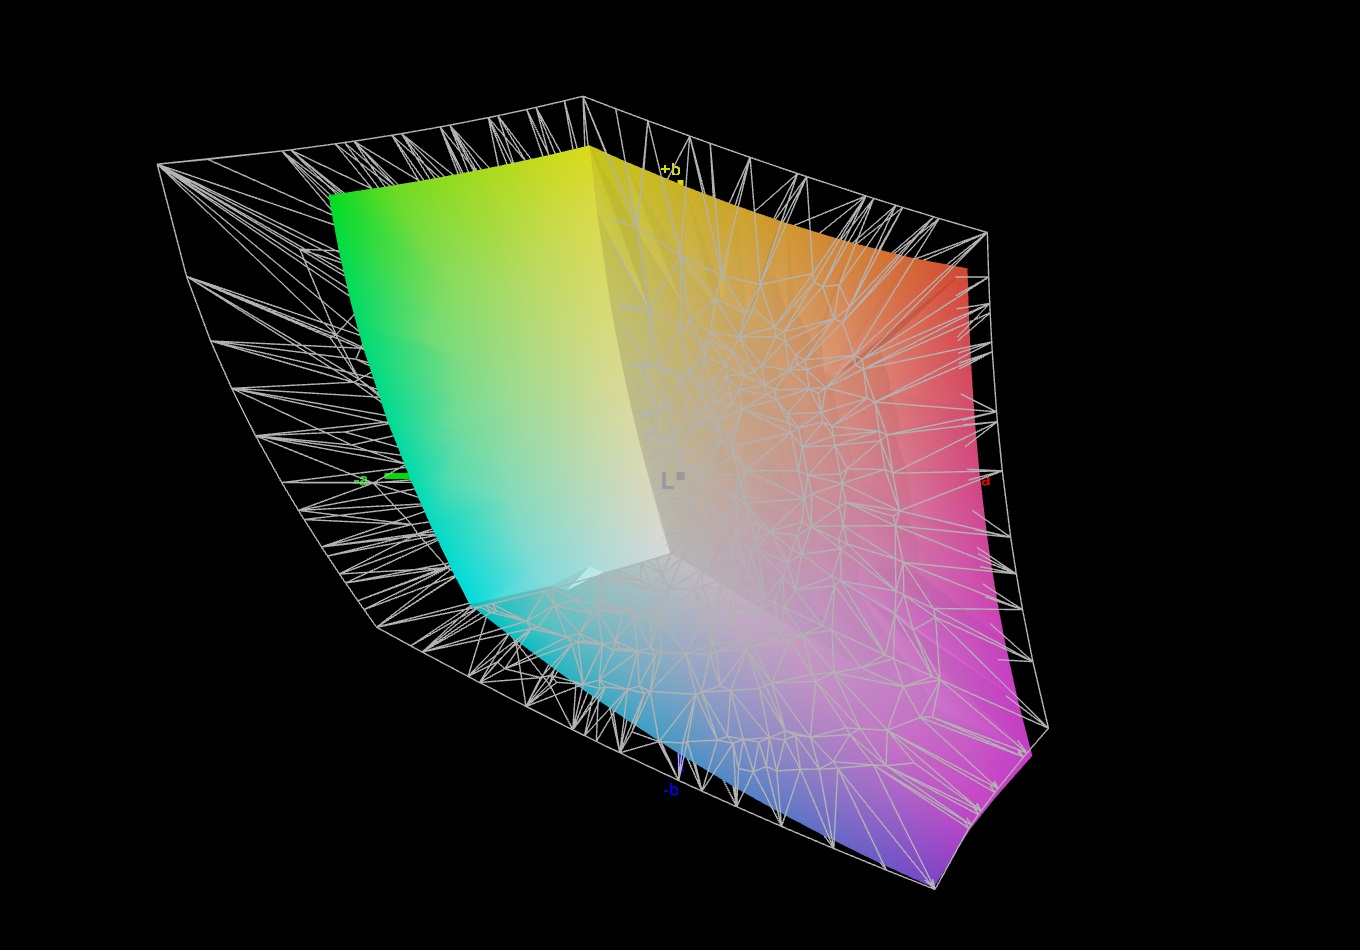
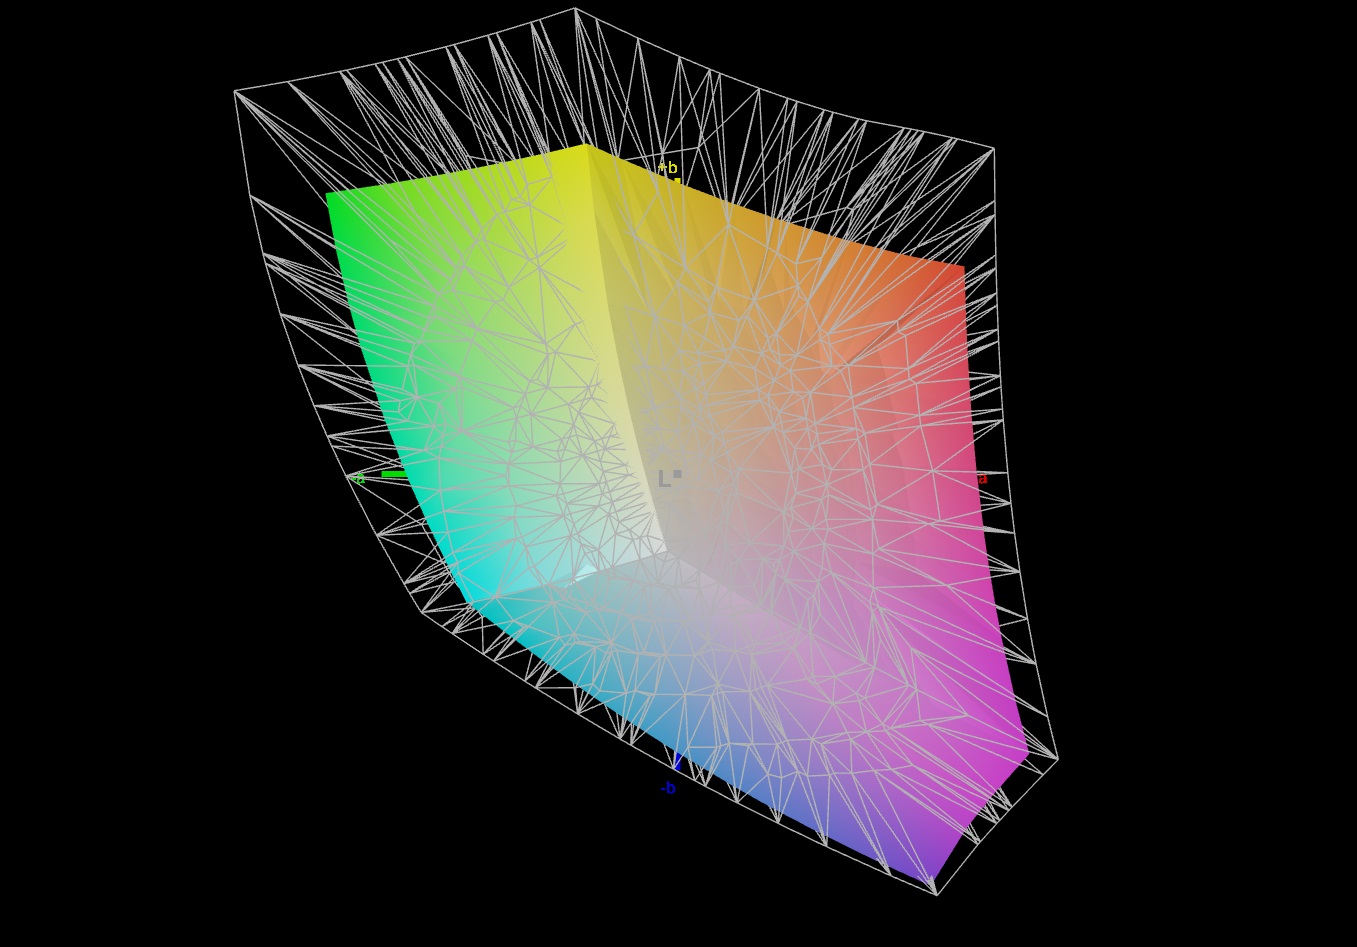
71.4% AdobeRGB 1998 (Argyll 3D)
99.3% sRGB (Argyll 3D)
71.1% Display P3 (Argyll 3D)
Gamma: 2.409
CCT: 6350 K
| Dell G15 5530, i5-13450HX RTX 4050 BOEhydis NV15NY9 (Dell 18PJX), IPS, 1920x1080, 15.6" | Medion Erazer Crawler E40 - MD 62518 BOE HF NV156FHM-N4G, IPS, 1920x1080, 15.6" | Lenovo LOQ 15IRH8 Core i7 BOE CQ NE156QHM-NY4, IPS, 2560x1440, 15.6" | Asus TUF A15 FA507 N156HMA-GA1, IPS, 1920x1080, 15.6" | Dell G15 5530 AUO B156HAN, IPS, 1920x1080, 15.6" | |
|---|---|---|---|---|---|
| Display | -12% | -5% | -6% | 2% | |
| Display P3 Coverage (%) | 71.1 | 61.4 -14% | 66.3 -7% | 64.9 -9% | 73.1 3% |
| sRGB Coverage (%) | 99.3 | 89.7 -10% | 96.6 -3% | 96.5 -3% | 98.4 -1% |
| AdobeRGB 1998 Coverage (%) | 71.4 | 63.2 -11% | 67.7 -5% | 66.6 -7% | 74.4 4% |
| Response Times | -19% | 8% | -234% | 40% | |
| Response Time Grey 50% / Grey 80% * (ms) | 8.5 ? | 8 ? 6% | 5 ? 41% | 30.4 ? -258% | 3.39 ? 60% |
| Response Time Black / White * (ms) | 6.7 ? | 9.6 ? -43% | 8.41 ? -26% | 20.8 ? -210% | 5.35 ? 20% |
| PWM Frequency (Hz) | 21620 ? | ||||
| Screen | -13% | -10% | 21% | -17% | |
| Brightness middle (cd/m²) | 389 | 364 -6% | 373 -4% | 288 -26% | 320 -18% |
| Brightness (cd/m²) | 374 | 351 -6% | 365 -2% | 271 -28% | 316 -16% |
| Brightness Distribution (%) | 89 | 91 2% | 90 1% | 91 2% | 94 6% |
| Black Level * (cd/m²) | 0.35 | 0.43 -23% | 0.33 6% | 0.17 51% | 0.21 40% |
| Contrast (:1) | 1111 | 847 -24% | 1130 2% | 1694 52% | 1524 37% |
| Colorchecker dE 2000 * | 3.08 | 3.98 -29% | 4.19 -36% | 1.9 38% | 4.55 -48% |
| Colorchecker dE 2000 max. * | 5.44 | 6.38 -17% | 8.47 -56% | 3.3 39% | 9.83 -81% |
| Colorchecker dE 2000 calibrated * | 1.17 | 1.36 -16% | 1.07 9% | 0.9 23% | 1.51 -29% |
| Greyscale dE 2000 * | 4.4 | 4.39 -0% | 5 -14% | 2.7 39% | 6.2 -41% |
| Gamma | 2.409 91% | 2.58 85% | 1.93 114% | 2.32 95% | 2.07 106% |
| CCT | 6350 102% | 7316 89% | 7520 86% | 6535 99% | 6479 100% |
| Total Average (Program / Settings) | -15% /
-14% | -2% /
-7% | -73% /
-21% | 8% /
-5% |
* ... smaller is better
虽然当前面板的黑度稍差(0.35 而不是 0.21 cd/m²),但其平均最大亮度略高(374 而不是 316 cd/m²)。另一款 G15 机型的对比度和响应时间均优于评测机型。尽管如此,对于 IPS 面板来说,1111:1 的对比度和 8.5 毫秒的灰阶到灰阶响应时间还是可圈可点的。
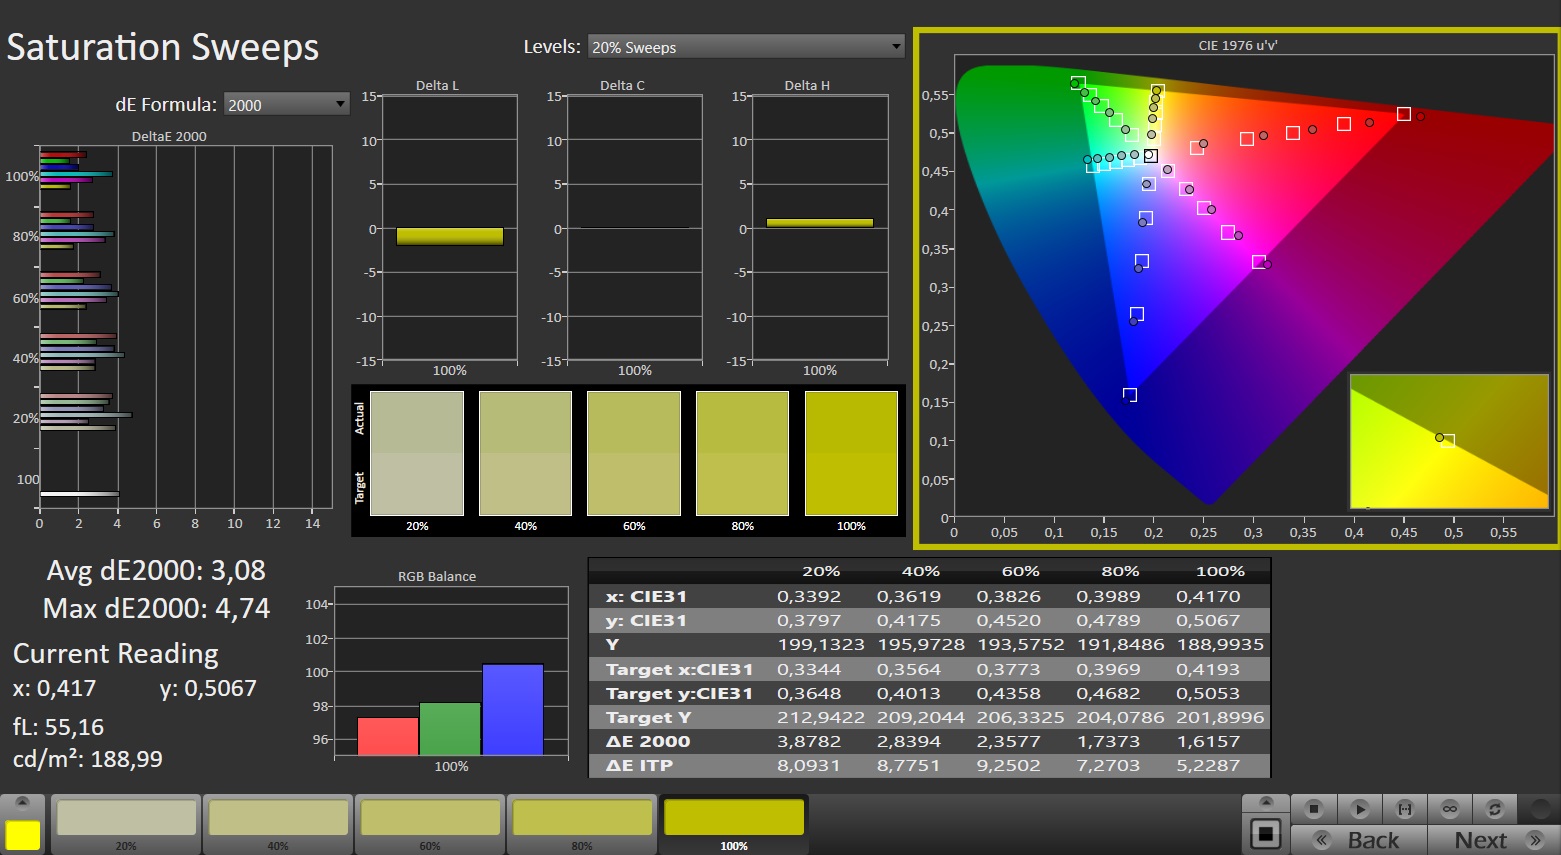
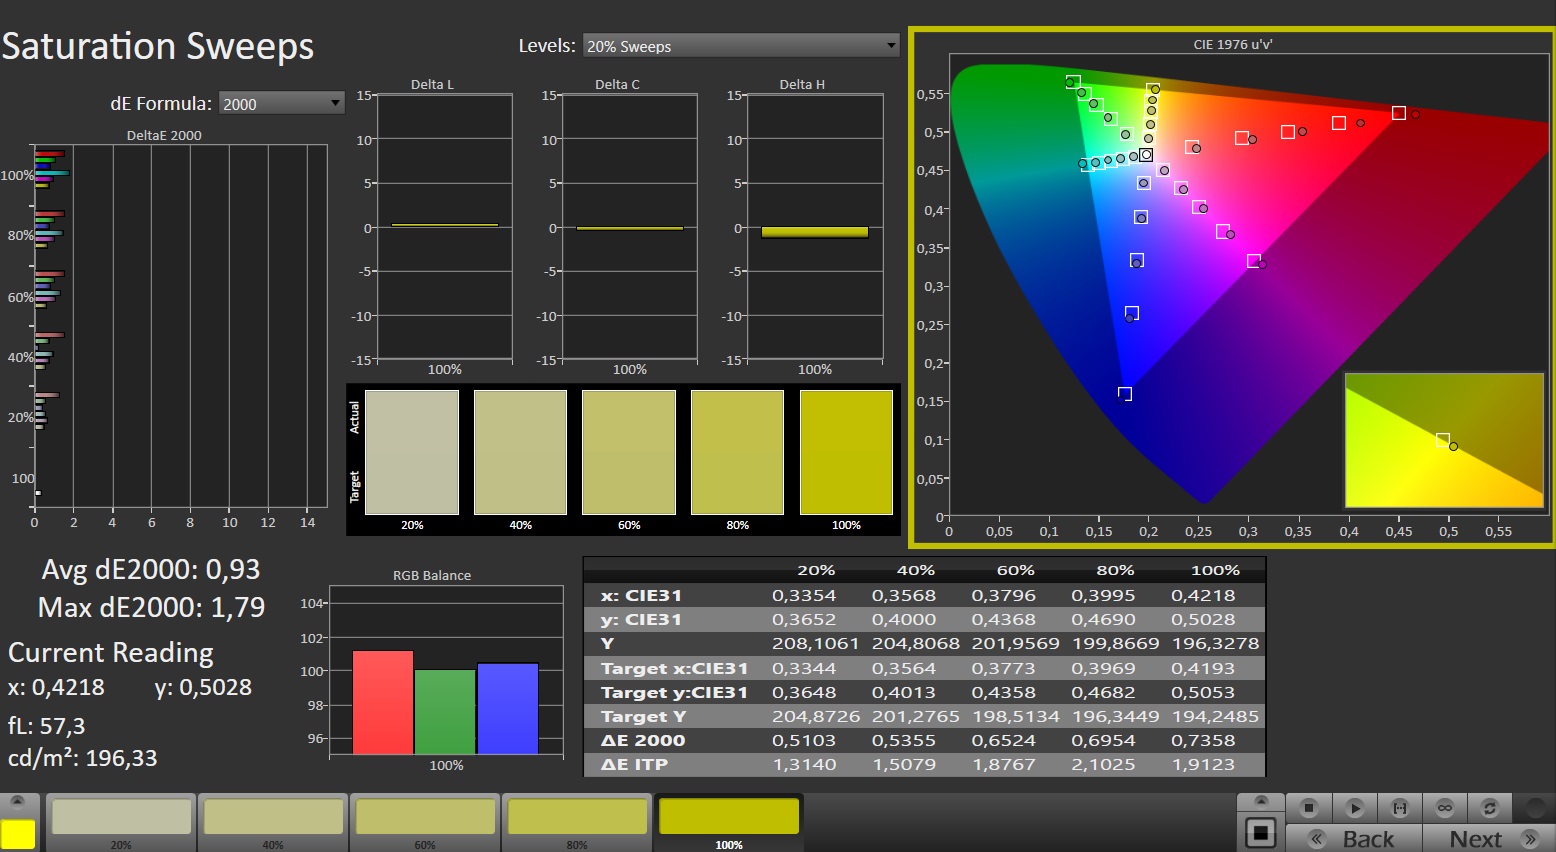
用 "可圈可点 "来形容色彩覆盖范围也很贴切:尽管这款 15 英寸笔记本电脑无法完全再现 DCI-P3 和 AdobeRGB 色彩空间,但在 1,000 欧元(1,090 美元)的价格范围内,sRGB 几乎 100% 的覆盖范围并不是必然的,宏碁 Nitro V 15 英寸笔记本电脑就证明了这一点。 宏碁 Nitro V 15就证明了这一点。
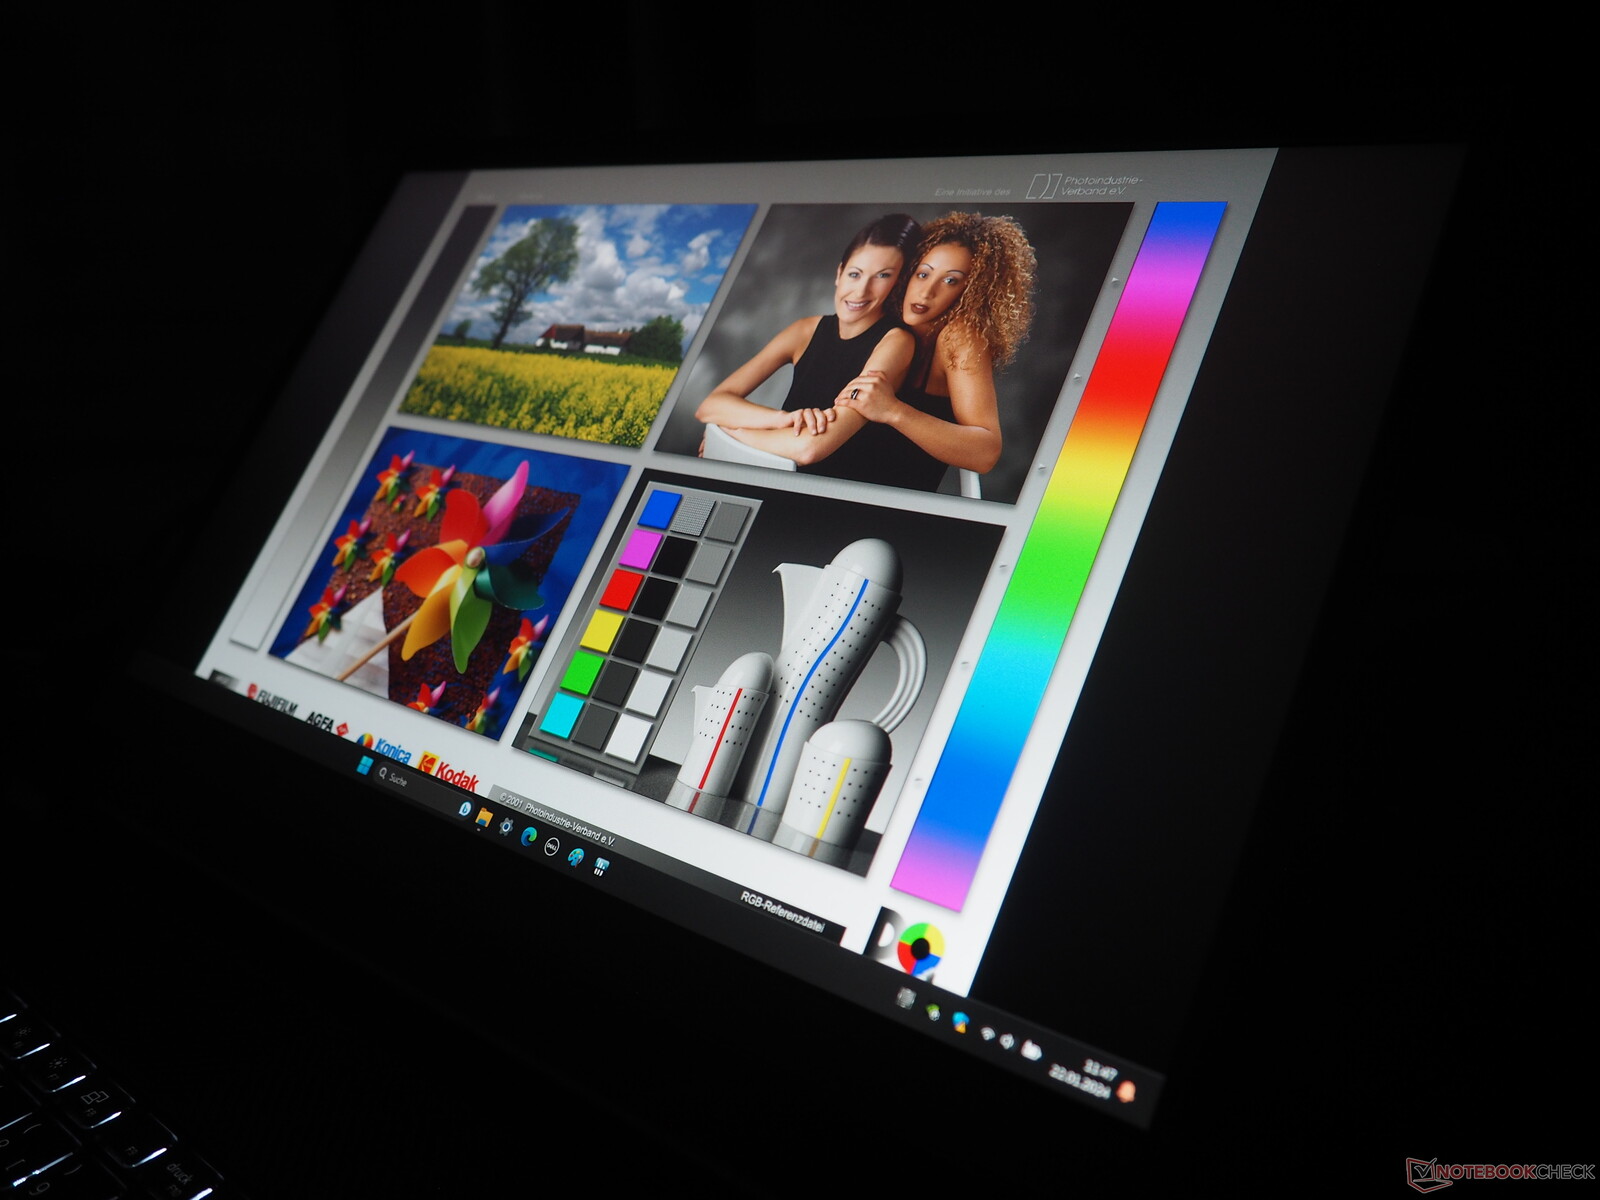
对于 IPS 显示屏来说,可视角度相当典型,即相当不错。大多数买家也会对色彩准确度感到满意。
Display Response Times
| ↔ Response Time Black to White | ||
|---|---|---|
| 6.7 ms ... rise ↗ and fall ↘ combined | ↗ 3.1 ms rise | 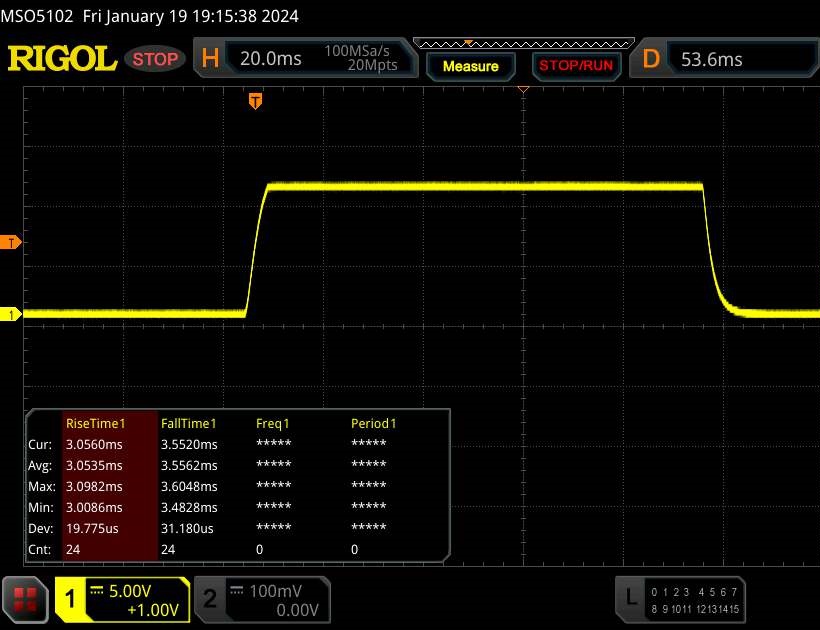 |
| ↘ 3.6 ms fall | ||
| The screen shows very fast response rates in our tests and should be very well suited for fast-paced gaming. In comparison, all tested devices range from 0.1 (minimum) to 240 (maximum) ms. » 21 % of all devices are better. This means that the measured response time is better than the average of all tested devices (19.8 ms). | ||
| ↔ Response Time 50% Grey to 80% Grey | ||
| 8.5 ms ... rise ↗ and fall ↘ combined | ↗ 4.2 ms rise | 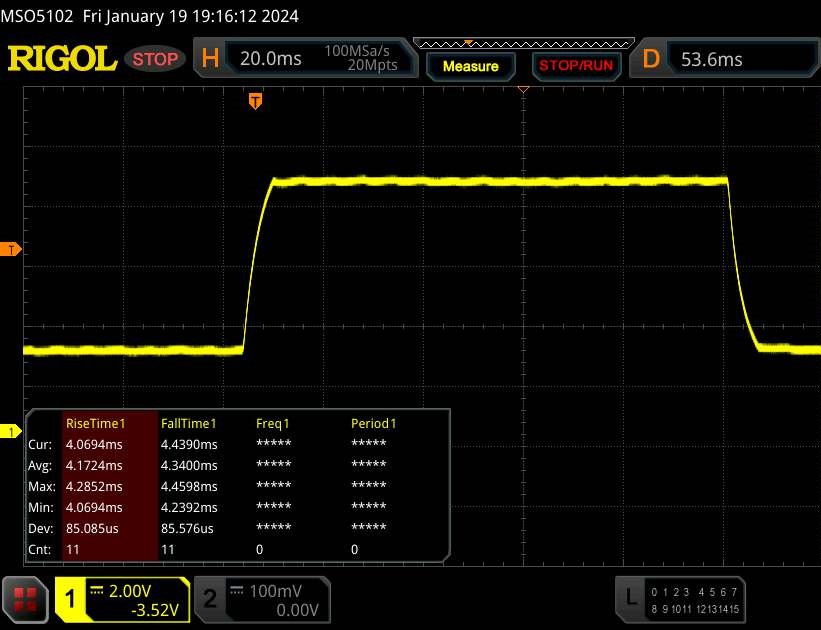 |
| ↘ 4.3 ms fall | ||
| The screen shows fast response rates in our tests and should be suited for gaming. In comparison, all tested devices range from 0.165 (minimum) to 636 (maximum) ms. » 22 % of all devices are better. This means that the measured response time is better than the average of all tested devices (31 ms). | ||
Screen Flickering / PWM (Pulse-Width Modulation)
| Screen flickering / PWM not detected | 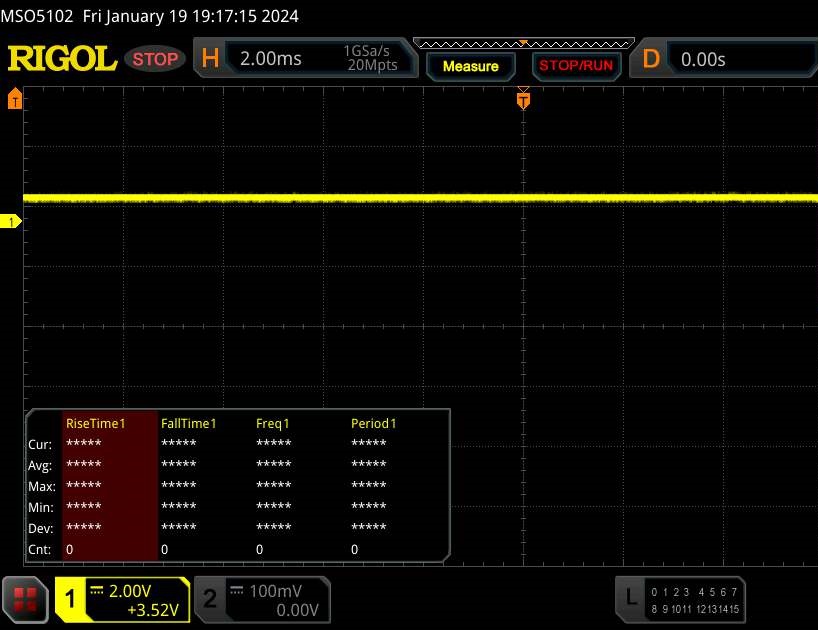 | ||
In comparison: 52 % of all tested devices do not use PWM to dim the display. If PWM was detected, an average of 7754 (minimum: 5 - maximum: 343500) Hz was measured. | |||
性能
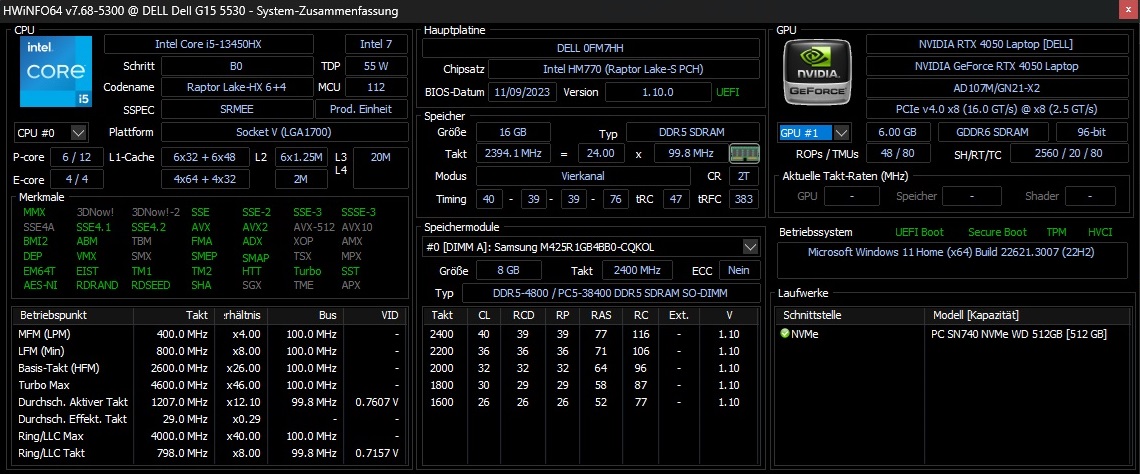
无论内置的是 RTX 4050 还是 RTX 4060,戴尔 G15 5530 仍然是一款中端游戏笔记本电脑。16 GB DDR5 内存目前绝对满足游戏需求;如上所述,略显不足的 512 GB SSD 存储空间可以通过添加更大的 M.2 硬盘进行扩展。
测试条件
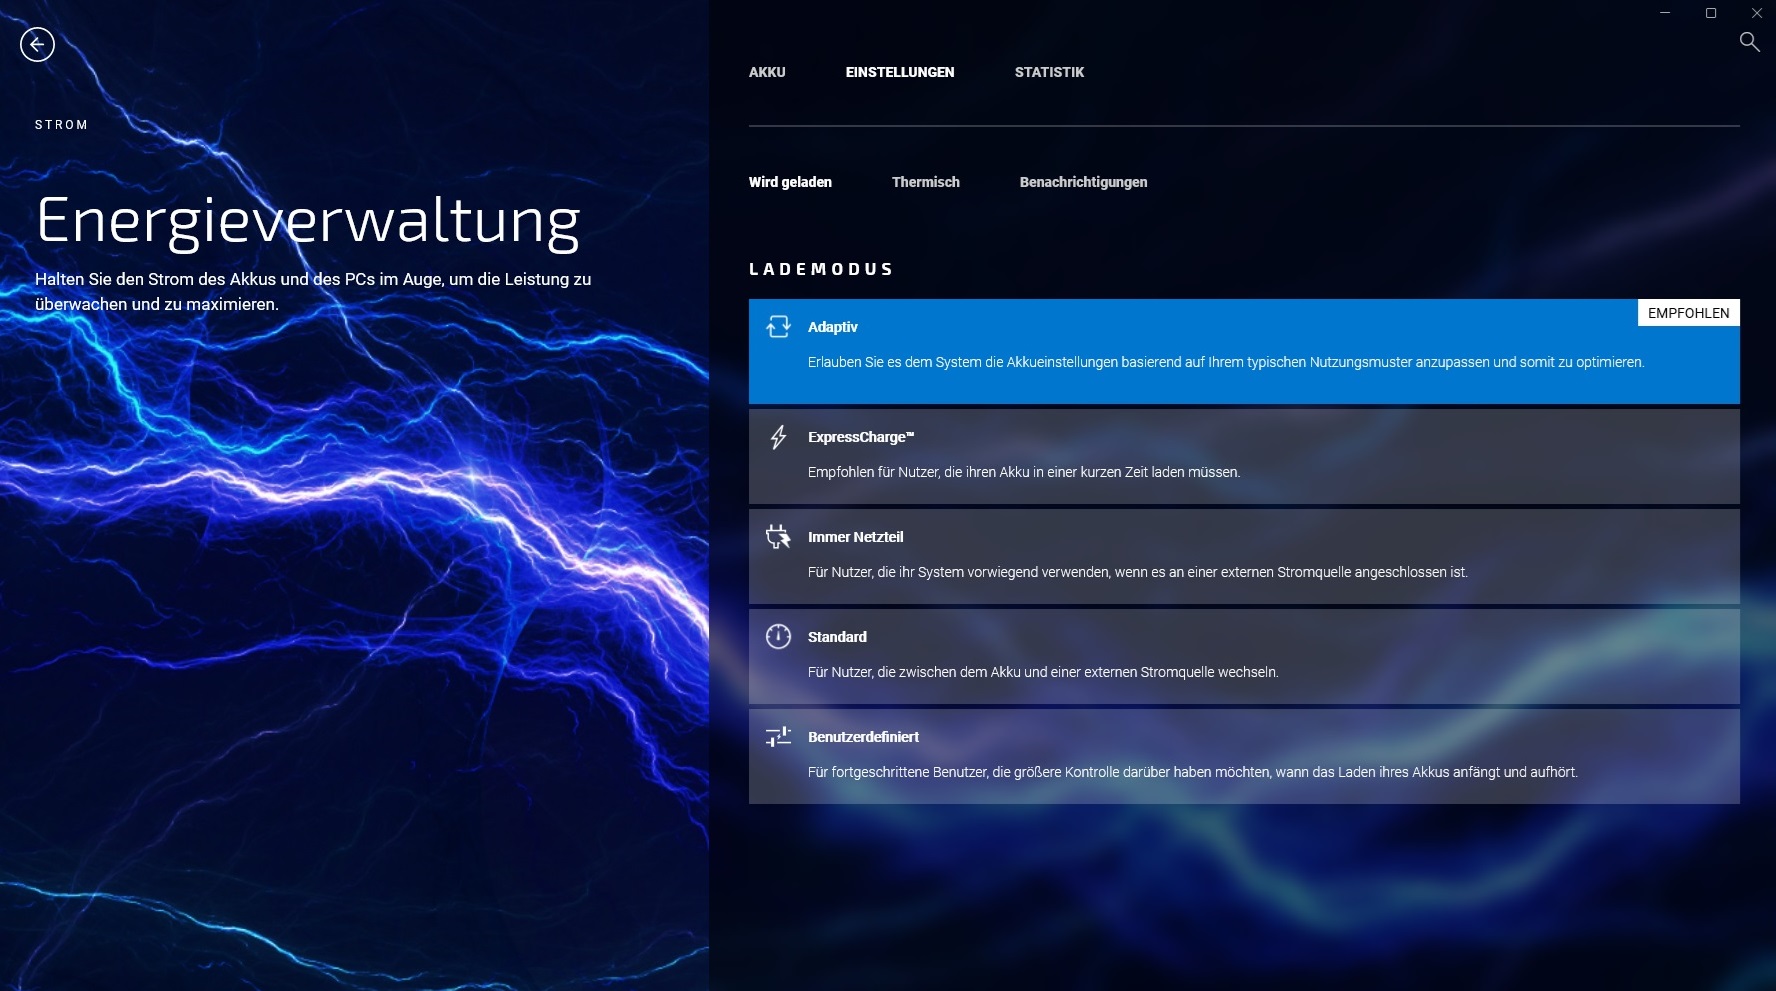
在预装的戴尔软件中,有几种电源模式隐藏在不同的菜单后面。根据我们的测量,这些模式对 3D 性能没有任何影响,而主要是影响笔记本电脑的运行噪音(见表)。因此,我们的所有测试都是在 "优化 "模式下进行的,该模式默认为开箱即启用。另外,Alienware 命令中心还提供了大量自定义选项。
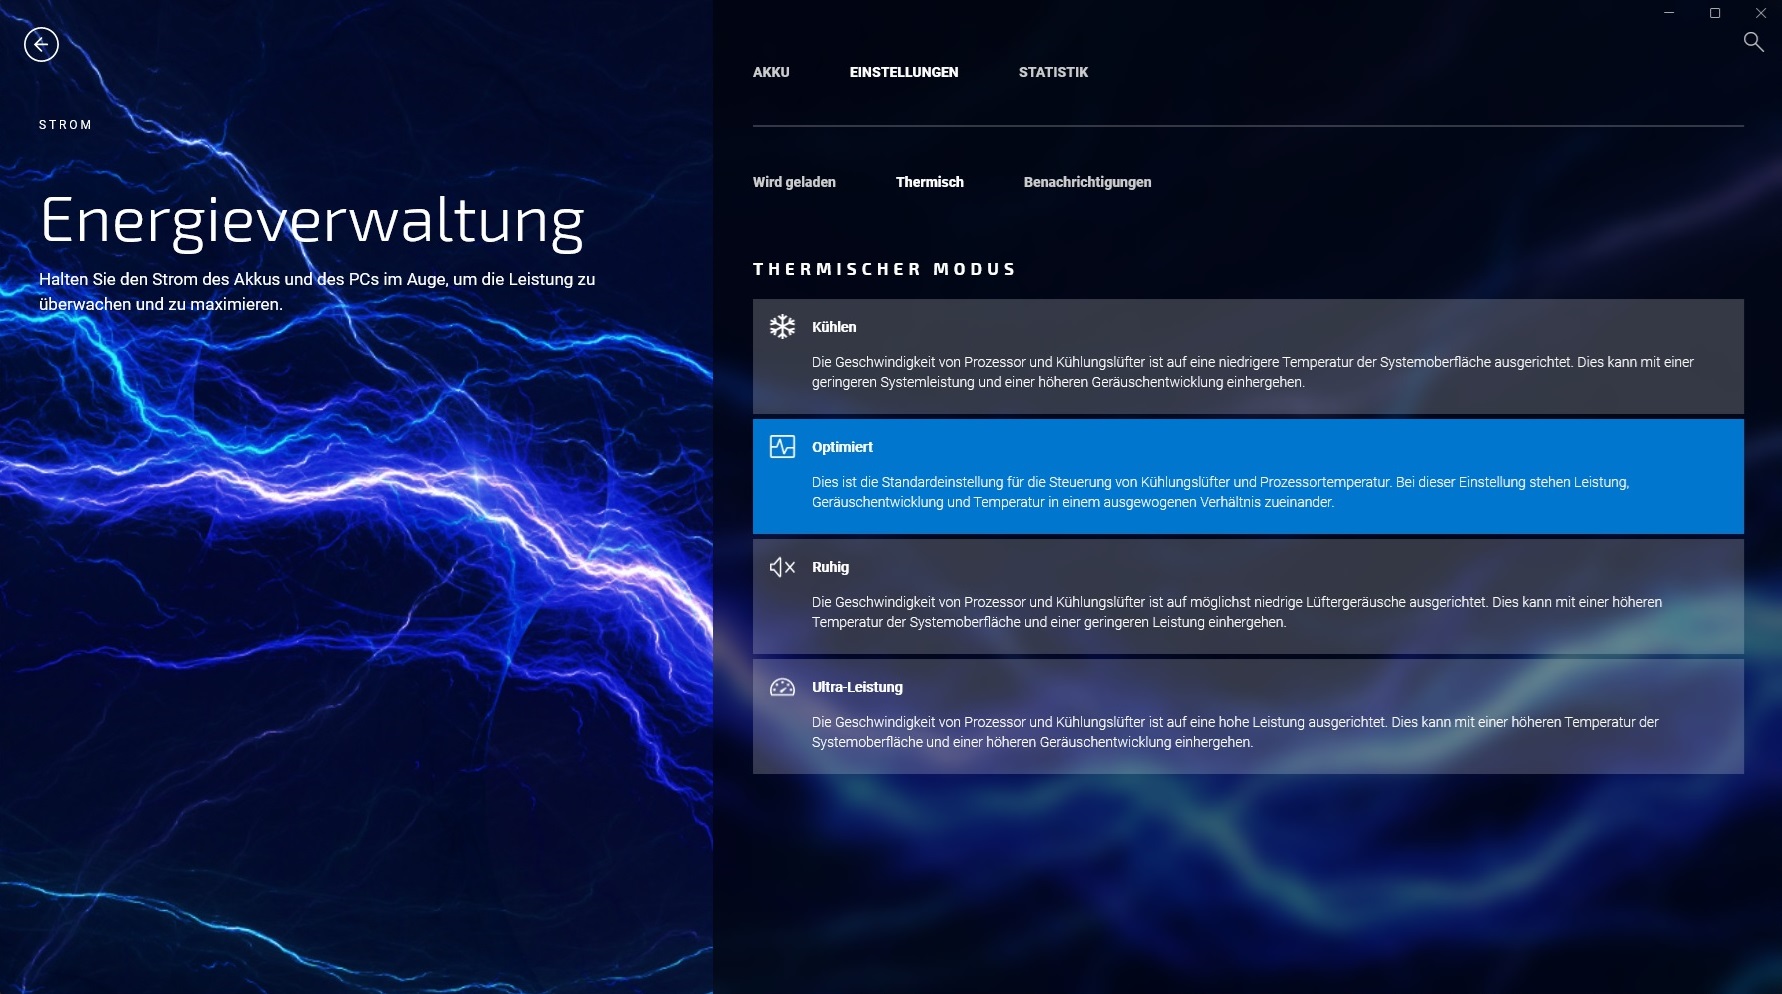
| Witcher 3 (FHD/Ultra) | 静音 | 优化 | 冷却 | 超高性能 |
| 噪音 | 40 - 41 dB(A) 43 - 44 dB(A) 46 - 47 dB(A) 49 - 50 dB(A) | |||
| 性能 | 84 fps 84 fps 84 fps 84 fps |
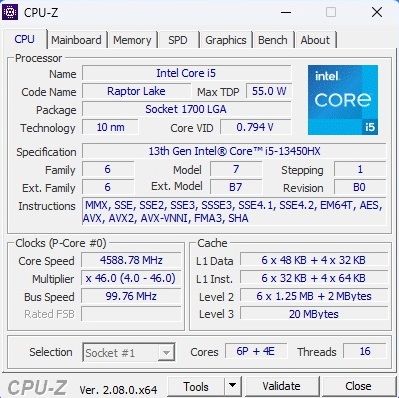
处理器
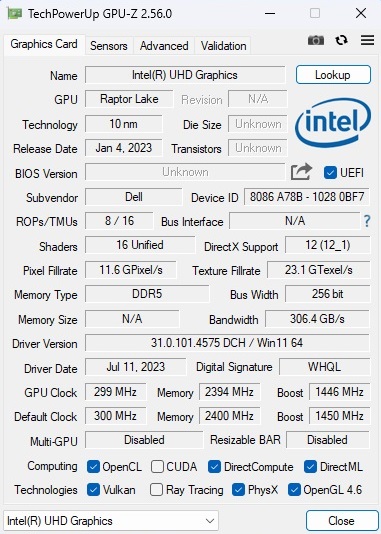
与酷睿 i7-13650HX 相比,酷睿 i5-13450HX 的效率内核从 8 个减少到 4 个,但性能内核仍为 6 个。这两款处理器都属于 Raptor Lake 系列,采用改进的 10 纳米工艺制造。考虑到所有的 CPU 基准测试,酷睿 i5-13450HX 比其更昂贵的同胞兄弟慢大约 15%,介于酷睿 i5-13500HX 和酷睿 i5-13450HX 之间。 酷睿 i5-13500H(Medion Erazer Crawler E40)和 酷睿 i7-13620H(联想 LOQ 15IRH8)之间。在我们进行的 Cinebench 循环测试中,得分随着时间的推移略有下降,但性能并没有急剧下降。
Cinebench R15 Multi Sustained Load
* ... smaller is better
AIDA64: FP32 Ray-Trace | FPU Julia | CPU SHA3 | CPU Queen | FPU SinJulia | FPU Mandel | CPU AES | CPU ZLib | FP64 Ray-Trace | CPU PhotoWorxx
| Performance rating | |
| Average of class Gaming | |
| Dell G15 5530 | |
| Asus TUF A15 FA507 | |
| Dell G15 5530, i5-13450HX RTX 4050 | |
| Average Intel Core i5-13450HX | |
| Medion Erazer Crawler E40 - MD 62518 | |
| Lenovo LOQ 15IRH8 Core i7 | |
| AIDA64 / FP32 Ray-Trace | |
| Average of class Gaming (10227 - 85542, n=105, last 2 years) | |
| Dell G15 5530 | |
| Dell G15 5530, i5-13450HX RTX 4050 | |
| Asus TUF A15 FA507 | |
| Average Intel Core i5-13450HX (13747 - 17767, n=3) | |
| Medion Erazer Crawler E40 - MD 62518 | |
| Lenovo LOQ 15IRH8 Core i7 | |
| AIDA64 / FPU Julia | |
| Average of class Gaming (51376 - 238426, n=105, last 2 years) | |
| Asus TUF A15 FA507 | |
| Dell G15 5530 | |
| Dell G15 5530, i5-13450HX RTX 4050 | |
| Average Intel Core i5-13450HX (71834 - 83862, n=3) | |
| Medion Erazer Crawler E40 - MD 62518 | |
| Lenovo LOQ 15IRH8 Core i7 | |
| AIDA64 / CPU SHA3 | |
| Average of class Gaming (2180 - 10115, n=105, last 2 years) | |
| Dell G15 5530 | |
| Average Intel Core i5-13450HX (3519 - 3530, n=3) | |
| Dell G15 5530, i5-13450HX RTX 4050 | |
| Medion Erazer Crawler E40 - MD 62518 | |
| Asus TUF A15 FA507 | |
| Lenovo LOQ 15IRH8 Core i7 | |
| AIDA64 / CPU Queen | |
| Average of class Gaming (49785 - 173351, n=90, last 2 years) | |
| Dell G15 5530 | |
| Asus TUF A15 FA507 | |
| Average Intel Core i5-13450HX (85888 - 86148, n=3) | |
| Dell G15 5530, i5-13450HX RTX 4050 | |
| Medion Erazer Crawler E40 - MD 62518 | |
| Lenovo LOQ 15IRH8 Core i7 | |
| AIDA64 / FPU SinJulia | |
| Average of class Gaming (4424 - 33636, n=105, last 2 years) | |
| Asus TUF A15 FA507 | |
| Dell G15 5530 | |
| Average Intel Core i5-13450HX (9325 - 9354, n=3) | |
| Dell G15 5530, i5-13450HX RTX 4050 | |
| Medion Erazer Crawler E40 - MD 62518 | |
| Lenovo LOQ 15IRH8 Core i7 | |
| AIDA64 / FPU Mandel | |
| Average of class Gaming (25115 - 128721, n=105, last 2 years) | |
| Asus TUF A15 FA507 | |
| Dell G15 5530 | |
| Dell G15 5530, i5-13450HX RTX 4050 | |
| Average Intel Core i5-13450HX (34956 - 42825, n=3) | |
| Medion Erazer Crawler E40 - MD 62518 | |
| Lenovo LOQ 15IRH8 Core i7 | |
| AIDA64 / CPU AES | |
| Average of class Gaming (39258 - 247074, n=105, last 2 years) | |
| Dell G15 5530 | |
| Dell G15 5530, i5-13450HX RTX 4050 | |
| Average Intel Core i5-13450HX (70296 - 70680, n=3) | |
| Asus TUF A15 FA507 | |
| Medion Erazer Crawler E40 - MD 62518 | |
| Lenovo LOQ 15IRH8 Core i7 | |
| AIDA64 / CPU ZLib | |
| Average of class Gaming (574 - 2531, n=105, last 2 years) | |
| Dell G15 5530 | |
| Dell G15 5530, i5-13450HX RTX 4050 | |
| Medion Erazer Crawler E40 - MD 62518 | |
| Average Intel Core i5-13450HX (977 - 1002, n=3) | |
| Lenovo LOQ 15IRH8 Core i7 | |
| Asus TUF A15 FA507 | |
| AIDA64 / FP64 Ray-Trace | |
| Average of class Gaming (5509 - 45446, n=105, last 2 years) | |
| Dell G15 5530 | |
| Dell G15 5530, i5-13450HX RTX 4050 | |
| Average Intel Core i5-13450HX (7428 - 9561, n=3) | |
| Asus TUF A15 FA507 | |
| Medion Erazer Crawler E40 - MD 62518 | |
| Lenovo LOQ 15IRH8 Core i7 | |
| AIDA64 / CPU PhotoWorxx | |
| Average of class Gaming (12271 - 89891, n=105, last 2 years) | |
| Dell G15 5530 | |
| Medion Erazer Crawler E40 - MD 62518 | |
| Average Intel Core i5-13450HX (36014 - 36764, n=3) | |
| Dell G15 5530, i5-13450HX RTX 4050 | |
| Lenovo LOQ 15IRH8 Core i7 | |
| Asus TUF A15 FA507 | |
系统性能
我们比较的所有设备在系统性能方面都相当接近。在 PCMark 10 中,评测设备的总得分几乎与更昂贵的 G15 型号相同。
CrossMark: Overall | Productivity | Creativity | Responsiveness
WebXPRT 3: Overall
WebXPRT 4: Overall
Mozilla Kraken 1.1: Total
| PCMark 10 / Score | |
| Average of class Gaming (5828 - 12414, n=93, last 2 years) | |
| Lenovo LOQ 15IRH8 Core i7 | |
| Medion Erazer Crawler E40 - MD 62518 | |
| Asus TUF A15 FA507 | |
| Dell G15 5530 | |
| Dell G15 5530, i5-13450HX RTX 4050 | |
| Average Intel Core i5-13450HX, NVIDIA GeForce RTX 4050 Laptop GPU (n=1) | |
| PCMark 10 / Essentials | |
| Dell G15 5530 | |
| Lenovo LOQ 15IRH8 Core i7 | |
| Average of class Gaming (8810 - 11935, n=97, last 2 years) | |
| Asus TUF A15 FA507 | |
| Medion Erazer Crawler E40 - MD 62518 | |
| Dell G15 5530, i5-13450HX RTX 4050 | |
| Average Intel Core i5-13450HX, NVIDIA GeForce RTX 4050 Laptop GPU (n=1) | |
| PCMark 10 / Productivity | |
| Average of class Gaming (6845 - 25323, n=95, last 2 years) | |
| Dell G15 5530 | |
| Lenovo LOQ 15IRH8 Core i7 | |
| Asus TUF A15 FA507 | |
| Medion Erazer Crawler E40 - MD 62518 | |
| Dell G15 5530, i5-13450HX RTX 4050 | |
| Average Intel Core i5-13450HX, NVIDIA GeForce RTX 4050 Laptop GPU (n=1) | |
| PCMark 10 / Digital Content Creation | |
| Average of class Gaming (7602 - 19954, n=95, last 2 years) | |
| Lenovo LOQ 15IRH8 Core i7 | |
| Medion Erazer Crawler E40 - MD 62518 | |
| Dell G15 5530, i5-13450HX RTX 4050 | |
| Average Intel Core i5-13450HX, NVIDIA GeForce RTX 4050 Laptop GPU (n=1) | |
| Asus TUF A15 FA507 | |
| Dell G15 5530 | |
| CrossMark / Overall | |
| Average of class Gaming (1366 - 2409, n=94, last 2 years) | |
| Lenovo LOQ 15IRH8 Core i7 | |
| Dell G15 5530 | |
| Medion Erazer Crawler E40 - MD 62518 | |
| Asus TUF A15 FA507 | |
| CrossMark / Productivity | |
| Average of class Gaming (1386 - 2254, n=94, last 2 years) | |
| Lenovo LOQ 15IRH8 Core i7 | |
| Dell G15 5530 | |
| Medion Erazer Crawler E40 - MD 62518 | |
| Asus TUF A15 FA507 | |
| CrossMark / Creativity | |
| Average of class Gaming (1343 - 2786, n=94, last 2 years) | |
| Dell G15 5530 | |
| Lenovo LOQ 15IRH8 Core i7 | |
| Medion Erazer Crawler E40 - MD 62518 | |
| Asus TUF A15 FA507 | |
| CrossMark / Responsiveness | |
| Lenovo LOQ 15IRH8 Core i7 | |
| Medion Erazer Crawler E40 - MD 62518 | |
| Average of class Gaming (1226 - 2334, n=94, last 2 years) | |
| Dell G15 5530 | |
| Asus TUF A15 FA507 | |
| WebXPRT 3 / Overall | |
| Average of class Gaming (220 - 532, n=98, last 2 years) | |
| Dell G15 5530 | |
| Asus TUF A15 FA507 | |
| Lenovo LOQ 15IRH8 Core i7 | |
| Dell G15 5530, i5-13450HX RTX 4050 | |
| Dell G15 5530, i5-13450HX RTX 4050 | |
| Average Intel Core i5-13450HX, NVIDIA GeForce RTX 4050 Laptop GPU (281 - 281, n=2) | |
| Medion Erazer Crawler E40 - MD 62518 | |
| WebXPRT 4 / Overall | |
| Average of class Gaming (165 - 354, n=98, last 2 years) | |
| Dell G15 5530 | |
| Lenovo LOQ 15IRH8 Core i7 | |
| Medion Erazer Crawler E40 - MD 62518 | |
| Asus TUF A15 FA507 | |
| Mozilla Kraken 1.1 / Total | |
| Asus TUF A15 FA507 | |
| Dell G15 5530, i5-13450HX RTX 4050 | |
| Dell G15 5530, i5-13450HX RTX 4050 | |
| Average Intel Core i5-13450HX, NVIDIA GeForce RTX 4050 Laptop GPU (531 - 531, n=2) | |
| Medion Erazer Crawler E40 - MD 62518 | |
| Dell G15 5530 | |
| Lenovo LOQ 15IRH8 Core i7 | |
| Average of class Gaming (391 - 590, n=100, last 2 years) | |
* ... smaller is better
| PCMark 10 Score | 6969 points | |
Help | ||
| AIDA64 / Memory Copy | |
| Average of class Gaming (21750 - 129946, n=105, last 2 years) | |
| Dell G15 5530 | |
| Dell G15 5530, i5-13450HX RTX 4050 | |
| Average Intel Core i5-13450HX (58673 - 58861, n=3) | |
| Medion Erazer Crawler E40 - MD 62518 | |
| Lenovo LOQ 15IRH8 Core i7 | |
| Asus TUF A15 FA507 | |
| AIDA64 / Memory Read | |
| Average of class Gaming (22956 - 118858, n=105, last 2 years) | |
| Average Intel Core i5-13450HX (66626 - 69024, n=3) | |
| Dell G15 5530 | |
| Dell G15 5530, i5-13450HX RTX 4050 | |
| Medion Erazer Crawler E40 - MD 62518 | |
| Lenovo LOQ 15IRH8 Core i7 | |
| Asus TUF A15 FA507 | |
| AIDA64 / Memory Write | |
| Average of class Gaming (22297 - 135096, n=105, last 2 years) | |
| Medion Erazer Crawler E40 - MD 62518 | |
| Dell G15 5530, i5-13450HX RTX 4050 | |
| Dell G15 5530 | |
| Average Intel Core i5-13450HX (58540 - 60196, n=3) | |
| Asus TUF A15 FA507 | |
| Lenovo LOQ 15IRH8 Core i7 | |
| AIDA64 / Memory Latency | |
| Lenovo LOQ 15IRH8 Core i7 | |
| Average of class Gaming (75.3 - 259, n=105, last 2 years) | |
| Medion Erazer Crawler E40 - MD 62518 | |
| Dell G15 5530, i5-13450HX RTX 4050 | |
| Average Intel Core i5-13450HX (90 - 94.2, n=3) | |
| Dell G15 5530 | |
| Asus TUF A15 FA507 | |
* ... smaller is better
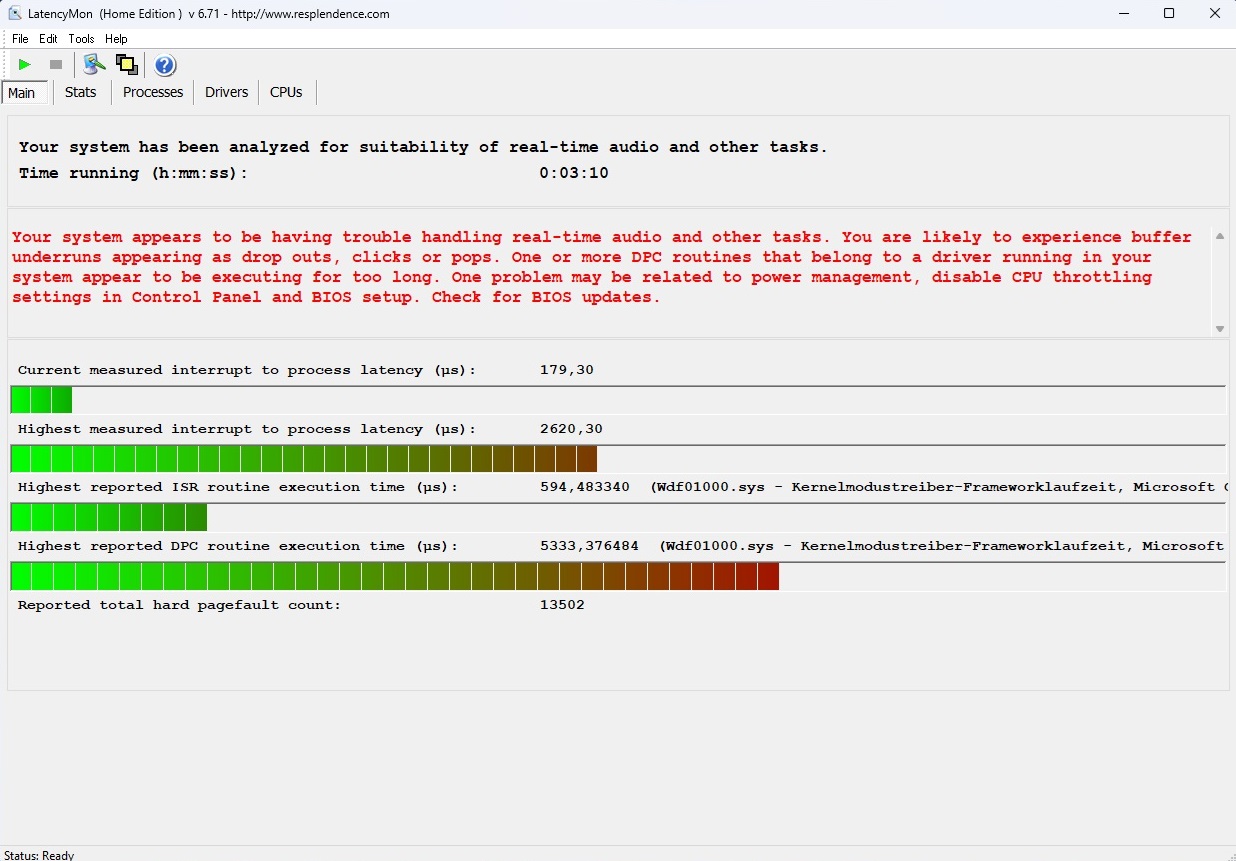
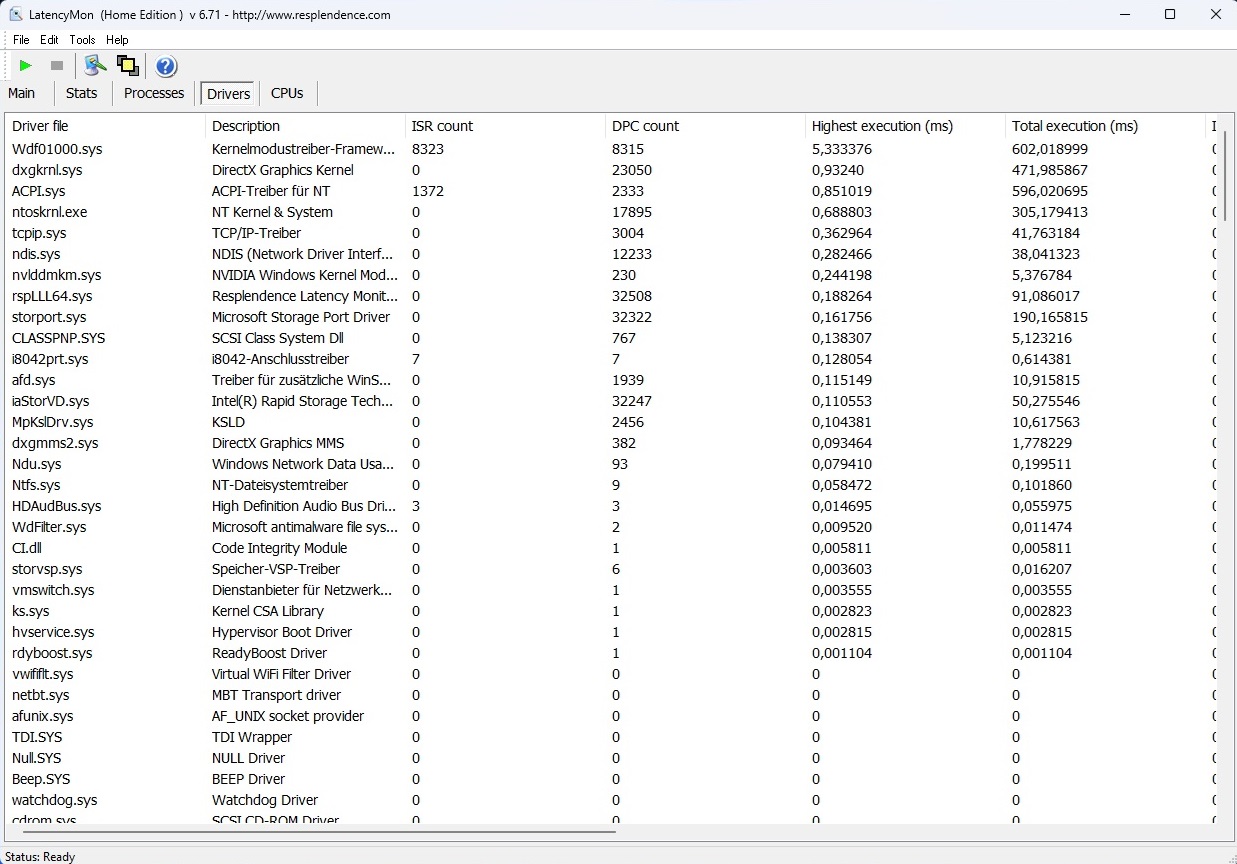
DPC 延迟
这款 15 英寸笔记本电脑在延迟方面存在缺陷。LatencyMon 报告说,这款笔记本电脑--至少是开箱即用的笔记本电脑--在处理实时音频和视频方面似乎存在问题。尽管如此,这只会影响那些打算将笔记本电脑用于此类目的的用户。
| DPC Latencies / LatencyMon - interrupt to process latency (max), Web, Youtube, Prime95 | |
| Dell G15 5530 | |
| Dell G15 5530, i5-13450HX RTX 4050 | |
| Medion Erazer Crawler E40 - MD 62518 | |
| Lenovo LOQ 15IRH8 Core i7 | |
* ... smaller is better
大容量存储器
乍一看,这款笔记本电脑的大容量存储设备非常出色。尽管体积小巧,但 WDC 制造的 512 GB M.2 2230 硬盘在我们的一系列基准测试中表现极为出色。尽管如此,我们的循环测试表明,在持续负载或压力下,硬盘有时会出现严重的节流现象,这是其他竞争对手所没有的。

* ... smaller is better
Sustained Load Read: DiskSpd Read Loop, Queue Depth 8
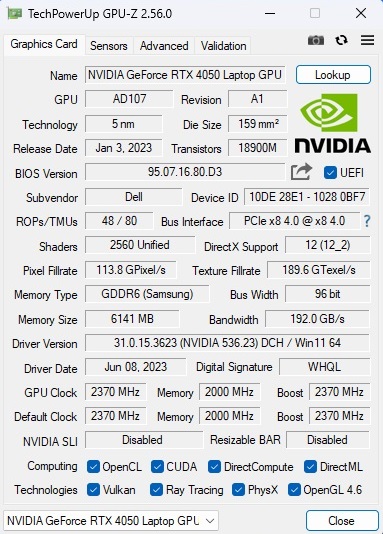
图形卡
GeForce RTX 4050 是 Nvidia 的 Ada Lovelace 系列中的一款热门中端 GPU,但 6 GB GDDR6 显存和 96 位总线在当今的标准下显得相当紧凑。实际性能主要取决于冷却系统和指定的 TGP。戴尔为 G15 确定了 140 瓦的 TGP,这相当于 RTX 4050 的最大允许值。因此,这款 15 英寸戴尔笔记本电脑在 3D 基准测试中取得高于平均水平的性能也就不足为奇了,不过我们必须提到的是,一些竞争对手往往在较低的 TGP 下也能取得类似的成绩,因此效率更高。
| 3DMark 11 Performance | 28326 points | |
| 3DMark Ice Storm Standard Score | 222203 points | |
| 3DMark Cloud Gate Standard Score | 58346 points | |
| 3DMark Fire Strike Score | 19919 points | |
| 3DMark Time Spy Score | 9091 points | |
Help | ||
* ... smaller is better
游戏性能
游戏性能与我们在合成基准测试中看到的类似。RTX 4050 的速度通常足以在 1080p 和高至最高设置下流畅运行大多数现代游戏。只有当你玩要求非常高的游戏时,情况才会变得紧张,例如 星际争霸.我们建议至少配备 GeForce RTX 4070如果您想使用更高分辨率(QHD 或以上),我们建议您至少配备 RTX 4070。
| The Witcher 3 - 1920x1080 Ultra Graphics & Postprocessing (HBAO+) | |
| Average of class Gaming (104.7 - 240, n=7, last 2 years) | |
| Dell G15 5530 | |
| Lenovo LOQ 15IRH8 Core i7 | |
| Dell G15 5530, i5-13450HX RTX 4050 | |
| Asus TUF A15 FA507 | |
| Medion Erazer Crawler E40 - MD 62518 | |
| Average NVIDIA GeForce RTX 4050 Laptop GPU (18.5 - 94.7, n=40) | |
| Lies of P - 1920x1080 Best Preset | |
| XMG Focus 15 E23 | |
| Average NVIDIA GeForce RTX 4050 Laptop GPU (101.4 - 105.7, n=3) | |
| Dell G15 5530, i5-13450HX RTX 4050 | |
| The Crew Motorfest - 1920x1080 Ultra Preset | |
| XMG Focus 15 E23 | |
| Dell G15 5530, i5-13450HX RTX 4050 | |
| Average NVIDIA GeForce RTX 4050 Laptop GPU (59 - 59, n=3) | |
| Starfield - 1920x1080 Ultra Preset | |
| Average of class Gaming (n=1last 2 years) | |
| Dell G15 5530, i5-13450HX RTX 4050 | |
| Average NVIDIA GeForce RTX 4050 Laptop GPU (35.7 - 37.3, n=3) | |
| XMG Focus 15 E23 | |
| Armored Core 6 - 1920x1080 Maximum Preset | |
| XMG Focus 15 E23 | |
| Average NVIDIA GeForce RTX 4050 Laptop GPU (79 - 87.8, n=3) | |
| Dell G15 5530, i5-13450HX RTX 4050 | |
| Average of class Gaming (n=1last 2 years) | |
| Atlas Fallen - 1920x1080 Very High Preset | |
| Average NVIDIA GeForce RTX 4050 Laptop GPU (81.1 - 94.2, n=3) | |
| Dell G15 5530, i5-13450HX RTX 4050 | |
| XMG Focus 15 E23 | |
| Baldur's Gate 3 - 1920x1080 Ultra Preset AA:T | |
| Average of class Gaming (59.4 - 246, n=104, last 2 years) | |
| XMG Focus 15 E23 | |
| Dell G15 5530, i5-13450HX RTX 4050 | |
| Average NVIDIA GeForce RTX 4050 Laptop GPU (48.3 - 81.3, n=11) | |
| Ratchet & Clank Rift Apart - 1920x1080 Very High Preset AA:T | |
| XMG Focus 15 E23 | |
| Average NVIDIA GeForce RTX 4050 Laptop GPU (32.9 - 45.8, n=3) | |
| Dell G15 5530, i5-13450HX RTX 4050 | |
| Resident Evil 4 Remake - 1920x1080 Max Preset | |
| Dell G15 5530, i5-13450HX RTX 4050 | |
| Average NVIDIA GeForce RTX 4050 Laptop GPU (36.8 - 53.9, n=2) | |
| XMG Focus 15 E23 | |
我们使用了 的Witcher 3(以全高清/超高清模式运行约 60 分钟)来了解每款笔记本电脑在 3D 应用程序中的长时间性能表现。结果是:G15 5530 的帧速率保持相当稳定。
Witcher 3 FPS chart
| low | med. | high | ultra | |
|---|---|---|---|---|
| GTA V (2015) | 178 | 168.6 | 96.6 | |
| The Witcher 3 (2015) | 84 | |||
| Dota 2 Reborn (2015) | 170 | 156.1 | 154.1 | 146.8 |
| Final Fantasy XV Benchmark (2018) | 120.3 | 84.1 | ||
| X-Plane 11.11 (2018) | 153.1 | 139.6 | 108.5 | |
| Strange Brigade (2018) | 203 | 171.4 | 145.1 | |
| Company of Heroes 3 (2023) | 127 | 70.2 | 68.7 | |
| Resident Evil 4 Remake (2023) | 88.6 | 80.9 | 53.9 | |
| Ratchet & Clank Rift Apart (2023) | 67.7 | 40.2 | 32.9 | |
| Atlas Fallen (2023) | 114.3 | 104.1 | 83.3 | |
| Armored Core 6 (2023) | 103.8 | 96.7 | 79 | |
| Starfield (2023) | 55.9 | 43.7 | 37.3 | |
| The Crew Motorfest (2023) | 60 | 60 | 59 | |
| Lies of P (2023) | 132.8 | 113.3 | 101.4 | |
| Baldur's Gate 3 (2023) | 84.4 | 71.3 | 69.3 |
排放量
噪音排放
戴尔 G15 5530 在空闲时基本保持安静。风扇要么完全静止不动,要么以适当的噪音水平运行。风扇很少运转起来,但在视频播放和网页浏览等日常任务中,这种情况会更频繁。不过,在 "优化 "模式下进行游戏时产生的噪音约为 44 分贝(A),低于 RTX 4050 笔记本电脑的平均噪音水平。
Noise level
| Idle |
| 25 / 26 / 30 dB(A) |
| Load |
| 38 / 50 dB(A) |
 | ||
30 dB silent 40 dB(A) audible 50 dB(A) loud |
||
min: | ||
| Dell G15 5530, i5-13450HX RTX 4050 GeForce RTX 4050 Laptop GPU, i5-13450HX | Medion Erazer Crawler E40 - MD 62518 GeForce RTX 4050 Laptop GPU, i5-13500H | Lenovo LOQ 15IRH8 Core i7 GeForce RTX 4050 Laptop GPU, i7-13620H | Asus TUF A15 FA507 GeForce RTX 4050 Laptop GPU, R7 7735HS | Dell G15 5530 GeForce RTX 4060 Laptop GPU, i7-13650HX | |
|---|---|---|---|---|---|
| Noise | -4% | -8% | 12% | 6% | |
| off / environment * (dB) | 25 | 23 8% | 23.69 5% | 23.3 7% | 20.41 18% |
| Idle Minimum * (dB) | 25 | 23 8% | 29.03 -16% | 23.3 7% | 26.85 -7% |
| Idle Average * (dB) | 26 | 23 12% | 29.03 -12% | 23.3 10% | 26.85 -3% |
| Idle Maximum * (dB) | 30 | 28.02 7% | 29.03 3% | 23.3 22% | 26.85 10% |
| Load Average * (dB) | 38 | 50.21 -32% | 48.7 -28% | 29.6 22% | 27.65 27% |
| Witcher 3 ultra * (dB) | 44 | 51.46 -17% | 48.5 -10% | 43 2% | 47.9 -9% |
| Load Maximum * (dB) | 50 | 56.79 -14% | 48.7 3% | 43 14% | 47.86 4% |
* ... smaller is better
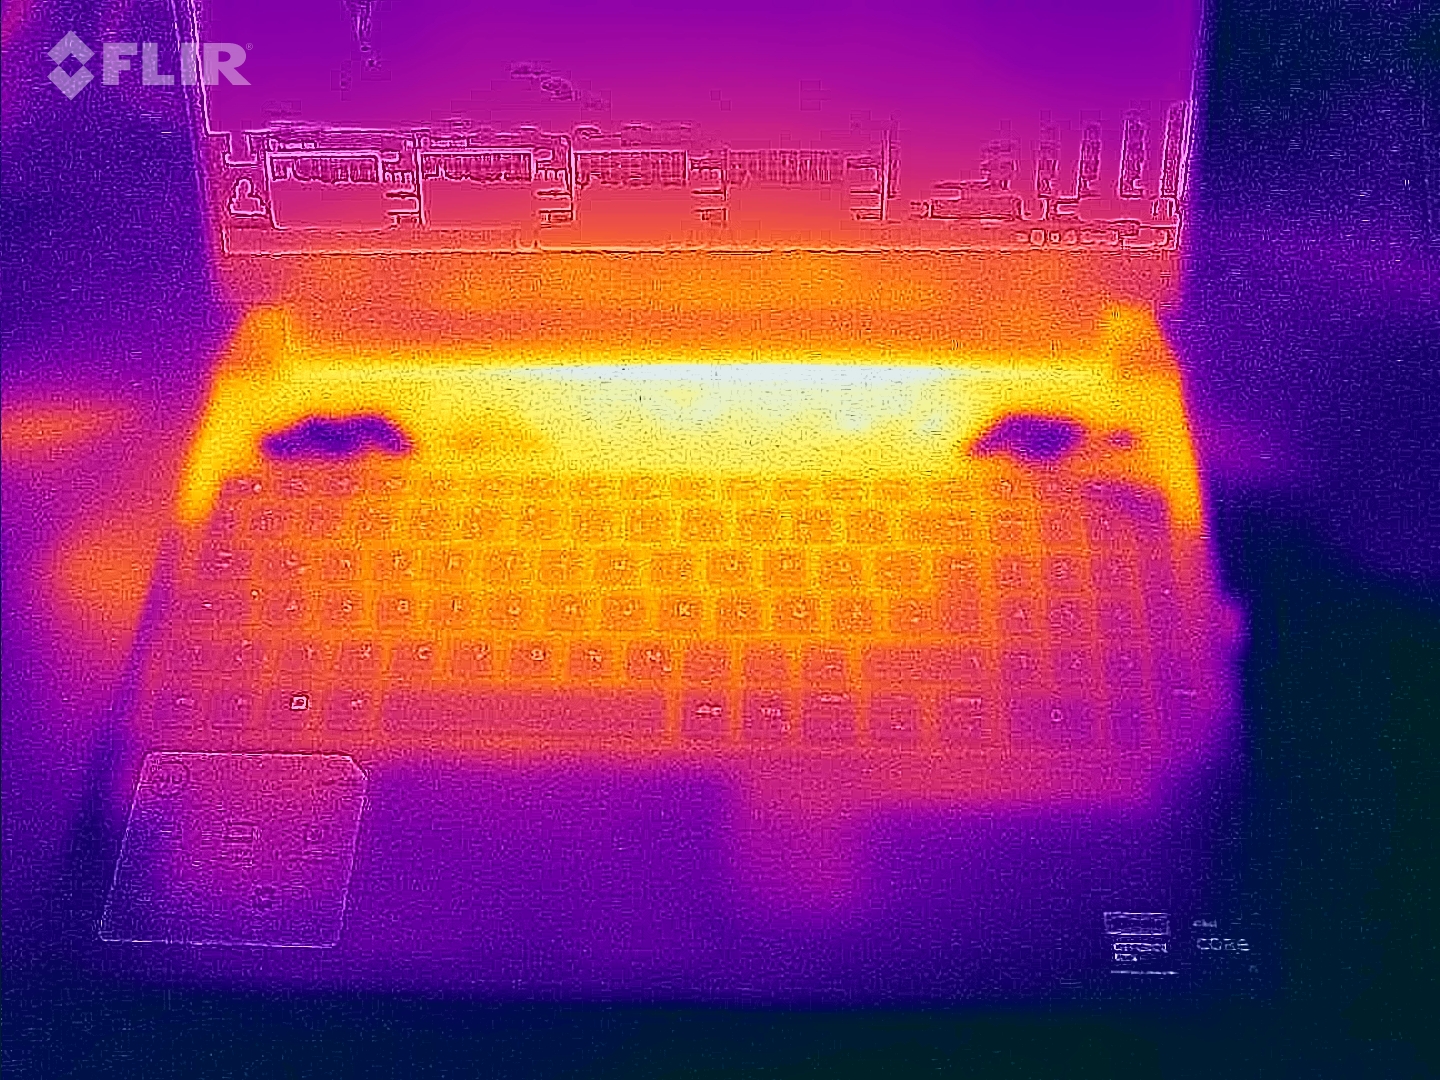
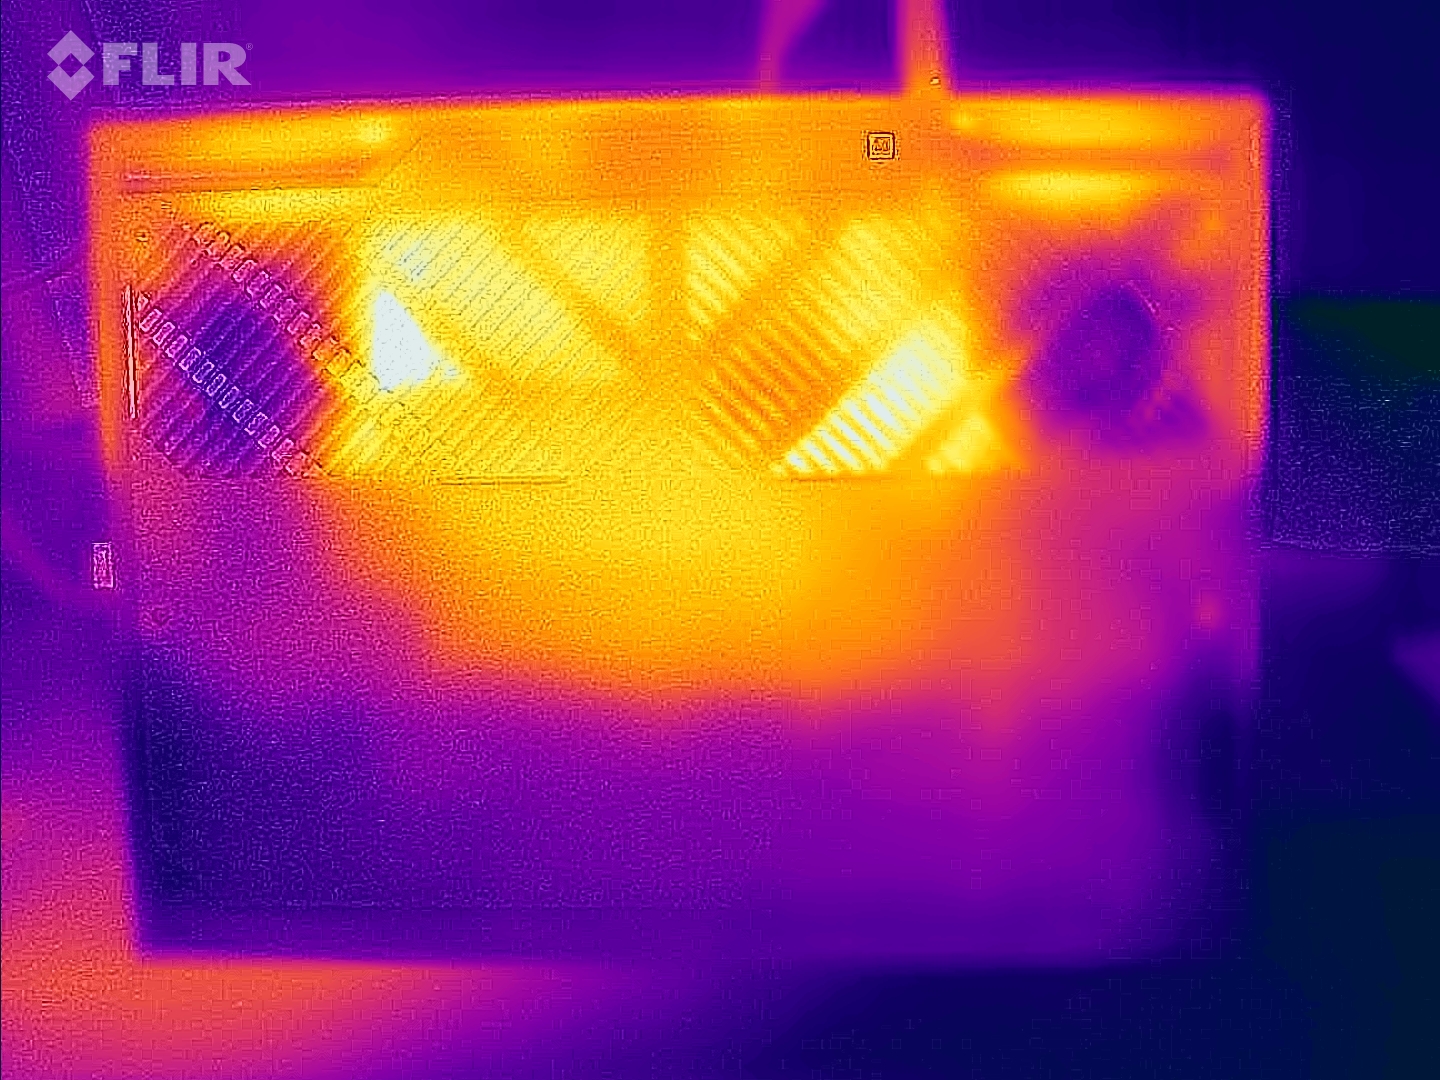
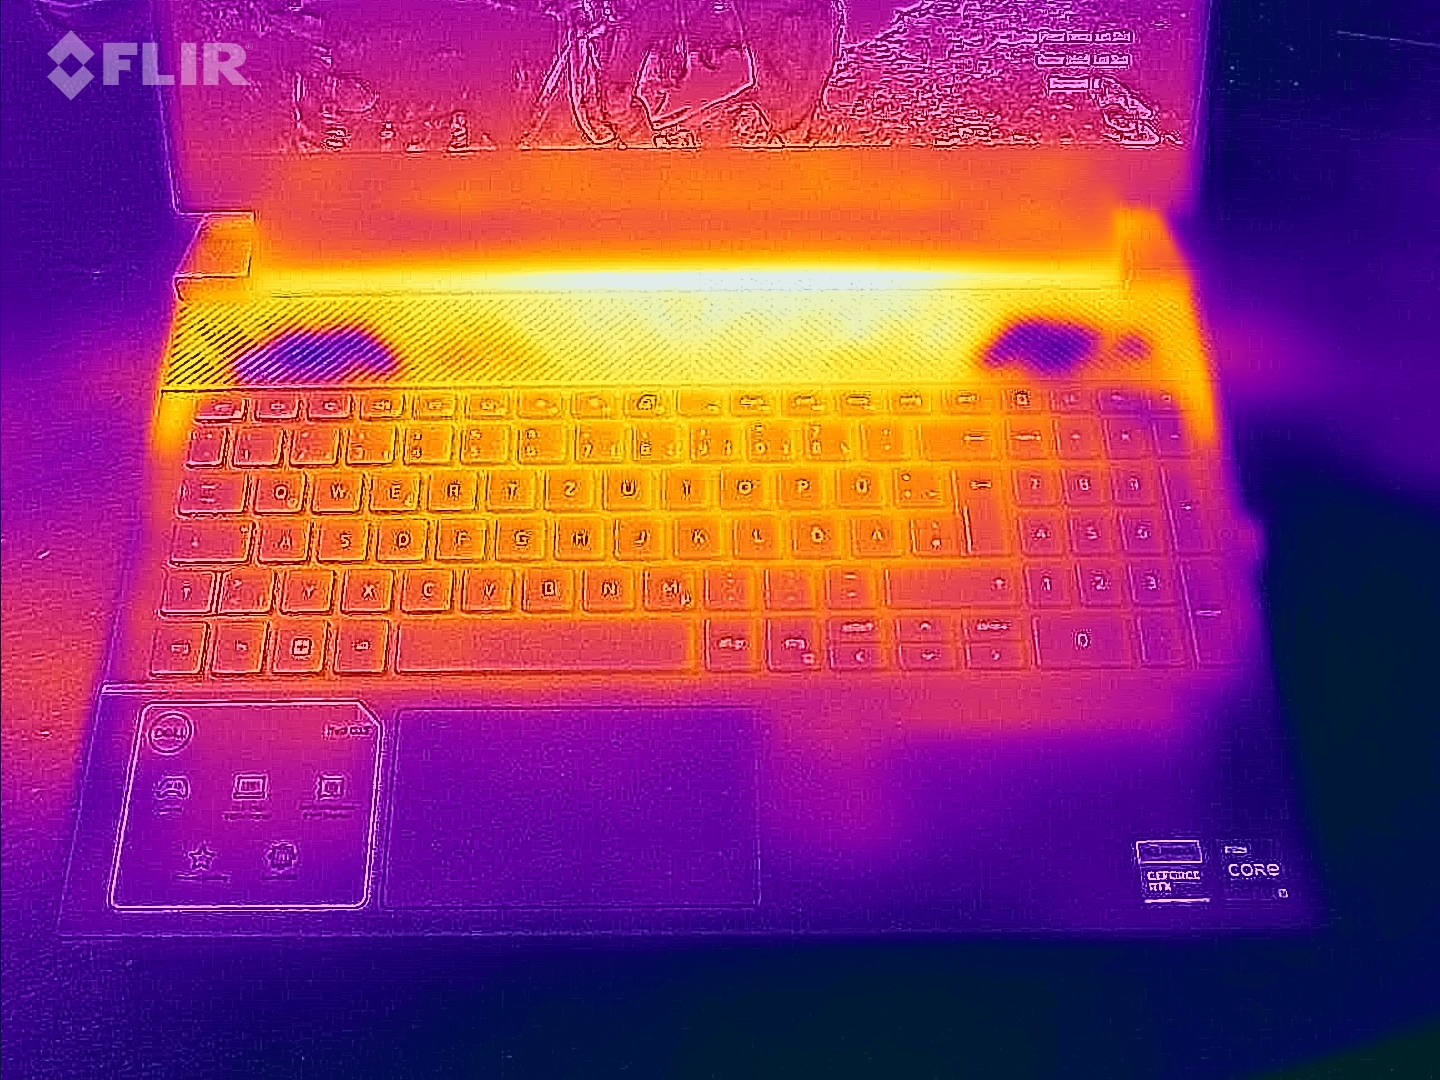
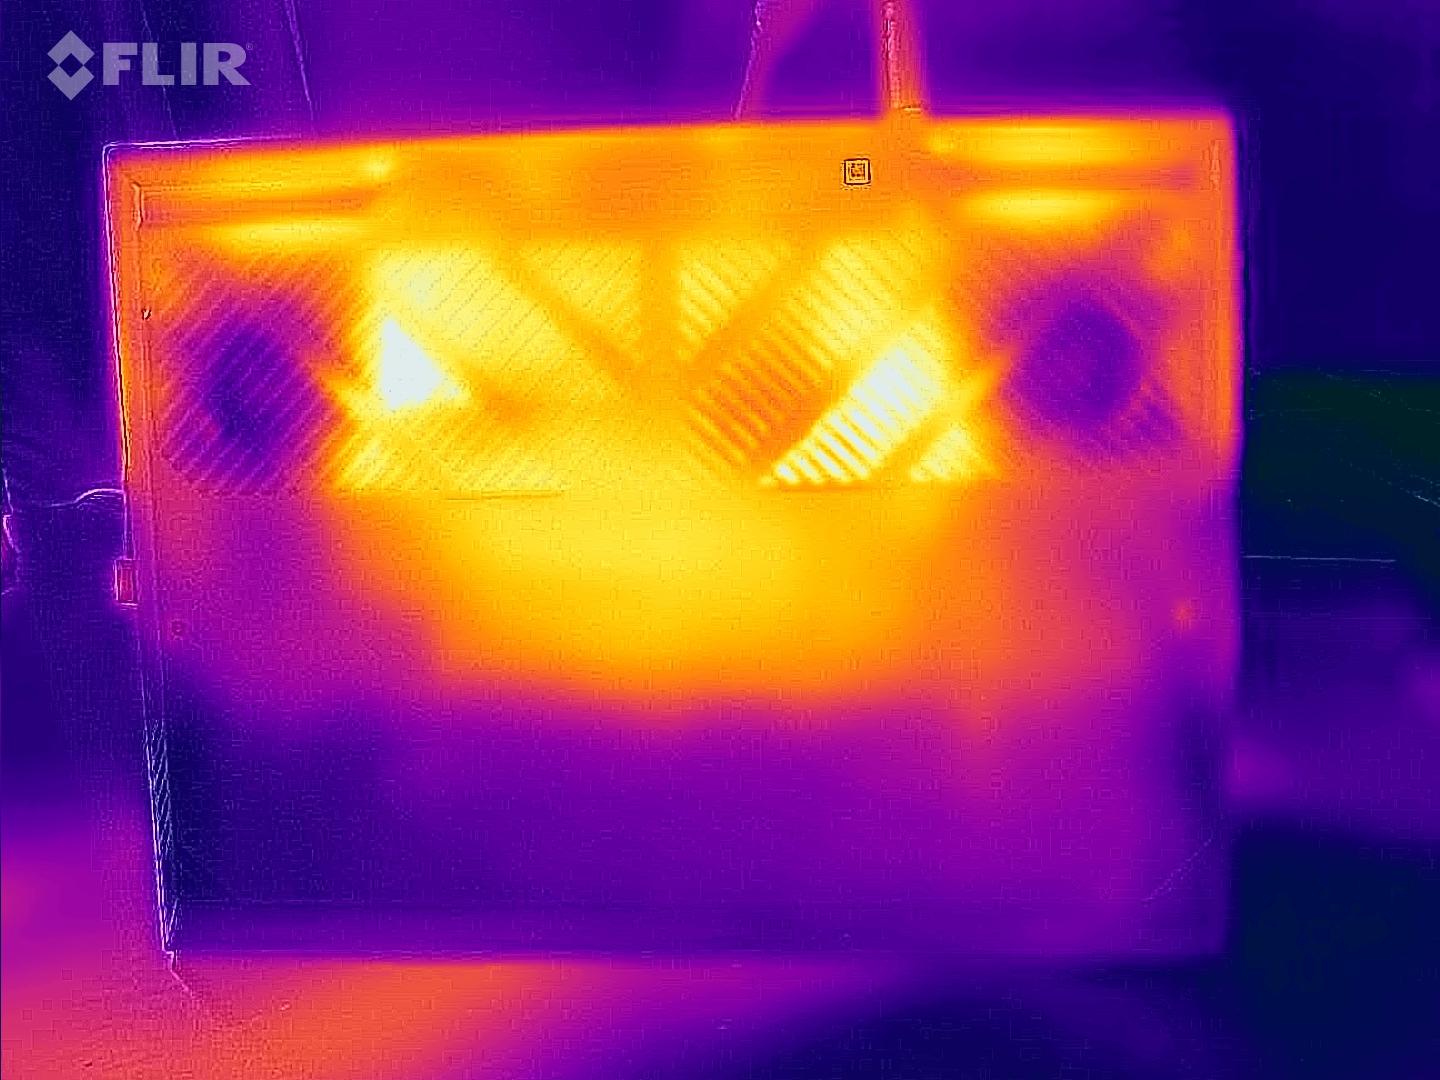
温度
平均而言,机箱温度略低于价格更高的 G15 机型。在运行《Witcher 3 》60 分钟后,键盘面板和底板测得的最高温度分别为 54°C (129.4°F) 和 52°C (125.6°F),理论上是相当高的。不过,由于掌托的温度从未超过 32°C (89.6°F),只要不把设备放在腿上,长时间游戏应该不会有太大问题。
(-) The maximum temperature on the upper side is 58 °C / 136 F, compared to the average of 40.4 °C / 105 F, ranging from 21.2 to 68.8 °C for the class Gaming.
(-) The bottom heats up to a maximum of 57 °C / 135 F, compared to the average of 43.2 °C / 110 F
(+) In idle usage, the average temperature for the upper side is 26 °C / 79 F, compared to the device average of 33.9 °C / 93 F.
(-) Playing The Witcher 3, the average temperature for the upper side is 41.7 °C / 107 F, compared to the device average of 33.9 °C / 93 F.
(+) The palmrests and touchpad are reaching skin temperature as a maximum (32 °C / 89.6 F) and are therefore not hot.
(-) The average temperature of the palmrest area of similar devices was 28.8 °C / 83.8 F (-3.2 °C / -5.8 F).
| Dell G15 5530, i5-13450HX RTX 4050 GeForce RTX 4050 Laptop GPU, i5-13450HX | Medion Erazer Crawler E40 - MD 62518 GeForce RTX 4050 Laptop GPU, i5-13500H | Lenovo LOQ 15IRH8 Core i7 GeForce RTX 4050 Laptop GPU, i7-13620H | Asus TUF A15 FA507 GeForce RTX 4050 Laptop GPU, R7 7735HS | Dell G15 5530 GeForce RTX 4060 Laptop GPU, i7-13650HX | |
|---|---|---|---|---|---|
| Heat | 24% | -6% | 13% | -7% | |
| Maximum Upper Side * (°C) | 58 | 36 38% | 46.4 20% | 48.9 16% | 54 7% |
| Maximum Bottom * (°C) | 57 | 36 37% | 59.2 -4% | 44.6 22% | 62.2 -9% |
| Idle Upper Side * (°C) | 30 | 26 13% | 34.4 -15% | 27.1 10% | 33.4 -11% |
| Idle Bottom * (°C) | 29 | 27 7% | 36.2 -25% | 27.5 5% | 33.4 -15% |
* ... smaller is better
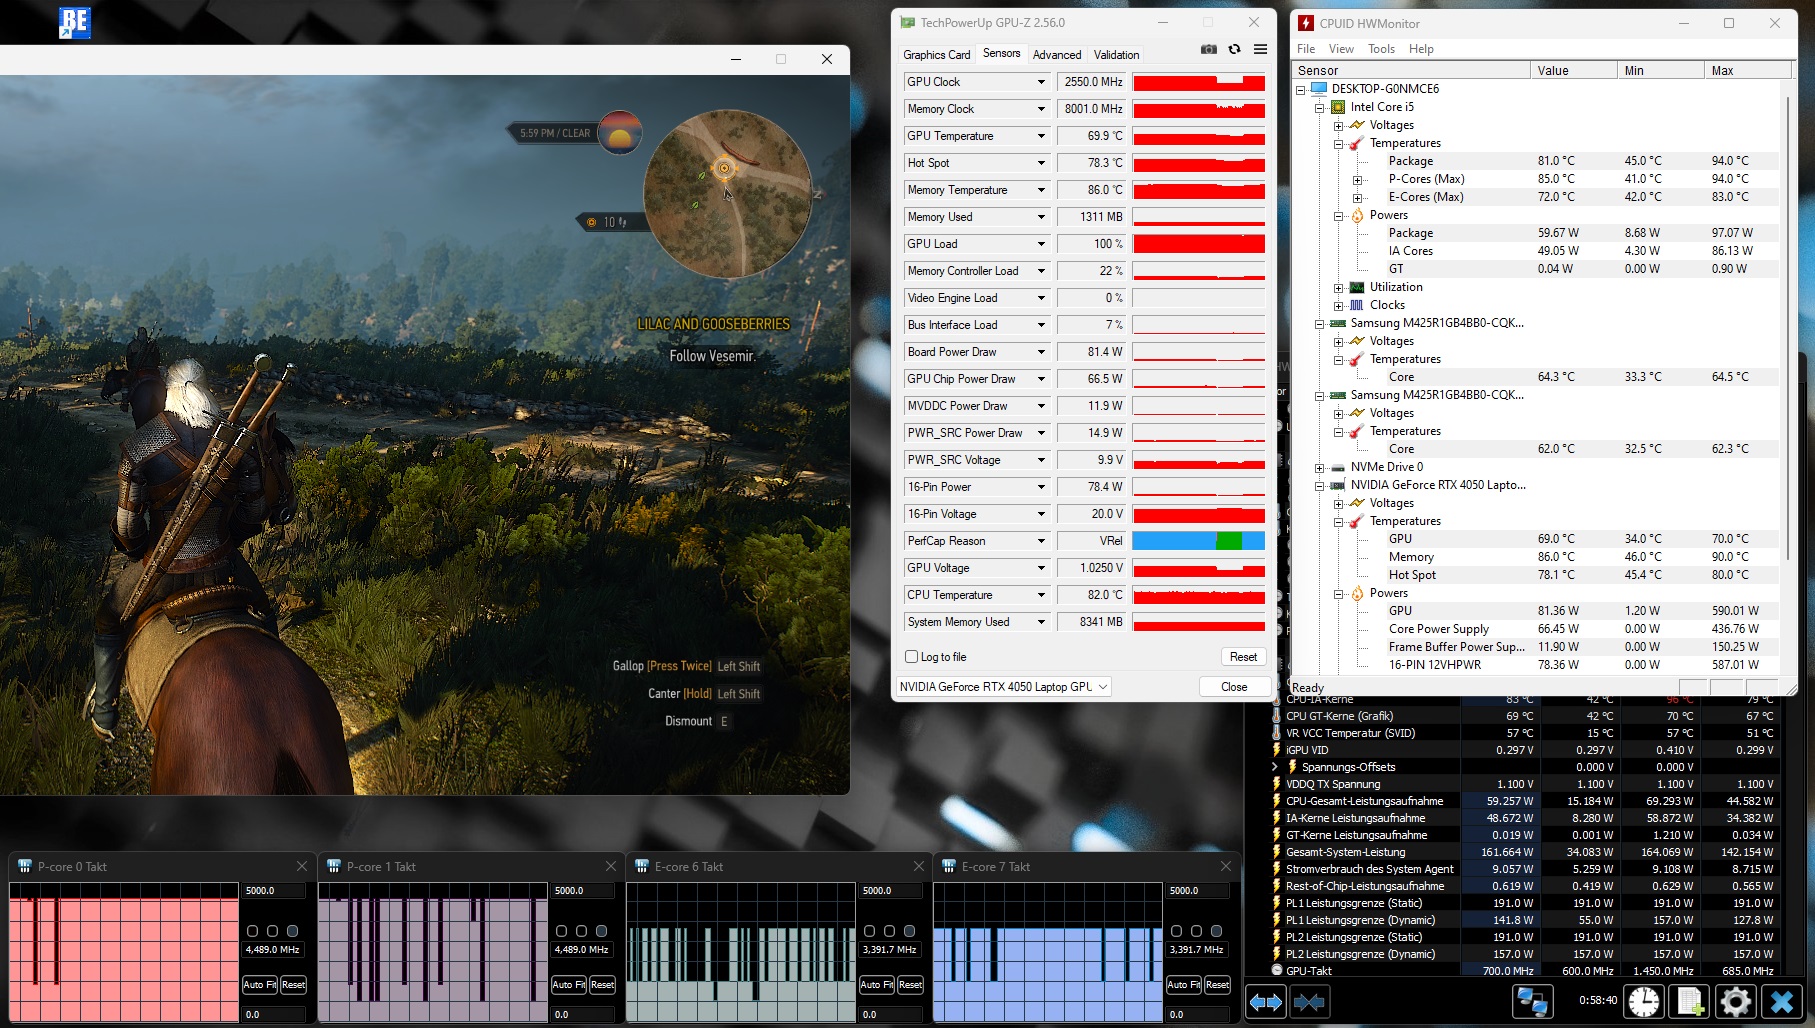
压力测试
在使用 FurMark 和 Prime95 进行的压力测试中,CPU 的表现尤为突出。在短暂达到 100°C (212°F) 之后,酷睿 i5-13450HX 降低了时钟速度,使温度稳定在 80 至 90°C (176 至 194°F)。GeForce RTX 4050 在一小时后 "仅 "达到 79°C (174.2°F),但热点温度约为 91°C (195.8°F)。

发言人
笔记本电脑的音质一般。扬声器的最大音量不错,但低音较弱。
Dell G15 5530, i5-13450HX RTX 4050 audio analysis
(+) | speakers can play relatively loud (86 dB)
Bass 100 - 315 Hz
(-) | nearly no bass - on average 32% lower than median
(±) | linearity of bass is average (14% delta to prev. frequency)
Mids 400 - 2000 Hz
(+) | balanced mids - only 3.5% away from median
(+) | mids are linear (4.3% delta to prev. frequency)
Highs 2 - 16 kHz
(+) | balanced highs - only 2.4% away from median
(+) | highs are linear (4.2% delta to prev. frequency)
Overall 100 - 16.000 Hz
(±) | linearity of overall sound is average (18% difference to median)
Compared to same class
» 56% of all tested devices in this class were better, 9% similar, 36% worse
» The best had a delta of 6%, average was 18%, worst was 132%
Compared to all devices tested
» 38% of all tested devices were better, 8% similar, 54% worse
» The best had a delta of 4%, average was 23%, worst was 134%
Medion Erazer Crawler E40 - MD 62518 audio analysis
(±) | speaker loudness is average but good (81.47 dB)
Bass 100 - 315 Hz
(-) | nearly no bass - on average 32.7% lower than median
(±) | linearity of bass is average (11% delta to prev. frequency)
Mids 400 - 2000 Hz
(+) | balanced mids - only 4.6% away from median
(±) | linearity of mids is average (7.1% delta to prev. frequency)
Highs 2 - 16 kHz
(+) | balanced highs - only 3.1% away from median
(+) | highs are linear (5.7% delta to prev. frequency)
Overall 100 - 16.000 Hz
(±) | linearity of overall sound is average (21.8% difference to median)
Compared to same class
» 78% of all tested devices in this class were better, 6% similar, 16% worse
» The best had a delta of 6%, average was 18%, worst was 132%
Compared to all devices tested
» 62% of all tested devices were better, 7% similar, 31% worse
» The best had a delta of 4%, average was 23%, worst was 134%
电源管理
耗电量
关于这款笔记本的功耗,我们的调查结果众说纷纭。虽然 G15 闲置时的平均功耗仅为 12 瓦,这对于游戏笔记本来说是非常小的,但相对于所提供的性能,它在负载情况下所需的 100 至 262 瓦功耗却高得惊人。
| Off / Standby | |
| Idle | |
| Load |
|
Key:
min: | |
| Dell G15 5530, i5-13450HX RTX 4050 i5-13450HX, GeForce RTX 4050 Laptop GPU | Medion Erazer Crawler E40 - MD 62518 i5-13500H, GeForce RTX 4050 Laptop GPU | Lenovo LOQ 15IRH8 Core i7 i7-13620H, GeForce RTX 4050 Laptop GPU | Asus TUF A15 FA507 R7 7735HS, GeForce RTX 4050 Laptop GPU | Dell G15 5530 i7-13650HX, GeForce RTX 4060 Laptop GPU | Average of class Gaming | |
|---|---|---|---|---|---|---|
| Power Consumption | -58% | -148% | -30% | -53% | -122% | |
| Idle Minimum * (Watt) | 2 | 10 -400% | 18.52 -826% | 8 -300% | 8.4 -320% | 13 ? -550% |
| Idle Average * (Watt) | 12 | 15.3 -28% | 22.54 -88% | 12.1 -1% | 14.98 -25% | 19 ? -58% |
| Idle Maximum * (Watt) | 27 | 15.5 43% | 29.79 -10% | 12.5 54% | 15.56 42% | 24.6 ? 9% |
| Load Average * (Watt) | 100 | 88 12% | 94.5 5% | 74.9 25% | 96.8 3% | 110.7 ? -11% |
| Witcher 3 ultra * (Watt) | 161.9 | 155 4% | 154.4 5% | 136.6 16% | 186 -15% | |
| Load Maximum * (Watt) | 262 | 202.47 23% | 190.4 27% | 185 29% | 271.42 -4% | 259 ? 1% |
* ... smaller is better
Power consumption Witcher 3 / Stresstest
Power consumption with external monitor
电池寿命
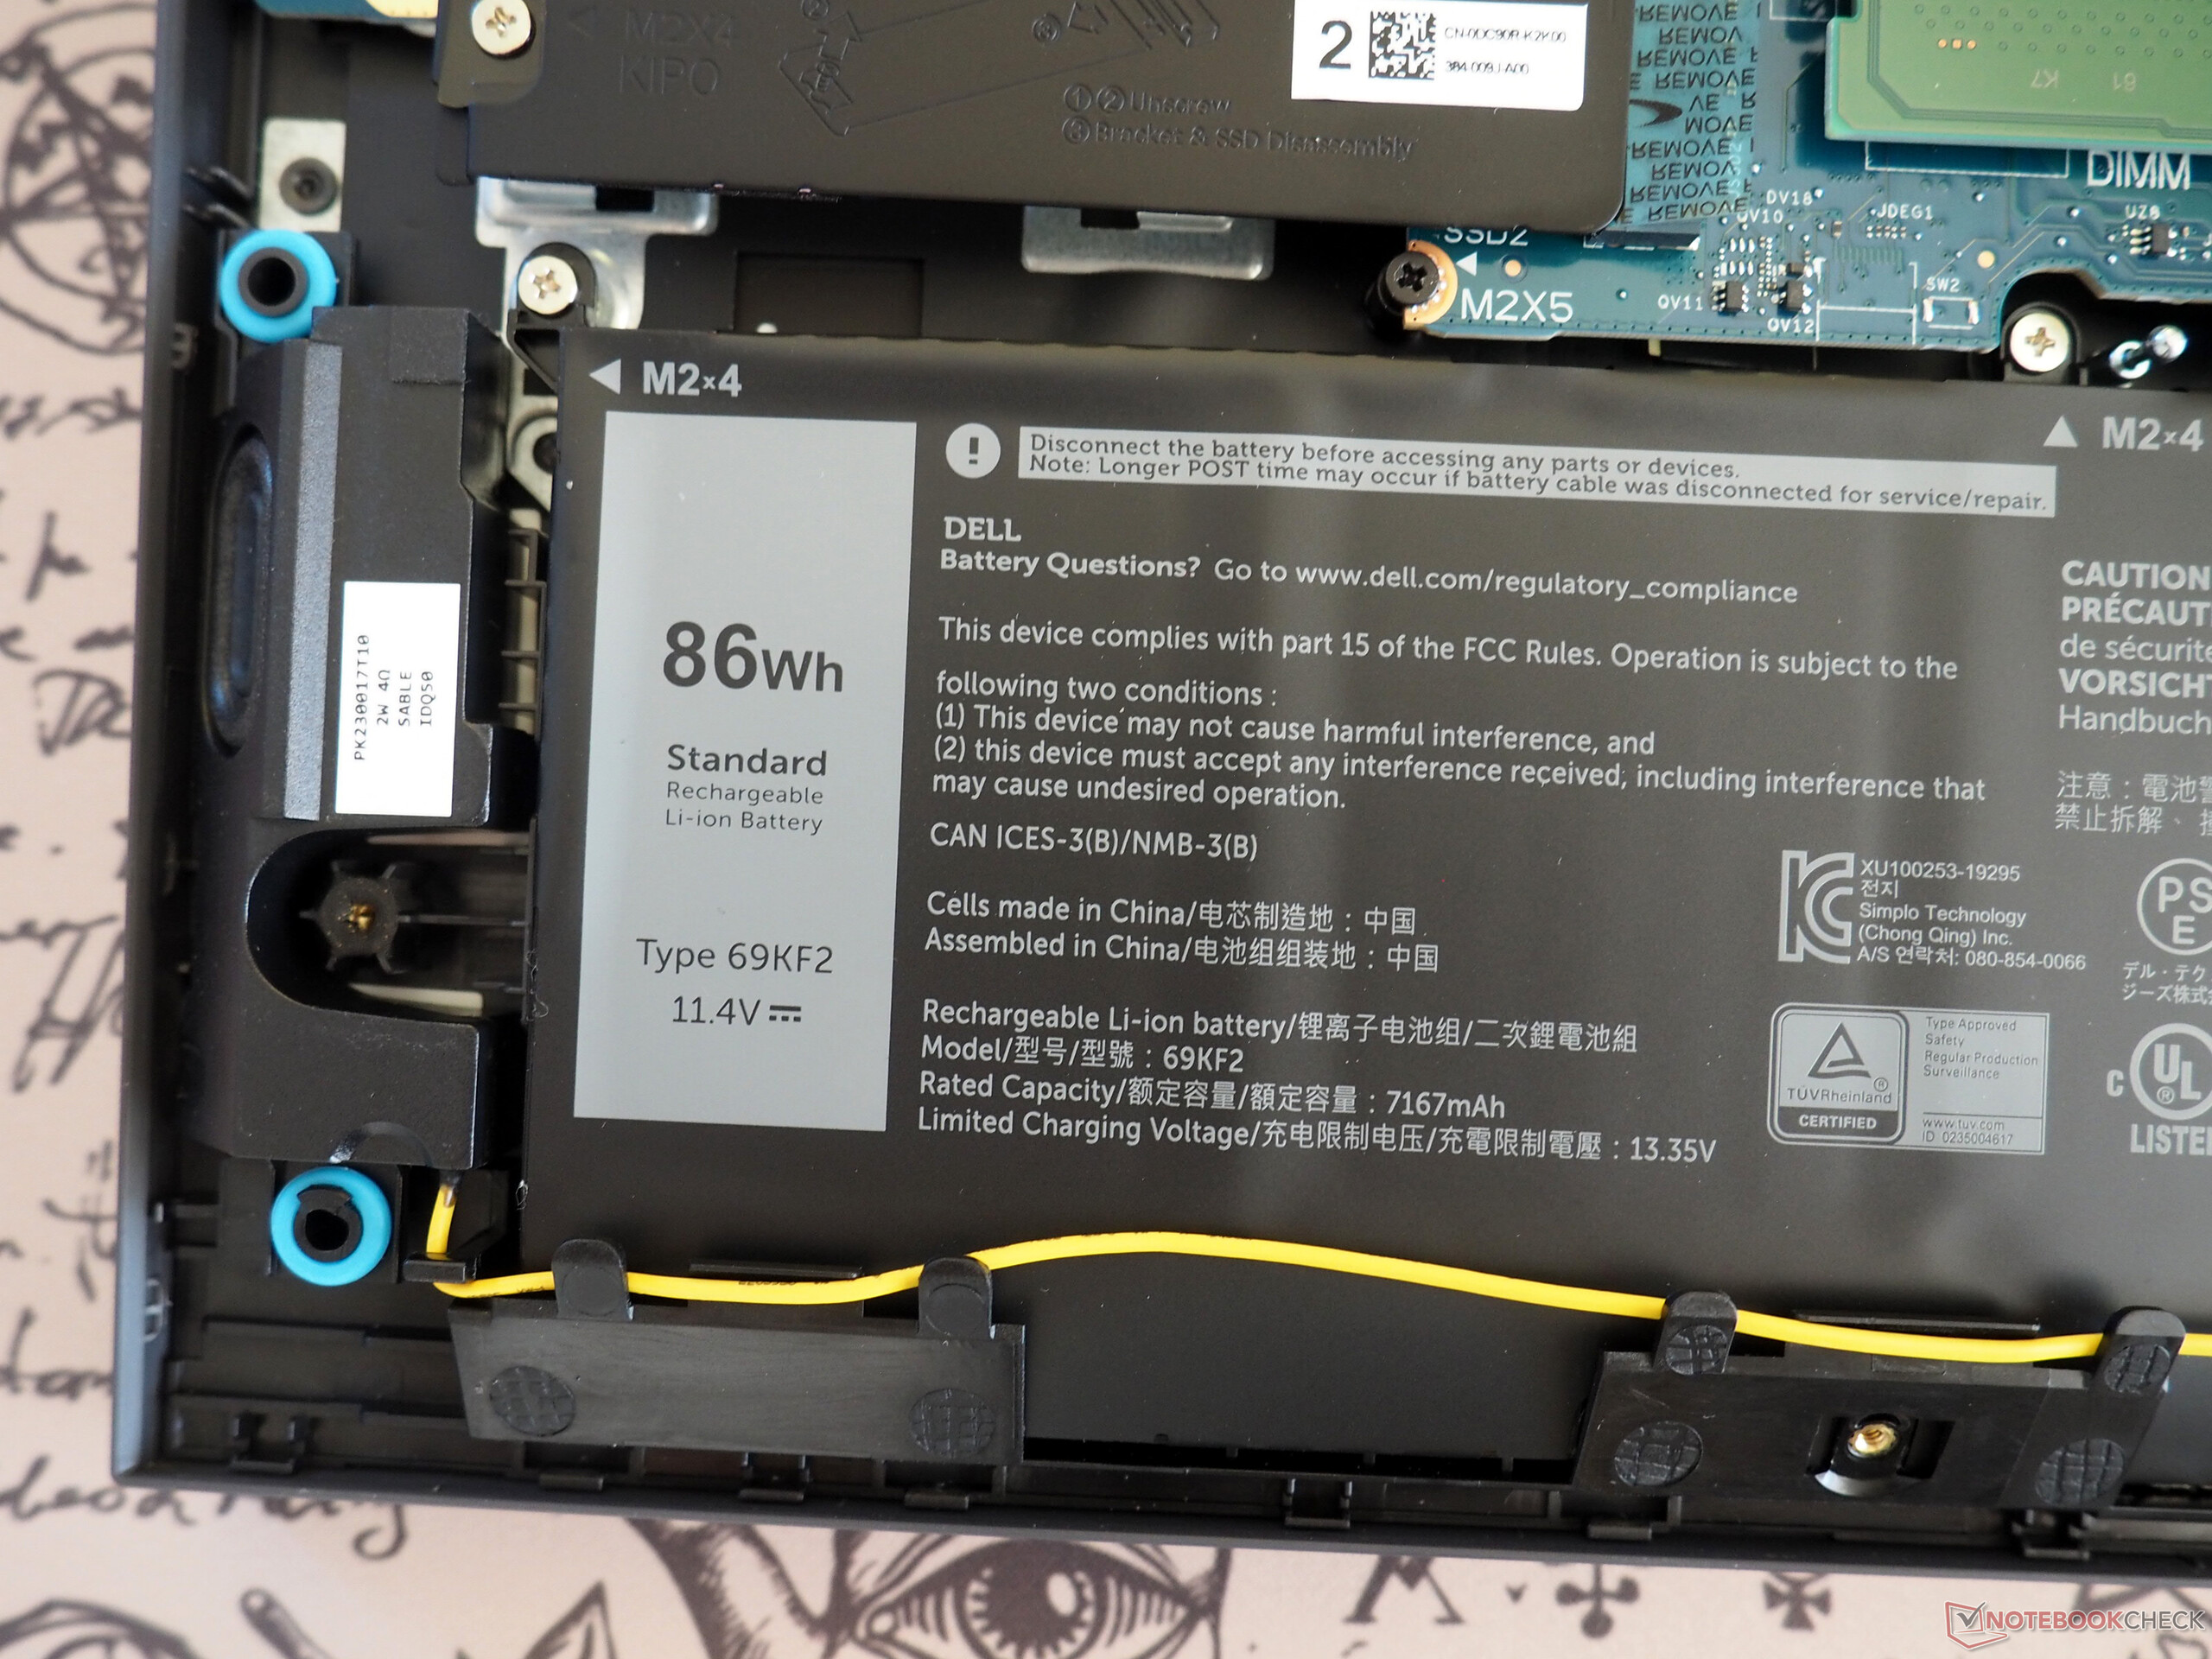
G15 的电池续航能力非常不错,这主要归功于图形切换功能。在我们的 Wi-Fi 测试中(屏幕亮度降低到 150 cd/m²),86 Wh 的大电池让我们使用了大约 7 个小时。
| Dell G15 5530, i5-13450HX RTX 4050 i5-13450HX, GeForce RTX 4050 Laptop GPU, 86 Wh | Medion Erazer Crawler E40 - MD 62518 i5-13500H, GeForce RTX 4050 Laptop GPU, 54 Wh | Lenovo LOQ 15IRH8 Core i7 i7-13620H, GeForce RTX 4050 Laptop GPU, 60 Wh | Asus TUF A15 FA507 R7 7735HS, GeForce RTX 4050 Laptop GPU, 90 Wh | Dell G15 5530 i7-13650HX, GeForce RTX 4060 Laptop GPU, 86 Wh | Average of class Gaming | |
|---|---|---|---|---|---|---|
| Battery runtime | -42% | -17% | 65% | -8% | 0% | |
| WiFi v1.3 (h) | 7.1 | 4.1 -42% | 5.9 -17% | 11.7 65% | 6.5 -8% | 7.11 ? 0% |
| H.264 (h) | 3.9 | 6.1 | 12.5 | 6.8 | 8.32 ? | |
| Load (h) | 1.2 | 1 | 0.8 | 1.502 ? | ||
| Witcher 3 ultra (h) | 0.8 |
Pros
Cons
判决
戴尔 G15 5530 配备 酷睿 i5-13450HX和 GeForce RTX 4050的优缺点。 的大部分优点和缺点与 i7-13650HX和 RTX 4060.从好的方面来看,该设备拥有相对较好的显示效果、稳定的电池续航时间以及合理的性价比等。
但缺点是机身笨重,充电器过于笨重,端口选择不足(没有 USB4 和读卡器)。戴尔还应该努力解决固态硬盘在持续压力下的大量跳动以及负载下的耗电量问题。
无论如何,G15 5530 对于预算有限、希望在 1,000 欧元(1,090 美元)价位内找到合适游戏机的玩家来说,总体而言是一个不错的选择。
评测中提到的竞争对手包括Medion Crawler E40, 华硕 TUF A15和 联想 LOQ 15)的性能大体相当,但有时也有其他优点和缺点。
价格和供应情况
配备酷睿 i5-13450HX 和GeForce RTX 4050 的戴尔 G15 5530 目前在德国亚马逊有售,售价 950 欧元。在美国,您可以直接从戴尔以 900 美元的价格购买到类似规格的版本,或者从美国亚马逊以 1200 美元的价格购买到配备酷睿 i7-13650HX 和 RTX 4060 的型号。
Dell G15 5530, i5-13450HX RTX 4050
- 01/23/2024 v7 (old)
Florian Glaser
Transparency
The selection of devices to be reviewed is made by our editorial team. The test sample was provided to the author as a loan by the manufacturer or retailer for the purpose of this review. The lender had no influence on this review, nor did the manufacturer receive a copy of this review before publication. There was no obligation to publish this review. As an independent media company, Notebookcheck is not subjected to the authority of manufacturers, retailers or publishers.
This is how Notebookcheck is testing
Every year, Notebookcheck independently reviews hundreds of laptops and smartphones using standardized procedures to ensure that all results are comparable. We have continuously developed our test methods for around 20 years and set industry standards in the process. In our test labs, high-quality measuring equipment is utilized by experienced technicians and editors. These tests involve a multi-stage validation process. Our complex rating system is based on hundreds of well-founded measurements and benchmarks, which maintains objectivity. Further information on our test methods can be found here.
Price comparison

