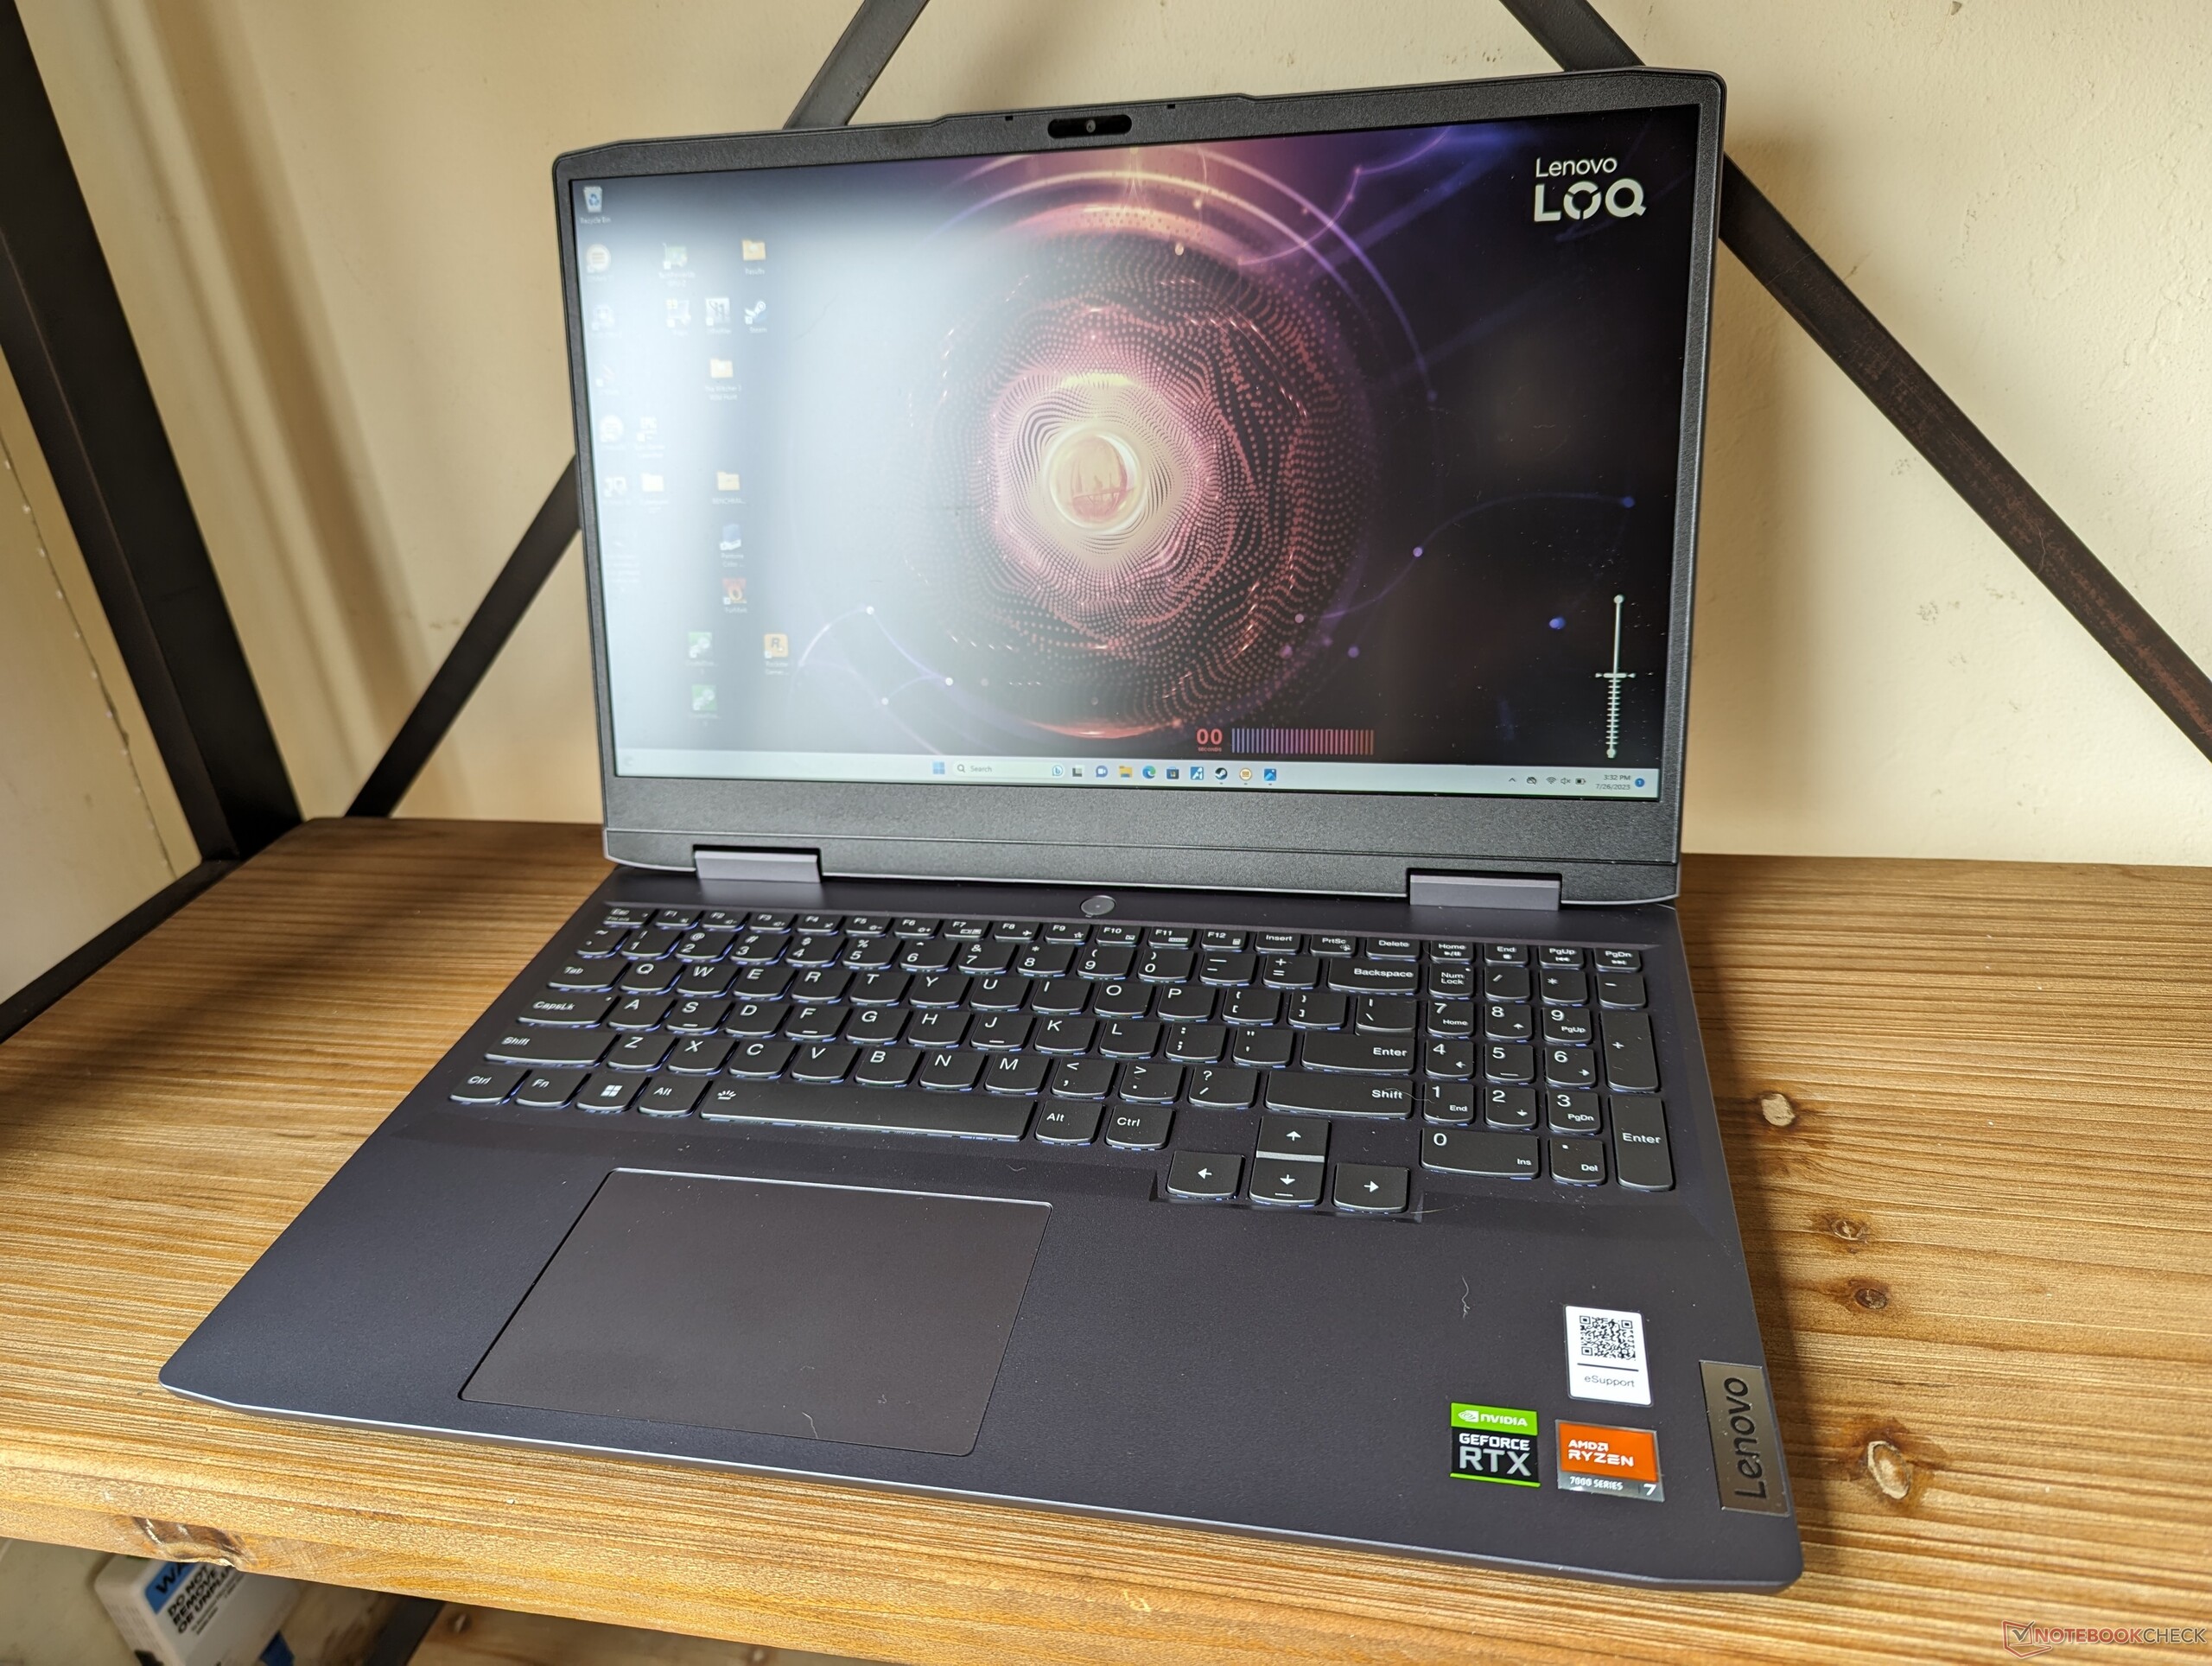
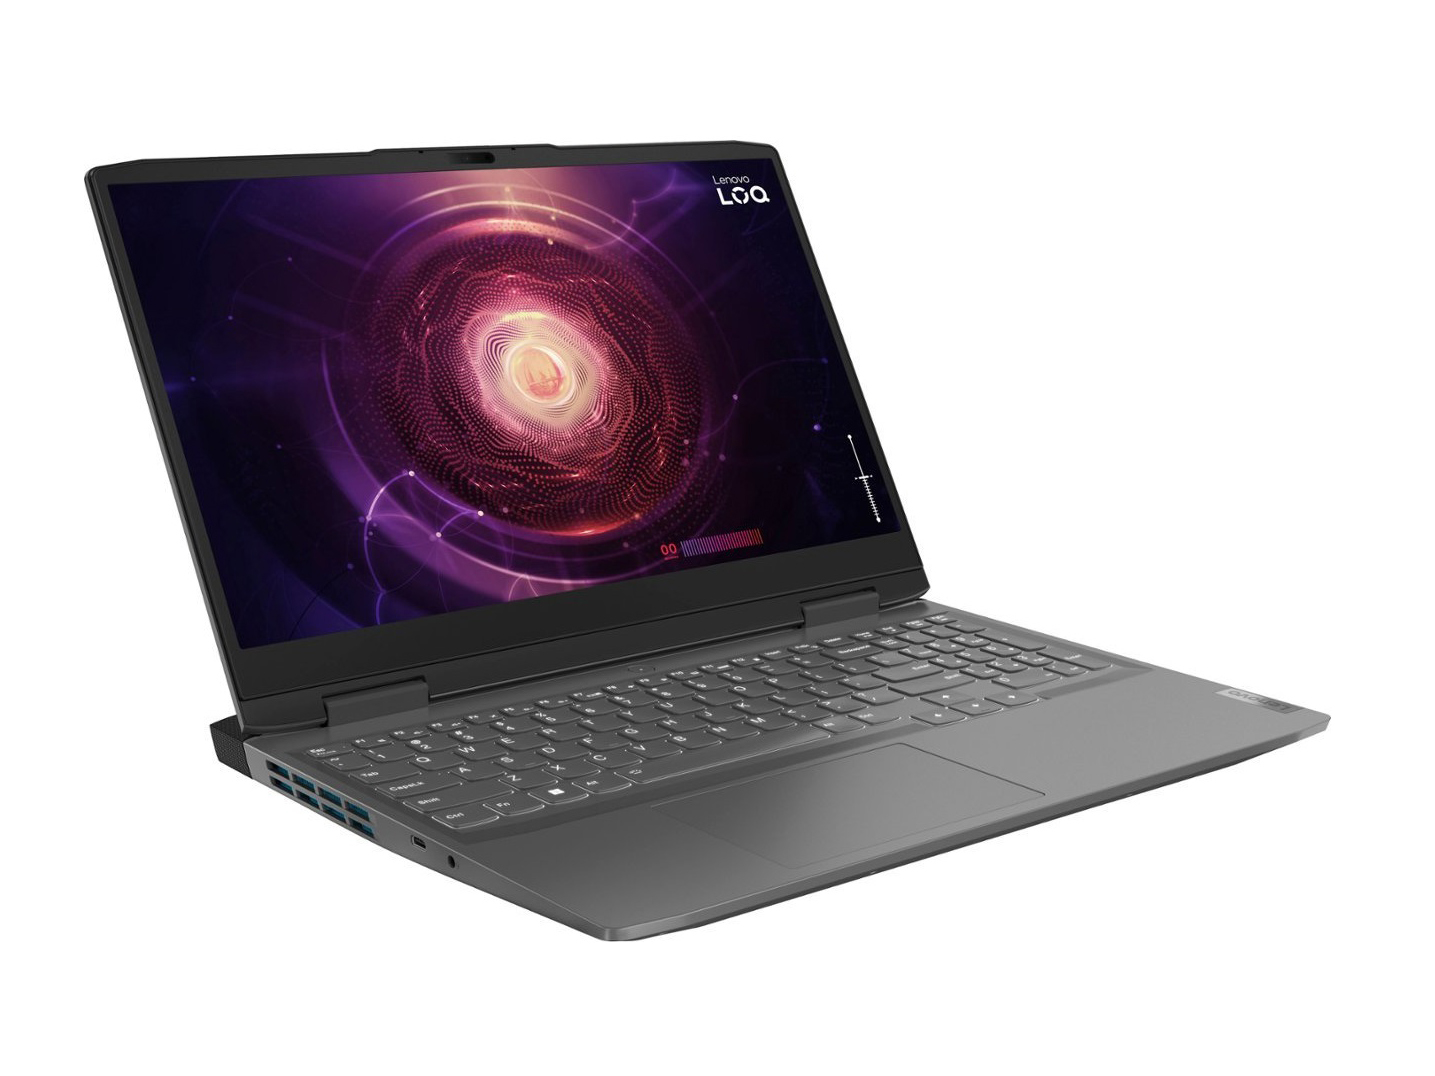
联想 LOQ 15 Ryzen 7 7840HS 笔记本电脑评测:不要称它为Legion

LOQ系列由联想的经济型游戏笔记本电脑组成,旨在取代旧款的 IdeaPad Gaming 3 系列.新的LOQ名称有助于在其经济型游戏产品与面向家庭办公或学生的Ideapad系列之间拉开距离。由于联想希望将Legion 定位为高端游戏机的 "旗舰 "系列,因此它显然不是 Legion 产品。
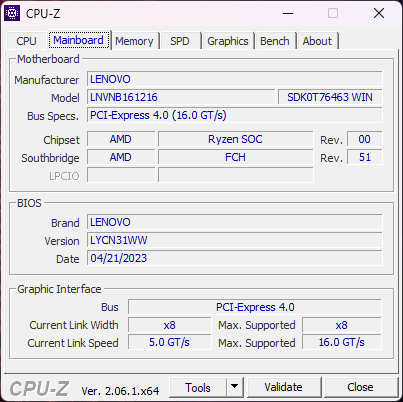
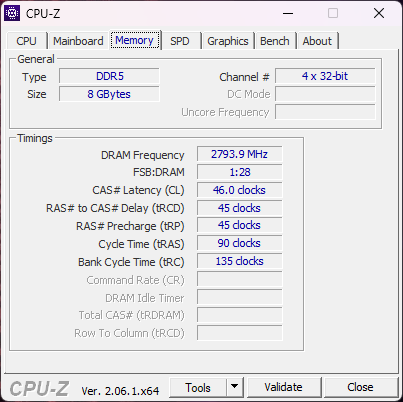
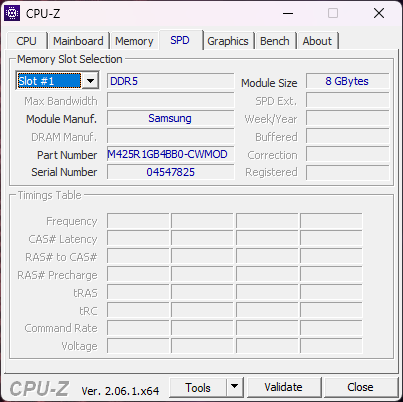
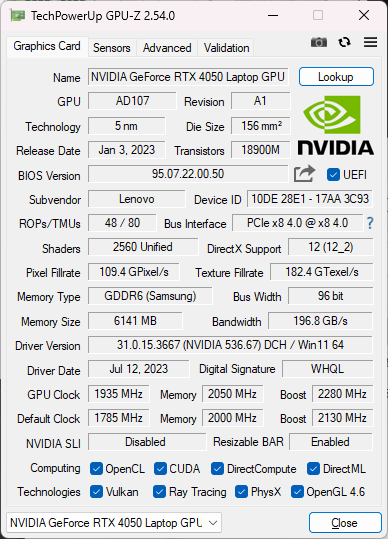
我们这次评测的是中端 AMD 版本(15APH8),配备 Zen 4 Ryzen 7 7840HS CPU、GeForce RTX 4050 GPU 和 1080p 144 Hz IPS 显示屏,零售价约为 1000 美元。它只配备了 8 GB 内存,但幸运的是用户可以升级。Ryzen 5 7640HS、RTX 3050 或 4060 和 1080p 60 Hz 至 1440p 165 Hz 显示屏的 SKU 价格从 800 美元以下到 1100 美元以上不等。英特尔版本的 LOQ 15(15IRH8)也有 15 英寸和 16 英寸(LOQ 16)两种屏幕尺寸。
竞争对手包括其他经济型 15 英寸游戏笔记本电脑,如 戴尔 G15 5530,华硕 TUF A15 FA507,微星 Cyborg 15或 惠普 Victus 15.
更多联想评论:
潜在的竞争对手比较
Rating | Date | Model | Weight | Height | Size | Resolution | Price |
|---|---|---|---|---|---|---|---|
| 85.7 % v7 (old) | 07 / 2023 | Lenovo LOQ 15APH8 R7 7840HS, GeForce RTX 4050 Laptop GPU | 2.5 kg | 25.2 mm | 15.60" | 1920x1080 | |
| 87.5 % v7 (old) | 11 / 2022 | Lenovo Legion 5 15IAH7H 82RB i7-12700H, GeForce RTX 3060 Laptop GPU | 2.4 kg | 19.99 mm | 15.60" | 1920x1080 | |
| 84.2 % v7 (old) | 06 / 2023 | Dell G15 5530 i7-13650HX, GeForce RTX 4060 Laptop GPU | 3 kg | 26.95 mm | 15.60" | 1920x1080 | |
| 86.3 % v7 (old) | 06 / 2023 | Asus TUF A15 FA507 R7 7735HS, GeForce RTX 4050 Laptop GPU | 2.2 kg | 24.9 mm | 15.60" | 1920x1080 | |
| 82.4 % v7 (old) | 04 / 2023 | MSI Cyborg 15 A12VF i7-12650H, GeForce RTX 4060 Laptop GPU | 2 kg | 22.9 mm | 15.60" | 1920x1080 | |
| 81 % v7 (old) | 01 / 2023 | HP Victus 15 fa0020nr i7-12700H, GeForce RTX 3050 Ti Laptop GPU | 2.3 kg | 23.6 mm | 15.60" | 1920x1080 |
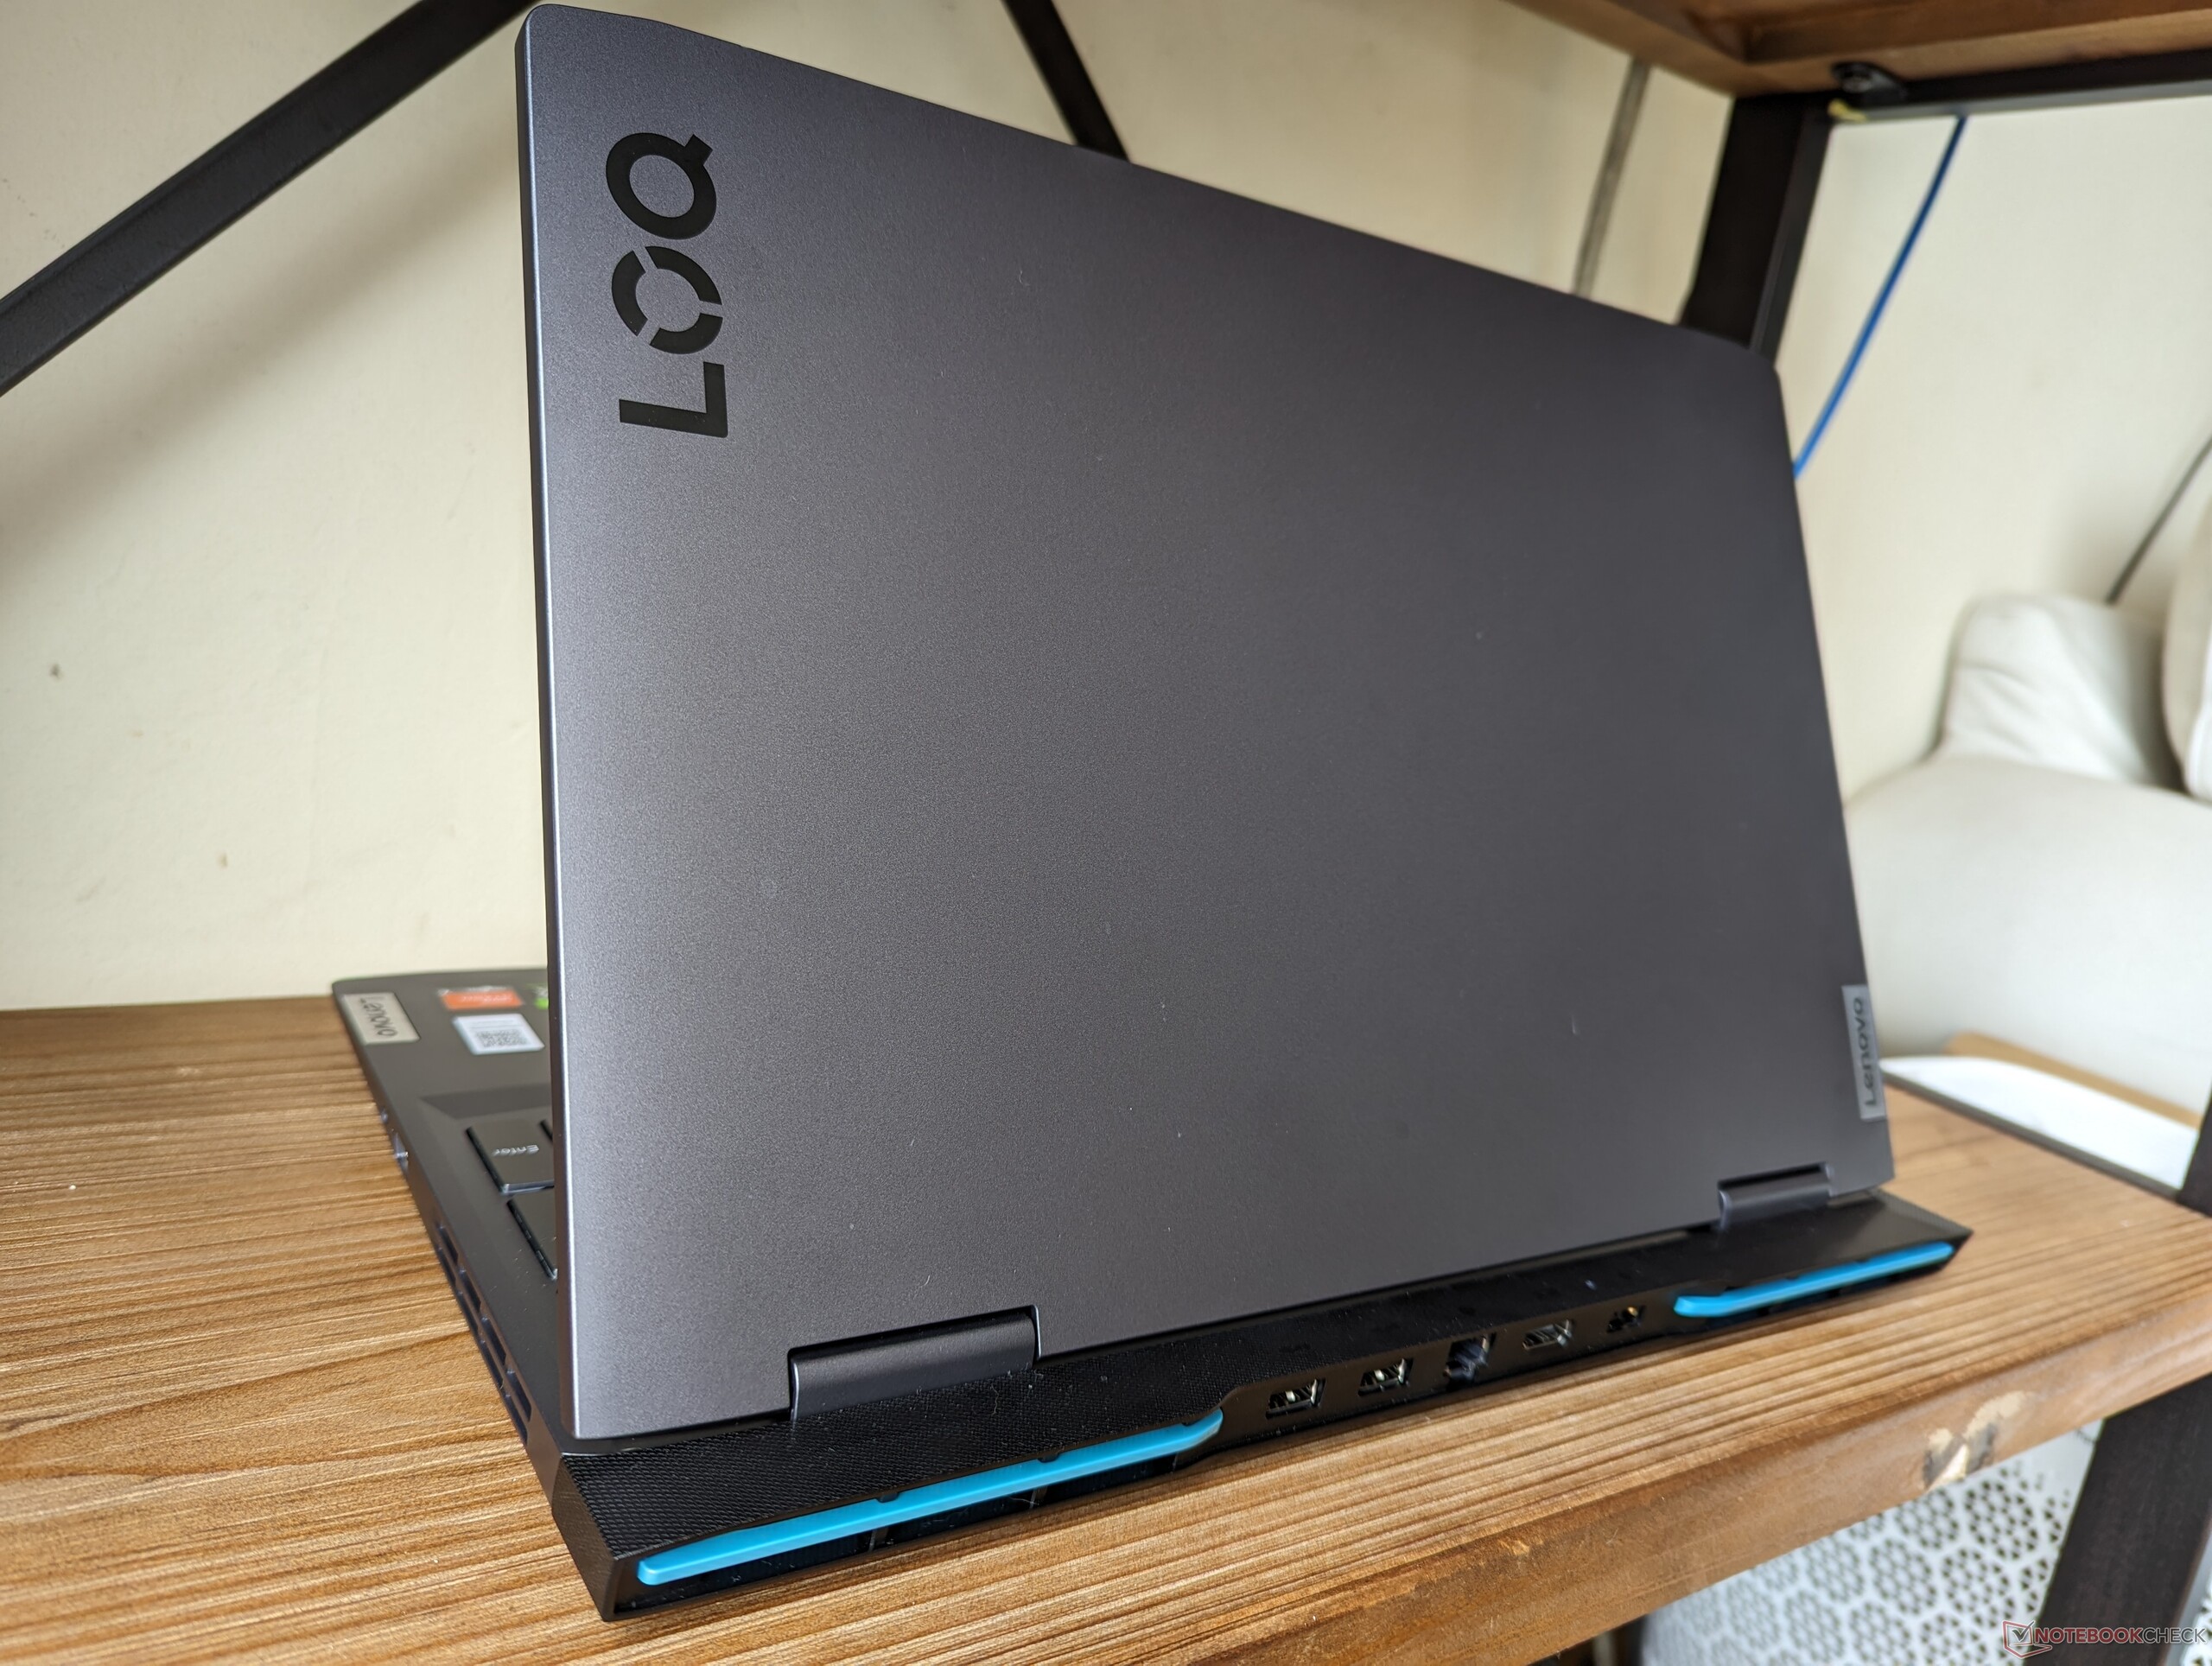
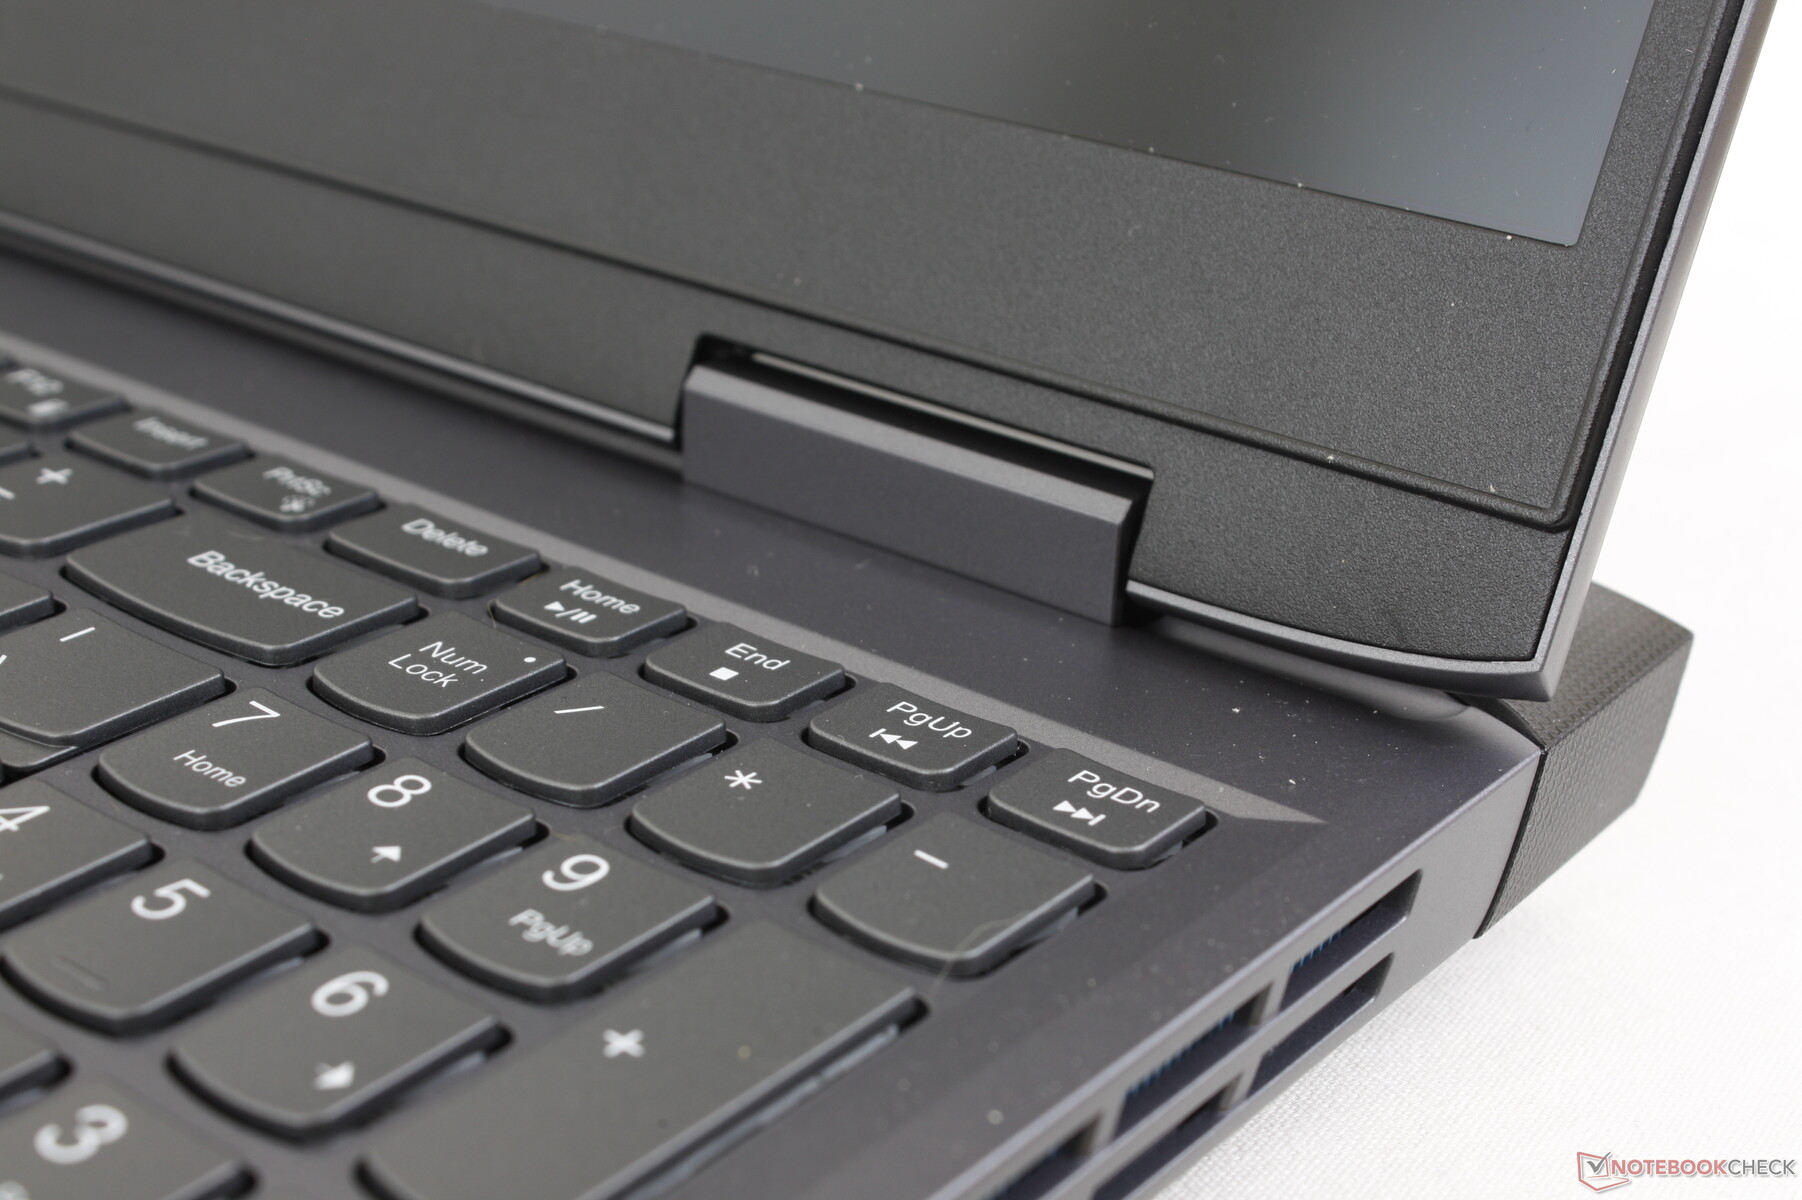
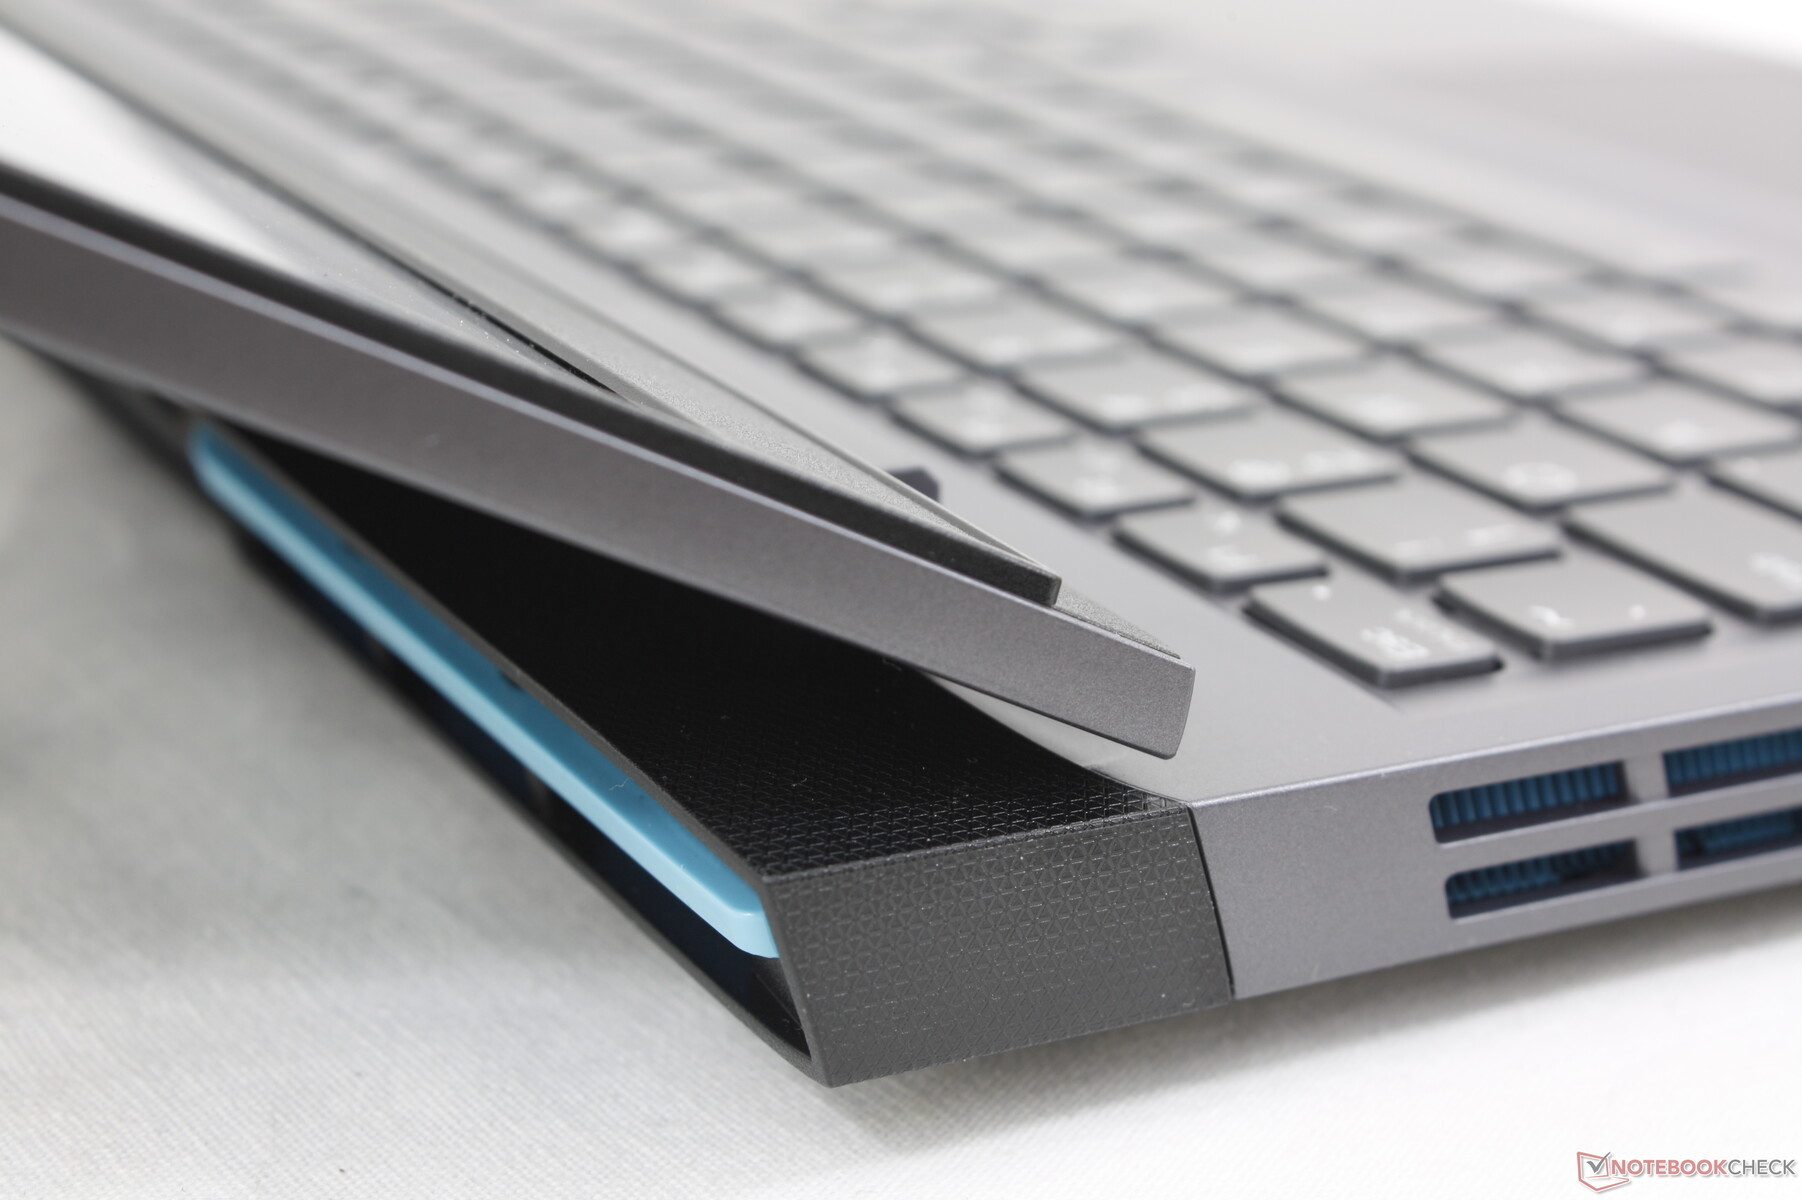
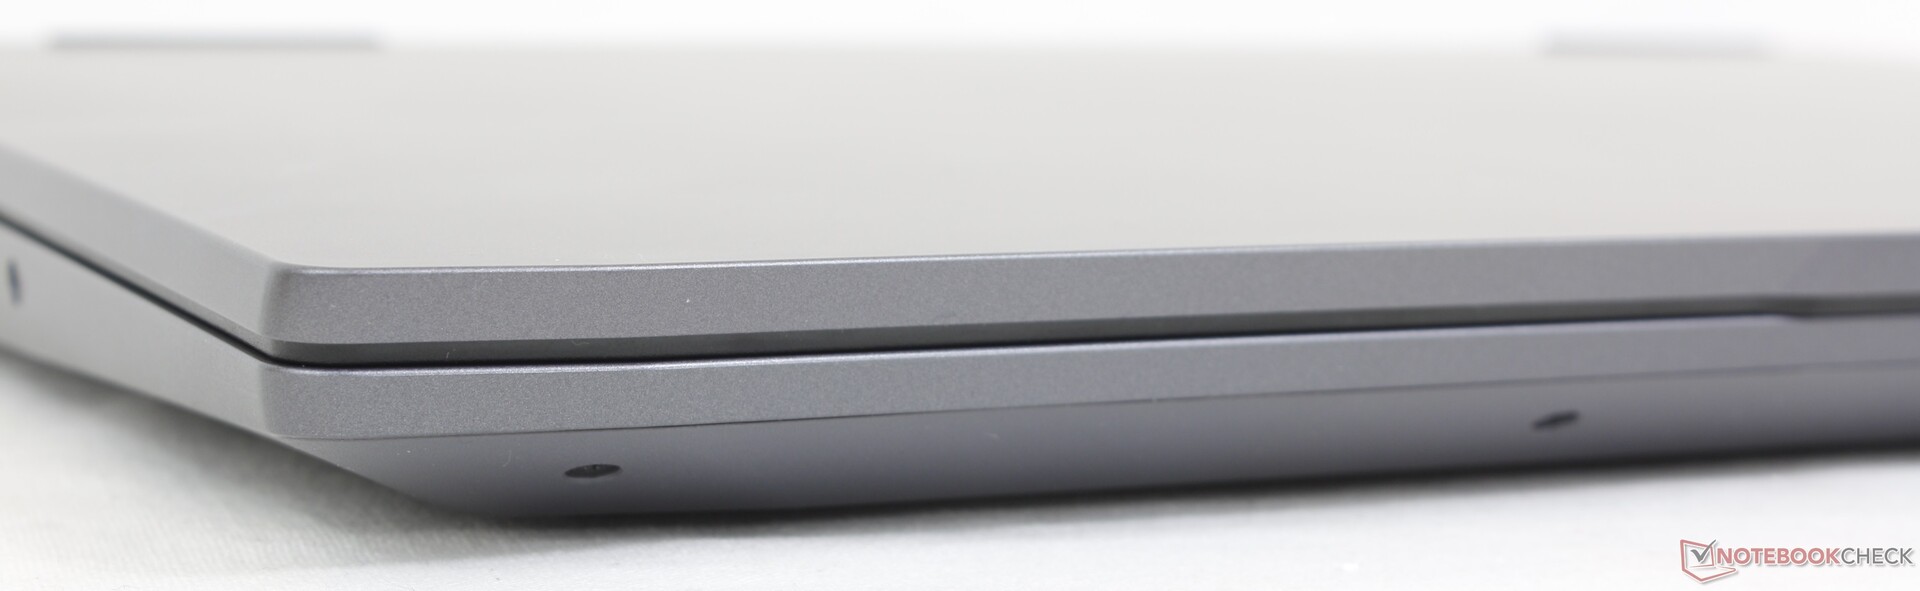
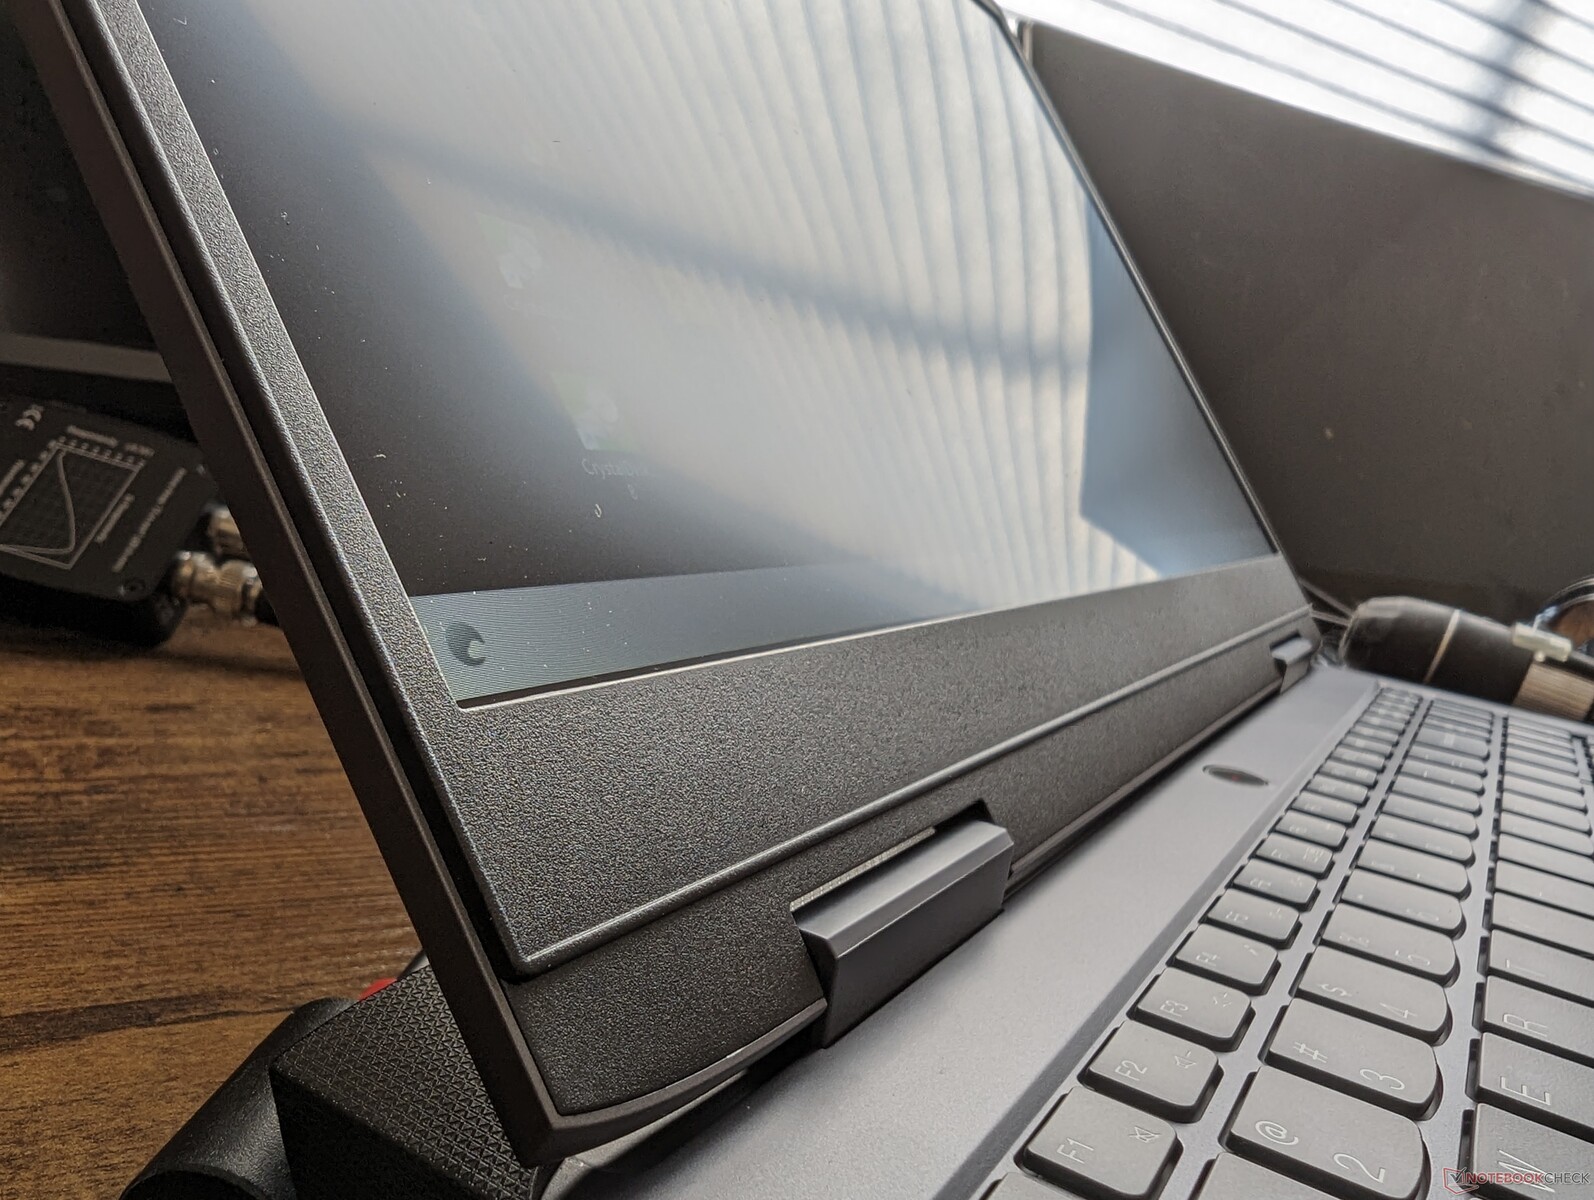
外壳 - 本质上是塑料Legion
虽然它不是Legion 的产品,但并不意味着它不能从Legion 的设计中获得灵感。LOQ 15 机箱最适合被描述为一个淡化了的 Legion 5 15Legion 的所有金属骨架材料都被顶盖和底部的 ABS 塑料所取代。这些变化让人感觉更便宜,但与其他经济型游戏笔记本电脑(如 微星 Cyborg 15或惠普 Victus 15 也是以塑料为主。
机箱刚性最弱的是掌托和键盘中心。与大多数其他游戏笔记本电脑(包括惠普 Victus 15 等廉价笔记本电脑)相比,在这些部位施加压力会使表面发生轻微翘曲。幸好这并不令人担忧,笔记本电脑的其他部分也很坚固。
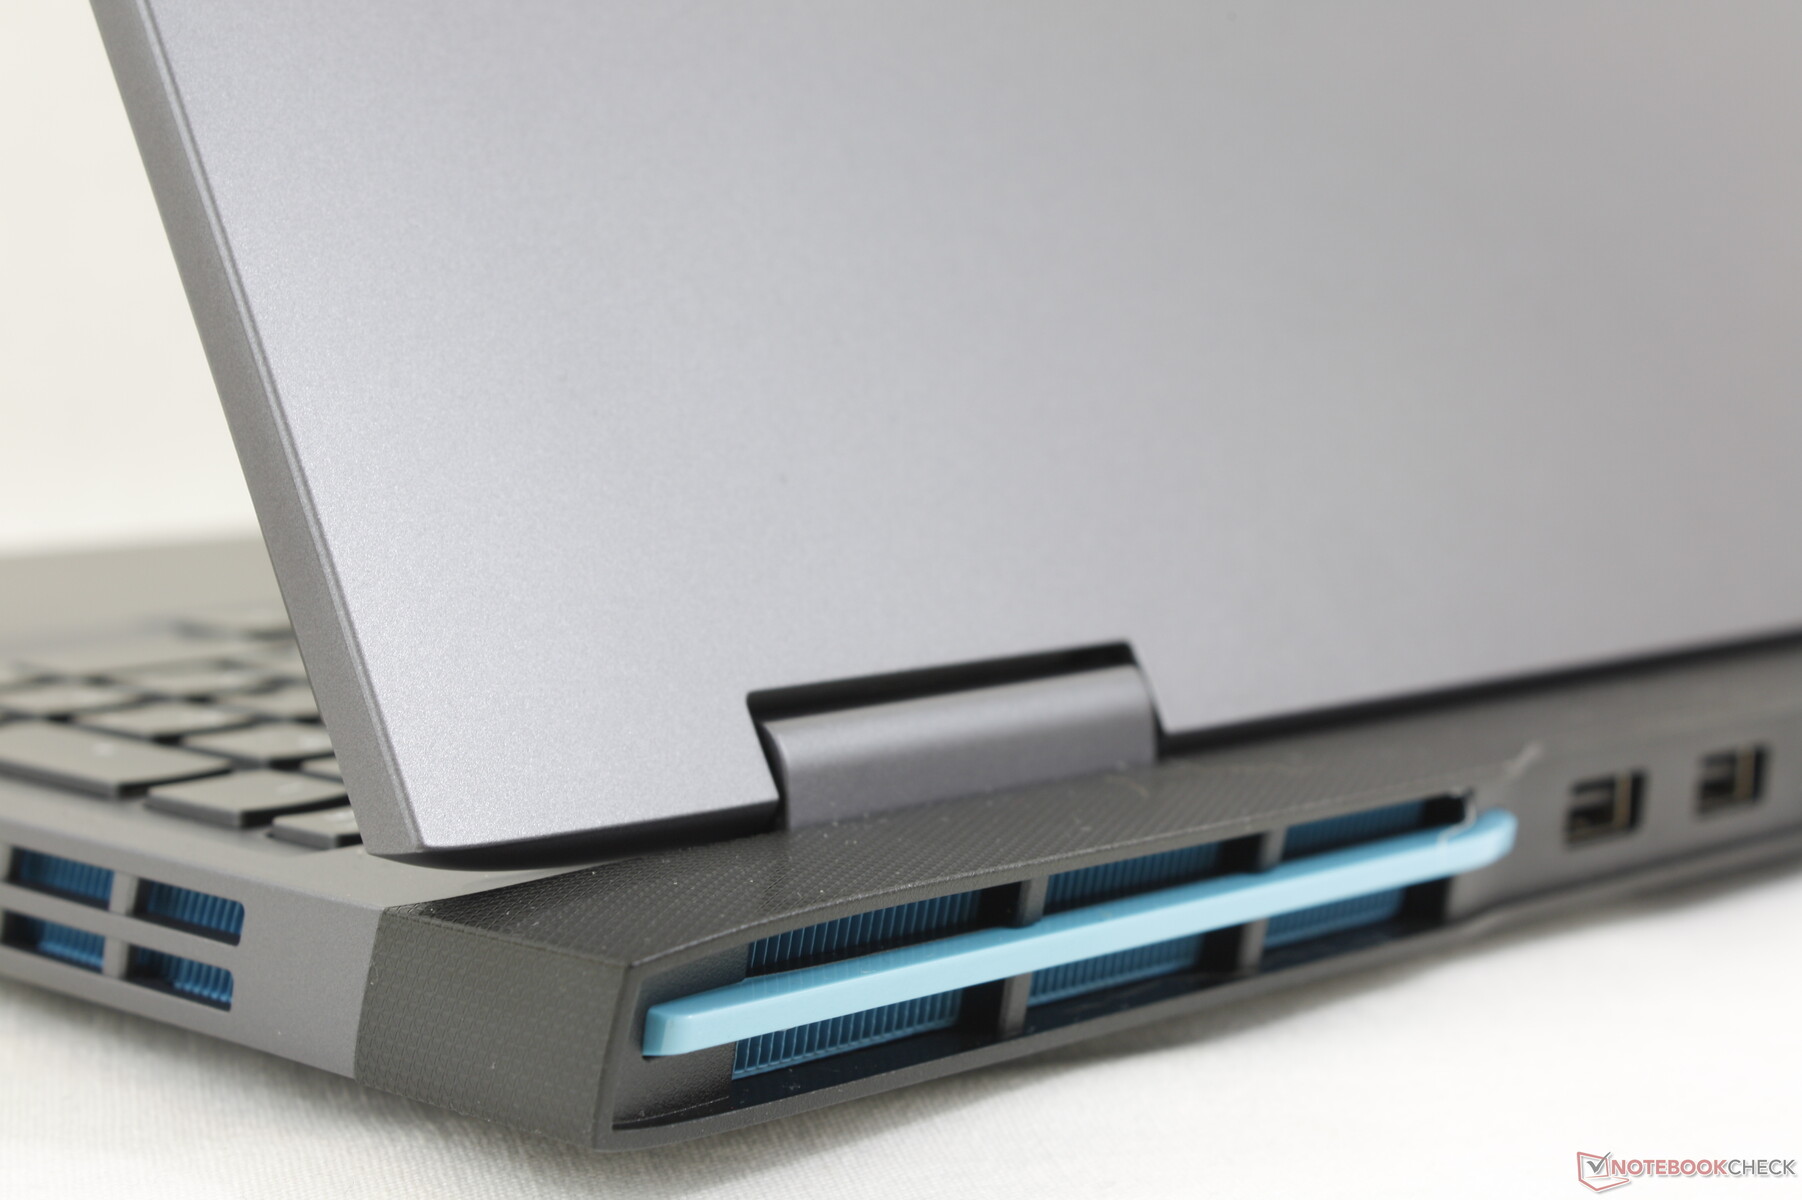
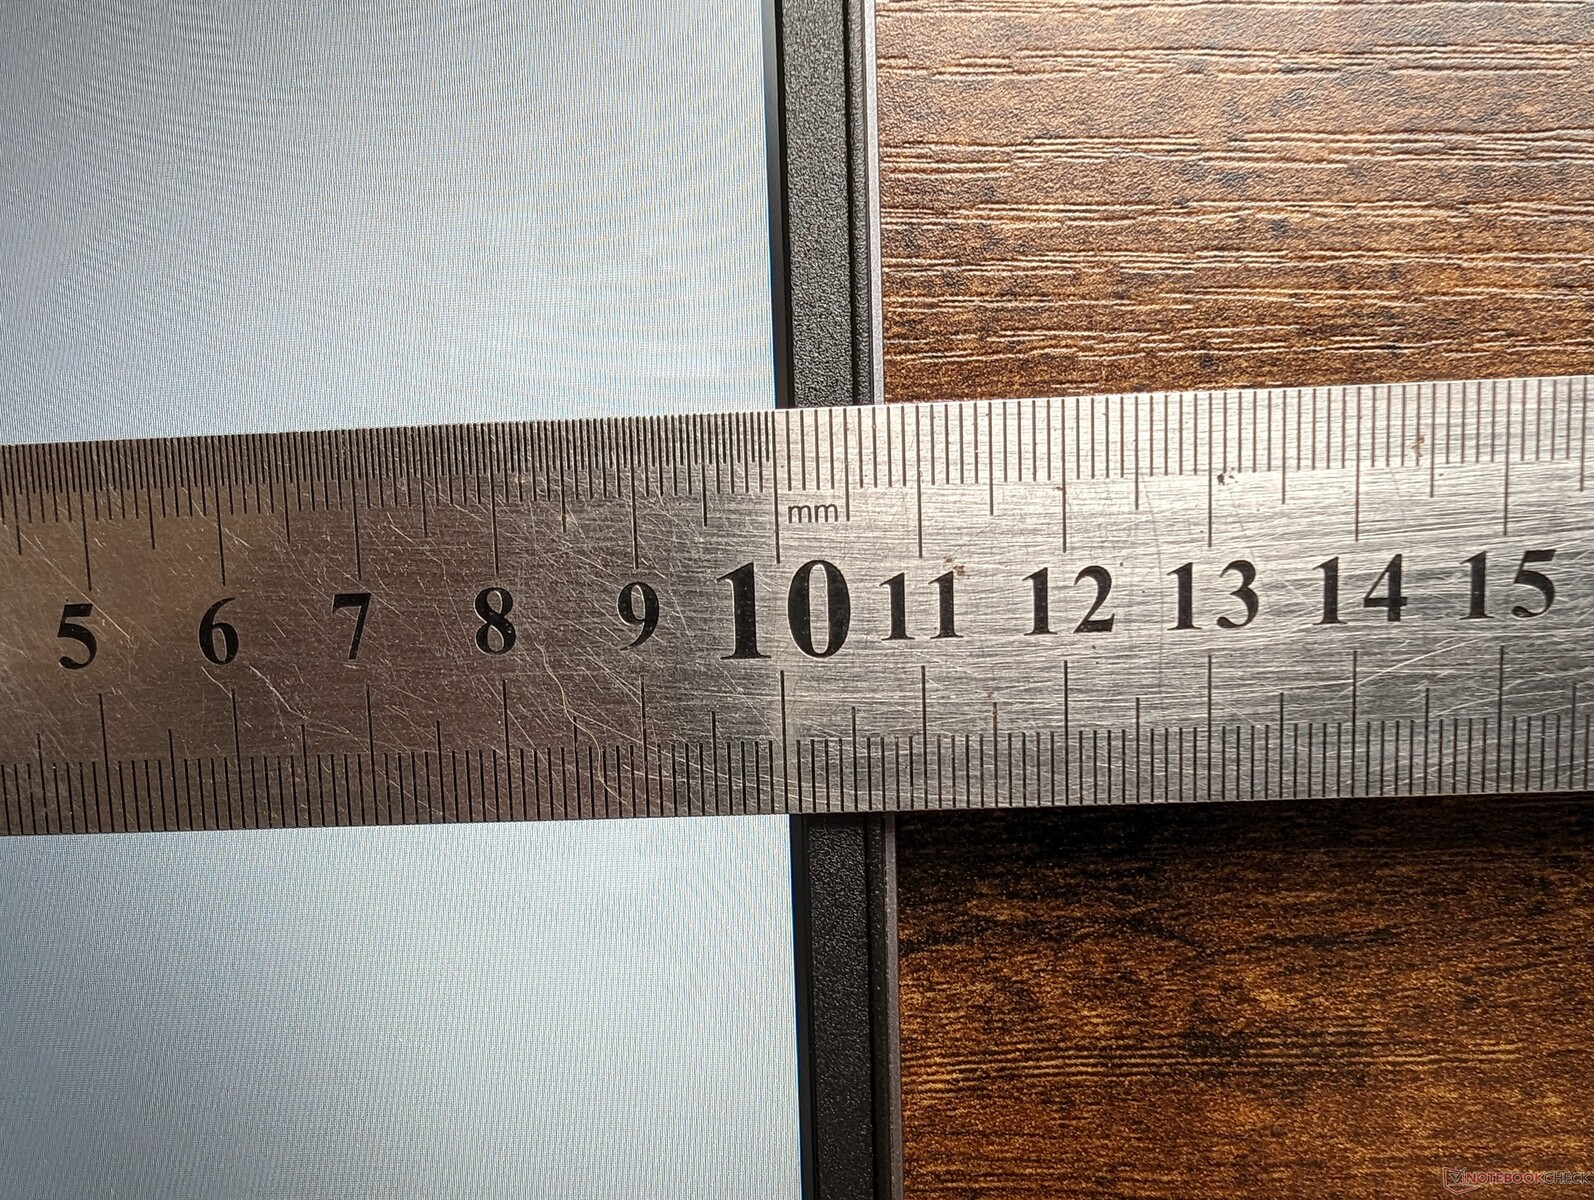
与包括华硕 TUF A15 在内的大多数其他经济型游戏笔记本电脑相比,LOQ 15 稍微厚重一些、惠普 Victus 15或微星 Cyborg 15 相比,LOQ 15 稍微厚重了一些,部分原因是它的后部加长了很多。笨重的 戴尔 G15 5530是一个明显的例外,它甚至更重、更大。
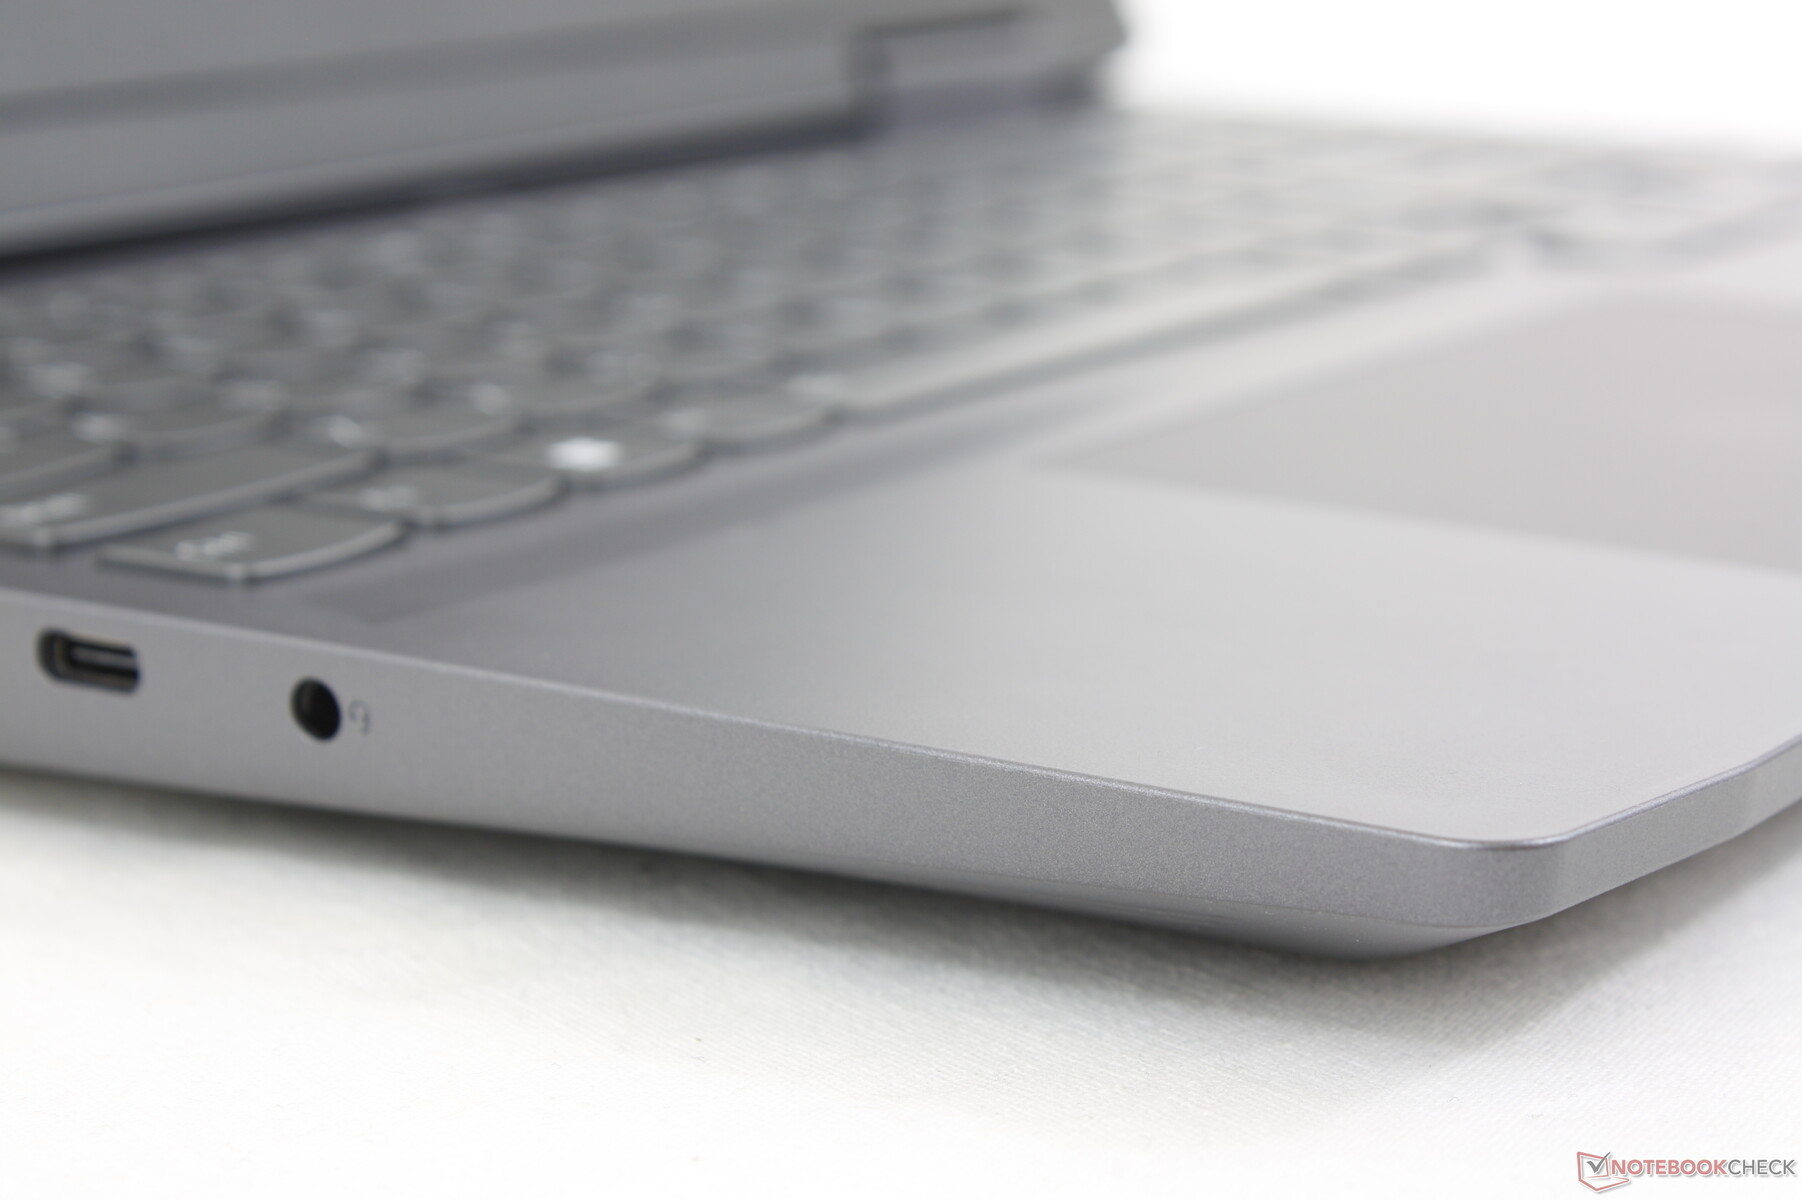
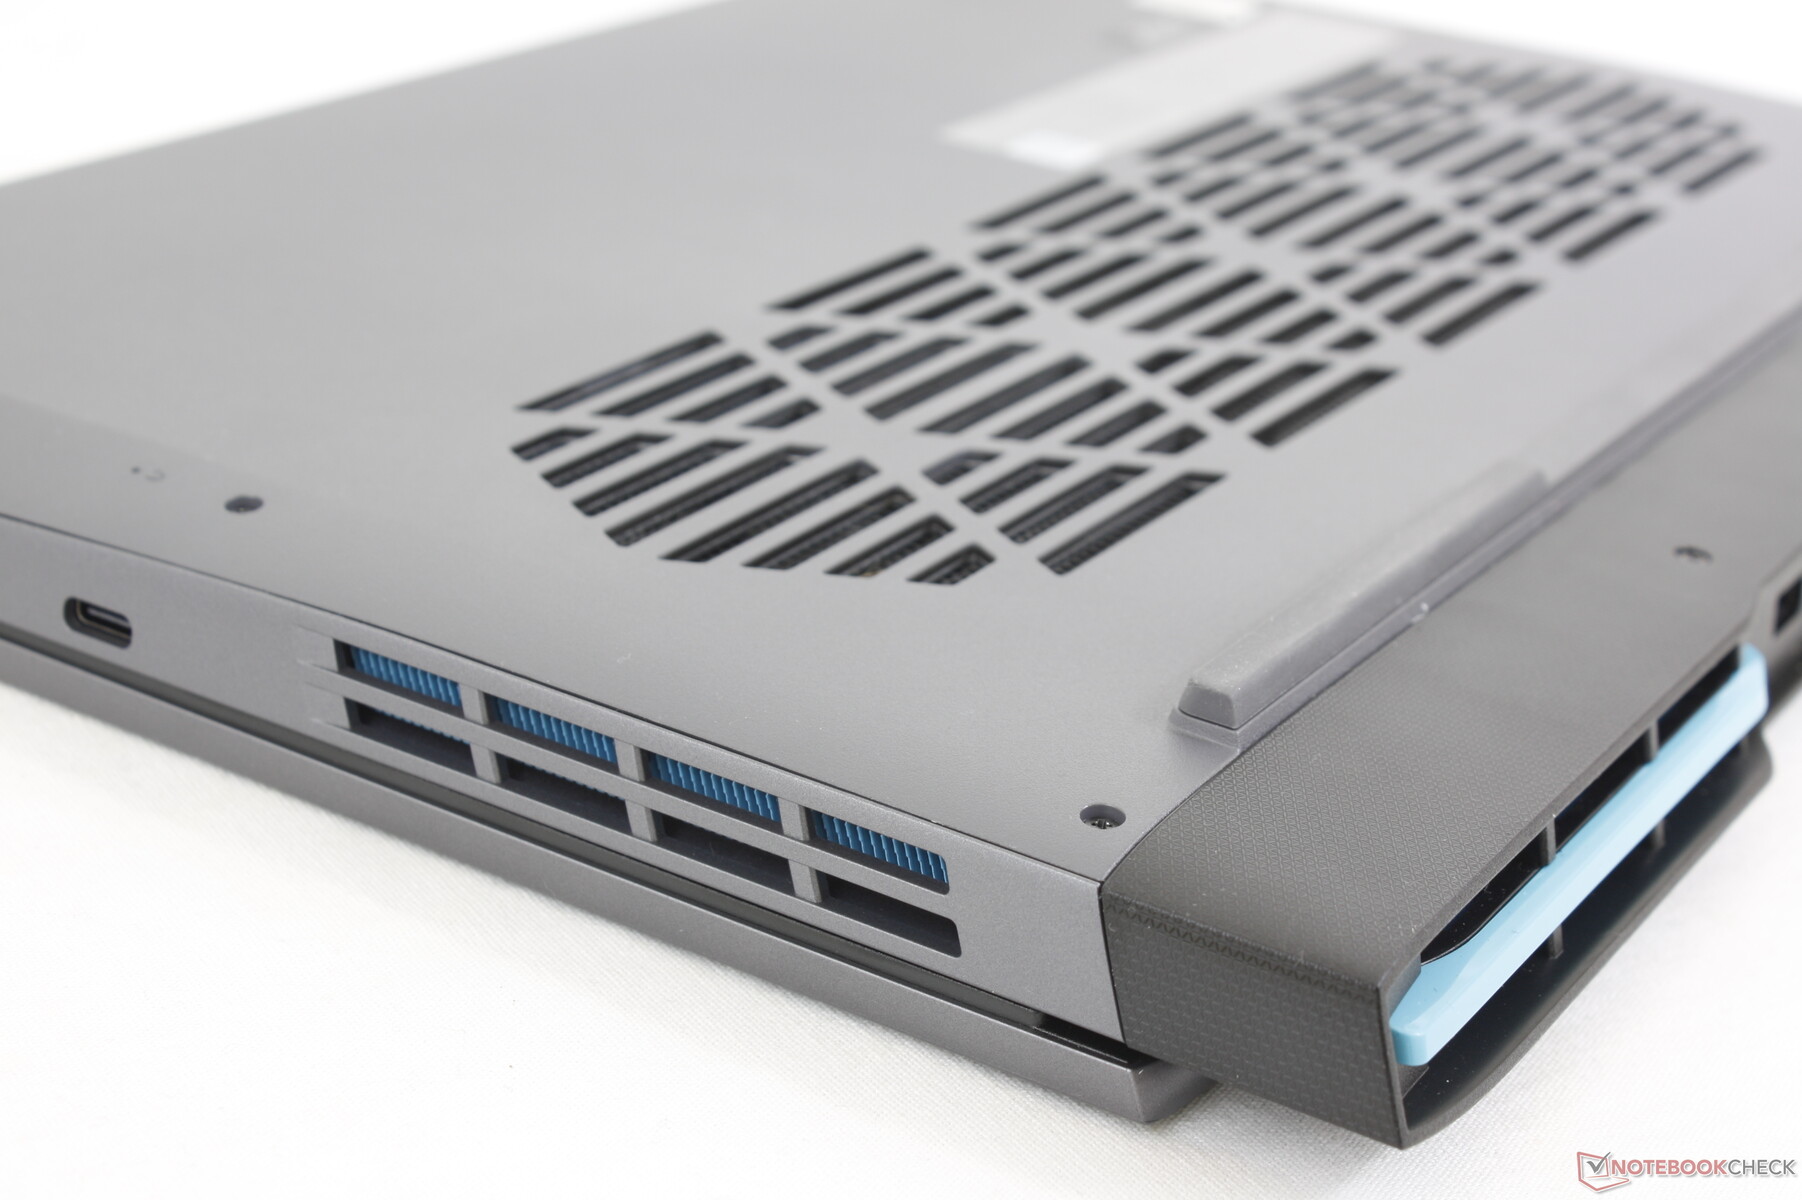
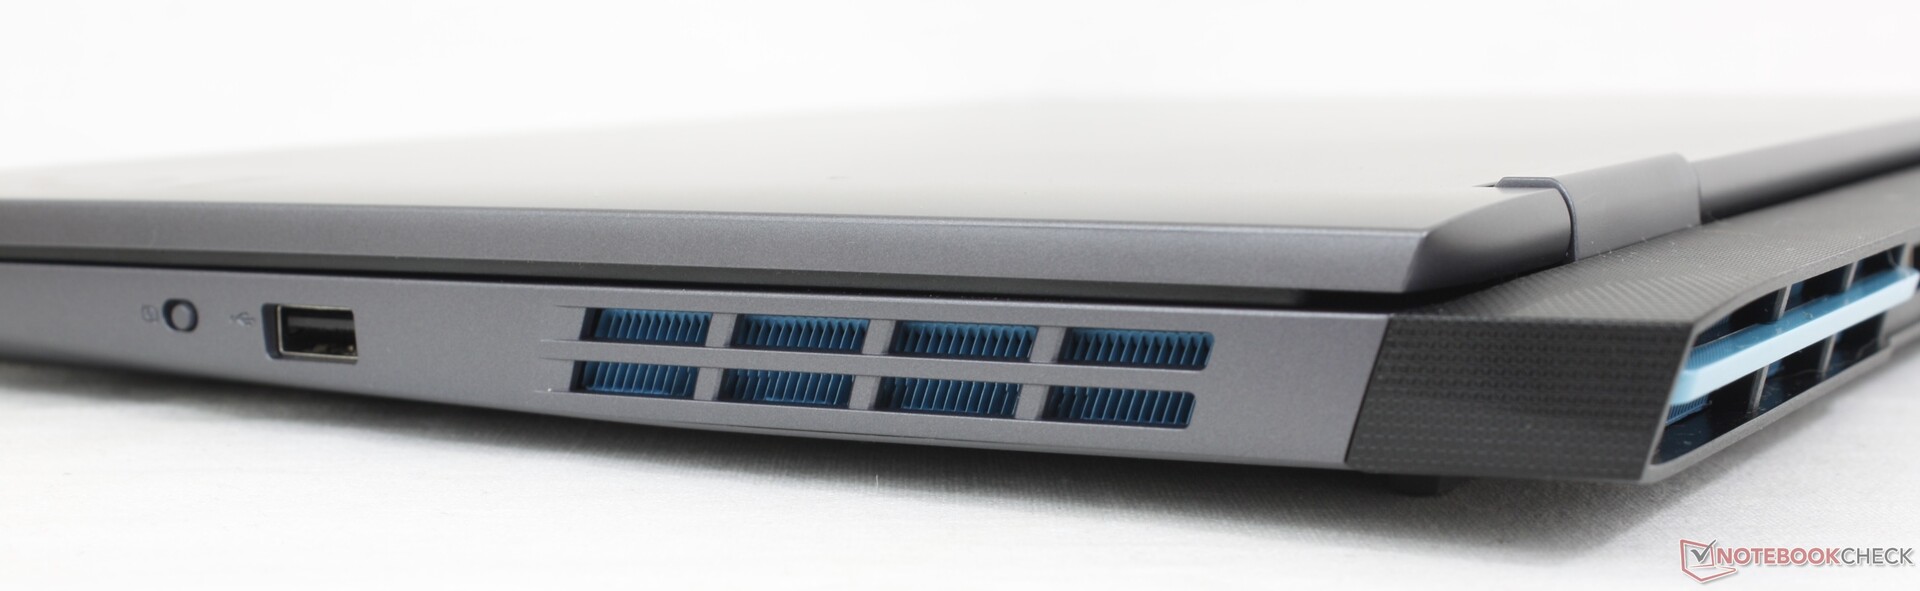
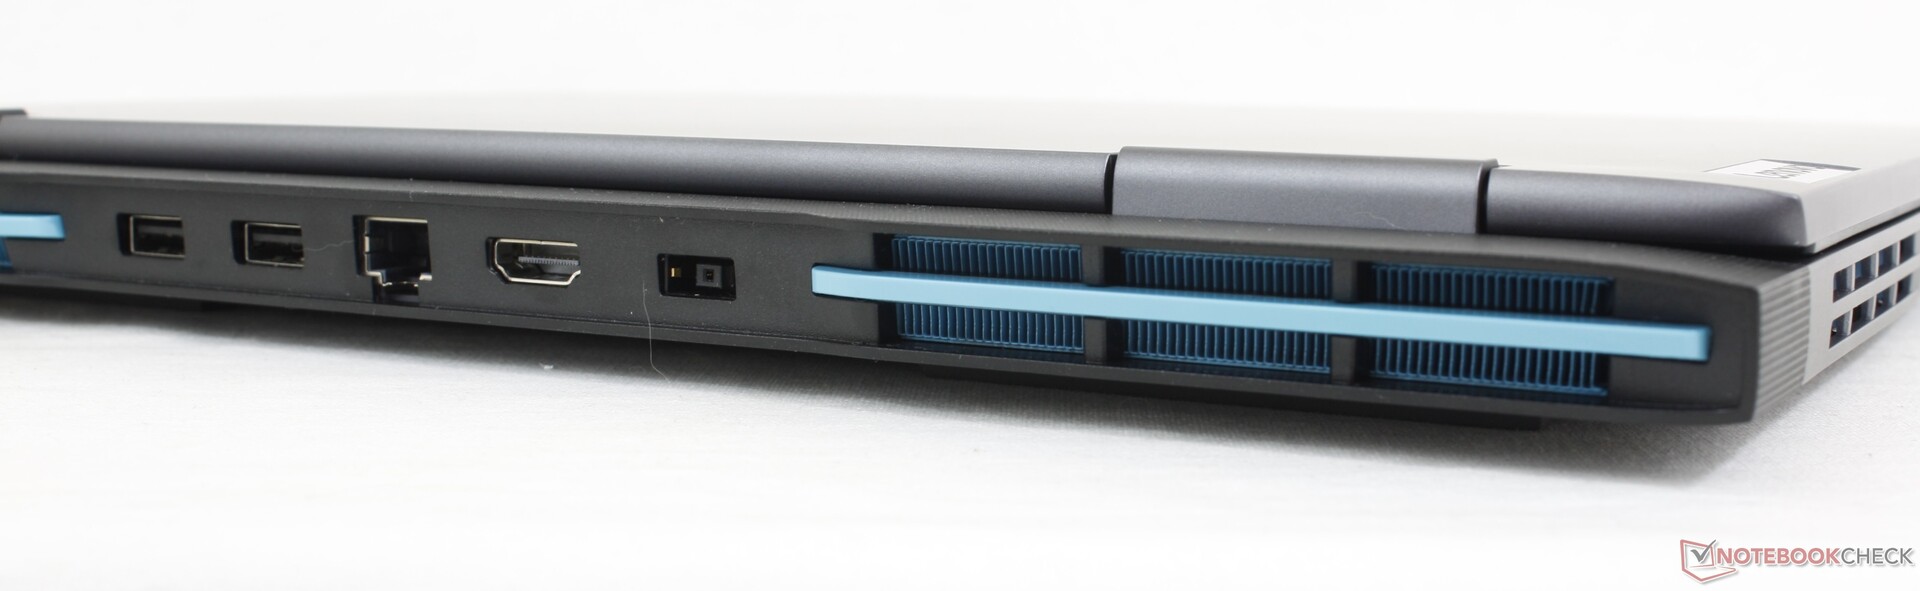
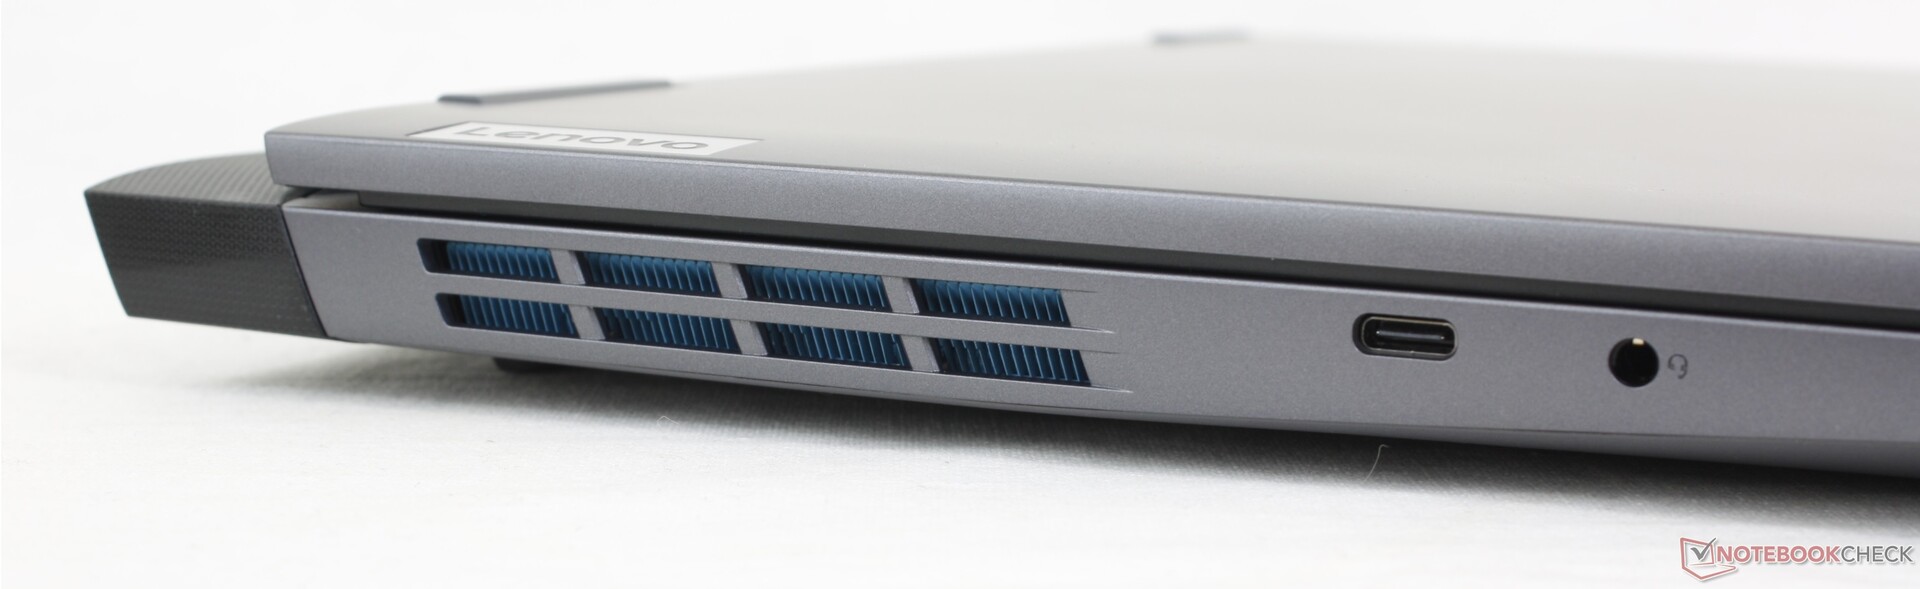
连接性 - 无 USB4 或 Thunderbolt
端口选项包括去年 IdeaPad Gaming 3 15 的所有端口,外加一个额外的 USB-A 端口。大部分端口都位于机身后部,但这次将单个 USB-C 端口移到了左侧边缘,以方便用户使用。
交流
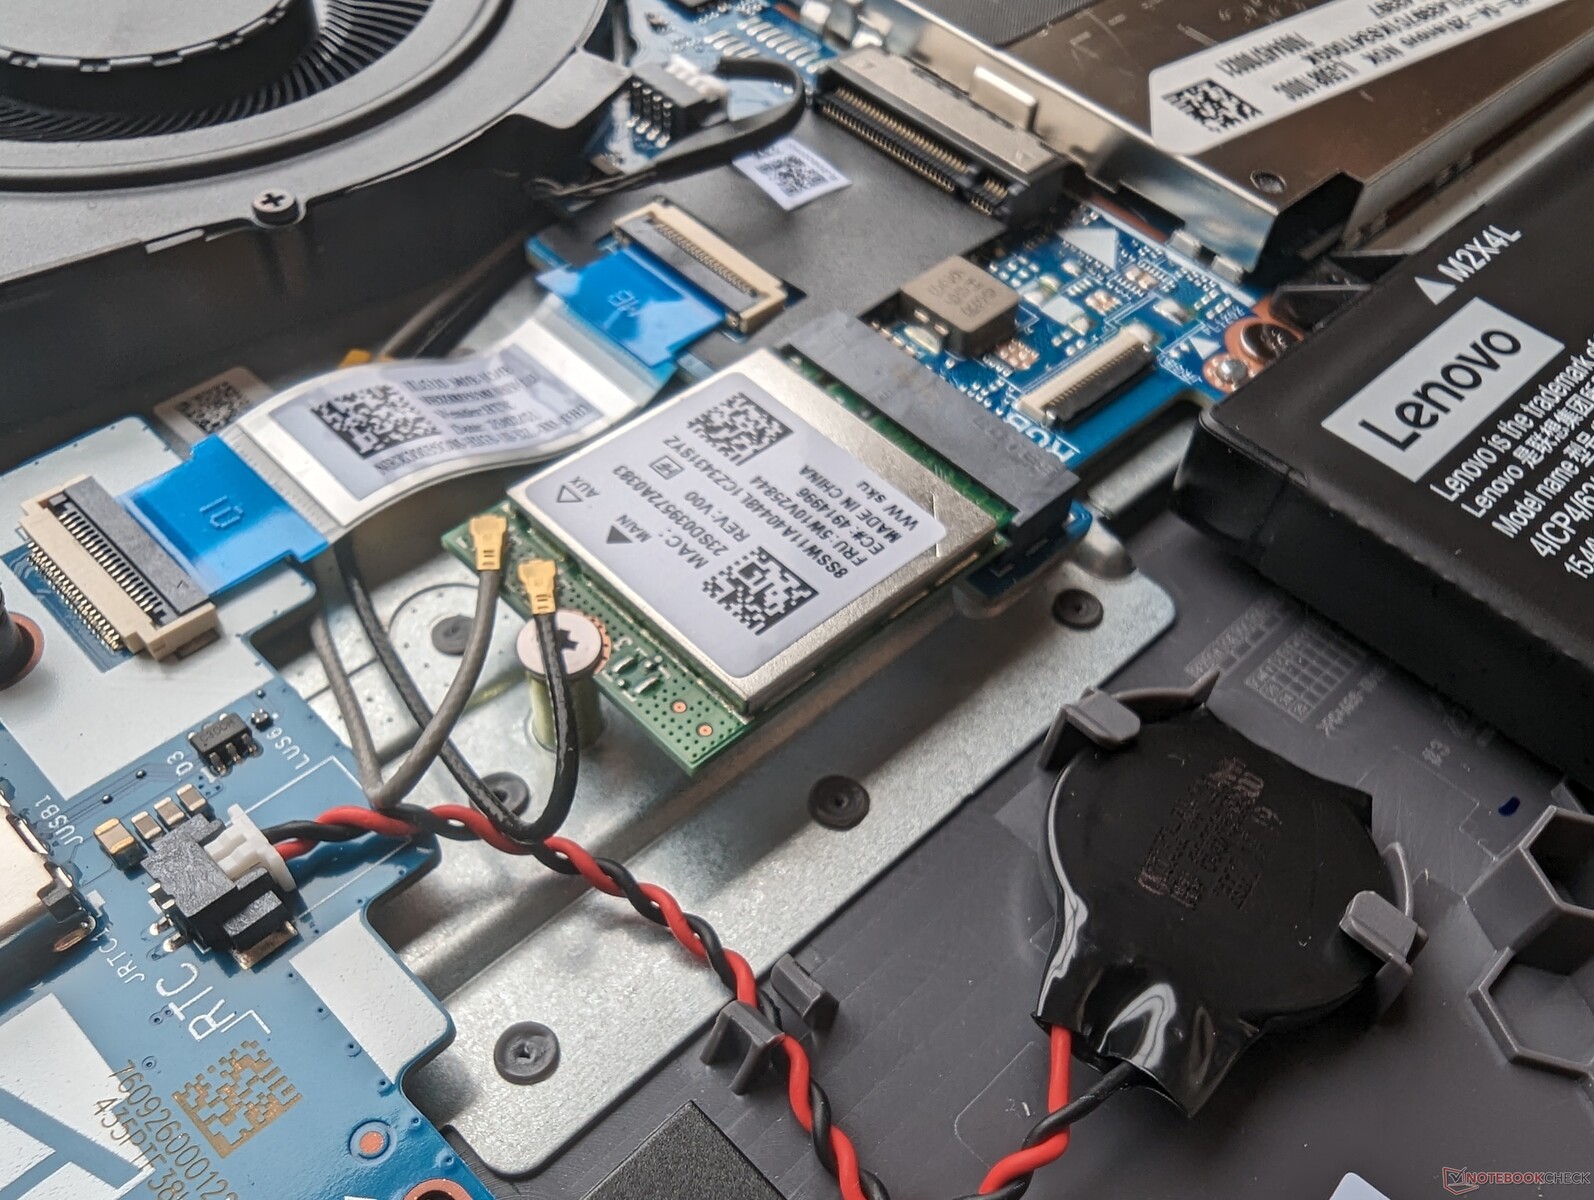
Realtek RTL8852BE 提供 Wi-Fi 6 和蓝牙 5.1 连接,但不支持 Wi-Fi 6E 或 6 GHz,这可能是为了节省成本。不过,与华硕 AXE11000 测试路由器配对后,传输速率稳定可靠。
| Networking | |
| iperf3 transmit AXE11000 | |
| MSI Cyborg 15 A12VF | |
| Dell G15 5530 | |
| Lenovo Legion 5 15IAH7H 82RB | |
| Asus TUF A15 FA507 | |
| Lenovo LOQ 15APH8 | |
| HP Victus 15 fa0020nr | |
| iperf3 receive AXE11000 | |
| MSI Cyborg 15 A12VF | |
| Dell G15 5530 | |
| Lenovo Legion 5 15IAH7H 82RB | |
| Asus TUF A15 FA507 | |
| HP Victus 15 fa0020nr | |
| Lenovo LOQ 15APH8 | |
| iperf3 transmit AXE11000 6GHz | |
| Lenovo Legion 5 15IAH7H 82RB | |
| iperf3 receive AXE11000 6GHz | |
| Lenovo Legion 5 15IAH7H 82RB | |
网络摄像头
200 万像素网络摄像头是旧版Legion 5 15 或 IdeaPad Gaming 15 系列 100 万像素网络摄像头的升级版。该机还配备了摄像头锁定开关,但红外摄像头却不见踪影。


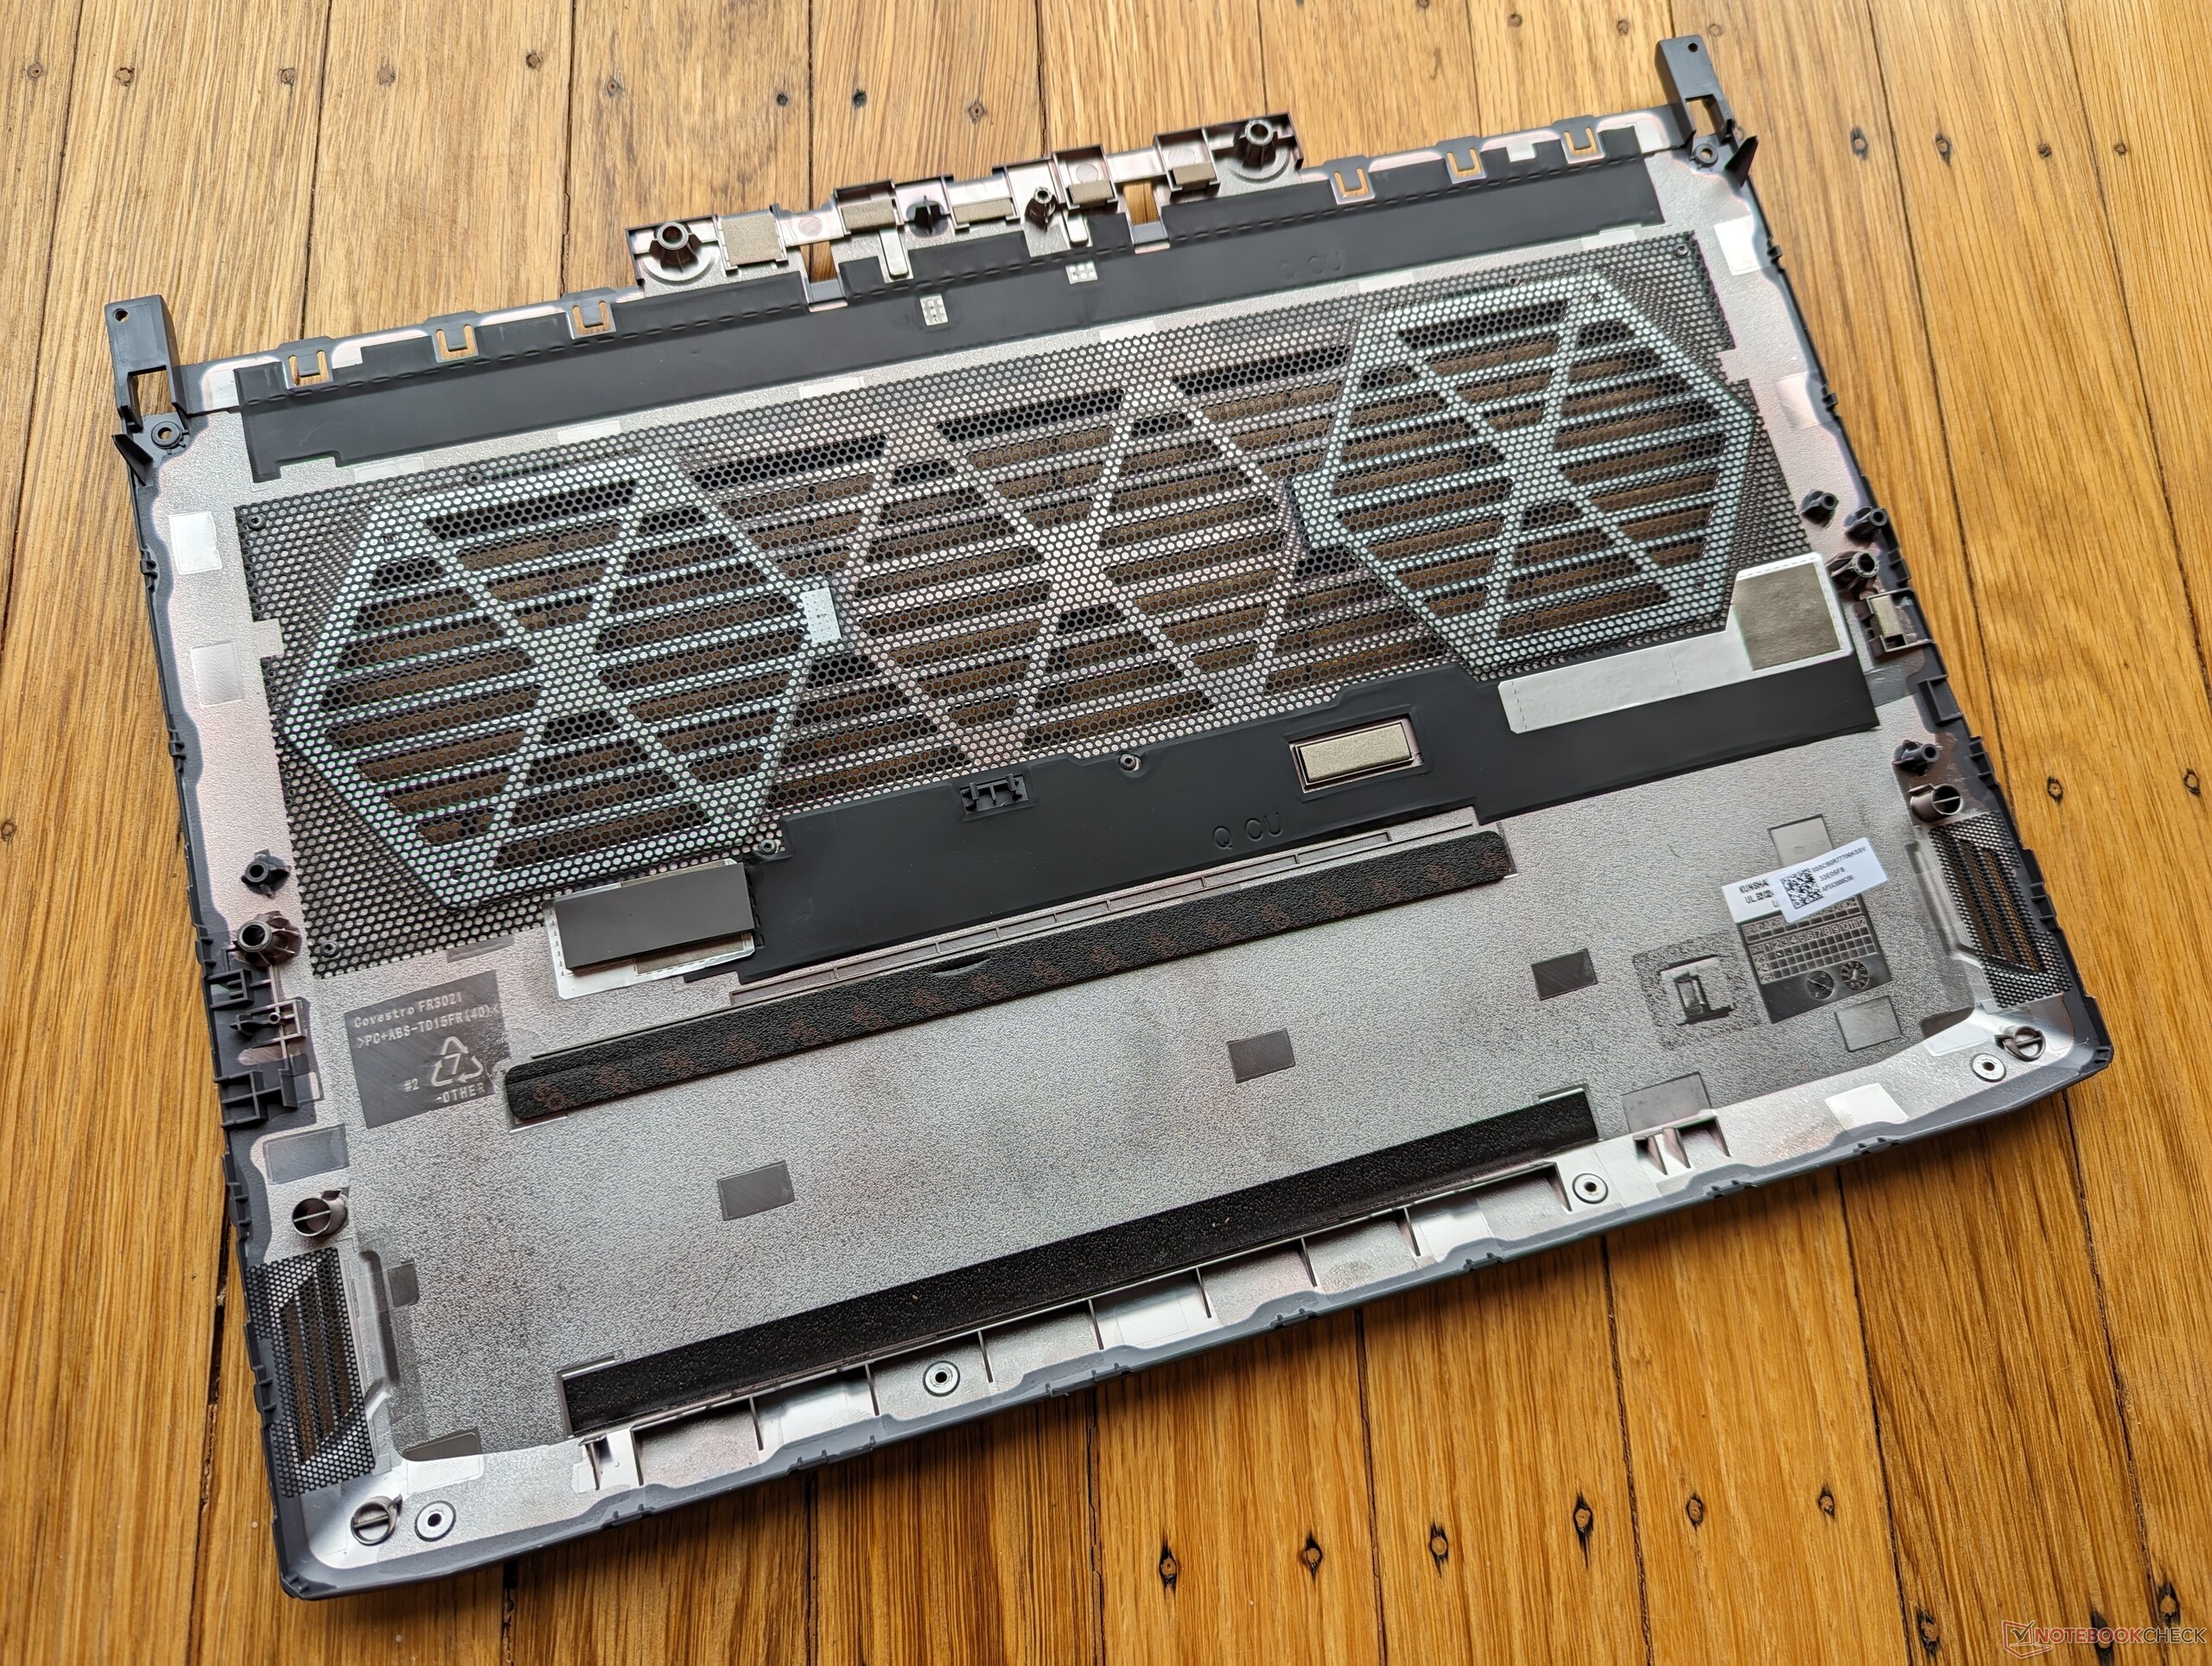
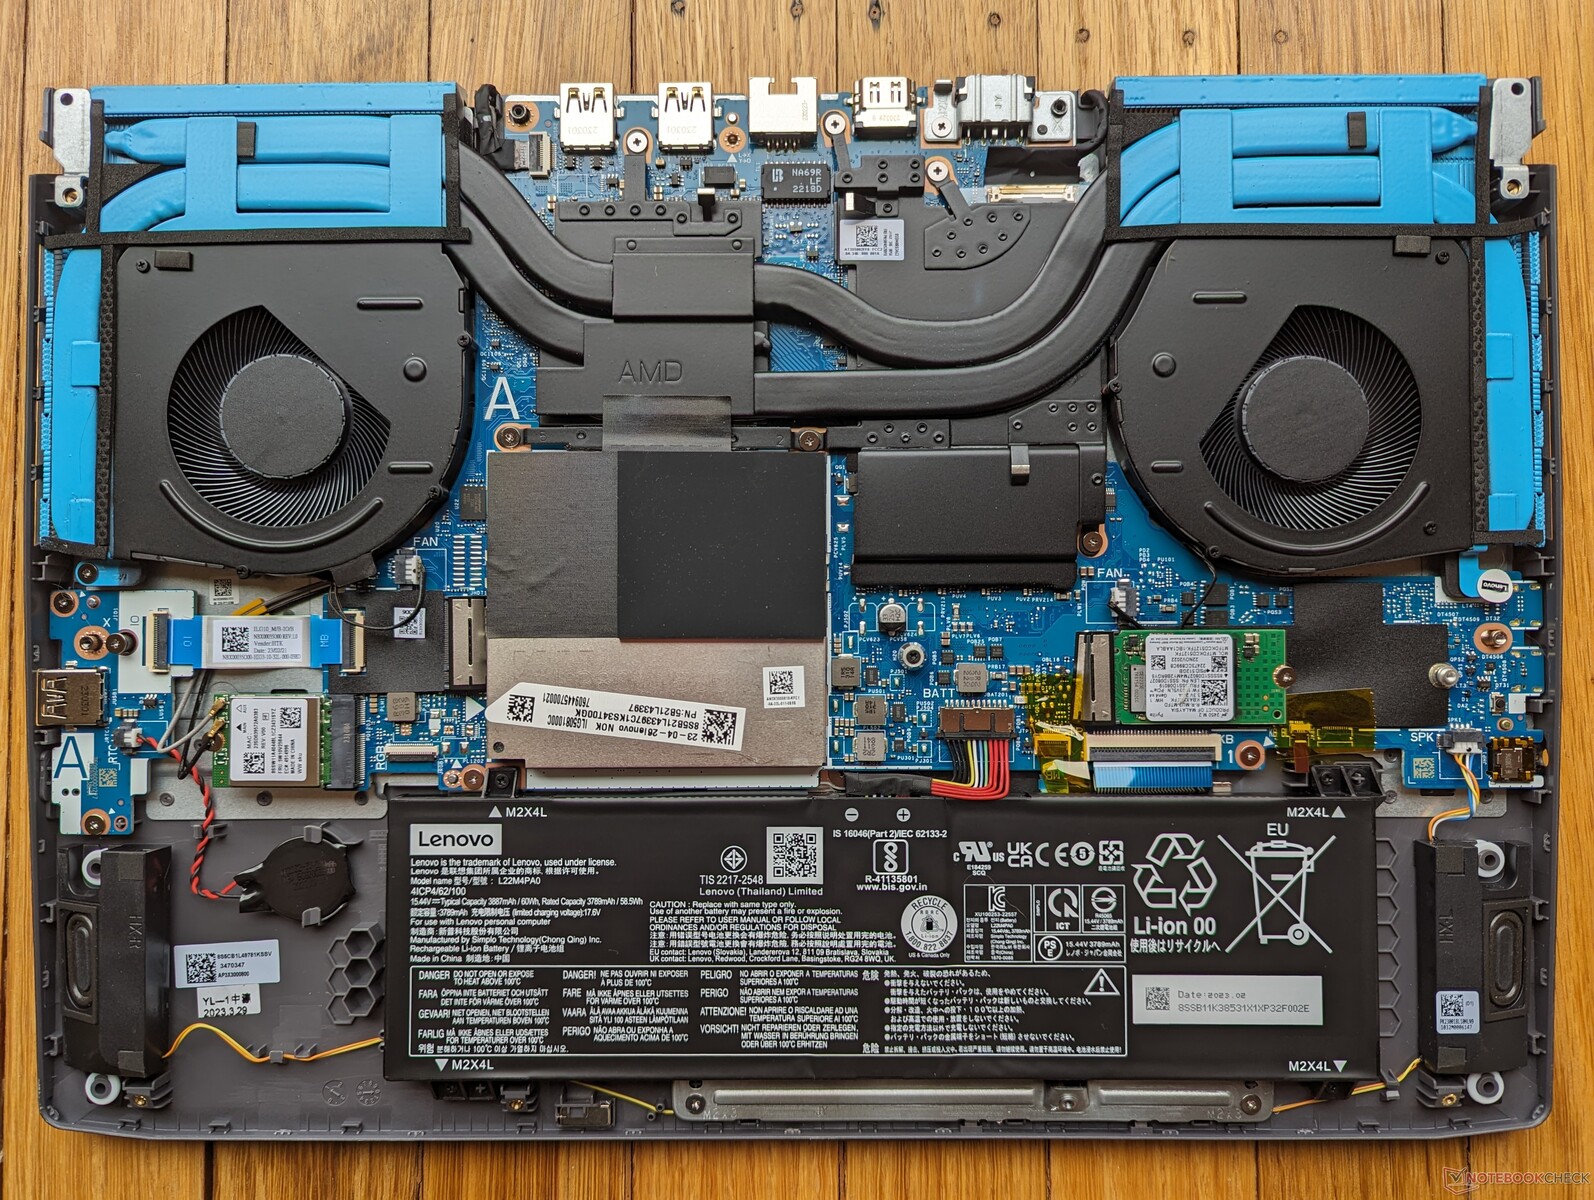
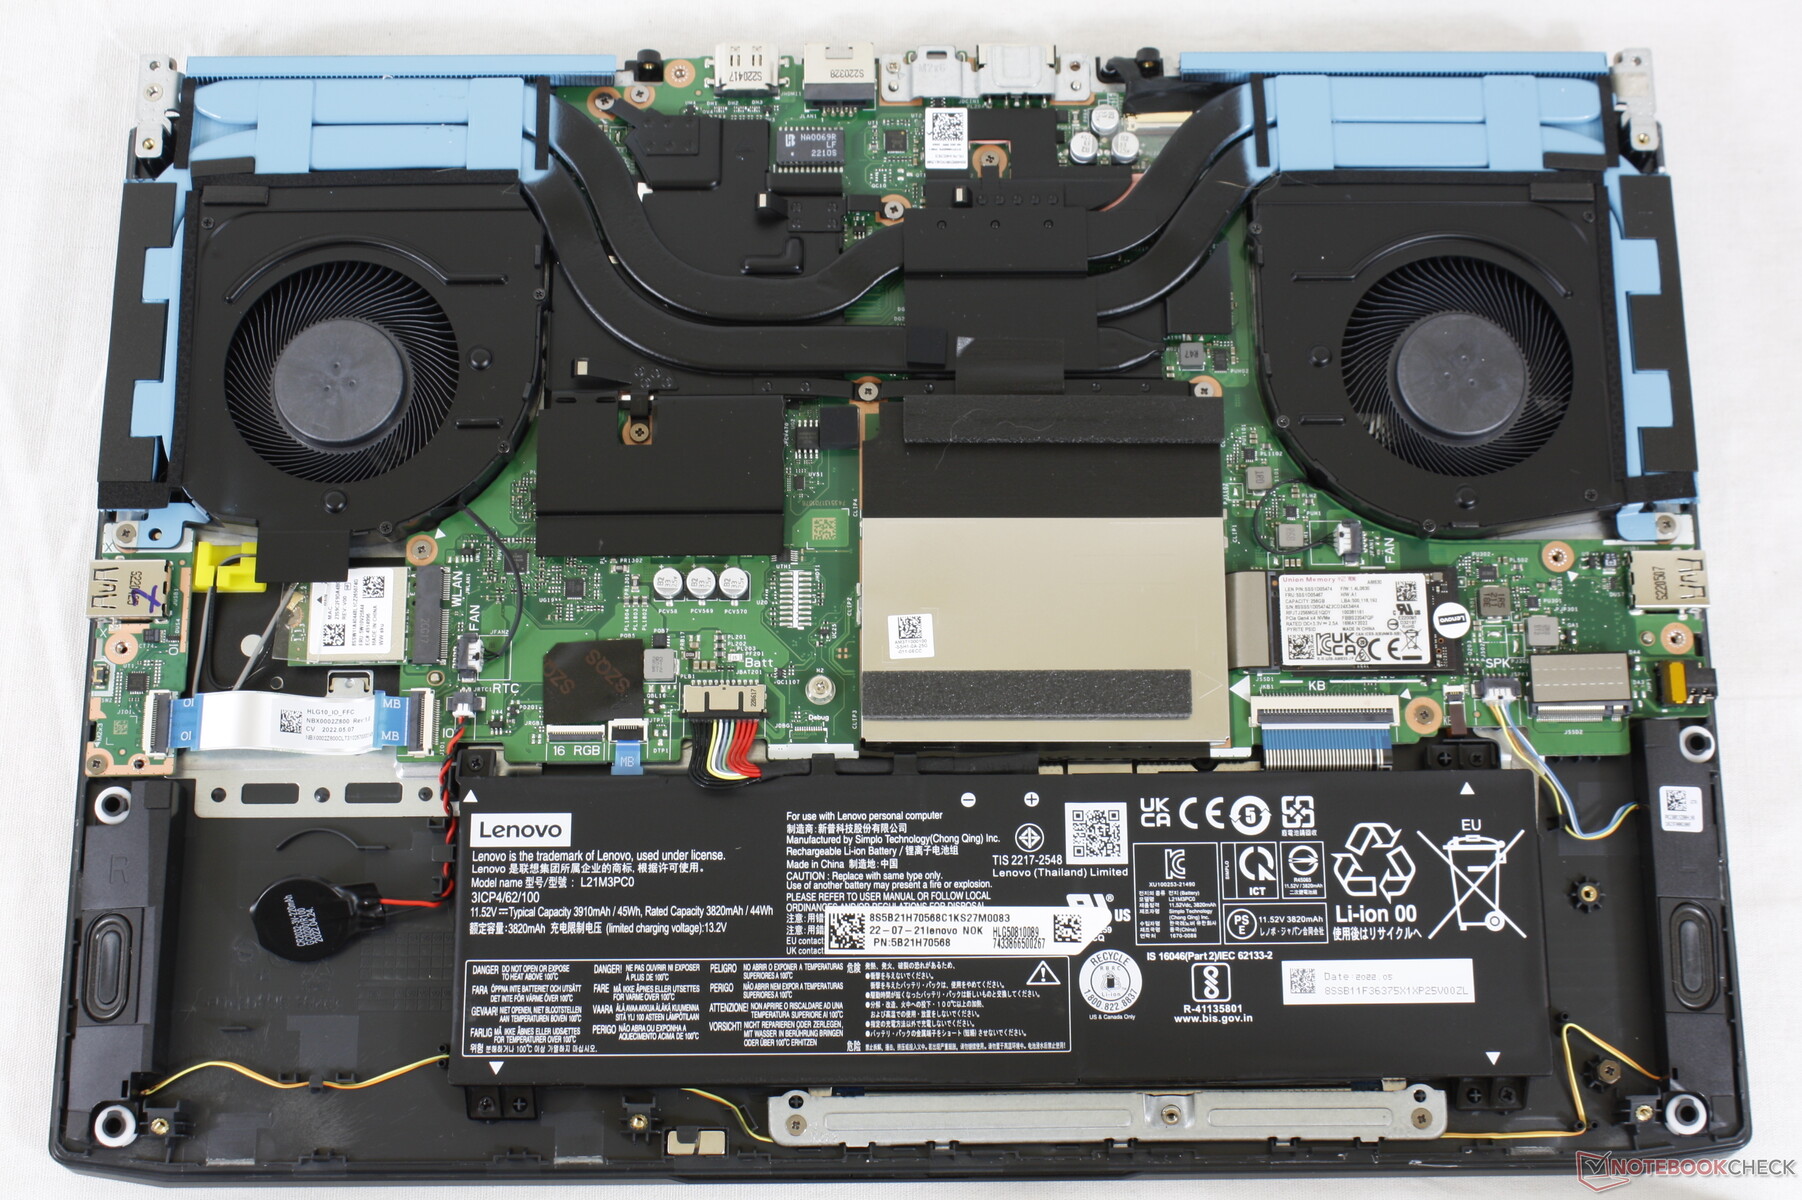
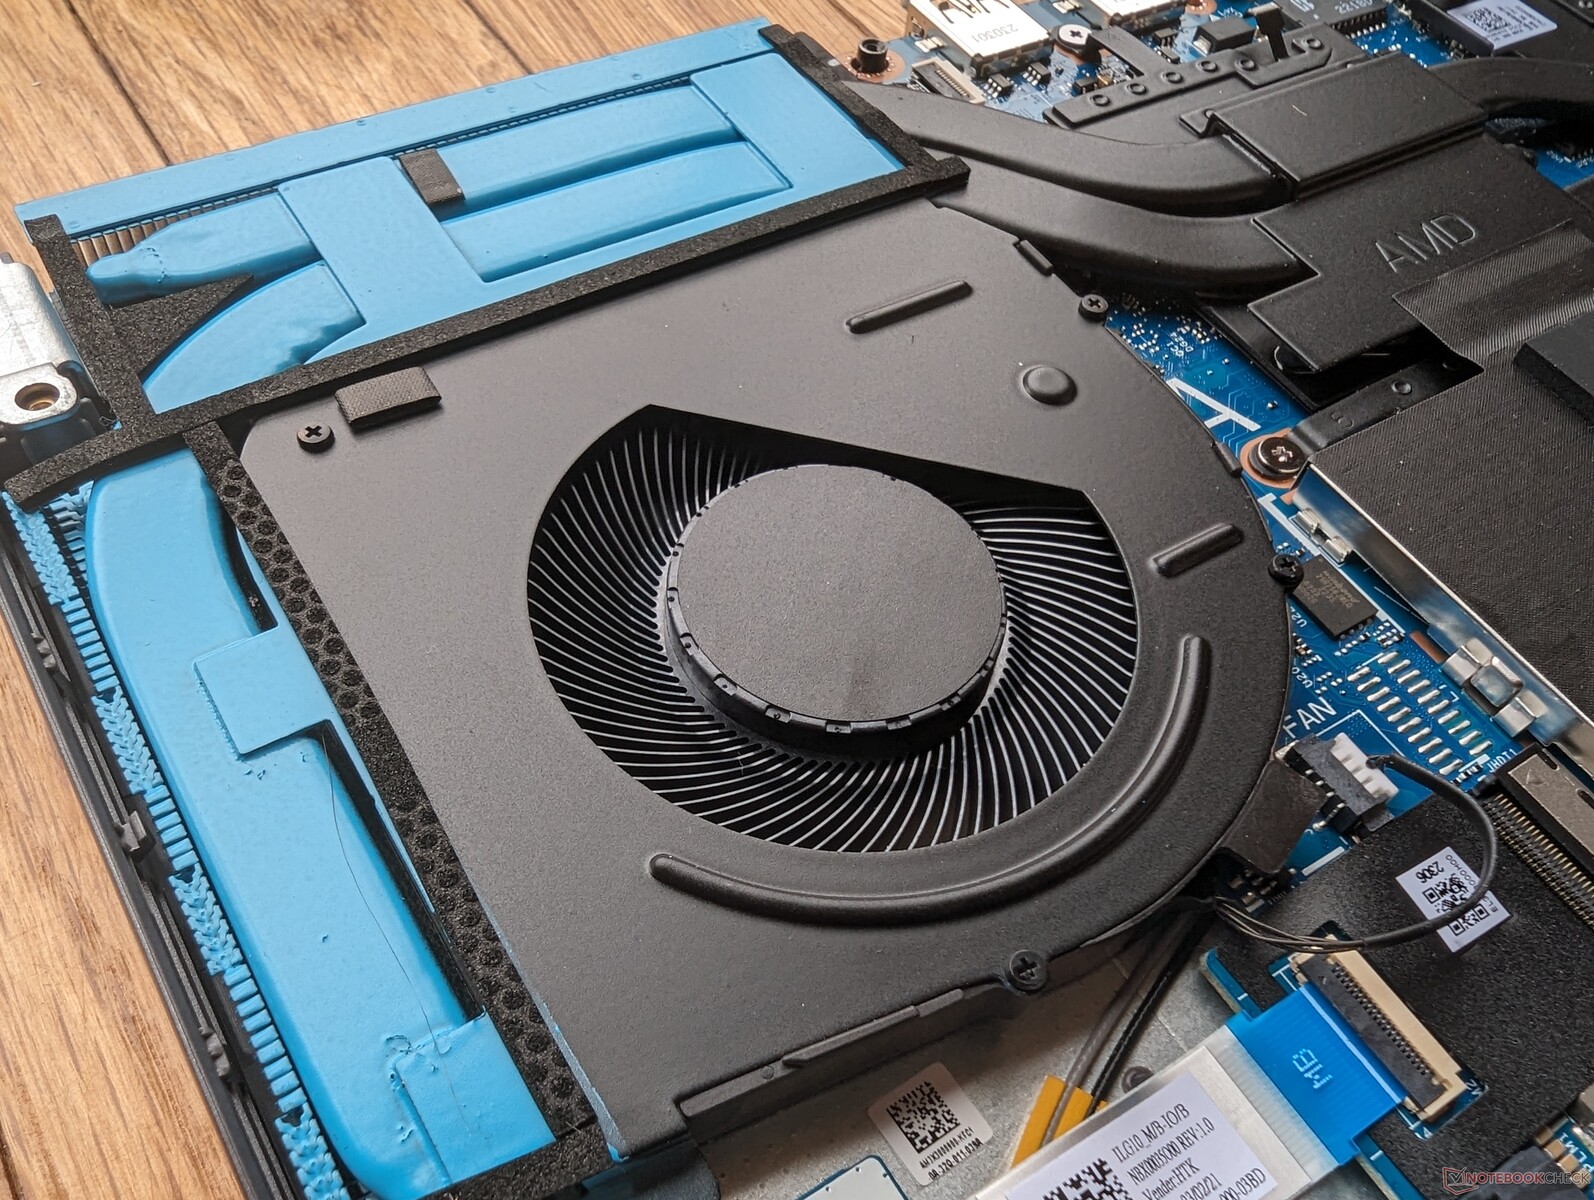
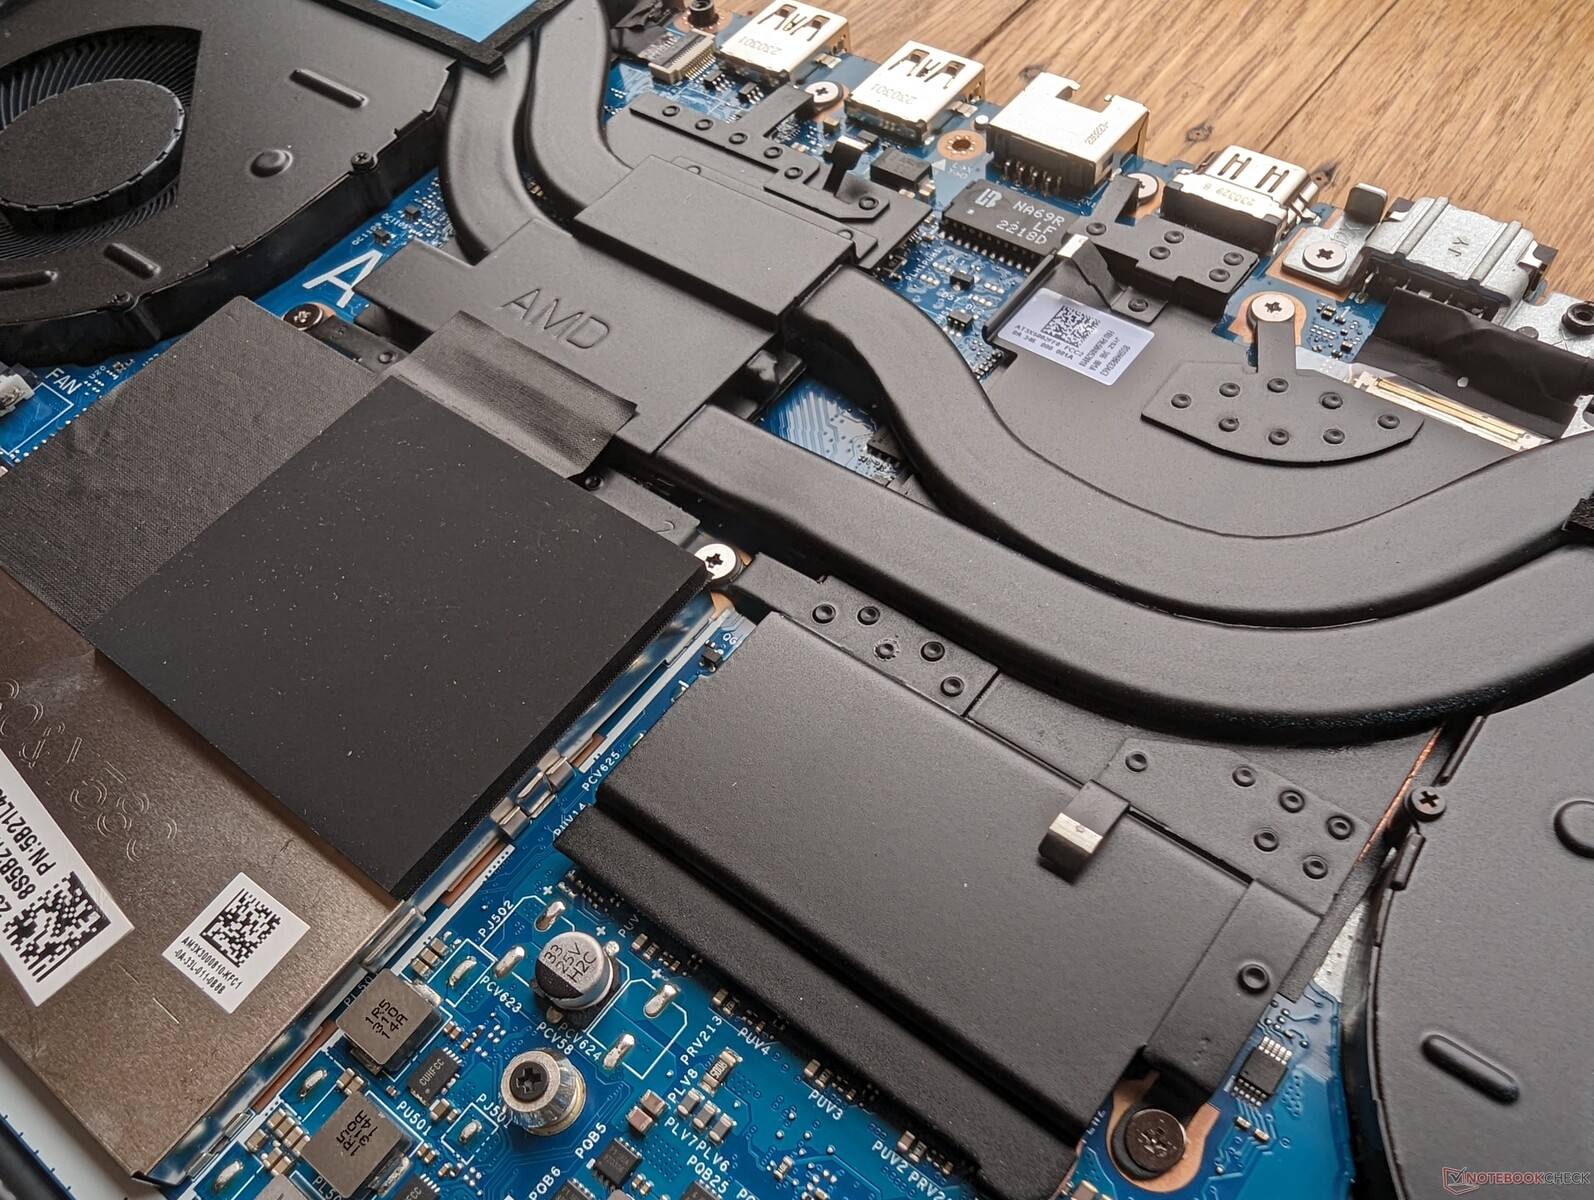
维护
与大多数其他游戏笔记本电脑相比,最终用户升级需要花费更多精力,因为必须先卸下机箱后部,然后才能卸下底板。底部和后部共用 13 颗十字螺丝固定。
配件和保修
包装盒内除了交流适配器和文件外没有其他附件。如果在美国购买,将享受制造商提供的一年有限保修服务。
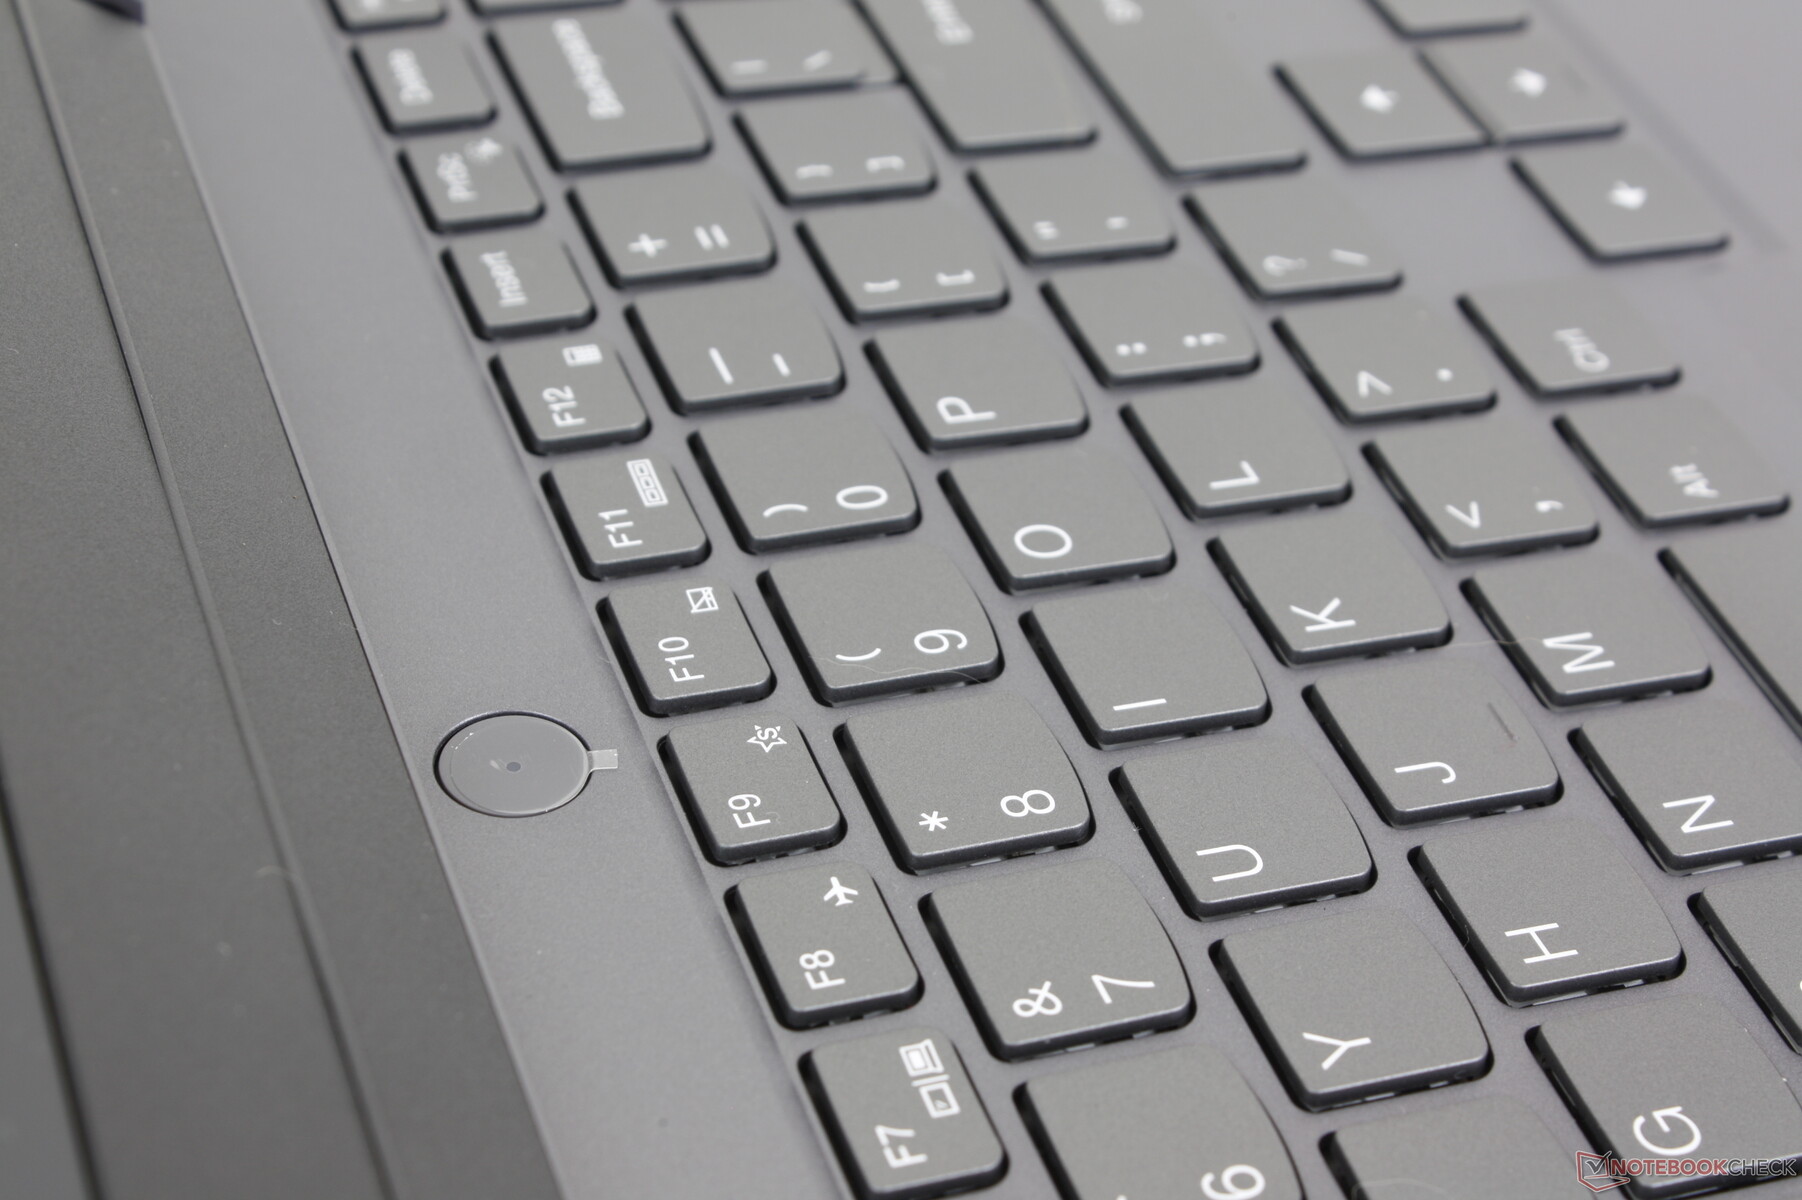
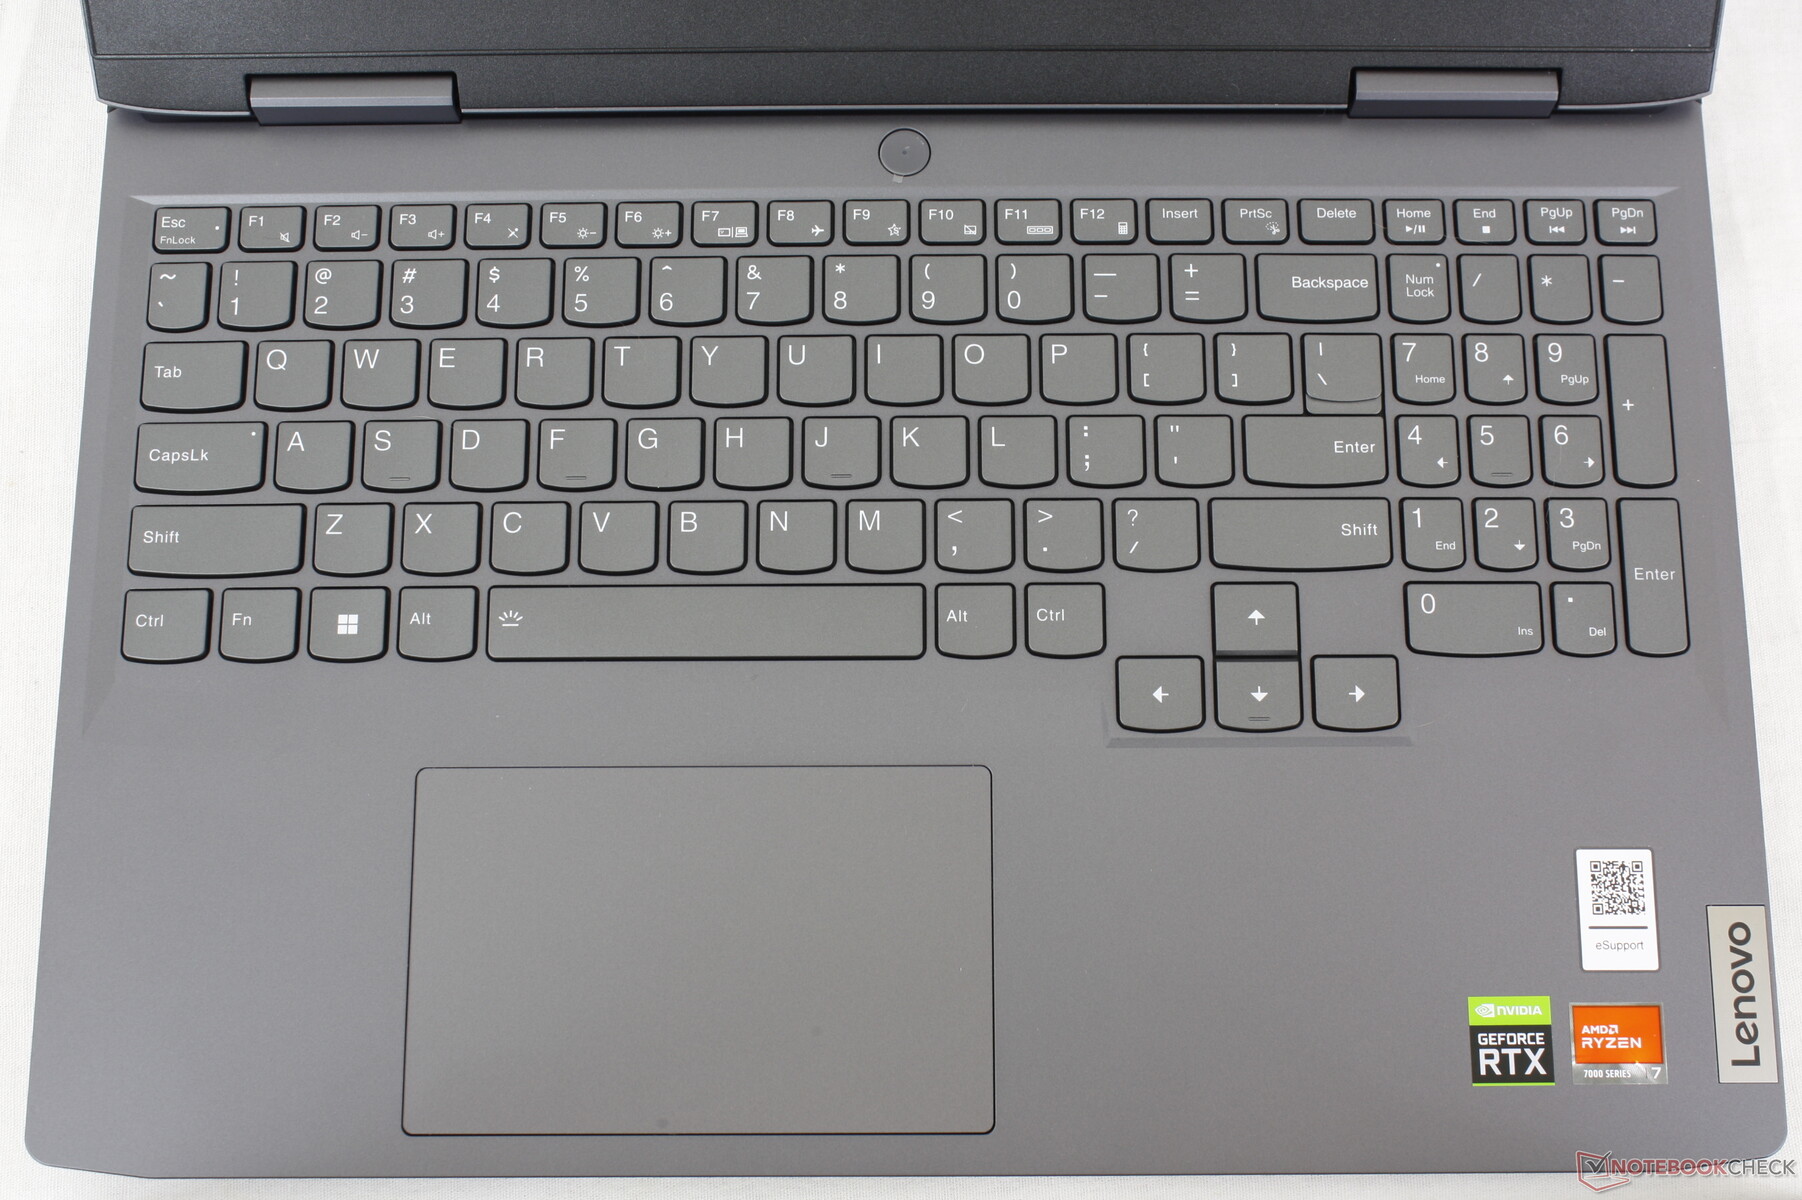
输入设备 - 非常像 IdeaPad
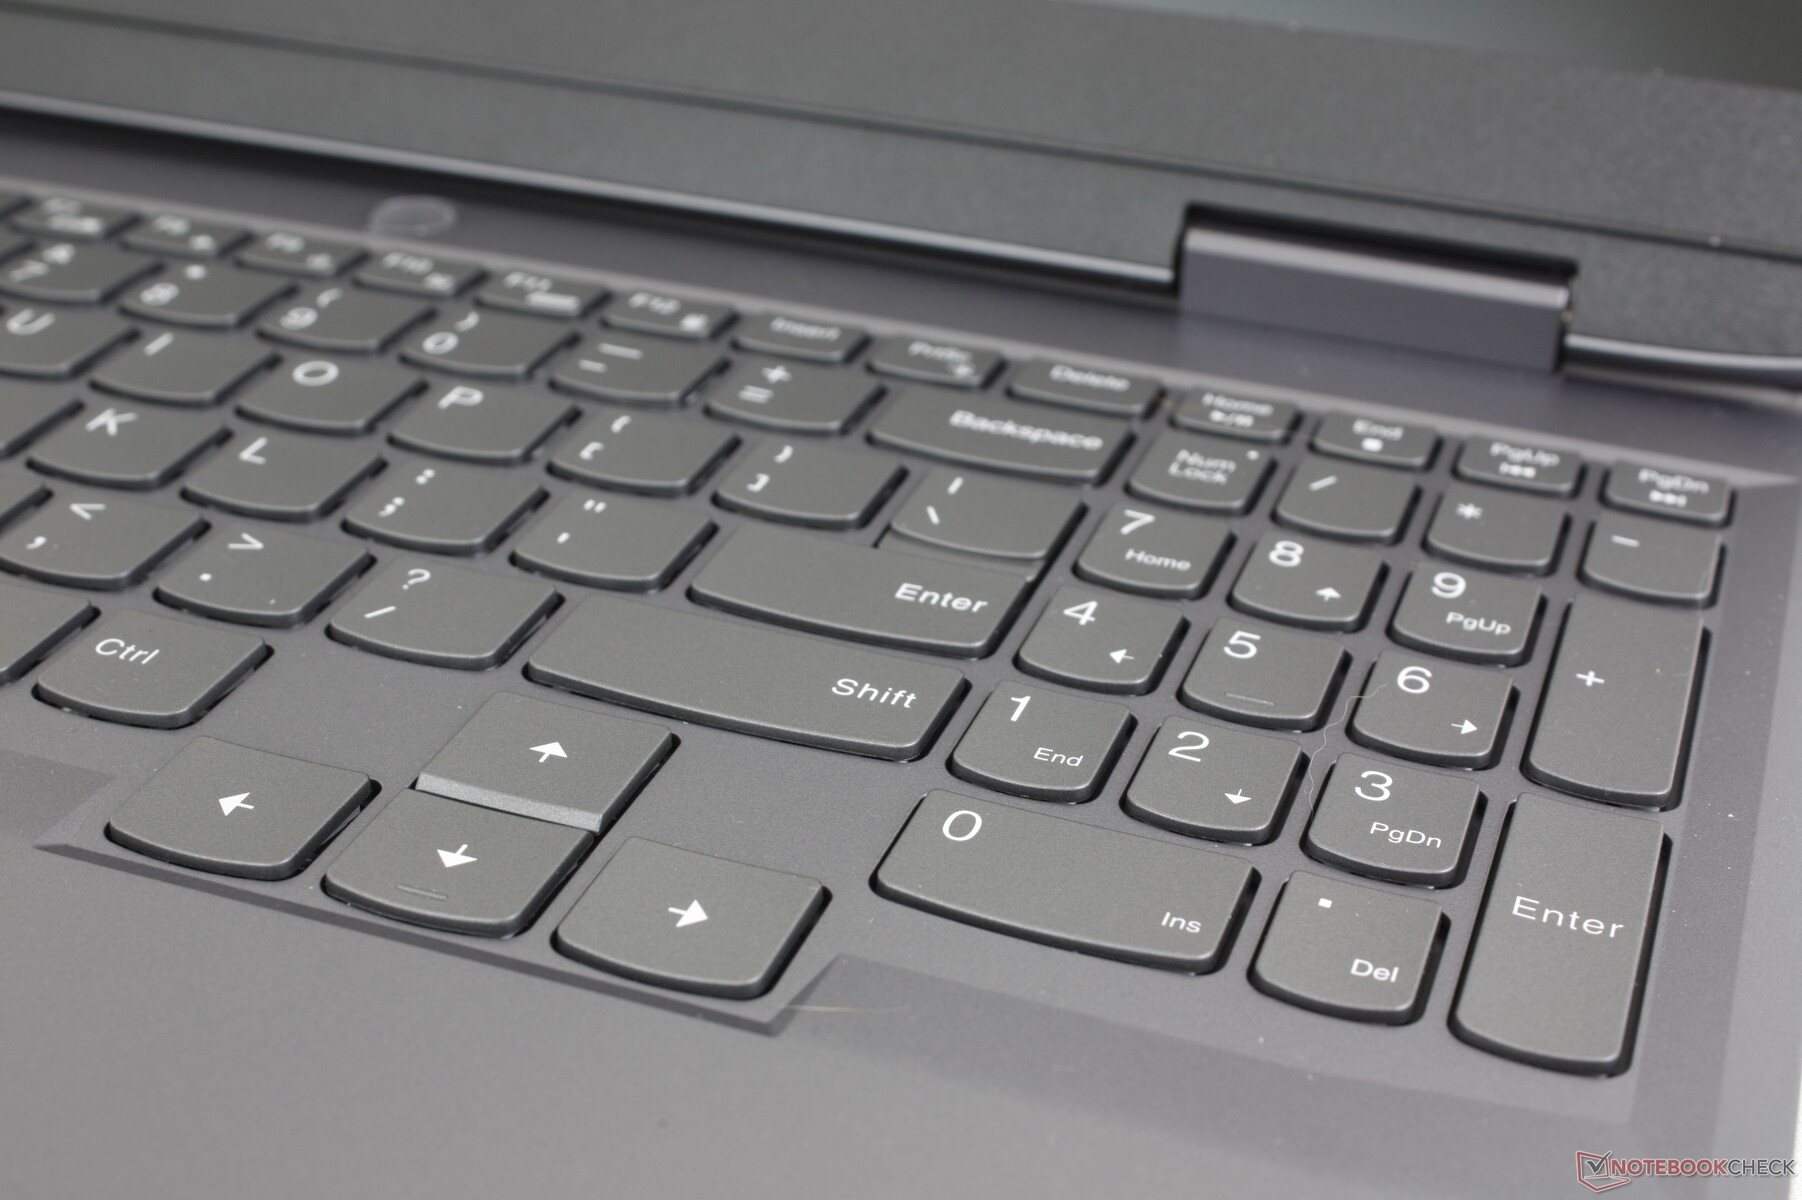
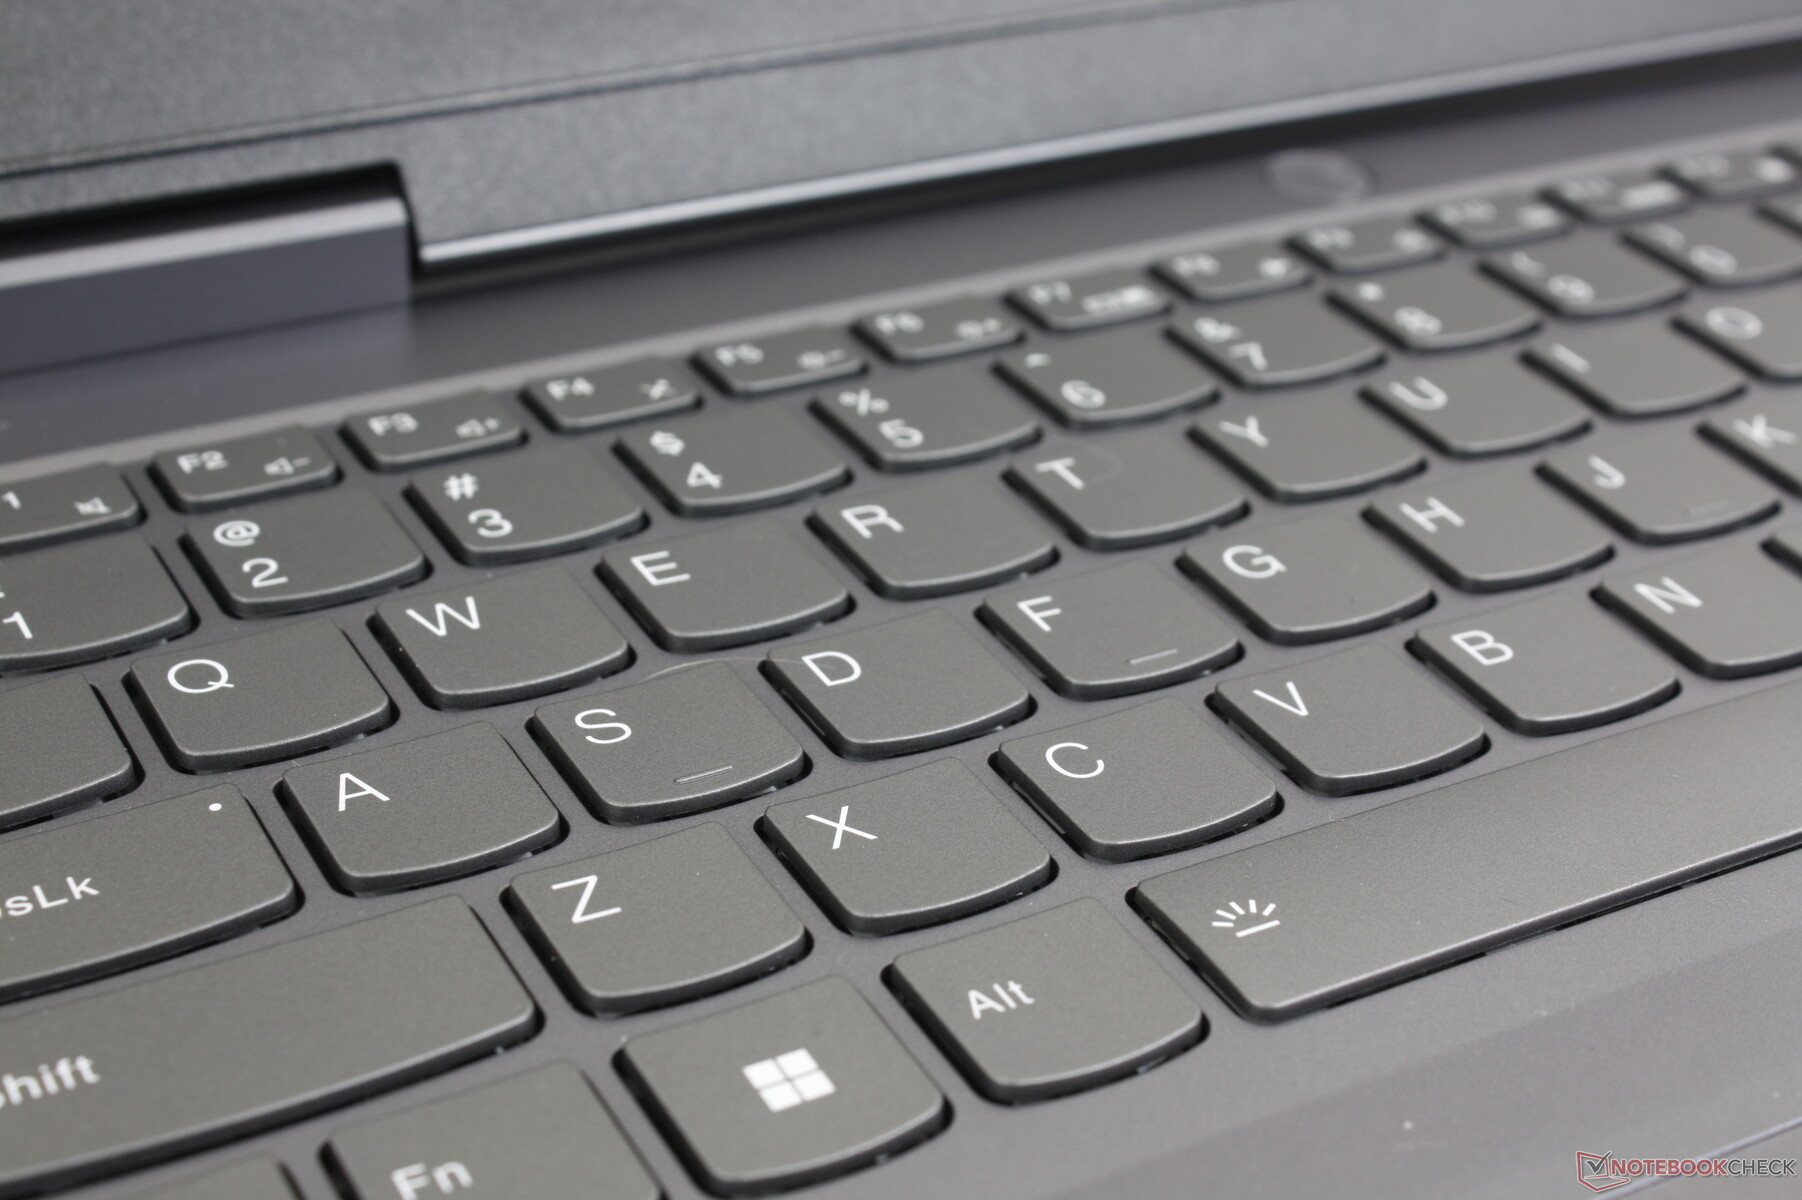
键盘
键盘与 IdeaPad Gaming 3 15的键盘完全相同。如果你过去曾在 IdeaPad 或 Yoga 笔记本电脑上打字,那么 LOQ 15 上的键盘会给你一种即刻熟悉的感觉。主观感觉上,LOQ 15 的按键比通常的键盘更坚硬、更有冲击力,与廉价的 华硕 VivoBook或惠普Pavilion 15 相比,LOQ 15 的按键感觉要更硬一些,也更有手感。
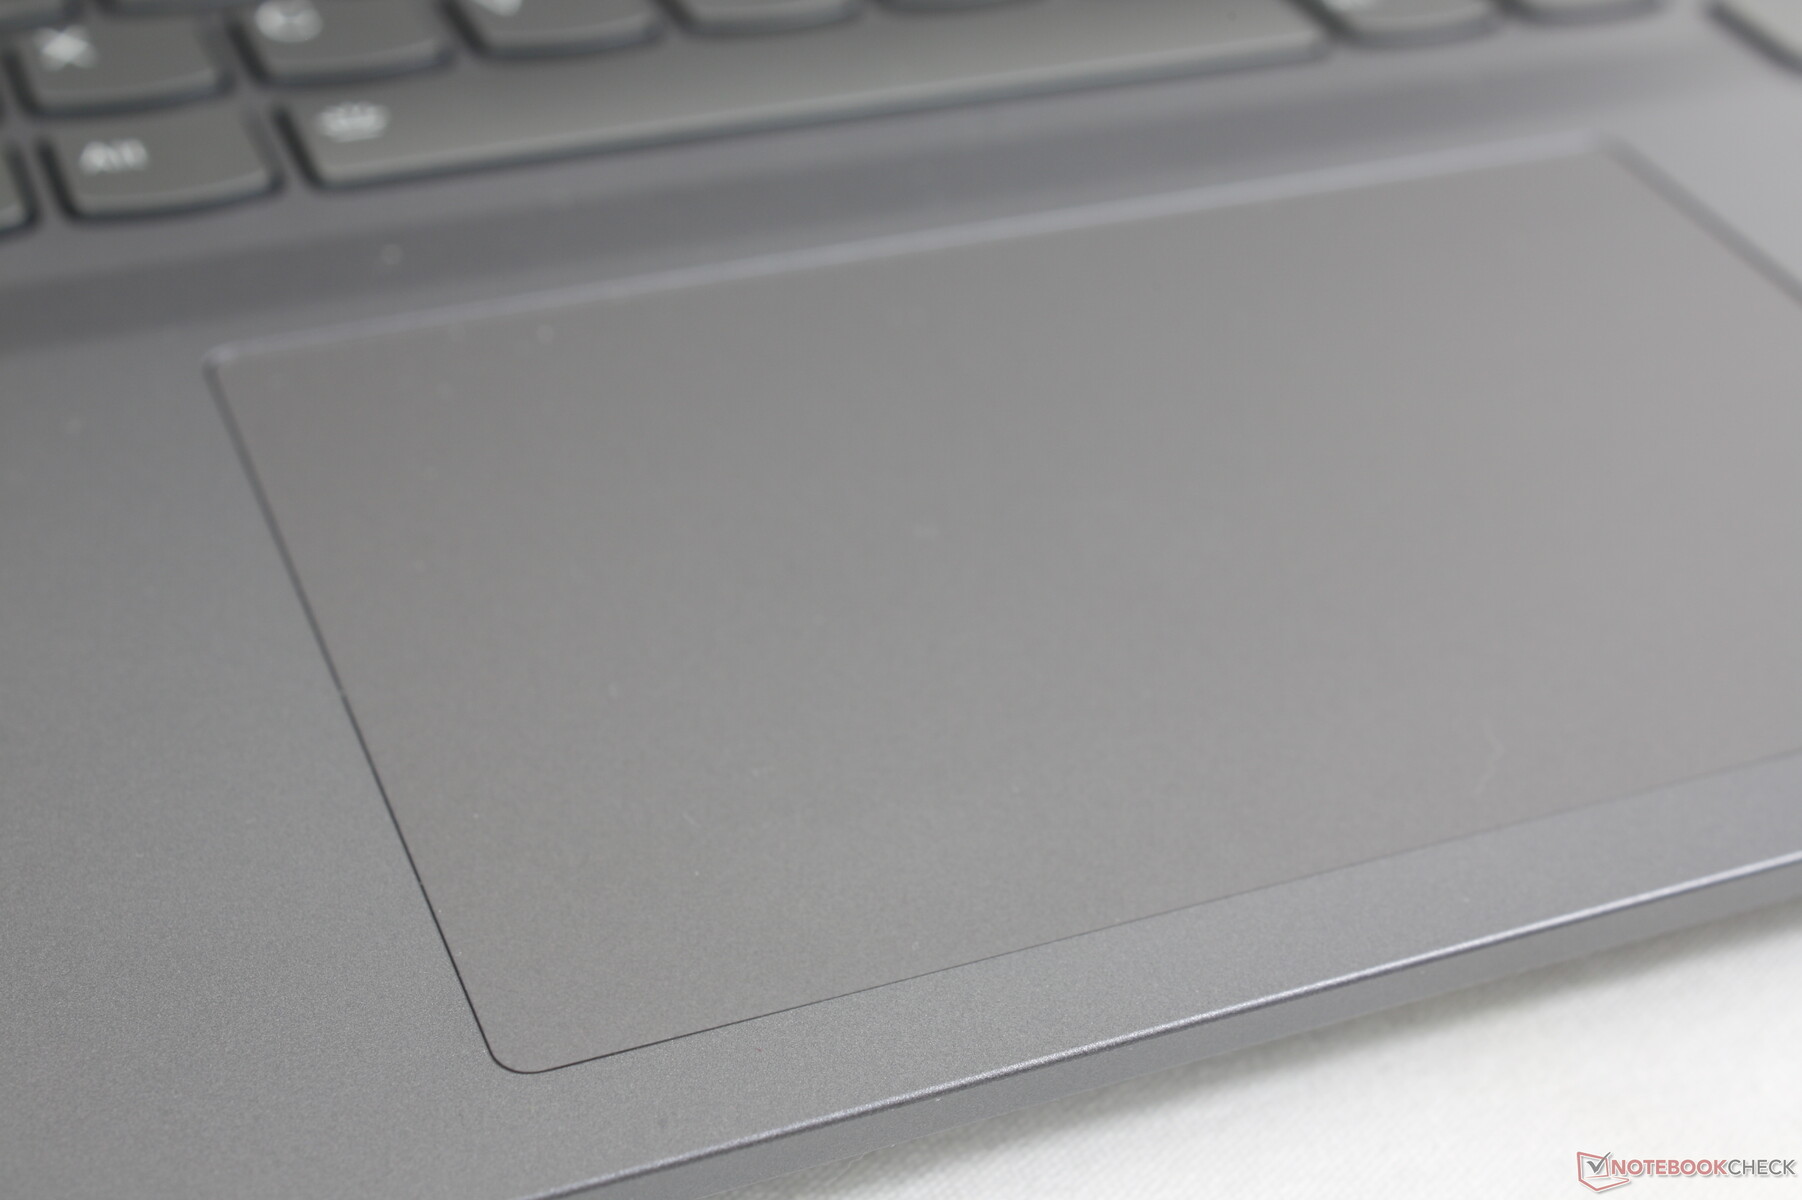
触摸板
点击板比去年 IdeaPad Gaming 3 15 上的点击板略小(12 x 7.5 厘米对 12.5 x 7.5 厘米)。不过,LOQ 15 的触控板比 IdeaPad 上的触控板更坚实、更有弹性,使用起来更令人满意。由于反馈更敏锐,咔哒声明显更大。
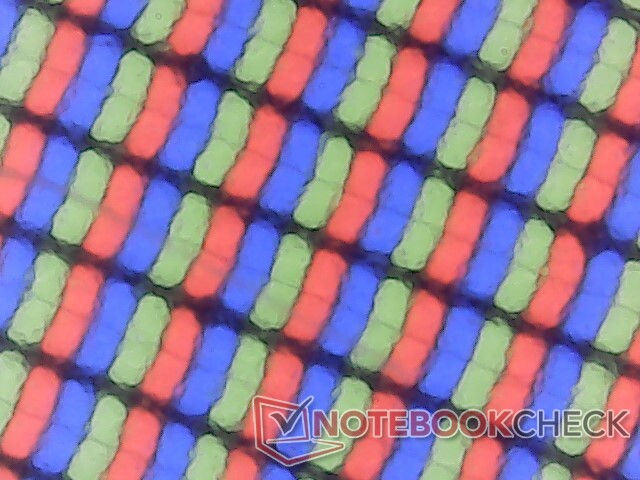
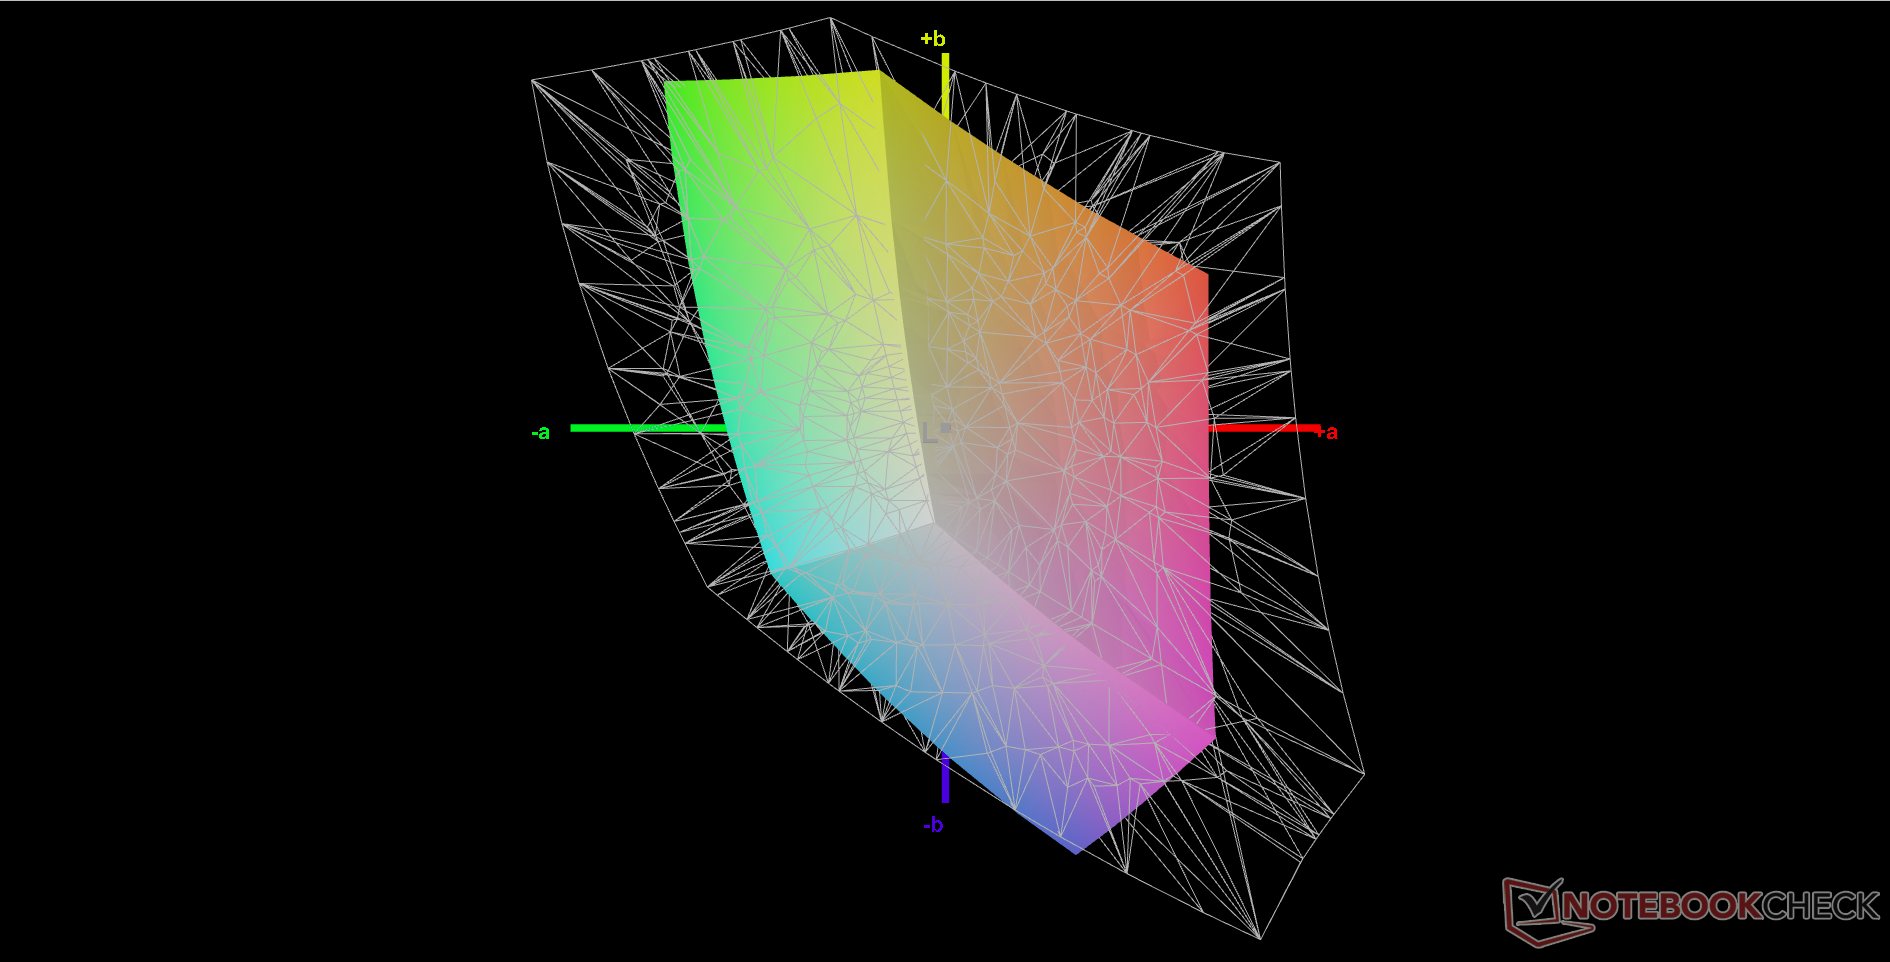
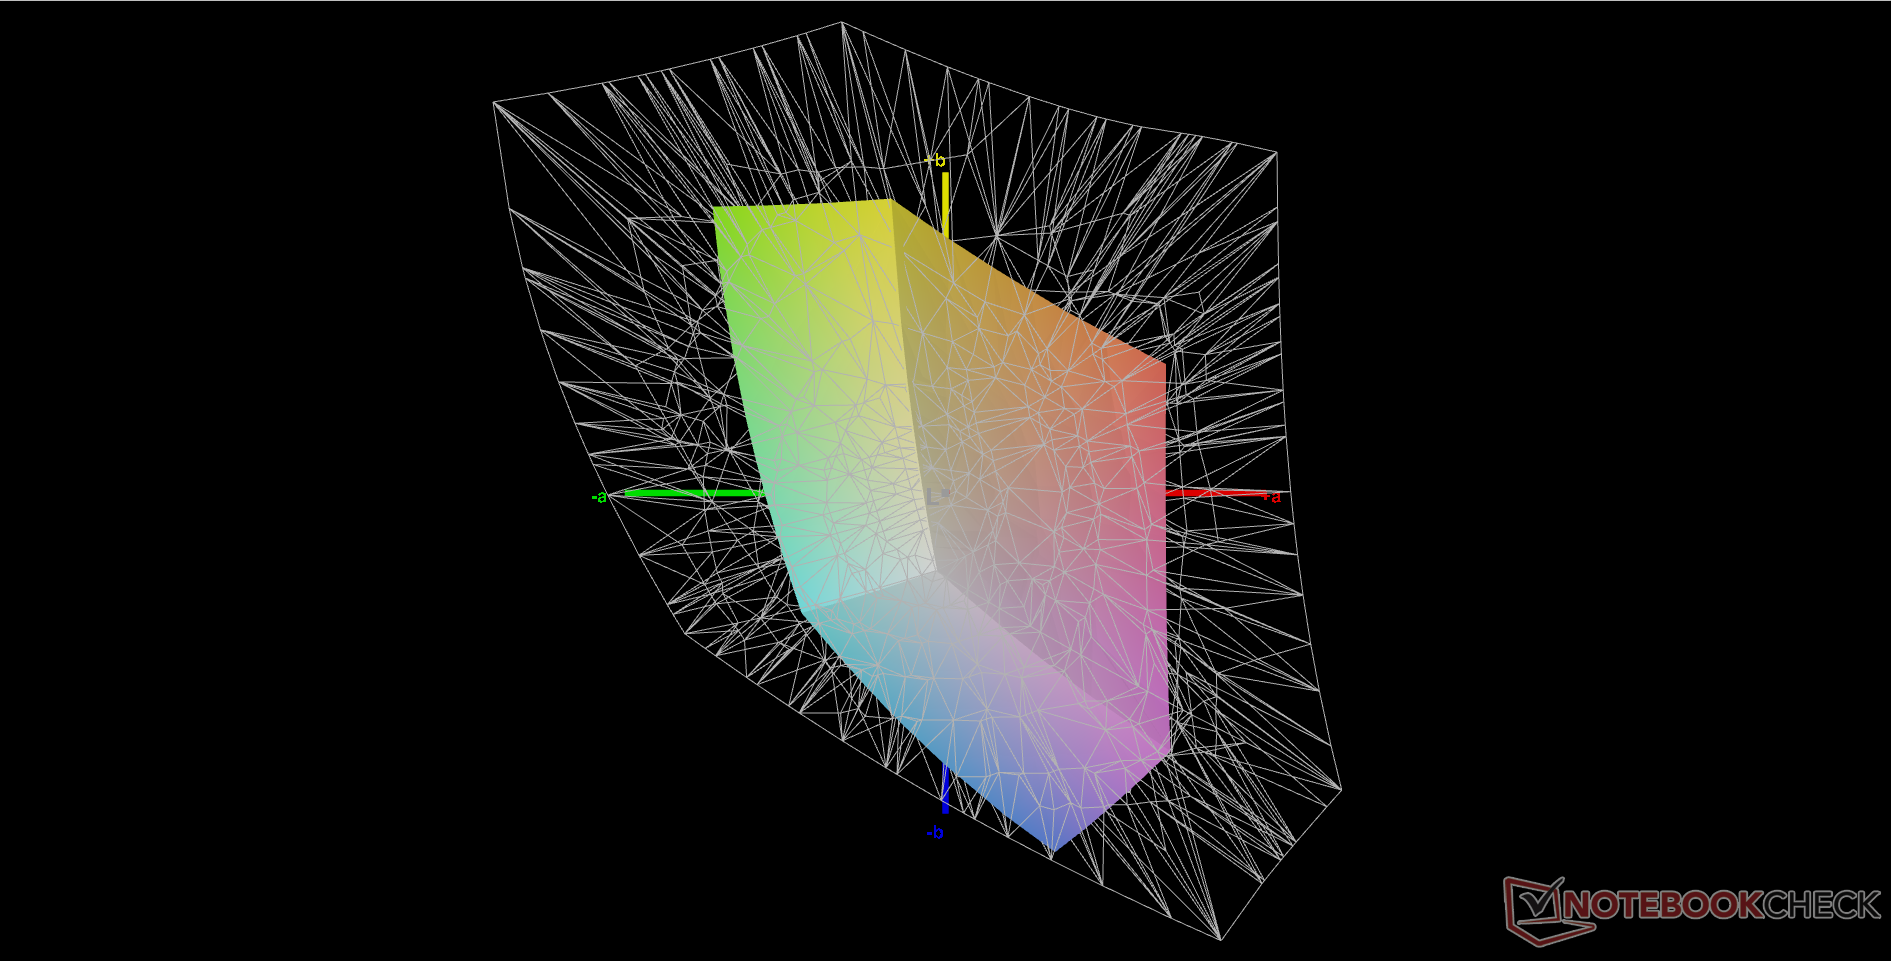
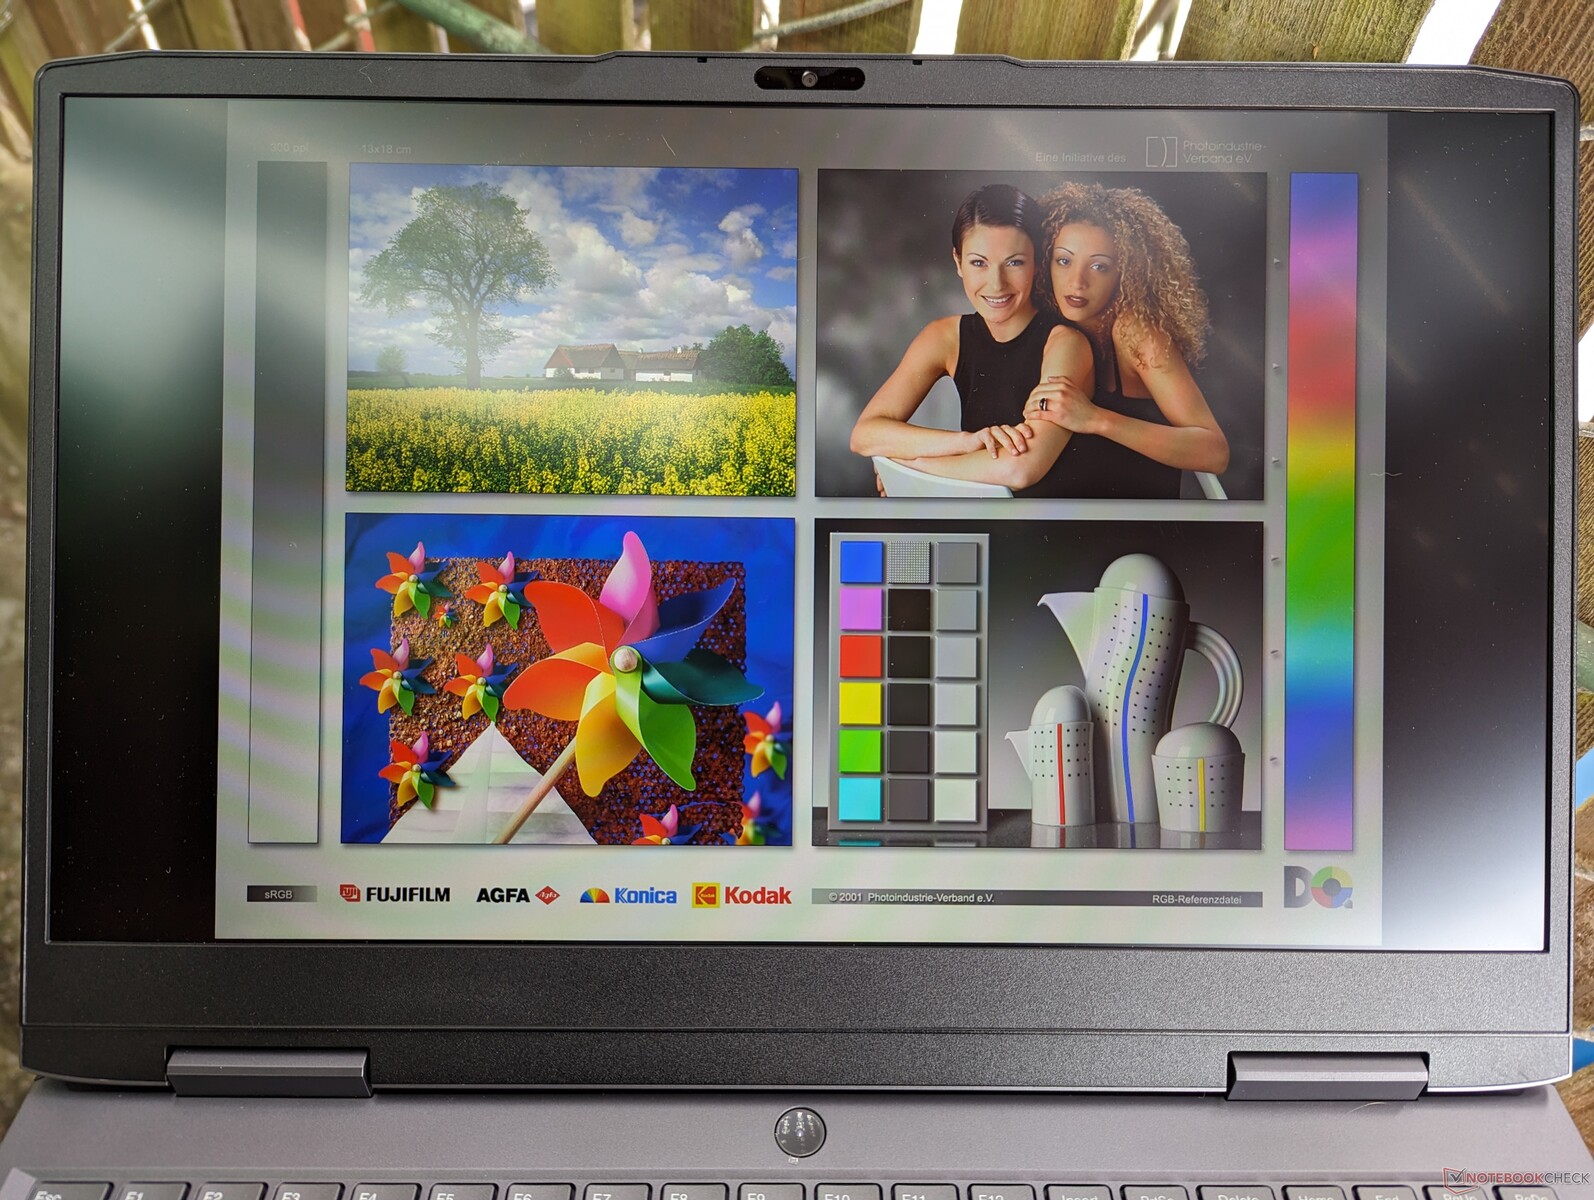
显示屏 - 1080p 与GeForce RTX 4050 搭配得当
有三种显示屏配置可供选择,均为 IPS 面板:
- 1080p、300 尼特、60% sRGB、60 赫兹
- 1080p、350 尼特、60% sRGB、144 赫兹、高级 Optimus、G-Sync
- 1440p、350 尼特、100% sRGB、165 赫兹、高级 Optimus、G-Sync
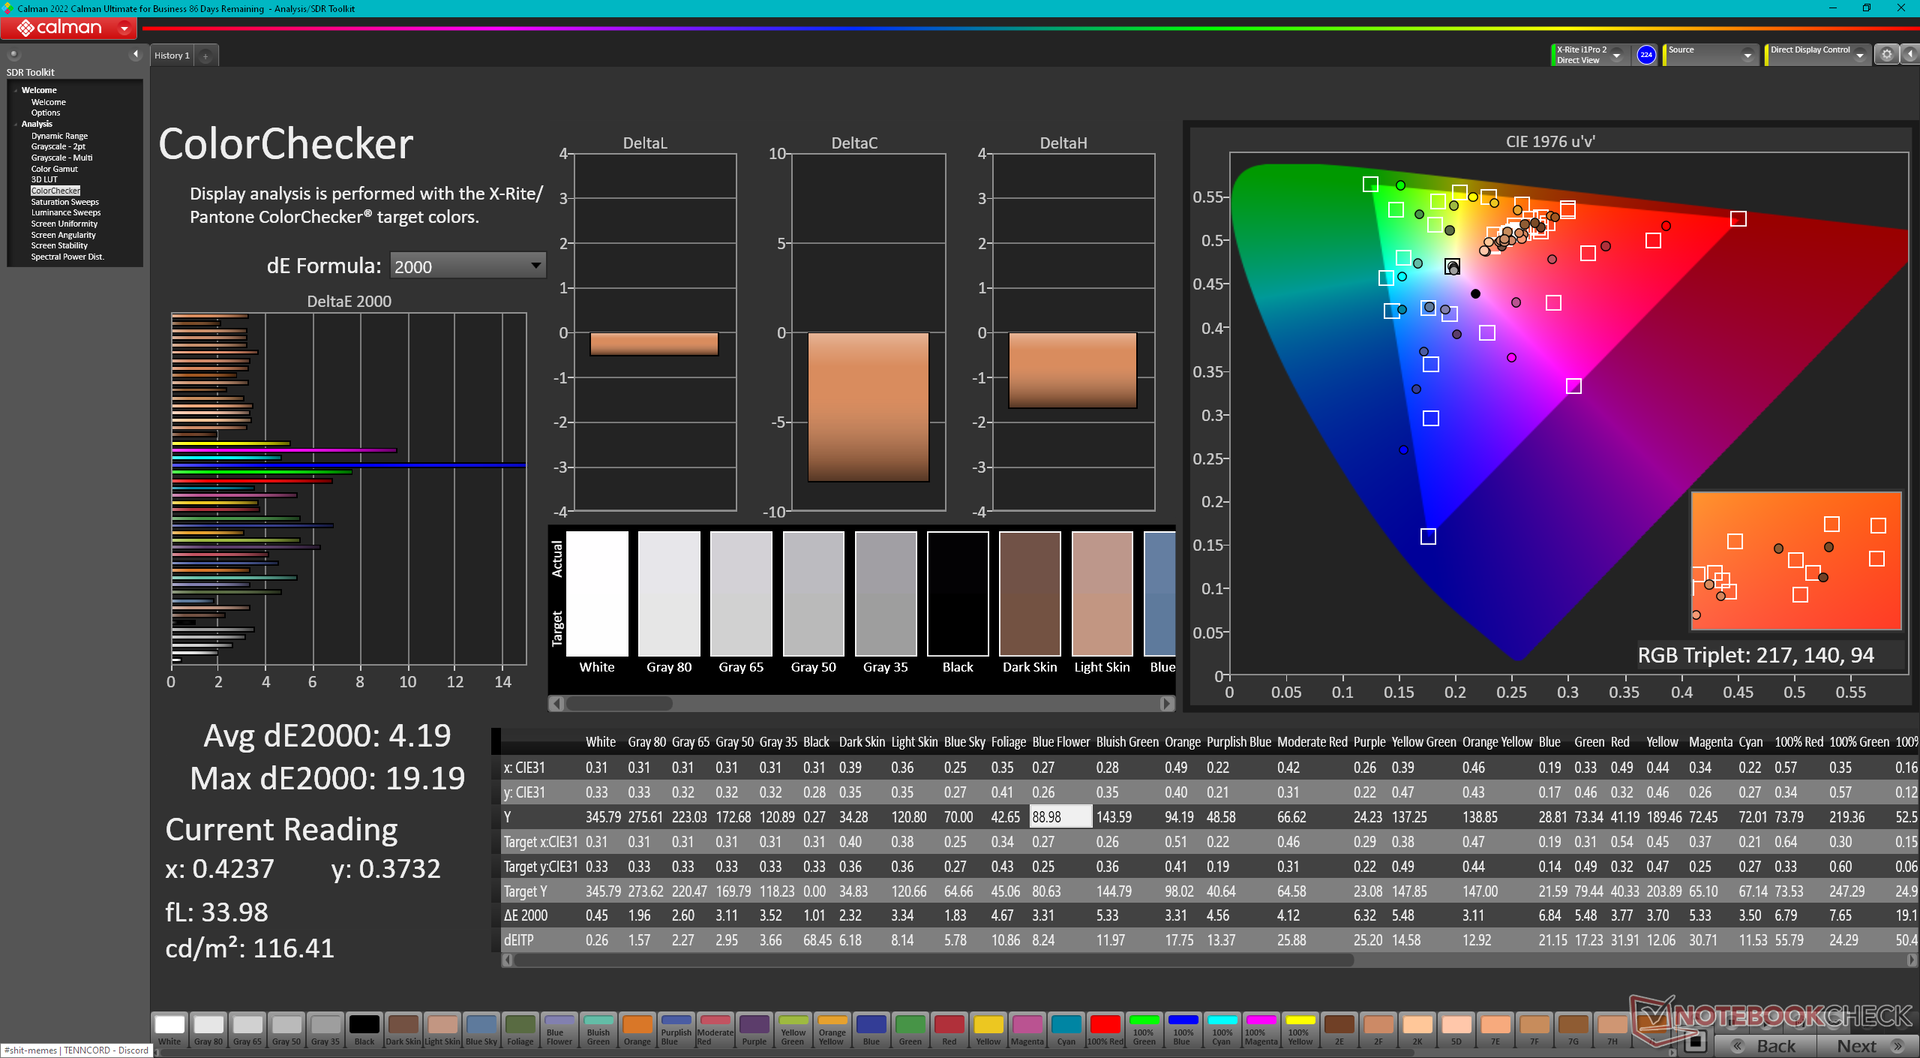
我们的配置和测量结果仅反映了上述粗体选项。虽然 1080p 对于一款廉价的游戏机来说已经足够,但有限的色彩覆盖范围和相对较慢的响应时间分别通过较浅的色彩和重影立即显现出来。如果你喜欢图形编辑或第一人称射击游戏,建议连接色彩更好、响应速度更快的外接显示器,或选择更高质量的 1440p 面板选项。竞争产品华硕 TUF A15提供了完全覆盖 sRGB 的 1080p 面板,而我们的联想却没有。
| |||||||||||||||||||||||||
Brightness Distribution: 81 %
Center on Battery: 346.2 cd/m²
Contrast: 1117:1 (Black: 0.31 cd/m²)
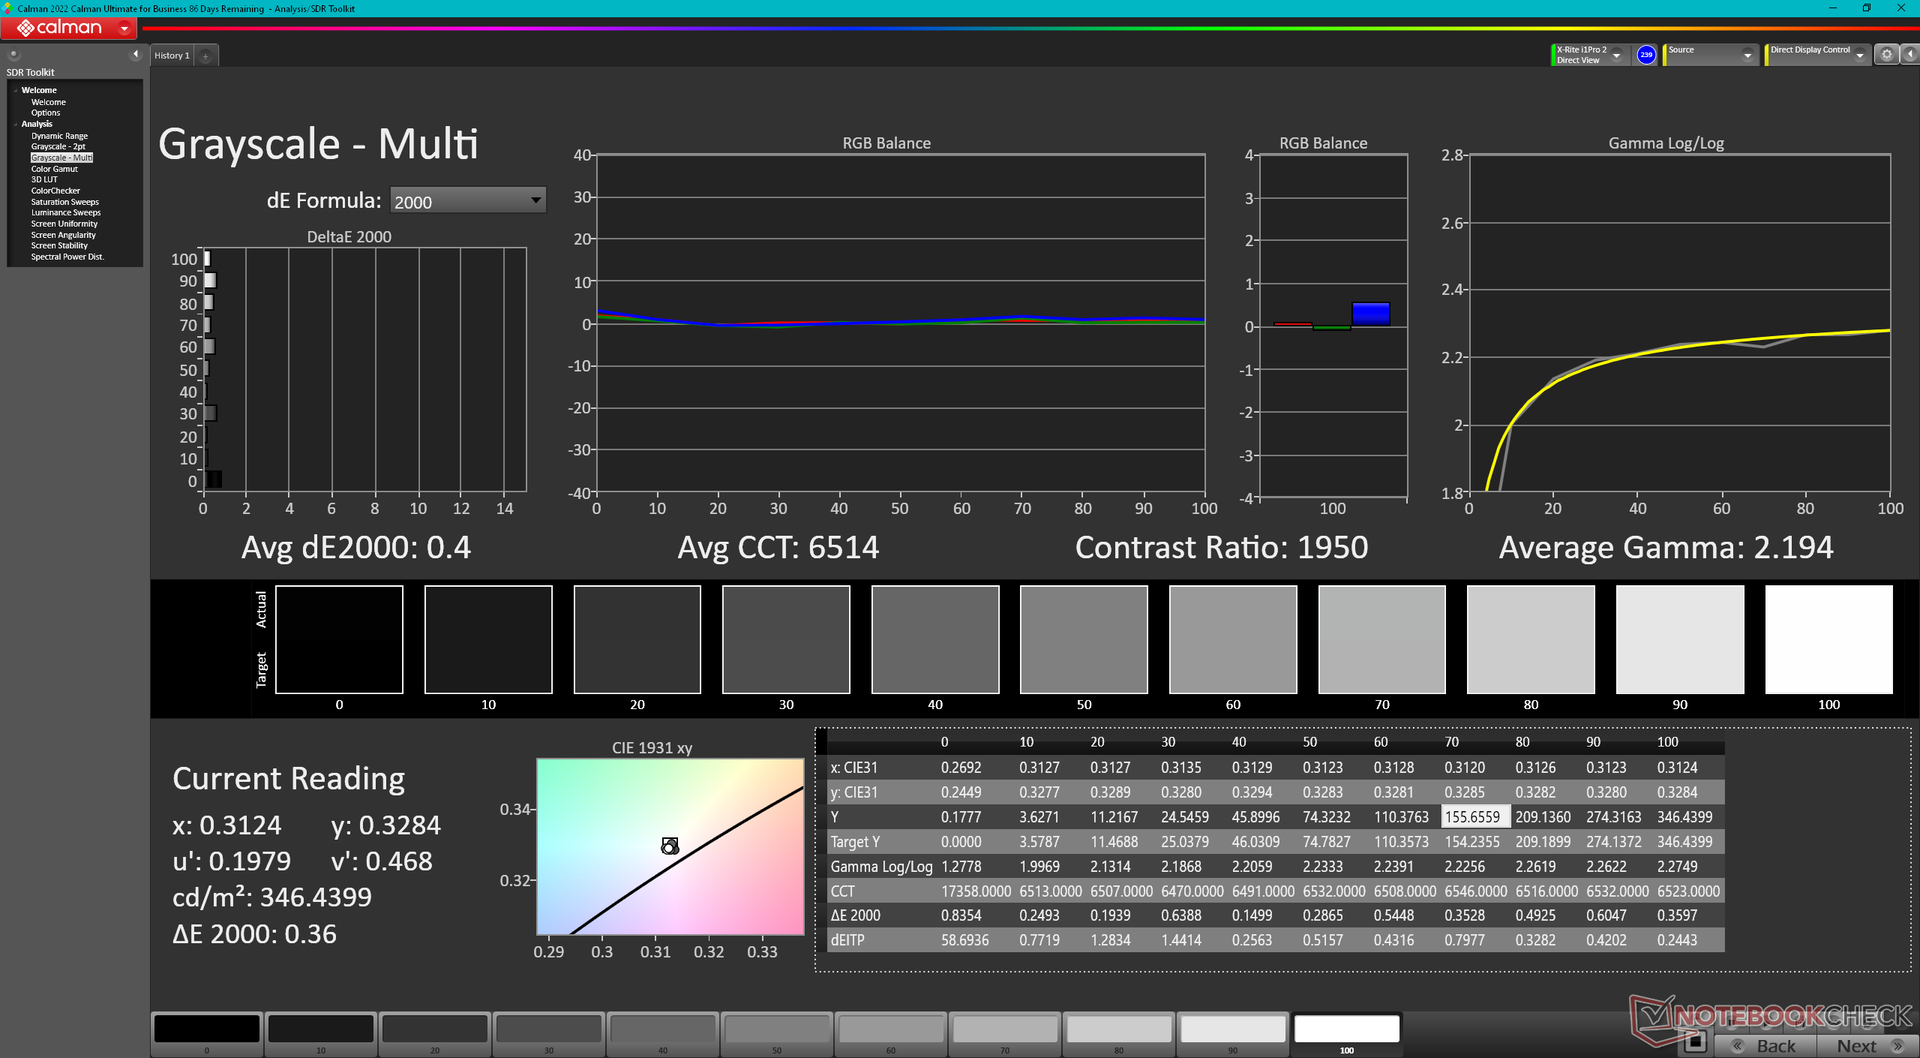
ΔE ColorChecker Calman: 4.19 | ∀{0.5-29.43 Ø4.72}
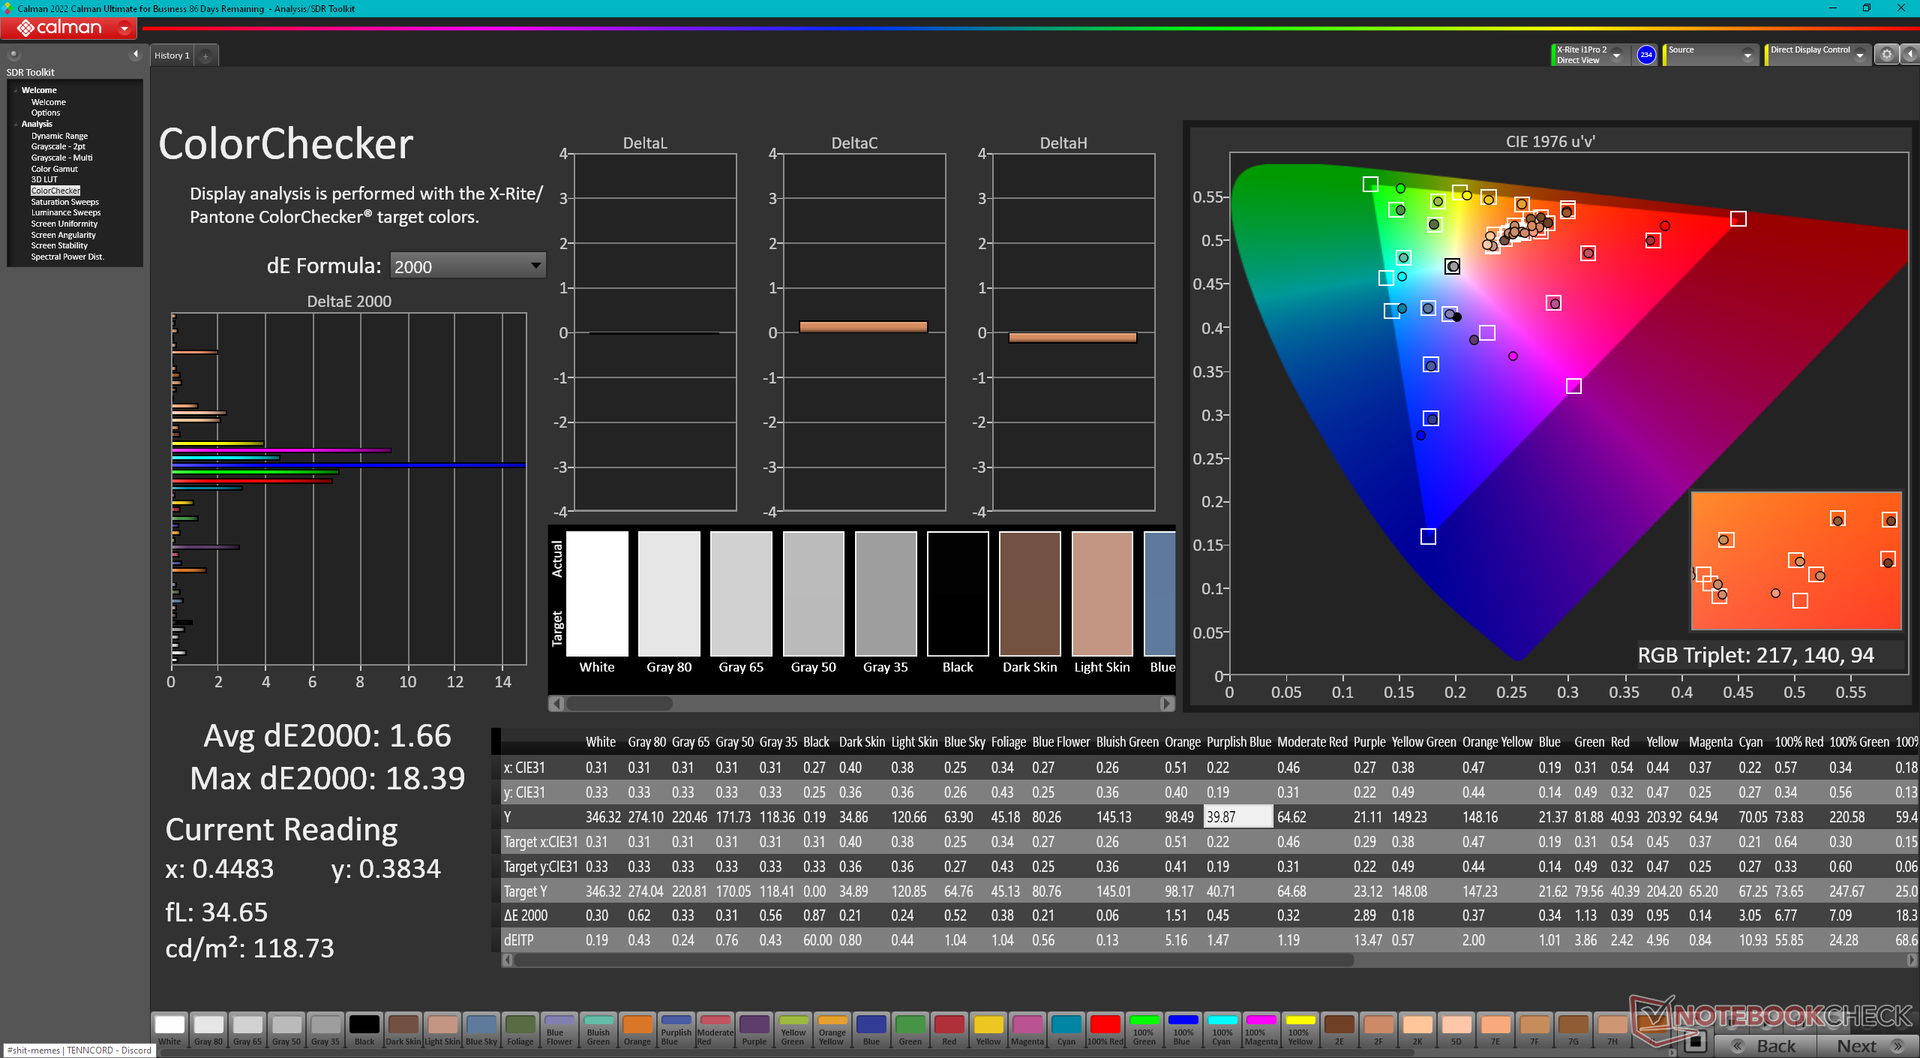
calibrated: 1.66
ΔE Greyscale Calman: 2.6 | ∀{0.09-98 Ø4.97}
41.5% AdobeRGB 1998 (Argyll 3D)
60.2% sRGB (Argyll 3D)
40.2% Display P3 (Argyll 3D)
Gamma: 2.19
CCT: 6749 K
| Lenovo LOQ 15APH8 BOE NJ NE156FHM-NX3, IPS, 1920x1080, 15.6" | Lenovo Legion 5 15IAH7H 82RB CSOT MNF601CA1-3, IPS, 1920x1080, 15.6" | Dell G15 5530 AUO B156HAN, IPS, 1920x1080, 15.6" | Asus TUF A15 FA507 N156HMA-GA1, IPS, 1920x1080, 15.6" | MSI Cyborg 15 A12VF AU Optronics B156HAN15.1, IPS, 1920x1080, 15.6" | HP Victus 15 fa0020nr CMN1521, IPS, 1920x1080, 15.6" | |
|---|---|---|---|---|---|---|
| Display | 69% | 75% | 60% | 5% | 4% | |
| Display P3 Coverage (%) | 40.2 | 69.1 72% | 73.1 82% | 64.9 61% | 42.3 5% | 42 4% |
| sRGB Coverage (%) | 60.2 | 99.5 65% | 98.4 63% | 96.5 60% | 62.6 4% | 62.7 4% |
| AdobeRGB 1998 Coverage (%) | 41.5 | 70 69% | 74.4 79% | 66.6 60% | 43.7 5% | 43.4 5% |
| Response Times | 58% | 85% | 22% | 46% | 4% | |
| Response Time Grey 50% / Grey 80% * (ms) | 42.7 ? | 14.8 ? 65% | 3.39 ? 92% | 30.4 ? 29% | 22 ? 48% | 35.2 ? 18% |
| Response Time Black / White * (ms) | 24.5 ? | 12 ? 51% | 5.35 ? 78% | 20.8 ? 15% | 14 ? 43% | 27.2 ? -11% |
| PWM Frequency (Hz) | 21620 ? | |||||
| Screen | -4% | -2% | 28% | -9% | 1% | |
| Brightness middle (cd/m²) | 346.2 | 363.5 5% | 320 -8% | 288 -17% | 247 -29% | 284.3 -18% |
| Brightness (cd/m²) | 329 | 350 6% | 316 -4% | 271 -18% | 234 -29% | 262 -20% |
| Brightness Distribution (%) | 81 | 89 10% | 94 16% | 91 12% | 89 10% | 87 7% |
| Black Level * (cd/m²) | 0.31 | 0.39 -26% | 0.21 32% | 0.17 45% | 0.25 19% | 0.17 45% |
| Contrast (:1) | 1117 | 932 -17% | 1524 36% | 1694 52% | 988 -12% | 1672 50% |
| Colorchecker dE 2000 * | 4.19 | 3.68 12% | 4.55 -9% | 1.9 55% | 3.78 10% | 4.52 -8% |
| Colorchecker dE 2000 max. * | 19.19 | 8.92 54% | 9.83 49% | 3.3 83% | 6.42 67% | 18.67 3% |
| Colorchecker dE 2000 calibrated * | 1.66 | 0.53 68% | 1.51 9% | 0.9 46% | 3.94 -137% | 1.55 7% |
| Greyscale dE 2000 * | 2.6 | 6.5 -150% | 6.2 -138% | 2.7 -4% | 2.16 17% | 4.1 -58% |
| Gamma | 2.19 100% | 2.2 100% | 2.07 106% | 2.32 95% | 2.33 94% | 2.3 96% |
| CCT | 6749 96% | 5995 108% | 6479 100% | 6535 99% | 6906 94% | 6529 100% |
| Total Average (Program / Settings) | 41% /
20% | 53% /
27% | 37% /
34% | 14% /
2% | 3% /
2% |
* ... smaller is better
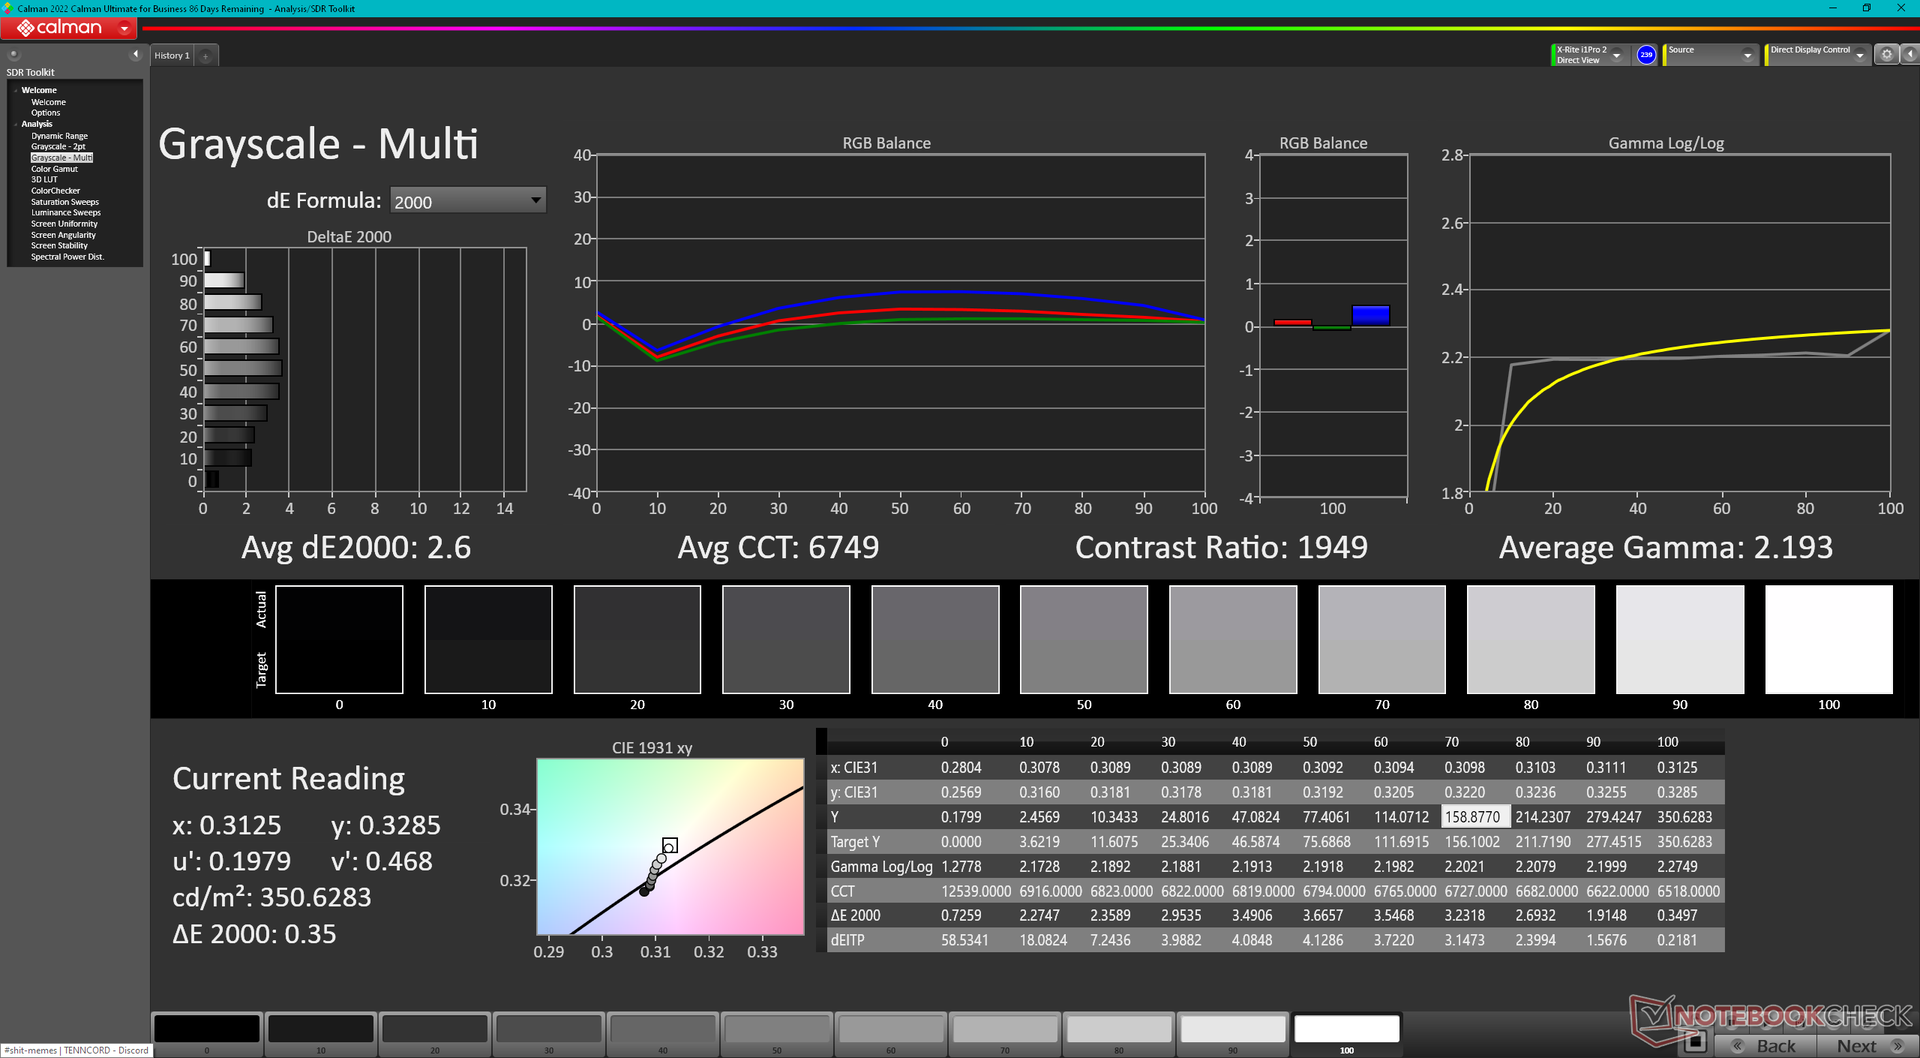
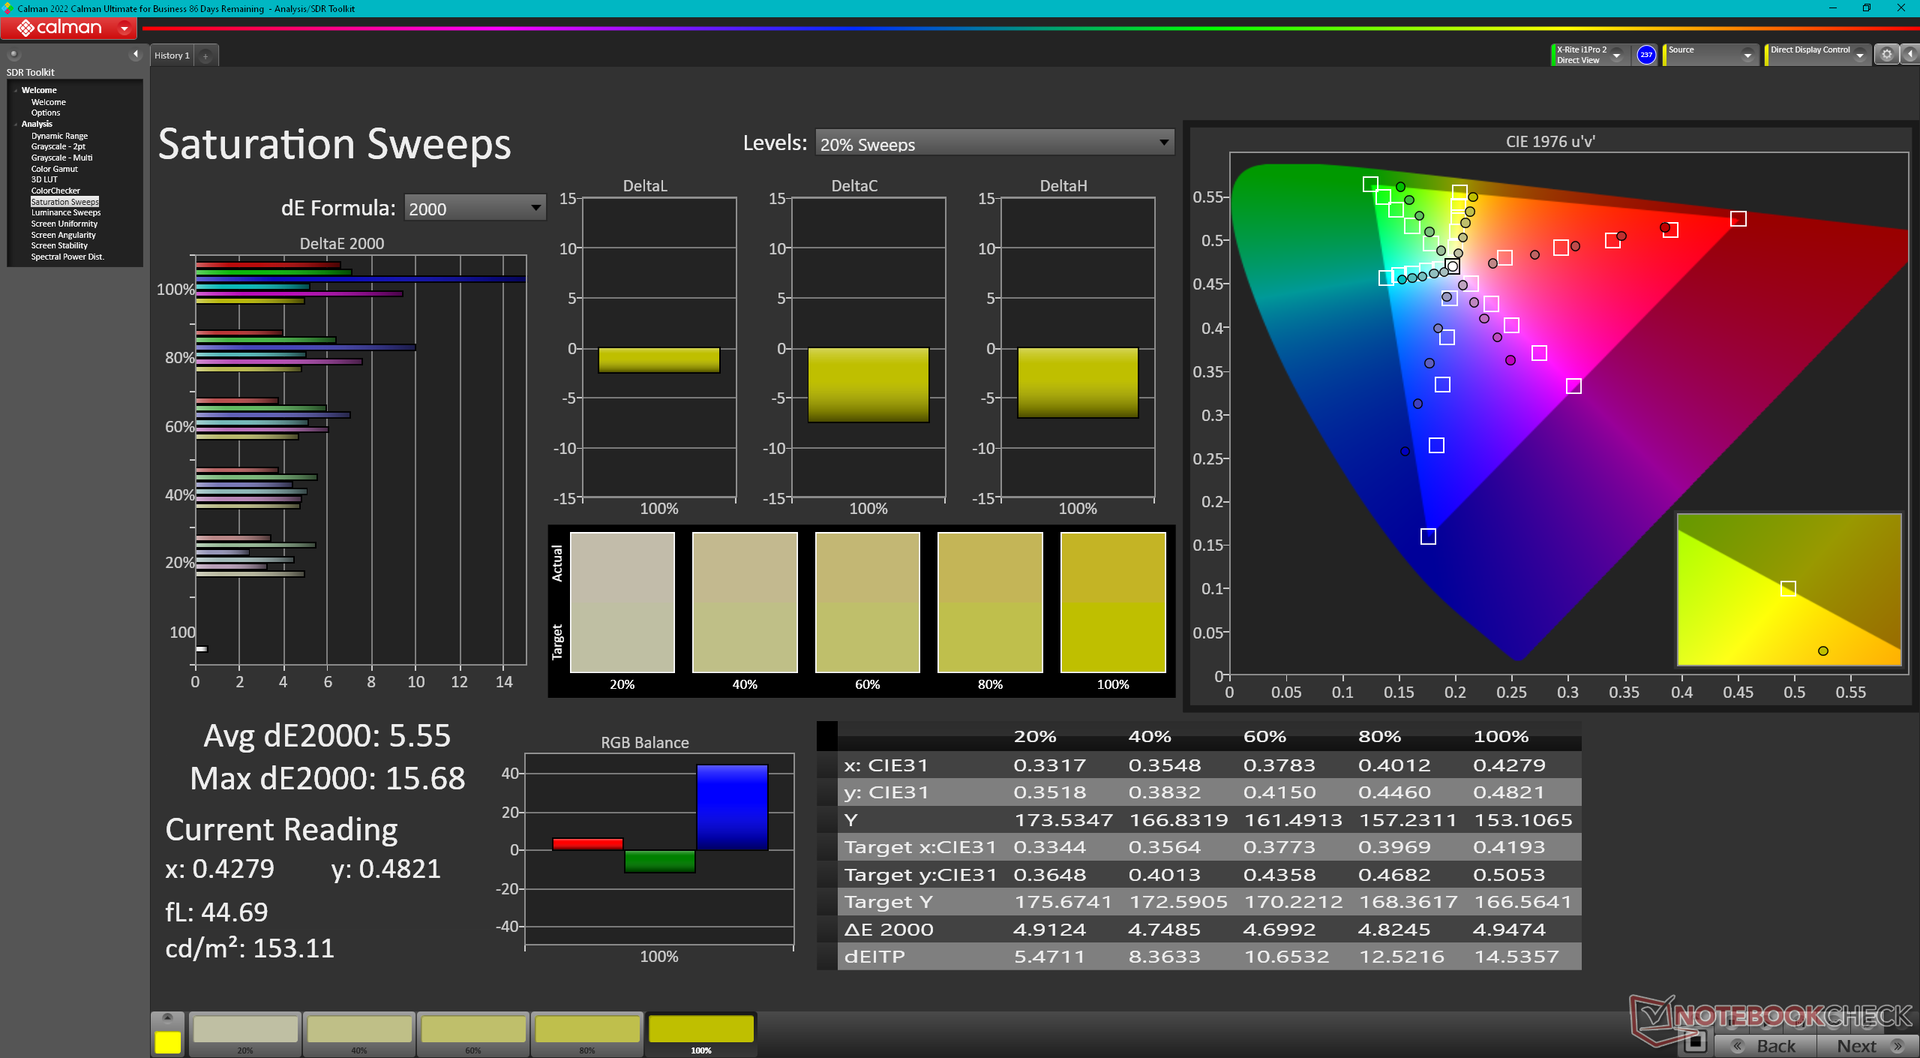
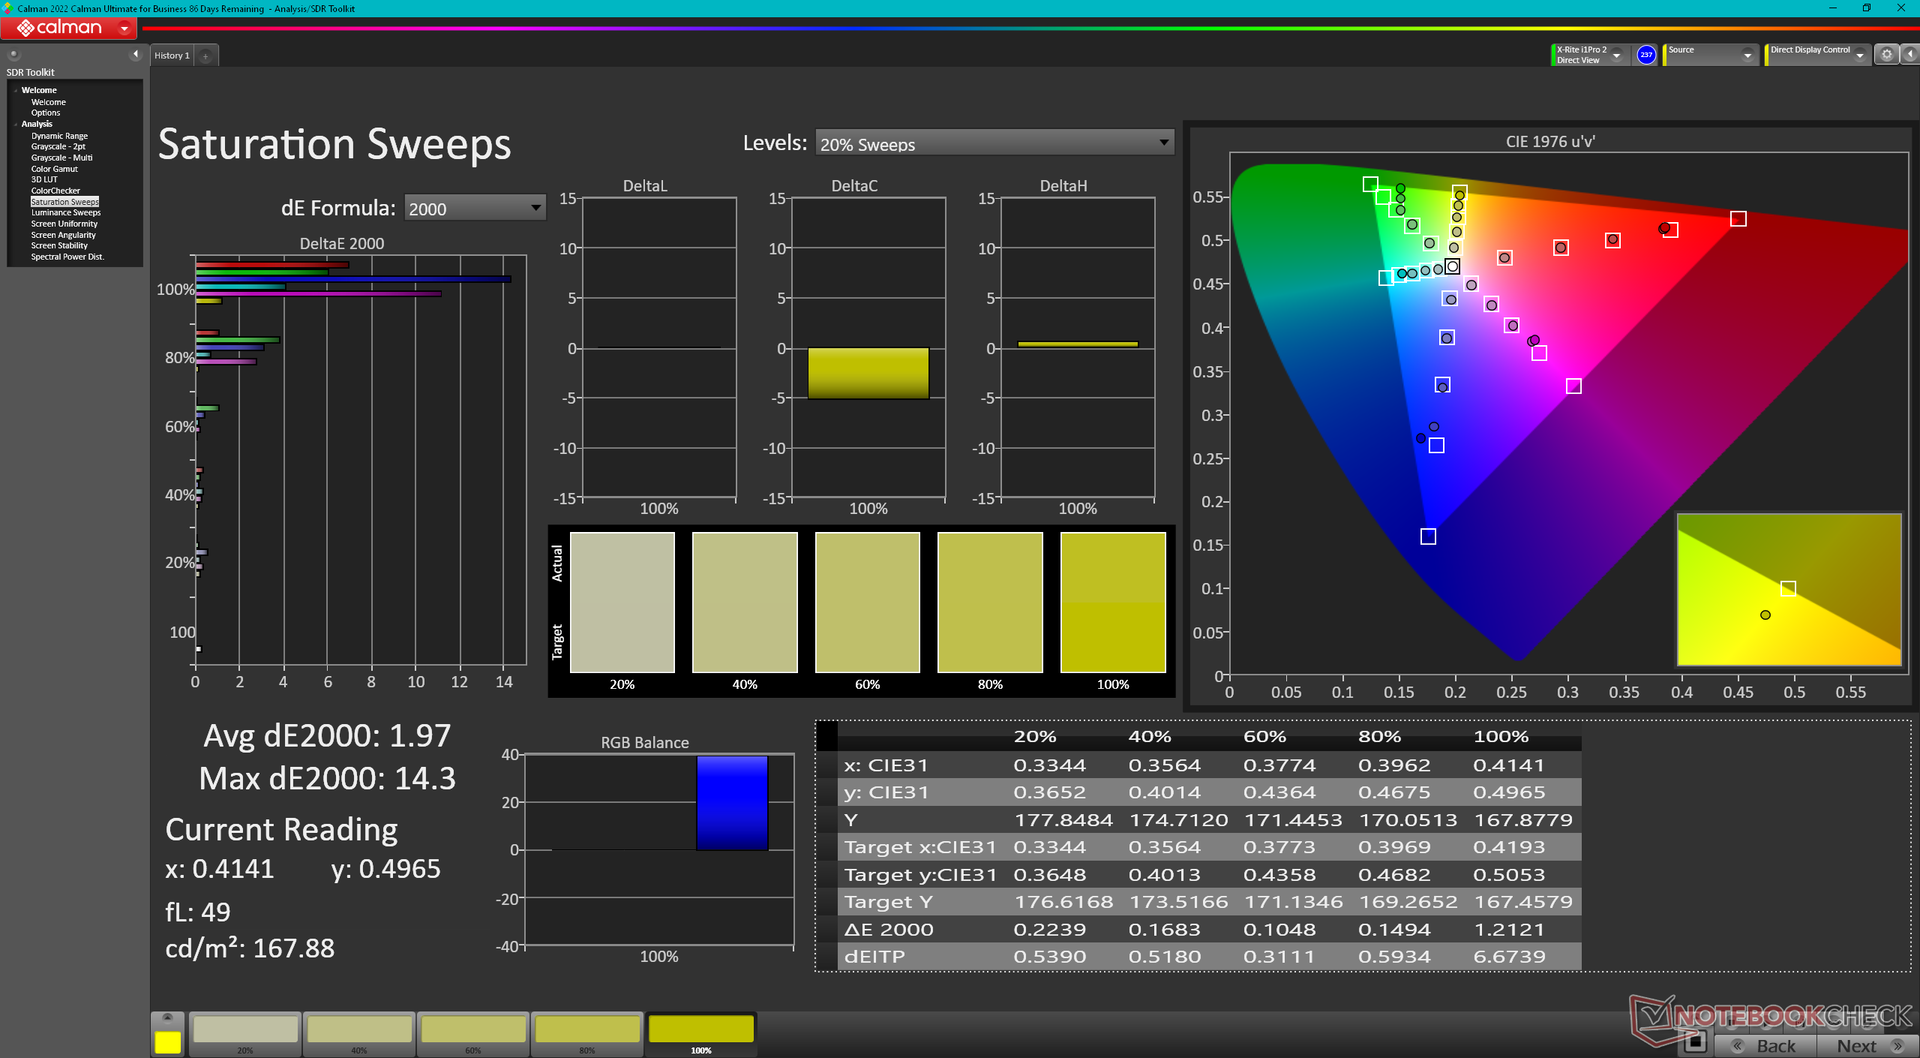
对于一款经济型游戏笔记本电脑来说,平均灰度和色彩 deltaE 值其实并不可怕,分别仅为 2.6 和 4.19。在使用 X-Rite 色差计进行适当校准后,我们可以将这些值分别降至 0.4 和 1.66。不过,请注意,由于上述色域较窄的原因,饱和度越高,色彩越不准确。
我们的校准 ICM 配置文件可在上方免费获取。
Display Response Times
| ↔ Response Time Black to White | ||
|---|---|---|
| 24.5 ms ... rise ↗ and fall ↘ combined | ↗ 12.2 ms rise | 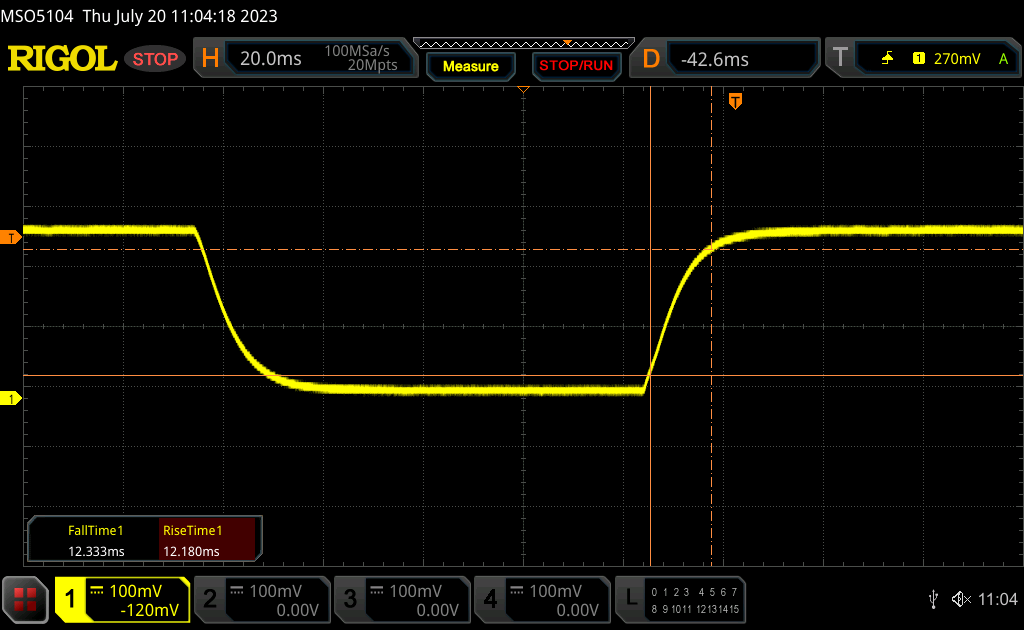 |
| ↘ 12.3 ms fall | ||
| The screen shows good response rates in our tests, but may be too slow for competitive gamers. In comparison, all tested devices range from 0.1 (minimum) to 240 (maximum) ms. » 58 % of all devices are better. This means that the measured response time is worse than the average of all tested devices (19.8 ms). | ||
| ↔ Response Time 50% Grey to 80% Grey | ||
| 42.7 ms ... rise ↗ and fall ↘ combined | ↗ 19.2 ms rise | 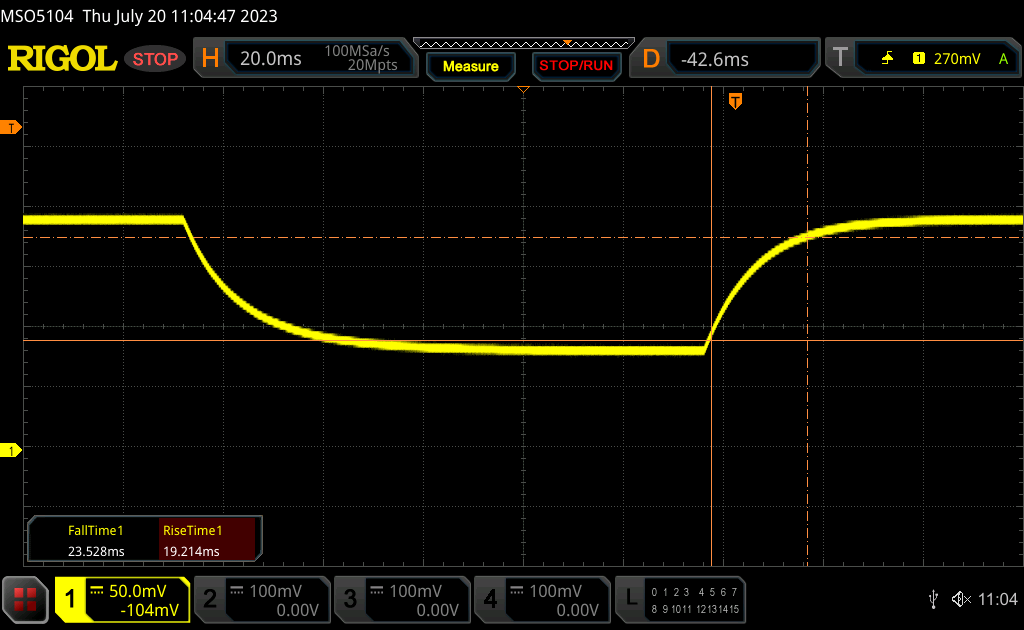 |
| ↘ 23.5 ms fall | ||
| The screen shows slow response rates in our tests and will be unsatisfactory for gamers. In comparison, all tested devices range from 0.165 (minimum) to 636 (maximum) ms. » 70 % of all devices are better. This means that the measured response time is worse than the average of all tested devices (31 ms). | ||
Screen Flickering / PWM (Pulse-Width Modulation)
| Screen flickering / PWM not detected | 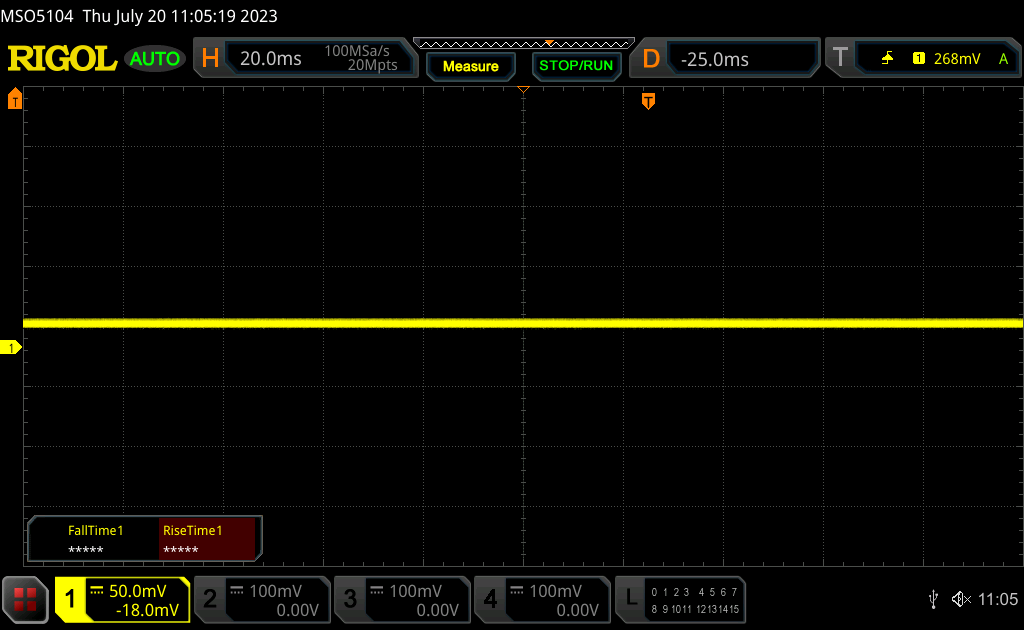 | ||
In comparison: 52 % of all tested devices do not use PWM to dim the display. If PWM was detected, an average of 7769 (minimum: 5 - maximum: 343500) Hz was measured. | |||
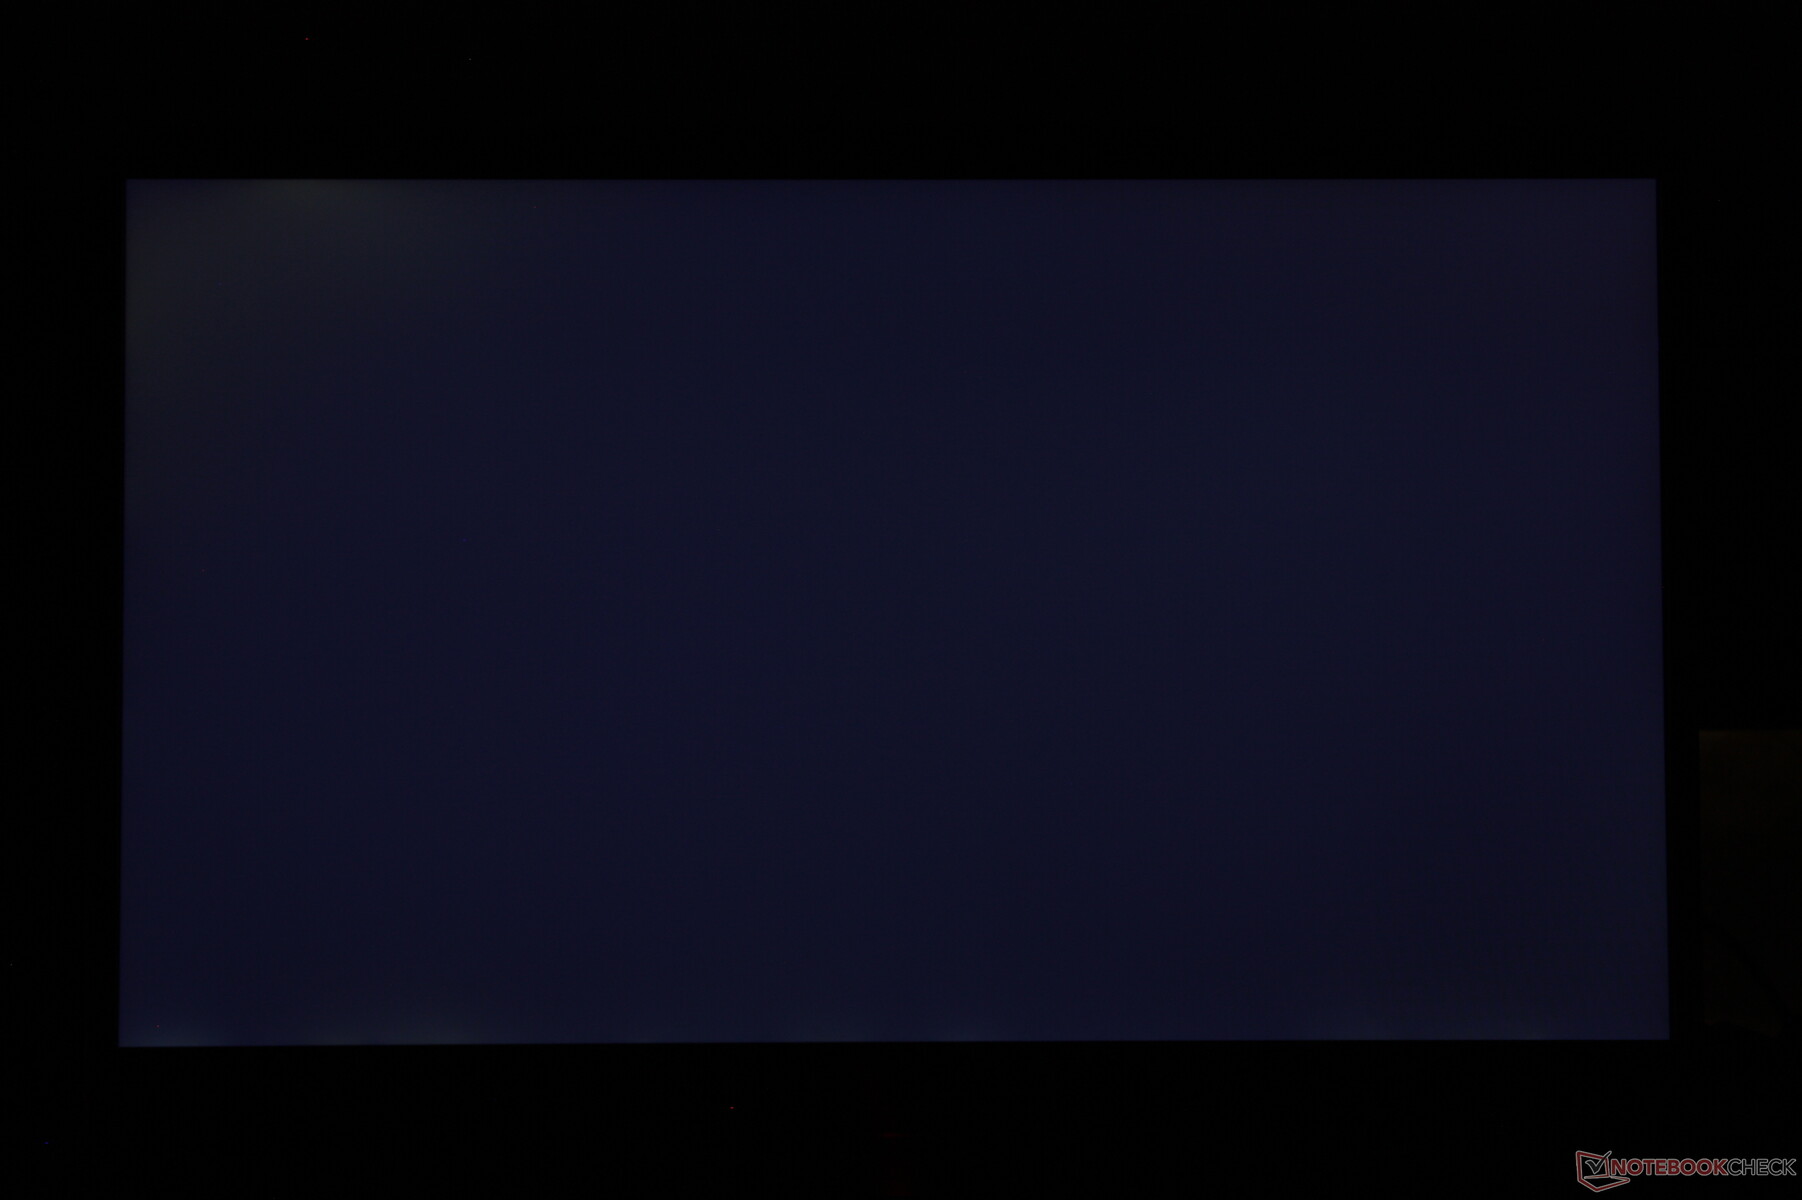
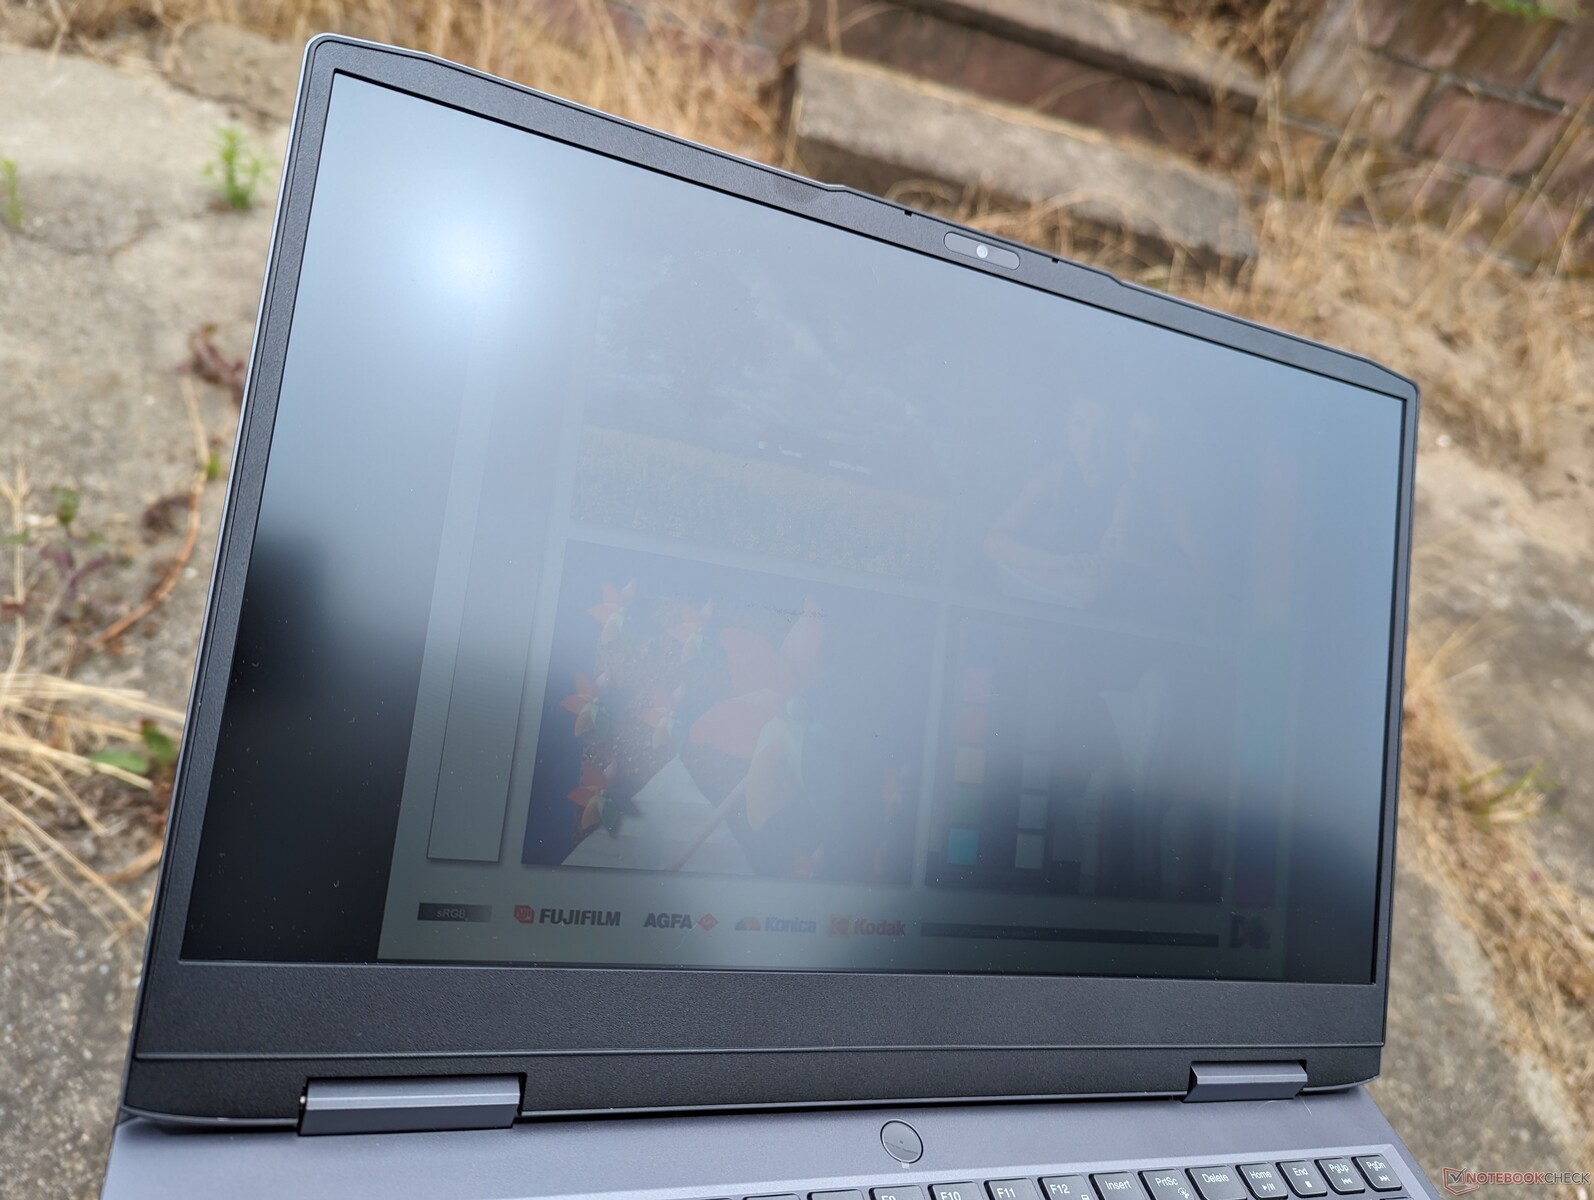
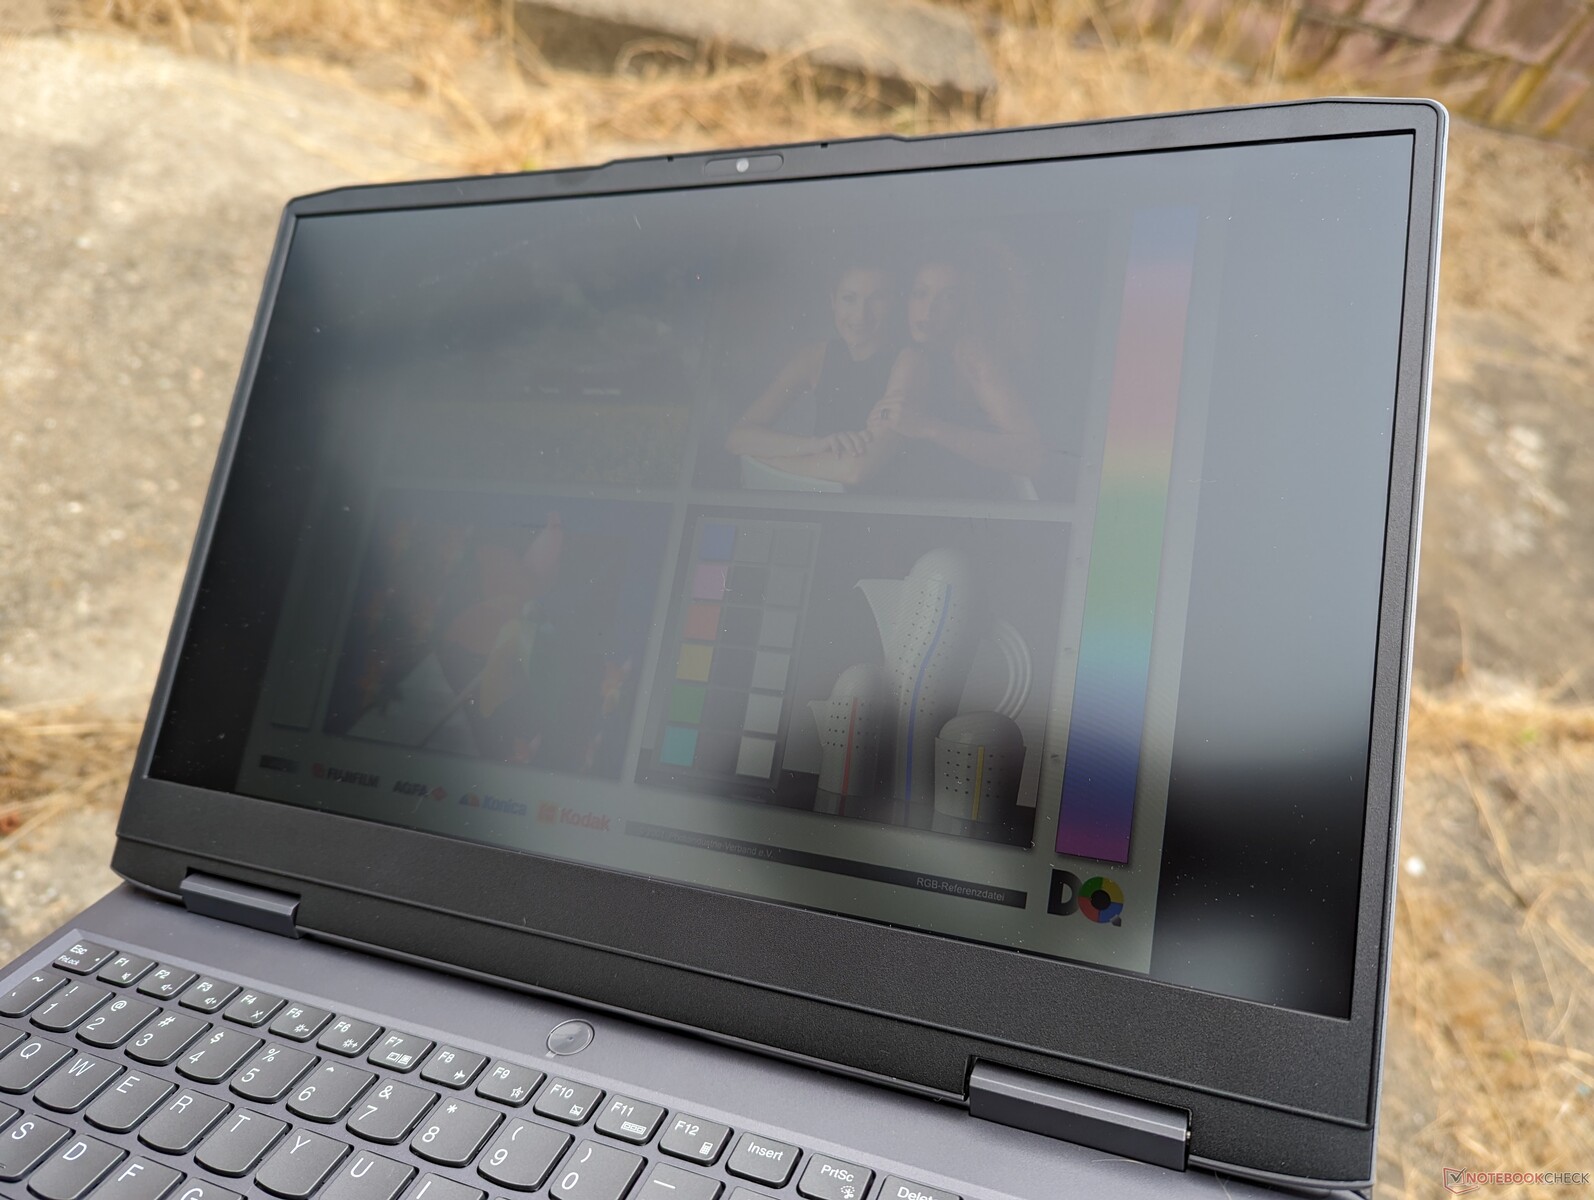
大多数采用 IPS 面板的游戏笔记本电脑亮度都在 300 尼特左右,LOQ 15 也不例外。因此,它的室外可视性在同类产品中属于中等水平,没有什么值得注意的地方。任何比阴暗处更亮的地方都会造成巨大的眩光,洗掉屏幕上的色彩。
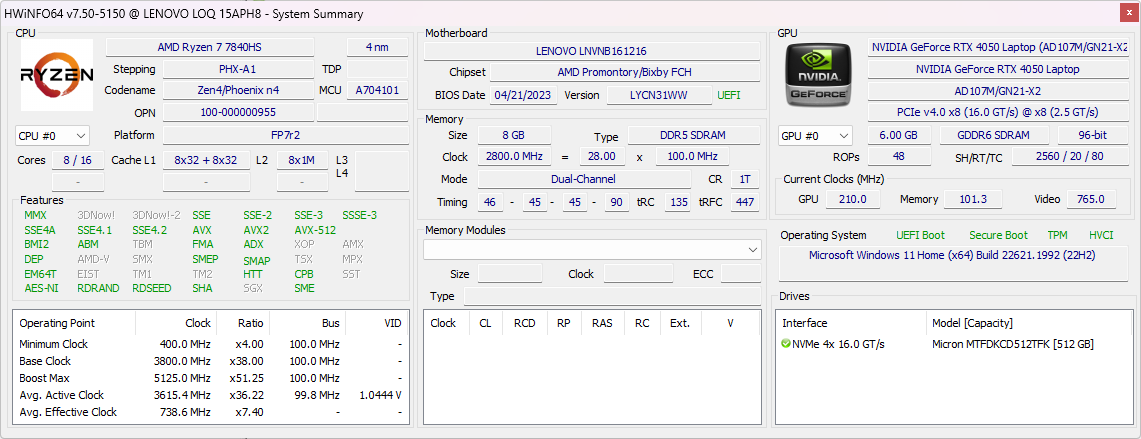
性能 - 中端 AMD Zen 4
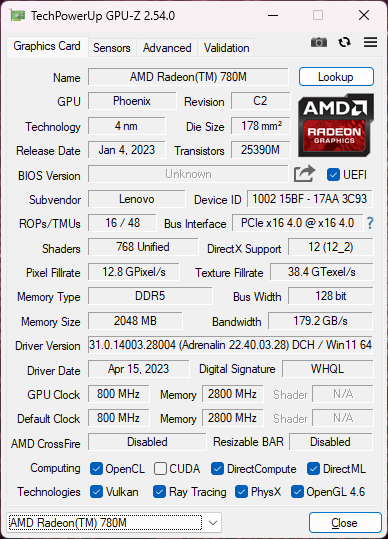
测试条件
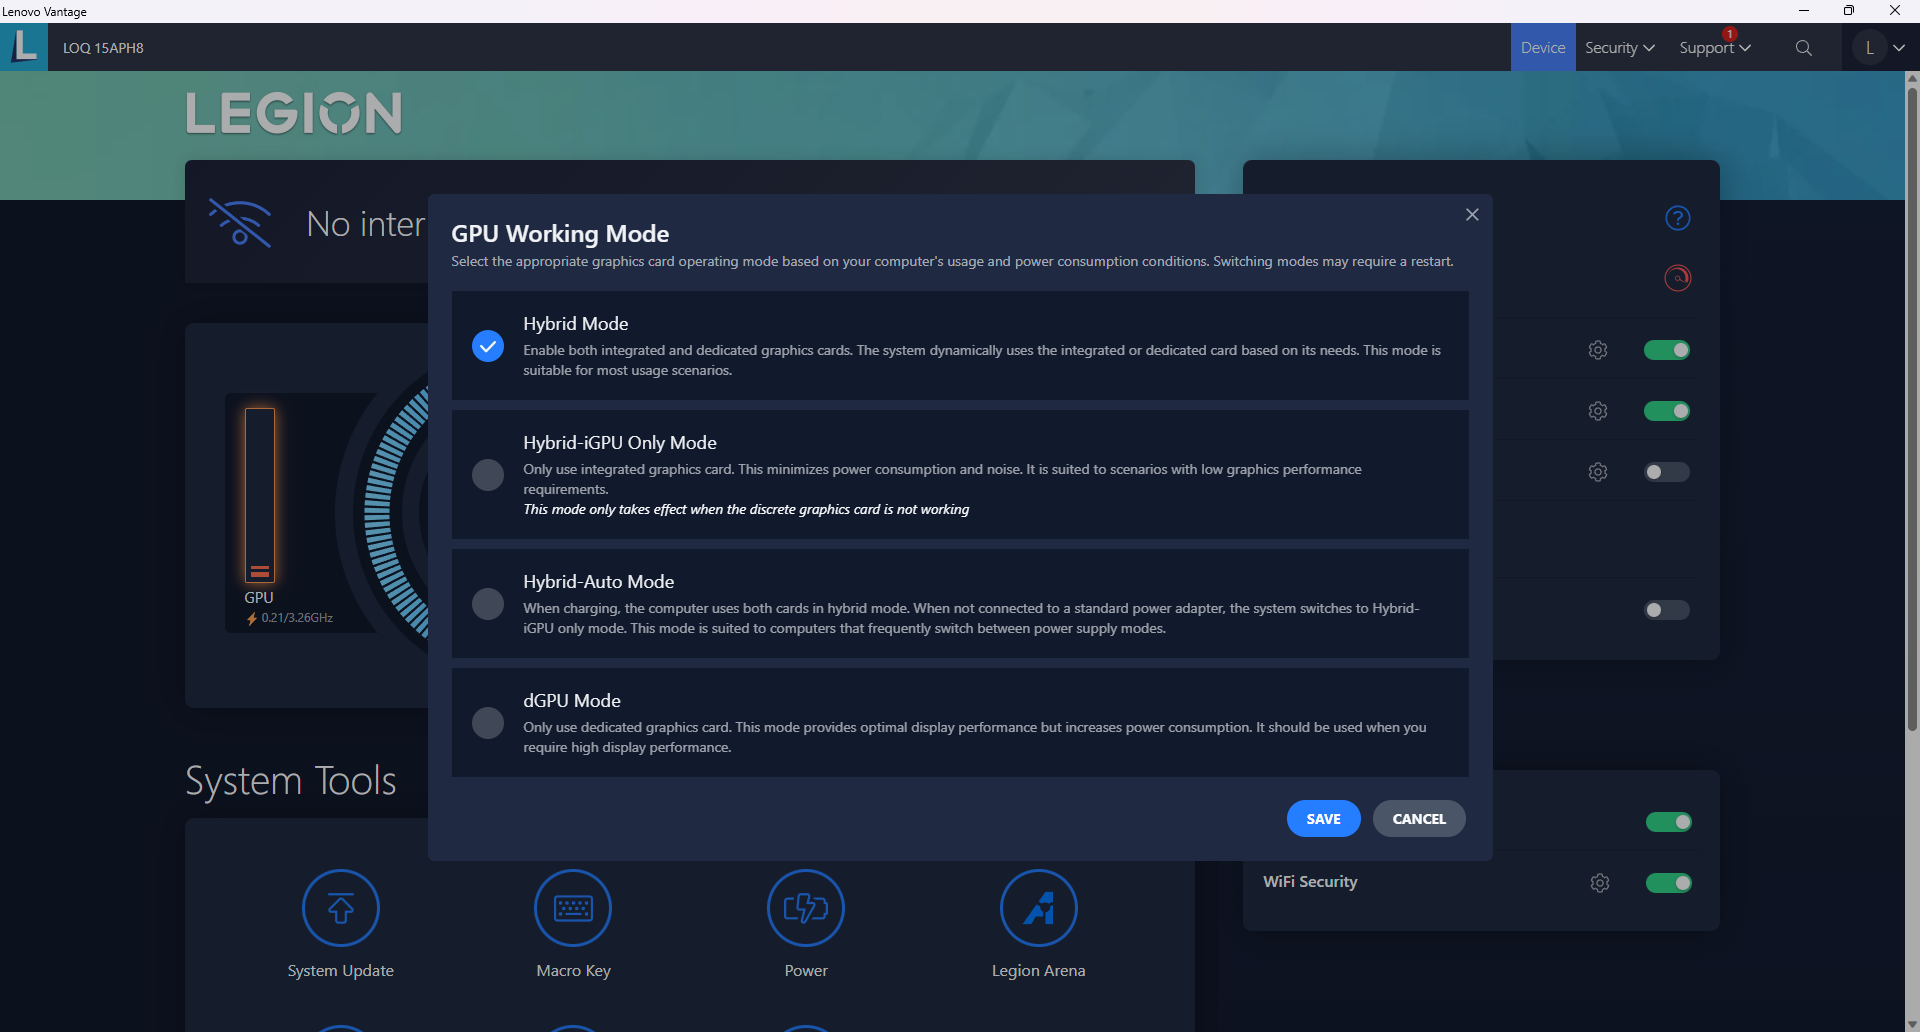
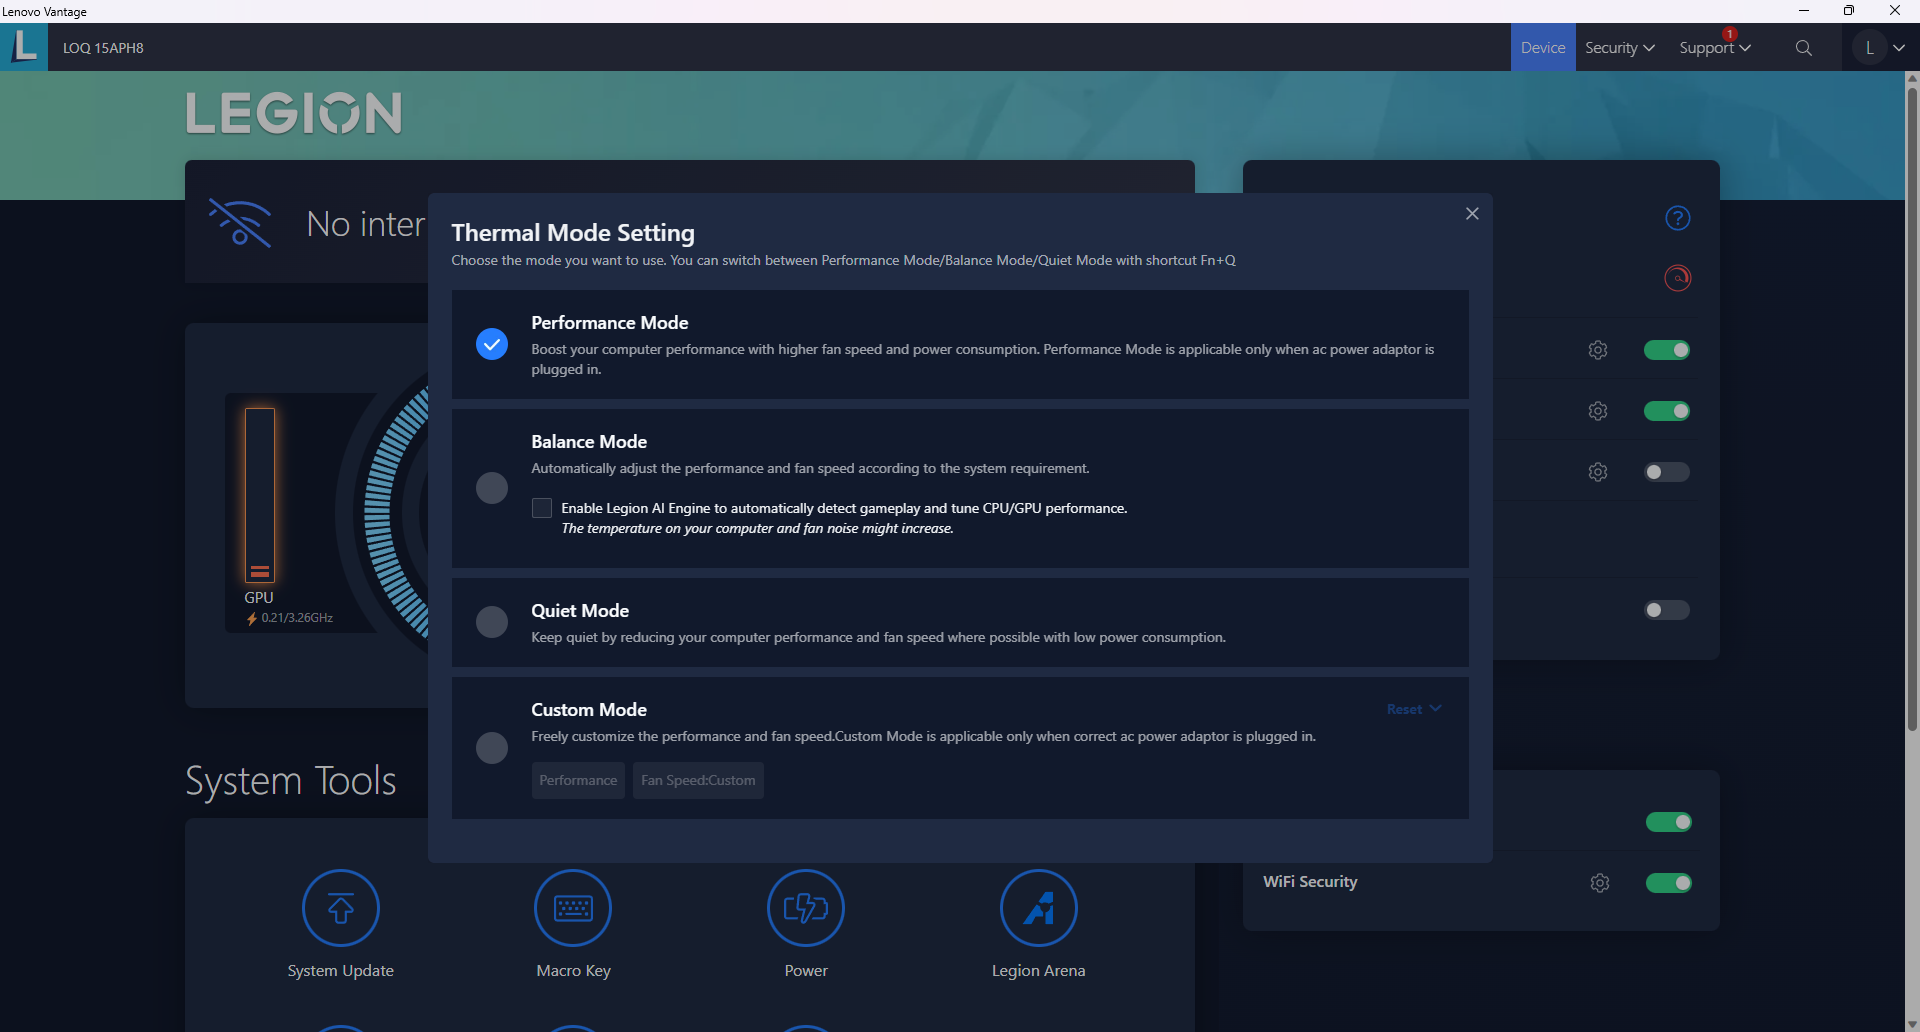
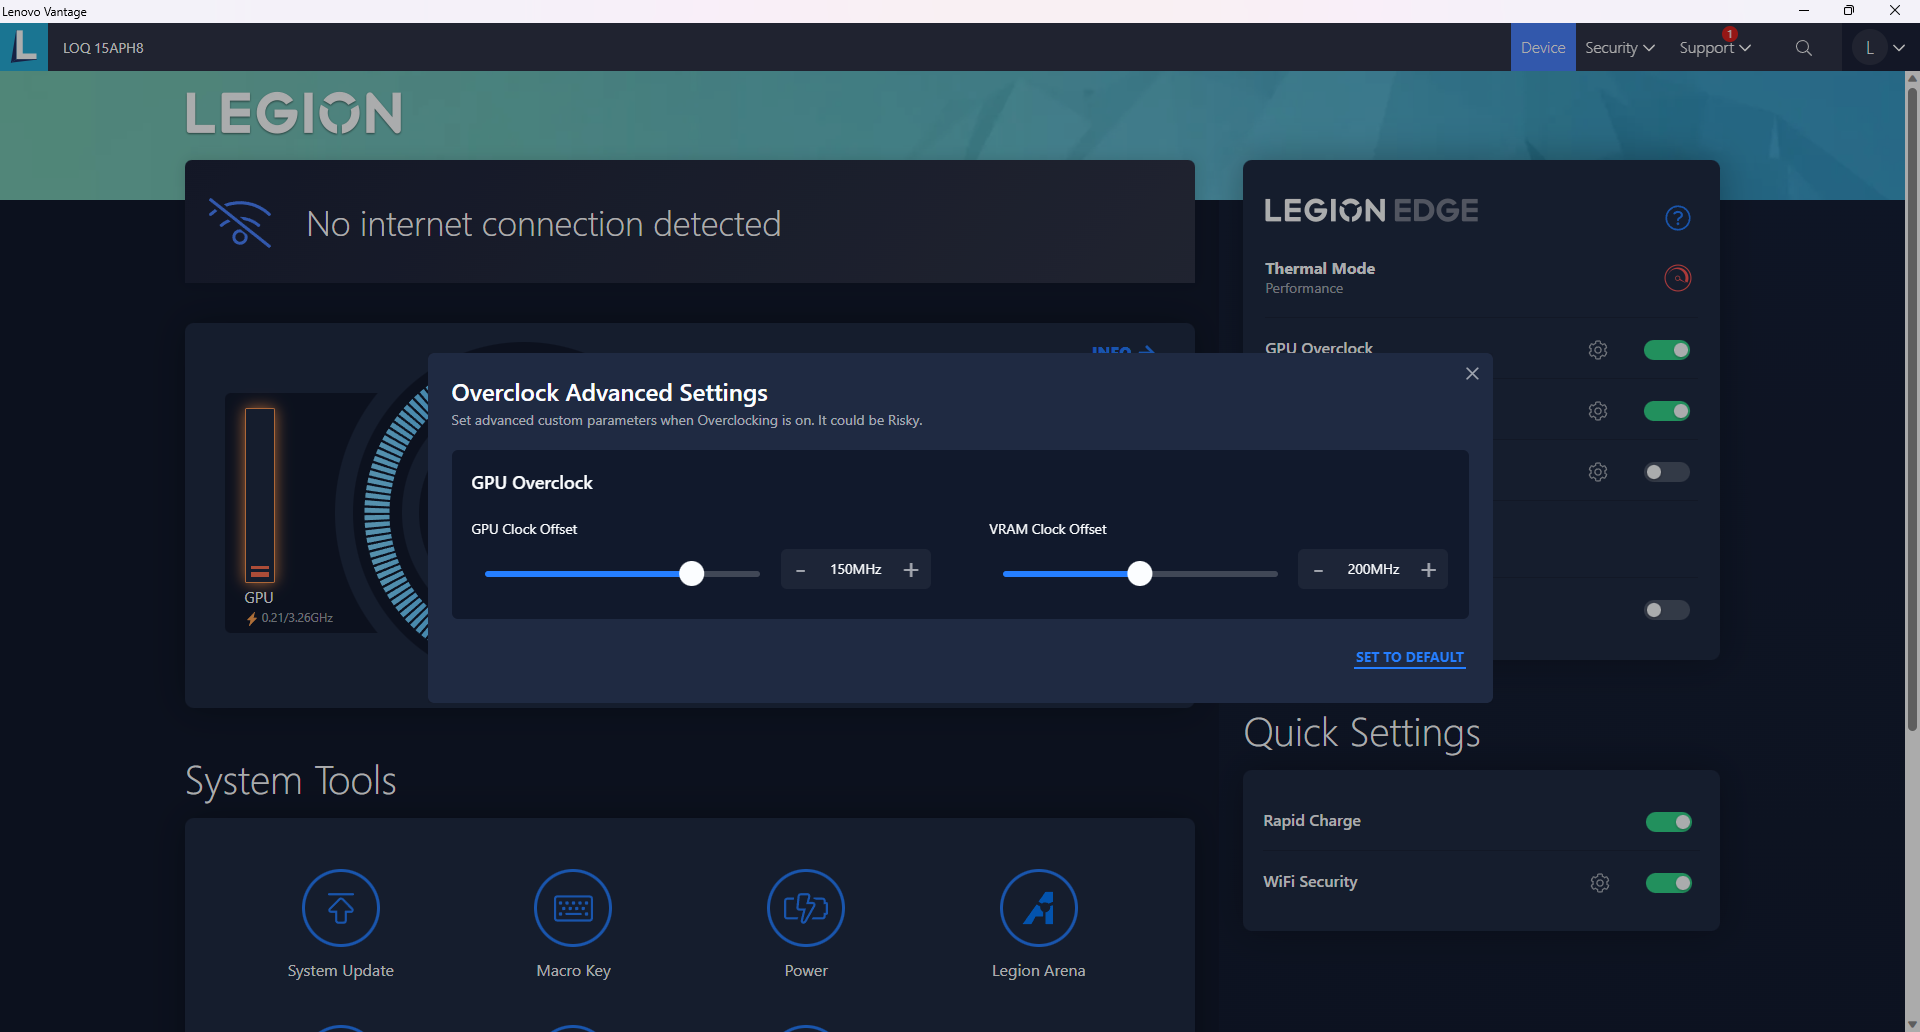
在运行下面的基准测试之前,我们通过 Windows 和联想 Vantage 将设备设置为性能模式。我们还确保将系统设置为 dGPU 模式,因为支持高级 Optimus。建议用户熟悉 Vantage 软件,因为它是联想 BIOS 更新、电源设置、保修信息和其他特定型号功能的中心枢纽。
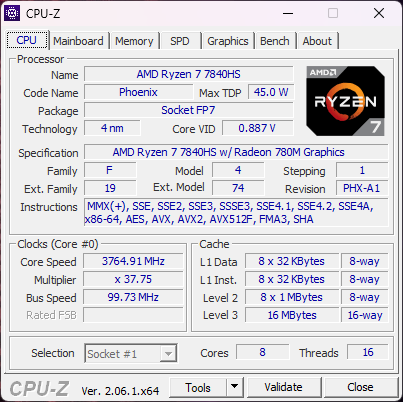
处理器
......(英文Ryzen 7 7840HS 比更高端的 Ryzen 7 7745HX性能差距仅为 5%。因此,整体性能与第 12 代 酷睿 i7-12700H的性能相当。让我们感到欣慰的是,LOQ 系列搭载的是 Zen 4 CPU,而不是 Zen 3(如 Ryzen 7 7735HS这样的 Zen 3 处理器。
升级到英特尔版本的 LOQ 15,配备了 酷睿 i7-13700H的英特尔版本,CPU 性能有望提升约 20%。 Aorus 15X.
Cinebench R15 Multi Loop
Cinebench R23: Multi Core | Single Core
Cinebench R20: CPU (Multi Core) | CPU (Single Core)
Cinebench R15: CPU Multi 64Bit | CPU Single 64Bit
Blender: v2.79 BMW27 CPU
7-Zip 18.03: 7z b 4 | 7z b 4 -mmt1
Geekbench 5.5: Multi-Core | Single-Core
HWBOT x265 Benchmark v2.2: 4k Preset
LibreOffice : 20 Documents To PDF
R Benchmark 2.5: Overall mean
* ... smaller is better
AIDA64: FP32 Ray-Trace | FPU Julia | CPU SHA3 | CPU Queen | FPU SinJulia | FPU Mandel | CPU AES | CPU ZLib | FP64 Ray-Trace | CPU PhotoWorxx
| Performance rating | |
| Average AMD Ryzen 7 7840HS | |
| Lenovo LOQ 15APH8 | |
| Lenovo Legion 5 15IAH7H 82RB | |
| Dell G15 5530 | |
| Asus TUF A15 FA507 | |
| MSI Cyborg 15 A12VF | |
| HP Victus 15 fa0020nr | |
| AIDA64 / FP32 Ray-Trace | |
| Lenovo LOQ 15APH8 | |
| Average AMD Ryzen 7 7840HS (22845 - 28921, n=21) | |
| Dell G15 5530 | |
| Lenovo Legion 5 15IAH7H 82RB | |
| Asus TUF A15 FA507 | |
| HP Victus 15 fa0020nr | |
| MSI Cyborg 15 A12VF | |
| AIDA64 / FPU Julia | |
| Lenovo LOQ 15APH8 | |
| Average AMD Ryzen 7 7840HS (97164 - 123167, n=21) | |
| Asus TUF A15 FA507 | |
| Dell G15 5530 | |
| Lenovo Legion 5 15IAH7H 82RB | |
| MSI Cyborg 15 A12VF | |
| HP Victus 15 fa0020nr | |
| AIDA64 / CPU SHA3 | |
| Lenovo LOQ 15APH8 | |
| Average AMD Ryzen 7 7840HS (4293 - 5155, n=21) | |
| Dell G15 5530 | |
| Lenovo Legion 5 15IAH7H 82RB | |
| Asus TUF A15 FA507 | |
| MSI Cyborg 15 A12VF | |
| HP Victus 15 fa0020nr | |
| AIDA64 / CPU Queen | |
| Lenovo LOQ 15APH8 | |
| Average AMD Ryzen 7 7840HS (102271 - 125820, n=21) | |
| Dell G15 5530 | |
| Asus TUF A15 FA507 | |
| Lenovo Legion 5 15IAH7H 82RB | |
| HP Victus 15 fa0020nr | |
| MSI Cyborg 15 A12VF | |
| AIDA64 / FPU SinJulia | |
| Lenovo LOQ 15APH8 | |
| Average AMD Ryzen 7 7840HS (13767 - 15525, n=21) | |
| Asus TUF A15 FA507 | |
| Dell G15 5530 | |
| Lenovo Legion 5 15IAH7H 82RB | |
| MSI Cyborg 15 A12VF | |
| HP Victus 15 fa0020nr | |
| AIDA64 / FPU Mandel | |
| Lenovo LOQ 15APH8 | |
| Average AMD Ryzen 7 7840HS (52084 - 65812, n=21) | |
| Asus TUF A15 FA507 | |
| Dell G15 5530 | |
| Lenovo Legion 5 15IAH7H 82RB | |
| HP Victus 15 fa0020nr | |
| MSI Cyborg 15 A12VF | |
| AIDA64 / CPU AES | |
| Lenovo Legion 5 15IAH7H 82RB | |
| Average AMD Ryzen 7 7840HS (67389 - 177158, n=21) | |
| Dell G15 5530 | |
| Lenovo LOQ 15APH8 | |
| Asus TUF A15 FA507 | |
| MSI Cyborg 15 A12VF | |
| HP Victus 15 fa0020nr | |
| AIDA64 / CPU ZLib | |
| Dell G15 5530 | |
| Lenovo Legion 5 15IAH7H 82RB | |
| Lenovo LOQ 15APH8 | |
| Average AMD Ryzen 7 7840HS (944 - 1123, n=21) | |
| MSI Cyborg 15 A12VF | |
| HP Victus 15 fa0020nr | |
| Asus TUF A15 FA507 | |
| AIDA64 / FP64 Ray-Trace | |
| Lenovo LOQ 15APH8 | |
| Average AMD Ryzen 7 7840HS (12248 - 15599, n=21) | |
| Dell G15 5530 | |
| Lenovo Legion 5 15IAH7H 82RB | |
| Asus TUF A15 FA507 | |
| HP Victus 15 fa0020nr | |
| MSI Cyborg 15 A12VF | |
| AIDA64 / CPU PhotoWorxx | |
| Average AMD Ryzen 7 7840HS (17615 - 41516, n=21) | |
| Dell G15 5530 | |
| MSI Cyborg 15 A12VF | |
| Lenovo Legion 5 15IAH7H 82RB | |
| Asus TUF A15 FA507 | |
| HP Victus 15 fa0020nr | |
| Lenovo LOQ 15APH8 | |
系统性能
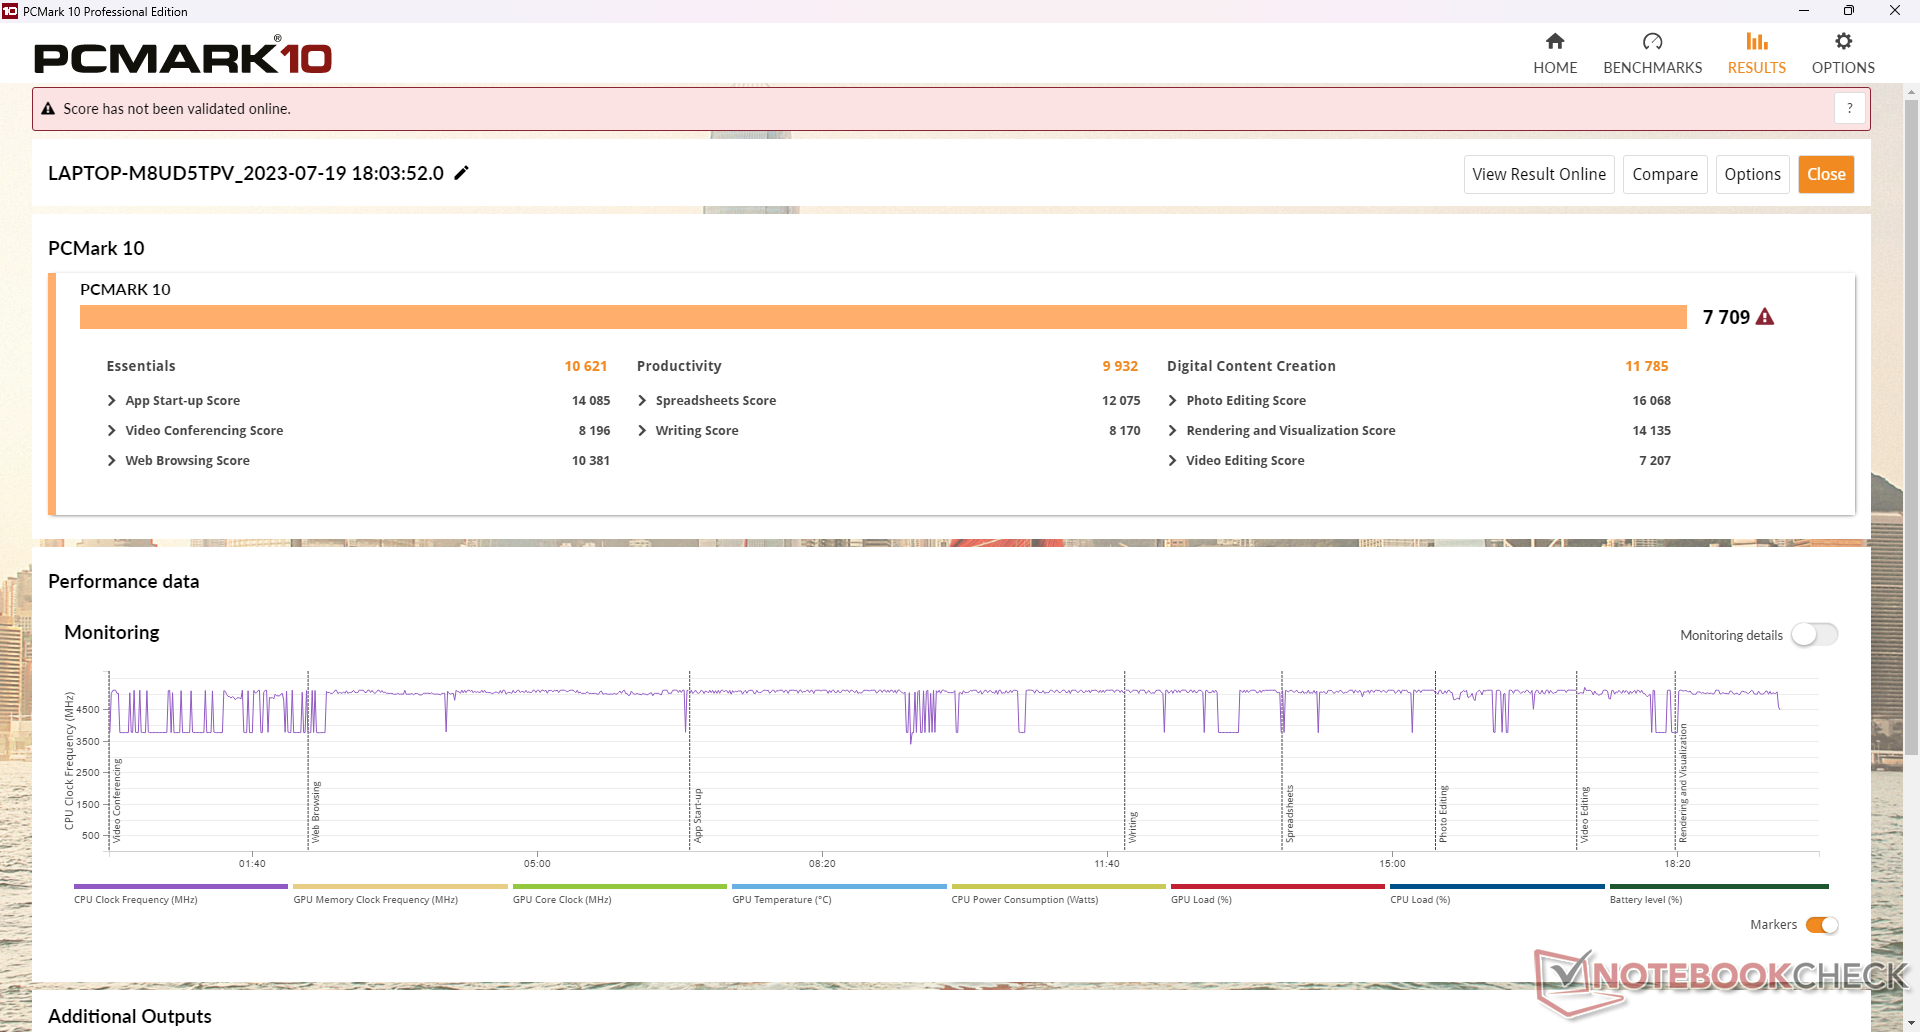
PCMark 10 结果可与戴尔 G15 5530 等竞争机型媲美,甚至还略逊于老款 2022。 联想Legion 5 15.不过,由于 8 GB 单通道内存的限制,AIDA64 内存测试的速度只有 LOQ 15 的一半。我们建议尽可能增加第二个内存模块,使内存总容量达到 16 GB。
CrossMark: Overall | Productivity | Creativity | Responsiveness
| PCMark 10 / Score | |
| Lenovo Legion 5 15IAH7H 82RB | |
| Lenovo LOQ 15APH8 | |
| Average AMD Ryzen 7 7840HS, NVIDIA GeForce RTX 4050 Laptop GPU (7683 - 7709, n=2) | |
| Asus TUF A15 FA507 | |
| MSI Cyborg 15 A12VF | |
| Dell G15 5530 | |
| HP Victus 15 fa0020nr | |
| PCMark 10 / Essentials | |
| Lenovo Legion 5 15IAH7H 82RB | |
| Dell G15 5530 | |
| Average AMD Ryzen 7 7840HS, NVIDIA GeForce RTX 4050 Laptop GPU (10621 - 10755, n=2) | |
| MSI Cyborg 15 A12VF | |
| Lenovo LOQ 15APH8 | |
| Asus TUF A15 FA507 | |
| HP Victus 15 fa0020nr | |
| PCMark 10 / Productivity | |
| Lenovo Legion 5 15IAH7H 82RB | |
| Dell G15 5530 | |
| Average AMD Ryzen 7 7840HS, NVIDIA GeForce RTX 4050 Laptop GPU (9932 - 9980, n=2) | |
| Lenovo LOQ 15APH8 | |
| MSI Cyborg 15 A12VF | |
| Asus TUF A15 FA507 | |
| HP Victus 15 fa0020nr | |
| PCMark 10 / Digital Content Creation | |
| Lenovo Legion 5 15IAH7H 82RB | |
| Lenovo LOQ 15APH8 | |
| Average AMD Ryzen 7 7840HS, NVIDIA GeForce RTX 4050 Laptop GPU (11467 - 11785, n=2) | |
| Asus TUF A15 FA507 | |
| HP Victus 15 fa0020nr | |
| MSI Cyborg 15 A12VF | |
| Dell G15 5530 | |
| CrossMark / Overall | |
| Lenovo Legion 5 15IAH7H 82RB | |
| Dell G15 5530 | |
| MSI Cyborg 15 A12VF | |
| Average AMD Ryzen 7 7840HS, NVIDIA GeForce RTX 4050 Laptop GPU (1586 - 1749, n=2) | |
| HP Victus 15 fa0020nr | |
| Lenovo LOQ 15APH8 | |
| Asus TUF A15 FA507 | |
| CrossMark / Productivity | |
| Lenovo Legion 5 15IAH7H 82RB | |
| Dell G15 5530 | |
| MSI Cyborg 15 A12VF | |
| Average AMD Ryzen 7 7840HS, NVIDIA GeForce RTX 4050 Laptop GPU (1625 - 1677, n=2) | |
| Lenovo LOQ 15APH8 | |
| HP Victus 15 fa0020nr | |
| Asus TUF A15 FA507 | |
| CrossMark / Creativity | |
| Dell G15 5530 | |
| Lenovo Legion 5 15IAH7H 82RB | |
| MSI Cyborg 15 A12VF | |
| HP Victus 15 fa0020nr | |
| Average AMD Ryzen 7 7840HS, NVIDIA GeForce RTX 4050 Laptop GPU (1628 - 1930, n=2) | |
| Asus TUF A15 FA507 | |
| Lenovo LOQ 15APH8 | |
| CrossMark / Responsiveness | |
| Lenovo Legion 5 15IAH7H 82RB | |
| MSI Cyborg 15 A12VF | |
| Dell G15 5530 | |
| Average AMD Ryzen 7 7840HS, NVIDIA GeForce RTX 4050 Laptop GPU (1364 - 1480, n=2) | |
| HP Victus 15 fa0020nr | |
| Lenovo LOQ 15APH8 | |
| Asus TUF A15 FA507 | |
| PCMark 10 Score | 7709 points | |
Help | ||
| AIDA64 / Memory Copy | |
| Average AMD Ryzen 7 7840HS (30937 - 72158, n=21) | |
| Dell G15 5530 | |
| MSI Cyborg 15 A12VF | |
| Lenovo Legion 5 15IAH7H 82RB | |
| Asus TUF A15 FA507 | |
| HP Victus 15 fa0020nr | |
| Lenovo LOQ 15APH8 | |
| AIDA64 / Memory Read | |
| Dell G15 5530 | |
| MSI Cyborg 15 A12VF | |
| Lenovo Legion 5 15IAH7H 82RB | |
| Average AMD Ryzen 7 7840HS (30497 - 62147, n=21) | |
| Asus TUF A15 FA507 | |
| HP Victus 15 fa0020nr | |
| Lenovo LOQ 15APH8 | |
| AIDA64 / Memory Write | |
| Average AMD Ryzen 7 7840HS (34590 - 93323, n=21) | |
| Dell G15 5530 | |
| Lenovo Legion 5 15IAH7H 82RB | |
| MSI Cyborg 15 A12VF | |
| Asus TUF A15 FA507 | |
| HP Victus 15 fa0020nr | |
| Lenovo LOQ 15APH8 | |
| AIDA64 / Memory Latency | |
| Lenovo Legion 5 15IAH7H 82RB | |
| Lenovo LOQ 15APH8 | |
| Average AMD Ryzen 7 7840HS (85.1 - 112, n=21) | |
| MSI Cyborg 15 A12VF | |
| Dell G15 5530 | |
| Asus TUF A15 FA507 | |
| HP Victus 15 fa0020nr | |
* ... smaller is better
DPC 延迟
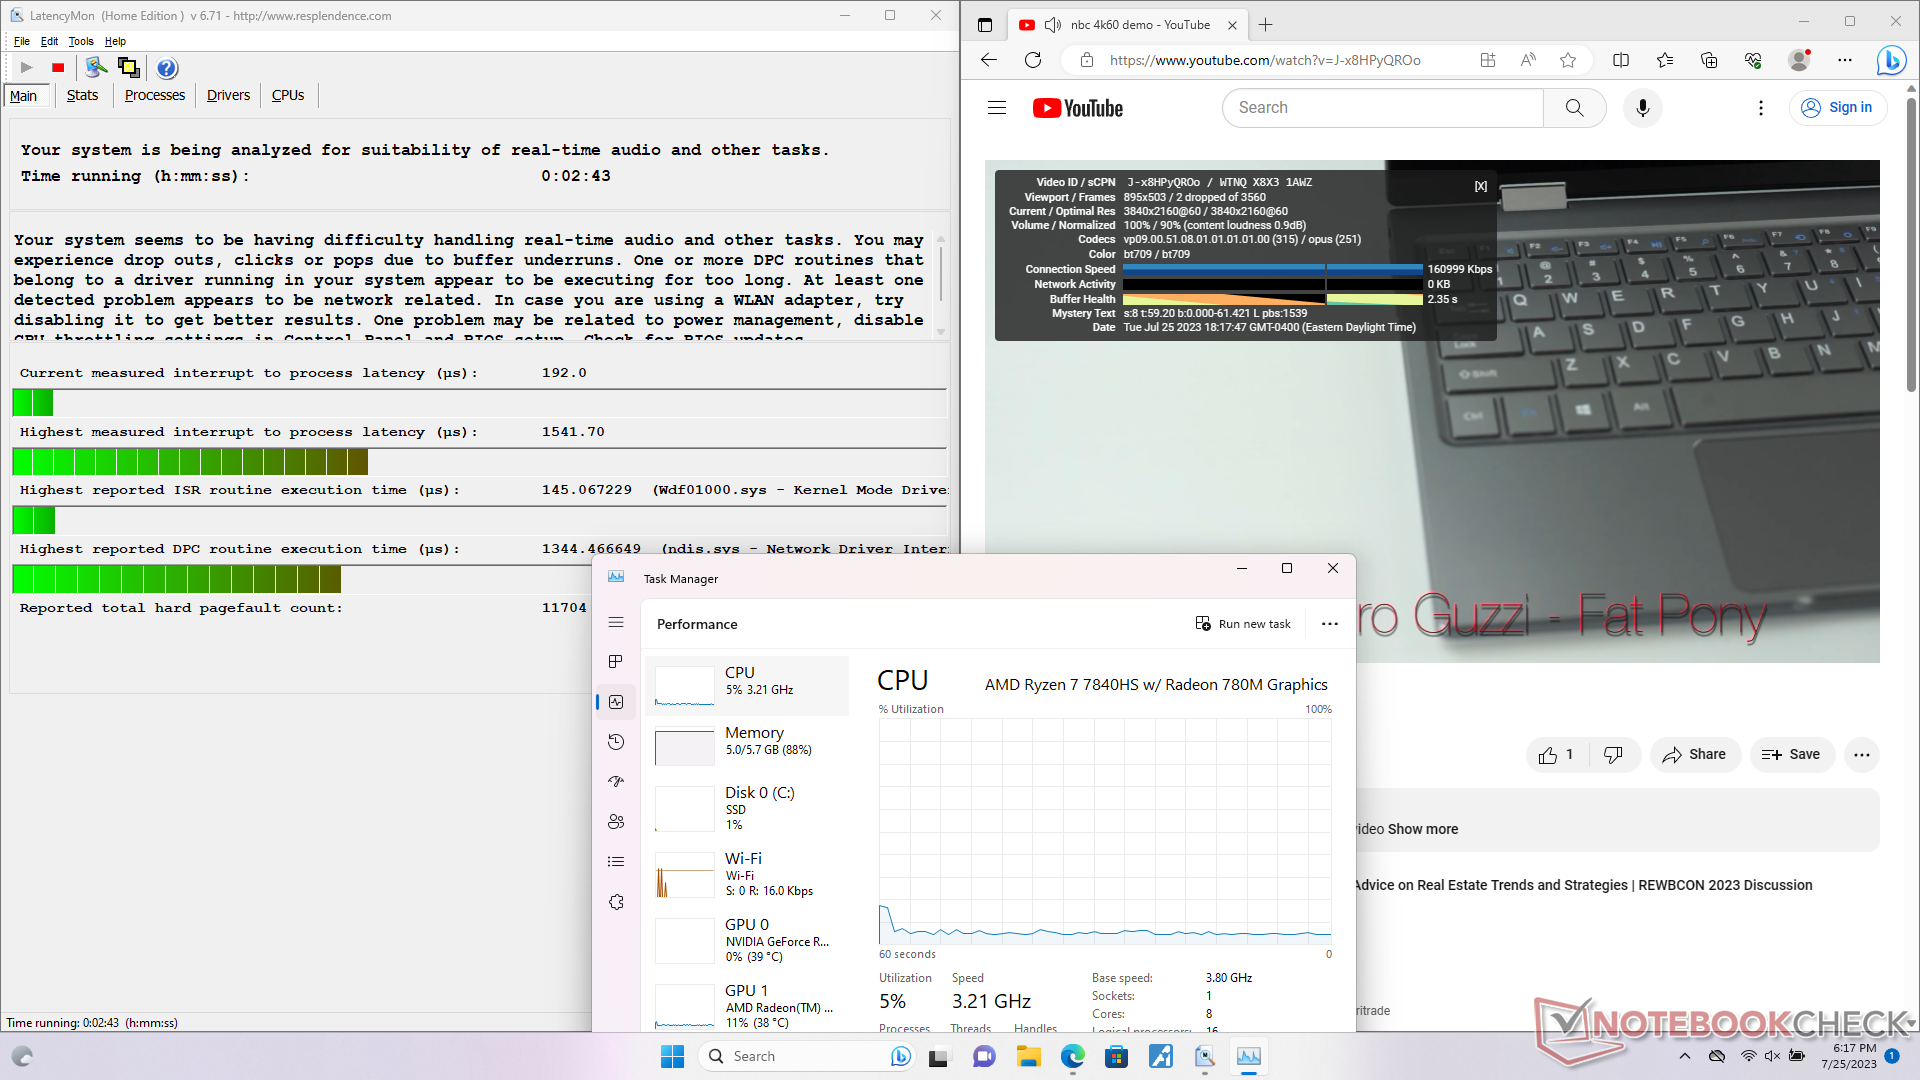
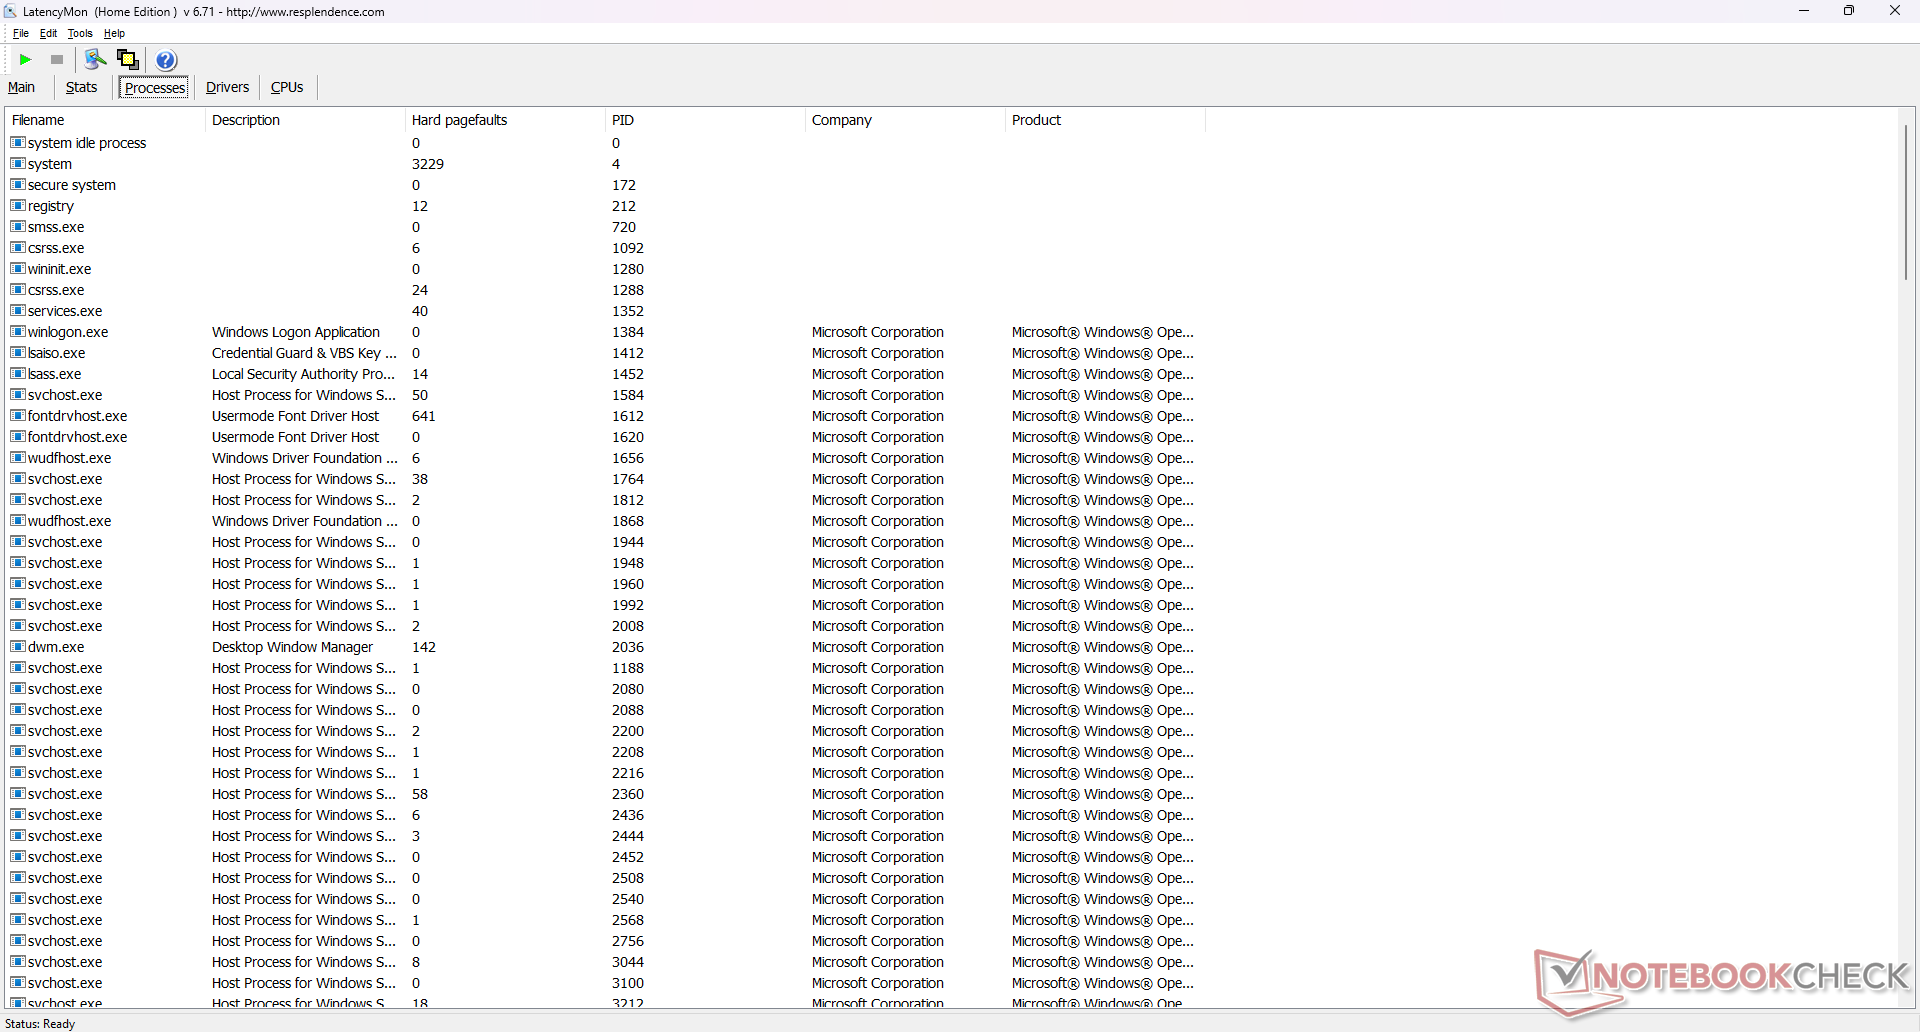
在打开我们主页的多个浏览器标签页时,LatencyMon 会显示轻微的 DPC 问题。60 FPS 的 4K 视频回放几乎完美,在一分钟的时间内仅出现 2 次丢帧。
| DPC Latencies / LatencyMon - interrupt to process latency (max), Web, Youtube, Prime95 | |
| Dell G15 5530 | |
| HP Victus 15 fa0020nr | |
| Lenovo LOQ 15APH8 | |
| MSI Cyborg 15 A12VF | |
| Lenovo Legion 5 15IAH7H 82RB | |
* ... smaller is better
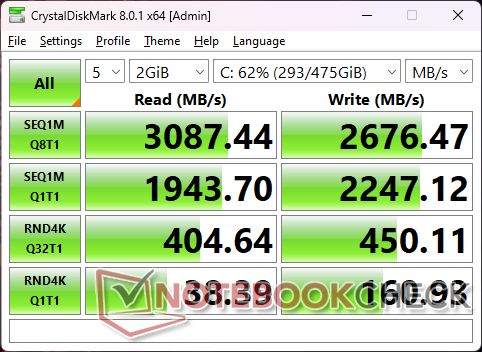
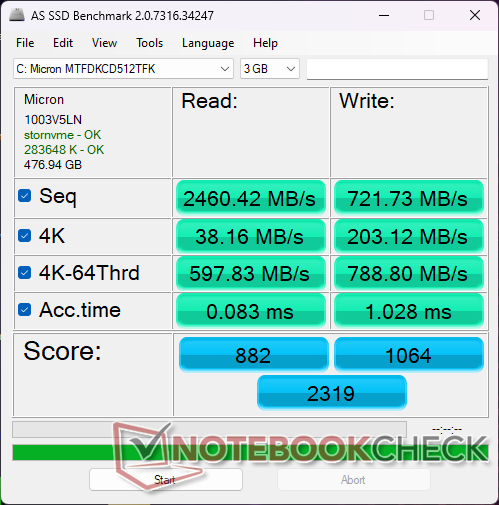
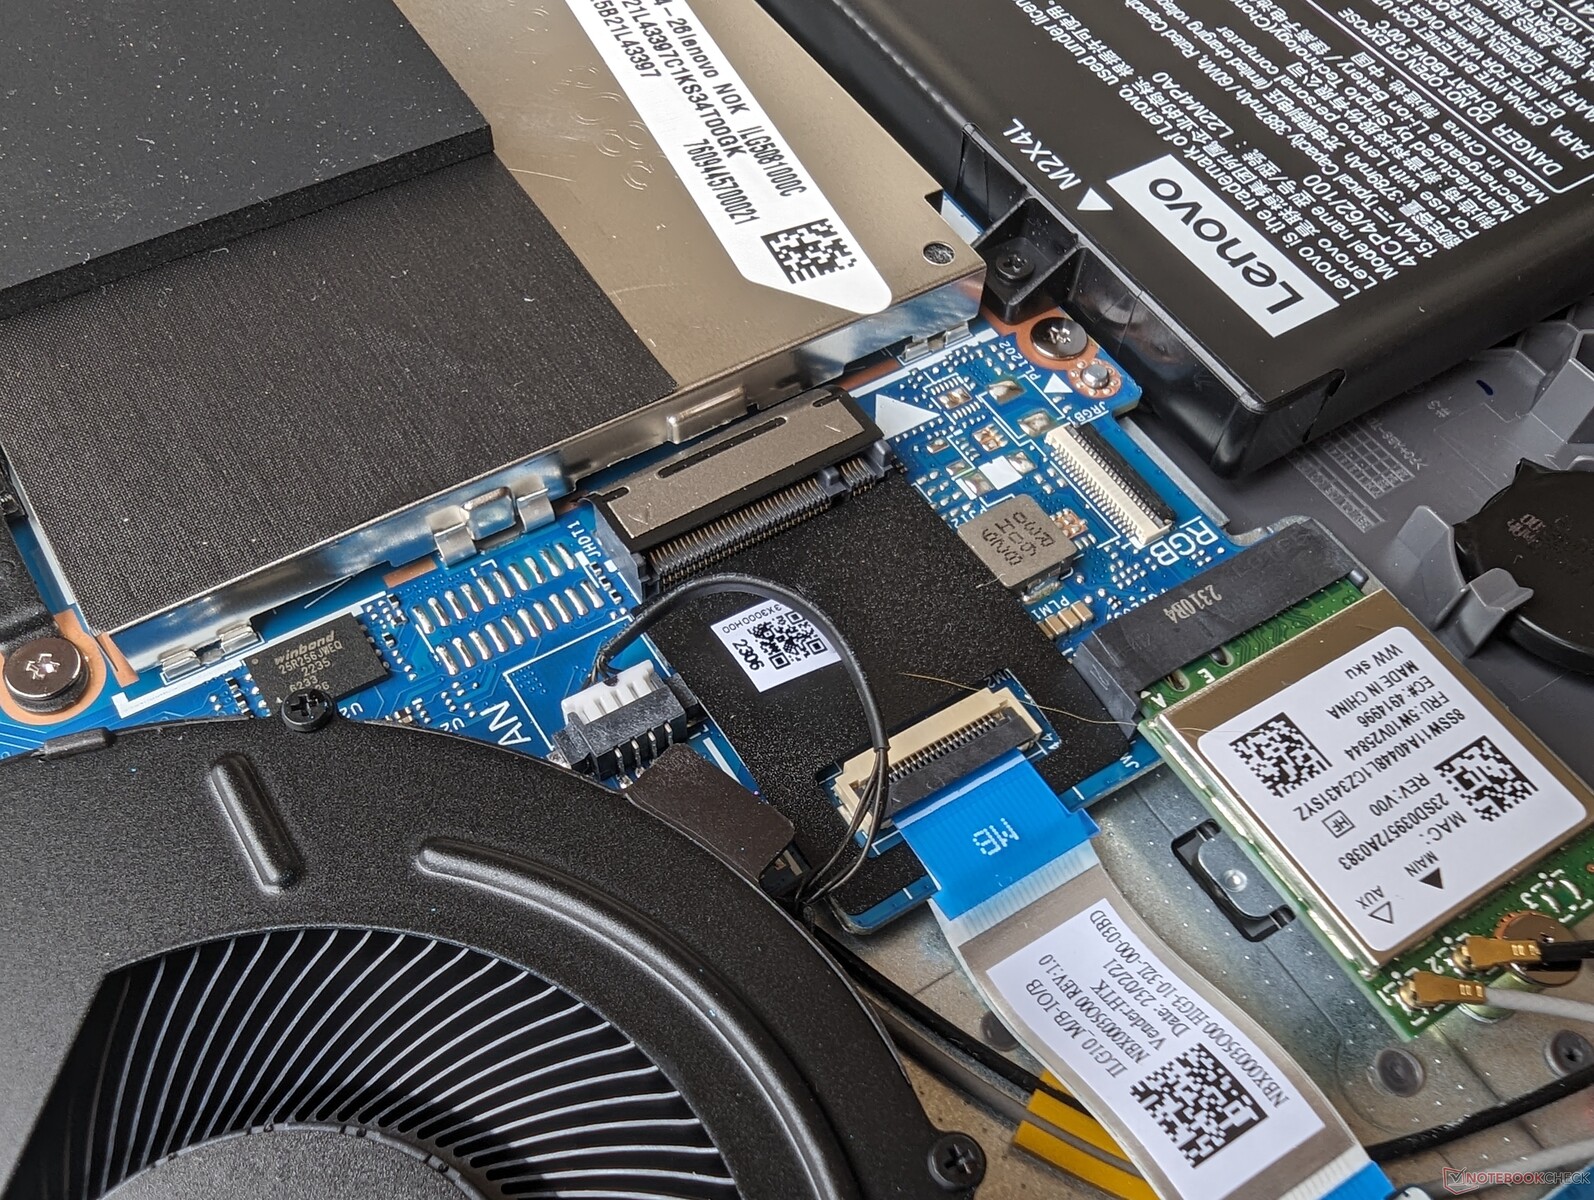
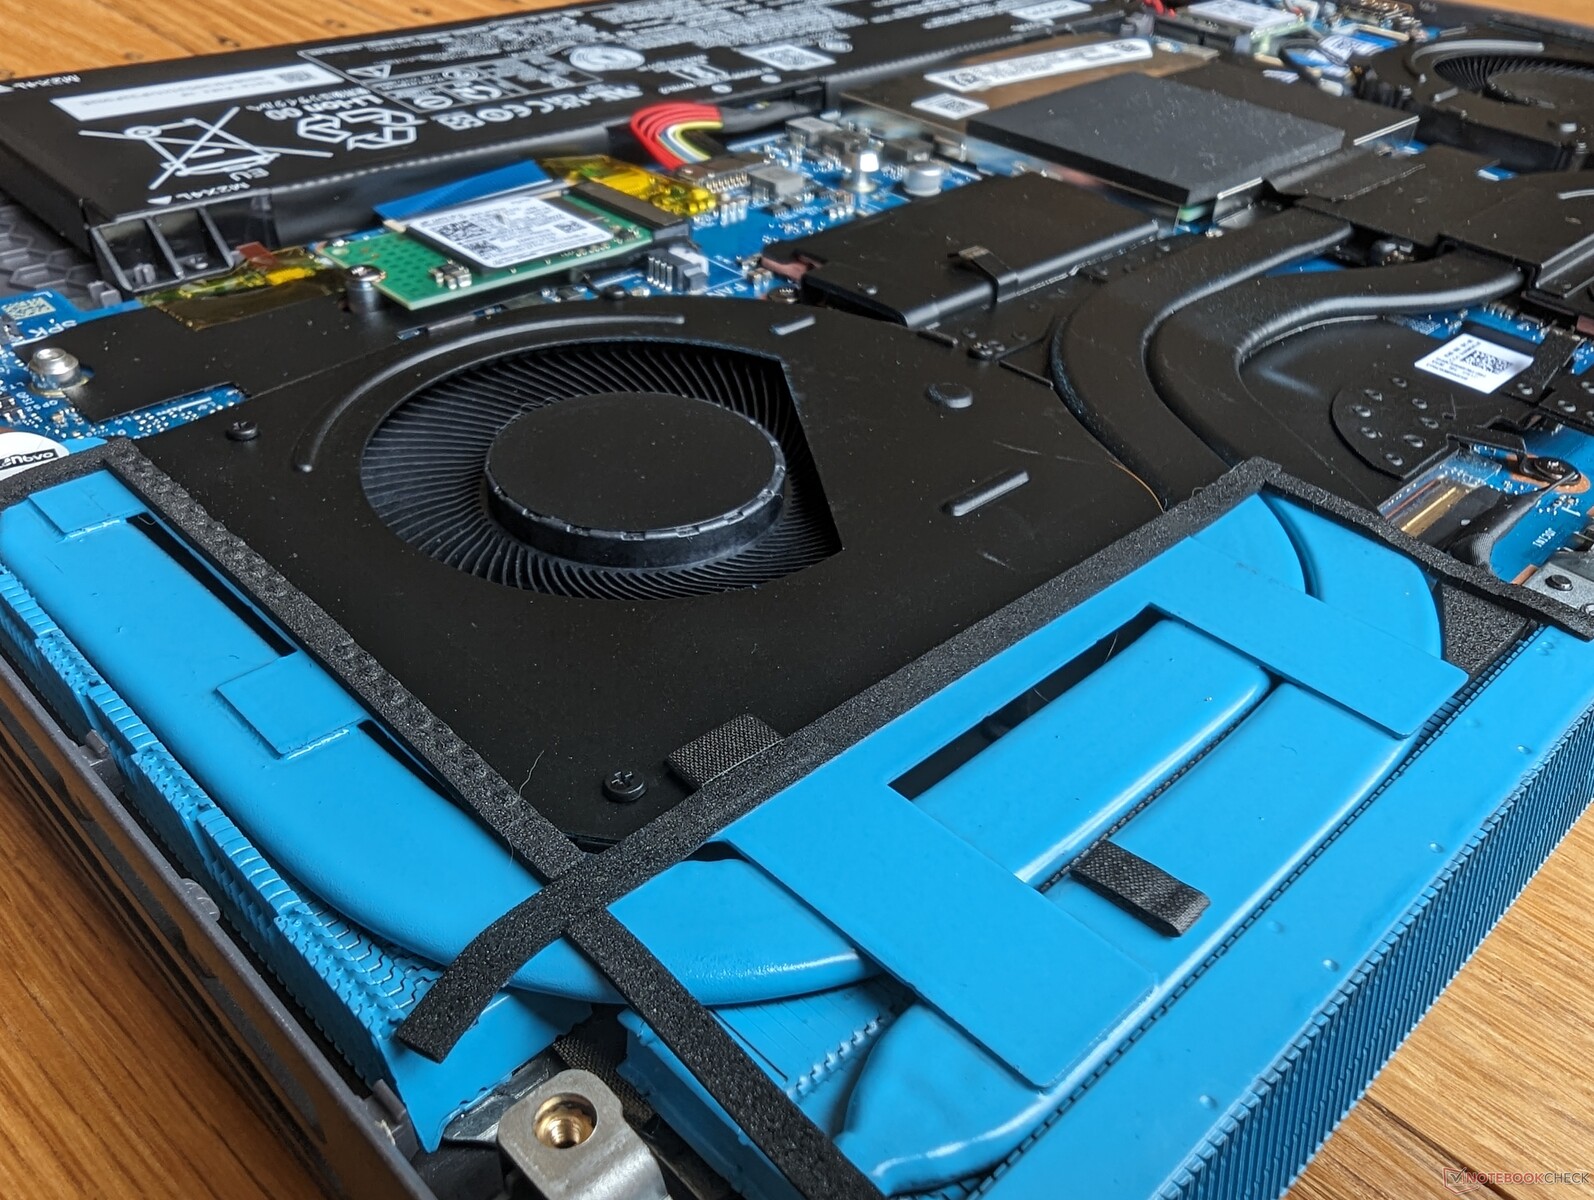
存储设备 - PCIe4 x4 NVMe 支持
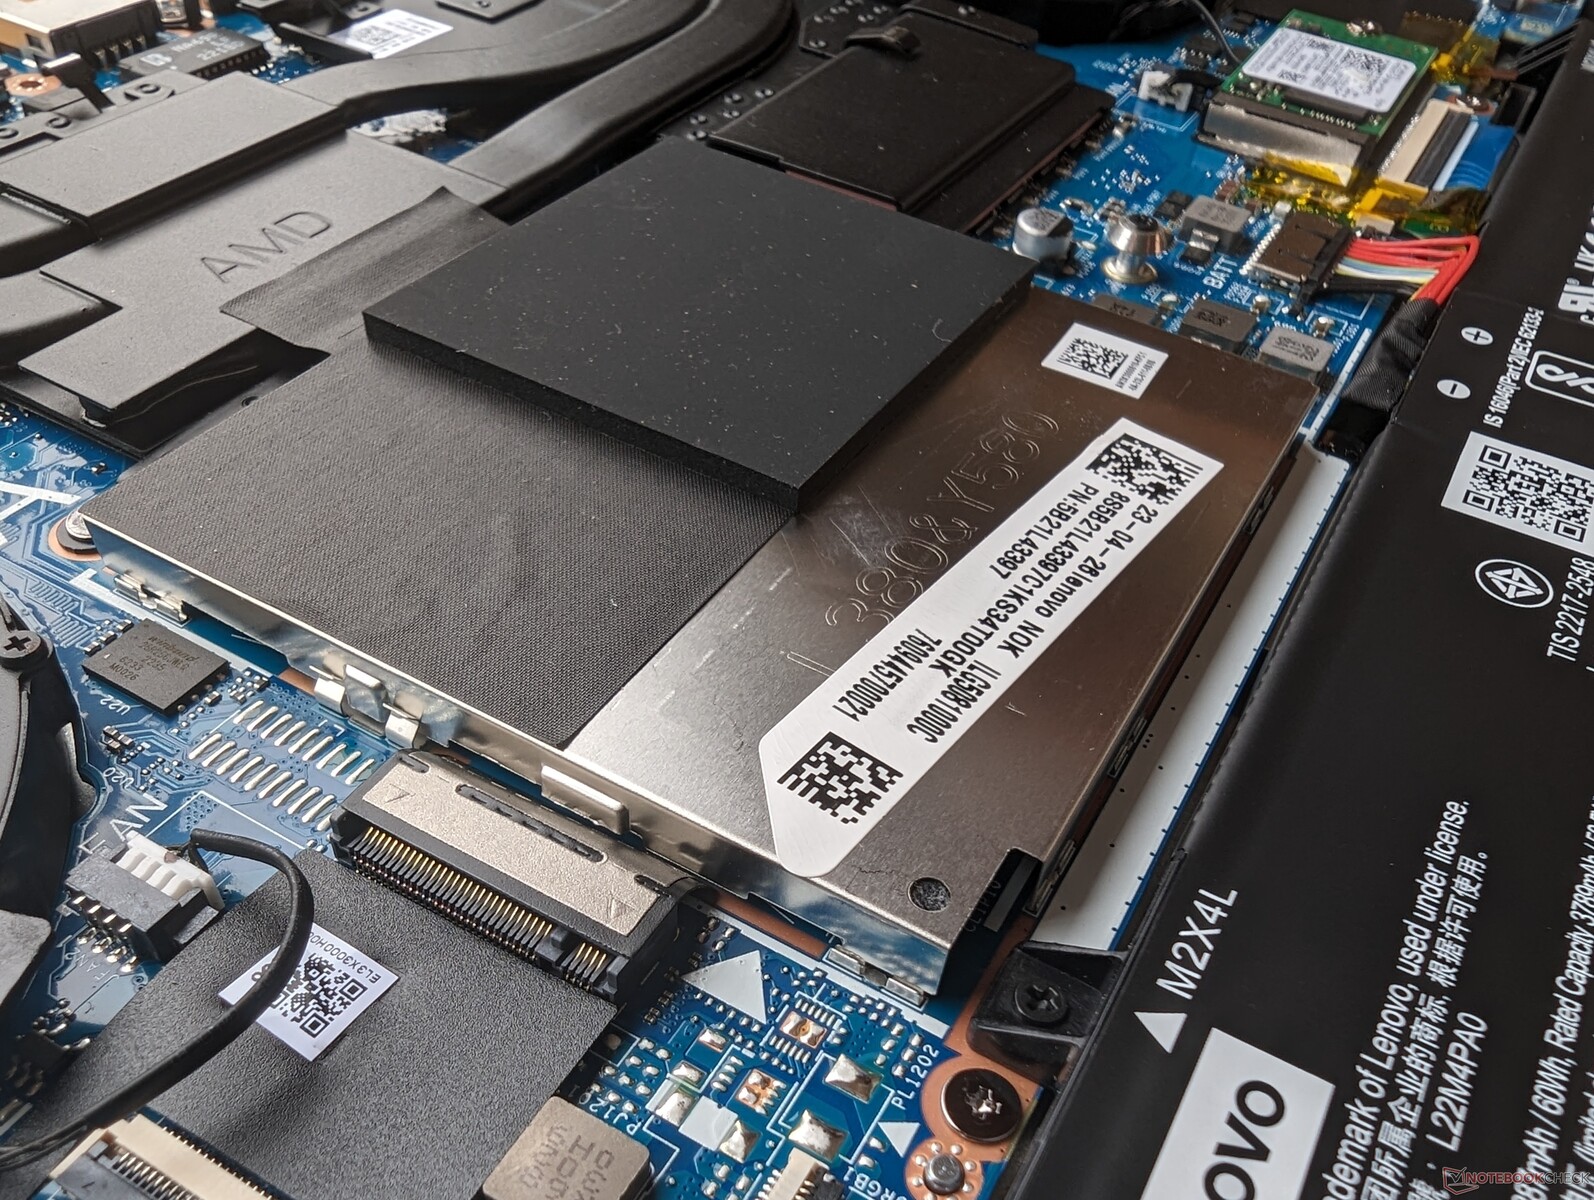
我们的设备配备了预算美光 2450 PCIe4 x4 NVMe 固态硬盘能够维持高达 2600 MB/s 的实际读取速率,而不会出现任何节流。最多支持两个内部固态硬盘,但第二个硬盘的长度必须为 42 毫米,如下图所示。
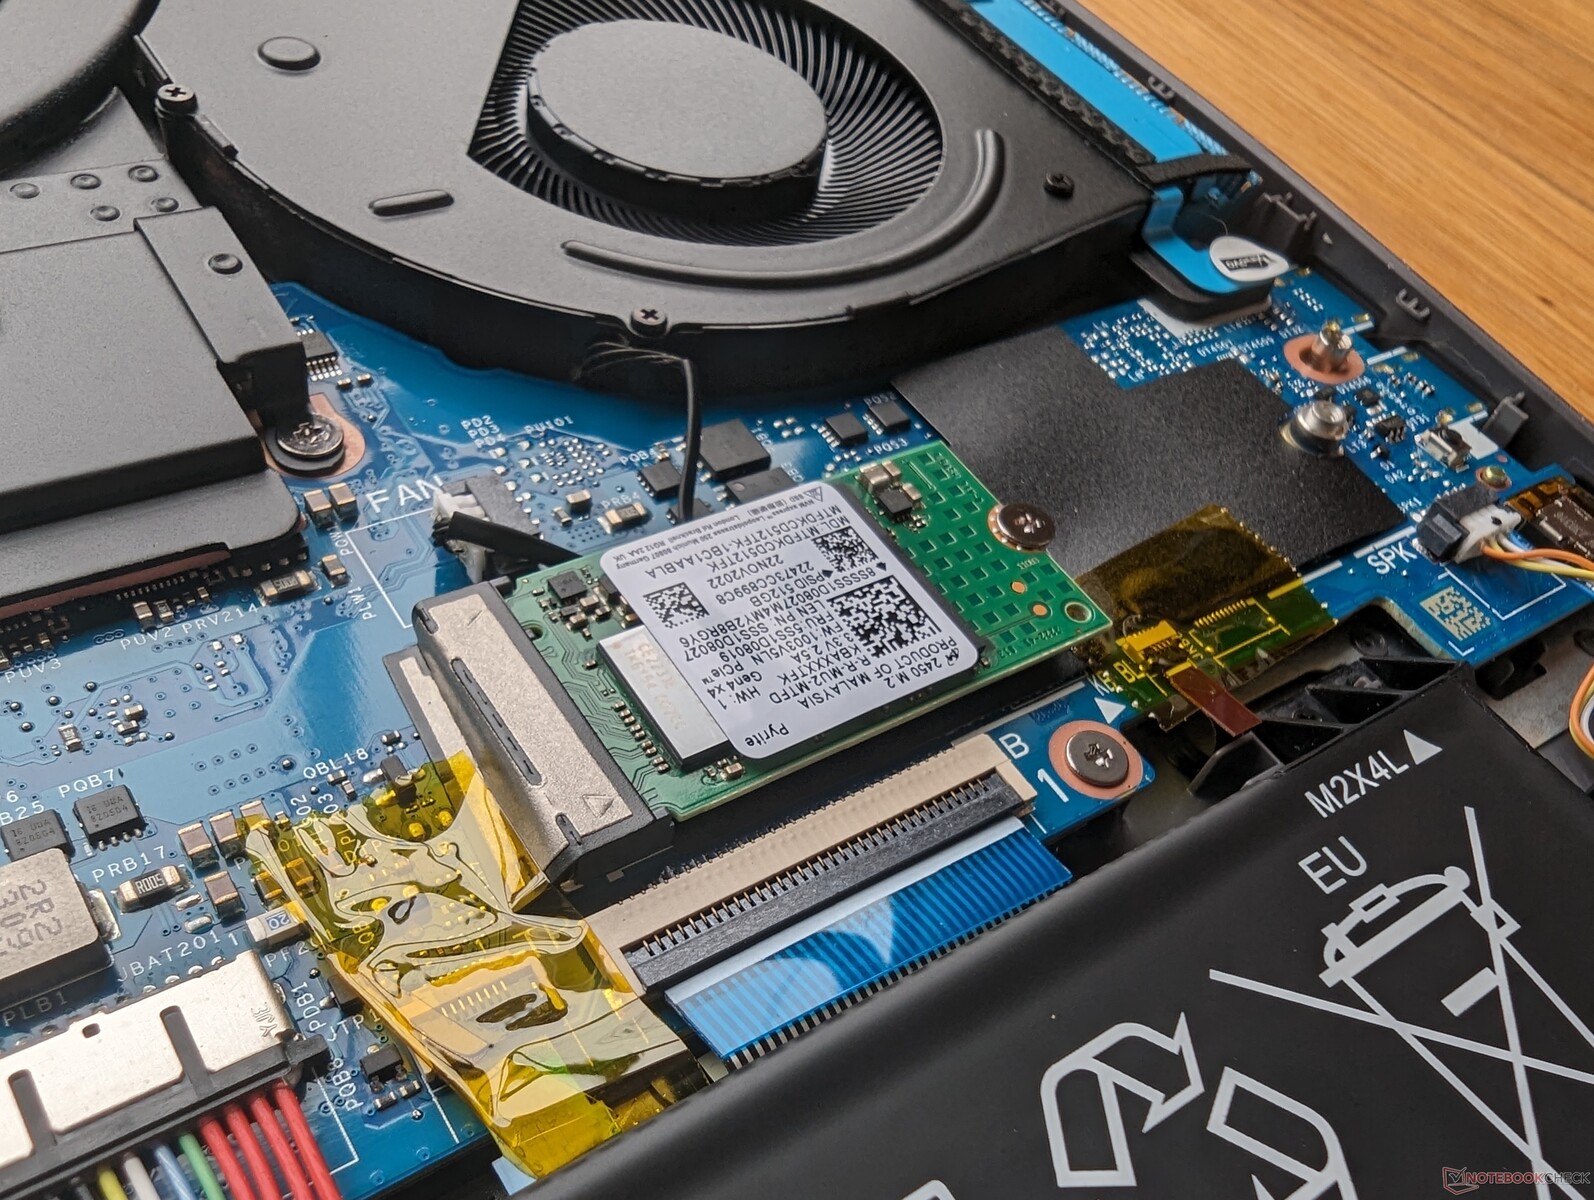

| Drive Performance rating - Percent | |
| Lenovo Legion 5 15IAH7H 82RB | |
| HP Victus 15 fa0020nr | |
| MSI Cyborg 15 A12VF | |
| Asus TUF A15 FA507 | |
| Dell G15 5530 | |
| Lenovo LOQ 15APH8 | |
* ... smaller is better
Disk Throttling: DiskSpd Read Loop, Queue Depth 8
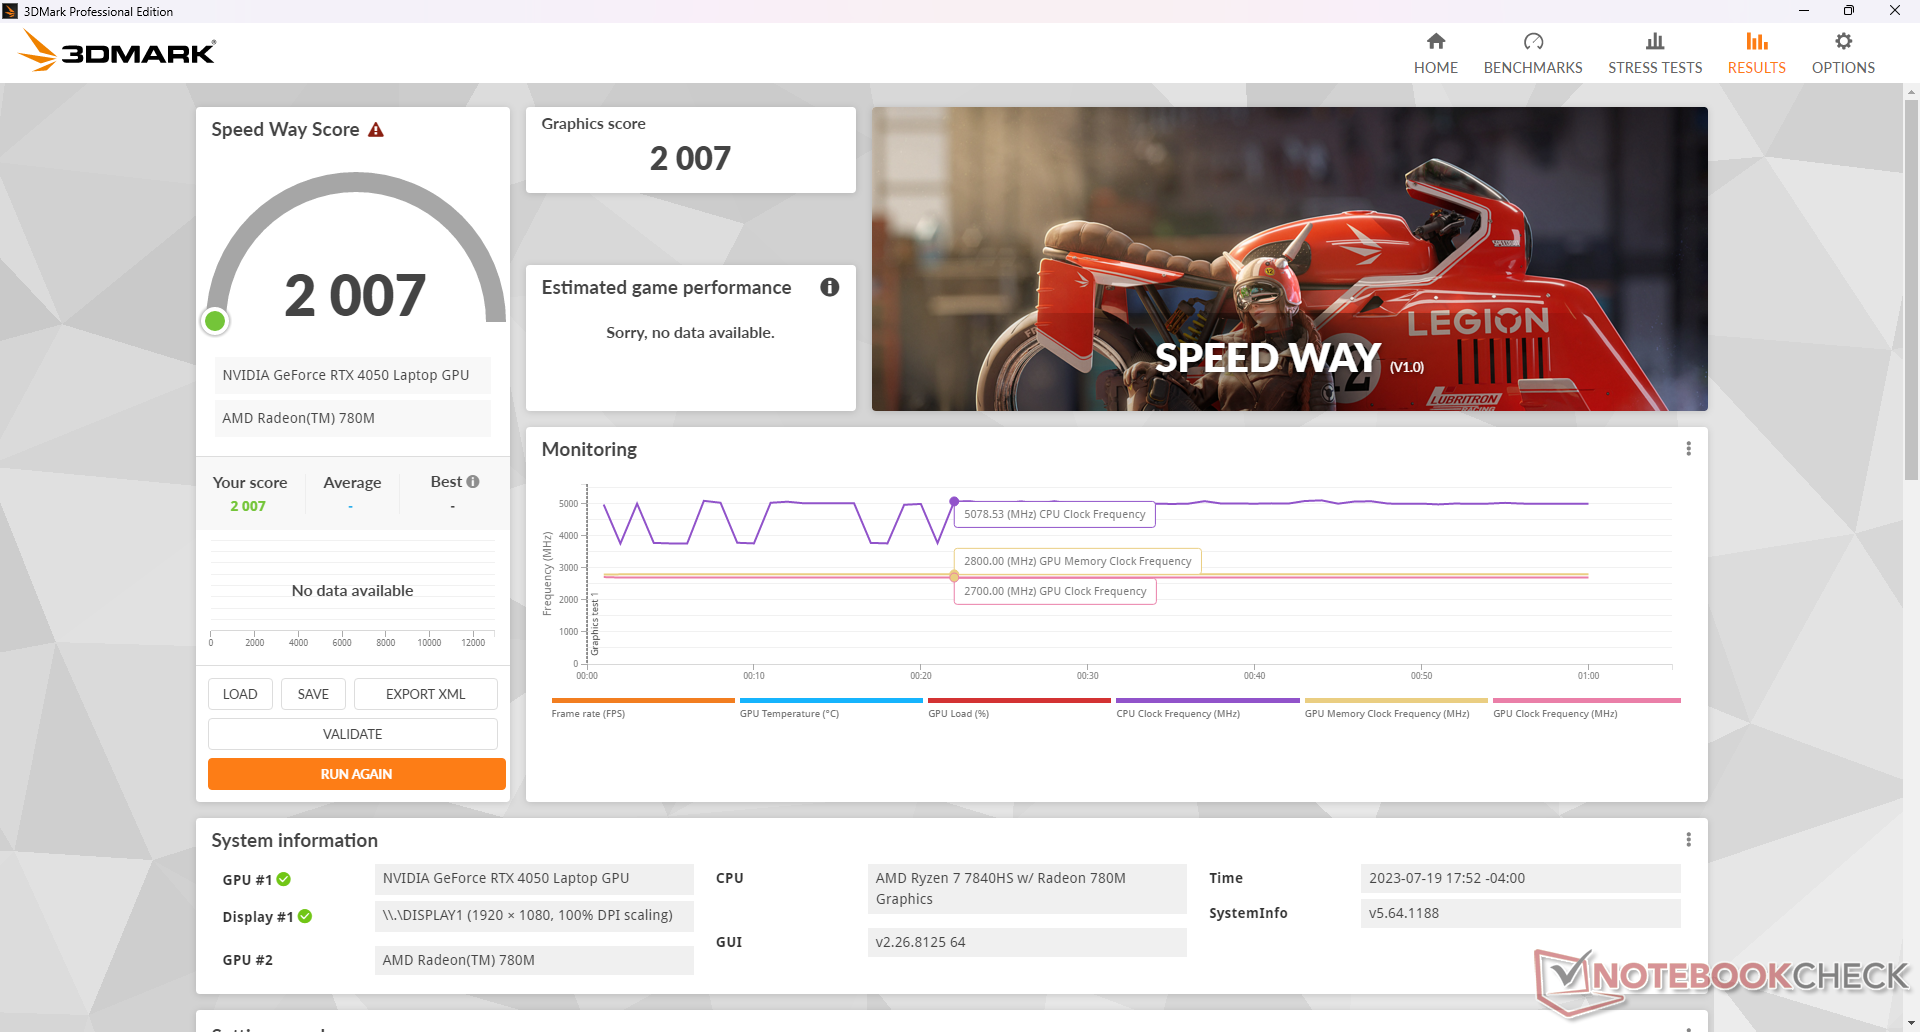
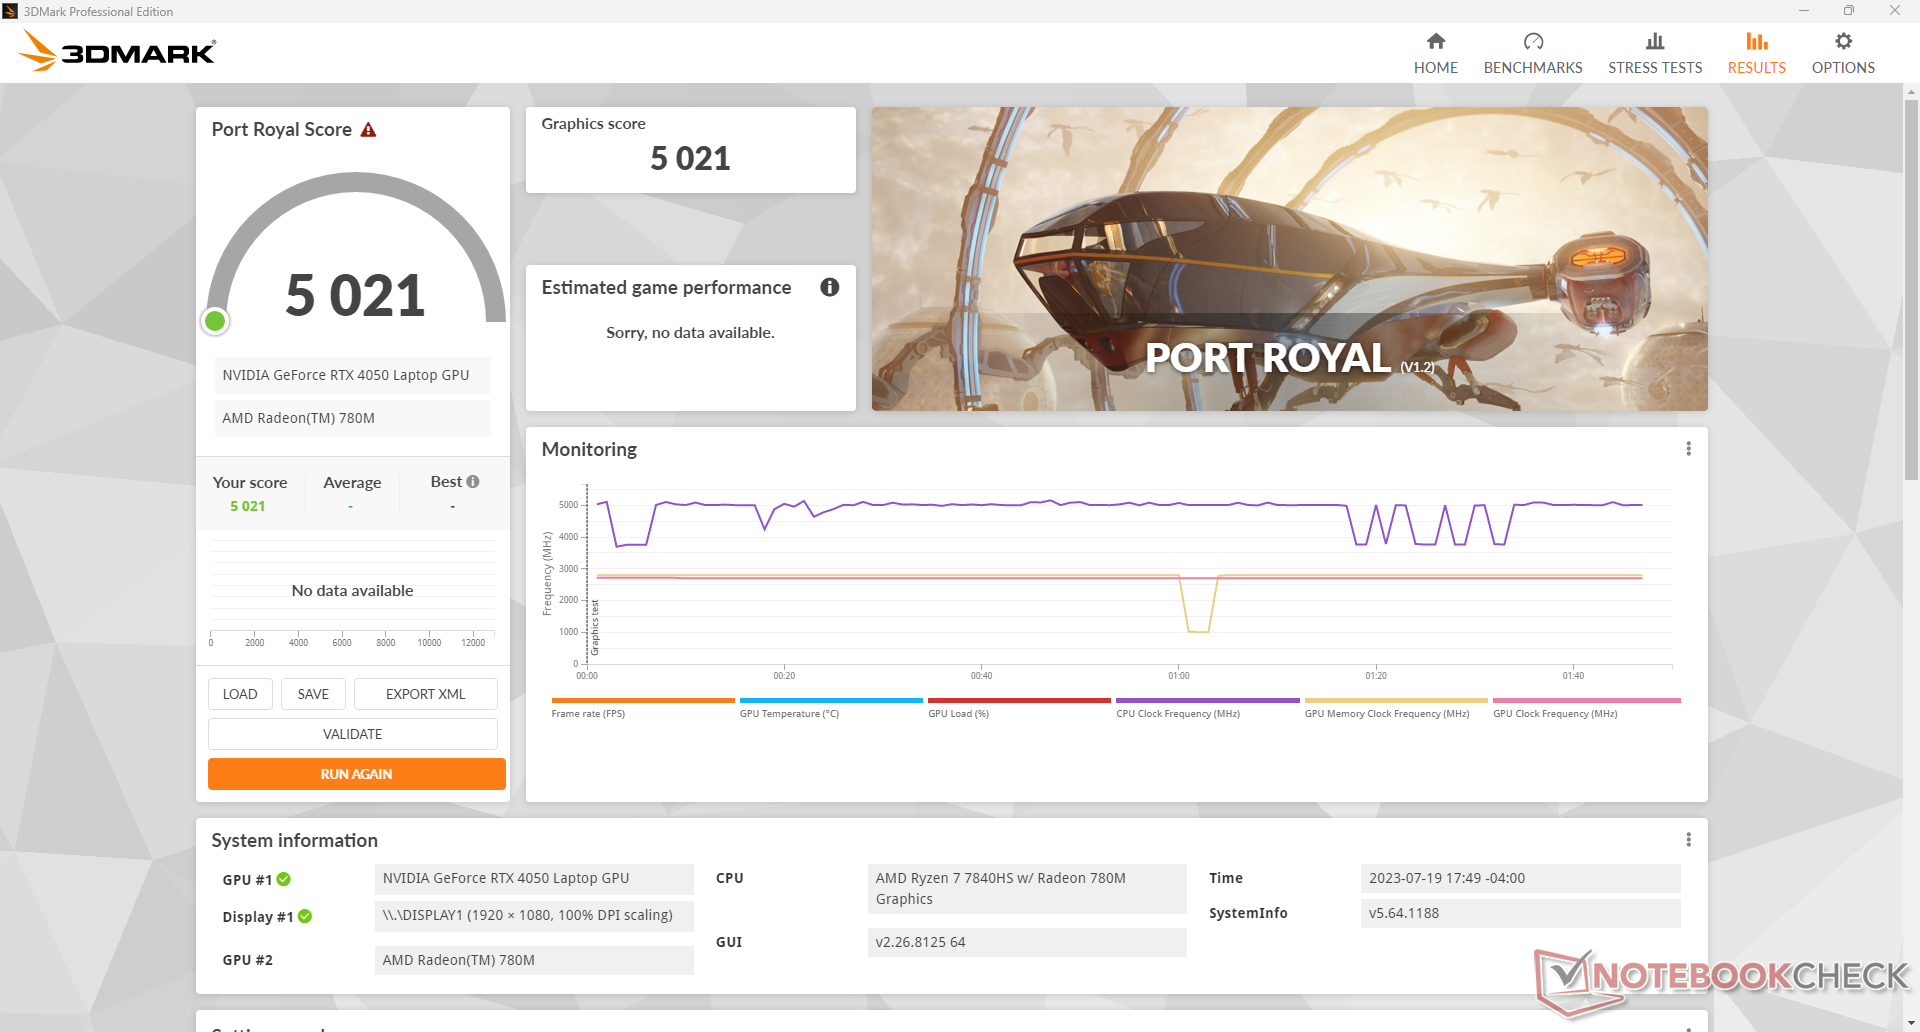
图形处理器性能
图形性能非常出色,3DMark 分数比我们数据库中配备相同 RTX 4050 的普通笔记本电脑高出大约 10%。 GeForce RTX 4050图形处理器。原始性能与 移动 RTX 3060 不出所料。
降级到 RTX 3050配置会降低高达 45% 的 GPU 性能,而升级到 RTX 4060则会将性能提升 15% 至 20%。对于预算有限的玩家,我们建议坚持使用 RTX 4050 或 RTX 4060 选项。
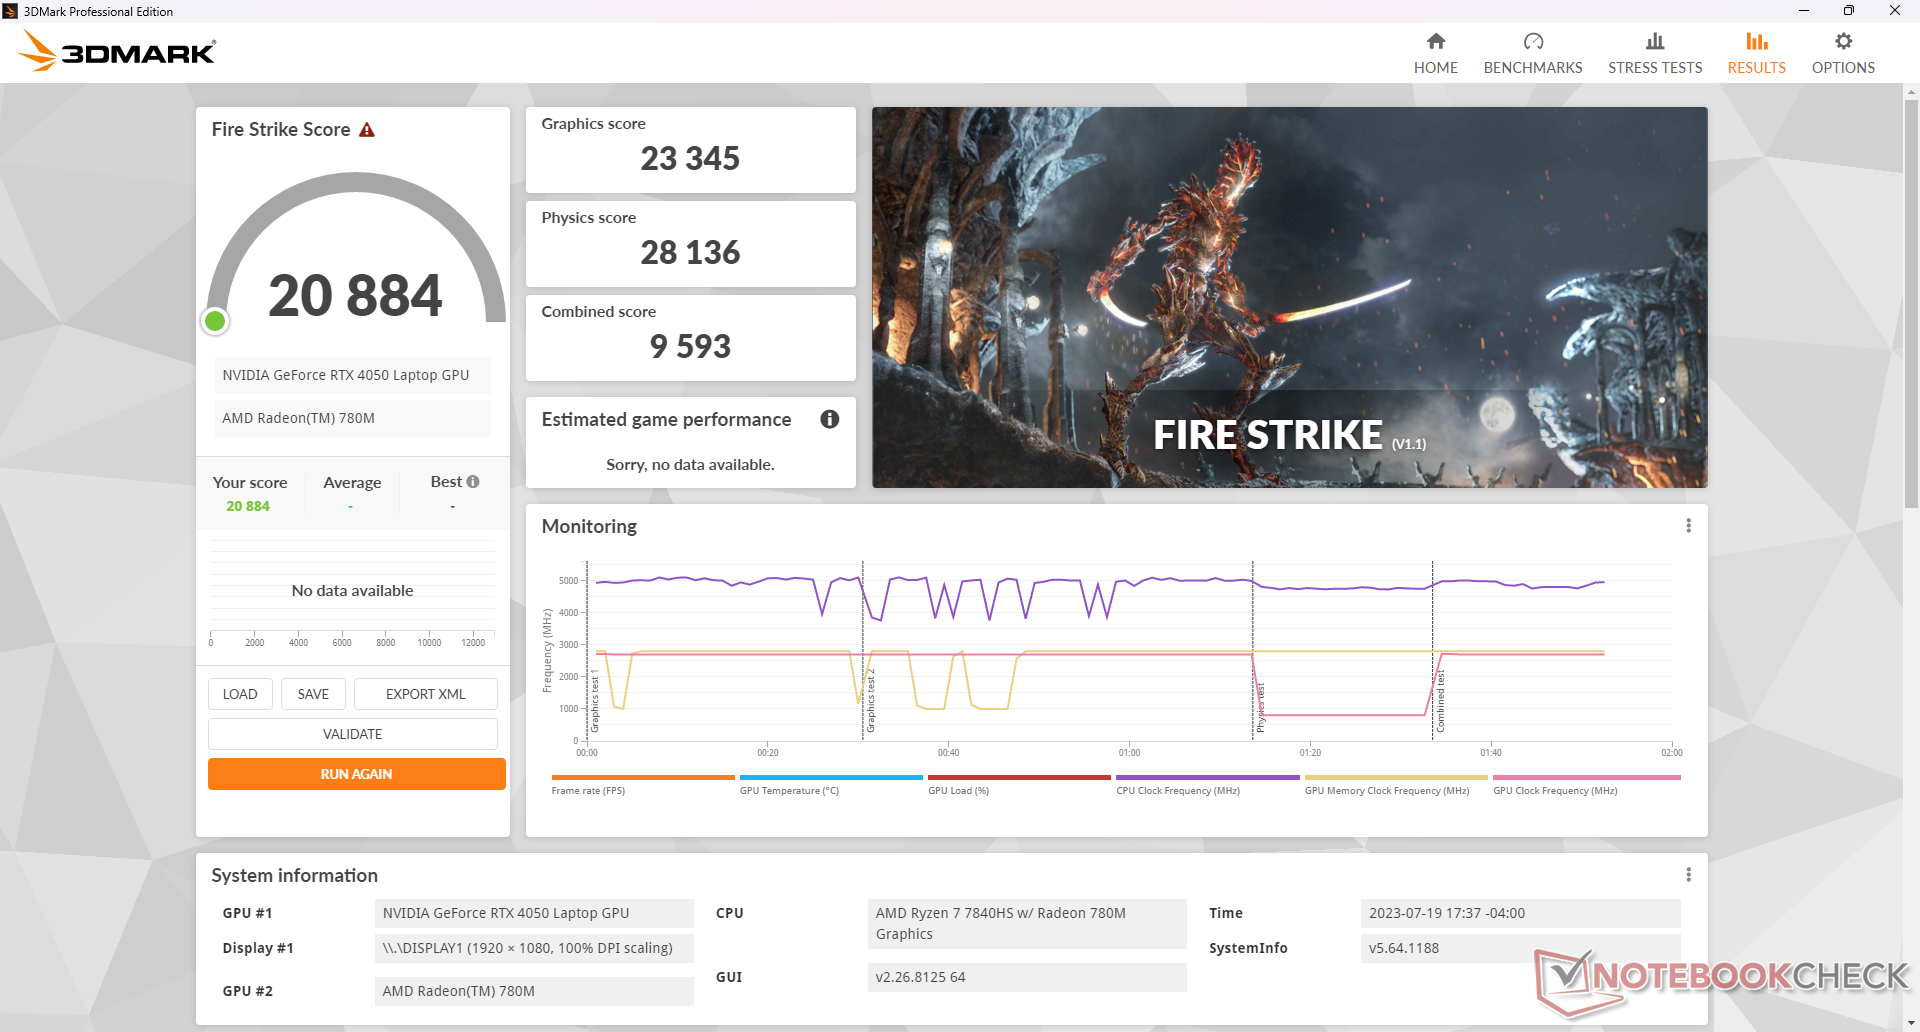
使用电池供电会降低性能。Fire Strike 测试使用电池时,物理和图形分数分别为 25672 分和 16335 分,而使用电源时分别为 28136 分和 23345 分。
如下表所示,在平衡模式而非性能模式下运行系统会对性能产生轻微影响,如下表Fire Strike 结果所示。
| 电源配置文件 | 图形分数 | 物理分数 | 综合得分 |
| 平衡模式 | 22598 (-3%) | 25910 (-8%) | 9507 (-1%) |
| 成绩 | 23345 | 28136 | 9593 |
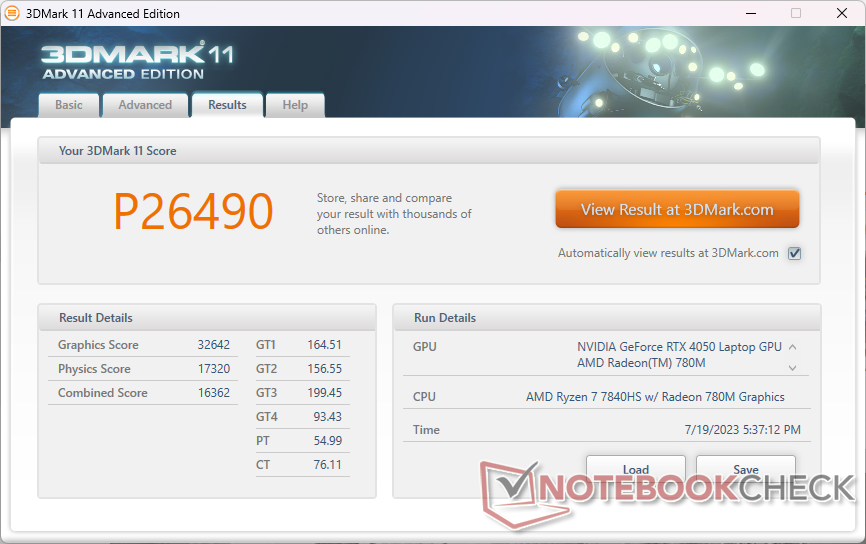
| 3DMark 11 Performance | 26490 points | |
| 3DMark Fire Strike Score | 20884 points | |
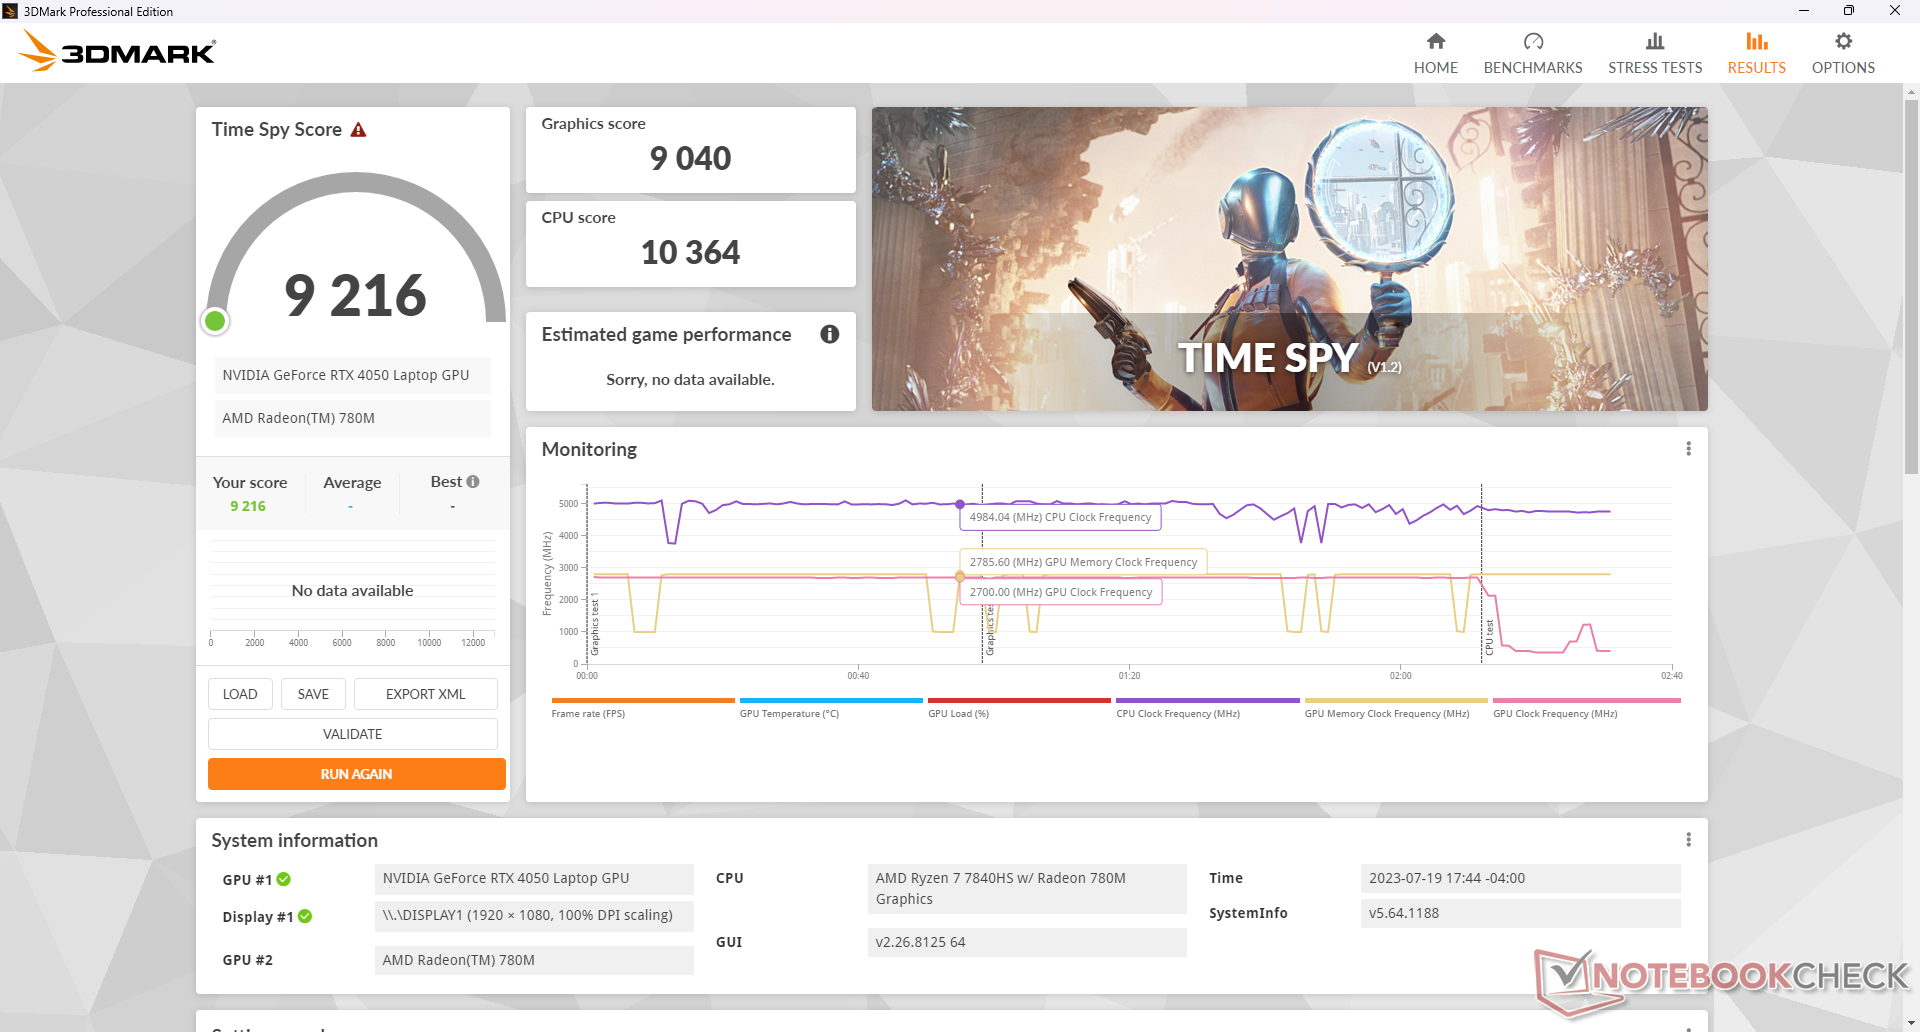
| 3DMark Time Spy Score | 9216 points | |
Help | ||
* ... smaller is better
游戏性能
令人惊讶的是,8 GB 系统内存对系统的游戏性能几乎没有影响。事实上,与配备相同 RTX 4050 GPU 的其他笔记本电脑相比,帧率在大多数情况下都达到了我们预期的水平,甚至还要稍快一些。但也有少数例外情况,由于内存限制,某些超图形设置会导致游戏崩溃,包括《F1 22》和《Returnal》。
Witcher 3 FPS Chart
| low | med. | high | ultra | |
|---|---|---|---|---|
| GTA V (2015) | 163.6 | 156 | 132.9 | 78.4 |
| The Witcher 3 (2015) | 286.5 | 251.2 | 165 | 83.8 |
| Dota 2 Reborn (2015) | 148 | 134.9 | 130 | 123.9 |
| Final Fantasy XV Benchmark (2018) | 166.8 | 122.4 | 86.1 | |
| X-Plane 11.11 (2018) | 113.2 | 101.4 | 81.3 | |
| Strange Brigade (2018) | 309 | 214 | 177 | 156.6 |
| Cyberpunk 2077 1.6 (2022) | 117 | 106.4 | 82.2 | 70.1 |
| Tiny Tina's Wonderlands (2022) | 169.2 | 148.8 | 99.5 | 77.3 |
| F1 22 (2022) | 191.2 | 184.3 | 163.2 | |
| Returnal (2023) | 66 | 66 | 63 | 53 |
排放量
系统噪音 - Loud Gamer
在轻度浏览或流媒体播放时,风扇噪音往往稳定在 25 dB(A),而安静的背景噪音为 23 dB(A),这在一般的办公室或房间环境中基本听不到。运行Witcher 3在性能模式下运行时,噪音可高达 46 dB(A),而在平衡模式下玩游戏时,噪音仅为 44 dB(A),略低于前者。不过,如上所述,后者会对性能造成一定影响。
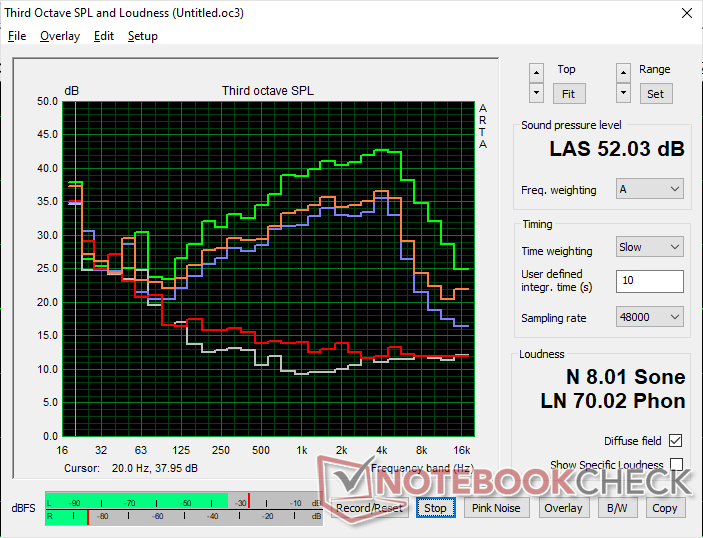
如果 CPU 和 GPU 的使用率达到 100%,风扇噪音可高达 52 dB(A),几乎与 Cyborg 15 的噪音相当。生化 15.
Noise level
| Idle |
| 23.1 / 23.1 / 25.2 dB(A) |
| Load |
| 44.3 / 52 dB(A) |
 | ||
30 dB silent 40 dB(A) audible 50 dB(A) loud |
||
min: | ||
| Lenovo LOQ 15APH8 GeForce RTX 4050 Laptop GPU, R7 7840HS, Micron 2450 512GB MTFDKCD512TFK | Lenovo Legion 5 15IAH7H 82RB GeForce RTX 3060 Laptop GPU, i7-12700H | Dell G15 5530 GeForce RTX 4060 Laptop GPU, i7-13650HX, SSTC CL4-3D512-Q11 | Asus TUF A15 FA507 GeForce RTX 4050 Laptop GPU, R7 7735HS, Micron 2400 MTFDKBA512QFM | MSI Cyborg 15 A12VF GeForce RTX 4060 Laptop GPU, i7-12650H, Samsung PM9B1 1024GB MZVL41T0HBLB | HP Victus 15 fa0020nr GeForce RTX 3050 Ti Laptop GPU, i7-12700H, Samsung PM9A1 MZVL2512HCJQ | |
|---|---|---|---|---|---|---|
| Noise | 1% | 2% | 9% | -30% | -1% | |
| off / environment * (dB) | 23.1 | 23.3 -1% | 20.41 12% | 23.3 -1% | 27 -17% | 24.8 -7% |
| Idle Minimum * (dB) | 23.1 | 23.5 -2% | 26.85 -16% | 23.3 -1% | 27 -17% | 26.2 -13% |
| Idle Average * (dB) | 23.1 | 23.5 -2% | 26.85 -16% | 23.3 -1% | 37.5 -62% | 29.2 -26% |
| Idle Maximum * (dB) | 25.2 | 26.8 -6% | 26.85 -7% | 23.3 8% | 38 -51% | 29.4 -17% |
| Load Average * (dB) | 44.3 | 29.3 34% | 27.65 38% | 29.6 33% | 56.3 -27% | 29.9 33% |
| Witcher 3 ultra * (dB) | 45.8 | 51.4 -12% | 47.9 -5% | 43 6% | 41.1 10% | |
| Load Maximum * (dB) | 52 | 53 -2% | 47.86 8% | 43 17% | 56.3 -8% | 45.5 12% |
* ... smaller is better
温度
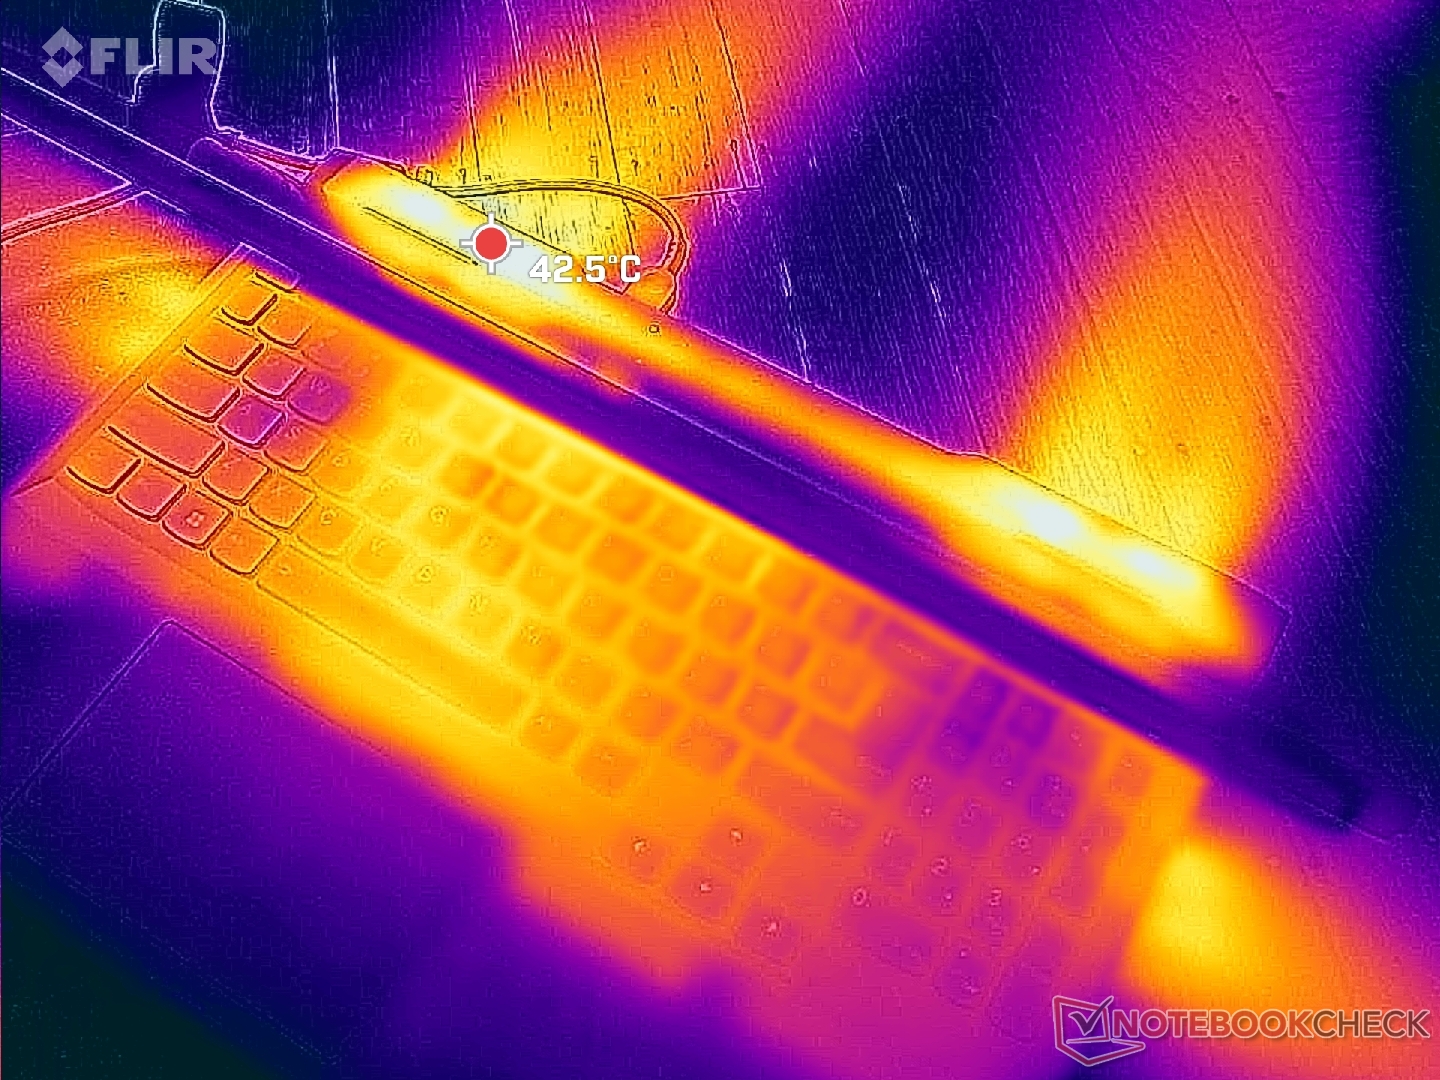
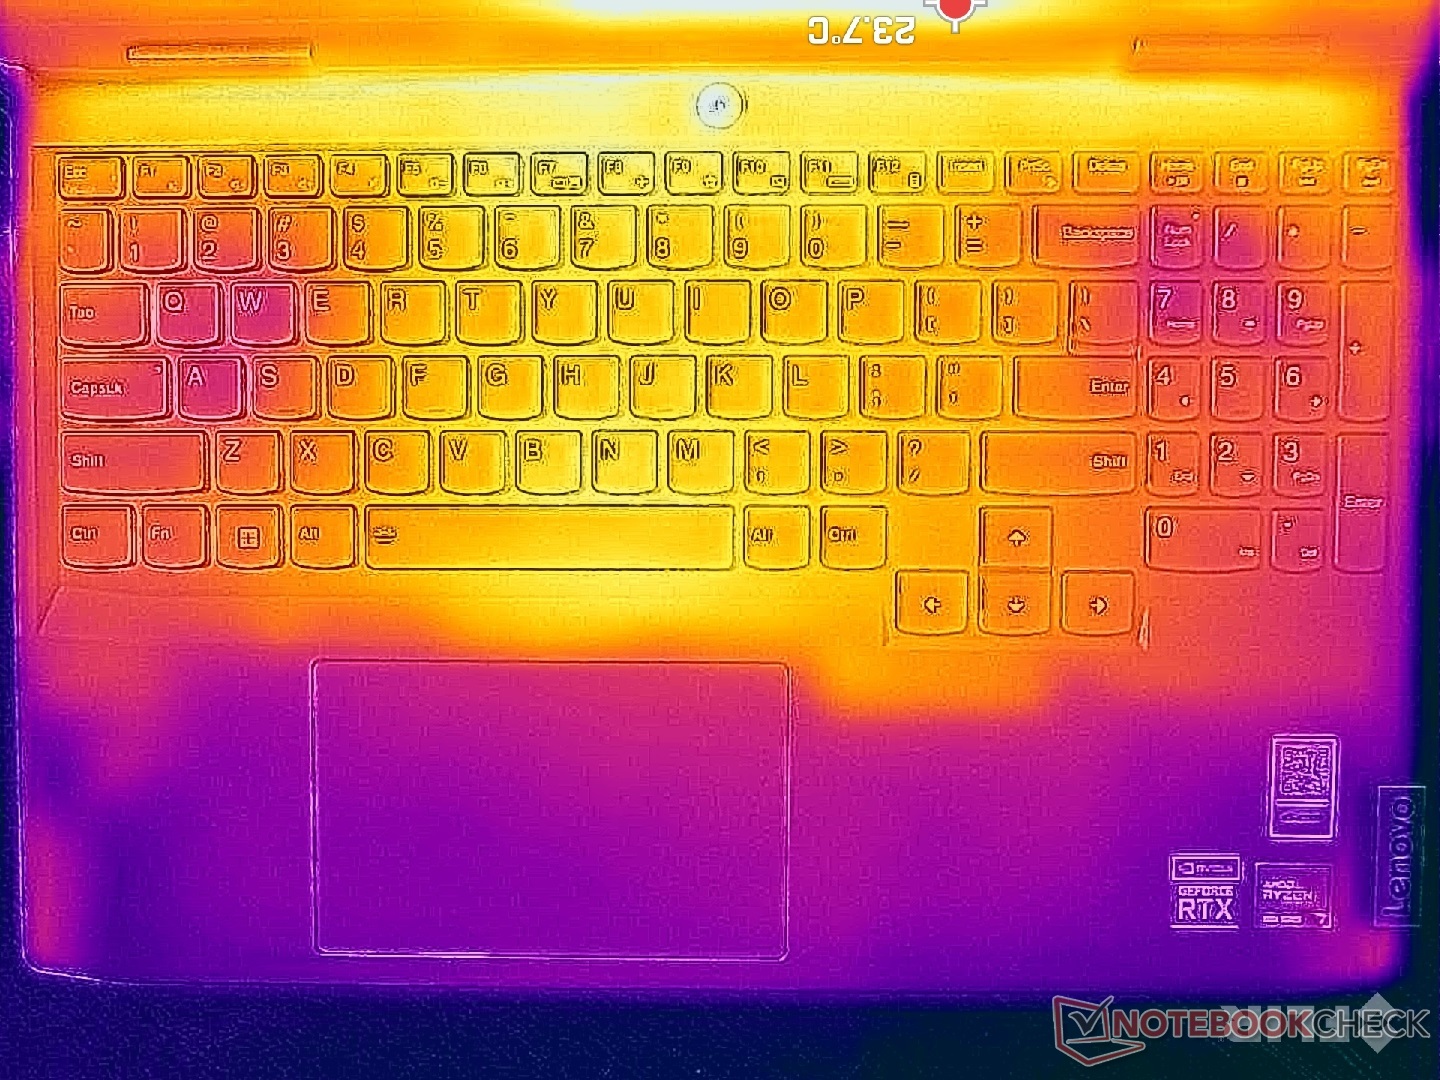
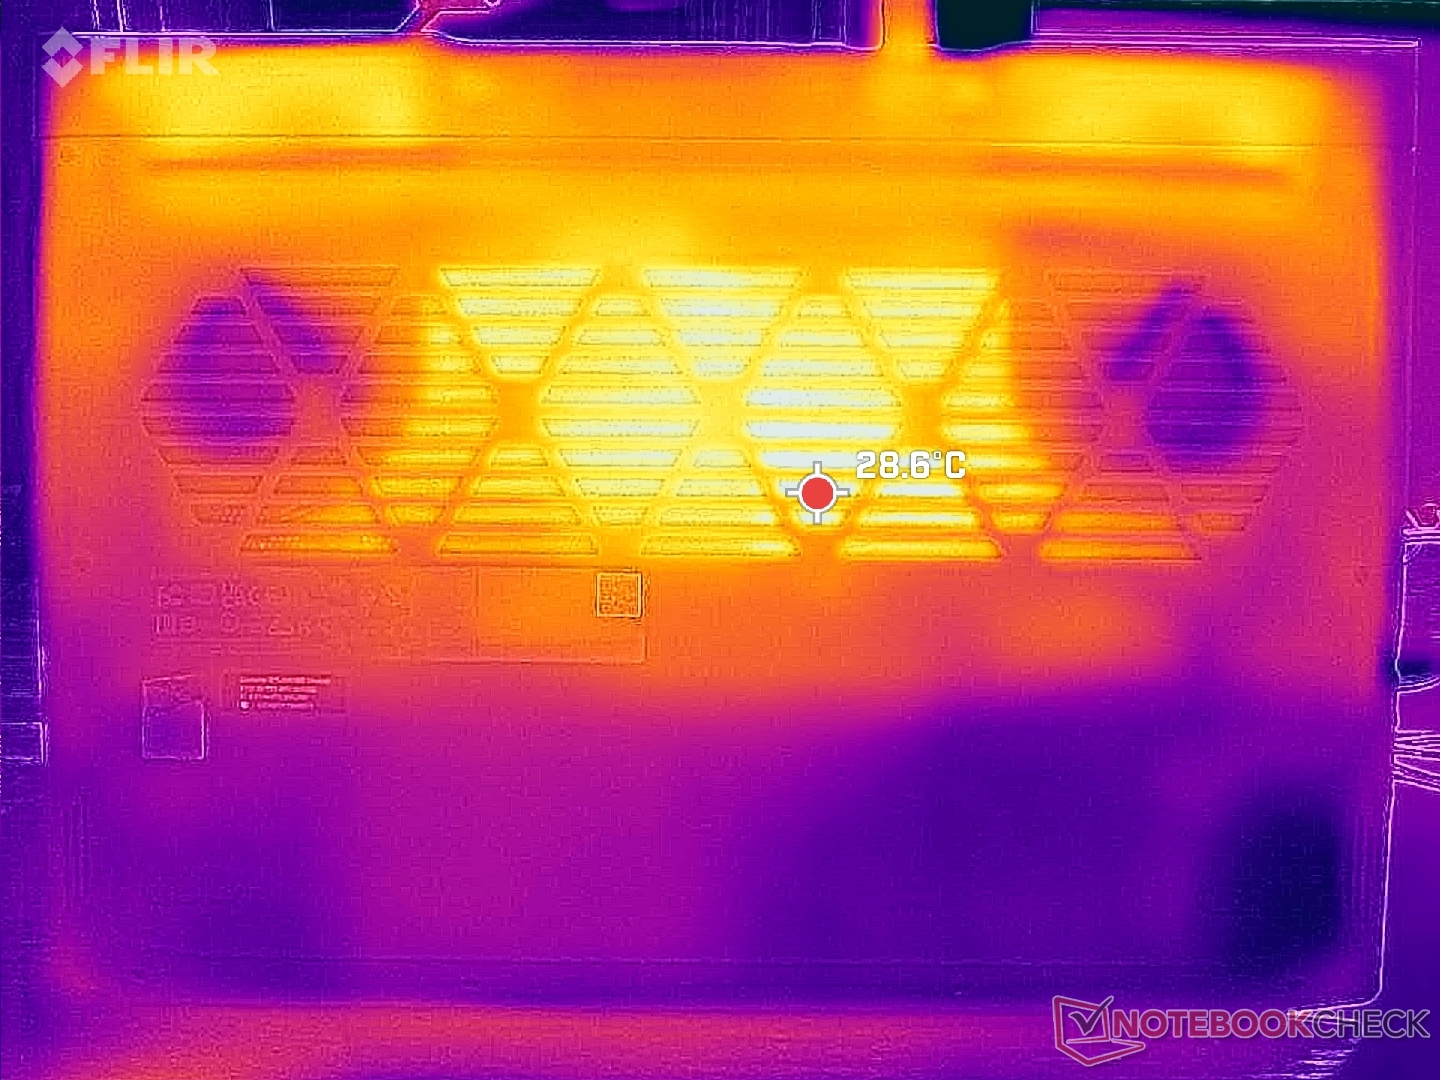
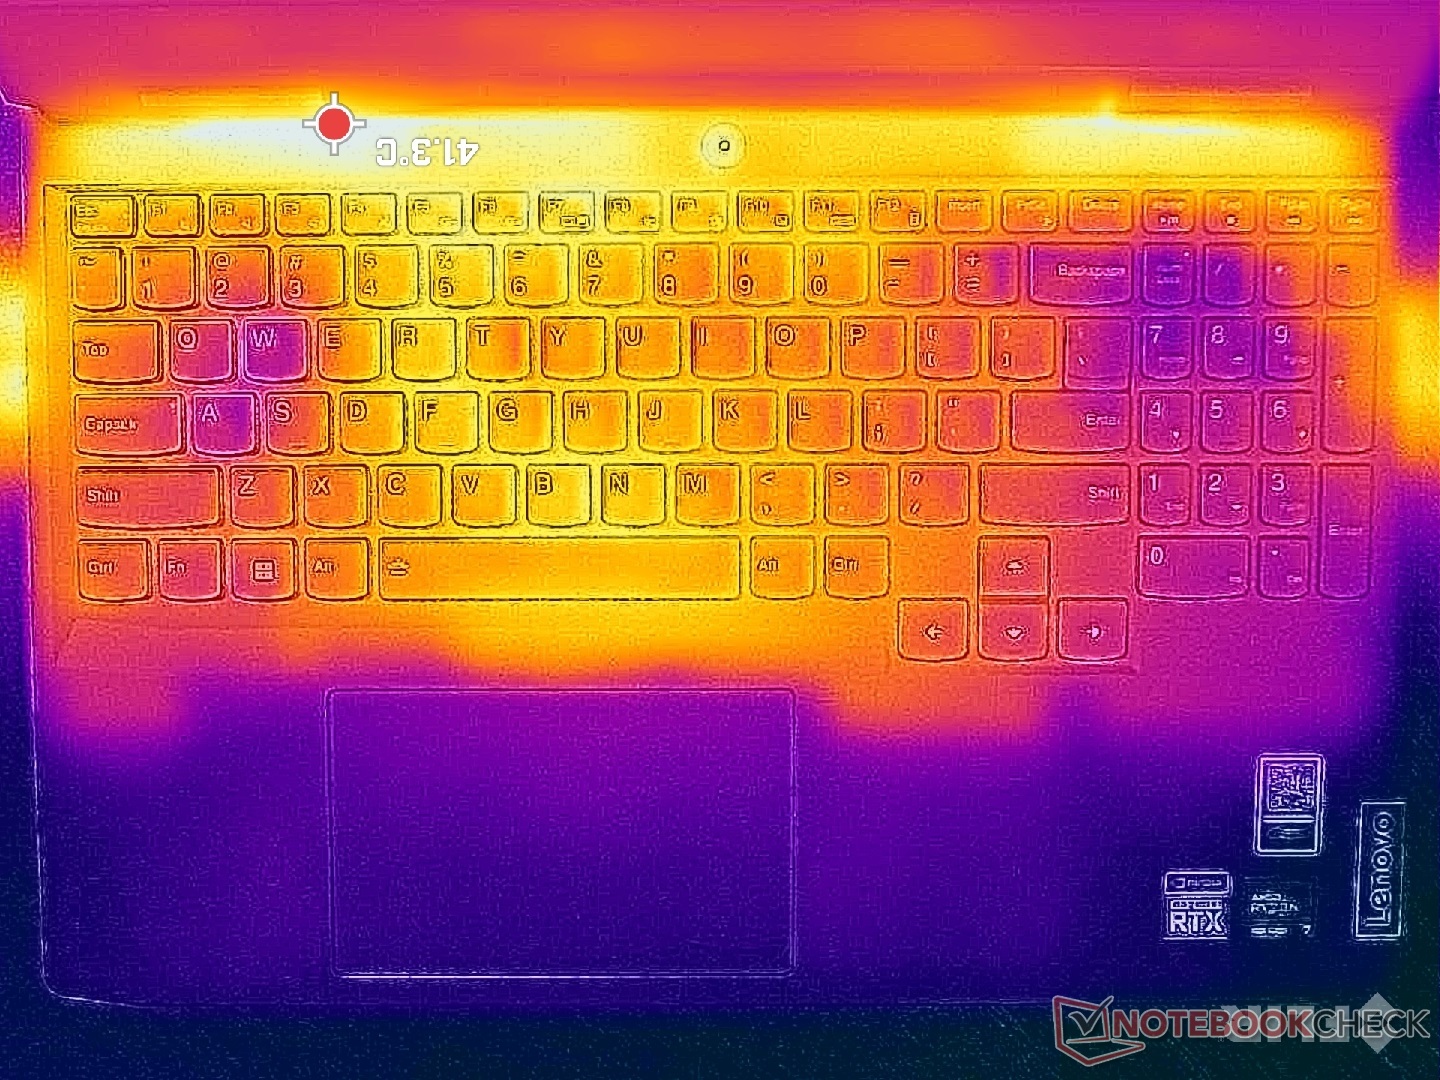
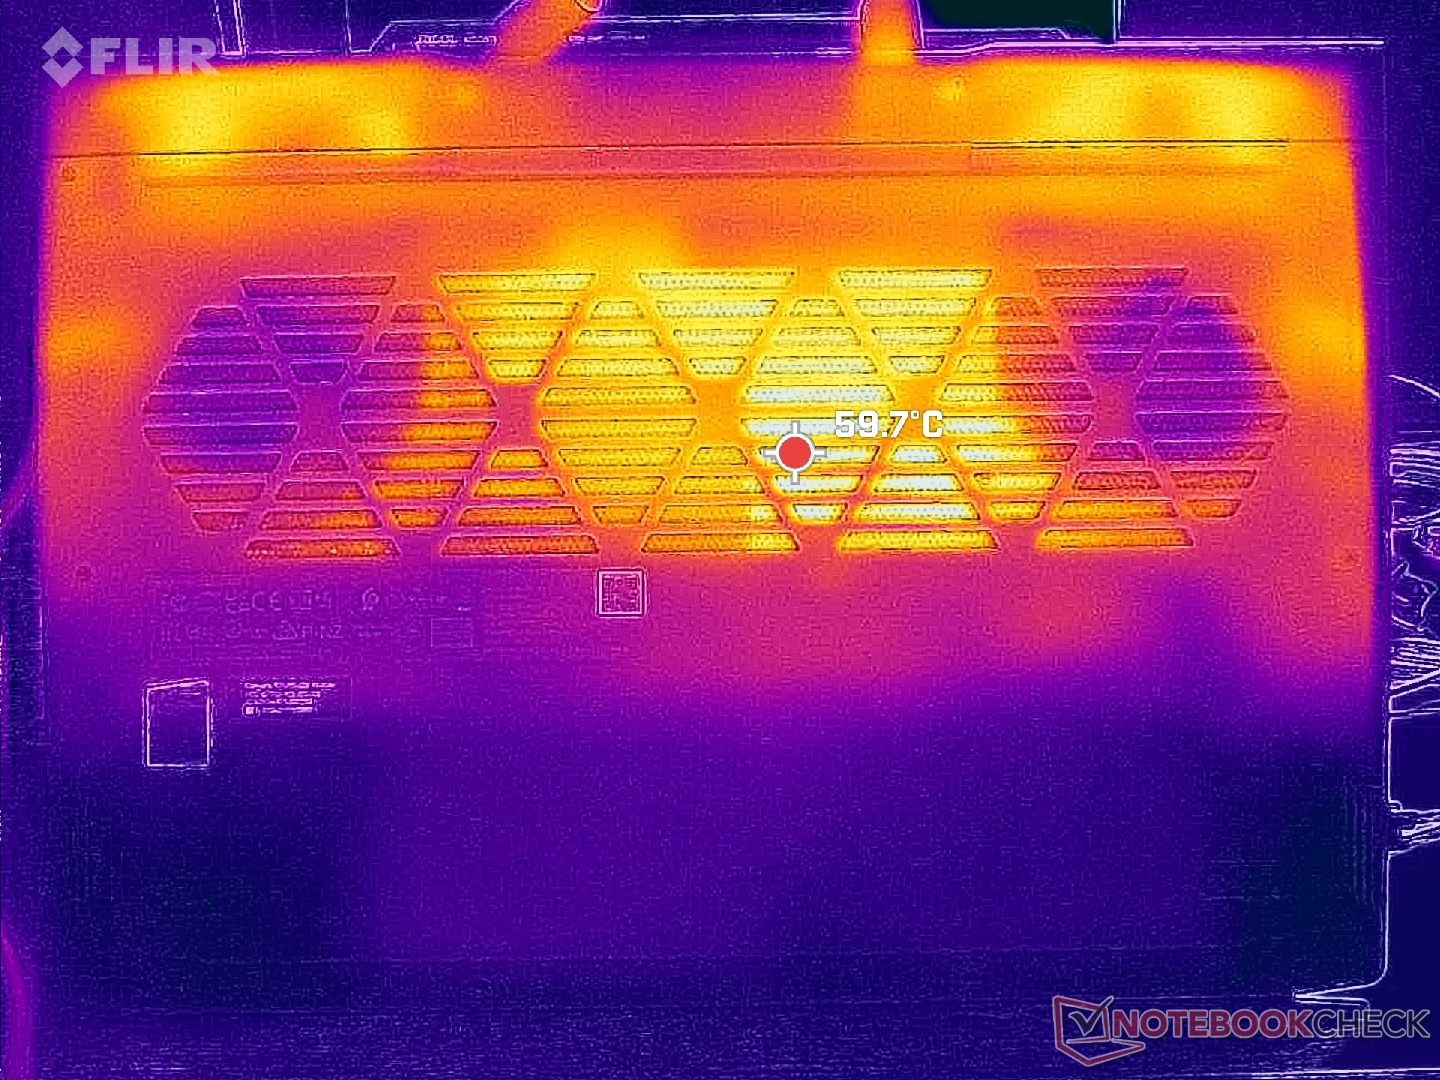
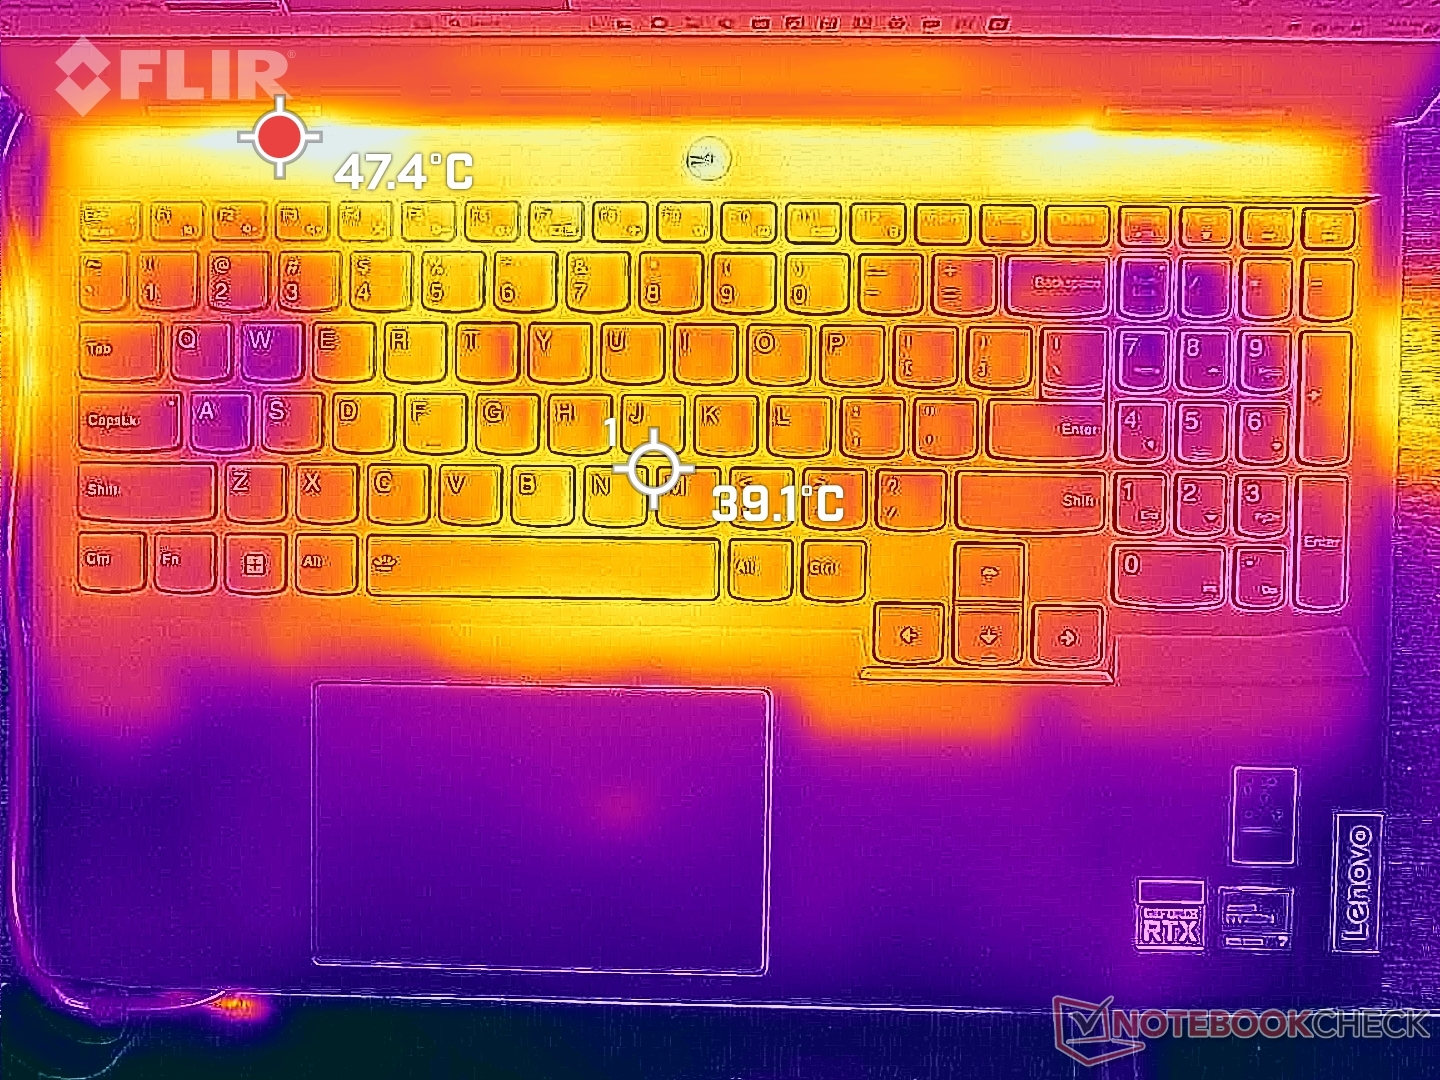
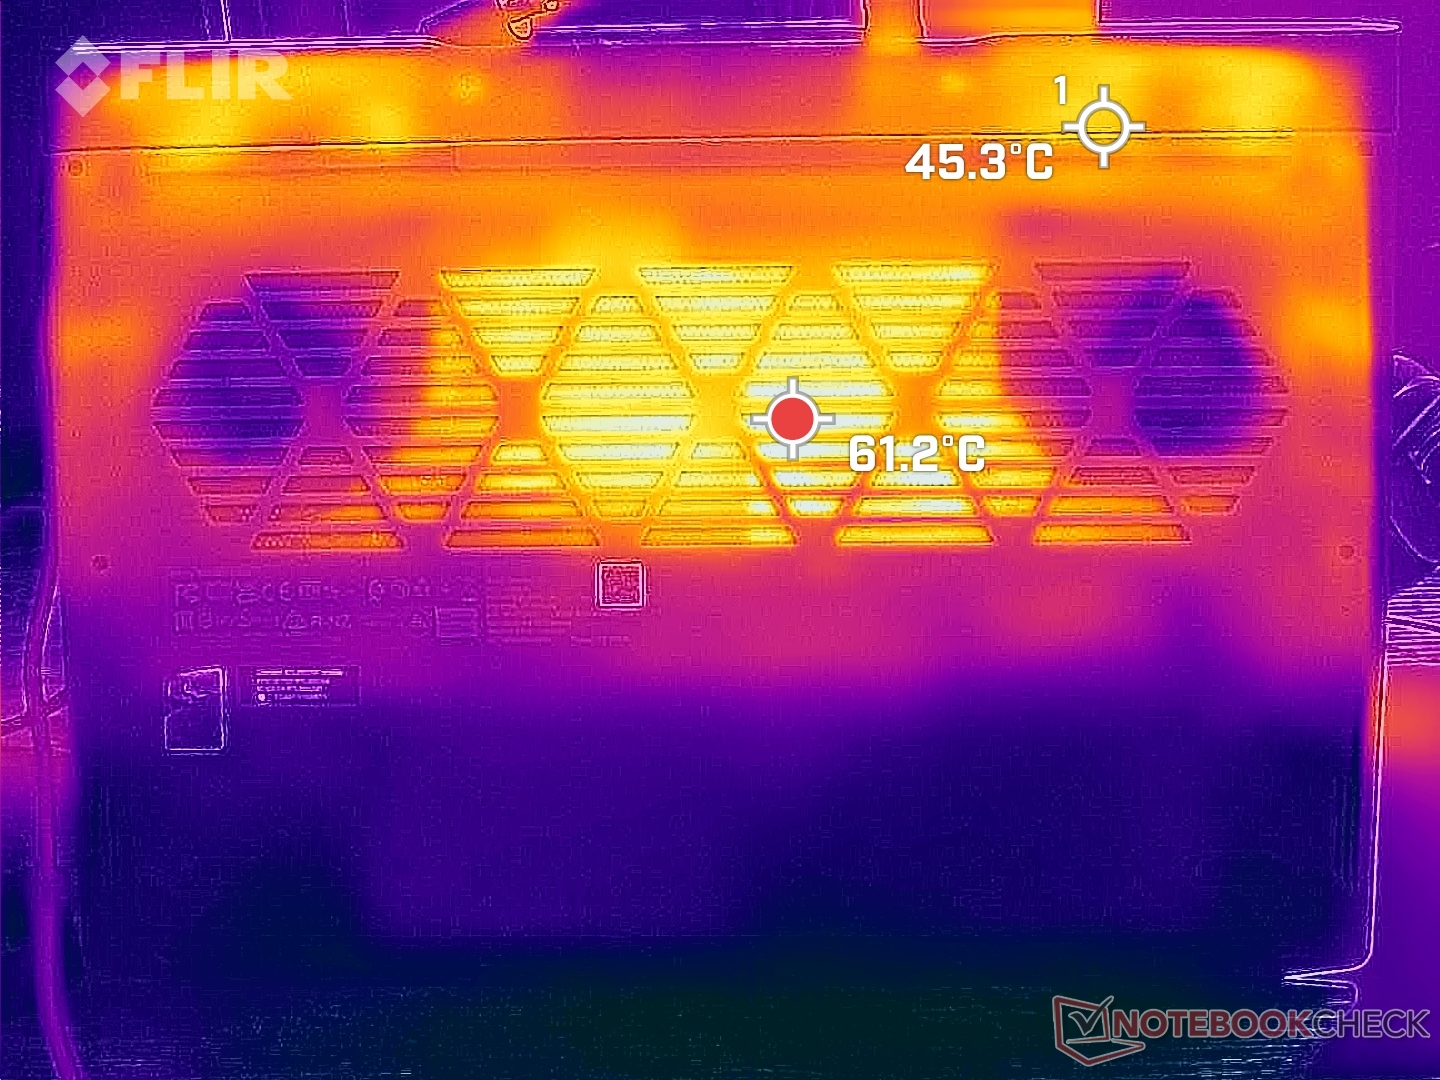
负载时的表面温度可高达 50 摄氏度,而 HP Victus 15 的表面温度仅为 38 摄氏度。 惠普 Victus 15.值得庆幸的是,LOQ 15 的发热点位于手指不太可能接触到的后部。正如下面的温度图所示,在游戏时,WASD 键、数字键盘和掌托的温度要比键盘后部和键盘中心低得多。
(±) The maximum temperature on the upper side is 44.4 °C / 112 F, compared to the average of 40.4 °C / 105 F, ranging from 21.2 to 68.8 °C for the class Gaming.
(-) The bottom heats up to a maximum of 52 °C / 126 F, compared to the average of 43.2 °C / 110 F
(+) In idle usage, the average temperature for the upper side is 25.1 °C / 77 F, compared to the device average of 33.9 °C / 93 F.
(±) Playing The Witcher 3, the average temperature for the upper side is 32.7 °C / 91 F, compared to the device average of 33.9 °C / 93 F.
(+) The palmrests and touchpad are cooler than skin temperature with a maximum of 30 °C / 86 F and are therefore cool to the touch.
(±) The average temperature of the palmrest area of similar devices was 28.8 °C / 83.8 F (-1.2 °C / -2.2 F).
| Lenovo LOQ 15APH8 AMD Ryzen 7 7840HS, NVIDIA GeForce RTX 4050 Laptop GPU | Lenovo Legion 5 15IAH7H 82RB Intel Core i7-12700H, NVIDIA GeForce RTX 3060 Laptop GPU | Dell G15 5530 Intel Core i7-13650HX, NVIDIA GeForce RTX 4060 Laptop GPU | Asus TUF A15 FA507 AMD Ryzen 7 7735HS, NVIDIA GeForce RTX 4050 Laptop GPU | MSI Cyborg 15 A12VF Intel Core i7-12650H, NVIDIA GeForce RTX 4060 Laptop GPU | HP Victus 15 fa0020nr Intel Core i7-12700H, NVIDIA GeForce RTX 3050 Ti Laptop GPU | |
|---|---|---|---|---|---|---|
| Heat | 7% | -19% | 4% | 7% | 23% | |
| Maximum Upper Side * (°C) | 44.4 | 37.8 15% | 54 -22% | 48.9 -10% | 47.5 -7% | 37.2 16% |
| Maximum Bottom * (°C) | 52 | 51 2% | 62.2 -20% | 44.6 14% | 35.5 32% | 35.4 32% |
| Idle Upper Side * (°C) | 28 | 25.8 8% | 33.4 -19% | 27.1 3% | 27.7 1% | 22.4 20% |
| Idle Bottom * (°C) | 29.6 | 28.8 3% | 33.4 -13% | 27.5 7% | 29.5 -0% | 22.6 24% |
* ... smaller is better
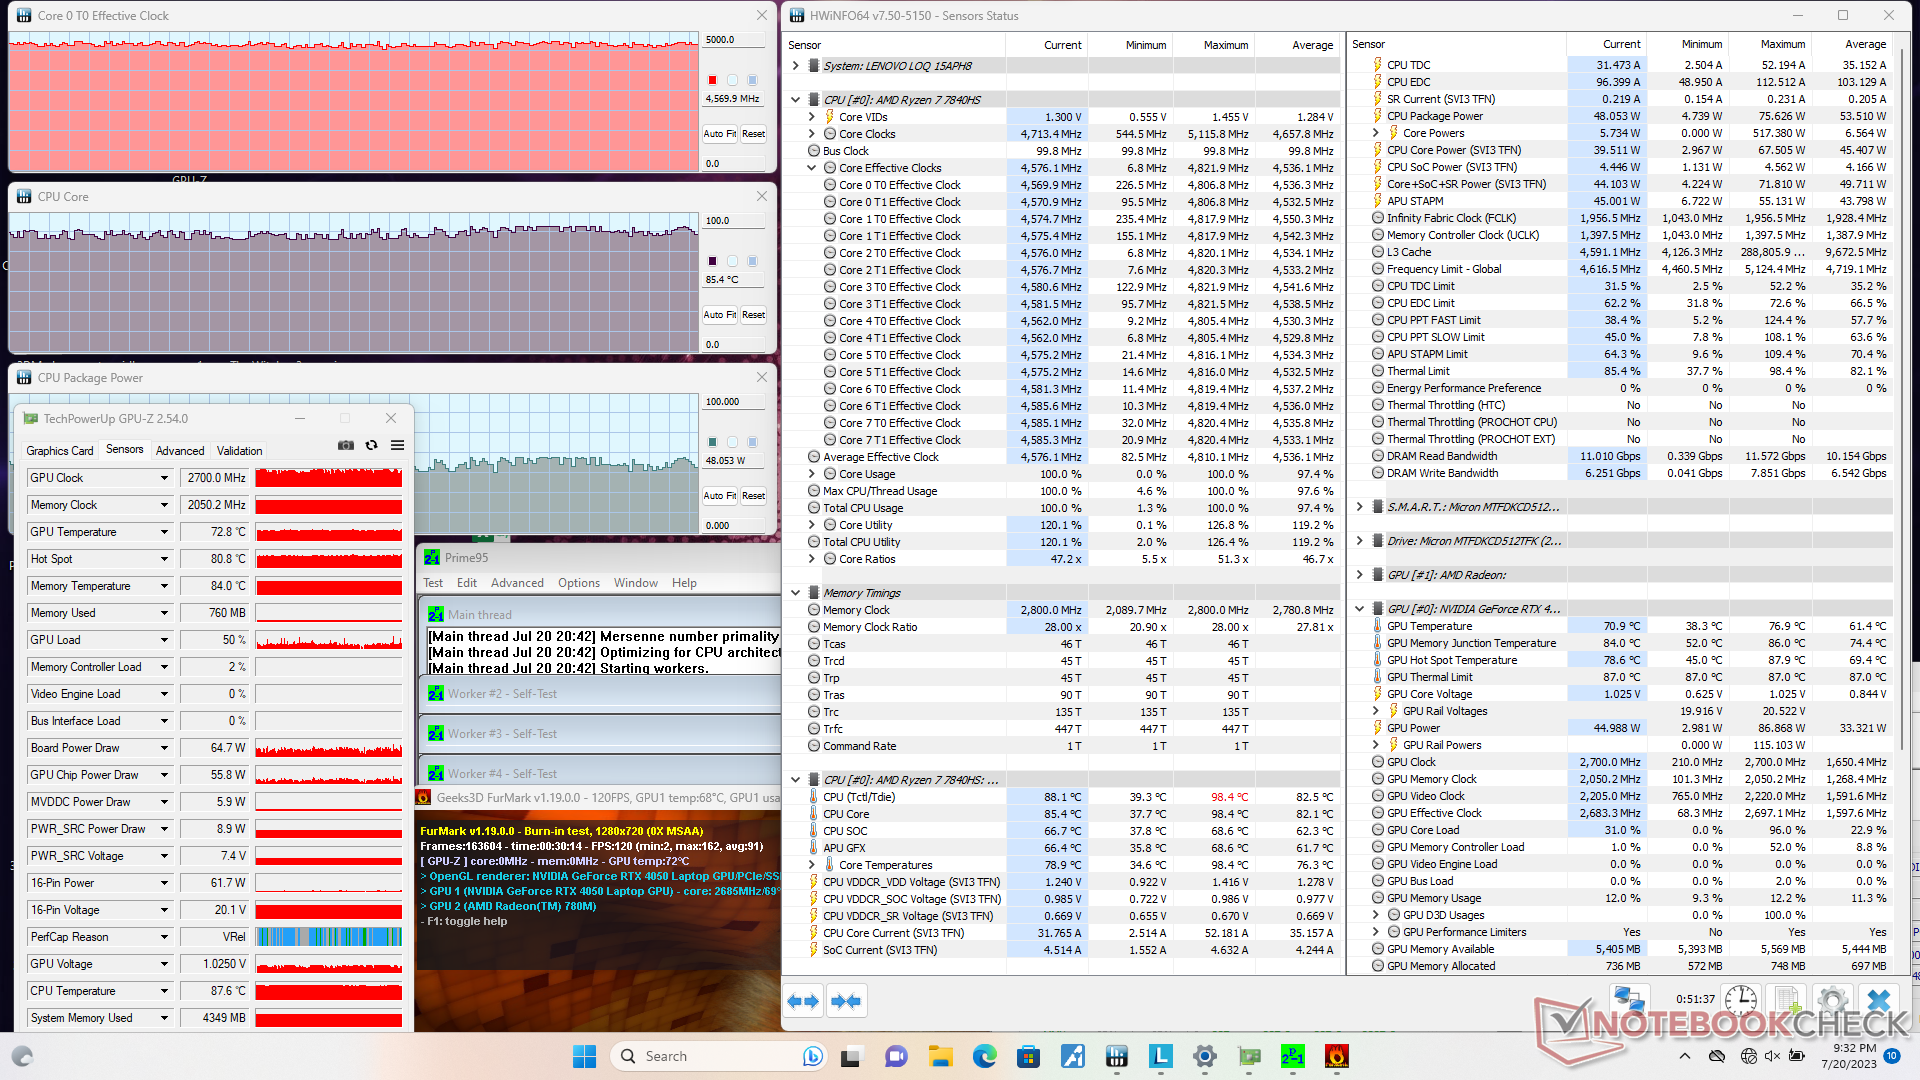
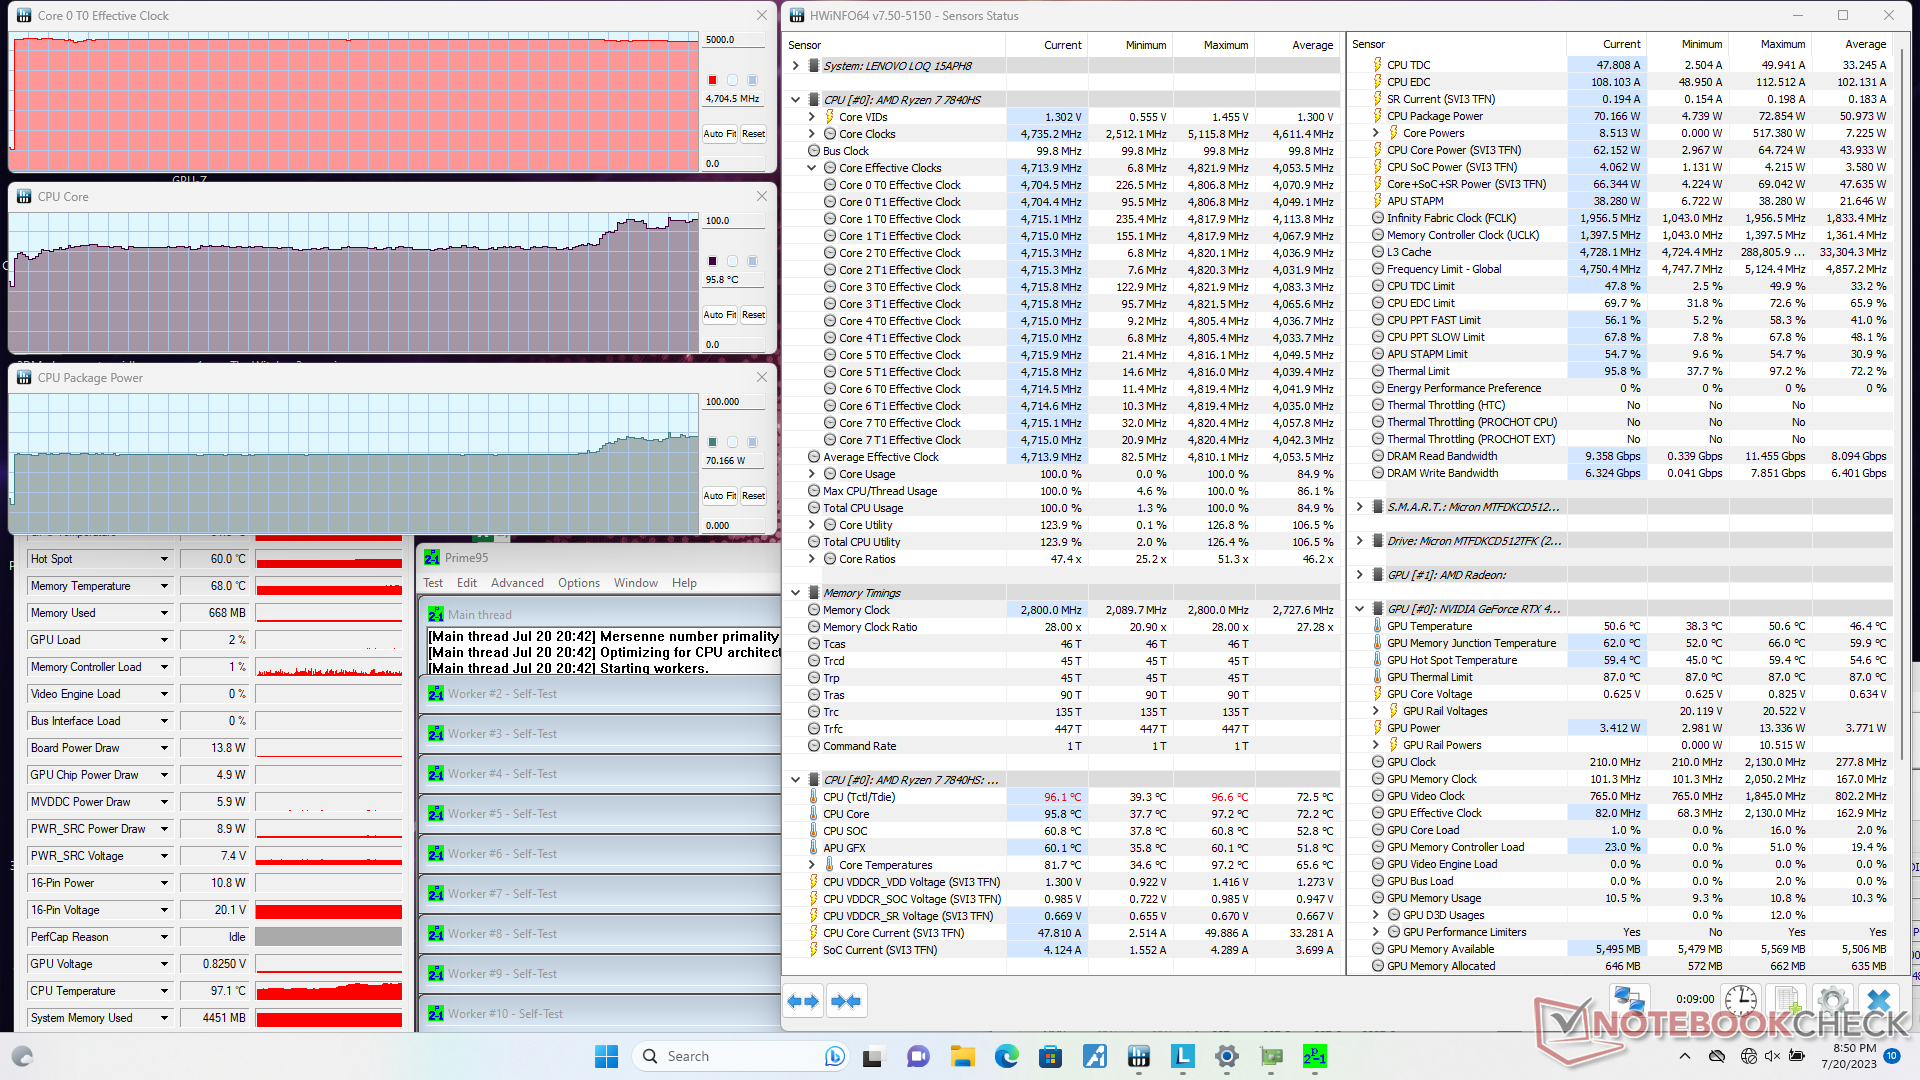
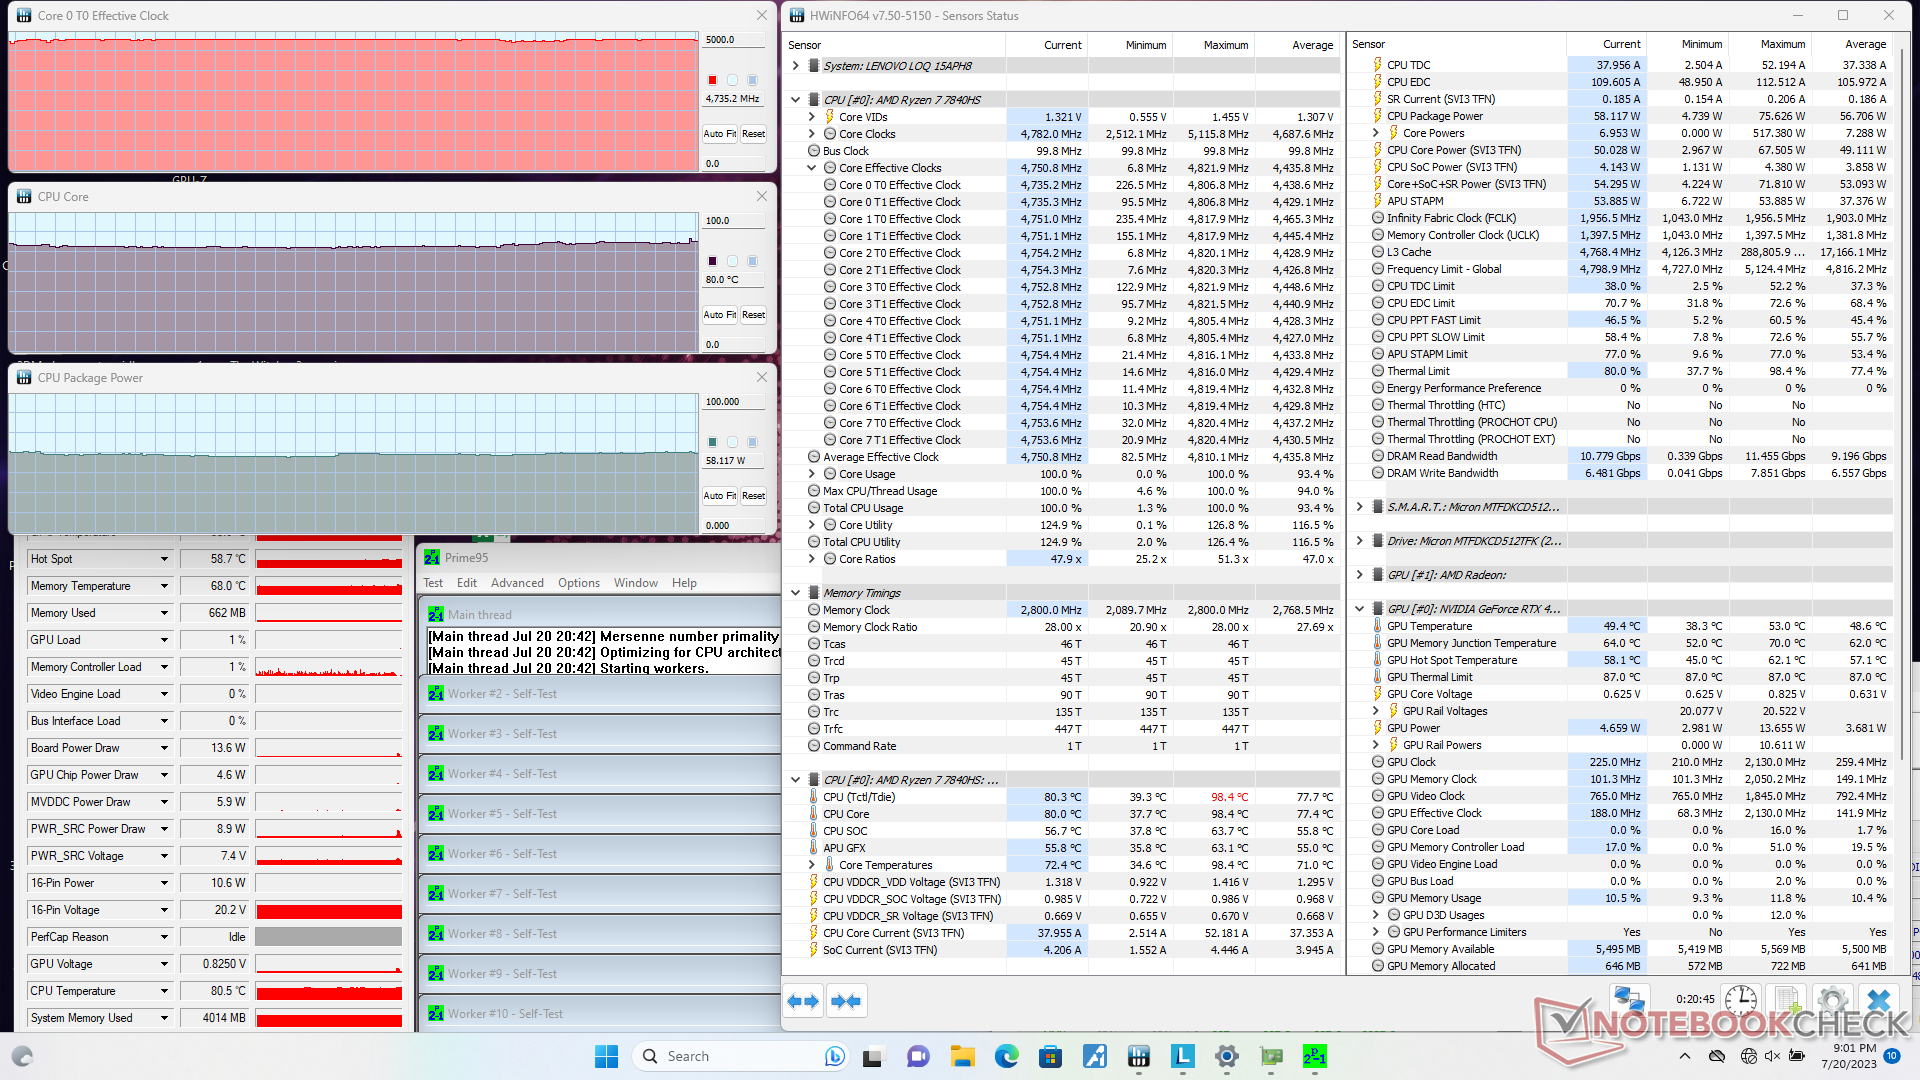
压力测试
在启动 Prime95 压力时,CPU 时钟频率、温度和电路板功耗将分别飙升至 4.8 GHz、75 C 和 58 W。时钟频率和电路板功耗可持续很长时间,内核温度最终稳定在 80 摄氏度,而英特尔处理器的内核温度为 76 摄氏度。 Victus 15.
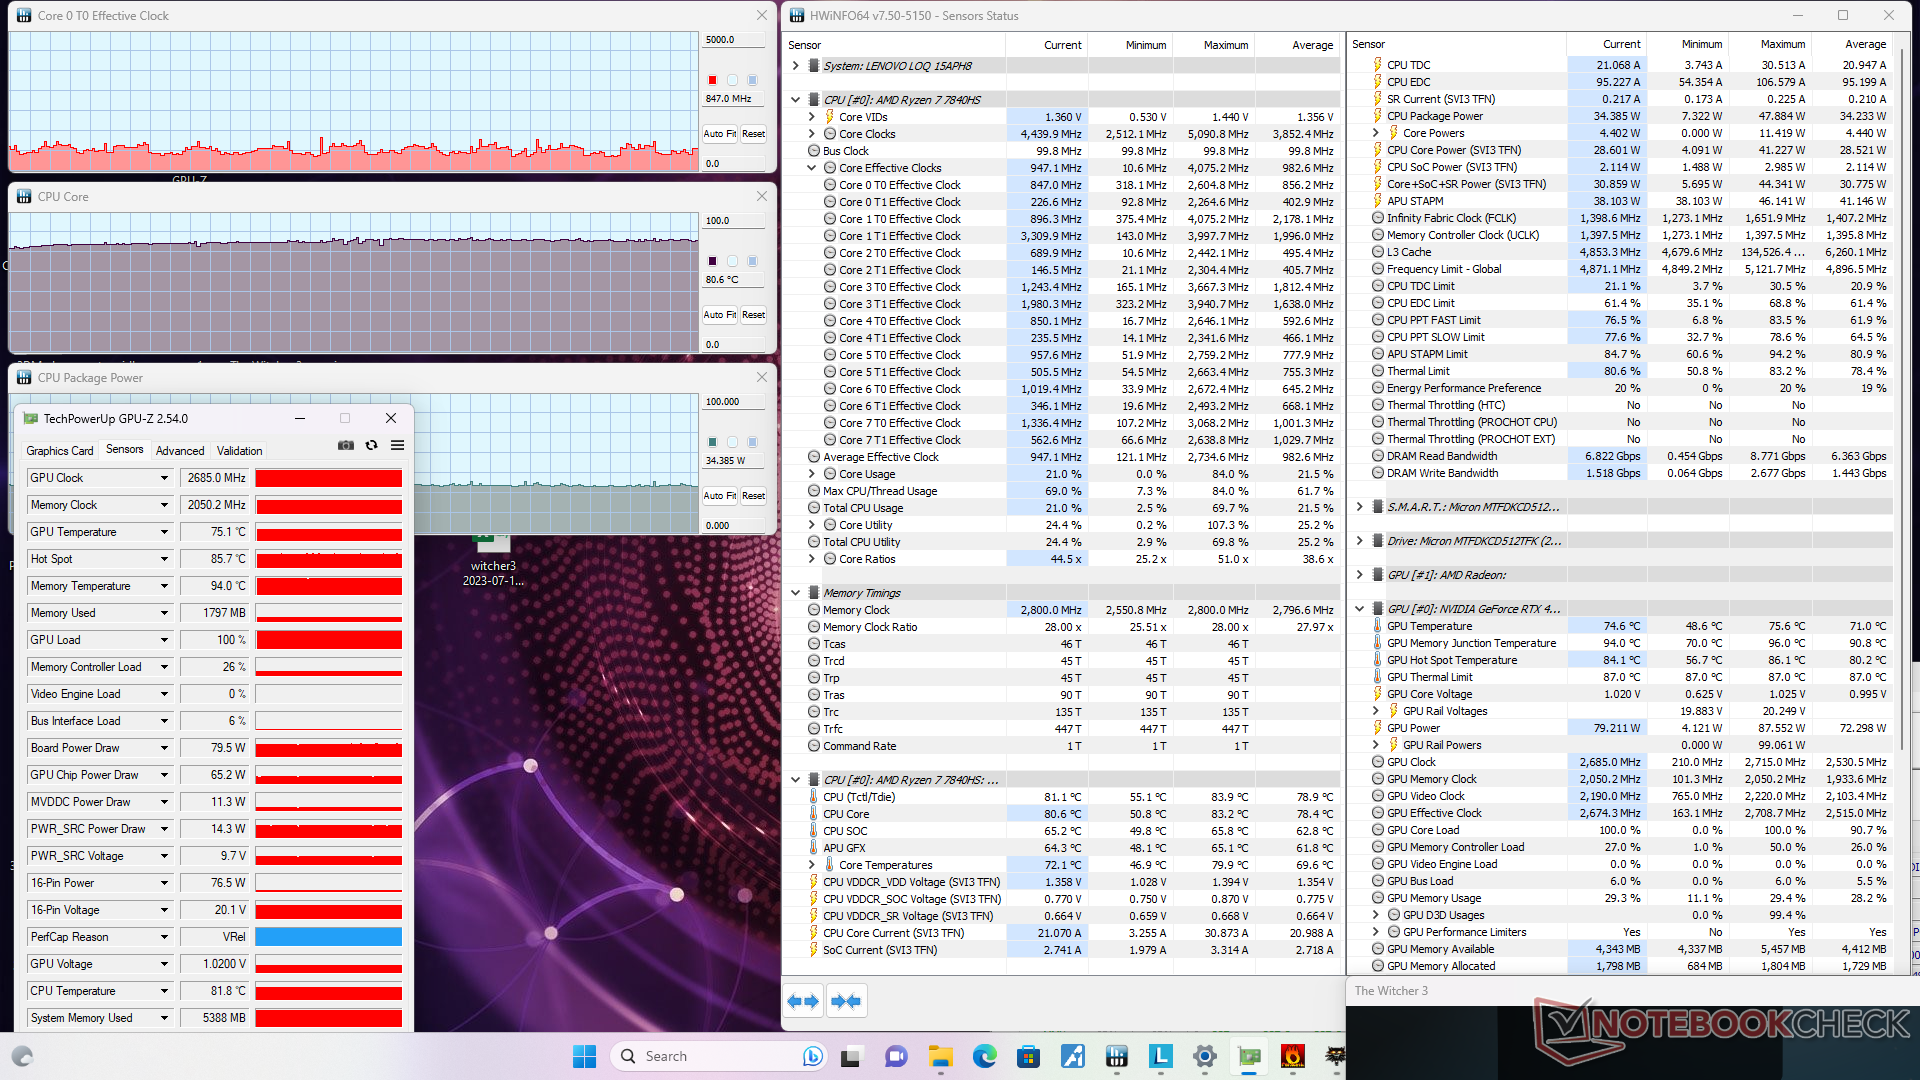
在性能模式下运行Witcher 3 时,Nvidia GPU 的频率稳定在 2685 MHz,温度为 75 C,功耗为 80 W。在平衡模式下运行时没有明显变化,这与上文 GPU 性能部分的观察结果一致。因此,平衡模式对 CPU 性能的影响大于对 GPU 性能的影响。
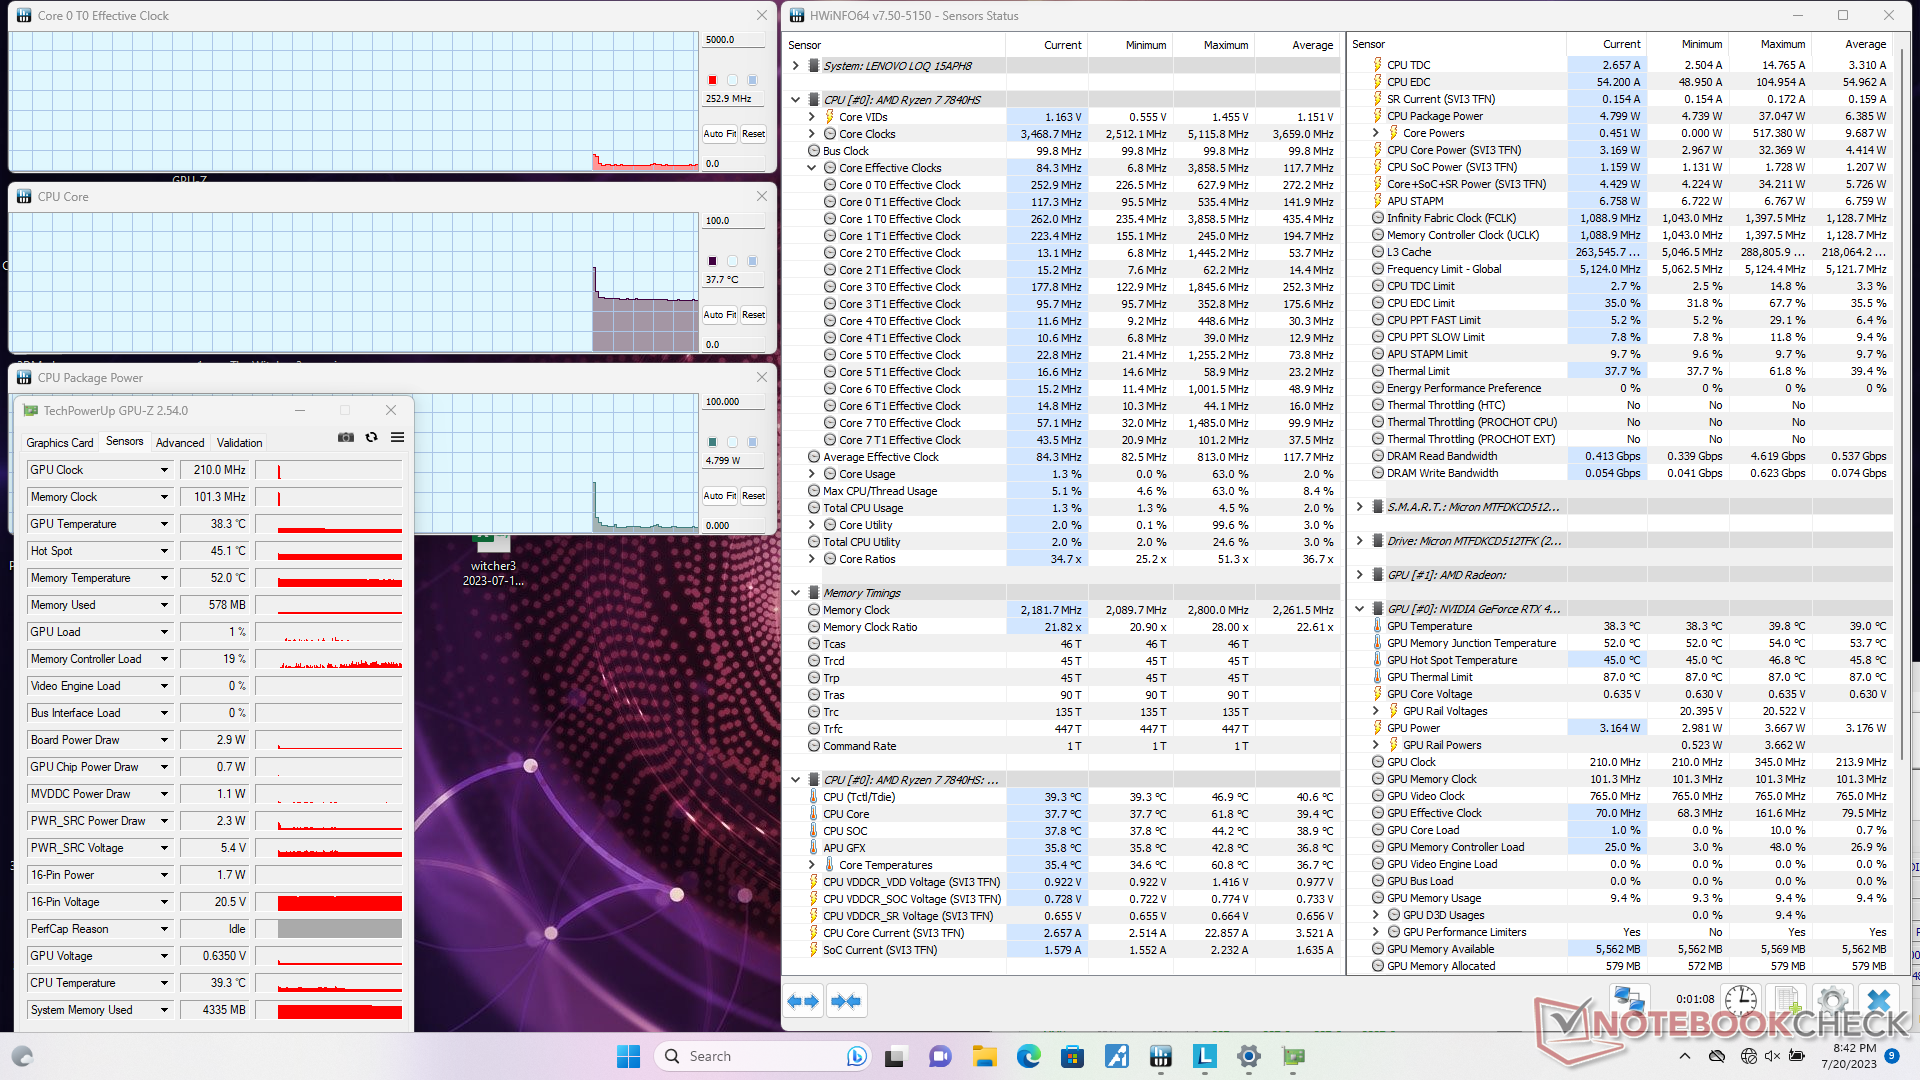

| CPU 时钟 (GHz) | GPU 时钟 (MHz) | CPU 平均温度 (°C) | GPU 平均温度(°C) | |
| 系统闲置 | -- | -- | 37 | 38 |
| Prime95 压力 | 4.7 | -- | 80 | 49 |
| Prime95 + FurMark 压力 | 4.5 | 2700 | 85 | 73 |
| Witcher 3 压力(平衡模式) | ~0.9 | 2685 | 69 | 73 |
| Witcher 3 压力(性能模式) | ~0.8 | 2685 | 81 | 75 |
发言人
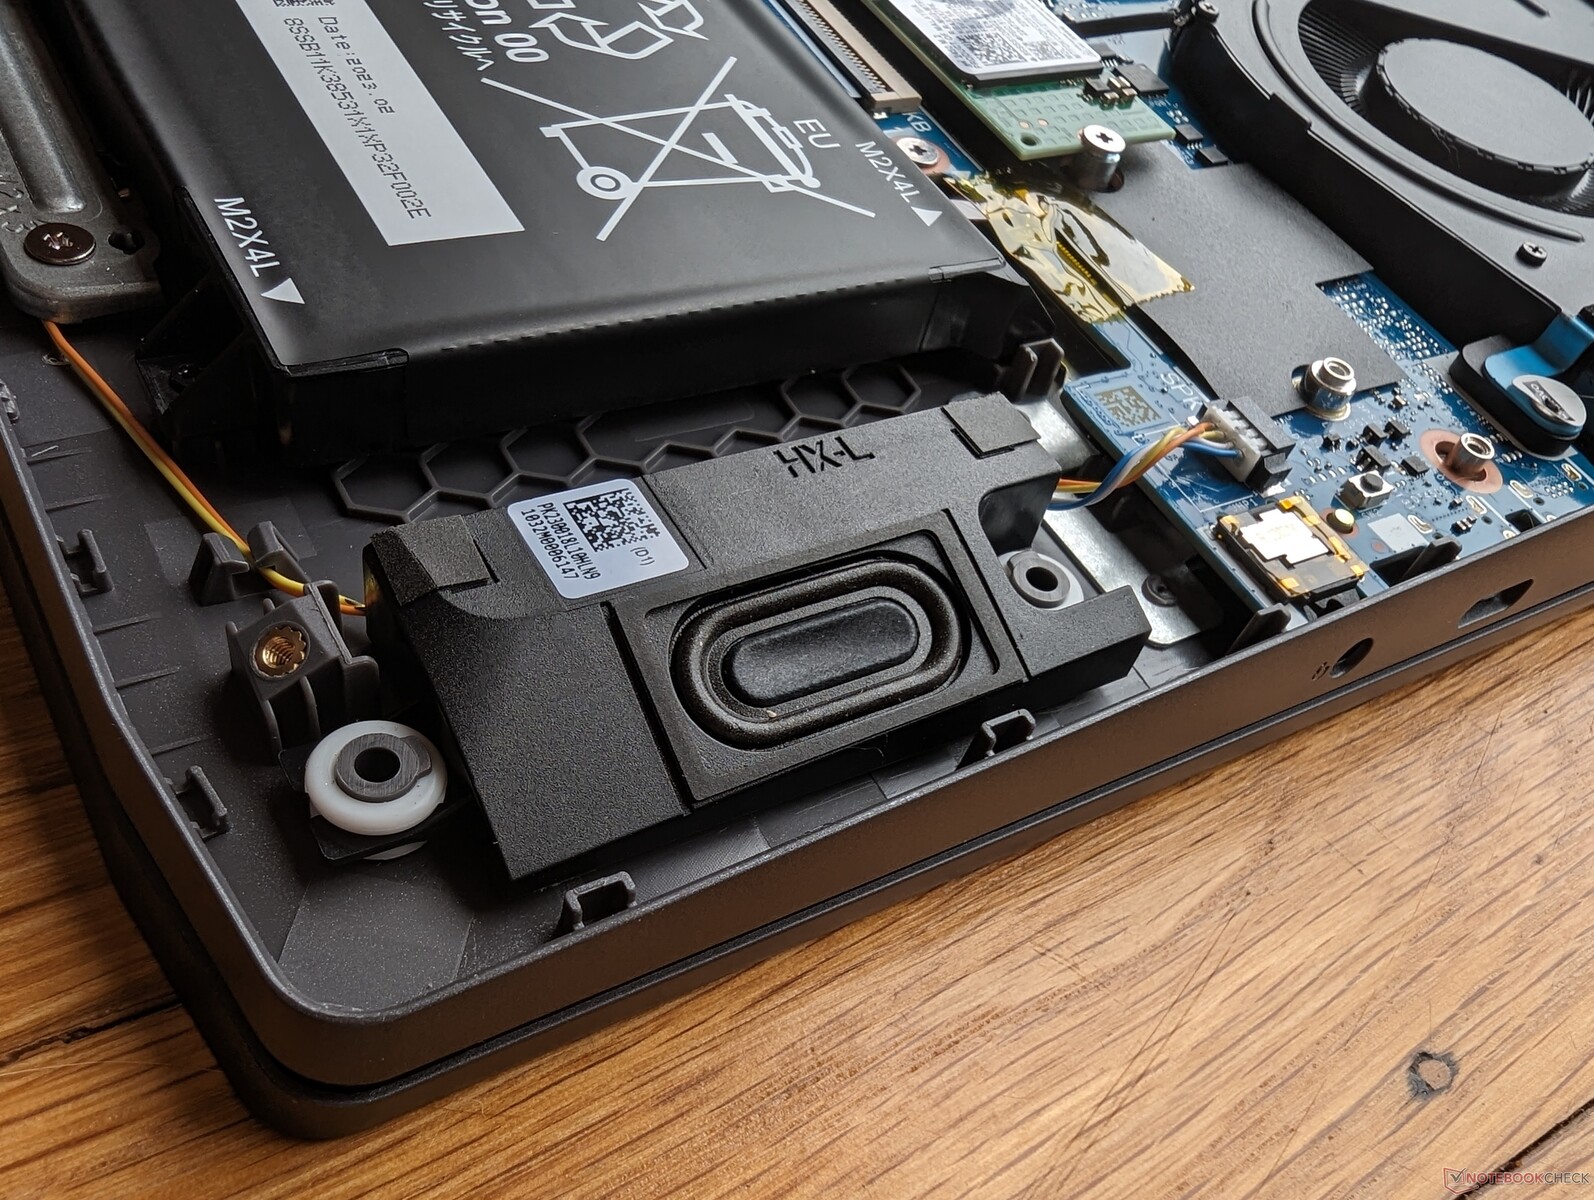
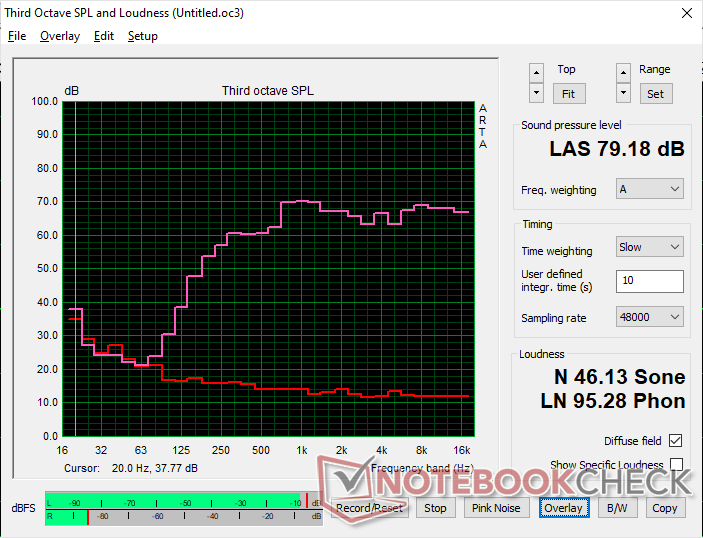
Lenovo LOQ 15APH8 audio analysis
(±) | speaker loudness is average but good (79.2 dB)
Bass 100 - 315 Hz
(-) | nearly no bass - on average 17.6% lower than median
(±) | linearity of bass is average (11.8% delta to prev. frequency)
Mids 400 - 2000 Hz
(+) | balanced mids - only 3.7% away from median
(+) | mids are linear (3.1% delta to prev. frequency)
Highs 2 - 16 kHz
(+) | balanced highs - only 1.9% away from median
(+) | highs are linear (4.7% delta to prev. frequency)
Overall 100 - 16.000 Hz
(+) | overall sound is linear (14.3% difference to median)
Compared to same class
» 26% of all tested devices in this class were better, 7% similar, 67% worse
» The best had a delta of 6%, average was 18%, worst was 132%
Compared to all devices tested
» 17% of all tested devices were better, 4% similar, 79% worse
» The best had a delta of 4%, average was 24%, worst was 134%
Apple MacBook Pro 16 2021 M1 Pro audio analysis
(+) | speakers can play relatively loud (84.7 dB)
Bass 100 - 315 Hz
(+) | good bass - only 3.8% away from median
(+) | bass is linear (5.2% delta to prev. frequency)
Mids 400 - 2000 Hz
(+) | balanced mids - only 1.3% away from median
(+) | mids are linear (2.1% delta to prev. frequency)
Highs 2 - 16 kHz
(+) | balanced highs - only 1.9% away from median
(+) | highs are linear (2.7% delta to prev. frequency)
Overall 100 - 16.000 Hz
(+) | overall sound is linear (4.6% difference to median)
Compared to same class
» 0% of all tested devices in this class were better, 0% similar, 100% worse
» The best had a delta of 5%, average was 17%, worst was 45%
Compared to all devices tested
» 0% of all tested devices were better, 0% similar, 100% worse
» The best had a delta of 4%, average was 24%, worst was 134%
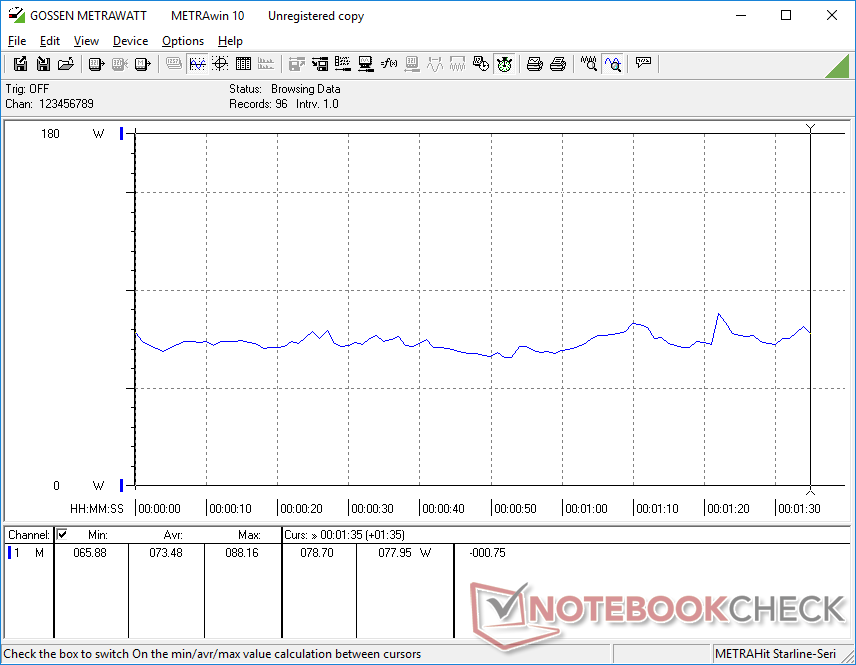
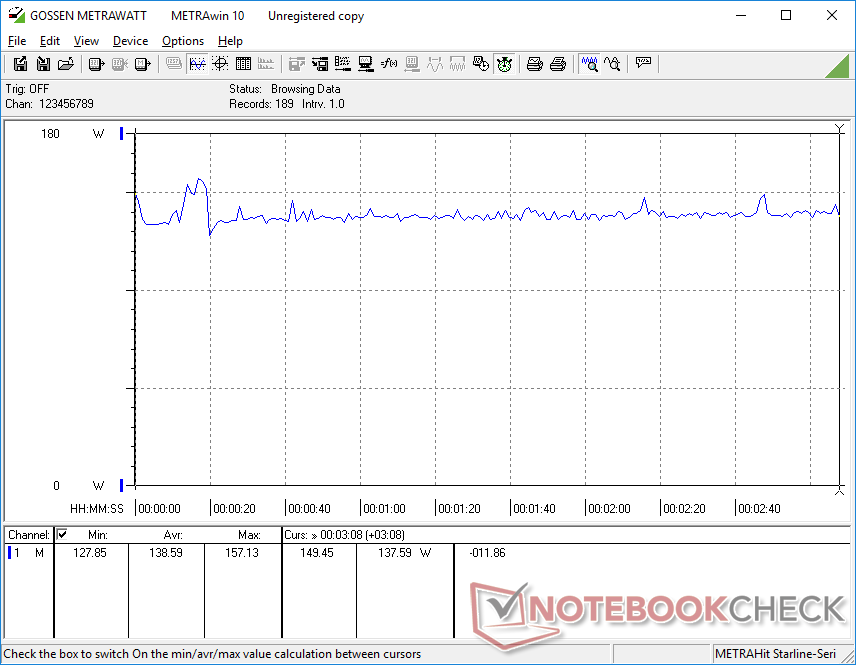
能源管理 - 非常高效的 CPU 和 GPU 组合
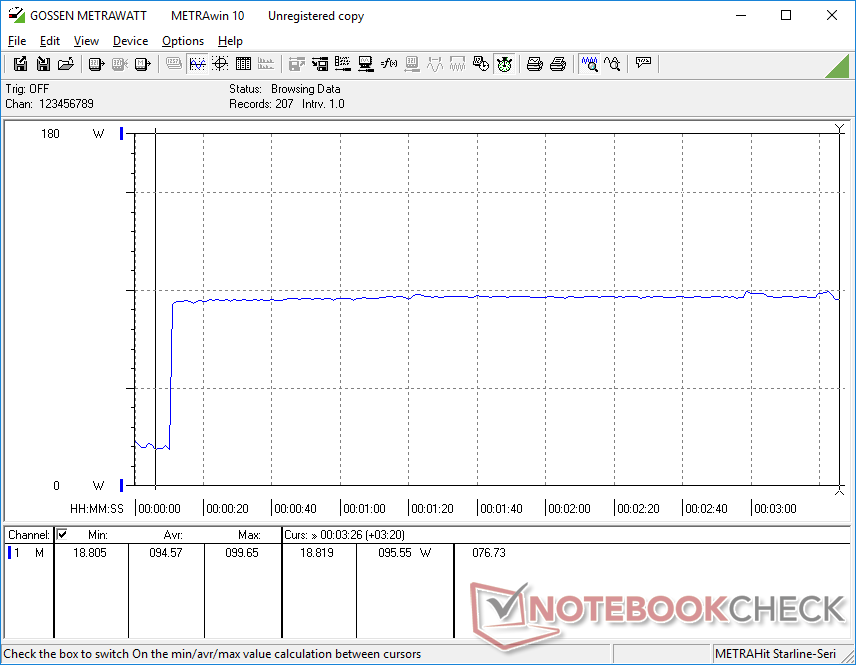
耗电量
游戏时的功耗实际上与去年非常接近 IdeaPad Gaming 3 15尽管显卡性能比 RTX 3050 Ti 提升了 60% 至 70%,处理器性能比酷睿 i5-12500H 提升了 15% 至 20%。因此,对于一款经济型游戏机来说,每瓦性能的提升是非常出色的。
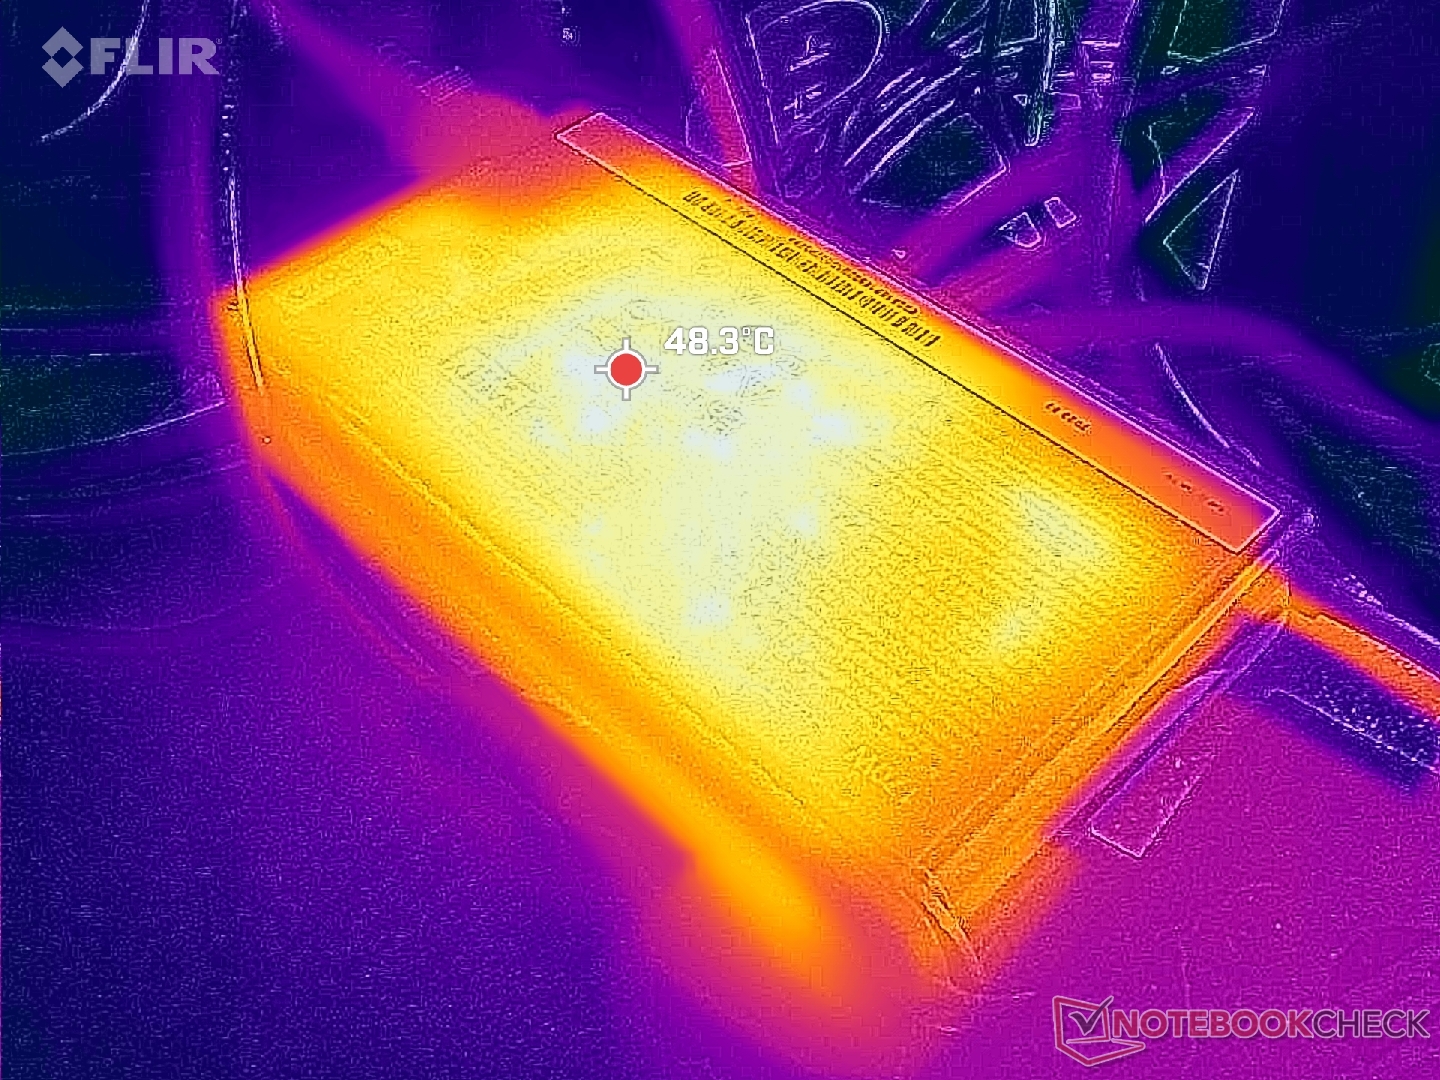
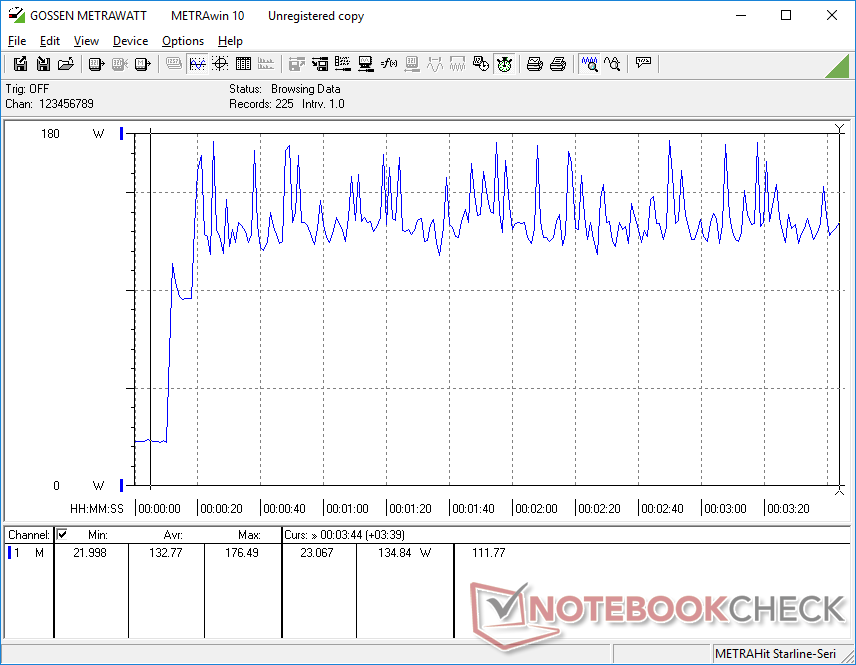
当 CPU 和 GPU 的使用率都达到 100%时,我们可以从中等尺寸(约 15 x 7.8 x 2.3 厘米)的 170 W AC 适配器记录到 177 W 的最大功耗。因此,如果同时运行游戏等高负载,充电速度会减慢。
| Off / Standby | |
| Idle | |
| Load |
|
Key:
min: | |
| Lenovo LOQ 15APH8 R7 7840HS, GeForce RTX 4050 Laptop GPU, Micron 2450 512GB MTFDKCD512TFK, IPS, 1920x1080, 15.6" | Lenovo Legion 5 15IAH7H 82RB i7-12700H, GeForce RTX 3060 Laptop GPU, , IPS, 1920x1080, 15.6" | Dell G15 5530 i7-13650HX, GeForce RTX 4060 Laptop GPU, SSTC CL4-3D512-Q11, IPS, 1920x1080, 15.6" | Asus TUF A15 FA507 R7 7735HS, GeForce RTX 4050 Laptop GPU, Micron 2400 MTFDKBA512QFM, IPS, 1920x1080, 15.6" | MSI Cyborg 15 A12VF i7-12650H, GeForce RTX 4060 Laptop GPU, Samsung PM9B1 1024GB MZVL41T0HBLB, IPS, 1920x1080, 15.6" | HP Victus 15 fa0020nr i7-12700H, GeForce RTX 3050 Ti Laptop GPU, Samsung PM9A1 MZVL2512HCJQ, IPS, 1920x1080, 15.6" | |
|---|---|---|---|---|---|---|
| Power Consumption | -55% | -6% | 19% | 36% | 10% | |
| Idle Minimum * (Watt) | 15 | 19.8 -32% | 8.4 44% | 8 47% | 6 60% | 5.1 66% |
| Idle Average * (Watt) | 17.7 | 26.2 -48% | 14.98 15% | 12.1 32% | 8.8 50% | 15.1 15% |
| Idle Maximum * (Watt) | 21.5 | 48.2 -124% | 15.56 28% | 12.5 42% | 11.9 45% | 18.9 12% |
| Load Average * (Watt) | 73.5 | 102.9 -40% | 96.8 -32% | 74.9 -2% | 89 -21% | 114.5 -56% |
| Witcher 3 ultra * (Watt) | 138.6 | 186.7 -35% | 186 -34% | 136.6 1% | 90.3 35% | 113.9 18% |
| Load Maximum * (Watt) | 176.5 | 268 -52% | 271.42 -54% | 185 -5% | 99 44% | 165.8 6% |
* ... smaller is better
Power Consumption Witcher 3 / Stresstest
Power Consumption external Monitor
电池寿命

我们的 60 Wh 电池相对较小,因为大多数其他 15 英寸游戏笔记本电脑通常配备 70 Wh 或更大的电池。尽管如此,实际 WLAN 浏览时间仍然达到了近 7.5 小时,这与Cyborg 15.
使用随附的交流适配器从空电充至满电的速度非常快,约为 45 分钟,比大多数其他游戏笔记本电脑快约 2 倍。联想快速充电功能默认通过 Vantage 软件启用。
系统可以通过 USB-C 接口充电,但不能保证与大多数 USB-C AC 适配器兼容。联想销售自己的 140 W USB-C 交流适配器,应该与大多数联想笔记本电脑兼容。
| Lenovo LOQ 15APH8 R7 7840HS, GeForce RTX 4050 Laptop GPU, 60 Wh | Lenovo Legion 5 15IAH7H 82RB i7-12700H, GeForce RTX 3060 Laptop GPU, 80 Wh | Dell G15 5530 i7-13650HX, GeForce RTX 4060 Laptop GPU, 86 Wh | Asus TUF A15 FA507 R7 7735HS, GeForce RTX 4050 Laptop GPU, 90 Wh | MSI Cyborg 15 A12VF i7-12650H, GeForce RTX 4060 Laptop GPU, 53.5 Wh | HP Victus 15 fa0020nr i7-12700H, GeForce RTX 3050 Ti Laptop GPU, 70 Wh | |
|---|---|---|---|---|---|---|
| Battery runtime | -16% | -20% | 25% | 50% | -48% | |
| Reader / Idle (h) | 9.8 | 8.1 -17% | 13.6 39% | 2.6 -73% | ||
| WiFi v1.3 (h) | 7.4 | 5 -32% | 6.5 -12% | 11.7 58% | 7.5 1% | 2.1 -72% |
| Load (h) | 1.1 | 1.1 0% | 0.8 -27% | 1 -9% | 2.3 109% | 1.1 0% |
| H.264 (h) | 6.8 | 12.5 | 8 | |||
| Witcher 3 ultra (h) | 0.8 |
Pros
Cons
结论--Ryzen 7 7840HS 和GeForce RTX 4050 达到完美平衡
作为一款仅配备 8GB 可升级系统内存的经济型游戏机,联想 LOQ 15 的性能超出预期,与 IdeaPad Gaming 15 或 HP Victim 15 等采用第 12 代酷睿-H 系列 CPU 的游戏笔记本电脑相比,每瓦性能表现出色。惠普 Victus 15.它的 1080p G-Sync 面板与GeForce RTX 4050 搭配得非常好,可以在现代游戏中流畅地运行 60 FPS 游戏,这对于任何廉价游戏笔记本电脑来说都是一个合理的目标。
虽然塑料机箱和 8 GB 内存让人不太满意,但其易于升级的特性和快速的性能帮助 LOQ 15 在 1000 美元及以下的笔记本电脑中脱颖而出。
LOQ 15 的主要缺点是色彩范围有限,黑白和灰白响应时间一般。更高端的 1440p 面板可解决这些问题,但随后的价格上涨将非常接近Legion 5 机型,LOQ 15 的价值主张将开始下降。1000美元或以下的价位是LOQ 15的甜蜜点,尤其是因为Ryzen 7 7840HS和GeForce RTX 4050与酷睿i7-12700H和RTX 3060不相上下,而后者在2022年为许多零售价接近1500美元的游戏笔记本电脑提供了动力。在撰写本文时,微星、惠普或华硕等主要竞争厂商尚未推出配备相同 Ryzen 7 7840HS 选件的经济型游戏笔记本电脑。
价格和供应情况
百思买(Best Buy)目前正以 1100 美元的价格出售与我们配置相同的联想 LOQ 15。联想还有其他配置可直接从其网站上购买,价格更便宜。
Lenovo LOQ 15APH8
- 07/26/2023 v7 (old)
Allen Ngo
Transparency
The selection of devices to be reviewed is made by our editorial team. The test sample was provided to the author as a loan by the manufacturer or retailer for the purpose of this review. The lender had no influence on this review, nor did the manufacturer receive a copy of this review before publication. There was no obligation to publish this review. As an independent media company, Notebookcheck is not subjected to the authority of manufacturers, retailers or publishers.
This is how Notebookcheck is testing
Every year, Notebookcheck independently reviews hundreds of laptops and smartphones using standardized procedures to ensure that all results are comparable. We have continuously developed our test methods for around 20 years and set industry standards in the process. In our test labs, high-quality measuring equipment is utilized by experienced technicians and editors. These tests involve a multi-stage validation process. Our complex rating system is based on hundreds of well-founded measurements and benchmarks, which maintains objectivity. Further information on our test methods can be found here.
Price comparison

