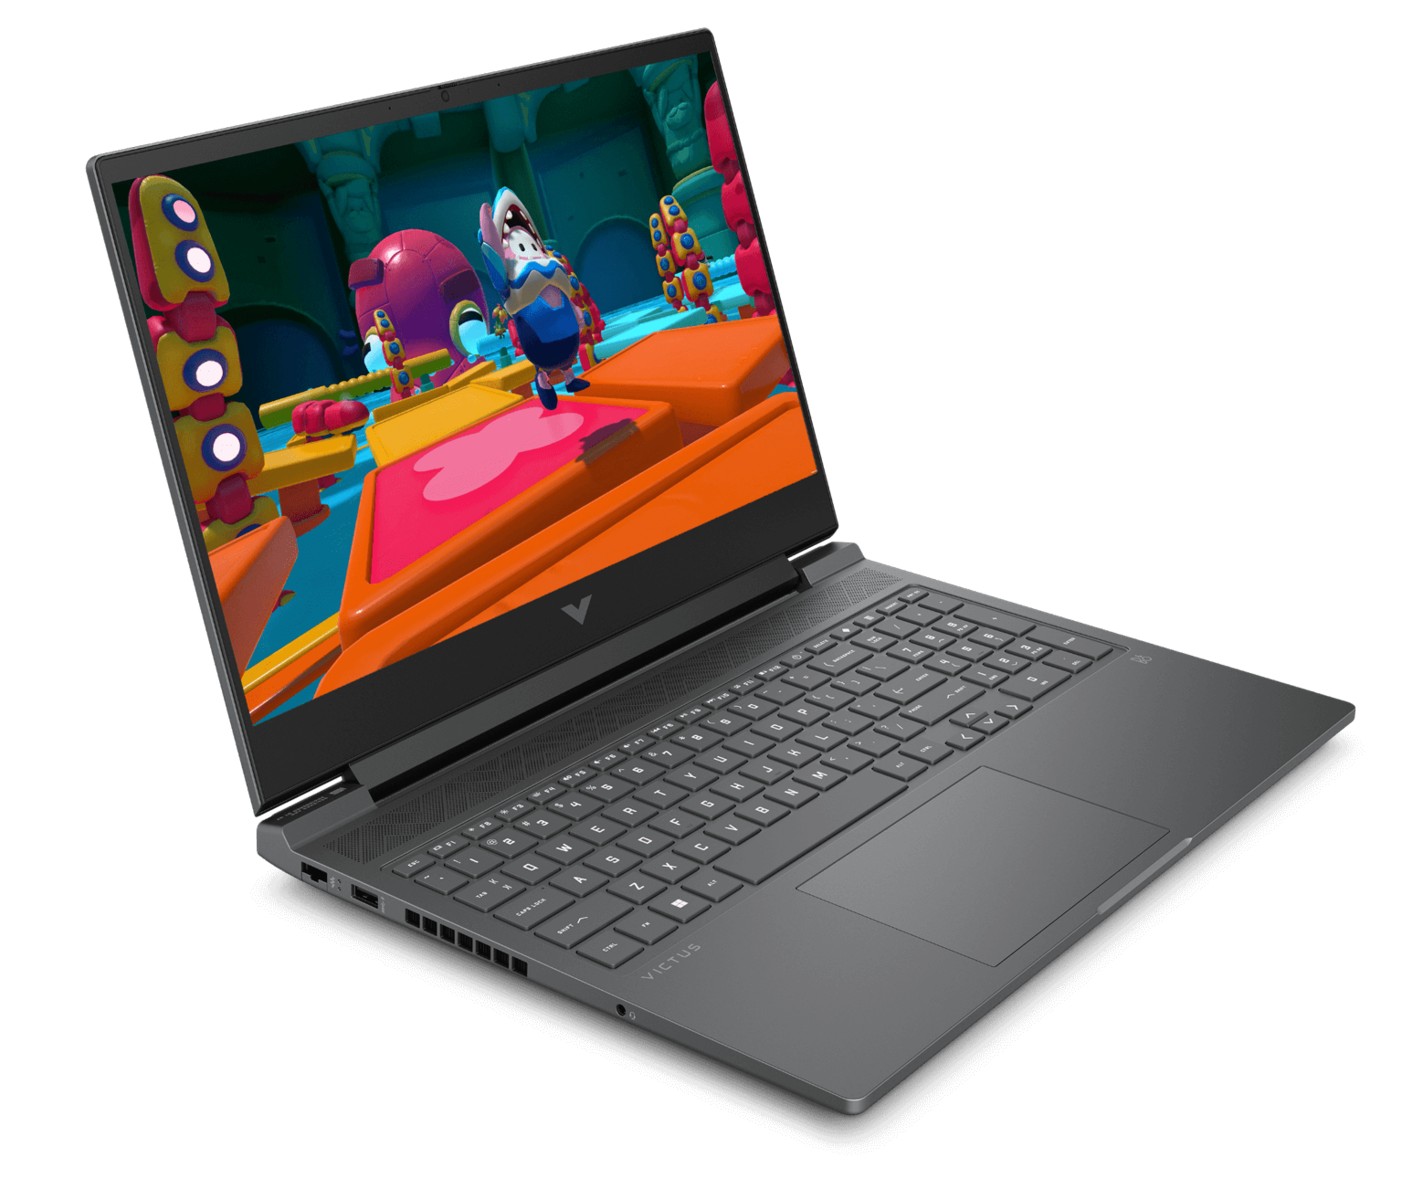
惠普 Victus 16 笔记本电脑评测:1080p 游戏利器,妥协不多

惠普的 Victus 系列笔记本电脑主要面向寻求游戏解决方案的预算有限的用户。不过,它仍然可以运行大量的 Omen 软件,从而有效地巩固了它在惠普游戏笔记本电脑中的地位。
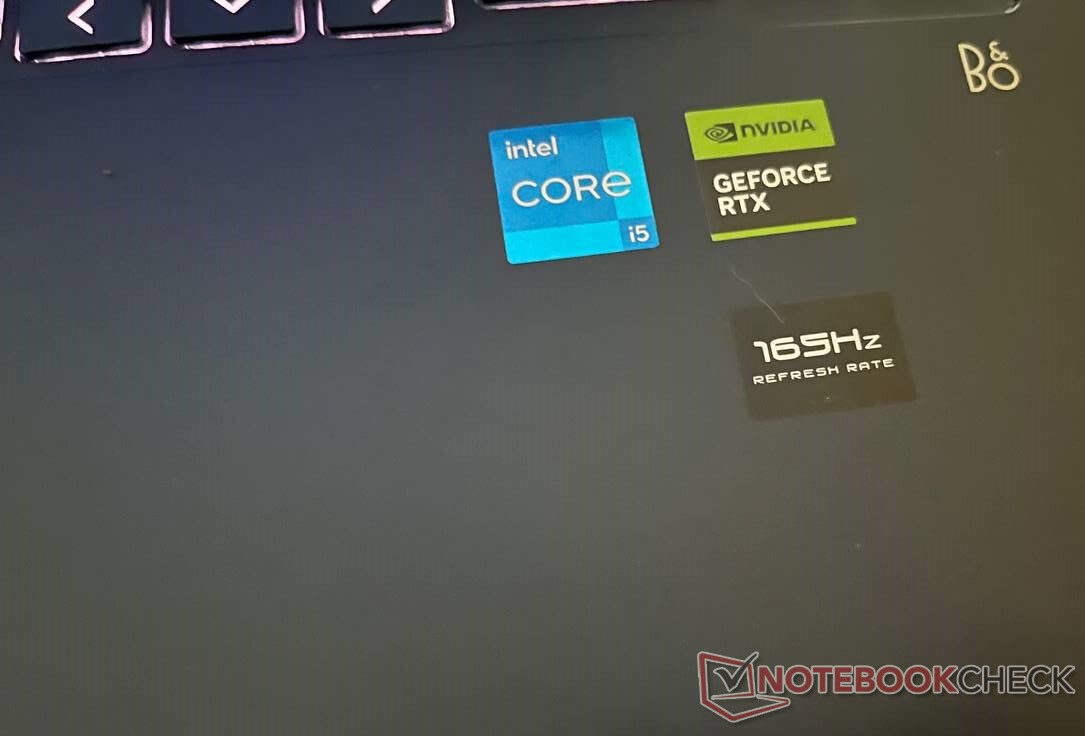
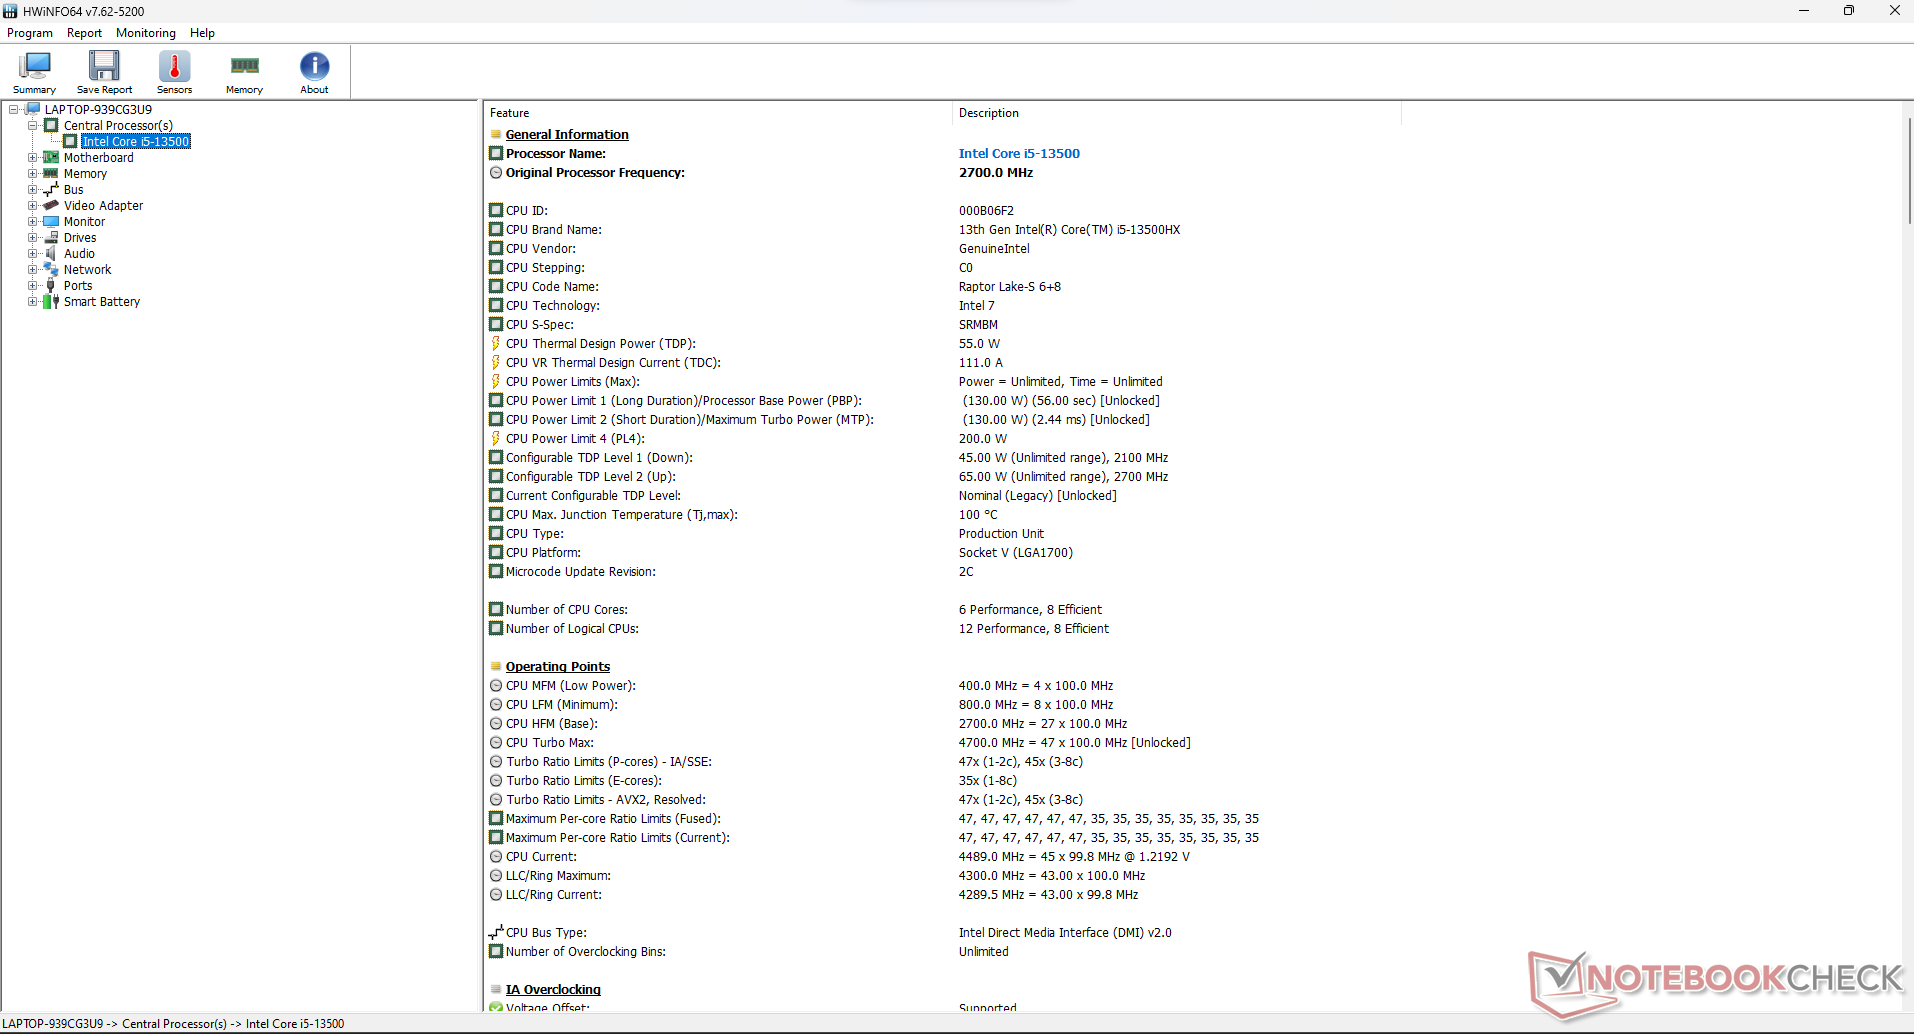
惠普 Victus 16-r0076TX 提供了一个有趣的中端硬件组合,搭载了英特尔酷睿 i5-13500H 处理器。 英特尔酷睿 i5-13500HXRaptor Lake-HX 处理器和 NvidiaGeForce RTX 4050(Ada Lovelace)显卡。
与上一代产品惠普 Victus 16-e0145ng 相比,它有了明显的改进。 惠普 Victus 16-e0145ng相比有了很大改进。 AMD Ryzen 5 5600H和 NvidiaGeForce RTX 3050 Ti.不过,规格升级也带来了相应的成本增加。
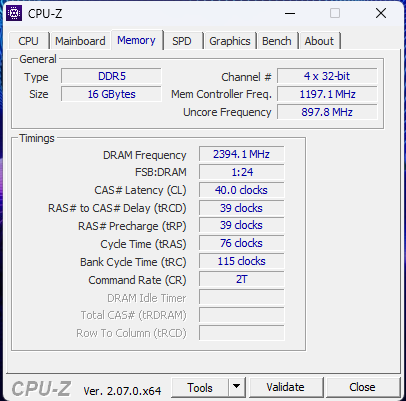
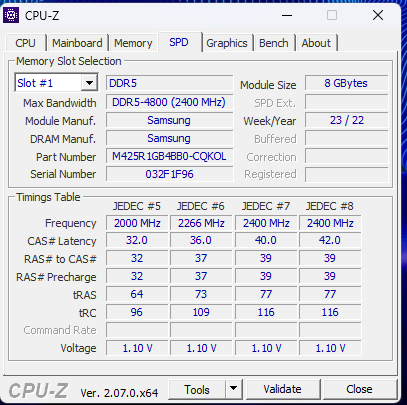
其他规格包括时钟频率为 165 Hz 的 16 英寸 FHD(1,920 x 1,080)IPS 面板、512 GB NVMe SSD 和 16 GB DDR5 内存(4,800 MT/s)。这是一款有趣的机器,可以满足大多数游戏玩家的需求。
潜在的竞争对手比较
Rating | Date | Model | Weight | Height | Size | Resolution | Price |
|---|---|---|---|---|---|---|---|
| 85.6 % v7 (old) | 09 / 2023 | HP Victus 16-r0076TX i5-13500HX, GeForce RTX 4050 Laptop GPU | 2.3 kg | 22.9 mm | 16.10" | 1920x1080 | |
| 86.7 % v7 (old) | 08 / 2023 | Acer Nitro 16 AN16-41-R7YE R5 7535HS, GeForce RTX 4050 Laptop GPU | 2.6 kg | 27.9 mm | 16.00" | 1920x1200 | |
| 87.3 % v7 (old) | 07 / 2023 | Acer Predator Triton 14 PT14-51 i7-13700H, GeForce RTX 4050 Laptop GPU | 1.7 kg | 19.81 mm | 14.00" | 2560x1600 | |
| 88.3 % v7 (old) | 09 / 2023 | Alienware m16 R1 Intel i7-13700HX, GeForce RTX 4060 Laptop GPU | 3 kg | 25.4 mm | 16.00" | 2560x1600 | |
| 89.5 % v7 (old) | 07 / 2023 | Acer Predator Helios 16 PH16-71-731Q i7-13700HX, GeForce RTX 4060 Laptop GPU | 2.6 kg | 26.9 mm | 16.00" | 2560x1600 | |
| 84.2 % v7 (old) | 06 / 2023 | Dell G15 5530 i7-13650HX, GeForce RTX 4060 Laptop GPU | 3 kg | 26.95 mm | 15.60" | 1920x1080 | |
| 89 % v7 (old) | 08 / 2023 | Lenovo Legion Pro 5 16ARX8 (R5 7645HX, RTX 4050) R5 7645HX, GeForce RTX 4050 Laptop GPU | 2.5 kg | 27.3 mm | 16.00" | 2560x1600 | |
| 85.7 % v7 (old) | 07 / 2023 | Lenovo LOQ 15APH8 R7 7840HS, GeForce RTX 4050 Laptop GPU | 2.5 kg | 25.2 mm | 15.60" | 1920x1080 |
外壳:坚固的塑料机身,脆弱的屏幕
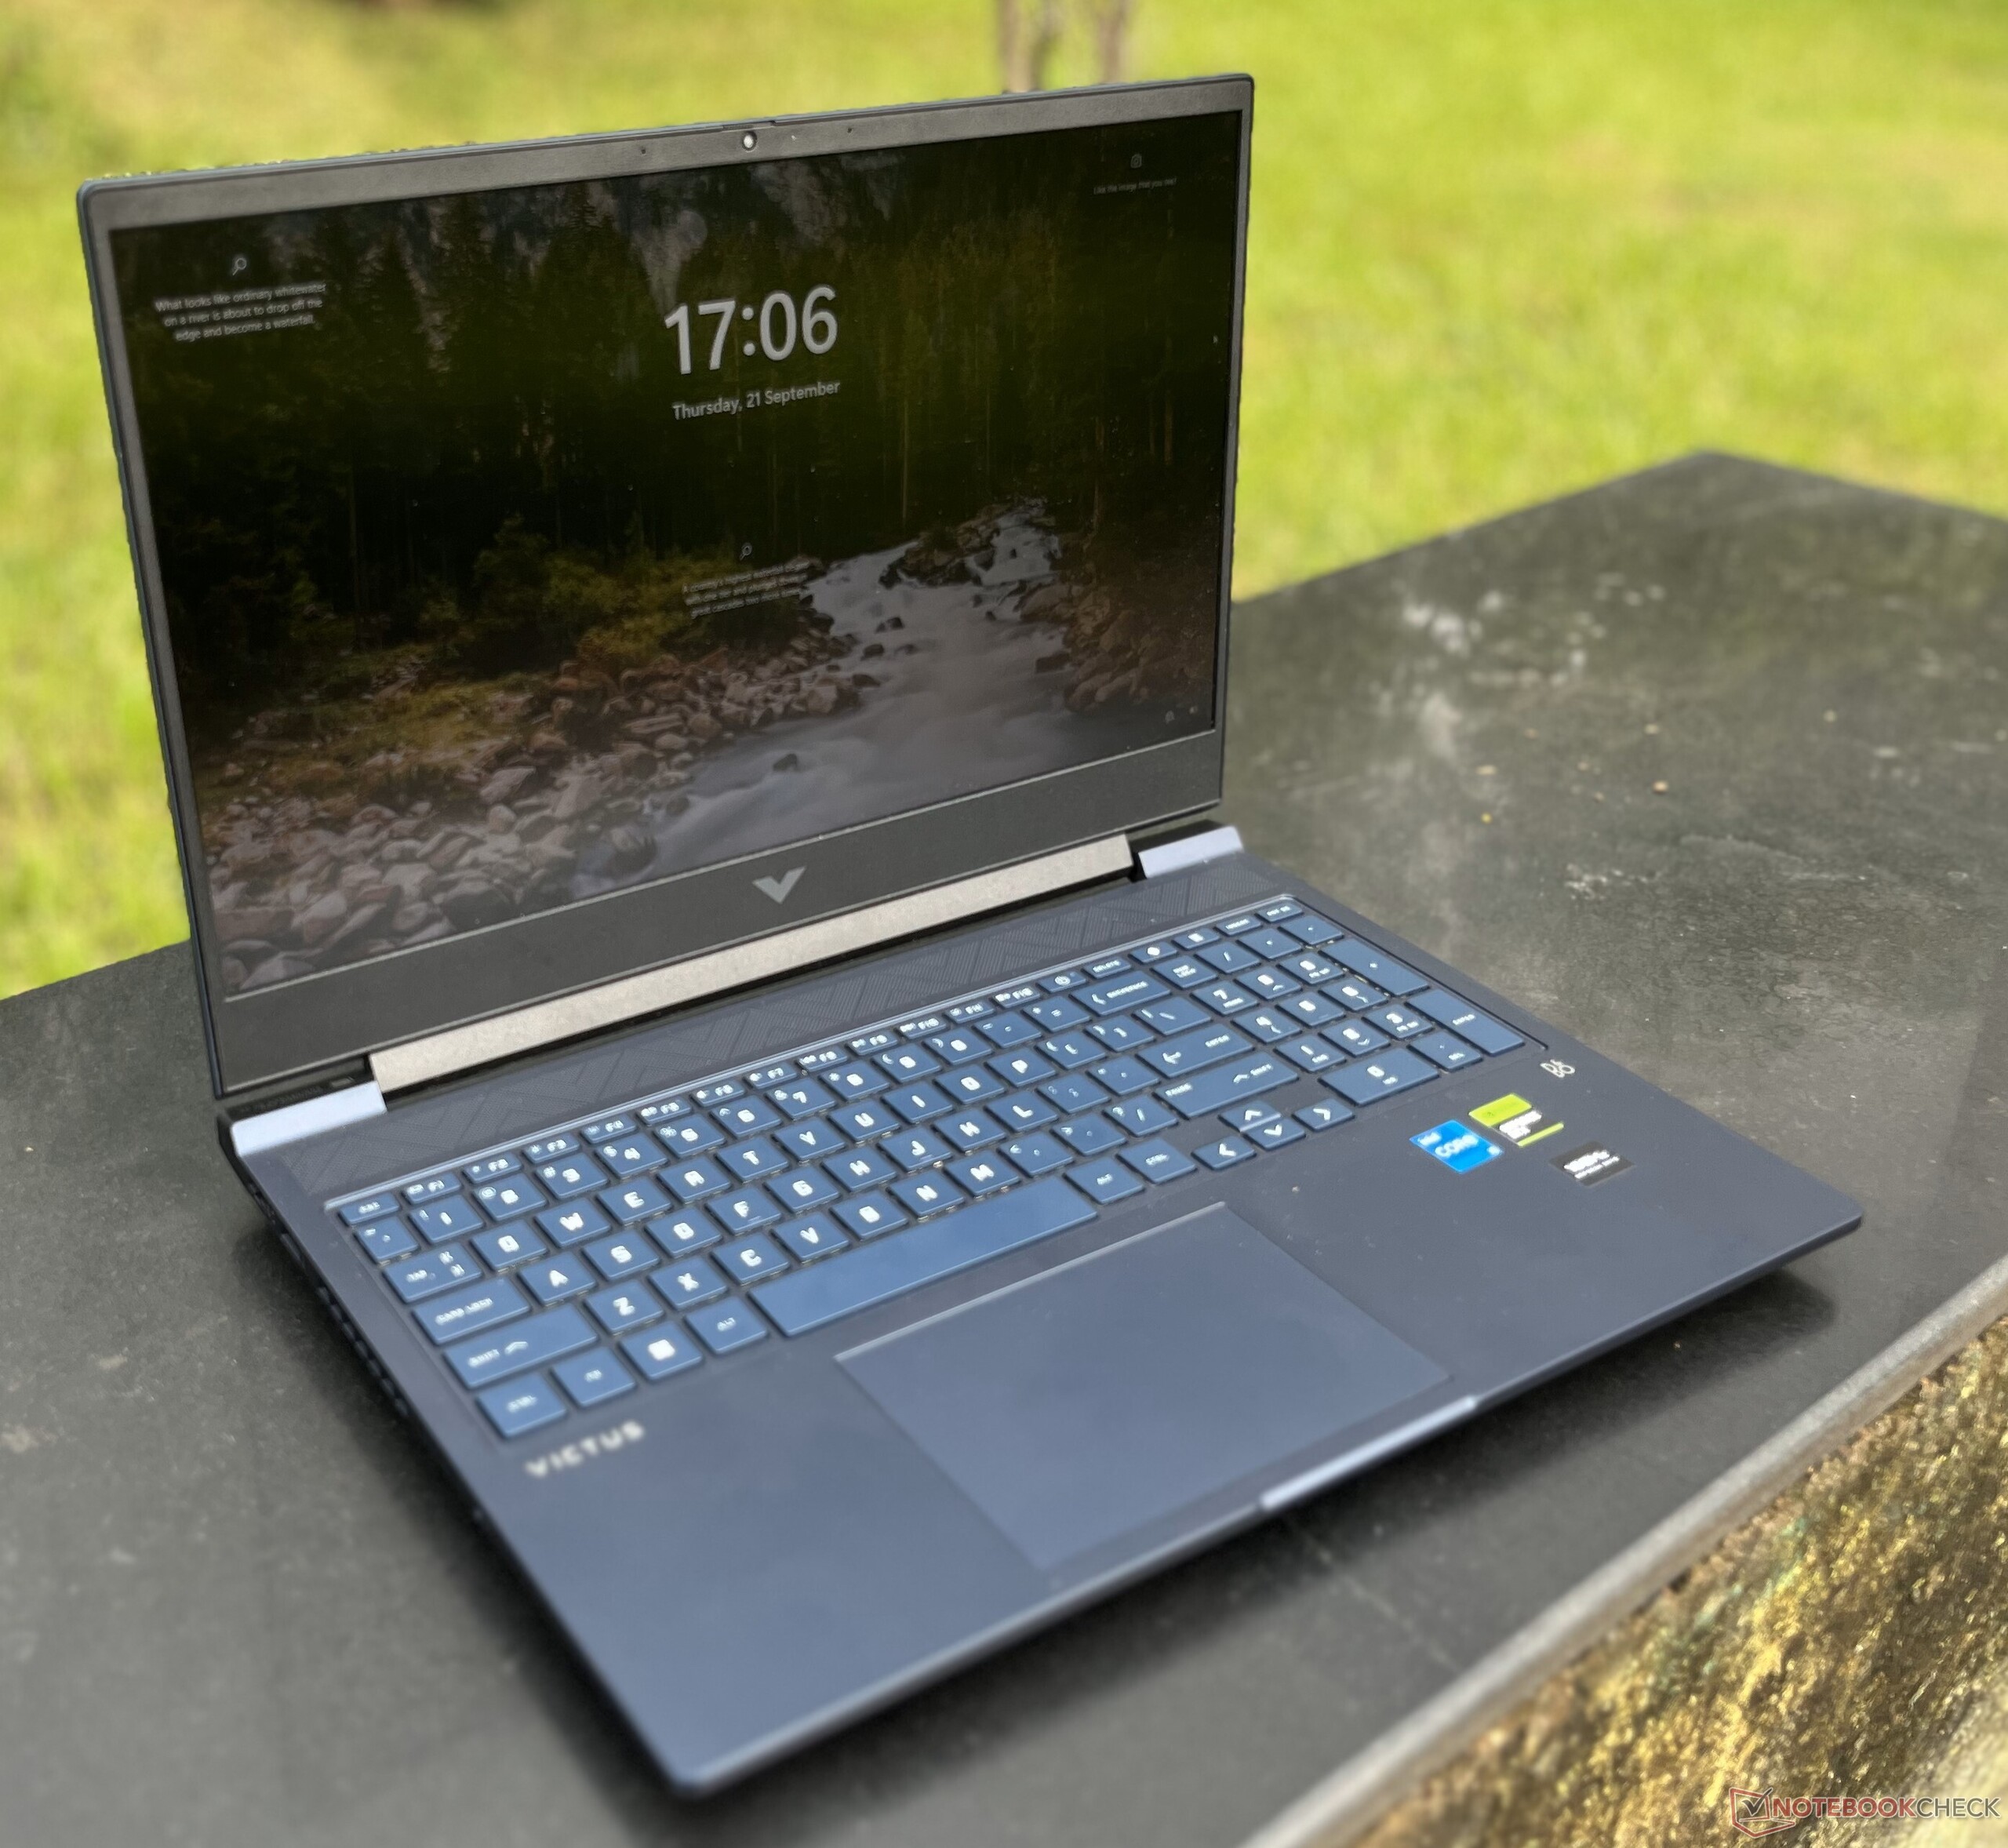
开箱后,惠普 Victus 16 显然不是非常便携。不过,游戏笔记本电脑很少轻便,而这款笔记本电脑重 2.3 千克(5.05 磅),实际上属于轻便型。
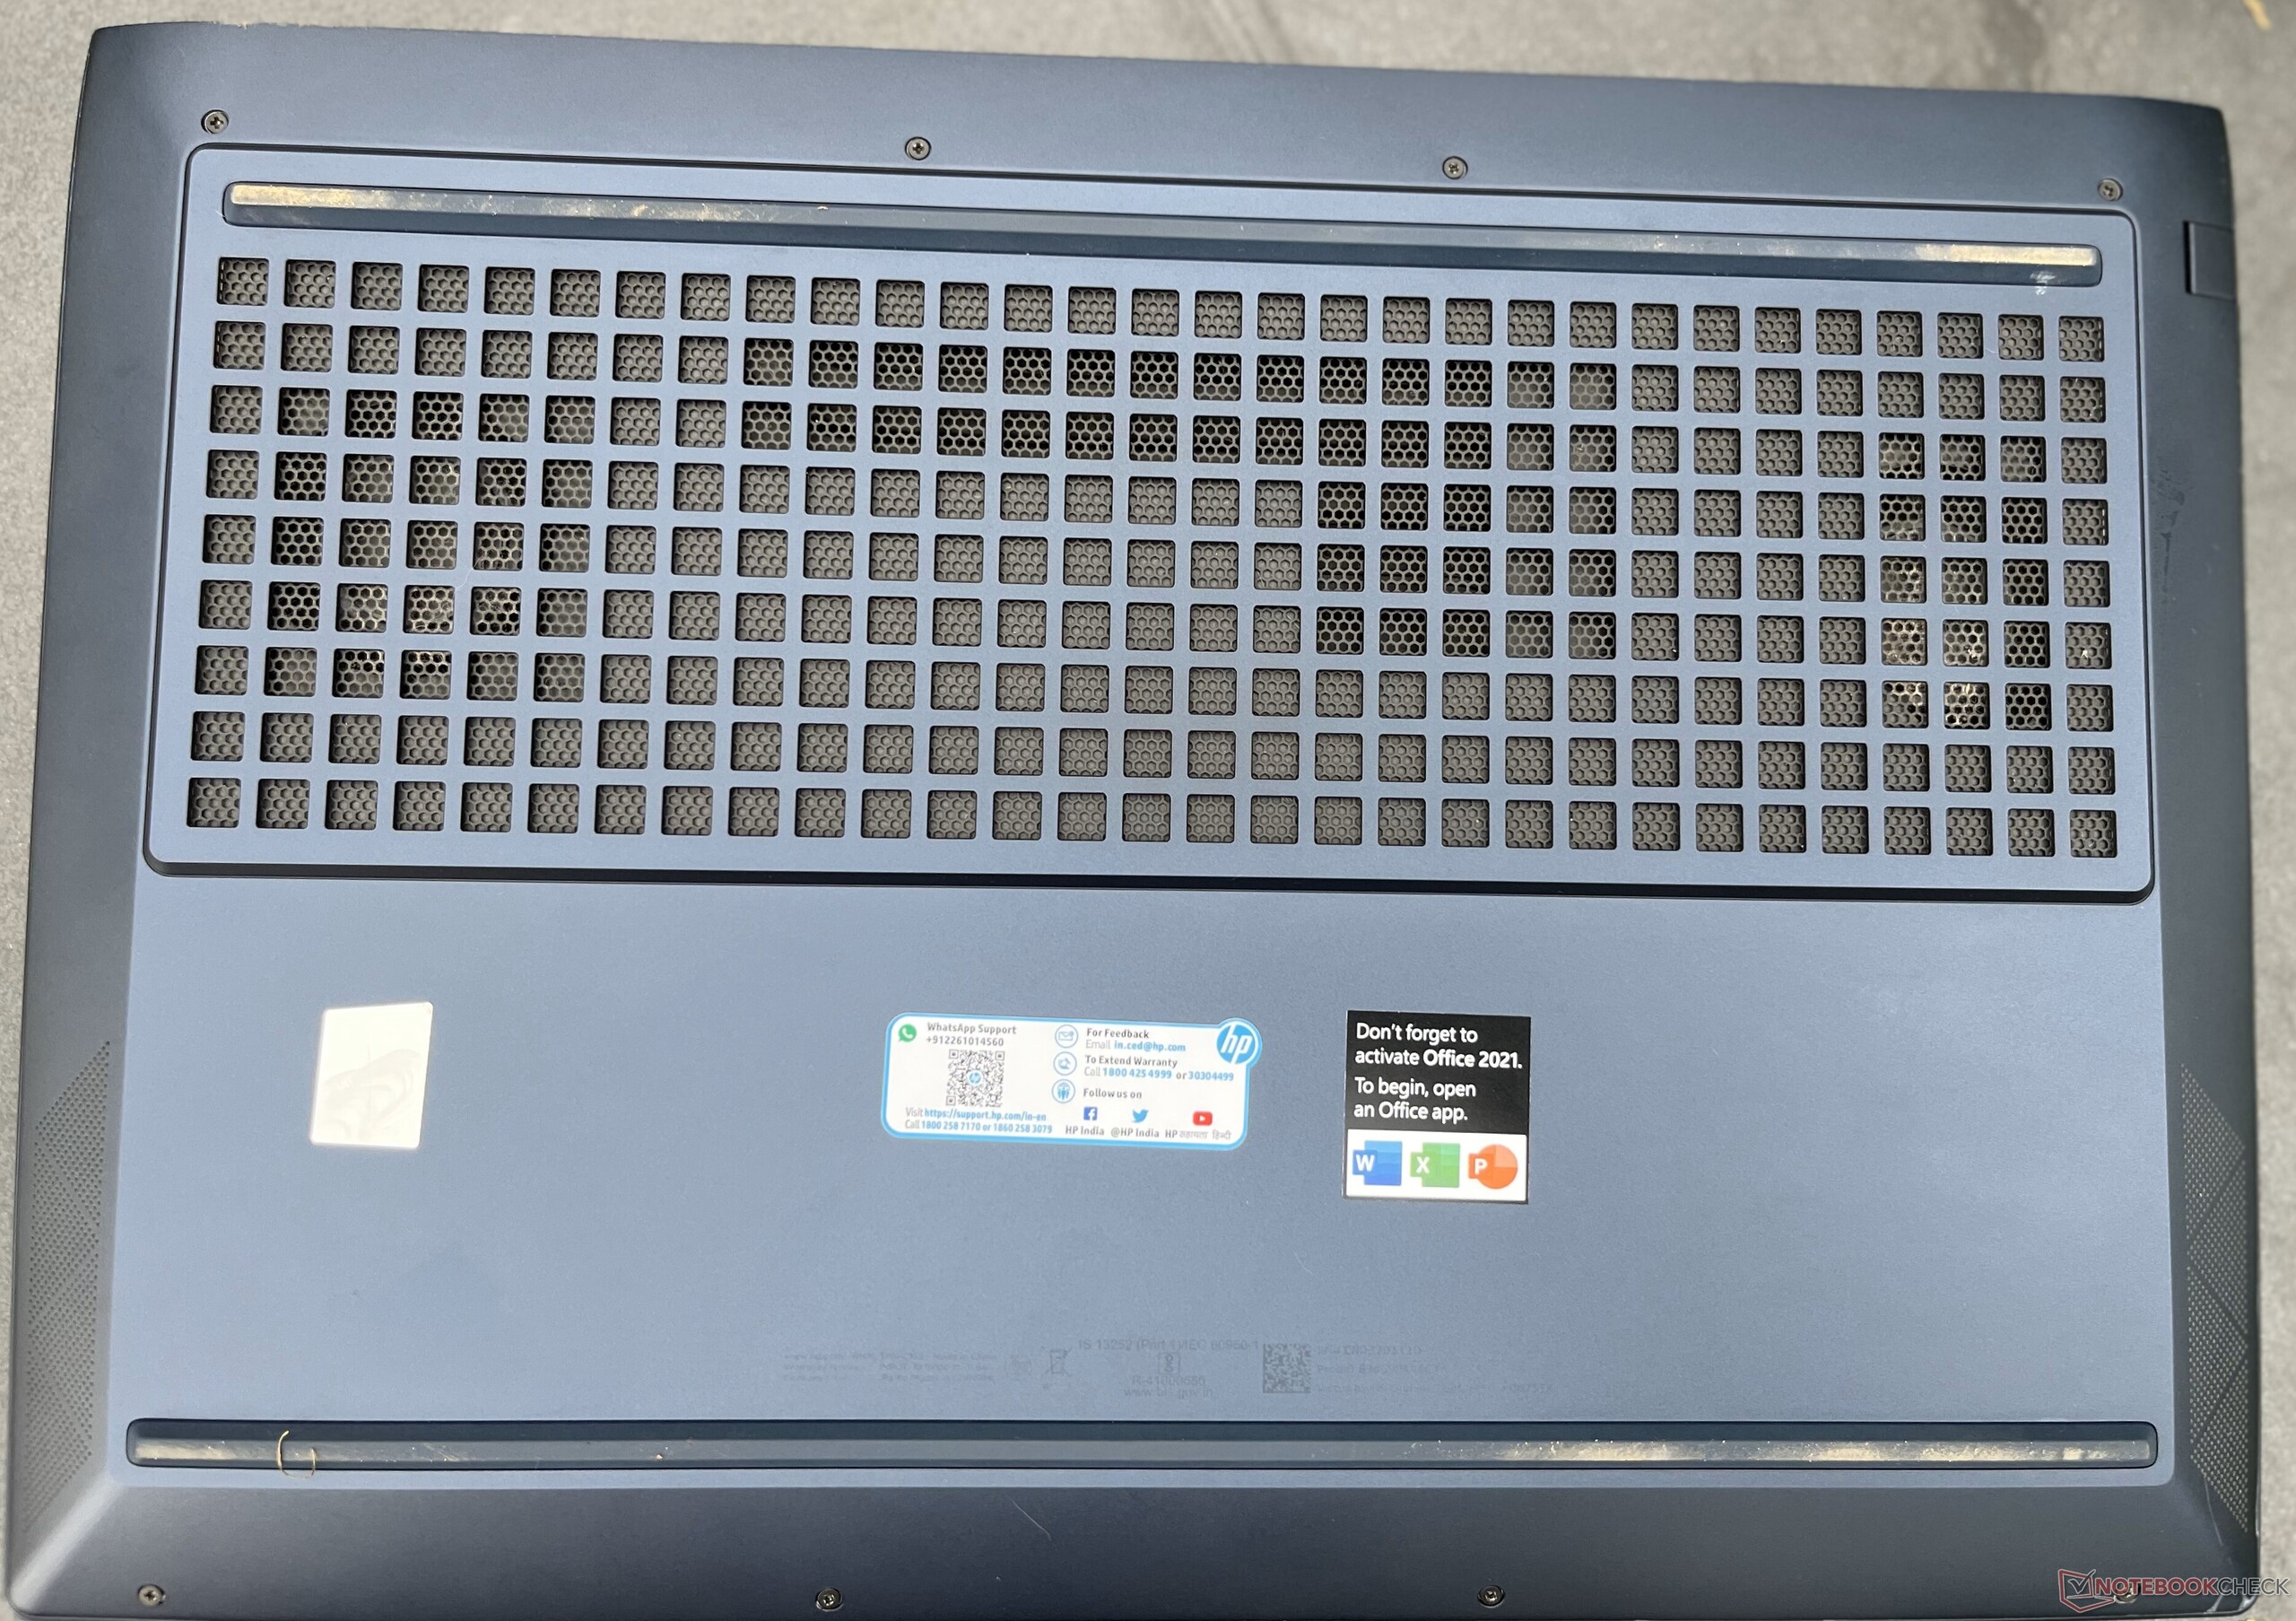
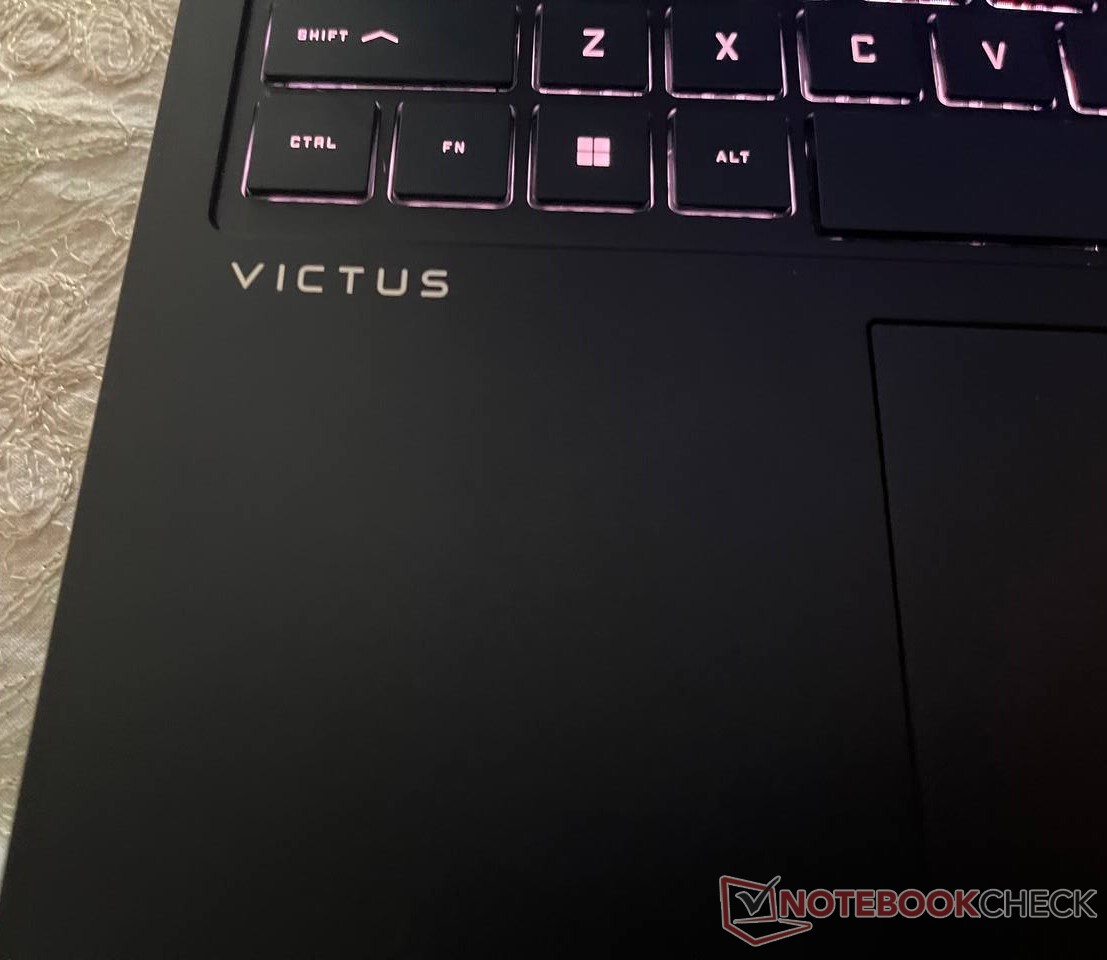
全黑的机身上没有太多的品牌标识,只有背面的 "V "字和正面的标准贴纸。 惠普在所有通风口都安装了防尘滤网,以保持笔记本电脑的清洁。
16 英寸的屏幕让惠普可以在 Victus 16 上安装全键盘(包括数字键盘)。屏幕的弯曲度有点大,如果惠普能在后续版本中加以修改就更好了。
连接性:本可以增加输入/输出接口
作为一款游戏笔记本电脑,惠普 Victus 16 的输入/输出接口之少令人惊讶。右侧有一个 USB-C 端口、两个 USB-A 端口(三个端口的额定速率均为 5 Gbps),一端有一个 HDMI 2.1 端口。旁边还有一个用于充电器的桶针接口。USB 和 HDMI 端口离得有点太近,尤其是靠近 HDMI 端口的地方。
另一侧只有一个 RJ-45 以太网接口、一个 USB Type-A 接口和一个 3.5 毫米音频接口。如果能在背面增加一些输入/输出接口就更好了。USB-C 端口的速度很差,几乎像是事后才想到的。


交流
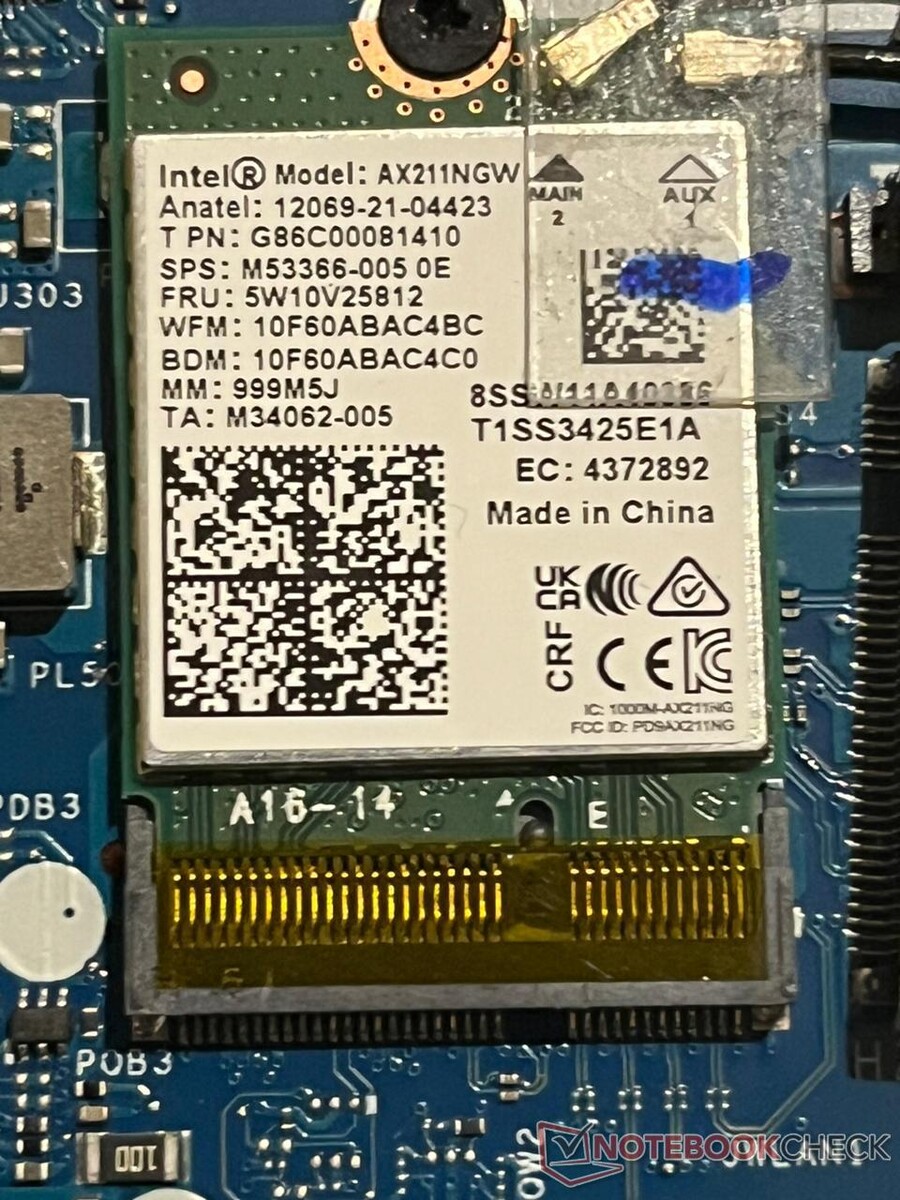
作为一款入门级笔记本电脑,惠普 Victus 16 有多种网络选项可供选择。你可以使用 Wi-Fi 6E 和以太网端口,这两个端口都能让你高速传输文件。
在 iPerf3 中,英特尔的 Wi-Fi 6E 调制解调器可通过华硕 ROG Rapture AXE11000 路由器以 1646 Mbps 的速度接收数据。这比同类产品要快得多,因为同类产品往往完全缺乏 Wi-Fi 6 功能。
| Networking / iperf3 transmit AXE11000 | |
| Lenovo Legion Pro 5 16ARX8 (R5 7645HX, RTX 4050) | |
| Dell G15 5530 | |
| HP Victus 16-r0076TX | |
| Acer Predator Triton 14 PT14-51 | |
| Acer Nitro 16 AN16-41-R7YE | |
| Acer Predator Helios 16 PH16-71-731Q | |
| Alienware m16 R1 Intel | |
| Average of class Gaming (560 - 1862, n=87, last 2 years) | |
| Average Intel Wi-Fi 6E AX211 (64 - 1921, n=276) | |
| Lenovo LOQ 15APH8 | |
| Networking / iperf3 receive AXE11000 | |
| Acer Predator Triton 14 PT14-51 | |
| Acer Nitro 16 AN16-41-R7YE | |
| Alienware m16 R1 Intel | |
| Lenovo Legion Pro 5 16ARX8 (R5 7645HX, RTX 4050) | |
| Dell G15 5530 | |
| HP Victus 16-r0076TX | |
| Average of class Gaming (680 - 1745, n=87, last 2 years) | |
| Acer Predator Helios 16 PH16-71-731Q | |
| Average Intel Wi-Fi 6E AX211 (582 - 1890, n=276) | |
| Lenovo LOQ 15APH8 | |
| Networking / iperf3 transmit AXE11000 6GHz | |
| Lenovo Legion Pro 5 16ARX8 (R5 7645HX, RTX 4050) | |
| Acer Predator Helios 16 PH16-71-731Q | |
| HP Victus 16-r0076TX | |
| Average of class Gaming (723 - 1868, n=36, last 2 years) | |
| Average Intel Wi-Fi 6E AX211 (385 - 1851, n=226) | |
| Networking / iperf3 receive AXE11000 6GHz | |
| Lenovo Legion Pro 5 16ARX8 (R5 7645HX, RTX 4050) | |
| HP Victus 16-r0076TX | |
| Average of class Gaming (975 - 1775, n=35, last 2 years) | |
| Average Intel Wi-Fi 6E AX211 (700 - 1857, n=226) | |
| Acer Predator Helios 16 PH16-71-731Q | |
网络摄像头
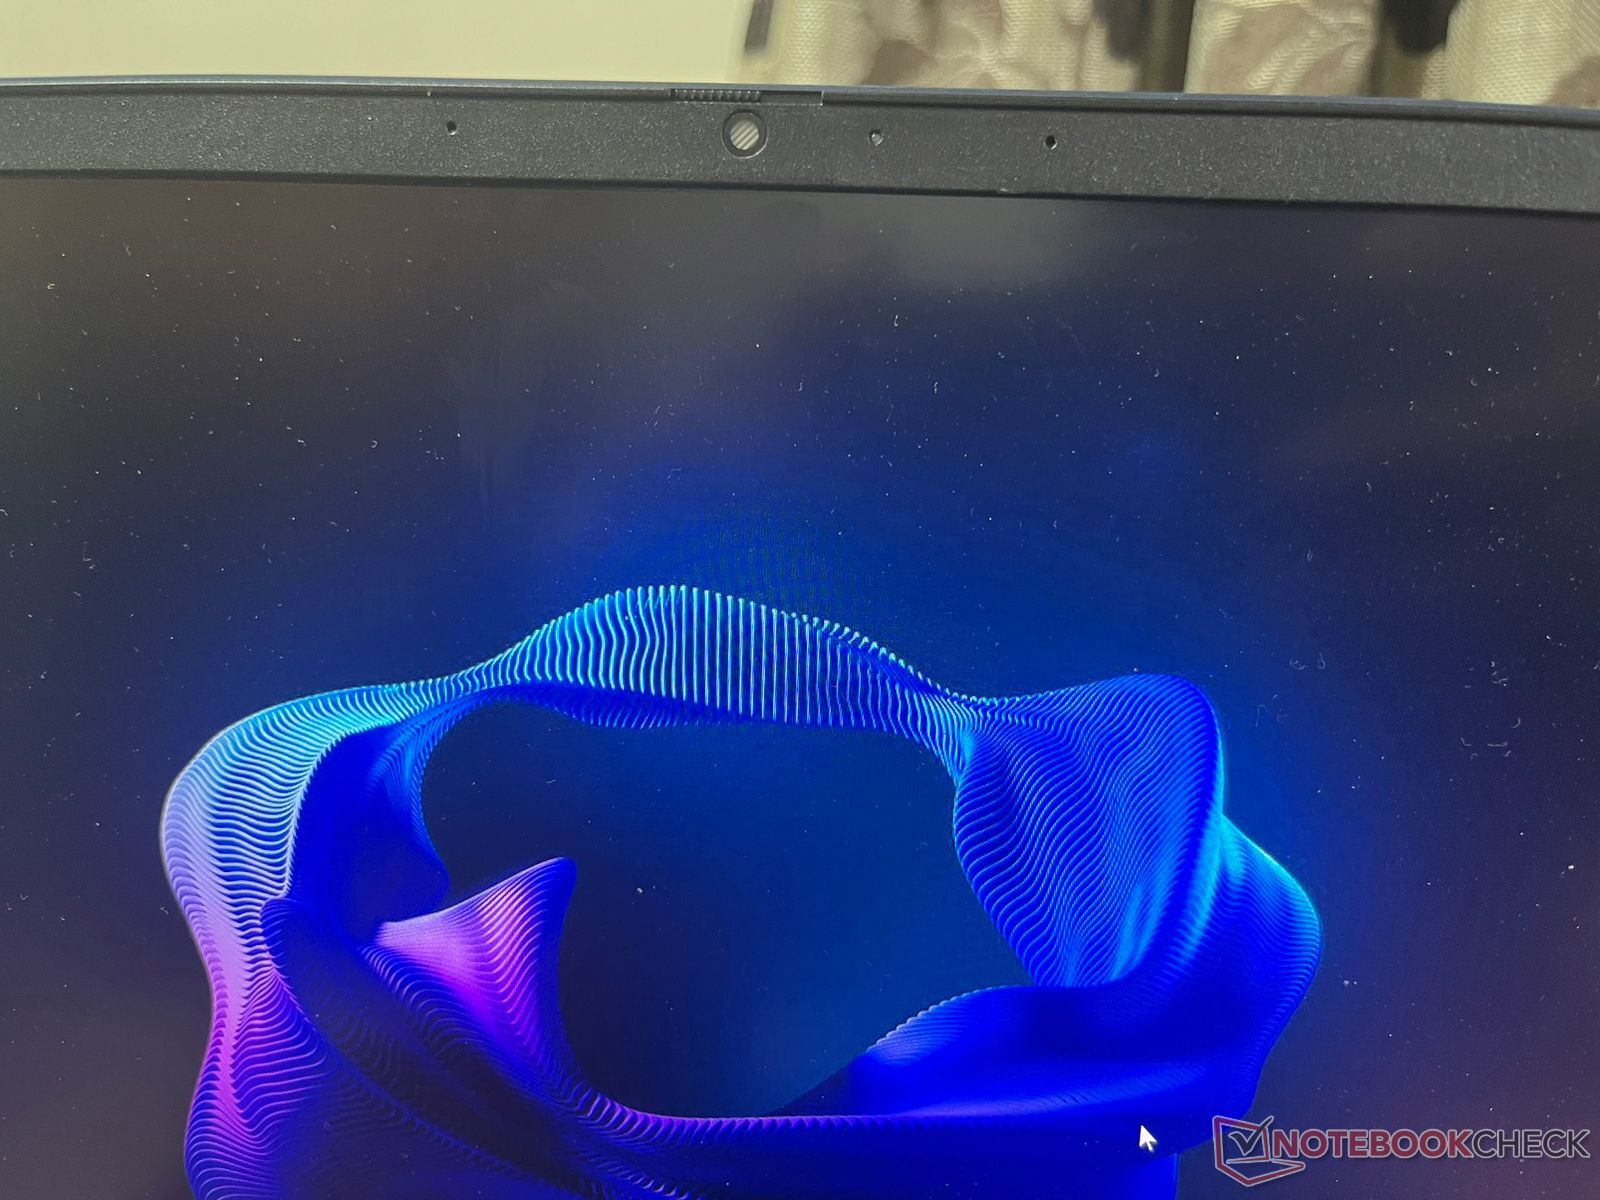
网络摄像头在游戏笔记本电脑上并不多见,而惠普 Victus 16 甚至配备了 1080p(约 200 万像素)模块,这无疑是一个额外的惊喜。它的色彩精确度不高,但可以满足视频会议和通话等基本任务的需要。
甚至还有一个(很难找到的)物理隐私快门,可以完全关闭摄像头。此外,Omen Gaming Hub 中还有一个专门的部分,用于使用 Nvidia 广播增强摄像头/麦克风功能。


安全
除了 Windows 11 所需的 TPM 模块外,惠普 Victus 16 完全没有安全功能。指纹传感器、Windows Hello 甚至 Kensington Lock 插槽都没有出现。
配件和保修
惠普Victus 16的包装没有太多可圈可点之处。它基本上是光秃秃的,只有笔记本电脑和一块电源砖。不过,与大多数游戏笔记本电脑一样,后者的体积非常大。
惠普印度公司为 Victus 16 提供一年有限保修。额外支付 2,999 镑,则可享受两年额外保修和三年防病毒计划。不过,该优惠有效期有限。
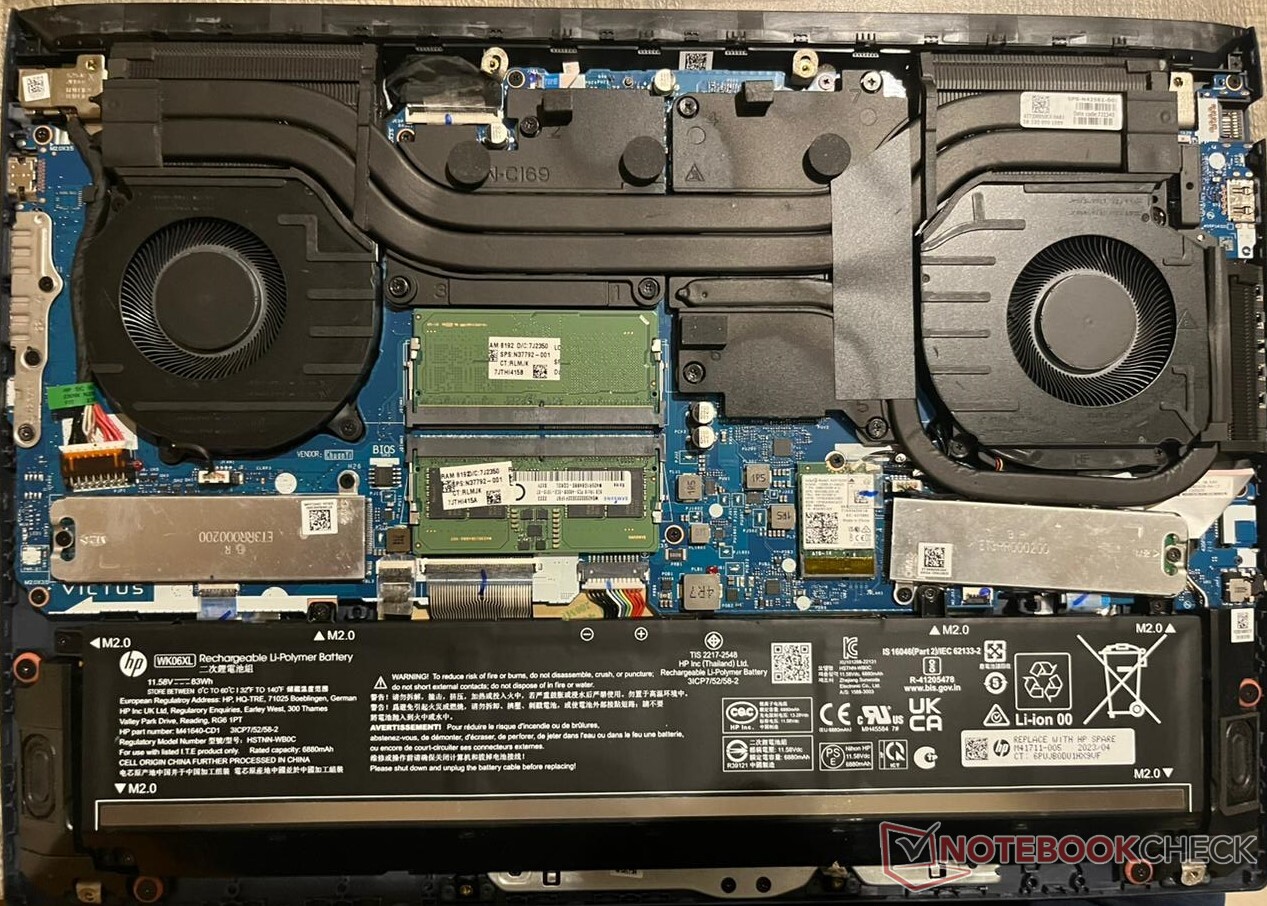
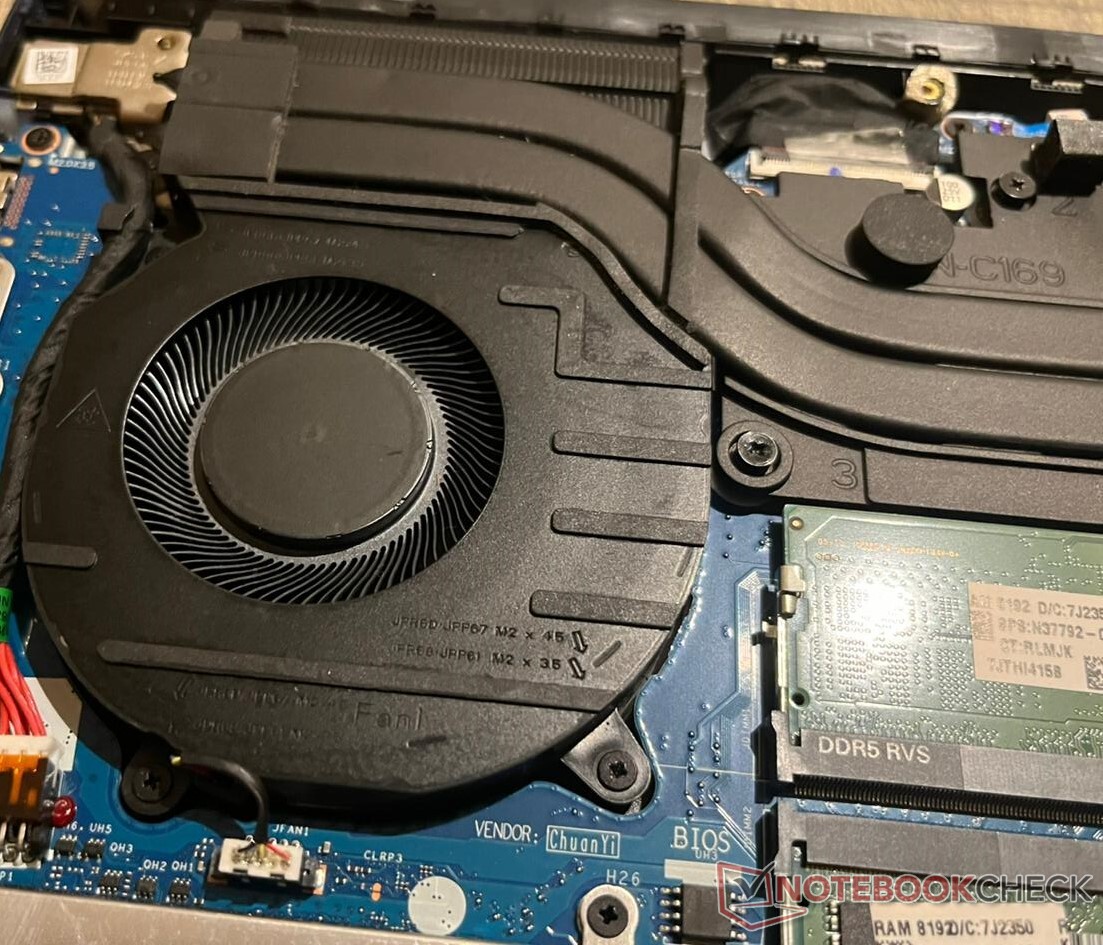
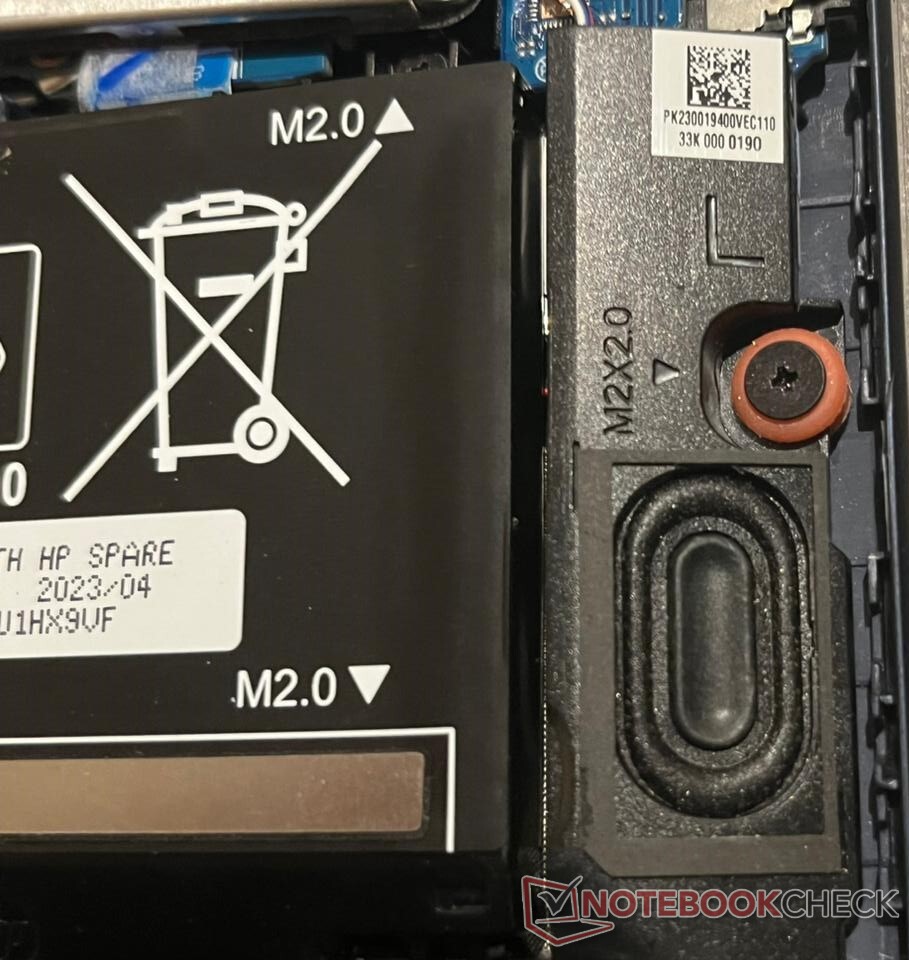
维护
进入惠普 Victus 16 非常简单。只需一把飞利浦螺丝刀,拧下背面的八颗螺丝,撬开盖板即可。WLAN 卡、DDR5 内存和 NVMe 固态硬盘都可以更换。如有必要,还可以拧下并更换电池。
输入设备:带 RGB 灯光的优质键盘
惠普 Victus 16 配备了全功能键盘和足够大的触控板。它的按键很大,台式机用户不需要花很长时间就能重新设置自己的肌肉记忆来使用笔记本电脑。它的数字键盘很受欢迎,但惠普却把电源键放在了最糟糕的位置,就在删除键旁边。我们花了一分钟才第一次找到电源键,而且我们相当肯定,我们不会是唯一一个找到电源键的人。
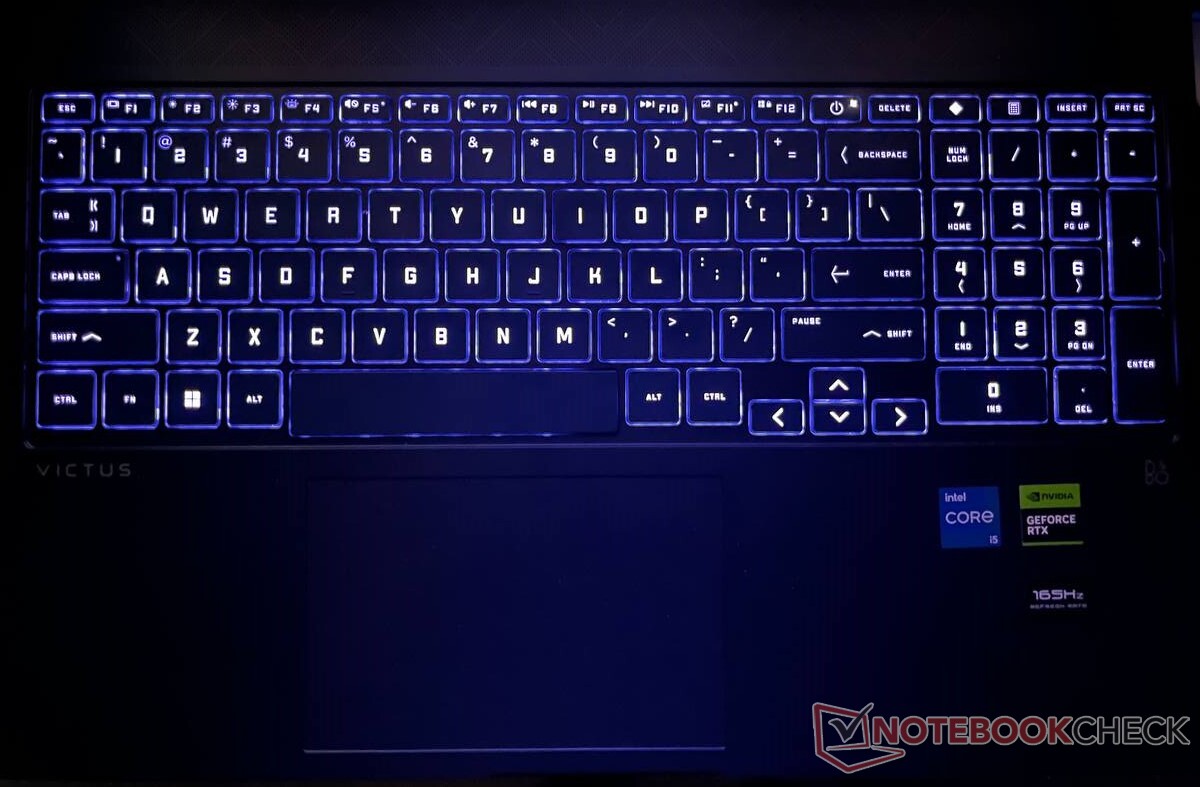
键盘
按键感觉有点糊,但不会破坏沉浸感。想要自定义键盘灯光的用户可以通过 Omen Lighting 应用程序来实现。
还有一个专用按钮用于打开 Omen Gaming Hub 应用程序,另一个按钮用于计算器。
尽管键盘的底盘是塑料的,但相当坚固,在压力下也不会有太大的弯曲。
触摸板
触摸板涵盖了所有 WindowsPrecision 手势。不过,整个触摸板并不是都可以点击,顶部的部分是硬的。
手掌剔除功能也很到位,在打字时不会出现意外的轻扫和点击。边缘的追踪和手势操作也没有任何问题。
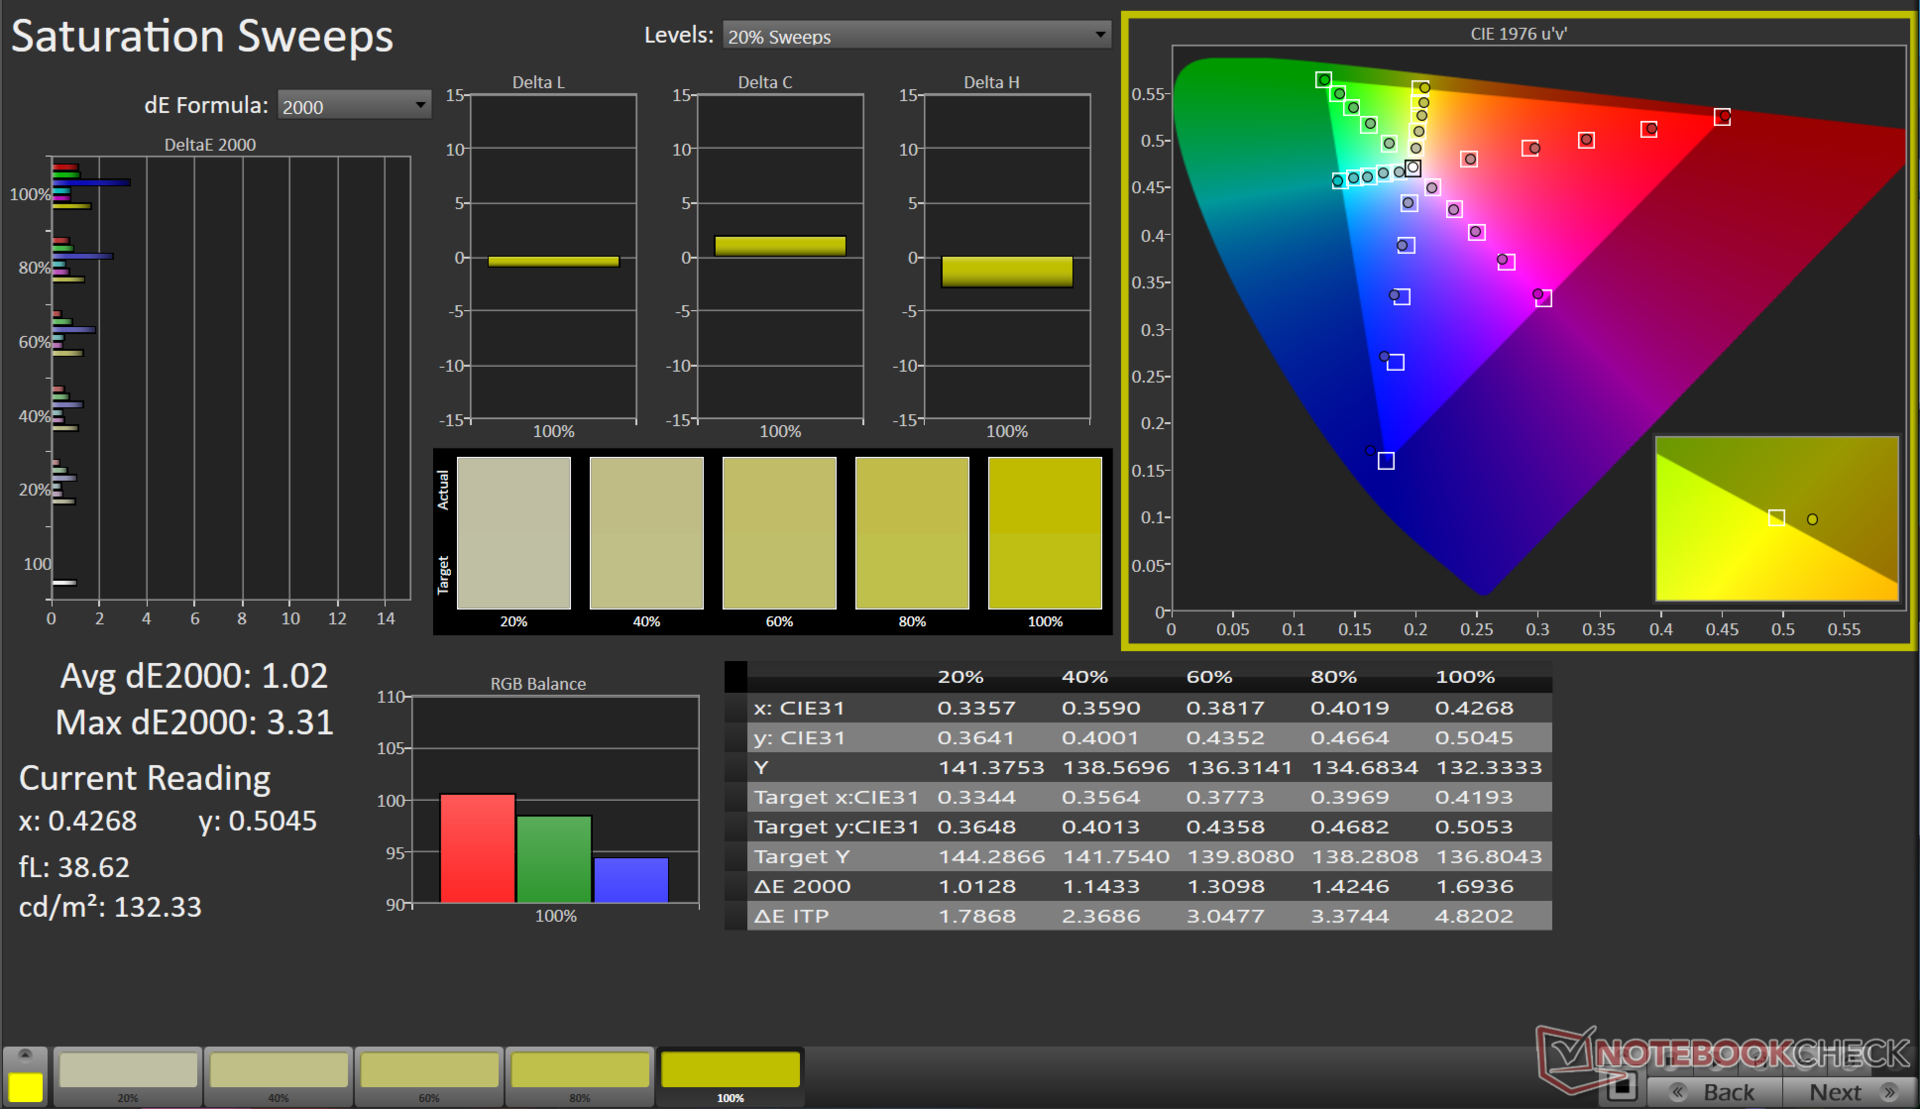
显示屏屏幕频率为 165 赫兹,亮度较低
我们的惠普 Victus 16 样品配备了奇美的 16.1 英寸 FHD(1,920 x 1,080)IPS 液晶面板。惠普还为 Victus 16 SKU 提供了另外两种屏幕选择:144 Hz FHD 和 240 Hz QHD(2,550 x 1,440)。
惠普网站称,这种面板的峰值亮度为 300 尼特。我们的测试证实了这一数字,但亮度分布偏低(82%)。此外,亮度也有些偏高,尤其是右中部。
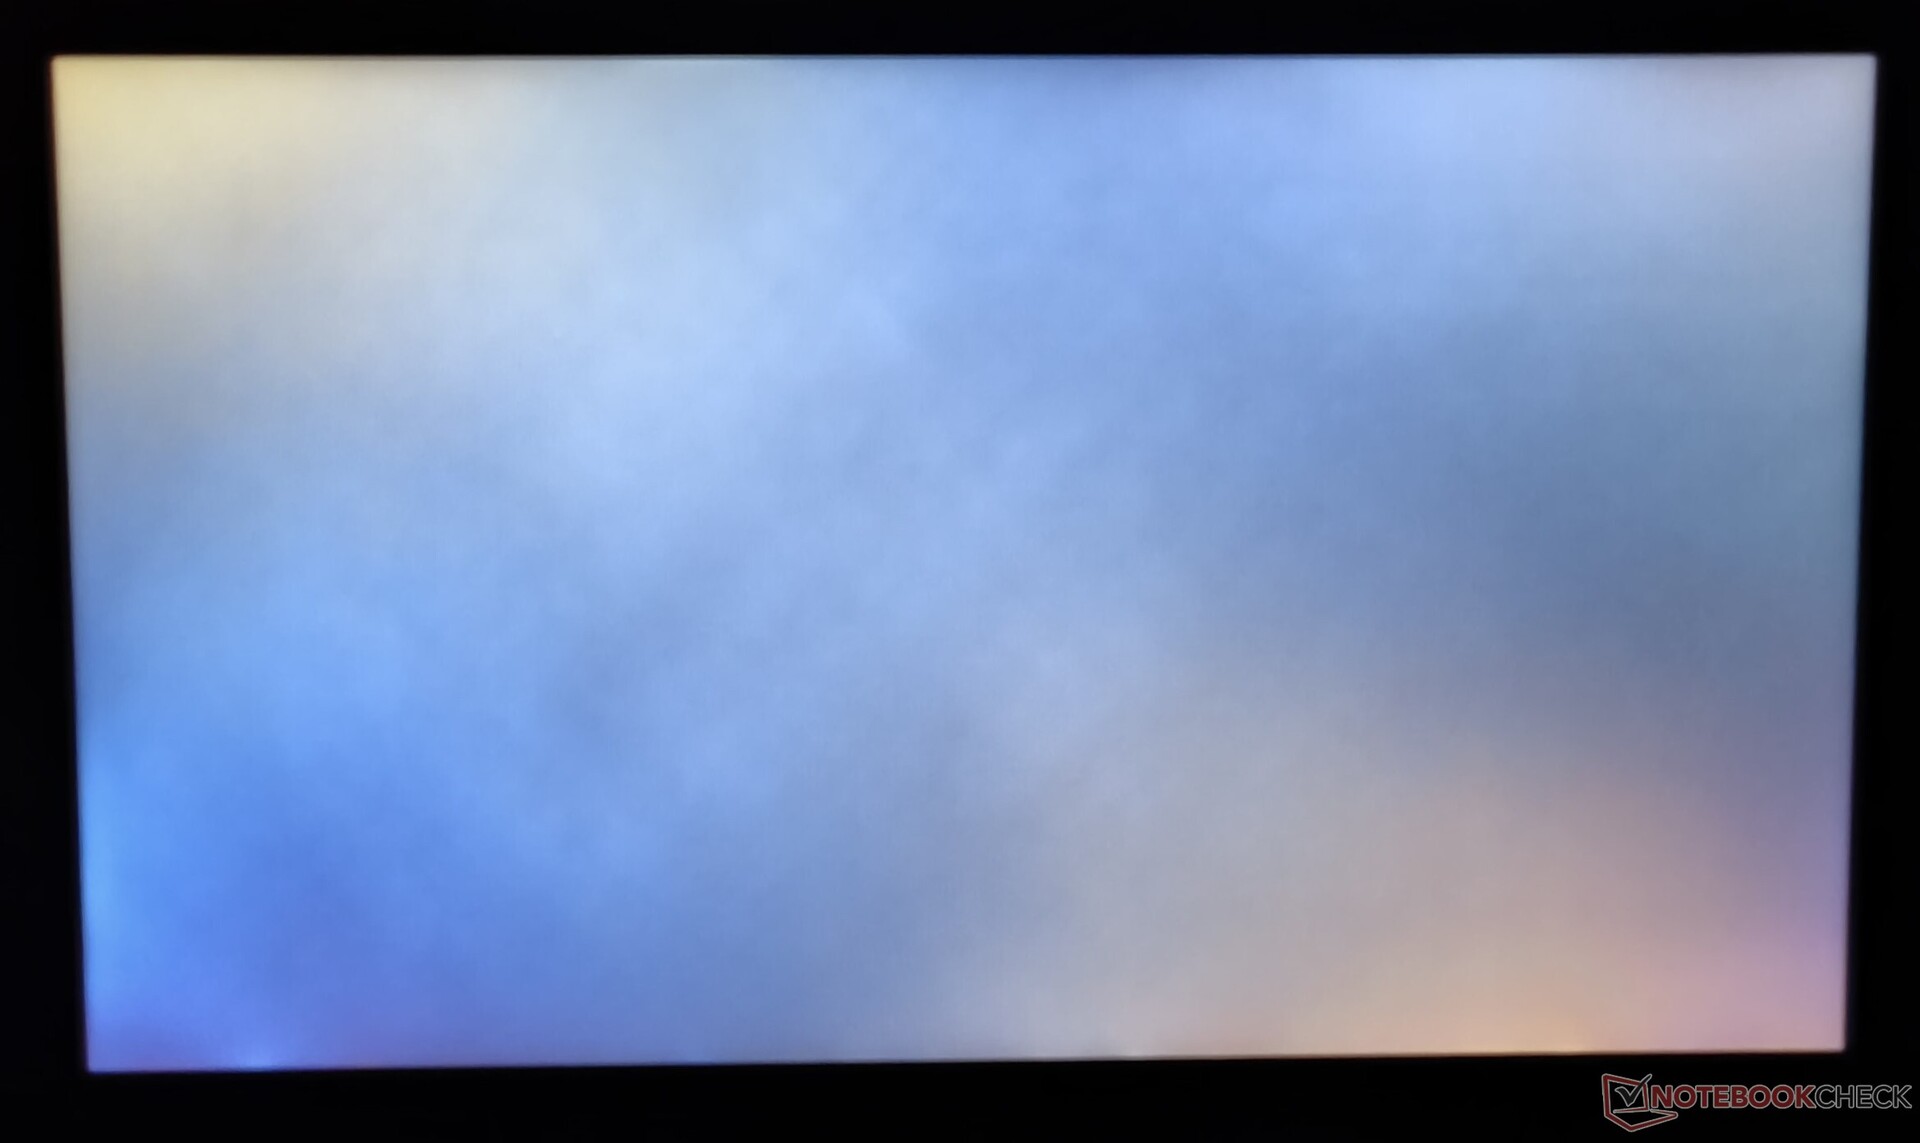
最后,1381:1 的对比度在可接受的范围内。不过,该面板存在严重的背光渗色问题,这也是 IPS 屏幕经常出现的问题。

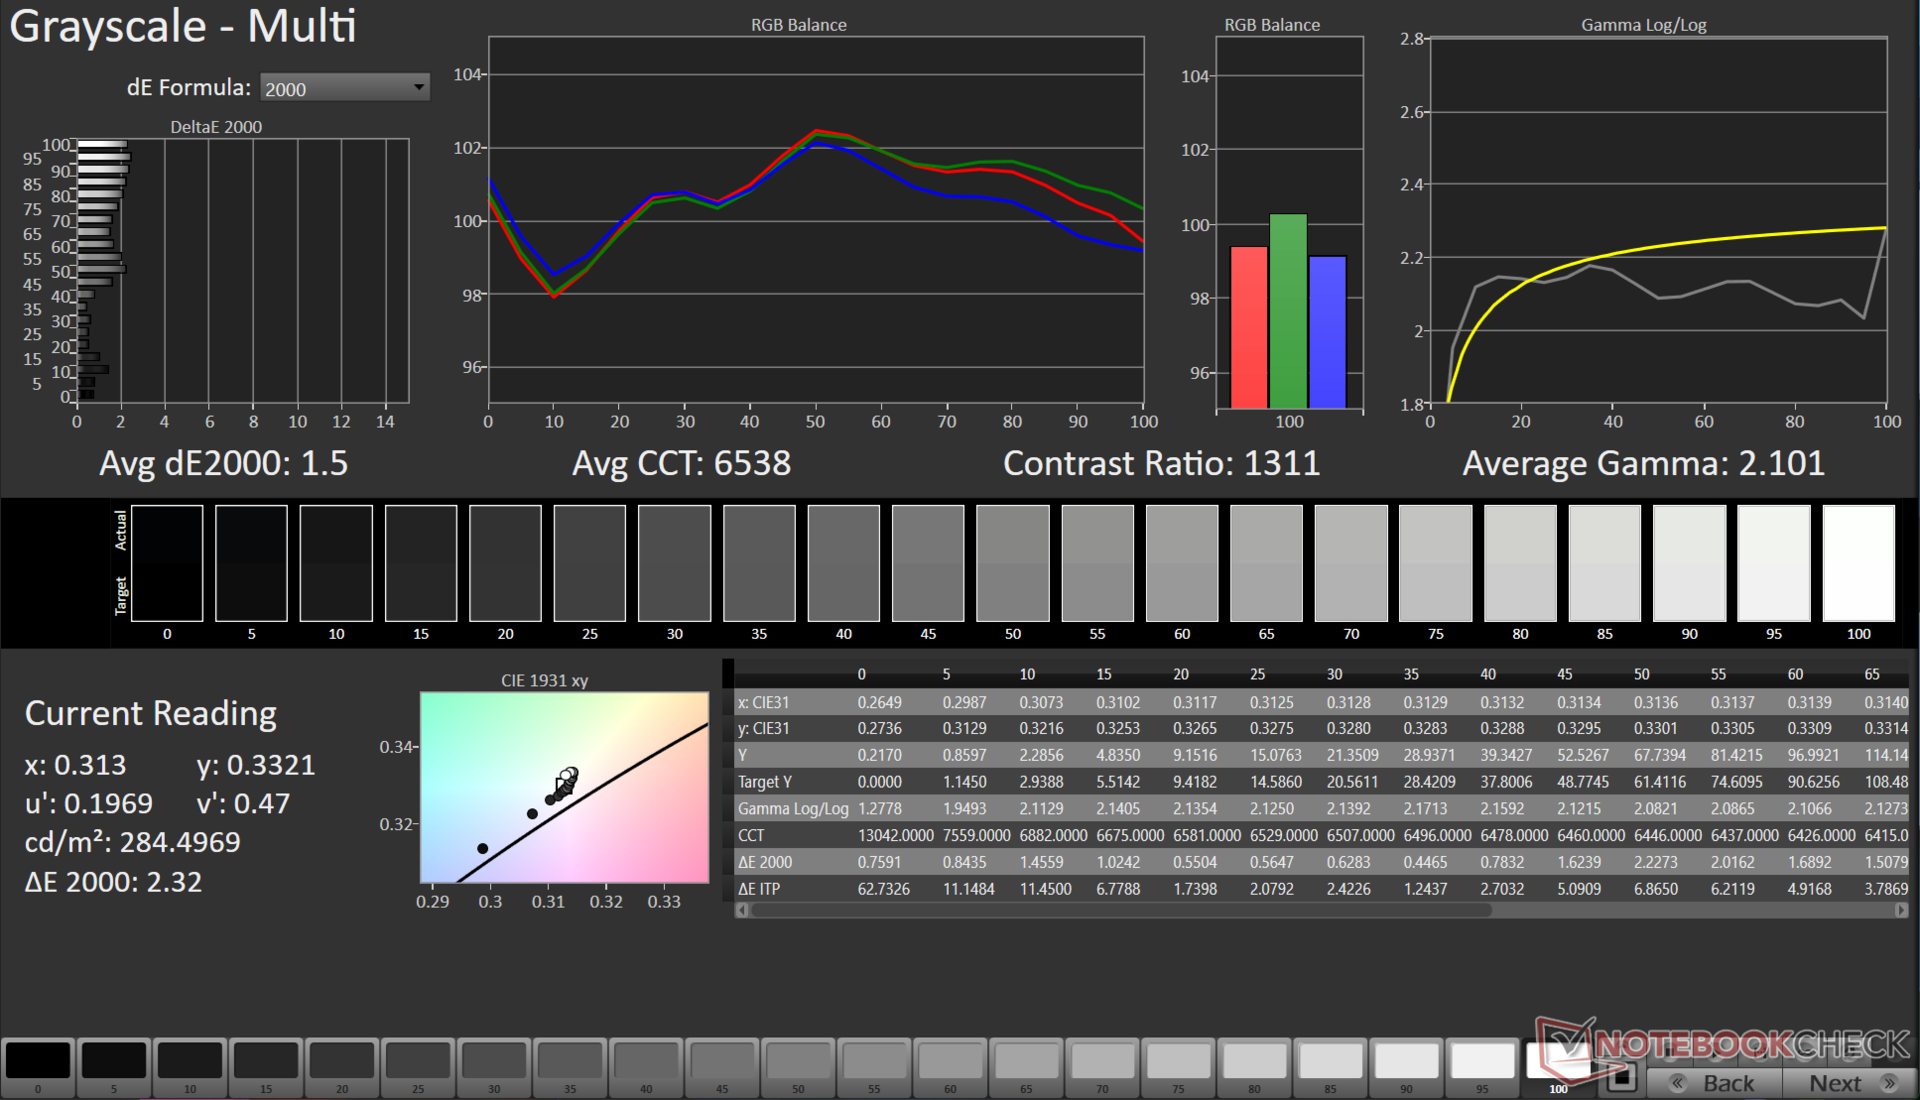
| |||||||||||||||||||||||||
Brightness Distribution: 82 %
Center on Battery: 287 cd/m²
Contrast: 1381:1 (Black: 0.21 cd/m²)
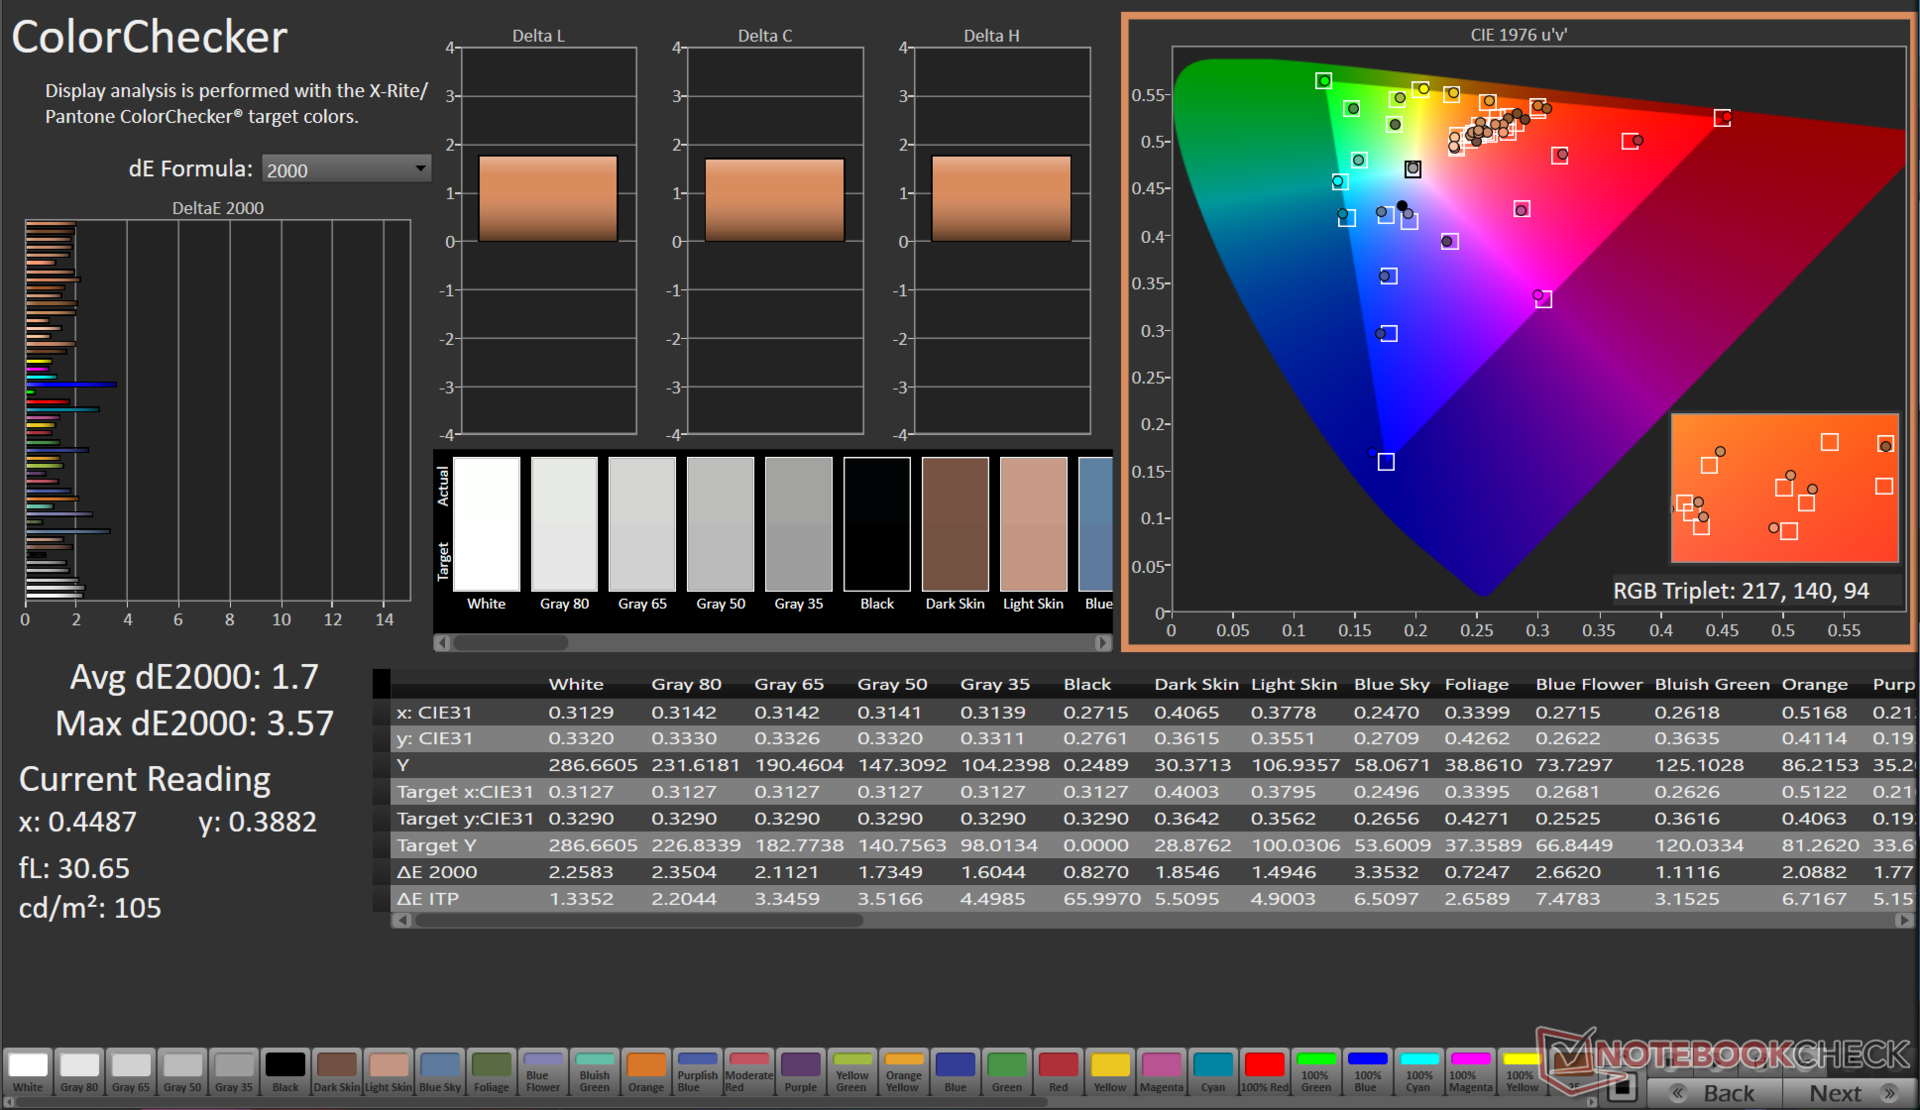
ΔE ColorChecker Calman: 1.7 | ∀{0.5-29.43 Ø4.71}
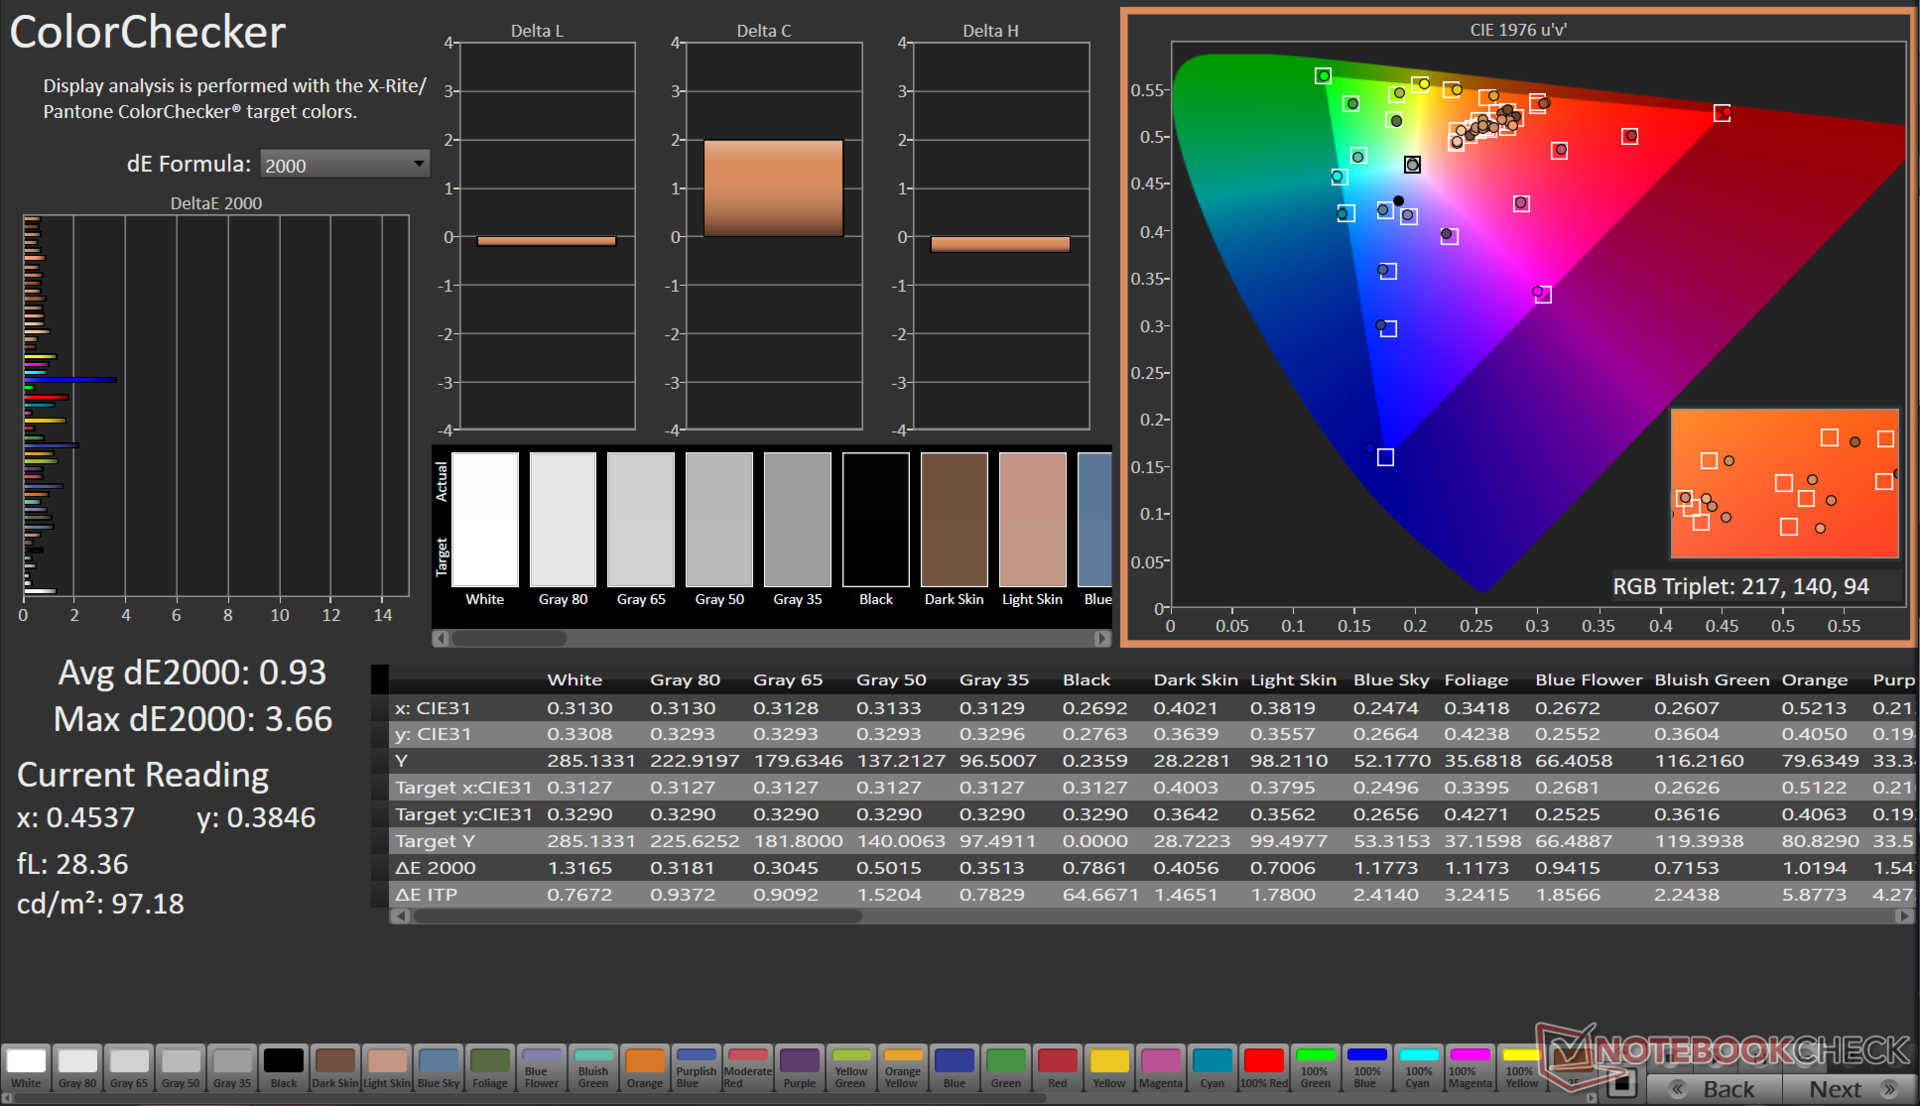
calibrated: 0.93
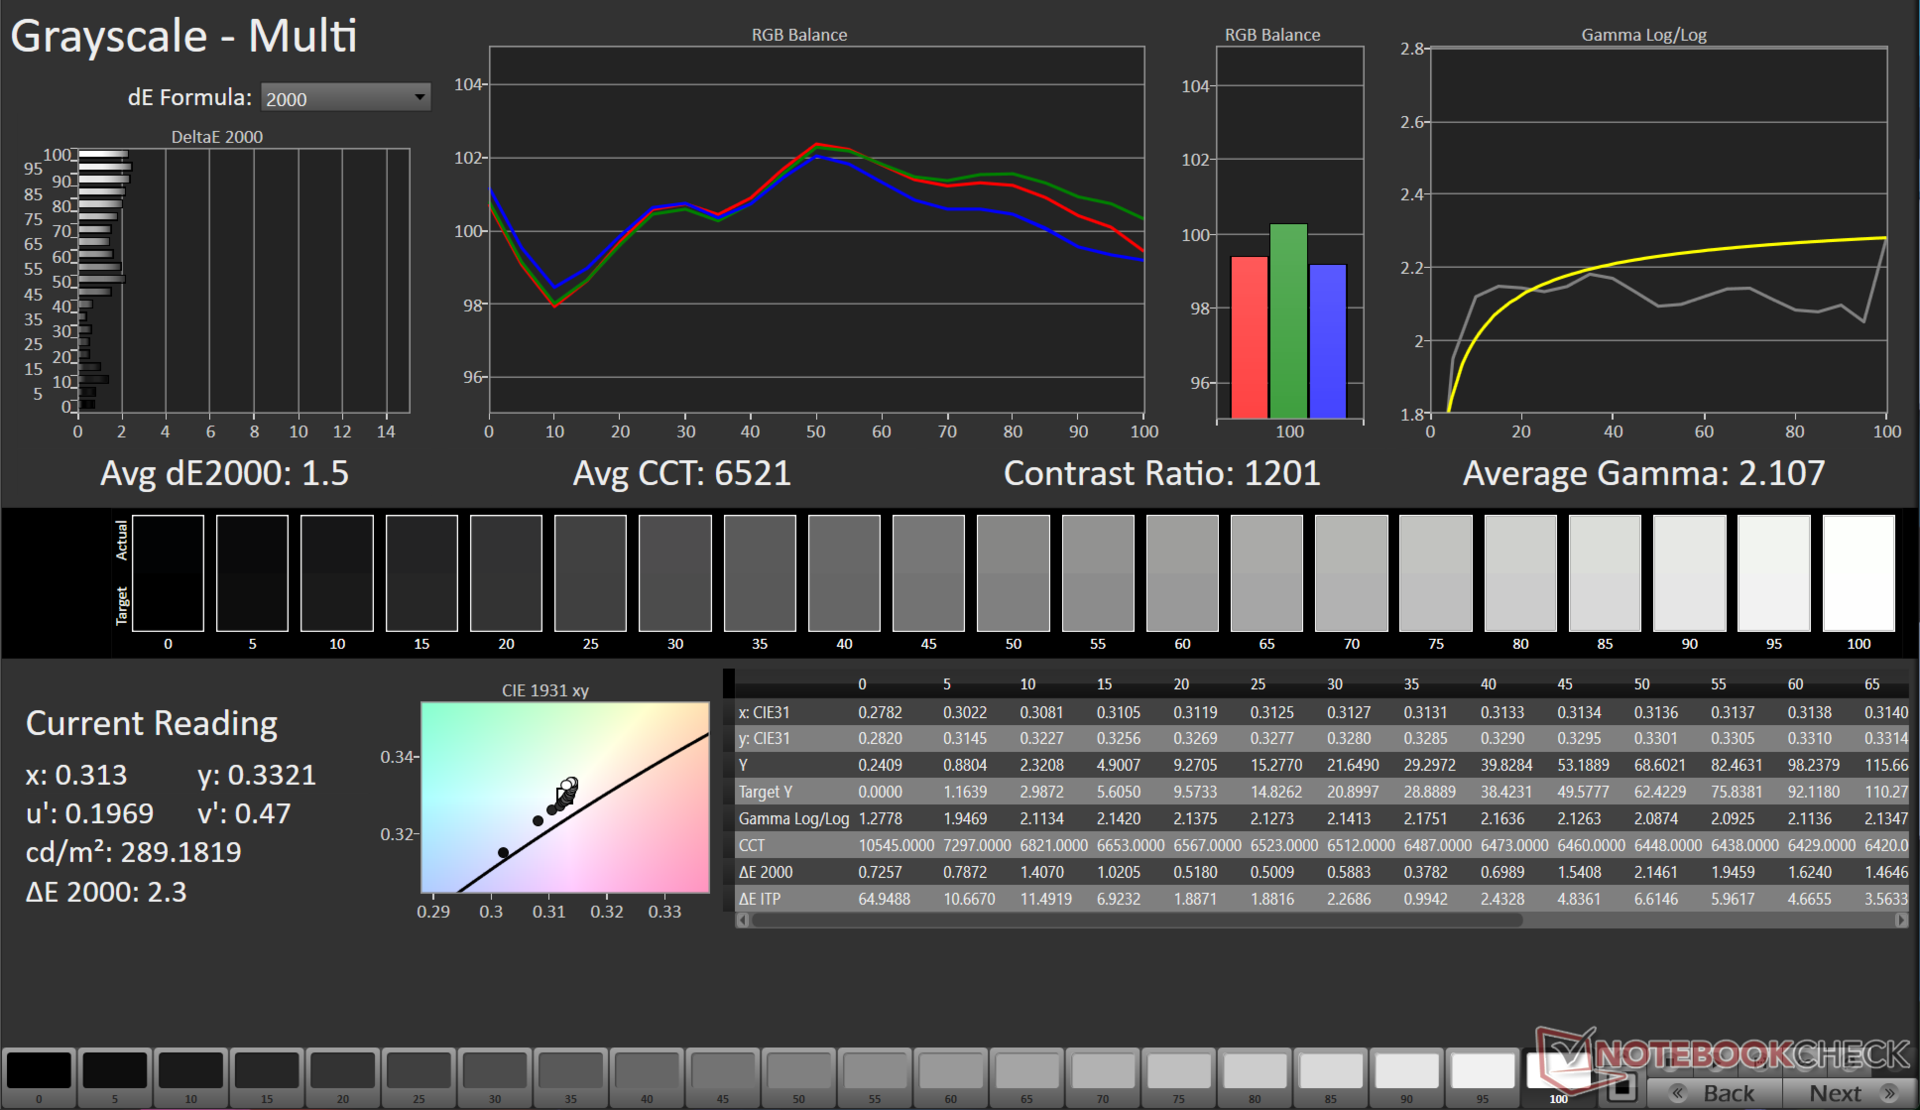
ΔE Greyscale Calman: 1.5 | ∀{0.09-98 Ø4.96}
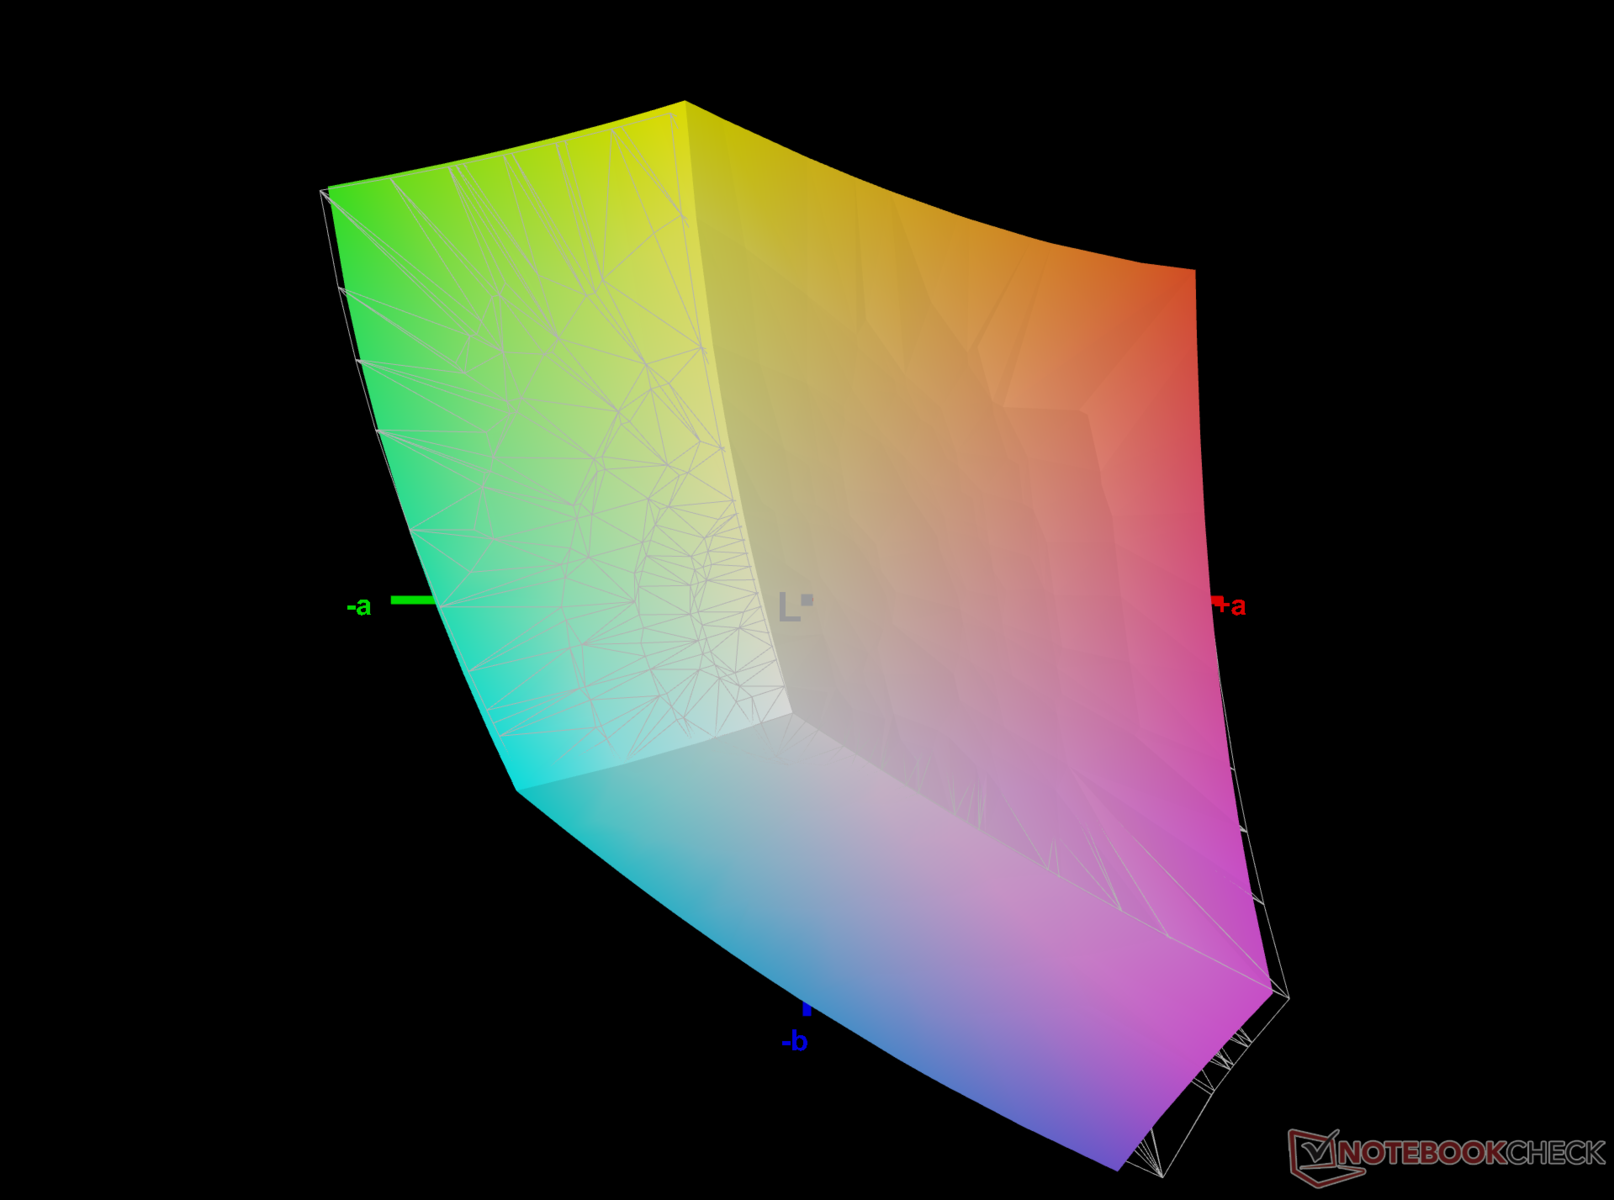
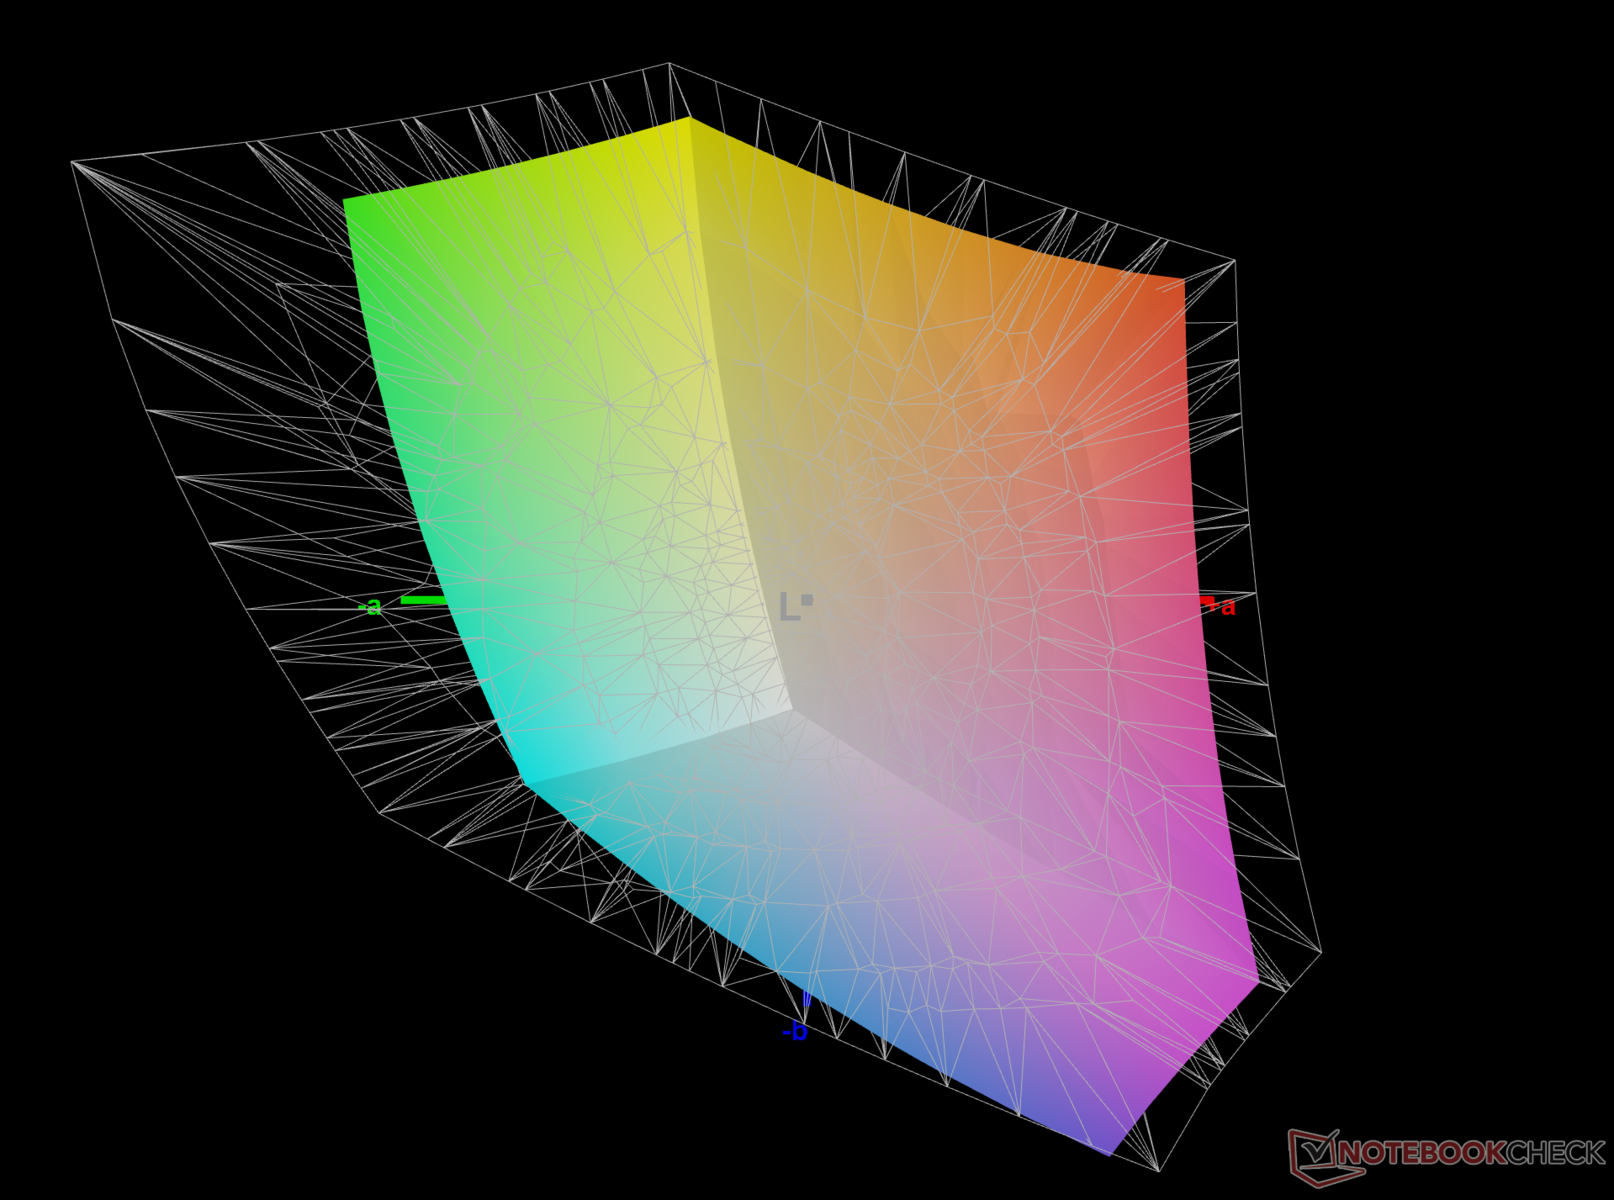
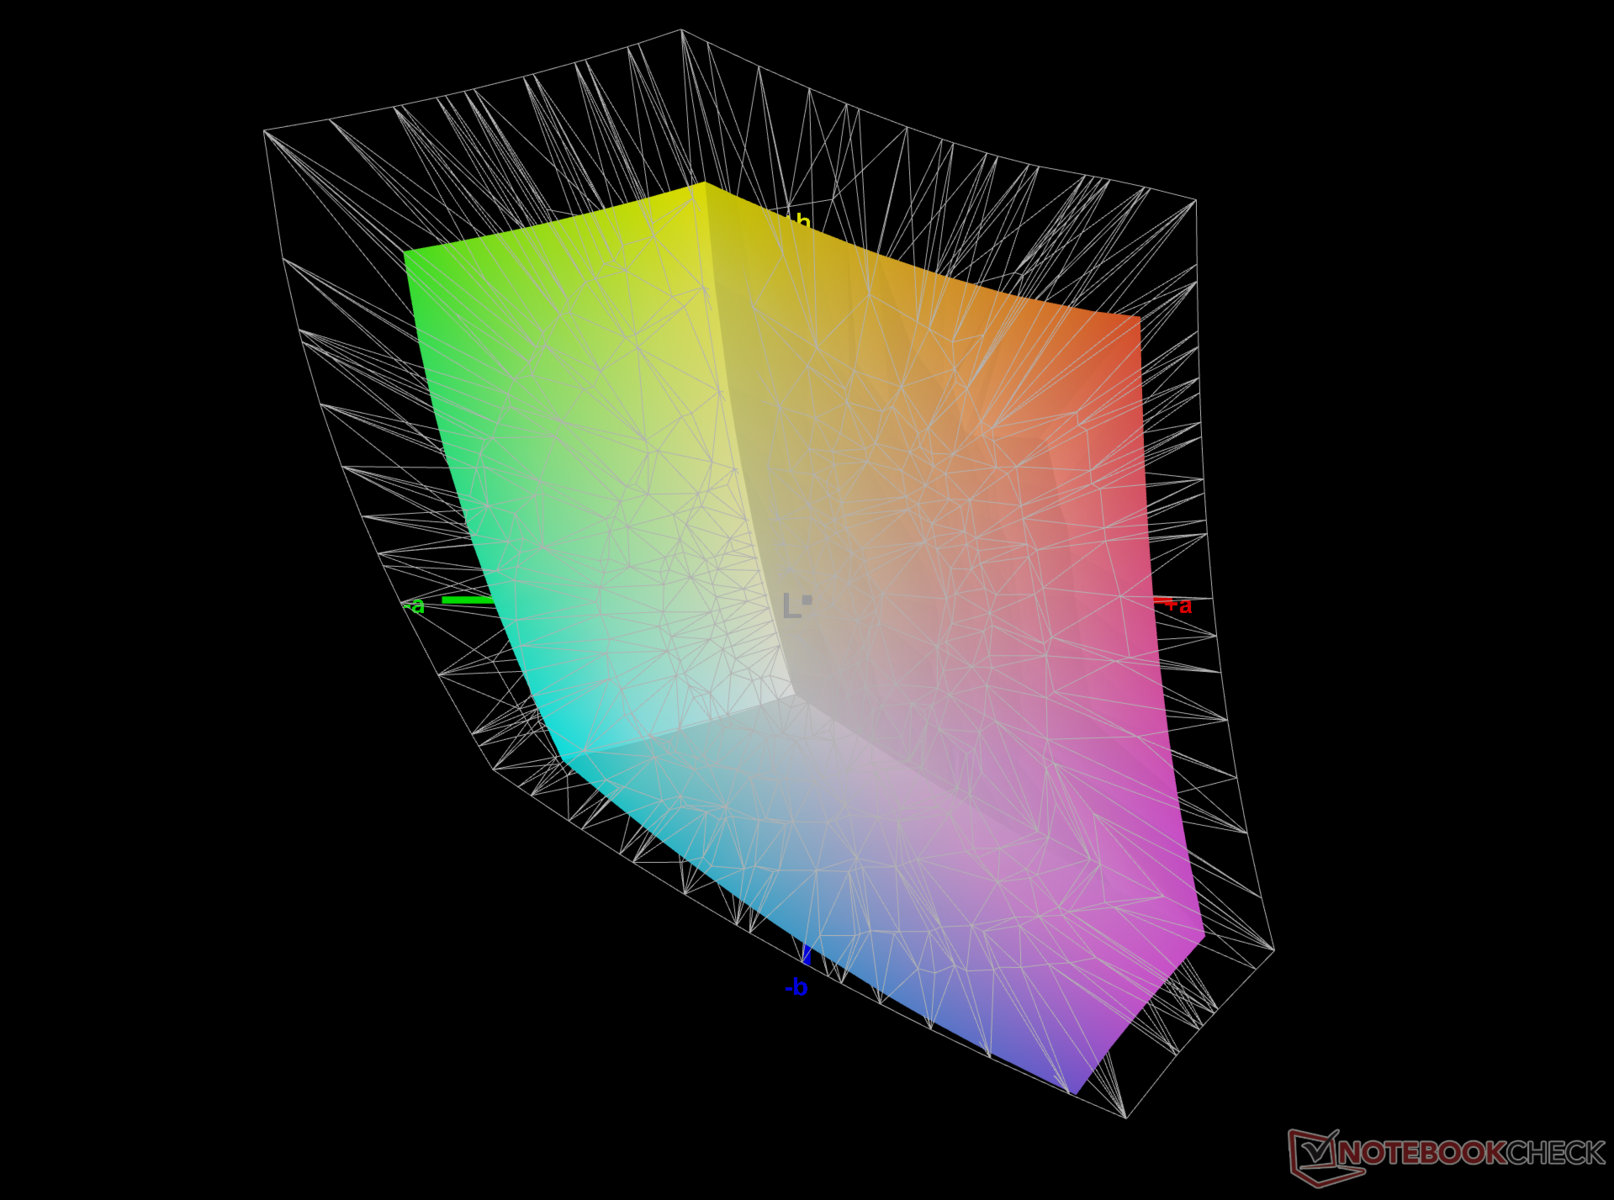
69.7% AdobeRGB 1998 (Argyll 3D)
97.5% sRGB (Argyll 3D)
67.5% Display P3 (Argyll 3D)
Gamma: 2.1
CCT: 6538 K
| HP Victus 16-r0076TX Chi Mei CMN1629, IPS, 1920x1080, 16.1" | Acer Nitro 16 AN16-41-R7YE AU Optronics B160UAN01.Q, IPS, 1920x1200, 16" | Dell G15 5530 AUO B156HAN, IPS, 1920x1080, 15.6" | Lenovo Legion Pro 5 16ARX8 (R5 7645HX, RTX 4050) CSOT T3 MNG007DA2-2, IPS, 2560x1600, 16" | Lenovo LOQ 15APH8 BOE NJ NE156FHM-NX3, IPS, 1920x1080, 15.6" | |
|---|---|---|---|---|---|
| Display | 11% | 5% | 4% | -39% | |
| Display P3 Coverage (%) | 67.5 | 80 19% | 73.1 8% | 71.6 6% | 40.2 -40% |
| sRGB Coverage (%) | 97.5 | 99.4 2% | 98.4 1% | 99.8 2% | 60.2 -38% |
| AdobeRGB 1998 Coverage (%) | 69.7 | 77.4 11% | 74.4 7% | 72.9 5% | 41.5 -40% |
| Response Times | -25% | 38% | -31% | -407% | |
| Response Time Grey 50% / Grey 80% * (ms) | 6.18 ? | 11.2 ? -81% | 3.39 ? 45% | 12 ? -94% | 42.7 ? -591% |
| Response Time Black / White * (ms) | 7.62 ? | 5.2 ? 32% | 5.35 ? 30% | 5.2 ? 32% | 24.5 ? -222% |
| PWM Frequency (Hz) | 21620 ? | ||||
| Screen | -67% | -74% | -1% | -85% | |
| Brightness middle (cd/m²) | 290 | 415 43% | 320 10% | 543 87% | 346.2 19% |
| Brightness (cd/m²) | 275 | 380 38% | 316 15% | 516 88% | 329 20% |
| Brightness Distribution (%) | 82 | 84 2% | 94 15% | 87 6% | 81 -1% |
| Black Level * (cd/m²) | 0.21 | 0.36 -71% | 0.21 -0% | 0.58 -176% | 0.31 -48% |
| Contrast (:1) | 1381 | 1153 -17% | 1524 10% | 936 -32% | 1117 -19% |
| Colorchecker dE 2000 * | 1.7 | 4.71 -177% | 4.55 -168% | 1.35 21% | 4.19 -146% |
| Colorchecker dE 2000 max. * | 3.57 | 6.98 -96% | 9.83 -175% | 3.22 10% | 19.19 -438% |
| Colorchecker dE 2000 calibrated * | 0.93 | 2.68 -188% | 1.51 -62% | 1.31 -41% | 1.66 -78% |
| Greyscale dE 2000 * | 1.5 | 3.6 -140% | 6.2 -313% | 1.03 31% | 2.6 -73% |
| Gamma | 2.1 105% | 2.182 101% | 2.07 106% | 2.38 92% | 2.19 100% |
| CCT | 6538 99% | 7153 91% | 6479 100% | 6452 101% | 6749 96% |
| Total Average (Program / Settings) | -27% /
-45% | -10% /
-41% | -9% /
-4% | -177% /
-121% |
* ... smaller is better
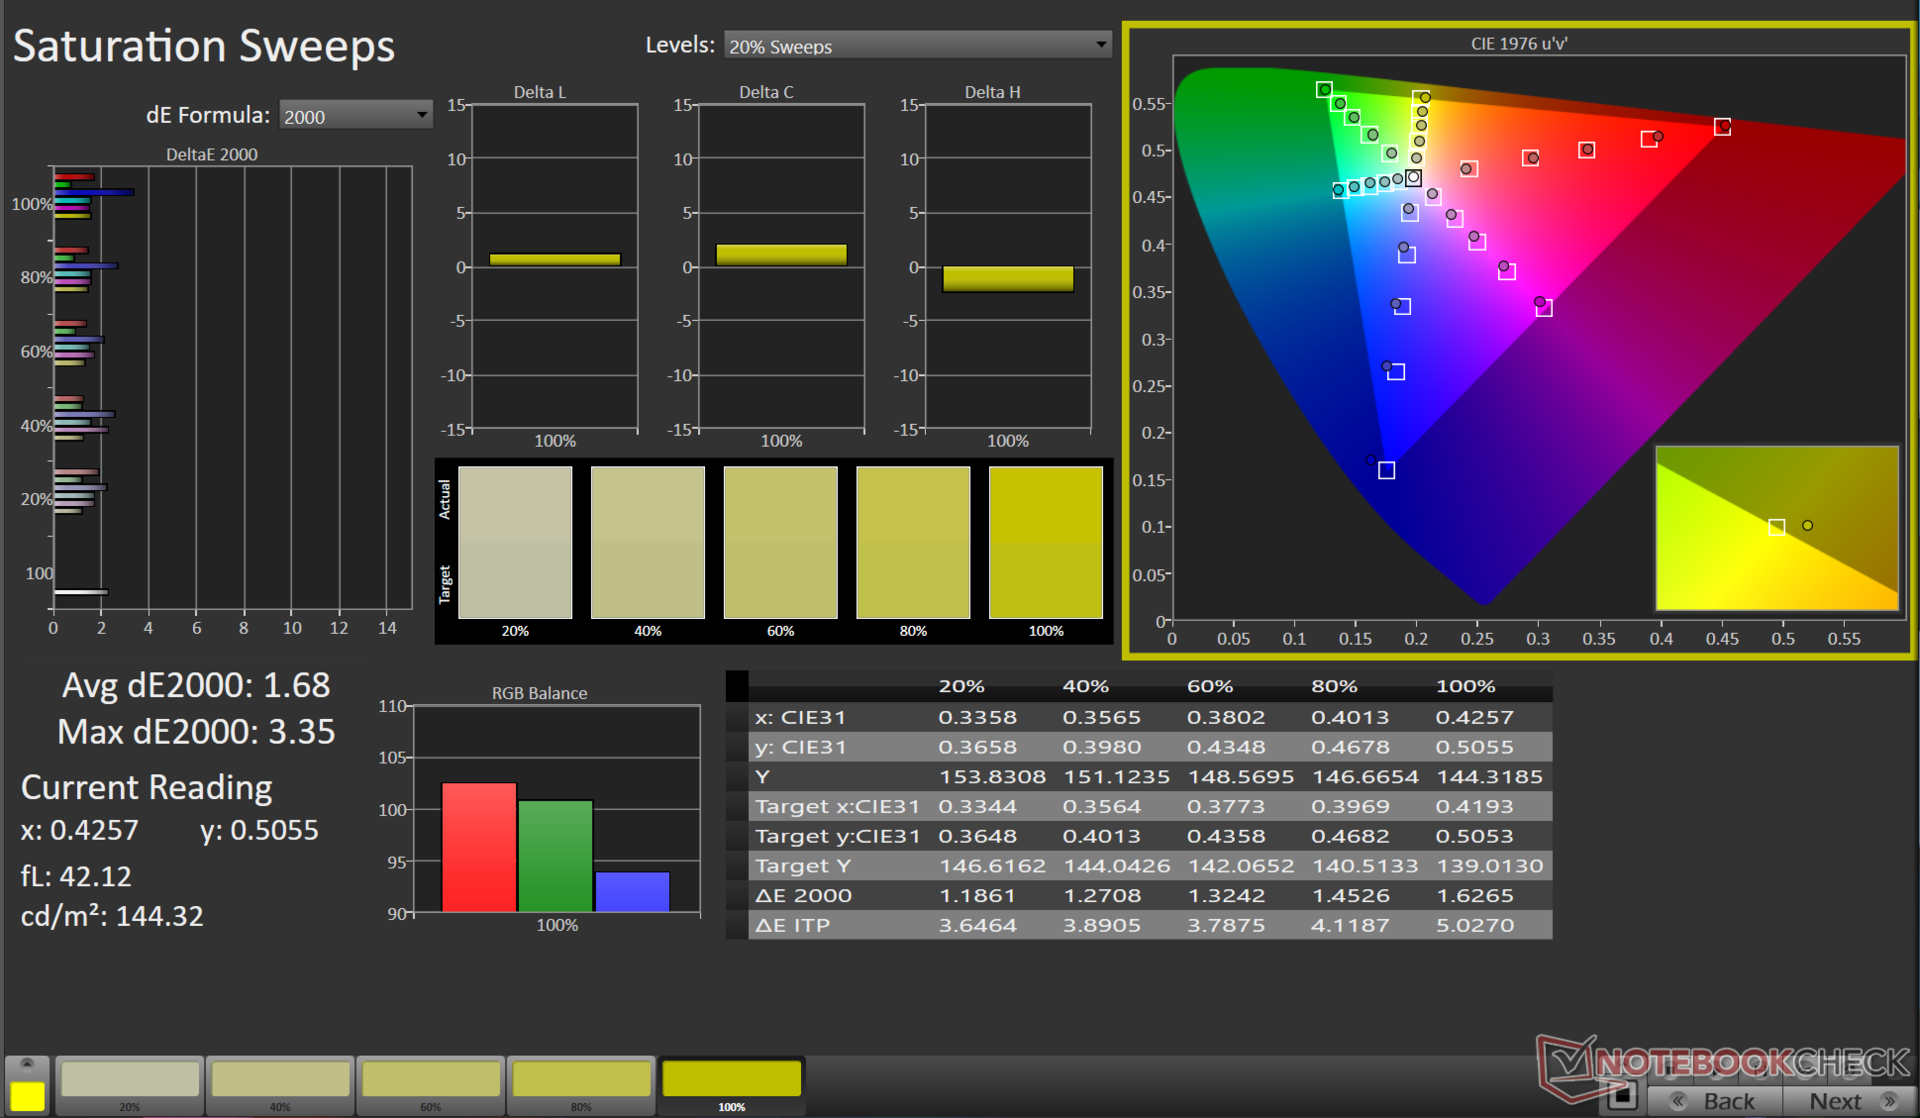
为了获得更高的刷新率体验,惠普 Victus 16 在色彩精确度方面有所欠缺。它覆盖了 97.5% 的 sRGB 色域、69.7% 的 Adobe RGB 和 67.5% 的 DCI-P3。与许多显示器一样,它也难以再现不同色调的蓝色。
Display Response Times
| ↔ Response Time Black to White | ||
|---|---|---|
| 7.62 ms ... rise ↗ and fall ↘ combined | ↗ 4.07 ms rise | 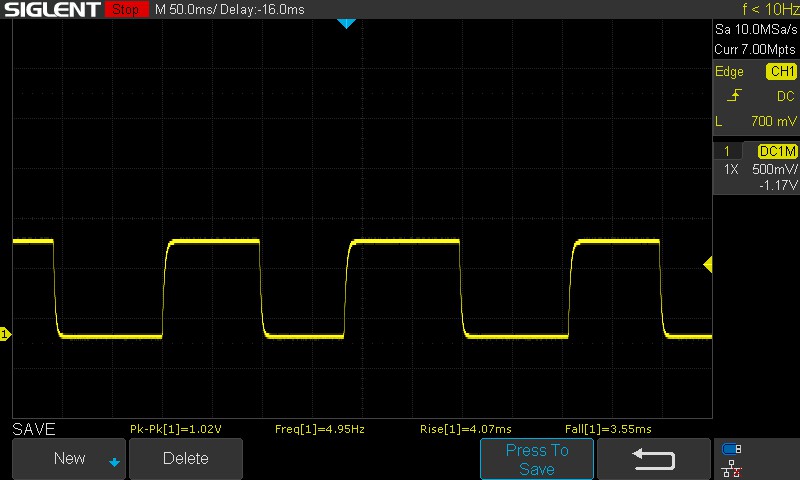 |
| ↘ 3.55 ms fall | ||
| The screen shows very fast response rates in our tests and should be very well suited for fast-paced gaming. In comparison, all tested devices range from 0.1 (minimum) to 240 (maximum) ms. » 22 % of all devices are better. This means that the measured response time is better than the average of all tested devices (19.8 ms). | ||
| ↔ Response Time 50% Grey to 80% Grey | ||
| 6.18 ms ... rise ↗ and fall ↘ combined | ↗ 3.01 ms rise | 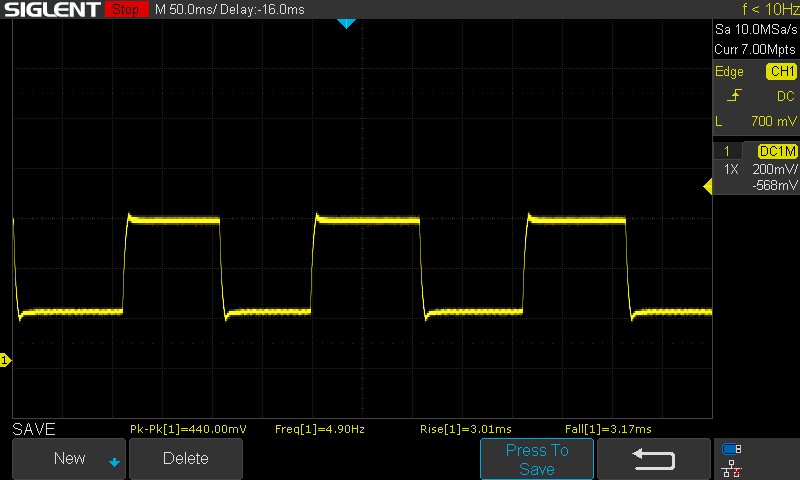 |
| ↘ 3.17 ms fall | ||
| The screen shows very fast response rates in our tests and should be very well suited for fast-paced gaming. In comparison, all tested devices range from 0.165 (minimum) to 636 (maximum) ms. » 19 % of all devices are better. This means that the measured response time is better than the average of all tested devices (30.9 ms). | ||
Screen Flickering / PWM (Pulse-Width Modulation)
| Screen flickering / PWM not detected | ≤ 100 % brightness setting | 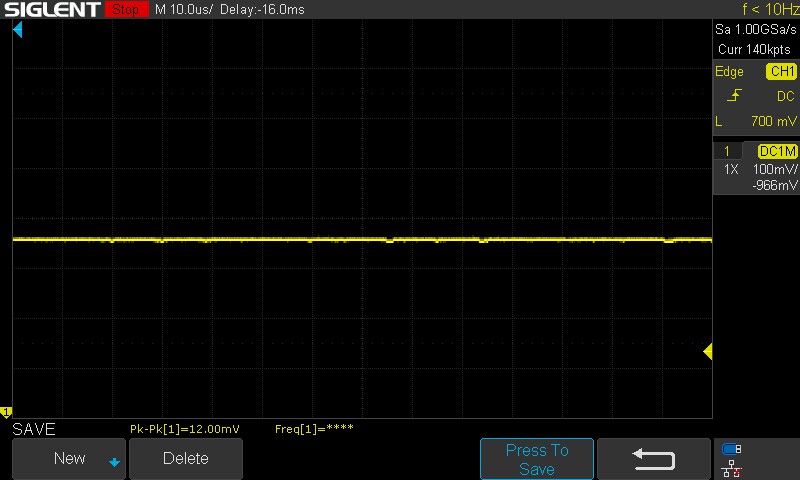 | |
In comparison: 52 % of all tested devices do not use PWM to dim the display. If PWM was detected, an average of 7741 (minimum: 5 - maximum: 343500) Hz was measured. | |||
惠普宣传的响应时间(灰到灰)为 7 毫秒,我们的测试也证实了这一点,测试结果为 6.18 毫秒。同样,黑色到白色的响应时间为 7.62 毫秒。
使用 X-rite i1Basic Pro 3 分光光度计和 Portrait Displays 公司的 Calman 校准软件后,结果略有改善,灰度偏差、ColourChecker 和饱和度扫描 Delta E 值都略有提高。
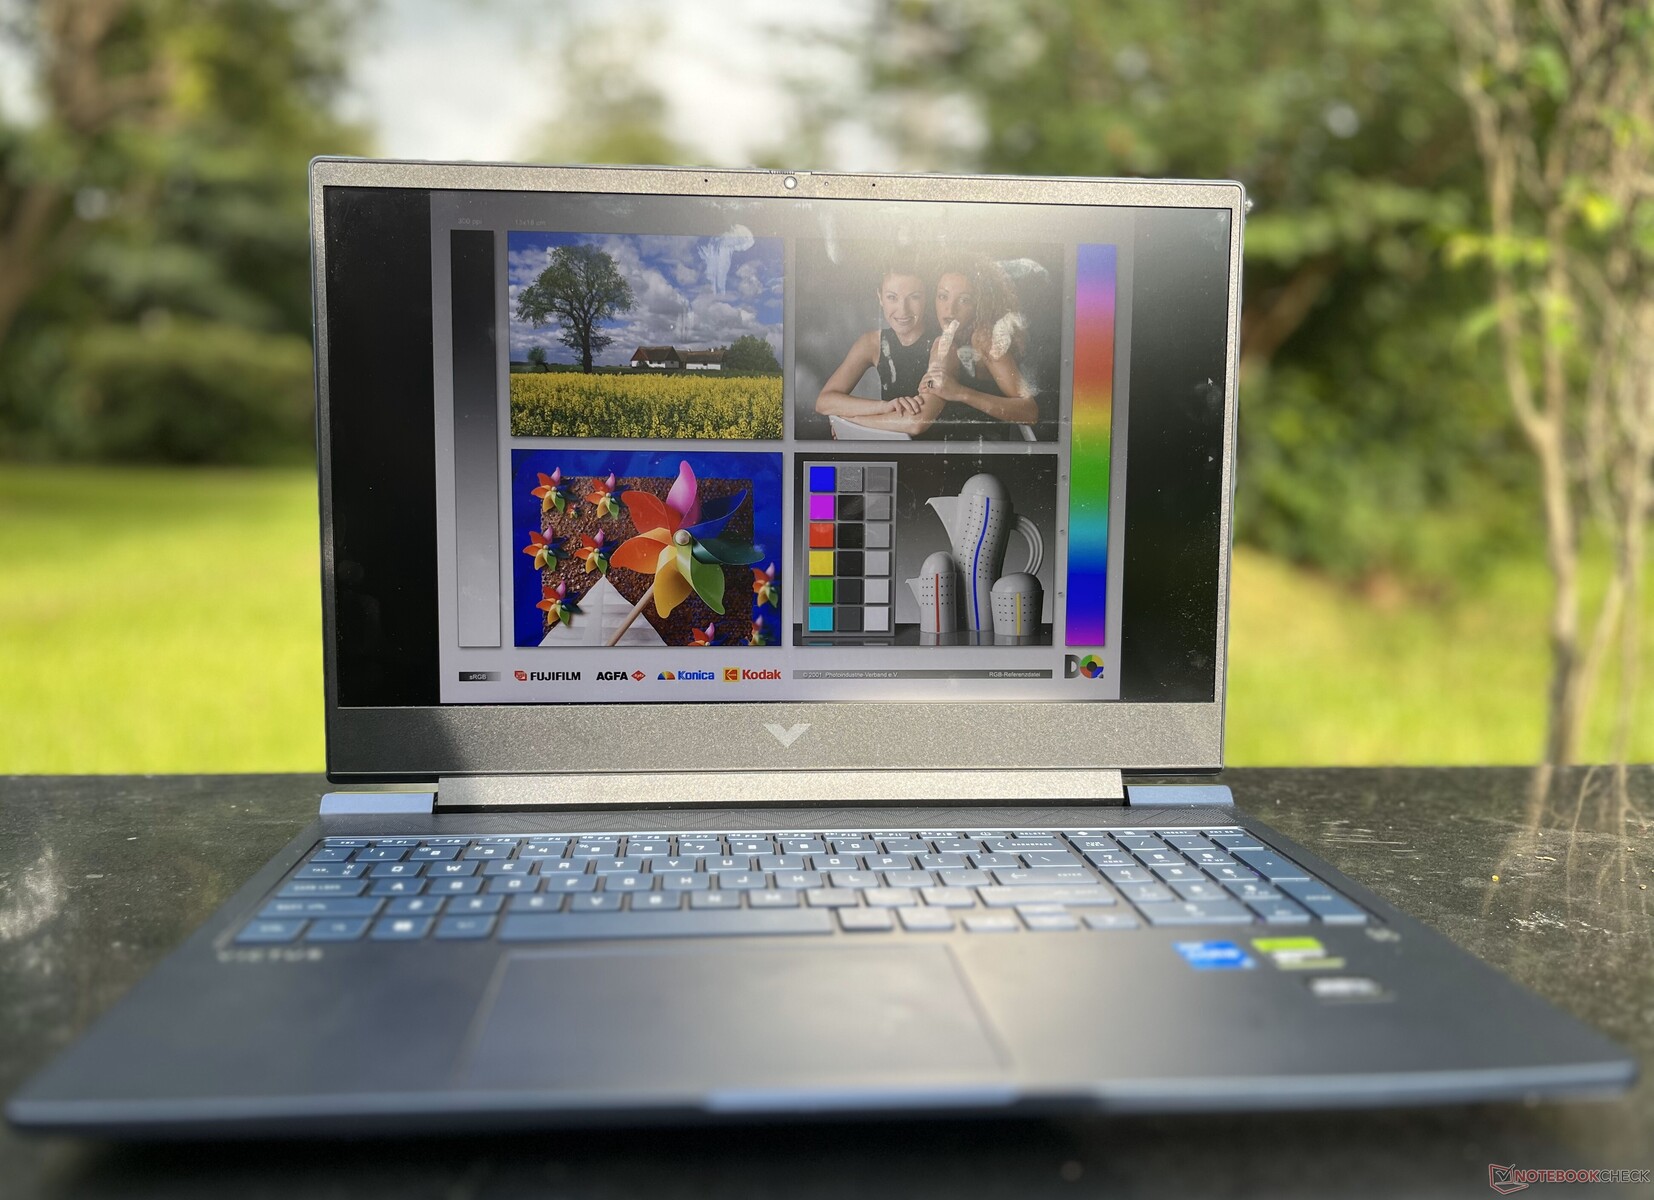
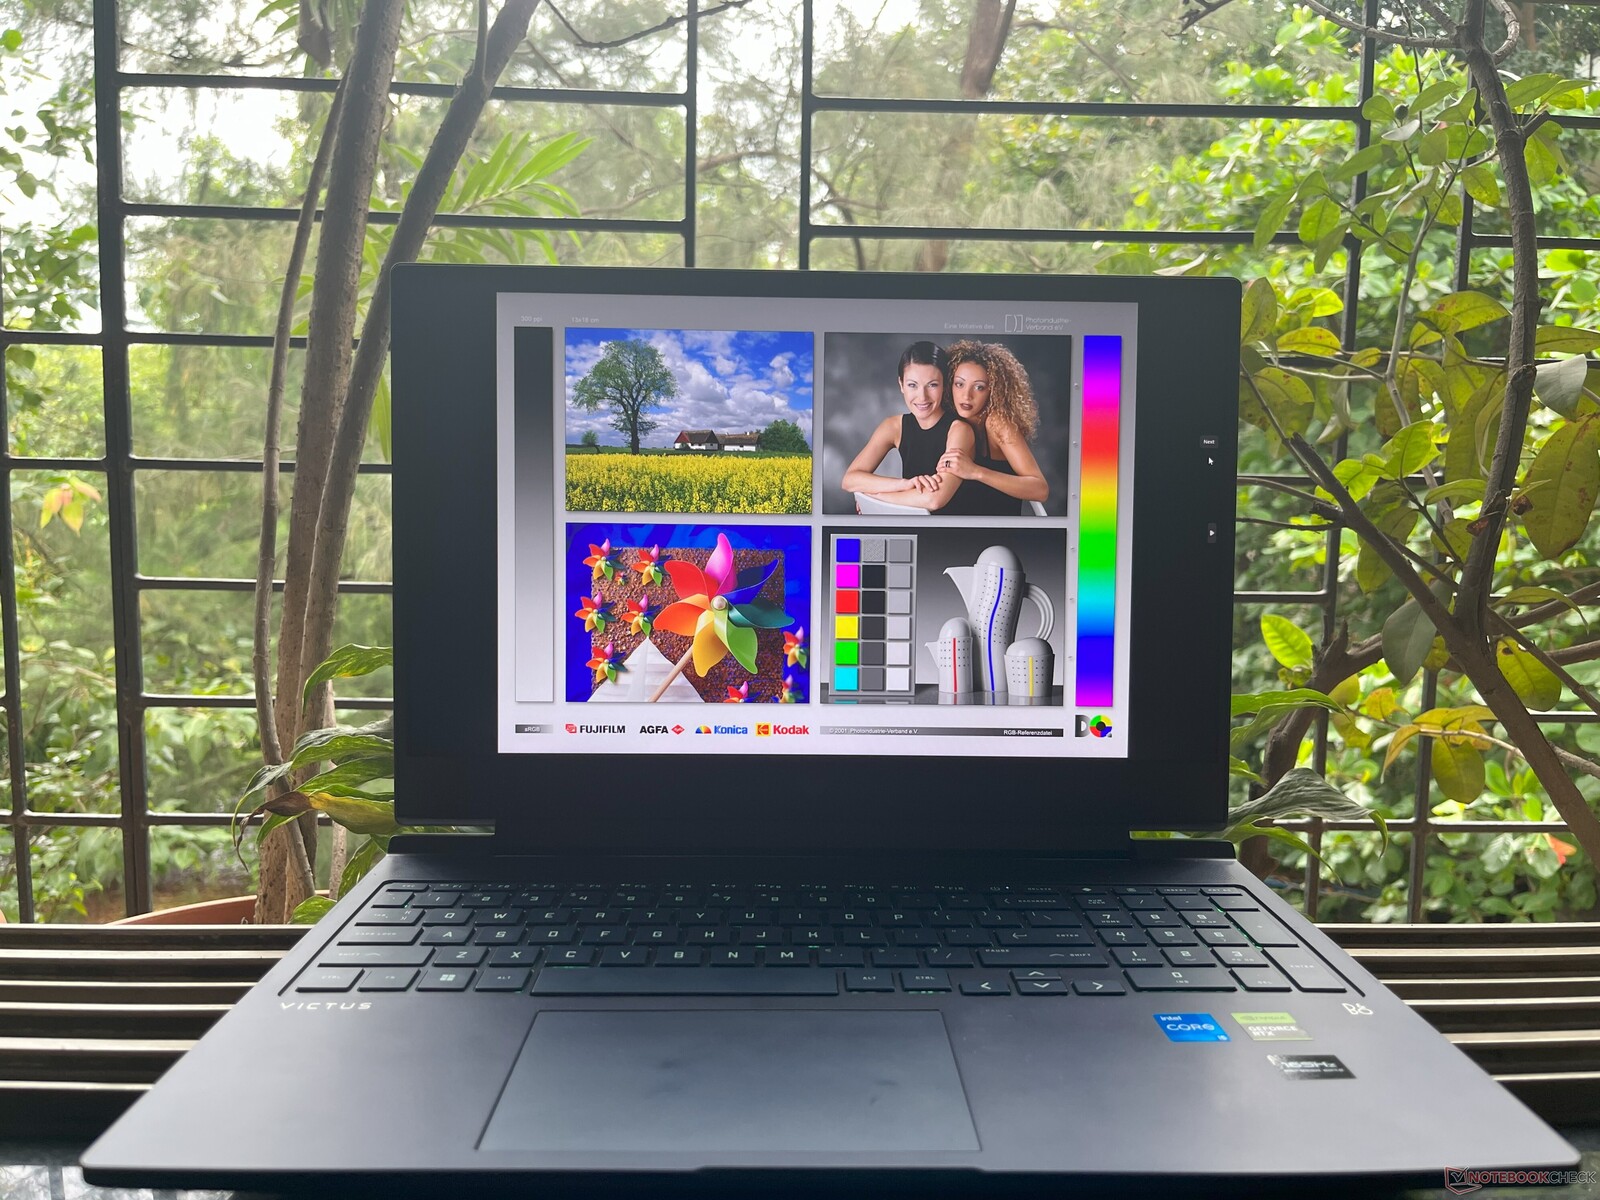
IPS 屏幕通常能确保良好的可视角度。然而,惠普 Omen 16 的奇美面板并非如此。从极端角度观看屏幕时,细节会明显丢失。
室外观看效果高于平均水平,尤其是对于一款亮度仅为 300 尼特的设备而言。在阴暗处和阳光直射下,细节损失很小。不过,我们建议将笔记本电脑放在室内,因为它并不适合携带。

表演:猛禽湖和艾达-拉芙蕾丝大显身手
惠普 Victus 16 有几种配置可供选择。我们这款是基本配置,配备 英特尔酷睿 i5-13500HX和 英伟达GeForce RTX 4050 笔记本电脑 GPU.您可以选择 GeForce RTX 4060和 RTX 4070如果需要的话。
想要更强大 CPU 的用户可以选择 酷睿 i7-13700HX变体,它只能与GeForce RTX 4070 搭配使用。希望获得额外内存的用户还可以选择配备 32 GB 内存和 1 TB 存储空间的版本。
测试条件
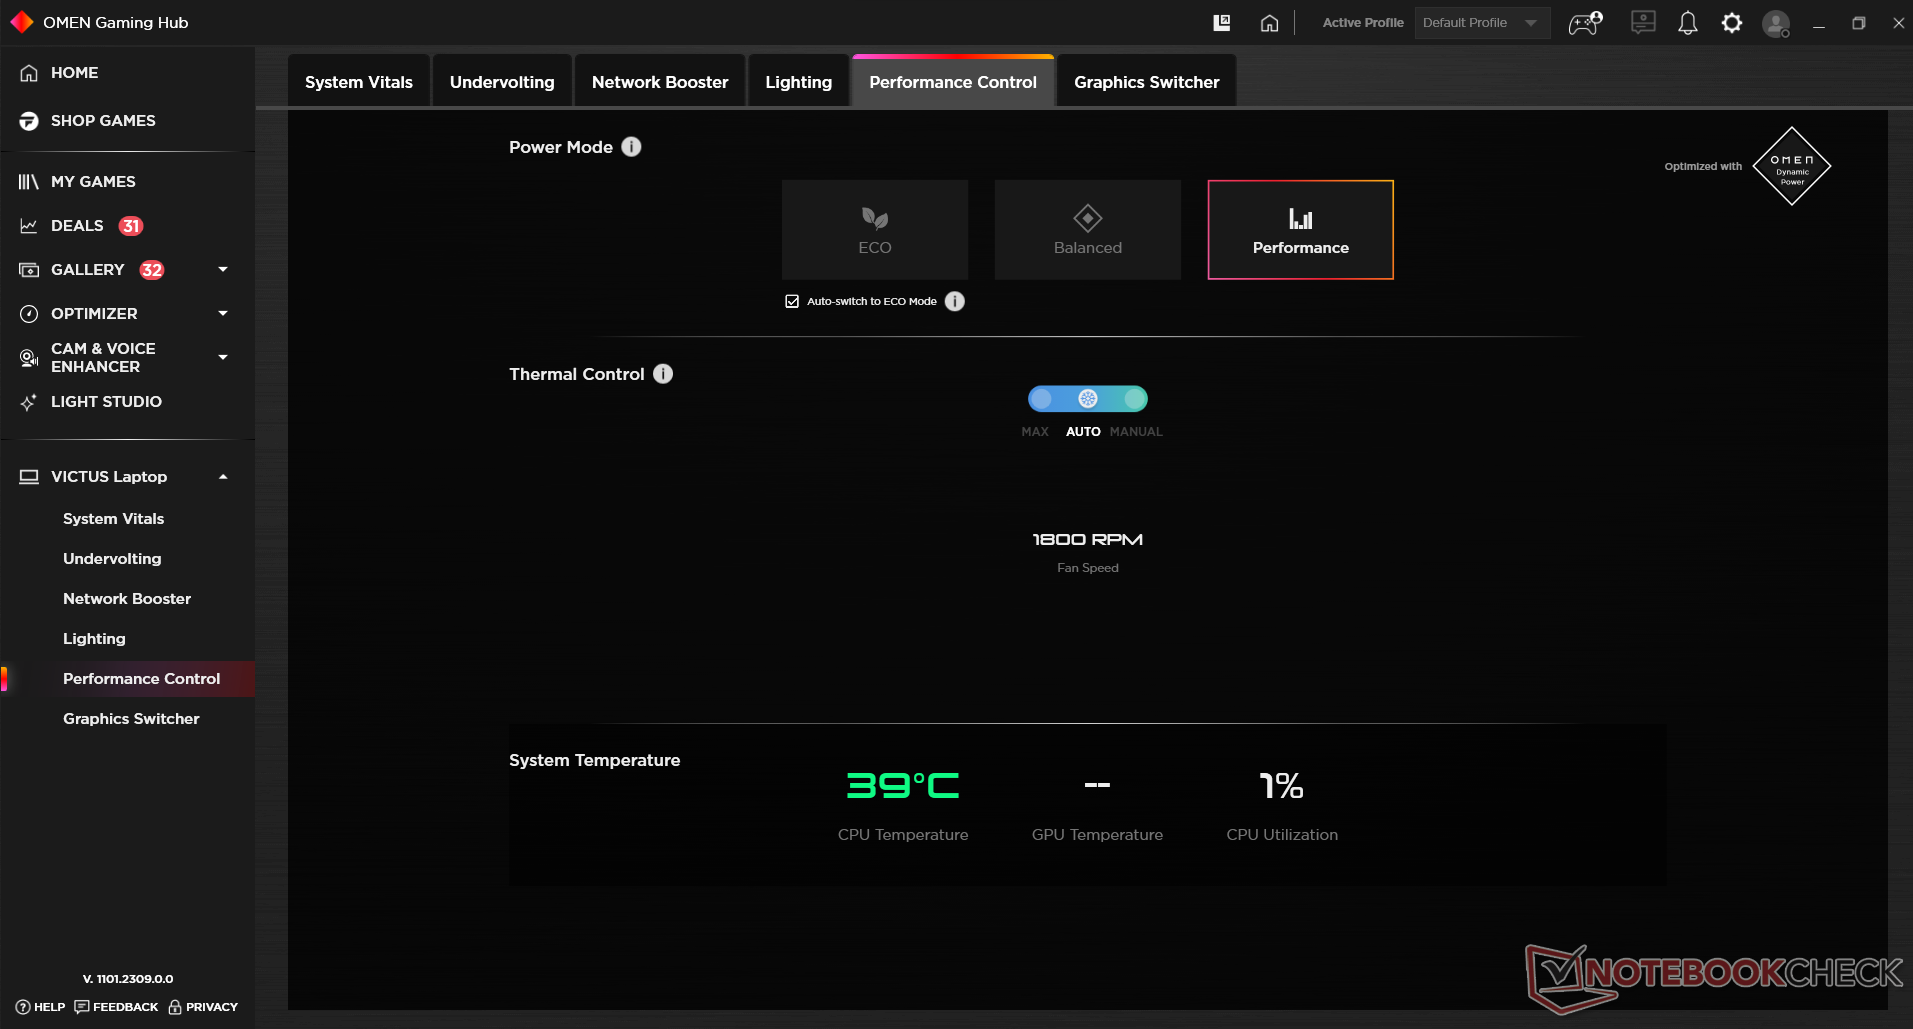
我们选择了 "性能 "计划,以将硬件推向极限。在 "Eco "模式下对电池进行了一些测试,以检查性能是否下降。HWInfo 无法针对不同配置文件显示正确的 PL1 和 PL2 信息,因此我们在 Cinebench R15 循环测试中获得了这些值。
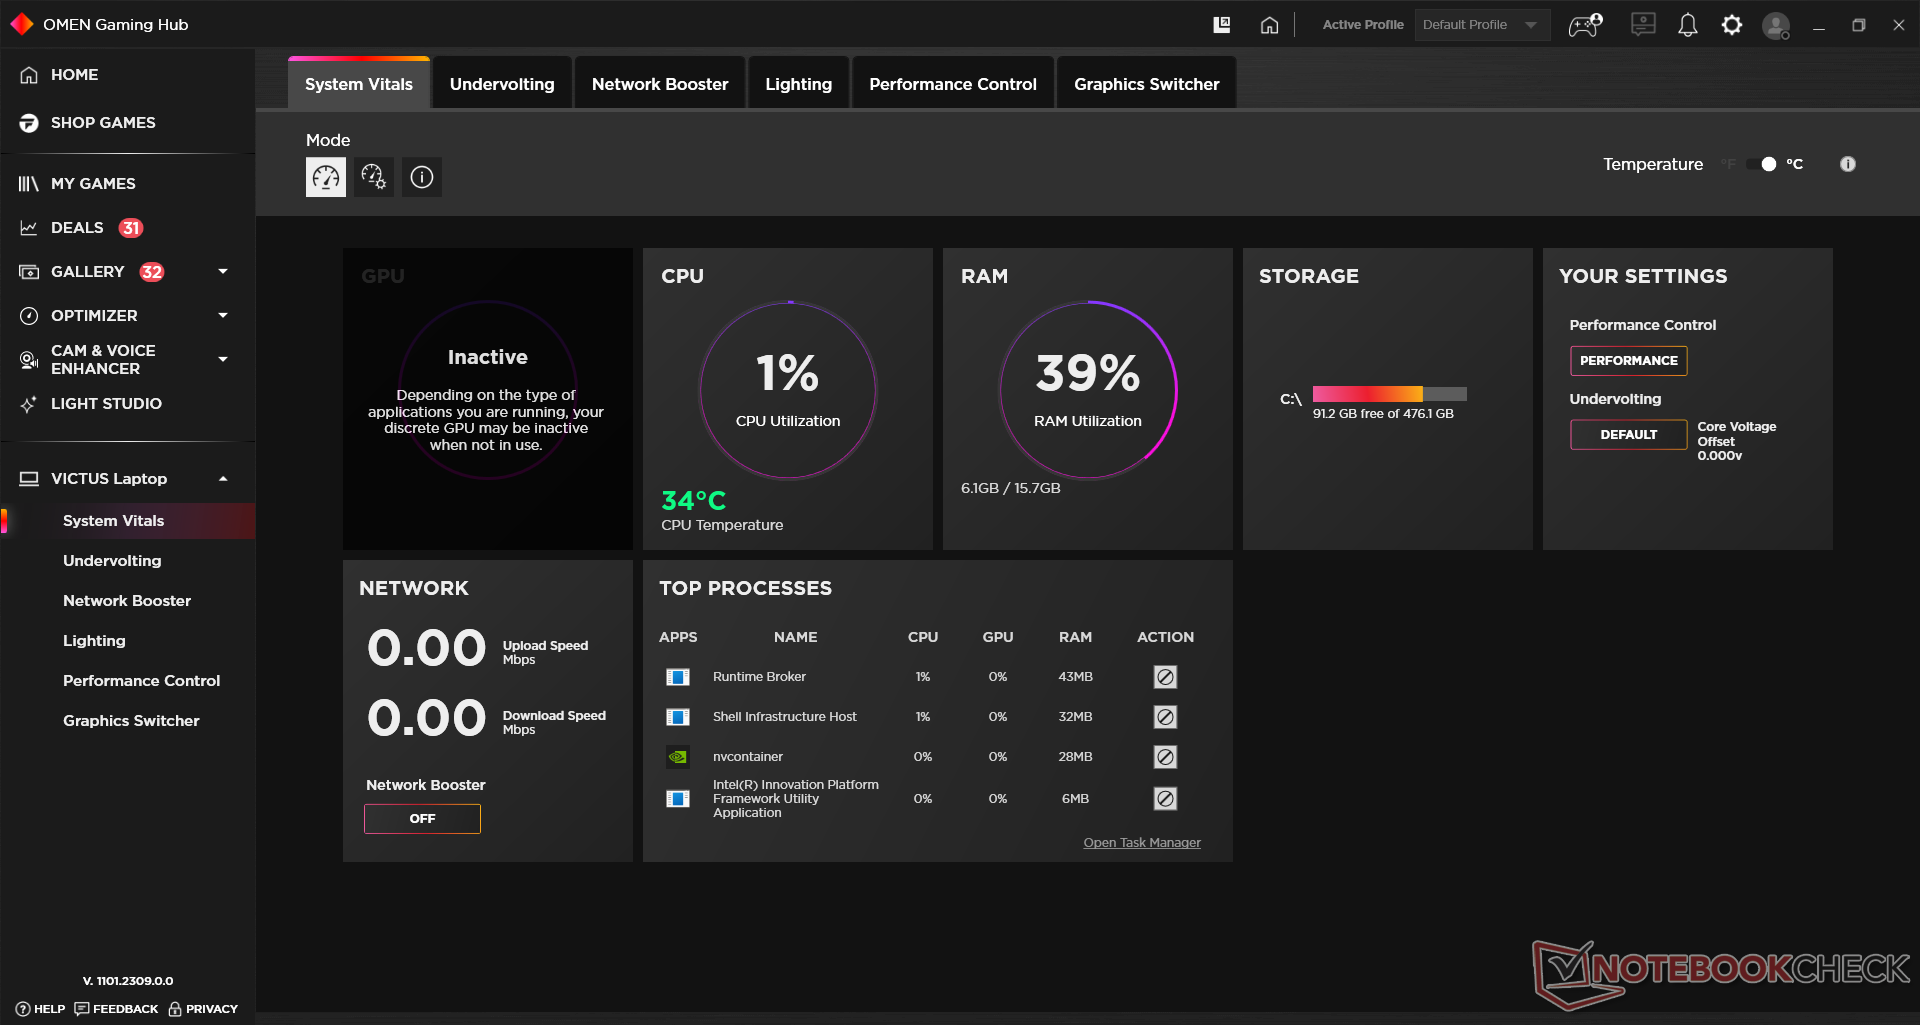
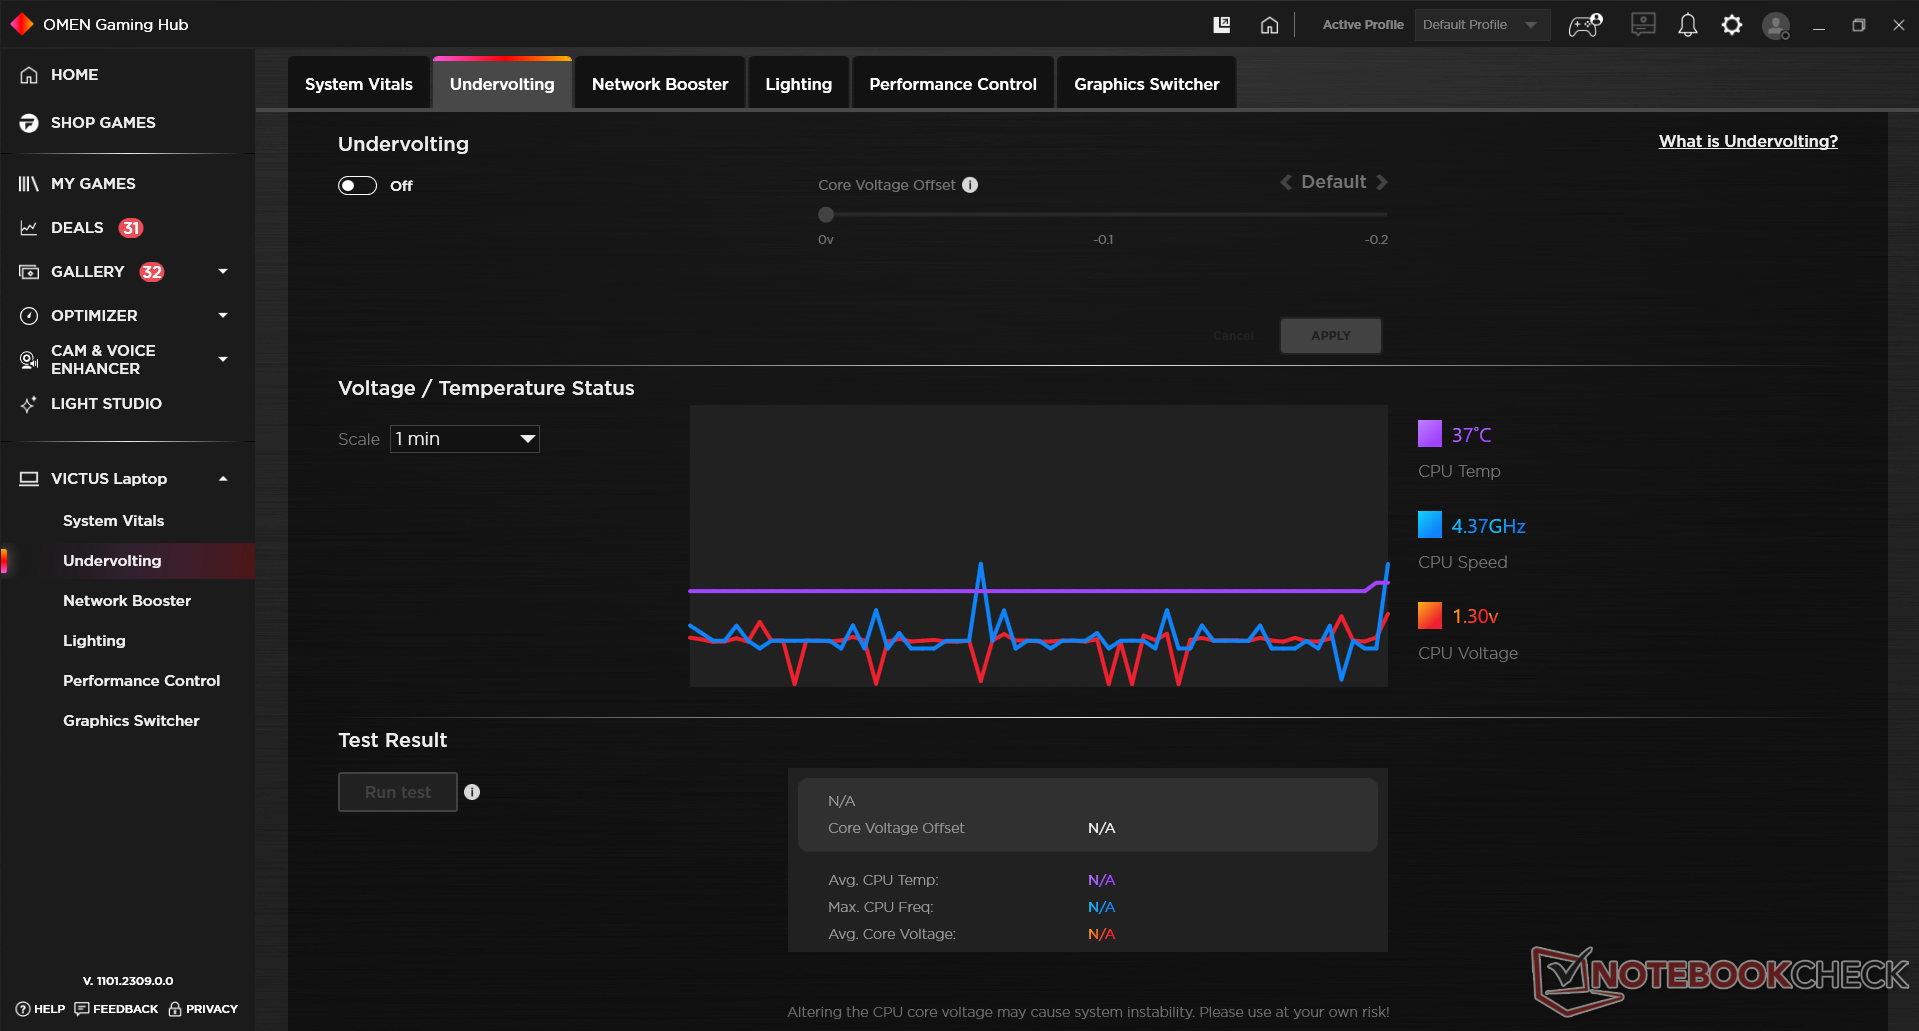
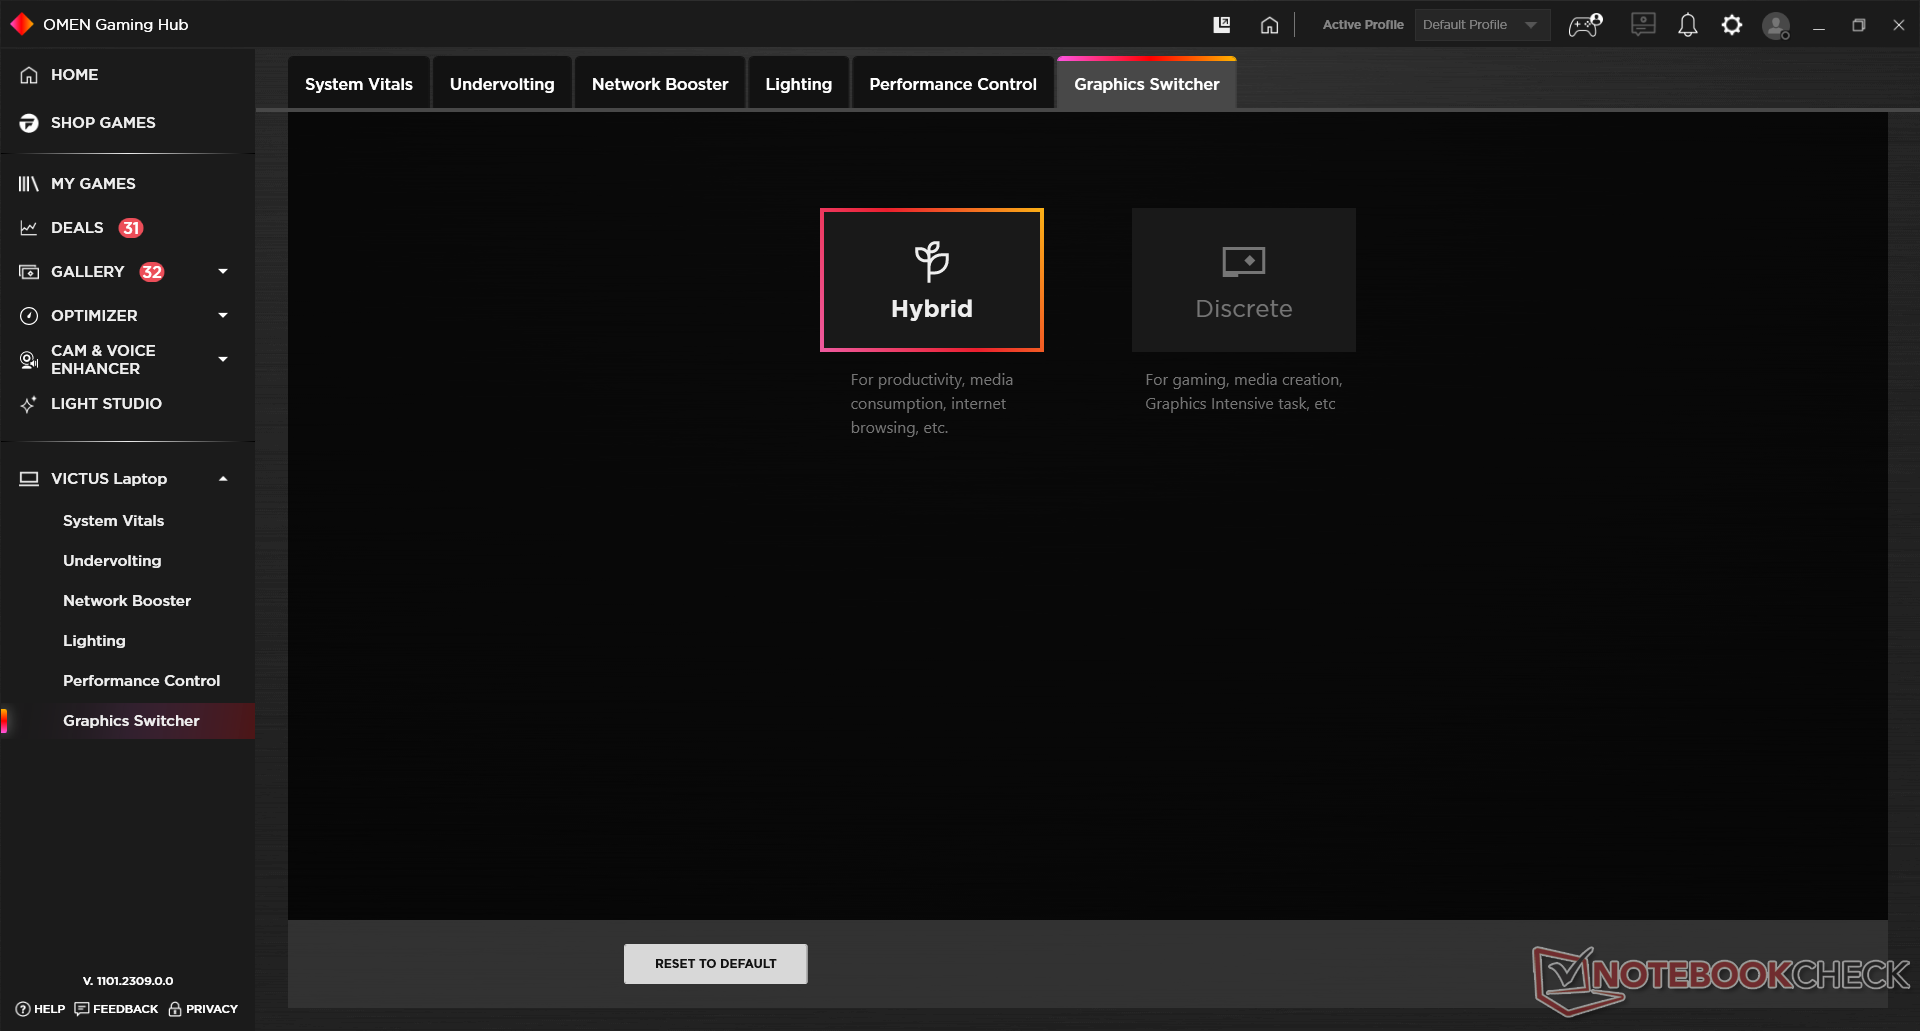
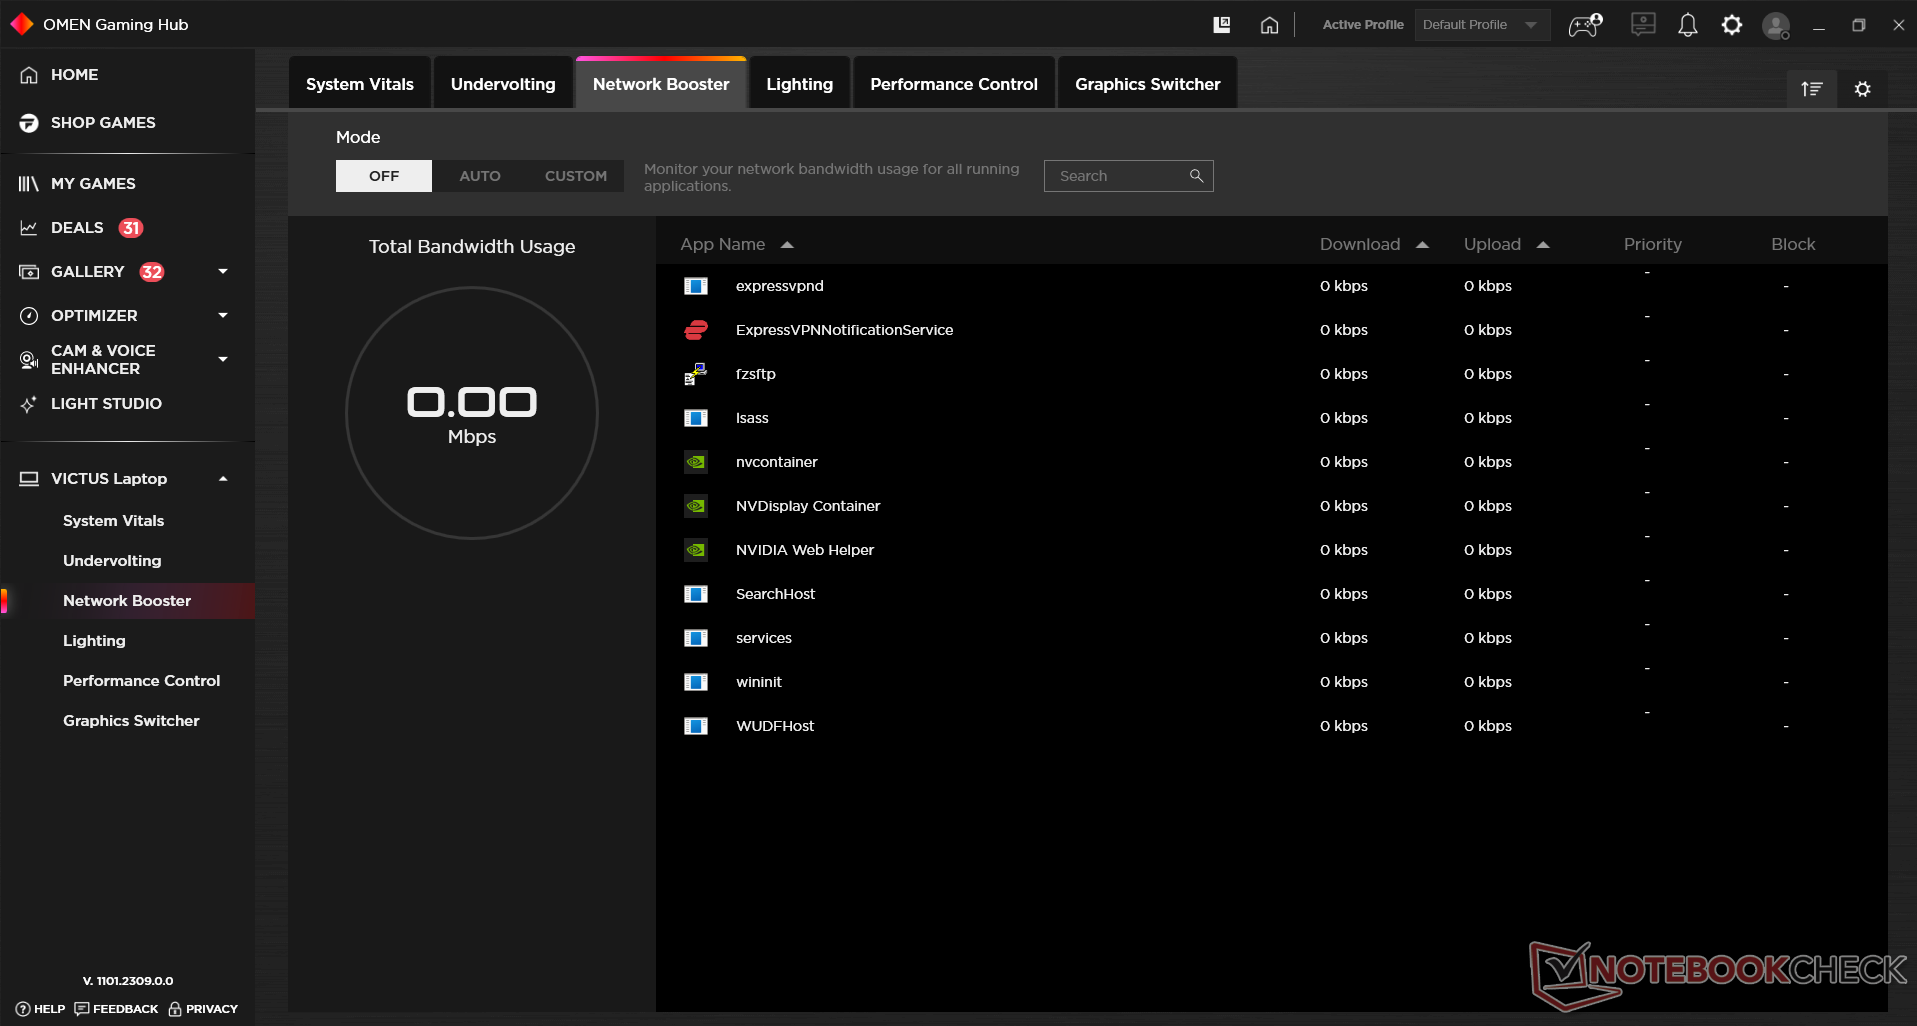
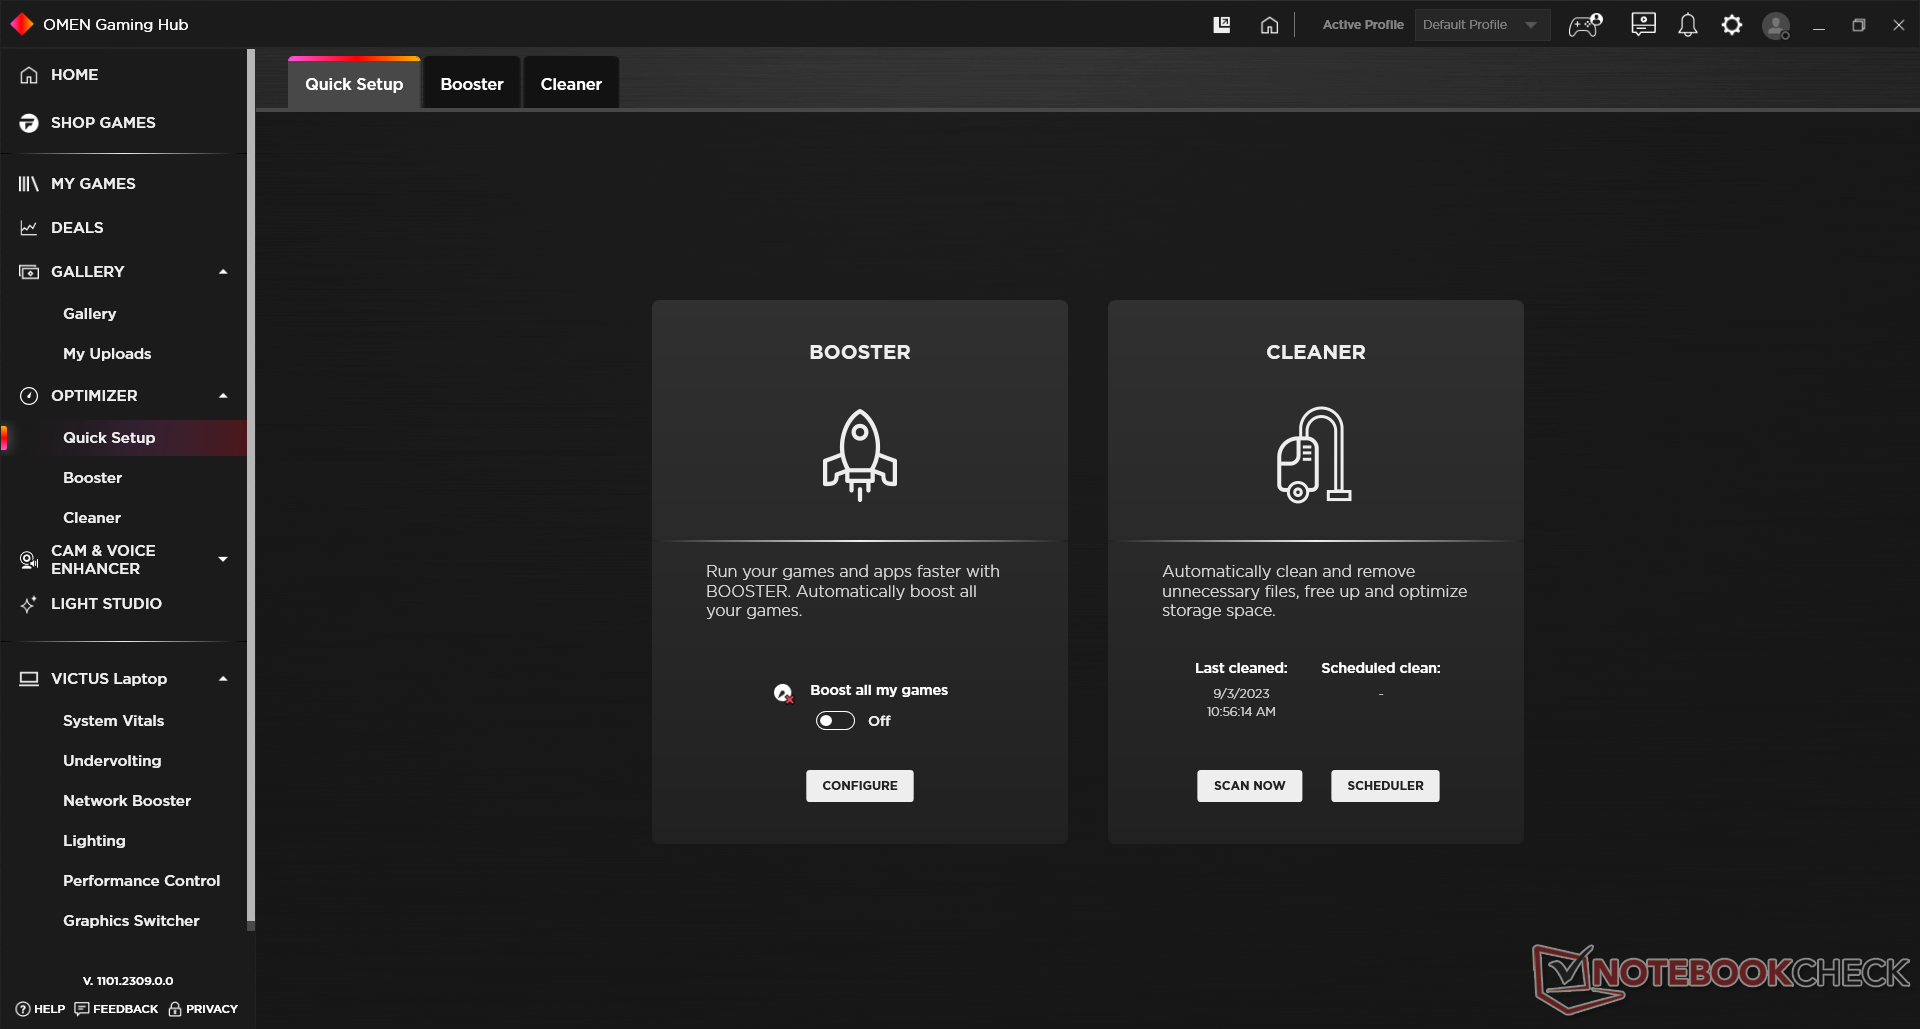
如果你对摆弄笔记本电脑感兴趣,你会发现自己在 Omen Gaming Hub 上花费了大量时间。它可以鸟瞰 CPU 温度、时钟和电压等一切信息。它甚至还能让发烧友们在无需浏览 BIOS 的情况下降低笔记本电脑的电压。
此外,还有一个 "网络助推器 "选项卡和一个 "性能控制 "部分,前者可让你访问上述电源计划,后者可让你对运行任务的流量进行优先排序。它还允许你设置自定义风扇曲线,或让风扇始终全速运转。
| 轮廓 | PL1 | PL2 | PL4 |
|---|---|---|---|
| 环保型 | 35 W | 46 W | 200 W |
| 平衡型 | 51 W | 130 W | 200 W |
| 性能 | 78 W | 130 W | 200 W |
处理器
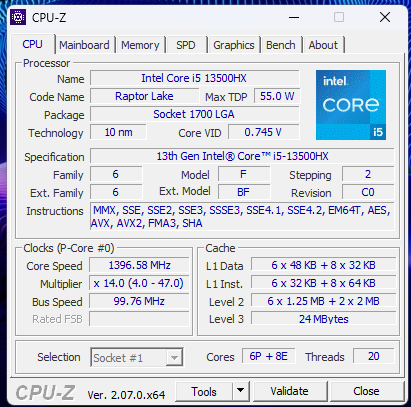
为惠普 Victus 16 提供动力的英特尔酷睿 i5-13500HX 是一款 14 核(6 性能加 8 效率)、20 线程的 Raptor Lake CPU。它作为 Raptor Lake-HX 系列芯片的一部分推出,与 H 品牌的同类产品相比,基本 TDP(55 瓦)有所提高。除了额外的 TDP 空间外,它还增加了性能内核的数量。
尽管酷睿 i5-13500HX 是最低端的 Raptor Lake-HX 处理器,但其性能却远超同级产品。在 PL2 状态下,该处理器的能耗高达 131 瓦。不过,在持续负载情况下,能耗会降至 83 瓦。
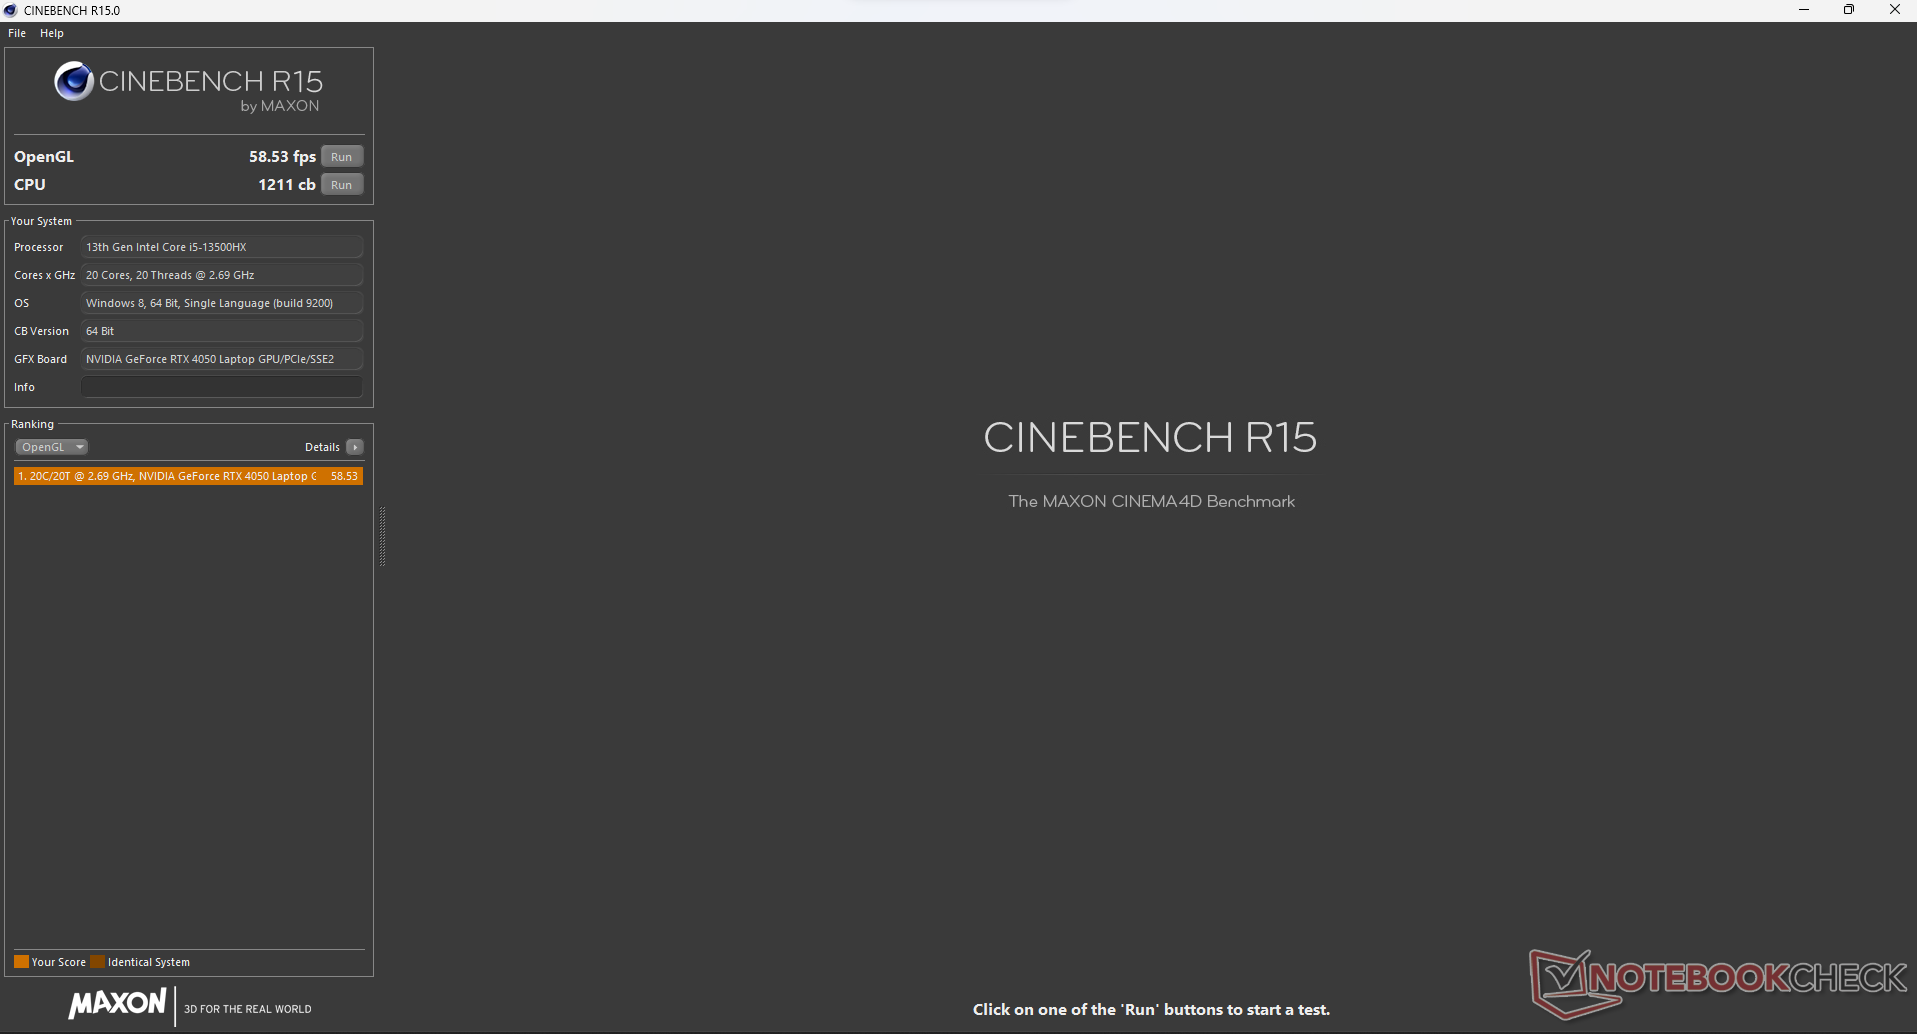
众所周知,游戏笔记本电脑在使用电池时会损失大量性能,惠普 Victus 16 也不例外。例如,当断开交流电源时,其 Cinebench R15 分数从 2,863 分降至 1,211 分,降幅高达约 58%。
Cinebench R15 Multi Loop
Cinebench R23: Multi Core | Single Core
Cinebench R20: CPU (Multi Core) | CPU (Single Core)
Cinebench R15: CPU Multi 64Bit | CPU Single 64Bit
Blender: v2.79 BMW27 CPU
7-Zip 18.03: 7z b 4 | 7z b 4 -mmt1
Geekbench 5.5: Multi-Core | Single-Core
HWBOT x265 Benchmark v2.2: 4k Preset
LibreOffice : 20 Documents To PDF
R Benchmark 2.5: Overall mean
| CPU Performance rating | |
| Average of class Gaming | |
| Acer Predator Helios 16 PH16-71-731Q | |
| Alienware m16 R1 Intel | |
| HP Victus 16-r0076TX -1! | |
| Average Intel Core i5-13500HX | |
| Acer Predator Triton 14 PT14-51 | |
| Aorus 15 BSF | |
| MSI Katana 15 B12VEK | |
| Asus TUF A15 FA507 | |
| Acer Nitro 16 AN16-41-R7YE | |
| Cinebench R23 / Multi Core | |
| Average of class Gaming (10488 - 42661, n=104, last 2 years) | |
| Acer Predator Helios 16 PH16-71-731Q | |
| Alienware m16 R1 Intel | |
| Acer Predator Triton 14 PT14-51 | |
| Average Intel Core i5-13500HX (18235 - 19176, n=3) | |
| HP Victus 16-r0076TX | |
| Aorus 15 BSF | |
| MSI Katana 15 B12VEK | |
| Asus TUF A15 FA507 | |
| Acer Nitro 16 AN16-41-R7YE | |
| Cinebench R23 / Single Core | |
| Average of class Gaming (1601 - 2415, n=104, last 2 years) | |
| Alienware m16 R1 Intel | |
| Aorus 15 BSF | |
| Acer Predator Helios 16 PH16-71-731Q | |
| Average Intel Core i5-13500HX (1689 - 1772, n=2) | |
| MSI Katana 15 B12VEK | |
| HP Victus 16-r0076TX | |
| Acer Predator Triton 14 PT14-51 | |
| Asus TUF A15 FA507 | |
| Acer Nitro 16 AN16-41-R7YE | |
| Cinebench R20 / CPU (Multi Core) | |
| Average of class Gaming (4029 - 16433, n=103, last 2 years) | |
| Acer Predator Helios 16 PH16-71-731Q | |
| Alienware m16 R1 Intel | |
| Acer Predator Triton 14 PT14-51 | |
| Average Intel Core i5-13500HX (6978 - 7371, n=3) | |
| HP Victus 16-r0076TX | |
| Aorus 15 BSF | |
| MSI Katana 15 B12VEK | |
| Asus TUF A15 FA507 | |
| Acer Nitro 16 AN16-41-R7YE | |
| Cinebench R20 / CPU (Single Core) | |
| Average of class Gaming (622 - 913, n=103, last 2 years) | |
| Alienware m16 R1 Intel | |
| Aorus 15 BSF | |
| Acer Predator Helios 16 PH16-71-731Q | |
| Average Intel Core i5-13500HX (648 - 695, n=3) | |
| MSI Katana 15 B12VEK | |
| Acer Predator Triton 14 PT14-51 | |
| HP Victus 16-r0076TX | |
| Asus TUF A15 FA507 | |
| Acer Nitro 16 AN16-41-R7YE | |
| Cinebench R15 / CPU Multi 64Bit | |
| Average of class Gaming (1578 - 6330, n=102, last 2 years) | |
| Acer Predator Helios 16 PH16-71-731Q | |
| Acer Predator Helios 16 PH16-71-731Q | |
| Alienware m16 R1 Intel | |
| Acer Predator Triton 14 PT14-51 | |
| Average Intel Core i5-13500HX (2856 - 2964, n=3) | |
| HP Victus 16-r0076TX | |
| Aorus 15 BSF | |
| Asus TUF A15 FA507 | |
| MSI Katana 15 B12VEK | |
| Acer Nitro 16 AN16-41-R7YE | |
| Cinebench R15 / CPU Single 64Bit | |
| Average of class Gaming (188.8 - 350, n=103, last 2 years) | |
| Alienware m16 R1 Intel | |
| Acer Predator Helios 16 PH16-71-731Q | |
| Aorus 15 BSF | |
| Average Intel Core i5-13500HX (242 - 263, n=3) | |
| Asus TUF A15 FA507 | |
| MSI Katana 15 B12VEK | |
| Acer Predator Triton 14 PT14-51 | |
| HP Victus 16-r0076TX | |
| Acer Nitro 16 AN16-41-R7YE | |
| Blender / v2.79 BMW27 CPU | |
| Acer Nitro 16 AN16-41-R7YE | |
| MSI Katana 15 B12VEK | |
| Asus TUF A15 FA507 | |
| Aorus 15 BSF | |
| HP Victus 16-r0076TX | |
| Average Intel Core i5-13500HX (178 - 193, n=3) | |
| Acer Predator Triton 14 PT14-51 | |
| Acer Predator Helios 16 PH16-71-731Q | |
| Alienware m16 R1 Intel | |
| Average of class Gaming (79 - 330, n=101, last 2 years) | |
| 7-Zip 18.03 / 7z b 4 | |
| Average of class Gaming (33491 - 148086, n=102, last 2 years) | |
| Alienware m16 R1 Intel | |
| Acer Predator Helios 16 PH16-71-731Q | |
| Acer Predator Triton 14 PT14-51 | |
| Average Intel Core i5-13500HX (68923 - 73701, n=3) | |
| HP Victus 16-r0076TX | |
| Aorus 15 BSF | |
| Asus TUF A15 FA507 | |
| MSI Katana 15 B12VEK | |
| Acer Nitro 16 AN16-41-R7YE | |
| 7-Zip 18.03 / 7z b 4 -mmt1 | |
| Average of class Gaming (4824 - 7436, n=102, last 2 years) | |
| Alienware m16 R1 Intel | |
| Acer Predator Helios 16 PH16-71-731Q | |
| Aorus 15 BSF | |
| Asus TUF A15 FA507 | |
| Acer Nitro 16 AN16-41-R7YE | |
| Average Intel Core i5-13500HX (5377 - 5850, n=3) | |
| MSI Katana 15 B12VEK | |
| Acer Predator Triton 14 PT14-51 | |
| HP Victus 16-r0076TX | |
| Geekbench 5.5 / Multi-Core | |
| Average of class Gaming (6460 - 28263, n=102, last 2 years) | |
| Acer Predator Helios 16 PH16-71-731Q | |
| Alienware m16 R1 Intel | |
| Acer Predator Triton 14 PT14-51 | |
| Aorus 15 BSF | |
| Average Intel Core i5-13500HX (12683 - 13767, n=3) | |
| HP Victus 16-r0076TX | |
| MSI Katana 15 B12VEK | |
| Asus TUF A15 FA507 | |
| Acer Nitro 16 AN16-41-R7YE | |
| Geekbench 5.5 / Single-Core | |
| Average of class Gaming (1403 - 2474, n=102, last 2 years) | |
| Acer Predator Helios 16 PH16-71-731Q | |
| Aorus 15 BSF | |
| Alienware m16 R1 Intel | |
| Average Intel Core i5-13500HX (1688 - 1779, n=3) | |
| Acer Predator Triton 14 PT14-51 | |
| HP Victus 16-r0076TX | |
| MSI Katana 15 B12VEK | |
| Asus TUF A15 FA507 | |
| Acer Nitro 16 AN16-41-R7YE | |
| HWBOT x265 Benchmark v2.2 / 4k Preset | |
| Average of class Gaming (11.5 - 44.4, n=102, last 2 years) | |
| Acer Predator Helios 16 PH16-71-731Q | |
| Alienware m16 R1 Intel | |
| Acer Predator Triton 14 PT14-51 | |
| Average Intel Core i5-13500HX (20.3 - 20.9, n=3) | |
| HP Victus 16-r0076TX | |
| MSI Katana 15 B12VEK | |
| Asus TUF A15 FA507 | |
| Aorus 15 BSF | |
| Acer Nitro 16 AN16-41-R7YE | |
| LibreOffice / 20 Documents To PDF | |
| Asus TUF A15 FA507 | |
| Average of class Gaming (33.2 - 88.8, n=102, last 2 years) | |
| Acer Predator Triton 14 PT14-51 | |
| Aorus 15 BSF | |
| MSI Katana 15 B12VEK | |
| Acer Nitro 16 AN16-41-R7YE | |
| Alienware m16 R1 Intel | |
| Average Intel Core i5-13500HX (42.5 - 45, n=2) | |
| Acer Predator Helios 16 PH16-71-731Q | |
| R Benchmark 2.5 / Overall mean | |
| Acer Nitro 16 AN16-41-R7YE | |
| Asus TUF A15 FA507 | |
| MSI Katana 15 B12VEK | |
| HP Victus 16-r0076TX | |
| Acer Predator Triton 14 PT14-51 | |
| Average Intel Core i5-13500HX (0.4512 - 0.4891, n=3) | |
| Alienware m16 R1 Intel | |
| Aorus 15 BSF | |
| Acer Predator Helios 16 PH16-71-731Q | |
| Average of class Gaming (0.3439 - 0.59, n=102, last 2 years) | |
* ... smaller is better
AIDA64: FP32 Ray-Trace | FPU Julia | CPU SHA3 | CPU Queen | FPU SinJulia | FPU Mandel | CPU AES | CPU ZLib | FP64 Ray-Trace | CPU PhotoWorxx
| Performance rating | |
| Average of class Gaming | |
| Alienware m16 R1 Intel | |
| Acer Predator Helios 16 PH16-71-731Q | |
| Acer Predator Triton 14 PT14-51 | |
| Average Intel Core i5-13500HX | |
| HP Victus 16-r0076TX | |
| Asus TUF A15 FA507 | |
| Aorus 15 BSF | |
| MSI Katana 15 B12VEK | |
| Acer Nitro 16 AN16-41-R7YE | |
| AIDA64 / FP32 Ray-Trace | |
| Average of class Gaming (10227 - 85542, n=102, last 2 years) | |
| Alienware m16 R1 Intel | |
| Acer Predator Helios 16 PH16-71-731Q | |
| Asus TUF A15 FA507 | |
| Average Intel Core i5-13500HX (15888 - 16544, n=3) | |
| Acer Predator Triton 14 PT14-51 | |
| HP Victus 16-r0076TX | |
| MSI Katana 15 B12VEK | |
| Aorus 15 BSF | |
| Acer Nitro 16 AN16-41-R7YE | |
| AIDA64 / FPU Julia | |
| Average of class Gaming (51376 - 372155, n=102, last 2 years) | |
| Alienware m16 R1 Intel | |
| Asus TUF A15 FA507 | |
| Acer Predator Helios 16 PH16-71-731Q | |
| Acer Predator Triton 14 PT14-51 | |
| HP Victus 16-r0076TX | |
| Average Intel Core i5-13500HX (80761 - 85623, n=3) | |
| Acer Nitro 16 AN16-41-R7YE | |
| MSI Katana 15 B12VEK | |
| Aorus 15 BSF | |
| AIDA64 / CPU SHA3 | |
| Average of class Gaming (2180 - 10115, n=102, last 2 years) | |
| Alienware m16 R1 Intel | |
| Acer Predator Helios 16 PH16-71-731Q | |
| Acer Predator Triton 14 PT14-51 | |
| Average Intel Core i5-13500HX (3868 - 4017, n=3) | |
| HP Victus 16-r0076TX | |
| Asus TUF A15 FA507 | |
| MSI Katana 15 B12VEK | |
| Aorus 15 BSF | |
| Acer Nitro 16 AN16-41-R7YE | |
| AIDA64 / CPU Queen | |
| Average of class Gaming (49785 - 173351, n=86, last 2 years) | |
| Alienware m16 R1 Intel | |
| Acer Predator Helios 16 PH16-71-731Q | |
| Average Intel Core i5-13500HX (105168 - 107075, n=3) | |
| Aorus 15 BSF | |
| HP Victus 16-r0076TX | |
| Asus TUF A15 FA507 | |
| Acer Predator Triton 14 PT14-51 | |
| MSI Katana 15 B12VEK | |
| Acer Nitro 16 AN16-41-R7YE | |
| AIDA64 / FPU SinJulia | |
| Average of class Gaming (4424 - 33636, n=102, last 2 years) | |
| Alienware m16 R1 Intel | |
| Acer Predator Helios 16 PH16-71-731Q | |
| Asus TUF A15 FA507 | |
| Average Intel Core i5-13500HX (10334 - 10793, n=3) | |
| Acer Predator Triton 14 PT14-51 | |
| HP Victus 16-r0076TX | |
| Acer Nitro 16 AN16-41-R7YE | |
| Aorus 15 BSF | |
| MSI Katana 15 B12VEK | |
| AIDA64 / FPU Mandel | |
| Average of class Gaming (25115 - 196829, n=102, last 2 years) | |
| Asus TUF A15 FA507 | |
| Alienware m16 R1 Intel | |
| Acer Predator Helios 16 PH16-71-731Q | |
| Acer Nitro 16 AN16-41-R7YE | |
| Average Intel Core i5-13500HX (39805 - 41418, n=3) | |
| HP Victus 16-r0076TX | |
| Acer Predator Triton 14 PT14-51 | |
| MSI Katana 15 B12VEK | |
| Aorus 15 BSF | |
| AIDA64 / CPU AES | |
| Alienware m16 R1 Intel | |
| Acer Predator Helios 16 PH16-71-731Q | |
| Acer Predator Triton 14 PT14-51 | |
| Aorus 15 BSF | |
| Average of class Gaming (39258 - 247074, n=102, last 2 years) | |
| Average Intel Core i5-13500HX (79903 - 154368, n=3) | |
| Acer Nitro 16 AN16-41-R7YE | |
| HP Victus 16-r0076TX | |
| MSI Katana 15 B12VEK | |
| Asus TUF A15 FA507 | |
| AIDA64 / CPU ZLib | |
| Average of class Gaming (574 - 2531, n=102, last 2 years) | |
| Acer Predator Helios 16 PH16-71-731Q | |
| Alienware m16 R1 Intel | |
| Acer Predator Triton 14 PT14-51 | |
| Average Intel Core i5-13500HX (1104 - 1233, n=3) | |
| HP Victus 16-r0076TX | |
| Aorus 15 BSF | |
| MSI Katana 15 B12VEK | |
| Acer Nitro 16 AN16-41-R7YE | |
| Asus TUF A15 FA507 | |
| AIDA64 / FP64 Ray-Trace | |
| Average of class Gaming (5509 - 45446, n=102, last 2 years) | |
| Alienware m16 R1 Intel | |
| Acer Predator Helios 16 PH16-71-731Q | |
| Average Intel Core i5-13500HX (8587 - 9008, n=3) | |
| Acer Predator Triton 14 PT14-51 | |
| HP Victus 16-r0076TX | |
| Asus TUF A15 FA507 | |
| MSI Katana 15 B12VEK | |
| Aorus 15 BSF | |
| Acer Nitro 16 AN16-41-R7YE | |
| AIDA64 / CPU PhotoWorxx | |
| Acer Predator Triton 14 PT14-51 | |
| Average of class Gaming (12271 - 89891, n=102, last 2 years) | |
| Average Intel Core i5-13500HX (36861 - 42683, n=3) | |
| Aorus 15 BSF | |
| MSI Katana 15 B12VEK | |
| HP Victus 16-r0076TX | |
| Alienware m16 R1 Intel | |
| Acer Predator Helios 16 PH16-71-731Q | |
| Acer Nitro 16 AN16-41-R7YE | |
| Asus TUF A15 FA507 | |
查看我们的 酷睿 i5-13500HX页面了解更多信息和比较
系统性能
虽然惠普 Victus 16 在日常使用中表现出色,但在 PCMark 10 中却落后于竞争对手,仅获得 6125 分。
它的 CrossMark 分数为 1,701 分,超过了 联想 LOQ 15和 宏碁 Nitro 16.
在 AIDA64 中,情况也大致相同,Raptor Lake-HX 处理器始终领先于 AMD 处理器。
CrossMark: Overall | Productivity | Creativity | Responsiveness
AIDA64: Memory Copy | Memory Read | Memory Write | Memory Latency
| PCMark 10 / Score | |
| Average of class Gaming (5828 - 12414, n=93, last 2 years) | |
| Lenovo Legion Pro 5 16ARX8 (R5 7645HX, RTX 4050) | |
| Acer Predator Helios 16 PH16-71-731Q | |
| Lenovo LOQ 15APH8 | |
| Acer Predator Triton 14 PT14-51 | |
| Alienware m16 R1 Intel | |
| Dell G15 5530 | |
| Acer Nitro 16 AN16-41-R7YE | |
| Average Intel Core i5-13500HX, NVIDIA GeForce RTX 4050 Laptop GPU (6125 - 6565, n=2) | |
| HP Victus 16-r0076TX | |
| PCMark 10 / Essentials | |
| Lenovo Legion Pro 5 16ARX8 (R5 7645HX, RTX 4050) | |
| Acer Predator Helios 16 PH16-71-731Q | |
| Dell G15 5530 | |
| Alienware m16 R1 Intel | |
| Average of class Gaming (8810 - 11935, n=97, last 2 years) | |
| Lenovo LOQ 15APH8 | |
| Acer Predator Triton 14 PT14-51 | |
| Average Intel Core i5-13500HX, NVIDIA GeForce RTX 4050 Laptop GPU (9625 - 10618, n=2) | |
| Acer Nitro 16 AN16-41-R7YE | |
| HP Victus 16-r0076TX | |
| PCMark 10 / Productivity | |
| Average of class Gaming (6845 - 25323, n=95, last 2 years) | |
| Lenovo Legion Pro 5 16ARX8 (R5 7645HX, RTX 4050) | |
| Acer Predator Helios 16 PH16-71-731Q | |
| Dell G15 5530 | |
| Lenovo LOQ 15APH8 | |
| Acer Predator Triton 14 PT14-51 | |
| Alienware m16 R1 Intel | |
| Average Intel Core i5-13500HX, NVIDIA GeForce RTX 4050 Laptop GPU (8471 - 9005, n=2) | |
| HP Victus 16-r0076TX | |
| Acer Nitro 16 AN16-41-R7YE | |
| PCMark 10 / Digital Content Creation | |
| Average of class Gaming (7602 - 19954, n=95, last 2 years) | |
| Lenovo LOQ 15APH8 | |
| Lenovo Legion Pro 5 16ARX8 (R5 7645HX, RTX 4050) | |
| Acer Predator Triton 14 PT14-51 | |
| Acer Nitro 16 AN16-41-R7YE | |
| Acer Predator Helios 16 PH16-71-731Q | |
| Alienware m16 R1 Intel | |
| Dell G15 5530 | |
| Average Intel Core i5-13500HX, NVIDIA GeForce RTX 4050 Laptop GPU (7649 - 8031, n=2) | |
| HP Victus 16-r0076TX | |
| CrossMark / Overall | |
| Acer Predator Helios 16 PH16-71-731Q | |
| Alienware m16 R1 Intel | |
| Average of class Gaming (1366 - 2409, n=94, last 2 years) | |
| Lenovo Legion Pro 5 16ARX8 (R5 7645HX, RTX 4050) | |
| Acer Predator Triton 14 PT14-51 | |
| Dell G15 5530 | |
| Average Intel Core i5-13500HX, NVIDIA GeForce RTX 4050 Laptop GPU (1701 - 1964, n=2) | |
| HP Victus 16-r0076TX | |
| Lenovo LOQ 15APH8 | |
| Acer Nitro 16 AN16-41-R7YE | |
| CrossMark / Productivity | |
| Acer Predator Helios 16 PH16-71-731Q | |
| Alienware m16 R1 Intel | |
| Lenovo Legion Pro 5 16ARX8 (R5 7645HX, RTX 4050) | |
| Average of class Gaming (1386 - 2254, n=94, last 2 years) | |
| Acer Predator Triton 14 PT14-51 | |
| Dell G15 5530 | |
| Average Intel Core i5-13500HX, NVIDIA GeForce RTX 4050 Laptop GPU (1585 - 1878, n=2) | |
| Lenovo LOQ 15APH8 | |
| HP Victus 16-r0076TX | |
| Acer Nitro 16 AN16-41-R7YE | |
| CrossMark / Creativity | |
| Acer Predator Helios 16 PH16-71-731Q | |
| Average of class Gaming (1343 - 2786, n=94, last 2 years) | |
| Alienware m16 R1 Intel | |
| Dell G15 5530 | |
| Lenovo Legion Pro 5 16ARX8 (R5 7645HX, RTX 4050) | |
| Acer Predator Triton 14 PT14-51 | |
| Average Intel Core i5-13500HX, NVIDIA GeForce RTX 4050 Laptop GPU (1912 - 2022, n=2) | |
| HP Victus 16-r0076TX | |
| Lenovo LOQ 15APH8 | |
| Acer Nitro 16 AN16-41-R7YE | |
| CrossMark / Responsiveness | |
| Acer Predator Helios 16 PH16-71-731Q | |
| Alienware m16 R1 Intel | |
| Lenovo Legion Pro 5 16ARX8 (R5 7645HX, RTX 4050) | |
| Average Intel Core i5-13500HX, NVIDIA GeForce RTX 4050 Laptop GPU (1478 - 2053, n=2) | |
| Acer Predator Triton 14 PT14-51 | |
| Average of class Gaming (1226 - 2334, n=94, last 2 years) | |
| Dell G15 5530 | |
| HP Victus 16-r0076TX | |
| Lenovo LOQ 15APH8 | |
| Acer Nitro 16 AN16-41-R7YE | |
| AIDA64 / Memory Copy | |
| Acer Predator Triton 14 PT14-51 | |
| Average of class Gaming (21750 - 129946, n=102, last 2 years) | |
| Dell G15 5530 | |
| Average Intel Core i5-13500HX, NVIDIA GeForce RTX 4050 Laptop GPU (56320 - 62153, n=3) | |
| Alienware m16 R1 Intel | |
| Acer Predator Helios 16 PH16-71-731Q | |
| HP Victus 16-r0076TX | |
| Acer Nitro 16 AN16-41-R7YE | |
| Lenovo Legion Pro 5 16ARX8 (R5 7645HX, RTX 4050) | |
| Lenovo LOQ 15APH8 | |
| AIDA64 / Memory Read | |
| Average of class Gaming (22956 - 118858, n=102, last 2 years) | |
| Dell G15 5530 | |
| Alienware m16 R1 Intel | |
| Acer Predator Helios 16 PH16-71-731Q | |
| Acer Predator Triton 14 PT14-51 | |
| Average Intel Core i5-13500HX, NVIDIA GeForce RTX 4050 Laptop GPU (66057 - 66667, n=3) | |
| HP Victus 16-r0076TX | |
| Acer Nitro 16 AN16-41-R7YE | |
| Lenovo Legion Pro 5 16ARX8 (R5 7645HX, RTX 4050) | |
| Lenovo LOQ 15APH8 | |
| AIDA64 / Memory Write | |
| Acer Predator Helios 16 PH16-71-731Q | |
| Acer Predator Triton 14 PT14-51 | |
| Average of class Gaming (22297 - 135096, n=102, last 2 years) | |
| Average Intel Core i5-13500HX, NVIDIA GeForce RTX 4050 Laptop GPU (56956 - 66135, n=3) | |
| Dell G15 5530 | |
| Alienware m16 R1 Intel | |
| HP Victus 16-r0076TX | |
| Acer Nitro 16 AN16-41-R7YE | |
| Lenovo Legion Pro 5 16ARX8 (R5 7645HX, RTX 4050) | |
| Lenovo LOQ 15APH8 | |
| AIDA64 / Memory Latency | |
| Average of class Gaming (75.3 - 165.4, n=102, last 2 years) | |
| Acer Predator Triton 14 PT14-51 | |
| HP Victus 16-r0076TX | |
| Lenovo LOQ 15APH8 | |
| Average Intel Core i5-13500HX, NVIDIA GeForce RTX 4050 Laptop GPU (87.1 - 96.8, n=3) | |
| Dell G15 5530 | |
| Alienware m16 R1 Intel | |
| Acer Nitro 16 AN16-41-R7YE | |
| Acer Predator Helios 16 PH16-71-731Q | |
| Lenovo Legion Pro 5 16ARX8 (R5 7645HX, RTX 4050) | |
* ... smaller is better
| PCMark 8 Home Score Accelerated | 4602 points | |
| PCMark 8 Work Score Accelerated | 6227 points | |
| PCMark 10 Score | 6125 points | |
Help | ||
DPC 延迟
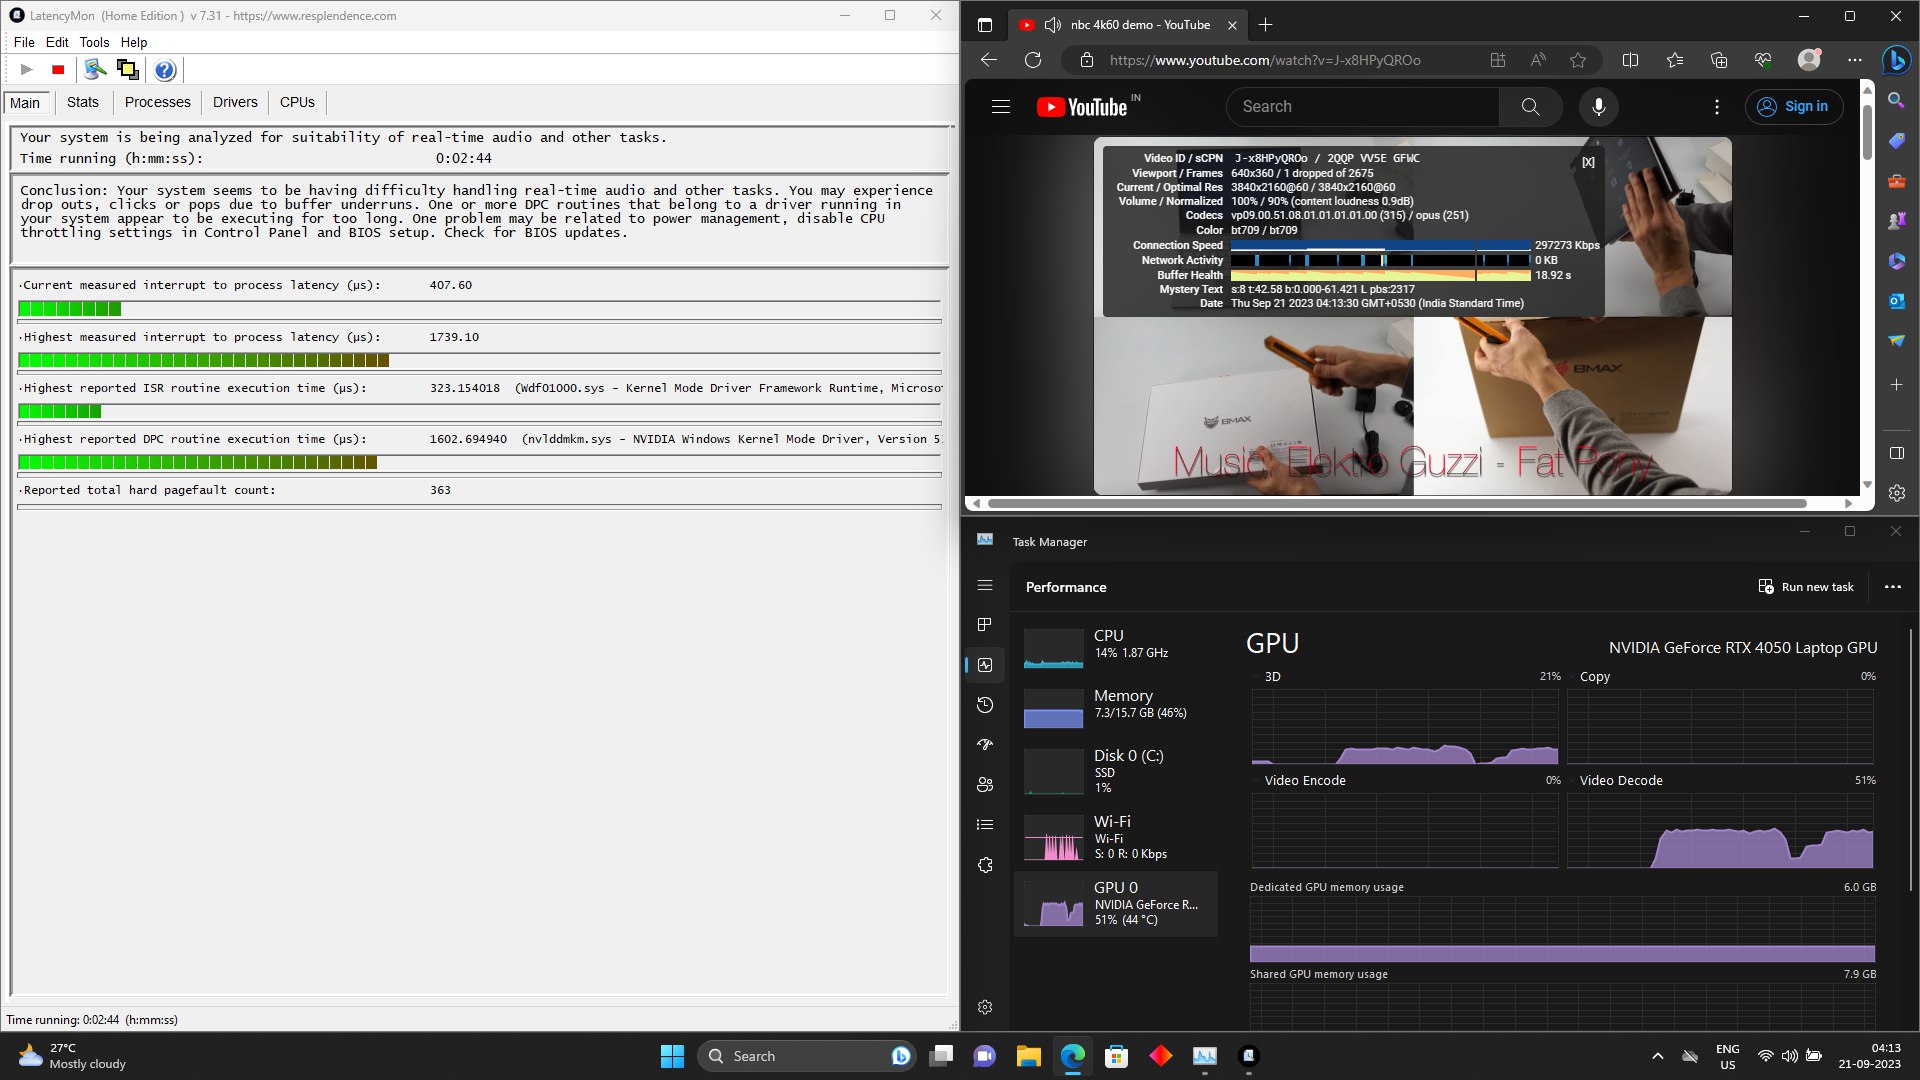
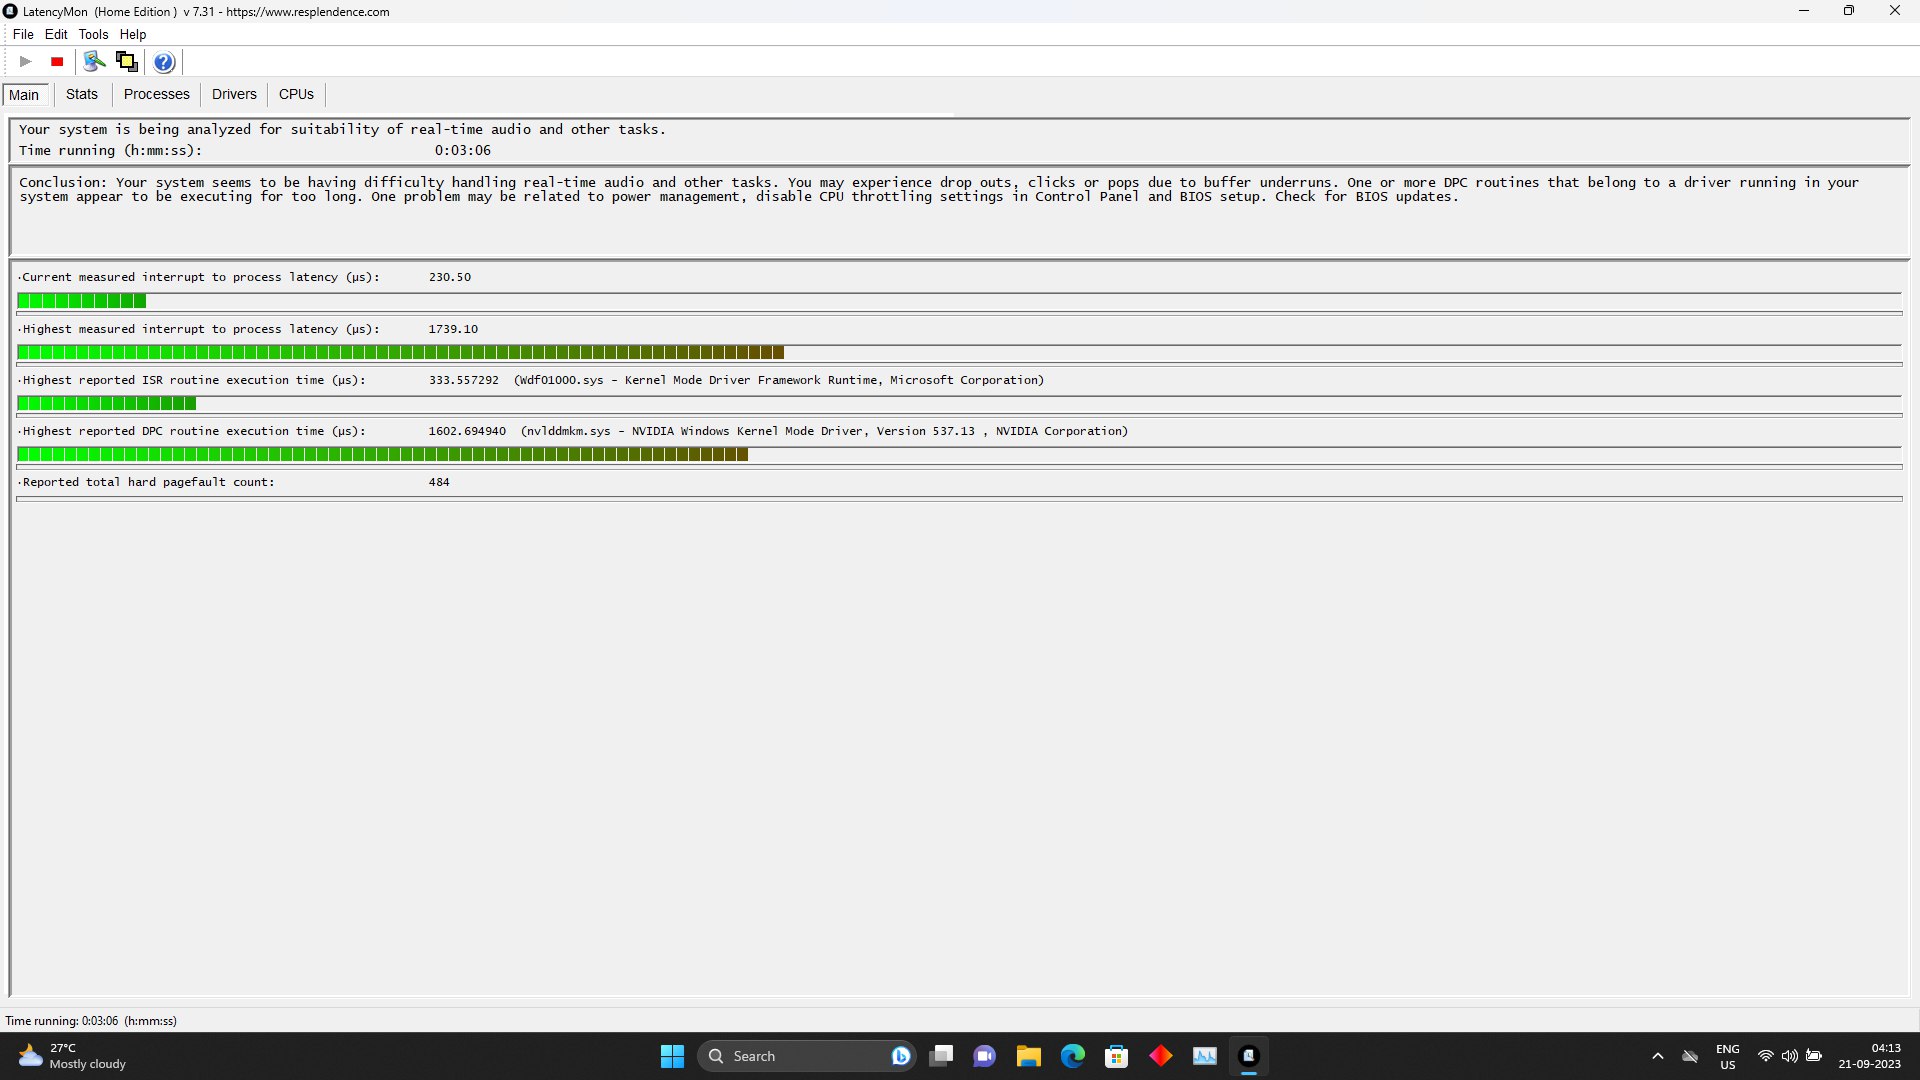
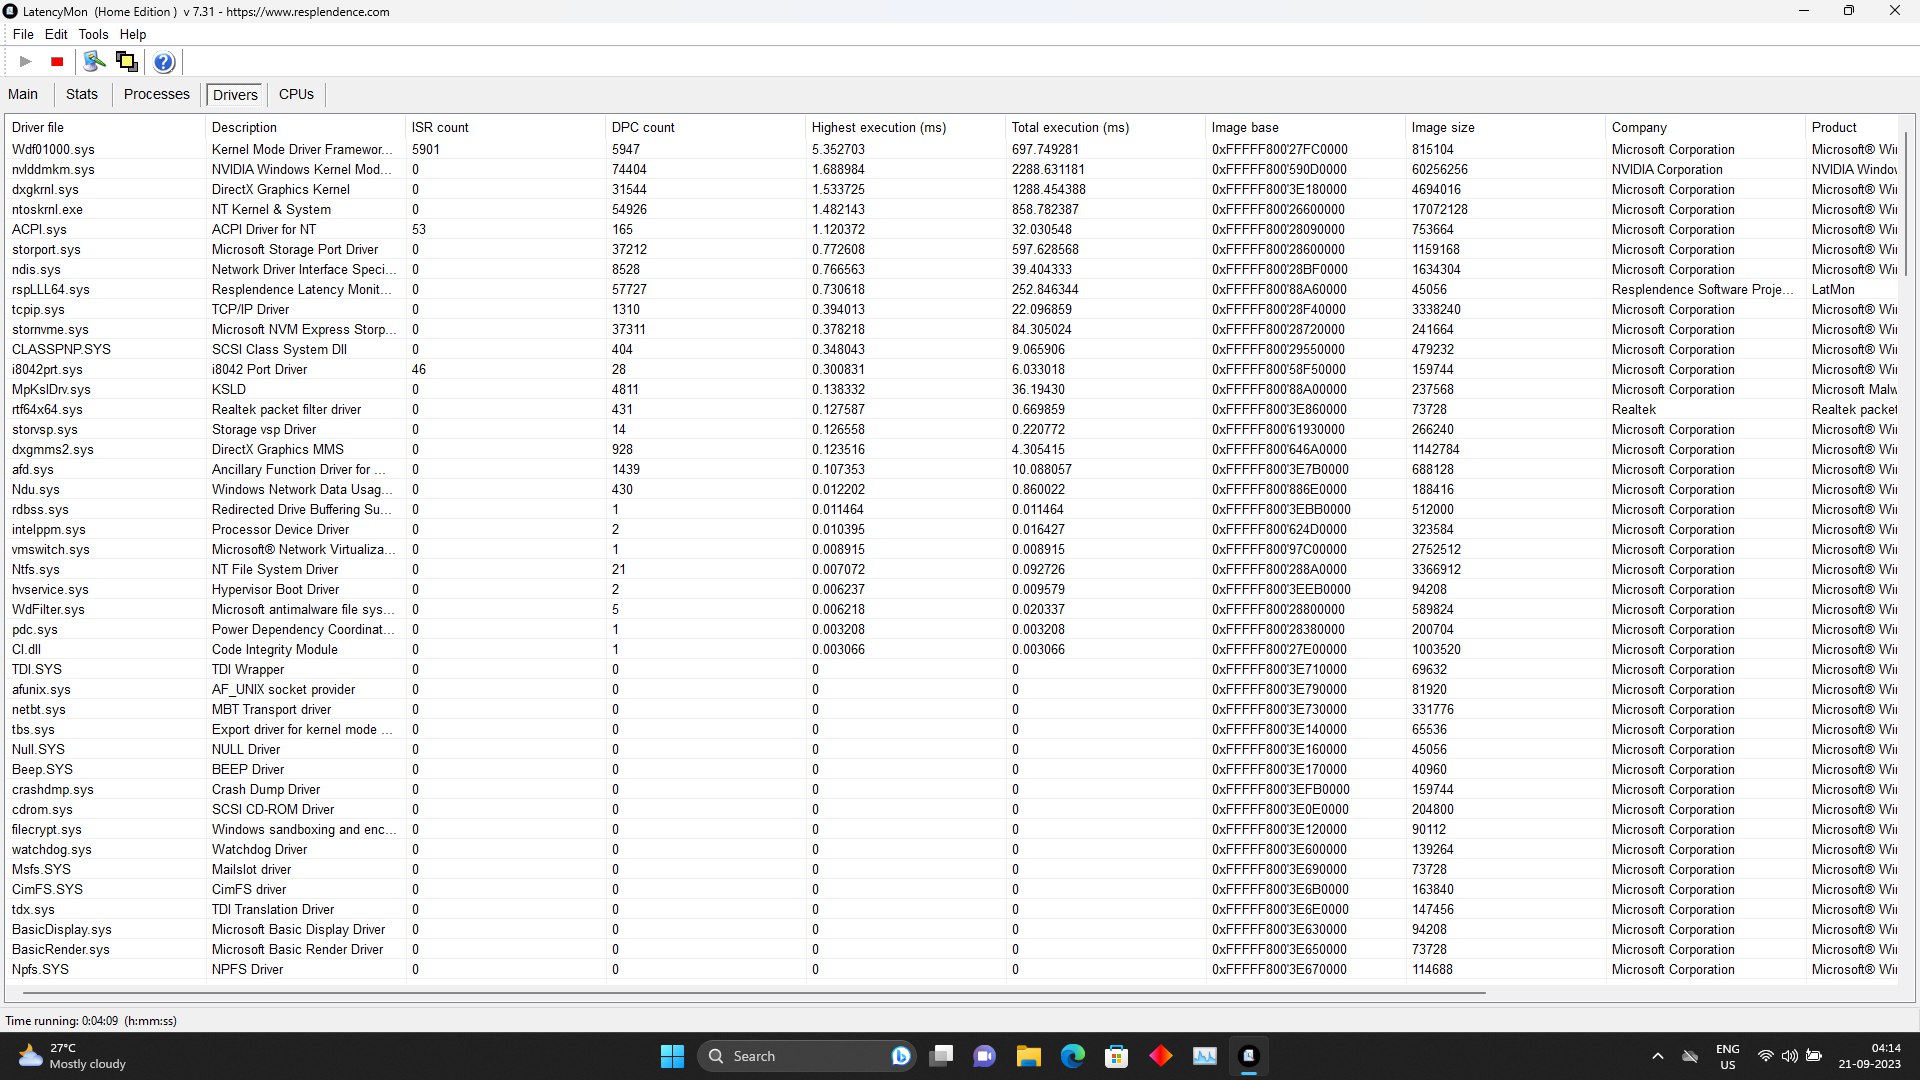
自推出以来,DPC 延迟过高一直是台式机版 Ada Lovelace 显卡存在的问题。这个问题似乎也延续到了笔记本电脑上。快速查看 LatencyMon 后发现,罪魁祸首是 "Wdf0100.sys"(Windows 驱动程序框架)和 "Nvlddmkm.sys"(Nvidia Windows 内核模块),这表明软件更新可以在稍后解决问题。
查看 延迟排名页面 查看更多结果。
| DPC Latencies / LatencyMon - interrupt to process latency (max), Web, Youtube, Prime95 | |
| Dell G15 5530 | |
| Alienware m16 R1 Intel | |
| HP Victus 16-r0076TX | |
| Acer Predator Helios 16 PH16-71-731Q | |
| Acer Predator Triton 14 PT14-51 | |
| Lenovo LOQ 15APH8 | |
| Acer Nitro 16 AN16-41-R7YE | |
| Lenovo Legion Pro 5 16ARX8 (R5 7645HX, RTX 4050) | |
* ... smaller is better
存储设备
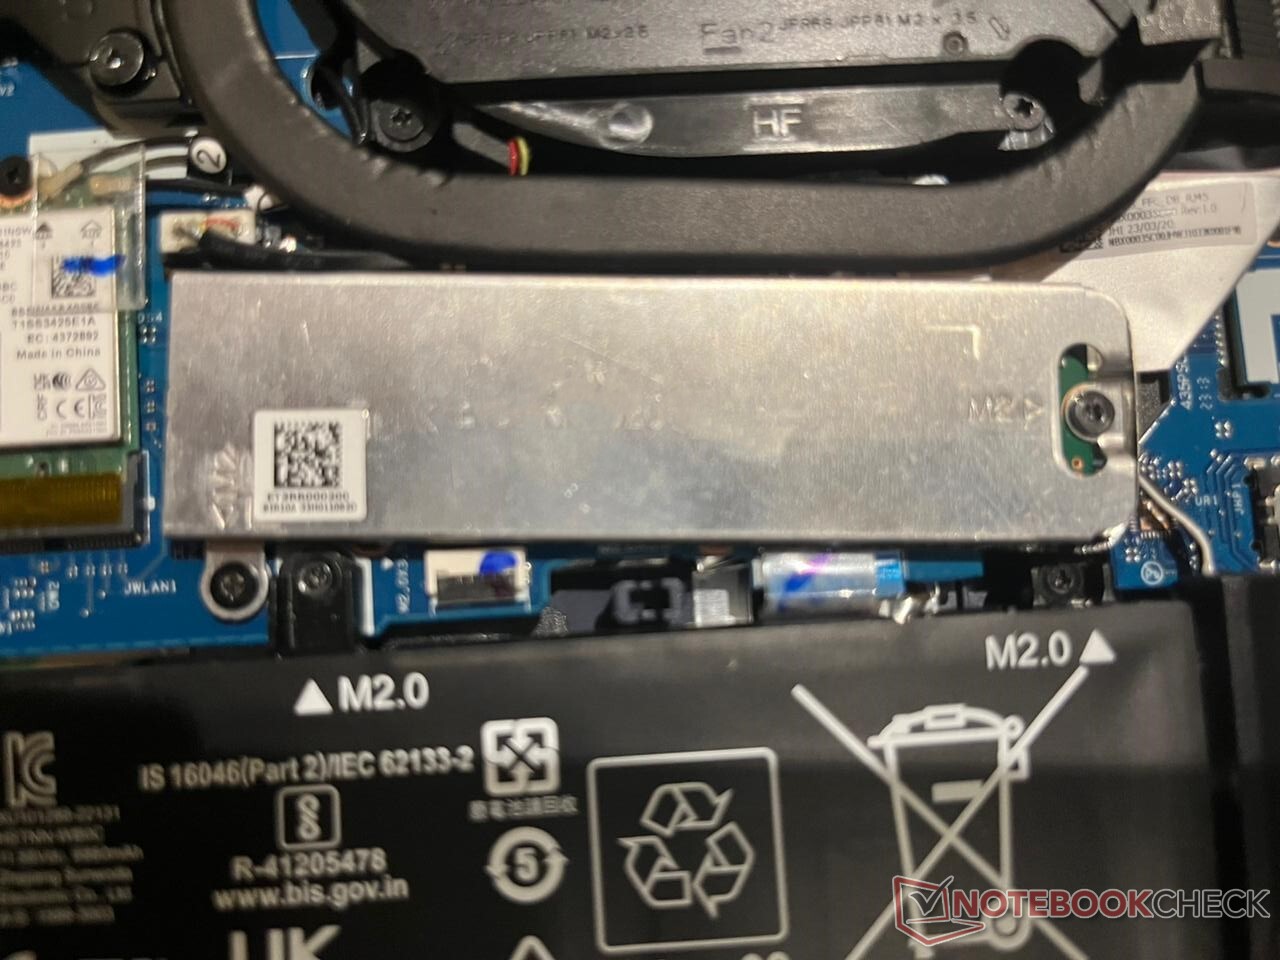
惠普 Victus 16 的 SK Hynix PC801 NVMe 固态硬盘在各种工作负载下都能提供不错的传输速度。我们的测试表明,得益于其厚实的金属屏蔽,即使长时间使用也不会出现卡顿。
不过,在 2023 年,512 GB 的容量还是少得可怜,尤其是在臃肿的游戏大小成为常态的情况下。幸好惠普允许用户相对轻松地安装额外的硬盘。

* ... smaller is better
Disk Throttling: DiskSpd Read Loop, Queue Depth 8
了解更多 硬盘和固态硬盘基准测试。
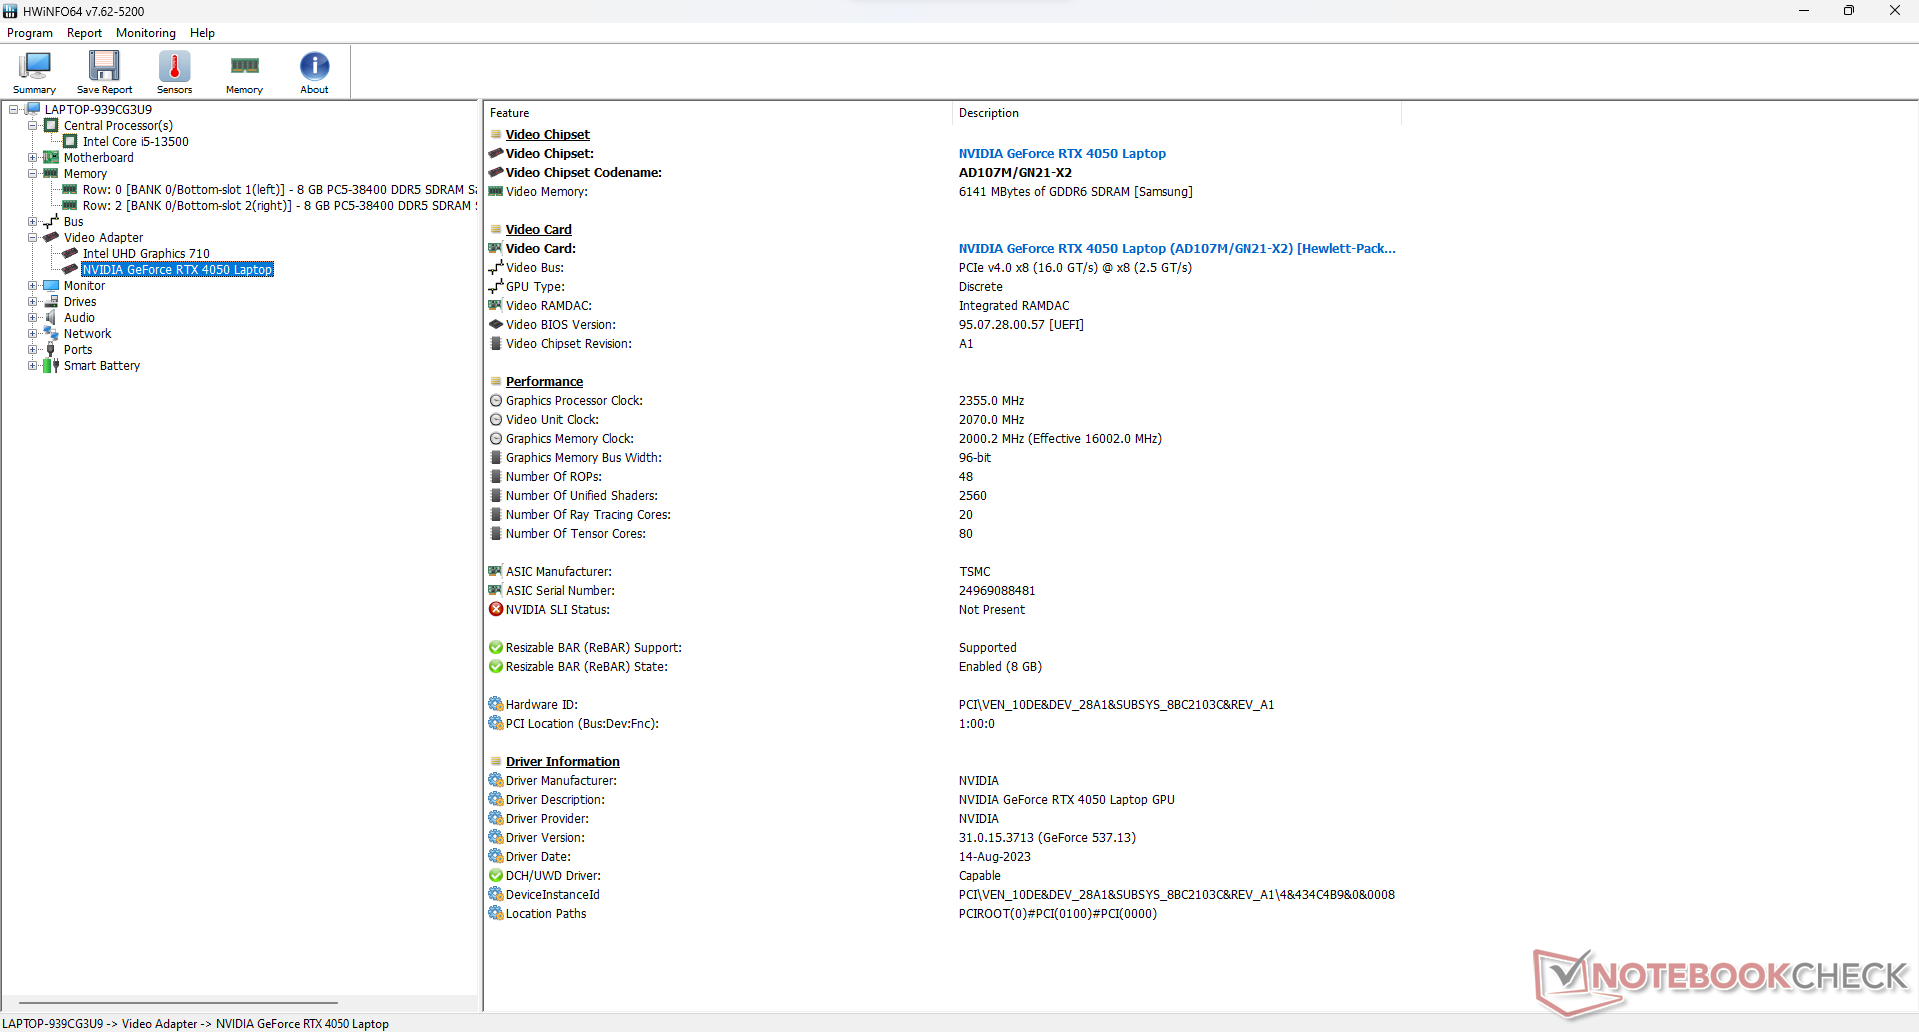
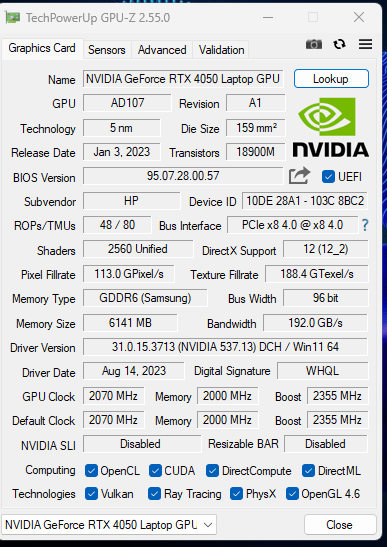
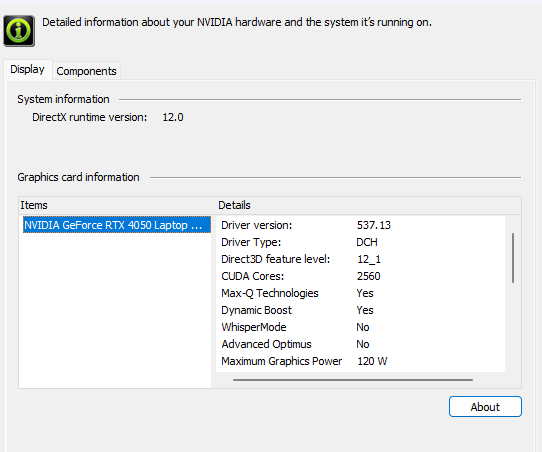
图形处理器性能
乍一看,NvidiaGeForce RTX 4050 并不像市场上最强大的 GPU。它在 96 位总线上有 6 GB GDDR6 VRAM,2,560 个 CUDA 内核,TGP 值在 35 到 115 瓦之间。
在 Nvidia 控制面板中进行的一些调查显示,它的最大 TGP 上限约为 100 瓦,这是值得尊敬的。有趣的是,GeForce RTX 4050 可以从 CPU "借用 "多达 20 瓦的功率。
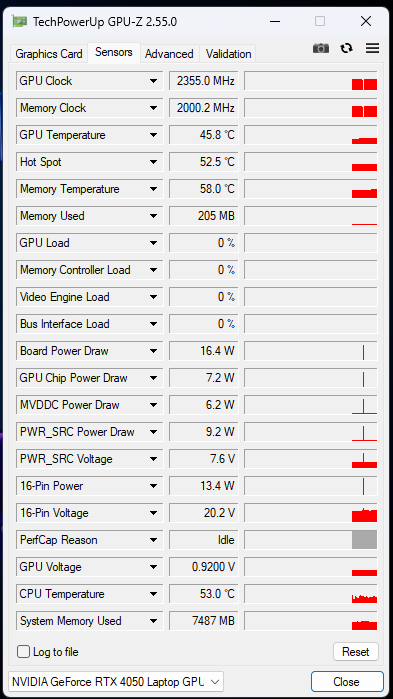
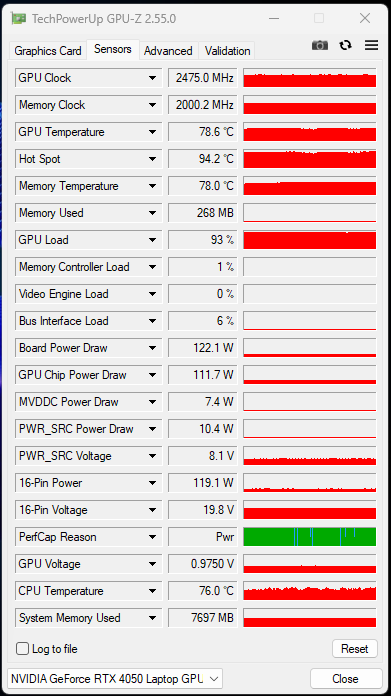
这一点在 FurMark 中得到了体现,在负载情况下,电路板的最大功率跃升至 122.1 瓦。不过,它并不能长时间保持这种状态,过一段时间后就会稳定在一个较低的数字上。
惠普 Victus 16 在 3DMark 11 中的表现略好于其他 RTX 4050 笔记本电脑,得分为 31,571 分。在较早的 3DMark 测试中,如Ice Storm 、Fire Strike 和Time Spy ,差距并不明显。
总之,尽管GeForce RTX 4050 的参数表不尽如人意,但它仍能跟上竞争对手的步伐,是一款无可挑剔的入门级显卡。
| 3DMark 06 Standard Score | 46228 points | |
| 3DMark 11 Performance | 28214 points | |
| 3DMark Ice Storm Standard Score | 198276 points | |
| 3DMark Cloud Gate Standard Score | 61259 points | |
| 3DMark Fire Strike Score | 21070 points | |
| 3DMark Fire Strike Extreme Score | 10180 points | |
| 3DMark Time Spy Score | 9069 points | |
Help | ||
| Blender / v3.3 Classroom OPTIX/RTX | |
| Average NVIDIA GeForce RTX 4050 Laptop GPU (25 - 37, n=40) | |
| HP Victus 16-r0076TX | |
| MSI Katana 15 B12VEK | |
| Asus TUF A15 FA507 | |
| Asus TUF A15 FA507 | |
| Acer Predator Triton 14 PT14-51 | |
| Acer Nitro 16 AN16-41-R7YE | |
| Alienware m16 R1 Intel | |
| Aorus 15 BSF | |
| Acer Predator Helios 16 PH16-71-731Q | |
| Average of class Gaming (9 - 32, n=103, last 2 years) | |
| Blender / v3.3 Classroom CUDA | |
| Average NVIDIA GeForce RTX 4050 Laptop GPU (47 - 68, n=39) | |
| MSI Katana 15 B12VEK | |
| Acer Predator Triton 14 PT14-51 | |
| Asus TUF A15 FA507 | |
| Asus TUF A15 FA507 | |
| Acer Nitro 16 AN16-41-R7YE | |
| HP Victus 16-r0076TX | |
| Acer Predator Helios 16 PH16-71-731Q | |
| Alienware m16 R1 Intel | |
| Aorus 15 BSF | |
| Average of class Gaming (15 - 228, n=103, last 2 years) | |
| Blender / v3.3 Classroom CPU | |
| Acer Nitro 16 AN16-41-R7YE | |
| MSI Katana 15 B12VEK | |
| Average NVIDIA GeForce RTX 4050 Laptop GPU (243 - 907, n=40) | |
| Aorus 15 BSF | |
| Asus TUF A15 FA507 | |
| Asus TUF A15 FA507 | |
| HP Victus 16-r0076TX | |
| Acer Predator Triton 14 PT14-51 | |
| Acer Predator Helios 16 PH16-71-731Q | |
| Alienware m16 R1 Intel | |
| Average of class Gaming (122 - 565, n=99, last 2 years) | |
* ... smaller is better
查看我们的 英伟达GeForce RTX 4050基准页面,了解更多信息和比较。
游戏性能
| The Witcher 3 - 1920x1080 Ultra Graphics & Postprocessing (HBAO+) | |
| Average of class Gaming (104.7 - 240, n=7, last 2 years) | |
| Alienware m16 R1 Intel | |
| Dell G15 5530 | |
| Acer Predator Helios 16 PH16-71-731Q | |
| HP Victus 16-r0076TX | |
| Lenovo Legion Pro 5 16ARX8 (R5 7645HX, RTX 4050) | |
| Acer Nitro 16 AN16-41-R7YE | |
| Lenovo LOQ 15APH8 | |
| Acer Predator Triton 14 PT14-51 | |
在我们的持续测试中,TheWitcher 3 在任何时候都能以至少 90 帧/秒的速度运行,表现相当不错。虽然帧率在某些情况下徘徊在 100 帧左右,但由于热节流,帧率又降了下来。从本质上讲,这款笔记本电脑能以相当稳定的帧速率玩要求较高的游戏。
Witcher 3 FPS Chart
| low | med. | high | ultra | |
|---|---|---|---|---|
| The Witcher 3 (2015) | 365 | 282 | 160.2 | 94.7 |
| Dota 2 Reborn (2015) | 181.5 | 163.4 | 159 | 145 |
| Final Fantasy XV Benchmark (2018) | 190.5 | 120.3 | 84.8 | |
| X-Plane 11.11 (2018) | 157.2 | 138.8 | 106.5 | |
| Far Cry 5 (2018) | 155 | 122 | 110 | 109 |
| Strange Brigade (2018) | 355 | 213 | 171.8 | 149.3 |
| Cyberpunk 2077 1.6 (2022) | 111.2 | 85.3 | 65.5 | 71.8 |
| F1 22 (2022) | 214 | 207 | 154.4 | 54.1 |
| F1 23 (2023) | 217 | 210 | 156.2 | 60.8 |
排放:运行时声音有点大,温度有点高
系统噪音
尽管惠普竭尽所能为 Victus 16 降温,但它仍很难保持硬件正常运行。你首先会注意到笔记本电脑在最轻微的负载下都会变得很吵,游戏时噪音会逐渐变大。
我们的测试确定最大噪音输出为 55 dB(A)。虽然它远远低于可以被认为是大声的临界值,但如果没有一副耳机,它是无法融入背景的。
Noise level
| Idle |
| 23.68 / 23.68 / 23.68 dB(A) |
| Load |
| 39.44 / 55.37 dB(A) |
 | ||
30 dB silent 40 dB(A) audible 50 dB(A) loud |
||
min: | ||
| 性能模式 | 空闲 dB(A) | 负载平均 dB(A) | 负载最大 dB(A) | Witcher 3 1080p Ultra dB(A) |
|---|---|---|---|---|
| 生态 | 23.67 | 32.50 | 40.80 | 41.03 / 84 帧/秒 |
| 平衡型 | 23.87 | 35.06 | 44.72 | 44.78 / 86 帧/秒 |
| 性能 | 23.68 | 39.44 | 55.37 | 55.42 / 87 帧/秒 |
| HP Victus 16-r0076TX i5-13500HX, GeForce RTX 4050 Laptop GPU | Acer Nitro 16 AN16-41-R7YE R5 7535HS, GeForce RTX 4050 Laptop GPU | Acer Predator Triton 14 PT14-51 i7-13700H, GeForce RTX 4050 Laptop GPU | Alienware m16 R1 Intel i7-13700HX, GeForce RTX 4060 Laptop GPU | Acer Predator Helios 16 PH16-71-731Q i7-13700HX, GeForce RTX 4060 Laptop GPU | Dell G15 5530 i7-13650HX, GeForce RTX 4060 Laptop GPU | Lenovo Legion Pro 5 16ARX8 (R5 7645HX, RTX 4050) R5 7645HX, GeForce RTX 4050 Laptop GPU | Lenovo LOQ 15APH8 R7 7840HS, GeForce RTX 4050 Laptop GPU | |
|---|---|---|---|---|---|---|---|---|
| Noise | -1% | -7% | -9% | -3% | 3% | 5% | 0% | |
| off / environment * (dB) | 21.57 | 24 -11% | 25 -16% | 25 -16% | 24 -11% | 20.41 5% | 23 -7% | 23.1 -7% |
| Idle Minimum * (dB) | 23.68 | 25 -6% | 27 -14% | 25 -6% | 24 -1% | 26.85 -13% | 23 3% | 23.1 2% |
| Idle Average * (dB) | 23.68 | 26 -10% | 29 -22% | 26 -10% | 24 -1% | 26.85 -13% | 23 3% | 23.1 2% |
| Idle Maximum * (dB) | 23.68 | 27 -14% | 31 -31% | 27 -14% | 32.32 -36% | 26.85 -13% | 24.42 -3% | 25.2 -6% |
| Load Average * (dB) | 39.44 | 42 -6% | 42 -6% | 52 -32% | 36.66 7% | 27.65 30% | 34.94 11% | 44.3 -12% |
| Witcher 3 ultra * (dB) | 55.4 | 43 22% | 43 22% | 51 8% | 49.06 11% | 47.9 14% | 43.79 21% | 45.8 17% |
| Load Maximum * (dB) | 55.37 | 45 19% | 45 19% | 53 4% | 49.49 11% | 47.86 14% | 50 10% | 52 6% |
* ... smaller is better
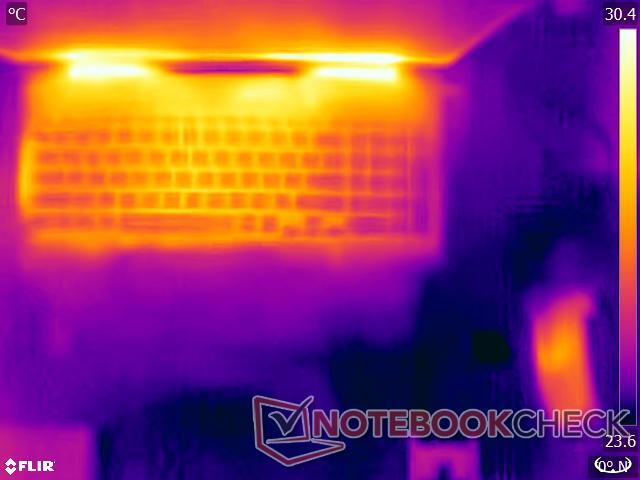
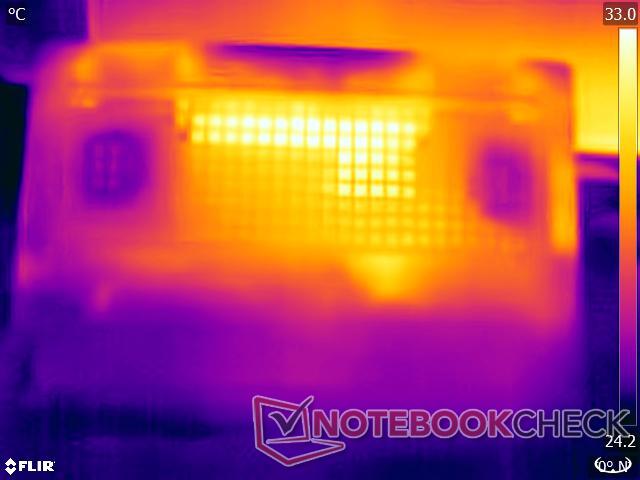
温度
在游戏一段时间后,惠普 Victus 16 会立即发热。它的塑料机身无法很好地隔绝耗电部件产生的热量。尤其是键盘,在游戏几分钟后温度会明显升高。
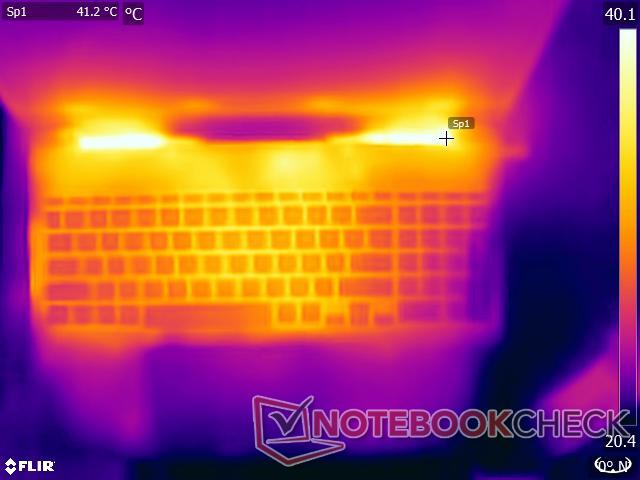
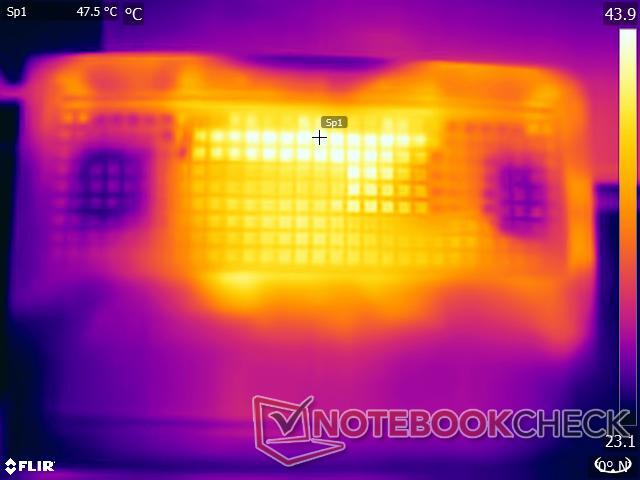
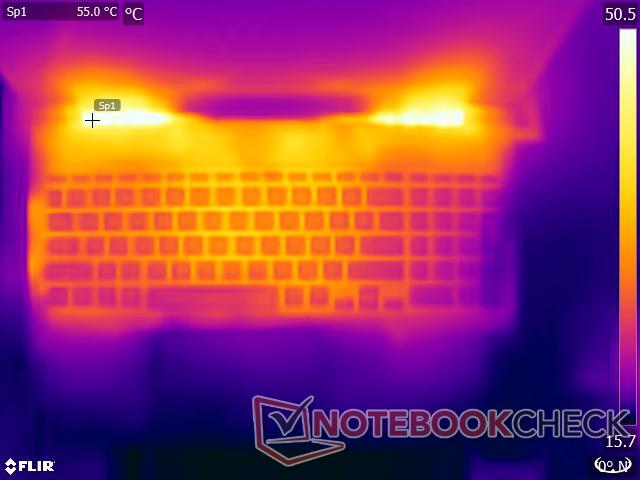
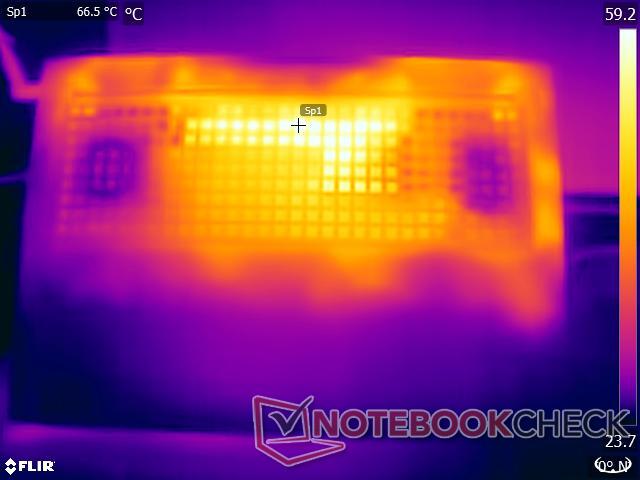
惠普的设计使部分热量从各个方向散发出去。我们的测试表明,在负载情况下,与通风口直接相邻的区域温度可高达 48°C。这是笔记本电脑最热的地方,其周围区域的温度徘徊在 44°C 和 45.8°C。
(-) The maximum temperature on the upper side is 48 °C / 118 F, compared to the average of 40.4 °C / 105 F, ranging from 21.2 to 68.8 °C for the class Gaming.
(-) The bottom heats up to a maximum of 48 °C / 118 F, compared to the average of 43.2 °C / 110 F
(+) In idle usage, the average temperature for the upper side is 28 °C / 82 F, compared to the device average of 33.9 °C / 93 F.
(-) Playing The Witcher 3, the average temperature for the upper side is 38.7 °C / 102 F, compared to the device average of 33.9 °C / 93 F.
(+) The palmrests and touchpad are cooler than skin temperature with a maximum of 31.2 °C / 88.2 F and are therefore cool to the touch.
(-) The average temperature of the palmrest area of similar devices was 28.8 °C / 83.8 F (-2.4 °C / -4.4 F).
| HP Victus 16-r0076TX Intel Core i5-13500HX, NVIDIA GeForce RTX 4050 Laptop GPU | Acer Nitro 16 AN16-41-R7YE AMD Ryzen 5 7535HS, NVIDIA GeForce RTX 4050 Laptop GPU | Acer Predator Triton 14 PT14-51 Intel Core i7-13700H, NVIDIA GeForce RTX 4050 Laptop GPU | Alienware m16 R1 Intel Intel Core i7-13700HX, NVIDIA GeForce RTX 4060 Laptop GPU | Acer Predator Helios 16 PH16-71-731Q Intel Core i7-13700HX, NVIDIA GeForce RTX 4060 Laptop GPU | Dell G15 5530 Intel Core i7-13650HX, NVIDIA GeForce RTX 4060 Laptop GPU | Lenovo Legion Pro 5 16ARX8 (R5 7645HX, RTX 4050) AMD Ryzen 5 7645HX, NVIDIA GeForce RTX 4050 Laptop GPU | Lenovo LOQ 15APH8 AMD Ryzen 7 7840HS, NVIDIA GeForce RTX 4050 Laptop GPU | |
|---|---|---|---|---|---|---|---|---|
| Heat | -15% | -10% | -17% | -17% | -17% | -14% | 2% | |
| Maximum Upper Side * (°C) | 48 | 51 -6% | 54 -13% | 49 -2% | 41 15% | 54 -13% | 45 6% | 44.4 7% |
| Maximum Bottom * (°C) | 48 | 63 -31% | 56 -17% | 48 -0% | 66 -38% | 62.2 -30% | 54 -13% | 52 -8% |
| Idle Upper Side * (°C) | 29.6 | 34 -15% | 31 -5% | 40 -35% | 36 -22% | 33.4 -13% | 36 -22% | 28 5% |
| Idle Bottom * (°C) | 30.2 | 32 -6% | 31 -3% | 39 -29% | 37 -23% | 33.4 -11% | 38 -26% | 29.6 2% |
* ... smaller is better
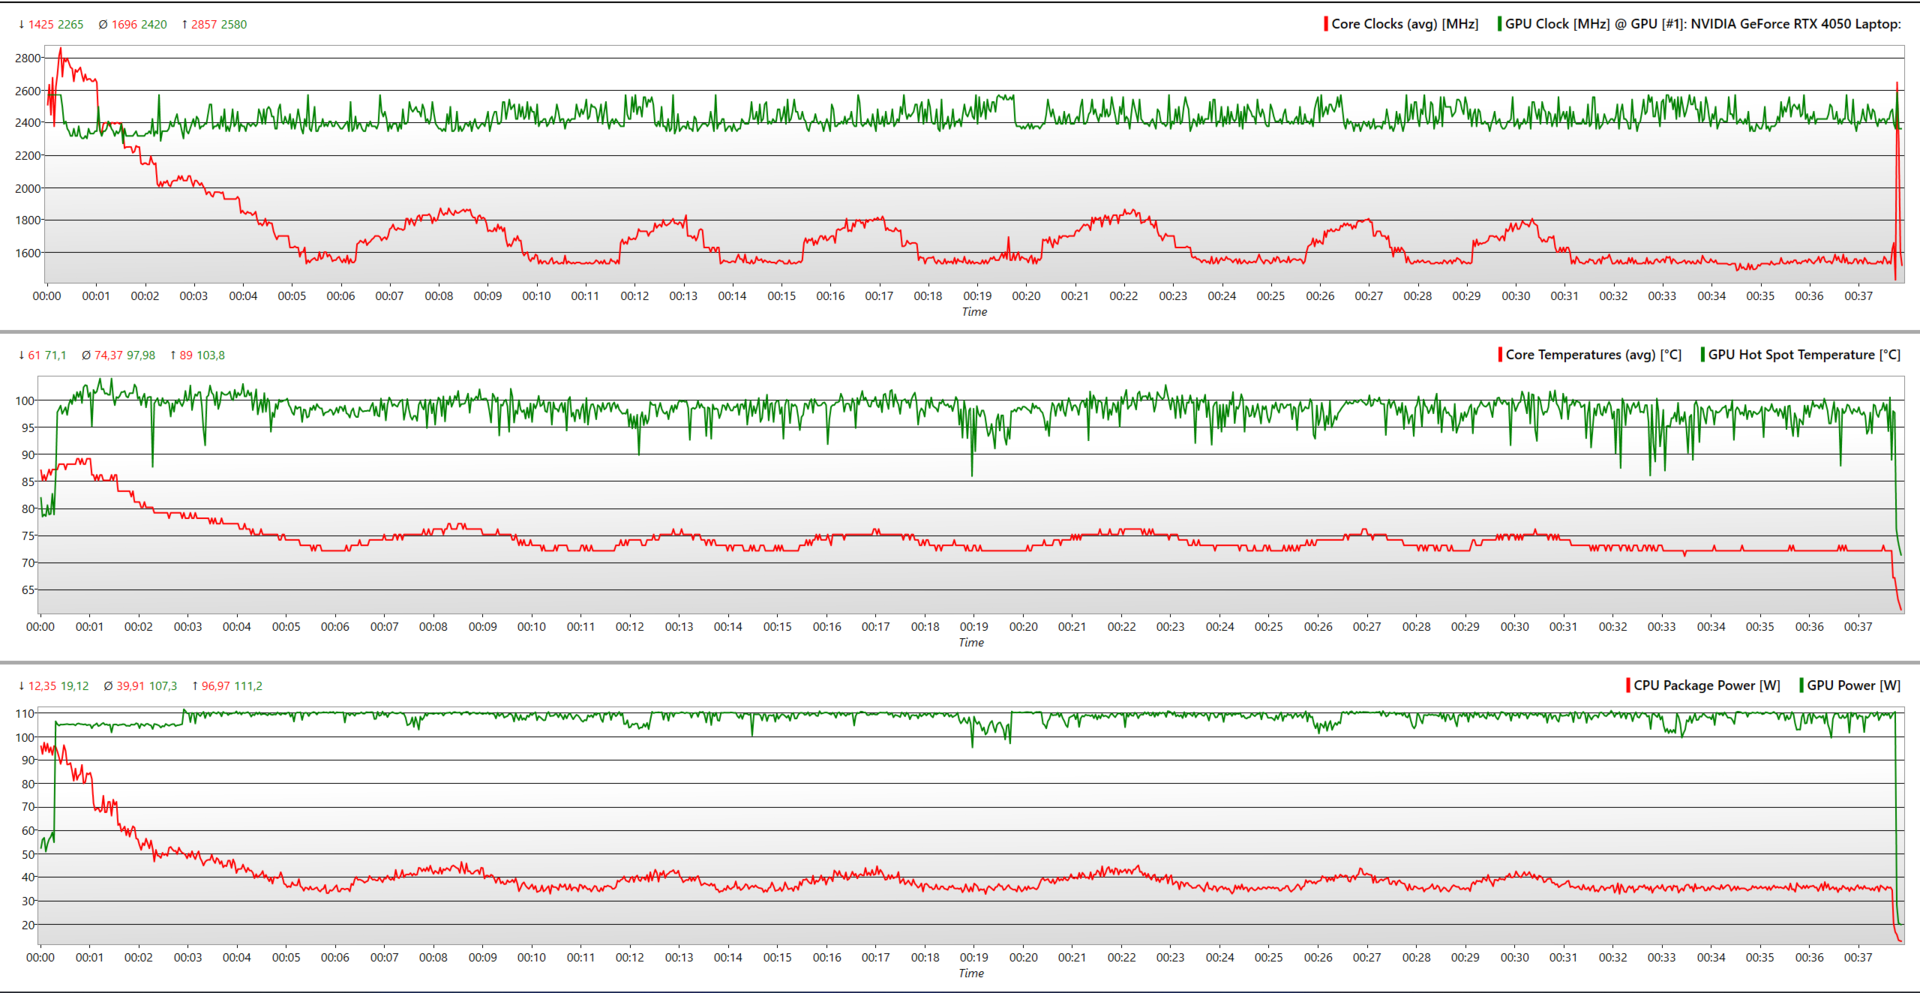
压力测试
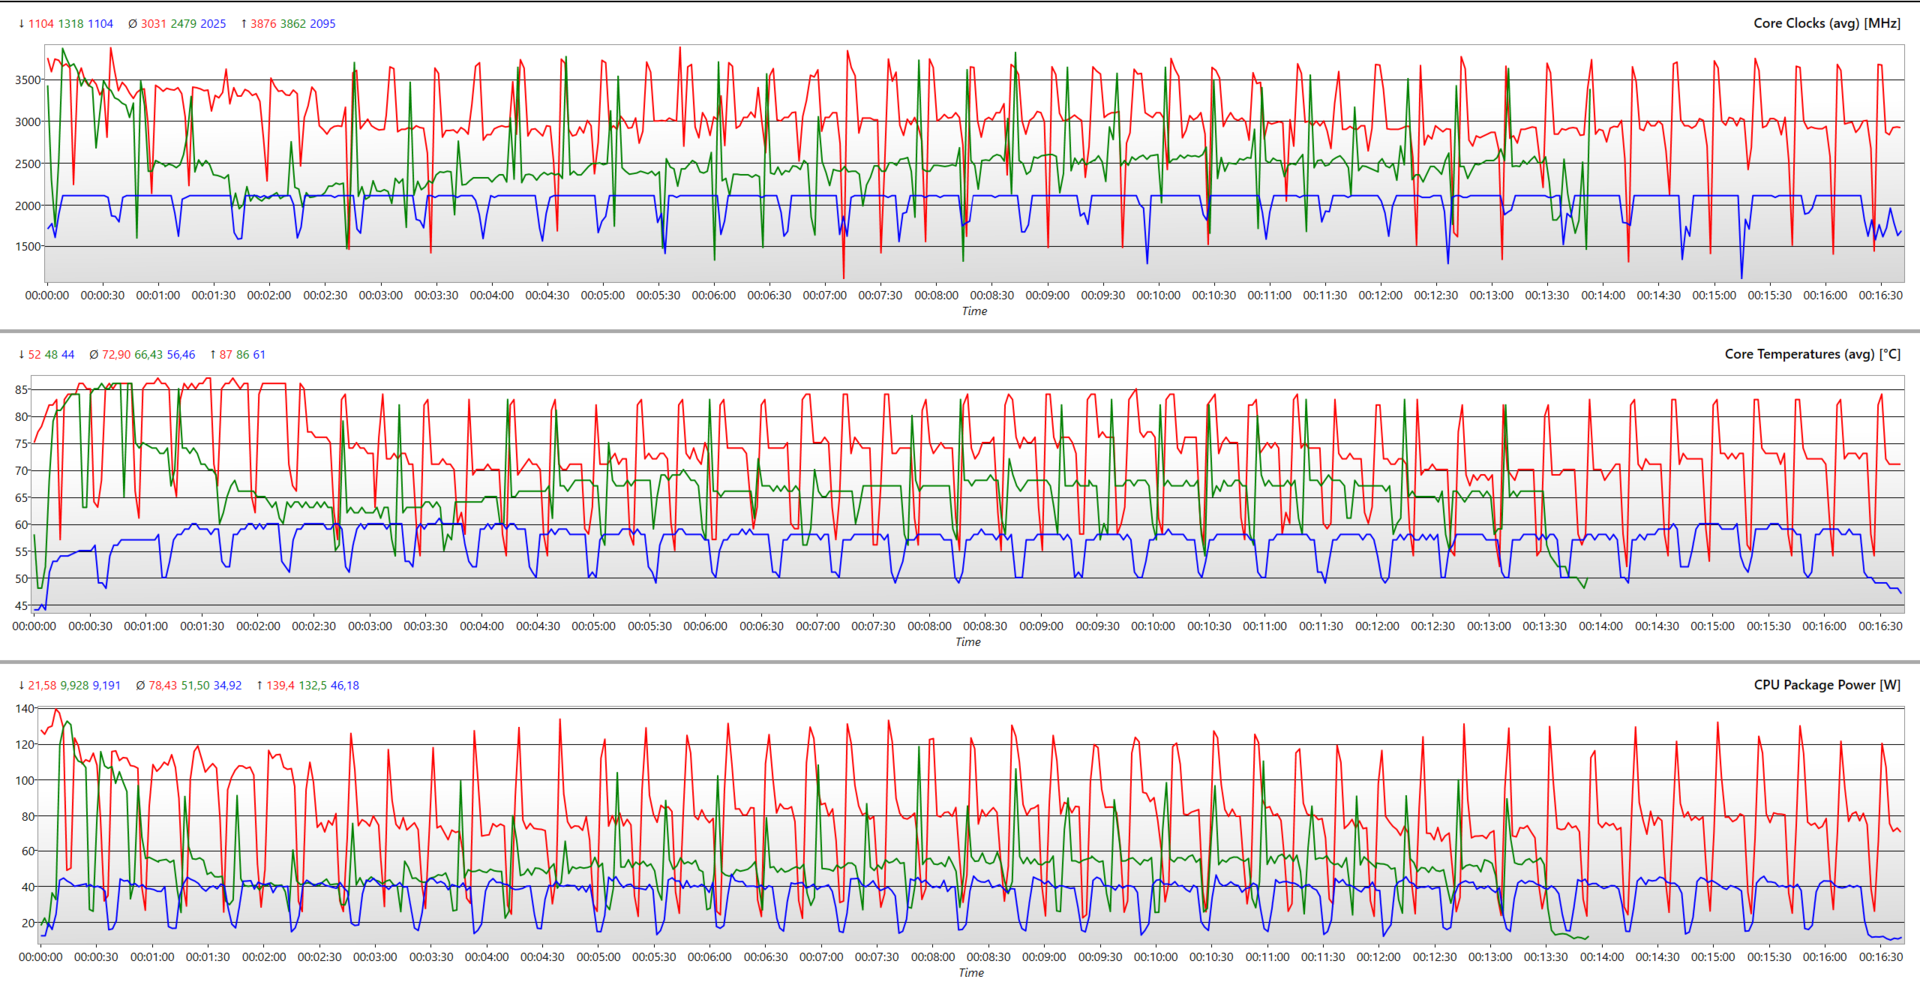
在持续负载情况下,惠普 Victus 16 的 CPU 和 GPU 时钟速度会出现明显下降。酷睿 i5-13500HX 处理器的主频可暂时提升至 2.8 GHz,然后稳定在 1.69 GHz 左右。其温度徘徊在 77°C 左右。
同样,GeForce RTX 4050 试图将时钟频率维持在 2,580 MHz,但最终定格在 2,420 MHz,在 Nvidia 公布的提升时钟频率范围内。它的运行温度比 CPU 稍高,平均温度为 82.5°C,这要归功于两个强劲的风扇和通过通风口将热量排出的热管。
P 核心可在短时间内提升至 4.4 GHz,比英特尔宣传的 4.7 GHz 稍低。同样,E 核心的最高频率为 3.49 GHz,比 3.50 GHz 低一些。平均而言,整体提升频率高达 3.8 GHz。经过一段时间后,最终稳定在 2.53 GHz 左右。
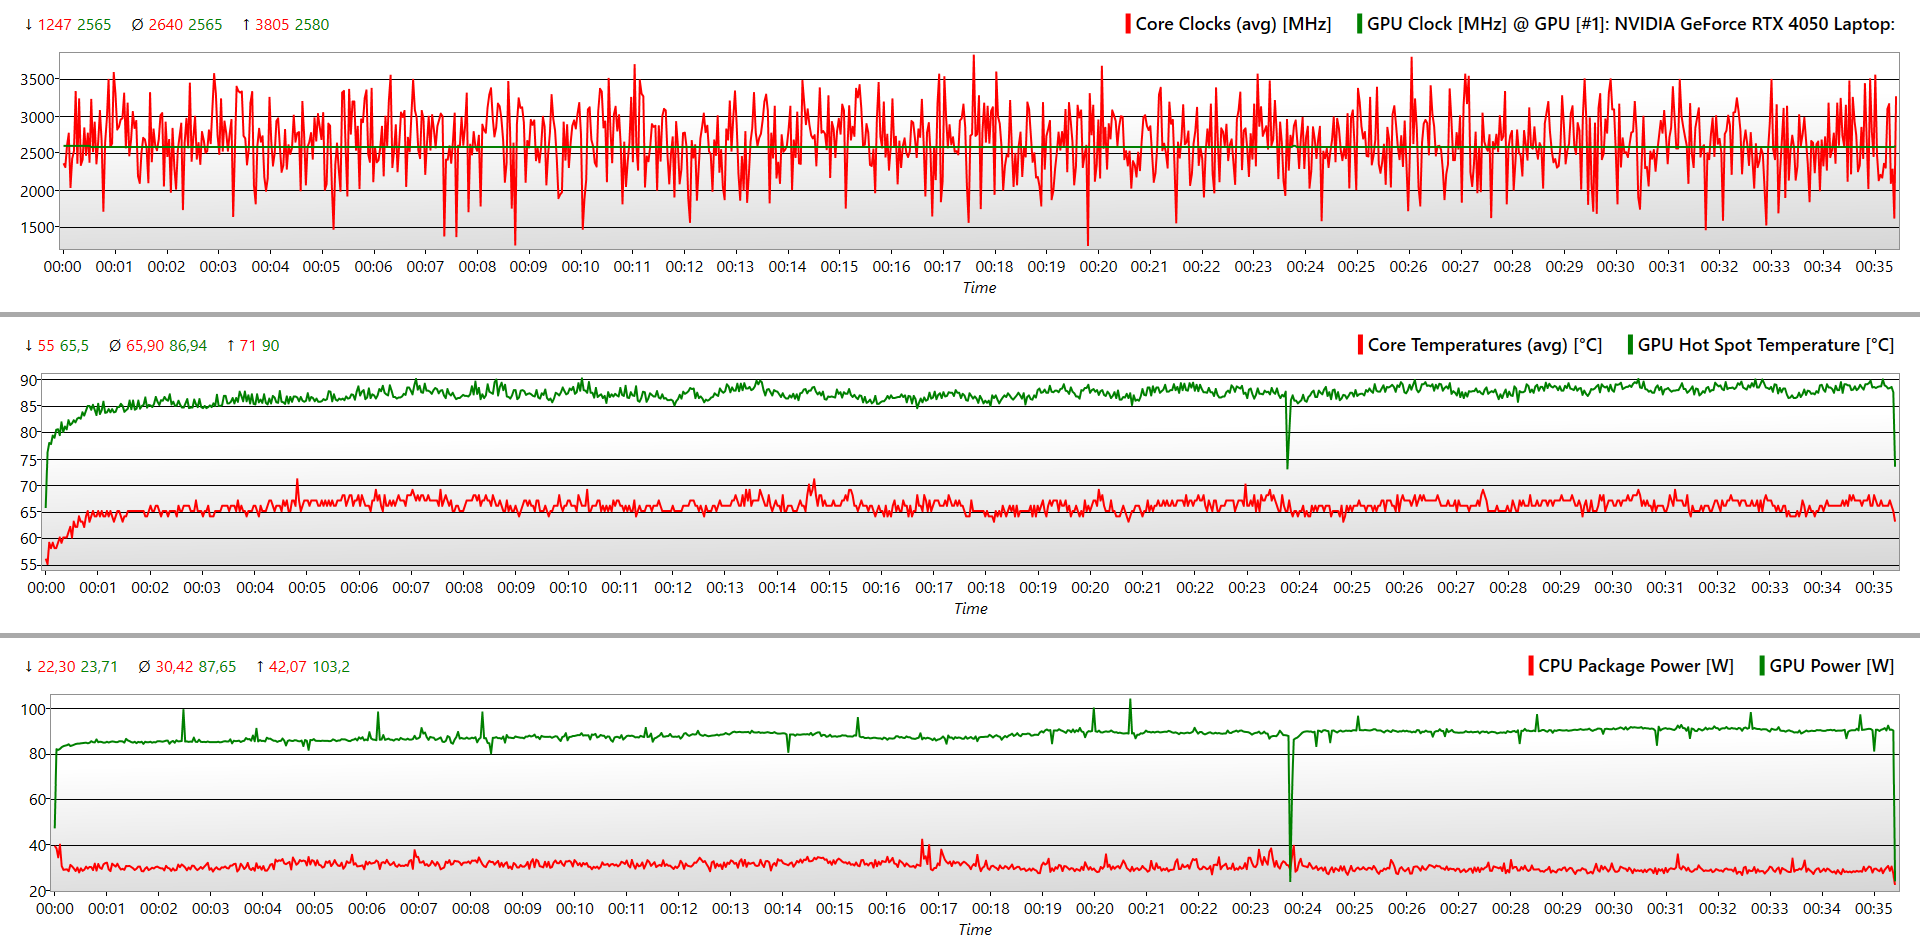
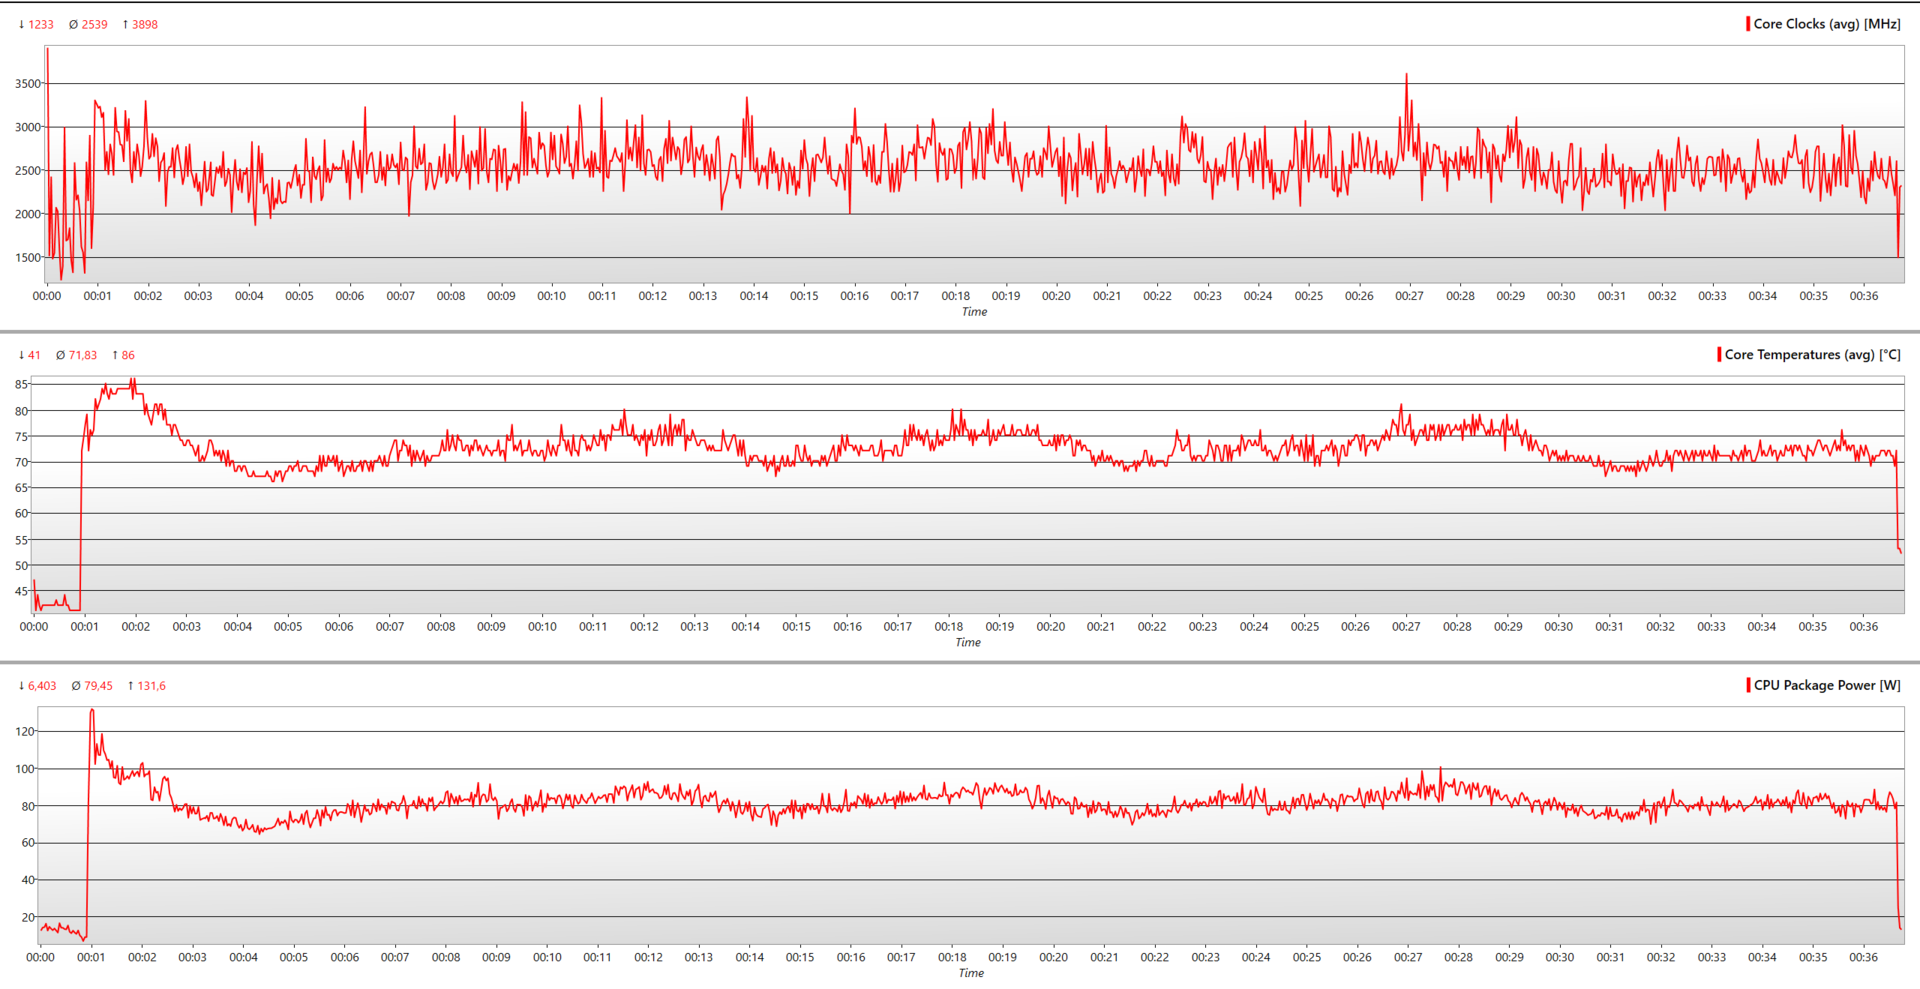
| 压力 | CPU 时钟 (GHz) | GPU 时钟 (MHz) | CPU 平均温度 (°C) | GPU 平均温度(°C) |
| 系统空闲 | 1.755 | 700 | 41 | 45 |
| Prime95 | 2.539 | 500 | 82.5 | 63.1 |
| Prime95 + FurMark | 1.696 | 2,420 | 77.2 | 82.5 |
| Witcher 3 1080p Ultra | 3.047 | 2,565 | 80 | 74 |
发言人
它们的最大音量为 70.7 dB(A),在压力条件下几乎不比风扇的声音大。实际驱动器本身微不足道,没什么可写的。
尽管如此,惠普还是付出了一些努力,加入了 B&O (Bang and Olufsen)调谐技术。这使得中音和高音效果可圈可点,但低音效果就不敢恭维了。这对于视频消费来说没有问题,但如果风扇决定加大功率,音频质量可能会受到影响。
另外,您还可以通过 3.5 毫米音频接口连接耳机/扬声器,或使用蓝牙 5.3 进行全无线连接。
HP Victus 16-r0076TX audio analysis
(-) | not very loud speakers (70.7 dB)
Bass 100 - 315 Hz
(±) | reduced bass - on average 9.7% lower than median
(±) | linearity of bass is average (7.6% delta to prev. frequency)
Mids 400 - 2000 Hz
(+) | balanced mids - only 3.2% away from median
(+) | mids are linear (2.5% delta to prev. frequency)
Highs 2 - 16 kHz
(+) | balanced highs - only 4% away from median
(+) | highs are linear (5.7% delta to prev. frequency)
Overall 100 - 16.000 Hz
(±) | linearity of overall sound is average (15.4% difference to median)
Compared to same class
» 34% of all tested devices in this class were better, 7% similar, 59% worse
» The best had a delta of 6%, average was 18%, worst was 132%
Compared to all devices tested
» 23% of all tested devices were better, 4% similar, 73% worse
» The best had a delta of 4%, average was 23%, worst was 134%
Apple MacBook Pro 16 2021 M1 Pro audio analysis
(+) | speakers can play relatively loud (84.7 dB)
Bass 100 - 315 Hz
(+) | good bass - only 3.8% away from median
(+) | bass is linear (5.2% delta to prev. frequency)
Mids 400 - 2000 Hz
(+) | balanced mids - only 1.3% away from median
(+) | mids are linear (2.1% delta to prev. frequency)
Highs 2 - 16 kHz
(+) | balanced highs - only 1.9% away from median
(+) | highs are linear (2.7% delta to prev. frequency)
Overall 100 - 16.000 Hz
(+) | overall sound is linear (4.6% difference to median)
Compared to same class
» 0% of all tested devices in this class were better, 0% similar, 100% worse
» The best had a delta of 5%, average was 17%, worst was 45%
Compared to all devices tested
» 0% of all tested devices were better, 0% similar, 100% worse
» The best had a delta of 4%, average was 23%, worst was 134%
能源管理:电池续航时间本应更长
耗电量
惠普 Victus 16 的 Raptor Lake-HX 处理器和 Ada Lovelace GPU 占用了 230 瓦的电源模块,耗电量高达 237 瓦。不过,空闲时的情况要好得多,最大功耗为 22.1 瓦。
在竞争对手的 AMD HX 处理器上,这一数值并没有太大变化。有趣的是 戴尔 G5 15's 酷睿 i7-13700HX空闲时的效率更高一些,平均功耗为 14.98 瓦。
| Off / Standby | |
| Idle | |
| Load |
|
Key:
min: | |
| HP Victus 16-r0076TX i5-13500HX, GeForce RTX 4050 Laptop GPU, SK hynix PC801 HFS512GEJ9X101N BF, IPS, 1920x1080, 16.1" | Acer Nitro 16 AN16-41-R7YE R5 7535HS, GeForce RTX 4050 Laptop GPU, SK hynix HFS512GEJ9X125N, IPS, 1920x1200, 16" | Acer Predator Helios 16 PH16-71-731Q i7-13700HX, GeForce RTX 4060 Laptop GPU, Micron 3400 1TB MTFDKBA1T0TFH, IPS-LED, 2560x1600, 16" | Dell G15 5530 i7-13650HX, GeForce RTX 4060 Laptop GPU, SSTC CL4-3D512-Q11, IPS, 1920x1080, 15.6" | Lenovo Legion Pro 5 16ARX8 (R5 7645HX, RTX 4050) R5 7645HX, GeForce RTX 4050 Laptop GPU, SK hynix PC801 HFS512GEJ9X115N, IPS, 2560x1600, 16" | Lenovo LOQ 15APH8 R7 7840HS, GeForce RTX 4050 Laptop GPU, Micron 2450 512GB MTFDKCD512TFK, IPS, 1920x1080, 15.6" | Average NVIDIA GeForce RTX 4050 Laptop GPU | Average of class Gaming | |
|---|---|---|---|---|---|---|---|---|
| Power Consumption | 7% | -5% | 13% | 12% | 15% | 21% | -2% | |
| Idle Minimum * (Watt) | 16.12 | 19 -18% | 15.9 1% | 8.4 48% | 13 19% | 15 7% | 9.95 ? 38% | 13.1 ? 19% |
| Idle Average * (Watt) | 20.47 | 20 2% | 20.5 -0% | 14.98 27% | 17.4 15% | 17.7 14% | 15.8 ? 23% | 19 ? 7% |
| Idle Maximum * (Watt) | 22.11 | 23 -4% | 20.9 5% | 15.56 30% | 21.8 1% | 21.5 3% | 20.1 ? 9% | 24.6 ? -11% |
| Load Average * (Watt) | 94.8 | 80 16% | 106 -12% | 96.8 -2% | 96.4 -2% | 73.5 22% | 88 ? 7% | 111.3 ? -17% |
| Witcher 3 ultra * (Watt) | 166.9 | 125.8 25% | 175 -5% | 186 -11% | 125 25% | 138.6 17% | ||
| Load Maximum * (Watt) | 237 | 184 22% | 276 -16% | 271.42 -15% | 204 14% | 176.5 26% | 176.3 ? 26% | 260 ? -10% |
* ... smaller is better
Power Consumption: The Witcher 3 / Stress test
Power Consumption: External monitor
电池寿命
惠普 Victus 16 配备了 83 Wh 的电池。如果有 99 Wh 的电池就更理想了,但这种电池只有顶级产品才配备。
在亮度设置为 150 尼特的 Wi-Fi 网上冲浪测试中,我们的电池使用时间约为 8 小时 51 分钟。将亮度调到最大后,这个数字减少到了 8 小时 10 分钟。
有趣的是,在亮度设置为 150 尼特、关闭所有无线电(Wi-Fi、蓝牙)的 Big Buck Bunny FHD H.264 测试中,笔记本电脑的表现更糟。它只坚持了 7 小时 39 分钟。在理想情况下,这个数字应该更高。
最后,在 Witcher 3 测试中,亮度为 150 尼特,游戏运行在 "Ultra "设置下,仅用了 1 小时 31 分钟,它就 "翘辫子 "了。在 Prime95 和 FurMark 的综合负载下,这个数字下降到了 1 小时 11 分钟。
| HP Victus 16-r0076TX i5-13500HX, GeForce RTX 4050 Laptop GPU, 83 Wh | Alienware m16 R1 Intel i7-13700HX, GeForce RTX 4060 Laptop GPU, 86 Wh | Acer Predator Helios 16 PH16-71-731Q i7-13700HX, GeForce RTX 4060 Laptop GPU, 90 Wh | Dell G15 5530 i7-13650HX, GeForce RTX 4060 Laptop GPU, 86 Wh | Lenovo Legion Pro 5 16ARX8 (R5 7645HX, RTX 4050) R5 7645HX, GeForce RTX 4050 Laptop GPU, 80 Wh | Lenovo LOQ 15APH8 R7 7840HS, GeForce RTX 4050 Laptop GPU, 60 Wh | Average of class Gaming | |
|---|---|---|---|---|---|---|---|
| Battery runtime | -30% | -13% | -30% | -38% | -13% | 4% | |
| H.264 (h) | 7.7 | 5.6 -27% | 4.8 -38% | 6.8 -12% | 5.4 -30% | 8.27 ? 7% | |
| WiFi v1.3 (h) | 8.9 | 4.8 -46% | 5.6 -37% | 6.5 -27% | 5.6 -37% | 7.4 -17% | 7.08 ? -20% |
| Witcher 3 ultra (h) | 1.5 | 1.5 0% | 0.8 -47% | 0.8 -47% | |||
| Load (h) | 1.2 | 1 -17% | 1.5 25% | 0.8 -33% | 1.1 -8% | 1.496 ? 25% | |
| Reader / Idle (h) | 6.4 | 9.8 | 7.84 ? |
Pros
Cons
结论适合预算有限的用户使用的 1080p 游戏笔记本电脑
惠普 Victus 16 是一款不错的游戏笔记本电脑,但也并非没有缺点。尽管惠普尽最大努力通过两个风扇和迷宫般的散热片来控制热量,但我们仍然发现热辐射很高。
一开始,Raptor Lake-HX 处理器就发挥了它的威力,使这款笔记本电脑的性能超过了配置更高的竞争对手,如 L.E. Pro 5 16ARX。联想Legion Pro 5 16ARX8处理器 Ryzen 5 7645HX和相同 GPU 的竞争对手。
然后是臃肿软件的问题。我们都喜欢好的 VPN 服务,但每隔几分钟就会出现 ExpressVPN 弹出窗口,这让人很不爽。而且,这款笔记本电脑并没有捆绑 ExpressVPN 计划。
对于预算有限的电子竞技爱好者来说,惠普 Victus 16 是一款理想的 1080p 游戏机,这要归功于它强大的处理器和 165 Hz 的屏幕,如果你能忍受它的噪音和热量的话。
目前,市场上搭载入门级 Raptor Lake-HX 处理器的笔记本电脑寥寥无几。仅凭这一点,惠普 Victus 16 就比 宏碁 Nitro 16 AN16-41和 联想 LOQ 15.
价格和供应情况
惠普 Victus 16 可以在 惠普印度公司网站上购买售价为 12990 ₹。更便宜的型号具有相同的规格(酷睿 i5-13500HX、GeForce RTX 4050、16 GB 内存)和更低端的 144 Hz 屏幕,售价为 124,990 英镑。.另外,在印度亚马逊上也能以 6.84 万英镑的价格买到其上一代版本。在美国亚马逊上,配置更高的版本配备了 QHD(2560 x 1440)屏幕和 AMD Ryzen 7 7840HS和GeForce RTX 4060,售价 为 1,279 美元。
HP Victus 16-r0076TX
- 09/25/2023 v7 (old)
Anil Ganti
Transparency
The selection of devices to be reviewed is made by our editorial team. The test sample was provided to the author as a loan by the manufacturer or retailer for the purpose of this review. The lender had no influence on this review, nor did the manufacturer receive a copy of this review before publication. There was no obligation to publish this review. As an independent media company, Notebookcheck is not subjected to the authority of manufacturers, retailers or publishers.
This is how Notebookcheck is testing
Every year, Notebookcheck independently reviews hundreds of laptops and smartphones using standardized procedures to ensure that all results are comparable. We have continuously developed our test methods for around 20 years and set industry standards in the process. In our test labs, high-quality measuring equipment is utilized by experienced technicians and editors. These tests involve a multi-stage validation process. Our complex rating system is based on hundreds of well-founded measurements and benchmarks, which maintains objectivity. Further information on our test methods can be found here.
Price comparison

