Acer Nitro 5 AN517回顾:一个拥有安静的RTX4050的游戏笔记本
相对较大的宏碁Nitro 5 AN517采用了Alder Lake处理器--它不再是街区上最新的孩子--并与NvidiaGeForce RTX 4000系列显卡相结合。其结果是一个坚实的入门级游戏笔记本电脑,配备了RGB照明、144赫兹面板和雷电4端口,规格适中。
去年,我们审查了非常类似的前身,即Acer Nitro 5 AN517-55-738R有一个RTX 3060除其他事项外,它因噪音水平过高而引起了人们的注意。正是在这一领域,宏碁进行了改进,并同时设法受益于 RTX 4050的效率,正如在我们的审查模型中发现的那样。我们的审查揭示了你可以期待哪种水平的安静游戏。
具有可比技术的竞争者是 Medion Erazer Scout E20它配备了一个更新、更大的处理器或 华硕TUF Gaming A16它采用了AMD组件。
潜在的竞争对手比较
Rating | Date | Model | Weight | Height | Size | Resolution | Price |
|---|---|---|---|---|---|---|---|
| 85.5 % v7 (old) | 06 / 2023 | Acer Nitro 5 AN517-55-5552 i5-12500H, GeForce RTX 4050 Laptop GPU | 3 kg | 28.9 mm | 17.30" | 1920x1080 | |
| 86.9 % v7 (old) | 06 / 2023 | Asus TUF Gaming A16 FA617XS R9 7940HS, Radeon RX 7600S | 2.2 kg | 22.1 mm | 16.00" | 1920x1200 | |
| 83.9 % v7 (old) | 08 / 2022 | Acer Nitro 5 AN517-55-738R i7-12700H, GeForce RTX 3060 Laptop GPU | 3.1 kg | 28.6 mm | 17.30" | 1920x1080 | |
| 83 % v7 (old) | 05 / 2023 | Medion Erazer Scout E20 i7-13700H, GeForce RTX 4050 Laptop GPU | 2.8 kg | 29 mm | 17.30" | 1920x1080 | |
| 82.9 % v7 (old) | 03 / 2023 | MSI Katana 15 B12VEK i7-12650H, GeForce RTX 4050 Laptop GPU | 2.3 kg | 24.9 mm | 15.60" | 1920x1080 | |
| 82.4 % v7 (old) | 04 / 2023 | MSI Cyborg 15 A12VF i7-12650H, GeForce RTX 4060 Laptop GPU | 2 kg | 22.9 mm | 15.60" | 1920x1080 |
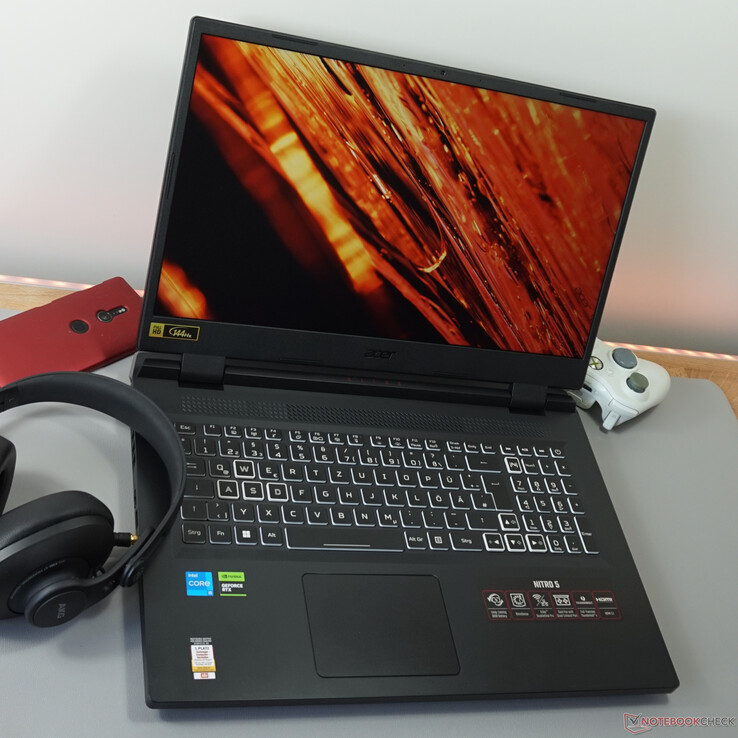
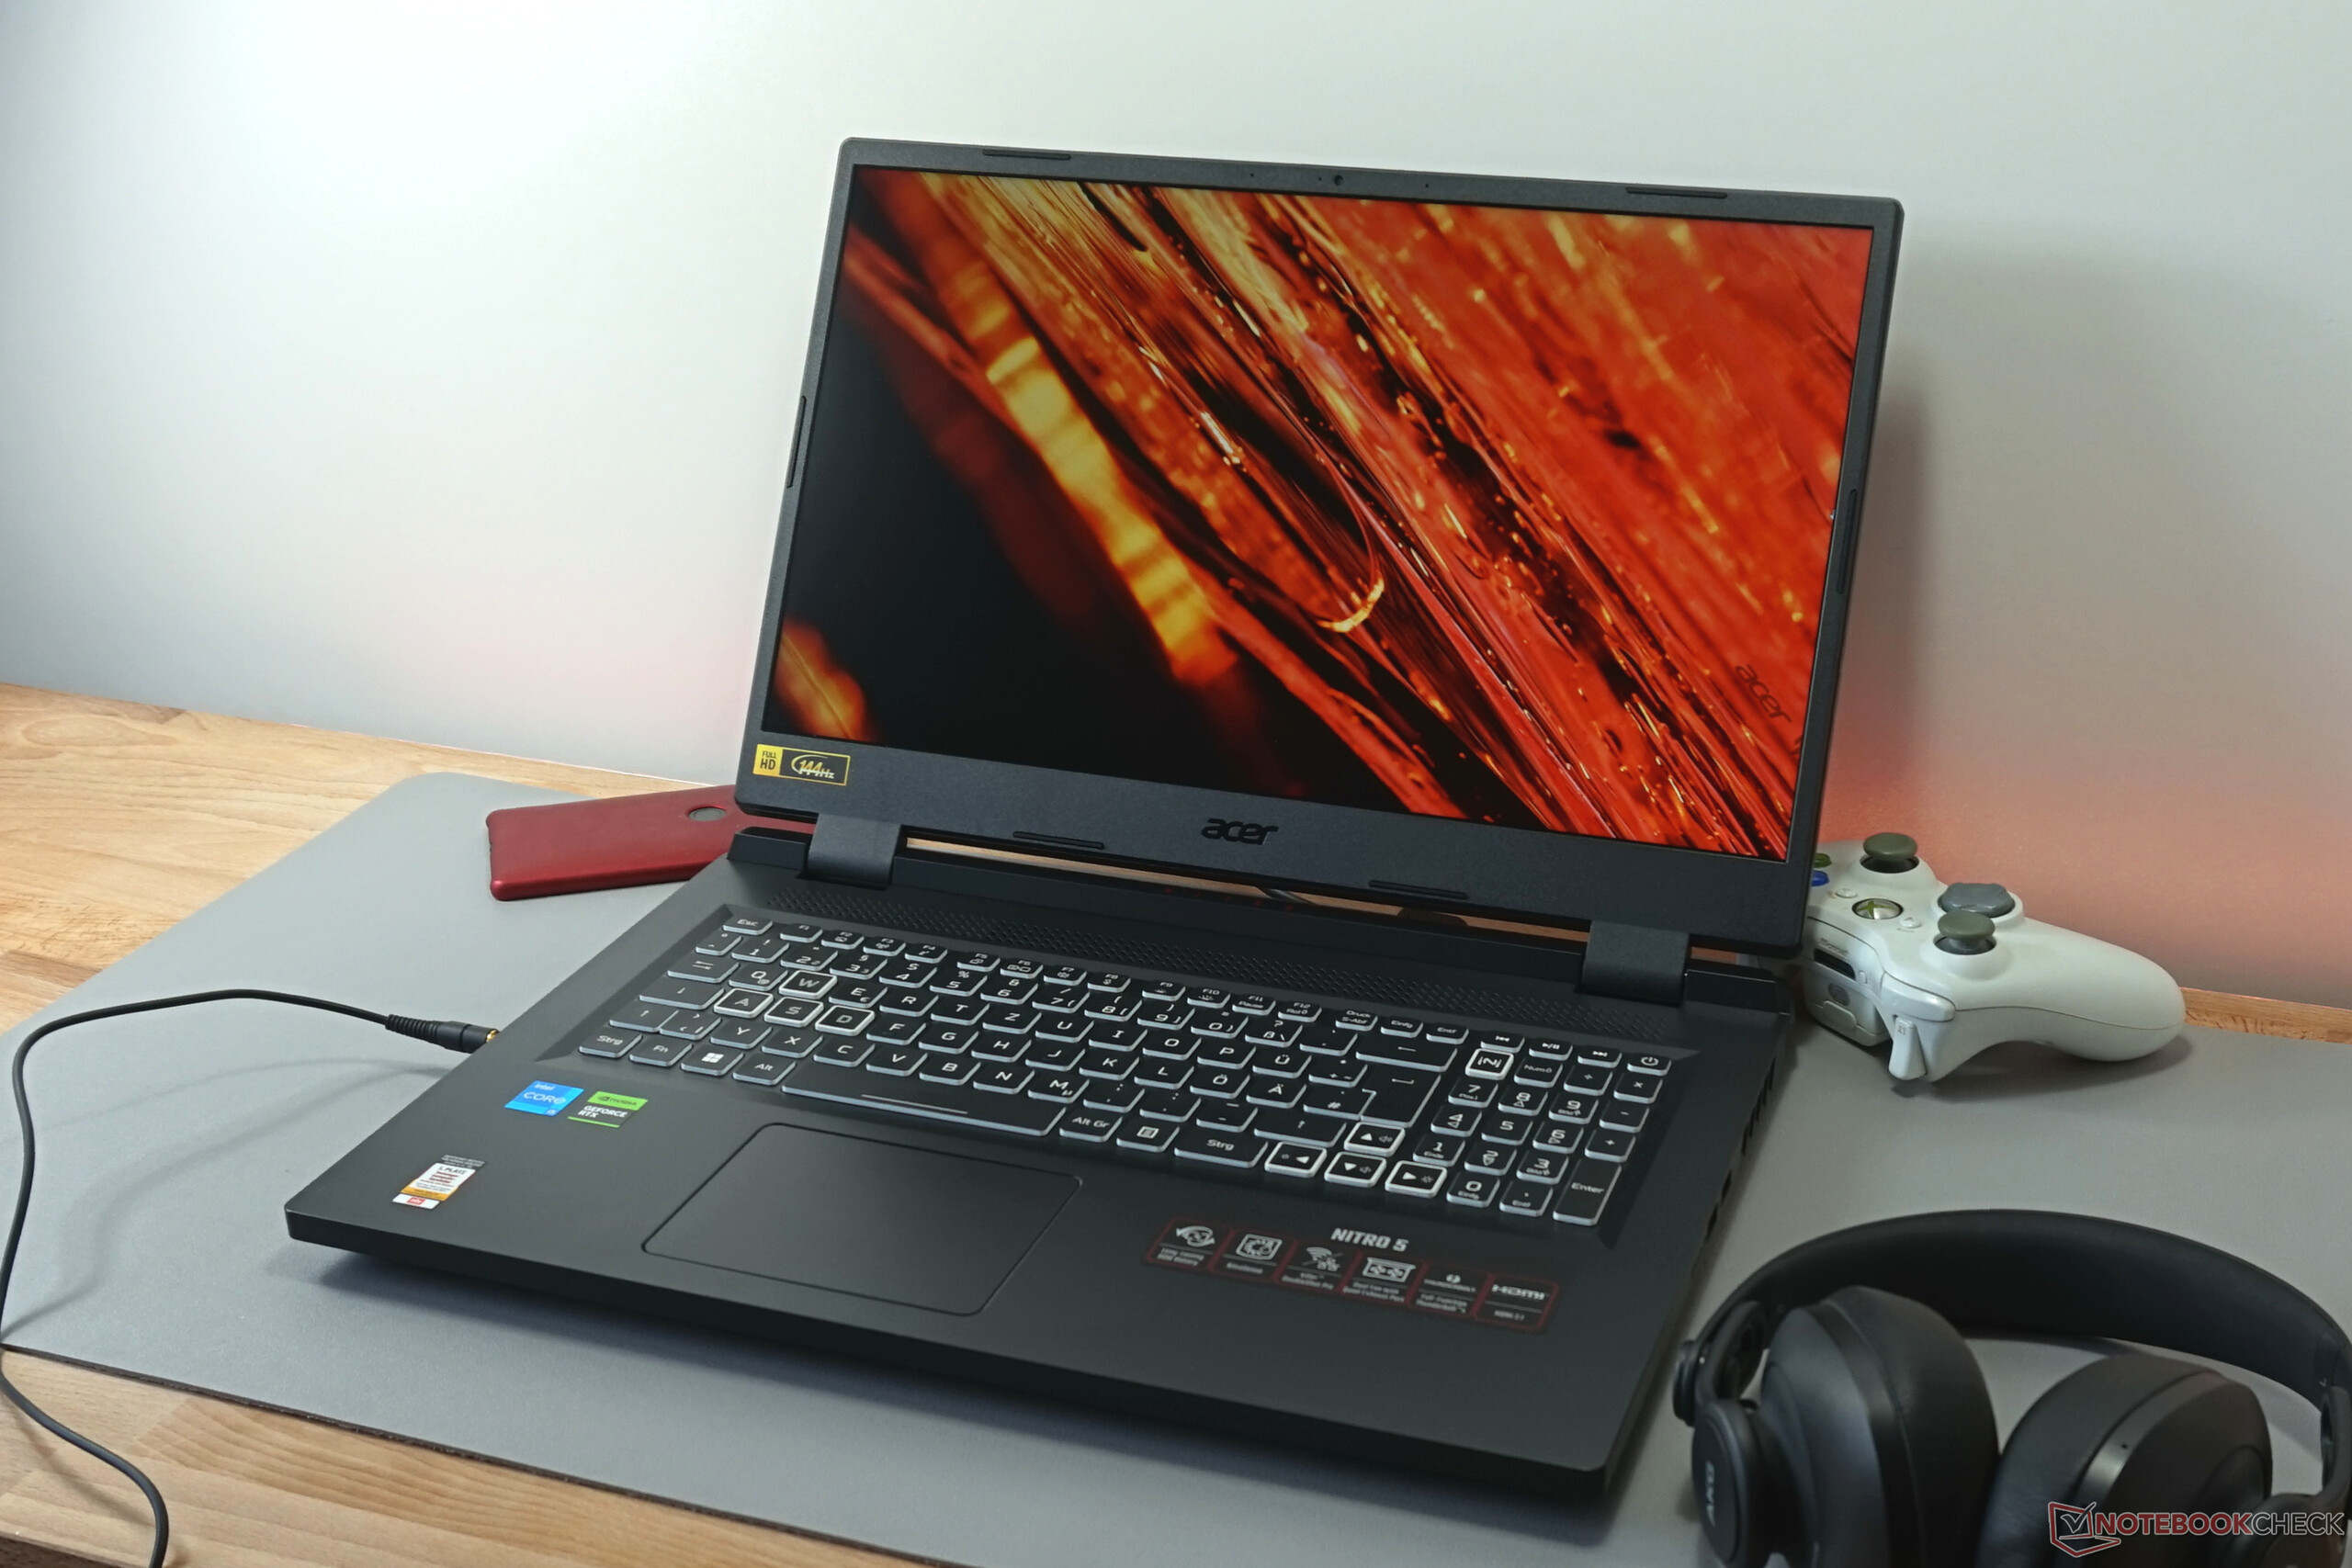
箱子 - 大型的Nitro 5需要空间
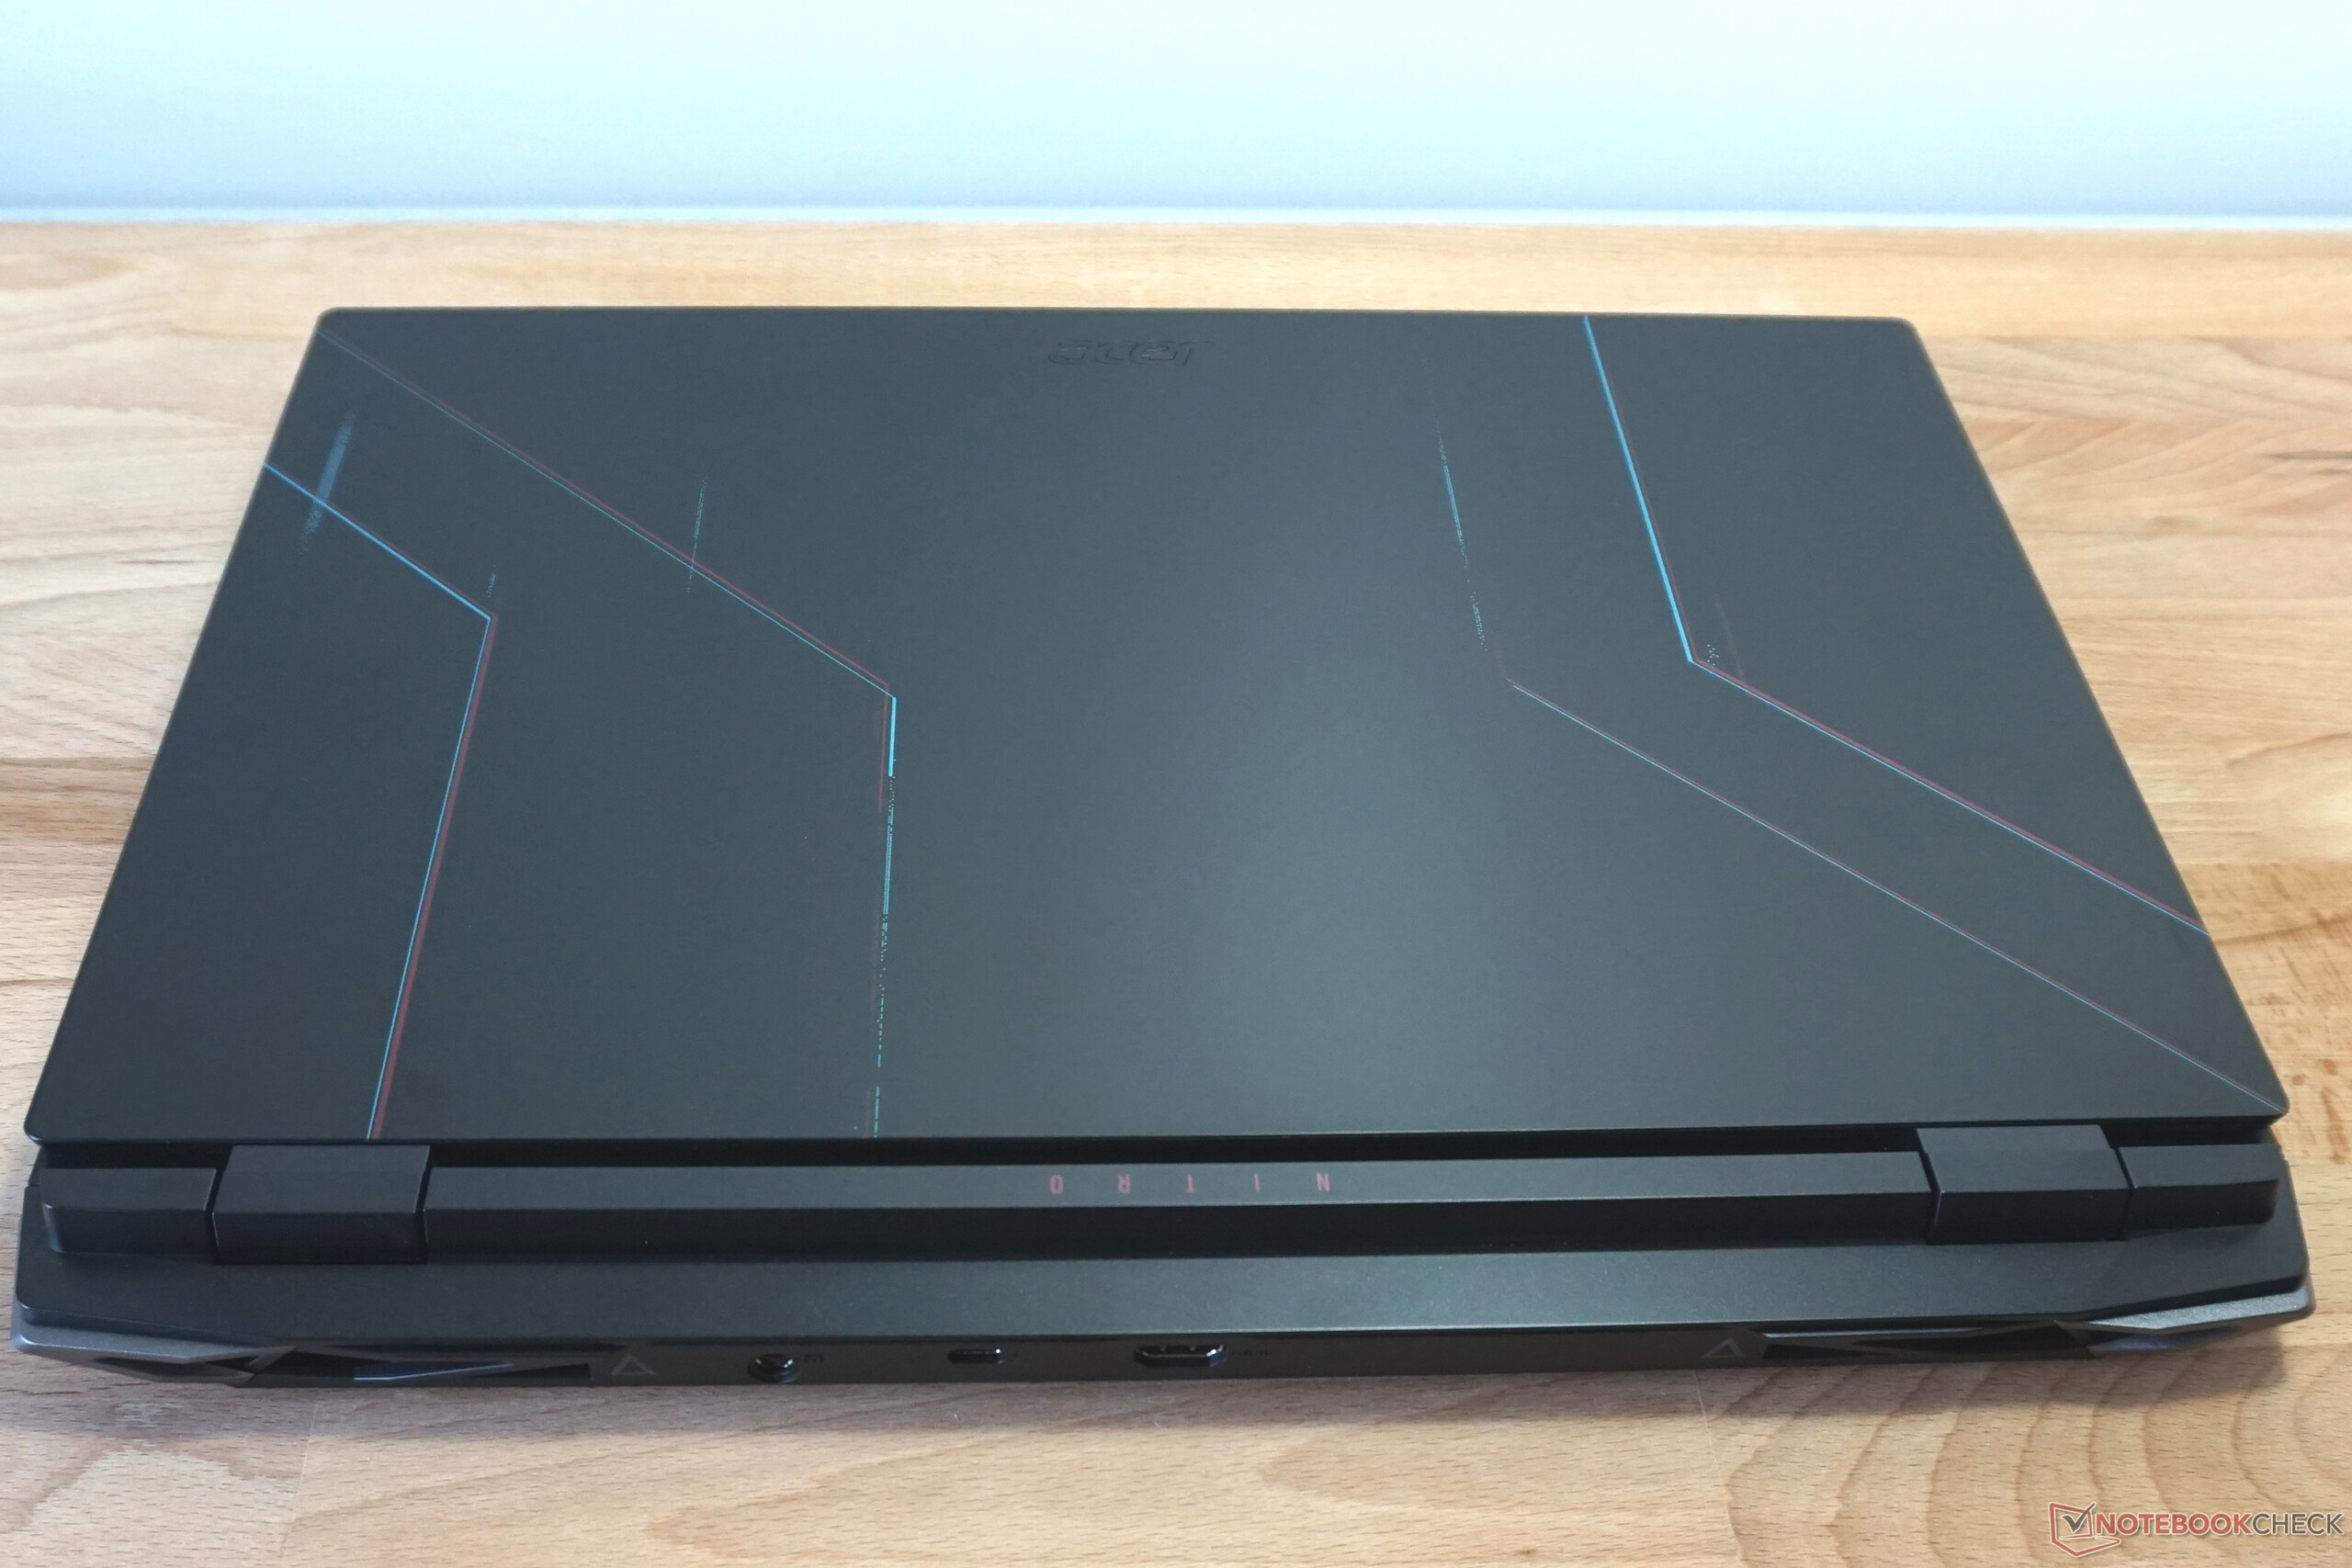
Acer Nitro 5的深度远远超过平均水平,即使是对于17.3英寸的设备来说也是相当大的。因此,该设备比类似配置的竞争对手要重一些也就不奇怪了。作为回报,这款笔记本电脑的结构非常坚固。
铰链是牢固的,它们可以打开到145°的角度,并防止大型显示器晃动。整个外壳由塑料组成,不会对设备的抗扭刚度产生负面影响。屏幕的框架可以轻微扭曲。相比之下,底座在任何时候都保持绝对稳固--而且安静。
当然,关于设计的意见可能会有分歧。然而,略微偏移的银色边角和薄薄的彩色条纹显得有些不那么冒险。与一个完全黑色的箱子相比,其差异是否会被注意到,这一点是值得怀疑的。
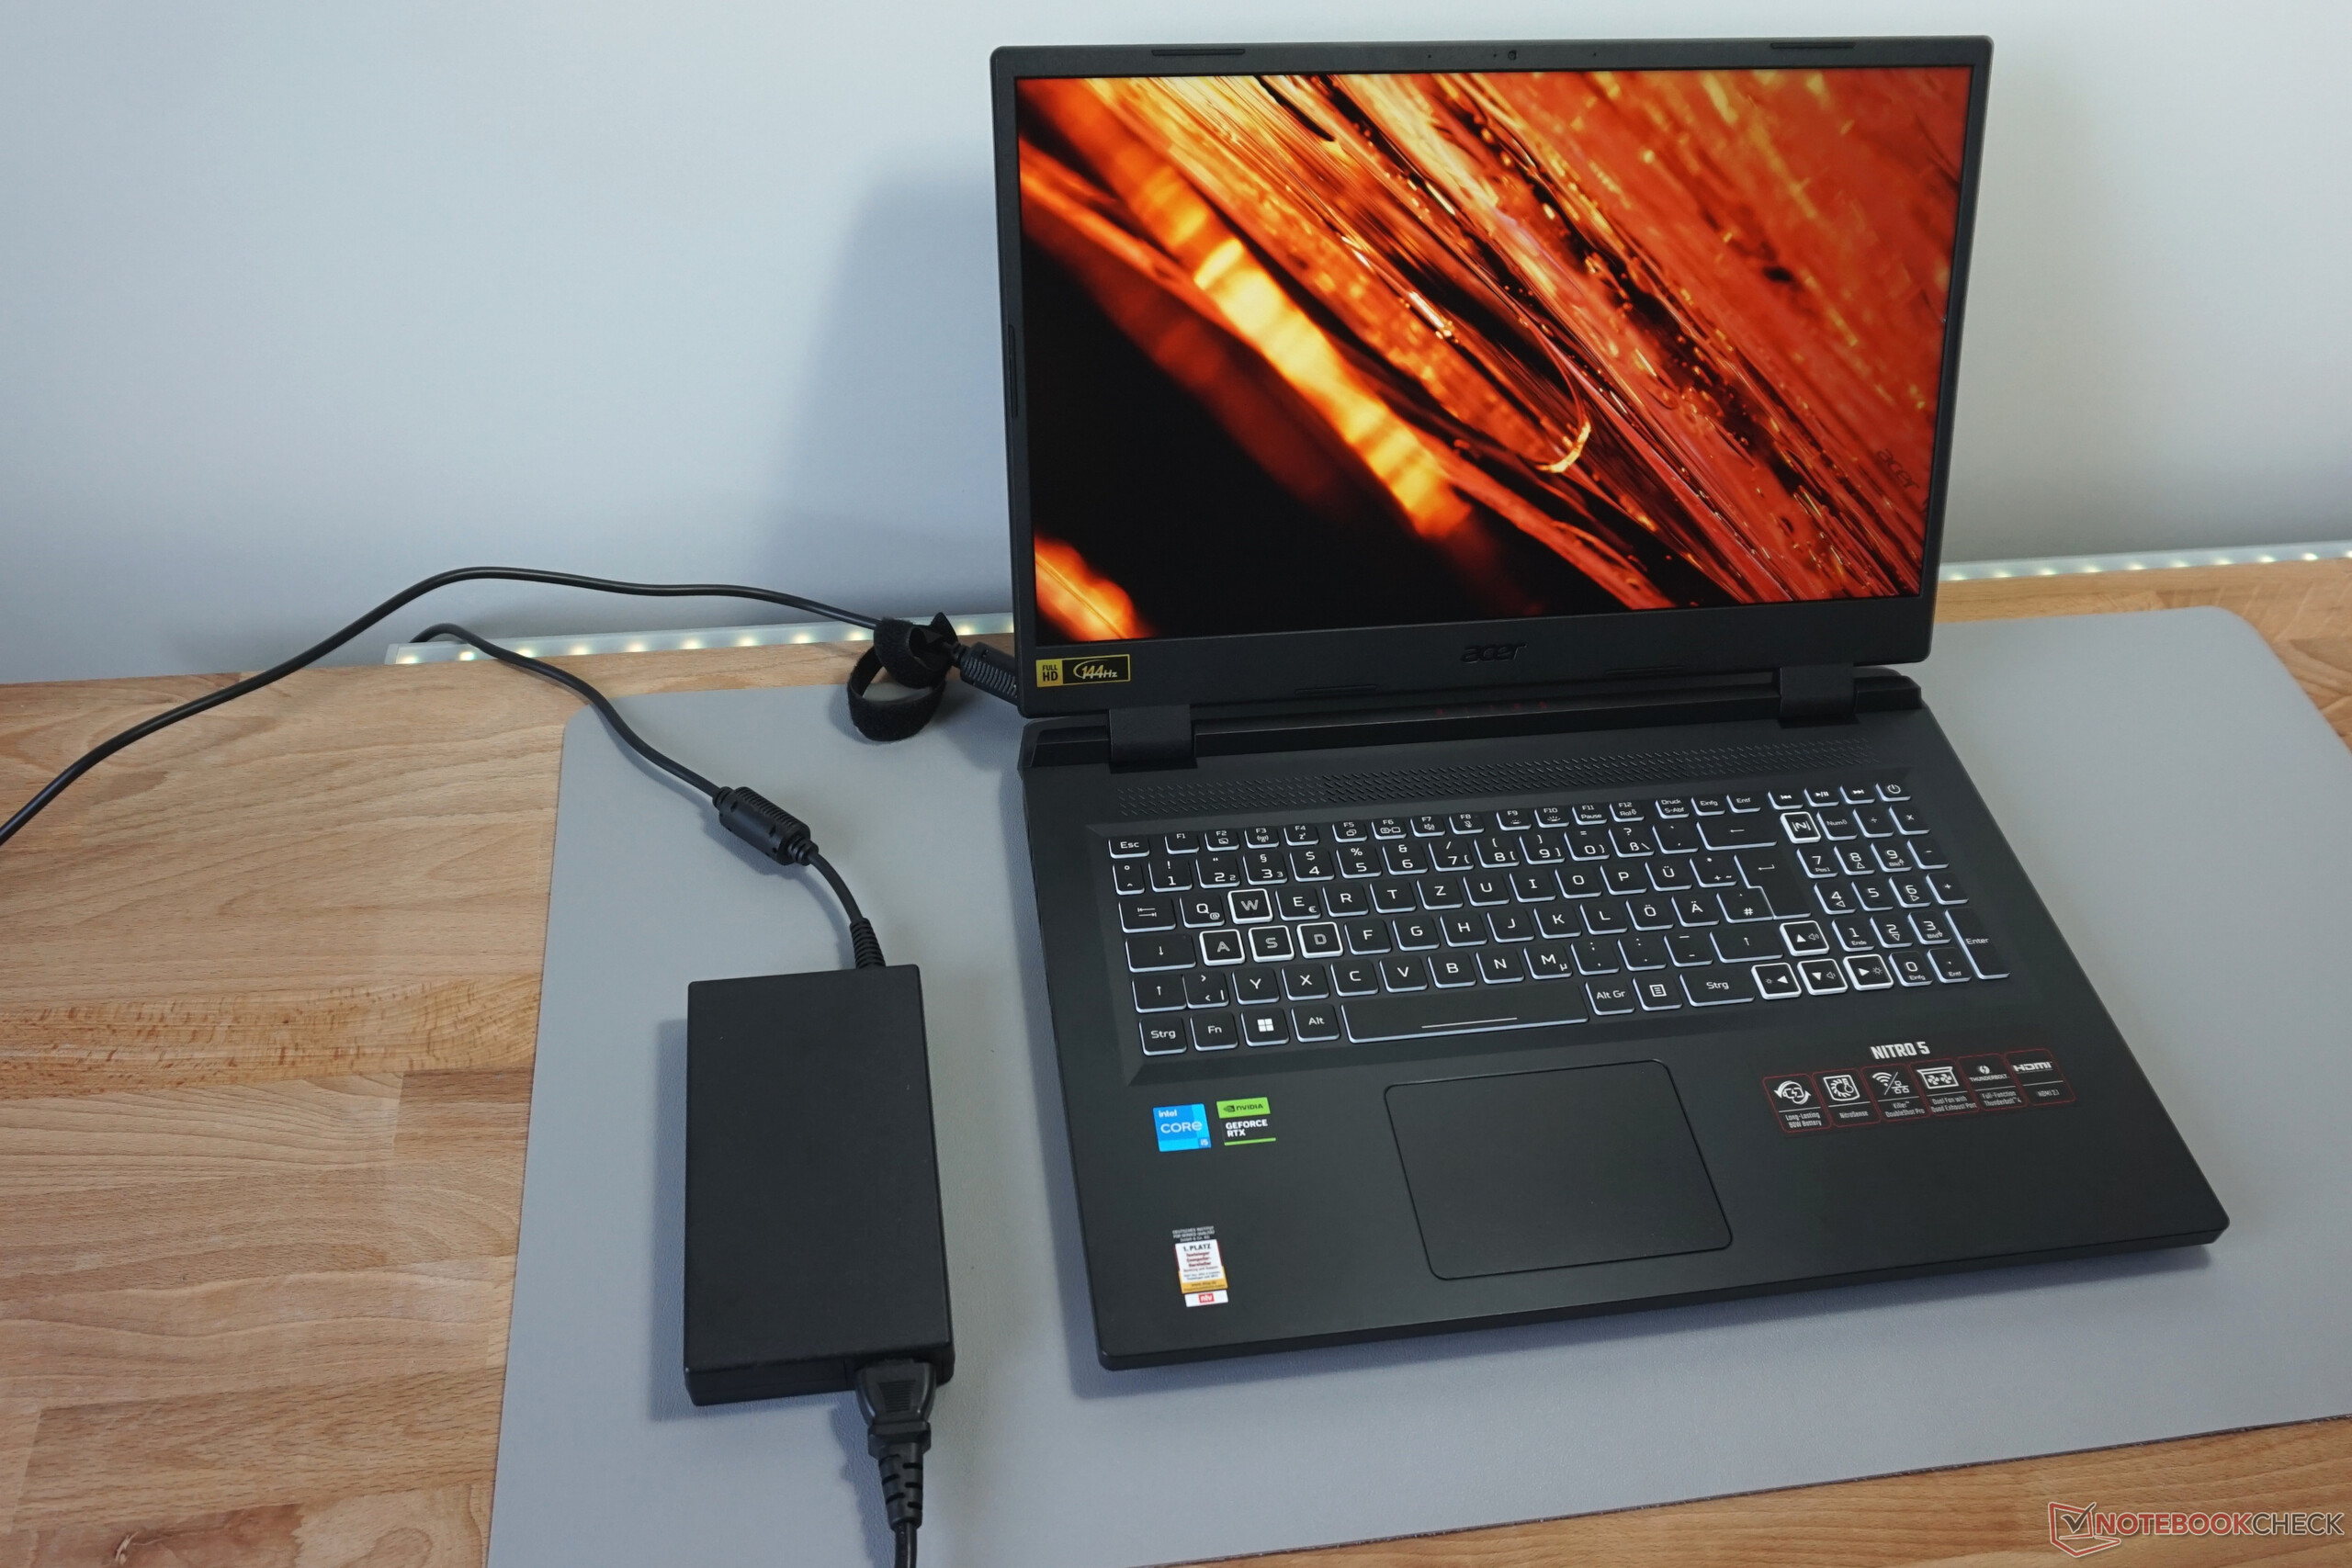
特点 - 一台具有必要附加功能的游戏笔记本电脑
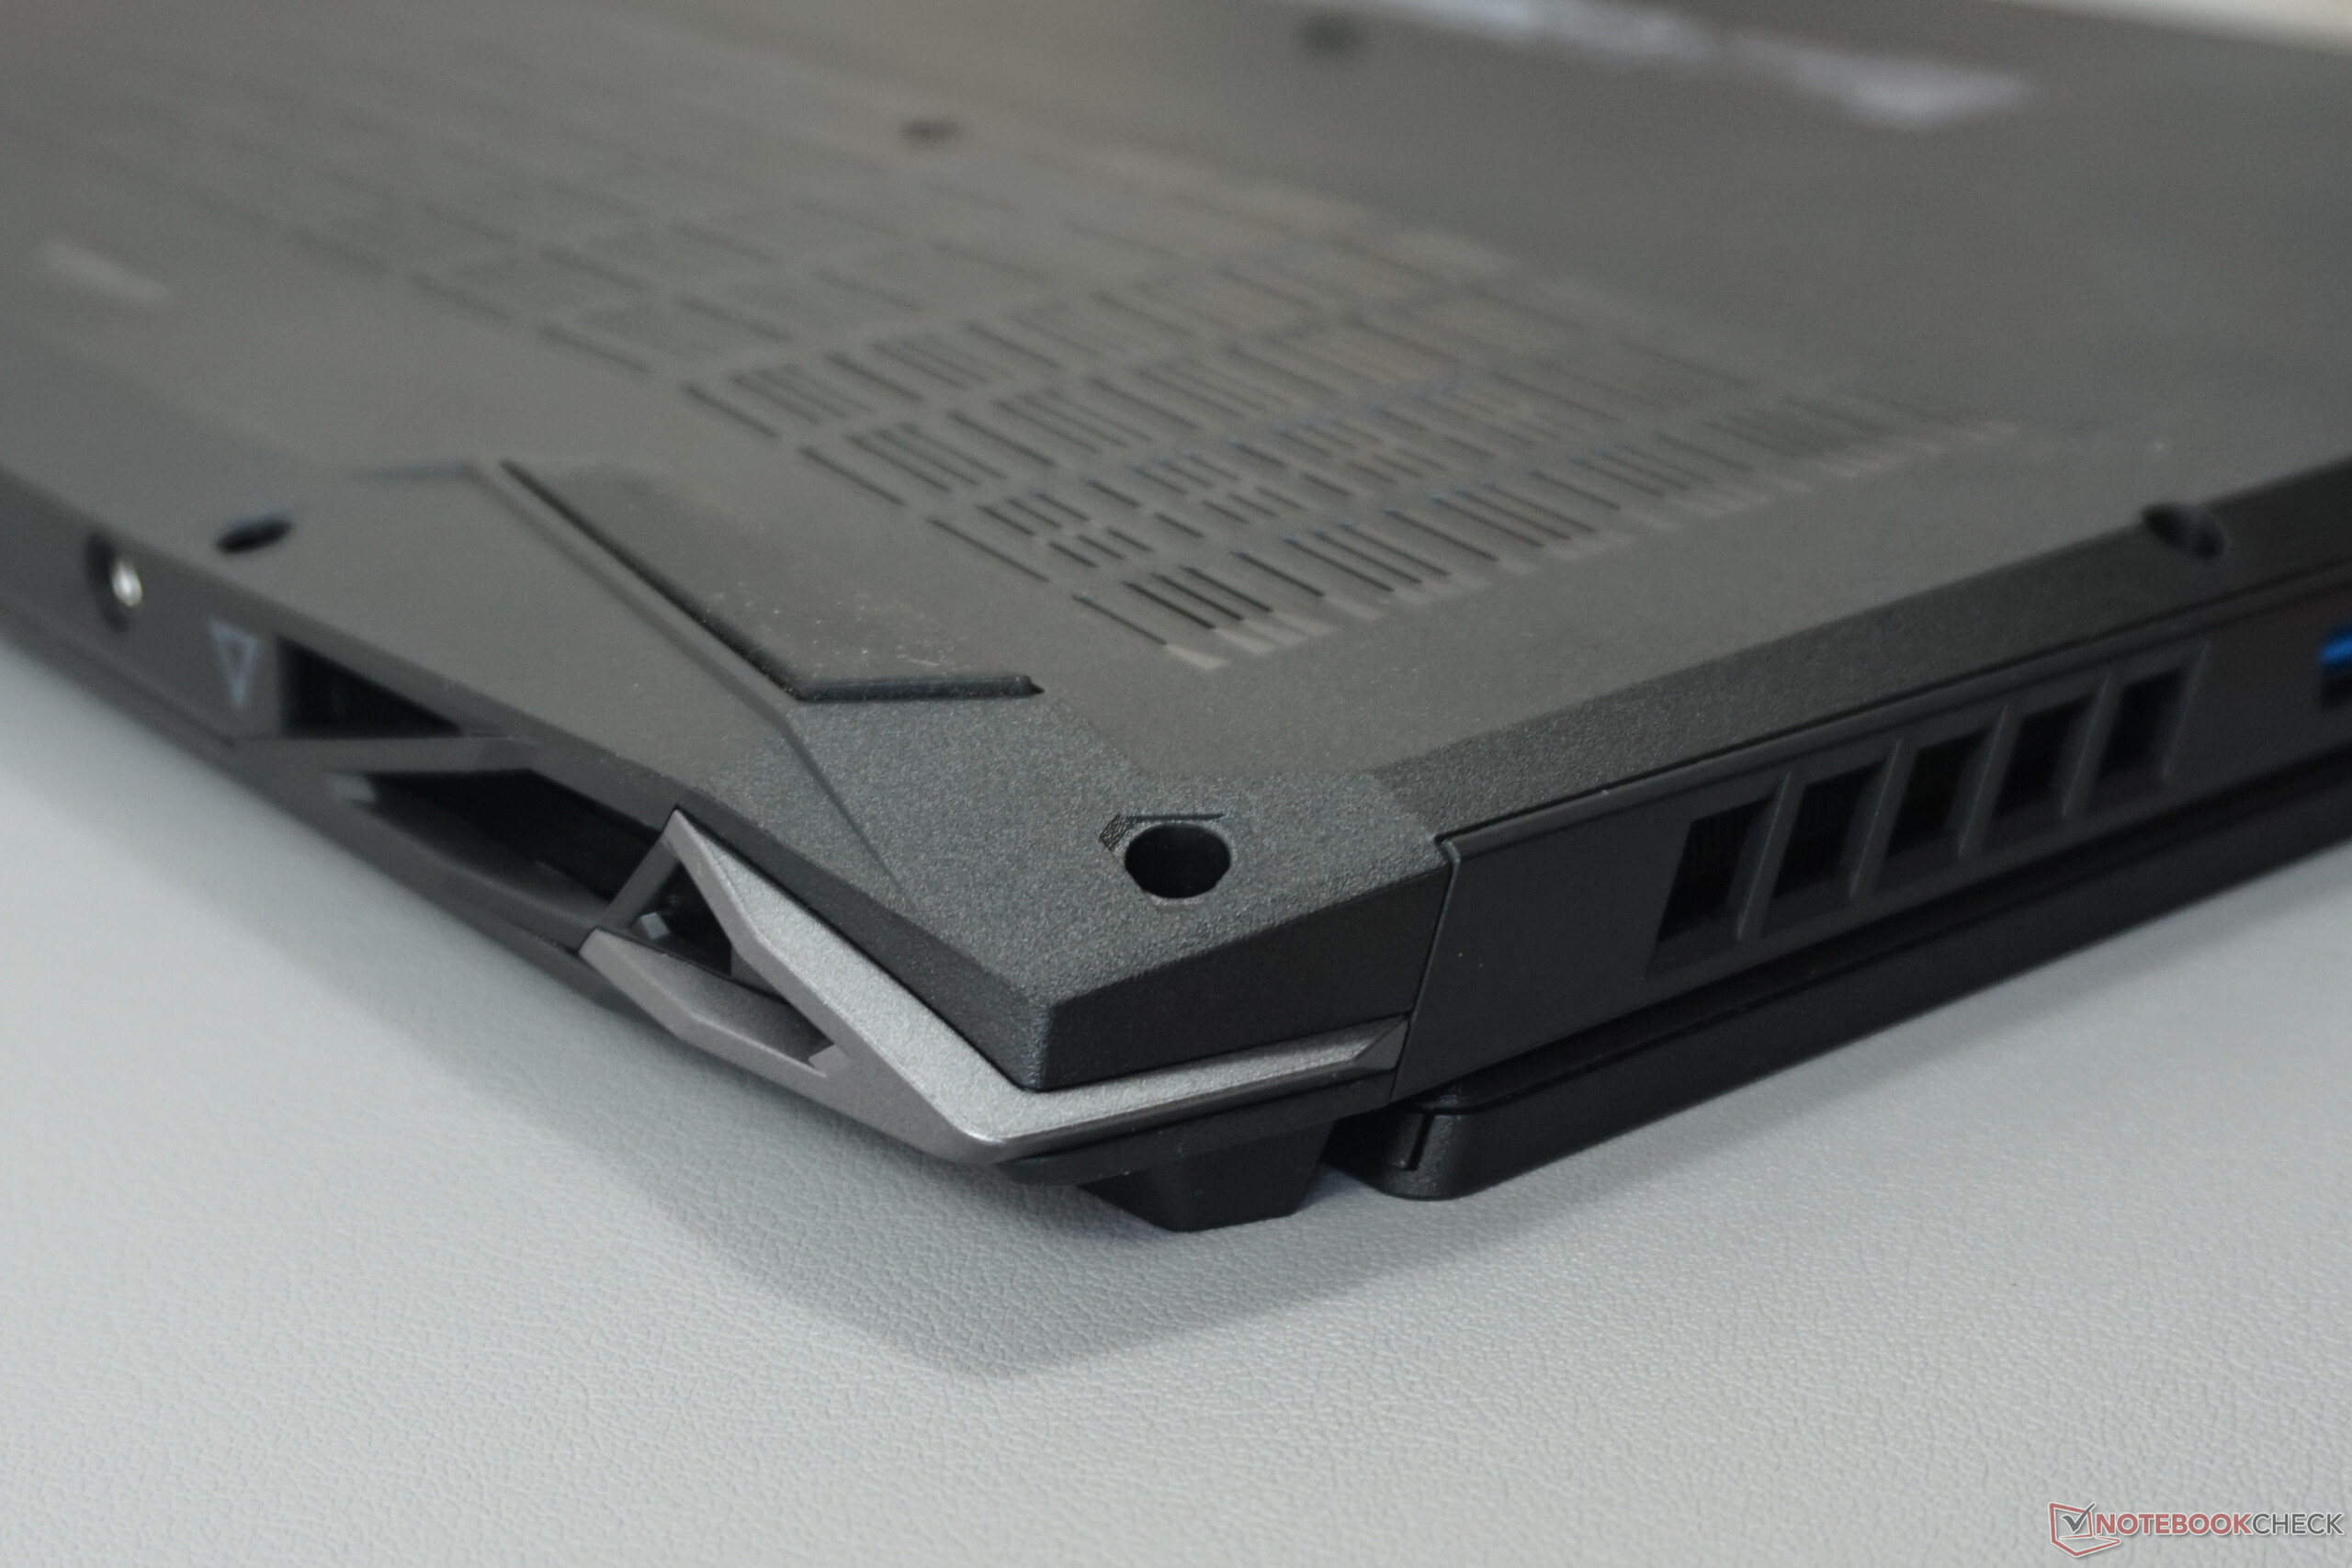
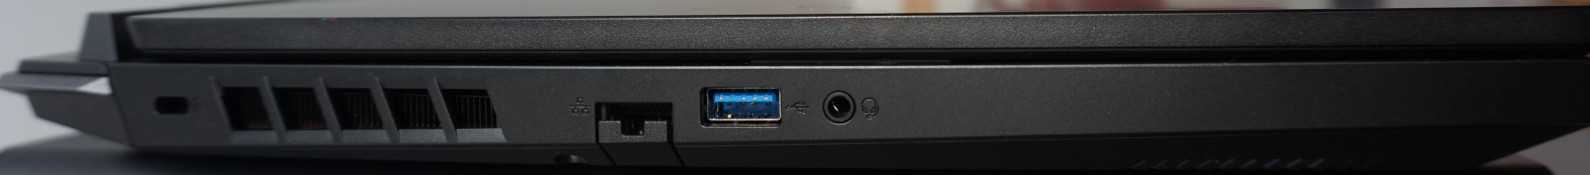
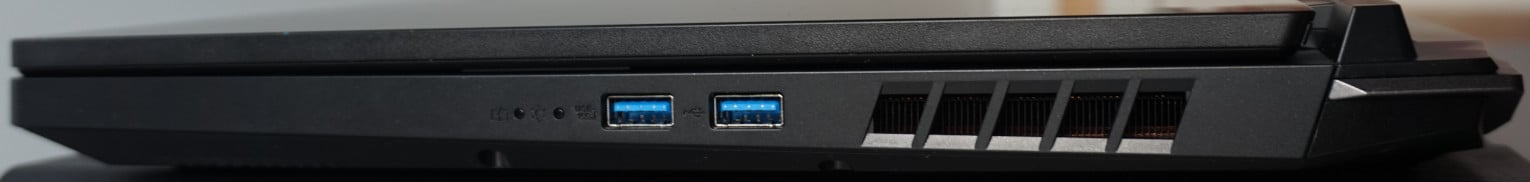
端口的选择是有限的,但令人高兴的是,最重要的端口都在手边。左边和右边是USB-A端口,右边有两个。它们的最大传输速率为10 Gbit/s(USB 3.2 Gen2)。在笔记本电脑的后面,你可以找到一个HDMI和Thunderbolt 4端口,以及两个视频输出。此外,TB4有一个合适的接口,以便能够以最大速度使用外部SSD。
缺少一个卡槽,第三个视频输出--有时作为Mini DP使用,但通常作为支持DP的额外USB-C端口--没有。此外,LAN端口的数据传输率只有1 Gbit/s。

沟通
杀手Wi-Fi 6 AX1650i Wi-Fi模块按预期工作。如果与路由器的距离很短,有可能达到1.5Gbit/s以上的速度。
不支持Wi-Fi 6E,这意味着理论上可能的数据传输速度应明显降低,特别是在有多个无线网络的地区。
网络摄像头
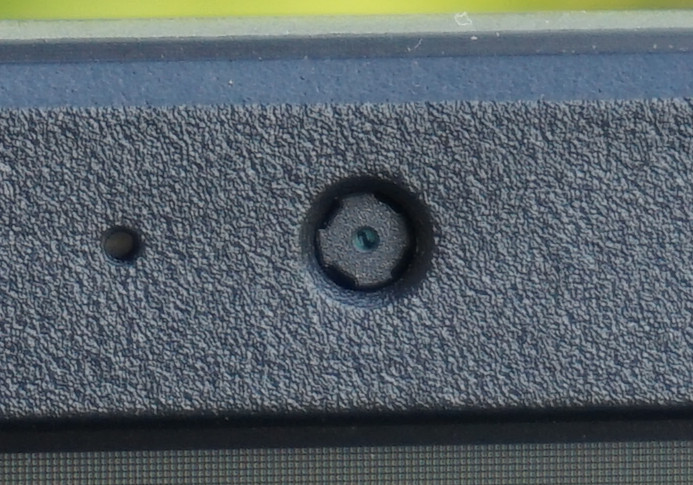
网络摄像头的表现很差,高清分辨率,最大30fps,图像质量勉强可以接受。但是,至少在低光照条件下有体面的亮度,不会产生太多的图像噪音。
在仔细检查下,双阵列麦克风的表现要好得多。它能很好地记录用户从多个方向和距离发出的声音,音量相对稳定,而且没有失真、噪音或金属音。这使得这款笔记本电脑具备了处理视频通话或游戏聊天的能力。


服务
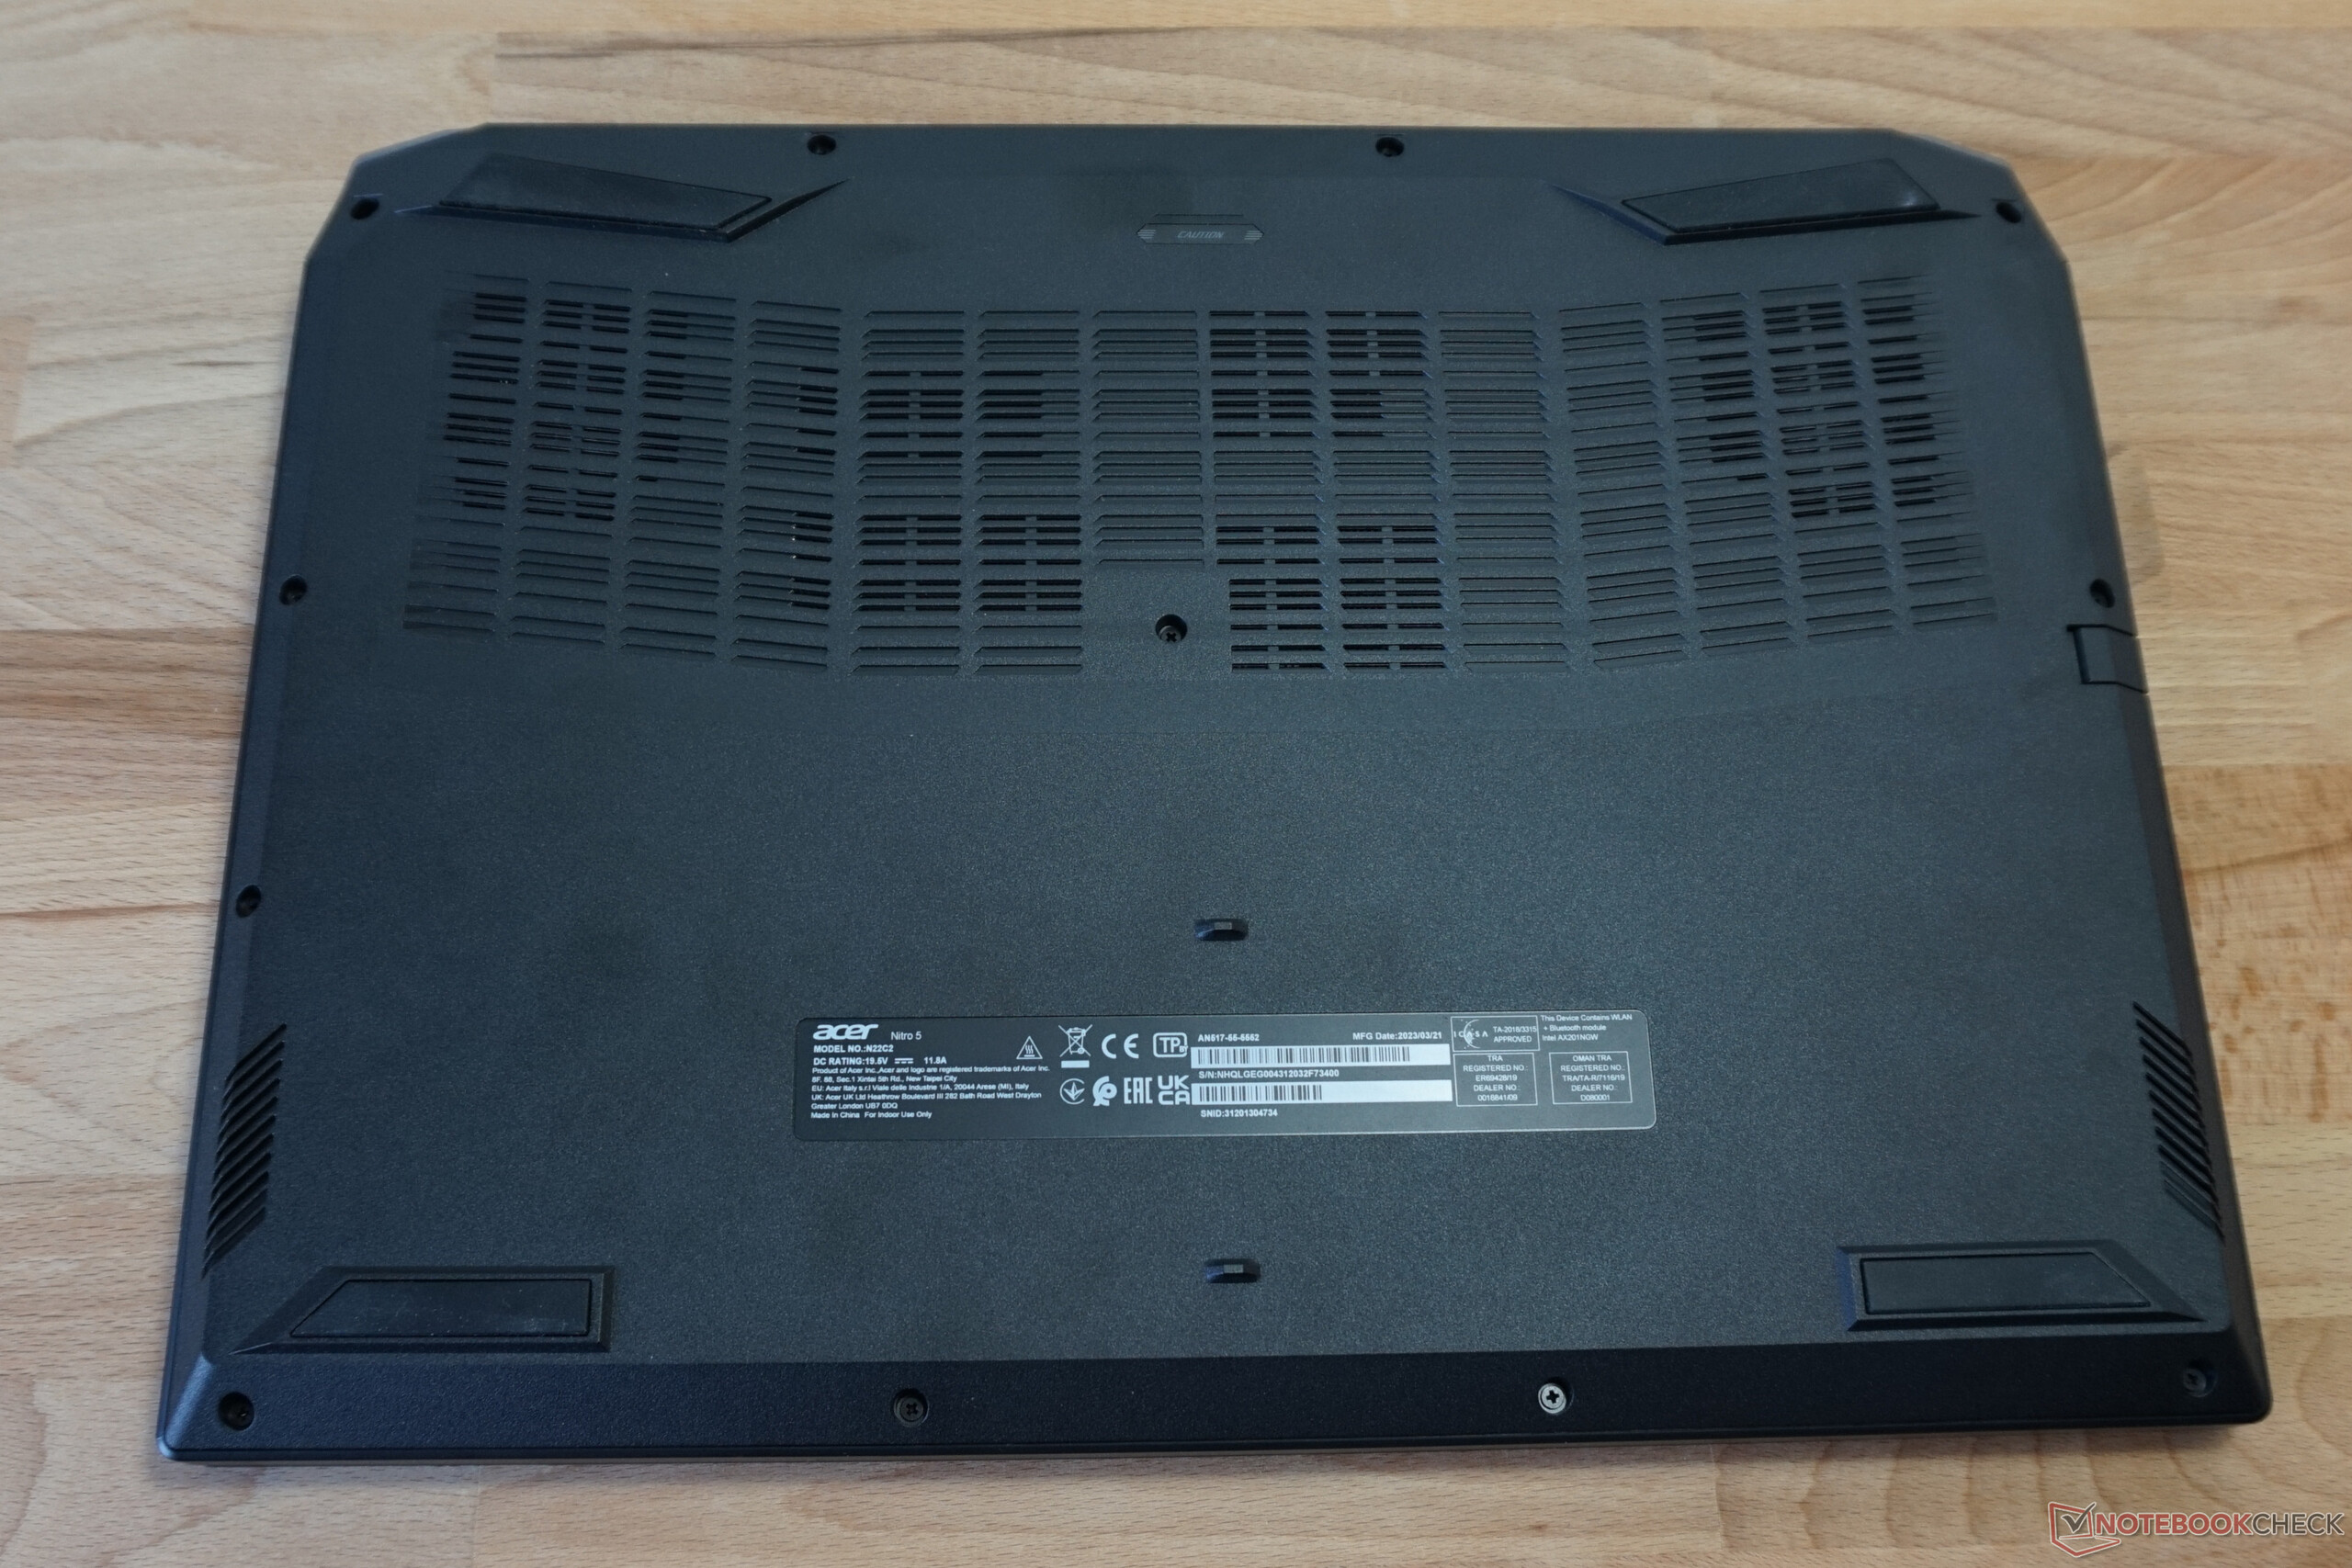
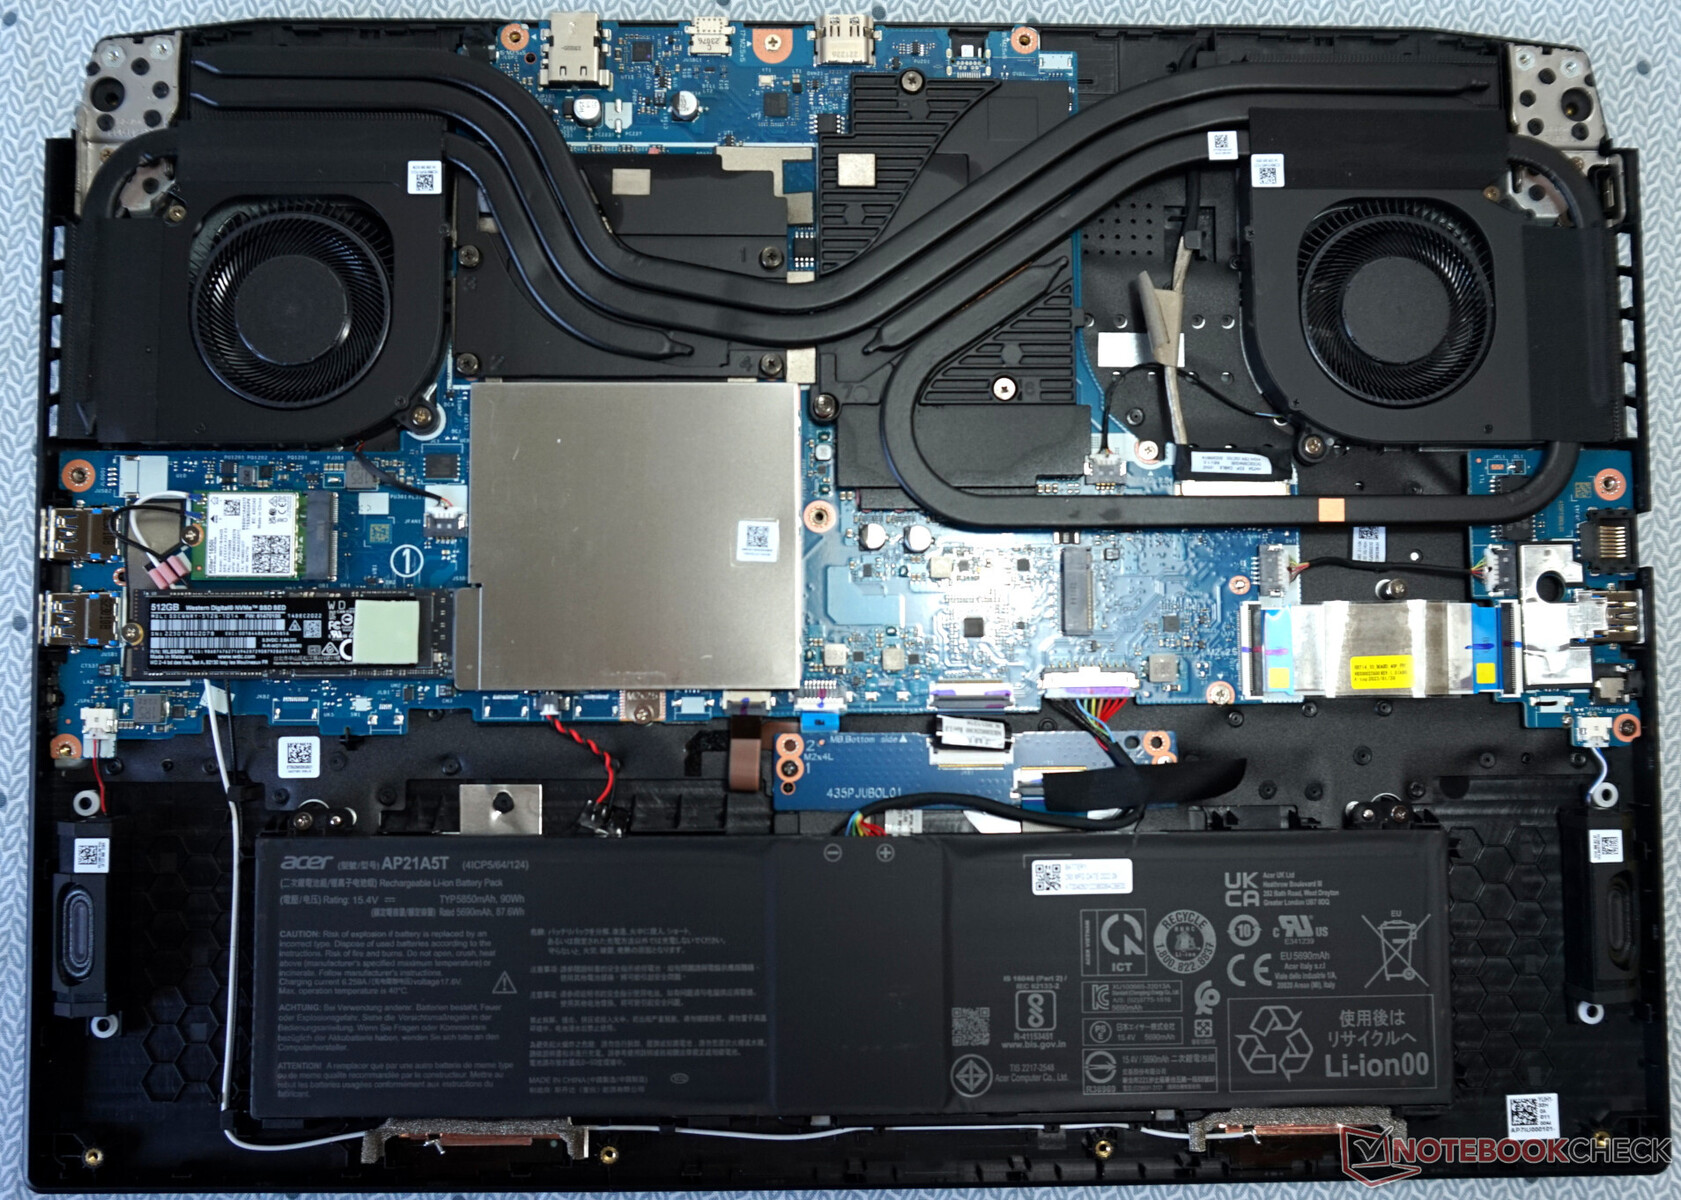
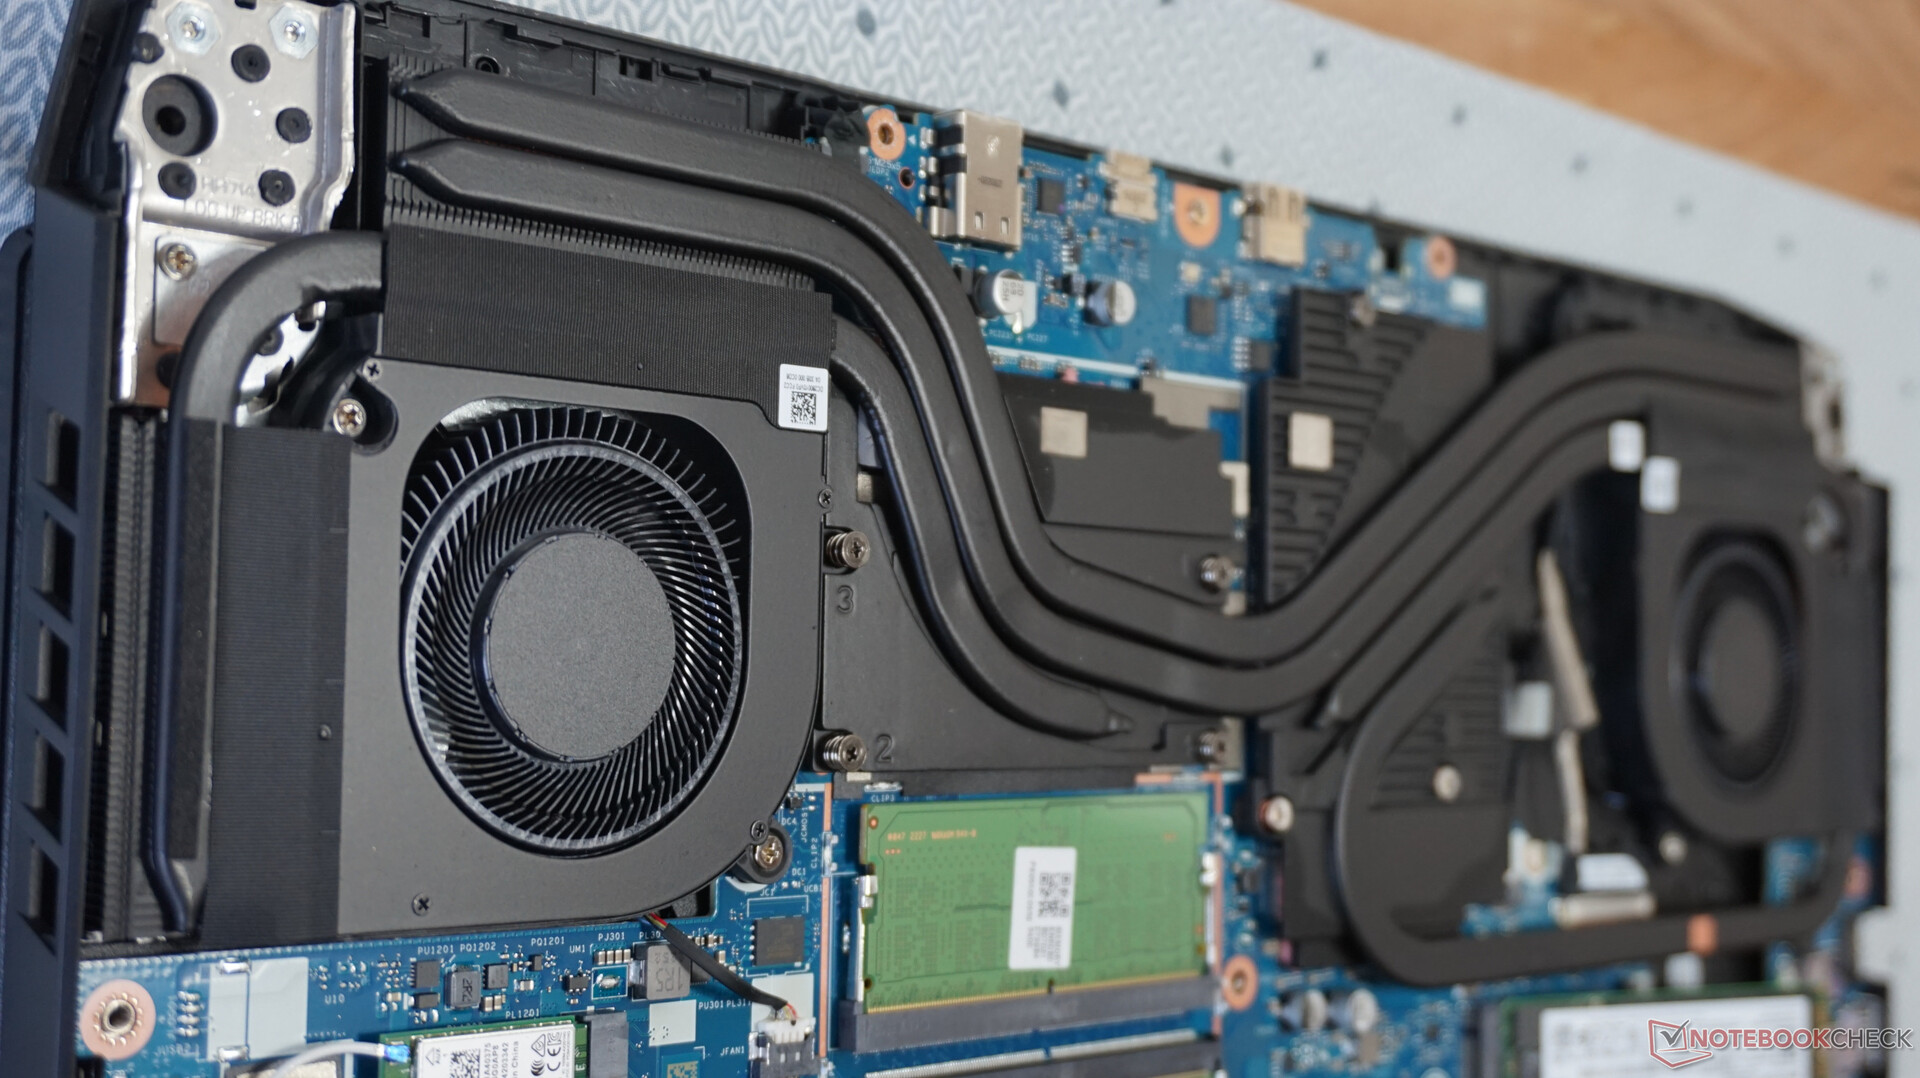
打开宏碁Nitro 5并没有特别大的问题:首先,有必要卸下12颗大小相同的十字头螺钉。做完这些后,就可以从后角取下底座--所有这些都只需最小的努力。
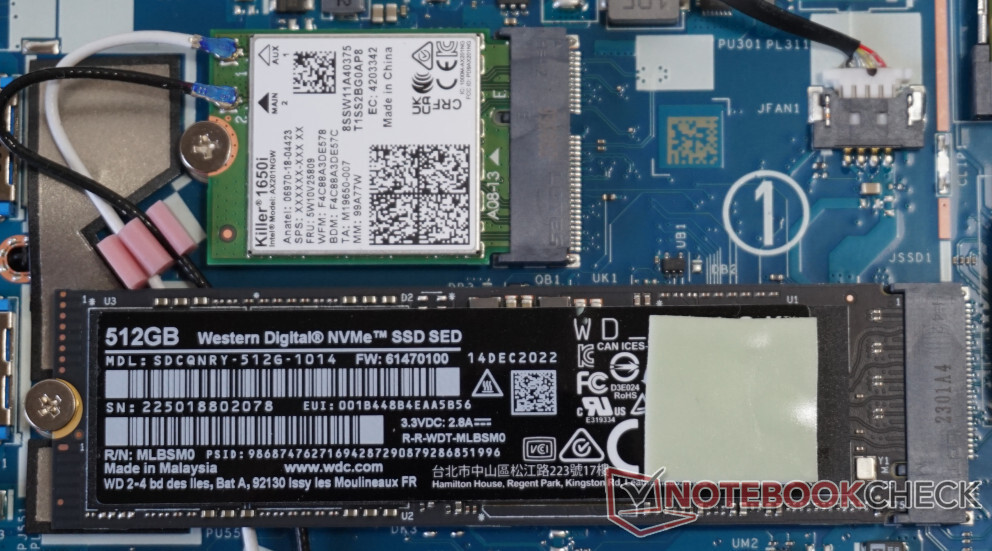
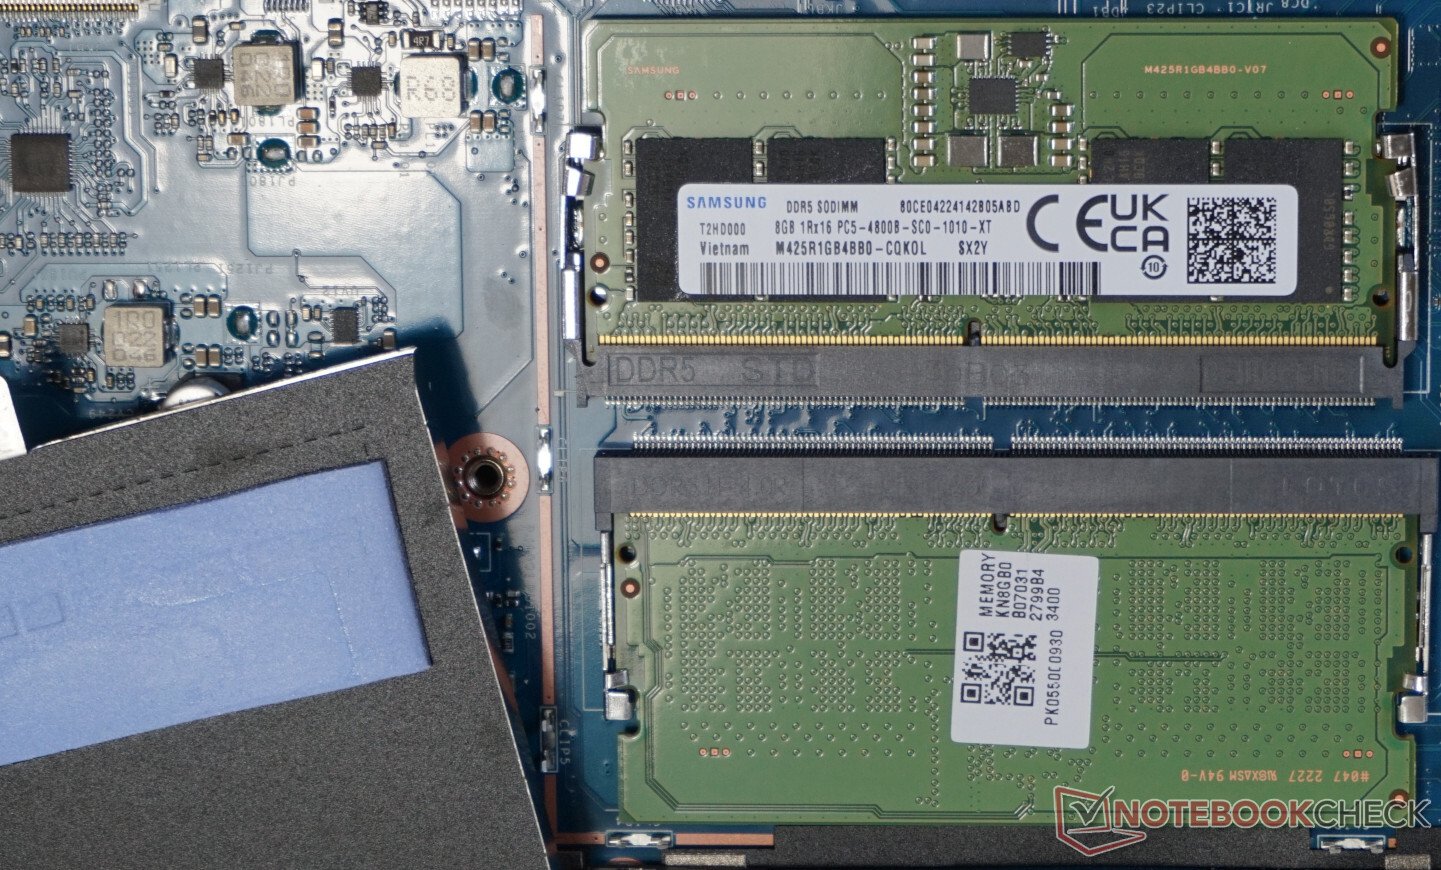
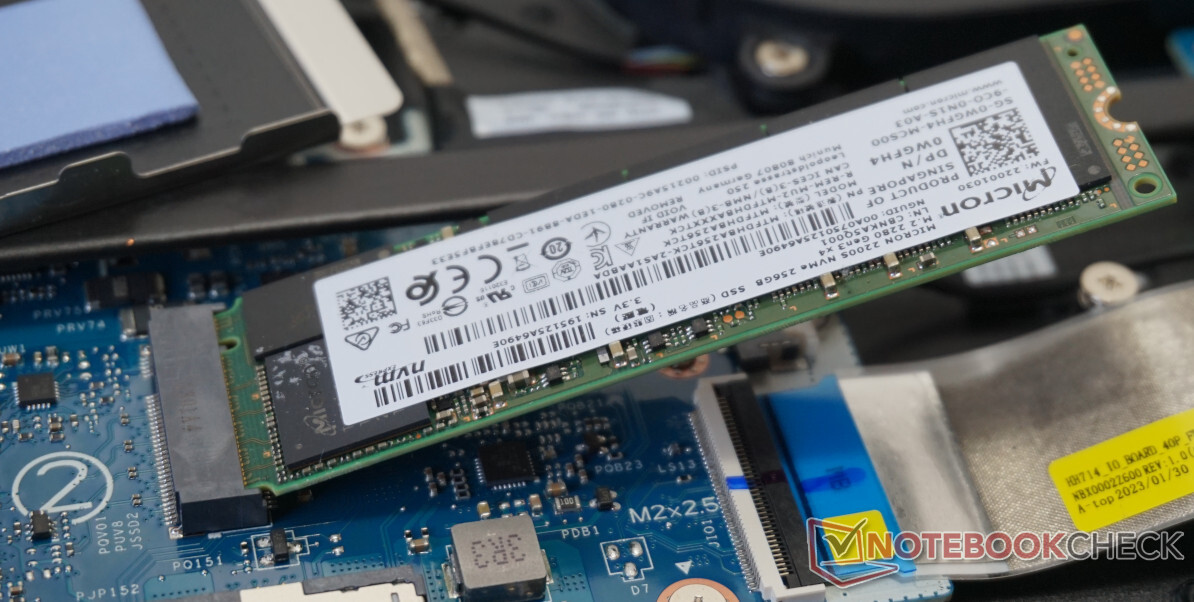
快速浏览一下内部,就会发现有一个很大的宽敞区域。然而,可用的自由空间可以用得更好一些,特别是在电池周围的区域,可以用来放置M.2固态硬盘等东西。两个插槽也很容易进入。第二个插槽可以在以后投入使用,并明确标有数字 "2"。Wi-Fi模块、内存芯片和电池都可以轻松更换。
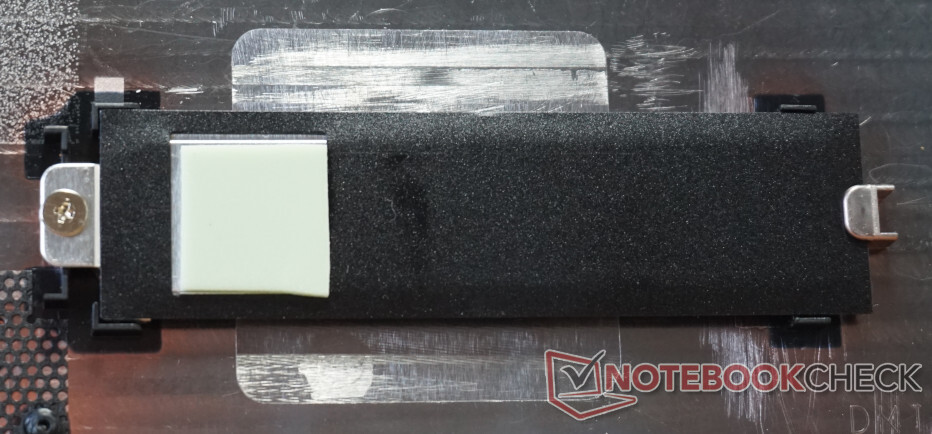
大量的被动冷却元件吸引了人们的目光。盖子下面的RAM配备了大型散热垫。此外,固态硬盘的控制器上也有一个这种类型的垫子,当盖子关闭时,它与底板上的冷却元件接触。这样的元件和散热垫也是为第二个M.2插槽预装的。
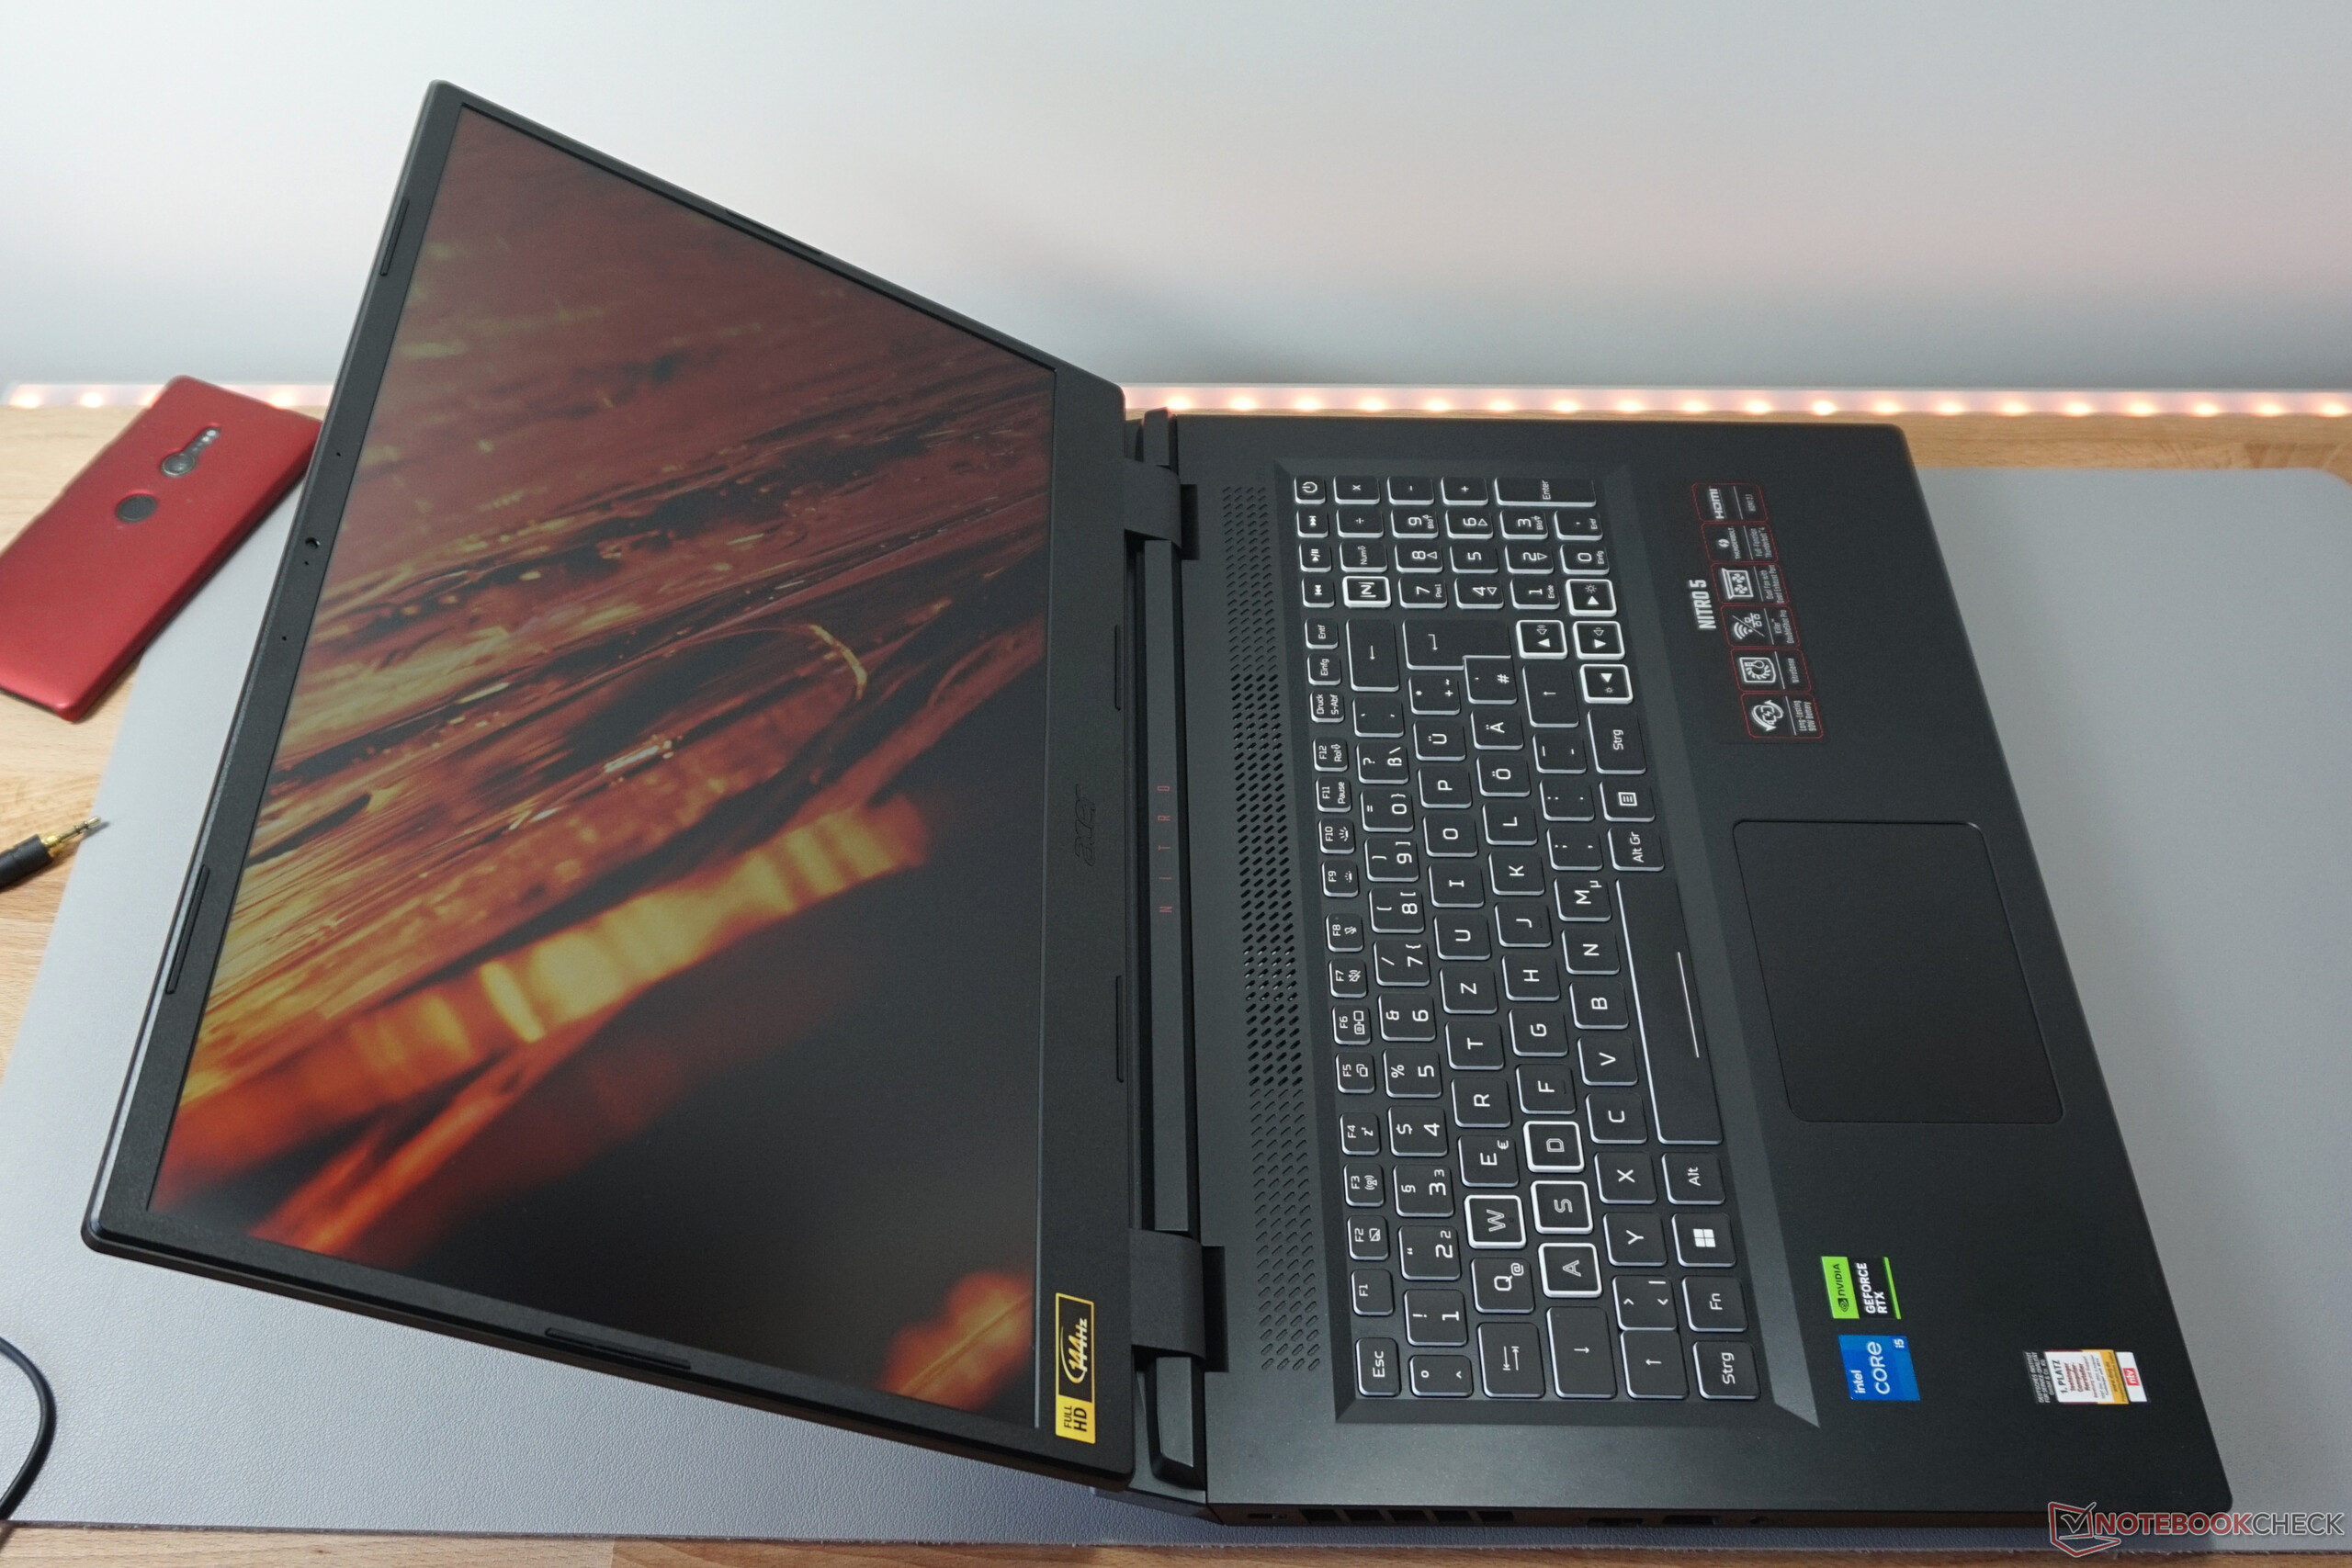
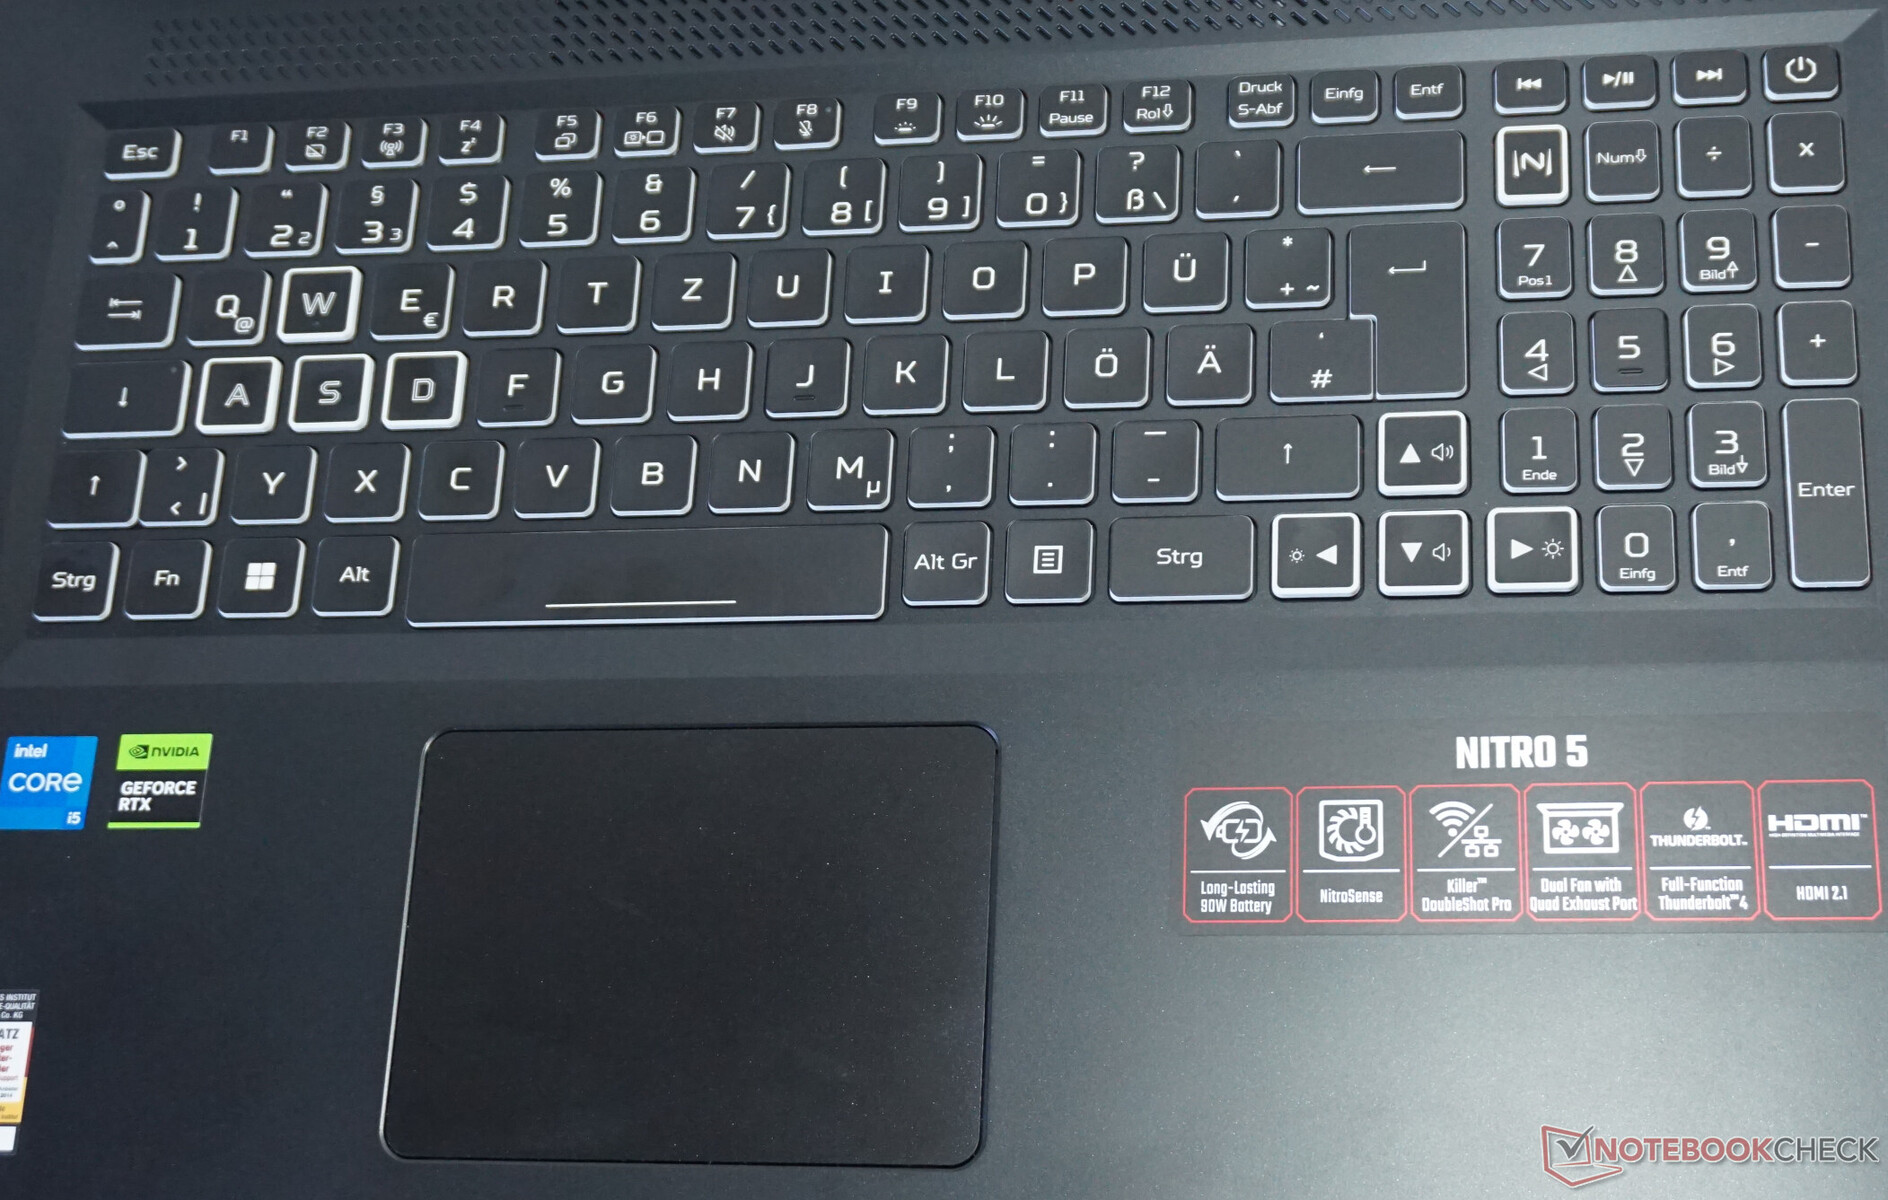
输入设备
打字的体验是令人愉快的。当然,它不像机械键盘,但它仍然拥有1.5毫米的键程(我们的测量),具有均匀和令人放心的阻力以及稳定的键盘框架。
此外,视觉设计也做得很好:由于采用了白色的边缘,这些按键彼此之间显得非常突出。方向键、"WASD "和宏碁的 "NitroSense "软件的一个特殊键有一个额外的标记,这使得找到它们明显更容易,特别是在你的眼角处。
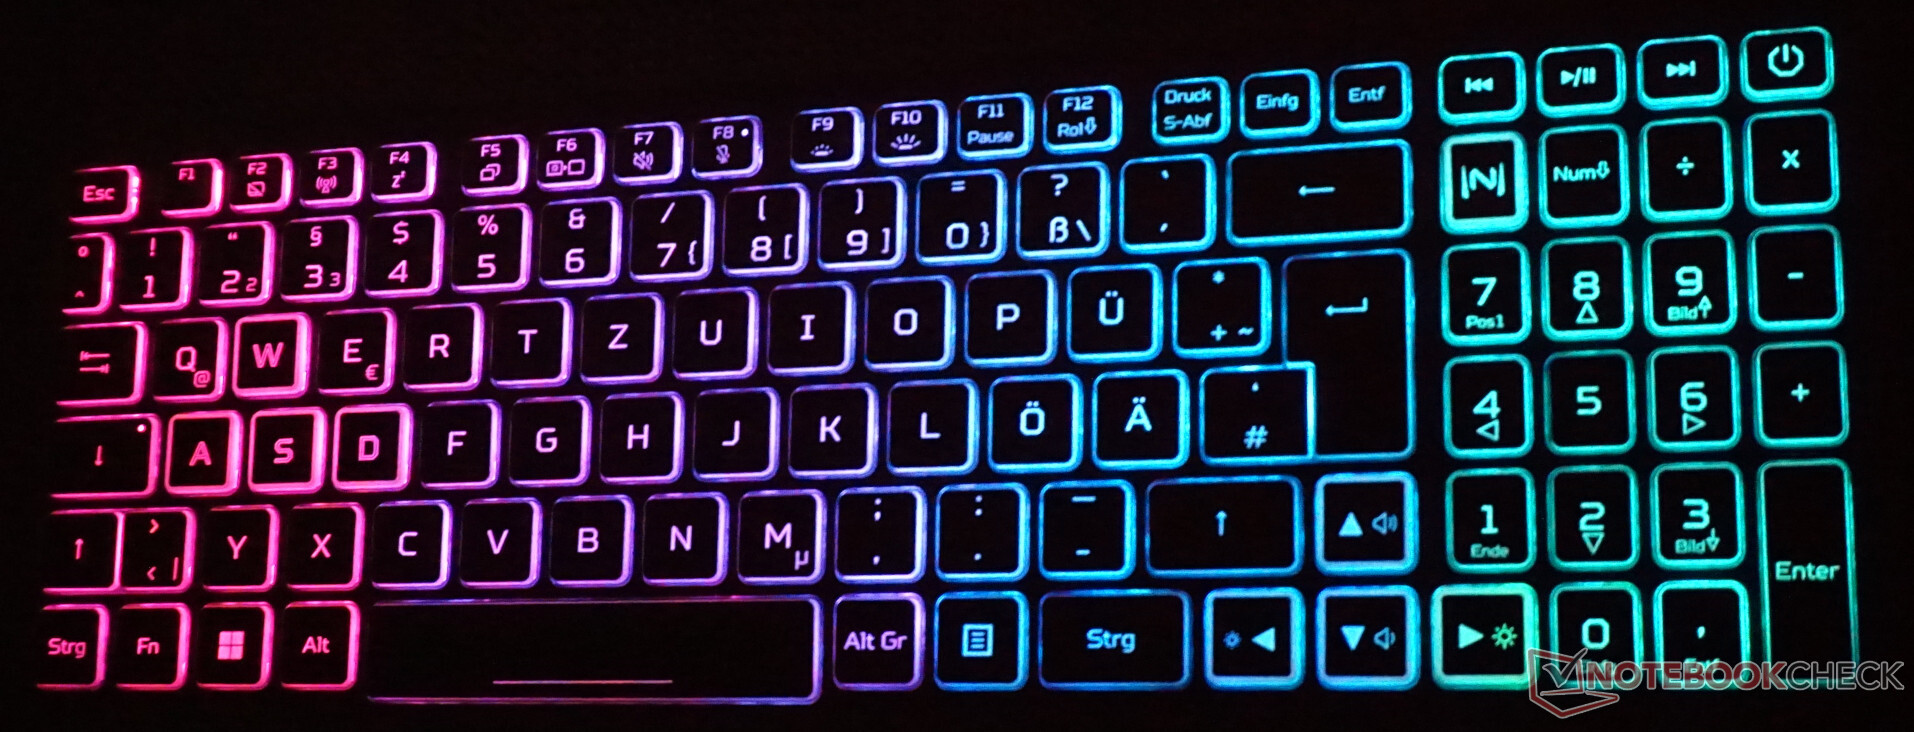
丰富多彩的按键照明只使用了四个可定制的区域。同时,有一个大的和精细分级的彩色光谱,使彩虹效果,除其他外,真的很有效。
触摸板就不那么令人印象深刻了,它的尺寸为10 x 8厘米,不是特别大。隐藏的按键并不总是立即响应。这一点在手指运动的不准确表现中屡屡被注意到。然而,与大多数游戏笔记本一样,这在游戏时不应该出现。
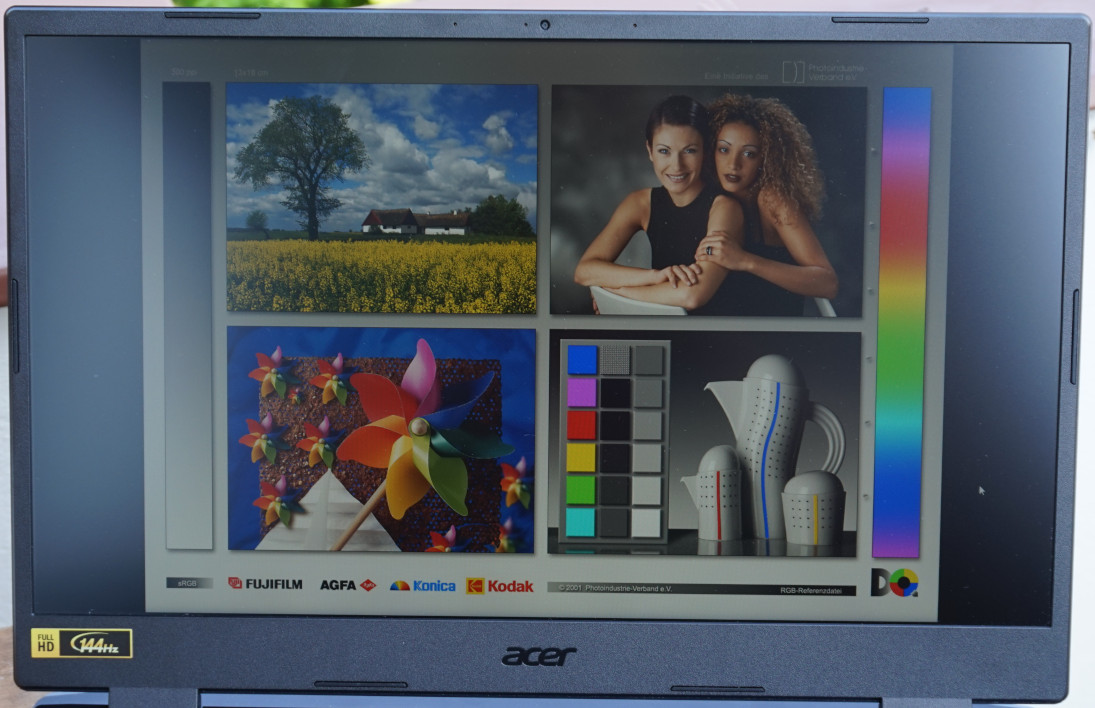
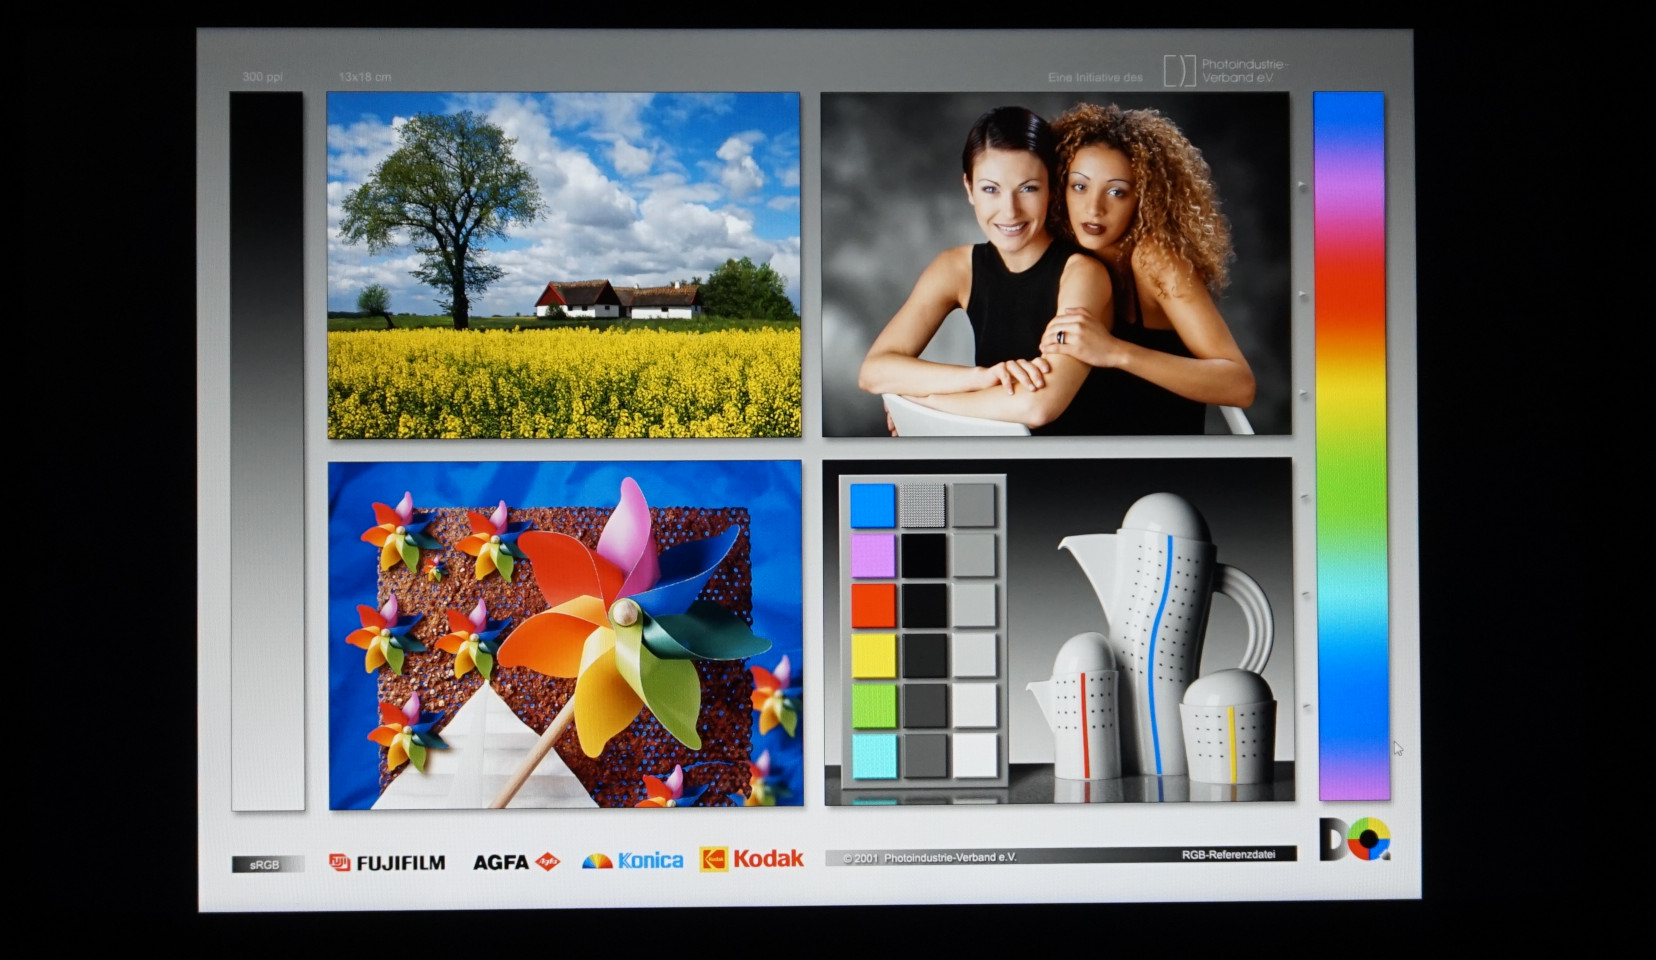
显示屏--对于一台游戏笔记本来说,太暗太平淡了

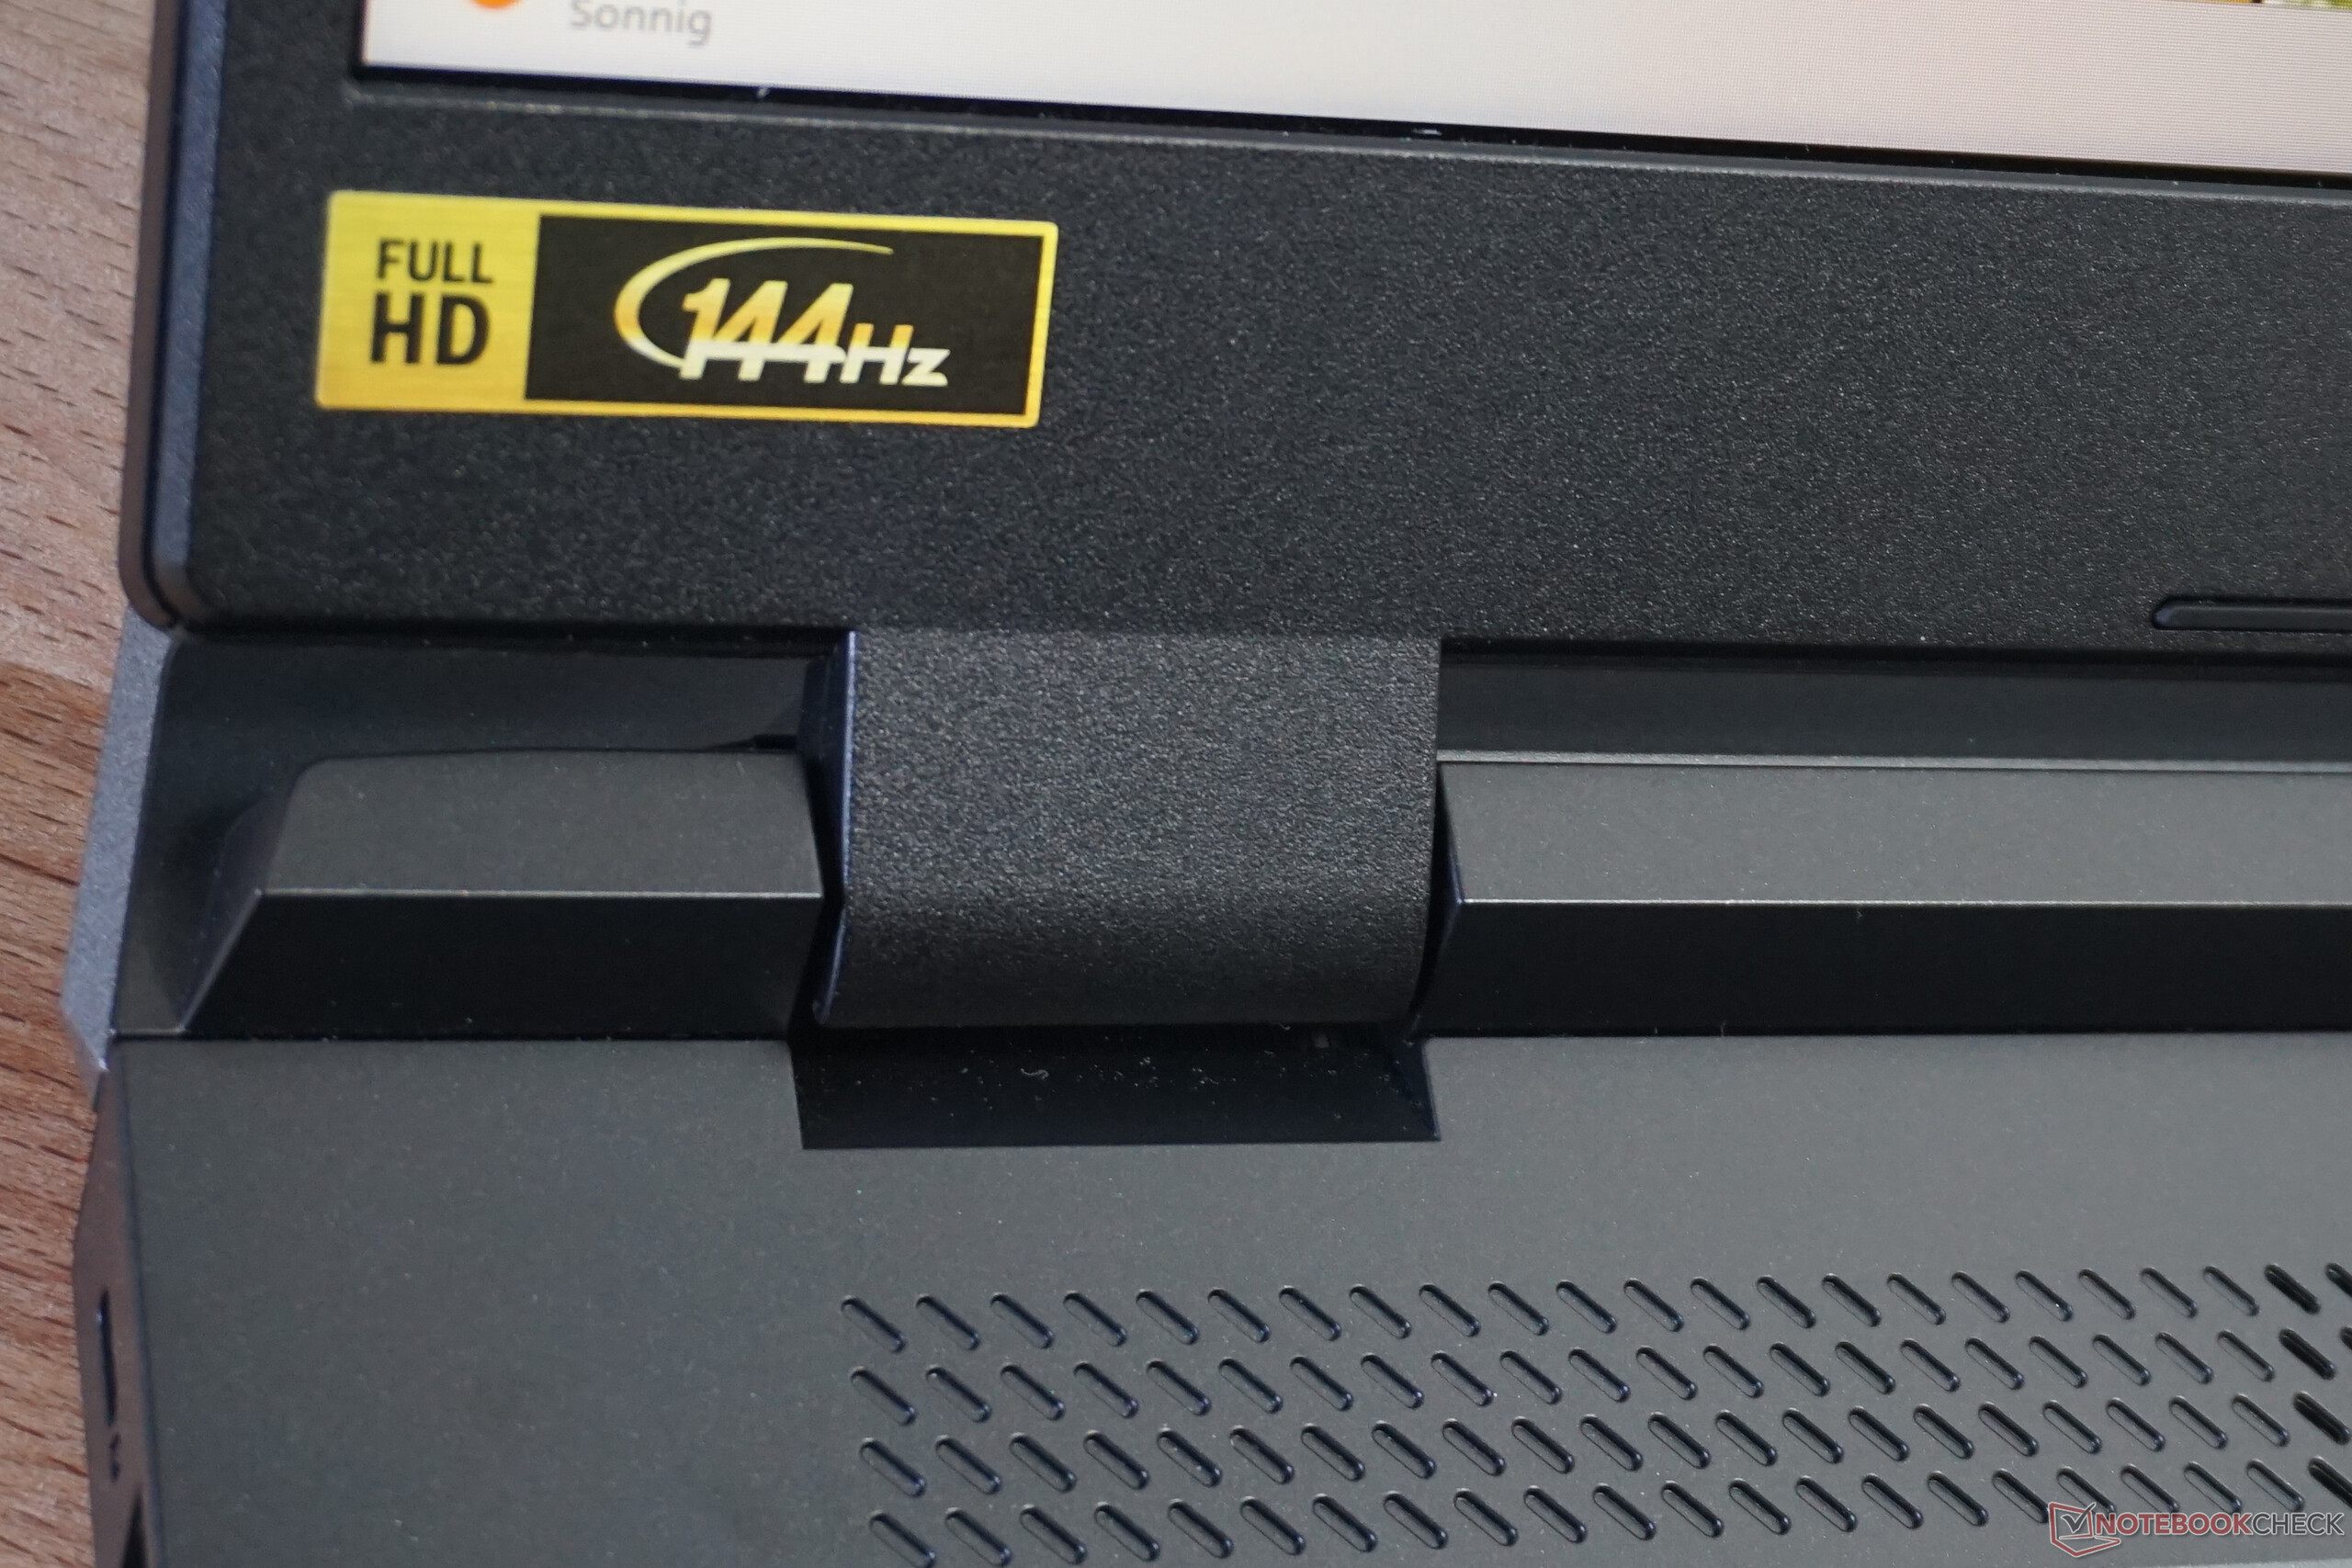
如果不是144赫兹的刷新率,宏碁Nitro 5的非常基本的IPS面板几乎让我们想起了办公室显示器。而这与全高清分辨率以及有限的图形性能是和谐的。此外,测得的响应时间也还算不错。
不幸的是,所有其他方面都低于平均水平。近250cd/m²的中等亮度和相对较差的黑色水平导致对比度差。在黑暗的房间里观看黑暗的图像时,可以看到显示器周围有明显的屏幕出血现象。
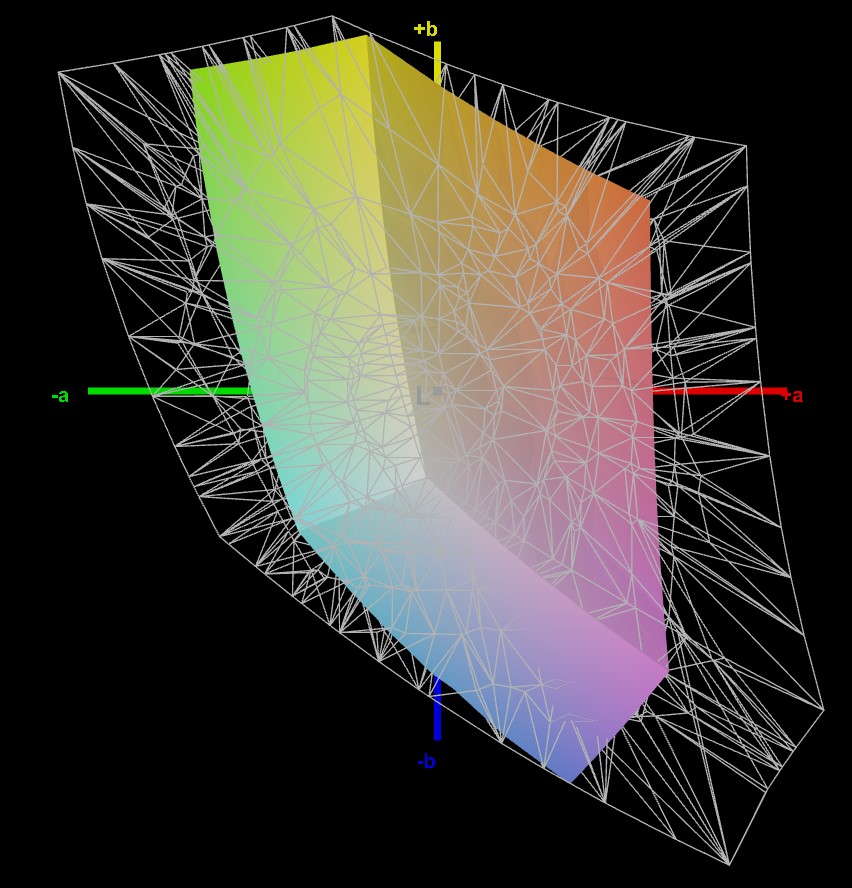
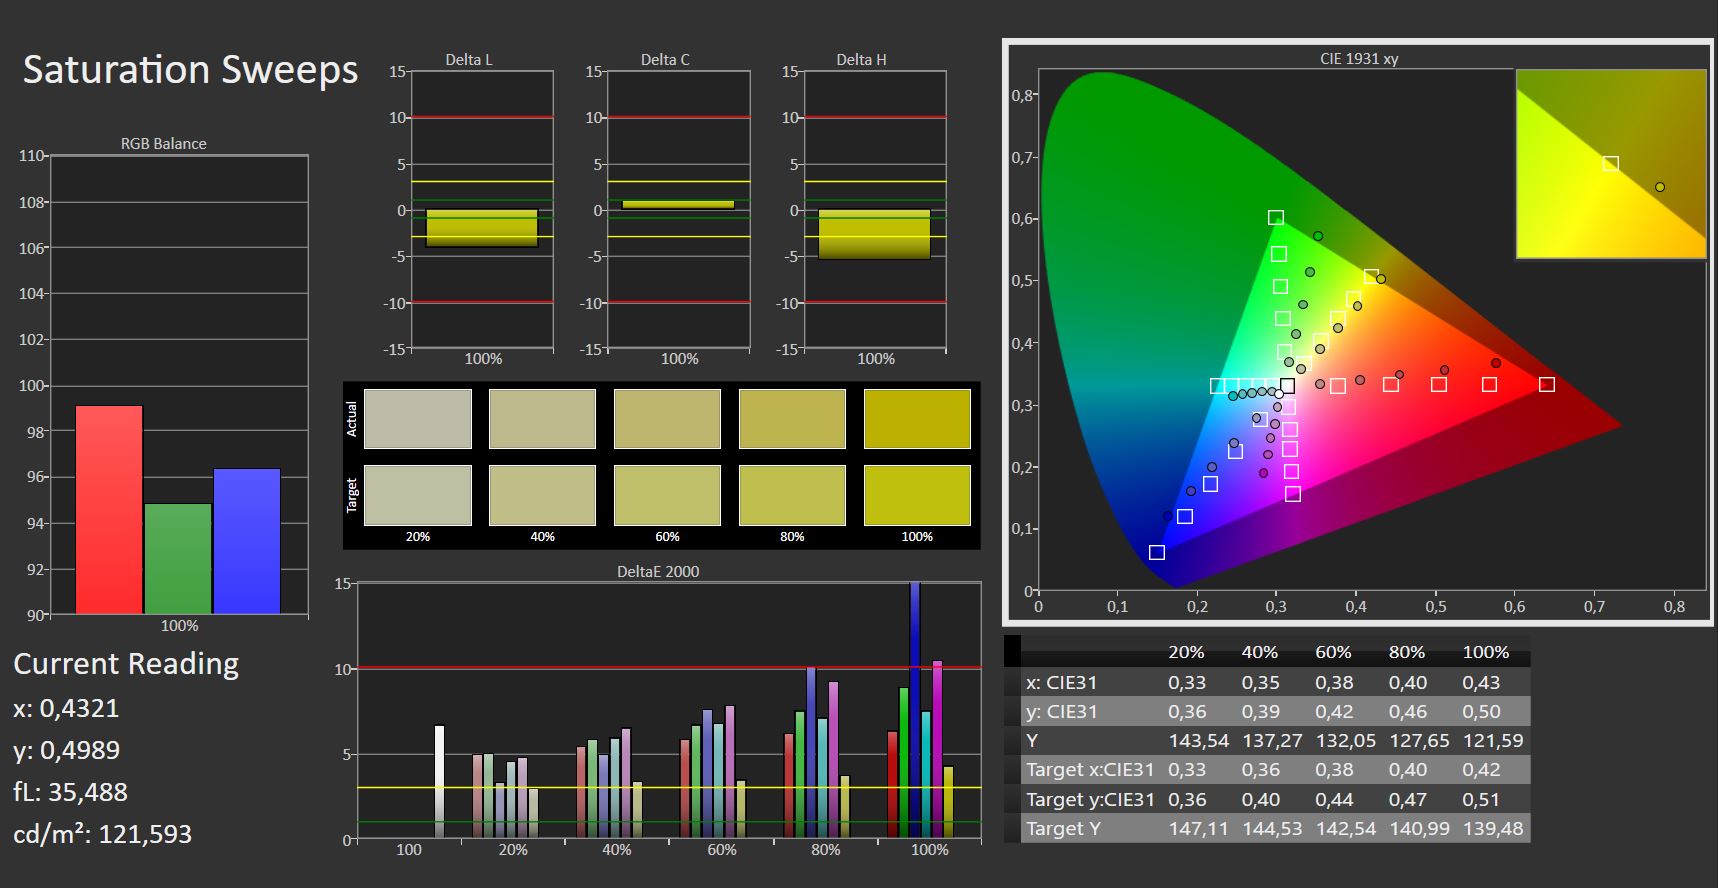
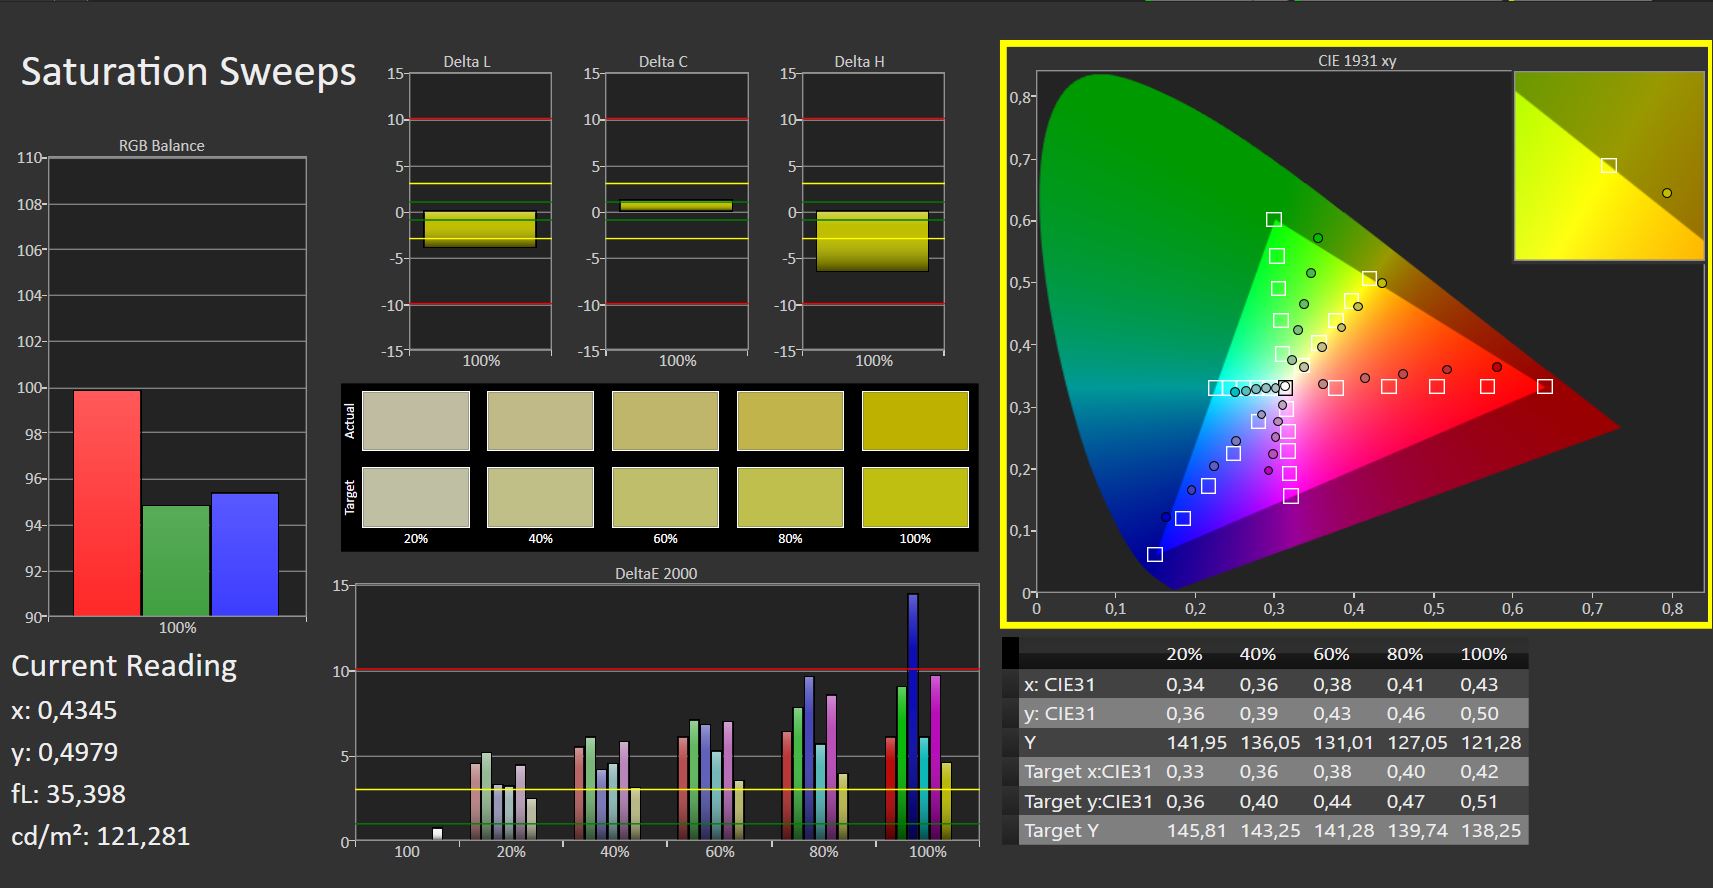
颜色的种类、色彩再现的准确性和照明也一直很差。这不会对玩游戏产生负面影响,但确实会导致一些效果不那么令人瞠目结舌。
此外,它还限制了笔记本电脑的多功能性。这块屏幕不是一个严肃的选择,即使是对有适度野心的爱好摄影的人来说。
| |||||||||||||||||||||||||
Brightness Distribution: 81 %
Center on Battery: 285 cd/m²
Contrast: 491:1 (Black: 0.58 cd/m²)
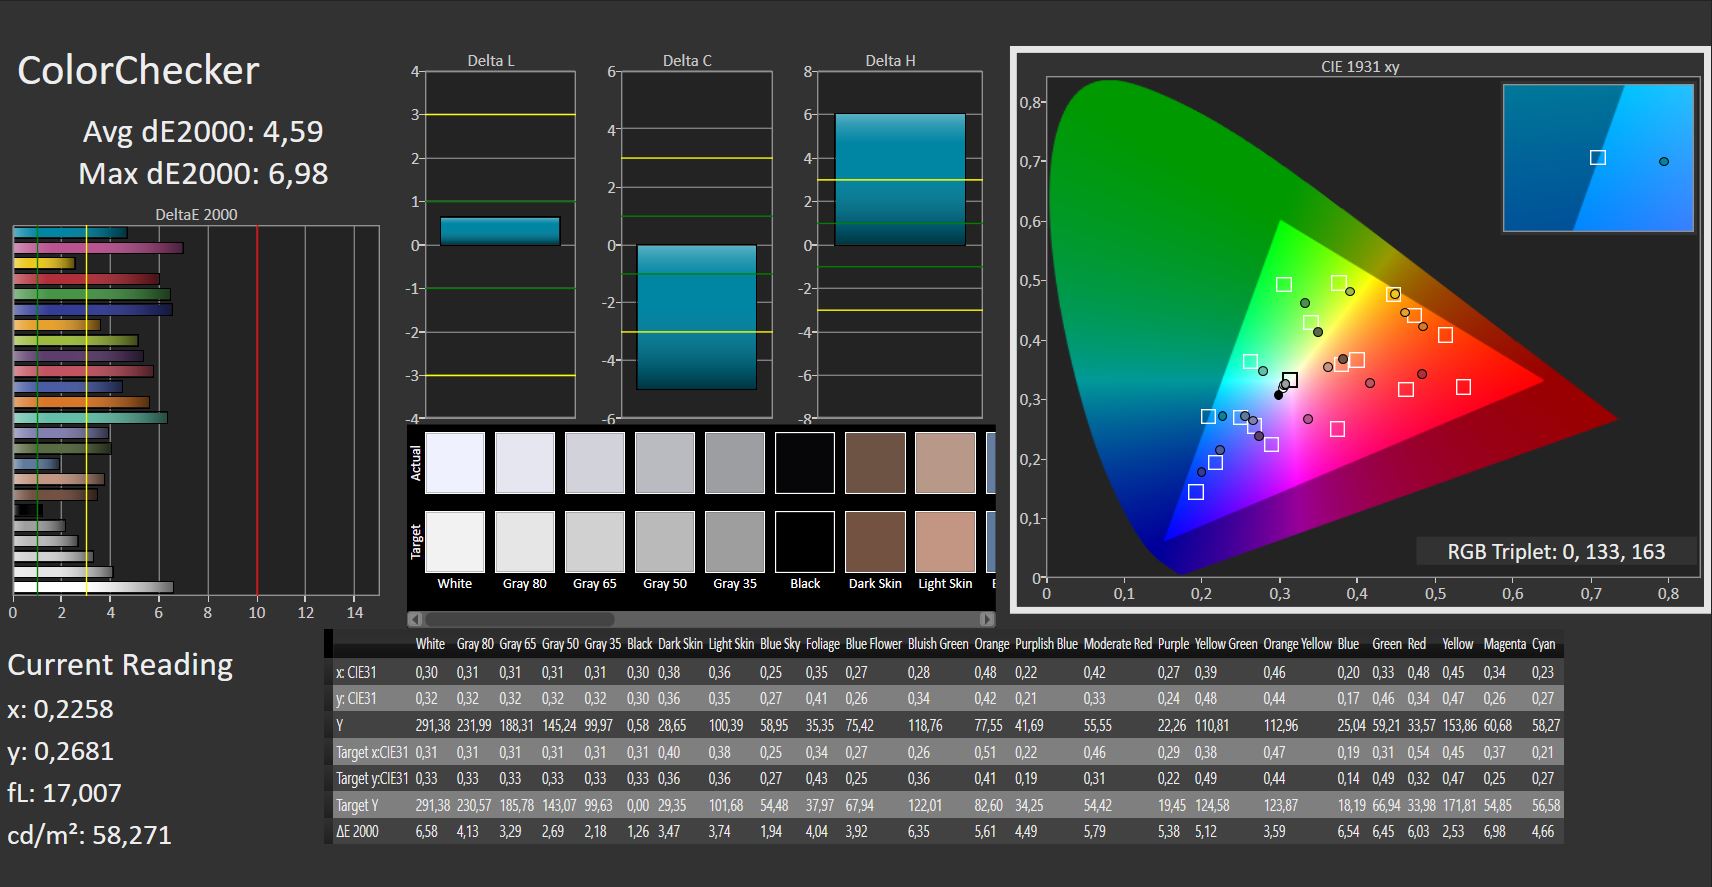
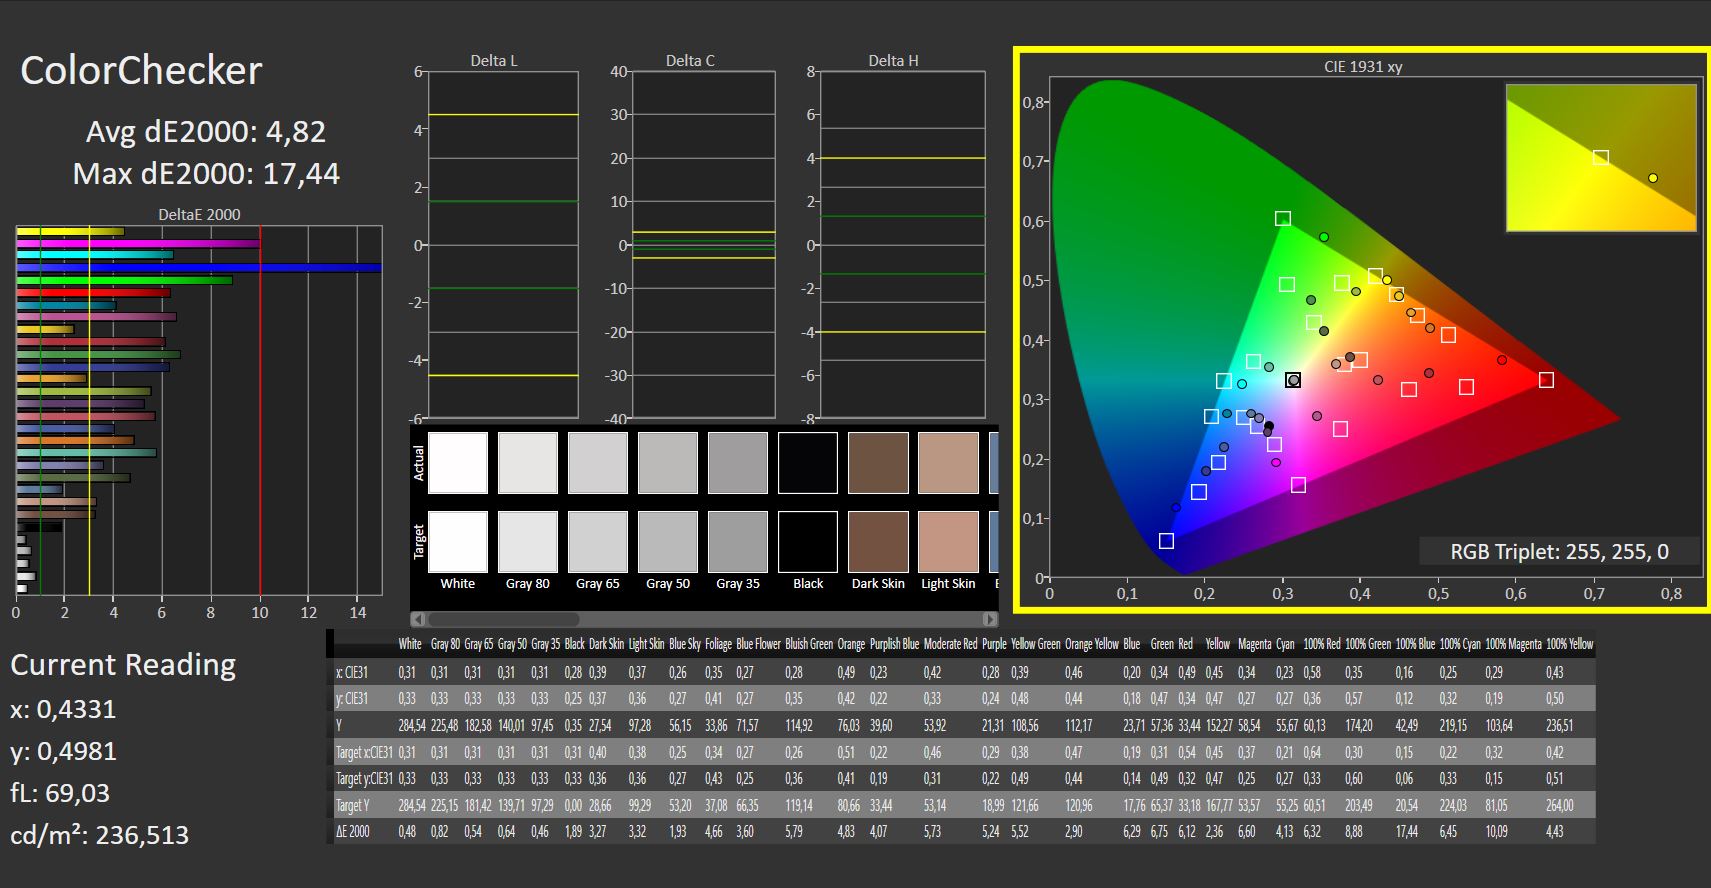
ΔE ColorChecker Calman: 4.59 | ∀{0.5-29.43 Ø4.71}
calibrated: 4.82
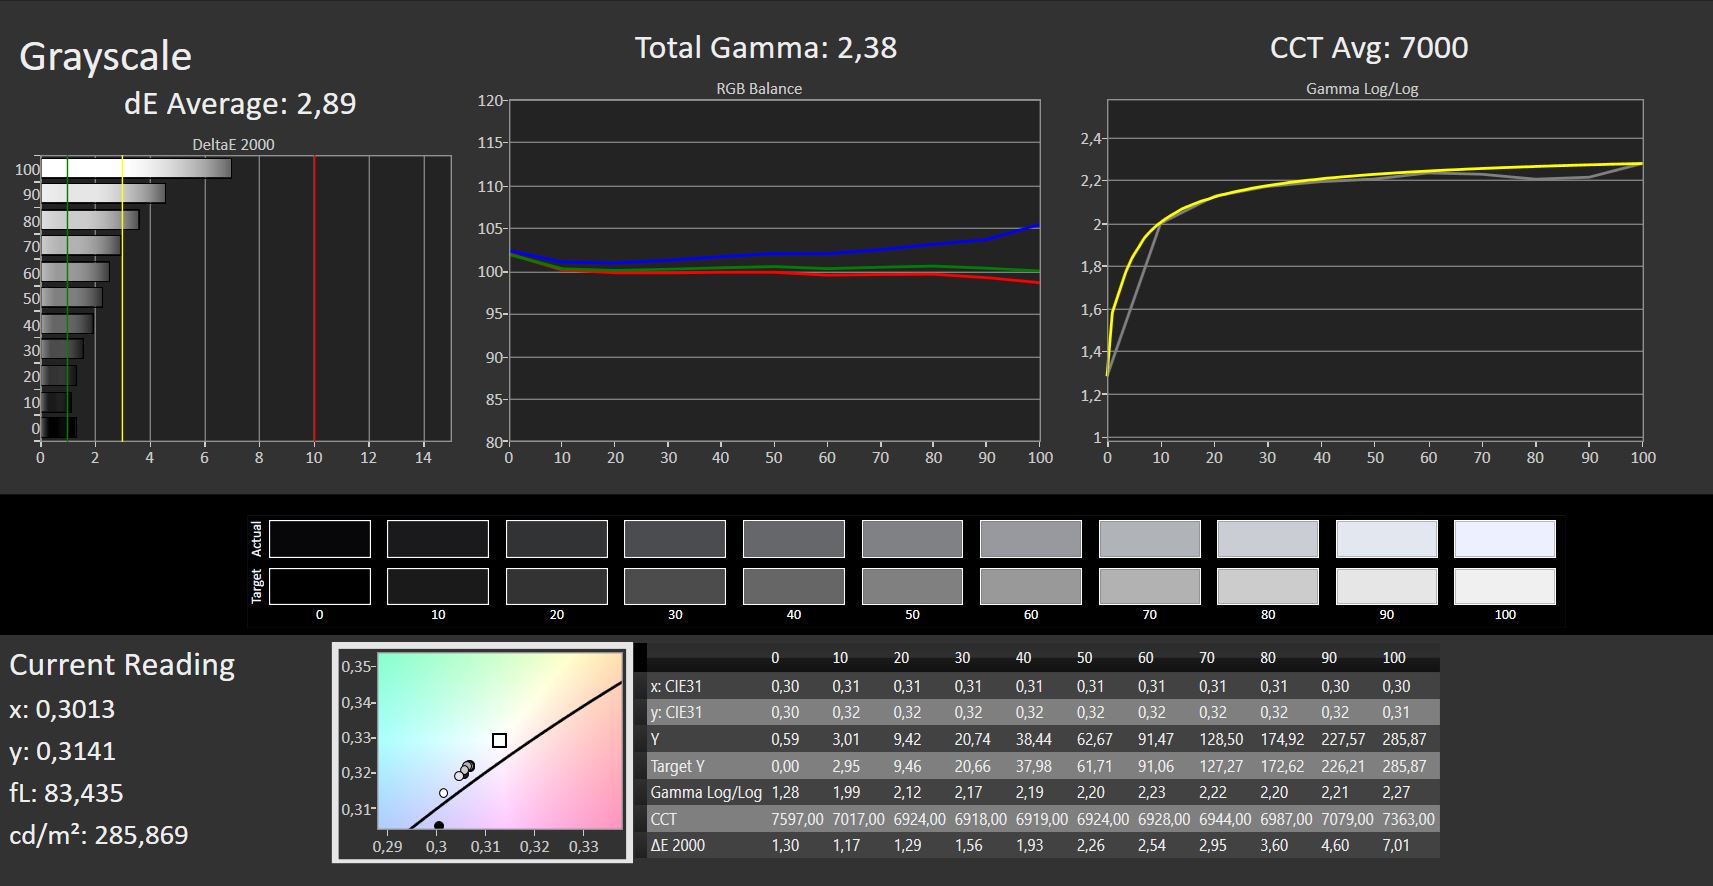
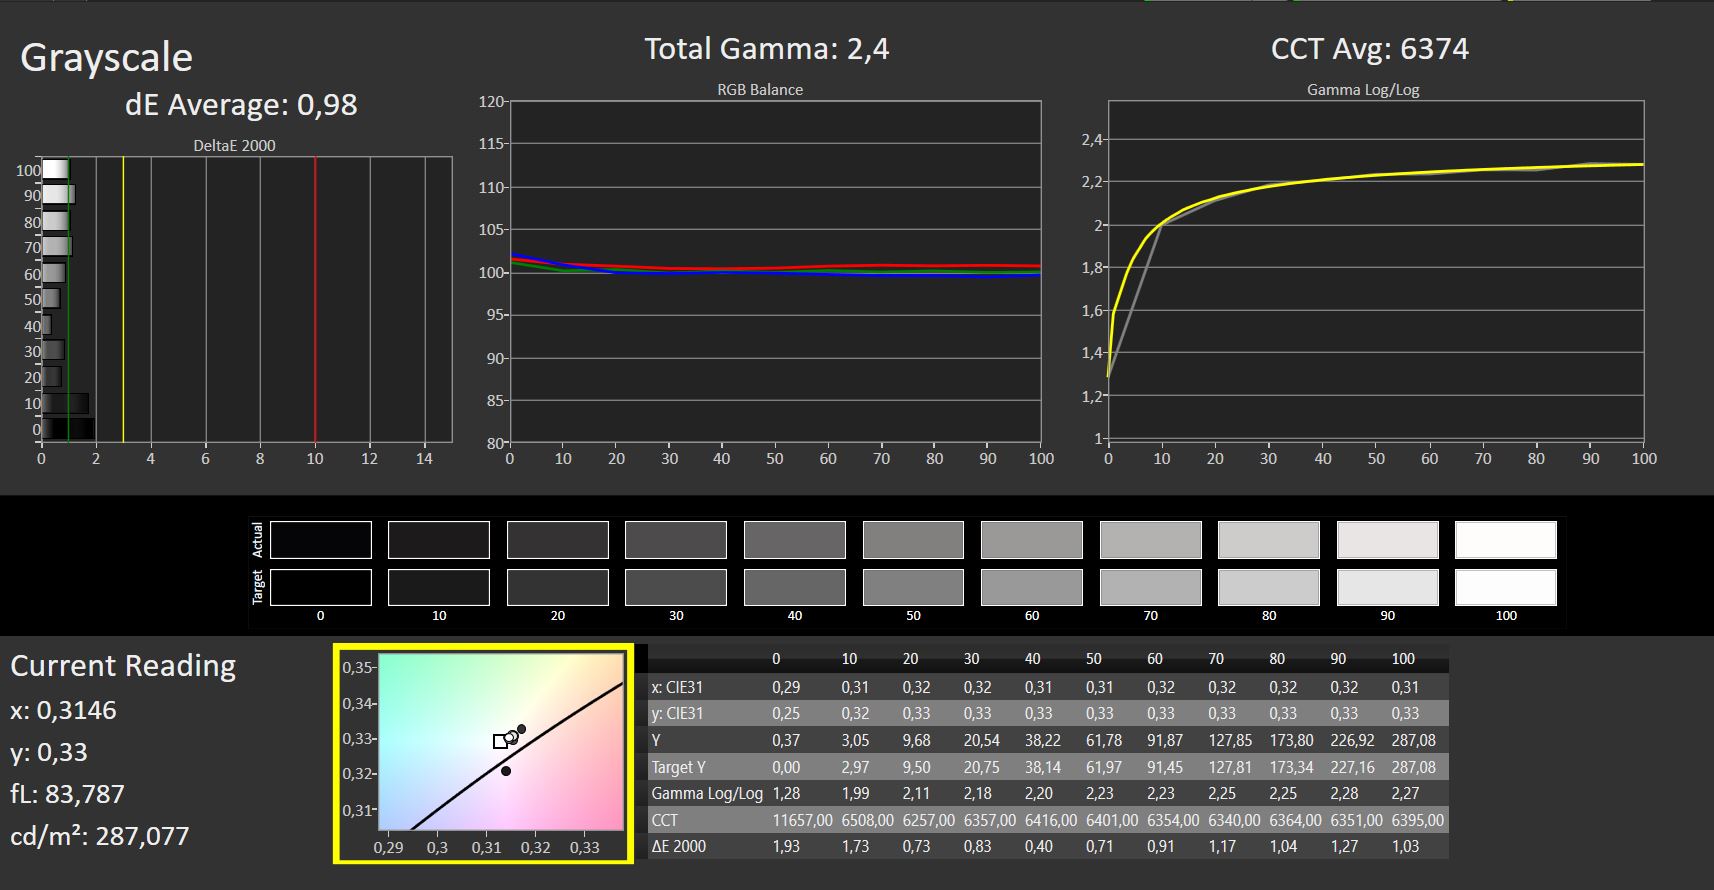
ΔE Greyscale Calman: 2.89 | ∀{0.09-98 Ø4.96}
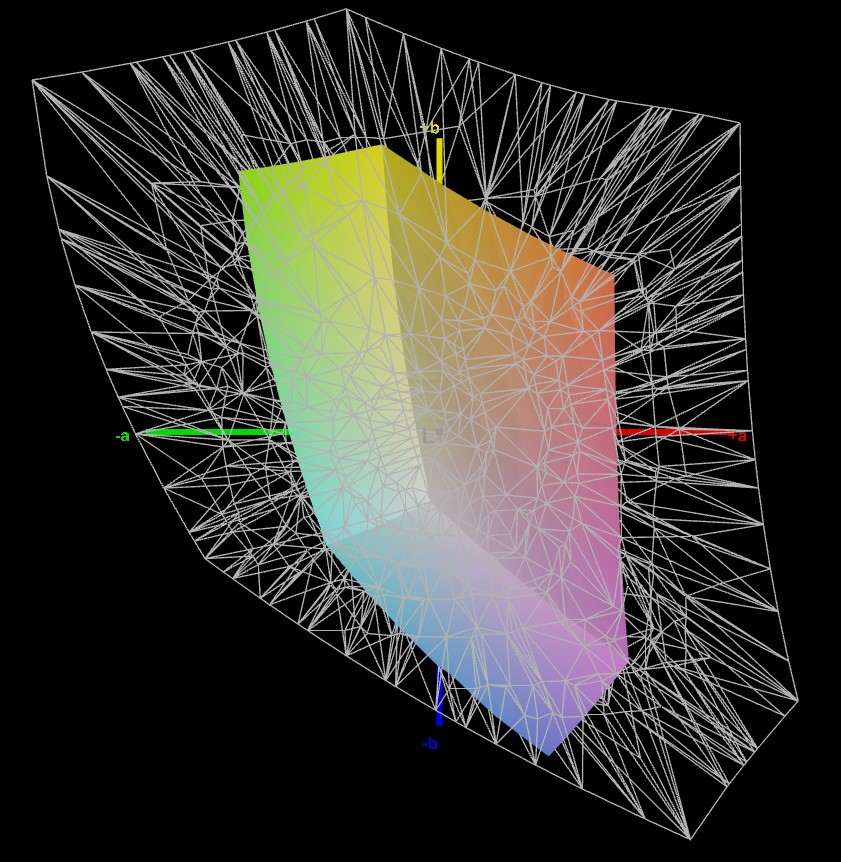
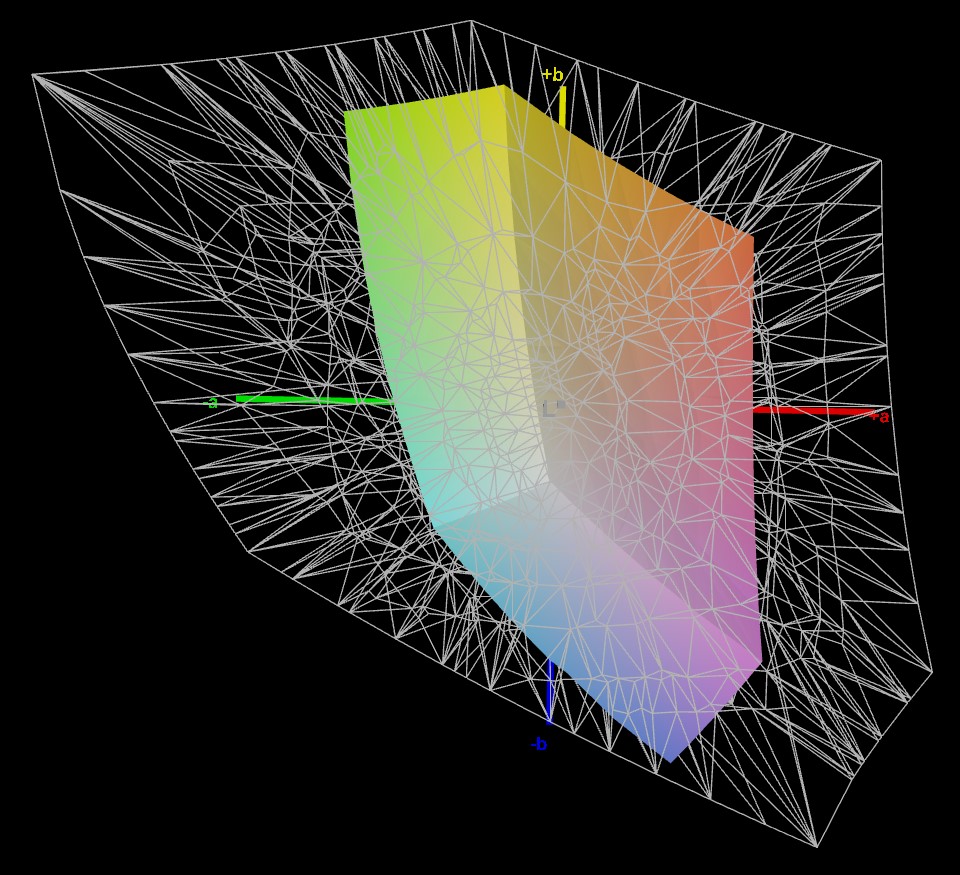
38.9% AdobeRGB 1998 (Argyll 3D)
56.4% sRGB (Argyll 3D)
37.6% Display P3 (Argyll 3D)
Gamma: 2.38
CCT: 7000 K
| Acer Nitro 5 AN517-55-5552 BOE0A6F NV173FHM-NX4, IPS, 1920x1080, 17.3" | Asus TUF Gaming A16 FA617XS BOE NE160WUM-NX2, IPS, 1920x1200, 16" | Acer Nitro 5 AN517-55-738R B173HAN04.0, IPS, 1920x1080, 17.3" | Medion Erazer Scout E20 LG Philips LGD0611, IPS, 1920x1080, 17.3" | MSI Katana 15 B12VEK AUOAF90 (B156HAN08.4), IPS, 1920x1080, 15.6" | MSI Cyborg 15 A12VF AU Optronics B156HAN15.1, IPS, 1920x1080, 15.6" | |
|---|---|---|---|---|---|---|
| Display | 80% | 55% | 72% | 1% | 12% | |
| Display P3 Coverage (%) | 37.6 | 69.3 84% | 58.9 57% | 65.1 73% | 38.1 1% | 42.3 12% |
| sRGB Coverage (%) | 56.4 | 97.3 73% | 86.4 53% | 96.7 71% | 56.8 1% | 62.6 11% |
| AdobeRGB 1998 Coverage (%) | 38.9 | 70.7 82% | 60.5 56% | 66.5 71% | 39.3 1% | 43.7 12% |
| Response Times | 21% | 55% | 22% | -104% | -11% | |
| Response Time Grey 50% / Grey 80% * (ms) | 18 ? | 15.6 ? 13% | 6 ? 67% | 14.8 ? 18% | 38.8 ? -116% | 22 ? -22% |
| Response Time Black / White * (ms) | 14 ? | 10 ? 29% | 8 ? 43% | 10.4 ? 26% | 26.8 ? -91% | 14 ? -0% |
| PWM Frequency (Hz) | ||||||
| Screen | 55% | 24% | 41% | 3% | 24% | |
| Brightness middle (cd/m²) | 285 | 301 6% | 286 0% | 312 9% | 261 -8% | 247 -13% |
| Brightness (cd/m²) | 257 | 294 14% | 278 8% | 303 18% | 258 0% | 234 -9% |
| Brightness Distribution (%) | 81 | 94 16% | 89 10% | 91 12% | 92 14% | 89 10% |
| Black Level * (cd/m²) | 0.58 | 0.21 64% | 0.32 45% | 0.25 57% | 0.19 67% | 0.25 57% |
| Contrast (:1) | 491 | 1433 192% | 894 82% | 1248 154% | 1374 180% | 988 101% |
| Colorchecker dE 2000 * | 4.59 | 1.79 61% | 3.05 34% | 2.65 42% | 5.57 -21% | 3.78 18% |
| Colorchecker dE 2000 max. * | 6.98 | 3.48 50% | 5.83 16% | 6.44 8% | 20.6 -195% | 6.42 8% |
| Colorchecker dE 2000 calibrated * | 4.82 | 1.2 75% | 3.13 35% | 0.96 80% | 4.63 4% | 3.94 18% |
| Greyscale dE 2000 * | 2.89 | 2.5 13% | 3.17 -10% | 3.2 -11% | 3.19 -10% | 2.16 25% |
| Gamma | 2.38 92% | 2.265 97% | 2.29 96% | 2.246 98% | 2.45 90% | 2.33 94% |
| CCT | 7000 93% | 6157 106% | 6916 94% | 7258 90% | 6146 106% | 6906 94% |
| Total Average (Program / Settings) | 52% /
55% | 45% /
35% | 45% /
45% | -33% /
-12% | 8% /
16% |
* ... smaller is better
屏幕可以显示大约一半以上的sRGB,这是游戏中通常使用的色彩空间。因此,精细的调色,如对天空的表现,最终可能看起来是块状的。期待至少接近完整的sRGB覆盖率是正确的,正如在其前身--Nitro 5 AN517-55-7中所看到的那样。Nitro 5 AN517-55-738R.但是,不幸的是,这里的情况并非如此。对于游戏来说,它只是足够好,但仍然令人失望。
我们测量了色彩再现的偏差,特别是当它涉及到蓝色调时,这甚至对经验不足的眼睛也是可见的。然而,考虑到总体上较差的色彩再现,不可能期待一个更好的结果。平均DeltaE略低于5,这无法通过校准来改善,如果重点基本上只放在游戏上,那是相当不错的。
Display Response Times
| ↔ Response Time Black to White | ||
|---|---|---|
| 14 ms ... rise ↗ and fall ↘ combined | ↗ 7 ms rise |  |
| ↘ 7 ms fall | ||
| The screen shows good response rates in our tests, but may be too slow for competitive gamers. In comparison, all tested devices range from 0.1 (minimum) to 240 (maximum) ms. » 34 % of all devices are better. This means that the measured response time is better than the average of all tested devices (19.8 ms). | ||
| ↔ Response Time 50% Grey to 80% Grey | ||
| 18 ms ... rise ↗ and fall ↘ combined | ↗ 8 ms rise |  |
| ↘ 10 ms fall | ||
| The screen shows good response rates in our tests, but may be too slow for competitive gamers. In comparison, all tested devices range from 0.165 (minimum) to 636 (maximum) ms. » 32 % of all devices are better. This means that the measured response time is better than the average of all tested devices (30.9 ms). | ||
Screen Flickering / PWM (Pulse-Width Modulation)
| Screen flickering / PWM not detected |  | ||
In comparison: 52 % of all tested devices do not use PWM to dim the display. If PWM was detected, an average of 7748 (minimum: 5 - maximum: 343500) Hz was measured. | |||
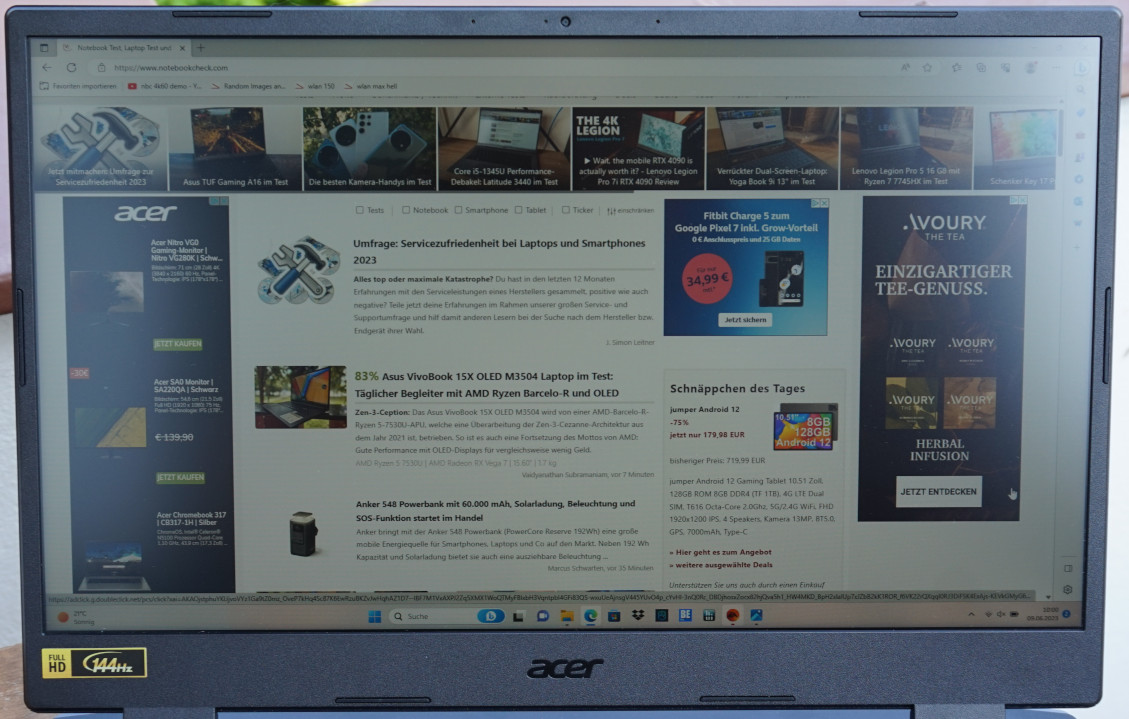
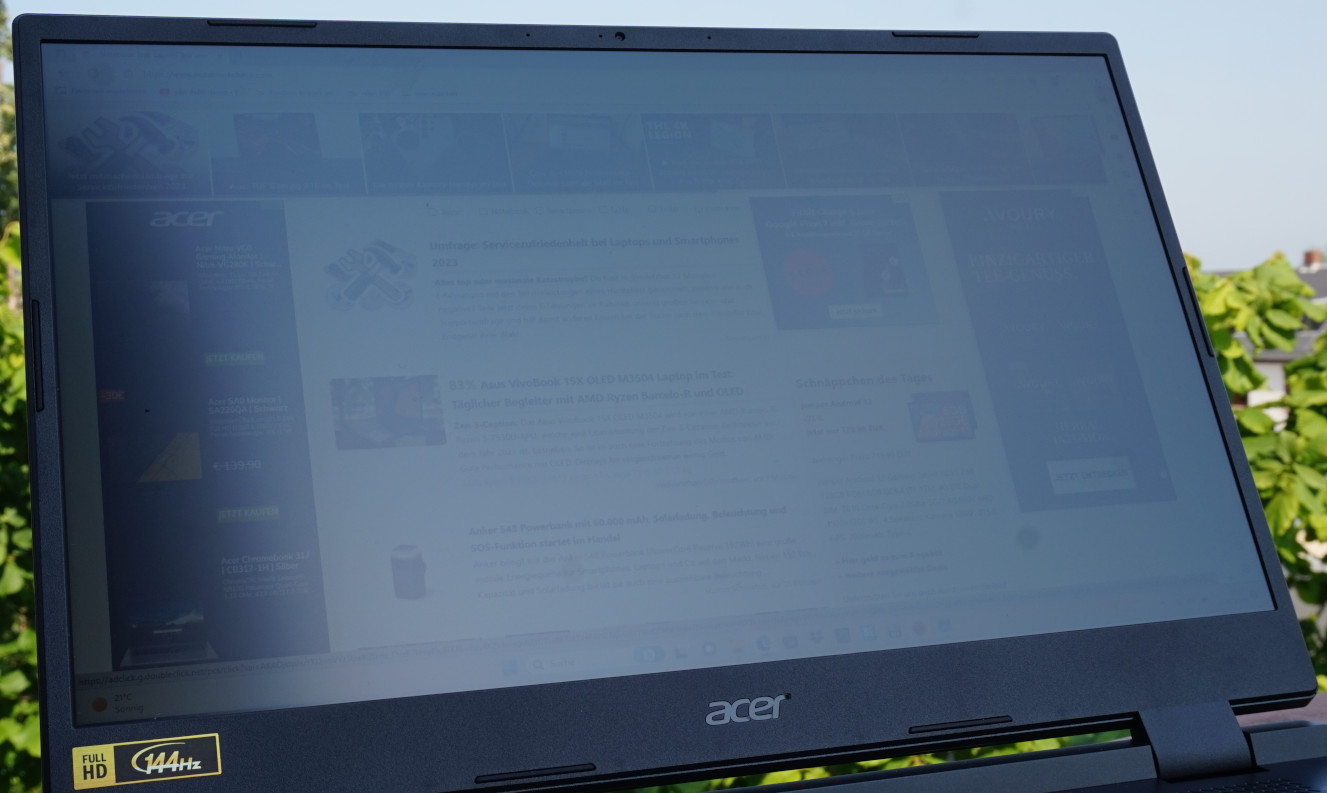
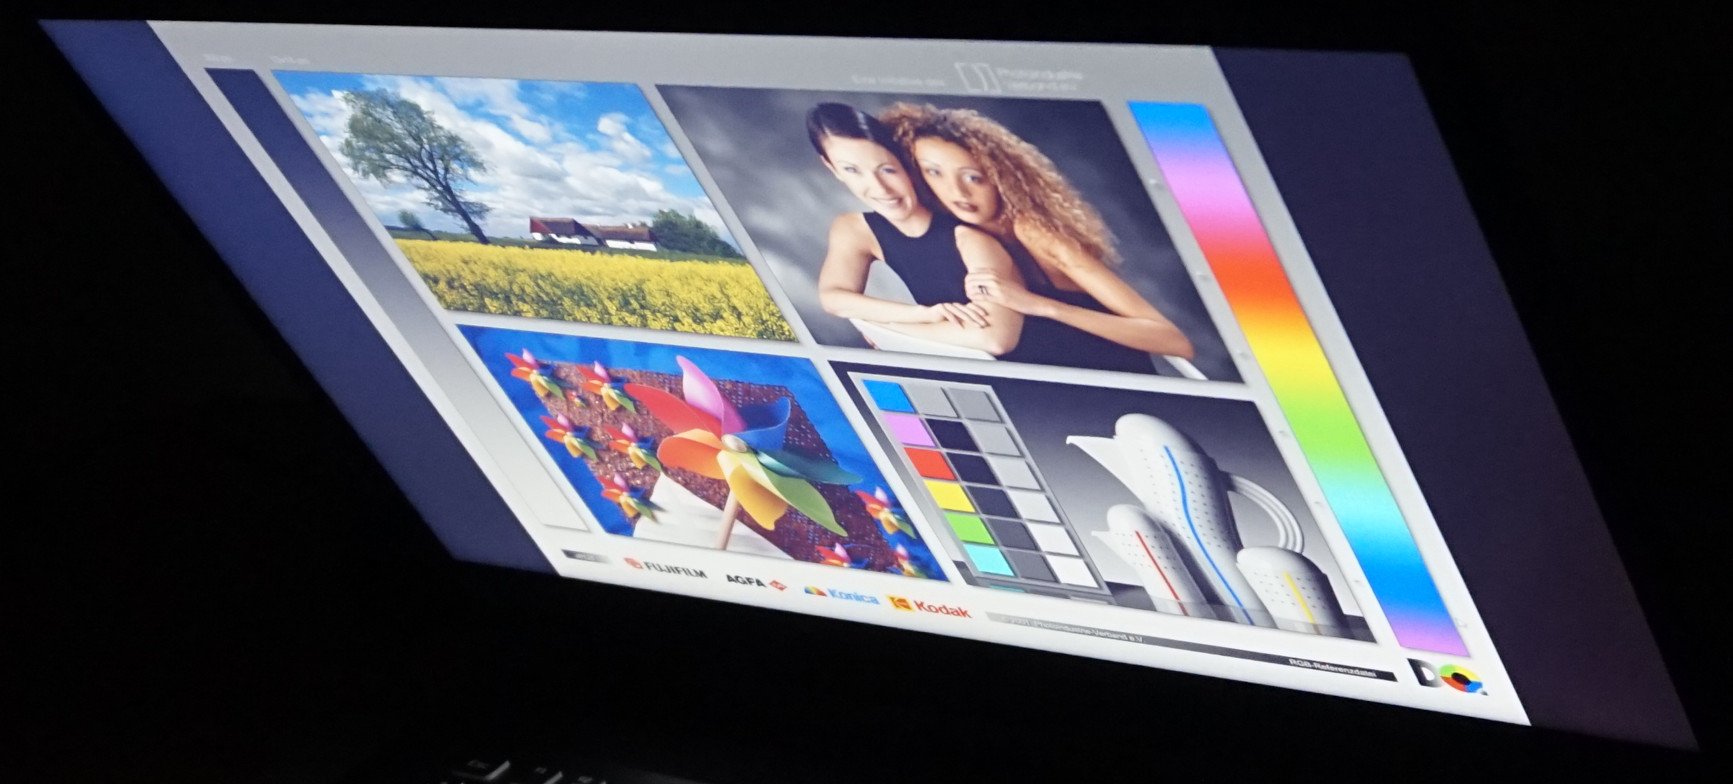
在阴凉处,照片和文字都清晰可辨,即使有点灰暗。只要阳光落在屏幕上或天空从后面反射过来,即使是文字也只能是难以破译。
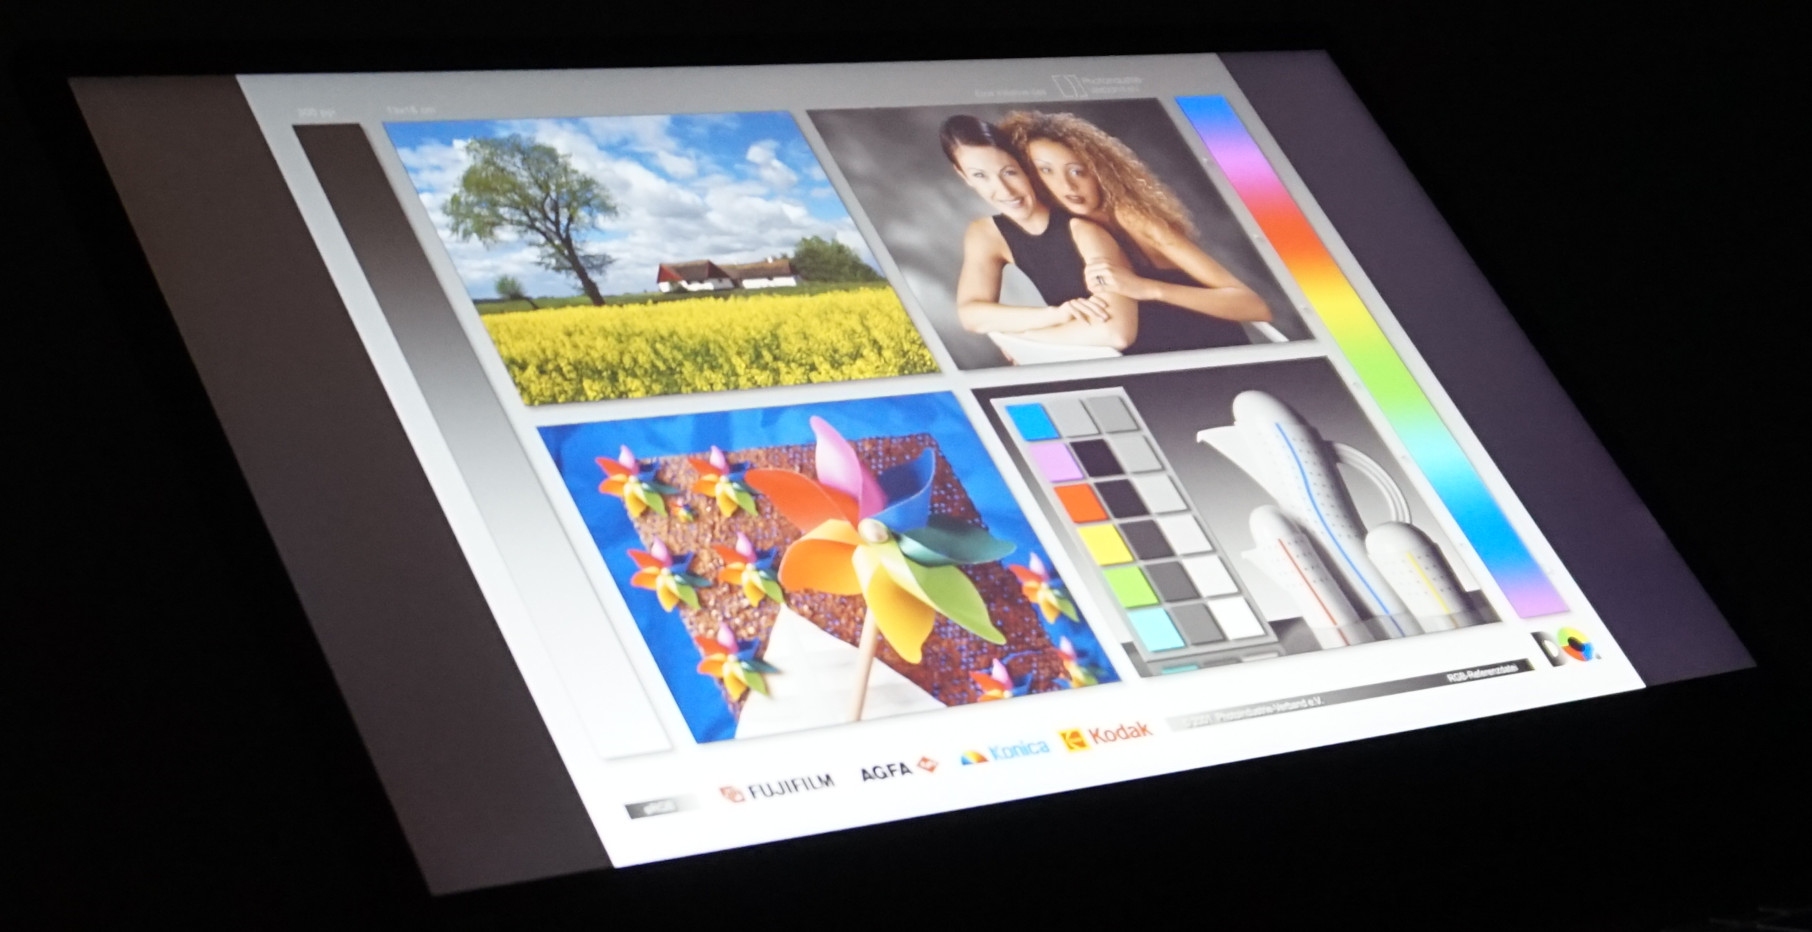
当我们转到可视角度时,对显示屏的失望并没有消退:在45°左右的角度,可以看到明显的色彩失真,向黄色或蓝色转移。对于一个IPS面板来说,这是异常糟糕的表现。
性能--宏碁Nitro 517令人印象深刻,但仅归功于RTX 4050。
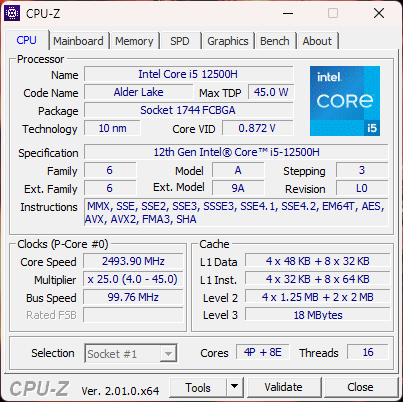
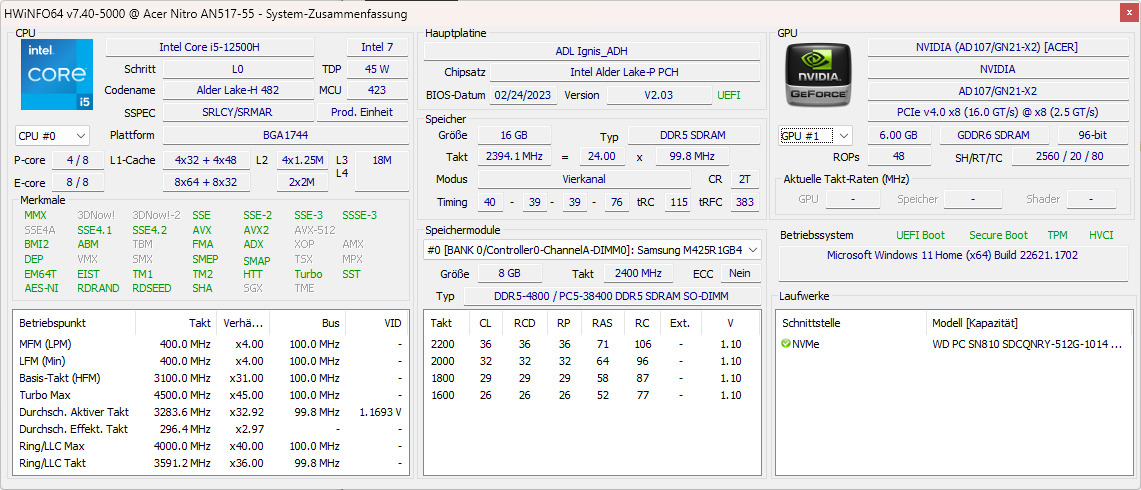
凭借RTX 4000系列中最小的GPU,... RTX 4050,Nitro属于游戏笔记本的入门级产品。这是与2022年初已经推出的芯片,即 英特尔酷睿i5-12500H.它不是一个顶级模型,即使在它被推出时,但仍然为其预期用途提供足够的计算能力。此外,这两个组件可以提供大量的电力,至少在纸面上。CPU的消耗量高达115瓦,而GPU在动态提升的情况下甚至可以达到140瓦。
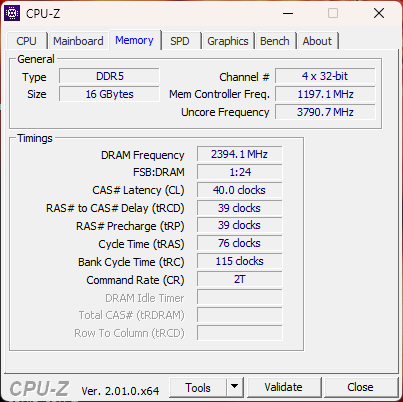
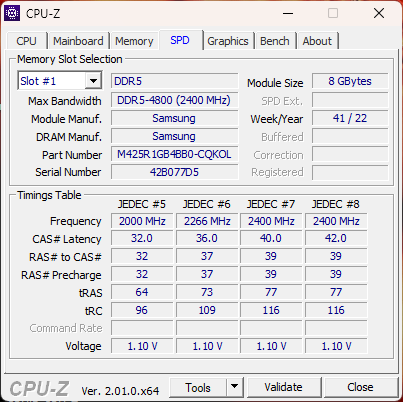
除此之外,我们还有来自三星的16GB DDR5 4800内存,其速度足以满足要求不高的游戏中的高帧率。对于全高清游戏来说,只要你能忍受这里或那里没有一两个细节,基本的东西似乎是相对一致的。
测试条件
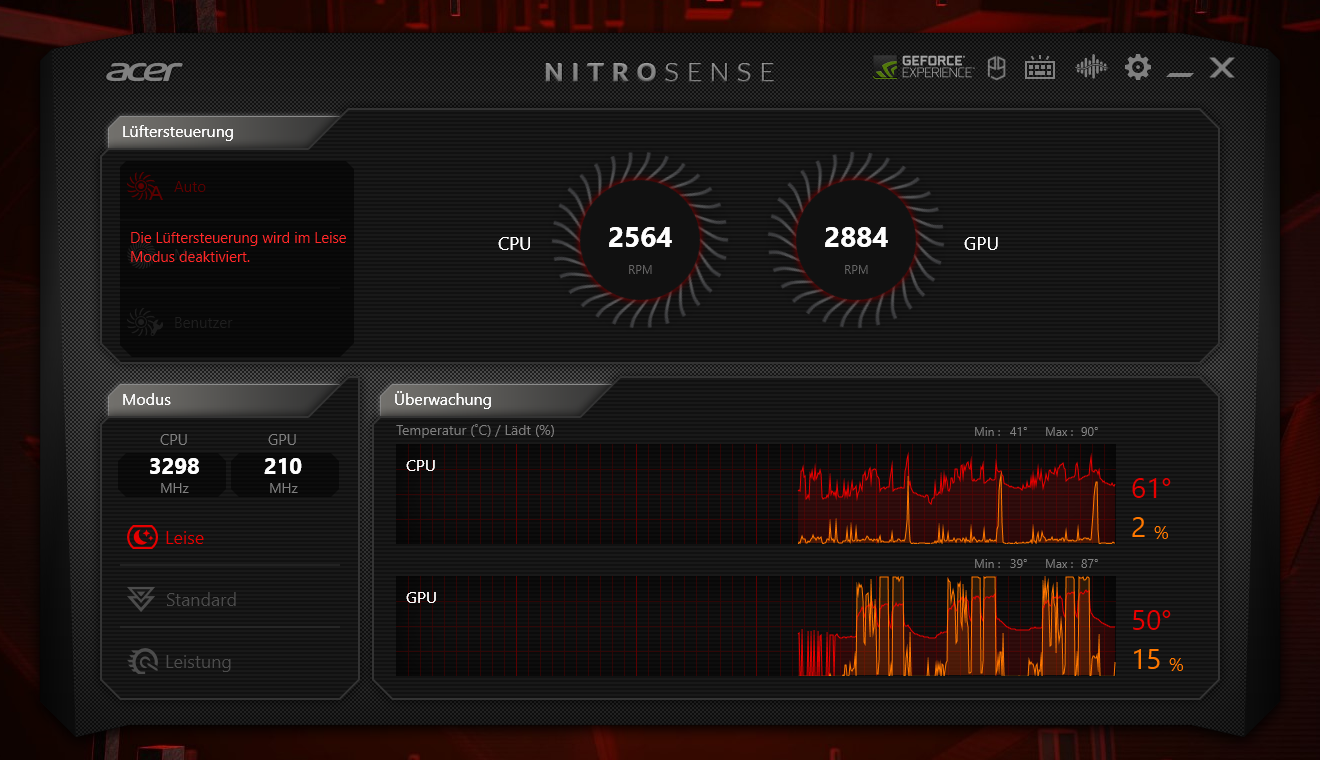
宏碁提供的 "NitroSense "控制软件可以通过一个指定的按钮进入,并允许访问各种性能模式设置以及风扇管理。此外,还可以调整按键照明,选择扬声器声音配置文件,并进行一些基本设置。
对于我们的游戏测试和基准测试,我们选择了 "性能 "配置文件,并保留了自动风扇。使用 "标准 "配置文件,噪音水平大幅降低,而在 "安静 "模式下,冷却声音的音量进一步下降,但仍然持续可闻。
| 性能模式 | 标准模式 | 静音 | 电池模式 | |
| PL1 | 95瓦特 | 80瓦 | 80瓦 | 70瓦 |
| PL2 | 115瓦特 | 115瓦特 | 115瓦特 | 115瓦特 |
处理器
ǞǞǞ 英特尔酷睿i5-12500H这是一个小型处理器--至少对于游戏笔记本电脑来说--提供12个核心,其中4个是性能核心,8个效率核心,共有16个线程。这对于高级别的多任务处理来说是足够的。这款笔记本电脑仍然很容易使用,即使与高要求的程序一起使用。最大的时钟速度只有4.5GHz,而且,18MB的L3缓存也不是特别大。
尽管这些规格相当适中,Cinebench R15循环运行得非常好。例如,Medion公司的Medion Erazer Defender P40在开始的时候,其相当快的i7-13700HX可以多运行30%。 i7-13700HX.在循环结束时,它甚至没有10%的优势。这就是慷慨的冷却的地方,从几乎平缓的一系列测量中可以看出。该处理器可以在较长时间内消耗95瓦,在短时间内消耗115瓦,而不会出现温度急剧上升。
在 "安静 "模式下(Cinebench循环中的绿线)--期间几乎听不到破坏性的噪音--也得到了可靠的结果,平均而言,与微星Cyborg 15 A12F相近。MSI Cyborg 15 A12VF.尽管微星拥有更大的CPU,但Nitro消耗的电力更少。事实上,Nitro 5在这里继续表现良好,是由于减少到70瓦,而短暂的最大115瓦保持不变。在 "标准 "和电池模式下,功率限制为80瓦。
更多的基准和信息可以在这里找到,我们的CPU基准测试列表.
Cinebench R15 Multi continuous test
Cinebench R23: Multi Core | Single Core
Cinebench R20: CPU (Multi Core) | CPU (Single Core)
Cinebench R15: CPU Multi 64Bit | CPU Single 64Bit
Blender: v2.79 BMW27 CPU
7-Zip 18.03: 7z b 4 | 7z b 4 -mmt1
Geekbench 5.5: Multi-Core | Single-Core
HWBOT x265 Benchmark v2.2: 4k Preset
LibreOffice : 20 Documents To PDF
R Benchmark 2.5: Overall mean
| CPU Performance rating | |
| Average of class Gaming | |
| Asus TUF Gaming A16 FA617XS | |
| Medion Erazer Scout E20 | |
| MSI Cyborg 15 A12VF | |
| MSI Katana 15 B12VEK | |
| Acer Nitro 5 AN517-55-738R | |
| Acer Nitro 5 AN517-55-5552 | |
| Average Intel Core i5-12500H | |
| Cinebench R23 / Multi Core | |
| Average of class Gaming (10488 - 42661, n=108, last 2 years) | |
| Asus TUF Gaming A16 FA617XS | |
| Medion Erazer Scout E20 | |
| MSI Katana 15 B12VEK | |
| MSI Cyborg 15 A12VF | |
| Acer Nitro 5 AN517-55-5552 | |
| Acer Nitro 5 AN517-55-738R | |
| Average Intel Core i5-12500H (11330 - 14686, n=9) | |
| Cinebench R23 / Single Core | |
| Average of class Gaming (1166 - 2415, n=108, last 2 years) | |
| Medion Erazer Scout E20 | |
| Acer Nitro 5 AN517-55-738R | |
| Asus TUF Gaming A16 FA617XS | |
| MSI Cyborg 15 A12VF | |
| MSI Katana 15 B12VEK | |
| Average Intel Core i5-12500H (1558 - 1701, n=9) | |
| Acer Nitro 5 AN517-55-5552 | |
| Cinebench R20 / CPU (Multi Core) | |
| Average of class Gaming (4029 - 16433, n=107, last 2 years) | |
| Asus TUF Gaming A16 FA617XS | |
| Medion Erazer Scout E20 | |
| Acer Nitro 5 AN517-55-738R | |
| MSI Katana 15 B12VEK | |
| MSI Cyborg 15 A12VF | |
| Acer Nitro 5 AN517-55-5552 | |
| Average Intel Core i5-12500H (4687 - 5640, n=9) | |
| Cinebench R20 / CPU (Single Core) | |
| Average of class Gaming (442 - 913, n=107, last 2 years) | |
| Medion Erazer Scout E20 | |
| Asus TUF Gaming A16 FA617XS | |
| Acer Nitro 5 AN517-55-738R | |
| MSI Cyborg 15 A12VF | |
| MSI Katana 15 B12VEK | |
| Average Intel Core i5-12500H (602 - 656, n=9) | |
| Acer Nitro 5 AN517-55-5552 | |
| Cinebench R15 / CPU Multi 64Bit | |
| Average of class Gaming (1578 - 6330, n=106, last 2 years) | |
| Medion Erazer Scout E20 | |
| Asus TUF Gaming A16 FA617XS | |
| Acer Nitro 5 AN517-55-738R | |
| MSI Katana 15 B12VEK | |
| Acer Nitro 5 AN517-55-5552 | |
| MSI Cyborg 15 A12VF | |
| Average Intel Core i5-12500H (1970 - 2283, n=10) | |
| Cinebench R15 / CPU Single 64Bit | |
| Average of class Gaming (188.8 - 350, n=107, last 2 years) | |
| Asus TUF Gaming A16 FA617XS | |
| Medion Erazer Scout E20 | |
| Acer Nitro 5 AN517-55-738R | |
| MSI Katana 15 B12VEK | |
| MSI Cyborg 15 A12VF | |
| Average Intel Core i5-12500H (220 - 250, n=9) | |
| Acer Nitro 5 AN517-55-5552 | |
| Blender / v2.79 BMW27 CPU | |
| MSI Cyborg 15 A12VF | |
| Average Intel Core i5-12500H (223 - 288, n=9) | |
| MSI Katana 15 B12VEK | |
| Acer Nitro 5 AN517-55-5552 | |
| Acer Nitro 5 AN517-55-738R | |
| Medion Erazer Scout E20 | |
| Asus TUF Gaming A16 FA617XS | |
| Average of class Gaming (79 - 330, n=105, last 2 years) | |
| 7-Zip 18.03 / 7z b 4 | |
| Average of class Gaming (33491 - 148086, n=106, last 2 years) | |
| Asus TUF Gaming A16 FA617XS | |
| Medion Erazer Scout E20 | |
| MSI Katana 15 B12VEK | |
| MSI Cyborg 15 A12VF | |
| Acer Nitro 5 AN517-55-738R | |
| Acer Nitro 5 AN517-55-5552 | |
| Average Intel Core i5-12500H (44105 - 54380, n=9) | |
| 7-Zip 18.03 / 7z b 4 -mmt1 | |
| Asus TUF Gaming A16 FA617XS | |
| Average of class Gaming (4199 - 7436, n=106, last 2 years) | |
| Medion Erazer Scout E20 | |
| MSI Cyborg 15 A12VF | |
| Acer Nitro 5 AN517-55-738R | |
| MSI Katana 15 B12VEK | |
| Average Intel Core i5-12500H (5151 - 5563, n=9) | |
| Acer Nitro 5 AN517-55-5552 | |
| Geekbench 5.5 / Multi-Core | |
| Average of class Gaming (6460 - 28263, n=106, last 2 years) | |
| Acer Nitro 5 AN517-55-738R | |
| Medion Erazer Scout E20 | |
| Asus TUF Gaming A16 FA617XS | |
| MSI Katana 15 B12VEK | |
| MSI Cyborg 15 A12VF | |
| Acer Nitro 5 AN517-55-5552 | |
| Average Intel Core i5-12500H (7962 - 10828, n=9) | |
| Geekbench 5.5 / Single-Core | |
| Average of class Gaming (986 - 2474, n=106, last 2 years) | |
| Asus TUF Gaming A16 FA617XS | |
| Medion Erazer Scout E20 | |
| MSI Cyborg 15 A12VF | |
| Acer Nitro 5 AN517-55-738R | |
| MSI Katana 15 B12VEK | |
| Average Intel Core i5-12500H (1471 - 1693, n=9) | |
| Acer Nitro 5 AN517-55-5552 | |
| HWBOT x265 Benchmark v2.2 / 4k Preset | |
| Average of class Gaming (11.5 - 44.4, n=106, last 2 years) | |
| Asus TUF Gaming A16 FA617XS | |
| MSI Katana 15 B12VEK | |
| Medion Erazer Scout E20 | |
| Acer Nitro 5 AN517-55-5552 | |
| MSI Cyborg 15 A12VF | |
| MSI Cyborg 15 A12VF | |
| Average Intel Core i5-12500H (12 - 16.6, n=9) | |
| Acer Nitro 5 AN517-55-738R | |
| LibreOffice / 20 Documents To PDF | |
| Acer Nitro 5 AN517-55-5552 | |
| Acer Nitro 5 AN517-55-738R | |
| Average of class Gaming (33.2 - 88.8, n=106, last 2 years) | |
| Average Intel Core i5-12500H (40.1 - 58.5, n=9) | |
| MSI Katana 15 B12VEK | |
| Medion Erazer Scout E20 | |
| Asus TUF Gaming A16 FA617XS | |
| MSI Cyborg 15 A12VF | |
| R Benchmark 2.5 / Overall mean | |
| Acer Nitro 5 AN517-55-5552 | |
| Average Intel Core i5-12500H (0.4748 - 0.535, n=9) | |
| MSI Katana 15 B12VEK | |
| MSI Cyborg 15 A12VF | |
| Acer Nitro 5 AN517-55-738R | |
| Medion Erazer Scout E20 | |
| Average of class Gaming (0.3439 - 0.759, n=107, last 2 years) | |
| Asus TUF Gaming A16 FA617XS | |
* ... smaller is better
AIDA64: FP32 Ray-Trace | FPU Julia | CPU SHA3 | CPU Queen | FPU SinJulia | FPU Mandel | CPU AES | CPU ZLib | FP64 Ray-Trace | CPU PhotoWorxx
| Performance rating | |
| Average of class Gaming | |
| Asus TUF Gaming A16 FA617XS | |
| Medion Erazer Scout E20 | |
| MSI Katana 15 B12VEK | |
| MSI Cyborg 15 A12VF | |
| Acer Nitro 5 AN517-55-5552 | |
| Average Intel Core i5-12500H | |
| Acer Nitro 5 AN517-55-738R | |
| AIDA64 / FP32 Ray-Trace | |
| Average of class Gaming (10227 - 85542, n=106, last 2 years) | |
| Asus TUF Gaming A16 FA617XS (v6.75.6100) | |
| MSI Katana 15 B12VEK (v6.85.6300) | |
| Medion Erazer Scout E20 (v6.75.6100) | |
| Acer Nitro 5 AN517-55-5552 (v6.75.6100) | |
| MSI Cyborg 15 A12VF (v6.75.6100) | |
| Average Intel Core i5-12500H (6851 - 13947, n=9) | |
| Acer Nitro 5 AN517-55-738R (v6.50.5800) | |
| AIDA64 / FPU Julia | |
| Average of class Gaming (51376 - 372155, n=106, last 2 years) | |
| Asus TUF Gaming A16 FA617XS (v6.75.6100) | |
| MSI Katana 15 B12VEK (v6.85.6300) | |
| Medion Erazer Scout E20 | |
| MSI Cyborg 15 A12VF (v6.75.6100) | |
| Acer Nitro 5 AN517-55-5552 (v6.75.6100) | |
| Average Intel Core i5-12500H (29874 - 68178, n=9) | |
| Acer Nitro 5 AN517-55-738R (v6.50.5800) | |
| AIDA64 / CPU SHA3 | |
| Average of class Gaming (2180 - 10115, n=106, last 2 years) | |
| Asus TUF Gaming A16 FA617XS (v6.75.6100) | |
| MSI Katana 15 B12VEK (v6.85.6300) | |
| Medion Erazer Scout E20 (v6.75.6100) | |
| Acer Nitro 5 AN517-55-5552 (v6.75.6100) | |
| MSI Cyborg 15 A12VF (v6.75.6100) | |
| Average Intel Core i5-12500H (2287 - 3337, n=9) | |
| Acer Nitro 5 AN517-55-738R (v6.50.5800) | |
| AIDA64 / CPU Queen | |
| Asus TUF Gaming A16 FA617XS (v6.75.6100) | |
| Average of class Gaming (49785 - 173351, n=90, last 2 years) | |
| Medion Erazer Scout E20 (v6.75.6100) | |
| Acer Nitro 5 AN517-55-738R (v6.50.5800) | |
| MSI Katana 15 B12VEK (v6.85.6300) | |
| MSI Cyborg 15 A12VF (v6.75.6100) | |
| Average Intel Core i5-12500H (77935 - 80703, n=9) | |
| Acer Nitro 5 AN517-55-5552 (v6.75.6100) | |
| AIDA64 / FPU SinJulia | |
| Asus TUF Gaming A16 FA617XS (v6.75.6100) | |
| Average of class Gaming (4424 - 33636, n=106, last 2 years) | |
| Medion Erazer Scout E20 (v6.75.6100) | |
| Acer Nitro 5 AN517-55-738R (v6.50.5800) | |
| MSI Katana 15 B12VEK (v6.85.6300) | |
| MSI Cyborg 15 A12VF (v6.75.6100) | |
| Acer Nitro 5 AN517-55-5552 (v6.75.6100) | |
| Average Intel Core i5-12500H (6590 - 7431, n=9) | |
| AIDA64 / FPU Mandel | |
| Average of class Gaming (25115 - 196829, n=106, last 2 years) | |
| Asus TUF Gaming A16 FA617XS (v6.75.6100) | |
| MSI Katana 15 B12VEK (v6.85.6300) | |
| Medion Erazer Scout E20 (v6.75.6100) | |
| Acer Nitro 5 AN517-55-5552 (v6.75.6100) | |
| MSI Cyborg 15 A12VF (v6.75.6100) | |
| Average Intel Core i5-12500H (18252 - 34041, n=9) | |
| Acer Nitro 5 AN517-55-738R (v6.50.5800) | |
| AIDA64 / CPU AES | |
| Average of class Gaming (39258 - 247074, n=106, last 2 years) | |
| Average Intel Core i5-12500H (50298 - 111567, n=9) | |
| Asus TUF Gaming A16 FA617XS (v6.75.6100) | |
| Medion Erazer Scout E20 (v6.75.6100) | |
| MSI Katana 15 B12VEK (v6.85.6300) | |
| MSI Cyborg 15 A12VF (v6.75.6100) | |
| Acer Nitro 5 AN517-55-5552 (v6.75.6100) | |
| Acer Nitro 5 AN517-55-738R (v6.50.5800) | |
| AIDA64 / CPU ZLib | |
| Average of class Gaming (574 - 2531, n=106, last 2 years) | |
| Asus TUF Gaming A16 FA617XS (v6.75.6100) | |
| Medion Erazer Scout E20 (v6.75.6100) | |
| Acer Nitro 5 AN517-55-738R (v6.50.5800) | |
| Acer Nitro 5 AN517-55-5552 (v6.75.6100) | |
| MSI Cyborg 15 A12VF (v6.75.6100) | |
| MSI Katana 15 B12VEK (v6.85.6300) | |
| Average Intel Core i5-12500H (746 - 924, n=9) | |
| AIDA64 / FP64 Ray-Trace | |
| Average of class Gaming (5509 - 45446, n=106, last 2 years) | |
| Asus TUF Gaming A16 FA617XS (v6.75.6100) | |
| MSI Katana 15 B12VEK (v6.85.6300) | |
| Medion Erazer Scout E20 (v6.75.6100) | |
| Acer Nitro 5 AN517-55-5552 (v6.75.6100) | |
| MSI Cyborg 15 A12VF (v6.75.6100) | |
| Average Intel Core i5-12500H (3848 - 7405, n=9) | |
| Acer Nitro 5 AN517-55-738R (v6.50.5800) | |
| AIDA64 / CPU PhotoWorxx | |
| Average of class Gaming (12271 - 89891, n=106, last 2 years) | |
| Medion Erazer Scout E20 (v6.75.6100) | |
| MSI Katana 15 B12VEK (v6.85.6300) | |
| MSI Cyborg 15 A12VF (v6.75.6100) | |
| Acer Nitro 5 AN517-55-5552 (v6.75.6100) | |
| Average Intel Core i5-12500H (13686 - 43813, n=9) | |
| Asus TUF Gaming A16 FA617XS (v6.75.6100) | |
| Acer Nitro 5 AN517-55-738R (v6.50.5800) | |
系统性能
由于CPU并不强大,CrossMark和PCMark的结果也不完全是令人激动的。相似的游戏笔记本电脑可以实现额外的几个百分点。
尽管如此,我们面对的是一个强大的16线程处理器,它在处理多任务、启动程序以及安装和卸载过程方面没有任何困难。打开浏览器、播放视频和其他日常任务都可以完成,没有任何滞后可言。
CrossMark: Overall | Productivity | Creativity | Responsiveness
| PCMark 10 / Score | |
| Average of class Gaming (5828 - 12414, n=94, last 2 years) | |
| Asus TUF Gaming A16 FA617XS | |
| Medion Erazer Scout E20 | |
| MSI Cyborg 15 A12VF | |
| MSI Katana 15 B12VEK | |
| Acer Nitro 5 AN517-55-5552 | |
| Average Intel Core i5-12500H, NVIDIA GeForce RTX 4050 Laptop GPU (6220 - 6719, n=2) | |
| Gigabyte G7 KE | |
| PCMark 10 / Essentials | |
| Medion Erazer Scout E20 | |
| Asus TUF Gaming A16 FA617XS | |
| MSI Cyborg 15 A12VF | |
| Average of class Gaming (8810 - 11935, n=98, last 2 years) | |
| Gigabyte G7 KE | |
| MSI Katana 15 B12VEK | |
| Acer Nitro 5 AN517-55-5552 | |
| Average Intel Core i5-12500H, NVIDIA GeForce RTX 4050 Laptop GPU (9418 - 9985, n=2) | |
| PCMark 10 / Productivity | |
| Average of class Gaming (6845 - 25323, n=96, last 2 years) | |
| Asus TUF Gaming A16 FA617XS | |
| MSI Cyborg 15 A12VF | |
| Medion Erazer Scout E20 | |
| MSI Katana 15 B12VEK | |
| Gigabyte G7 KE | |
| Acer Nitro 5 AN517-55-5552 | |
| Average Intel Core i5-12500H, NVIDIA GeForce RTX 4050 Laptop GPU (8822 - 8980, n=2) | |
| PCMark 10 / Digital Content Creation | |
| Average of class Gaming (7602 - 19954, n=96, last 2 years) | |
| Asus TUF Gaming A16 FA617XS | |
| Medion Erazer Scout E20 | |
| Acer Nitro 5 AN517-55-5552 | |
| MSI Cyborg 15 A12VF | |
| MSI Katana 15 B12VEK | |
| Average Intel Core i5-12500H, NVIDIA GeForce RTX 4050 Laptop GPU (7862 - 9180, n=2) | |
| Gigabyte G7 KE | |
| CrossMark / Overall | |
| Average of class Gaming (1366 - 2409, n=95, last 2 years) | |
| Medion Erazer Scout E20 | |
| Gigabyte G7 KE | |
| MSI Cyborg 15 A12VF | |
| Asus TUF Gaming A16 FA617XS | |
| Acer Nitro 5 AN517-55-5552 | |
| MSI Katana 15 B12VEK | |
| Average Intel Core i5-12500H, NVIDIA GeForce RTX 4050 Laptop GPU (1702 - 1726, n=2) | |
| CrossMark / Productivity | |
| Medion Erazer Scout E20 | |
| Average of class Gaming (1386 - 2254, n=95, last 2 years) | |
| Gigabyte G7 KE | |
| MSI Cyborg 15 A12VF | |
| Asus TUF Gaming A16 FA617XS | |
| Acer Nitro 5 AN517-55-5552 | |
| Average Intel Core i5-12500H, NVIDIA GeForce RTX 4050 Laptop GPU (1648 - 1675, n=2) | |
| MSI Katana 15 B12VEK | |
| CrossMark / Creativity | |
| Average of class Gaming (1343 - 2786, n=95, last 2 years) | |
| Medion Erazer Scout E20 | |
| Asus TUF Gaming A16 FA617XS | |
| MSI Cyborg 15 A12VF | |
| MSI Katana 15 B12VEK | |
| Gigabyte G7 KE | |
| Acer Nitro 5 AN517-55-5552 | |
| Average Intel Core i5-12500H, NVIDIA GeForce RTX 4050 Laptop GPU (1752 - 1775, n=2) | |
| CrossMark / Responsiveness | |
| Gigabyte G7 KE | |
| Medion Erazer Scout E20 | |
| Acer Nitro 5 AN517-55-5552 | |
| Average Intel Core i5-12500H, NVIDIA GeForce RTX 4050 Laptop GPU (1718 - 1736, n=2) | |
| Average of class Gaming (1226 - 2334, n=95, last 2 years) | |
| MSI Cyborg 15 A12VF | |
| MSI Katana 15 B12VEK | |
| Asus TUF Gaming A16 FA617XS | |
| PCMark 10 Score | 6719 points | |
Help | ||
| AIDA64 / Memory Copy | |
| Average of class Gaming (21750 - 129946, n=106, last 2 years) | |
| Asus TUF Gaming A16 FA617XS | |
| Medion Erazer Scout E20 | |
| MSI Cyborg 15 A12VF | |
| MSI Katana 15 B12VEK | |
| Acer Nitro 5 AN517-55-5552 | |
| Average Intel Core i5-12500H (23850 - 66598, n=9) | |
| Acer Nitro 5 AN517-55-738R | |
| AIDA64 / Memory Read | |
| Average of class Gaming (22956 - 118858, n=106, last 2 years) | |
| Medion Erazer Scout E20 | |
| MSI Katana 15 B12VEK | |
| MSI Cyborg 15 A12VF | |
| Asus TUF Gaming A16 FA617XS | |
| Acer Nitro 5 AN517-55-5552 | |
| Average Intel Core i5-12500H (24879 - 68013, n=9) | |
| Acer Nitro 5 AN517-55-738R | |
| AIDA64 / Memory Write | |
| Average of class Gaming (22297 - 135096, n=106, last 2 years) | |
| Asus TUF Gaming A16 FA617XS | |
| Medion Erazer Scout E20 | |
| MSI Katana 15 B12VEK | |
| MSI Cyborg 15 A12VF | |
| Acer Nitro 5 AN517-55-5552 | |
| Acer Nitro 5 AN517-55-738R | |
| Average Intel Core i5-12500H (23543 - 58797, n=9) | |
| AIDA64 / Memory Latency | |
| Average of class Gaming (75.3 - 259, n=106, last 2 years) | |
| Acer Nitro 5 AN517-55-5552 | |
| Average Intel Core i5-12500H (83.8 - 114.7, n=9) | |
| Medion Erazer Scout E20 | |
| MSI Katana 15 B12VEK | |
| MSI Cyborg 15 A12VF | |
| Asus TUF Gaming A16 FA617XS | |
| Acer Nitro 5 AN517-55-738R | |
* ... smaller is better
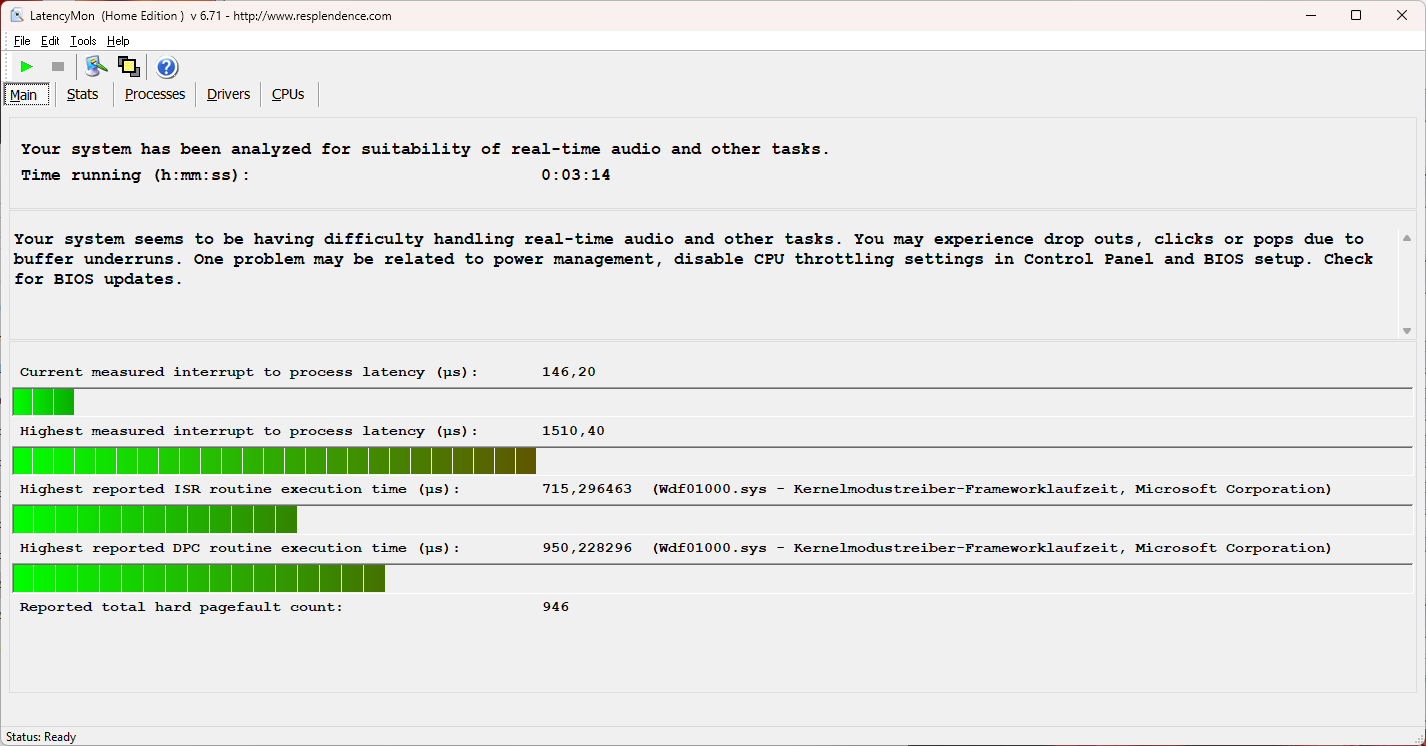
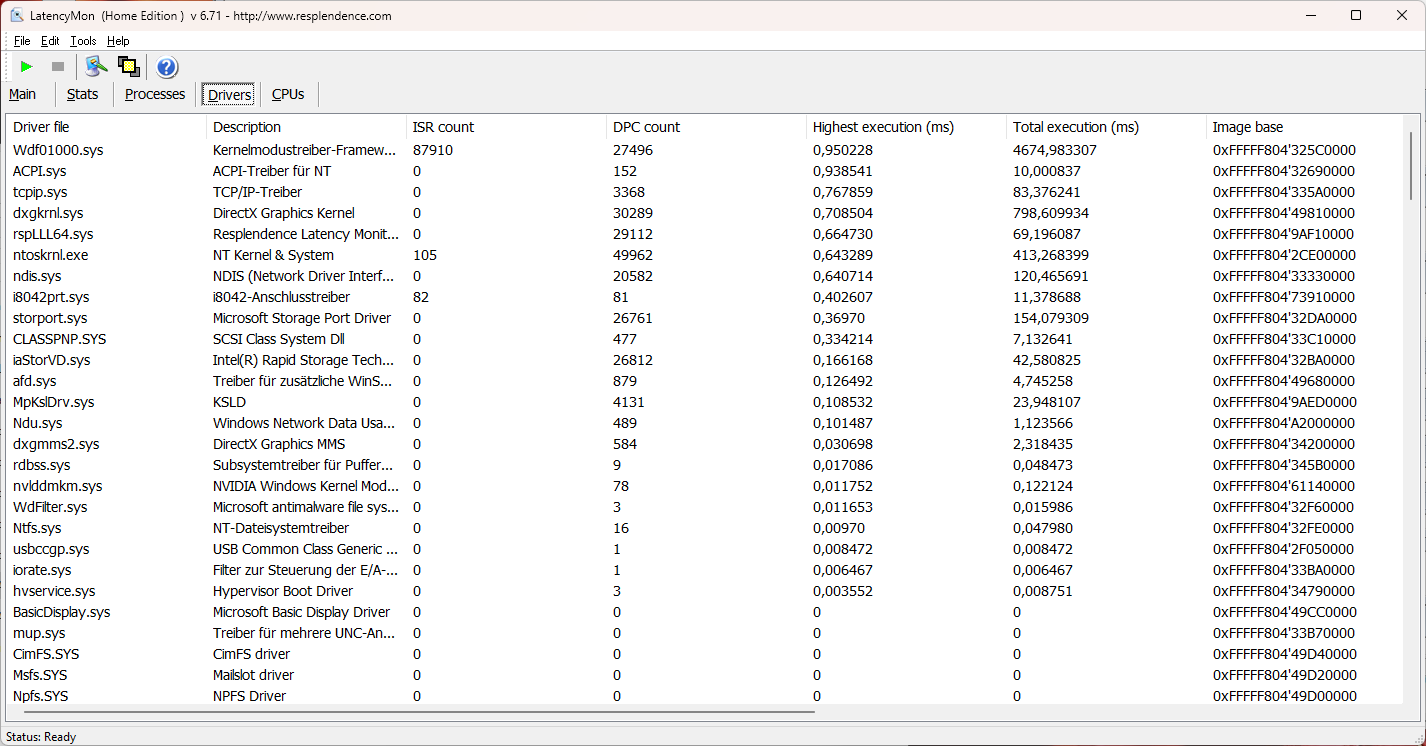
DPC延迟
我们的LatencyMon测试非常稳固。对于实时音频编辑等特殊测试,宏碁Nitro 5只提供了有限的适用性,但仍然能够处理,很少出现故障。
目前,Nvidia驱动程序对测得的性能下降有贡献。更新和普遍改变或删除的驱动程序可以进一步改善或大大恶化结果。
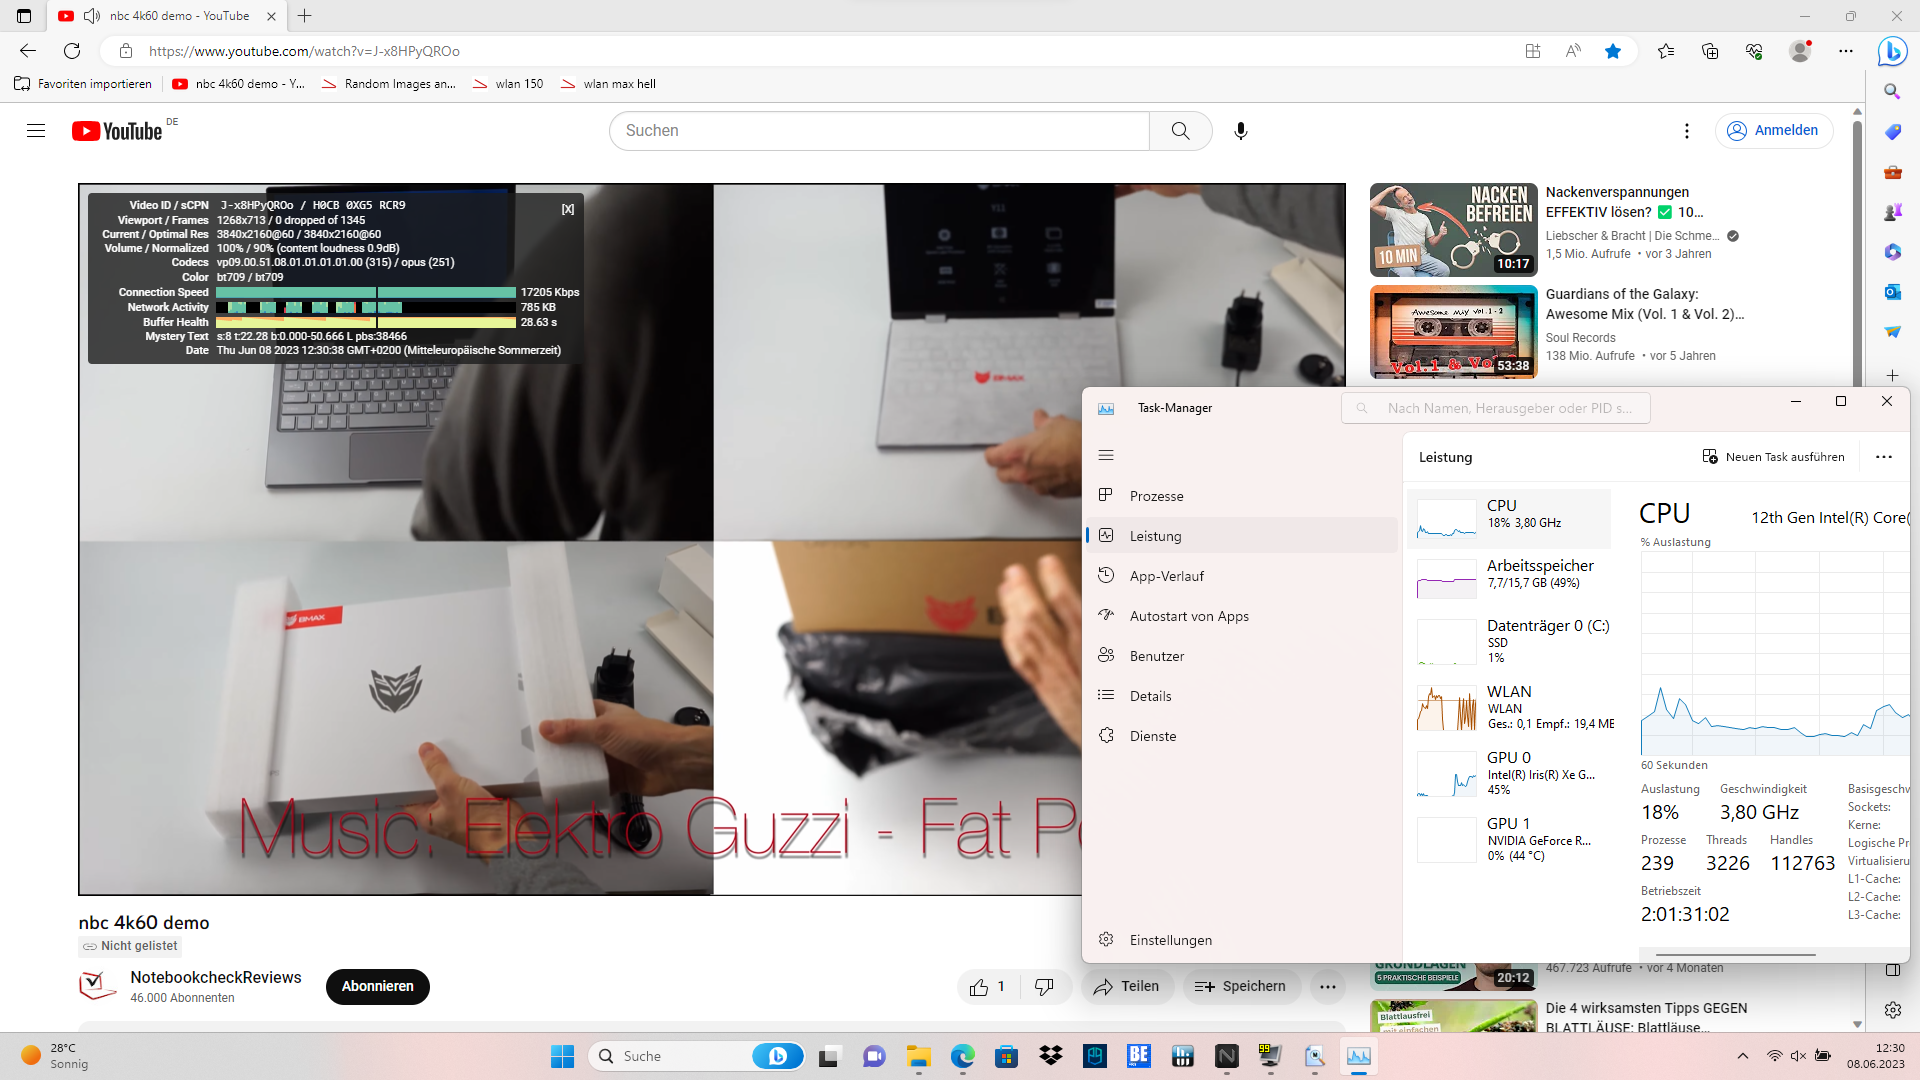
4K视频播放并行运行没有问题。没有检测到跳过的帧。iGPU的超载率几乎为40%,这可以归咎于大多数Alder Lake处理器。
| DPC Latencies / LatencyMon - interrupt to process latency (max), Web, Youtube, Prime95 | |
| MSI Katana 15 B12VEK | |
| Medion Erazer Scout E20 | |
| Acer Nitro 5 AN517-55-5552 | |
| MSI Cyborg 15 A12VF | |
| Asus TUF Gaming A16 FA617XS | |
| Acer Nitro 5 AN517-55-738R | |
* ... smaller is better
大容量存储
西部数据的M.2 NVMe固态硬盘取得了优异的成绩,比我们评测的游戏笔记本的大容量存储的平均水平要好。
尽管有一个被动冷却的控制器,它无法在连续测试中保持非常高的访问率,但仍然取得了平均超过6GB/s的成绩。

* ... smaller is better
Continuous Performance Read: DiskSpd Read Loop, Queue Depth 8
图形卡
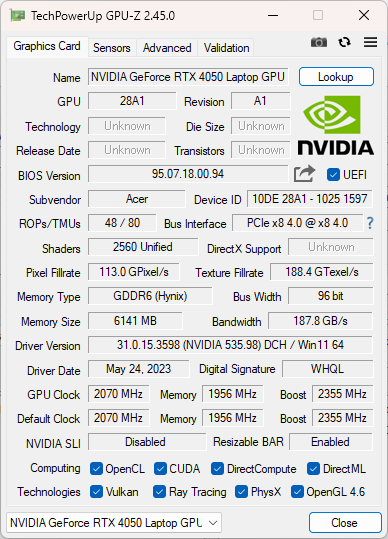
的NvidiaGeForce RTX 4050是RTX 4000系列的入门级模型,其性能水平可与 RTX 3060.与前一代不同,该GPU的TDP为140瓦,包括25瓦的动态提升。而RTX 3050的最大功率为105瓦。RTX 3050(但也有140瓦的RTX 3060).
Acer Nitro 5的 RTX 4050只有在极端情况下才能达到这个数值。在显卡压力测试中,我们简短地测量了最大可能的140瓦,但是,除此之外,在最高性能和最大风扇速度下的功耗坐在100瓦左右,因为达到GPU的临界温度是导致时钟速度下降的原因。在较长的时间内,例如,在Witcher 3 连续测试中,只有80瓦持续可用,在安静模式下,只有50瓦。
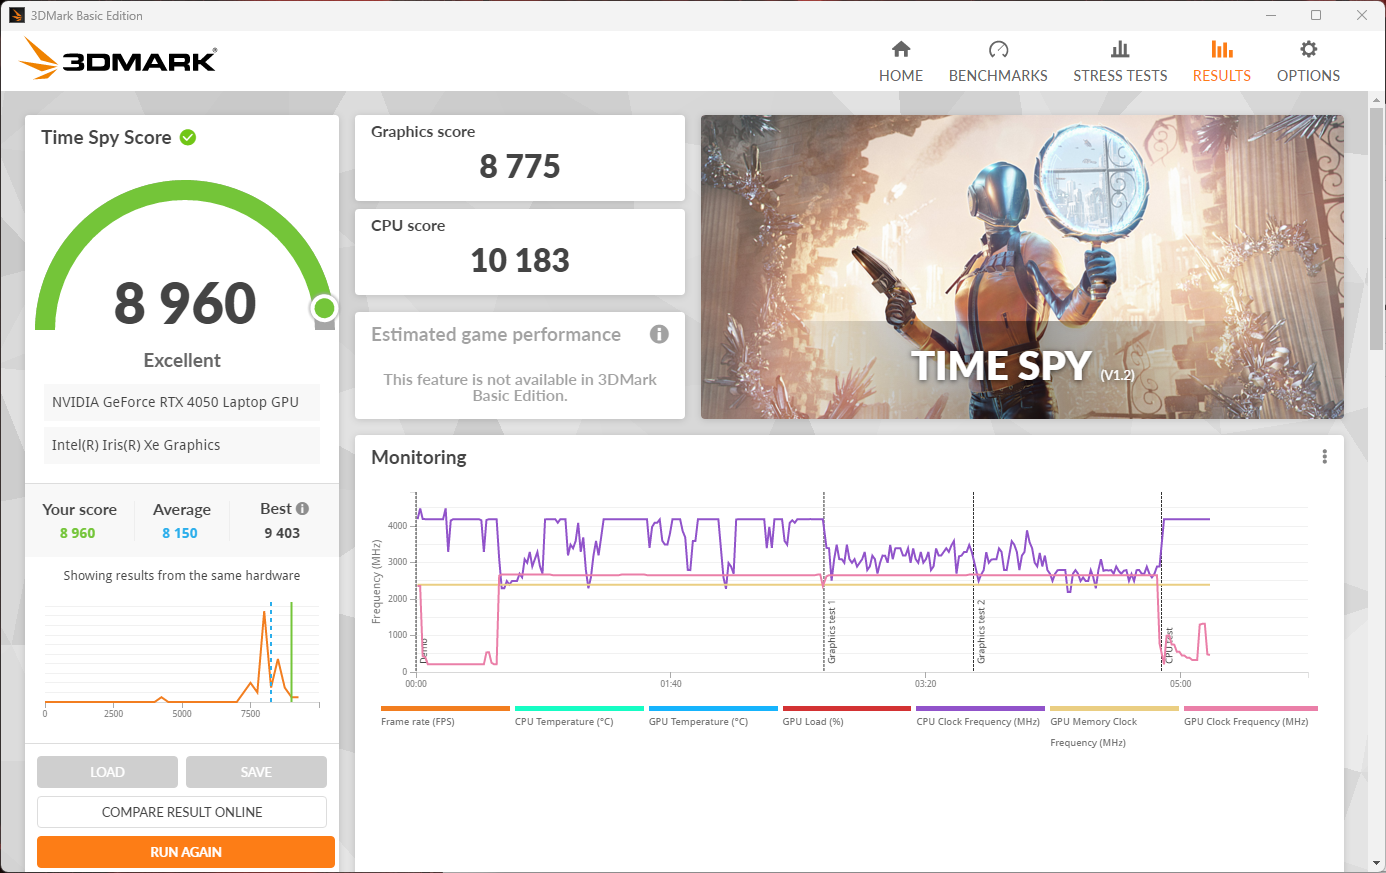
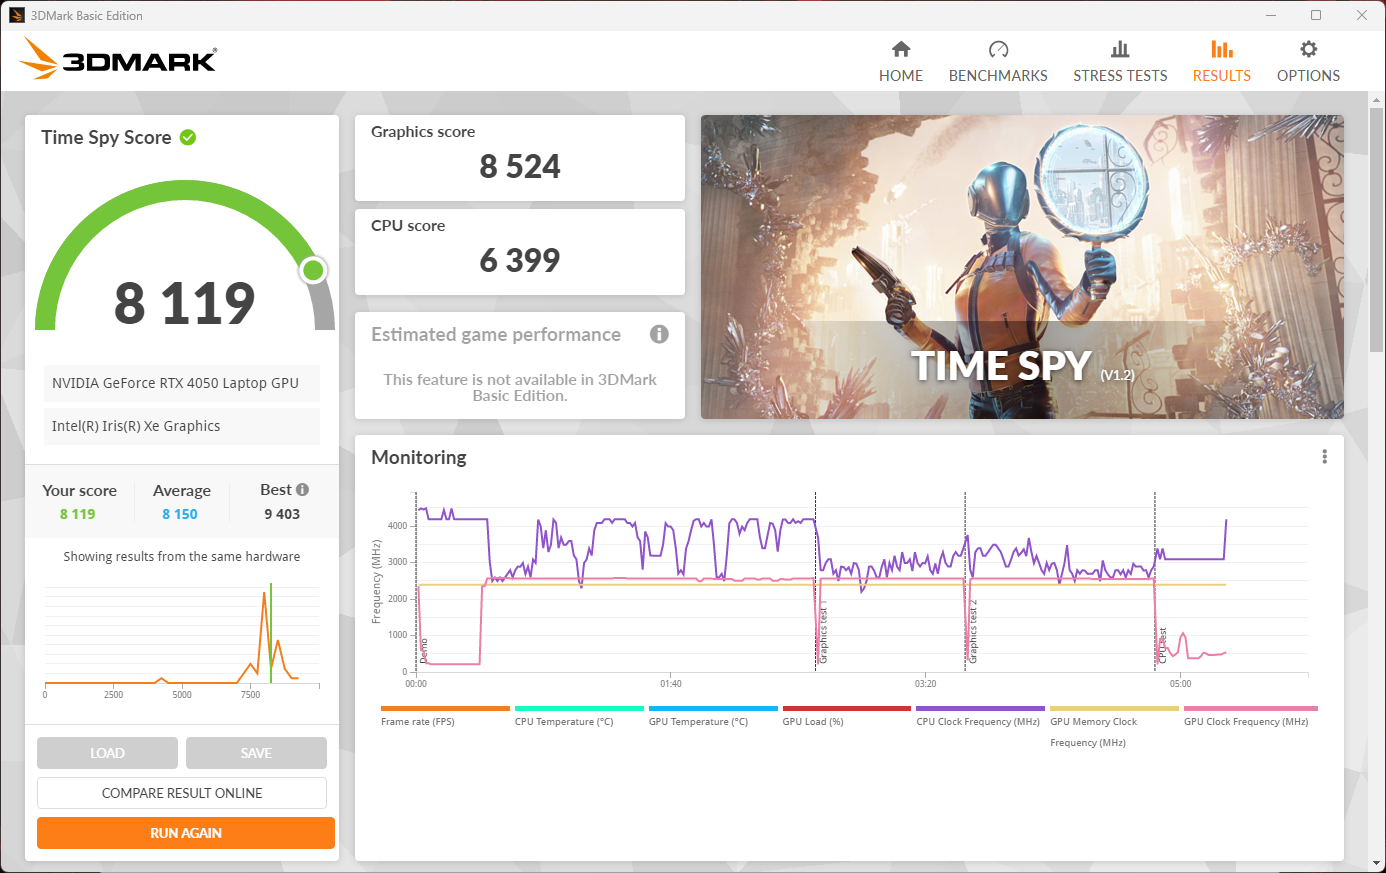
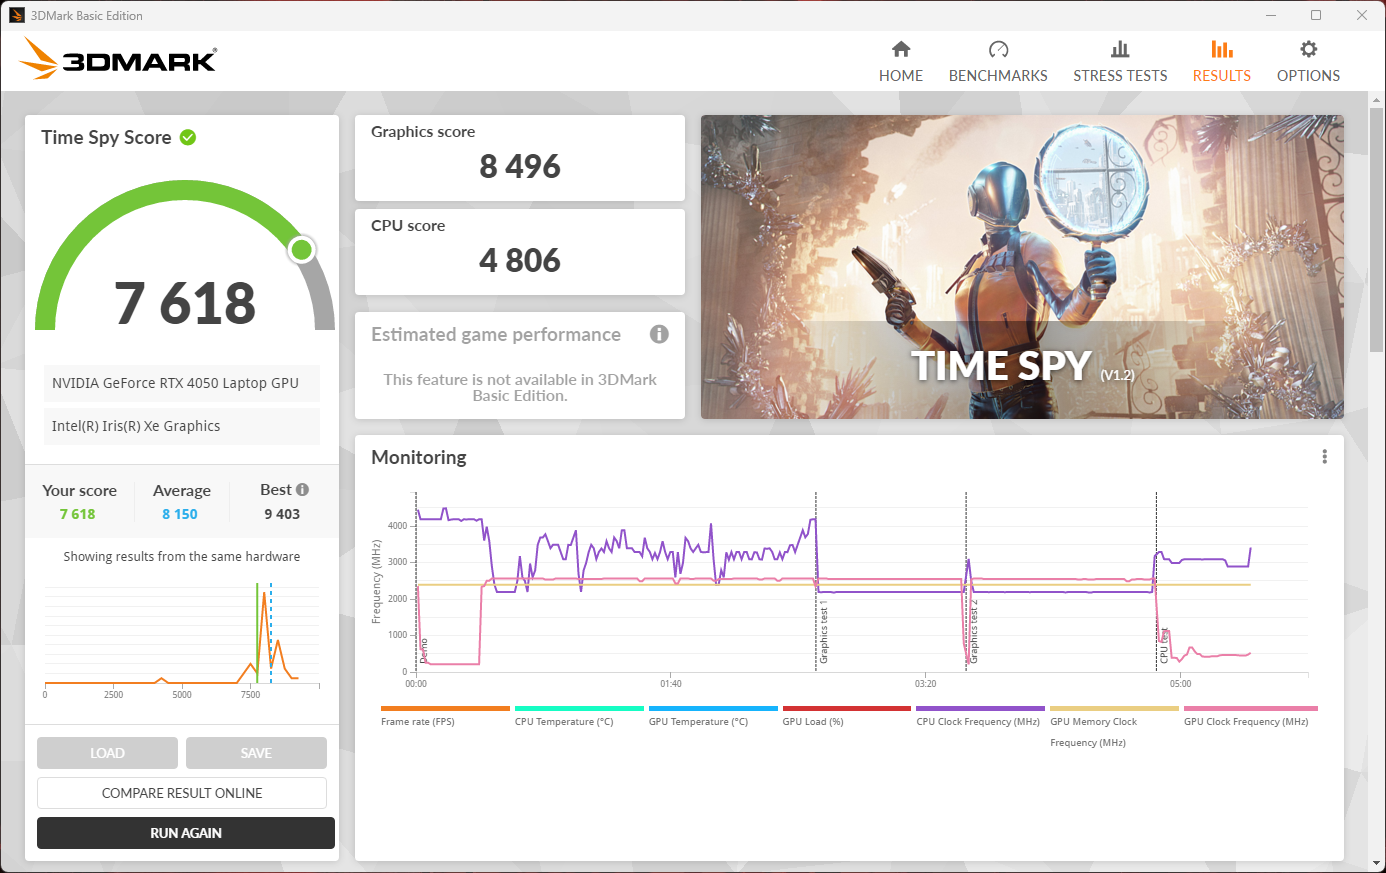
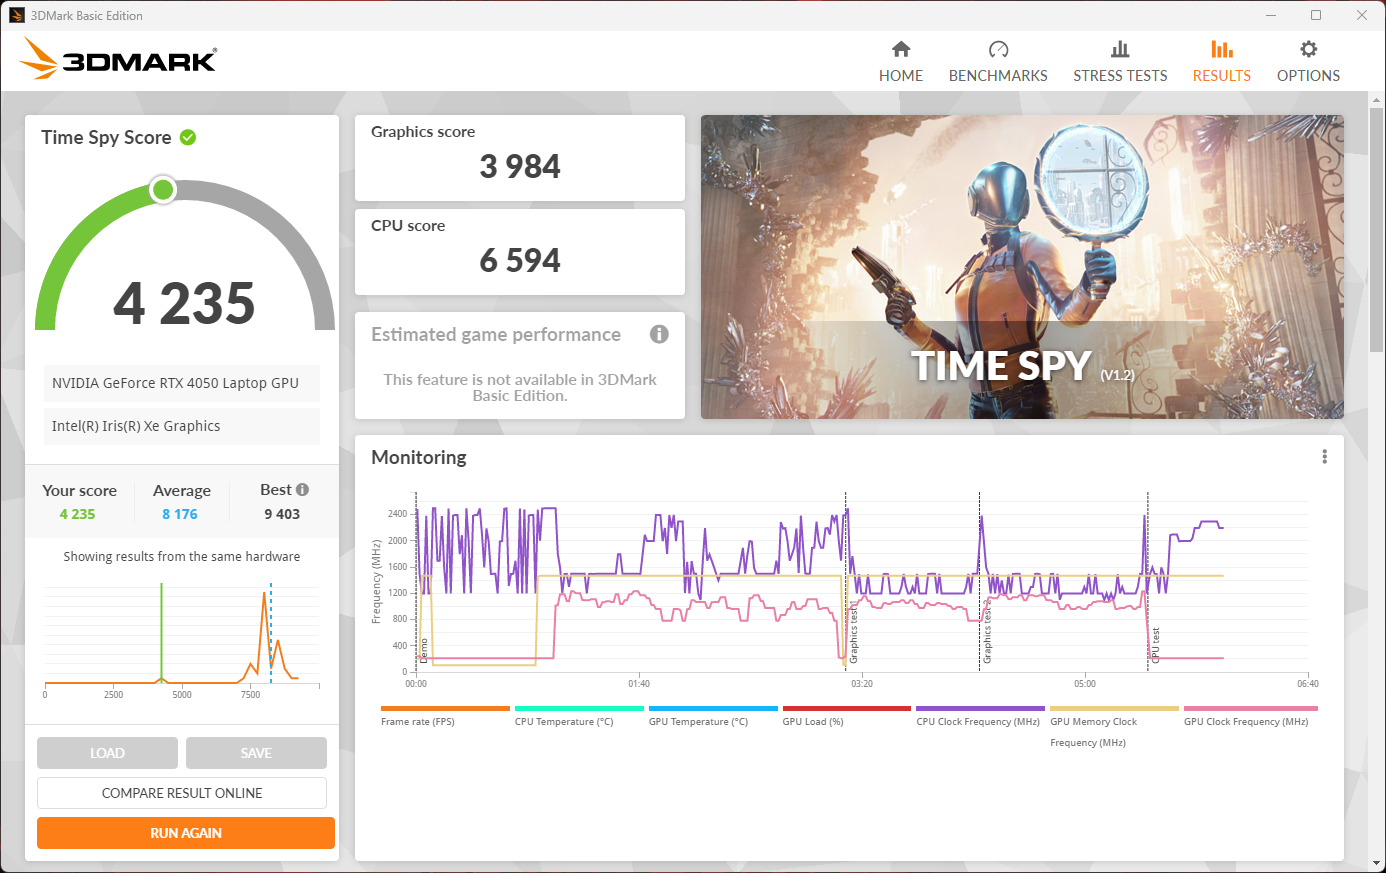
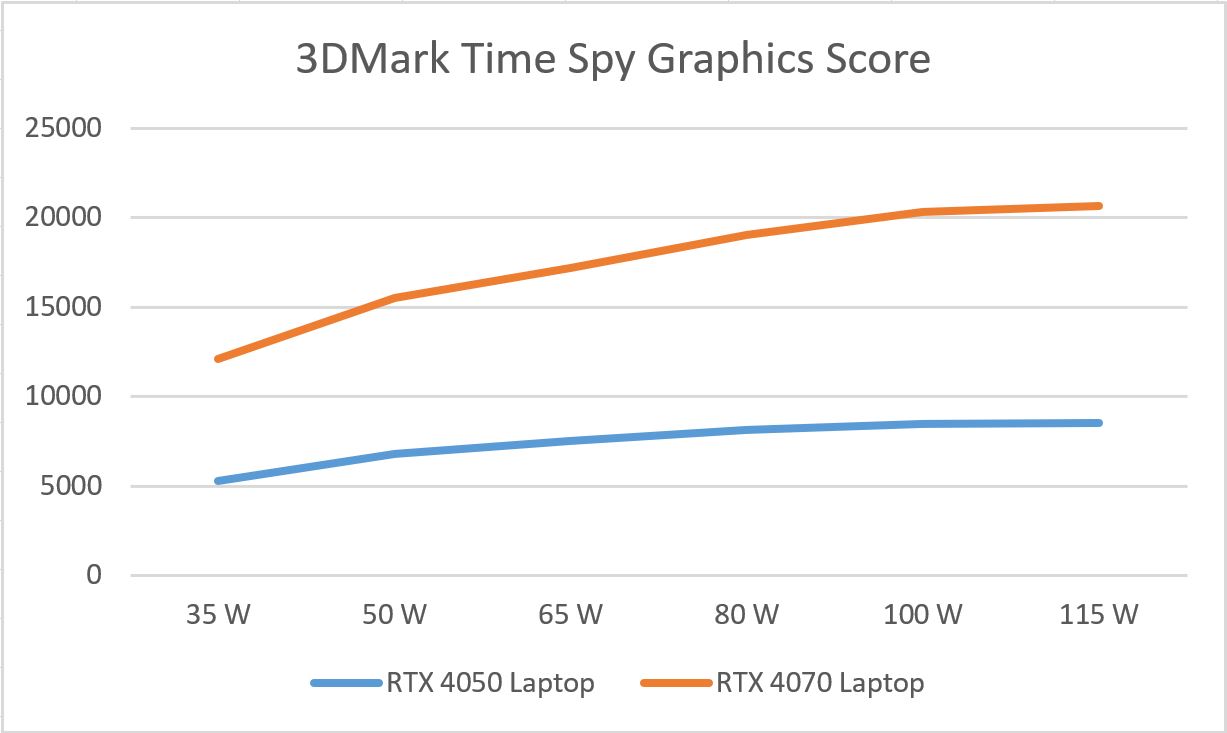
同时,我们的Witcher 3 测量和合成基准显示,如果风扇设置为 "静音",则没有性能下降可言。在真实的游戏情况下,平均帧率下降了不到10%,在3DMarkTime Spy 中只下降了15%。在Blender基准测试中,这些数值只相差1秒。
在安静模式下,图形性能仍然很高,虽然功耗大大降低,但对图形要求很高的应用却能顺利运行。作为回报,这大大降低了冷却要求。
| 3DMark Performance rating - Percent | |
| Average of class Gaming | |
| Medion Erazer Defender P40 | |
| Asus TUF Gaming A16 FA617XS | |
| Acer Nitro 5 AN517-55-5552 | |
| MSI Katana 15 B12VEK | |
| Medion Erazer Scout E20 | |
| Acer Nitro 5 AN517-55-5552 | |
| MSI Cyborg 15 A12VF | |
| Average NVIDIA GeForce RTX 4050 Laptop GPU | |
| Acer Nitro 5 AN517-55-738R | |
| 3DMark 11 Performance | 27855 points | |
| 3DMark Cloud Gate Standard Score | 56305 points | |
| 3DMark Fire Strike Score | 19904 points | |
| 3DMark Time Spy Score | 8960 points | |
Help | ||
* ... smaller is better
游戏性能
说到游戏性能,Nitro 5 AN517实现了体面的帧率,即使是在当前的游戏中。如果你能在这里和那里没有一些细节,要求高的游戏可以在60fps以上运行。这与我们在类似装备的游戏笔记本上得到的结果相一致。 前一代的Nitro 5,配备了 RTX 3060,大多处于同一水平。同样地,这也适用于AMD 华硕TUF Gaming A16.系统性能与该设备的全高清显示分辨率一致。
当涉及到安静冷却时,Nitro的基准测试特别有趣,一些结果几乎保持一致。有时,它们会在最大性能测量值的基础上略微降低。只有在GTA V中,我们注意到帧率下降了约22%。这意味着在六个游戏中只有6%的差异。把《GTA V》拿出来,虽然风扇噪音水平下降了约三分之一,但差异仅有3%。
这意味着,随着额外的40至50瓦的功耗和相当多的噪音产生,应该预期只有微小的性能提升。RTX 4050似乎非常高效,但当它以最大可能的功率要求运行时,几乎没有任何好处。我们分析了 GPU在不同负载下的性能值.这篇文章的图片显示在右边。
| Performance rating - Percent | |
| Average of class Gaming | |
| Medion Erazer Defender P40 | |
| Medion Erazer Scout E20 | |
| MSI Katana 15 B12VEK | |
| MSI Cyborg 15 A12VF | |
| Acer Nitro 5 AN517-55-738R | |
| Acer Nitro 5 AN517-55-5552 | |
| Asus TUF Gaming A16 FA617XS | |
| Acer Nitro 5 AN517-55-5552 | |
| The Witcher 3 - 1920x1080 Ultra Graphics & Postprocessing (HBAO+) | |
| Average of class Gaming (104.7 - 240, n=7, last 2 years) | |
| Medion Erazer Defender P40 | |
| Asus TUF Gaming A16 FA617XS (neu) | |
| Acer Nitro 5 AN517-55-5552 | |
| Acer Nitro 5 AN517-55-5552 (Leiser Modus) | |
| Medion Erazer Scout E20 | |
| Acer Nitro 5 AN517-55-738R | |
| MSI Katana 15 B12VEK | |
| MSI Cyborg 15 A12VF | |
| GTA V - 1920x1080 Highest AA:4xMSAA + FX AF:16x | |
| Average of class Gaming (48.3 - 186.9, n=94, last 2 years) | |
| Medion Erazer Defender P40 | |
| Medion Erazer Scout E20 | |
| Asus TUF Gaming A16 FA617XS | |
| MSI Katana 15 B12VEK | |
| MSI Cyborg 15 A12VF | |
| Acer Nitro 5 AN517-55-5552 | |
| Acer Nitro 5 AN517-55-738R | |
| Acer Nitro 5 AN517-55-5552 (Leiser Modus) | |
| Final Fantasy XV Benchmark - 1920x1080 High Quality | |
| Average of class Gaming (41 - 215, n=95, last 2 years) | |
| Medion Erazer Defender P40 (1.3) | |
| Asus TUF Gaming A16 FA617XS (1.3) | |
| Acer Nitro 5 AN517-55-5552 (1.3) | |
| MSI Katana 15 B12VEK (1.3) | |
| Medion Erazer Scout E20 (1.3) | |
| MSI Cyborg 15 A12VF (1.3) | |
| Acer Nitro 5 AN517-55-5552 (Leiser Modus) | |
| Acer Nitro 5 AN517-55-738R (1.3) | |
| Strange Brigade - 1920x1080 ultra AA:ultra AF:16 | |
| Average of class Gaming (76.3 - 458, n=87, last 2 years) | |
| Medion Erazer Defender P40 (1.47.22.14 D3D12) | |
| Asus TUF Gaming A16 FA617XS (1.47.22.14 D3D12) | |
| Acer Nitro 5 AN517-55-5552 (1.47.22.14 D3D12) | |
| MSI Katana 15 B12VEK (1.47.22.14 D3D12) | |
| Acer Nitro 5 AN517-55-5552 (Leiser Modus) | |
| Medion Erazer Scout E20 (1.47.22.14 D3D12) | |
| Acer Nitro 5 AN517-55-738R (1.47.22.14 D3D12) | |
| MSI Cyborg 15 A12VF (1.47.22.14 D3D12) | |
| Dota 2 Reborn - 1920x1080 ultra (3/3) best looking | |
| Acer Nitro 5 AN517-55-738R | |
| Average of class Gaming (84.8 - 252, n=108, last 2 years) | |
| Medion Erazer Defender P40 | |
| MSI Katana 15 B12VEK | |
| Medion Erazer Scout E20 | |
| MSI Cyborg 15 A12VF | |
| Acer Nitro 5 AN517-55-5552 | |
| Acer Nitro 5 AN517-55-5552 (Leiser Modus) | |
| Asus TUF Gaming A16 FA617XS | |
| X-Plane 11.11 - 1920x1080 high (fps_test=3) | |
| Medion Erazer Defender P40 | |
| Medion Erazer Scout E20 | |
| Average of class Gaming (55.5 - 148.5, n=110, last 2 years) | |
| MSI Katana 15 B12VEK | |
| MSI Cyborg 15 A12VF | |
| Acer Nitro 5 AN517-55-738R | |
| Acer Nitro 5 AN517-55-5552 (Leiser Modus) | |
| Acer Nitro 5 AN517-55-5552 | |
| Asus TUF Gaming A16 FA617XS | |
| The Witcher 3 | |
| 1920x1080 High Graphics & Postprocessing (Nvidia HairWorks Off) | |
| Average of class Gaming (341 - 404, n=2, last 2 years) | |
| Asus TUF Gaming A16 FA617XS | |
| Acer Nitro 5 AN517-55-5552 | |
| MSI Katana 15 B12VEK | |
| Acer Nitro 5 AN517-55-738R | |
| Medion Erazer Scout E20 | |
| Average NVIDIA GeForce RTX 4050 Laptop GPU (87 - 177, n=28) | |
| MSI Cyborg 15 A12VF | |
| 1920x1080 Ultra Graphics & Postprocessing (HBAO+) | |
| Average of class Gaming (104.7 - 240, n=7, last 2 years) | |
| Asus TUF Gaming A16 FA617XS | |
| Acer Nitro 5 AN517-55-5552 | |
| Medion Erazer Scout E20 | |
| Acer Nitro 5 AN517-55-738R | |
| MSI Katana 15 B12VEK | |
| MSI Cyborg 15 A12VF | |
| Average NVIDIA GeForce RTX 4050 Laptop GPU (18.5 - 94.7, n=40) | |
| Hogwarts Legacy | |
| 1920x1080 High Preset AA:High T | |
| MSI Cyborg 15 A12VF | |
| Asus TUF Gaming A16 FA617XS | |
| Acer Nitro 5 AN517-55-5552 | |
| Average NVIDIA GeForce RTX 4050 Laptop GPU (44.8 - 93.6, n=8) | |
| 1920x1080 Ultra Preset AA:High T | |
| Average of class Gaming (n=1last 2 years) | |
| MSI Cyborg 15 A12VF | |
| Asus TUF Gaming A16 FA617XS | |
| Average NVIDIA GeForce RTX 4050 Laptop GPU (39 - 77.3, n=8) | |
| Acer Nitro 5 AN517-55-5552 | |
| Sons of the Forest | |
| 1920x1080 Ultra Preset AA:T | |
| Asus TUF Gaming A16 FA617XS | |
| Acer Nitro 5 AN517-55-5552 | |
| Average NVIDIA GeForce RTX 4050 Laptop GPU (61.9 - 76, n=4) | |
| MSI Cyborg 15 A12VF | |
| 1920x1080 High Preset AA:T | |
| Asus TUF Gaming A16 FA617XS | |
| Acer Nitro 5 AN517-55-5552 | |
| Average NVIDIA GeForce RTX 4050 Laptop GPU (63.5 - 76, n=4) | |
| MSI Cyborg 15 A12VF | |
| Star Wars Jedi Survivor | |
| 1920x1080 High Preset | |
| Medion Erazer Scout E20 | |
| Average NVIDIA GeForce RTX 4050 Laptop GPU (51.6 - 65.9, n=7) | |
| Acer Nitro 5 AN517-55-5552 | |
| Average of class Gaming (n=1last 2 years) | |
| 1920x1080 Epic Preset | |
| Acer Nitro 5 AN517-55-5552 | |
| Average NVIDIA GeForce RTX 4050 Laptop GPU (48.4 - 56, n=7) | |
| Medion Erazer Scout E20 | |
在Witcher 3 耐力测试中,宏碁Nitro 5 AN517没有表现出任何弱点,帧率始终保持稳定。轻微的波动与游戏中白天和黑夜周期的节奏相对应。
相比之下,使用 "静音 "模式,我们观察到轻微的下降。起初,绿线(安静)与红线(性能)几乎保持一致。在较低的时钟速度和电源的情况下,一小时后,帧数降低了7%。
此外,还出现了小幅下降。由于风扇不能简单地在 "安静 "状态下调高,时钟速度不得不再次短时间内降低。尽管如此,这个数值仍然保持在一个较高的水平,只有一次低于60fps。这台Medion Erazer Scout E20采用相同的显卡,在性能模式下只能达到相当的fps值。
Witcher 3 FPS diagram
| low | med. | high | ultra | |
|---|---|---|---|---|
| GTA V (2015) | 162.4 | 88.8 | ||
| The Witcher 3 (2015) | 164 | 88 | ||
| Dota 2 Reborn (2015) | 129 | 123.1 | ||
| Final Fantasy XV Benchmark (2018) | 83.6 | |||
| X-Plane 11.11 (2018) | 79.7 | |||
| Far Cry 5 (2018) | 123 | 116 | ||
| Strange Brigade (2018) | 174.8 | 152 | ||
| Cyberpunk 2077 1.6 (2022) | 91.3 | 79.4 | ||
| F1 22 (2022) | 149 | 55 | ||
| Hogwarts Legacy (2023) | 67 | 53 | ||
| Sons of the Forest (2023) | 75 | 73 | ||
| Star Wars Jedi Survivor (2023) | 56 | 53 |
排放--安静、温暖的Nitro 5
噪声排放
即使在系统处于轻度负载时,风扇也会打开。这导致了背景噪音,既不干扰游戏会话,也不干扰你自己的思想。
相反,使用 "性能 "设置时,游戏笔记本变得非常响亮。即使在关上门的情况下,也能看出有人在玩游戏。在 "静音 "状态下,情况会有很大变化。Wie测量到的噪音水平只有原来的三分之一。
所产生的声音高于噪音水平,例如,在一个有风扇的商务笔记本电脑中发现的噪音。然而,你永远不会觉得需要拿起一副耳机。一些台式电脑和大多数游戏笔记本电脑的声音会更大。
Noise level
| Idle |
| 25.7 / 31.5 / 31.2 dB(A) |
| Load |
| 62.9 / 67.5 dB(A) |
 | ||
30 dB silent 40 dB(A) audible 50 dB(A) loud |
||
min: | ||
| Acer Nitro 5 AN517-55-5552 GeForce RTX 4050 Laptop GPU, i5-12500H, WDC PC SN810 512GB | Asus TUF Gaming A16 FA617XS Radeon RX 7600S, R9 7940HS, Micron 2400 MTFDKBA512QFM | Acer Nitro 5 AN517-55-738R GeForce RTX 3060 Laptop GPU, i7-12700H, Samsung PM9A1 MZVL2512HCJQ | Medion Erazer Scout E20 GeForce RTX 4050 Laptop GPU, i7-13700H, Phison PS5021-E21 1TB | MSI Katana 15 B12VEK GeForce RTX 4050 Laptop GPU, i7-12650H, Micron 2400 MTFDKBA1T0QFM | MSI Cyborg 15 A12VF GeForce RTX 4060 Laptop GPU, i7-12650H, Samsung PM9B1 1024GB MZVL41T0HBLB | |
|---|---|---|---|---|---|---|
| Noise | 14% | 8% | 6% | 20% | -4% | |
| off / environment * (dB) | 25.7 | 25 3% | 25.5 1% | 25 3% | 24 7% | 27 -5% |
| Idle Minimum * (dB) | 25.7 | 25 3% | 25.5 1% | 26 -1% | 24 7% | 27 -5% |
| Idle Average * (dB) | 31.5 | 26 17% | 25.5 19% | 27 14% | 24 24% | 37.5 -19% |
| Idle Maximum * (dB) | 31.2 | 28 10% | 27 13% | 32 -3% | 24 23% | 38 -22% |
| Load Average * (dB) | 62.9 | 43 32% | 52.6 16% | 57 9% | 37.71 40% | 56.3 10% |
| Load Maximum * (dB) | 67.5 | 53 21% | 68.2 -1% | 57 16% | 54.55 19% | 56.3 17% |
| Witcher 3 ultra * (dB) | 51 | 50 | 45.75 |
* ... smaller is better
温度
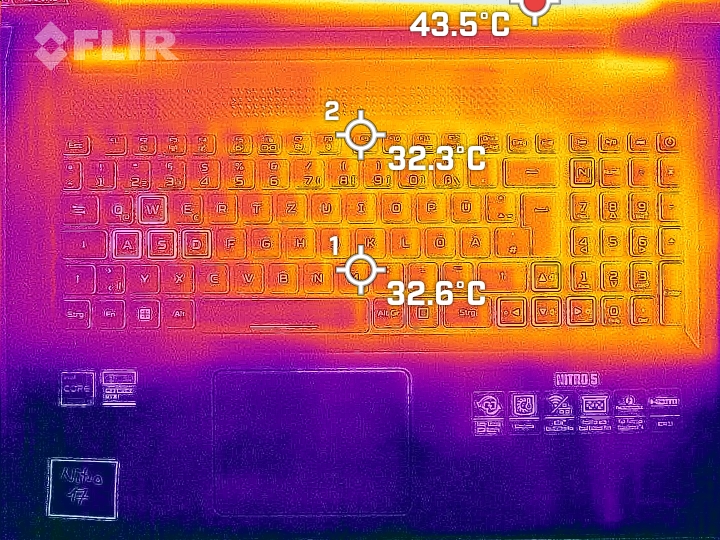
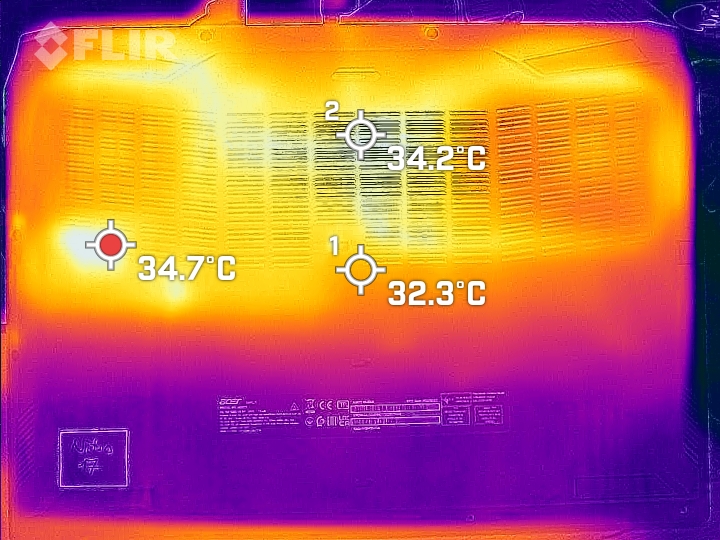
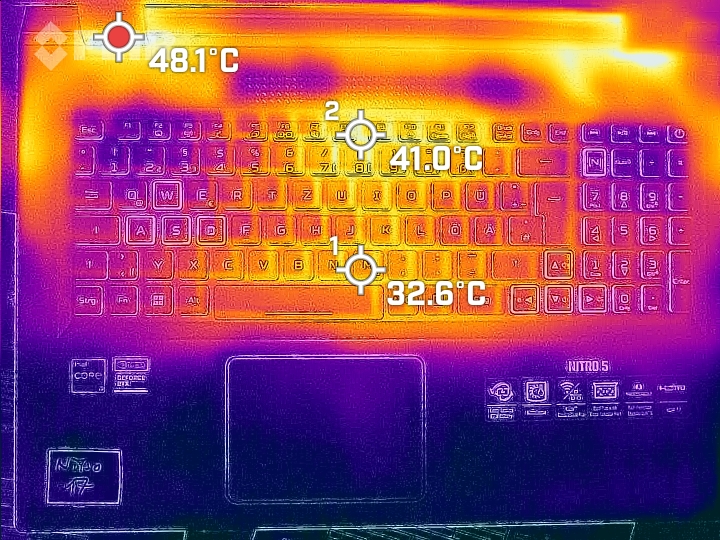
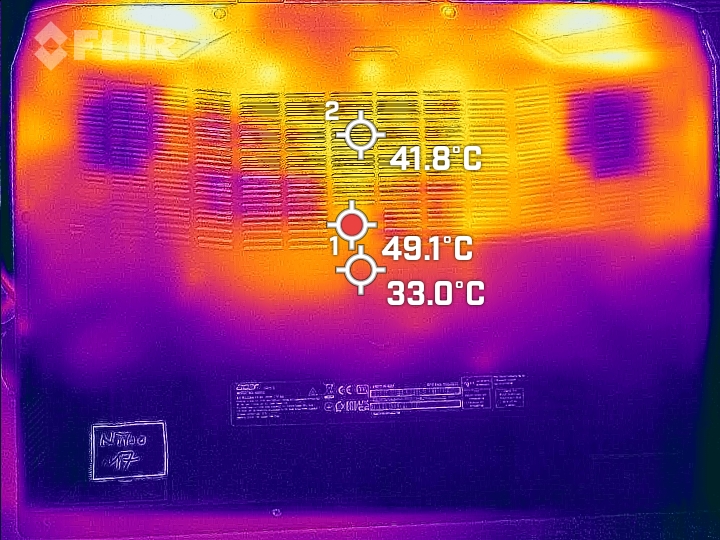
从 "维护 "部分的图片中你已经可以猜到,即使是在理论上的最大负荷情况下运行,手托也保持凉爽。我们只在中间测量了30℃多一点。相比之下,在Witcher 3 ,没有发生明显的温度上升。
这意味着至少键盘区域保持在40℃以下。这并不理想,但还是可以应付的。在风扇所在的后部区域,温度上升,但仍保持在50°C以下,这一点与前代产品相同。 前代产品这也是上一代产品无法做到的。
在其他性能模式下,散热情况仍然相当。这意味着你可以期待一个温暖的键盘。
(±) The maximum temperature on the upper side is 42.4 °C / 108 F, compared to the average of 40.4 °C / 105 F, ranging from 21.2 to 68.8 °C for the class Gaming.
(-) The bottom heats up to a maximum of 48.2 °C / 119 F, compared to the average of 43.2 °C / 110 F
(+) In idle usage, the average temperature for the upper side is 29.2 °C / 85 F, compared to the device average of 33.9 °C / 93 F.
(±) Playing The Witcher 3, the average temperature for the upper side is 32.2 °C / 90 F, compared to the device average of 33.9 °C / 93 F.
(+) The palmrests and touchpad are cooler than skin temperature with a maximum of 27.4 °C / 81.3 F and are therefore cool to the touch.
(±) The average temperature of the palmrest area of similar devices was 28.8 °C / 83.8 F (+1.4 °C / 2.5 F).
| Acer Nitro 5 AN517-55-5552 Intel Core i5-12500H, NVIDIA GeForce RTX 4050 Laptop GPU | Asus TUF Gaming A16 FA617XS AMD Ryzen 9 7940HS, AMD Radeon RX 7600S | Acer Nitro 5 AN517-55-738R Intel Core i7-12700H, NVIDIA GeForce RTX 3060 Laptop GPU | Medion Erazer Scout E20 Intel Core i7-13700H, NVIDIA GeForce RTX 4050 Laptop GPU | MSI Katana 15 B12VEK Intel Core i7-12650H, NVIDIA GeForce RTX 4050 Laptop GPU | MSI Cyborg 15 A12VF Intel Core i7-12650H, NVIDIA GeForce RTX 4060 Laptop GPU | |
|---|---|---|---|---|---|---|
| Heat | -3% | -10% | 9% | -9% | 9% | |
| Maximum Upper Side * (°C) | 42.4 | 53 -25% | 48.3 -14% | 41 3% | 47 -11% | 47.5 -12% |
| Maximum Bottom * (°C) | 48.2 | 48 -0% | 52 -8% | 39 19% | 48 -0% | 35.5 26% |
| Idle Upper Side * (°C) | 31.6 | 30 5% | 34.5 -9% | 31 2% | 35 -11% | 27.7 12% |
| Idle Bottom * (°C) | 33.1 | 30 9% | 35.8 -8% | 29 12% | 38 -15% | 29.5 11% |
* ... smaller is better
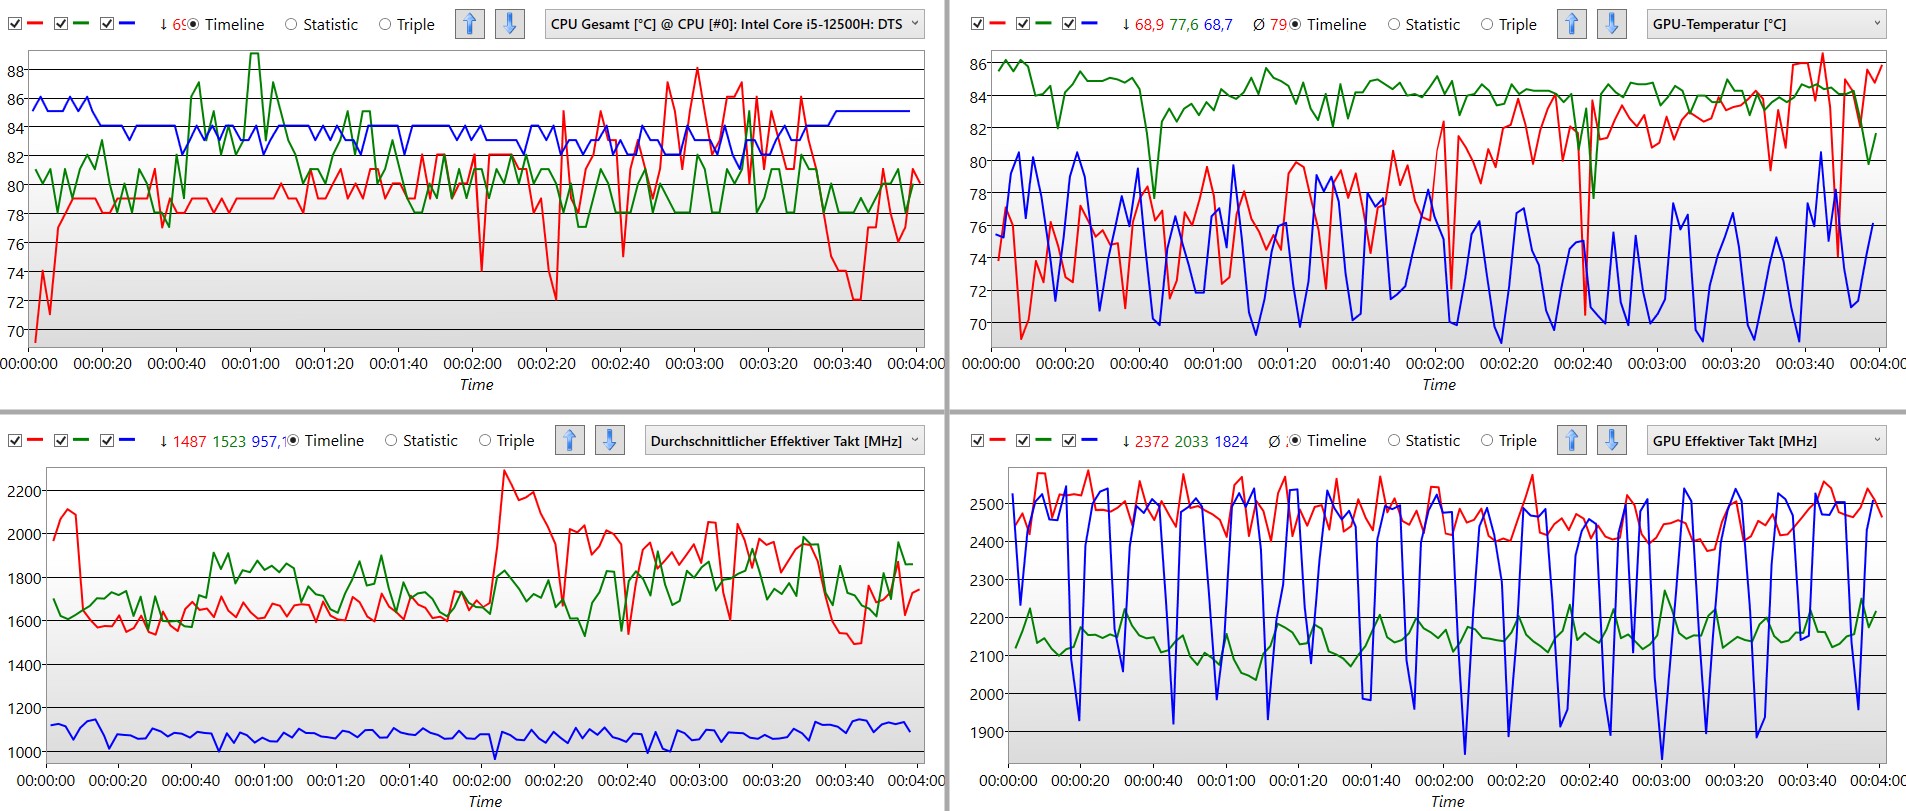
压力测试
即使在最大负荷下,该处理器也没有达到115瓦的最大可能的功耗。有那么一会儿,我们测量到几乎100瓦,而温度上升到100℃,这反过来又降低了功耗。
相比之下,CPU可以短暂地消耗140瓦,并设法在超过100瓦的情况下永久地保持在远低于90℃的水平。这正是制作一台游戏笔记本电脑的方法。
性能模式的比较很有趣,尤其是设置为 "安静"(蓝线)时:处理器的性能明显受到限制,而图形芯片仍然能够达到通常只有在使用 "性能 "模式时才允许的水平。 尽管在我们的图表中看起来不稳定,但GPU的时钟频率只在1800和超过2500MHz之间波动。同时,温度明显保持在80℃以上。
由于处理器的功率受到很大限制,"静音 "模式可以在不产生过多热量的情况下实现高图形性能。
发言人
小型立体声扬声器符合最低要求。特别是,语音播放做得很好。从口语到复杂的人声,听起来都不错。
低音基本上没有,而且中音的定义也很弱。Nitro 5的扬声器并不真正适合音乐,但对于视频流或游戏来说是相当足够的。
Acer Nitro 5 AN517-55-5552 audio analysis
(±) | speaker loudness is average but good (80.4 dB)
Bass 100 - 315 Hz
(-) | nearly no bass - on average 23.4% lower than median
(±) | linearity of bass is average (14.9% delta to prev. frequency)
Mids 400 - 2000 Hz
(+) | balanced mids - only 2.2% away from median
(+) | mids are linear (5.8% delta to prev. frequency)
Highs 2 - 16 kHz
(+) | balanced highs - only 4.6% away from median
(+) | highs are linear (4.8% delta to prev. frequency)
Overall 100 - 16.000 Hz
(±) | linearity of overall sound is average (17.1% difference to median)
Compared to same class
» 46% of all tested devices in this class were better, 12% similar, 42% worse
» The best had a delta of 6%, average was 18%, worst was 132%
Compared to all devices tested
» 31% of all tested devices were better, 8% similar, 61% worse
» The best had a delta of 4%, average was 23%, worst was 134%
Apple MacBook Pro 16 2021 M1 Pro audio analysis
(+) | speakers can play relatively loud (84.7 dB)
Bass 100 - 315 Hz
(+) | good bass - only 3.8% away from median
(+) | bass is linear (5.2% delta to prev. frequency)
Mids 400 - 2000 Hz
(+) | balanced mids - only 1.3% away from median
(+) | mids are linear (2.1% delta to prev. frequency)
Highs 2 - 16 kHz
(+) | balanced highs - only 1.9% away from median
(+) | highs are linear (2.7% delta to prev. frequency)
Overall 100 - 16.000 Hz
(+) | overall sound is linear (4.6% difference to median)
Compared to same class
» 0% of all tested devices in this class were better, 0% similar, 100% worse
» The best had a delta of 5%, average was 17%, worst was 45%
Compared to all devices tested
» 0% of all tested devices were better, 0% similar, 100% worse
» The best had a delta of 4%, average was 23%, worst was 134%
能源管理
消耗功率
事实上,处理器不是最新的,在消耗方面很明显。在刚刚超过7瓦的时候,最小的功耗是不错的,但可以更低一些,就像 美迪安Erazer Scout其i7-13700H.即使在典型的使用情况下,150瓦也是一个相当差的数值。的平均水平。RTX 4050笔记本电脑的平均功率低于100瓦。然而,在安静模式下,总耗电量也在100瓦左右。
244瓦的最大功耗只记录在一个单一的峰值测量中。因此,230瓦的PSU应该是足够的,并且有足够的储备,以便为电池充电。
| Off / Standby | |
| Idle | |
| Load |
|
Key:
min: | |
| Acer Nitro 5 AN517-55-5552 i5-12500H, GeForce RTX 4050 Laptop GPU, WDC PC SN810 512GB, IPS, 1920x1080, 17.3" | Asus TUF Gaming A16 FA617XS R9 7940HS, Radeon RX 7600S, Micron 2400 MTFDKBA512QFM, IPS, 1920x1200, 16" | Acer Nitro 5 AN517-55-738R i7-12700H, GeForce RTX 3060 Laptop GPU, Samsung PM9A1 MZVL2512HCJQ, IPS, 1920x1080, 17.3" | Medion Erazer Scout E20 i7-13700H, GeForce RTX 4050 Laptop GPU, Phison PS5021-E21 1TB, IPS, 1920x1080, 17.3" | MSI Katana 15 B12VEK i7-12650H, GeForce RTX 4050 Laptop GPU, Micron 2400 MTFDKBA1T0QFM, IPS, 1920x1080, 15.6" | MSI Cyborg 15 A12VF i7-12650H, GeForce RTX 4060 Laptop GPU, Samsung PM9B1 1024GB MZVL41T0HBLB, IPS, 1920x1080, 15.6" | Average NVIDIA GeForce RTX 4050 Laptop GPU | Average of class Gaming | |
|---|---|---|---|---|---|---|---|---|
| Power Consumption | 13% | -14% | 7% | 17% | 33% | -6% | -36% | |
| Idle Minimum * (Watt) | 7.6 | 7 8% | 9.7 -28% | 5 34% | 8.5 -12% | 6 21% | 9.95 ? -31% | 13 ? -71% |
| Idle Average * (Watt) | 11.3 | 10 12% | 14.6 -29% | 11 3% | 10.2 10% | 8.8 22% | 15.8 ? -40% | 19 ? -68% |
| Idle Maximum * (Watt) | 15.4 | 15 3% | 16.7 -8% | 22 -43% | 11.3 27% | 11.9 23% | 20.1 ? -31% | 24.5 ? -59% |
| Load Average * (Watt) | 151 | 86 43% | 166 -10% | 96 36% | 84 44% | 89 41% | 88 ? 42% | 111.1 ? 26% |
| Witcher 3 ultra * (Watt) | 137.8 | 160.6 -17% | 145.2 -5% | 128 7% | 90.3 34% | |||
| Load Maximum * (Watt) | 244 | 172 30% | 235 4% | 201 18% | 189 23% | 99 59% | 176.3 ? 28% | 260 ? -7% |
* ... smaller is better
Power consumption Witcher 3 / stress test
Power consumption with an external monitor
电池寿命
宏碁Nitro 5的电池寿命非常实用:即使在最大的屏幕亮度下,在我们的Wi-Fi测试中,笔记本电脑在切换网站时也能大大超过8小时。在有限的亮度下,你可以期待一个额外的小时。然而,电池容量为90Wh,也是非常高的。
华硕华硕TUF Gaming 16- 它可以从同样大小的电池中获得12个小时甚至更多--显示出游戏笔记本电脑可以更有效地运行。
| Acer Nitro 5 AN517-55-5552 i5-12500H, GeForce RTX 4050 Laptop GPU, 90 Wh | Asus TUF Gaming A16 FA617XS R9 7940HS, Radeon RX 7600S, 90 Wh | Acer Nitro 5 AN517-55-738R i7-12700H, GeForce RTX 3060 Laptop GPU, 90.61 Wh | Medion Erazer Scout E20 i7-13700H, GeForce RTX 4050 Laptop GPU, 53.35 Wh | MSI Katana 15 B12VEK i7-12650H, GeForce RTX 4050 Laptop GPU, 53.5 Wh | MSI Cyborg 15 A12VF i7-12650H, GeForce RTX 4060 Laptop GPU, 53.5 Wh | Average of class Gaming | |
|---|---|---|---|---|---|---|---|
| Battery runtime | 50% | -30% | -44% | -48% | -6% | -6% | |
| H.264 (h) | 7.4 | 12.4 68% | 5.3 -28% | 4.6 -38% | 4.4 -41% | 8 8% | 8.32 ? 12% |
| WiFi v1.3 (h) | 9.4 | 12.4 32% | 6.5 -31% | 4.7 -50% | 4.3 -54% | 7.5 -20% | 7.11 ? -24% |
Pros
Cons
结论 - Nitro 5的高效GPU实现得很好
凭借直接的i5-12500H和入门级的RTX 4050显卡,宏碁Nitro 5的性能并不差,但最多是平均水平。然后,"安静 "模式被打开:
由于有声音,但绝不是恼人的风扇噪音,游戏性能降到最低,特别是在游戏中,我们只确定了几个百分点的差异。Nitro在全高清分辨率下流畅地播放当前的游戏,在高细节设置下,从未超过其同行的噪音水平。
安静的风扇和全高清游戏在宏碁Nitro 5中并不相互排斥。
这是可能的,因为Nvidia的高效图形芯片并没有从更高的功耗中获益。然而,这也是由于非常大的机箱和同样大的冷却系统,拥有巧妙的设置。除此之外,还有一个RGB键盘、Thunderbolt 4和两个,10 Gbit/s的USB端口。
真正令人失望的是显示屏:虽然分辨率和尺寸完全符合宏碁笔记本电脑的尺寸,但色彩再现、对比度和峰值亮度显然低于平均水平,即使对于在价格方面进入自己的入门级标准。
如果只是为了游戏性能,还有更快的笔记本电脑。比如说Medion Erazer Scout E20也配备了一个RTX 4050而且还有一个明显更好的显示屏。然而,它不像Nitro那样安静,而且价格也略高。
价格和可用性
宏碁Nitro 5(RTX 4050,16GB DDR5内存)在亚马逊 上售价约为1225美元。
Acer Nitro 5 AN517-55-5552
- 06/13/2023 v7 (old)
Mario Petzold
Transparency
The selection of devices to be reviewed is made by our editorial team. The test sample was provided to the author as a loan by the manufacturer or retailer for the purpose of this review. The lender had no influence on this review, nor did the manufacturer receive a copy of this review before publication. There was no obligation to publish this review. As an independent media company, Notebookcheck is not subjected to the authority of manufacturers, retailers or publishers.
This is how Notebookcheck is testing
Every year, Notebookcheck independently reviews hundreds of laptops and smartphones using standardized procedures to ensure that all results are comparable. We have continuously developed our test methods for around 20 years and set industry standards in the process. In our test labs, high-quality measuring equipment is utilized by experienced technicians and editors. These tests involve a multi-stage validation process. Our complex rating system is based on hundreds of well-founded measurements and benchmarks, which maintains objectivity. Further information on our test methods can be found here.
Price comparison

