三星Galaxy Book3 Ultra 16评论:耐用的16英寸超极本与RTX 4050

在Galaxy Book 3 Ultra 16中,三星为创意工作者引入了游戏笔记本、工作站和笔记本电脑的组合,重点关注移动性、人体工程学和低能耗。不需要太高的性能:采用酷睿i7-13700H和 GeForce RTX 4050被保守的功率限制所拖累,即低TGP(60瓦)。一个100瓦的电源涵盖了所有的硬件需求。
竞争者包括以下设备申克Vision 16 Pro,以及 LG Gram 17,以及 戴尔XPS 15 9520,华硕 华硕VivoBook Pro 16X OLED, 宏碁Swift X SFX16-52G Acer Swift X SFX16-52G和 联想ThinkBook 16p G3 ARH.
潜在的竞争对手比较
Rating | Date | Model | Weight | Height | Size | Resolution | Price |
|---|---|---|---|---|---|---|---|
| 89.4 % v7 (old) | 04 / 2023 | Samsung Galaxy Book3 Ultra 16 i7-13700H, GeForce RTX 4050 Laptop GPU | 1.8 kg | 16.5 mm | 16.00" | 2880x1800 | |
| 87.8 % v7 (old) | 11 / 2022 | Schenker Vision 16 Pro RTX 3070 Ti i7-12700H, GeForce RTX 3070 Ti Laptop GPU | 1.7 kg | 17.1 mm | 16.00" | 2560x1600 | |
| 86.4 % v7 (old) | 03 / 2023 | LG Gram 17Z90Q-E.AD78G i7-1260P, GeForce RTX 2050 Mobile | 1.4 kg | 17.8 mm | 17.00" | 2560x1600 | |
| 87.9 % v7 (old) | 10 / 2022 | Lenovo ThinkBook 16p G3 ARH R9 6900HX, GeForce RTX 3060 Laptop GPU | 2.1 kg | 19.5 mm | 16.00" | 2560x1600 | |
| 89.5 % v7 (old) | 05 / 2022 | Dell XPS 15 9520 RTX 3050 Ti i7-12700H, GeForce RTX 3050 Ti Laptop GPU | 1.9 kg | 18 mm | 15.60" | 3456x2160 | |
| 83.7 % v7 (old) | 11 / 2022 | Asus VivoBook Pro 16X OLED N7600PC-L2026X i7-11370H, GeForce RTX 3050 4GB Laptop GPU | 2 kg | 18.9 mm | 16.00" | 3840x2400 | |
| 86.4 % v7 (old) | 11 / 2022 | Acer Swift X SFX16-52G-77RX i7-1260P, A370M | 1.8 kg | 21.2 mm | 16.00" | 2560x1600 |
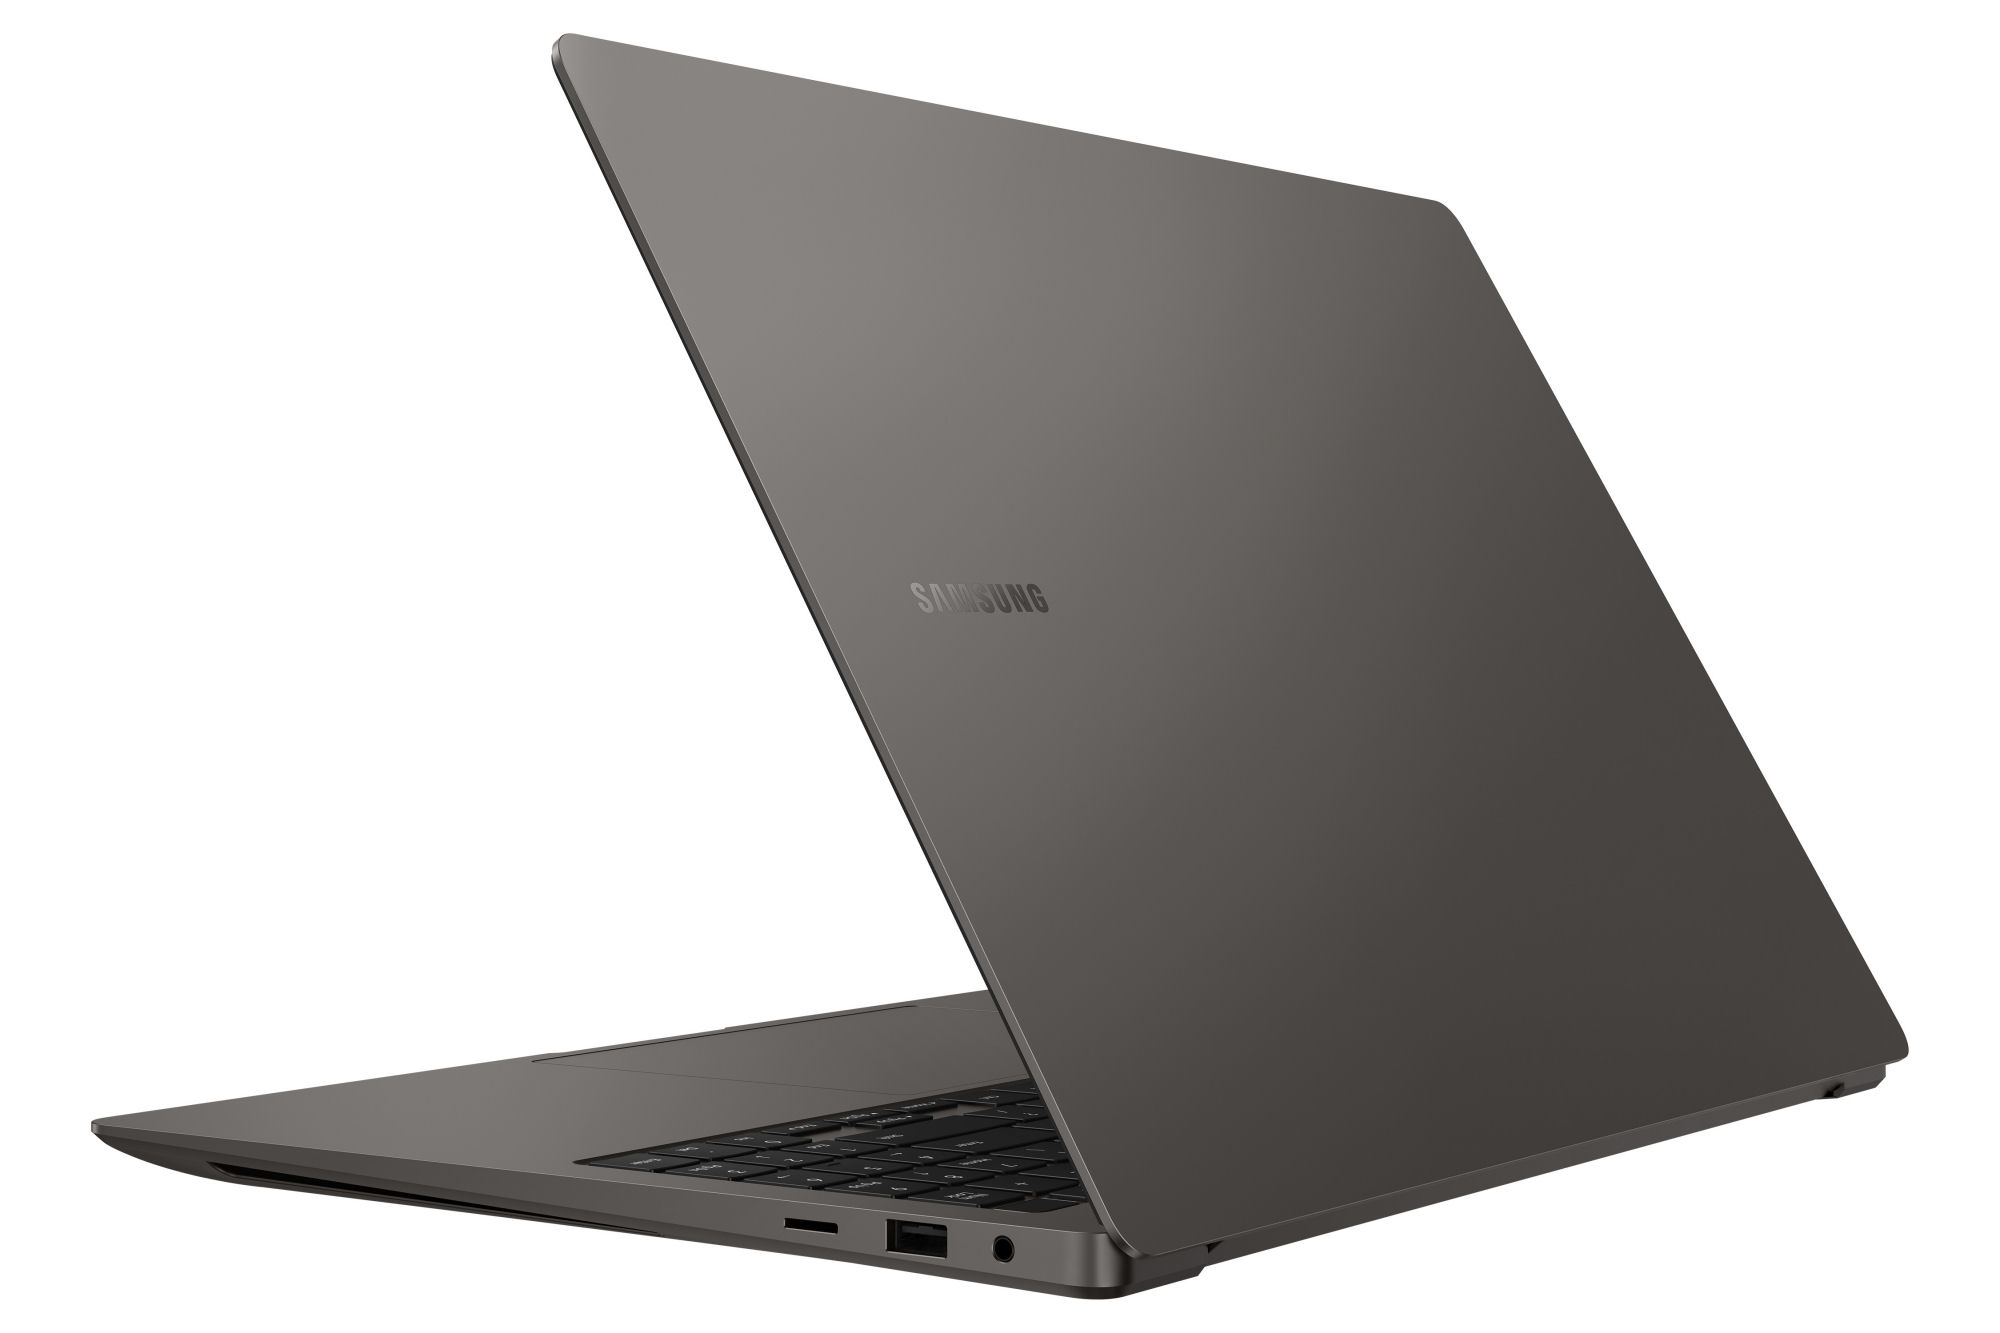
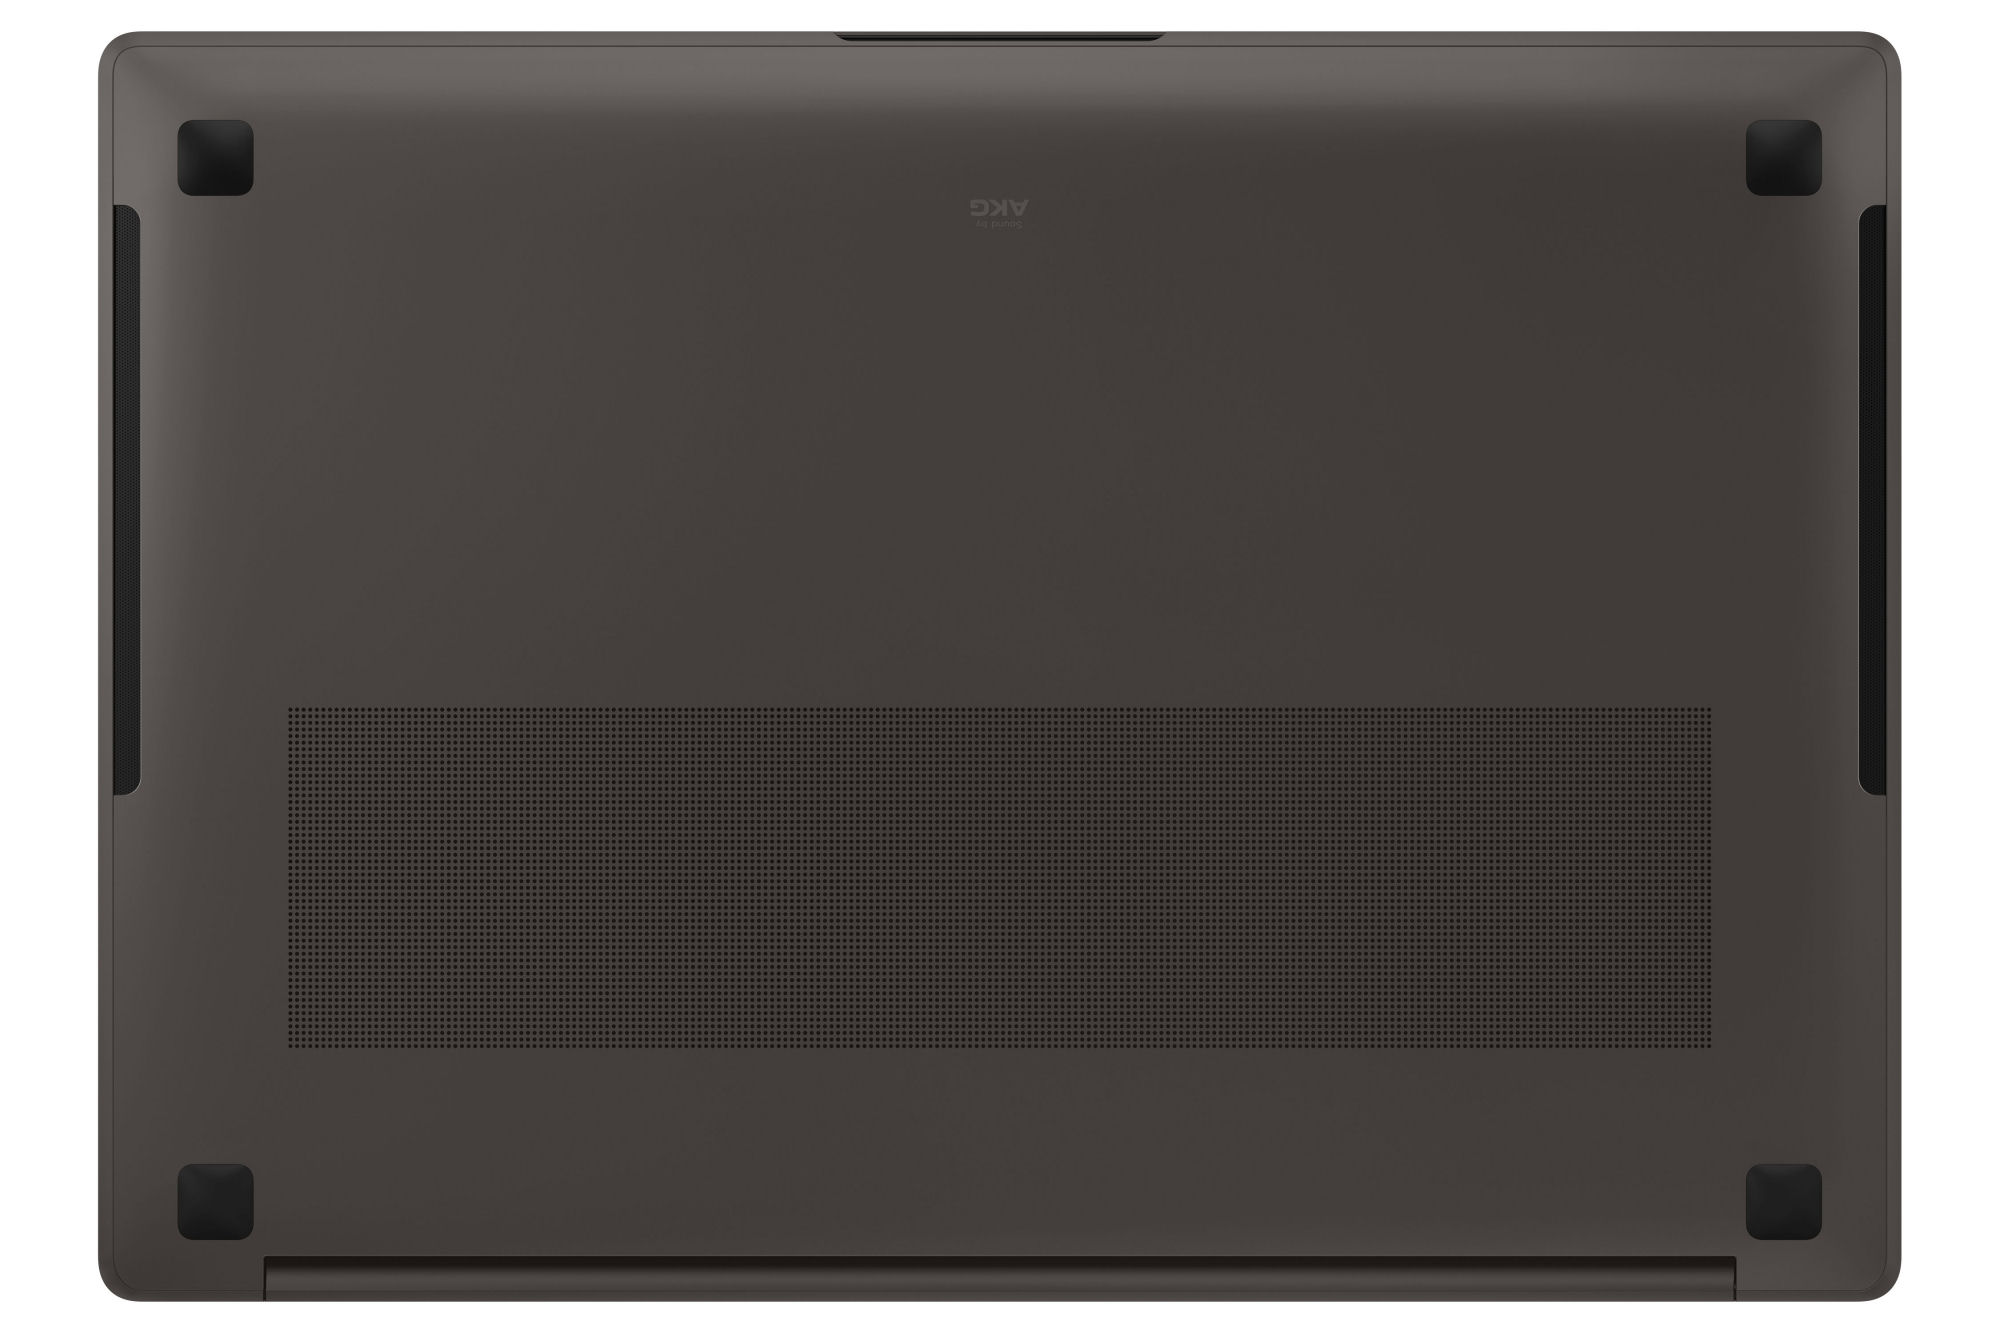
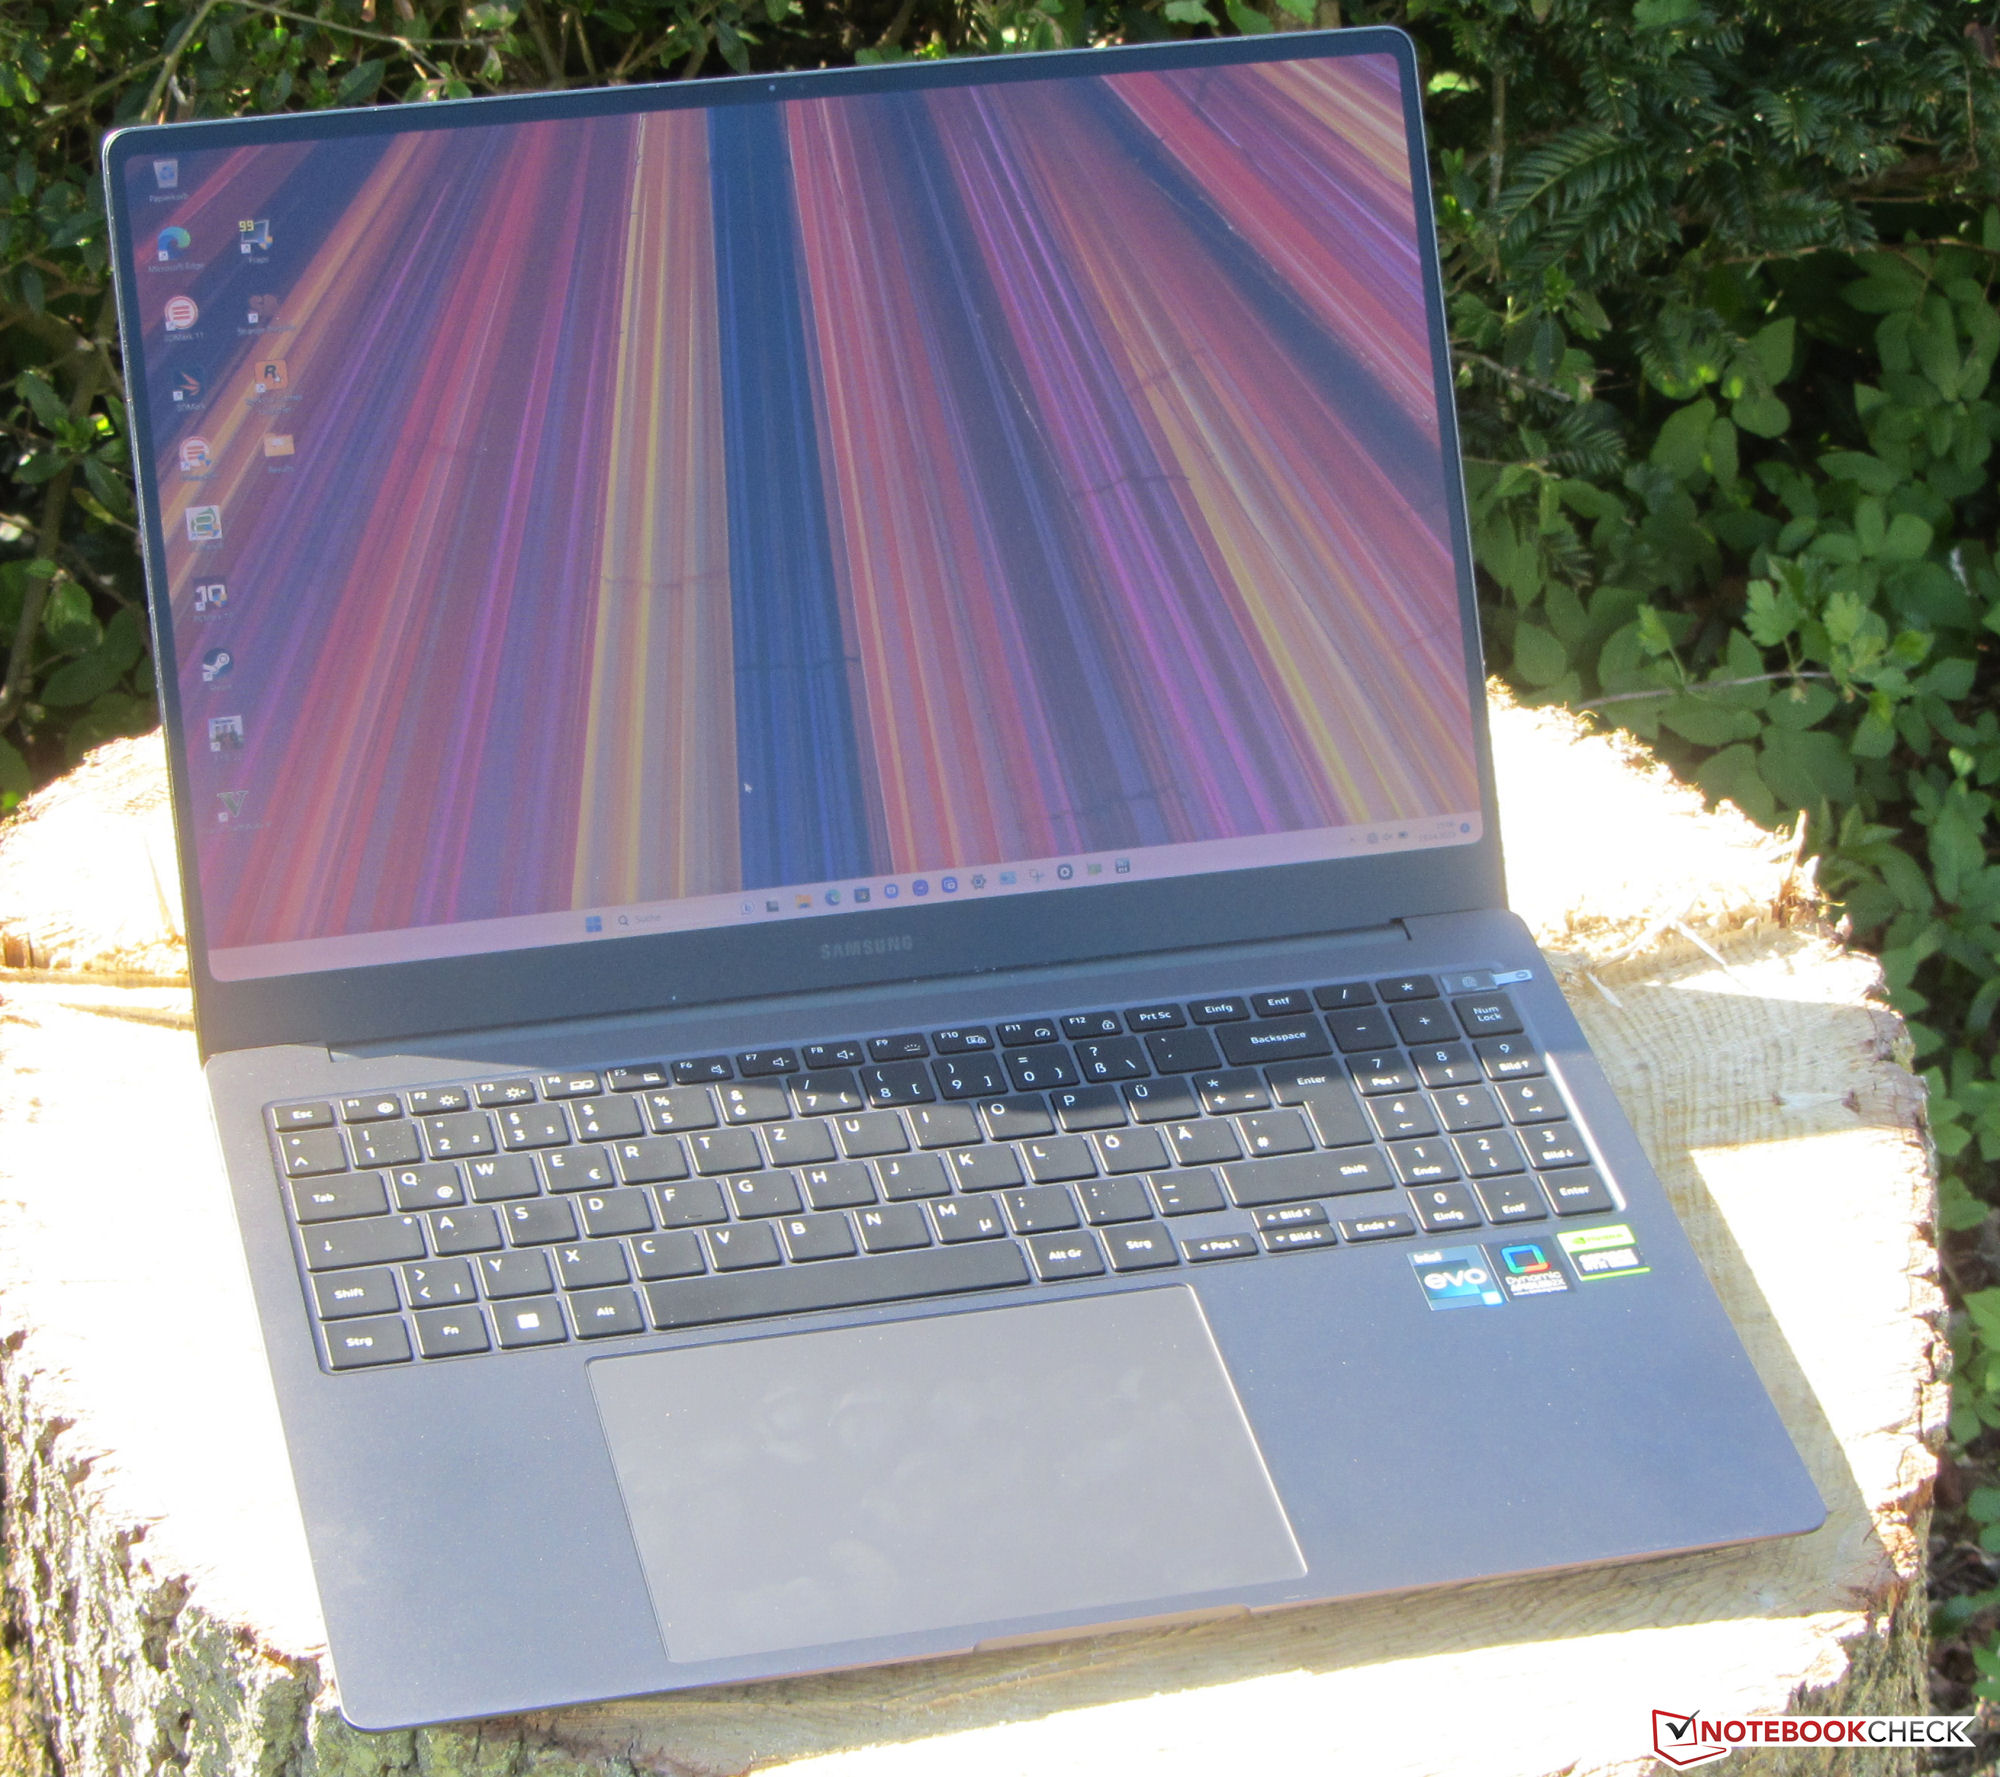
机箱 - 一个花哨的铝制机箱,用于Galaxy
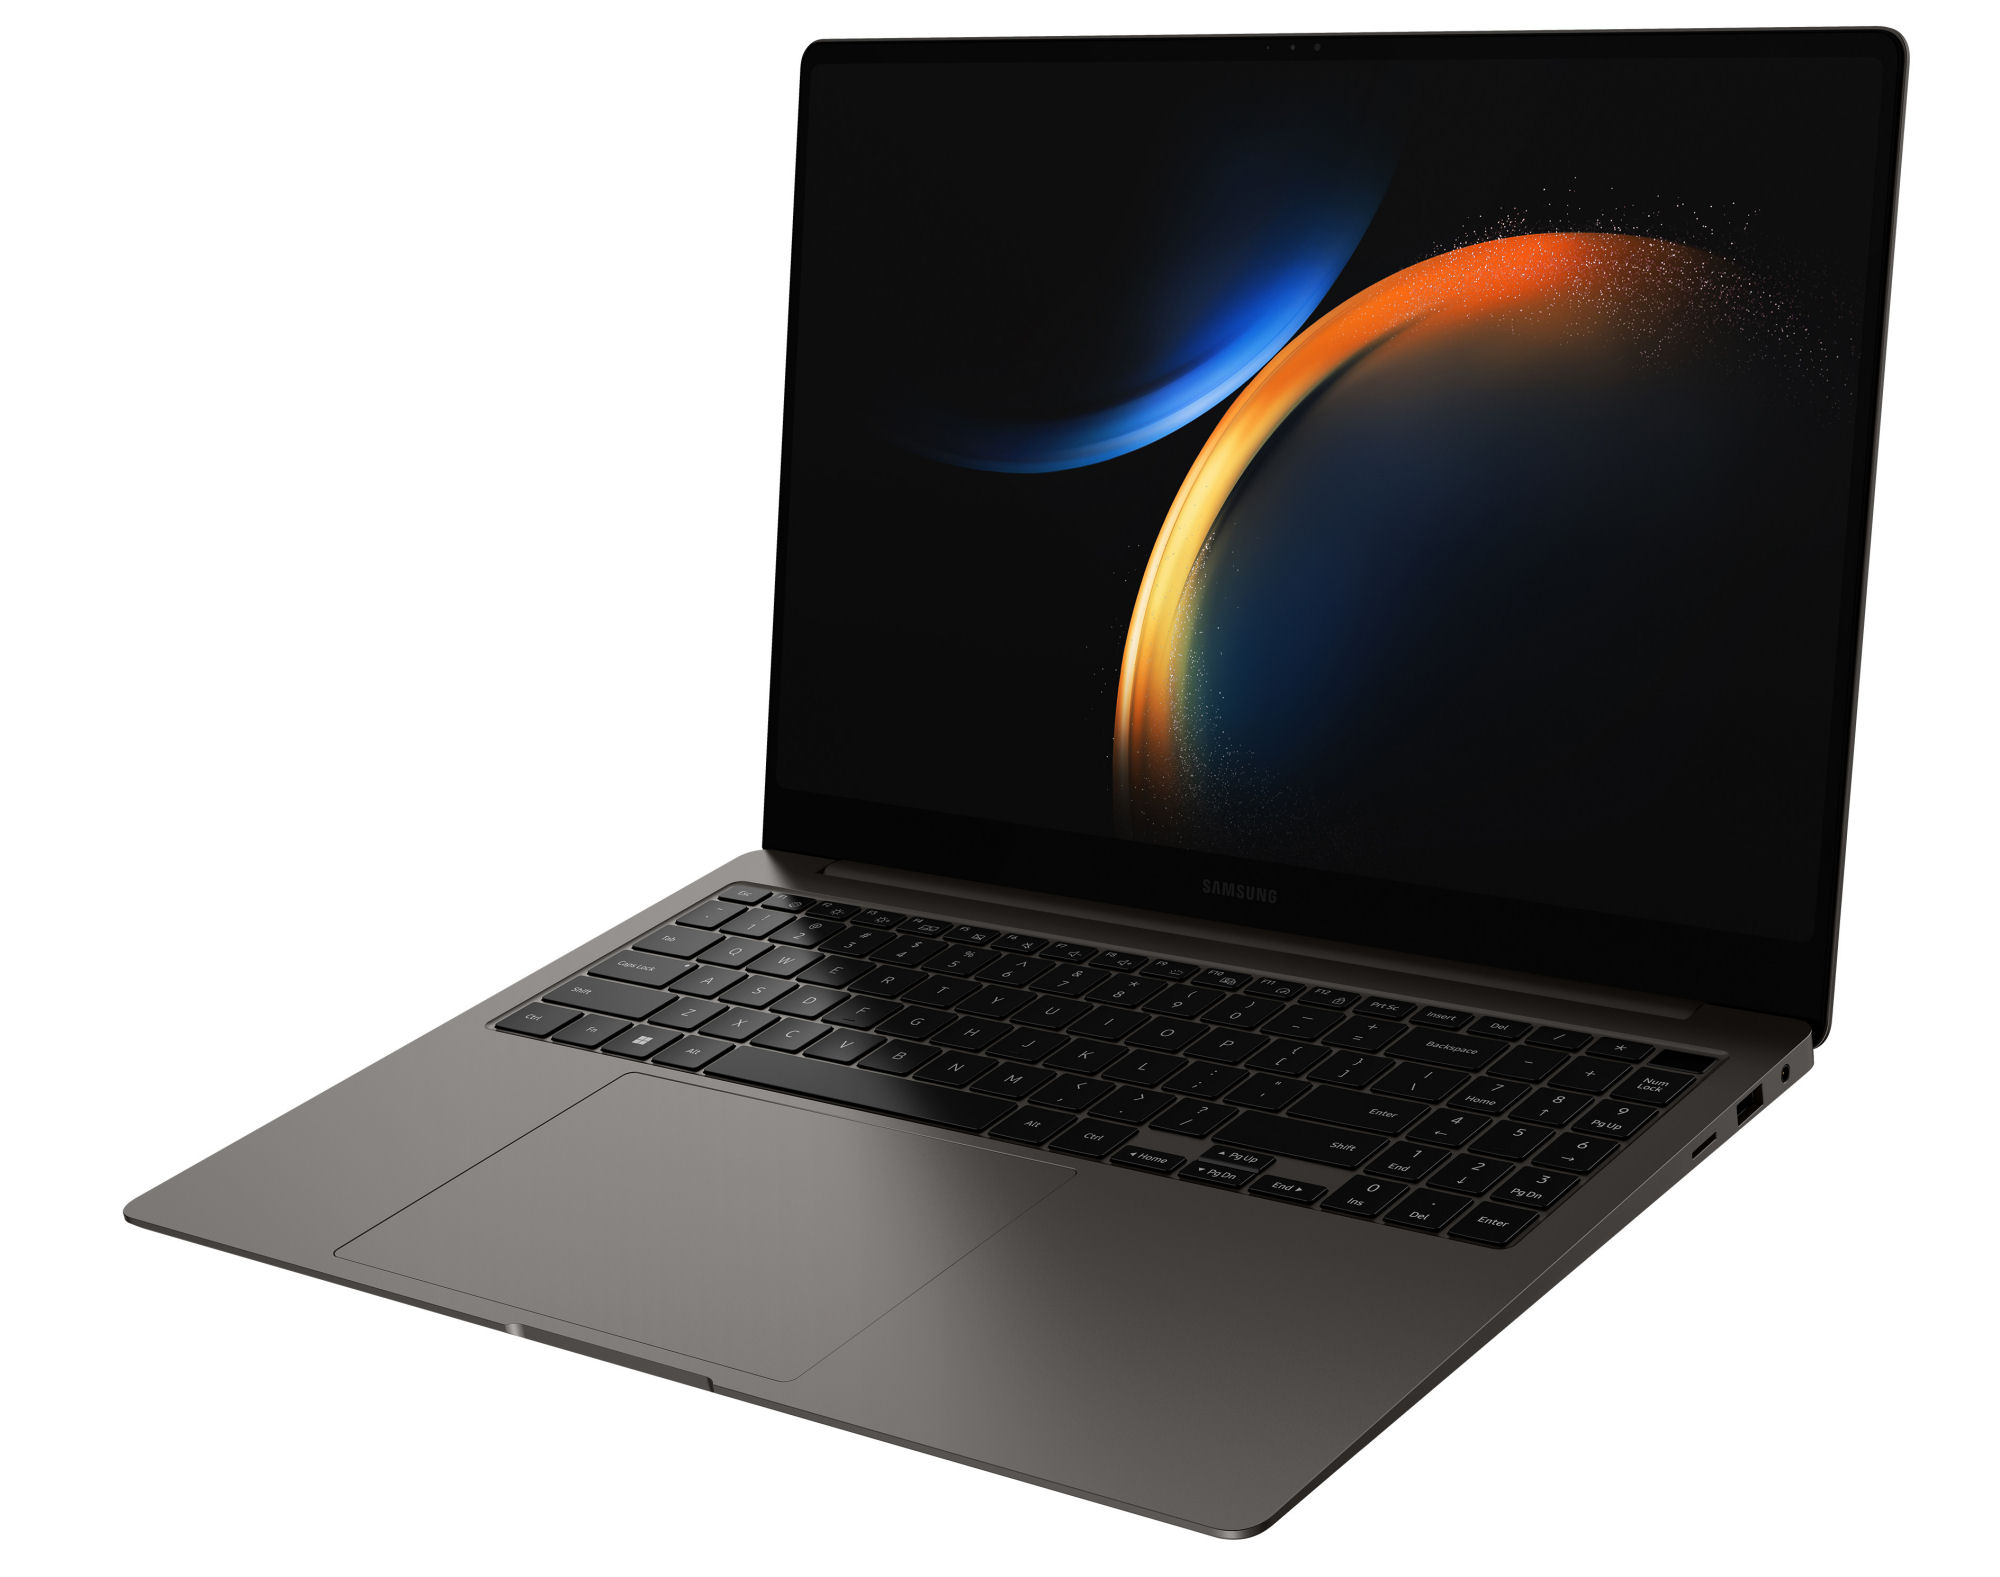
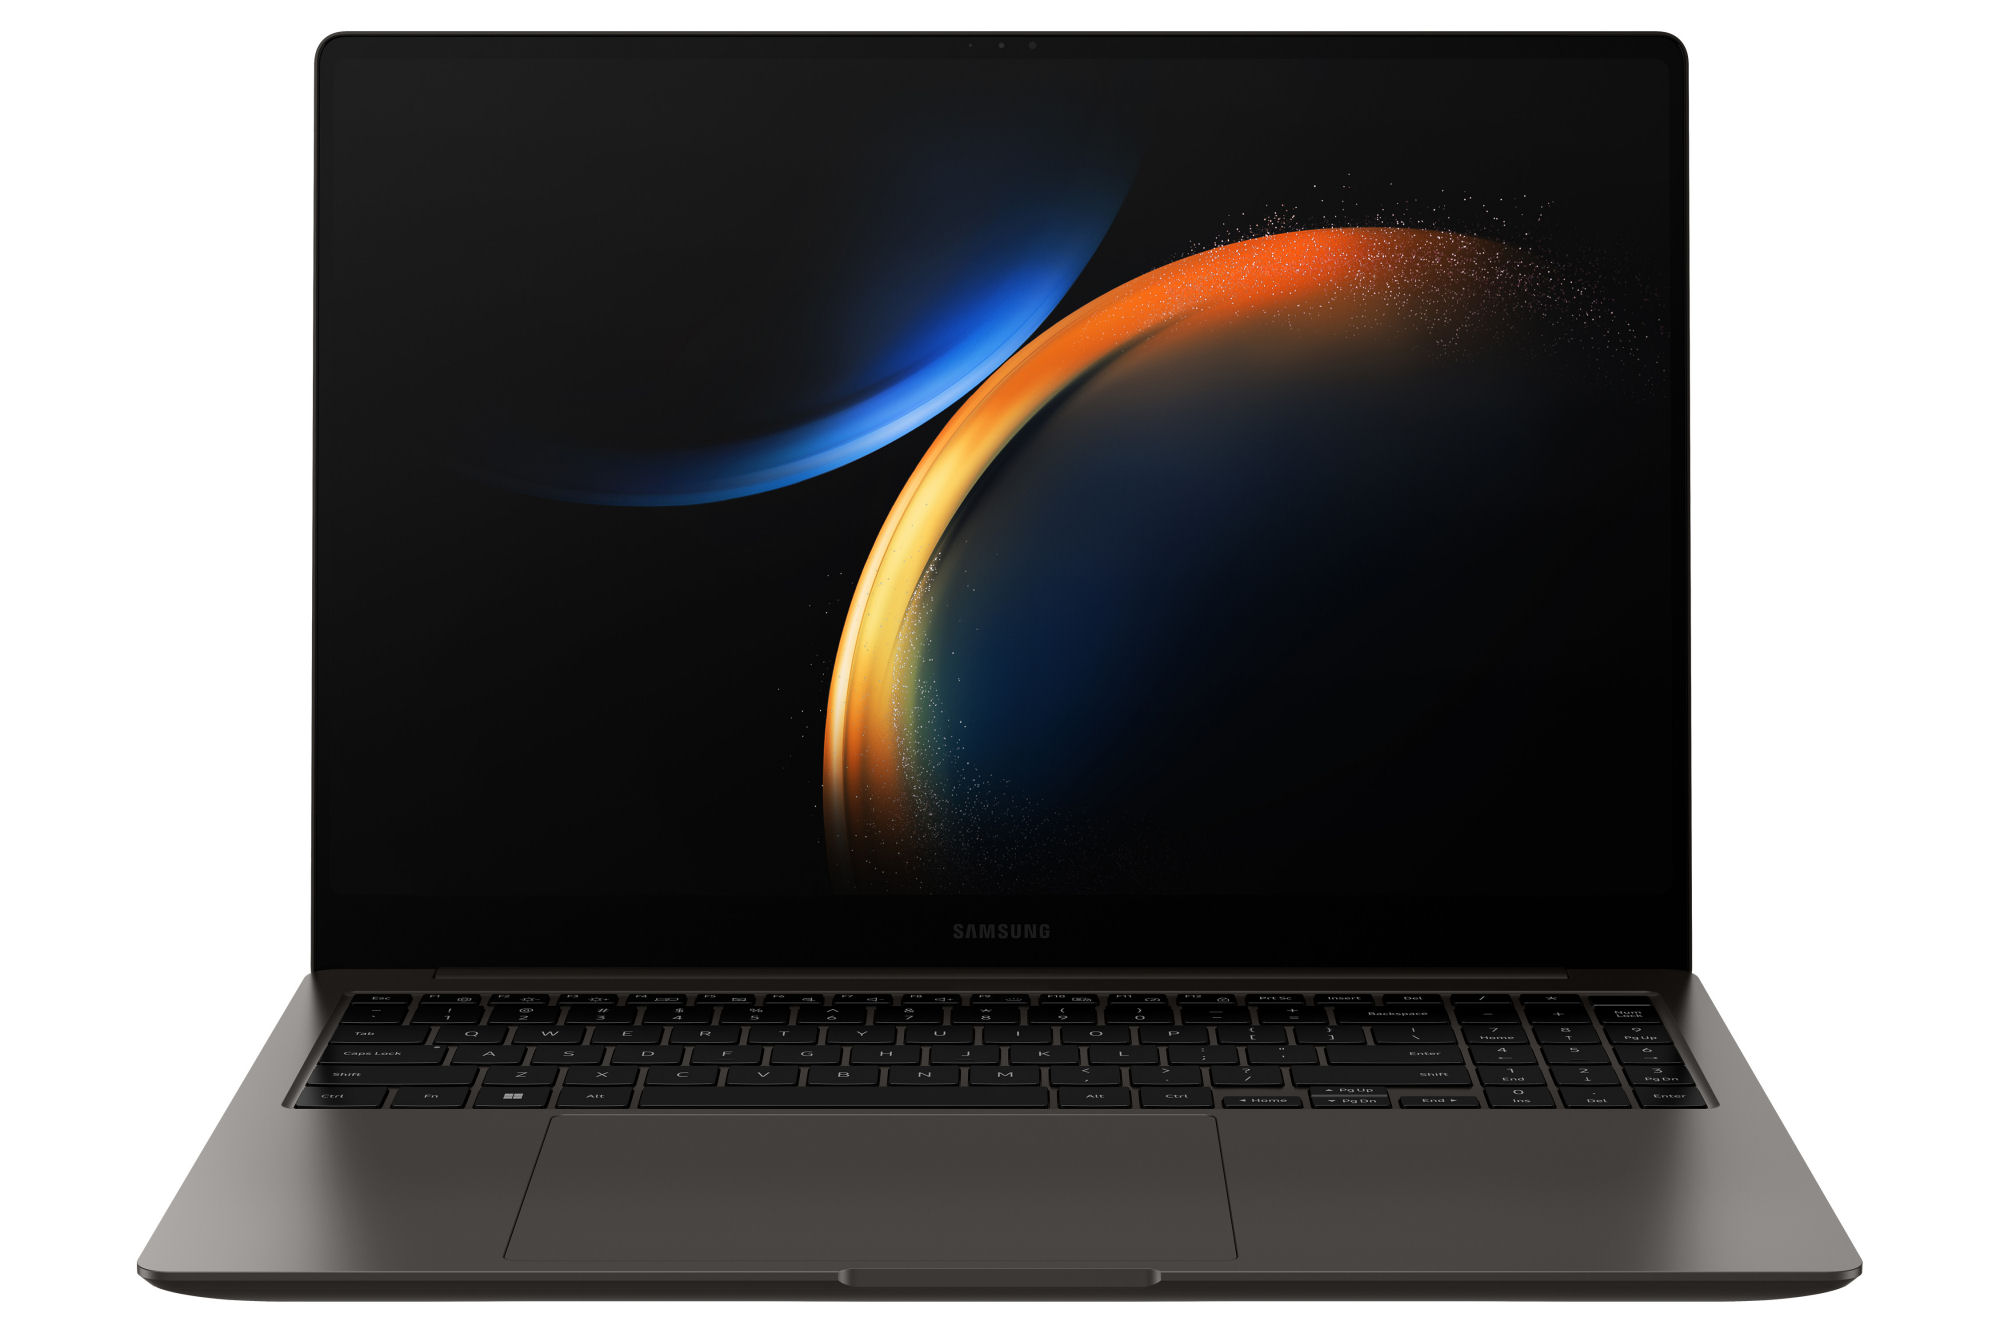
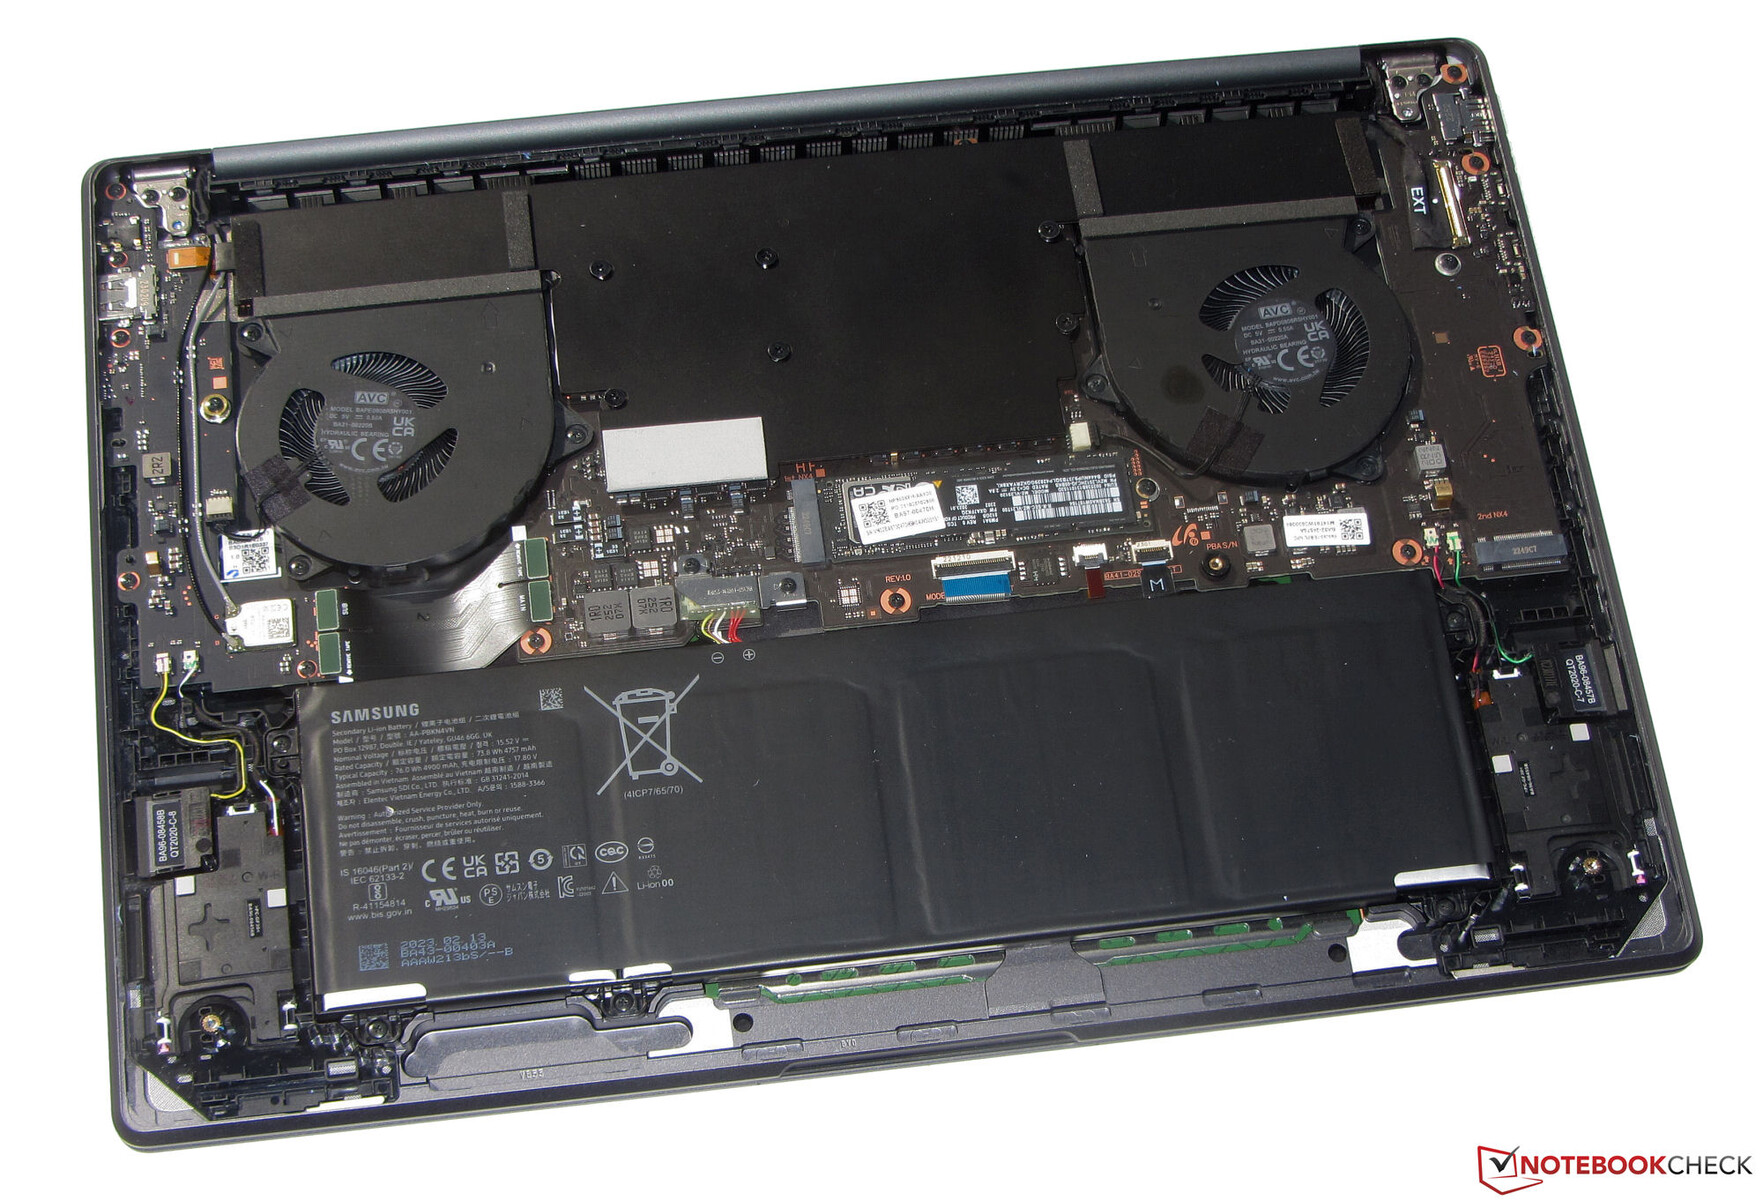
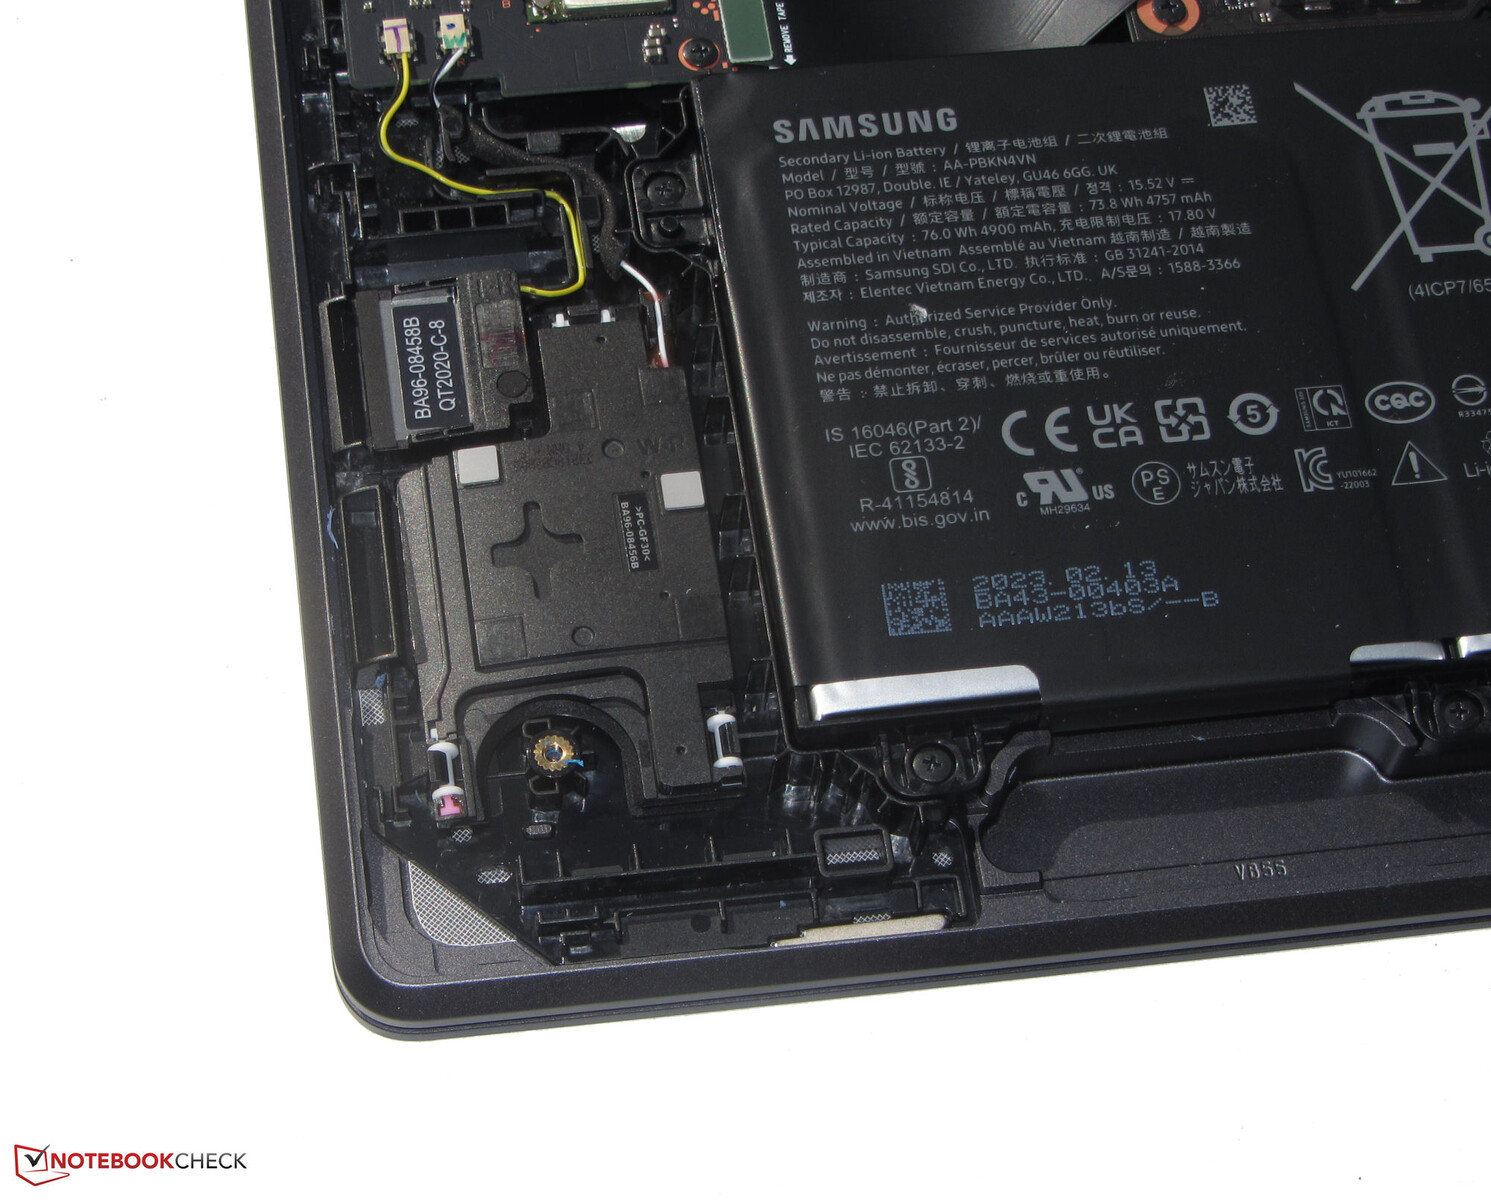
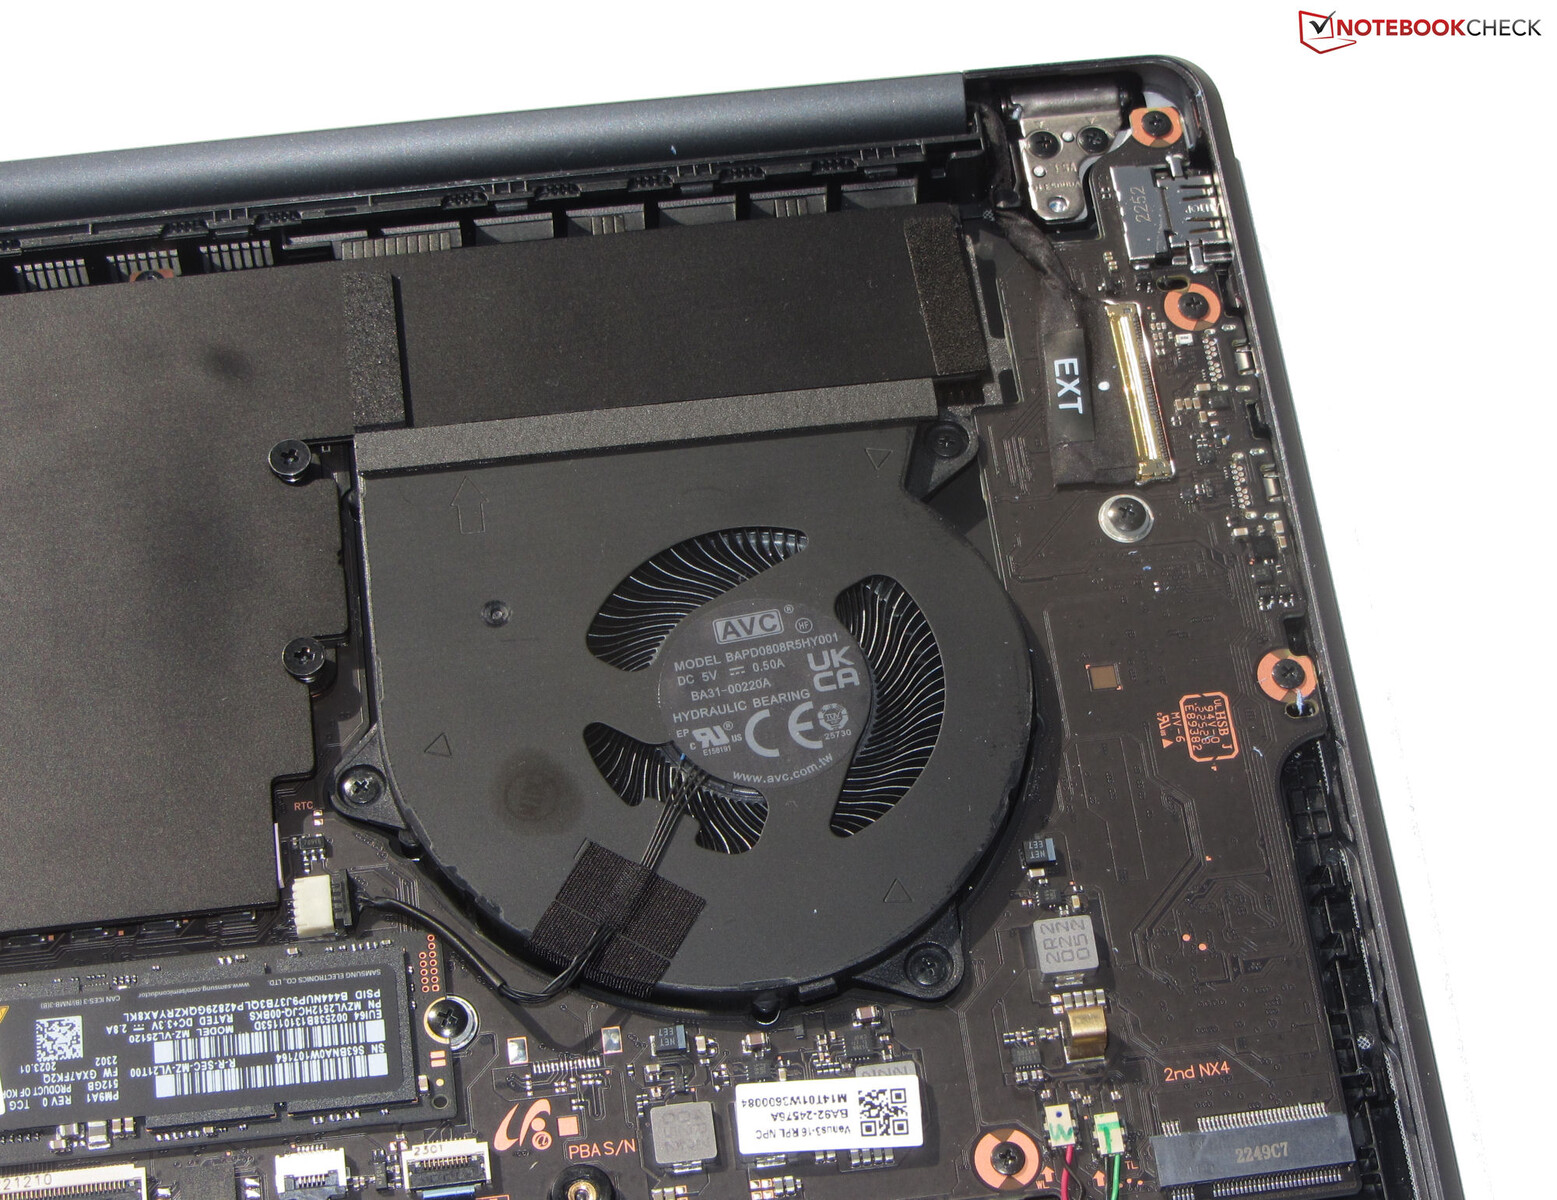
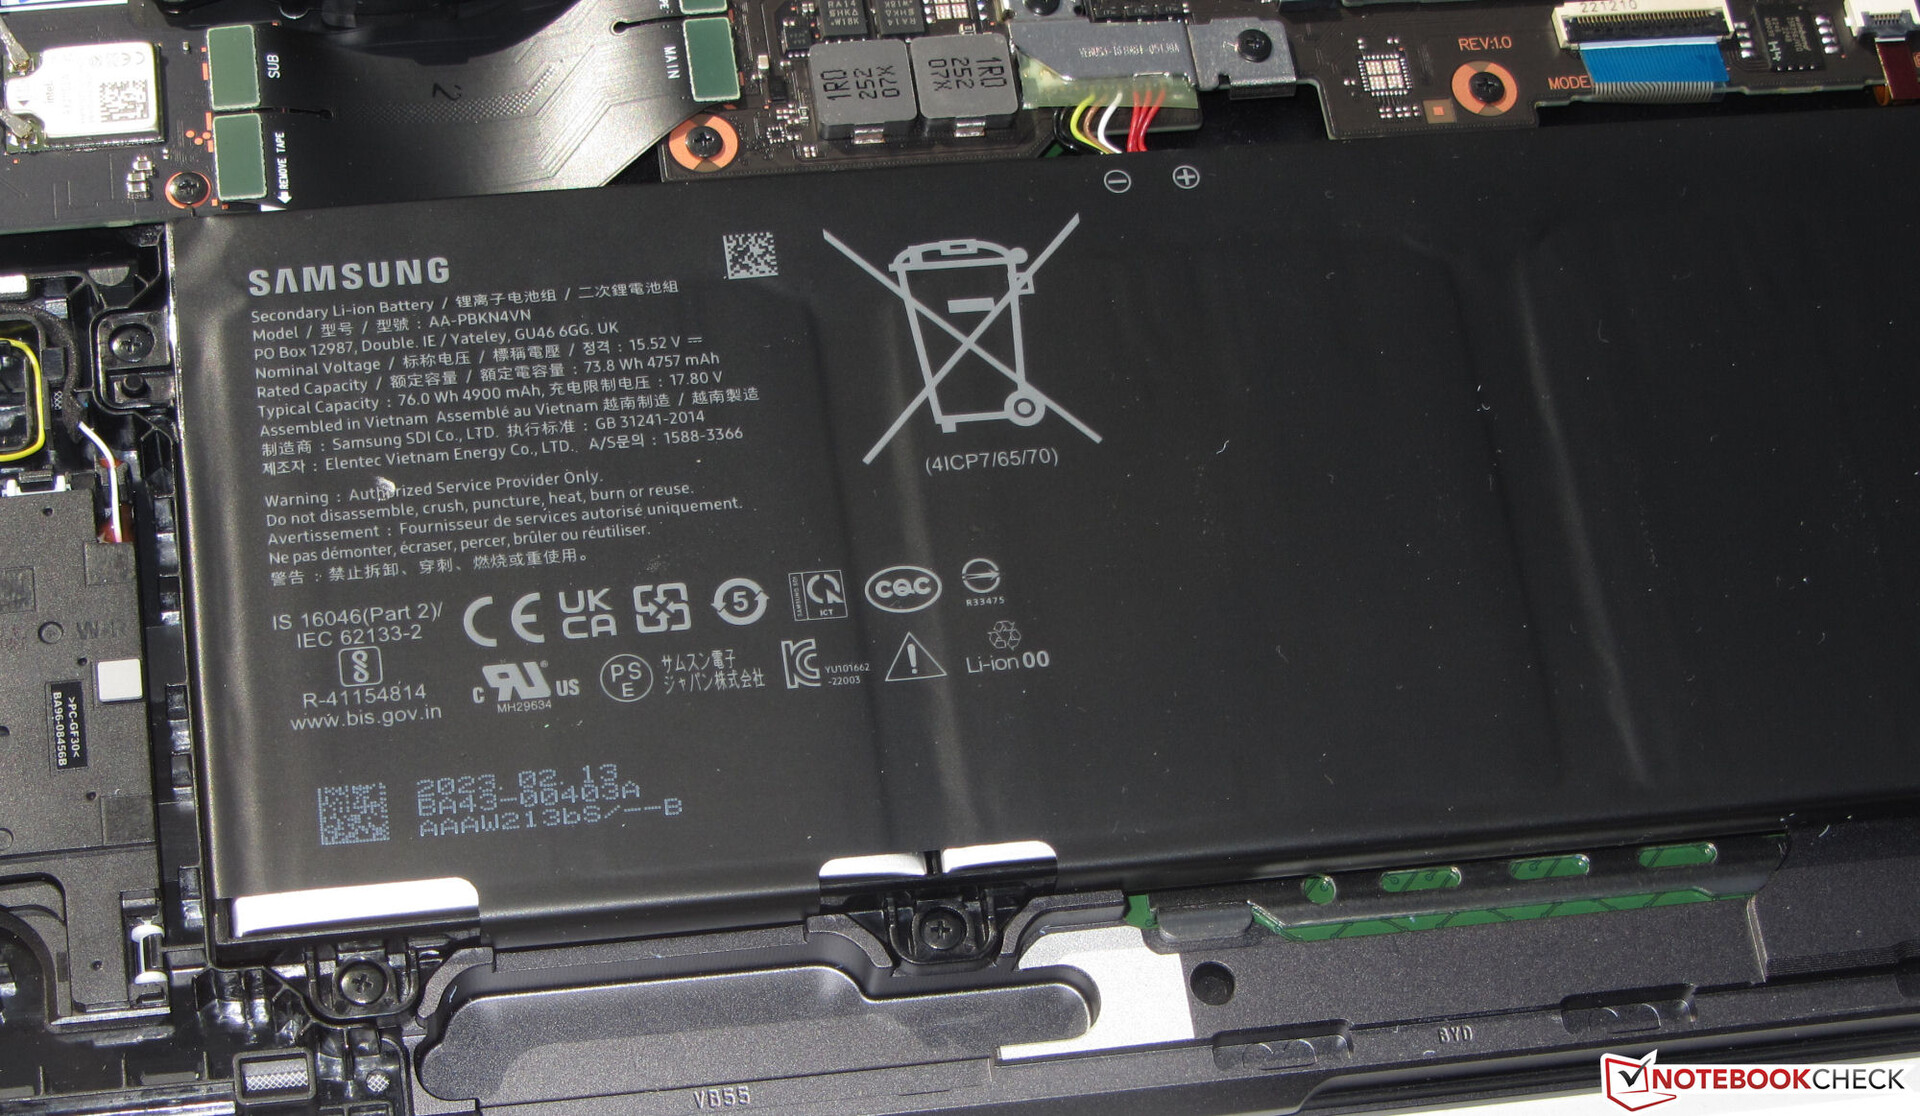
三星采用了灰黑色(石墨色)的铝制外壳,表面光滑、无光泽。这台别致优雅的电脑没有任何醒目的设计特征,也不需要这些特征。电池(用螺丝固定,不是用胶粘)和其他内部组件在拆下底壳后可以接触到。
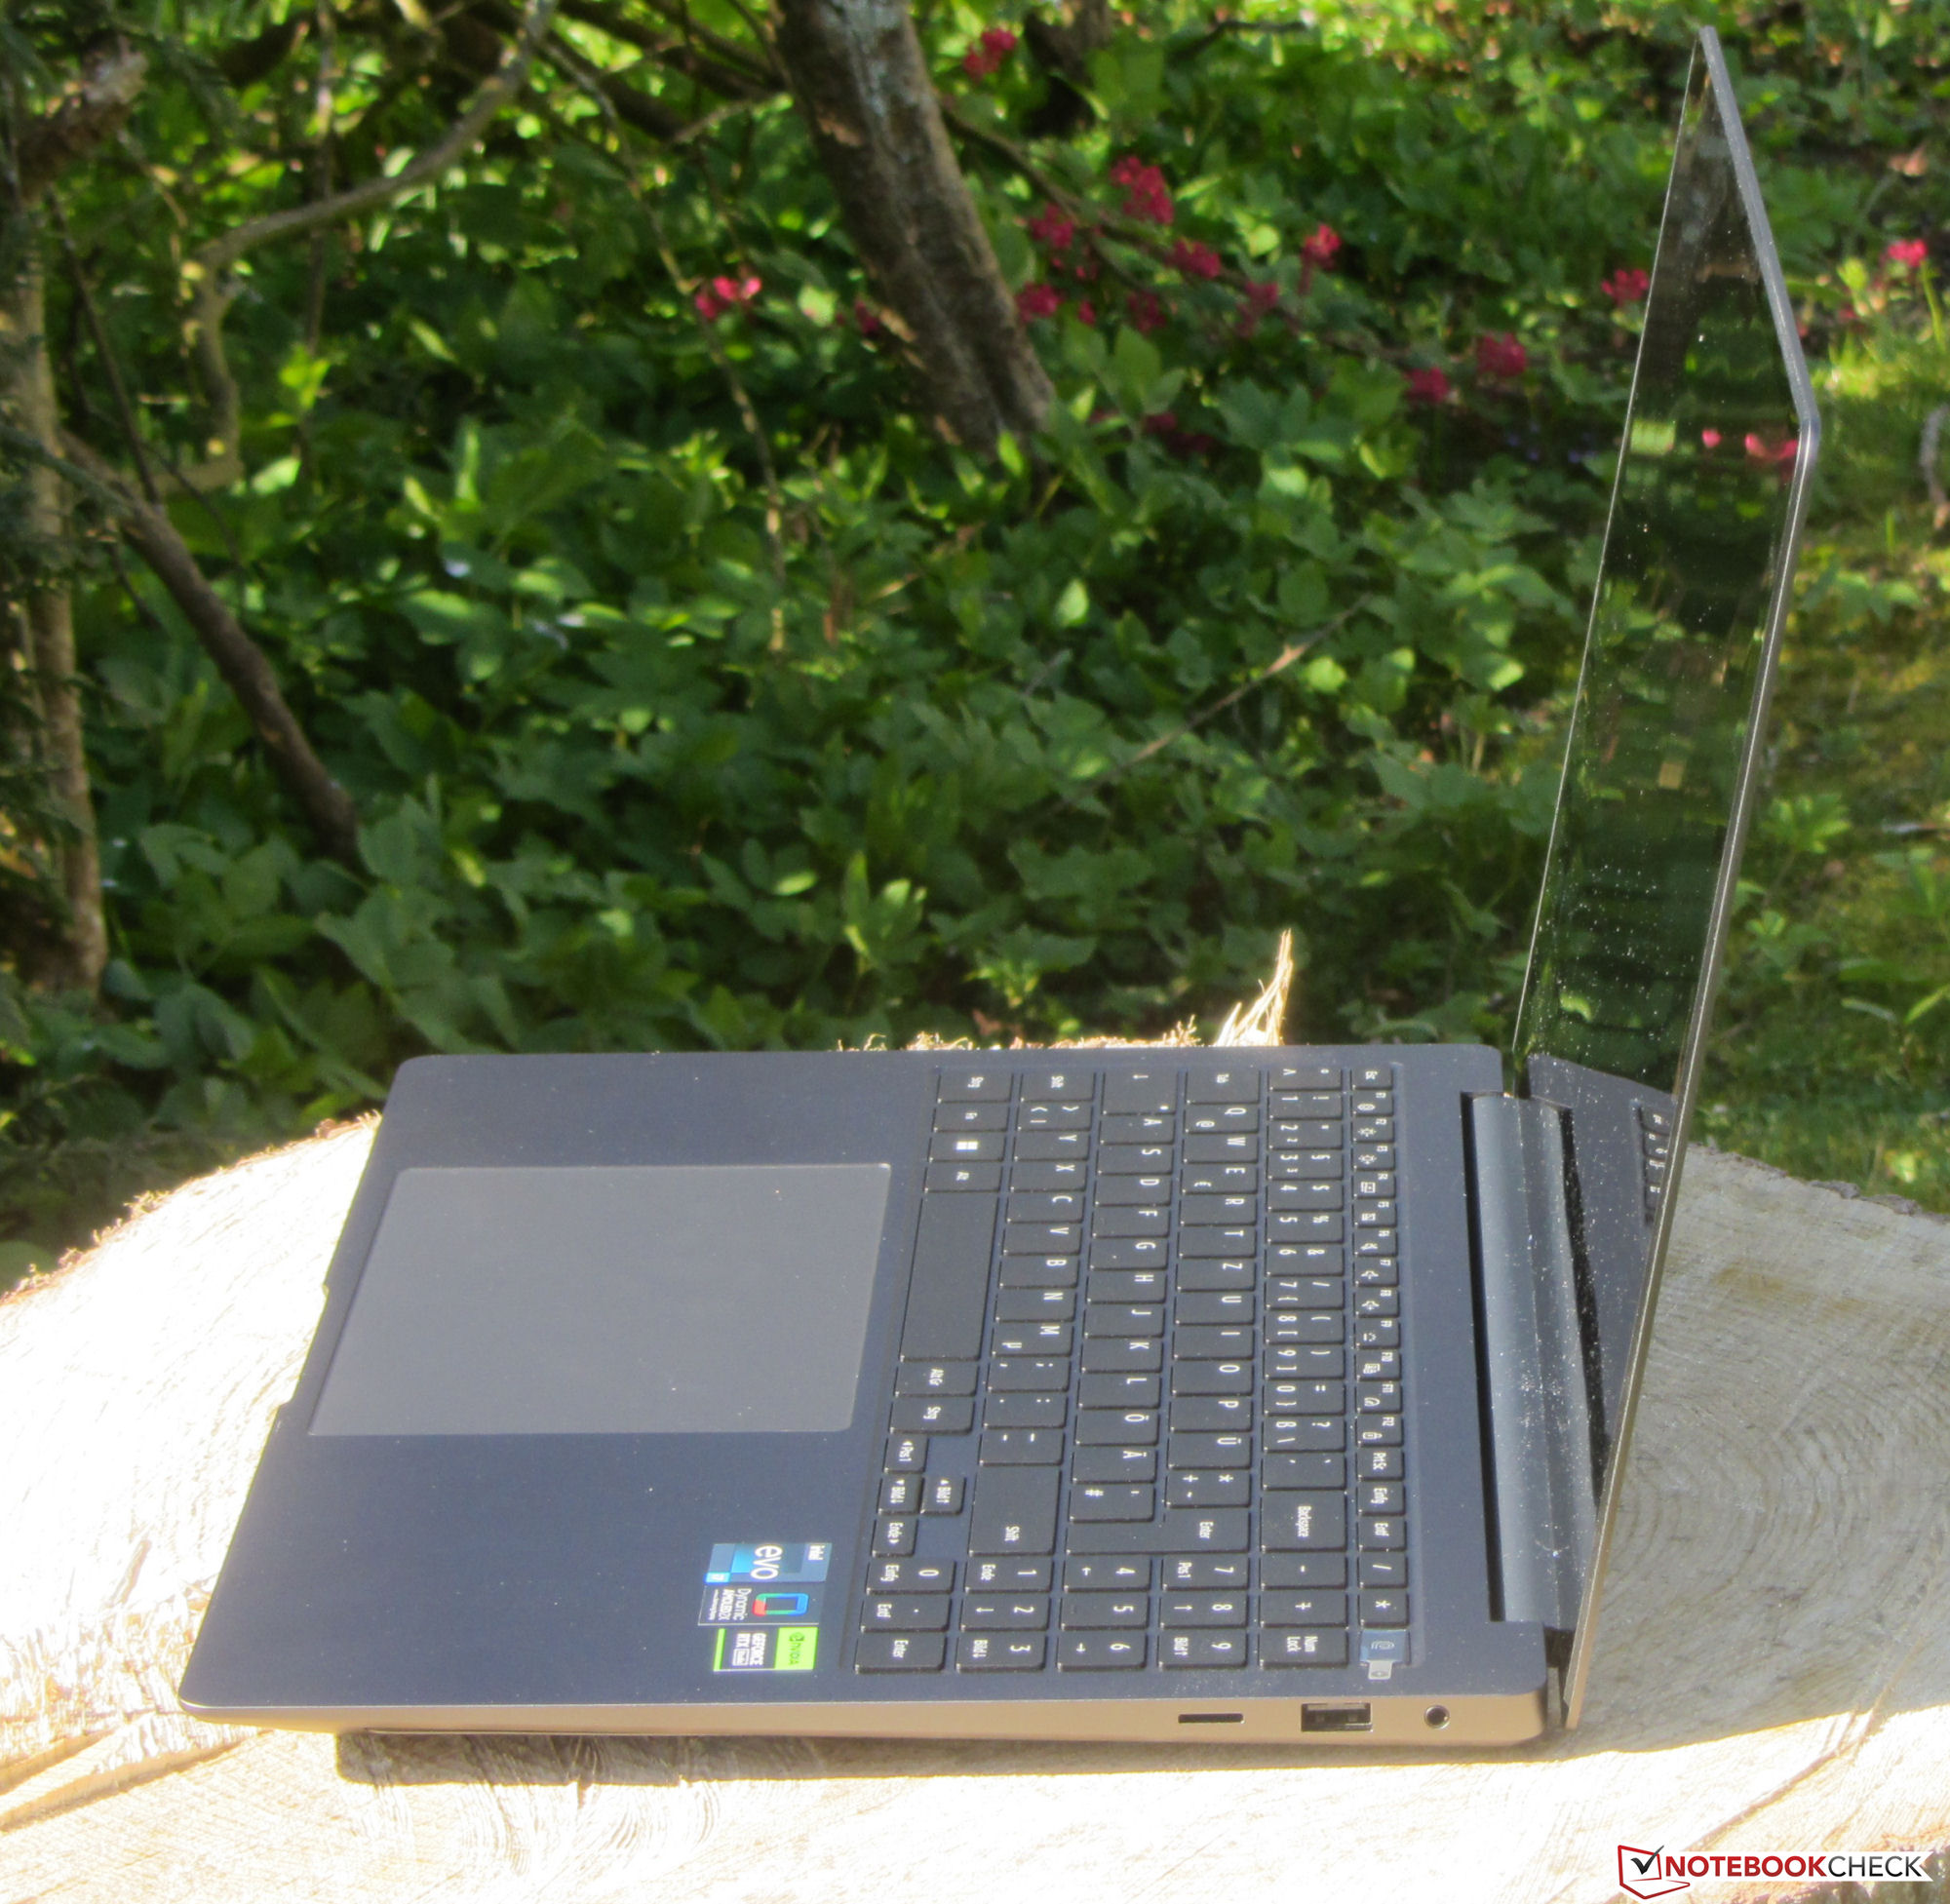
笔记本的做工很好。间隙尺寸均匀,没有发现任何材料的突起。底部装置和盖子只能扭曲到很小的程度。铰链将盖子牢牢地固定住,最大打开角度约为125度。单手打开是可能的。
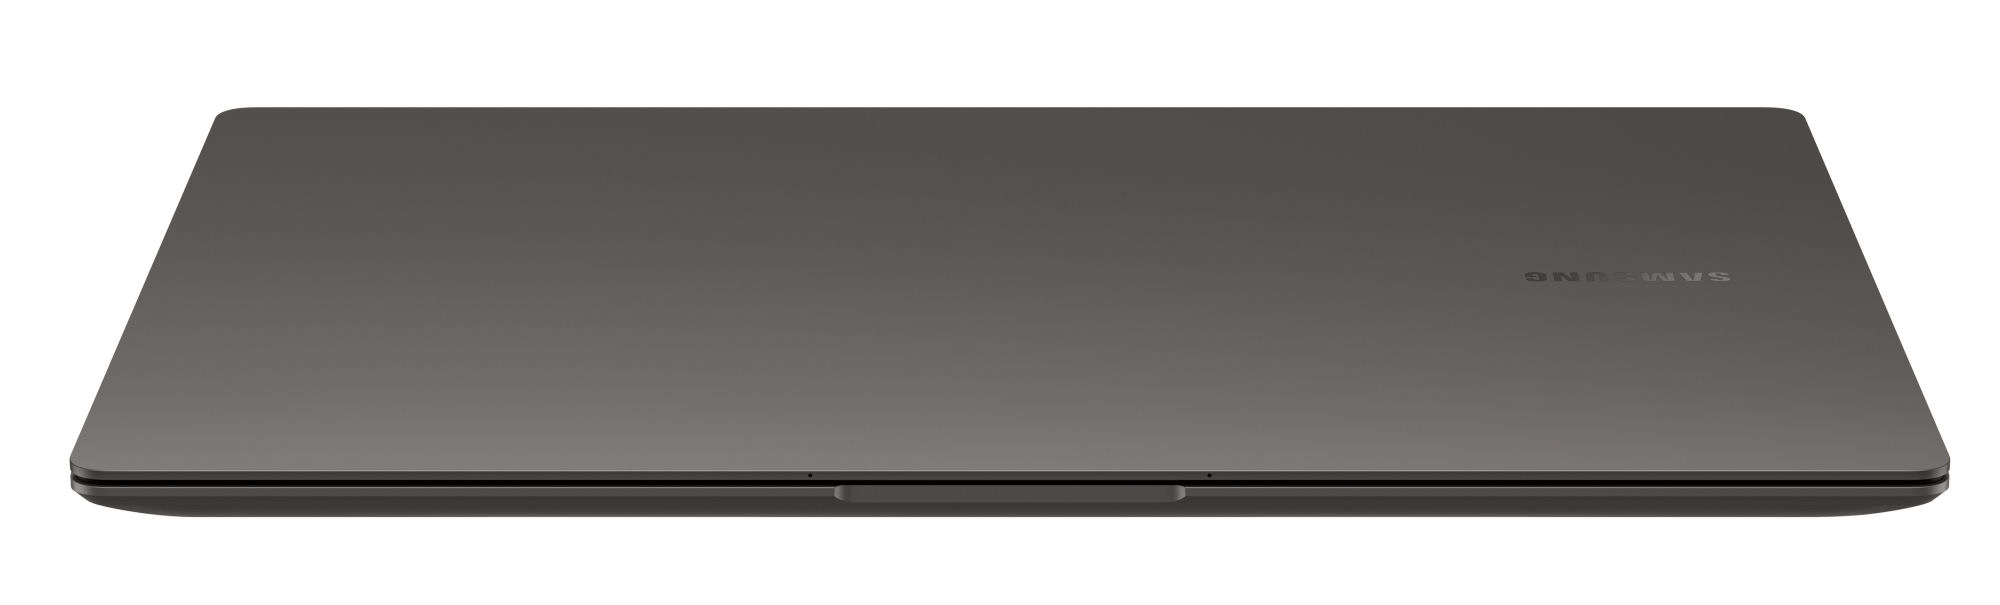

Galaxy Book3从根本上说属于小型和轻型笔记本的范畴。然而,它处于比较领域的中间位置。它的直接竞争对手是 Schenker Vision 16 Pro、更加紧凑和轻便。没有一台笔记本电脑能与低重量(1.4公斤)的 LG Gram 17.
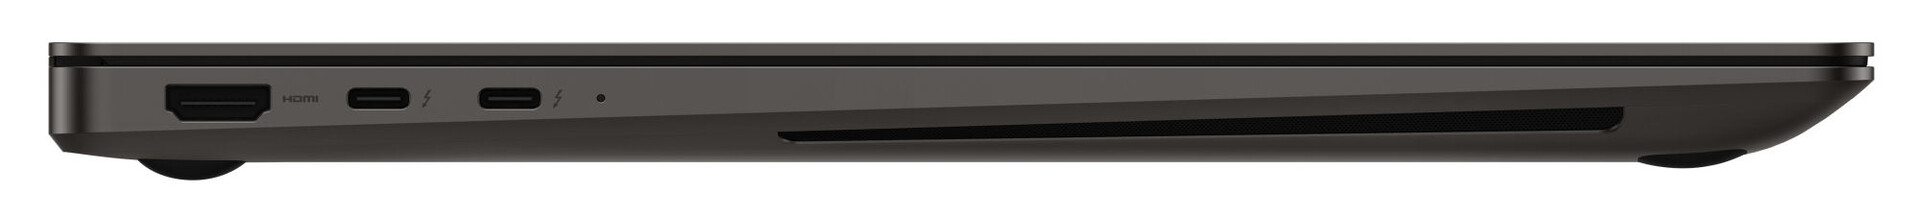
设备 - 三星将Thunderbolt 4安装在Ultra 16中
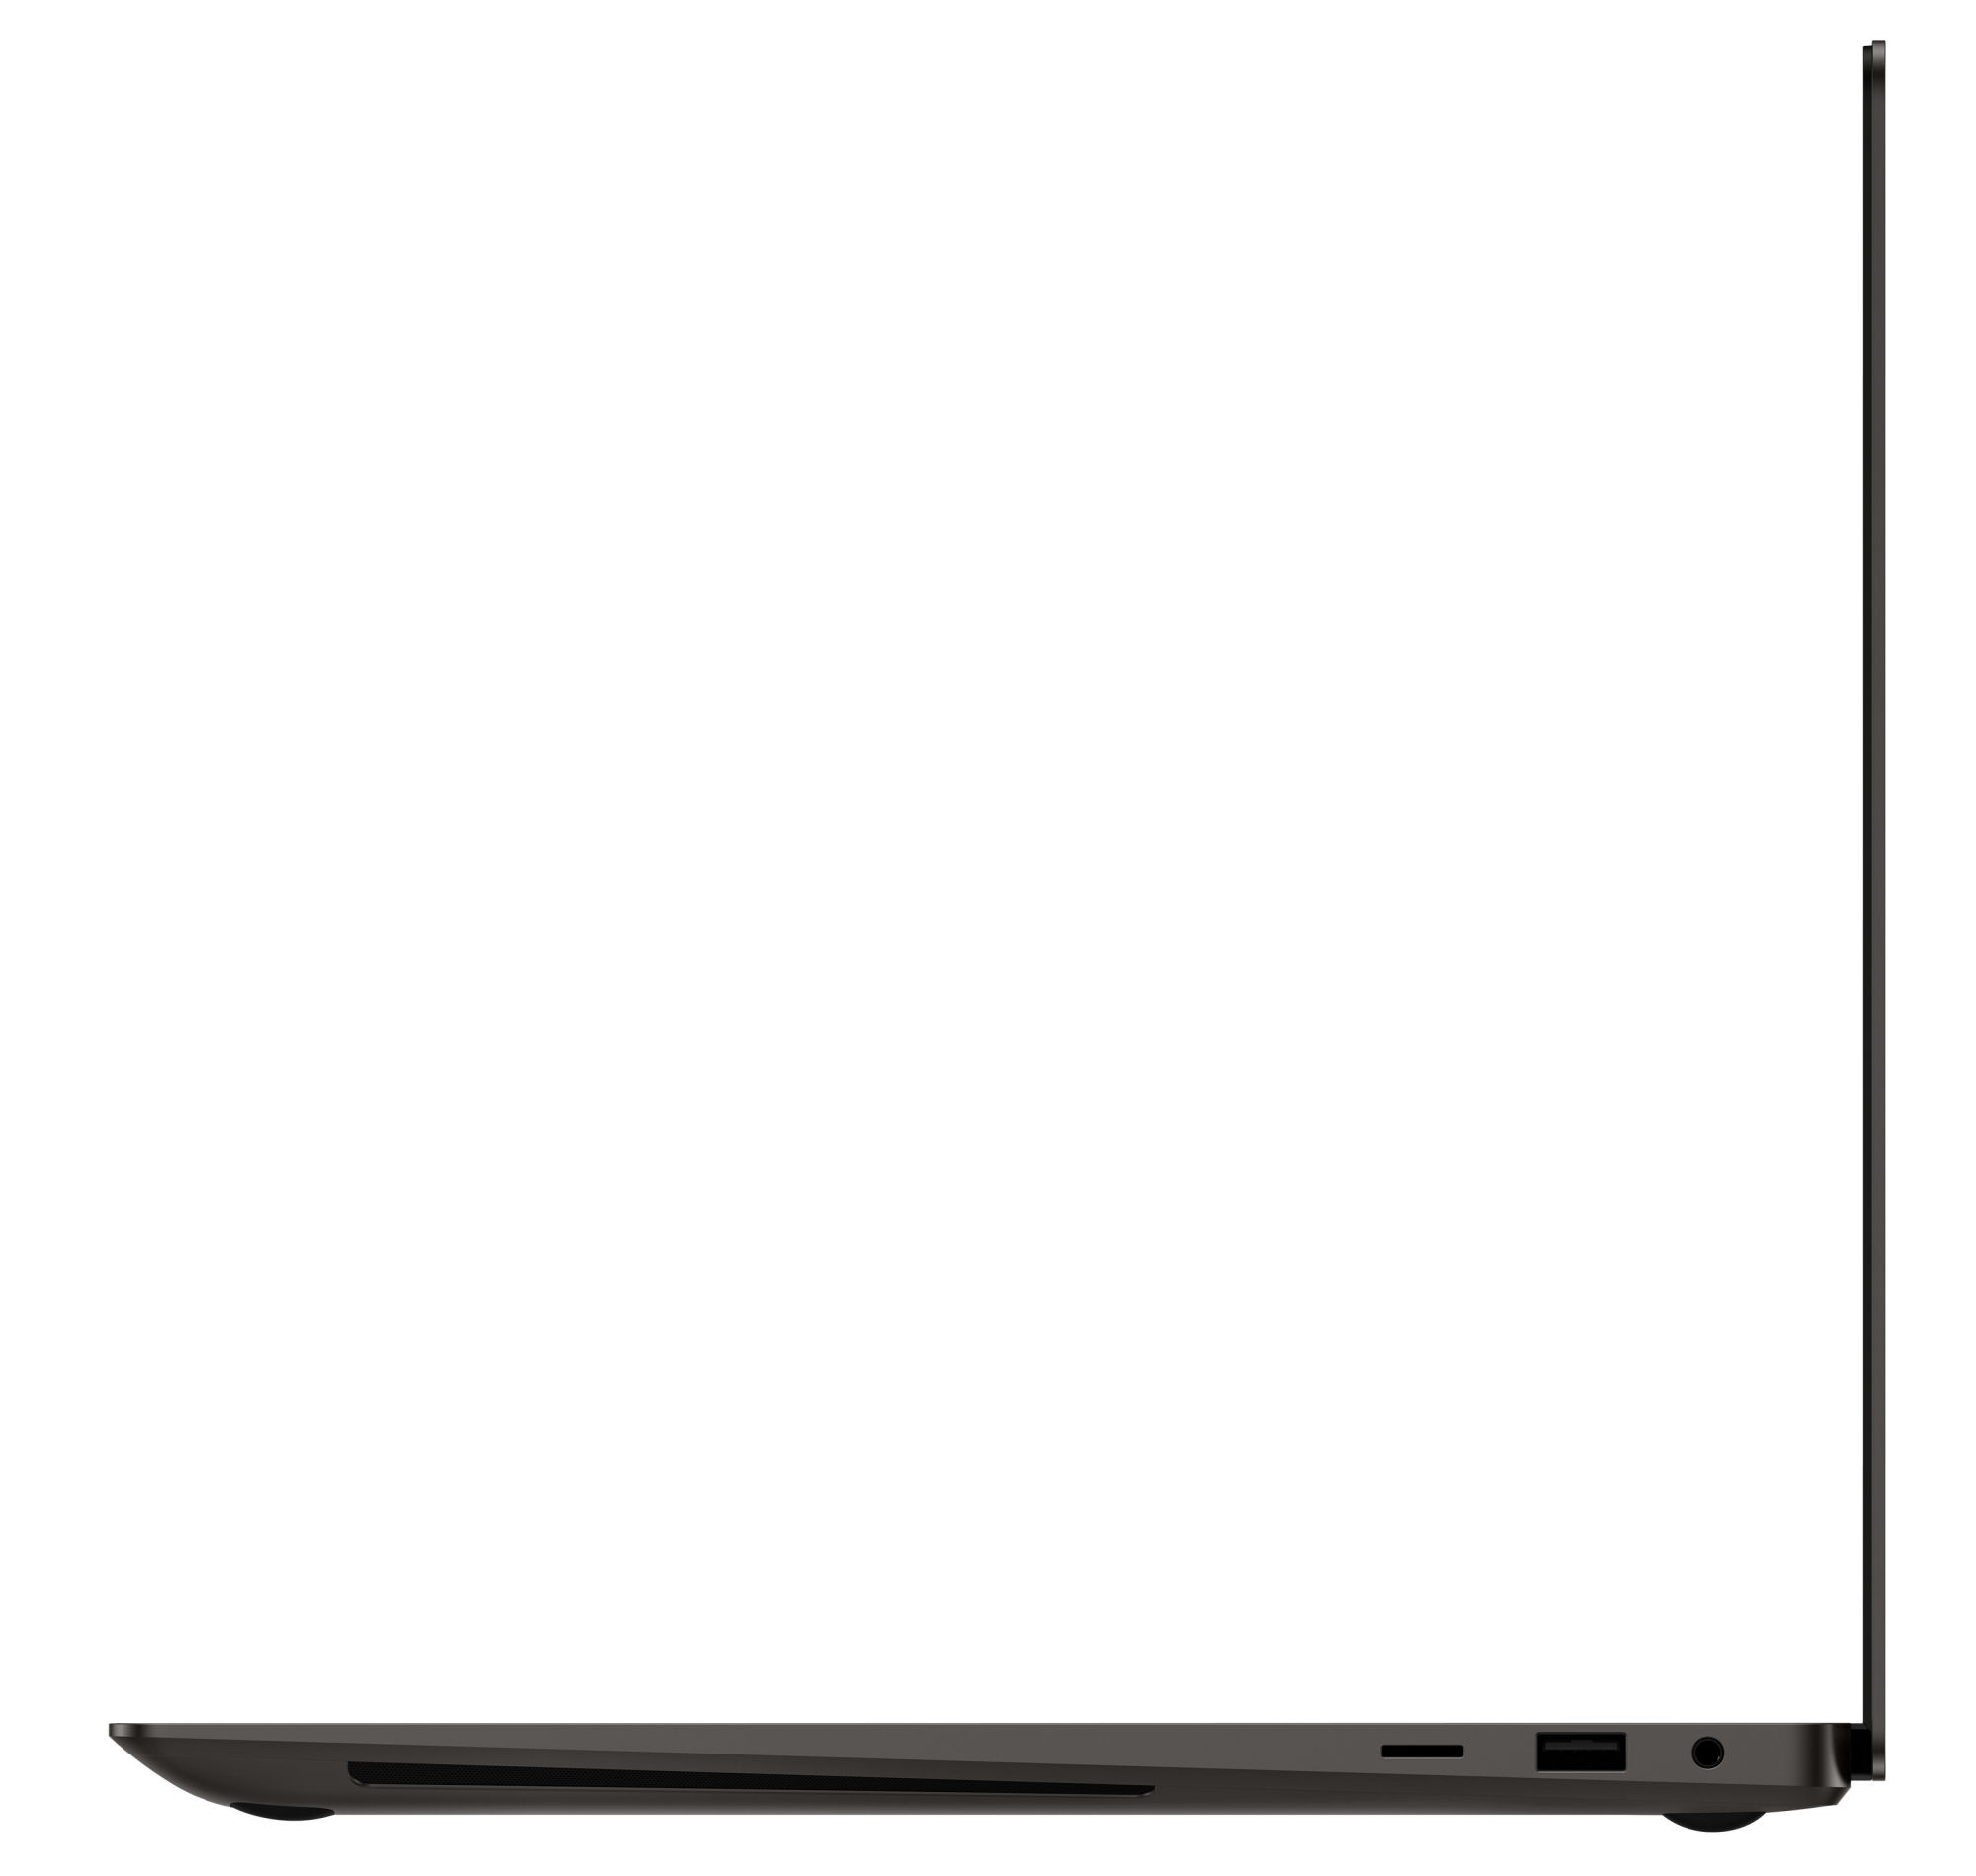
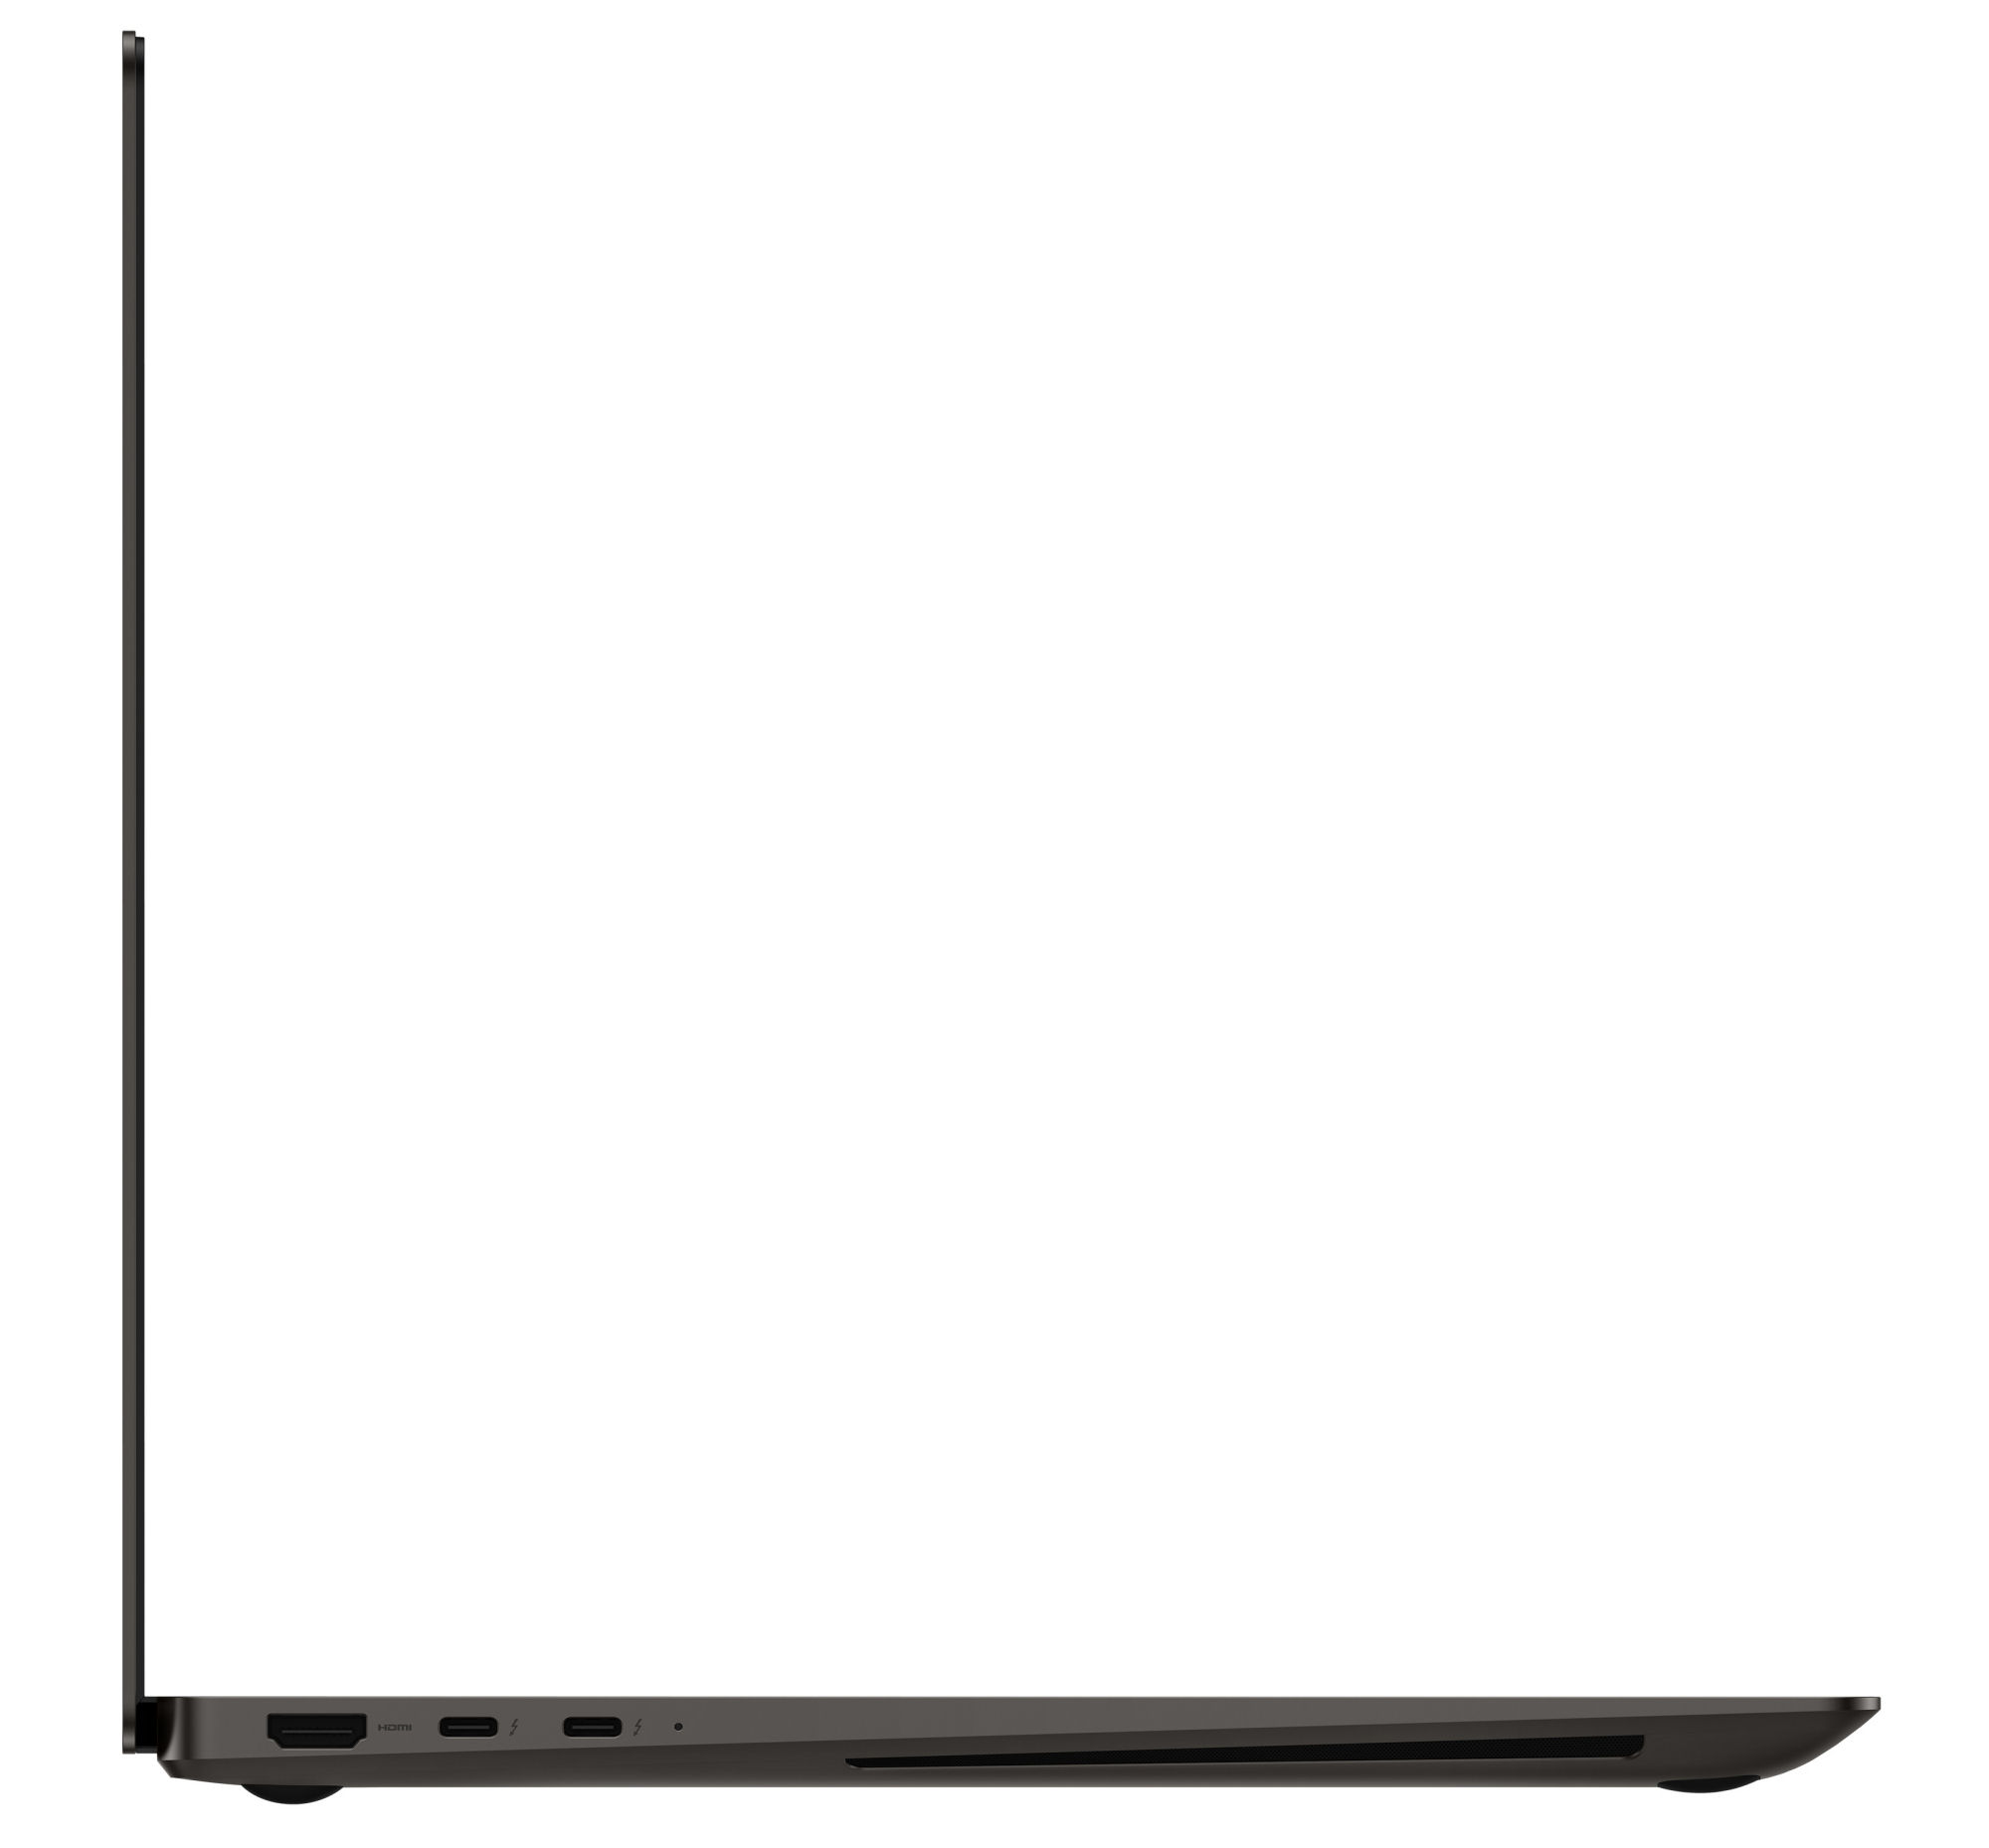
笔记本电脑有一个USB-A端口(USB 3.2 Gen 1)和两个USB-C端口(Thunderbolt 4)。后者可以为笔记本电脑供电(Power Delivery),也可以输出DisplayPort。总共有三个视频输出(2个DP,1个HDMI)。缺少的端口可以用一个扩展坞来添加。
这些端口位于右侧和左侧的背面区域,因此掌托旁边的空间仍然没有电缆。有一个缺点:所有视频输出和电源连接都在左边。如果在两侧都安装Thunderbolt 4,这里就有意义了。
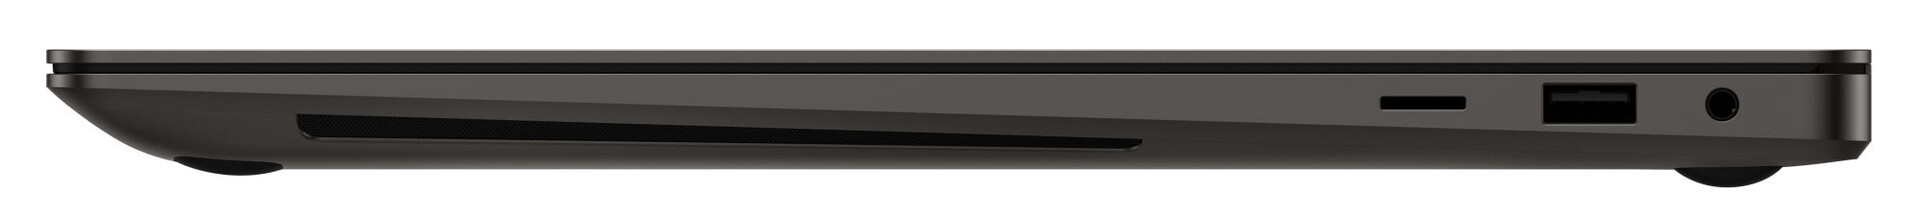
SD卡阅读器
microSD存储卡读卡器(参考卡:AV PRO microSD 128 GB V60)属于中等速度的型号,最大传输速率为74 MB/s(传输250个jpg图像文件,每个约5MB)和83 MB/s(复制大数据块)。
| SD Card Reader | |
| average JPG Copy Test (av. of 3 runs) | |
| Dell XPS 15 9520 RTX 3050 Ti (Toshiba Exceria Pro SDXC 64 GB UHS-II) | |
| Average of class Multimedia (23 - 531, n=37, last 2 years) | |
| Schenker Vision 16 Pro RTX 3070 Ti (AV Pro V60) | |
| Lenovo ThinkBook 16p G3 ARH (AV PRO microSD 128 GB V60) | |
| LG Gram 17Z90Q-E.AD78G (AV Pro SD microSD 128 GB V60) | |
| Samsung Galaxy Book3 Ultra 16 (AV PRO microSD 128 GB V60) | |
| Asus VivoBook Pro 16X OLED N7600PC-L2026X | |
| maximum AS SSD Seq Read Test (1GB) | |
| Average of class Multimedia (37.3 - 1455, n=36, last 2 years) | |
| Dell XPS 15 9520 RTX 3050 Ti (Toshiba Exceria Pro SDXC 64 GB UHS-II) | |
| LG Gram 17Z90Q-E.AD78G (AV Pro SD microSD 128 GB V60) | |
| Lenovo ThinkBook 16p G3 ARH (AV PRO microSD 128 GB V60) | |
| Samsung Galaxy Book3 Ultra 16 (AV PRO microSD 128 GB V60) | |
| Schenker Vision 16 Pro RTX 3070 Ti (AV Pro V60) | |
| Asus VivoBook Pro 16X OLED N7600PC-L2026X | |
沟通
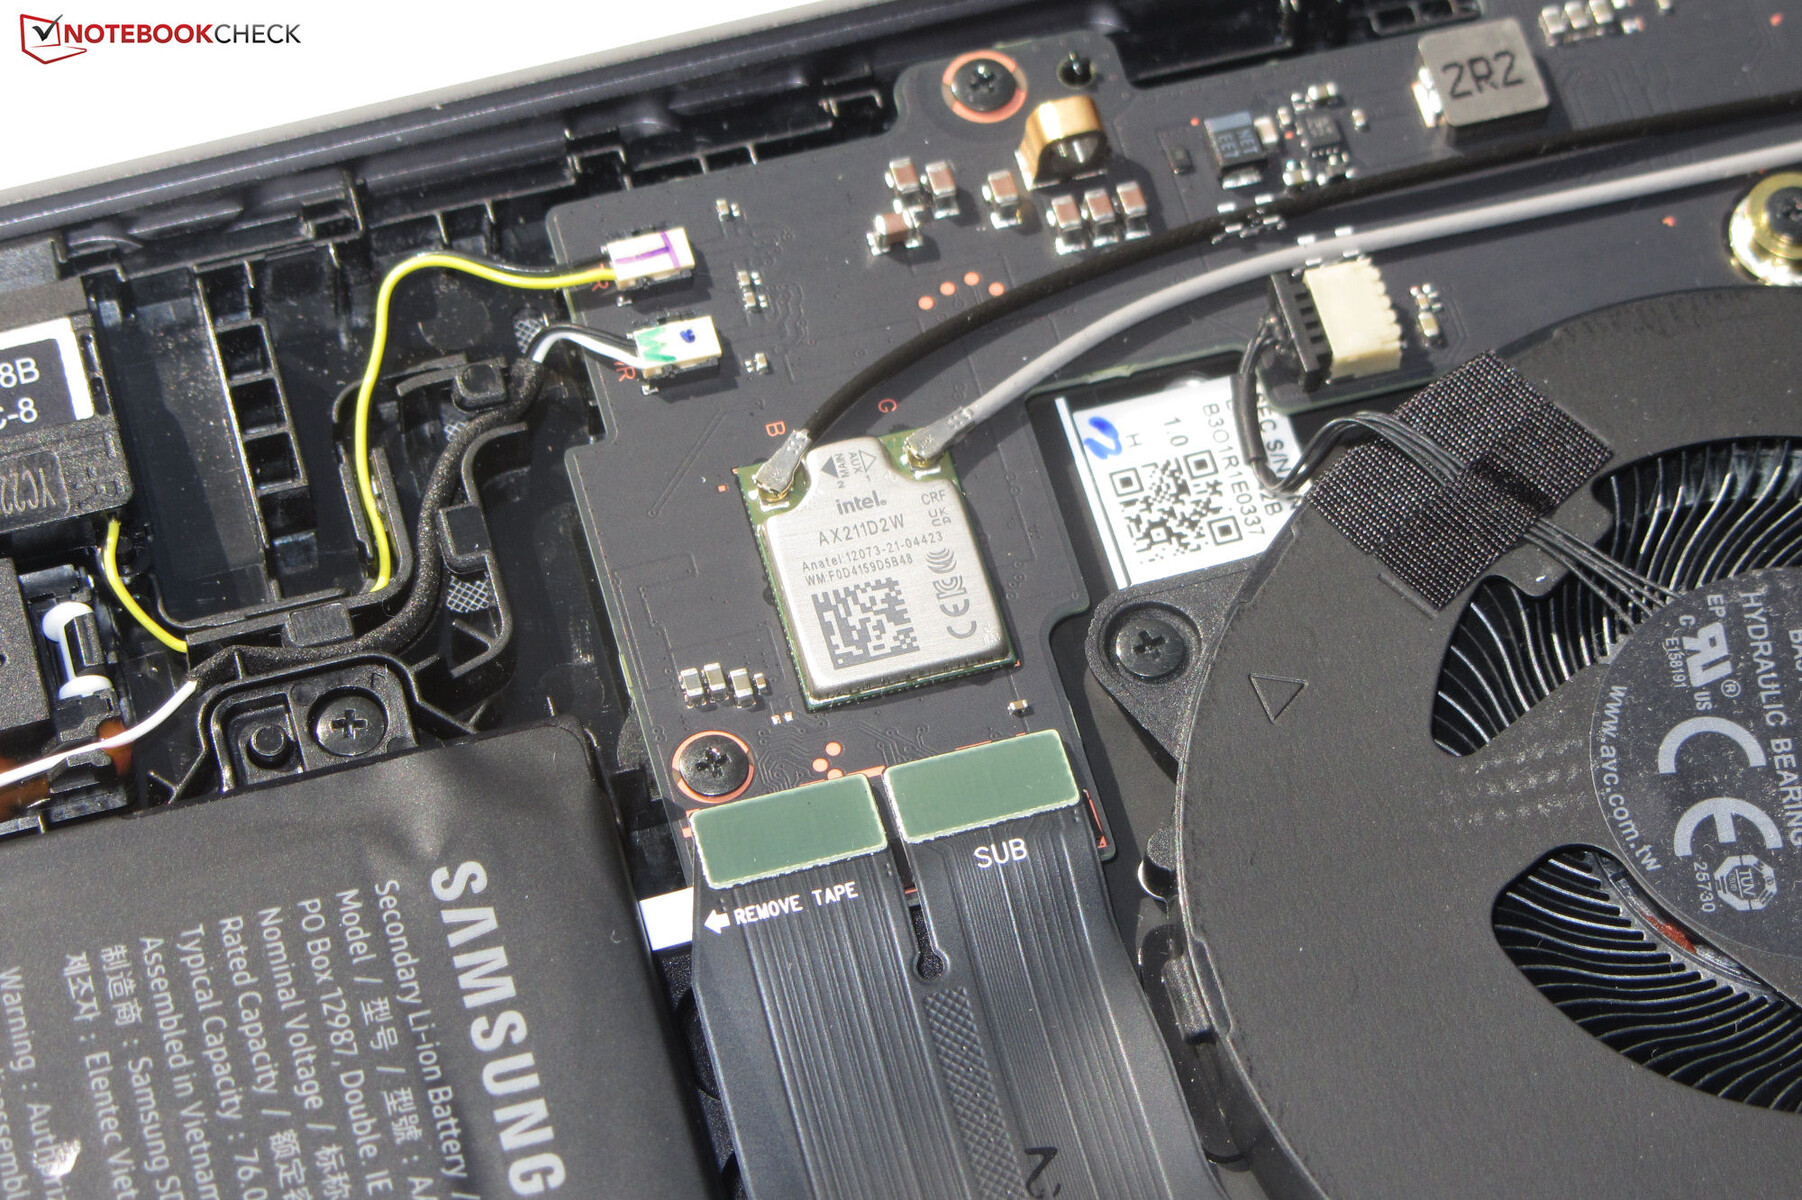
在最佳条件下(附近没有WLAN设备,笔记本电脑和服务器PC之间的距离较小),可以实现出色的WiFi数据速率。三星笔记本上有一个WiFi 6E芯片(英特尔AX211)。不提供以太网插槽。
网络摄像头
网络摄像头(210万像素,最大1,920 x 1,080)没有一个机械快门。从质量上看,它提供了标准的服务。色彩准确性是个问题,因为目标(DeltaE小于3)没有达到,色彩偏差几乎达到8。


辅料
除了通常的文件(保修信息、快速入门指南)外,该笔记本没有附带任何其他附件。
维护
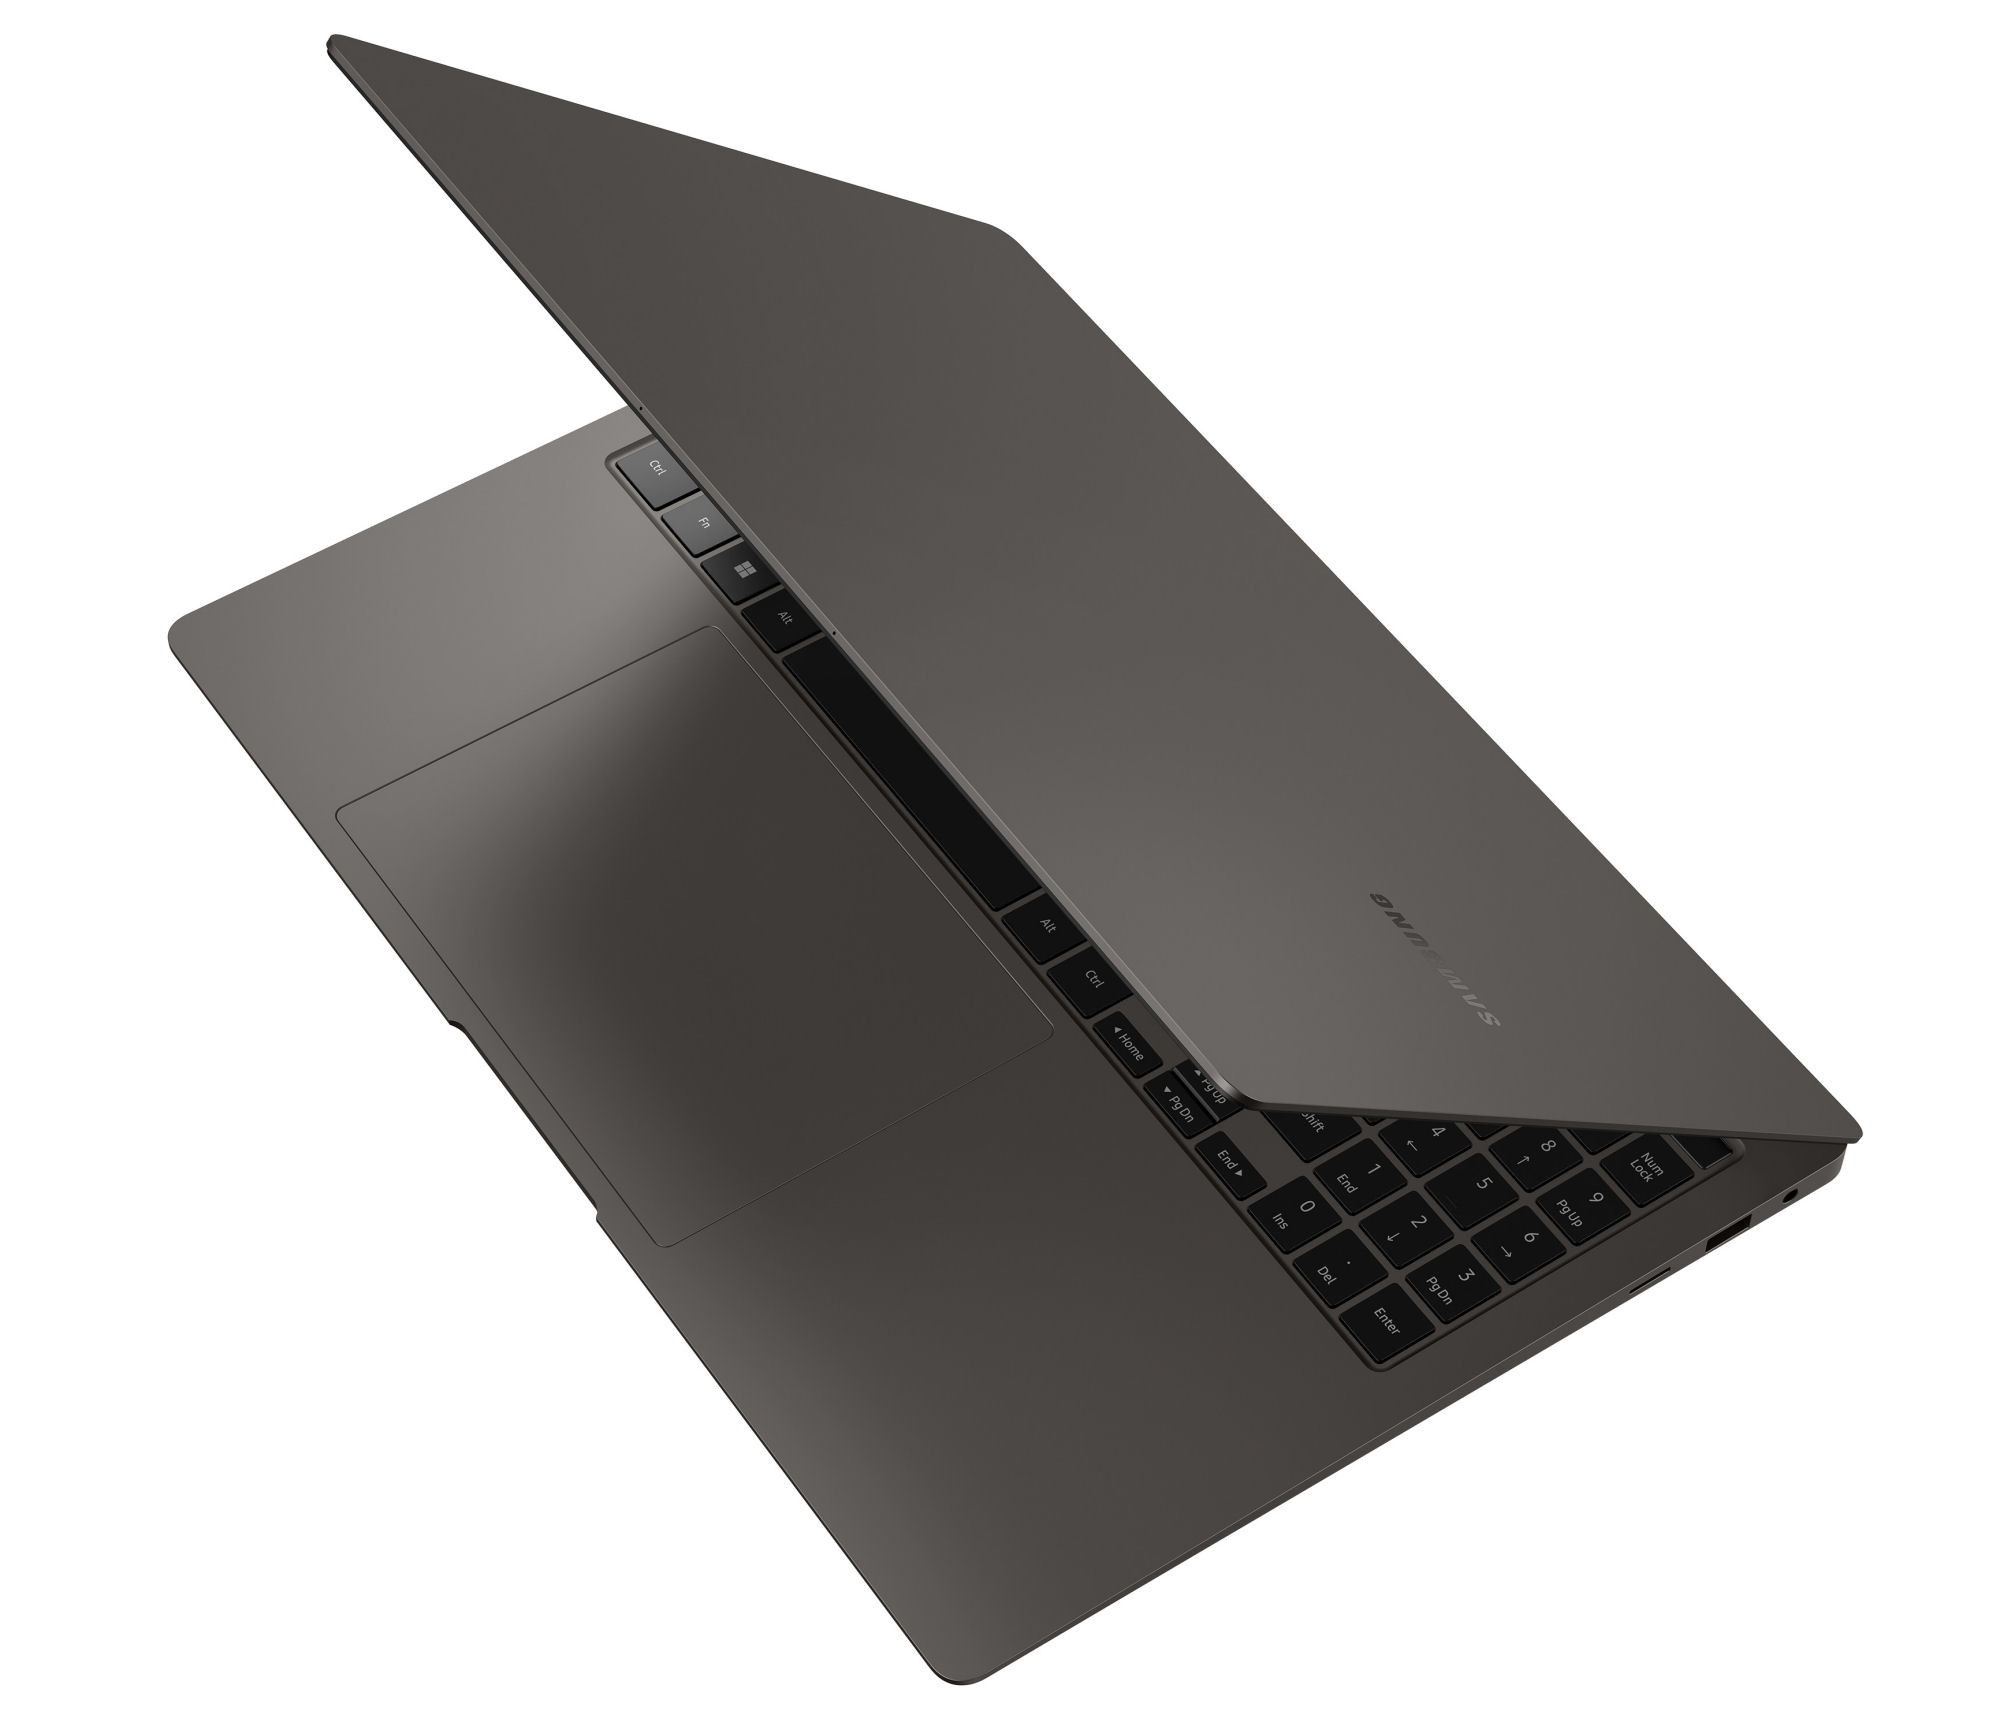
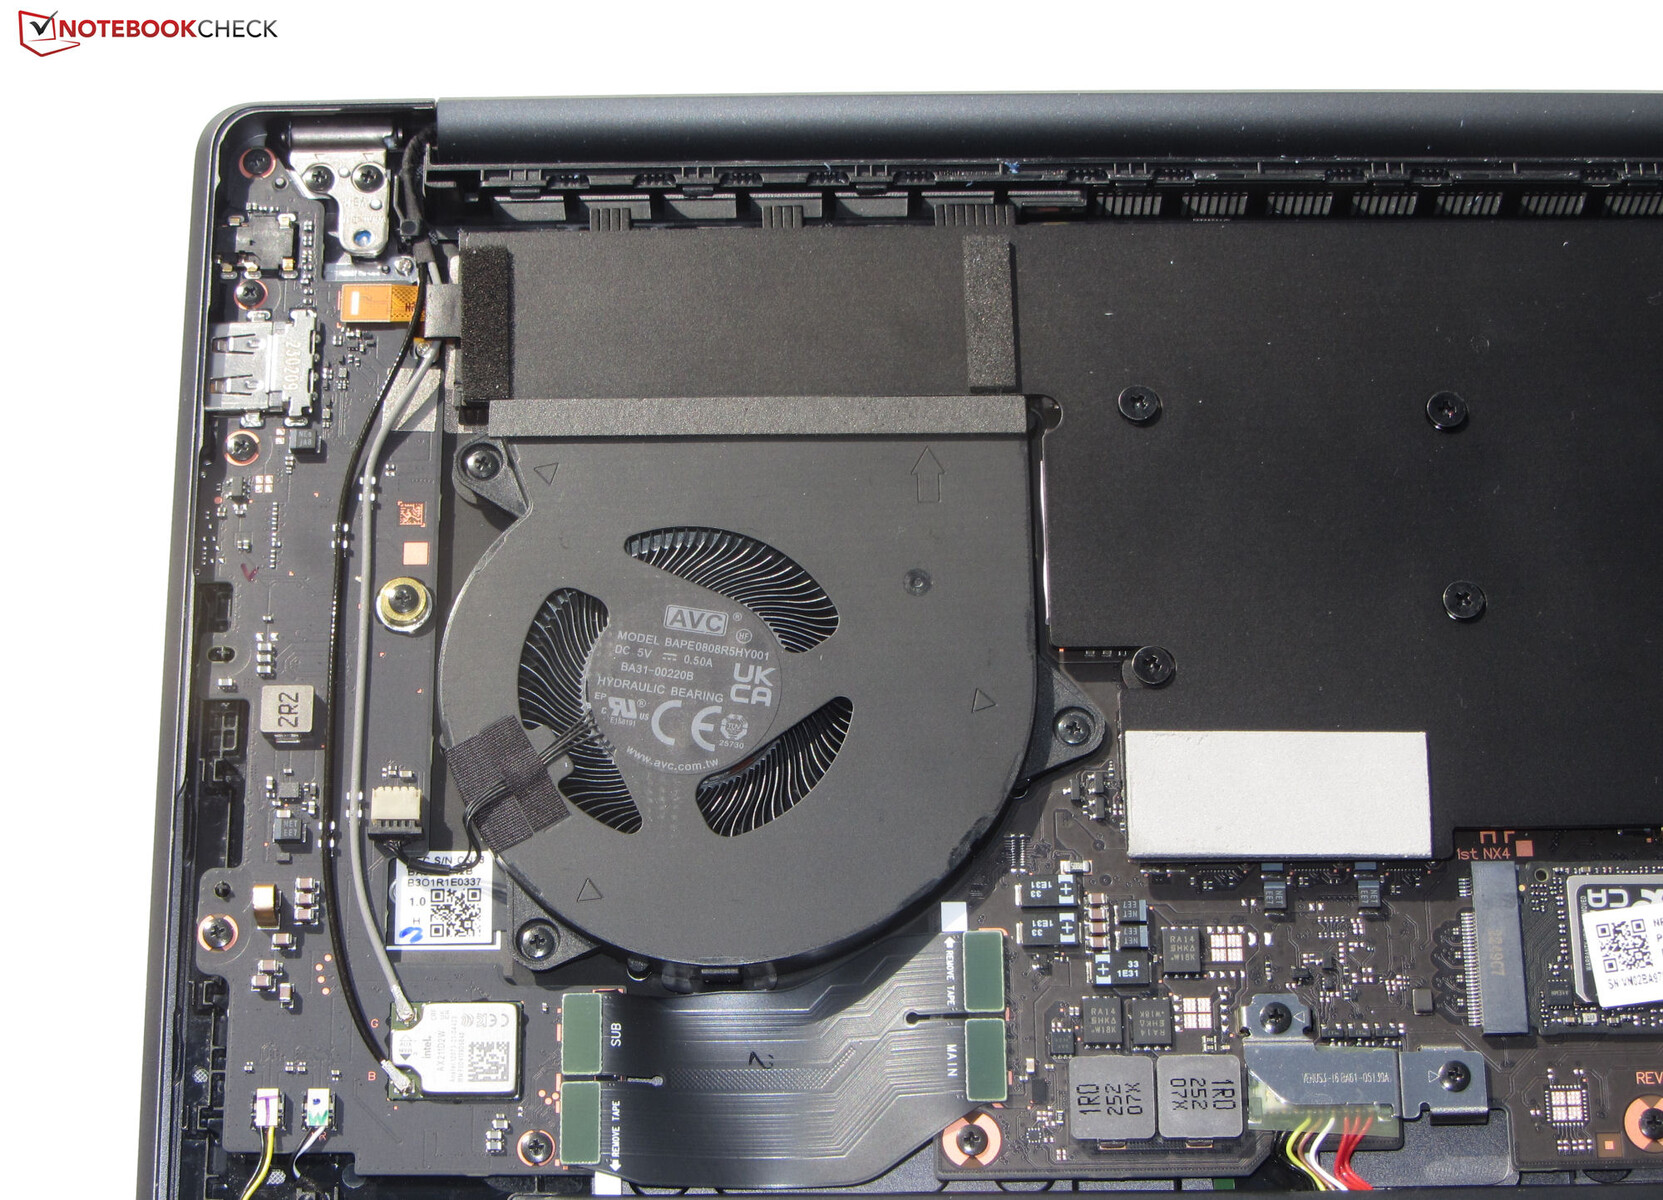
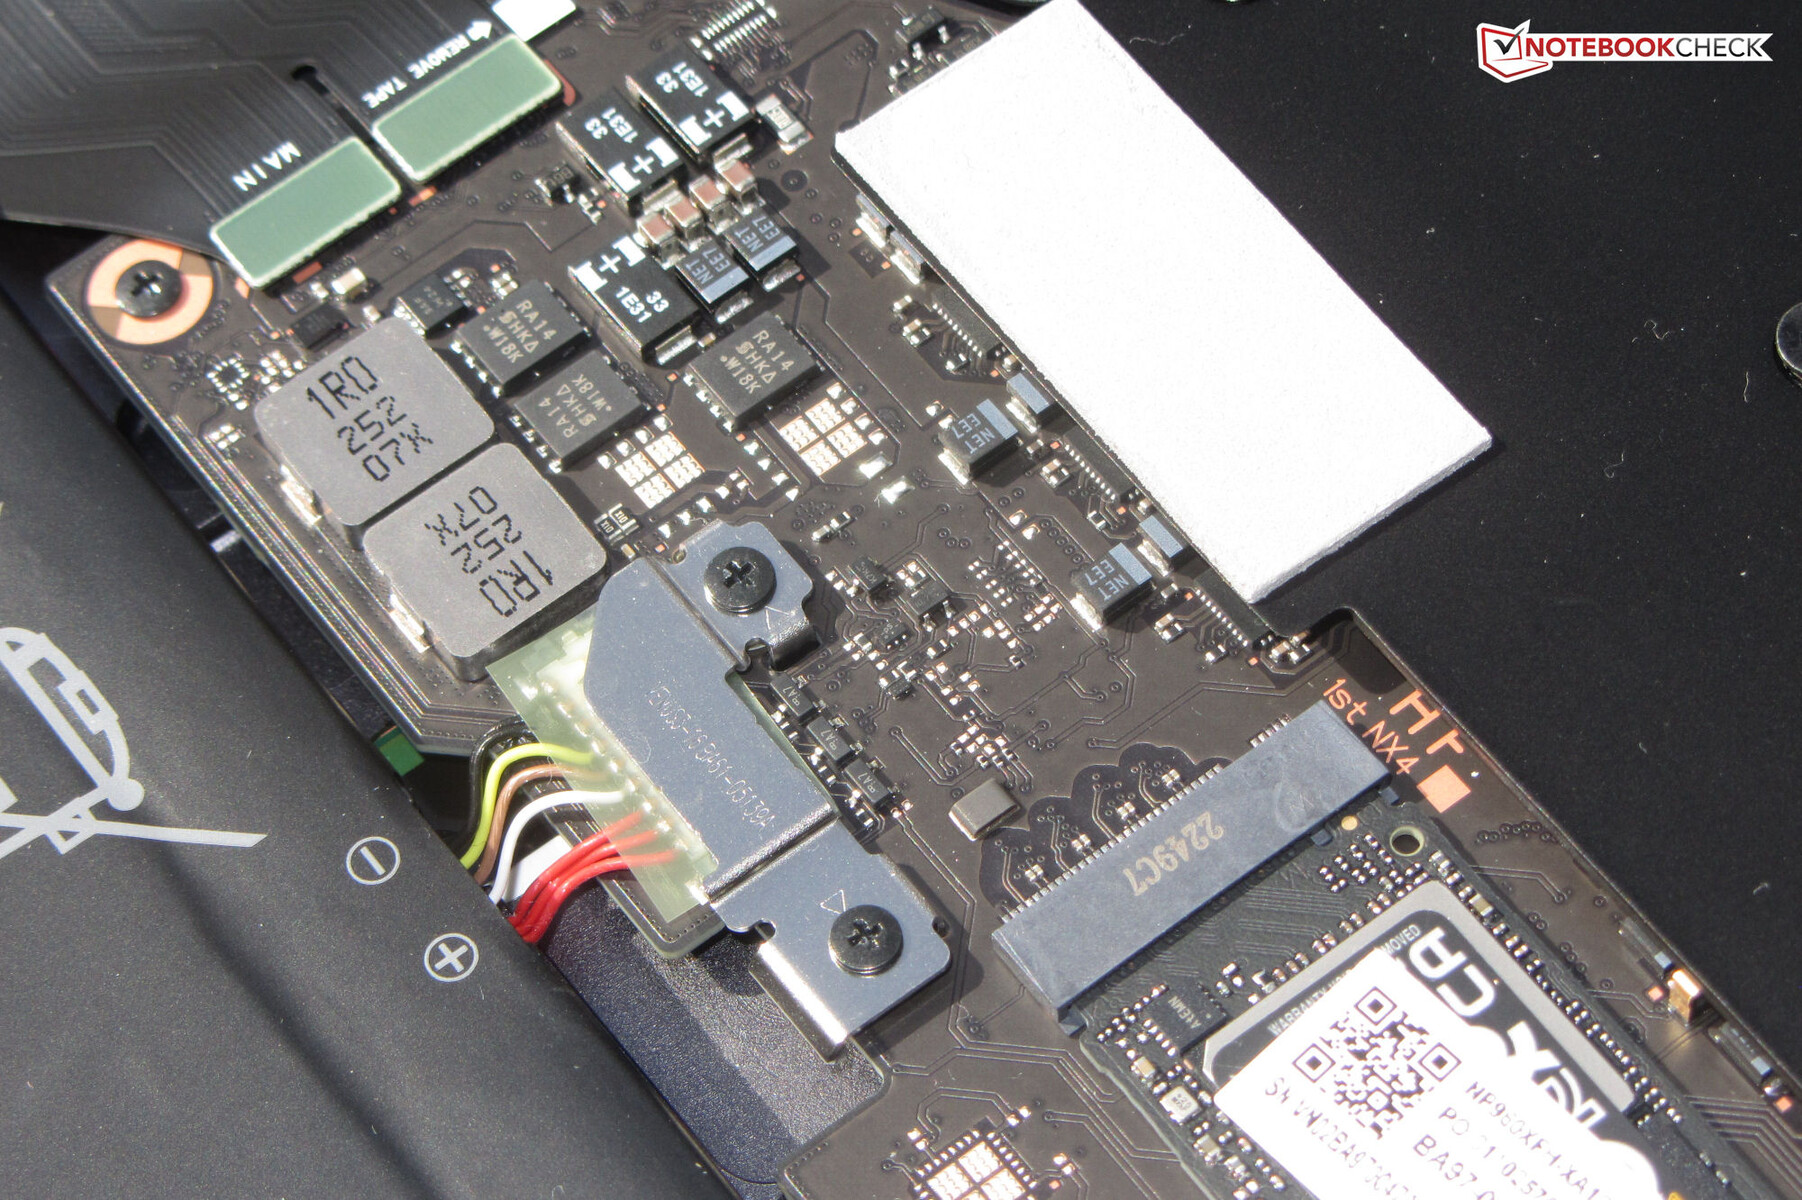
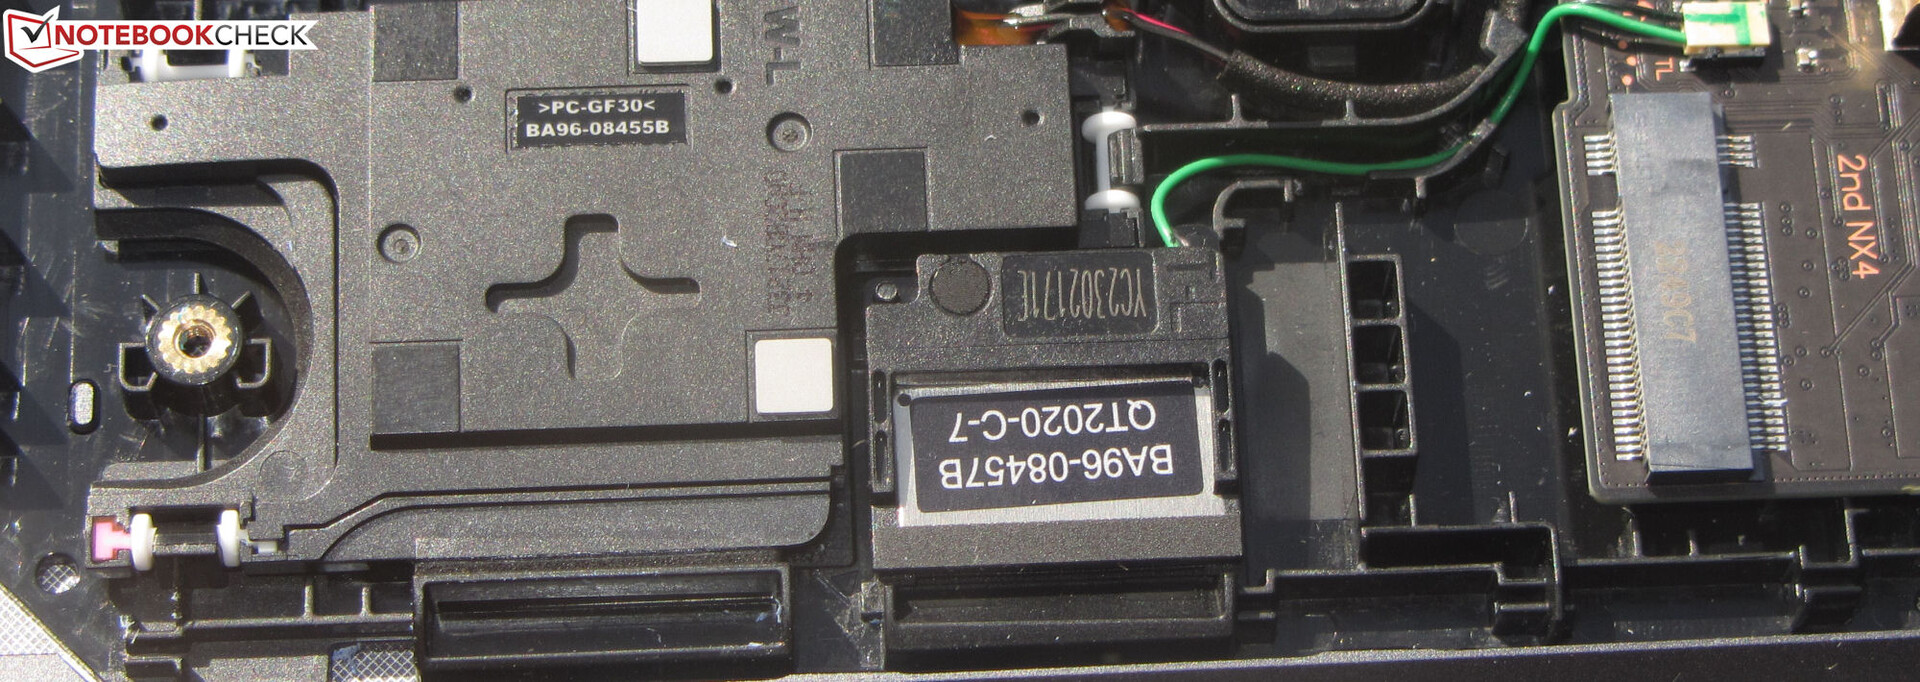
拆卸底盖需要卸下隐藏在四个橡胶脚下的所有螺钉(插入的,没有粘上)。之后,在拆卸底盖时要小心(!),底盖非常紧,可能会被损坏。我们建议使用一个平坦的铲子。之后,可以接触到SSD(PCIe 4,M.2-2280)、第二个SSD插槽、风扇、扬声器和电池。
担保
在德国,三星为这台16英寸机子提供了两年的保修期。延长一年或两年的费用分别为79欧元和149欧元。这些条款在其他国家可能有所不同,所以买家在购买前应仔细检查。
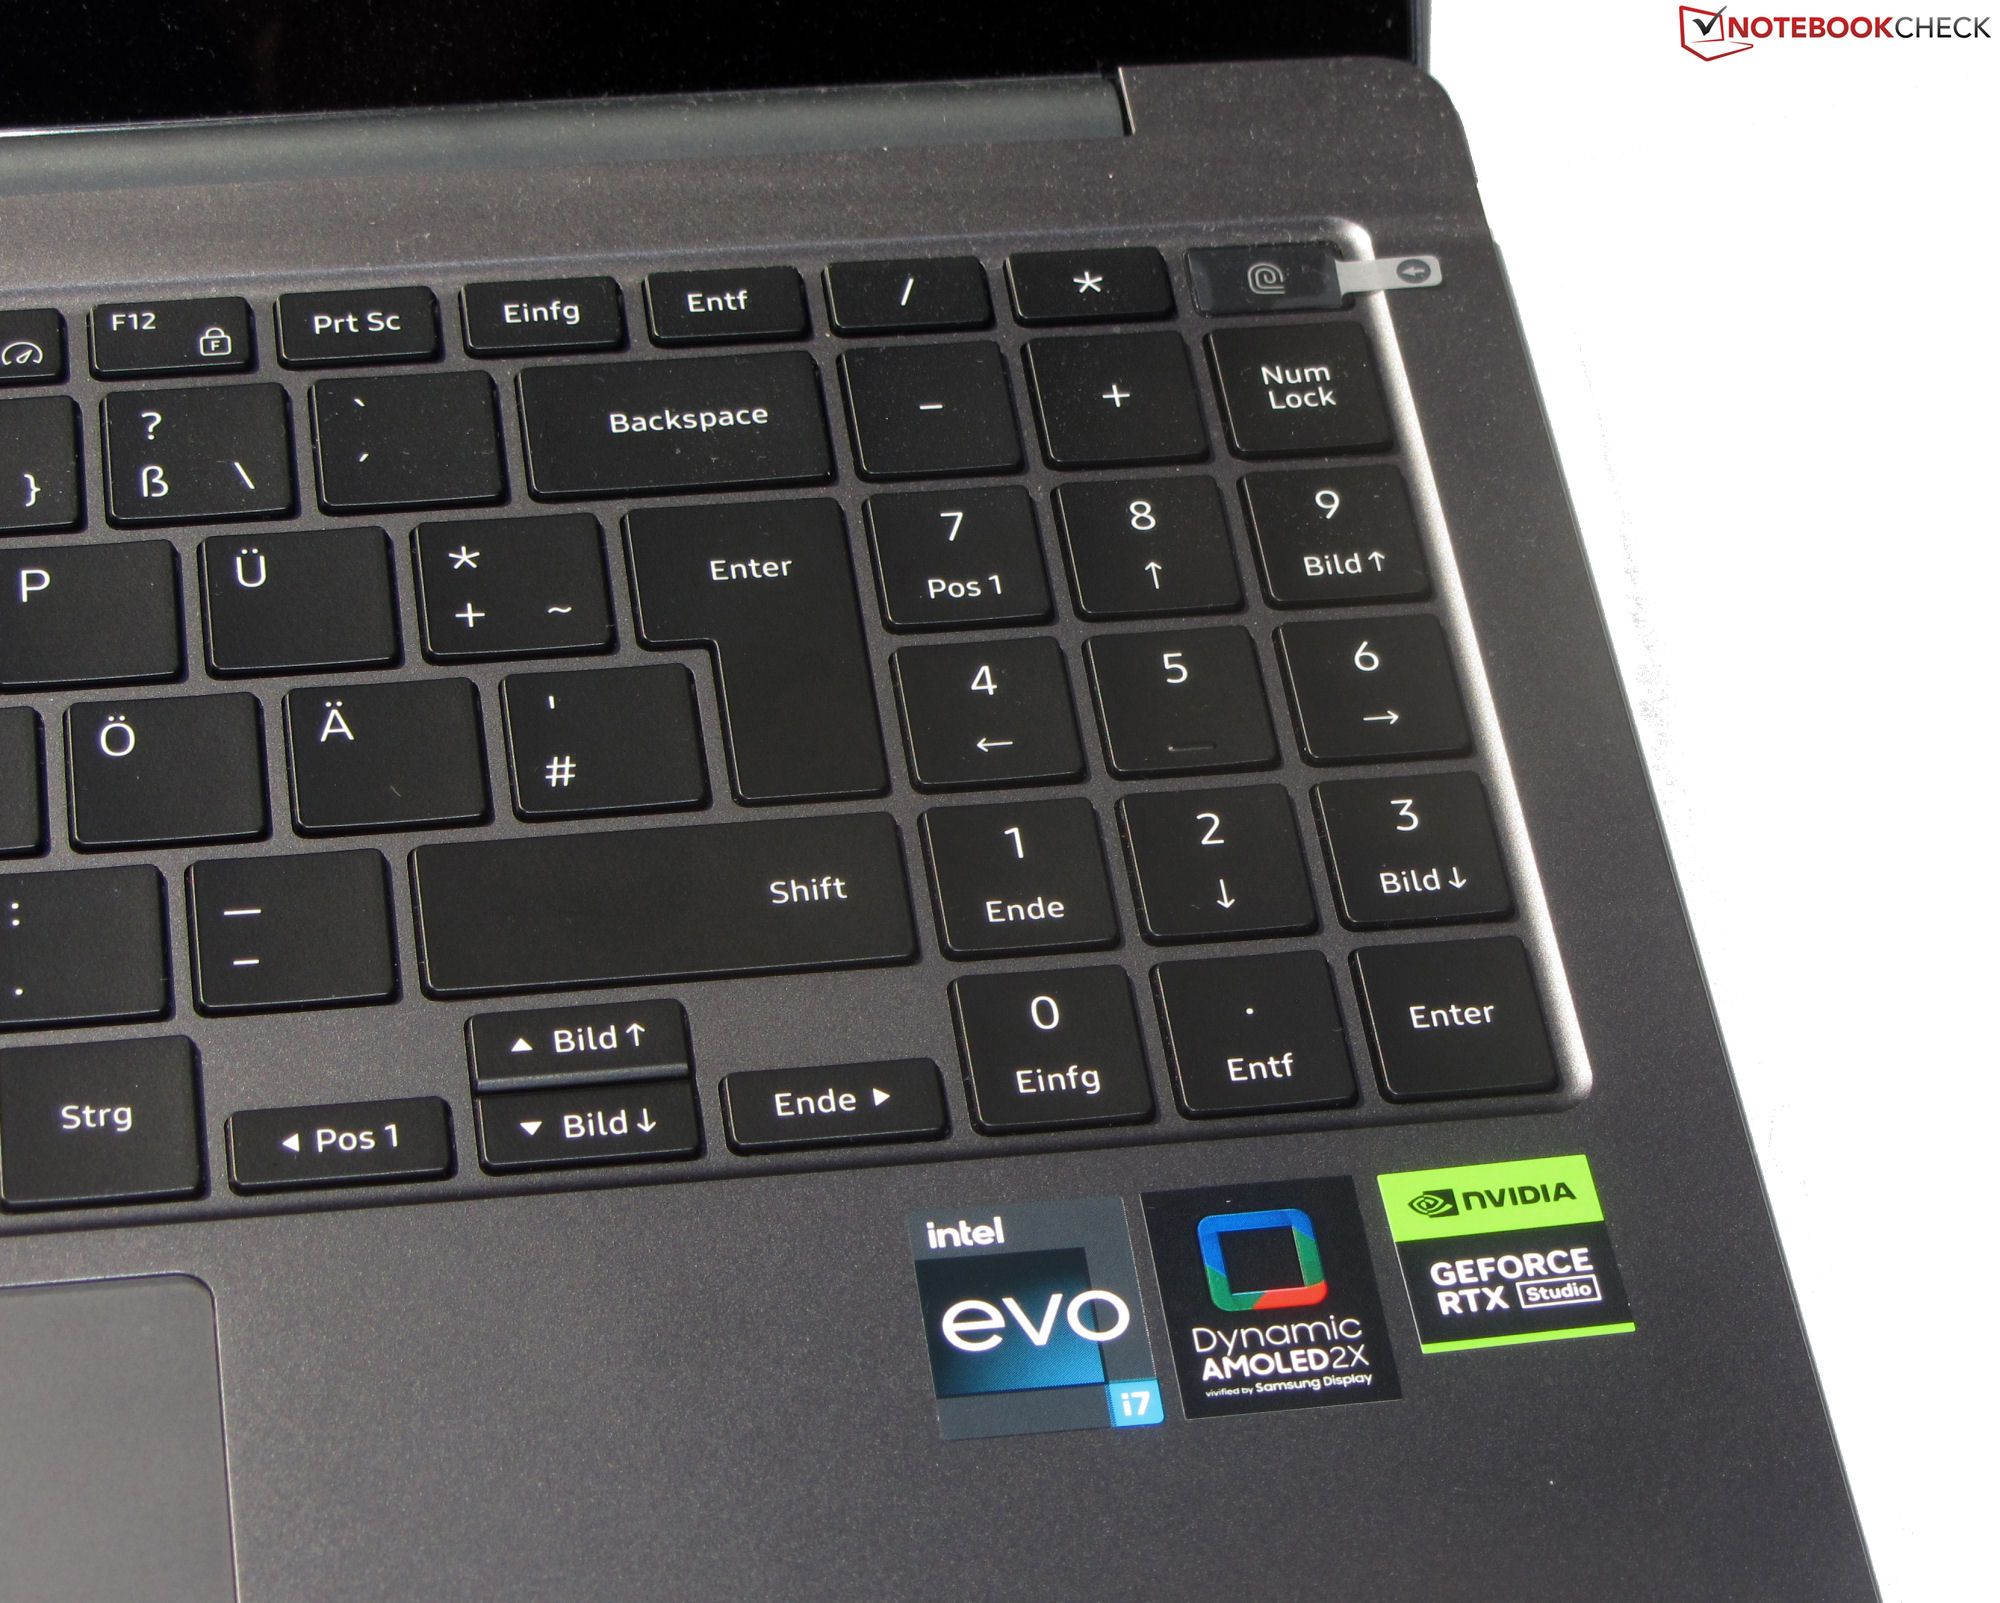
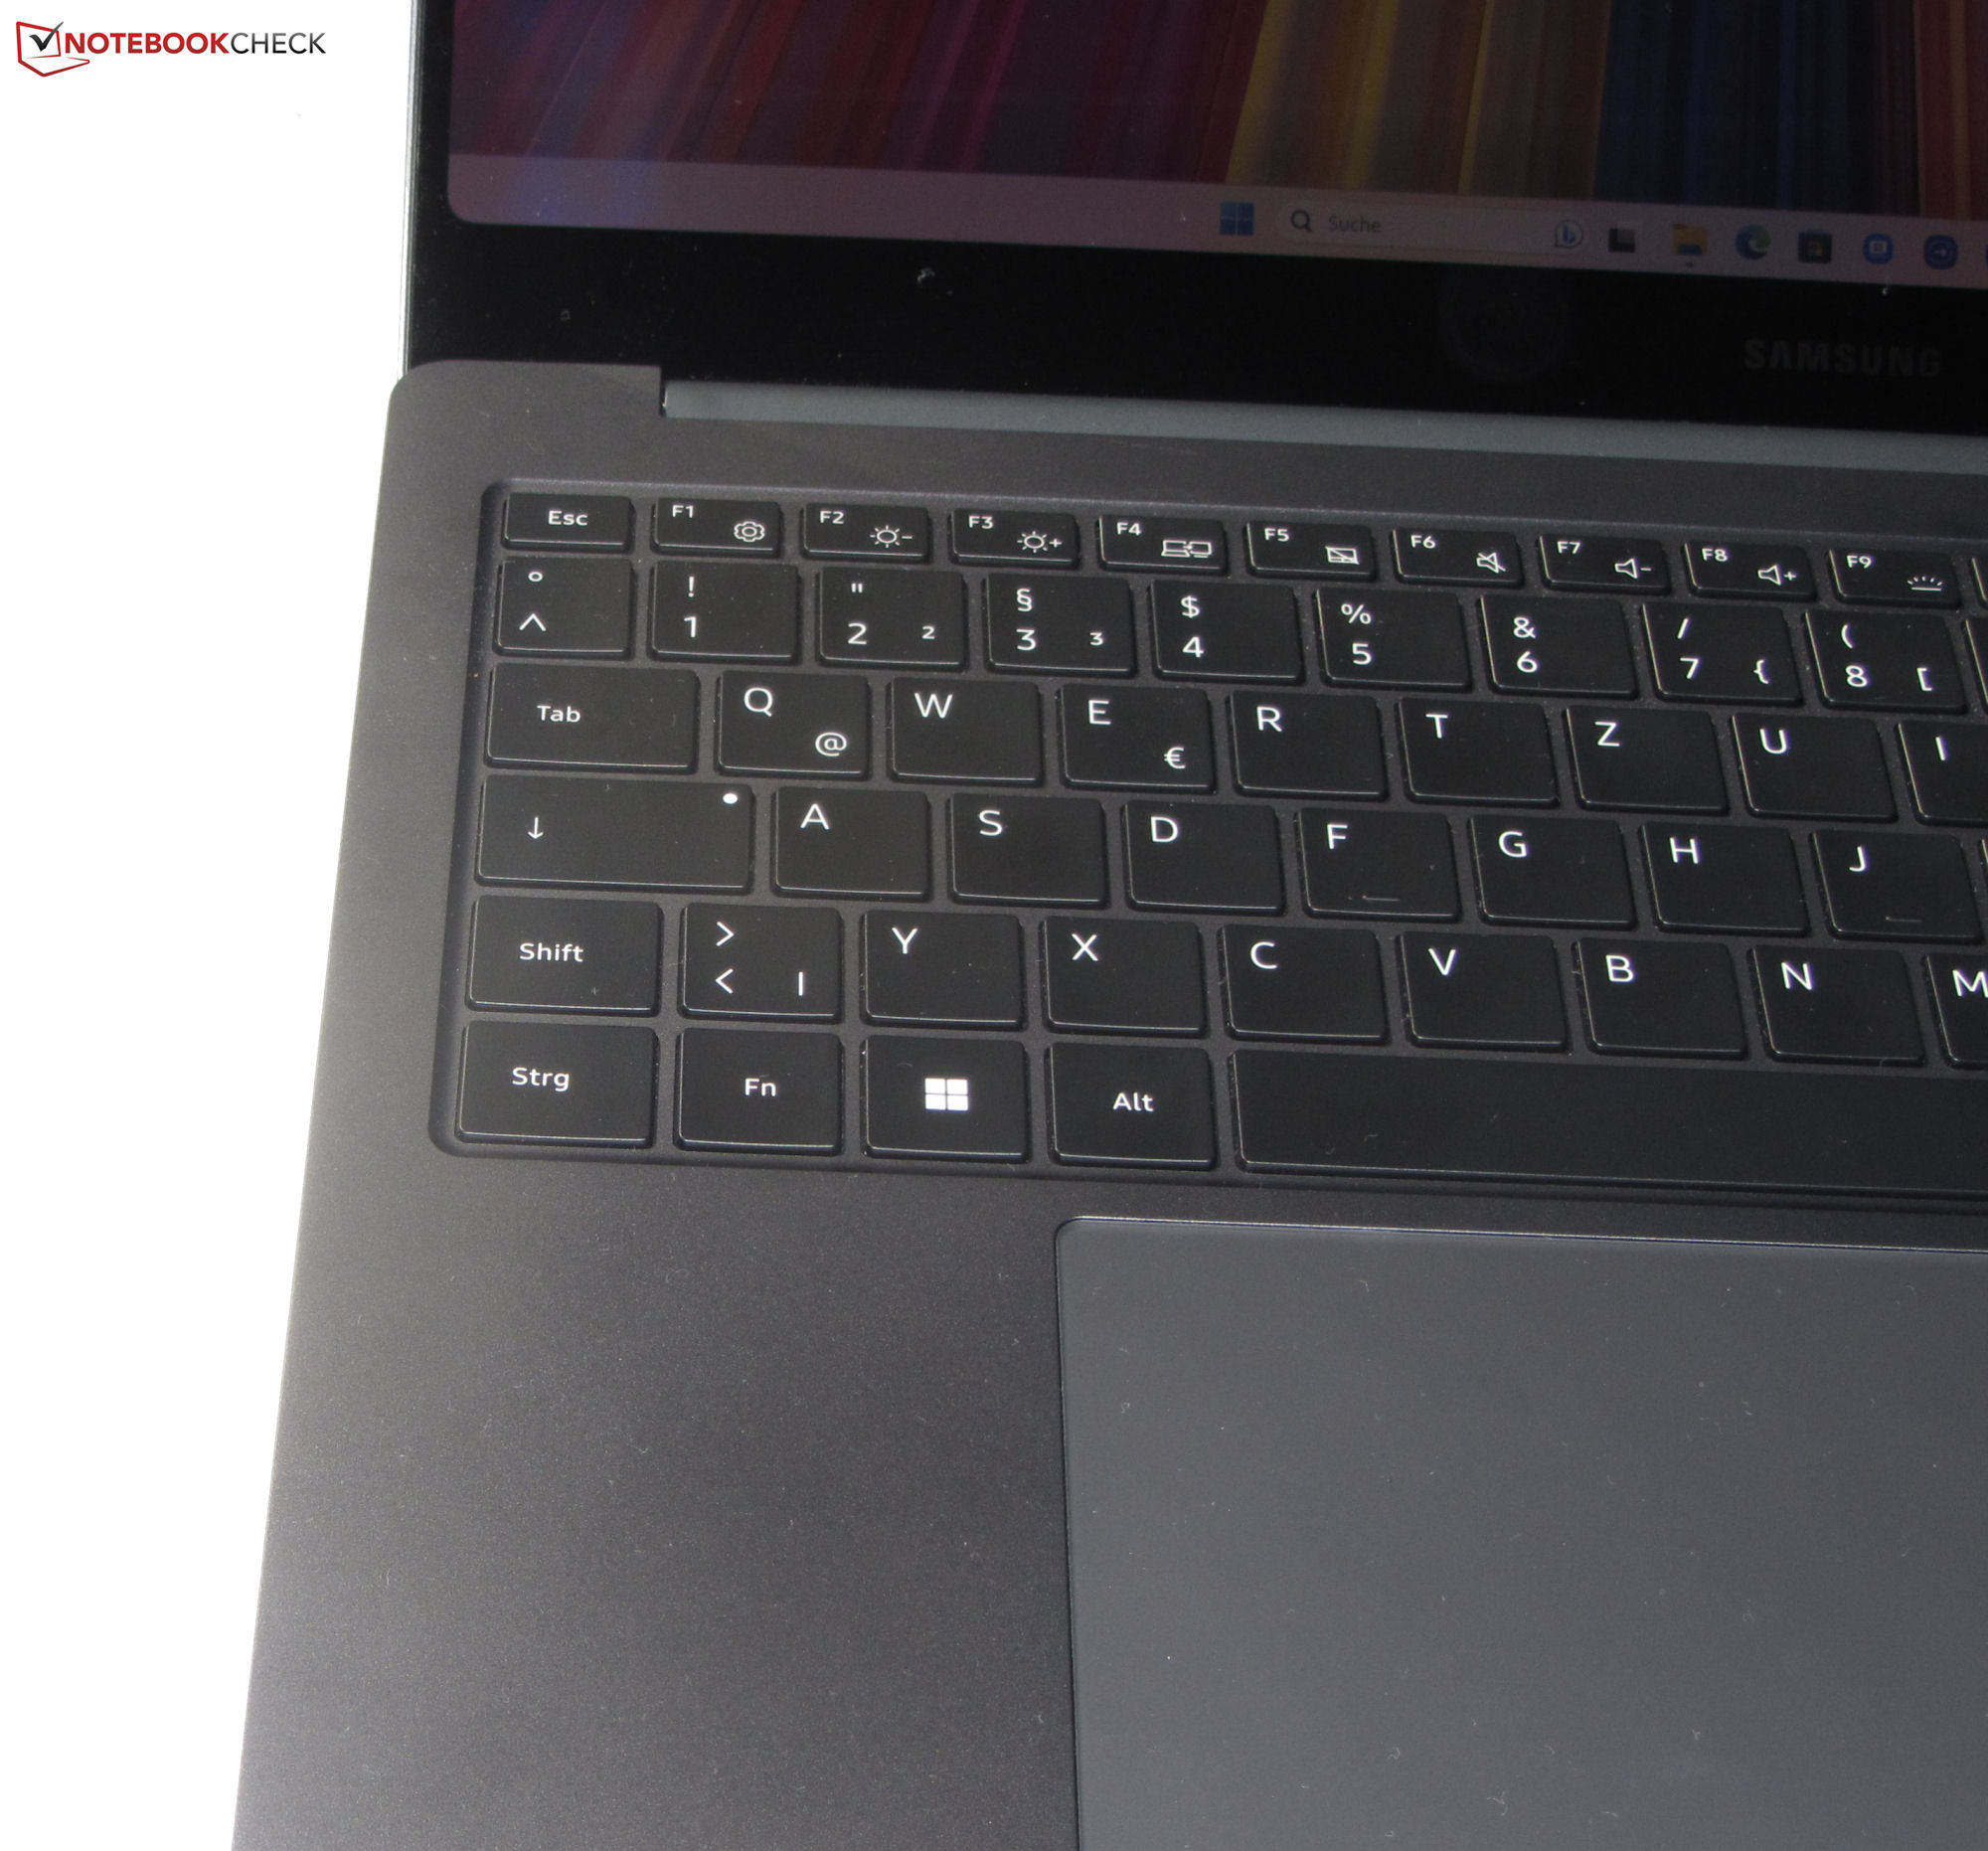
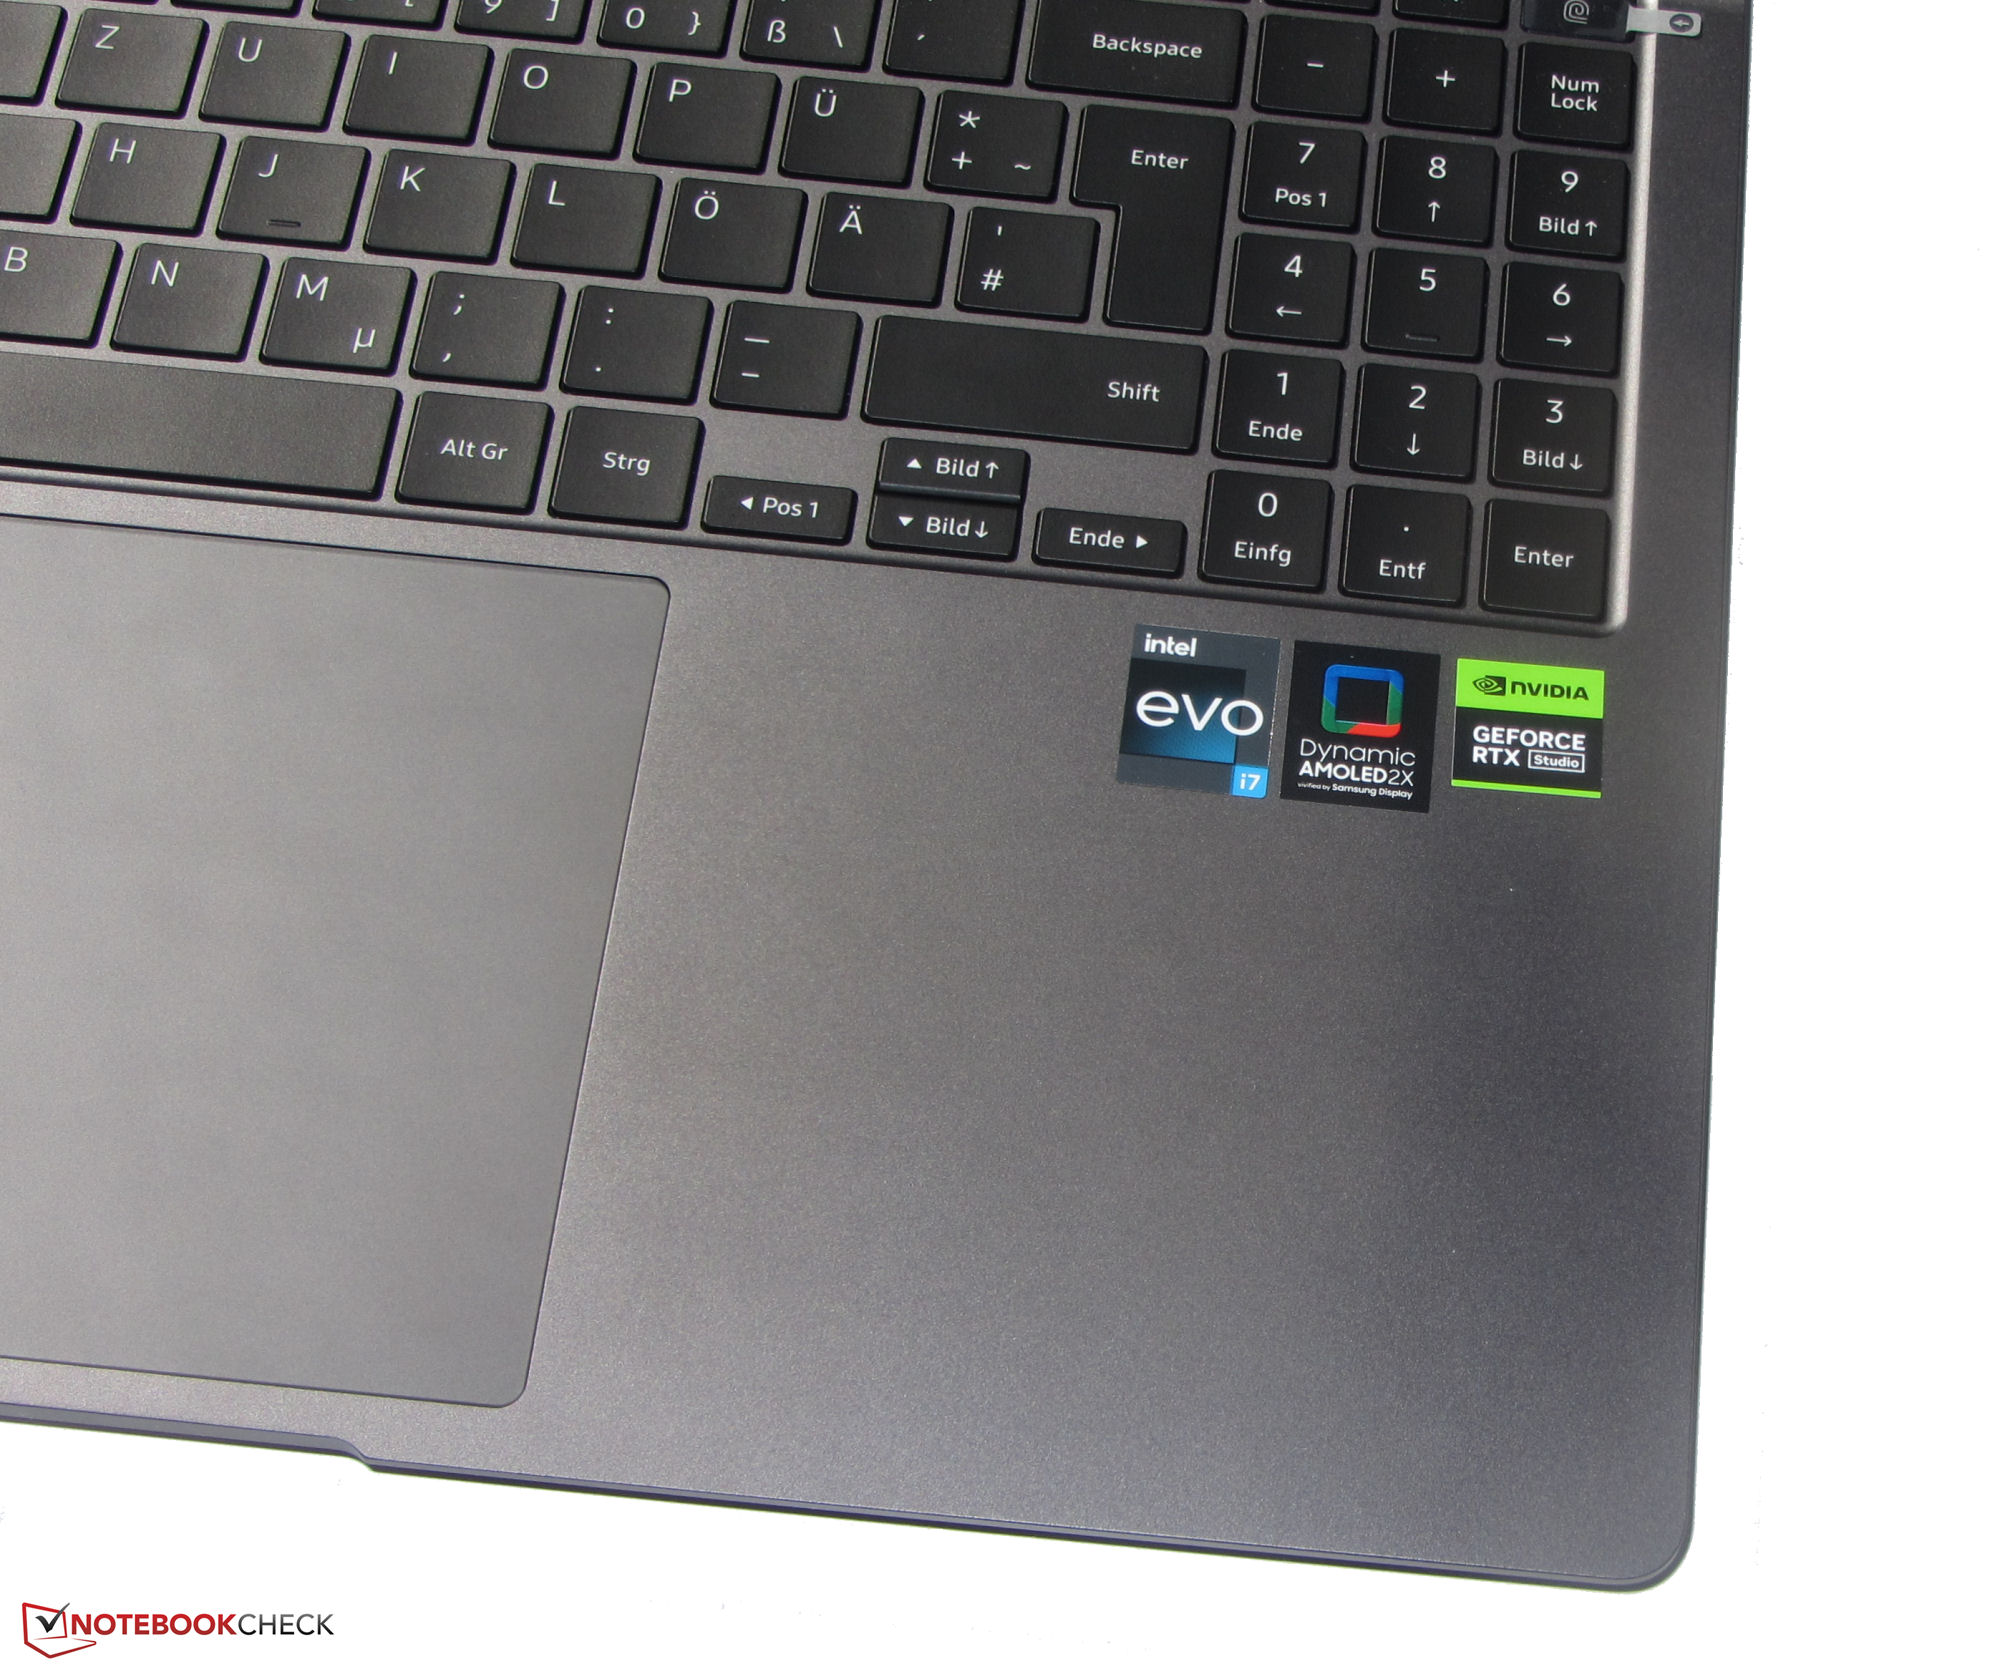
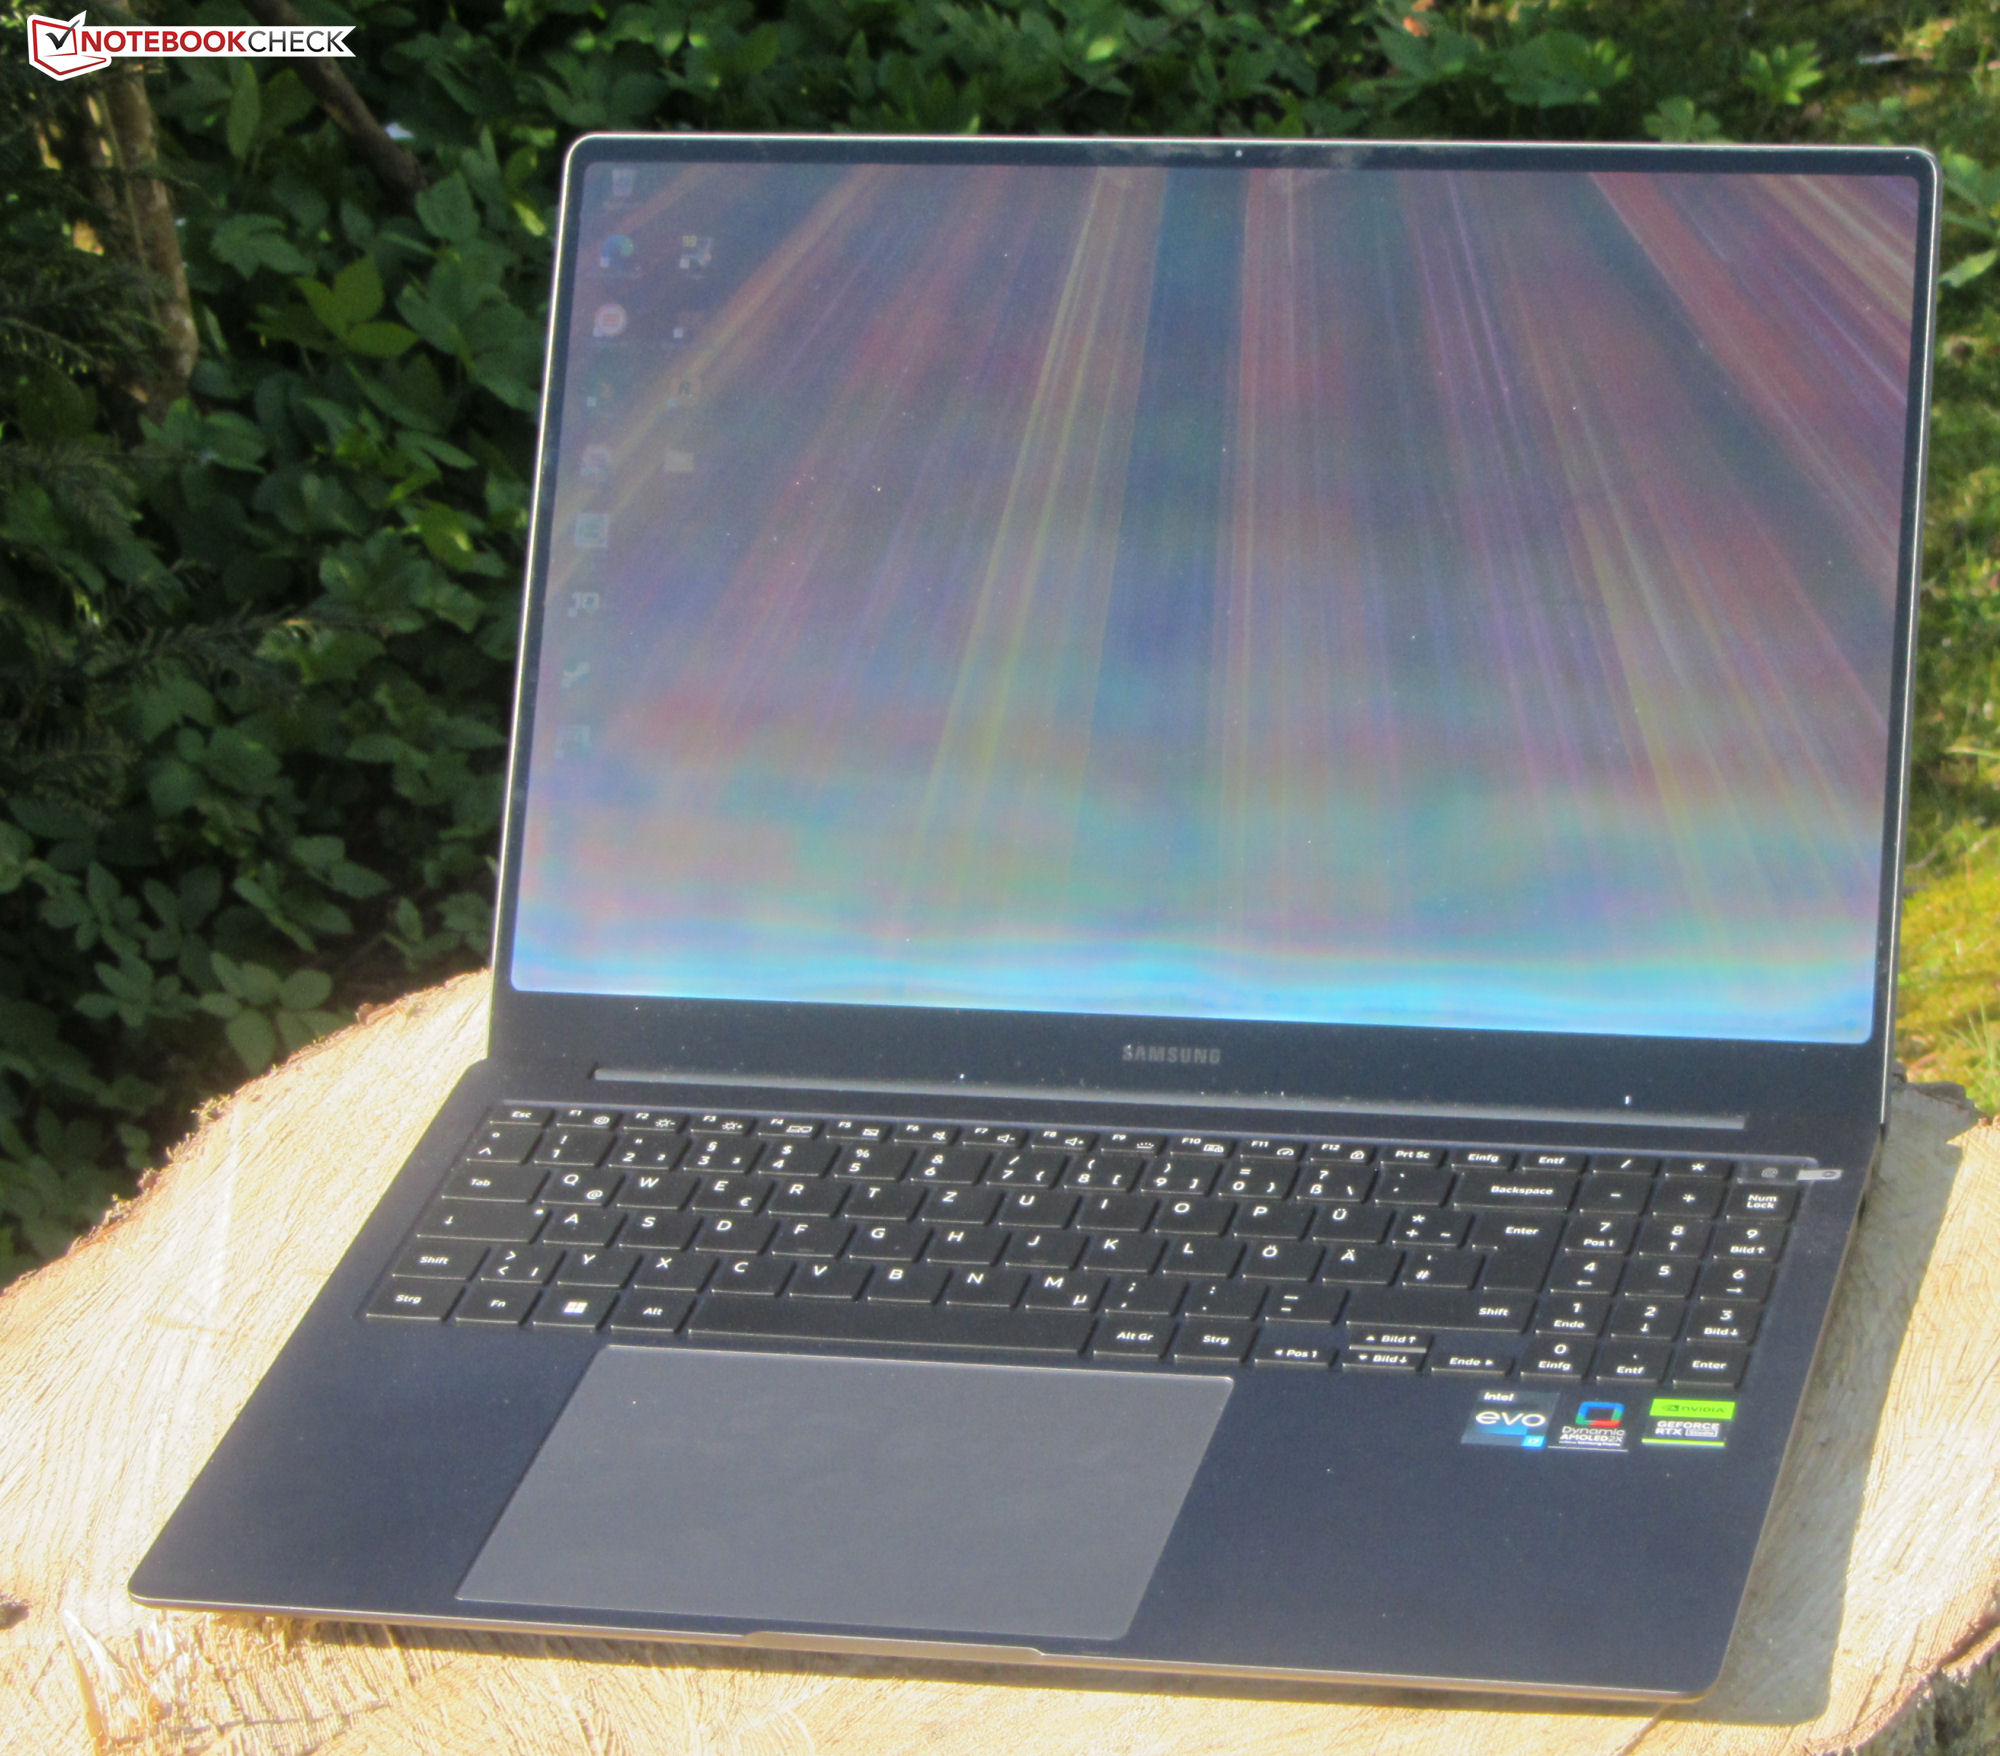
输入设备 -Galaxy Book3提供了一个背光键盘
键盘
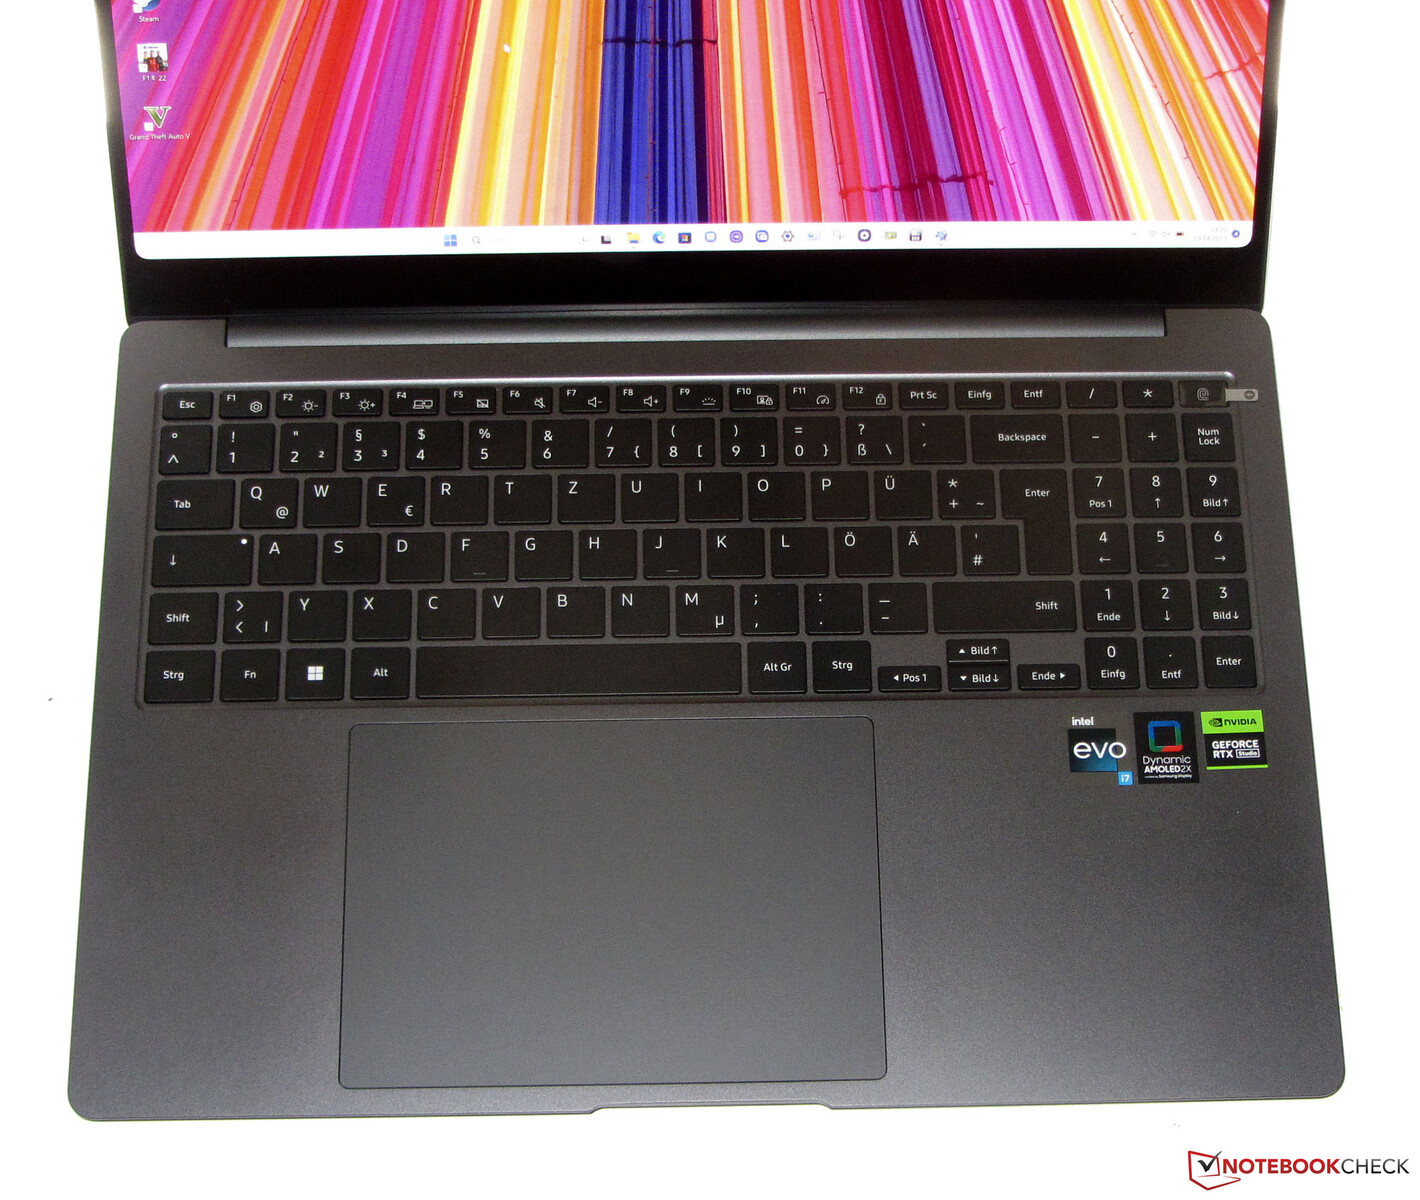
NP960XFH有一个背光的Chiclet键盘和一个数字键盘。平滑、略微凹陷的按键提供了短程和清晰的压力点。按键阻力是可以接受的。键盘在压力下会有轻微的弯曲,但这并不是一个值得关注的问题。三段式背光是通过一个功能键控制的。总而言之,三星提供了一个适合日常使用的键盘。
触摸板
ClickPad的尺寸约为15.1 x 10.8厘米。小一点的尺寸也足够了:如果用左手使用WASD键,整个拇指就会放在垫子上。所以在这种情况下,后者必须被关闭。否则,光滑的表面非常有利于手指的滑行和刷卡。它对角落里的输入有反应,提供短程和清晰的压力点。
显示屏 - AMOLED,16:10格式
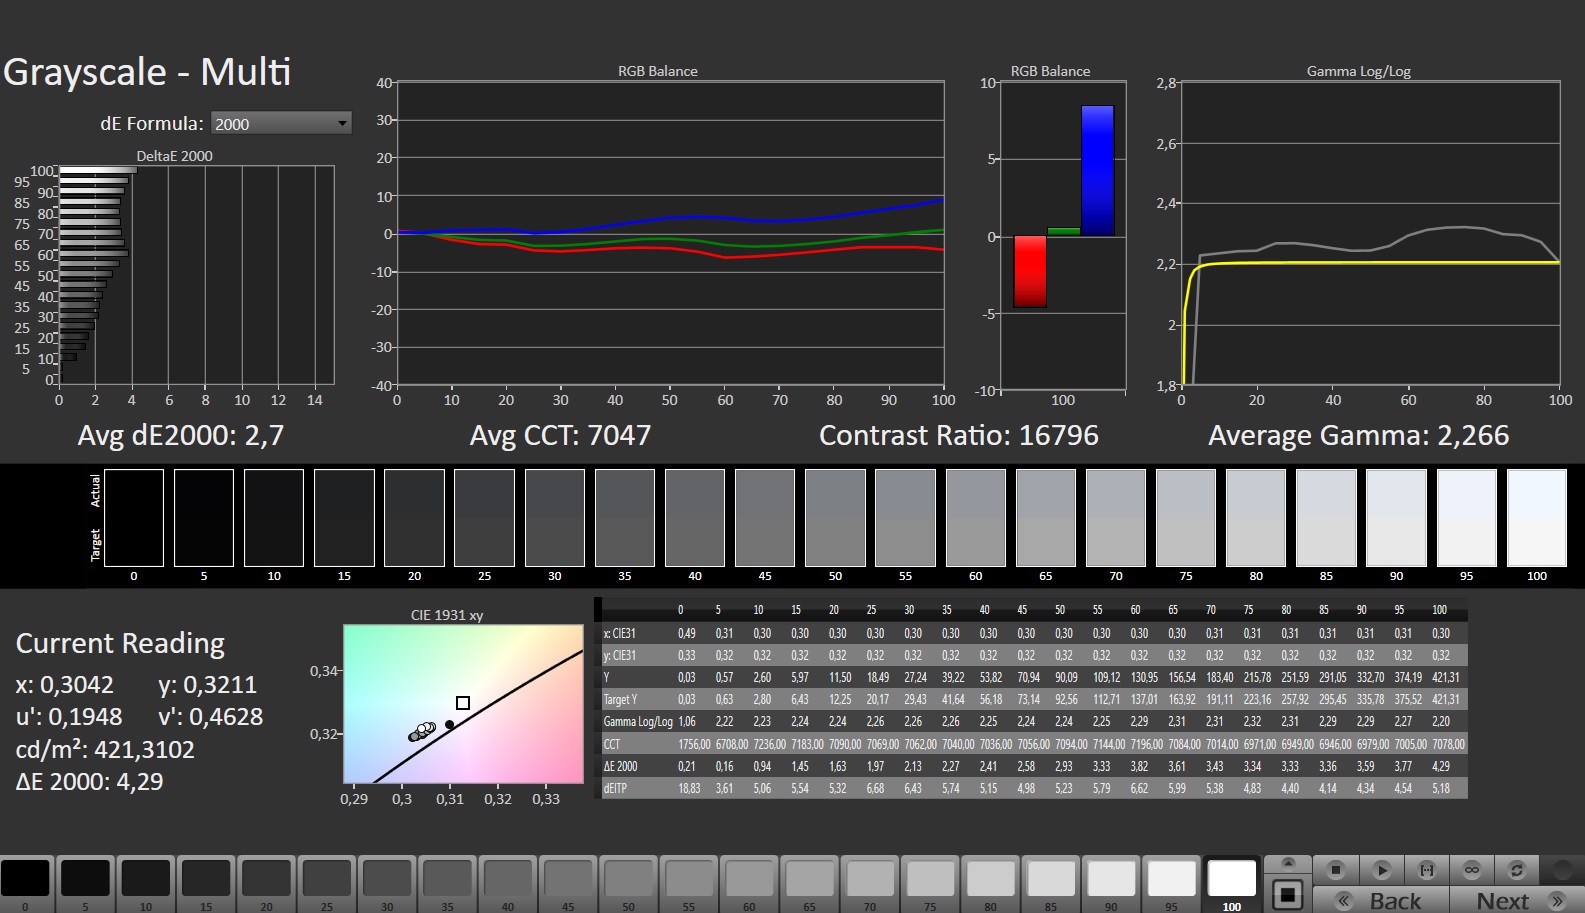
16英寸的大屏幕(2880x1800)采用工作友好的16:10格式,具有出色的黑值和较短的响应时间,这是OLED的典型特征。显示器的亮度超过了目标,尽管ThinkBook 16p G3 ARH有一个更亮的显示屏。
OLED面板的弱点:它有一个反射表面,在亮度≤100%的情况下会闪烁,频率为240赫兹。这种闪烁与面板的亮度控制有关。
| |||||||||||||||||||||||||
Brightness Distribution: 93 %
Center on Battery: 400 cd/m²
Contrast: 13333:1 (Black: 0.03 cd/m²)
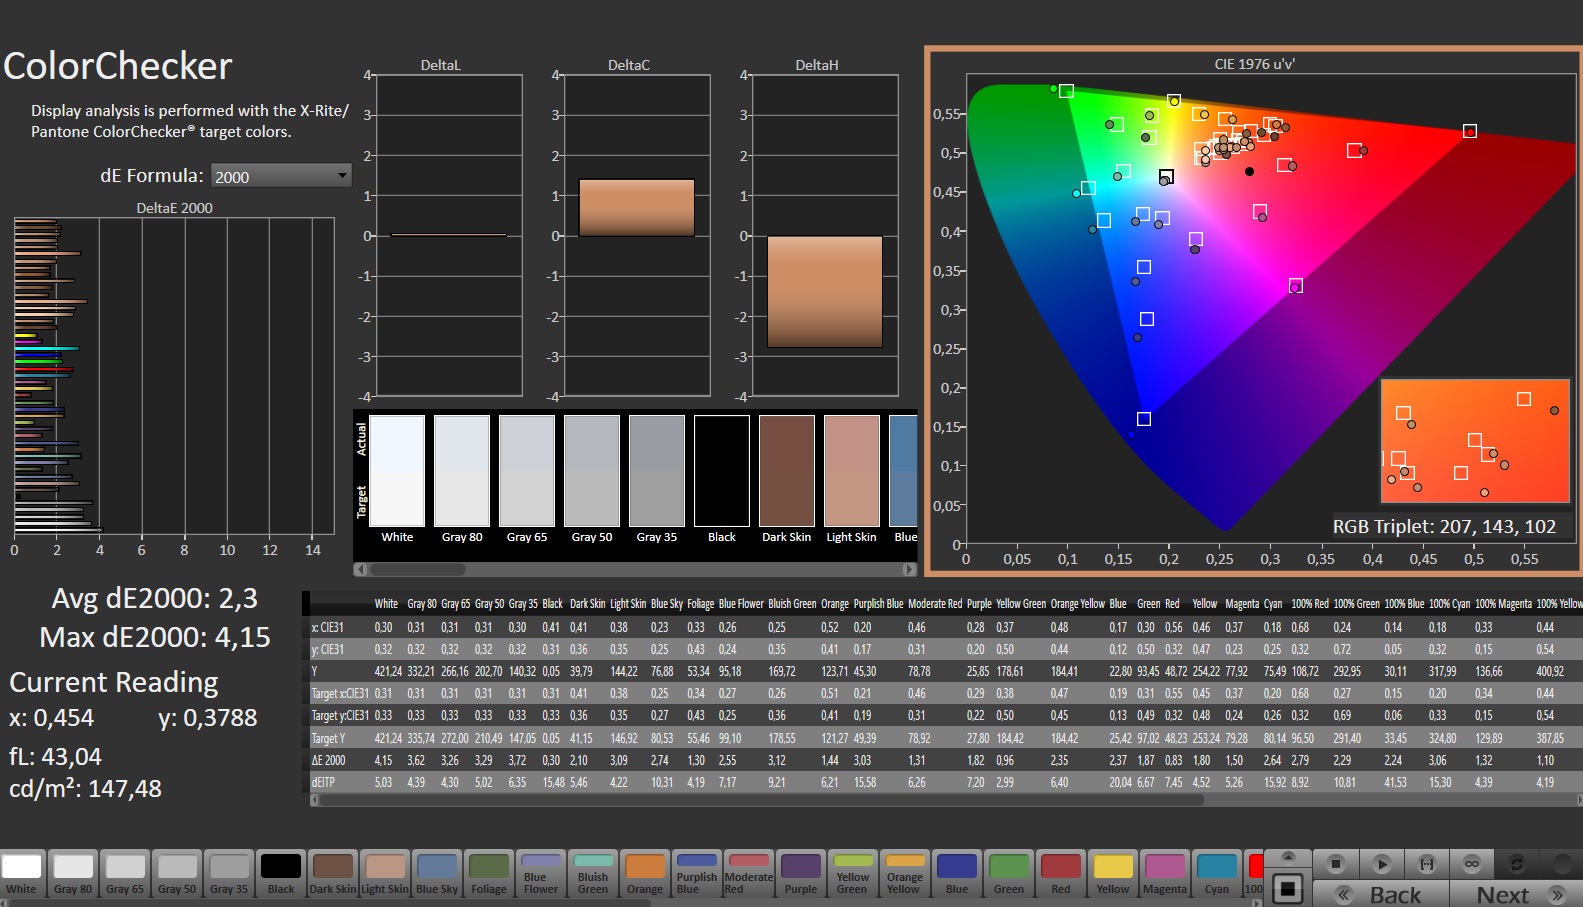
ΔE ColorChecker Calman: 2.3 | ∀{0.5-29.43 Ø4.71}
calibrated: 1.66
ΔE Greyscale Calman: 2.7 | ∀{0.09-98 Ø4.96}
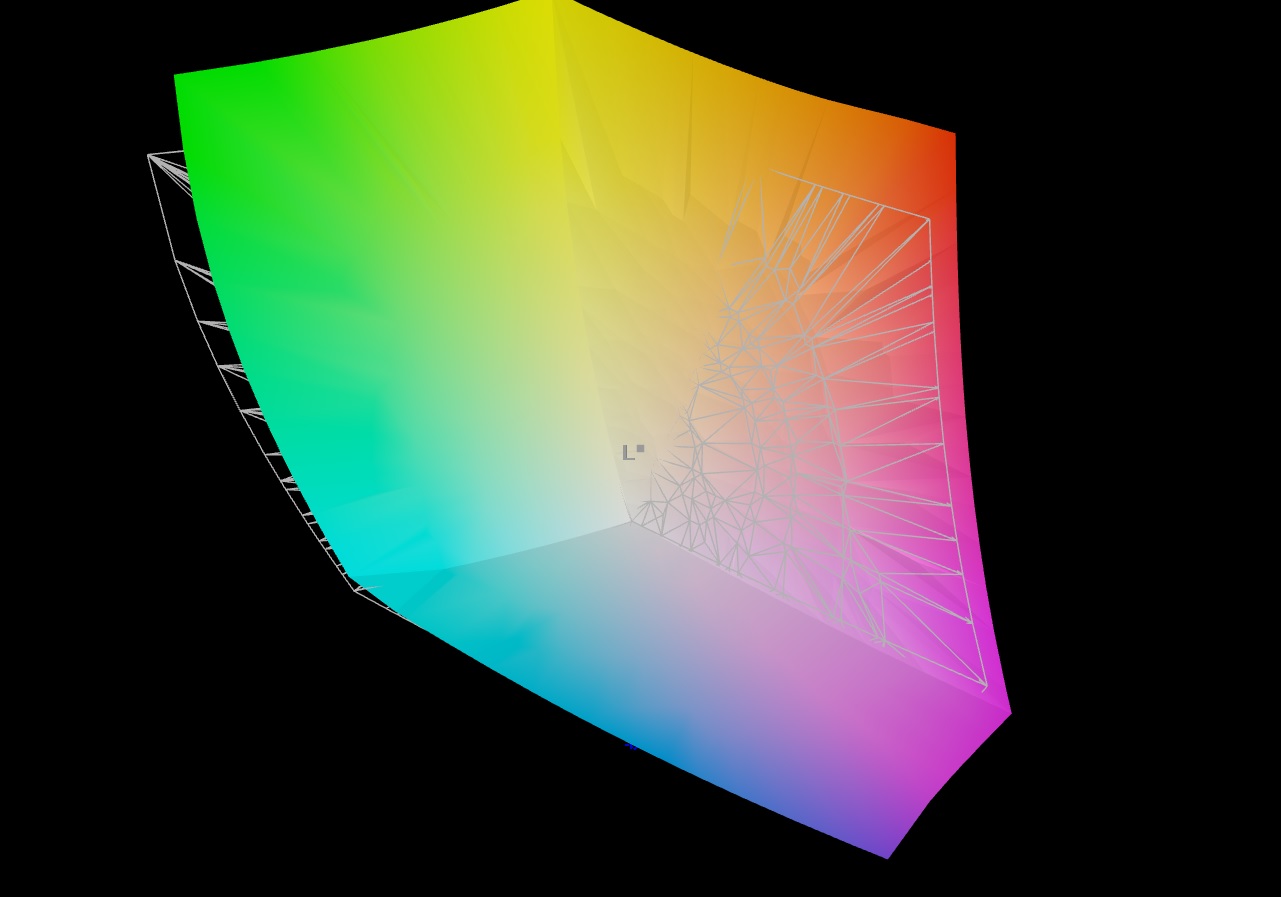
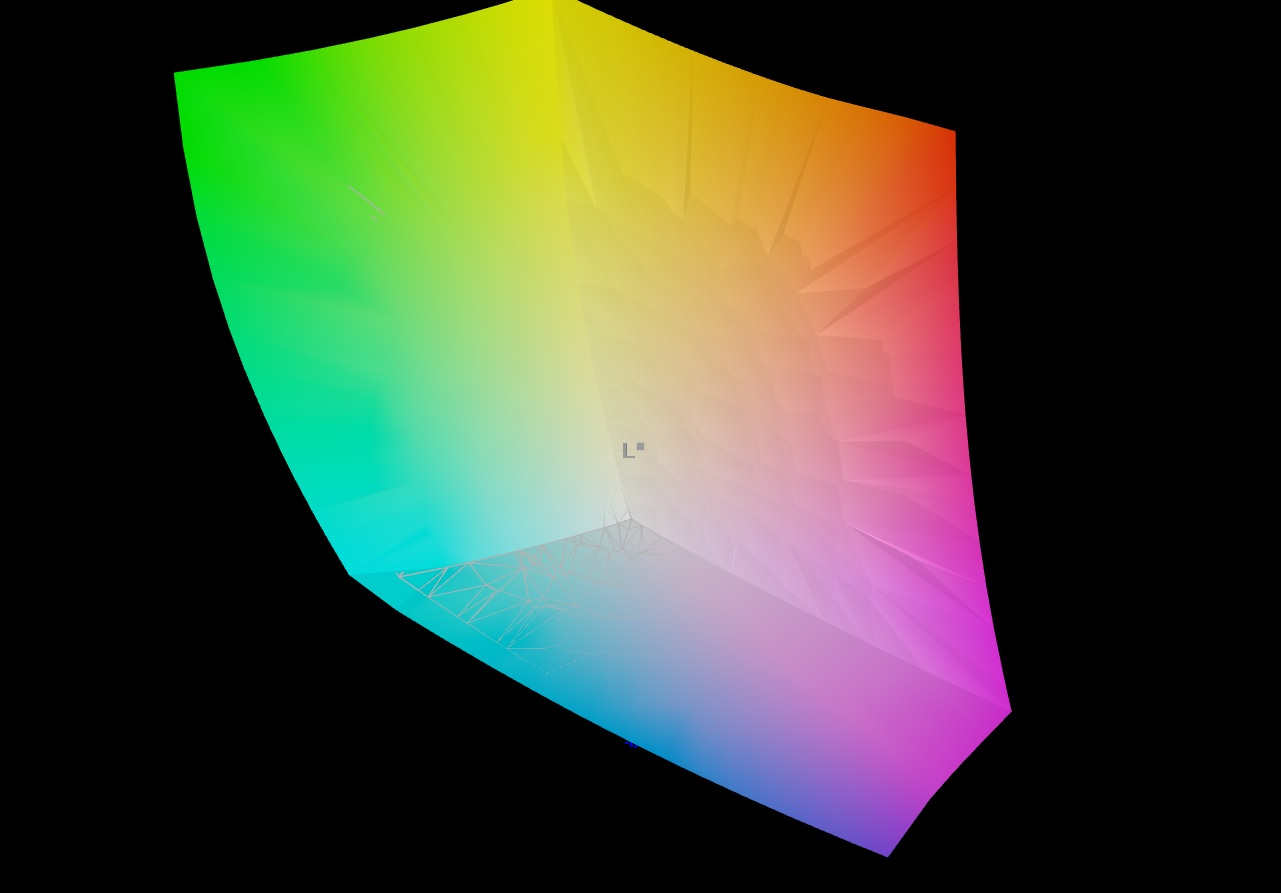
96.3% AdobeRGB 1998 (Argyll 3D)
100% sRGB (Argyll 3D)
99.9% Display P3 (Argyll 3D)
Gamma: 2.266
CCT: 7047 K
| Samsung Galaxy Book3 Ultra 16 Samsung ATNA60CL03-0, AMOLED, 2880x1800, 16" | Schenker Vision 16 Pro RTX 3070 Ti N160QDM-NZ1, IPS, 2560x1600, 16" | LG Gram 17Z90Q-E.AD78G LG Display LP170WQ1-SPF2, IPS, 2560x1600, 17" | Lenovo ThinkBook 16p G3 ARH BOE CQ NE160QDM-NY1, IPS, 2560x1600, 16" | Dell XPS 15 9520 RTX 3050 Ti Samsung 156XG01, OLED, 3456x2160, 15.6" | Asus VivoBook Pro 16X OLED N7600PC-L2026X Samsung ATNA60YV02-0, OLED, 3840x2400, 16" | Acer Swift X SFX16-52G-77RX B160QAN02.M, IPS-LED, 2560x1600, 16" | |
|---|---|---|---|---|---|---|---|
| Display | -20% | -8% | -19% | -4% | 1% | -15% | |
| Display P3 Coverage (%) | 99.9 | 68.7 -31% | 92.2 -8% | 69.8 -30% | 97.8 -2% | 99.9 0% | 76.4 -24% |
| sRGB Coverage (%) | 100 | 96.7 -3% | 98.66 -1% | 98.2 -2% | 99.9 0% | 100 0% | 100 0% |
| AdobeRGB 1998 Coverage (%) | 96.3 | 70 -27% | 82.98 -14% | 71.4 -26% | 86 -11% | 98.05 2% | 76.6 -20% |
| Response Times | -2021% | -3068% | -2354% | -240% | -156% | -4422% | |
| Response Time Grey 50% / Grey 80% * (ms) | 0.49 ? | 14.3 ? -2818% | 22 ? -4390% | 15.6 ? -3084% | 1.9 ? -288% | 1 -104% | 33 ? -6635% |
| Response Time Black / White * (ms) | 0.65 ? | 8.6 ? -1223% | 12 ? -1746% | 11.2 ? -1623% | 1.9 ? -192% | 2 ? -208% | 15 ? -2208% |
| PWM Frequency (Hz) | 240 ? | 59.52 ? | 247 ? | ||||
| Screen | -140% | -125% | -186% | -32% | 8% | -108% | |
| Brightness middle (cd/m²) | 400 | 364 -9% | 391 -2% | 532.8 33% | 381.4 -5% | 383 -4% | 411 3% |
| Brightness (cd/m²) | 399 | 347 -13% | 358 -10% | 519 30% | 384 -4% | 390 -2% | 378 -5% |
| Brightness Distribution (%) | 93 | 89 -4% | 84 -10% | 94 1% | 95 2% | 96 3% | 83 -11% |
| Black Level * (cd/m²) | 0.03 | 0.3 -900% | 0.29 -867% | 0.55 -1733% | 0.027 10% | 0.29 -867% | |
| Contrast (:1) | 13333 | 1213 -91% | 1348 -90% | 969 -93% | 14185 6% | 1417 -89% | |
| Colorchecker dE 2000 * | 2.3 | 3.3 -43% | 3.52 -53% | 1.32 43% | 4.34 -89% | 2.29 -0% | 2.18 5% |
| Colorchecker dE 2000 max. * | 4.15 | 6.6 -59% | 6.06 -46% | 3.97 4% | 9.24 -123% | 3.47 16% | 4.84 -17% |
| Colorchecker dE 2000 calibrated * | 1.66 | 2.5 -51% | 1.43 14% | 1.59 4% | 1.48 11% | ||
| Greyscale dE 2000 * | 2.7 | 5.2 -93% | 4.27 -58% | 1.8 33% | 2 26% | 1.84 32% | 2.68 1% |
| Gamma | 2.266 97% | 2.14 103% | 2.3 96% | 2.64 83% | 2.13 103% | 2.32 95% | 2.43 91% |
| CCT | 7047 92% | 6331 103% | 7203 90% | 6761 96% | 6210 105% | 6308 103% | 6717 97% |
| Total Average (Program / Settings) | -727% /
-383% | -1067% /
-520% | -853% /
-460% | -92% /
-62% | -49% /
-19% | -1515% /
-704% |
* ... smaller is better
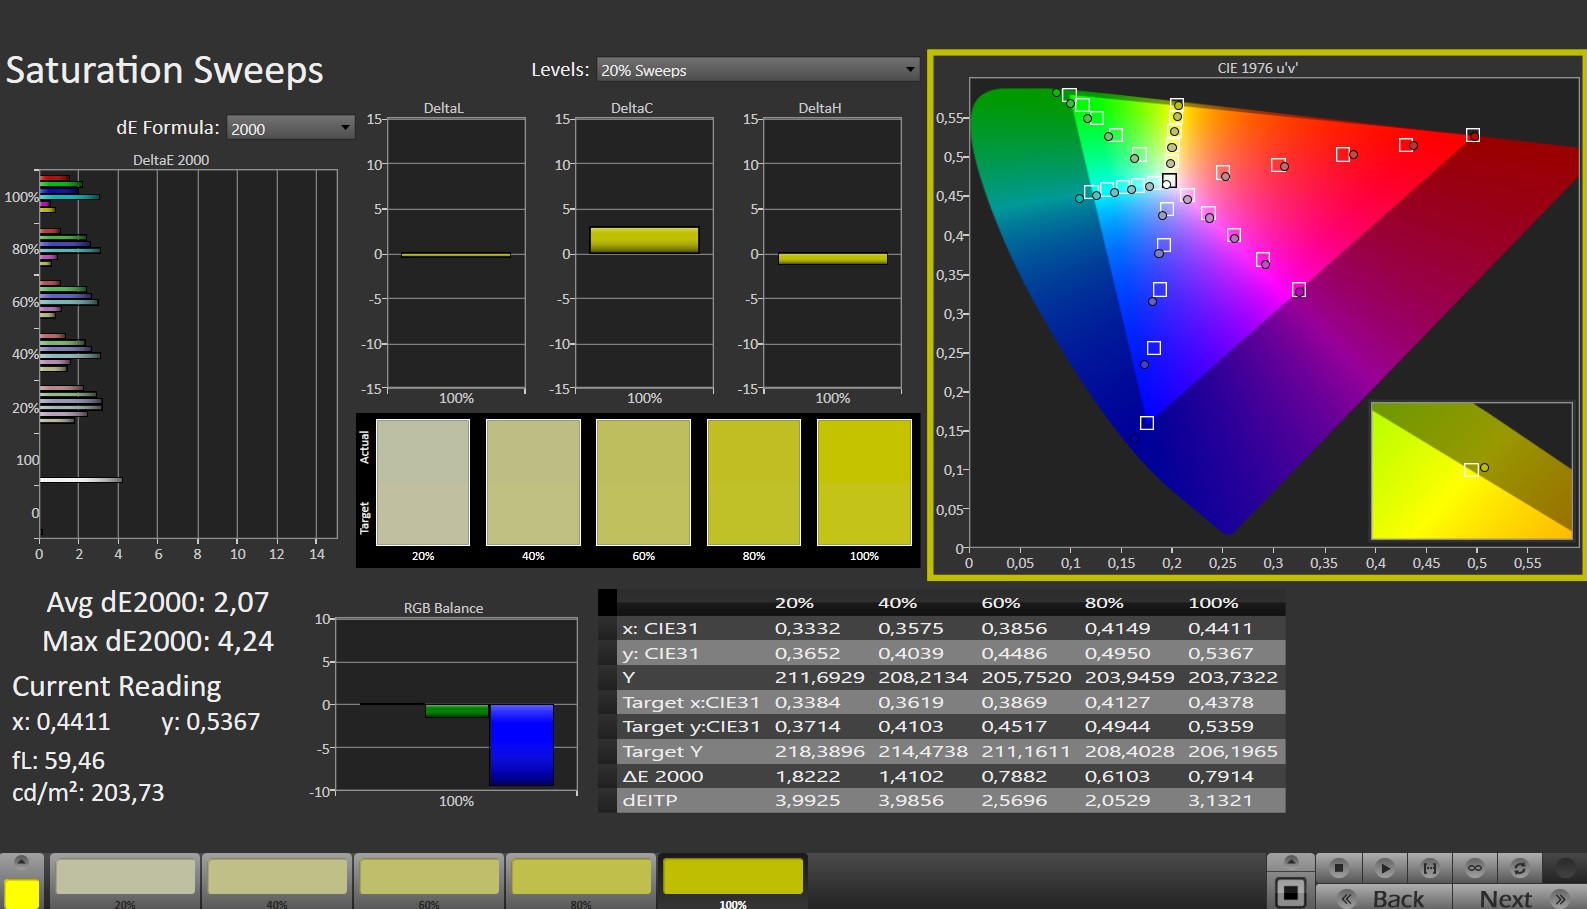
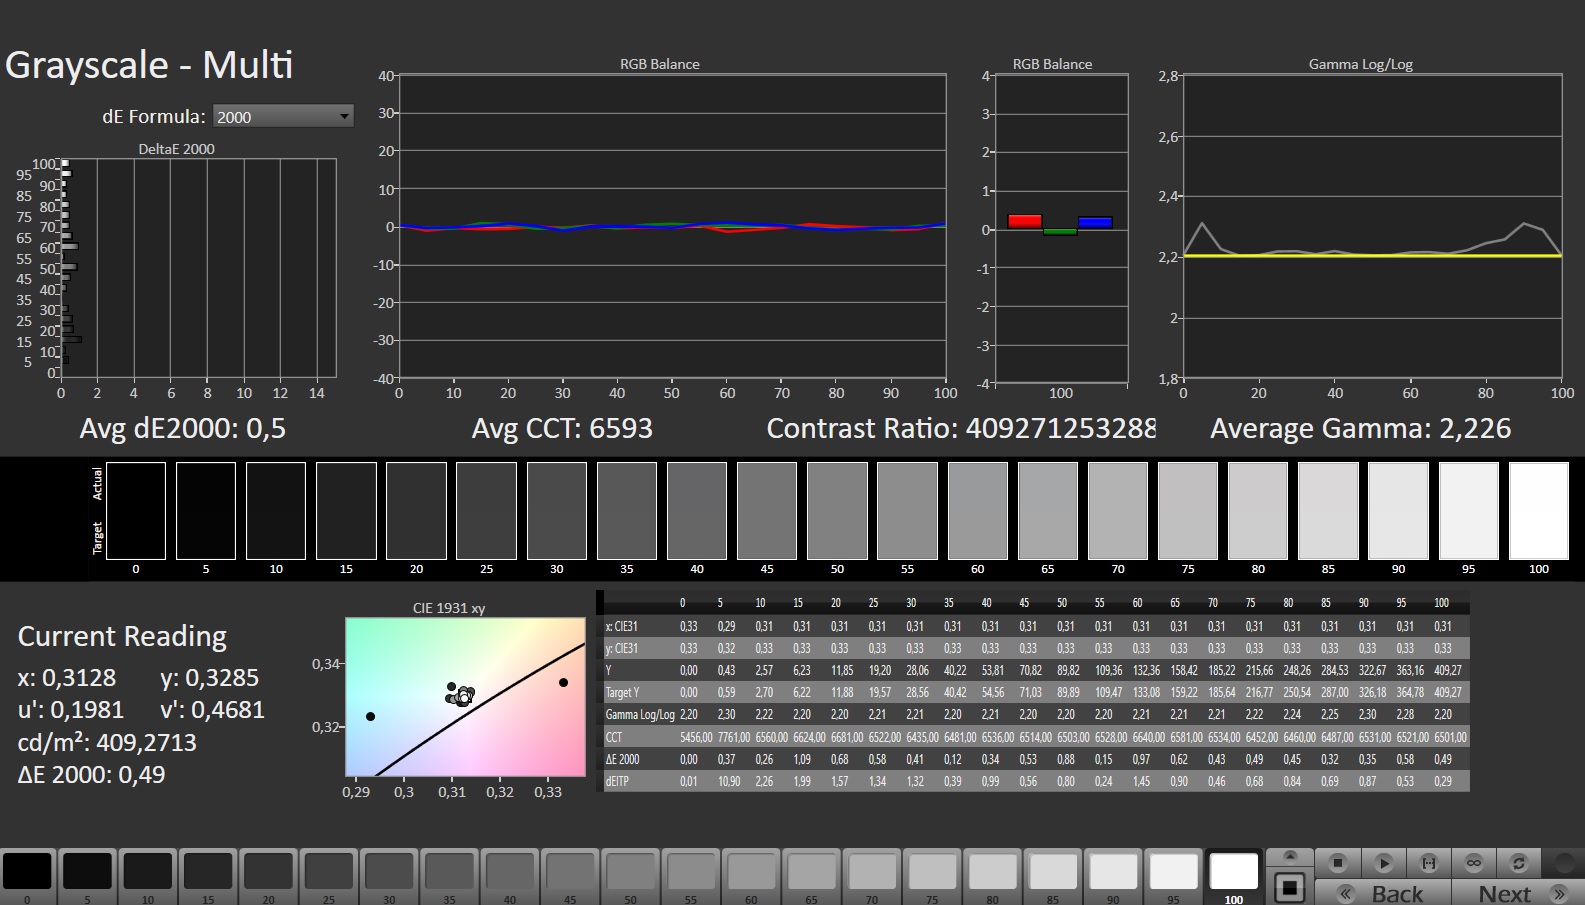
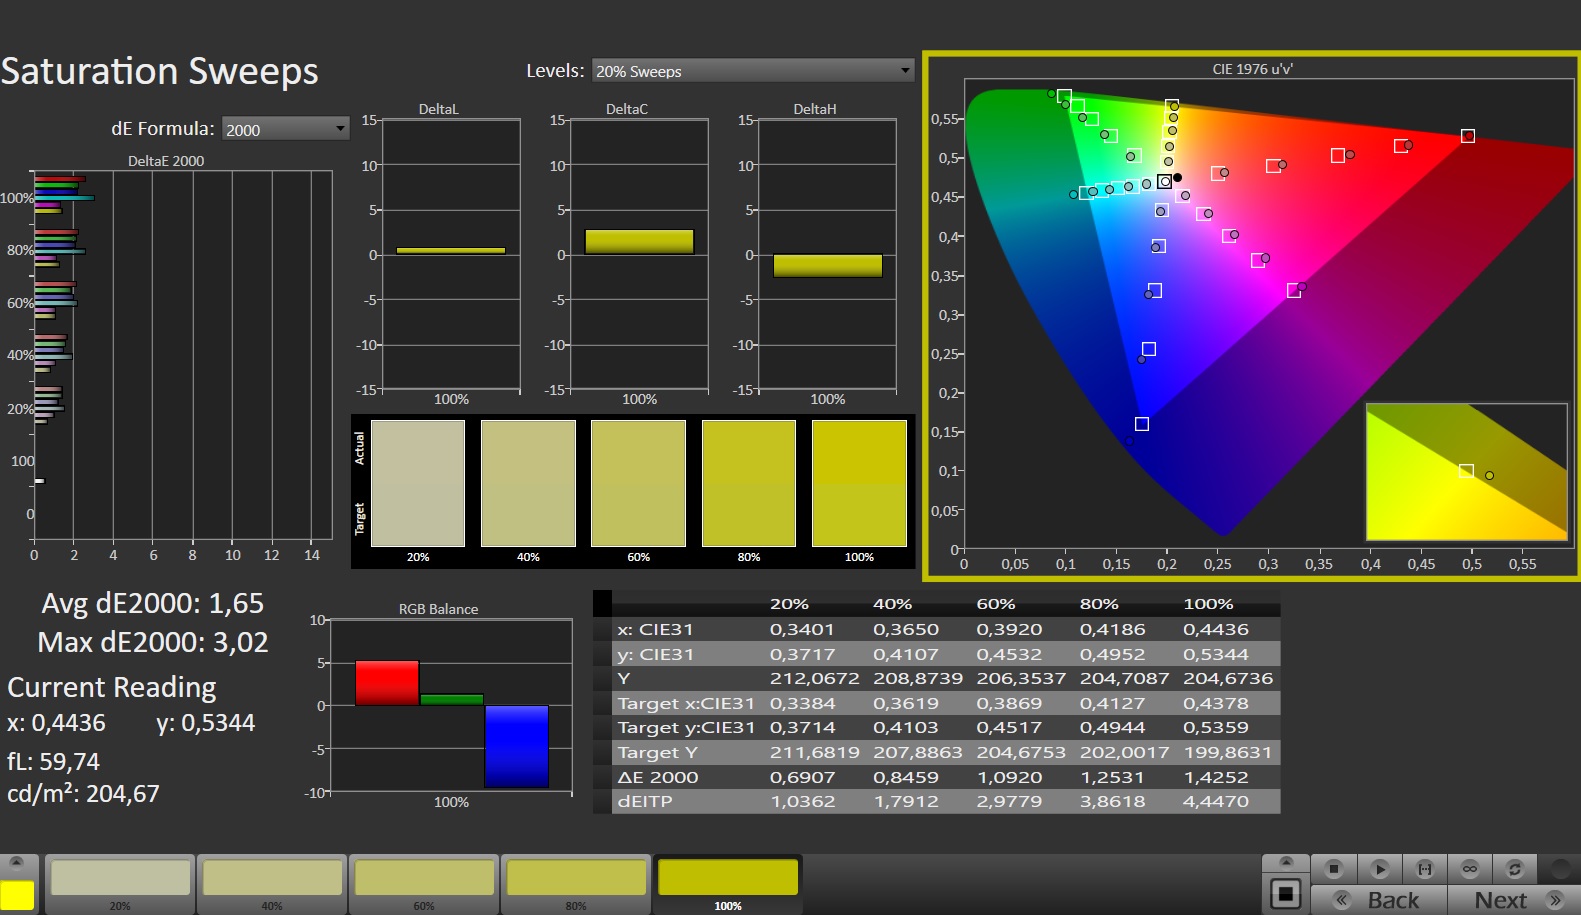
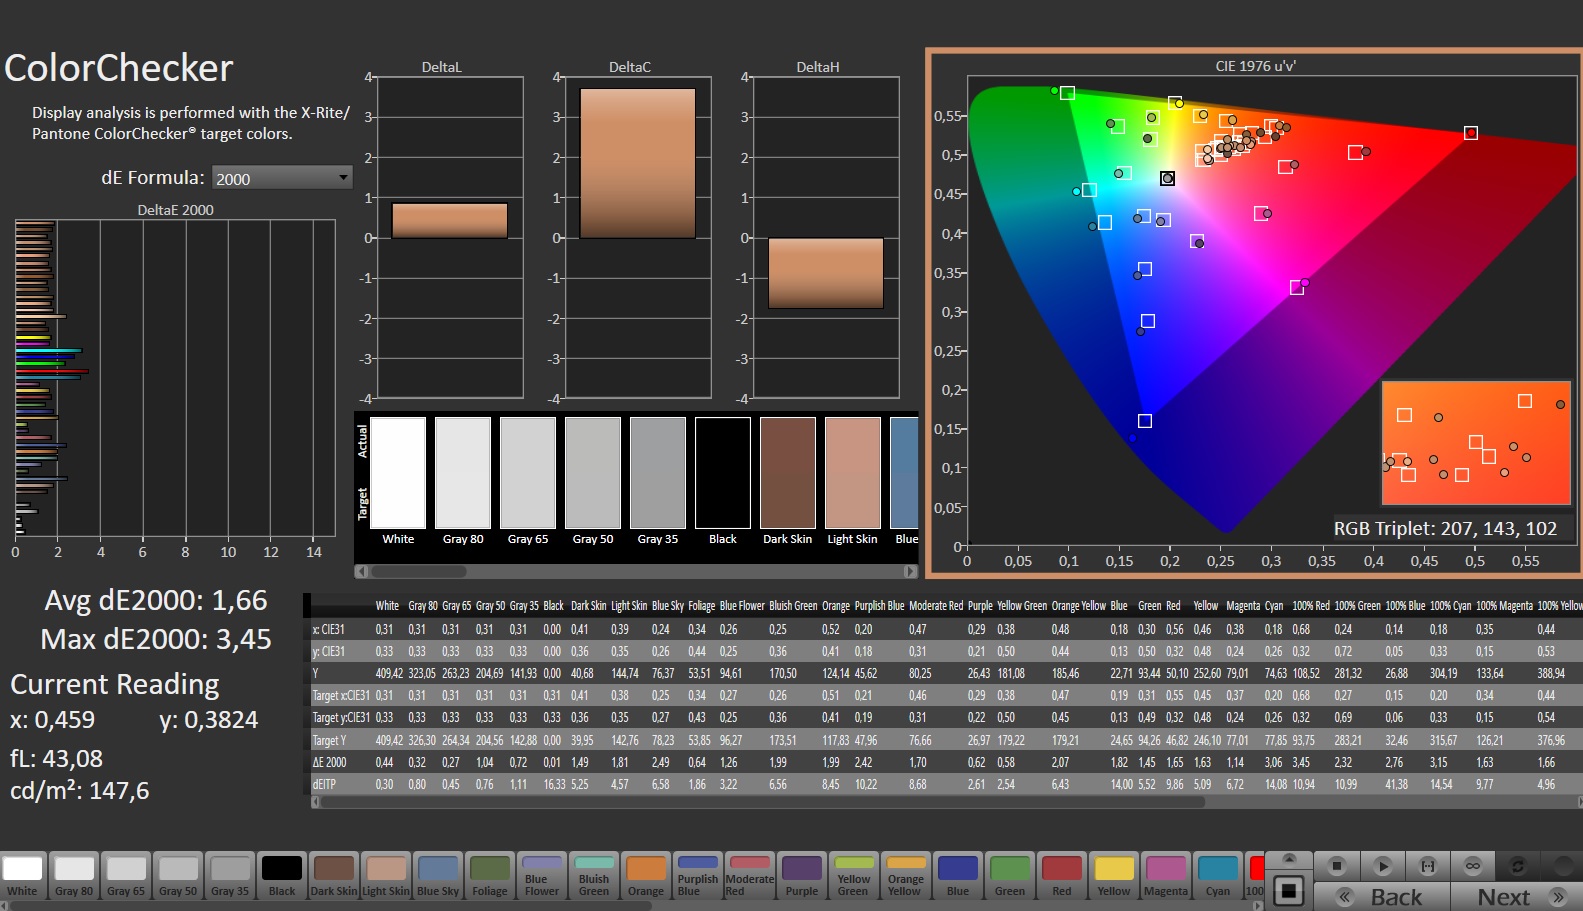
屏幕在交付状态下已经具有良好的色彩再现:在2.3的偏差下,达到了目标(DeltaE < 3)。校准将该值降至1.66,并确保灰度水平更加平衡。
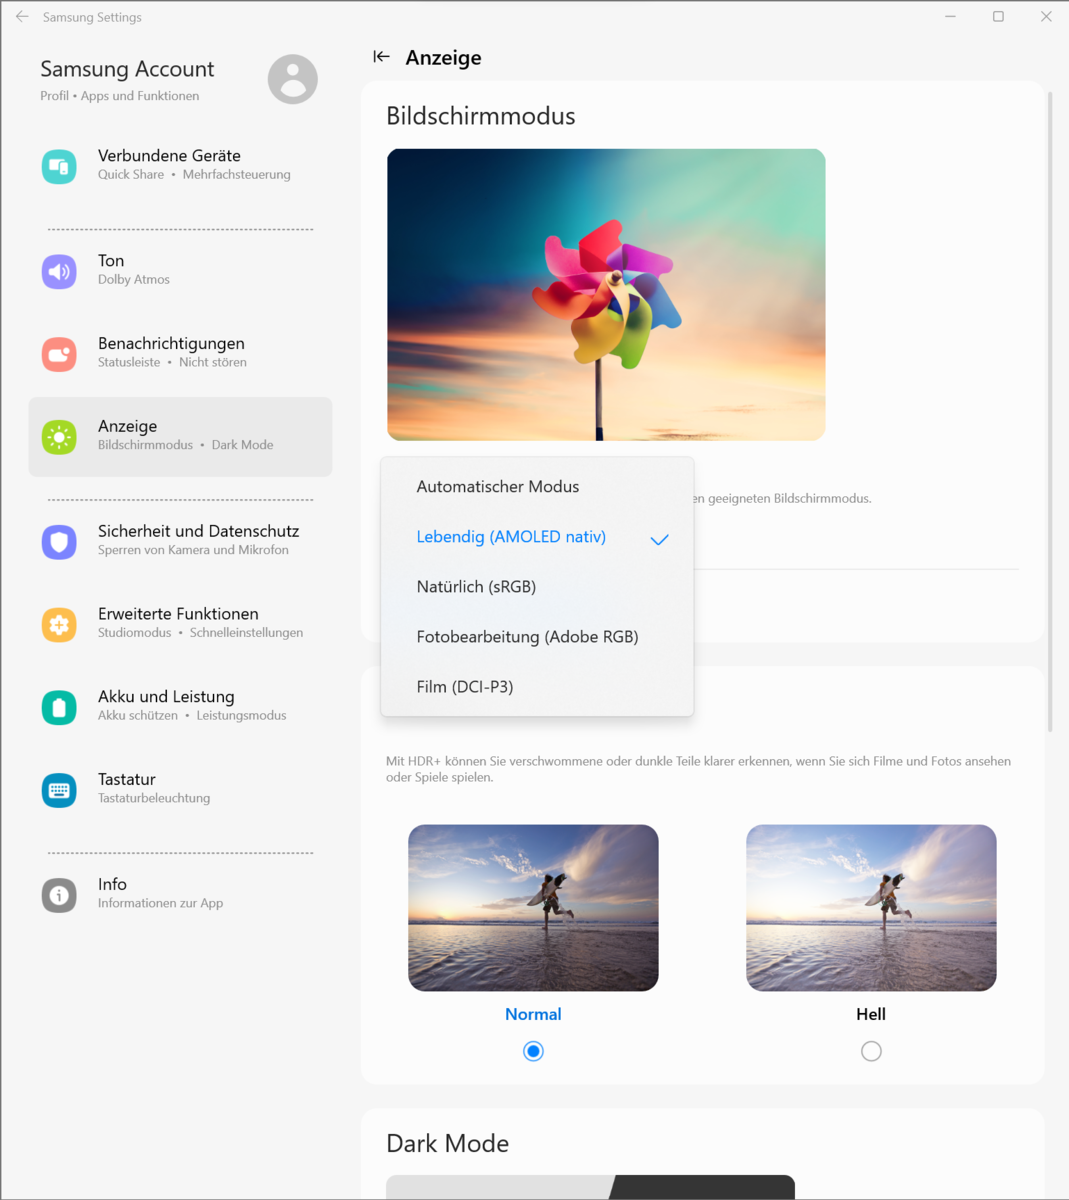
色彩保真是必然的:sRGB和DCI-P3色彩空间被完全再现,Adobe RGB空间几乎完全再现。显示器可以通过预装的三星软件设置调整到三个空间中的一个。我们在这里使用默认设置 "生动(AMOLED原生)"。

Display Response Times
| ↔ Response Time Black to White | ||
|---|---|---|
| 0.65 ms ... rise ↗ and fall ↘ combined | ↗ 0.37 ms rise |  |
| ↘ 0.28 ms fall | ||
| The screen shows very fast response rates in our tests and should be very well suited for fast-paced gaming. In comparison, all tested devices range from 0.1 (minimum) to 240 (maximum) ms. » 2 % of all devices are better. This means that the measured response time is better than the average of all tested devices (19.8 ms). | ||
| ↔ Response Time 50% Grey to 80% Grey | ||
| 0.49 ms ... rise ↗ and fall ↘ combined | ↗ 0.26 ms rise | 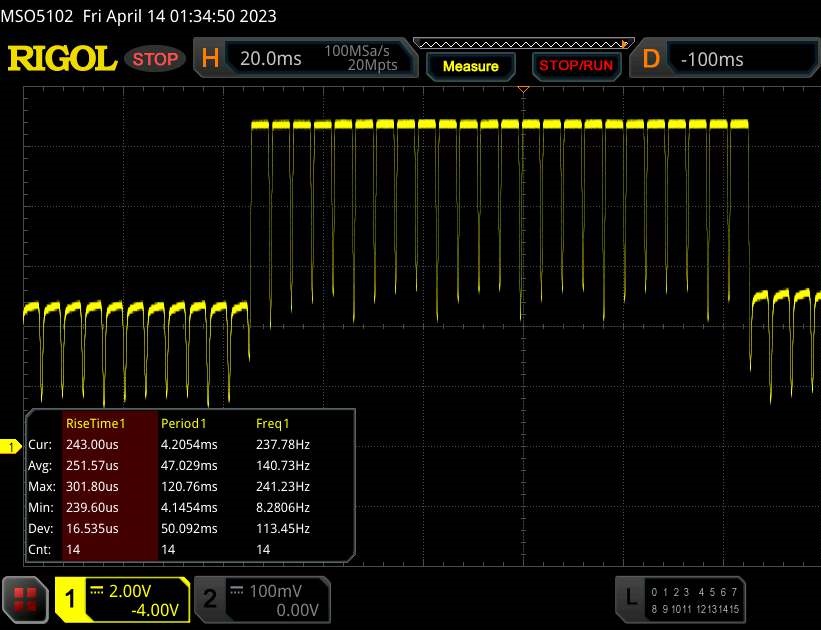 |
| ↘ 0.23 ms fall | ||
| The screen shows very fast response rates in our tests and should be very well suited for fast-paced gaming. In comparison, all tested devices range from 0.165 (minimum) to 636 (maximum) ms. » 1 % of all devices are better. This means that the measured response time is better than the average of all tested devices (31 ms). | ||
Screen Flickering / PWM (Pulse-Width Modulation)
| Screen flickering / PWM detected | 240 Hz | ≤ 100 % brightness setting | 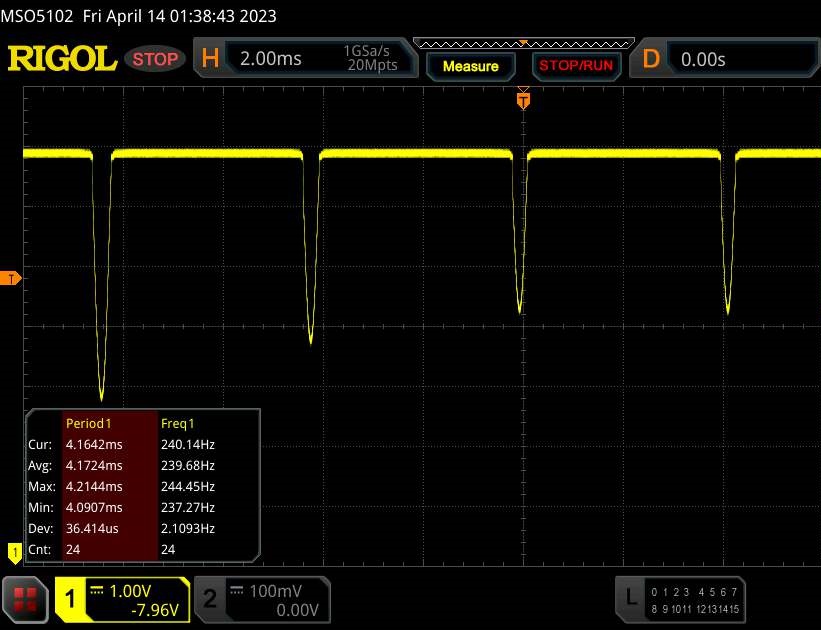 |
The display backlight flickers at 240 Hz (worst case, e.g., utilizing PWM) Flickering detected at a brightness setting of 100 % and below. There should be no flickering or PWM above this brightness setting. The frequency of 240 Hz is relatively low, so sensitive users will likely notice flickering and experience eyestrain at the stated brightness setting and below. In comparison: 52 % of all tested devices do not use PWM to dim the display. If PWM was detected, an average of 7754 (minimum: 5 - maximum: 343500) Hz was measured. | |||
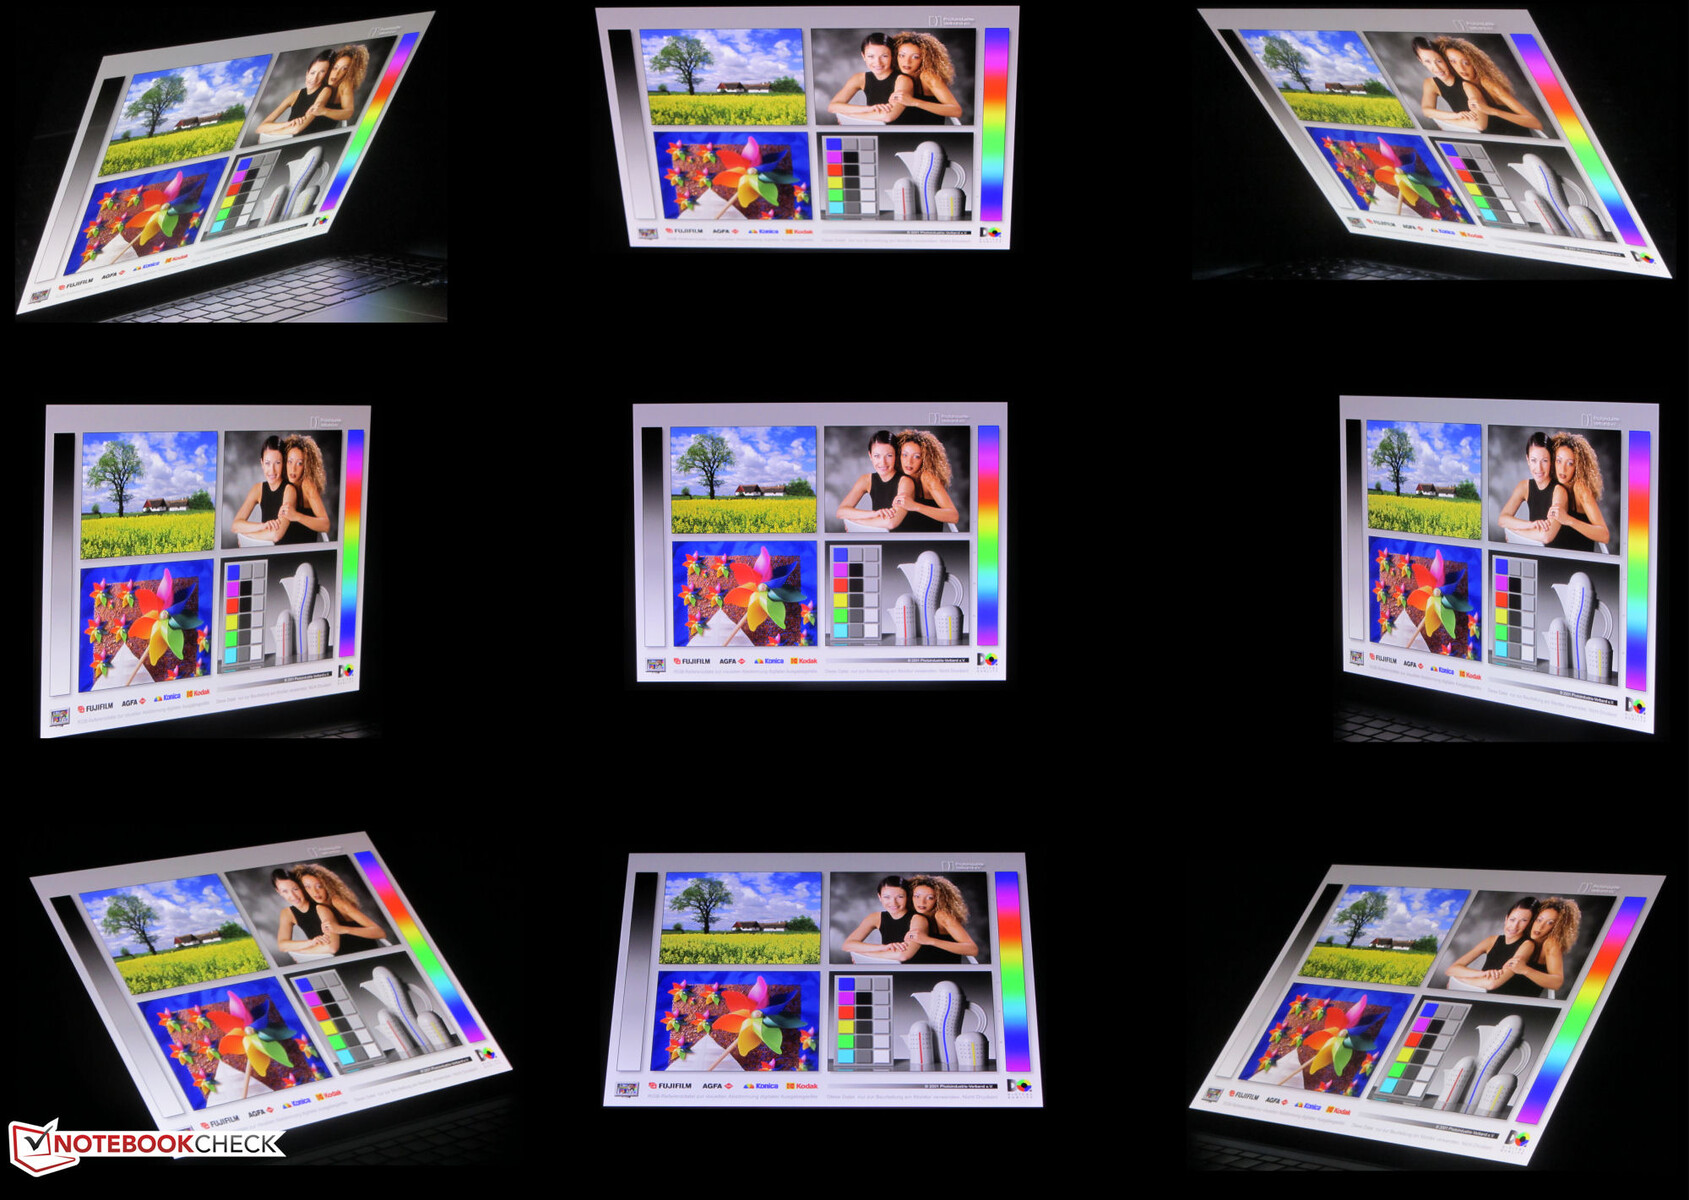
视角稳定的面板可以从任何位置阅读。由于显示表面的反光,在户外阅读很困难。
演出--阿尔德湖和阿达-拉芙蕾丝登场
凭借其Galaxy Book3 Ultra 16型号,三星为游戏玩家和创意工作者提供了一系列移动笔记本。GeForce RTX Studio的认证应能保证高计算能力、调整后的驱动程序、良好的软件支持和合适的显示器色彩空间覆盖。
使用低功耗版本的RTX 4050或RTX 4070 GPU,而处理器来自英特尔(Raptor Lake)。这个变体基于RTX 4050,是入门级型号,价格约为2400美元。
测试条件
笔记本有三种制造商特定的性能模式(见表),可以通过组合键 "Fn "+"F11"(或通过三星在笔记本控制中心的软件设置)进行切换。使用了 "优化"(基准测试)和 "静音"(电池测试)模式。
| 高效能 | 优化的 | 静音的 | |
|---|---|---|---|
| 功率限制1 (HWInfo) | 70瓦 | 45瓦 | 30瓦 |
| 功率限制2 (HWInfo) | 75瓦 | 75瓦 | 75瓦 |
| TGP RTX 4050 | 60 watts | ~ 40 - 45 watts | 20 watts |
| 噪音 (Witcher 3) | 48 dB(A) | 39 dB(A) | 34 dB(A) |
| 性能 (Witcher 3) | ~ 73 fps | ~ 60 fps | ~ 20 fps |

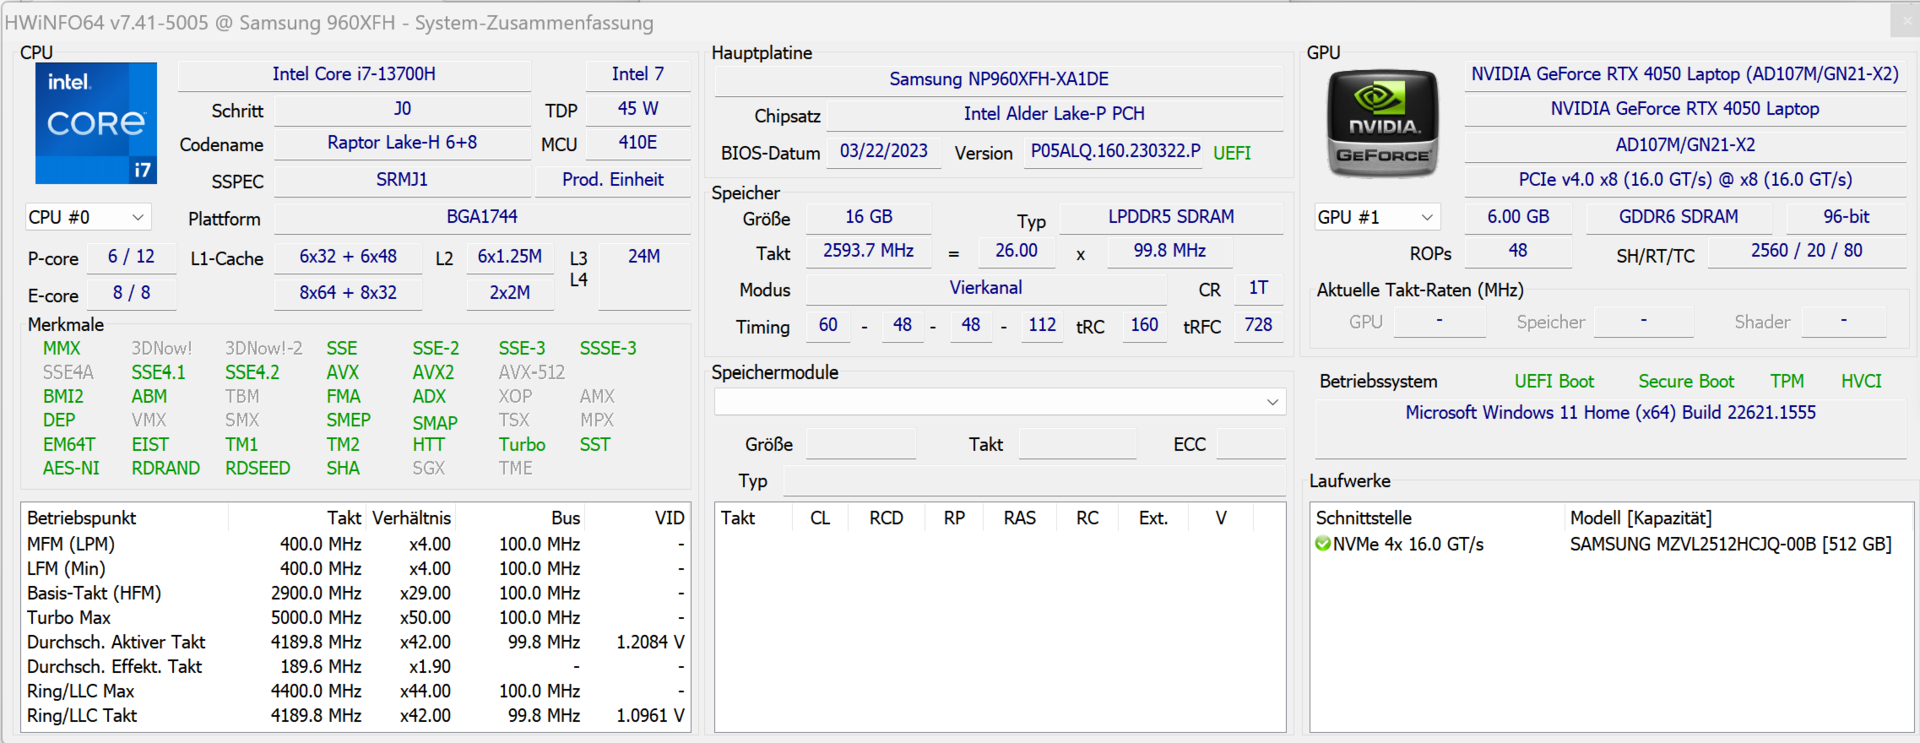
处理器
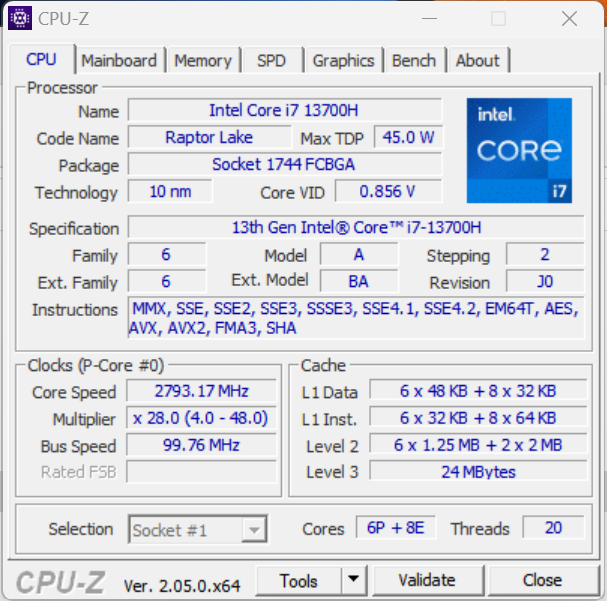
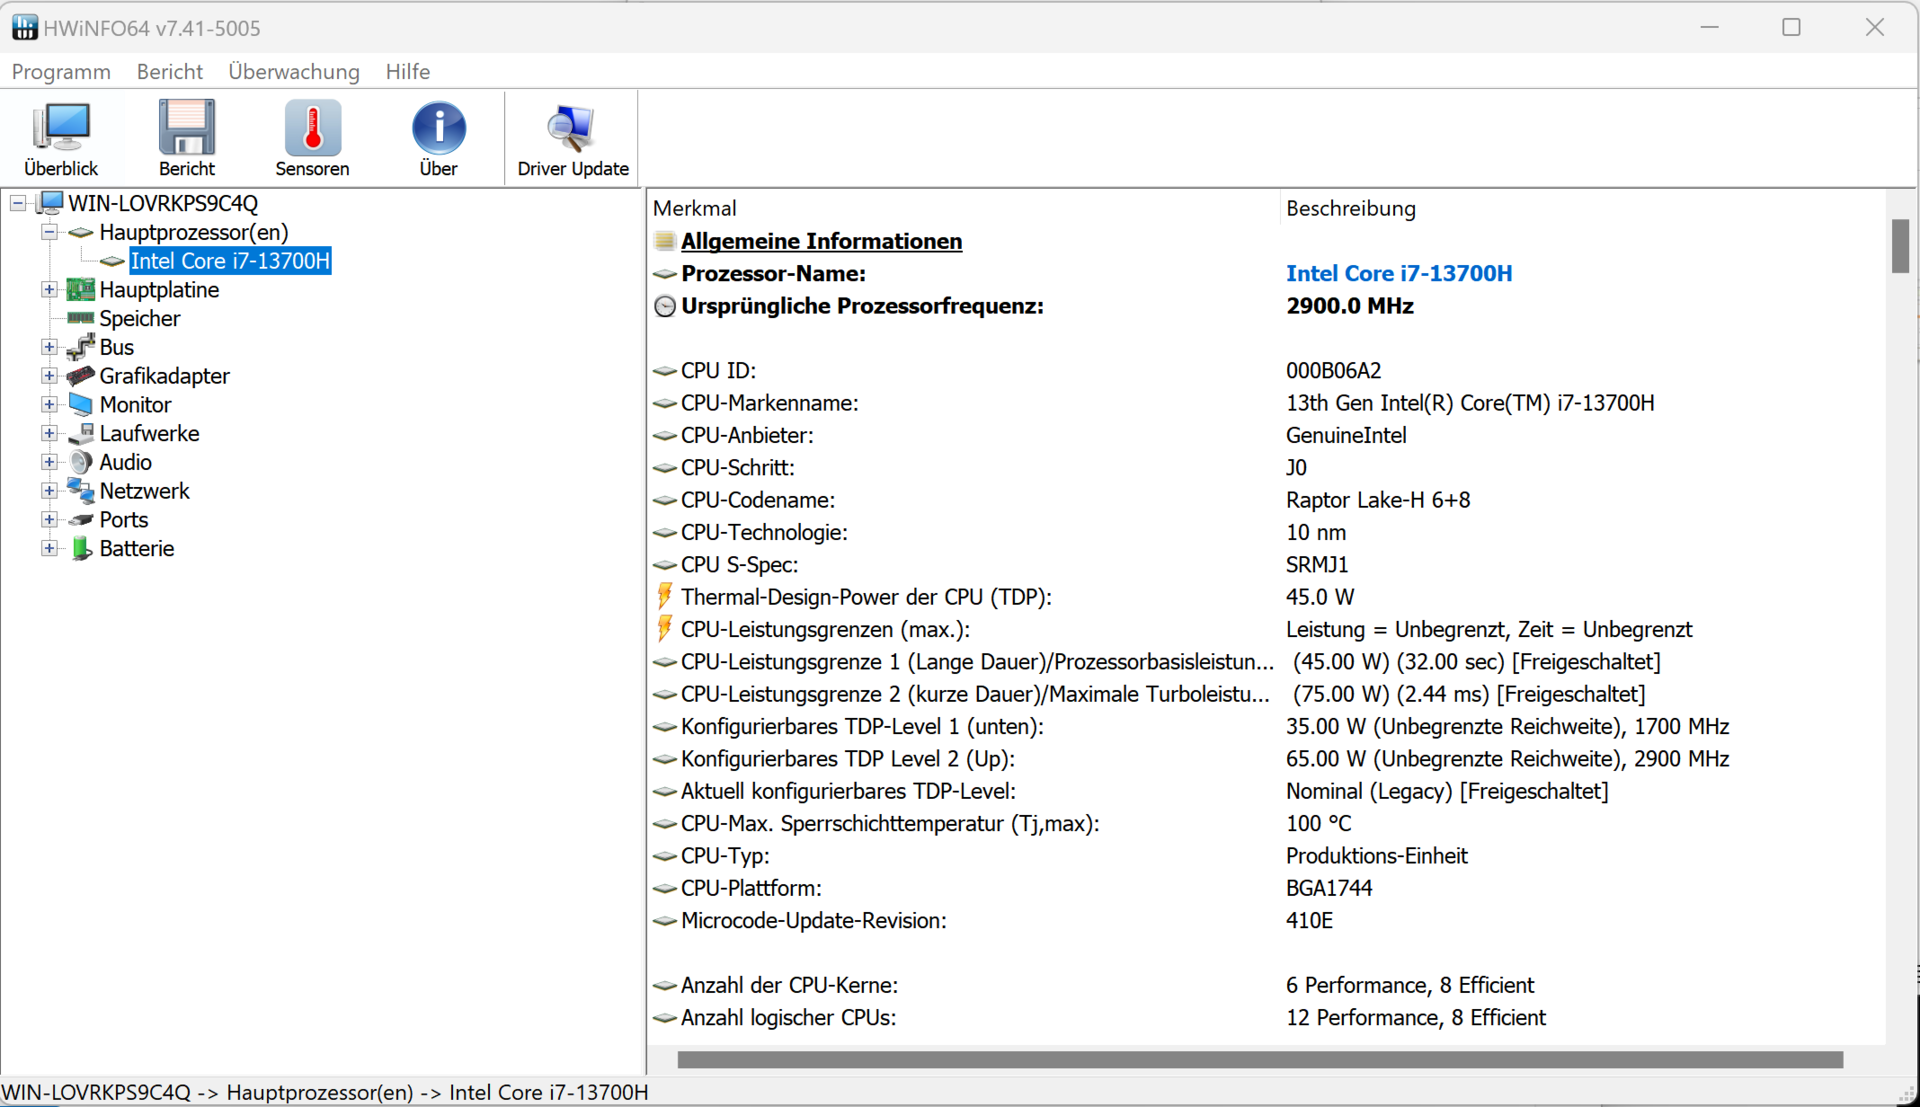
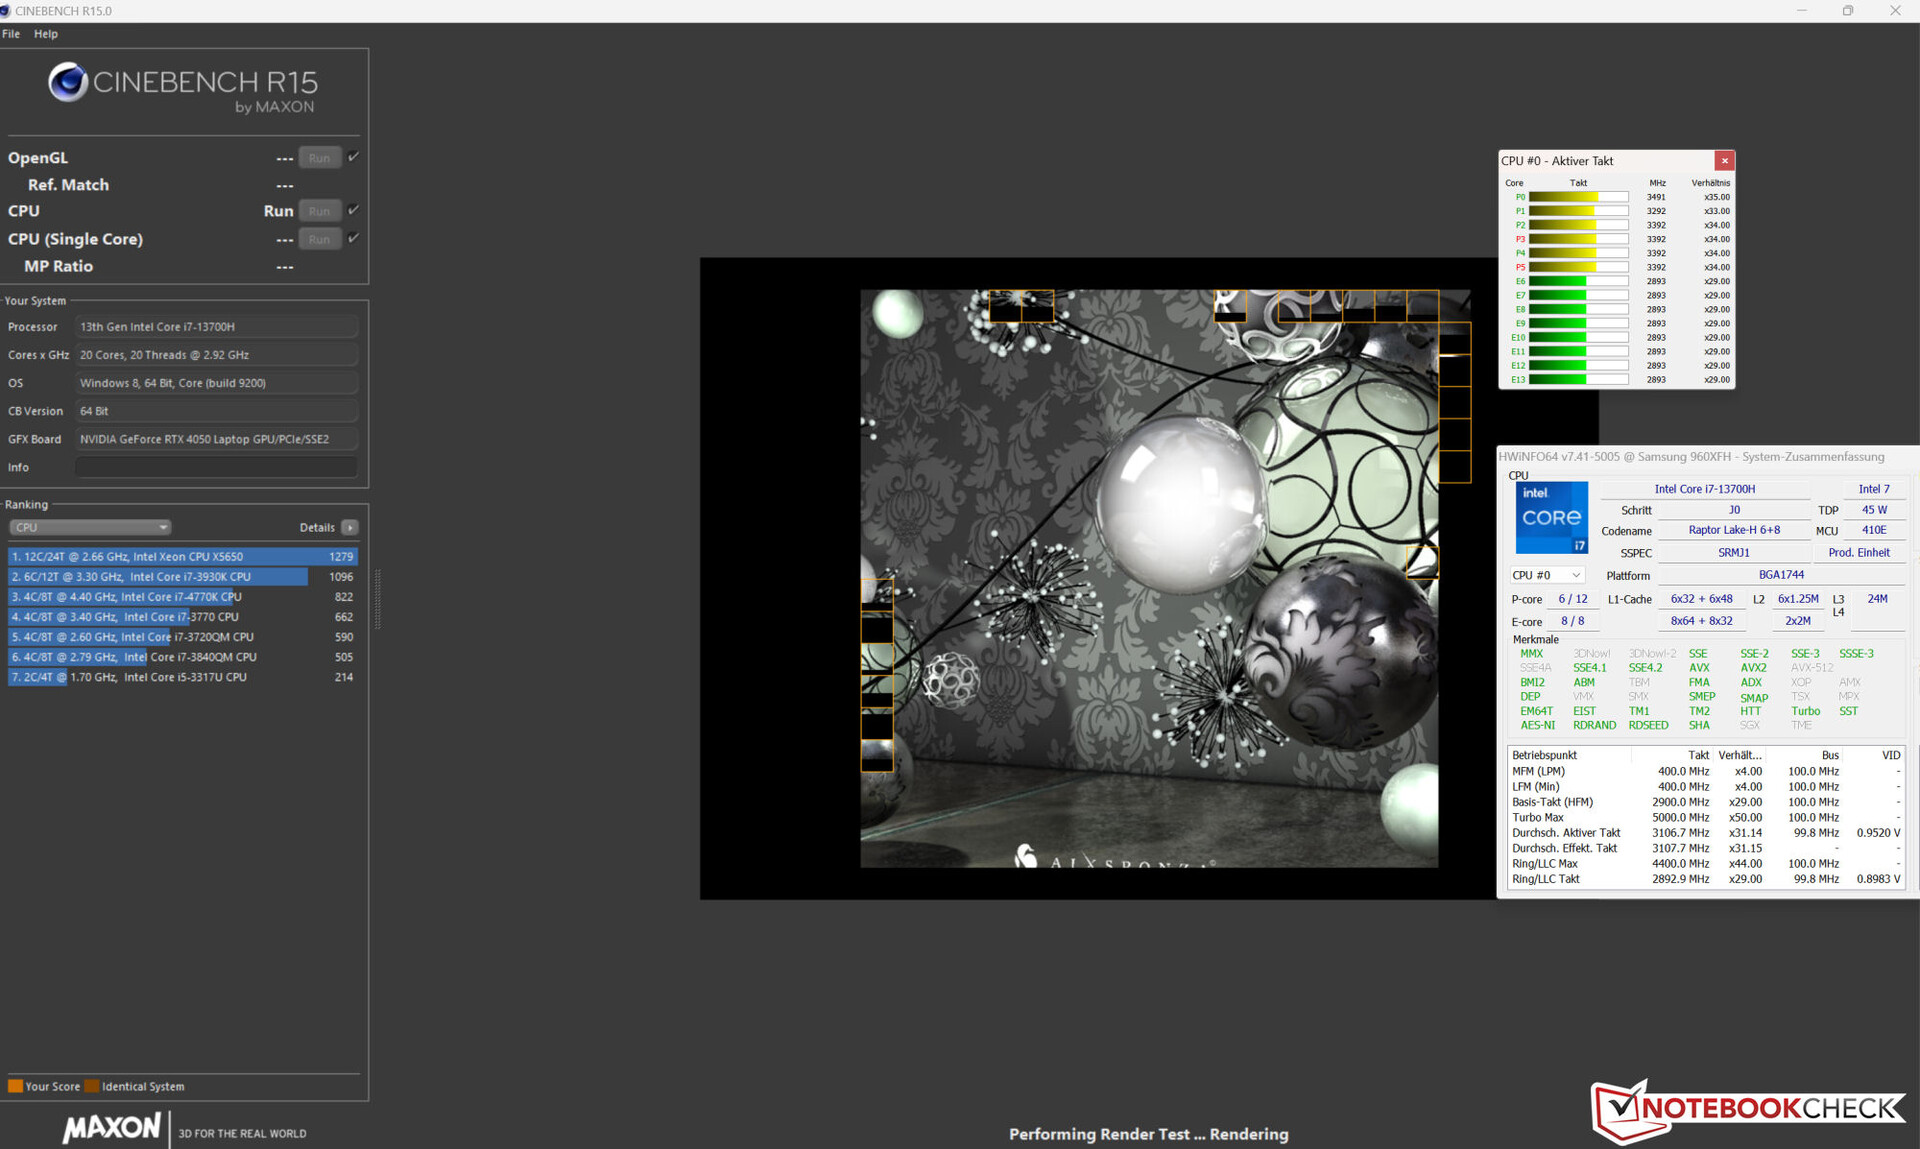
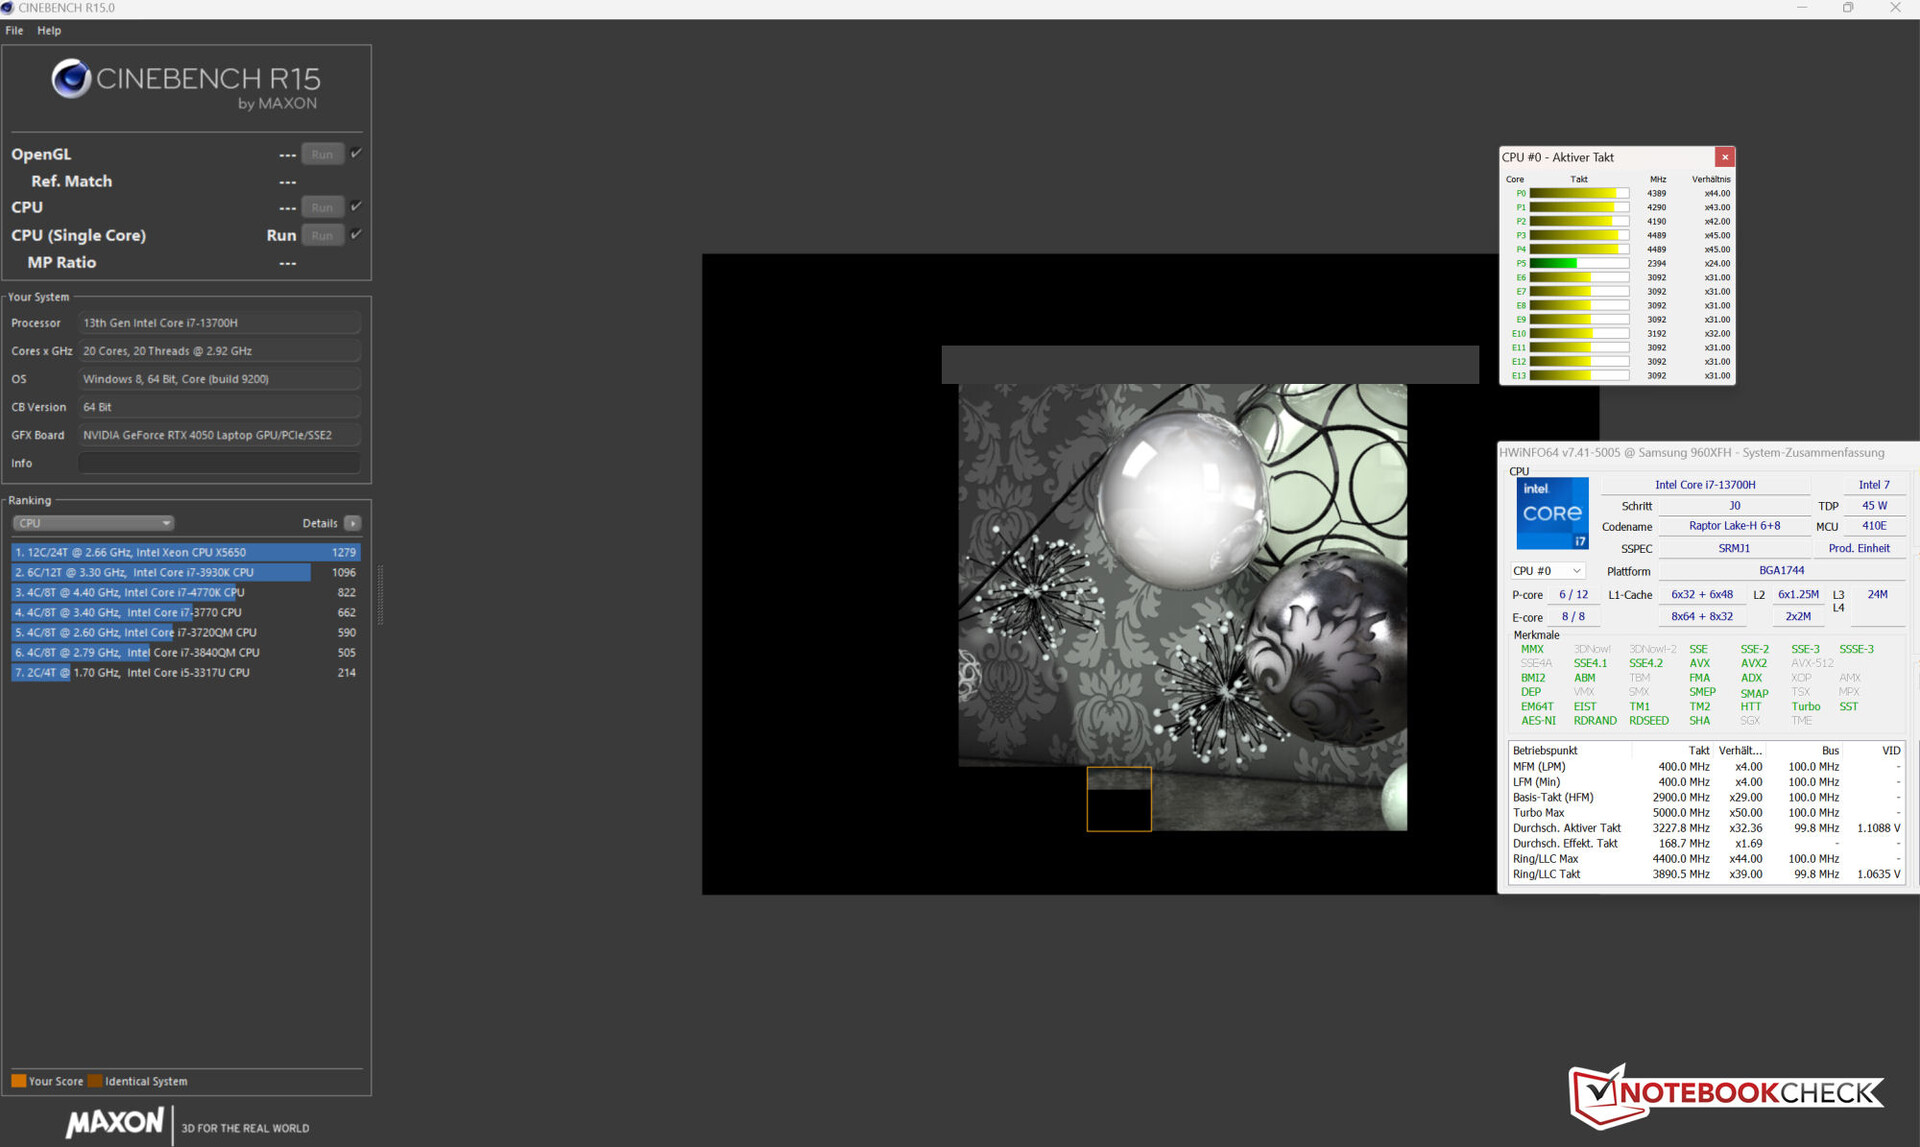
芯片 酷睿i7-13700H猛禽湖)处理器由八个高效核心(无超线程,1.8至3.7 GHz)和六个性能核心(超线程,2.4至5 GHz)组成。这相当于总共有20个逻辑CPU核心。
高性能 "和 "优化 "性能模式提供的基准测试结果大致与迄今为止确定的CPU平均水平相当。静音 "模式将这些数值远远推低,但仍能为日常使用提供足够的性能。
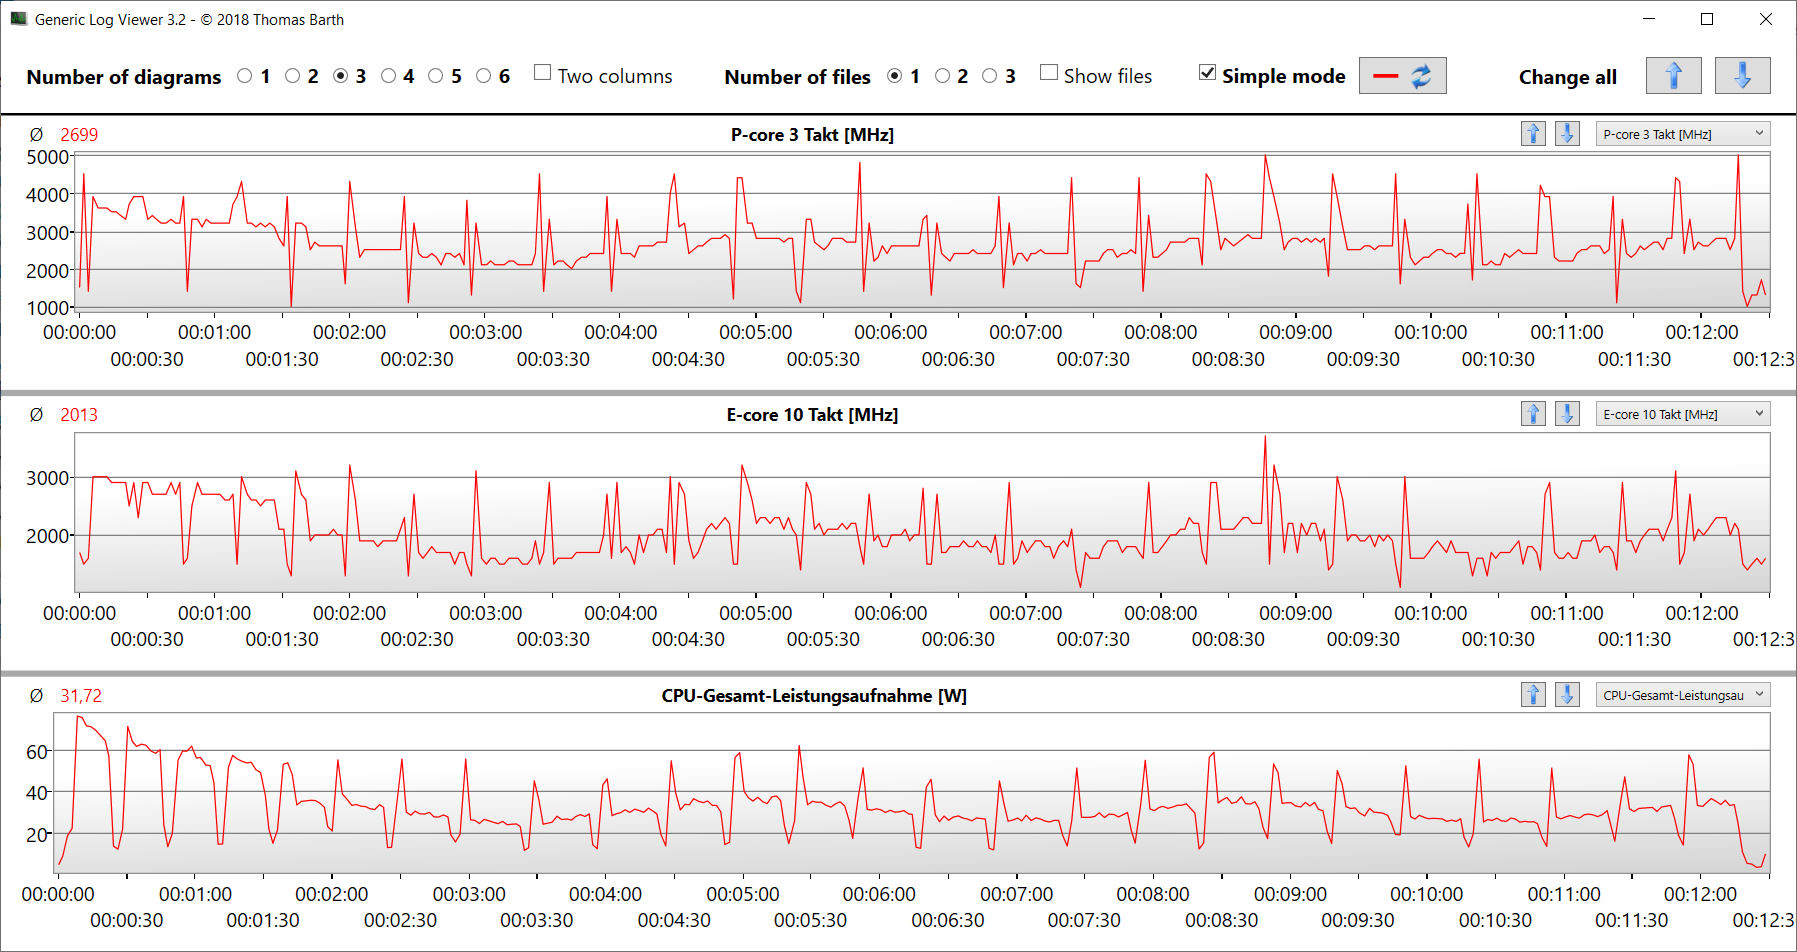
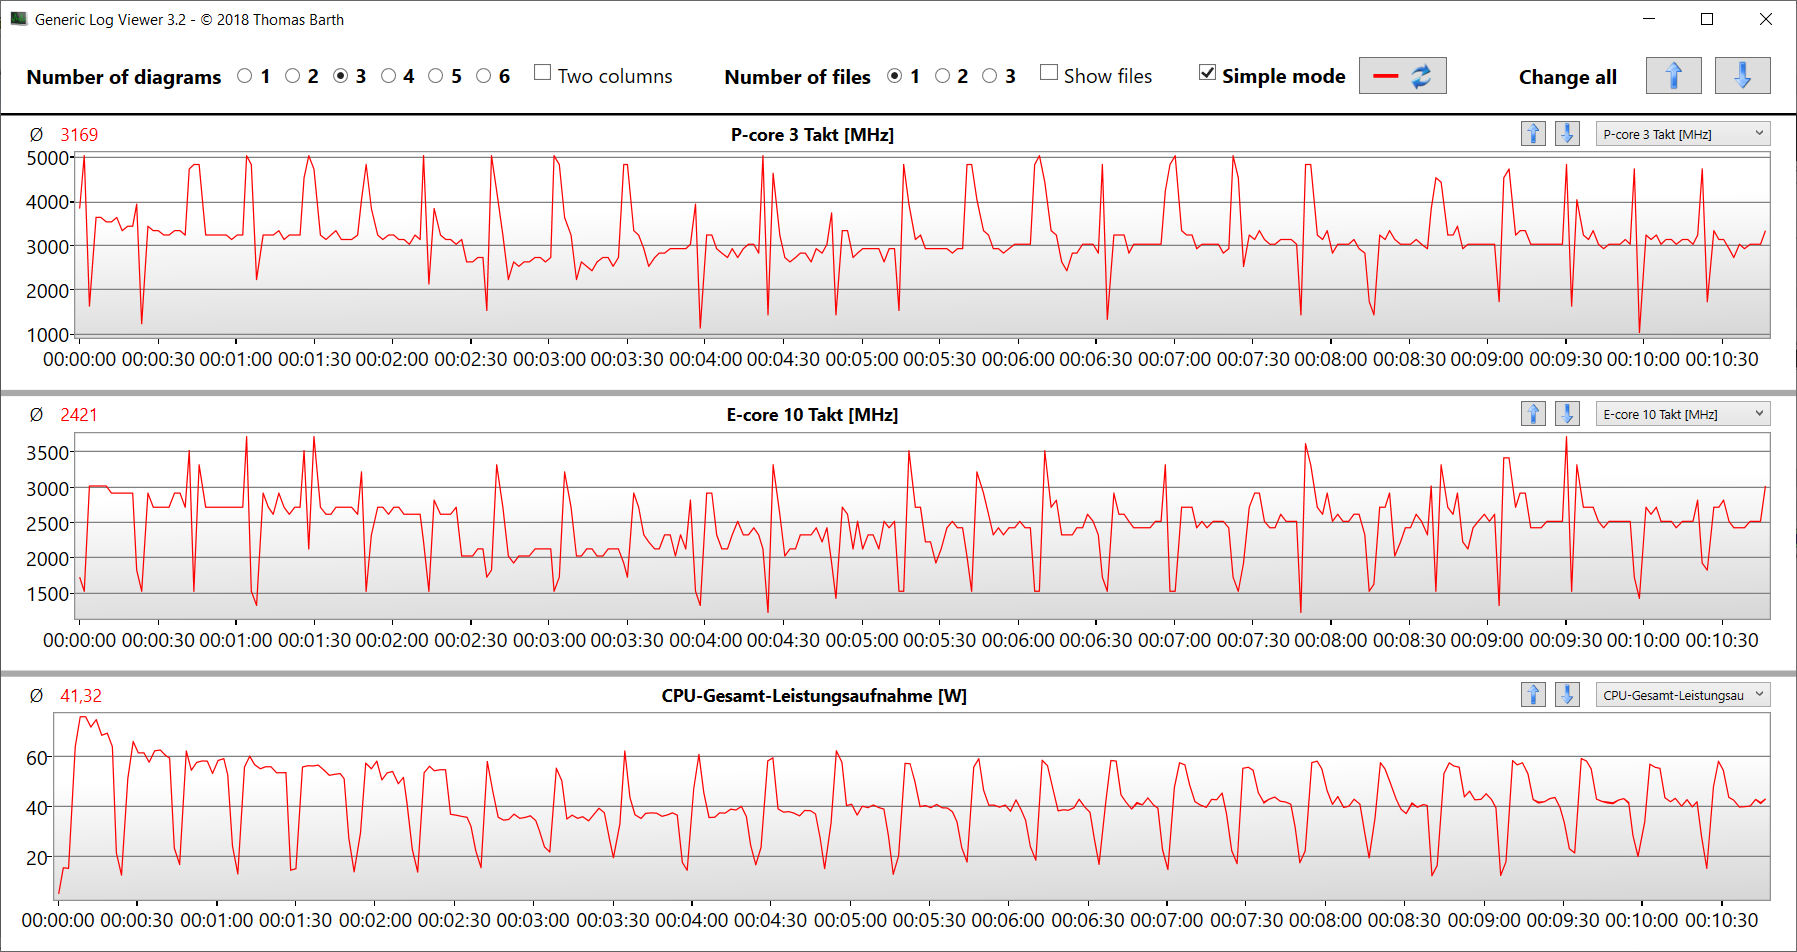
CB15循环测试显示,连续的多线程负载导致涡轮增压时钟随着每一次额外的运行而下降,并从第八次运行开始出现波动。一个恒定的水平无法保持。高性能 "配置文件确保了更高的平均时钟和更低的波动。
Cinebench R15 Multi Sustained Load
| CPU Performance rating - Percent | |
| Average of class Multimedia | |
| Samsung Galaxy Book3 Ultra 16 | |
| Average Intel Core i7-13700H | |
| Dell XPS 15 9520 RTX 3050 Ti | |
| Samsung Galaxy Book3 Ultra 16 | |
| Schenker Vision 16 Pro RTX 3070 Ti | |
| Lenovo ThinkBook 16p G3 ARH | |
| Acer Swift X SFX16-52G-77RX | |
| Samsung Galaxy Book3 Ultra 16 | |
| LG Gram 17Z90Q-E.AD78G | |
| Asus VivoBook Pro 16X OLED N7600PC-L2026X | |
| Cinebench R23 | |
| Multi Core | |
| Average of class Multimedia (4861 - 33362, n=74, last 2 years) | |
| Samsung Galaxy Book3 Ultra 16 | |
| Average Intel Core i7-13700H (5890 - 20034, n=29) | |
| Samsung Galaxy Book3 Ultra 16 (Hohe Leistung) | |
| Dell XPS 15 9520 RTX 3050 Ti | |
| Lenovo ThinkBook 16p G3 ARH | |
| Schenker Vision 16 Pro RTX 3070 Ti | |
| Samsung Galaxy Book3 Ultra 16 (Leise) | |
| Acer Swift X SFX16-52G-77RX | |
| LG Gram 17Z90Q-E.AD78G | |
| LG Gram 17Z90Q-E.AD78G | |
| Asus VivoBook Pro 16X OLED N7600PC-L2026X | |
| Single Core | |
| Average of class Multimedia (1128 - 2459, n=66, last 2 years) | |
| Samsung Galaxy Book3 Ultra 16 (Hohe Leistung) | |
| Schenker Vision 16 Pro RTX 3070 Ti | |
| Average Intel Core i7-13700H (1323 - 1914, n=29) | |
| Dell XPS 15 9520 RTX 3050 Ti | |
| Acer Swift X SFX16-52G-77RX | |
| Samsung Galaxy Book3 Ultra 16 | |
| LG Gram 17Z90Q-E.AD78G | |
| Lenovo ThinkBook 16p G3 ARH | |
| Asus VivoBook Pro 16X OLED N7600PC-L2026X | |
| Samsung Galaxy Book3 Ultra 16 (Leise) | |
| Cinebench R20 | |
| CPU (Multi Core) | |
| Average of class Multimedia (1887 - 12912, n=57, last 2 years) | |
| Samsung Galaxy Book3 Ultra 16 | |
| Average Intel Core i7-13700H (2322 - 7674, n=29) | |
| Samsung Galaxy Book3 Ultra 16 (Hohe Leistung) | |
| Dell XPS 15 9520 RTX 3050 Ti | |
| Lenovo ThinkBook 16p G3 ARH | |
| Schenker Vision 16 Pro RTX 3070 Ti | |
| Samsung Galaxy Book3 Ultra 16 (Leise) | |
| Acer Swift X SFX16-52G-77RX | |
| LG Gram 17Z90Q-E.AD78G | |
| Asus VivoBook Pro 16X OLED N7600PC-L2026X | |
| CPU (Single Core) | |
| Average of class Multimedia (425 - 853, n=57, last 2 years) | |
| Samsung Galaxy Book3 Ultra 16 (Hohe Leistung) | |
| Schenker Vision 16 Pro RTX 3070 Ti | |
| Average Intel Core i7-13700H (508 - 741, n=29) | |
| Dell XPS 15 9520 RTX 3050 Ti | |
| Acer Swift X SFX16-52G-77RX | |
| Samsung Galaxy Book3 Ultra 16 | |
| LG Gram 17Z90Q-E.AD78G | |
| Lenovo ThinkBook 16p G3 ARH | |
| Asus VivoBook Pro 16X OLED N7600PC-L2026X | |
| Samsung Galaxy Book3 Ultra 16 (Leise) | |
| Cinebench R15 | |
| CPU Multi 64Bit | |
| Schenker Vision 16 Pro RTX 3070 Ti (Turbo) | |
| Schenker Vision 16 Pro RTX 3070 Ti | |
| Average of class Multimedia (856 - 5224, n=61, last 2 years) | |
| Samsung Galaxy Book3 Ultra 16 | |
| Samsung Galaxy Book3 Ultra 16 (Hohe Leistung) | |
| Average Intel Core i7-13700H (905 - 2982, n=29) | |
| Samsung Galaxy Book3 Ultra 16 (Leise) | |
| Dell XPS 15 9520 RTX 3050 Ti | |
| Lenovo ThinkBook 16p G3 ARH | |
| Acer Swift X SFX16-52G-77RX | |
| LG Gram 17Z90Q-E.AD78G | |
| Asus VivoBook Pro 16X OLED N7600PC-L2026X | |
| CPU Single 64Bit | |
| Average of class Multimedia (184.8 - 326, n=59, last 2 years) | |
| Samsung Galaxy Book3 Ultra 16 (Hohe Leistung) | |
| Schenker Vision 16 Pro RTX 3070 Ti | |
| Average Intel Core i7-13700H (213 - 278, n=29) | |
| Dell XPS 15 9520 RTX 3050 Ti | |
| Acer Swift X SFX16-52G-77RX | |
| Samsung Galaxy Book3 Ultra 16 | |
| Lenovo ThinkBook 16p G3 ARH | |
| Asus VivoBook Pro 16X OLED N7600PC-L2026X | |
| Asus VivoBook Pro 16X OLED N7600PC-L2026X | |
| LG Gram 17Z90Q-E.AD78G | |
| Samsung Galaxy Book3 Ultra 16 (Leise) | |
| Blender - v2.79 BMW27 CPU | |
| Asus VivoBook Pro 16X OLED N7600PC-L2026X | |
| LG Gram 17Z90Q-E.AD78G | |
| Acer Swift X SFX16-52G-77RX | |
| Samsung Galaxy Book3 Ultra 16 (Leise) | |
| Schenker Vision 16 Pro RTX 3070 Ti | |
| Average of class Multimedia (100 - 557, n=58, last 2 years) | |
| Lenovo ThinkBook 16p G3 ARH | |
| Average Intel Core i7-13700H (169 - 555, n=29) | |
| Dell XPS 15 9520 RTX 3050 Ti | |
| Samsung Galaxy Book3 Ultra 16 | |
| Samsung Galaxy Book3 Ultra 16 (Hohe Leistung) | |
| 7-Zip 18.03 | |
| 7z b 4 | |
| Dell XPS 15 9520 RTX 3050 Ti | |
| Samsung Galaxy Book3 Ultra 16 | |
| Average Intel Core i7-13700H (27322 - 76344, n=29) | |
| Average of class Multimedia (26062 - 130368, n=55, last 2 years) | |
| Samsung Galaxy Book3 Ultra 16 (Hohe Leistung) | |
| Lenovo ThinkBook 16p G3 ARH | |
| Schenker Vision 16 Pro RTX 3070 Ti | |
| Samsung Galaxy Book3 Ultra 16 (Leise) | |
| Acer Swift X SFX16-52G-77RX | |
| LG Gram 17Z90Q-E.AD78G | |
| Asus VivoBook Pro 16X OLED N7600PC-L2026X | |
| 7z b 4 -mmt1 | |
| Samsung Galaxy Book3 Ultra 16 (Hohe Leistung) | |
| Average of class Multimedia (3666 - 7545, n=56, last 2 years) | |
| Average Intel Core i7-13700H (4825 - 6238, n=29) | |
| Schenker Vision 16 Pro RTX 3070 Ti | |
| Dell XPS 15 9520 RTX 3050 Ti | |
| Samsung Galaxy Book3 Ultra 16 | |
| Asus VivoBook Pro 16X OLED N7600PC-L2026X | |
| Acer Swift X SFX16-52G-77RX | |
| Lenovo ThinkBook 16p G3 ARH | |
| LG Gram 17Z90Q-E.AD78G | |
| Samsung Galaxy Book3 Ultra 16 (Leise) | |
| Geekbench 5.5 | |
| Multi-Core | |
| Average of class Multimedia (4652 - 20422, n=56, last 2 years) | |
| Samsung Galaxy Book3 Ultra 16 (Hohe Leistung) | |
| Dell XPS 15 9520 RTX 3050 Ti | |
| Average Intel Core i7-13700H (6165 - 14215, n=29) | |
| Samsung Galaxy Book3 Ultra 16 | |
| Schenker Vision 16 Pro RTX 3070 Ti | |
| Acer Swift X SFX16-52G-77RX | |
| Samsung Galaxy Book3 Ultra 16 (Leise) | |
| Lenovo ThinkBook 16p G3 ARH | |
| LG Gram 17Z90Q-E.AD78G | |
| Asus VivoBook Pro 16X OLED N7600PC-L2026X | |
| Single-Core | |
| Average of class Multimedia (805 - 2974, n=56, last 2 years) | |
| Samsung Galaxy Book3 Ultra 16 (Hohe Leistung) | |
| Schenker Vision 16 Pro RTX 3070 Ti | |
| Average Intel Core i7-13700H (1362 - 1919, n=29) | |
| Acer Swift X SFX16-52G-77RX | |
| Dell XPS 15 9520 RTX 3050 Ti | |
| Samsung Galaxy Book3 Ultra 16 | |
| LG Gram 17Z90Q-E.AD78G | |
| Lenovo ThinkBook 16p G3 ARH | |
| Asus VivoBook Pro 16X OLED N7600PC-L2026X | |
| Samsung Galaxy Book3 Ultra 16 (Leise) | |
| HWBOT x265 Benchmark v2.2 - 4k Preset | |
| Average of class Multimedia (5.26 - 36.1, n=56, last 2 years) | |
| Samsung Galaxy Book3 Ultra 16 (Hohe Leistung) | |
| Lenovo ThinkBook 16p G3 ARH | |
| Samsung Galaxy Book3 Ultra 16 | |
| Average Intel Core i7-13700H (6.72 - 21.2, n=29) | |
| Dell XPS 15 9520 RTX 3050 Ti | |
| Schenker Vision 16 Pro RTX 3070 Ti | |
| Acer Swift X SFX16-52G-77RX | |
| Samsung Galaxy Book3 Ultra 16 (Leise) | |
| LG Gram 17Z90Q-E.AD78G | |
| Asus VivoBook Pro 16X OLED N7600PC-L2026X | |
| LibreOffice - 20 Documents To PDF | |
| LG Gram 17Z90Q-E.AD78G | |
| Lenovo ThinkBook 16p G3 ARH | |
| Acer Swift X SFX16-52G-77RX | |
| Asus VivoBook Pro 16X OLED N7600PC-L2026X | |
| Samsung Galaxy Book3 Ultra 16 (Leise) | |
| Average of class Multimedia (23.9 - 146.7, n=57, last 2 years) | |
| Samsung Galaxy Book3 Ultra 16 | |
| Average Intel Core i7-13700H (31.3 - 62.4, n=29) | |
| Schenker Vision 16 Pro RTX 3070 Ti | |
| Dell XPS 15 9520 RTX 3050 Ti | |
| Samsung Galaxy Book3 Ultra 16 (Hohe Leistung) | |
| R Benchmark 2.5 - Overall mean | |
| Samsung Galaxy Book3 Ultra 16 (Leise) | |
| Asus VivoBook Pro 16X OLED N7600PC-L2026X | |
| LG Gram 17Z90Q-E.AD78G | |
| Lenovo ThinkBook 16p G3 ARH | |
| Samsung Galaxy Book3 Ultra 16 | |
| Samsung Galaxy Book3 Ultra 16 (Hohe Leistung) | |
| Acer Swift X SFX16-52G-77RX | |
| Average Intel Core i7-13700H (0.4308 - 0.607, n=29) | |
| Average of class Multimedia (0.3604 - 0.947, n=56, last 2 years) | |
| Schenker Vision 16 Pro RTX 3070 Ti | |
| Dell XPS 15 9520 RTX 3050 Ti | |
* ... smaller is better
AIDA64: FP32 Ray-Trace | FPU Julia | CPU SHA3 | CPU Queen | FPU SinJulia | FPU Mandel | CPU AES | CPU ZLib | FP64 Ray-Trace | CPU PhotoWorxx
| Performance rating | |
| Average of class Multimedia | |
| Lenovo ThinkBook 16p G3 ARH | |
| Samsung Galaxy Book3 Ultra 16 | |
| Average Intel Core i7-13700H | |
| Schenker Vision 16 Pro RTX 3070 Ti | |
| Dell XPS 15 9520 RTX 3050 Ti | |
| Acer Swift X SFX16-52G-77RX | |
| LG Gram 17Z90Q-E.AD78G | |
| Asus VivoBook Pro 16X OLED N7600PC-L2026X | |
| AIDA64 / FP32 Ray-Trace | |
| Average of class Multimedia (2214 - 50388, n=53, last 2 years) | |
| Lenovo ThinkBook 16p G3 ARH (v6.75.6100) | |
| Samsung Galaxy Book3 Ultra 16 (v6.75.6100) | |
| Average Intel Core i7-13700H (4986 - 18908, n=29) | |
| Schenker Vision 16 Pro RTX 3070 Ti (v6.75.6100) | |
| Acer Swift X SFX16-52G-77RX (v6.70.6000) | |
| Dell XPS 15 9520 RTX 3050 Ti (v6.50.5800) | |
| Asus VivoBook Pro 16X OLED N7600PC-L2026X (v6.75.6100) | |
| LG Gram 17Z90Q-E.AD78G (v6.50.5800) | |
| AIDA64 / FPU Julia | |
| Lenovo ThinkBook 16p G3 ARH (v6.75.6100) | |
| Average of class Multimedia (12867 - 201874, n=54, last 2 years) | |
| Average Intel Core i7-13700H (25360 - 92359, n=29) | |
| Samsung Galaxy Book3 Ultra 16 (v6.75.6100) | |
| Schenker Vision 16 Pro RTX 3070 Ti (v6.75.6100) | |
| Acer Swift X SFX16-52G-77RX (v6.70.6000) | |
| Dell XPS 15 9520 RTX 3050 Ti (v6.50.5800) | |
| Asus VivoBook Pro 16X OLED N7600PC-L2026X (v6.75.6100) | |
| LG Gram 17Z90Q-E.AD78G (v6.50.5800) | |
| AIDA64 / CPU SHA3 | |
| Average of class Multimedia (626 - 8623, n=54, last 2 years) | |
| Lenovo ThinkBook 16p G3 ARH (v6.75.6100) | |
| Samsung Galaxy Book3 Ultra 16 (v6.75.6100) | |
| Average Intel Core i7-13700H (1339 - 4224, n=29) | |
| Schenker Vision 16 Pro RTX 3070 Ti (v6.75.6100) | |
| Dell XPS 15 9520 RTX 3050 Ti (v6.50.5800) | |
| Acer Swift X SFX16-52G-77RX (v6.70.6000) | |
| Asus VivoBook Pro 16X OLED N7600PC-L2026X (v6.75.6100) | |
| LG Gram 17Z90Q-E.AD78G (v6.50.5800) | |
| AIDA64 / CPU Queen | |
| Lenovo ThinkBook 16p G3 ARH (v6.75.6100) | |
| Samsung Galaxy Book3 Ultra 16 (v6.75.6100) | |
| Dell XPS 15 9520 RTX 3050 Ti (v6.50.5800) | |
| Average Intel Core i7-13700H (59324 - 107159, n=29) | |
| Schenker Vision 16 Pro RTX 3070 Ti (v6.75.6100) | |
| Acer Swift X SFX16-52G-77RX (v6.70.6000) | |
| Average of class Multimedia (13483 - 181505, n=41, last 2 years) | |
| LG Gram 17Z90Q-E.AD78G (v6.50.5800) | |
| Asus VivoBook Pro 16X OLED N7600PC-L2026X (v6.75.6100) | |
| AIDA64 / FPU SinJulia | |
| Lenovo ThinkBook 16p G3 ARH (v6.75.6100) | |
| Samsung Galaxy Book3 Ultra 16 (v6.75.6100) | |
| Average Intel Core i7-13700H (4800 - 11050, n=29) | |
| Average of class Multimedia (886 - 28794, n=54, last 2 years) | |
| Dell XPS 15 9520 RTX 3050 Ti (v6.50.5800) | |
| Schenker Vision 16 Pro RTX 3070 Ti (v6.75.6100) | |
| Acer Swift X SFX16-52G-77RX (v6.70.6000) | |
| LG Gram 17Z90Q-E.AD78G (v6.50.5800) | |
| Asus VivoBook Pro 16X OLED N7600PC-L2026X (v6.75.6100) | |
| AIDA64 / FPU Mandel | |
| Lenovo ThinkBook 16p G3 ARH (v6.75.6100) | |
| Average of class Multimedia (6395 - 105740, n=53, last 2 years) | |
| Samsung Galaxy Book3 Ultra 16 (v6.75.6100) | |
| Average Intel Core i7-13700H (12321 - 45118, n=29) | |
| Schenker Vision 16 Pro RTX 3070 Ti (v6.75.6100) | |
| Acer Swift X SFX16-52G-77RX (v6.70.6000) | |
| Dell XPS 15 9520 RTX 3050 Ti (v6.50.5800) | |
| Asus VivoBook Pro 16X OLED N7600PC-L2026X (v6.75.6100) | |
| LG Gram 17Z90Q-E.AD78G (v6.50.5800) | |
| AIDA64 / CPU AES | |
| Dell XPS 15 9520 RTX 3050 Ti (v6.50.5800) | |
| Average Intel Core i7-13700H (28769 - 151254, n=29) | |
| Samsung Galaxy Book3 Ultra 16 (v6.75.6100) | |
| Average of class Multimedia (8171 - 126790, n=54, last 2 years) | |
| Schenker Vision 16 Pro RTX 3070 Ti (v6.75.6100) | |
| Asus VivoBook Pro 16X OLED N7600PC-L2026X (v6.75.6100) | |
| Lenovo ThinkBook 16p G3 ARH (v6.75.6100) | |
| Acer Swift X SFX16-52G-77RX (v6.70.6000) | |
| LG Gram 17Z90Q-E.AD78G (v6.50.5800) | |
| AIDA64 / CPU ZLib | |
| Samsung Galaxy Book3 Ultra 16 (v6.75.6100) | |
| Average of class Multimedia (143.8 - 2022, n=54, last 2 years) | |
| Average Intel Core i7-13700H (389 - 1215, n=29) | |
| Lenovo ThinkBook 16p G3 ARH (v6.75.6100) | |
| Schenker Vision 16 Pro RTX 3070 Ti (v6.75.6100) | |
| Dell XPS 15 9520 RTX 3050 Ti (v6.50.5800) | |
| Acer Swift X SFX16-52G-77RX (v6.70.6000) | |
| LG Gram 17Z90Q-E.AD78G (v6.50.5800) | |
| Asus VivoBook Pro 16X OLED N7600PC-L2026X (v6.75.6100) | |
| AIDA64 / FP64 Ray-Trace | |
| Average of class Multimedia (1014 - 26875, n=54, last 2 years) | |
| Lenovo ThinkBook 16p G3 ARH (v6.75.6100) | |
| Samsung Galaxy Book3 Ultra 16 (v6.75.6100) | |
| Average Intel Core i7-13700H (2540 - 10135, n=29) | |
| Schenker Vision 16 Pro RTX 3070 Ti (v6.75.6100) | |
| Acer Swift X SFX16-52G-77RX (v6.70.6000) | |
| Dell XPS 15 9520 RTX 3050 Ti (v6.50.5800) | |
| Asus VivoBook Pro 16X OLED N7600PC-L2026X (v6.75.6100) | |
| LG Gram 17Z90Q-E.AD78G (v6.50.5800) | |
| AIDA64 / CPU PhotoWorxx | |
| Average of class Multimedia (8187 - 88154, n=54, last 2 years) | |
| Samsung Galaxy Book3 Ultra 16 (v6.75.6100) | |
| Acer Swift X SFX16-52G-77RX (v6.70.6000) | |
| Schenker Vision 16 Pro RTX 3070 Ti (v6.75.6100) | |
| Average Intel Core i7-13700H (12872 - 52727, n=29) | |
| LG Gram 17Z90Q-E.AD78G (v6.50.5800) | |
| Dell XPS 15 9520 RTX 3050 Ti (v6.50.5800) | |
| Lenovo ThinkBook 16p G3 ARH (v6.75.6100) | |
| Asus VivoBook Pro 16X OLED N7600PC-L2026X (v6.75.6100) | |
系统性能
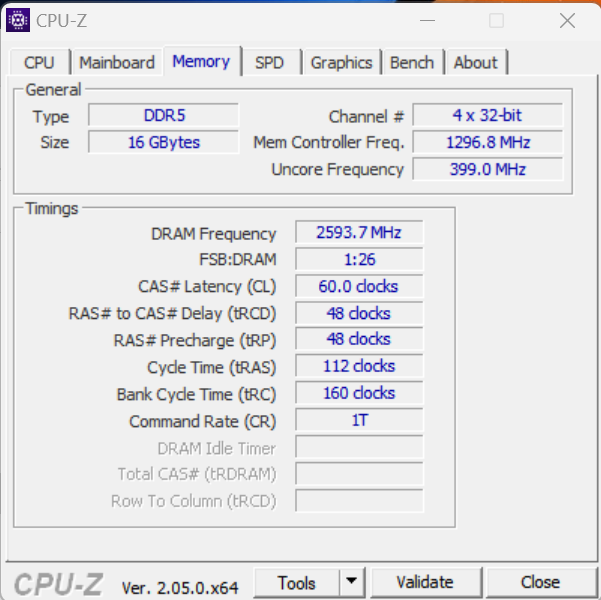
平稳运行的系统并不是为最大性能而设计的。这里的目的是在紧凑性、移动性、能耗和性能之间做出妥协。尽管如此,这台笔记本电脑可以处理要求很高的应用程序,如渲染和游戏,这一点已被PCMark的良好结果所证实。对于LPDDR5-5200内存来说,内存的传输率处于正常水平。
CrossMark: Overall | Productivity | Creativity | Responsiveness
| PCMark 10 / Score | |
| Average of class Multimedia (4325 - 10386, n=52, last 2 years) | |
| Average Intel Core i7-13700H, NVIDIA GeForce RTX 4050 Laptop GPU (6822 - 7556, n=7) | |
| Dell XPS 15 9520 RTX 3050 Ti | |
| Lenovo ThinkBook 16p G3 ARH | |
| Samsung Galaxy Book3 Ultra 16 | |
| LG Gram 17Z90Q-E.AD78G | |
| Acer Swift X SFX16-52G-77RX | |
| Asus VivoBook Pro 16X OLED N7600PC-L2026X | |
| PCMark 10 / Essentials | |
| Dell XPS 15 9520 RTX 3050 Ti | |
| Average Intel Core i7-13700H, NVIDIA GeForce RTX 4050 Laptop GPU (10283 - 11549, n=7) | |
| Acer Swift X SFX16-52G-77RX | |
| Samsung Galaxy Book3 Ultra 16 | |
| Average of class Multimedia (8025 - 11664, n=51, last 2 years) | |
| Lenovo ThinkBook 16p G3 ARH | |
| LG Gram 17Z90Q-E.AD78G | |
| Asus VivoBook Pro 16X OLED N7600PC-L2026X | |
| PCMark 10 / Productivity | |
| Average of class Multimedia (7323 - 18233, n=51, last 2 years) | |
| Dell XPS 15 9520 RTX 3050 Ti | |
| LG Gram 17Z90Q-E.AD78G | |
| Average Intel Core i7-13700H, NVIDIA GeForce RTX 4050 Laptop GPU (8368 - 9836, n=7) | |
| Lenovo ThinkBook 16p G3 ARH | |
| Samsung Galaxy Book3 Ultra 16 | |
| Asus VivoBook Pro 16X OLED N7600PC-L2026X | |
| Acer Swift X SFX16-52G-77RX | |
| PCMark 10 / Digital Content Creation | |
| Average of class Multimedia (3651 - 16240, n=51, last 2 years) | |
| Average Intel Core i7-13700H, NVIDIA GeForce RTX 4050 Laptop GPU (9527 - 10643, n=7) | |
| Samsung Galaxy Book3 Ultra 16 | |
| Lenovo ThinkBook 16p G3 ARH | |
| Dell XPS 15 9520 RTX 3050 Ti | |
| LG Gram 17Z90Q-E.AD78G | |
| Acer Swift X SFX16-52G-77RX | |
| Asus VivoBook Pro 16X OLED N7600PC-L2026X | |
| CrossMark / Overall | |
| Average of class Multimedia (866 - 2728, n=60, last 2 years) | |
| Dell XPS 15 9520 RTX 3050 Ti | |
| Average Intel Core i7-13700H, NVIDIA GeForce RTX 4050 Laptop GPU (1205 - 1937, n=9) | |
| Acer Swift X SFX16-52G-77RX | |
| Schenker Vision 16 Pro RTX 3070 Ti | |
| Samsung Galaxy Book3 Ultra 16 | |
| Lenovo ThinkBook 16p G3 ARH | |
| LG Gram 17Z90Q-E.AD78G | |
| Asus VivoBook Pro 16X OLED N7600PC-L2026X | |
| CrossMark / Productivity | |
| Dell XPS 15 9520 RTX 3050 Ti | |
| Average of class Multimedia (931 - 2489, n=60, last 2 years) | |
| Acer Swift X SFX16-52G-77RX | |
| Average Intel Core i7-13700H, NVIDIA GeForce RTX 4050 Laptop GPU (1158 - 1877, n=9) | |
| Schenker Vision 16 Pro RTX 3070 Ti | |
| Lenovo ThinkBook 16p G3 ARH | |
| Samsung Galaxy Book3 Ultra 16 | |
| LG Gram 17Z90Q-E.AD78G | |
| Asus VivoBook Pro 16X OLED N7600PC-L2026X | |
| CrossMark / Creativity | |
| Average of class Multimedia (907 - 3465, n=60, last 2 years) | |
| Dell XPS 15 9520 RTX 3050 Ti | |
| Average Intel Core i7-13700H, NVIDIA GeForce RTX 4050 Laptop GPU (1293 - 2044, n=9) | |
| Schenker Vision 16 Pro RTX 3070 Ti | |
| Acer Swift X SFX16-52G-77RX | |
| Samsung Galaxy Book3 Ultra 16 | |
| LG Gram 17Z90Q-E.AD78G | |
| Lenovo ThinkBook 16p G3 ARH | |
| Asus VivoBook Pro 16X OLED N7600PC-L2026X | |
| CrossMark / Responsiveness | |
| Dell XPS 15 9520 RTX 3050 Ti | |
| Acer Swift X SFX16-52G-77RX | |
| Average Intel Core i7-13700H, NVIDIA GeForce RTX 4050 Laptop GPU (1097 - 1929, n=9) | |
| Average of class Multimedia (605 - 2024, n=60, last 2 years) | |
| Samsung Galaxy Book3 Ultra 16 | |
| Schenker Vision 16 Pro RTX 3070 Ti | |
| Lenovo ThinkBook 16p G3 ARH | |
| LG Gram 17Z90Q-E.AD78G | |
| Asus VivoBook Pro 16X OLED N7600PC-L2026X | |
| PCMark 8 Home Score Accelerated v2 | 4564 points | |
| PCMark 8 Work Score Accelerated v2 | 5090 points | |
| PCMark 10 Score | 6822 points | |
Help | ||
| AIDA64 / Memory Copy | |
| Average of class Multimedia (11299 - 132135, n=54, last 2 years) | |
| Samsung Galaxy Book3 Ultra 16 | |
| LG Gram 17Z90Q-E.AD78G | |
| Acer Swift X SFX16-52G-77RX | |
| Schenker Vision 16 Pro RTX 3070 Ti | |
| Average Intel Core i7-13700H (24334 - 78081, n=29) | |
| Dell XPS 15 9520 RTX 3050 Ti | |
| Lenovo ThinkBook 16p G3 ARH | |
| Asus VivoBook Pro 16X OLED N7600PC-L2026X | |
| AIDA64 / Memory Read | |
| Average of class Multimedia (11624 - 174586, n=54, last 2 years) | |
| LG Gram 17Z90Q-E.AD78G | |
| Samsung Galaxy Book3 Ultra 16 | |
| Acer Swift X SFX16-52G-77RX | |
| Schenker Vision 16 Pro RTX 3070 Ti | |
| Average Intel Core i7-13700H (23681 - 79656, n=29) | |
| Dell XPS 15 9520 RTX 3050 Ti | |
| Lenovo ThinkBook 16p G3 ARH | |
| Asus VivoBook Pro 16X OLED N7600PC-L2026X | |
| AIDA64 / Memory Write | |
| Samsung Galaxy Book3 Ultra 16 | |
| Average of class Multimedia (11755 - 134998, n=54, last 2 years) | |
| Average Intel Core i7-13700H (22986 - 99898, n=29) | |
| Schenker Vision 16 Pro RTX 3070 Ti | |
| LG Gram 17Z90Q-E.AD78G | |
| Acer Swift X SFX16-52G-77RX | |
| Dell XPS 15 9520 RTX 3050 Ti | |
| Lenovo ThinkBook 16p G3 ARH | |
| Asus VivoBook Pro 16X OLED N7600PC-L2026X | |
| AIDA64 / Memory Latency | |
| Average of class Multimedia (7 - 535, n=53, last 2 years) | |
| Lenovo ThinkBook 16p G3 ARH | |
| Acer Swift X SFX16-52G-77RX | |
| LG Gram 17Z90Q-E.AD78G | |
| Dell XPS 15 9520 RTX 3050 Ti | |
| Samsung Galaxy Book3 Ultra 16 | |
| Average Intel Core i7-13700H (82.4 - 136.8, n=29) | |
| Schenker Vision 16 Pro RTX 3070 Ti | |
| Asus VivoBook Pro 16X OLED N7600PC-L2026X | |
* ... smaller is better
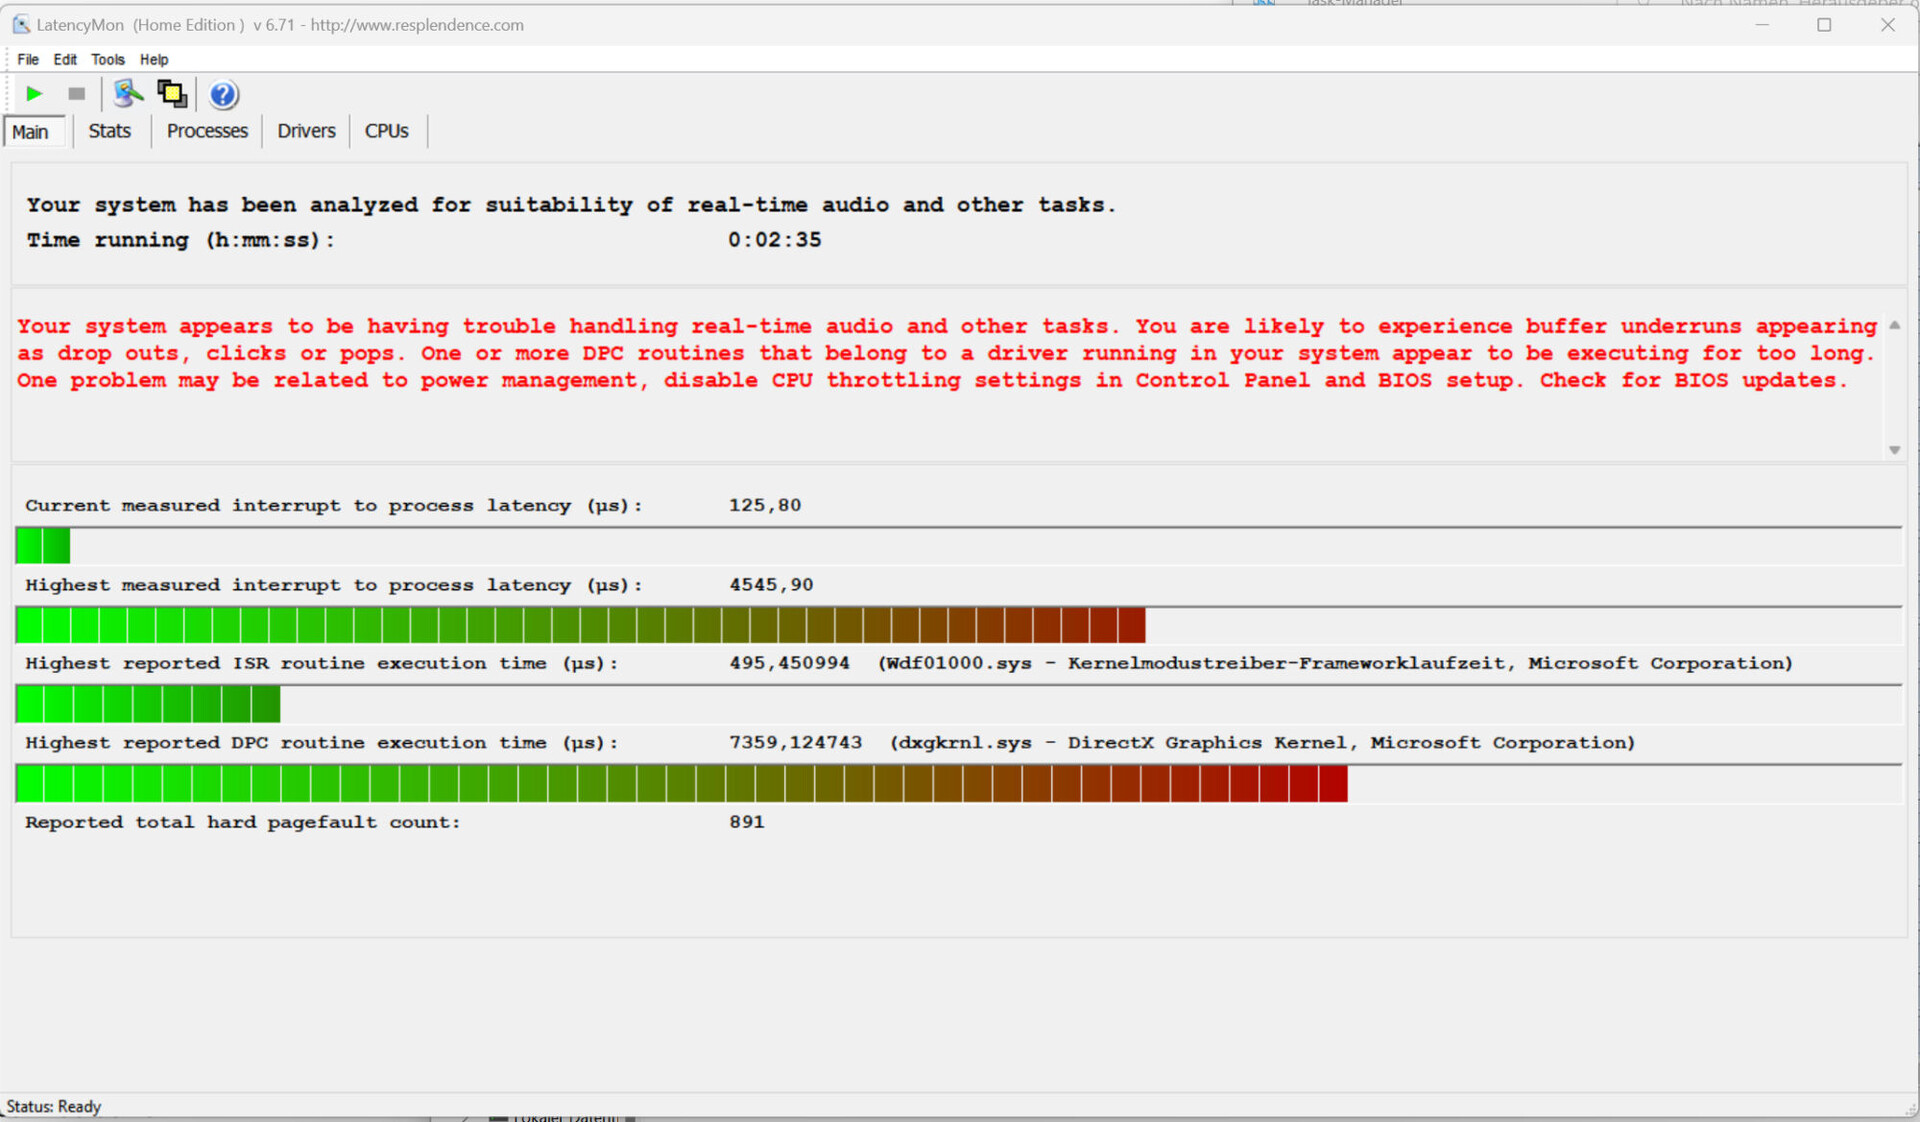
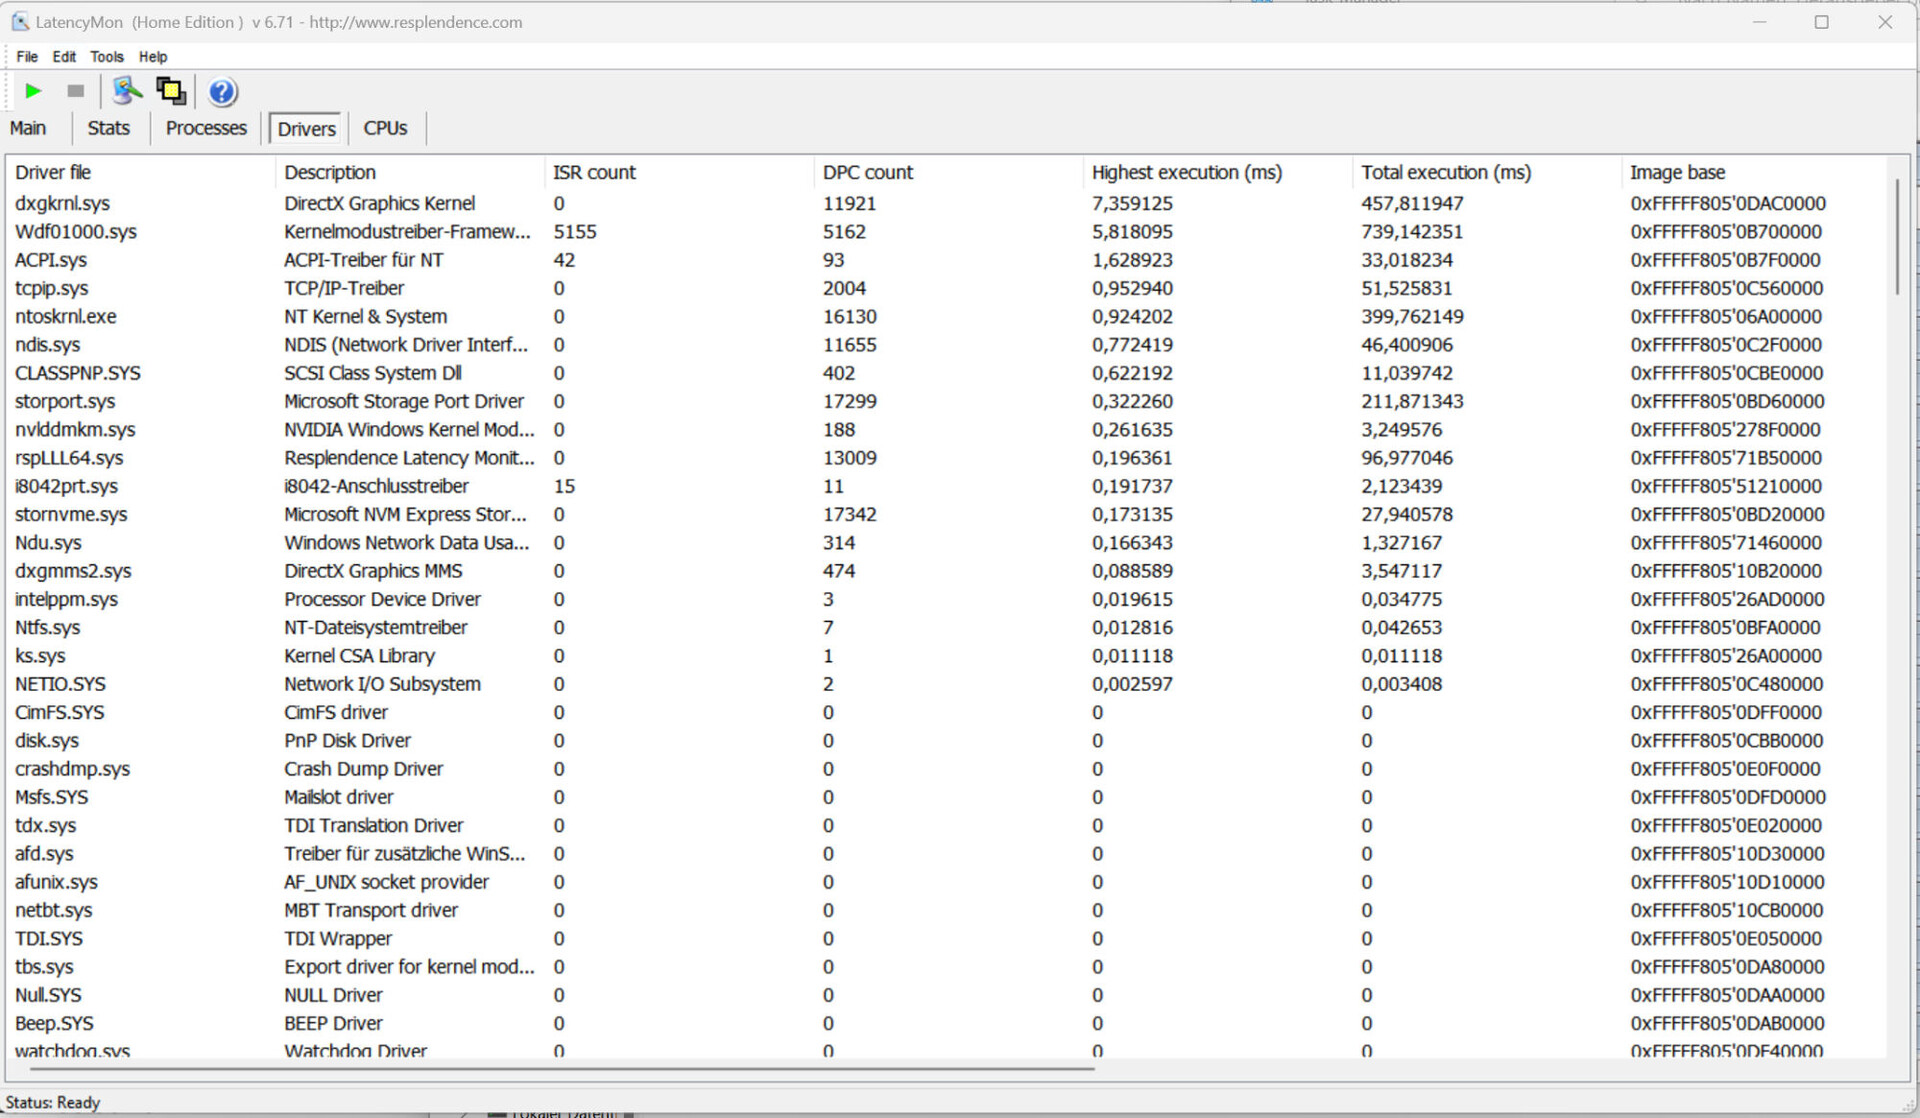
DPC延时
标准化的延迟监测测试(网络冲浪、4k视频播放、Prime95高负荷)发现了异常情况,因此该系统似乎不适合实时视频和音频编辑。未来的软件更新可能会导致改善,甚至恶化。
| DPC Latencies / LatencyMon - interrupt to process latency (max), Web, Youtube, Prime95 | |
| LG Gram 17Z90Q-E.AD78G | |
| Samsung Galaxy Book3 Ultra 16 | |
| Lenovo ThinkBook 16p G3 ARH | |
| Dell XPS 15 9520 RTX 3050 Ti | |
| Acer Swift X SFX16-52G-77RX | |
| Schenker Vision 16 Pro RTX 3070 Ti | |
| Asus VivoBook Pro 16X OLED N7600PC-L2026X | |
* ... smaller is better
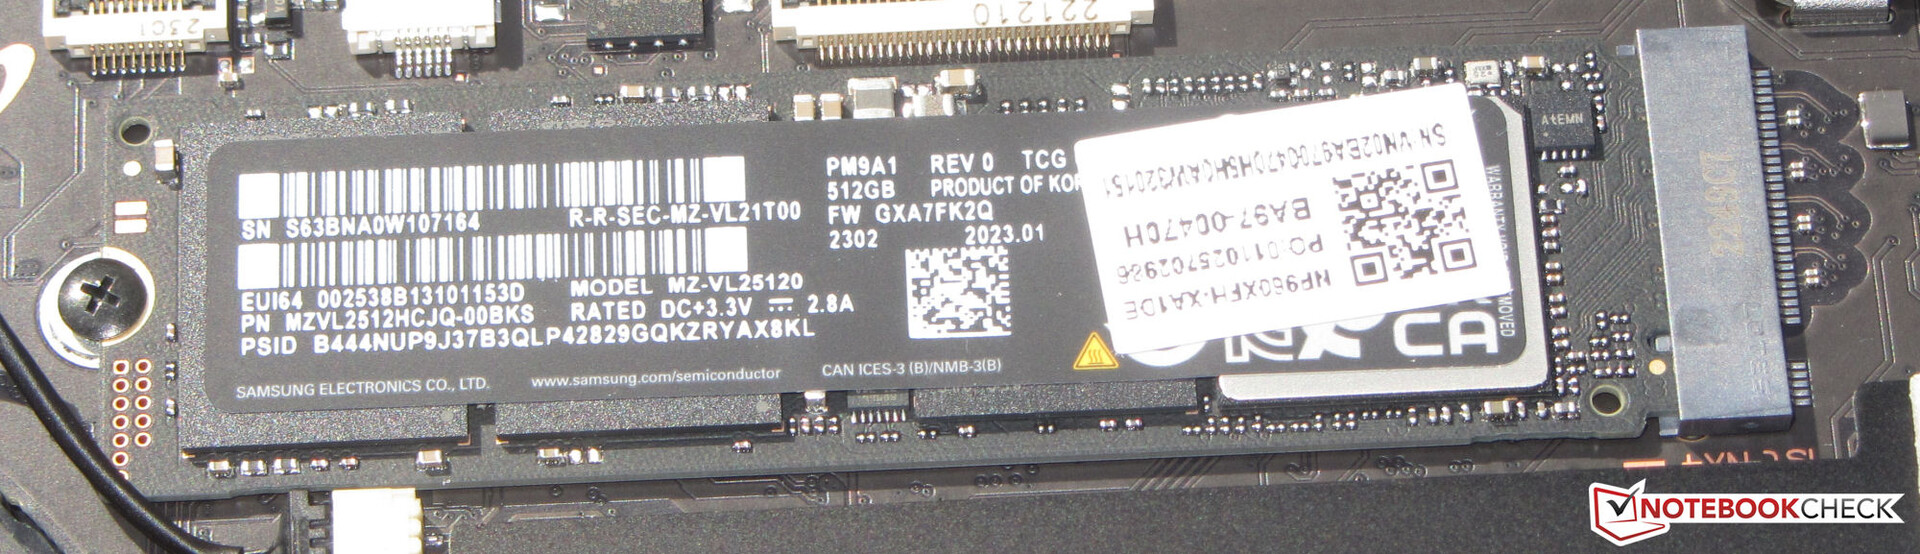
存储设备
三星在存储空间方面很吝啬,因为我们测试设备的内置PCIe 4 SSD(M.2 2280)只有512GB--对于2400美元的笔记本电脑来说太少了。至少它能提供出色的数据速率。可以安装第二个固态硬盘。

* ... smaller is better
Sustained Read Performance: DiskSpd Read Loop, Queue Depth 8
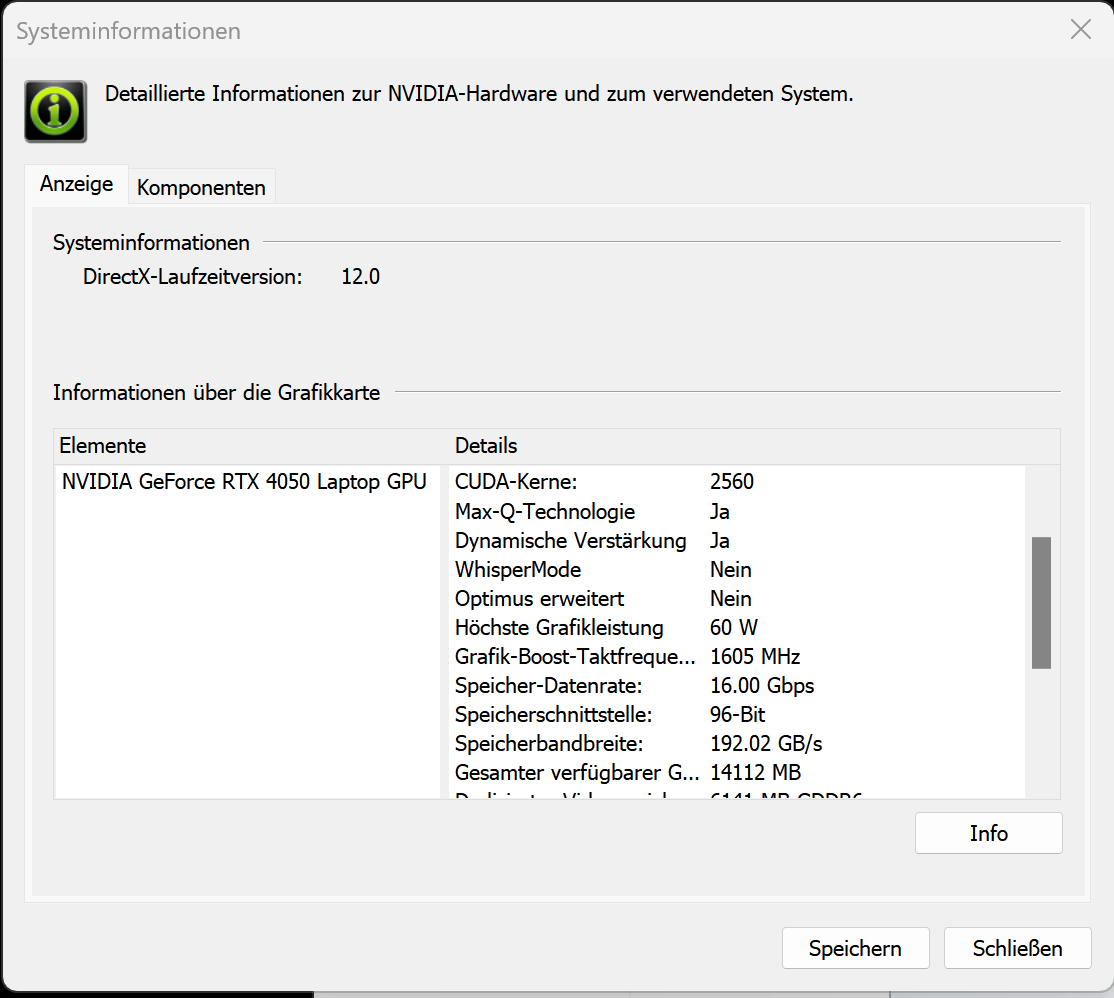
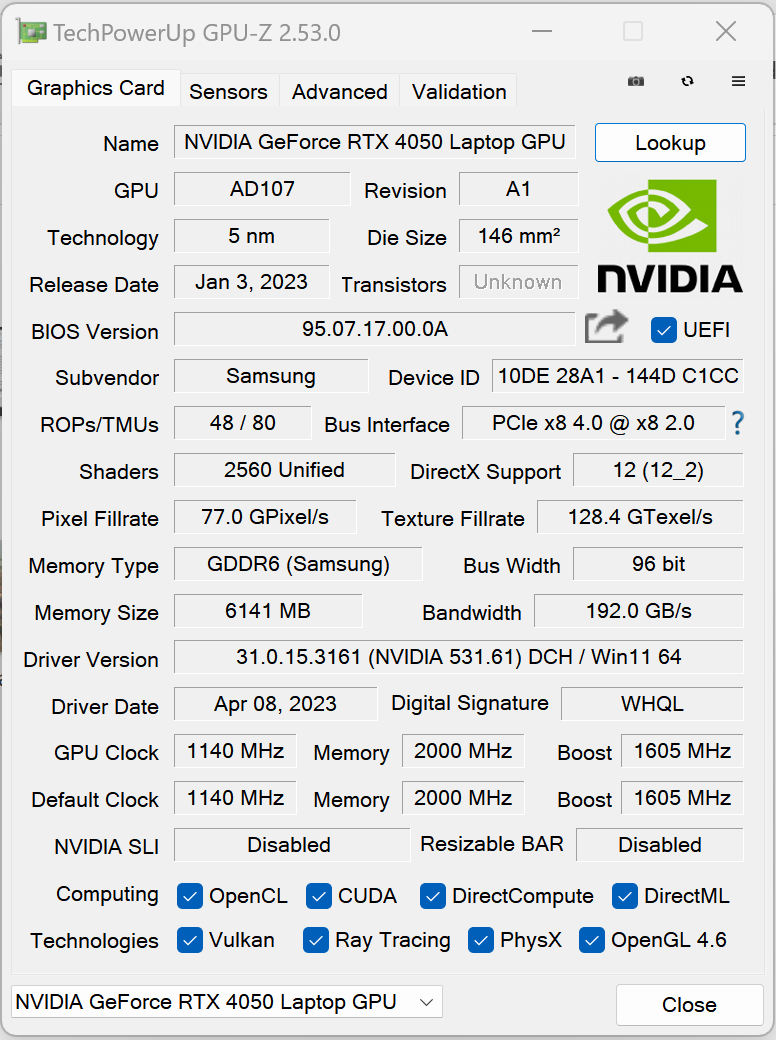
图形卡
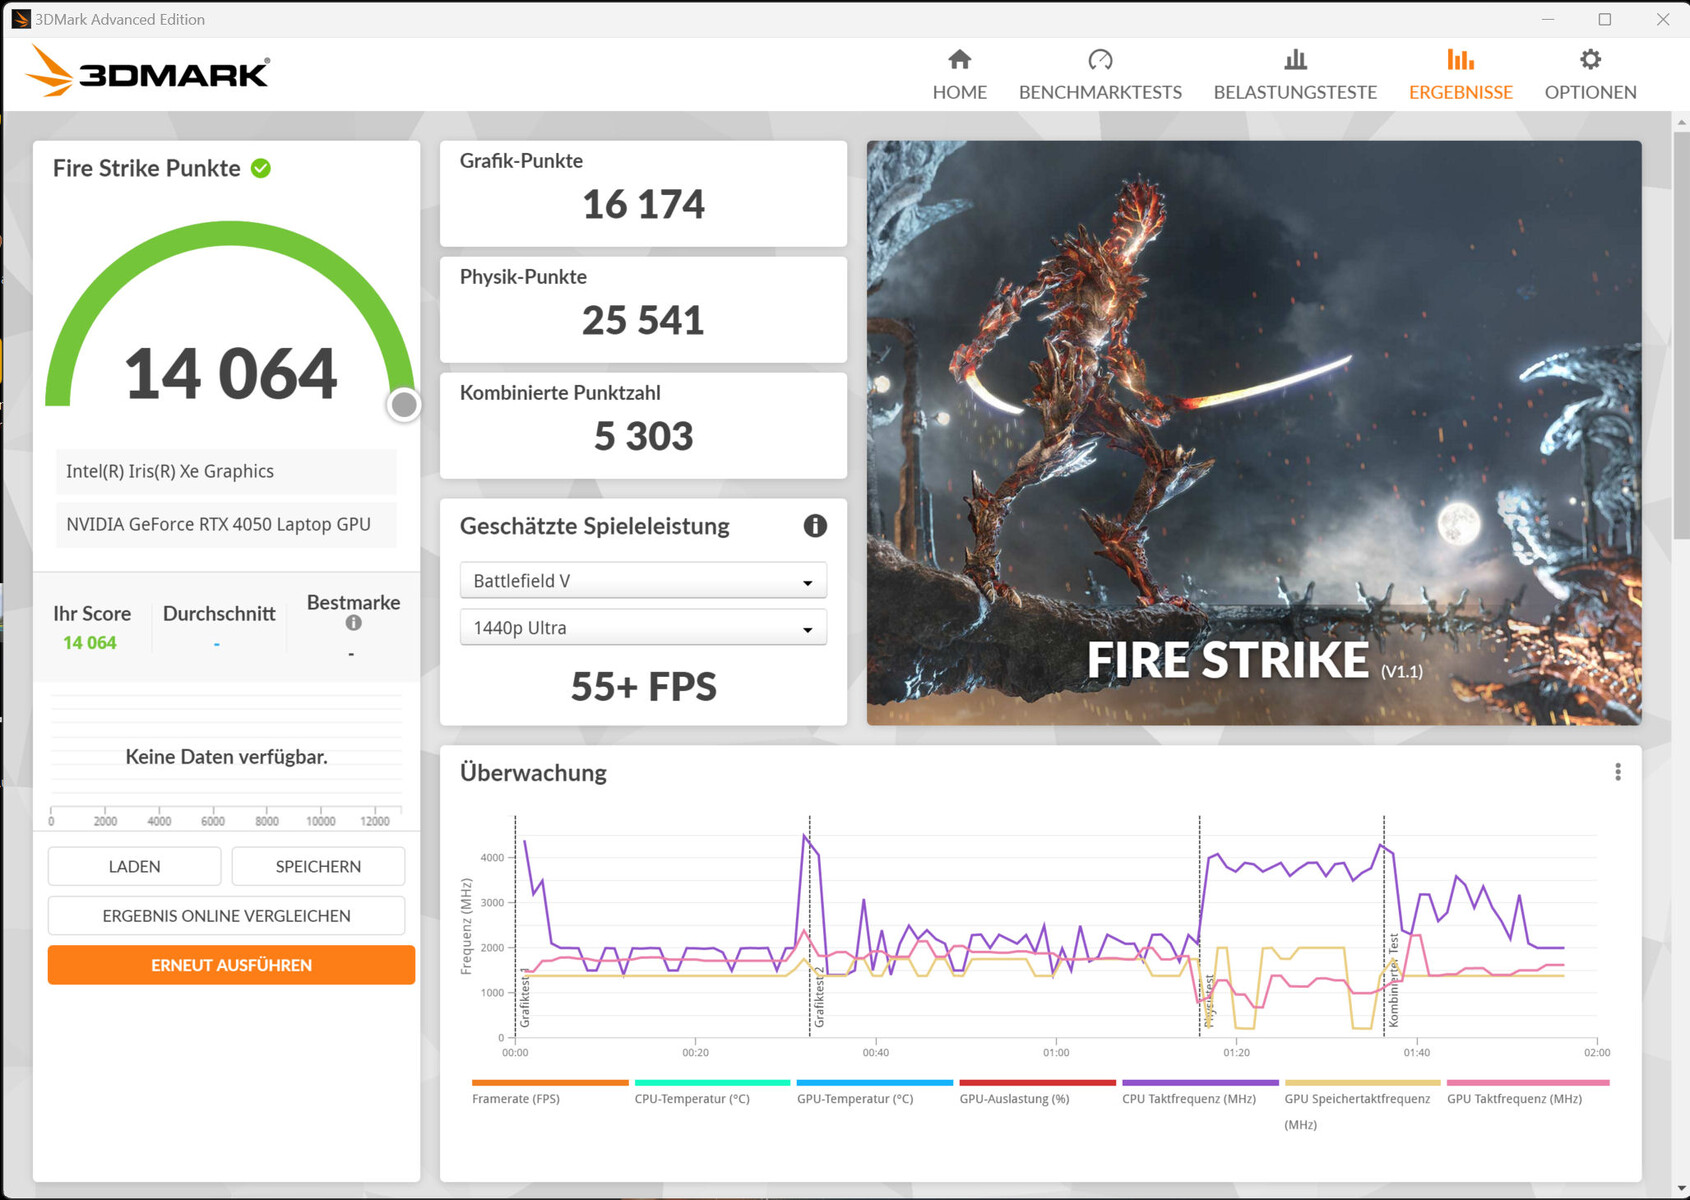
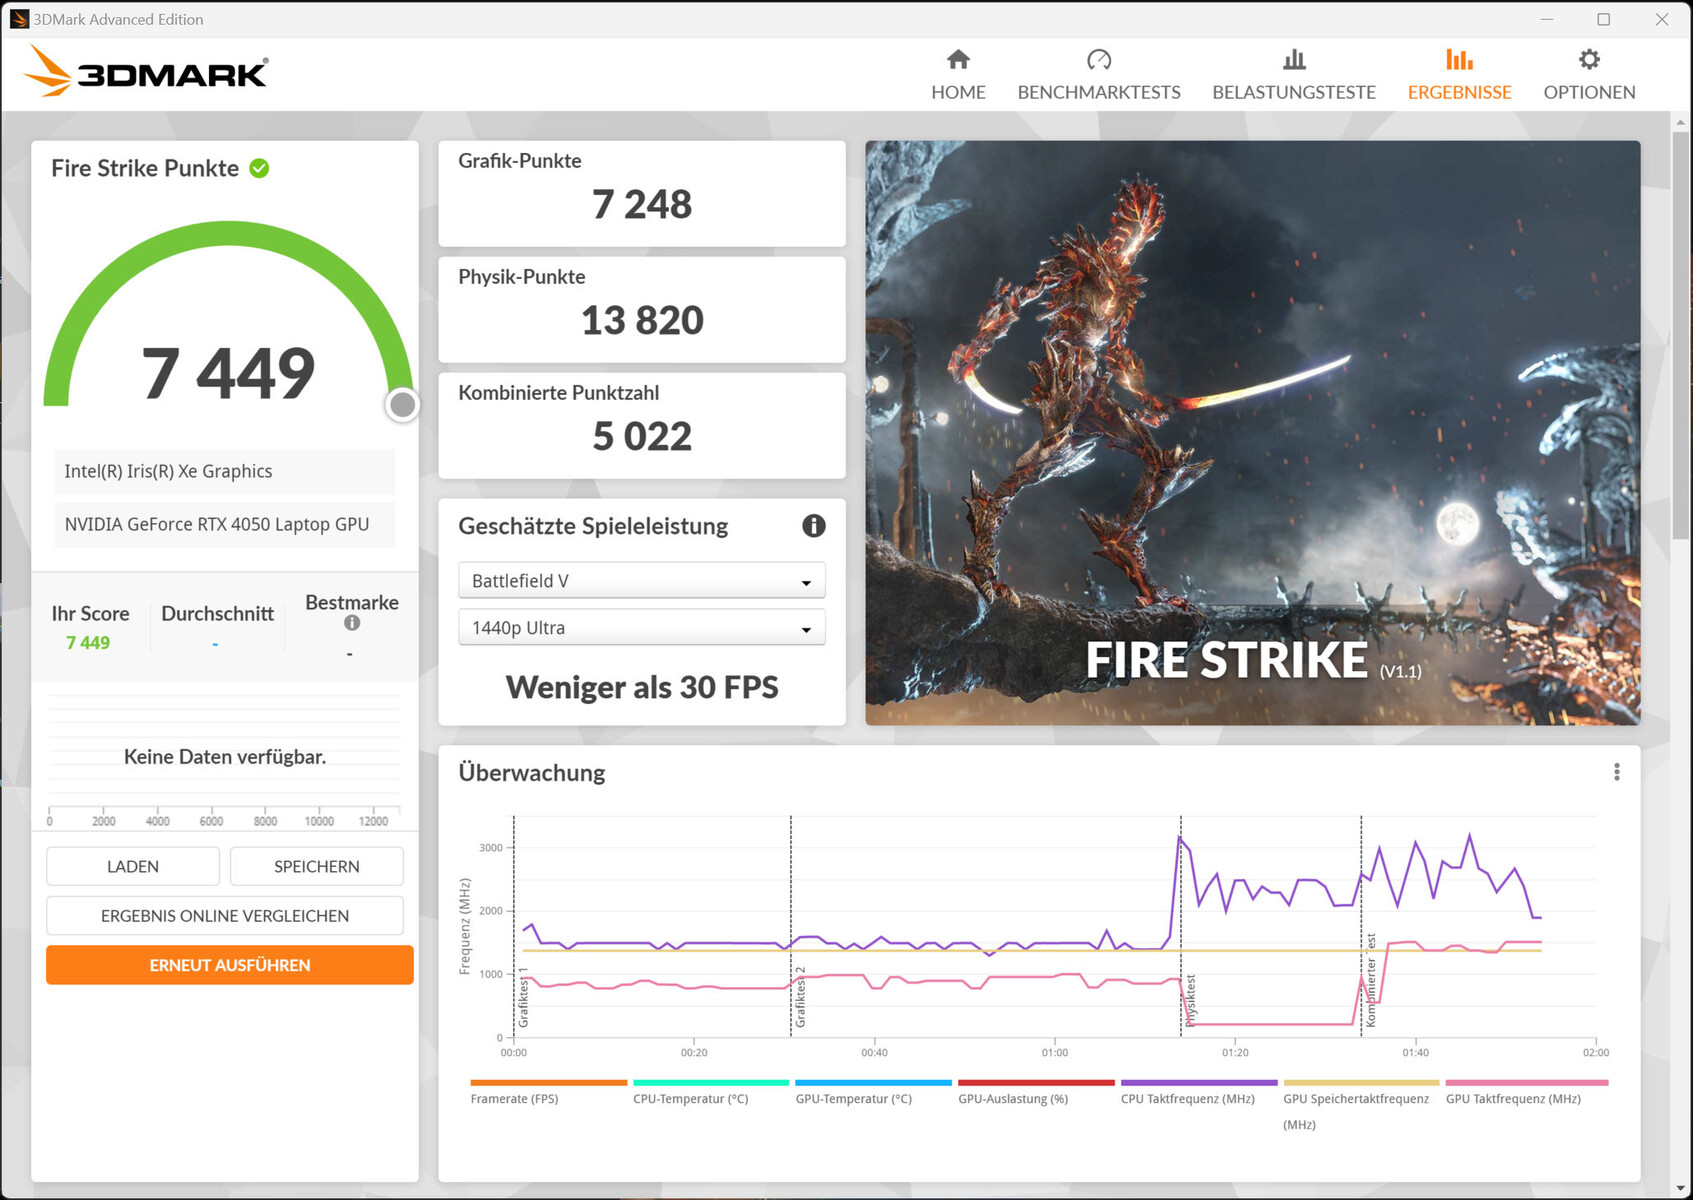
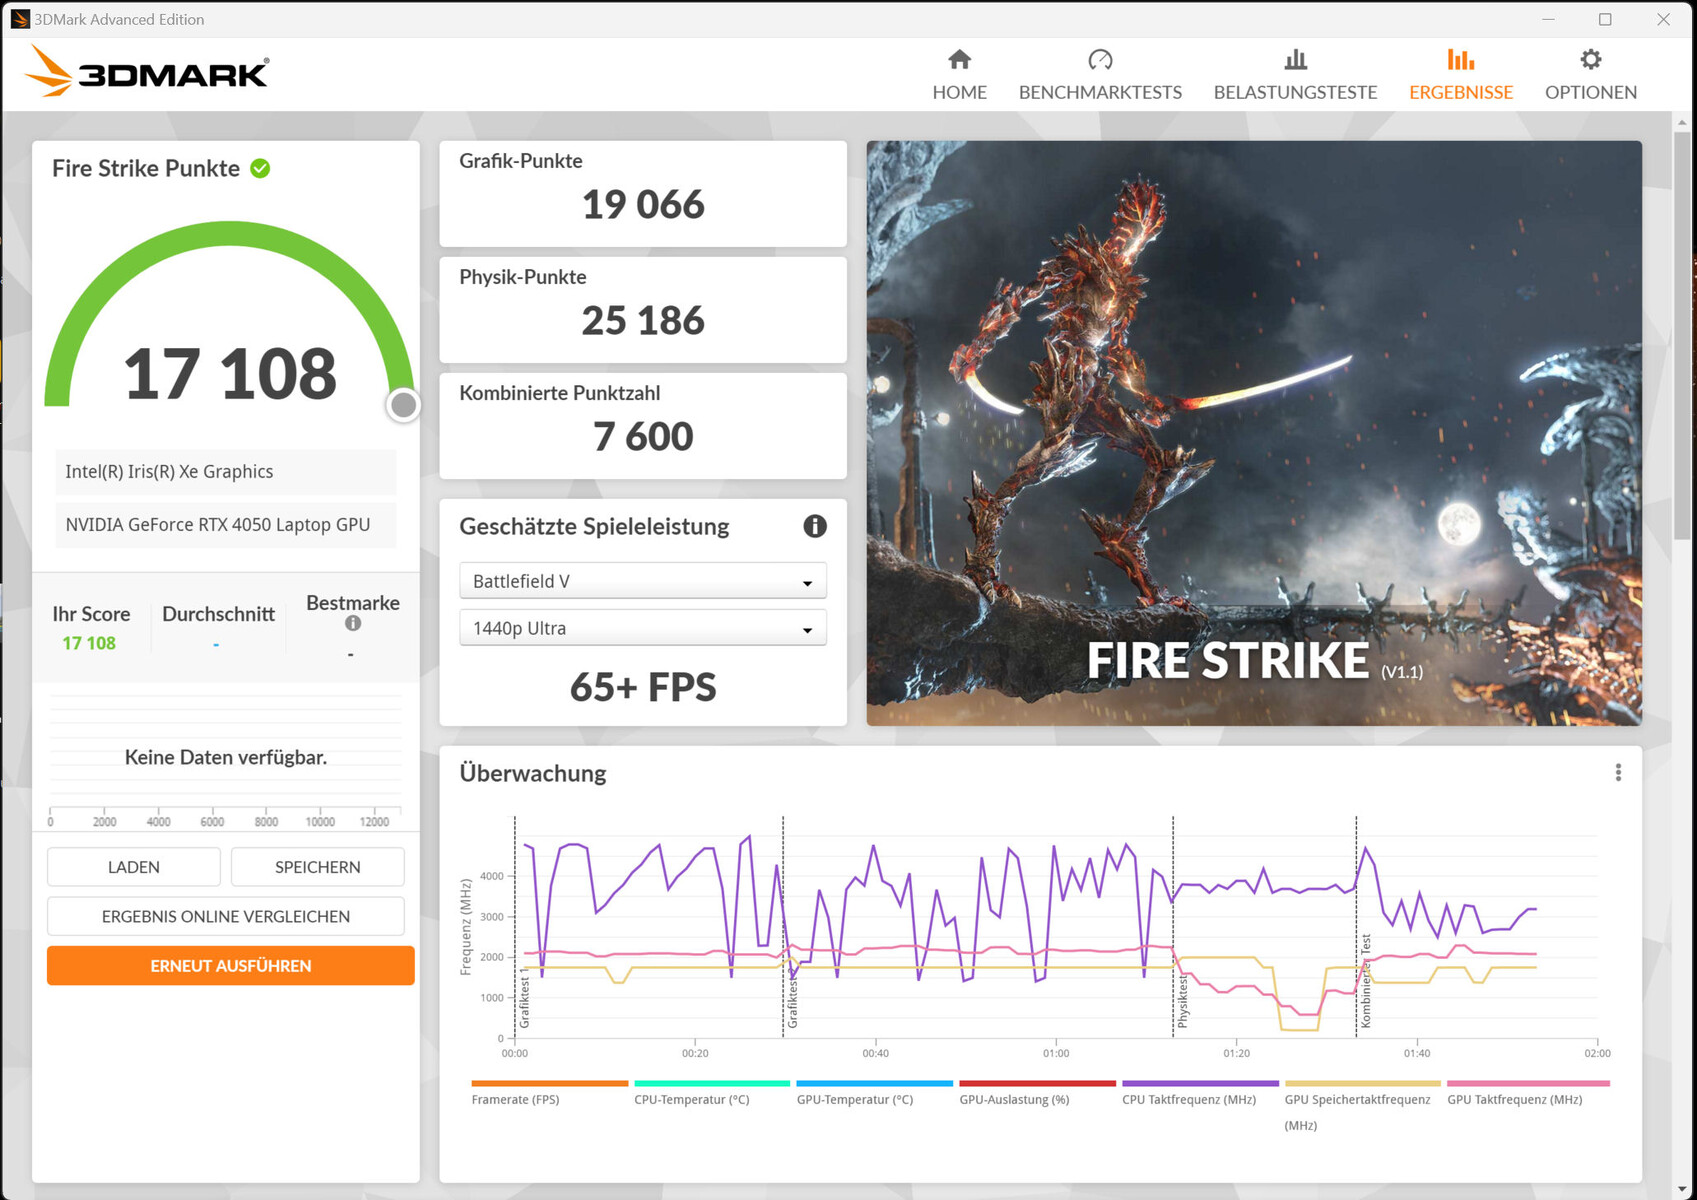
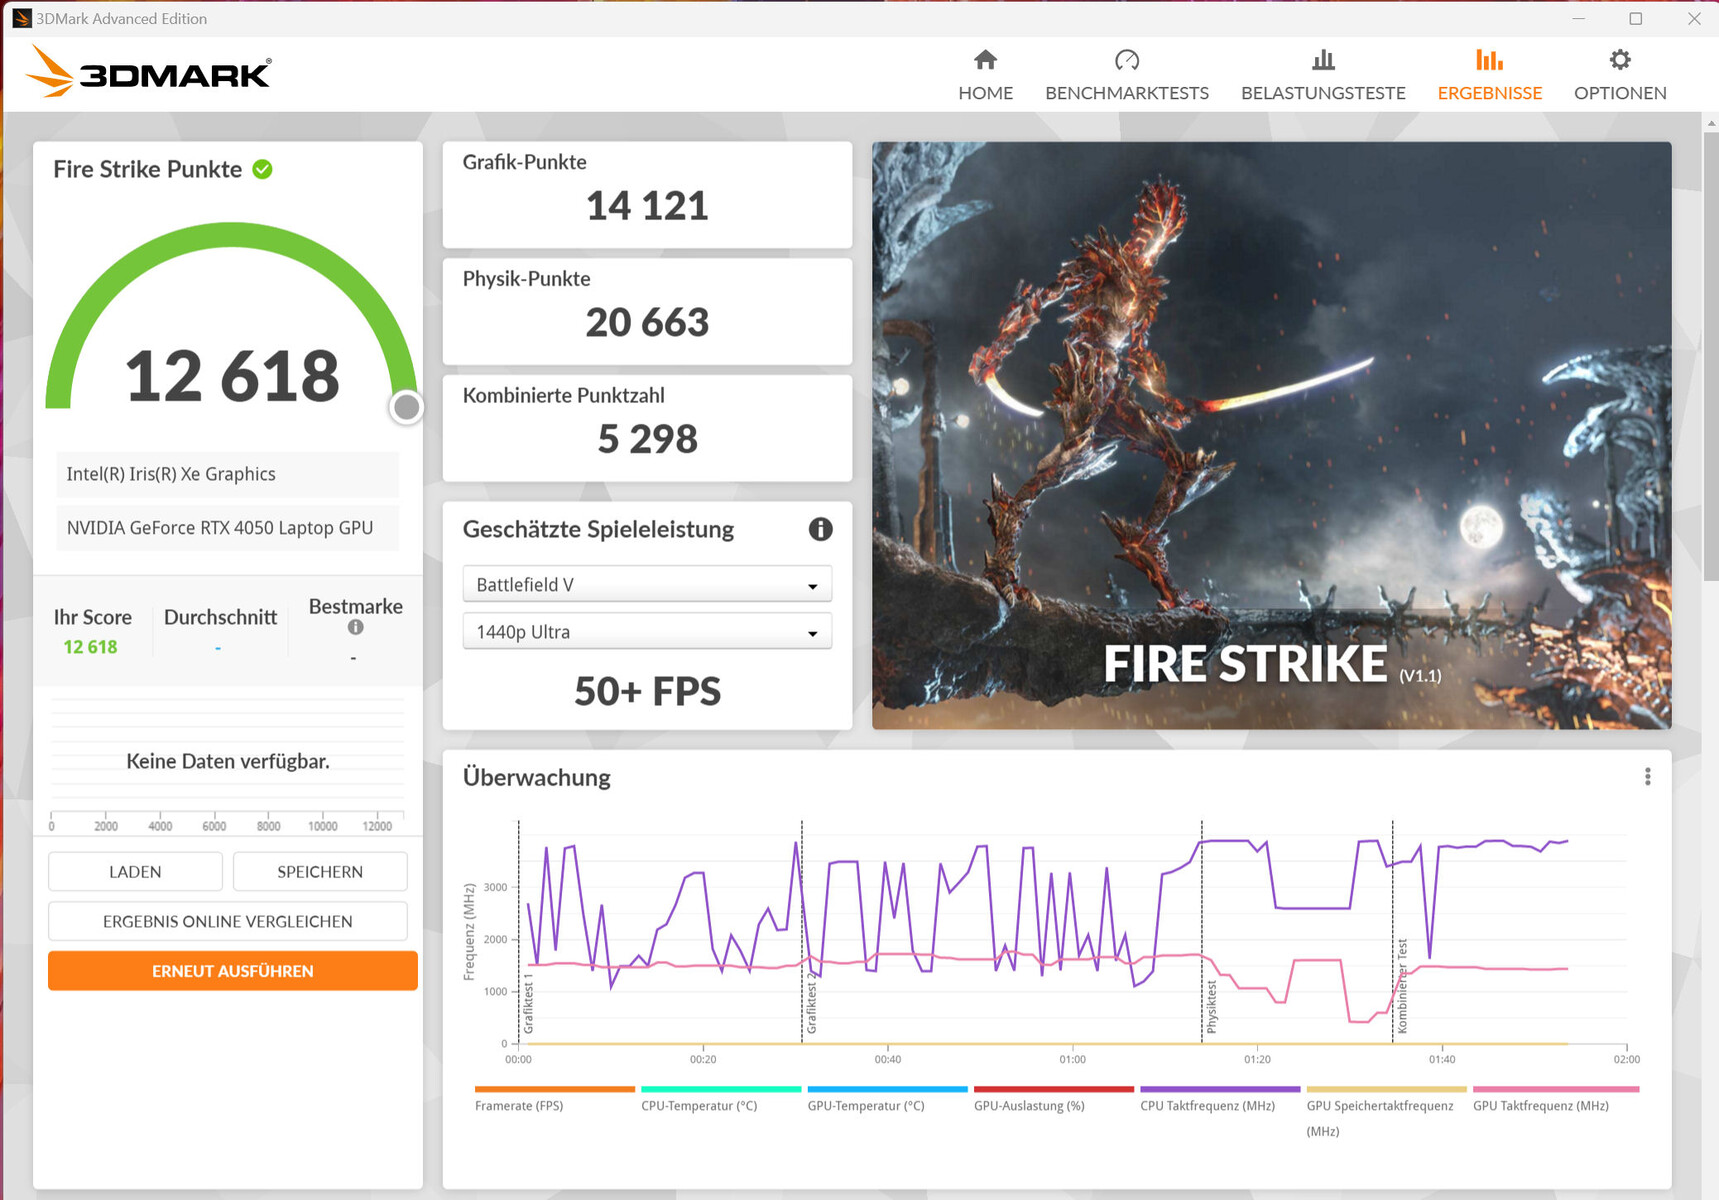
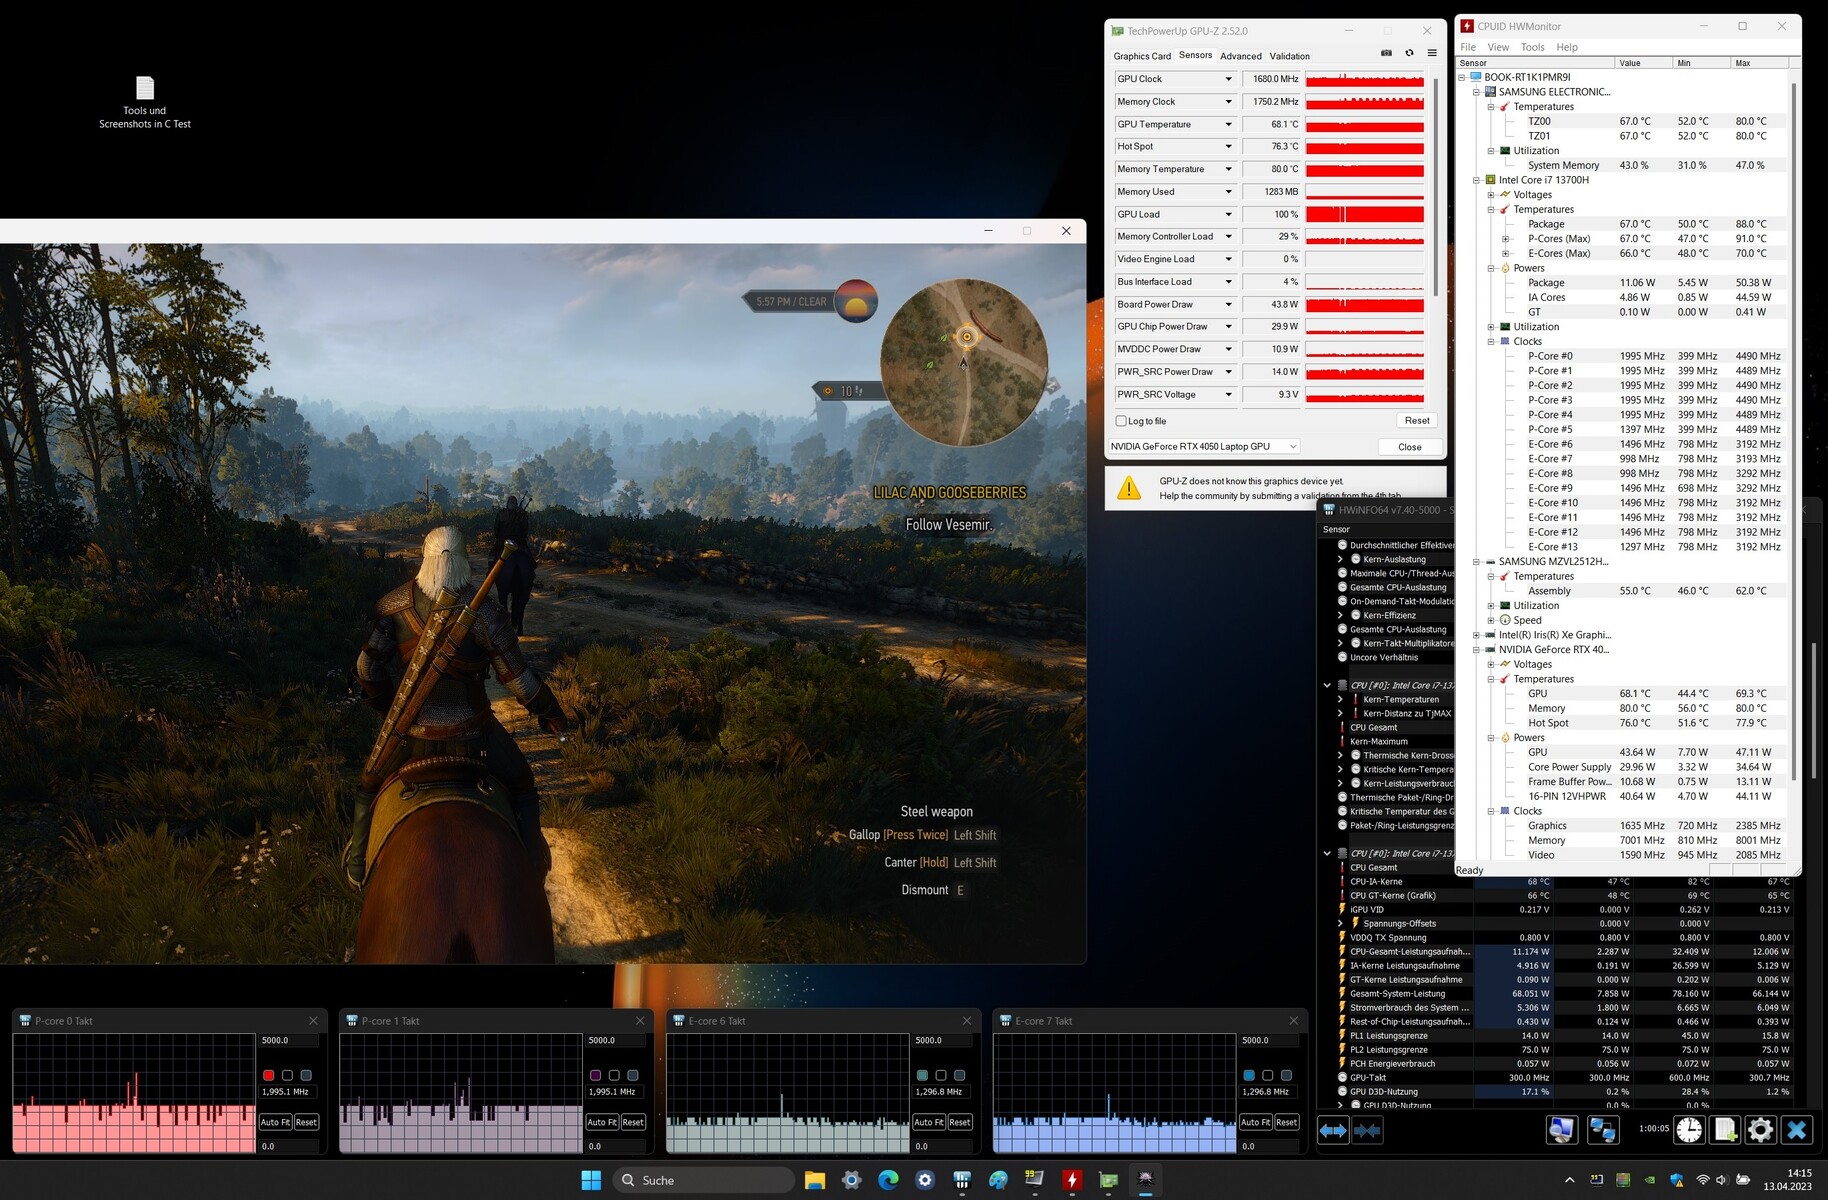
的 GeForce RTX 4050笔记本电脑提供2560个着色器,96位宽总线和快速GDDR6内存(6144MB)。三星授予它60瓦的TGP(35瓦+25瓦的动态)--一个可能的低端值。根据Witcher 3 测试,TGP得到了充分的利用--但只有在 "高性能 "模式下才会被激活。该笔记本不提供dGPU模式。
基准测试结果取决于所选择的性能配置文件,但总是低于RTX 4050的平均值。基本上,RTX 4050在低TGP的情况下相当有效地工作,每瓦特实现更多的分数或更高的帧率,比微星Katana 15的RTX 4050要高。 微星Katana 15(TGP: 105瓦)。
| 3DMark Performance rating - Percent | |
| Schenker Vision 16 Pro RTX 3070 Ti -1! | |
| MSI Katana 15 B12VEK | |
| Average NVIDIA GeForce RTX 4050 Laptop GPU | |
| Lenovo ThinkBook 16p G3 ARH | |
| Samsung Galaxy Book3 Ultra 16 | |
| Samsung Galaxy Book3 Ultra 16 | |
| Average of class Multimedia | |
| Samsung Galaxy Book3 Ultra 16 | |
| Dell XPS 15 9520 RTX 3050 Ti | |
| Asus VivoBook Pro 16X OLED N7600PC-L2026X | |
| Acer Swift X SFX16-52G-77RX | |
| LG Gram 17Z90Q-E.AD78G | |
| 3DMark 11 - 1280x720 Performance GPU | |
| Schenker Vision 16 Pro RTX 3070 Ti | |
| MSI Katana 15 B12VEK | |
| Average NVIDIA GeForce RTX 4050 Laptop GPU (13339 - 32642, n=41) | |
| Samsung Galaxy Book3 Ultra 16 (Hohe Leistung) | |
| Lenovo ThinkBook 16p G3 ARH | |
| Samsung Galaxy Book3 Ultra 16 | |
| Average of class Multimedia (3749 - 60002, n=55, last 2 years) | |
| Samsung Galaxy Book3 Ultra 16 (Leise) | |
| Asus VivoBook Pro 16X OLED N7600PC-L2026X | |
| Dell XPS 15 9520 RTX 3050 Ti | |
| Acer Swift X SFX16-52G-77RX | |
| LG Gram 17Z90Q-E.AD78G | |
| 3DMark 06 Standard Score | 45618 points | |
| 3DMark 11 Performance | 18217 points | |
| 3DMark Cloud Gate Standard Score | 41061 points | |
| 3DMark Fire Strike Score | 14064 points | |
| 3DMark Time Spy Score | 5784 points | |
Help | ||
| Blender | |
| v3.3 Classroom OPTIX/RTX | |
| LG Gram 17Z90Q-E.AD78G (3.3.2) | |
| Asus VivoBook Pro 16X OLED N7600PC-L2026X (3.3.0) | |
| Samsung Galaxy Book3 Ultra 16 (3.3.3, Leise) | |
| Average of class Multimedia (12 - 105, n=22, last 2 years) | |
| Lenovo ThinkBook 16p G3 ARH (3.3.0) | |
| Samsung Galaxy Book3 Ultra 16 (3.3.3) | |
| Average NVIDIA GeForce RTX 4050 Laptop GPU (25 - 37, n=40) | |
| Samsung Galaxy Book3 Ultra 16 (3.3.3, Hohe Leistung) | |
| Schenker Vision 16 Pro RTX 3070 Ti (3.3.0) | |
| v3.3 Classroom CUDA | |
| LG Gram 17Z90Q-E.AD78G (3.3.2) | |
| Asus VivoBook Pro 16X OLED N7600PC-L2026X (3.3.0) | |
| Samsung Galaxy Book3 Ultra 16 (3.3.3, Leise) | |
| Average of class Multimedia (20 - 186, n=22, last 2 years) | |
| Samsung Galaxy Book3 Ultra 16 (3.3.3) | |
| Lenovo ThinkBook 16p G3 ARH (3.3.0) | |
| Samsung Galaxy Book3 Ultra 16 (3.3.3, Hohe Leistung) | |
| Average NVIDIA GeForce RTX 4050 Laptop GPU (47 - 68, n=39) | |
| Schenker Vision 16 Pro RTX 3070 Ti (3.3.0) | |
| v3.3 Classroom oneAPI/Intel | |
| Average of class Multimedia (105 - 492, n=17, last 2 years) | |
| Acer Swift X SFX16-52G-77RX | |
| V-Ray Benchmark Next 4.10 | |
| GPU | |
| Average NVIDIA GeForce RTX 4050 Laptop GPU (333 - 565, n=35) | |
| Schenker Vision 16 Pro RTX 3070 Ti (v4.10.07 ) | |
| Samsung Galaxy Book3 Ultra 16 (v4.10.07, Hohe Leistung) | |
| Samsung Galaxy Book3 Ultra 16 (v4.10.07 ) | |
| Samsung Galaxy Book3 Ultra 16 (v4.10.07, Leise) | |
| Average of class Multimedia (32 - 1191, n=53, last 2 years) | |
| Asus VivoBook Pro 16X OLED N7600PC-L2026X (v4.10.07 ) | |
| LG Gram 17Z90Q-E.AD78G (v4.10.07 ) | |
| Acer Swift X SFX16-52G-77RX (v4.10.07 ) | |
| CPU | |
| Average of class Multimedia (4772 - 35165, n=53, last 2 years) | |
| Samsung Galaxy Book3 Ultra 16 (v4.10.07, Hohe Leistung ) | |
| Average NVIDIA GeForce RTX 4050 Laptop GPU (5413 - 24181, n=35) | |
| Samsung Galaxy Book3 Ultra 16 (v4.10.07 ) | |
| Schenker Vision 16 Pro RTX 3070 Ti (v4.10.07 ) | |
| Samsung Galaxy Book3 Ultra 16 (v4.10.07, Leise) | |
| Acer Swift X SFX16-52G-77RX (v4.10.07 ) | |
| LG Gram 17Z90Q-E.AD78G (v4.10.07 ) | |
| Asus VivoBook Pro 16X OLED N7600PC-L2026X (v4.10.07 ) | |
* ... smaller is better
游戏性能
这款笔记本电脑可以在中等到高等,有时是最高设置下处理FHD游戏。OLED屏幕的全部辉煌(2880x1800)可以在降低的设置下发挥出来。帧率取决于使用的性能模式,但总是低于RTX 4050的平均水平。"高性能 "提供的帧率比 "优化 "高约20%至30%。沉默 "配置文件主要适用于高清级别的游戏。
| Performance rating - Percent | |
| Schenker Vision 16 Pro RTX 3070 Ti | |
| MSI Katana 15 B12VEK | |
| Average NVIDIA GeForce RTX 4050 Laptop GPU | |
| Samsung Galaxy Book3 Ultra 16 | |
| Lenovo ThinkBook 16p G3 ARH | |
| Samsung Galaxy Book3 Ultra 16 | |
| Dell XPS 15 9520 RTX 3050 Ti | |
| Average of class Multimedia | |
| Asus VivoBook Pro 16X OLED N7600PC-L2026X | |
| LG Gram 17Z90Q-E.AD78G | |
| Samsung Galaxy Book3 Ultra 16 | |
| Acer Swift X SFX16-52G-77RX | |
| The Witcher 3 - 1920x1080 Ultra Graphics & Postprocessing (HBAO+) | |
| Schenker Vision 16 Pro RTX 3070 Ti | |
| MSI Katana 15 B12VEK | |
| Average NVIDIA GeForce RTX 4050 Laptop GPU (18.5 - 94.7, n=40) | |
| Lenovo ThinkBook 16p G3 ARH | |
| Samsung Galaxy Book3 Ultra 16 (Hohe Leistung) | |
| Samsung Galaxy Book3 Ultra 16 | |
| Average of class Multimedia (11 - 121, n=7, last 2 years) | |
| Asus VivoBook Pro 16X OLED N7600PC-L2026X | |
| Dell XPS 15 9520 RTX 3050 Ti | |
| LG Gram 17Z90Q-E.AD78G | |
| Acer Swift X SFX16-52G-77RX | |
| Samsung Galaxy Book3 Ultra 16 | |
| GTA V - 1920x1080 Highest AA:4xMSAA + FX AF:16x | |
| Schenker Vision 16 Pro RTX 3070 Ti | |
| MSI Katana 15 B12VEK | |
| Samsung Galaxy Book3 Ultra 16 (Hohe Leistung) | |
| Average NVIDIA GeForce RTX 4050 Laptop GPU (14.9 - 101.7, n=35) | |
| Lenovo ThinkBook 16p G3 ARH | |
| Samsung Galaxy Book3 Ultra 16 | |
| Average of class Multimedia (7.92 - 141.6, n=55, last 2 years) | |
| Asus VivoBook Pro 16X OLED N7600PC-L2026X | |
| Dell XPS 15 9520 RTX 3050 Ti | |
| LG Gram 17Z90Q-E.AD78G | |
| Acer Swift X SFX16-52G-77RX | |
| Samsung Galaxy Book3 Ultra 16 (Leise) | |
| Final Fantasy XV Benchmark - 1920x1080 High Quality | |
| Schenker Vision 16 Pro RTX 3070 Ti (1.3) | |
| MSI Katana 15 B12VEK (1.3) | |
| Lenovo ThinkBook 16p G3 ARH (1.3) | |
| Average NVIDIA GeForce RTX 4050 Laptop GPU (15.5 - 122.3, n=39) | |
| Samsung Galaxy Book3 Ultra 16 (1.3, Hohe Leistung) | |
| Samsung Galaxy Book3 Ultra 16 (1.3) | |
| Average of class Multimedia (7.61 - 144.4, n=57, last 2 years) | |
| Dell XPS 15 9520 RTX 3050 Ti (1.3) | |
| Asus VivoBook Pro 16X OLED N7600PC-L2026X (1.3) | |
| LG Gram 17Z90Q-E.AD78G (1.3) | |
| Acer Swift X SFX16-52G-77RX (1.3) | |
| Samsung Galaxy Book3 Ultra 16 (1.3, Leise) | |
| Strange Brigade - 1920x1080 ultra AA:ultra AF:16 | |
| Schenker Vision 16 Pro RTX 3070 Ti (1.47.22.14 D3D12) | |
| MSI Katana 15 B12VEK (1.47.22.14 D3D12) | |
| Average NVIDIA GeForce RTX 4050 Laptop GPU (21.2 - 156.6, n=38) | |
| Lenovo ThinkBook 16p G3 ARH (1.47.22.14 D3D12) | |
| Samsung Galaxy Book3 Ultra 16 (1.47.22.14 D3D12, Hohe Leistung) | |
| Samsung Galaxy Book3 Ultra 16 (1.47.22.14 D3D12) | |
| Average of class Multimedia (13.3 - 303, n=57, last 2 years) | |
| Dell XPS 15 9520 RTX 3050 Ti (1.47.22.14 D3D12) | |
| Asus VivoBook Pro 16X OLED N7600PC-L2026X (1.47.22.14 D3D12) | |
| Acer Swift X SFX16-52G-77RX (1.47.22.14 D3D12) | |
| LG Gram 17Z90Q-E.AD78G (1.47.22.14 D3D12) | |
| Samsung Galaxy Book3 Ultra 16 (1.47.22.14 D3D12, Leise) | |
| Dota 2 Reborn - 1920x1080 ultra (3/3) best looking | |
| Schenker Vision 16 Pro RTX 3070 Ti | |
| MSI Katana 15 B12VEK | |
| Samsung Galaxy Book3 Ultra 16 (Hohe Leistung) | |
| Average NVIDIA GeForce RTX 4050 Laptop GPU (73.5 - 175.6, n=39) | |
| Samsung Galaxy Book3 Ultra 16 (Leise) | |
| Dell XPS 15 9520 RTX 3050 Ti | |
| Asus VivoBook Pro 16X OLED N7600PC-L2026X | |
| Lenovo ThinkBook 16p G3 ARH | |
| Average of class Multimedia (29 - 179.9, n=59, last 2 years) | |
| Samsung Galaxy Book3 Ultra 16 | |
| Acer Swift X SFX16-52G-77RX | |
| LG Gram 17Z90Q-E.AD78G | |
| X-Plane 11.11 - 1920x1080 high (fps_test=3) | |
| Schenker Vision 16 Pro RTX 3070 Ti | |
| Dell XPS 15 9520 RTX 3050 Ti | |
| Samsung Galaxy Book3 Ultra 16 (Hohe Leistung) | |
| MSI Katana 15 B12VEK | |
| Average NVIDIA GeForce RTX 4050 Laptop GPU (55.5 - 117, n=40) | |
| Samsung Galaxy Book3 Ultra 16 (Leise) | |
| Samsung Galaxy Book3 Ultra 16 | |
| Asus VivoBook Pro 16X OLED N7600PC-L2026X | |
| Lenovo ThinkBook 16p G3 ARH | |
| LG Gram 17Z90Q-E.AD78G | |
| LG Gram 17Z90Q-E.AD78G | |
| Average of class Multimedia (16.9 - 141.1, n=54, last 2 years) | |
| Acer Swift X SFX16-52G-77RX | |
为了检查帧率是否在较长时间内保持恒定,我们在全高清分辨率和最高质量设置下运行了 "TheWitcher 3" 约60分钟。游戏角色没有被移动。没有发现帧率下降。
Witcher 3 FPS chart
| low | med. | high | ultra | QHD | |
|---|---|---|---|---|---|
| GTA V (2015) | 182.1 | 166.5 | 133.2 | 65.3 | 50.5 |
| The Witcher 3 (2015) | 268.5 | 184.1 | 107.1 | 60.1 | |
| Dota 2 Reborn (2015) | 161.8 | 138.7 | 79.2 | 73.5 | |
| Final Fantasy XV Benchmark (2018) | 105 | 77.2 | 56.9 | 41.5 | |
| X-Plane 11.11 (2018) | 143.6 | 88.2 | 79 | ||
| Far Cry 5 (2018) | 148 | 87 | 74 | 71 | 56 |
| Strange Brigade (2018) | 321 | 153.5 | 120.1 | 103.9 | 72.7 |
| The Division 2 (2019) | 130 | 83 | 69 | 53 | 35 |
| Doom Eternal (2020) | 228 | 135.6 | 124.7 | 114.3 | 82.5 |
| Gears Tactics (2020) | 268.5 | 141.8 | 95.2 | 64.8 | 44.8 |
| Flight Simulator 2020 (2020) | 107.2 | 57.6 | 40.5 | 30.6 | 22.9 |
| Crysis Remastered (2020) | 242 | 121.1 | 49.5 | 41.6 | 28.6 |
| Hitman 3 (2021) | 193.9 | 111.4 | 101 | 94.2 | 60.1 |
| Alan Wake Remastered (2021) | 161.5 | 98.3 | 86.7 | 63.2 | |
| Riders Republic (2021) | 138 | 72 | 67 | 63 | 44 |
| Forza Horizon 5 (2021) | 119 | 68 | 69 | 42 | 36 |
| Rainbow Six Extraction (2022) | 139 | 115 | 111 | 89 | 56 |
| Cyberpunk 2077 1.6 (2022) | 71 | 54.7 | 48 | 44.4 | 27.2 |
| Tiny Tina's Wonderlands (2022) | 104.5 | 93.4 | 63.3 | 49.8 | 33.6 |
| F1 22 (2022) | 135.3 | 127.4 | 97.5 | 36.2 | 23.1 |
| The Quarry (2022) | 91 | 68.8 | 57 | 44.6 | 28.5 |
| FIFA 23 (2022) | 94.3 | ||||
| A Plague Tale Requiem (2022) | 58.6 | 49 | 42.8 | 36.3 | 27.5 |
| Call of Duty Modern Warfare 2 2022 (2022) | 79 | 73 | 56 | 54 | 36 |
| Spider-Man Miles Morales (2022) | 72.9 | 67.1 | 56.9 | 51.5 | 42.5 |
| The Callisto Protocol (2022) | 74 | 62.5 | 59.3 | 41.4 | 29.5 |
| Need for Speed Unbound (2022) | 51.2 | 42.8 | 37 | 28.9 | 26.7 |
| High On Life (2023) | 104.9 | 78.1 | 65.3 | 57.3 | 35.7 |
| The Witcher 3 v4 (2023) | 113.4 | 82.5 | 43 | 38.1 | 23.8 |
| Dead Space Remake (2023) | 47.9 | 47.7 | 40.2 | 39.8 | 25.1 |
| Hogwarts Legacy (2023) | 92 | 74.2 | 59.6 | 51.9 | 23.9 |
| Returnal (2023) | 59 | 57 | 52 | 44 | |
| Atomic Heart (2023) | 95 | 76.1 | 47.8 | 37.8 | 28.2 |
| Company of Heroes 3 (2023) | 116.4 | 106.2 | 79 | 79.7 | 55.7 |
| Resident Evil 4 Remake (2023) | 81 | 57.7 | 53.4 | 36.8 | 23.8 |
排放--三星超极本,噪音发展适度
噪声
总的来说,三星对噪音的发展控制得相当好。笔记本的配置文件在噪音和性能之间提供了一个可接受的平衡。在Witcher 3 "高性能 "的测试中,达到了48 dB(A)的最高值。"优化 "确保了适度的噪音水平,同时仍有可播放的帧率。"静音 "配置文件不愧为它的名字。在空闲和日常使用中,几乎听不到两个风扇的声音,因为它们经常处于静止状态。
Noise level
| Idle |
| 26 / 27 / 28 dB(A) |
| Load |
| 40 / 41 dB(A) |
 | ||
30 dB silent 40 dB(A) audible 50 dB(A) loud |
||
min: | ||
| Samsung Galaxy Book3 Ultra 16 i7-13700H, GeForce RTX 4050 Laptop GPU | Schenker Vision 16 Pro RTX 3070 Ti i7-12700H, GeForce RTX 3070 Ti Laptop GPU | LG Gram 17Z90Q-E.AD78G i7-1260P, GeForce RTX 2050 Mobile | Lenovo ThinkBook 16p G3 ARH R9 6900HX, GeForce RTX 3060 Laptop GPU | Dell XPS 15 9520 RTX 3050 Ti i7-12700H, GeForce RTX 3050 Ti Laptop GPU | Asus VivoBook Pro 16X OLED N7600PC-L2026X i7-11370H, GeForce RTX 3050 4GB Laptop GPU | Acer Swift X SFX16-52G-77RX i7-1260P, A370M | |
|---|---|---|---|---|---|---|---|
| Noise | -2% | -10% | 5% | 10% | -22% | -0% | |
| off / environment * (dB) | 25 | 22.9 8% | 26 -4% | 22.7 9% | 22.8 9% | 25.15 -1% | 25 -0% |
| Idle Minimum * (dB) | 26 | 24.3 7% | 28 -8% | 23.1 11% | 22.9 12% | 30 -15% | 25 4% |
| Idle Average * (dB) | 27 | 24.3 10% | 28 -4% | 23.2 14% | 22.9 15% | 30 -11% | 25 7% |
| Idle Maximum * (dB) | 28 | 24.3 13% | 28.8 -3% | 23.6 16% | 22.9 18% | 30 -7% | 25 11% |
| Load Average * (dB) | 40 | 38.5 4% | 49.3 -23% | 30.6 23% | 30.9 23% | 57.6 -44% | 44.7 -12% |
| Witcher 3 ultra * (dB) | 39 | 51 -31% | 47.6 -22% | 37.8 3% | |||
| Load Maximum * (dB) | 41 | 51 -24% | 49.1 -20% | 47.5 -16% | 44.7 -9% | 62.9 -53% | 45.6 -11% |
* ... smaller is better
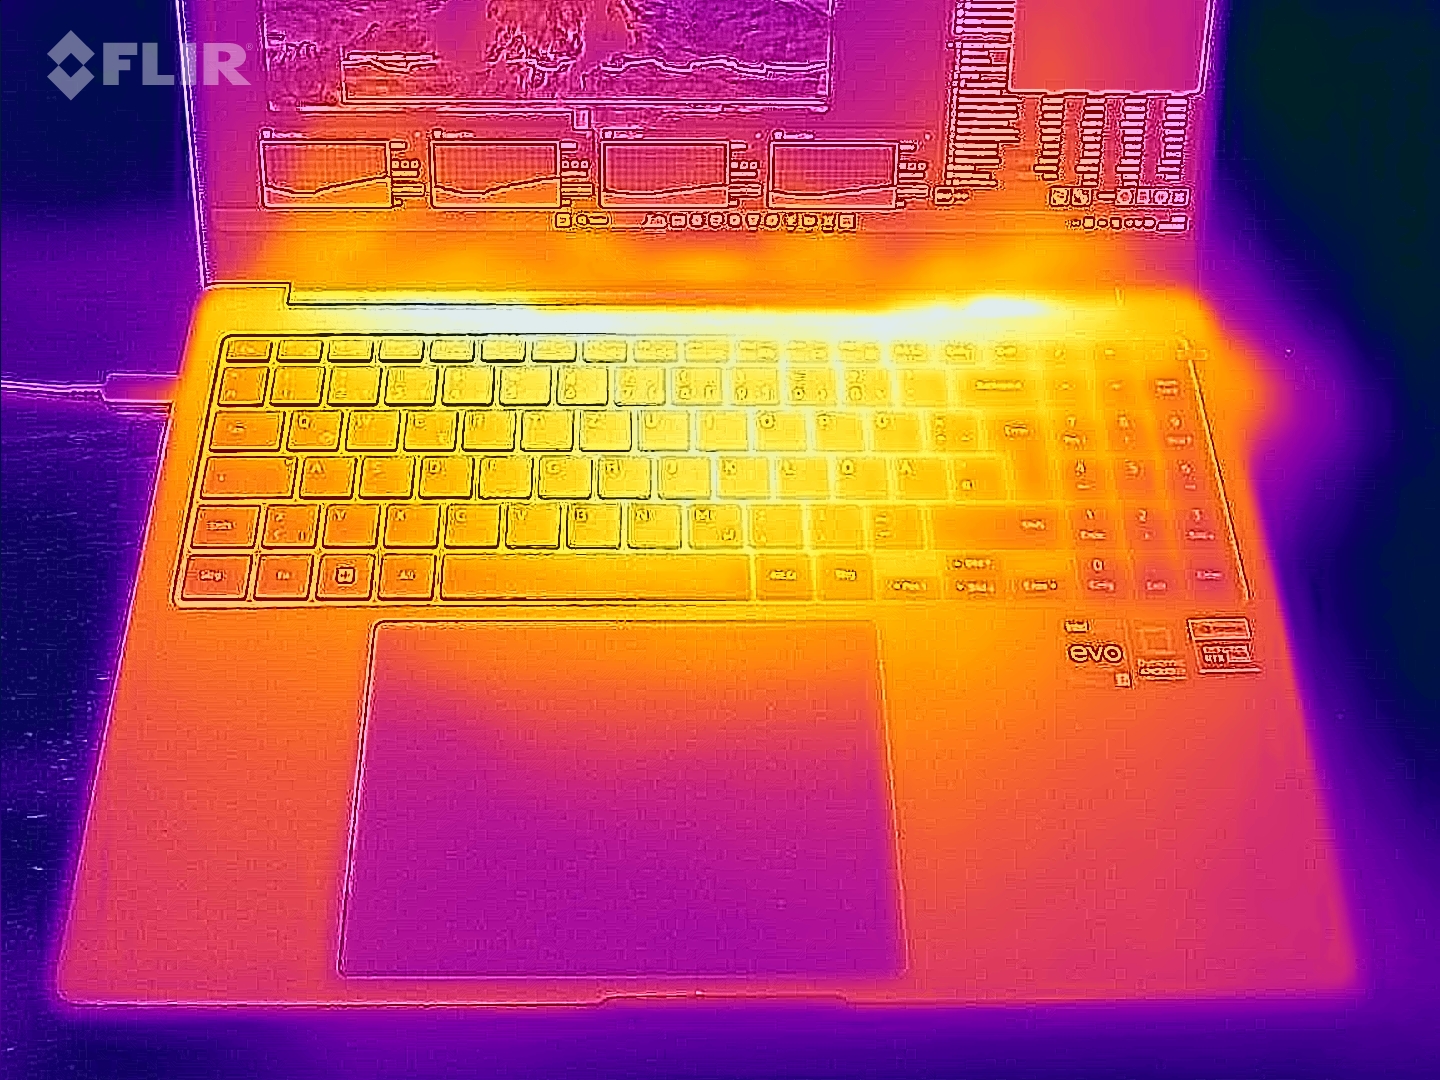
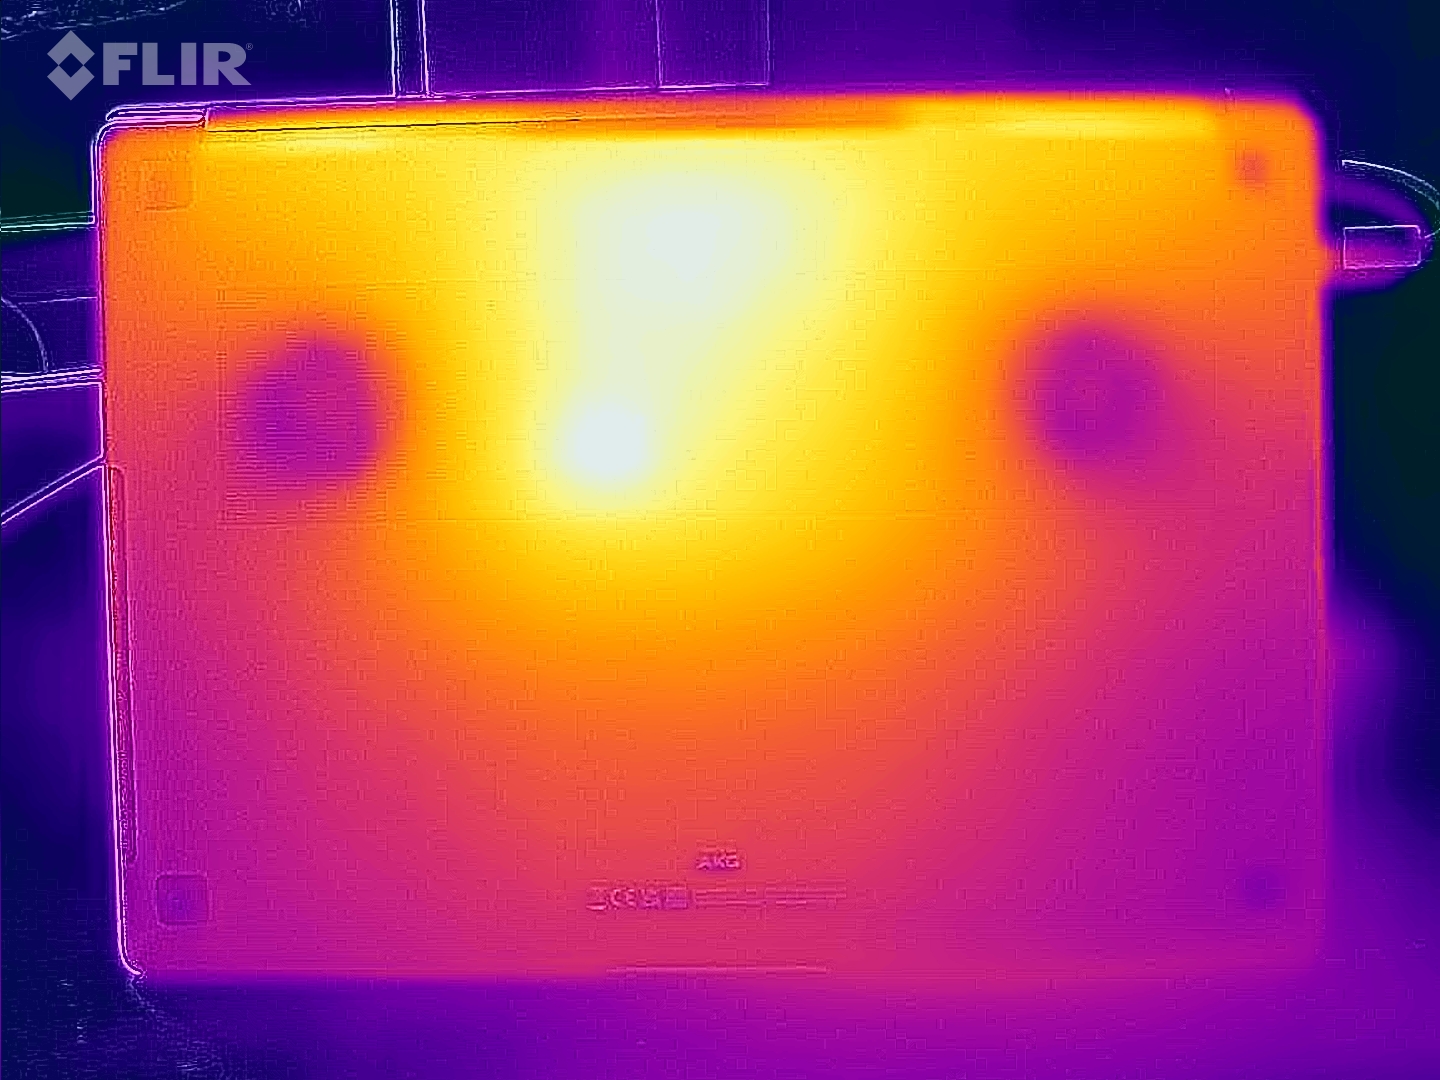
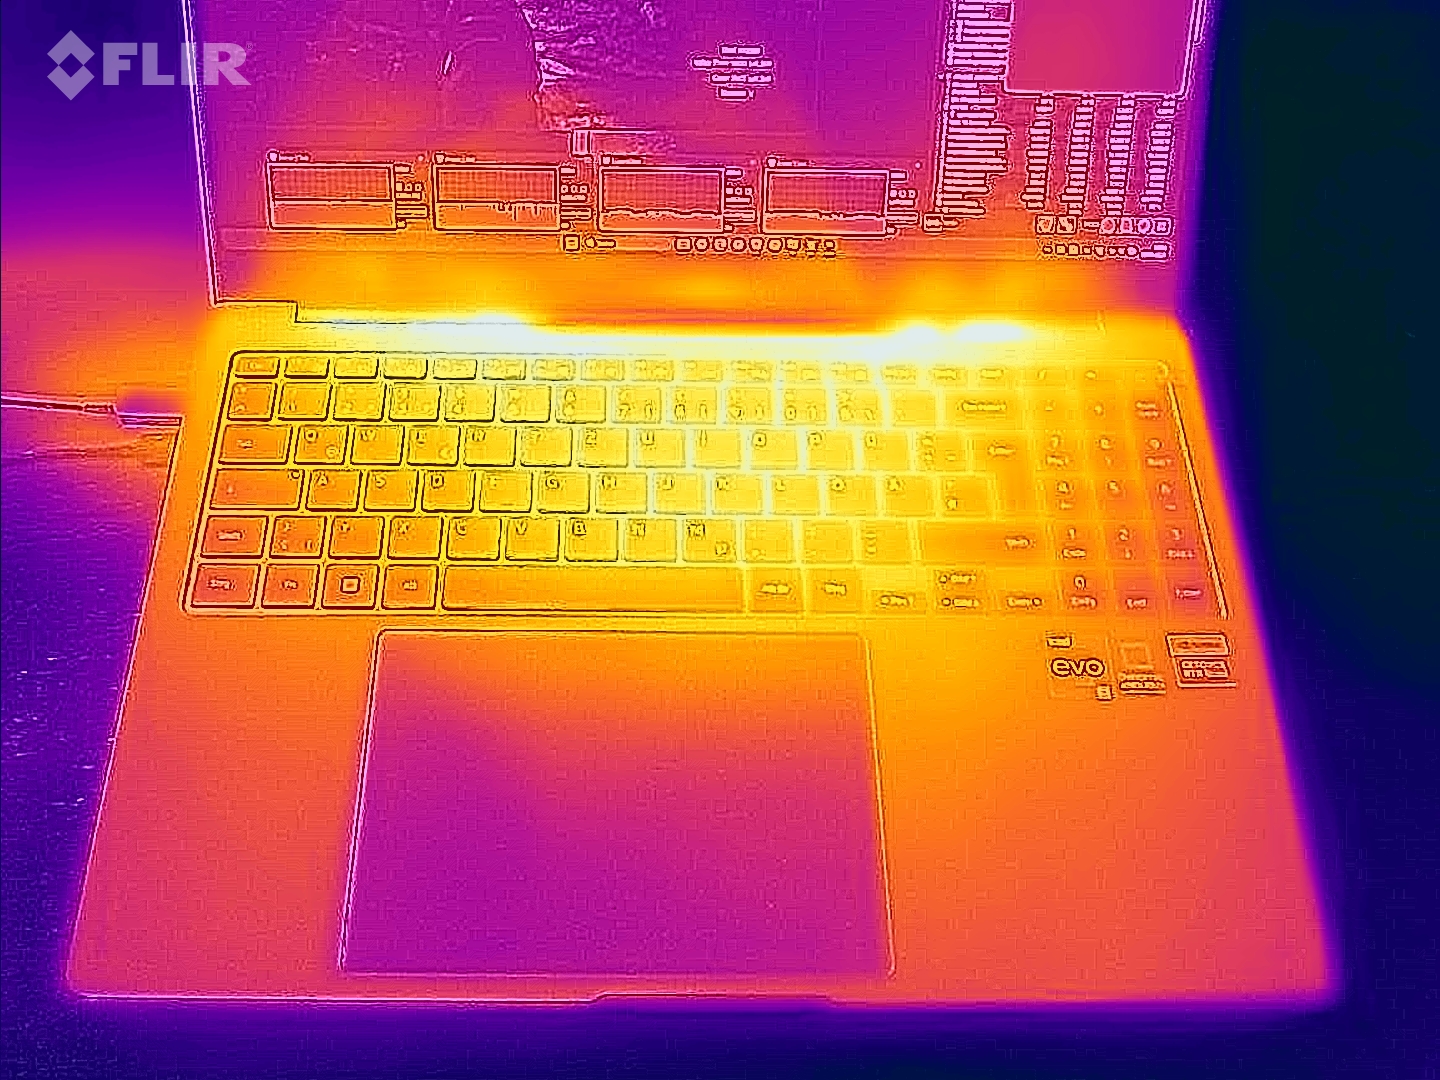
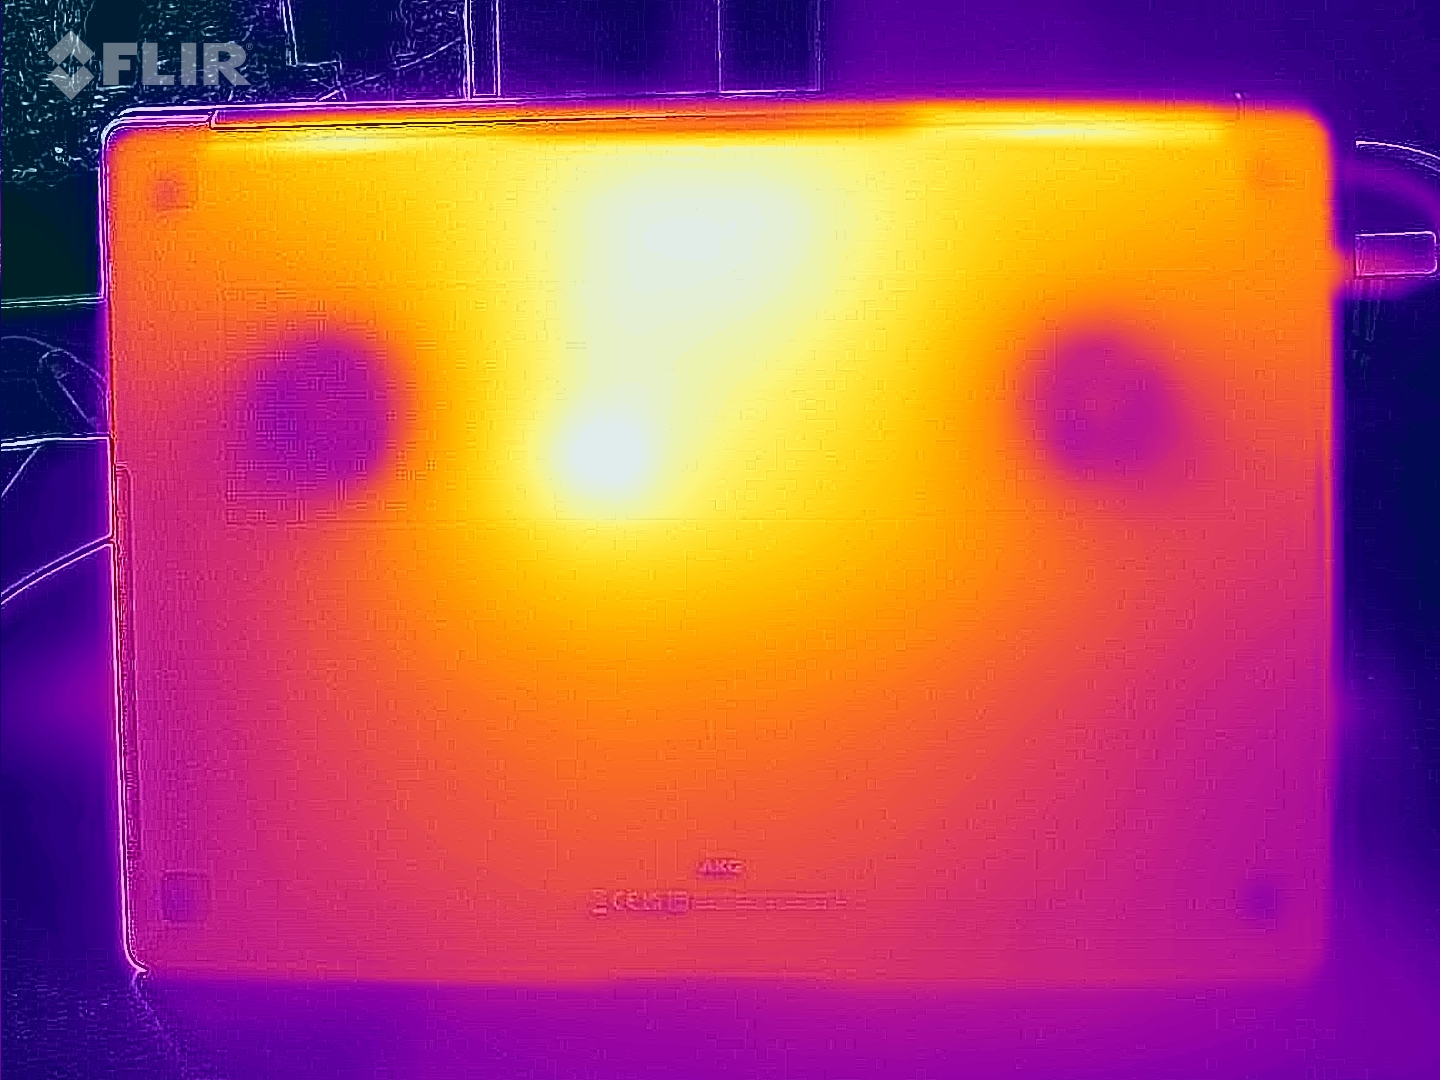
温度
在日常使用中(办公室、互联网),外壳温度保持在绿色区域内。在负载情况下(压力测试,Witcher 3 测试),笔记本明显发热,但不会过度。CPU的温度不值得担心。
(±) The maximum temperature on the upper side is 41 °C / 106 F, compared to the average of 36.8 °C / 98 F, ranging from 21 to 71 °C for the class Multimedia.
(±) The bottom heats up to a maximum of 44 °C / 111 F, compared to the average of 39.1 °C / 102 F
(+) In idle usage, the average temperature for the upper side is 22.9 °C / 73 F, compared to the device average of 31.3 °C / 88 F.
(-) Playing The Witcher 3, the average temperature for the upper side is 38.6 °C / 101 F, compared to the device average of 31.3 °C / 88 F.
(+) The palmrests and touchpad are reaching skin temperature as a maximum (35 °C / 95 F) and are therefore not hot.
(-) The average temperature of the palmrest area of similar devices was 28.7 °C / 83.7 F (-6.3 °C / -11.3 F).
| Samsung Galaxy Book3 Ultra 16 Intel Core i7-13700H, NVIDIA GeForce RTX 4050 Laptop GPU | Schenker Vision 16 Pro RTX 3070 Ti Intel Core i7-12700H, NVIDIA GeForce RTX 3070 Ti Laptop GPU | LG Gram 17Z90Q-E.AD78G Intel Core i7-1260P, NVIDIA GeForce RTX 2050 Mobile | Lenovo ThinkBook 16p G3 ARH AMD Ryzen 9 6900HX, NVIDIA GeForce RTX 3060 Laptop GPU | Dell XPS 15 9520 RTX 3050 Ti Intel Core i7-12700H, NVIDIA GeForce RTX 3050 Ti Laptop GPU | Asus VivoBook Pro 16X OLED N7600PC-L2026X Intel Core i7-11370H, NVIDIA GeForce RTX 3050 4GB Laptop GPU | Acer Swift X SFX16-52G-77RX Intel Core i7-1260P, Intel Arc A370M | |
|---|---|---|---|---|---|---|---|
| Heat | -12% | -15% | -25% | -25% | -14% | -24% | |
| Maximum Upper Side * (°C) | 41 | 50.8 -24% | 50.3 -23% | 48.2 -18% | 51.4 -25% | 40.6 1% | 49.4 -20% |
| Maximum Bottom * (°C) | 44 | 46.3 -5% | 52.5 -19% | 49.6 -13% | 51 -16% | 53 -20% | 55.5 -26% |
| Idle Upper Side * (°C) | 23 | 27.2 -18% | 26.9 -17% | 31.8 -38% | 30 -30% | 29 -26% | 28.4 -23% |
| Idle Bottom * (°C) | 26 | 26.6 -2% | 26.5 -2% | 33.6 -29% | 33 -27% | 28.3 -9% | 32.6 -25% |
* ... smaller is better
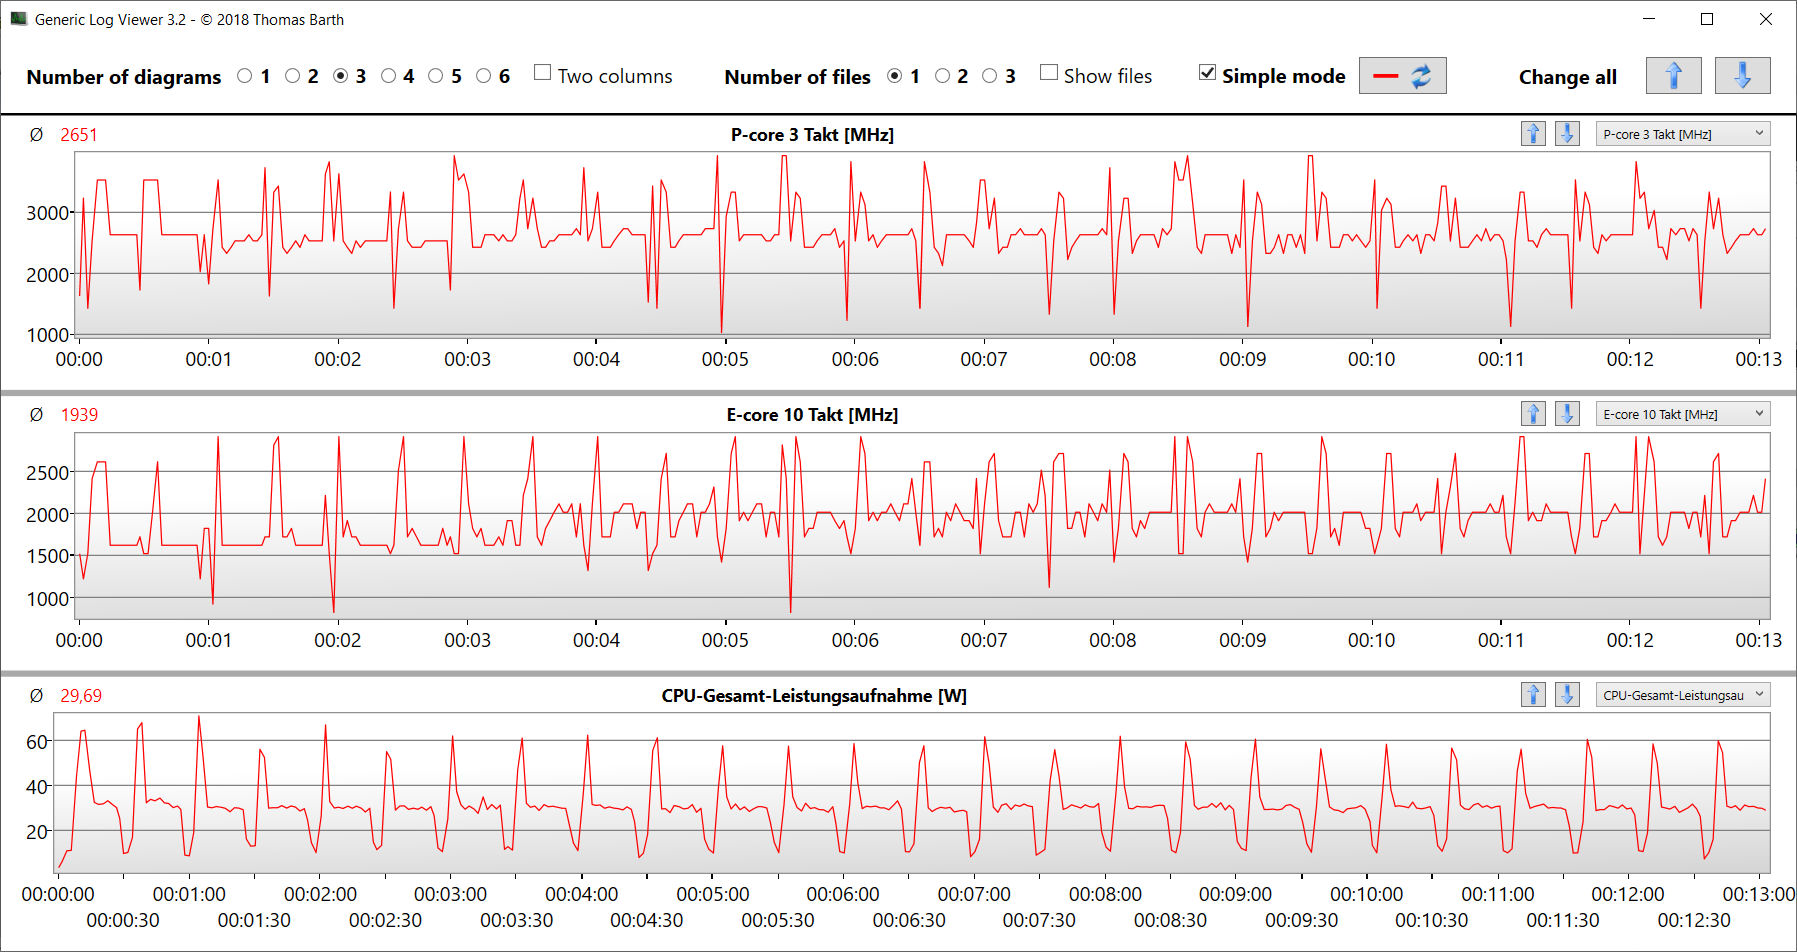
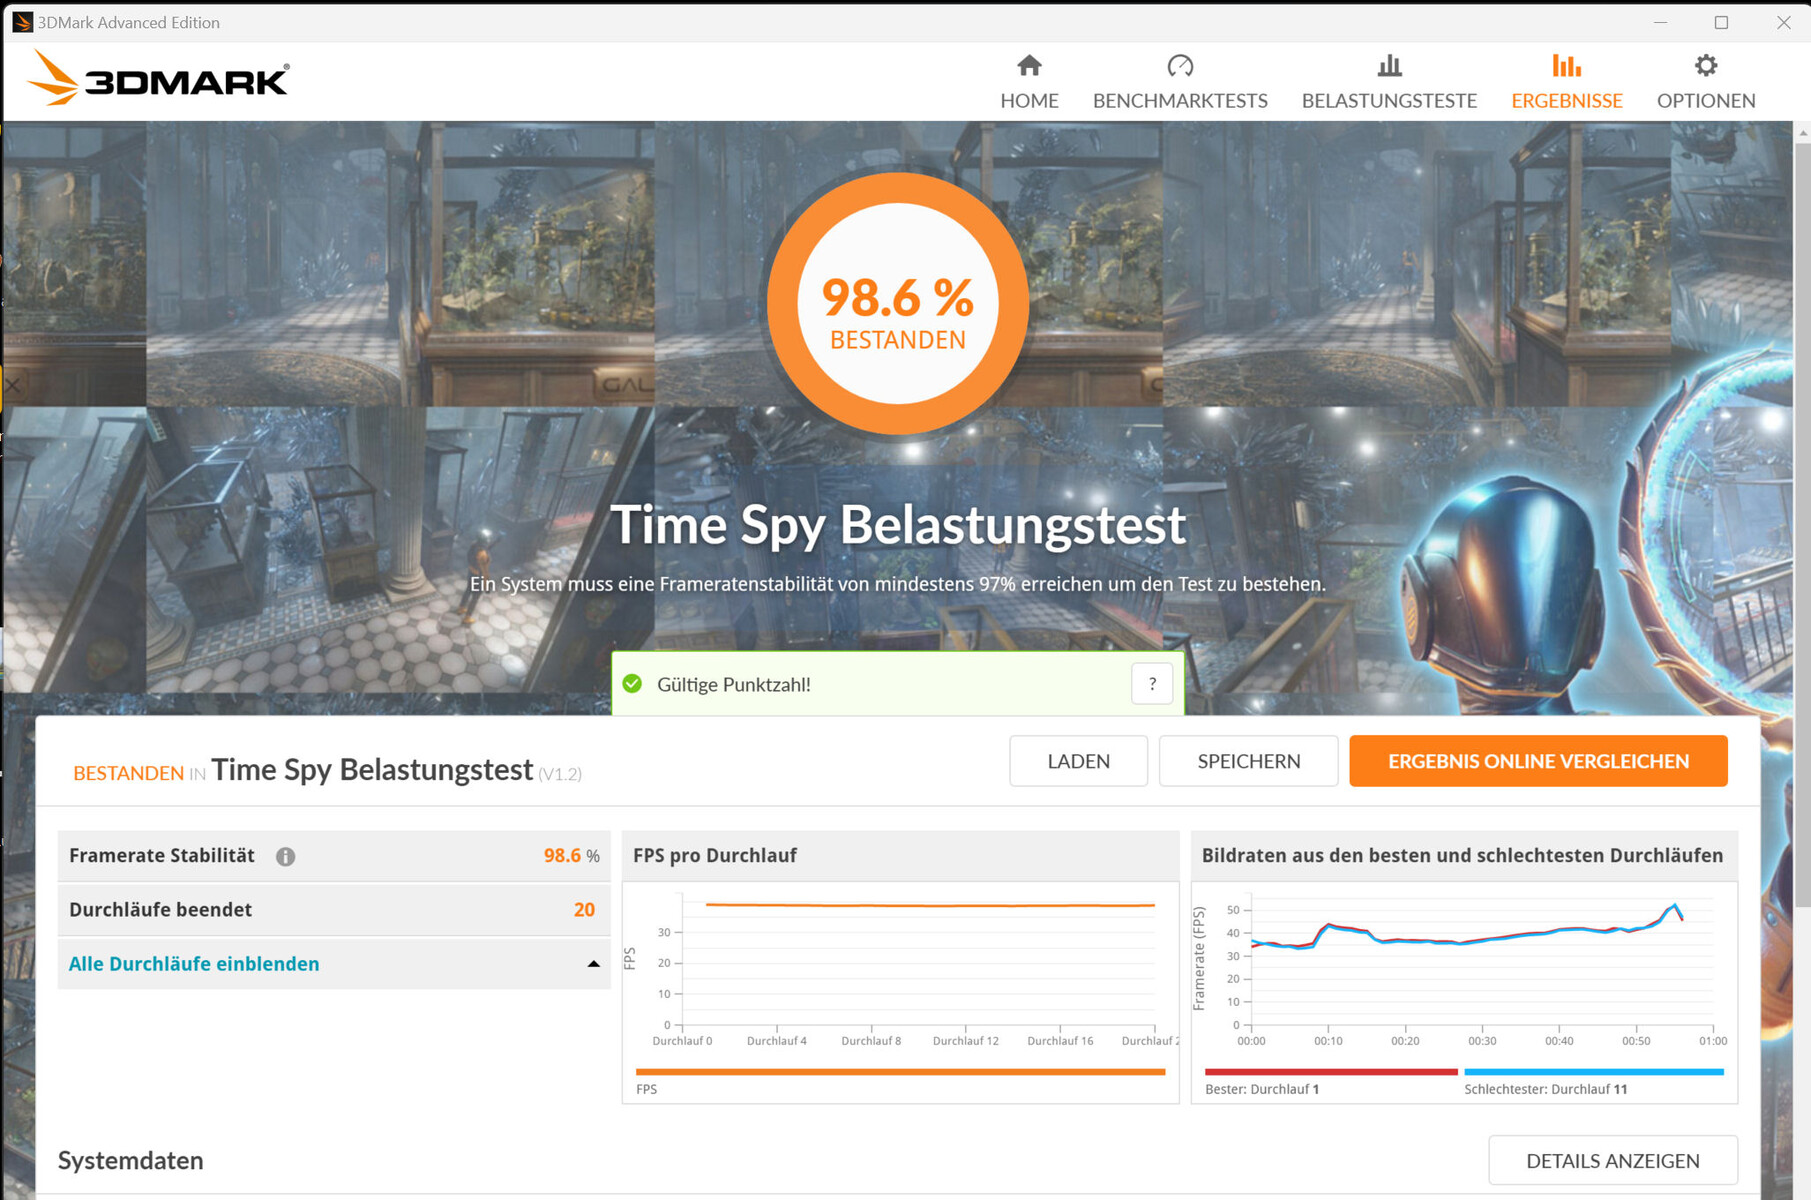
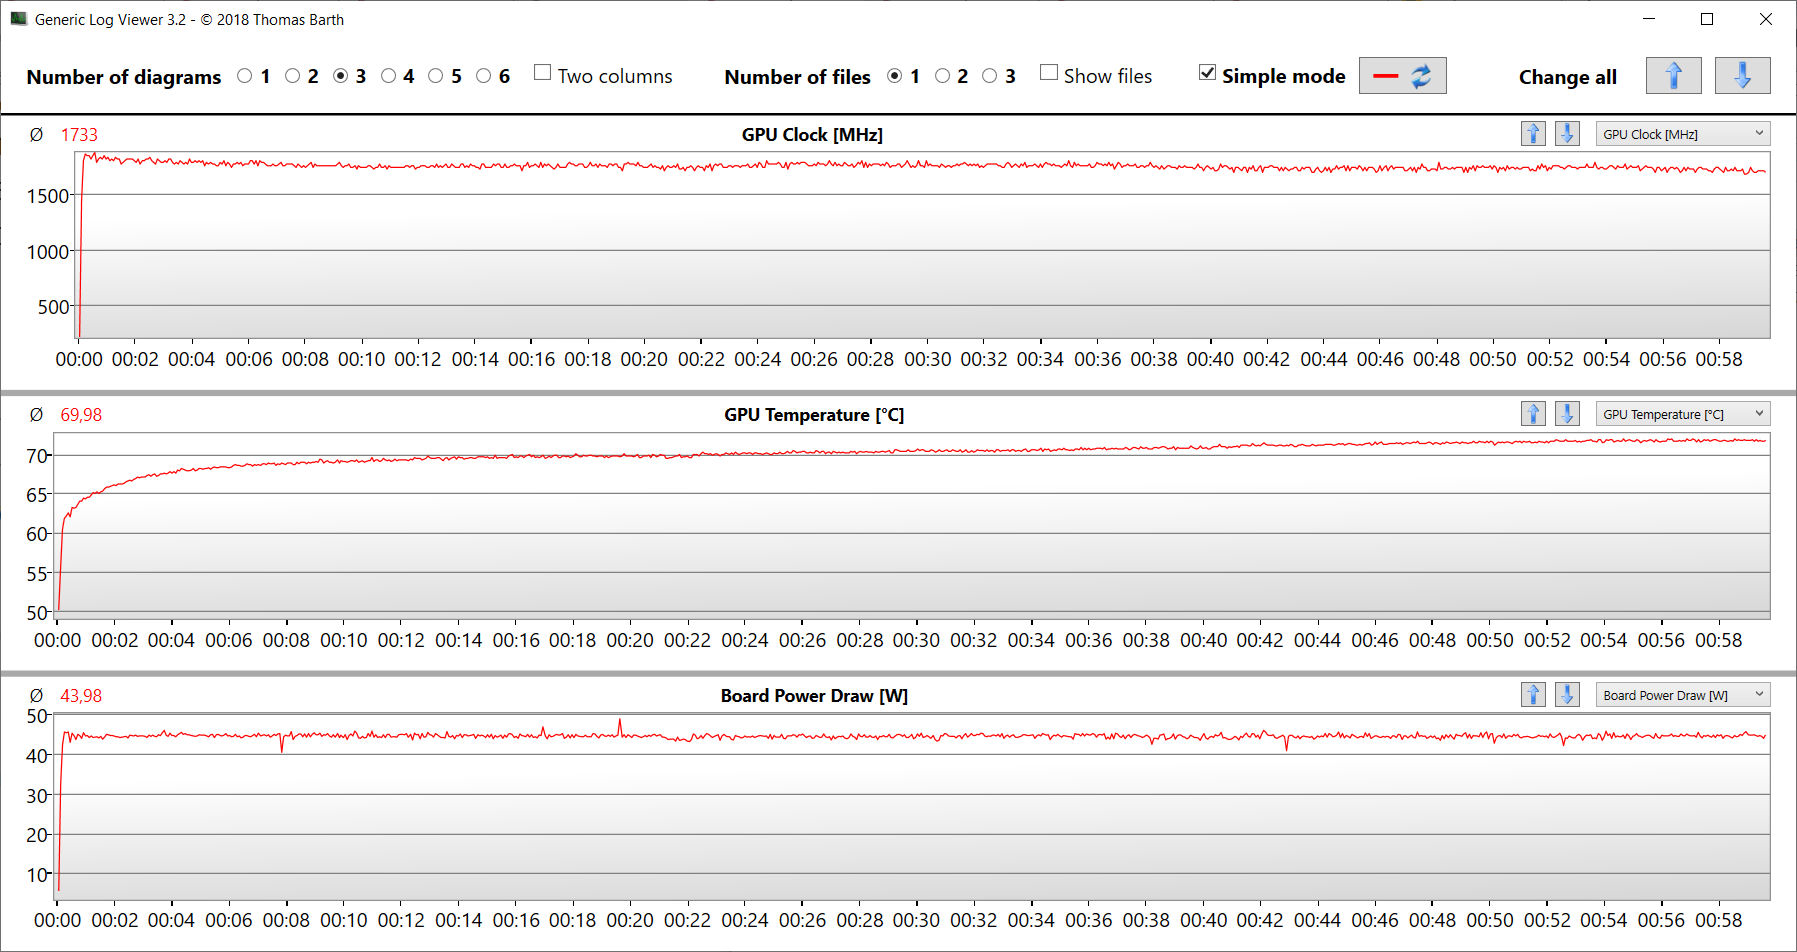
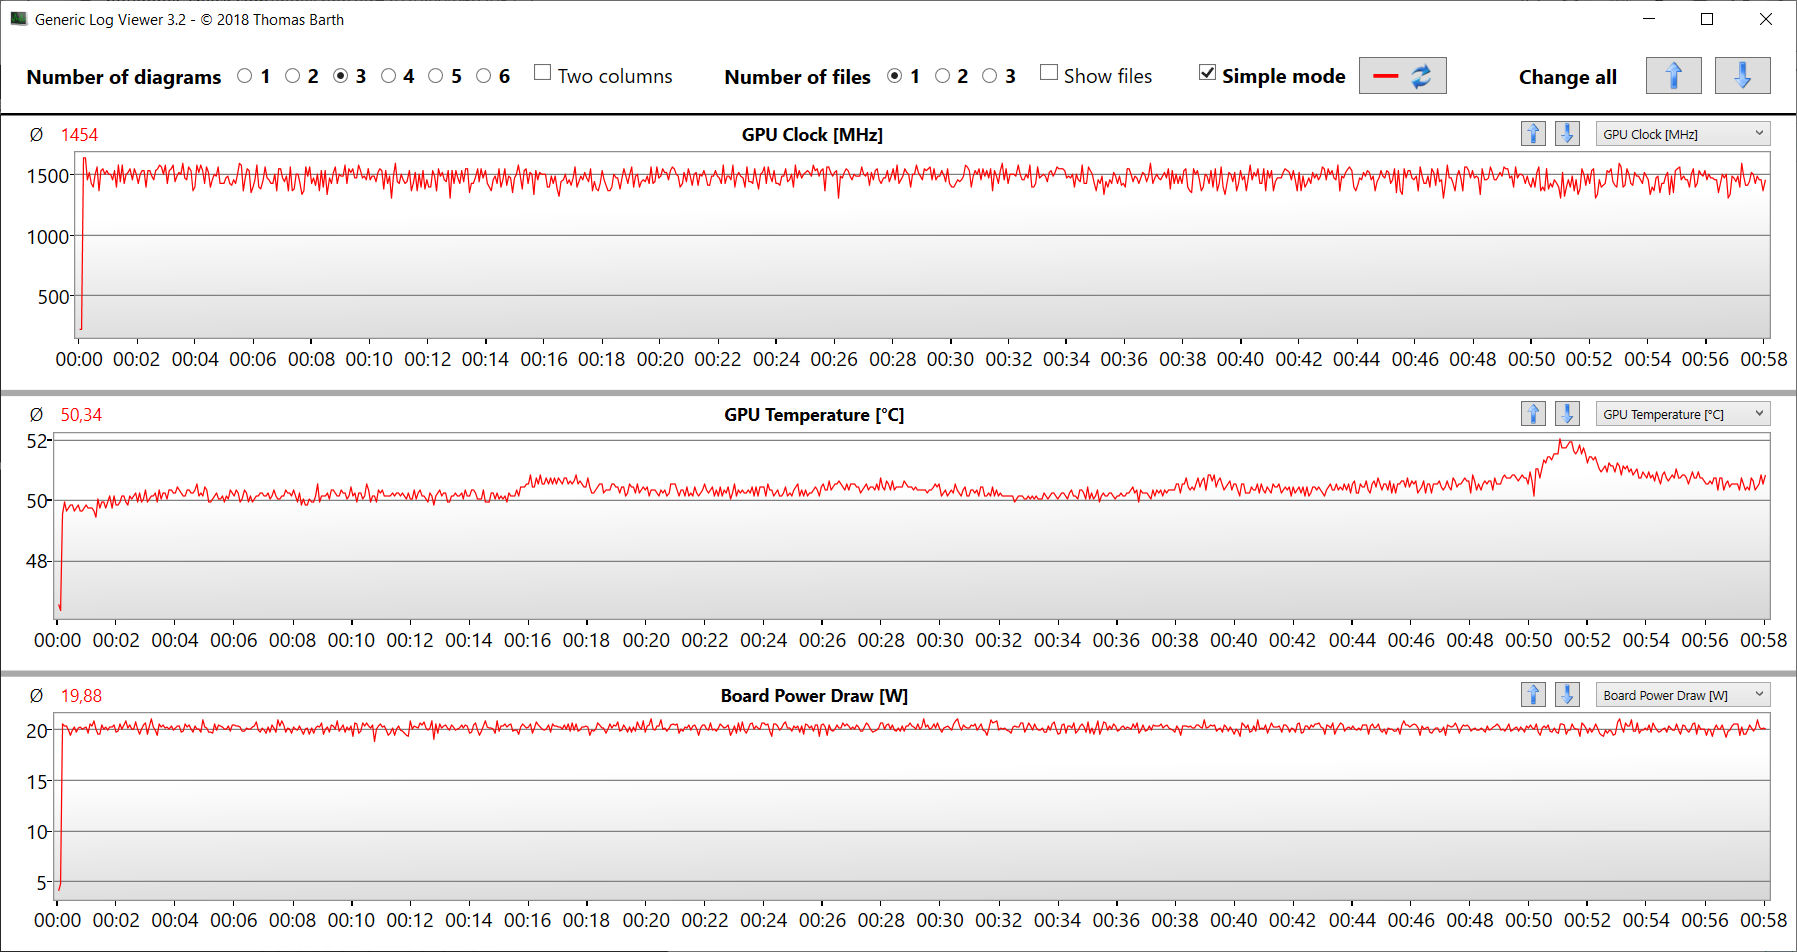
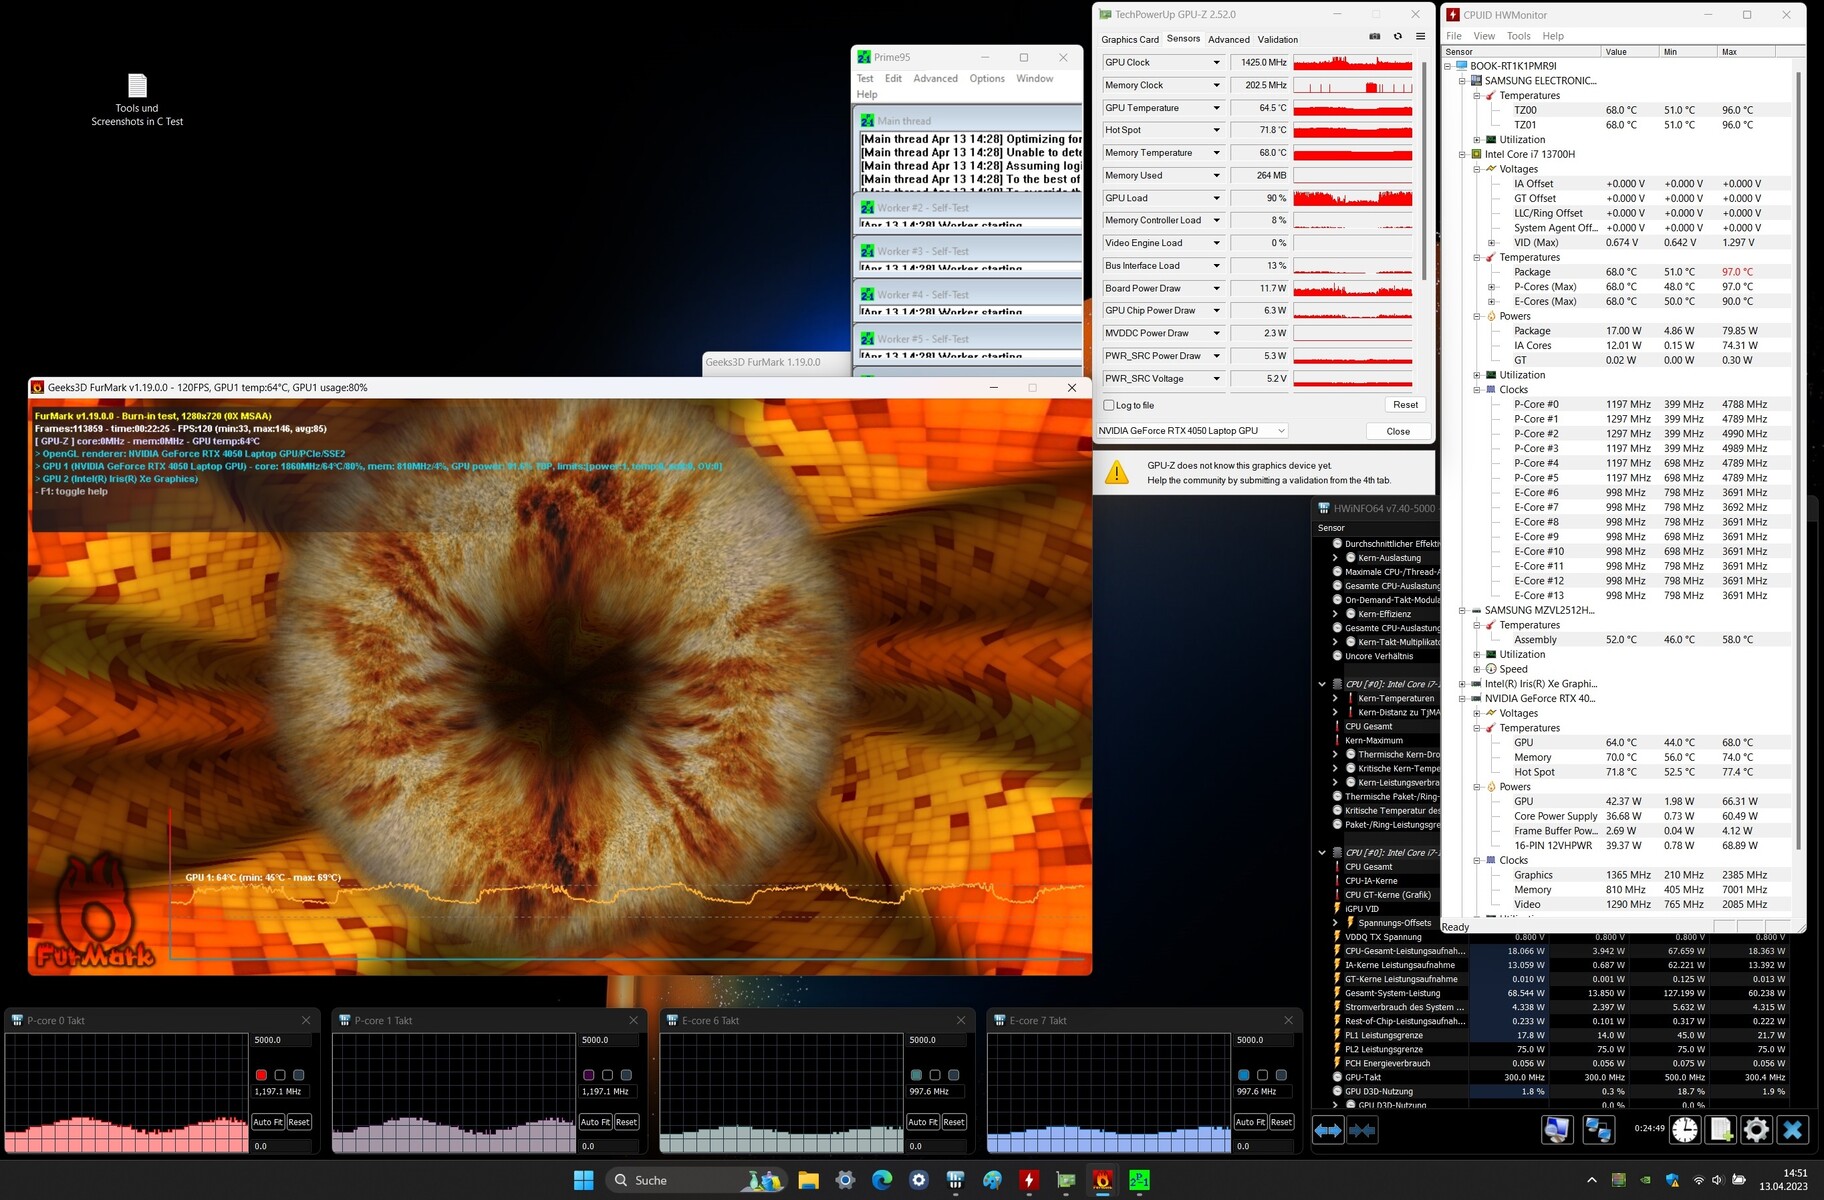
压力测试
压力测试(Prime95和Furmark的持续运行)代表了在全负荷下检查系统稳定性的一个极端情况。CPU(P:2.8至2.9GHz,E:2.3至2.4GHz)和GPU(约1,100MHz)在测试开始时的速度大致在基础时钟水平左右,在测试过程中明显下降。
发言人
立体声扬声器产生非常体面的声音,但可以使用更多的低音。建议使用耳机或外部扬声器以获得更好的音质。
Samsung Galaxy Book3 Ultra 16 audio analysis
(+) | speakers can play relatively loud (83 dB)
Bass 100 - 315 Hz
(±) | reduced bass - on average 11.4% lower than median
(±) | linearity of bass is average (10.3% delta to prev. frequency)
Mids 400 - 2000 Hz
(±) | higher mids - on average 5.4% higher than median
(+) | mids are linear (3% delta to prev. frequency)
Highs 2 - 16 kHz
(+) | balanced highs - only 1.6% away from median
(+) | highs are linear (3.8% delta to prev. frequency)
Overall 100 - 16.000 Hz
(+) | overall sound is linear (11.8% difference to median)
Compared to same class
» 19% of all tested devices in this class were better, 4% similar, 76% worse
» The best had a delta of 5%, average was 17%, worst was 45%
Compared to all devices tested
» 9% of all tested devices were better, 3% similar, 89% worse
» The best had a delta of 4%, average was 23%, worst was 134%
Schenker Vision 16 Pro RTX 3070 Ti audio analysis
(±) | speaker loudness is average but good (77.6 dB)
Bass 100 - 315 Hz
(-) | nearly no bass - on average 17.9% lower than median
(±) | linearity of bass is average (12.2% delta to prev. frequency)
Mids 400 - 2000 Hz
(+) | balanced mids - only 3.3% away from median
(+) | mids are linear (4.9% delta to prev. frequency)
Highs 2 - 16 kHz
(+) | balanced highs - only 2.8% away from median
(+) | highs are linear (5.1% delta to prev. frequency)
Overall 100 - 16.000 Hz
(±) | linearity of overall sound is average (15.1% difference to median)
Compared to same class
» 36% of all tested devices in this class were better, 4% similar, 60% worse
» The best had a delta of 5%, average was 17%, worst was 45%
Compared to all devices tested
» 21% of all tested devices were better, 4% similar, 75% worse
» The best had a delta of 4%, average was 23%, worst was 134%
电源管理 - NP960XFH并不缺乏耐力
消耗功率
总的来说,三星的笔记本电脑用相对较少的能量就可以满足。无论是在空闲状态还是在负载状态下,能源需求都低于竞争对手,但LG Gram除外.Witcher 3 测试和压力测试在相对恒定的功耗下运行。在压力测试接近尾声的时候,需求会有一些下降。USB-C电源(100瓦)的规模足够大。
| Off / Standby | |
| Idle | |
| Load |
|
Key:
min: | |
| Samsung Galaxy Book3 Ultra 16 i7-13700H, GeForce RTX 4050 Laptop GPU | Schenker Vision 16 Pro RTX 3070 Ti i7-12700H, GeForce RTX 3070 Ti Laptop GPU | LG Gram 17Z90Q-E.AD78G i7-1260P, GeForce RTX 2050 Mobile | Lenovo ThinkBook 16p G3 ARH R9 6900HX, GeForce RTX 3060 Laptop GPU | Dell XPS 15 9520 RTX 3050 Ti i7-12700H, GeForce RTX 3050 Ti Laptop GPU | Asus VivoBook Pro 16X OLED N7600PC-L2026X i7-11370H, GeForce RTX 3050 4GB Laptop GPU | Acer Swift X SFX16-52G-77RX i7-1260P, A370M | Average NVIDIA GeForce RTX 4050 Laptop GPU | Average of class Multimedia | |
|---|---|---|---|---|---|---|---|---|---|
| Power Consumption | -105% | -7% | -126% | -39% | -63% | -12% | -123% | -41% | |
| Idle Minimum * (Watt) | 3 | 9 -200% | 4.1 -37% | 10.3 -243% | 5.5 -83% | 8.9 -197% | 3.7 -23% | 9.95 ? -232% | 5.66 ? -89% |
| Idle Average * (Watt) | 5 | 13.3 -166% | 9.8 -96% | 16 -220% | 7.2 -44% | 10.2 -104% | 7.6 -52% | 15.8 ? -216% | 10.2 ? -104% |
| Idle Maximum * (Watt) | 11 | 14.3 -30% | 12 -9% | 24 -118% | 16 -45% | 12 -9% | 11.1 -1% | 20.1 ? -83% | 12.5 ? -14% |
| Load Average * (Watt) | 72 | 107 -49% | 49.3 32% | 85.4 -19% | 91.8 -27% | 94 -31% | 70 3% | 88 ? -22% | 65.2 ? 9% |
| Witcher 3 ultra * (Watt) | 69.7 | 155.2 -123% | 49.3 29% | 132.2 -90% | 74.6 -7% | 93.1 -34% | 68.8 1% | ||
| Load Maximum * (Watt) | 108 | 172 -59% | 66 39% | 181.9 -68% | 134.7 -25% | 112 -4% | 108 -0% | 176.3 ? -63% | 113.5 ? -5% |
* ... smaller is better
Power consumption Witcher 3 / Stress test
Power consumption with an external monitor
电池寿命
在WLAN测试(通过脚本调用网站)和视频测试(短片《Big Buck Bunny》,H.264编码,FHD,循环播放)中,16英寸笔记本的运行时间分别为9:36小时和13:23小时。在这两项测试中,笔记本的节能功能被禁用,显示亮度被设置为大约150cd/m²。在视频测试中,无线模块也被禁用。
| Samsung Galaxy Book3 Ultra 16 i7-13700H, GeForce RTX 4050 Laptop GPU, 76 Wh | Schenker Vision 16 Pro RTX 3070 Ti i7-12700H, GeForce RTX 3070 Ti Laptop GPU, 80 Wh | LG Gram 17Z90Q-E.AD78G i7-1260P, GeForce RTX 2050 Mobile, 90 Wh | Lenovo ThinkBook 16p G3 ARH R9 6900HX, GeForce RTX 3060 Laptop GPU, 71 Wh | Dell XPS 15 9520 RTX 3050 Ti i7-12700H, GeForce RTX 3050 Ti Laptop GPU, 86 Wh | Asus VivoBook Pro 16X OLED N7600PC-L2026X i7-11370H, GeForce RTX 3050 4GB Laptop GPU, 96 Wh | Acer Swift X SFX16-52G-77RX i7-1260P, A370M, 56 Wh | Average of class Multimedia | |
|---|---|---|---|---|---|---|---|---|
| Battery runtime | -40% | 37% | -32% | 17% | -3% | -22% | 21% | |
| Reader / Idle (h) | 18.2 | 14.8 -19% | 11.1 -39% | 24.9 ? 37% | ||||
| H.264 (h) | 13.4 | 6.1 -54% | 10.4 -22% | 17.1 ? 28% | ||||
| WiFi v1.3 (h) | 9.6 | 6 -37% | 14.5 51% | 6.5 -32% | 8.8 -8% | 8.7 -9% | 9.1 -5% | 12.2 ? 27% |
| Load (h) | 1.8 | 1.3 -28% | 2.2 22% | 3.2 78% | 2.5 39% | 1.1 -39% | 1.664 ? -8% |
Pros
Cons
结论 - 一个成功的妥协
Galaxy Book3 Ultra 16是性能、移动性和人体工程学之间的一个很好的妥协。它的 酷睿i7-13700H和 GeForce RTX 4050笔记本电脑运行时性能降低,但仍然为FHD游戏和渲染提供足够的动力。
三星在Galaxy Book3 Ultra 16中为游戏玩家和创意工作者提供了一款移动笔记本。但过高的价格标签给这台笔记本电脑原本强大的特性蒙上了一层阴影。
这款紧凑的设备重量不大,只有1.8公斤。结合9至13小时的实用电池寿命,你的手上有一个相当移动的设备。噪音和热量的发展是适度的。两个USB-C插槽(Thunderbolt 4)用于供电,能够轻松整合到现有的工作场所设置中。
16英寸的大屏幕(2880×1800,OLED)采用适合工作的16:10格式,亮度高,对比度好,视角稳定,响应时间短,色彩还原度高,色彩空间覆盖度非常好。缺点是:该面板有一个反射表面,而且它还使用PWM来实现所有的亮度水平--一台2399.99美元的设备应该在这里提供更多的东西。
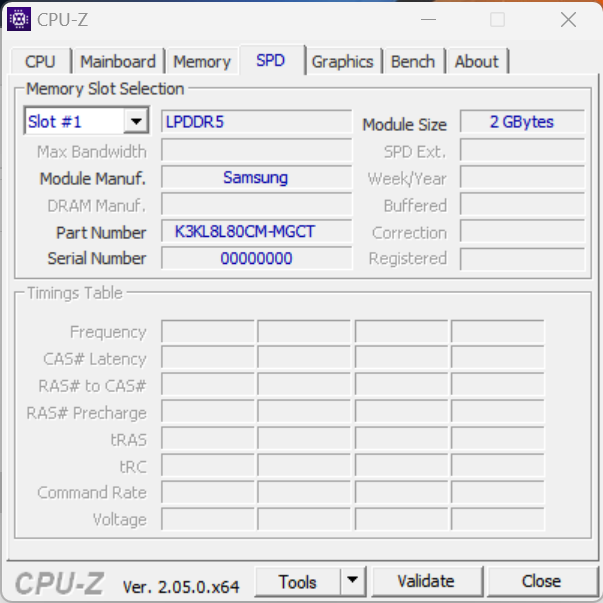
内存也有点薄,只有16GB。像Galaxy Book这样的设备应该在这里提供32GB,特别是由于内存(板载)不能扩展。至少有更高价位的32GB机型可供选择。
这款 申克Vision 16 Pro可以考虑作为一个替代品。它提供更多的图形性能和可扩展的内存,但在运行时间和排放方面处于劣势。这款 华硕VivoBook Pro 16X OLED(约1,400美元)和 Acer Swift X 16(约1,100美元)是三星电脑的便宜和较弱的替代品。它们的性能较差,运行时间偶尔较短,并有永久焊接的工作存储器。
价格和可用性
我们测试设备的配置可通过 英国亚马逊和 加拿大亚马逊分别为2449.00英镑和2799.99加元。在美国,1TB似乎是三星网站上的最低配置,起价为2399.99美元。
Samsung Galaxy Book3 Ultra 16
- 04/26/2023 v7 (old)
Sascha Mölck
Transparency
The selection of devices to be reviewed is made by our editorial team. The test sample was provided to the author as a loan by the manufacturer or retailer for the purpose of this review. The lender had no influence on this review, nor did the manufacturer receive a copy of this review before publication. There was no obligation to publish this review. As an independent media company, Notebookcheck is not subjected to the authority of manufacturers, retailers or publishers.
This is how Notebookcheck is testing
Every year, Notebookcheck independently reviews hundreds of laptops and smartphones using standardized procedures to ensure that all results are comparable. We have continuously developed our test methods for around 20 years and set industry standards in the process. In our test labs, high-quality measuring equipment is utilized by experienced technicians and editors. These tests involve a multi-stage validation process. Our complex rating system is based on hundreds of well-founded measurements and benchmarks, which maintains objectivity. Further information on our test methods can be found here.
Price comparison

