Medion Erazer Crawler E40 笔记本电脑评测:经济实惠的游戏玩家,RTX 4050 性能卓越

Medion Erazer Crawler E40 取代了 E30(采用英特尔 Gen12 和 RTX 30xx),并通过英特尔 Gen 13 和 RTX 4050 将该系列提升到当前的技术水平。这款入门级游戏笔记本电脑目前的售价略低于 1100 美元。
与其他经济型游戏笔记本电脑相比,Medion Erazer Crawler E40 面临的竞争对手包括 联想 LOQ 15、华硕 华硕 TUF GAMING A15、 XMG Apex 15或 微星卡塔纳 15.
Medion 在 "Erazer "品牌下包含了众多型号,这使得对它们进行跟踪具有挑战性。其他制造商会将不同配置的产品组合在同一机箱中,形成一个系列,而 Medion 似乎认为每种配置都应该有一个新的系列名称。Erazer Crawler E40 只有这一种特定配置,因此只作为这一种型号销售。没有关于 CPU、GPU 或显示器的选项。
我们之前测试过的其他 Medion Erazer 型号包括
潜在的竞争对手比较
Rating | Date | Model | Weight | Height | Size | Resolution | Price |
|---|---|---|---|---|---|---|---|
| 85.4 % v7 (old) | 12 / 2023 | Medion Erazer Crawler E40 - MD 62518 i5-13500H, GeForce RTX 4050 Laptop GPU | 2.3 kg | 28 mm | 15.60" | 1920x1080 | |
| 85.9 % v7 (old) | 10 / 2023 | Lenovo LOQ 15IRH8 Core i7 i7-13620H, GeForce RTX 4050 Laptop GPU | 2.4 kg | 25.2 mm | 15.60" | 2560x1440 | |
| 86.3 % v7 (old) | 06 / 2023 | Asus TUF A15 FA507 R7 7735HS, GeForce RTX 4050 Laptop GPU | 2.2 kg | 24.9 mm | 15.60" | 1920x1080 | |
| 86.2 % v7 (old) | 10 / 2023 | Schenker XMG Apex 15 (Late 23) R7 7840HS, GeForce RTX 4050 Laptop GPU | 2.2 kg | 26.7 mm | 15.60" | 2560x1440 | |
| 82.9 % v7 (old) | 03 / 2023 | MSI Katana 15 B12VEK i7-12650H, GeForce RTX 4050 Laptop GPU | 2.3 kg | 24.9 mm | 15.60" | 1920x1080 |
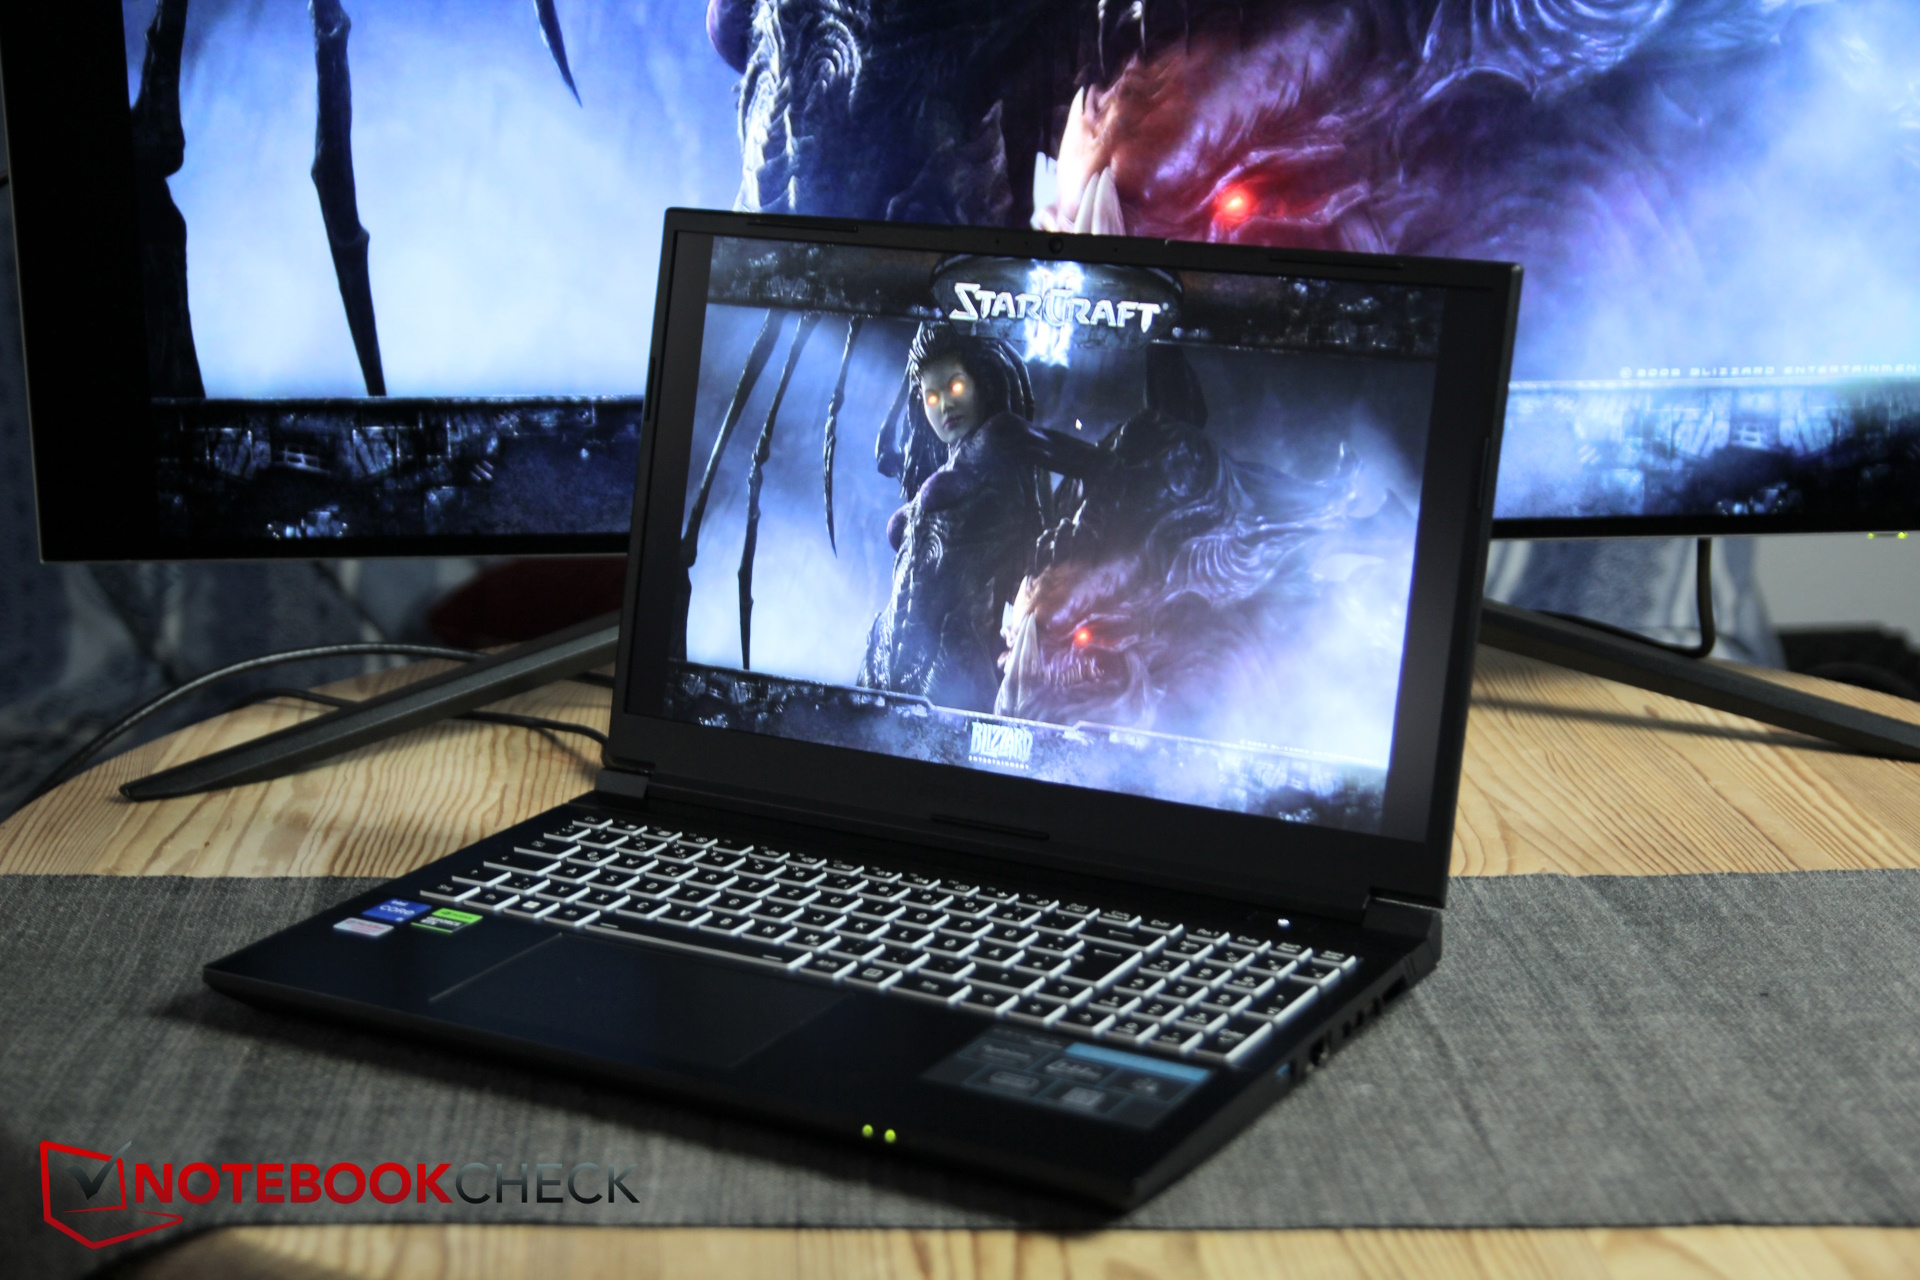
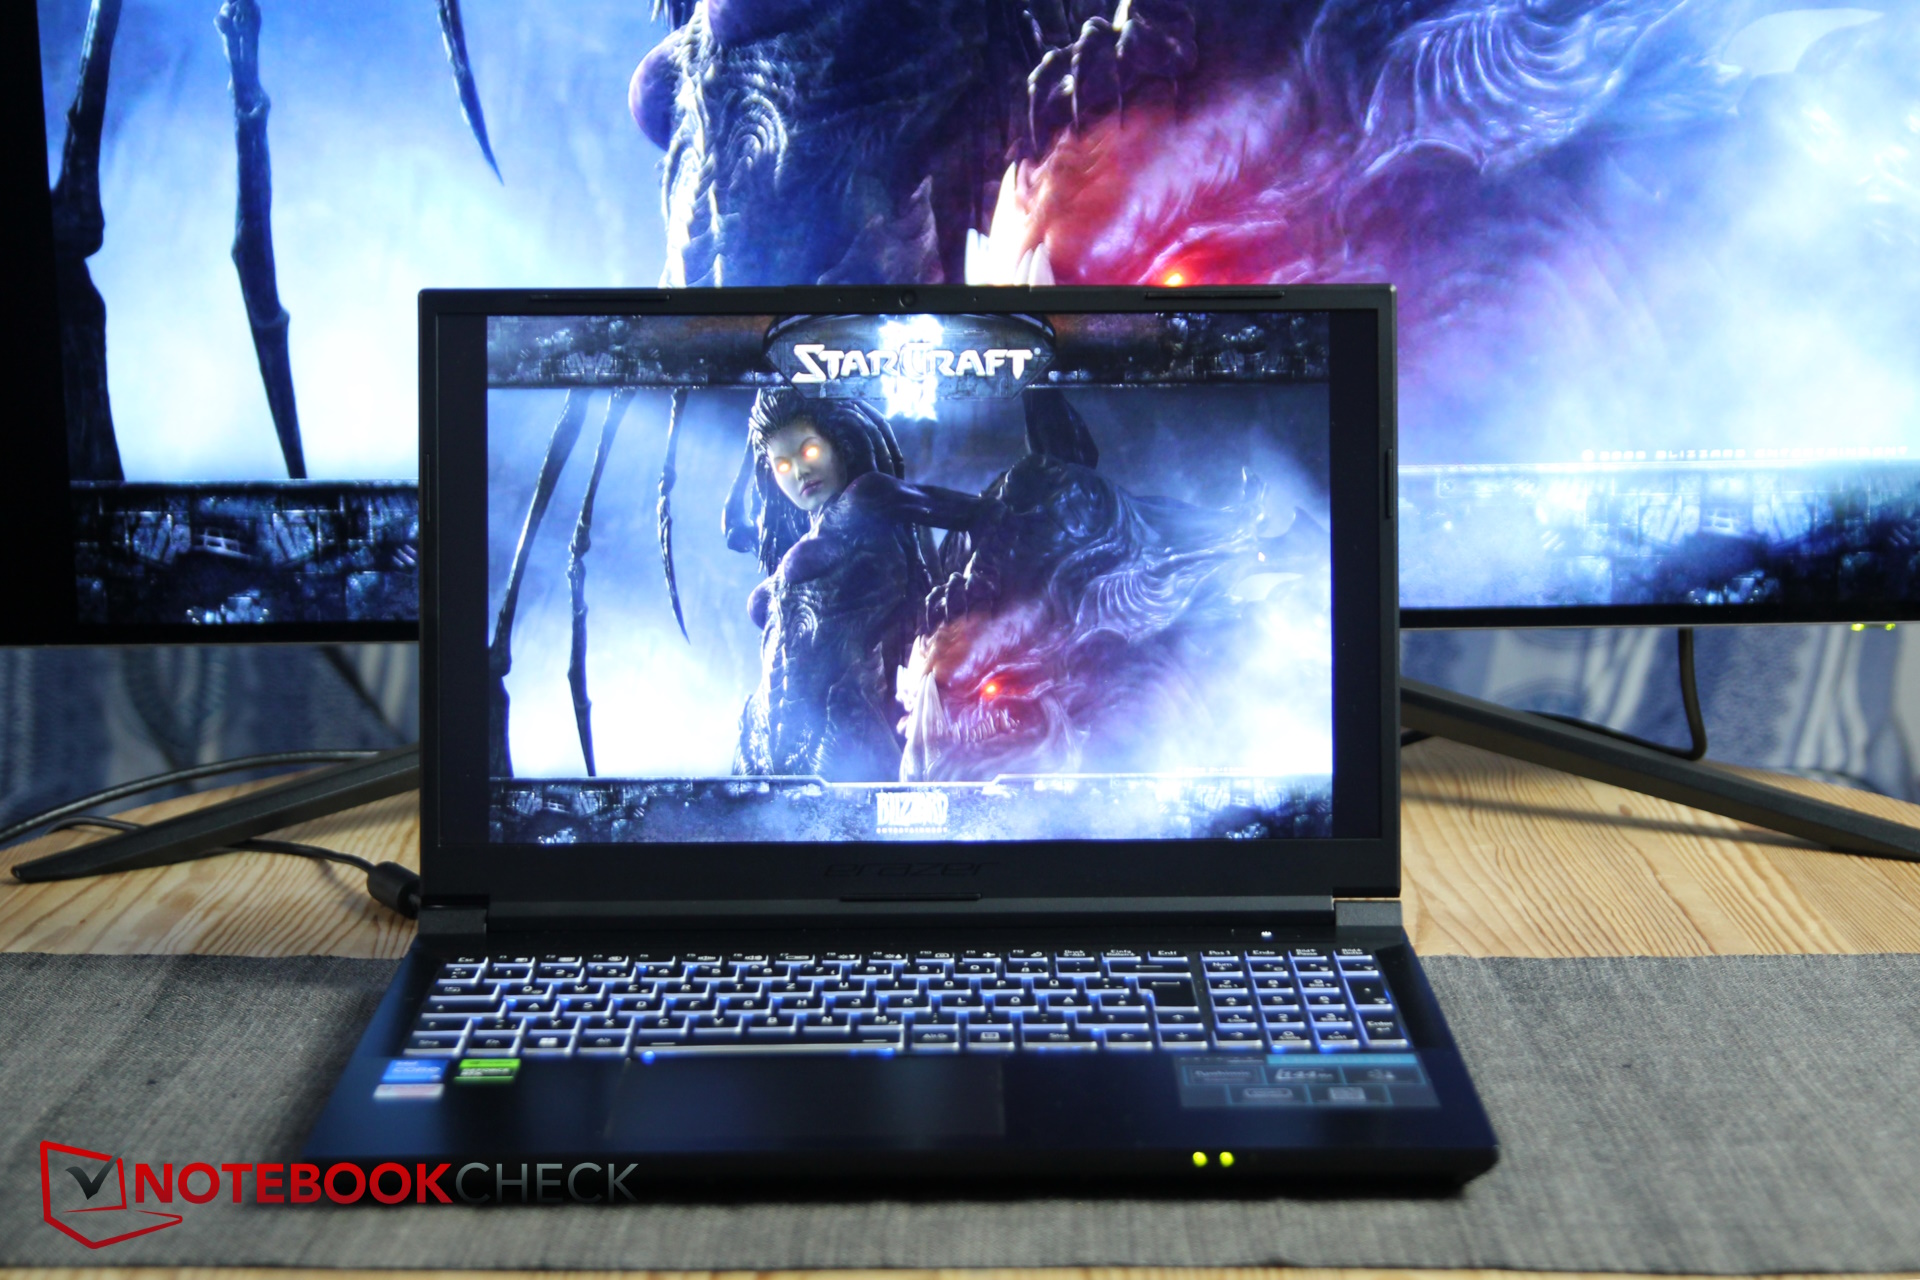
外壳和连接 - 拉丝塑料外壳的 Crawler E40
显示屏的盖子和底座由坚固的塑料制成,与铝合金非常相似,给人一种有意为之的感觉。显示屏边缘和笔记本底部由软质塑料制成。光滑的盖子和底座都很容易沾染指纹。
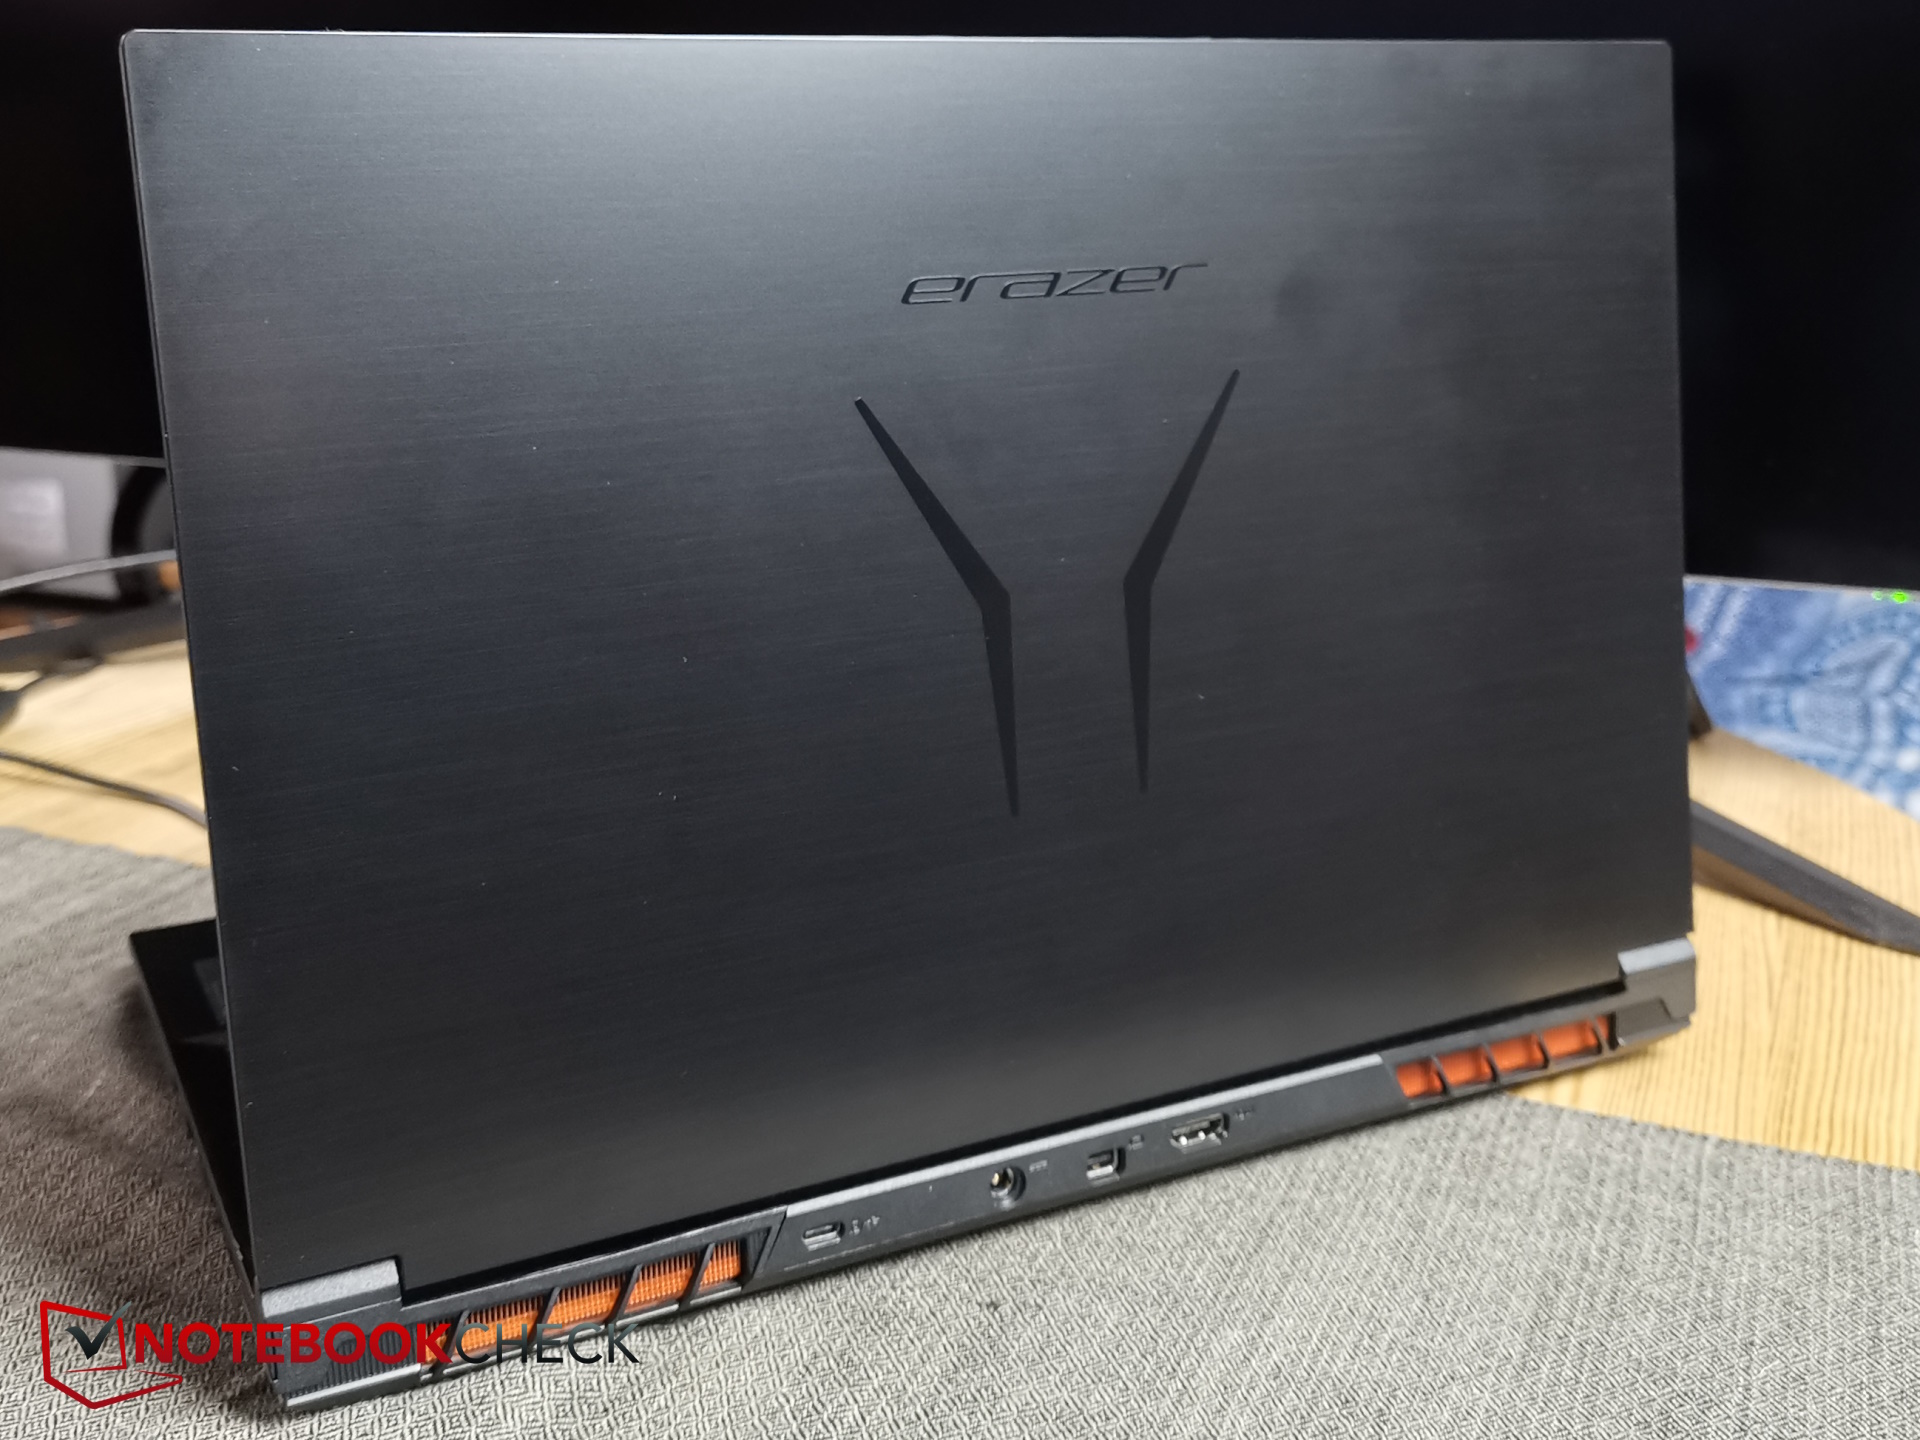
这款笔记本电脑采用全黑色设计,包括盖子上的 Erazer 徽标,具有相对简洁的美感。底座具有较高的抗扭转能力,而机盖虽然抗扭转能力较弱,但却显得非常 "柔软",在扭转时会产生较大的弯曲,而显示屏却能很好地承受。整体工艺水平良好,没有明显的缝隙。
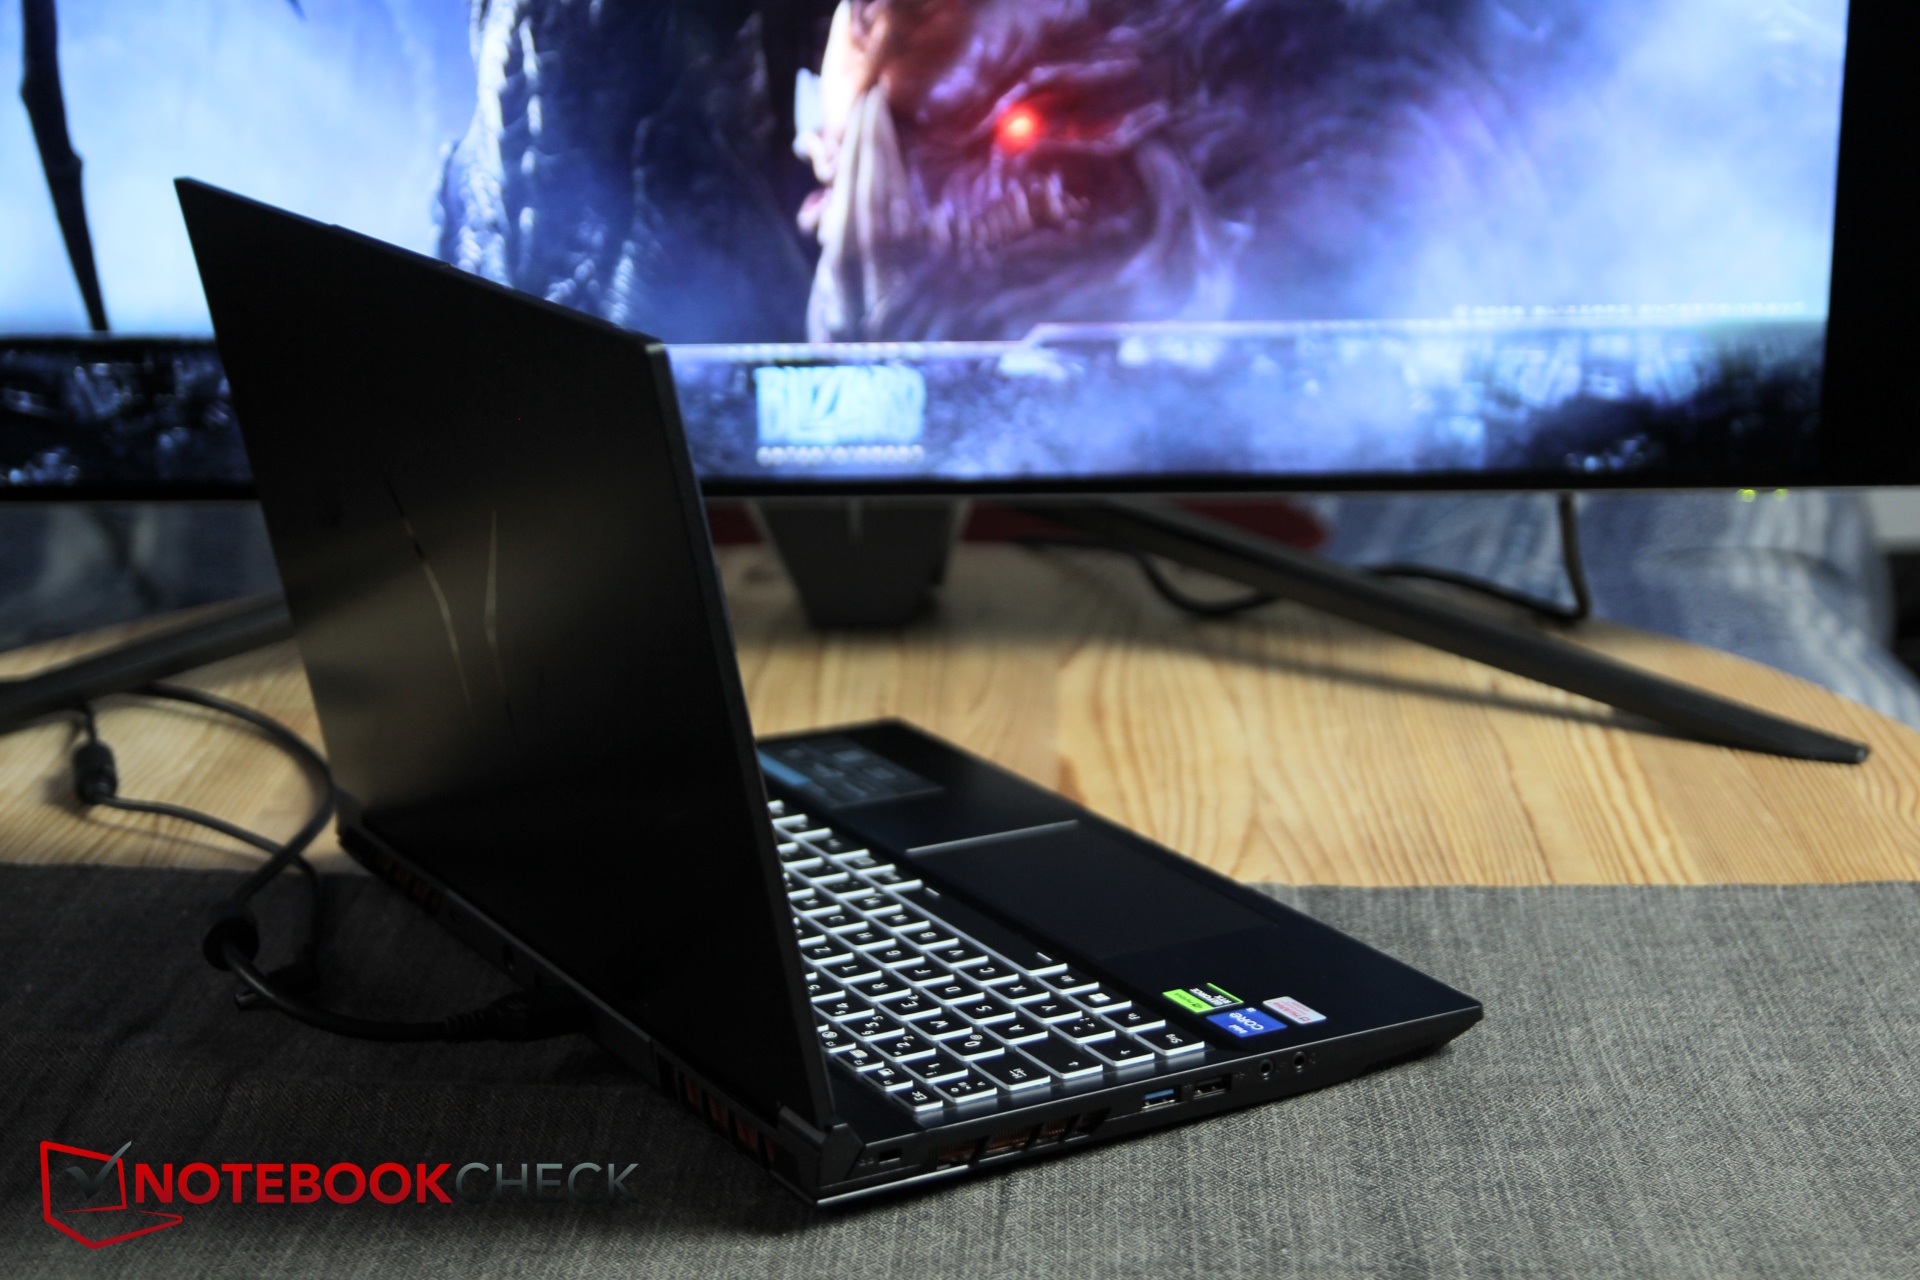
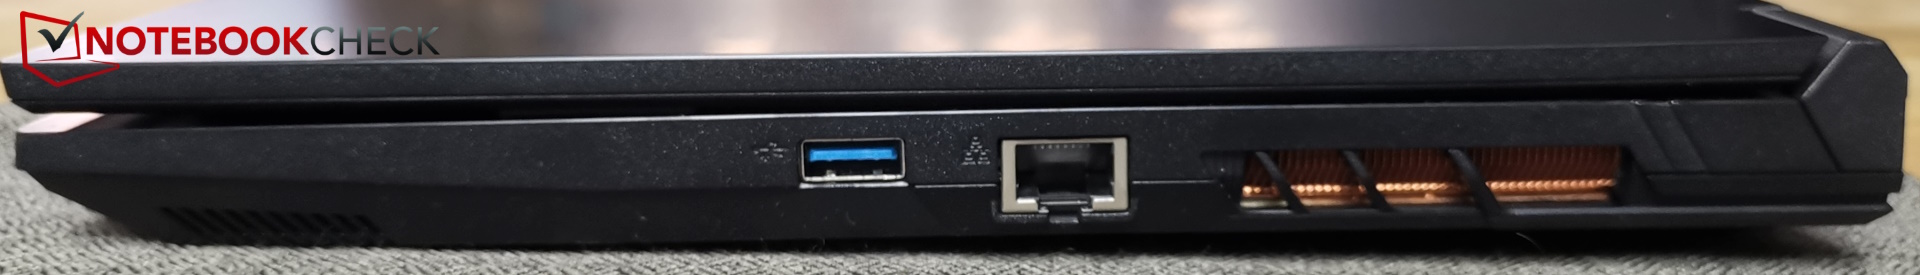
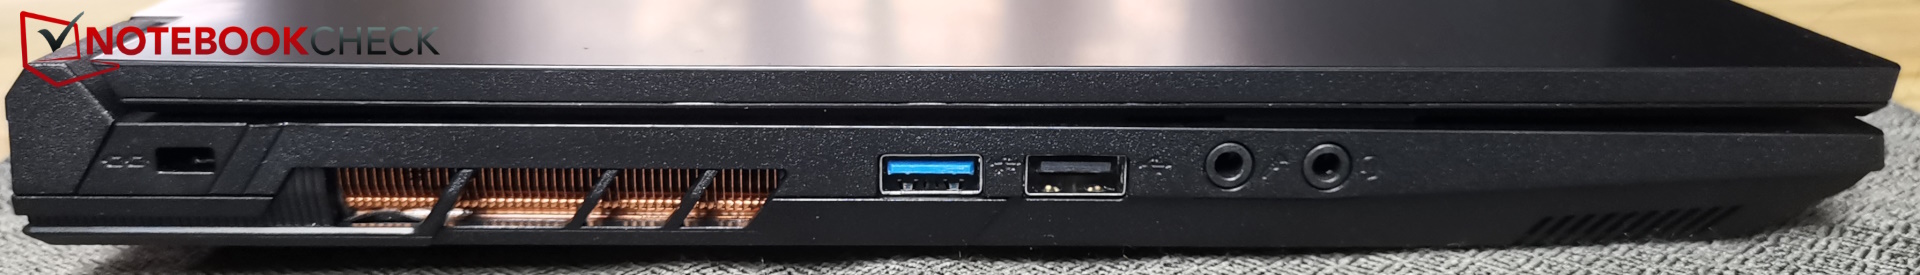
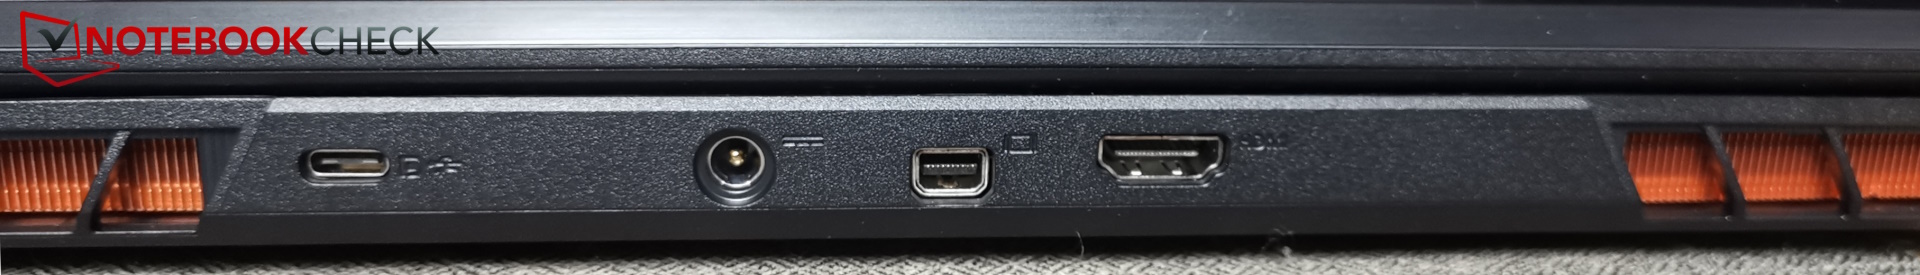
连接 - 没有 Thunderbolt,而是 USB 2.0
尽管 E40 配备了英特尔 CPU,但不支持 Thunderbolt。它包括速度为 10 Gb/s 的 USB-C。不过,它还配备了一个过时的 USB-A 2.0 端口,有可能升级为速度更快的替代端口。值得注意的是,它没有读卡器。


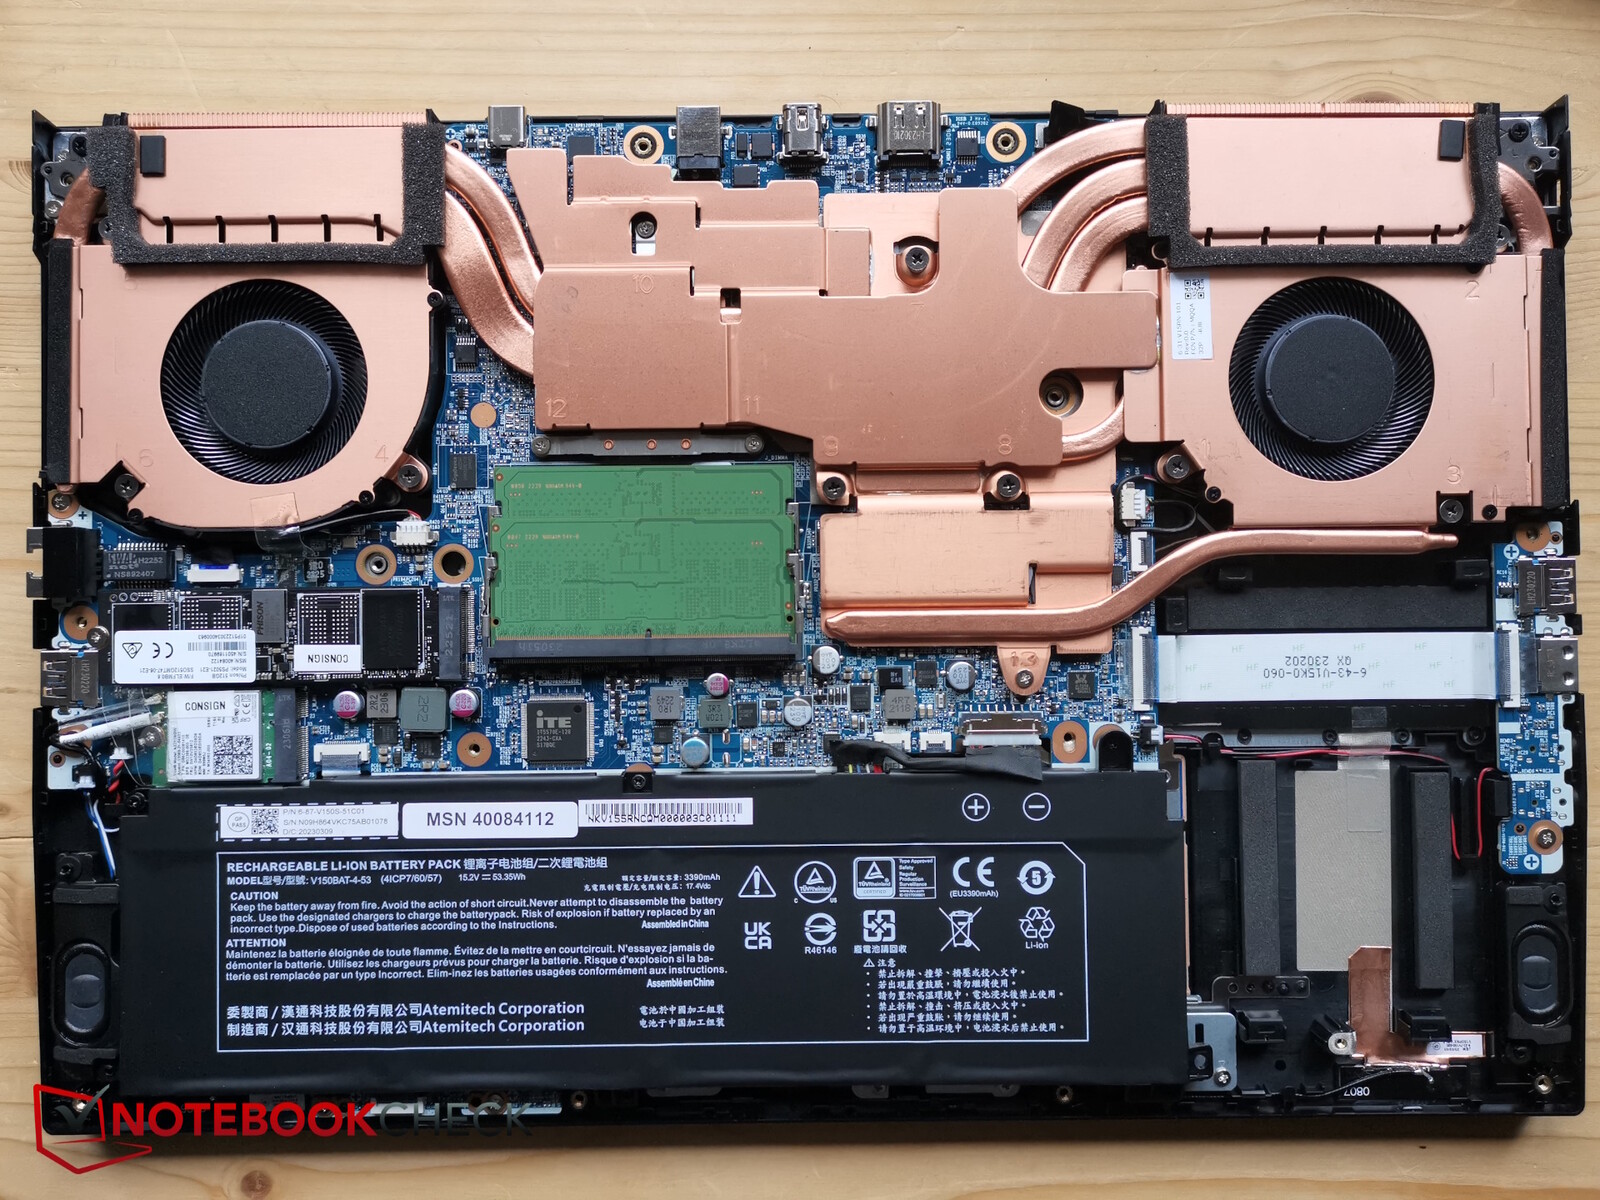
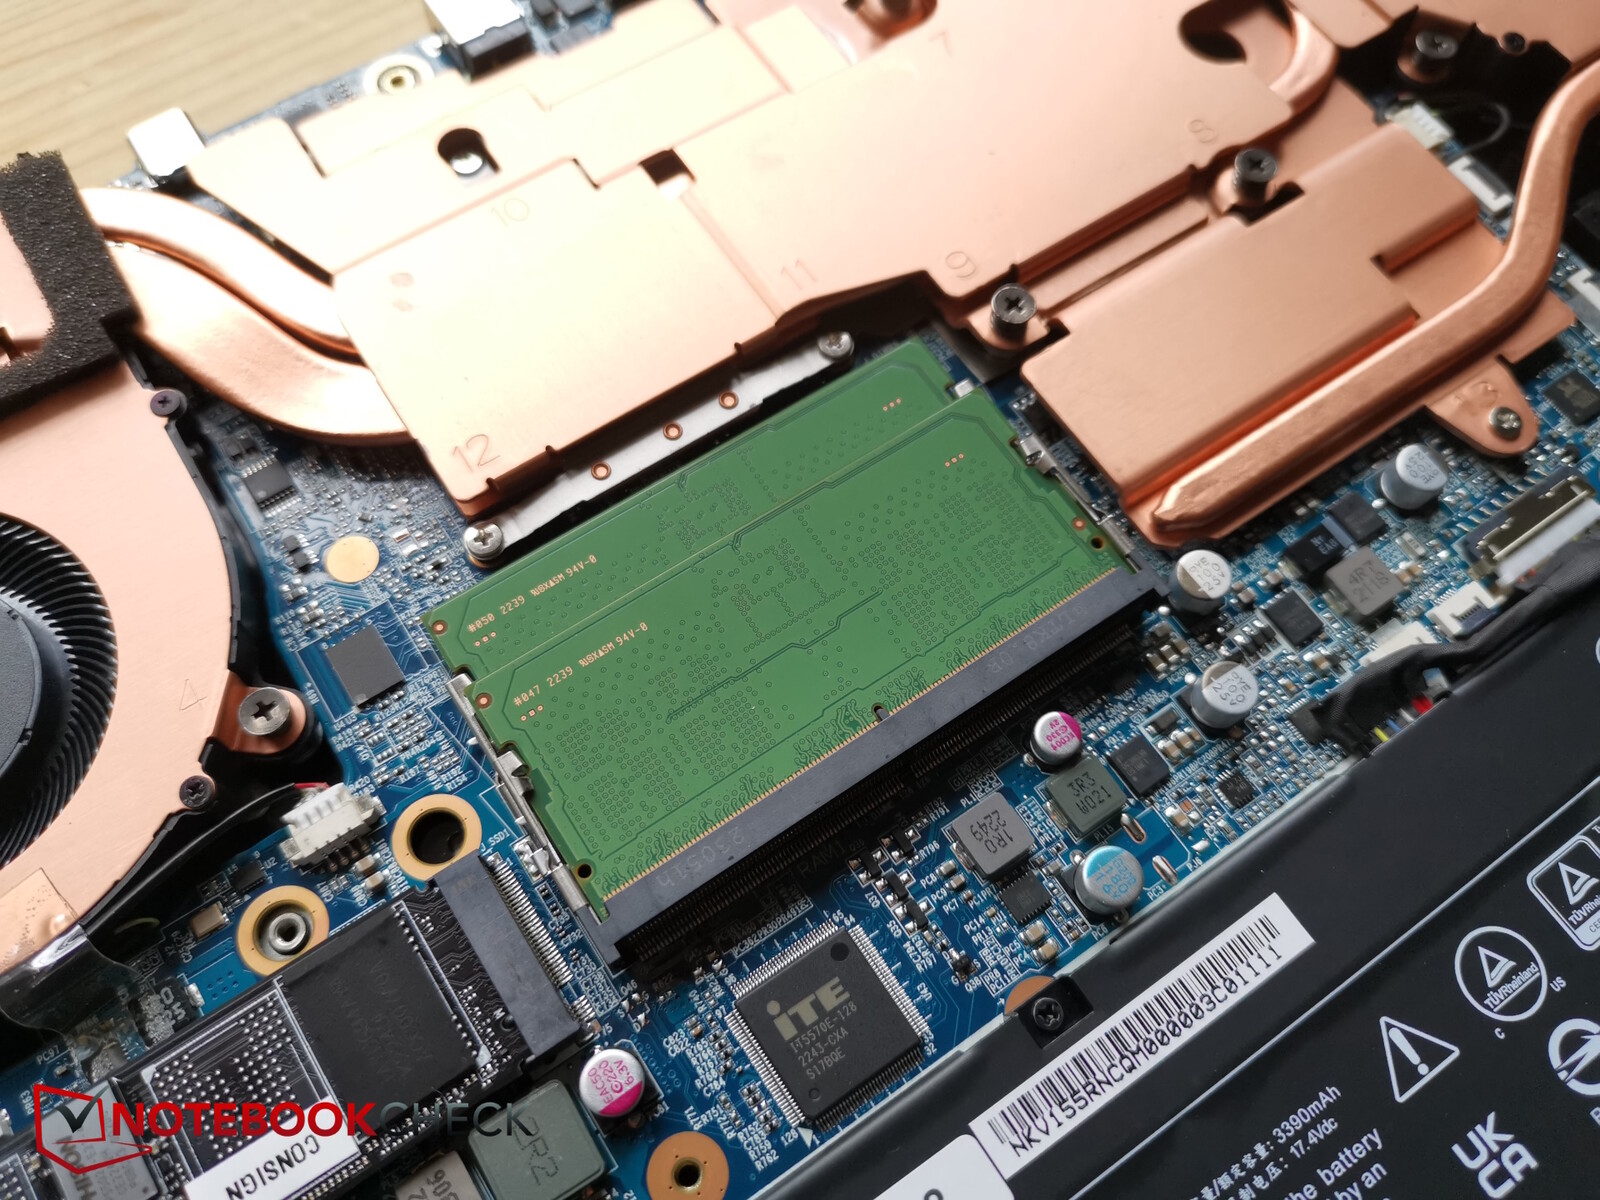
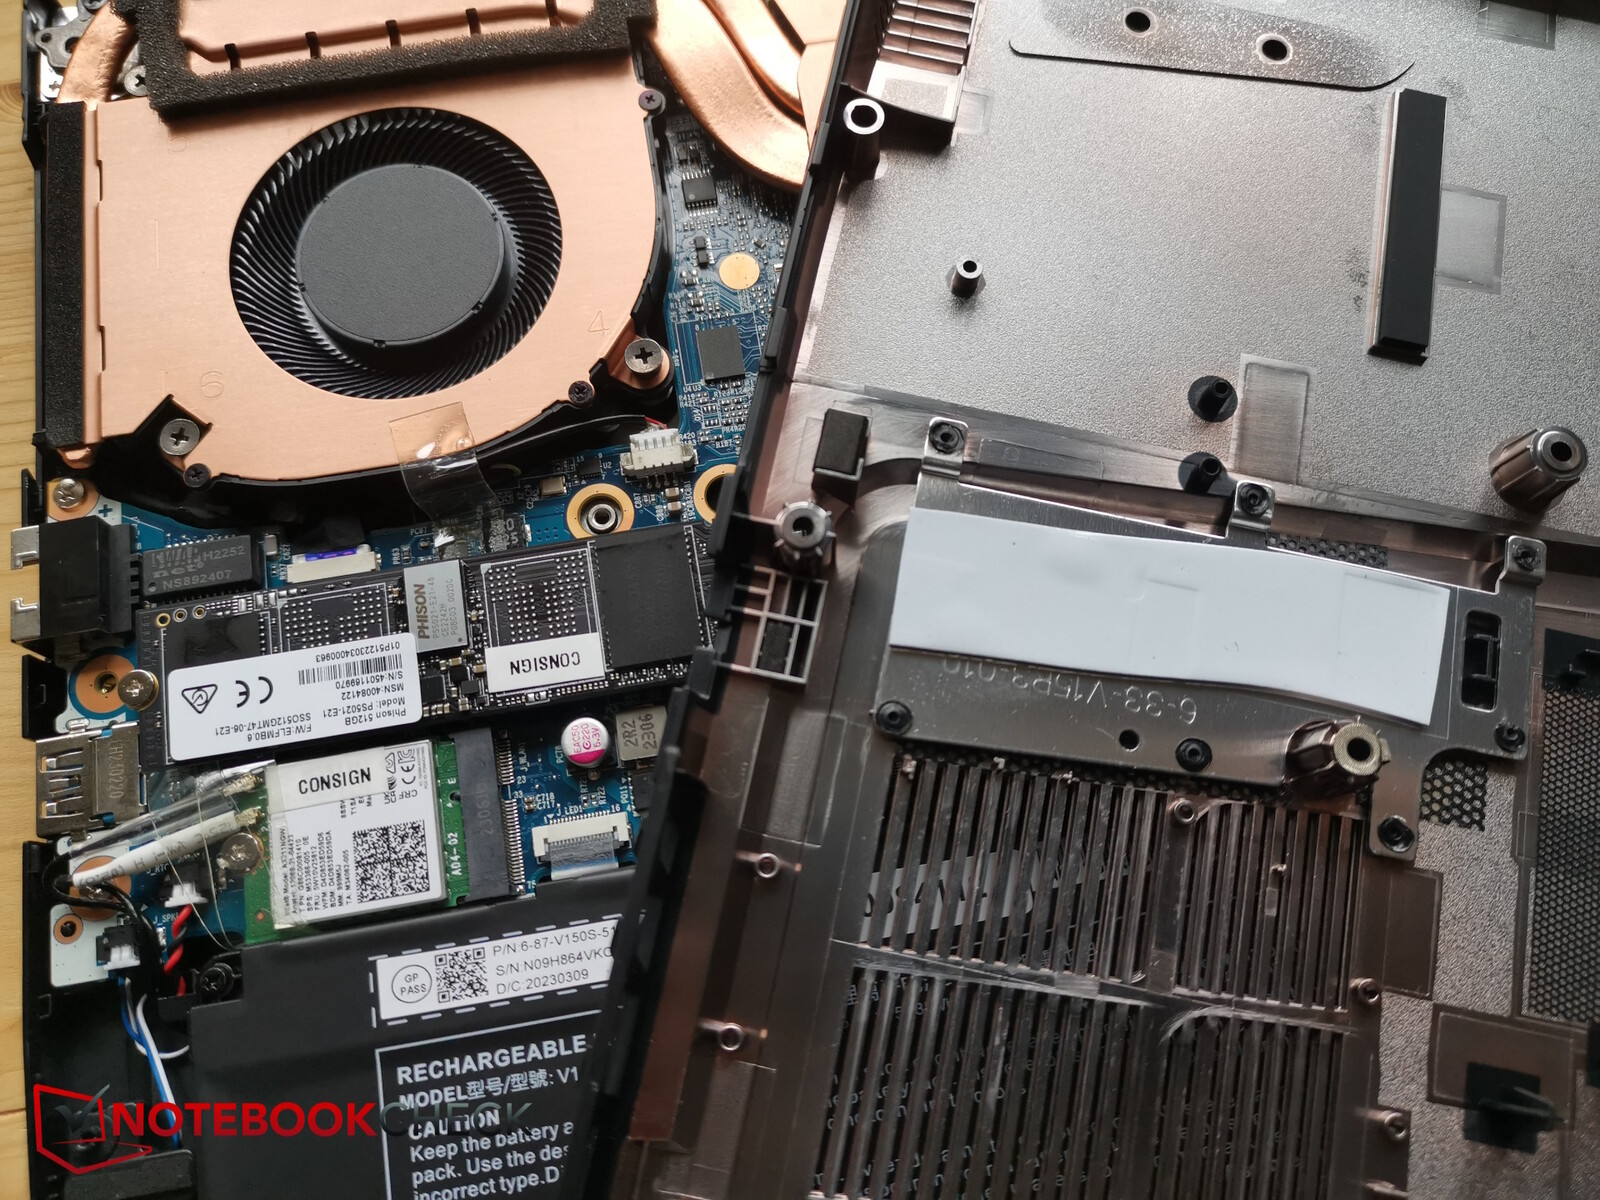
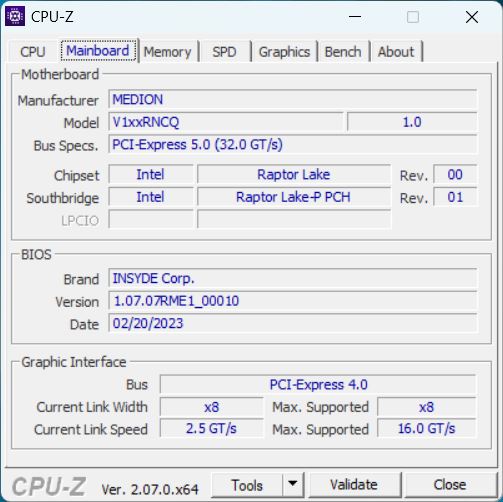
维护
要进入内部组件,需要卸下 14 颗相同大小的十字螺丝。然后就可以轻松撬开塑料底板。在底板下面,你会看到一个含有大量铜的冷却系统、一个螺丝固定的电池、两个内存插槽、由两个垫片冷却的固态硬盘以及可更换的 WiFi 模块。
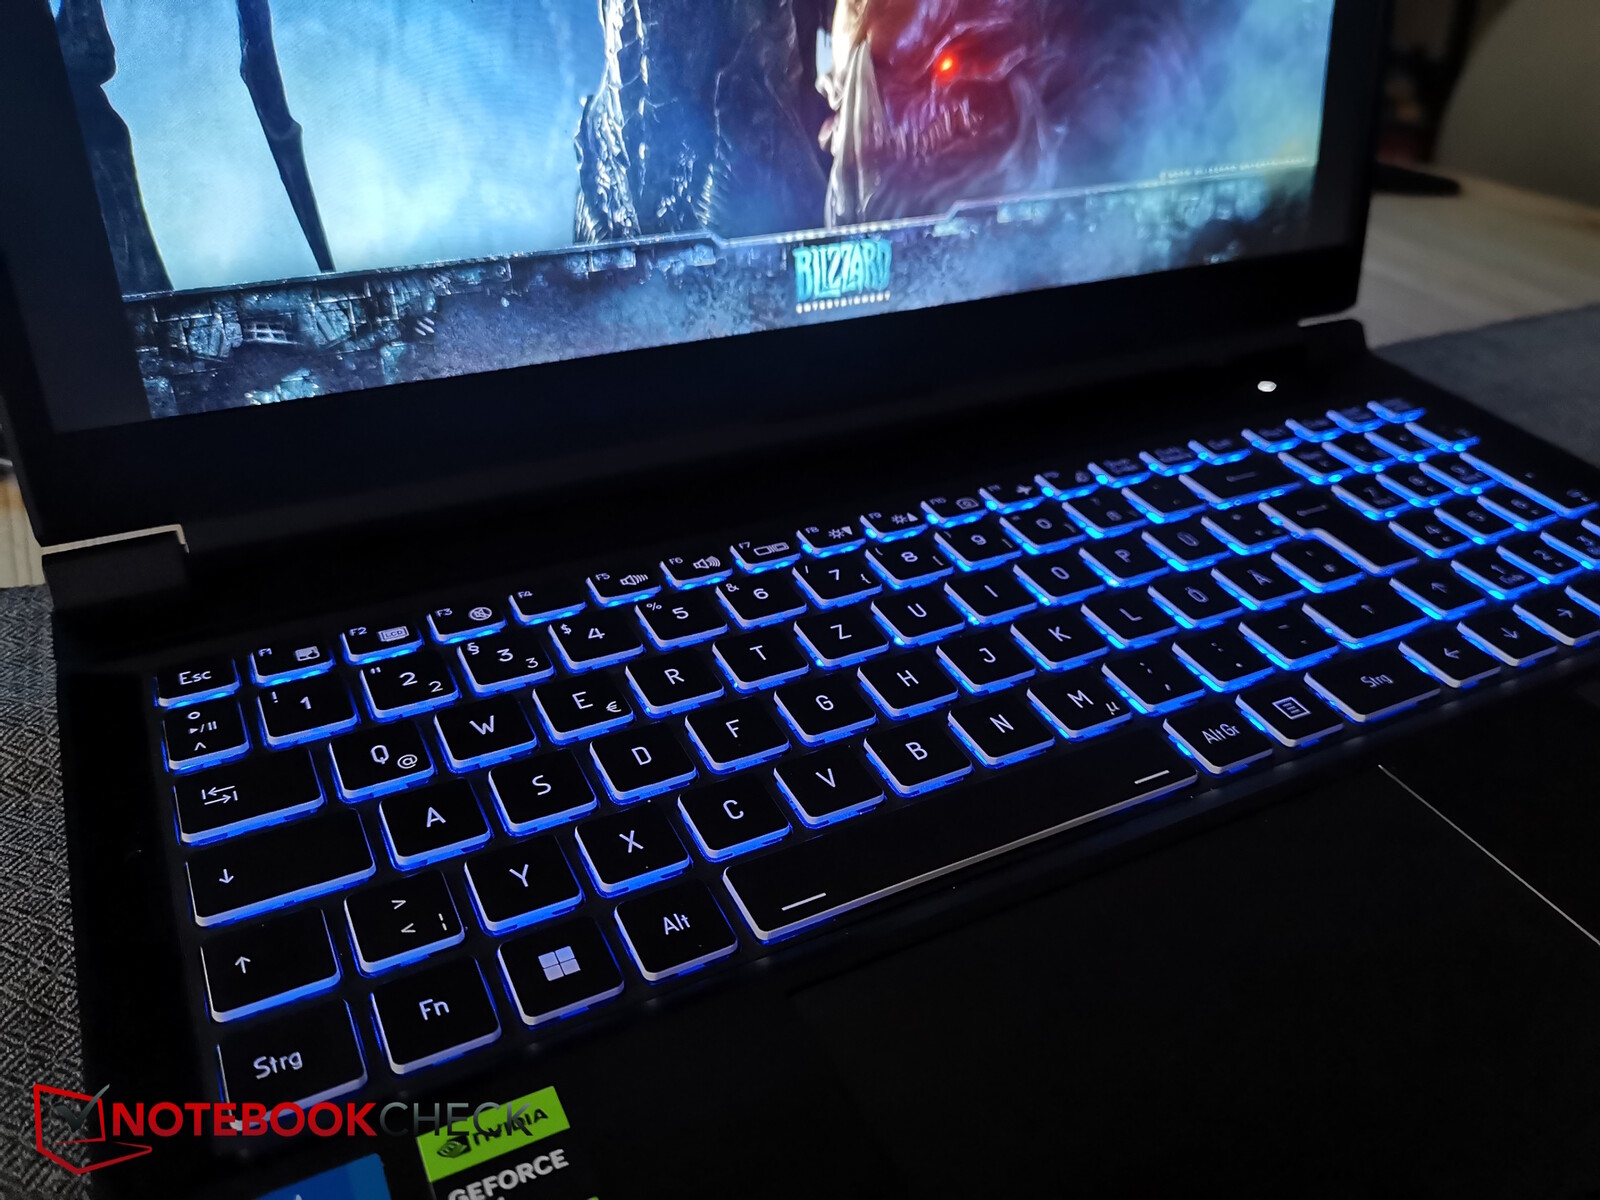
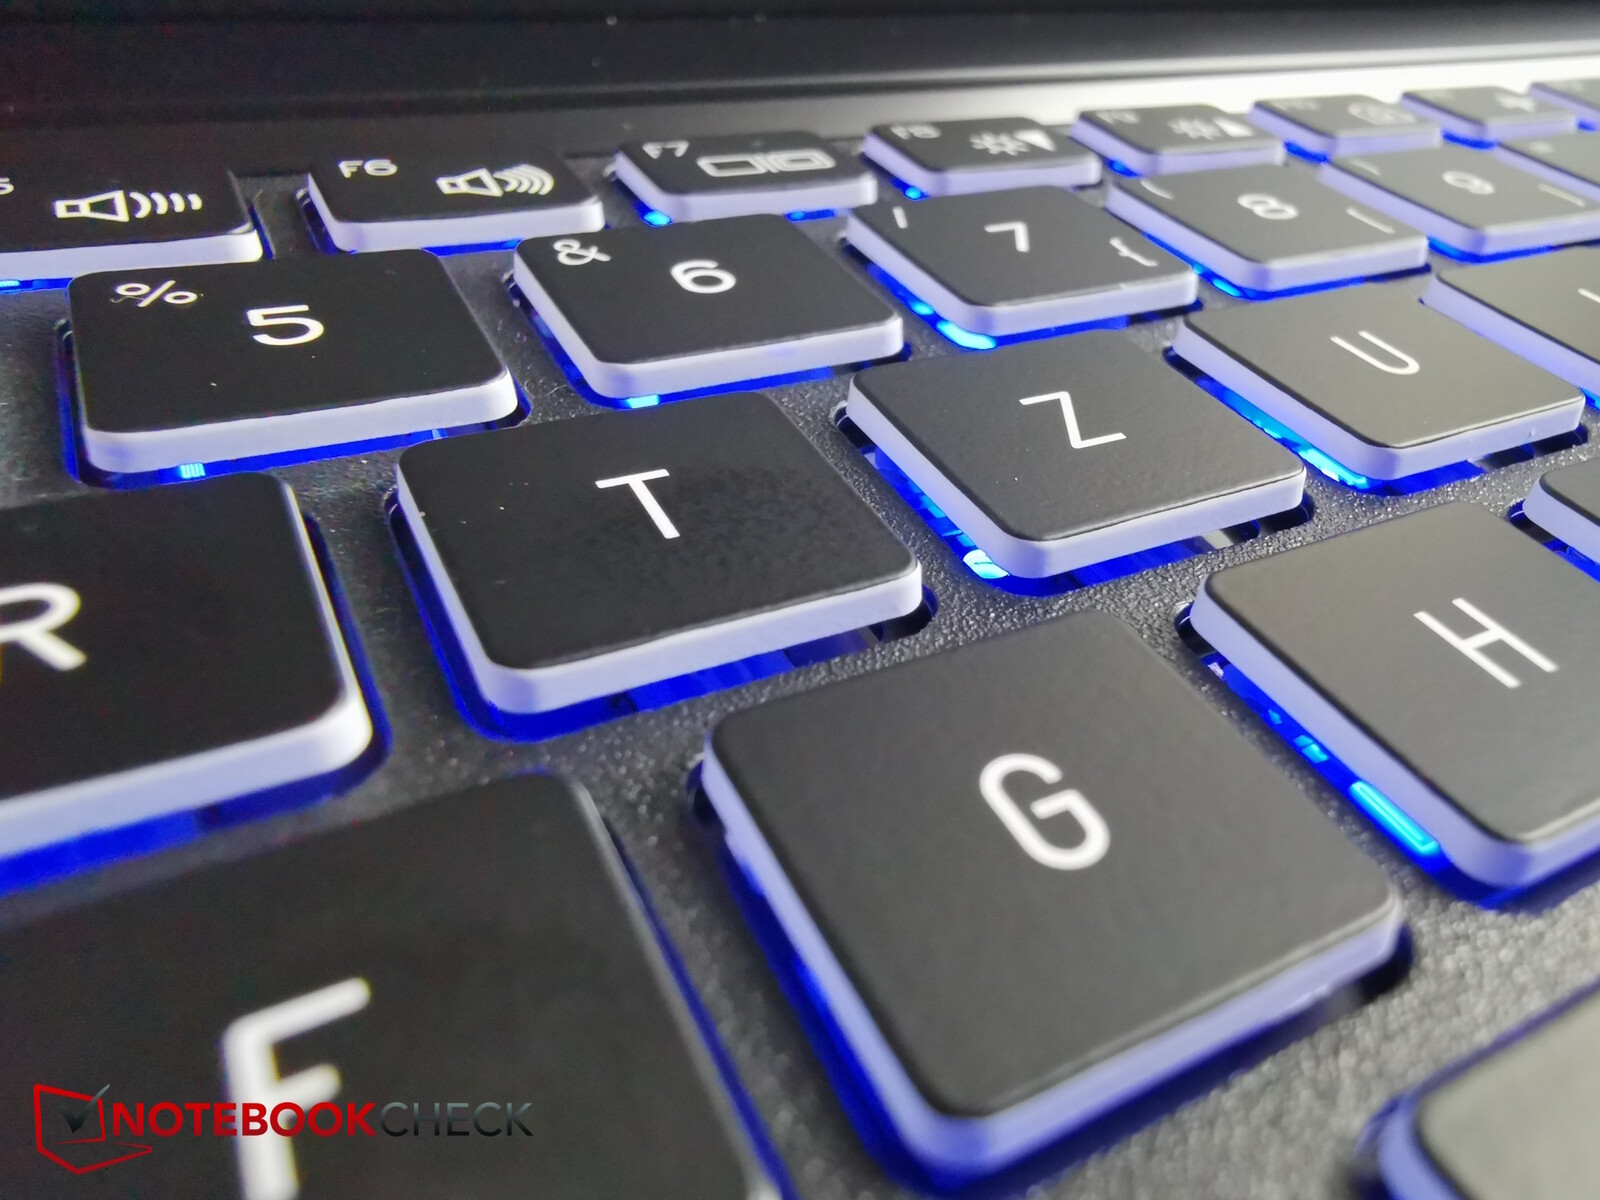
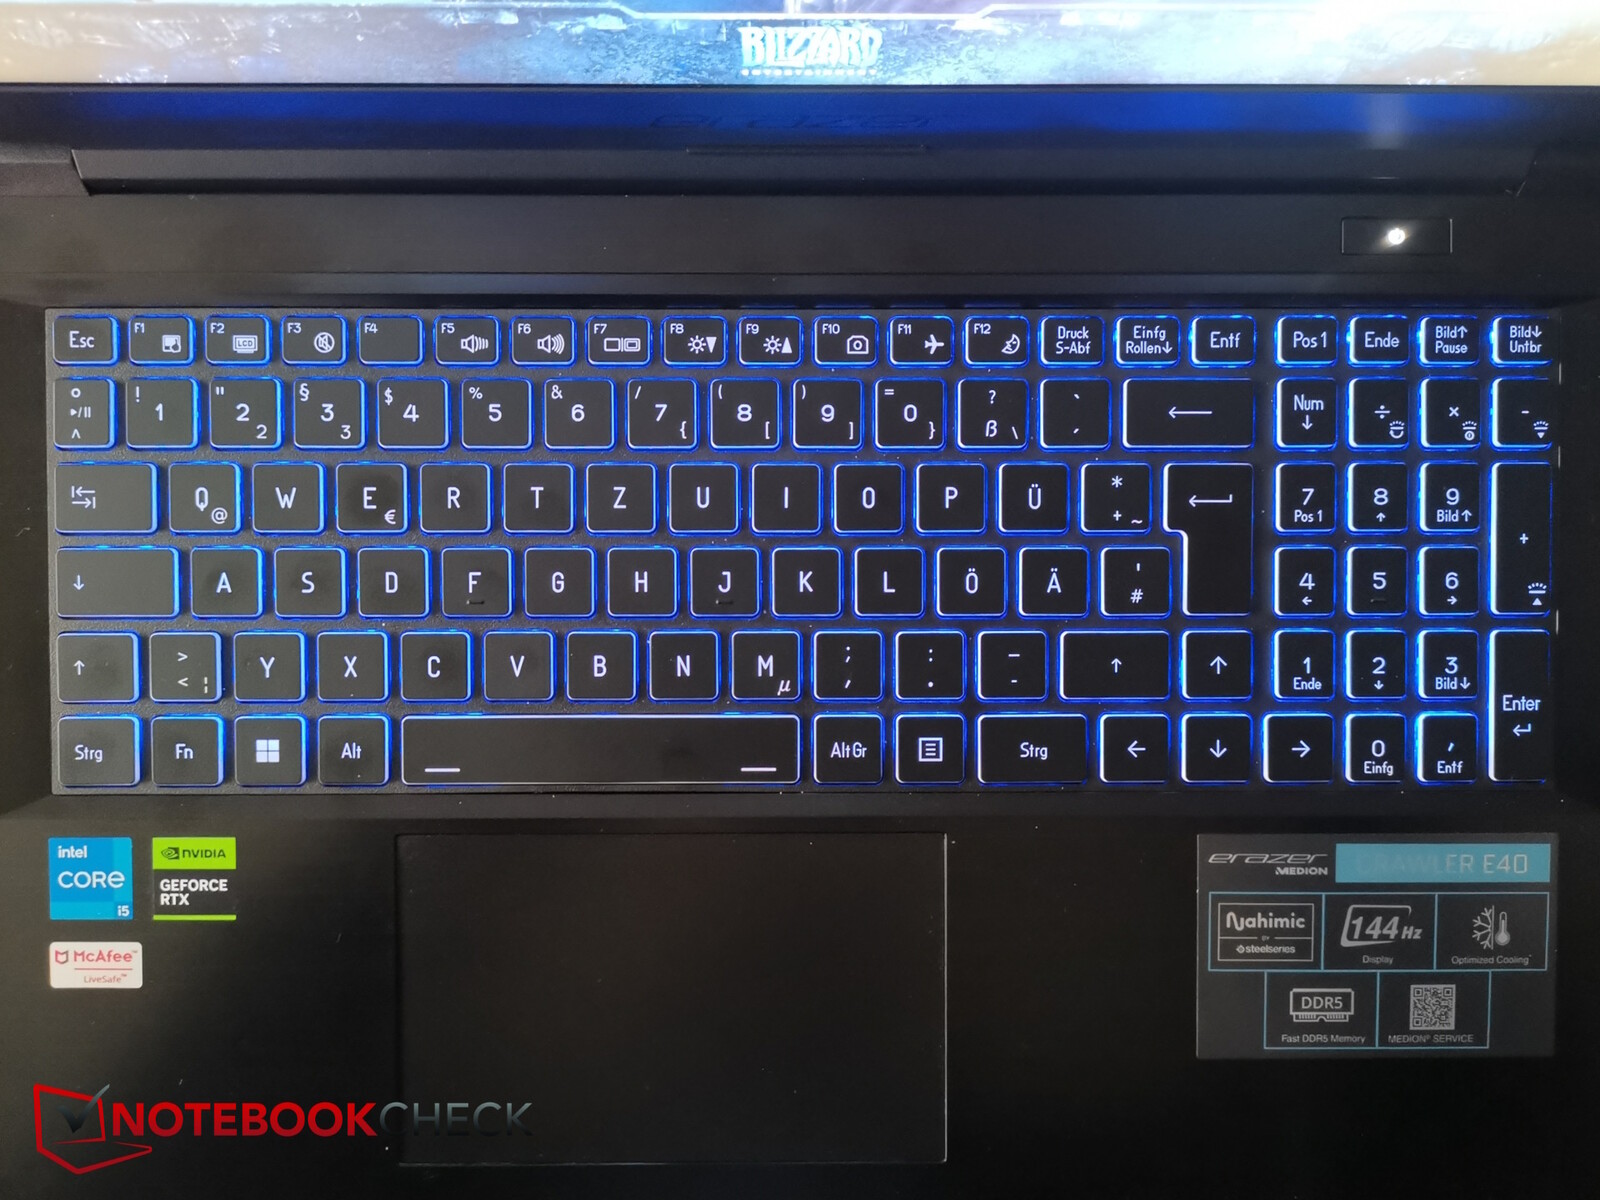
输入设备 - 总体稳固
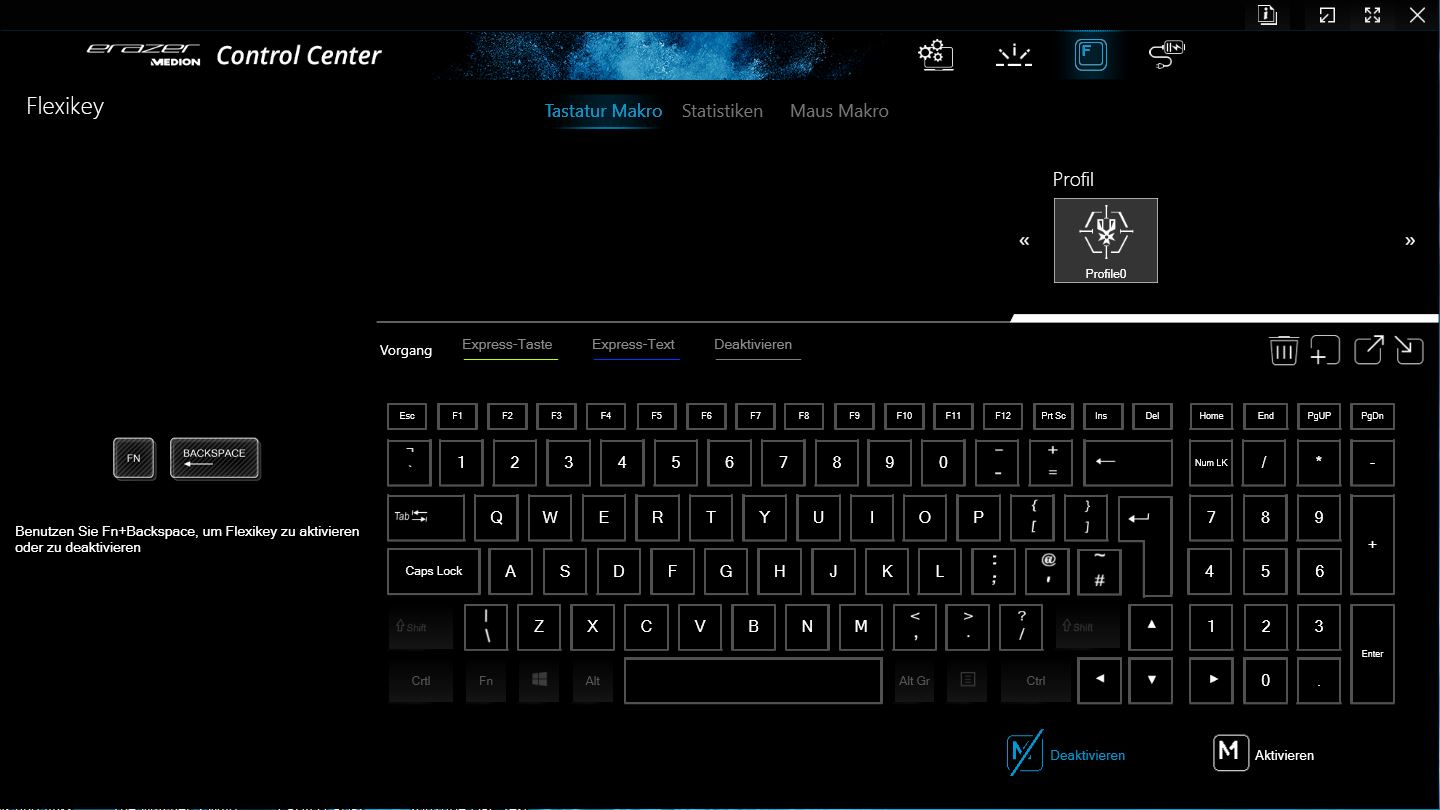
键盘布局与今年评测的其他 Medion 设备一样,非常简洁。不过,键盘的按键较小(1.4 厘米),但间距适当。右侧是数字键盘,按键更小。
键程一般,反馈有点软。
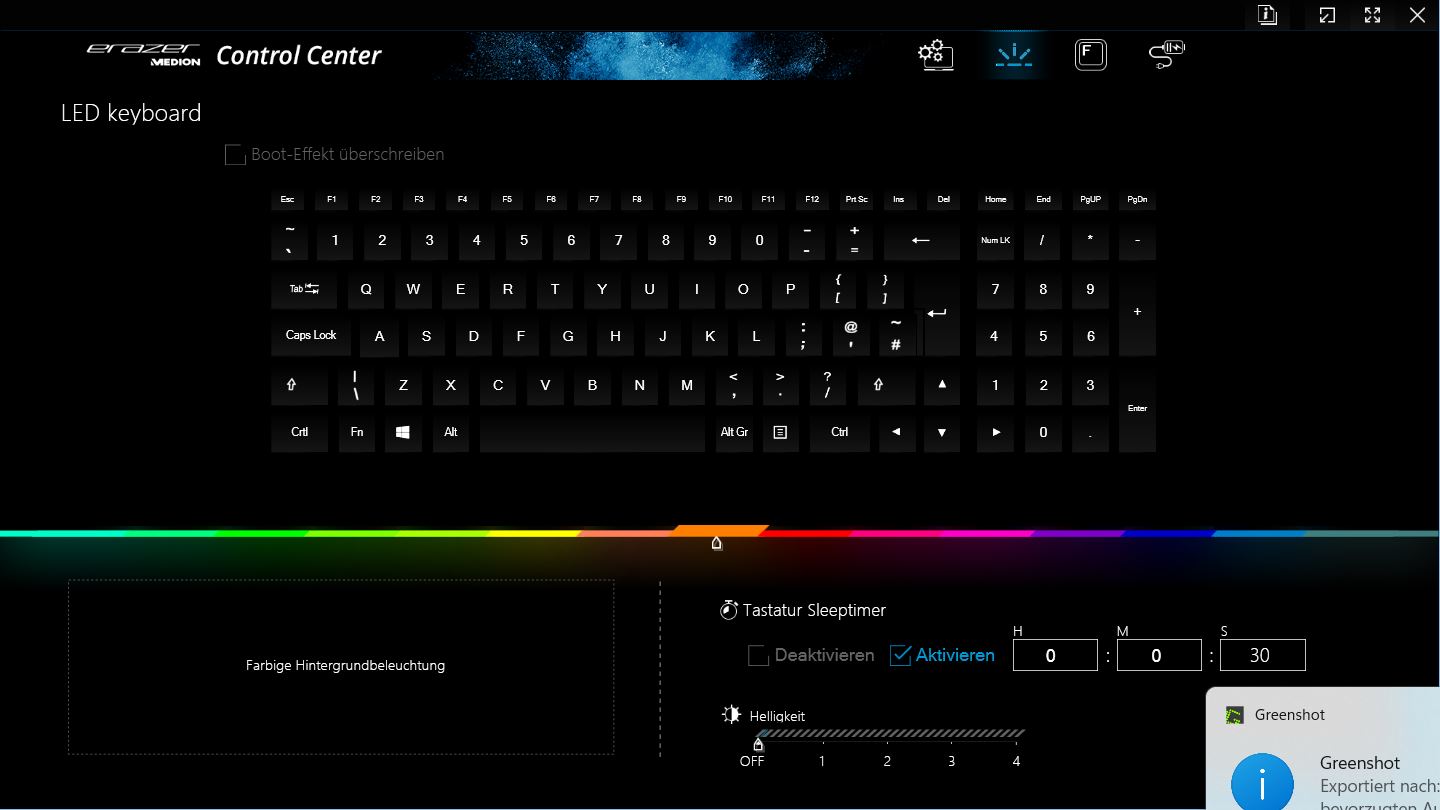
两段式 RGB 背光可通过控制中心进行配置(多种颜色),并可通过特殊按键进行控制,在黑暗环境中也能发挥作用。但这只是单区。
触摸板(约 12.1 x 7.3 厘米)略微偏向左侧,以便尽可能位于数字键盘下其他按键的中央。表面很滑,但并不安静的咔哒声显得有些廉价。
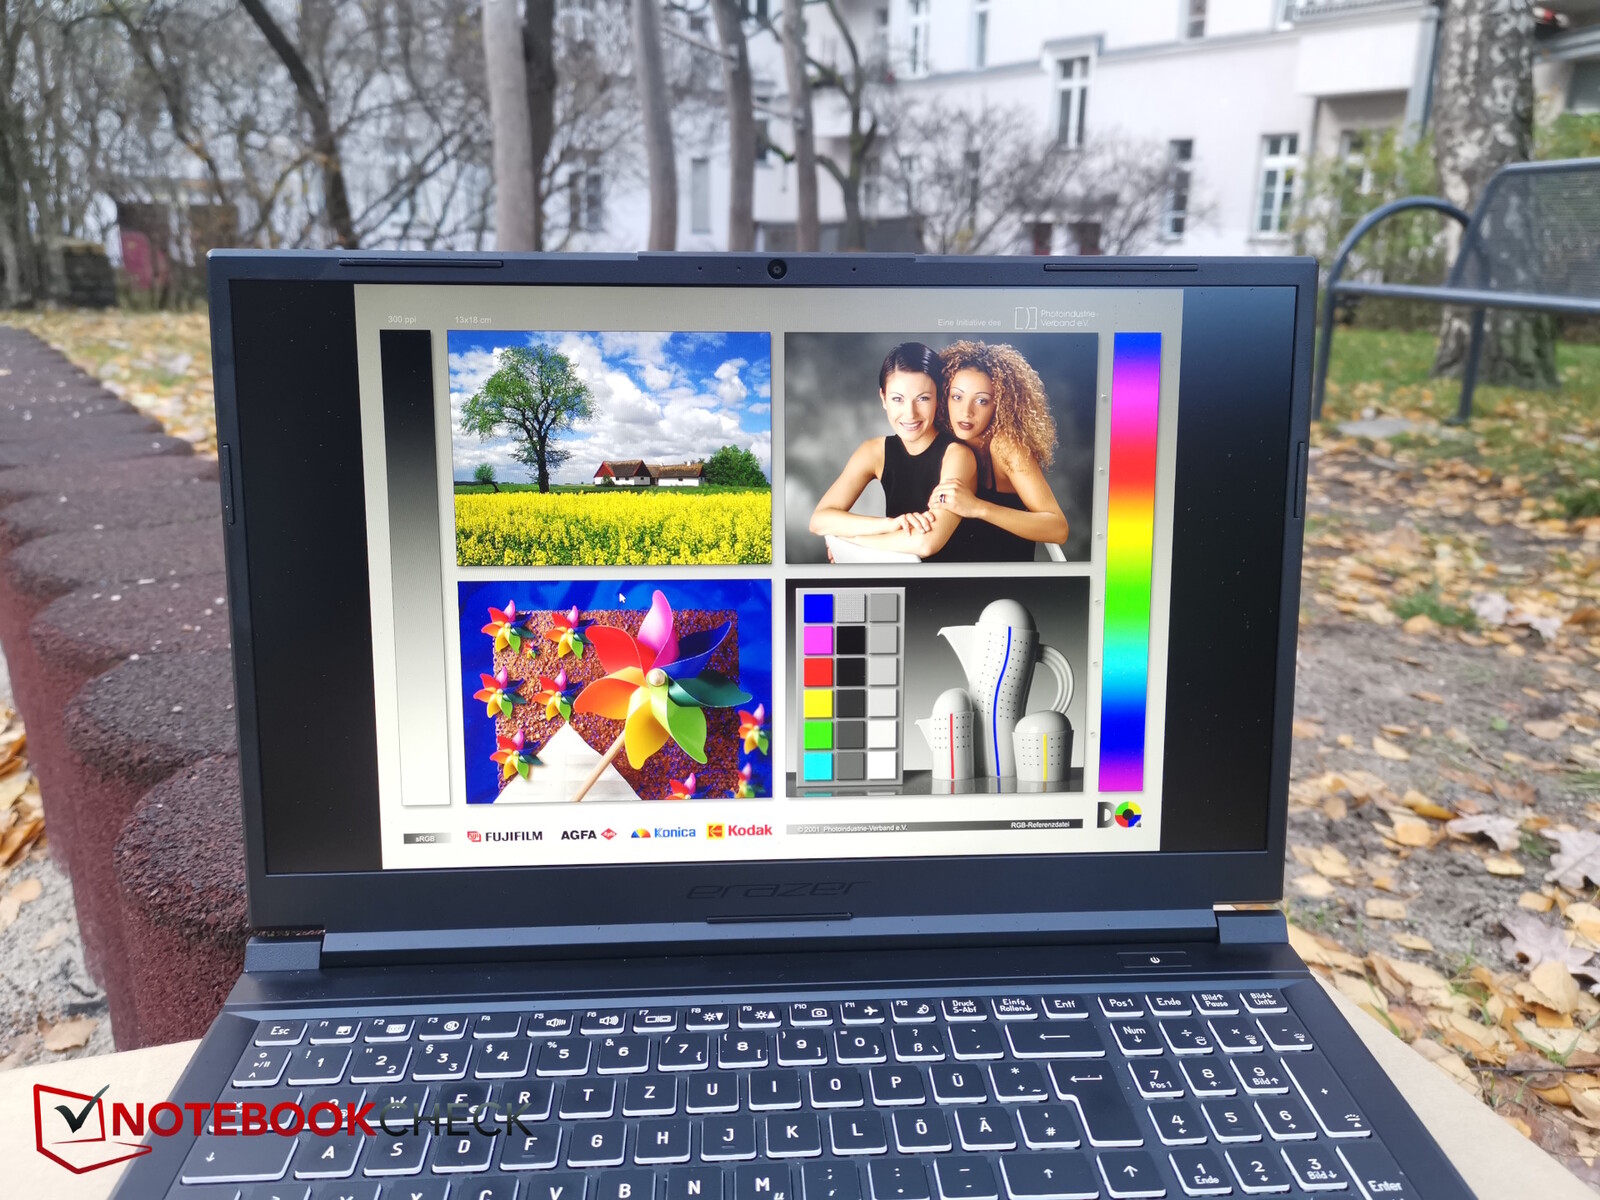
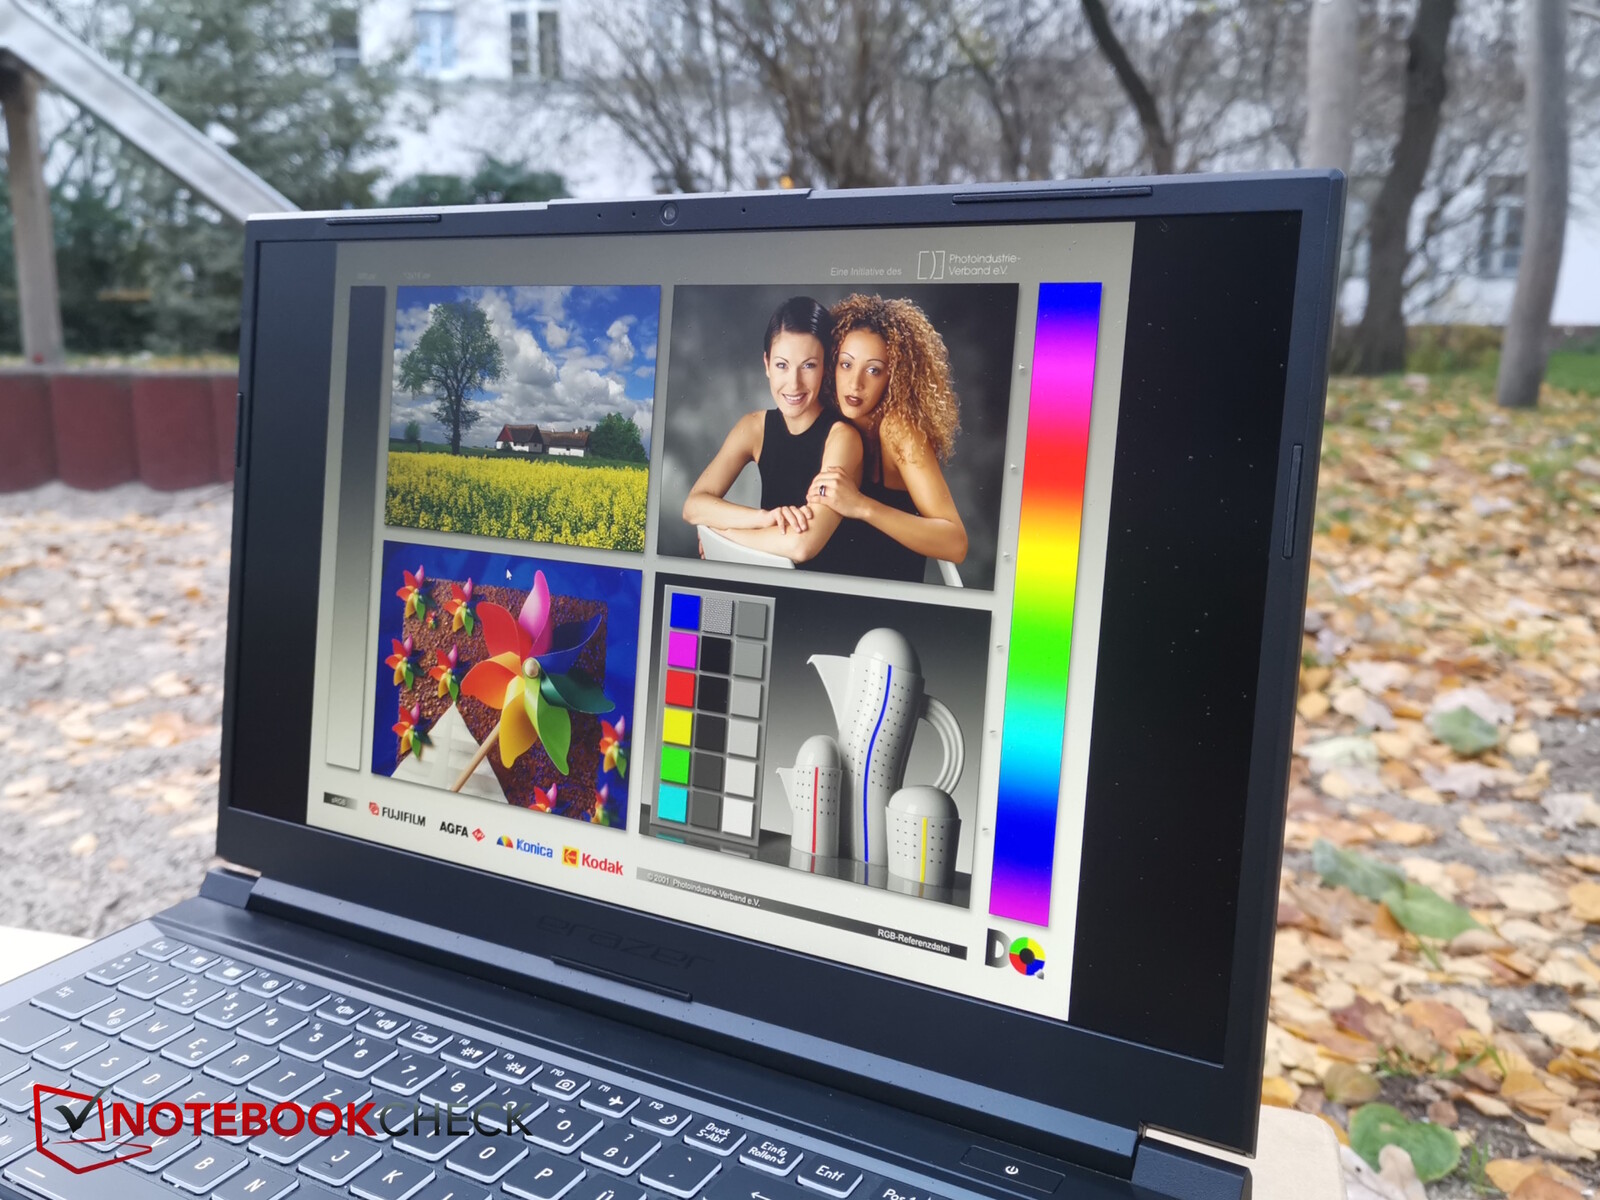
显示屏 - 2019 年的老熟人
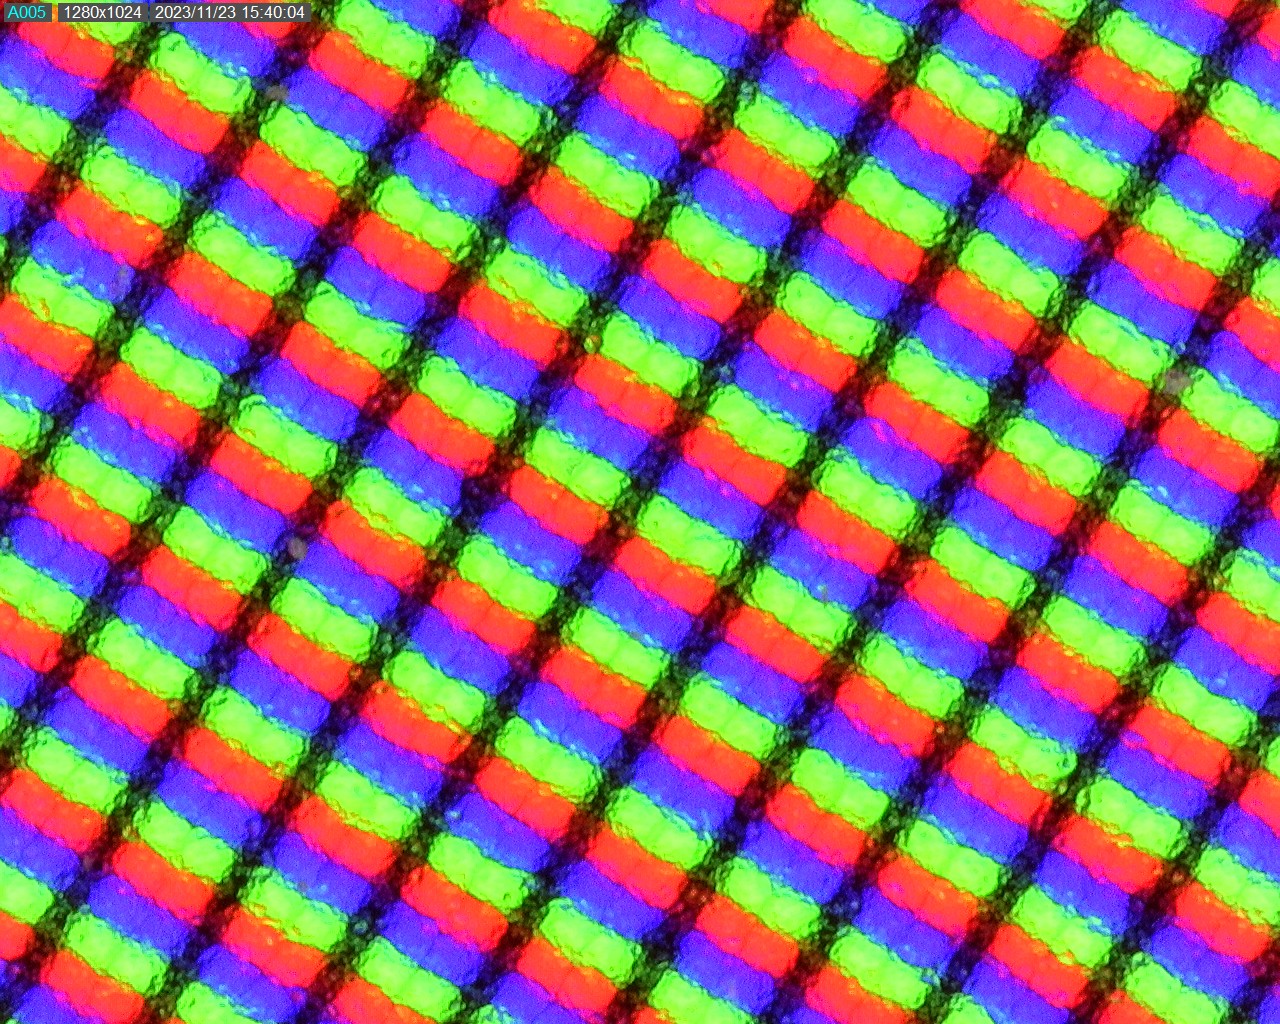
Medion Erazer Crawler E40 采用了我们熟悉的显示屏,这种显示屏以前曾用于多款笔记本电脑。采用 144 Hz 刷新率的哑光全高清 IPS 显示屏并非最新产品,它曾用于 XMG Fusion 15中使用过。
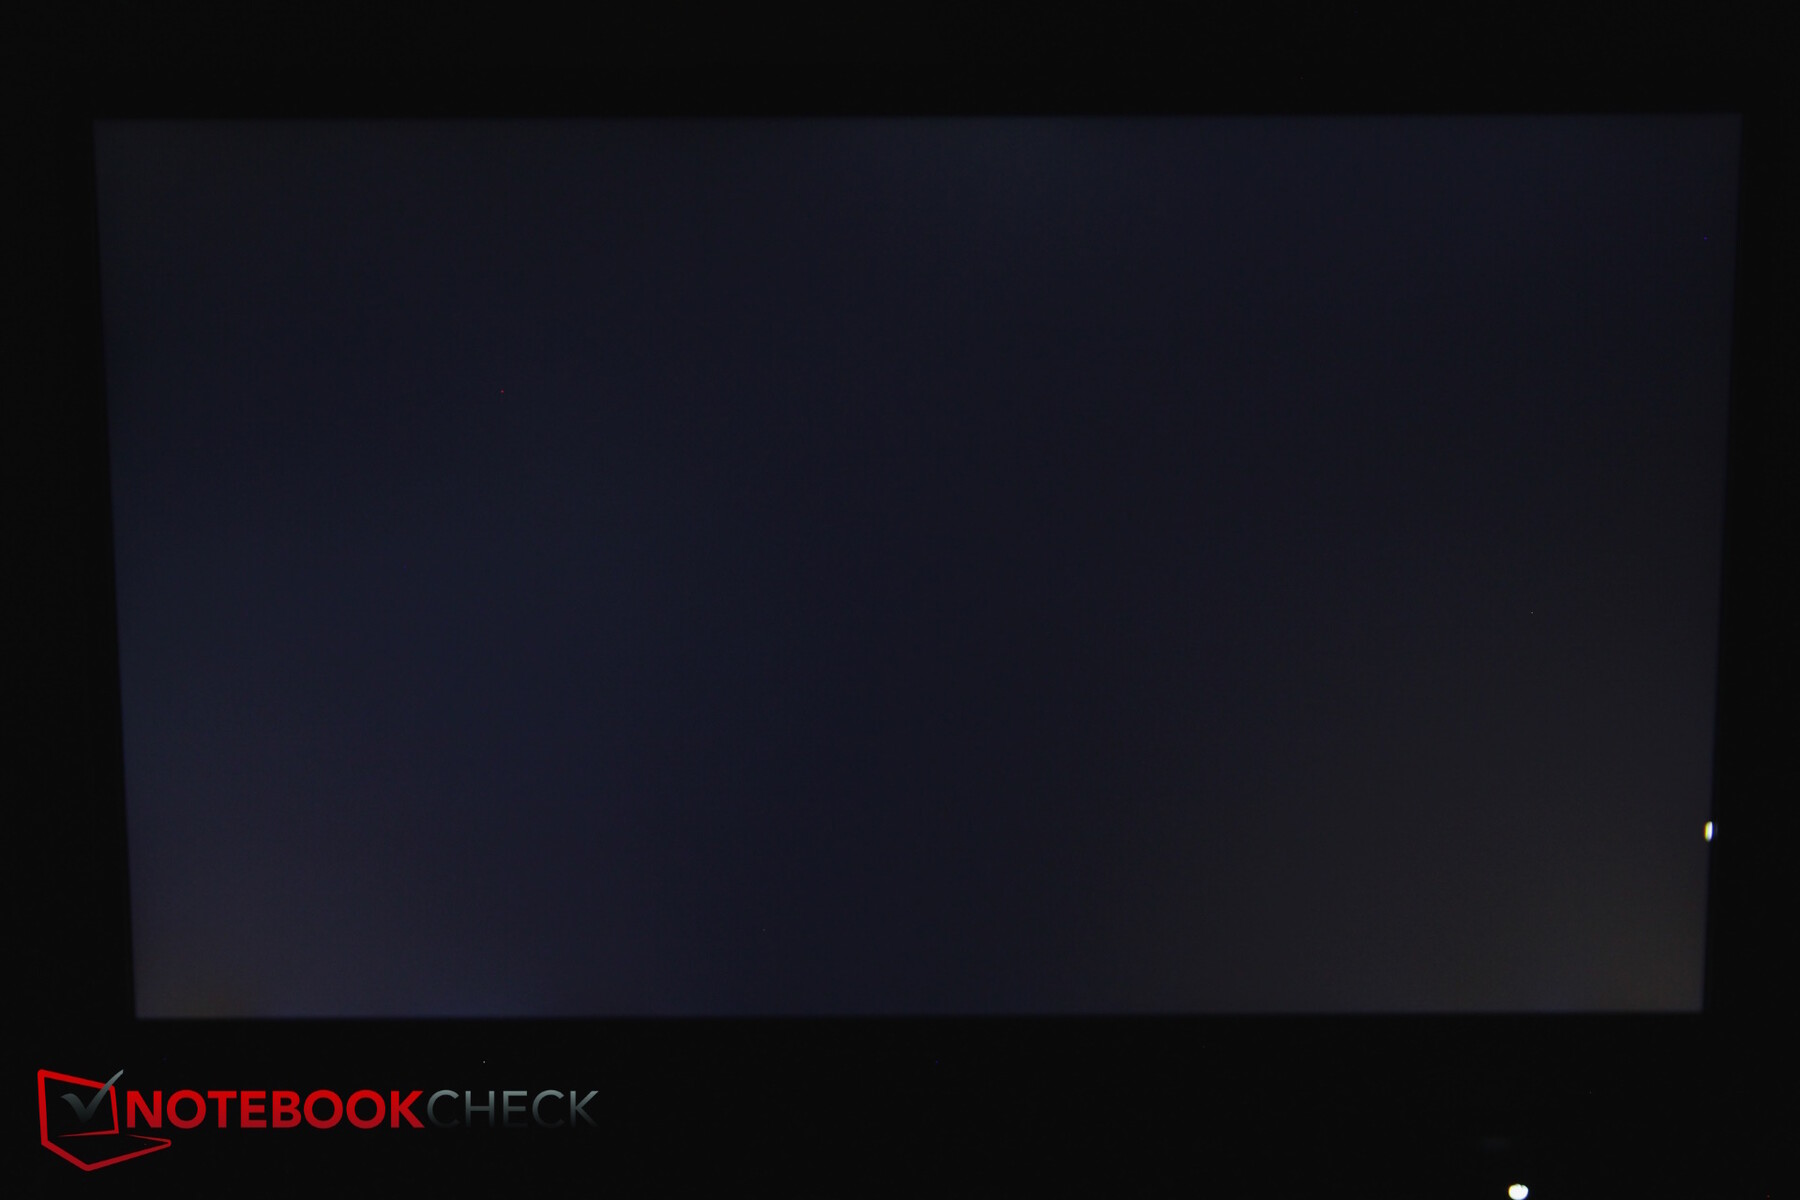
显示屏的平均亮度为 350 尼特,虽然对比度因黑色值较弱而受到一定影响,但还是可以接受的。
响应时间对于游戏笔记本电脑来说还算不错,背光出血现象略有存在。
| |||||||||||||||||||||||||
Brightness Distribution: 91 %
Center on Battery: 356 cd/m²
Contrast: 847:1 (Black: 0.43 cd/m²)
ΔE ColorChecker Calman: 3.98 | ∀{0.5-29.43 Ø4.71}
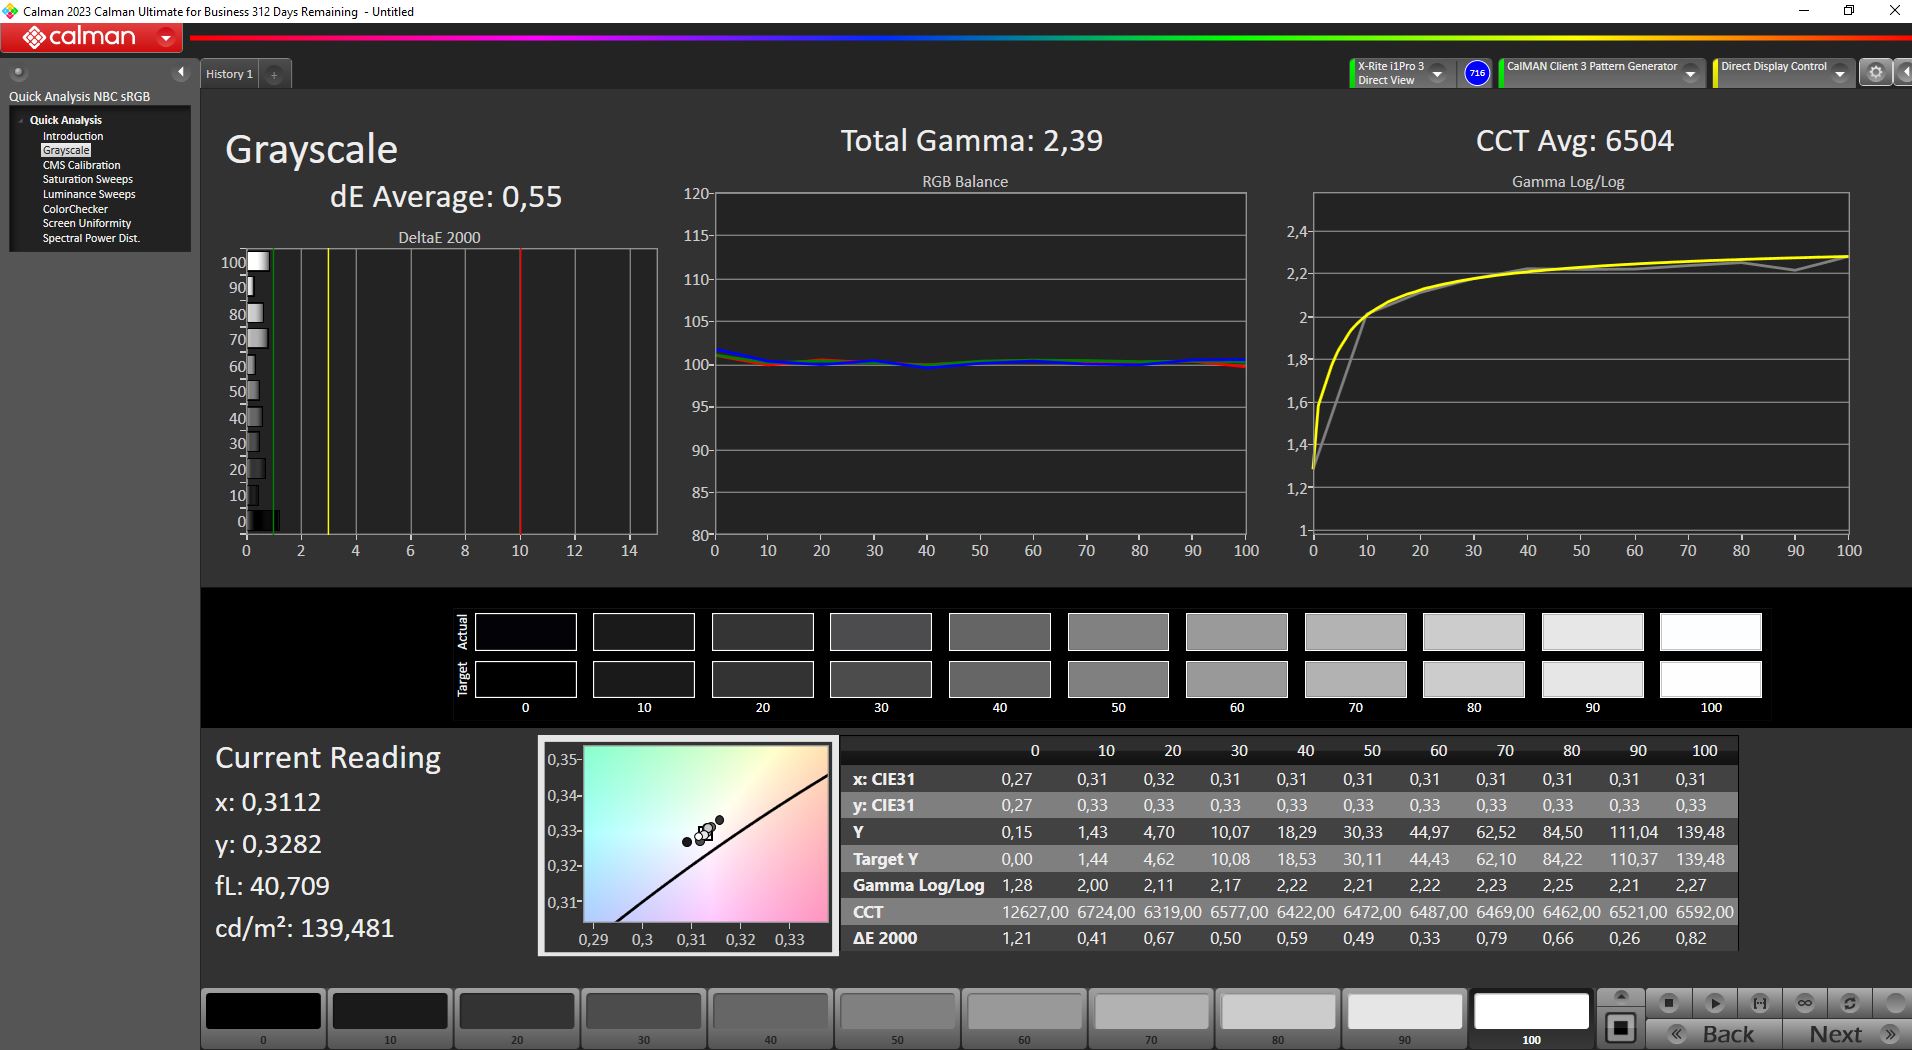
calibrated: 1.36
ΔE Greyscale Calman: 4.39 | ∀{0.09-98 Ø4.96}
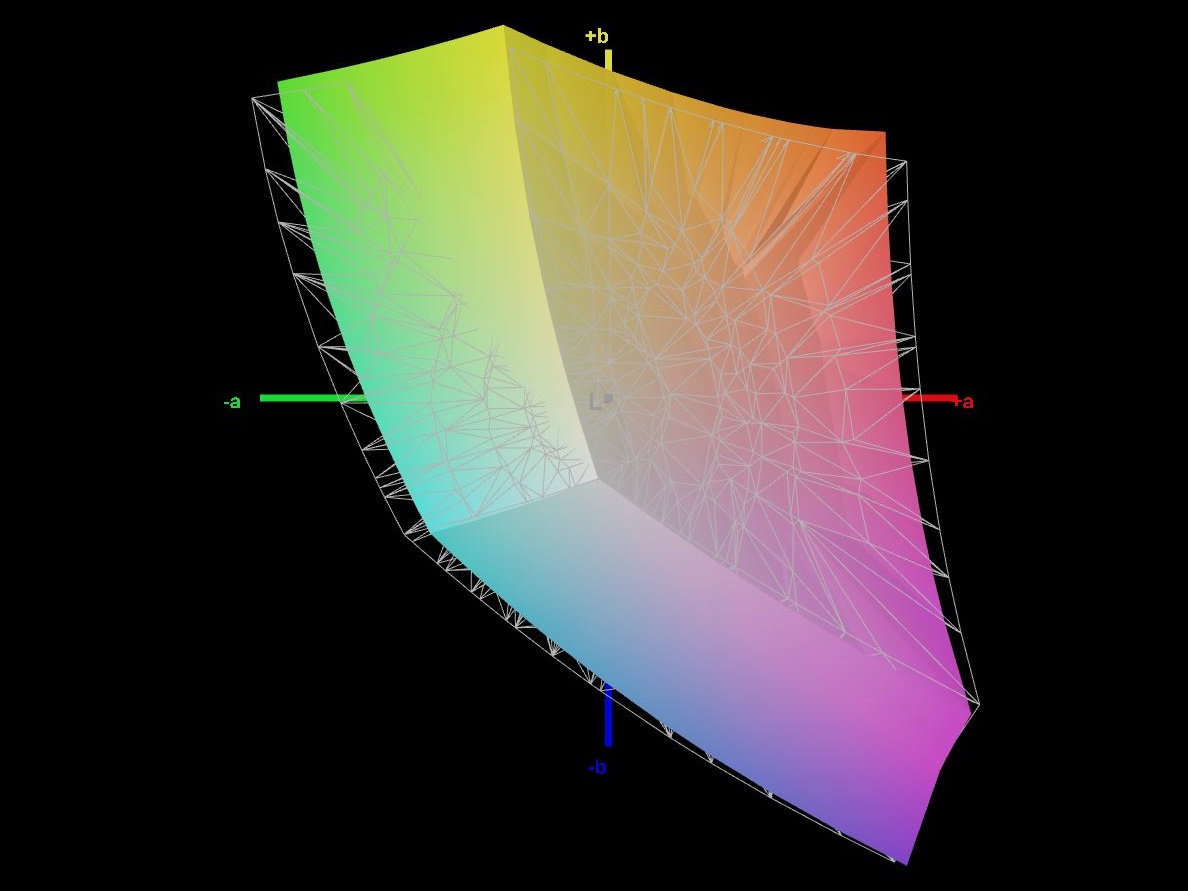
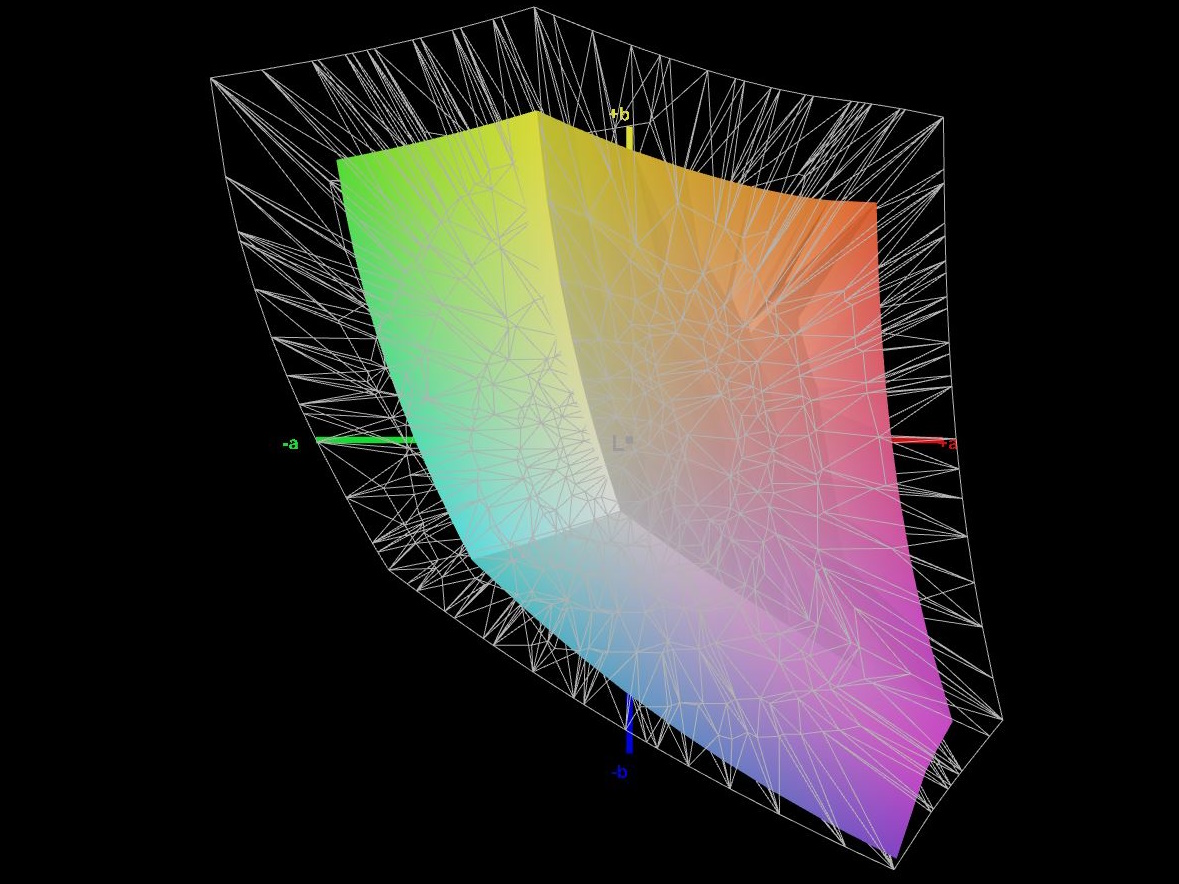
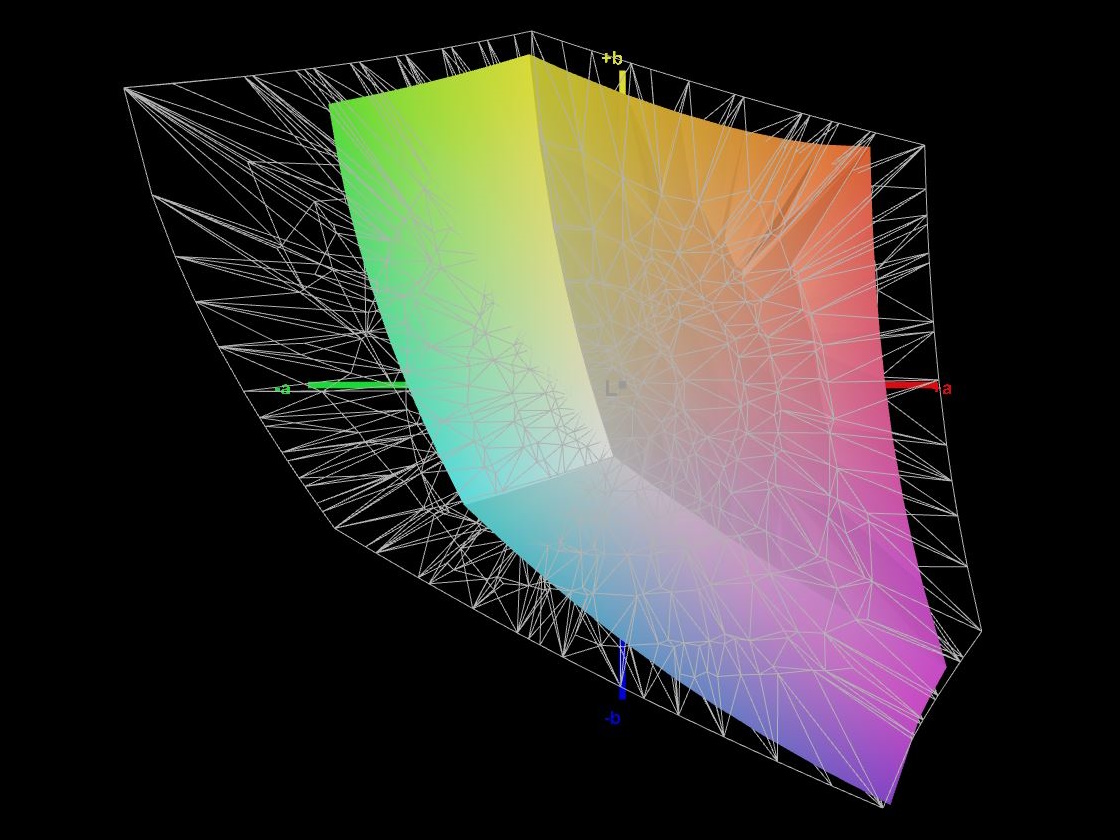
63.2% AdobeRGB 1998 (Argyll 3D)
89.7% sRGB (Argyll 3D)
61.4% Display P3 (Argyll 3D)
Gamma: 2.58
CCT: 7316 K
| Medion Erazer Crawler E40 - MD 62518 BOE HF NV156FHM-N4G, IPS, 1920x1080, 15.6" | Lenovo LOQ 15IRH8 Core i7 BOE CQ NE156QHM-NY4, IPS, 2560x1440, 15.6" | Asus TUF A15 FA507 N156HMA-GA1, IPS, 1920x1080, 15.6" | Schenker XMG Apex 15 (Late 23) BOE CQ NE156QHM-NY2, IPS, 2560x1440, 15.6" | MSI Katana 15 B12VEK AUOAF90 (B156HAN08.4), IPS, 1920x1080, 15.6" | |
|---|---|---|---|---|---|
| Display | 8% | 6% | 9% | -38% | |
| Display P3 Coverage (%) | 61.4 | 66.3 8% | 64.9 6% | 67.5 10% | 38.1 -38% |
| sRGB Coverage (%) | 89.7 | 96.6 8% | 96.5 8% | 97.6 9% | 56.8 -37% |
| AdobeRGB 1998 Coverage (%) | 63.2 | 67.7 7% | 66.6 5% | 68.9 9% | 39.3 -38% |
| Response Times | 25% | -199% | -29% | -282% | |
| Response Time Grey 50% / Grey 80% * (ms) | 8 ? | 5 ? 37% | 30.4 ? -280% | 13.2 ? -65% | 38.8 ? -385% |
| Response Time Black / White * (ms) | 9.6 ? | 8.41 ? 12% | 20.8 ? -117% | 8.8 ? 8% | 26.8 ? -179% |
| PWM Frequency (Hz) | |||||
| Screen | 3% | 32% | 12% | -46% | |
| Brightness middle (cd/m²) | 364 | 373 2% | 288 -21% | 336 -8% | 261 -28% |
| Brightness (cd/m²) | 351 | 365 4% | 271 -23% | 307 -13% | 258 -26% |
| Brightness Distribution (%) | 91 | 90 -1% | 91 0% | 77 -15% | 92 1% |
| Black Level * (cd/m²) | 0.43 | 0.33 23% | 0.17 60% | 0.38 12% | 0.19 56% |
| Contrast (:1) | 847 | 1130 33% | 1694 100% | 884 4% | 1374 62% |
| Colorchecker dE 2000 * | 3.98 | 4.19 -5% | 1.9 52% | 1.96 51% | 5.57 -40% |
| Colorchecker dE 2000 max. * | 6.38 | 8.47 -33% | 3.3 48% | 5.07 21% | 20.6 -223% |
| Colorchecker dE 2000 calibrated * | 1.36 | 1.07 21% | 0.9 34% | 1.27 7% | 4.63 -240% |
| Greyscale dE 2000 * | 4.39 | 5 -14% | 2.7 38% | 2.3 48% | 3.19 27% |
| Gamma | 2.58 85% | 1.93 114% | 2.32 95% | 2.017 109% | 2.45 90% |
| CCT | 7316 89% | 7520 86% | 6535 99% | 6644 98% | 6146 106% |
| Total Average (Program / Settings) | 12% /
7% | -54% /
-6% | -3% /
6% | -122% /
-78% |
* ... smaller is better
开箱即用的显示器性能并不理想,色彩和灰度的 DeltaE 值远高于目标值,黑阶也过高。不过,校准面板并降低亮度可显著改善显示质量。校准后,灰阶的 DeltaE 值降至 0.55,ColorChecker 的 DeltaE 值降至 1.36,值得称赞。
您可以在上面免费下载我们的校准色彩配置文件。
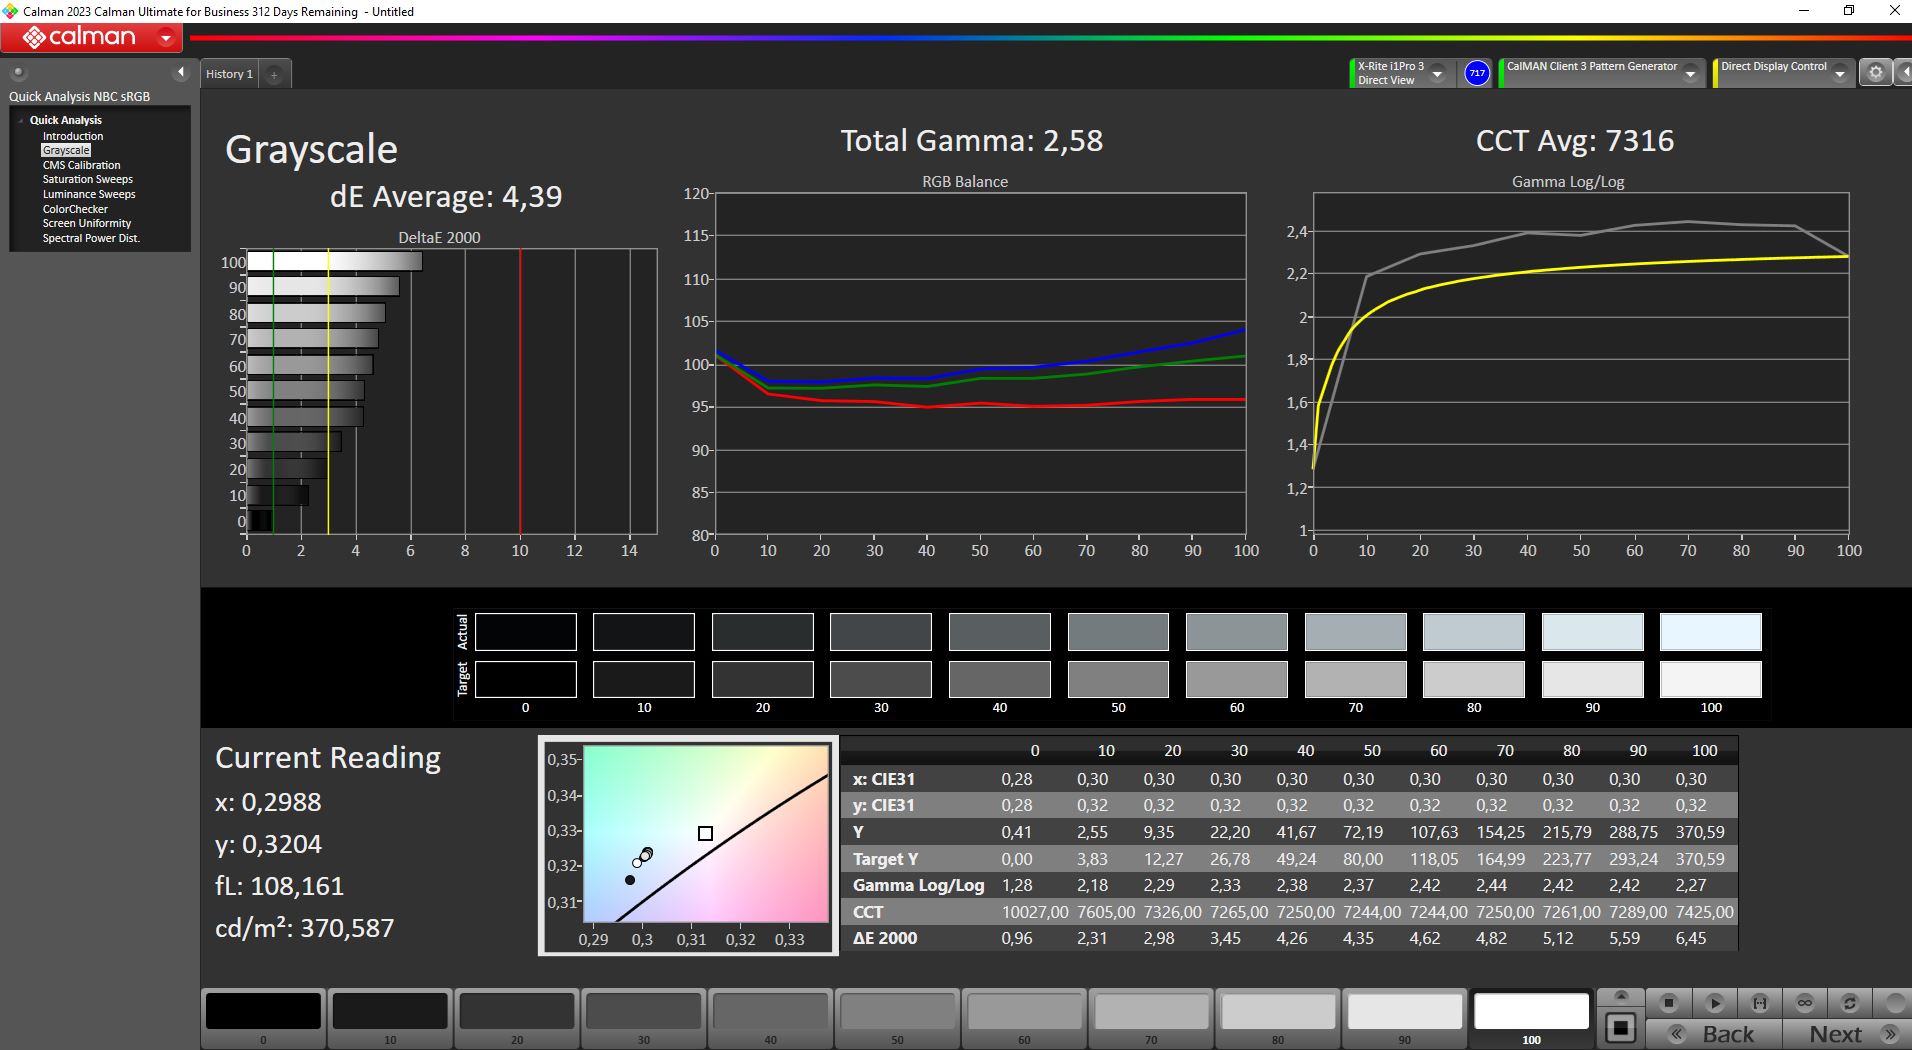
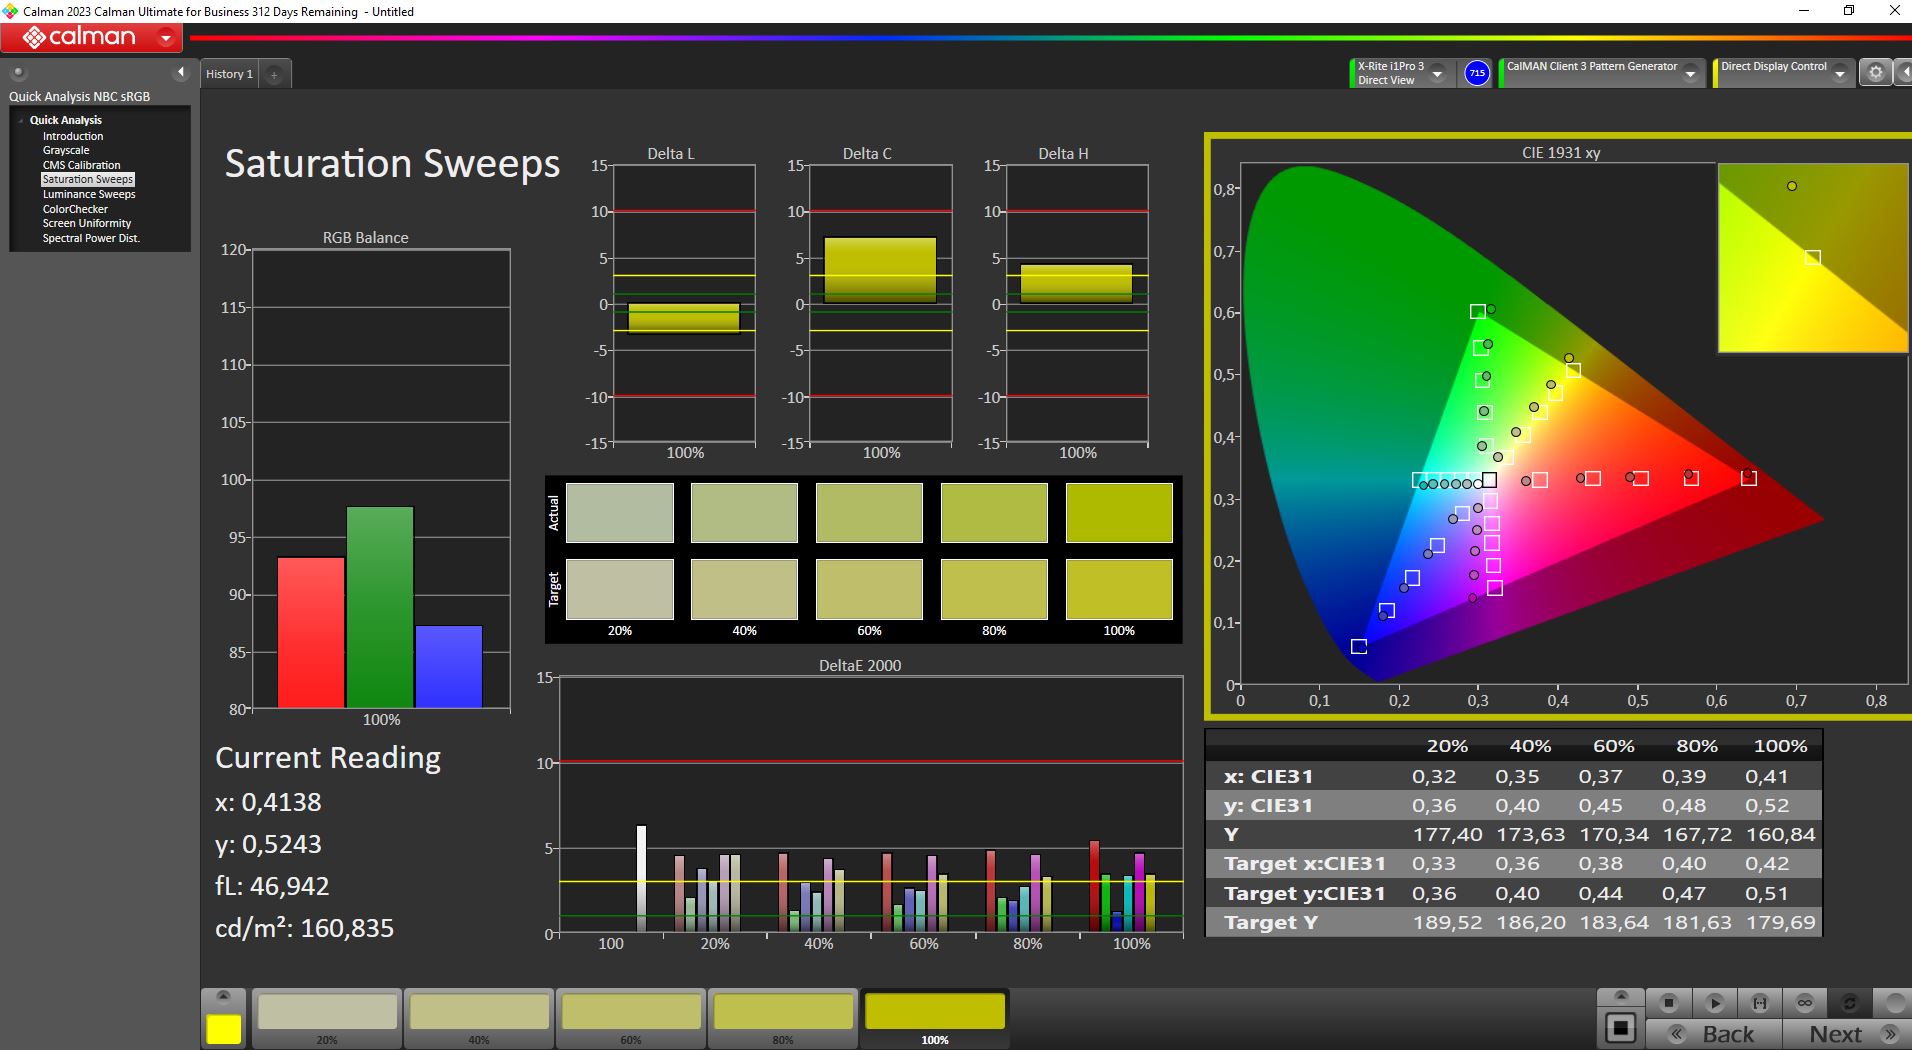
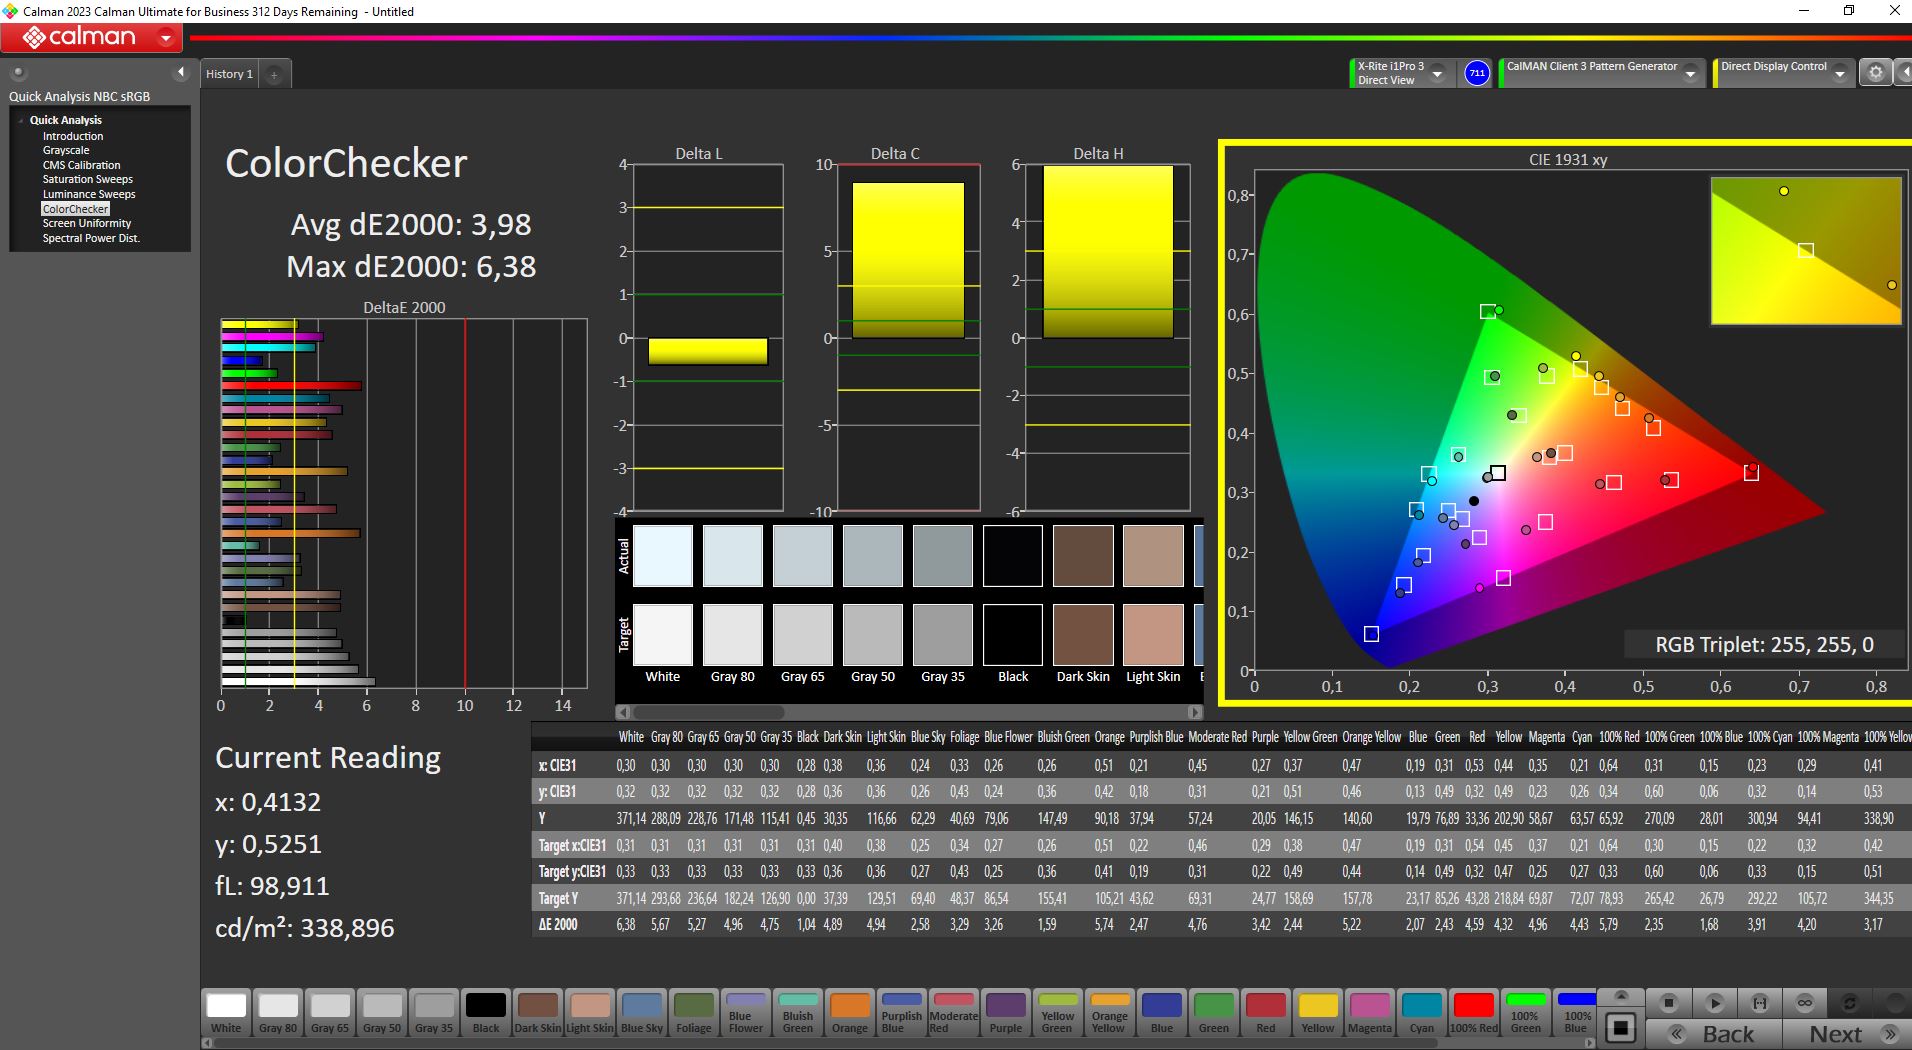
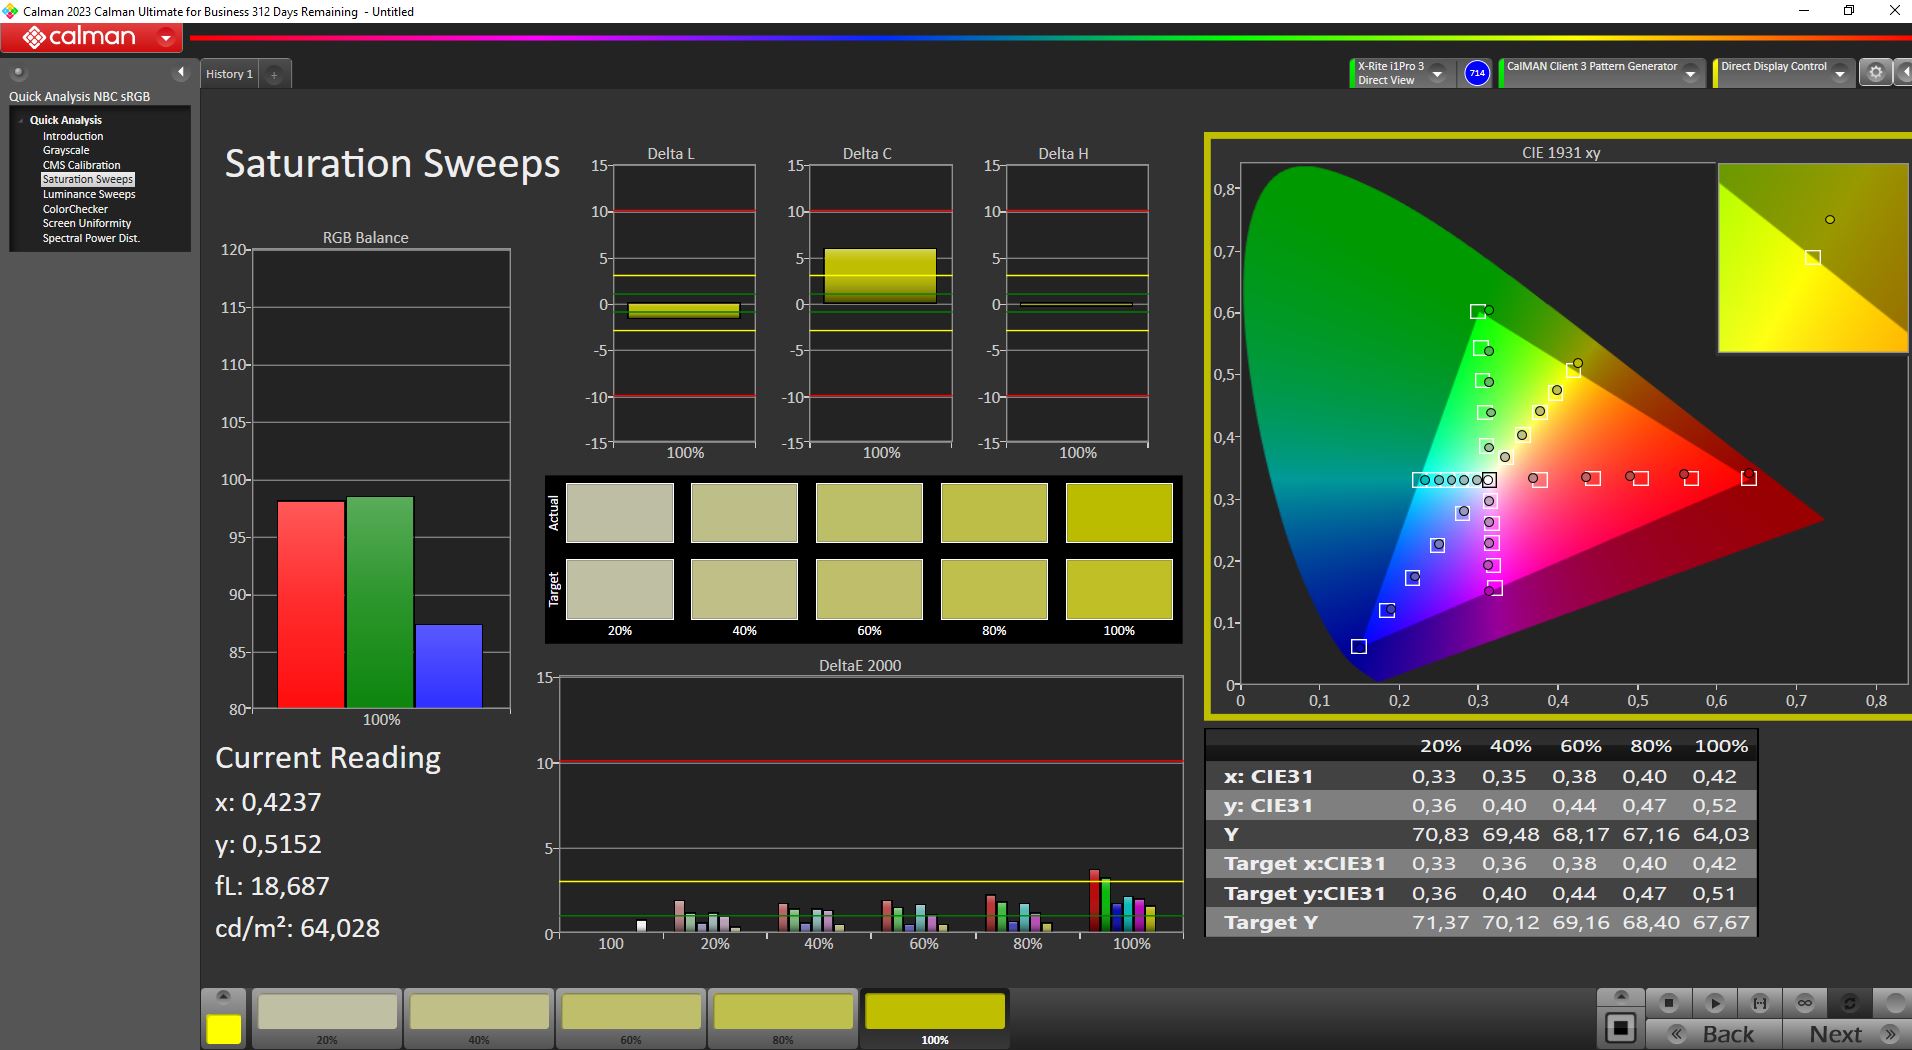
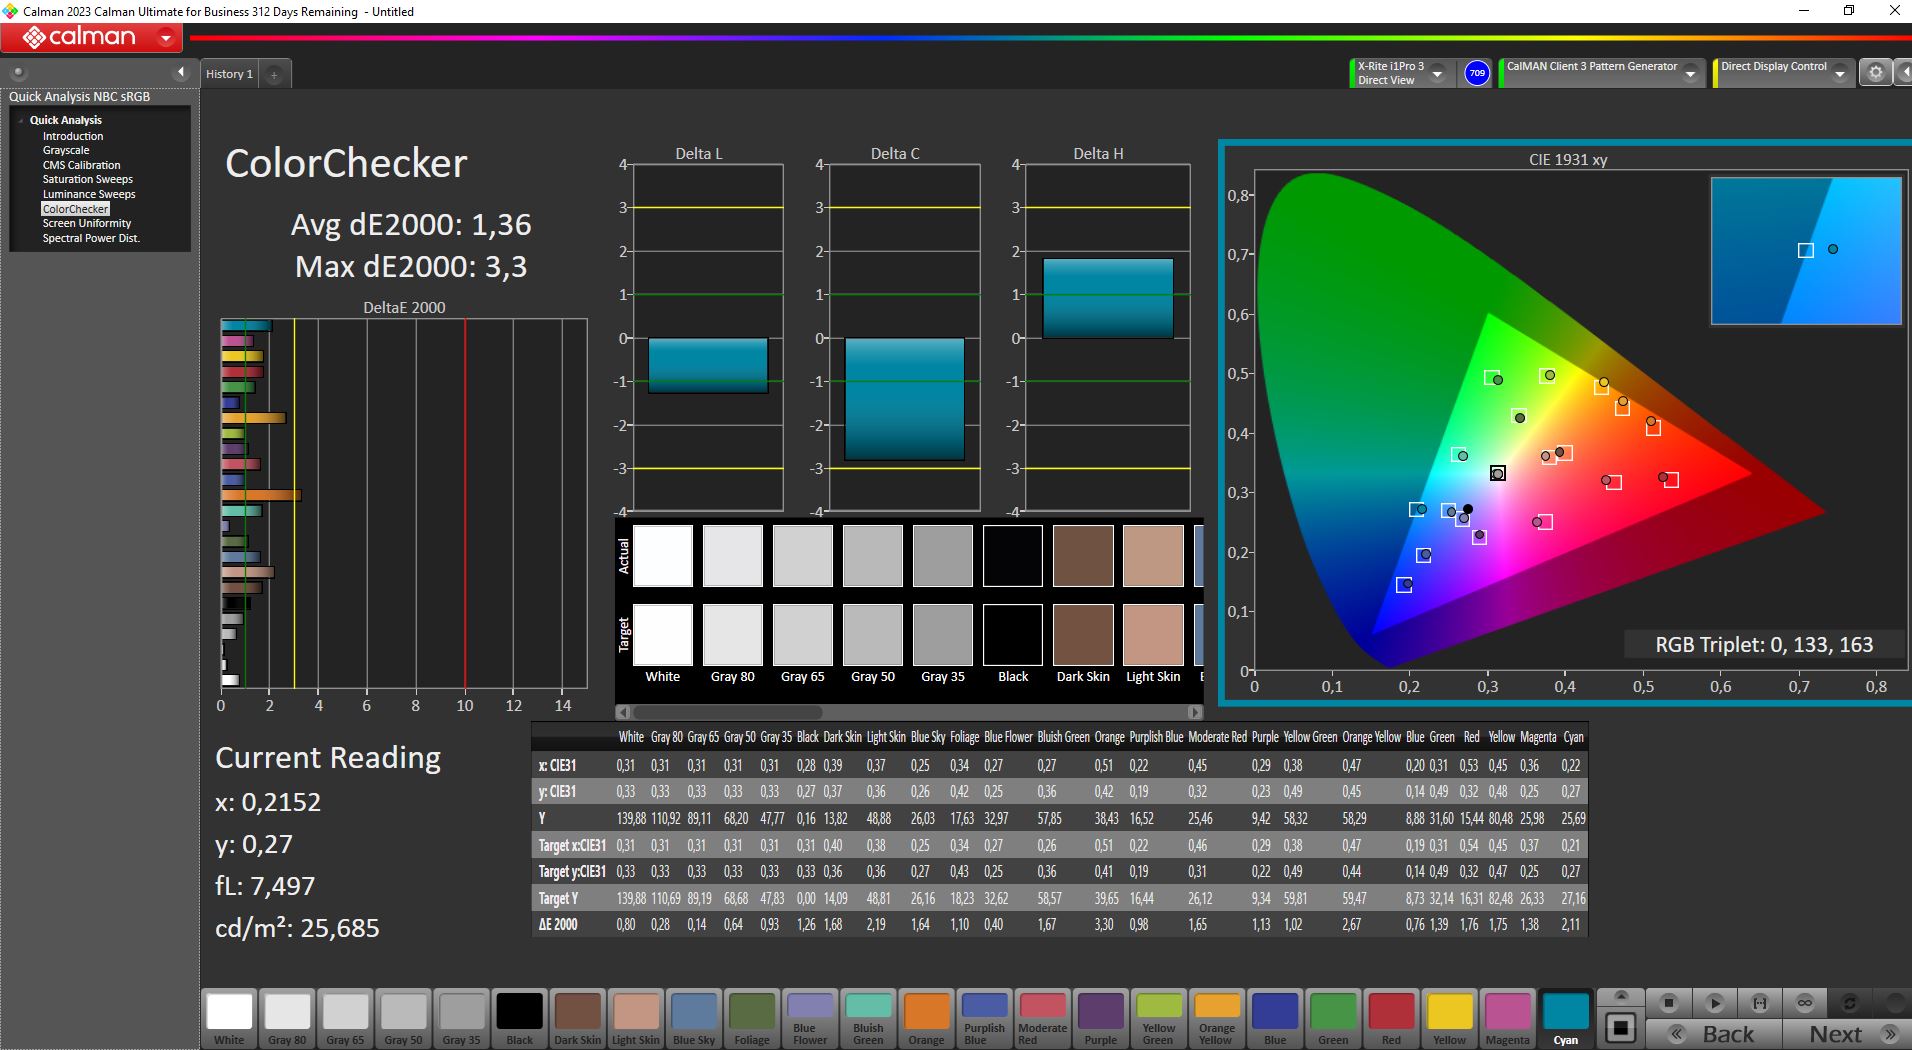
这款老面板在色彩空间覆盖率方面表现出明显的弱点,即使是 sRGB 也最多只能覆盖 90%。尽管 DeltaE 值不错,但该面板可能不太适合内容创作者。
Display Response Times
| ↔ Response Time Black to White | ||
|---|---|---|
| 9.6 ms ... rise ↗ and fall ↘ combined | ↗ 5.4 ms rise | 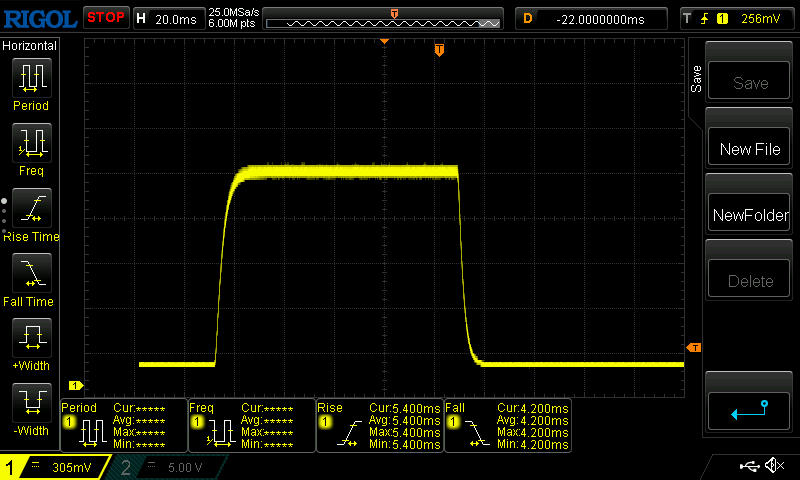 |
| ↘ 4.2 ms fall | ||
| The screen shows fast response rates in our tests and should be suited for gaming. In comparison, all tested devices range from 0.1 (minimum) to 240 (maximum) ms. » 26 % of all devices are better. This means that the measured response time is better than the average of all tested devices (19.8 ms). | ||
| ↔ Response Time 50% Grey to 80% Grey | ||
| 8 ms ... rise ↗ and fall ↘ combined | ↗ 3.8 ms rise | 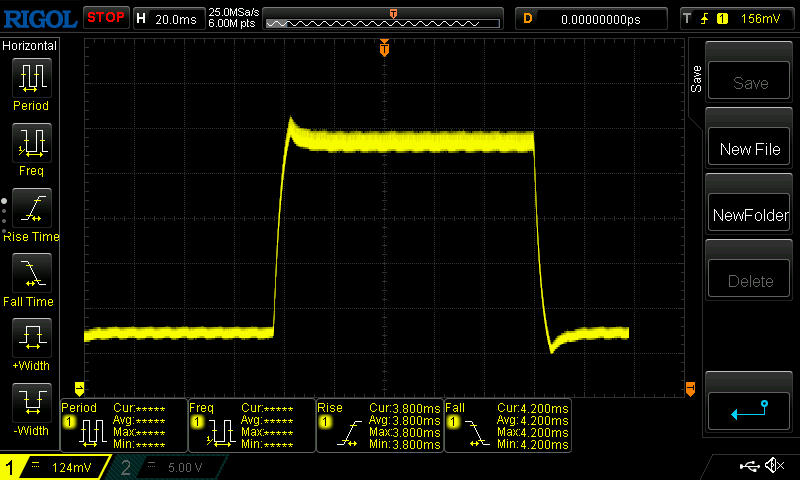 |
| ↘ 4.2 ms fall | ||
| The screen shows fast response rates in our tests and should be suited for gaming. In comparison, all tested devices range from 0.165 (minimum) to 636 (maximum) ms. » 21 % of all devices are better. This means that the measured response time is better than the average of all tested devices (31 ms). | ||
Screen Flickering / PWM (Pulse-Width Modulation)
| Screen flickering / PWM not detected | 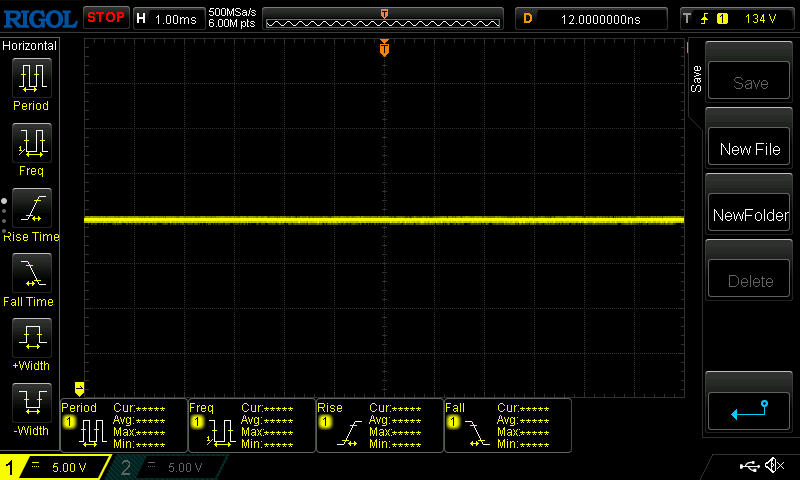 | ||
In comparison: 52 % of all tested devices do not use PWM to dim the display. If PWM was detected, an average of 7751 (minimum: 5 - maximum: 343500) Hz was measured. | |||
亚光表面和 350 尼特的亮度确保了在户外工作时,至少在阴凉处工作时,不会遇到困难。

性能 - i5-13500H 和 RTX 4050 的完美组合
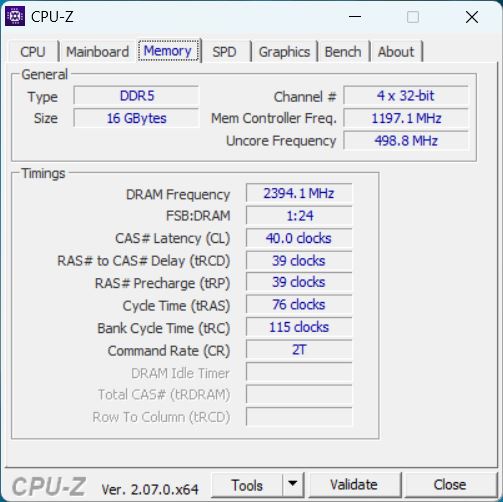
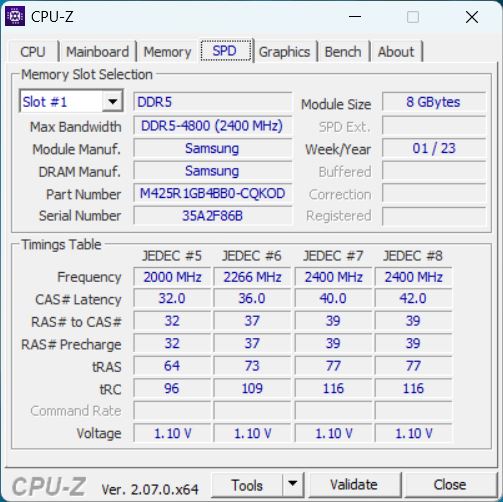
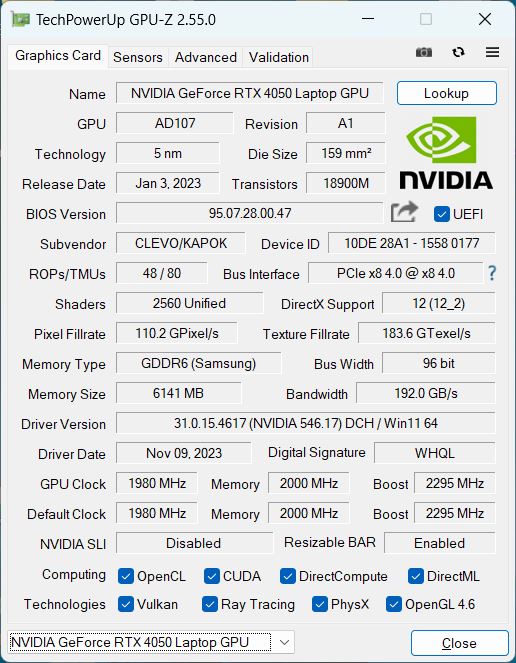
Crawler 是一款入门级游戏笔记本电脑。 英伟达GeForce RTX 4050 和 英特尔酷睿 i5-13500H这两款产品在游戏组件中都属于经济型产品。此外,还有 16GB 的现代 DDR5-4800 内存和 512GB 的 NVMe 固态硬盘,存储空间也更偏向于预算选择。
,这使得这款笔记本电脑适合那些不一定要以最大细节玩遍当前所有游戏的人。不过,对于许多游戏来说,原生 1080p 分辨率下的性能应该足以满足高细节要求。内容创作者可能也会对性能和简单的设计感兴趣,但对于真正的创作工作(图片、视频)来说,显示屏很可能是一个敲门砖。
测试条件
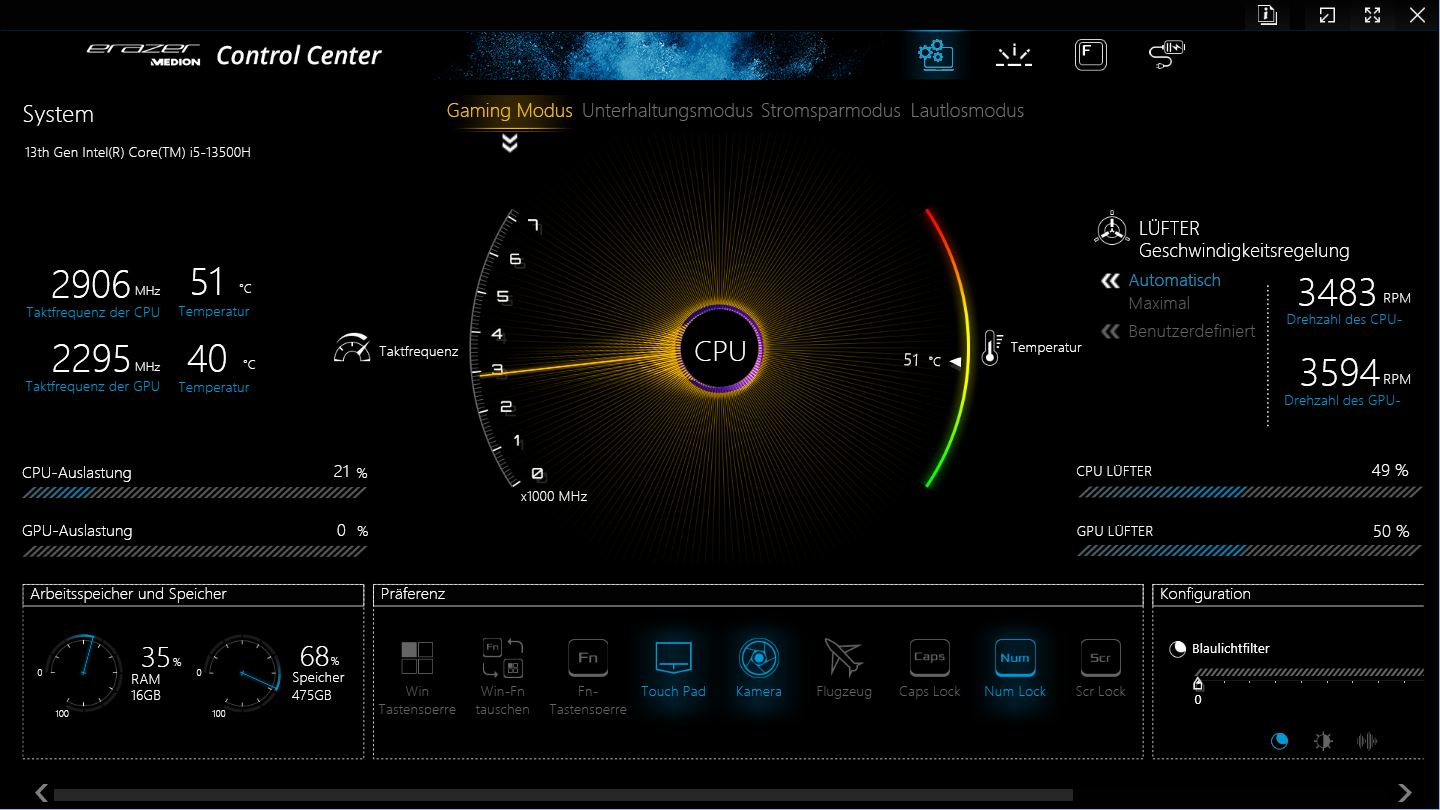
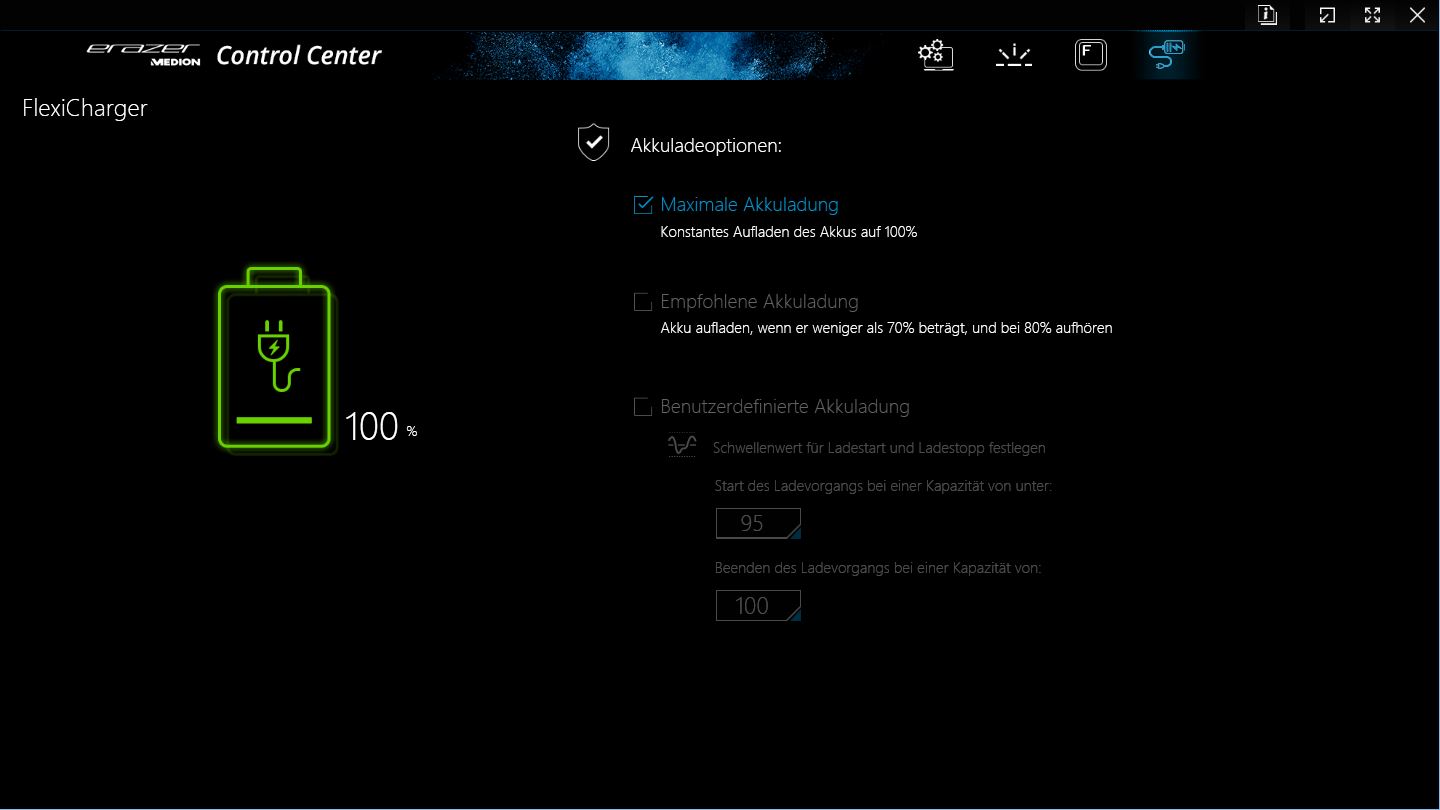
Medion 在 Crawler E40 上预装了一个通用的控制中心,其中包含性能配置文件、键盘照明和其他设置。该应用程序的运行速度不是特别快,在处理输入时经常会略有延迟。
主屏幕上的 GPU 开关(MSHybrid 与 dGPU,需要重启)必须滚动到右下角,这也有点恼人。
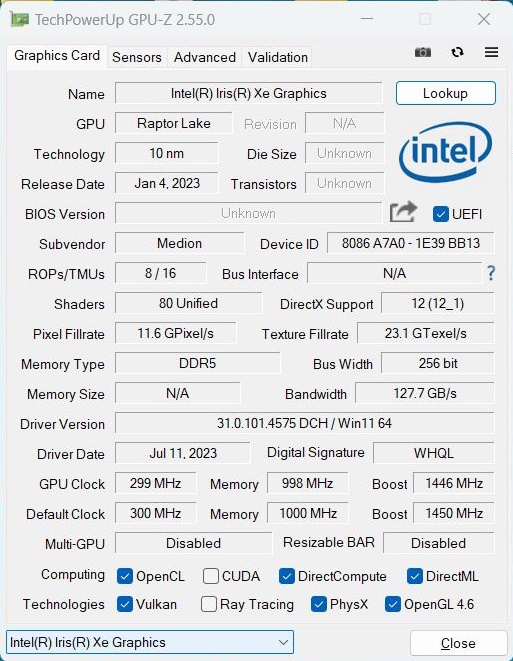
我们使用游戏模式进行性能基准测试,使用省电模式进行电池测试,因为此时 dGPU 处于停用状态,由集成 GPU 接管。
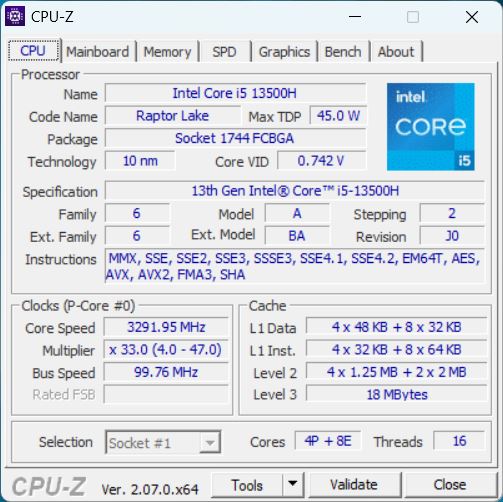
处理器
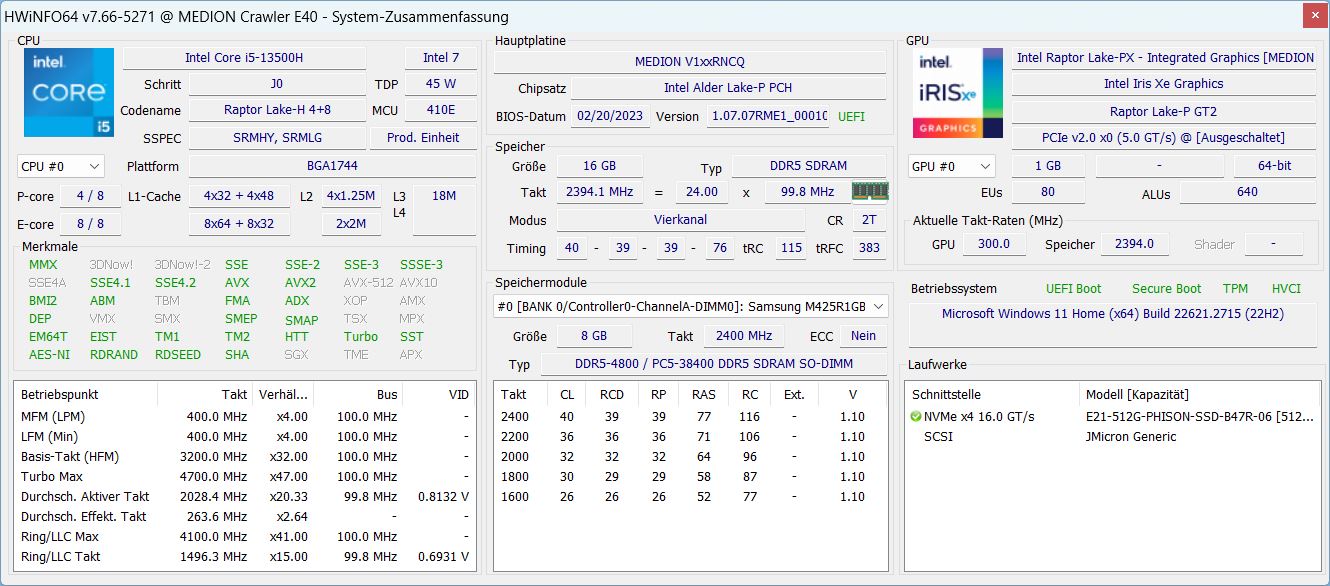
英特尔 英特尔酷睿 i5-13500H是当前 Raptor Lake-H 系列(Intel Gen13)中的一款中端 CPU。它拥有 6 个 P 核心中的 4 个和 8 个 E 核心。总共有 12 个核心和 16 个线程(只有 P 核心支持超线程)。E 核心的基本时钟频率为 1.9 GHz,P 核心的单个时钟频率最高可达 4.7 GHz,总时钟频率最高可达 4.6 GHz。
顺便提一下,还有一款 Medion Erazer Crawler E50 配备了英特尔 12 代 i5-12450H。Medion 的命名方式确实很不透明,可能会误导买家,因此购买时一定要小心!
在我们的基准测试中,该 CPU 性能良好,与我们数据库中 i5-13500 的平均水平相当。
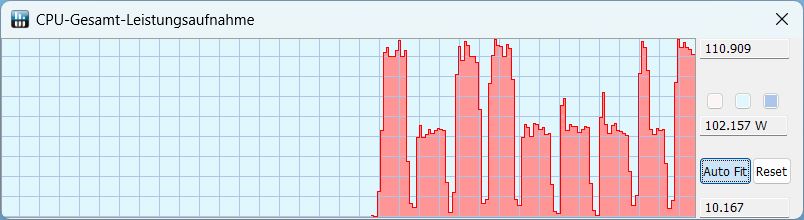
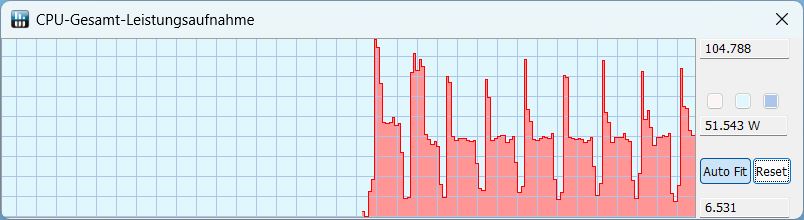
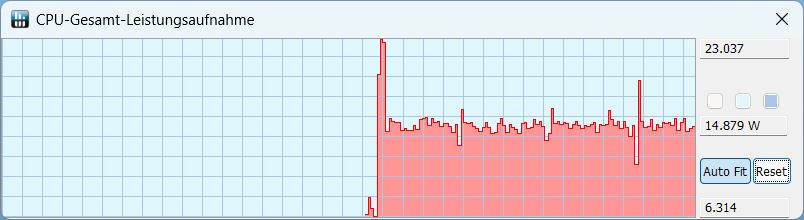
在 Cinebench R15 循环测试中,处理器从一开始就表现出非常稳定的性能,前几次运行后性能没有下降。下表显示了各种性能模式(包括电池模式)下的性能表现。
| 模式/值 | Cinebench R15 分数 | CPU 功耗范围 | CPU 功耗典型值 |
|---|---|---|---|
| 游戏 | 2,331 | 60 - 110 W | 105 |
| 娱乐 | 2.135 | 50-105 | 51 |
| 静音 | 835 | 15-23 | 15 |
| 电池 | 1,065 | 19-21 | 21 |
Cinebench R15 Multi Loop
Cinebench R23: Multi Core | Single Core
Cinebench R20: CPU (Multi Core) | CPU (Single Core)
Cinebench R15: CPU Multi 64Bit | CPU Single 64Bit
Blender: v2.79 BMW27 CPU
7-Zip 18.03: 7z b 4 | 7z b 4 -mmt1
Geekbench 5.5: Multi-Core | Single-Core
HWBOT x265 Benchmark v2.2: 4k Preset
LibreOffice : 20 Documents To PDF
R Benchmark 2.5: Overall mean
| CPU Performance rating | |
| Average of class Gaming | |
| Schenker XMG Apex 15 (Late 23) | |
| Lenovo LOQ 15IRH8 Core i7 | |
| MSI Katana 15 B12VEK | |
| Medion Erazer Crawler E40 - MD 62518 | |
| Average Intel Core i5-13500H | |
| Asus TUF A15 FA507 | |
| Cinebench R23 / Multi Core | |
| Average of class Gaming (10488 - 42661, n=108, last 2 years) | |
| Schenker XMG Apex 15 (Late 23) | |
| MSI Katana 15 B12VEK | |
| Lenovo LOQ 15IRH8 Core i7 | |
| Average Intel Core i5-13500H (13542 - 16335, n=5) | |
| Medion Erazer Crawler E40 - MD 62518 | |
| Asus TUF A15 FA507 | |
| Cinebench R23 / Single Core | |
| Average of class Gaming (1166 - 2415, n=108, last 2 years) | |
| Lenovo LOQ 15IRH8 Core i7 | |
| Medion Erazer Crawler E40 - MD 62518 | |
| Schenker XMG Apex 15 (Late 23) | |
| Average Intel Core i5-13500H (1704 - 1799, n=5) | |
| MSI Katana 15 B12VEK | |
| Asus TUF A15 FA507 | |
| Cinebench R20 / CPU (Multi Core) | |
| Average of class Gaming (4029 - 16433, n=107, last 2 years) | |
| Schenker XMG Apex 15 (Late 23) | |
| MSI Katana 15 B12VEK | |
| Lenovo LOQ 15IRH8 Core i7 | |
| Average Intel Core i5-13500H (5108 - 6212, n=5) | |
| Asus TUF A15 FA507 | |
| Medion Erazer Crawler E40 - MD 62518 | |
| Cinebench R20 / CPU (Single Core) | |
| Average of class Gaming (442 - 913, n=107, last 2 years) | |
| Lenovo LOQ 15IRH8 Core i7 | |
| Schenker XMG Apex 15 (Late 23) | |
| Medion Erazer Crawler E40 - MD 62518 | |
| Average Intel Core i5-13500H (655 - 687, n=5) | |
| MSI Katana 15 B12VEK | |
| Asus TUF A15 FA507 | |
| Cinebench R15 / CPU Multi 64Bit | |
| Average of class Gaming (1578 - 6330, n=106, last 2 years) | |
| Schenker XMG Apex 15 (Late 23) | |
| Medion Erazer Crawler E40 - MD 62518 | |
| Average Intel Core i5-13500H (2234 - 2475, n=5) | |
| Lenovo LOQ 15IRH8 Core i7 | |
| Asus TUF A15 FA507 | |
| MSI Katana 15 B12VEK | |
| Cinebench R15 / CPU Single 64Bit | |
| Average of class Gaming (188.8 - 350, n=107, last 2 years) | |
| Schenker XMG Apex 15 (Late 23) | |
| Lenovo LOQ 15IRH8 Core i7 | |
| Average Intel Core i5-13500H (243 - 261, n=5) | |
| Asus TUF A15 FA507 | |
| Medion Erazer Crawler E40 - MD 62518 | |
| MSI Katana 15 B12VEK | |
| Blender / v2.79 BMW27 CPU | |
| Lenovo LOQ 15IRH8 Core i7 | |
| Average Intel Core i5-13500H (205 - 263, n=6) | |
| MSI Katana 15 B12VEK | |
| Asus TUF A15 FA507 | |
| Medion Erazer Crawler E40 - MD 62518 | |
| Schenker XMG Apex 15 (Late 23) | |
| Average of class Gaming (79 - 330, n=105, last 2 years) | |
| 7-Zip 18.03 / 7z b 4 | |
| Average of class Gaming (33491 - 148086, n=106, last 2 years) | |
| Schenker XMG Apex 15 (Late 23) | |
| Asus TUF A15 FA507 | |
| MSI Katana 15 B12VEK | |
| Medion Erazer Crawler E40 - MD 62518 | |
| Lenovo LOQ 15IRH8 Core i7 | |
| Average Intel Core i5-13500H (50846 - 58567, n=6) | |
| 7-Zip 18.03 / 7z b 4 -mmt1 | |
| Schenker XMG Apex 15 (Late 23) | |
| Average of class Gaming (4199 - 7436, n=106, last 2 years) | |
| Lenovo LOQ 15IRH8 Core i7 | |
| Asus TUF A15 FA507 | |
| Average Intel Core i5-13500H (5500 - 5885, n=6) | |
| MSI Katana 15 B12VEK | |
| Medion Erazer Crawler E40 - MD 62518 | |
| Geekbench 5.5 / Multi-Core | |
| Average of class Gaming (6460 - 28263, n=106, last 2 years) | |
| Schenker XMG Apex 15 (Late 23) | |
| Lenovo LOQ 15IRH8 Core i7 | |
| MSI Katana 15 B12VEK | |
| Medion Erazer Crawler E40 - MD 62518 | |
| Average Intel Core i5-13500H (9312 - 11465, n=5) | |
| Asus TUF A15 FA507 | |
| Geekbench 5.5 / Single-Core | |
| Average of class Gaming (986 - 2474, n=106, last 2 years) | |
| Schenker XMG Apex 15 (Late 23) | |
| Lenovo LOQ 15IRH8 Core i7 | |
| Average Intel Core i5-13500H (1674 - 1762, n=5) | |
| Medion Erazer Crawler E40 - MD 62518 | |
| MSI Katana 15 B12VEK | |
| Asus TUF A15 FA507 | |
| HWBOT x265 Benchmark v2.2 / 4k Preset | |
| Average of class Gaming (11.5 - 44.4, n=106, last 2 years) | |
| Schenker XMG Apex 15 (Late 23) | |
| Medion Erazer Crawler E40 - MD 62518 | |
| MSI Katana 15 B12VEK | |
| Asus TUF A15 FA507 | |
| Lenovo LOQ 15IRH8 Core i7 | |
| Average Intel Core i5-13500H (14.4 - 17.9, n=6) | |
| LibreOffice / 20 Documents To PDF | |
| Medion Erazer Crawler E40 - MD 62518 | |
| Average Intel Core i5-13500H (44 - 65.5, n=5) | |
| Asus TUF A15 FA507 | |
| Average of class Gaming (33.2 - 88.8, n=106, last 2 years) | |
| MSI Katana 15 B12VEK | |
| Schenker XMG Apex 15 (Late 23) | |
| Lenovo LOQ 15IRH8 Core i7 | |
| R Benchmark 2.5 / Overall mean | |
| Asus TUF A15 FA507 | |
| MSI Katana 15 B12VEK | |
| Average Intel Core i5-13500H (0.471 - 0.51, n=6) | |
| Medion Erazer Crawler E40 - MD 62518 | |
| Lenovo LOQ 15IRH8 Core i7 | |
| Schenker XMG Apex 15 (Late 23) | |
| Average of class Gaming (0.3439 - 0.759, n=107, last 2 years) | |
* ... smaller is better
AIDA64: FP32 Ray-Trace | FPU Julia | CPU SHA3 | CPU Queen | FPU SinJulia | FPU Mandel | CPU AES | CPU ZLib | FP64 Ray-Trace | CPU PhotoWorxx
| Performance rating | |
| Average of class Gaming | |
| Schenker XMG Apex 15 (Late 23) | |
| Asus TUF A15 FA507 | |
| MSI Katana 15 B12VEK | |
| Medion Erazer Crawler E40 - MD 62518 | |
| Average Intel Core i5-13500H | |
| Lenovo LOQ 15IRH8 Core i7 | |
| AIDA64 / FP32 Ray-Trace | |
| Average of class Gaming (10227 - 85542, n=106, last 2 years) | |
| Schenker XMG Apex 15 (Late 23) | |
| Asus TUF A15 FA507 | |
| MSI Katana 15 B12VEK | |
| Medion Erazer Crawler E40 - MD 62518 | |
| Average Intel Core i5-13500H (11081 - 15390, n=6) | |
| Lenovo LOQ 15IRH8 Core i7 | |
| AIDA64 / FPU Julia | |
| Average of class Gaming (51376 - 372155, n=106, last 2 years) | |
| Schenker XMG Apex 15 (Late 23) | |
| Asus TUF A15 FA507 | |
| MSI Katana 15 B12VEK | |
| Medion Erazer Crawler E40 - MD 62518 | |
| Average Intel Core i5-13500H (56813 - 74251, n=6) | |
| Lenovo LOQ 15IRH8 Core i7 | |
| AIDA64 / CPU SHA3 | |
| Average of class Gaming (2180 - 10115, n=106, last 2 years) | |
| Schenker XMG Apex 15 (Late 23) | |
| Medion Erazer Crawler E40 - MD 62518 | |
| Asus TUF A15 FA507 | |
| MSI Katana 15 B12VEK | |
| Average Intel Core i5-13500H (2621 - 3623, n=6) | |
| Lenovo LOQ 15IRH8 Core i7 | |
| AIDA64 / CPU Queen | |
| Average of class Gaming (49785 - 173351, n=90, last 2 years) | |
| Schenker XMG Apex 15 (Late 23) | |
| Asus TUF A15 FA507 | |
| MSI Katana 15 B12VEK | |
| Medion Erazer Crawler E40 - MD 62518 | |
| Average Intel Core i5-13500H (77835 - 85727, n=6) | |
| Lenovo LOQ 15IRH8 Core i7 | |
| AIDA64 / FPU SinJulia | |
| Schenker XMG Apex 15 (Late 23) | |
| Average of class Gaming (4424 - 33636, n=106, last 2 years) | |
| Asus TUF A15 FA507 | |
| MSI Katana 15 B12VEK | |
| Medion Erazer Crawler E40 - MD 62518 | |
| Average Intel Core i5-13500H (7249 - 8086, n=6) | |
| Lenovo LOQ 15IRH8 Core i7 | |
| AIDA64 / FPU Mandel | |
| Average of class Gaming (25115 - 196829, n=106, last 2 years) | |
| Schenker XMG Apex 15 (Late 23) | |
| Asus TUF A15 FA507 | |
| MSI Katana 15 B12VEK | |
| Medion Erazer Crawler E40 - MD 62518 | |
| Average Intel Core i5-13500H (27820 - 38336, n=6) | |
| Lenovo LOQ 15IRH8 Core i7 | |
| AIDA64 / CPU AES | |
| Schenker XMG Apex 15 (Late 23) | |
| Average of class Gaming (39258 - 247074, n=106, last 2 years) | |
| Average Intel Core i5-13500H (62657 - 120493, n=6) | |
| MSI Katana 15 B12VEK | |
| Asus TUF A15 FA507 | |
| Medion Erazer Crawler E40 - MD 62518 | |
| Lenovo LOQ 15IRH8 Core i7 | |
| AIDA64 / CPU ZLib | |
| Average of class Gaming (574 - 2531, n=106, last 2 years) | |
| Schenker XMG Apex 15 (Late 23) | |
| Medion Erazer Crawler E40 - MD 62518 | |
| Average Intel Core i5-13500H (782 - 992, n=6) | |
| MSI Katana 15 B12VEK | |
| Lenovo LOQ 15IRH8 Core i7 | |
| Asus TUF A15 FA507 | |
| AIDA64 / FP64 Ray-Trace | |
| Average of class Gaming (5509 - 45446, n=106, last 2 years) | |
| Schenker XMG Apex 15 (Late 23) | |
| Asus TUF A15 FA507 | |
| MSI Katana 15 B12VEK | |
| Medion Erazer Crawler E40 - MD 62518 | |
| Average Intel Core i5-13500H (5955 - 8495, n=6) | |
| Lenovo LOQ 15IRH8 Core i7 | |
| AIDA64 / CPU PhotoWorxx | |
| Average of class Gaming (12271 - 89891, n=106, last 2 years) | |
| MSI Katana 15 B12VEK | |
| Medion Erazer Crawler E40 - MD 62518 | |
| Schenker XMG Apex 15 (Late 23) | |
| Lenovo LOQ 15IRH8 Core i7 | |
| Average Intel Core i5-13500H (20212 - 37618, n=6) | |
| Asus TUF A15 FA507 | |
系统性能
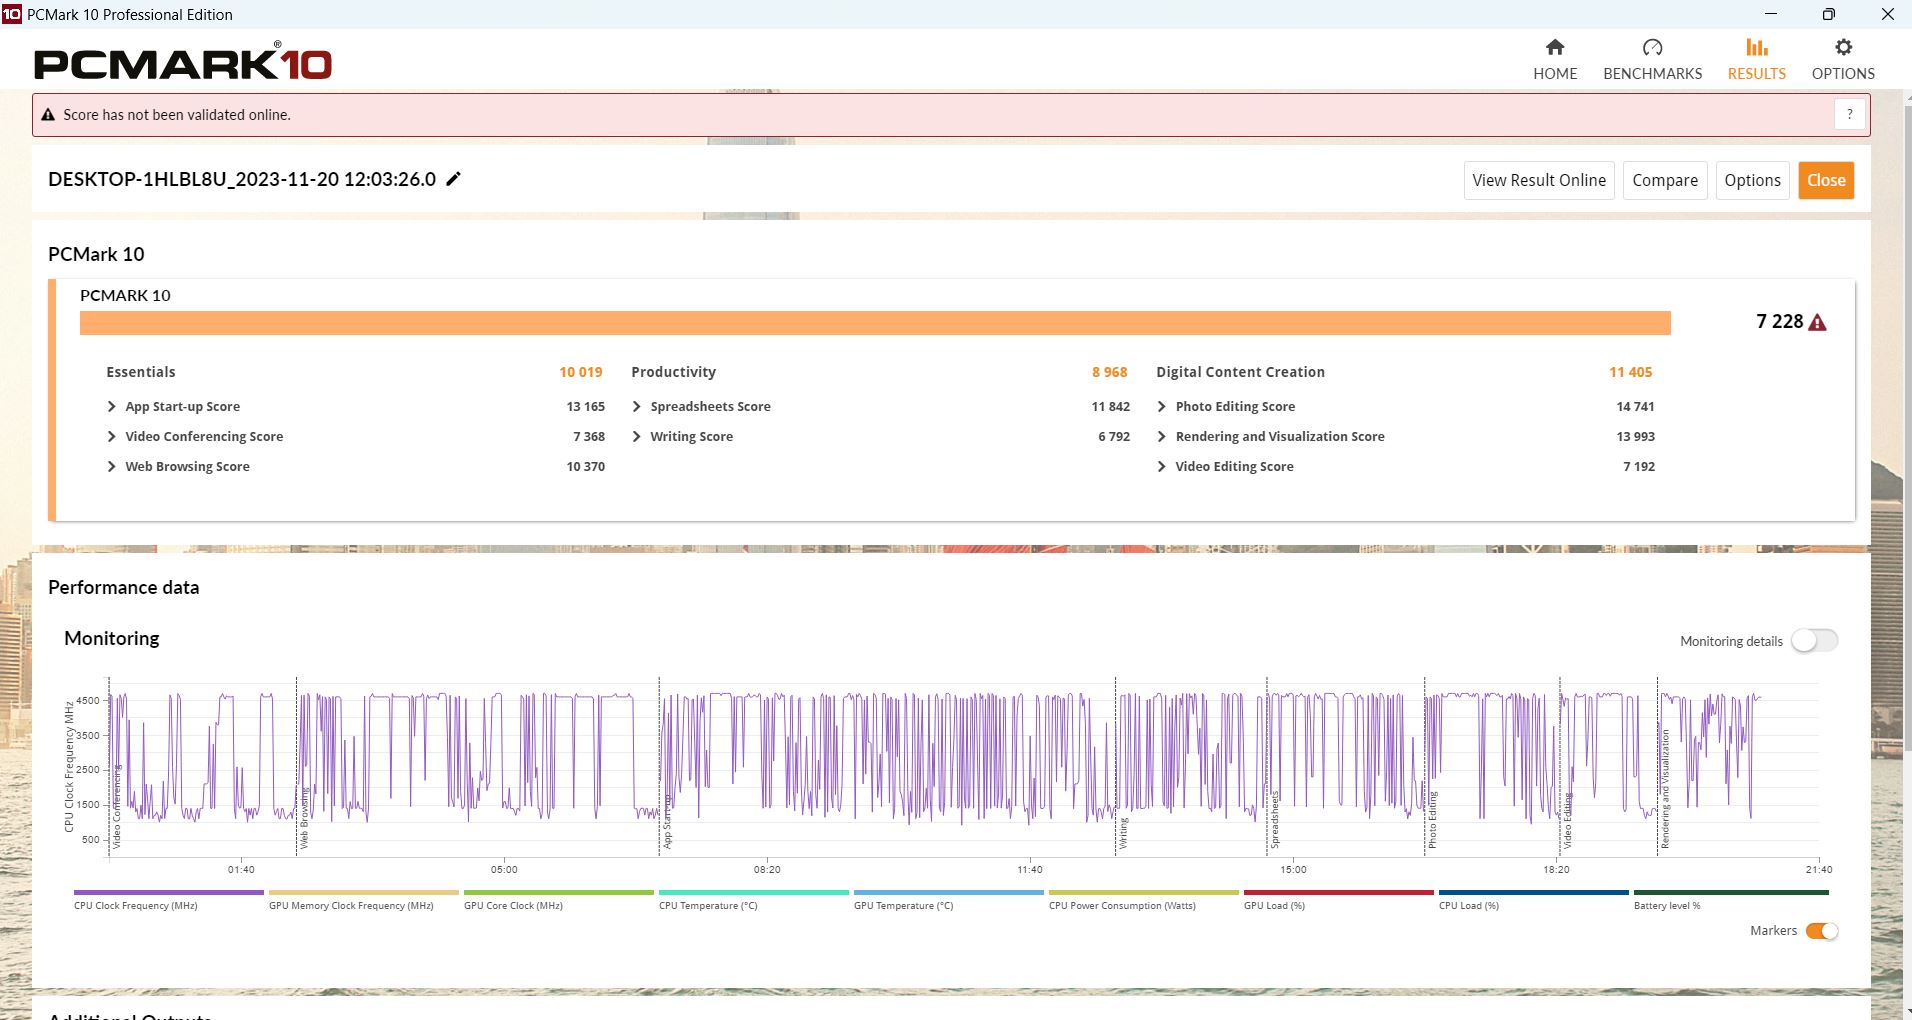
在 PCMark 10 中,XMG Apex 15 XMG Apex 15 和联想 LOQ 15 略胜一筹,尤其是在生产力和基本功能方面。在 "数字内容创建 "中,Crawler不相上下。只有 LOQ 15 在 Crossmark 中稍快一些。
CrossMark: Overall | Productivity | Creativity | Responsiveness
| PCMark 10 / Score | |
| Average of class Gaming (5828 - 12414, n=94, last 2 years) | |
| Schenker XMG Apex 15 (Late 23) | |
| Lenovo LOQ 15IRH8 Core i7 | |
| Medion Erazer Crawler E40 - MD 62518 | |
| Asus TUF A15 FA507 | |
| Average Intel Core i5-13500H, NVIDIA GeForce RTX 4050 Laptop GPU (6812 - 7228, n=2) | |
| MSI Katana 15 B12VEK | |
| PCMark 10 / Essentials | |
| Lenovo LOQ 15IRH8 Core i7 | |
| Schenker XMG Apex 15 (Late 23) | |
| Average of class Gaming (8810 - 11935, n=98, last 2 years) | |
| Asus TUF A15 FA507 | |
| MSI Katana 15 B12VEK | |
| Medion Erazer Crawler E40 - MD 62518 | |
| Average Intel Core i5-13500H, NVIDIA GeForce RTX 4050 Laptop GPU (9521 - 10019, n=2) | |
| PCMark 10 / Productivity | |
| Average of class Gaming (6845 - 25323, n=96, last 2 years) | |
| Schenker XMG Apex 15 (Late 23) | |
| MSI Katana 15 B12VEK | |
| Lenovo LOQ 15IRH8 Core i7 | |
| Asus TUF A15 FA507 | |
| Medion Erazer Crawler E40 - MD 62518 | |
| Average Intel Core i5-13500H, NVIDIA GeForce RTX 4050 Laptop GPU (8890 - 8968, n=2) | |
| PCMark 10 / Digital Content Creation | |
| Average of class Gaming (7602 - 19954, n=96, last 2 years) | |
| Lenovo LOQ 15IRH8 Core i7 | |
| Schenker XMG Apex 15 (Late 23) | |
| Medion Erazer Crawler E40 - MD 62518 | |
| Average Intel Core i5-13500H, NVIDIA GeForce RTX 4050 Laptop GPU (10134 - 11405, n=2) | |
| Asus TUF A15 FA507 | |
| MSI Katana 15 B12VEK | |
| CrossMark / Overall | |
| Average of class Gaming (1366 - 2409, n=95, last 2 years) | |
| Lenovo LOQ 15IRH8 Core i7 | |
| Medion Erazer Crawler E40 - MD 62518 | |
| Average Intel Core i5-13500H, NVIDIA GeForce RTX 4050 Laptop GPU (n=1) | |
| Schenker XMG Apex 15 (Late 23) | |
| MSI Katana 15 B12VEK | |
| Asus TUF A15 FA507 | |
| CrossMark / Productivity | |
| Average of class Gaming (1386 - 2254, n=95, last 2 years) | |
| Lenovo LOQ 15IRH8 Core i7 | |
| Medion Erazer Crawler E40 - MD 62518 | |
| Average Intel Core i5-13500H, NVIDIA GeForce RTX 4050 Laptop GPU (n=1) | |
| Schenker XMG Apex 15 (Late 23) | |
| MSI Katana 15 B12VEK | |
| Asus TUF A15 FA507 | |
| CrossMark / Creativity | |
| Average of class Gaming (1343 - 2786, n=95, last 2 years) | |
| Lenovo LOQ 15IRH8 Core i7 | |
| Schenker XMG Apex 15 (Late 23) | |
| Medion Erazer Crawler E40 - MD 62518 | |
| Average Intel Core i5-13500H, NVIDIA GeForce RTX 4050 Laptop GPU (n=1) | |
| MSI Katana 15 B12VEK | |
| Asus TUF A15 FA507 | |
| CrossMark / Responsiveness | |
| Lenovo LOQ 15IRH8 Core i7 | |
| Medion Erazer Crawler E40 - MD 62518 | |
| Average Intel Core i5-13500H, NVIDIA GeForce RTX 4050 Laptop GPU (n=1) | |
| Average of class Gaming (1226 - 2334, n=95, last 2 years) | |
| MSI Katana 15 B12VEK | |
| Schenker XMG Apex 15 (Late 23) | |
| Asus TUF A15 FA507 | |
| PCMark 10 Score | 7228 points | |
Help | ||
| AIDA64 / Memory Copy | |
| Average of class Gaming (21750 - 129946, n=106, last 2 years) | |
| Schenker XMG Apex 15 (Late 23) | |
| Medion Erazer Crawler E40 - MD 62518 | |
| MSI Katana 15 B12VEK | |
| Lenovo LOQ 15IRH8 Core i7 | |
| Average Intel Core i5-13500H (36916 - 57830, n=6) | |
| Asus TUF A15 FA507 | |
| AIDA64 / Memory Read | |
| Average of class Gaming (22956 - 118858, n=106, last 2 years) | |
| MSI Katana 15 B12VEK | |
| Medion Erazer Crawler E40 - MD 62518 | |
| Lenovo LOQ 15IRH8 Core i7 | |
| Schenker XMG Apex 15 (Late 23) | |
| Average Intel Core i5-13500H (41676 - 65633, n=6) | |
| Asus TUF A15 FA507 | |
| AIDA64 / Memory Write | |
| Schenker XMG Apex 15 (Late 23) | |
| Average of class Gaming (22297 - 135096, n=106, last 2 years) | |
| Medion Erazer Crawler E40 - MD 62518 | |
| MSI Katana 15 B12VEK | |
| Asus TUF A15 FA507 | |
| Lenovo LOQ 15IRH8 Core i7 | |
| Average Intel Core i5-13500H (36826 - 60523, n=6) | |
| AIDA64 / Memory Latency | |
| Lenovo LOQ 15IRH8 Core i7 | |
| Average of class Gaming (75.3 - 259, n=106, last 2 years) | |
| Medion Erazer Crawler E40 - MD 62518 | |
| MSI Katana 15 B12VEK | |
| Average Intel Core i5-13500H (86.2 - 96.1, n=6) | |
| Schenker XMG Apex 15 (Late 23) | |
| Asus TUF A15 FA507 | |
* ... smaller is better
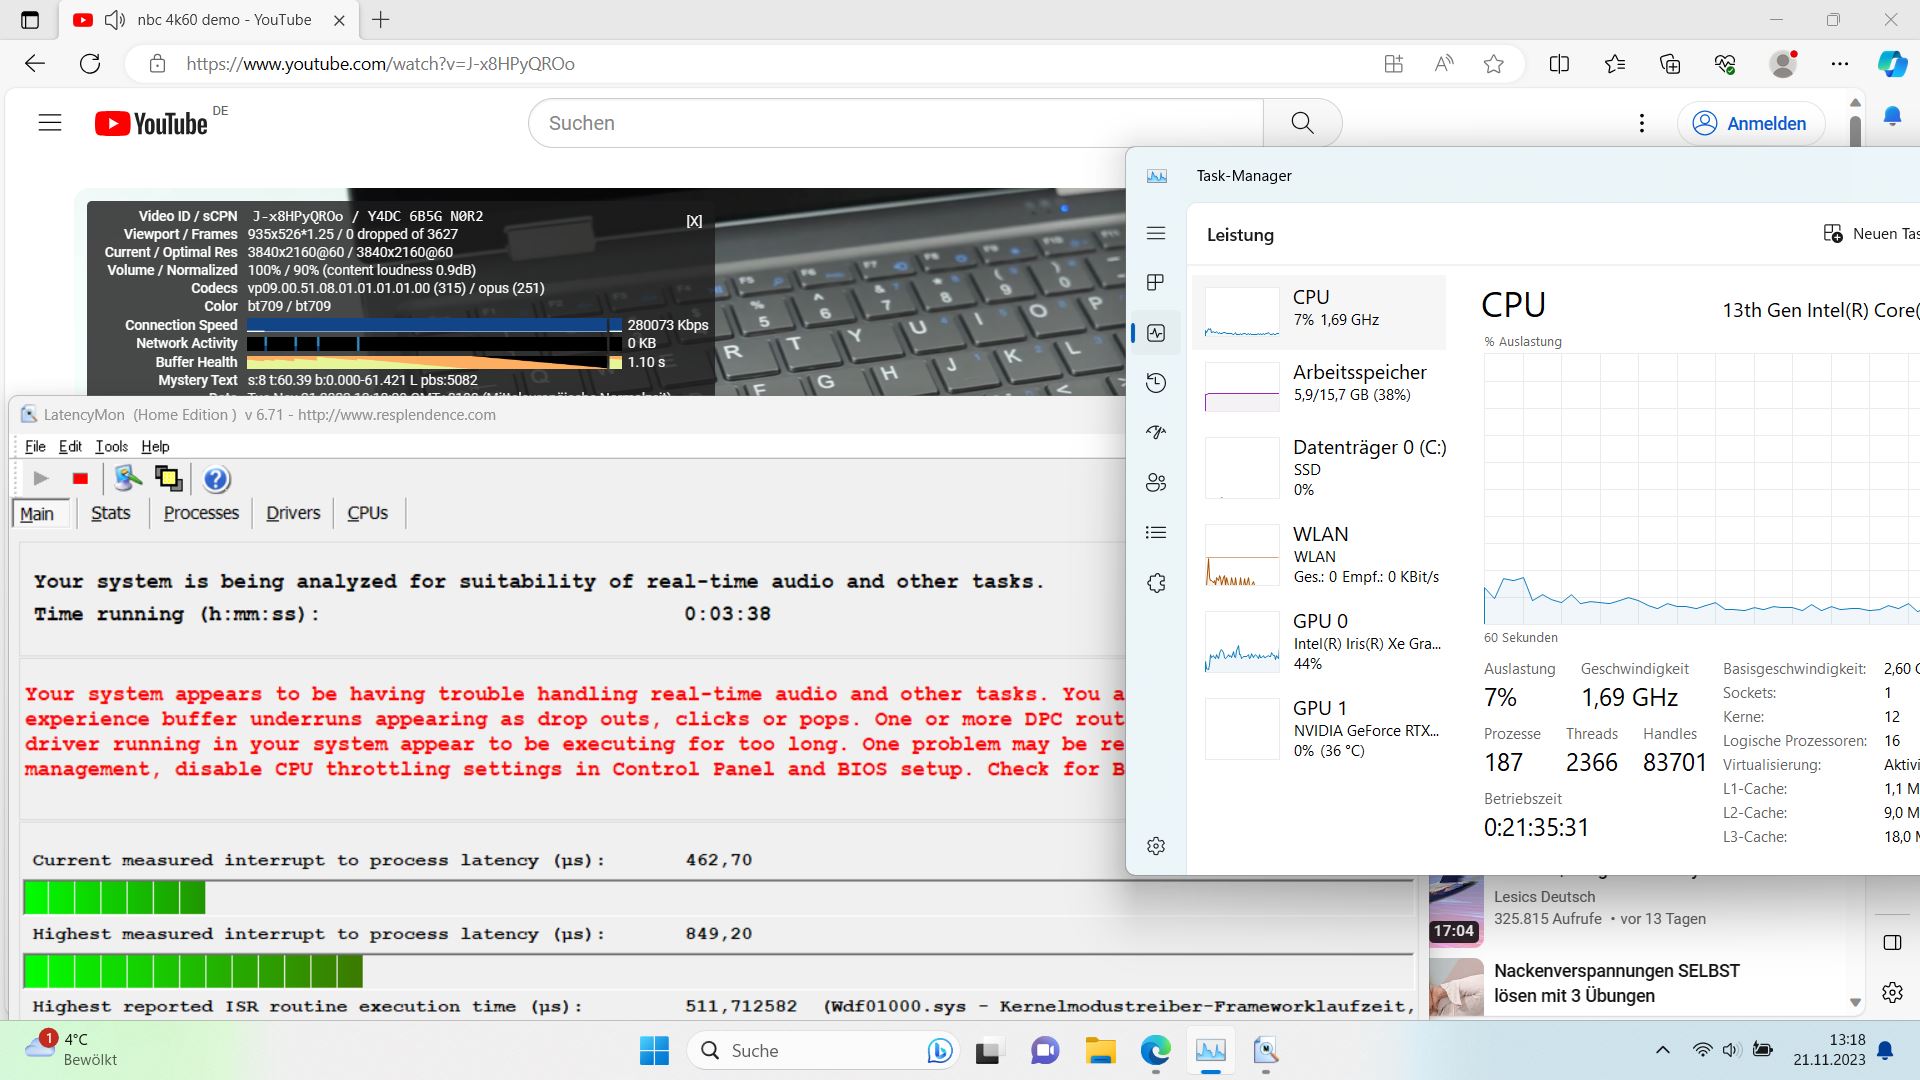
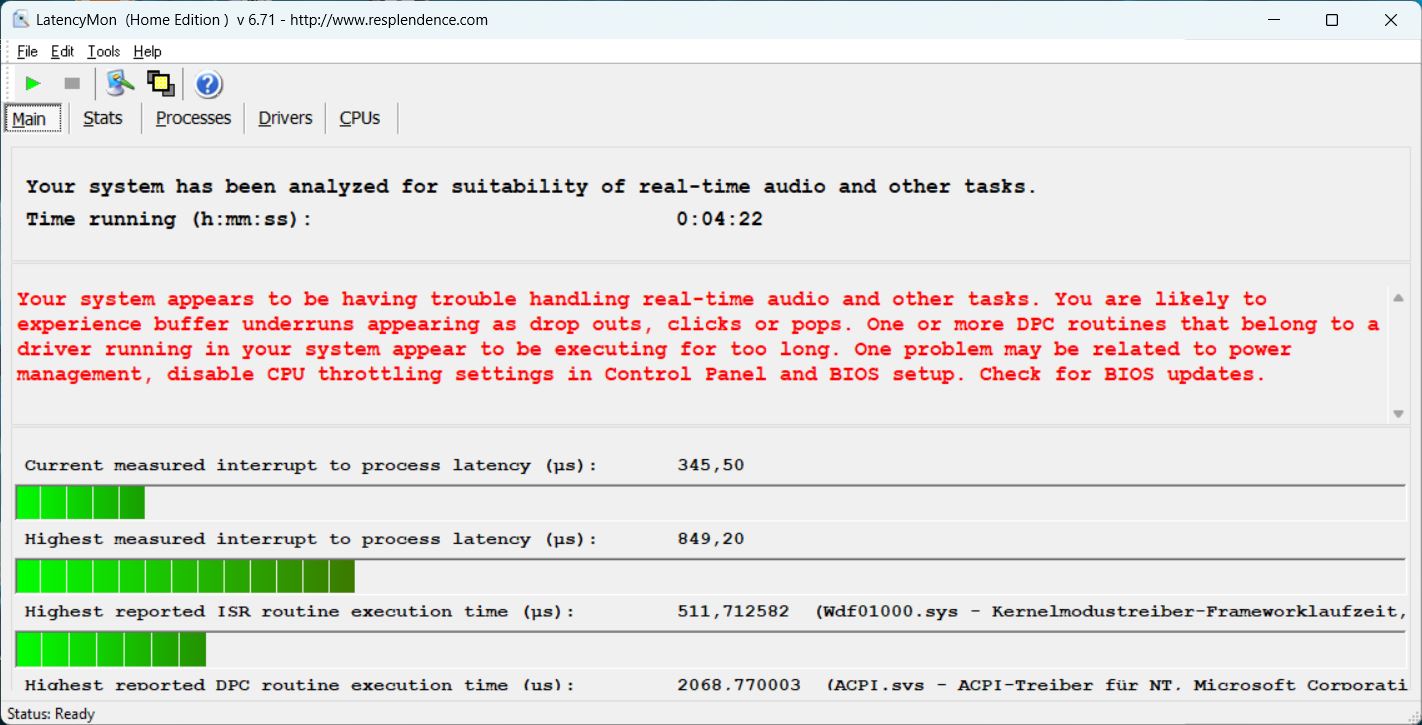
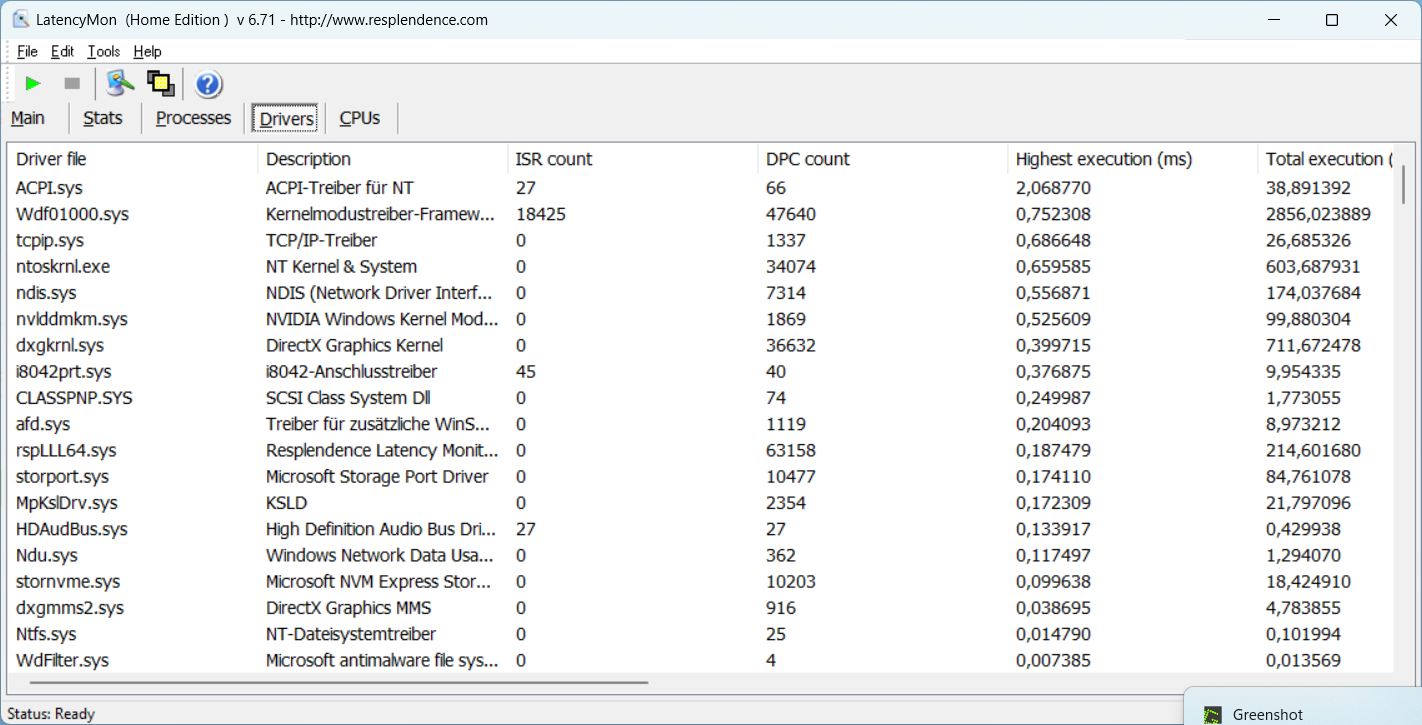
DPC 延迟
打开浏览器或多个标签页时没有问题。不过,在播放 4K/60 fps YouTube 视频时,LatencyMon 发现了一些问题。至少在播放时没有出现掉帧现象。在 Prime95 下,延迟值略有增加。
| DPC Latencies / LatencyMon - interrupt to process latency (max), Web, Youtube, Prime95 | |
| MSI Katana 15 B12VEK | |
| Medion Erazer Crawler E40 - MD 62518 | |
| Lenovo LOQ 15IRH8 Core i7 | |
| Schenker XMG Apex 15 (Late 23) | |
* ... smaller is better
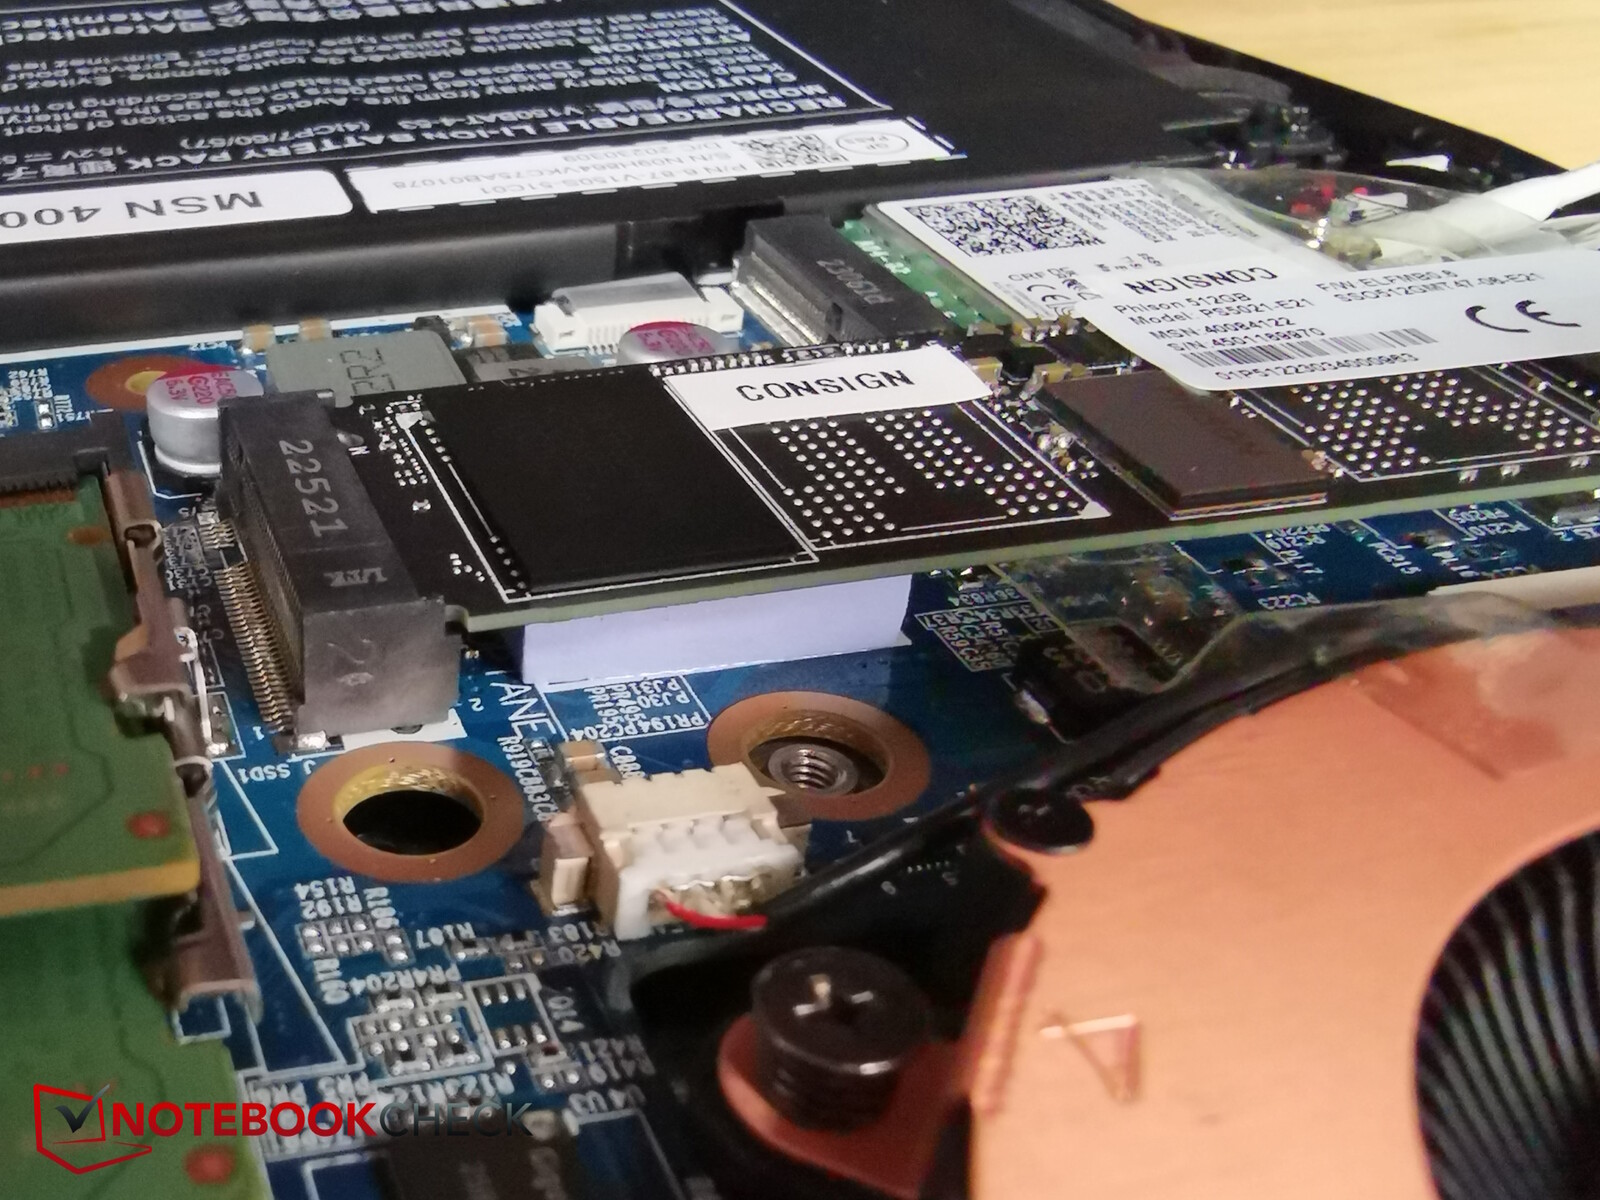
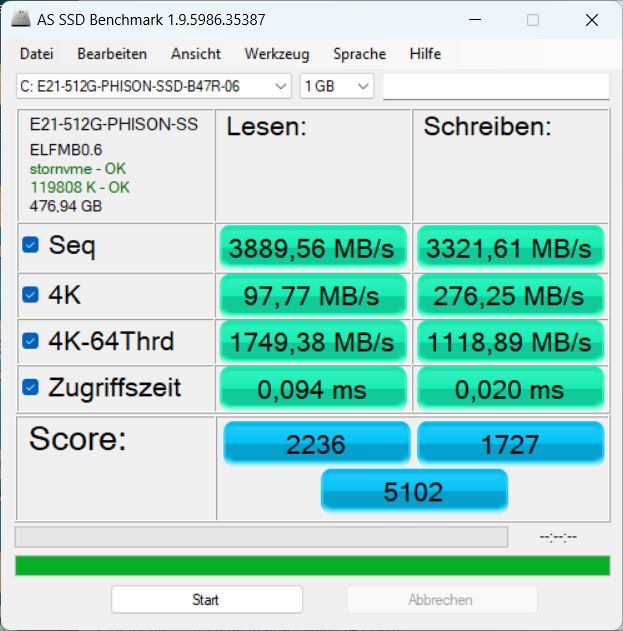
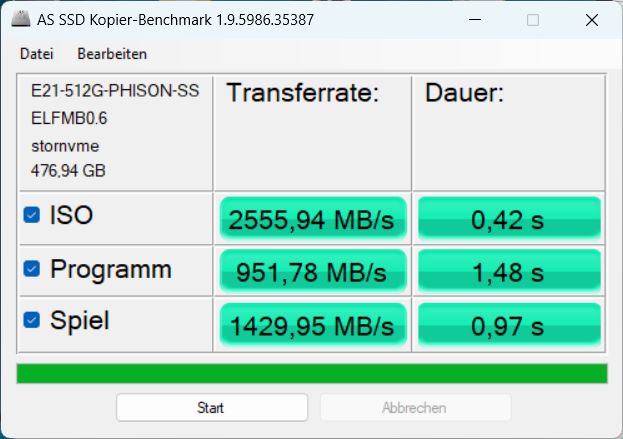
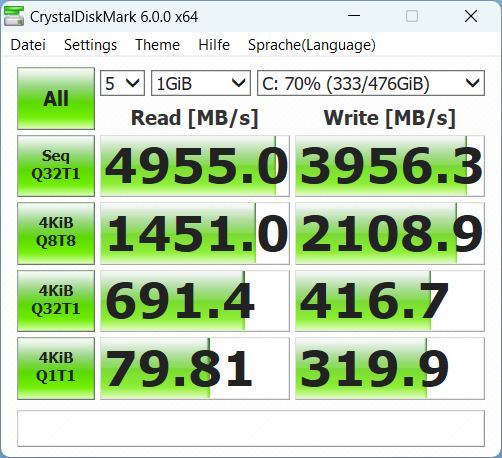
存储设备
Medion 使用的是 Phison 的 512 GB NVMe SSD。虽然它的速度无法与 XMG Apex 15 中的三星 990 Pro 相提并论,但它的存储性能却优于其他三个竞争对手,而且在较长时间内性能也非常稳定。我们的固态硬盘最佳列表中还有更多固态硬盘比较。

* ... smaller is better
Continuous power read: DiskSpd Read Loop, Queue Depth 8
图形卡
在我们的 E40 履带中,一台 RTX 4050安装了最大额定功率为 100 W 的 RTX 4050。
E40 在 3DMark 基准测试中表现非常出色,略高于普通 RTX 4050,与同类产品中的 XMG Apex 15 和微星 Katana 15 不相上下。
在电池模式下,Fire Strike ,3D 性能整整下降了 70%。
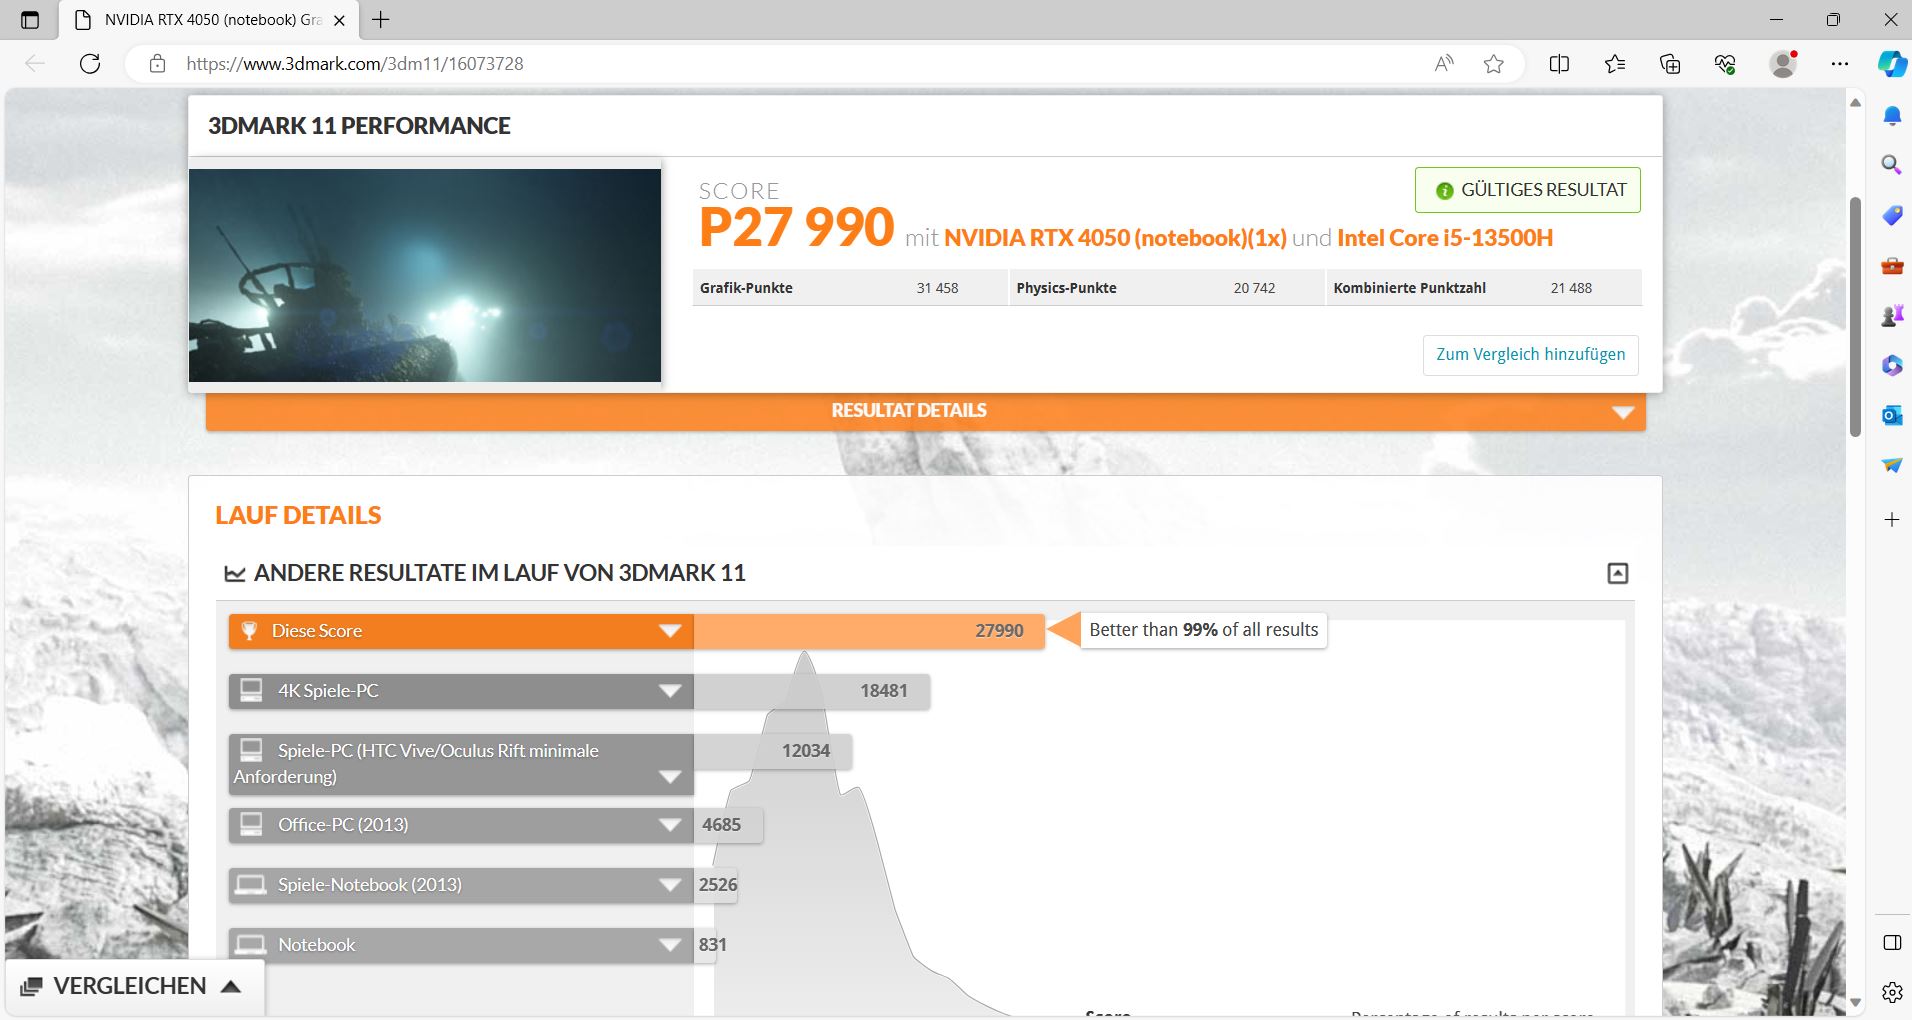
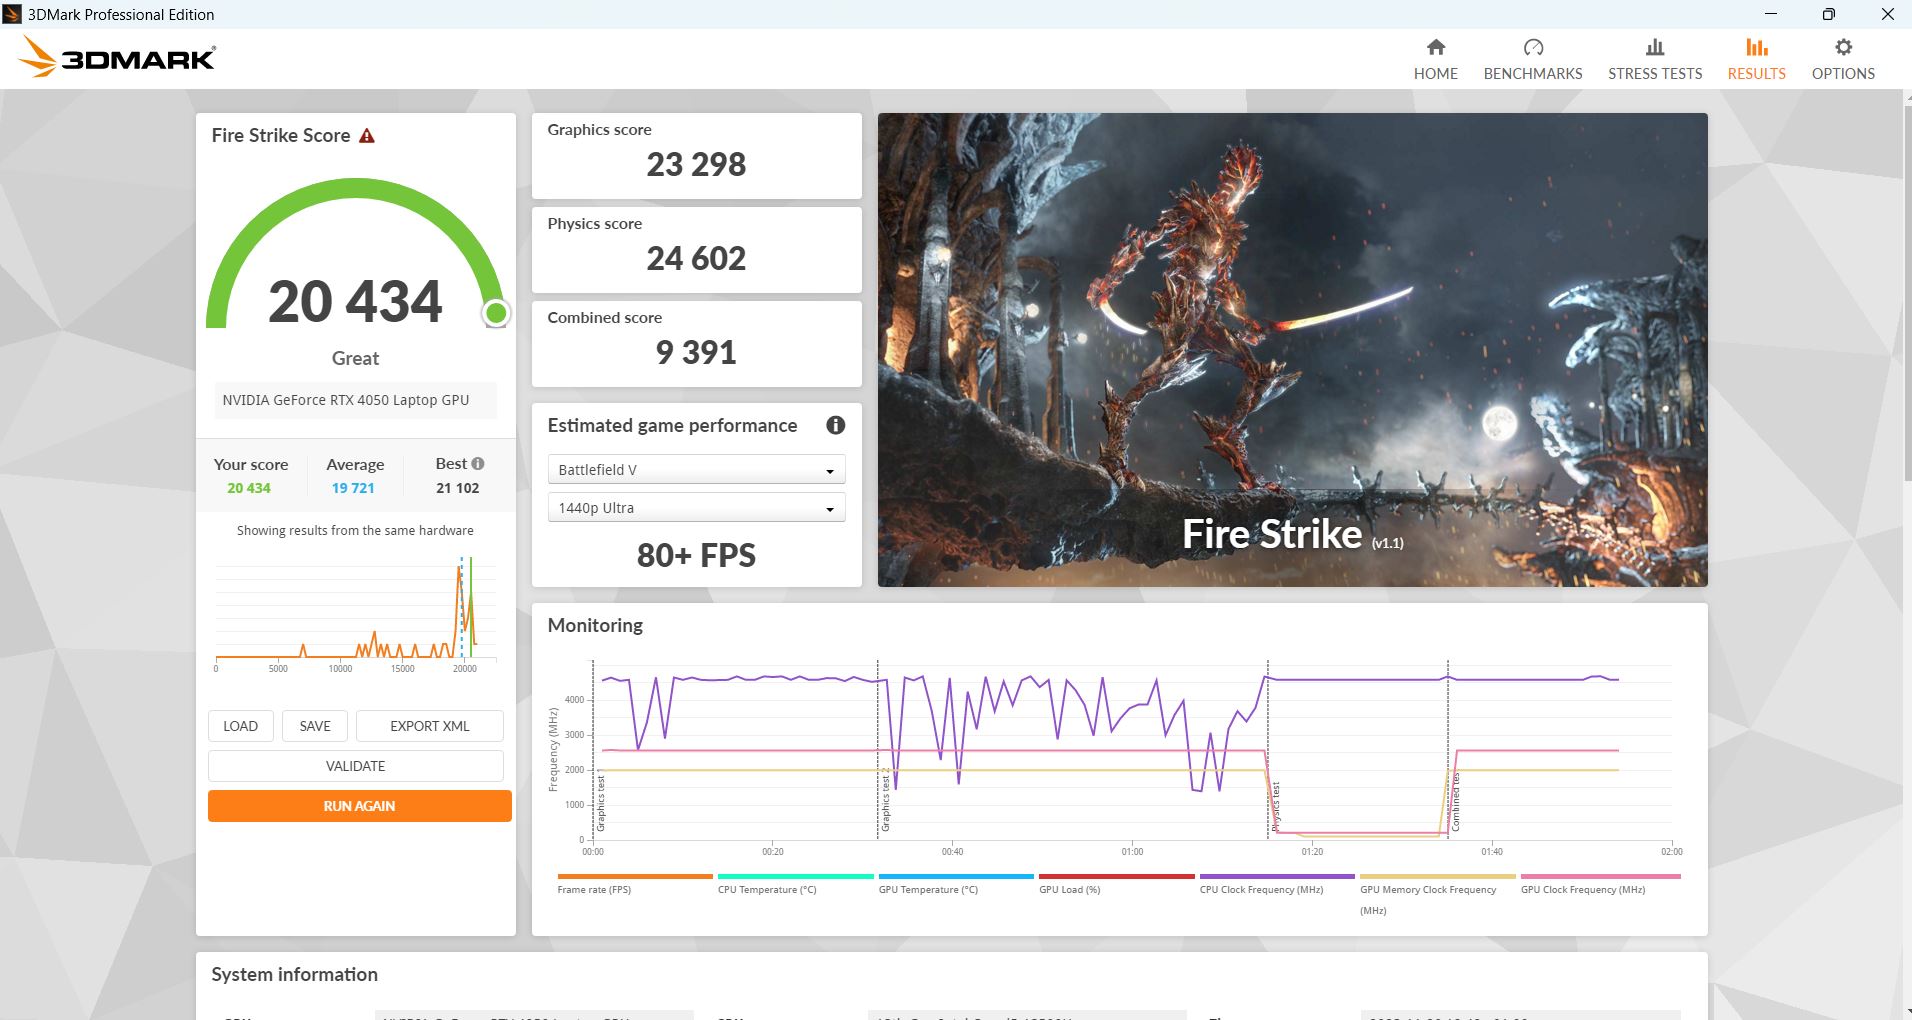
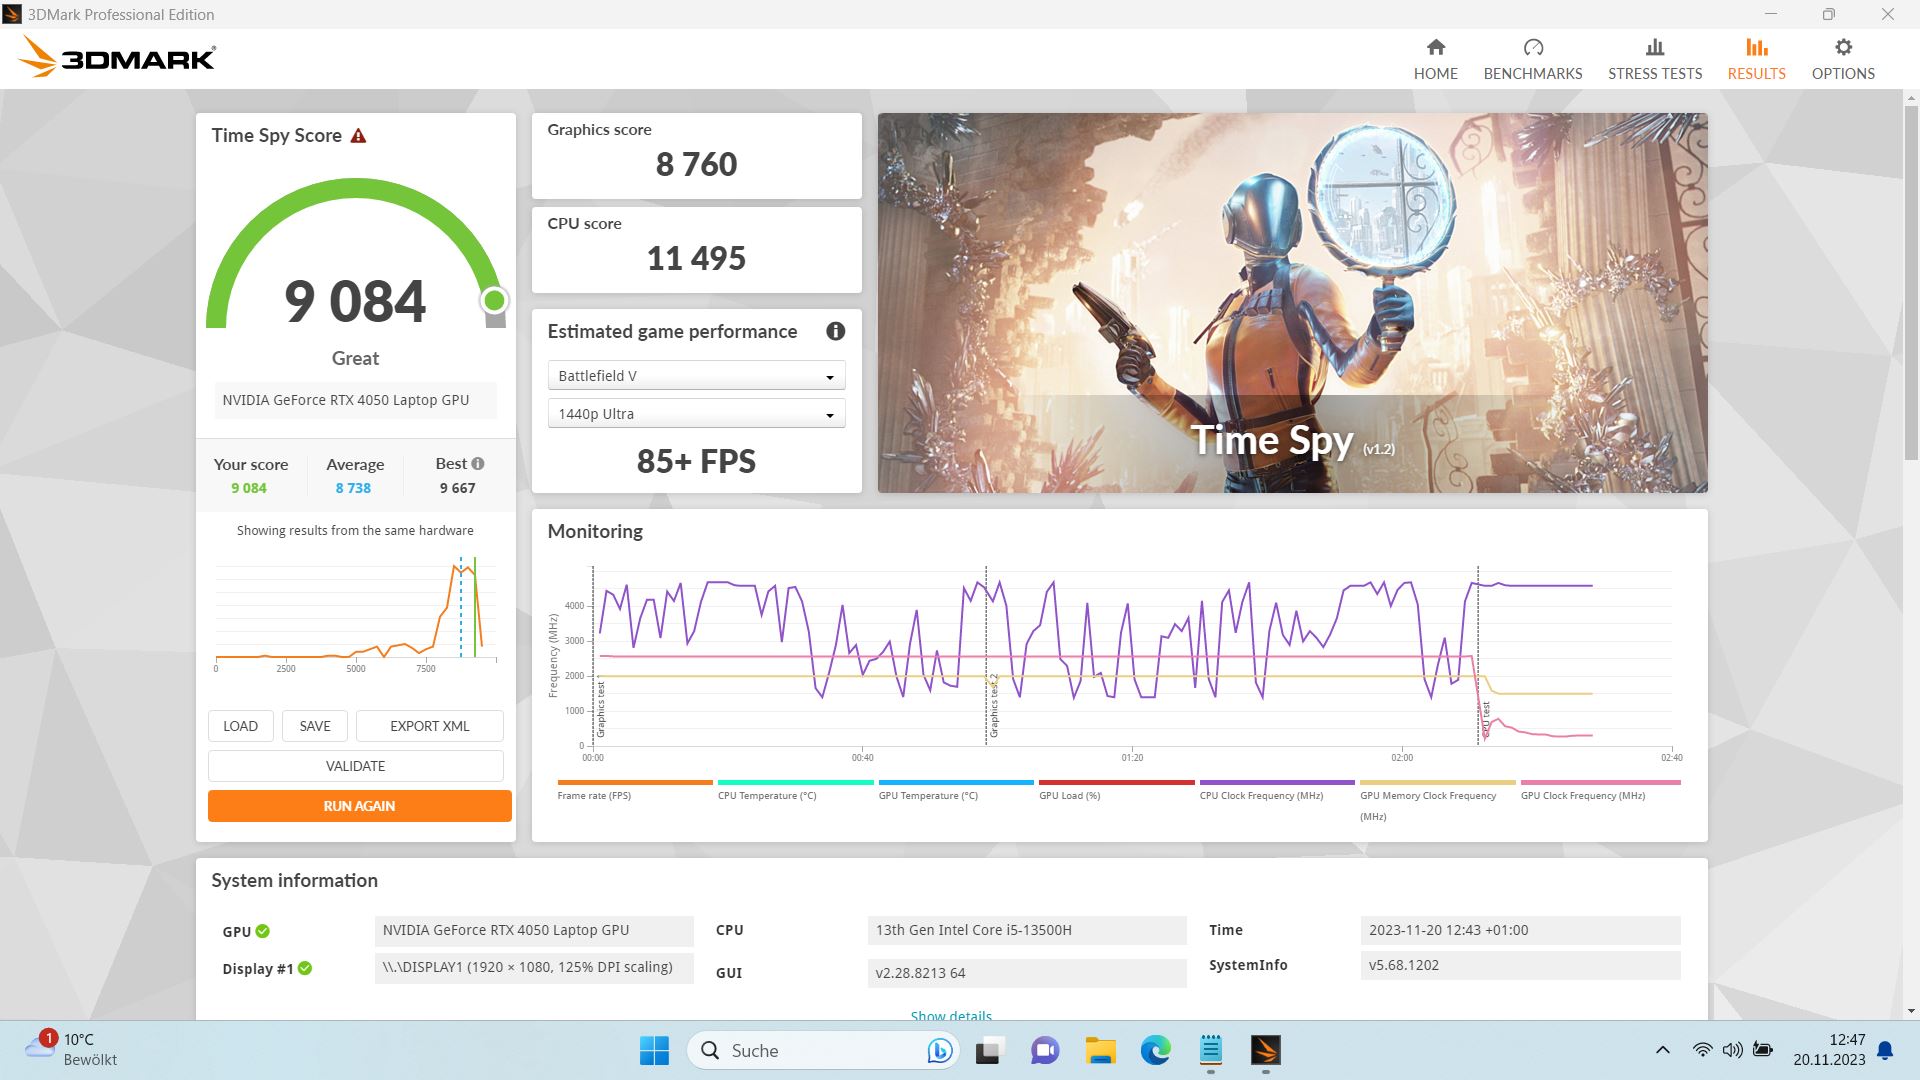
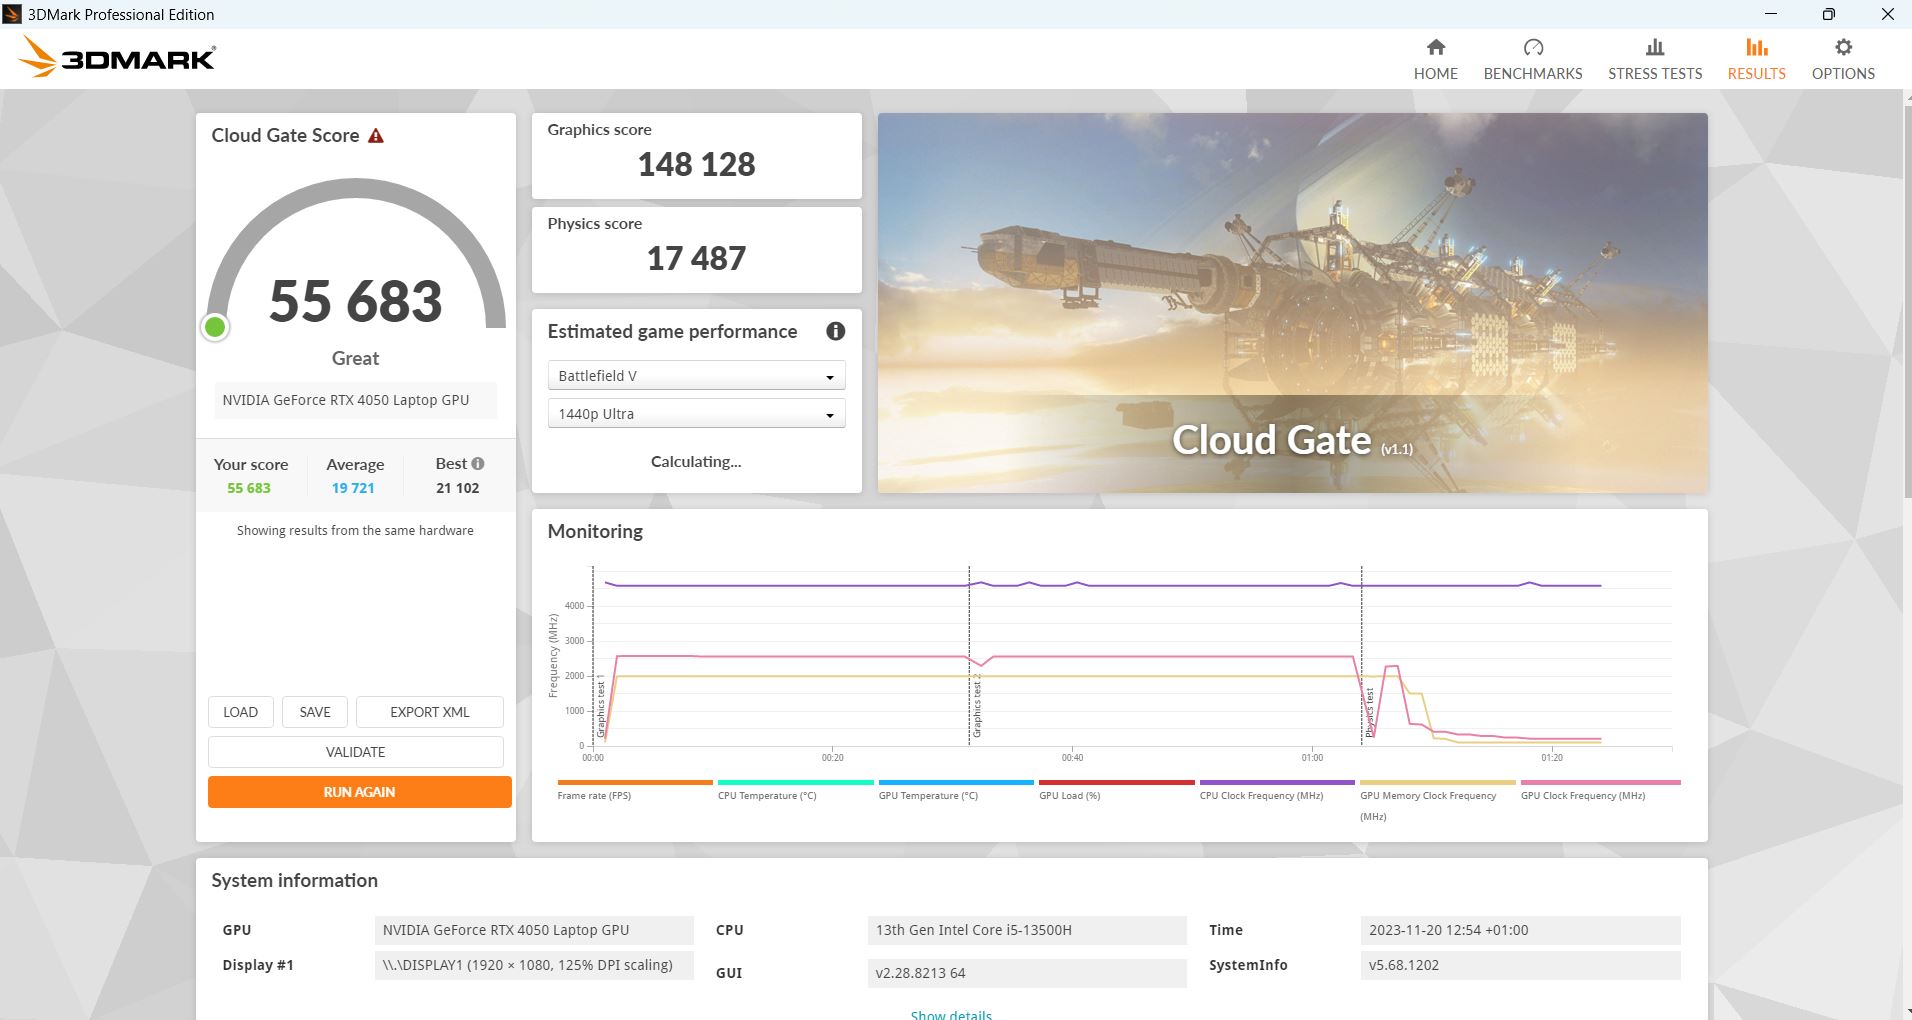
| 3DMark 11 Performance | 27990 points | |
| 3DMark Cloud Gate Standard Score | 55683 points | |
| 3DMark Fire Strike Score | 20434 points | |
| 3DMark Time Spy Score | 9084 points | |
Help | ||
* ... smaller is better
游戏
从Witcher 3 的日志数据(见下面的截图)中可以看出,娱乐模式和静音模式下的 GPU 时钟和功耗几乎完全相同,只是略低于游戏模式。相应地,帧速率也几乎没有差别。模式间唯一的区别是风扇的行为,这会导致不同的音量和温度变化。在静音模式下,GPU 比其他模式下更热。在游戏模式下,Witcher 3 帧率非常稳定。
与竞争对手相比,E40 表现出色。特别是在《孤岛惊魂 5》中,它的表现名列前茅。而在Witcher 3 中,它则排在最后,但差距很小。在整体游戏效果方面,竞争对手的表现接近,LOQ 15 略好于我们的爬虫,Katana 15 大致相同,而 Apex 15 尤其是华硕 TUF A15 则较弱。
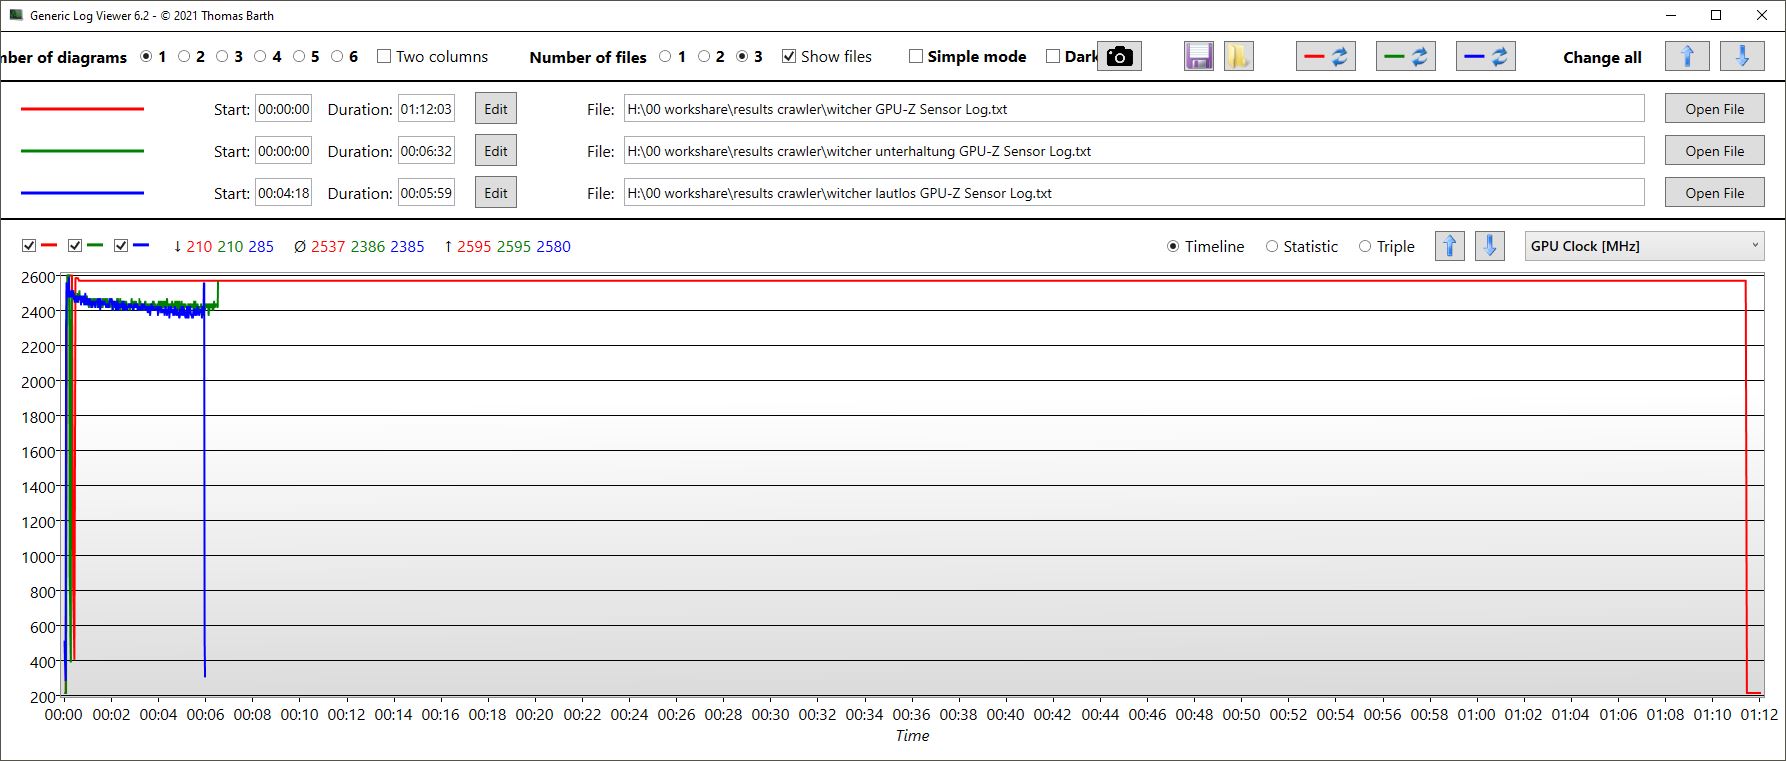
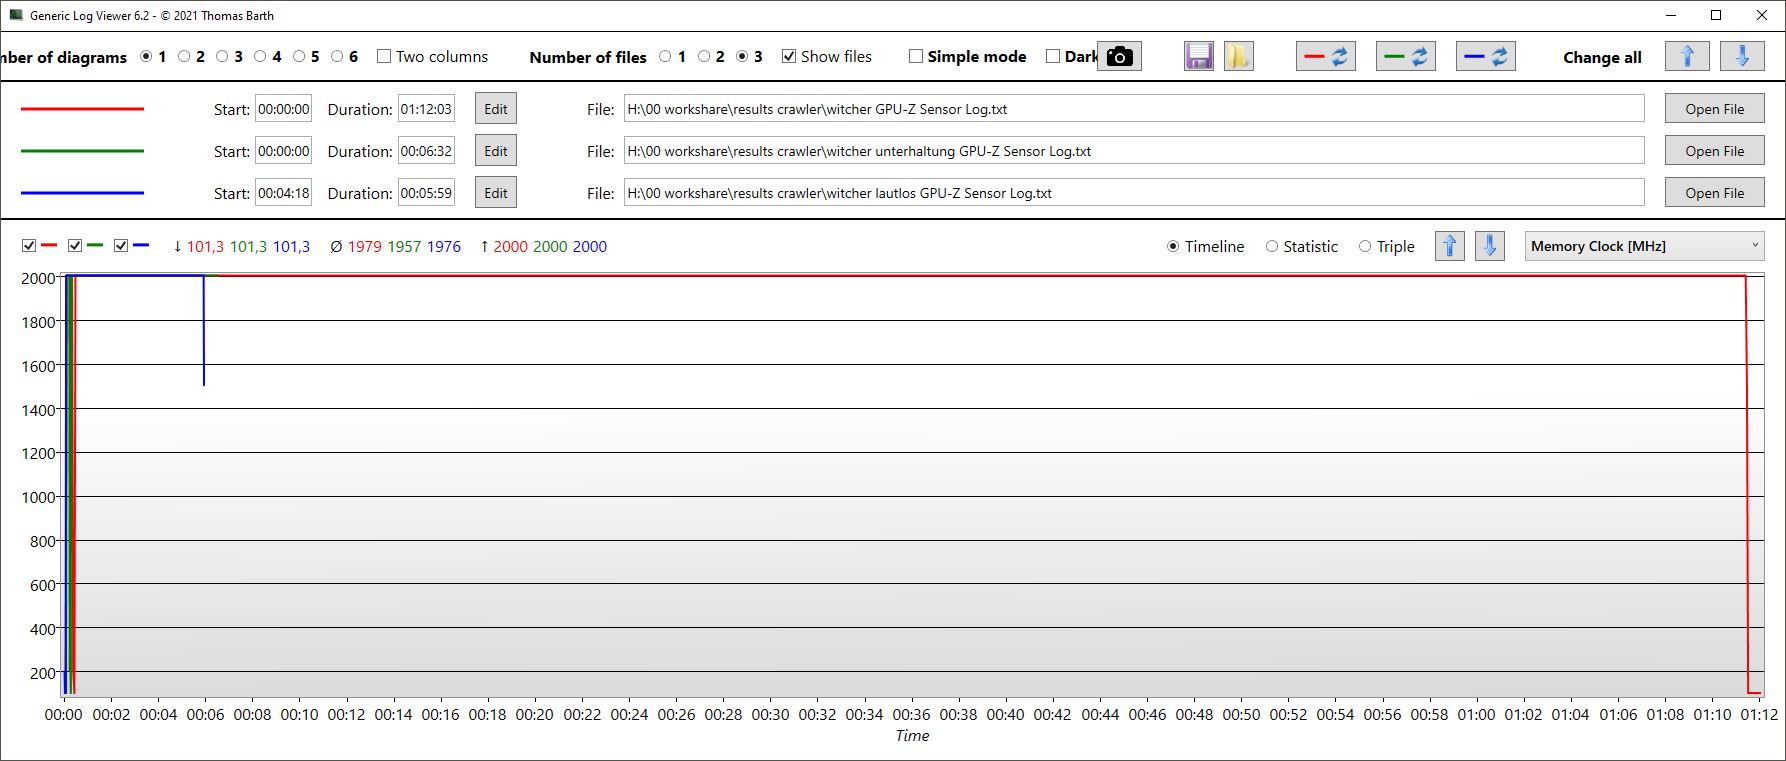
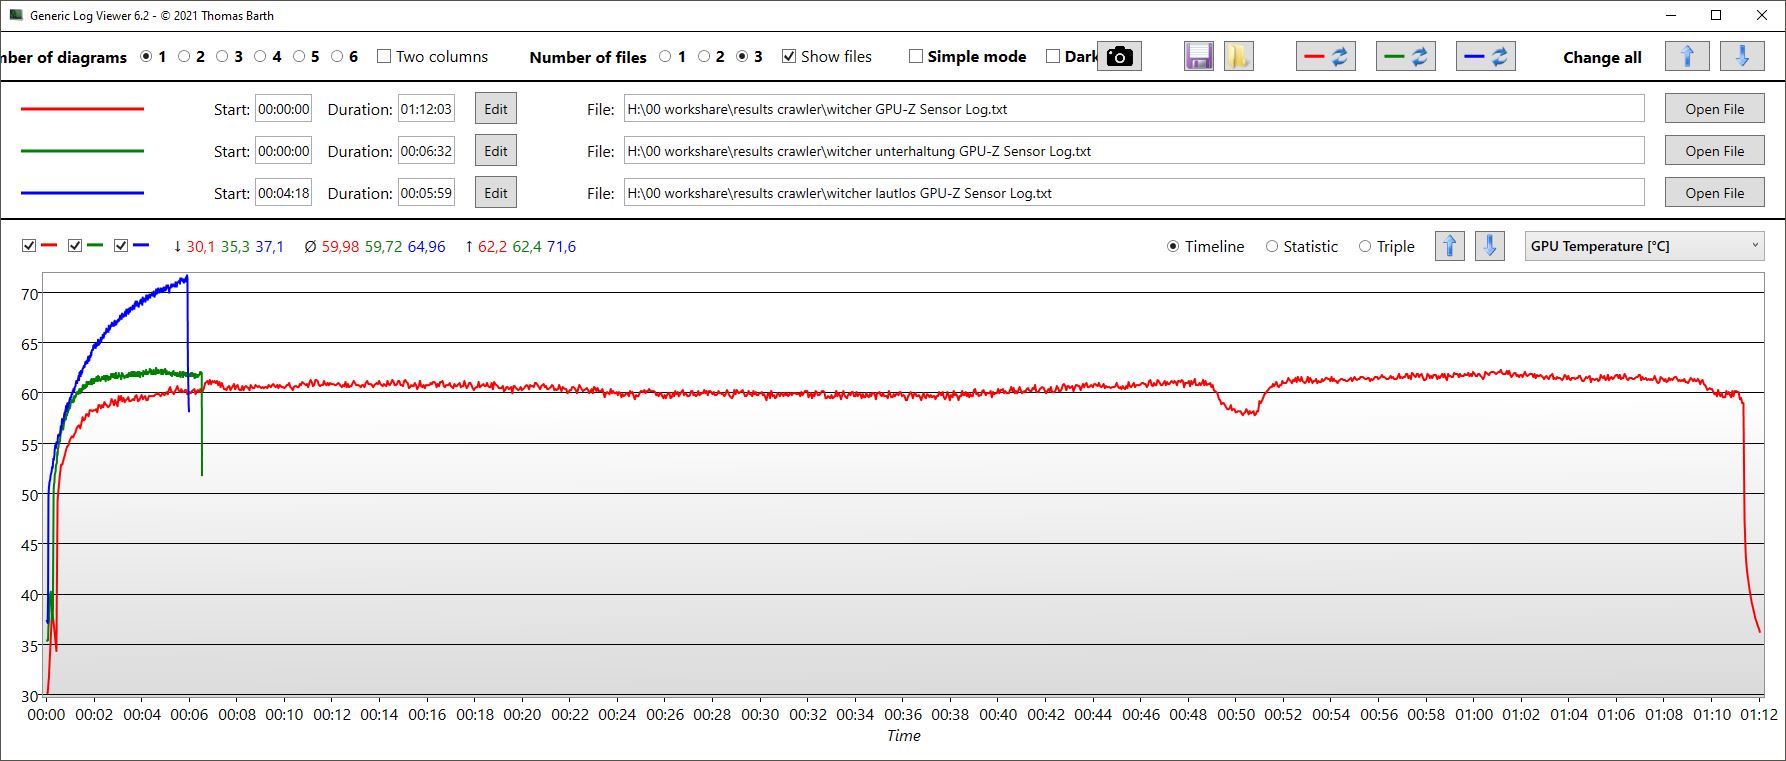
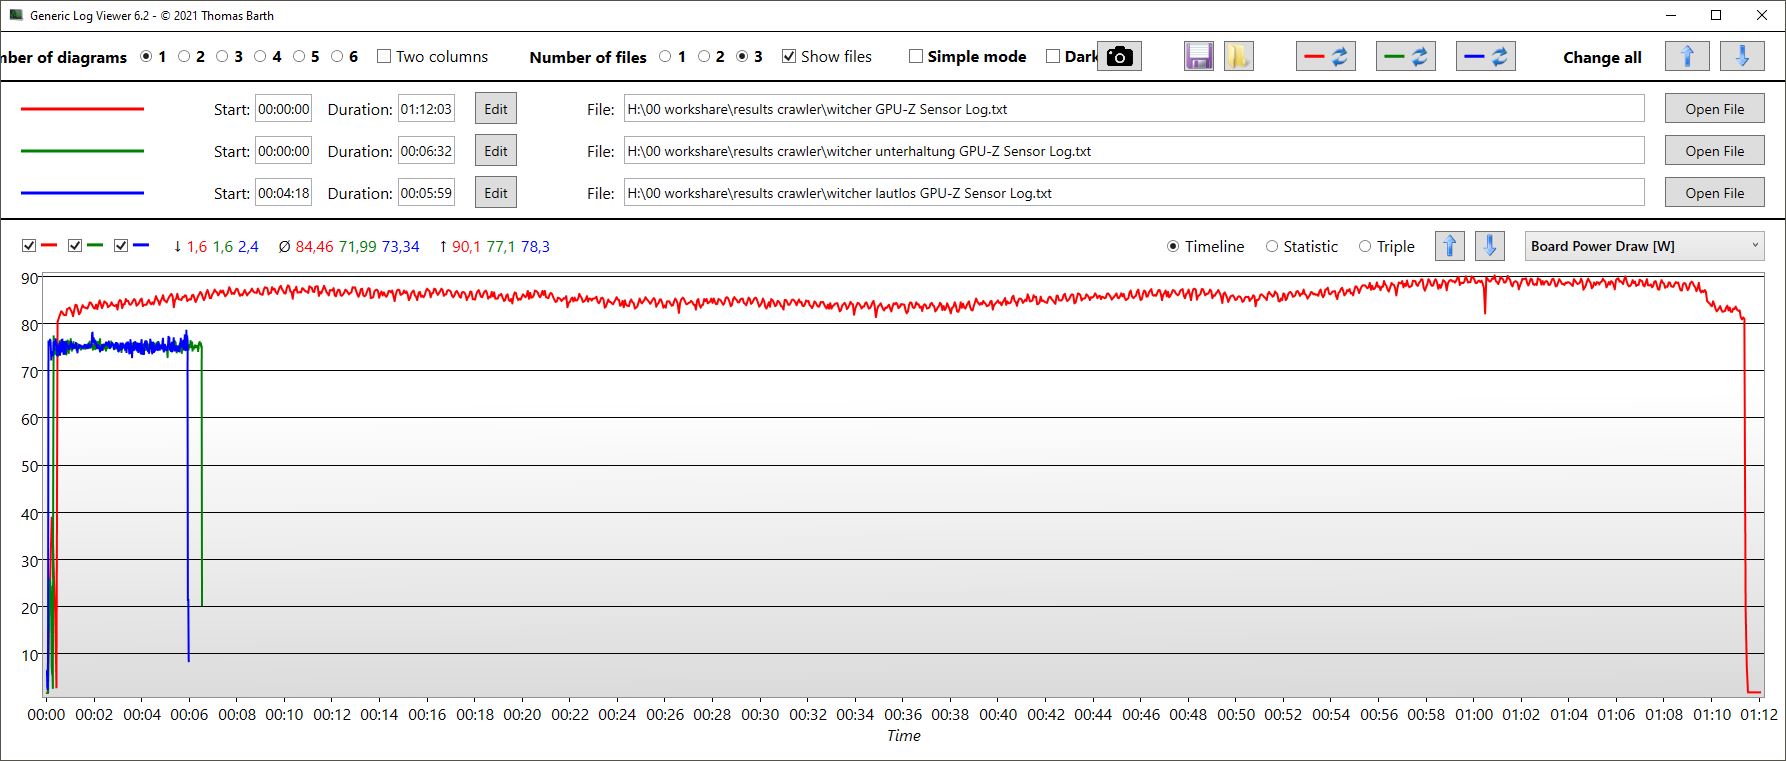
| 模式/Witcher 3 GPU 测量 | 平均 FPS | GPU 时钟 | 内存时钟 | 平均温度 | 功耗 |
|---|---|---|---|---|---|
| 游戏 | 79.5 | 2.595 MHz | 2.000 MHz | 60 °C | 85 W |
| 娱乐 | 77 | 2.400 MHz | 2.000 MHz | 约 62 °C | 72 W |
| 静音 | 78 | 2.400 MHz | 2.000 MHz | 约 75 °C | 73 W |
| Performance rating - Percent | |
| Average of class Gaming | |
| Lenovo LOQ 15IRH8 Core i7 | |
| Medion Erazer Crawler E40 - MD 62518 | |
| MSI Katana 15 B12VEK | |
| Schenker XMG Apex 15 (Late 23) -1! | |
| Asus TUF A15 FA507 | |
| The Witcher 3 - 1920x1080 Ultra Graphics & Postprocessing (HBAO+) | |
| Average of class Gaming (104.7 - 240, n=7, last 2 years) | |
| Lenovo LOQ 15IRH8 Core i7 | |
| Schenker XMG Apex 15 (Late 23) | |
| MSI Katana 15 B12VEK | |
| Asus TUF A15 FA507 | |
| Medion Erazer Crawler E40 - MD 62518 | |
| GTA V - 1920x1080 Highest AA:4xMSAA + FX AF:16x | |
| Average of class Gaming (48.3 - 186.9, n=94, last 2 years) | |
| Medion Erazer Crawler E40 - MD 62518 | |
| Lenovo LOQ 15IRH8 Core i7 | |
| MSI Katana 15 B12VEK | |
| Asus TUF A15 FA507 | |
| Final Fantasy XV Benchmark - 1920x1080 High Quality | |
| Average of class Gaming (41 - 215, n=95, last 2 years) | |
| Schenker XMG Apex 15 (Late 23) | |
| Medion Erazer Crawler E40 - MD 62518 | |
| Lenovo LOQ 15IRH8 Core i7 | |
| MSI Katana 15 B12VEK | |
| Asus TUF A15 FA507 | |
| Strange Brigade - 1920x1080 ultra AA:ultra AF:16 | |
| Average of class Gaming (76.3 - 458, n=87, last 2 years) | |
| Lenovo LOQ 15IRH8 Core i7 | |
| MSI Katana 15 B12VEK | |
| Schenker XMG Apex 15 (Late 23) | |
| Asus TUF A15 FA507 | |
| Medion Erazer Crawler E40 - MD 62518 | |
| Dota 2 Reborn - 1920x1080 ultra (3/3) best looking | |
| Lenovo LOQ 15IRH8 Core i7 | |
| Average of class Gaming (84.8 - 252, n=108, last 2 years) | |
| MSI Katana 15 B12VEK | |
| Medion Erazer Crawler E40 - MD 62518 | |
| Schenker XMG Apex 15 (Late 23) | |
| Asus TUF A15 FA507 | |
| X-Plane 11.11 - 1920x1080 high (fps_test=3) | |
| Lenovo LOQ 15IRH8 Core i7 | |
| Average of class Gaming (55.5 - 148.5, n=110, last 2 years) | |
| Medion Erazer Crawler E40 - MD 62518 | |
| MSI Katana 15 B12VEK | |
| Schenker XMG Apex 15 (Late 23) | |
| Asus TUF A15 FA507 | |
Witcher 3 FPS chart
| low | med. | high | ultra | |
|---|---|---|---|---|
| GTA V (2015) | 182.2 | 176.4 | 169.1 | 97.7 |
| The Witcher 3 (2015) | 369 | 283 | 170 | 81 |
| Dota 2 Reborn (2015) | 162.7 | 152.7 | 147.9 | 140.2 |
| Final Fantasy XV Benchmark (2018) | 183.5 | 122.9 | 84.6 | |
| X-Plane 11.11 (2018) | 128.5 | 121.8 | 98.6 | |
| Far Cry 5 (2018) | 146 | 140 | 133 | 124 |
| Strange Brigade (2018) | 391 | 205 | 167.6 | 146.9 |
排放与能源 - 冷却系统噪音过大
系统噪音
Crawler 绝不是一款安静的产品。与竞争对手相比,它是噪音最大的玩家,我们在压力测试中测得的噪音高达 56 分贝,在Witcher 3 下仍超过 51 分贝,而竞争对手在这里通常保持在 50 分贝以下。这同样适用于 3DMark06 运行:其他笔记本电脑在阶段性测试中保持完全静音,只有在测试的后半段才让风扇安静地转动,而 E40 的风扇转速已经达到 50 分贝。
对我们来说,散热系统过于激进,噪音过大。正如您在下一节中看到的那样,这里的温度非常低,可以轻松实现更安静的风扇。我们建议在娱乐甚至静音模式下进行游戏。
至少在空闲模式下,E40 通常会保持安静,只有当后台进程产生的负载超过空闲模式下所需的负载时,风扇才会开启。不过,即使爬虫 E40 承受了较长时间的负载,风扇也不会完全安静下来。即使在静音模式下,风扇也不会在可预见的将来关闭。
| 模式/Witcher 3 测量 | 音量 | 系统功耗 |
|---|---|---|
| 游戏 | 51.46 dB | 155 W |
| 娱乐 | 48.21 | 139 W |
| 静音 | 31.37 dB | 117 W |
Noise level
| Idle |
| 23 / 23 / 28.02 dB(A) |
| Load |
| 50.21 / 56.79 dB(A) |
 | ||
30 dB silent 40 dB(A) audible 50 dB(A) loud |
||
min: | ||
| Medion Erazer Crawler E40 - MD 62518 GeForce RTX 4050 Laptop GPU, i5-13500H, Phison PS5021-E21 512GB | Lenovo LOQ 15IRH8 Core i7 GeForce RTX 4050 Laptop GPU, i7-13620H, Kioxia BG5 KBG50ZNT512G | Asus TUF A15 FA507 GeForce RTX 4050 Laptop GPU, R7 7735HS, Micron 2400 MTFDKBA512QFM | Schenker XMG Apex 15 (Late 23) GeForce RTX 4050 Laptop GPU, R7 7840HS, Samsung 990 Pro 1 TB | MSI Katana 15 B12VEK GeForce RTX 4050 Laptop GPU, i7-12650H, Micron 2400 MTFDKBA1T0QFM | |
|---|---|---|---|---|---|
| Noise | -5% | 14% | -2% | 6% | |
| off / environment * (dB) | 23 | 23.69 -3% | 23.3 -1% | 24 -4% | 24 -4% |
| Idle Minimum * (dB) | 23 | 29.03 -26% | 23.3 -1% | 25 -9% | 24 -4% |
| Idle Average * (dB) | 23 | 29.03 -26% | 23.3 -1% | 29 -26% | 24 -4% |
| Idle Maximum * (dB) | 28.02 | 29.03 -4% | 23.3 17% | 33 -18% | 24 14% |
| Load Average * (dB) | 50.21 | 48.7 3% | 29.6 41% | 36 28% | 37.71 25% |
| Witcher 3 ultra * (dB) | 51.46 | 48.5 6% | 43 16% | 48 7% | 45.75 11% |
| Load Maximum * (dB) | 56.79 | 48.7 14% | 43 24% | 53 7% | 54.55 4% |
* ... smaller is better
温度
得益于强大的冷却系统,机身表面温度低得惊人。即使在最大负载情况下,游戏模式下的温度也几乎不会超过 96.8 °F(环境温度为 64.4 °F)。在此,我们仍有很大的余地采用更安静的散热系统。
(+) The maximum temperature on the upper side is 36 °C / 97 F, compared to the average of 40.4 °C / 105 F, ranging from 21.2 to 68.8 °C for the class Gaming.
(+) The bottom heats up to a maximum of 36 °C / 97 F, compared to the average of 43.2 °C / 110 F
(+) In idle usage, the average temperature for the upper side is 23.7 °C / 75 F, compared to the device average of 33.9 °C / 93 F.
(+) Playing The Witcher 3, the average temperature for the upper side is 27.4 °C / 81 F, compared to the device average of 33.9 °C / 93 F.
(+) The palmrests and touchpad are cooler than skin temperature with a maximum of 24 °C / 75.2 F and are therefore cool to the touch.
(+) The average temperature of the palmrest area of similar devices was 28.8 °C / 83.8 F (+4.8 °C / 8.6 F).
| Medion Erazer Crawler E40 - MD 62518 Intel Core i5-13500H, NVIDIA GeForce RTX 4050 Laptop GPU | Lenovo LOQ 15IRH8 Core i7 Intel Core i7-13620H, NVIDIA GeForce RTX 4050 Laptop GPU | Asus TUF A15 FA507 AMD Ryzen 7 7735HS, NVIDIA GeForce RTX 4050 Laptop GPU | Schenker XMG Apex 15 (Late 23) AMD Ryzen 7 7840HS, NVIDIA GeForce RTX 4050 Laptop GPU | MSI Katana 15 B12VEK Intel Core i7-12650H, NVIDIA GeForce RTX 4050 Laptop GPU | |
|---|---|---|---|---|---|
| Heat | -40% | -17% | -31% | -35% | |
| Maximum Upper Side * (°C) | 36 | 46.4 -29% | 48.9 -36% | 52 -44% | 47 -31% |
| Maximum Bottom * (°C) | 36 | 59.2 -64% | 44.6 -24% | 47 -31% | 48 -33% |
| Idle Upper Side * (°C) | 26 | 34.4 -32% | 27.1 -4% | 33 -27% | 35 -35% |
| Idle Bottom * (°C) | 27 | 36.2 -34% | 27.5 -2% | 33 -22% | 38 -41% |
* ... smaller is better
发言人
立体声扬声器位于前角,向下辐射。高音均衡,但几乎没有低音。我们建议通过插孔输出连接耳机。
Medion Erazer Crawler E40 - MD 62518 audio analysis
(±) | speaker loudness is average but good (81.47 dB)
Bass 100 - 315 Hz
(-) | nearly no bass - on average 32.7% lower than median
(±) | linearity of bass is average (11% delta to prev. frequency)
Mids 400 - 2000 Hz
(+) | balanced mids - only 4.6% away from median
(±) | linearity of mids is average (7.1% delta to prev. frequency)
Highs 2 - 16 kHz
(+) | balanced highs - only 3.1% away from median
(+) | highs are linear (5.7% delta to prev. frequency)
Overall 100 - 16.000 Hz
(±) | linearity of overall sound is average (21.8% difference to median)
Compared to same class
» 78% of all tested devices in this class were better, 6% similar, 16% worse
» The best had a delta of 6%, average was 18%, worst was 132%
Compared to all devices tested
» 62% of all tested devices were better, 7% similar, 31% worse
» The best had a delta of 4%, average was 23%, worst was 134%
Lenovo LOQ 15IRH8 Core i7 audio analysis
(±) | speaker loudness is average but good (75.9 dB)
Bass 100 - 315 Hz
(-) | nearly no bass - on average 18.6% lower than median
(±) | linearity of bass is average (10.2% delta to prev. frequency)
Mids 400 - 2000 Hz
(+) | balanced mids - only 2.2% away from median
(+) | mids are linear (3.1% delta to prev. frequency)
Highs 2 - 16 kHz
(+) | balanced highs - only 2.3% away from median
(+) | highs are linear (4.4% delta to prev. frequency)
Overall 100 - 16.000 Hz
(+) | overall sound is linear (13.7% difference to median)
Compared to same class
» 21% of all tested devices in this class were better, 7% similar, 72% worse
» The best had a delta of 6%, average was 18%, worst was 132%
Compared to all devices tested
» 15% of all tested devices were better, 4% similar, 81% worse
» The best had a delta of 4%, average was 23%, worst was 134%
耗电量
空闲和压力测试时的功耗略高,但并不突出。在正常负载下,功耗在同类产品的平均水平之内。在游戏中,功耗与联想 LOQ 15 相当,但高于其他竞争对手。
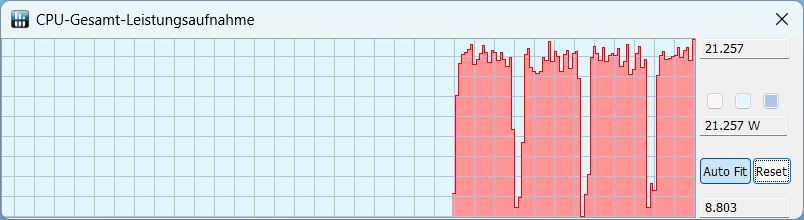
在同时进行的 CPU 和 GPU 压力测试中,我们测得的临时最大功耗为 202.5 W。LiteOn 的 230 W 电源在这方面应该没有问题。
| Off / Standby | |
| Idle | |
| Load |
|
Key:
min: | |
| Medion Erazer Crawler E40 - MD 62518 GeForce RTX 4050 Laptop GPU, i5-13500H, Phison PS5021-E21 512GB | Lenovo LOQ 15IRH8 Core i7 GeForce RTX 4050 Laptop GPU, i7-13620H, Kioxia BG5 KBG50ZNT512G | Asus TUF A15 FA507 GeForce RTX 4050 Laptop GPU, R7 7735HS, Micron 2400 MTFDKBA512QFM | Schenker XMG Apex 15 (Late 23) GeForce RTX 4050 Laptop GPU, R7 7840HS, Samsung 990 Pro 1 TB | MSI Katana 15 B12VEK GeForce RTX 4050 Laptop GPU, i7-12650H, Micron 2400 MTFDKBA1T0QFM | |
|---|---|---|---|---|---|
| Power Consumption | 1% | 23% | 15% | 18% | |
| Idle 150cd/m2 * (Watt) | 15.3 | 9.48 38% | 10.8 29% | 9.8 36% | |
| 3DMark06 Return To Proxycon * (Watt) | 88 | 94.5 -7% | 84 5% | ||
| Witcher 3 ultra * (Watt) | 155 | 154.4 -0% | 136.6 12% | 136.5 12% | 128 17% |
| 1280x720 Prime95 28.10 and Furmark 1.25 * (Watt) | 190 | 169.2 11% | 156.7 18% | 181 5% | 165 13% |
* ... smaller is better
Power consumption Witcher 3 / stress test
Power consumption with external monitor
电池寿命
Medion 使用的电池容量为 54 Wh。只有微星 Katana 的电池容量同样较小,但在所有测试中续航时间稍长。其他竞争产品的电池容量至少为 60 Wh,华硕 TUF A15 的电池容量甚至达到了 90 Wh。简而言之:在直接比较中,Medion 的续航时间最短。在亮度降低的视频或浏览测试中,该笔记本电脑的运行时间约为 4 小时,这并不令人振奋。
| Medion Erazer Crawler E40 - MD 62518 i5-13500H, GeForce RTX 4050 Laptop GPU, 54 Wh | Lenovo LOQ 15IRH8 Core i7 i7-13620H, GeForce RTX 4050 Laptop GPU, 60 Wh | Asus TUF A15 FA507 R7 7735HS, GeForce RTX 4050 Laptop GPU, 90 Wh | Schenker XMG Apex 15 (Late 23) R7 7840HS, GeForce RTX 4050 Laptop GPU, 62.32 Wh | MSI Katana 15 B12VEK i7-12650H, GeForce RTX 4050 Laptop GPU, 53.5 Wh | Average of class Gaming | |
|---|---|---|---|---|---|---|
| Battery runtime | 50% | 130% | 73% | 14% | 70% | |
| H.264 (h) | 3.9 | 6.1 56% | 12.5 221% | 8.3 113% | 4.4 13% | 8.32 ? 113% |
| WiFi v1.3 (h) | 4.1 | 5.9 44% | 11.7 185% | 7.1 73% | 4.3 5% | 7.11 ? 73% |
| Load (h) | 1.2 | 1 -17% | 1.6 33% | 1.5 25% | 1.502 ? 25% | |
| Reader / Idle (h) | 8.4 | 8.27 ? |
Pros
Cons
结论:经济型游戏机,有取舍,但性能良好
Medion Crawler E40 的价格约为 1300 美元,是配备 RTX 4050 的游戏笔记本电脑中的经济实惠之选。虽然它属于预算范围,但还有更便宜的机型可供选择,这促使我们仔细研究其性价比。Crawler E40 在 i5-13500H 而不是 i7-13700H、2019 年的显示屏、720p 网络摄像头和 USB 2.0 插槽等方面的配置都暴露了它的预算出身。因此,它可能无法满足高要求玩家的期望。不过,CPU 和 GPU 性能值得称赞,固态硬盘性能也不错。显示屏虽然不是最新的,但亮度达到 350 尼特,反应灵敏,并提供 144 赫兹的刷新率,即使它不能完全覆盖典型的色彩空间。
虽然有一些值得批评的地方,但对于一款经济型笔记本电脑来说,其中很多都是可以接受的。另一方面,明显较弱的电池续航能力和过大的散热系统噪音是更值得关注的问题。优化软件可以解决散热系统的问题,因为在低温条件下似乎还有改进的余地。
总之,Medion Crawler E40 是一款经济实惠的游戏笔记本电脑,虽然有一些妥协,但其组件的性能值得称赞。主要的诟病在于散热系统的噪音过大,以及电池续航能力较弱。
测试中讨论的每个竞争对手都有其优点,它们之间的差异相对较小。华硕 TUF A15 性能稍弱,但电池续航时间令人印象深刻。如果您希望在性能相当的情况下延长电池续航时间,并且愿意多花一点钱,那么联想 LOQ 15 可能是一个合适的选择,尽管它也有一些缺点。必须指出的是,这两款产品并没有明显的优胜者,尤其是考虑到 XMG Apex 15 的价格要高出近 550 美元。
价格和供应情况
Medion Erazer Crawler E40 直接从Medion 购买,价格约为 1300 美元。.
Medion Erazer Crawler E40 - MD 62518
- 11/28/2023 v7 (old)
Christian Hintze
Transparency
The selection of devices to be reviewed is made by our editorial team. The test sample was provided to the author as a loan by the manufacturer or retailer for the purpose of this review. The lender had no influence on this review, nor did the manufacturer receive a copy of this review before publication. There was no obligation to publish this review. As an independent media company, Notebookcheck is not subjected to the authority of manufacturers, retailers or publishers.
This is how Notebookcheck is testing
Every year, Notebookcheck independently reviews hundreds of laptops and smartphones using standardized procedures to ensure that all results are comparable. We have continuously developed our test methods for around 20 years and set industry standards in the process. In our test labs, high-quality measuring equipment is utilized by experienced technicians and editors. These tests involve a multi-stage validation process. Our complex rating system is based on hundreds of well-founded measurements and benchmarks, which maintains objectivity. Further information on our test methods can be found here.
Price comparison

