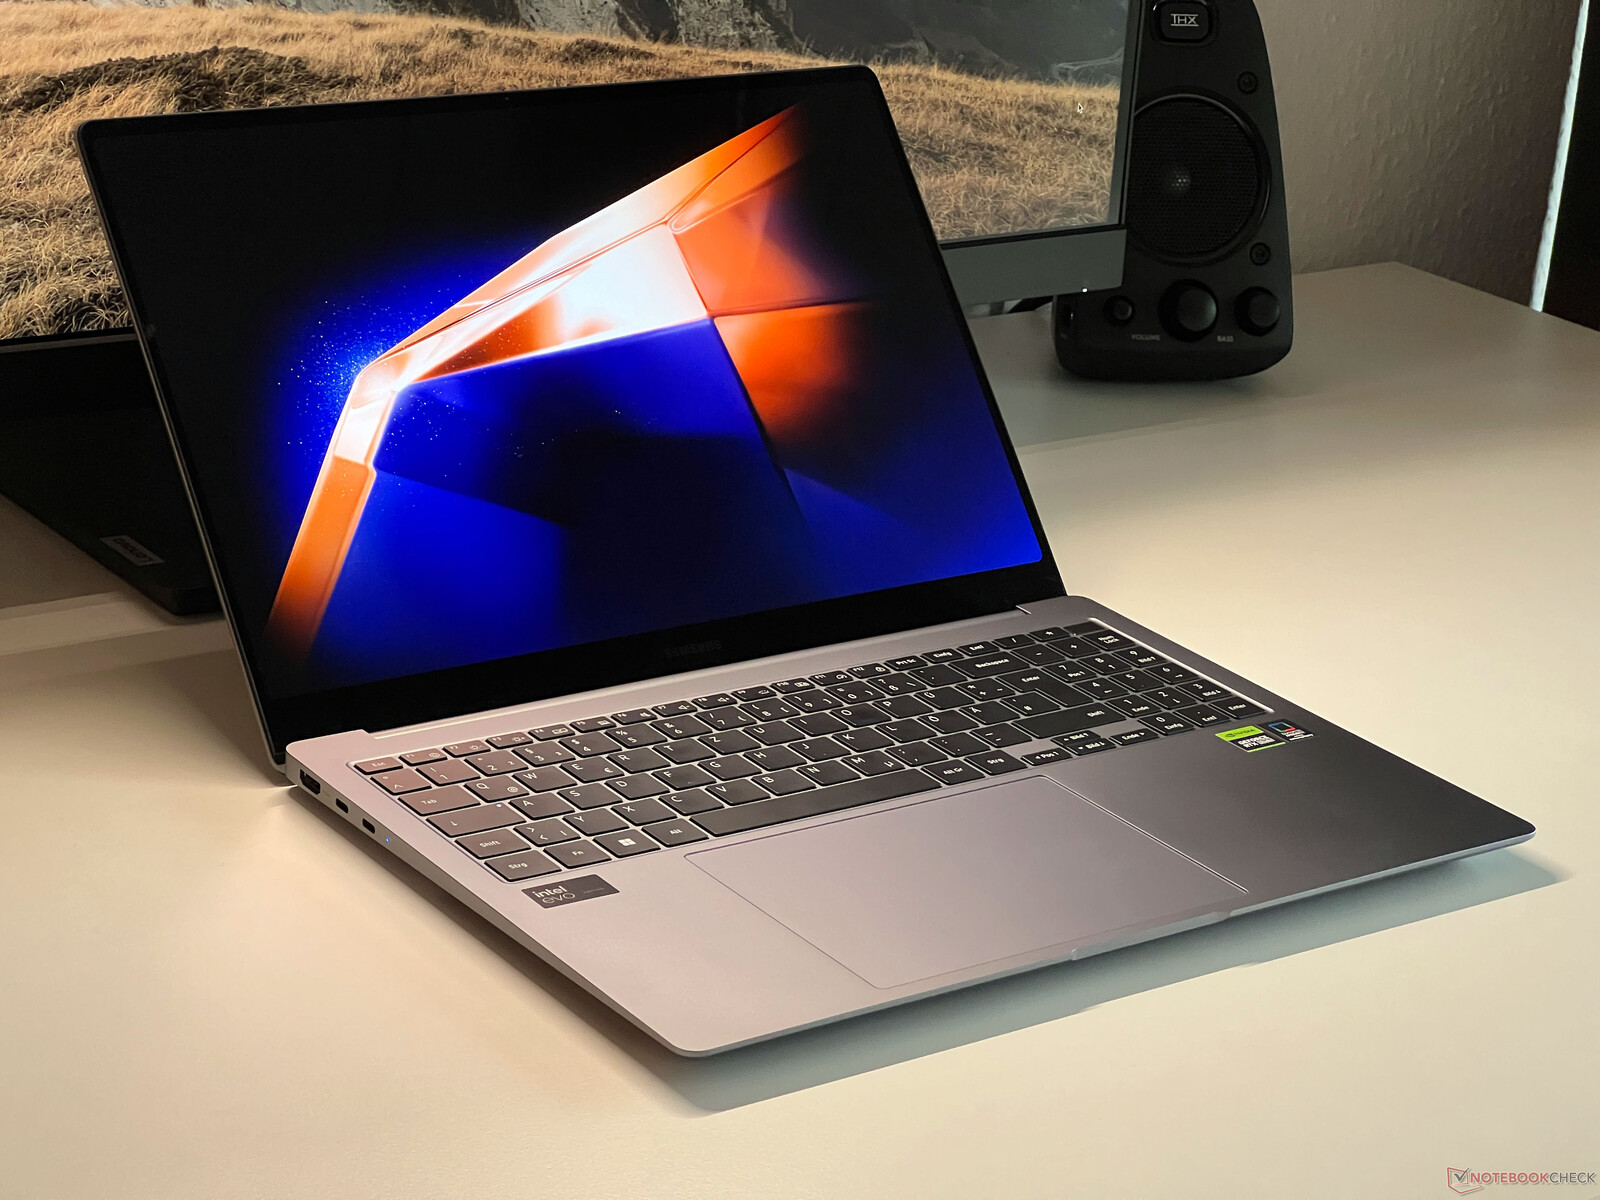
三星Galaxy Book4 Ultra 评测--配备 120 Hz OLED 和 RTX 4050 的多媒体笔记本电脑
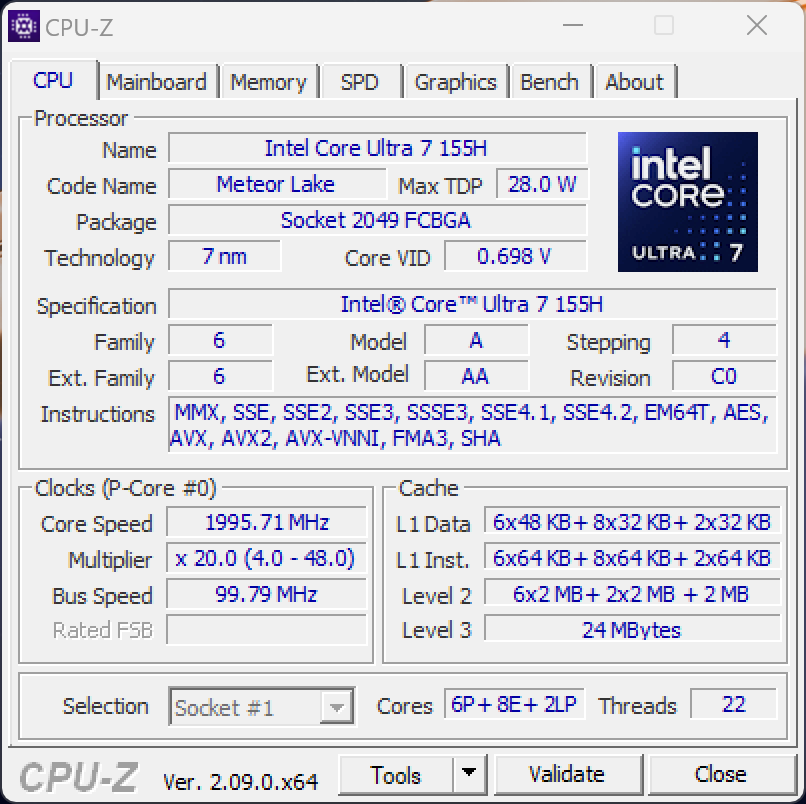
三星将其Galaxy Book 系列更新至第四代,并推出Galaxy Book 4 Ultra,欲与Apple 的 MacBook Pro 16 直接竞争。与前一年的机型相比,这款产品变化不大,只有酷睿 i7-13700H 被流星湖酷睿 Ultra 7 155H 芯片取代。
价格方面也没有什么变化,基本型号及其酷睿至尊 7 155H 和GeForce RTX 4050 笔记本电脑的价格为 2399 美元。这仍然是一个非常雄心勃勃的价格,尤其是考虑到微薄的存储规格(16 GB 内存、512 GB 固态硬盘)。如果你花 2999 美元,就能买到配备了 Core Ultra 9 185H和 GeForce RTX 4070 笔记本电脑以及更多内存和存储空间(32 GB 内存、1 TB SSD)。
潜在的竞争对手比较
Rating | Date | Model | Weight | Height | Size | Resolution | Price |
|---|---|---|---|---|---|---|---|
| 90.4 % v7 (old) | 03 / 2024 | Samsung Galaxy Book4 Ultra Ultra 7 155H, GeForce RTX 4050 Laptop GPU | 1.8 kg | 17 mm | 16.00" | 2880x1800 | |
| 88.6 % v7 (old) | 12 / 2023 | Lenovo ThinkPad Z16 Gen 2 R9 PRO 7940HS, Radeon RX 6550M | 1.8 kg | 15.8 mm | 16.00" | 3840x2400 | |
| 93.7 % v7 (old) | 11 / 2023 | Apple MacBook Pro 16 2023 M3 Pro Apple M3 Pro 12-Core, M3 Pro 18-Core GPU | 2.1 kg | 16.9 mm | 16.20" | 3456x2234 | |
| 88 % v7 (old) | 08 / 2023 | Lenovo Slim Pro 9i 16IRP8 i9-13905H, GeForce RTX 4050 Laptop GPU | 2.2 kg | 18.2 mm | 16.00" | 3200x2000 | |
| 91.1 % v7 (old) | 03 / 2024 | HP Spectre x360 16 RTX 4050 Ultra 7 155H, GeForce RTX 4050 Laptop GPU | 2 kg | 19.8 mm | 16.00" | 2880x1800 | |
| 88.6 % v7 (old) | 07 / 2023 | Schenker VISION 16 Pro (M23) i7-13700H, GeForce RTX 4070 Laptop GPU | 1.6 kg | 17.1 mm | 16.00" | 2560x1600 | |
| 89.4 % v7 (old) | 04 / 2023 | Samsung Galaxy Book3 Ultra 16 i7-13700H, GeForce RTX 4050 Laptop GPU | 1.8 kg | 16.5 mm | 16.00" | 2880x1800 |
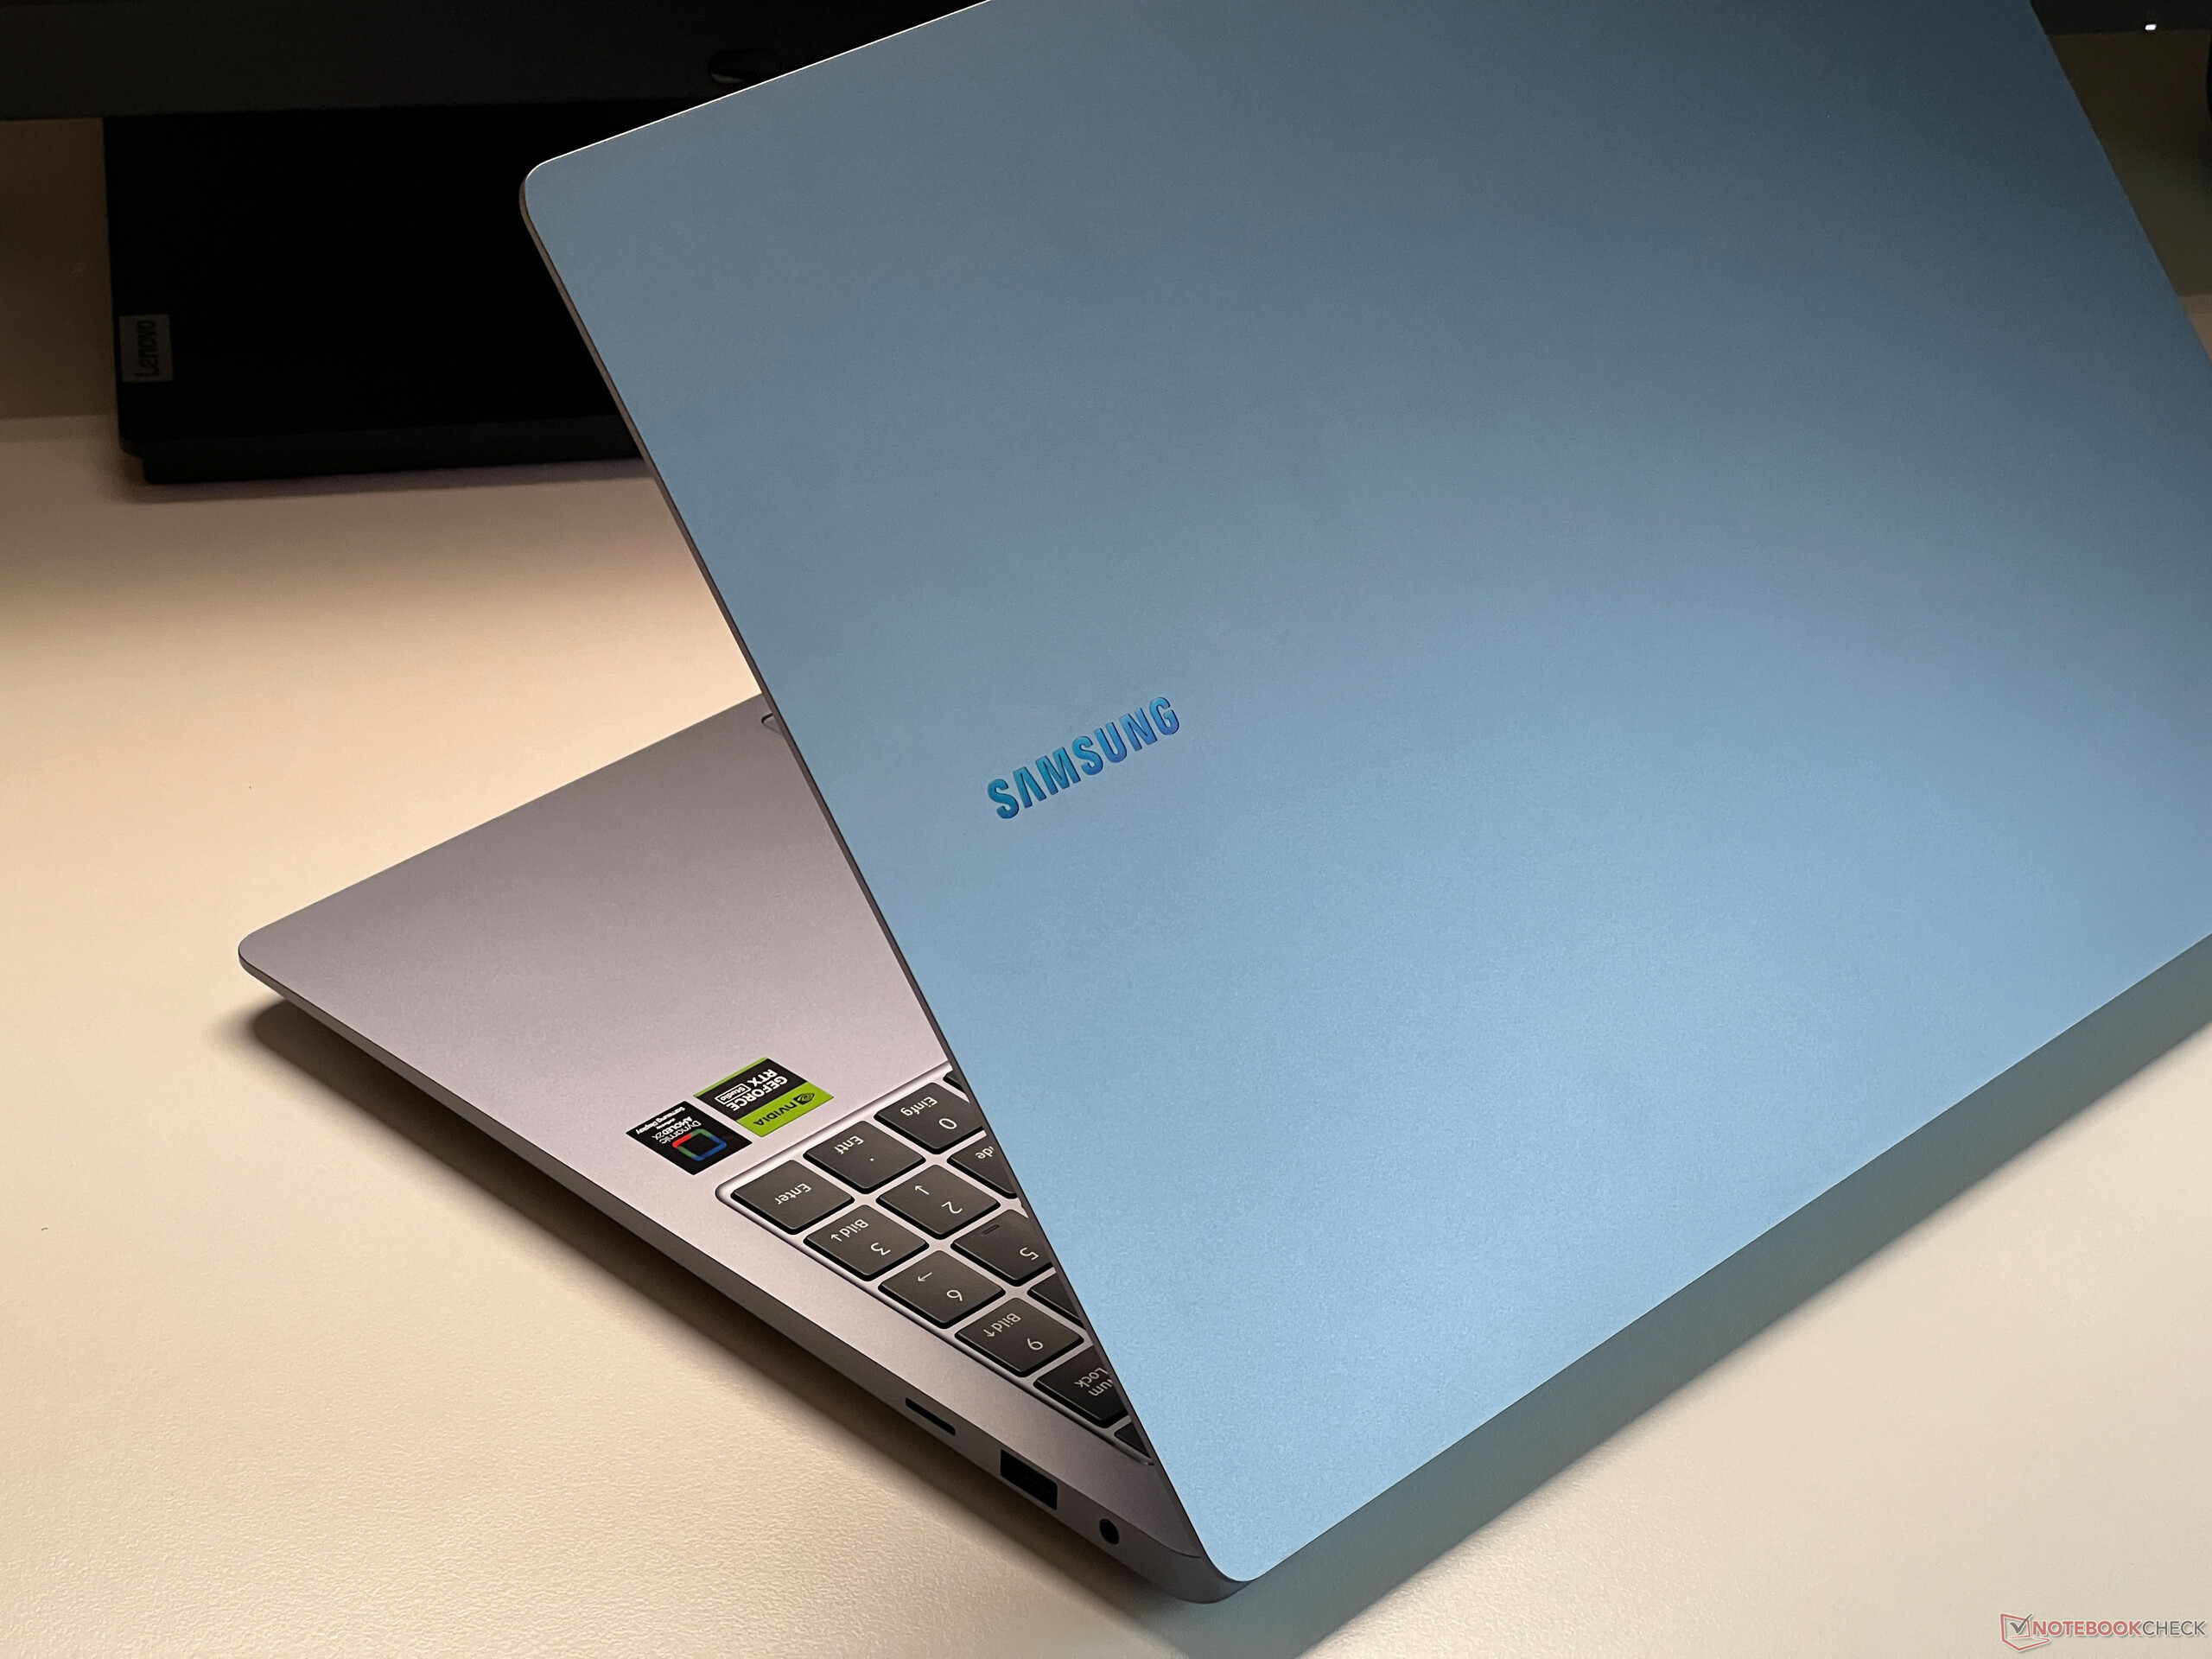
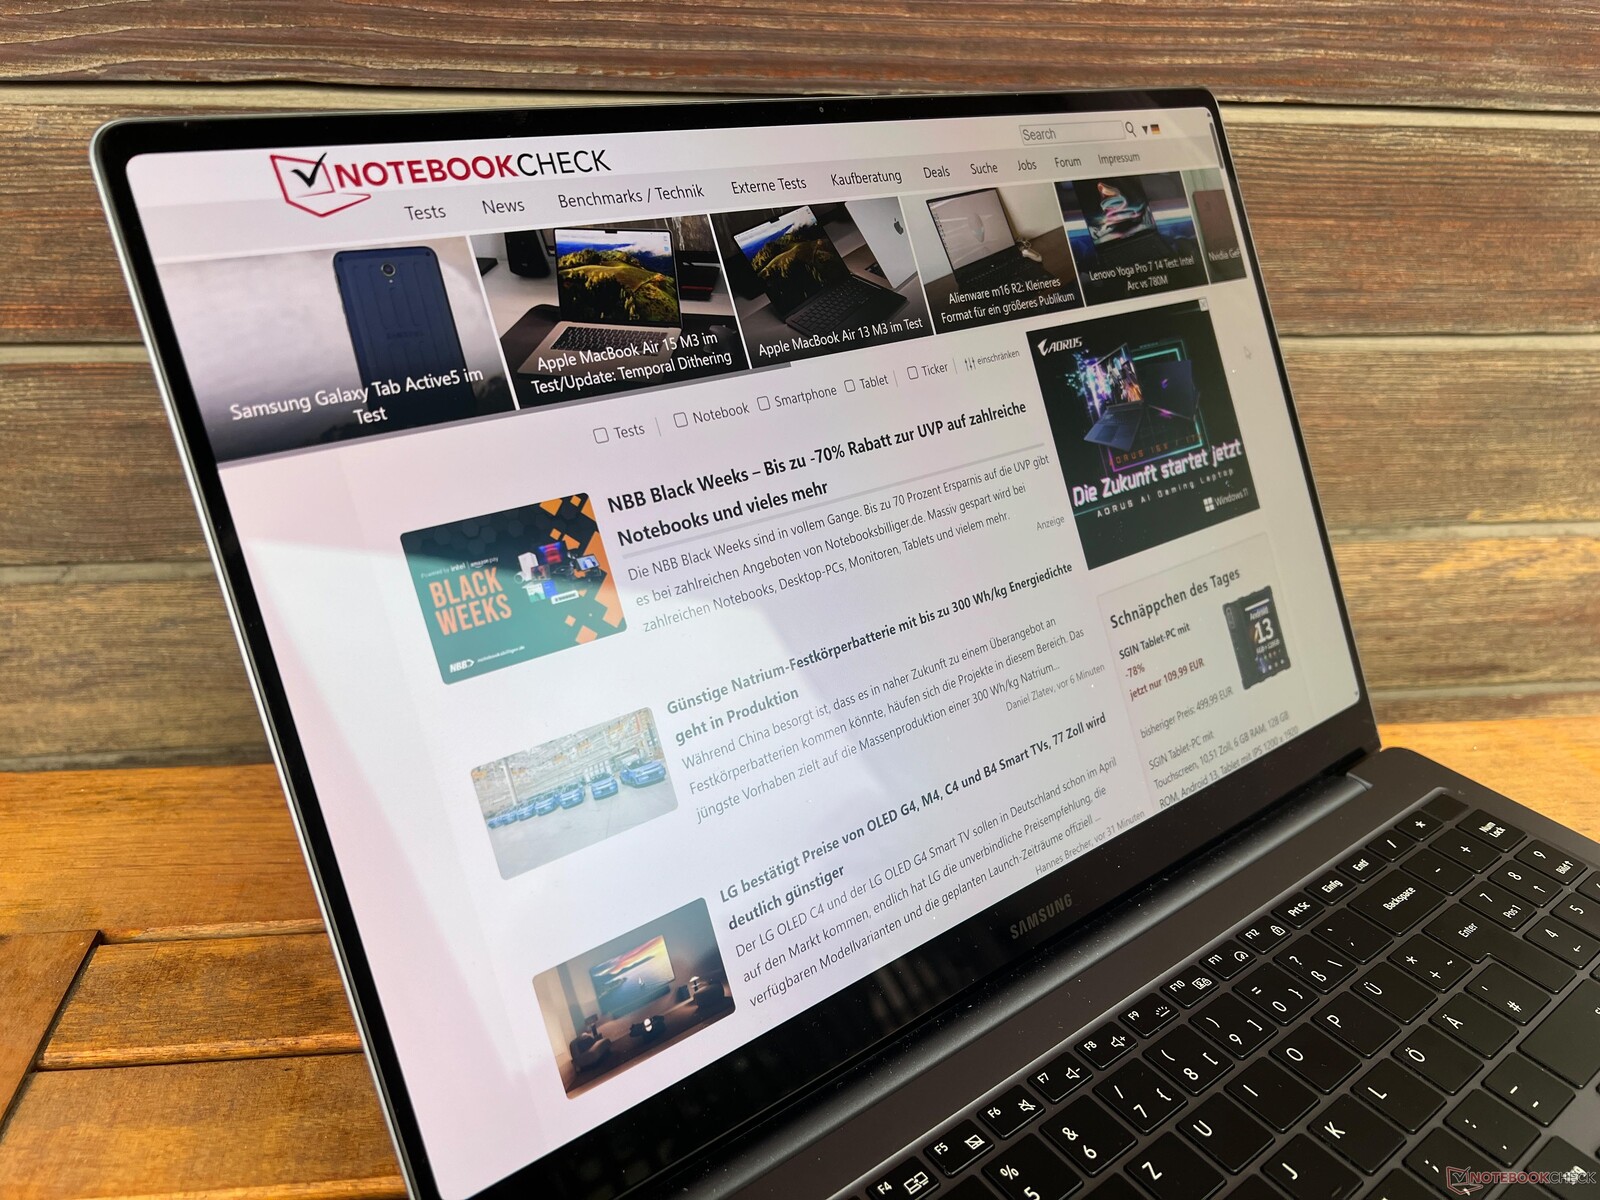
保护套 -Galaxy Book 配有金属保护套
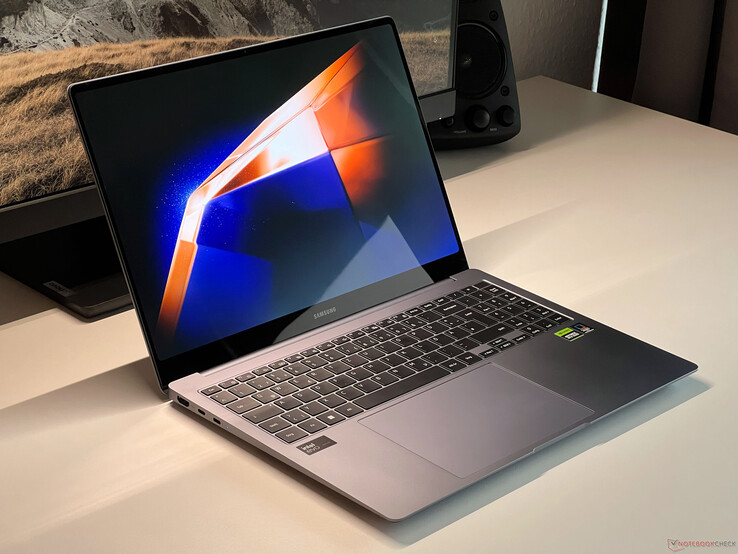
外壳设计与旧款相比没有变化 旧型号.深灰色的铝制外壳(月光石灰)非常高档,表面不仅反馈舒适,而且对指纹不敏感,易于清洁。不过,屏幕下边框较厚(1.7 厘米),有些影响整体外观。
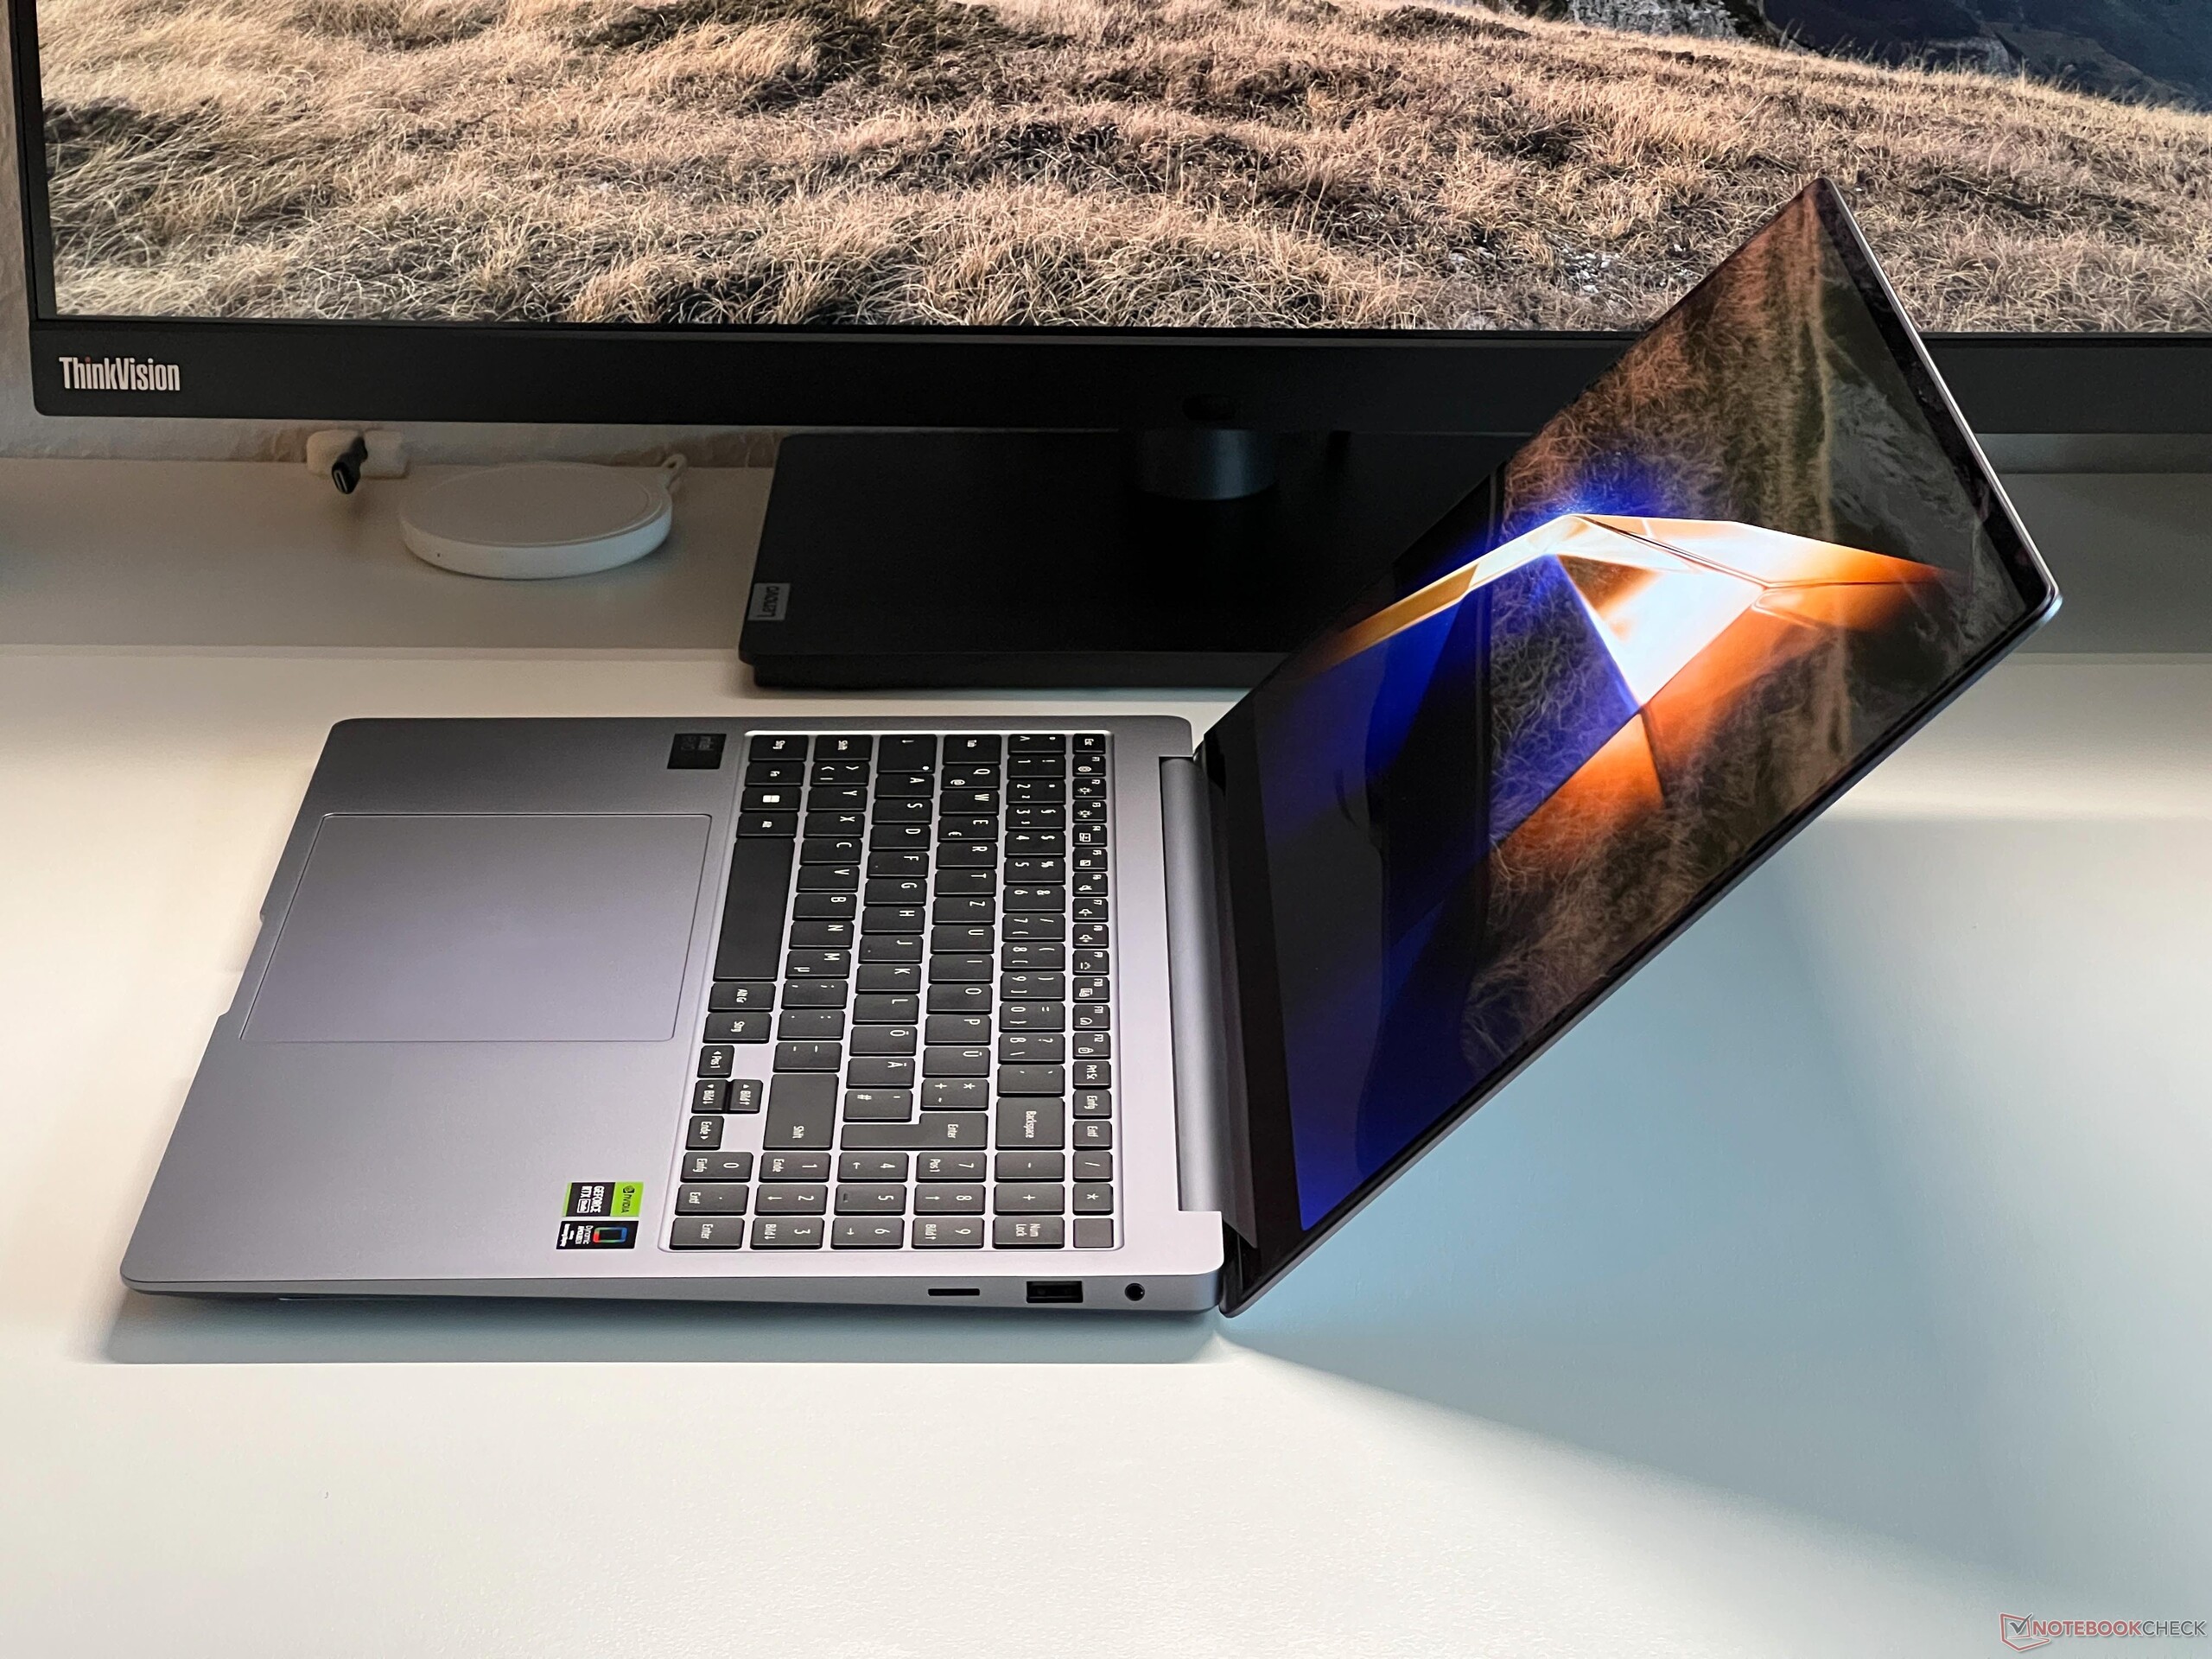
Galaxy Book4 Ultra 在制造质量和稳定性方面都给人留下了良好的印象。键盘区域仅有轻微松动,整个底座具有抗扭转性。除此之外,没有任何吱吱嘎嘎的声音。显示屏盖本身要薄得多,同样也非常稳定。铰链调整得很好,基本能防止任何晃动,单手也能轻松打开盖子。最大开启角度为 135 度。
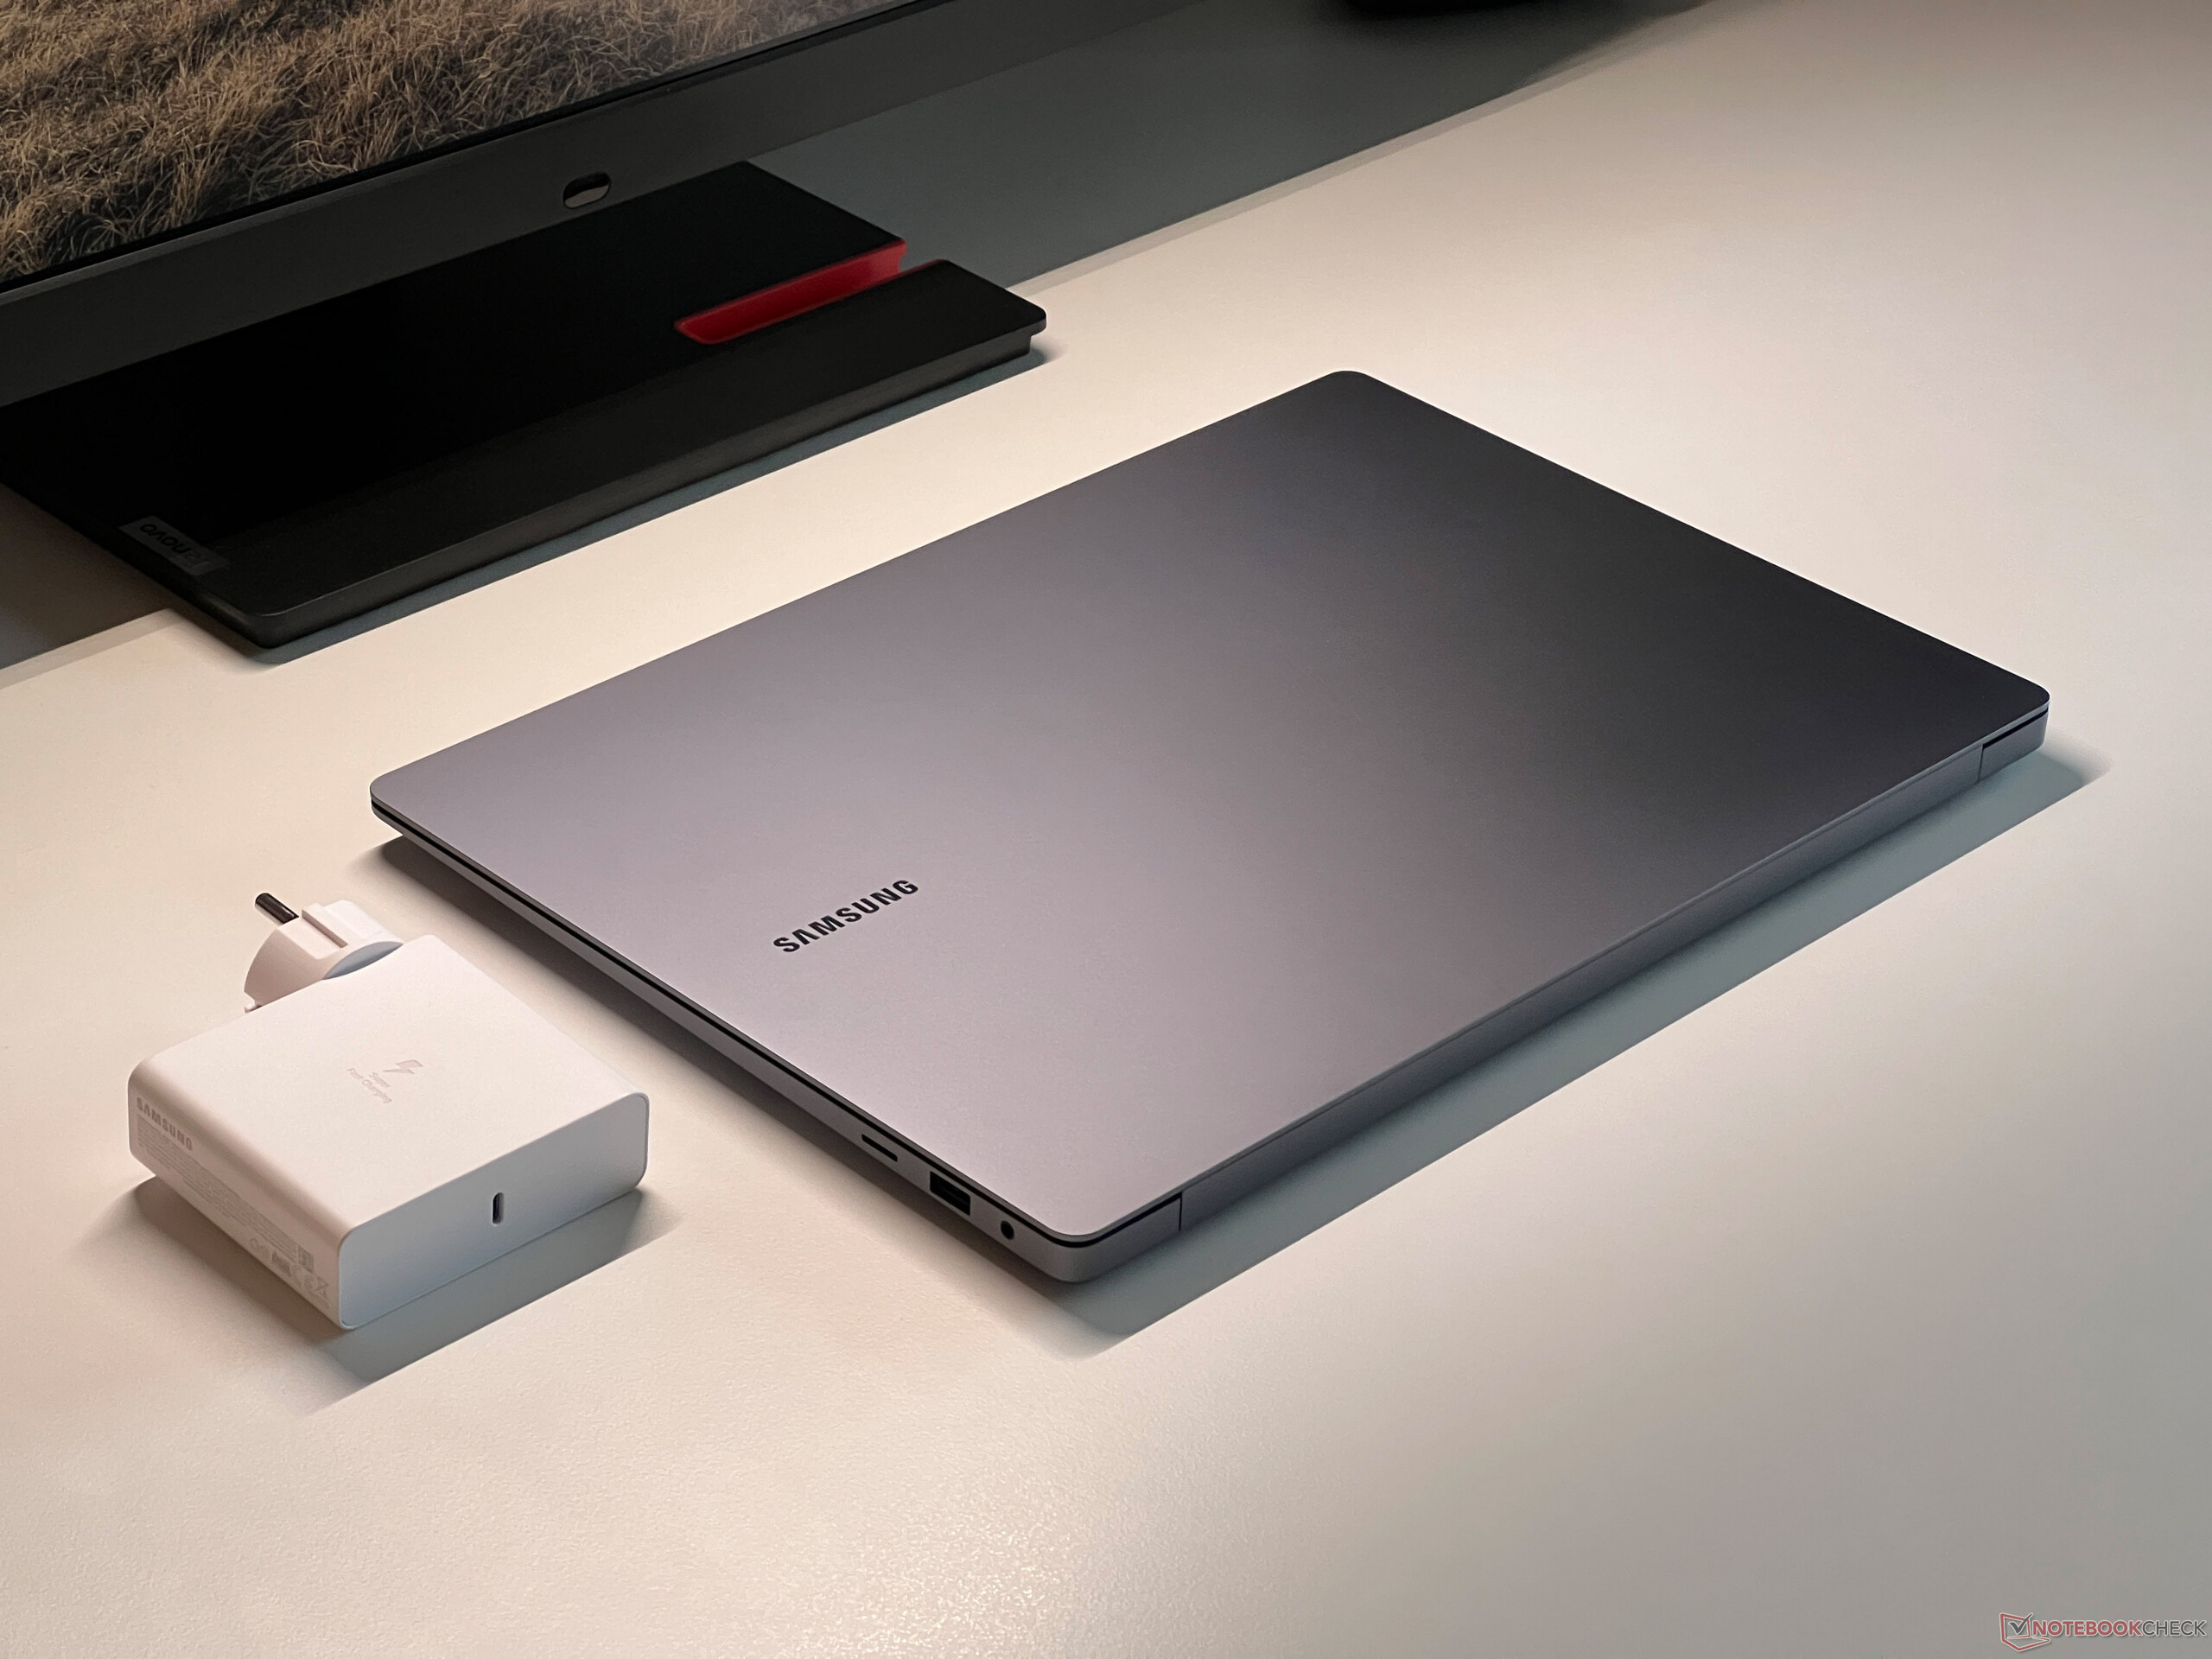
从设备的厚度来看,Book4 Ultra 的屏幕边框也很厚,与同类产品相比占用空间最大。评测设备的高度为 16.5 毫米,重量为 1.82 千克,在同类产品中处于中等水平。随机附带的 140 瓦 PSU 又增加了 351 克的重量。
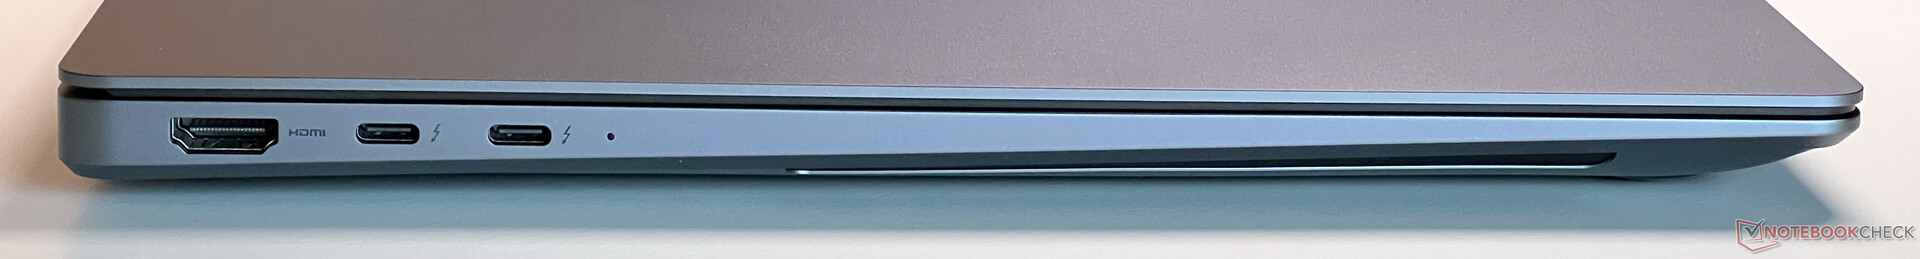
功能 - 雷电 4 和 HDMI 2.1
除了包括 Thunderbolt 4 在内的现代 USB-C 接口外,Galaxy Book4 Ultra 还提供一个普通 USB-A 端口和 HDMI 2.1。不过,其中一个 USB 接口还可用于供电。设备后部两侧的端口位置无可挑剔。HDMI 接口可直接连接到 Nvidia GPU,但两个 USB-C 接口均无法连接。使用外接显示器时,dGPU 并不总是自动同时运行。
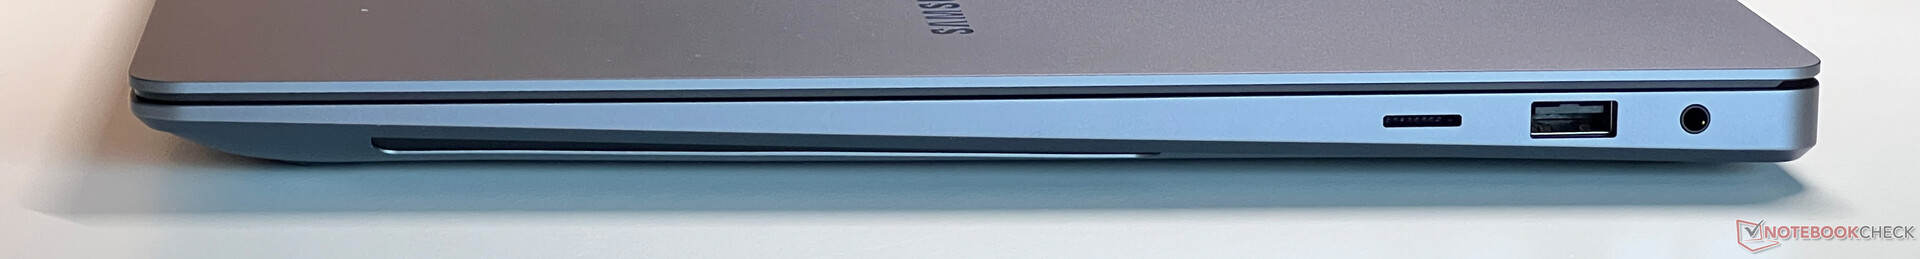
SD 读卡器
在我们的测试中,右侧的 microSD 读卡器与我们的参考卡 Angelbird AV Pro V60 配对后的平均速度为 80 到 90 MB/s。不过,读卡器本身存在问题(弹簧装置),因为连接点位于机壳内部很深的位置,因此在没有工具/辅助工具的帮助下很难轻松安装或取出卡。
| SD Card Reader | |
| average JPG Copy Test (av. of 3 runs) | |
| Lenovo ThinkPad Z16 Gen 2 (Toshiba Exceria Pro SDXC 64 GB UHS-II) | |
| Average of class Multimedia (23 - 531, n=40, last 2 years) | |
| Samsung Galaxy Book4 Ultra (Angelbird AV Pro V60) | |
| Lenovo Slim Pro 9i 16IRP8 (PNY EliteX-Pro60 V60 256 GB) | |
| Samsung Galaxy Book3 Ultra 16 (AV PRO microSD 128 GB V60) | |
| Schenker VISION 16 Pro (M23) (Angelbird AV Pro V60) | |
| maximum AS SSD Seq Read Test (1GB) | |
| Lenovo ThinkPad Z16 Gen 2 (Toshiba Exceria Pro SDXC 64 GB UHS-II) | |
| Average of class Multimedia (37.3 - 1455, n=39, last 2 years) | |
| Samsung Galaxy Book4 Ultra (Angelbird AV Pro V60) | |
| Lenovo Slim Pro 9i 16IRP8 (PNY EliteX-Pro60 V60 256 GB) | |
| Samsung Galaxy Book3 Ultra 16 (AV PRO microSD 128 GB V60) | |
| Schenker VISION 16 Pro (M23) (Angelbird AV Pro V60) | |
交流
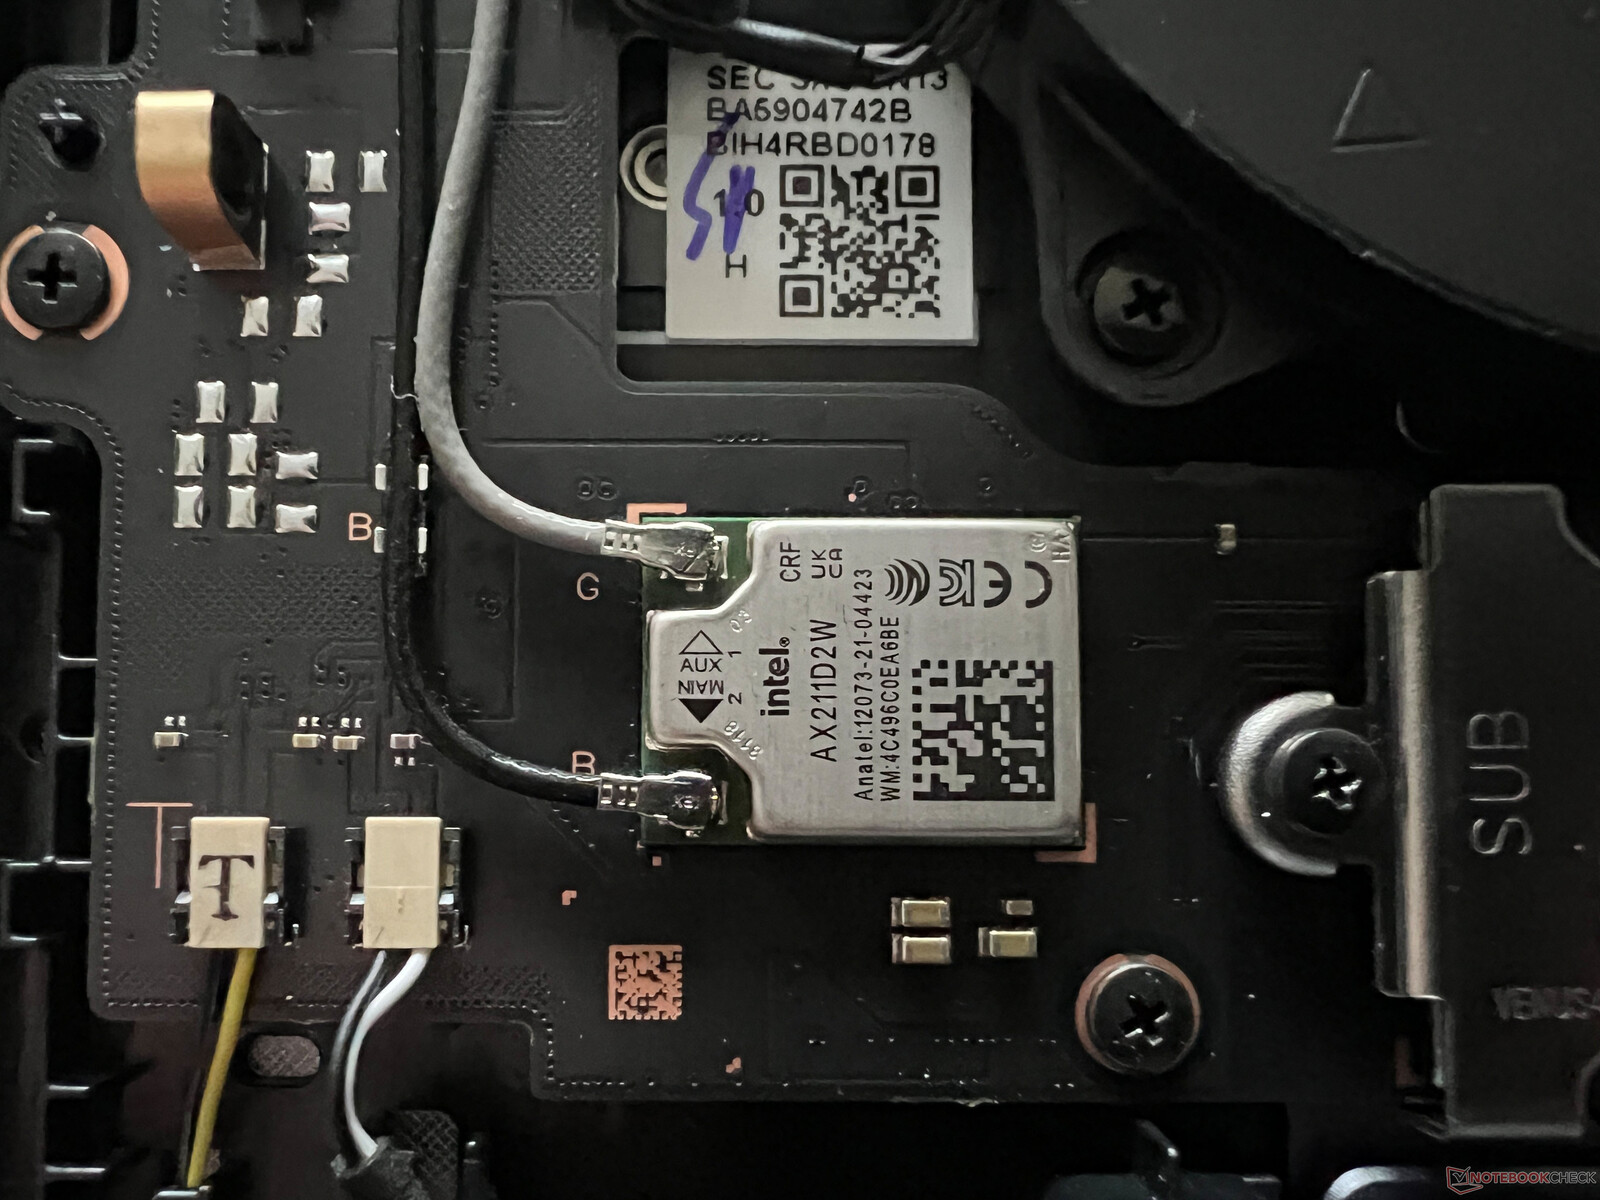
三星使用了我们熟悉的英特尔 AX211 模块,该模块支持 6 GHz 网络中的 Wi-Fi 6E 标准以及蓝牙 5.3。与华硕参考路由器配合使用,传输速度非常好且稳定。尽管如此,新的Galaxy Book4 Ultra 并不支持 Wi-Fi 7。
| Networking | |
| Samsung Galaxy Book4 Ultra | |
| iperf3 transmit AXE11000 | |
| iperf3 receive AXE11000 | |
| Lenovo ThinkPad Z16 Gen 2 | |
| iperf3 transmit AXE11000 | |
| iperf3 receive AXE11000 | |
| iperf3 transmit AXE11000 6GHz | |
| iperf3 receive AXE11000 6GHz | |
| Lenovo Slim Pro 9i 16IRP8 | |
| iperf3 transmit AXE11000 | |
| iperf3 receive AXE11000 | |
| iperf3 transmit AXE11000 6GHz | |
| iperf3 receive AXE11000 6GHz | |
| Schenker VISION 16 Pro (M23) | |
| iperf3 transmit AXE11000 | |
| iperf3 receive AXE11000 | |
| Samsung Galaxy Book3 Ultra 16 | |
| iperf3 transmit AXE11000 | |
| iperf3 receive AXE11000 | |
| Apple MacBook Pro 16 2023 M3 Max | |
| iperf3 transmit AXE11000 | |
| iperf3 receive AXE11000 | |
| HP Spectre x360 16 RTX 4050 | |
| iperf3 transmit AXE11000 | |
| iperf3 receive AXE11000 | |
| iperf3 transmit AXE11000 6GHz | |
| iperf3 receive AXE11000 6GHz | |
网络摄像头
1080p 网络摄像头没有任何变化,质量仍然一般。该设备缺少机械快门和用于人脸识别的红外模块。得益于 Meteor Lake 芯片的全新 NPU,网络摄像头的 Studio Effects(背景虚化、眼神接触、头部跟踪)可直接从操作系统中获得支持,无论使用何种应用程序。


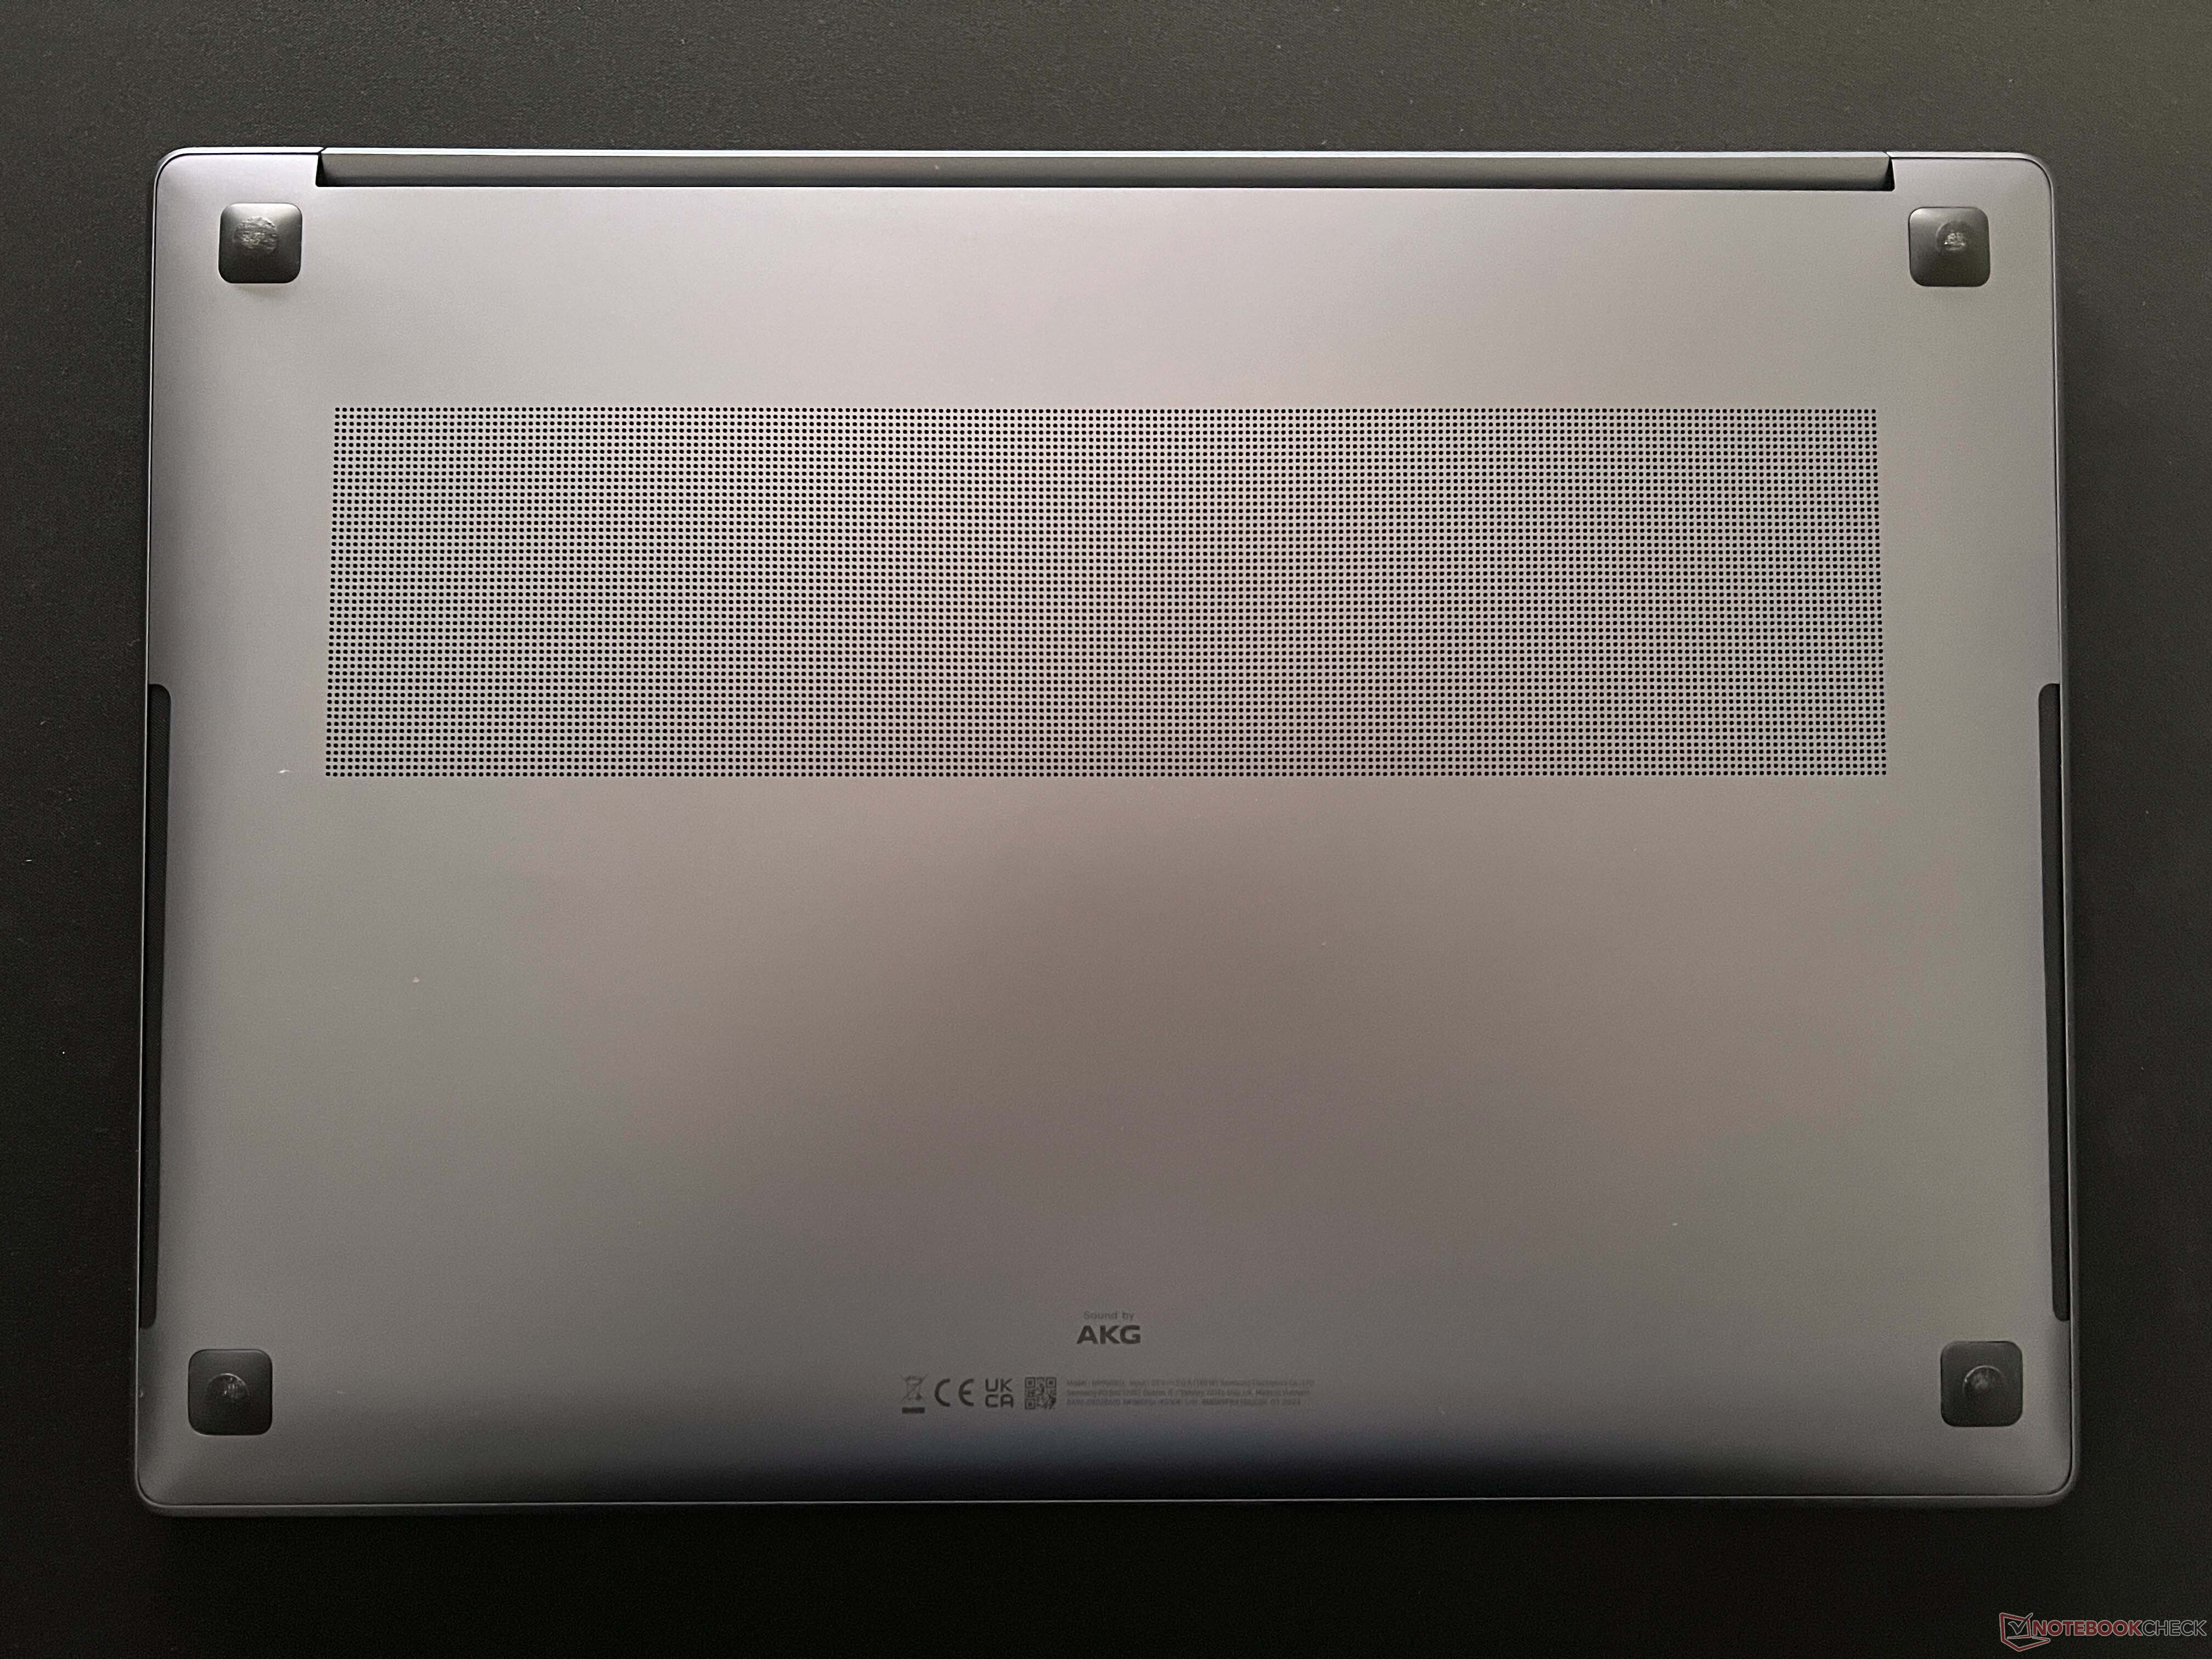
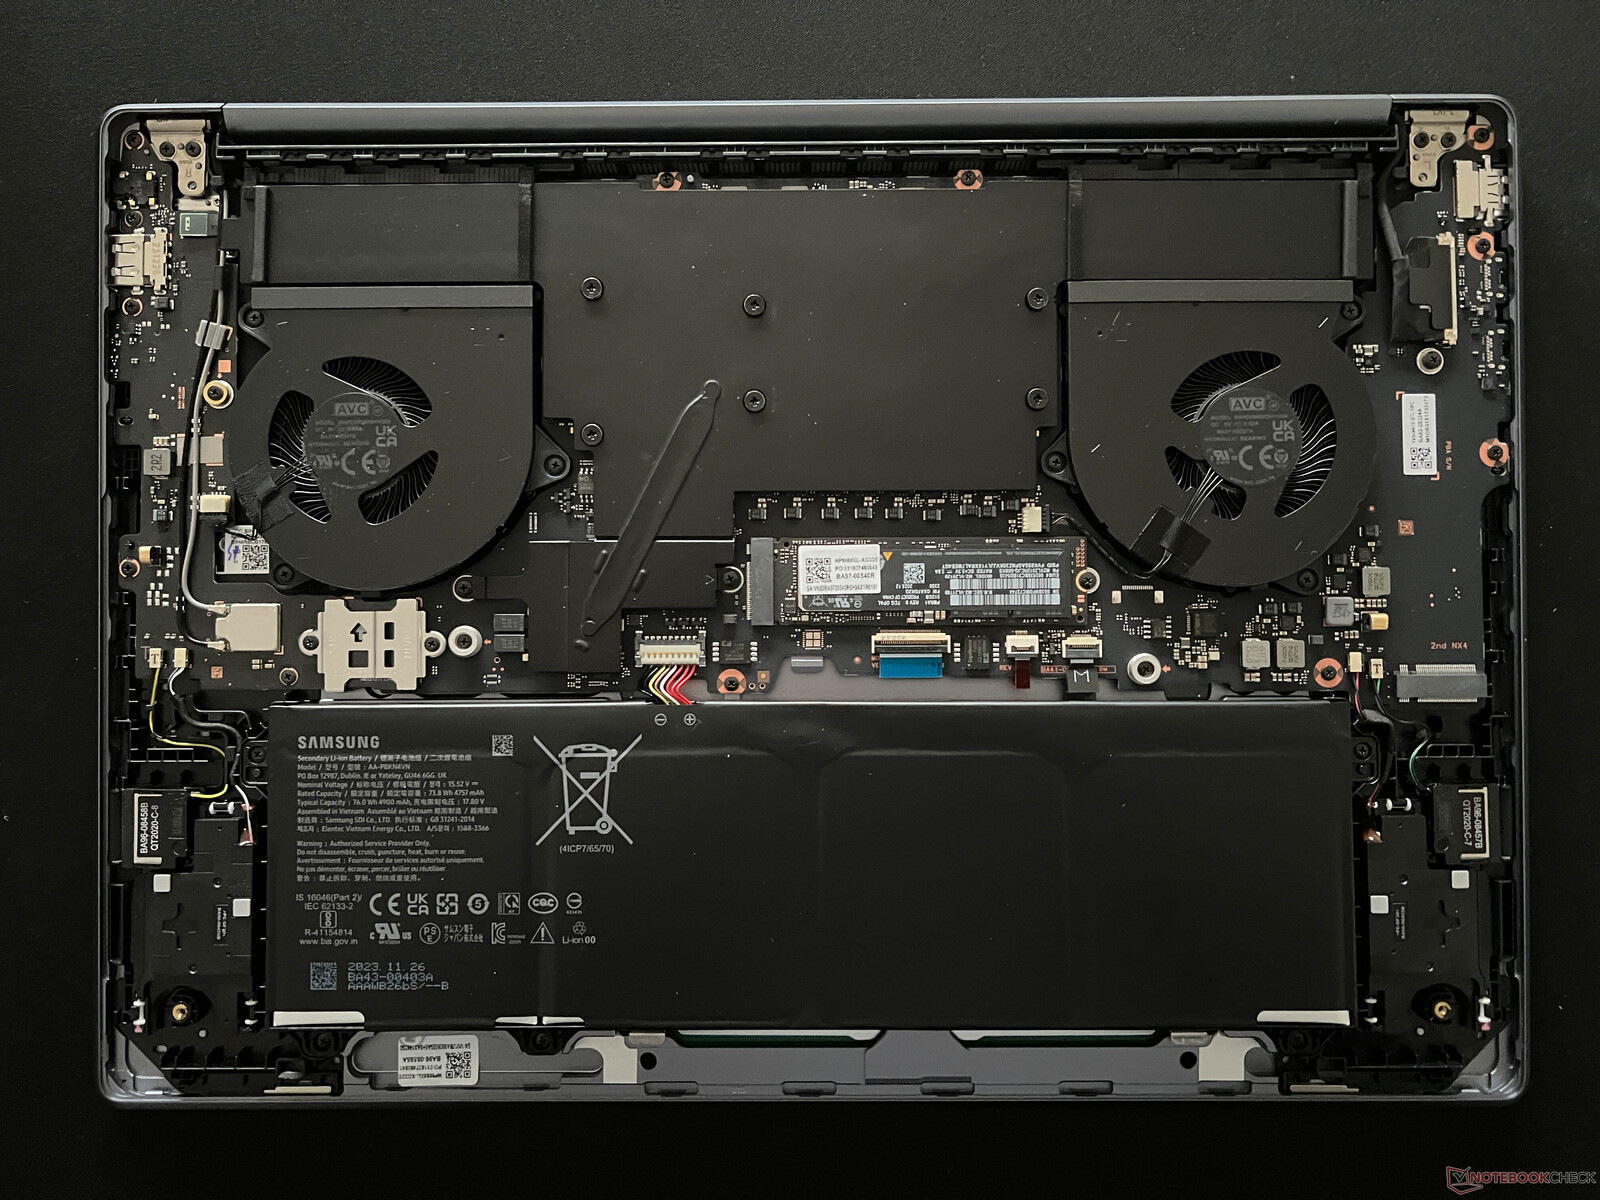
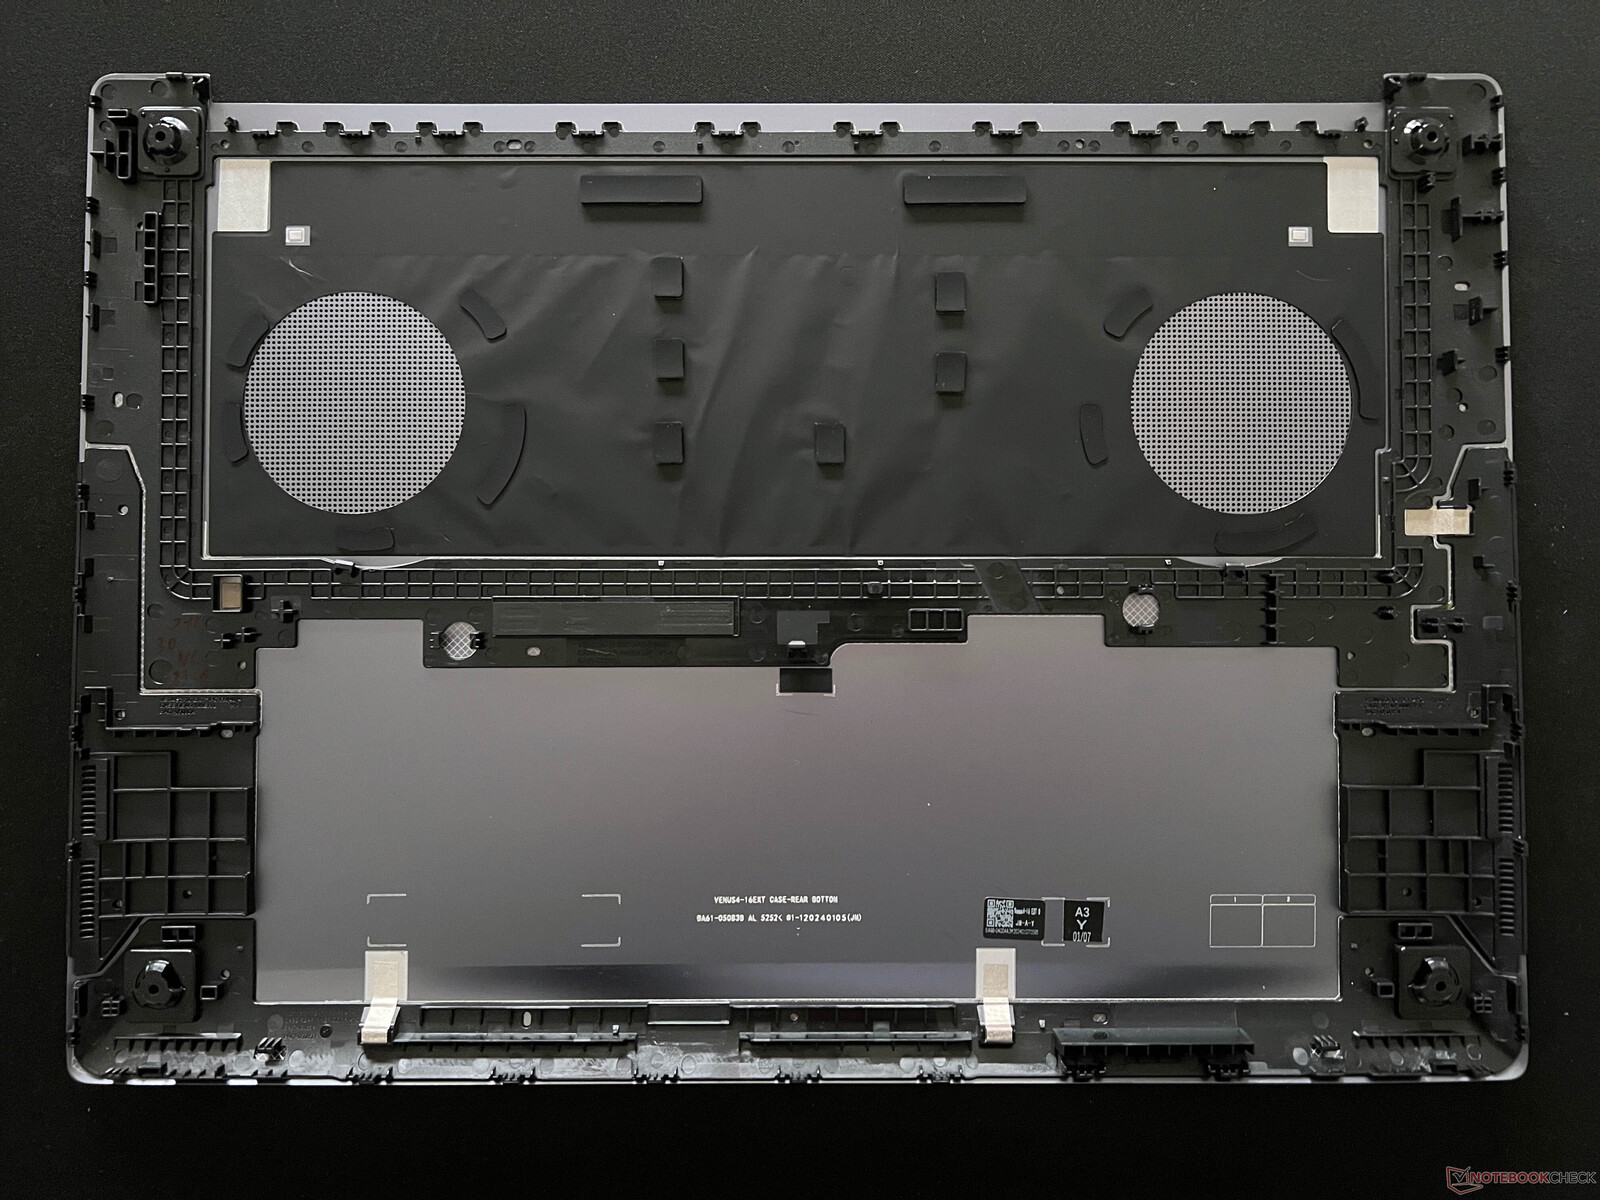
维护
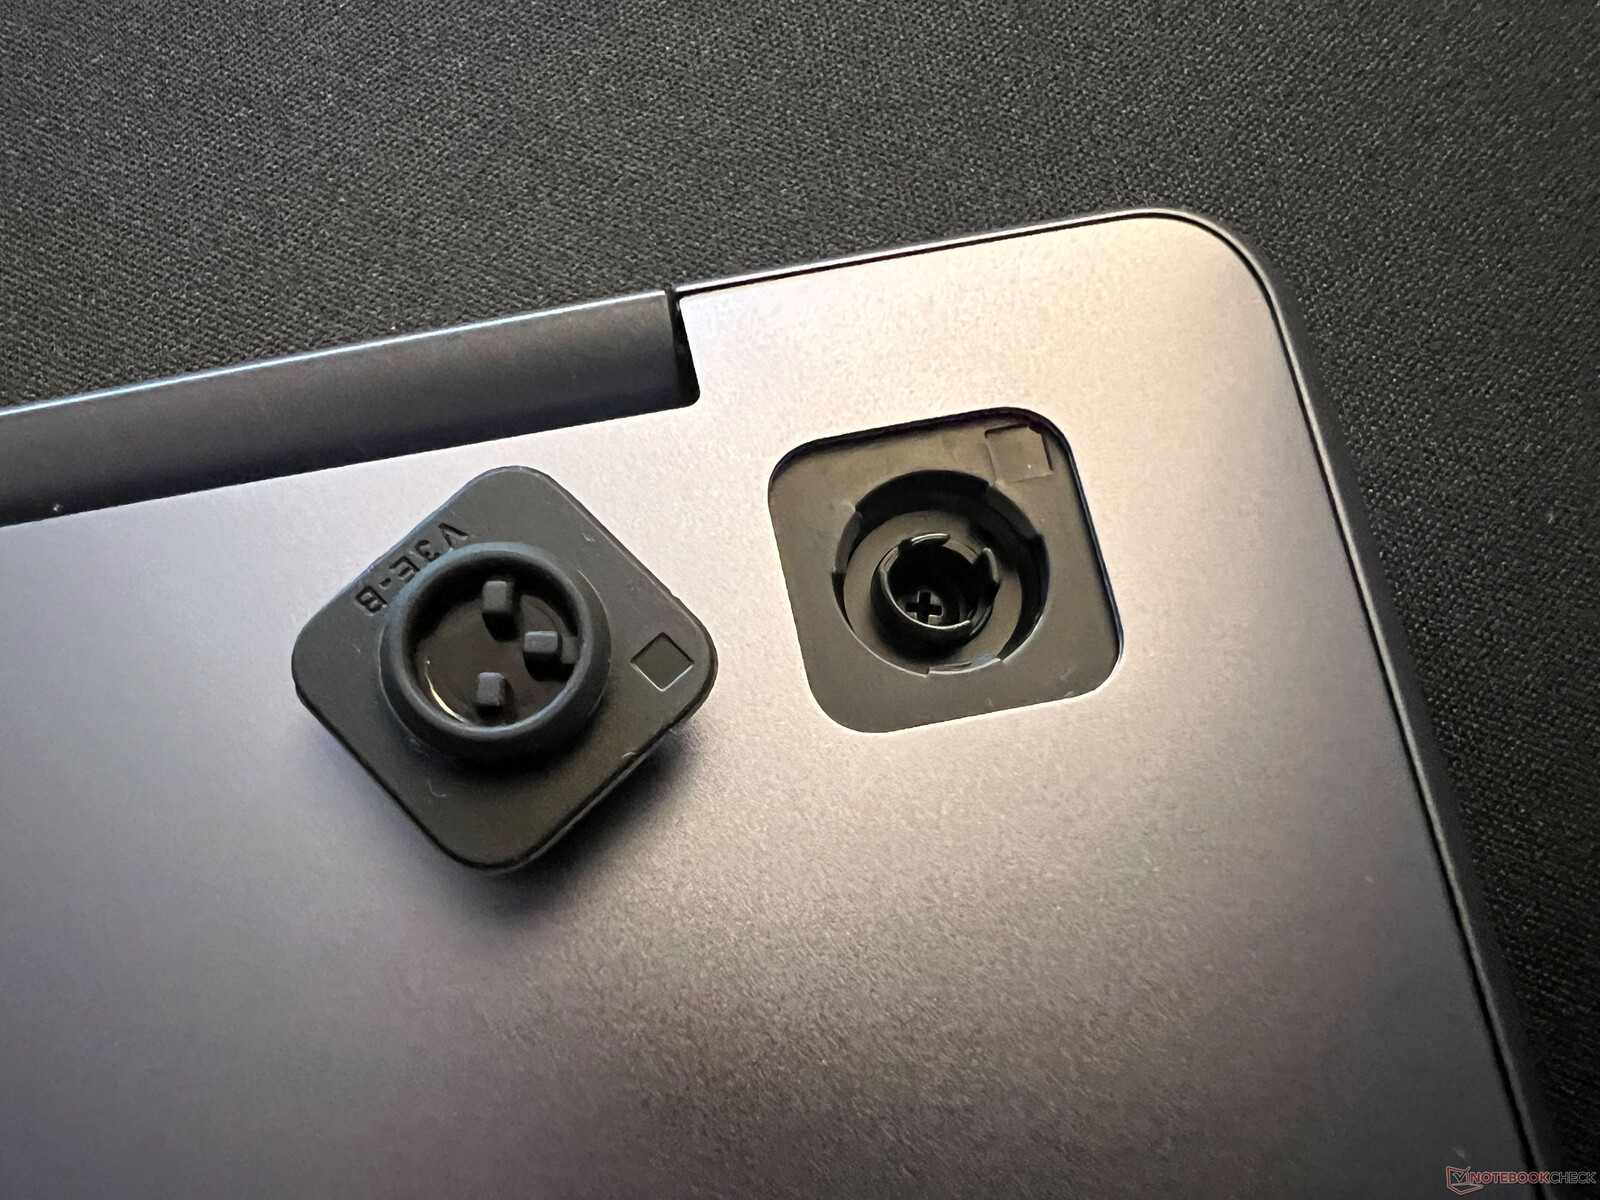
在设备的底座上,四颗螺丝隐藏在橡胶脚垫下。不过,即使没有螺丝,底盖也会被牢牢固定,因为中间还有额外的固定夹。在设备内部,你会看到风扇和大型蒸发腔。有两个用于 M.2 2280 固态硬盘的插槽,虽然旋入式电池可以更换,但所有其他组件都是焊接的。
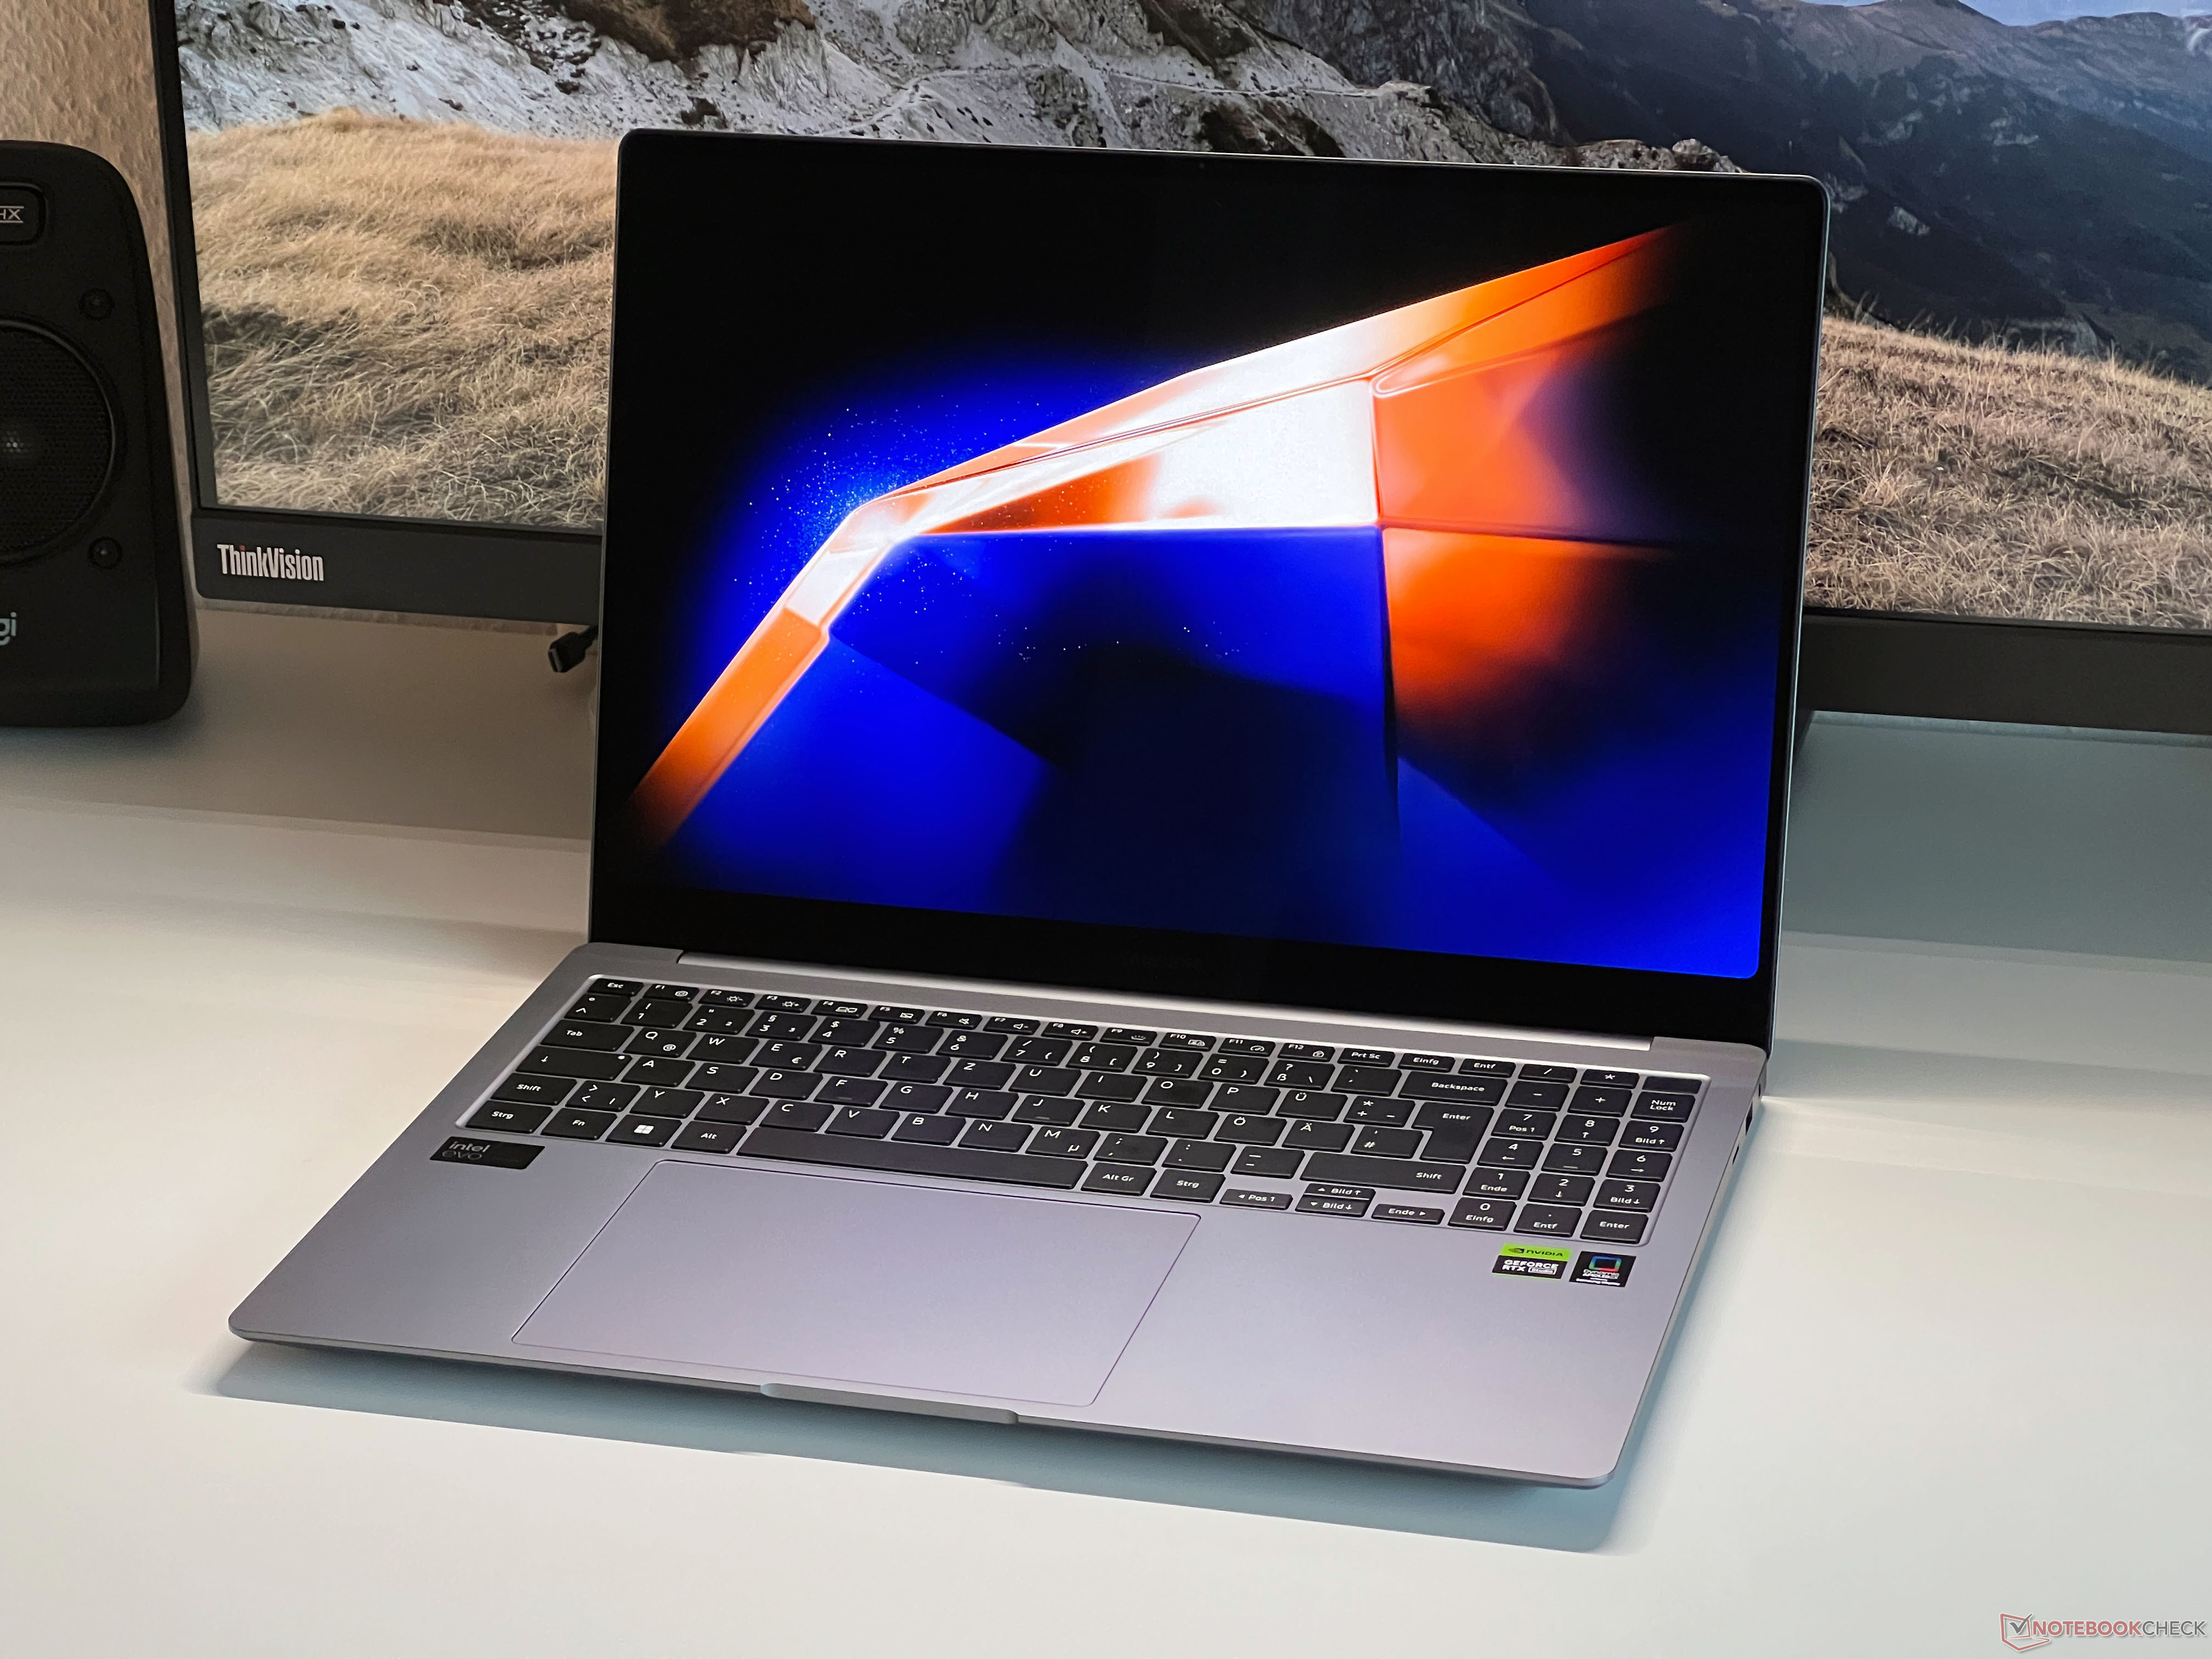
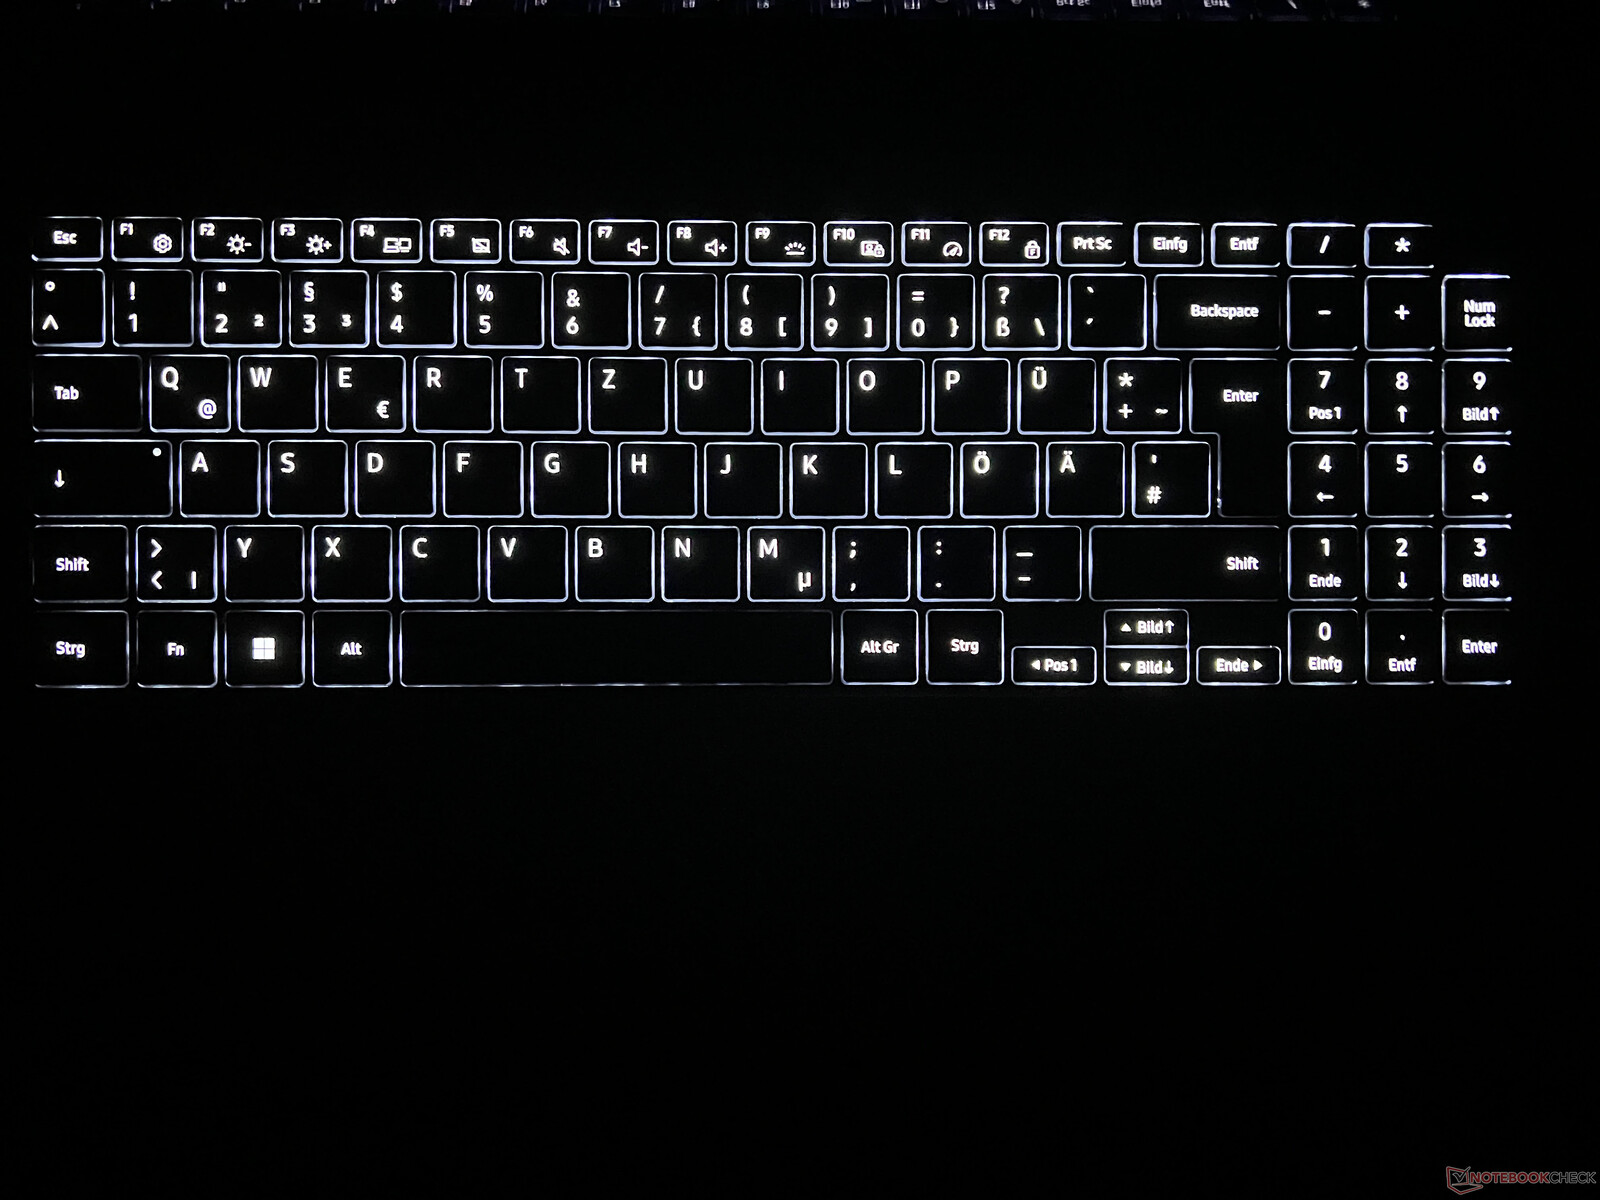
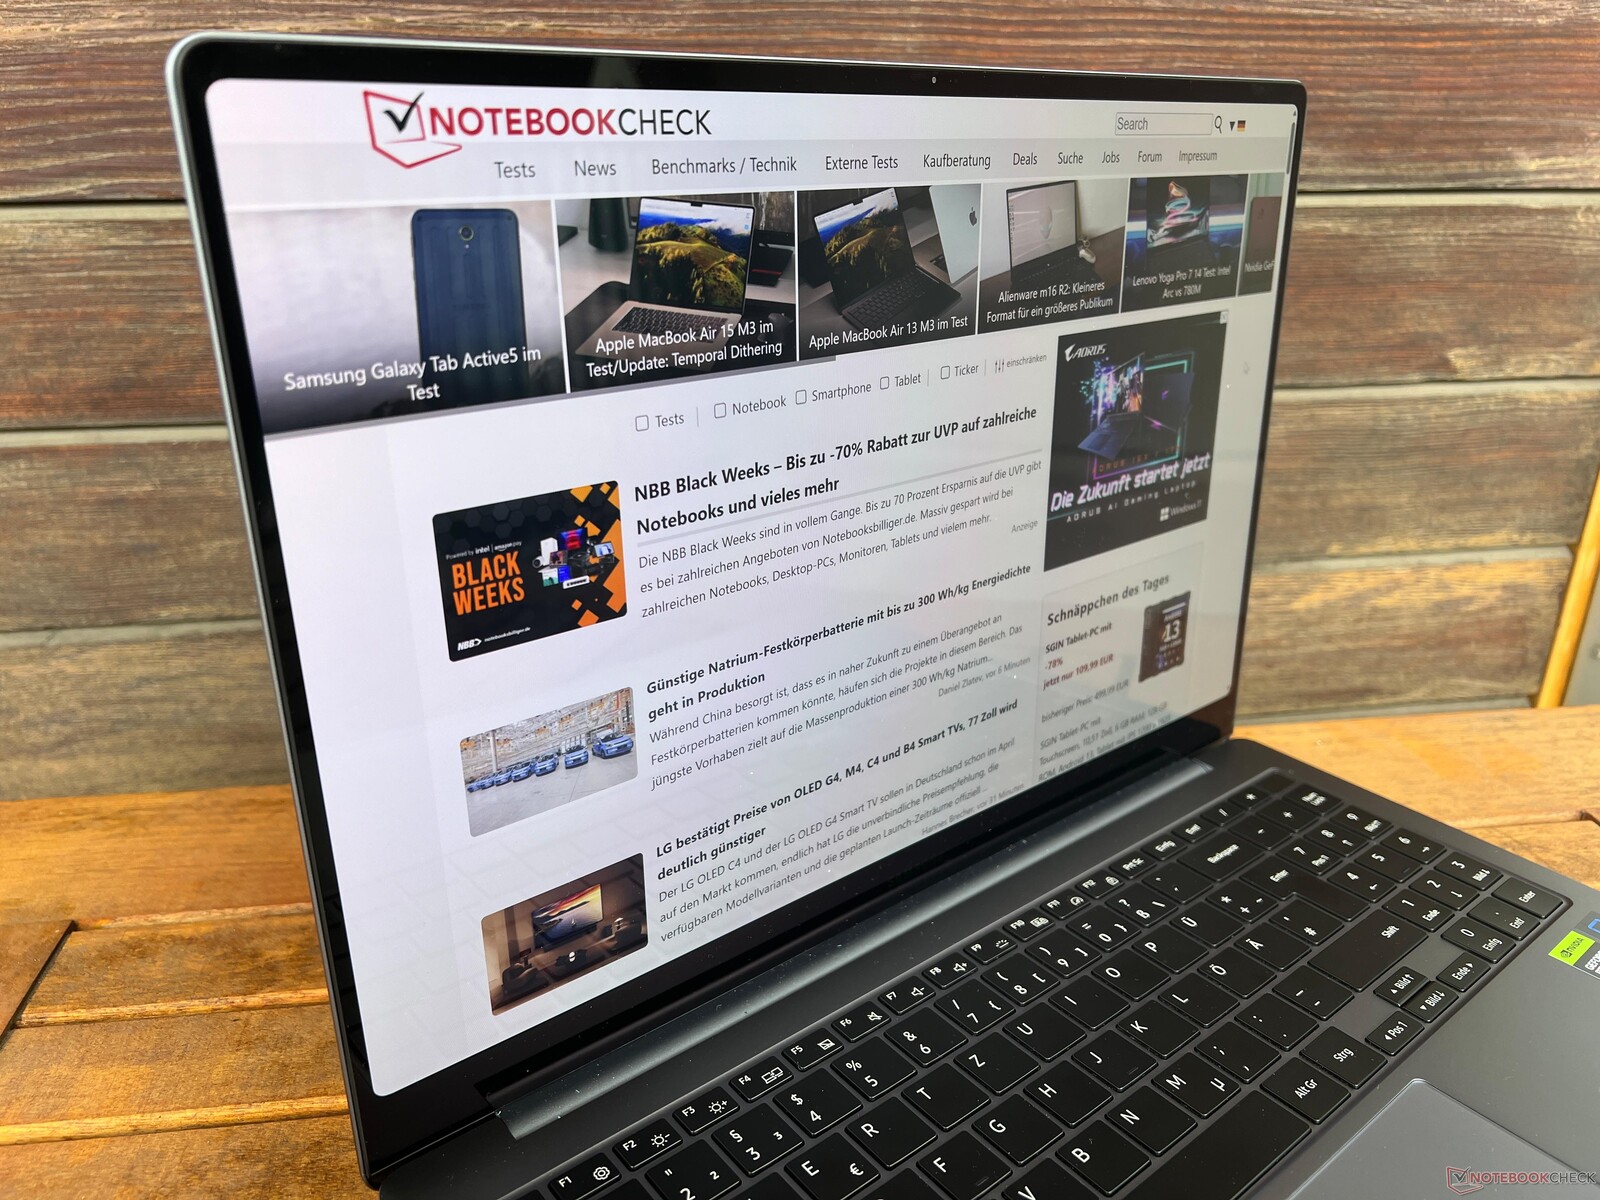
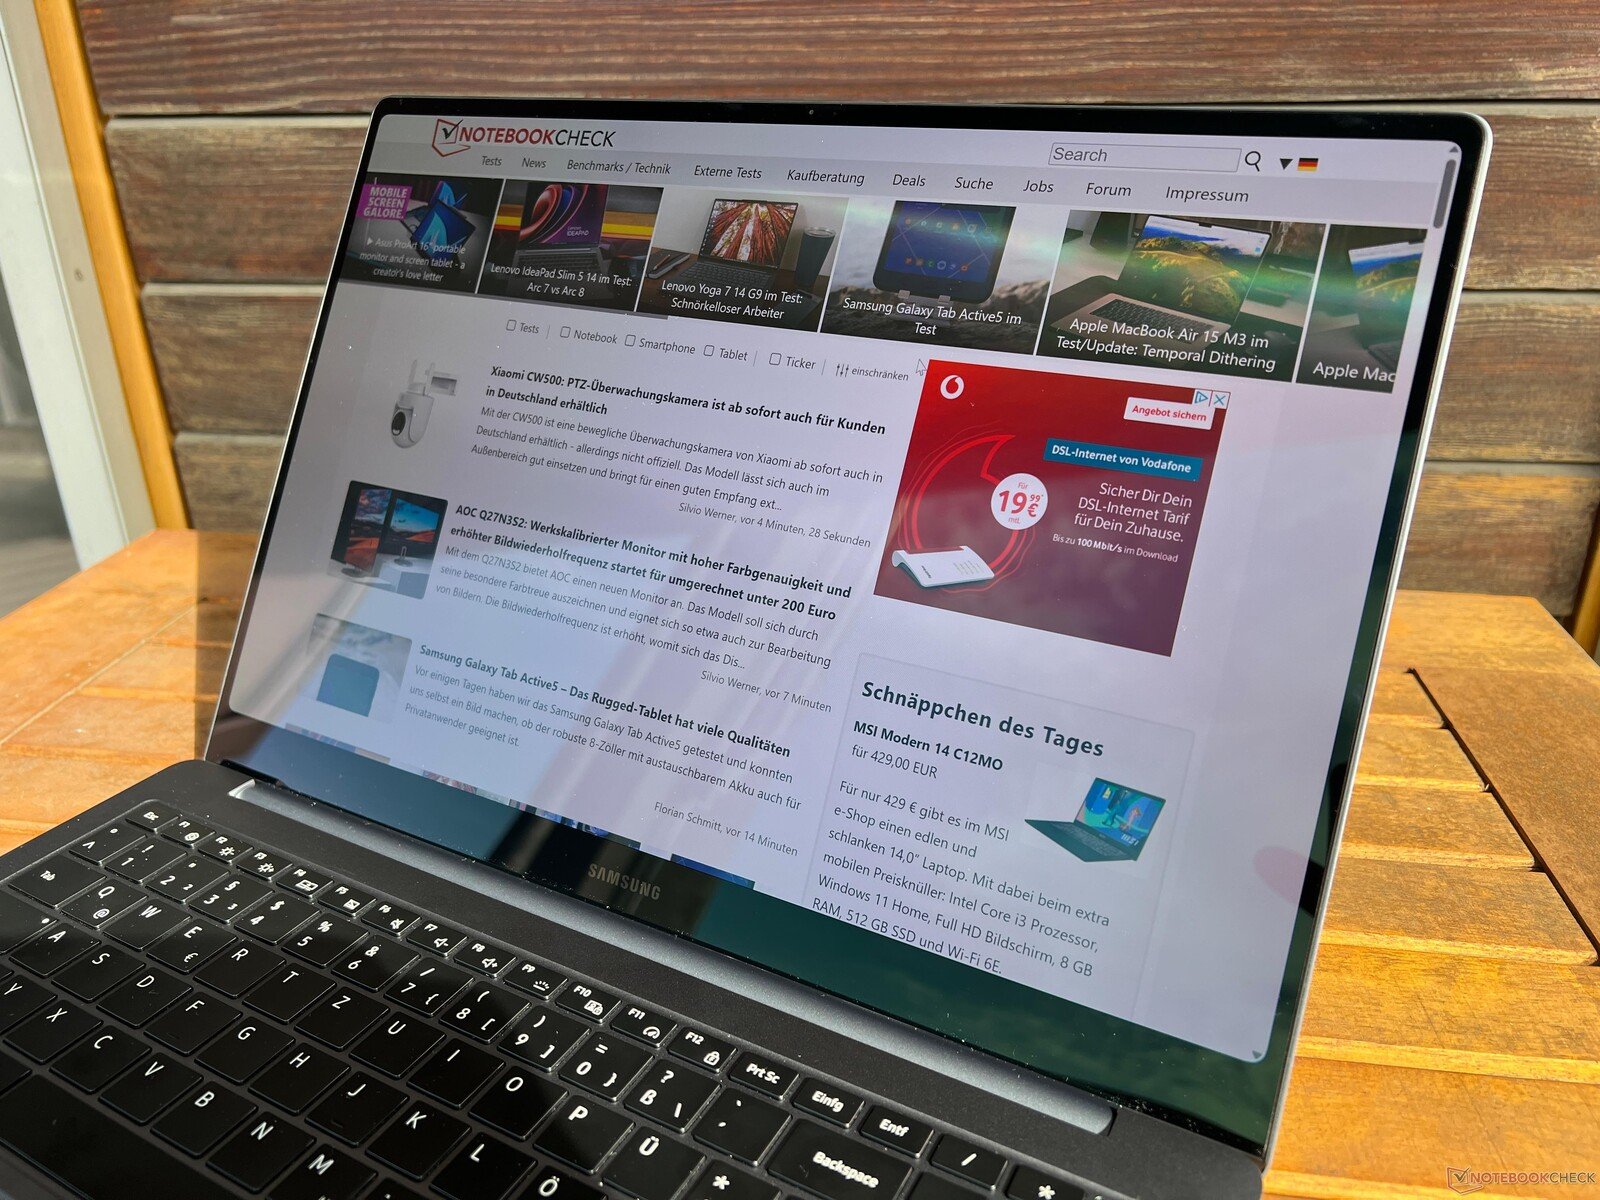
输入设备 - 超大触摸板,普通键盘
三星为Galaxy Book4 Ultra 配备了键盘和数字键盘。由于键程太浅,打字体验略有欠缺,而且按键时还会发出声音,与普通的Galaxy Book4 Pro 相比,敲击也不那么精确。在这方面,三星笔记本电脑也落后于竞争对手。经常打字的人应该先试试键盘。位于右上方的电源按钮同时也是指纹传感器。白色背光有三个强度级别,可以自动激活。
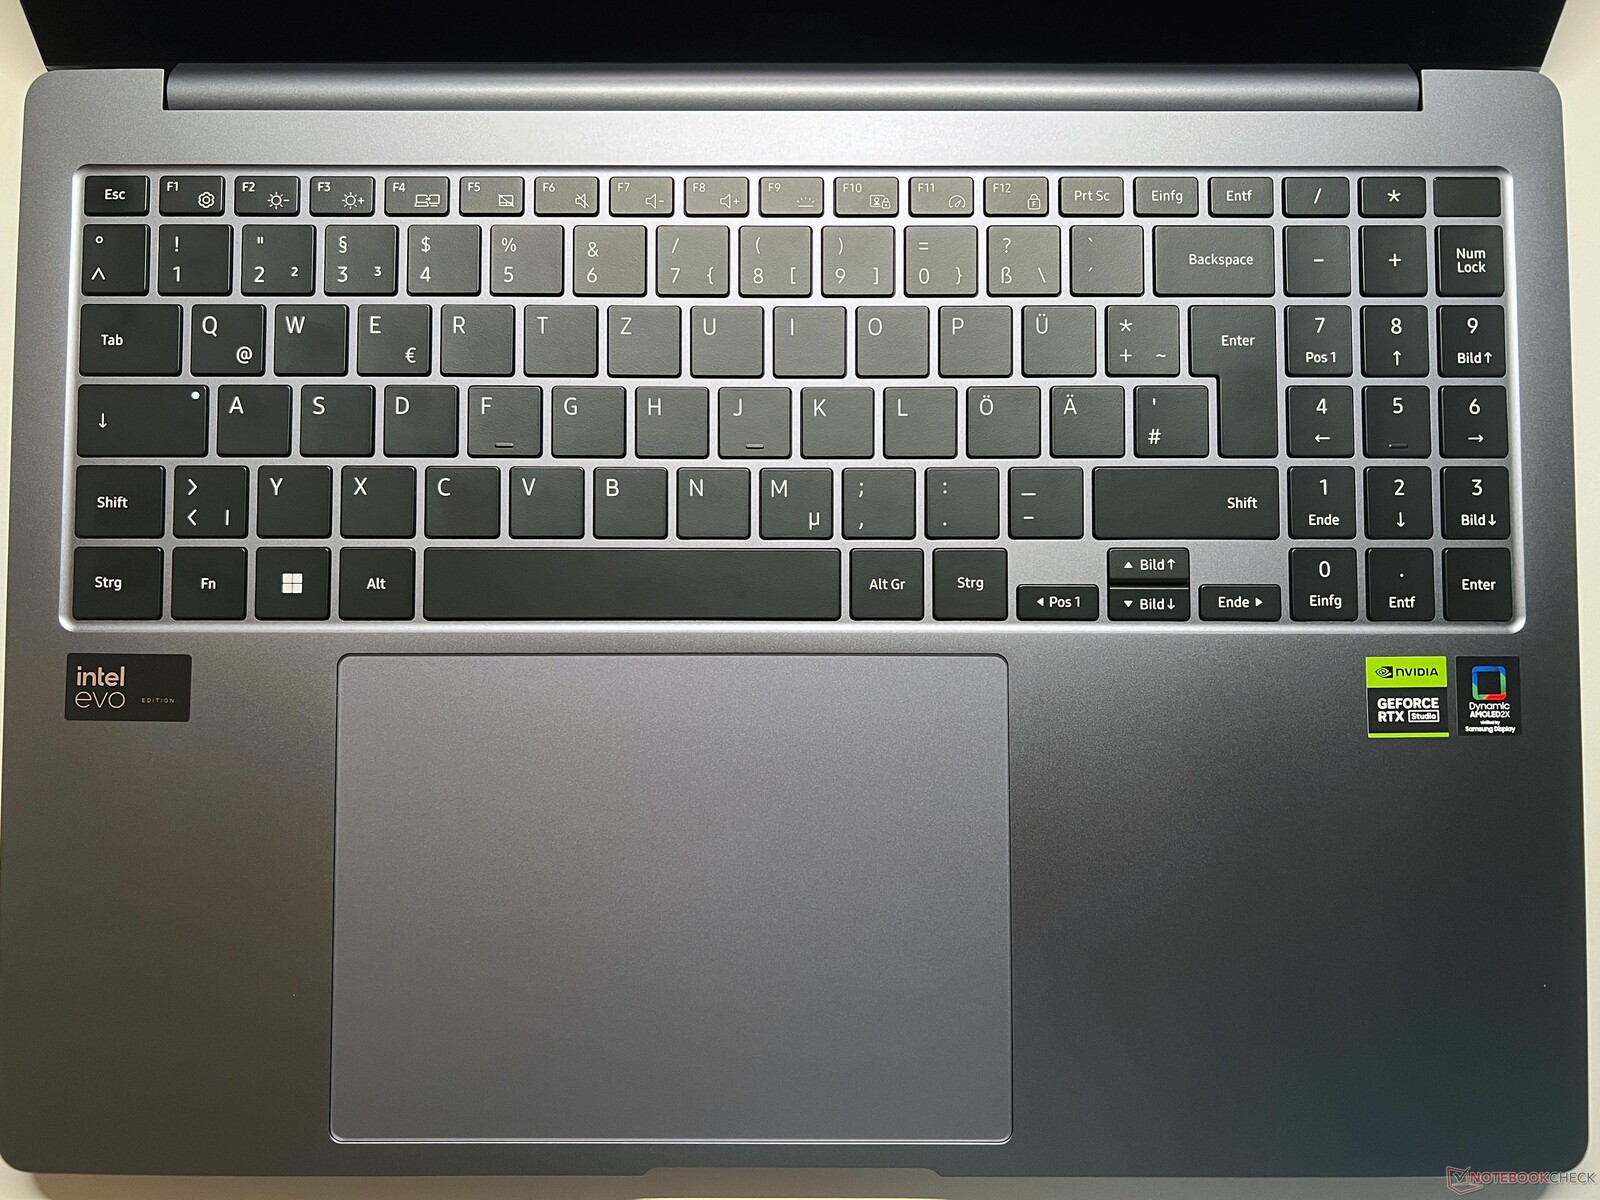
在巨大的触控板(15.1 x 10.8 厘米)上做出的轻扫手势非常好,尽管触控板的位置偏左。在打字时,左手的球几乎总是在触摸板上,但在测试过程中这并没有成为问题。触摸板的下部可以点击,但这样做的代价是发出相对响亮和廉价的噪音。
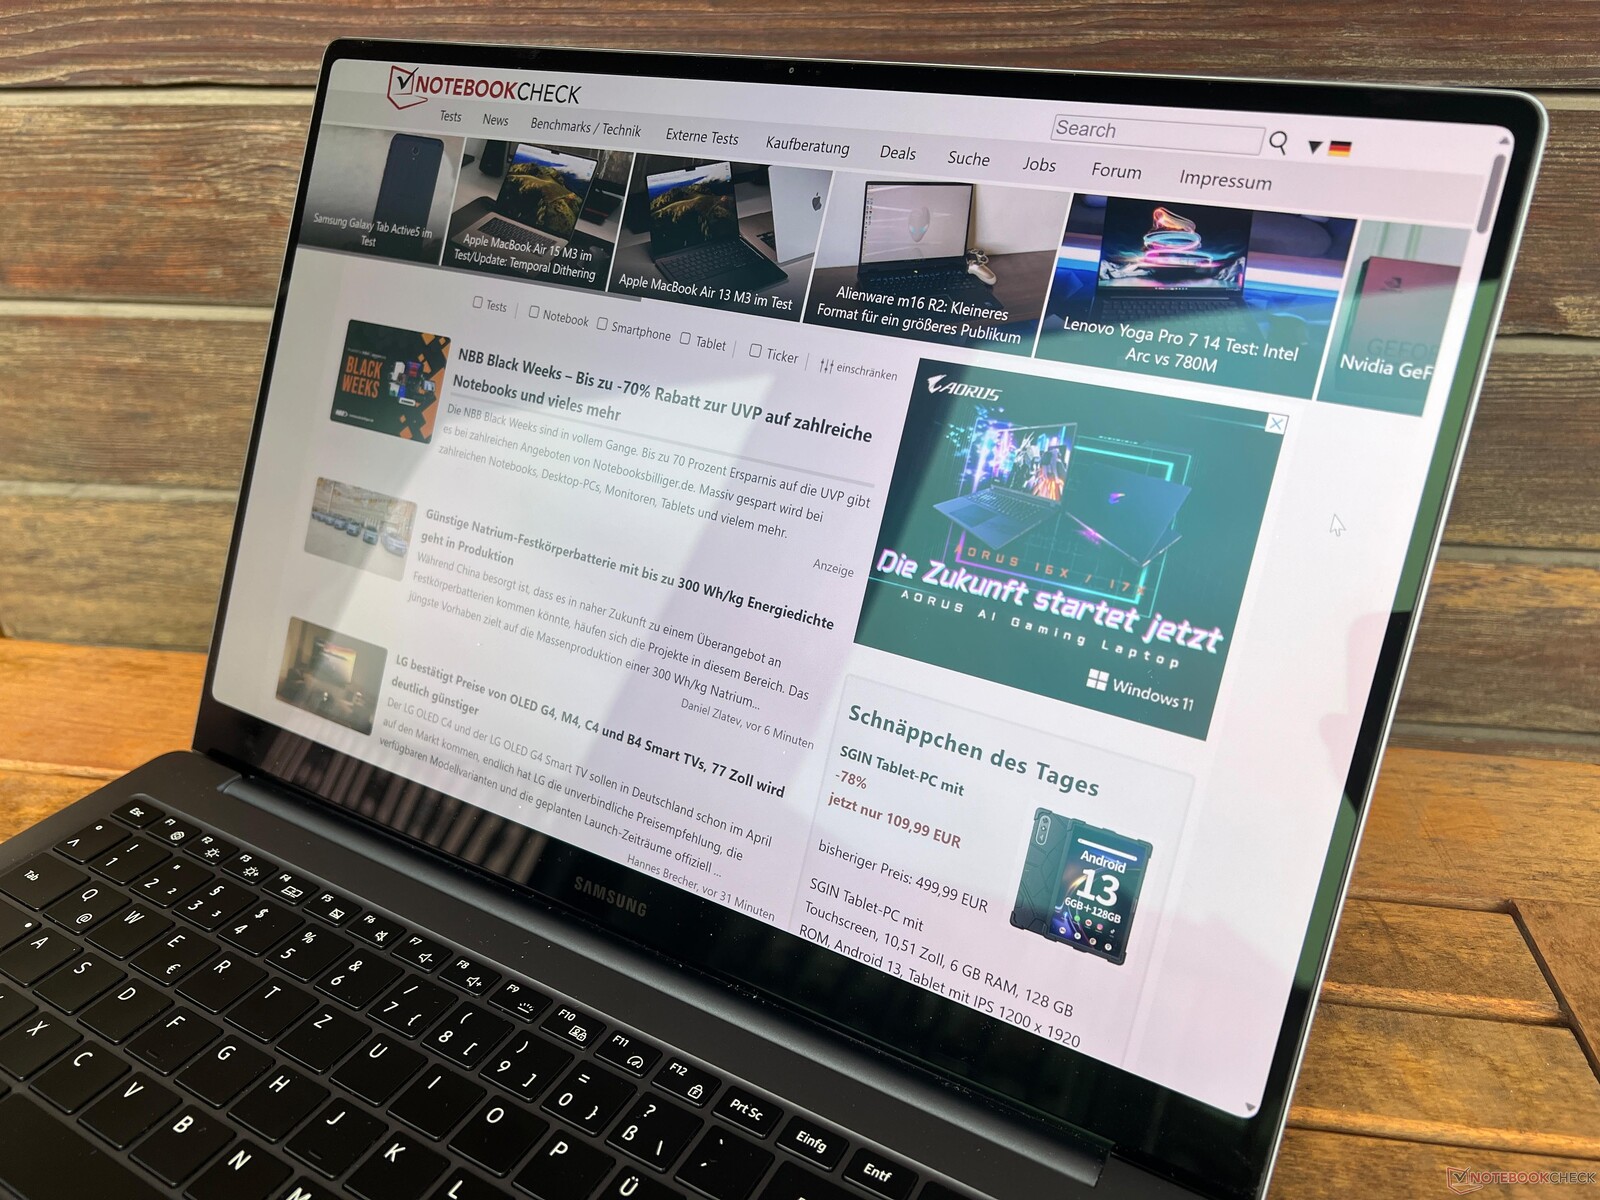
显示屏 - 120 Hz AMOLED
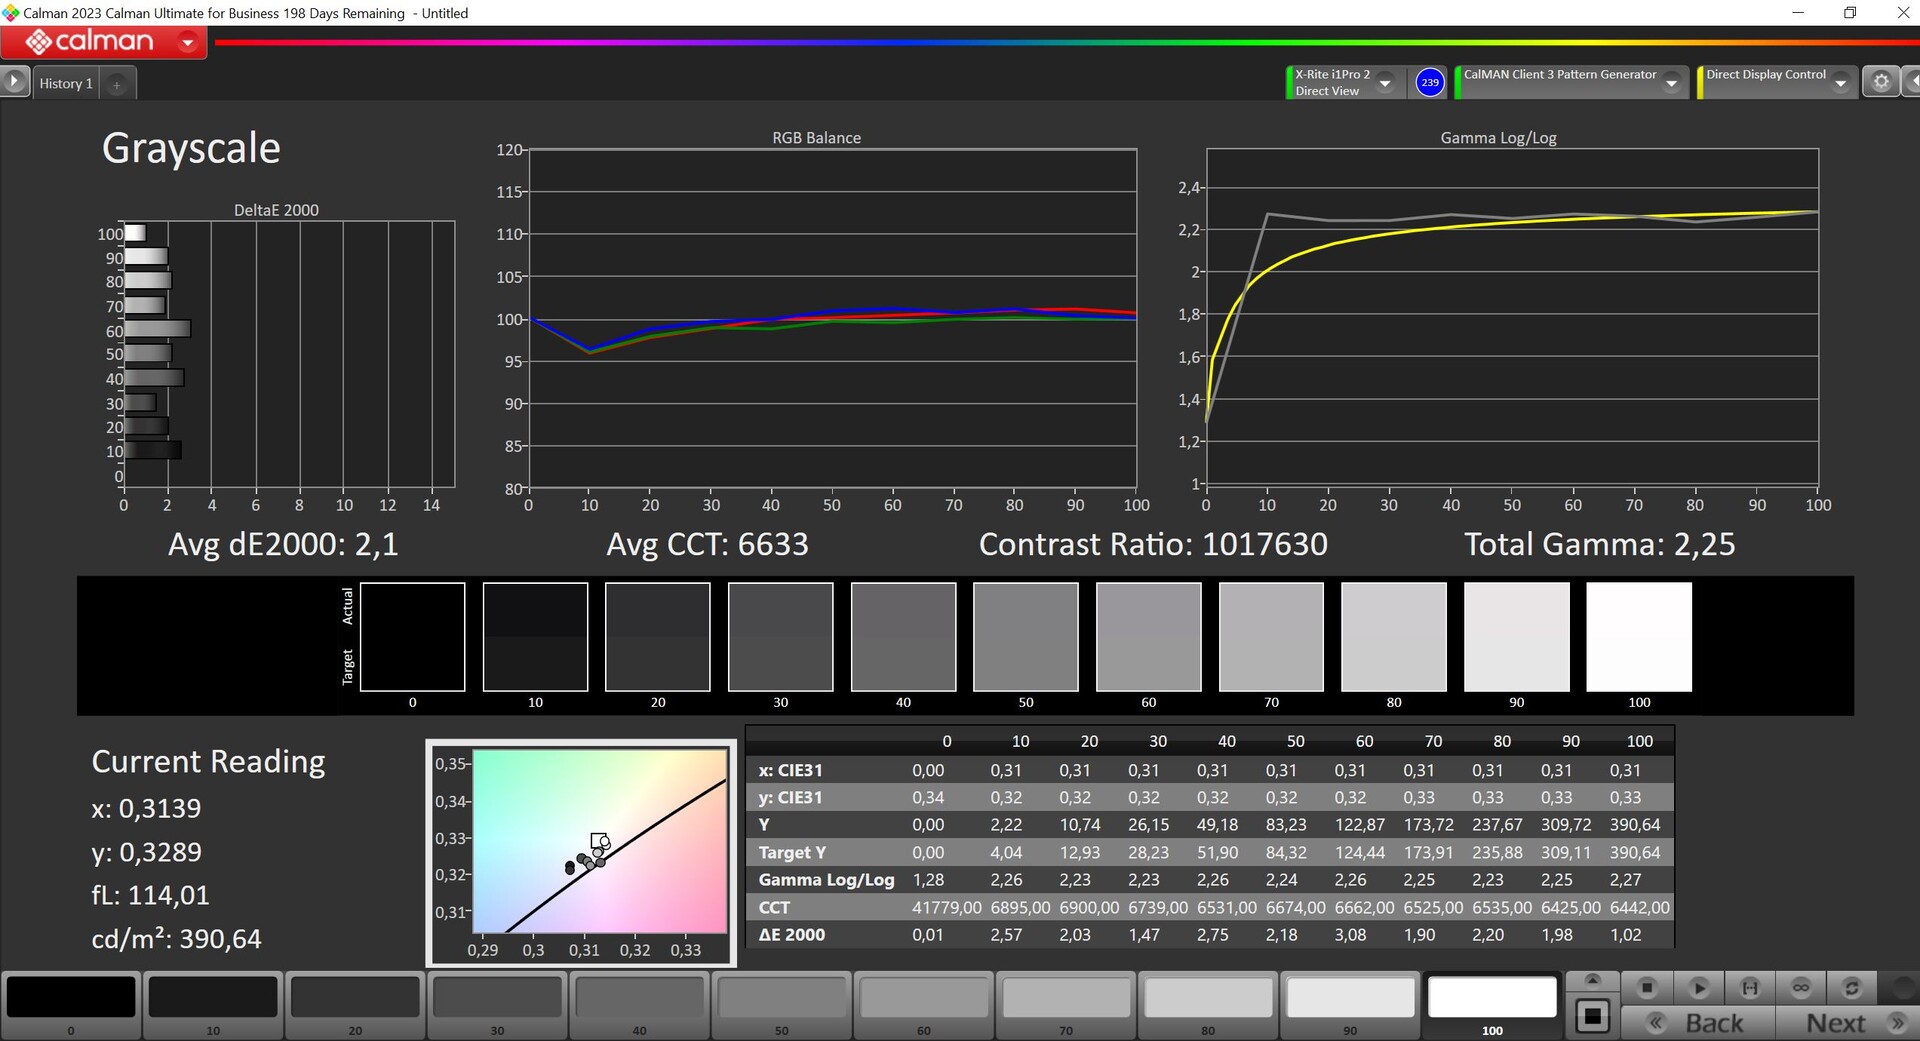
三星只销售配备 16 英寸 OLED 触摸屏(2880 x 1800 像素,16:10)的Galaxy Book4 Ultra。主观画质色彩鲜艳、黑色深邃,给人留下深刻印象。响应速度极快,支持 HDR 内容。此外,由于采用了 120 Hz 的刷新率,移动非常流畅。与所有 Windows 设备一样,HDR 模式可以手动激活,但不再提供色彩管理功能。亮度和色温均可通过传感器自动调节。
SDR 模式的最大亮度平均为 393 cd/m²,黑色值为 0 cd/m²,对比度非常高。我们测得图像部分的 HDR 亮度为 564 cd/m²,而几乎全白图像的 HDR 亮度为 540 cd/m²。这意味着,与微型 LED 面板相比,HDR 功能明显受到限制,再加上更好的 macOS 处理能力,MacBook Pro 1600 的 HDR 功能将更加出色。 MacBook Pro 16在 HDR 方面要优越得多。
| |||||||||||||||||||||||||
Brightness Distribution: 98 %
Center on Battery: 389 cd/m²
Contrast: ∞:1 (Black: 0 cd/m²)
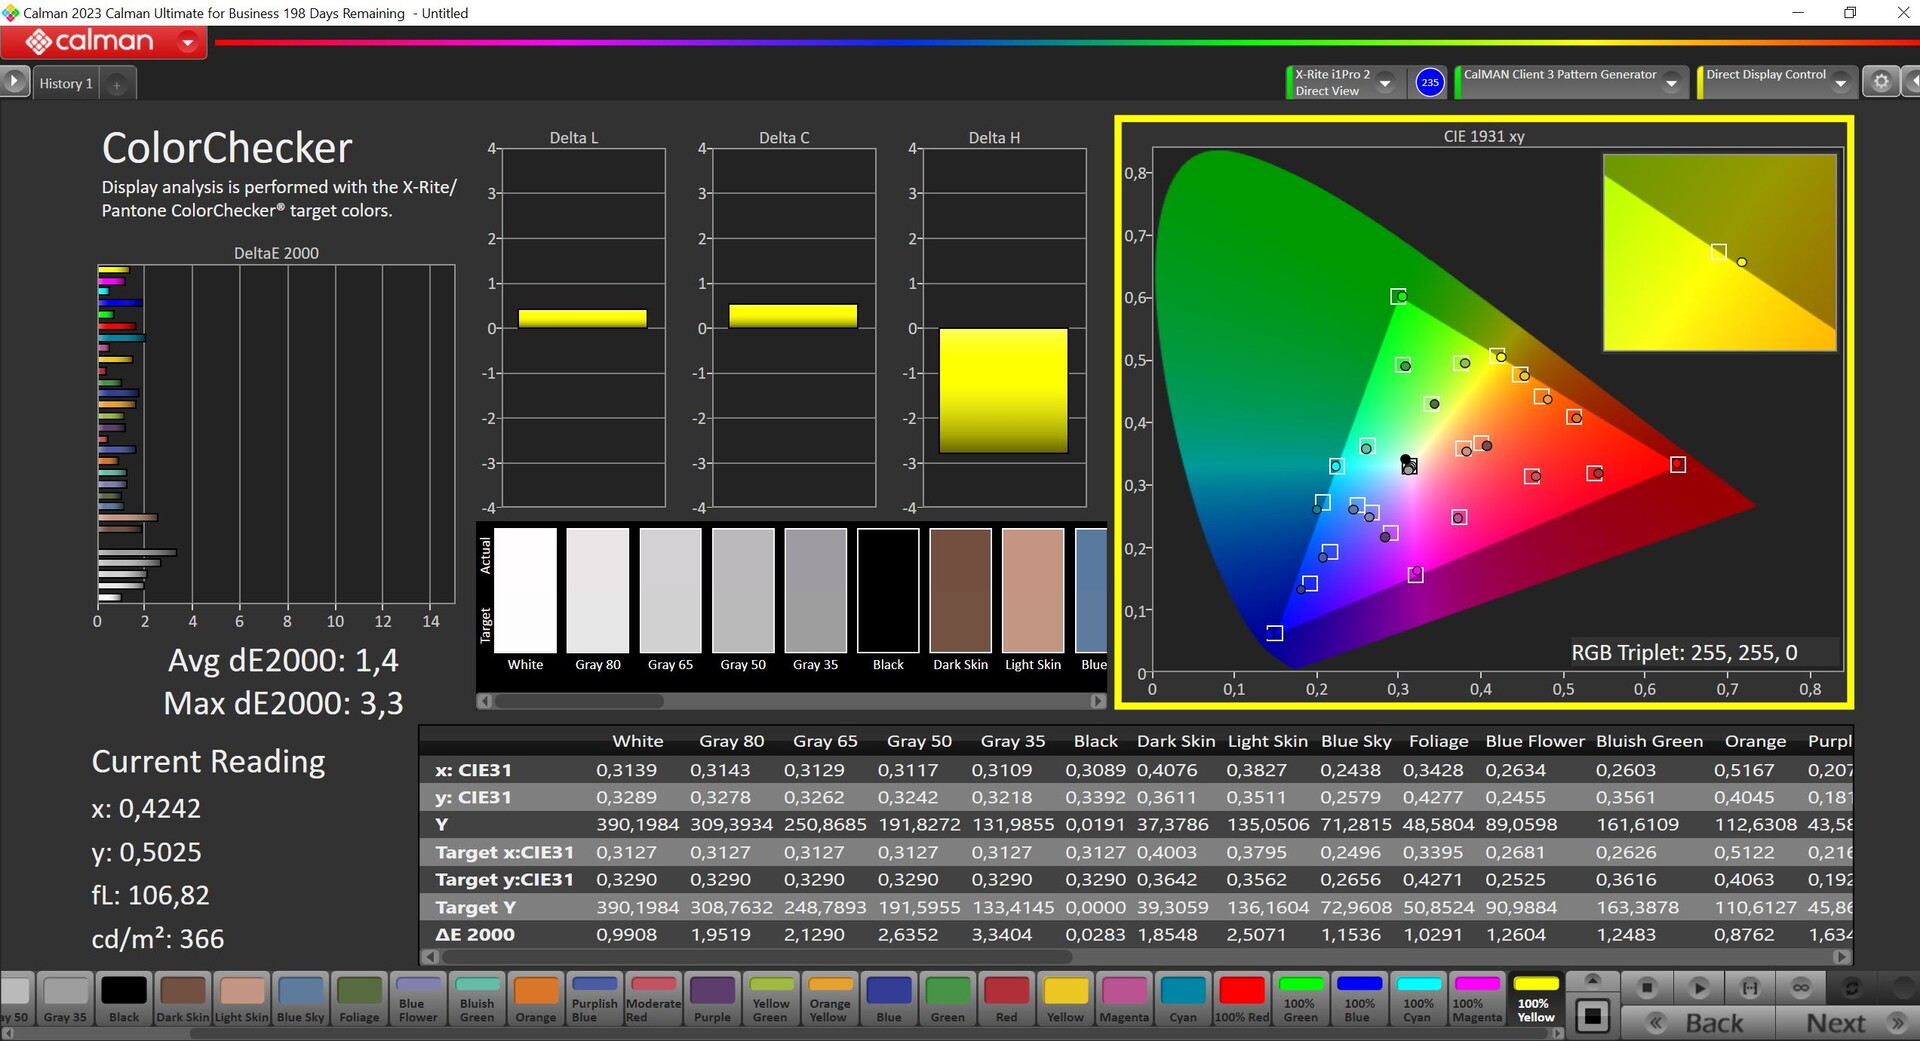
ΔE ColorChecker Calman: 1.4 | ∀{0.5-29.43 Ø4.71}
ΔE Greyscale Calman: 2.1 | ∀{0.09-98 Ø4.96}
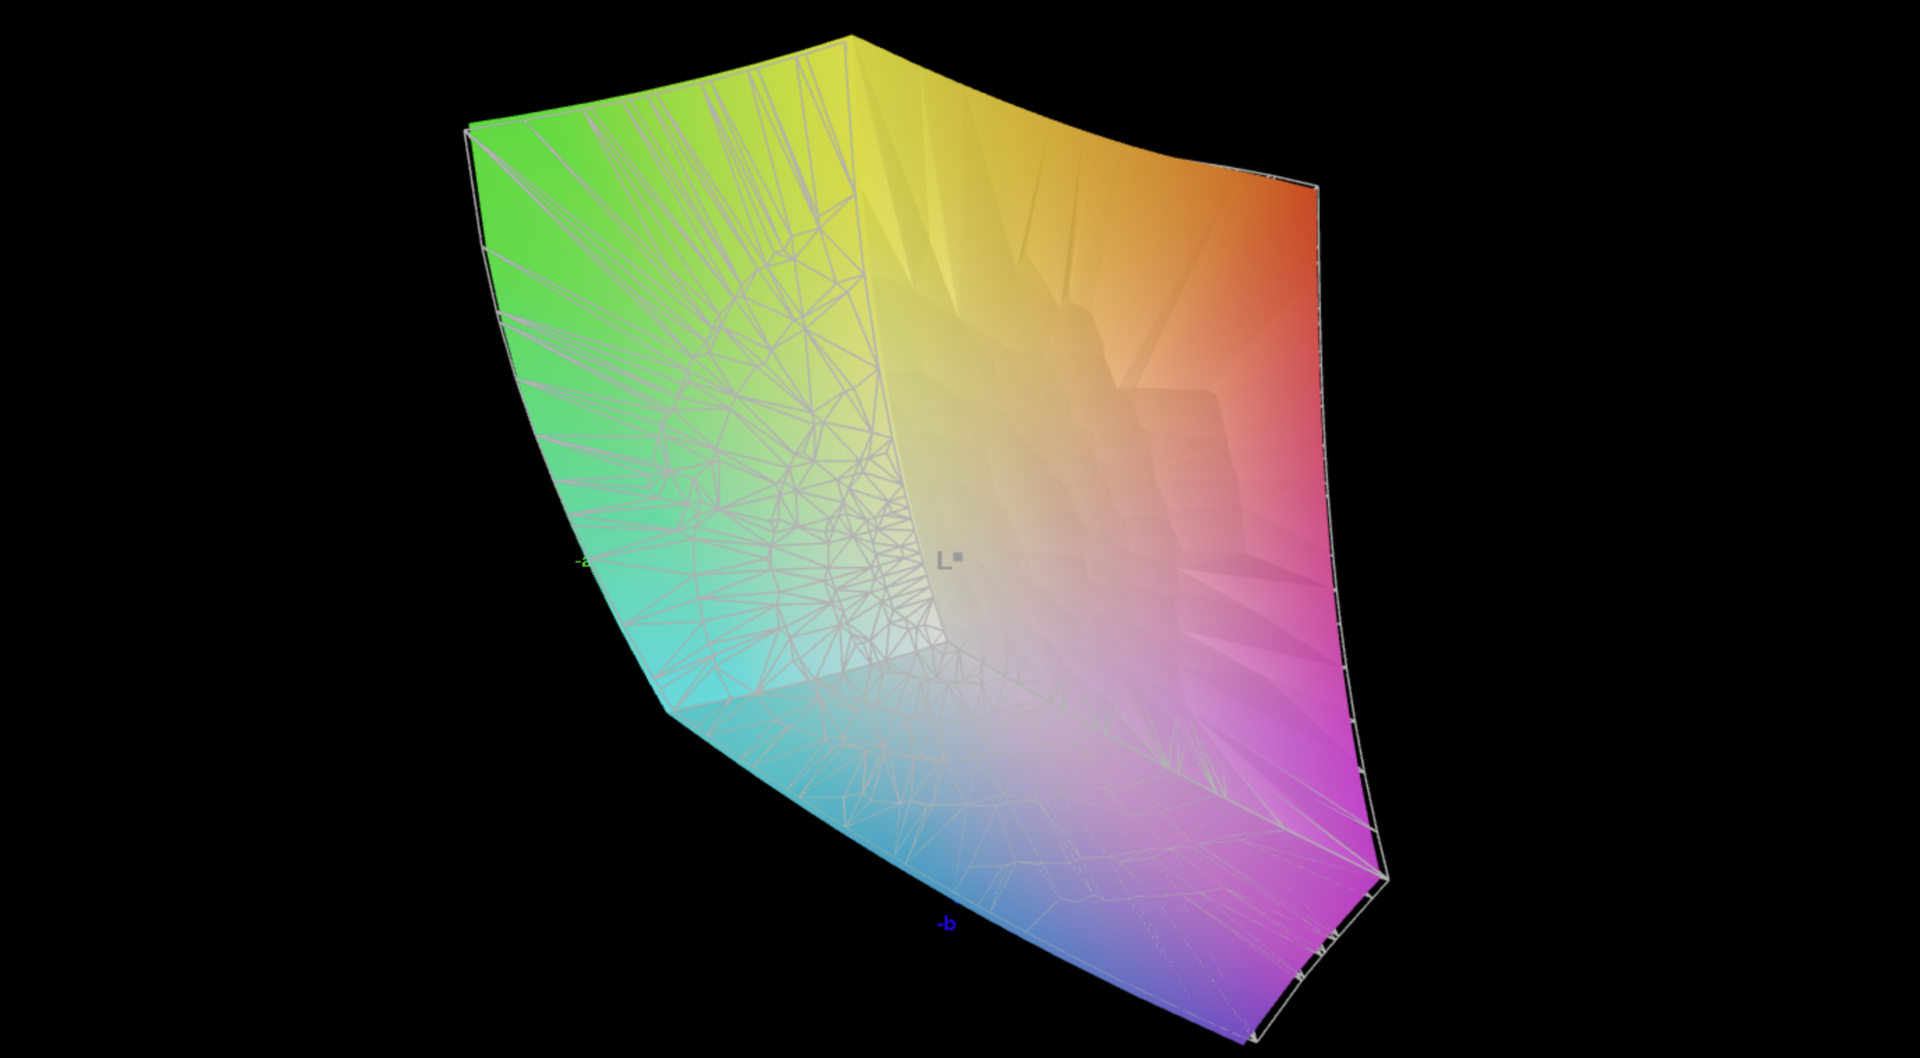
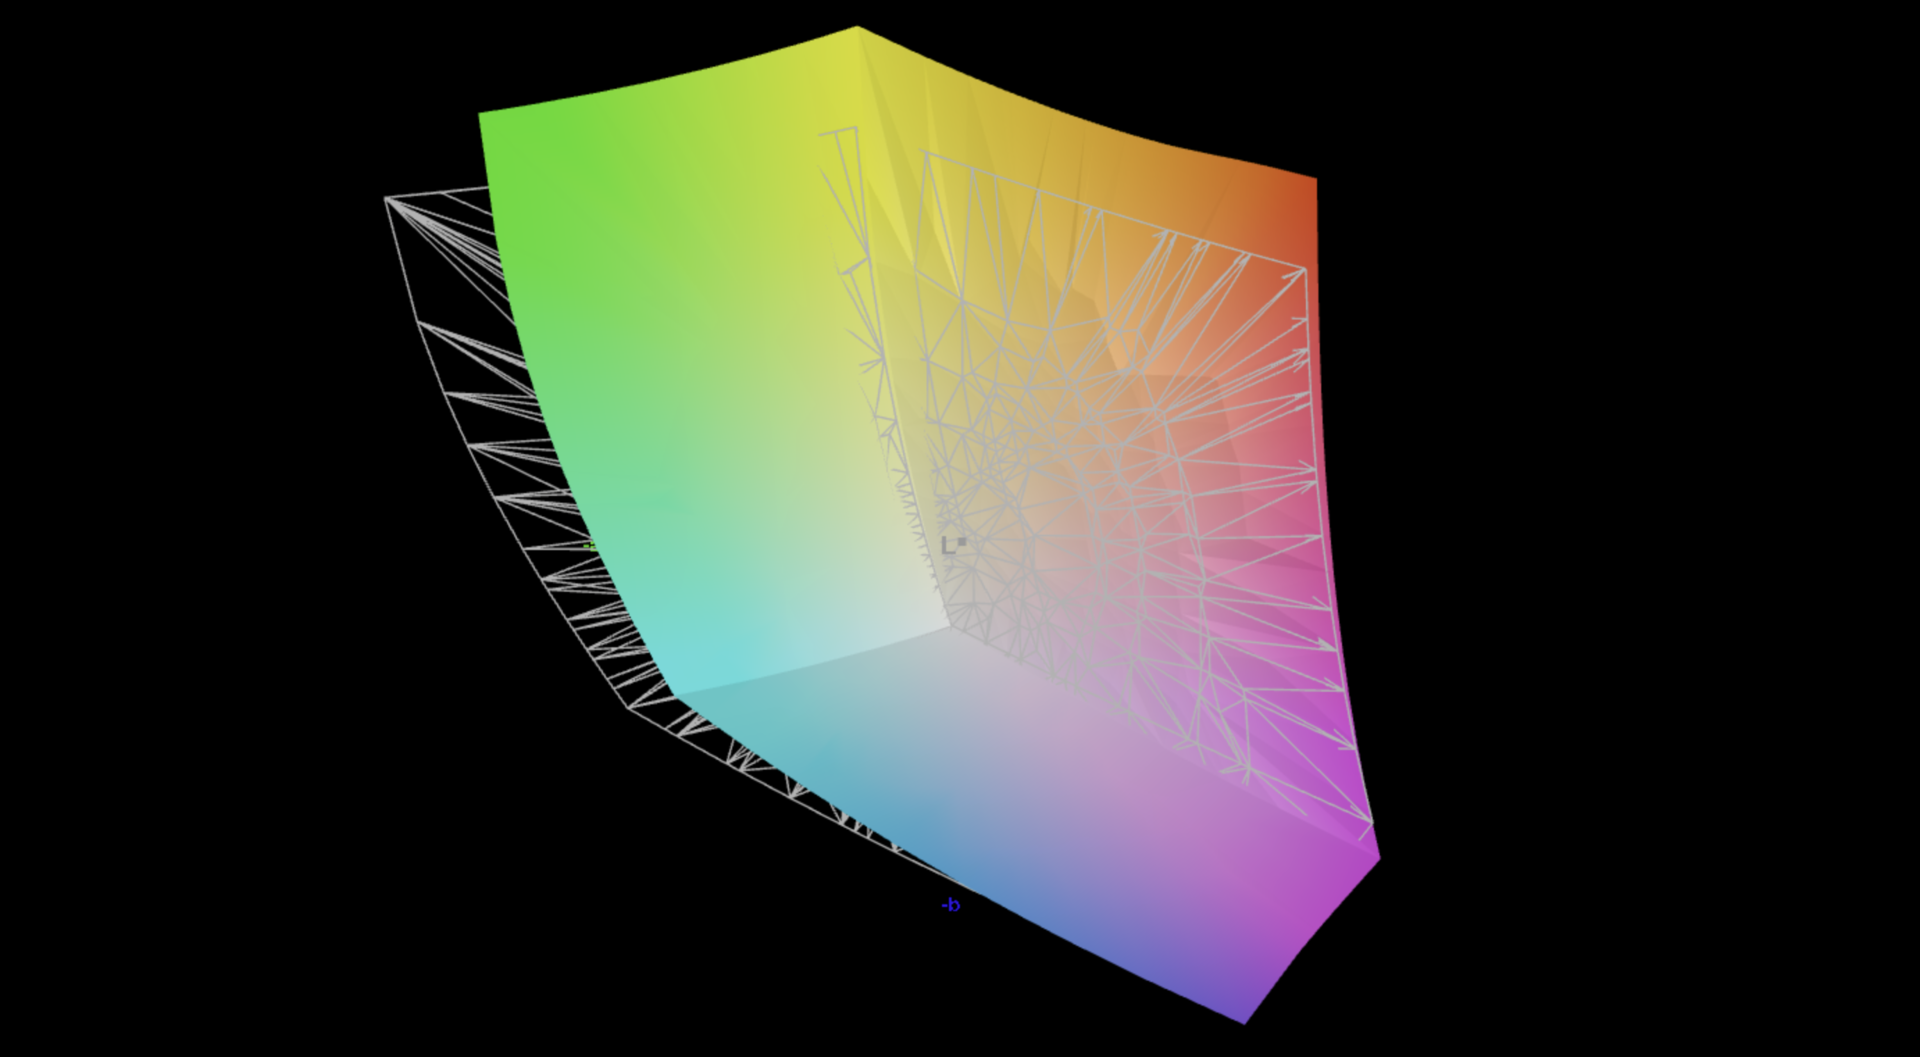
88.5% AdobeRGB 1998 (Argyll 3D)
99.9% sRGB (Argyll 3D)
98.6% Display P3 (Argyll 3D)
Gamma: 2.27
CCT: 6431 K
| Samsung Galaxy Book4 Ultra ATNA60CL07-0, OLED, 2880x1800, 16" | Lenovo ThinkPad Z16 Gen 2 Samsung ATNA60YV04-0, OLED, 3840x2400, 16" | Lenovo Slim Pro 9i 16IRP8 LEN160-3.2K, Mini-LED, 3200x2000, 16" | Schenker VISION 16 Pro (M23) NE160QDM-NZ1, IPS, 2560x1600, 16" | Samsung Galaxy Book3 Ultra 16 Samsung ATNA60CL03-0, AMOLED, 2880x1800, 16" | Apple MacBook Pro 16 2023 M3 Max Mini-LED, 3456x2234, 16" | HP Spectre x360 16 RTX 4050 Samsung SDC41A6, OLED, 2880x1800, 16" | |
|---|---|---|---|---|---|---|---|
| Display | 3% | -3% | -17% | 3% | 1% | 3% | |
| Display P3 Coverage (%) | 98.6 | 99.7 1% | 95.1 -4% | 68.8 -30% | 99.9 1% | 99.2 1% | 99.6 1% |
| sRGB Coverage (%) | 99.9 | 100 0% | 99.9 0% | 98.8 -1% | 100 0% | 100 0% | |
| AdobeRGB 1998 Coverage (%) | 88.5 | 96.7 9% | 84.6 -4% | 70 -21% | 96.3 9% | 96.7 9% | |
| Response Times | -209% | -1863% | -1756% | 8% | -9254% | -35% | |
| Response Time Grey 50% / Grey 80% * (ms) | 0.54 ? | 1.86 ? -244% | 14 ? -2493% | 13.7 ? -2437% | 0.49 ? 9% | 66.9 ? -12289% | 0.78 ? -44% |
| Response Time Black / White * (ms) | 0.69 ? | 1.89 ? -174% | 9.2 ? -1233% | 8.1 ? -1074% | 0.65 ? 6% | 43.6 ? -6219% | 0.86 ? -25% |
| PWM Frequency (Hz) | 240 ? | 60 ? | 5784 ? | 240 ? | 14877 | 480 ? | |
| Screen | -4% | -117% | -77% | -25% | 22% | -16% | |
| Brightness middle (cd/m²) | 390 | 390.1 0% | 627.4 61% | 384 -2% | 400 3% | 630 62% | 385.2 -1% |
| Brightness (cd/m²) | 393 | 393 0% | 618 57% | 371 -6% | 399 2% | 604 54% | 387 -2% |
| Brightness Distribution (%) | 98 | 97 -1% | 95 -3% | 88 -10% | 93 -5% | 94 -4% | 99 1% |
| Black Level * (cd/m²) | 0.19 | 0.3 | 0.03 | ||||
| Colorchecker dE 2000 * | 1.4 | 1.41 -1% | 5.84 -317% | 3.4 -143% | 2.3 -64% | 1.2 14% | 1.73 -24% |
| Colorchecker dE 2000 max. * | 2.7 | 3.43 -27% | 10.22 -279% | 9.2 -241% | 4.15 -54% | 2.8 -4% | 3.95 -46% |
| Greyscale dE 2000 * | 2.1 | 2 5% | 6.7 -219% | 3.4 -62% | 2.7 -29% | 1.9 10% | 2.6 -24% |
| Gamma | 2.27 97% | 2.22 99% | 2.77 79% | 2.16 102% | 2.266 97% | 2.29 96% | 2.17 101% |
| CCT | 6431 101% | 6324 103% | 5795 112% | 7462 87% | 7047 92% | 6812 95% | 6133 106% |
| Contrast (:1) | 3302 | 1280 | 13333 | ||||
| Colorchecker dE 2000 calibrated * | 4.45 | 1.3 | 1.66 | ||||
| Total Average (Program / Settings) | -70% /
-39% | -661% /
-403% | -617% /
-366% | -5% /
-11% | -3077% /
-2042% | -16% /
-14% |
* ... smaller is better
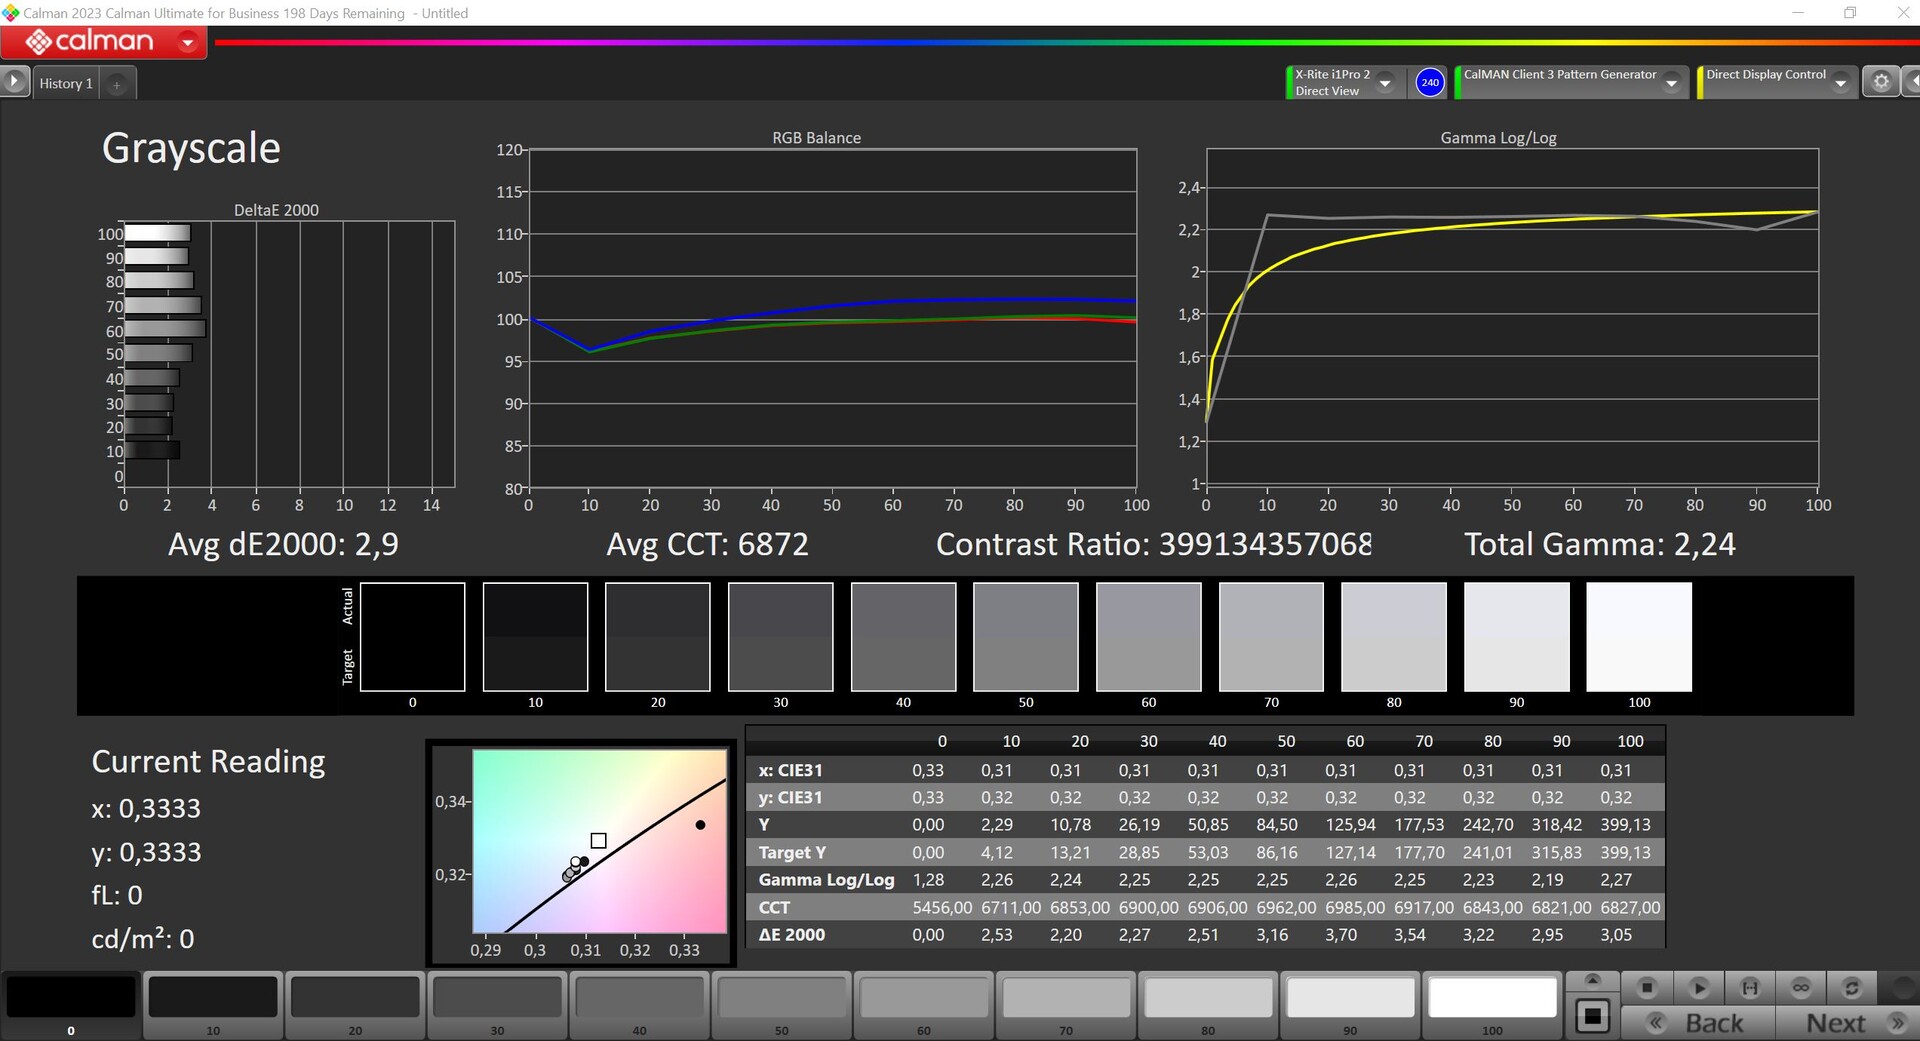

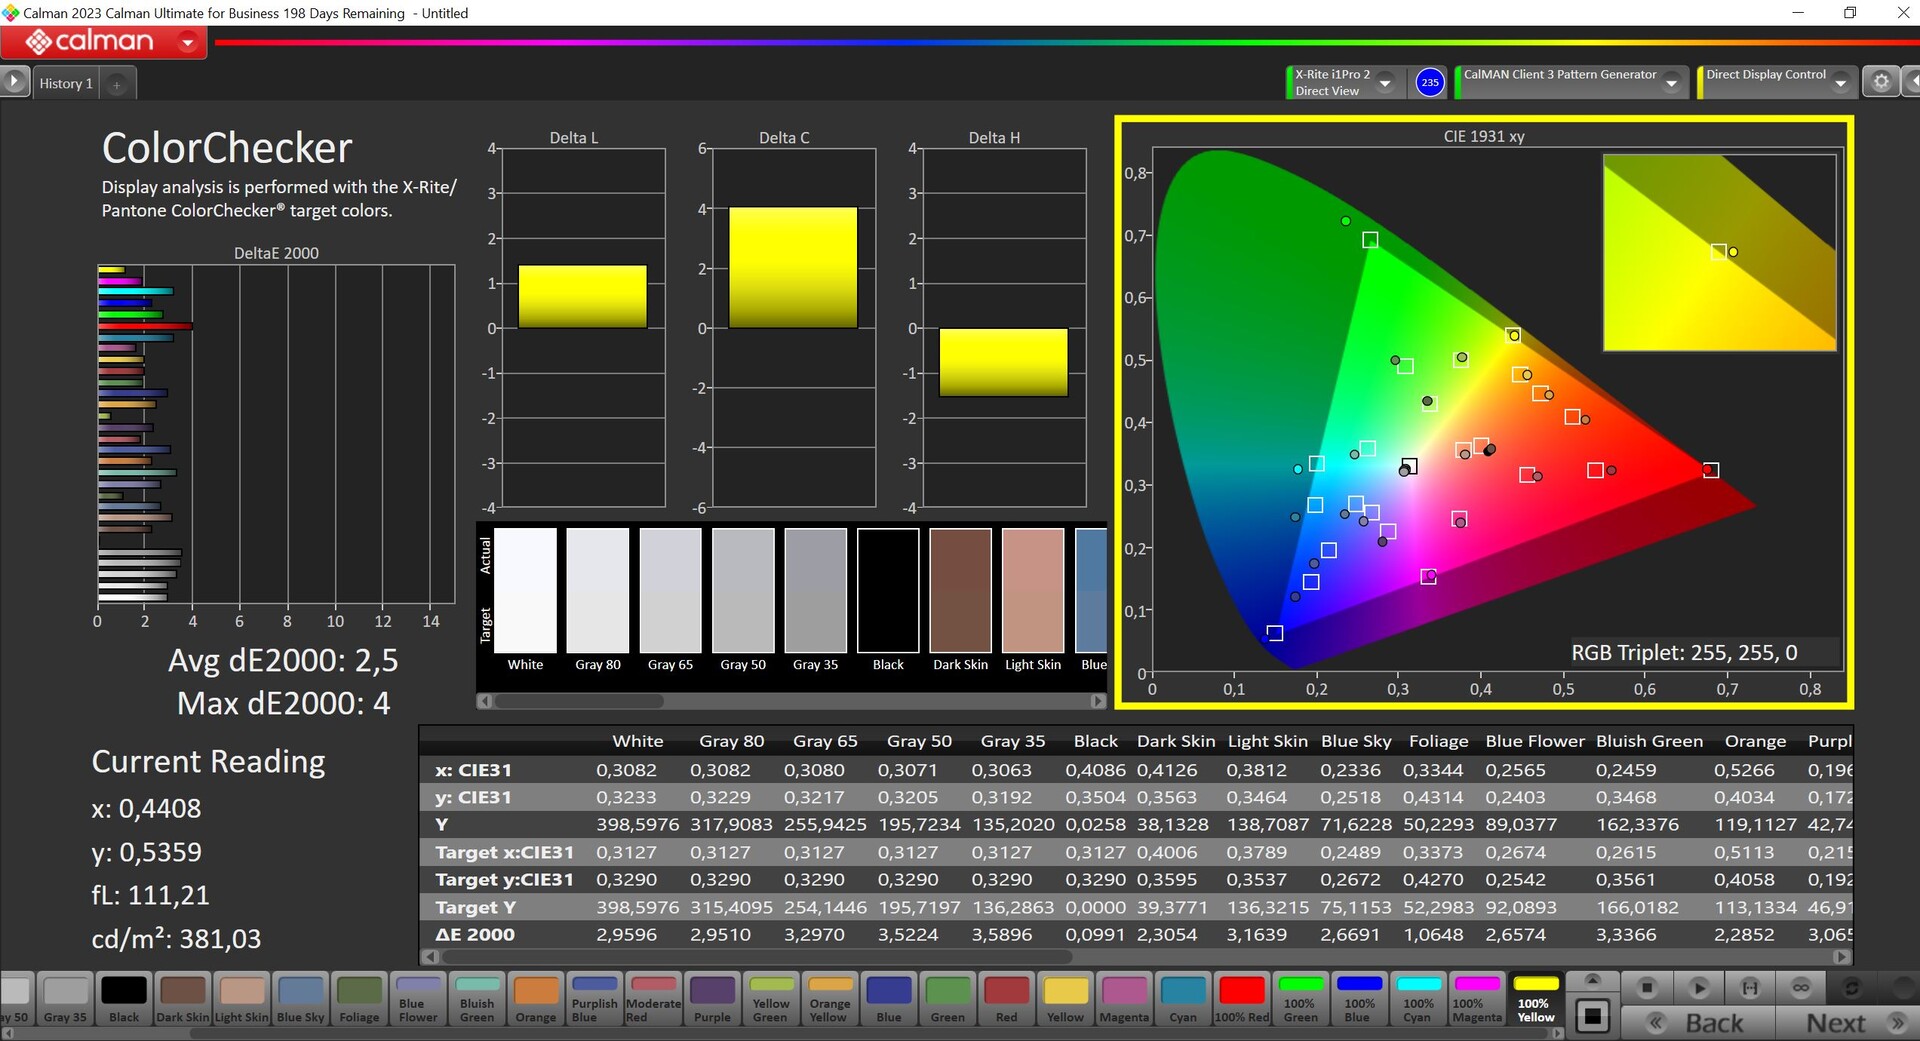
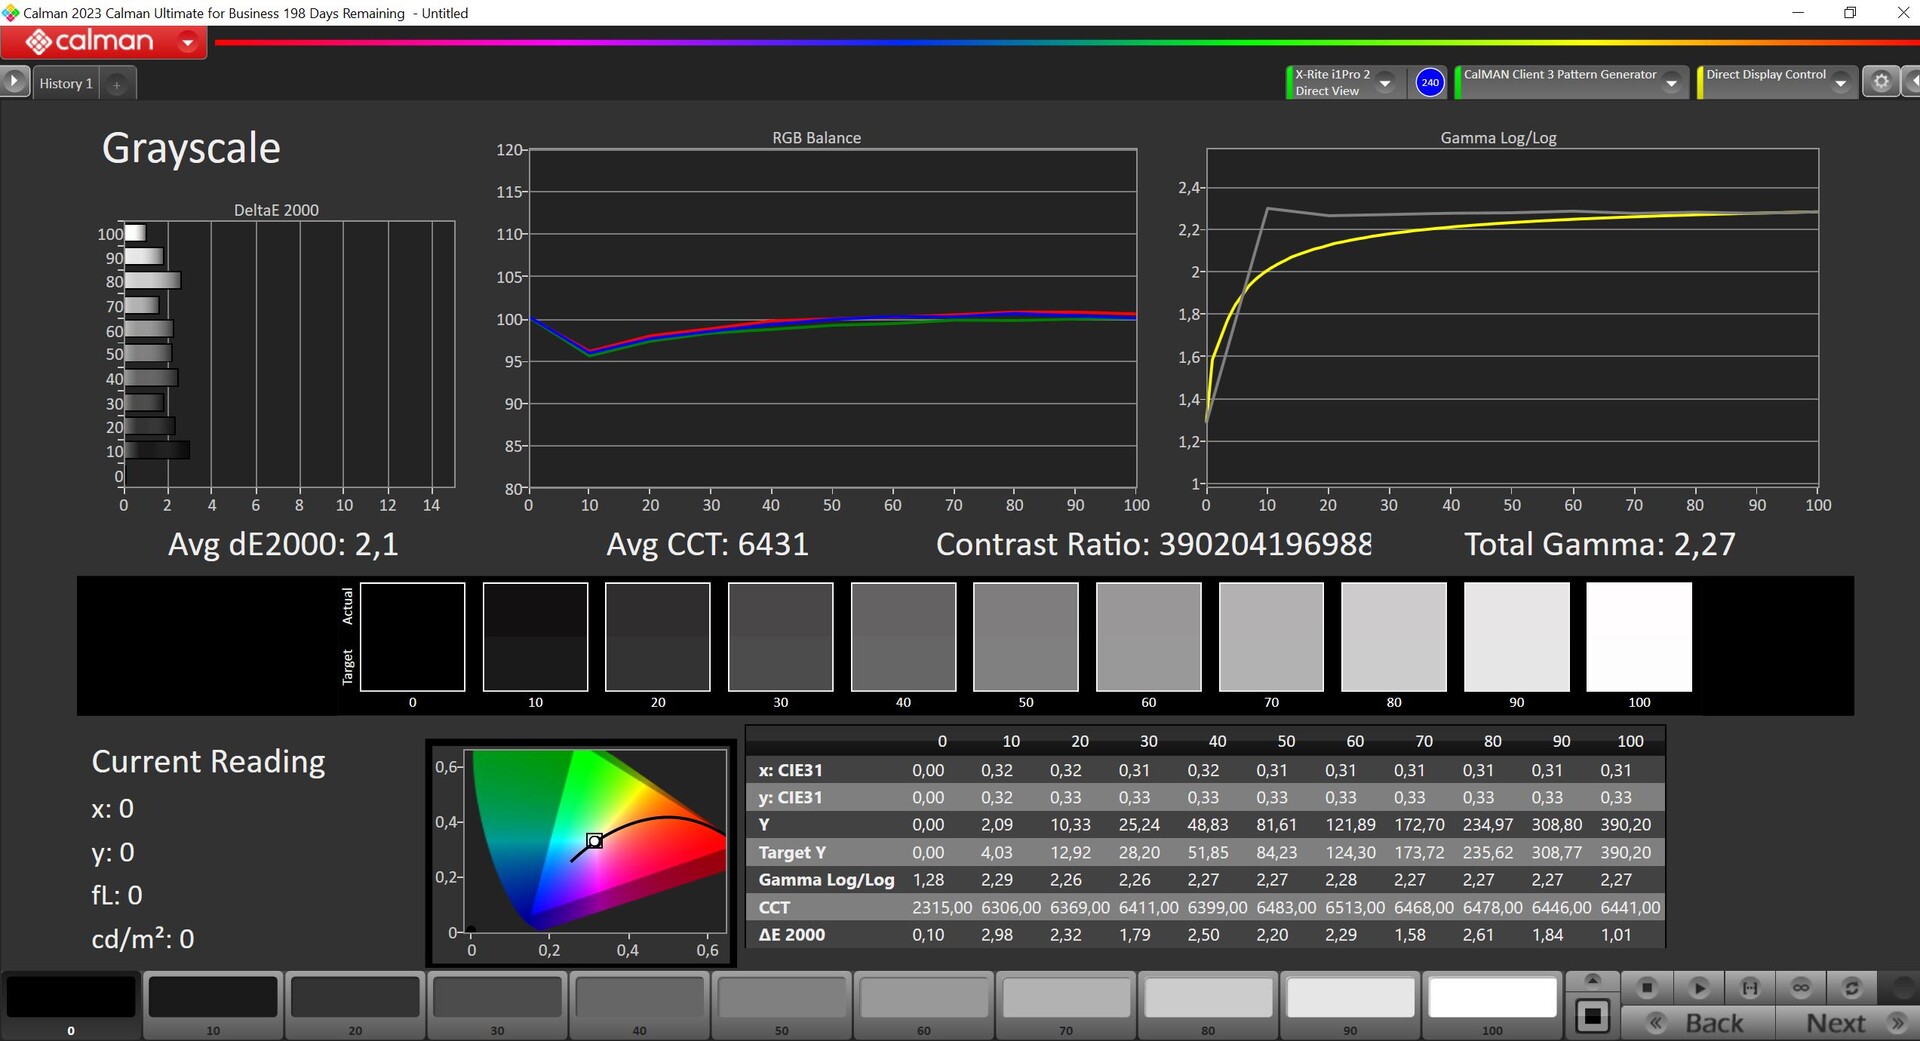
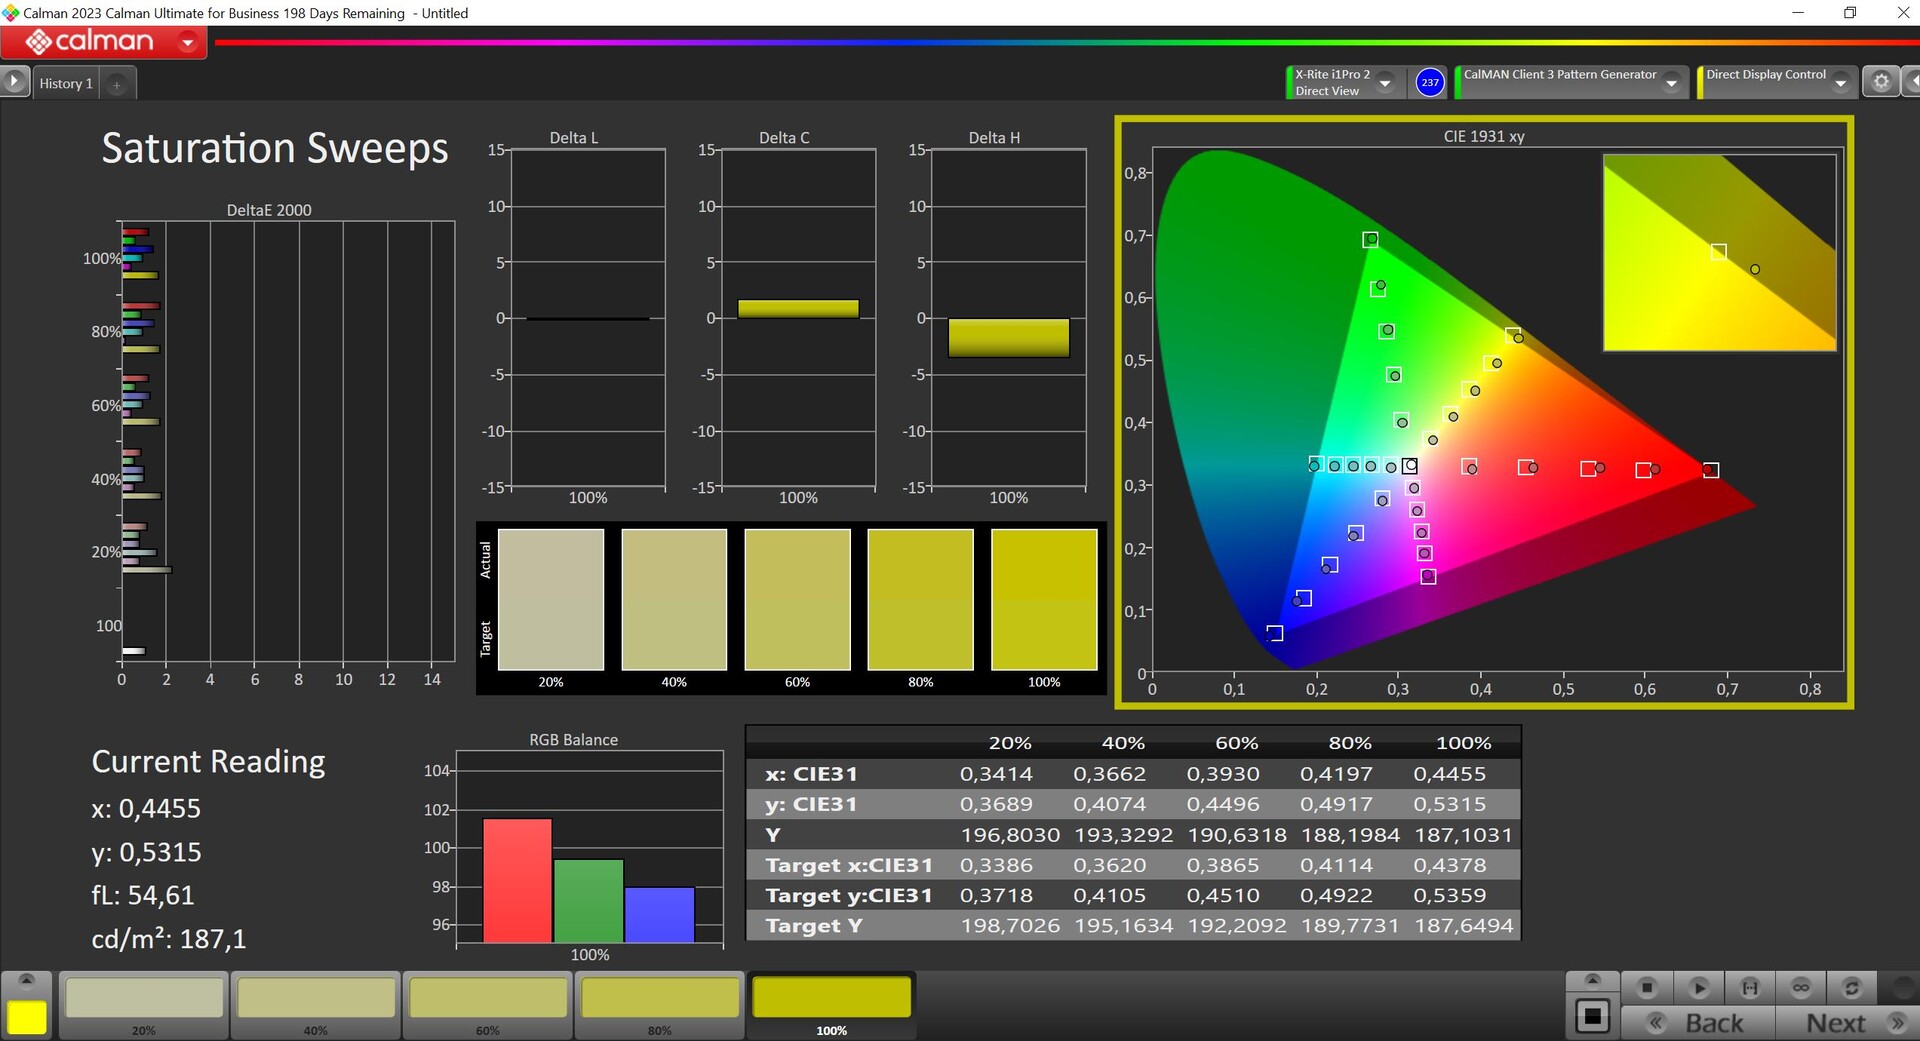
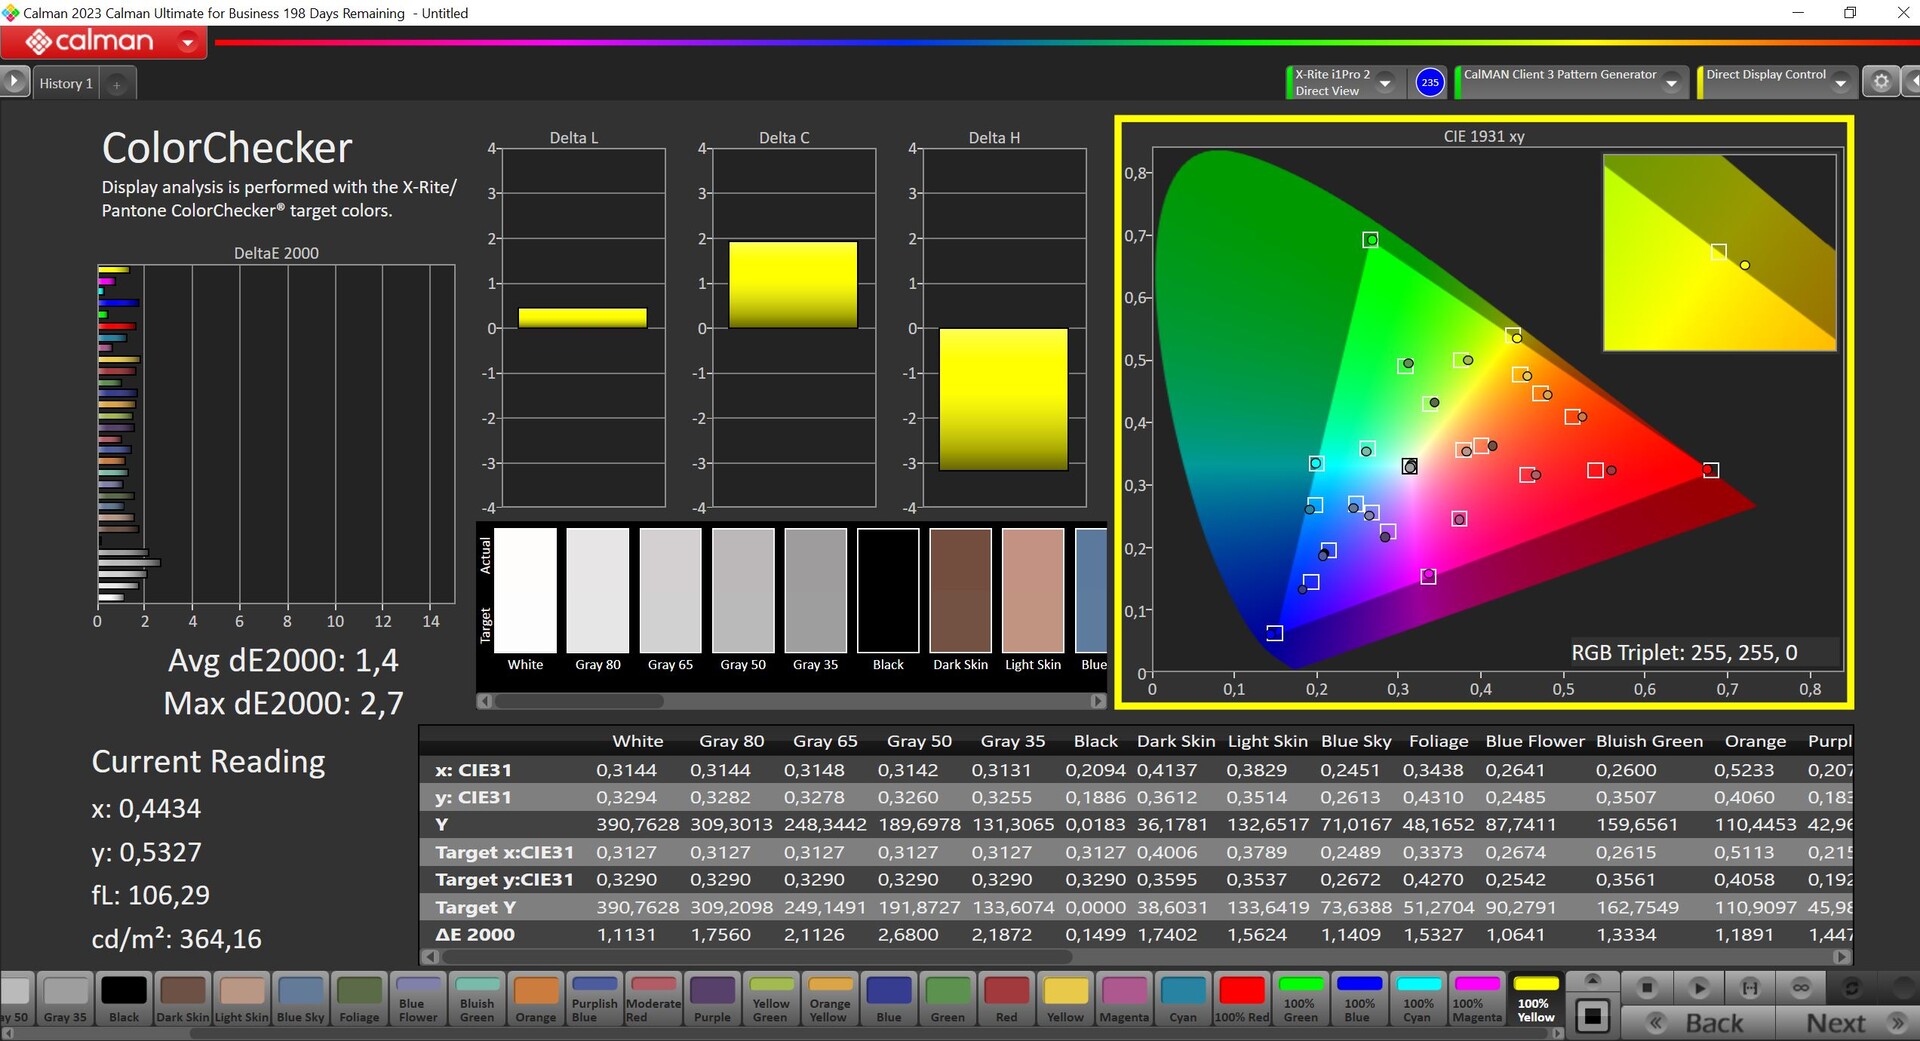
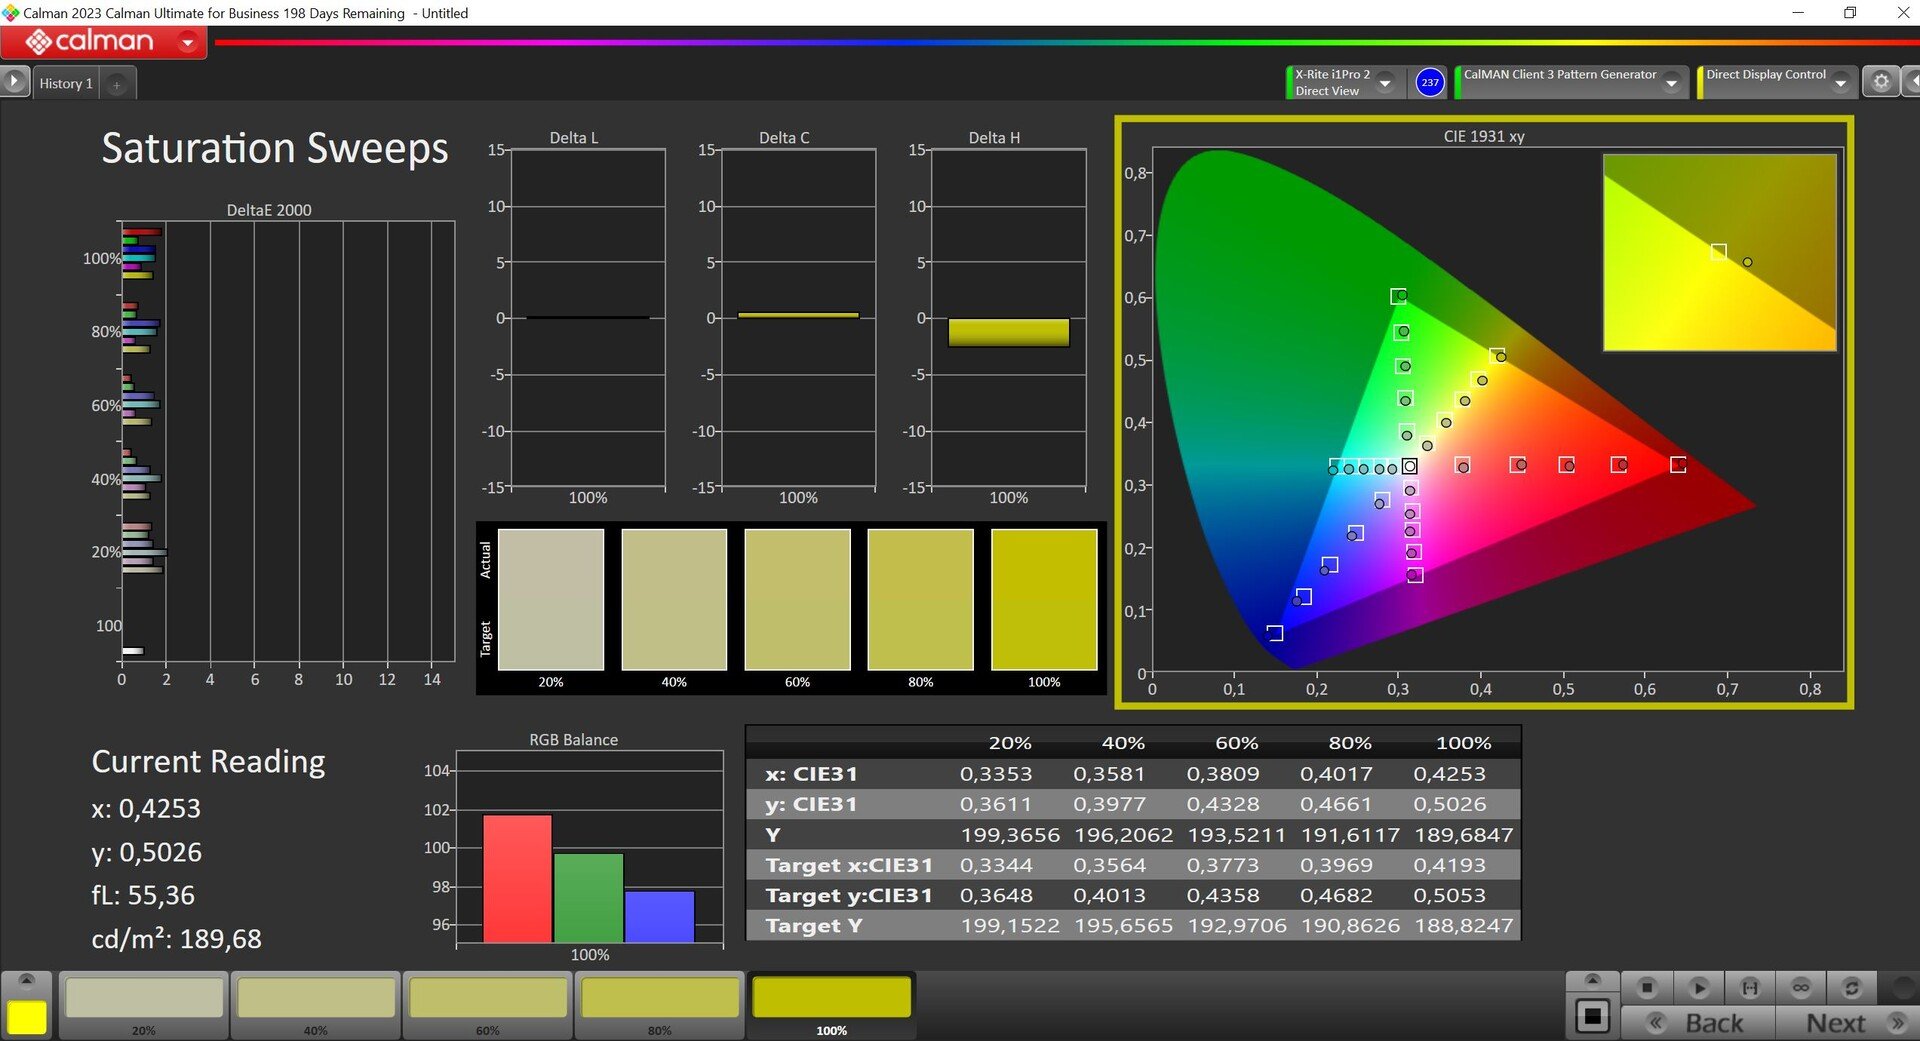
在三星的设置应用中,有多种色彩配置文件,标准的活动配置文件是 "鲜艳"。像往常一样,这里的色彩有点过度饱和,这让图像显得更加鲜艳。不过,开箱即用的 P3 模式也能提供大部分准确的色彩,我们就是使用这种模式进行测量的。通过自己的校准,我们无法进一步改善这一性能。该面板完全覆盖了 sRGB 和 P3 色彩空间,喜欢编辑图像的人会对同样精确的 sRGB 模式感到满意。

Display Response Times
| ↔ Response Time Black to White | ||
|---|---|---|
| 0.69 ms ... rise ↗ and fall ↘ combined | ↗ 0.39 ms rise | 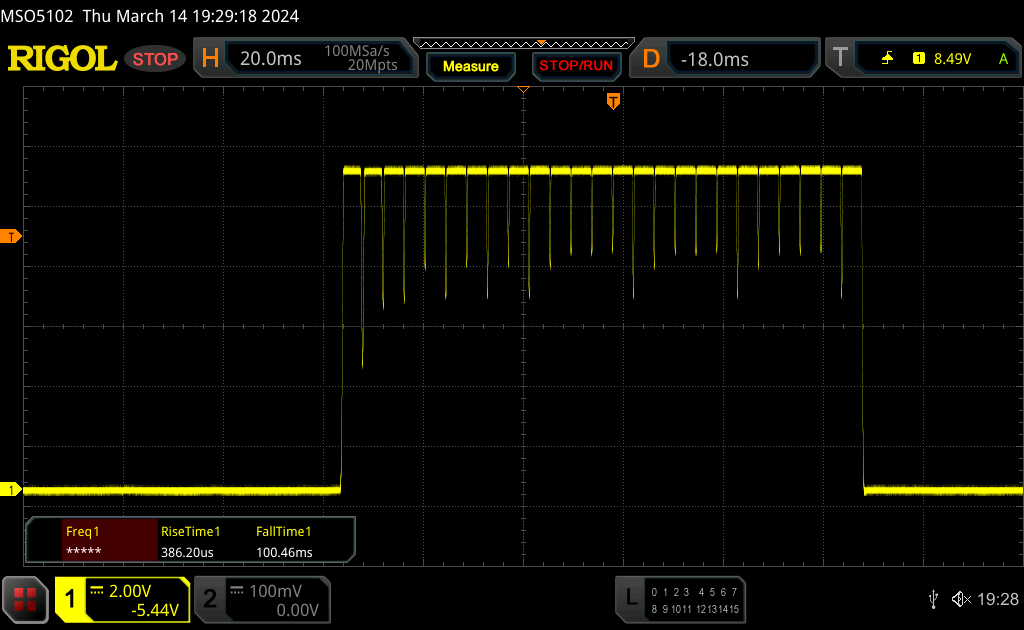 |
| ↘ 0.3 ms fall | ||
| The screen shows very fast response rates in our tests and should be very well suited for fast-paced gaming. In comparison, all tested devices range from 0.1 (minimum) to 240 (maximum) ms. » 2 % of all devices are better. This means that the measured response time is better than the average of all tested devices (19.8 ms). | ||
| ↔ Response Time 50% Grey to 80% Grey | ||
| 0.54 ms ... rise ↗ and fall ↘ combined | ↗ 0.29 ms rise | 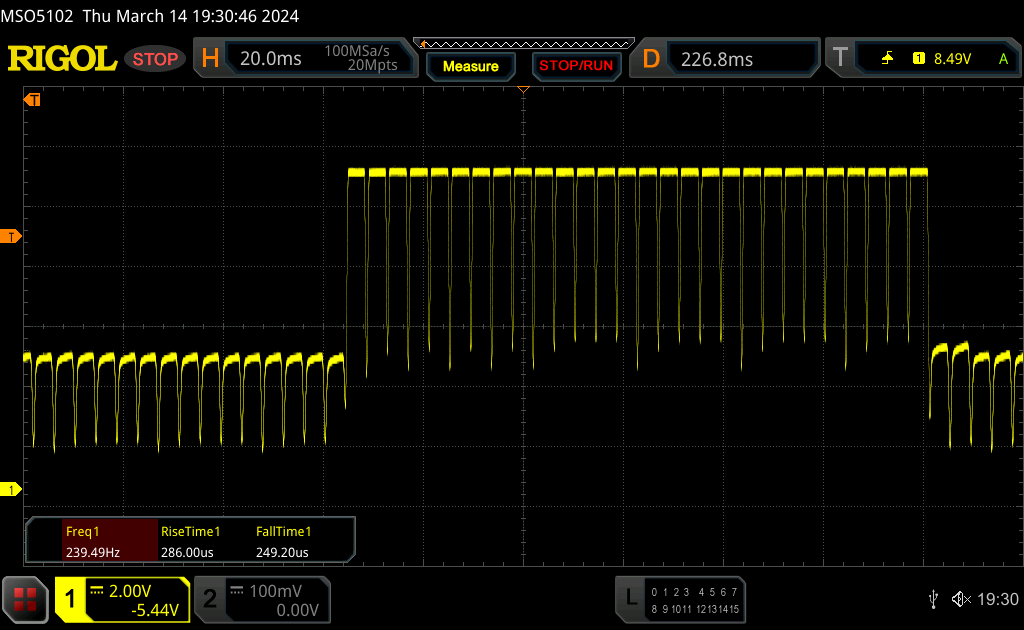 |
| ↘ 0.25 ms fall | ||
| The screen shows very fast response rates in our tests and should be very well suited for fast-paced gaming. In comparison, all tested devices range from 0.165 (minimum) to 636 (maximum) ms. » 1 % of all devices are better. This means that the measured response time is better than the average of all tested devices (31 ms). | ||
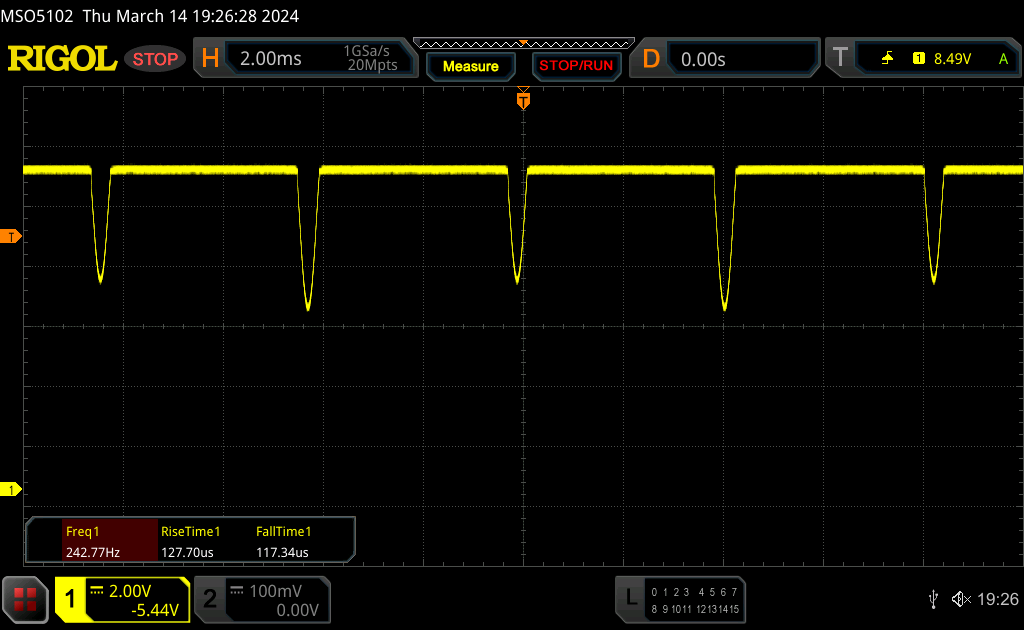
Screen Flickering / PWM (Pulse-Width Modulation)
| Screen flickering / PWM detected | 240 Hz | ≤ 100 % brightness setting | 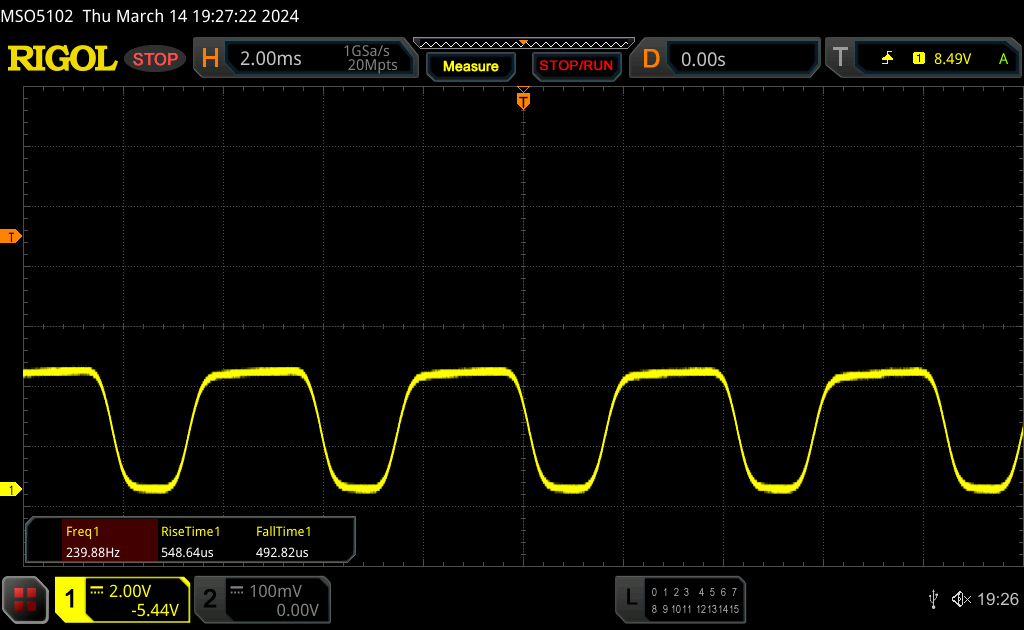 |
The display backlight flickers at 240 Hz (worst case, e.g., utilizing PWM) Flickering detected at a brightness setting of 100 % and below. There should be no flickering or PWM above this brightness setting. The frequency of 240 Hz is relatively low, so sensitive users will likely notice flickering and experience eyestrain at the stated brightness setting and below. In comparison: 52 % of all tested devices do not use PWM to dim the display. If PWM was detected, an average of 7757 (minimum: 5 - maximum: 343500) Hz was measured. | |||
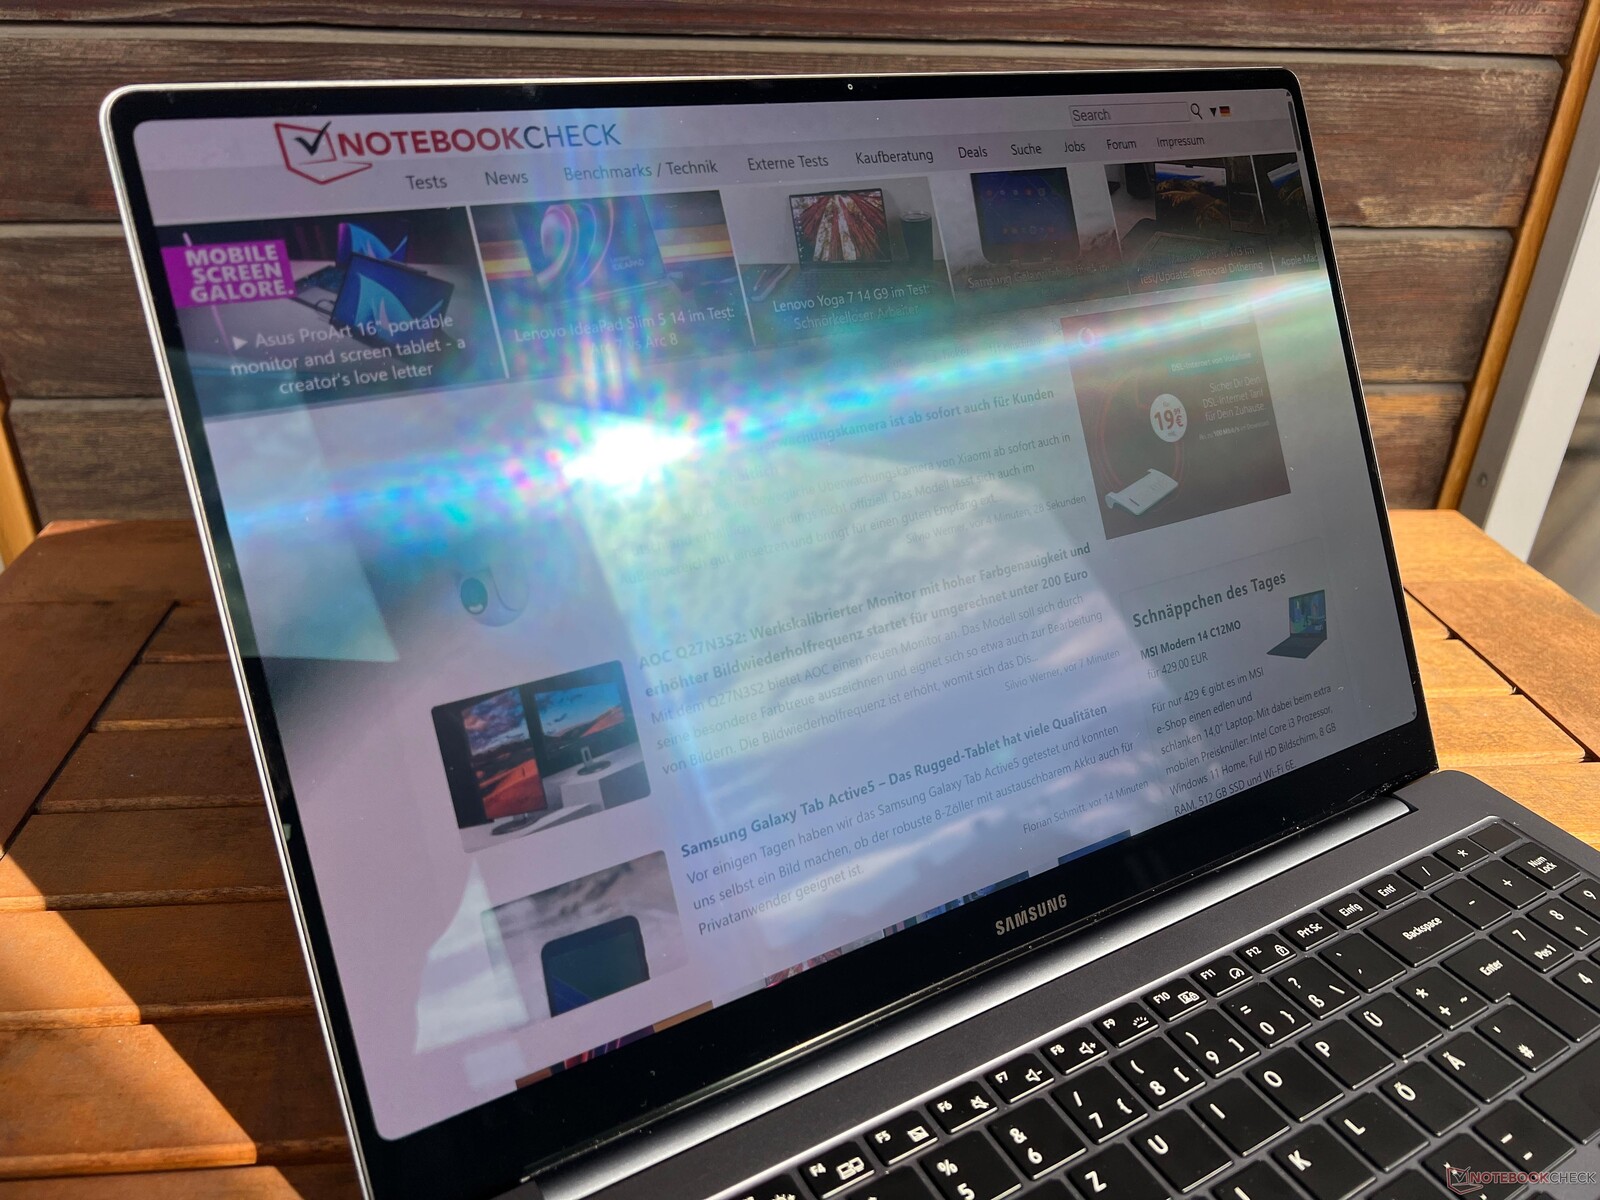
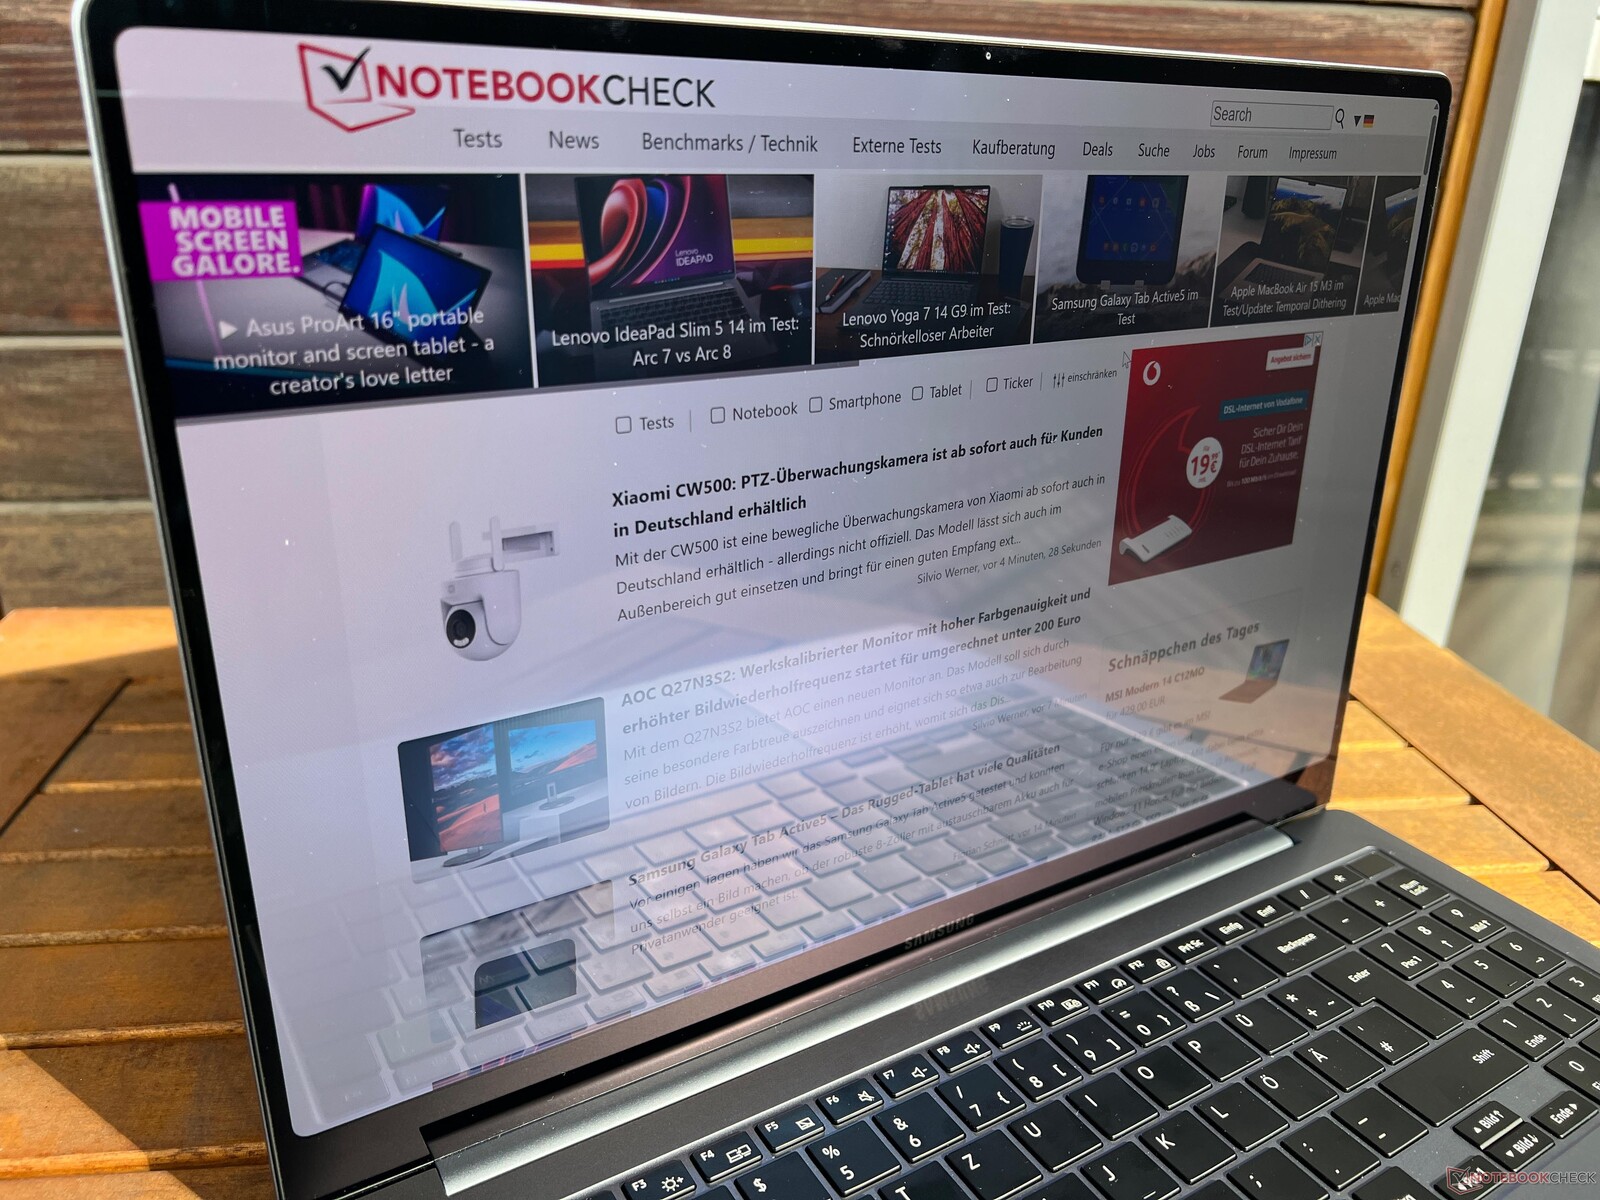
OLED 触摸屏基本上是反光的,但由于采用了康宁大猩猩玻璃 DX,其反光程度低于其他光面面板,在这方面,三星与Apple 的 MacBook 不相上下。原则上,只要避免光源的反射,你也可以在明亮的户外使用该设备。可视角度的稳定性非常好,但如果偏差较大,你会发现典型的 OLED 蓝色光泽。

性能 - 流星湖取代猛禽湖
三星用新的流星湖处理器取代了旧的英特尔猛禽湖芯片,您可以获得 酷睿至尊 7 155H或 酷睿至尊 9 185H.无论采用哪种处理器,您都将获得 16 或 32 GB 的焊接内存,在 GPU 方面,您可以选择 GeForce RTX 4050 笔记本电脑或速度更快的 RTX 4070 笔记本电脑.
测试条件
在三星设置应用中,有多种能源配置文件,但标准选择是 "优化"模式。我们也使用该模式进行了以下基准测试和测量。您还可以选择静音 模式或高性能模式。我们在下表中总结了相应的 TDP/TGP 值。
| 能源概况 | CPU TDP | R23 Multi | GPU TGP | Time Spy 图形 | 压力测试 | 赛博朋克 2077 1080p Ultra |
最大风扇强度 |
|---|---|---|---|---|---|---|---|
| 静音 | 35/25 瓦 | 11,327 点 | 55 瓦 | 1,529 点 | CPU:20 瓦 GPU:20 瓦 |
12fps | 32 dB(A) |
| 优化后 | 65/40 瓦 | 15,342 分 | 55 瓦 | 6,073 分 | CPU:25 瓦 GPU:33 瓦 |
39.4fps | 41.7 dB(A) |
| 高性能 | 80/70 瓦 | 17,088 分 | 80 瓦 | 7,849 分 | CPU:30 瓦 GPU:80 瓦 |
55.4fps | 51.3 dB(A) |
处理器
酷睿至尊 7 155H Core Ultra 7 155H的继任者 酷睿 i7-13700H的继任者,总共提供 16 个内核/22 个线程(6 倍性能,10 倍效率)。该处理器的功耗限制为 65/40 瓦,即使与老一代 Raptor Lake 处理器相比几乎没有任何差异,也能提供不错的性能。这意味着它并不值得升级。使用 Ryzen 9 Pro 7940HS,AMD 稍稍领先。普通的 M3 Pro也处于这一水平,在单核测试中占据优势。在持续负载下,多核性能下降了约 15%。在电池模式下,处理器的最大功耗为 45 瓦,因此性能下降了 7%。其他 CPU 基准测试可在 技术部分.
Cinebench R15 Multi Continuous Test
Cinebench R23: Multi Core | Single Core
Cinebench R20: CPU (Multi Core) | CPU (Single Core)
Cinebench R15: CPU Multi 64Bit | CPU Single 64Bit
Blender: v2.79 BMW27 CPU
7-Zip 18.03: 7z b 4 | 7z b 4 -mmt1
Geekbench 6.7: Multi-Core | Single-Core
Geekbench 5.5: Multi-Core | Single-Core
HWBOT x265 Benchmark v2.2: 4k Preset
LibreOffice : 20 Documents To PDF
R Benchmark 2.5: Overall mean
| CPU Performance rating | |
| Lenovo Slim Pro 9i 16IRP8 -2! | |
| Apple MacBook Pro 16 2023 M3 Pro -8! | |
| Lenovo ThinkPad Z16 Gen 2 | |
| Average of class Multimedia | |
| Samsung Galaxy Book4 Ultra | |
| Schenker VISION 16 Pro (M23) -2! | |
| HP Spectre x360 16 RTX 4050 -1! | |
| Average Intel Core Ultra 7 155H | |
| Samsung Galaxy Book3 Ultra 16 -2! | |
| Cinebench R23 / Multi Core | |
| Lenovo Slim Pro 9i 16IRP8 | |
| Lenovo ThinkPad Z16 Gen 2 | |
| Average of class Multimedia (4861 - 33362, n=76, last 2 years) | |
| Samsung Galaxy Book4 Ultra | |
| Samsung Galaxy Book3 Ultra 16 | |
| HP Spectre x360 16 RTX 4050 | |
| Apple MacBook Pro 16 2023 M3 Pro | |
| Average Intel Core Ultra 7 155H (9769 - 19007, n=52) | |
| Schenker VISION 16 Pro (M23) | |
| Cinebench R23 / Single Core | |
| Lenovo Slim Pro 9i 16IRP8 | |
| Apple MacBook Pro 16 2023 M3 Pro | |
| Average of class Multimedia (1128 - 2459, n=68, last 2 years) | |
| Schenker VISION 16 Pro (M23) | |
| Lenovo ThinkPad Z16 Gen 2 | |
| Samsung Galaxy Book4 Ultra | |
| Average Intel Core Ultra 7 155H (1496 - 1815, n=52) | |
| HP Spectre x360 16 RTX 4050 | |
| Samsung Galaxy Book3 Ultra 16 | |
| Cinebench R20 / CPU (Multi Core) | |
| Lenovo Slim Pro 9i 16IRP8 | |
| Lenovo ThinkPad Z16 Gen 2 | |
| Average of class Multimedia (1887 - 12912, n=59, last 2 years) | |
| Samsung Galaxy Book4 Ultra | |
| Samsung Galaxy Book3 Ultra 16 | |
| Average Intel Core Ultra 7 155H (3798 - 7409, n=50) | |
| Schenker VISION 16 Pro (M23) | |
| HP Spectre x360 16 RTX 4050 | |
| Cinebench R20 / CPU (Single Core) | |
| Lenovo Slim Pro 9i 16IRP8 | |
| Average of class Multimedia (425 - 853, n=59, last 2 years) | |
| Schenker VISION 16 Pro (M23) | |
| Lenovo ThinkPad Z16 Gen 2 | |
| Samsung Galaxy Book4 Ultra | |
| Average Intel Core Ultra 7 155H (601 - 696, n=50) | |
| HP Spectre x360 16 RTX 4050 | |
| Samsung Galaxy Book3 Ultra 16 | |
| Cinebench R15 / CPU Multi 64Bit | |
| Lenovo Slim Pro 9i 16IRP8 | |
| Lenovo ThinkPad Z16 Gen 2 | |
| Average of class Multimedia (856 - 5224, n=63, last 2 years) | |
| Samsung Galaxy Book4 Ultra | |
| Samsung Galaxy Book3 Ultra 16 | |
| Average Intel Core Ultra 7 155H (1932 - 2880, n=56) | |
| HP Spectre x360 16 RTX 4050 | |
| Schenker VISION 16 Pro (M23) | |
| Apple MacBook Pro 16 2023 M3 Pro | |
| Cinebench R15 / CPU Single 64Bit | |
| Lenovo Slim Pro 9i 16IRP8 | |
| Average of class Multimedia (184.8 - 326, n=61, last 2 years) | |
| Lenovo ThinkPad Z16 Gen 2 | |
| Schenker VISION 16 Pro (M23) | |
| Samsung Galaxy Book4 Ultra | |
| HP Spectre x360 16 RTX 4050 | |
| Average Intel Core Ultra 7 155H (99.6 - 268, n=52) | |
| Samsung Galaxy Book3 Ultra 16 | |
| Blender / v2.79 BMW27 CPU | |
| Apple MacBook Pro 16 2023 M3 Pro | |
| Average of class Multimedia (100 - 557, n=60, last 2 years) | |
| Average Intel Core Ultra 7 155H (175 - 381, n=47) | |
| Schenker VISION 16 Pro (M23) | |
| Samsung Galaxy Book3 Ultra 16 | |
| Samsung Galaxy Book4 Ultra | |
| Lenovo ThinkPad Z16 Gen 2 | |
| Lenovo Slim Pro 9i 16IRP8 | |
| 7-Zip 18.03 / 7z b 4 | |
| Lenovo Slim Pro 9i 16IRP8 | |
| Lenovo ThinkPad Z16 Gen 2 | |
| Samsung Galaxy Book4 Ultra | |
| Schenker VISION 16 Pro (M23) | |
| Samsung Galaxy Book3 Ultra 16 | |
| HP Spectre x360 16 RTX 4050 | |
| Average Intel Core Ultra 7 155H (41739 - 70254, n=50) | |
| Average of class Multimedia (26062 - 130368, n=57, last 2 years) | |
| 7-Zip 18.03 / 7z b 4 -mmt1 | |
| Schenker VISION 16 Pro (M23) | |
| Lenovo ThinkPad Z16 Gen 2 | |
| Lenovo Slim Pro 9i 16IRP8 | |
| Average of class Multimedia (3666 - 7545, n=58, last 2 years) | |
| Samsung Galaxy Book4 Ultra | |
| Samsung Galaxy Book3 Ultra 16 | |
| Average Intel Core Ultra 7 155H (4594 - 5621, n=50) | |
| HP Spectre x360 16 RTX 4050 | |
| Geekbench 6.7 / Multi-Core | |
| Apple MacBook Pro 16 2023 M3 Pro | |
| Average of class Multimedia (4983 - 29415, n=71, last 2 years) | |
| Lenovo ThinkPad Z16 Gen 2 | |
| Samsung Galaxy Book4 Ultra | |
| Average Intel Core Ultra 7 155H (7732 - 13656, n=55) | |
| HP Spectre x360 16 RTX 4050 | |
| Geekbench 6.7 / Single-Core | |
| Apple MacBook Pro 16 2023 M3 Pro | |
| Average of class Multimedia (1534 - 4335, n=70, last 2 years) | |
| Lenovo ThinkPad Z16 Gen 2 | |
| Samsung Galaxy Book4 Ultra | |
| Average Intel Core Ultra 7 155H (1901 - 2473, n=52) | |
| HP Spectre x360 16 RTX 4050 | |
| Geekbench 5.5 / Multi-Core | |
| Apple MacBook Pro 16 2023 M3 Pro | |
| Lenovo Slim Pro 9i 16IRP8 | |
| Average of class Multimedia (4652 - 20422, n=58, last 2 years) | |
| Samsung Galaxy Book4 Ultra | |
| HP Spectre x360 16 RTX 4050 | |
| Lenovo ThinkPad Z16 Gen 2 | |
| Average Intel Core Ultra 7 155H (10017 - 13556, n=52) | |
| Schenker VISION 16 Pro (M23) | |
| Samsung Galaxy Book3 Ultra 16 | |
| Geekbench 5.5 / Single-Core | |
| Apple MacBook Pro 16 2023 M3 Pro | |
| Average of class Multimedia (805 - 2974, n=58, last 2 years) | |
| Lenovo Slim Pro 9i 16IRP8 | |
| Lenovo ThinkPad Z16 Gen 2 | |
| Schenker VISION 16 Pro (M23) | |
| Samsung Galaxy Book4 Ultra | |
| Average Intel Core Ultra 7 155H (1462 - 1824, n=52) | |
| HP Spectre x360 16 RTX 4050 | |
| Samsung Galaxy Book3 Ultra 16 | |
| HWBOT x265 Benchmark v2.2 / 4k Preset | |
| Lenovo Slim Pro 9i 16IRP8 | |
| Lenovo ThinkPad Z16 Gen 2 | |
| Average of class Multimedia (5.26 - 36.1, n=58, last 2 years) | |
| Samsung Galaxy Book4 Ultra | |
| Samsung Galaxy Book3 Ultra 16 | |
| Schenker VISION 16 Pro (M23) | |
| Average Intel Core Ultra 7 155H (9.93 - 21.2, n=50) | |
| HP Spectre x360 16 RTX 4050 | |
| LibreOffice / 20 Documents To PDF | |
| Average of class Multimedia (23.9 - 146.7, n=59, last 2 years) | |
| Samsung Galaxy Book3 Ultra 16 | |
| Average Intel Core Ultra 7 155H (37.5 - 79.2, n=49) | |
| Schenker VISION 16 Pro (M23) | |
| Samsung Galaxy Book4 Ultra | |
| Lenovo ThinkPad Z16 Gen 2 | |
| HP Spectre x360 16 RTX 4050 | |
| Lenovo Slim Pro 9i 16IRP8 | |
| R Benchmark 2.5 / Overall mean | |
| HP Spectre x360 16 RTX 4050 | |
| Samsung Galaxy Book3 Ultra 16 | |
| Average Intel Core Ultra 7 155H (0.4457 - 0.53, n=49) | |
| Samsung Galaxy Book4 Ultra | |
| Average of class Multimedia (0.3604 - 0.947, n=58, last 2 years) | |
| Lenovo ThinkPad Z16 Gen 2 | |
| Schenker VISION 16 Pro (M23) | |
| Lenovo Slim Pro 9i 16IRP8 | |
* ... smaller is better
AIDA64: FP32 Ray-Trace | FPU Julia | CPU SHA3 | CPU Queen | FPU SinJulia | FPU Mandel | CPU AES | CPU ZLib | FP64 Ray-Trace | CPU PhotoWorxx
| Performance rating | |
| Lenovo ThinkPad Z16 Gen 2 | |
| Lenovo Slim Pro 9i 16IRP8 | |
| Average of class Multimedia | |
| Samsung Galaxy Book3 Ultra 16 | |
| HP Spectre x360 16 RTX 4050 | |
| Samsung Galaxy Book4 Ultra | |
| Average Intel Core Ultra 7 155H | |
| Schenker VISION 16 Pro (M23) | |
| AIDA64 / FP32 Ray-Trace | |
| Lenovo ThinkPad Z16 Gen 2 | |
| Lenovo Slim Pro 9i 16IRP8 | |
| Average of class Multimedia (2214 - 50388, n=55, last 2 years) | |
| Samsung Galaxy Book3 Ultra 16 | |
| HP Spectre x360 16 RTX 4050 | |
| Samsung Galaxy Book4 Ultra | |
| Schenker VISION 16 Pro (M23) | |
| Average Intel Core Ultra 7 155H (6670 - 18470, n=50) | |
| AIDA64 / FPU Julia | |
| Lenovo ThinkPad Z16 Gen 2 | |
| Lenovo Slim Pro 9i 16IRP8 | |
| Average of class Multimedia (12867 - 201874, n=56, last 2 years) | |
| HP Spectre x360 16 RTX 4050 | |
| Samsung Galaxy Book4 Ultra | |
| Schenker VISION 16 Pro (M23) | |
| Average Intel Core Ultra 7 155H (40905 - 93181, n=50) | |
| Samsung Galaxy Book3 Ultra 16 | |
| AIDA64 / CPU SHA3 | |
| Lenovo ThinkPad Z16 Gen 2 | |
| Lenovo Slim Pro 9i 16IRP8 | |
| Average of class Multimedia (626 - 8623, n=56, last 2 years) | |
| HP Spectre x360 16 RTX 4050 | |
| Samsung Galaxy Book4 Ultra | |
| Average Intel Core Ultra 7 155H (1940 - 4436, n=50) | |
| Samsung Galaxy Book3 Ultra 16 | |
| Schenker VISION 16 Pro (M23) | |
| AIDA64 / CPU Queen | |
| Lenovo ThinkPad Z16 Gen 2 | |
| Lenovo Slim Pro 9i 16IRP8 | |
| Samsung Galaxy Book3 Ultra 16 | |
| Schenker VISION 16 Pro (M23) | |
| Samsung Galaxy Book4 Ultra | |
| Average Intel Core Ultra 7 155H (64698 - 94181, n=50) | |
| HP Spectre x360 16 RTX 4050 | |
| Average of class Multimedia (13483 - 181505, n=43, last 2 years) | |
| AIDA64 / FPU SinJulia | |
| Lenovo ThinkPad Z16 Gen 2 | |
| Lenovo Slim Pro 9i 16IRP8 | |
| Samsung Galaxy Book4 Ultra | |
| HP Spectre x360 16 RTX 4050 | |
| Average Intel Core Ultra 7 155H (5639 - 10647, n=50) | |
| Samsung Galaxy Book3 Ultra 16 | |
| Schenker VISION 16 Pro (M23) | |
| Average of class Multimedia (886 - 28794, n=56, last 2 years) | |
| AIDA64 / FPU Mandel | |
| Lenovo ThinkPad Z16 Gen 2 | |
| Lenovo Slim Pro 9i 16IRP8 | |
| Average of class Multimedia (6395 - 105740, n=55, last 2 years) | |
| HP Spectre x360 16 RTX 4050 | |
| Samsung Galaxy Book4 Ultra | |
| Samsung Galaxy Book3 Ultra 16 | |
| Average Intel Core Ultra 7 155H (18236 - 47685, n=50) | |
| Schenker VISION 16 Pro (M23) | |
| AIDA64 / CPU AES | |
| Lenovo ThinkPad Z16 Gen 2 | |
| Lenovo Slim Pro 9i 16IRP8 | |
| Average Intel Core Ultra 7 155H (45713 - 152179, n=50) | |
| HP Spectre x360 16 RTX 4050 | |
| Samsung Galaxy Book4 Ultra | |
| Samsung Galaxy Book3 Ultra 16 | |
| Schenker VISION 16 Pro (M23) | |
| Average of class Multimedia (8171 - 126790, n=56, last 2 years) | |
| AIDA64 / CPU ZLib | |
| Lenovo Slim Pro 9i 16IRP8 | |
| Lenovo ThinkPad Z16 Gen 2 | |
| Samsung Galaxy Book3 Ultra 16 | |
| HP Spectre x360 16 RTX 4050 | |
| Average of class Multimedia (143.8 - 2022, n=56, last 2 years) | |
| Samsung Galaxy Book4 Ultra | |
| Average Intel Core Ultra 7 155H (557 - 1250, n=50) | |
| Schenker VISION 16 Pro (M23) | |
| AIDA64 / FP64 Ray-Trace | |
| Lenovo ThinkPad Z16 Gen 2 | |
| Lenovo Slim Pro 9i 16IRP8 | |
| Average of class Multimedia (1014 - 26875, n=56, last 2 years) | |
| Samsung Galaxy Book3 Ultra 16 | |
| HP Spectre x360 16 RTX 4050 | |
| Schenker VISION 16 Pro (M23) | |
| Samsung Galaxy Book4 Ultra | |
| Average Intel Core Ultra 7 155H (3569 - 9802, n=50) | |
| AIDA64 / CPU PhotoWorxx | |
| Lenovo Slim Pro 9i 16IRP8 | |
| Samsung Galaxy Book4 Ultra | |
| Average of class Multimedia (8187 - 88154, n=56, last 2 years) | |
| HP Spectre x360 16 RTX 4050 | |
| Samsung Galaxy Book3 Ultra 16 | |
| Average Intel Core Ultra 7 155H (32719 - 54223, n=50) | |
| Schenker VISION 16 Pro (M23) | |
| Lenovo ThinkPad Z16 Gen 2 | |
系统性能
在合成基准测试中,Galaxy Book4 Ultra 表现出色,是一款速度快、反应灵敏的电脑。在测试过程中,我们没有发现任何问题。
CrossMark: Overall | Productivity | Creativity | Responsiveness
WebXPRT 3: Overall
WebXPRT 4: Overall
Mozilla Kraken 1.1: Total
| PCMark 10 / Score | |
| Lenovo ThinkPad Z16 Gen 2 | |
| Average of class Multimedia (4325 - 10386, n=54, last 2 years) | |
| Lenovo Slim Pro 9i 16IRP8 | |
| Schenker VISION 16 Pro (M23) | |
| Samsung Galaxy Book4 Ultra | |
| Average Intel Core Ultra 7 155H, NVIDIA GeForce RTX 4050 Laptop GPU (6537 - 6973, n=5) | |
| Samsung Galaxy Book3 Ultra 16 | |
| HP Spectre x360 16 RTX 4050 | |
| PCMark 10 / Essentials | |
| Lenovo ThinkPad Z16 Gen 2 | |
| Lenovo Slim Pro 9i 16IRP8 | |
| Schenker VISION 16 Pro (M23) | |
| Samsung Galaxy Book3 Ultra 16 | |
| Average of class Multimedia (8025 - 11664, n=53, last 2 years) | |
| Samsung Galaxy Book4 Ultra | |
| HP Spectre x360 16 RTX 4050 | |
| Average Intel Core Ultra 7 155H, NVIDIA GeForce RTX 4050 Laptop GPU (9463 - 10446, n=5) | |
| PCMark 10 / Productivity | |
| Average of class Multimedia (7323 - 18233, n=53, last 2 years) | |
| Lenovo ThinkPad Z16 Gen 2 | |
| Lenovo Slim Pro 9i 16IRP8 | |
| Schenker VISION 16 Pro (M23) | |
| HP Spectre x360 16 RTX 4050 | |
| Samsung Galaxy Book4 Ultra | |
| Average Intel Core Ultra 7 155H, NVIDIA GeForce RTX 4050 Laptop GPU (8769 - 9272, n=5) | |
| Samsung Galaxy Book3 Ultra 16 | |
| PCMark 10 / Digital Content Creation | |
| Lenovo Slim Pro 9i 16IRP8 | |
| Lenovo ThinkPad Z16 Gen 2 | |
| Schenker VISION 16 Pro (M23) | |
| Average of class Multimedia (3651 - 16240, n=53, last 2 years) | |
| Samsung Galaxy Book4 Ultra | |
| Samsung Galaxy Book3 Ultra 16 | |
| Average Intel Core Ultra 7 155H, NVIDIA GeForce RTX 4050 Laptop GPU (8602 - 10622, n=5) | |
| HP Spectre x360 16 RTX 4050 | |
| CrossMark / Overall | |
| Apple MacBook Pro 16 2023 M3 Pro | |
| Schenker VISION 16 Pro (M23) | |
| Average of class Multimedia (866 - 2728, n=62, last 2 years) | |
| Lenovo Slim Pro 9i 16IRP8 | |
| Samsung Galaxy Book4 Ultra | |
| Average Intel Core Ultra 7 155H, NVIDIA GeForce RTX 4050 Laptop GPU (1552 - 1740, n=5) | |
| HP Spectre x360 16 RTX 4050 | |
| Samsung Galaxy Book3 Ultra 16 | |
| Lenovo ThinkPad Z16 Gen 2 | |
| CrossMark / Productivity | |
| Schenker VISION 16 Pro (M23) | |
| Apple MacBook Pro 16 2023 M3 Pro | |
| Average of class Multimedia (931 - 2489, n=62, last 2 years) | |
| Samsung Galaxy Book4 Ultra | |
| Lenovo Slim Pro 9i 16IRP8 | |
| Average Intel Core Ultra 7 155H, NVIDIA GeForce RTX 4050 Laptop GPU (1459 - 1659, n=5) | |
| HP Spectre x360 16 RTX 4050 | |
| Lenovo ThinkPad Z16 Gen 2 | |
| Samsung Galaxy Book3 Ultra 16 | |
| CrossMark / Creativity | |
| Apple MacBook Pro 16 2023 M3 Pro | |
| Average of class Multimedia (907 - 3465, n=62, last 2 years) | |
| Lenovo Slim Pro 9i 16IRP8 | |
| Schenker VISION 16 Pro (M23) | |
| Samsung Galaxy Book4 Ultra | |
| Average Intel Core Ultra 7 155H, NVIDIA GeForce RTX 4050 Laptop GPU (1811 - 1943, n=5) | |
| HP Spectre x360 16 RTX 4050 | |
| Lenovo ThinkPad Z16 Gen 2 | |
| Samsung Galaxy Book3 Ultra 16 | |
| CrossMark / Responsiveness | |
| Schenker VISION 16 Pro (M23) | |
| Average of class Multimedia (605 - 2024, n=62, last 2 years) | |
| Samsung Galaxy Book3 Ultra 16 | |
| Samsung Galaxy Book4 Ultra | |
| Apple MacBook Pro 16 2023 M3 Pro | |
| Lenovo Slim Pro 9i 16IRP8 | |
| Lenovo ThinkPad Z16 Gen 2 | |
| Average Intel Core Ultra 7 155H, NVIDIA GeForce RTX 4050 Laptop GPU (1167 - 1467, n=5) | |
| HP Spectre x360 16 RTX 4050 | |
| WebXPRT 3 / Overall | |
| Apple MacBook Pro 16 2023 M3 Pro | |
| Average of class Multimedia (136.4 - 596, n=65, last 2 years) | |
| Lenovo Slim Pro 9i 16IRP8 | |
| Lenovo ThinkPad Z16 Gen 2 | |
| Schenker VISION 16 Pro (M23) | |
| Samsung Galaxy Book4 Ultra | |
| HP Spectre x360 16 RTX 4050 | |
| Average Intel Core Ultra 7 155H, NVIDIA GeForce RTX 4050 Laptop GPU (262 - 285, n=5) | |
| Samsung Galaxy Book3 Ultra 16 | |
| WebXPRT 4 / Overall | |
| Average of class Multimedia (167.3 - 402, n=67, last 2 years) | |
| Lenovo Slim Pro 9i 16IRP8 | |
| Schenker VISION 16 Pro (M23) | |
| Samsung Galaxy Book4 Ultra | |
| Lenovo ThinkPad Z16 Gen 2 | |
| HP Spectre x360 16 RTX 4050 | |
| Average Intel Core Ultra 7 155H, NVIDIA GeForce RTX 4050 Laptop GPU (247 - 260, n=5) | |
| Samsung Galaxy Book3 Ultra 16 | |
| Mozilla Kraken 1.1 / Total | |
| Samsung Galaxy Book3 Ultra 16 | |
| Lenovo ThinkPad Z16 Gen 2 | |
| HP Spectre x360 16 RTX 4050 | |
| Average Intel Core Ultra 7 155H, NVIDIA GeForce RTX 4050 Laptop GPU (416 - 561, n=5) | |
| Schenker VISION 16 Pro (M23) | |
| Lenovo Slim Pro 9i 16IRP8 | |
| Average of class Multimedia (228 - 835, n=68, last 2 years) | |
| Samsung Galaxy Book4 Ultra | |
| Apple MacBook Pro 16 2023 M3 Pro | |
* ... smaller is better
| PCMark 10 Score | 6973 points | |
Help | ||
| AIDA64 / Memory Copy | |
| Samsung Galaxy Book4 Ultra | |
| HP Spectre x360 16 RTX 4050 | |
| Average Intel Core Ultra 7 155H (62397 - 96791, n=50) | |
| Average of class Multimedia (11299 - 132135, n=56, last 2 years) | |
| Lenovo Slim Pro 9i 16IRP8 | |
| Samsung Galaxy Book3 Ultra 16 | |
| Lenovo ThinkPad Z16 Gen 2 | |
| Schenker VISION 16 Pro (M23) | |
| AIDA64 / Memory Read | |
| Samsung Galaxy Book4 Ultra | |
| HP Spectre x360 16 RTX 4050 | |
| Average of class Multimedia (11624 - 174586, n=56, last 2 years) | |
| Average Intel Core Ultra 7 155H (60544 - 90647, n=50) | |
| Lenovo Slim Pro 9i 16IRP8 | |
| Schenker VISION 16 Pro (M23) | |
| Samsung Galaxy Book3 Ultra 16 | |
| Lenovo ThinkPad Z16 Gen 2 | |
| AIDA64 / Memory Write | |
| HP Spectre x360 16 RTX 4050 | |
| Lenovo ThinkPad Z16 Gen 2 | |
| Lenovo Slim Pro 9i 16IRP8 | |
| Samsung Galaxy Book3 Ultra 16 | |
| Average of class Multimedia (11755 - 134998, n=56, last 2 years) | |
| Samsung Galaxy Book4 Ultra | |
| Average Intel Core Ultra 7 155H (58692 - 93451, n=50) | |
| Schenker VISION 16 Pro (M23) | |
| AIDA64 / Memory Latency | |
| Average Intel Core Ultra 7 155H (116.2 - 233, n=50) | |
| Samsung Galaxy Book4 Ultra | |
| HP Spectre x360 16 RTX 4050 | |
| Average of class Multimedia (7 - 535, n=55, last 2 years) | |
| Lenovo ThinkPad Z16 Gen 2 | |
| Lenovo Slim Pro 9i 16IRP8 | |
| Samsung Galaxy Book3 Ultra 16 | |
| Schenker VISION 16 Pro (M23) | |
* ... smaller is better
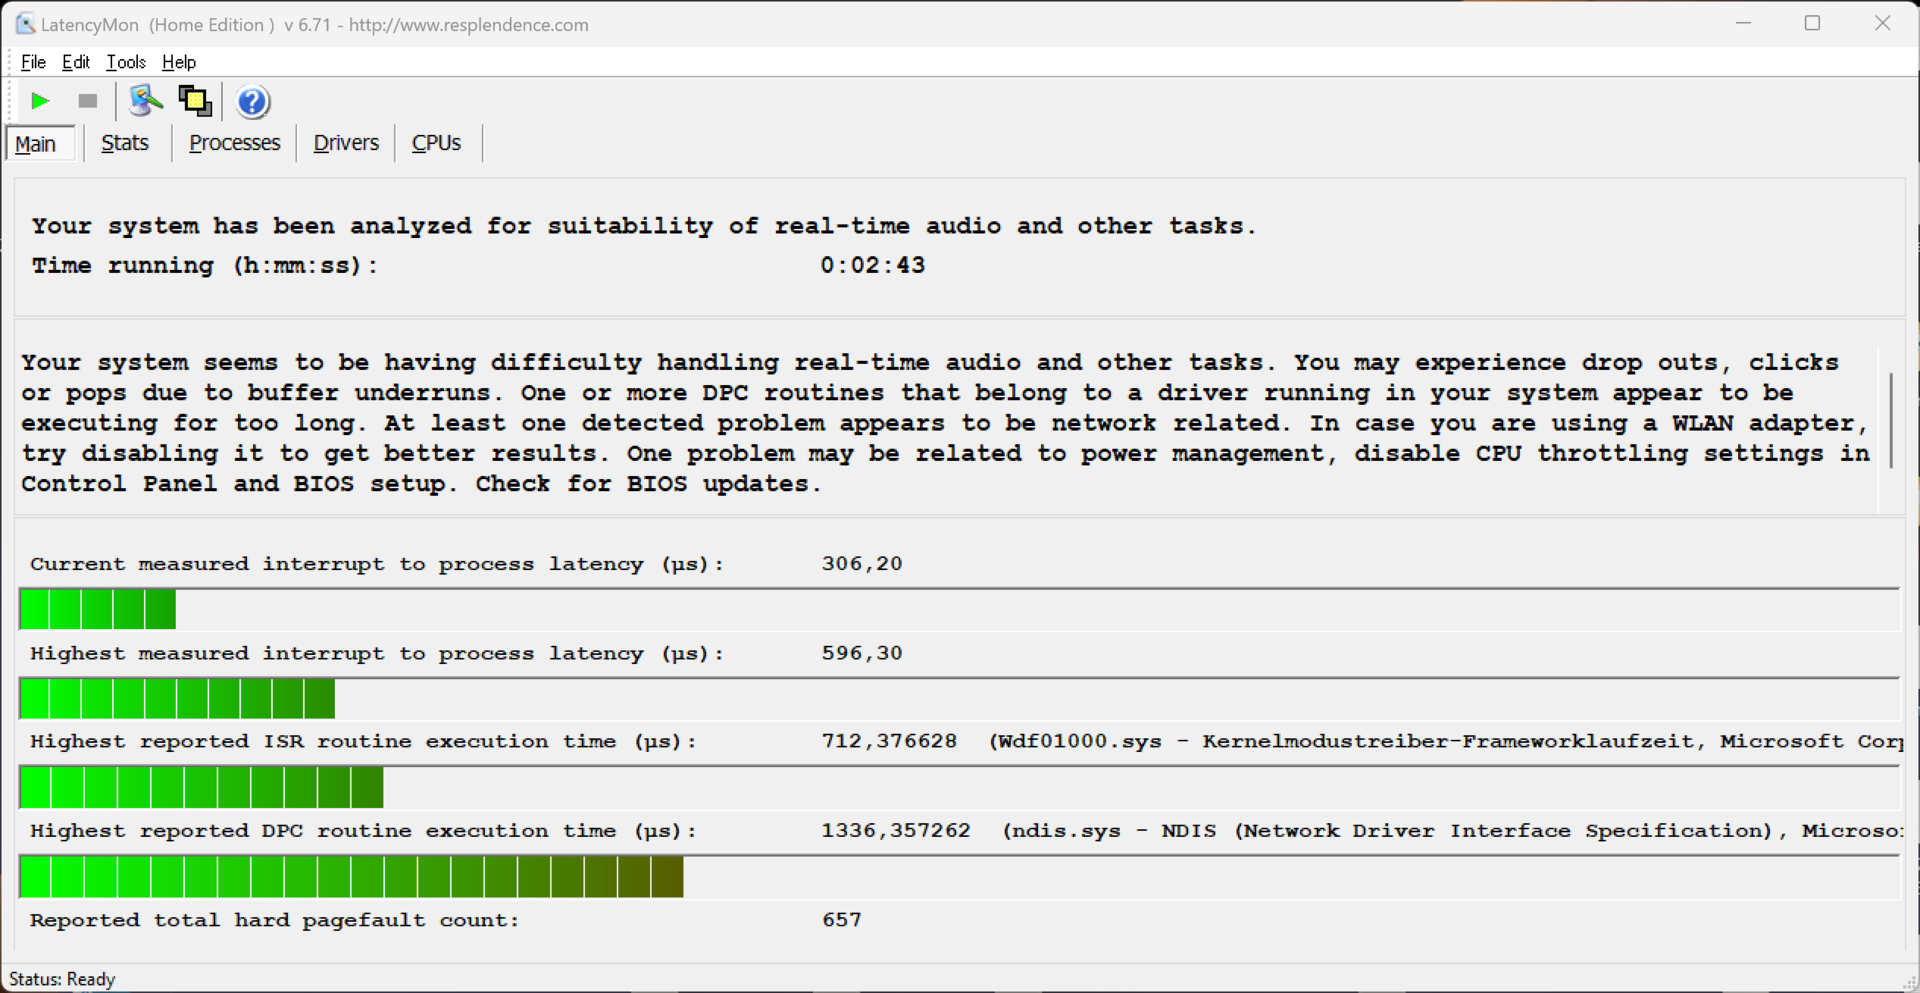
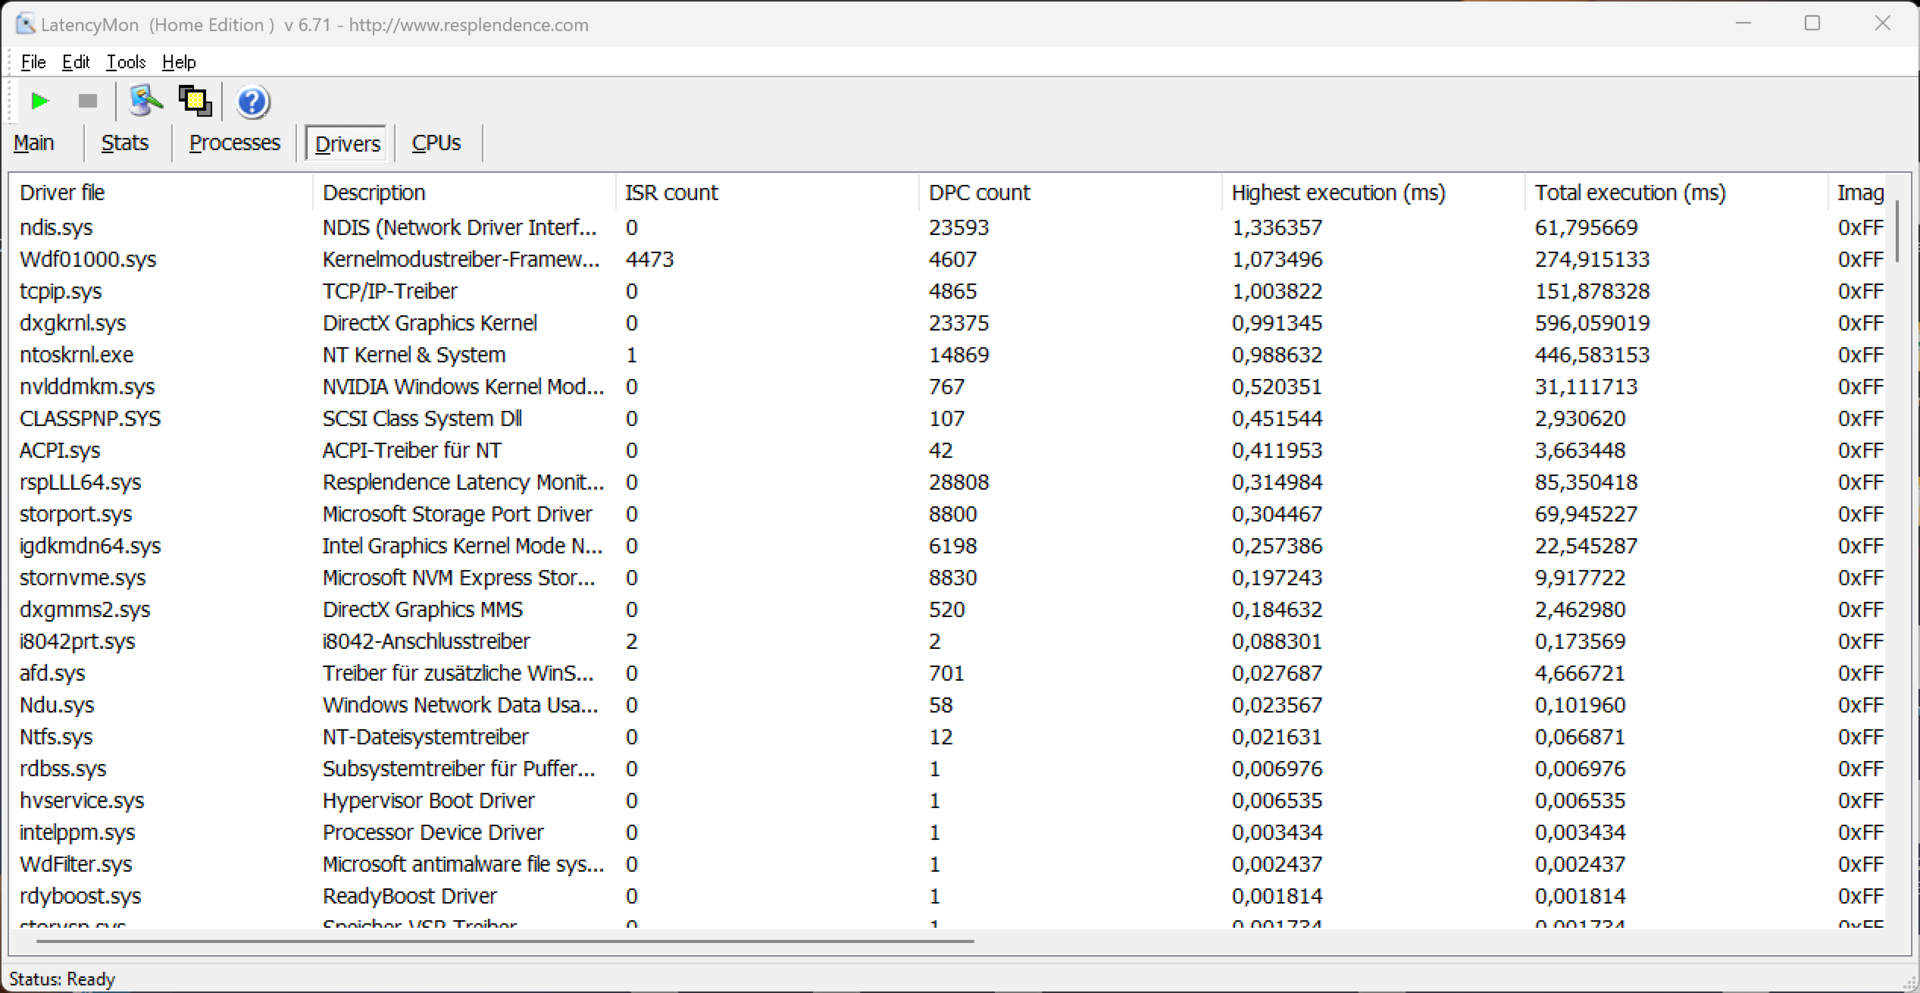
DPC 延迟
在我们的标准化延迟测试(上网、4K YouTube 播放、CPU 负载)中,评测设备及其当前的 BIOS 版本表现非常出色。一个驱动程序确实出现了峰值,但重要的 "中断到处理延迟 "值非常低。
| DPC Latencies / LatencyMon - interrupt to process latency (max), Web, Youtube, Prime95 | |
| HP Spectre x360 16 RTX 4050 | |
| Samsung Galaxy Book3 Ultra 16 | |
| Lenovo Slim Pro 9i 16IRP8 | |
| Lenovo ThinkPad Z16 Gen 2 | |
| Schenker VISION 16 Pro (M23) | |
| Samsung Galaxy Book4 Ultra | |
* ... smaller is better
大容量存储器
不出所料,三星安装了自己的一款固态硬盘(PM9A1),但容量只有 512 GB。首次安装后,用户只能使用 403 GB。至少,由于有了第二个 M.2 2280 插槽,存储容量可以轻松、经济地扩展。固态硬盘的性能无可挑剔,即使在长时间负载的情况下,性能也不会下降。其他固态硬盘基准测试 在此列出.

* ... smaller is better
Continuous Performance Read : DiskSpd Read Loop, Queue Depth 8
图形卡
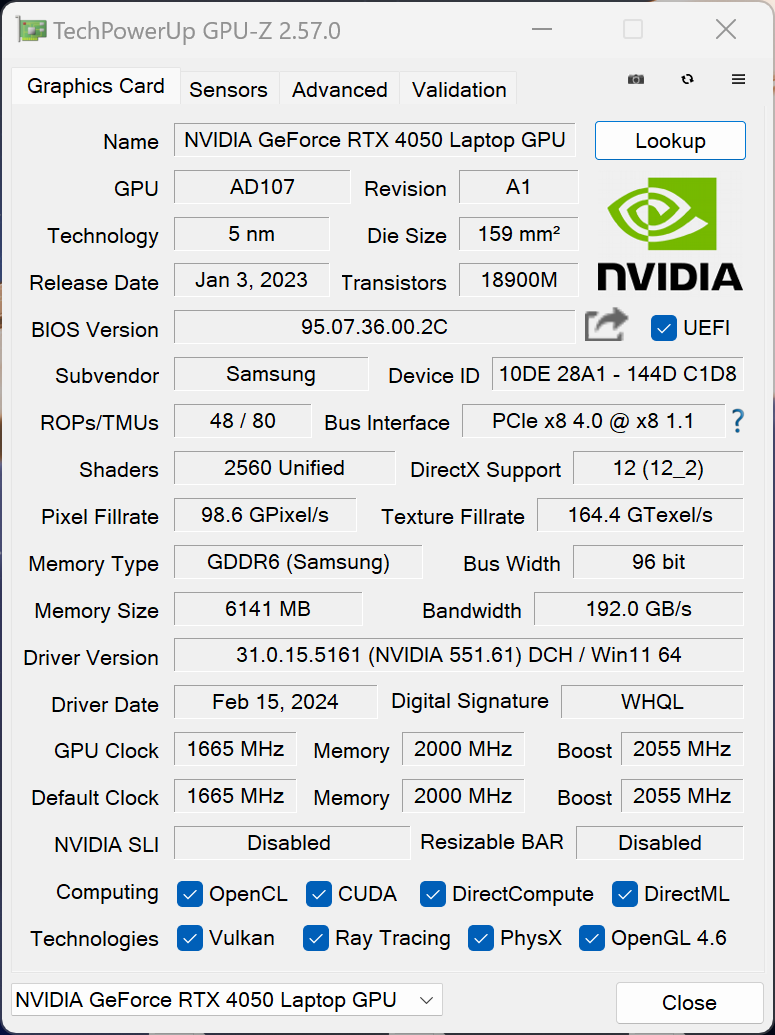
在日常情况下,集成的 Arc GPU 负责图形计算,而在要求较高的应用中,Nvidia GPU 会自动开启。使用普通 Optimus 图形切换器,但不提供 MUX 切换器或高级 Optimus。笔记本电脑 RTX 4050 笔记本电脑Galaxy Book4 Ultra 内安装的 RTX 4050 笔记本电脑在高性能模式下的最大功耗为 80 瓦,在优化模式下为 55 瓦。
基准测试结果与旧款 Galaxy Book3 Ultra同样使用 RTX 4050 笔记本电脑,功耗为 55 瓦。这比 Radeon RX 6550M但 M3 Pro GPU 有时更快。对于多媒体笔记本电脑来说,RTX 4050 笔记本电脑仍然是一个不错的选择。不过,Galaxy Book4 Ultra 未能通过 3DMark 压力测试 (Time Spy) ,在持续负载下性能下降了 7%。
在电池模式下,Nvidia GPU 的最大功耗为 35 瓦,因此 GPU 性能降低了约 13%。 其他 GPU 基准测试 这里.
| 3DMark 11 Performance | 21479 points | |
| 3DMark Fire Strike Score | 14587 points | |
| 3DMark Time Spy Score | 6449 points | |
Help | ||
| Blender / v3.3 Classroom OPTIX/RTX | |
| Average of class Multimedia (12 - 105, n=23, last 2 years) | |
| Samsung Galaxy Book3 Ultra 16 | |
| Samsung Galaxy Book4 Ultra | |
| HP Spectre x360 16 RTX 4050 | |
| Average NVIDIA GeForce RTX 4050 Laptop GPU (25 - 37, n=40) | |
| Lenovo Slim Pro 9i 16IRP8 | |
| Schenker VISION 16 Pro (M23) | |
| Blender / v3.3 Classroom CUDA | |
| Samsung Galaxy Book3 Ultra 16 | |
| Average of class Multimedia (20 - 186, n=23, last 2 years) | |
| Samsung Galaxy Book4 Ultra | |
| HP Spectre x360 16 RTX 4050 | |
| Average NVIDIA GeForce RTX 4050 Laptop GPU (47 - 68, n=39) | |
| Lenovo Slim Pro 9i 16IRP8 | |
| Schenker VISION 16 Pro (M23) | |
| Blender / v3.3 Classroom METAL | |
| Apple MacBook Pro 16 2023 M3 Pro | |
| Average of class Multimedia (17.8 - 68, n=5, last 2 years) | |
| Blender / v3.3 Classroom CPU | |
| Average of class Multimedia (134.5 - 1042, n=63, last 2 years) | |
| HP Spectre x360 16 RTX 4050 | |
| Average NVIDIA GeForce RTX 4050 Laptop GPU (243 - 907, n=40) | |
| Schenker VISION 16 Pro (M23) | |
| Samsung Galaxy Book3 Ultra 16 | |
| Samsung Galaxy Book4 Ultra | |
| Apple MacBook Pro 16 2023 M3 Pro | |
| Lenovo Slim Pro 9i 16IRP8 | |
| Lenovo ThinkPad Z16 Gen 2 | |
* ... smaller is better
游戏性能
在Galaxy Book4 Ultra 的 OLED 显示屏上,游戏看起来非常棒,由于响应时间极短,即使是快节奏的射击游戏也能让人乐在其中。相比之下,在游戏性能方面,RTX 4050 笔记本不得不接受妥协,目前的游戏几乎无法以设备的原生分辨率运行。最理想的分辨率是全高清分辨率,一般来说,你希望以最高的细节来玩游戏。对于要求非常苛刻的游戏或光线追踪,就无法避免使用 DLSS 等升频技术。
| The Witcher 3 - 1920x1080 Ultra Graphics & Postprocessing (HBAO+) | |
| Schenker VISION 16 Pro (M23) | |
| Lenovo Slim Pro 9i 16IRP8 | |
| HP Spectre x360 16 RTX 4050 | |
| Samsung Galaxy Book3 Ultra 16 | |
| Average of class Multimedia (11 - 121, n=10, last 2 years) | |
| Samsung Galaxy Book4 Ultra | |
| Lenovo ThinkPad Z16 Gen 2 | |
| GTA V - 1920x1080 Highest AA:4xMSAA + FX AF:16x | |
| Lenovo Slim Pro 9i 16IRP8 | |
| Schenker VISION 16 Pro (M23) | |
| HP Spectre x360 16 RTX 4050 | |
| Samsung Galaxy Book4 Ultra | |
| Samsung Galaxy Book3 Ultra 16 | |
| Average of class Multimedia (7.92 - 141.6, n=58, last 2 years) | |
| Final Fantasy XV Benchmark - 1920x1080 High Quality | |
| Schenker VISION 16 Pro (M23) | |
| Lenovo Slim Pro 9i 16IRP8 | |
| HP Spectre x360 16 RTX 4050 | |
| Samsung Galaxy Book3 Ultra 16 | |
| Samsung Galaxy Book4 Ultra | |
| Average of class Multimedia (7.61 - 144.4, n=60, last 2 years) | |
| Lenovo ThinkPad Z16 Gen 2 | |
| F1 23 - 1920x1080 Ultra High Preset AA:T AF:16x | |
| Average NVIDIA GeForce RTX 4050 Laptop GPU (25.7 - 60.8, n=14) | |
| Average of class Multimedia (11 - 70.3, n=4, last 2 years) | |
| Samsung Galaxy Book4 Ultra | |
Witcher 3 FPS diagram
| low | med. | high | ultra | QHD | |
|---|---|---|---|---|---|
| GTA V (2015) | 142.8 | 67.6 | 48.1 | ||
| The Witcher 3 (2015) | 121 | 54.5 | 46 | ||
| Dota 2 Reborn (2015) | 162.2 | 147.6 | 141.3 | 126.8 | |
| Final Fantasy XV Benchmark (2018) | 130.2 | 77.8 | 56.7 | 40.7 | |
| X-Plane 11.11 (2018) | 122.4 | 104.2 | 81.5 | ||
| Far Cry 5 (2018) | 132 | 93 | 88 | 80 | 58 |
| Strange Brigade (2018) | 321 | 158 | 127 | 113 | 77 |
| F1 23 (2023) | 145.5 | 137 | 93.7 | 25.7 | 16.7 |
| Cyberpunk 2077 (2023) | 74.2 | 54.3 | 45.7 | 39.4 | 23.3 |
排放 - 每款车型均配备蒸发室
噪音排放
三星在Galaxy Book4 Ultra 的两款机型上都安装了带有两个风扇的蒸汽腔冷却系统,总体而言,它给人留下了非常深刻的印象。在执行简单任务时,风扇通常会完全关闭,在短时间内达到负载峰值时风扇也不会启动。在负载情况下,噪音会明显增大,但笔记本电脑的最大噪音为 41.7 dB(A),即使不戴耳机也能忍受。相反,在高性能模式下达到 51 分贝(A)时,声音就会大得多。 评测设备中没有其他电子噪音
| 能耗曲线 | 3DMark 06 | Witcher 3 | 赛博朋克 2077 | 压力测试 |
|---|---|---|---|---|
| 静音 | 36.2 dB(A) | 36.2 dB(A) | 36.2 dB(A) | 32 dB(A) |
| 优化型 | 37.9 dB(A) | 41.7 dB(A) | 41.7 dB(A) | 41.7 dB(A) |
| 高性能 | 41.7 dB(A) | 50.5 dB(A) | 51.3 dB(A) | 51.3 dB(A) |
Noise level
| Idle |
| 24.2 / 24.2 / 24.2 dB(A) |
| Load |
| 37.9 / 41.7 dB(A) |
 | ||
30 dB silent 40 dB(A) audible 50 dB(A) loud |
||
min: | ||
| Samsung Galaxy Book4 Ultra GeForce RTX 4050 Laptop GPU, Ultra 7 155H, Samsung PM9A1 MZVL2512HCJQ | Lenovo ThinkPad Z16 Gen 2 Radeon RX 6550M, R9 PRO 7940HS, Kioxia XG8 KXG8AZNV1T02 | Apple MacBook Pro 16 2023 M3 Pro M3 Pro 18-Core GPU, Apple M3 Pro 12-Core, Apple SSD AP0512Z | Lenovo Slim Pro 9i 16IRP8 GeForce RTX 4050 Laptop GPU, i9-13905H, Samsung PM9A1 MZVL21T0HCLR | HP Spectre x360 16 RTX 4050 GeForce RTX 4050 Laptop GPU, Ultra 7 155H, SK hynix PC801 HFS001TEJ9X101N | Schenker VISION 16 Pro (M23) GeForce RTX 4070 Laptop GPU, i7-13700H, Samsung 990 Pro 1 TB | Samsung Galaxy Book3 Ultra 16 GeForce RTX 4050 Laptop GPU, i7-13700H, Samsung PM9A1 MZVL2512HCJQ | |
|---|---|---|---|---|---|---|---|
| Noise | -8% | 6% | -3% | 11% | -19% | -5% | |
| off / environment * (dB) | 24.2 | 22.6 7% | 24.4 -1% | 22.7 6% | 23.3 4% | 25.9 -7% | 25 -3% |
| Idle Minimum * (dB) | 24.2 | 22.9 5% | 24.4 -1% | 22.7 6% | 23.6 2% | 25.9 -7% | 26 -7% |
| Idle Average * (dB) | 24.2 | 29.4 -21% | 24.4 -1% | 22.7 6% | 23.6 2% | 25.9 -7% | 27 -12% |
| Idle Maximum * (dB) | 24.2 | 29.4 -21% | 24.4 -1% | 27.5 -14% | 23.6 2% | 32 -32% | 28 -16% |
| Load Average * (dB) | 37.9 | 29.5 22% | 26.9 29% | 28.9 24% | 29.2 23% | 47.2 -25% | 40 -6% |
| Witcher 3 ultra * (dB) | 41.7 | 52 -25% | 25.1 40% | 52.6 -26% | 32.1 23% | 53.1 -27% | 39 6% |
| Load Maximum * (dB) | 41.7 | 52 -25% | 50.4 -21% | 52.5 -26% | 32.1 23% | 53.1 -27% | 41 2% |
* ... smaller is better
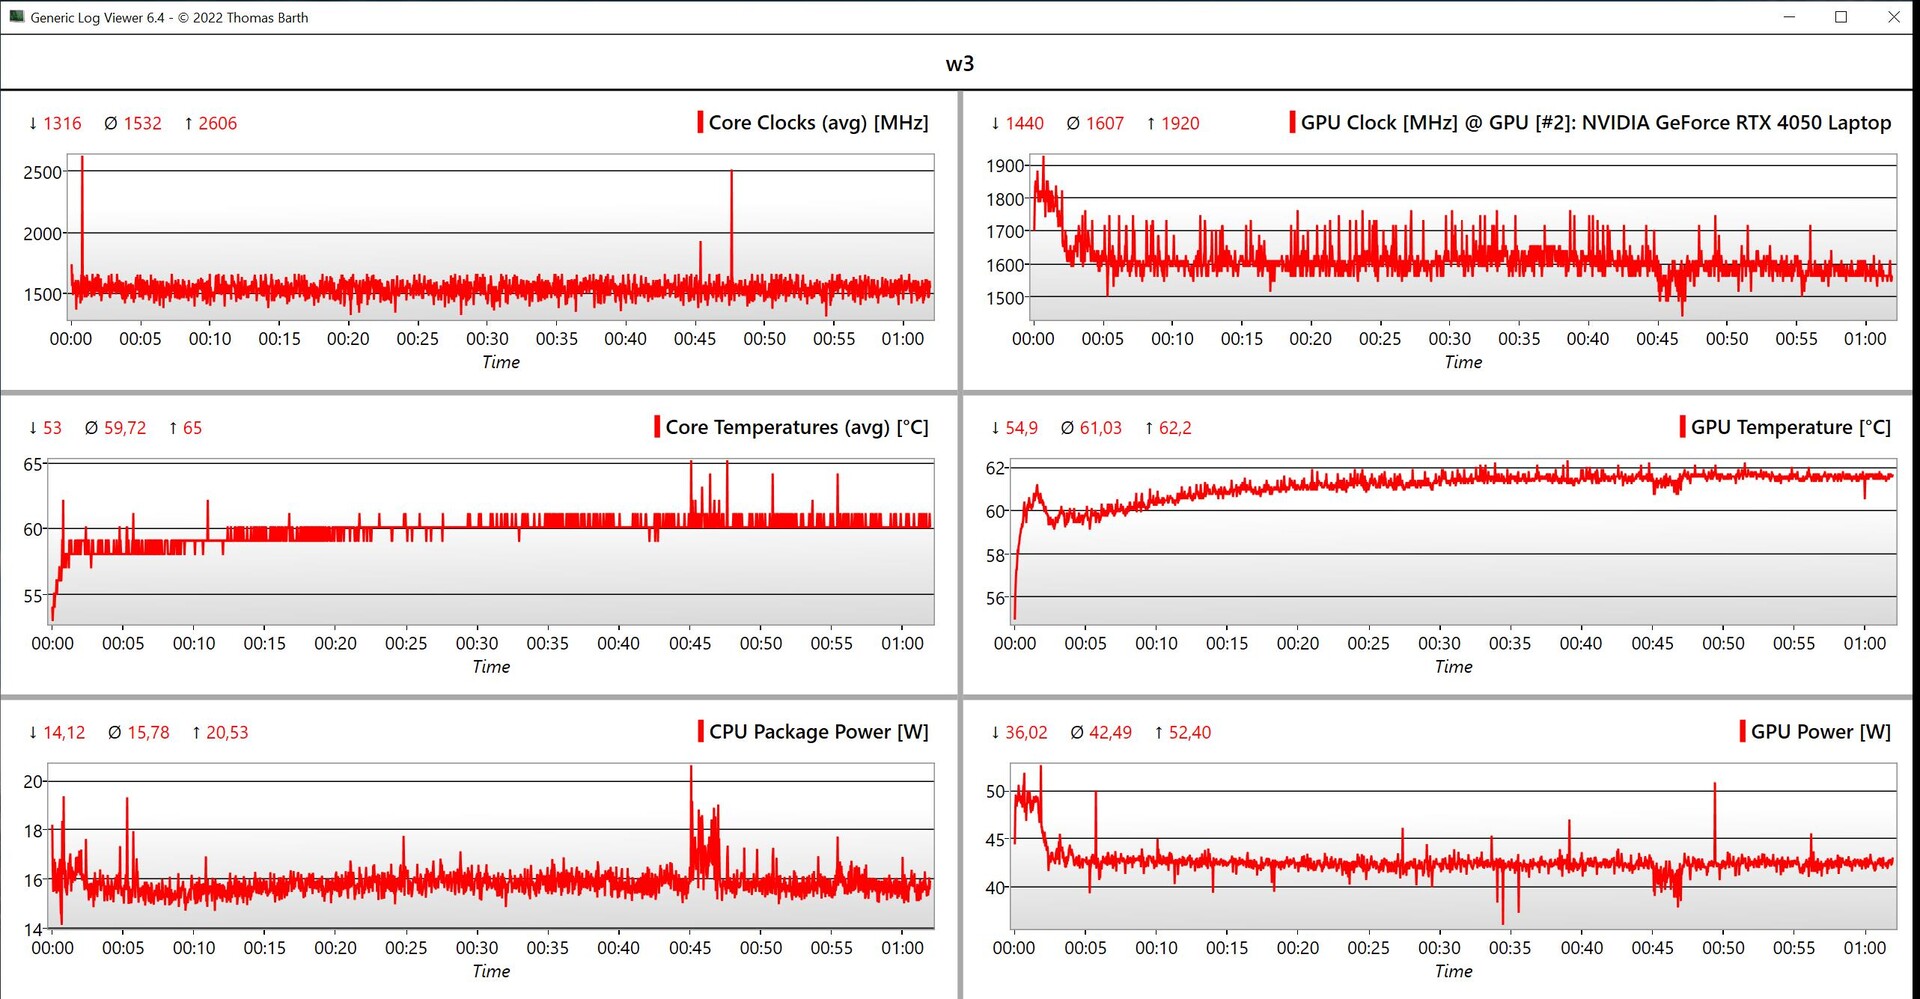
温度
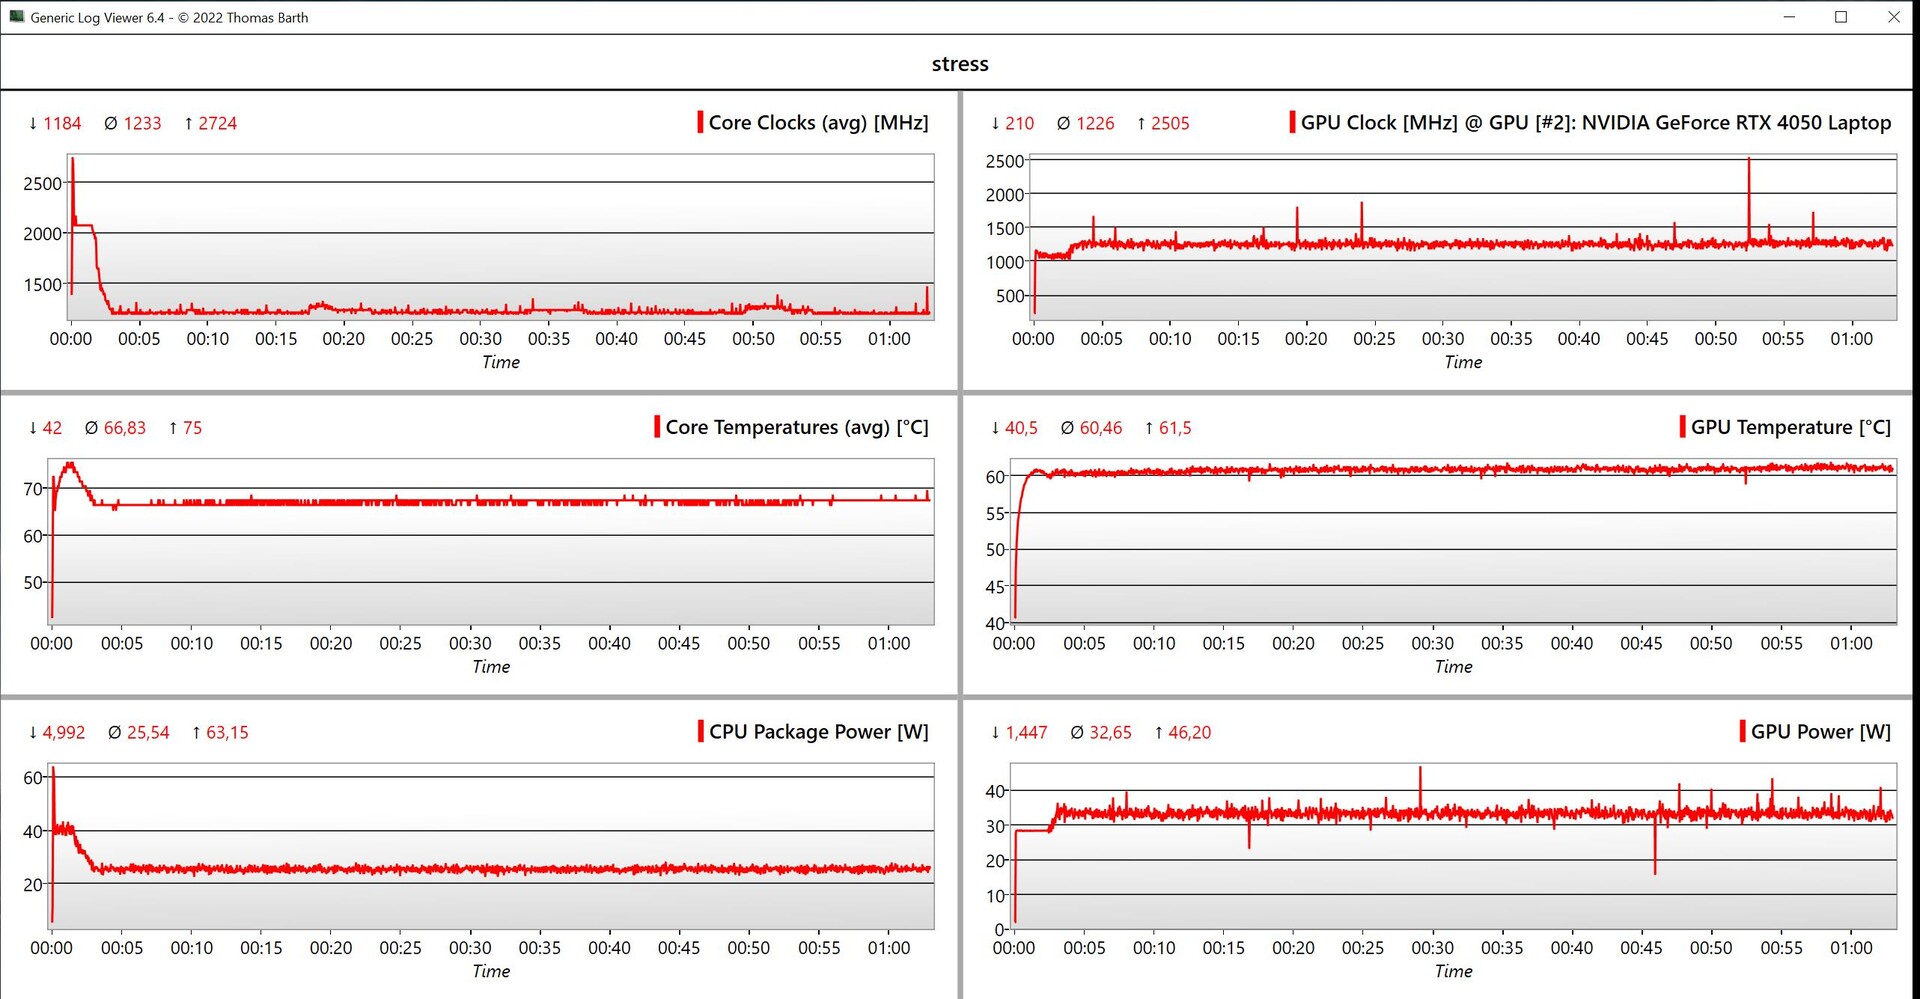
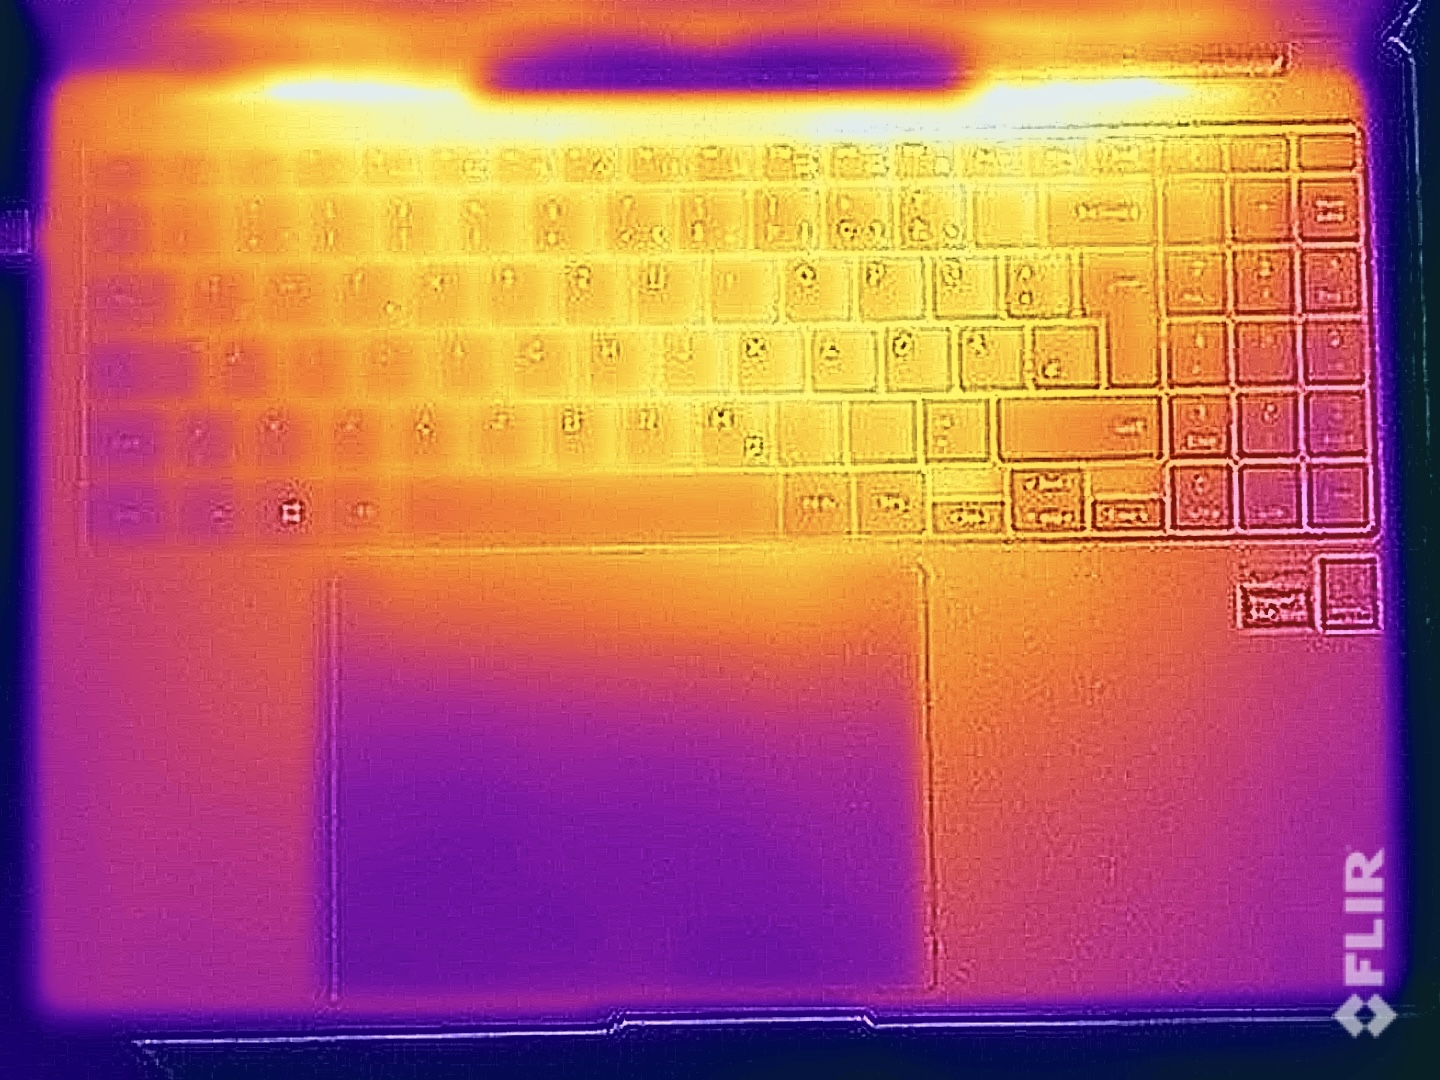
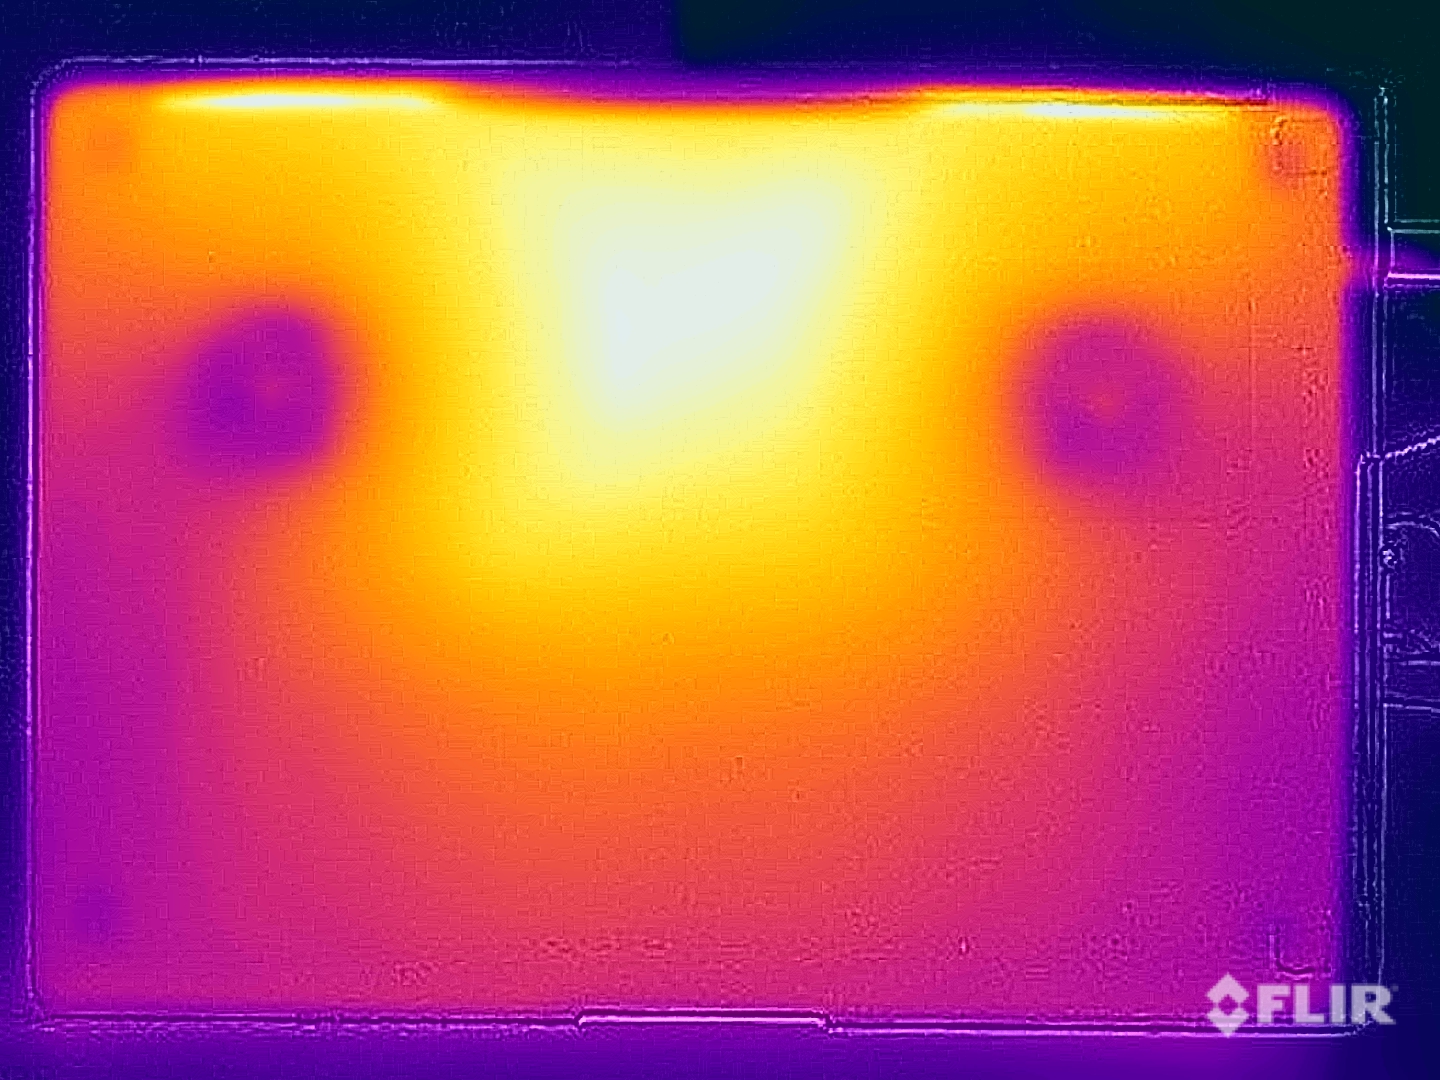
Galaxy Book4 Ultra 的金属外壳在闲置或运行简单任务时几乎不会发热。即使在压力测试中,表面温度也完全在限制范围内,因为我们在底座顶部测得的温度仅略低于 39 °C,而在底部后部中间区域测得的最高温度为 41.2 °C。这意味着您可以无限制地使用该设备。在压力测试中,处理器和显卡的功率很快就达到了 25/33 瓦。
(+) The maximum temperature on the upper side is 38.5 °C / 101 F, compared to the average of 36.8 °C / 98 F, ranging from 21 to 71 °C for the class Multimedia.
(±) The bottom heats up to a maximum of 41.2 °C / 106 F, compared to the average of 39.1 °C / 102 F
(+) In idle usage, the average temperature for the upper side is 23.2 °C / 74 F, compared to the device average of 31.3 °C / 88 F.
(±) Playing The Witcher 3, the average temperature for the upper side is 35 °C / 95 F, compared to the device average of 31.3 °C / 88 F.
(+) The palmrests and touchpad are cooler than skin temperature with a maximum of 31.9 °C / 89.4 F and are therefore cool to the touch.
(-) The average temperature of the palmrest area of similar devices was 28.7 °C / 83.7 F (-3.2 °C / -5.7 F).
| Samsung Galaxy Book4 Ultra Intel Core Ultra 7 155H, NVIDIA GeForce RTX 4050 Laptop GPU | Lenovo ThinkPad Z16 Gen 2 AMD Ryzen 9 PRO 7940HS, AMD Radeon RX 6550M | Apple MacBook Pro 16 2023 M3 Pro Apple M3 Pro 12-Core, Apple M3 Pro 18-Core GPU | Lenovo Slim Pro 9i 16IRP8 Intel Core i9-13905H, NVIDIA GeForce RTX 4050 Laptop GPU | HP Spectre x360 16 RTX 4050 Intel Core Ultra 7 155H, NVIDIA GeForce RTX 4050 Laptop GPU | Schenker VISION 16 Pro (M23) Intel Core i7-13700H, NVIDIA GeForce RTX 4070 Laptop GPU | Samsung Galaxy Book3 Ultra 16 Intel Core i7-13700H, NVIDIA GeForce RTX 4050 Laptop GPU | |
|---|---|---|---|---|---|---|---|
| Heat | 2% | 2% | -17% | -13% | -19% | -5% | |
| Maximum Upper Side * (°C) | 38.5 | 43 -12% | 38.1 1% | 37.8 2% | 39.6 -3% | 46.7 -21% | 41 -6% |
| Maximum Bottom * (°C) | 41.2 | 41.6 -1% | 37 10% | 44.8 -9% | 39.2 5% | 54.1 -31% | 44 -7% |
| Idle Upper Side * (°C) | 23.5 | 21.2 10% | 24.2 -3% | 30.6 -30% | 29 -23% | 26.5 -13% | 23 2% |
| Idle Bottom * (°C) | 24.1 | 21.4 11% | 24.6 -2% | 31 -29% | 31.6 -31% | 26.8 -11% | 26 -8% |
* ... smaller is better
发言人
虽然总的来说,Galaxy Book4 Ultra 的音质还不错,但它无法与最好的 16 英寸多媒体笔记本电脑相媲美,例如 MacBook Pro, Yoga Pro 9i或 惠普 Spectre x360 16.特别是,在直接对比中,这些模块可以更突出一些。
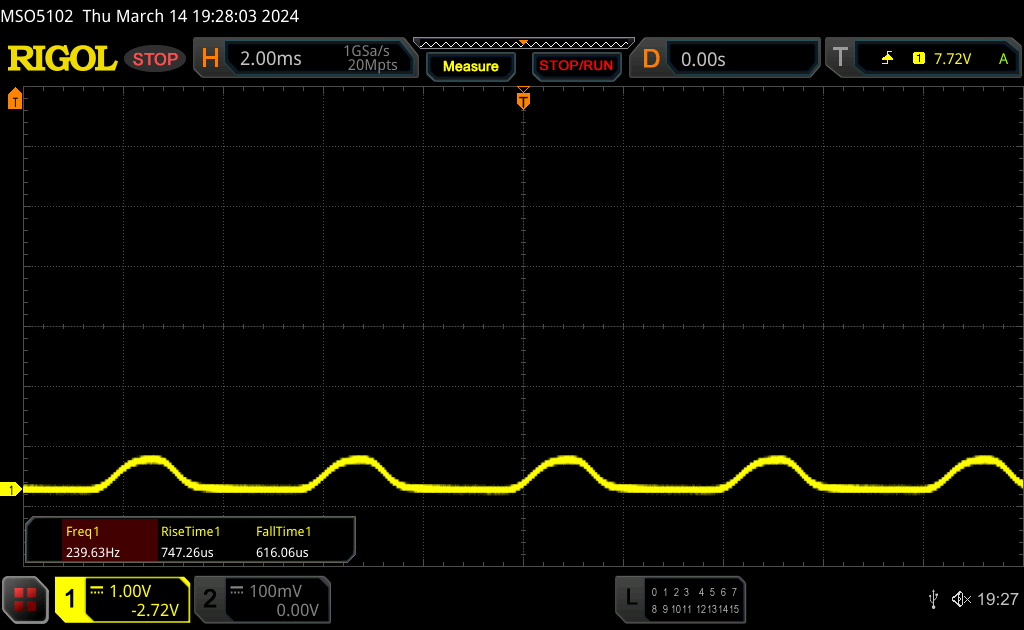
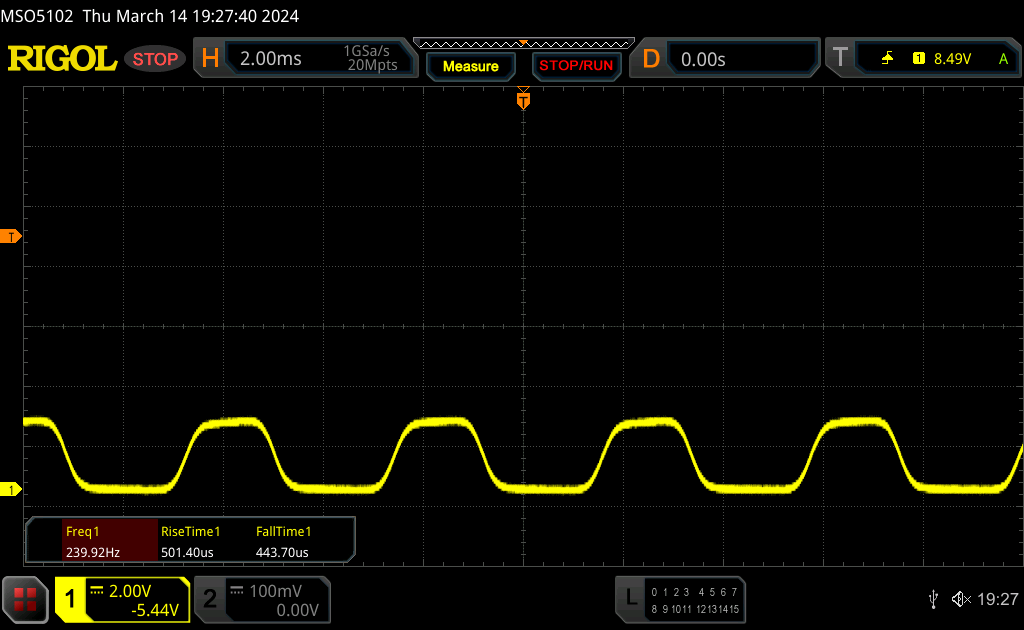
Samsung Galaxy Book4 Ultra audio analysis
(+) | speakers can play relatively loud (85 dB)
Bass 100 - 315 Hz
(±) | reduced bass - on average 14.4% lower than median
(±) | linearity of bass is average (11.3% delta to prev. frequency)
Mids 400 - 2000 Hz
(+) | balanced mids - only 3.4% away from median
(+) | mids are linear (3.4% delta to prev. frequency)
Highs 2 - 16 kHz
(+) | balanced highs - only 3% away from median
(+) | highs are linear (5.6% delta to prev. frequency)
Overall 100 - 16.000 Hz
(+) | overall sound is linear (11.5% difference to median)
Compared to same class
» 18% of all tested devices in this class were better, 4% similar, 78% worse
» The best had a delta of 5%, average was 17%, worst was 45%
Compared to all devices tested
» 8% of all tested devices were better, 2% similar, 90% worse
» The best had a delta of 4%, average was 23%, worst was 134%
Lenovo Slim Pro 9i 16IRP8 audio analysis
(±) | speaker loudness is average but good (79.7 dB)
Bass 100 - 315 Hz
(+) | good bass - only 2.8% away from median
(±) | linearity of bass is average (8.9% delta to prev. frequency)
Mids 400 - 2000 Hz
(+) | balanced mids - only 2.4% away from median
(+) | mids are linear (4.9% delta to prev. frequency)
Highs 2 - 16 kHz
(+) | balanced highs - only 3.6% away from median
(+) | highs are linear (4.3% delta to prev. frequency)
Overall 100 - 16.000 Hz
(+) | overall sound is linear (7.3% difference to median)
Compared to same class
» 6% of all tested devices in this class were better, 1% similar, 94% worse
» The best had a delta of 5%, average was 17%, worst was 45%
Compared to all devices tested
» 1% of all tested devices were better, 0% similar, 99% worse
» The best had a delta of 4%, average was 23%, worst was 134%
Apple MacBook Pro 16 2023 M3 Max audio analysis
(+) | speakers can play relatively loud (84.3 dB)
Bass 100 - 315 Hz
(±) | reduced bass - on average 5% lower than median
(+) | bass is linear (5.6% delta to prev. frequency)
Mids 400 - 2000 Hz
(+) | balanced mids - only 1.2% away from median
(+) | mids are linear (3.1% delta to prev. frequency)
Highs 2 - 16 kHz
(+) | balanced highs - only 2.4% away from median
(+) | highs are linear (2.4% delta to prev. frequency)
Overall 100 - 16.000 Hz
(+) | overall sound is linear (5.3% difference to median)
Compared to same class
» 1% of all tested devices in this class were better, 1% similar, 98% worse
» The best had a delta of 5%, average was 17%, worst was 45%
Compared to all devices tested
» 0% of all tested devices were better, 0% similar, 100% worse
» The best had a delta of 4%, average was 23%, worst was 134%
HP Spectre x360 16 RTX 4050 audio analysis
(+) | speakers can play relatively loud (89.5 dB)
Bass 100 - 315 Hz
(±) | reduced bass - on average 13.2% lower than median
(±) | linearity of bass is average (7.9% delta to prev. frequency)
Mids 400 - 2000 Hz
(+) | balanced mids - only 3.2% away from median
(+) | mids are linear (3% delta to prev. frequency)
Highs 2 - 16 kHz
(+) | balanced highs - only 1.6% away from median
(+) | highs are linear (3.5% delta to prev. frequency)
Overall 100 - 16.000 Hz
(+) | overall sound is linear (9.2% difference to median)
Compared to same class
» 4% of all tested devices in this class were better, 1% similar, 95% worse
» The best had a delta of 6%, average was 20%, worst was 57%
Compared to all devices tested
» 3% of all tested devices were better, 1% similar, 96% worse
» The best had a delta of 4%, average was 23%, worst was 134%
能量管理 - 增强耐力
耗电量
在空闲运行时,OLED 显示屏显示本身非常经济,但三星的深色标准壁纸有所帮助。在游戏模式下,根据游戏内容的不同,功耗大约在 80 到 90 瓦之间,而在压力测试中,功耗曾短暂达到 125 瓦,之后又迅速降至 90 瓦。在高性能模式下,最大功耗为 141.6 瓦,之后为 128 瓦。这说明所提供的 140 瓦电源适配器大小合适。
| Off / Standby | |
| Idle | |
| Load |
|
Key:
min: | |
| Samsung Galaxy Book4 Ultra Ultra 7 155H, GeForce RTX 4050 Laptop GPU, Samsung PM9A1 MZVL2512HCJQ, OLED, 2880x1800, 16" | Lenovo ThinkPad Z16 Gen 2 R9 PRO 7940HS, Radeon RX 6550M, Kioxia XG8 KXG8AZNV1T02, OLED, 3840x2400, 16" | Apple MacBook Pro 16 2023 M3 Pro Apple M3 Pro 12-Core, M3 Pro 18-Core GPU, Apple SSD AP0512Z, Mini-LED, 3456x2234, 16.2" | Lenovo Slim Pro 9i 16IRP8 i9-13905H, GeForce RTX 4050 Laptop GPU, Samsung PM9A1 MZVL21T0HCLR, Mini-LED, 3200x2000, 16" | Schenker VISION 16 Pro (M23) i7-13700H, GeForce RTX 4070 Laptop GPU, Samsung 990 Pro 1 TB, IPS, 2560x1600, 16" | Samsung Galaxy Book3 Ultra 16 i7-13700H, GeForce RTX 4050 Laptop GPU, Samsung PM9A1 MZVL2512HCJQ, AMOLED, 2880x1800, 16" | Average NVIDIA GeForce RTX 4050 Laptop GPU | Average of class Multimedia | |
|---|---|---|---|---|---|---|---|---|
| Power Consumption | -40% | -25% | -160% | -54% | 11% | -85% | -17% | |
| Idle Minimum * (Watt) | 4.8 | 7.5 -56% | 4.5 6% | 16 -233% | 8.6 -79% | 3 37% | 9.95 ? -107% | 5.72 ? -19% |
| Idle Average * (Watt) | 7.5 | 9.6 -28% | 16.5 -120% | 30 -300% | 12 -60% | 5 33% | 15.8 ? -111% | 10.2 ? -36% |
| Idle Maximum * (Watt) | 7.9 | 18.5 -134% | 16.7 -111% | 30.4 -285% | 12.4 -57% | 11 -39% | 20.1 ? -154% | 12.4 ? -57% |
| Load Average * (Watt) | 79.3 | 57.1 28% | 60.4 24% | 78.9 1% | 80 -1% | 72 9% | 88 ? -11% | 65.5 ? 17% |
| Witcher 3 ultra * (Watt) | 79.2 | 115.8 -46% | 52.1 34% | 155.3 -96% | 147.7 -86% | 69.7 12% | ||
| Load Maximum * (Watt) | 125 | 131.7 -5% | 102.9 18% | 180.4 -44% | 173.1 -38% | 108 14% | 176.3 ? -41% | 114 ? 9% |
* ... smaller is better
Power consumption Witcher 3 / stress test
Power consumption with an external monitor
电池寿命
电池容量为 76 Wh,保持不变,但由于采用了新的 Meteor Lake 处理器,电池续航时间更长。 顺便提一下,我们只能在 120 Hz 的频率下进行电池测试,因为尽管在活动信号模式下选择了 60 Hz,但仍保持在 120 Hz。我们在Galaxy Book4 系列的其他机型上也发现了这个问题。
在 150 cd/m²(相当于评测设备最大 SDR 亮度的 66%)的 Wi-Fi 测试中,我们记录了将近 11 个小时,比前代产品长了将近 1.5 个小时。在全亮度条件下,Wi-Fi 测试持续了 7 个多小时。视频测试运行时间(同样为 150 cd/m²)从约 13.5 小时增加到近 18 小时。这就是全新 Meteor Lake 处理器及其低功耗内核的优势所在。
在负载情况下,大约 80 分钟就可以耗尽电池电量,全亮度 HDR 视频可播放约 5.5 小时。使用 140 瓦的 PSU 充电大约需要 2.5 小时,而且没有快速充电功能。
| Samsung Galaxy Book4 Ultra Ultra 7 155H, GeForce RTX 4050 Laptop GPU, 76 Wh | Lenovo ThinkPad Z16 Gen 2 R9 PRO 7940HS, Radeon RX 6550M, 72 Wh | Apple MacBook Pro 16 2023 M3 Pro Apple M3 Pro 12-Core, M3 Pro 18-Core GPU, 99.6 Wh | Lenovo Slim Pro 9i 16IRP8 i9-13905H, GeForce RTX 4050 Laptop GPU, 75 Wh | HP Spectre x360 16 RTX 4050 Ultra 7 155H, GeForce RTX 4050 Laptop GPU, 83 Wh | Schenker VISION 16 Pro (M23) i7-13700H, GeForce RTX 4070 Laptop GPU, 80 Wh | Samsung Galaxy Book3 Ultra 16 i7-13700H, GeForce RTX 4050 Laptop GPU, 76 Wh | Average of class Multimedia | |
|---|---|---|---|---|---|---|---|---|
| Battery runtime | -7% | 43% | -39% | 1% | -28% | 0% | 11% | |
| H.264 (h) | 17.9 | 24.7 38% | 7.8 -56% | 13.4 -25% | 16.4 ? -8% | |||
| WiFi v1.3 (h) | 10.9 | 6 -45% | 20.1 84% | 6.6 -39% | 11 1% | 7.8 -28% | 9.6 -12% | 12.2 ? 12% |
| Load (h) | 1.3 | 1.7 31% | 1.4 8% | 1.3 0% | 1.8 38% | 1.668 ? 28% | ||
| Reader / Idle (h) | 10.2 | 18.2 | 24.9 ? |
Pros
Cons
结论 -Galaxy Book4 Ultra 仅有微小改进
从根本上说,三星为自己目前的Galaxy Book4 Ultra 带来了生活上的便利,因为这款 16 英寸的多媒体电脑已经获得了新的流星湖处理器,然而,除此之外,它还是和原来一样。有两种不同的配置和 酷睿至尊 7 155H和 GeForce RTX 4050 笔记本电脑评测变体适合作为多媒体机器。组件性能不错,各种能耗曲线也很均衡。此外,新的流星湖处理器还提高了电池续航时间。
120 Hz 的显示屏也提供了非常好的图像质量,各种色彩配置文件包括非常精确的 P3 和 sRGB 色彩空间配置文件。尽管如此,还是存在一些问题,如持续的 240 Hz PWM 闪烁,而且该设备的 HDR 功能也受到很大限制,尤其是与迷你 LED 竞争对手相比,如 联想 Yoga Pro 9i或 Apple MacBook Pro 16.
Galaxy Book4 Ultra 是一款非常出色的多媒体计算机,它将 AMOLED 显示屏与高级机壳结合在一起,机壳内有一个有效的蒸发腔,性能不错,电池续航时间长。遗憾的是,三星在内存和存储方面偷工减料。2399 美元只能获得 16GB 内存和 512GB 固态硬盘。
不过,它也存在一些缺点,比如底部边框过宽和采用焊接内存。特别是,在我们的评测配置中,16 GB 内存并不是特别宽裕。此外,键盘也很一般,主要原因是键程有限。
不过,最大的问题还是价格,三星为我们的 16GB 内存和 512GB SSD 评测机型开出了 2399 美元的高价。即使是配备 M3 Pro 和 HDR 功能明显更好的 MacBook Pro 16,在商店里也要便宜 200 美元左右。Windows 系统的竞争产品也更便宜,而且还有其他优势。联想 Yoga Pro 9i 提供了更好的键盘、更亮的迷你 LED 面板和更好的扬声器。申克公司的 Vision 16 Pro 仍然是一款非常便携的 16 英寸设备,配备速度更快的 RTX 4070 和无 PWM 的 IPS 面板。Galaxy Book4 Ultra 绝不是一款糟糕的机器,但考虑到这一细分市场上竞争设备的强劲实力,它的性价比并不是特别高,而且很快它就会在市场上迎来另一个竞争对手,那就是新款戴尔 XPS 16。
价格和供应情况
GalaxyBook4 Ultra 可以直接从三星公司订购,起价 2399 美元。
Samsung Galaxy Book4 Ultra
- 03/16/2024 v7 (old)
Andreas Osthoff
Transparency
The selection of devices to be reviewed is made by our editorial team. The test sample was provided to the author as a loan by the manufacturer or retailer for the purpose of this review. The lender had no influence on this review, nor did the manufacturer receive a copy of this review before publication. There was no obligation to publish this review. As an independent media company, Notebookcheck is not subjected to the authority of manufacturers, retailers or publishers.
This is how Notebookcheck is testing
Every year, Notebookcheck independently reviews hundreds of laptops and smartphones using standardized procedures to ensure that all results are comparable. We have continuously developed our test methods for around 20 years and set industry standards in the process. In our test labs, high-quality measuring equipment is utilized by experienced technicians and editors. These tests involve a multi-stage validation process. Our complex rating system is based on hundreds of well-founded measurements and benchmarks, which maintains objectivity. Further information on our test methods can be found here.
Price comparison

