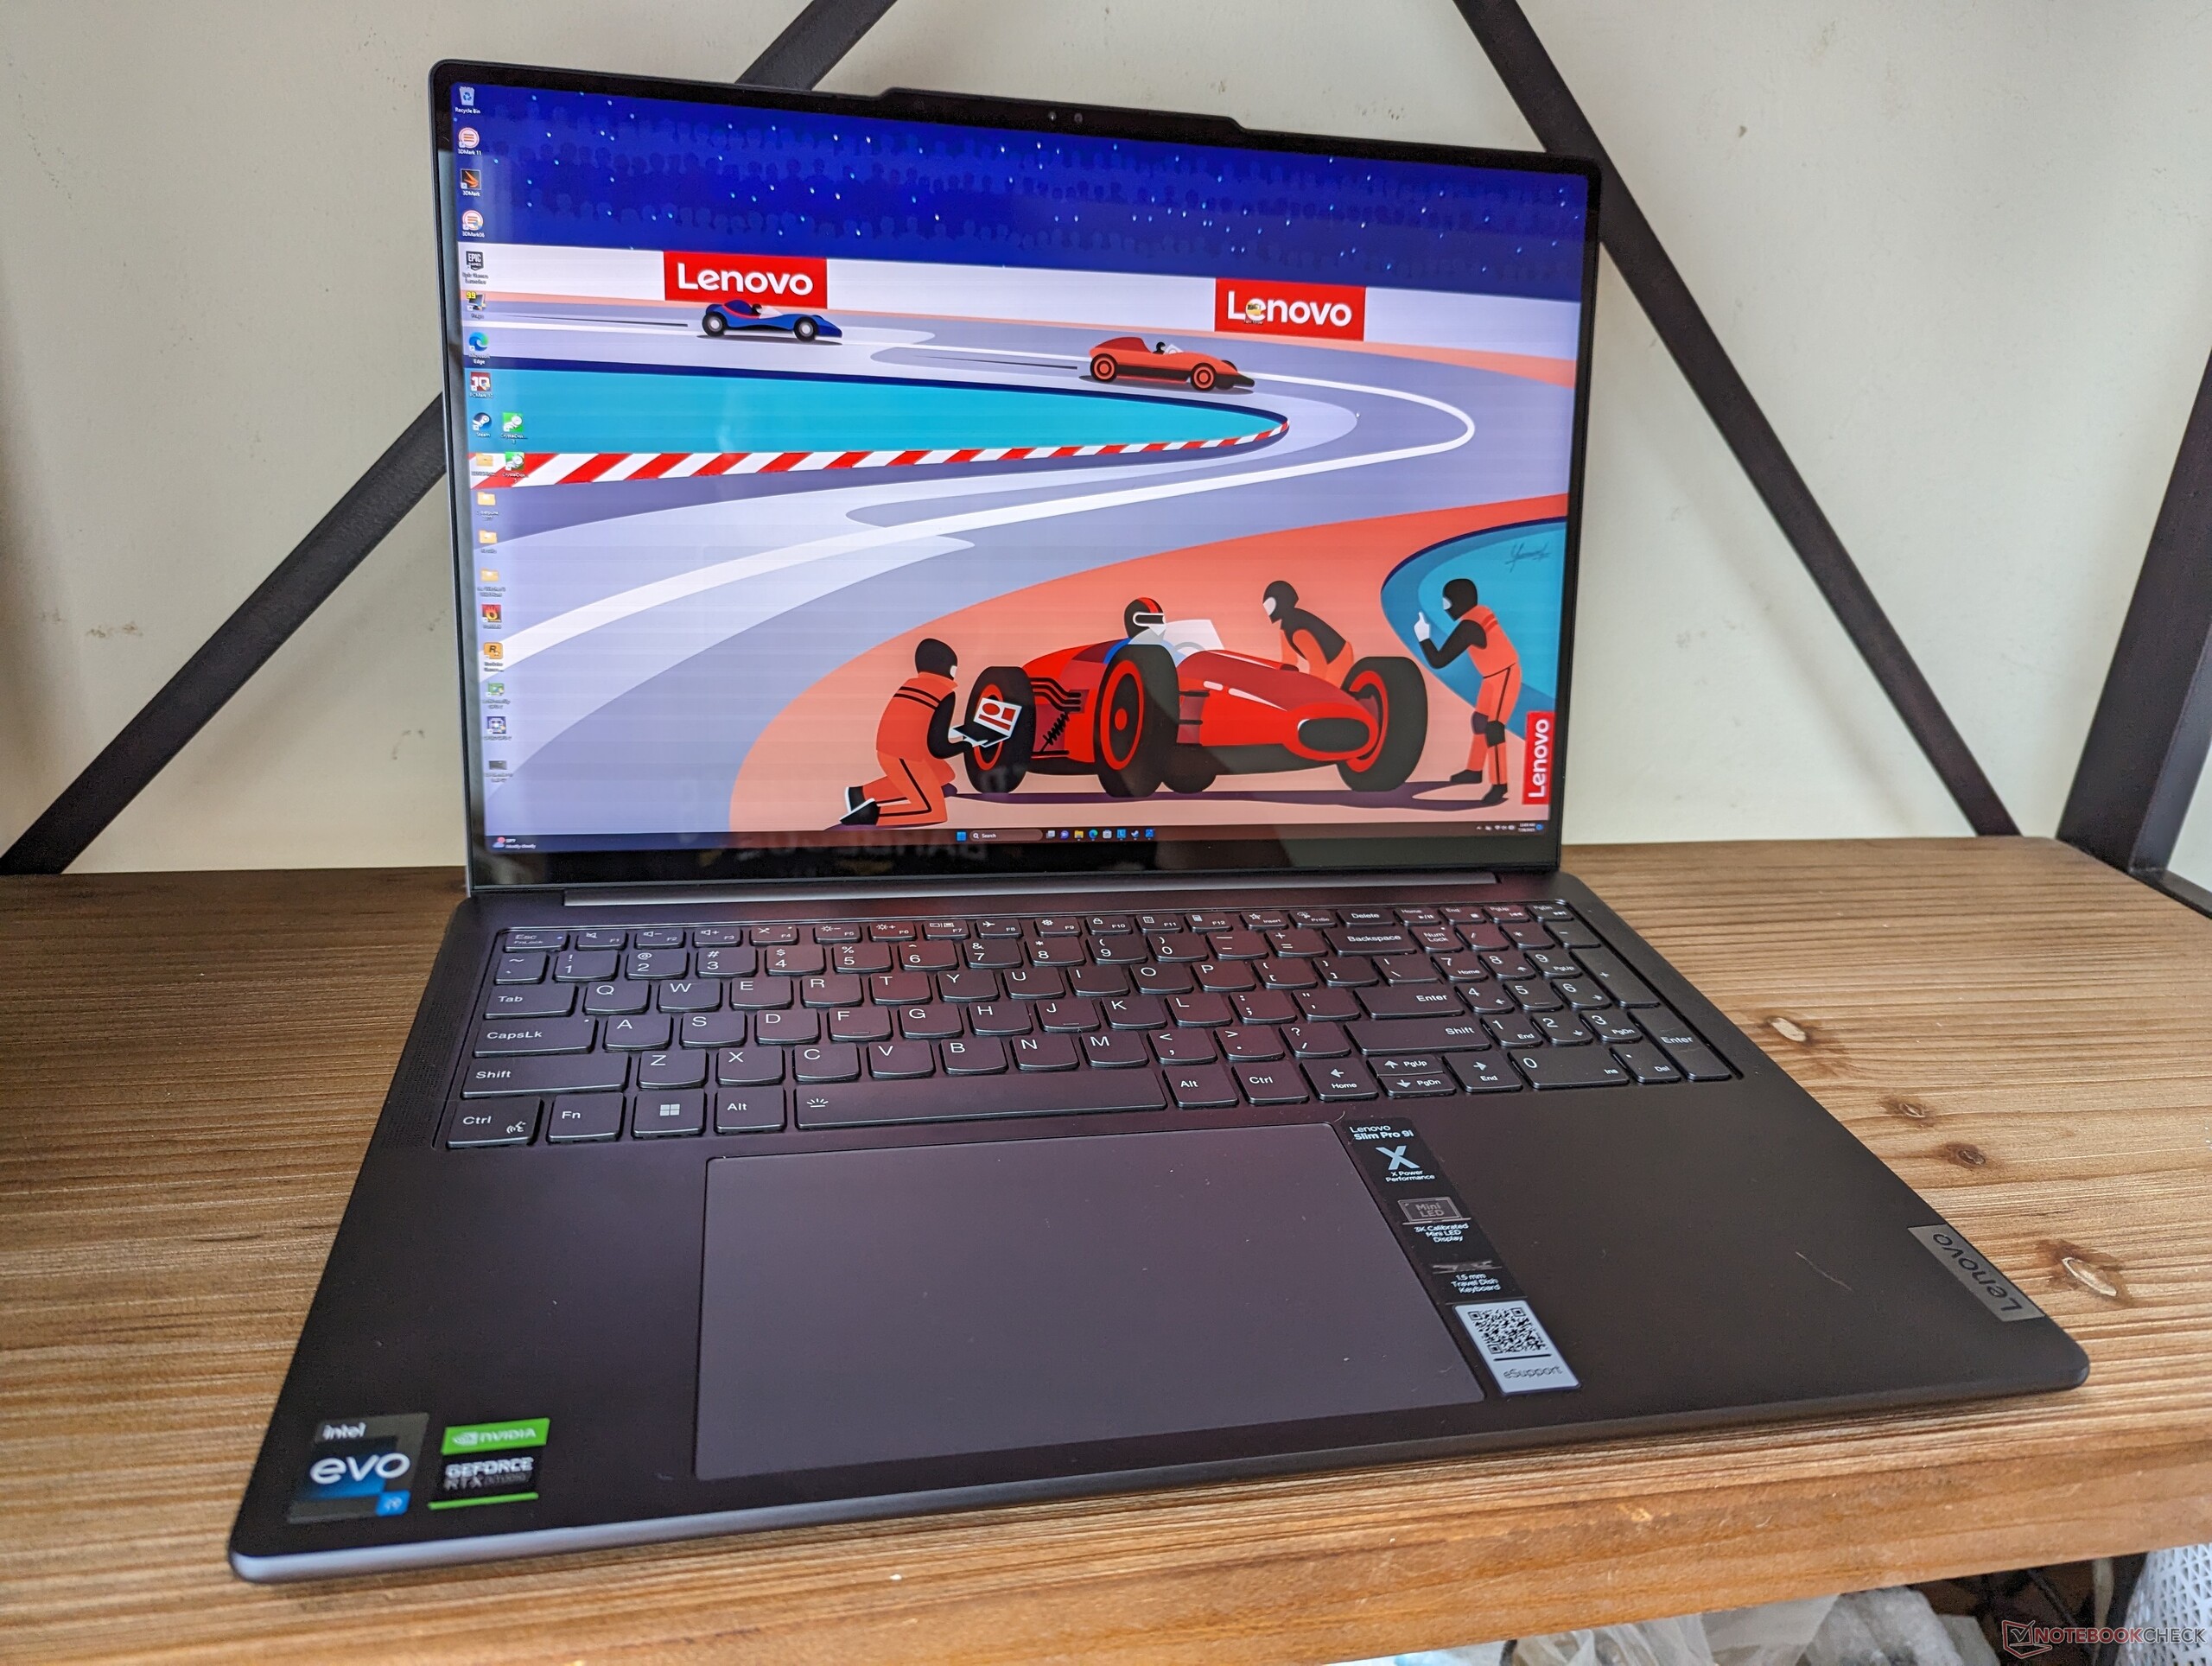
联想 Slim Pro 9i 16IRP8 笔记本电脑评测:Apple MacBook Pro 16 的替代品

联想 Slim Pro 9i 16 G8 是一款专为内容创作和多媒体用途设计的高端笔记本电脑。它的竞争对手是以创作者为中心的 16 英寸机型,如 微星 CreatorPro Z16P, Apple MacBook Pro 16, 惠普 Envy 16或 华硕 ProArt StudioBook 16.
令人困惑的是,该机型的名称因地区而异。例如,在欧洲,该机型被称为 Yoga Pro 9i 16,而在北美则被称为 Slim Pro 9i 16。我们建议您查看我们的 关于 Yoga Pro 9i 16 的评论了解这款笔记本电脑的更多物理特性。
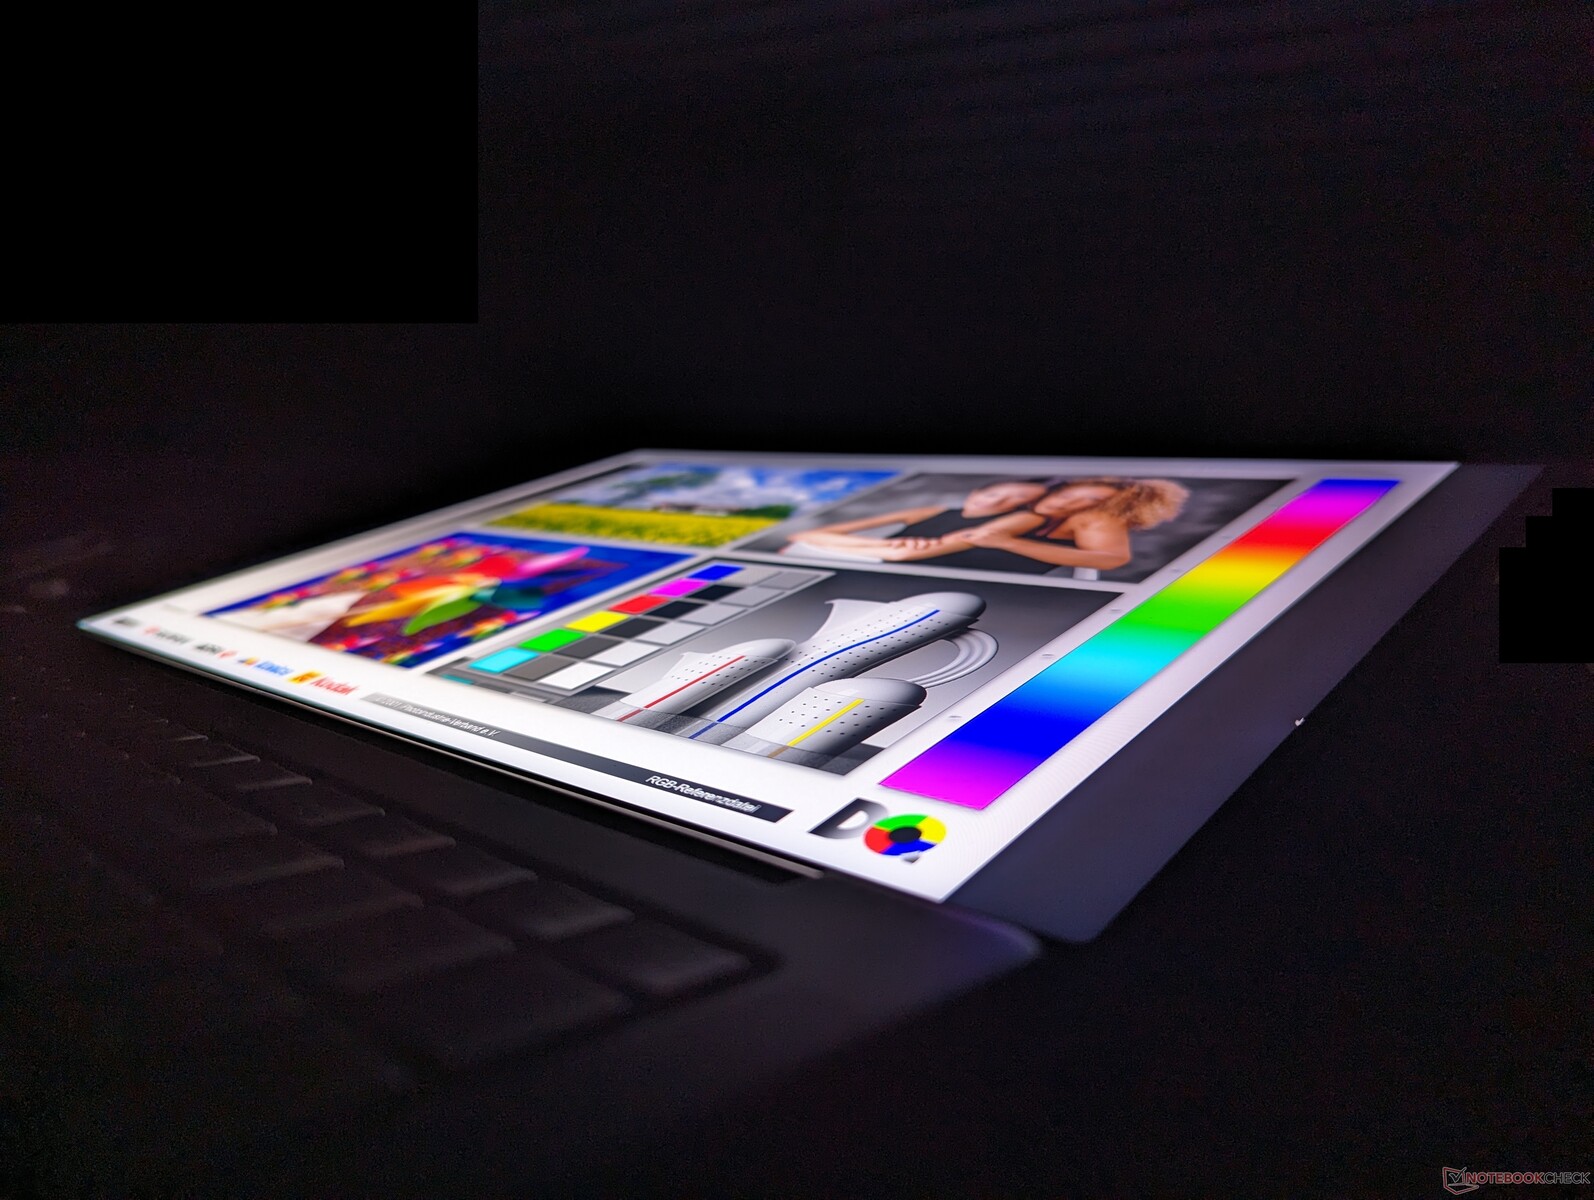
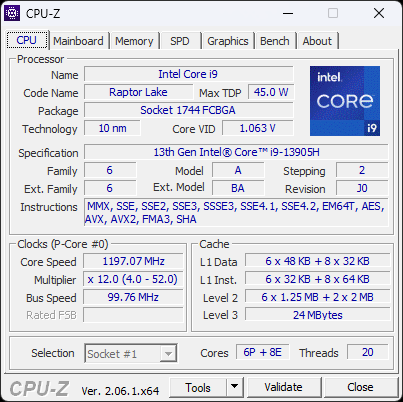
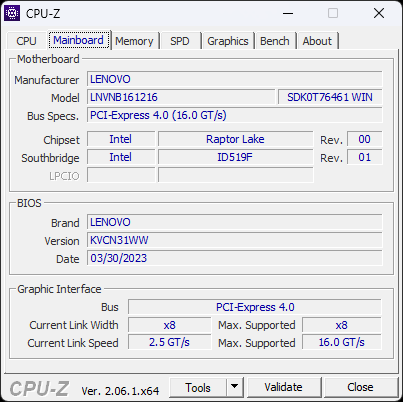
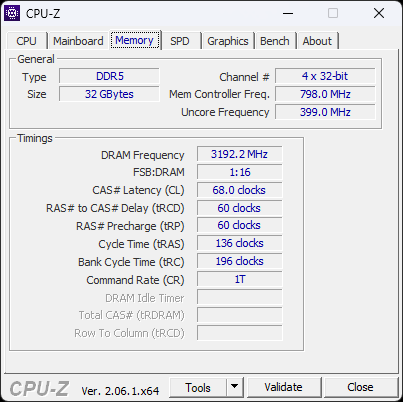
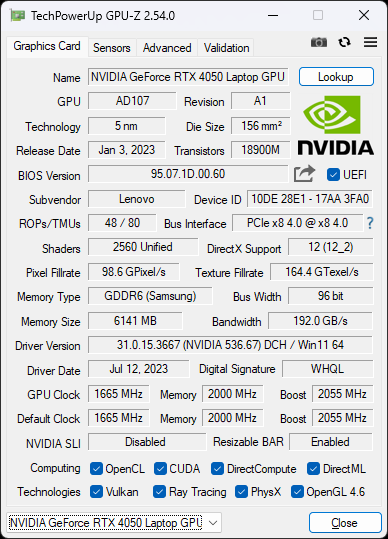
我们的评测配置配备了不常见的第 13 代猛禽湖酷睿 i9-13905H CPU 和 100 WGeForce RTX 4050,而我们的 Yoga Pro 9i 16 则配备了酷睿 i7-13705H 和 RTX 4060。此外,两种配置都配备了相同的 3.2K(3200 x 2000)迷你 LED 触摸屏,具有完整的 DCI-P3 色彩。
该机型还有一个 14 英寸版本,称为 Slim Pro 9i 14 或 Yoga Pro 9i 14.
更多联想评论:
潜在的竞争对手比较
Rating | Date | Model | Weight | Height | Size | Resolution | Price |
|---|---|---|---|---|---|---|---|
| 88 % v7 (old) | 08 / 2023 | Lenovo Slim Pro 9i 16IRP8 i9-13905H, GeForce RTX 4050 Laptop GPU | 2.2 kg | 18.2 mm | 16.00" | 3200x2000 | |
| 88.4 % v7 (old) | 08 / 2023 | Lenovo Yoga Pro 9 16-IRP G8 i7-13705H, GeForce RTX 4060 Laptop GPU | 2.2 kg | 18.2 mm | 16.00" | 3200x2000 | |
| 86.3 % v7 (old) | 05 / 2023 | Asus VivoBook Pro 16 i7-12700H, GeForce RTX 3050 Ti Laptop GPU | 1.9 kg | 20 mm | 16.00" | 2560x1600 | |
| 87.5 % v7 (old) | 06 / 2023 | Acer Swift Edge SFE16-42-R1GM R7 7735U, Radeon 680M | 1.2 kg | 13.95 mm | 16.00" | 3840x2400 | |
| 87.4 % v7 (old) | 08 / 2022 | Dell Inspiron 16 Plus 7620 i7-12700H, GeForce RTX 3050 Ti Laptop GPU | 2.1 kg | 18.99 mm | 16.00" | 3072x1920 | |
| 86.9 % v7 (old) | 09 / 2022 | HP Envy 16 h0112nr i7-12700H, GeForce RTX 3060 Laptop GPU | 2.3 kg | 19.8 mm | 16.00" | 3840x2400 |
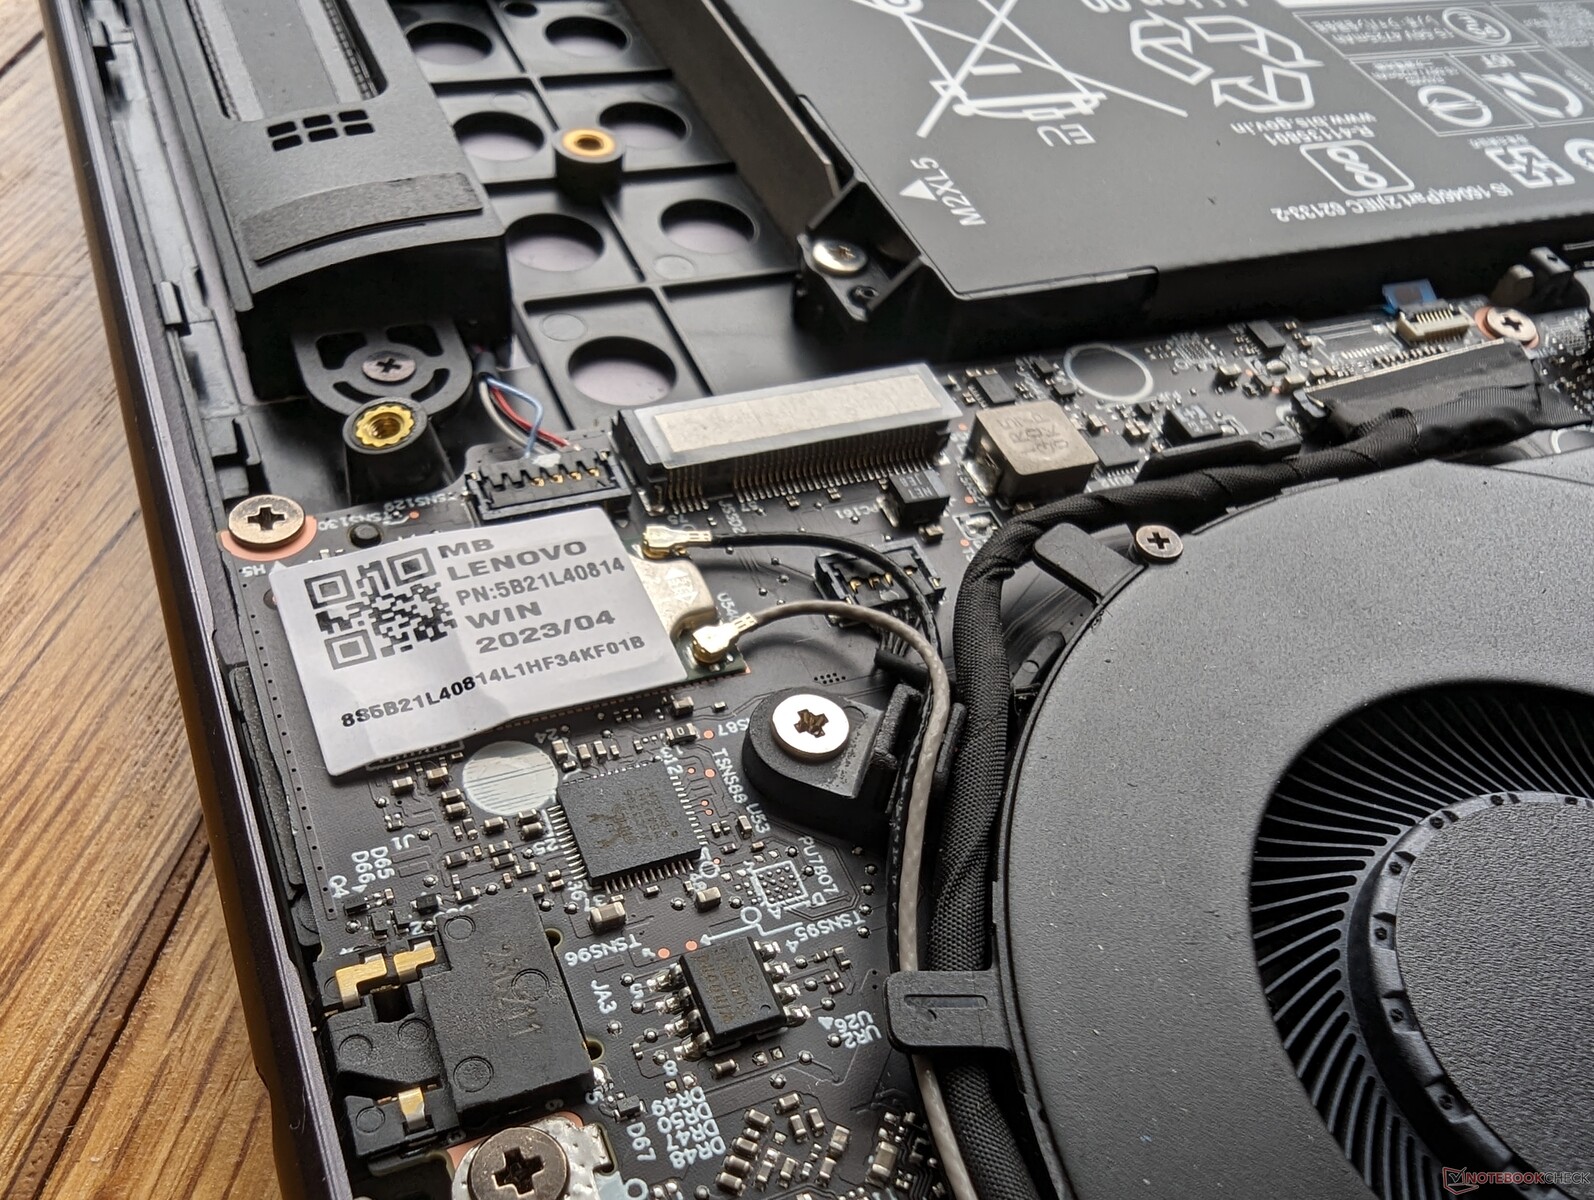
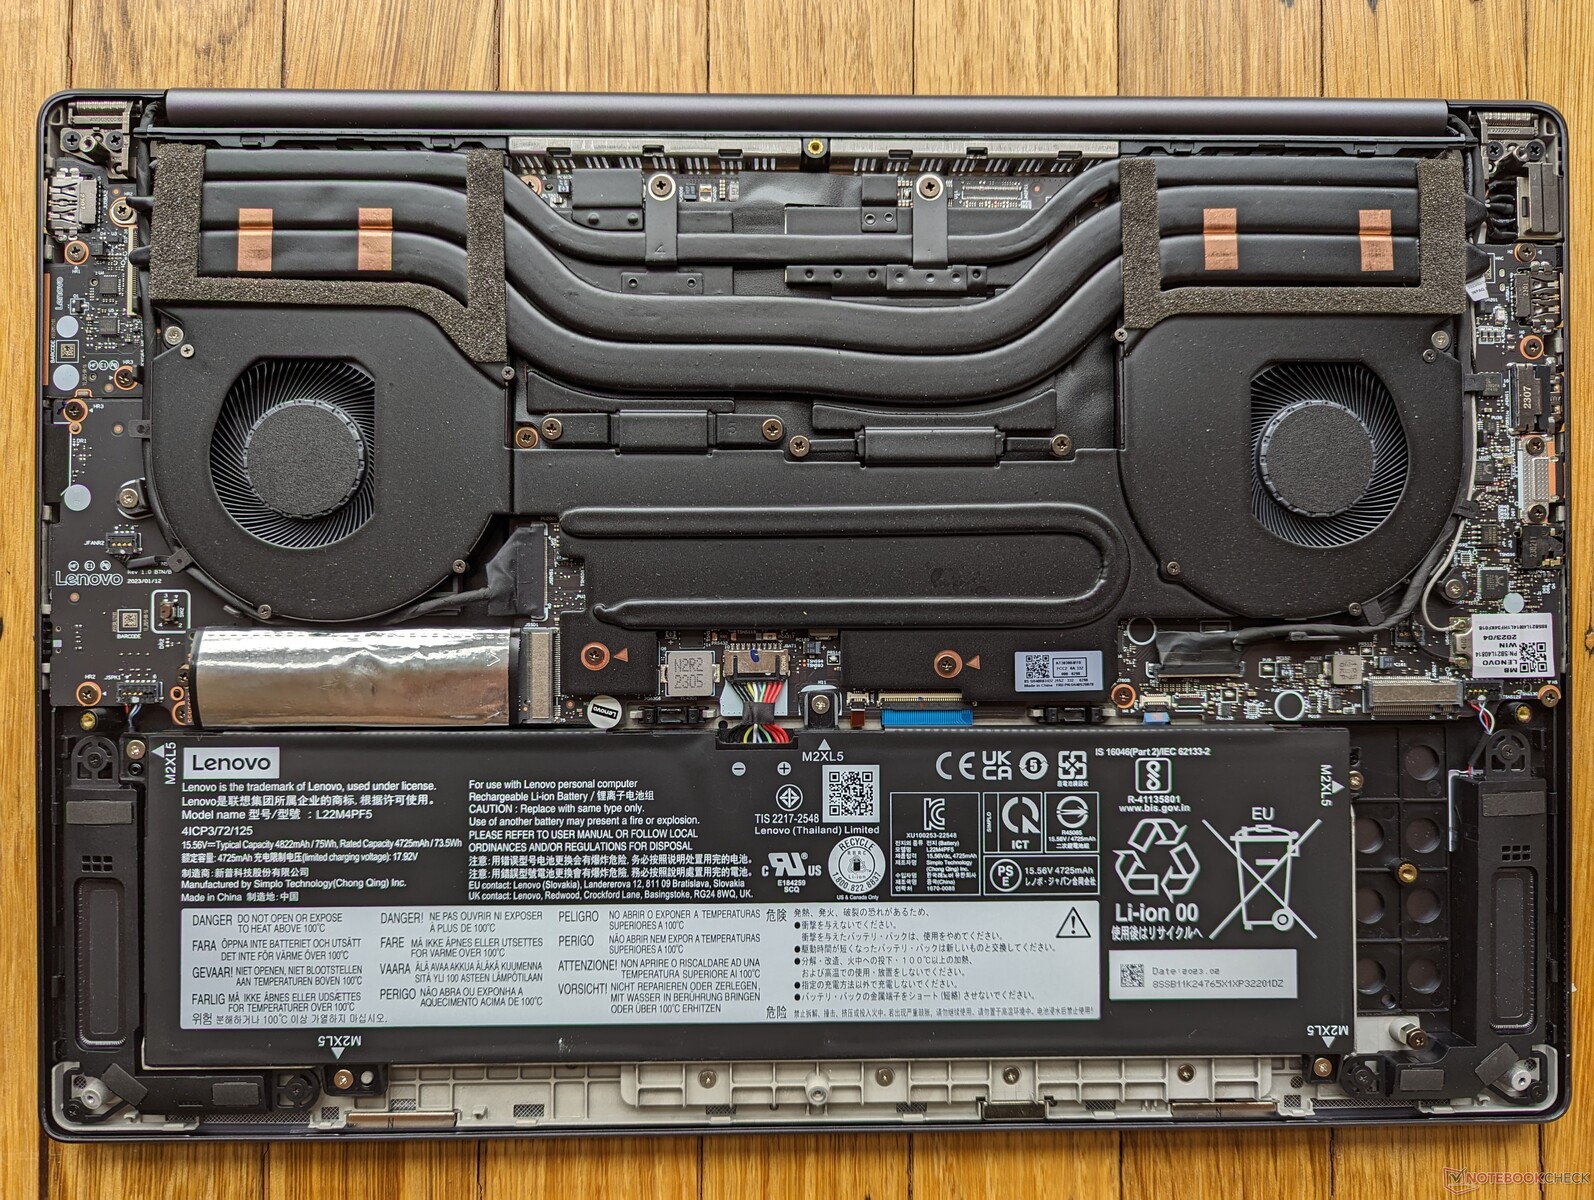
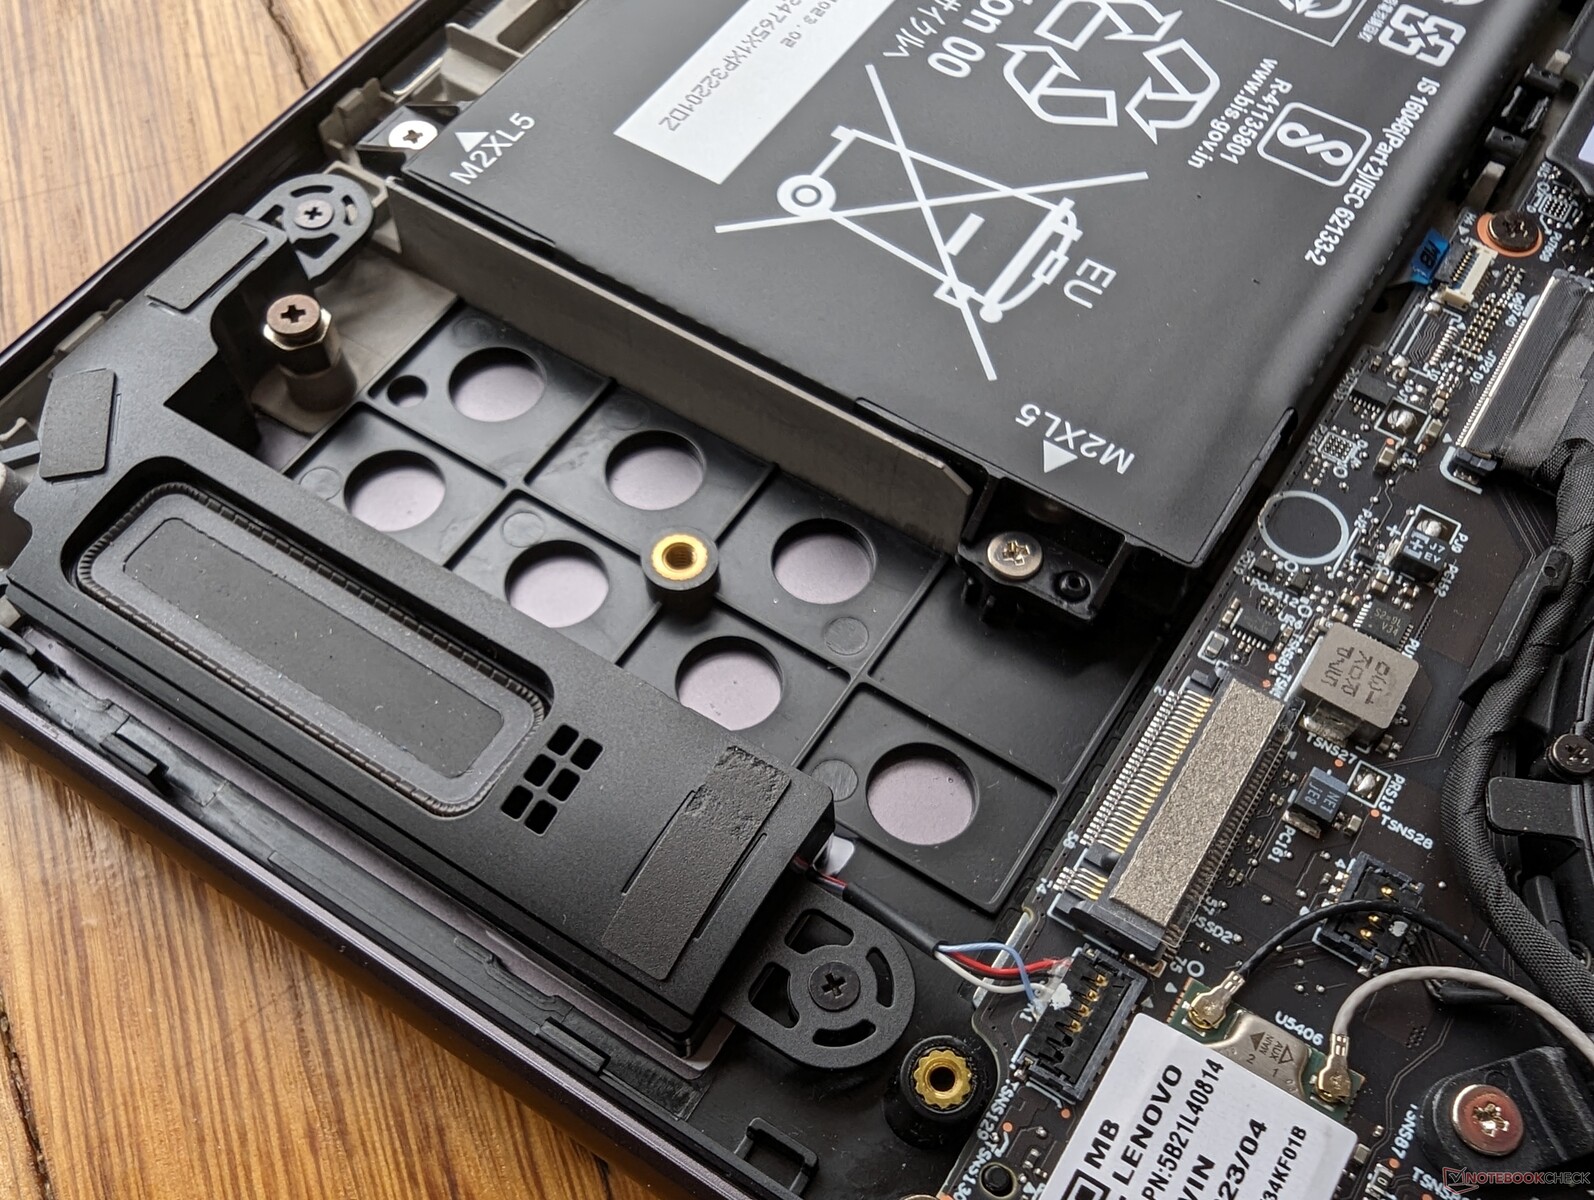
案例
SD 读卡器
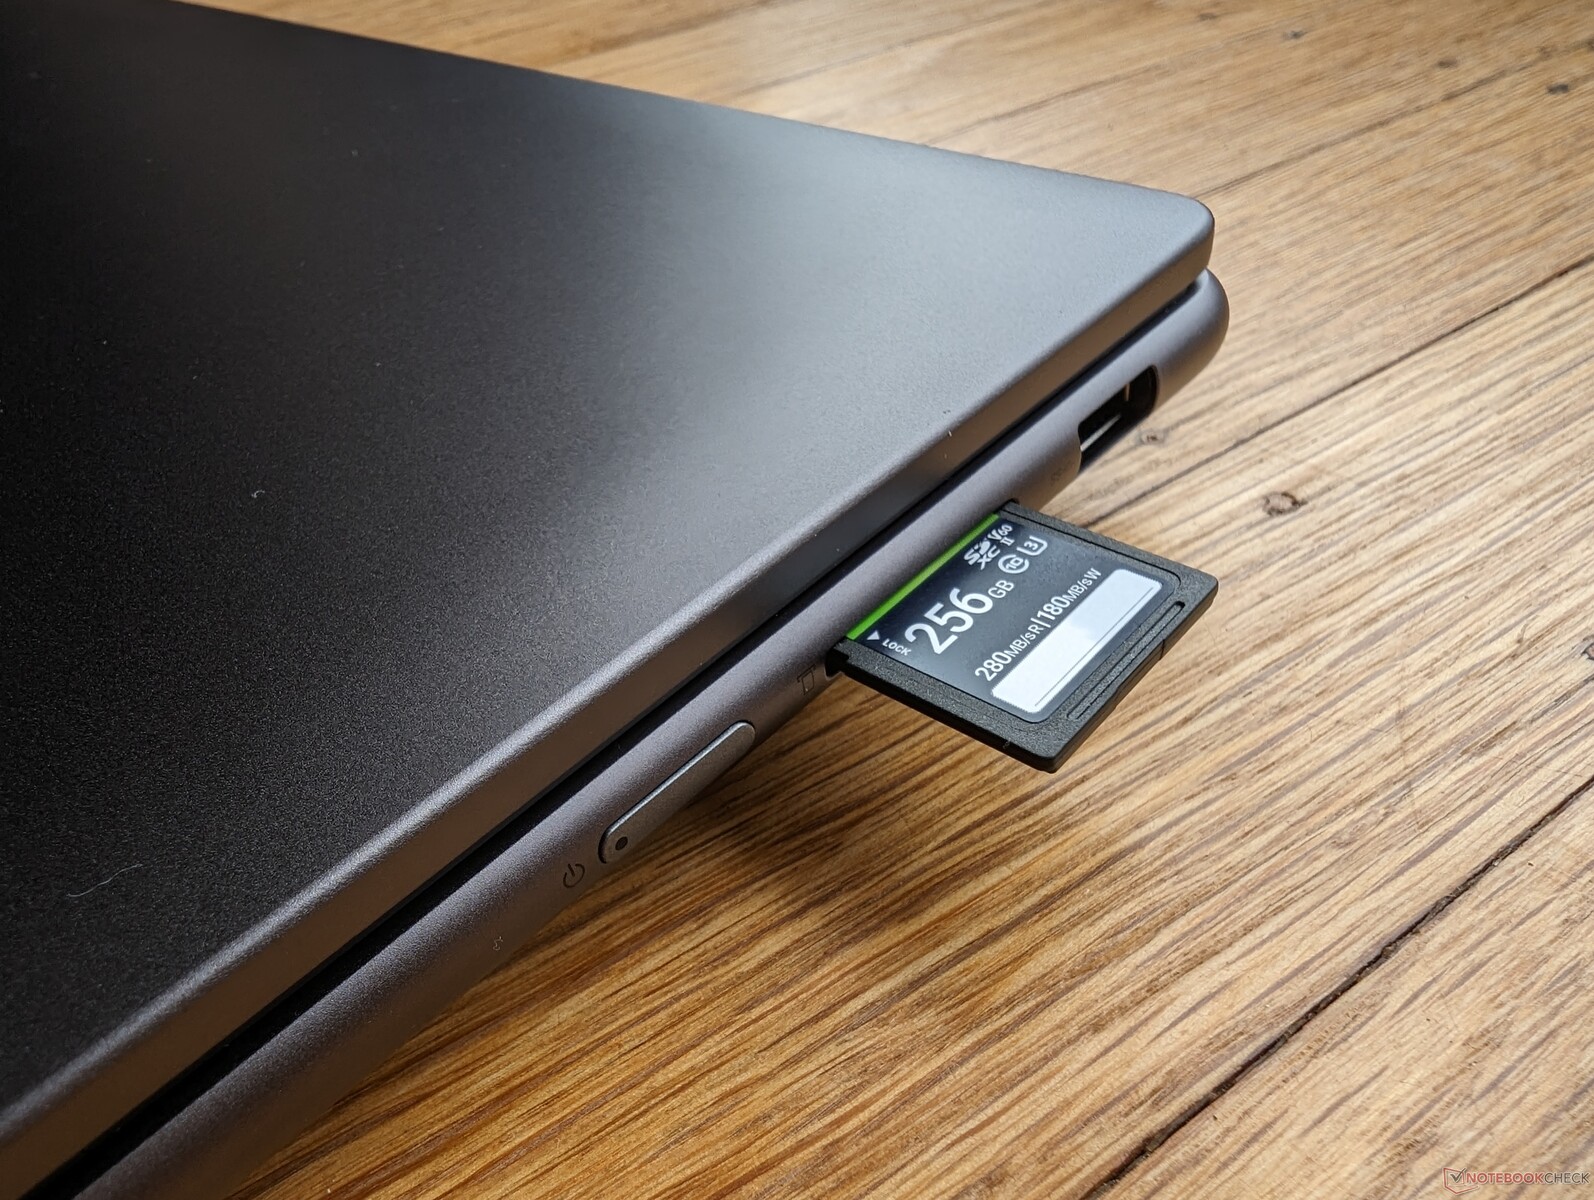
PNY EliteX-Pro60 V60 UHS-II 测试卡的传输速率在同类产品中处于平均水平。遗憾的是,联想的读卡器较浅,因此 SD 卡会突出一半以上的长度,运输时很不安全。
| SD Card Reader | |
| average JPG Copy Test (av. of 3 runs) | |
| Lenovo Slim Pro 9i 16IRP8 (PNY EliteX-Pro60 V60 256 GB) | |
| Lenovo Yoga Pro 9 16-IRP G8 (Angelibird AV Pro V60) | |
| Asus VivoBook Pro 16 (AV Pro SD microSD 128 GB V60) | |
| HP Envy 16 h0112nr (AV Pro SD microSD 128 GB V60) | |
| Dell Inspiron 16 Plus 7620 (Toshiba Exceria Pro SDXC 64 GB UHS-II) | |
| maximum AS SSD Seq Read Test (1GB) | |
| Lenovo Slim Pro 9i 16IRP8 (PNY EliteX-Pro60 V60 256 GB) | |
| HP Envy 16 h0112nr (AV Pro SD microSD 128 GB V60) | |
| Lenovo Yoga Pro 9 16-IRP G8 (Angelibird AV Pro V60) | |
| Asus VivoBook Pro 16 (AV Pro SD microSD 128 GB V60) | |
| Dell Inspiron 16 Plus 7620 (Toshiba Exceria Pro SDXC 64 GB UHS-II) | |
交流
| Networking | |
| iperf3 transmit AXE11000 | |
| Lenovo Yoga Pro 9 16-IRP G8 | |
| Asus VivoBook Pro 16 | |
| Lenovo Slim Pro 9i 16IRP8 | |
| Acer Swift Edge SFE16-42-R1GM | |
| iperf3 receive AXE11000 | |
| Lenovo Yoga Pro 9 16-IRP G8 | |
| Lenovo Slim Pro 9i 16IRP8 | |
| Acer Swift Edge SFE16-42-R1GM | |
| iperf3 transmit AXE11000 6GHz | |
| Lenovo Slim Pro 9i 16IRP8 | |
| Acer Swift Edge SFE16-42-R1GM | |
| HP Envy 16 h0112nr | |
| Dell Inspiron 16 Plus 7620 | |
| iperf3 receive AXE11000 6GHz | |
| Asus VivoBook Pro 16 | |
| Acer Swift Edge SFE16-42-R1GM | |
| Lenovo Slim Pro 9i 16IRP8 | |
| HP Envy 16 h0112nr | |
| Dell Inspiron 16 Plus 7620 | |
网络摄像头
500 万像素传感器的质量高于大多数其他笔记本电脑上的网络摄像头,因为在其他笔记本电脑上,200 万像素或 100 万像素的摄像头还是很常见的。红外和摄像头锁定开关均包括在内。


维护
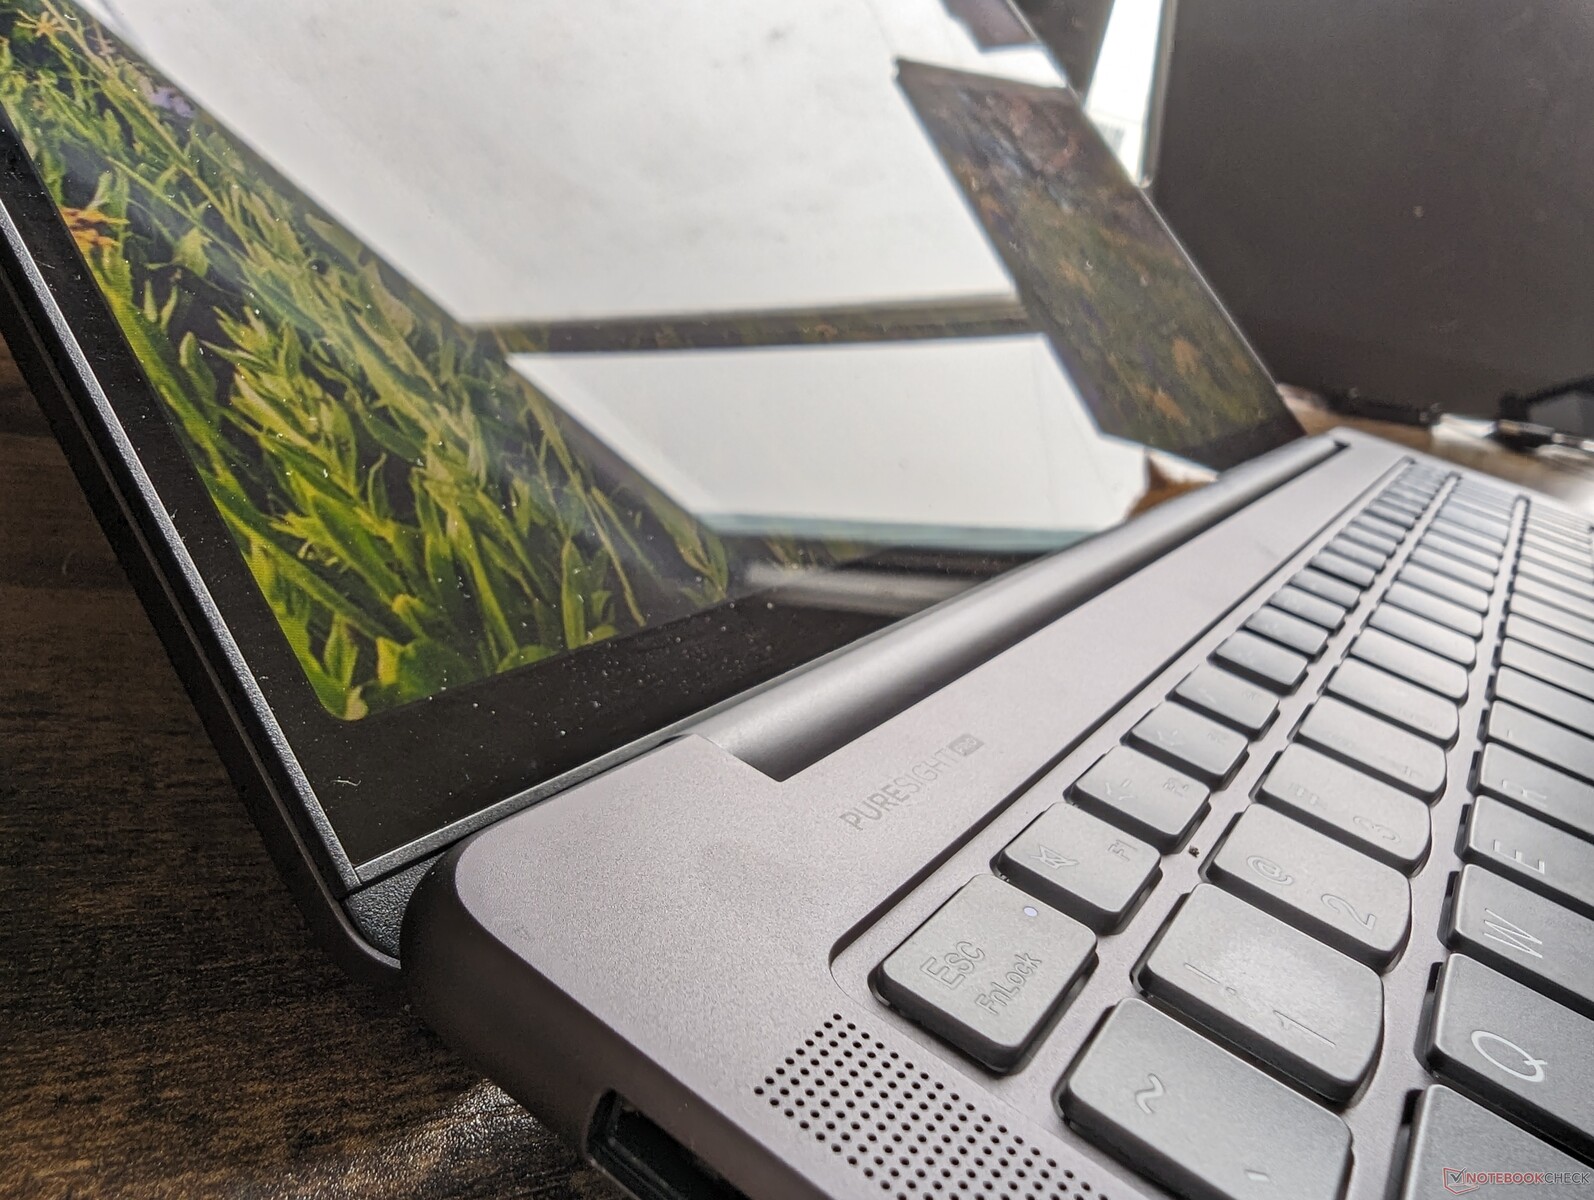
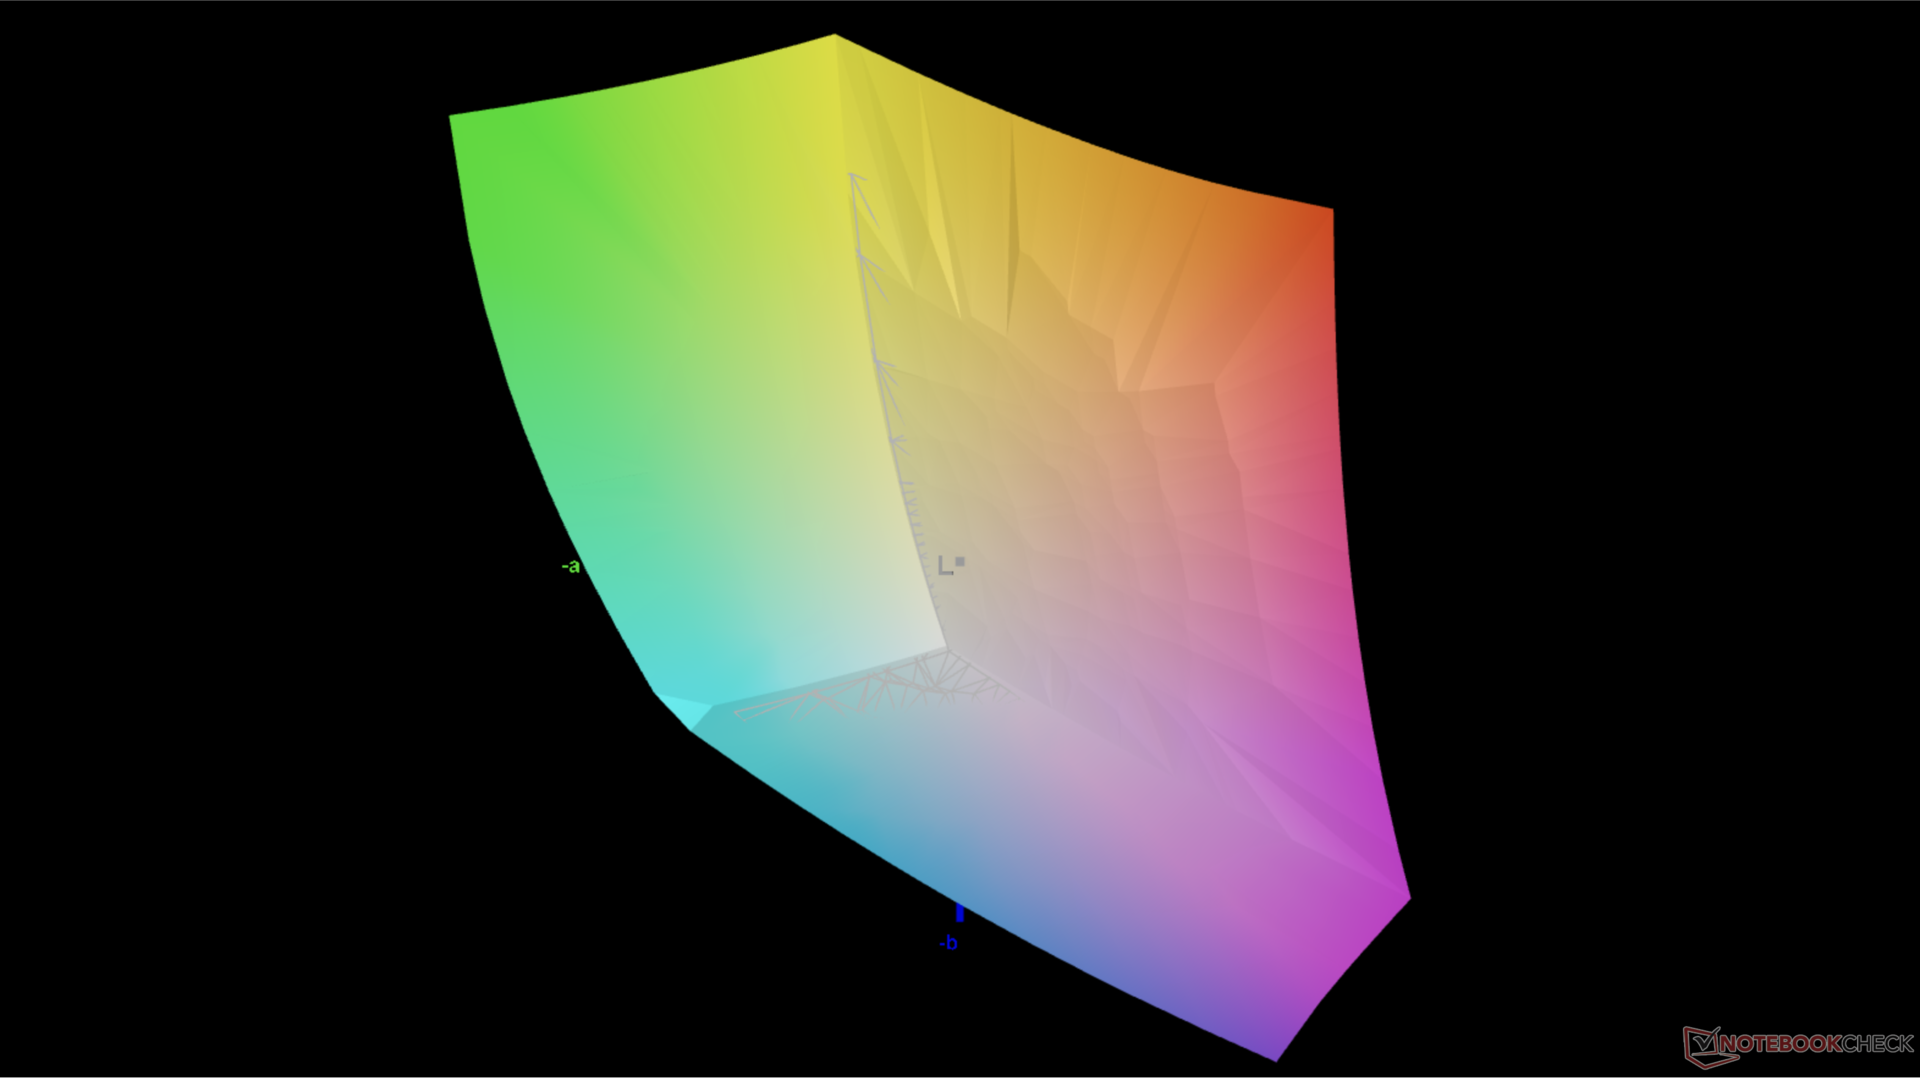
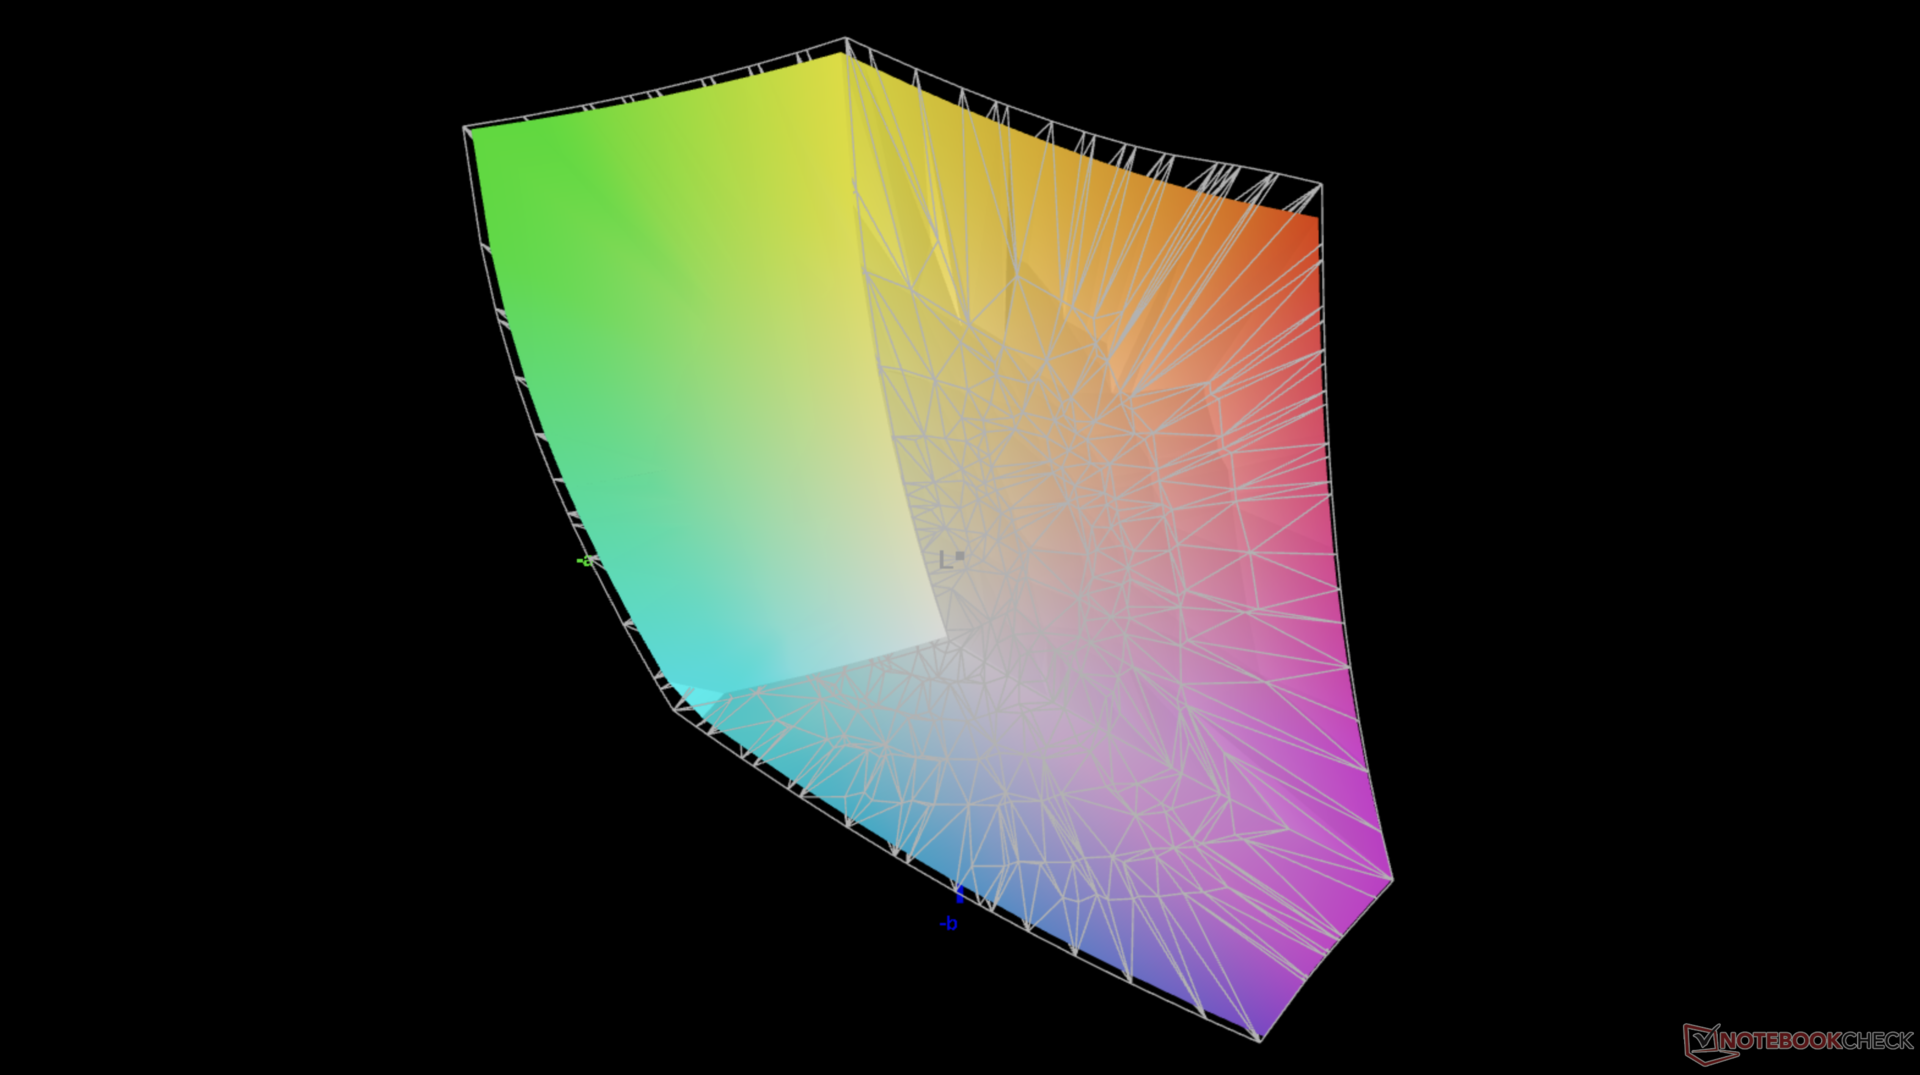
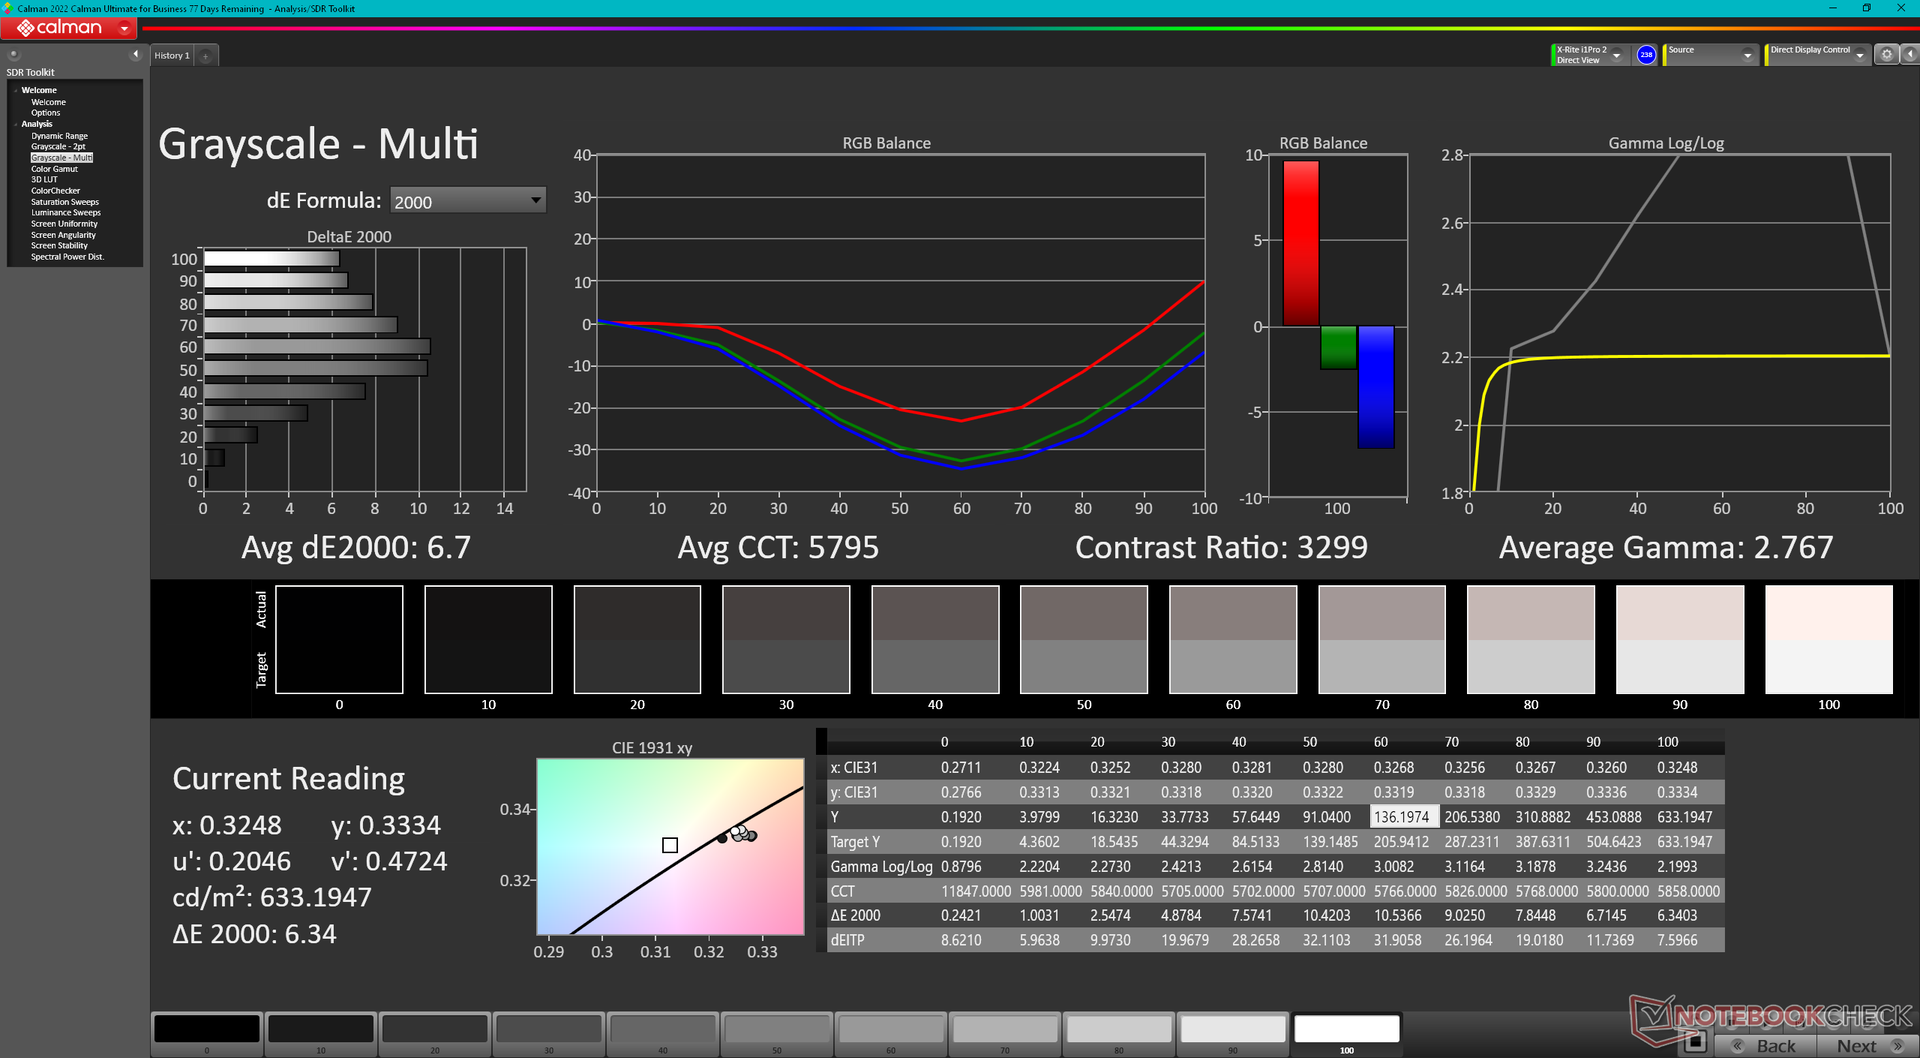
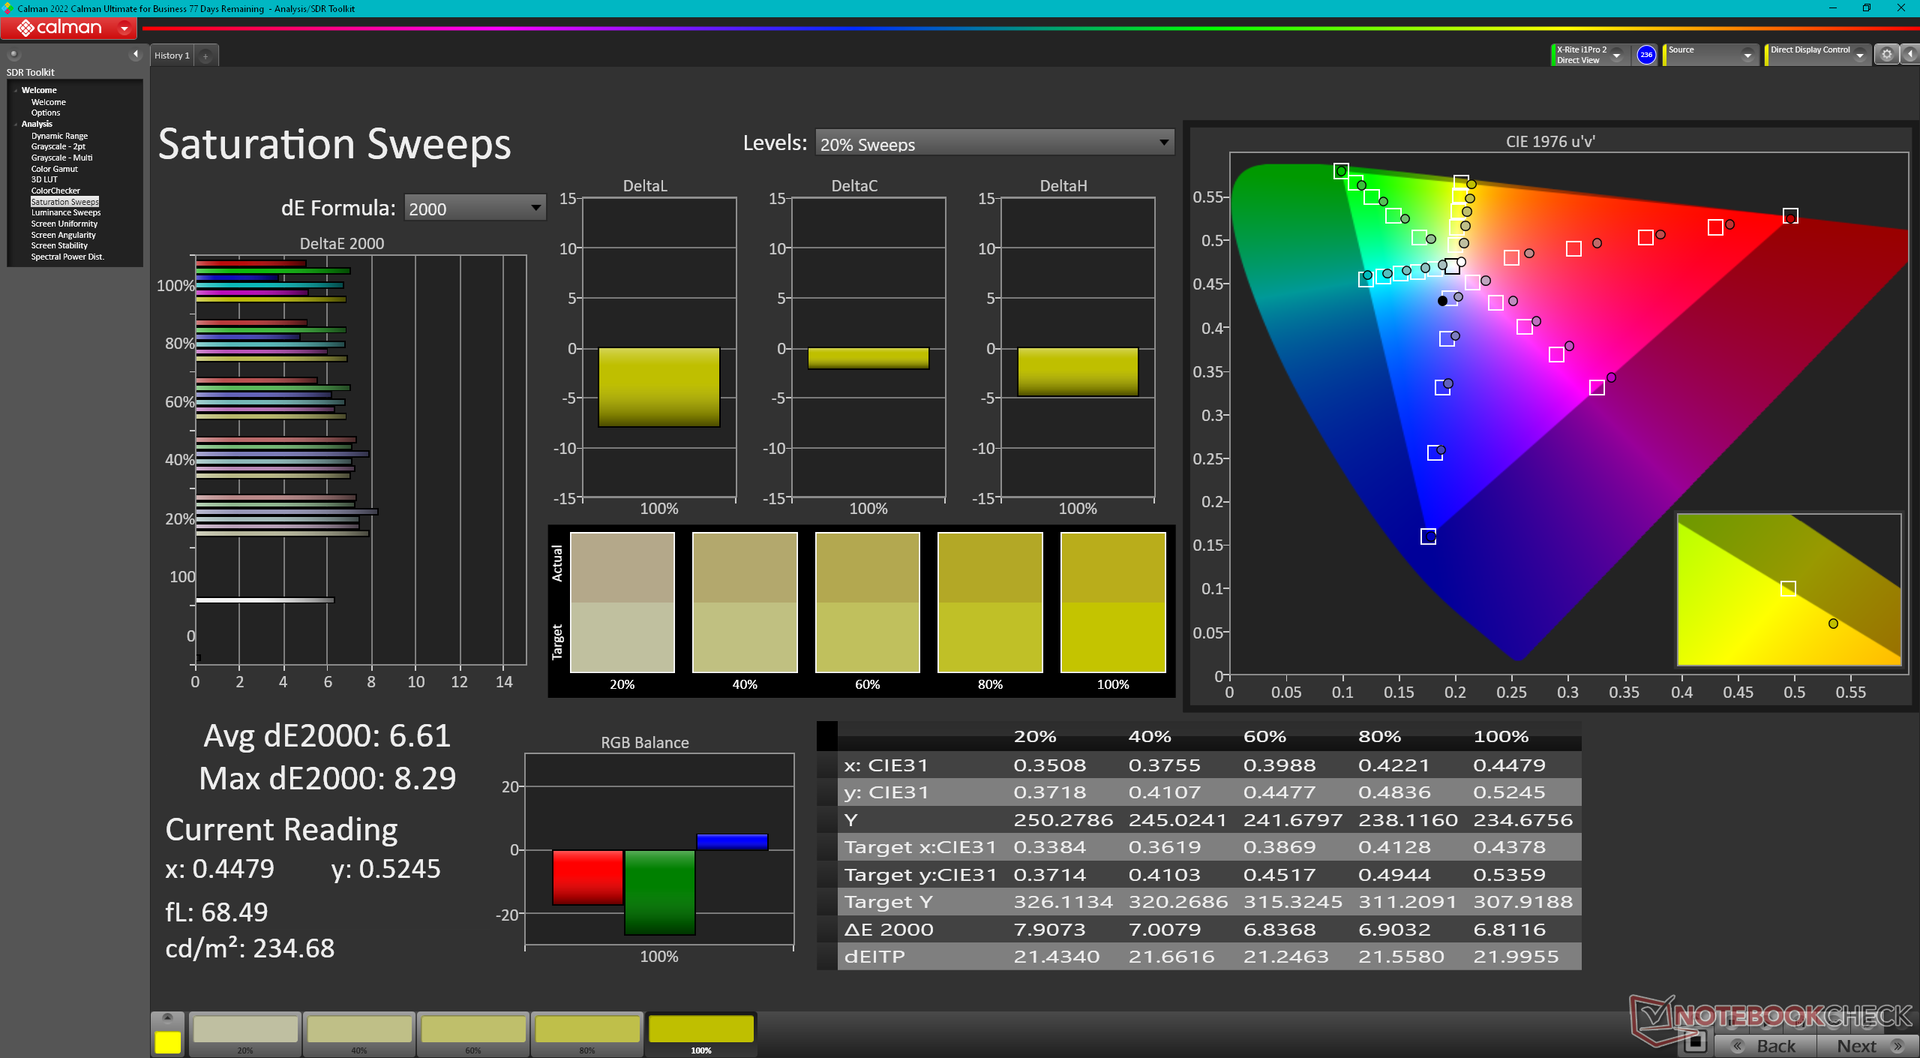
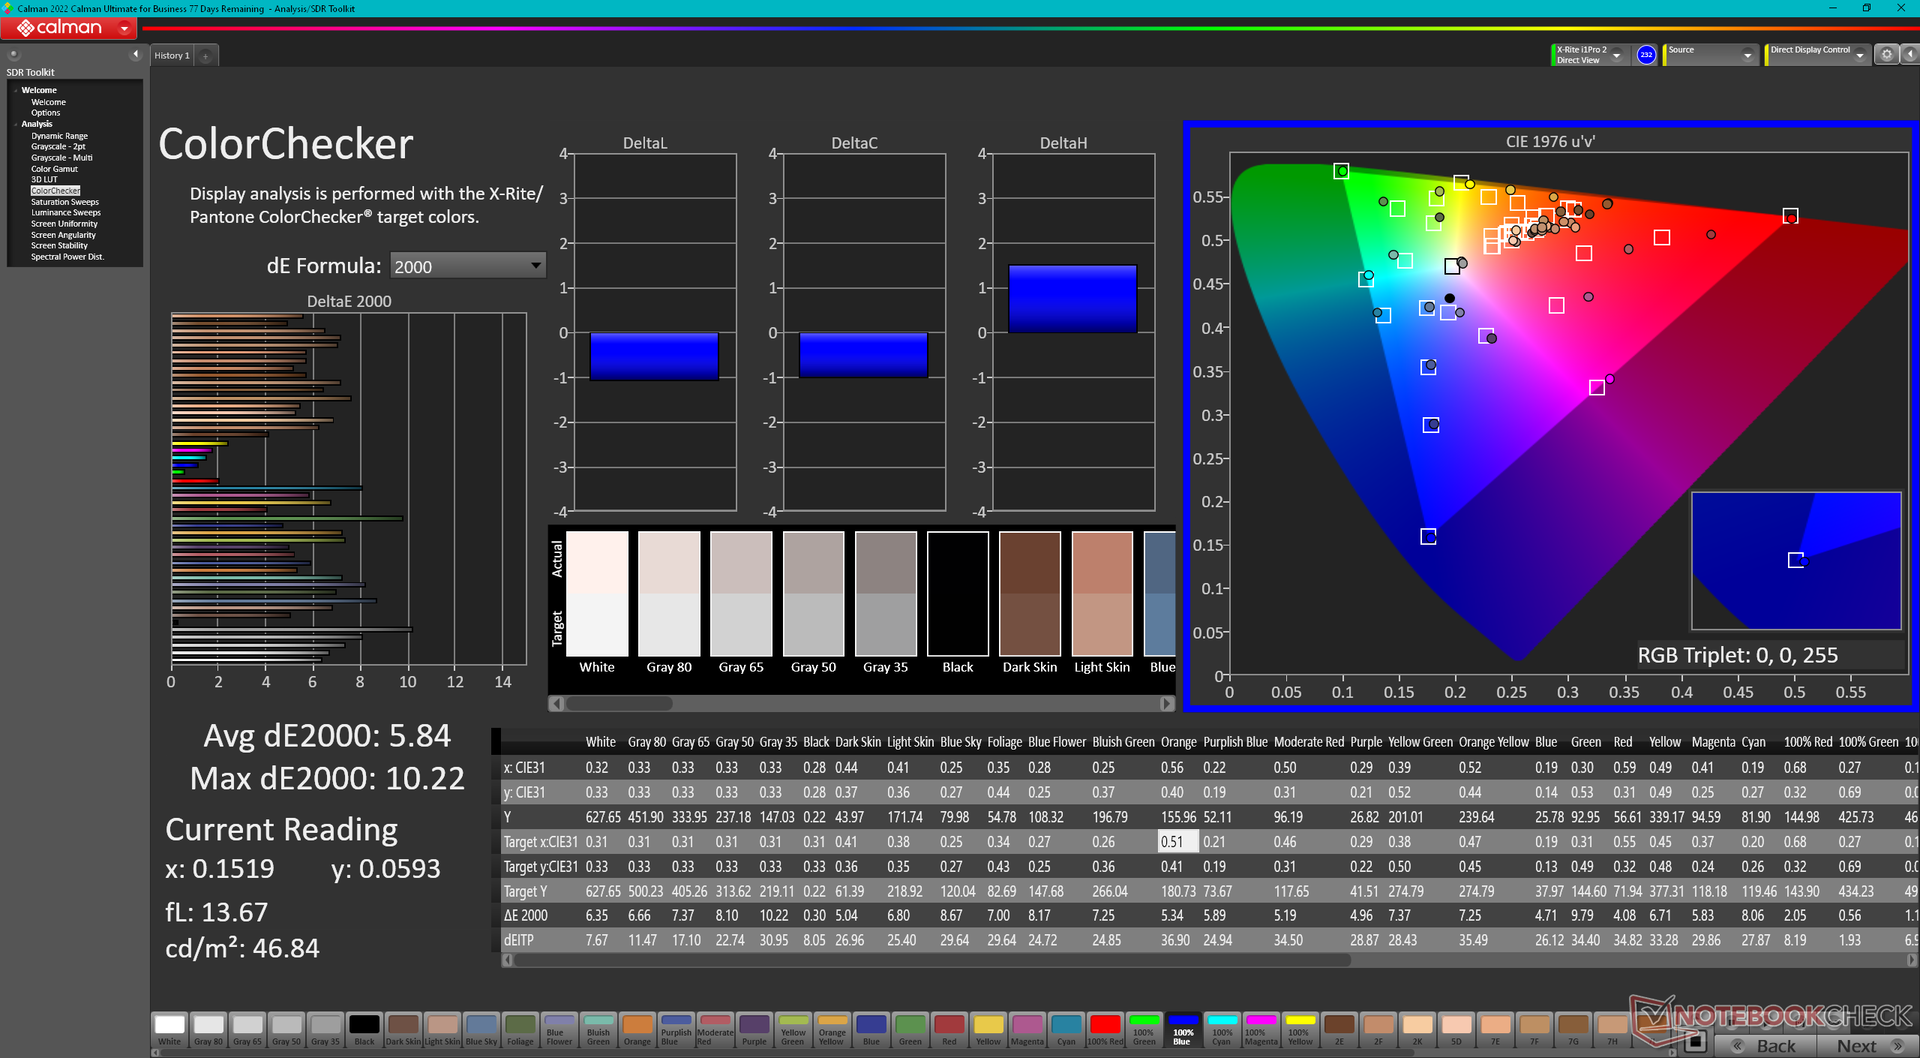
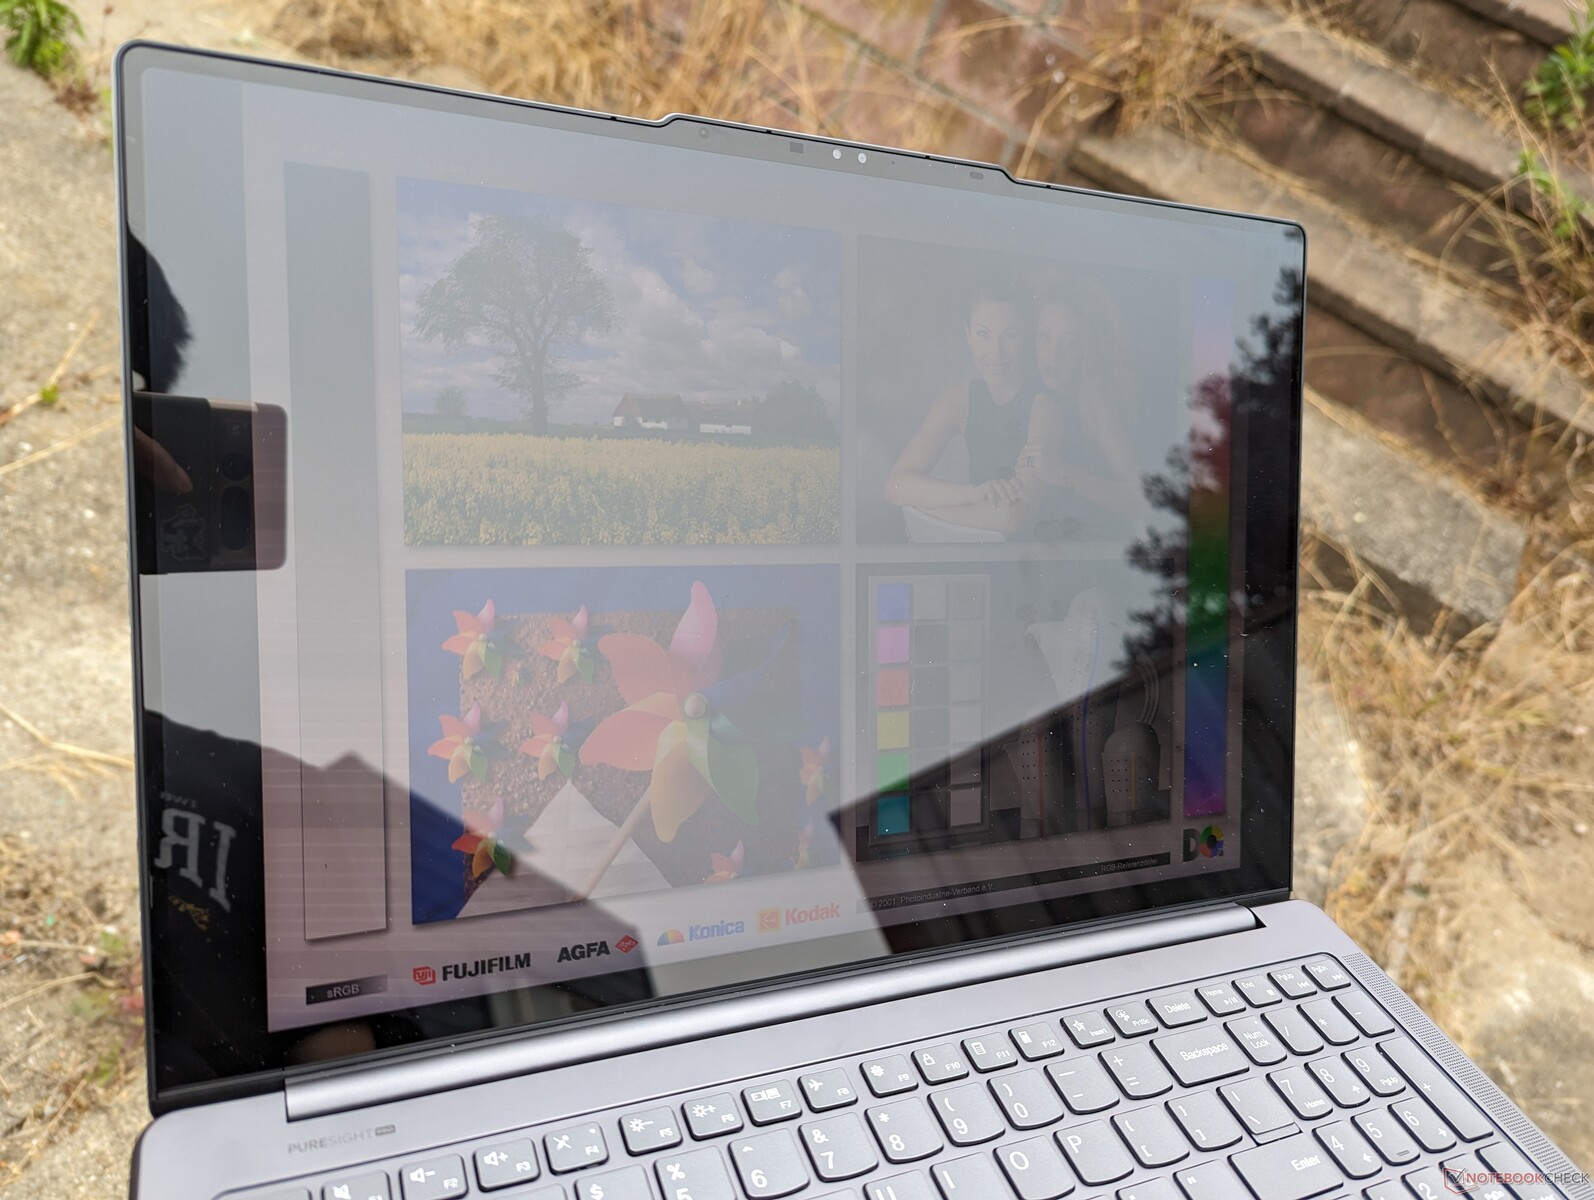
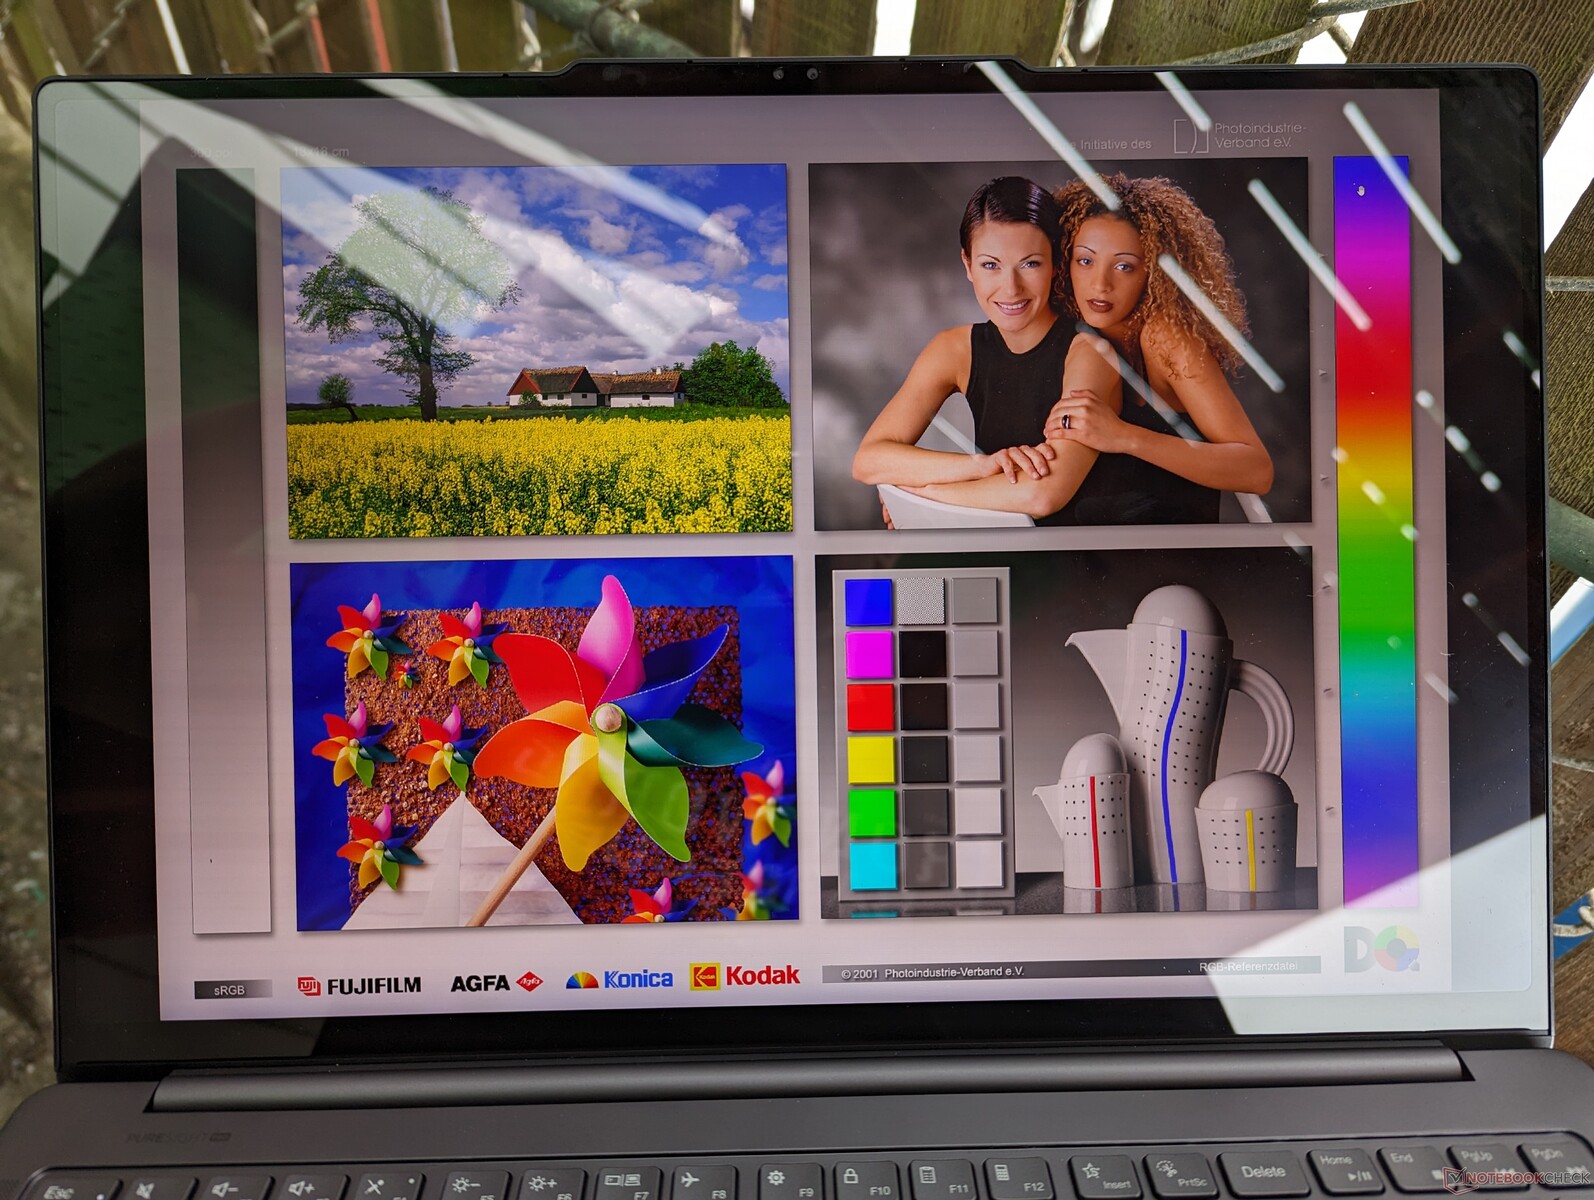
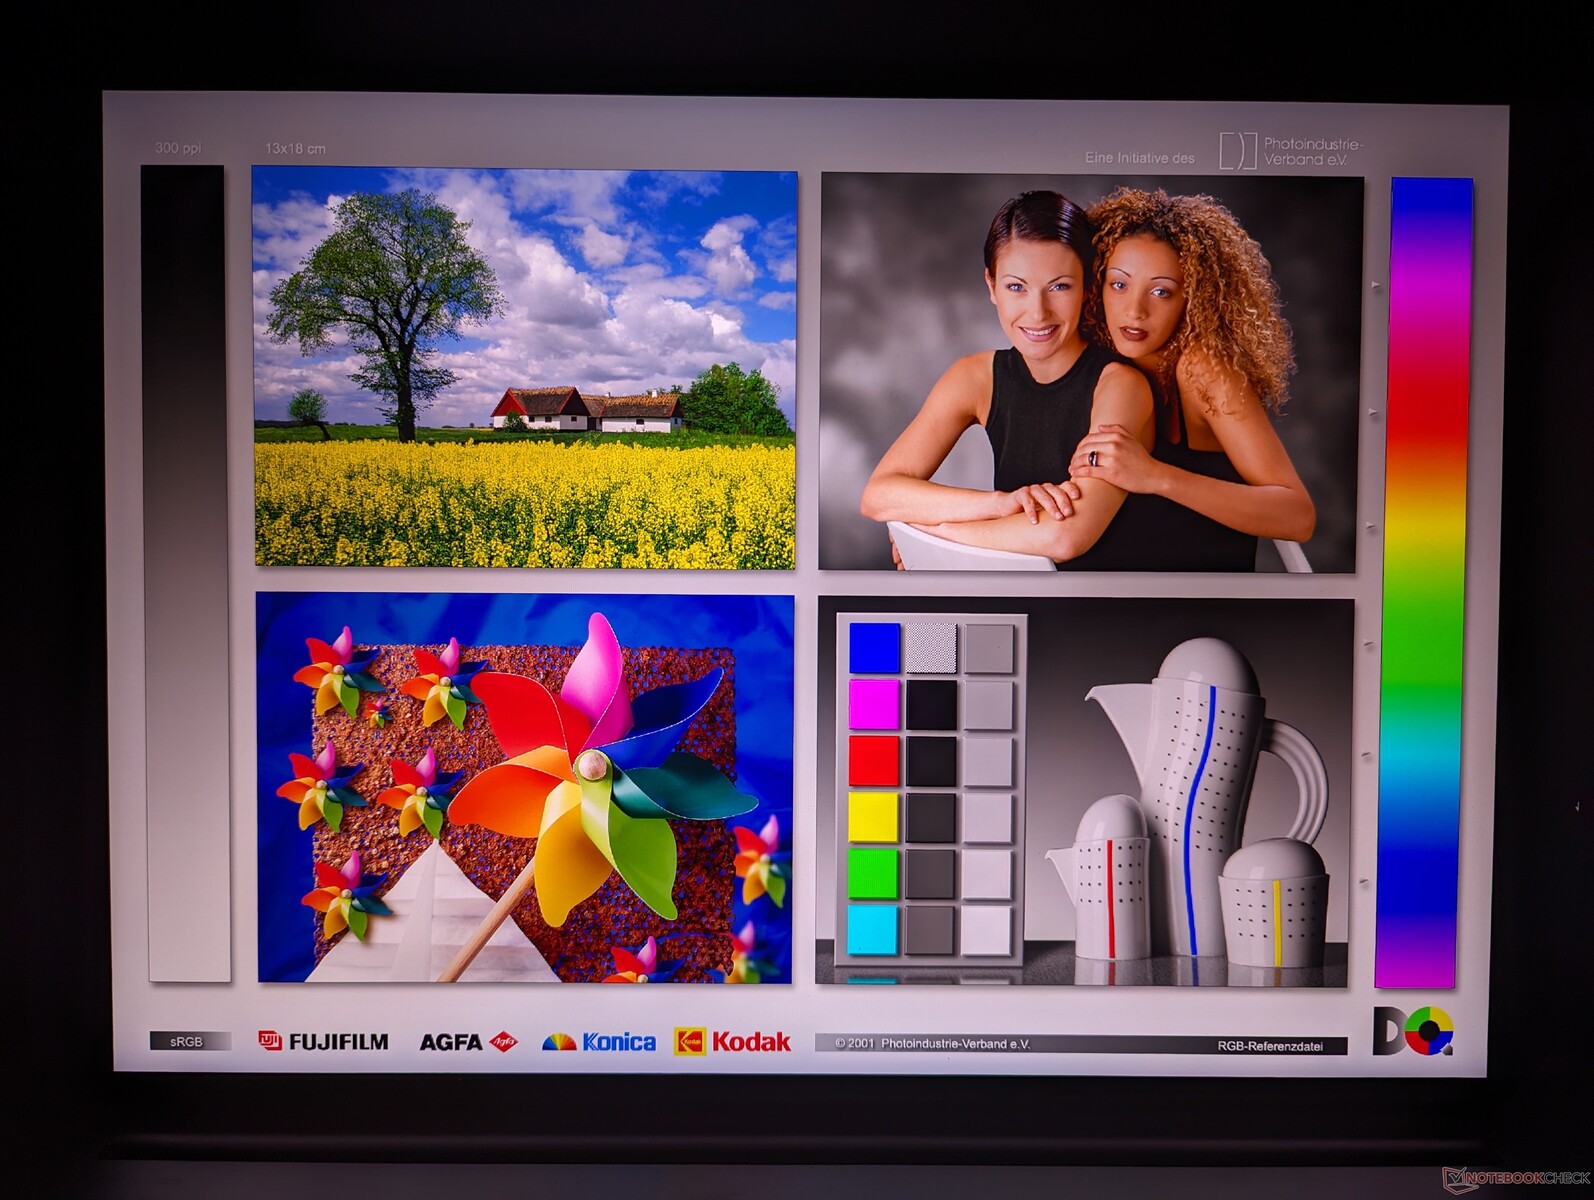
显示屏 - 100% DCI-P3、165 Hz、微型 LED、低蓝光、3.2K
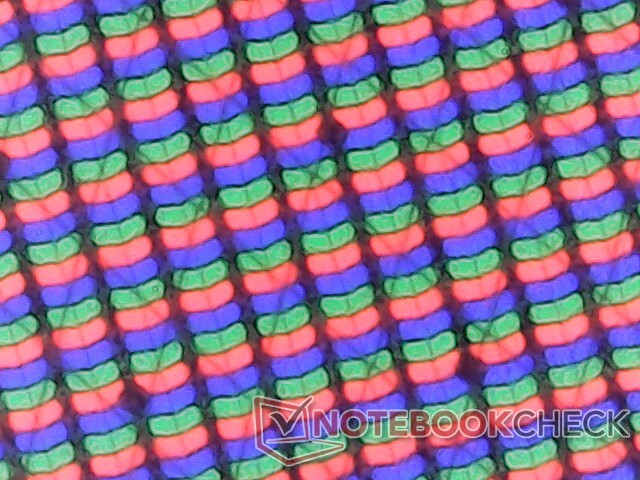
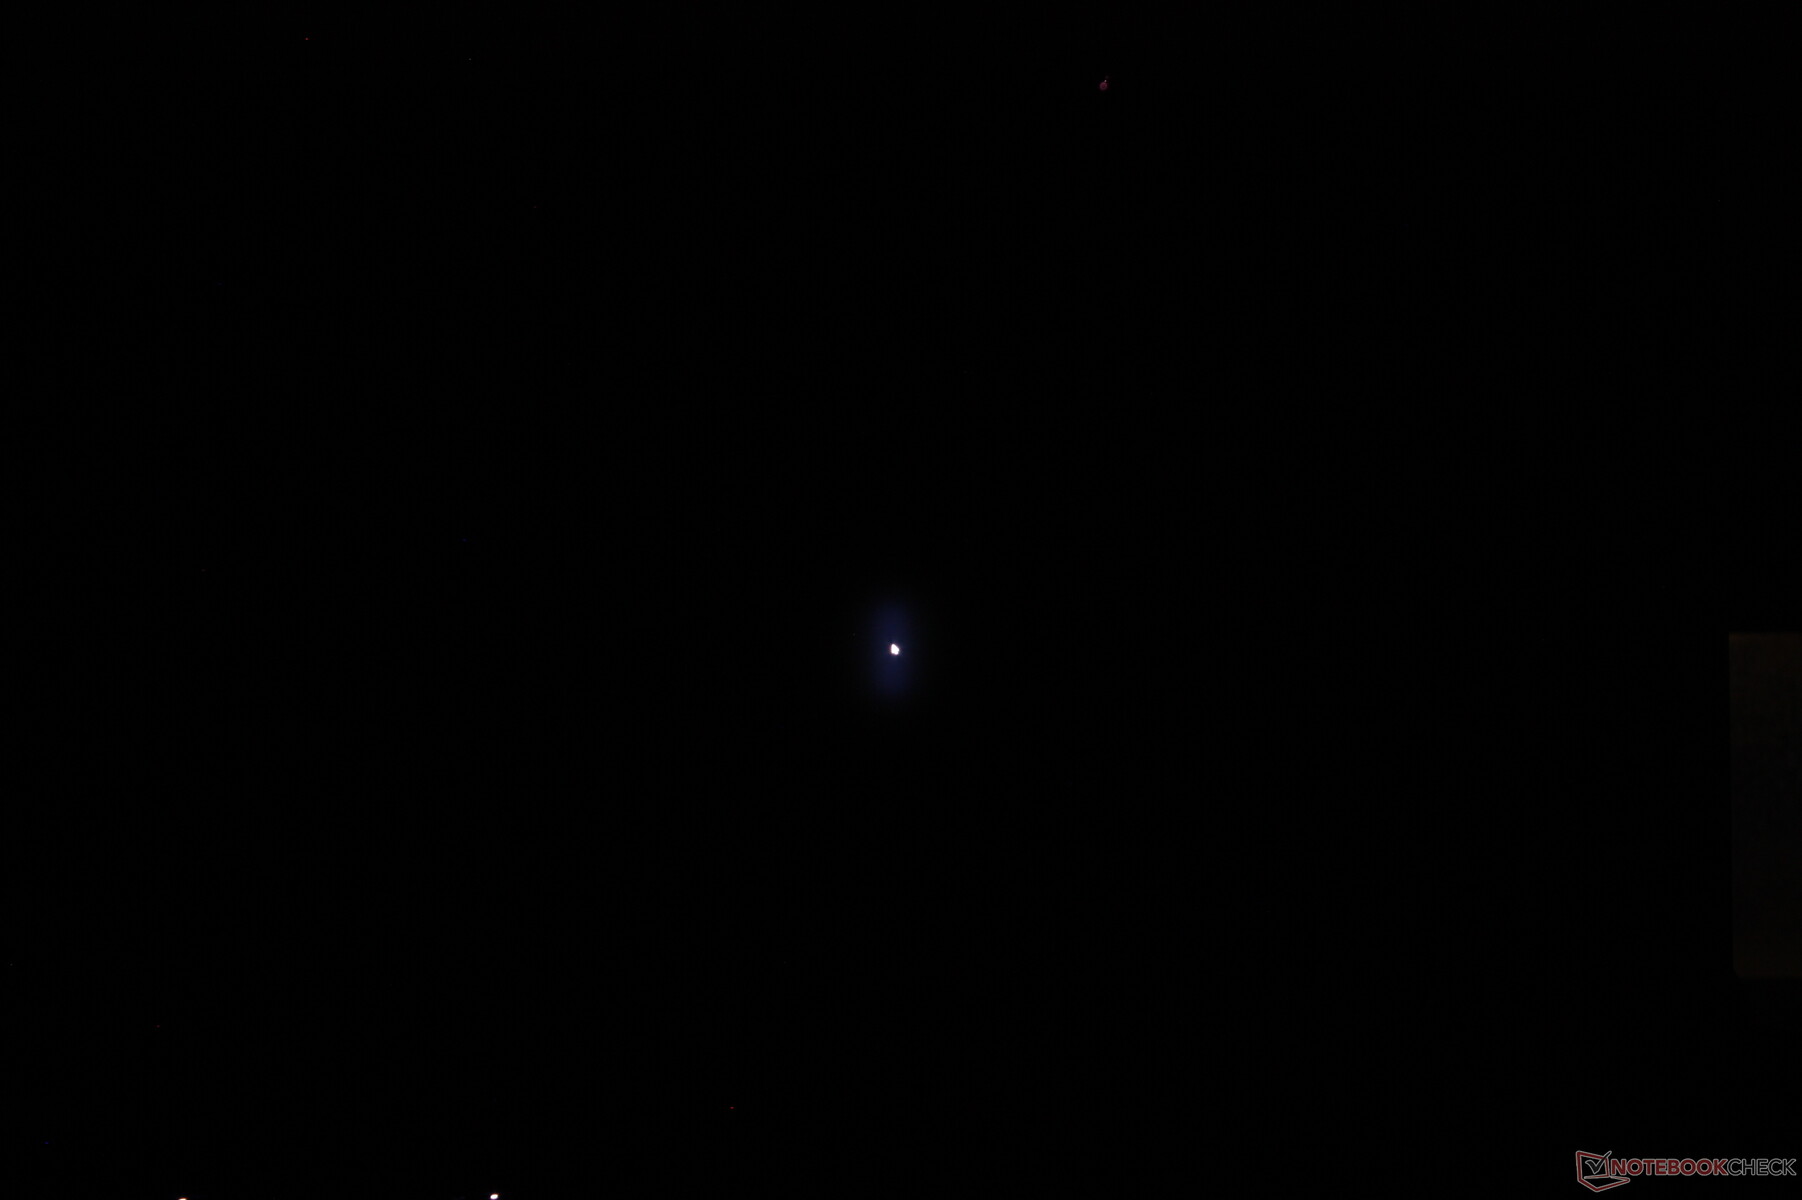
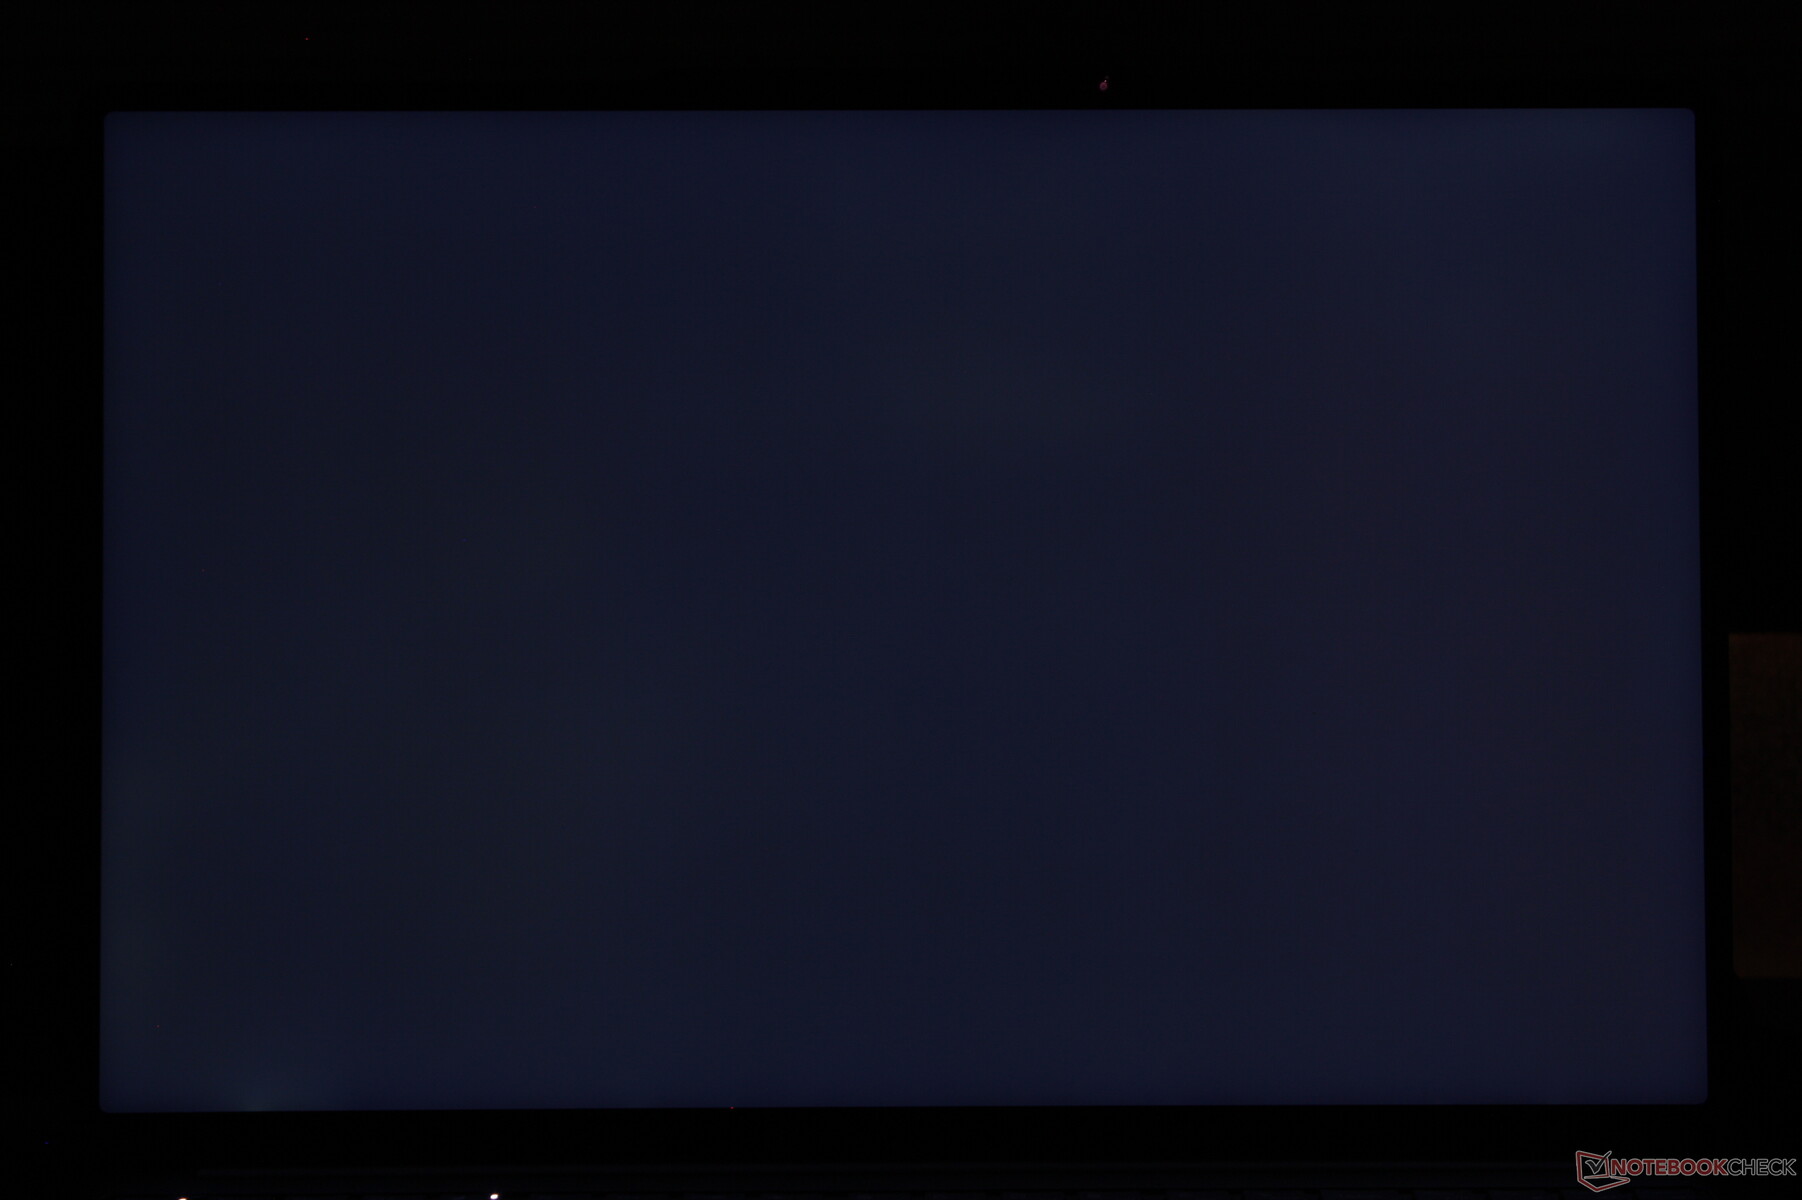
Mini-LED 结合了价格更低的 IPS 和更昂贵的 OLED 的优点。它既能提供 IPS 非常快的原生刷新率,又能通过局部调光实现 OLED 更高的最大亮度,从而带来更鲜艳的色彩。但缺点是在非常暗的背景下显示非常亮的物体时,会出现明显的 "光晕 "效果。例如,下面的截图显示的是全黑背景下的白色鼠标光标。在 OLED 面板上,光标边缘清晰,但在迷你 LED 上,由于局部调光并不完美,光标反而会发光。
在显示全白图像时,最大亮度被限制在 600 尼特左右。在运行这个 HDR 测试时时,我们测得的最大亮度为 1330 尼特,与联想宣称的 1200 尼特相符。
| |||||||||||||||||||||||||
Brightness Distribution: 95 %
Center on Battery: 627.4 cd/m²
Contrast: 3302:1 (Black: 0.19 cd/m²)
ΔE ColorChecker Calman: 5.84 | ∀{0.5-29.43 Ø4.71}
calibrated: 4.45
ΔE Greyscale Calman: 6.7 | ∀{0.09-98 Ø4.96}
84.6% AdobeRGB 1998 (Argyll 3D)
99.9% sRGB (Argyll 3D)
95.1% Display P3 (Argyll 3D)
Gamma: 2.77
CCT: 5795 K
| Lenovo Slim Pro 9i 16IRP8 LEN160-3.2K, Mini-LED, 3200x2000, 16" | Lenovo Yoga Pro 9 16-IRP G8 LEN160-3.2K, Mini-LED, 3200x2000, 16" | Asus VivoBook Pro 16 Au Optronics B160QAN02.L, IPS, 2560x1600, 16" | Acer Swift Edge SFE16-42-R1GM Samsung SDC4168, OLED, 3840x2400, 16" | Dell Inspiron 16 Plus 7620 BOE NE16N41, IPS, 3072x1920, 16" | HP Envy 16 h0112nr Samsung SDC4174, OLED, 3840x2400, 16" | |
|---|---|---|---|---|---|---|
| Display | 5% | 2% | 7% | -13% | 3% | |
| Display P3 Coverage (%) | 95.1 | 97 2% | 98.5 4% | 99.7 5% | 70.8 -26% | 99.3 4% |
| sRGB Coverage (%) | 99.9 | 99.8 0% | 99.9 0% | 100 0% | 99.5 0% | 100 0% |
| AdobeRGB 1998 Coverage (%) | 84.6 | 95.1 12% | 86.1 2% | 97.2 15% | 73.2 -13% | 88 4% |
| Response Times | 0% | 50% | 77% | -188% | 83% | |
| Response Time Grey 50% / Grey 80% * (ms) | 14 ? | 14 ? -0% | 2 ? 86% | 2 ? 86% | 38 ? -171% | 2 ? 86% |
| Response Time Black / White * (ms) | 9.2 ? | 9.2 ? -0% | 8 ? 13% | 3 ? 67% | 28 ? -204% | 1.9 ? 79% |
| PWM Frequency (Hz) | 5784 ? | 5800 ? | 239 ? | 240.4 ? | ||
| Screen | 24% | 5% | 21% | 9% | 17% | |
| Brightness middle (cd/m²) | 627.4 | 539 -14% | 504 -20% | 369 -41% | 288.9 -54% | 328.8 -48% |
| Brightness (cd/m²) | 618 | 546 -12% | 465 -25% | 371 -40% | 276 -55% | 332 -46% |
| Brightness Distribution (%) | 95 | 96 1% | 87 -8% | 97 2% | 92 -3% | 97 2% |
| Black Level * (cd/m²) | 0.19 | 0.18 5% | 0.35 -84% | 0.26 -37% | ||
| Contrast (:1) | 3302 | 2994 -9% | 1440 -56% | 1111 -66% | ||
| Colorchecker dE 2000 * | 5.84 | 1.4 76% | 1.83 69% | 2.3 61% | 1.88 68% | 1.53 74% |
| Colorchecker dE 2000 max. * | 10.22 | 2.1 79% | 5.51 46% | 4.37 57% | 4.37 57% | 6.04 41% |
| Colorchecker dE 2000 calibrated * | 4.45 | 1.34 70% | 2.87 36% | 0.42 91% | ||
| Greyscale dE 2000 * | 6.7 | 2.2 67% | 3.02 55% | 1.83 73% | 1.4 79% | 1.3 81% |
| Gamma | 2.77 79% | 2.19 100% | 2.39 92% | 2.39 92% | 2.3 96% | 2.18 101% |
| CCT | 5795 112% | 6479 100% | 6688 97% | 6392 102% | 6634 98% | 6362 102% |
| Total Average (Program / Settings) | 10% /
16% | 19% /
11% | 35% /
27% | -64% /
-24% | 34% /
25% |
* ... smaller is better
设置为 P3 模式时,色温比预期的要高。与许多微星机型不同,联想 Vantage 软件没有色温调节滑块。
Display Response Times
| ↔ Response Time Black to White | ||
|---|---|---|
| 9.2 ms ... rise ↗ and fall ↘ combined | ↗ 2.2 ms rise | 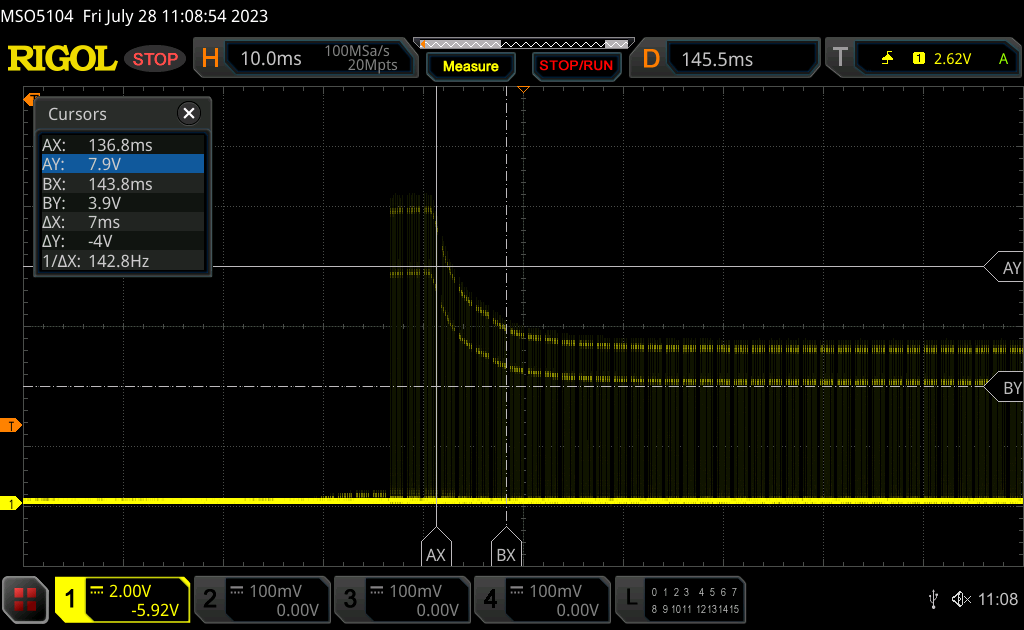 |
| ↘ 7 ms fall | ||
| The screen shows fast response rates in our tests and should be suited for gaming. In comparison, all tested devices range from 0.1 (minimum) to 240 (maximum) ms. » 26 % of all devices are better. This means that the measured response time is better than the average of all tested devices (19.8 ms). | ||
| ↔ Response Time 50% Grey to 80% Grey | ||
| 14 ms ... rise ↗ and fall ↘ combined | ↗ 7.4 ms rise |  |
| ↘ 6.6 ms fall | ||
| The screen shows good response rates in our tests, but may be too slow for competitive gamers. In comparison, all tested devices range from 0.165 (minimum) to 636 (maximum) ms. » 28 % of all devices are better. This means that the measured response time is better than the average of all tested devices (31 ms). | ||
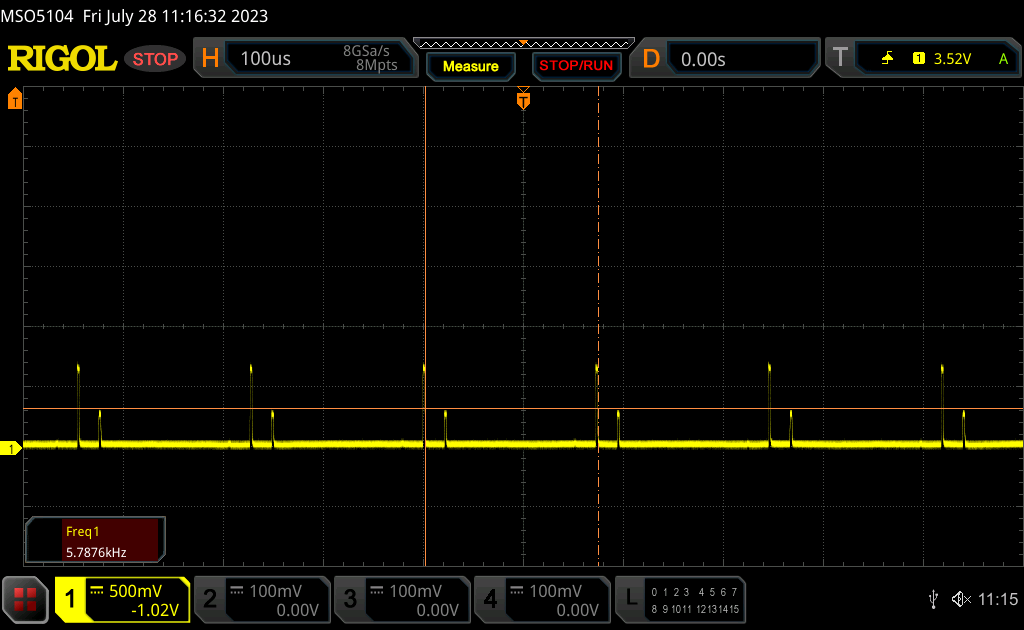
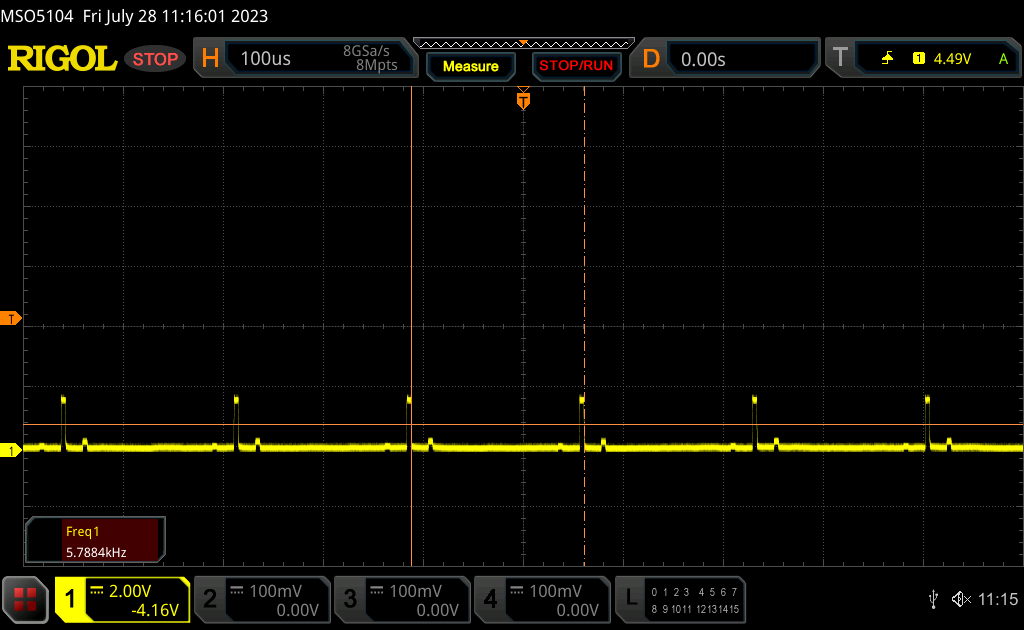
Screen Flickering / PWM (Pulse-Width Modulation)
| Screen flickering / PWM detected | 5784 Hz | ≤ 100 % brightness setting | 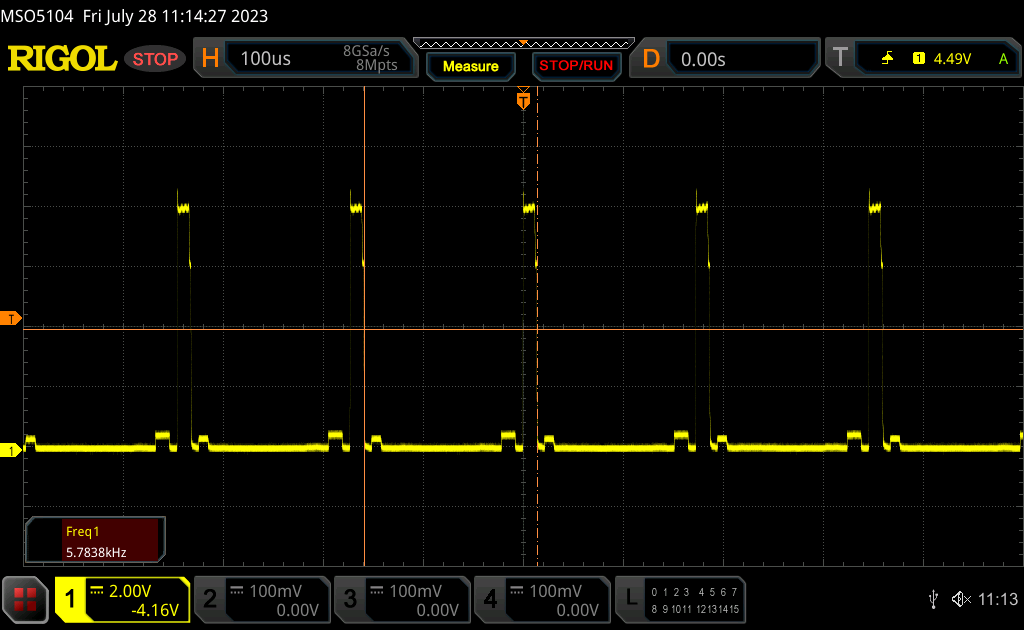 |
The display backlight flickers at 5784 Hz (worst case, e.g., utilizing PWM) Flickering detected at a brightness setting of 100 % and below. There should be no flickering or PWM above this brightness setting. The frequency of 5784 Hz is quite high, so most users sensitive to PWM should not notice any flickering. In comparison: 52 % of all tested devices do not use PWM to dim the display. If PWM was detected, an average of 7757 (minimum: 5 - maximum: 343500) Hz was measured. | |||
在 SDR 模式下,所有亮度级别都会出现闪烁。不过,它的频率相对较高,为 5784 Hz,因此对绝大多数用户来说应该不是问题。
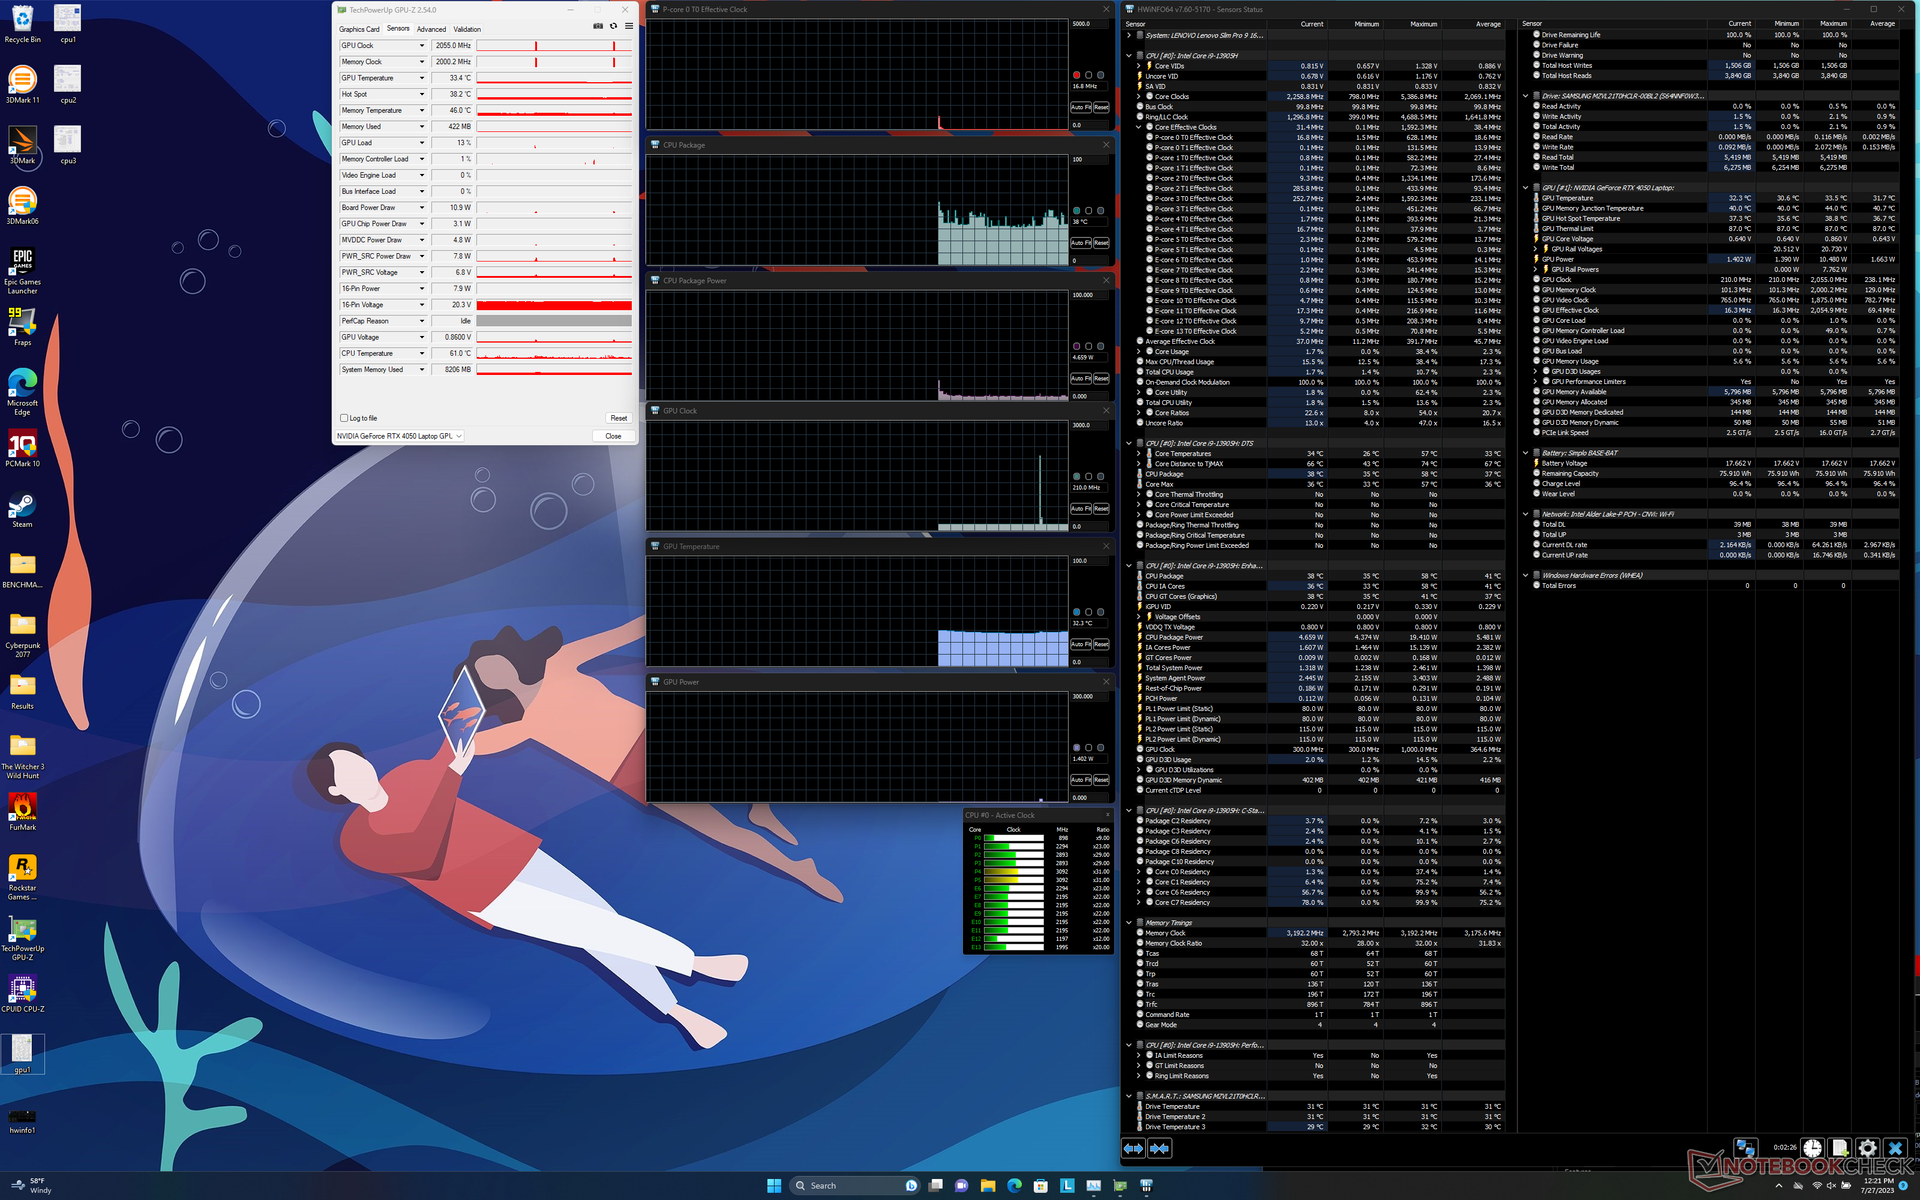
性能 - 第 13 代猛禽 Lake-H
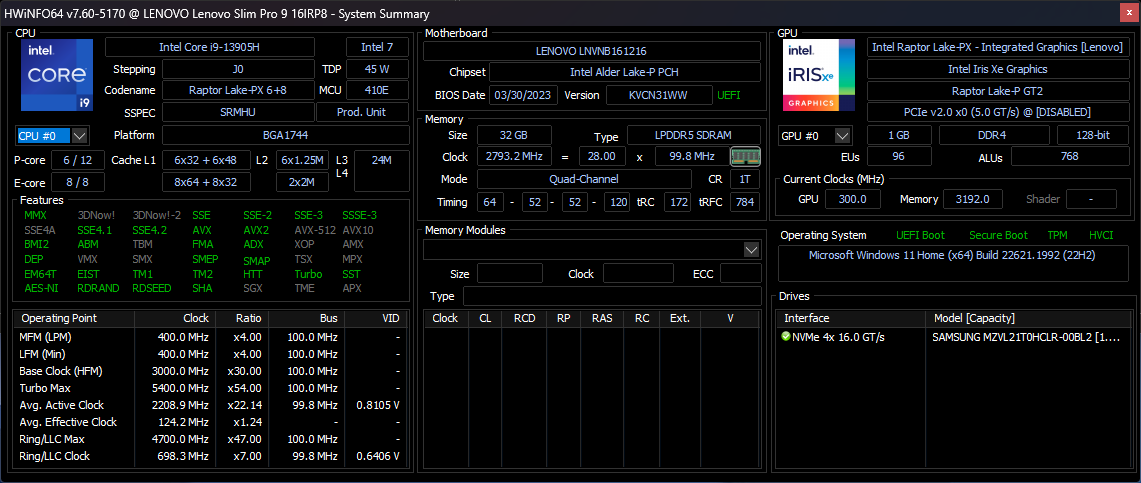
测试条件
在运行下面的基准测试之前,我们通过 Windows 将设备设置为 "性能模式",并通过联想 Vantage 将其设置为 "极致性能模式"。令人讨厌的是,联想经常重新设计其 Vantage UI,因此与其他联想笔记本电脑上的相同软件相比,所有设置都在不同的子菜单下。
处理器
酷睿 i9-13905H酷睿 i9-13905H可能比酷睿 i7-13705H在纸面上可能比酷睿 i7-13705H 更快,但充其量优势不大。两者的多线程性能几乎相同,而单线程性能仅比酷睿 i9 快 5% 至 10%。
Cinebench R15 Multi Loop
Cinebench R23: Multi Core | Single Core
Cinebench R20: CPU (Multi Core) | CPU (Single Core)
Cinebench R15: CPU Multi 64Bit | CPU Single 64Bit
Blender: v2.79 BMW27 CPU
7-Zip 18.03: 7z b 4 | 7z b 4 -mmt1
Geekbench 5.5: Multi-Core | Single-Core
HWBOT x265 Benchmark v2.2: 4k Preset
LibreOffice : 20 Documents To PDF
R Benchmark 2.5: Overall mean
* ... smaller is better
AIDA64: FP32 Ray-Trace | FPU Julia | CPU SHA3 | CPU Queen | FPU SinJulia | FPU Mandel | CPU AES | CPU ZLib | FP64 Ray-Trace | CPU PhotoWorxx
| Performance rating | |
| Lenovo Slim Pro 9i 16IRP8 | |
| Average Intel Core i9-13905H | |
| Lenovo Yoga Pro 9 16-IRP G8 | |
| HP Envy 16 h0112nr | |
| Asus VivoBook Pro 16 | |
| Dell Inspiron 16 Plus 7620 | |
| Acer Swift Edge SFE16-42-R1GM | |
| AIDA64 / FP32 Ray-Trace | |
| Average Intel Core i9-13905H (17642 - 19900, n=3) | |
| Lenovo Slim Pro 9i 16IRP8 | |
| Lenovo Yoga Pro 9 16-IRP G8 | |
| Asus VivoBook Pro 16 | |
| Dell Inspiron 16 Plus 7620 | |
| HP Envy 16 h0112nr | |
| Acer Swift Edge SFE16-42-R1GM | |
| AIDA64 / FPU Julia | |
| Lenovo Yoga Pro 9 16-IRP G8 | |
| Lenovo Slim Pro 9i 16IRP8 | |
| Average Intel Core i9-13905H (89198 - 94350, n=3) | |
| Asus VivoBook Pro 16 | |
| Acer Swift Edge SFE16-42-R1GM | |
| Dell Inspiron 16 Plus 7620 | |
| HP Envy 16 h0112nr | |
| AIDA64 / CPU SHA3 | |
| Lenovo Slim Pro 9i 16IRP8 | |
| Lenovo Yoga Pro 9 16-IRP G8 | |
| Average Intel Core i9-13905H (3945 - 4296, n=3) | |
| Asus VivoBook Pro 16 | |
| Dell Inspiron 16 Plus 7620 | |
| HP Envy 16 h0112nr | |
| Acer Swift Edge SFE16-42-R1GM | |
| AIDA64 / CPU Queen | |
| Lenovo Slim Pro 9i 16IRP8 | |
| Lenovo Yoga Pro 9 16-IRP G8 | |
| Average Intel Core i9-13905H (94506 - 117697, n=3) | |
| Asus VivoBook Pro 16 | |
| HP Envy 16 h0112nr | |
| Dell Inspiron 16 Plus 7620 | |
| Acer Swift Edge SFE16-42-R1GM | |
| AIDA64 / FPU SinJulia | |
| Lenovo Slim Pro 9i 16IRP8 | |
| Lenovo Yoga Pro 9 16-IRP G8 | |
| Acer Swift Edge SFE16-42-R1GM | |
| Average Intel Core i9-13905H (10478 - 11328, n=3) | |
| Asus VivoBook Pro 16 | |
| Dell Inspiron 16 Plus 7620 | |
| HP Envy 16 h0112nr | |
| AIDA64 / FPU Mandel | |
| Average Intel Core i9-13905H (43922 - 48884, n=3) | |
| Lenovo Slim Pro 9i 16IRP8 | |
| Lenovo Yoga Pro 9 16-IRP G8 | |
| Acer Swift Edge SFE16-42-R1GM | |
| Asus VivoBook Pro 16 | |
| Dell Inspiron 16 Plus 7620 | |
| HP Envy 16 h0112nr | |
| AIDA64 / CPU AES | |
| HP Envy 16 h0112nr | |
| Lenovo Slim Pro 9i 16IRP8 | |
| Lenovo Yoga Pro 9 16-IRP G8 | |
| Average Intel Core i9-13905H (80275 - 86469, n=3) | |
| Asus VivoBook Pro 16 | |
| Dell Inspiron 16 Plus 7620 | |
| Acer Swift Edge SFE16-42-R1GM | |
| AIDA64 / CPU ZLib | |
| Lenovo Slim Pro 9i 16IRP8 | |
| Lenovo Yoga Pro 9 16-IRP G8 | |
| Average Intel Core i9-13905H (1154 - 1234, n=3) | |
| Dell Inspiron 16 Plus 7620 | |
| Asus VivoBook Pro 16 | |
| HP Envy 16 h0112nr | |
| Acer Swift Edge SFE16-42-R1GM | |
| AIDA64 / FP64 Ray-Trace | |
| Average Intel Core i9-13905H (9483 - 10804, n=3) | |
| Lenovo Slim Pro 9i 16IRP8 | |
| Lenovo Yoga Pro 9 16-IRP G8 | |
| Asus VivoBook Pro 16 | |
| Dell Inspiron 16 Plus 7620 | |
| HP Envy 16 h0112nr | |
| Acer Swift Edge SFE16-42-R1GM | |
| AIDA64 / CPU PhotoWorxx | |
| Average Intel Core i9-13905H (51720 - 60161, n=3) | |
| Lenovo Slim Pro 9i 16IRP8 | |
| Lenovo Yoga Pro 9 16-IRP G8 | |
| HP Envy 16 h0112nr | |
| Dell Inspiron 16 Plus 7620 | |
| Acer Swift Edge SFE16-42-R1GM | |
| Asus VivoBook Pro 16 | |
系统性能
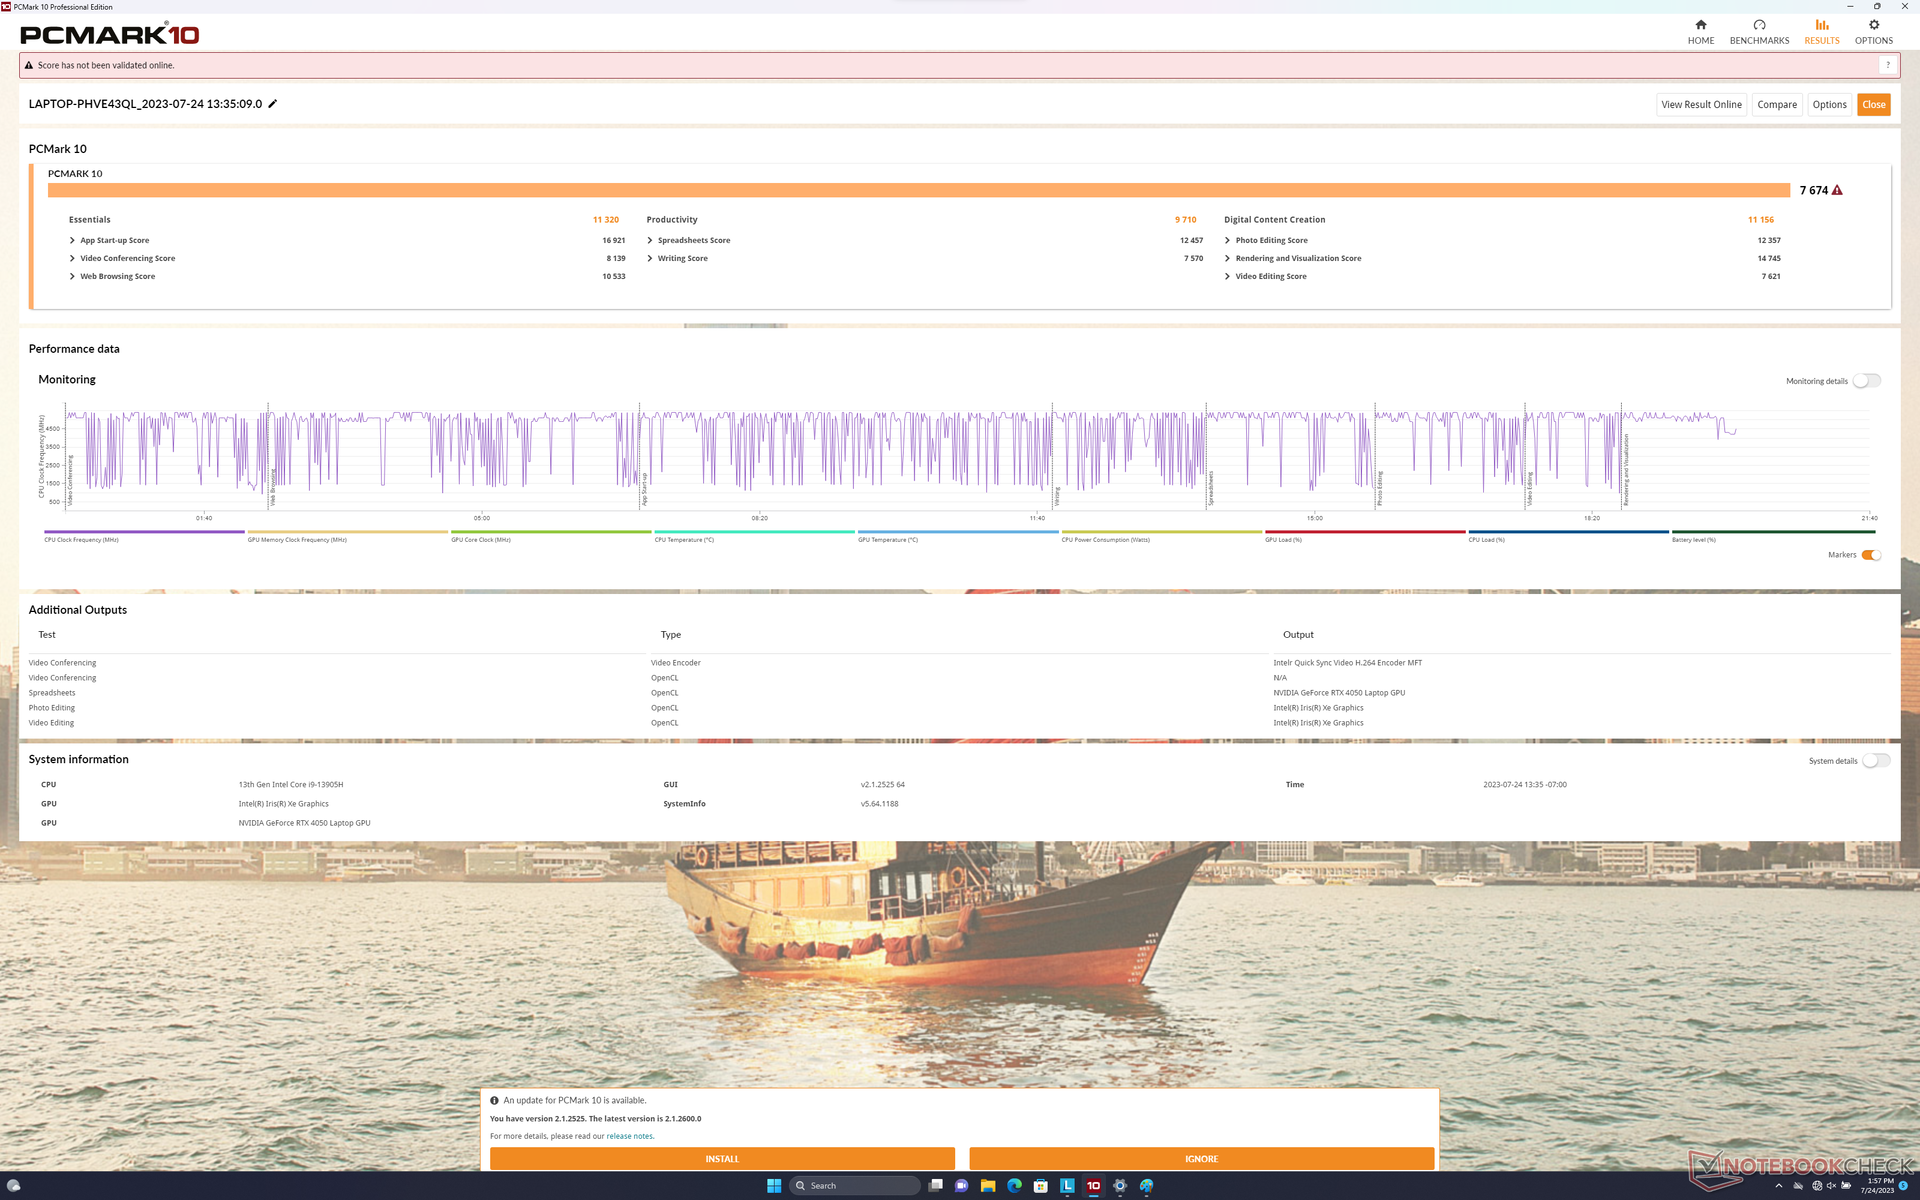
在测试过程中,我们遇到过从睡眠状态唤醒的问题,甚至出现过 BSOD。在尝试从睡眠中唤醒时,屏幕有时会保持空白,然后需要重启才能返回 Windows。
CrossMark: Overall | Productivity | Creativity | Responsiveness
| PCMark 10 / Score | |
| Lenovo Slim Pro 9i 16IRP8 | |
| HP Envy 16 h0112nr | |
| Lenovo Yoga Pro 9 16-IRP G8 | |
| Dell Inspiron 16 Plus 7620 | |
| Asus VivoBook Pro 16 | |
| Acer Swift Edge SFE16-42-R1GM | |
| PCMark 10 / Essentials | |
| HP Envy 16 h0112nr | |
| Lenovo Slim Pro 9i 16IRP8 | |
| Lenovo Yoga Pro 9 16-IRP G8 | |
| Dell Inspiron 16 Plus 7620 | |
| Asus VivoBook Pro 16 | |
| Acer Swift Edge SFE16-42-R1GM | |
| PCMark 10 / Productivity | |
| Lenovo Slim Pro 9i 16IRP8 | |
| HP Envy 16 h0112nr | |
| Acer Swift Edge SFE16-42-R1GM | |
| Dell Inspiron 16 Plus 7620 | |
| Asus VivoBook Pro 16 | |
| Lenovo Yoga Pro 9 16-IRP G8 | |
| PCMark 10 / Digital Content Creation | |
| Lenovo Slim Pro 9i 16IRP8 | |
| Lenovo Yoga Pro 9 16-IRP G8 | |
| HP Envy 16 h0112nr | |
| Dell Inspiron 16 Plus 7620 | |
| Asus VivoBook Pro 16 | |
| Acer Swift Edge SFE16-42-R1GM | |
| CrossMark / Overall | |
| Lenovo Yoga Pro 9 16-IRP G8 | |
| HP Envy 16 h0112nr | |
| Lenovo Slim Pro 9i 16IRP8 | |
| Dell Inspiron 16 Plus 7620 | |
| Asus VivoBook Pro 16 | |
| Acer Swift Edge SFE16-42-R1GM | |
| CrossMark / Productivity | |
| HP Envy 16 h0112nr | |
| Lenovo Yoga Pro 9 16-IRP G8 | |
| Asus VivoBook Pro 16 | |
| Dell Inspiron 16 Plus 7620 | |
| Lenovo Slim Pro 9i 16IRP8 | |
| Acer Swift Edge SFE16-42-R1GM | |
| CrossMark / Creativity | |
| Lenovo Yoga Pro 9 16-IRP G8 | |
| Lenovo Slim Pro 9i 16IRP8 | |
| HP Envy 16 h0112nr | |
| Dell Inspiron 16 Plus 7620 | |
| Asus VivoBook Pro 16 | |
| Acer Swift Edge SFE16-42-R1GM | |
| CrossMark / Responsiveness | |
| Asus VivoBook Pro 16 | |
| HP Envy 16 h0112nr | |
| Lenovo Yoga Pro 9 16-IRP G8 | |
| Dell Inspiron 16 Plus 7620 | |
| Lenovo Slim Pro 9i 16IRP8 | |
| Acer Swift Edge SFE16-42-R1GM | |
| PCMark 10 Score | 7674 points | |
Help | ||
| AIDA64 / Memory Copy | |
| Average Intel Core i9-13905H (76905 - 88014, n=3) | |
| Lenovo Slim Pro 9i 16IRP8 | |
| Lenovo Yoga Pro 9 16-IRP G8 | |
| HP Envy 16 h0112nr | |
| Dell Inspiron 16 Plus 7620 | |
| Acer Swift Edge SFE16-42-R1GM | |
| Asus VivoBook Pro 16 | |
| AIDA64 / Memory Read | |
| Lenovo Yoga Pro 9 16-IRP G8 | |
| Average Intel Core i9-13905H (68837 - 79123, n=3) | |
| Lenovo Slim Pro 9i 16IRP8 | |
| HP Envy 16 h0112nr | |
| Dell Inspiron 16 Plus 7620 | |
| Acer Swift Edge SFE16-42-R1GM | |
| Asus VivoBook Pro 16 | |
| AIDA64 / Memory Write | |
| Lenovo Yoga Pro 9 16-IRP G8 | |
| Average Intel Core i9-13905H (89545 - 103259, n=3) | |
| Lenovo Slim Pro 9i 16IRP8 | |
| HP Envy 16 h0112nr | |
| Dell Inspiron 16 Plus 7620 | |
| Acer Swift Edge SFE16-42-R1GM | |
| Asus VivoBook Pro 16 | |
| AIDA64 / Memory Latency | |
| Lenovo Yoga Pro 9 16-IRP G8 | |
| Average Intel Core i9-13905H (101.4 - 134.8, n=3) | |
| Lenovo Slim Pro 9i 16IRP8 | |
| Acer Swift Edge SFE16-42-R1GM | |
| Dell Inspiron 16 Plus 7620 | |
| HP Envy 16 h0112nr | |
| Asus VivoBook Pro 16 | |
* ... smaller is better
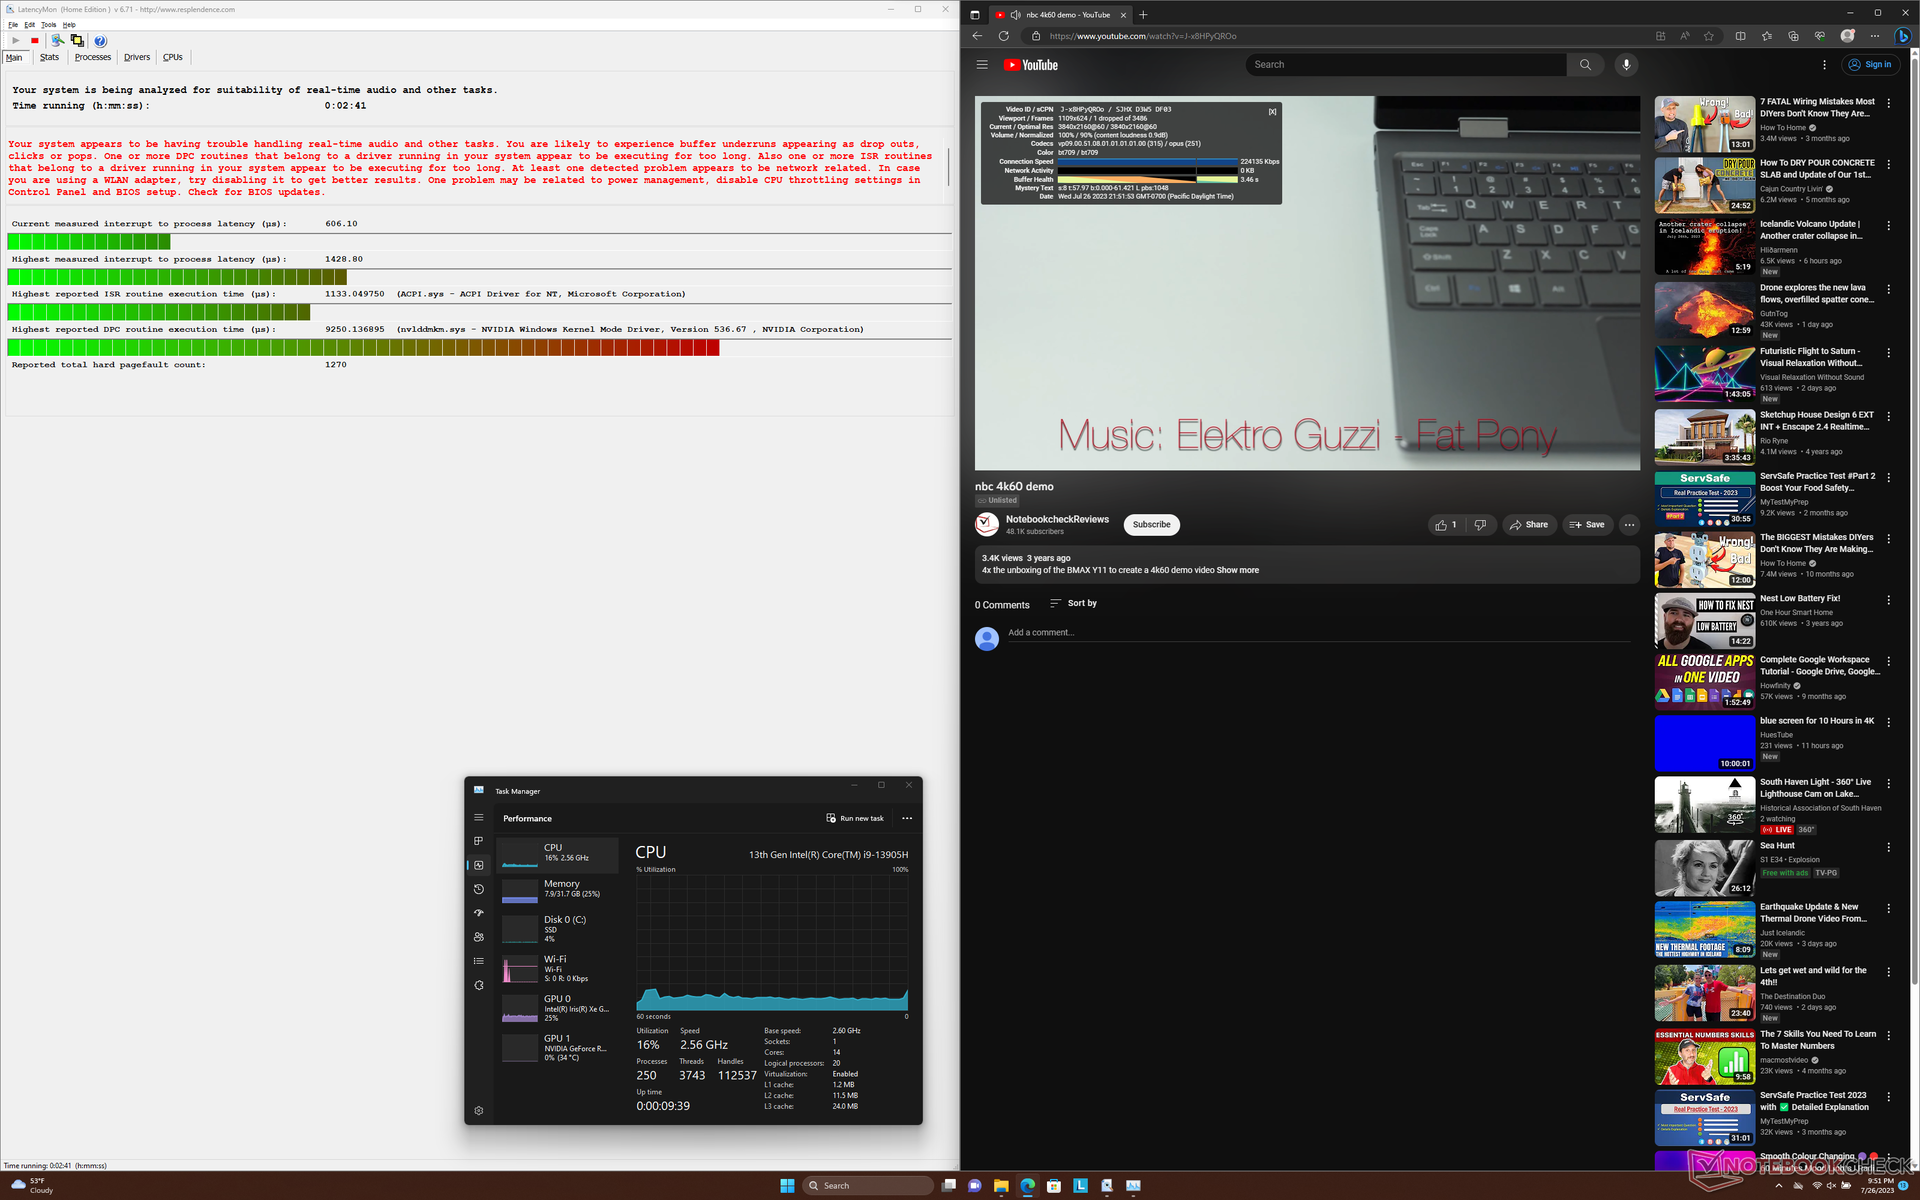
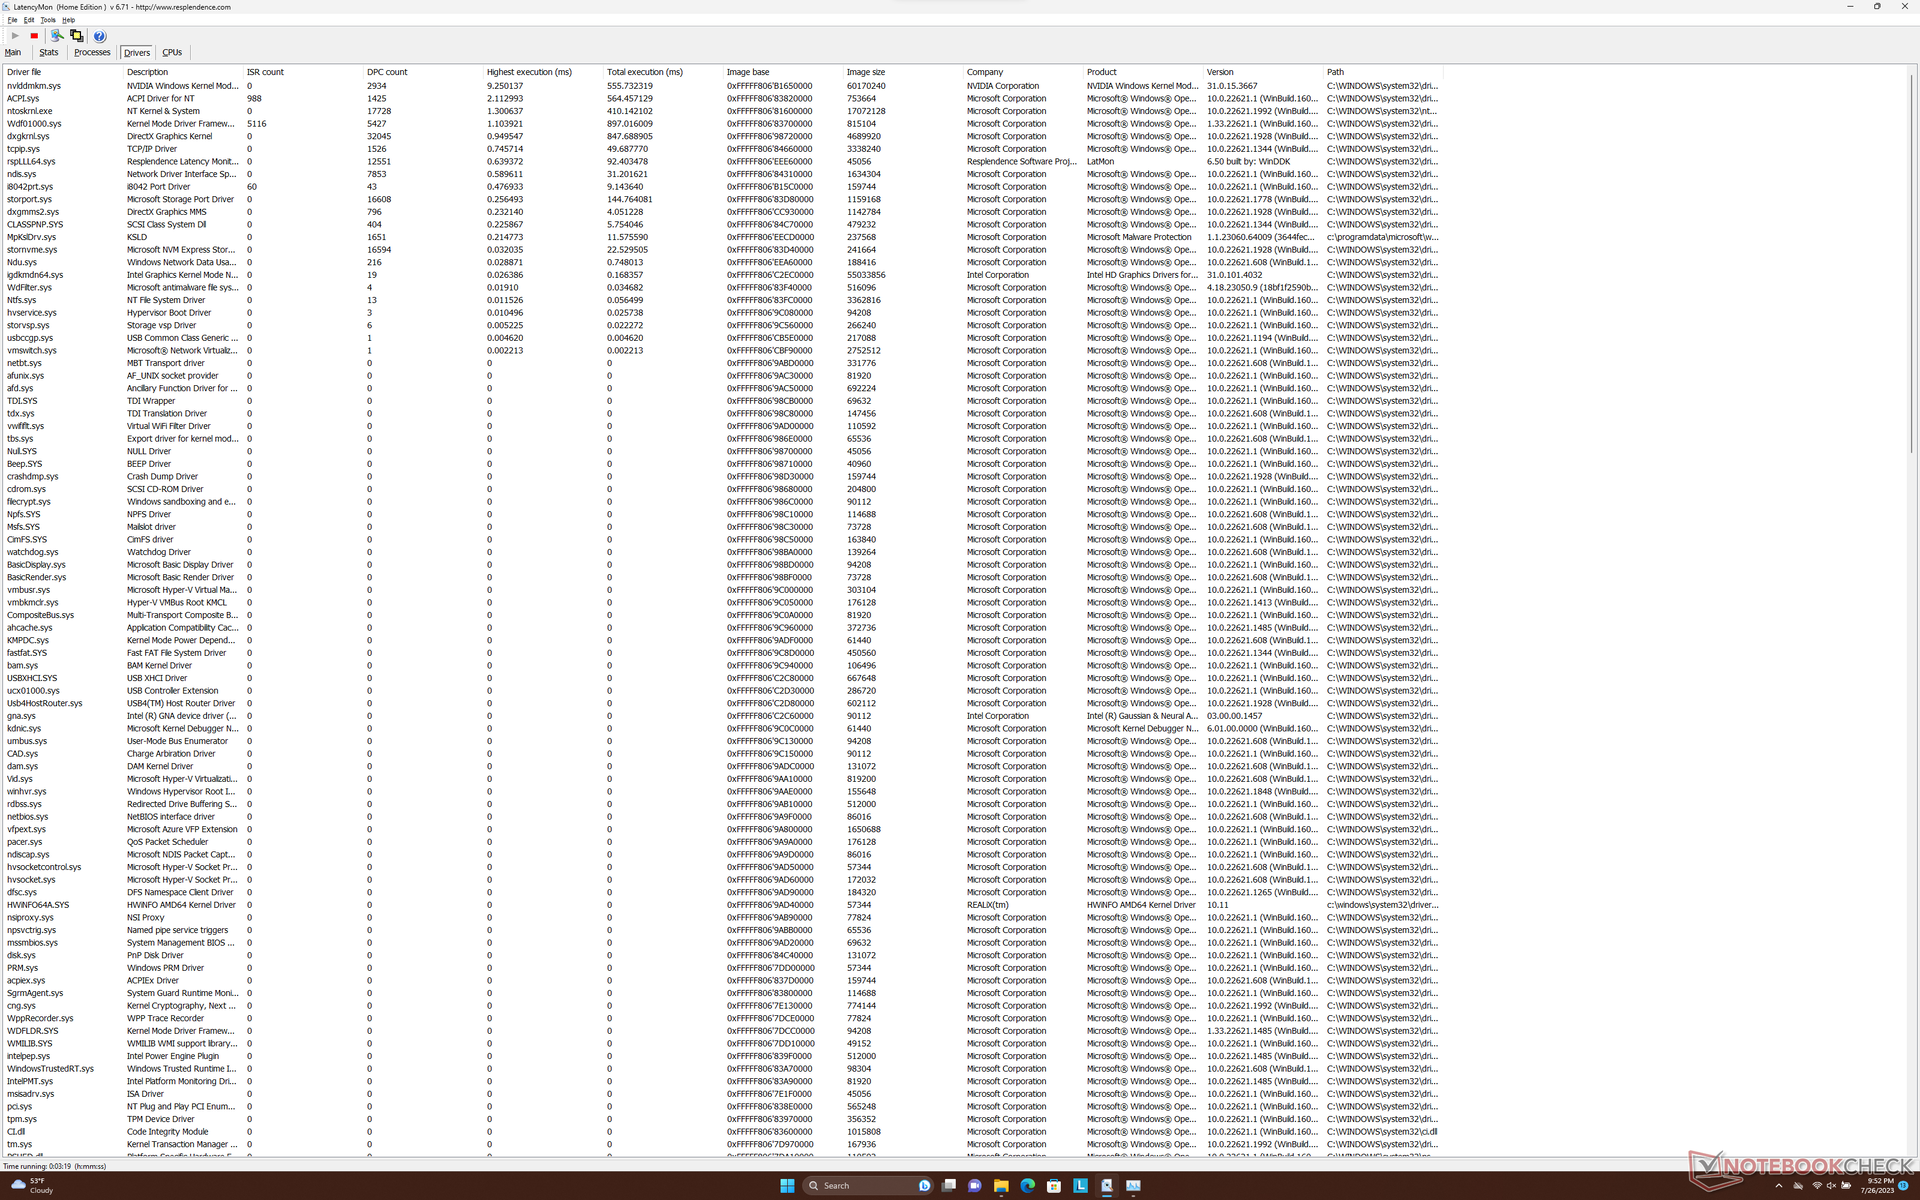
DPC 延迟
在打开我们主页的多个浏览器标签时,LatencyMon 显示了 DPC 问题。此外,以 60 FPS 播放 4K 视频也非常出色,在 60 秒的时间范围内仅出现过一次丢帧。
| DPC Latencies / LatencyMon - interrupt to process latency (max), Web, Youtube, Prime95 | |
| Lenovo Yoga Pro 9 16-IRP G8 | |
| Acer Swift Edge SFE16-42-R1GM | |
| Asus VivoBook Pro 16 | |
| Lenovo Slim Pro 9i 16IRP8 | |
| Dell Inspiron 16 Plus 7620 | |
| HP Envy 16 h0112nr | |
* ... smaller is better
存储设备
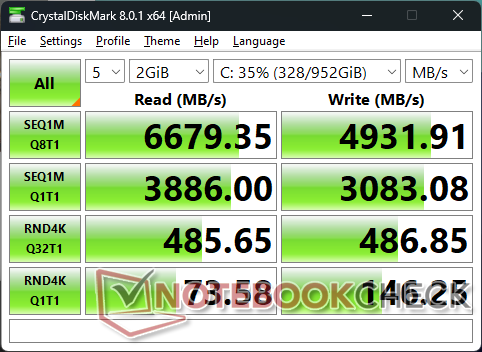
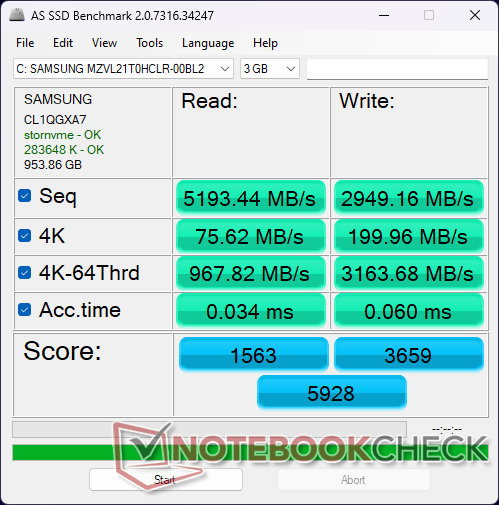

| Drive Performance rating - Percent | |
| Acer Swift Edge SFE16-42-R1GM | |
| Lenovo Yoga Pro 9 16-IRP G8 | |
| Lenovo Slim Pro 9i 16IRP8 | |
| HP Envy 16 h0112nr | |
| Asus VivoBook Pro 16 | |
| Dell Inspiron 16 Plus 7620 | |
* ... smaller is better
Disk Throttling: DiskSpd Read Loop, Queue Depth 8
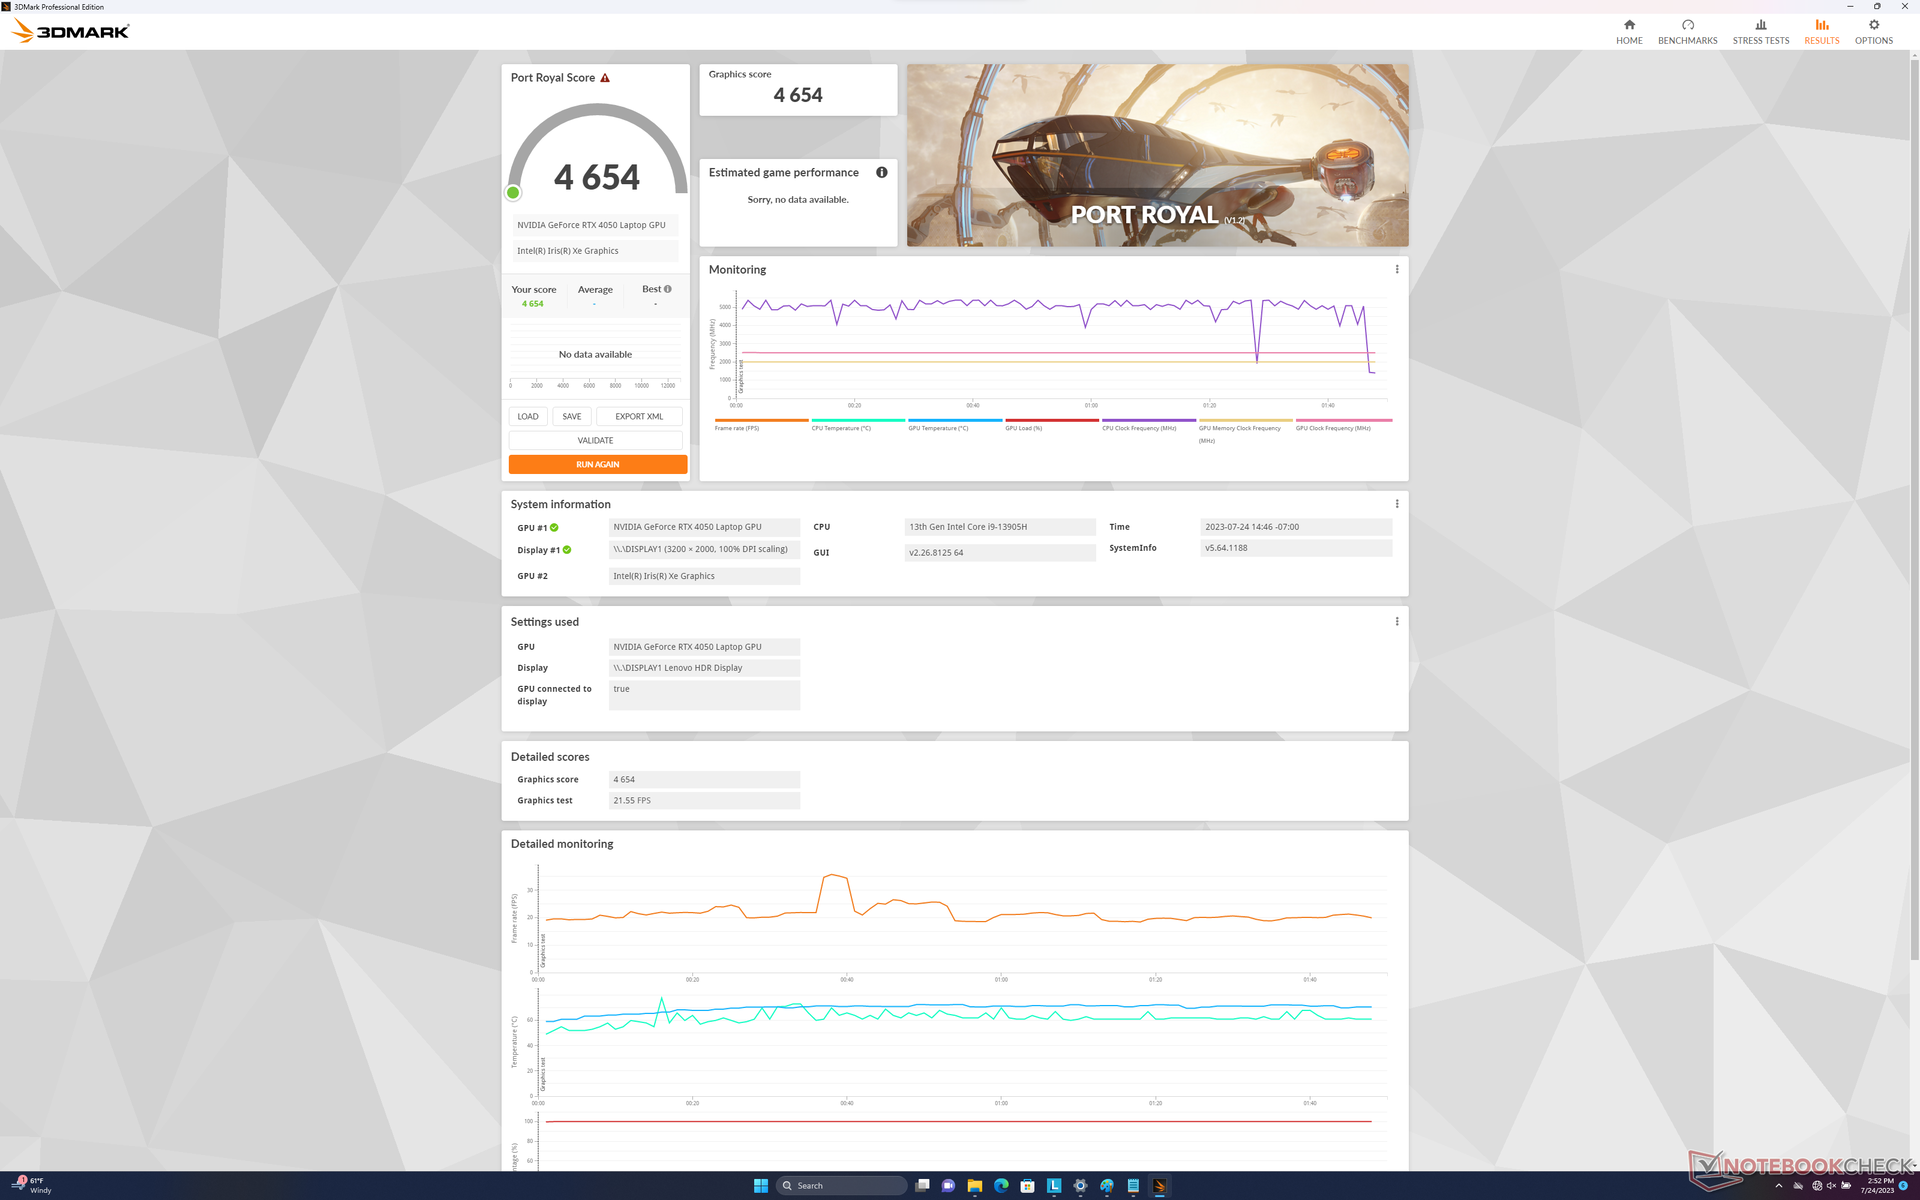
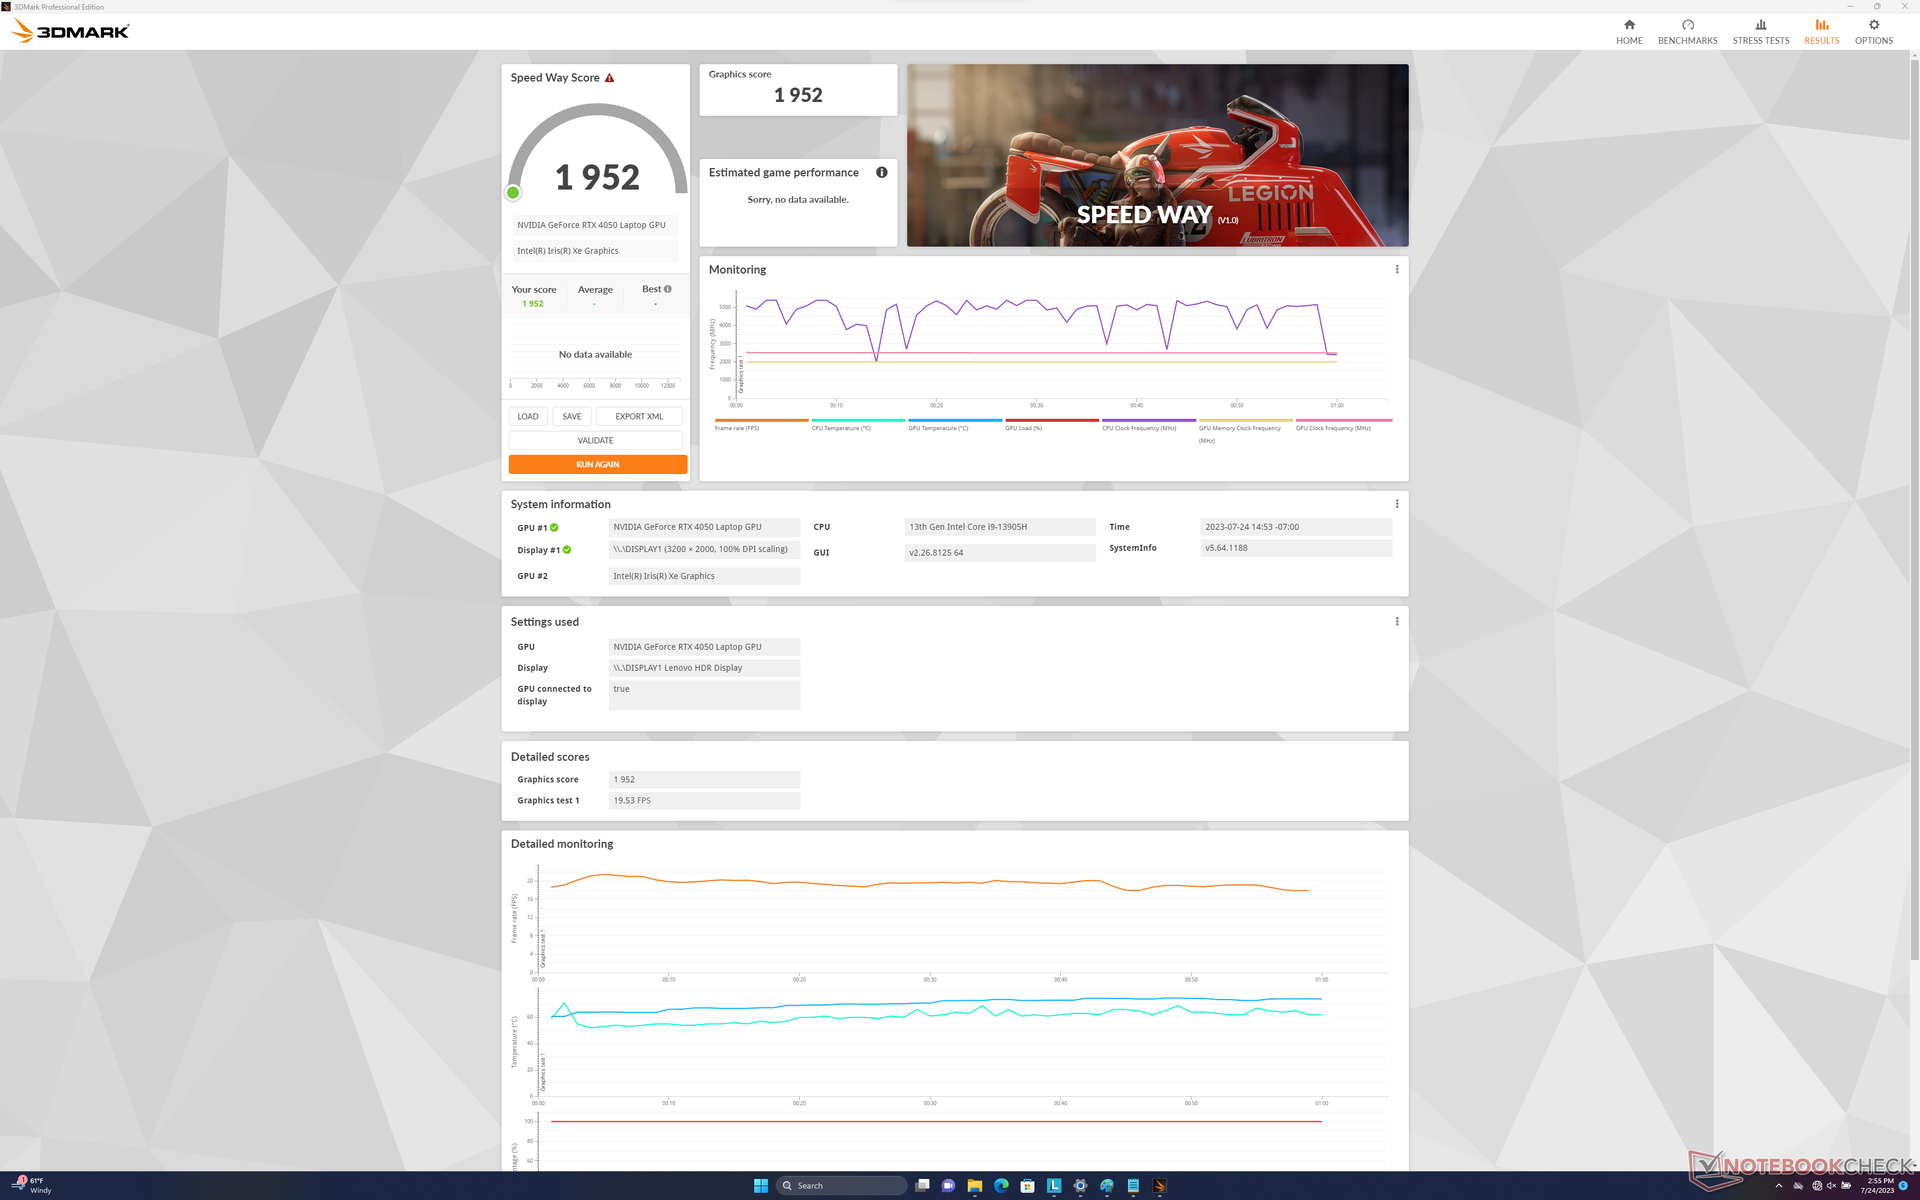
图形处理器性能
手机 移动版GeForce RTX 4050比去年令人失望的 移动 RTX 3050系列的显著升级。原始图形性能比 RTX 3050 Ti与 移动 RTX 3060.
升级到 RTX 4060配置有望将性能提升约 20%。
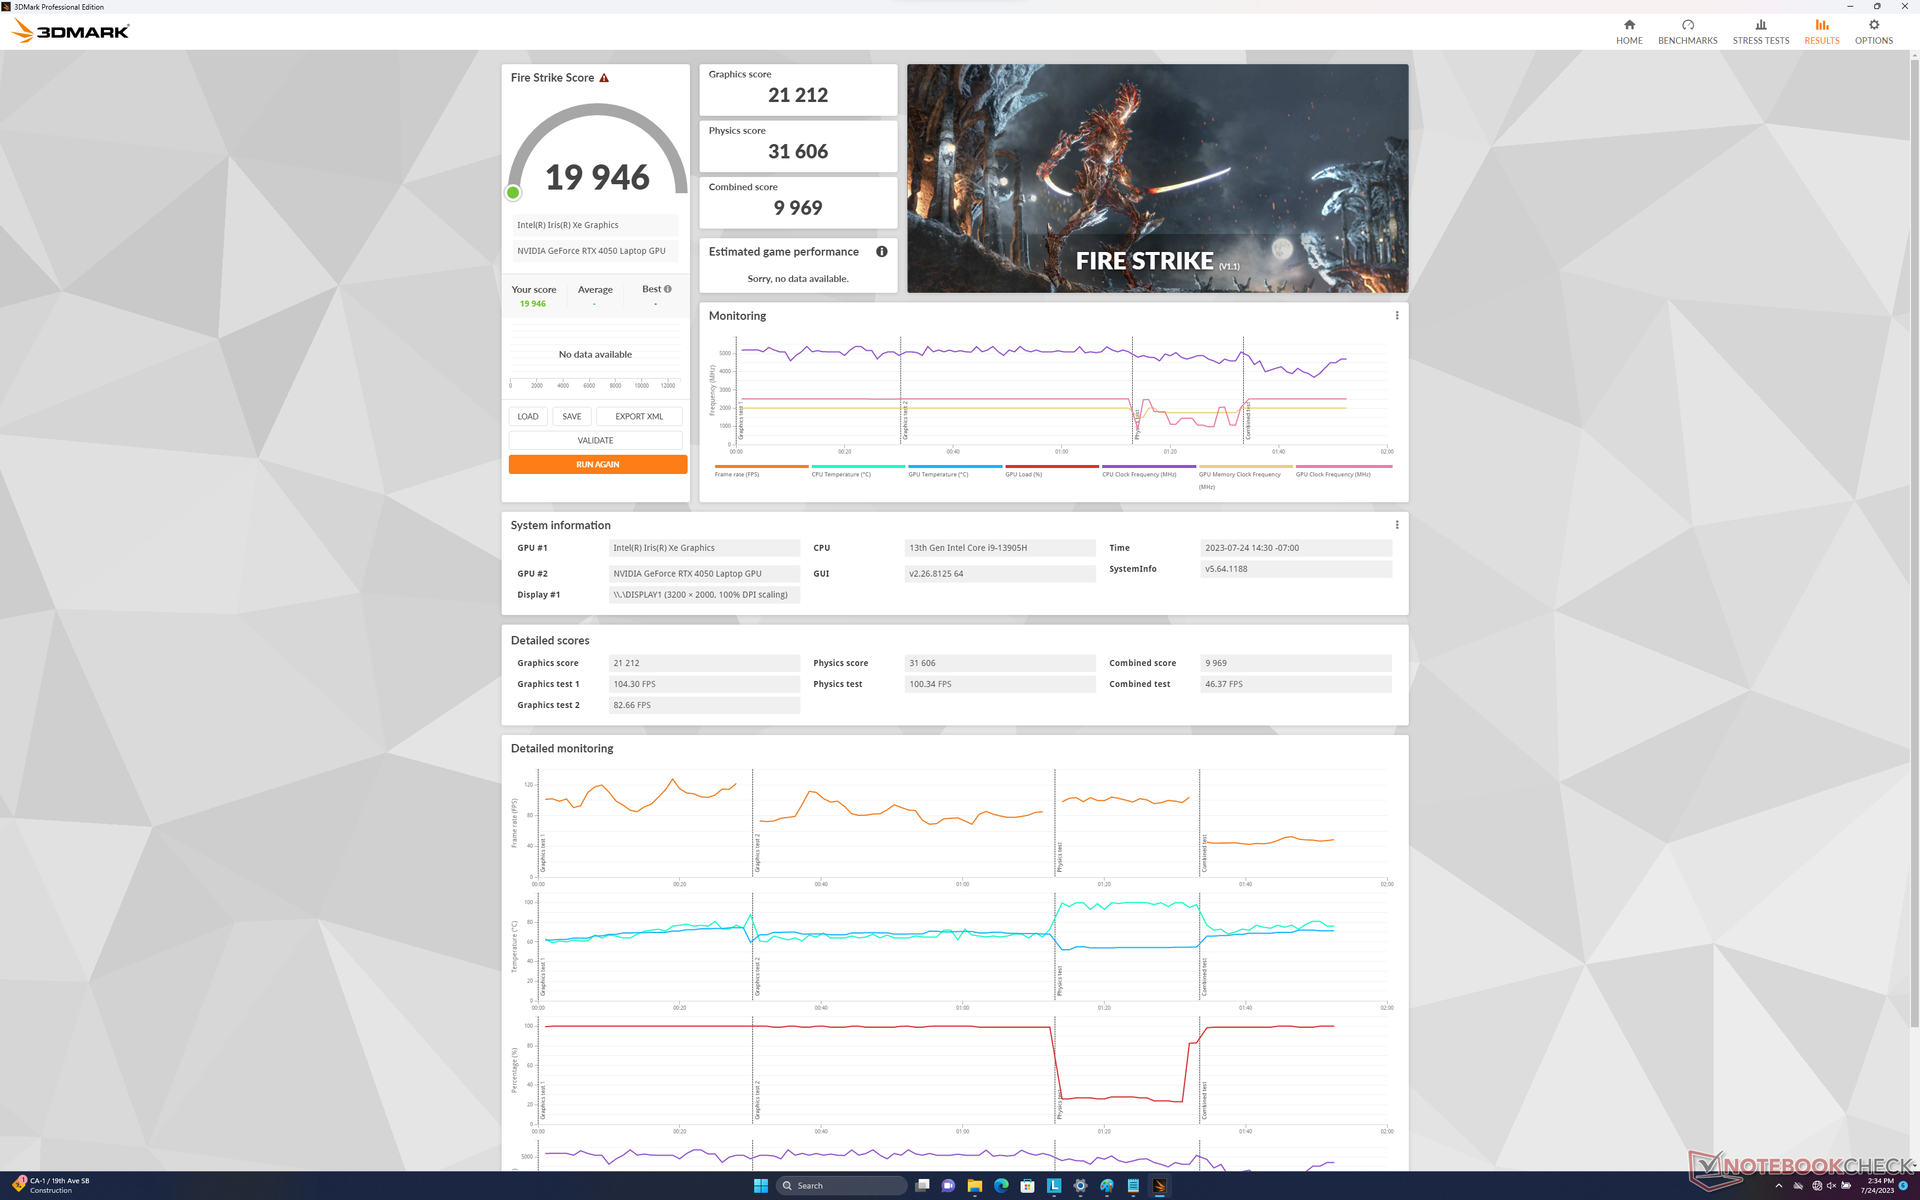
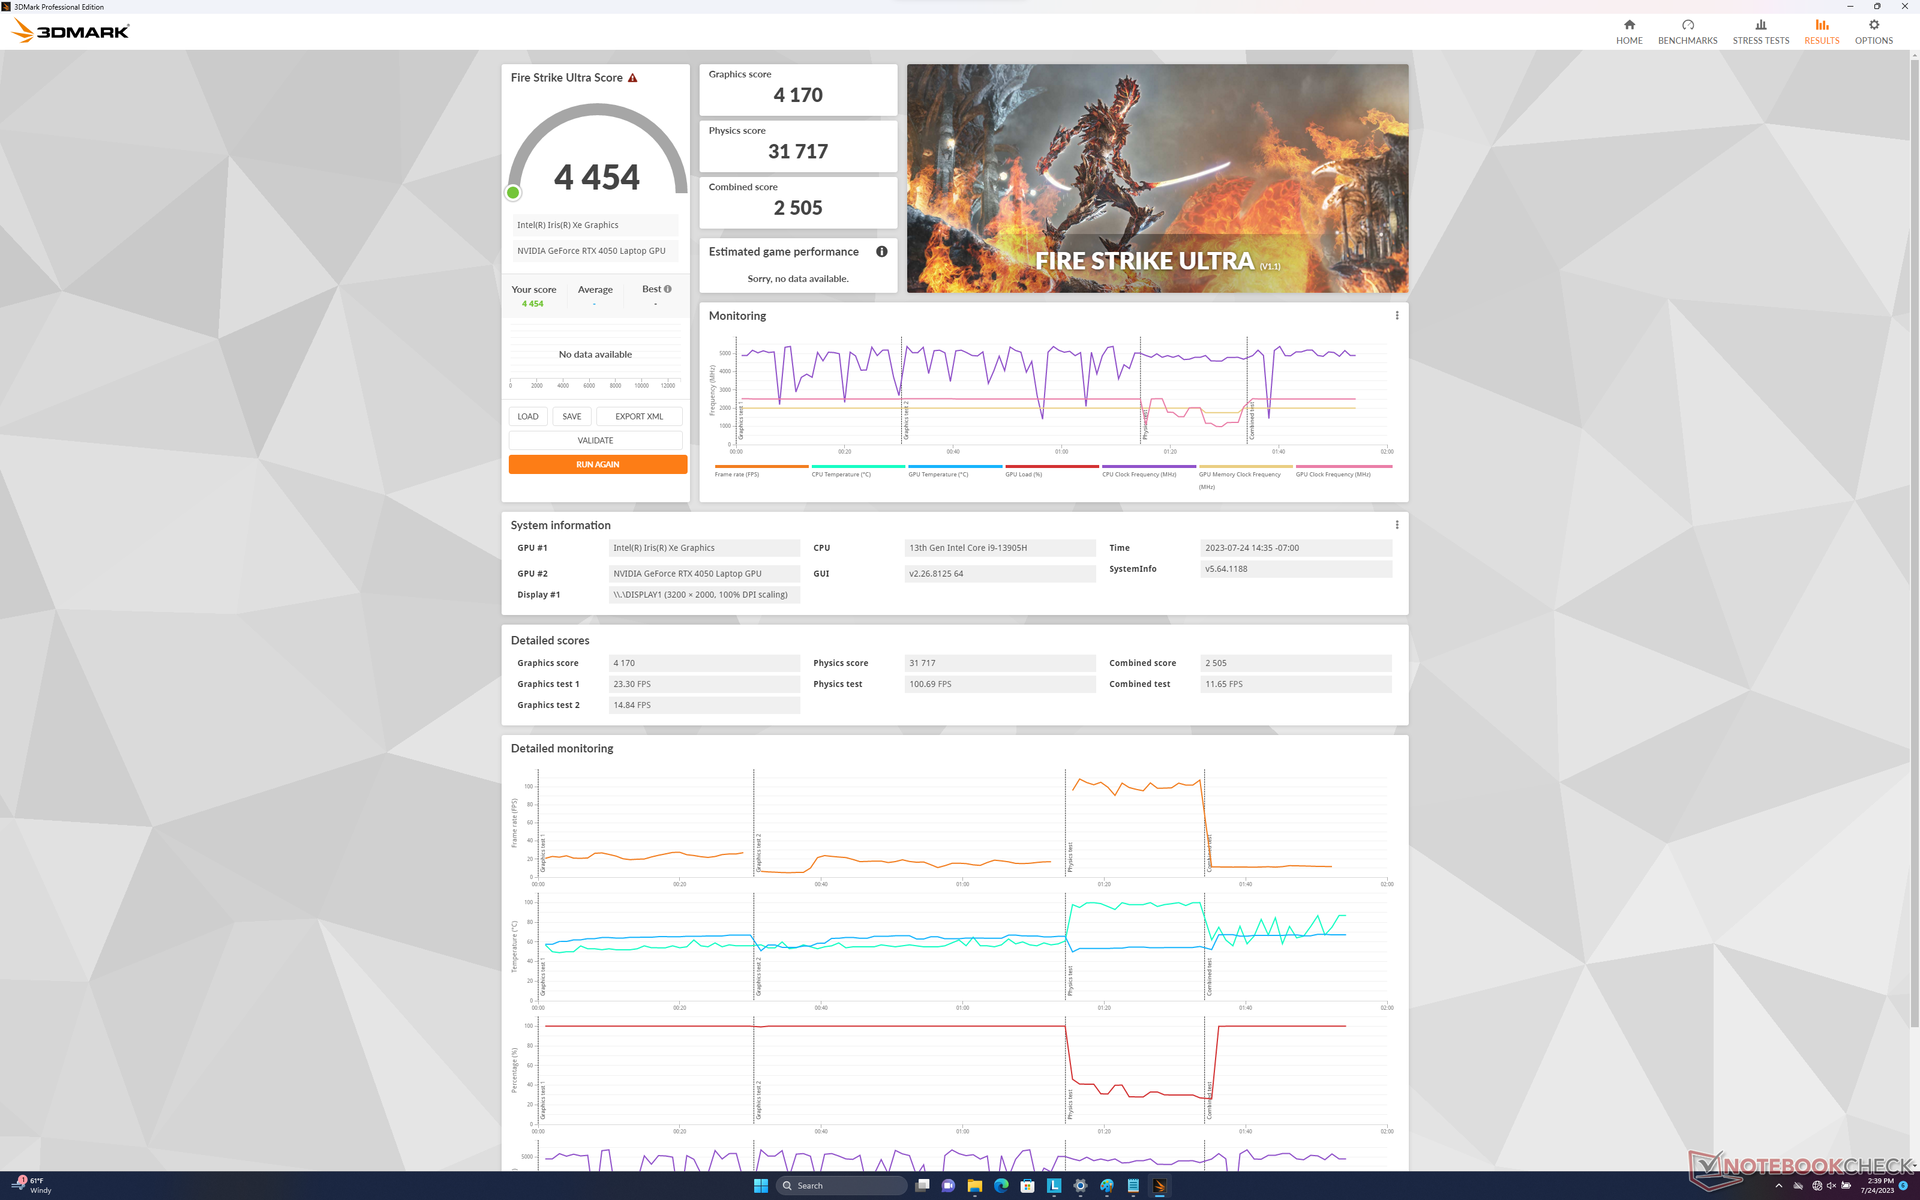
在平衡模式而非性能模式下运行会对性能产生轻微影响,如下表中的Fire Strike 结果所示。
| 电源配置文件 | Fire Strike 物理分数 | 图形得分 | 综合得分 |
| 电池 | 30199 (-4%) | 12900 (-39%) | 5642 (-43%) |
| 平衡 | 28925 (-8%) | 20047 (-6%) | 7581 (-24%) |
| 绩效 | 31606 | 21212 | 9969 |

| 3DMark Performance rating - Percent | |
| MSI GeForce RTX 4060 Ti Gaming X Trio 8G -2! | |
| Lenovo Legion Pro 5 16ARX8 | |
| Lenovo Legion 5 Pro 16ARH7H RTX 3070 Ti -2! | |
| Lenovo Yoga Pro 9 16-IRP G8 | |
| Lenovo Slim Pro 9i 16IRP8 | |
| Average NVIDIA GeForce RTX 4050 Laptop GPU | |
| Asus ZenBook Pro 16X OLED UX7602ZM-ME115W -2! | |
| Dell Inspiron 16 Plus 7620 -2! | |
| MSI Stealth 15M A11SEK -2! | |
| Lenovo IdeaPad 5 Pro 16ACH -2! | |
| Acer Swift Edge SFE16-42-R1GM -2! | |
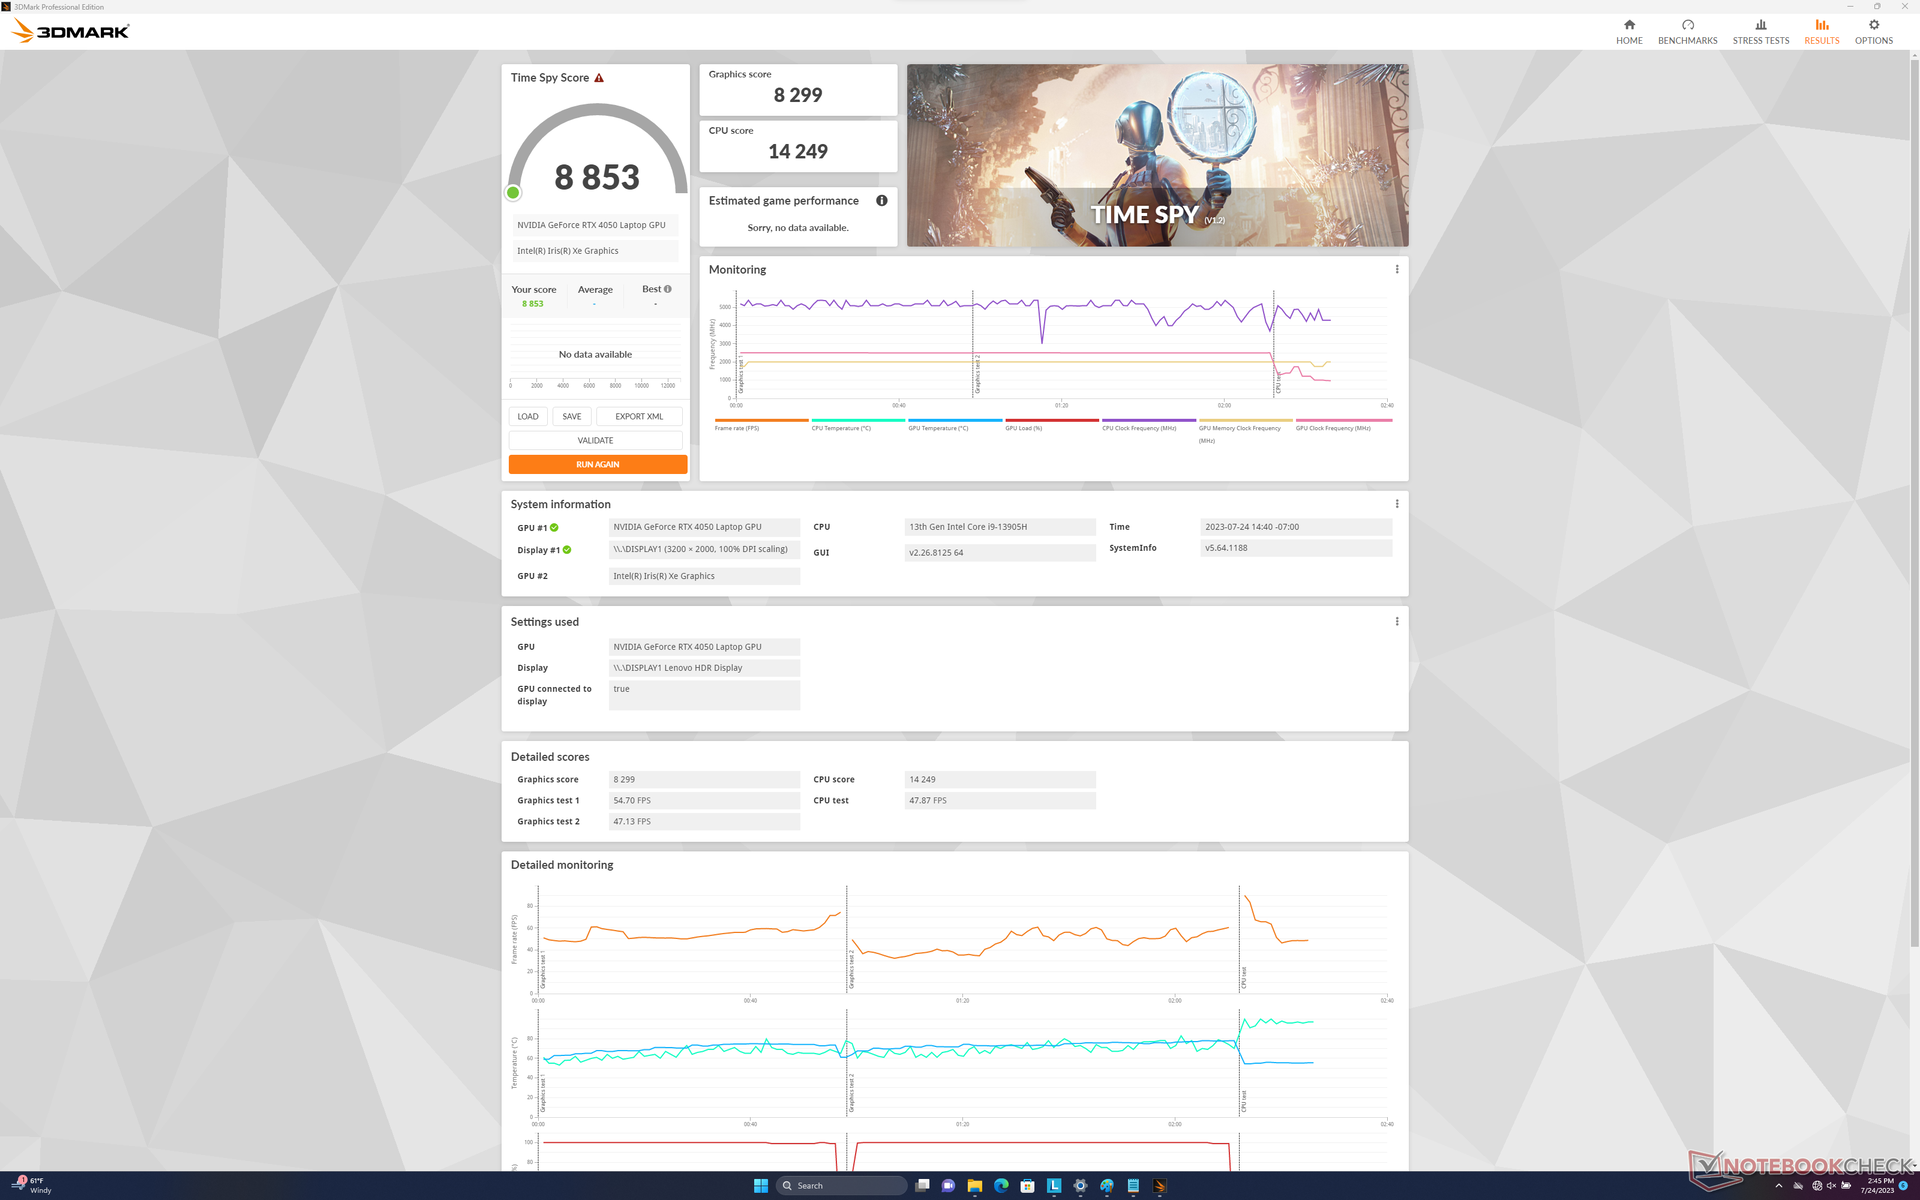
| 3DMark 11 Performance | 28168 points | |
| 3DMark Fire Strike Score | 19946 points | |
| 3DMark Time Spy Score | 8853 points | |
Help | ||
* ... smaller is better
游戏性能
虽然从技术上讲这不是一台游戏机,但即使在原生 QHD+ 分辨率下,该系统也能胜任最新的游戏。像《Returnal》这样要求较高的新游戏可以在最高设置下运行,但建议使用 DLSS 以获得更高的帧率。
遗憾的是,内置显示屏不支持 G-Sync。
Witcher 3 FPS Chart
| low | med. | high | ultra | QHD | |
|---|---|---|---|---|---|
| GTA V (2015) | 183.7 | 180.6 | 167.8 | 96.8 | 67.5 |
| The Witcher 3 (2015) | 410.2 | 271.1 | 164.7 | 84.9 | 59.2 |
| Dota 2 Reborn (2015) | 180 | 162.5 | 155 | 138.6 | |
| Final Fantasy XV Benchmark (2018) | 186.9 | 118.6 | 83.5 | 60 | |
| X-Plane 11.11 (2018) | 153 | 130.6 | 103.2 | ||
| Strange Brigade (2018) | 429 | 202 | 164.7 | 144.1 | 96.3 |
| Cyberpunk 2077 1.6 (2022) | 121.3 | 105.9 | 78.7 | 64.1 | 38.5 |
| Tiny Tina's Wonderlands (2022) | 183.3 | 142.8 | 91.5 | 70.2 | 47.7 |
| F1 22 (2022) | 214 | 199.8 | 150.8 | 52.6 | 32.3 |
| Returnal (2023) | 64 | 63 | 59 | 52 | 34 |
排放量
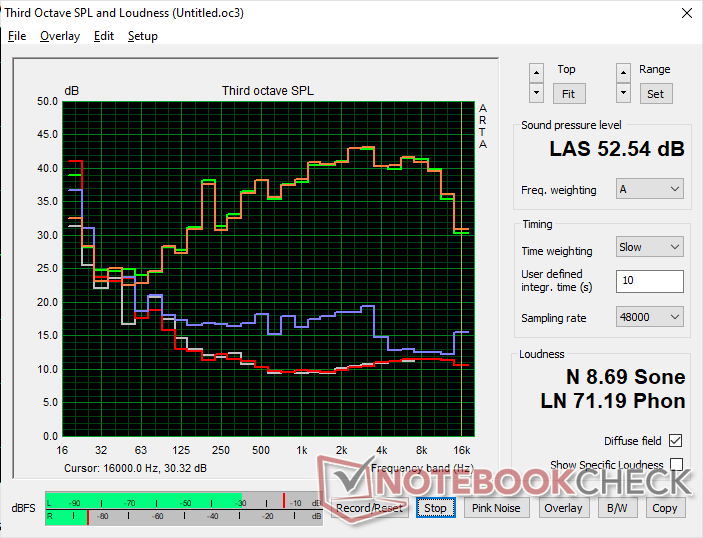
系统噪音
在运行浏览器或视频流等要求不高的负载时,在 22.7 分贝(A)的静音背景下,风扇噪音往往稳定在 25 至 27 分贝(A)的范围内。然而,当引入游戏等较高负载时,风扇会逐渐增大,直至达到 52.6 分贝(A)的最大值,与许多游戏笔记本电脑一样响亮。
值得注意的是,当在平衡模式而非性能模式下运行游戏时,风扇噪音会大幅下降至仅 44.2 分贝(A)。因此,根据用户的喜好,较低的风扇噪音可能值得性能的轻微下降。
Noise level
| Idle |
| 22.7 / 22.7 / 27.5 dB(A) |
| Load |
| 28.9 / 52.5 dB(A) |
 | ||
30 dB silent 40 dB(A) audible 50 dB(A) loud |
||
min: | ||
| Lenovo Slim Pro 9i 16IRP8 GeForce RTX 4050 Laptop GPU, i9-13905H, Samsung PM9A1 MZVL21T0HCLR | Lenovo Yoga Pro 9 16-IRP G8 GeForce RTX 4060 Laptop GPU, i7-13705H, Samsung PM9A1 MZVL21T0HCLR | Asus VivoBook Pro 16 GeForce RTX 3050 Ti Laptop GPU, i7-12700H, Intel SSD 670p SSDPEKNU010TZ | Acer Swift Edge SFE16-42-R1GM Radeon 680M, R7 7735U, Micron 3400 1TB MTFDKBA1T0TFH | Dell Inspiron 16 Plus 7620 GeForce RTX 3050 Ti Laptop GPU, i7-12700H, Kioxia BG5 KBG50ZNS512G | HP Envy 16 h0112nr GeForce RTX 3060 Laptop GPU, i7-12700H, Micron 3400 1TB MTFDKBA1T0TFH | |
|---|---|---|---|---|---|---|
| Noise | -10% | -22% | -13% | -13% | -7% | |
| off / environment * (dB) | 22.7 | 24.7 -9% | 25.2 -11% | 25.7 -13% | 23.3 -3% | 22.8 -0% |
| Idle Minimum * (dB) | 22.7 | 24.7 -9% | 25.2 -11% | 25.7 -13% | 25.7 -13% | 22.9 -1% |
| Idle Average * (dB) | 22.7 | 26.2 -15% | 25.2 -11% | 27 -19% | 26.1 -15% | 22.9 -1% |
| Idle Maximum * (dB) | 27.5 | 26.2 5% | 25.2 8% | 29.3 -7% | 30.6 -11% | 30.5 -11% |
| Load Average * (dB) | 28.9 | 39.7 -37% | 55.1 -91% | 42.3 -46% | 46.2 -60% | 41.4 -43% |
| Witcher 3 ultra * (dB) | 52.6 | 53.2 -1% | 49.2 6% | 51.1 3% | ||
| Load Maximum * (dB) | 52.5 | 53.2 -1% | 61.5 -17% | 42.7 19% | 49.4 6% | 51.4 2% |
* ... smaller is better
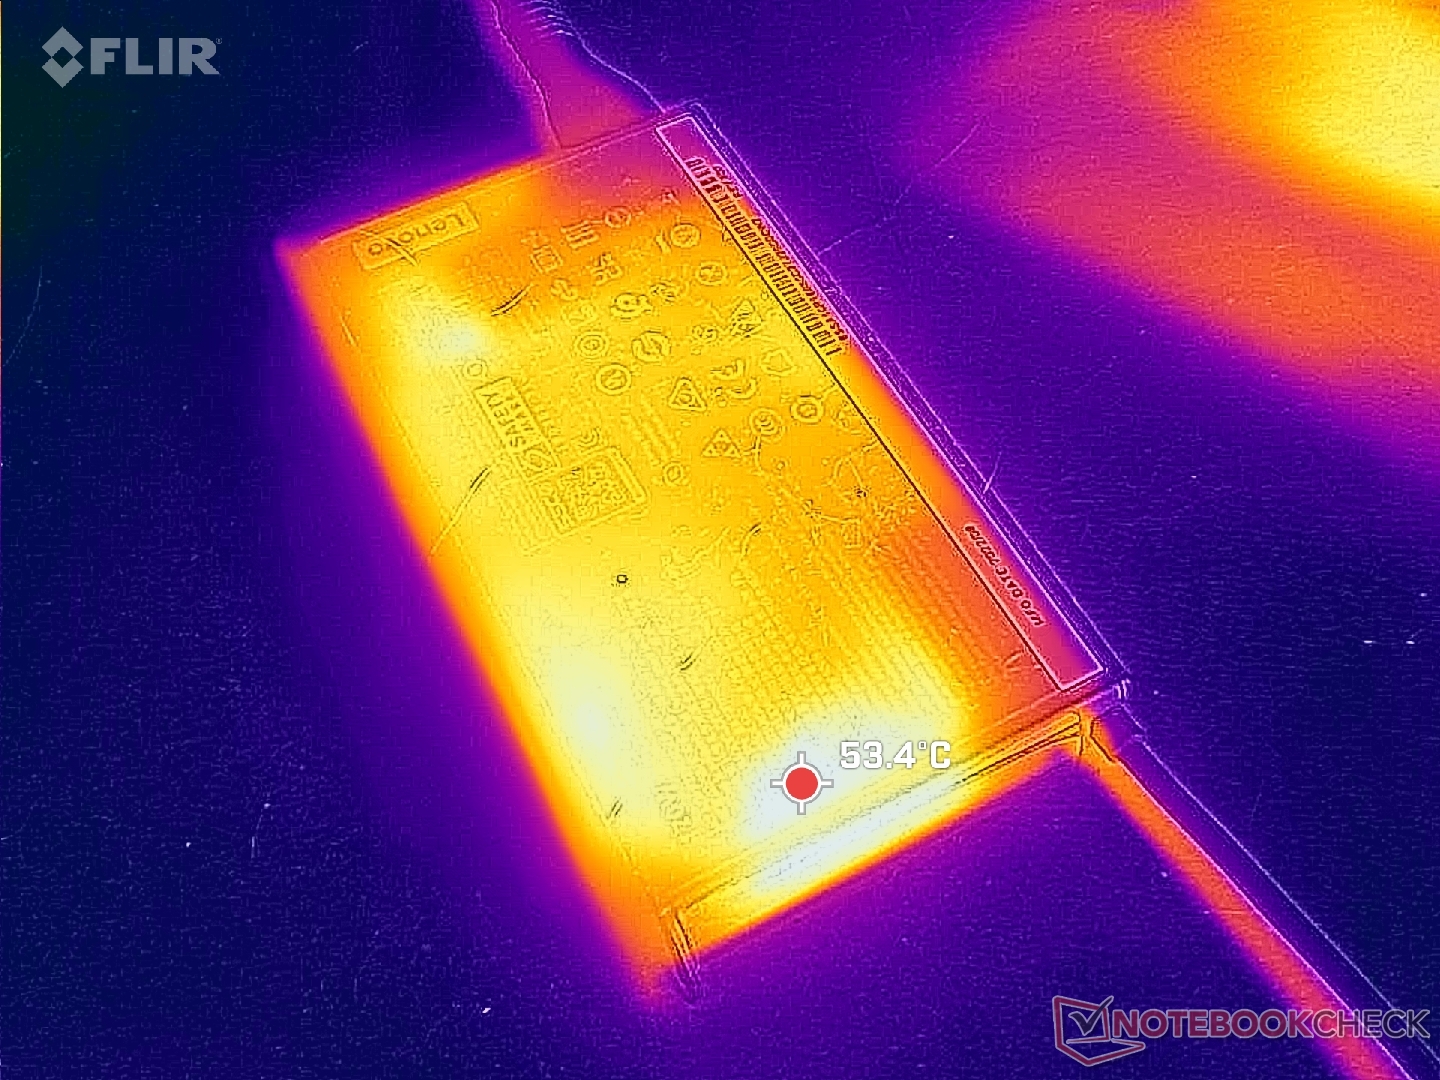
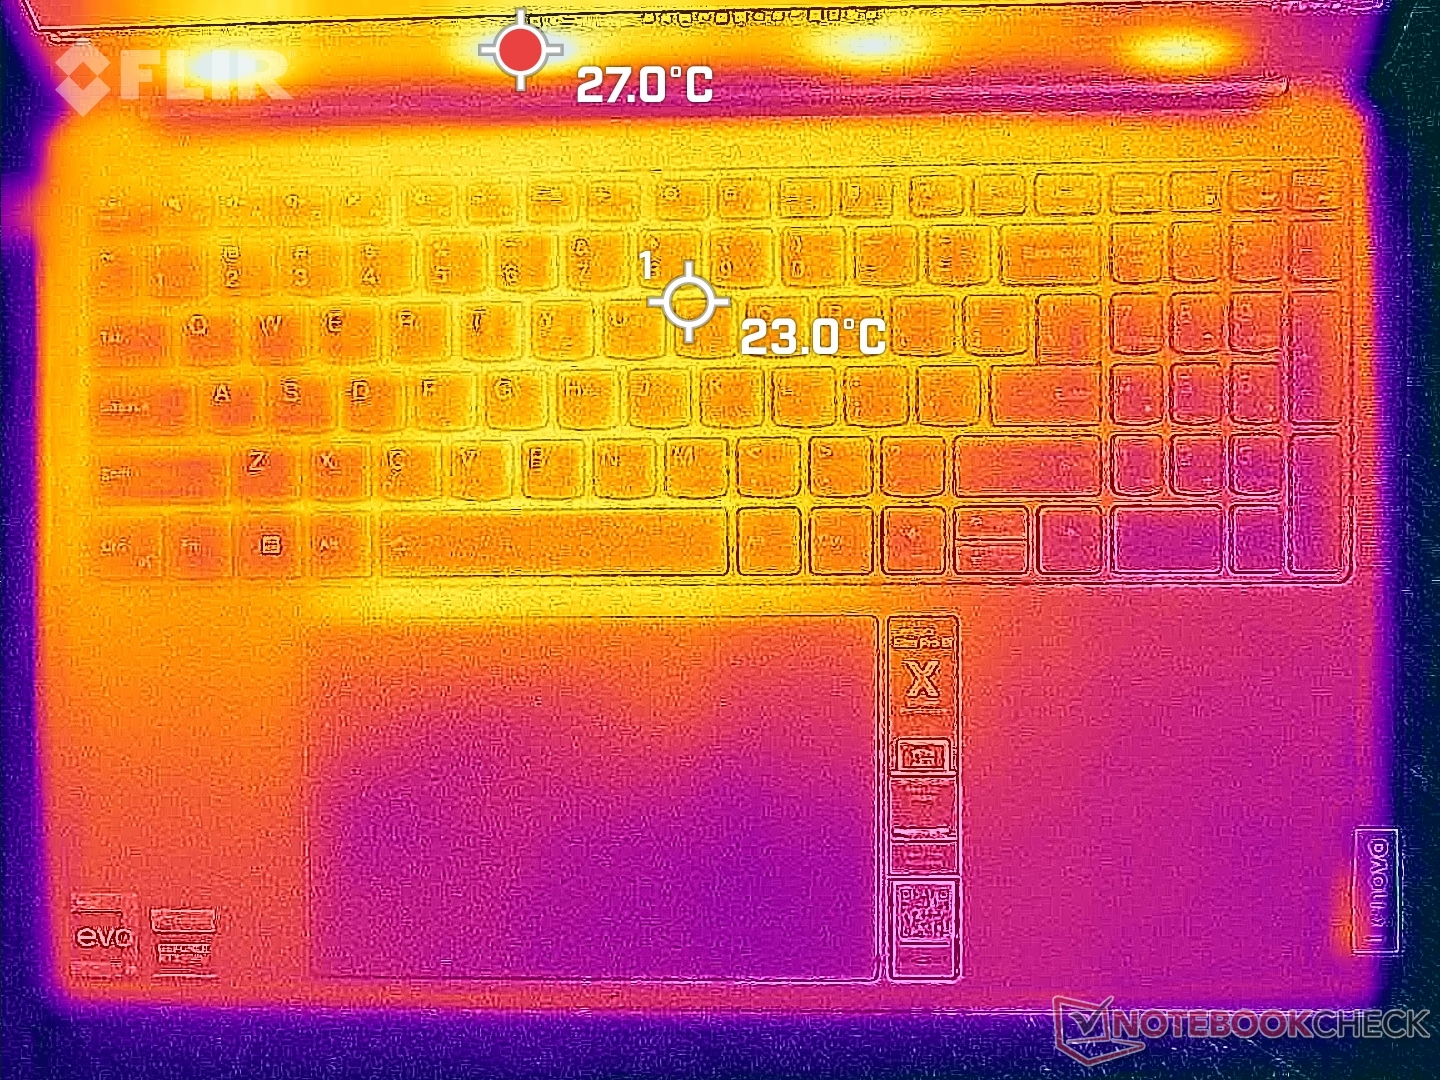
温度
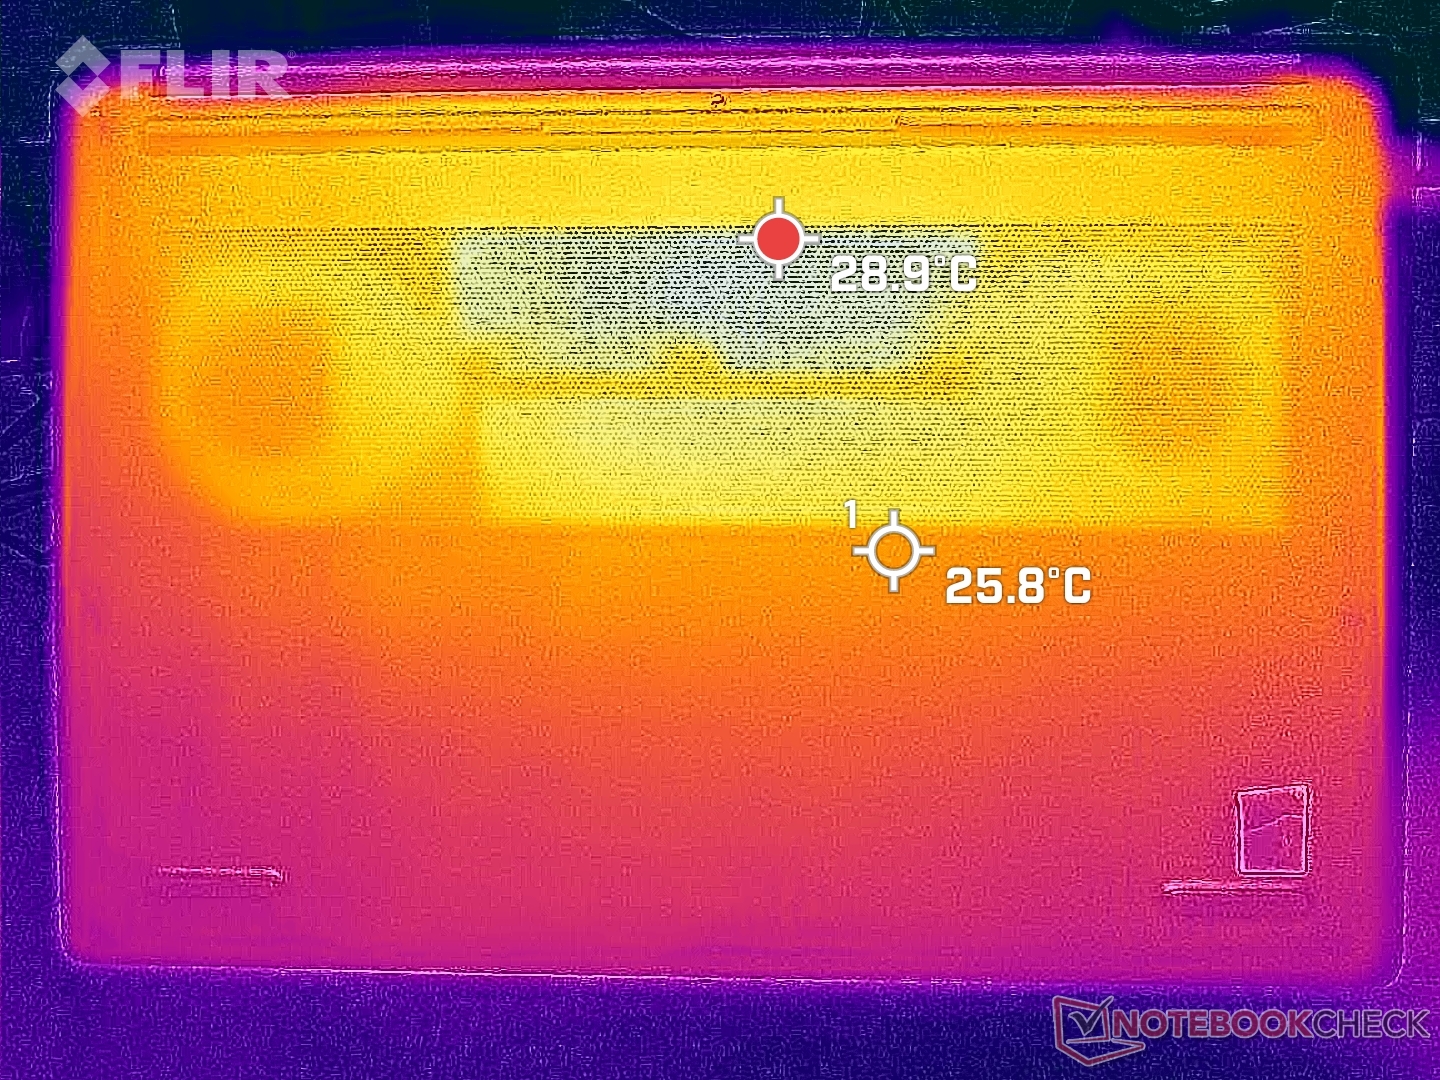
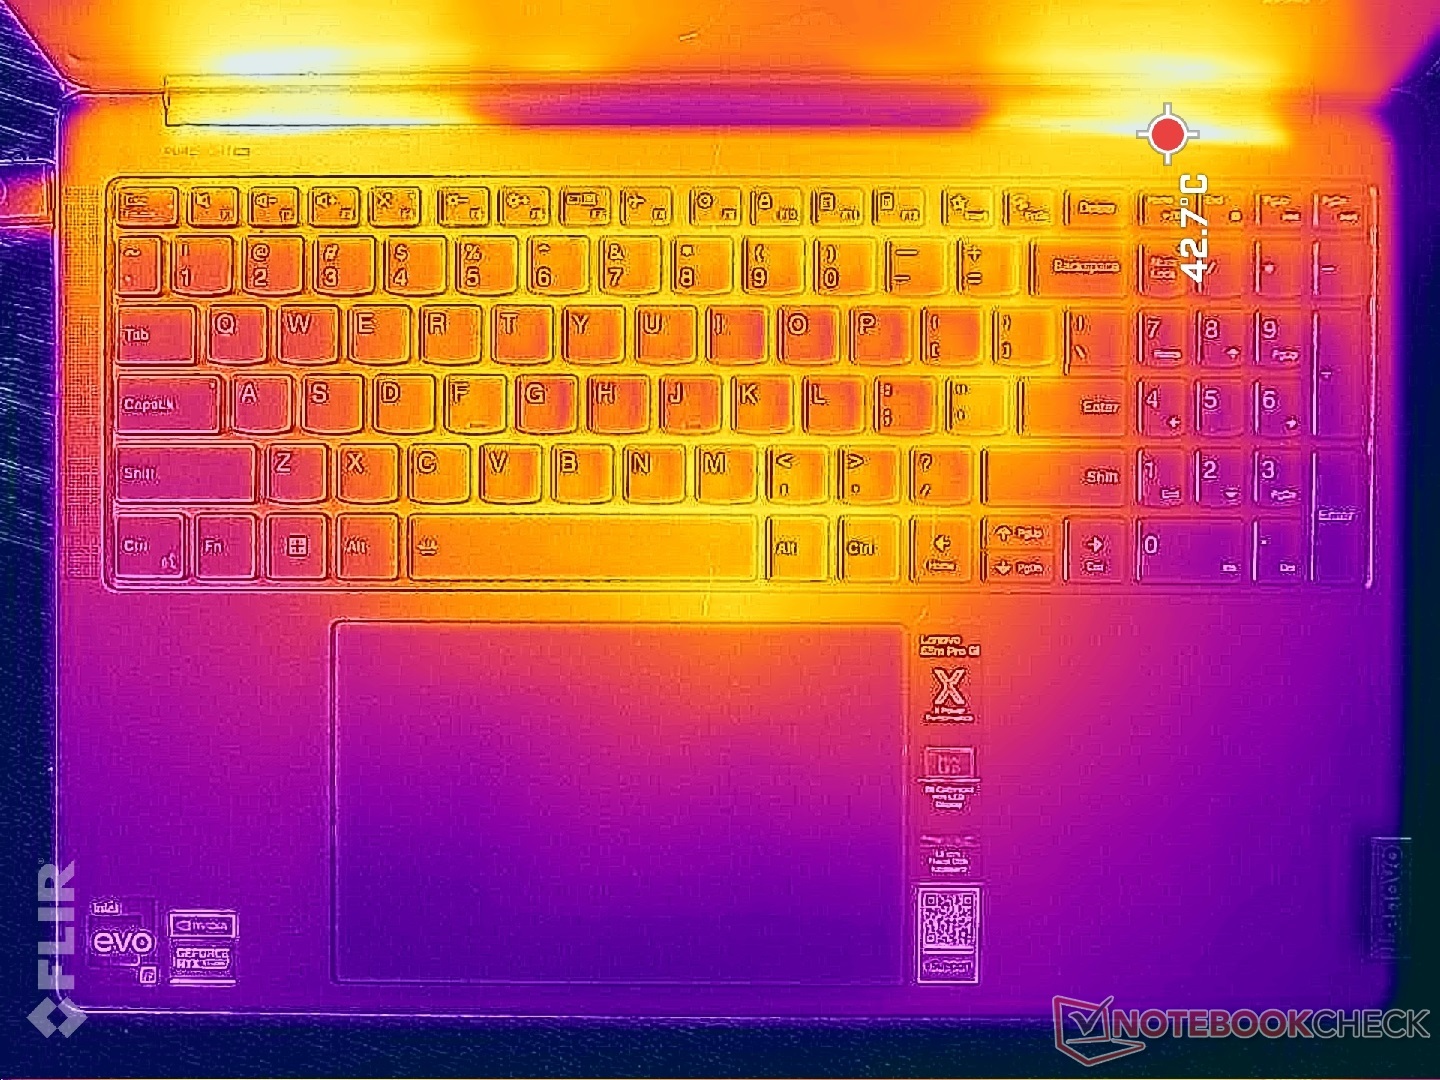
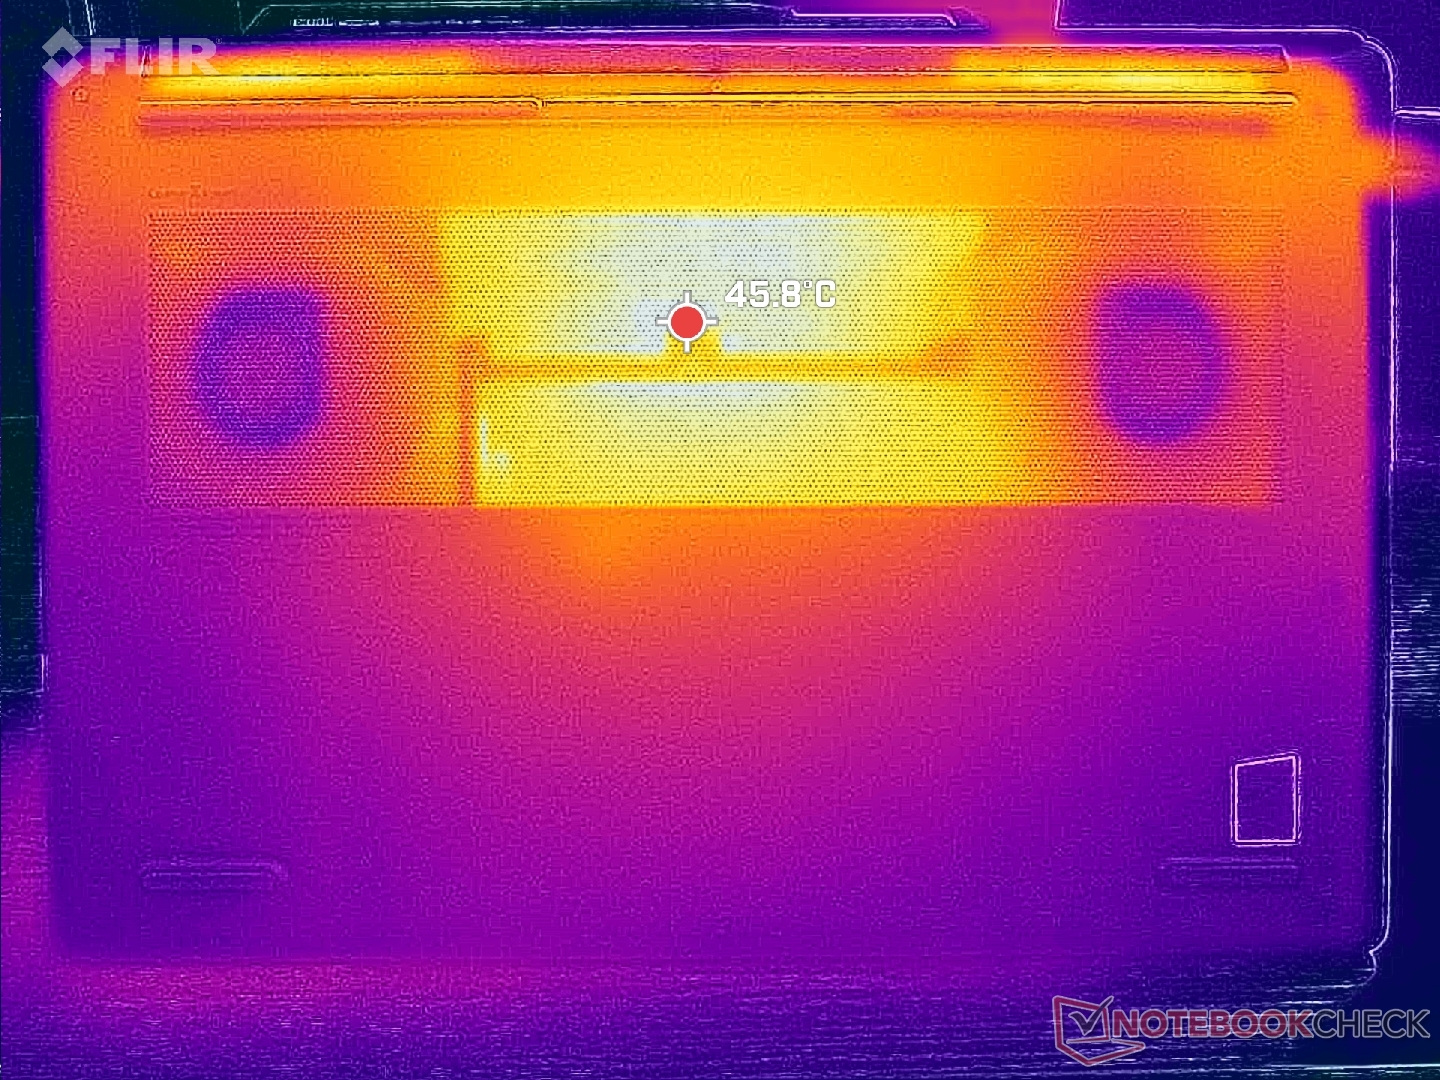
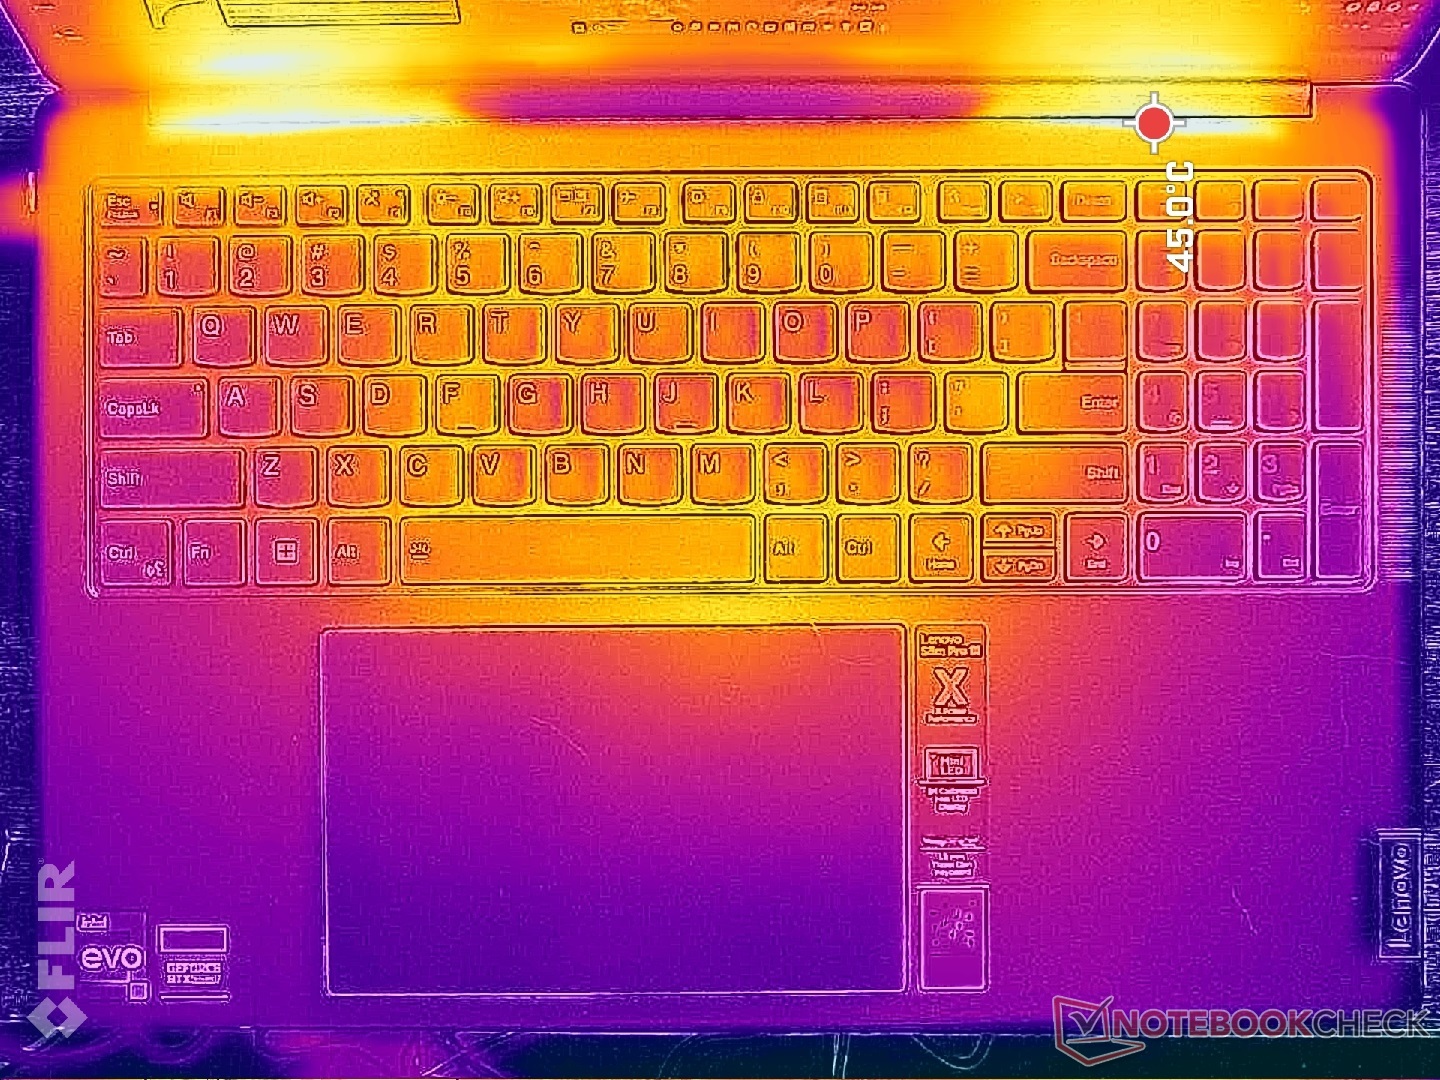
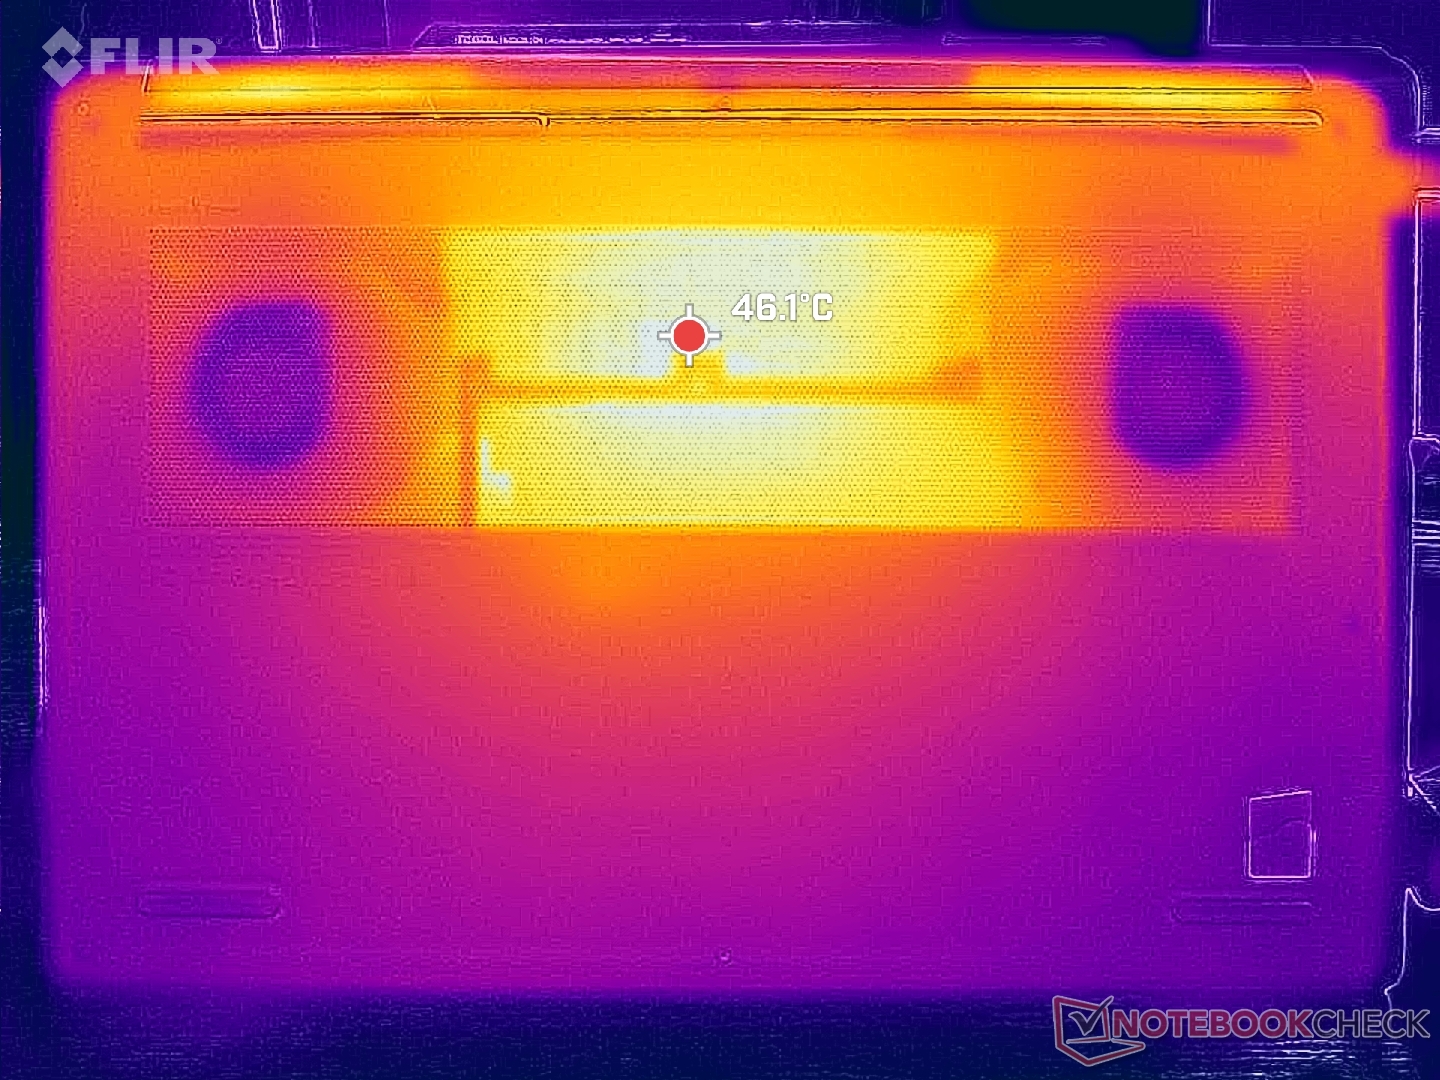
靠近中心区域的表面温度最高,顶部和底部的热点温度分别可达 38 摄氏度和 44 摄氏度以上。联想的键盘温度没有 Inspiron 16 Plus 7620 高。Inspiron 16 Plus 7620 在负载情况下,键盘中心温度可达 50 摄氏度。
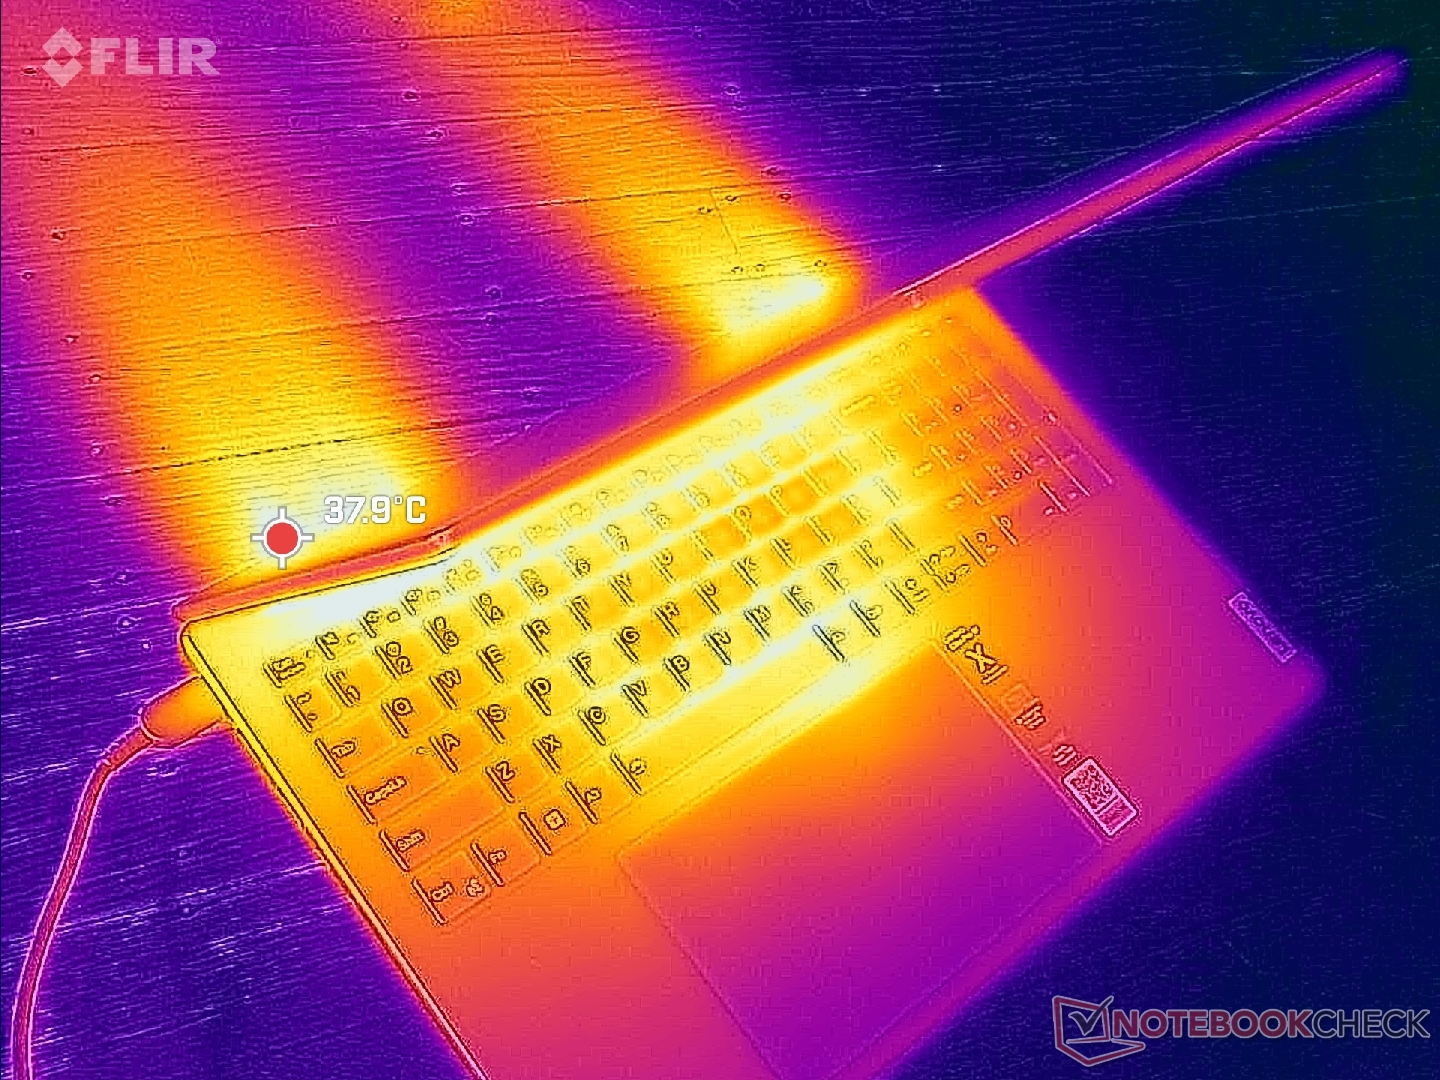
(+) The maximum temperature on the upper side is 37.8 °C / 100 F, compared to the average of 36.8 °C / 98 F, ranging from 21 to 71 °C for the class Multimedia.
(±) The bottom heats up to a maximum of 44.8 °C / 113 F, compared to the average of 39.1 °C / 102 F
(+) In idle usage, the average temperature for the upper side is 28.8 °C / 84 F, compared to the device average of 31.3 °C / 88 F.
(±) Playing The Witcher 3, the average temperature for the upper side is 35.4 °C / 96 F, compared to the device average of 31.3 °C / 88 F.
(+) The palmrests and touchpad are reaching skin temperature as a maximum (32 °C / 89.6 F) and are therefore not hot.
(-) The average temperature of the palmrest area of similar devices was 28.7 °C / 83.7 F (-3.3 °C / -5.9 F).
| Lenovo Slim Pro 9i 16IRP8 Intel Core i9-13905H, NVIDIA GeForce RTX 4050 Laptop GPU | Lenovo Yoga Pro 9 16-IRP G8 Intel Core i7-13705H, NVIDIA GeForce RTX 4060 Laptop GPU | Asus VivoBook Pro 16 Intel Core i7-12700H, NVIDIA GeForce RTX 3050 Ti Laptop GPU | Acer Swift Edge SFE16-42-R1GM AMD Ryzen 7 7735U, AMD Radeon 680M | Dell Inspiron 16 Plus 7620 Intel Core i7-12700H, NVIDIA GeForce RTX 3050 Ti Laptop GPU | HP Envy 16 h0112nr Intel Core i7-12700H, NVIDIA GeForce RTX 3060 Laptop GPU | |
|---|---|---|---|---|---|---|
| Heat | 0% | -16% | -11% | -5% | -8% | |
| Maximum Upper Side * (°C) | 37.8 | 41.6 -10% | 44.2 -17% | 49.4 -31% | 46 -22% | 45.2 -20% |
| Maximum Bottom * (°C) | 44.8 | 50 -12% | 53 -18% | 44.7 -0% | 45.8 -2% | 44 2% |
| Idle Upper Side * (°C) | 30.6 | 26.8 12% | 32.1 -5% | 34 -11% | 29.2 5% | 33.6 -10% |
| Idle Bottom * (°C) | 31 | 27.9 10% | 38.4 -24% | 31.6 -2% | 31 -0% | 32.6 -5% |
* ... smaller is better
压力测试
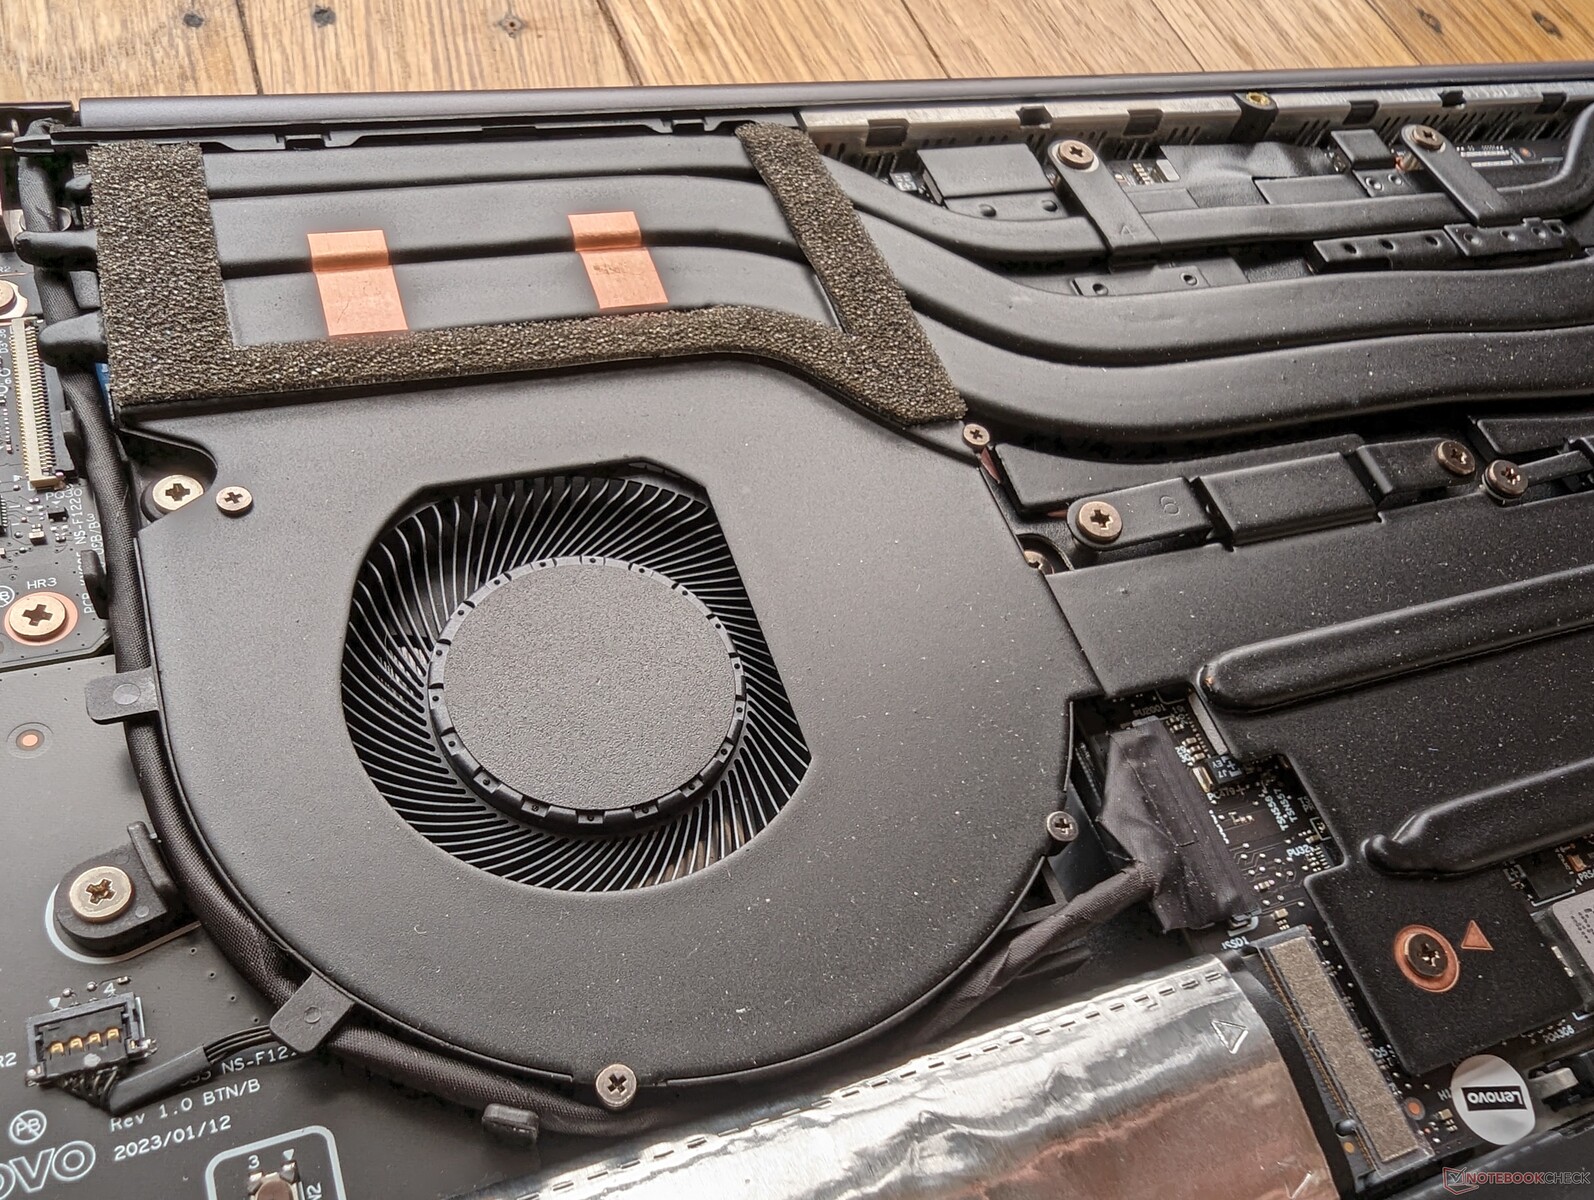
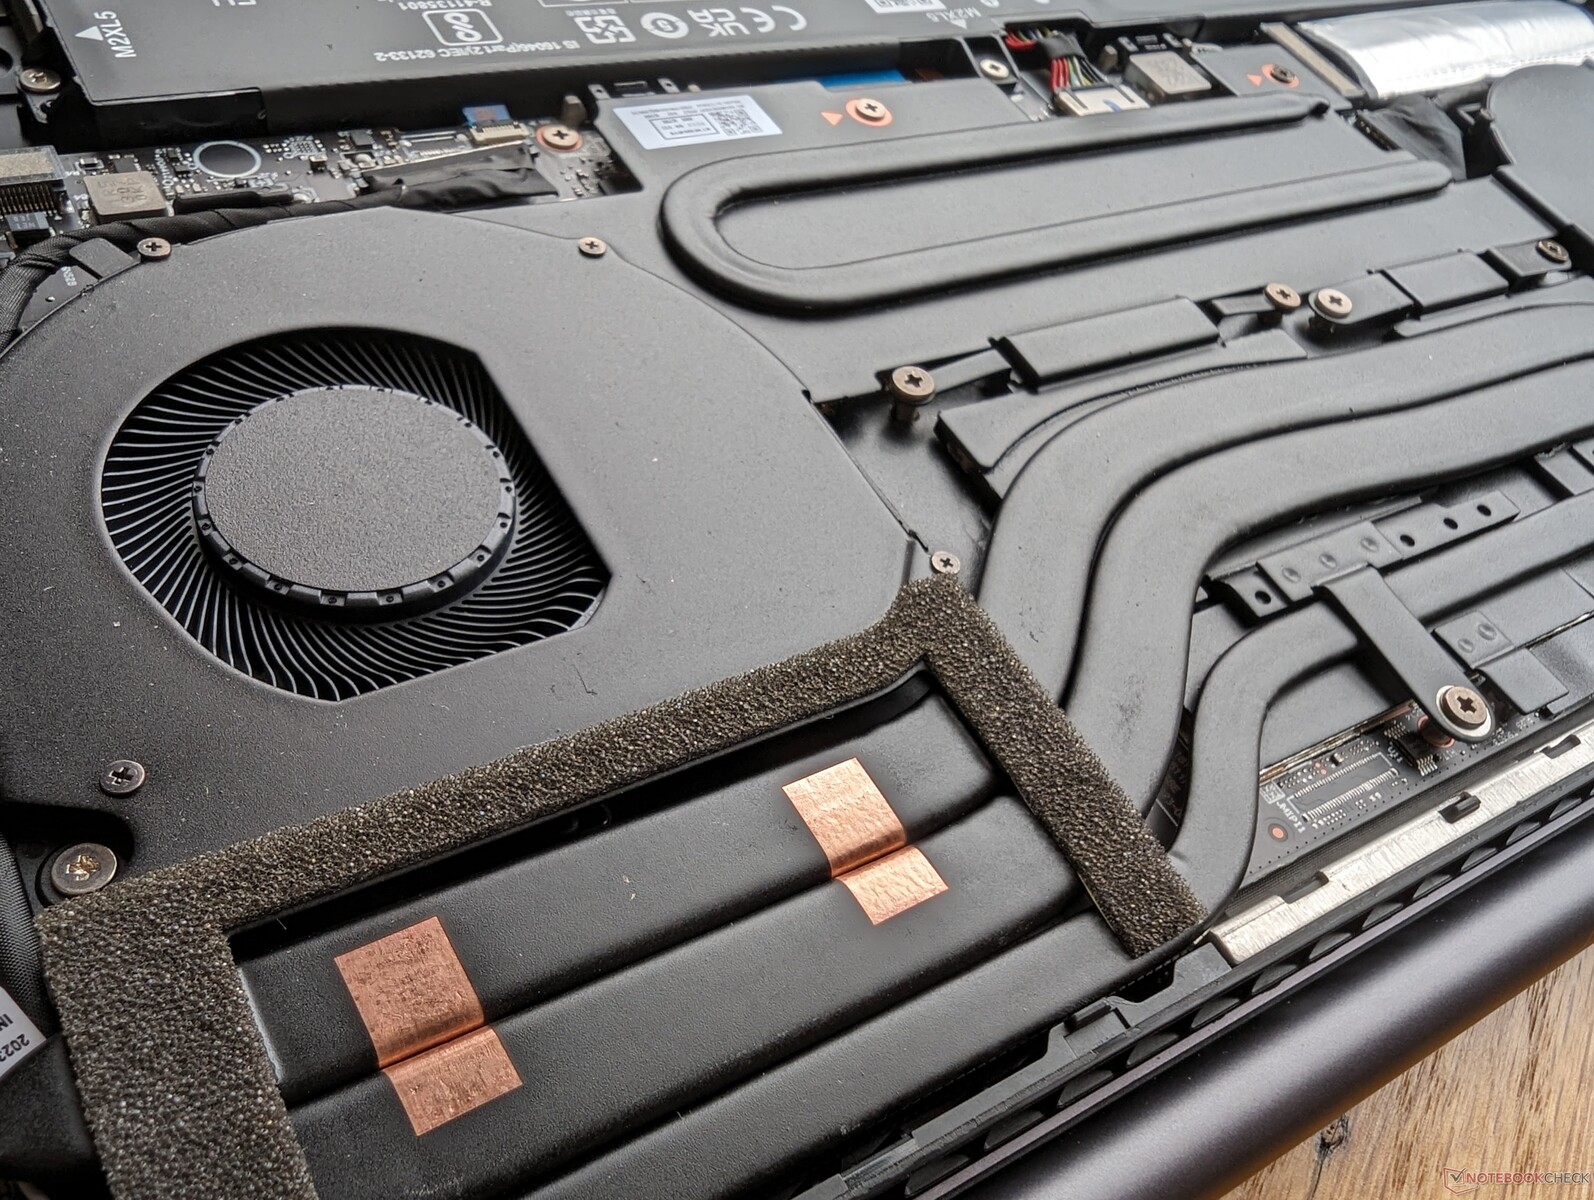
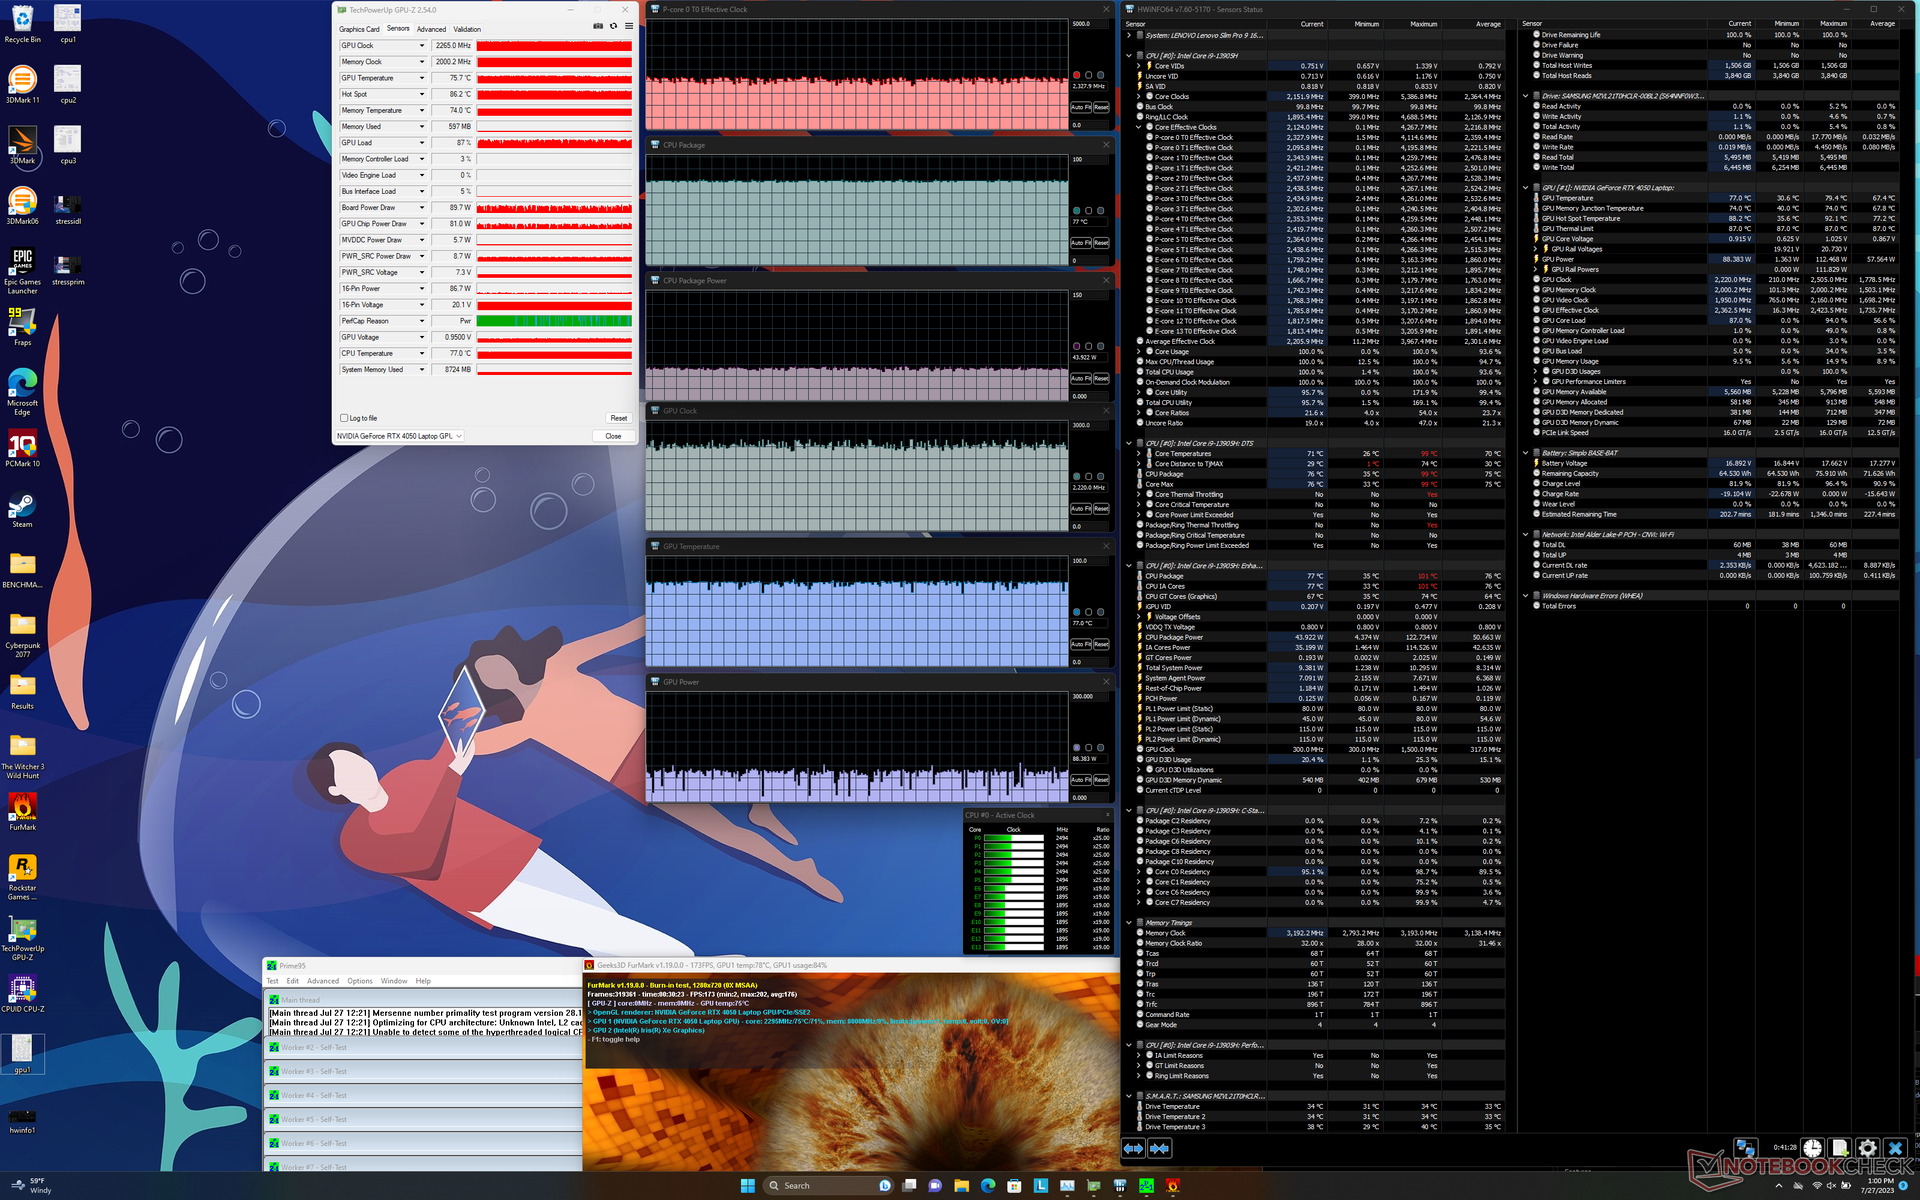
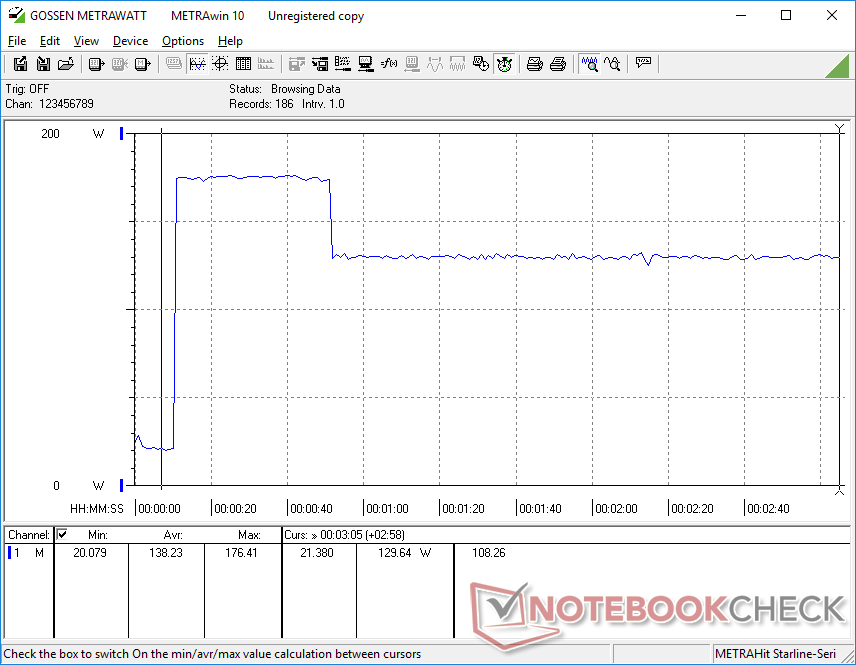
在启动 Prime95 压力测试的前 40 秒内,CPU 会提升至 4 GHz、120 W 和 100 C。由于 100 摄氏度的温度并不理想,时钟频率和电路板功耗将很快分别降至 3.0 至 3.2 GHz 和 85 W,以维持 82 摄氏度的合理核心温度。由于散热限制,酷睿 i9-13905H 的高 Turbo Boost 时钟频率在 Slim Pro 9i 上难以为继。
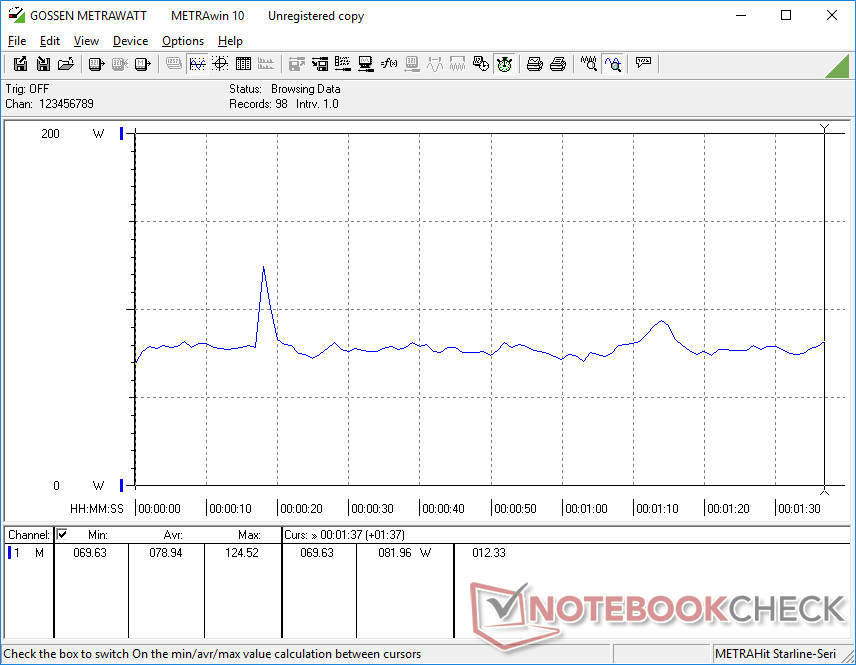
在性能模式下运行时,Nvidia GPU 将稳定在 2505 MHz、70 C 和 72 W。 Witcher 3相比之下,平衡模式下的频率为 2460 MHz,温度为 62 C,功率为 56 W。GPU 功耗峰值接近 92 W,而 TGP 目标值为 100 W。
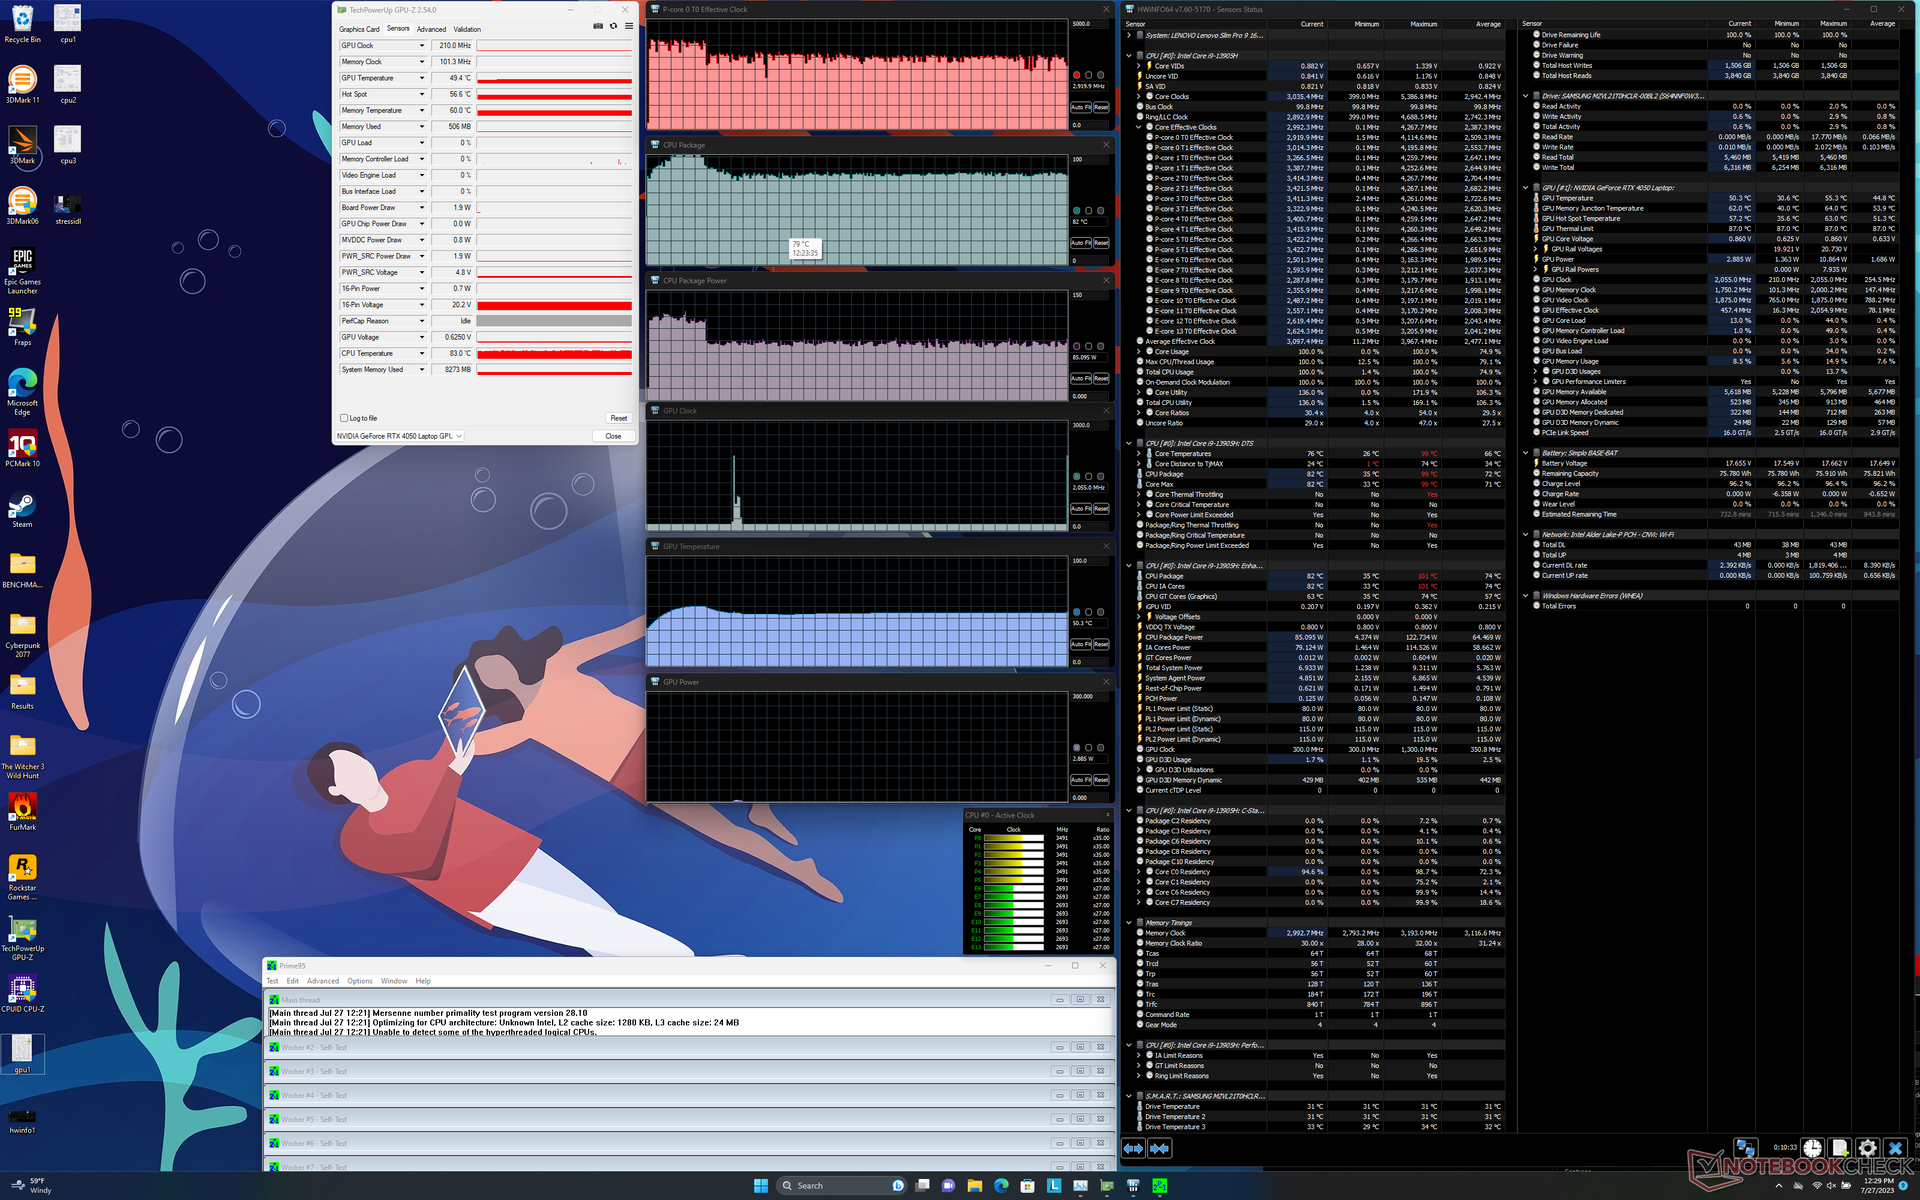
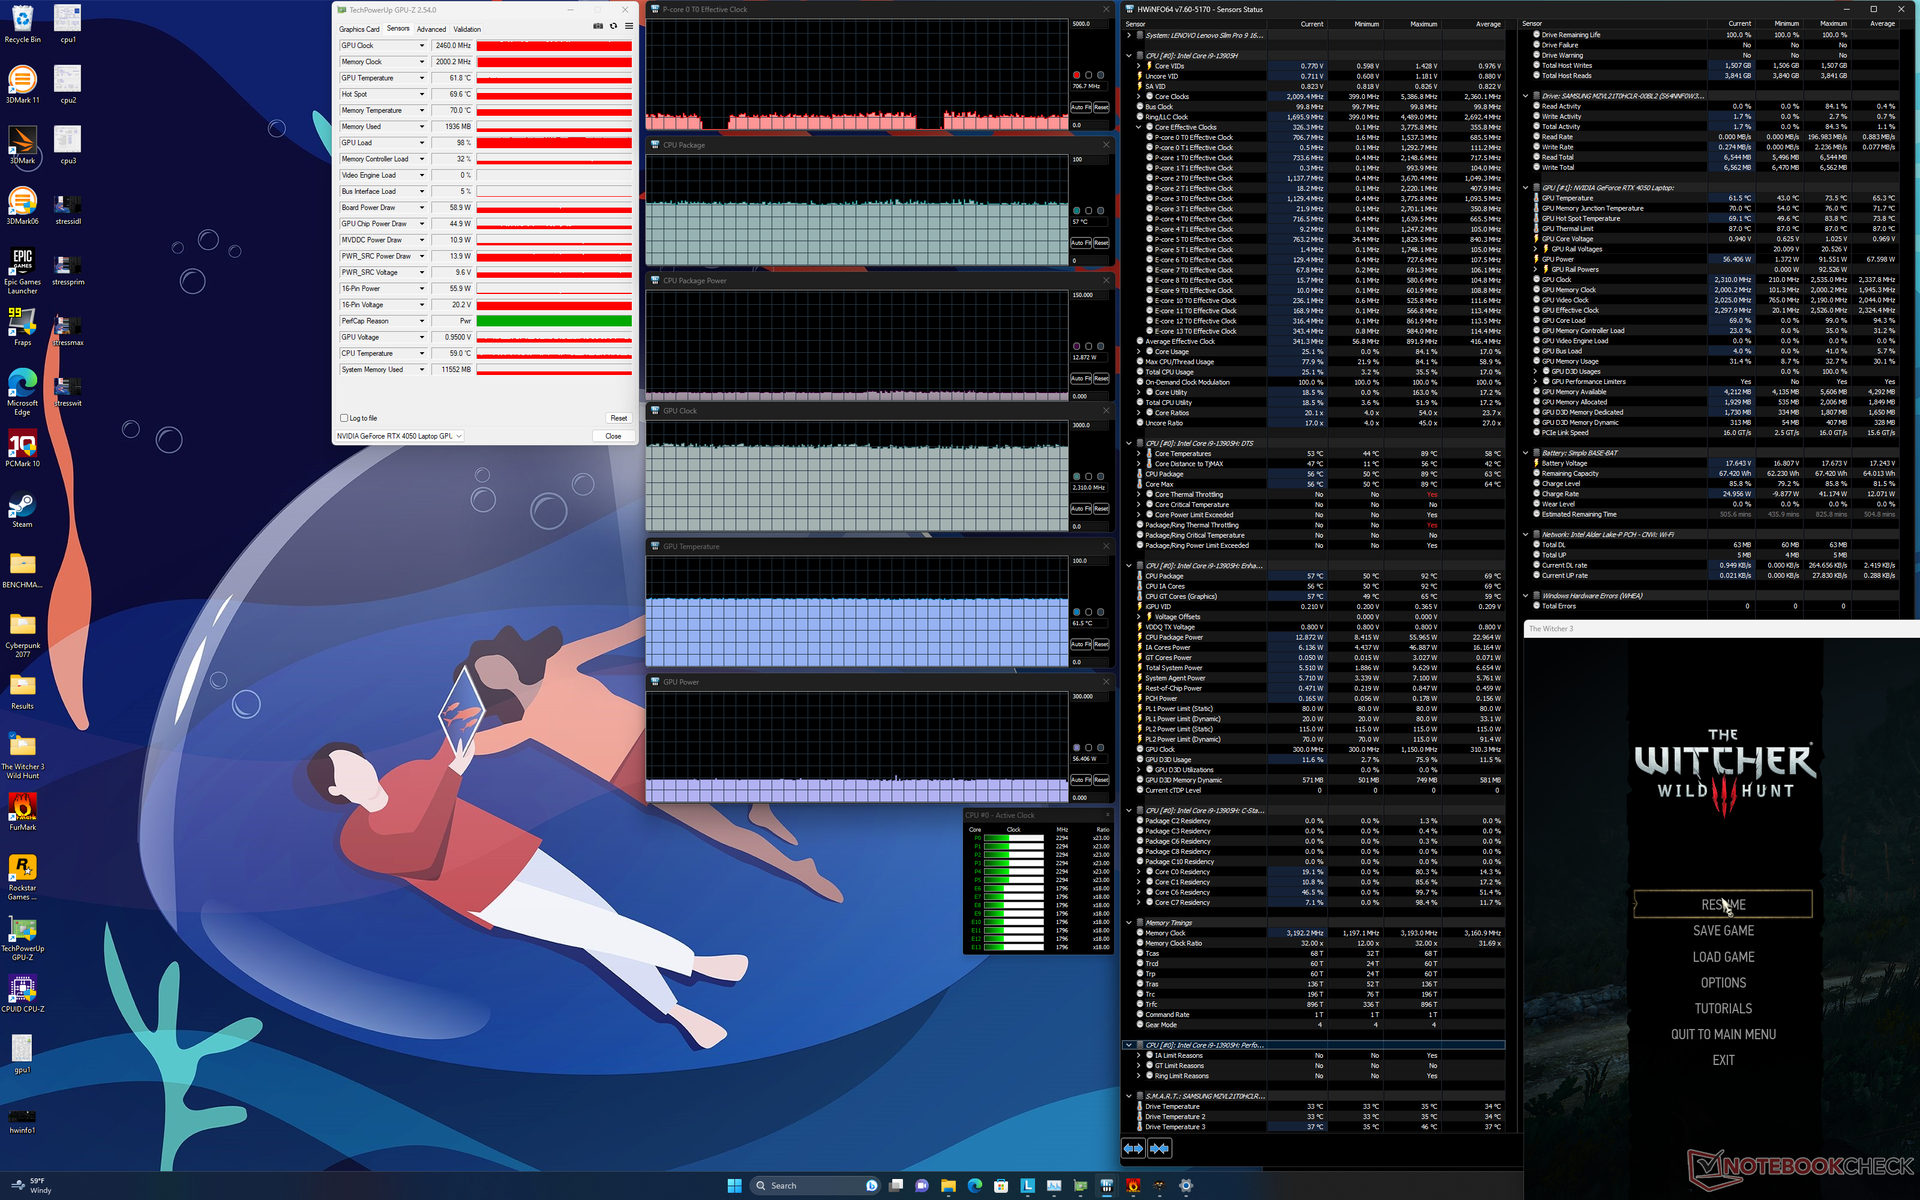
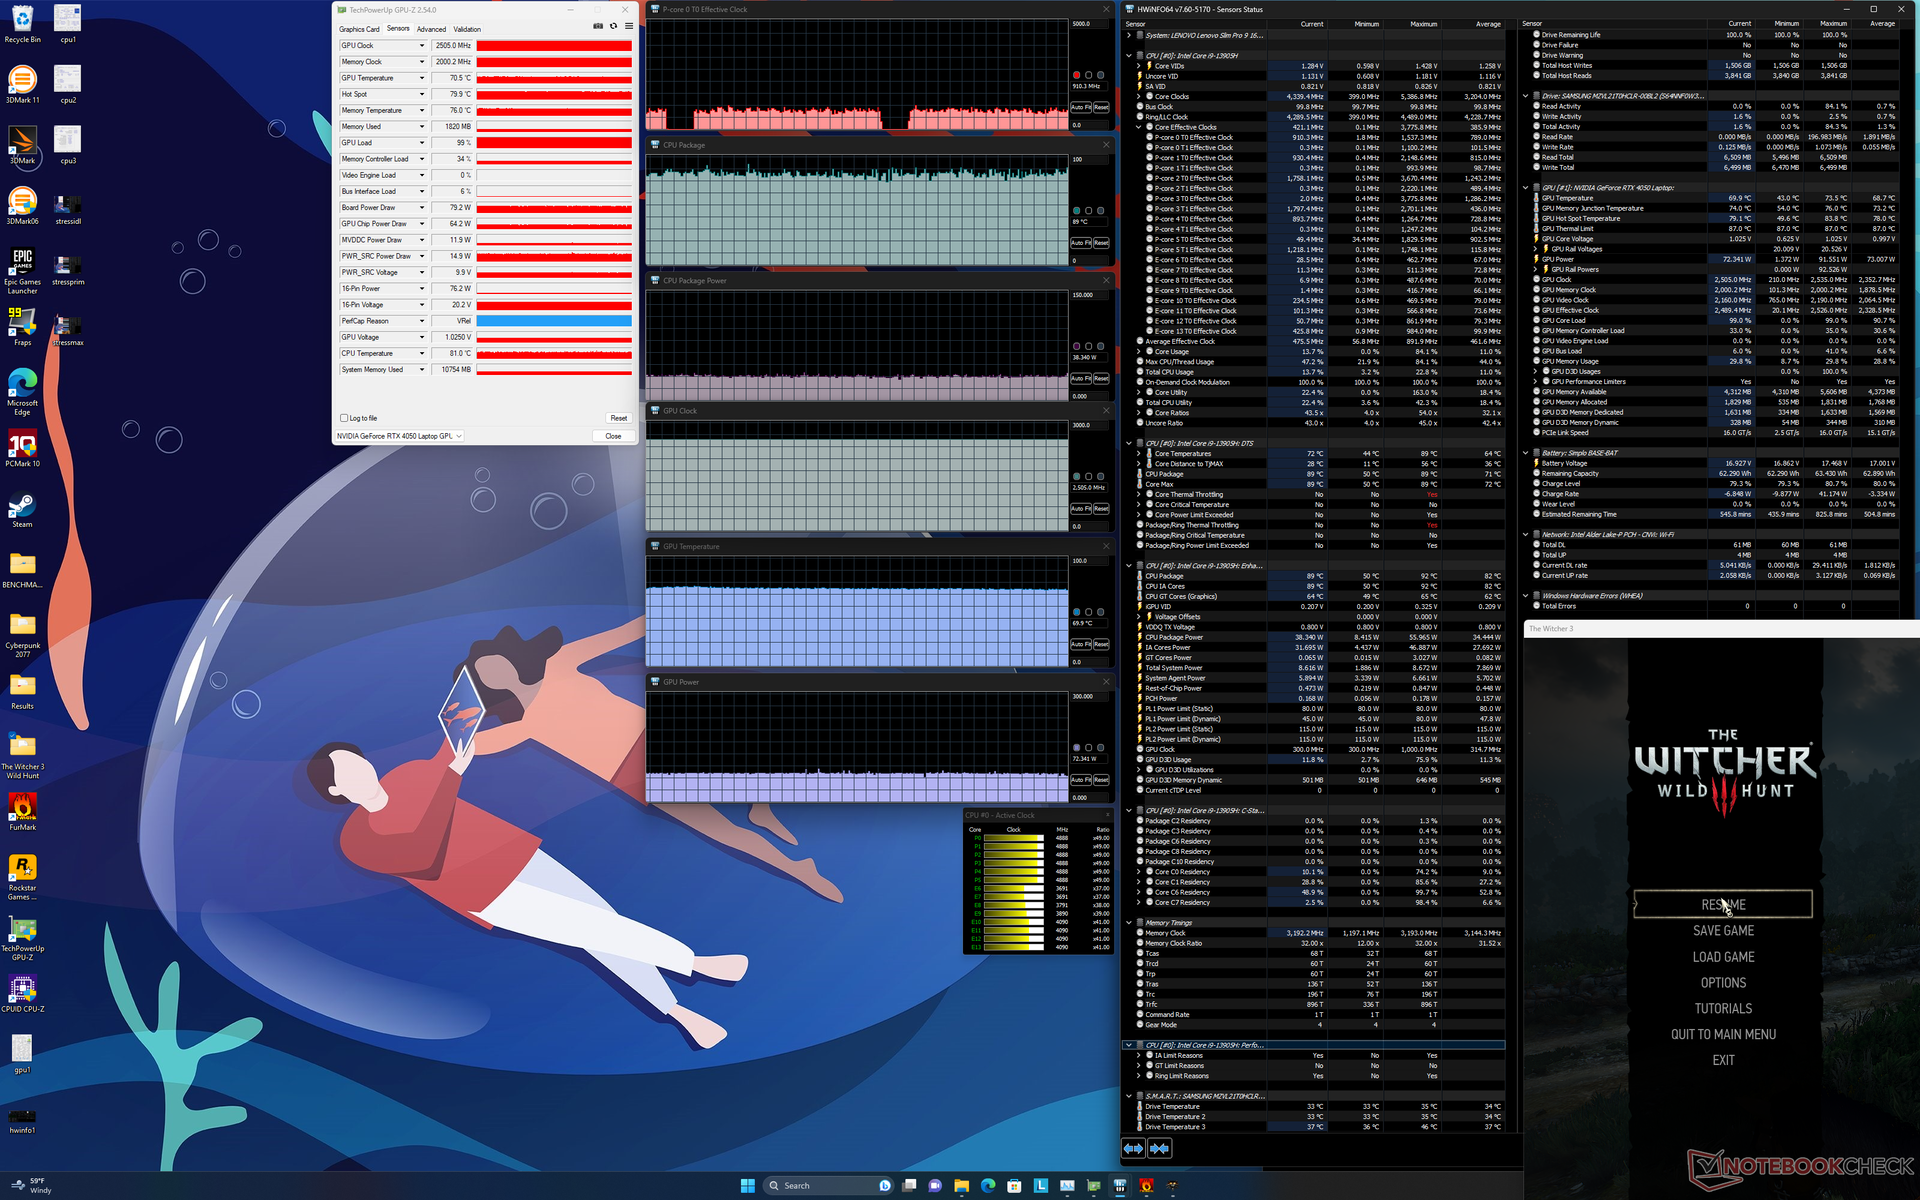
| CPU 时钟 (GHz) | GPU 时钟 (MHz) | CPU 平均温度 (°C) | GPU 平均温度(°C) | |
| 系统闲置 | -- | -- | 38 | 32 |
| Prime95 压力 | ~3.0 | -- | 82 | 50 |
| Prime95 + FurMark 压力 | ~2.4 | 2265 | 77 | 77 |
| Witcher 3 压力(性能模式) | ~0.9 | 2505 | 89 | 70 |
| Witcher 3 压力(平衡模式) | ~0.7 | 2460 | 57 | 62 |
发言人
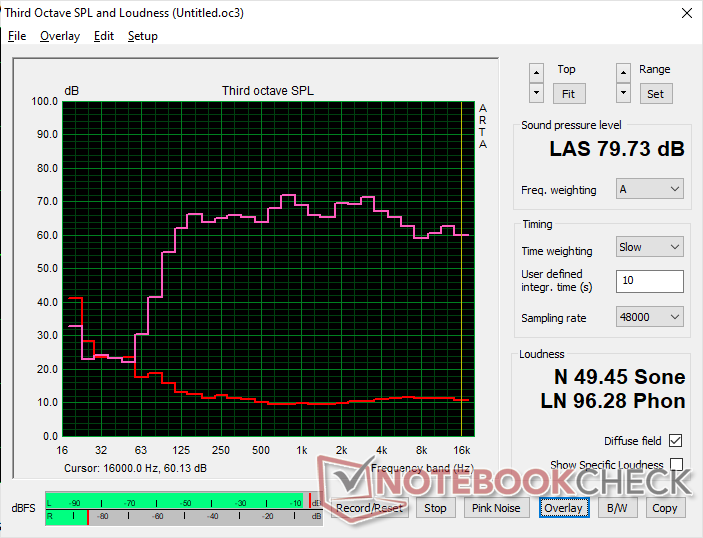
Lenovo Slim Pro 9i 16IRP8 audio analysis
(±) | speaker loudness is average but good (79.7 dB)
Bass 100 - 315 Hz
(+) | good bass - only 2.8% away from median
(±) | linearity of bass is average (8.9% delta to prev. frequency)
Mids 400 - 2000 Hz
(+) | balanced mids - only 2.4% away from median
(+) | mids are linear (4.9% delta to prev. frequency)
Highs 2 - 16 kHz
(+) | balanced highs - only 3.6% away from median
(+) | highs are linear (4.3% delta to prev. frequency)
Overall 100 - 16.000 Hz
(+) | overall sound is linear (7.3% difference to median)
Compared to same class
» 6% of all tested devices in this class were better, 1% similar, 94% worse
» The best had a delta of 5%, average was 17%, worst was 45%
Compared to all devices tested
» 1% of all tested devices were better, 0% similar, 99% worse
» The best had a delta of 4%, average was 23%, worst was 134%
Apple MacBook Pro 16 2021 M1 Pro audio analysis
(+) | speakers can play relatively loud (84.7 dB)
Bass 100 - 315 Hz
(+) | good bass - only 3.8% away from median
(+) | bass is linear (5.2% delta to prev. frequency)
Mids 400 - 2000 Hz
(+) | balanced mids - only 1.3% away from median
(+) | mids are linear (2.1% delta to prev. frequency)
Highs 2 - 16 kHz
(+) | balanced highs - only 1.9% away from median
(+) | highs are linear (2.7% delta to prev. frequency)
Overall 100 - 16.000 Hz
(+) | overall sound is linear (4.6% difference to median)
Compared to same class
» 0% of all tested devices in this class were better, 0% similar, 100% worse
» The best had a delta of 5%, average was 17%, worst was 45%
Compared to all devices tested
» 0% of all tested devices were better, 0% similar, 100% worse
» The best had a delta of 4%, average was 23%, worst was 134%
能源管理
耗电量
在 iGPU 激活的情况下,最低亮度设置的功耗为 16 W,而在 dGPU 激活的情况下,最高亮度设置显示全白图像时的功耗为 30 W。因此,与 OLED 面板一样,如果电池寿命是个问题,建议在亮度设置和色彩方面多加注意。
游戏时的功耗与我们在 Yoga Pro 9i 上记录的几乎完全相同,尽管后者的图形性能快达 20%。RTX 4050 和 RTX 4060 配置的目标功耗均为 100 W TGP,这也解释了它们在 GPU 负载时功耗水平相似的原因。
在启动 Prime95 时,我们的酷睿 i9-13905H 的峰值略高于酷睿 i7-13705H,最终稳定在相似的水平。
| Off / Standby | |
| Idle | |
| Load |
|
Key:
min: | |
| Lenovo Slim Pro 9i 16IRP8 i9-13905H, GeForce RTX 4050 Laptop GPU, Samsung PM9A1 MZVL21T0HCLR, Mini-LED, 3200x2000, 16" | Lenovo Yoga Pro 9 16-IRP G8 i7-13705H, GeForce RTX 4060 Laptop GPU, Samsung PM9A1 MZVL21T0HCLR, Mini-LED, 3200x2000, 16" | Asus VivoBook Pro 16 i7-12700H, GeForce RTX 3050 Ti Laptop GPU, Intel SSD 670p SSDPEKNU010TZ, IPS, 2560x1600, 16" | Acer Swift Edge SFE16-42-R1GM R7 7735U, Radeon 680M, Micron 3400 1TB MTFDKBA1T0TFH, OLED, 3840x2400, 16" | Dell Inspiron 16 Plus 7620 i7-12700H, GeForce RTX 3050 Ti Laptop GPU, Kioxia BG5 KBG50ZNS512G, IPS, 3072x1920, 16" | HP Envy 16 h0112nr i7-12700H, GeForce RTX 3060 Laptop GPU, Micron 3400 1TB MTFDKBA1T0TFH, OLED, 3840x2400, 16" | |
|---|---|---|---|---|---|---|
| Power Consumption | 12% | 22% | 61% | 29% | 10% | |
| Idle Minimum * (Watt) | 16 | 10.9 32% | 8.7 46% | 8.6 46% | 6.8 57% | 10 37% |
| Idle Average * (Watt) | 30 | 22.6 25% | 13.1 56% | 7.7 74% | 9.6 68% | 10.9 64% |
| Idle Maximum * (Watt) | 30.4 | 23.5 23% | 18.3 40% | 9.3 69% | 17 44% | 27.8 9% |
| Load Average * (Watt) | 78.9 | 84.6 -7% | 116 -47% | 47.9 39% | 117.5 -49% | 116.4 -48% |
| Witcher 3 ultra * (Watt) | 155.3 | 159.5 -3% | 117.6 24% | 46.3 70% | 113.1 27% | 133.7 14% |
| Load Maximum * (Watt) | 180.4 | 177.3 2% | 162 10% | 56 69% | 137.4 24% | 209.8 -16% |
* ... smaller is better
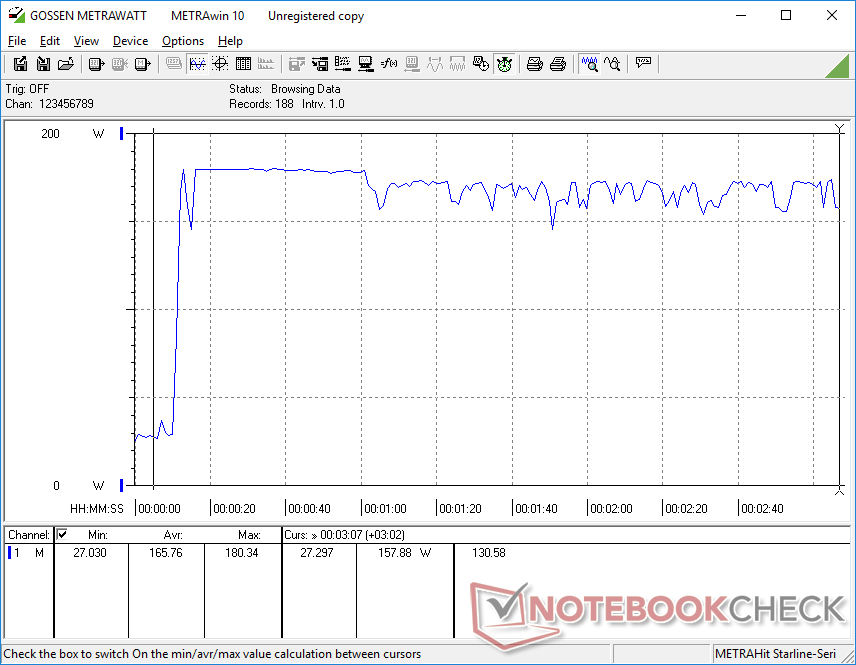
Power Consumption Witcher 3 / Stresstest
Power Consumption external Monitor
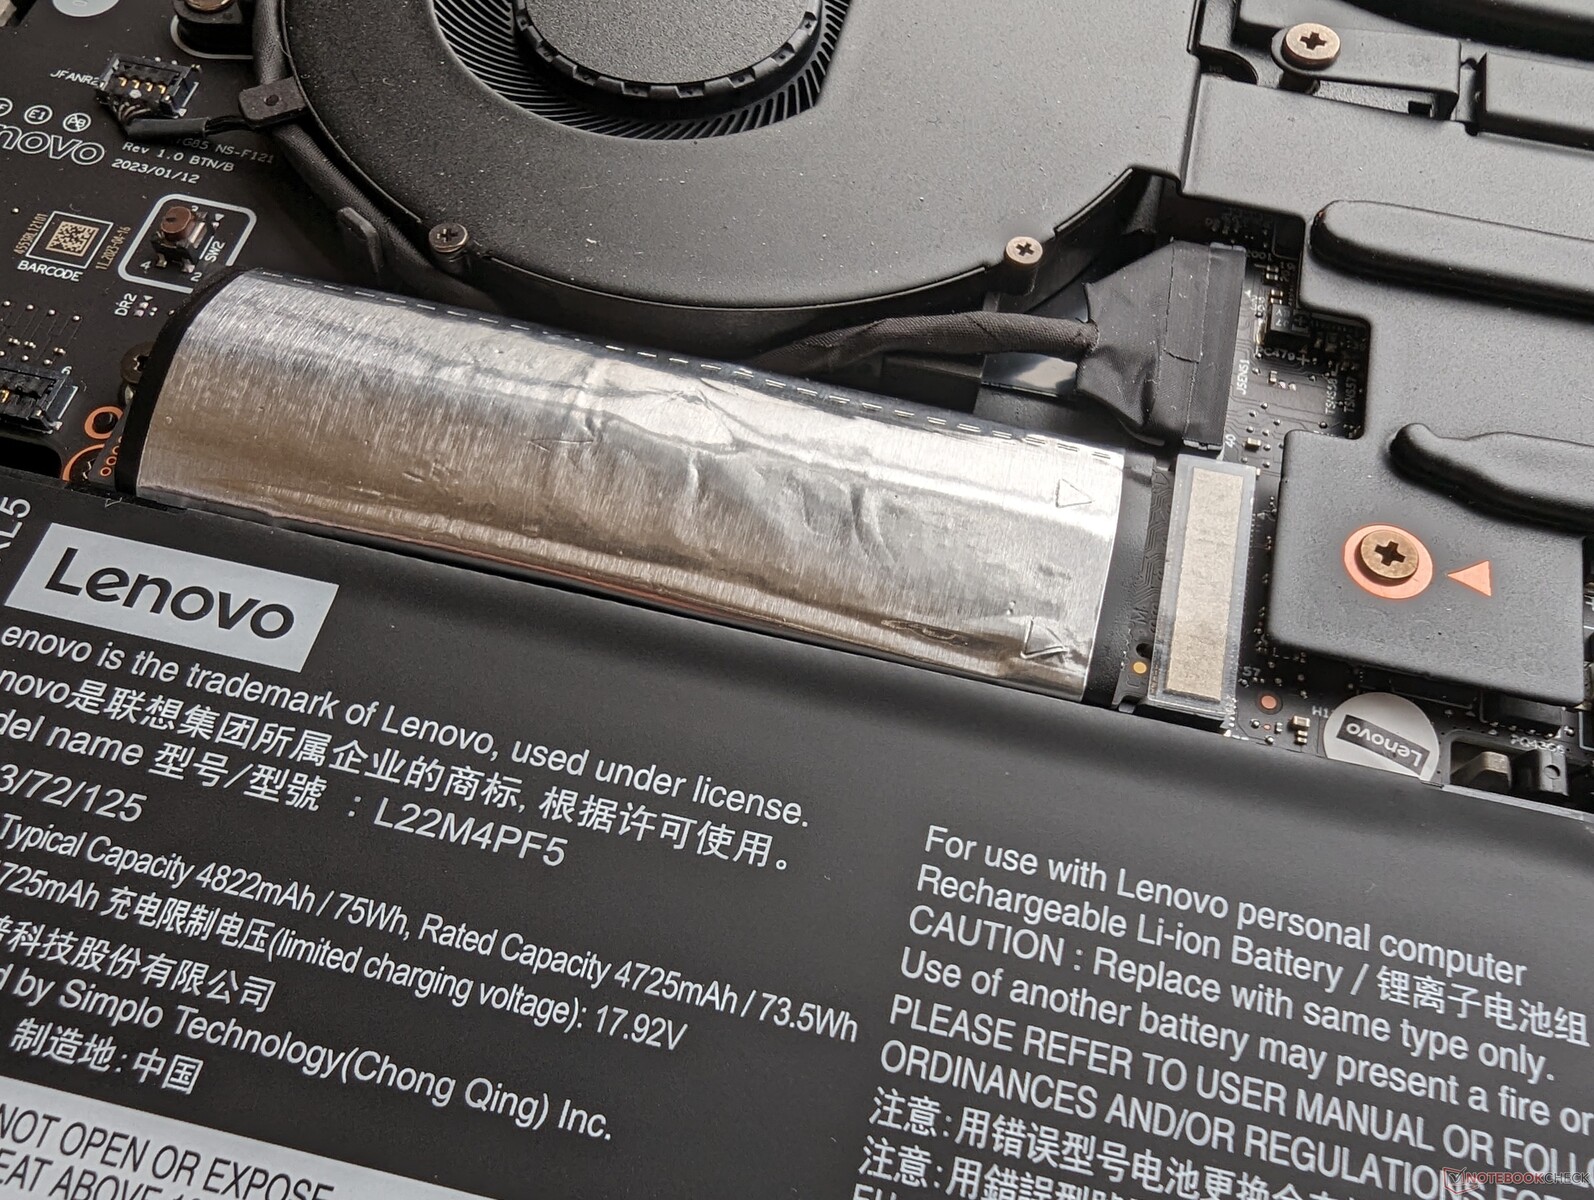
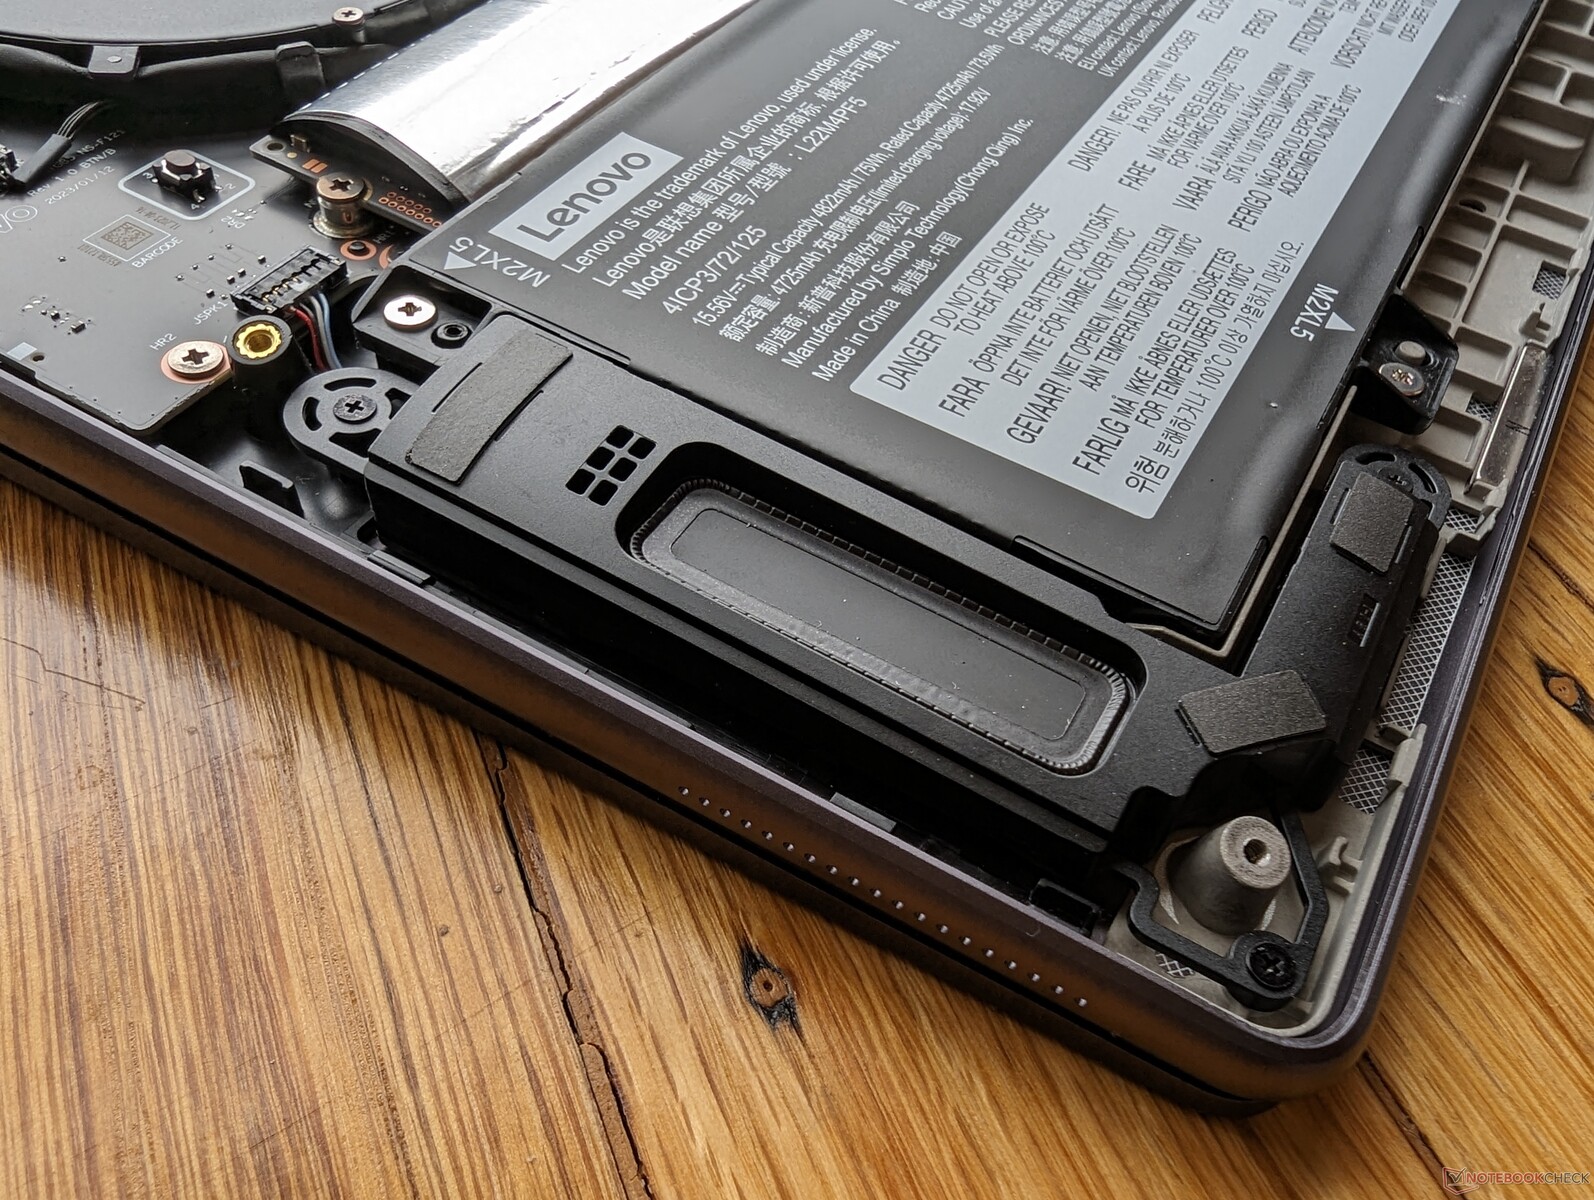
电池寿命
运行时间与我们在 Yoga Pro 9 16 上记录的实际浏览时间基本相同,约为 6.5 小时。即使启用了快速充电功能,从空电到满电也需要约 90 分钟。
如果运行要求较高的负载,即使连接到主电源,电池电量也可能下降。例如,在长达一小时的 Prime95 和 FurMark 测试中,我们的电池电量实际上会从 100% 下降到 79%,这表明该机型可能需要使用容量更大的交流适配器。
某些 USB-C 适配器可以为系统充电。例如,我们的 130 瓦戴尔 XPS 15 USB-C 适配器似乎不兼容,而 140 瓦联想 USB-C 适配器可以正常工作。
| Lenovo Slim Pro 9i 16IRP8 i9-13905H, GeForce RTX 4050 Laptop GPU, 75 Wh | Lenovo Yoga Pro 9 16-IRP G8 i7-13705H, GeForce RTX 4060 Laptop GPU, 75 Wh | Asus VivoBook Pro 16 i7-12700H, GeForce RTX 3050 Ti Laptop GPU, 70 Wh | Acer Swift Edge SFE16-42-R1GM R7 7735U, Radeon 680M, 54 Wh | Dell Inspiron 16 Plus 7620 i7-12700H, GeForce RTX 3050 Ti Laptop GPU, 86 Wh | HP Envy 16 h0112nr i7-12700H, GeForce RTX 3060 Laptop GPU, 83 Wh | |
|---|---|---|---|---|---|---|
| Battery runtime | -3% | 11% | 11% | 45% | 20% | |
| WiFi v1.3 (h) | 6.6 | 6.4 -3% | 7.3 11% | 7.3 11% | 9.6 45% | 7.9 20% |
| H.264 (h) | 7.5 | 8.6 | ||||
| Load (h) | 0.7 | 1.5 | 1.2 | 1.6 | ||
| Reader / Idle (h) | 10.9 | 18.6 | 17.8 |
Pros
Cons
结论 - 酷睿 i7 搭配GeForce RTX 4060 更划算
Slim Pro 9i 16 目前至少有两种配置可供选择:一种是酷睿 i7-13705H 和GeForce RTX 4060,另一种是酷睿 i9-13905H 和GeForce RTX 4050。由于两者的价格非常接近,因此强烈建议选择配备 RTX 4060 的酷睿 i7,而不是配备 RTX 4050 的酷睿 i9,因为酷睿 i7 的性能几乎与酷睿 i9 相同。同时,从 RTX 4050 升级到 RTX 4060,图形性能的提升更大、更明显。
酷睿 i7 和GeForce RTX 4060 配置是考虑购买联想 Slim Pro 9i 16 的最佳选择。
该机型的其他方面可与其他产品媲美,如惠普 Envy 16或MacBook Pro 16从广泛的端口选项到整体的快速性能、轻巧的重量和合理的尺寸。不过,Envy 16 没有用户可扩展的内存,MacBook Pro 也没有预校准的显示屏和更长的电池续航时间。
价格和供应情况
联想现已出货Slim Pro 9i 16,售价 2200 美元,配备更高端的GeForce RTX 4060。该机型在百思买(Best Buy)也有销售。
Lenovo Slim Pro 9i 16IRP8
- 08/10/2023 v7 (old)
Allen Ngo
Transparency
The selection of devices to be reviewed is made by our editorial team. The test sample was provided to the author as a loan by the manufacturer or retailer for the purpose of this review. The lender had no influence on this review, nor did the manufacturer receive a copy of this review before publication. There was no obligation to publish this review. As an independent media company, Notebookcheck is not subjected to the authority of manufacturers, retailers or publishers.
This is how Notebookcheck is testing
Every year, Notebookcheck independently reviews hundreds of laptops and smartphones using standardized procedures to ensure that all results are comparable. We have continuously developed our test methods for around 20 years and set industry standards in the process. In our test labs, high-quality measuring equipment is utilized by experienced technicians and editors. These tests involve a multi-stage validation process. Our complex rating system is based on hundreds of well-founded measurements and benchmarks, which maintains objectivity. Further information on our test methods can be found here.
Price comparison

