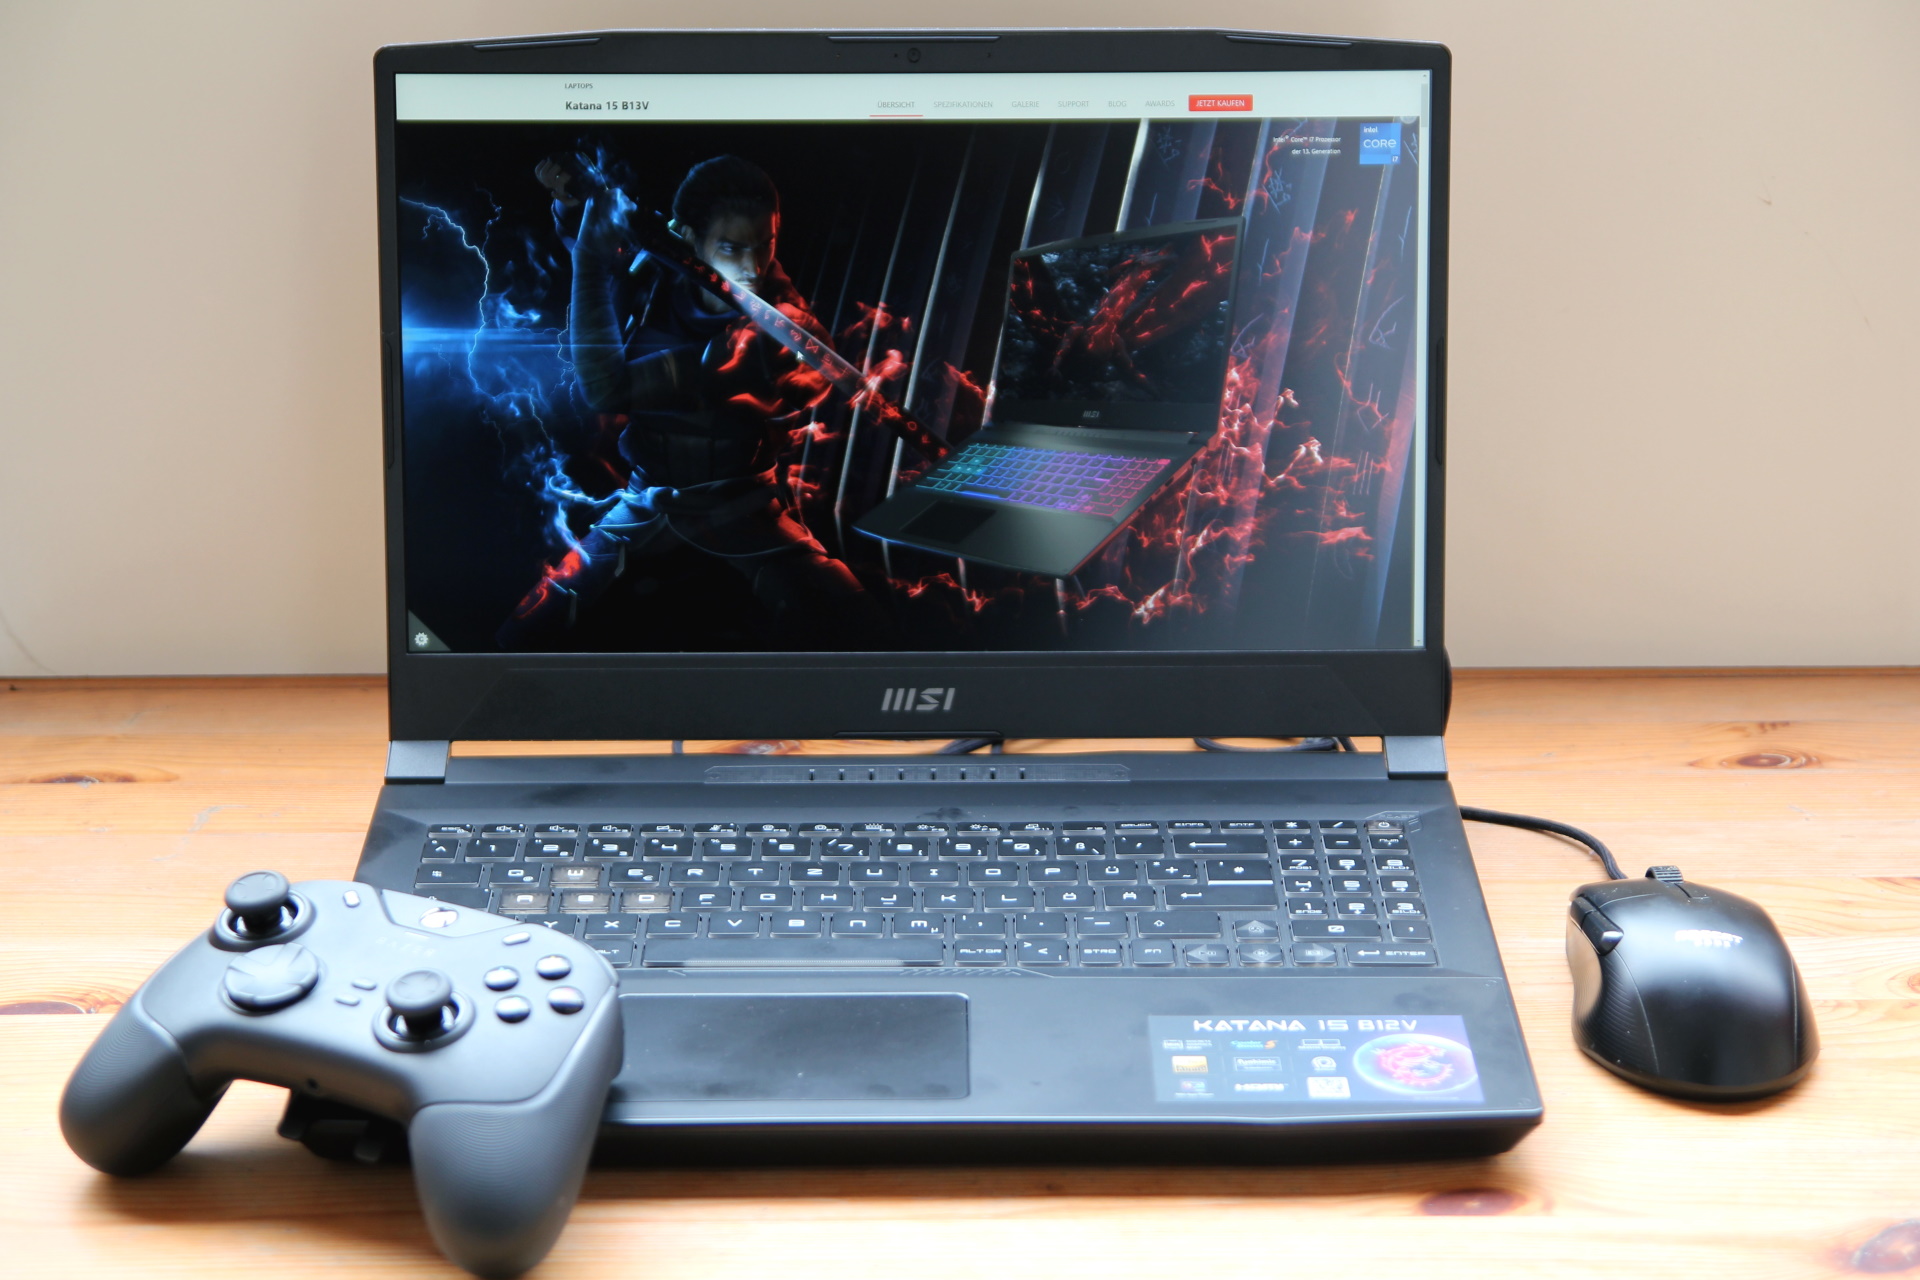
微星Katana 15笔记本电脑回顾:拥有RTX 4050和Alder Lake CPU的预算游戏机

微星公司有一系列笔记本电脑,在视觉上看起来非常相似。去年,我们审查了15.6英寸的准前辈,即微星Katana GF66 12UGS,但 脉冲GL66或MSI Sword也有相同的视觉效果。我们目前的审查配置是有趣的,因为微星已经决定将一个 "老 "桤木湖处理器与一个新的 RTX 4050以便可能成为第一批发布带有RTX 40xx卡的游戏笔记本电脑。名称是Katana 15 B12,而Katana 15 B13已经有一个英特尔Gen13和一个RTX 40xx。我们将看看这两代CPU/GPU在我们的B12模型中如何比较。
由于Katana 15是首批接受审查的带有RTX 4050的笔记本电脑之一,我们在很大程度上回落到上一代的入门级到中端玩家的RTX 3060进行比较。这些产品包括 联想Legion 5,以及 申克XMG核心15, 微星 MSI Pulse GL66和 华硕TUF Gaming F15。前者也被包括在内进行比较,但读者应该注意,它配备了更强大的 RTX 3070 Ti.
潜在的竞争对手比较
Rating | Date | Model | Weight | Height | Size | Resolution | Price |
|---|---|---|---|---|---|---|---|
| 82.9 % v7 (old) | 03 / 2023 | MSI Katana 15 B12VEK i7-12650H, GeForce RTX 4050 Laptop GPU | 2.3 kg | 24.9 mm | 15.60" | 1920x1080 | |
| 80.3 % v7 (old) | 06 / 2022 | MSI Katana GF66 12UGS i7-12700H, GeForce RTX 3070 Ti Laptop GPU | 2.3 kg | 27.5 mm | 15.60" | 1920x1080 | |
| 80.7 % v7 (old) | 04 / 2022 | MSI Pulse GL66 12UEK i9-12900H, GeForce RTX 3060 Laptop GPU | 2.3 kg | 25 mm | 15.60" | 1920x1080 | |
| 87.5 % v7 (old) | 11 / 2022 | Lenovo Legion 5 15IAH7H 82RB i7-12700H, GeForce RTX 3060 Laptop GPU | 2.4 kg | 19.99 mm | 15.60" | 1920x1080 | |
| 87.2 % v7 (old) | 03 / 2022 | Asus TUF Gaming F15 FX507ZM i7-12700H, GeForce RTX 3060 Laptop GPU | 2.1 kg | 24.95 mm | 15.60" | 1920x1080 | |
| 87.9 % v7 (old) | 01 / 2023 | Schenker XMG Core 15 (M22) R7 6800H, GeForce RTX 3060 Laptop GPU | 2.1 kg | 23 mm | 15.60" | 2560x1440 |
箱子 - 塑料卡塔纳
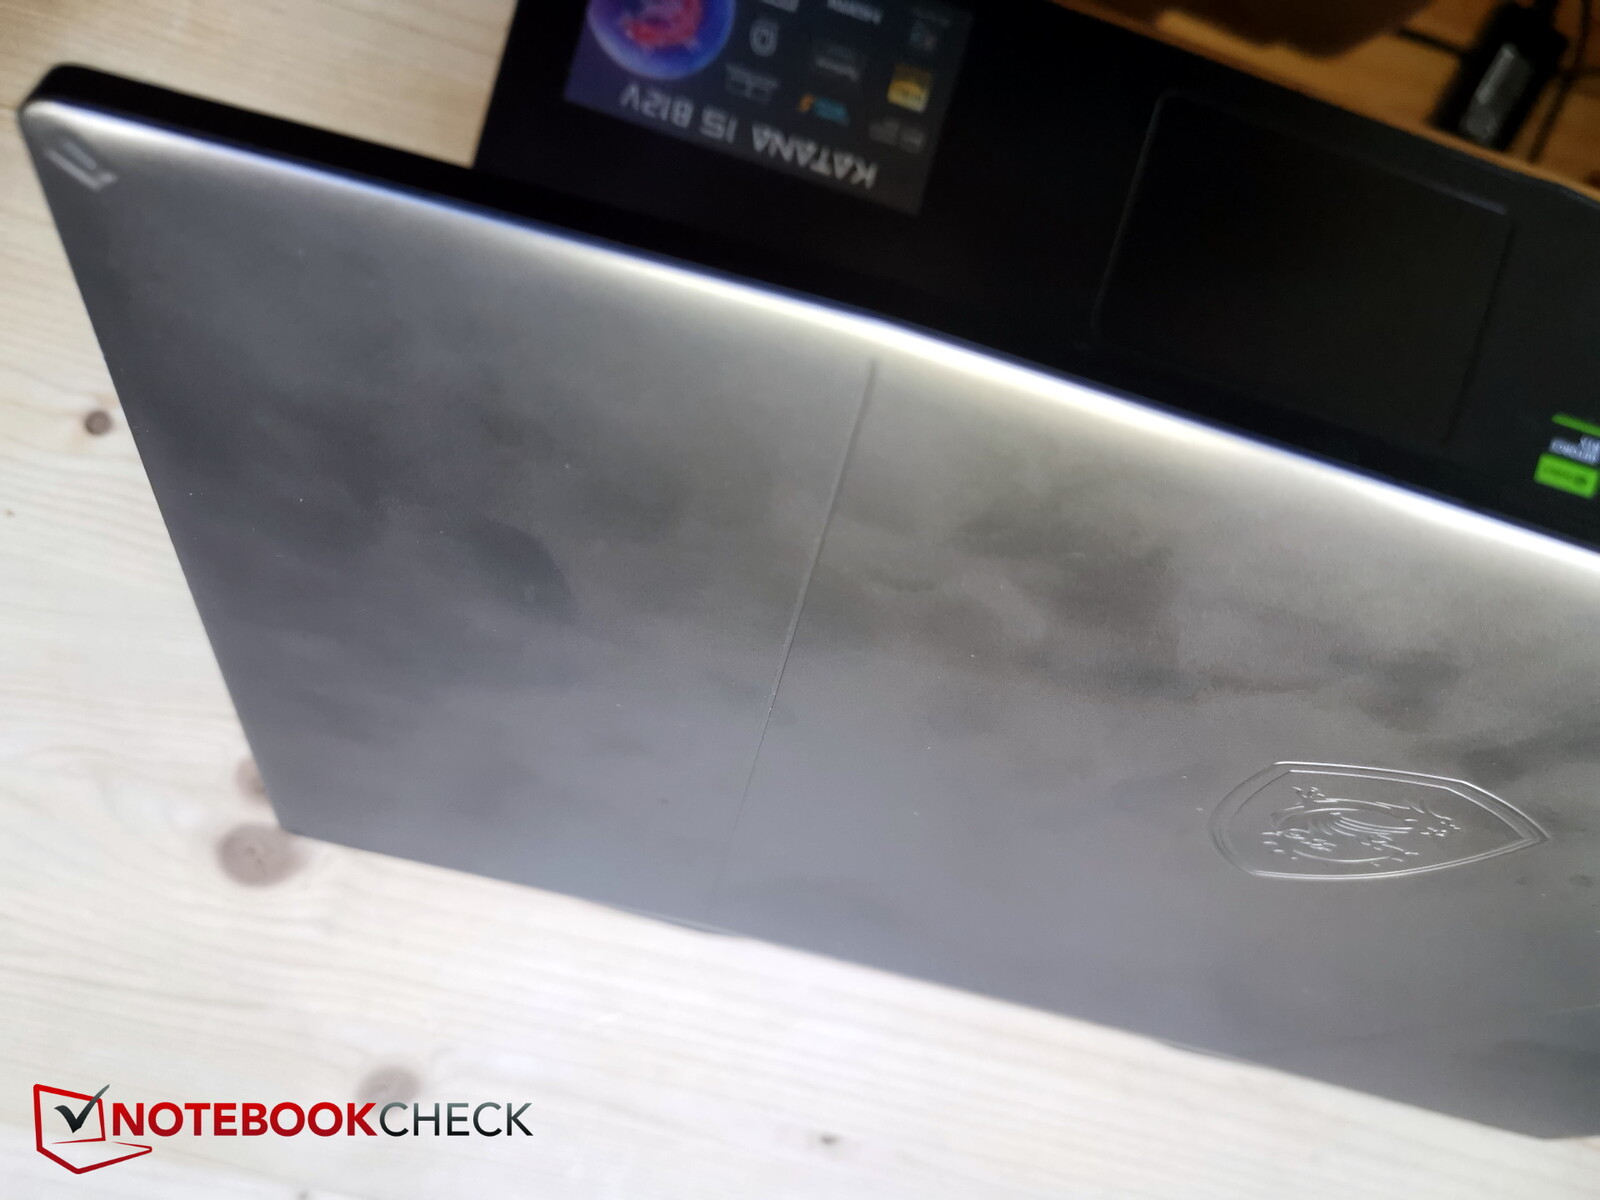
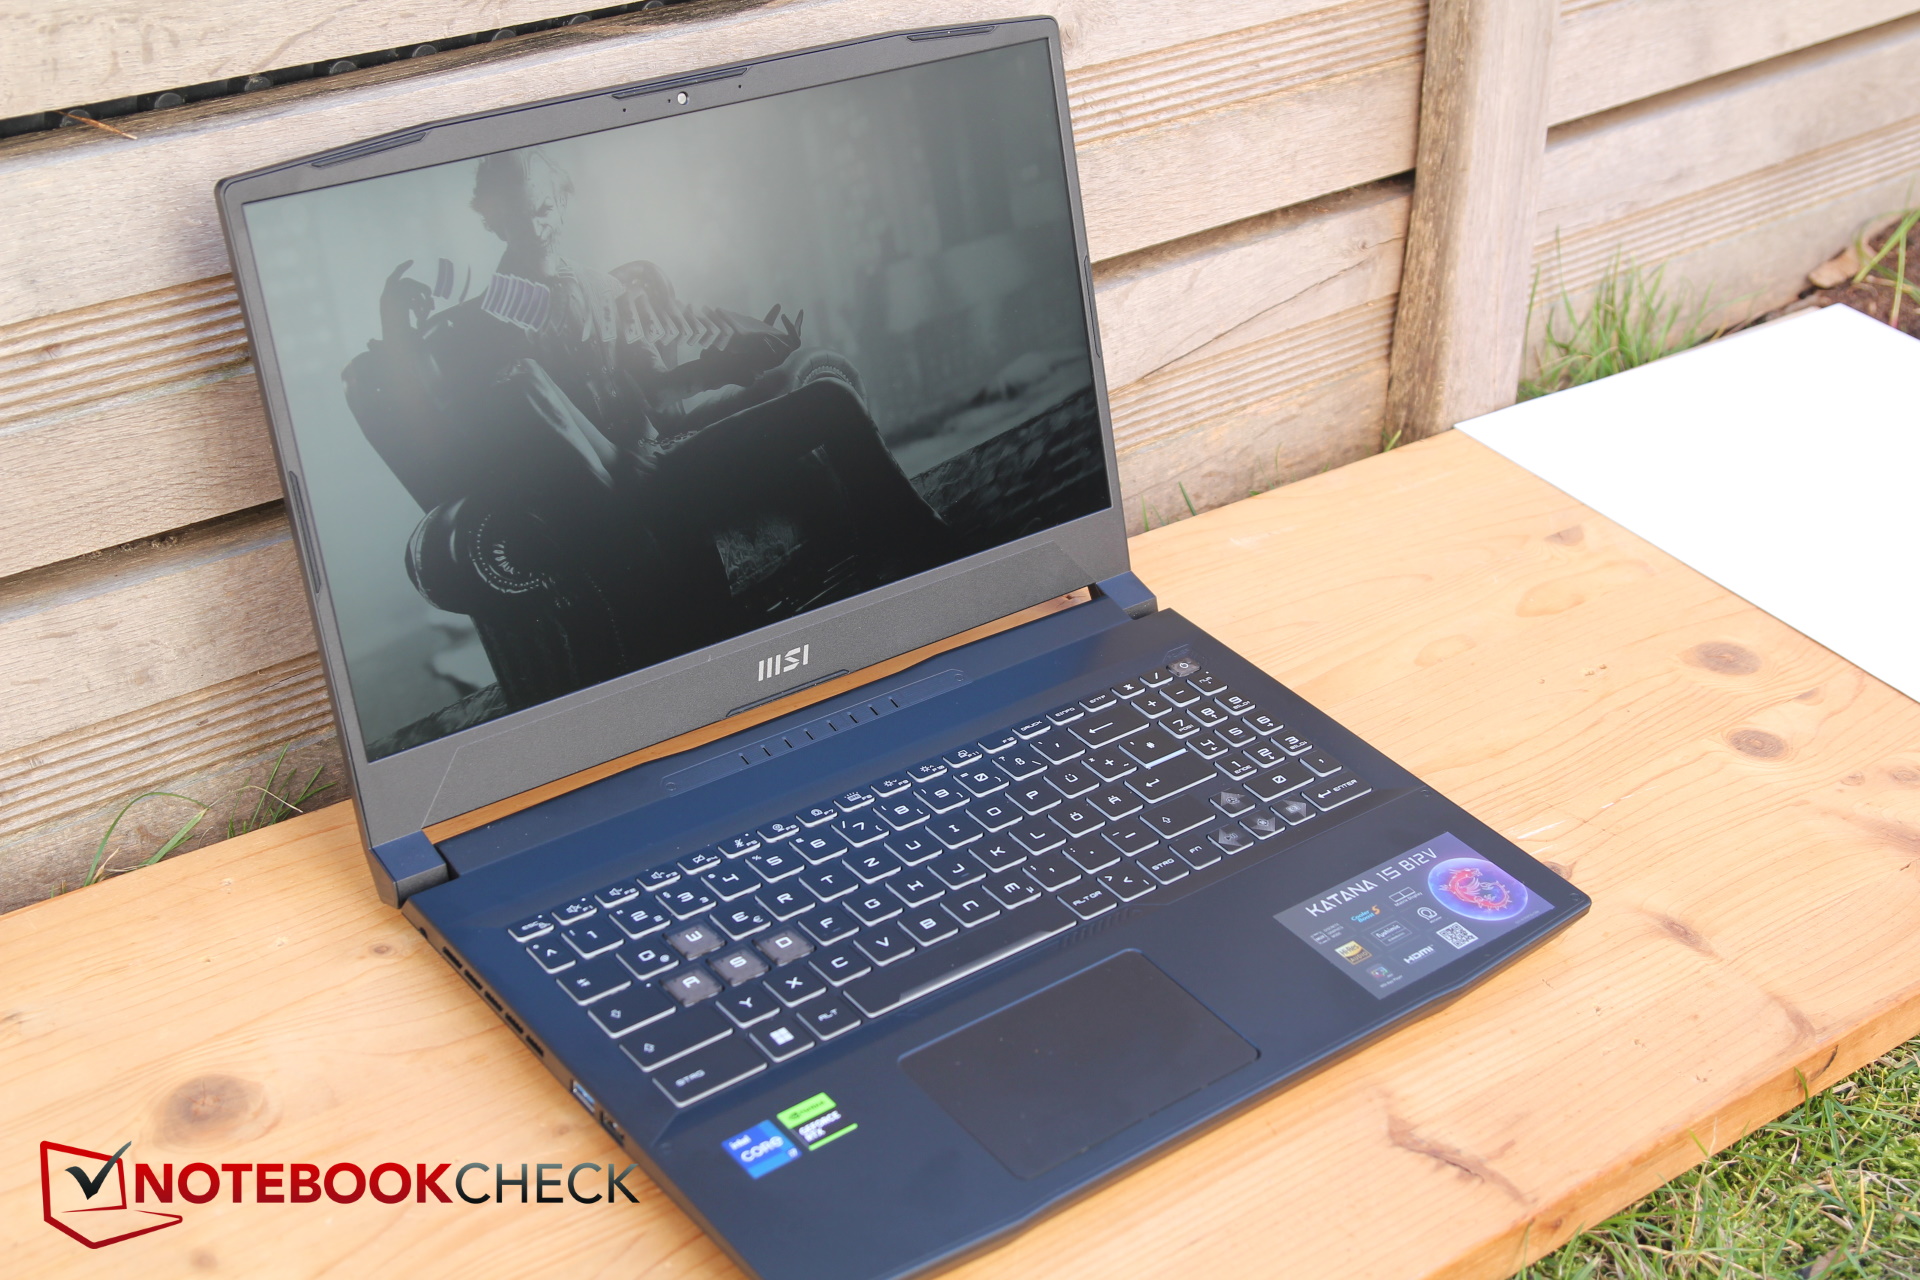
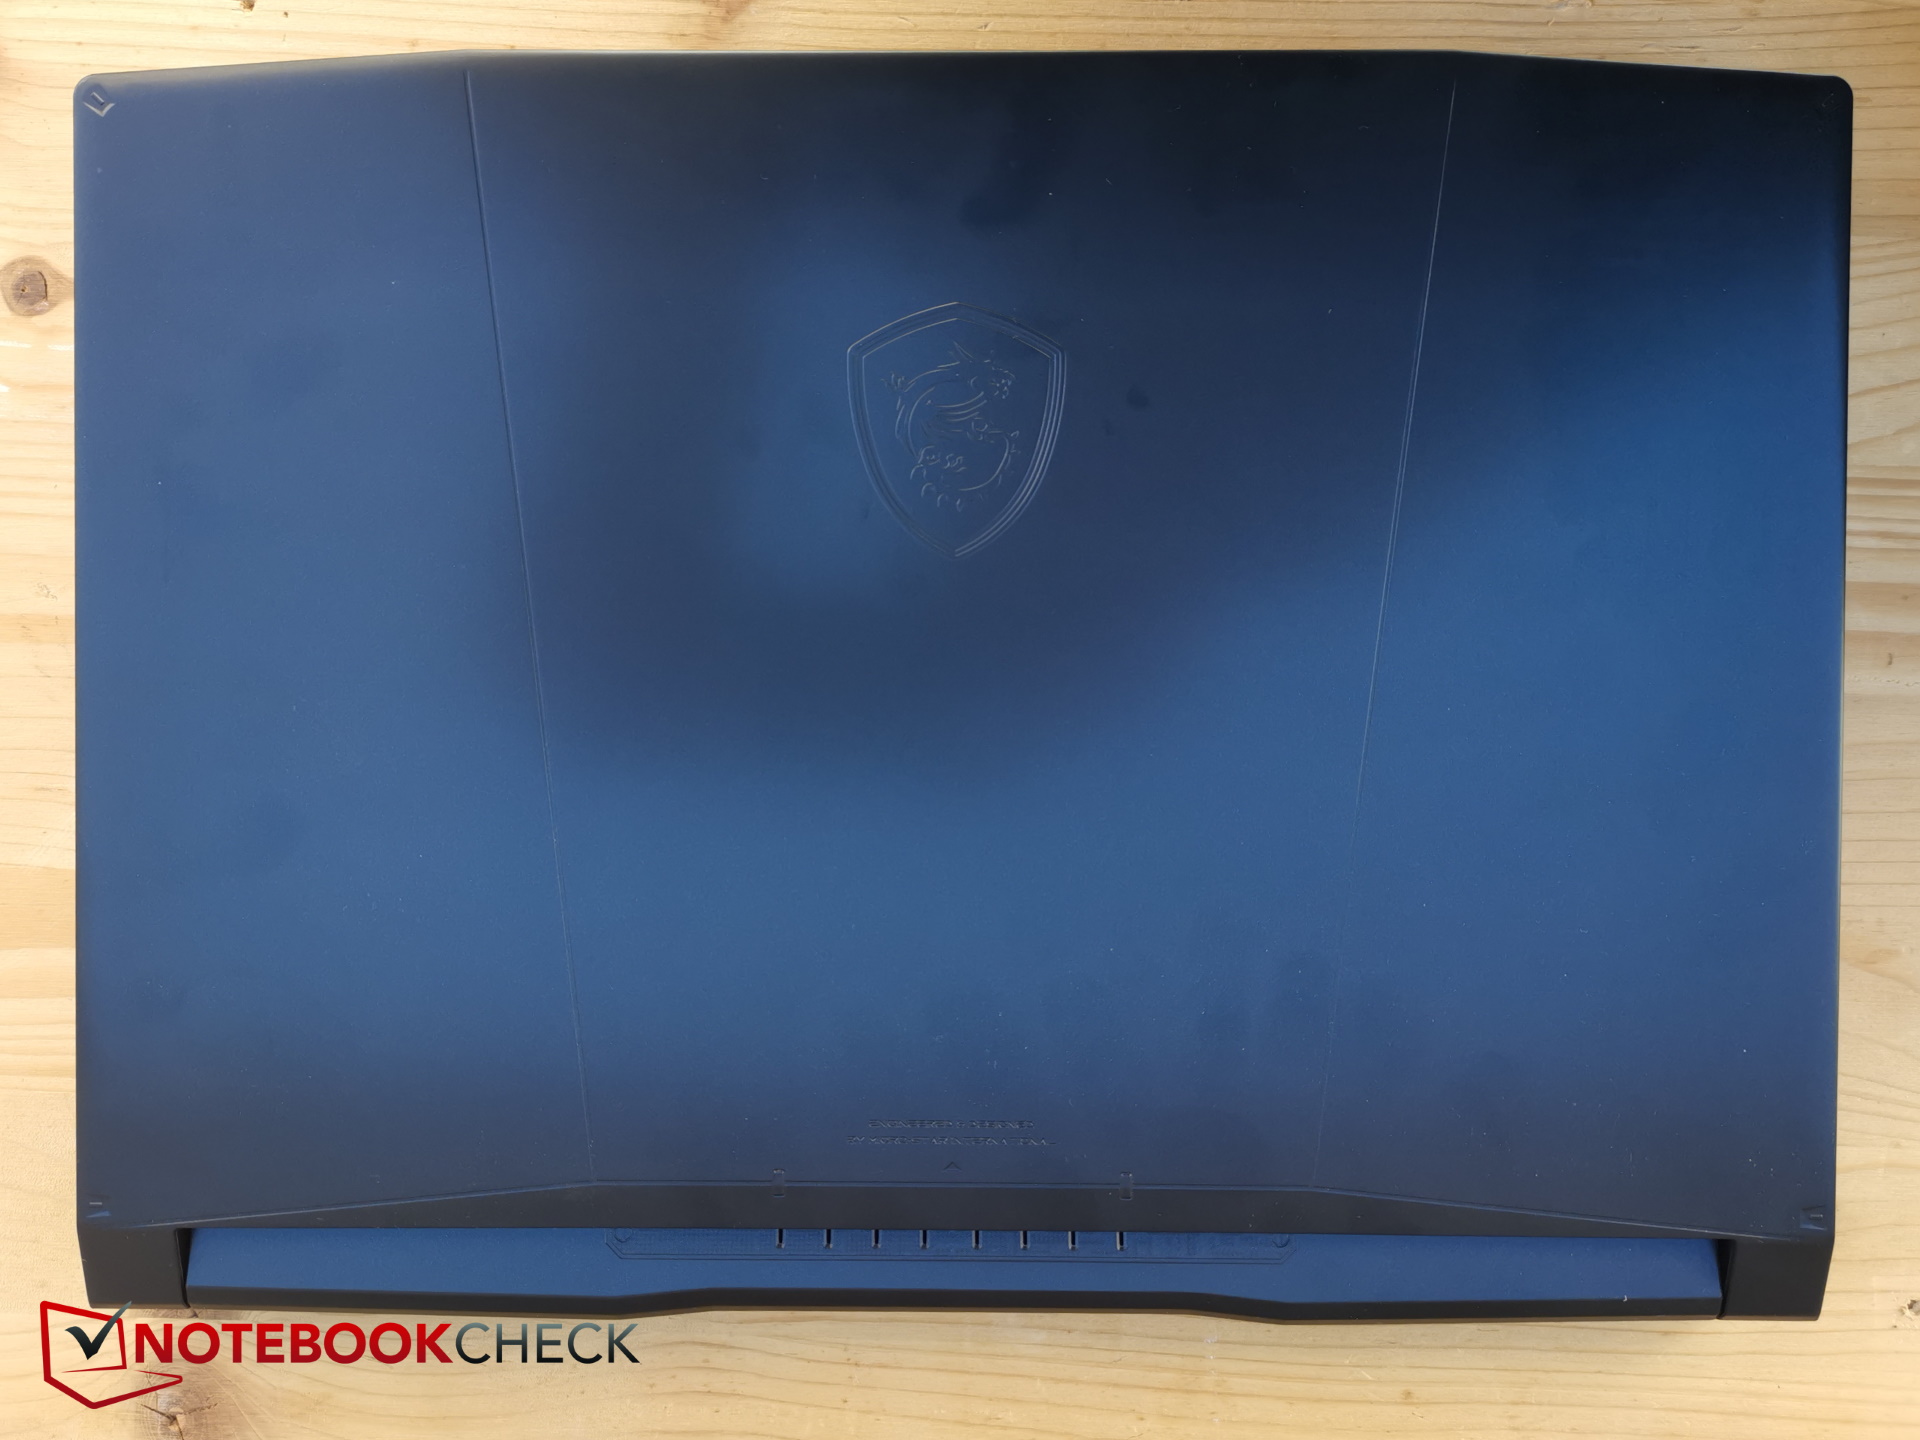
Katana 15的外壳完全由塑料制成,即使显示屏盖子和底座的光滑表面材料看起来几乎像金属。侧面现在显示出黑色和灰色的图案。不幸的是,事实证明,这个箱子也非常容易沾染指纹。
开启角度为180度。在标志旁边,一些线条和模切装饰着盖子的黑色闪亮表面。打开或调整角度后,显示屏晃动的时间比平时长。
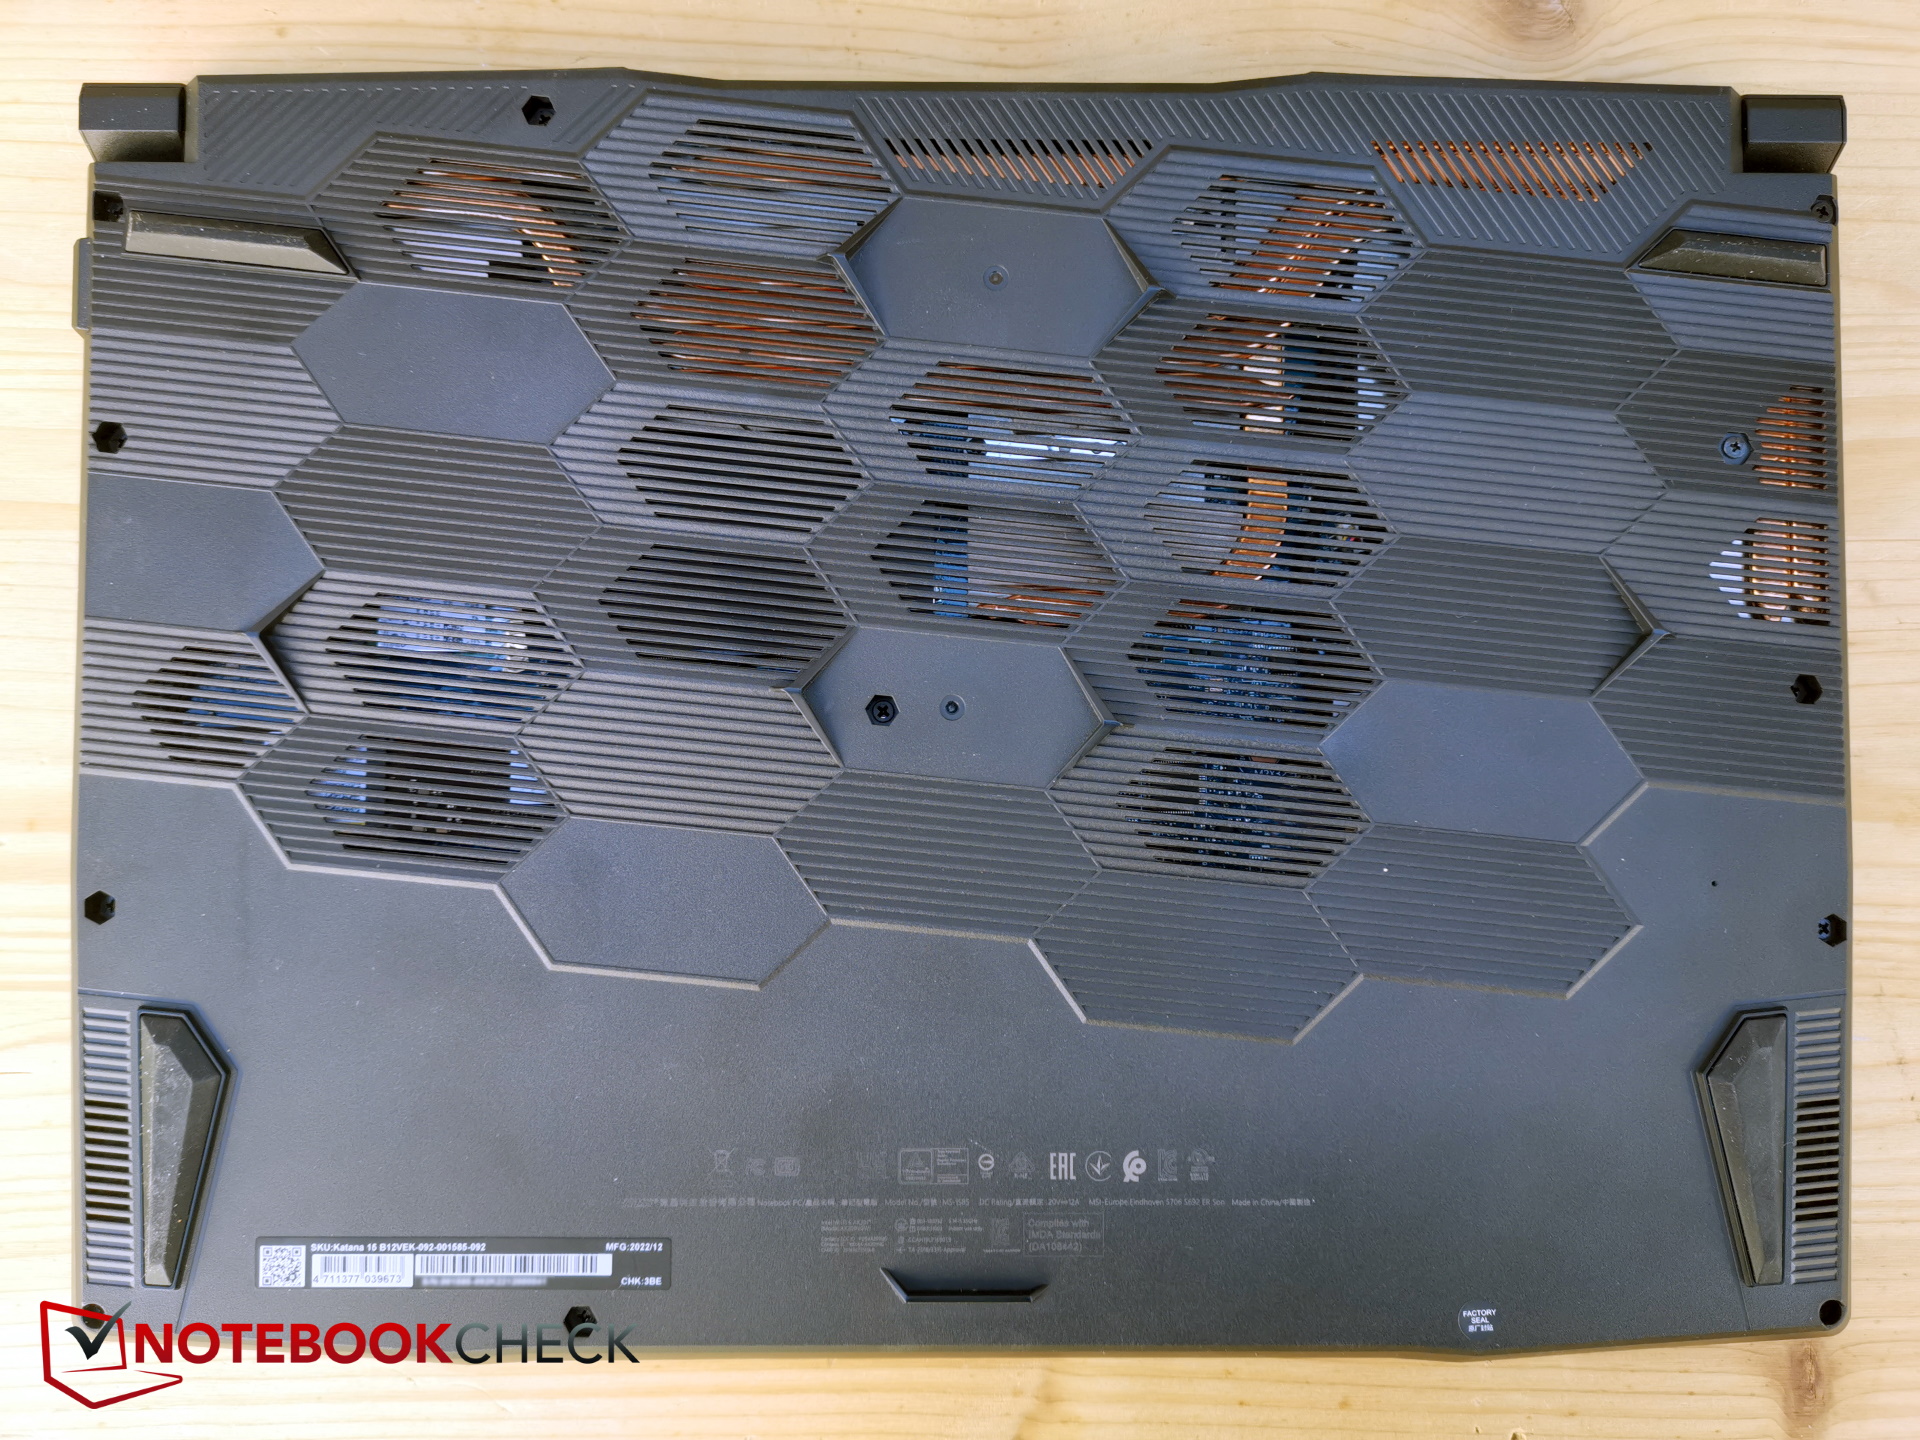
底部是由较软的塑料制成。底部相对抗扭,但会发出一些破裂的声音。相反,盖子更容易弯曲,并发出吱吱的声音。显示屏的边缘在侧面很窄,但按照今天的标准,顶部和底部相当宽。
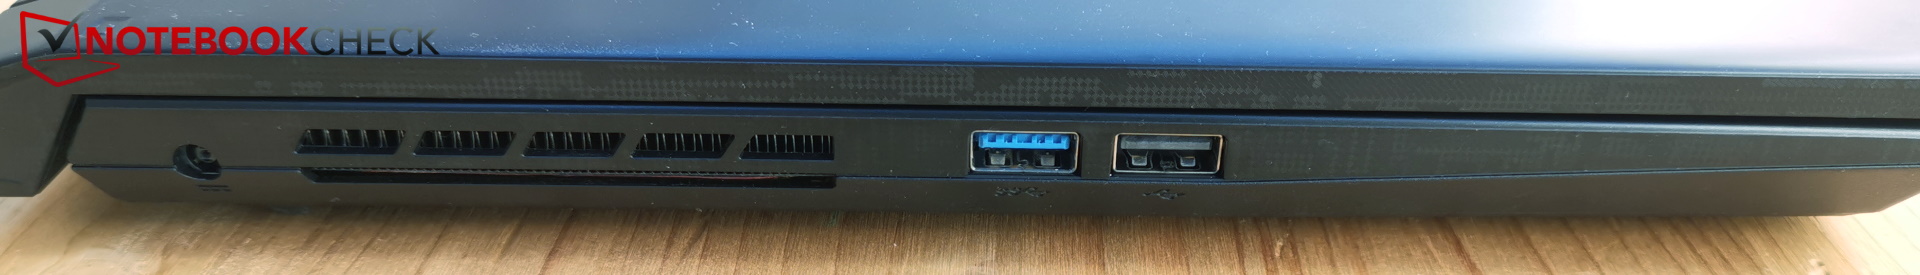
装备--上一代产品
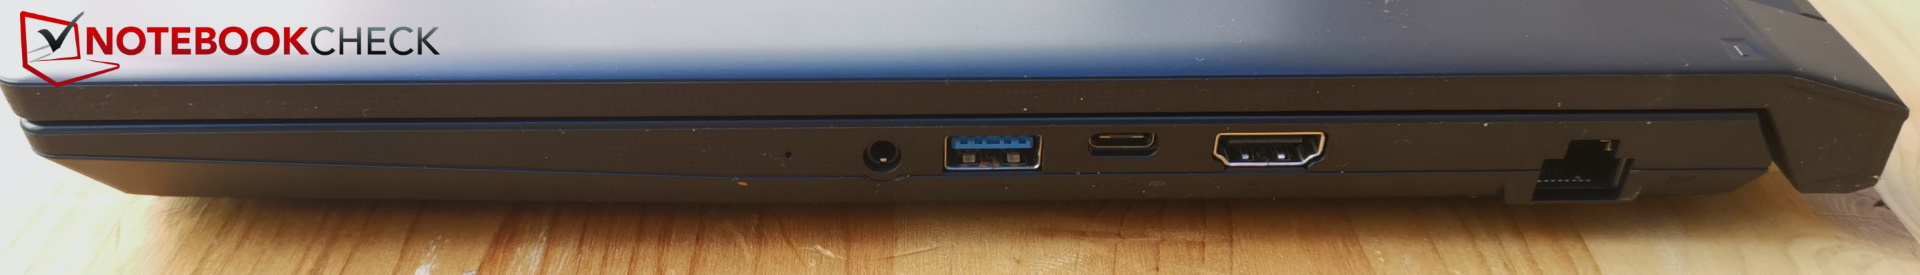
三个微星型号的端口安排都是一样的。事实上,三个USB-A端口中的一个仍然是2.0型,这并不真正属于当前的时代。这同样适用于一个USB-C插槽,它不支持Thunderbolt,只提供3.0速度。
缺少一个SD读卡器,但至少LAN和HDMI都在机上。耳机插孔不寻常地位于右侧,就像HDMI端口一样,这两个端口可能会干扰鼠标的使用。尽管有足够的空间,但背面却没有端口。
沟通
微星安装了英特尔Wi-Fi 6 AX201无线局域网模块,它还不支持Wi-Fi 6E,所以目前无法连接到6GHz网络。但它确实在5GHz范围内运行(当然还有2.4GHz),这还是相当快的。
网络摄像头
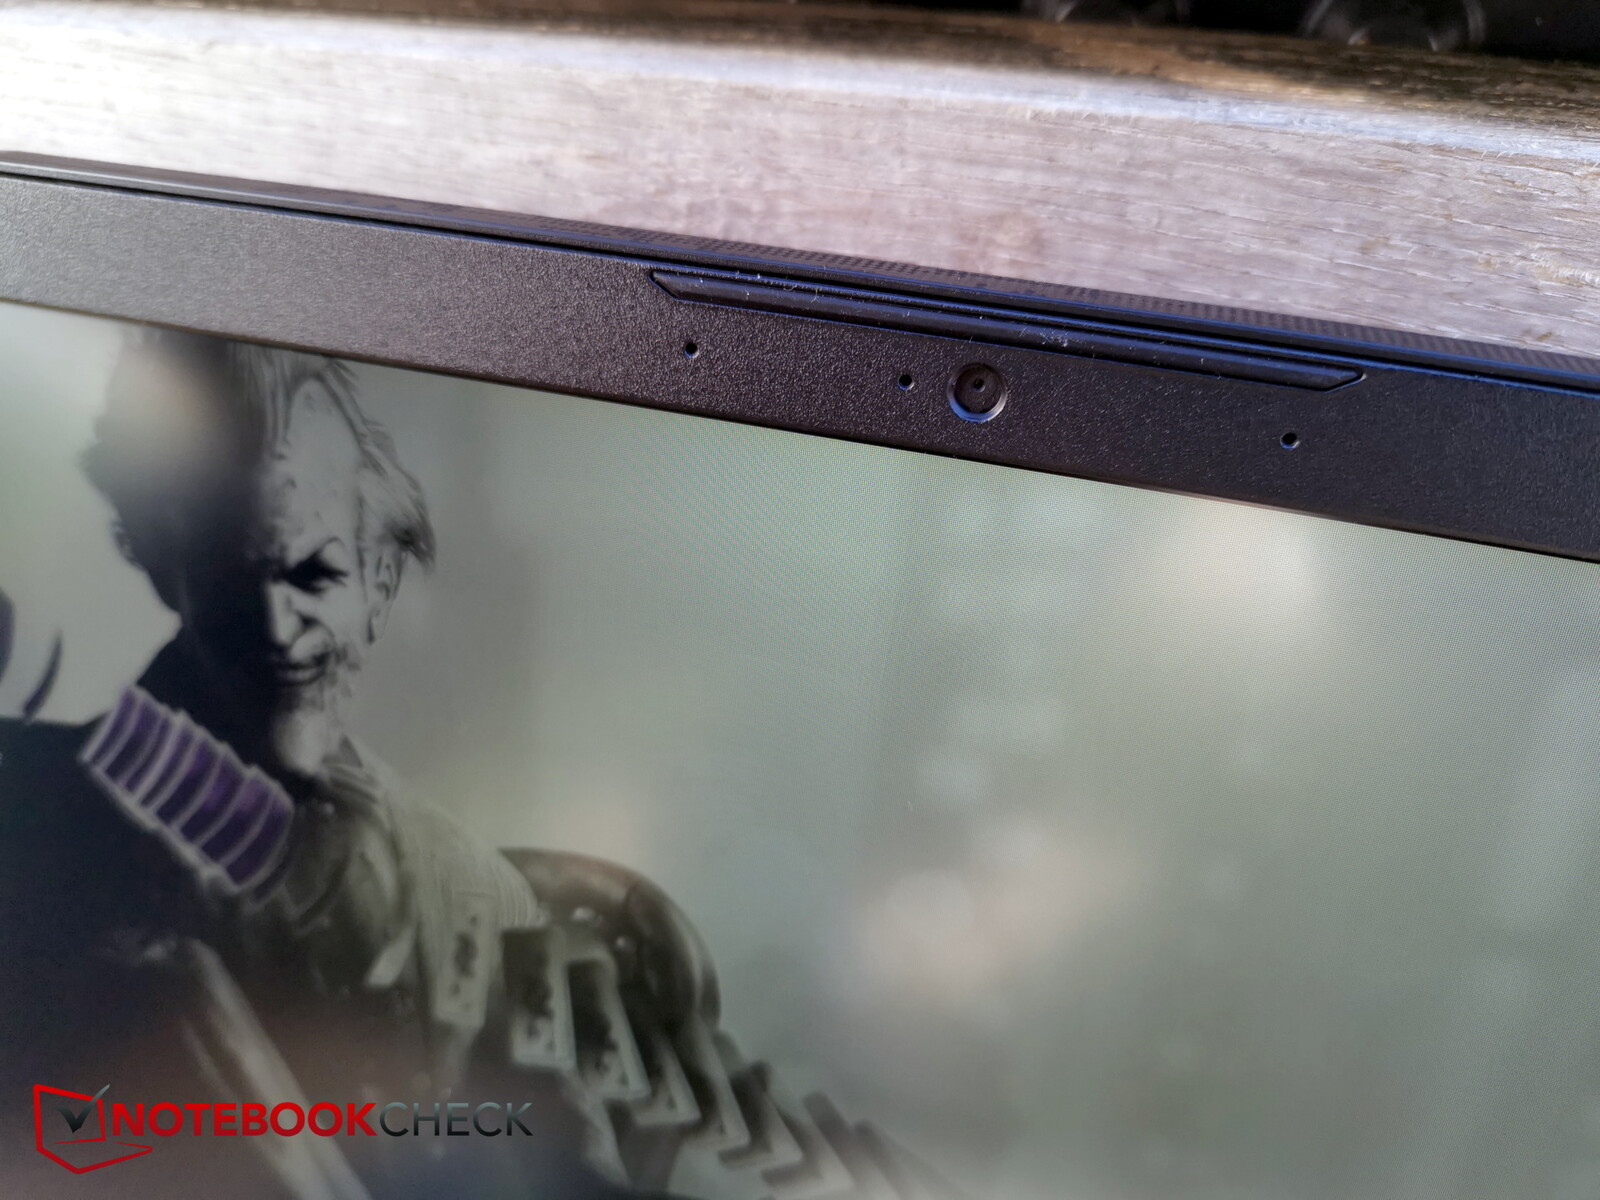
网络摄像头也是上一代产品,其分辨率为720p。即使是较新的B13也有一个720p的摄像头。这可以通过fn+F6打开或关闭。
色彩偏差通常相当高,而且图像质量相当次优。


安全问题
板上有TPM,否则缺少一个Kensington插槽。也没有指纹传感器。
配件和保修
价格低廉的笔记本电脑通常不附带任何额外的东西。Katana 15的情况也是如此。
微星公司提供24个月的保修期,并包括提货和退货服务。
维护
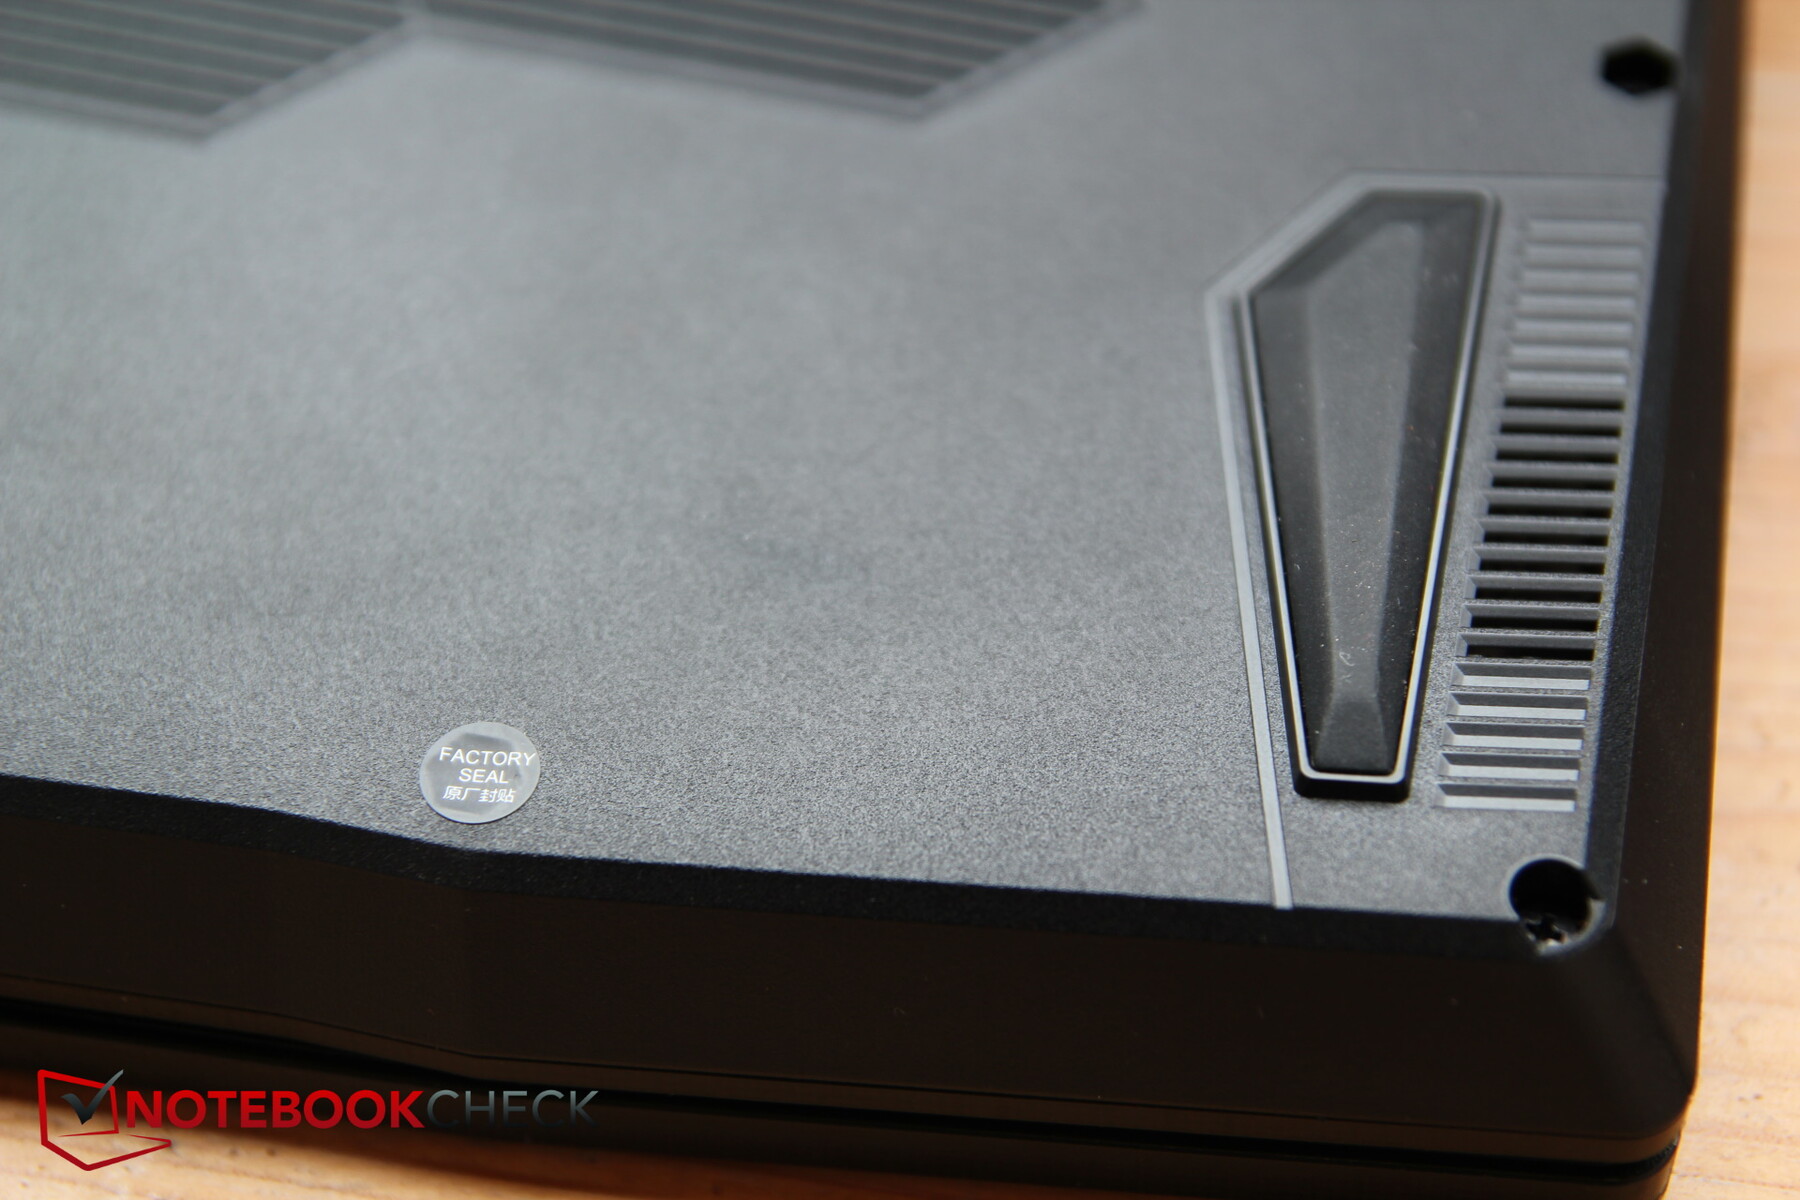
不幸的是,微星使用密封贴纸来确定用户是否已经自己打开过设备。由于我们的测试模型来自数码港,所以我们避免打开它,以免损坏我们借出的设备。
根据微星公司的说法,设备的所有者也可以为维护目的打开设备。只要这是 "专业 "的,设备的保修就不会受到影响。
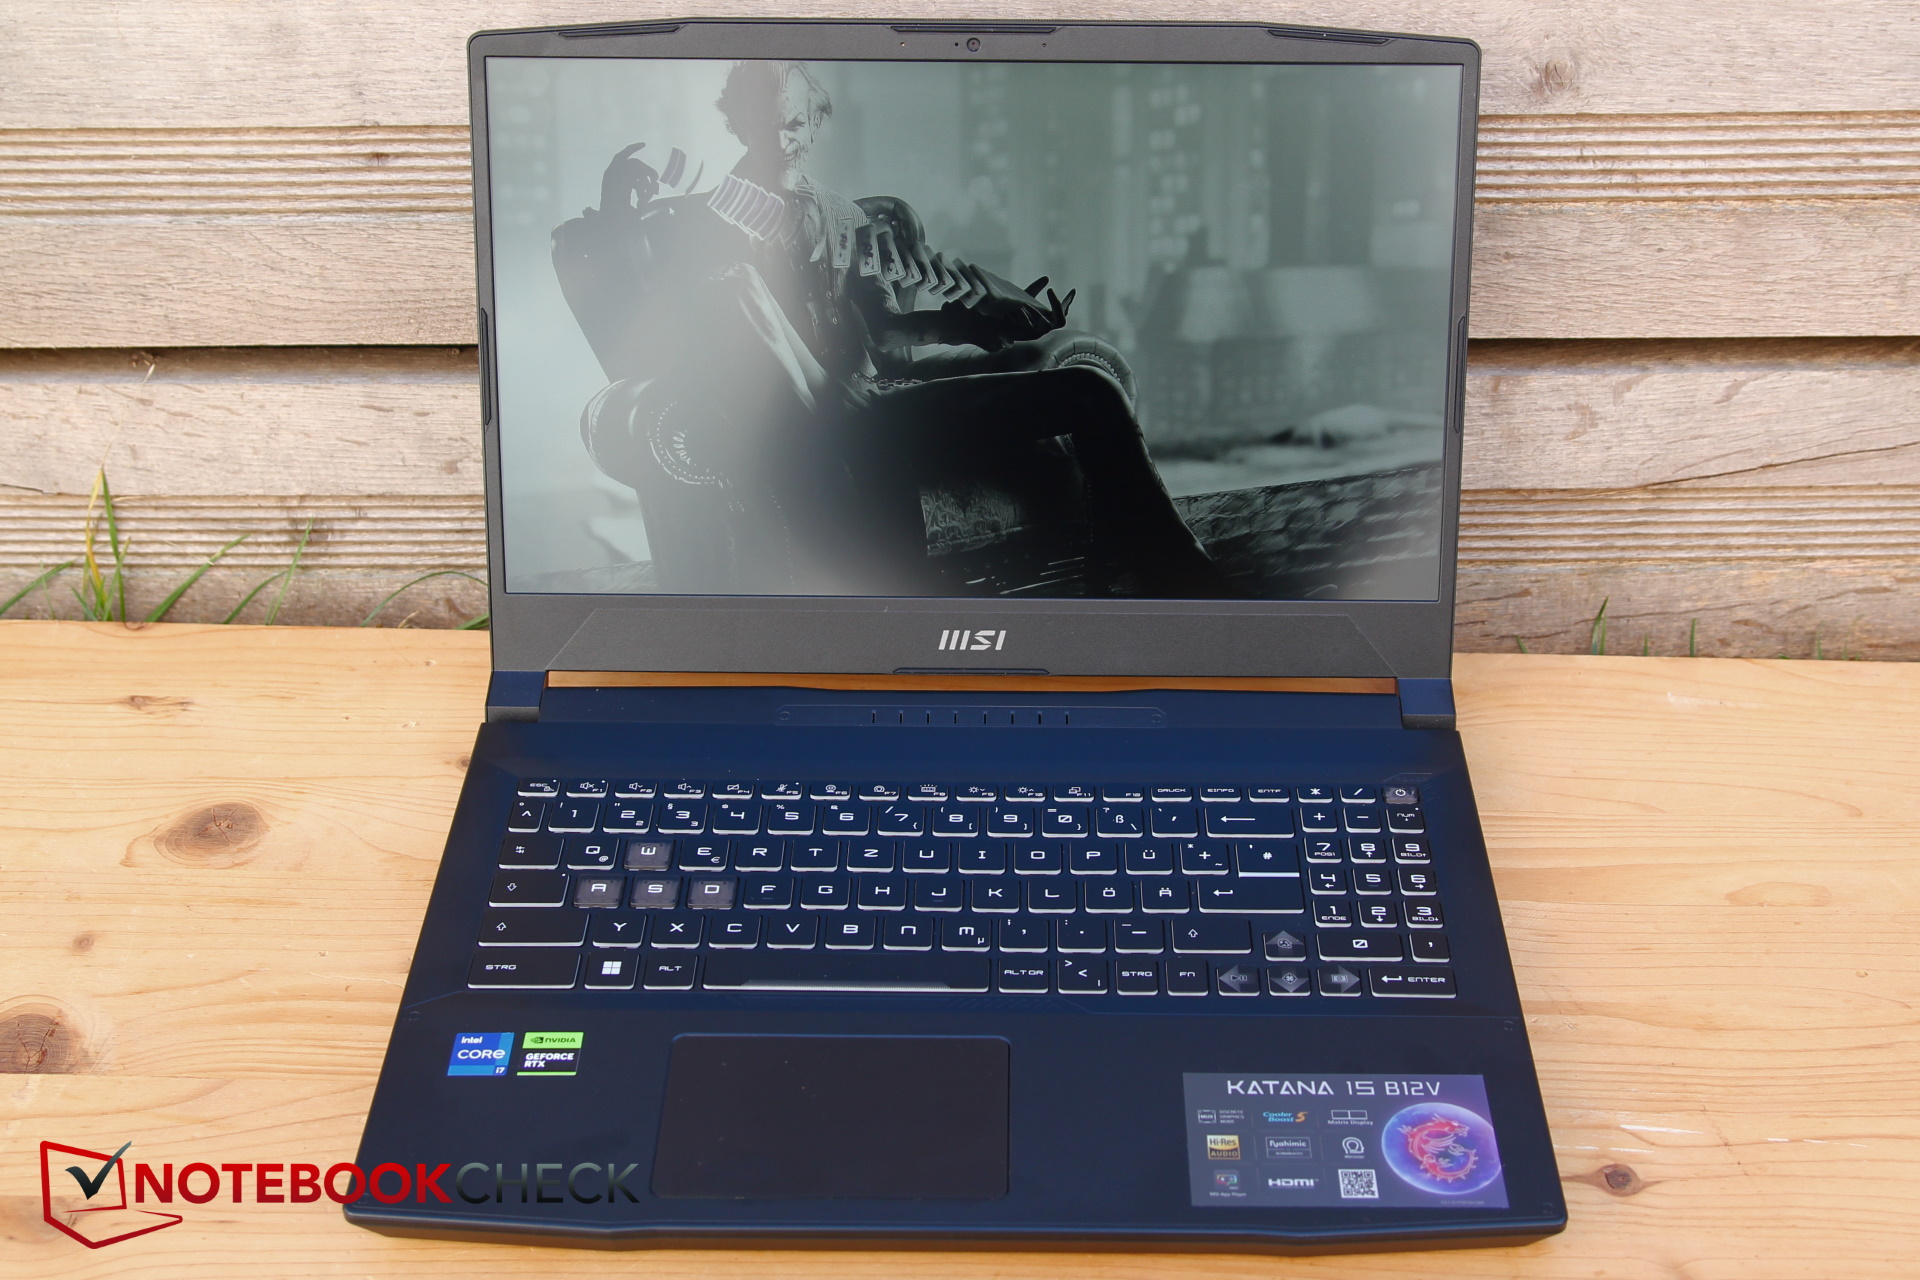
输入设备 - 体面的键盘,小型触摸板
键盘
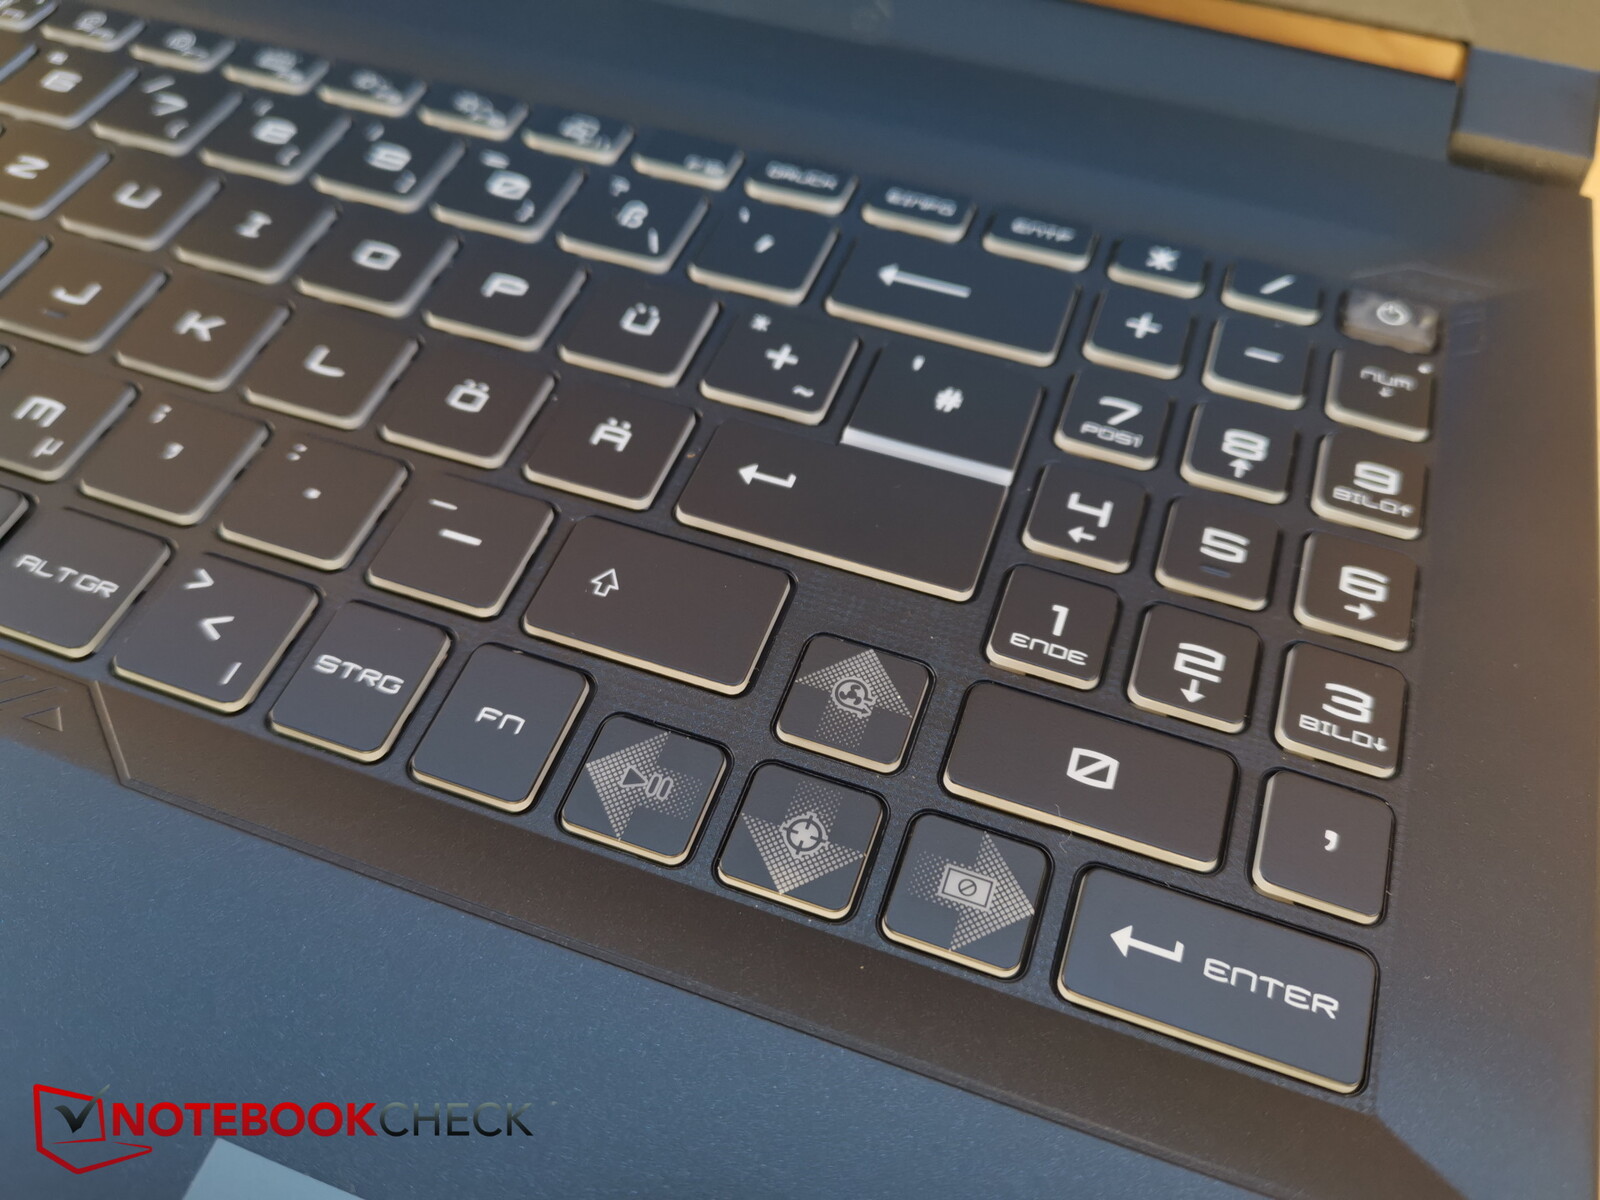
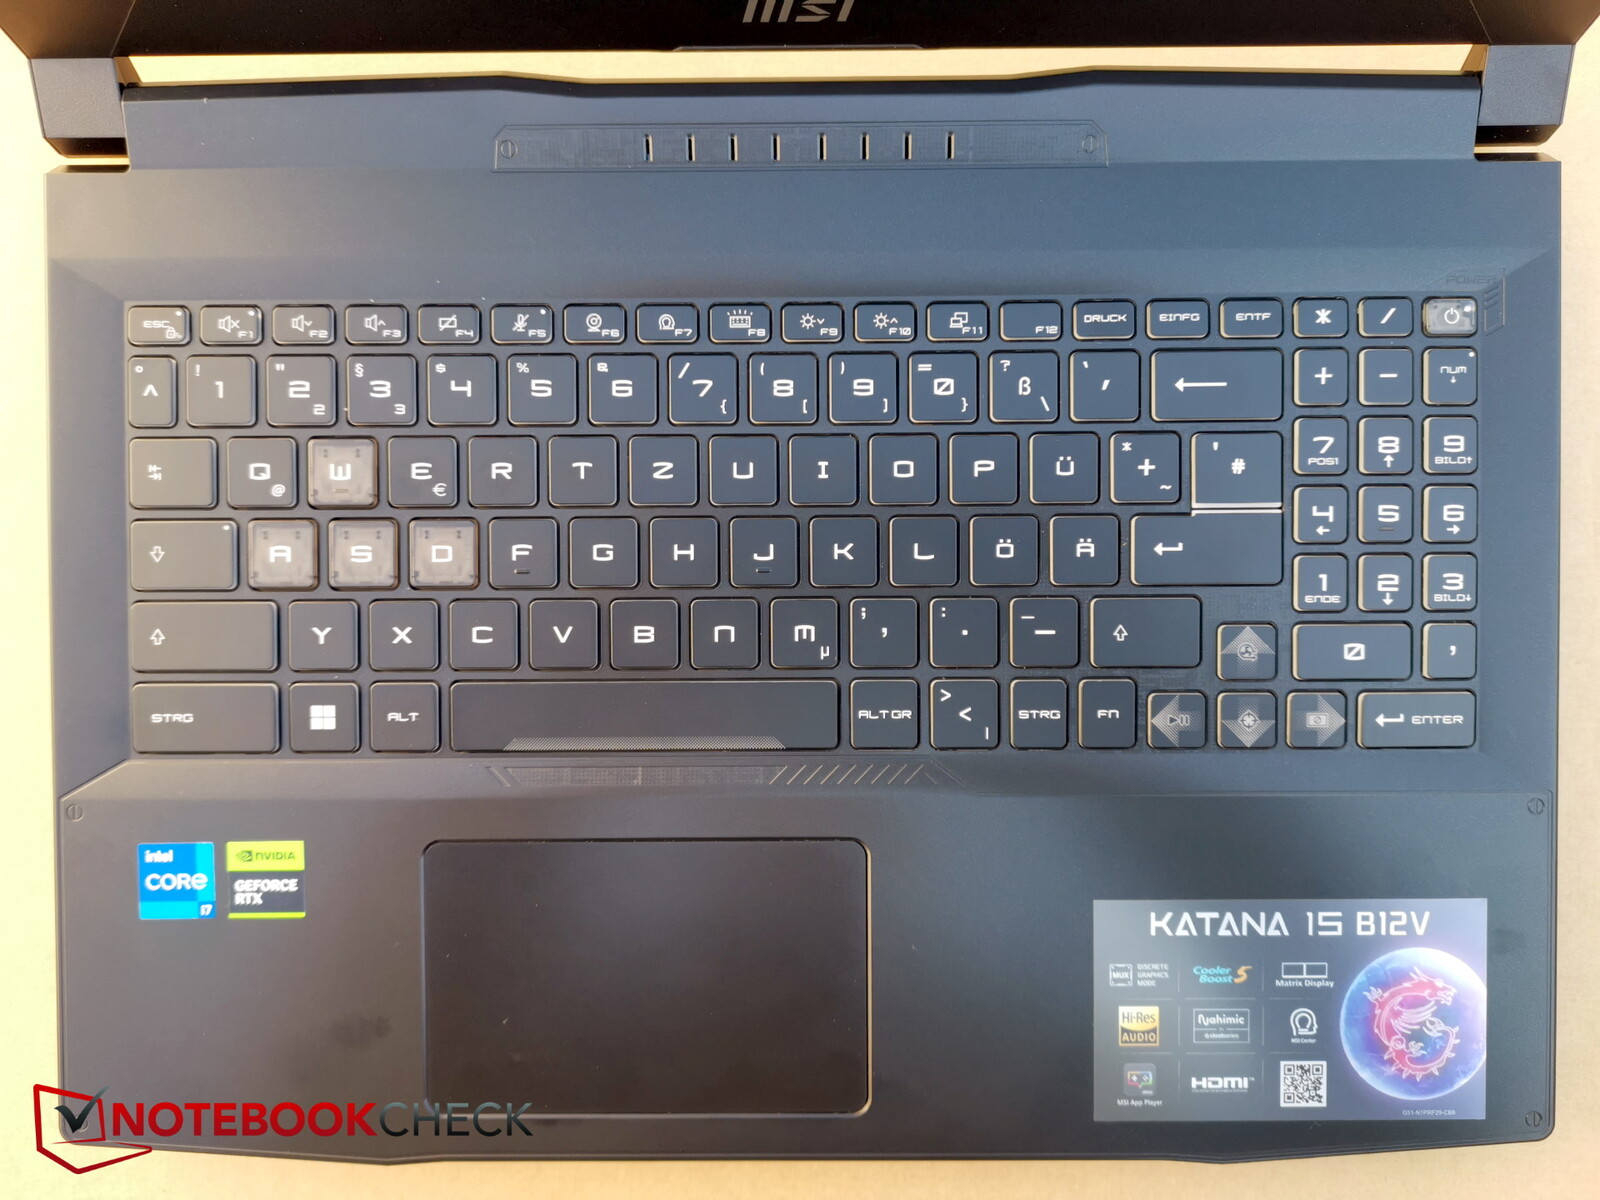
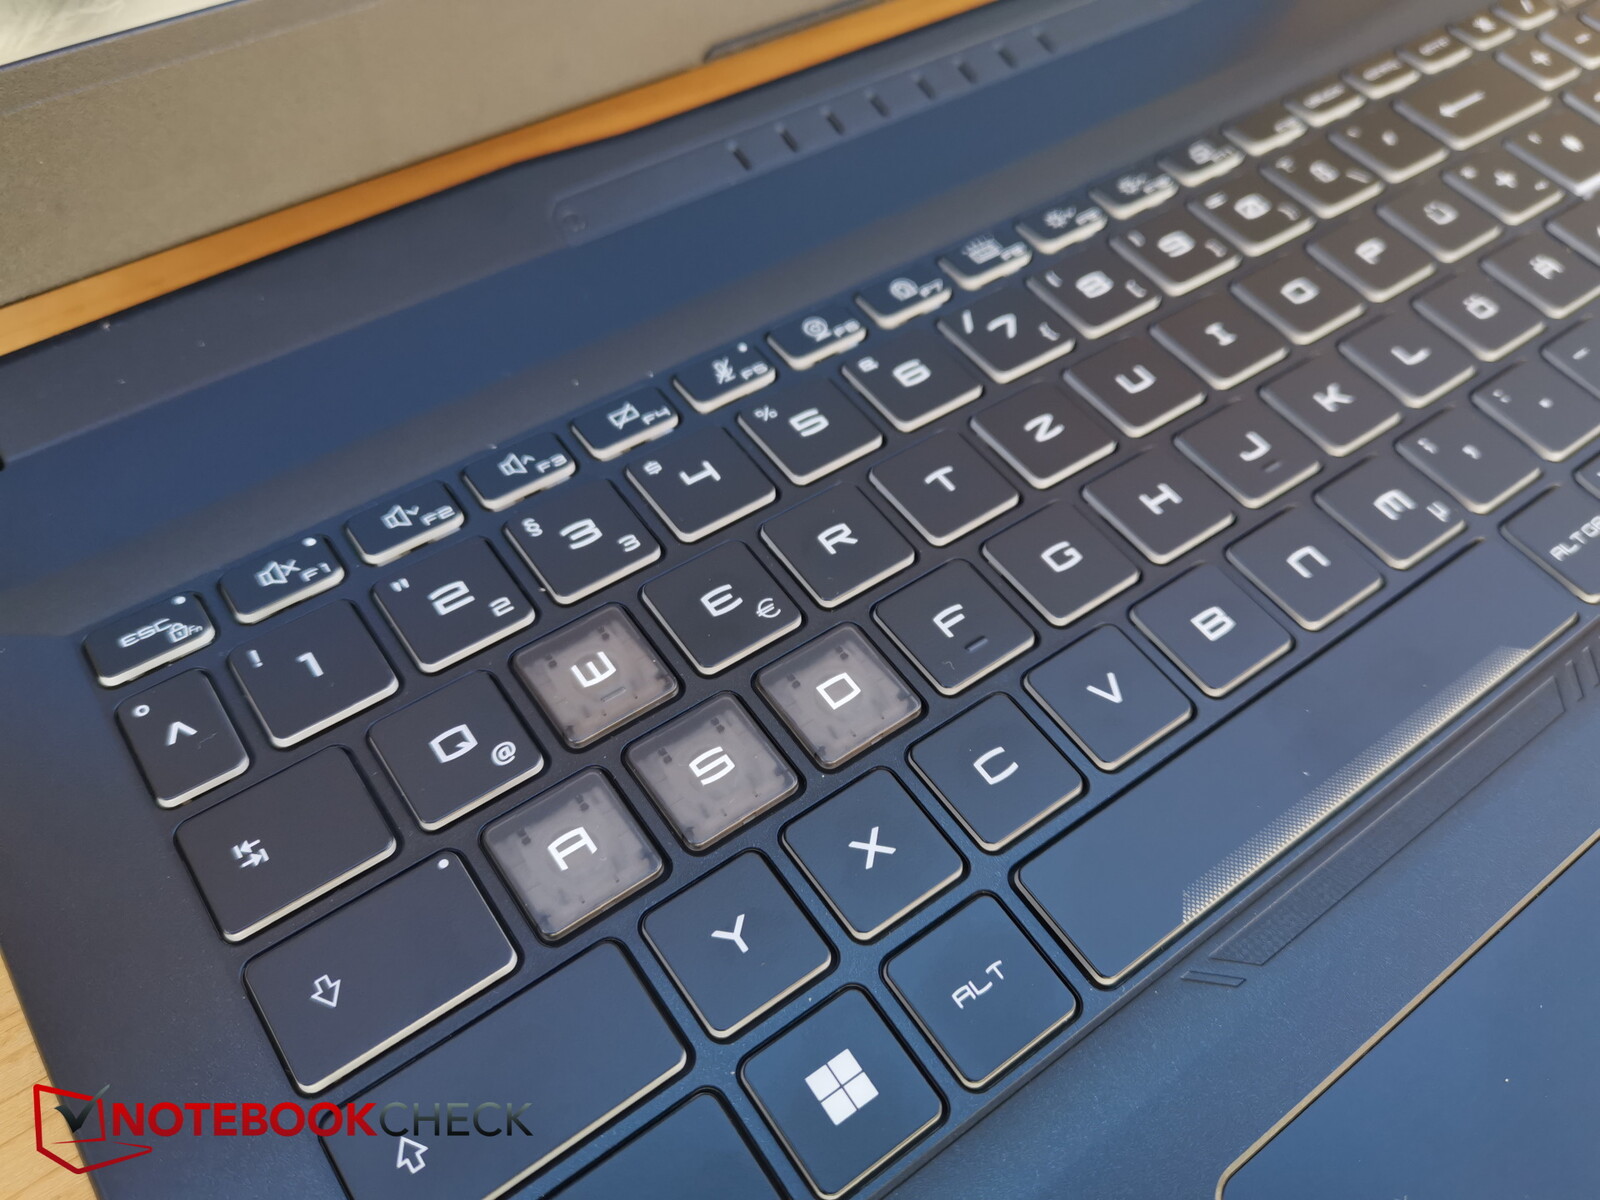
所有Katana型号的布局都非常相似:它看起来非常整洁,但右侧的数字键盘看起来被严重挤压,但至少有一个。
中间的方向键并没有像通常情况下那样高度减半,而是在长度和高度上都有些小。WASD键是透明的,因此在颜色上很突出。F键和特别键也非常小。
不幸的是,微星公司又把fn键移到了空格键的右边,这需要一些时间来适应。很奇怪,为什么微星继续走自己的路。如果有必要,你可以将fn键和Windows键的功能对调,但这样一来,你就会遇到同样的问题,Windows键在右边而不是fn键。
按键行程相当短,但反馈很明显,所以打字感觉相当快。击键噪音适中,底座保持稳定,打字时不会弯曲。
键盘背光提供四个区域,每个区域有四个级别的亮度可调。
触摸板
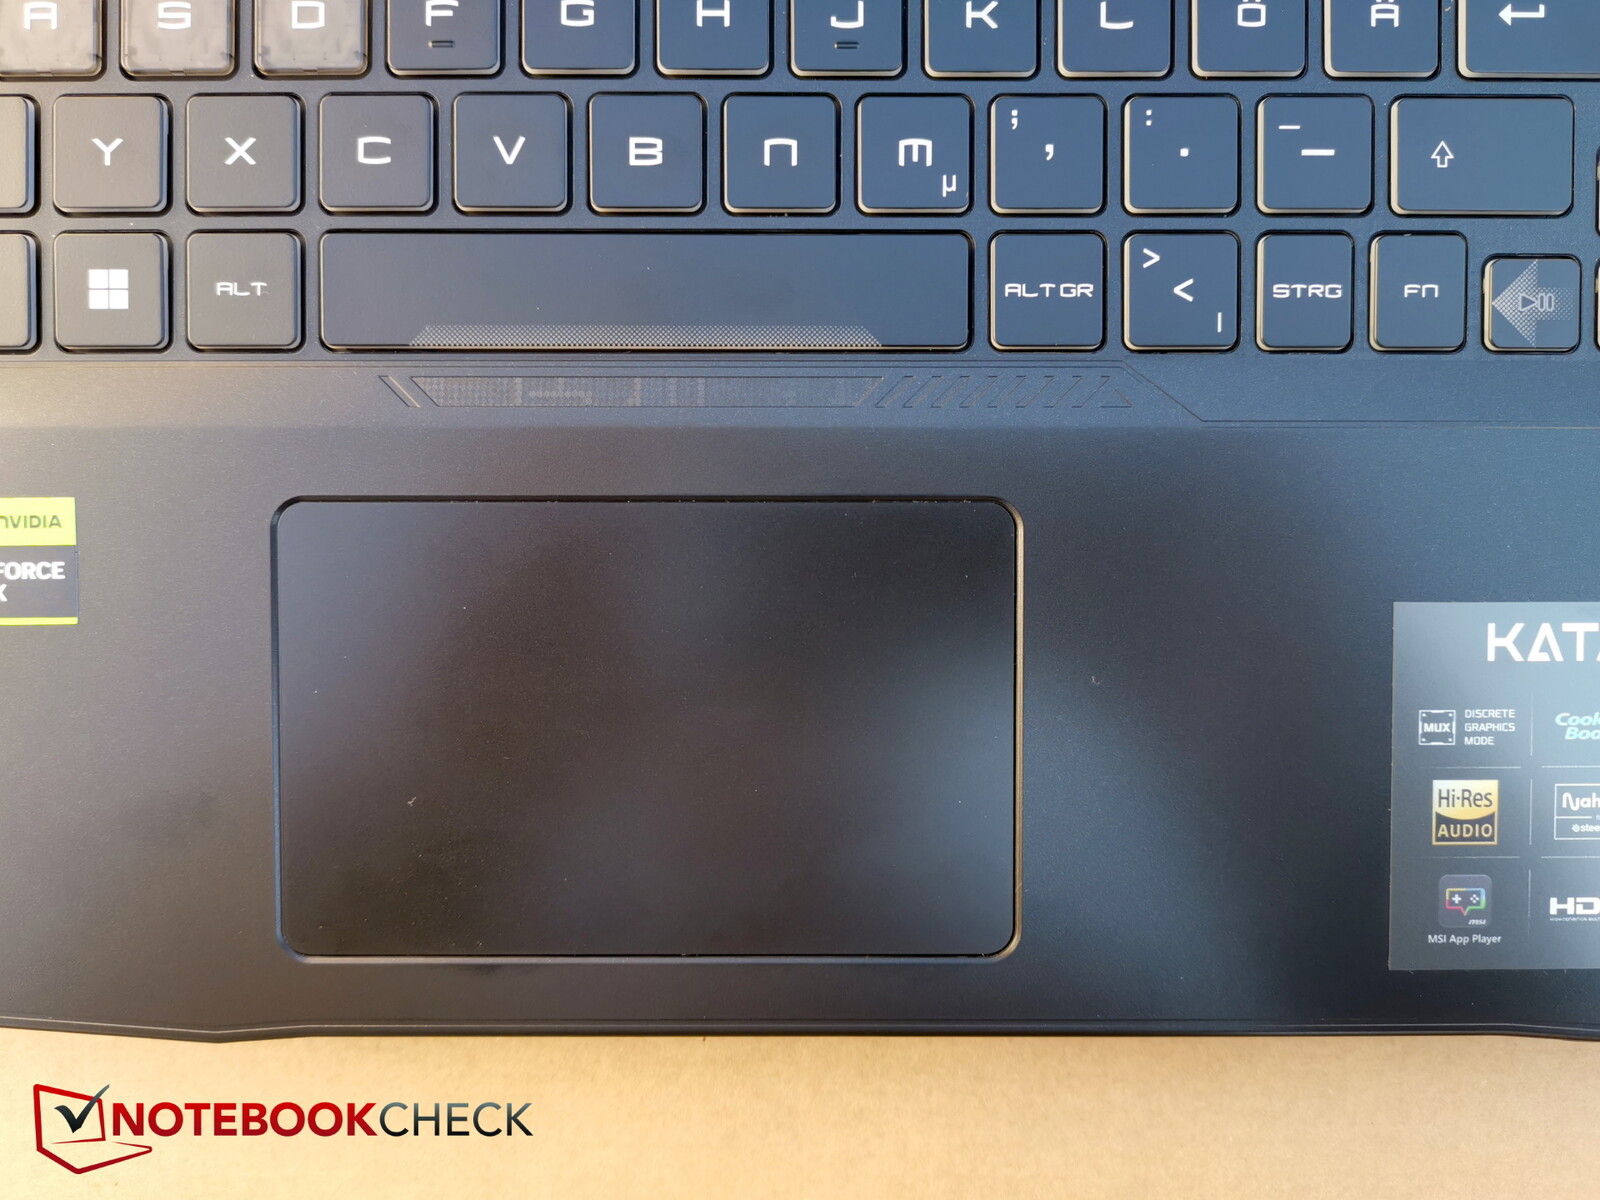
Katana 15拥有感觉上是市场上最小的触摸板之一。它看起来有点复古。当然,无论如何,游戏玩家通常会连接一个鼠标,但更大的触摸板只是在旅途中使用时更加舒适。
触摸板就在空格键下面,因此在布局上非常靠左。如果能把它放在稍稍中心的位置会更有优势。
集成键的点击声有些大,而且看起来质量不是很高,但它们的反应可靠而准确。
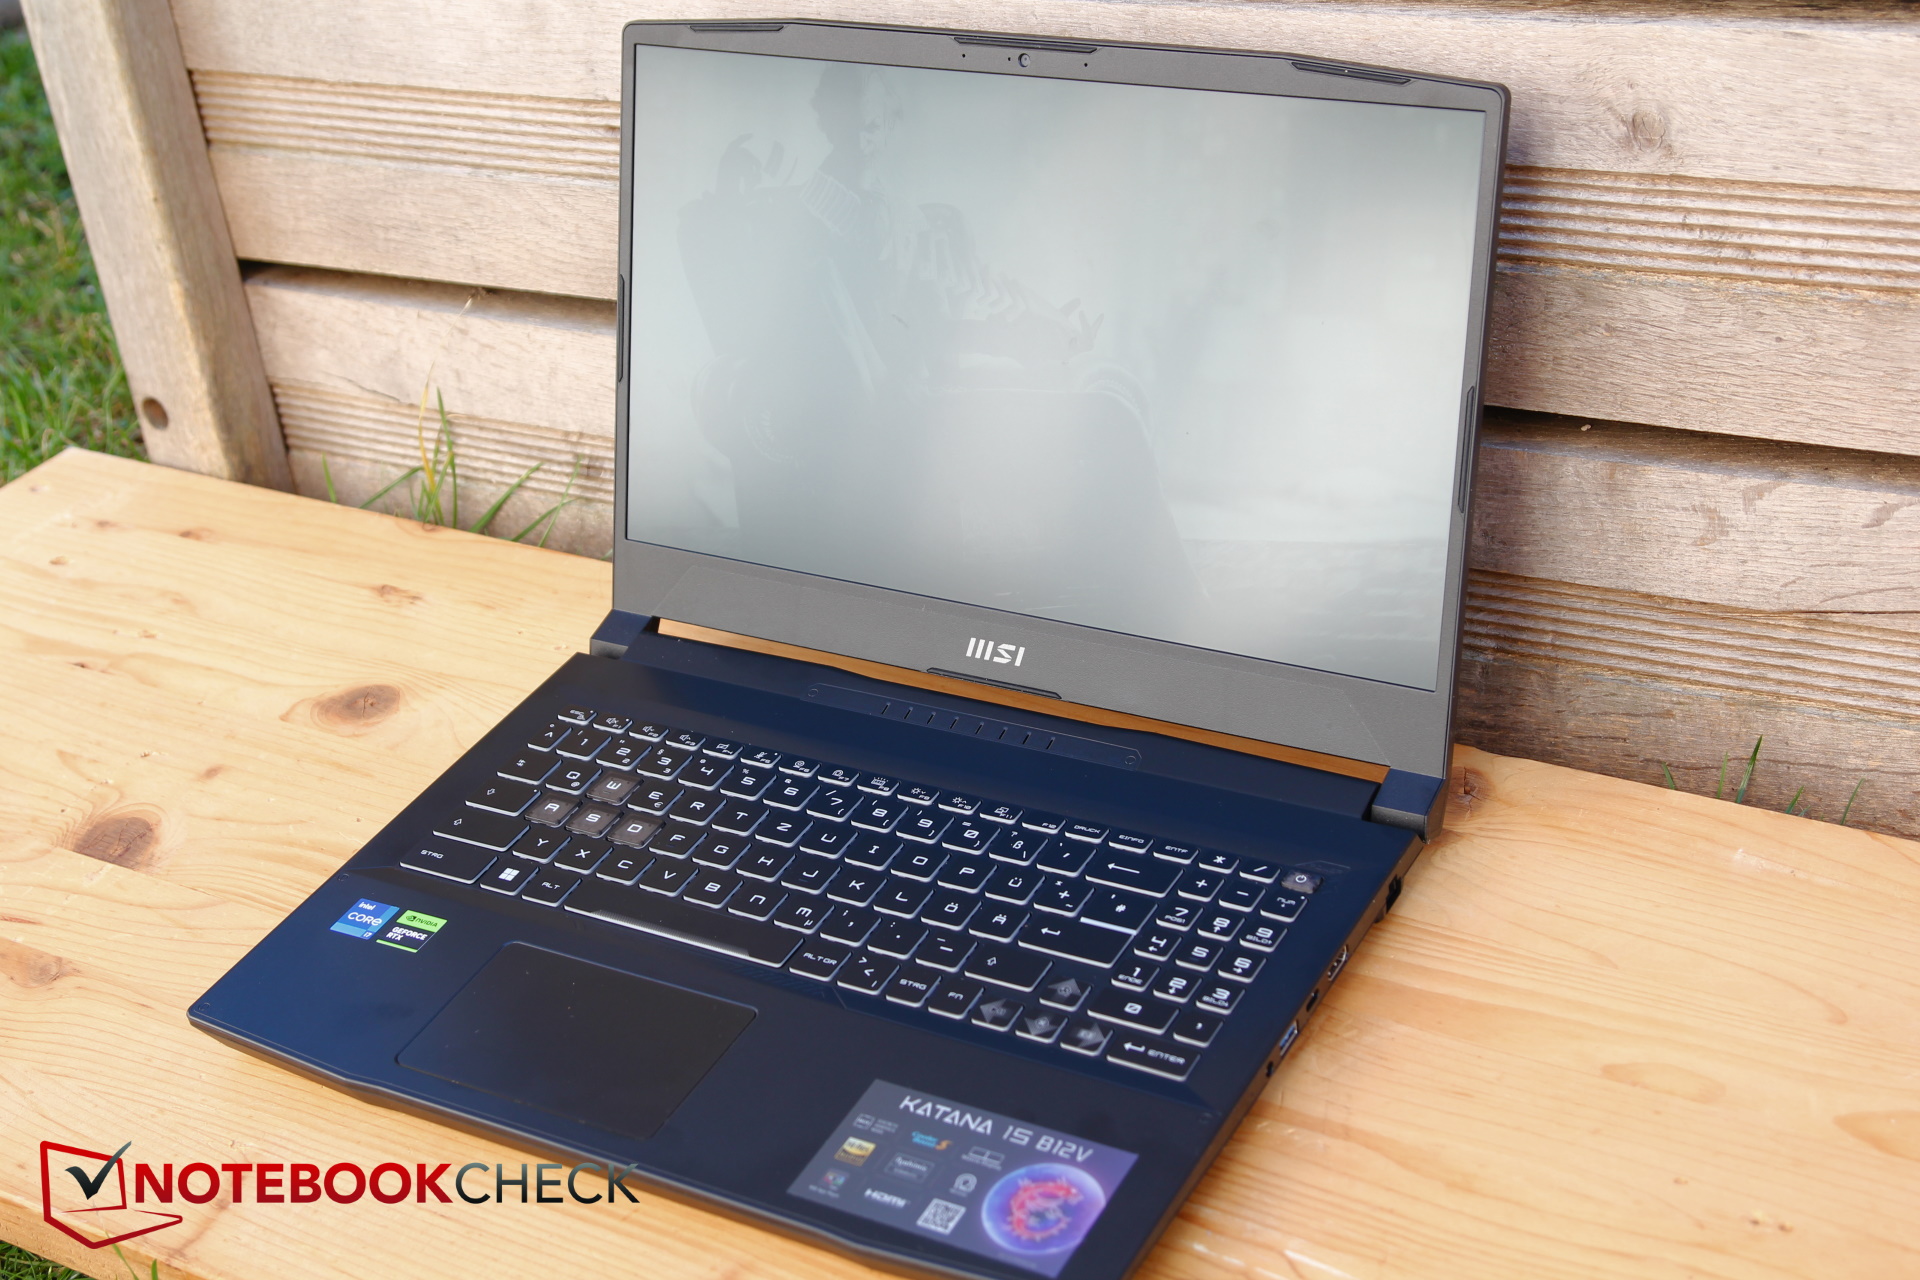
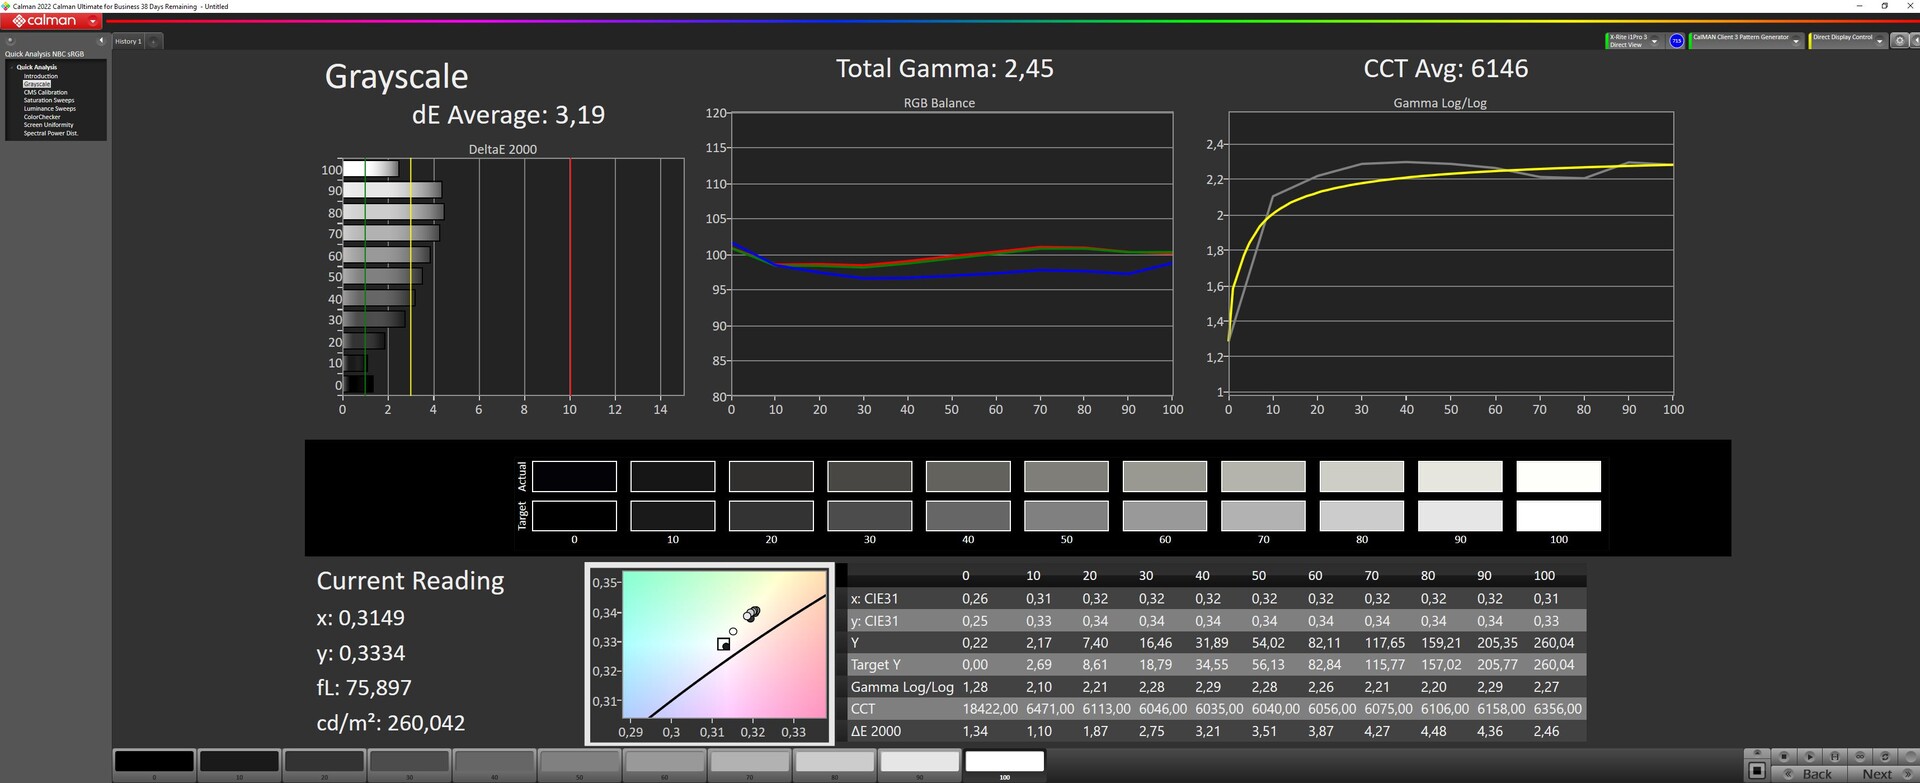
显示器 - 250尼特和57%sRGB是预算值
微星继续为Katana使用全高清显示屏,而许多竞争对手已经使用QHD和更高的分辨率。这不一定是个问题,因为分辨率和144赫兹应该很适合与RTX 4050一起使用。到目前为止,B13似乎也没有任何替代性的显示屏选择。归根结底,它与Katana GF66 和Pulse GL66 中的面板相同。
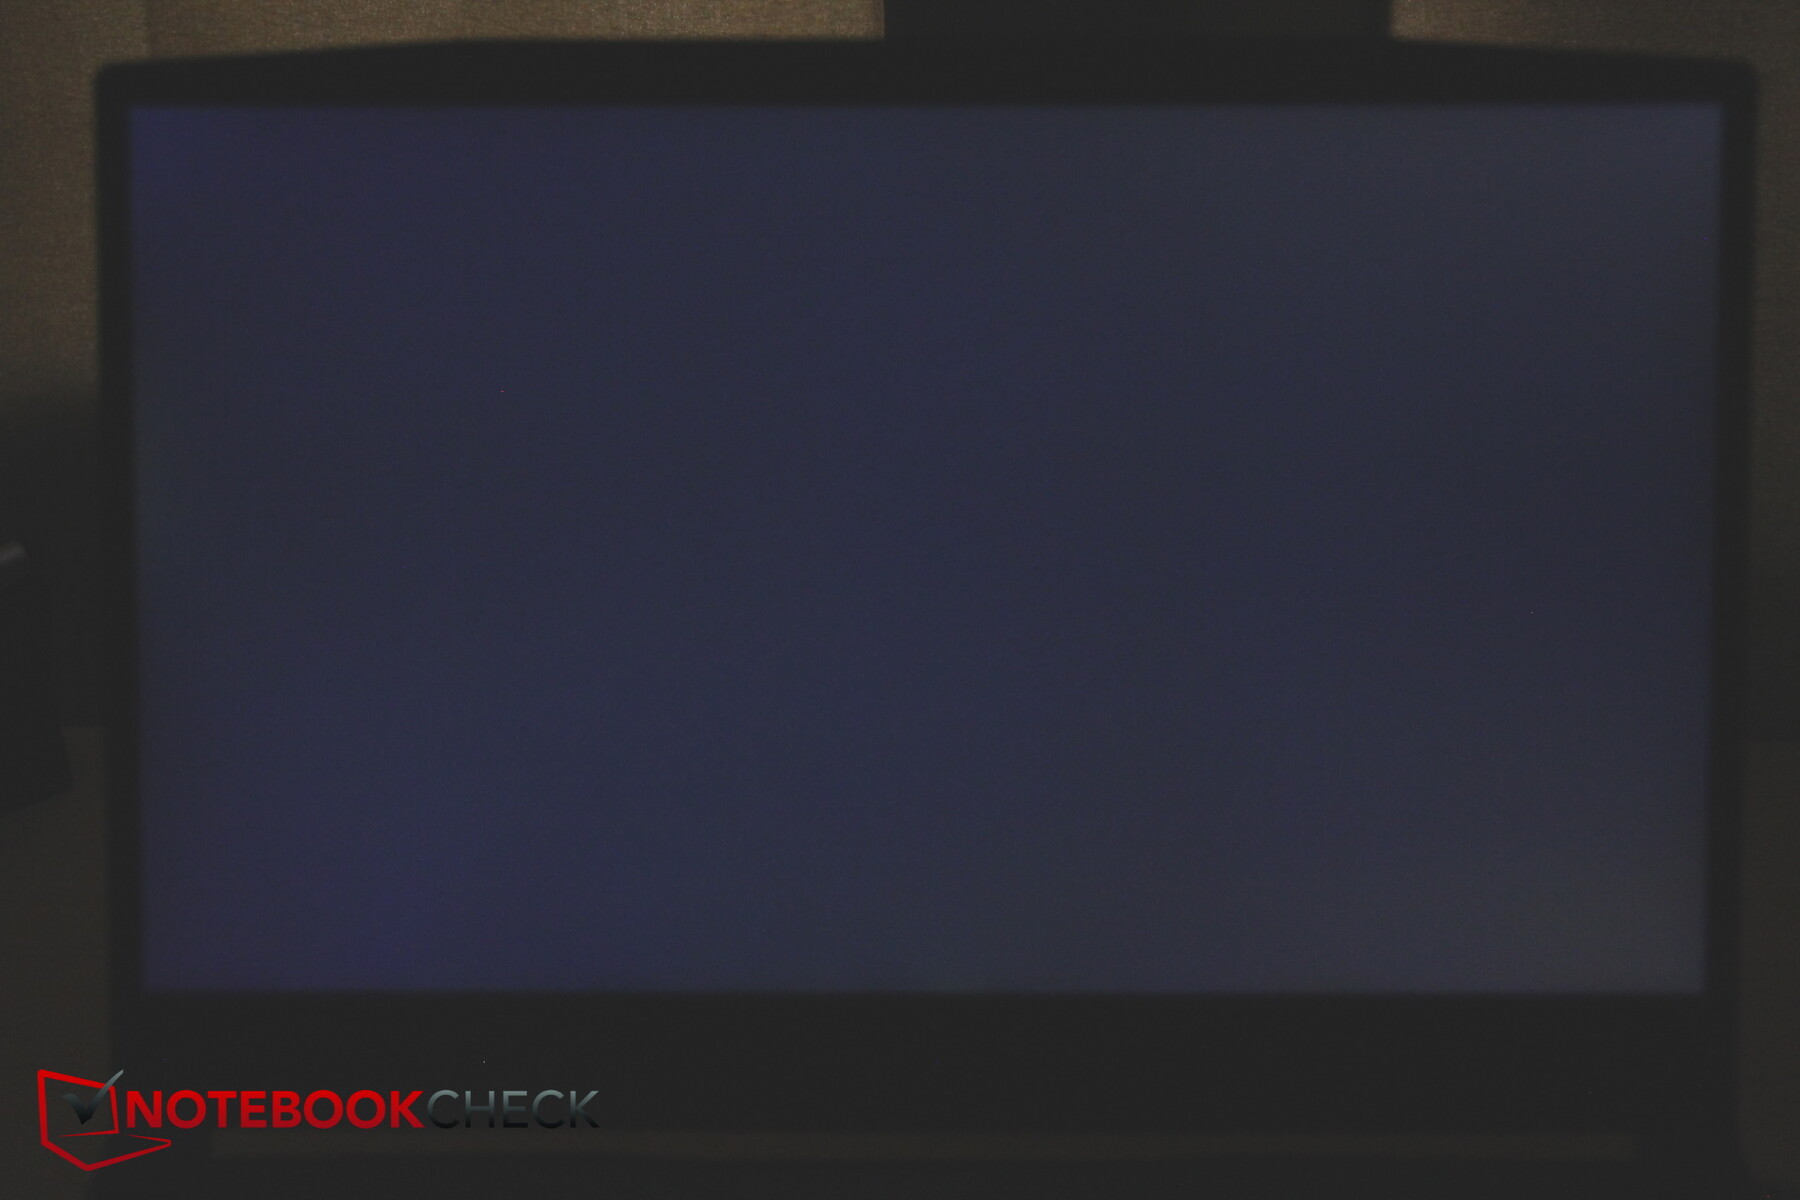
不幸的是,258尼特的平均亮度相当低于现在的平均水平,因为大多数竞争对手的笔记本电脑都提供更亮的显示屏。至少92%的照度是相当均匀的,而且亮度向右下方有所下降。
对于一个游戏玩家来说,响应时间相当不理想,甚至是平庸的。至少在我们的模型中,PWM不是一个问题。屏幕出血只是轻微的,在大多数情况下并不明显。
| |||||||||||||||||||||||||
Brightness Distribution: 92 %
Center on Battery: 257 cd/m²
Contrast: 1374:1 (Black: 0.19 cd/m²)
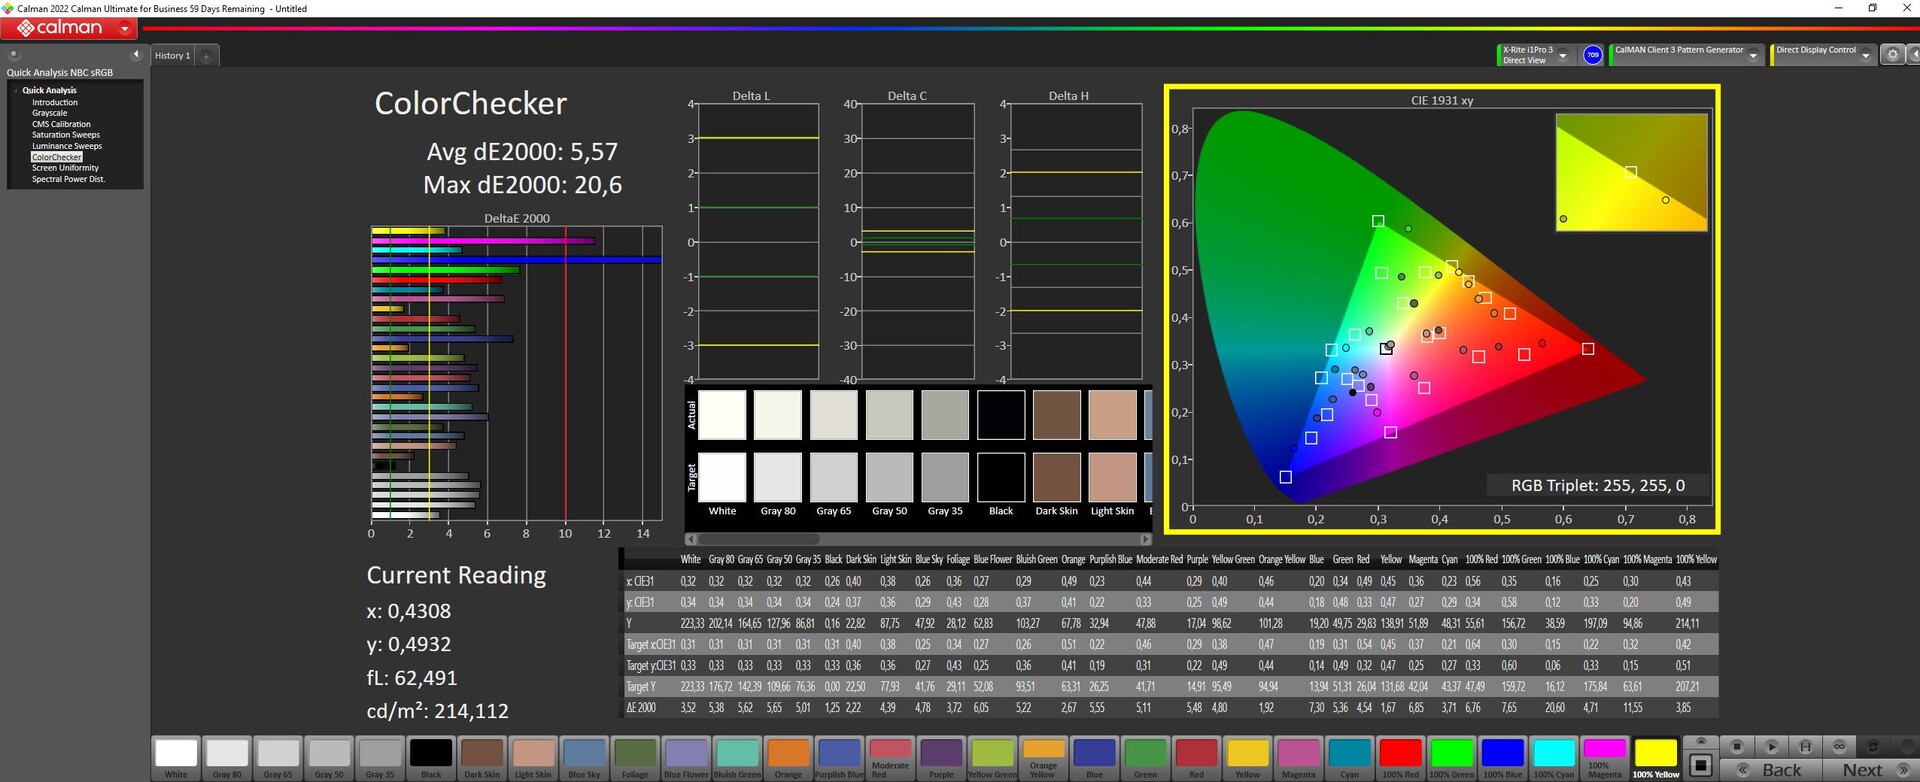
ΔE ColorChecker Calman: 5.57 | ∀{0.5-29.43 Ø4.71}
calibrated: 4.63
ΔE Greyscale Calman: 3.19 | ∀{0.09-98 Ø4.96}
39.3% AdobeRGB 1998 (Argyll 3D)
56.8% sRGB (Argyll 3D)
38.1% Display P3 (Argyll 3D)
Gamma: 2.45
CCT: 6146 K
| MSI Katana 15 B12VEK AUOAF90 (B156HAN08.4), IPS, 1920x1080, 15.6" | MSI Katana GF66 12UGS AU Optronics AUOAF90, IPS, 1920x1080, 15.6" | MSI Pulse GL66 12UEK AU Optronics B156HAN08.4 (AUOAF90), IPS, 1920x1080, 15.6" | Lenovo Legion 5 15IAH7H 82RB CSOT MNF601CA1-3, IPS, 1920x1080, 15.6" | Asus TUF Gaming F15 FX507ZM TL156VDXP0101, IPS, 1920x1080, 15.6" | Schenker XMG Core 15 (M22) CSOT MNF601CA1-1, IPS, 2560x1440, 15.6" | |
|---|---|---|---|---|---|---|
| Display | 3% | 3% | 78% | 73% | 78% | |
| Display P3 Coverage (%) | 38.1 | 39.1 3% | 39 2% | 69.1 81% | 66.4 74% | 68.8 81% |
| sRGB Coverage (%) | 56.8 | 58.3 3% | 58.4 3% | 99.5 75% | 97 71% | 99.3 75% |
| AdobeRGB 1998 Coverage (%) | 39.3 | 40.4 3% | 40.3 3% | 70 78% | 68.5 74% | 69.9 78% |
| Response Times | -5% | -2% | 59% | 69% | 66% | |
| Response Time Grey 50% / Grey 80% * (ms) | 38.8 ? | 40 ? -3% | 38.8 ? -0% | 14.8 ? 62% | 5.6 ? 86% | 16 ? 59% |
| Response Time Black / White * (ms) | 26.8 ? | 28.4 ? -6% | 28 ? -4% | 12 ? 55% | 12.8 ? 52% | 7.6 ? 72% |
| PWM Frequency (Hz) | ||||||
| Screen | 1% | 29% | 1% | 26% | 15% | |
| Brightness middle (cd/m²) | 261 | 227 -13% | 248 -5% | 363.5 39% | 353.7 36% | 378 45% |
| Brightness (cd/m²) | 258 | 225 -13% | 245 -5% | 350 36% | 340 32% | 371 44% |
| Brightness Distribution (%) | 92 | 90 -2% | 86 -7% | 89 -3% | 89 -3% | 93 1% |
| Black Level * (cd/m²) | 0.19 | 0.21 -11% | 0.13 32% | 0.39 -105% | 0.34 -79% | 0.33 -74% |
| Contrast (:1) | 1374 | 1081 -21% | 1908 39% | 932 -32% | 1040 -24% | 1145 -17% |
| Colorchecker dE 2000 * | 5.57 | 4.19 25% | 3.14 44% | 3.68 34% | 1.74 69% | 2.84 49% |
| Colorchecker dE 2000 max. * | 20.6 | 17.45 15% | 5.82 72% | 8.92 57% | 3.63 82% | 5.51 73% |
| Colorchecker dE 2000 calibrated * | 4.63 | 3.81 18% | 3.14 32% | 0.53 89% | 0.5 89% | 2.75 41% |
| Greyscale dE 2000 * | 3.19 | 2.7 15% | 1.2 62% | 6.5 -104% | 2.1 34% | 4.08 -28% |
| Gamma | 2.45 90% | 2.208 100% | 2.49 88% | 2.2 100% | 2.3 96% | 2.4 92% |
| CCT | 6146 106% | 6176 105% | 6468 100% | 5995 108% | 6257 104% | 5841 111% |
| Total Average (Program / Settings) | -0% /
1% | 10% /
19% | 46% /
26% | 56% /
42% | 53% /
36% |
* ... smaller is better
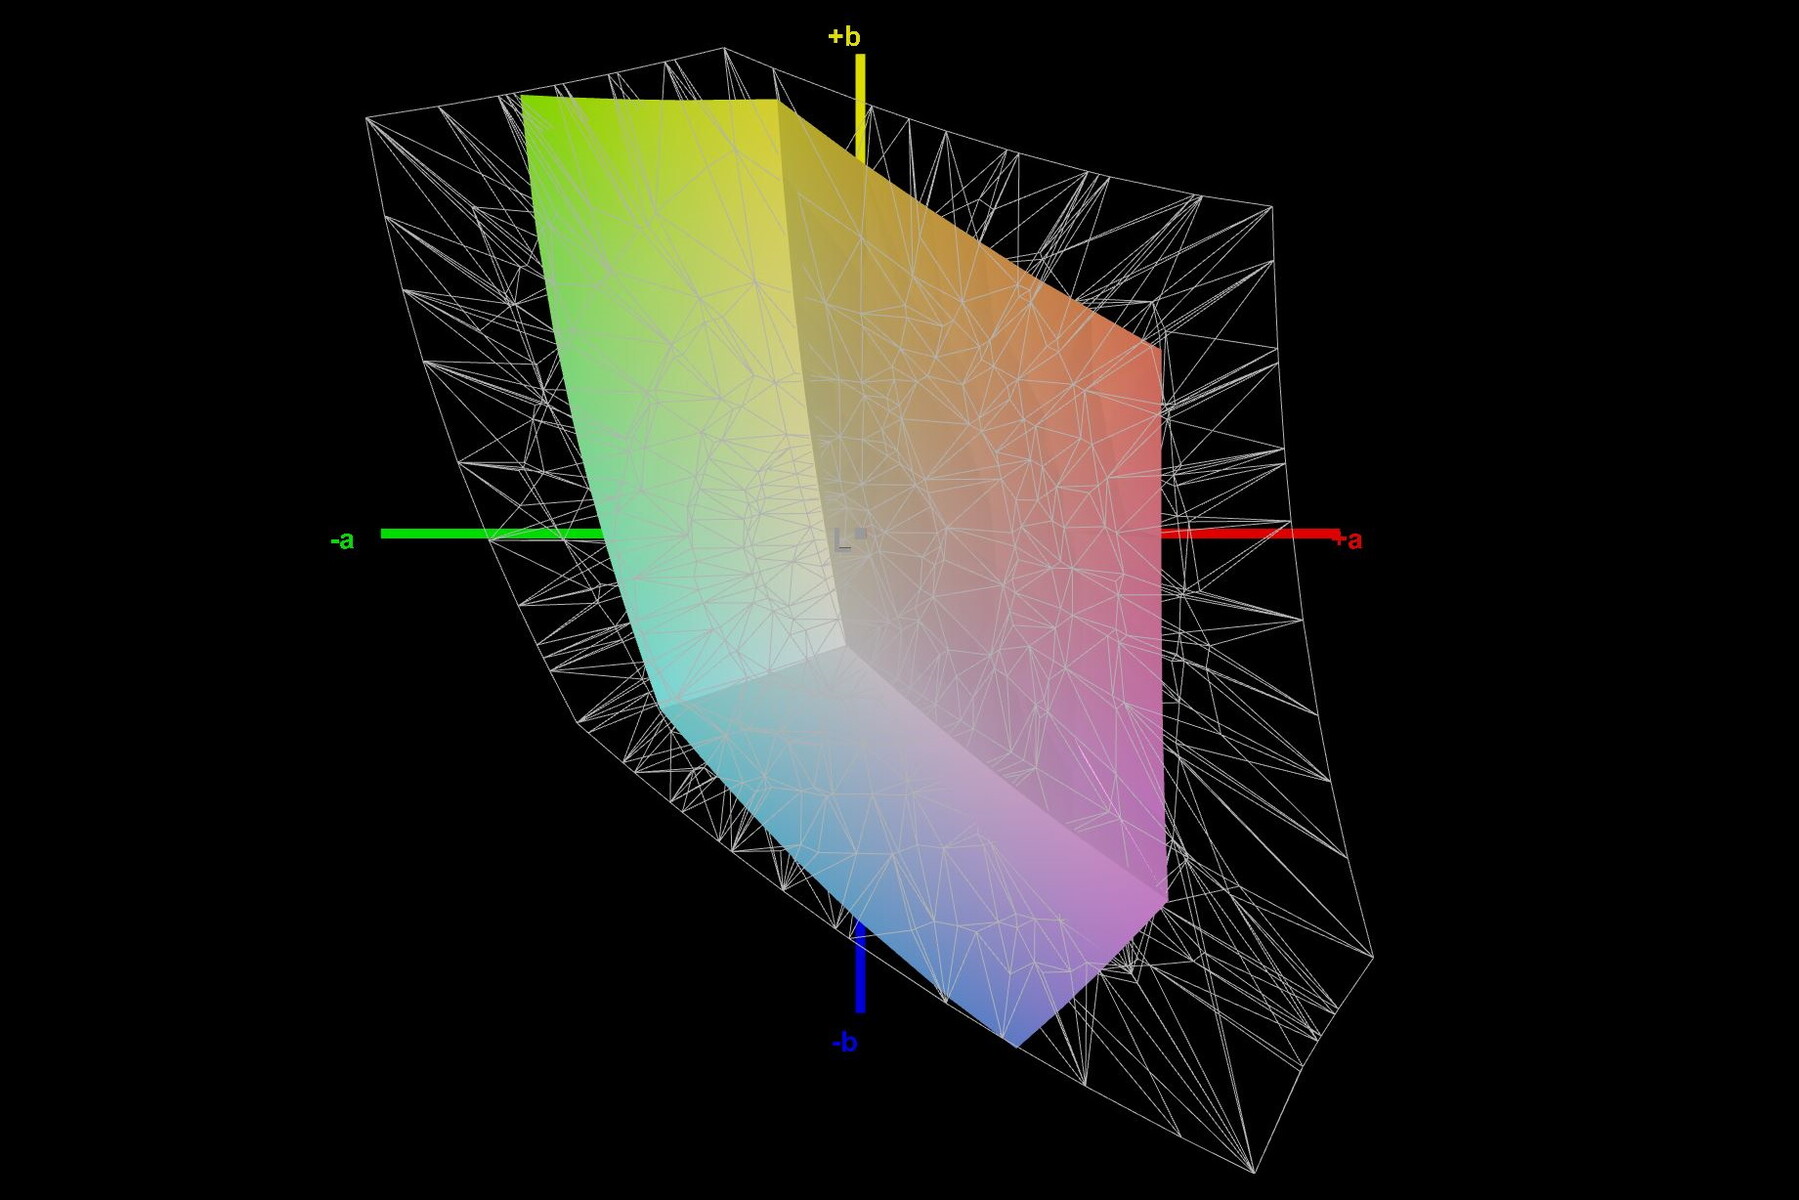
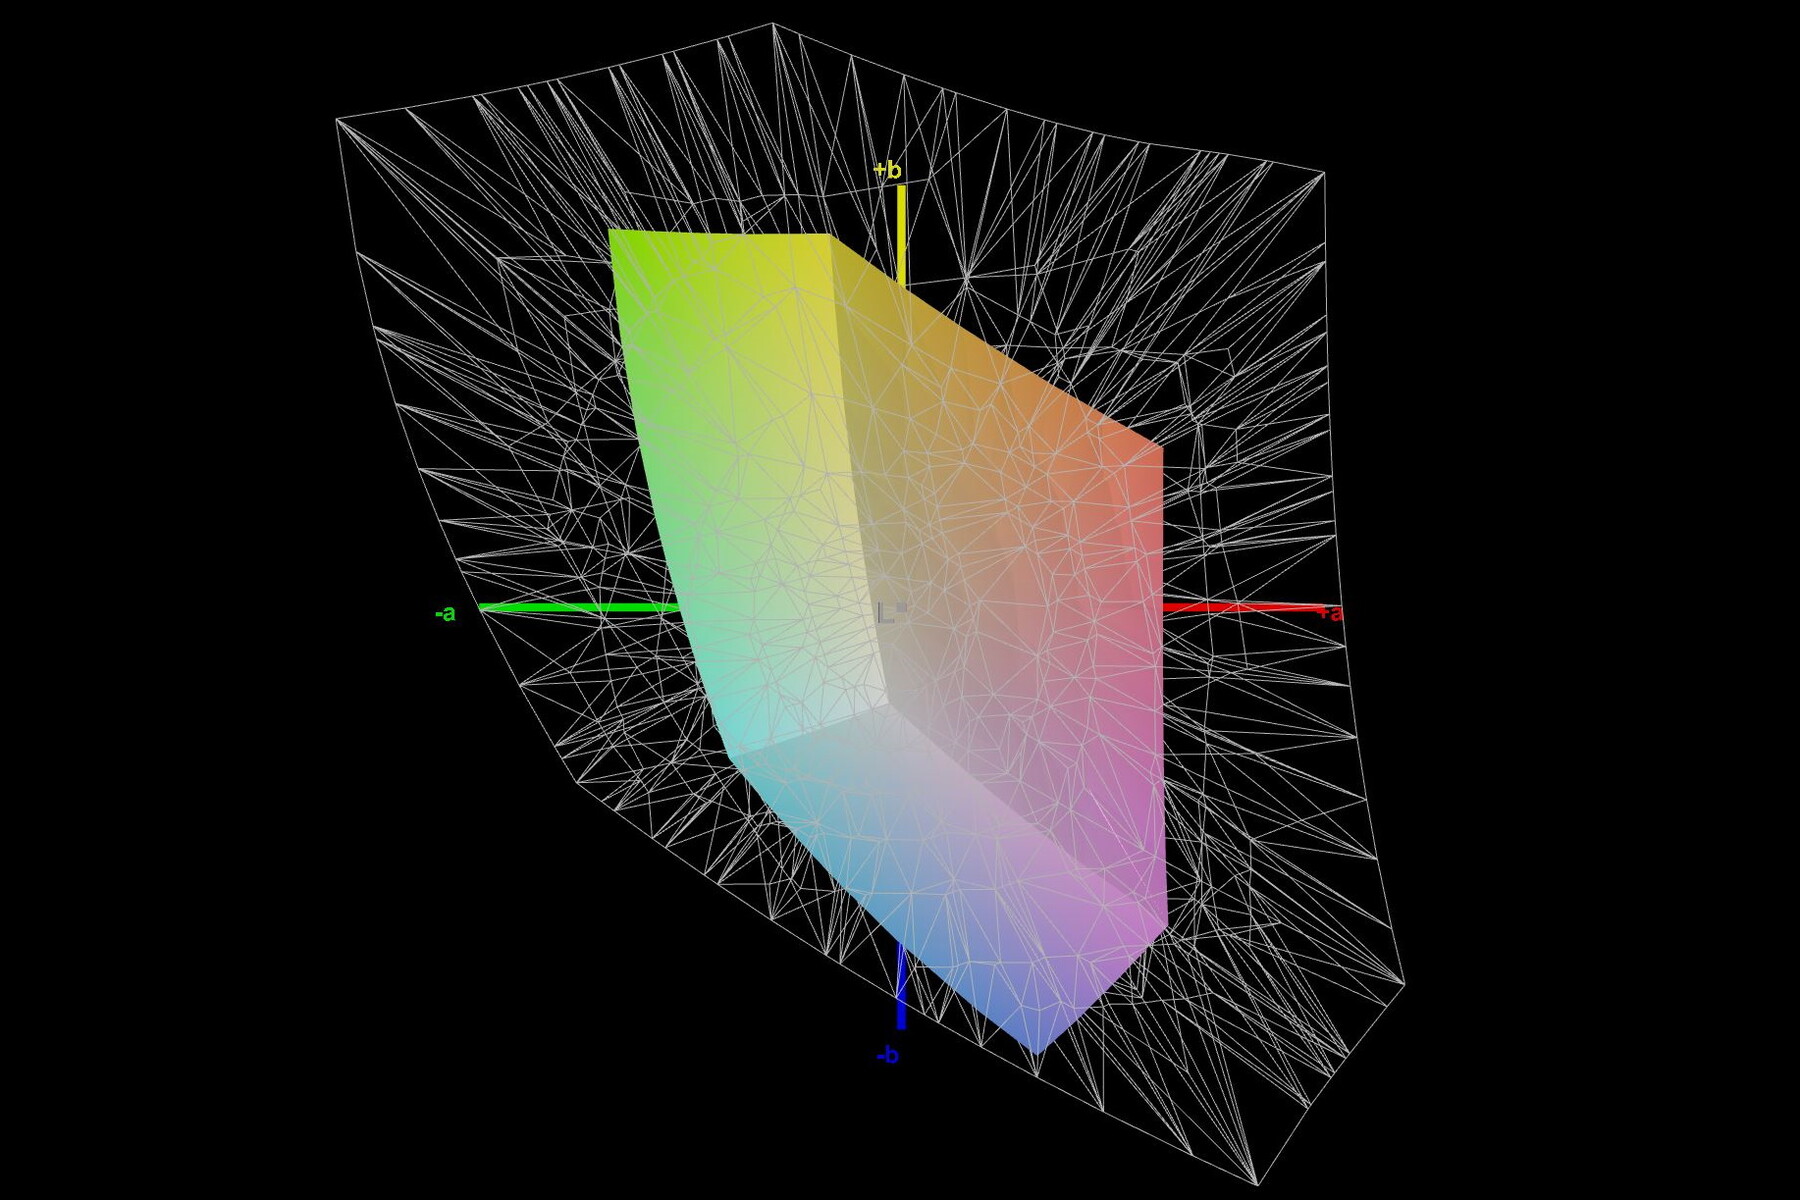
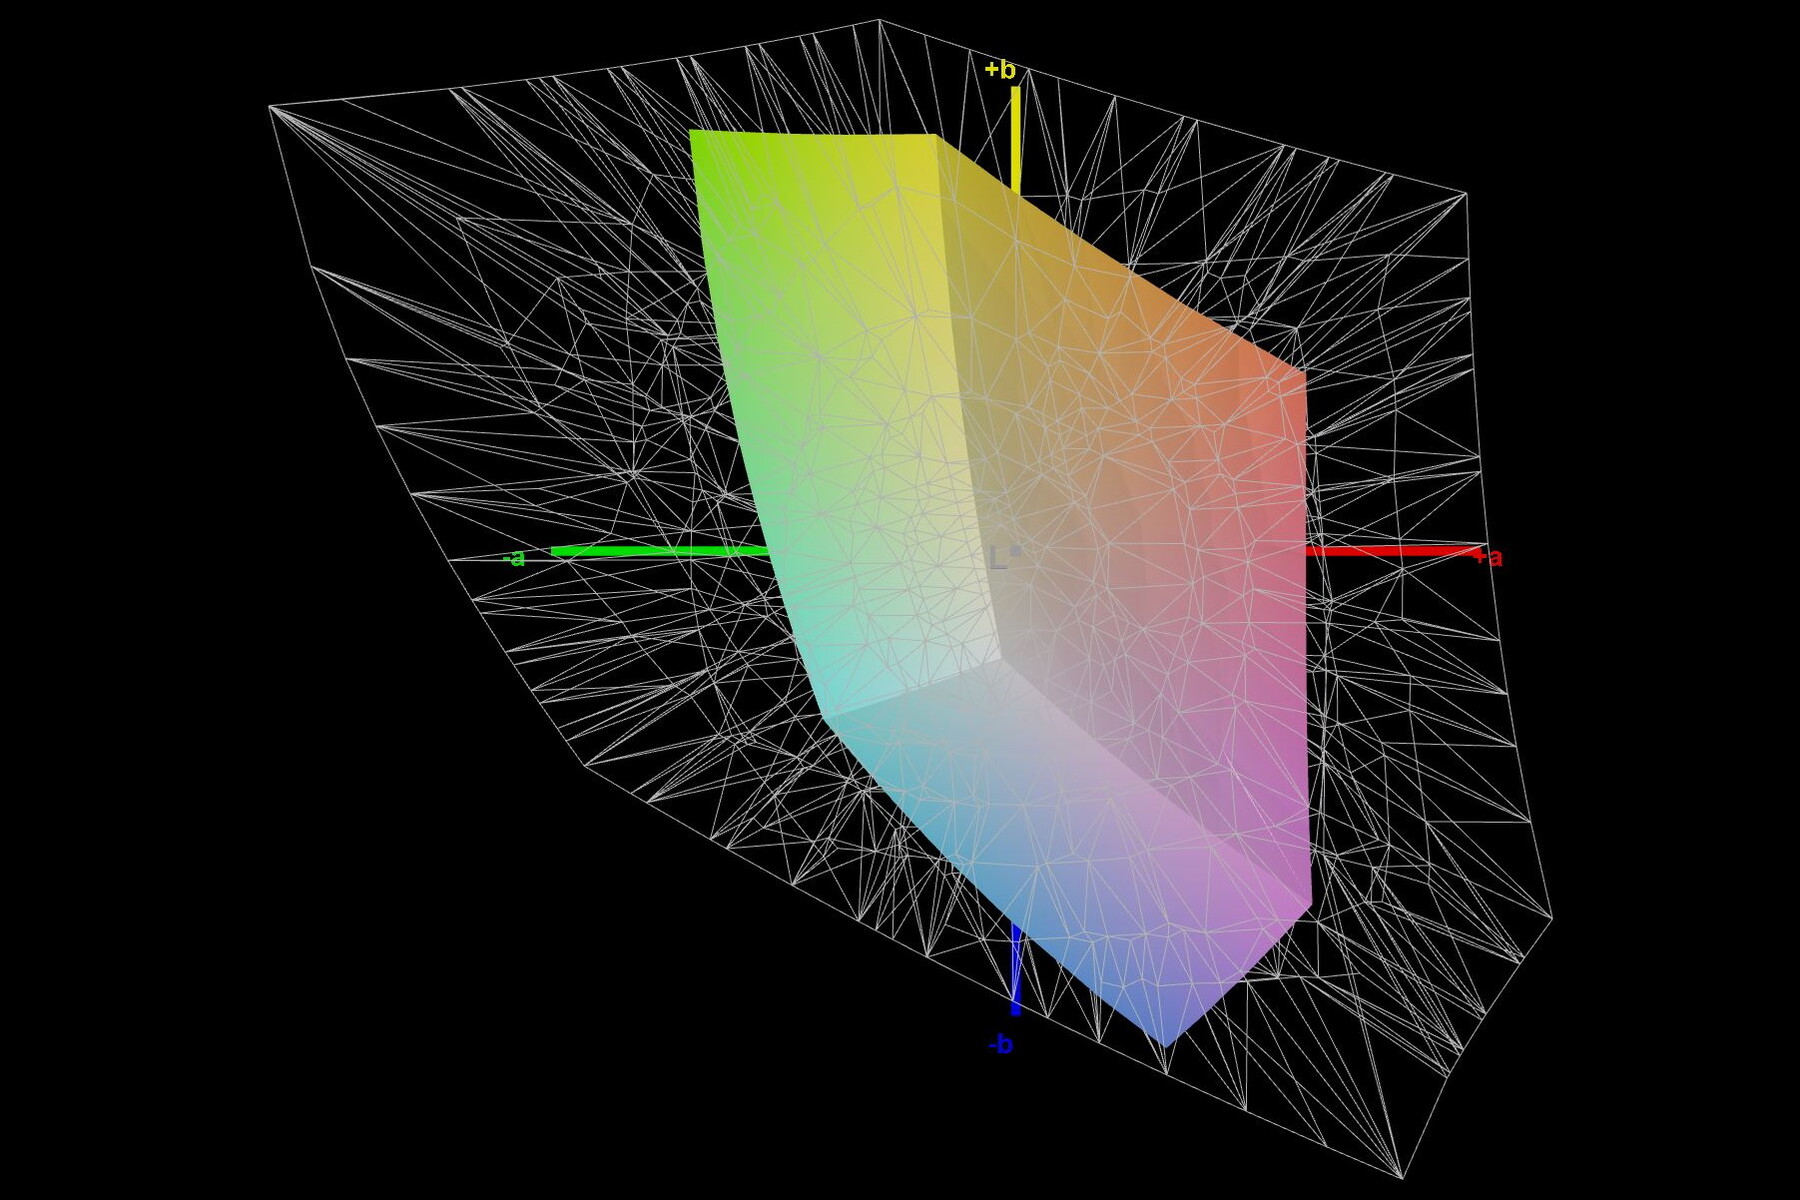
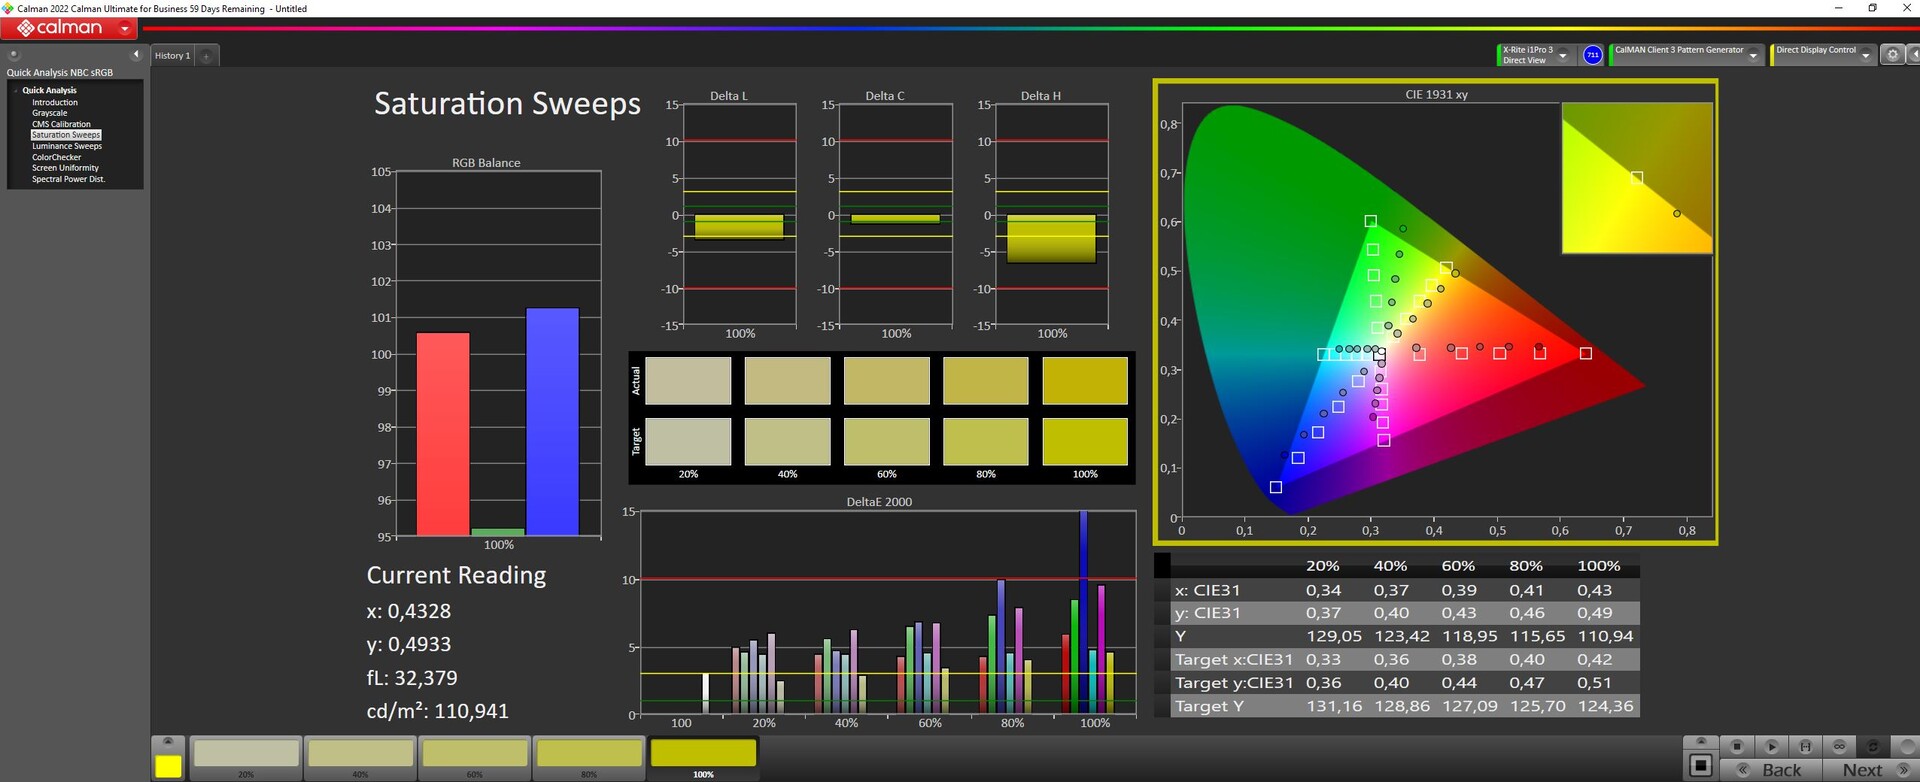
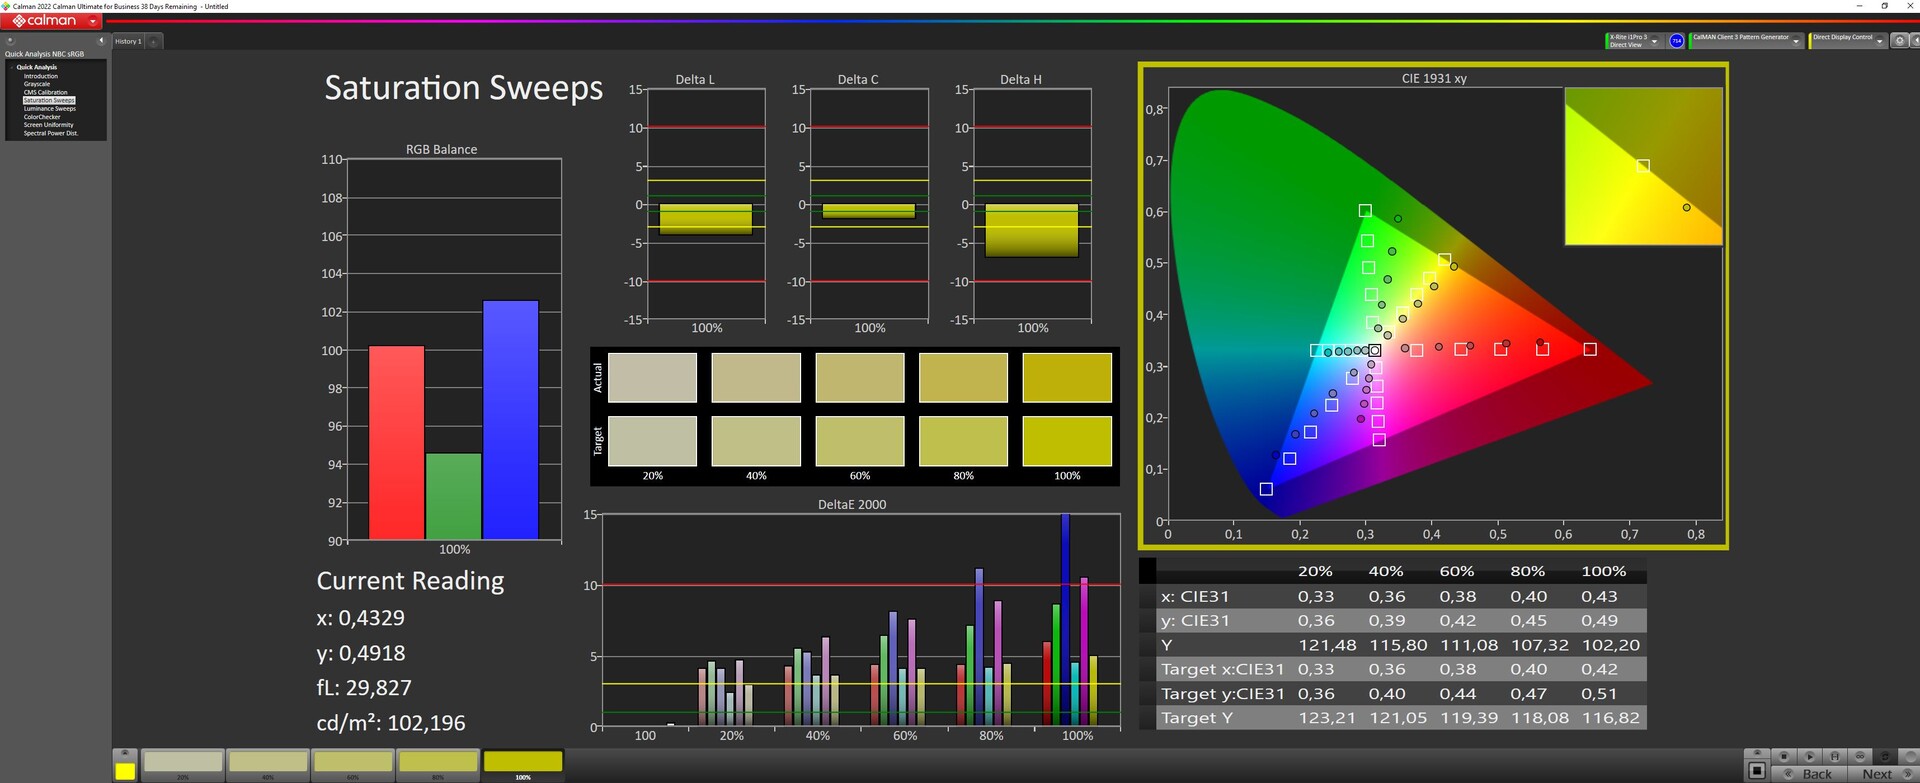
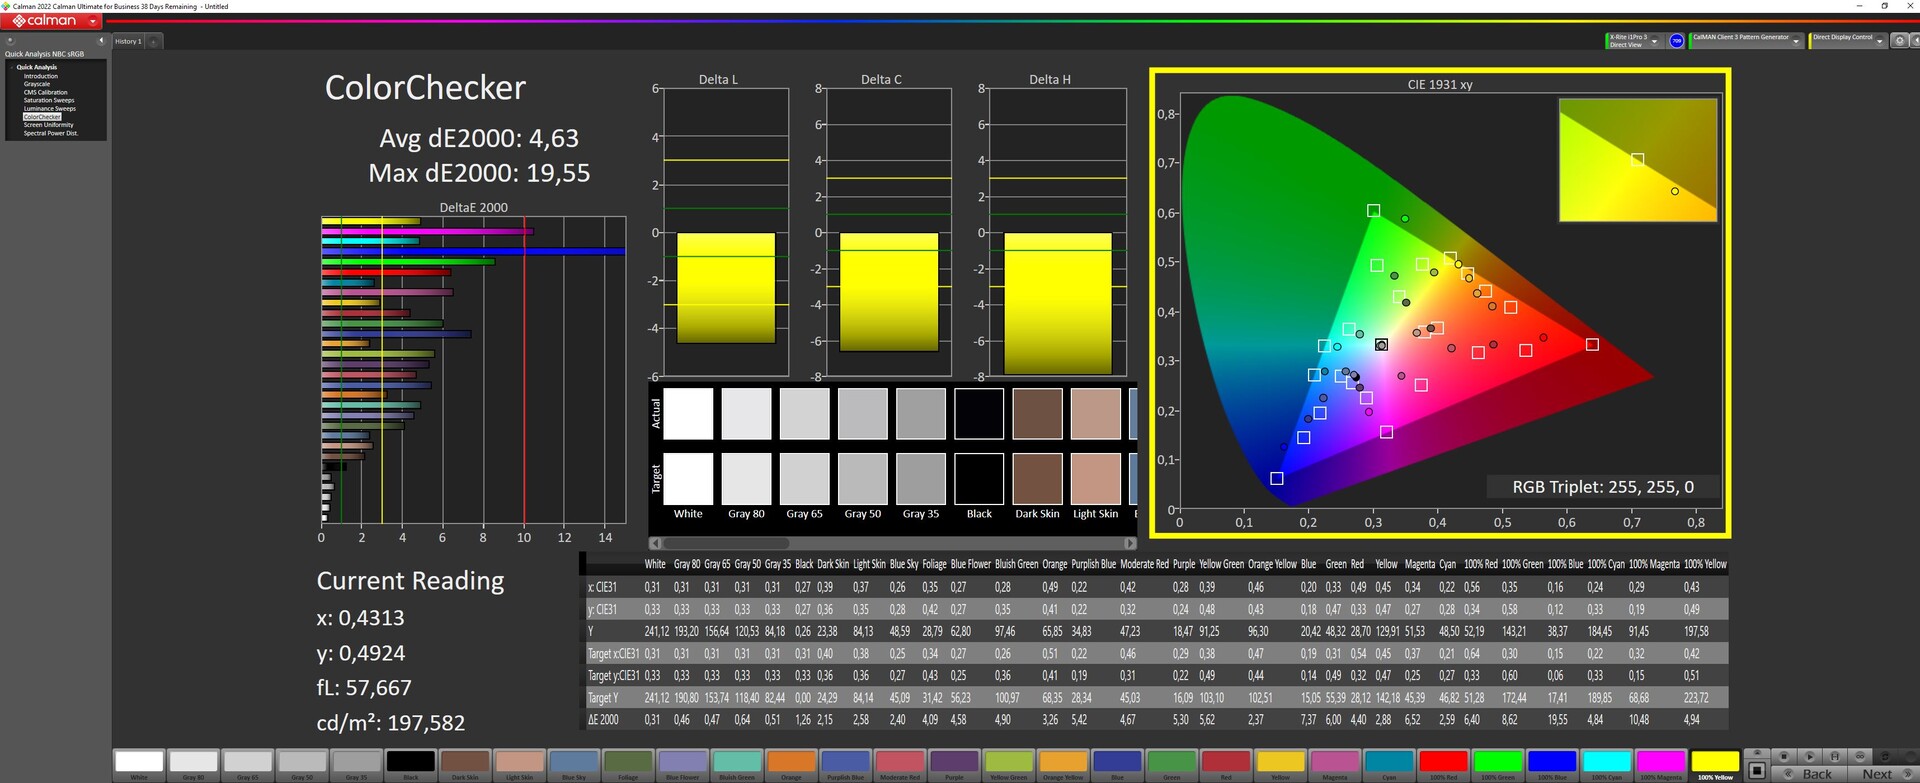
制造商没有提供任何有关色彩空间覆盖的信息。我们测得sRGB的覆盖率略低于57%,AdobeRGB和DisplayP3的覆盖率约为39%。在这里,Katana 15的预算特点也很明显;竞争对手提供了更高的色彩空间覆盖率。
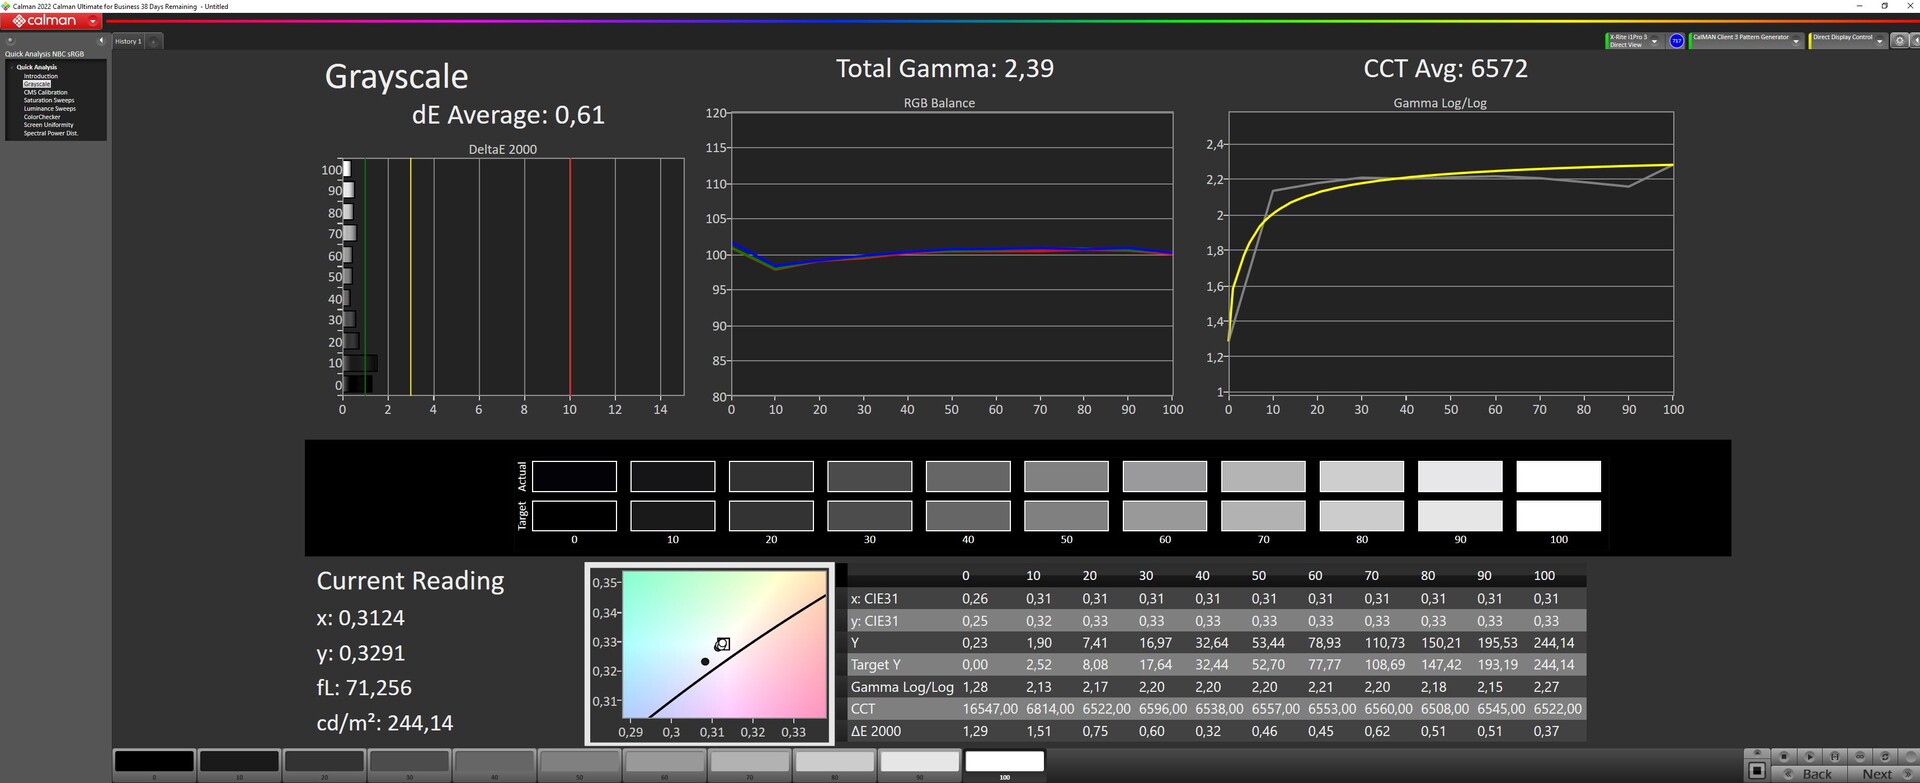
显示器在出厂前并没有调整得那么好。我们在这里只根据sRGB标准进行测量。降低亮度只是稍微降低了灰度等级的DeltaE值,但它仍然保持在3以下。然而,Calman ColorChecker显示出很高的色彩偏差。
手动校准将灰度偏差降至0.61,但ColorChecker的DeltaE值为4.63,仍然太高。显示器似乎没有能力做得更多。我们校准过的icc色彩配置文件可以在上面下载。
Display Response Times
| ↔ Response Time Black to White | ||
|---|---|---|
| 26.8 ms ... rise ↗ and fall ↘ combined | ↗ 14.2 ms rise | 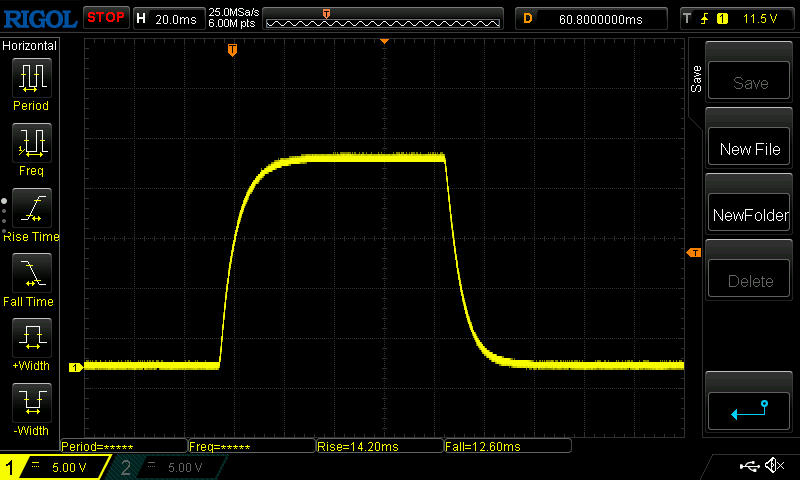 |
| ↘ 12.6 ms fall | ||
| The screen shows relatively slow response rates in our tests and may be too slow for gamers. In comparison, all tested devices range from 0.1 (minimum) to 240 (maximum) ms. » 67 % of all devices are better. This means that the measured response time is worse than the average of all tested devices (19.8 ms). | ||
| ↔ Response Time 50% Grey to 80% Grey | ||
| 38.8 ms ... rise ↗ and fall ↘ combined | ↗ 18.6 ms rise | 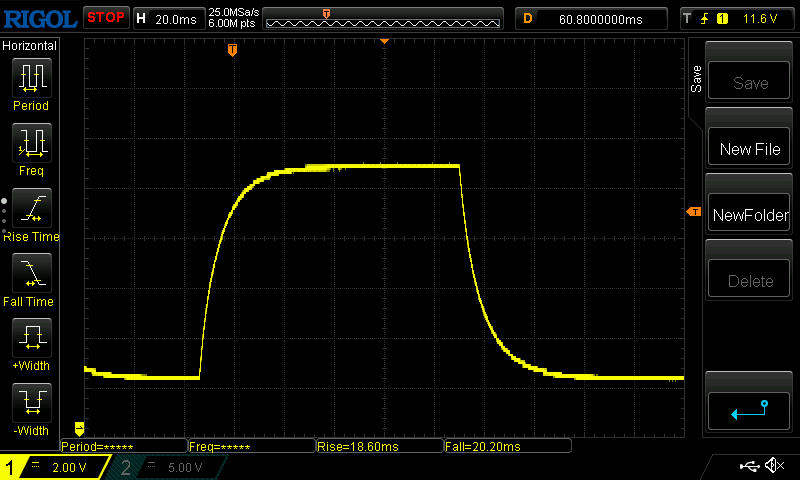 |
| ↘ 20.2 ms fall | ||
| The screen shows slow response rates in our tests and will be unsatisfactory for gamers. In comparison, all tested devices range from 0.165 (minimum) to 636 (maximum) ms. » 58 % of all devices are better. This means that the measured response time is worse than the average of all tested devices (31 ms). | ||
Screen Flickering / PWM (Pulse-Width Modulation)
| Screen flickering / PWM not detected |  | ||
In comparison: 52 % of all tested devices do not use PWM to dim the display. If PWM was detected, an average of 7757 (minimum: 5 - maximum: 343500) Hz was measured. | |||
哑光的表面可以过滤掉户外的强烈反射。然而,该面板的亮度较弱,肯定需要在阴凉处放置。
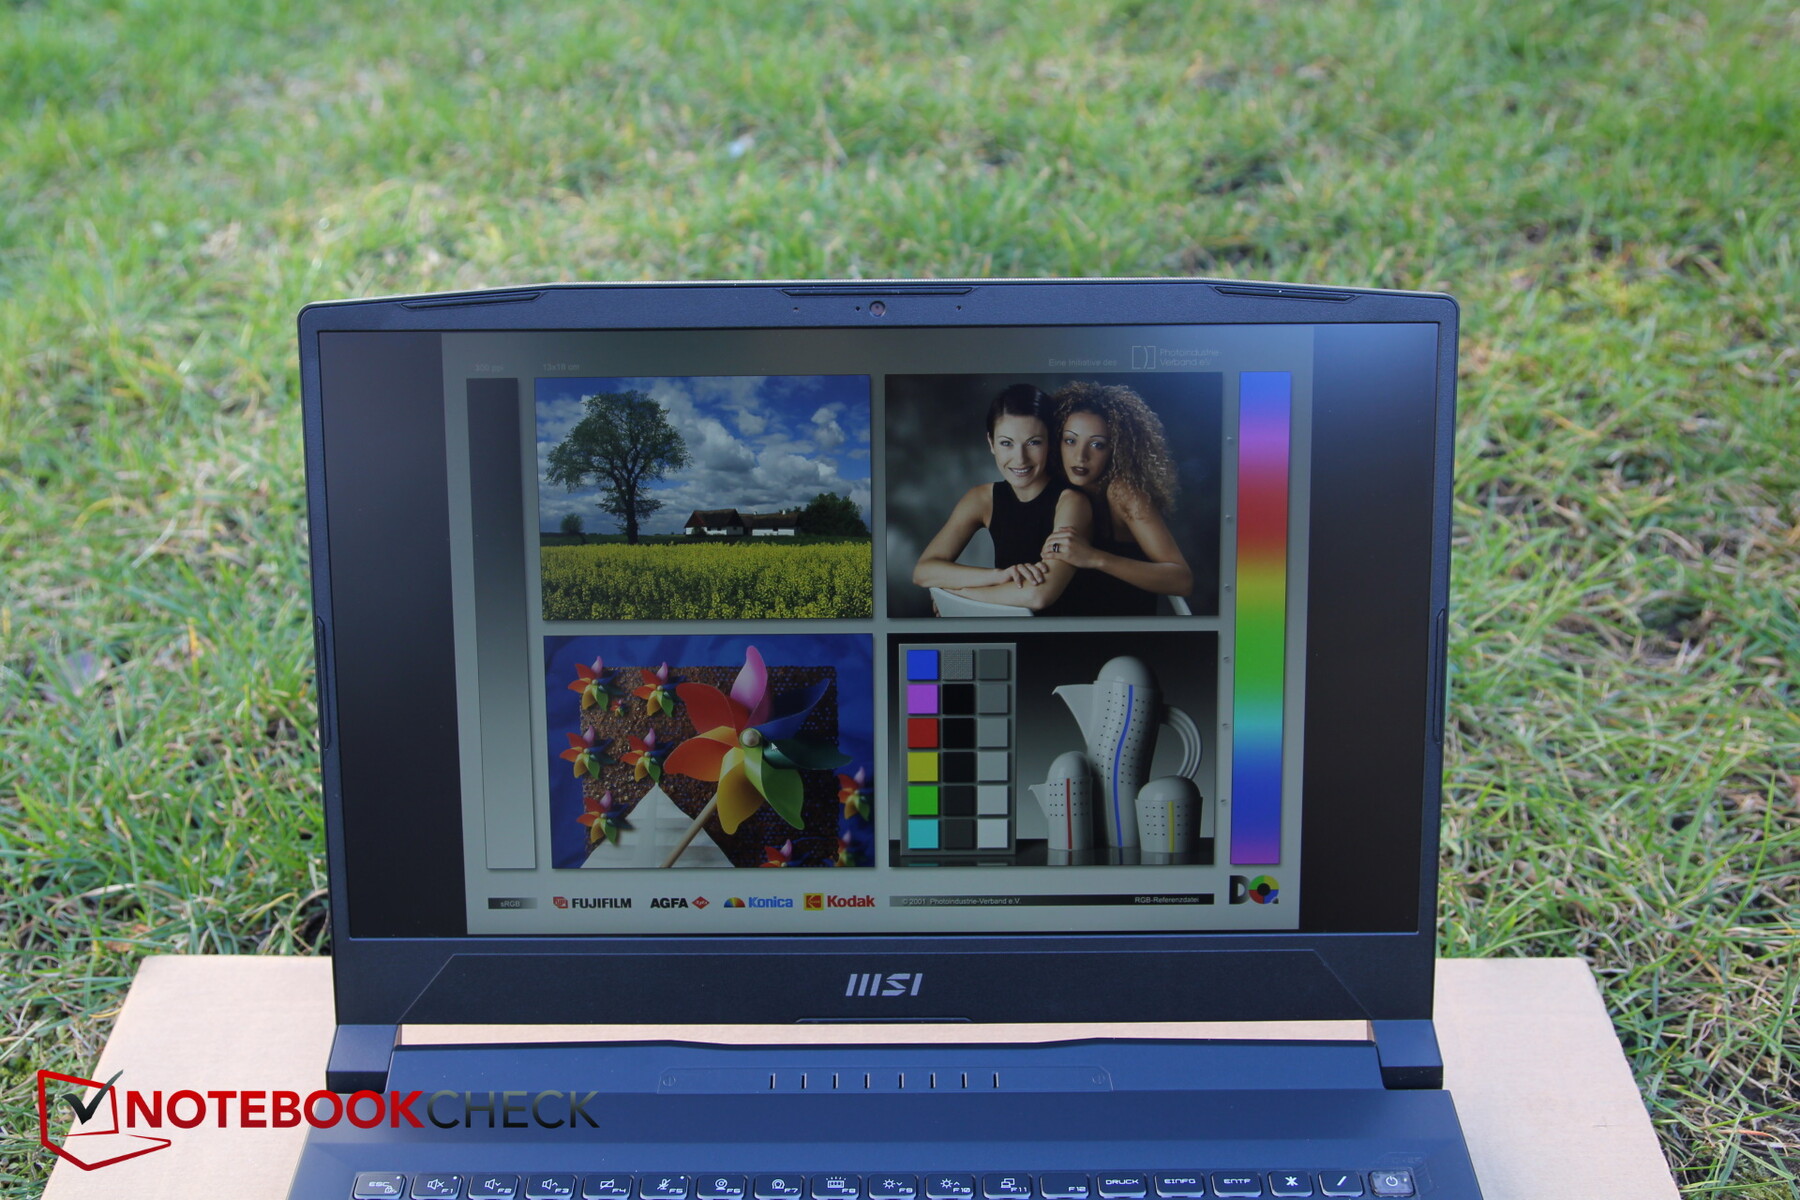
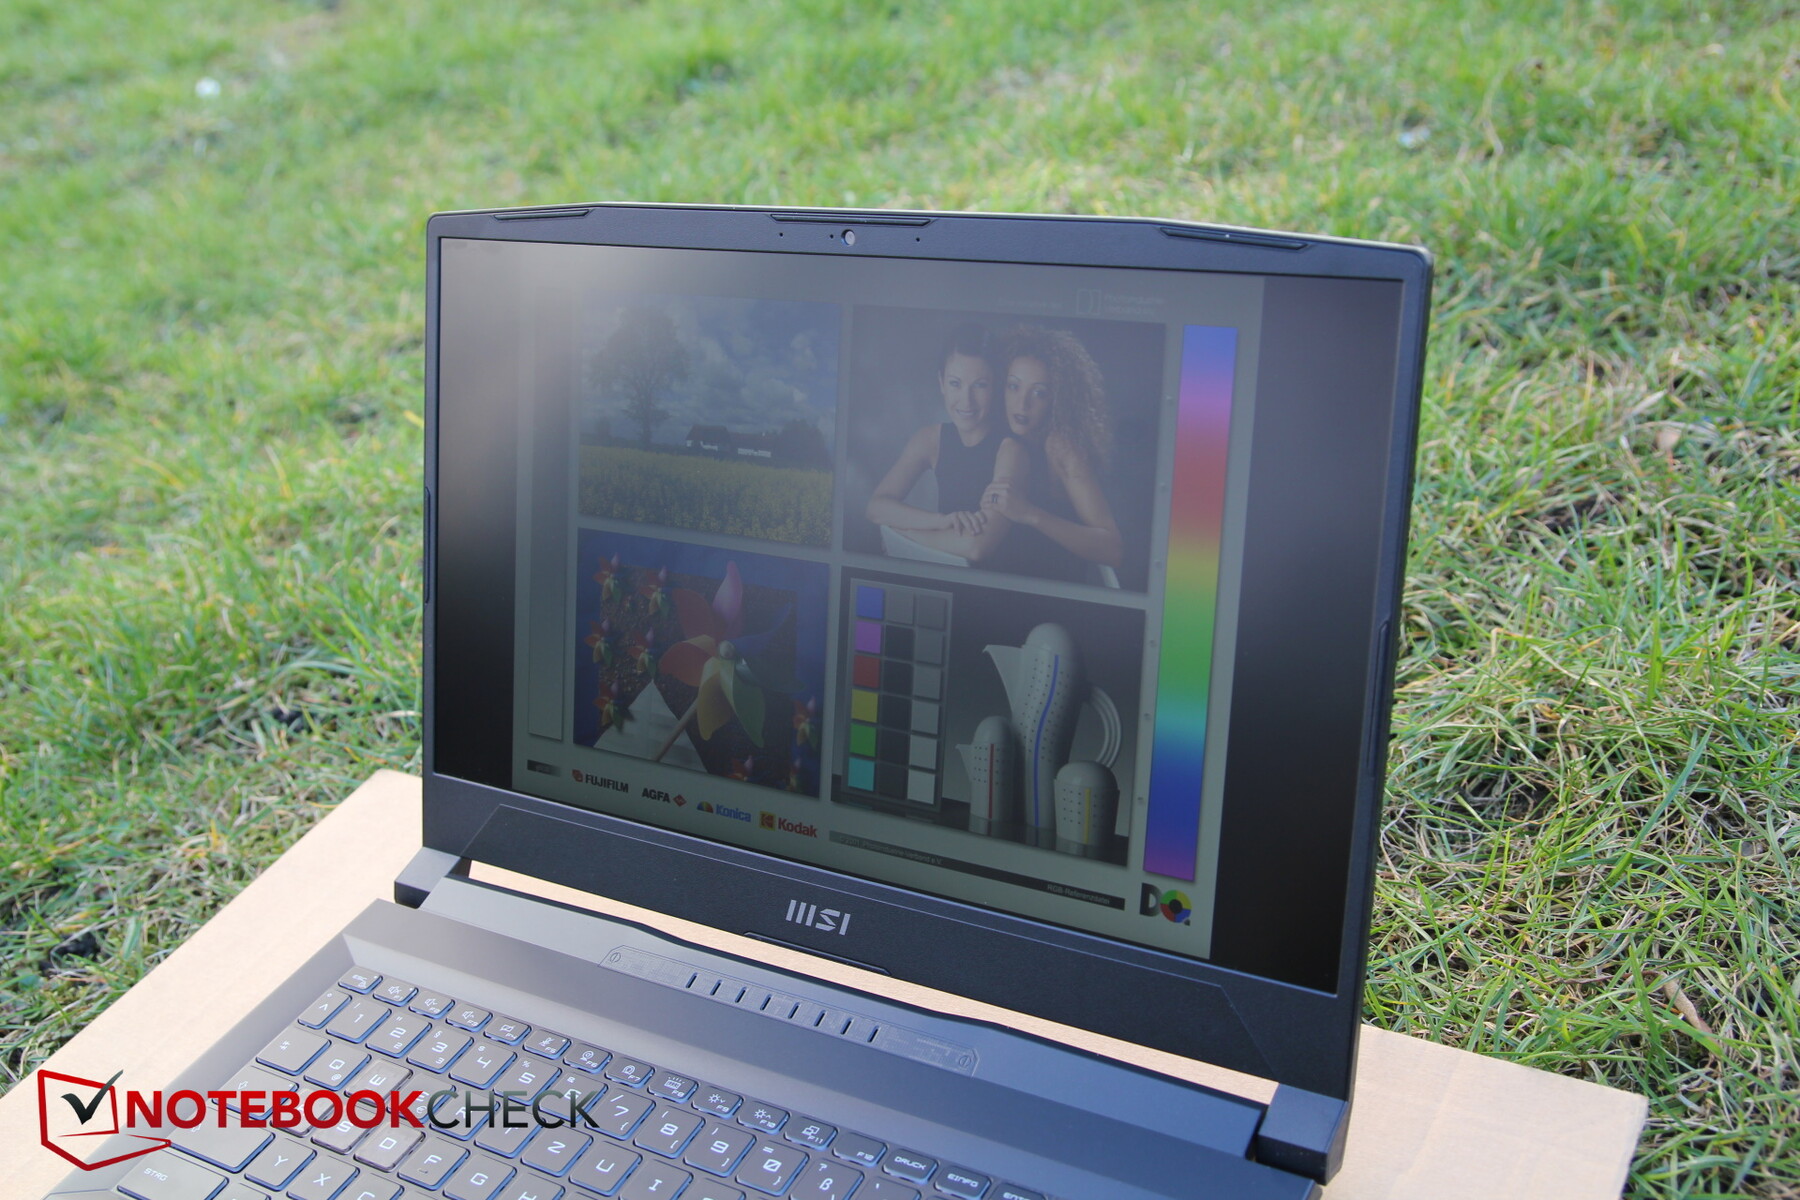
视角的稳定性还可以。亮度的下降只有在极端的视角下才能看到。

性能 - Katana 15处于RTX 3060的水平
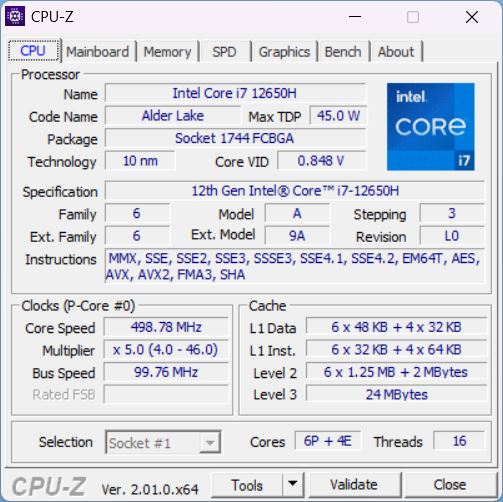
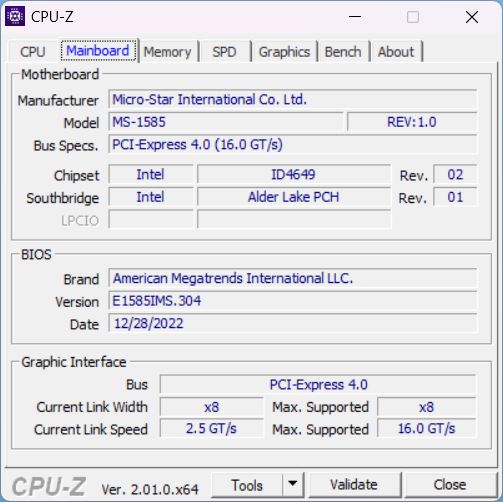
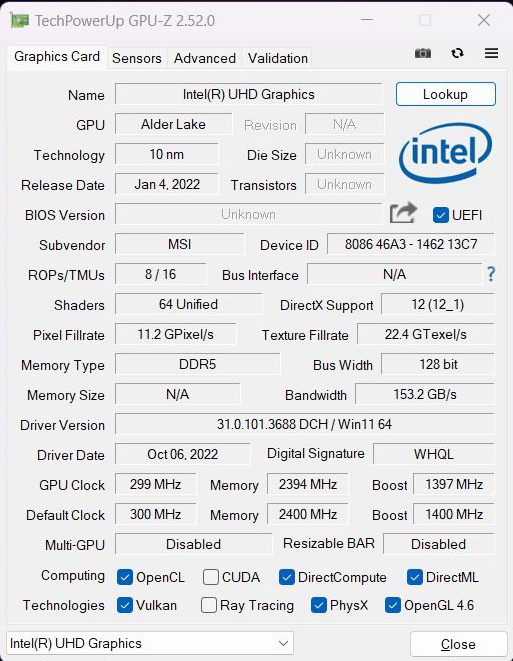
微星Katana 15被宣传为一款游戏笔记本电脑,虽然它的酷睿i7-12650H属于去年的桤木湖系列,但它绝对是低端的一部分。
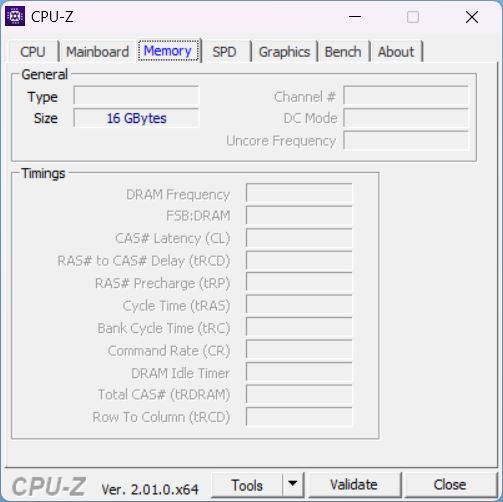
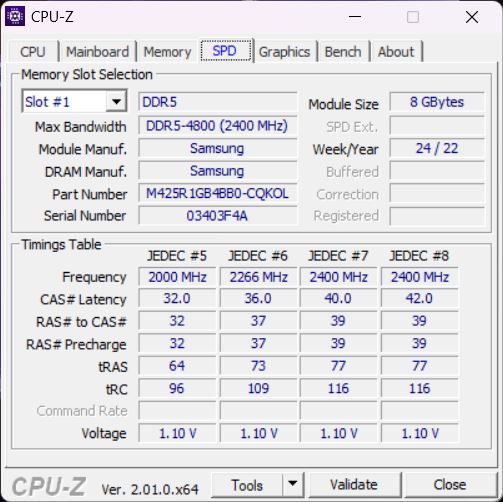
该CPU是与Nvidia RTX 4050这是新的RTX 40xx型号中的入门级卡。在Katana中,它的功耗高达105瓦。16GB内存是如今游戏玩家的(低)标准。
测试条件
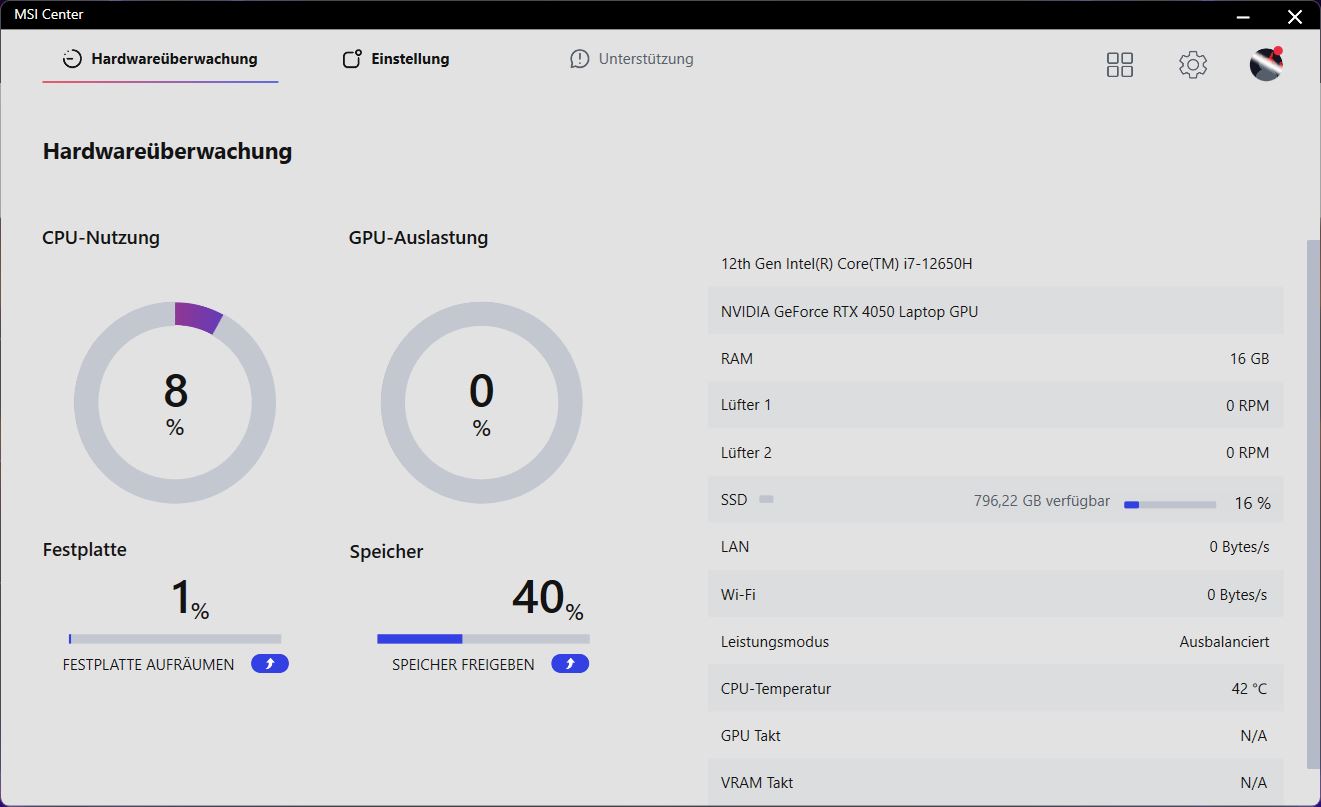
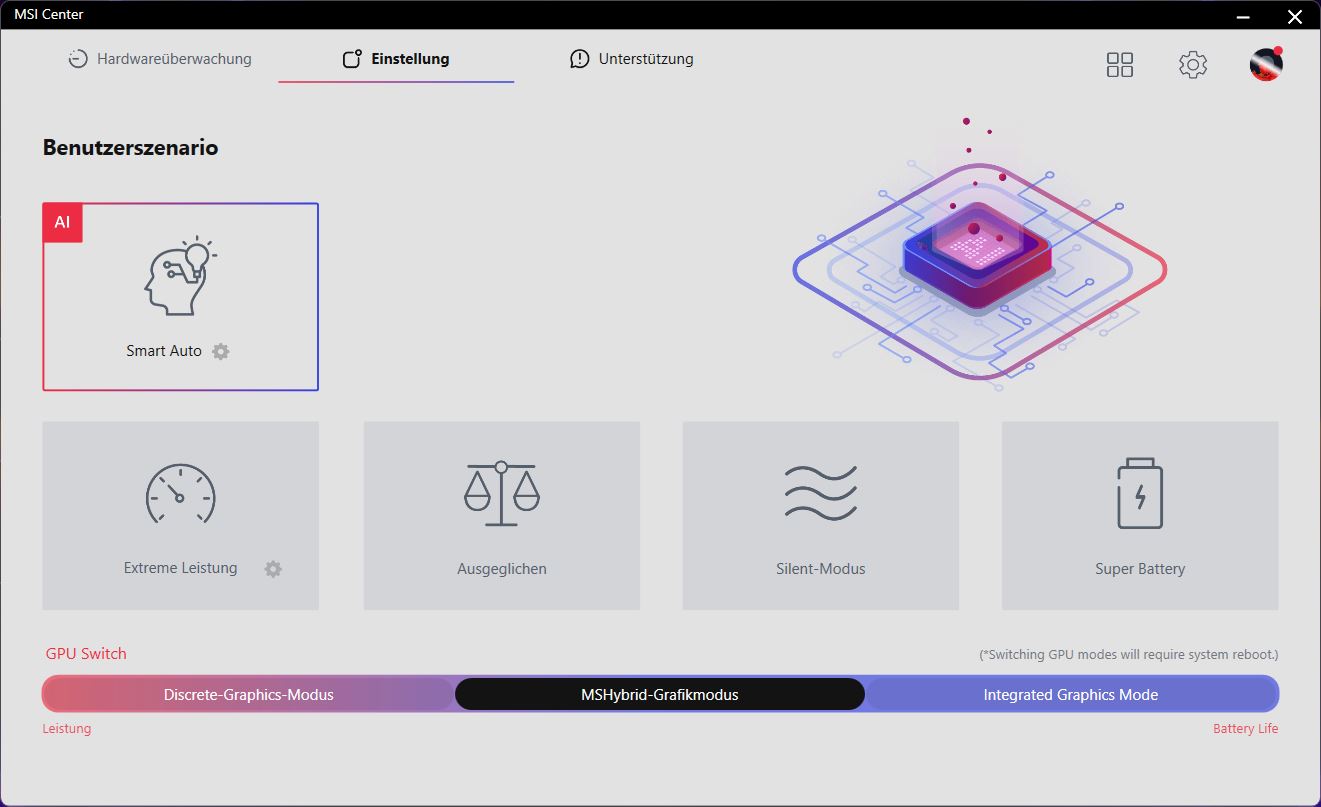
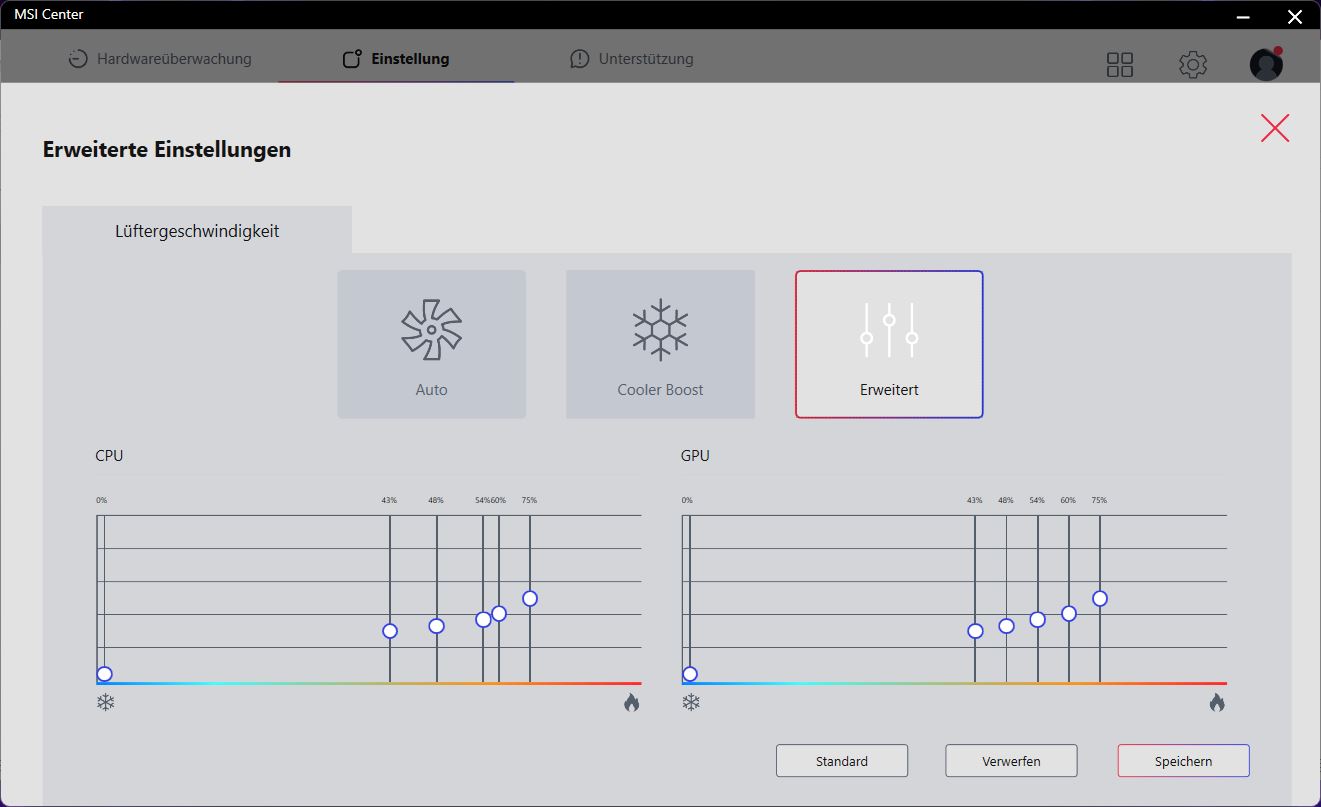
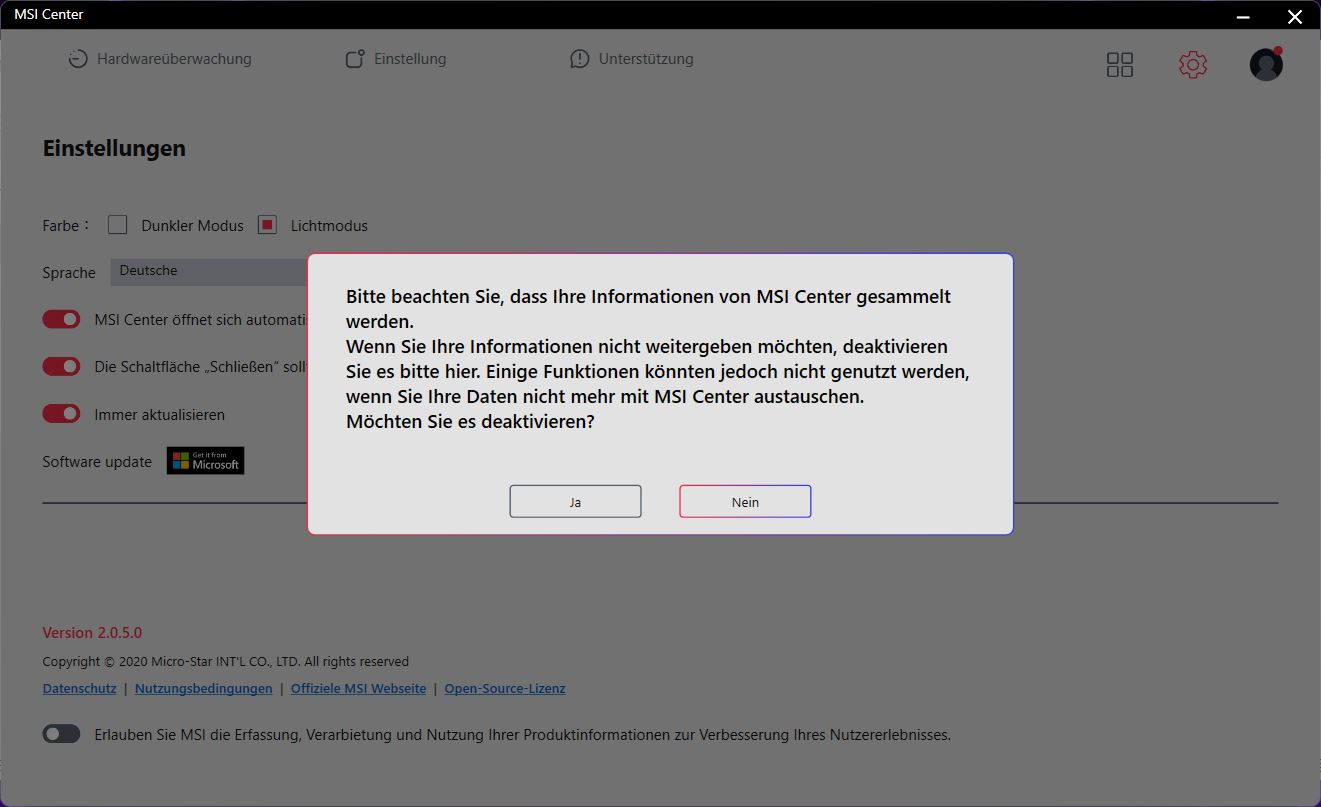
微星中心是控制中心,当然,制造商用它来收集各种数据。在其他方面,性能设置在这里被调整。这里默认预设了AI模式,它根据应用的负载自动调整性能值。我们对人工智能的能力充满信心,在这种模式下运行所有的基准测试。
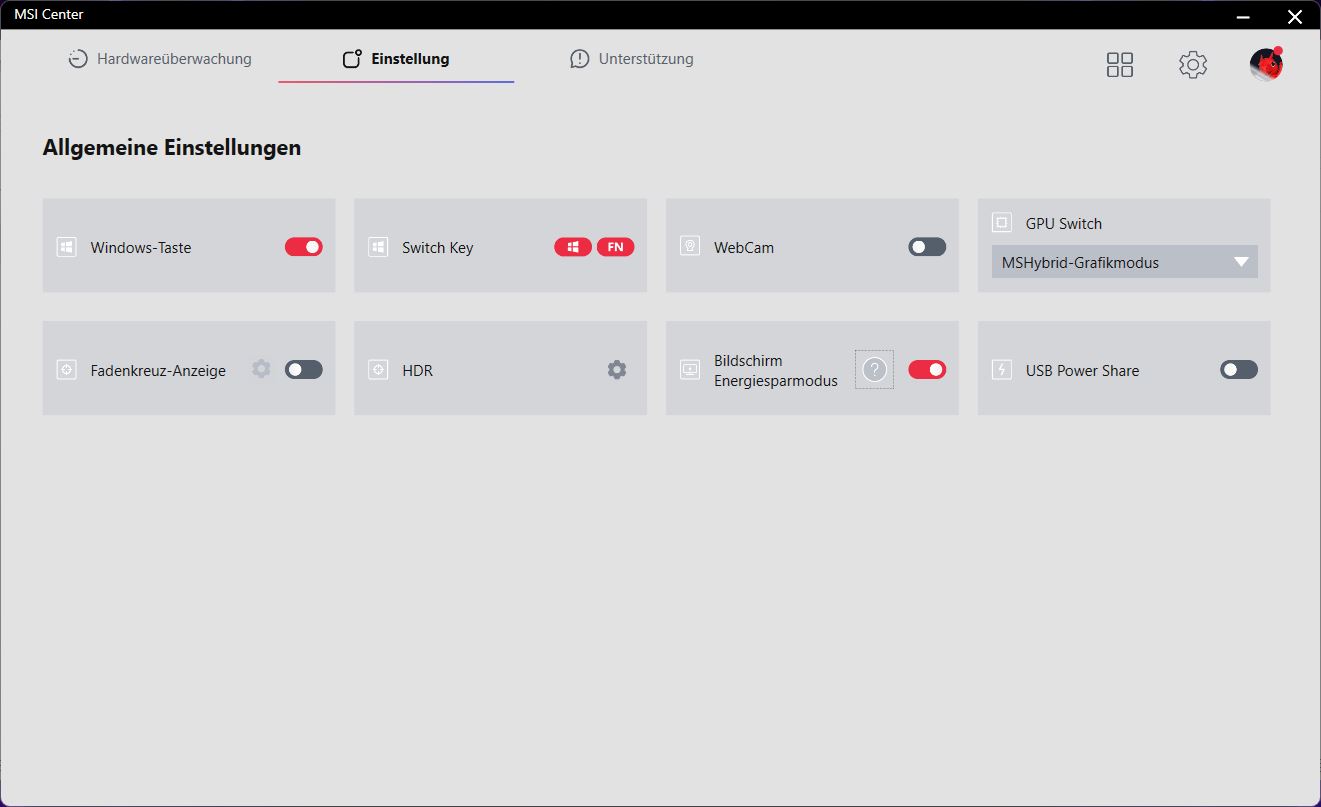
除了性能之外,其他设置也可以在MSI中心进行调整。例如,你可以调换fn键和Windows键的功能,在极限性能模式下手动调整风扇曲线,或者切换iGPU和dGPU。该工具在某些分辨率下有问题。
大多数时候,在MSI中心激活了GPU混合模式,它可以自动在iGPU和dGPU之间切换。然而,这在我们的基准测试中并没有可靠地工作。例如,我们不得不手动激活Blender的dGPU,因为测试自动只运行iGPU,产生的结果非常差。
处理器
在Cinebench循环中,我们观察到在前两次运行中性能有小幅下降。之后,性能基本保持不变,但总体上不是太高。我们的Katana与拥有i7-12700H的竞争对手相比处于劣势,它也被Ryzen 7 6800H击败。
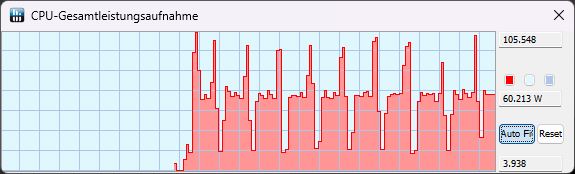
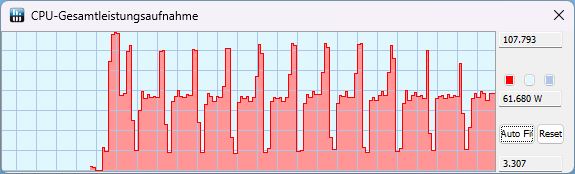
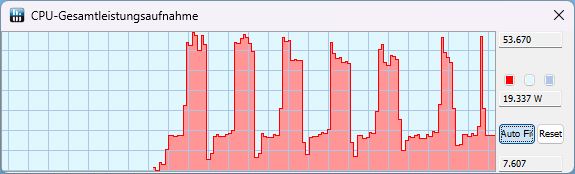
TDP在KI和Extreme模式下几乎保持不变:我们在运行开始和结束时分别测量了约105W,在运行过程中功耗下降到60W。在电池模式下,峰值只有53W,否则只有19W。
总的来说,CPU性能达到了预期水平,但Katana的单核性能稍弱一些。
Cinebench R15 Multi Sustained Load
Cinebench R23: Multi Core | Single Core
Cinebench R20: CPU (Multi Core) | CPU (Single Core)
Cinebench R15: CPU Multi 64Bit | CPU Single 64Bit
Blender: v2.79 BMW27 CPU
7-Zip 18.03: 7z b 4 | 7z b 4 -mmt1
Geekbench 5.5: Multi-Core | Single-Core
HWBOT x265 Benchmark v2.2: 4k Preset
LibreOffice : 20 Documents To PDF
R Benchmark 2.5: Overall mean
| CPU Performance rating | |
| Average of class Gaming | |
| Lenovo Legion 5 15IAH7H 82RB | |
| MSI Pulse GL66 12UEK | |
| Asus TUF Gaming F15 FX507ZM | |
| MSI Katana GF66 12UGS | |
| MSI Katana 15 B12VEK | |
| Schenker XMG Core 15 (M22) | |
| Average Intel Core i7-12650H | |
| Cinebench R23 / Multi Core | |
| Average of class Gaming (10488 - 42661, n=107, last 2 years) | |
| Lenovo Legion 5 15IAH7H 82RB | |
| Asus TUF Gaming F15 FX507ZM | |
| MSI Pulse GL66 12UEK | |
| MSI Katana GF66 12UGS | |
| MSI Katana 15 B12VEK | |
| Schenker XMG Core 15 (M22) | |
| Average Intel Core i7-12650H (5362 - 15537, n=14) | |
| Cinebench R23 / Single Core | |
| Average of class Gaming (1166 - 2415, n=107, last 2 years) | |
| MSI Pulse GL66 12UEK | |
| MSI Katana GF66 12UGS | |
| Lenovo Legion 5 15IAH7H 82RB | |
| Asus TUF Gaming F15 FX507ZM | |
| Average Intel Core i7-12650H (1428 - 1808, n=14) | |
| MSI Katana 15 B12VEK | |
| Schenker XMG Core 15 (M22) | |
| Cinebench R20 / CPU (Multi Core) | |
| Average of class Gaming (4029 - 16433, n=106, last 2 years) | |
| Lenovo Legion 5 15IAH7H 82RB | |
| Asus TUF Gaming F15 FX507ZM | |
| MSI Pulse GL66 12UEK | |
| MSI Katana GF66 12UGS | |
| MSI Katana 15 B12VEK | |
| Schenker XMG Core 15 (M22) | |
| Average Intel Core i7-12650H (2106 - 6009, n=14) | |
| Cinebench R20 / CPU (Single Core) | |
| Average of class Gaming (442 - 913, n=106, last 2 years) | |
| MSI Pulse GL66 12UEK | |
| MSI Katana GF66 12UGS | |
| Lenovo Legion 5 15IAH7H 82RB | |
| Asus TUF Gaming F15 FX507ZM | |
| Average Intel Core i7-12650H (552 - 696, n=14) | |
| MSI Katana 15 B12VEK | |
| Schenker XMG Core 15 (M22) | |
| Cinebench R15 / CPU Multi 64Bit | |
| Average of class Gaming (1578 - 6330, n=105, last 2 years) | |
| Lenovo Legion 5 15IAH7H 82RB | |
| Asus TUF Gaming F15 FX507ZM | |
| MSI Pulse GL66 12UEK | |
| MSI Katana GF66 12UGS | |
| MSI Katana GF66 12UGS | |
| Schenker XMG Core 15 (M22) | |
| MSI Katana 15 B12VEK | |
| Average Intel Core i7-12650H (753 - 2253, n=14) | |
| Cinebench R15 / CPU Single 64Bit | |
| Average of class Gaming (188.8 - 350, n=106, last 2 years) | |
| MSI Pulse GL66 12UEK | |
| MSI Katana GF66 12UGS | |
| MSI Katana GF66 12UGS | |
| Lenovo Legion 5 15IAH7H 82RB | |
| Asus TUF Gaming F15 FX507ZM | |
| Schenker XMG Core 15 (M22) | |
| MSI Katana 15 B12VEK | |
| Average Intel Core i7-12650H (206 - 261, n=14) | |
| Blender / v2.79 BMW27 CPU | |
| Average Intel Core i7-12650H (222 - 553, n=15) | |
| MSI Katana GF66 12UGS | |
| MSI Katana 15 B12VEK | |
| Schenker XMG Core 15 (M22) | |
| MSI Pulse GL66 12UEK | |
| Asus TUF Gaming F15 FX507ZM | |
| Lenovo Legion 5 15IAH7H 82RB | |
| Average of class Gaming (79 - 330, n=104, last 2 years) | |
| 7-Zip 18.03 / 7z b 4 | |
| Average of class Gaming (33491 - 148086, n=105, last 2 years) | |
| Lenovo Legion 5 15IAH7H 82RB | |
| Asus TUF Gaming F15 FX507ZM | |
| MSI Pulse GL66 12UEK | |
| Schenker XMG Core 15 (M22) | |
| MSI Katana 15 B12VEK | |
| MSI Katana GF66 12UGS | |
| Average Intel Core i7-12650H (27053 - 59034, n=14) | |
| 7-Zip 18.03 / 7z b 4 -mmt1 | |
| Average of class Gaming (4199 - 7436, n=105, last 2 years) | |
| MSI Pulse GL66 12UEK | |
| MSI Katana GF66 12UGS | |
| Lenovo Legion 5 15IAH7H 82RB | |
| Schenker XMG Core 15 (M22) | |
| Average Intel Core i7-12650H (5265 - 6116, n=14) | |
| MSI Katana 15 B12VEK | |
| Asus TUF Gaming F15 FX507ZM | |
| Geekbench 5.5 / Multi-Core | |
| Average of class Gaming (6460 - 28263, n=105, last 2 years) | |
| Lenovo Legion 5 15IAH7H 82RB | |
| Asus TUF Gaming F15 FX507ZM | |
| MSI Pulse GL66 12UEK | |
| MSI Katana GF66 12UGS | |
| MSI Katana 15 B12VEK | |
| Schenker XMG Core 15 (M22) | |
| Average Intel Core i7-12650H (6478 - 11284, n=16) | |
| Geekbench 5.5 / Single-Core | |
| Average of class Gaming (986 - 2474, n=105, last 2 years) | |
| MSI Pulse GL66 12UEK | |
| MSI Katana GF66 12UGS | |
| Lenovo Legion 5 15IAH7H 82RB | |
| Asus TUF Gaming F15 FX507ZM | |
| Average Intel Core i7-12650H (1590 - 1797, n=16) | |
| MSI Katana 15 B12VEK | |
| Schenker XMG Core 15 (M22) | |
| HWBOT x265 Benchmark v2.2 / 4k Preset | |
| Average of class Gaming (11.5 - 44.4, n=105, last 2 years) | |
| Lenovo Legion 5 15IAH7H 82RB | |
| Asus TUF Gaming F15 FX507ZM | |
| MSI Pulse GL66 12UEK | |
| Schenker XMG Core 15 (M22) | |
| MSI Katana 15 B12VEK | |
| Average Intel Core i7-12650H (6.62 - 17.4, n=16) | |
| MSI Katana GF66 12UGS | |
| LibreOffice / 20 Documents To PDF | |
| Schenker XMG Core 15 (M22) | |
| Asus TUF Gaming F15 FX507ZM | |
| Average of class Gaming (33.2 - 88.8, n=105, last 2 years) | |
| MSI Katana 15 B12VEK | |
| Average Intel Core i7-12650H (35.1 - 58.5, n=14) | |
| MSI Pulse GL66 12UEK | |
| Lenovo Legion 5 15IAH7H 82RB | |
| MSI Katana GF66 12UGS | |
| R Benchmark 2.5 / Overall mean | |
| MSI Katana 15 B12VEK | |
| Schenker XMG Core 15 (M22) | |
| Average Intel Core i7-12650H (0.4584 - 0.515, n=14) | |
| Asus TUF Gaming F15 FX507ZM | |
| Lenovo Legion 5 15IAH7H 82RB | |
| MSI Katana GF66 12UGS | |
| Average of class Gaming (0.3439 - 0.759, n=106, last 2 years) | |
| MSI Pulse GL66 12UEK | |
* ... smaller is better
AIDA64: FP32 Ray-Trace | FPU Julia | CPU SHA3 | CPU Queen | FPU SinJulia | FPU Mandel | CPU AES | CPU ZLib | FP64 Ray-Trace | CPU PhotoWorxx
| Performance rating | |
| Average of class Gaming | |
| Lenovo Legion 5 15IAH7H 82RB | |
| Schenker XMG Core 15 (M22) | |
| MSI Katana 15 B12VEK | |
| MSI Pulse GL66 12UEK | |
| Asus TUF Gaming F15 FX507ZM | |
| MSI Katana GF66 12UGS | |
| Average Intel Core i7-12650H | |
| AIDA64 / FP32 Ray-Trace | |
| Average of class Gaming (10227 - 85542, n=105, last 2 years) | |
| Lenovo Legion 5 15IAH7H 82RB | |
| Schenker XMG Core 15 (M22) | |
| MSI Katana 15 B12VEK | |
| Average Intel Core i7-12650H (5422 - 15620, n=14) | |
| Asus TUF Gaming F15 FX507ZM | |
| MSI Pulse GL66 12UEK | |
| MSI Katana GF66 12UGS | |
| AIDA64 / FPU Julia | |
| Average of class Gaming (51376 - 238426, n=105, last 2 years) | |
| Schenker XMG Core 15 (M22) | |
| Lenovo Legion 5 15IAH7H 82RB | |
| MSI Katana 15 B12VEK | |
| Average Intel Core i7-12650H (26386 - 76434, n=14) | |
| Asus TUF Gaming F15 FX507ZM | |
| MSI Pulse GL66 12UEK | |
| MSI Katana GF66 12UGS | |
| AIDA64 / CPU SHA3 | |
| Average of class Gaming (2180 - 10115, n=105, last 2 years) | |
| Lenovo Legion 5 15IAH7H 82RB | |
| Schenker XMG Core 15 (M22) | |
| Asus TUF Gaming F15 FX507ZM | |
| MSI Katana 15 B12VEK | |
| MSI Pulse GL66 12UEK | |
| MSI Katana GF66 12UGS | |
| Average Intel Core i7-12650H (1479 - 3244, n=14) | |
| AIDA64 / CPU Queen | |
| Average of class Gaming (49785 - 173351, n=90, last 2 years) | |
| MSI Pulse GL66 12UEK | |
| Lenovo Legion 5 15IAH7H 82RB | |
| MSI Katana GF66 12UGS | |
| Asus TUF Gaming F15 FX507ZM | |
| Schenker XMG Core 15 (M22) | |
| MSI Katana 15 B12VEK | |
| Average Intel Core i7-12650H (59278 - 89537, n=14) | |
| AIDA64 / FPU SinJulia | |
| Average of class Gaming (4424 - 33636, n=105, last 2 years) | |
| Schenker XMG Core 15 (M22) | |
| Lenovo Legion 5 15IAH7H 82RB | |
| MSI Pulse GL66 12UEK | |
| Asus TUF Gaming F15 FX507ZM | |
| MSI Katana GF66 12UGS | |
| MSI Katana 15 B12VEK | |
| Average Intel Core i7-12650H (4690 - 8726, n=14) | |
| AIDA64 / FPU Mandel | |
| Average of class Gaming (25115 - 128721, n=105, last 2 years) | |
| Schenker XMG Core 15 (M22) | |
| Lenovo Legion 5 15IAH7H 82RB | |
| MSI Katana 15 B12VEK | |
| Average Intel Core i7-12650H (15001 - 37738, n=14) | |
| Asus TUF Gaming F15 FX507ZM | |
| MSI Pulse GL66 12UEK | |
| MSI Katana GF66 12UGS | |
| AIDA64 / CPU AES | |
| Lenovo Legion 5 15IAH7H 82RB | |
| Average of class Gaming (39258 - 247074, n=105, last 2 years) | |
| MSI Pulse GL66 12UEK | |
| MSI Katana GF66 12UGS | |
| Schenker XMG Core 15 (M22) | |
| MSI Katana 15 B12VEK | |
| Asus TUF Gaming F15 FX507ZM | |
| Average Intel Core i7-12650H (32702 - 92530, n=14) | |
| AIDA64 / CPU ZLib | |
| Average of class Gaming (574 - 2531, n=105, last 2 years) | |
| Asus TUF Gaming F15 FX507ZM | |
| Lenovo Legion 5 15IAH7H 82RB | |
| MSI Pulse GL66 12UEK | |
| MSI Katana GF66 12UGS | |
| Schenker XMG Core 15 (M22) | |
| MSI Katana 15 B12VEK | |
| Average Intel Core i7-12650H (443 - 891, n=14) | |
| AIDA64 / FP64 Ray-Trace | |
| Average of class Gaming (5509 - 45446, n=105, last 2 years) | |
| Lenovo Legion 5 15IAH7H 82RB | |
| Schenker XMG Core 15 (M22) | |
| MSI Katana 15 B12VEK | |
| Average Intel Core i7-12650H (3096 - 8448, n=14) | |
| Asus TUF Gaming F15 FX507ZM | |
| MSI Pulse GL66 12UEK | |
| MSI Katana GF66 12UGS | |
| AIDA64 / CPU PhotoWorxx | |
| Average of class Gaming (12271 - 89891, n=105, last 2 years) | |
| MSI Katana 15 B12VEK | |
| Lenovo Legion 5 15IAH7H 82RB | |
| Asus TUF Gaming F15 FX507ZM | |
| Average Intel Core i7-12650H (22046 - 44164, n=14) | |
| Schenker XMG Core 15 (M22) | |
| MSI Katana GF66 12UGS | |
| MSI Pulse GL66 12UEK | |
系统性能
CrossMark: Overall | Productivity | Creativity | Responsiveness
| PCMark 10 / Score | |
| Average of class Gaming (5828 - 12414, n=93, last 2 years) | |
| Lenovo Legion 5 15IAH7H 82RB | |
| MSI Katana GF66 12UGS | |
| Asus TUF Gaming F15 FX507ZM | |
| Schenker XMG Core 15 (M22) | |
| MSI Pulse GL66 12UEK | |
| MSI Katana 15 B12VEK | |
| Average Intel Core i7-12650H, NVIDIA GeForce RTX 4050 Laptop GPU (n=1) | |
| PCMark 10 / Essentials | |
| Lenovo Legion 5 15IAH7H 82RB | |
| Schenker XMG Core 15 (M22) | |
| Average of class Gaming (8810 - 11935, n=97, last 2 years) | |
| Asus TUF Gaming F15 FX507ZM | |
| MSI Pulse GL66 12UEK | |
| MSI Katana GF66 12UGS | |
| MSI Katana 15 B12VEK | |
| Average Intel Core i7-12650H, NVIDIA GeForce RTX 4050 Laptop GPU (n=1) | |
| PCMark 10 / Productivity | |
| Average of class Gaming (6845 - 25323, n=95, last 2 years) | |
| Lenovo Legion 5 15IAH7H 82RB | |
| MSI Katana GF66 12UGS | |
| MSI Pulse GL66 12UEK | |
| MSI Katana 15 B12VEK | |
| Average Intel Core i7-12650H, NVIDIA GeForce RTX 4050 Laptop GPU (n=1) | |
| Schenker XMG Core 15 (M22) | |
| Asus TUF Gaming F15 FX507ZM | |
| PCMark 10 / Digital Content Creation | |
| Average of class Gaming (7602 - 19954, n=95, last 2 years) | |
| Lenovo Legion 5 15IAH7H 82RB | |
| Asus TUF Gaming F15 FX507ZM | |
| MSI Katana GF66 12UGS | |
| Schenker XMG Core 15 (M22) | |
| MSI Pulse GL66 12UEK | |
| MSI Katana 15 B12VEK | |
| Average Intel Core i7-12650H, NVIDIA GeForce RTX 4050 Laptop GPU (n=1) | |
| CrossMark / Overall | |
| MSI Pulse GL66 12UEK | |
| Lenovo Legion 5 15IAH7H 82RB | |
| Average of class Gaming (1366 - 2409, n=94, last 2 years) | |
| MSI Katana GF66 12UGS | |
| MSI Katana 15 B12VEK | |
| Average Intel Core i7-12650H, NVIDIA GeForce RTX 4050 Laptop GPU (n=1) | |
| Schenker XMG Core 15 (M22) | |
| CrossMark / Productivity | |
| MSI Pulse GL66 12UEK | |
| Lenovo Legion 5 15IAH7H 82RB | |
| MSI Katana GF66 12UGS | |
| Average of class Gaming (1386 - 2254, n=94, last 2 years) | |
| MSI Katana 15 B12VEK | |
| Average Intel Core i7-12650H, NVIDIA GeForce RTX 4050 Laptop GPU (n=1) | |
| Schenker XMG Core 15 (M22) | |
| CrossMark / Creativity | |
| Average of class Gaming (1343 - 2786, n=94, last 2 years) | |
| MSI Pulse GL66 12UEK | |
| Lenovo Legion 5 15IAH7H 82RB | |
| MSI Katana GF66 12UGS | |
| MSI Katana 15 B12VEK | |
| Average Intel Core i7-12650H, NVIDIA GeForce RTX 4050 Laptop GPU (n=1) | |
| Schenker XMG Core 15 (M22) | |
| CrossMark / Responsiveness | |
| MSI Pulse GL66 12UEK | |
| Lenovo Legion 5 15IAH7H 82RB | |
| MSI Katana GF66 12UGS | |
| Average of class Gaming (1226 - 2334, n=94, last 2 years) | |
| MSI Katana 15 B12VEK | |
| Average Intel Core i7-12650H, NVIDIA GeForce RTX 4050 Laptop GPU (n=1) | |
| Schenker XMG Core 15 (M22) | |
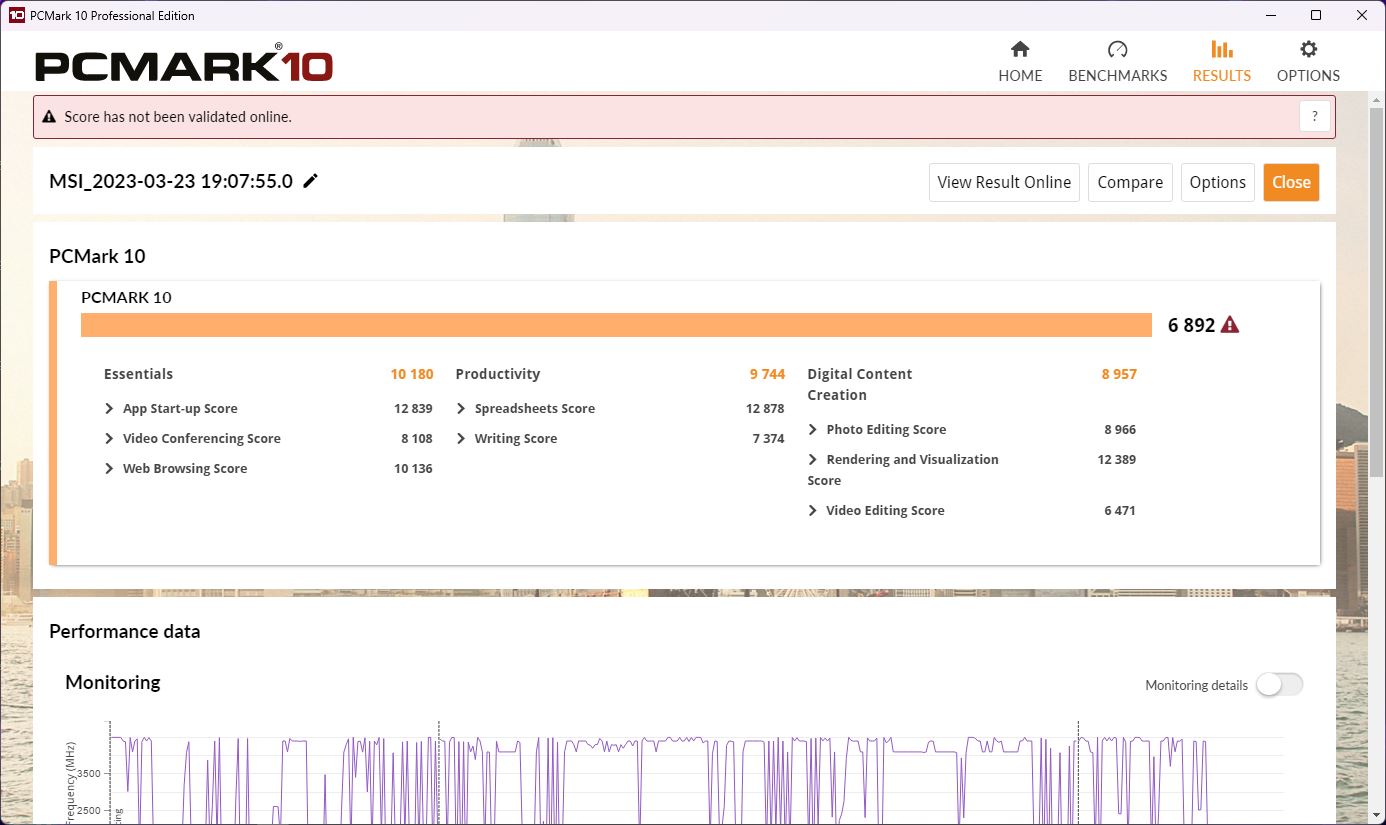
| PCMark 10 Score | 6892 points | |
Help | ||
| AIDA64 / Memory Copy | |
| Average of class Gaming (21750 - 129946, n=105, last 2 years) | |
| MSI Katana 15 B12VEK | |
| Asus TUF Gaming F15 FX507ZM | |
| Lenovo Legion 5 15IAH7H 82RB | |
| Average Intel Core i7-12650H (43261 - 69735, n=14) | |
| Schenker XMG Core 15 (M22) | |
| MSI Katana GF66 12UGS | |
| MSI Pulse GL66 12UEK | |
| AIDA64 / Memory Read | |
| Average of class Gaming (22956 - 118858, n=105, last 2 years) | |
| MSI Katana 15 B12VEK | |
| Lenovo Legion 5 15IAH7H 82RB | |
| Asus TUF Gaming F15 FX507ZM | |
| Average Intel Core i7-12650H (47313 - 67412, n=14) | |
| Schenker XMG Core 15 (M22) | |
| MSI Pulse GL66 12UEK | |
| MSI Katana GF66 12UGS | |
| AIDA64 / Memory Write | |
| Average of class Gaming (22297 - 135096, n=105, last 2 years) | |
| Lenovo Legion 5 15IAH7H 82RB | |
| Asus TUF Gaming F15 FX507ZM | |
| MSI Katana 15 B12VEK | |
| Schenker XMG Core 15 (M22) | |
| Average Intel Core i7-12650H (45617 - 59361, n=14) | |
| MSI Katana GF66 12UGS | |
| MSI Pulse GL66 12UEK | |
| AIDA64 / Memory Latency | |
| Average of class Gaming (75.3 - 259, n=105, last 2 years) | |
| Lenovo Legion 5 15IAH7H 82RB | |
| MSI Katana GF66 12UGS | |
| MSI Katana 15 B12VEK | |
| MSI Pulse GL66 12UEK | |
| Schenker XMG Core 15 (M22) | |
| Average Intel Core i7-12650H (71.6 - 103.9, n=14) | |
| Asus TUF Gaming F15 FX507ZM | |
* ... smaller is better
DPC延时
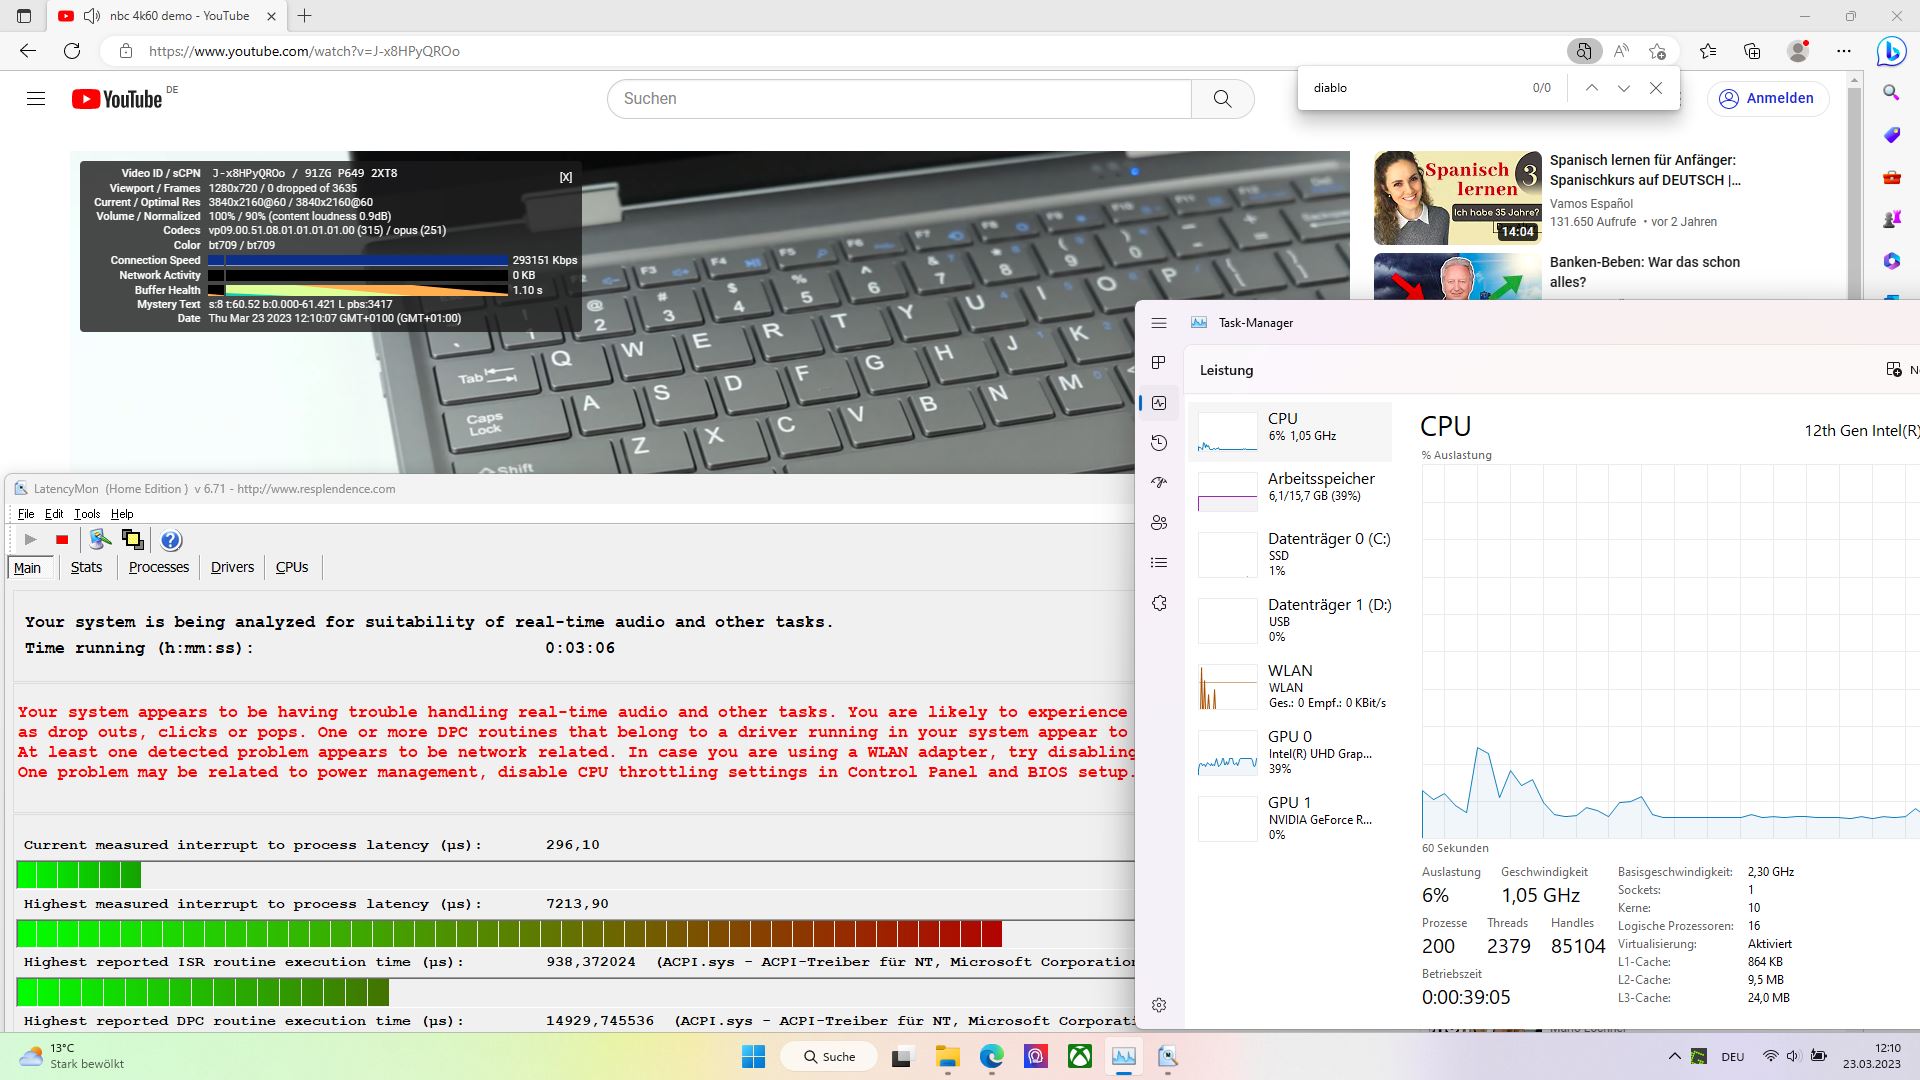
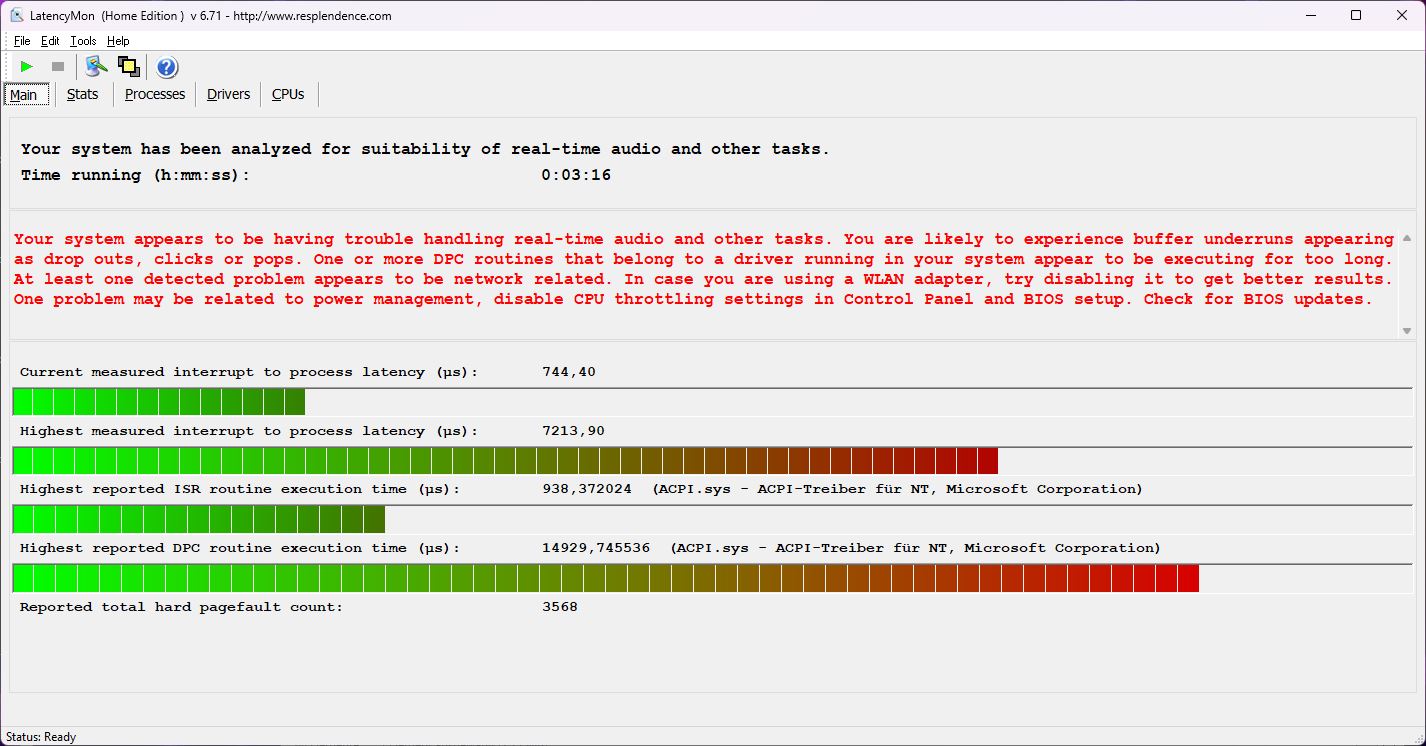
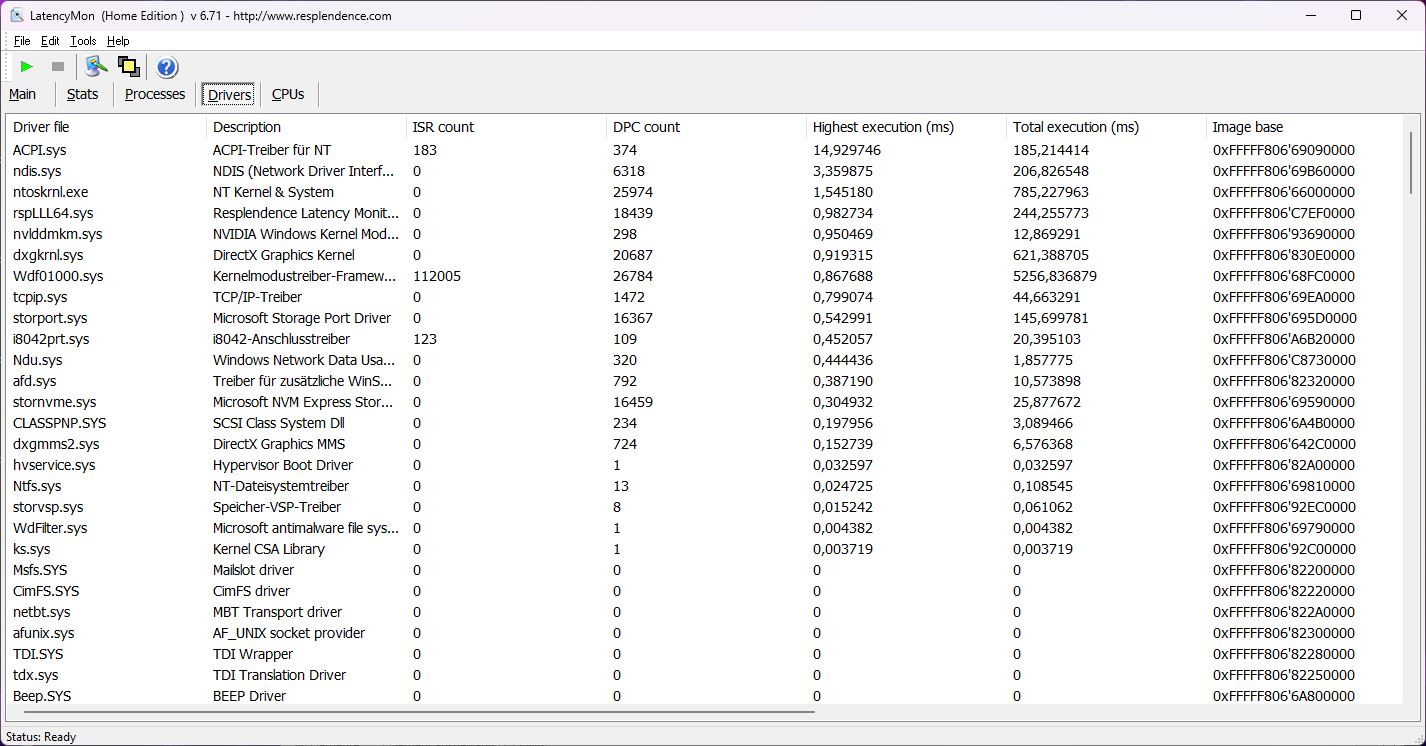
目前,配备RTX 40xx卡的笔记本电脑的Nvidia驱动程序在LatencyMon下仍然有非常高的延迟,我们的Katana也不例外。启动该工具后,第一个延迟立即出现。打开几个浏览器标签并播放我们的4K/60帧YouTube视频,将该值急剧上升。但是没有跳帧。
| DPC Latencies / LatencyMon - interrupt to process latency (max), Web, Youtube, Prime95 | |
| MSI Katana 15 B12VEK | |
| Schenker XMG Core 15 (M22) | |
| MSI Pulse GL66 12UEK | |
| Lenovo Legion 5 15IAH7H 82RB | |
| Asus TUF Gaming F15 FX507ZM | |
| MSI Katana GF66 12UGS | |
* ... smaller is better
存储设备
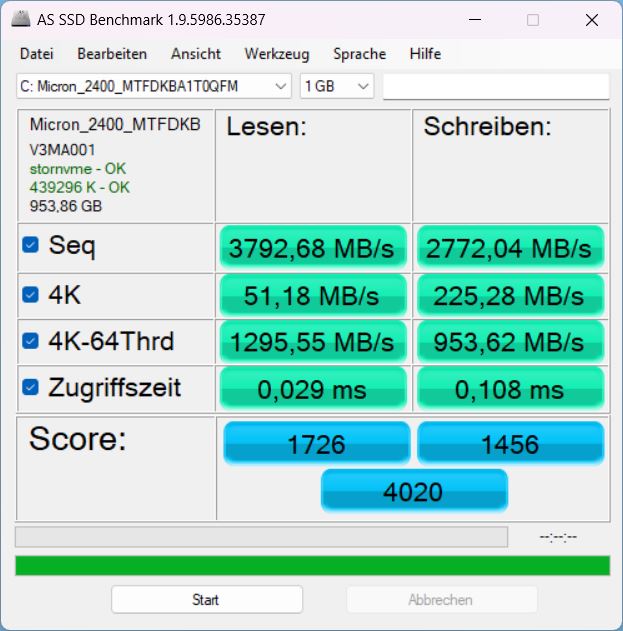
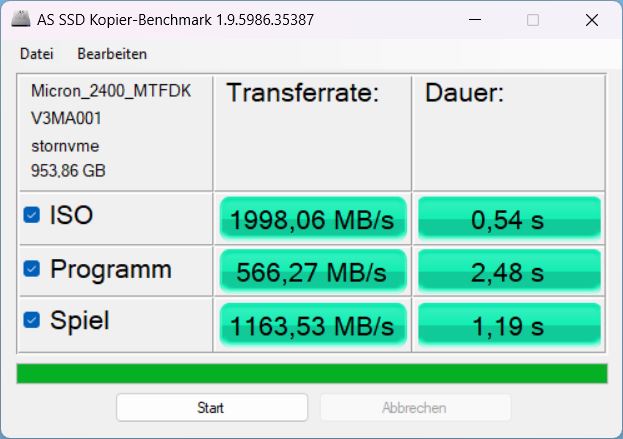
来自美光的1TB PCIe 4.0 x4 NVMe SSD作为主要存储设备。在Katana中,它并没有完全发挥其性能潜力,而且远远落后于美光2450型号中的Katana GF66或 脉冲GL66.
至少它的性能是相对稳定的,只有在较长的时间内才会有最小的下降。你可以在我们的 "SSD畅销榜 "中找到更多关于该型号的信息。 SSD畅销榜.

* ... smaller is better
Sustained Read Performance: DiskSpd Read Loop, Queue Depth 8
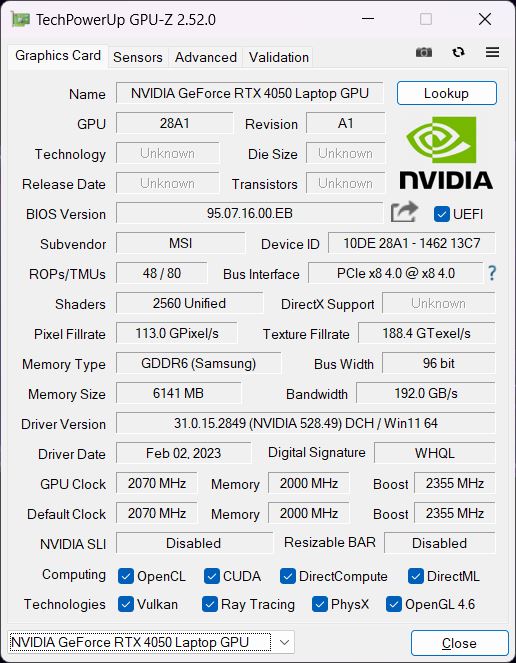
图形卡
的 英伟达Geforce RTX 4050是新的RTX 40xx一代的入门卡。它的性能应该大致与旧的 RTX 3060这取决于所选择的TGP(这里是105W),尽管目前的基准测试表明,该卡在超过10W的情况下很难受益。 基准测试表明,该卡很难从超过100W的功率中获益。.
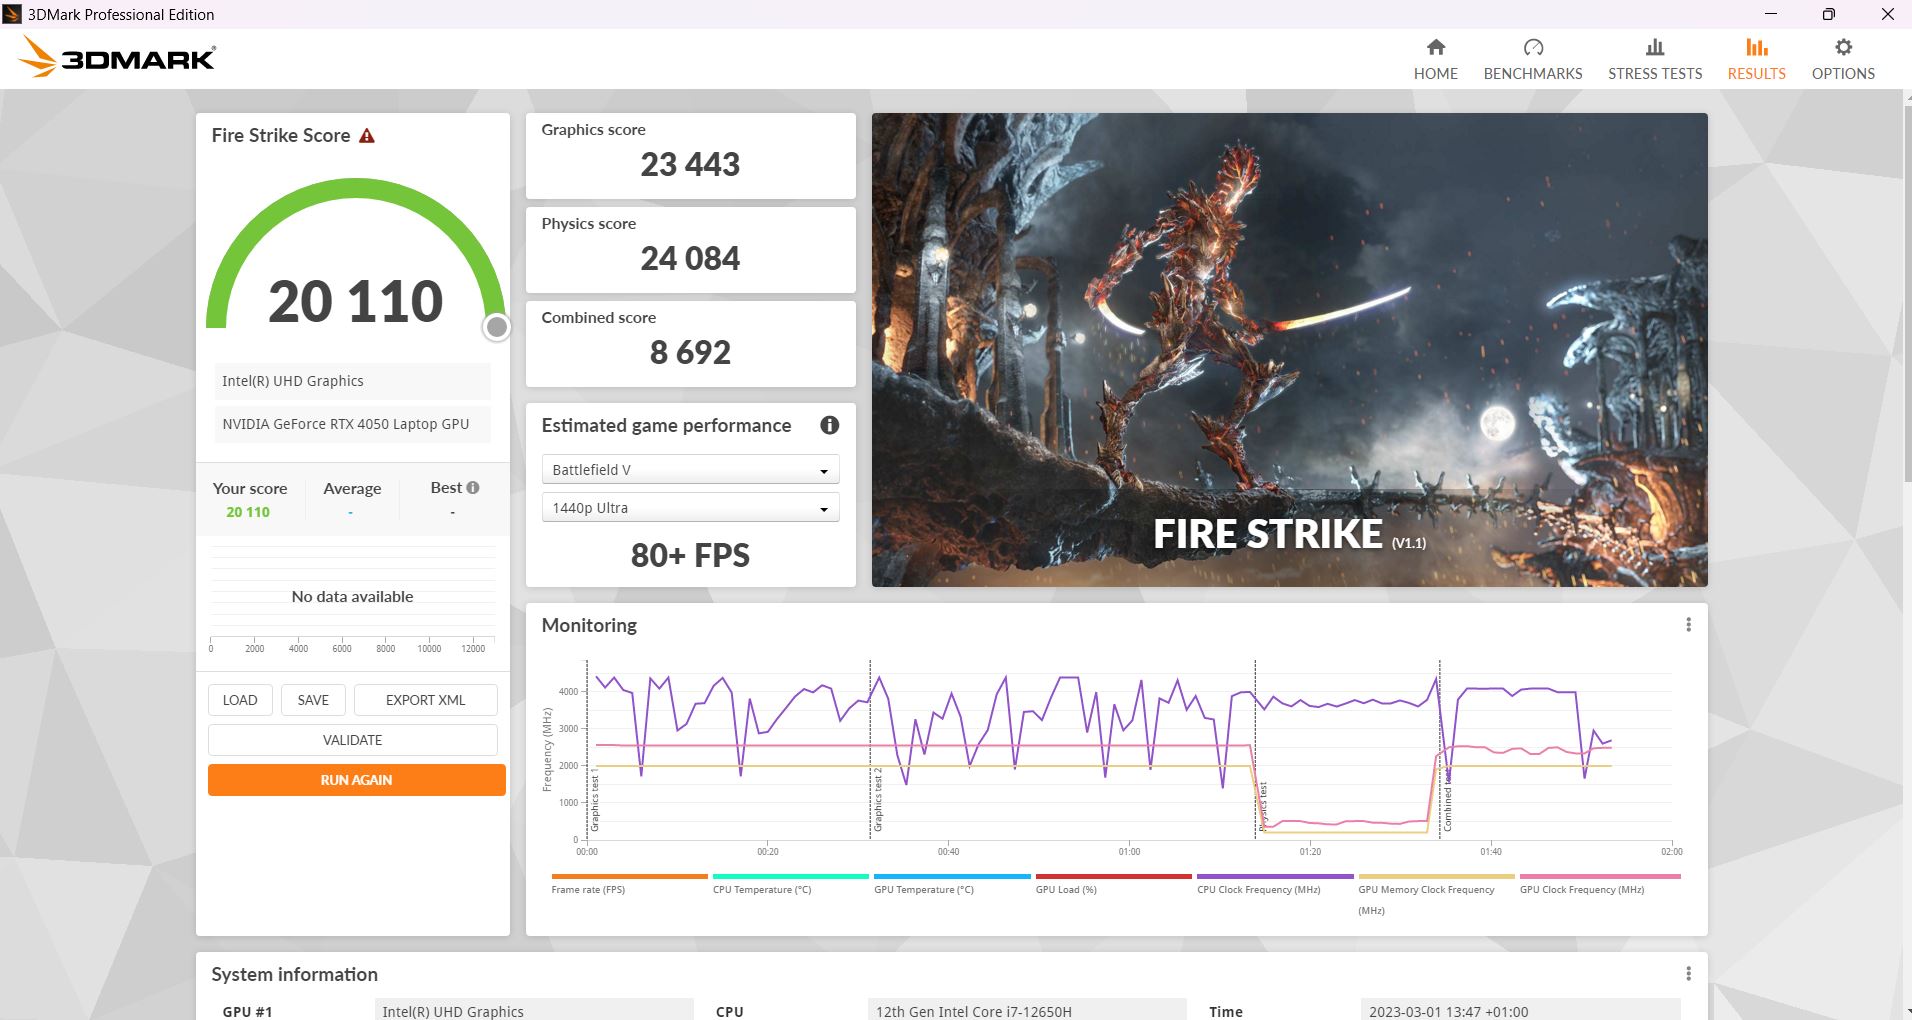
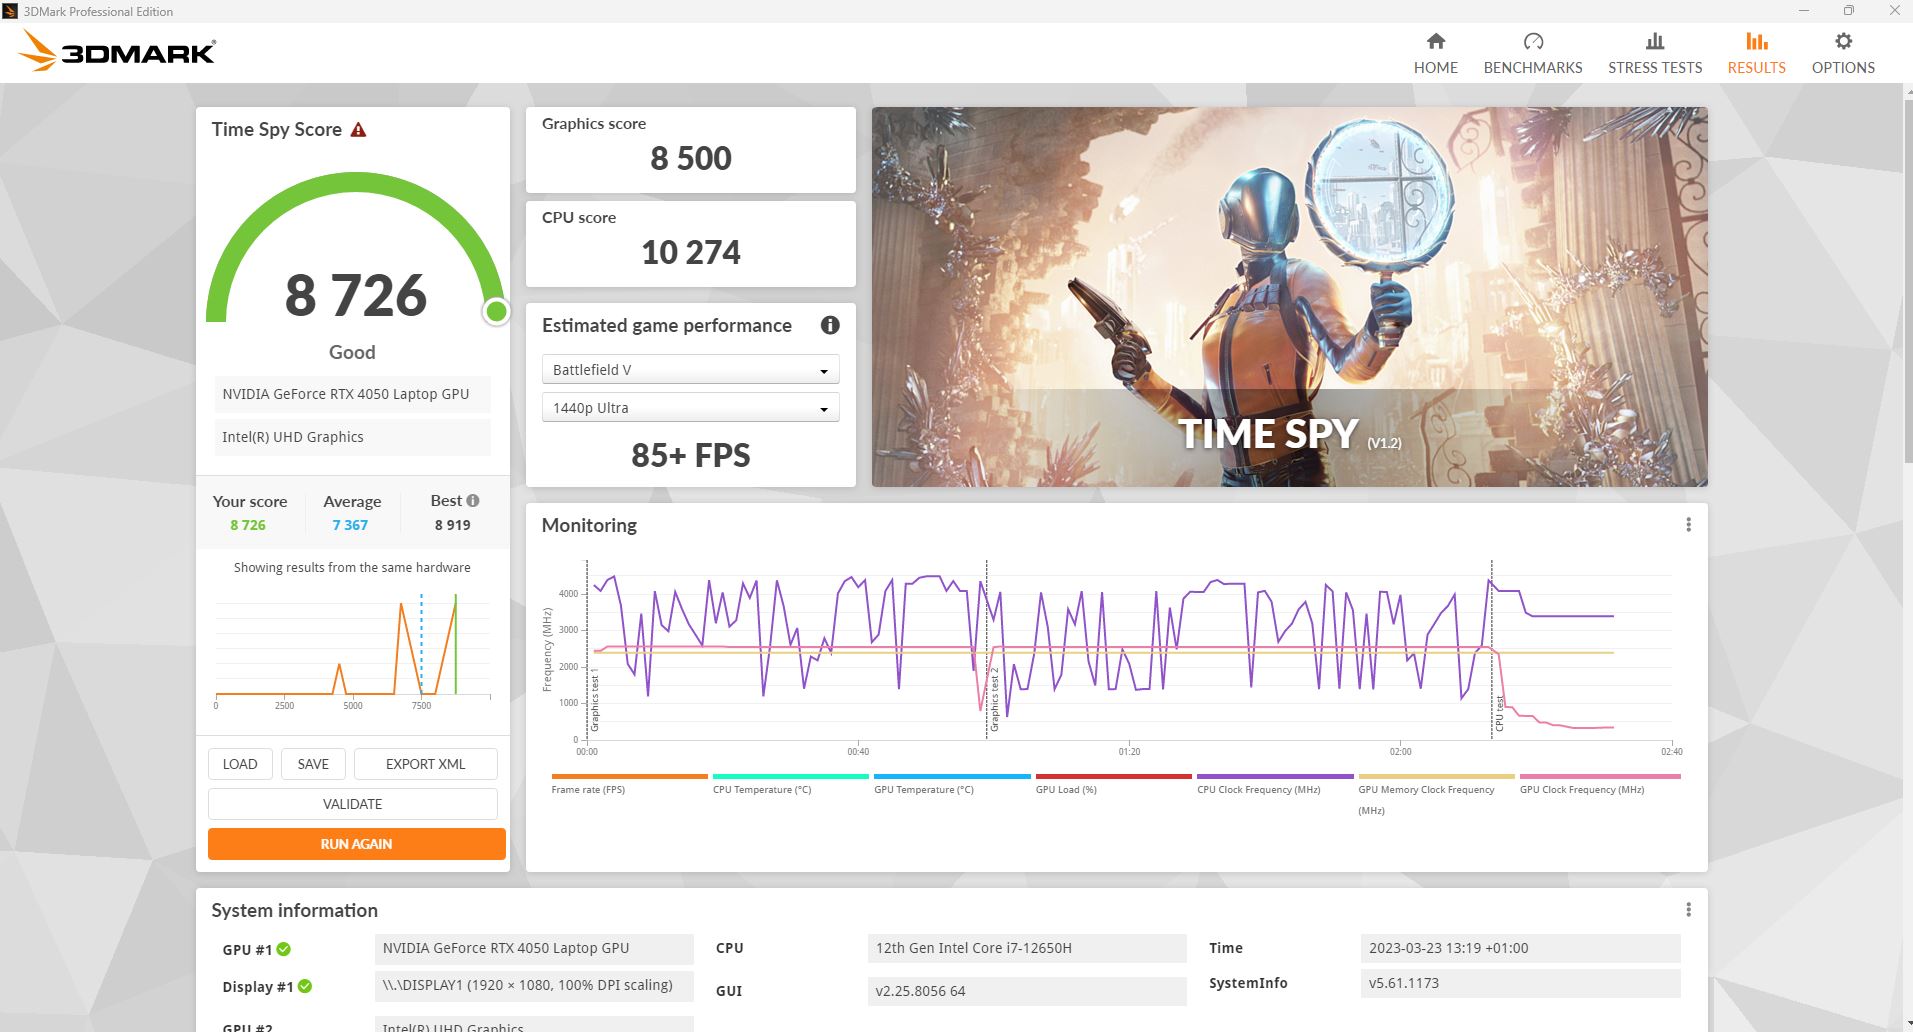
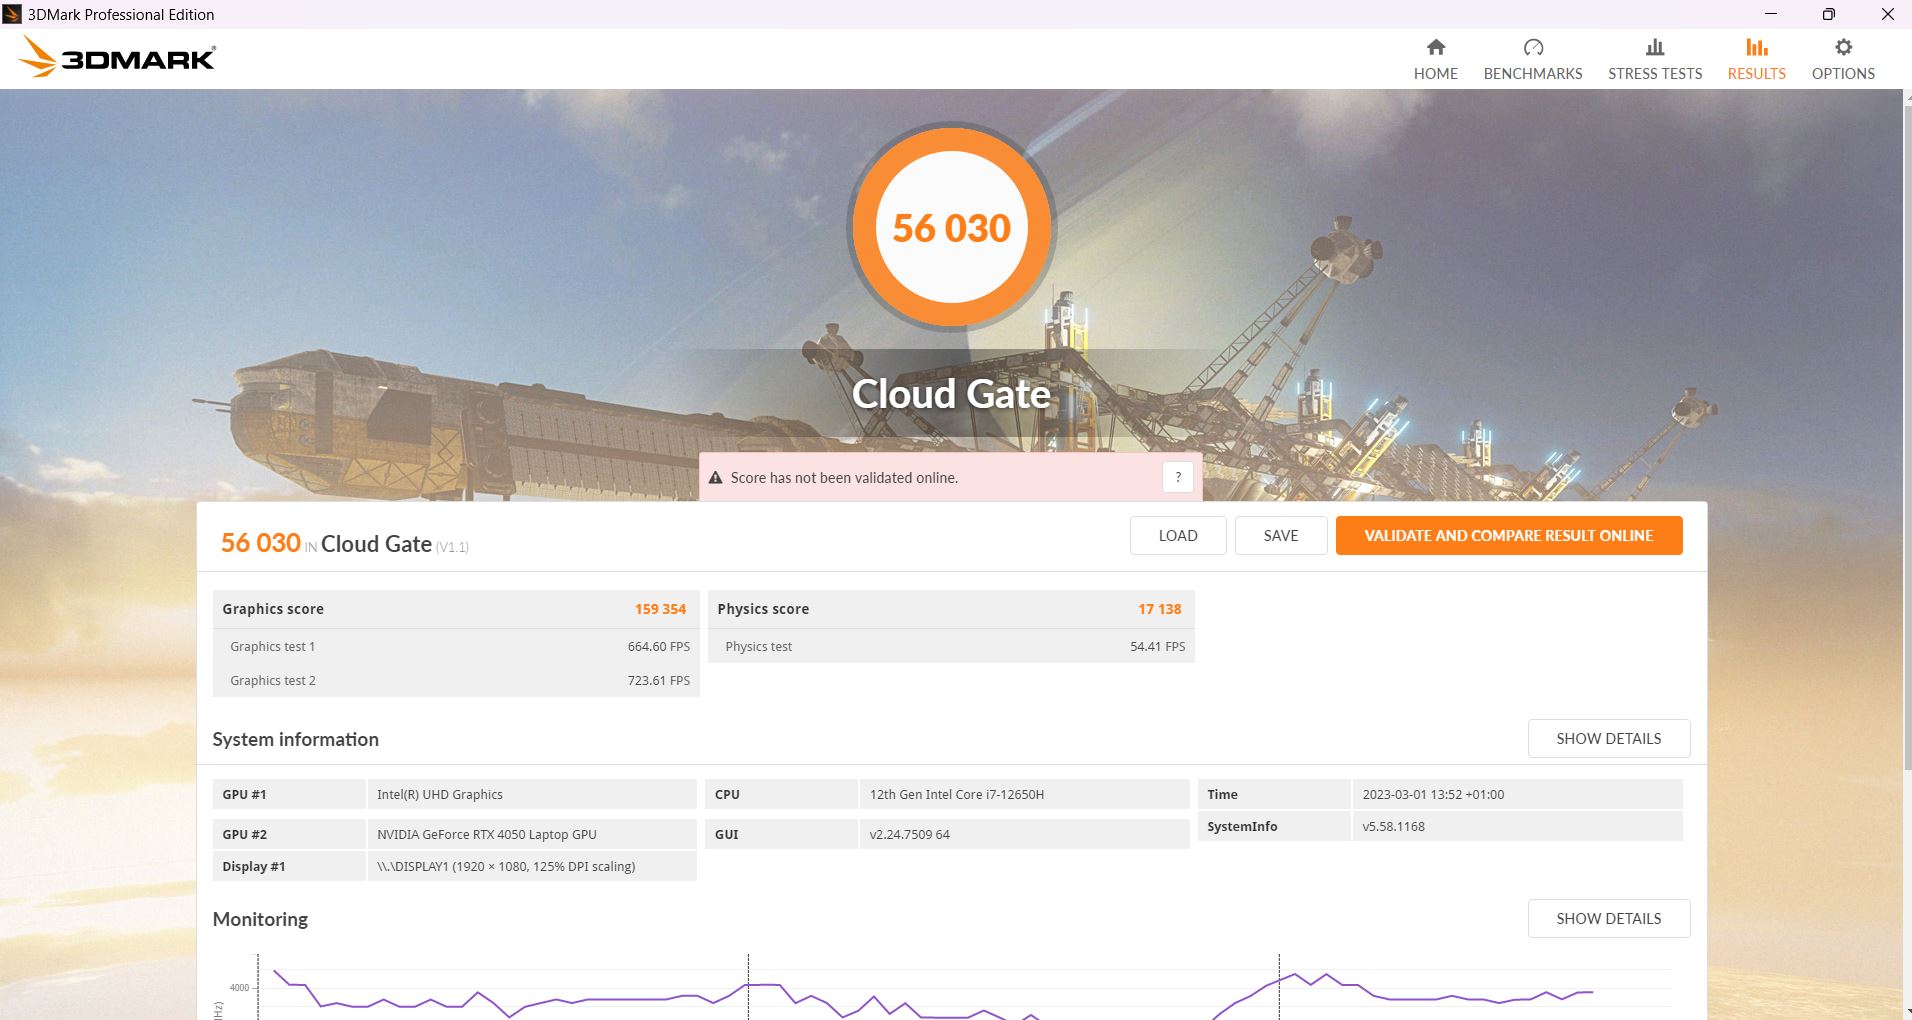
在合成的3DMarks中,该GPU的性能基本达到了预期水平,只是领先于去年的RTX 3060的竞争。这款卡塔纳GF66与 RTX 3070 Ti只领先10%左右。
当然,离开了插座,性能就会受到影响。在另一个Fire Strike ,在电池模式下运行,Katana只达到14,446个图形点,而不是插电时的23,443个点。
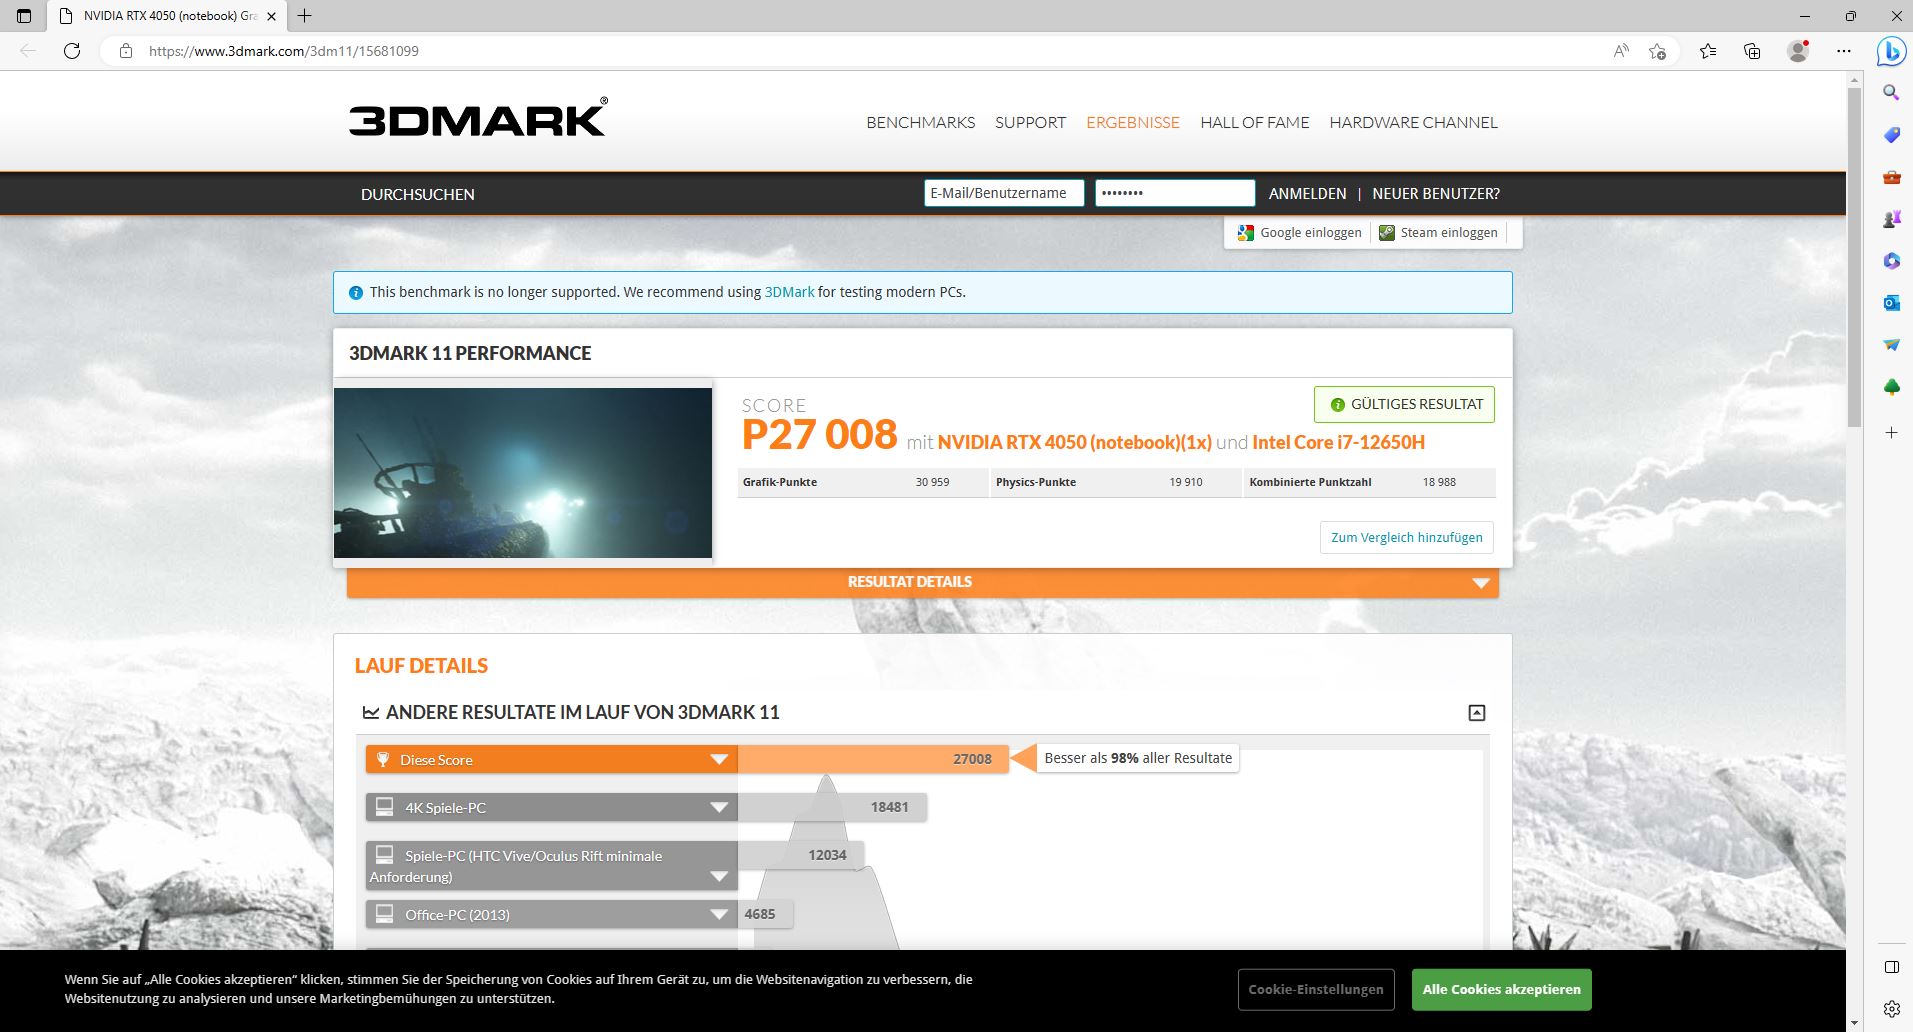
| 3DMark 11 Performance | 27008 points | |
| 3DMark Cloud Gate Standard Score | 56030 points | |
| 3DMark Fire Strike Score | 20110 points | |
| 3DMark Time Spy Score | 8726 points | |
Help | ||
* ... smaller is better
游戏性能
在游戏基准测试中,Katana 15与直接竞争对手相比,往往排名较低。只有XMG Core 15与它的 RTX 3060稍微慢一些,而 脉冲GL66与RTX 3060的速度差不多。的 Legion 5尤其是同样配备RTX 3060的5,明显更快。
另一方面,在《远征5》中,卡塔纳甚至略微领先于竞争对手。所以这也在很大程度上取决于你玩的游戏。
| The Witcher 3 - 1920x1080 Ultra Graphics & Postprocessing (HBAO+) | |
| Average of class Gaming (104.7 - 240, n=7, last 2 years) | |
| MSI Katana GF66 12UGS | |
| Asus TUF Gaming F15 FX507ZM | |
| Lenovo Legion 5 15IAH7H 82RB | |
| MSI Katana 15 B12VEK | |
| Schenker XMG Core 15 (M22) | |
| MSI Pulse GL66 12UEK | |
| GTA V - 1920x1080 Highest AA:4xMSAA + FX AF:16x | |
| Average of class Gaming (48.3 - 186.9, n=94, last 2 years) | |
| Lenovo Legion 5 15IAH7H 82RB | |
| MSI Katana GF66 12UGS | |
| Asus TUF Gaming F15 FX507ZM | |
| Schenker XMG Core 15 (M22) | |
| MSI Katana 15 B12VEK | |
| Final Fantasy XV Benchmark - 1920x1080 High Quality | |
| Average of class Gaming (41 - 215, n=95, last 2 years) | |
| Lenovo Legion 5 15IAH7H 82RB | |
| Asus TUF Gaming F15 FX507ZM | |
| Schenker XMG Core 15 (M22) | |
| MSI Katana GF66 12UGS | |
| MSI Katana 15 B12VEK | |
| Strange Brigade - 1920x1080 ultra AA:ultra AF:16 | |
| Average of class Gaming (76.3 - 458, n=87, last 2 years) | |
| MSI Katana GF66 12UGS | |
| Lenovo Legion 5 15IAH7H 82RB | |
| Asus TUF Gaming F15 FX507ZM | |
| Schenker XMG Core 15 (M22) | |
| MSI Katana 15 B12VEK | |
| Dota 2 Reborn - 1920x1080 ultra (3/3) best looking | |
| Lenovo Legion 5 15IAH7H 82RB | |
| Average of class Gaming (84.8 - 248, n=107, last 2 years) | |
| Asus TUF Gaming F15 FX507ZM | |
| MSI Pulse GL66 12UEK | |
| MSI Katana 15 B12VEK | |
| MSI Katana GF66 12UGS | |
| Schenker XMG Core 15 (M22) | |
有一个MUX开关,允许你在MSI中心选择iGPU或dGPU,这总是涉及到重新启动。
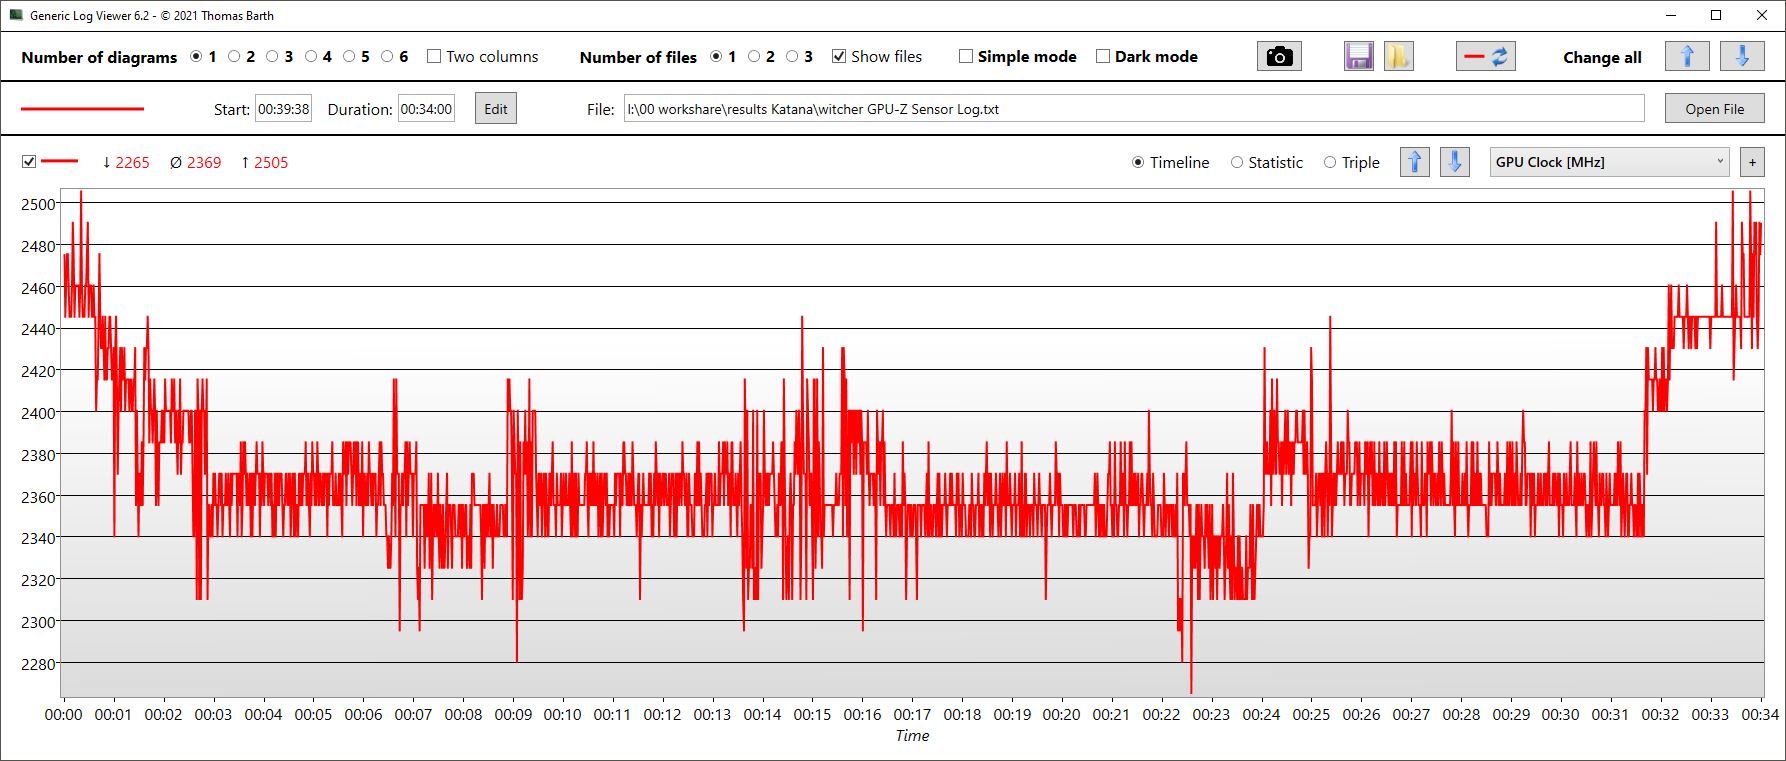
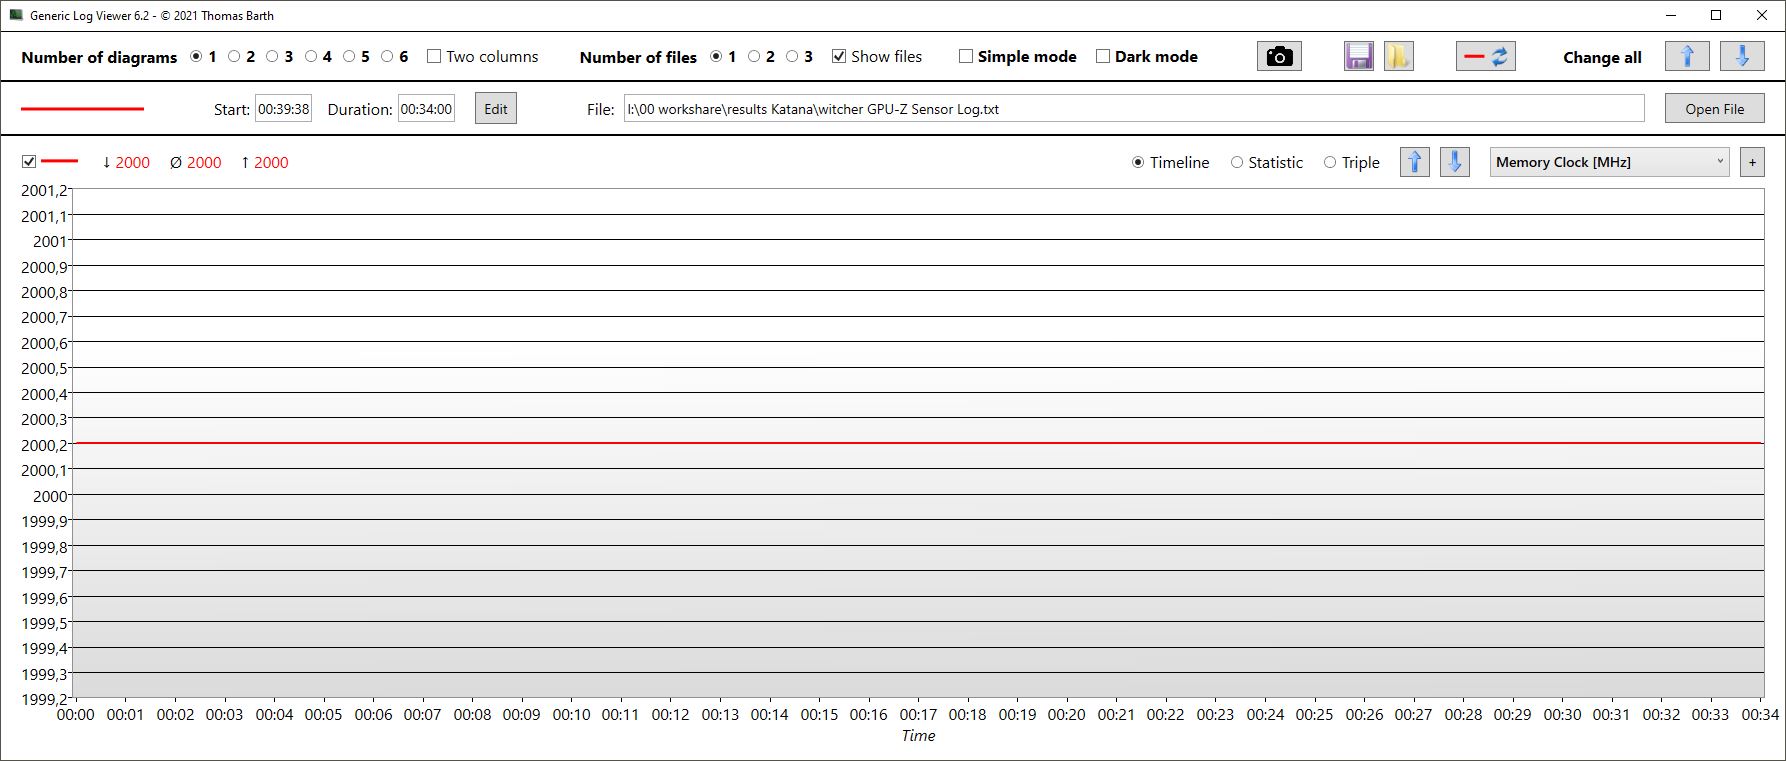
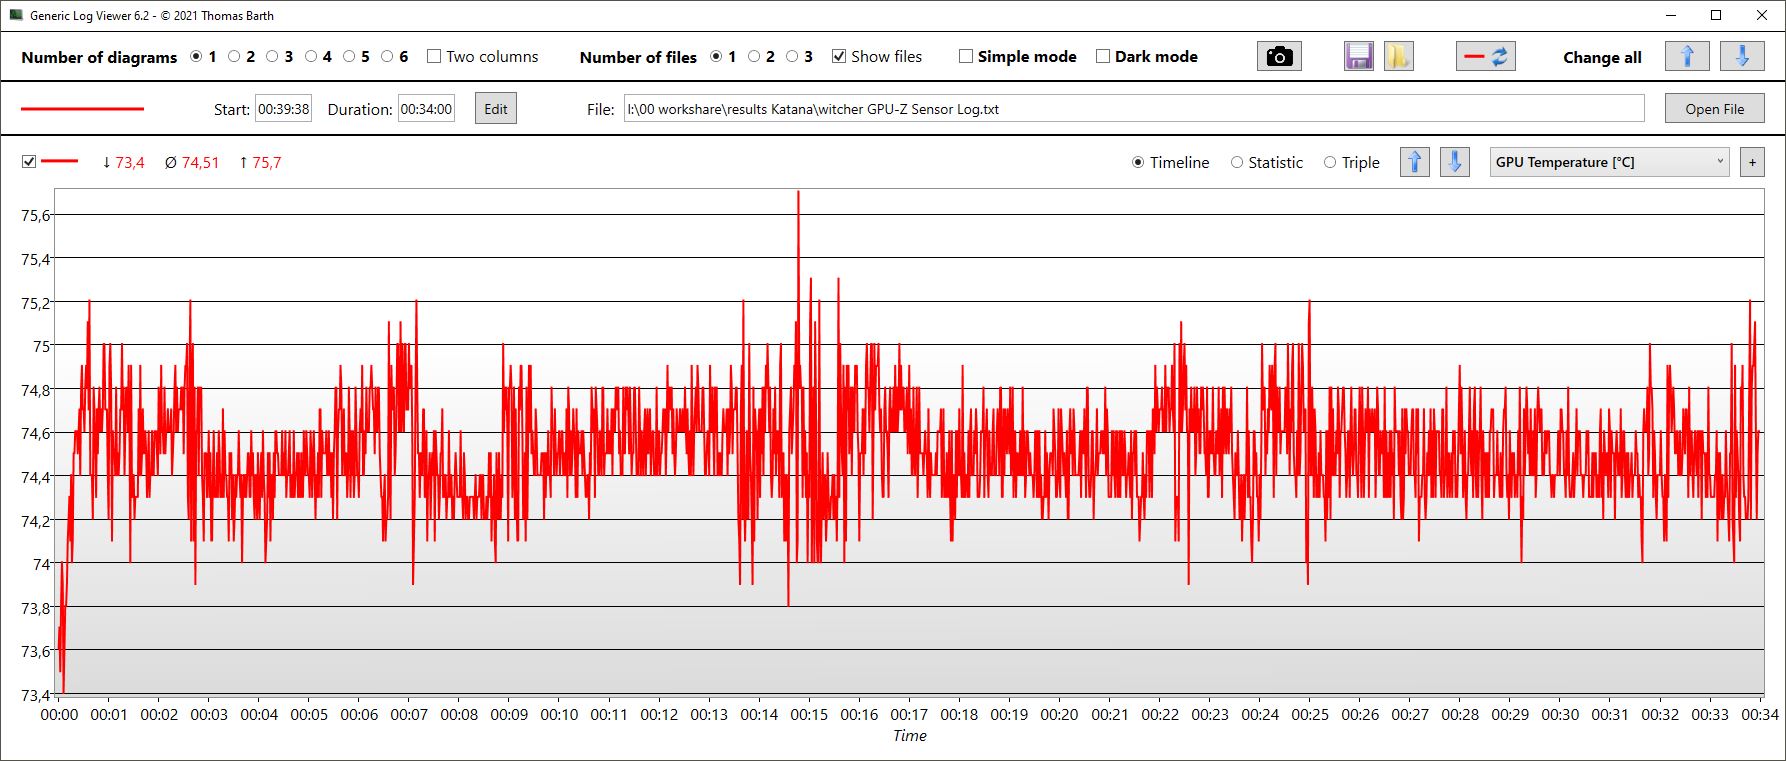
Witcher 3 帧率在通常的波动中保持稳定(游戏中的日/夜周期)。但竞争的笔记本电脑往往略快,甚至那些有RTX 3060的笔记本电脑。
GPU时钟速率相当稳定,为2.4GHz,内存时钟也恒定在2GHz。GPU温度不超过76℃,平均在75℃左右。平均76瓦的功耗与规定的105瓦相差甚远。
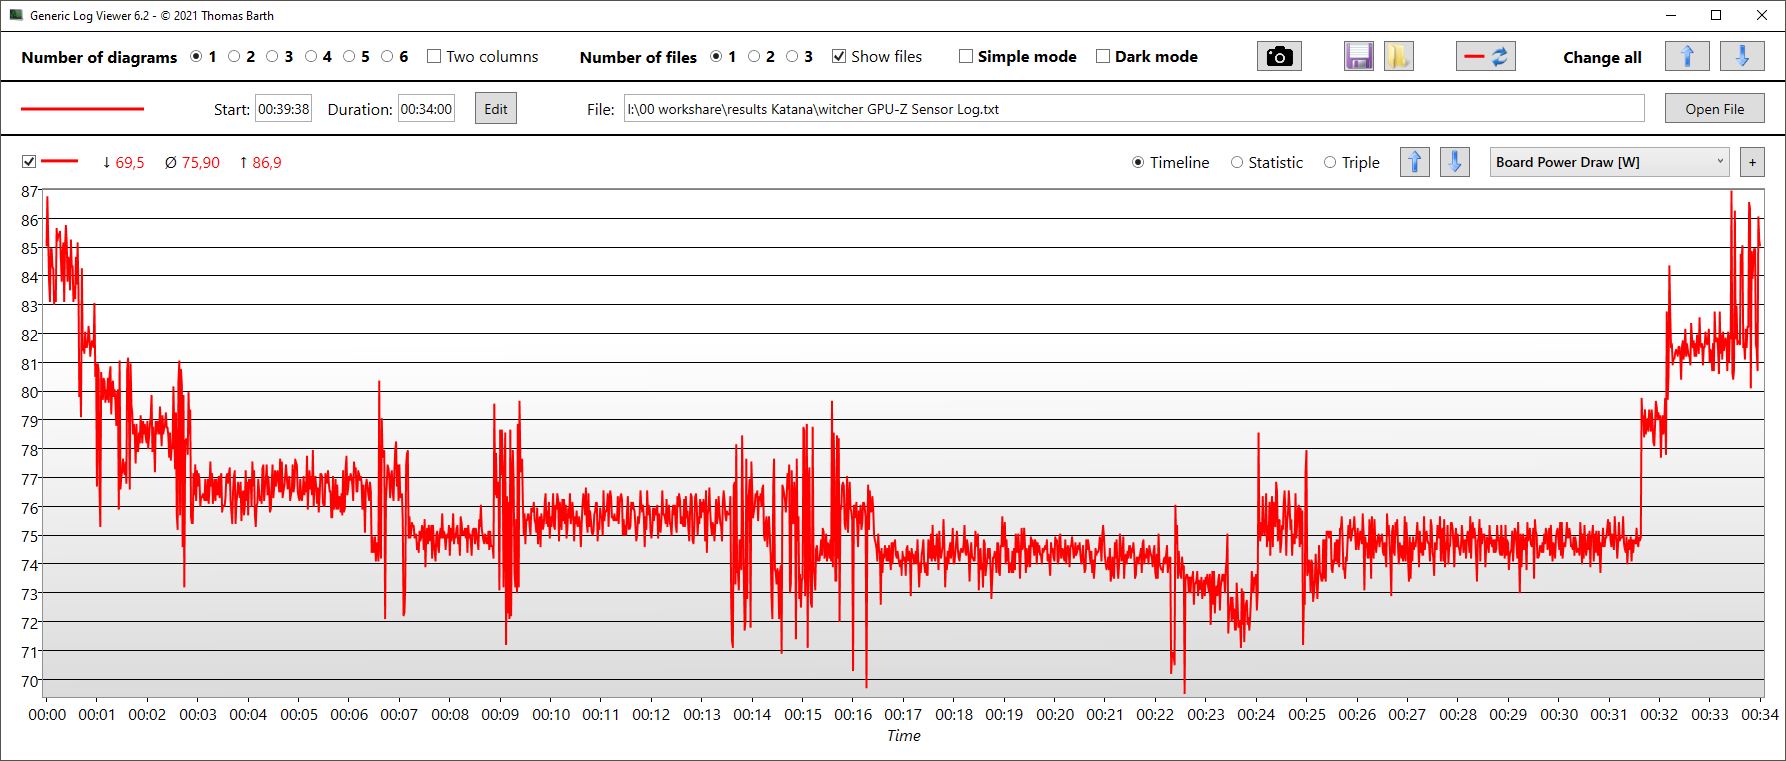
Witcher 3 FPS Chart
| low | med. | high | ultra | |
|---|---|---|---|---|
| GTA V (2015) | 183.5 | 176.6 | 172.7 | 92.2 |
| The Witcher 3 (2015) | 395 | 293 | 161 | 83 |
| Dota 2 Reborn (2015) | 175.1 | 158.1 | 150.5 | 142.5 |
| Final Fantasy XV Benchmark (2018) | 188 | 120.7 | 82.8 | |
| X-Plane 11.11 (2018) | 139.9 | 122.4 | 97 | |
| Far Cry 5 (2018) | 170 | 135 | 126 | 119 |
| Strange Brigade (2018) | 214 | 173 | 148.7 | |
| Dying Light 2 (2022) | 122.1 | 75.2 | 62.4 |
排放 - 宁静中蕴含着剑的力量
噪声
在桌面上闲置时,风扇大多是静音的,即使在极限性能模式下也是如此,这很不寻常。即使在3DMark06中,风扇也启动得相对较晚,在第一个基准场景结束时只达到37.7分贝。只有 Legion 5更加安静,而 华硕TUF Gaming也同样安静,而姐妹型号和 XMG Core则更响亮。
适度的噪音发展在游戏中也很明显(AI模式),Katana只有在CPU/GPU综合压力下才会变得很吵。
Noise level
| Idle |
| 24 / 24 / 24 dB(A) |
| Load |
| 37.71 / 54.55 dB(A) |
 | ||
30 dB silent 40 dB(A) audible 50 dB(A) loud |
||
min: | ||
| MSI Katana 15 B12VEK GeForce RTX 4050 Laptop GPU, i7-12650H, Micron 2400 MTFDKBA1T0QFM | MSI Katana GF66 12UGS GeForce RTX 3070 Ti Laptop GPU, i7-12700H, Micron 2450 1TB MTFDKBA1T0TFK | MSI Pulse GL66 12UEK GeForce RTX 3060 Laptop GPU, i9-12900H, Micron 2450 512GB MTFDKBA512TFK | Lenovo Legion 5 15IAH7H 82RB GeForce RTX 3060 Laptop GPU, i7-12700H | Asus TUF Gaming F15 FX507ZM GeForce RTX 3060 Laptop GPU, i7-12700H, SK Hynix HFM001TD3JX013N | Schenker XMG Core 15 (M22) GeForce RTX 3060 Laptop GPU, R7 6800H, Samsung SSD 980 Pro 1TB MZ-V8P1T0BW | |
|---|---|---|---|---|---|---|
| Noise | -9% | -11% | 1% | -3% | -2% | |
| off / environment * (dB) | 24 | 26 -8% | 23 4% | 23.3 3% | 23.2 3% | 23 4% |
| Idle Minimum * (dB) | 24 | 27 -13% | 23 4% | 23.5 2% | 23.6 2% | 23 4% |
| Idle Average * (dB) | 24 | 28 -17% | 27 -13% | 23.5 2% | 23.6 2% | 23 4% |
| Idle Maximum * (dB) | 24 | 31 -29% | 27 -13% | 26.8 -12% | 25.4 -6% | 23 4% |
| Load Average * (dB) | 37.71 | 44 -17% | 48.2 -28% | 29.3 22% | 38 -1% | 42.41 -12% |
| Witcher 3 ultra * (dB) | 45.75 | 44 4% | 56.9 -24% | 51.4 -12% | 54.1 -18% | 54.71 -20% |
| Load Maximum * (dB) | 54.55 | 45 18% | 56.94 -4% | 53 3% | 57.2 -5% | 55.05 -1% |
* ... smaller is better
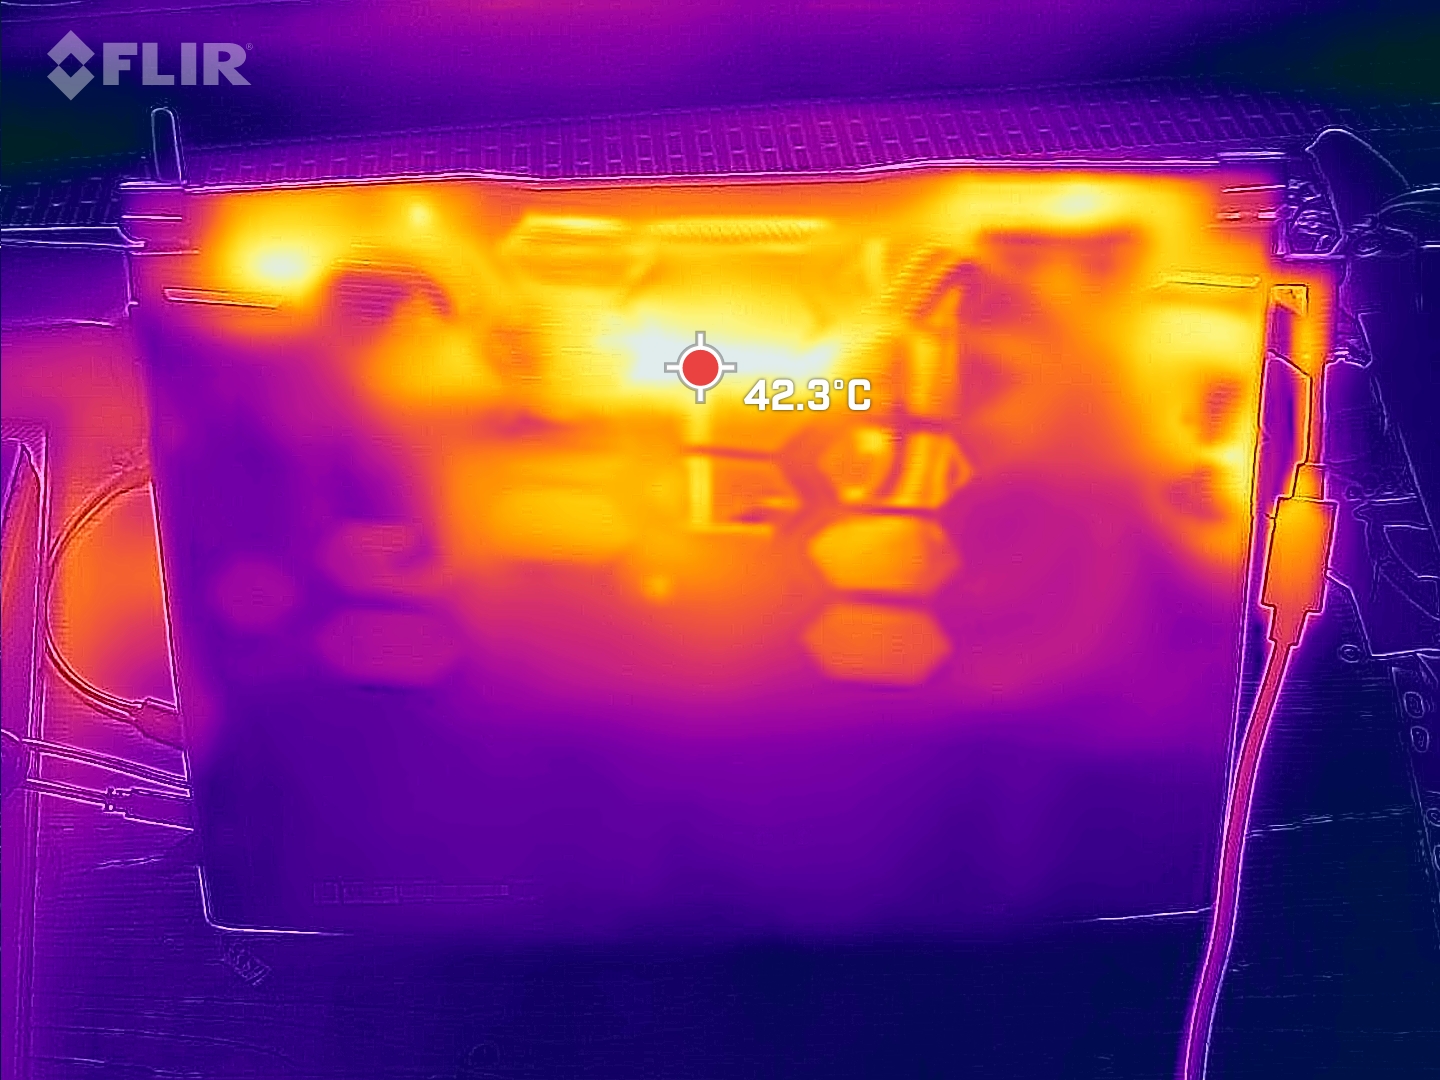
温度
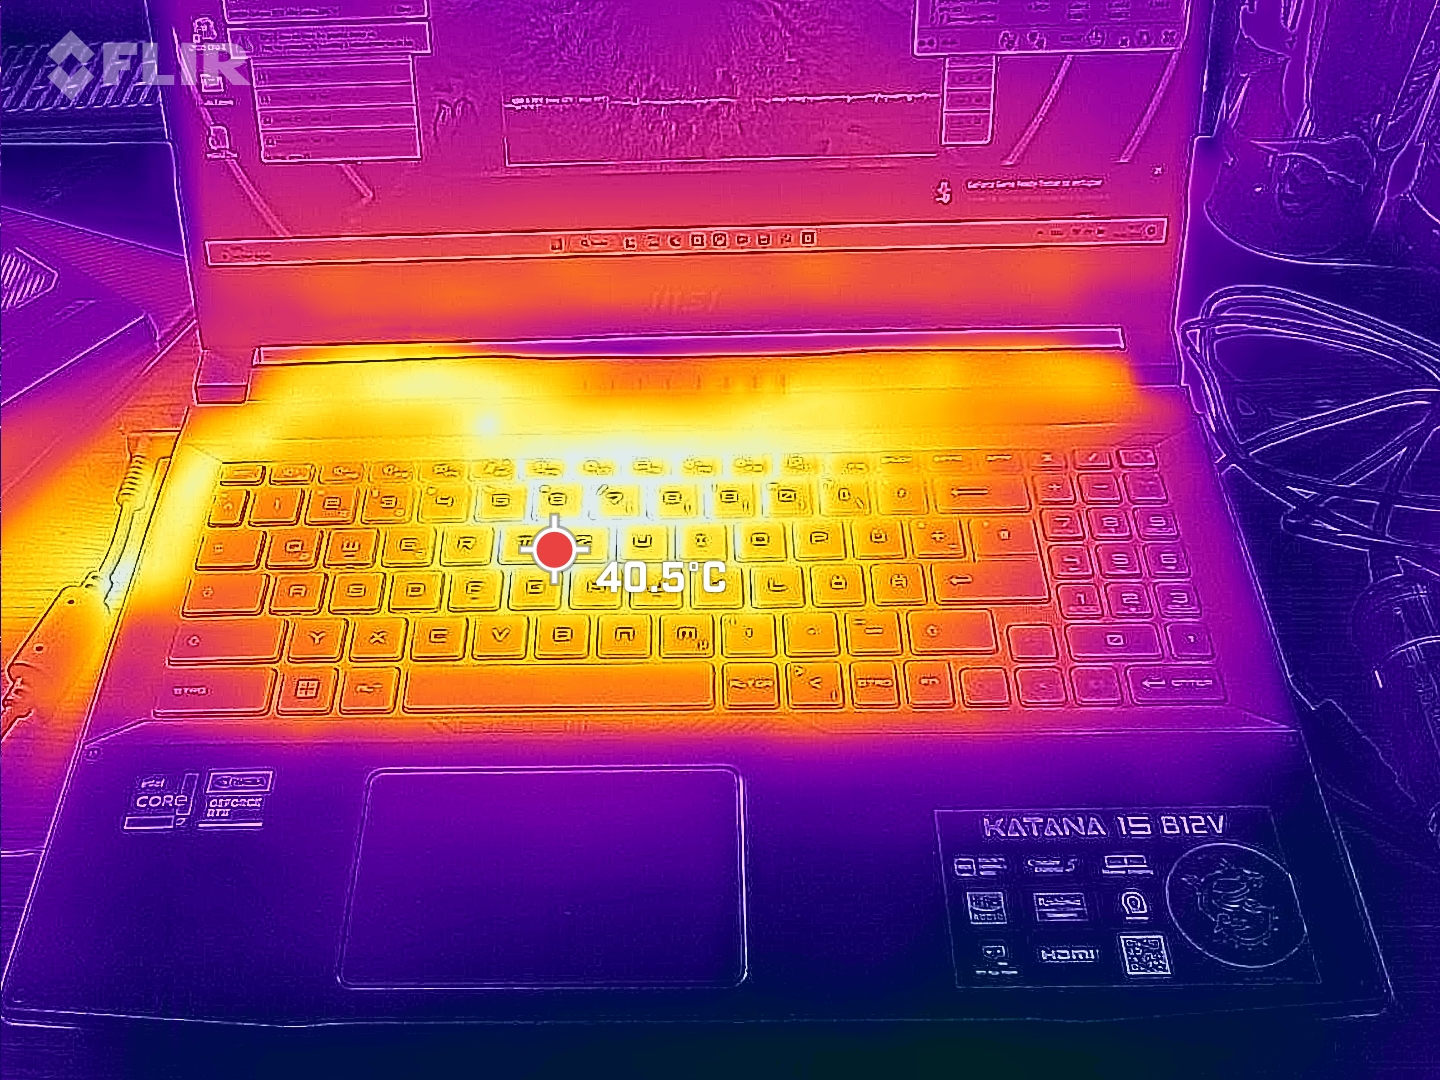
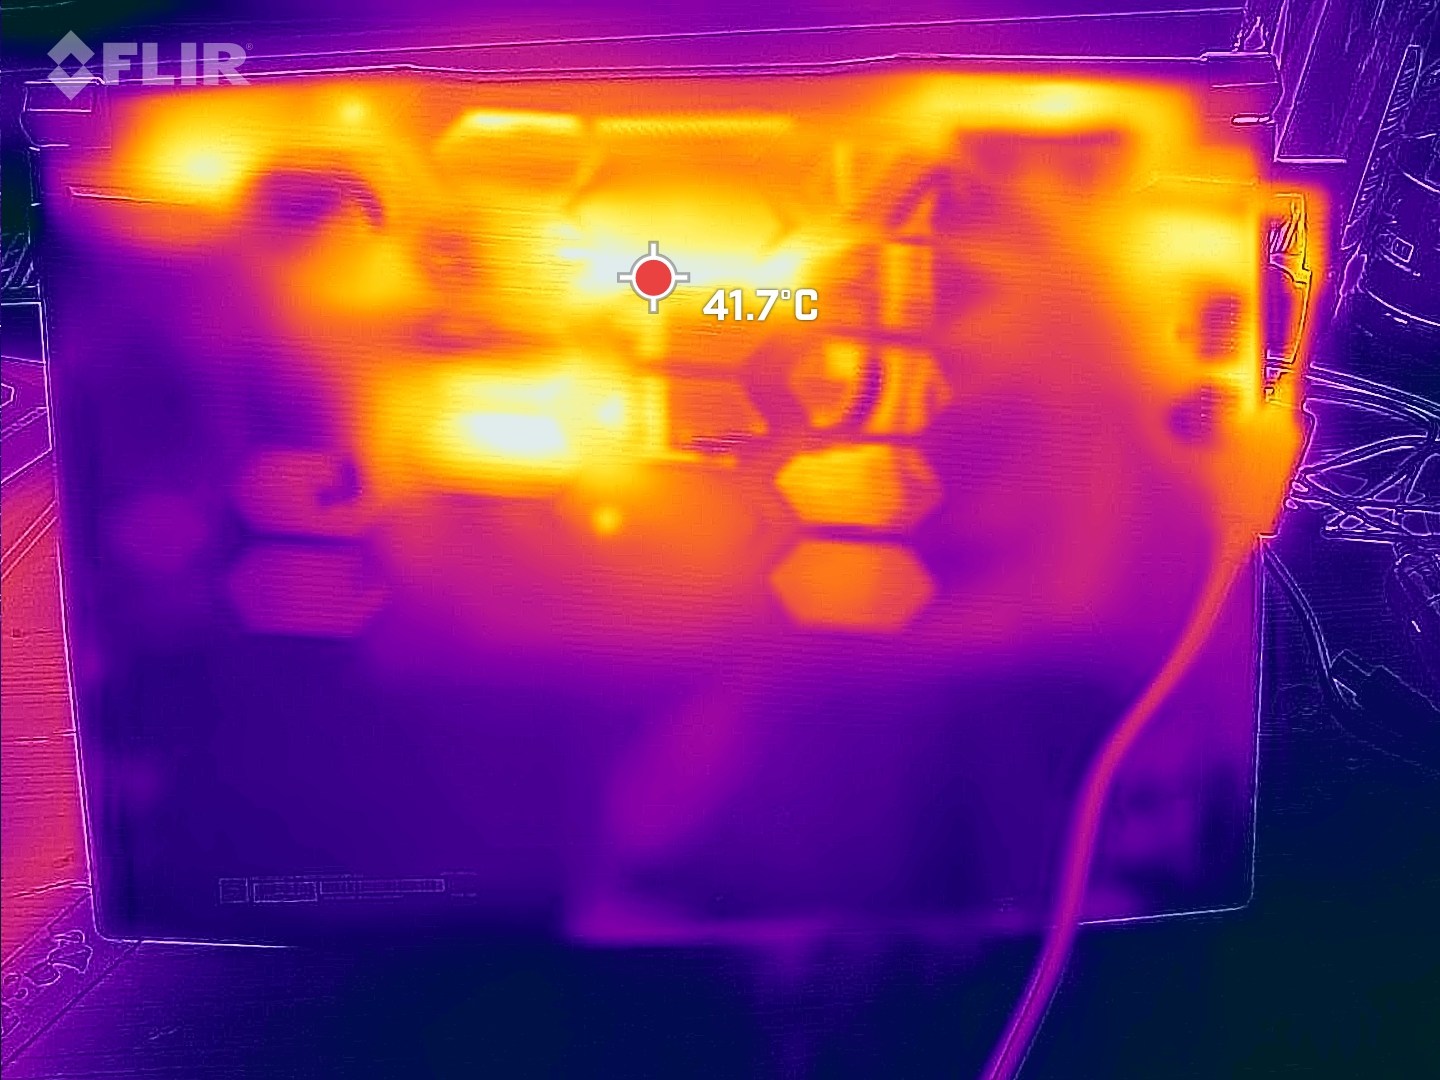
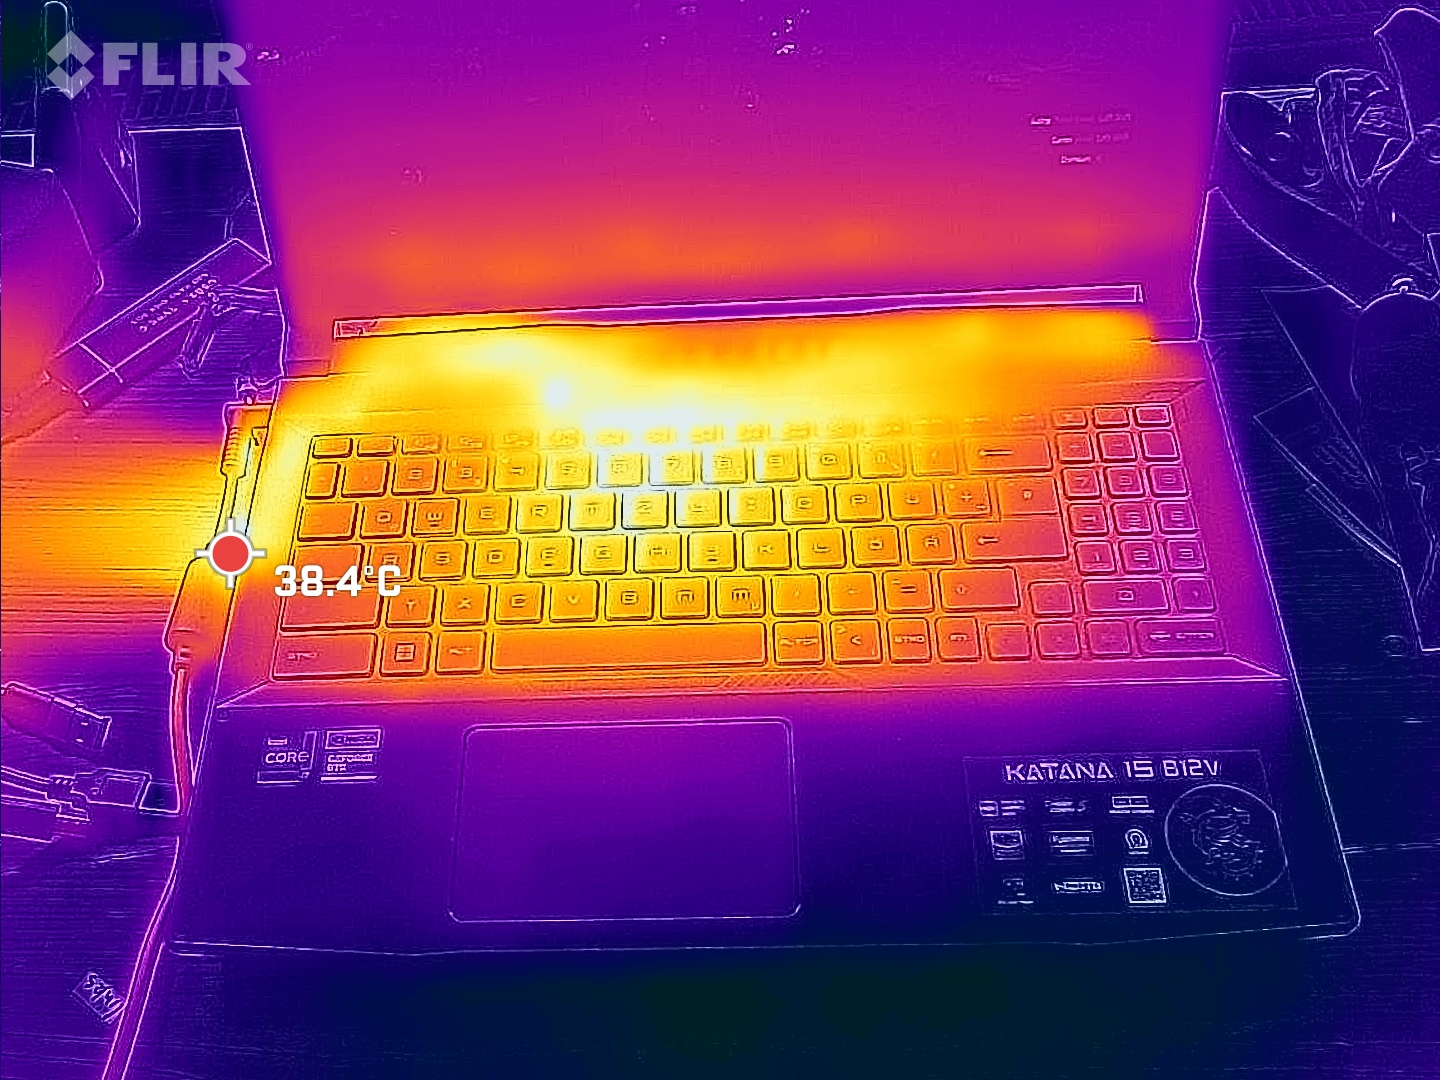
热点是在靠近背部的中心位置,略低于50℃。掌托在任何时候都保持凉爽,但WASD键在重压下会发热,有点不舒服。
(-) The maximum temperature on the upper side is 47 °C / 117 F, compared to the average of 40.4 °C / 105 F, ranging from 21.2 to 68.8 °C for the class Gaming.
(-) The bottom heats up to a maximum of 48 °C / 118 F, compared to the average of 43.2 °C / 110 F
(+) In idle usage, the average temperature for the upper side is 29 °C / 84 F, compared to the device average of 33.9 °C / 93 F.
(±) Playing The Witcher 3, the average temperature for the upper side is 35 °C / 95 F, compared to the device average of 33.9 °C / 93 F.
(+) The palmrests and touchpad are cooler than skin temperature with a maximum of 23 °C / 73.4 F and are therefore cool to the touch.
(+) The average temperature of the palmrest area of similar devices was 28.8 °C / 83.8 F (+5.8 °C / 10.4 F).
| MSI Katana 15 B12VEK Intel Core i7-12650H, NVIDIA GeForce RTX 4050 Laptop GPU | MSI Katana GF66 12UGS Intel Core i7-12700H, NVIDIA GeForce RTX 3070 Ti Laptop GPU | MSI Pulse GL66 12UEK Intel Core i9-12900H, NVIDIA GeForce RTX 3060 Laptop GPU | Lenovo Legion 5 15IAH7H 82RB Intel Core i7-12700H, NVIDIA GeForce RTX 3060 Laptop GPU | Asus TUF Gaming F15 FX507ZM Intel Core i7-12700H, NVIDIA GeForce RTX 3060 Laptop GPU | Schenker XMG Core 15 (M22) AMD Ryzen 7 6800H, NVIDIA GeForce RTX 3060 Laptop GPU | |
|---|---|---|---|---|---|---|
| Heat | -17% | -2% | 16% | -2% | 6% | |
| Maximum Upper Side * (°C) | 47 | 61 -30% | 50 -6% | 37.8 20% | 44.4 6% | 48 -2% |
| Maximum Bottom * (°C) | 48 | 55 -15% | 47 2% | 51 -6% | 48.8 -2% | 51 -6% |
| Idle Upper Side * (°C) | 35 | 43 -23% | 36 -3% | 25.8 26% | 37.8 -8% | 28 20% |
| Idle Bottom * (°C) | 38 | 38 -0% | 38 -0% | 28.8 24% | 39.6 -4% | 33 13% |
* ... smaller is better
压力测试
核心以3.1GHz的频率开始我们的压力测试,时间非常短暂。几秒钟后,核心温度上升到89℃,之后时钟速率下降,平均达到稳定的2.5GHz。功耗平均为50W。温度稳定在82℃左右。
GPU的时钟在2到2.5 GHz之间波动。平均温度达到75℃,而功耗只有62W左右。
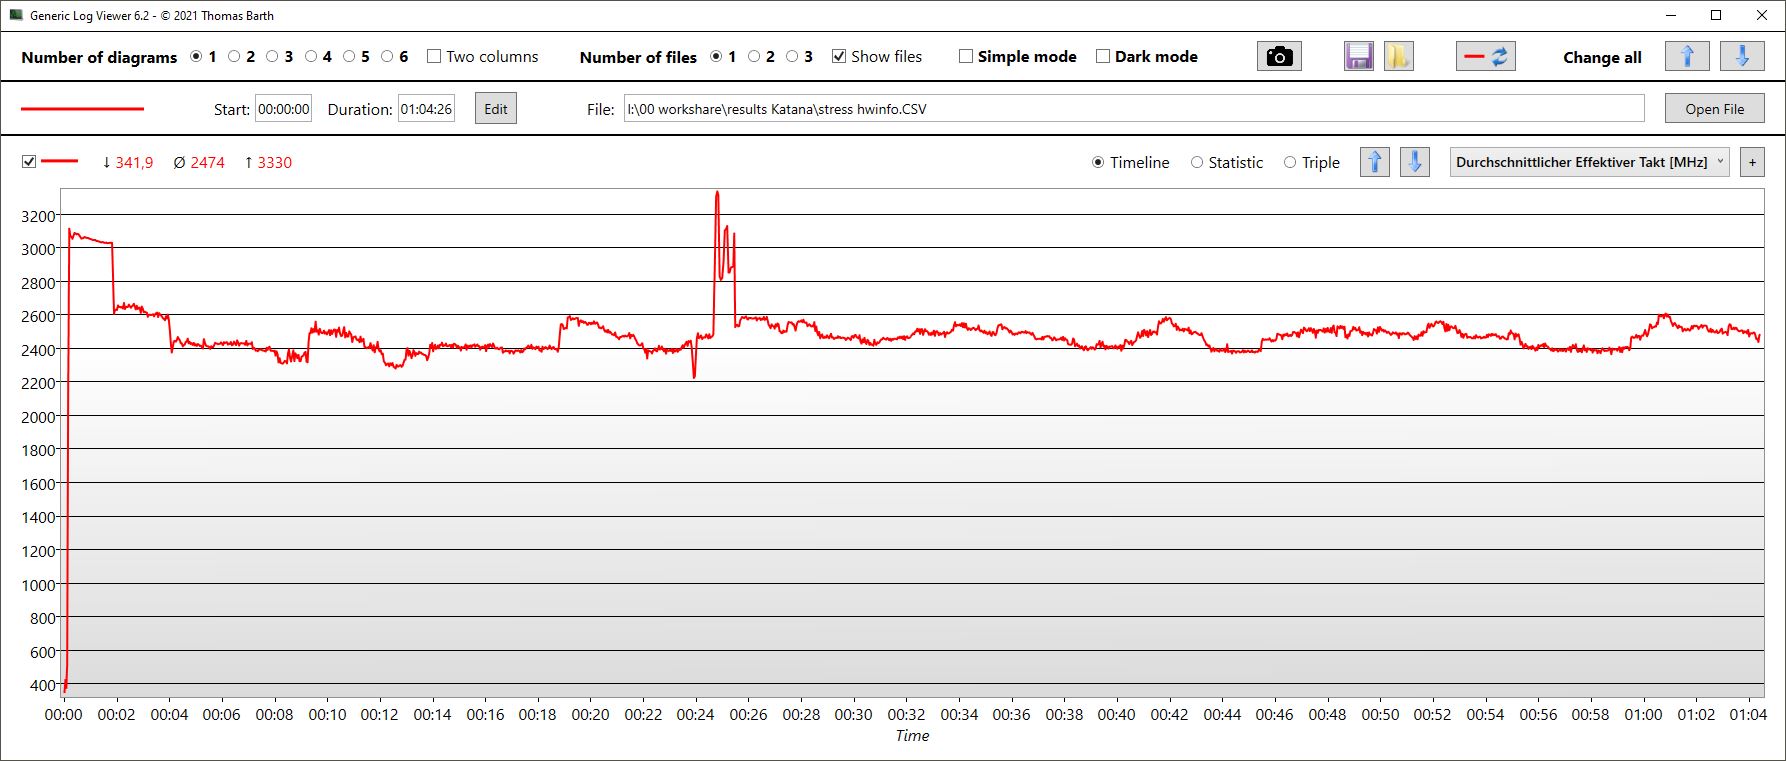
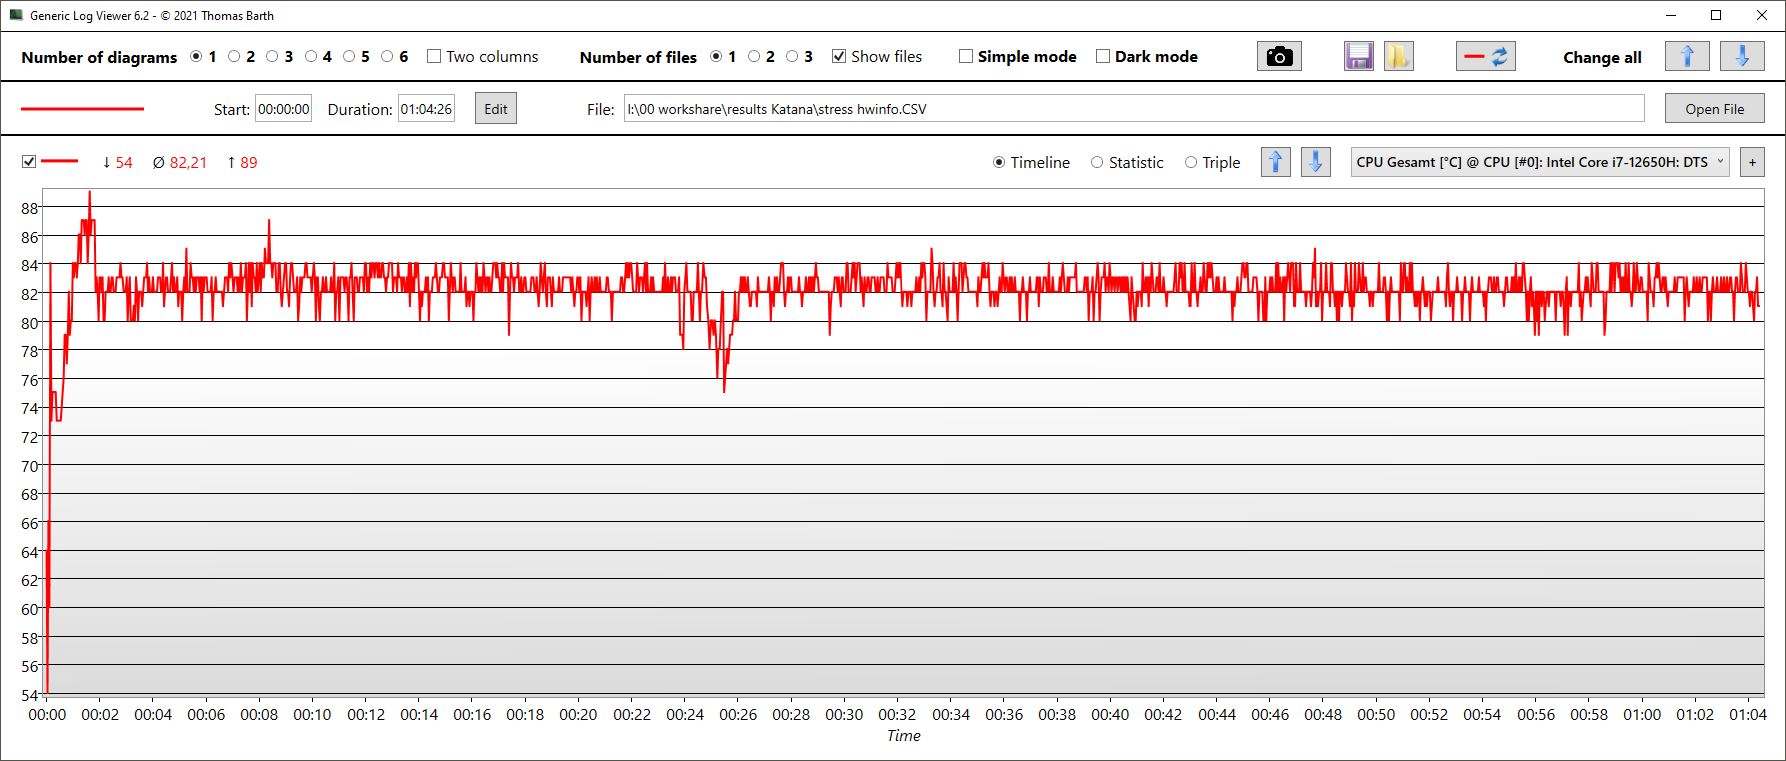
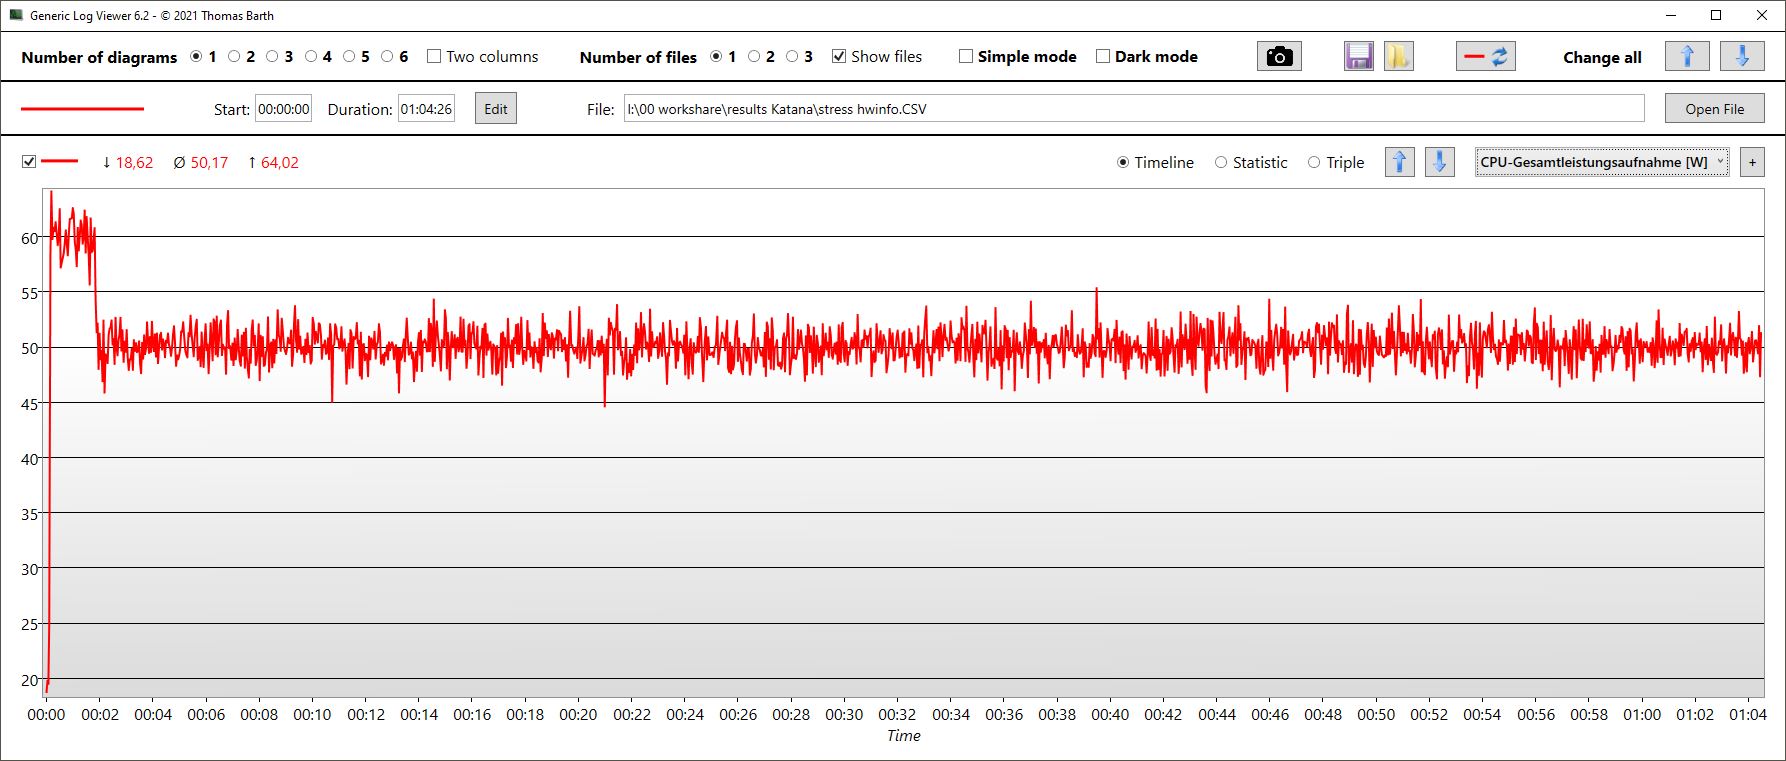
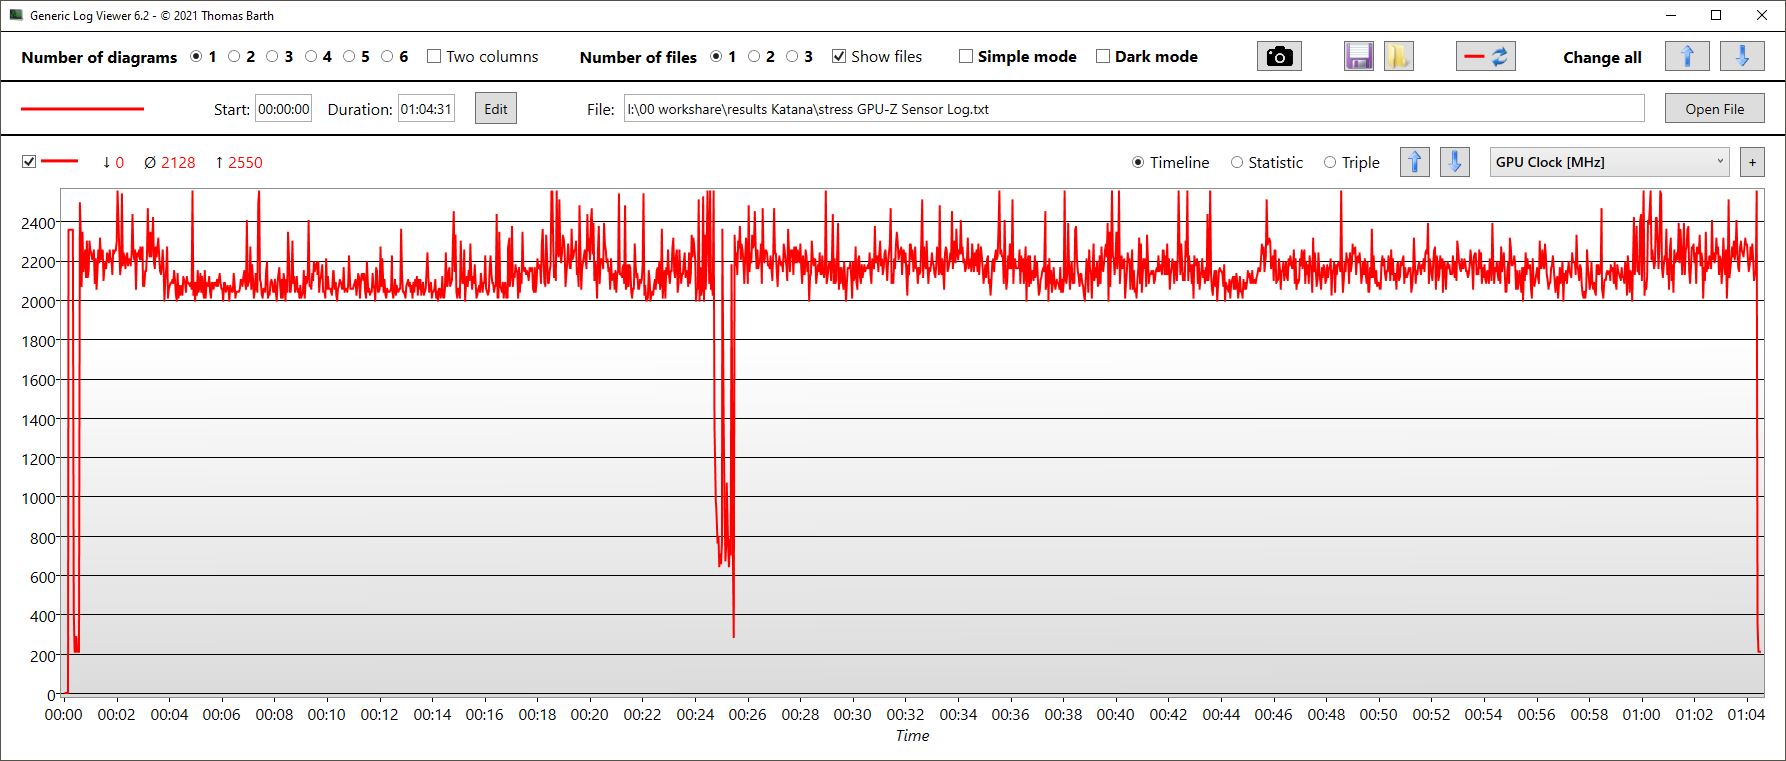
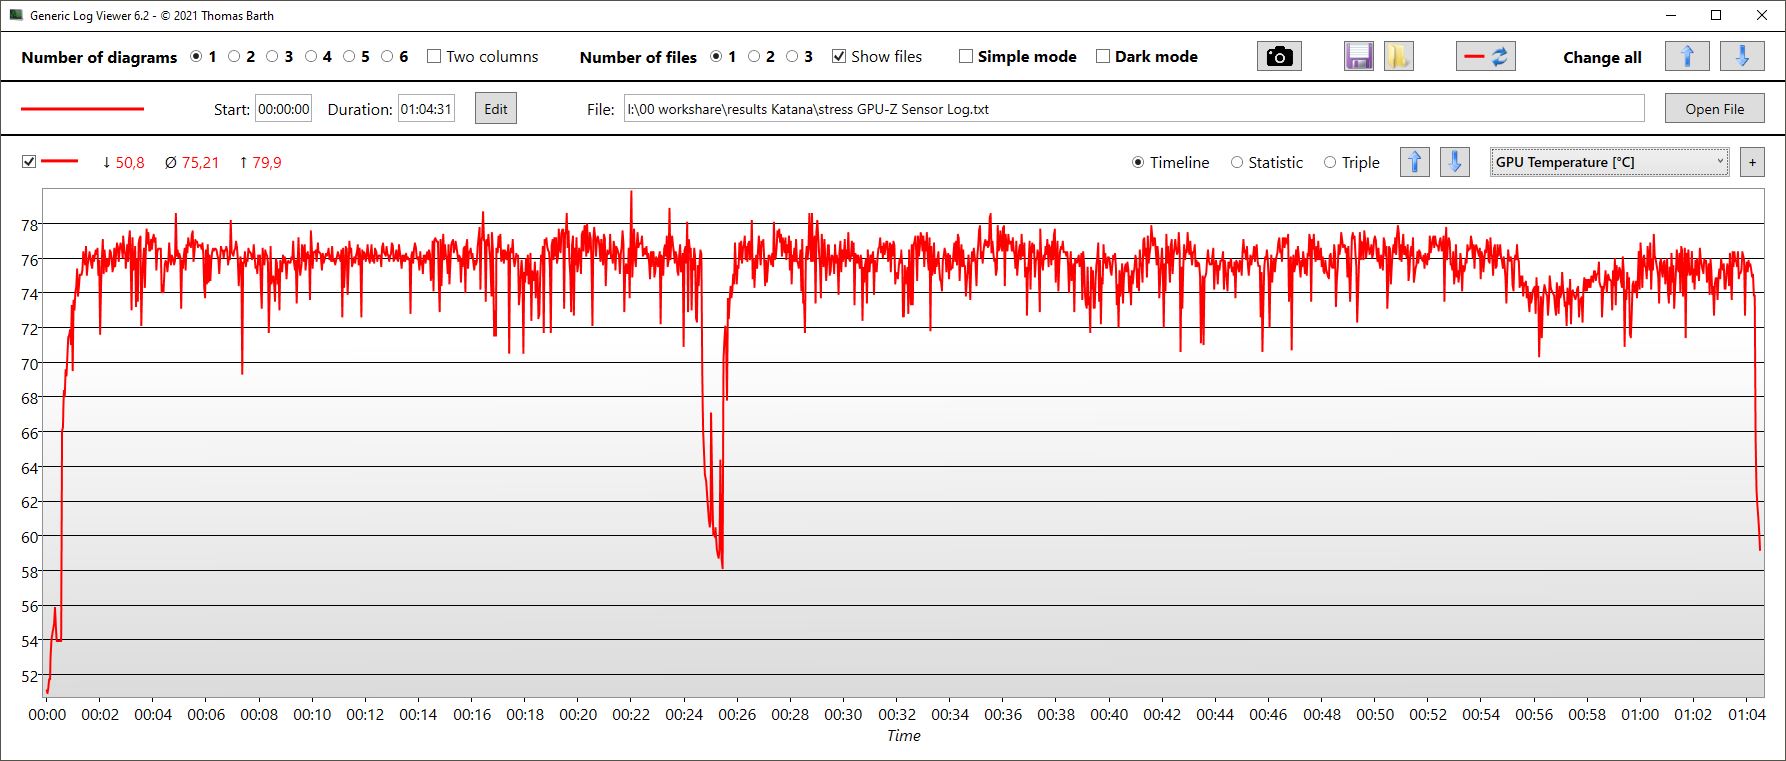
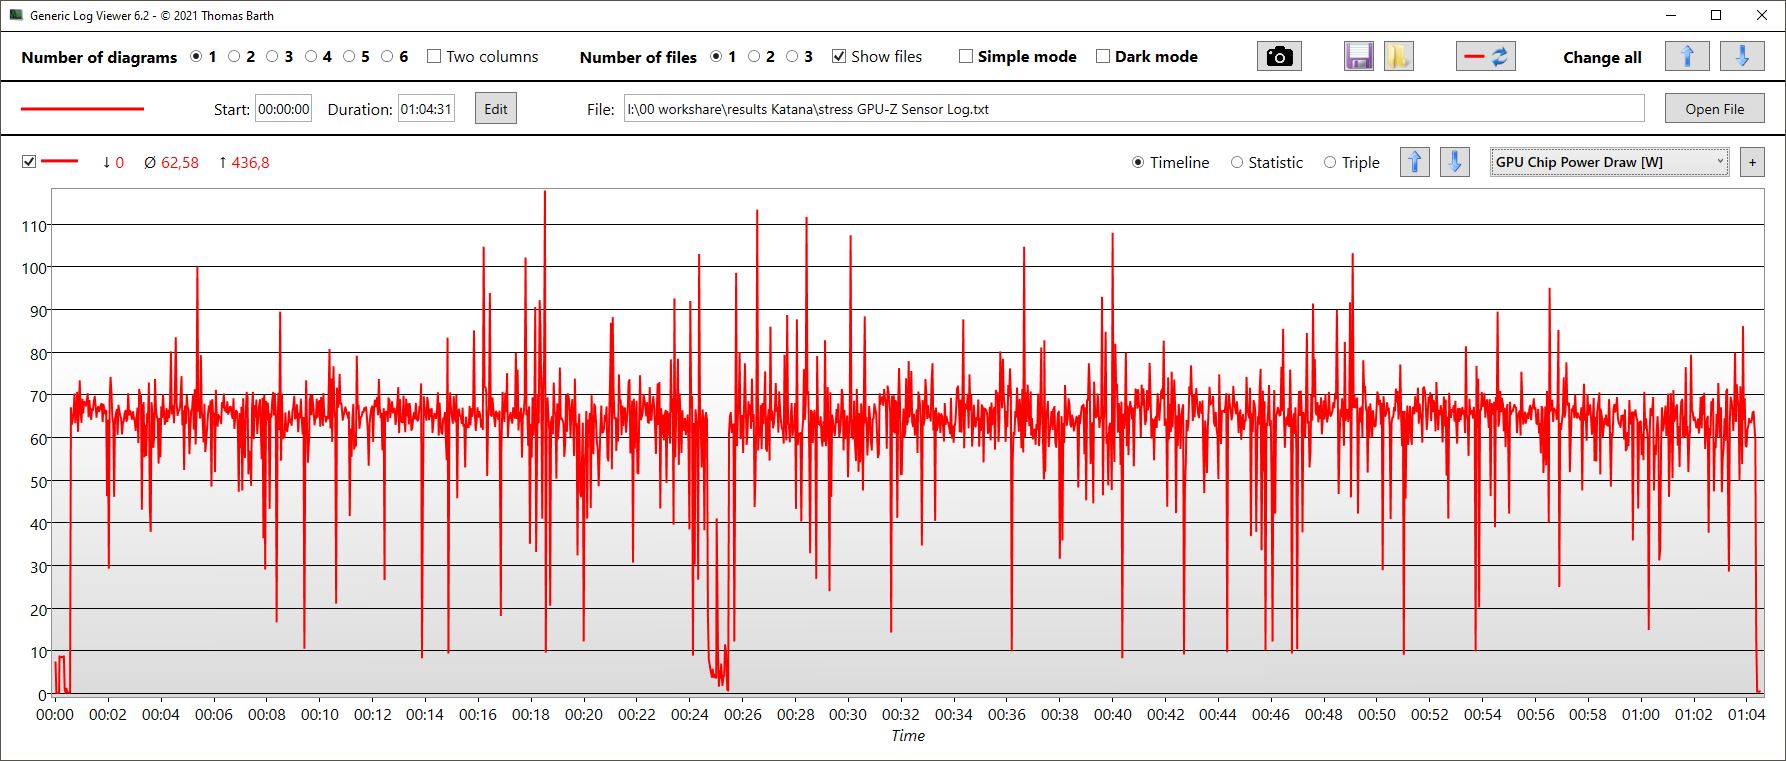
| CPU时钟(GHz) | GPU时钟(MHz) | CPU平均温度(℃) | GPU平均温度(℃) | |
| Prime95 + FurMark 压力 | 2,5 | 2.121 | 82 | 75 |
| Witcher 3 应力 | 0.6 | 2.400 | 75 | 75 |
发言人
立体声扬声器提供平衡的中音和高音,但几乎没有低音,充其量是中等音量。耳机插孔是模拟设备的理想选择。
MSI Katana 15 B12VEK audio analysis
(±) | speaker loudness is average but good (75.69 dB)
Bass 100 - 315 Hz
(-) | nearly no bass - on average 21.5% lower than median
(±) | linearity of bass is average (8.8% delta to prev. frequency)
Mids 400 - 2000 Hz
(+) | balanced mids - only 4.1% away from median
(+) | mids are linear (4.8% delta to prev. frequency)
Highs 2 - 16 kHz
(+) | balanced highs - only 2.3% away from median
(+) | highs are linear (4% delta to prev. frequency)
Overall 100 - 16.000 Hz
(±) | linearity of overall sound is average (17.3% difference to median)
Compared to same class
» 47% of all tested devices in this class were better, 12% similar, 41% worse
» The best had a delta of 6%, average was 18%, worst was 132%
Compared to all devices tested
» 32% of all tested devices were better, 8% similar, 59% worse
» The best had a delta of 4%, average was 23%, worst was 134%
Lenovo Legion 5 15IAH7H 82RB audio analysis
(+) | speakers can play relatively loud (83.3 dB)
Bass 100 - 315 Hz
(-) | nearly no bass - on average 28.2% lower than median
(±) | linearity of bass is average (12.9% delta to prev. frequency)
Mids 400 - 2000 Hz
(±) | higher mids - on average 5.7% higher than median
(±) | linearity of mids is average (7.4% delta to prev. frequency)
Highs 2 - 16 kHz
(+) | balanced highs - only 3.3% away from median
(+) | highs are linear (6.4% delta to prev. frequency)
Overall 100 - 16.000 Hz
(±) | linearity of overall sound is average (23.6% difference to median)
Compared to same class
» 86% of all tested devices in this class were better, 4% similar, 10% worse
» The best had a delta of 6%, average was 18%, worst was 132%
Compared to all devices tested
» 71% of all tested devices were better, 6% similar, 23% worse
» The best had a delta of 4%, average was 23%, worst was 134%
电源管理--微星Katana的高效RTX 4050
消耗功率
在功耗方面,新的Katana 15比采用上一代GPU的竞争对手更经济。我们的测试模型在空转时有很好的速率,即使在游戏或重度压力下也保持如此。虽然3D性能也略低,但消耗的差异远远大于性能的差异。
例如,无论是Legion 5 ,还是XMG Core 15 ,直至华硕TUF Gaming F15 ,在使用Witcher 3 游戏时的消耗量几乎比我们的Katana 15高出50%!但Katana GF66 ,其RTX 3070 Ti ,在游戏中也只多消耗了16%。
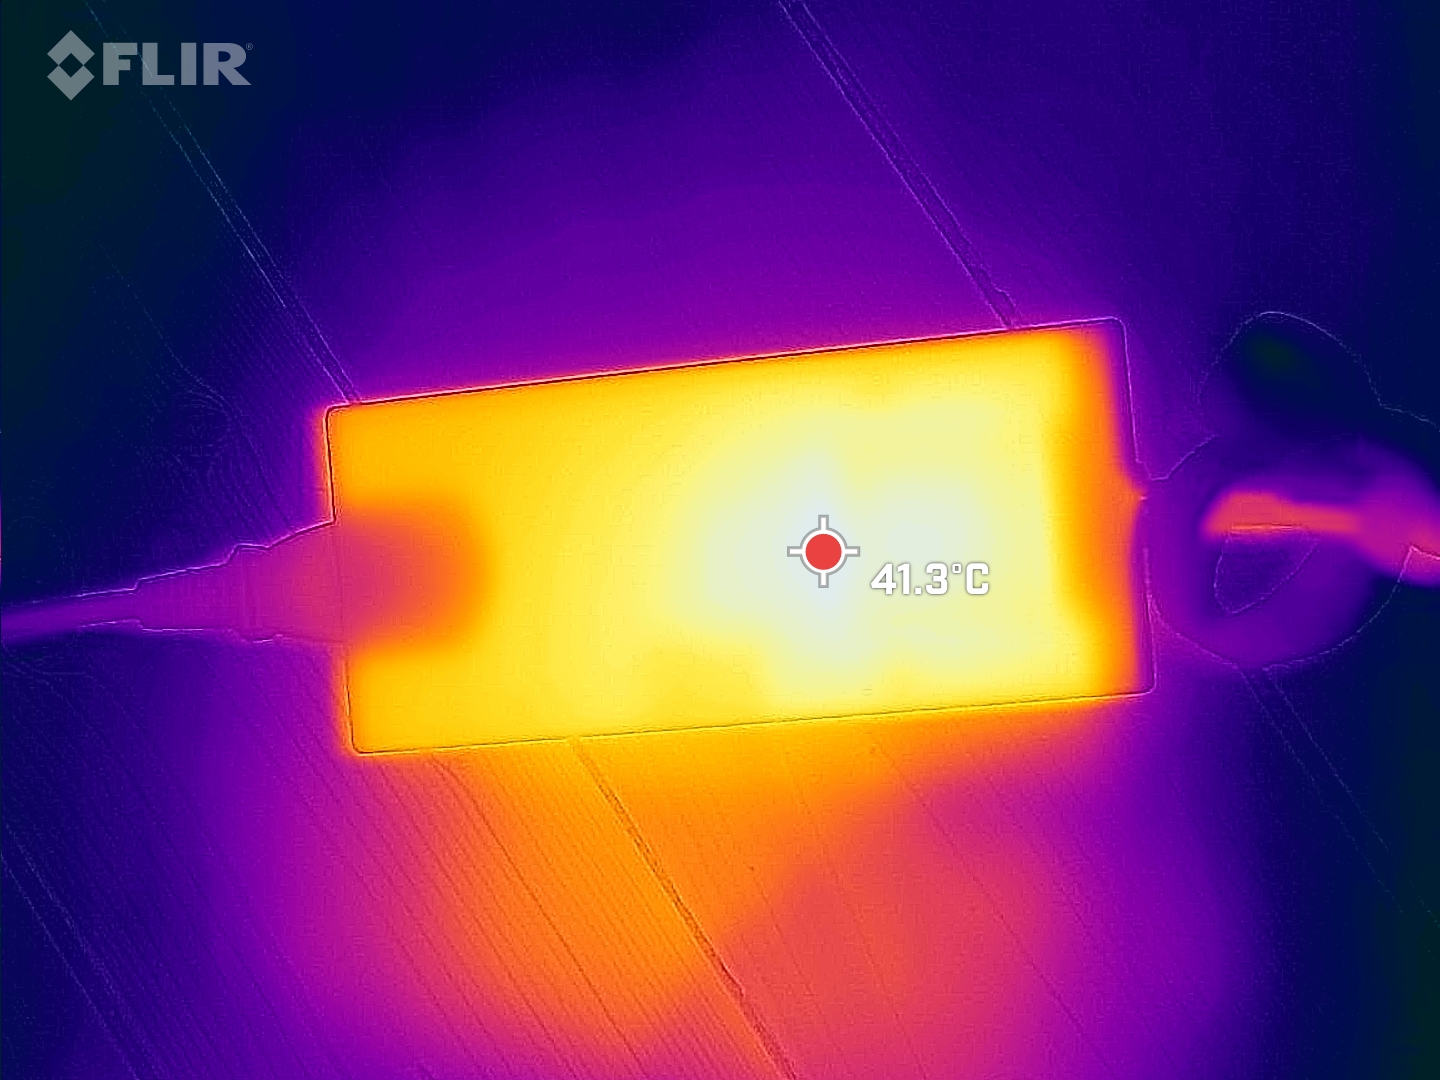
我们测得的短期最大消耗量高达189W。标准的Chicony电源设计为240W,应该能够很好地处理这个问题。
| Off / Standby | |
| Idle | |
| Load |
|
Key:
min: | |
| MSI Katana 15 B12VEK i7-12650H, GeForce RTX 4050 Laptop GPU, Micron 2400 MTFDKBA1T0QFM, IPS, 1920x1080, 15.6" | MSI Katana GF66 12UGS i7-12700H, GeForce RTX 3070 Ti Laptop GPU, Micron 2450 1TB MTFDKBA1T0TFK, IPS, 1920x1080, 15.6" | MSI Pulse GL66 12UEK i9-12900H, GeForce RTX 3060 Laptop GPU, Micron 2450 512GB MTFDKBA512TFK, IPS, 1920x1080, 15.6" | Lenovo Legion 5 15IAH7H 82RB i7-12700H, GeForce RTX 3060 Laptop GPU, , IPS, 1920x1080, 15.6" | Asus TUF Gaming F15 FX507ZM i7-12700H, GeForce RTX 3060 Laptop GPU, SK Hynix HFM001TD3JX013N, IPS, 1920x1080, 15.6" | Schenker XMG Core 15 (M22) R7 6800H, GeForce RTX 3060 Laptop GPU, Samsung SSD 980 Pro 1TB MZ-V8P1T0BW, IPS, 2560x1440, 15.6" | Average NVIDIA GeForce RTX 4050 Laptop GPU | Average of class Gaming | |
|---|---|---|---|---|---|---|---|---|
| Power Consumption | -26% | -6% | -121% | -34% | -34% | -30% | -65% | |
| Idle Minimum * (Watt) | 8.5 | 9 -6% | 7 18% | 19.8 -133% | 6.3 26% | 11.8 -39% | 9.95 ? -17% | 13 ? -53% |
| Idle Average * (Watt) | 10.2 | 13 -27% | 13 -27% | 26.2 -157% | 9.8 4% | 14.7 -44% | 15.8 ? -55% | 19 ? -86% |
| Idle Maximum * (Watt) | 11.3 | 20 -77% | 13.7 -21% | 48.2 -327% | 26.5 -135% | 15 -33% | 20.1 ? -78% | 24.6 ? -118% |
| Load Average * (Watt) | 84 | 100 -19% | 48.4 42% | 102.9 -23% | 103.8 -24% | 100 -19% | 88 ? -5% | 110.7 ? -32% |
| Witcher 3 ultra * (Watt) | 128 | 149 -16% | 148 -16% | 186.7 -46% | 189 -48% | 184 -44% | ||
| Load Maximum * (Watt) | 189 | 212 -12% | 244 -29% | 268 -42% | 241.9 -28% | 237 -25% | 176.3 ? 7% | 259 ? -37% |
* ... smaller is better
Power Consumption Witcher 3 / Stresstest
Power Consumption with an External Monitor
电池寿命
经济型笔记本电脑还能在哪里省钱?正确,电池。Katana 15中的模型只有53Wh,这是Katana或Pulse中的标准。其他竞争者的电池容量从62到90Wh不等。因此,尽管能源效率相对较好,但运行时间却相当平庸。
一个电影之夜可以计划大约4小时20分钟。我们的WLAN测试产生了明显不同的结果,这取决于所选择的模式。在最大亮度(258尼特)的平衡模式下,电池只能维持2小时20分钟。另一方面,在150尼特的省电模式下,我们测得的时间与视频测试中的时间差不多。
| MSI Katana 15 B12VEK i7-12650H, GeForce RTX 4050 Laptop GPU, 53.5 Wh | MSI Katana GF66 12UGS i7-12700H, GeForce RTX 3070 Ti Laptop GPU, 52 Wh | MSI Pulse GL66 12UEK i9-12900H, GeForce RTX 3060 Laptop GPU, 53.5 Wh | Lenovo Legion 5 15IAH7H 82RB i7-12700H, GeForce RTX 3060 Laptop GPU, 80 Wh | Asus TUF Gaming F15 FX507ZM i7-12700H, GeForce RTX 3060 Laptop GPU, 90 Wh | Schenker XMG Core 15 (M22) R7 6800H, GeForce RTX 3060 Laptop GPU, 62 Wh | Average of class Gaming | |
|---|---|---|---|---|---|---|---|
| Battery runtime | -26% | 9% | -6% | -8% | 27% | 51% | |
| H.264 (h) | 4.4 | 4 -9% | 8.32 ? 89% | ||||
| WiFi v1.3 (h) | 4.3 | 2.4 -44% | 5 16% | 4.8 12% | 7.8 81% | 7.11 ? 65% | |
| Load (h) | 1.5 | 1.4 -7% | 1.9 27% | 1.1 -27% | 1.1 -27% | 1.1 -27% | 1.502 ? 0% |
| Reader / Idle (h) | 8.1 | 15.8 | 8.27 ? |
Pros
Cons
结论 - 预算型RTX 4050仍然太贵了
微星Katana 15 B12将一个12代CPU与一个 RTX 4050这对预算玩家来说其实是个不错的主意。CPU的性能并不差,而且Katana 15的GPU被证明比去年的型号明显更有效率。
然而,我们对预算玩家的主要批评点是价格:虽然你可以从800美元左右买到配备RTX 3060的预算笔记本电脑,但你在这里支付了整整1499.99美元RTX 4050的效率优势并不能证明这个价格的合理性。更重要的是,Katana 15的几乎所有其他部件都明显属于预算级别,从部分过时的端口到相当暗的全高清显示屏,再到相对较小的电池。除此之外,该笔记本电脑的性能往往落后于大多数RTX 3060玩家,而RTX 4050显然没有达到其TGP 105的目标。
微星Katana 15 B12结合了良好的上一代CPU和当前的RTX 4050,但未能设定一个合理的价格,以满足众多预算组件。目前,Katana 15简直太贵了。
毕竟,有很多替代品。如果你想以更低的价格获得更多的性能和更少的预算组件,你最好的选择是 联想Legion 5,其RTX 3060.但其他大多数RTX 3060游戏机也应该更便宜,装备更好,而且大多更快。
价格和可用性
在微星的官方网站,Katana 15 B12VGK-082的售价为1499.99美元。.有兴趣的买家(取决于地点)可以在其他地方的转售商(如亚马逊)找到相同型号的产品,价格更便宜。
MSI Katana 15 B12VEK
- 03/28/2023 v7 (old)
Christian Hintze
Transparency
The selection of devices to be reviewed is made by our editorial team. The test sample was provided to the author as a loan by the manufacturer or retailer for the purpose of this review. The lender had no influence on this review, nor did the manufacturer receive a copy of this review before publication. There was no obligation to publish this review. As an independent media company, Notebookcheck is not subjected to the authority of manufacturers, retailers or publishers.
This is how Notebookcheck is testing
Every year, Notebookcheck independently reviews hundreds of laptops and smartphones using standardized procedures to ensure that all results are comparable. We have continuously developed our test methods for around 20 years and set industry standards in the process. In our test labs, high-quality measuring equipment is utilized by experienced technicians and editors. These tests involve a multi-stage validation process. Our complex rating system is based on hundreds of well-founded measurements and benchmarks, which maintains objectivity. Further information on our test methods can be found here.
Price comparison

