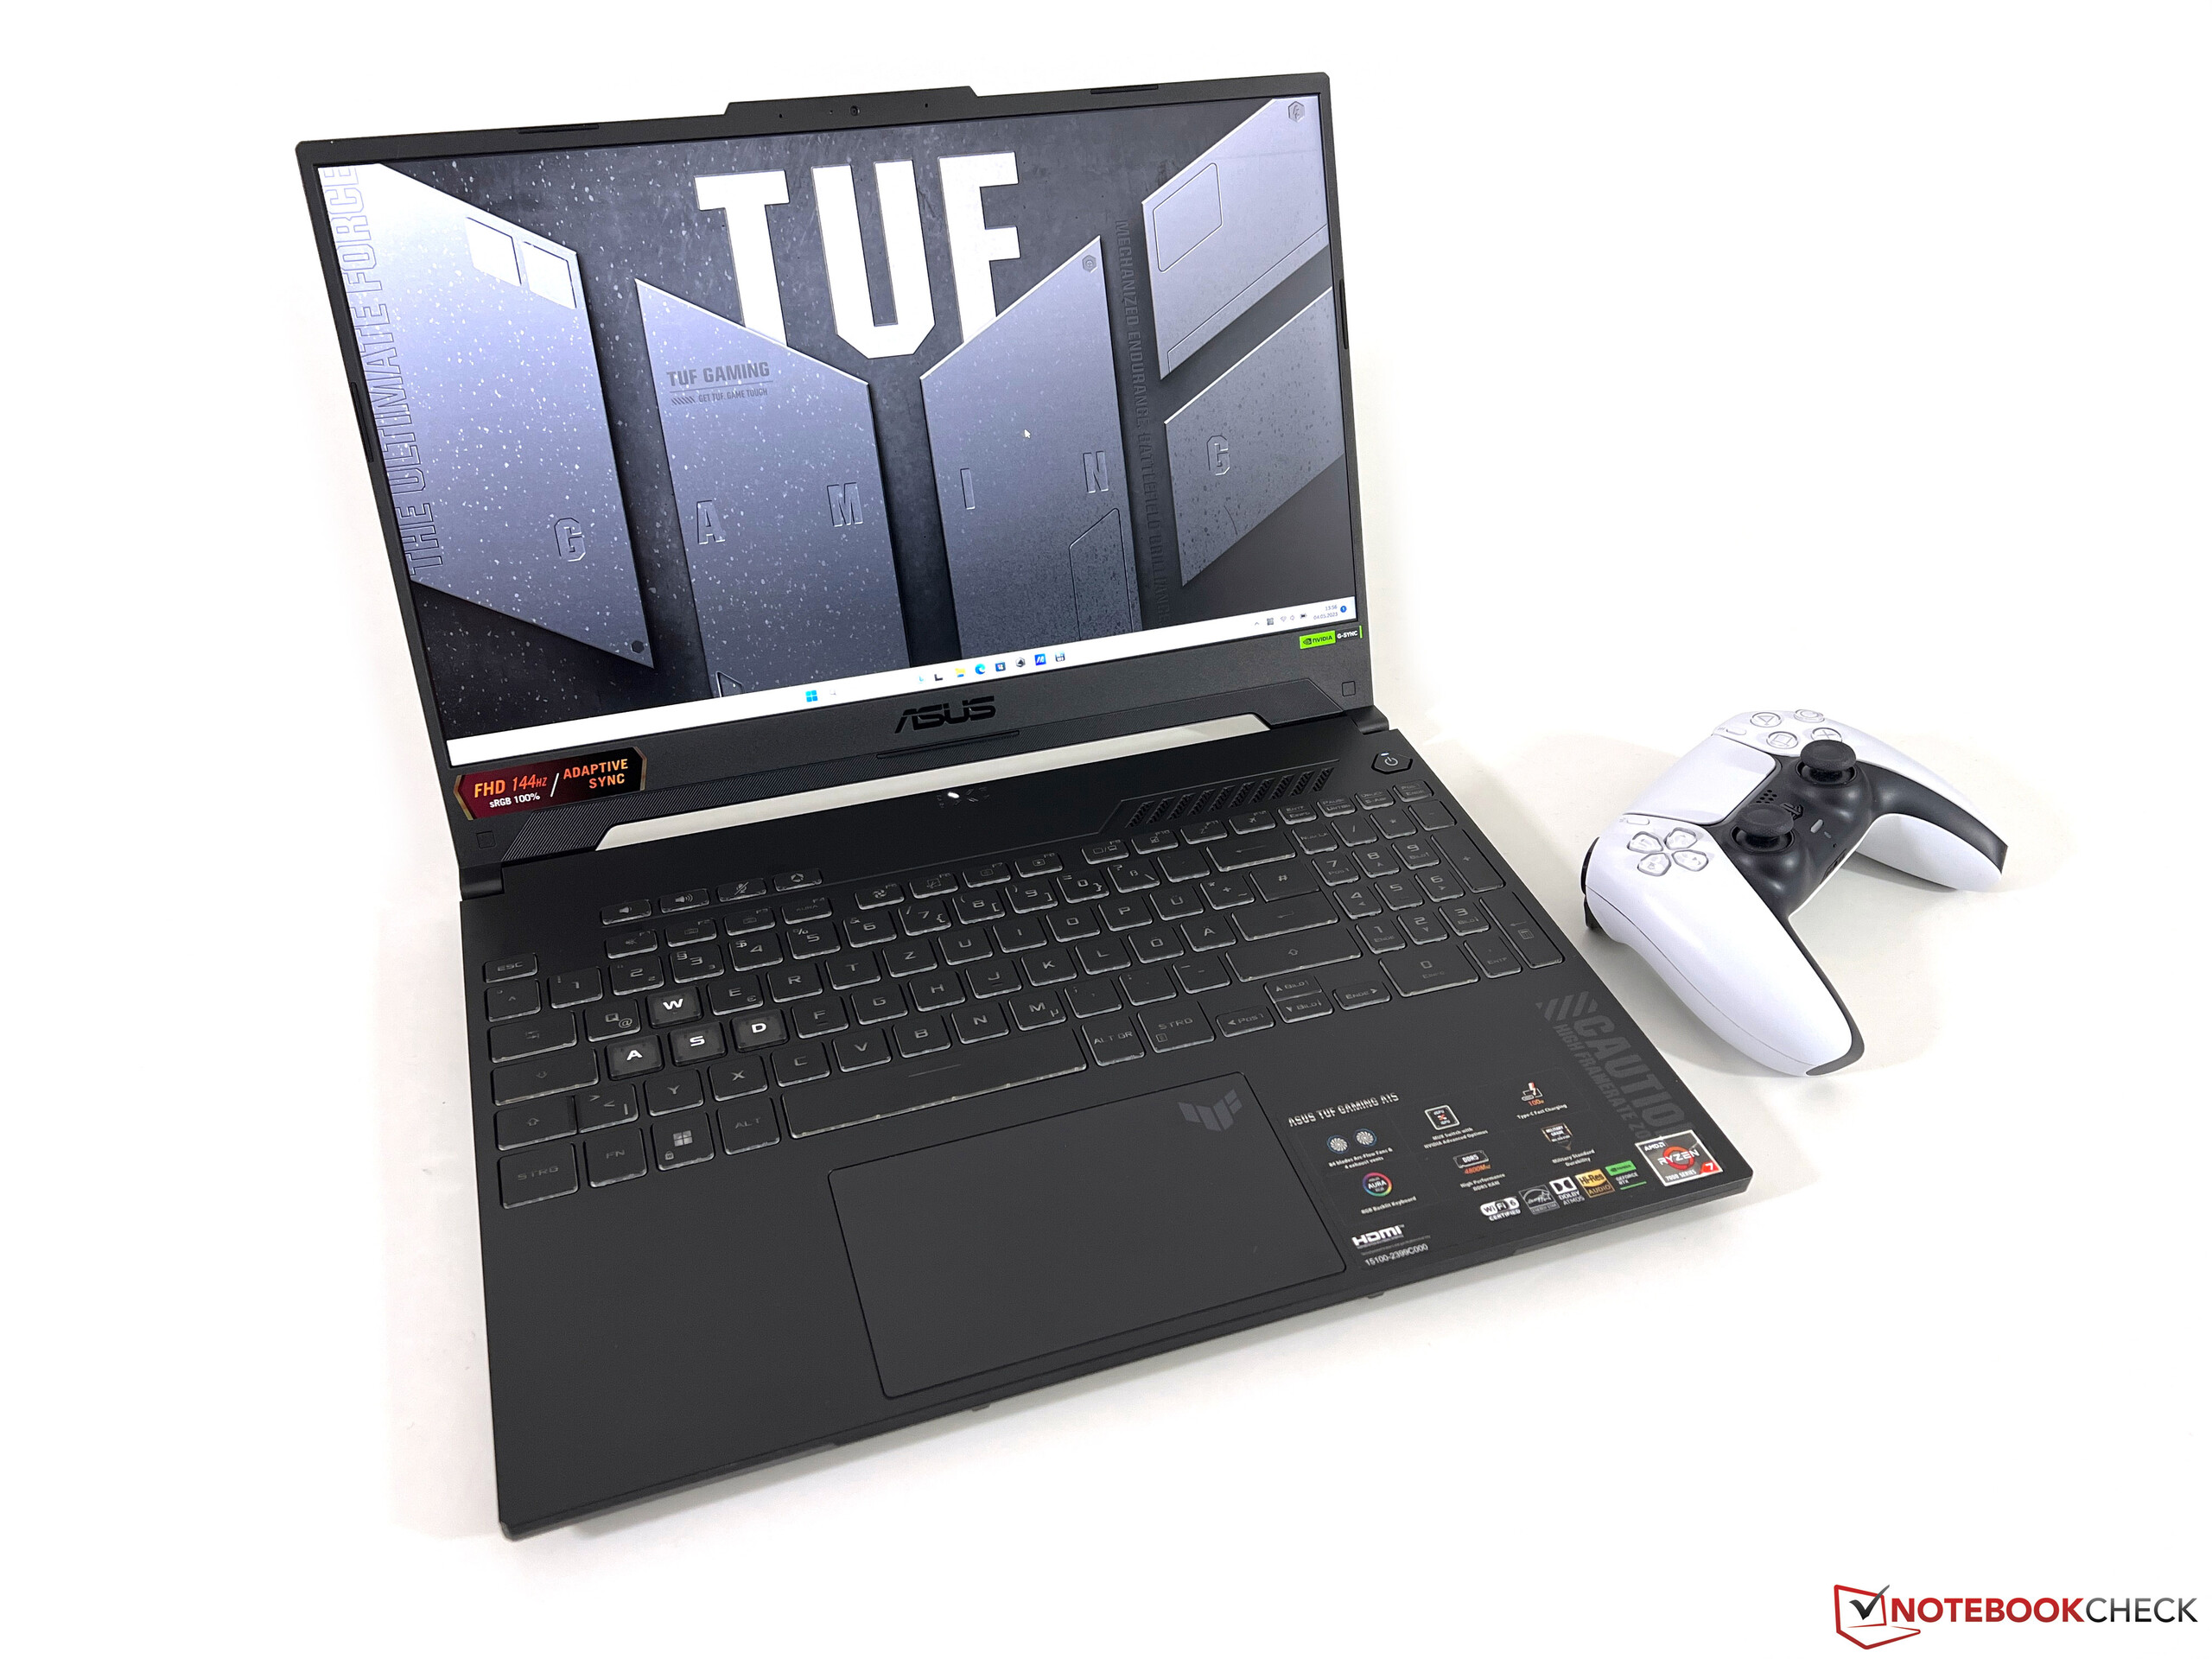
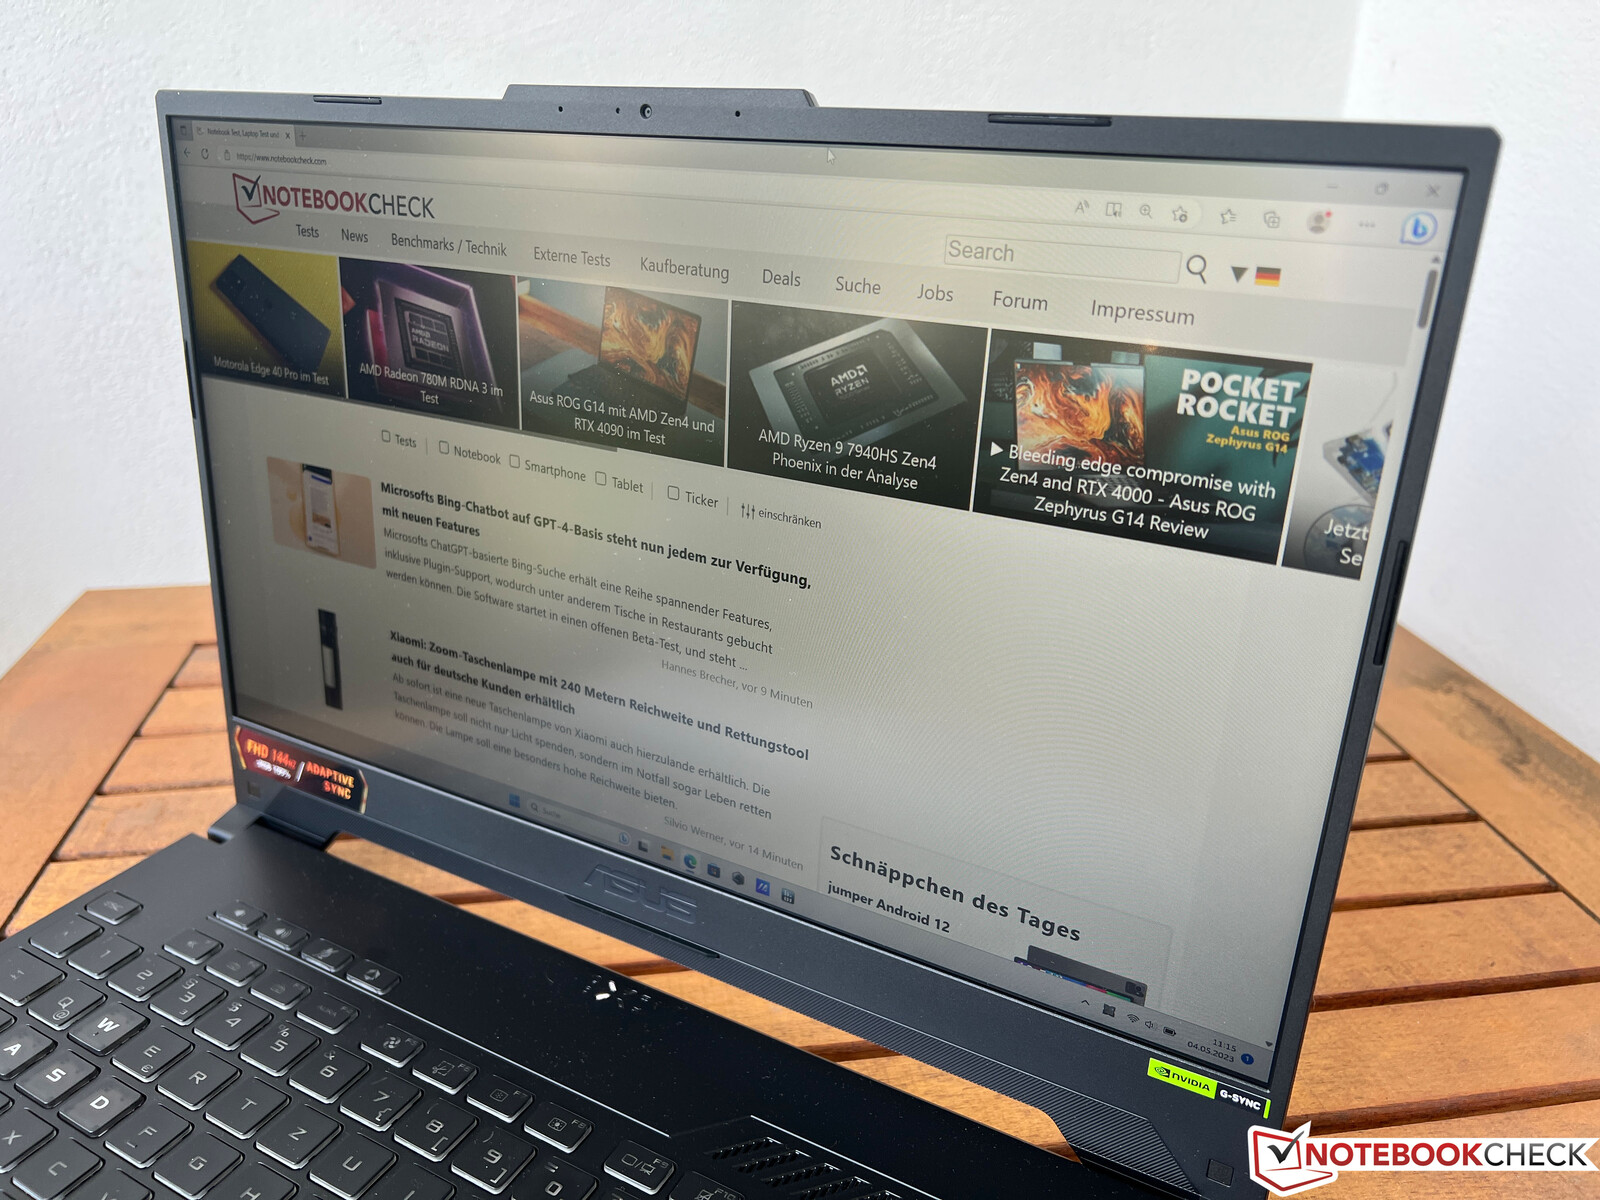
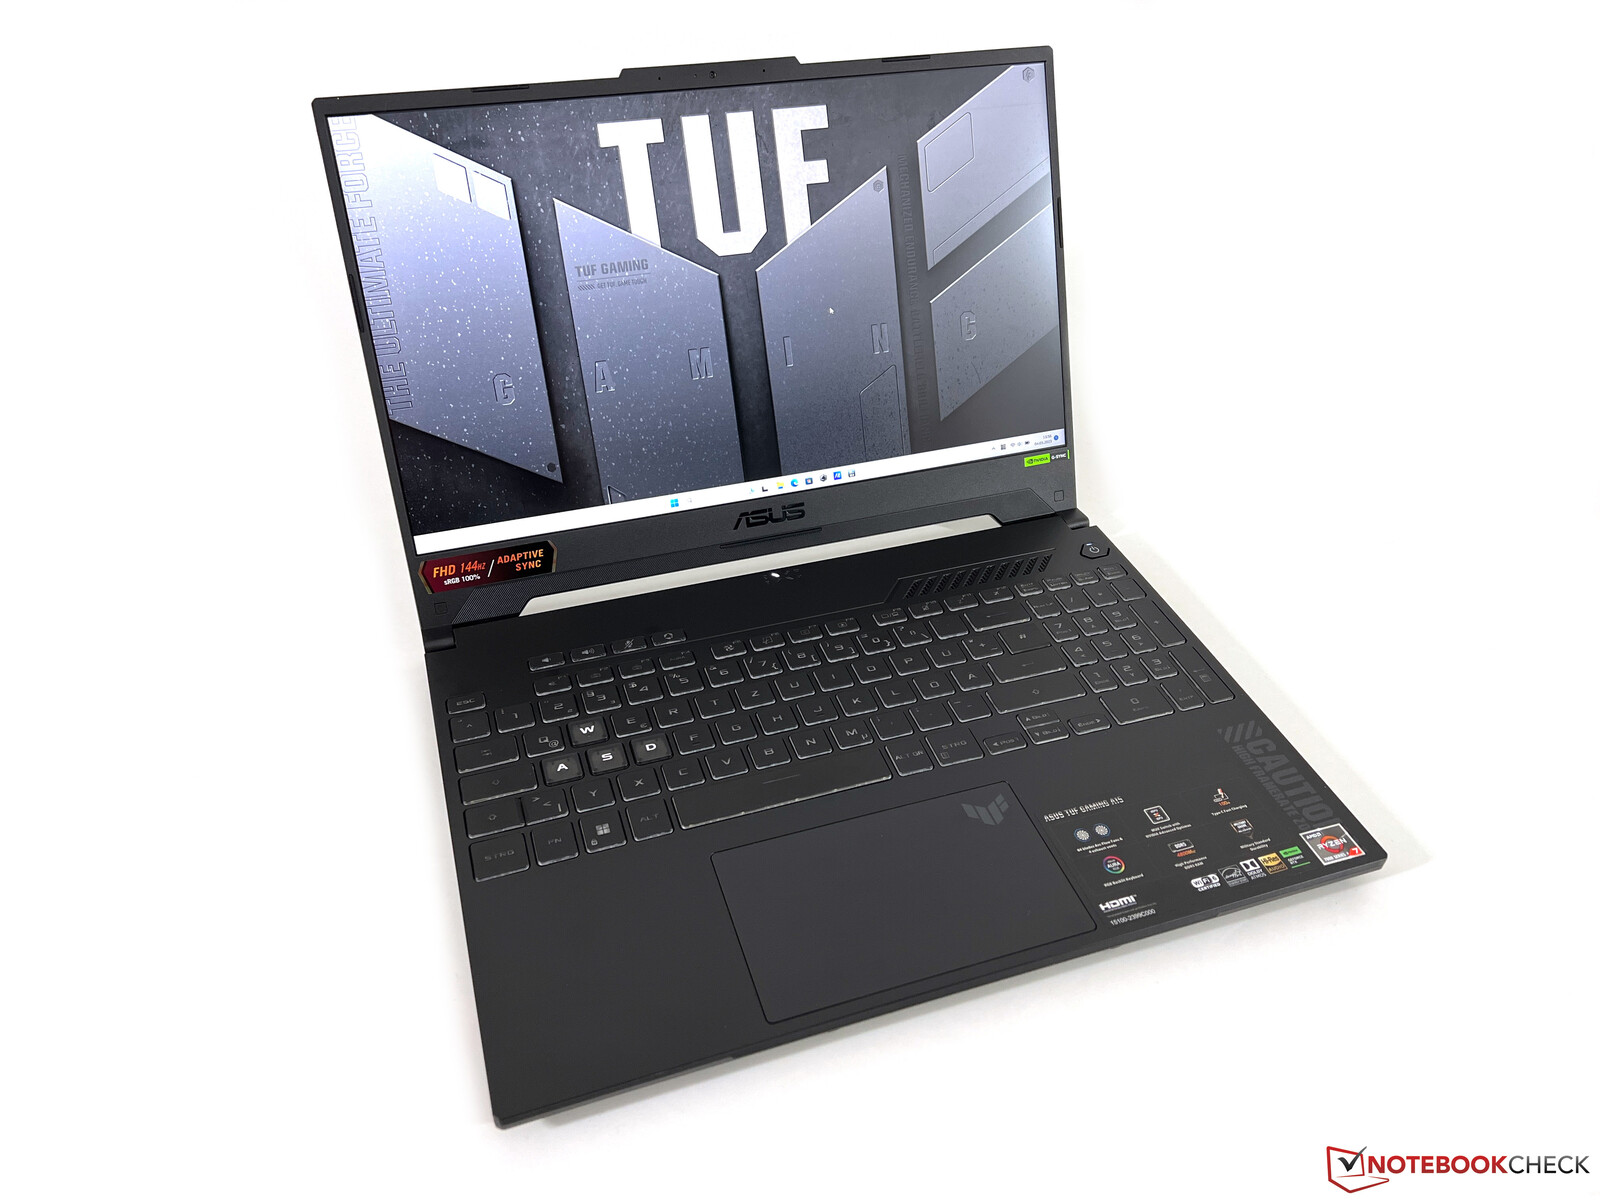
华硕TUF游戏A15笔记本评测--拥有RTX4050和144Hz屏幕的预算玩家
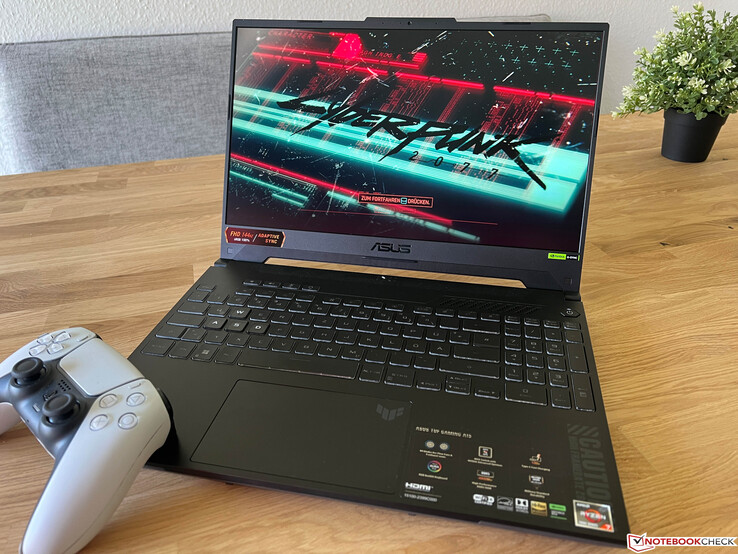
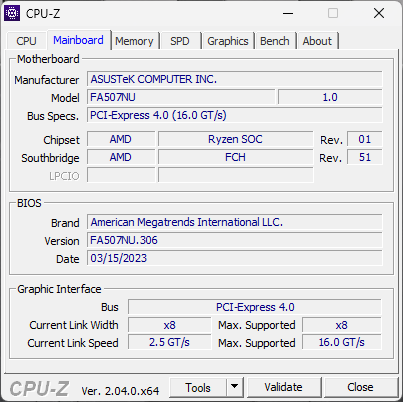
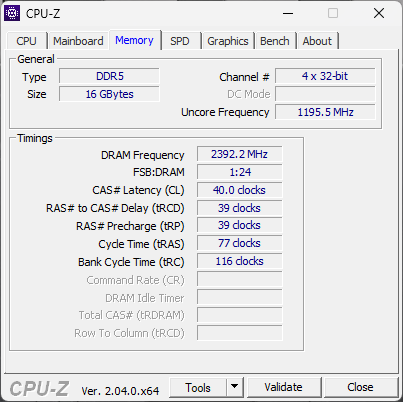
位于ROG系列之下,华硕的TUF游戏系列旨在为游戏玩家提供更便宜的笔记本电脑选择。我们最近测试了16英寸模型与AMD硬件现在是时候看看15英寸的版本了:配备AMD处理器(Ryzen 7 7735HS)的TUF Gaming A15。Ryzen 7 7735HS)和当前的Nvidia显卡(GeForce RTX 4050 Laptop).它的MRSP约为1,300美元,目前可以在网上找到,价格为1,169美元。此外,该设备有一个刷新率为144赫兹的哑光IPS面板,16GB内存和512GB NVMe SSD。FA507NU-LP031的零售版没有操作系统,但我们收到时已经安装了Windows 11 Home。
潜在的竞争对手比较
Rating | Date | Model | Weight | Height | Size | Resolution | Price |
|---|---|---|---|---|---|---|---|
| 86.3 % v7 (old) | 06 / 2023 | Asus TUF A15 FA507 R7 7735HS, GeForce RTX 4050 Laptop GPU | 2.2 kg | 24.9 mm | 15.60" | 1920x1080 | |
| 81.8 % v7 (old) | 04 / 2023 | Gigabyte G5 KE i5-12500H, GeForce RTX 3060 Laptop GPU | 2 kg | 23.9 mm | 15.60" | 1920x1080 | |
| 87.9 % v7 (old) | 01 / 2023 | Schenker XMG Core 15 (M22) R7 6800H, GeForce RTX 3060 Laptop GPU | 2.1 kg | 23 mm | 15.60" | 2560x1440 | |
| 82.9 % v7 (old) | 03 / 2023 | MSI Katana 15 B12VEK i7-12650H, GeForce RTX 4050 Laptop GPU | 2.3 kg | 24.9 mm | 15.60" | 1920x1080 | |
| 81 % v7 (old) | 01 / 2023 | HP Victus 15 fa0020nr i7-12700H, GeForce RTX 3050 Ti Laptop GPU | 2.3 kg | 23.6 mm | 15.60" | 1920x1080 | |
| 82.8 % v7 (old) | 10 / 2022 | Lenovo IdeaPad Gaming 3 15IAH7 i5-12500H, GeForce RTX 3050 Ti Laptop GPU | 2.4 kg | 26 mm | 15.60" | 1920x1080 | |
| 87.2 % v7 (old) | 03 / 2022 | Asus TUF Gaming F15 FX507ZM i7-12700H, GeForce RTX 3060 Laptop GPU | 2.1 kg | 24.95 mm | 15.60" | 1920x1080 |
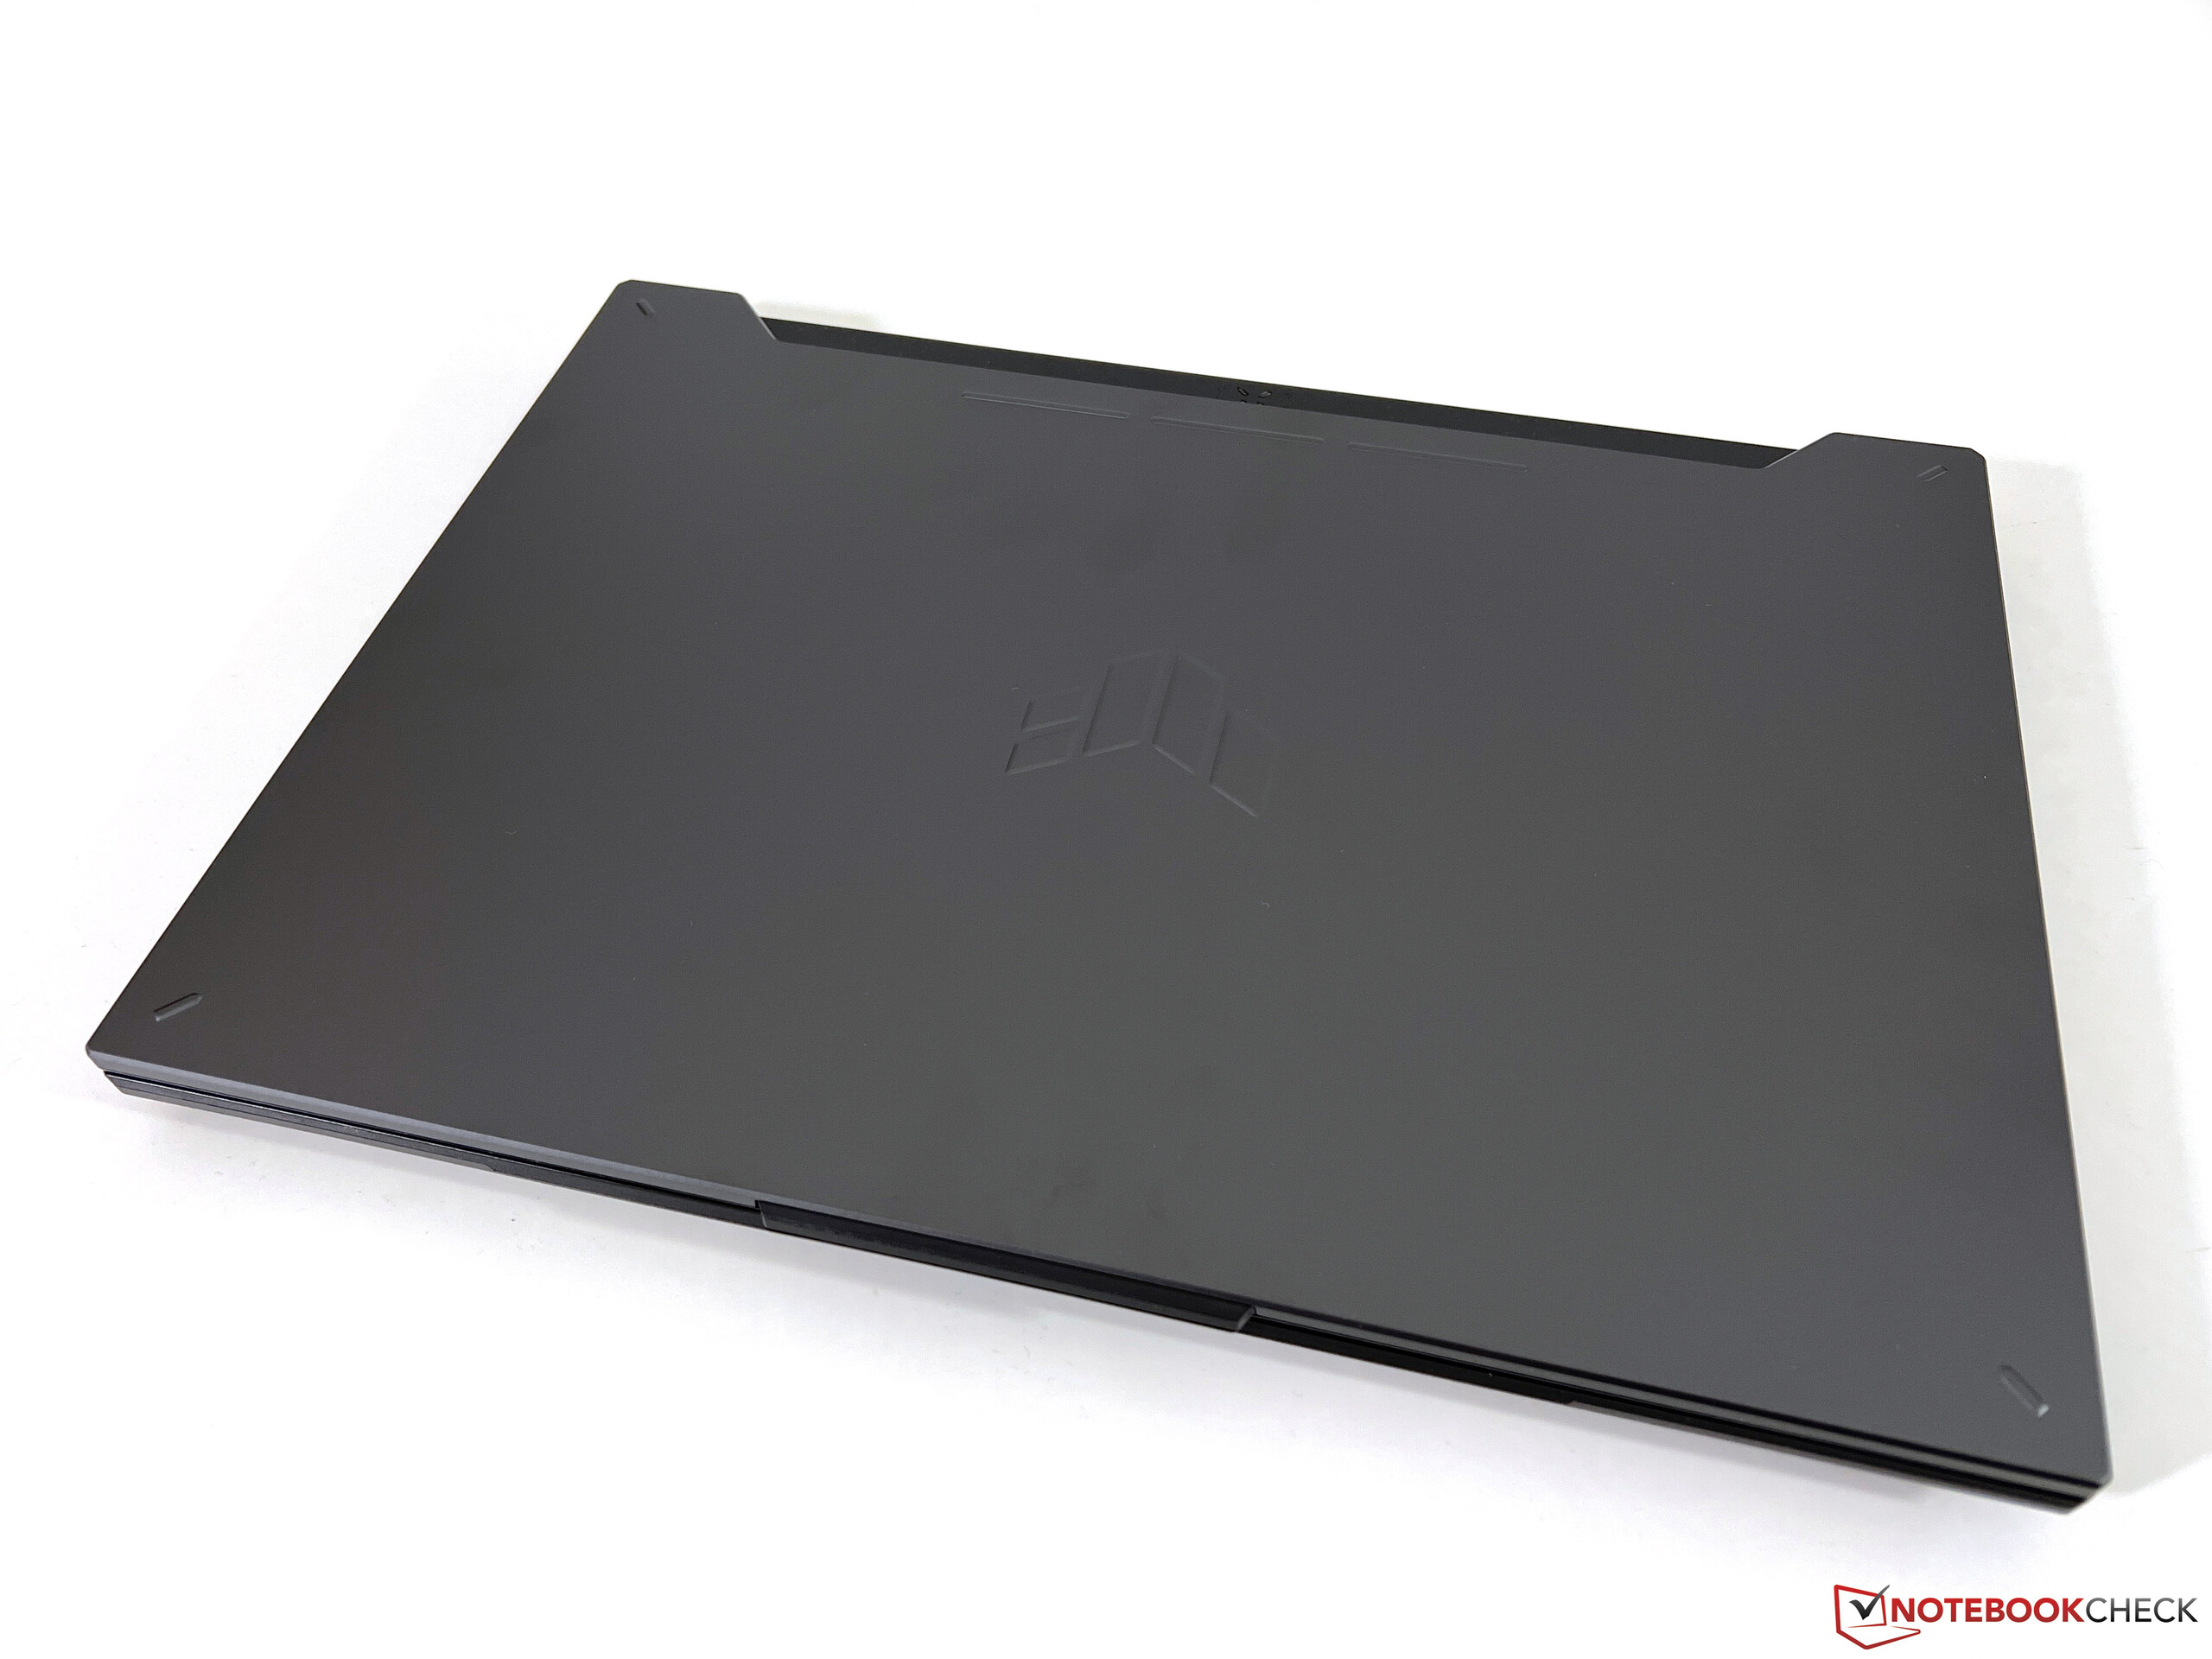
案例--低调的游戏笔记本,没有照明
与其采用英特尔处理器的前代产品相比,TUF Gaming F15,这款笔记本的外壳设计几乎没有变化。只有一些小的区别,如WASD键不再是白色的,盖子的四个角现在有小条而不是圆圈。目前的型号仍然没有任何花哨的照明功能,总的来说,这款笔记本电脑采用了相当低调的深灰色外观。特别是沿着屏幕的底边相当大,因为笔记本电脑仍然采用16:9的比例。你很可能需要经常清洁它的深色表面,因为它们很容易收集指纹印。
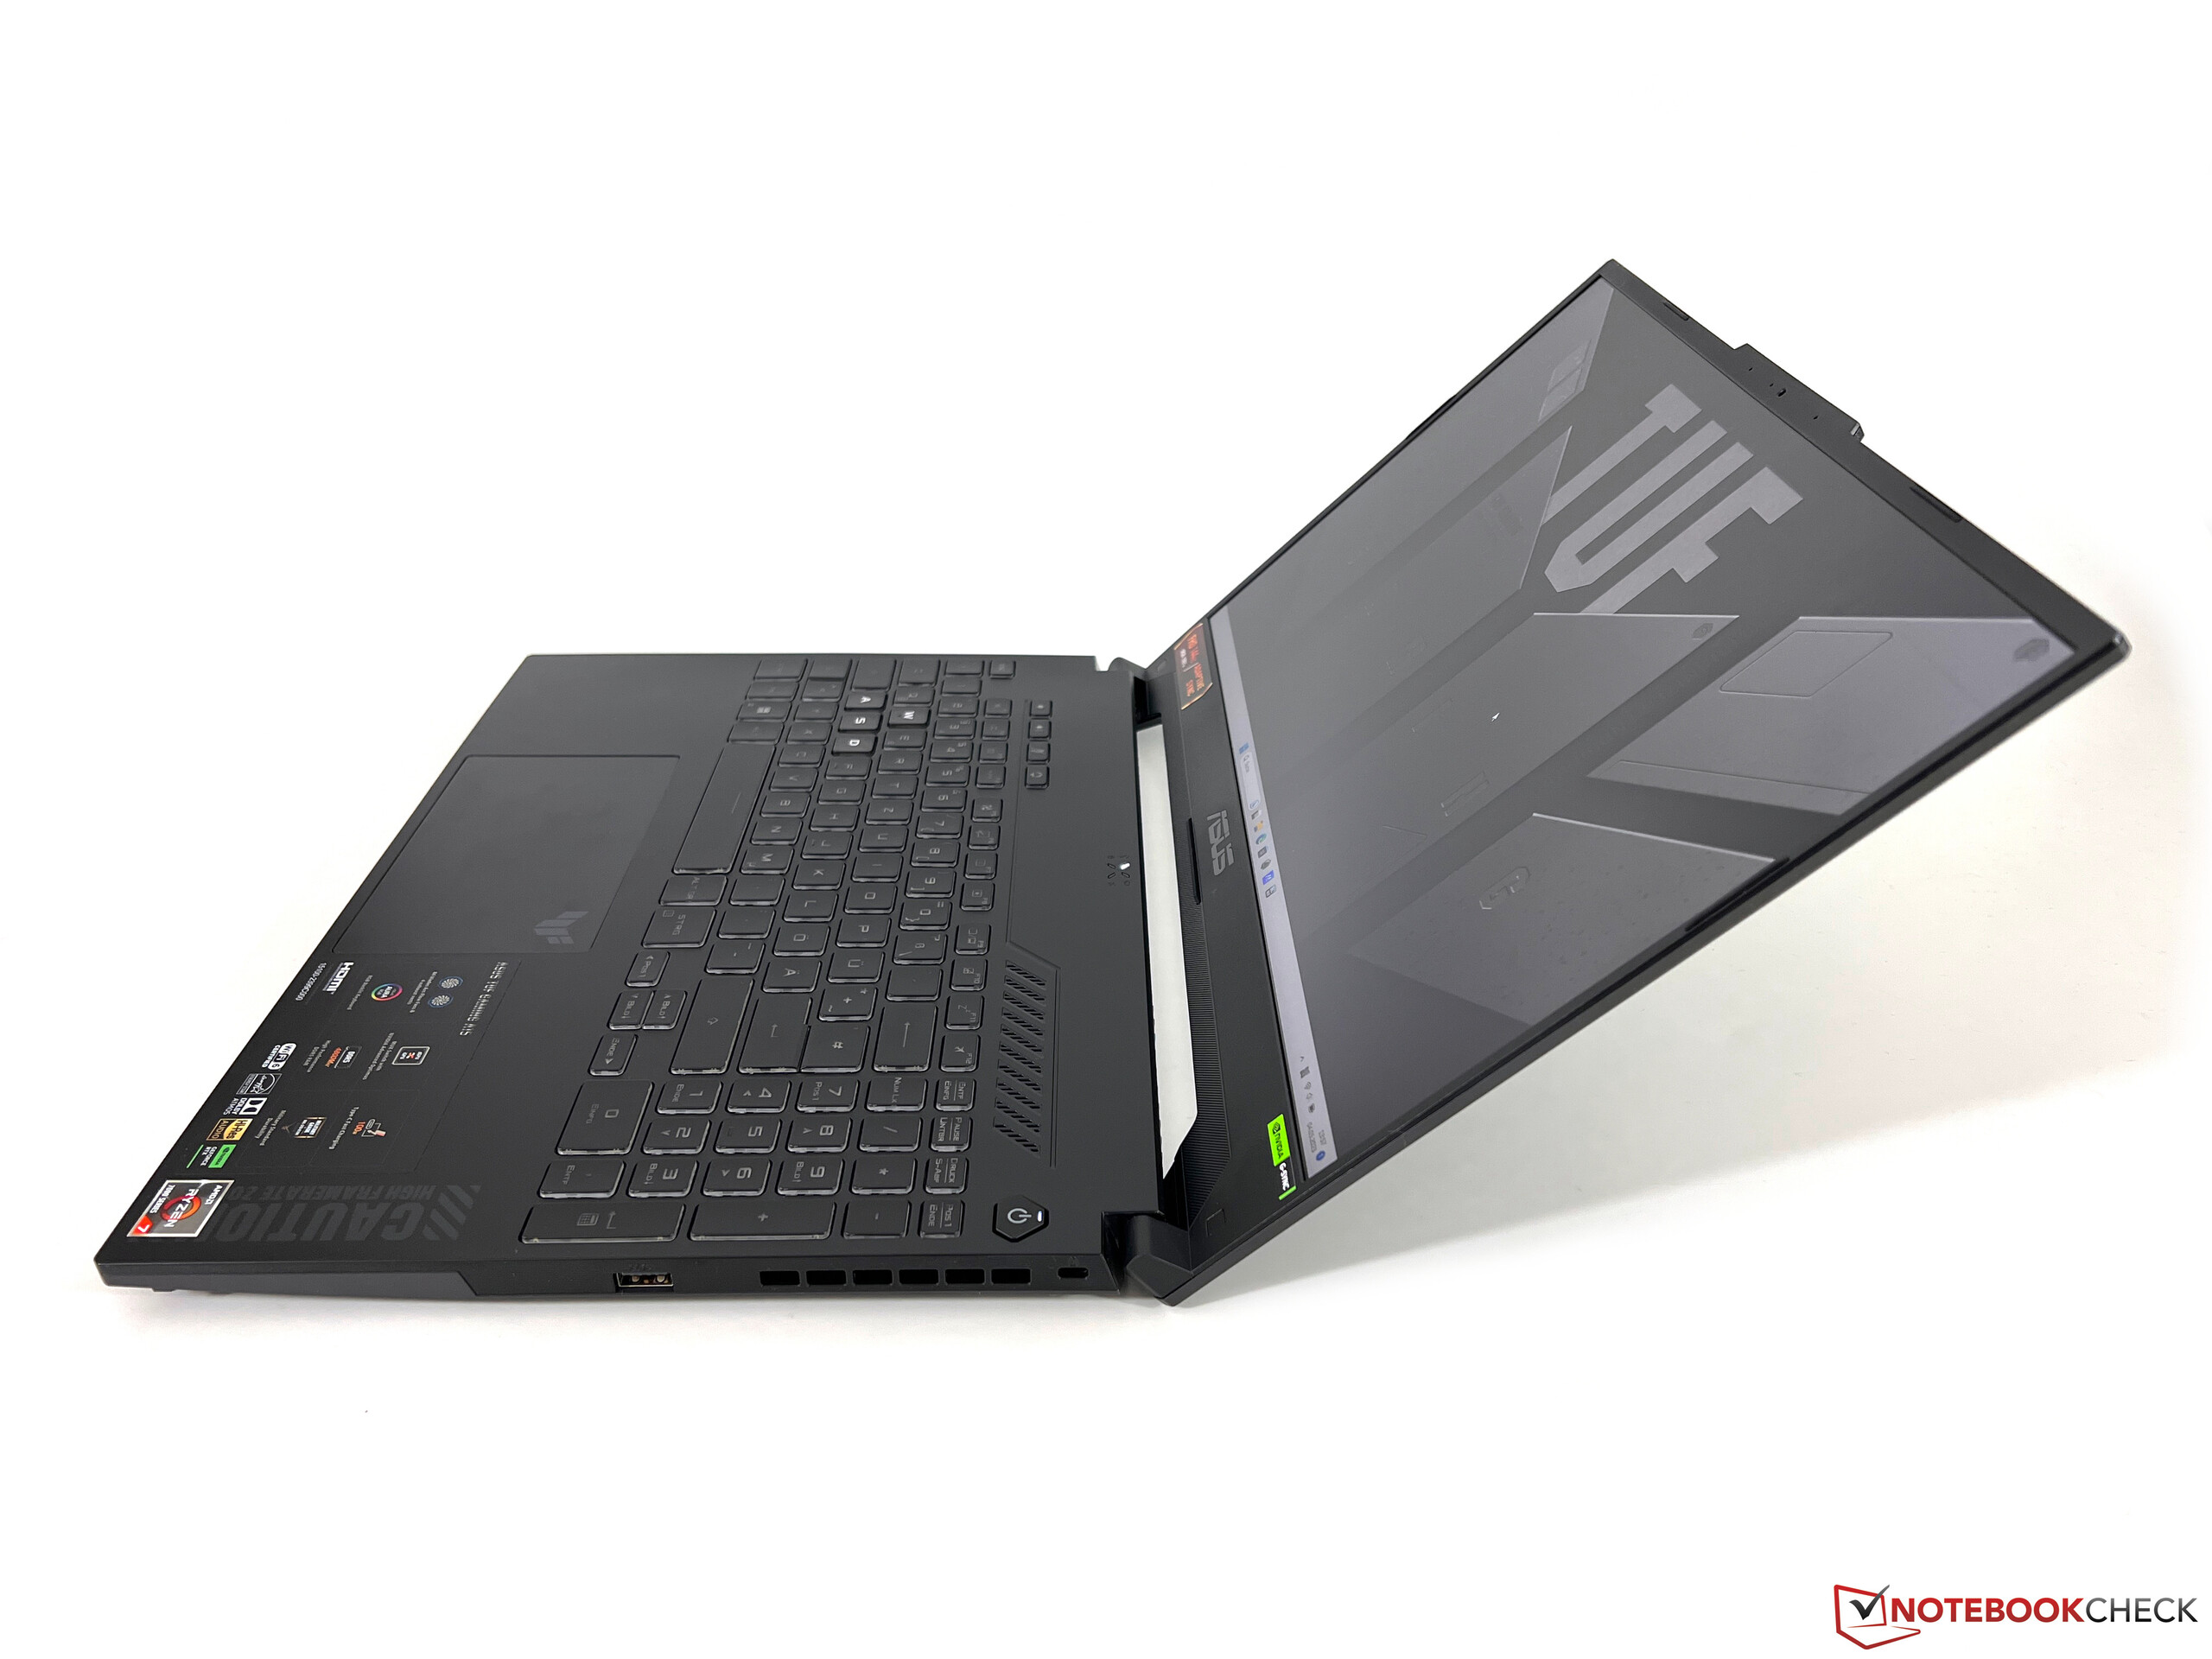
笔记本电脑的盖子是由金属制成的,箱子的其余部分是塑料。底部装置足够稳定,但你可以很容易地推到键盘的中间。虽然,当你试图扭动和弯曲设备时,它不会发出任何吱吱嘎嘎的声音。它的薄盖子不是最好的,因为当你用很小的压力压住它或试图改变打开角度(最大~135度)时,屏幕已经开始出现干扰了。
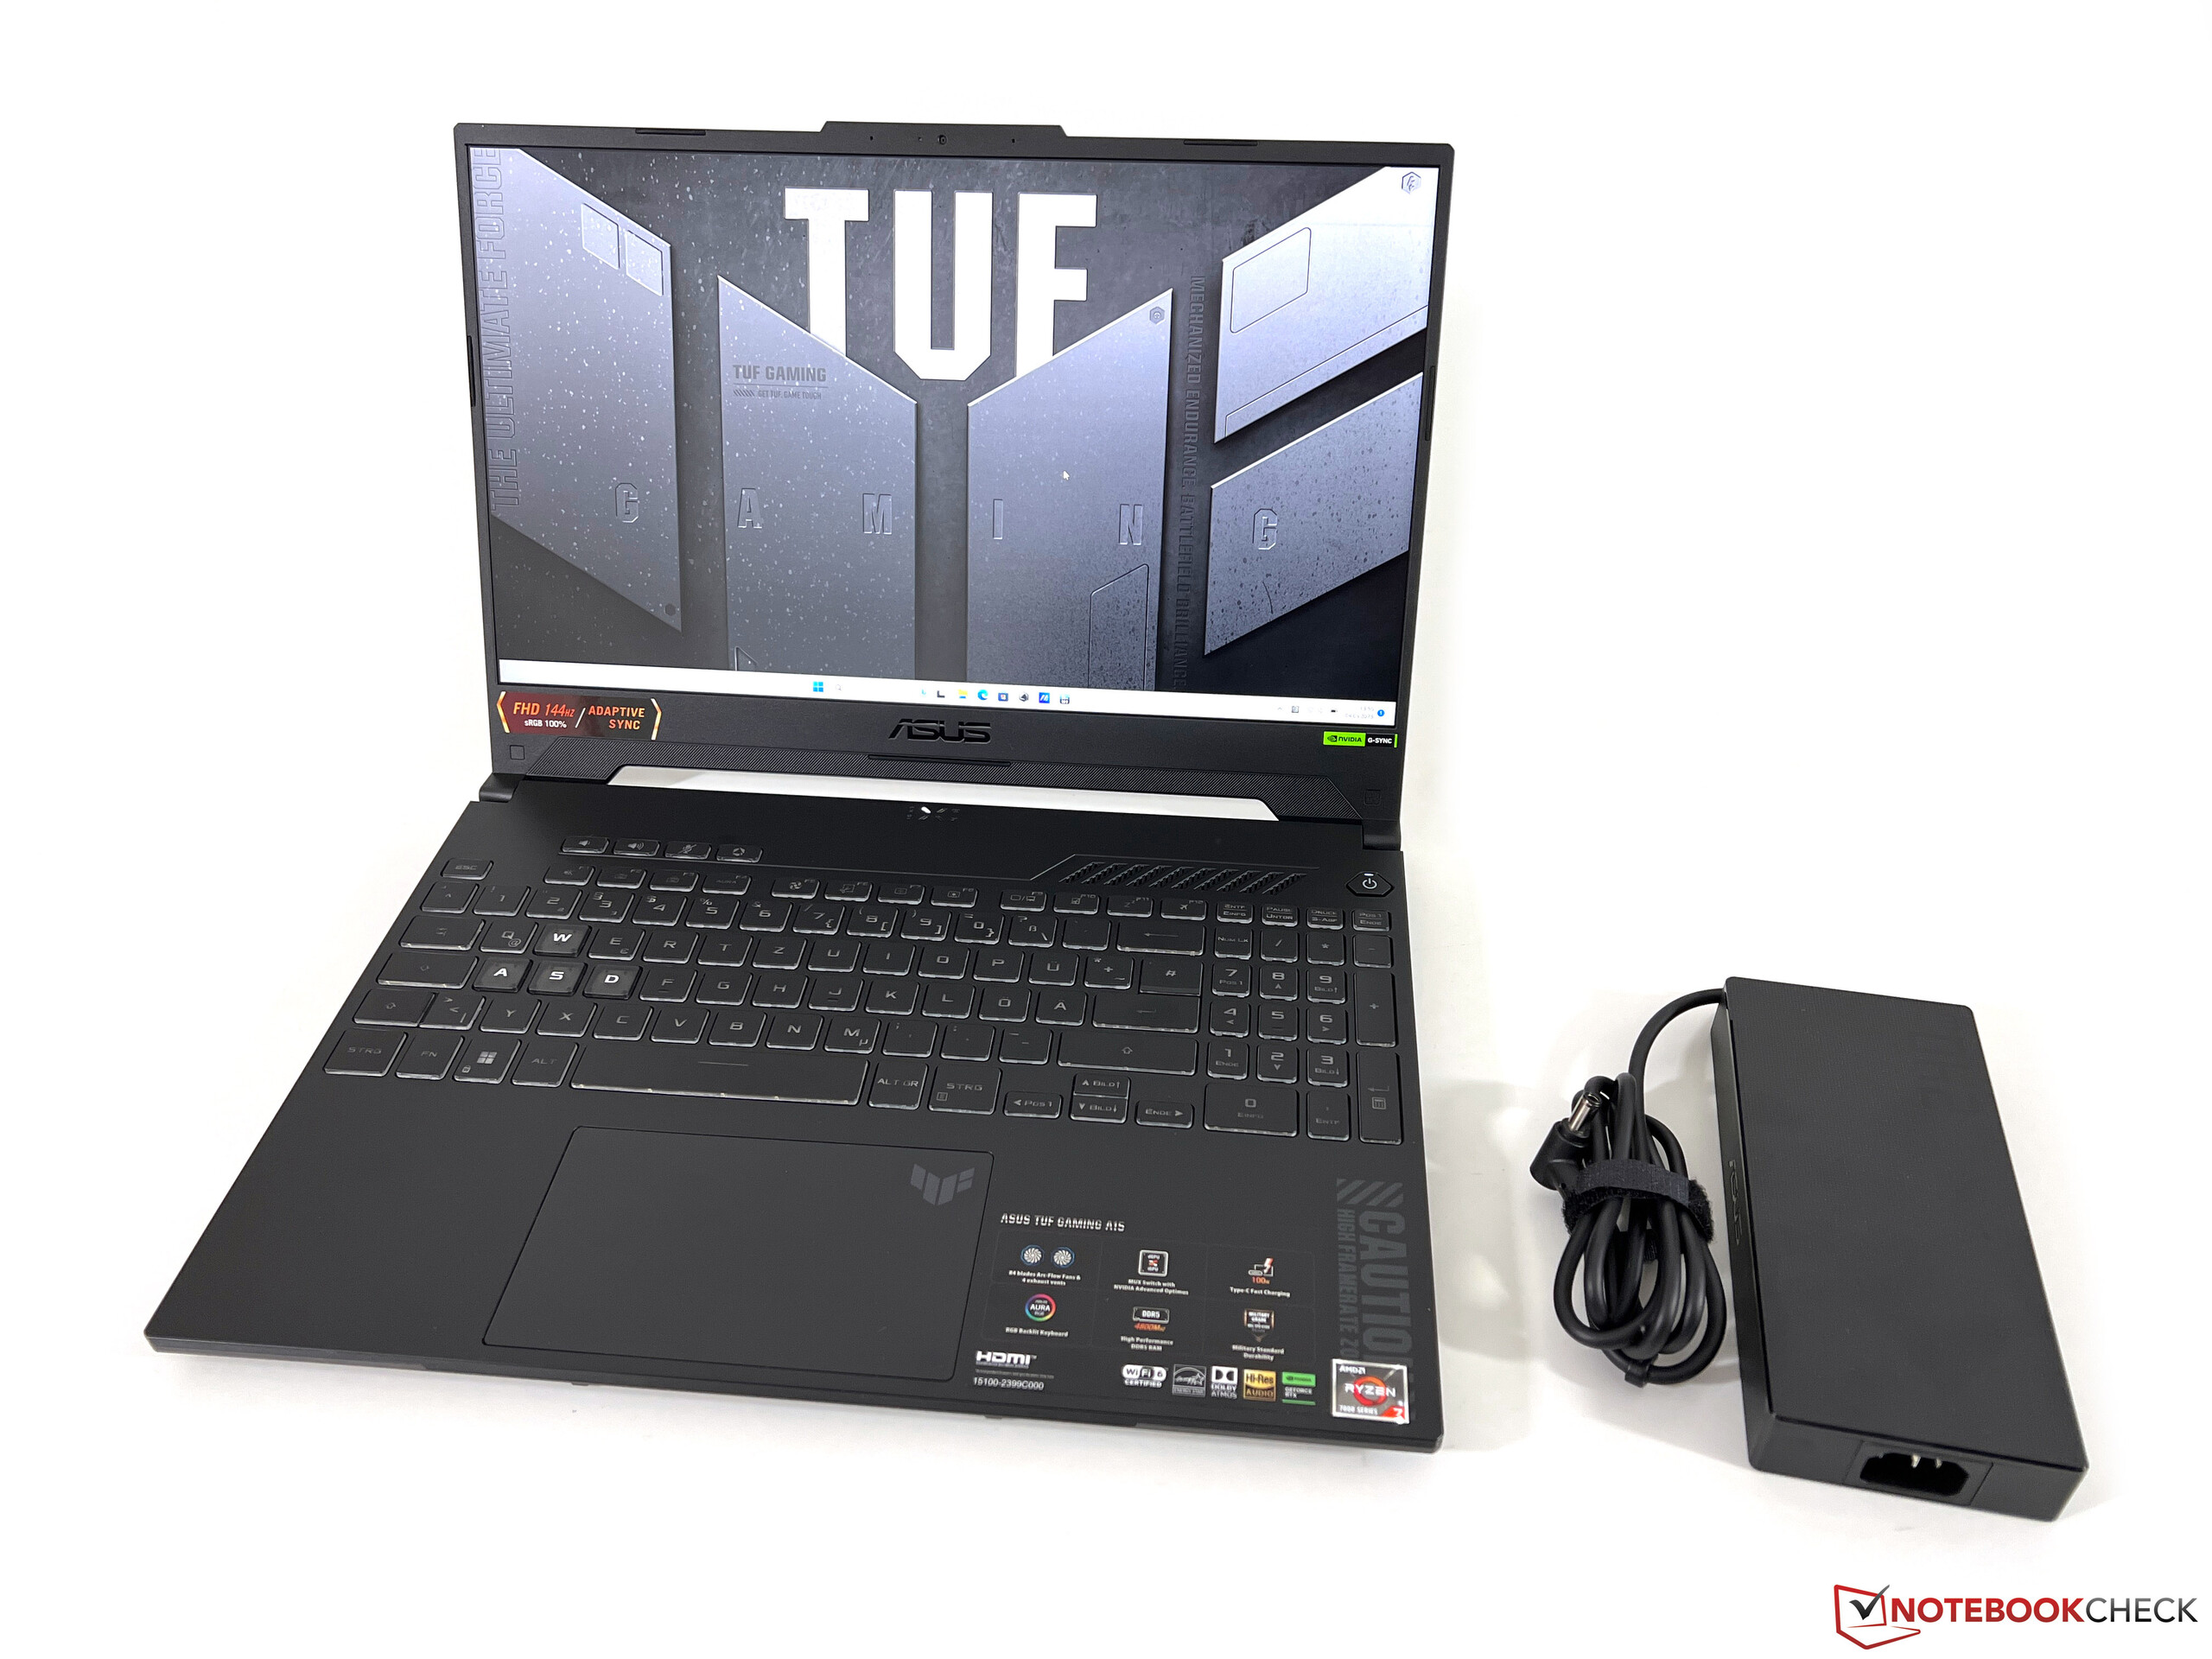
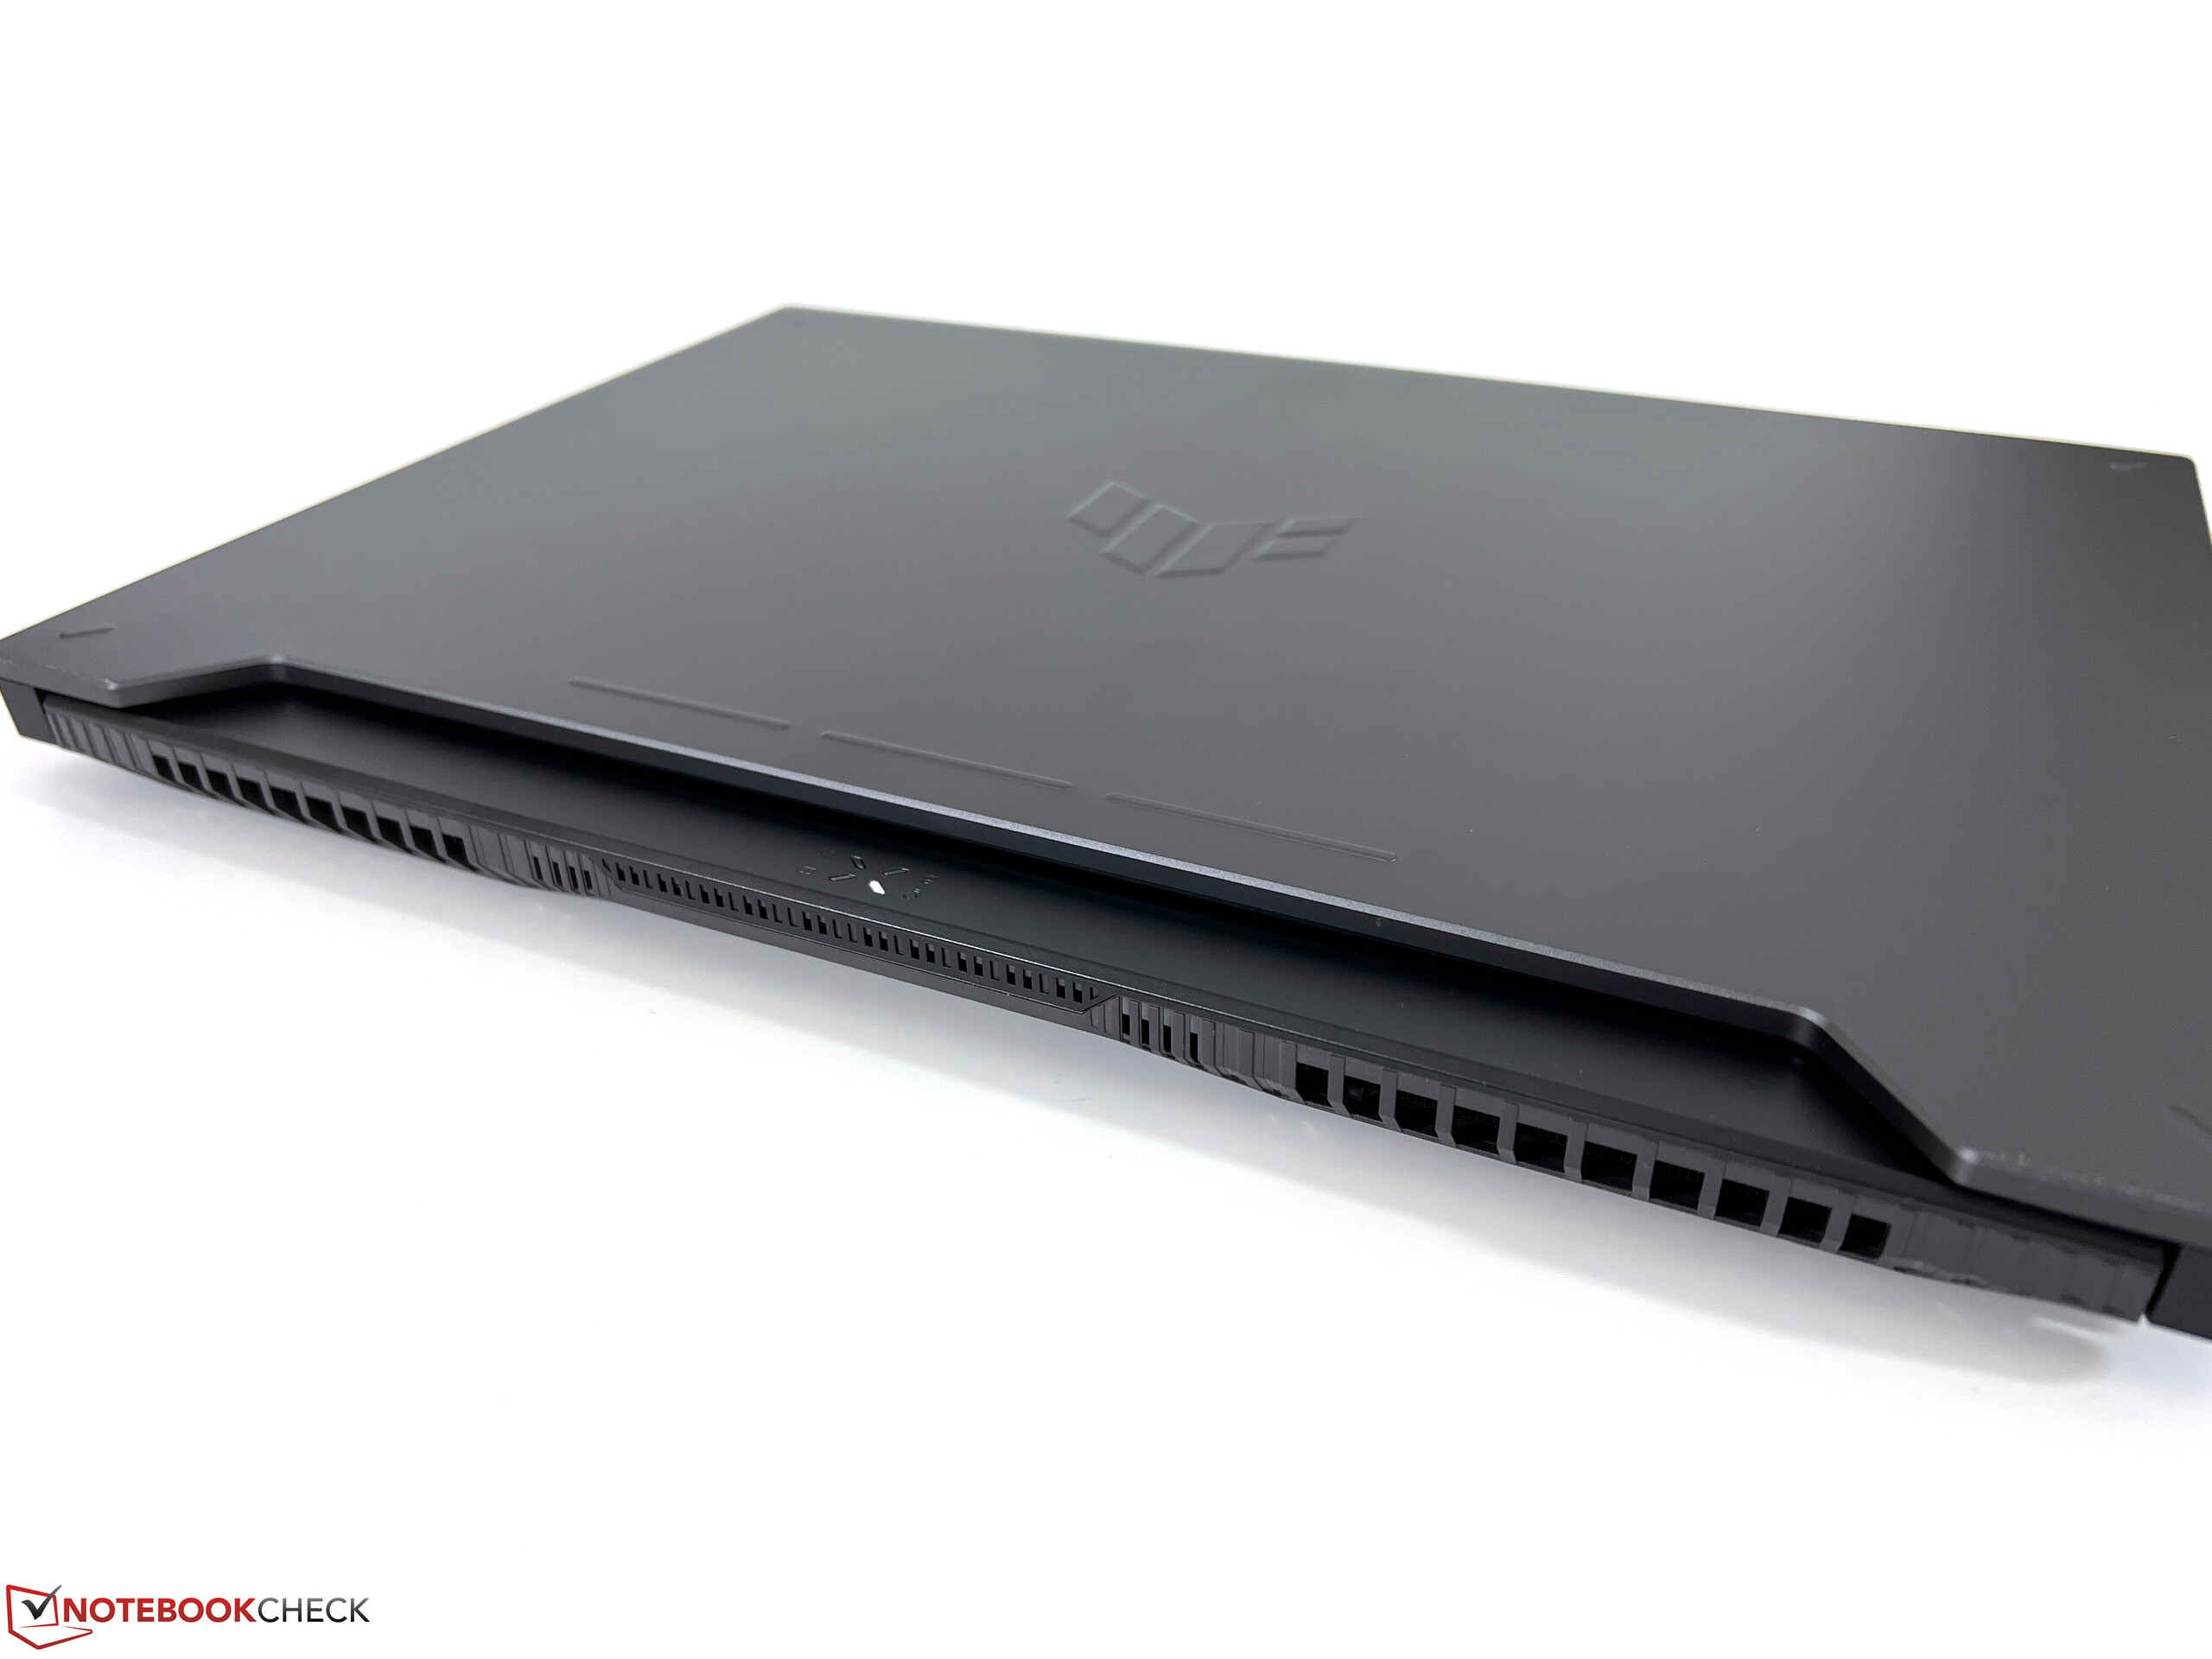
从尺寸上看,所有的竞争对手都很相似--但TUF Gaming A15拥有最小的蓝图。它的重量刚刚超过2.1公斤,使笔记本电脑相对便携,你很可能会把它装进大多数背包或袋子里。附带的240瓦电源的重量为额外的735克。
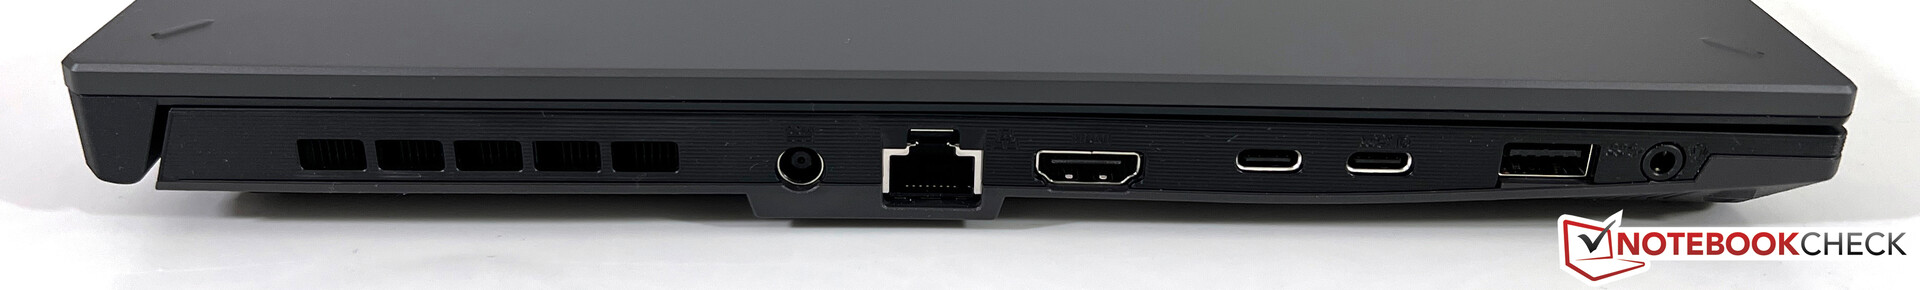
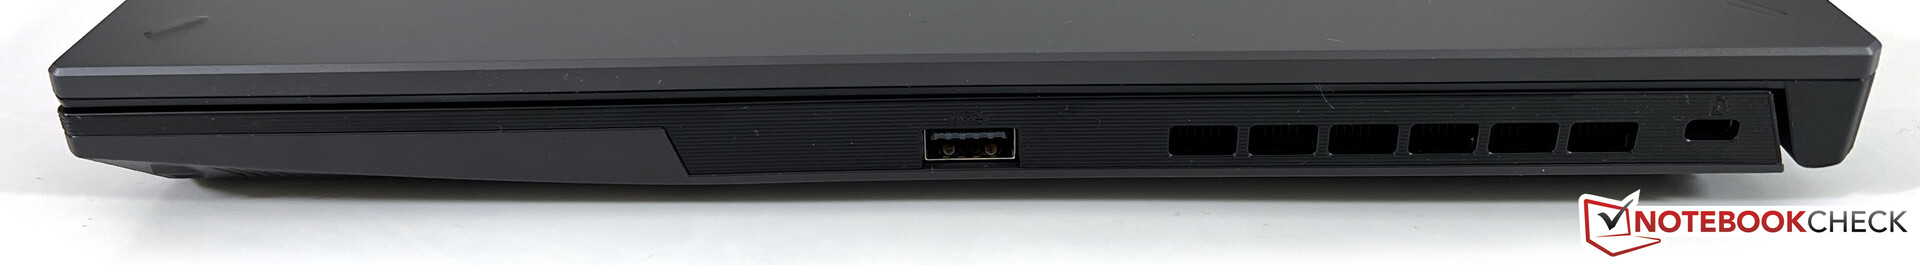
连接性 - 华硕已经包括了USB 4
基本单元的后面部分被冷却装置占据,几乎所有的端口都位于设备的左侧。只有一个USB端口在右侧。如果你使用所有的端口,空间可能会变得有点紧张。有两个USB-C端口,其中一个支持USB 4.0,另一个支持G-Sync,如果你连接一个相应的显示器。
沟通
除了千兆以太网端口外,该笔记本电脑还使用了联发科MT7921无线局域网模块,支持Wi-Fi 6和160-MHz频段的连接。然而,其最大传输速率为1200比特/秒。在我们使用华硕的参考路由器进行的测试中,这些速率得到了证实,虽然它们是体面的,但市场上肯定有更快的WLAN模块。在一天结束时,这不应该在日常使用中造成任何问题(例如,在下载内容时)。
| Networking | |
| Asus TUF A15 FA507 | |
| iperf3 transmit AXE11000 | |
| iperf3 receive AXE11000 | |
| Gigabyte G5 KE | |
| iperf3 transmit AXE11000 | |
| iperf3 receive AXE11000 | |
| Schenker XMG Core 15 (M22) | |
| iperf3 transmit AXE11000 | |
| iperf3 receive AXE11000 | |
| iperf3 transmit AXE11000 6GHz | |
| iperf3 receive AXE11000 6GHz | |
| MSI Katana 15 B12VEK | |
| iperf3 transmit AXE11000 | |
| iperf3 receive AXE11000 | |
| HP Victus 15 fa0020nr | |
| iperf3 transmit AXE11000 | |
| iperf3 receive AXE11000 | |
| Lenovo IdeaPad Gaming 3 15IAH7 | |
| iperf3 receive AXE11000 | |
| Asus TUF Gaming F15 FX507ZM | |
| iperf3 transmit AX12 | |
| iperf3 receive AX12 | |
网络摄像头
尽管TUF Gaming A15的摄像头有一个凸起,但它只能达到720p,即使在良好的照明条件下也很难拍出像样的照片。它的锐利度极低,颜色也描绘得不是很准确。


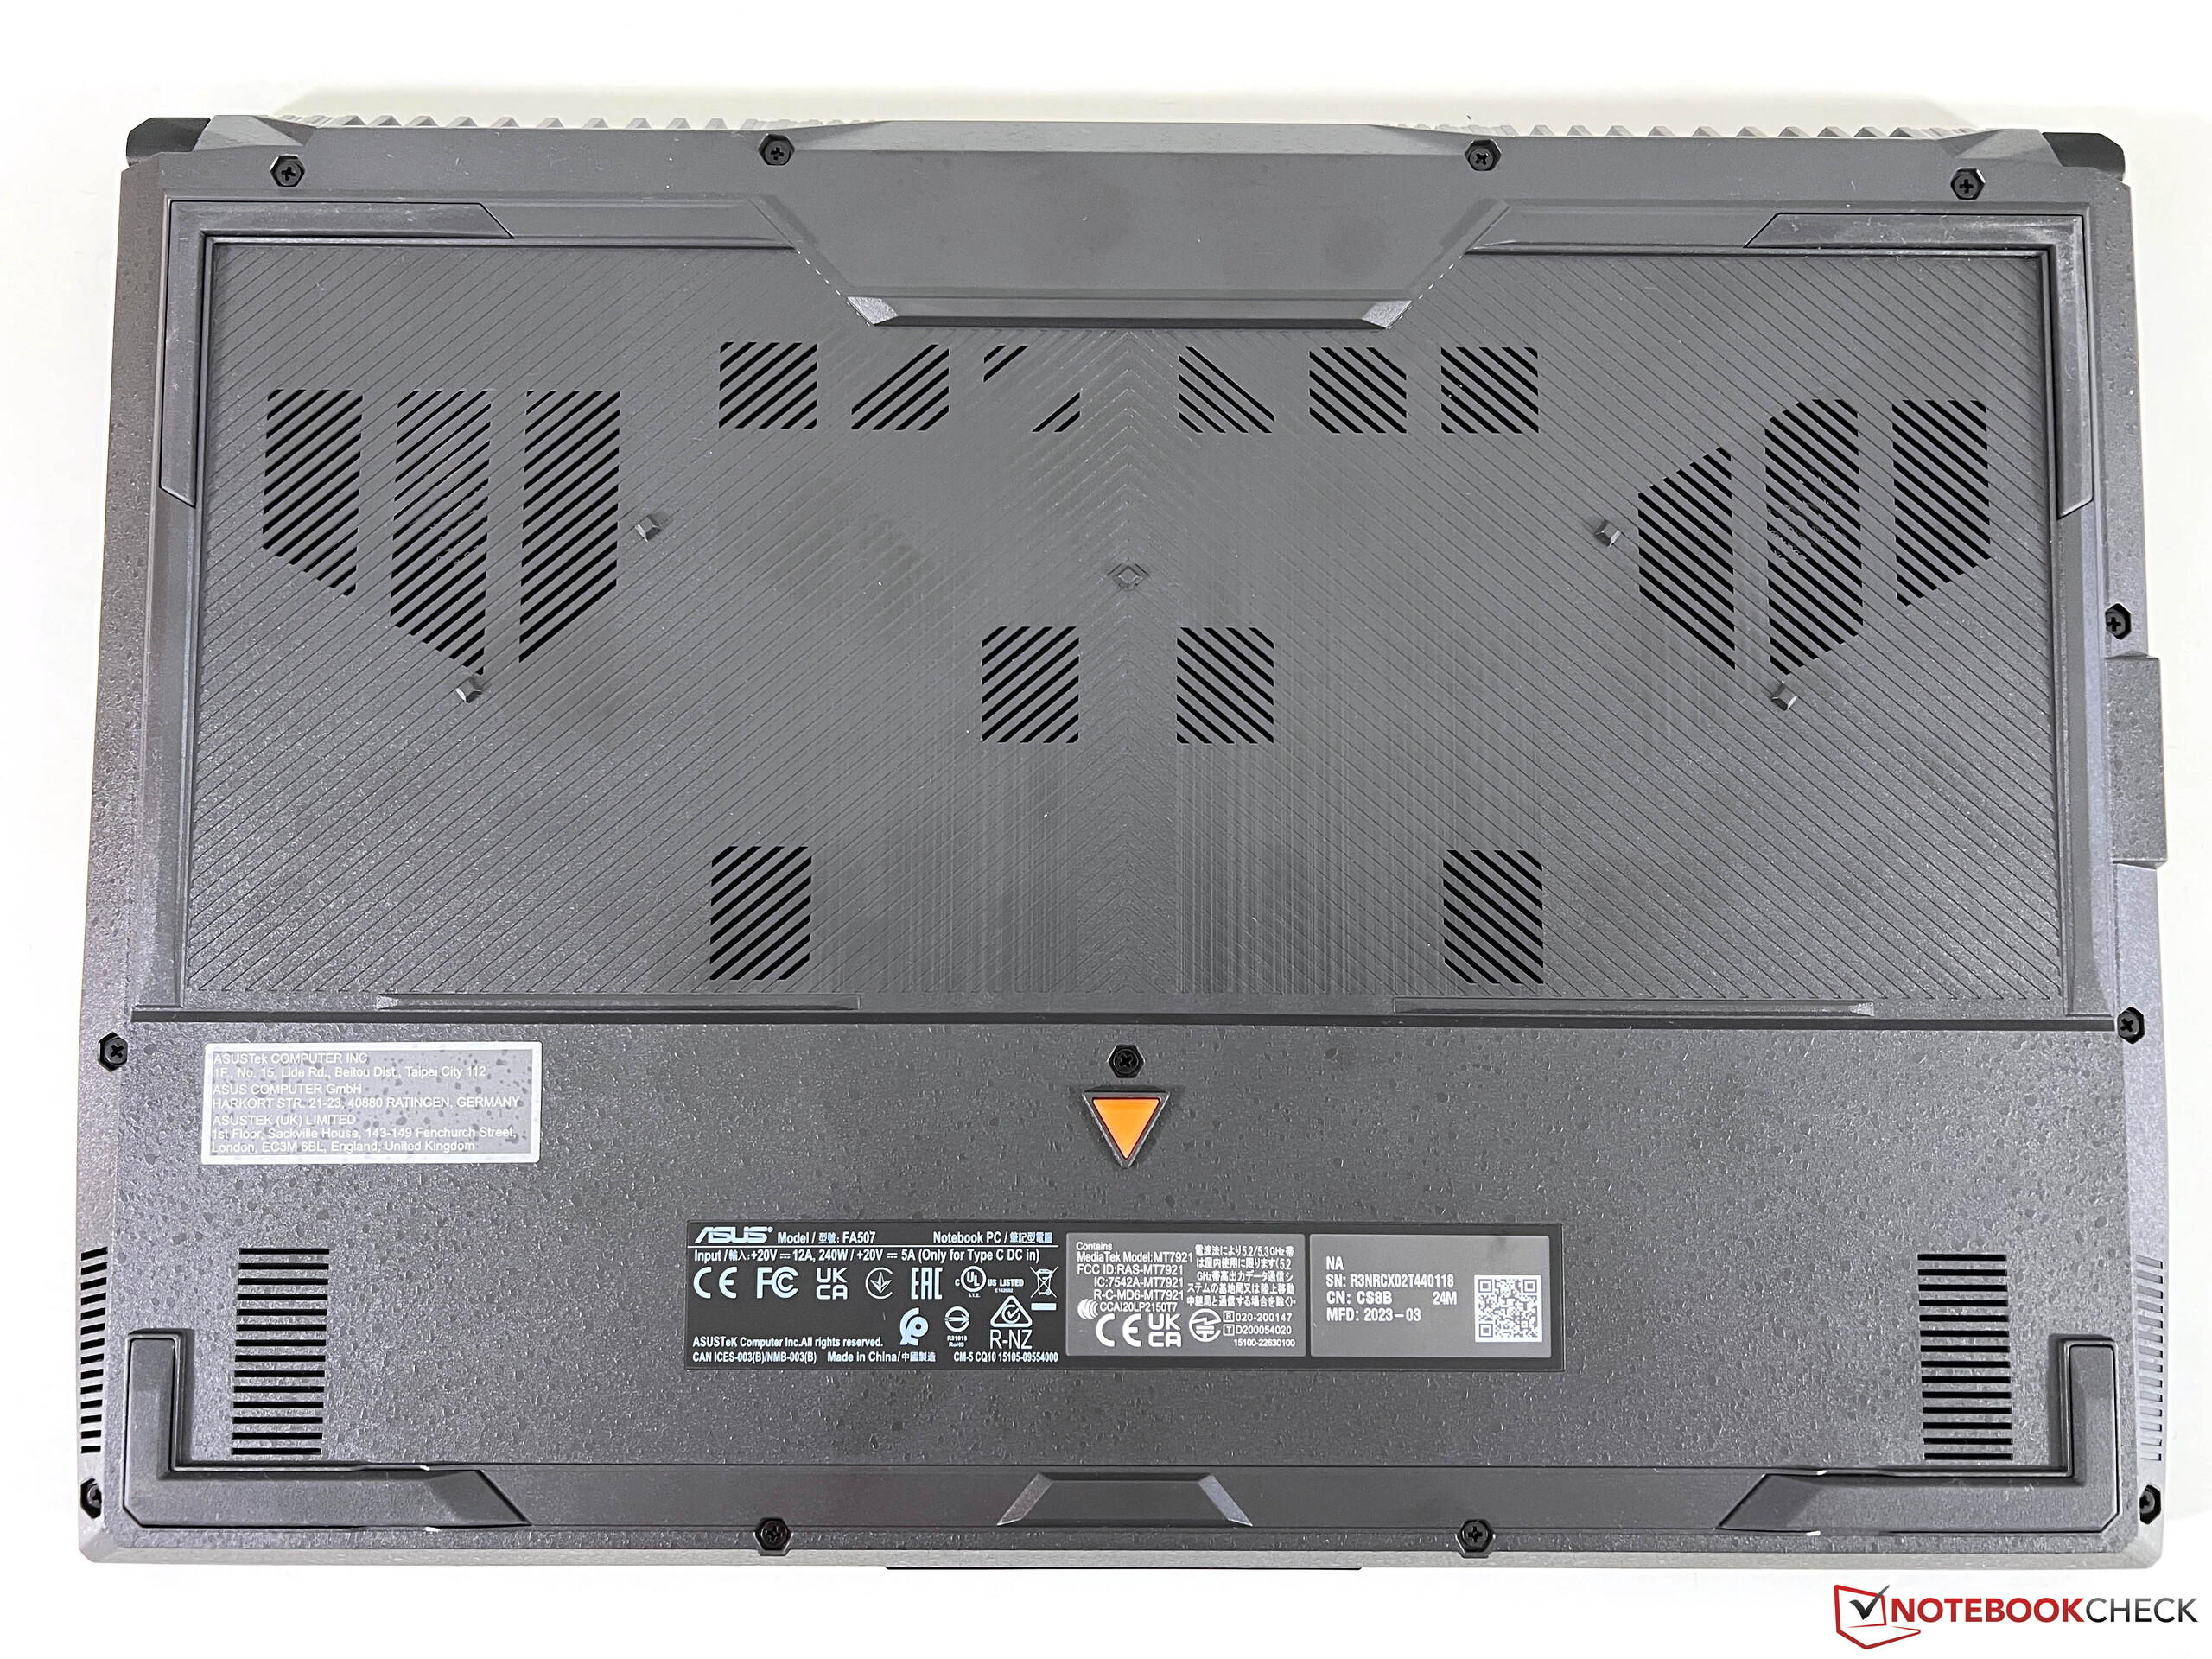
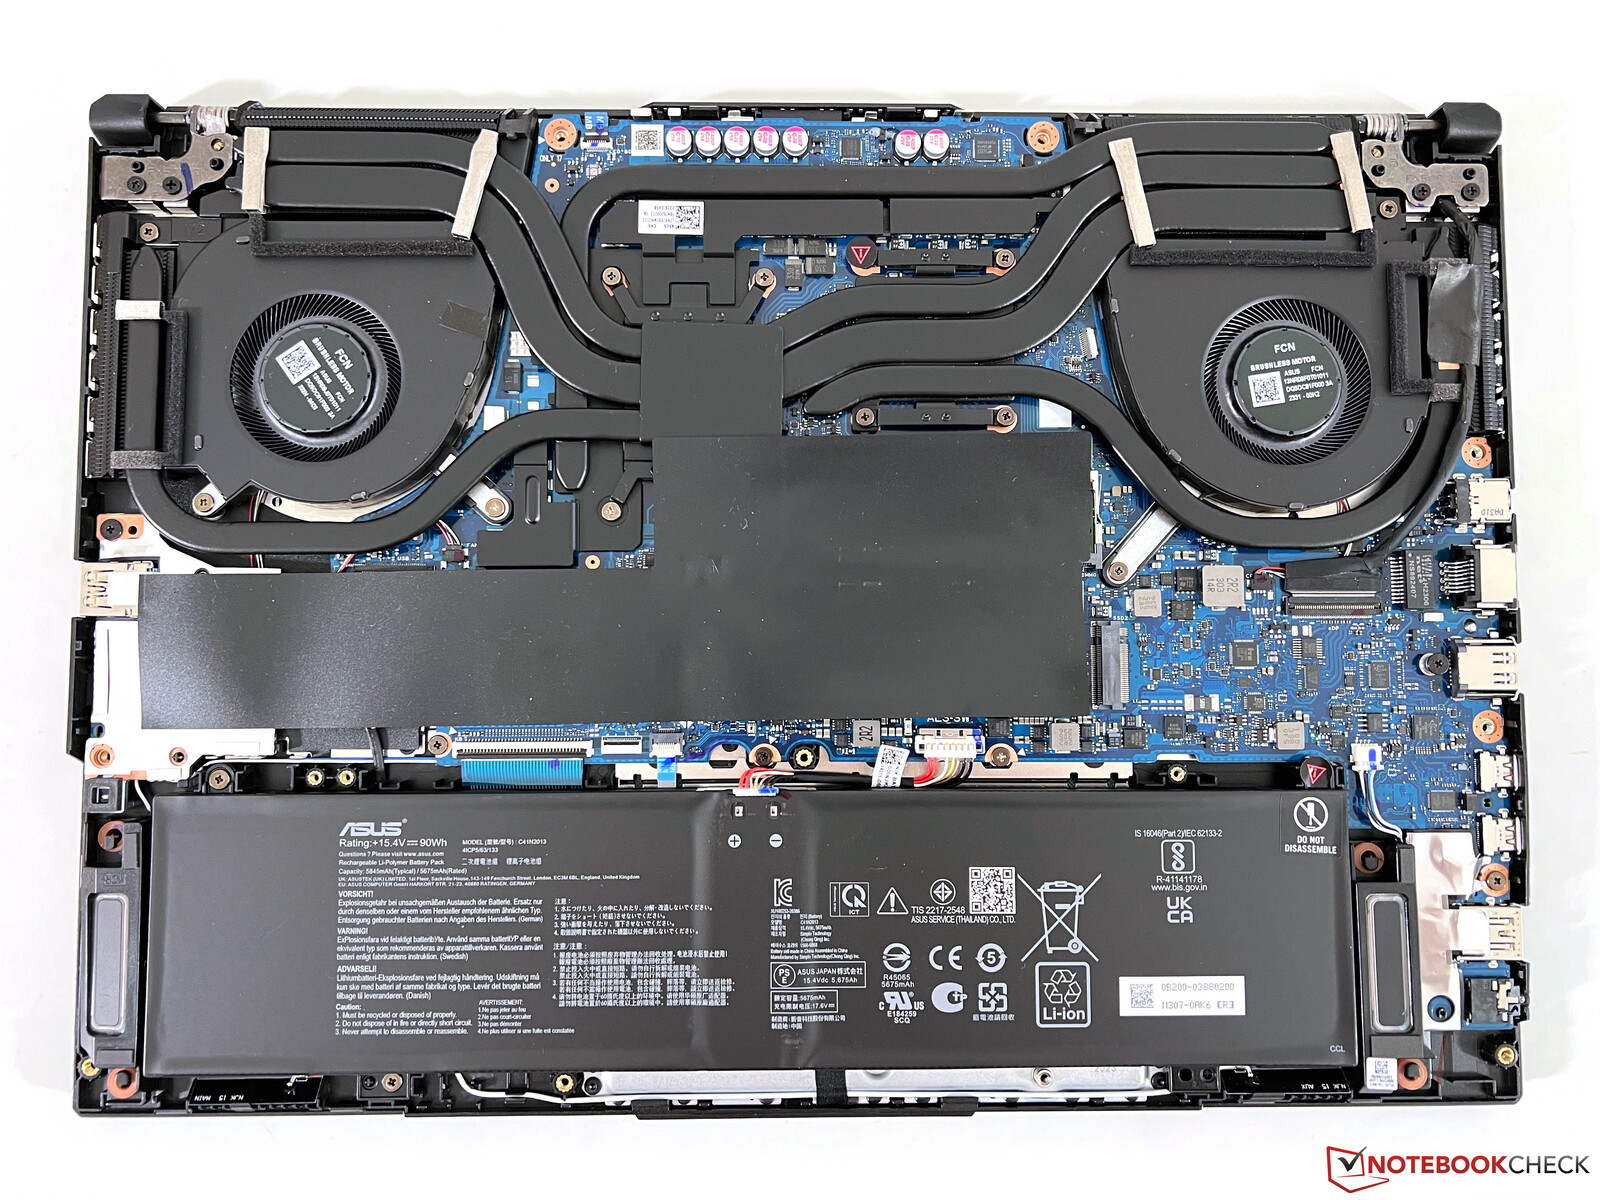
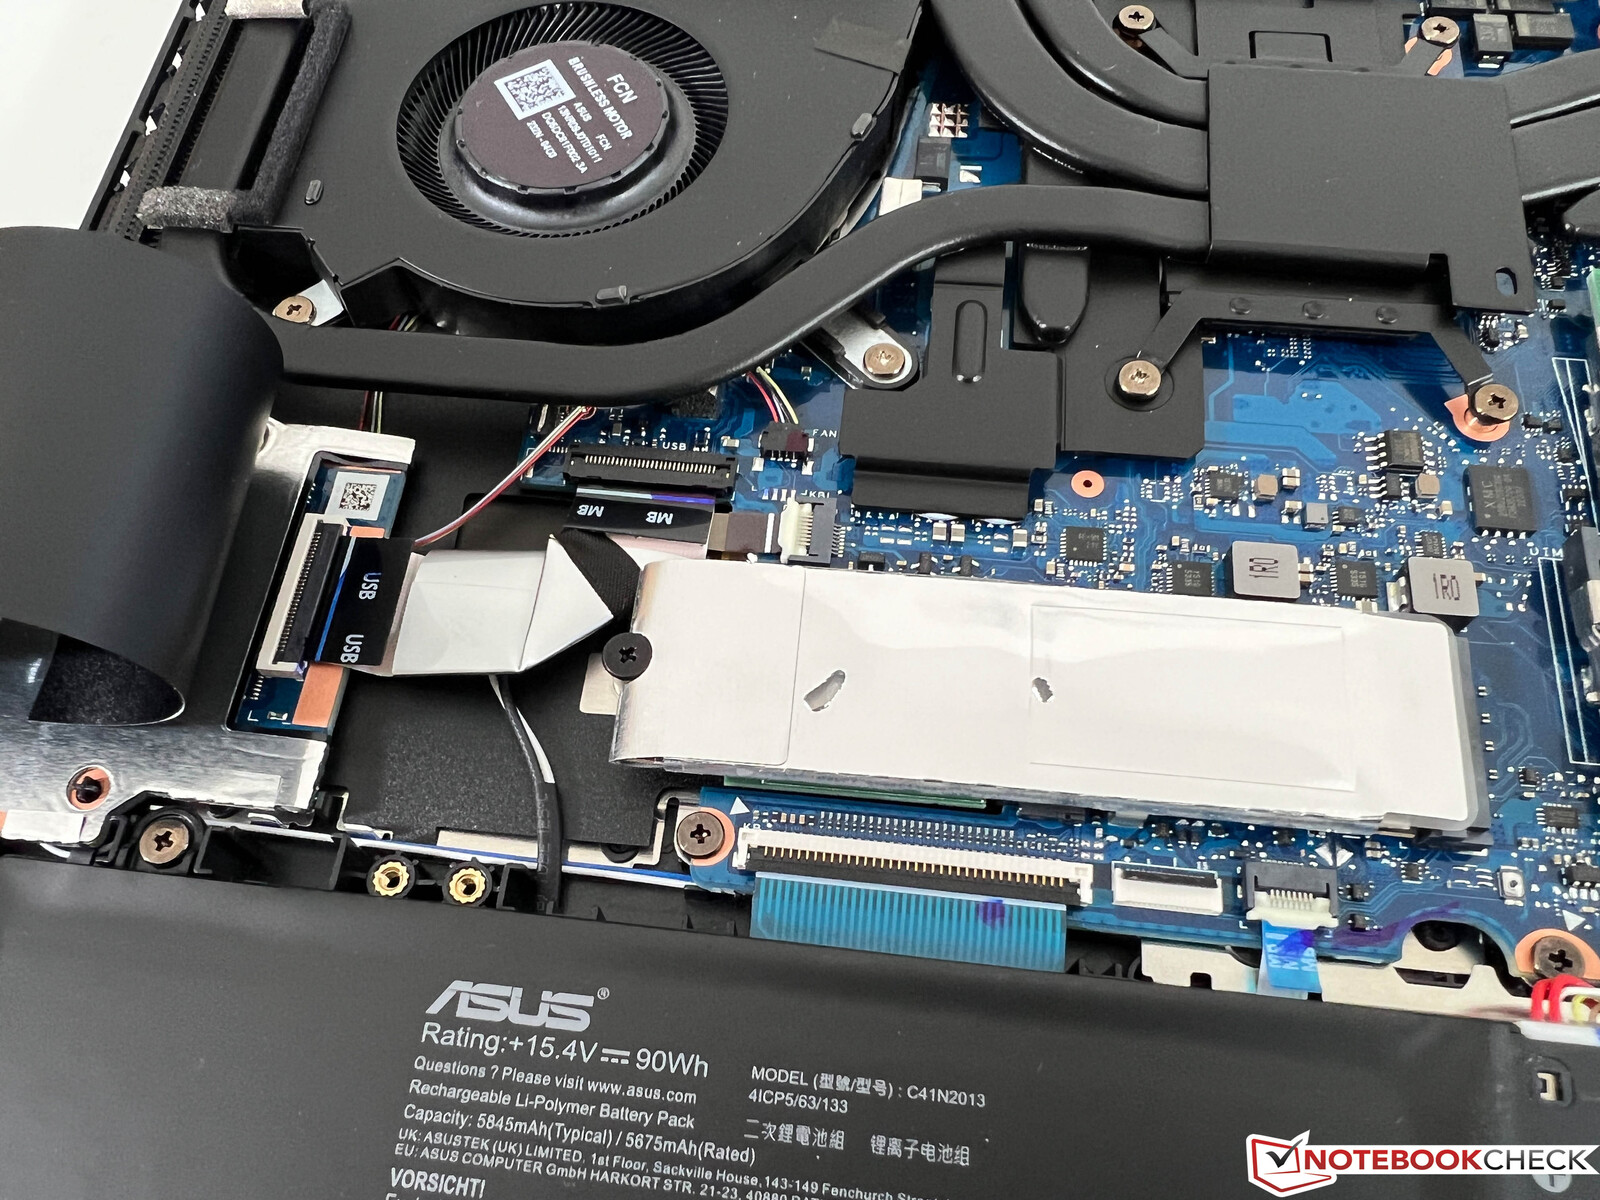
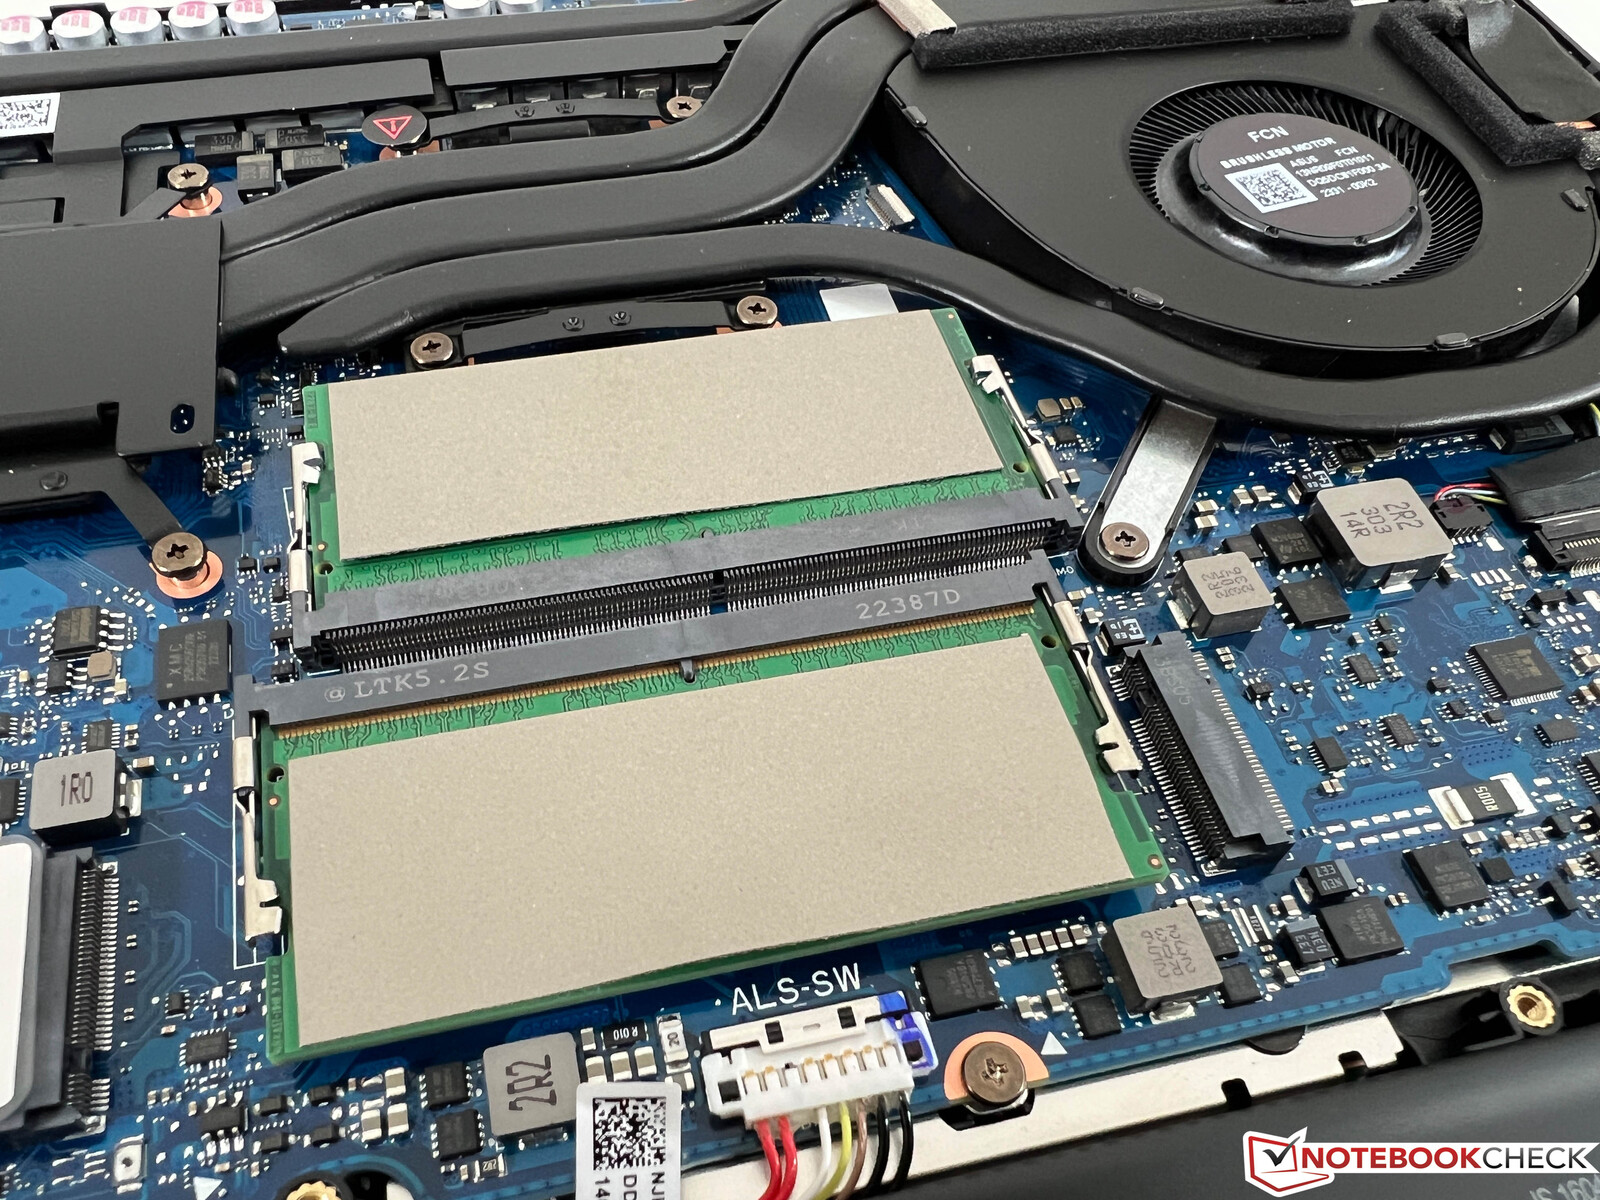
维护
底部的机箱盖与设备的其他部分连接得很紧--即使在松开螺丝之后。拆卸机箱的这一部分被证明是有点麻烦的。一旦你这样做了,你就可以接触到两个内存插槽、电池、风扇和M.2 2280 SSD。
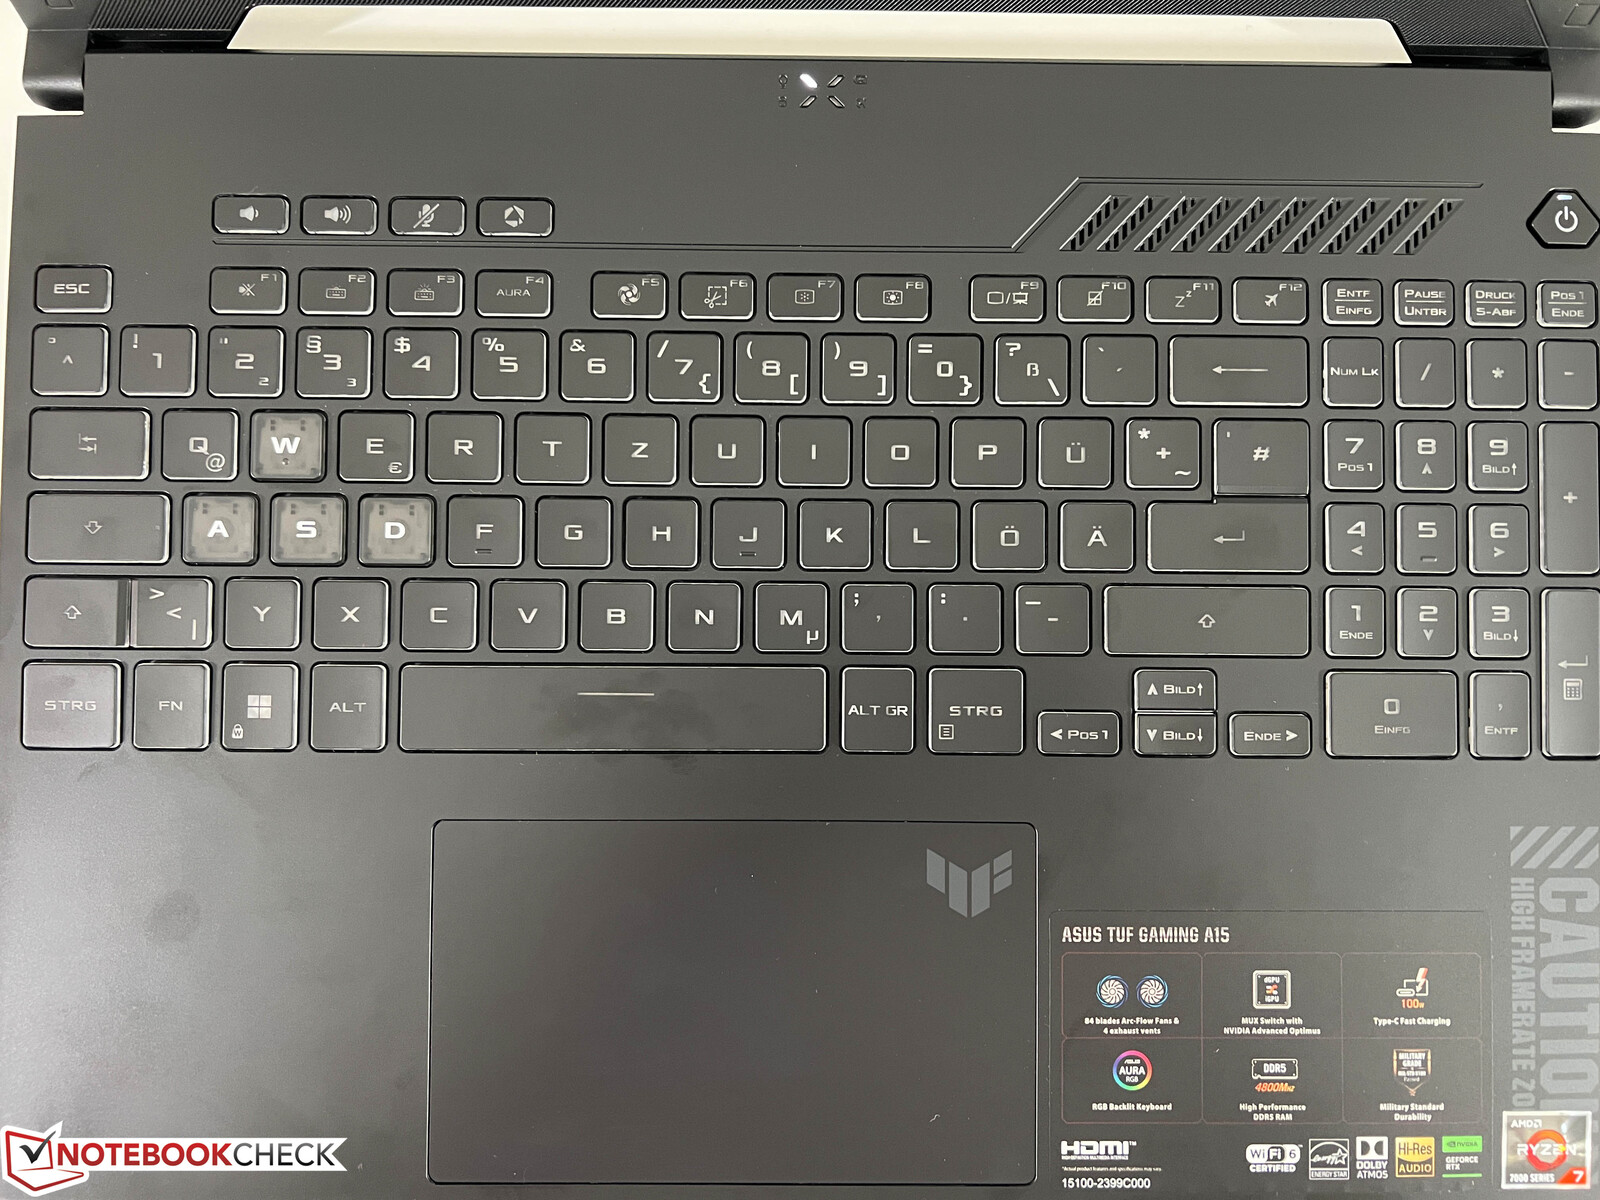
输入设备 - 带有数字键盘的大键盘
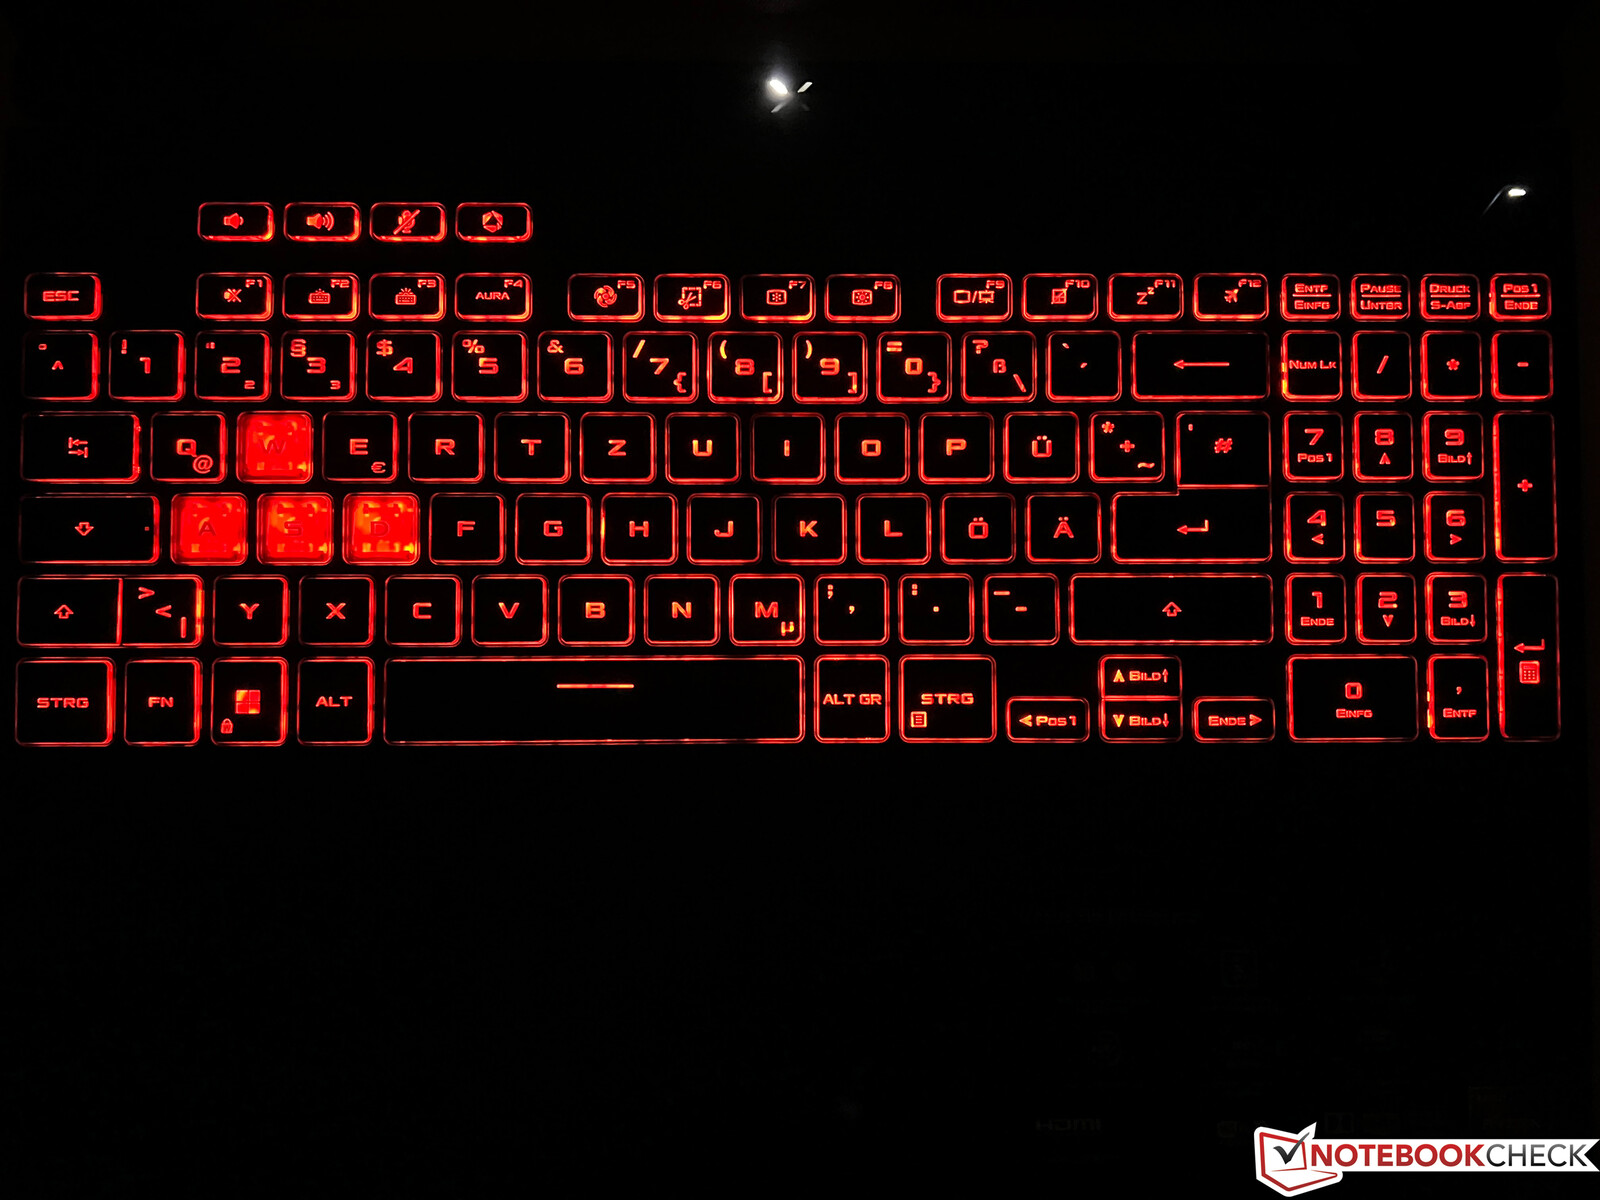
键盘有一个专门的数字键盘,在上面打字很舒服。然而,问题在于键盘上的标签。除了WASD键是白色的外,其他所有的键都有透明的标签。因此,即使在良好的照明条件下,启动背光灯通常也会更舒适。有三个照明级别,你也可以选择自己的颜色--在一个区域内。它的布局很好,但你必须习惯于单行的回车键。在常规键盘的上方,还有四个特殊的按键:三个是用来控制音量的,一个可以个人分配。必须说,对于一台游戏笔记本来说,方向键特别小。
触摸板工作得很好--普通的手指运动可以顺利输入,其表面有很好的感觉。它的点击噪音也很好,很安静。总的来说,性能稳定,当然,大多数用户会转向使用外部鼠标或控制器,反正。
显示屏 - 144-Hz的IPS面板

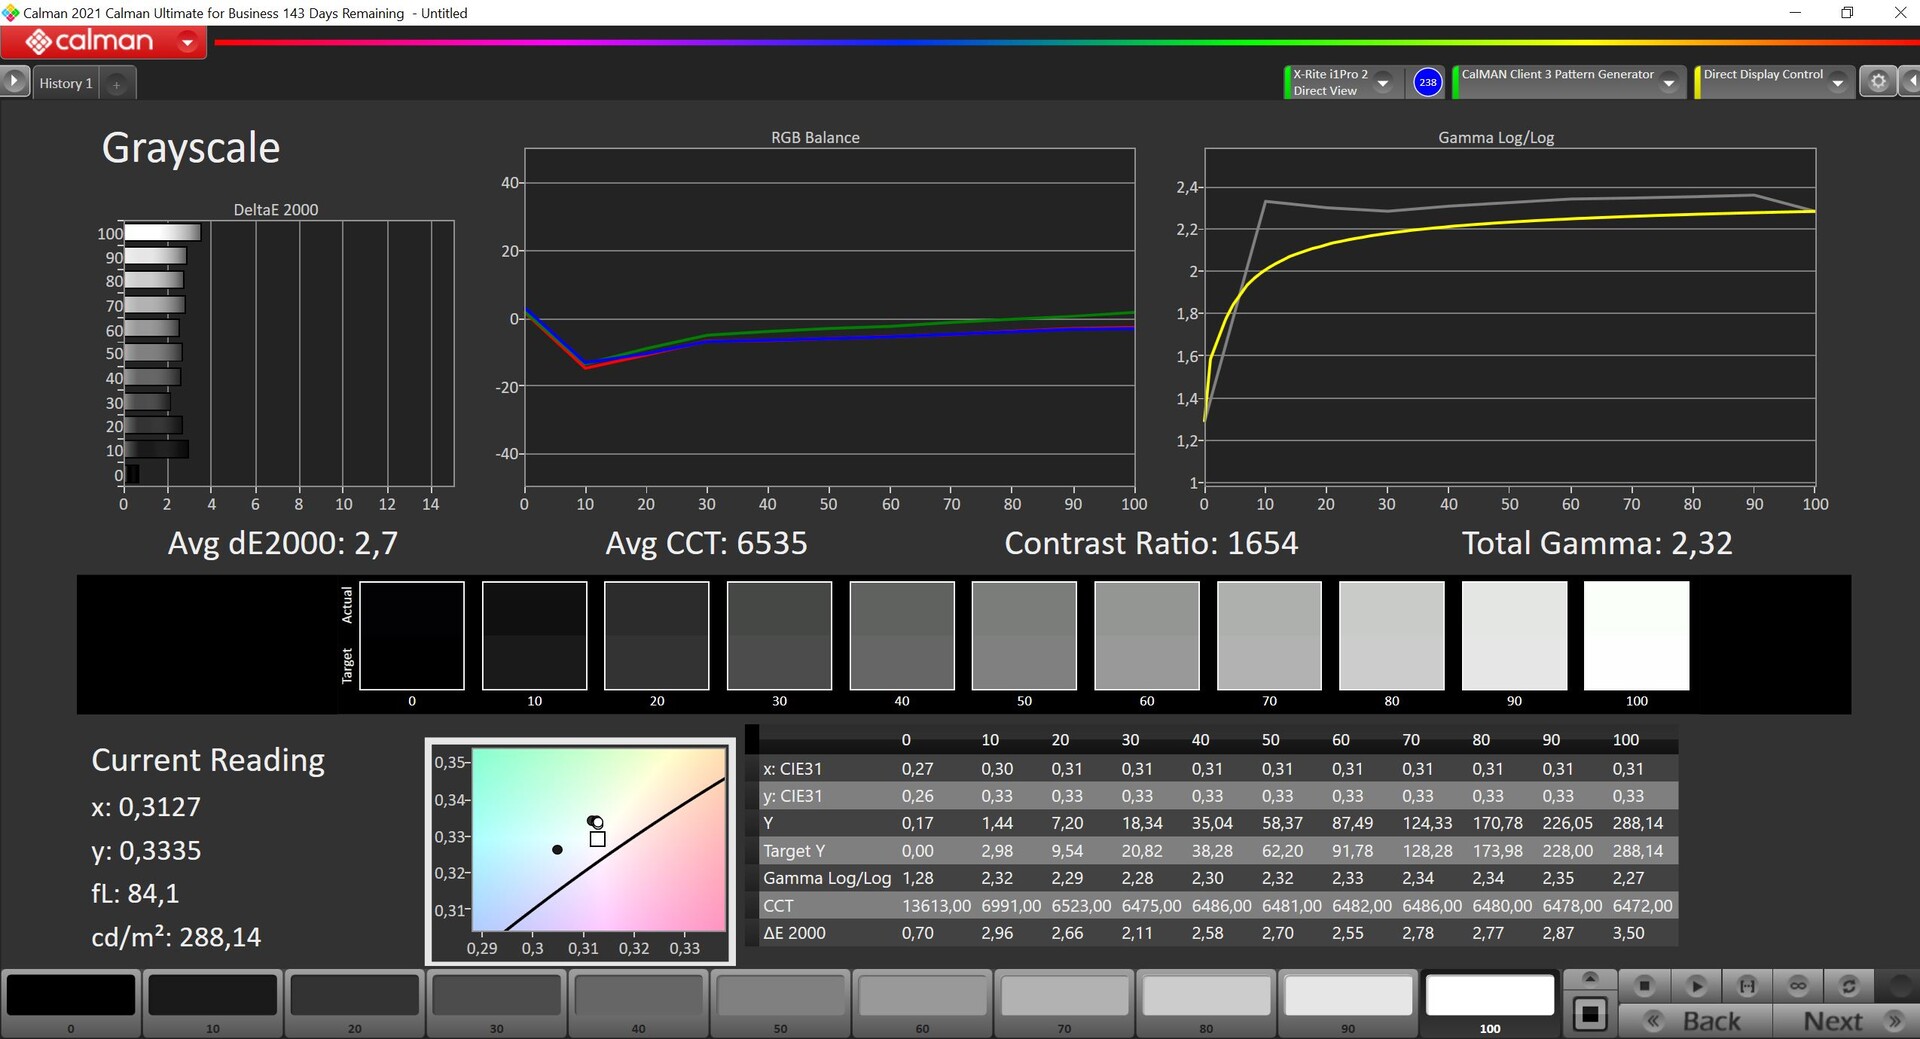
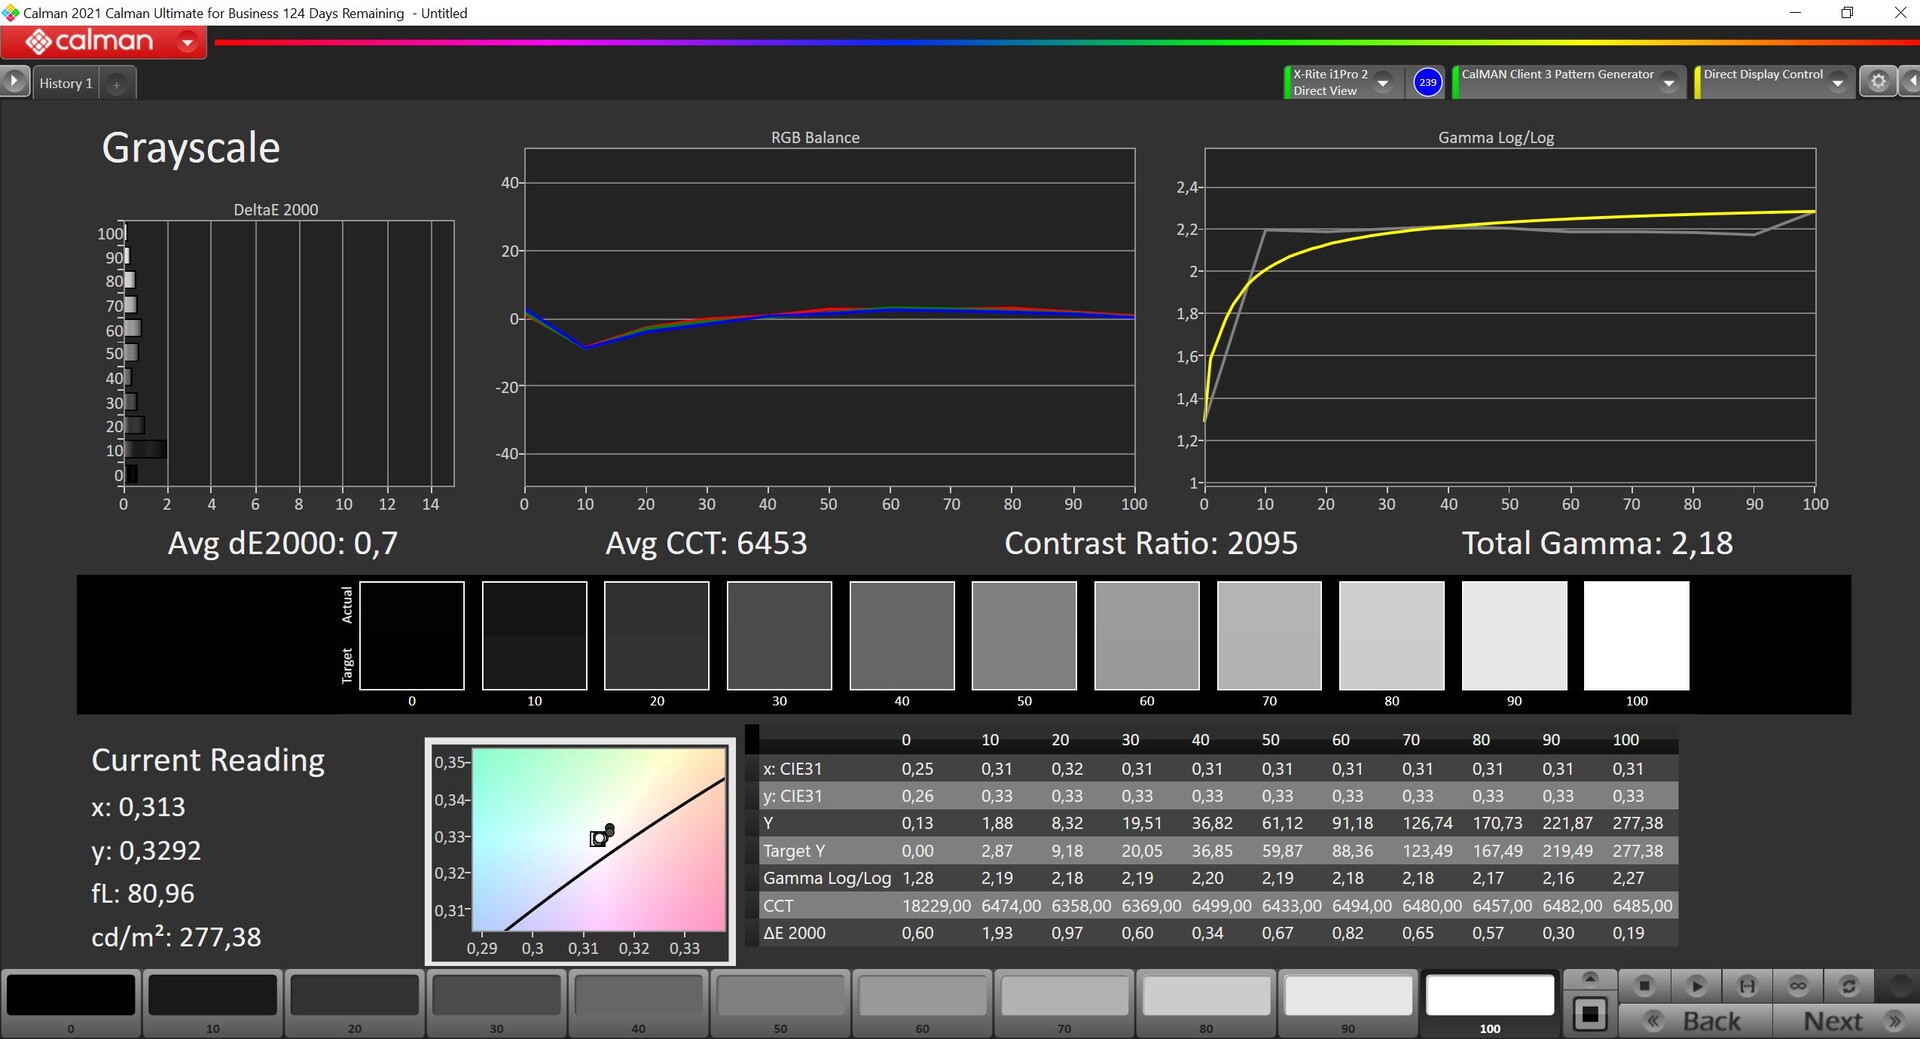
这台笔记本电脑有一个相对简单的哑光IPS面板,分辨率为全高清(1,920 x 1,080像素),格式为16:9。主观上,它给我们留下了相当好的印象--内容被描绘得足够清晰,浅色区域看起来没有颗粒感。它的144赫兹刷新率有助于快速移动,而且没有PWM闪烁,但总的来说,这块屏幕并没有什么值得称道的地方。
广告上说的屏幕亮度是250cd/m²,但我们测量的是270cd/m²(平均)。当然,这不是最好的,但对于室内使用和室外(如果阳光不强的话)来说,这已经足够了。反过来,它的黑值也很一般,这意味着它的对比度最多只能测到~1.700:1。该设备的反应速度对于游戏笔记本来说有点慢,当屏幕完全变暗时,你可以看到一些明显的背光渗漏。在日常使用中,这不应该是太大的烦恼。
| |||||||||||||||||||||||||
Brightness Distribution: 91 %
Center on Battery: 288 cd/m²
Contrast: 1694:1 (Black: 0.17 cd/m²)
ΔE ColorChecker Calman: 1.9 | ∀{0.5-29.43 Ø4.71}
calibrated: 0.9
ΔE Greyscale Calman: 2.7 | ∀{0.09-98 Ø4.96}
66.6% AdobeRGB 1998 (Argyll 3D)
96.5% sRGB (Argyll 3D)
64.9% Display P3 (Argyll 3D)
Gamma: 2.32
CCT: 6535 K
| Asus TUF A15 FA507 N156HMA-GA1, IPS, 1920x1080, 15.6" | Gigabyte G5 KE Chi Mei N156HRA-EA1, IPS, 1920x1080, 15.6" | Schenker XMG Core 15 (M22) CSOT MNF601CA1-1, IPS, 2560x1440, 15.6" | MSI Katana 15 B12VEK AUOAF90 (B156HAN08.4), IPS, 1920x1080, 15.6" | HP Victus 15 fa0020nr CMN1521, IPS, 1920x1080, 15.6" | Lenovo IdeaPad Gaming 3 15IAH7 Lenovo LEN156FHD, IPS, 1920x1080, 15.6" | Asus TUF Gaming F15 FX507ZM TL156VDXP0101, IPS, 1920x1080, 15.6" | |
|---|---|---|---|---|---|---|---|
| Display | -37% | 5% | -41% | -35% | 5% | 2% | |
| Display P3 Coverage (%) | 64.9 | 40.7 -37% | 68.8 6% | 38.1 -41% | 42 -35% | 69.1 6% | 66.4 2% |
| sRGB Coverage (%) | 96.5 | 61 -37% | 99.3 3% | 56.8 -41% | 62.7 -35% | 99.2 3% | 97 1% |
| AdobeRGB 1998 Coverage (%) | 66.6 | 42.1 -37% | 69.9 5% | 39.3 -41% | 43.4 -35% | 69.9 5% | 68.5 3% |
| Response Times | 11% | 55% | -29% | -24% | 59% | 60% | |
| Response Time Grey 50% / Grey 80% * (ms) | 30.4 ? | 26.64 ? 12% | 16 ? 47% | 38.8 ? -28% | 35.2 ? -16% | 13 ? 57% | 5.6 ? 82% |
| Response Time Black / White * (ms) | 20.8 ? | 18.65 ? 10% | 7.6 ? 63% | 26.8 ? -29% | 27.2 ? -31% | 8.4 ? 60% | 12.8 ? 38% |
| PWM Frequency (Hz) | |||||||
| Screen | -129% | -48% | -133% | -82% | -45% | -3% | |
| Brightness middle (cd/m²) | 288 | 269 -7% | 378 31% | 261 -9% | 284.3 -1% | 338 17% | 353.7 23% |
| Brightness (cd/m²) | 271 | 248 -8% | 371 37% | 258 -5% | 262 -3% | 329 21% | 340 25% |
| Brightness Distribution (%) | 91 | 85 -7% | 93 2% | 92 1% | 87 -4% | 92 1% | 89 -2% |
| Black Level * (cd/m²) | 0.17 | 0.5 -194% | 0.33 -94% | 0.19 -12% | 0.17 -0% | 0.27 -59% | 0.34 -100% |
| Contrast (:1) | 1694 | 538 -68% | 1145 -32% | 1374 -19% | 1672 -1% | 1252 -26% | 1040 -39% |
| Colorchecker dE 2000 * | 1.9 | 4.54 -139% | 2.84 -49% | 5.57 -193% | 4.52 -138% | 2.88 -52% | 1.74 8% |
| Colorchecker dE 2000 max. * | 3.3 | 17.28 -424% | 5.51 -67% | 20.6 -524% | 18.67 -466% | 9.35 -183% | 3.63 -10% |
| Colorchecker dE 2000 calibrated * | 0.9 | 3.34 -271% | 2.75 -206% | 4.63 -414% | 1.55 -72% | 1.22 -36% | 0.5 44% |
| Greyscale dE 2000 * | 2.7 | 3.8 -41% | 4.08 -51% | 3.19 -18% | 4.1 -52% | 5 -85% | 2.1 22% |
| Gamma | 2.32 95% | 2.17 101% | 2.4 92% | 2.45 90% | 2.3 96% | 2.162 102% | 2.3 96% |
| CCT | 6535 99% | 7408 88% | 5841 111% | 6146 106% | 6529 100% | 7497 87% | 6257 104% |
| Total Average (Program / Settings) | -52% /
-89% | 4% /
-22% | -68% /
-98% | -47% /
-64% | 6% /
-19% | 20% /
7% |
* ... smaller is better

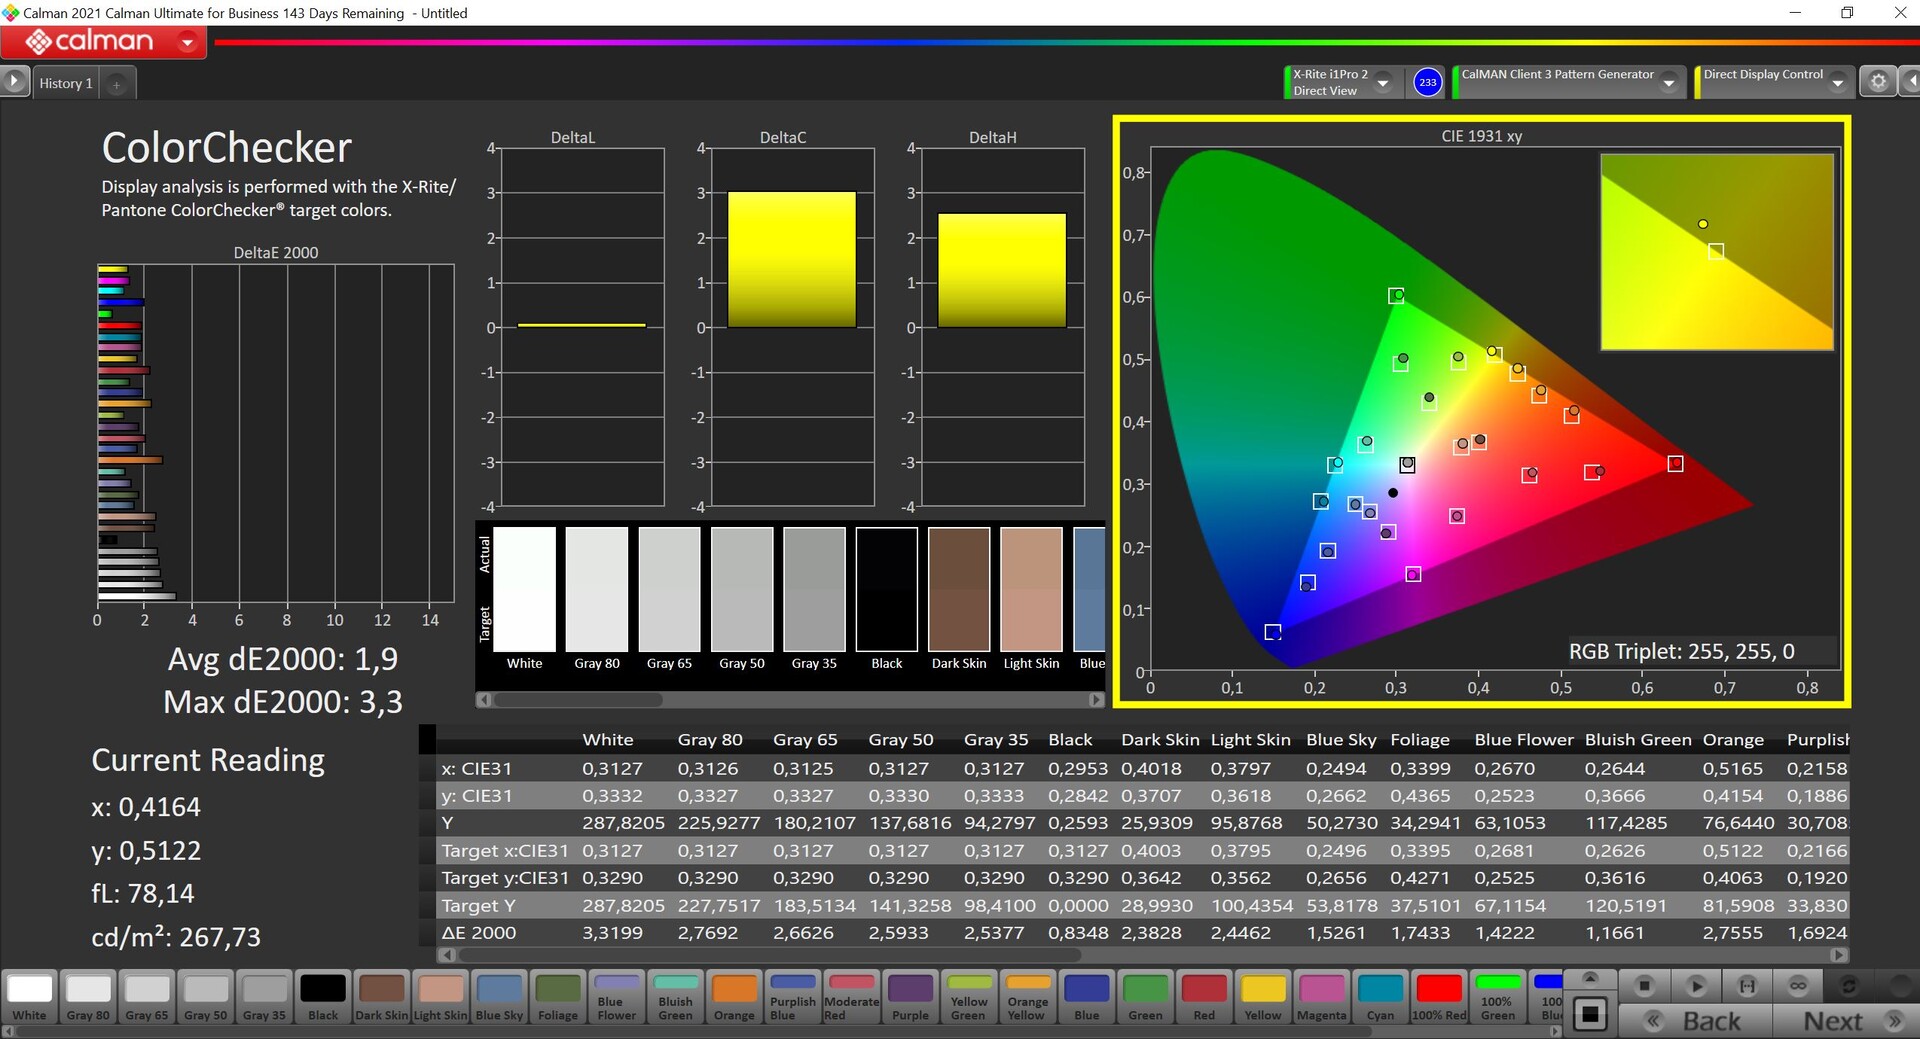
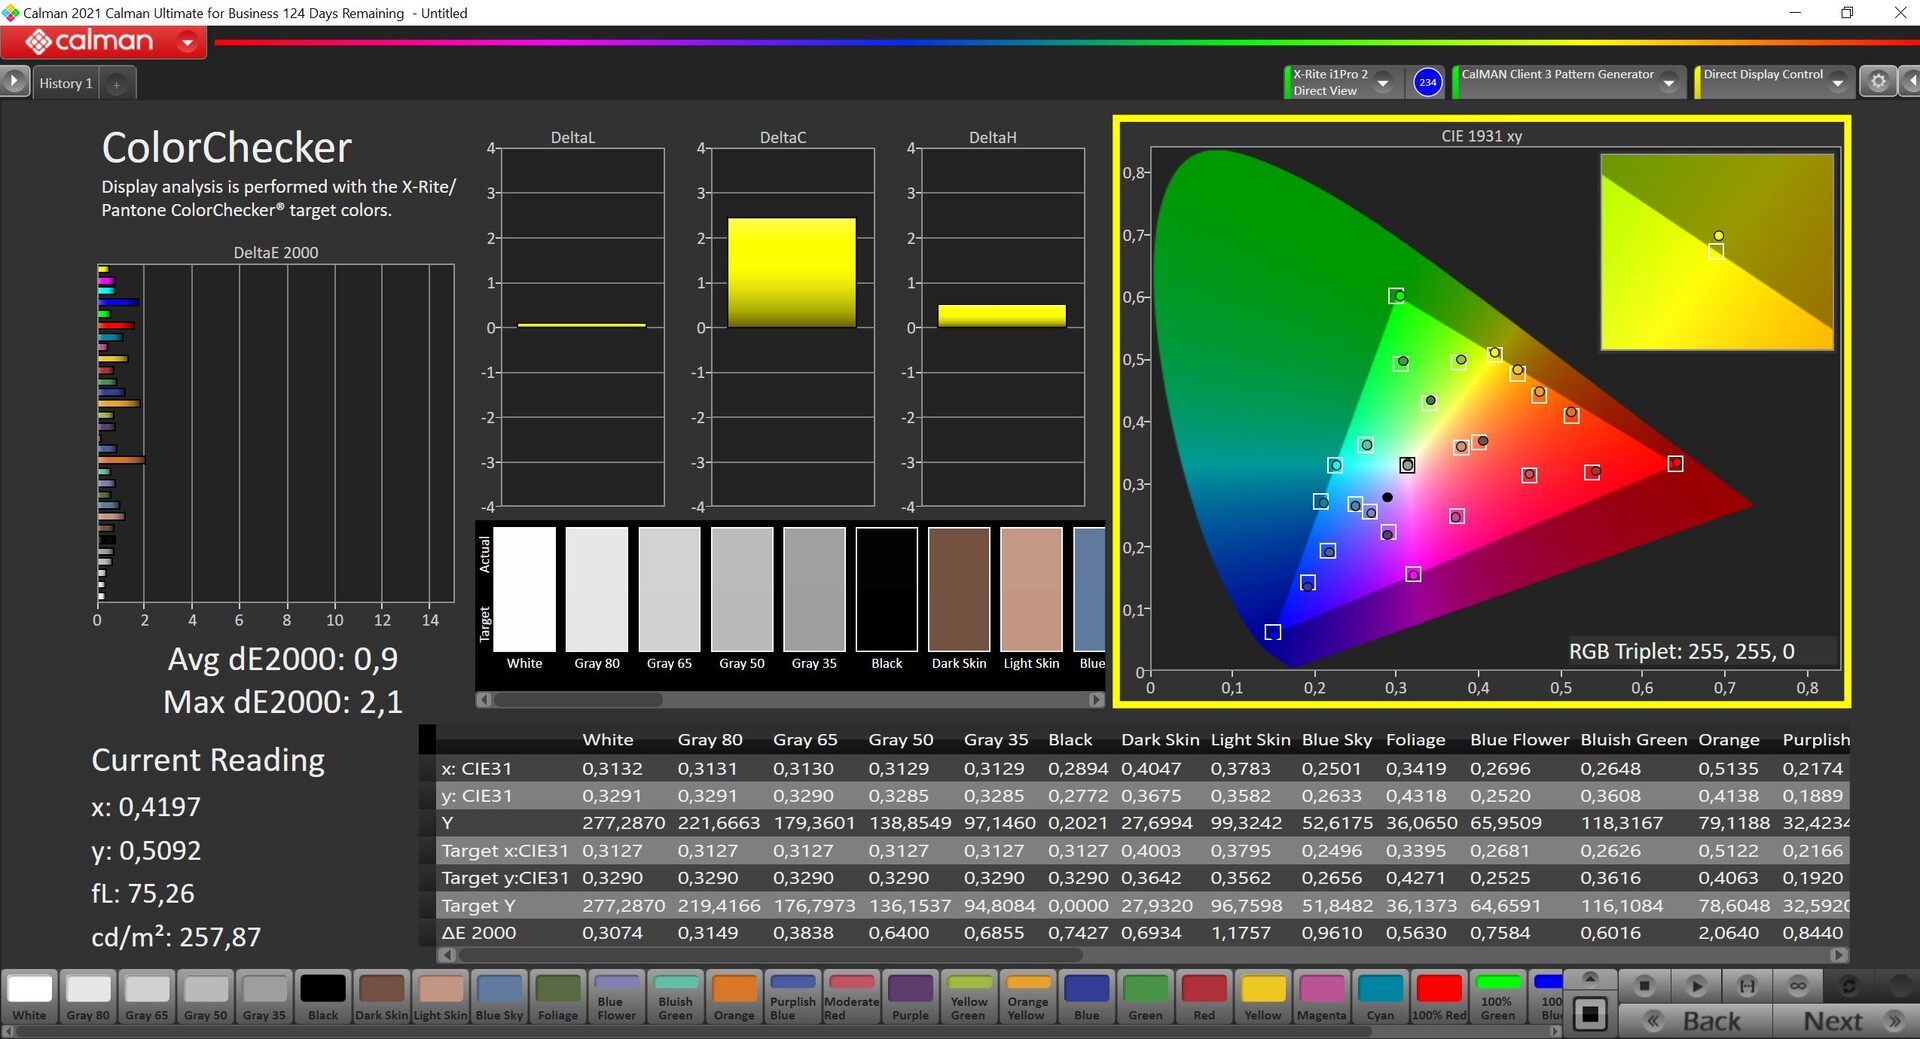
使用专业的CalMAN软件(X-Rite i1 Pro 2),我们对该面板进行了测量,其性能在开箱后就非常好。没有色差,其色彩描述已经非常准确,这意味着你可以直接进行图像编辑工作(至少在较小的sRGB色彩空间内)。经过我们自己的校准(你可以在上面免费下载这个配置文件),我们能够在此基础上稍作改进,但这并不是真正必要的--特别是对于游戏而言。
Display Response Times
| ↔ Response Time Black to White | ||
|---|---|---|
| 20.8 ms ... rise ↗ and fall ↘ combined | ↗ 11.7 ms rise | 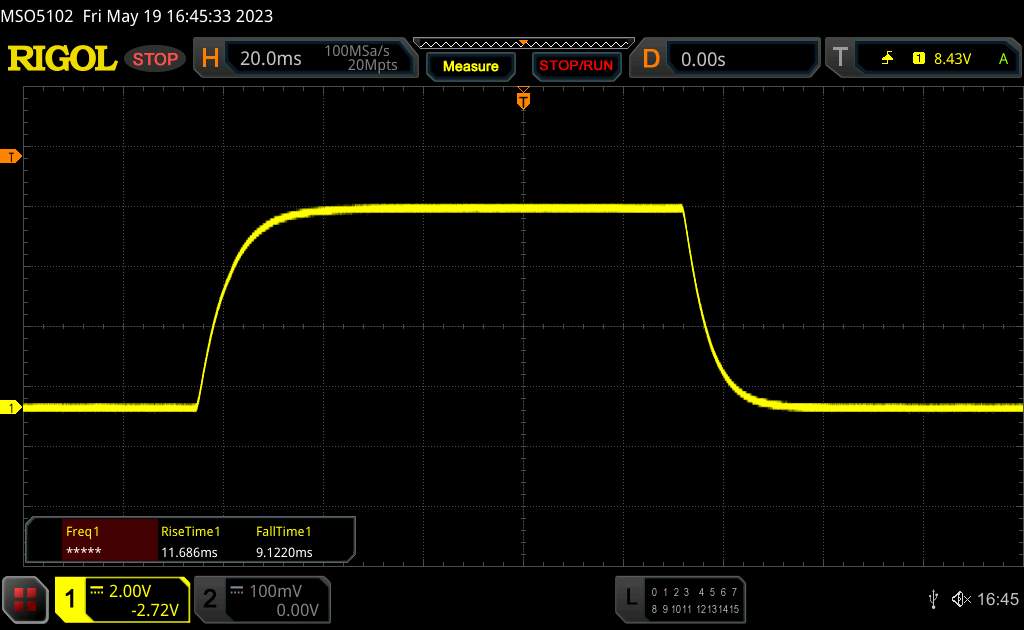 |
| ↘ 9.1 ms fall | ||
| The screen shows good response rates in our tests, but may be too slow for competitive gamers. In comparison, all tested devices range from 0.1 (minimum) to 240 (maximum) ms. » 46 % of all devices are better. This means that the measured response time is similar to the average of all tested devices (19.8 ms). | ||
| ↔ Response Time 50% Grey to 80% Grey | ||
| 30.4 ms ... rise ↗ and fall ↘ combined | ↗ 14.8 ms rise | 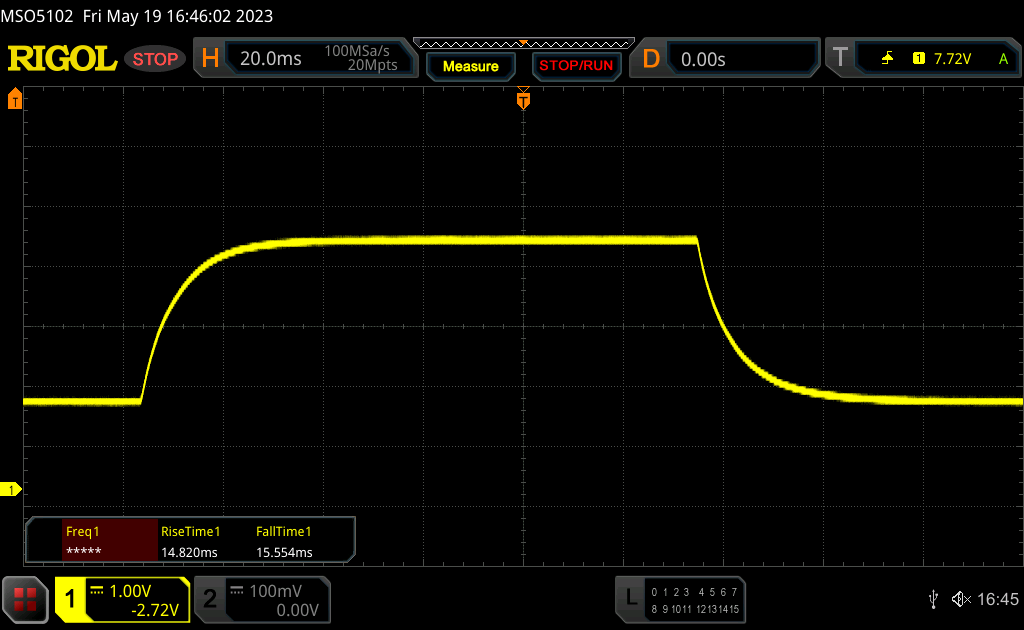 |
| ↘ 15.6 ms fall | ||
| The screen shows slow response rates in our tests and will be unsatisfactory for gamers. In comparison, all tested devices range from 0.165 (minimum) to 636 (maximum) ms. » 41 % of all devices are better. This means that the measured response time is similar to the average of all tested devices (31 ms). | ||
Screen Flickering / PWM (Pulse-Width Modulation)
| Screen flickering / PWM not detected | 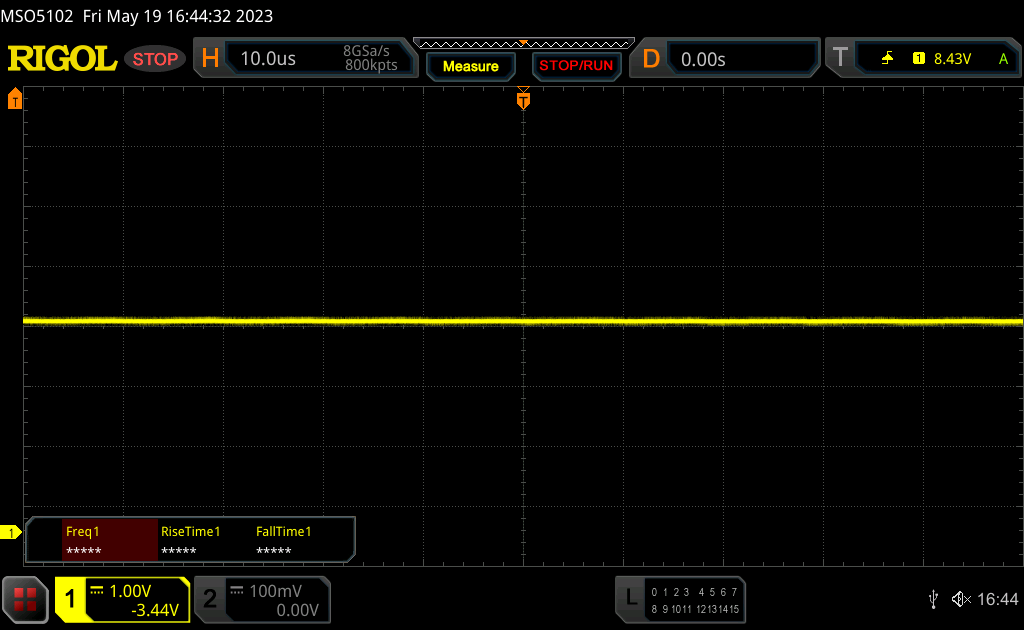 | ||
In comparison: 52 % of all tested devices do not use PWM to dim the display. If PWM was detected, an average of 7757 (minimum: 5 - maximum: 343500) Hz was measured. | |||

在户外,你肯定会从屏幕的哑光中受益,但如果太亮,你还是会努力看清屏幕上的内容。屏幕亮度可以做得更亮。IPS面板的视角稳定性很好--然而,从某些角度看,屏幕有时会显得太亮(尤其是从顶部和侧面看)。

性能 - TUF Gaming将Ryzen 7与RTX 4050结合起来。
我们的测试配置是该系列中最弱的型号--作为选择,华硕TUF Gaming A15可以安装较新的Ryzen 9 7940HS和一台GeForce RTX 4070笔记本电脑在最好的情况下。当然,在这种配置下,笔记本电脑的成本将大大增加。
测试条件
华硕为其游戏笔记本电脑使用Armoury Crate软件,其中也有不同的能量配置文件。然而,在我们的配置中,可选的Turbo模式并没有带来性能的提升,这就是为什么我们在性能模式下进行所有的测量和基准测试。此外,Advanced Optimus处于激活状态,然而,这导致在切换图形时出现轻微停顿(例如,在启动游戏时)。如果你不希望这样,你可以永久停用iGPU或使用正常的Optimus功能。
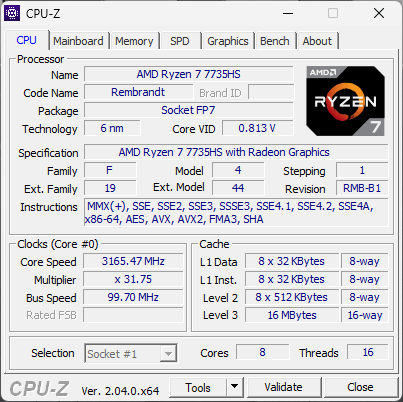
处理器 - Ryzen 7 7735HS
淘宝网AMD Ryzen 7 7735HS被用作笔记本电脑的处理器,这基本上是旧的Ryzen 7 6800HS但最大时钟提高了50MHz。Zen3+芯片有8个核心,可以同时处理16个线程。TUF Gaming A15的功率限制为80/65瓦,这使得它的多核性能相当不错,往往领先于采用Alder Lake CPU的竞争对手。然而,在单核测试中,拥有性能核心的英特尔芯片有明显的优势。不出所料,7735HS与申科XMG Core 15'sRyzen 7 6800H.总的来说,对于经济型游戏笔记本来说,该CPU是一个不错的选择。在电池供电的情况下,CPU短暂地消耗45瓦,然后回落到32瓦,这就是为什么多核性能下降了20%。更多的CPU基准测试可在 这里.
Cinebench R15 Multi continuous test
Cinebench R23: Multi Core | Single Core
Cinebench R20: CPU (Multi Core) | CPU (Single Core)
Cinebench R15: CPU Multi 64Bit | CPU Single 64Bit
Blender: v2.79 BMW27 CPU
7-Zip 18.03: 7z b 4 | 7z b 4 -mmt1
Geekbench 5.5: Multi-Core | Single-Core
HWBOT x265 Benchmark v2.2: 4k Preset
LibreOffice : 20 Documents To PDF
R Benchmark 2.5: Overall mean
| CPU Performance rating | |
| Average of class Gaming | |
| Asus TUF Gaming F15 FX507ZM | |
| HP Victus 15 fa0020nr | |
| MSI Katana 15 B12VEK | |
| Asus TUF A15 FA507 | |
| Schenker XMG Core 15 (M22) | |
| Lenovo IdeaPad Gaming 3 15IAH7 | |
| Gigabyte G5 KE | |
| Average AMD Ryzen 7 7735HS | |
| Cinebench R23 / Multi Core | |
| Average of class Gaming (10488 - 42661, n=107, last 2 years) | |
| Asus TUF Gaming F15 FX507ZM | |
| MSI Katana 15 B12VEK | |
| HP Victus 15 fa0020nr | |
| Lenovo IdeaPad Gaming 3 15IAH7 | |
| Schenker XMG Core 15 (M22) | |
| Asus TUF A15 FA507 | |
| Gigabyte G5 KE | |
| Average AMD Ryzen 7 7735HS (10283 - 14131, n=15) | |
| Cinebench R23 / Single Core | |
| Average of class Gaming (1166 - 2415, n=107, last 2 years) | |
| Asus TUF Gaming F15 FX507ZM | |
| HP Victus 15 fa0020nr | |
| MSI Katana 15 B12VEK | |
| Lenovo IdeaPad Gaming 3 15IAH7 | |
| Gigabyte G5 KE | |
| Schenker XMG Core 15 (M22) | |
| Asus TUF A15 FA507 | |
| Average AMD Ryzen 7 7735HS (1288 - 1570, n=15) | |
| Cinebench R20 / CPU (Multi Core) | |
| Average of class Gaming (4029 - 16433, n=106, last 2 years) | |
| Asus TUF Gaming F15 FX507ZM | |
| MSI Katana 15 B12VEK | |
| HP Victus 15 fa0020nr | |
| Lenovo IdeaPad Gaming 3 15IAH7 | |
| Schenker XMG Core 15 (M22) | |
| Asus TUF A15 FA507 | |
| Gigabyte G5 KE | |
| Average AMD Ryzen 7 7735HS (3968 - 5502, n=15) | |
| Cinebench R20 / CPU (Single Core) | |
| Average of class Gaming (442 - 913, n=106, last 2 years) | |
| HP Victus 15 fa0020nr | |
| Asus TUF Gaming F15 FX507ZM | |
| Lenovo IdeaPad Gaming 3 15IAH7 | |
| MSI Katana 15 B12VEK | |
| Gigabyte G5 KE | |
| Schenker XMG Core 15 (M22) | |
| Asus TUF A15 FA507 | |
| Average AMD Ryzen 7 7735HS (502 - 613, n=15) | |
| Cinebench R15 / CPU Multi 64Bit | |
| Average of class Gaming (1578 - 6330, n=105, last 2 years) | |
| Asus TUF Gaming F15 FX507ZM | |
| HP Victus 15 fa0020nr | |
| Schenker XMG Core 15 (M22) | |
| Asus TUF A15 FA507 | |
| Lenovo IdeaPad Gaming 3 15IAH7 | |
| MSI Katana 15 B12VEK | |
| Average AMD Ryzen 7 7735HS (1758 - 2355, n=17) | |
| Gigabyte G5 KE | |
| Cinebench R15 / CPU Single 64Bit | |
| Average of class Gaming (188.8 - 350, n=106, last 2 years) | |
| HP Victus 15 fa0020nr | |
| Asus TUF Gaming F15 FX507ZM | |
| Schenker XMG Core 15 (M22) | |
| Asus TUF A15 FA507 | |
| Lenovo IdeaPad Gaming 3 15IAH7 | |
| MSI Katana 15 B12VEK | |
| Average AMD Ryzen 7 7735HS (206 - 255, n=16) | |
| Gigabyte G5 KE | |
| Blender / v2.79 BMW27 CPU | |
| Average AMD Ryzen 7 7735HS (214 - 351, n=15) | |
| HP Victus 15 fa0020nr | |
| MSI Katana 15 B12VEK | |
| Gigabyte G5 KE | |
| Lenovo IdeaPad Gaming 3 15IAH7 | |
| Asus TUF A15 FA507 | |
| Schenker XMG Core 15 (M22) | |
| Asus TUF Gaming F15 FX507ZM | |
| Average of class Gaming (79 - 330, n=104, last 2 years) | |
| 7-Zip 18.03 / 7z b 4 | |
| Average of class Gaming (33491 - 148086, n=105, last 2 years) | |
| Asus TUF Gaming F15 FX507ZM | |
| Schenker XMG Core 15 (M22) | |
| Asus TUF A15 FA507 | |
| MSI Katana 15 B12VEK | |
| Average AMD Ryzen 7 7735HS (43455 - 63698, n=15) | |
| Gigabyte G5 KE | |
| HP Victus 15 fa0020nr | |
| Lenovo IdeaPad Gaming 3 15IAH7 | |
| 7-Zip 18.03 / 7z b 4 -mmt1 | |
| Average of class Gaming (4199 - 7436, n=105, last 2 years) | |
| HP Victus 15 fa0020nr | |
| Asus TUF A15 FA507 | |
| Schenker XMG Core 15 (M22) | |
| Average AMD Ryzen 7 7735HS (4779 - 5849, n=15) | |
| MSI Katana 15 B12VEK | |
| Lenovo IdeaPad Gaming 3 15IAH7 | |
| Gigabyte G5 KE | |
| Asus TUF Gaming F15 FX507ZM | |
| Geekbench 5.5 / Multi-Core | |
| Average of class Gaming (6460 - 28263, n=105, last 2 years) | |
| Asus TUF Gaming F15 FX507ZM | |
| MSI Katana 15 B12VEK | |
| HP Victus 15 fa0020nr | |
| Gigabyte G5 KE | |
| Schenker XMG Core 15 (M22) | |
| Asus TUF A15 FA507 | |
| Average AMD Ryzen 7 7735HS (7151 - 10258, n=15) | |
| Lenovo IdeaPad Gaming 3 15IAH7 | |
| Geekbench 5.5 / Single-Core | |
| Average of class Gaming (986 - 2474, n=105, last 2 years) | |
| HP Victus 15 fa0020nr | |
| Asus TUF Gaming F15 FX507ZM | |
| MSI Katana 15 B12VEK | |
| Gigabyte G5 KE | |
| Lenovo IdeaPad Gaming 3 15IAH7 | |
| Schenker XMG Core 15 (M22) | |
| Average AMD Ryzen 7 7735HS (1327 - 1615, n=15) | |
| Asus TUF A15 FA507 | |
| HWBOT x265 Benchmark v2.2 / 4k Preset | |
| Average of class Gaming (11.5 - 44.4, n=105, last 2 years) | |
| Asus TUF Gaming F15 FX507ZM | |
| Schenker XMG Core 15 (M22) | |
| MSI Katana 15 B12VEK | |
| Asus TUF A15 FA507 | |
| Gigabyte G5 KE | |
| HP Victus 15 fa0020nr | |
| Lenovo IdeaPad Gaming 3 15IAH7 | |
| Average AMD Ryzen 7 7735HS (10.8 - 17.9, n=15) | |
| LibreOffice / 20 Documents To PDF | |
| Schenker XMG Core 15 (M22) | |
| Gigabyte G5 KE | |
| Average AMD Ryzen 7 7735HS (44.3 - 63.9, n=15) | |
| Asus TUF A15 FA507 | |
| Asus TUF Gaming F15 FX507ZM | |
| Average of class Gaming (33.2 - 88.8, n=105, last 2 years) | |
| HP Victus 15 fa0020nr | |
| Lenovo IdeaPad Gaming 3 15IAH7 | |
| MSI Katana 15 B12VEK | |
| R Benchmark 2.5 / Overall mean | |
| Lenovo IdeaPad Gaming 3 15IAH7 | |
| Average AMD Ryzen 7 7735HS (0.4822 - 0.585, n=15) | |
| Asus TUF A15 FA507 | |
| MSI Katana 15 B12VEK | |
| Gigabyte G5 KE | |
| Schenker XMG Core 15 (M22) | |
| HP Victus 15 fa0020nr | |
| Asus TUF Gaming F15 FX507ZM | |
| Average of class Gaming (0.3439 - 0.759, n=106, last 2 years) | |
* ... smaller is better
AIDA64: FP32 Ray-Trace | FPU Julia | CPU SHA3 | CPU Queen | FPU SinJulia | FPU Mandel | CPU AES | CPU ZLib | FP64 Ray-Trace | CPU PhotoWorxx
| Performance rating | |
| Average of class Gaming | |
| Schenker XMG Core 15 (M22) | |
| Asus TUF A15 FA507 | |
| Average AMD Ryzen 7 7735HS | |
| MSI Katana 15 B12VEK | |
| Gigabyte G5 KE | |
| Asus TUF Gaming F15 FX507ZM | |
| Lenovo IdeaPad Gaming 3 15IAH7 | |
| HP Victus 15 fa0020nr | |
| AIDA64 / FP32 Ray-Trace | |
| Average of class Gaming (10227 - 85542, n=105, last 2 years) | |
| Schenker XMG Core 15 (M22) | |
| Asus TUF A15 FA507 | |
| MSI Katana 15 B12VEK | |
| Average AMD Ryzen 7 7735HS (11831 - 17161, n=16) | |
| Lenovo IdeaPad Gaming 3 15IAH7 | |
| HP Victus 15 fa0020nr | |
| Gigabyte G5 KE | |
| Asus TUF Gaming F15 FX507ZM | |
| AIDA64 / FPU Julia | |
| Average of class Gaming (51376 - 238426, n=105, last 2 years) | |
| Schenker XMG Core 15 (M22) | |
| Asus TUF A15 FA507 | |
| Average AMD Ryzen 7 7735HS (75370 - 105483, n=16) | |
| MSI Katana 15 B12VEK | |
| Lenovo IdeaPad Gaming 3 15IAH7 | |
| Gigabyte G5 KE | |
| HP Victus 15 fa0020nr | |
| Asus TUF Gaming F15 FX507ZM | |
| AIDA64 / CPU SHA3 | |
| Average of class Gaming (2180 - 10115, n=105, last 2 years) | |
| Schenker XMG Core 15 (M22) | |
| Asus TUF A15 FA507 | |
| Lenovo IdeaPad Gaming 3 15IAH7 | |
| Asus TUF Gaming F15 FX507ZM | |
| MSI Katana 15 B12VEK | |
| Gigabyte G5 KE | |
| Average AMD Ryzen 7 7735HS (2499 - 3494, n=16) | |
| HP Victus 15 fa0020nr | |
| AIDA64 / CPU Queen | |
| Average of class Gaming (49785 - 173351, n=90, last 2 years) | |
| Asus TUF A15 FA507 | |
| HP Victus 15 fa0020nr | |
| Average AMD Ryzen 7 7735HS (87486 - 108729, n=15) | |
| Asus TUF Gaming F15 FX507ZM | |
| Schenker XMG Core 15 (M22) | |
| MSI Katana 15 B12VEK | |
| Lenovo IdeaPad Gaming 3 15IAH7 | |
| Gigabyte G5 KE | |
| AIDA64 / FPU SinJulia | |
| Average of class Gaming (4424 - 33636, n=105, last 2 years) | |
| Schenker XMG Core 15 (M22) | |
| Asus TUF A15 FA507 | |
| Average AMD Ryzen 7 7735HS (11233 - 13097, n=16) | |
| Asus TUF Gaming F15 FX507ZM | |
| MSI Katana 15 B12VEK | |
| HP Victus 15 fa0020nr | |
| Gigabyte G5 KE | |
| Lenovo IdeaPad Gaming 3 15IAH7 | |
| AIDA64 / FPU Mandel | |
| Average of class Gaming (25115 - 128721, n=105, last 2 years) | |
| Schenker XMG Core 15 (M22) | |
| Asus TUF A15 FA507 | |
| Average AMD Ryzen 7 7735HS (41400 - 58232, n=16) | |
| MSI Katana 15 B12VEK | |
| Lenovo IdeaPad Gaming 3 15IAH7 | |
| Gigabyte G5 KE | |
| HP Victus 15 fa0020nr | |
| Asus TUF Gaming F15 FX507ZM | |
| AIDA64 / CPU AES | |
| Lenovo IdeaPad Gaming 3 15IAH7 | |
| Gigabyte G5 KE | |
| Average of class Gaming (39258 - 247074, n=105, last 2 years) | |
| Average AMD Ryzen 7 7735HS (44013 - 137629, n=16) | |
| Schenker XMG Core 15 (M22) | |
| MSI Katana 15 B12VEK | |
| Asus TUF Gaming F15 FX507ZM | |
| Asus TUF A15 FA507 | |
| HP Victus 15 fa0020nr | |
| AIDA64 / CPU ZLib | |
| Average of class Gaming (574 - 2531, n=105, last 2 years) | |
| Asus TUF Gaming F15 FX507ZM | |
| Gigabyte G5 KE | |
| Lenovo IdeaPad Gaming 3 15IAH7 | |
| Schenker XMG Core 15 (M22) | |
| MSI Katana 15 B12VEK | |
| HP Victus 15 fa0020nr | |
| Average AMD Ryzen 7 7735HS (651 - 906, n=16) | |
| Asus TUF A15 FA507 | |
| AIDA64 / FP64 Ray-Trace | |
| Average of class Gaming (5509 - 45446, n=105, last 2 years) | |
| Schenker XMG Core 15 (M22) | |
| Asus TUF A15 FA507 | |
| MSI Katana 15 B12VEK | |
| Average AMD Ryzen 7 7735HS (1459 - 9094, n=16) | |
| Lenovo IdeaPad Gaming 3 15IAH7 | |
| Gigabyte G5 KE | |
| HP Victus 15 fa0020nr | |
| Asus TUF Gaming F15 FX507ZM | |
| AIDA64 / CPU PhotoWorxx | |
| Average of class Gaming (12271 - 89891, n=105, last 2 years) | |
| MSI Katana 15 B12VEK | |
| Asus TUF Gaming F15 FX507ZM | |
| Schenker XMG Core 15 (M22) | |
| Gigabyte G5 KE | |
| Asus TUF A15 FA507 | |
| Average AMD Ryzen 7 7735HS (17524 - 30542, n=16) | |
| HP Victus 15 fa0020nr | |
| Lenovo IdeaPad Gaming 3 15IAH7 | |
系统性能
TUF Gaming A15在合成系统基准测试中表现良好,在PCMark 10测试中能够将自己置于中上层。总的来说,竞争者之间的差距不大,主观上,在性能方面,他们都给我们留下了良好的印象。除了前面提到的在GPU切换过程中的轻微停顿(这是正常的),系统在测试中始终运行平稳。
CrossMark: Overall | Productivity | Creativity | Responsiveness
| PCMark 10 / Score | |
| Average of class Gaming (5828 - 12414, n=93, last 2 years) | |
| Asus TUF Gaming F15 FX507ZM | |
| Schenker XMG Core 15 (M22) | |
| Asus TUF A15 FA507 | |
| Average AMD Ryzen 7 7735HS, NVIDIA GeForce RTX 4050 Laptop GPU (n=1) | |
| Gigabyte G5 KE | |
| HP Victus 15 fa0020nr | |
| MSI Katana 15 B12VEK | |
| Lenovo IdeaPad Gaming 3 15IAH7 | |
| PCMark 10 / Essentials | |
| Gigabyte G5 KE | |
| Schenker XMG Core 15 (M22) | |
| Average of class Gaming (8810 - 11935, n=97, last 2 years) | |
| Asus TUF A15 FA507 | |
| Average AMD Ryzen 7 7735HS, NVIDIA GeForce RTX 4050 Laptop GPU (n=1) | |
| Asus TUF Gaming F15 FX507ZM | |
| HP Victus 15 fa0020nr | |
| MSI Katana 15 B12VEK | |
| Lenovo IdeaPad Gaming 3 15IAH7 | |
| PCMark 10 / Productivity | |
| Average of class Gaming (6845 - 25323, n=95, last 2 years) | |
| MSI Katana 15 B12VEK | |
| Schenker XMG Core 15 (M22) | |
| Lenovo IdeaPad Gaming 3 15IAH7 | |
| Gigabyte G5 KE | |
| Asus TUF A15 FA507 | |
| Average AMD Ryzen 7 7735HS, NVIDIA GeForce RTX 4050 Laptop GPU (n=1) | |
| Asus TUF Gaming F15 FX507ZM | |
| HP Victus 15 fa0020nr | |
| PCMark 10 / Digital Content Creation | |
| Average of class Gaming (7602 - 19954, n=95, last 2 years) | |
| Asus TUF Gaming F15 FX507ZM | |
| Asus TUF A15 FA507 | |
| Average AMD Ryzen 7 7735HS, NVIDIA GeForce RTX 4050 Laptop GPU (n=1) | |
| Schenker XMG Core 15 (M22) | |
| Gigabyte G5 KE | |
| HP Victus 15 fa0020nr | |
| MSI Katana 15 B12VEK | |
| Lenovo IdeaPad Gaming 3 15IAH7 | |
| CrossMark / Overall | |
| Average of class Gaming (1366 - 2409, n=94, last 2 years) | |
| Gigabyte G5 KE | |
| MSI Katana 15 B12VEK | |
| HP Victus 15 fa0020nr | |
| Schenker XMG Core 15 (M22) | |
| Asus TUF A15 FA507 | |
| Average AMD Ryzen 7 7735HS, NVIDIA GeForce RTX 4050 Laptop GPU (n=1) | |
| CrossMark / Productivity | |
| Average of class Gaming (1386 - 2254, n=94, last 2 years) | |
| Gigabyte G5 KE | |
| MSI Katana 15 B12VEK | |
| HP Victus 15 fa0020nr | |
| Schenker XMG Core 15 (M22) | |
| Asus TUF A15 FA507 | |
| Average AMD Ryzen 7 7735HS, NVIDIA GeForce RTX 4050 Laptop GPU (n=1) | |
| CrossMark / Creativity | |
| Average of class Gaming (1343 - 2786, n=94, last 2 years) | |
| MSI Katana 15 B12VEK | |
| HP Victus 15 fa0020nr | |
| Gigabyte G5 KE | |
| Schenker XMG Core 15 (M22) | |
| Asus TUF A15 FA507 | |
| Average AMD Ryzen 7 7735HS, NVIDIA GeForce RTX 4050 Laptop GPU (n=1) | |
| CrossMark / Responsiveness | |
| Gigabyte G5 KE | |
| Average of class Gaming (1226 - 2334, n=94, last 2 years) | |
| MSI Katana 15 B12VEK | |
| HP Victus 15 fa0020nr | |
| Schenker XMG Core 15 (M22) | |
| Asus TUF A15 FA507 | |
| Average AMD Ryzen 7 7735HS, NVIDIA GeForce RTX 4050 Laptop GPU (n=1) | |
| PCMark 10 Score | 7210 points | |
Help | ||
| AIDA64 / Memory Copy | |
| Average of class Gaming (21750 - 129946, n=105, last 2 years) | |
| MSI Katana 15 B12VEK | |
| Asus TUF Gaming F15 FX507ZM | |
| Schenker XMG Core 15 (M22) | |
| Asus TUF A15 FA507 | |
| Average AMD Ryzen 7 7735HS (30324 - 52012, n=16) | |
| Gigabyte G5 KE | |
| HP Victus 15 fa0020nr | |
| Lenovo IdeaPad Gaming 3 15IAH7 | |
| AIDA64 / Memory Read | |
| Average of class Gaming (22956 - 118858, n=105, last 2 years) | |
| MSI Katana 15 B12VEK | |
| Asus TUF Gaming F15 FX507ZM | |
| Schenker XMG Core 15 (M22) | |
| Asus TUF A15 FA507 | |
| Gigabyte G5 KE | |
| HP Victus 15 fa0020nr | |
| Average AMD Ryzen 7 7735HS (33938 - 51856, n=16) | |
| Lenovo IdeaPad Gaming 3 15IAH7 | |
| AIDA64 / Memory Write | |
| Average of class Gaming (22297 - 135096, n=105, last 2 years) | |
| Asus TUF Gaming F15 FX507ZM | |
| MSI Katana 15 B12VEK | |
| Schenker XMG Core 15 (M22) | |
| Asus TUF A15 FA507 | |
| Average AMD Ryzen 7 7735HS (33175 - 55284, n=16) | |
| Gigabyte G5 KE | |
| HP Victus 15 fa0020nr | |
| Lenovo IdeaPad Gaming 3 15IAH7 | |
| AIDA64 / Memory Latency | |
| Average of class Gaming (75.3 - 259, n=105, last 2 years) | |
| Gigabyte G5 KE | |
| MSI Katana 15 B12VEK | |
| Lenovo IdeaPad Gaming 3 15IAH7 | |
| Average AMD Ryzen 7 7735HS (78.2 - 109.8, n=16) | |
| Schenker XMG Core 15 (M22) | |
| Asus TUF A15 FA507 | |
| HP Victus 15 fa0020nr | |
| Asus TUF Gaming F15 FX507ZM | |
* ... smaller is better
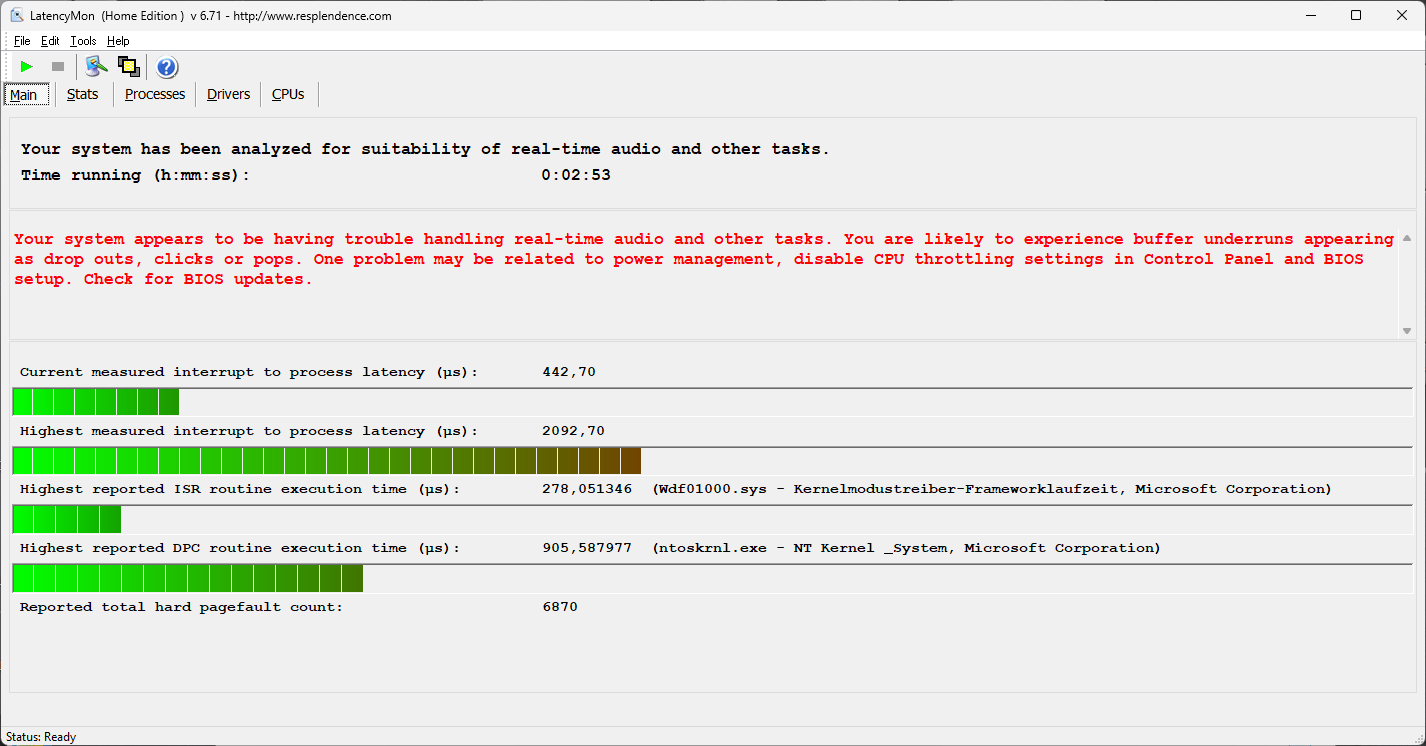
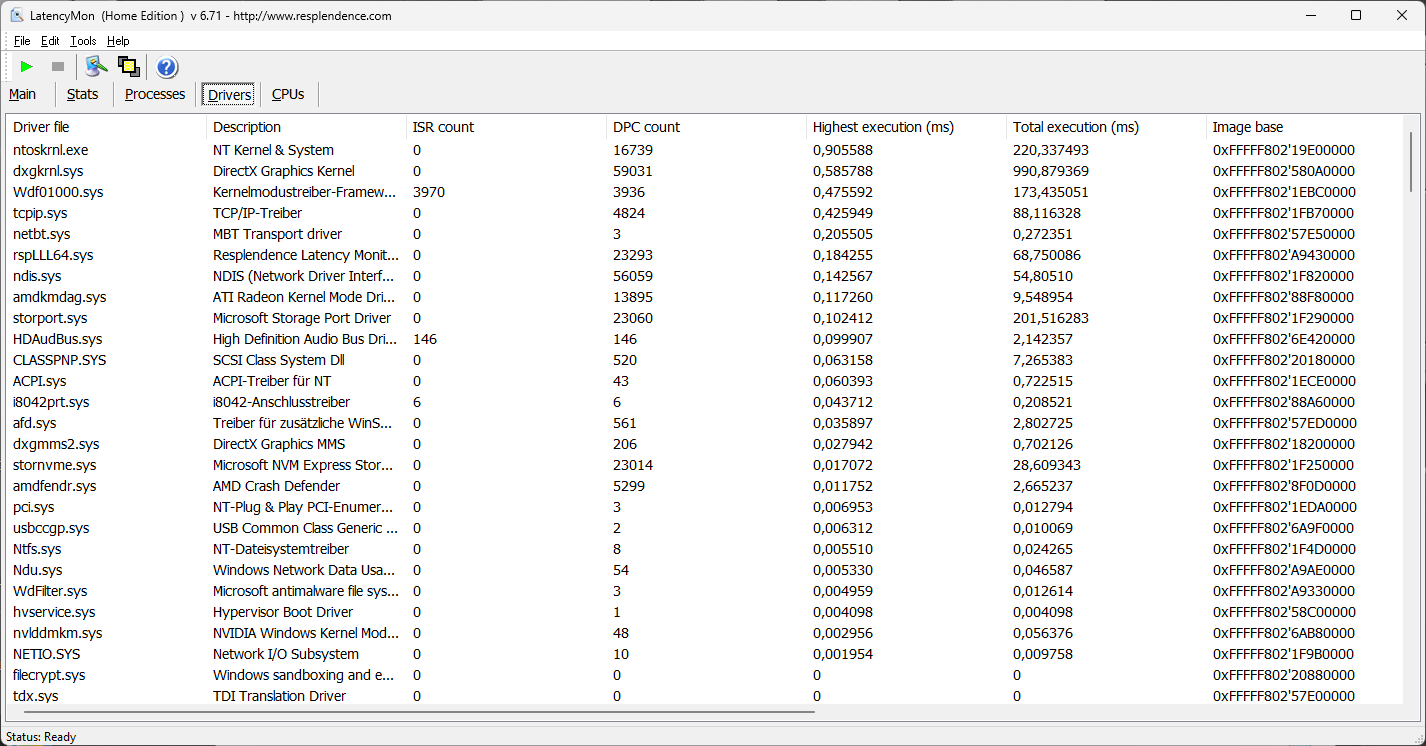
DPC延时
在我们的标准化延迟测试中(网页浏览、4K YouTube播放、CPU负载),测试设备在目前的BIOS版本下显示出一些限制,因此不适合无限制的实时音频软件。
| DPC Latencies / LatencyMon - interrupt to process latency (max), Web, Youtube, Prime95 | |
| MSI Katana 15 B12VEK | |
| Schenker XMG Core 15 (M22) | |
| HP Victus 15 fa0020nr | |
| Lenovo IdeaPad Gaming 3 15IAH7 | |
| Gigabyte G5 KE | |
| Asus TUF Gaming F15 FX507ZM | |
* ... smaller is better
存储设备
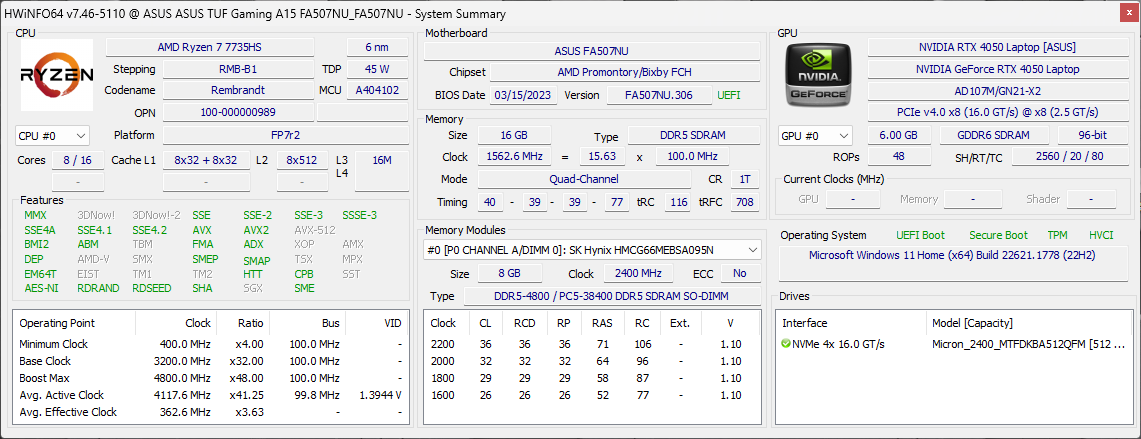
安装的固态硬盘是美光公司的PCIe 4.0硬盘(2400)。这块M.2 2280硬盘的存储容量为512GB,第一次启动后有420GB可用。QLC-SSD的最大传输速率为4200MB/s,这也与我们基准中的速率相符。总的来说,它的性能很好,即使在较长的负载下也很稳定。更多的SSD基准测试被列在 这里.

* ... smaller is better
reading continuous performance: DiskSpd Read Loop, Queue Depth 8
显卡 -GeForce RTX 4050 笔记本电脑
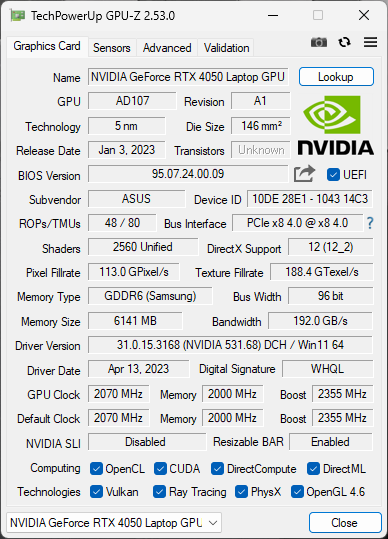
在日常使用中,图形计算是由集成的AMD Radeon 680M- 对于较大的工作量,它会自动切换到专用的NvidiaGeForce RTX 4050 笔记本电脑.后者有6GB内存,根据驱动程序,这是140瓦的版本。然而,这一规格有点误导,因为无论如何,新的GPU在游戏时最多消耗~95瓦。因此,它是RTX 4050笔记本电脑的最快版本。这也反映在基准测试中,TUF Gaming A15的平均表现比我们数据库中该GPU的平均值快10%左右。
这意味着RTX 4050笔记本电脑也非常接近于旧的 RTX 3060,在对比设备中,它的功耗也明显更高(在115瓦和140瓦TGP之间)。总的来说,它的性能非常好,即使在永久性负载下也没有性能下降--Time Spy 压力测试的运行没有任何问题,通过率为99.3%。在电池模式下,GPU的功耗被限制在50瓦左右,这就是为什么图形性能下降了约30%。更多GPU基准测试列在我们的技术部分。
| 3DMark Performance rating - Percent | |
| Average of class Gaming | |
| Asus TUF Gaming F15 FX507ZM -4! | |
| MSI Katana 15 B12VEK -3! | |
| Gigabyte G5 KE -3! | |
| Asus TUF A15 FA507 | |
| Schenker XMG Core 15 (M22) -1! | |
| Average NVIDIA GeForce RTX 4050 Laptop GPU | |
| Lenovo IdeaPad Gaming 3 15IAH7 -3! | |
| HP Victus 15 fa0020nr -2! | |
| Geekbench 6.0 - GPU OpenCL 6.0 | |
| Average of class Gaming (155885 - 241981, n=3, last 2 years) | |
| Asus TUF A15 FA507 | |
| Average NVIDIA GeForce RTX 4050 Laptop GPU (66574 - 84452, n=13) | |
| 3DMark 11 Performance | 26692 points | |
| 3DMark Fire Strike Score | 20183 points | |
| 3DMark Time Spy Score | 8902 points | |
Help | ||
| Blender / v3.3 Classroom HIP/AMD | |
| Schenker XMG Core 15 (M22) | |
| Asus TUF A15 FA507 | |
| Asus TUF A15 FA507 | |
| Average NVIDIA GeForce RTX 4050 Laptop GPU (345 - 345, n=2) | |
| Blender / v3.3 Classroom OPTIX/RTX | |
| Lenovo IdeaPad Gaming 3 15IAH7 | |
| HP Victus 15 fa0020nr | |
| Schenker XMG Core 15 (M22) | |
| Gigabyte G5 KE | |
| Average NVIDIA GeForce RTX 4050 Laptop GPU (25 - 37, n=40) | |
| MSI Katana 15 B12VEK | |
| Asus TUF A15 FA507 | |
| Asus TUF A15 FA507 | |
| Average of class Gaming (9 - 32, n=106, last 2 years) | |
| Blender / v3.3 Classroom CUDA | |
| Lenovo IdeaPad Gaming 3 15IAH7 | |
| HP Victus 15 fa0020nr | |
| Average NVIDIA GeForce RTX 4050 Laptop GPU (47 - 68, n=39) | |
| Schenker XMG Core 15 (M22) | |
| MSI Katana 15 B12VEK | |
| Gigabyte G5 KE | |
| Asus TUF A15 FA507 | |
| Asus TUF A15 FA507 | |
| Average of class Gaming (15 - 228, n=106, last 2 years) | |
| Blender / v3.3 Classroom CPU | |
| MSI Katana 15 B12VEK | |
| Gigabyte G5 KE | |
| HP Victus 15 fa0020nr | |
| Average NVIDIA GeForce RTX 4050 Laptop GPU (243 - 907, n=40) | |
| Lenovo IdeaPad Gaming 3 15IAH7 | |
| Asus TUF A15 FA507 | |
| Asus TUF A15 FA507 | |
| Schenker XMG Core 15 (M22) | |
| Average of class Gaming (122 - 565, n=102, last 2 years) | |
* ... smaller is better
游戏性能
我们的TUF Gaming A15的基本变体的游戏性能非常好--即使在以最大细节设置玩《霍格沃茨传奇》或《赛博朋克2077》等现代游戏时,对原生1080p分辨率来说也是绰绰有余。然而,如果你想使用光线追踪,你必须使用DLSS升频。例如,《赛博朋克2077》在1080p下使用光线追踪在Ultra下只能运行24FPS,而使用DLSS则可以运行74FPS。然而,在其他游戏中的差异可能更小。基本上,所有现代游戏都能运行,6GB的VRAM目前完全可以满足1080p的要求。该 Witcher 3测试还表明,即使在较长的时间内,游戏性能也保持稳定。
| The Witcher 3 - 1920x1080 Ultra Graphics & Postprocessing (HBAO+) | |
| Average of class Gaming (104.7 - 240, n=7, last 2 years) | |
| Asus TUF Gaming F15 FX507ZM | |
| Gigabyte G5 KE | |
| MSI Katana 15 B12VEK | |
| Asus TUF A15 FA507 | |
| Schenker XMG Core 15 (M22) | |
| Lenovo IdeaPad Gaming 3 15IAH7 | |
| HP Victus 15 fa0020nr | |
| Final Fantasy XV Benchmark - 1920x1080 High Quality | |
| Average of class Gaming (41 - 215, n=95, last 2 years) | |
| Asus TUF Gaming F15 FX507ZM | |
| Schenker XMG Core 15 (M22) | |
| Gigabyte G5 KE | |
| MSI Katana 15 B12VEK | |
| Asus TUF A15 FA507 | |
| Lenovo IdeaPad Gaming 3 15IAH7 | |
| HP Victus 15 fa0020nr | |
| Dota 2 Reborn - 1920x1080 ultra (3/3) best looking | |
| Average of class Gaming (84.8 - 248, n=107, last 2 years) | |
| Asus TUF Gaming F15 FX507ZM | |
| MSI Katana 15 B12VEK | |
| Gigabyte G5 KE | |
| HP Victus 15 fa0020nr | |
| Asus TUF A15 FA507 | |
| Schenker XMG Core 15 (M22) | |
| Lenovo IdeaPad Gaming 3 15IAH7 | |
| The Witcher 3 - 1920x1080 Ultra Graphics & Postprocessing (HBAO+) | |
| Average of class Gaming (104.7 - 240, n=7, last 2 years) | |
| Asus TUF Gaming F15 FX507ZM | |
| Gigabyte G5 KE | |
| MSI Katana 15 B12VEK | |
| Asus TUF A15 FA507 | |
| Schenker XMG Core 15 (M22) | |
| Average NVIDIA GeForce RTX 4050 Laptop GPU (18.5 - 94.7, n=40) | |
| Lenovo IdeaPad Gaming 3 15IAH7 | |
| HP Victus 15 fa0020nr | |
| F1 22 | |
| 1920x1080 High Preset AA:T AF:16x | |
| Average of class Gaming (99.3 - 271, n=4, last 2 years) | |
| Asus TUF A15 FA507 | |
| Gigabyte G5 KE | |
| Average NVIDIA GeForce RTX 4050 Laptop GPU (94.4 - 174.7, n=22) | |
| Lenovo IdeaPad Gaming 3 15IAH7 | |
| 1920x1080 Ultra High Preset AA:T AF:16x | |
| Average of class Gaming (40.1 - 121.2, n=4, last 2 years) | |
| Asus TUF A15 FA507 | |
| Gigabyte G5 KE | |
| Average NVIDIA GeForce RTX 4050 Laptop GPU (10.9 - 56.4, n=24) | |
| Lenovo IdeaPad Gaming 3 15IAH7 | |
| Cyberpunk 2077 1.6 | |
| 1920x1080 High Preset | |
| Gigabyte G5 KE | |
| Asus TUF A15 FA507 | |
| Average NVIDIA GeForce RTX 4050 Laptop GPU (48 - 91.3, n=14) | |
| HP Victus 15 fa0020nr | |
| 1920x1080 Ultra Preset | |
| Gigabyte G5 KE | |
| Asus TUF A15 FA507 | |
| Average NVIDIA GeForce RTX 4050 Laptop GPU (44.4 - 79.4, n=14) | |
| HP Victus 15 fa0020nr | |
| Hogwarts Legacy | |
| 1920x1080 High Preset AA:High T | |
| Asus TUF A15 FA507 | |
| Average NVIDIA GeForce RTX 4050 Laptop GPU (44.8 - 93.6, n=8) | |
| 1920x1080 Ultra Preset AA:High T | |
| Average of class Gaming (n=1last 2 years) | |
| Average NVIDIA GeForce RTX 4050 Laptop GPU (39 - 77.3, n=8) | |
| Asus TUF A15 FA507 | |
Witcher 3 FPS diagram
| low | med. | high | ultra | |
|---|---|---|---|---|
| GTA V (2015) | 168.6 | 153.1 | 83.5 | |
| The Witcher 3 (2015) | 171 | 82.2 | ||
| Dota 2 Reborn (2015) | 137.4 | 127.2 | 115.8 | |
| Final Fantasy XV Benchmark (2018) | 178.9 | 115.5 | 81.5 | |
| X-Plane 11.11 (2018) | 103.5 | 97 | 77.8 | |
| Far Cry 5 (2018) | 111 | 105 | 99 | |
| Strange Brigade (2018) | 211 | 171 | 147 | |
| F1 2021 (2021) | 283 | 260 | 209 | 110.3 |
| Cyberpunk 2077 1.6 (2022) | 103 | 82 | 71 | 66 |
| F1 22 (2022) | 192.7 | 191.4 | 161.2 | 56.4 |
| Hogwarts Legacy (2023) | 122 | 109 | 89 | 49 |
排放--带有酷炫键盘的游戏笔记本
噪声排放
对于一台游戏笔记本电脑来说,我们的测试设备是比较安静的。在简单的任务中,散热器经常是完全无声的,甚至在负载下,我们也感到非常惊讶:在压力测试中,风扇的最大噪音水平为43 dB(A)。在游戏时,我们测得的噪音在40-43 dB(A)之间,这意味着TUF Gaming A15仍然比其竞争对手更安静。我们假设更强的配置会有稍大的风扇。我们没有注意到任何其他电子噪音。
Noise level
| Idle |
| 23.3 / 23.3 / 23.3 dB(A) |
| Load |
| 29.6 / 43 dB(A) |
 | ||
30 dB silent 40 dB(A) audible 50 dB(A) loud |
||
min: | ||
| Asus TUF A15 FA507 GeForce RTX 4050 Laptop GPU, R7 7735HS, Micron 2400 MTFDKBA512QFM | Gigabyte G5 KE GeForce RTX 3060 Laptop GPU, i5-12500H, Gigabyte AG4512G-SI B10 | Schenker XMG Core 15 (M22) GeForce RTX 3060 Laptop GPU, R7 6800H, Samsung SSD 980 Pro 1TB MZ-V8P1T0BW | MSI Katana 15 B12VEK GeForce RTX 4050 Laptop GPU, i7-12650H, Micron 2400 MTFDKBA1T0QFM | HP Victus 15 fa0020nr GeForce RTX 3050 Ti Laptop GPU, i7-12700H, Samsung PM9A1 MZVL2512HCJQ | Lenovo IdeaPad Gaming 3 15IAH7 GeForce RTX 3050 Ti Laptop GPU, i5-12500H, Intel SSD 660p SSDPEKNW512G8 | Asus TUF Gaming F15 FX507ZM GeForce RTX 3060 Laptop GPU, i7-12700H, SK Hynix HFM001TD3JX013N | |
|---|---|---|---|---|---|---|---|
| Noise | -33% | -13% | -10% | -10% | -25% | -14% | |
| off / environment * (dB) | 23.3 | 19.52 16% | 23 1% | 24 -3% | 24.8 -6% | 25 -7% | 23.2 -0% |
| Idle Minimum * (dB) | 23.3 | 31.05 -33% | 23 1% | 24 -3% | 26.2 -12% | 29 -24% | 23.6 -1% |
| Idle Average * (dB) | 23.3 | 31.05 -33% | 23 1% | 24 -3% | 29.2 -25% | 30 -29% | 23.6 -1% |
| Idle Maximum * (dB) | 23.3 | 31.05 -33% | 23 1% | 24 -3% | 29.4 -26% | 32 -37% | 25.4 -9% |
| Load Average * (dB) | 29.6 | 55.66 -88% | 42.41 -43% | 37.71 -27% | 29.9 -1% | 42 -42% | 38 -28% |
| Witcher 3 ultra * (dB) | 43 | 55.7 -30% | 54.71 -27% | 45.75 -6% | 41.1 4% | 46 -7% | 54.1 -26% |
| Load Maximum * (dB) | 43 | 55.51 -29% | 55.05 -28% | 54.55 -27% | 45.5 -6% | 54 -26% | 57.2 -33% |
* ... smaller is better
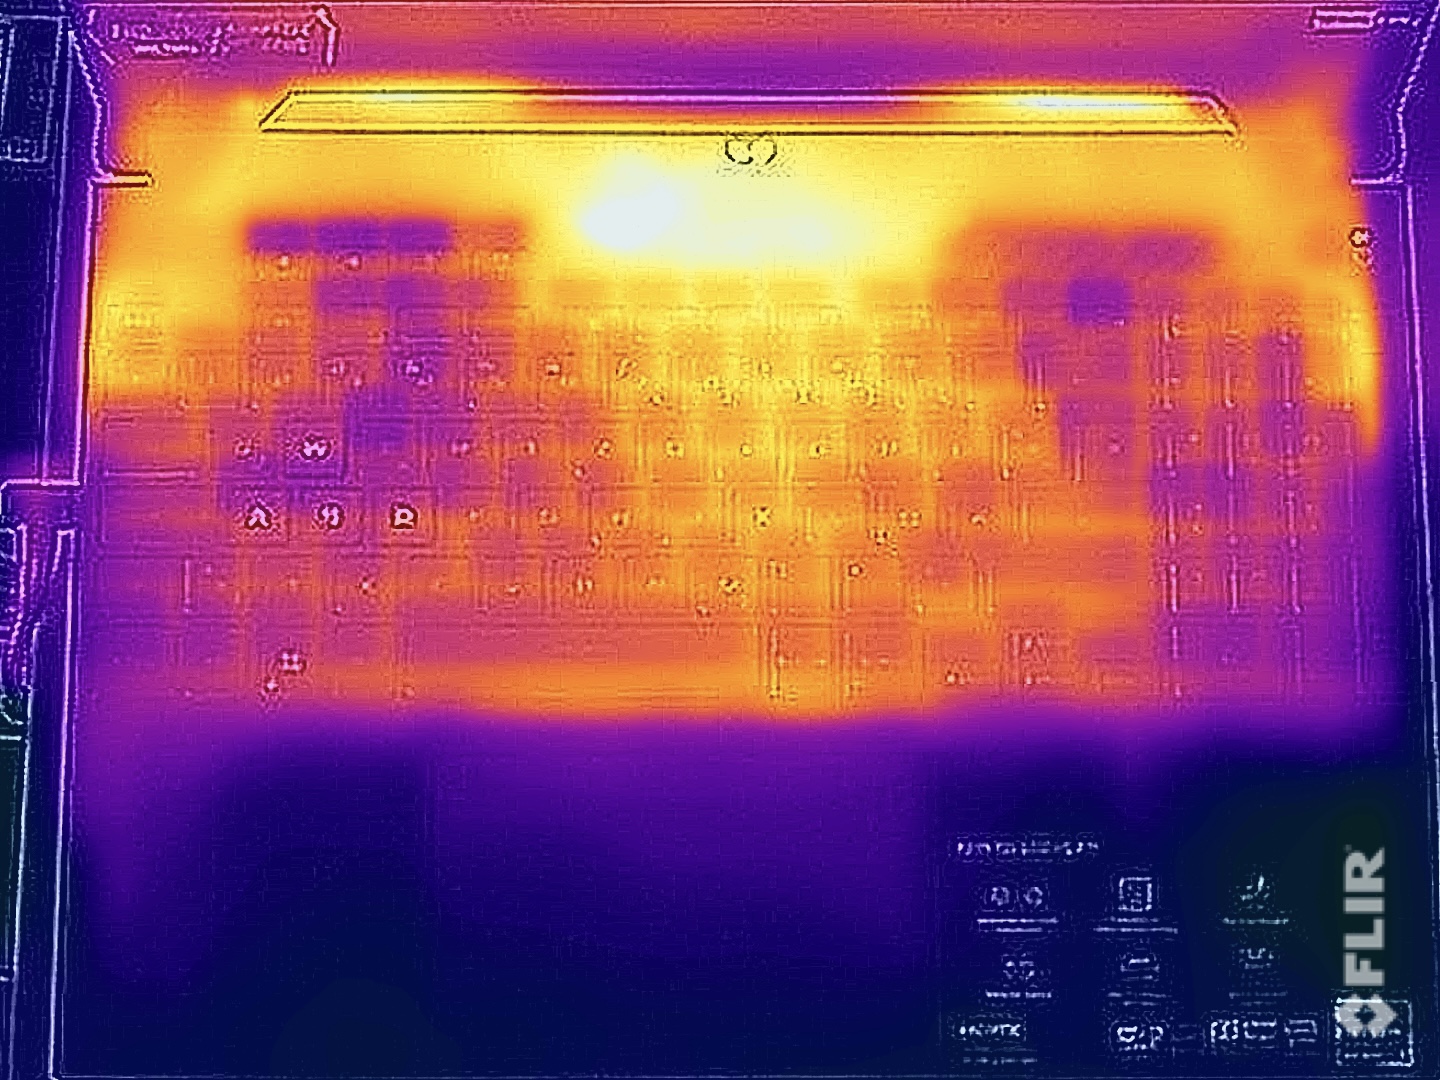
温度
在日常工作中没有温度问题,即使在负载下,华硕笔记本电脑的表面温度也得到了很好的控制。基本单元的上部中心区域变得非常热,几乎达到50℃,但这个热点在键盘上方,特别是WASD键区域保持非常凉爽,这在游戏时很重要。在底部,我们测量了后部区域的最高温度为44℃,你甚至可以将笔记本放在大腿上而没有任何问题。
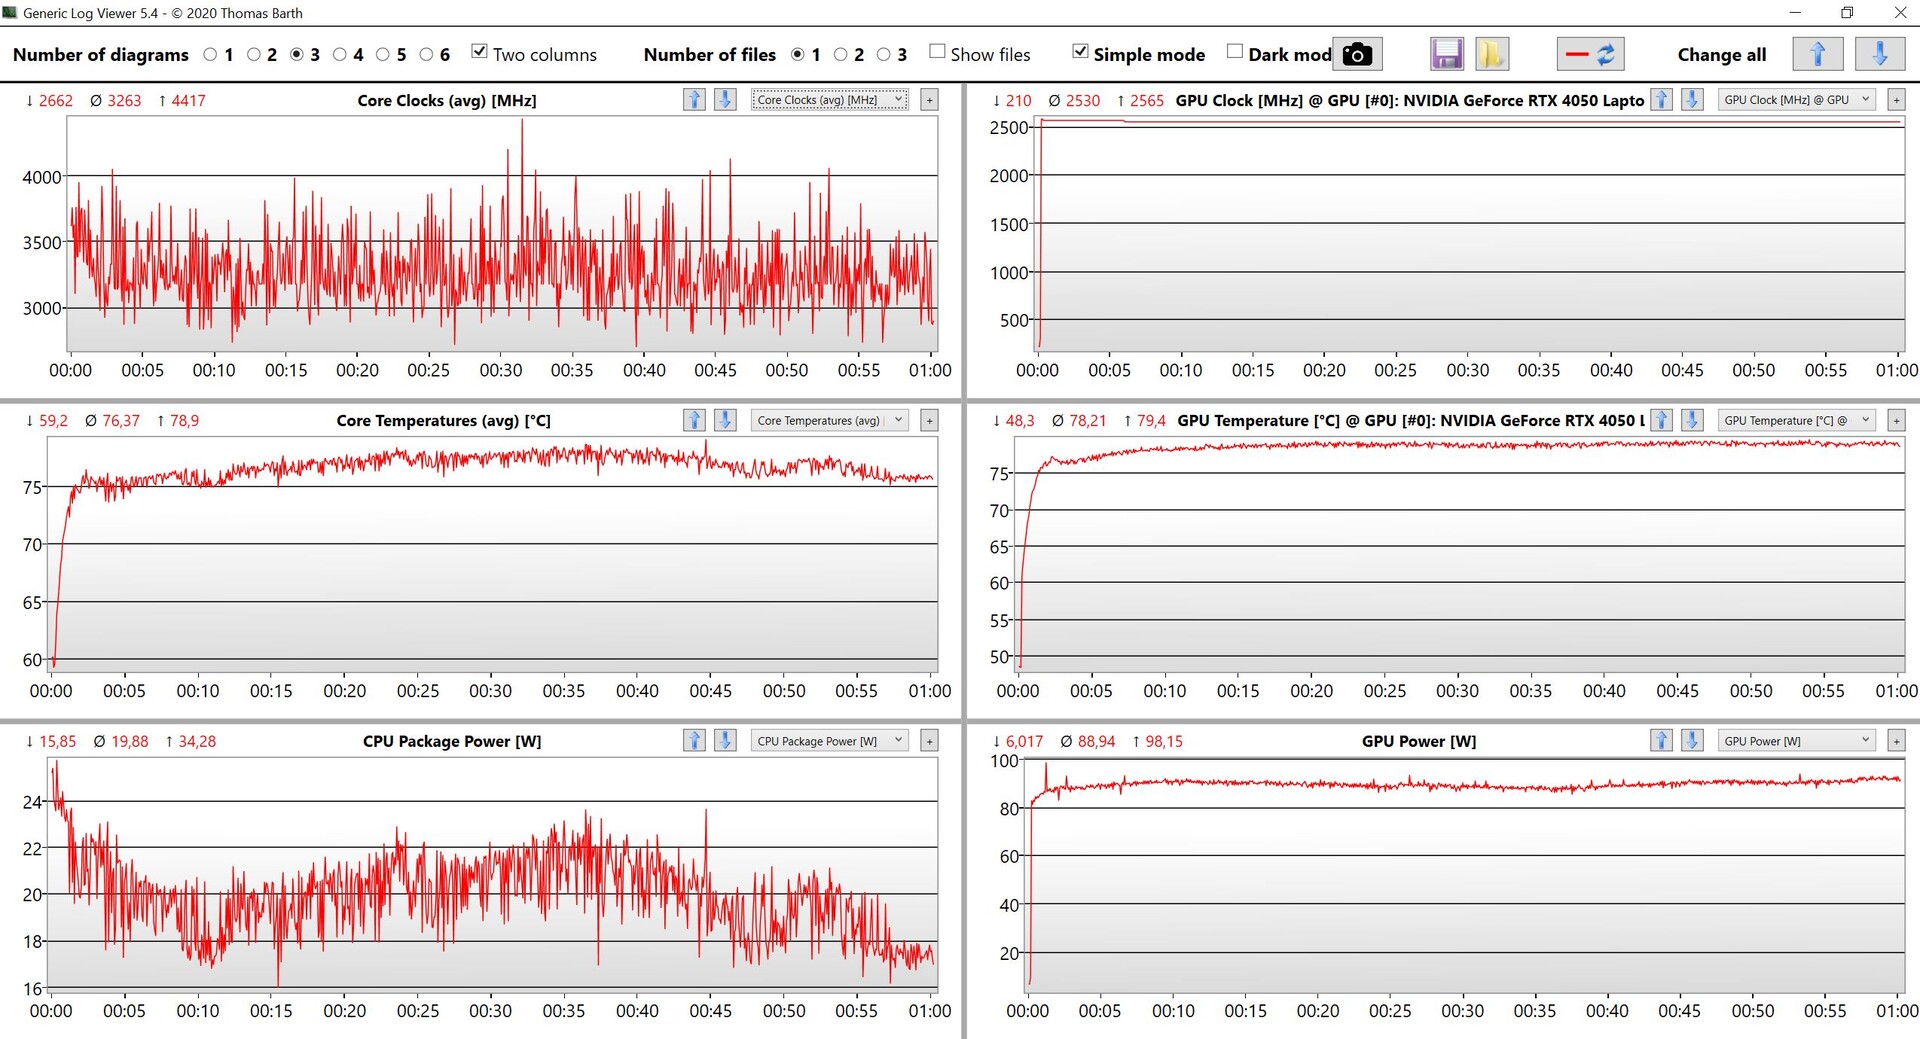
正如预期的那样,在压力测试中,dGPU受到了青睐。在最初的15分钟内仍有轻微的波动,然后处理器和显卡分别稳定在35瓦和80瓦的水平。
(-) The maximum temperature on the upper side is 48.9 °C / 120 F, compared to the average of 40.4 °C / 105 F, ranging from 21.2 to 68.8 °C for the class Gaming.
(±) The bottom heats up to a maximum of 44.6 °C / 112 F, compared to the average of 43.2 °C / 110 F
(+) In idle usage, the average temperature for the upper side is 26.2 °C / 79 F, compared to the device average of 33.9 °C / 93 F.
(±) Playing The Witcher 3, the average temperature for the upper side is 36.9 °C / 98 F, compared to the device average of 33.9 °C / 93 F.
(+) The palmrests and touchpad are cooler than skin temperature with a maximum of 30.6 °C / 87.1 F and are therefore cool to the touch.
(±) The average temperature of the palmrest area of similar devices was 28.8 °C / 83.8 F (-1.8 °C / -3.3 F).
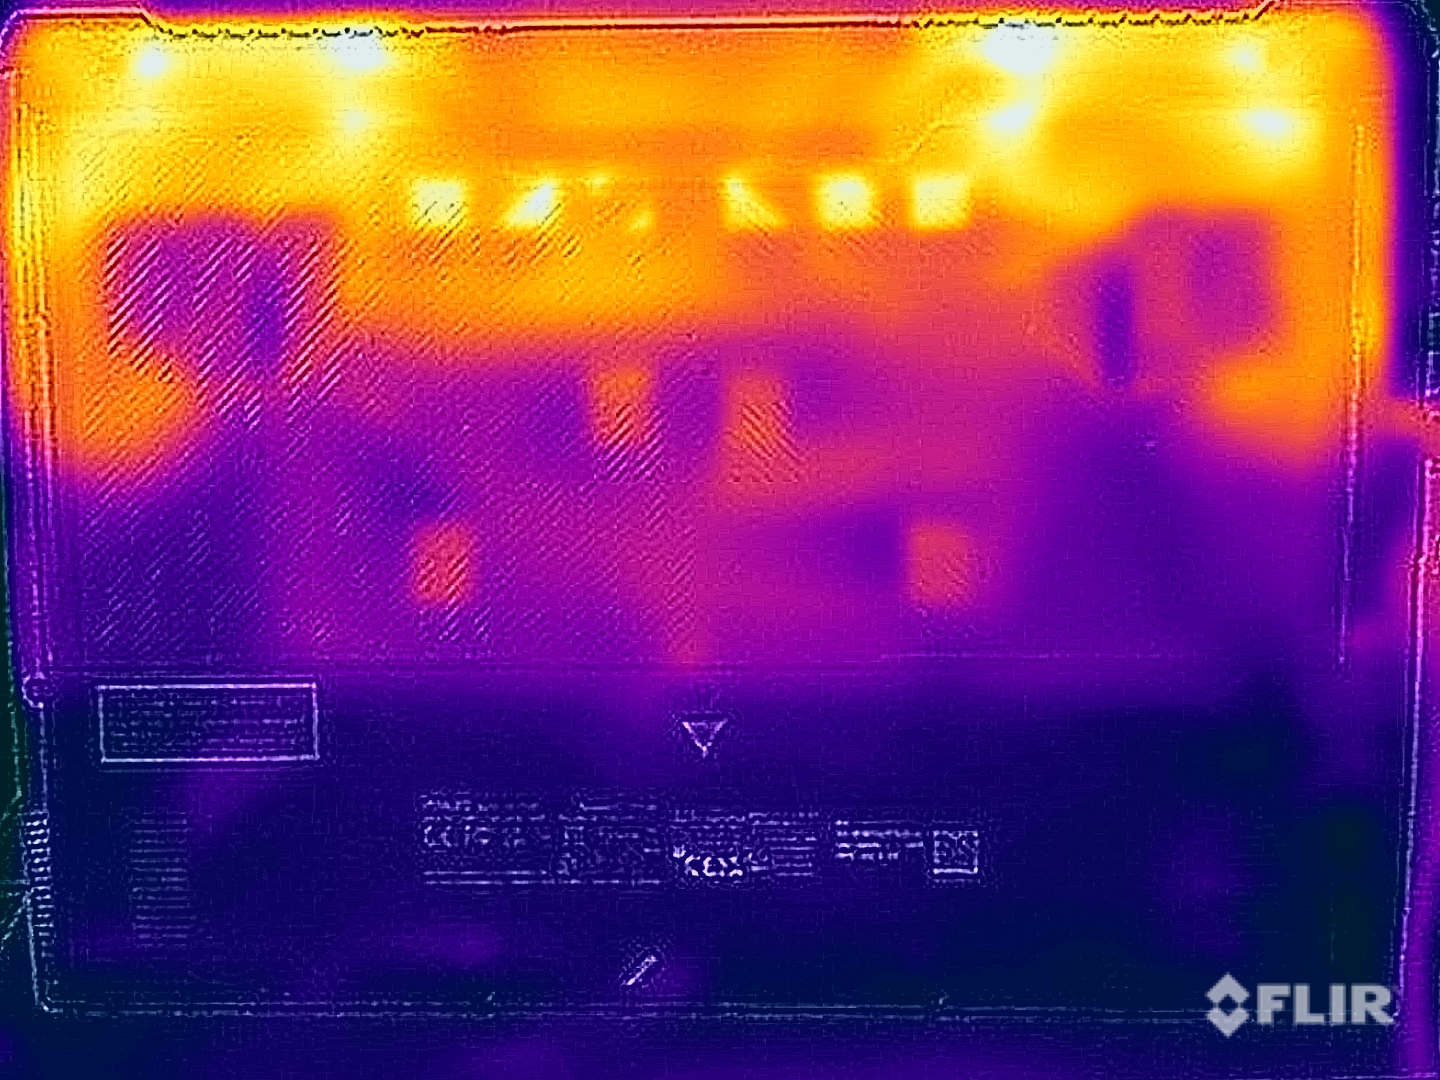
| Asus TUF A15 FA507 AMD Ryzen 7 7735HS, NVIDIA GeForce RTX 4050 Laptop GPU | Gigabyte G5 KE Intel Core i5-12500H, NVIDIA GeForce RTX 3060 Laptop GPU | Schenker XMG Core 15 (M22) AMD Ryzen 7 6800H, NVIDIA GeForce RTX 3060 Laptop GPU | MSI Katana 15 B12VEK Intel Core i7-12650H, NVIDIA GeForce RTX 4050 Laptop GPU | HP Victus 15 fa0020nr Intel Core i7-12700H, NVIDIA GeForce RTX 3050 Ti Laptop GPU | Lenovo IdeaPad Gaming 3 15IAH7 Intel Core i5-12500H, NVIDIA GeForce RTX 3050 Ti Laptop GPU | Asus TUF Gaming F15 FX507ZM Intel Core i7-12700H, NVIDIA GeForce RTX 3060 Laptop GPU | |
|---|---|---|---|---|---|---|---|
| Heat | -25% | -9% | -18% | 20% | 2% | -21% | |
| Maximum Upper Side * (°C) | 48.9 | 52.6 -8% | 48 2% | 47 4% | 37.2 24% | 47 4% | 44.4 9% |
| Maximum Bottom * (°C) | 44.6 | 62.4 -40% | 51 -14% | 48 -8% | 35.4 21% | 52 -17% | 48.8 -9% |
| Idle Upper Side * (°C) | 27.1 | 33.6 -24% | 28 -3% | 35 -29% | 22.4 17% | 25 8% | 37.8 -39% |
| Idle Bottom * (°C) | 27.5 | 34.8 -27% | 33 -20% | 38 -38% | 22.6 18% | 24 13% | 39.6 -44% |
* ... smaller is better
发言人
TUF Gaming A15当然不能夸耀惊人的声音,两个立体声扬声器相当平均--但这往往是廉价游戏笔记本电脑的情况。音乐和电影的收听和观看其实并不有趣--反正我们建议在游戏时使用耳机,因为否则风扇会很烦人。
Asus TUF A15 FA507 audio analysis
(±) | speaker loudness is average but good (79.3 dB)
Bass 100 - 315 Hz
(±) | reduced bass - on average 13.7% lower than median
(+) | bass is linear (6.2% delta to prev. frequency)
Mids 400 - 2000 Hz
(±) | higher mids - on average 7.6% higher than median
(±) | linearity of mids is average (7.3% delta to prev. frequency)
Highs 2 - 16 kHz
(+) | balanced highs - only 2.1% away from median
(±) | linearity of highs is average (7.5% delta to prev. frequency)
Overall 100 - 16.000 Hz
(±) | linearity of overall sound is average (17.2% difference to median)
Compared to same class
» 47% of all tested devices in this class were better, 11% similar, 42% worse
» The best had a delta of 6%, average was 18%, worst was 132%
Compared to all devices tested
» 32% of all tested devices were better, 8% similar, 60% worse
» The best had a delta of 4%, average was 23%, worst was 134%
Schenker XMG Core 15 (M22) audio analysis
(±) | speaker loudness is average but good (81.28 dB)
Bass 100 - 315 Hz
(-) | nearly no bass - on average 19.8% lower than median
(+) | bass is linear (6.4% delta to prev. frequency)
Mids 400 - 2000 Hz
(±) | higher mids - on average 6.2% higher than median
(±) | linearity of mids is average (7.9% delta to prev. frequency)
Highs 2 - 16 kHz
(+) | balanced highs - only 1.8% away from median
(+) | highs are linear (4.8% delta to prev. frequency)
Overall 100 - 16.000 Hz
(±) | linearity of overall sound is average (17.1% difference to median)
Compared to same class
» 46% of all tested devices in this class were better, 12% similar, 43% worse
» The best had a delta of 6%, average was 18%, worst was 132%
Compared to all devices tested
» 31% of all tested devices were better, 8% similar, 61% worse
» The best had a delta of 4%, average was 23%, worst was 134%
电源管理--由于有大电池,运行时间长
消耗功率
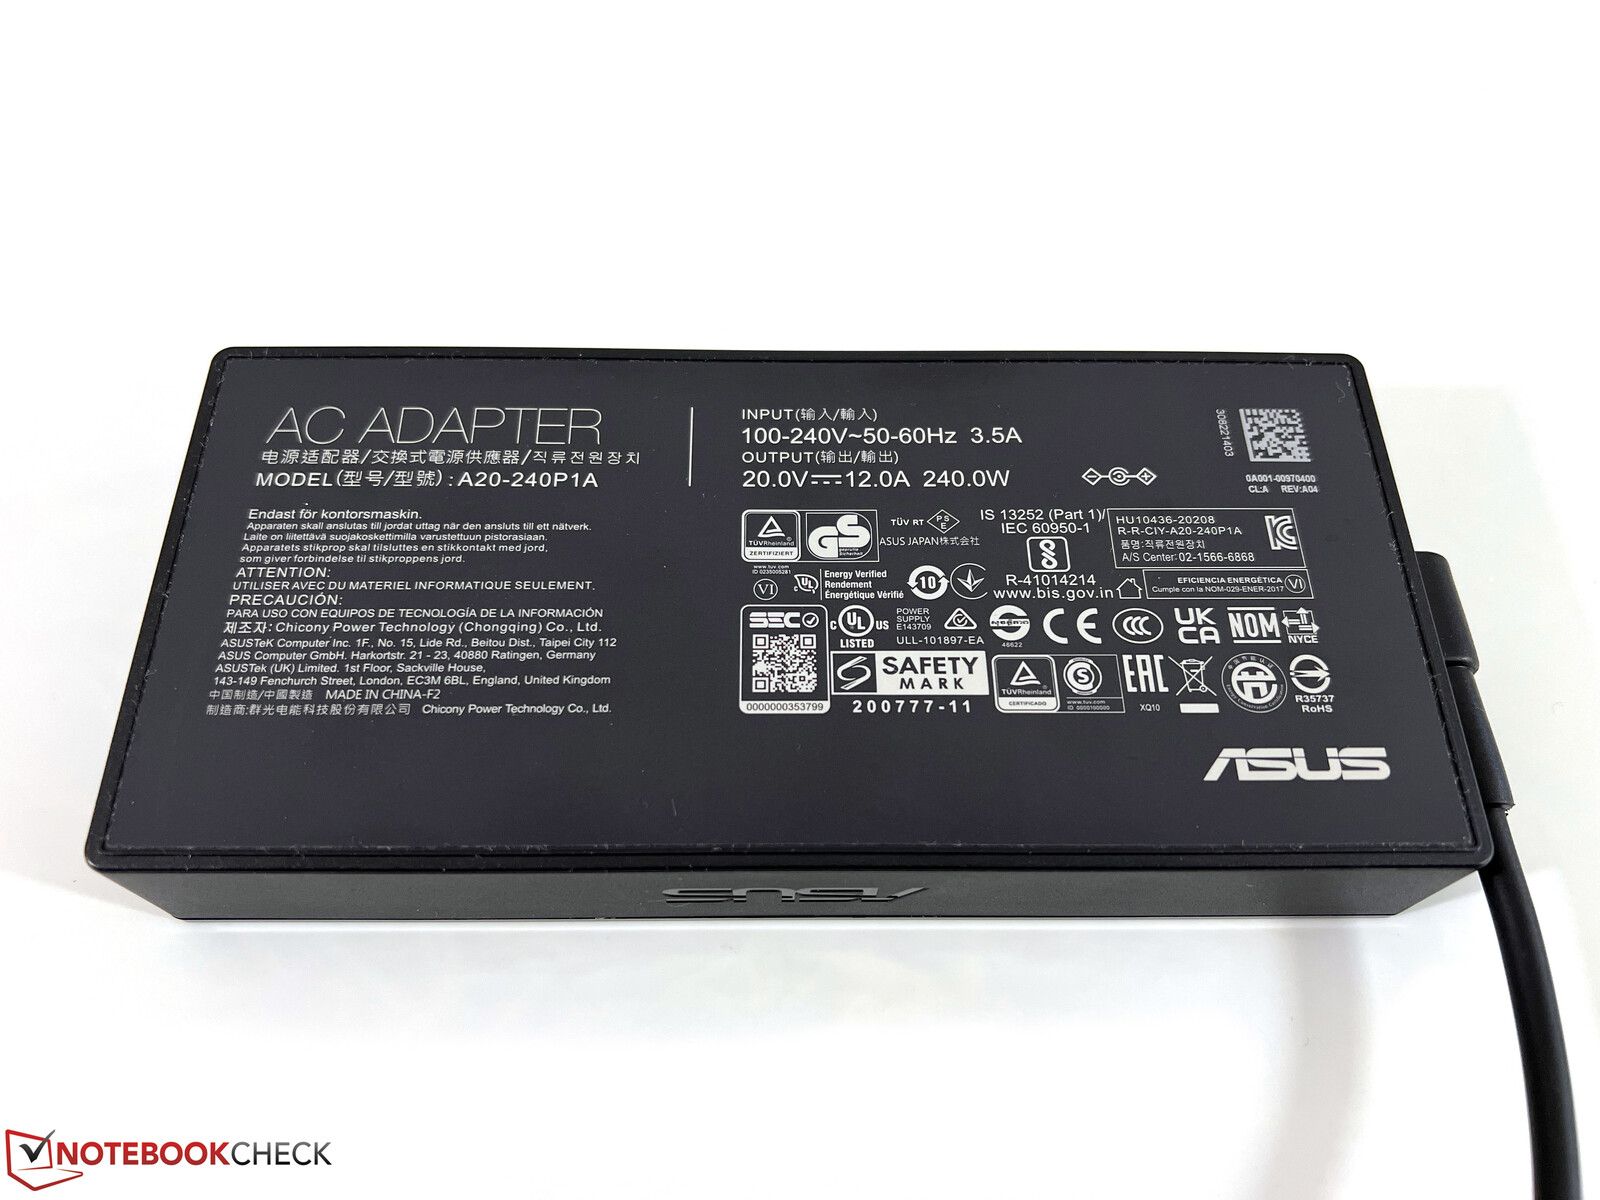
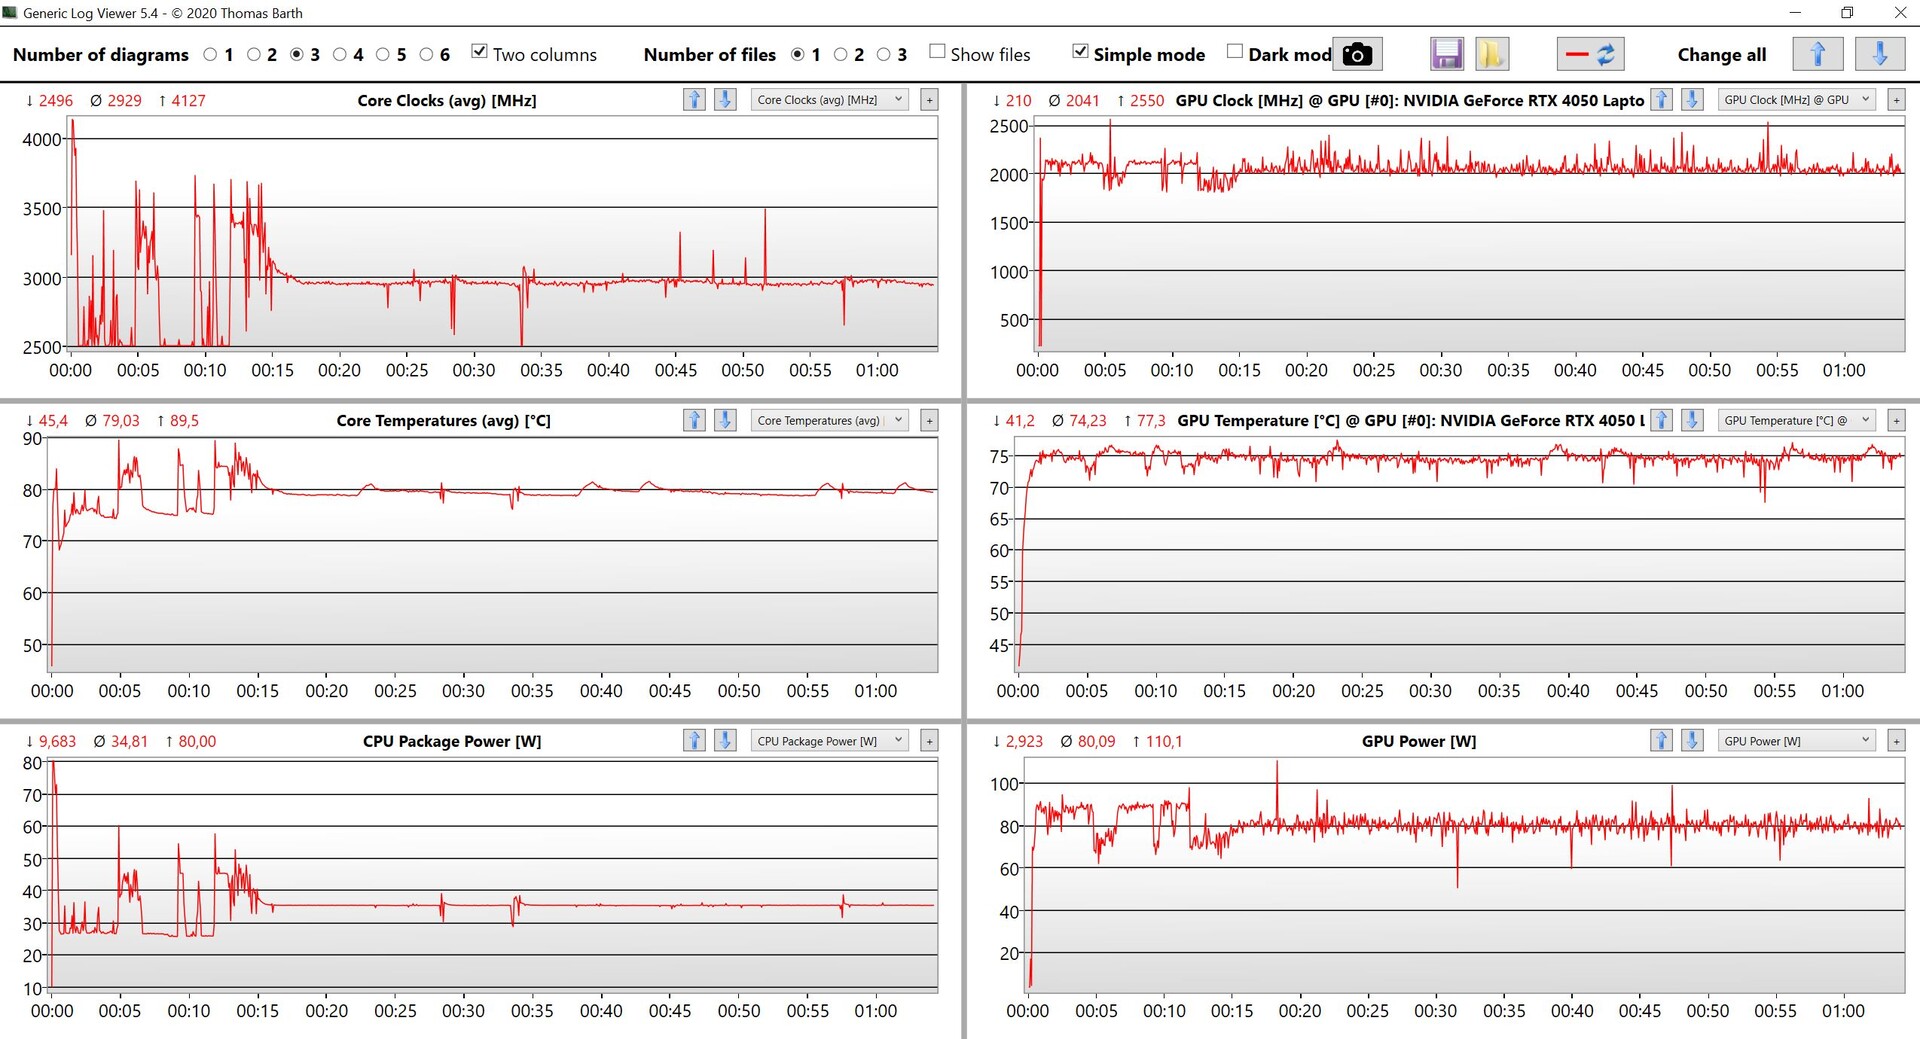
在我们的消耗测量中,评测样本仍然非常节俭,即使在游戏时,A15仍然比RTX-3060笔记本电脑高效得多,后者也没有提供更多的功率。我们在压力测试中确定的最大功率为185瓦,然后迅速稳定在155瓦左右。鉴于这些比率,所包含的240瓦的电源对于基本变体来说几乎是超大的,而目前更紧凑的200瓦模块的Zenbook Pro 14将完全足够。
| Off / Standby | |
| Idle | |
| Load |
|
Key:
min: | |
| Asus TUF A15 FA507 R7 7735HS, GeForce RTX 4050 Laptop GPU, Micron 2400 MTFDKBA512QFM, IPS, 1920x1080, 15.6" | Gigabyte G5 KE i5-12500H, GeForce RTX 3060 Laptop GPU, Gigabyte AG4512G-SI B10, IPS, 1920x1080, 15.6" | Schenker XMG Core 15 (M22) R7 6800H, GeForce RTX 3060 Laptop GPU, Samsung SSD 980 Pro 1TB MZ-V8P1T0BW, IPS, 2560x1440, 15.6" | MSI Katana 15 B12VEK i7-12650H, GeForce RTX 4050 Laptop GPU, Micron 2400 MTFDKBA1T0QFM, IPS, 1920x1080, 15.6" | HP Victus 15 fa0020nr i7-12700H, GeForce RTX 3050 Ti Laptop GPU, Samsung PM9A1 MZVL2512HCJQ, IPS, 1920x1080, 15.6" | Lenovo IdeaPad Gaming 3 15IAH7 i5-12500H, GeForce RTX 3050 Ti Laptop GPU, Intel SSD 660p SSDPEKNW512G8, IPS, 1920x1080, 15.6" | Asus TUF Gaming F15 FX507ZM i7-12700H, GeForce RTX 3060 Laptop GPU, SK Hynix HFM001TD3JX013N, IPS, 1920x1080, 15.6" | Average NVIDIA GeForce RTX 4050 Laptop GPU | Average of class Gaming | |
|---|---|---|---|---|---|---|---|---|---|
| Power Consumption | -19% | -31% | 2% | -11% | -7% | -30% | -26% | -61% | |
| Idle Minimum * (Watt) | 8 | 7.66 4% | 11.8 -48% | 8.5 -6% | 5.1 36% | 8 -0% | 6.3 21% | 9.95 ? -24% | 13 ? -63% |
| Idle Average * (Watt) | 12.1 | 10.3 15% | 14.7 -21% | 10.2 16% | 15.1 -25% | 10 17% | 9.8 19% | 15.8 ? -31% | 19 ? -57% |
| Idle Maximum * (Watt) | 12.5 | 16.05 -28% | 15 -20% | 11.3 10% | 18.9 -51% | 16 -28% | 26.5 -112% | 20.1 ? -61% | 24.6 ? -97% |
| Load Average * (Watt) | 74.9 | 115.8 -55% | 100 -34% | 84 -12% | 114.5 -53% | 99 -32% | 103.8 -39% | 88 ? -17% | 110.7 ? -48% |
| Witcher 3 ultra * (Watt) | 136.6 | 168.7 -23% | 184 -35% | 128 6% | 113.9 17% | 144.6 -6% | 189 -38% | ||
| Load Maximum * (Watt) | 185 | 234.6 -27% | 237 -28% | 189 -2% | 165.8 10% | 168 9% | 241.9 -31% | 176.3 ? 5% | 259 ? -40% |
* ... smaller is better
power consumption Witcher 3 / stress test
power consumption with external monitor
运行时间
这台笔记本电脑的90Wh电池导致了非常好的电池运行时间。除了几分钟之外,在我们的测试中,无论显示器是在60赫兹还是144赫兹模式下,都没有什么区别。在150cd/m²的WLAN测试中(相当于最大亮度的73%),我们注意到刚刚超过11.5小时,在全亮度下仍然超过9.5小时。在150cd/m²的视频测试中,我们测得超过12.5小时。当设备被打开时,一个完整的充电过程需要106分钟。充电曲线在70%时才趋于平缓,这是在~44分钟后的情况。
| Asus TUF A15 FA507 R7 7735HS, GeForce RTX 4050 Laptop GPU, 90 Wh | Gigabyte G5 KE i5-12500H, GeForce RTX 3060 Laptop GPU, 54 Wh | Schenker XMG Core 15 (M22) R7 6800H, GeForce RTX 3060 Laptop GPU, 62 Wh | MSI Katana 15 B12VEK i7-12650H, GeForce RTX 4050 Laptop GPU, 53.5 Wh | HP Victus 15 fa0020nr i7-12700H, GeForce RTX 3050 Ti Laptop GPU, 70 Wh | Lenovo IdeaPad Gaming 3 15IAH7 i5-12500H, GeForce RTX 3050 Ti Laptop GPU, 60 Wh | Asus TUF Gaming F15 FX507ZM i7-12700H, GeForce RTX 3060 Laptop GPU, 90 Wh | Average of class Gaming | |
|---|---|---|---|---|---|---|---|---|
| Battery runtime | -44% | -12% | -26% | -36% | -50% | -25% | -7% | |
| H.264 (h) | 12.5 | 2.2 -82% | 4.4 -65% | 8.32 ? -33% | ||||
| WiFi v1.3 (h) | 11.7 | 5.7 -51% | 7.8 -33% | 4.3 -63% | 2.1 -82% | 5.9 -50% | 4.8 -59% | 7.11 ? -39% |
| Load (h) | 1 | 1 0% | 1.1 10% | 1.5 50% | 1.1 10% | 1.1 10% | 1.502 ? 50% | |
| Witcher 3 ultra (h) | 1.3 | |||||||
| Reader / Idle (h) | 2.6 | 15.8 | 8.27 ? |
Pros
Cons
结论 - 一个适合1080p游戏的良好游戏笔记本电脑
随着TUF Gaming A15的发布,Asos将注意力集中在本质上:游戏性能。我们的基本版本,可以有大约1169美元,已经提供了足够的力量,以1080p的原生分辨率和最大的细节,顺利地玩目前的游戏 - 由于其新的NvidiaGeForce RTX 4050 笔记本电脑.如果你利用升频,那么你甚至可以设法运行光线追踪。它的Zen3+处理器是一个老朋友,但即使如此,它仍然能够提供坚实的性能。内存和固态硬盘可以扩展--虽然,16GB和512GB应该可以开始使用。
笔记本电脑的外壳质量很好;它没有任何形式的花哨照明(这不一定是件坏事)。键盘上的标签对比度有点低,你经常要依靠背光才能清楚地看到它们。但是,当你在游戏时,键盘能够保持良好的温度,而且风扇不会太响。
新的华硕TUF游戏A15的基础版本是一个很好的游戏笔记本电脑,其RTX 4050笔记本电脑为1080p显示屏提供足够的性能。
该屏幕做了它应该做的事。它的16:9哑光IPS面板的刷新率为144赫兹,色彩准确度良好,但其反应时间和亮度可以做得更好一些。我们测量了后者的亮度为300cd/m²。它的连接选项甚至包括USB 4.0,你可以连接一个G-Sync显示器。唯一的问题是,几乎所有笔记本电脑的端口都在设备的左前方和中间。
这台笔记本电脑并没有真正标出任何适当的弱点,但你必须记住,基本版本没有安装操作系统。在许多方面,该设备提供标准功能(WLAN、扬声器、网络摄像头)--但在所有核心领域,其性能令人满意。它大约1169美元的价格也相当有竞争力。
价格和可用性
我们测试的设备在亚马逊上可以找到,价格约为1169美元。
Asus TUF A15 FA507
- 06/13/2023 v7 (old)
Andreas Osthoff
Transparency
The selection of devices to be reviewed is made by our editorial team. The test sample was provided to the author as a loan by the manufacturer or retailer for the purpose of this review. The lender had no influence on this review, nor did the manufacturer receive a copy of this review before publication. There was no obligation to publish this review. As an independent media company, Notebookcheck is not subjected to the authority of manufacturers, retailers or publishers.
This is how Notebookcheck is testing
Every year, Notebookcheck independently reviews hundreds of laptops and smartphones using standardized procedures to ensure that all results are comparable. We have continuously developed our test methods for around 20 years and set industry standards in the process. In our test labs, high-quality measuring equipment is utilized by experienced technicians and editors. These tests involve a multi-stage validation process. Our complex rating system is based on hundreds of well-founded measurements and benchmarks, which maintains objectivity. Further information on our test methods can be found here.
Price comparison

