微星Stealth 14 Studio评测--昂贵的游戏笔记本,却做了太多妥协
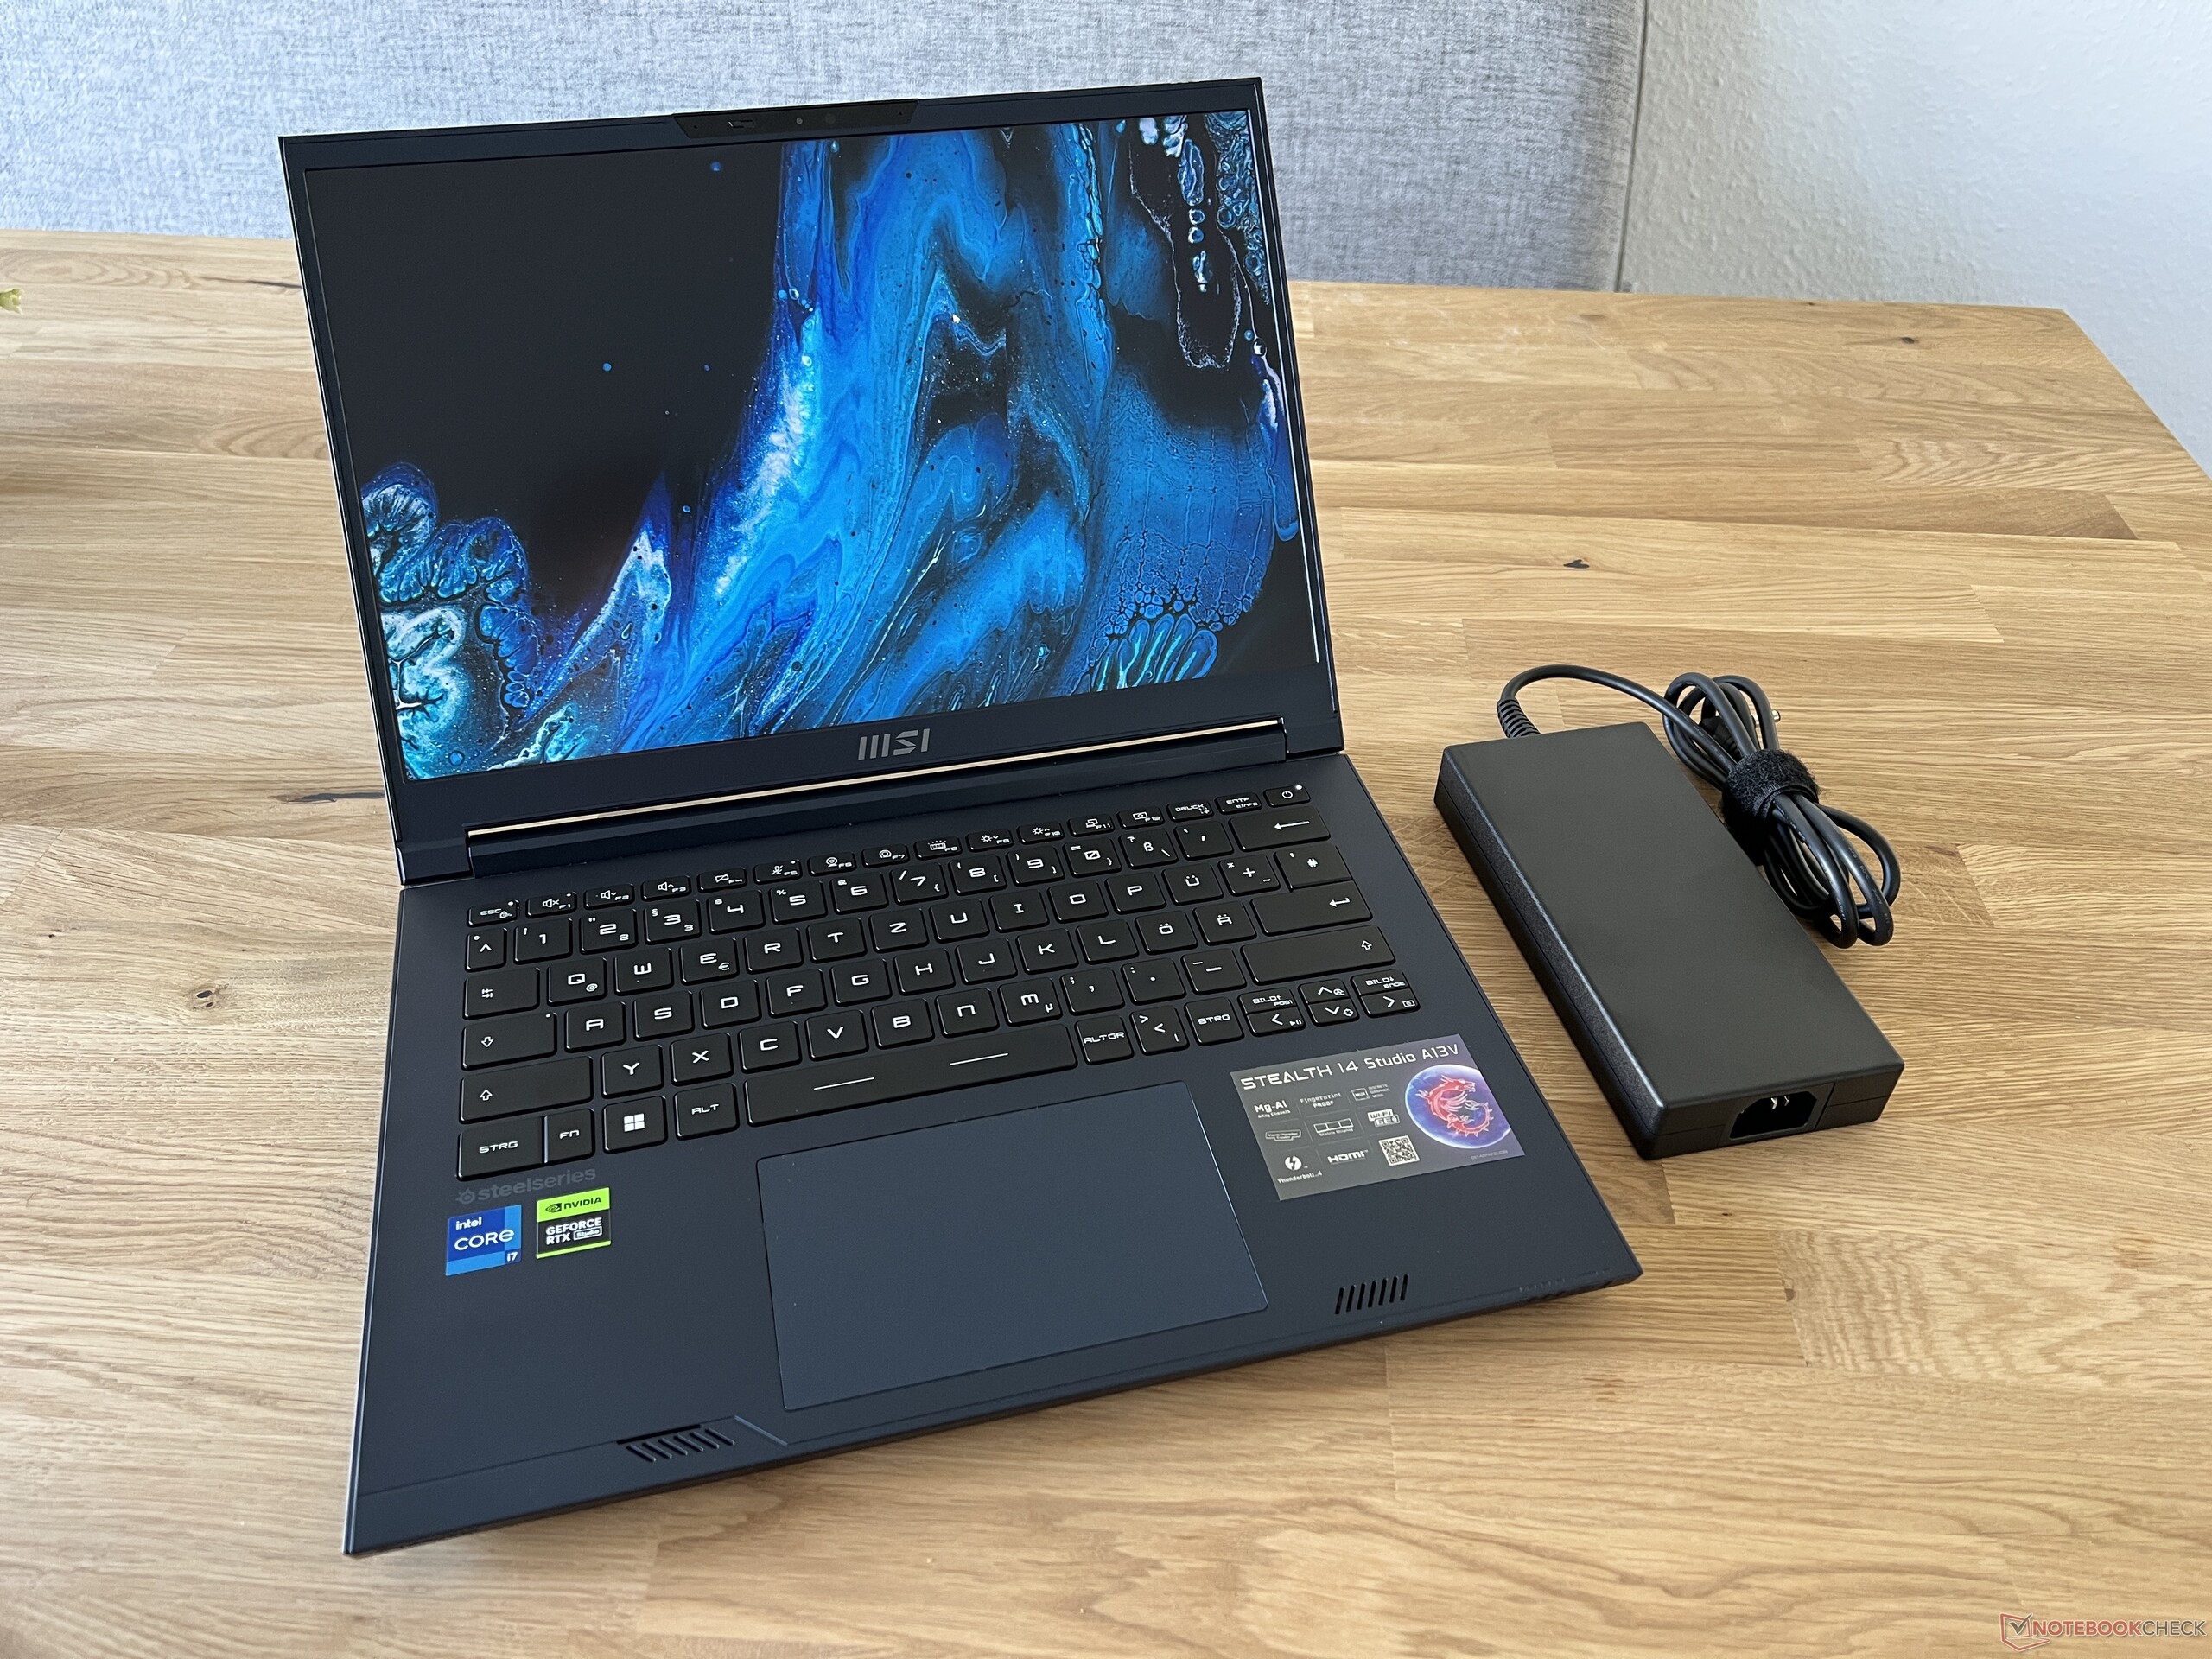
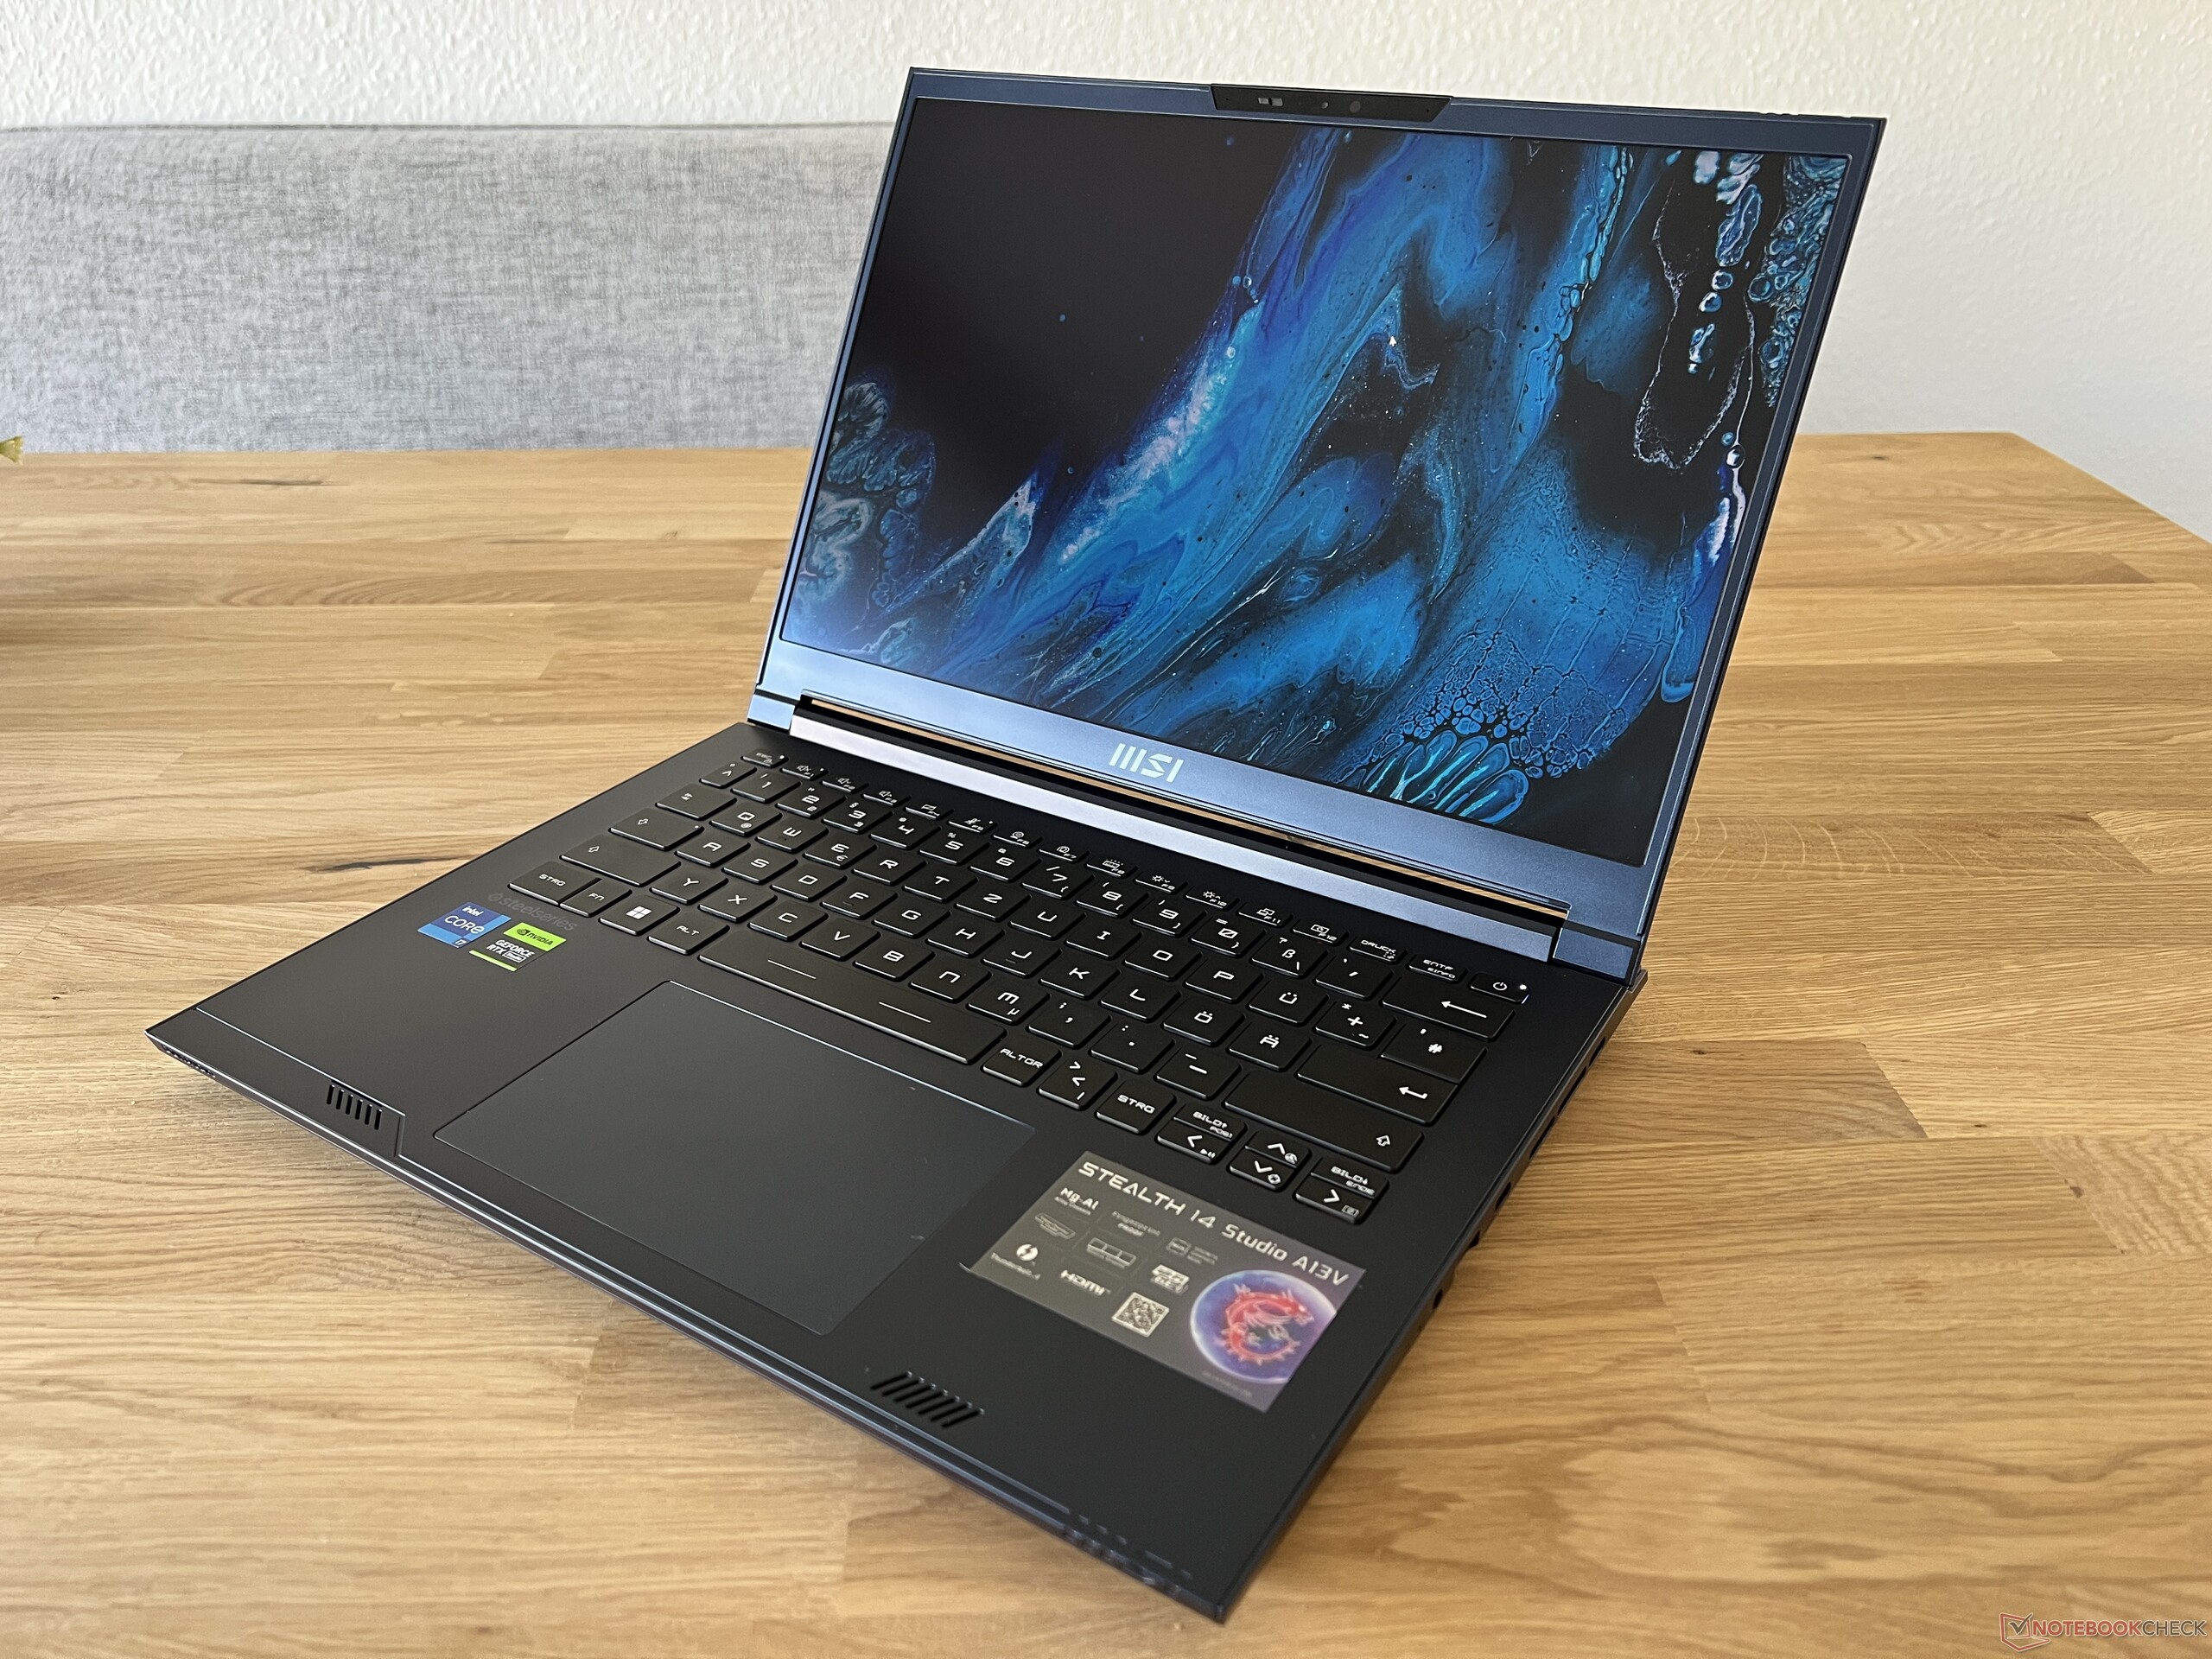
微星Stealth 14 Studio旨在成为一款小巧但功能强大的14英寸游戏笔记本电脑,其目标也是面向内容创作者--或任何在小机箱内寻求高性能水平的用户。该制造商依靠其久经考验的配方,将H45系列的英特尔Raptor Lake芯片与Nvidia新款RTX 4000笔记本电脑相结合。我们的测试设备是Stealth 14 Studio A13VE-029,售价1699.99美元,搭载了酷睿i7-13700H的GeForce RTX 4050笔记本电脑16GB内存以及1TB NVMe固态硬盘。它采用哑光IPS面板(2.560 x 1,600像素),刷新率为240Hz。Stealth 14 Studio可选配RTX 4070笔记本电脑和32GB内存。
潜在的竞争对手比较
Rating | Date | Model | Weight | Height | Size | Resolution | Price |
|---|---|---|---|---|---|---|---|
| 85.4 % v7 (old) | 07 / 2023 | MSI Stealth 14 Studio A13V i7-13700H, GeForce RTX 4050 Laptop GPU | 1.7 kg | 19 mm | 14.00" | 2560x1600 | |
| 89.4 % v7 (old) | 05 / 2023 | Gigabyte Aero 14 OLED BMF i7-13700H, GeForce RTX 4050 Laptop GPU | 1.4 kg | 17 mm | 14.00" | 2880x1800 | |
| 88.8 % v7 (old) | 10 / 2022 | Schenker Vision 14 2022 RTX 3050 Ti i7-12700H, GeForce RTX 3050 Ti Laptop GPU | 1.3 kg | 16.6 mm | 14.00" | 2880x1800 | |
| 86.8 % v7 (old) | 03 / 2022 | Asus ROG Flow Z13 GZ301ZE i9-12900H, GeForce RTX 3050 Ti Laptop GPU | 1.2 kg | 12 mm | 13.40" | 1920x1200 | |
| 86.7 % v7 (old) | 03 / 2022 | Alienware x14 i7 RTX 3060 i7-12700H, GeForce RTX 3060 Laptop GPU | 1.8 kg | 14.5 mm | 14.00" | 1920x1080 | |
| 89.4 % v7 (old) | 05 / 2022 | Razer Blade 14 Ryzen 9 6900HX R9 6900HX, GeForce RTX 3070 Ti Laptop GPU | 1.8 kg | 16.8 mm | 14.00" | 2560x1440 | |
| 86 % v7 (old) | 11 / 2022 | Acer Predator Triton 300 SE i9-12900H, GeForce RTX 3060 Laptop GPU | 1.7 kg | 19.8 mm | 14.00" | 2880x1800 |
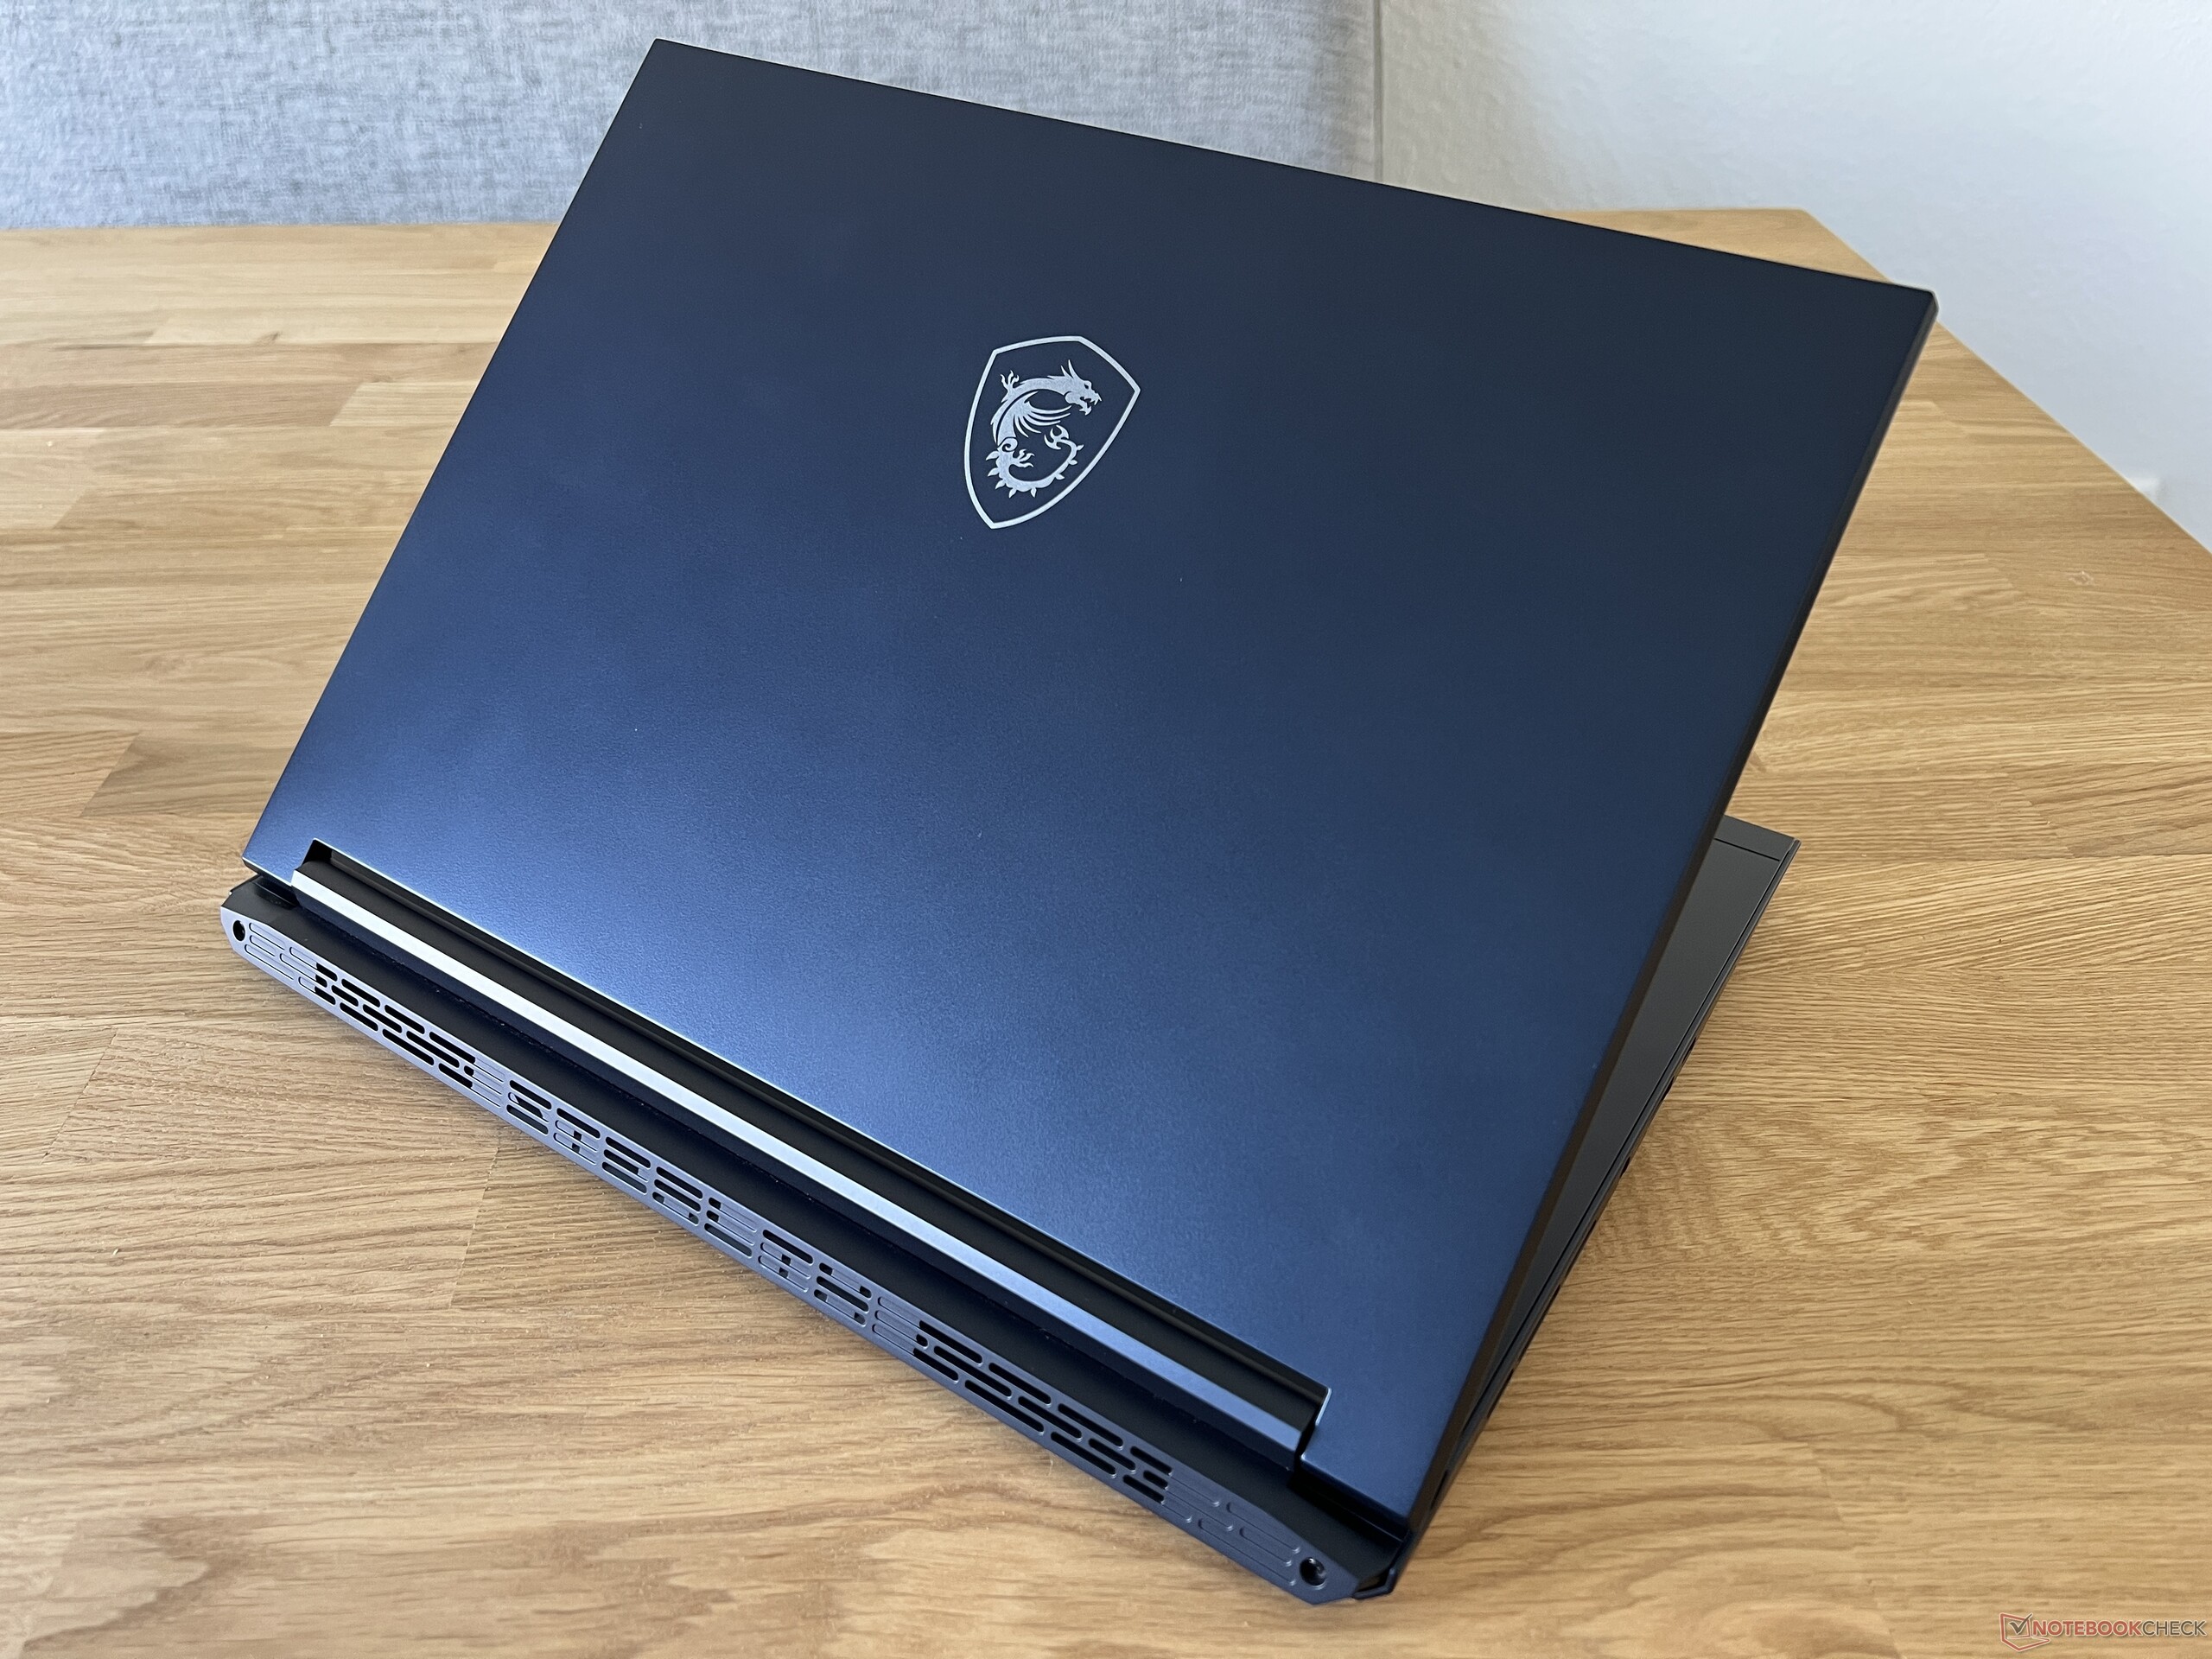
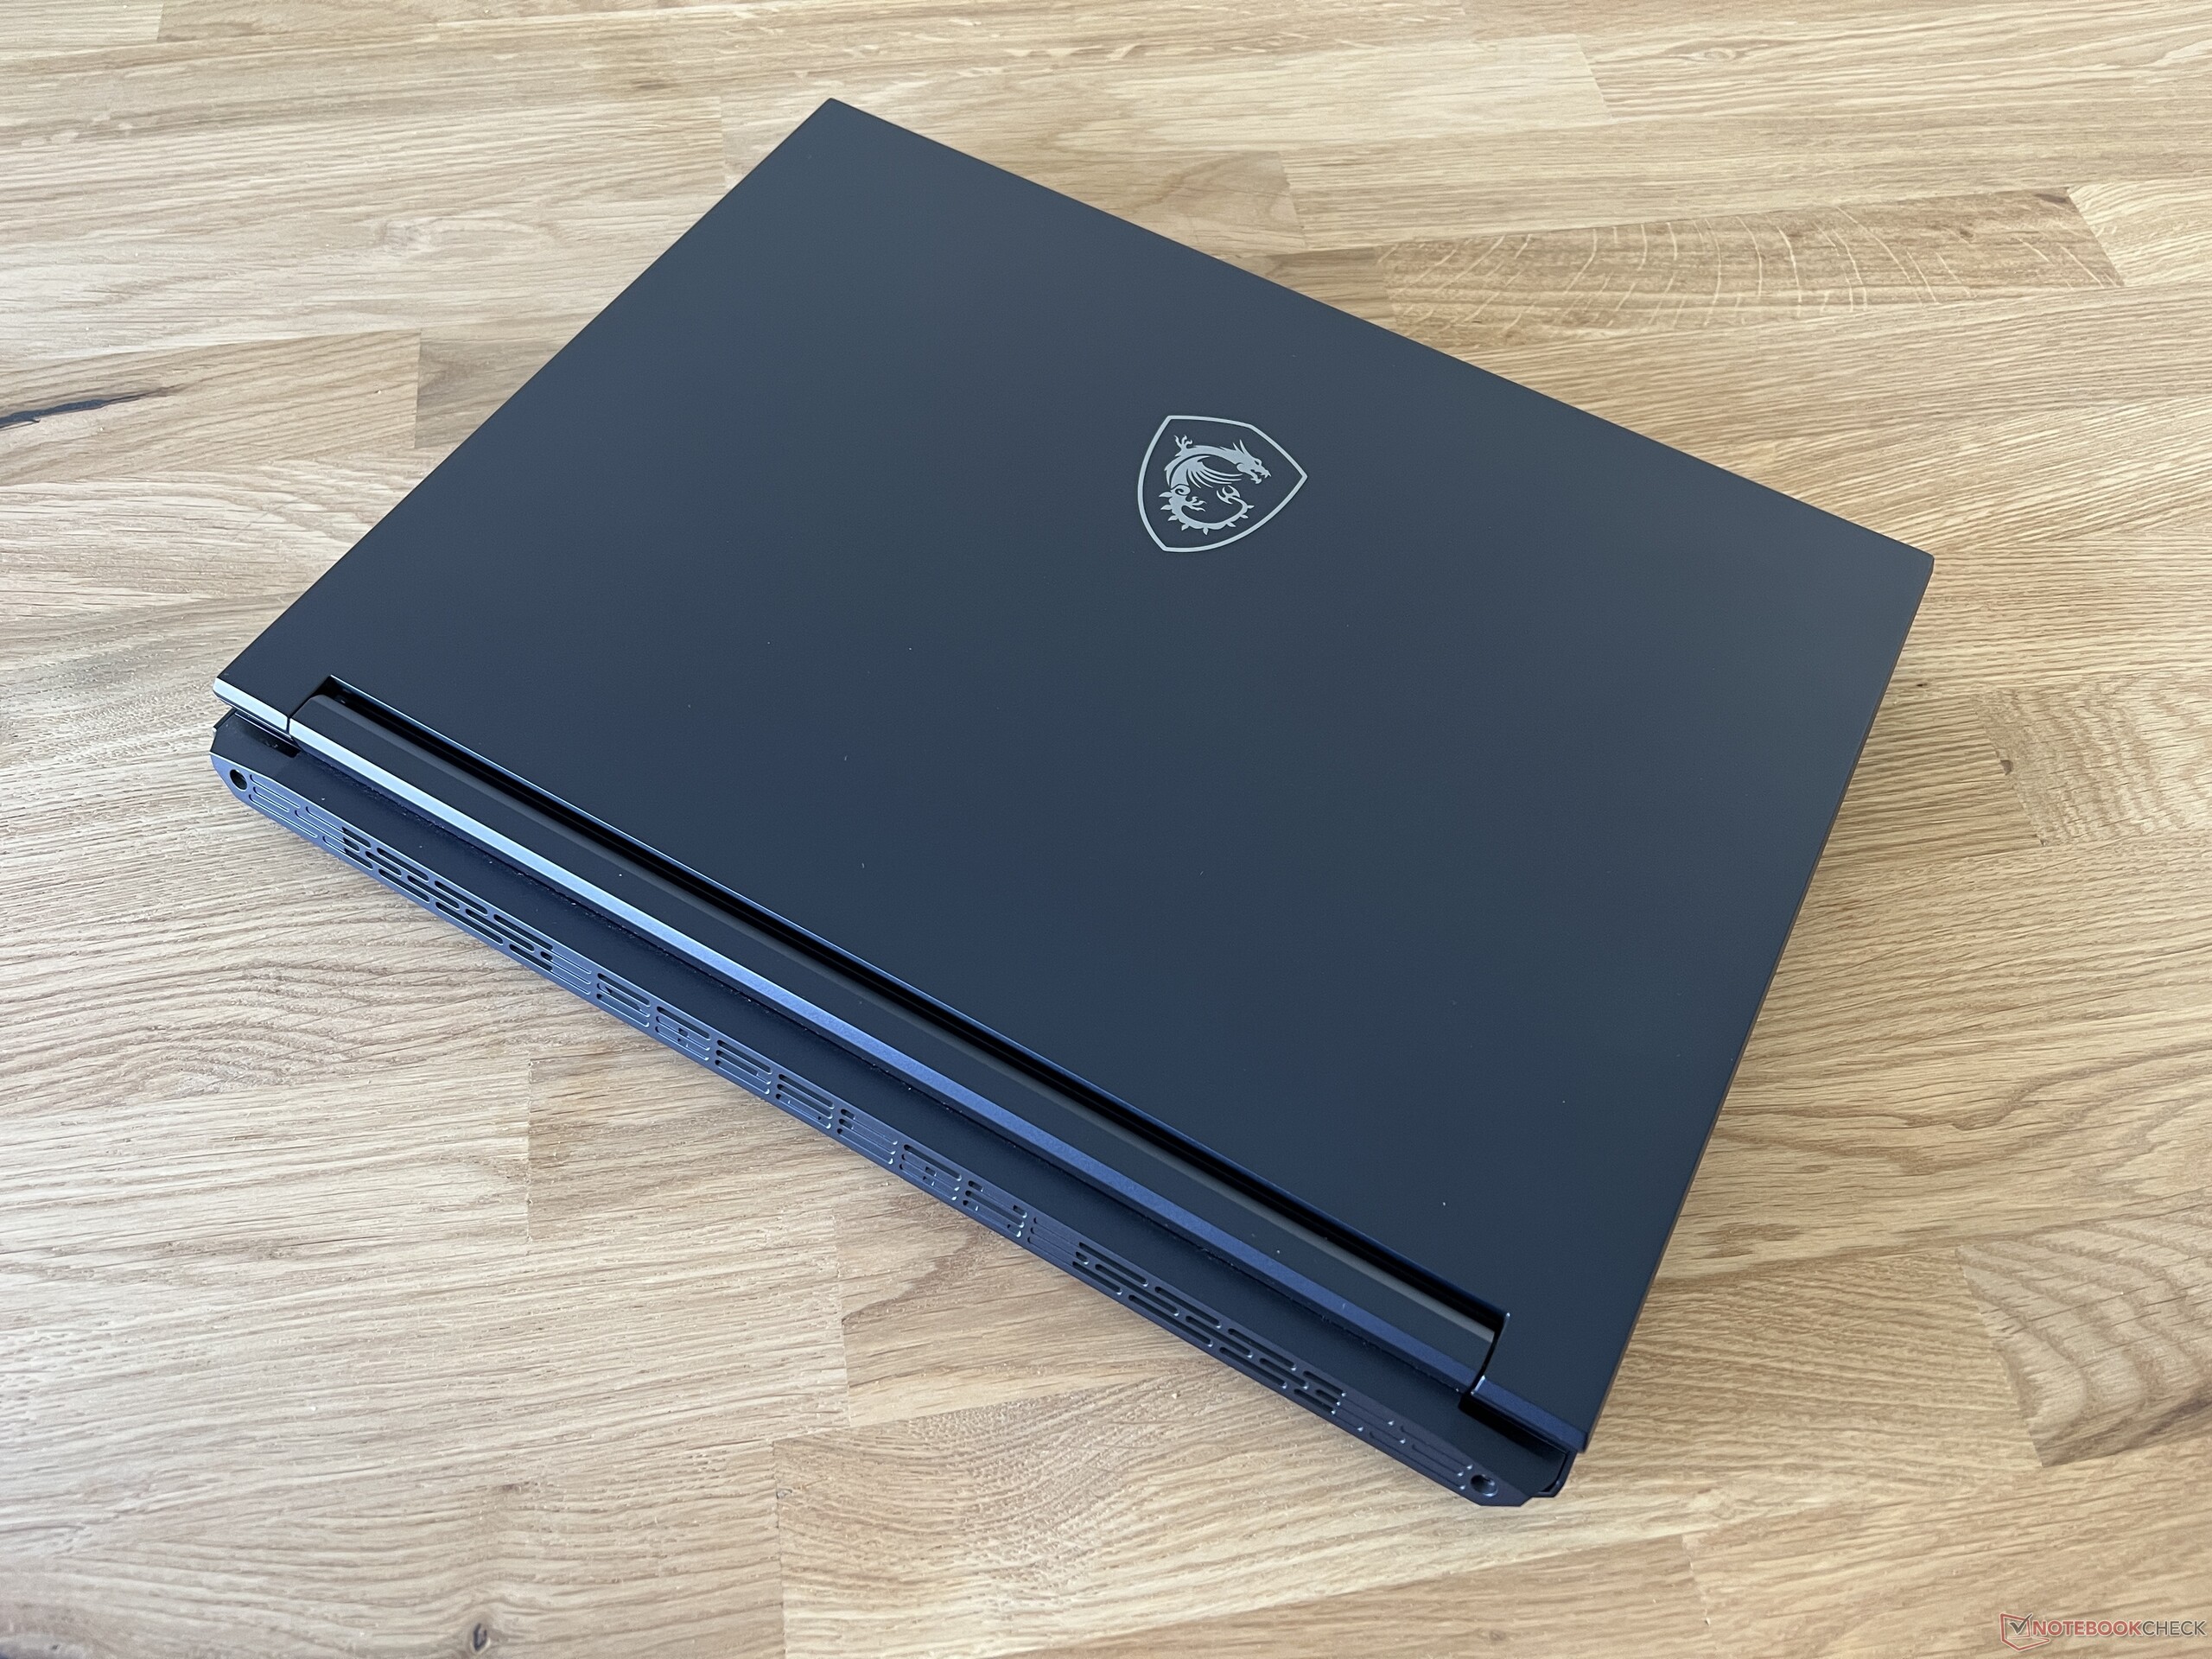
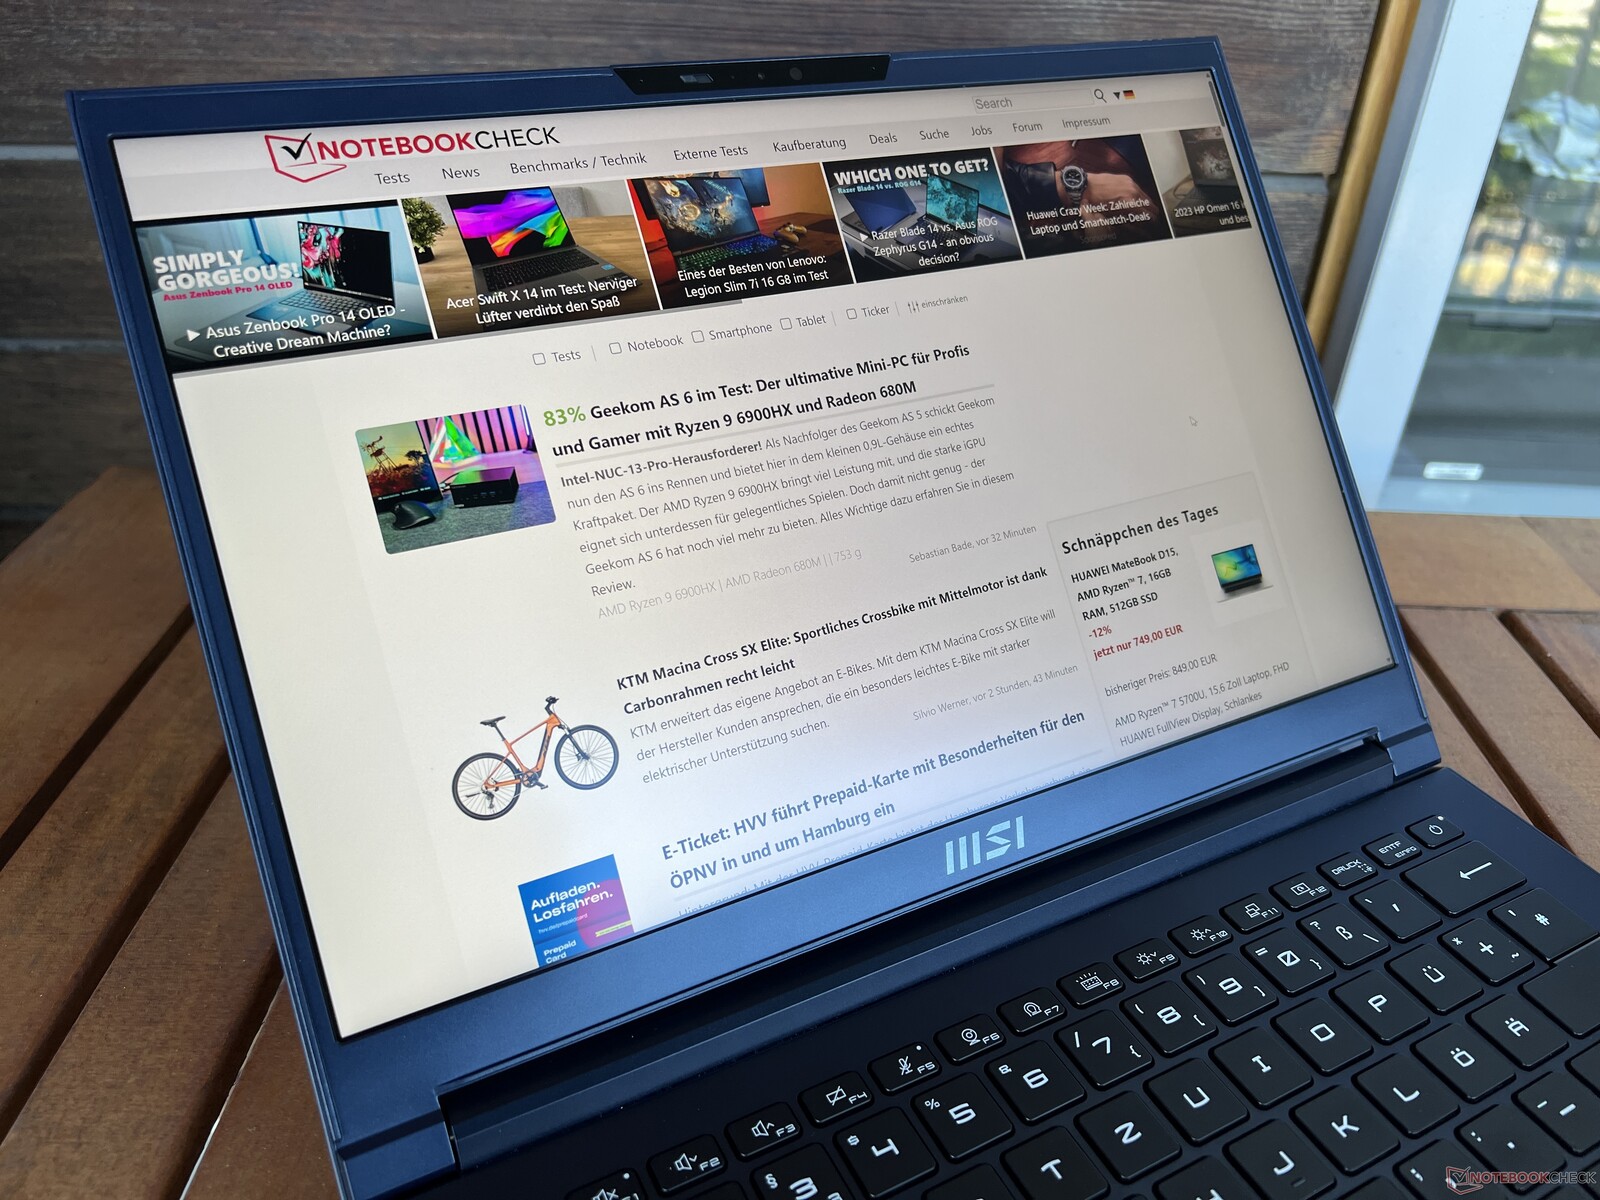
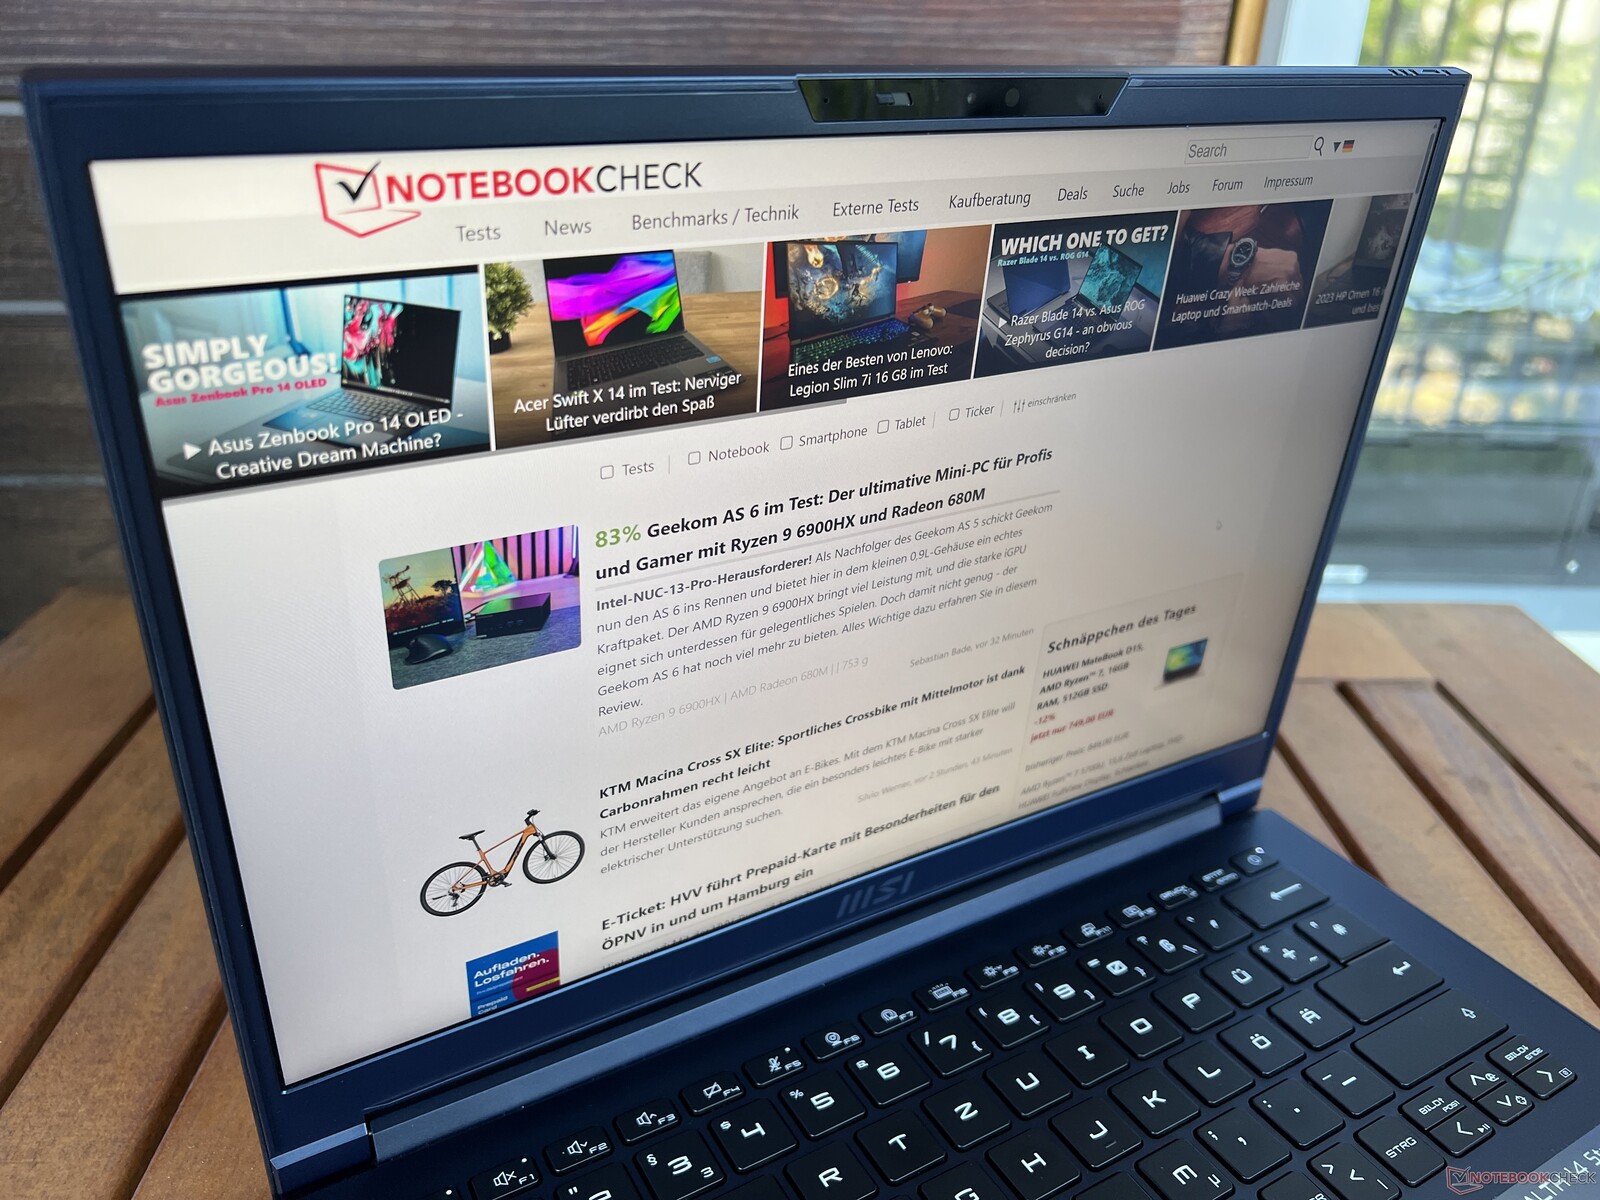
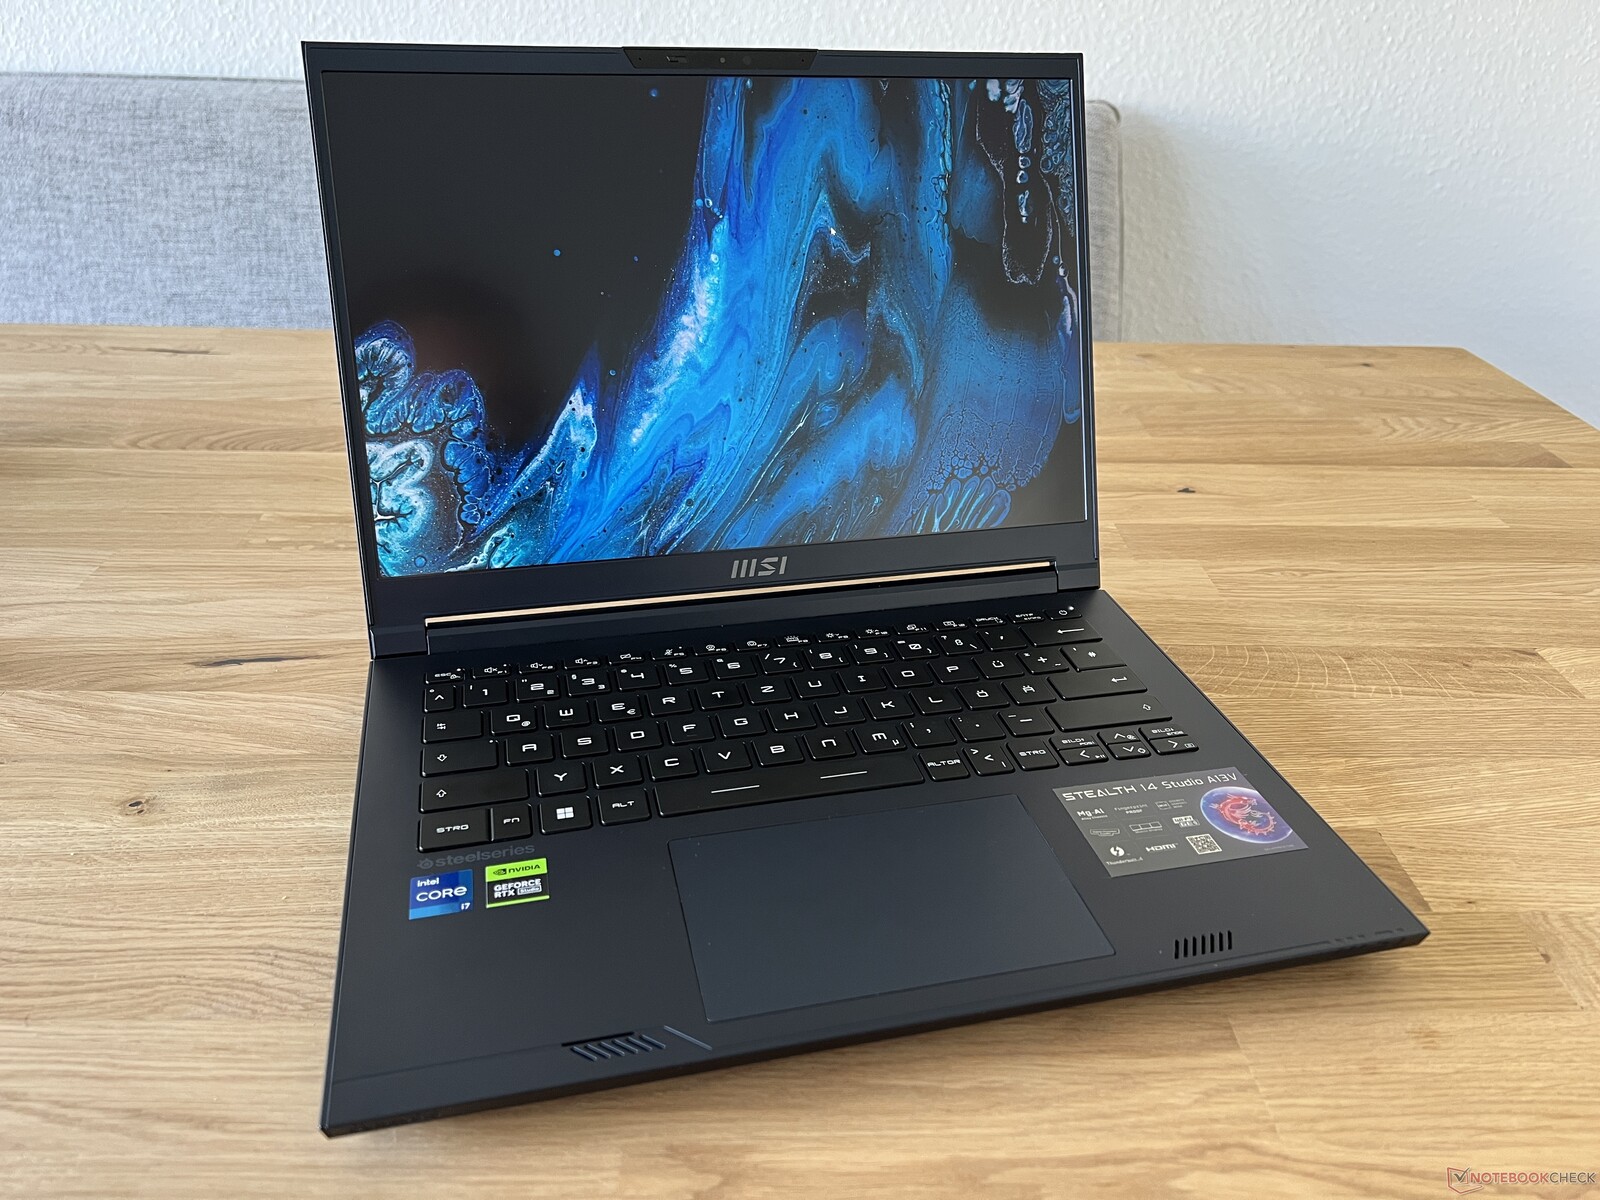
表壳 - 蓝色或白色金属
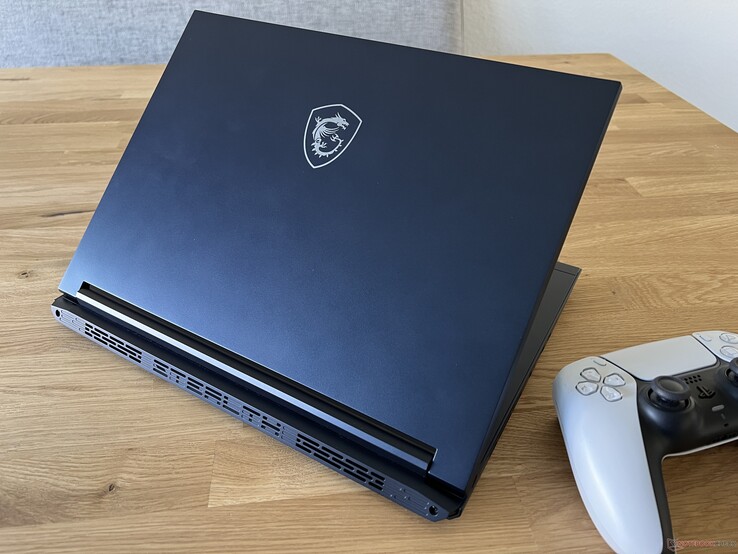
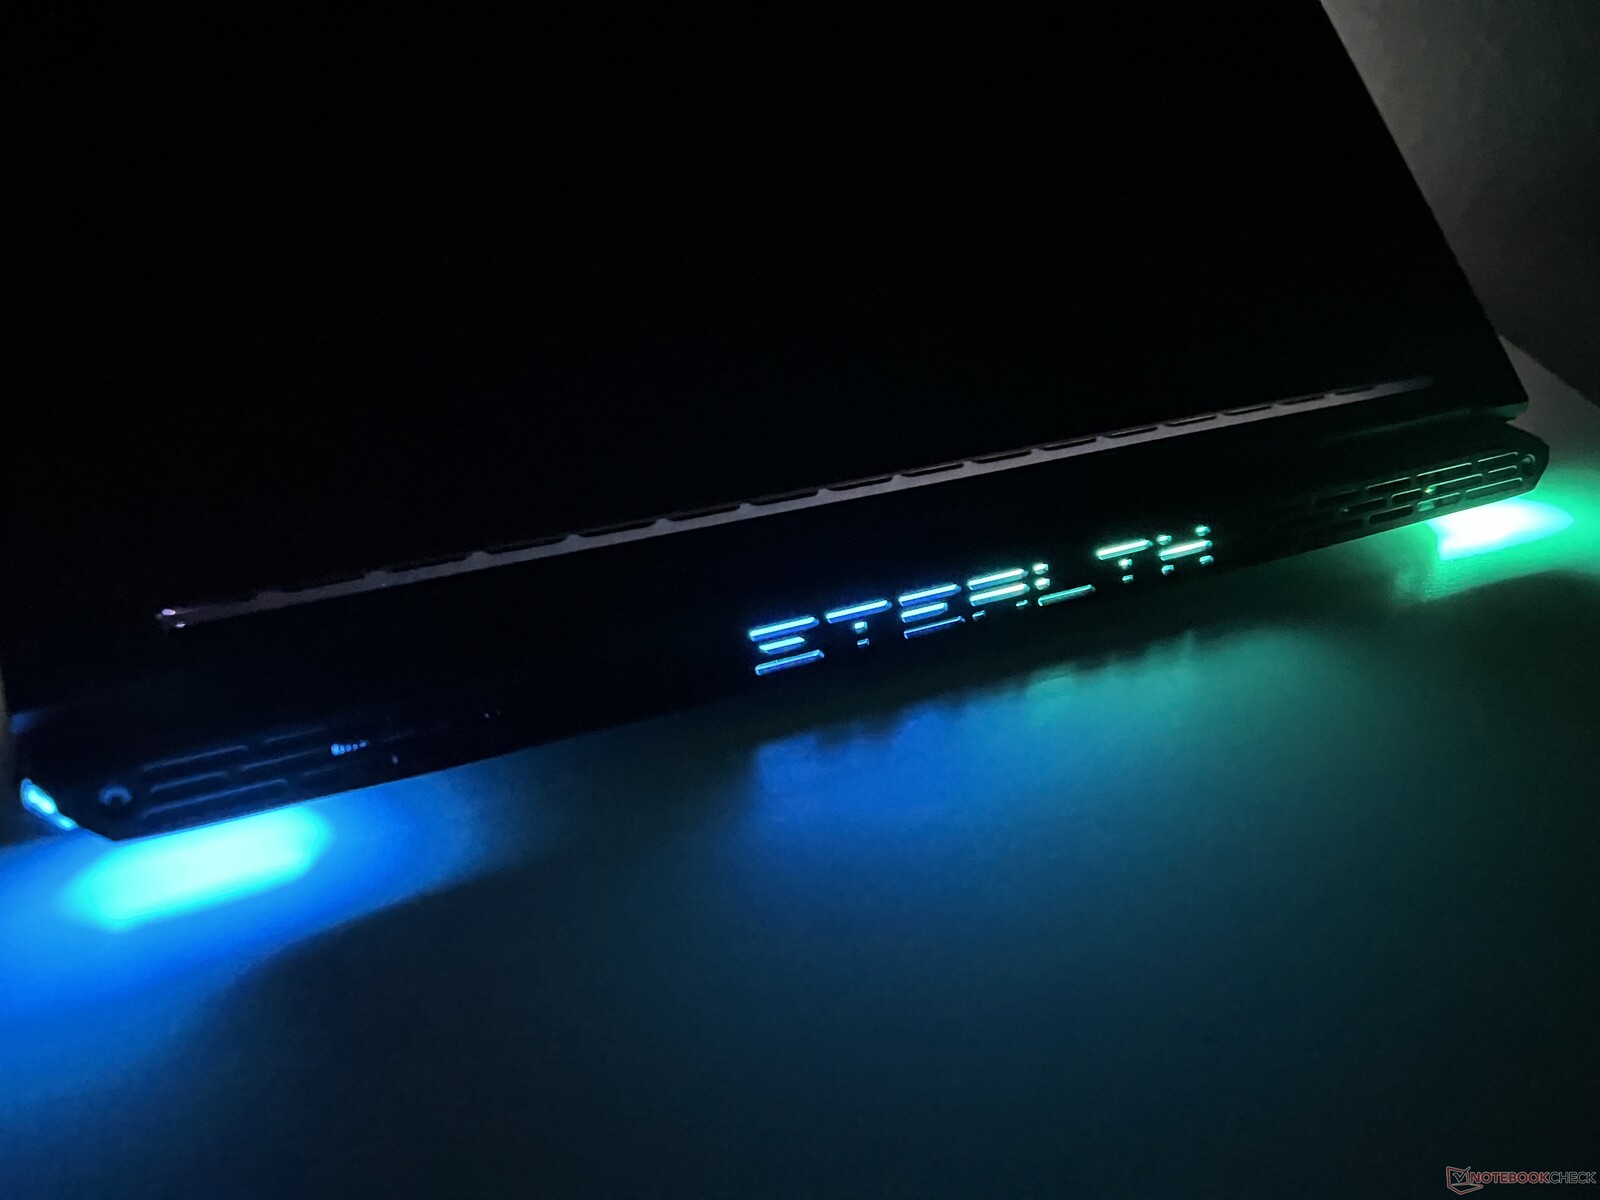
微星为Stealth 14 Studio提供深蓝色和白色两种颜色。我们测试的是蓝色款式,看起来相当优雅,但容易留下指纹痕迹。作为一款游戏笔记本电脑,这款产品的设计实际上相当保守--盖子上的龙形徽标是唯一能吸引人注意的设备系列。在背面,有一些额外的照明元素(您可以通过微星中心激活)--两个角以及Stealth标志都可以发光。遗憾的是,您无法改变照明的颜色或强度。
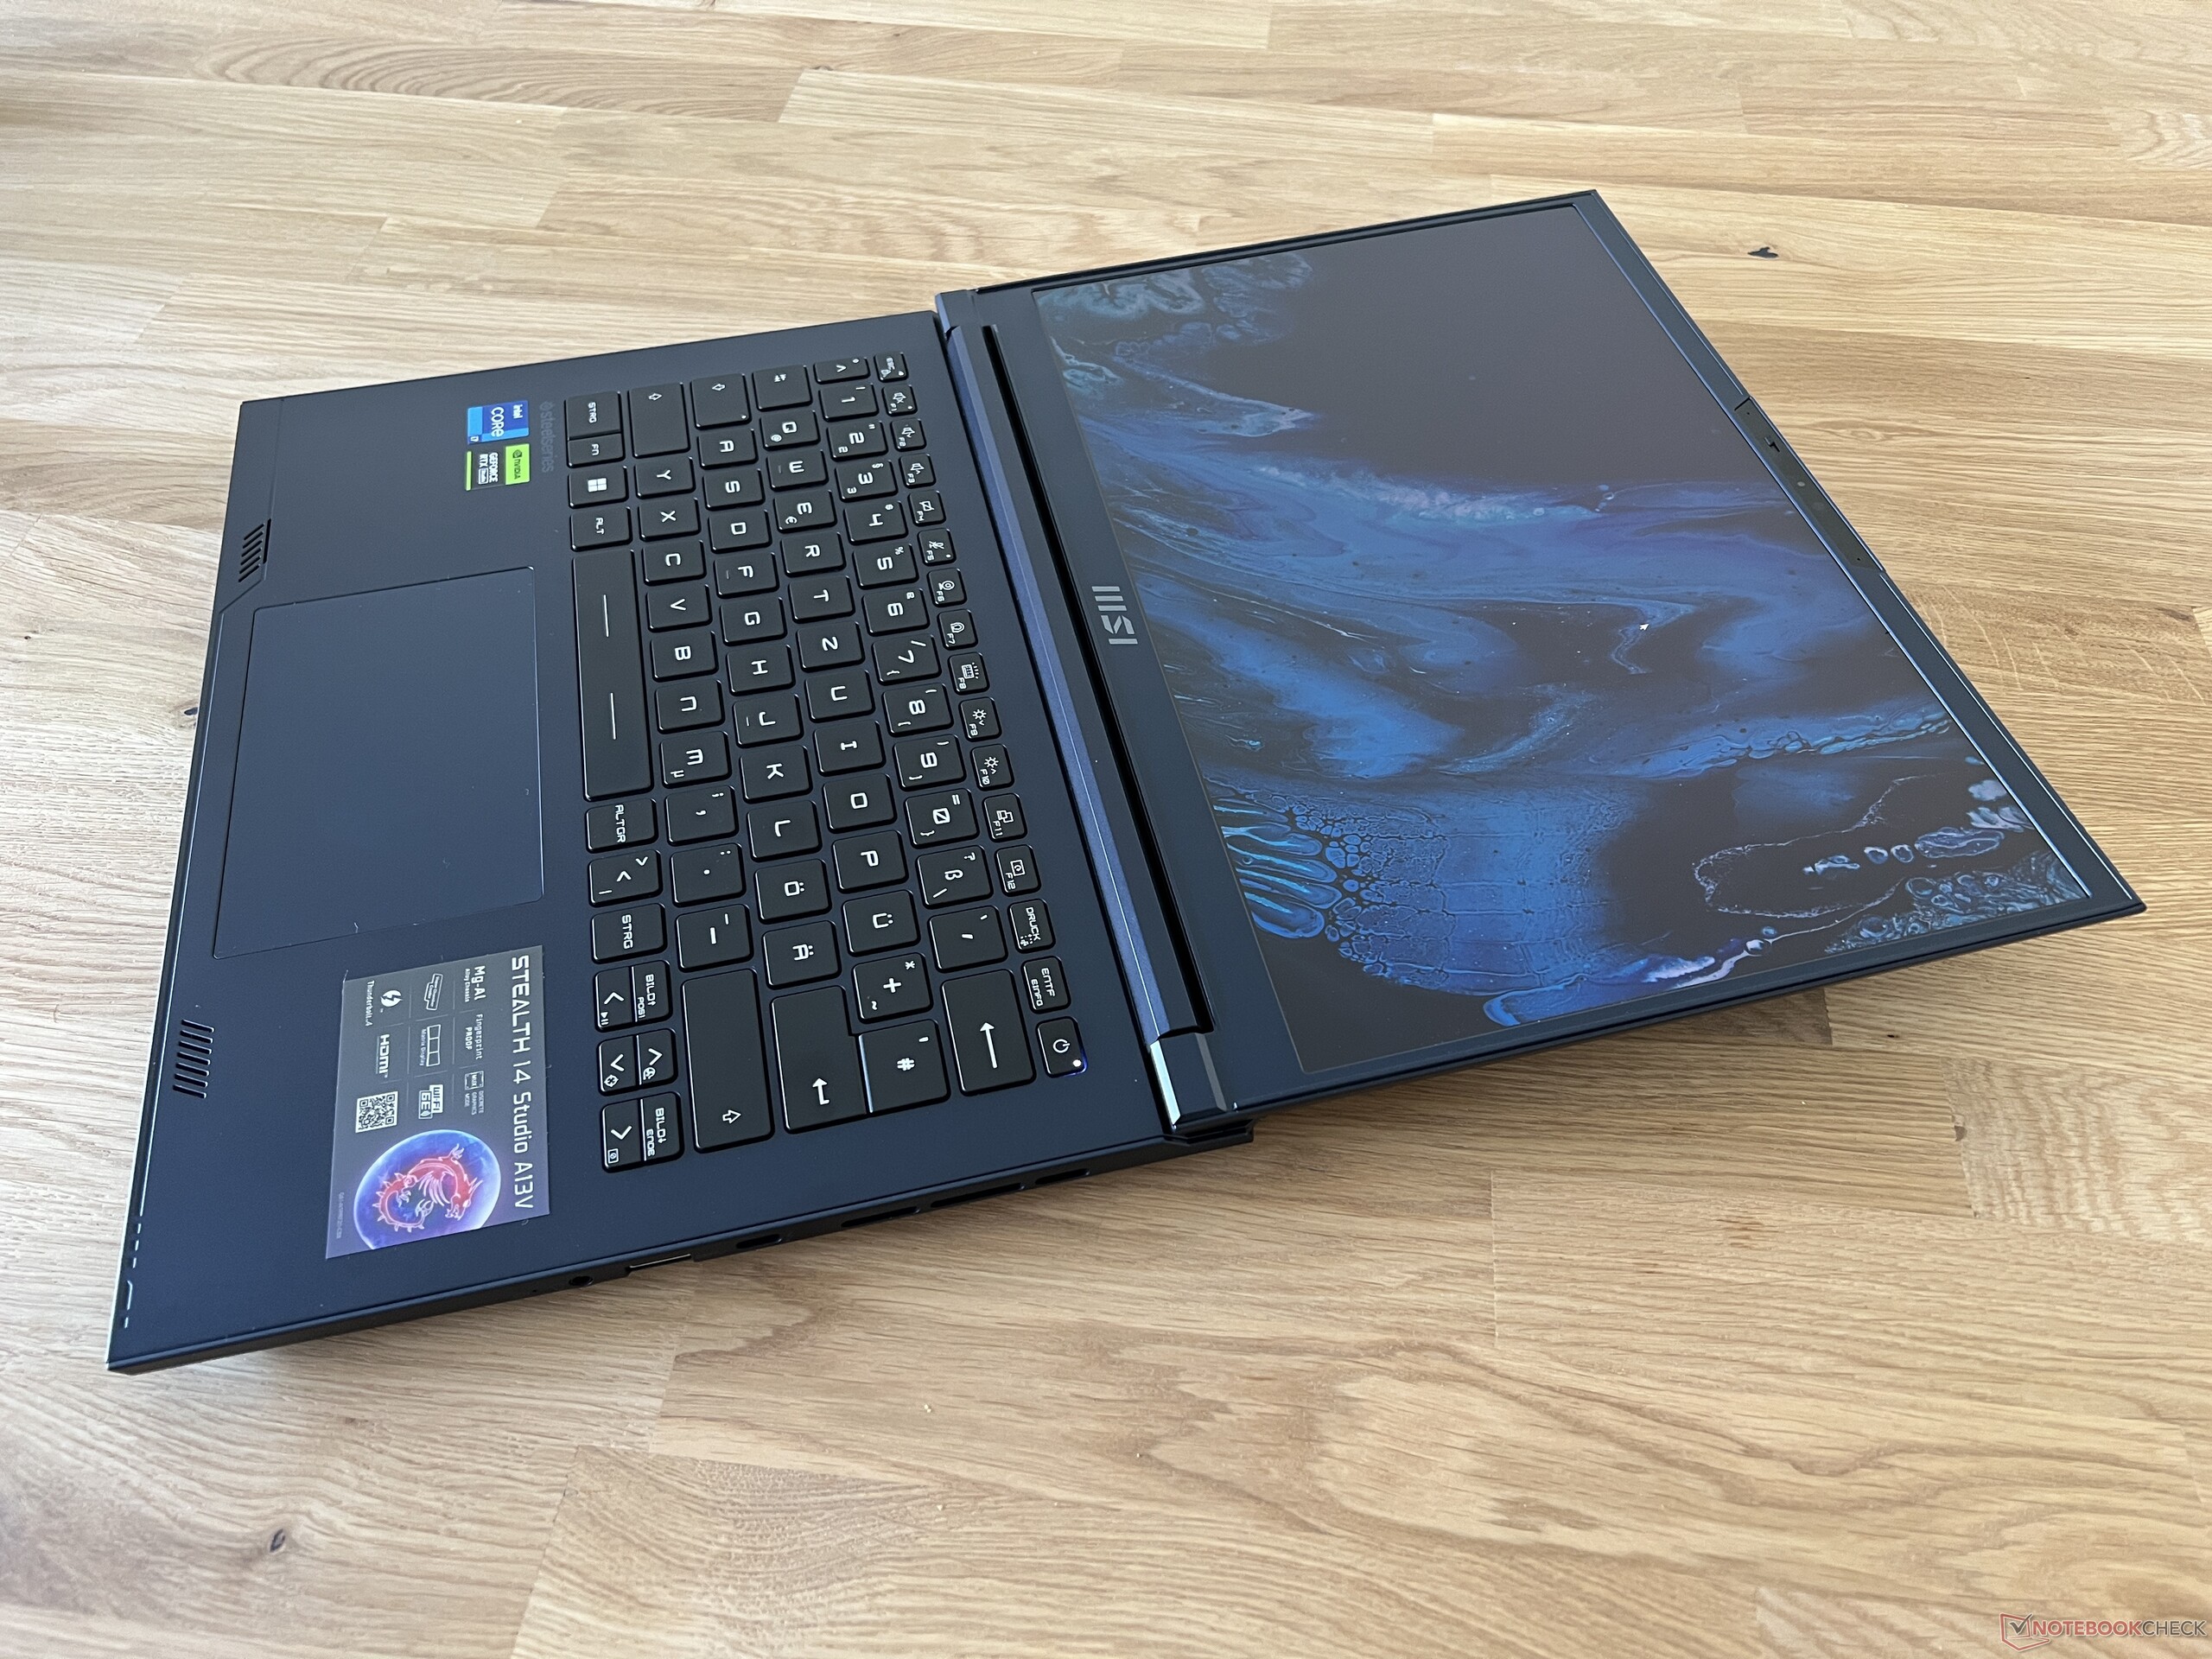
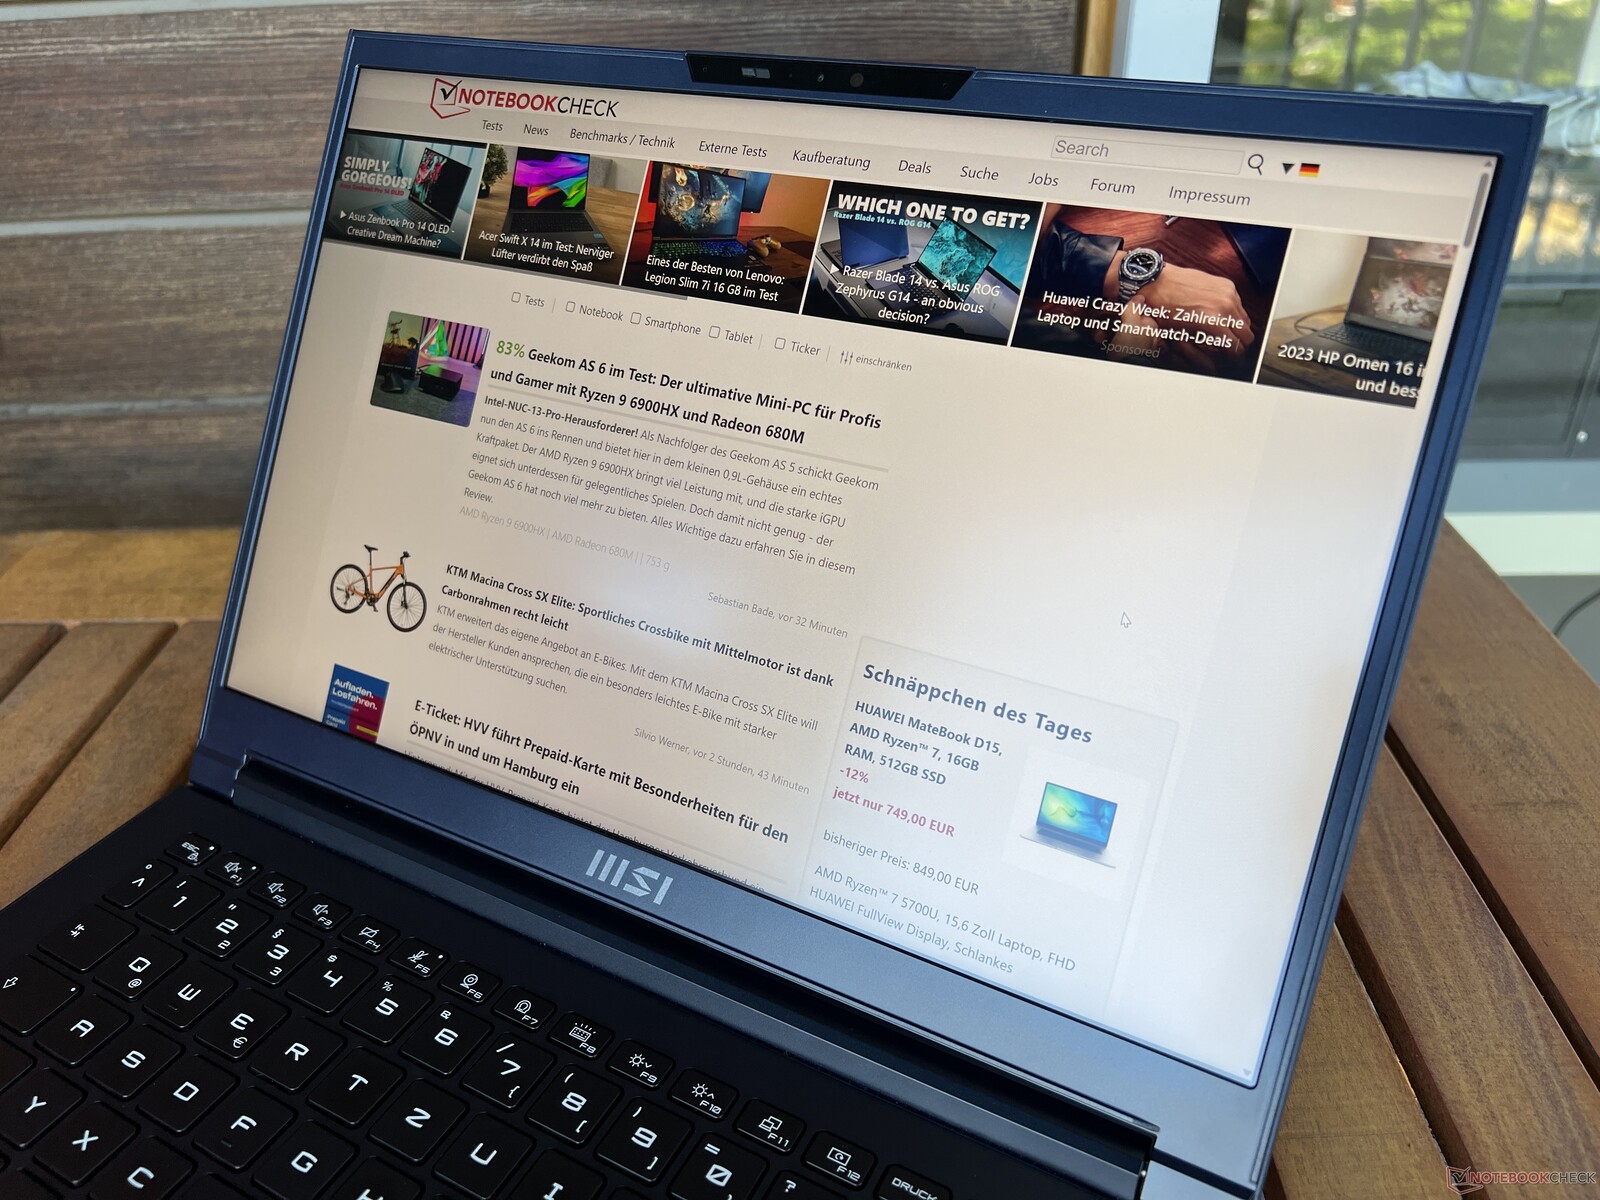
外壳由镁铝合金制成,底座非常稳定。它无法弯曲或扭曲,也不会发出吱吱嘎嘎的声音。遗憾的是,设备的盖子却并非如此,它的柔韧性要好得多,甚至可以轻微弯曲,从而产生可闻的吱吱声。通常情况下,这些问题在现代设备上早已被遗忘,因此您一定要小心,不要用屏幕拎起笔记本电脑,以免造成永久性损坏。两个铰链都调节得很好,允许的最大开启角度为180度。对于现代设备而言,边框相当厚,屏占比仅为73%。
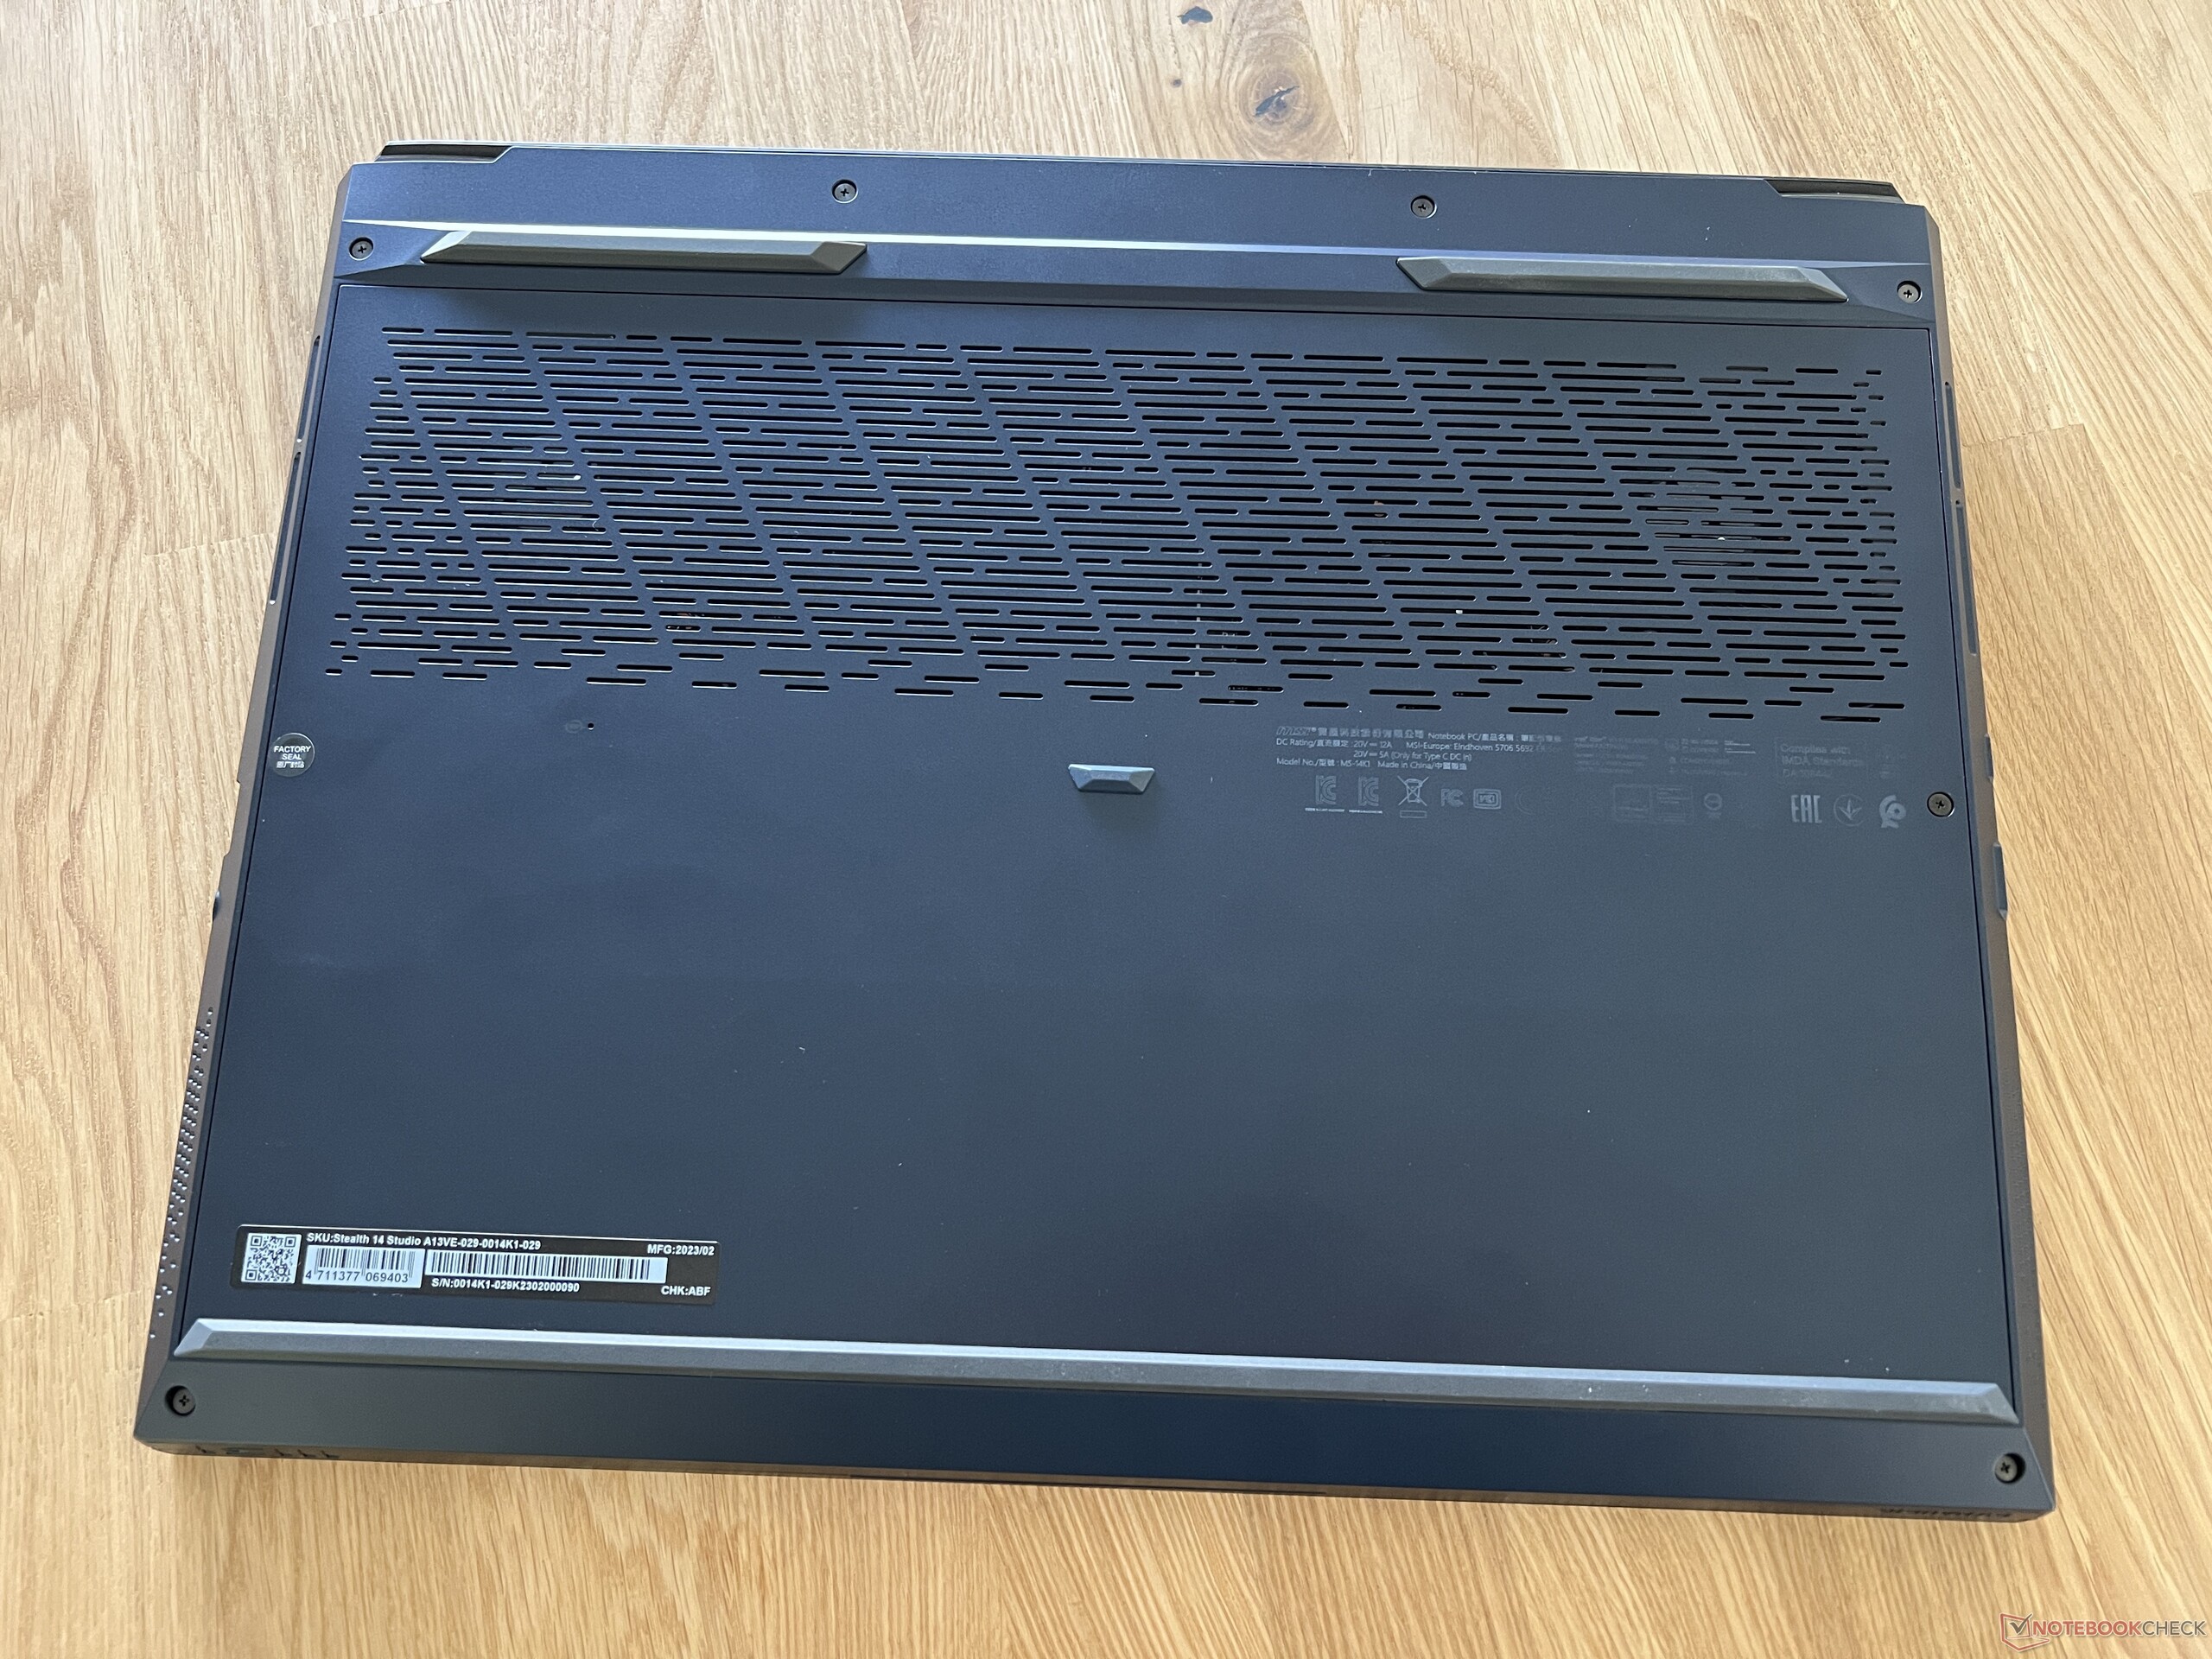
Stealth 14 Studio是我们对比组中最大的设备之一,仅次于Alienware x14。Alienware x14占用的空间更大。其重量略高于 1.7 千克,处于平均水平。240瓦的电源又增加了700克。
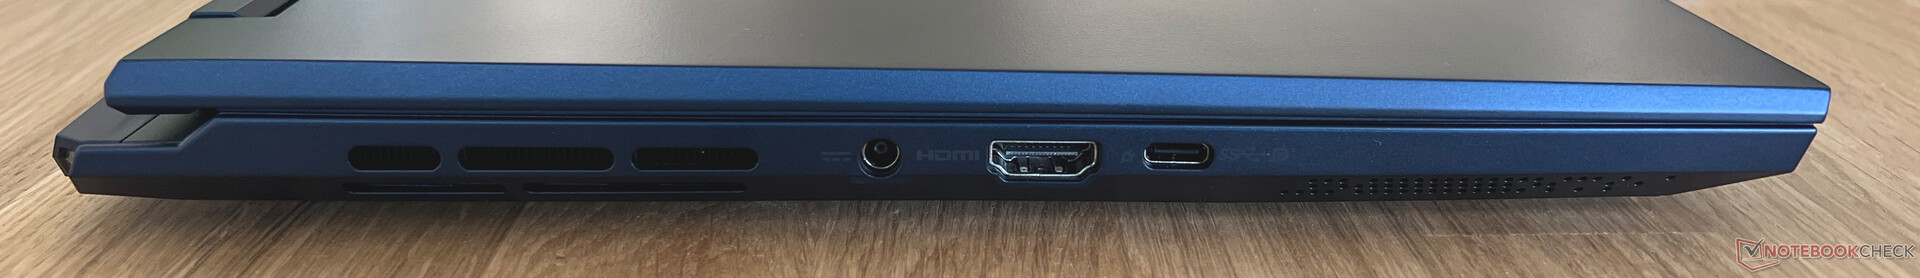
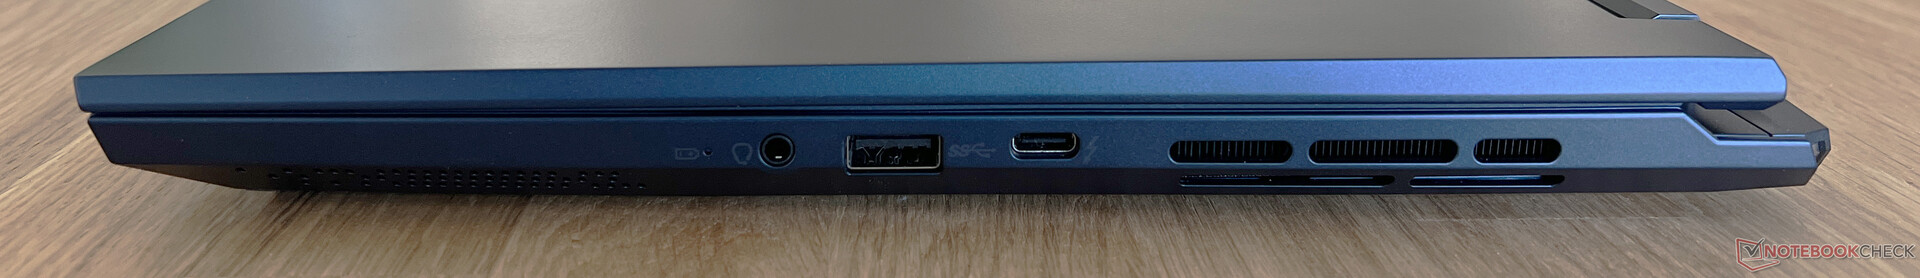
连接性 - Thunderbolt 4,但没有SD卡读卡器
Stealth 14 Studio的端口位于设备两侧的中间位置,但每侧只有三个。您只能找到最必要的连接,但该笔记本电脑的端口至少是最新的,因为它们包括Thunderbolt 4和HDMI 2.1。遗憾的是,SD读卡器和以太网端口未包括在内--您将不得不依赖适配器。
通讯
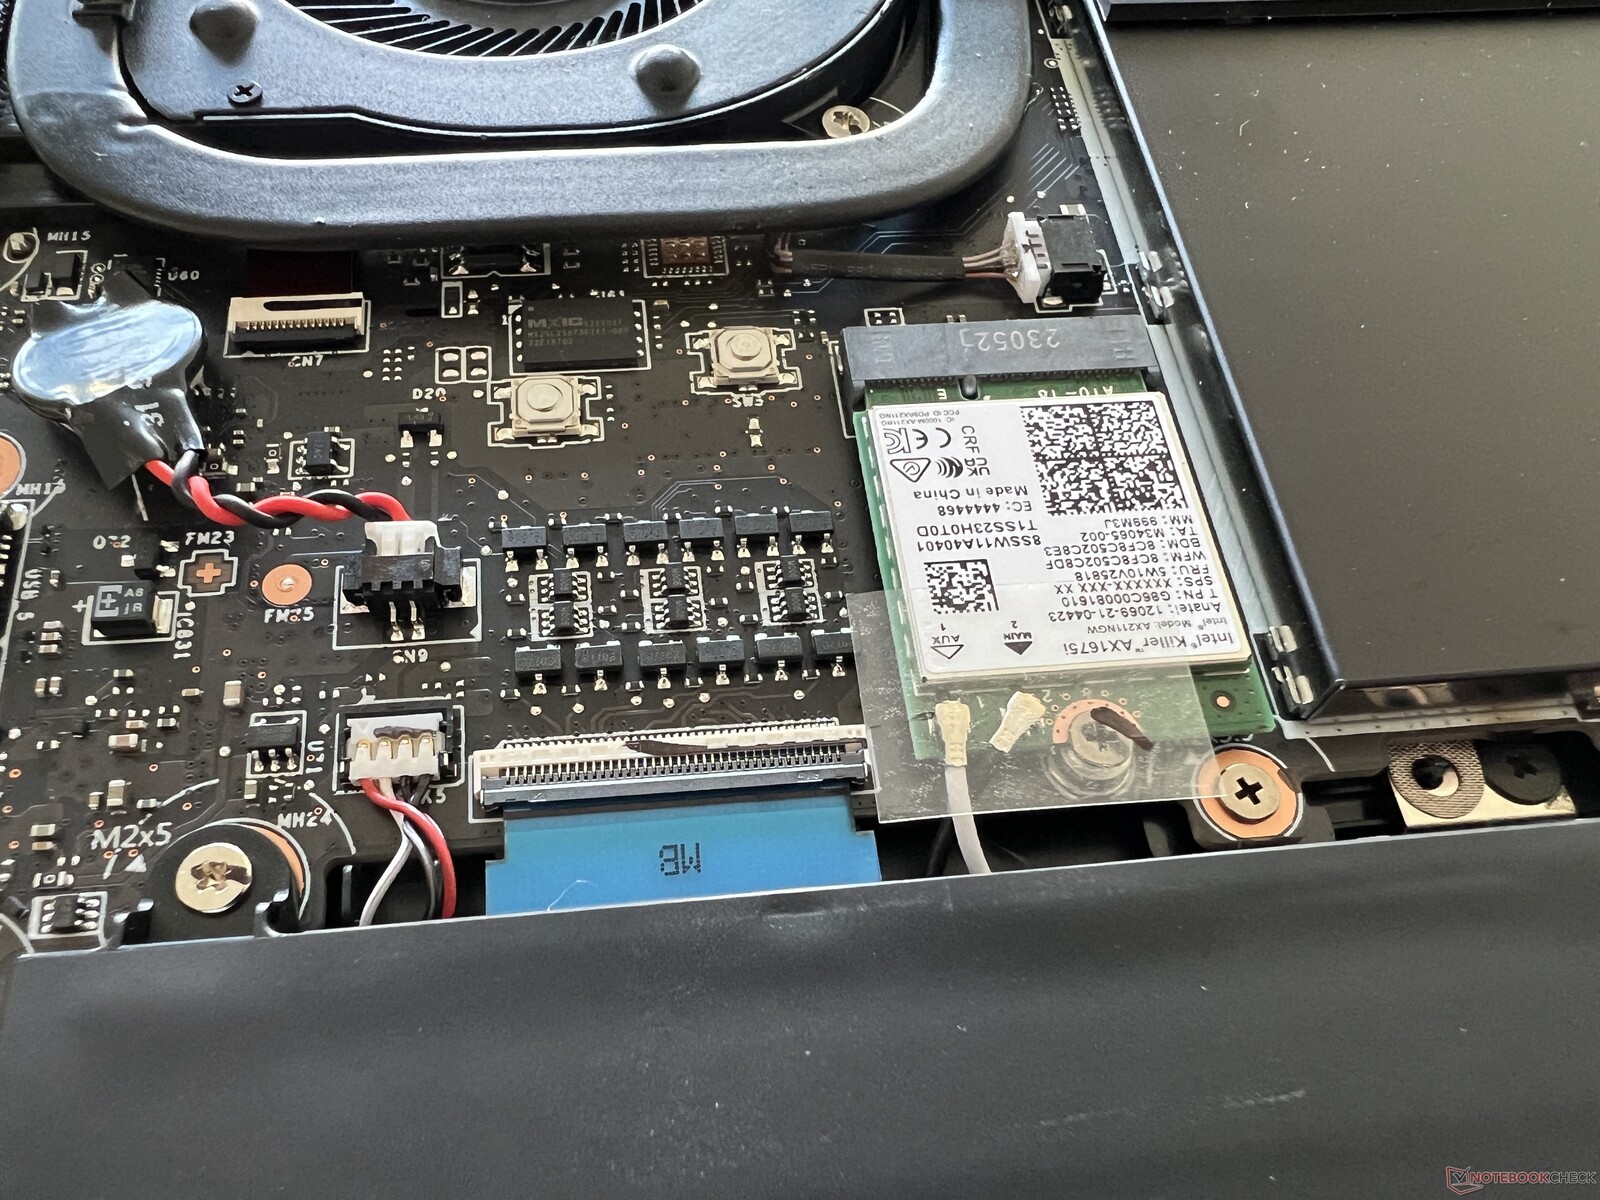
该笔记本电脑采用Killer AX1675i作为无线局域网模块,它还支持现代6-GHz连接(Wi-Fi 6E)。使用华硕的参考路由器,我们测得了良好(但不是很好)的传输效果。在日常使用中,这应该不会导致任何问题,我们在测试中也从未遇到任何信号稳定性问题。
| Networking | |
| MSI Stealth 14 Studio A13V | |
| iperf3 transmit AXE11000 | |
| iperf3 receive AXE11000 | |
| Gigabyte Aero 14 OLED BMF | |
| iperf3 transmit AXE11000 | |
| iperf3 receive AXE11000 | |
| iperf3 transmit AXE11000 6GHz | |
| iperf3 receive AXE11000 6GHz | |
| Schenker Vision 14 2022 RTX 3050 Ti | |
| iperf3 transmit AXE11000 | |
| iperf3 receive AXE11000 | |
| Asus ROG Flow Z13 GZ301ZE | |
| iperf3 transmit AX12 | |
| iperf3 receive AX12 | |
| Alienware x14 i7 RTX 3060 | |
| iperf3 transmit AX12 | |
| iperf3 receive AX12 | |
| Razer Blade 14 Ryzen 9 6900HX | |
| iperf3 transmit AX12 | |
| iperf3 receive AX12 | |
| Acer Predator Triton 300 SE | |
| iperf3 transmit AXE11000 6GHz | |
| iperf3 receive AXE11000 6GHz | |
网络摄像头
令人略感意外的是,Stealth 14 Studio 的 720p 网络摄像头即使在光线条件良好的情况下也很难提供像样的图像。此外,还安装了一个红外模块--通过Windows Hello支持面部识别。


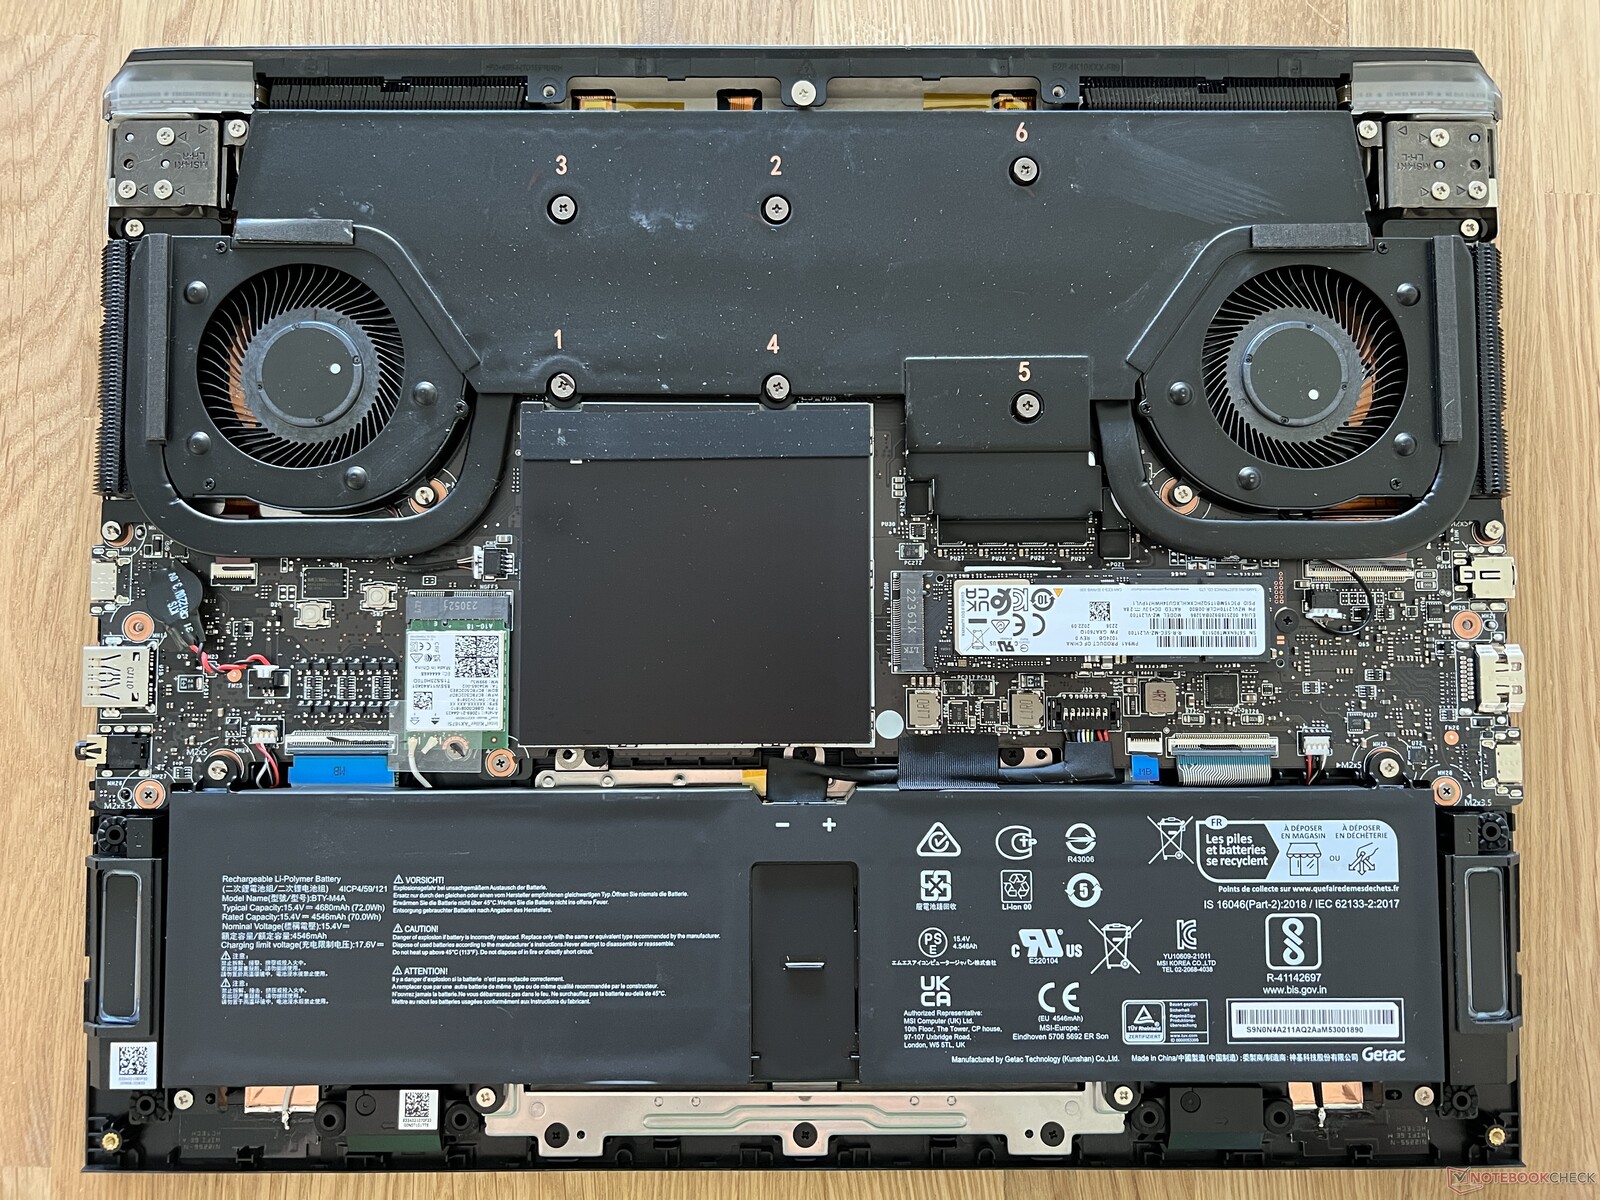
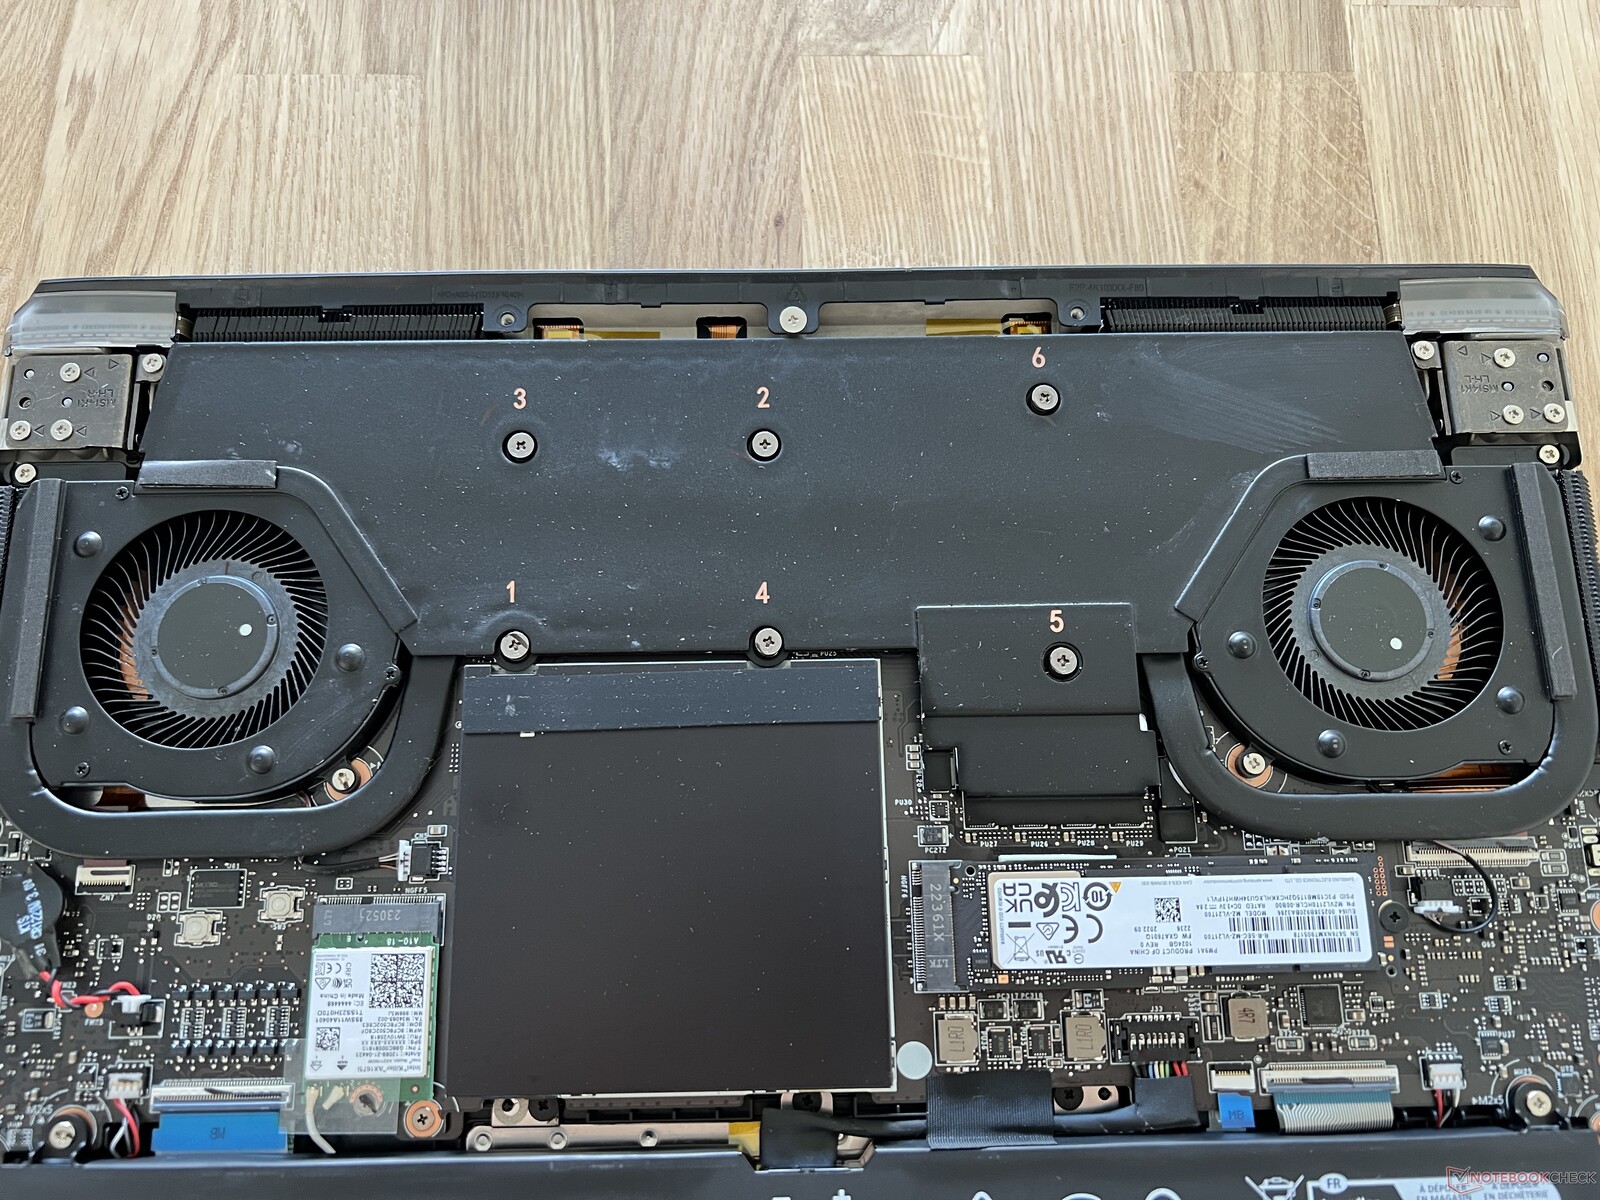
维护
为了接触笔记本电脑的部件,您必须拆开整个机箱的下部。至少在德国(我们进行测试的地方),其中一个十字螺丝有密封圈,适当使用不会影响保修。在内部,您可以清洁风扇,更换WLAN模块和M.2 2280固态硬盘。理论上,您也可以更换内存模块,但是,额外的盖子连接得很紧,我们无法将其拆下(并且不想对我们的测试样品造成任何损坏)。可能有一个额外的胶垫将其固定在适当的位置,这使得用户很难将其取出。
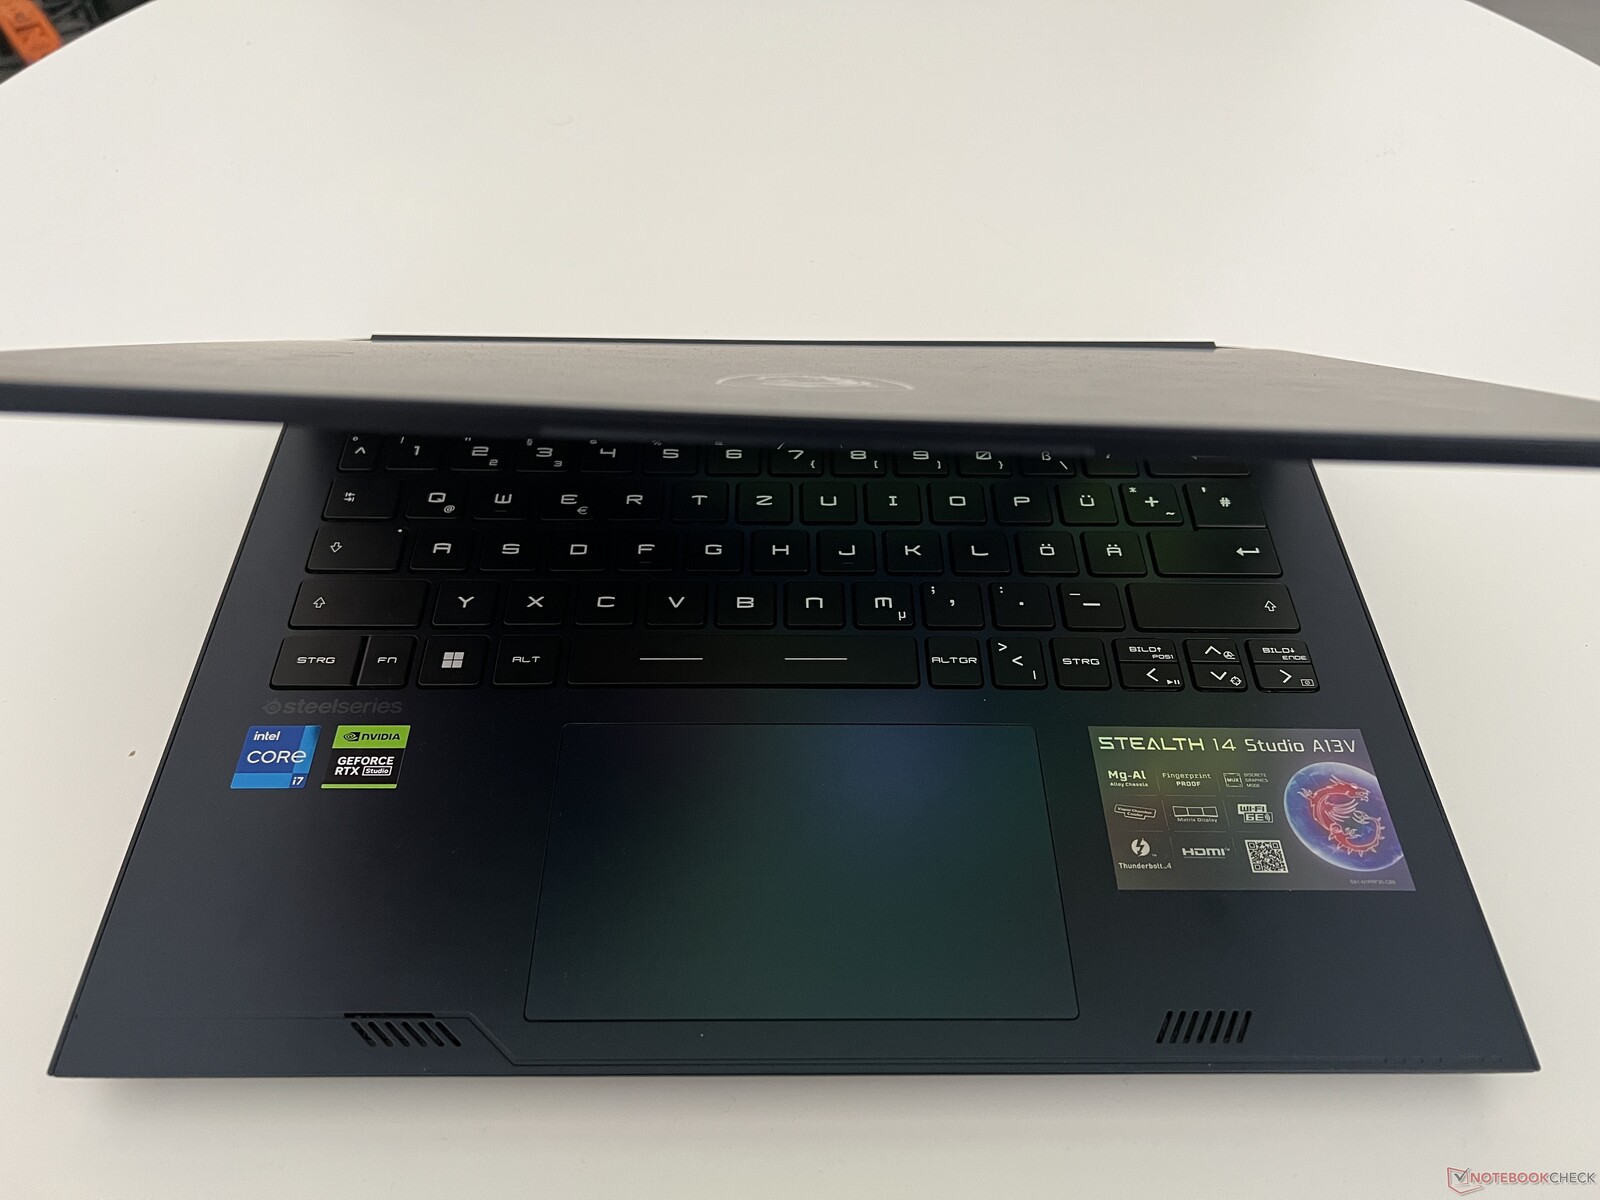
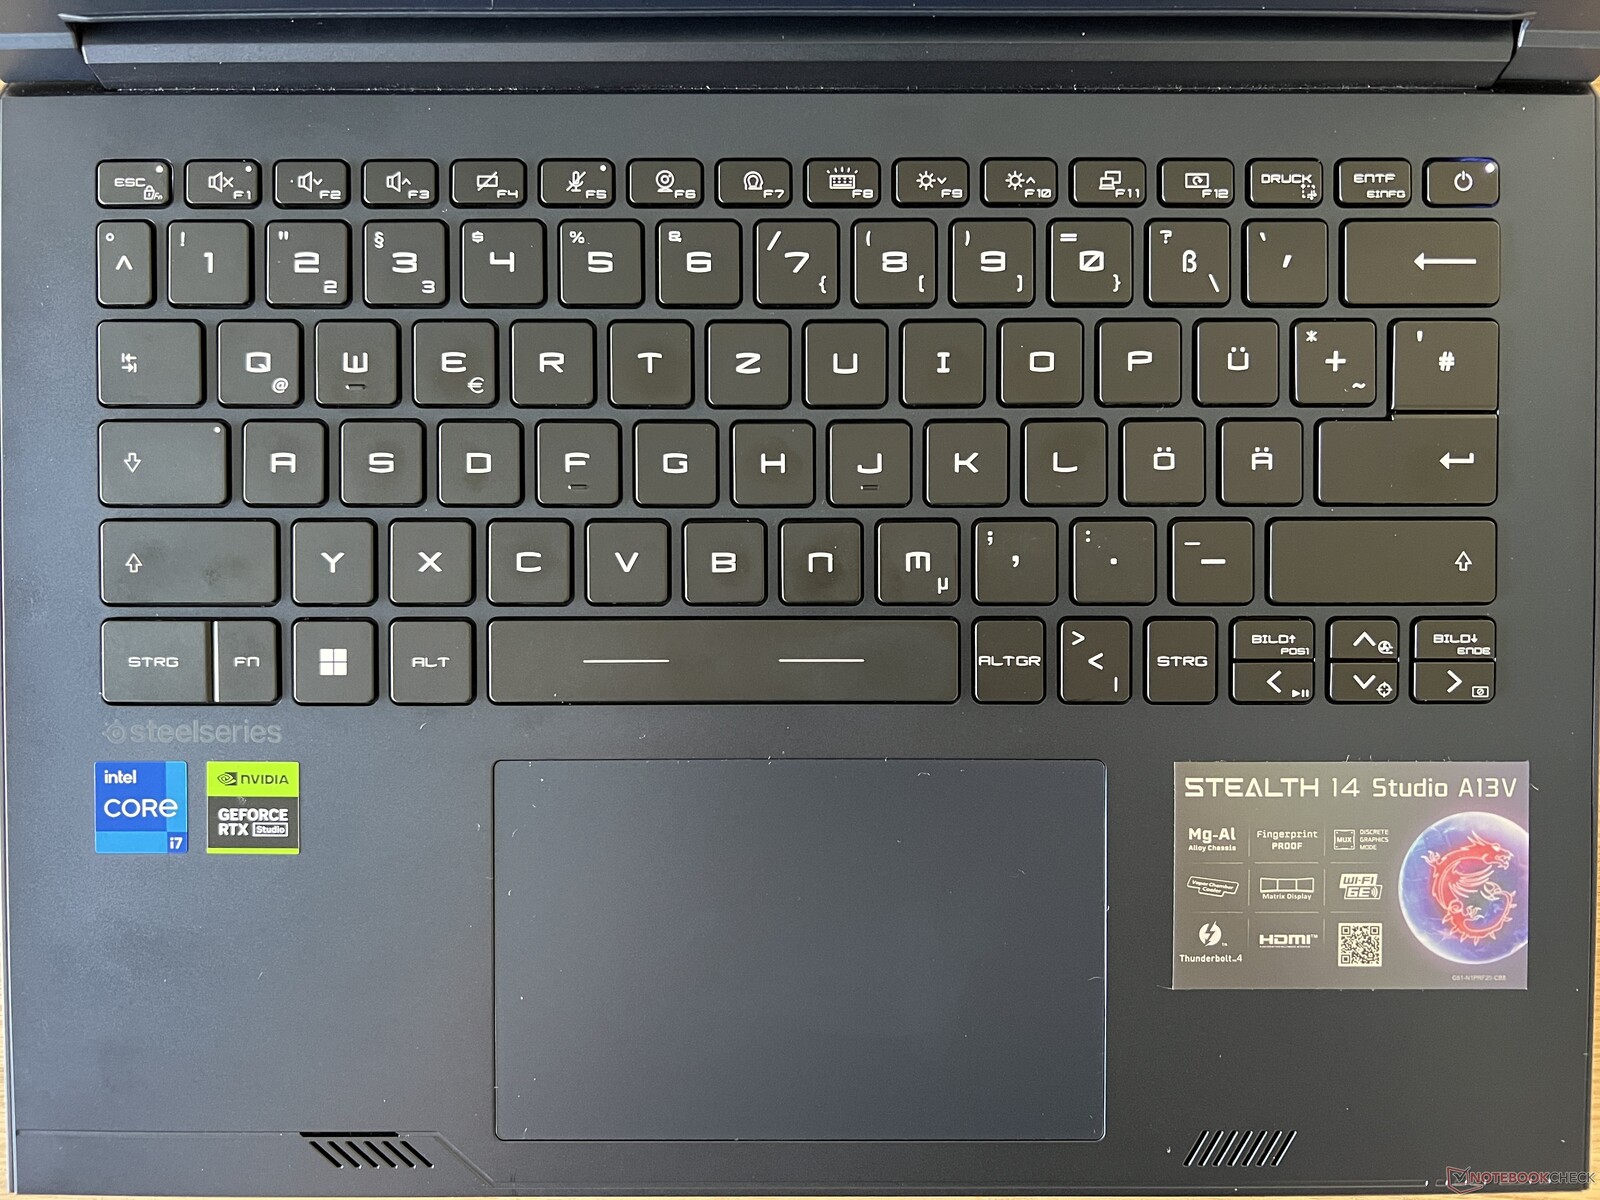
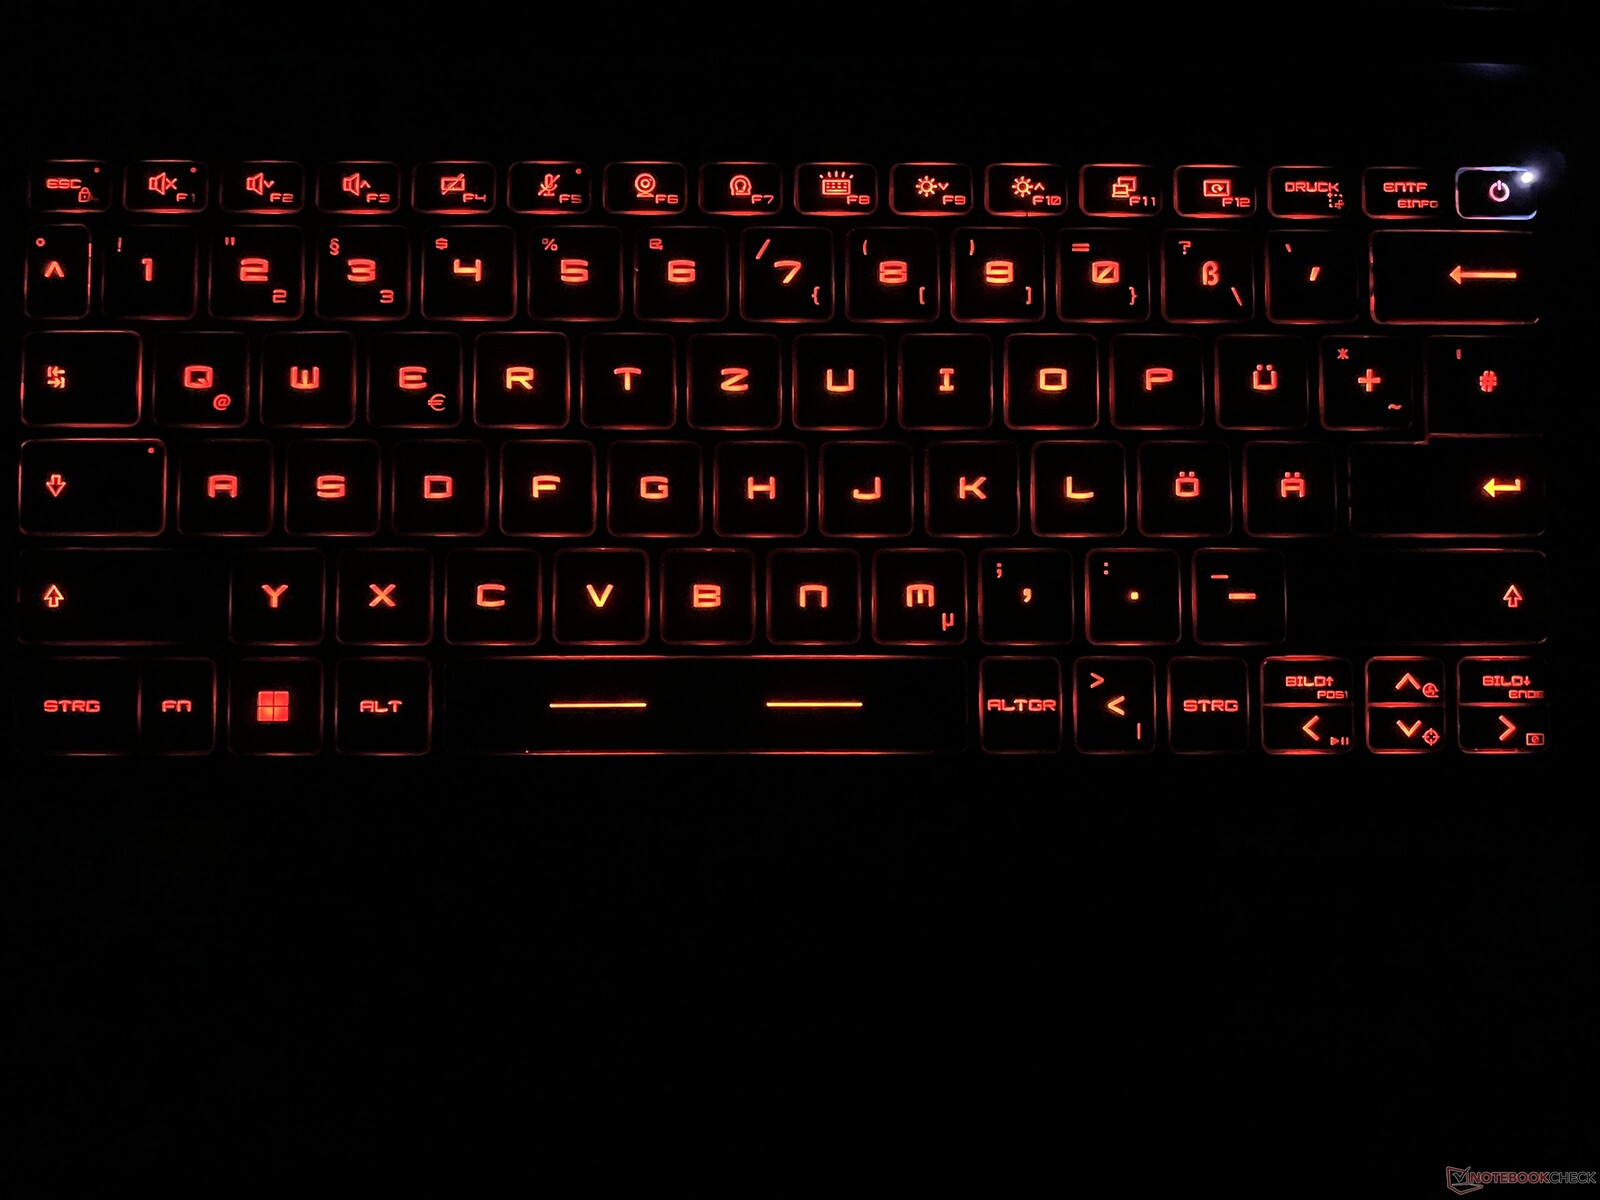
输入设备 - 带有独立点亮按键的键盘
键盘是Stealth 14 Studio的缺点之一,因为它的键程很浅,按键的手感很不稳定。即便如此,敲击键盘还是相当精确,我们没有注意到任何错误的输入。您只需习惯它的布局,因为它有一个单行回车键,而 "|<>"键的位置略显特殊。四个方向键也非常小,但至少有指定的 "图片向上 "和 "图片向下 "键。每个按键的灯光都可以通过Steelseries软件进行调节,但并不是很直观。
平滑的点击垫(12 x 7.5厘米)在日常使用中效果不错,但我们建议您只需轻按即可输入命令。如果您实际按压键盘底部,则会产生非常响亮且听起来廉价的咔嗒声。
显示屏 - 快速240Hz面板
微星采用14英寸IPS面板,分辨率为2560 x 1600像素。它的主要亮点是240Hz的刷新率以及快速的反应时间--不过,主观上,我们对它的画质并不完全满意。它的清晰度水平不错,但暗部看起来总像是蒙上了一层灰纱。
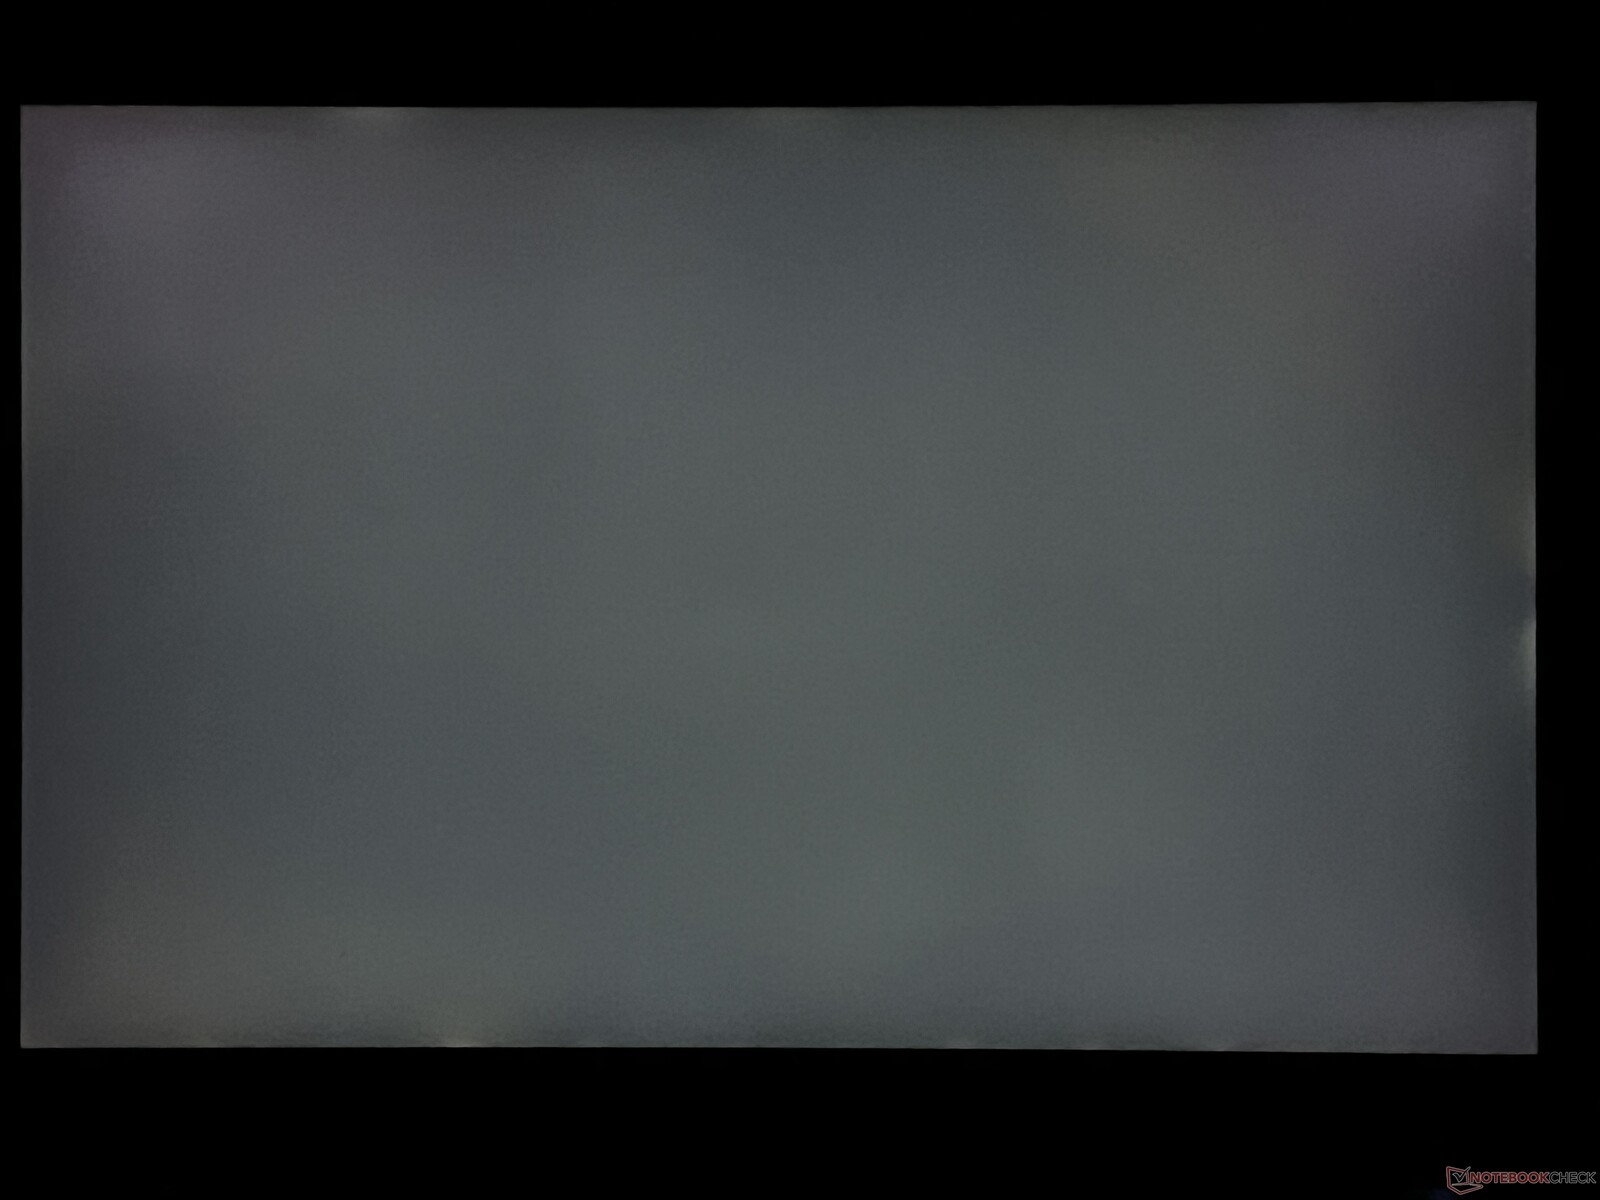
屏幕的黑度值高达0.43 cd/m²,即使结合约400 cd/m²的亮度,对比度也只有1.000:1。虽然显示效果并不差,但特别是在迷你LED和OLED时代,安装的面板仍有很多不足之处。背光出血似乎不是一个大问题,我们也没有注意到任何PWM闪烁。
| |||||||||||||||||||||||||
Brightness Distribution: 89 %
Center on Battery: 422 cd/m²
Contrast: 974:1 (Black: 0.43 cd/m²)
ΔE ColorChecker Calman: 2.3 | ∀{0.5-29.43 Ø4.71}
calibrated: 0.9
ΔE Greyscale Calman: 3.3 | ∀{0.09-98 Ø4.96}
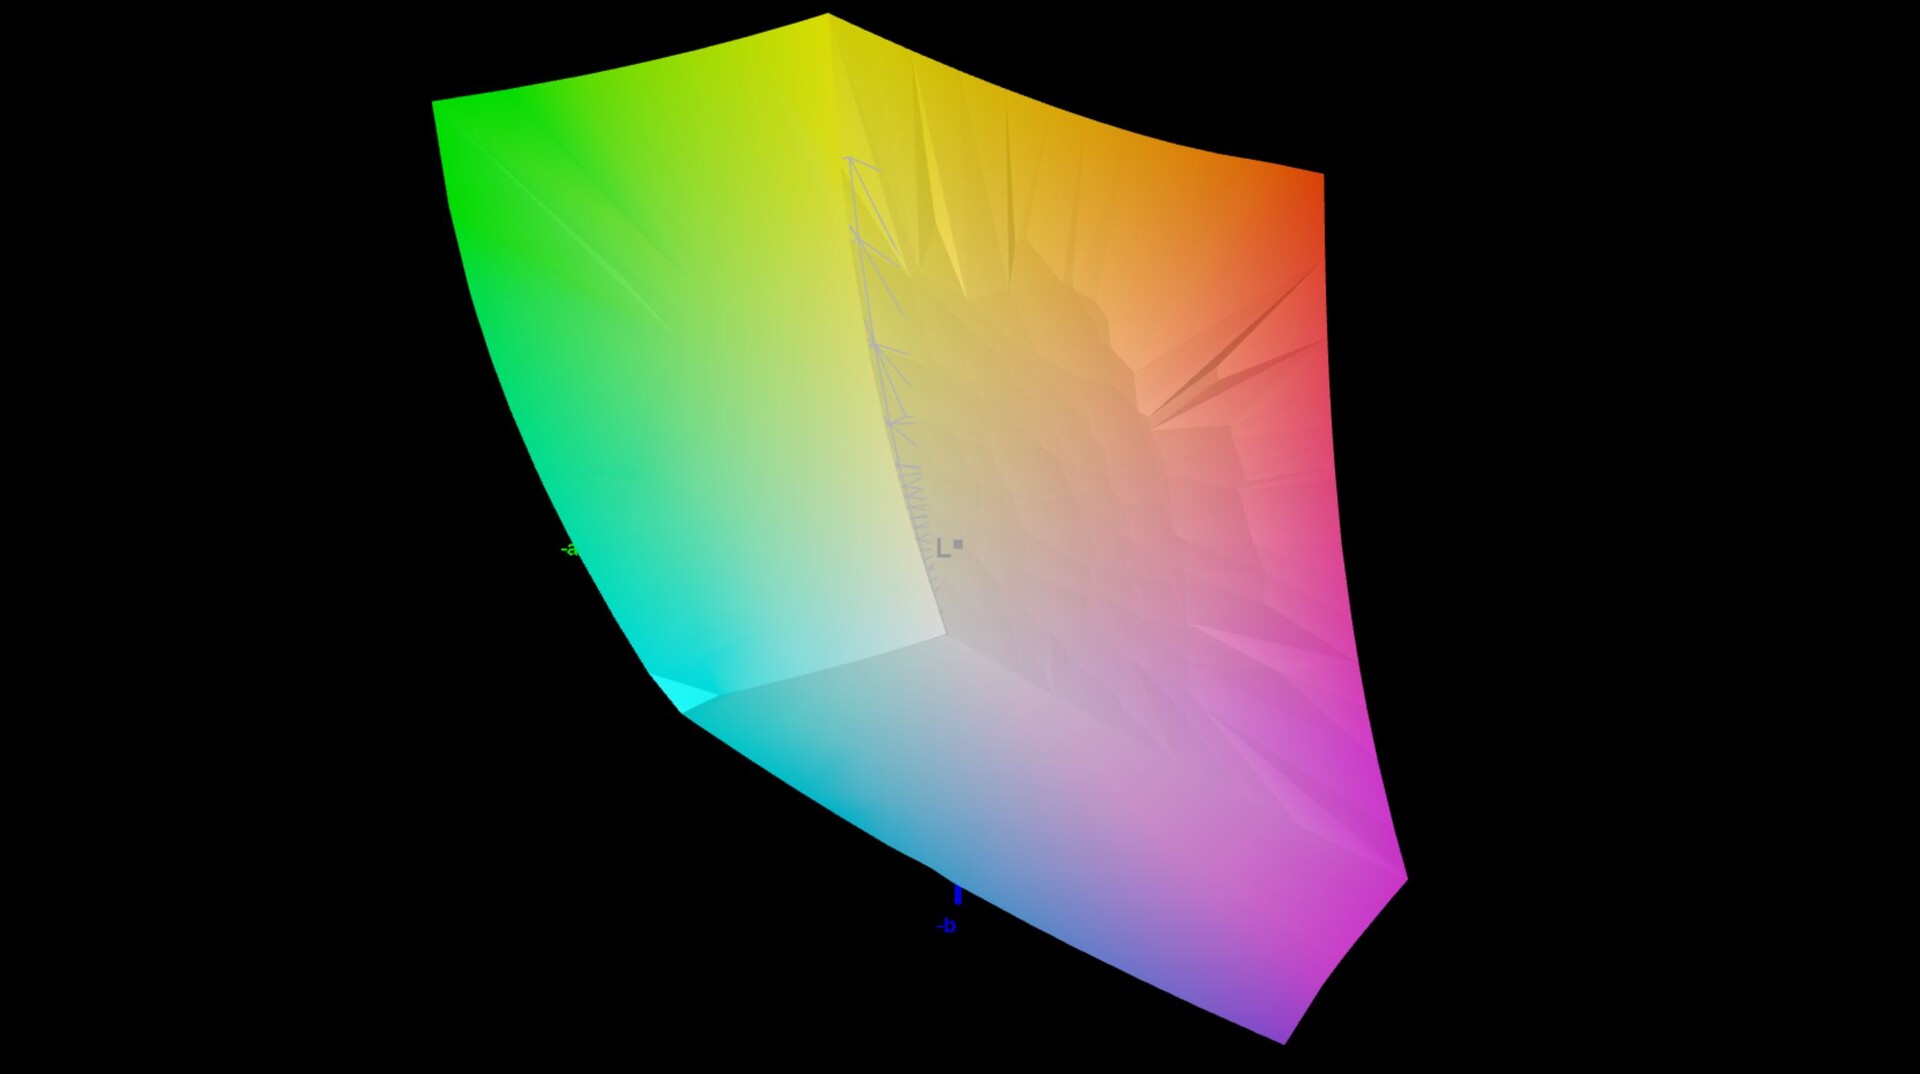
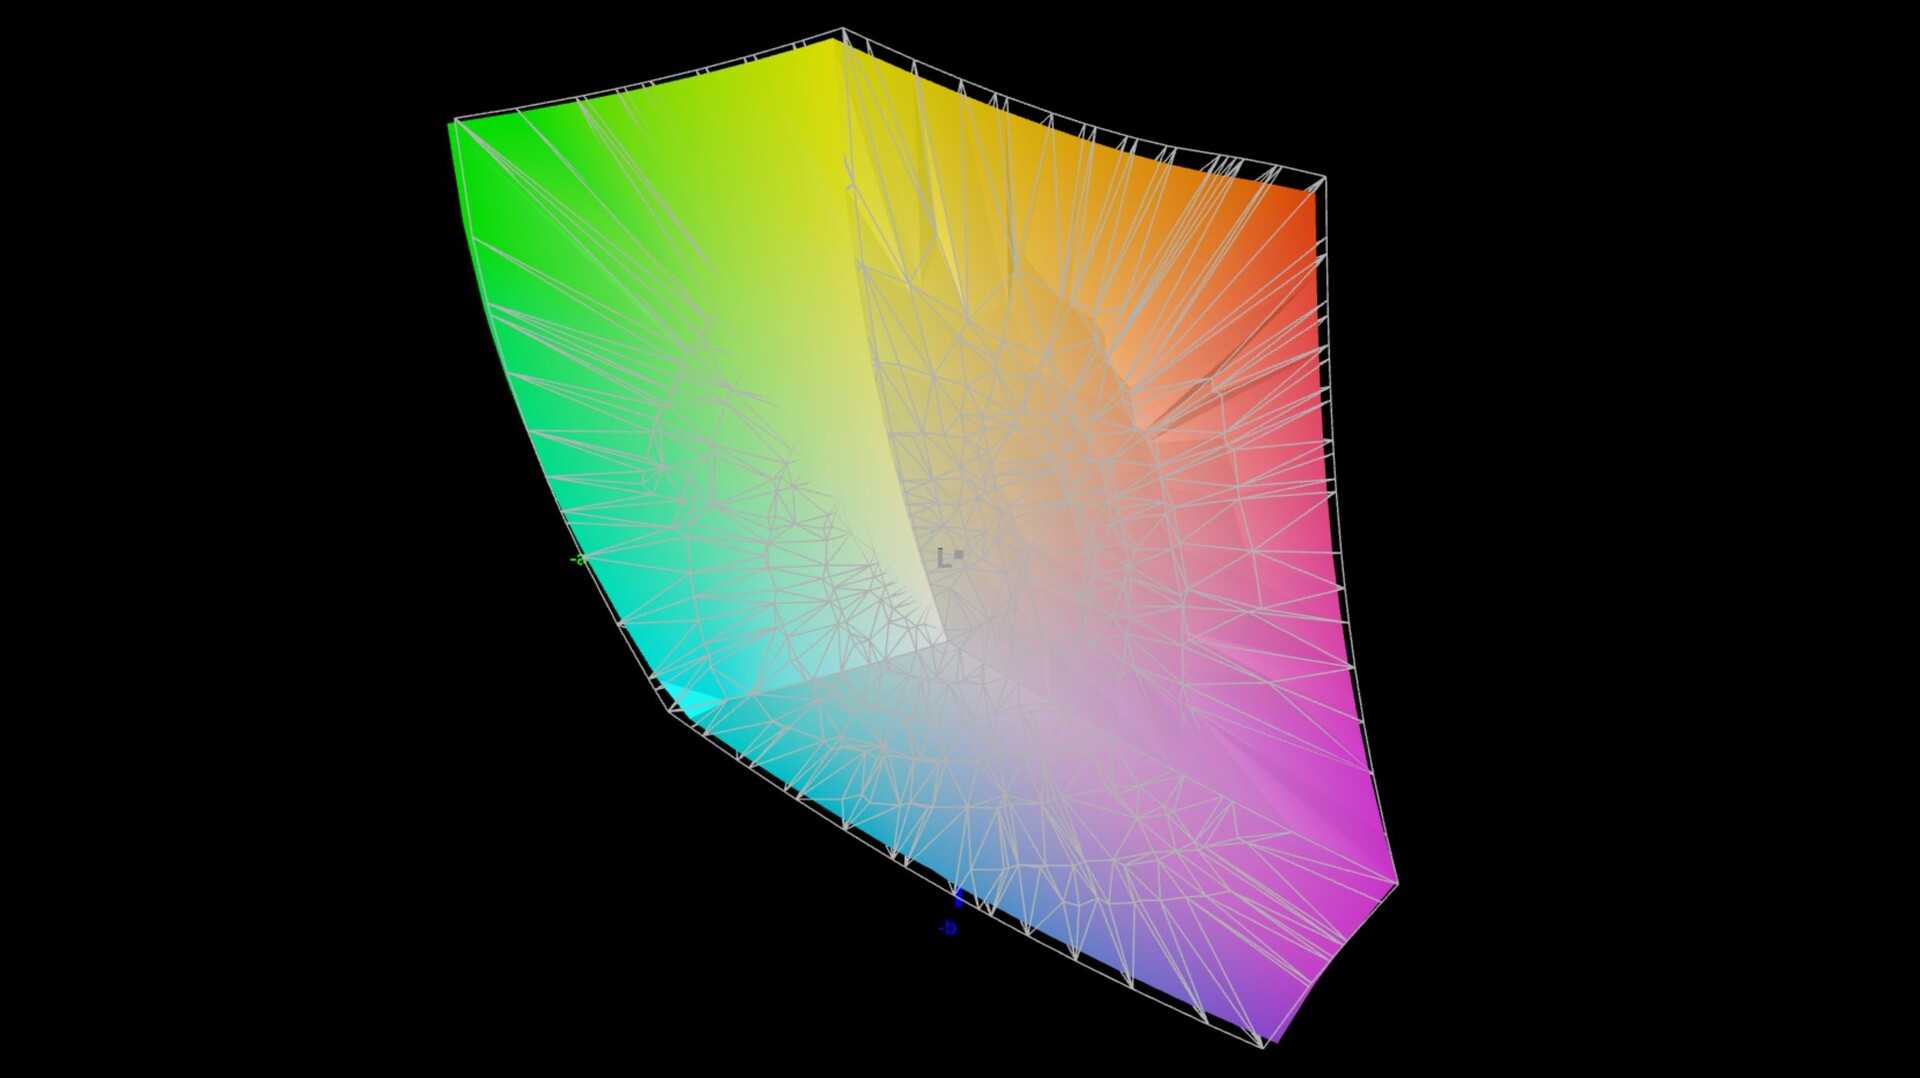
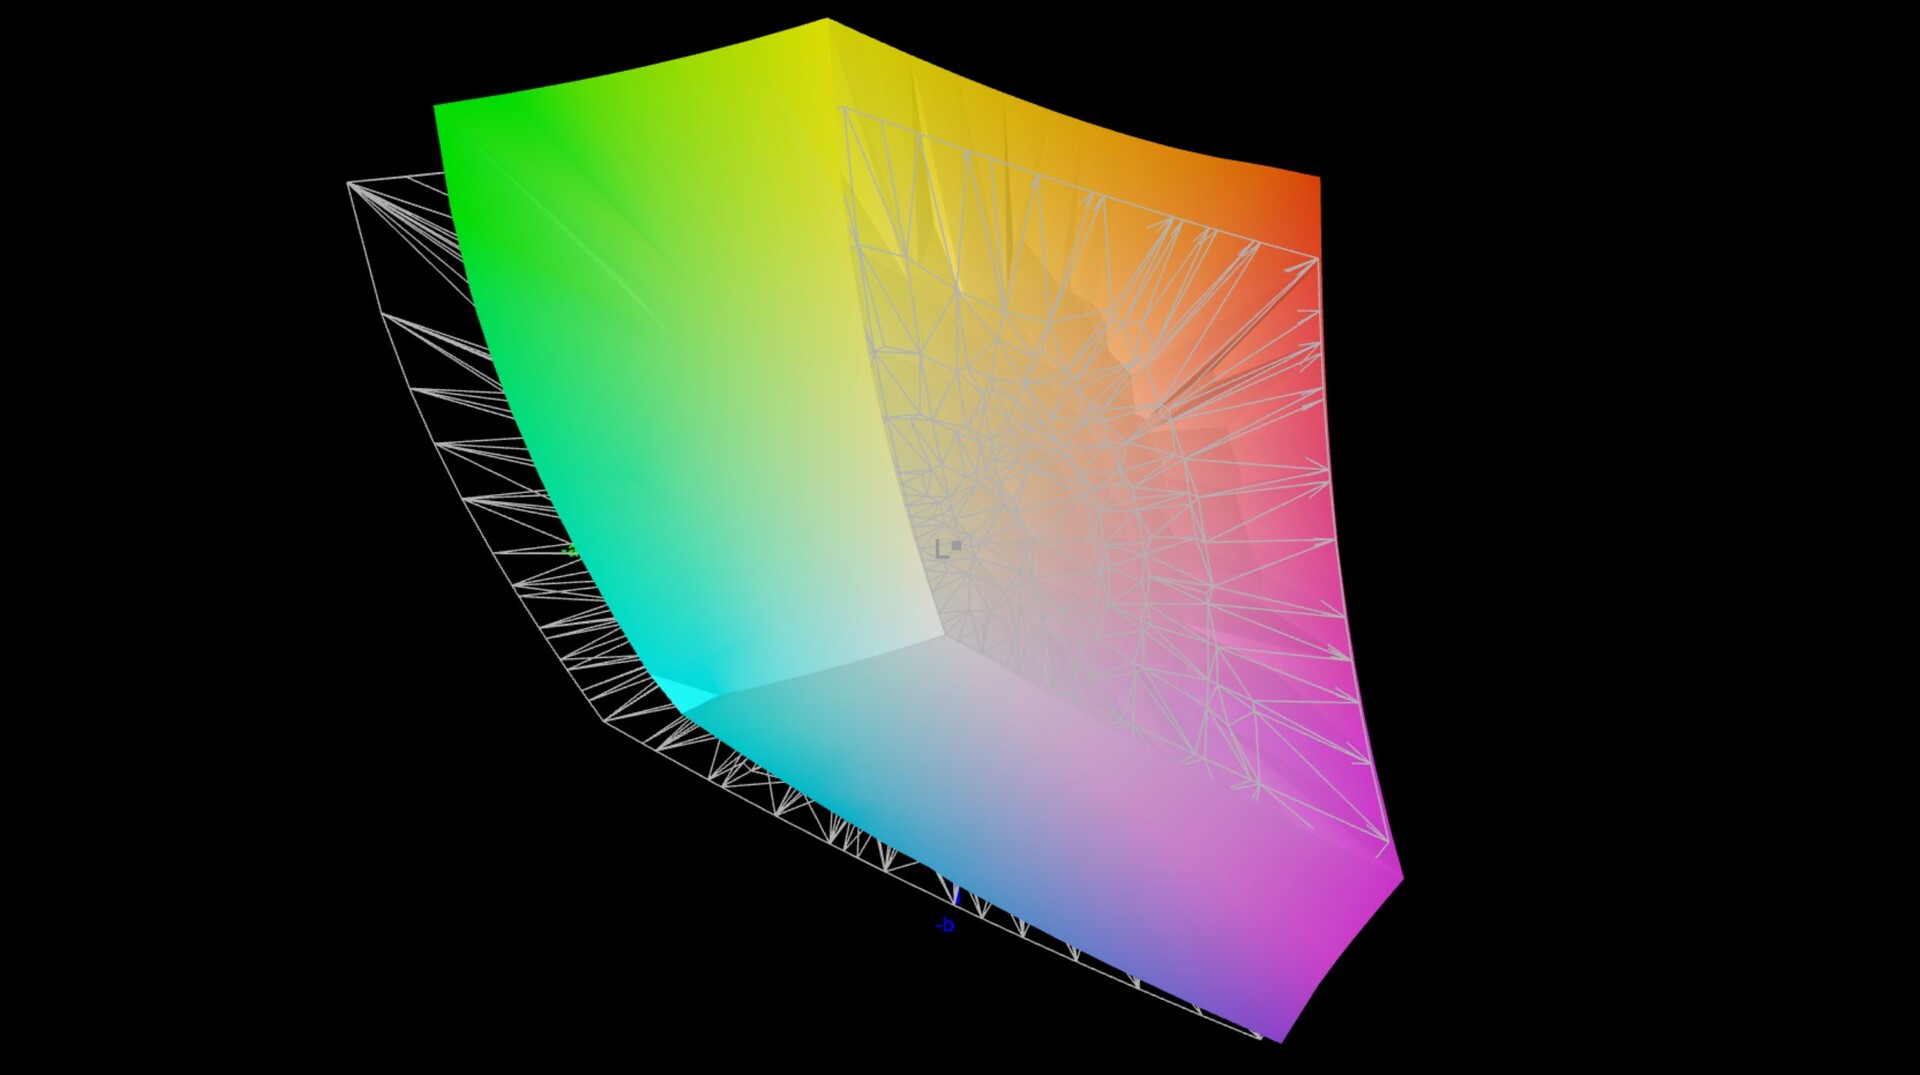
85.3% AdobeRGB 1998 (Argyll 3D)
99.6% sRGB (Argyll 3D)
96.2% Display P3 (Argyll 3D)
Gamma: 2.14
CCT: 6550 K
| MSI Stealth 14 Studio A13V B140QAN06.T, IPS, 2560x1600, 14" | Gigabyte Aero 14 OLED BMF Samsung SDC4192 (ATNA40YK14-0), OLED, 2880x1800, 14" | Schenker Vision 14 2022 RTX 3050 Ti MNE007ZA1-1, IPS, 2880x1800, 14" | Asus ROG Flow Z13 GZ301ZE LQ134N1JW54, IPS, 1920x1200, 13.4" | Alienware x14 i7 RTX 3060 SHP154D, IPS, 1920x1080, 14" | Razer Blade 14 Ryzen 9 6900HX TL140BDXP02-0, IPS, 2560x1440, 14" | Acer Predator Triton 300 SE Samsung ATNA40YK07-0, OLED, 2880x1800, 14" | |
|---|---|---|---|---|---|---|---|
| Display | 3% | -12% | -17% | 2% | 0% | 7% | |
| Display P3 Coverage (%) | 96.2 | 99.8 4% | 74.1 -23% | 67.5 -30% | 99.6 4% | 97.2 1% | 99.9 4% |
| sRGB Coverage (%) | 99.6 | 100 0% | 97.4 -2% | 97.1 -3% | 100 0% | 99.9 0% | 100 0% |
| AdobeRGB 1998 Coverage (%) | 85.3 | 88.7 4% | 75.3 -12% | 69.3 -19% | 87.6 3% | 85.7 0% | 99 16% |
| Response Times | 58% | -312% | -452% | -53% | -184% | 76% | |
| Response Time Grey 50% / Grey 80% * (ms) | 5.5 ? | 2.4 ? 56% | 31.5 ? -473% | 44 ? -700% | 9.6 ? -75% | 16.8 ? -205% | 1.36 ? 75% |
| Response Time Black / White * (ms) | 5.8 ? | 2.4 ? 59% | 14.5 ? -150% | 17.6 ? -203% | 7.6 ? -31% | 15.2 ? -162% | 1.36 ? 77% |
| PWM Frequency (Hz) | 300 | 367.6 ? | |||||
| Screen | 71% | -11% | 18% | 5% | 11% | -13% | |
| Brightness middle (cd/m²) | 419 | 423 1% | 421 0% | 515 23% | 434 4% | 354 -16% | 414.3 -1% |
| Brightness (cd/m²) | 402 | 427 6% | 416 3% | 476 18% | 411 2% | 328 -18% | 416 3% |
| Brightness Distribution (%) | 89 | 98 10% | 89 0% | 87 -2% | 89 0% | 86 -3% | 99 11% |
| Black Level * (cd/m²) | 0.43 | 0.1 77% | 0.28 35% | 0.35 19% | 0.25 42% | 0.37 14% | |
| Contrast (:1) | 974 | 4230 334% | 1504 54% | 1471 51% | 1736 78% | 957 -2% | |
| Colorchecker dE 2000 * | 2.3 | 0.55 76% | 3.2 -39% | 1.6 30% | 3 -30% | 1.66 28% | 4.68 -103% |
| Colorchecker dE 2000 max. * | 5.8 | 1.15 80% | 5.5 5% | 4 31% | 7.1 -22% | 3.83 34% | 7.78 -34% |
| Colorchecker dE 2000 calibrated * | 0.9 | 1.15 -28% | 2 -122% | 1.2 -33% | 0.7 22% | ||
| Greyscale dE 2000 * | 3.3 | 0.69 79% | 4.4 -33% | 2.5 24% | 5.1 -55% | 1.6 52% | 1.8 45% |
| Gamma | 2.14 103% | 2.42 91% | 2.22 99% | 2.2 100% | 2.19 100% | 2.23 99% | 2.22 99% |
| CCT | 6550 99% | 6479 100% | 6384 102% | 6939 94% | 6204 105% | 6542 99% | 6207 105% |
| Total Average (Program / Settings) | 44% /
54% | -112% /
-54% | -150% /
-57% | -15% /
-4% | -58% /
-21% | 23% /
8% |
* ... smaller is better
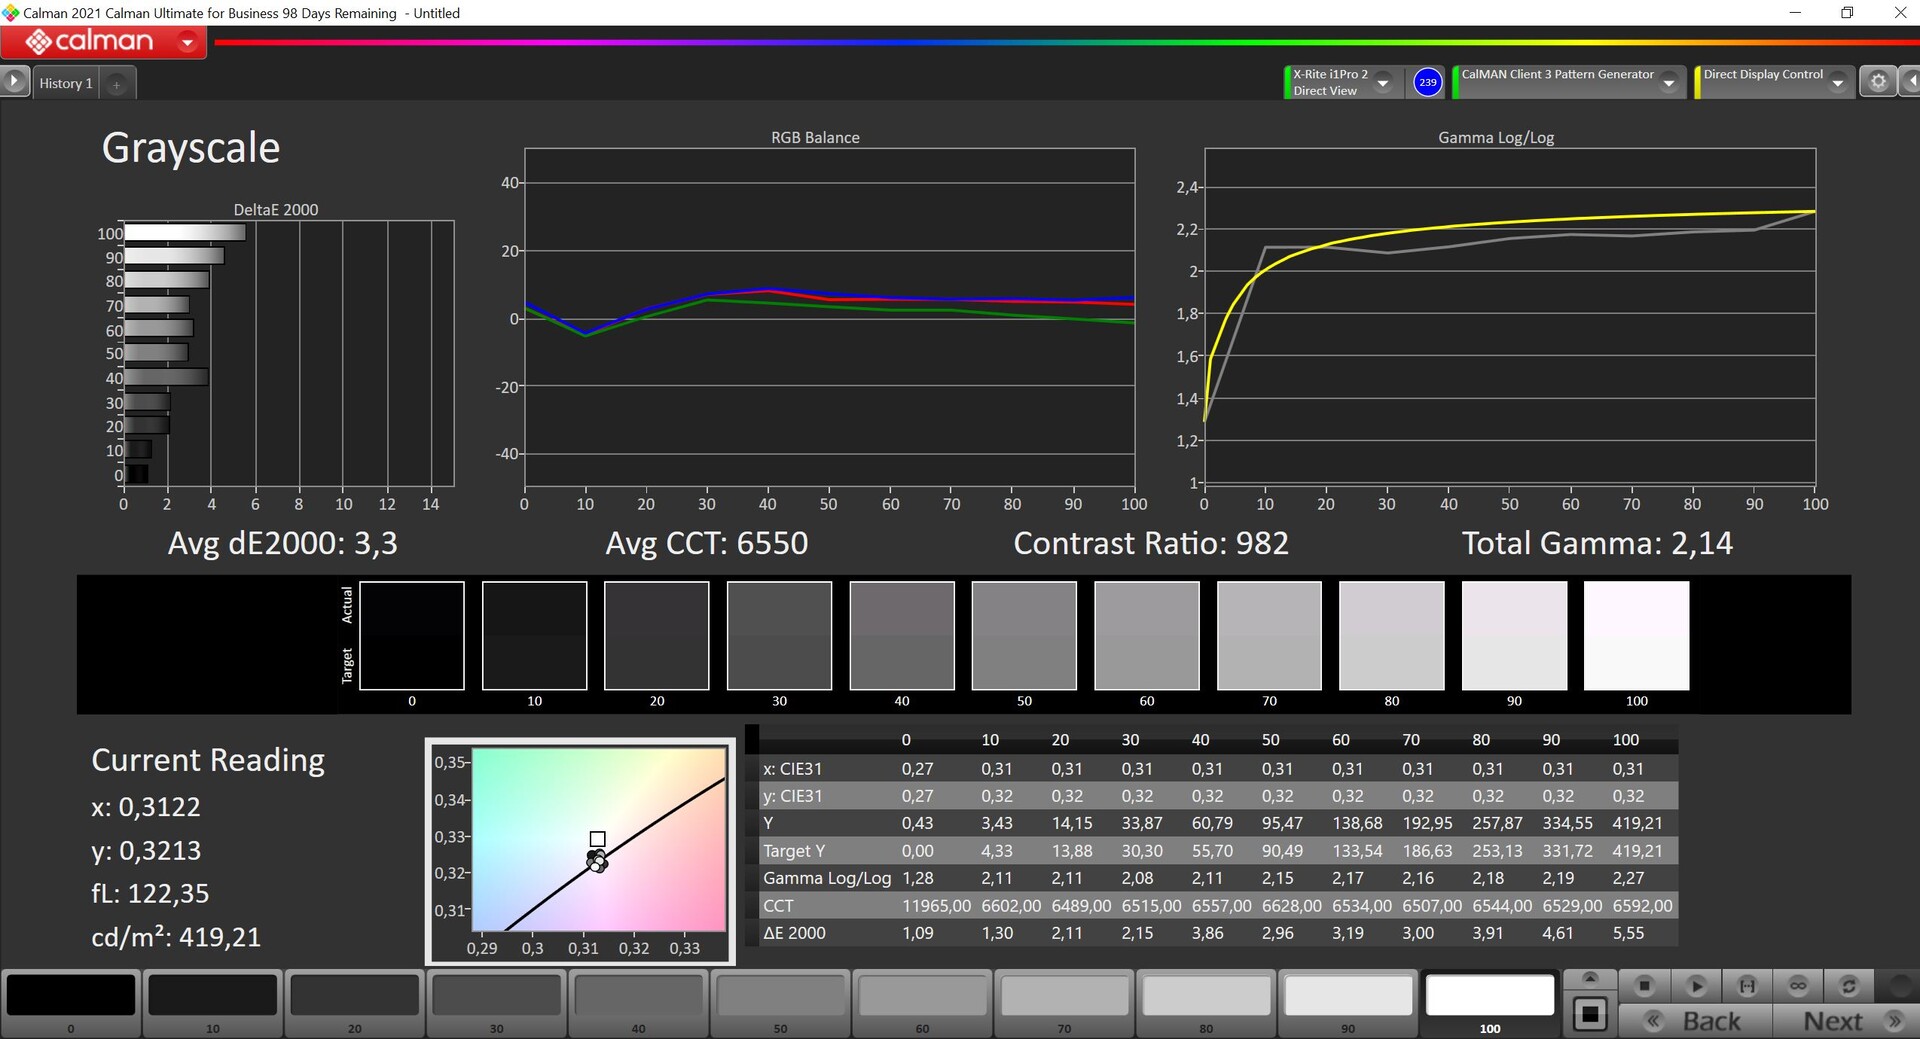
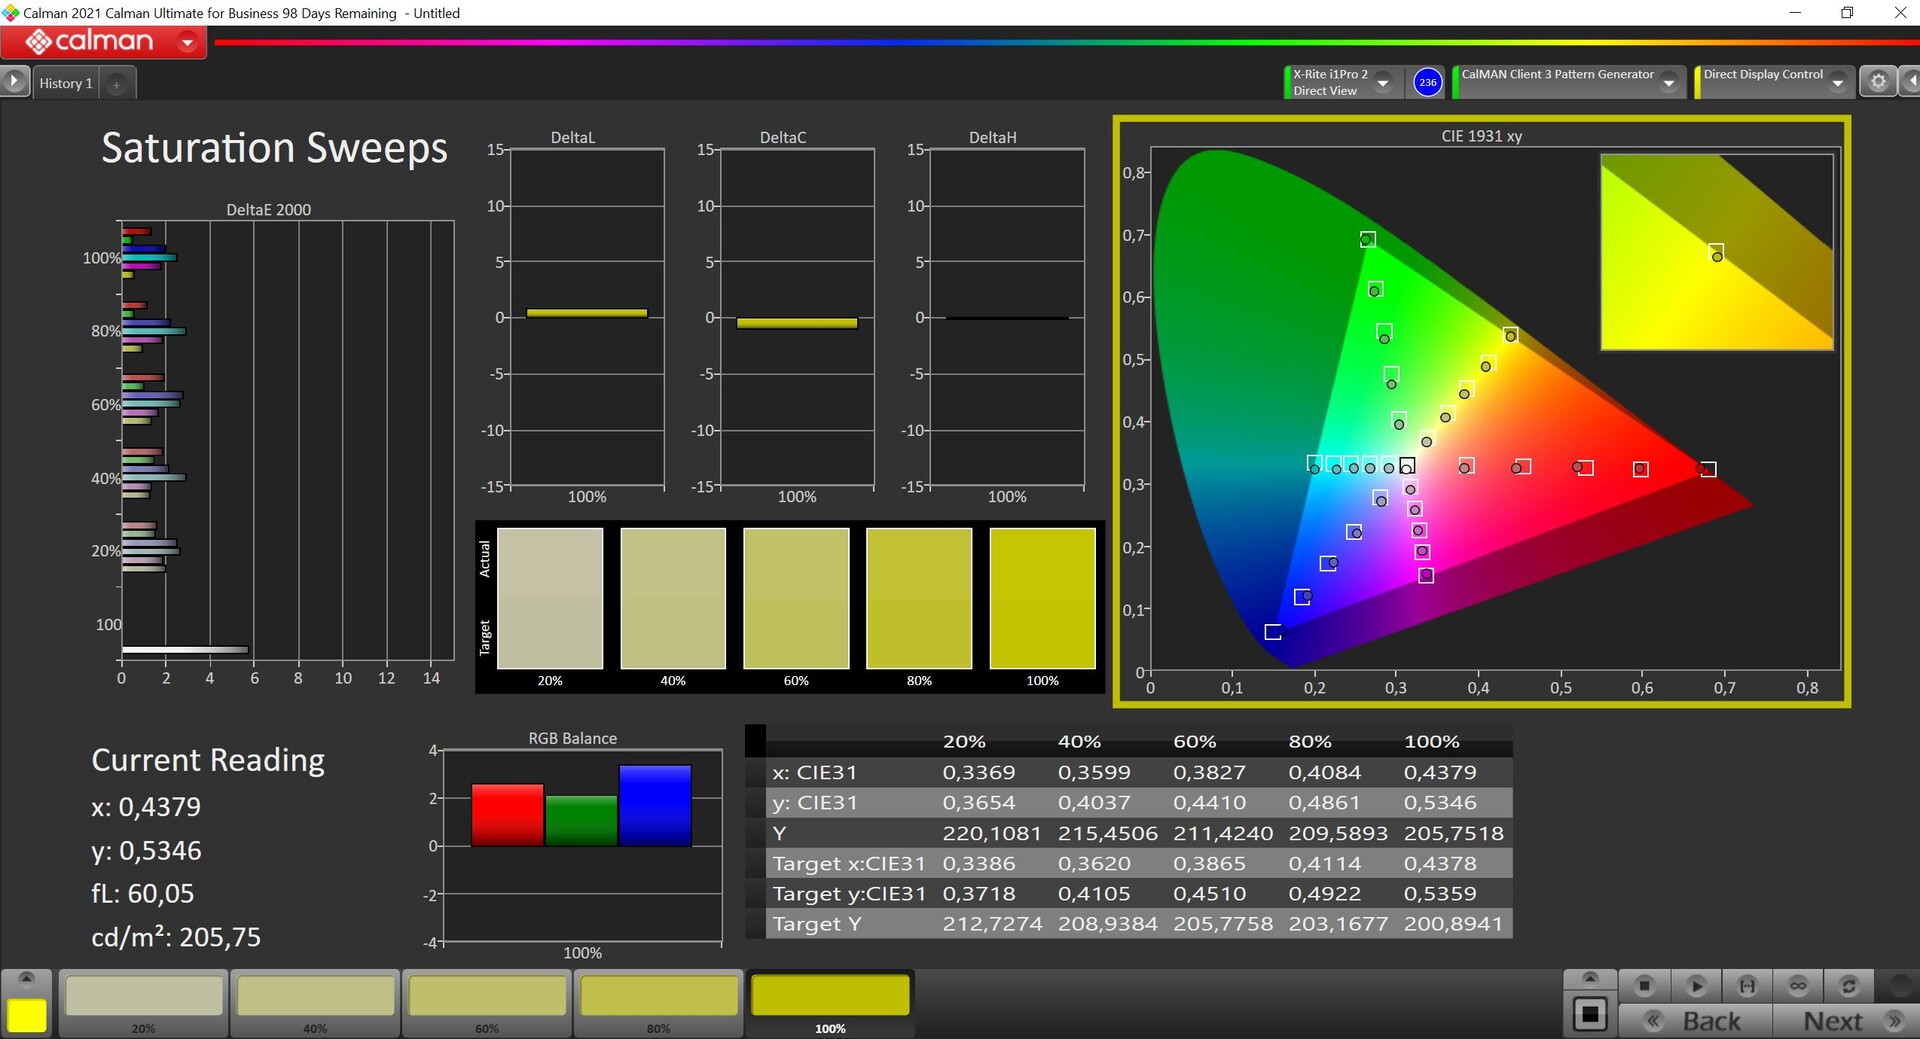
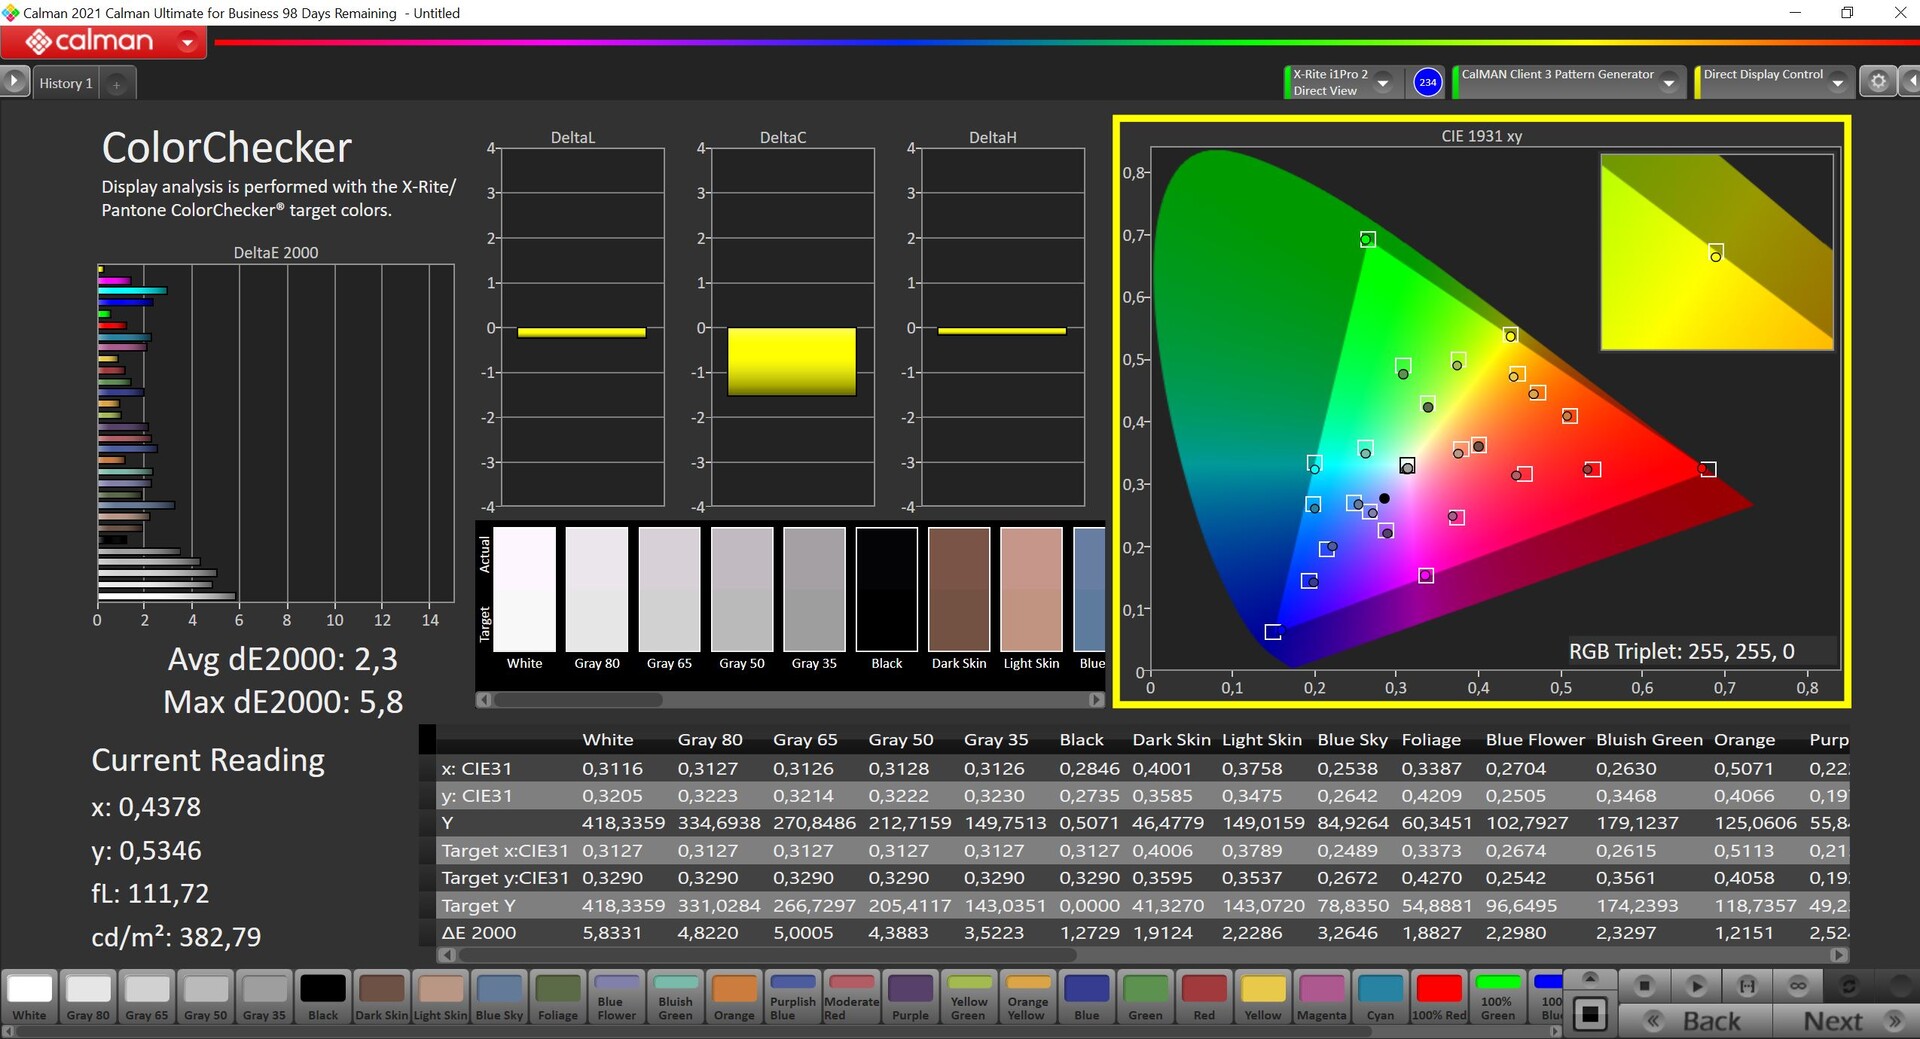
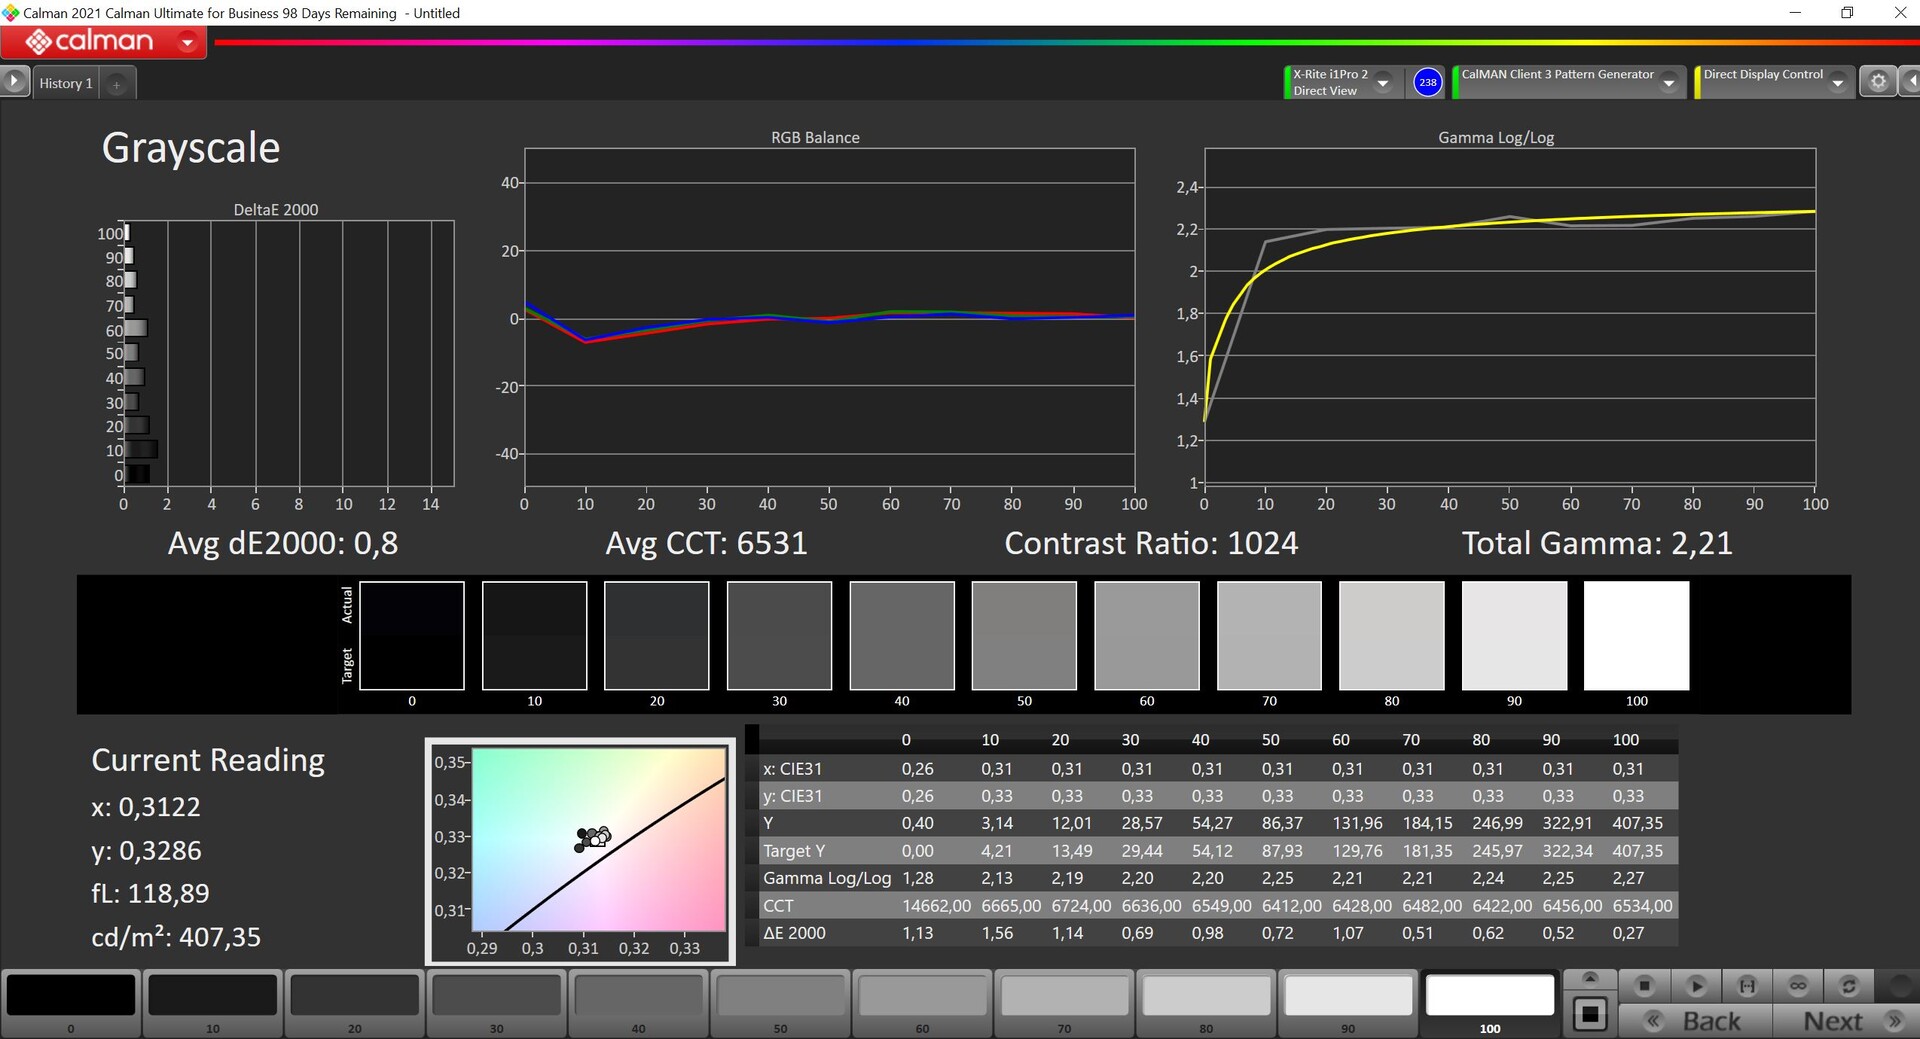
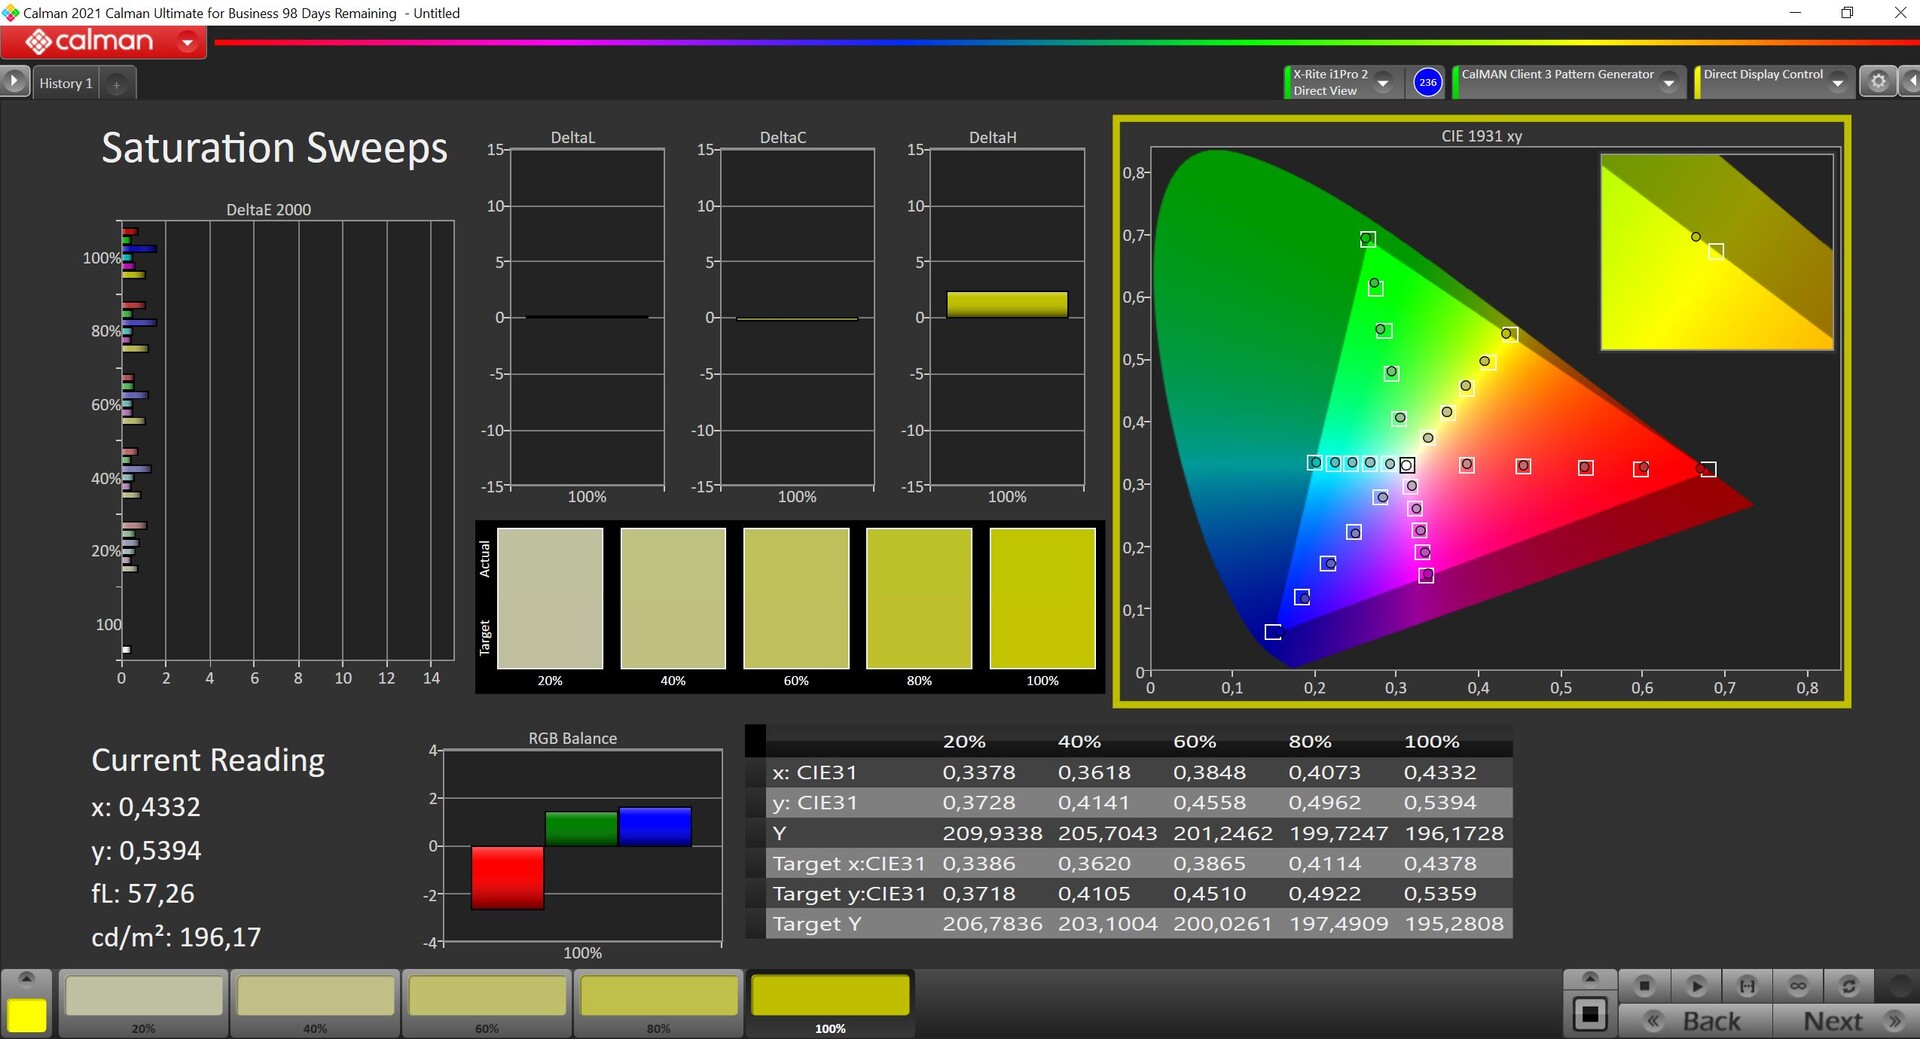
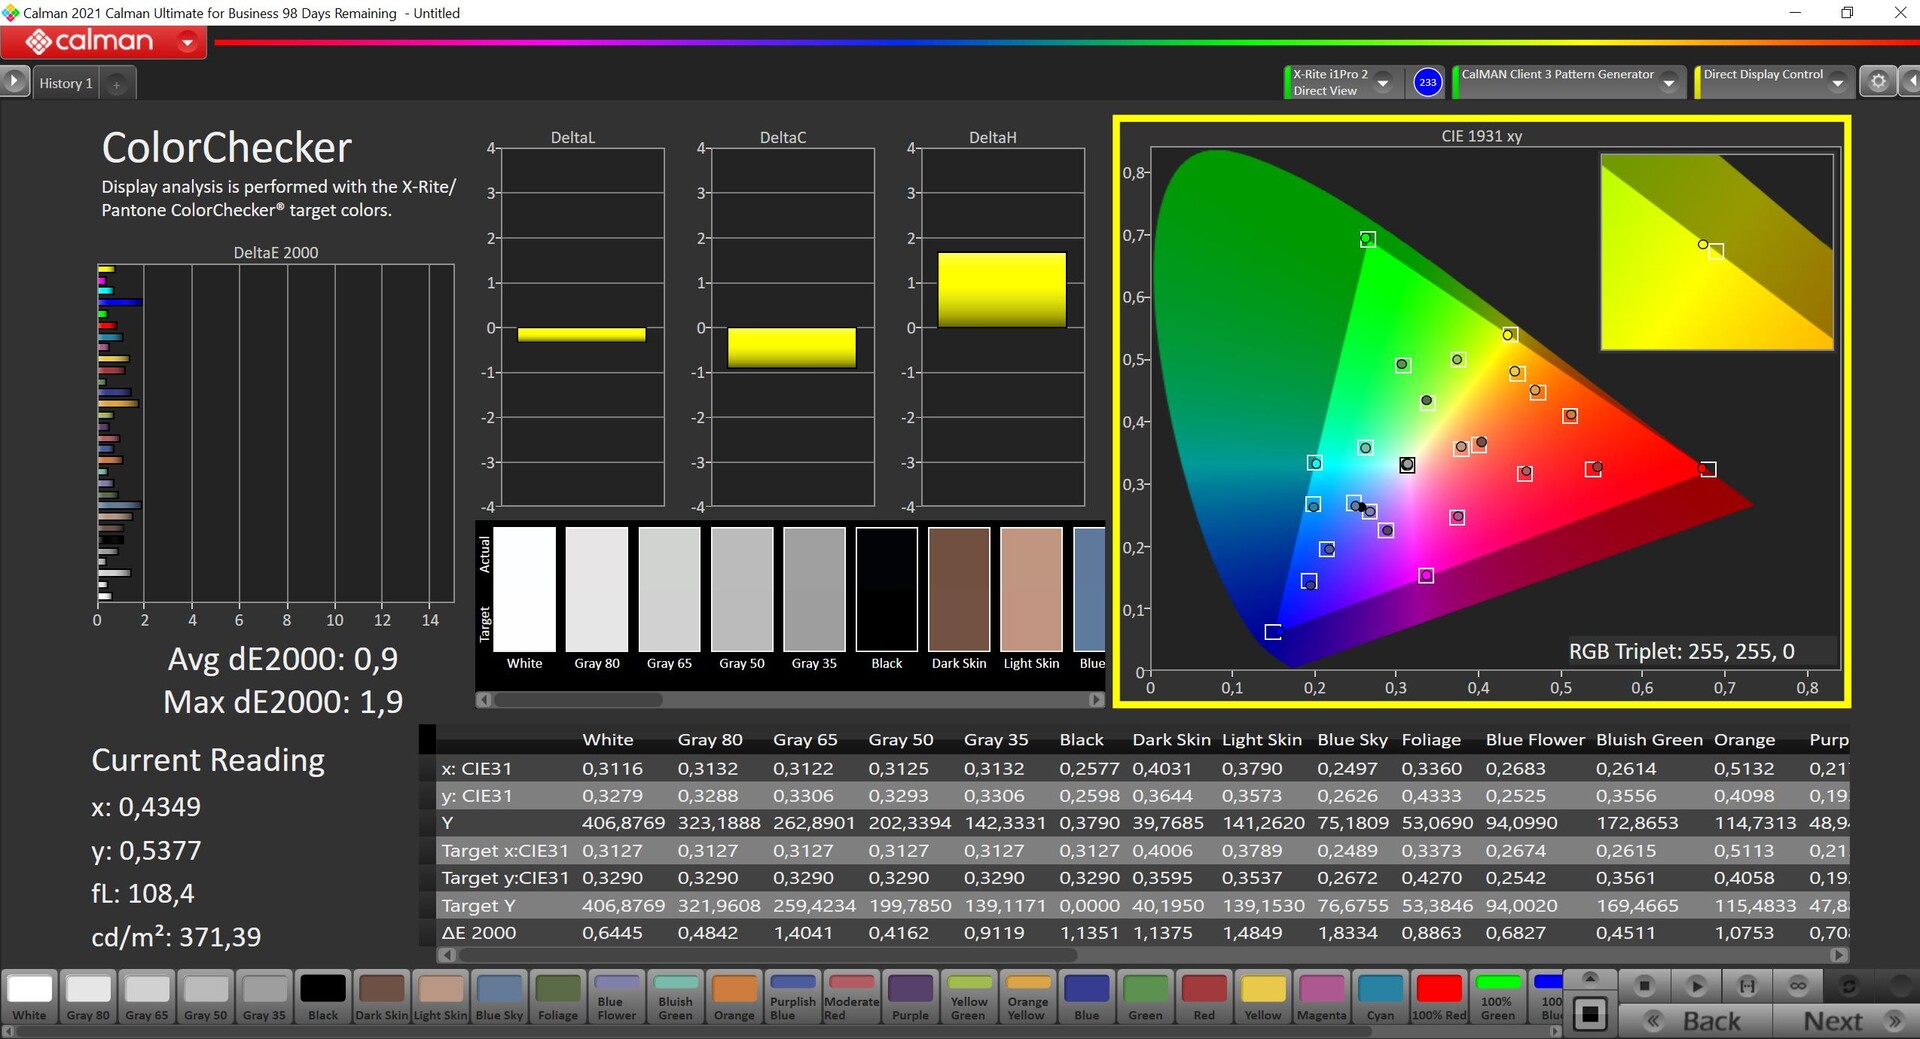
微星通过其TrueColor软件提供多种不同的色彩配置文件,我们选择了Display P3模式,使用专业的CalMAN软件(X-Rite i1 Pro2)进行测量。这是标准激活的模式。我们测量的颜色与P3参考值相比,低于重要的DeltaE 2000偏差3,但是灰色调似乎显示出轻微的紫色调。使用我们自己的校准(您可以在上面免费下载我们的配置文件),我们很容易就控制住了这种情况。P3色彩空间几乎可以完全呈现。
Display Response Times
| ↔ Response Time Black to White | ||
|---|---|---|
| 5.8 ms ... rise ↗ and fall ↘ combined | ↗ 2.1 ms rise | 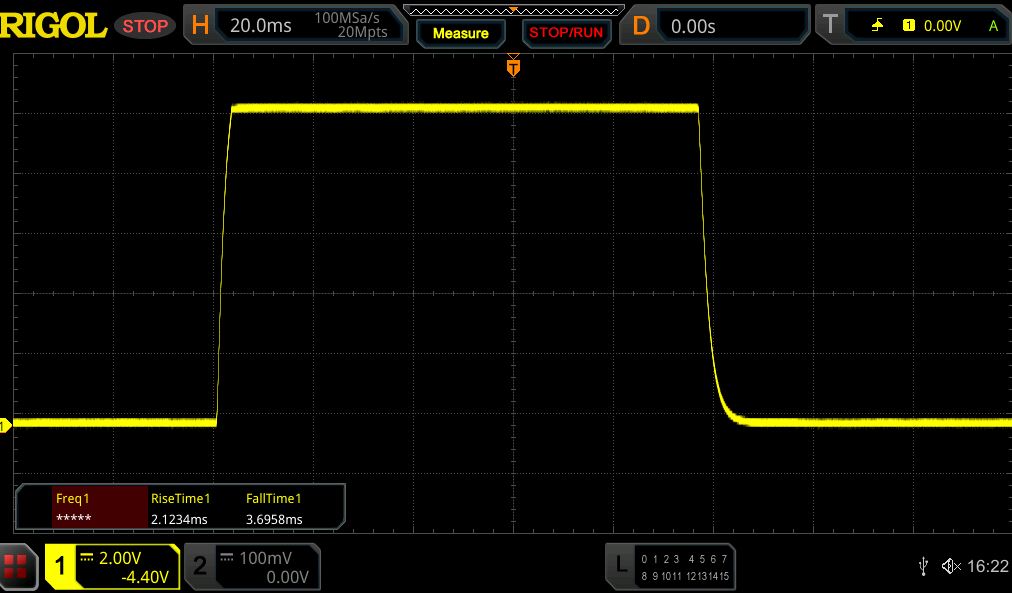 |
| ↘ 3.7 ms fall | ||
| The screen shows very fast response rates in our tests and should be very well suited for fast-paced gaming. In comparison, all tested devices range from 0.1 (minimum) to 240 (maximum) ms. » 18 % of all devices are better. This means that the measured response time is better than the average of all tested devices (19.8 ms). | ||
| ↔ Response Time 50% Grey to 80% Grey | ||
| 5.5 ms ... rise ↗ and fall ↘ combined | ↗ 2.7 ms rise | 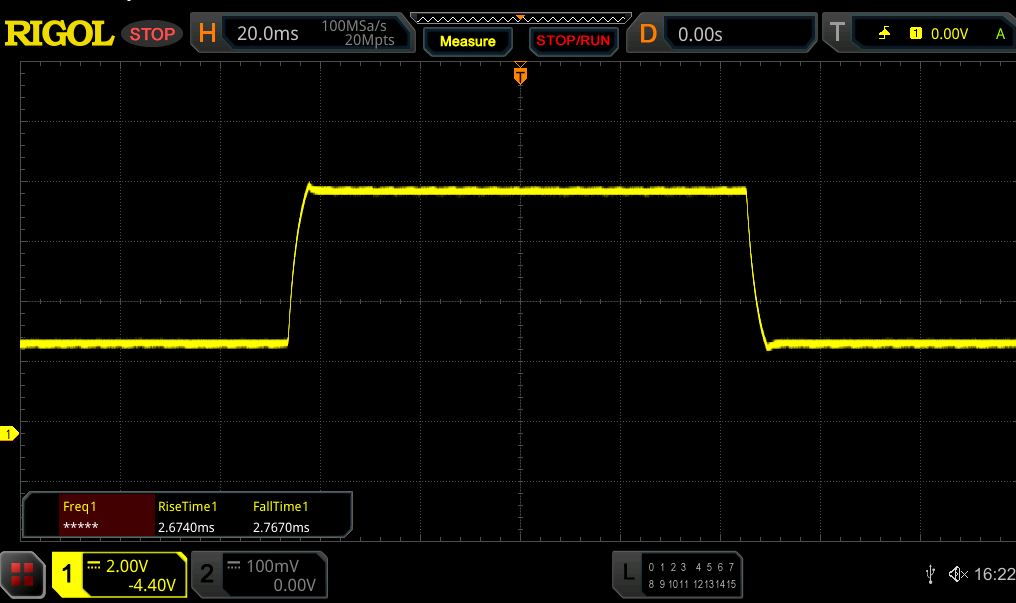 |
| ↘ 2.8 ms fall | ||
| The screen shows very fast response rates in our tests and should be very well suited for fast-paced gaming. In comparison, all tested devices range from 0.165 (minimum) to 636 (maximum) ms. » 18 % of all devices are better. This means that the measured response time is better than the average of all tested devices (31 ms). | ||
Screen Flickering / PWM (Pulse-Width Modulation)
| Screen flickering / PWM not detected |  | ||
In comparison: 52 % of all tested devices do not use PWM to dim the display. If PWM was detected, an average of 7757 (minimum: 5 - maximum: 343500) Hz was measured. | |||
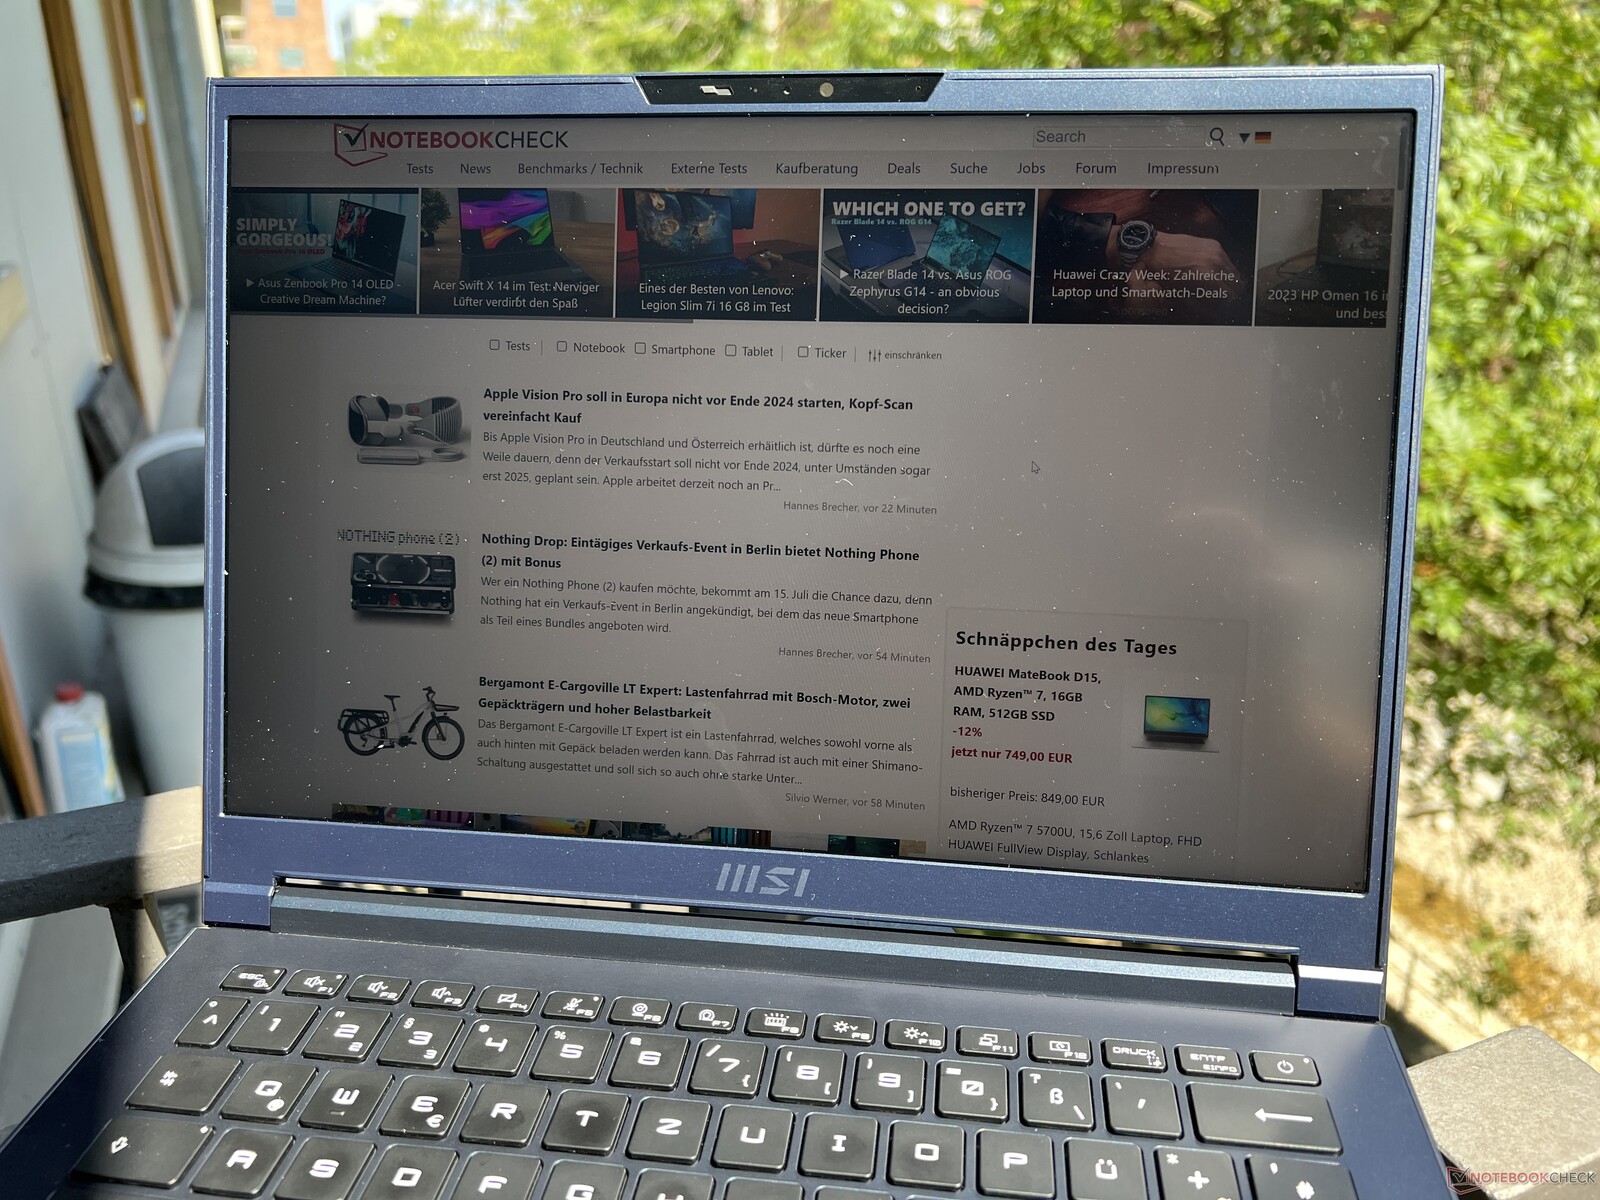
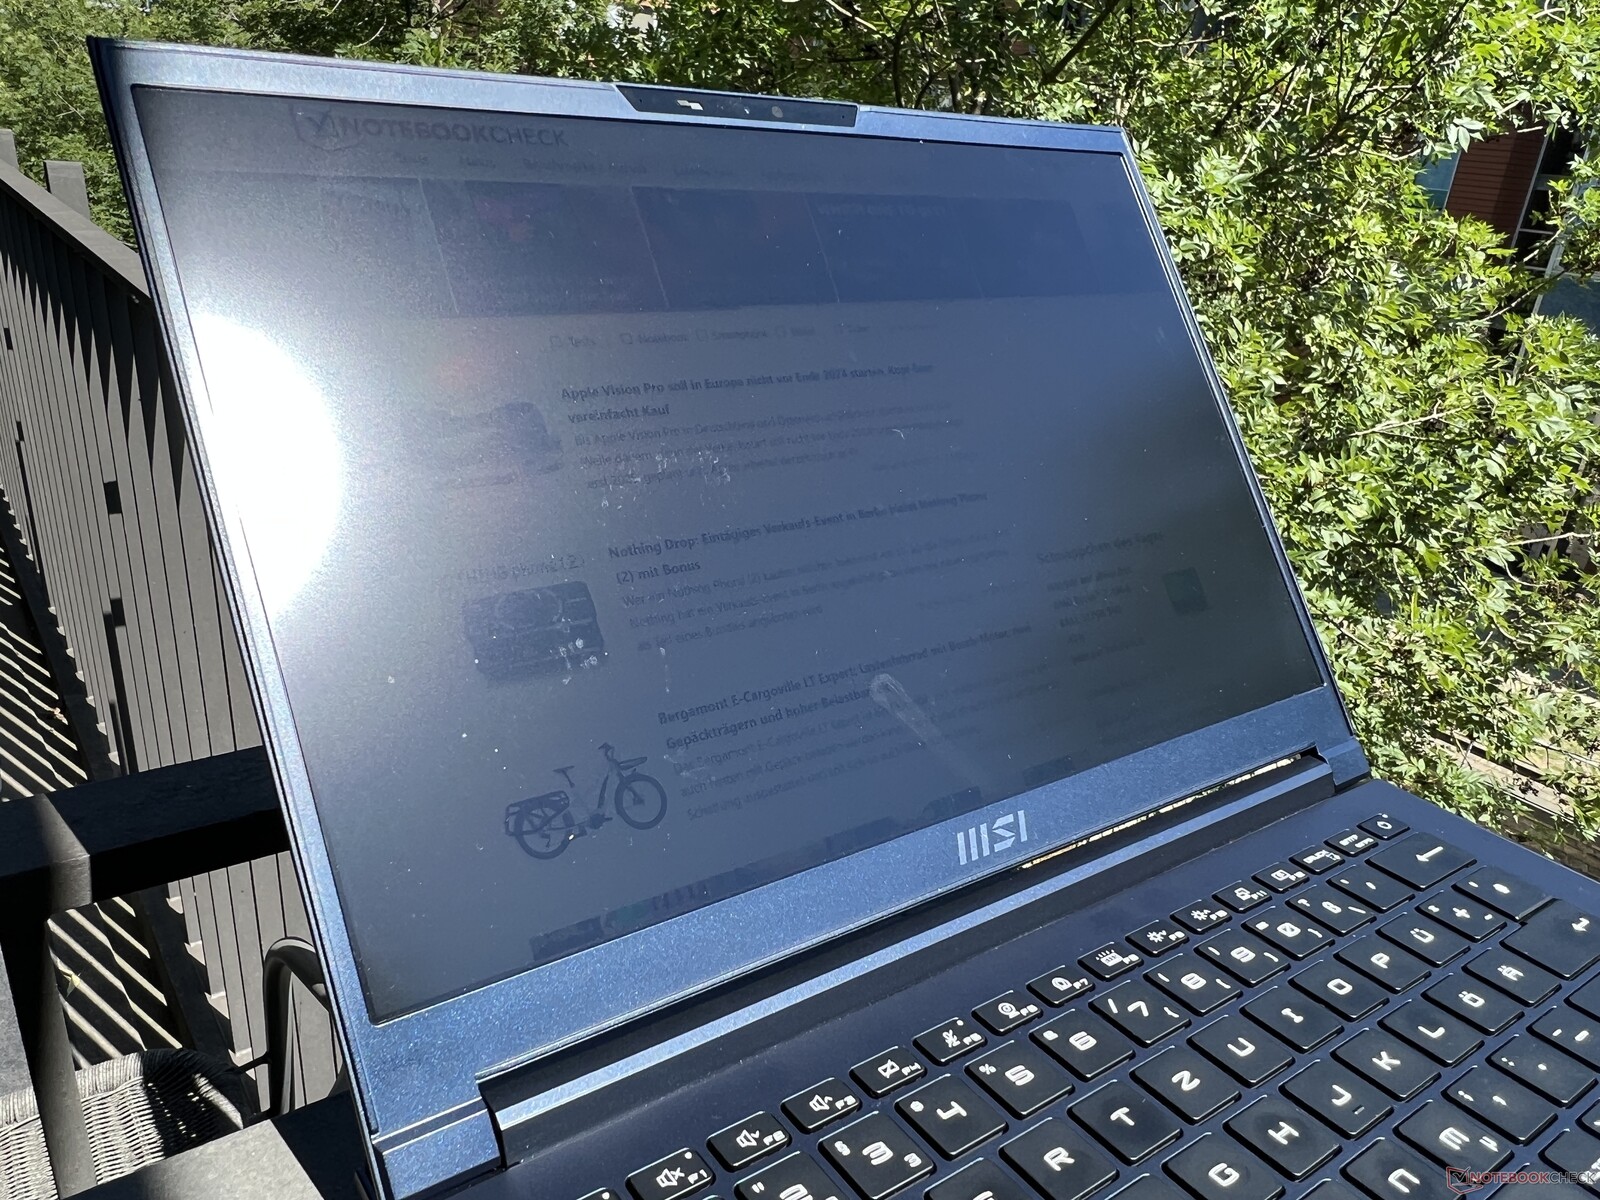
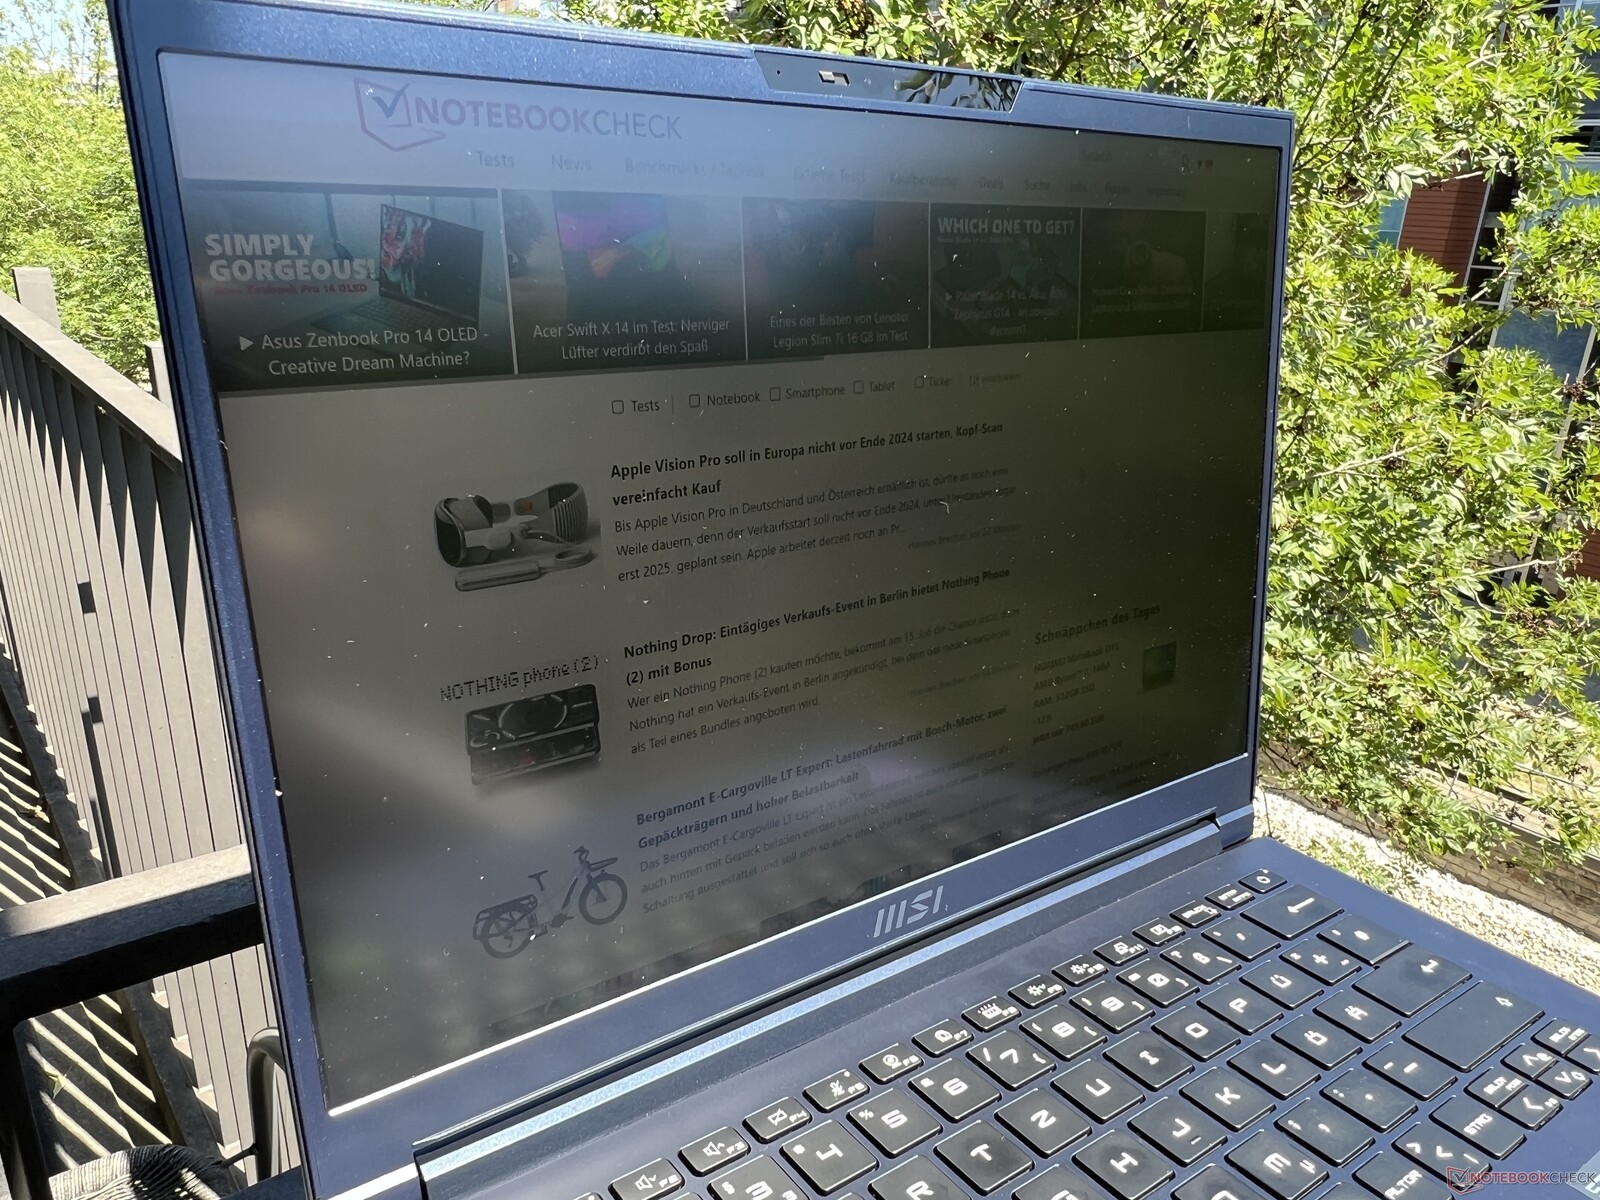
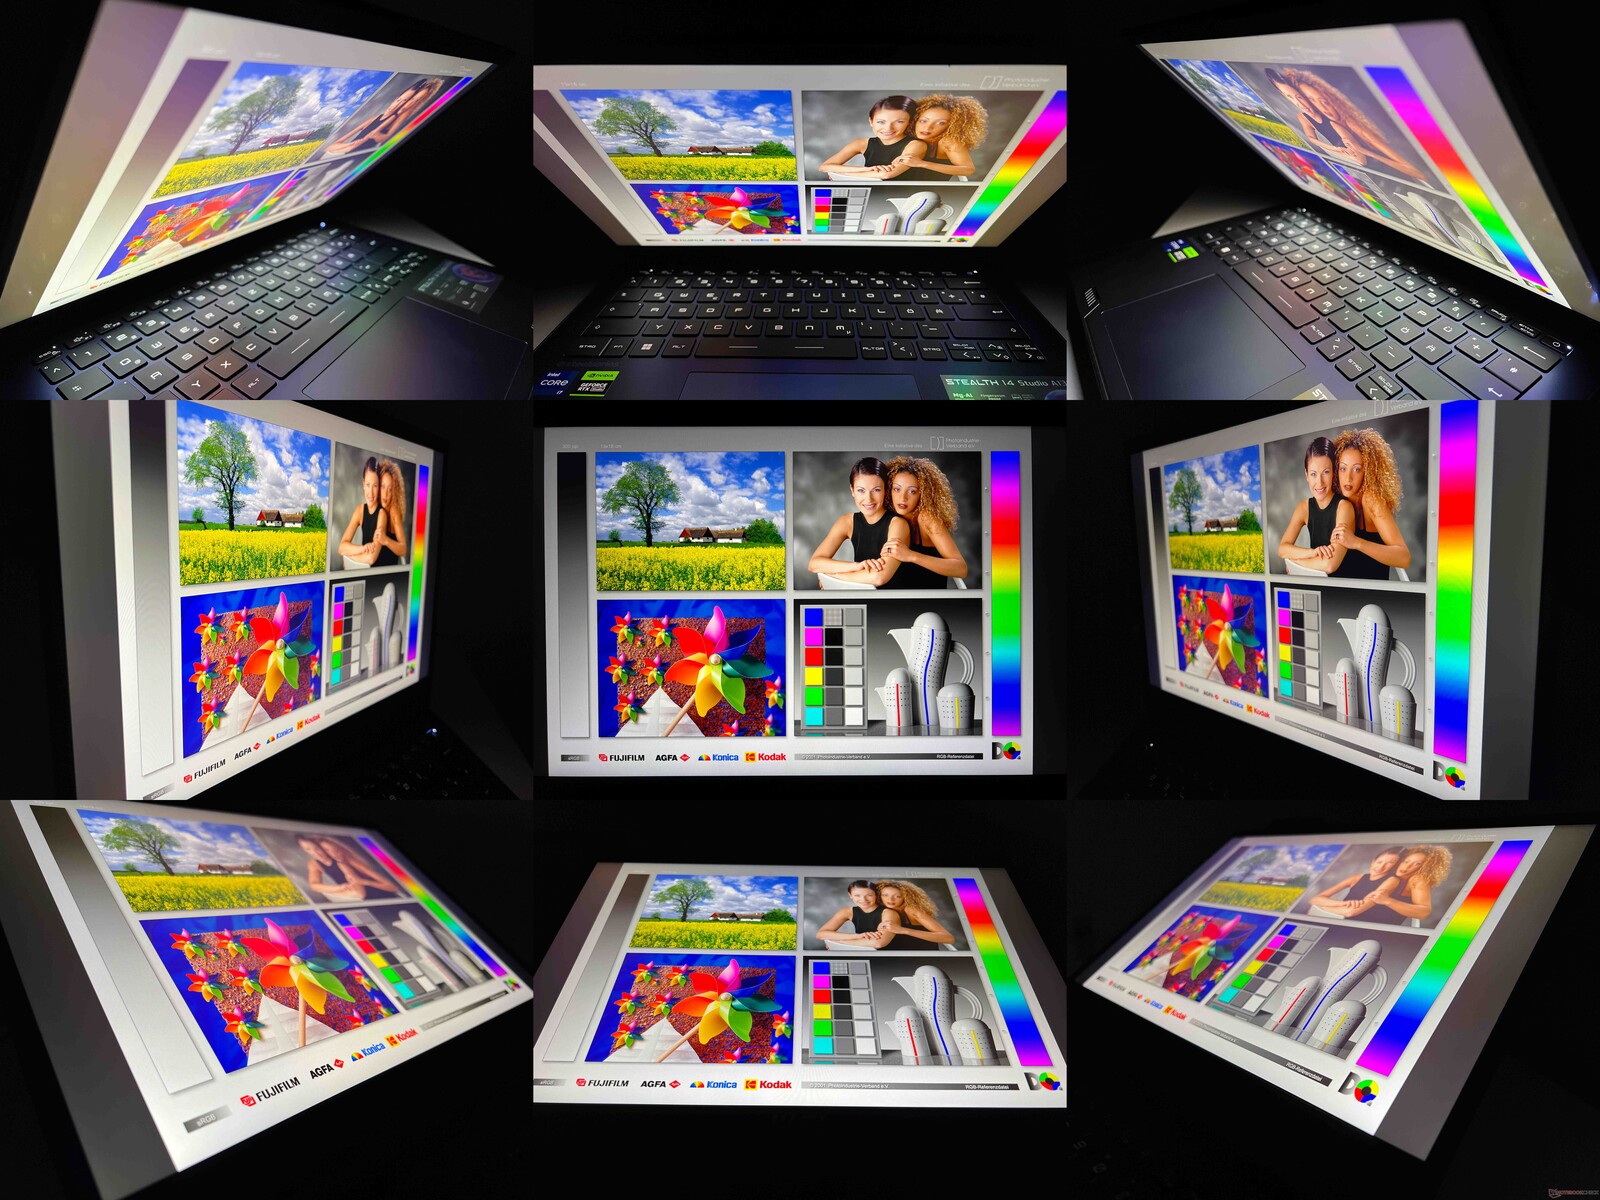
只要不将 Stealth 14 Studio 安装在阳光直射的地方,即使在非常明亮的日子里,在室外阅读哑光显示屏也不会有任何问题。它的视角稳定性很好,但还可以做得更好。尤其是从对角线上方观看,画面很快就会变得太亮,对比度也会下降很多。
性能 - Raptor Lake和RTX 4050笔记本电脑
测试条件
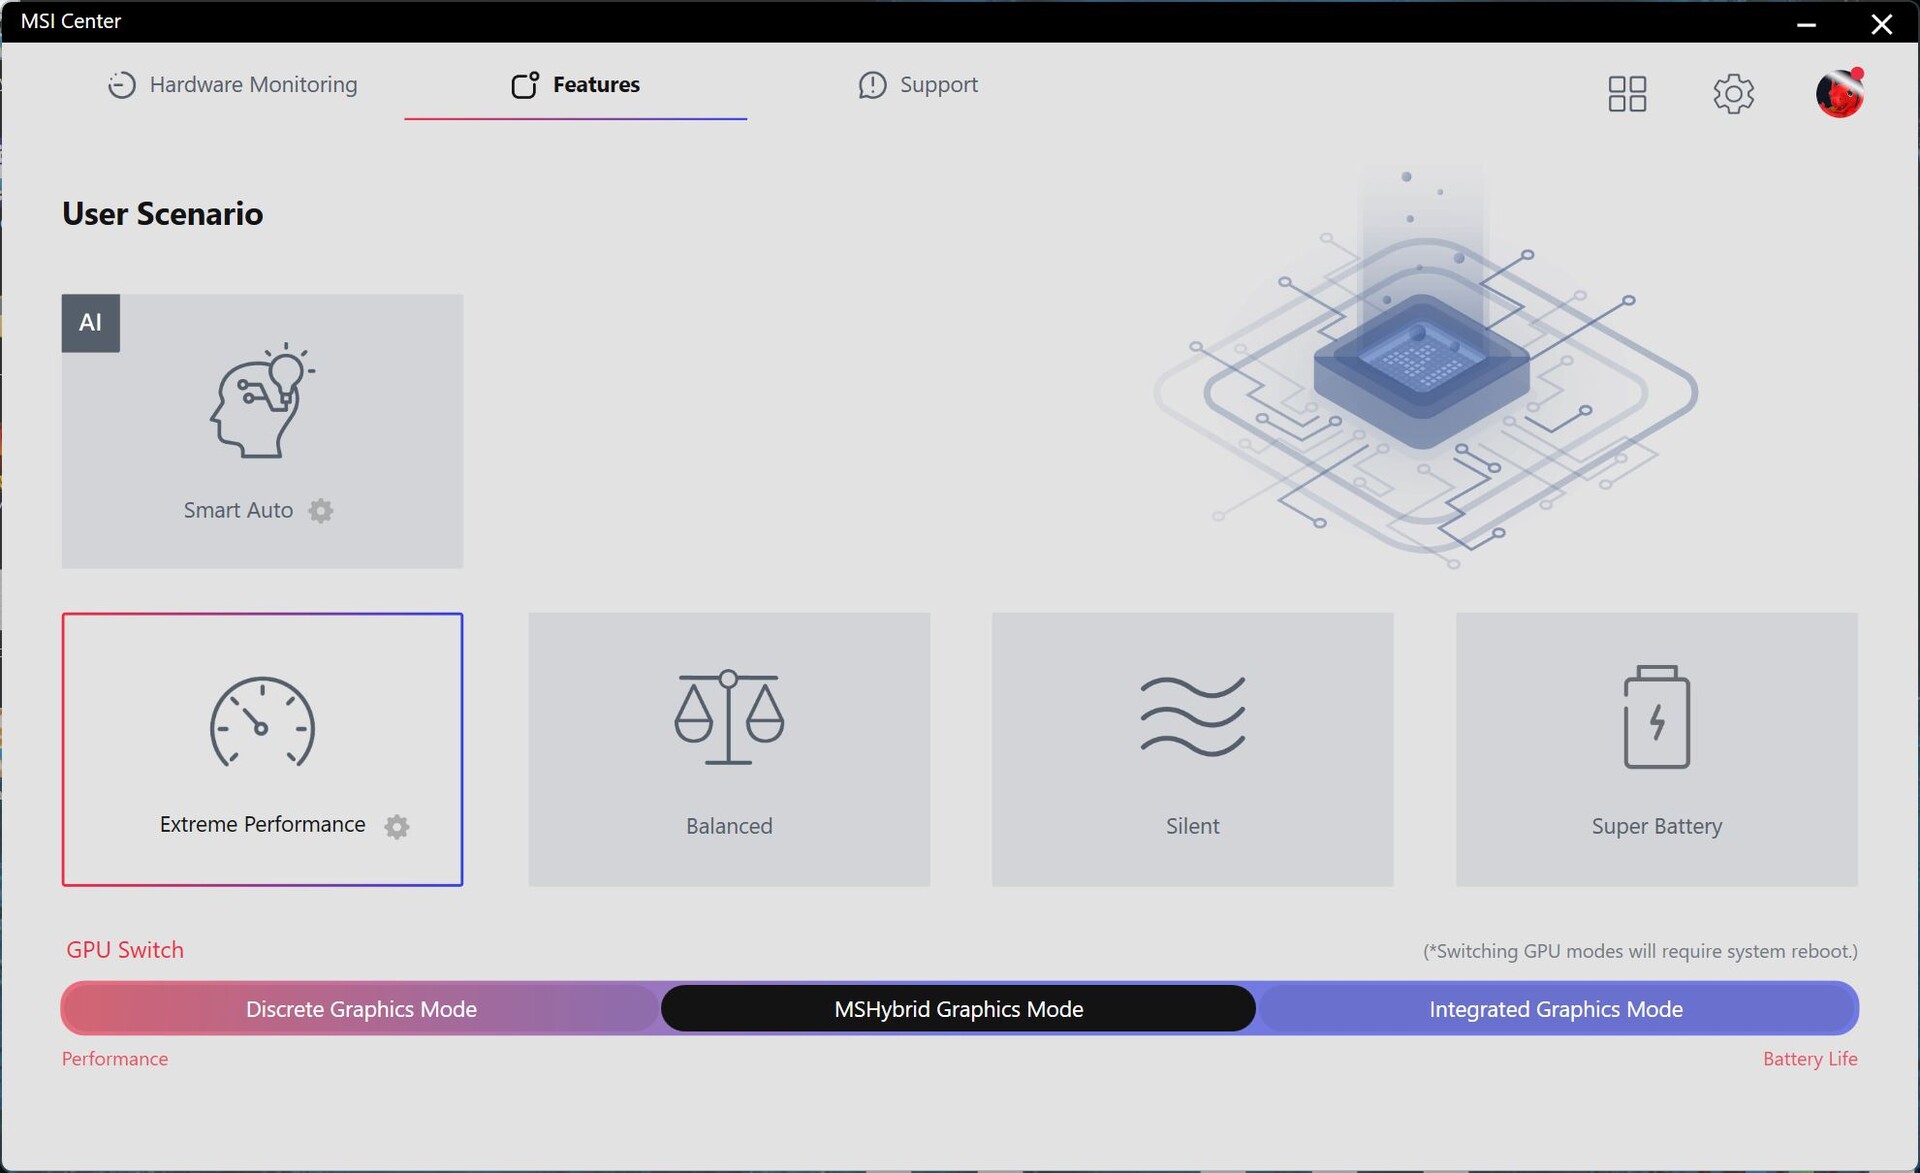
在预装的MSI Center中,有不同的能源配置文件可供选择。智能自动模式可以根据笔记本电脑的要求,通过一些不同的参数动态调整性能水平--在我们的测试中,结果似乎并不总是保持一致。因此,我们决定在基准测试和测量中使用 "极致性能"节能模式,以最大限度地提高性能水平,尤其是在CPU/GPU联合负载期间。我们在电池测试中使用了平衡模式。同时,微星的混合图形模式始终处于激活状态,在必要时切换到专用的Nvidia GPU。MUX控制是可用的,但切换需要重新启动。在价格方面,我们希望看到Advanced Optimus技术在这里得到应用。
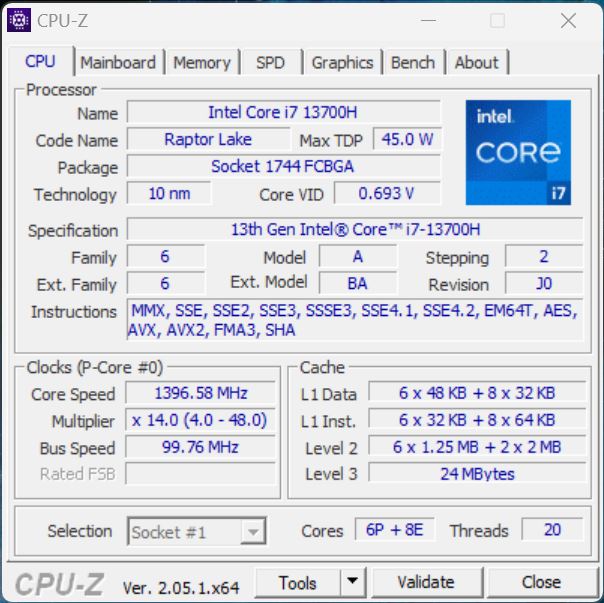
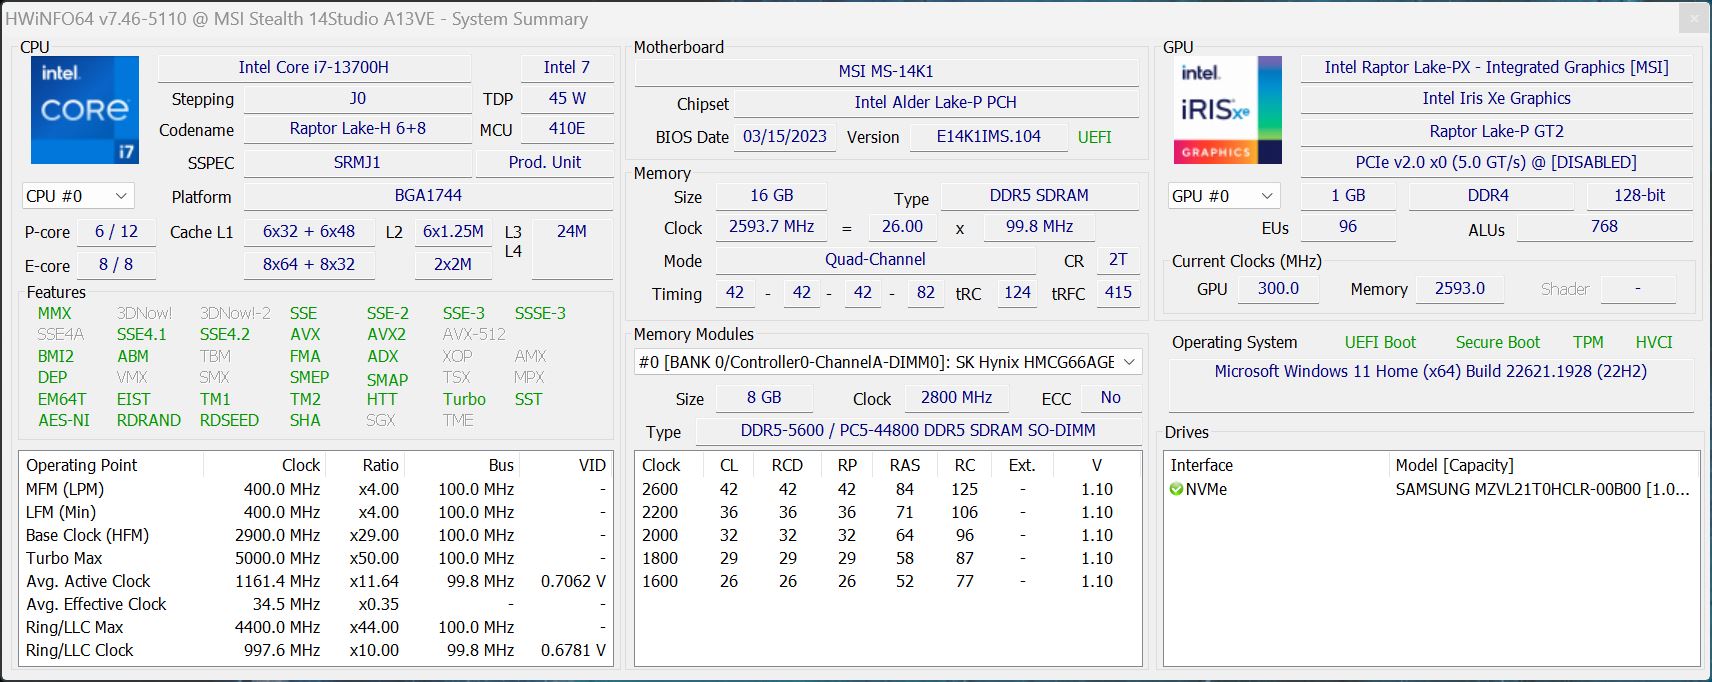
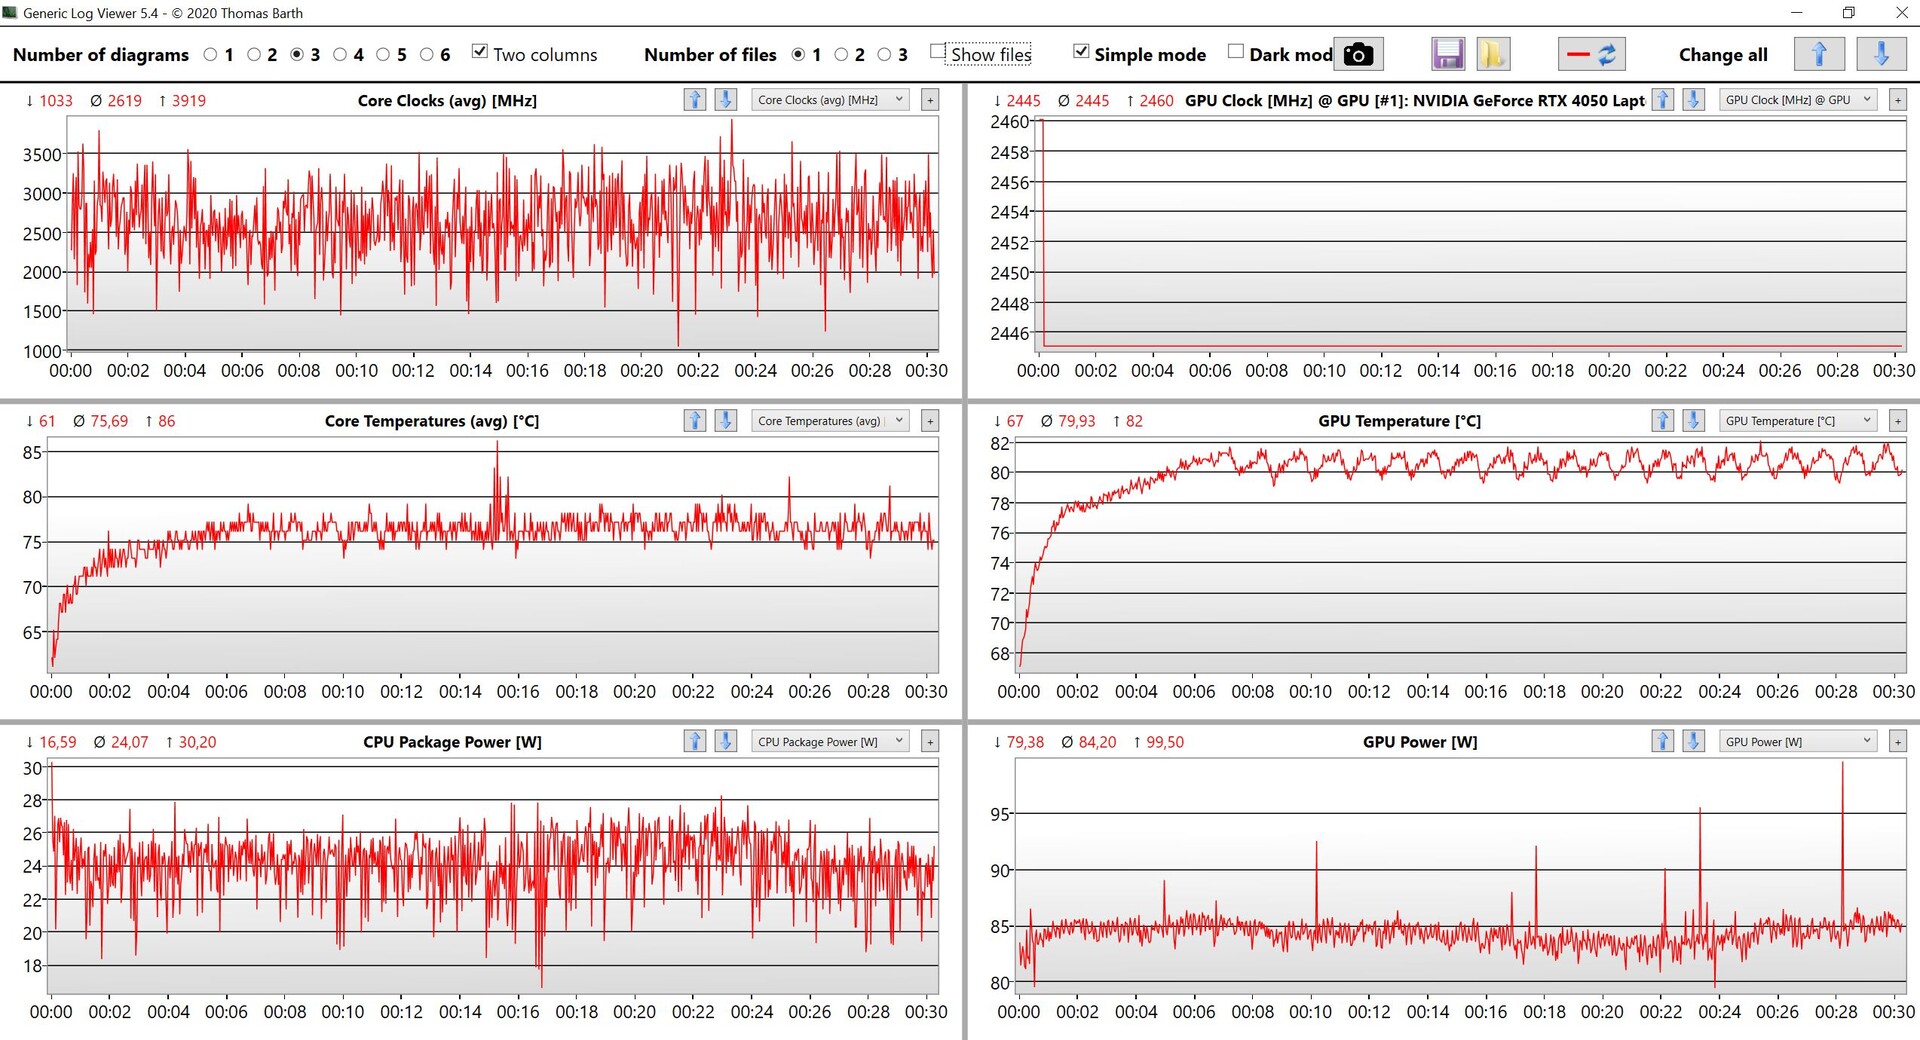
处理器 - 酷睿 i7-13700H
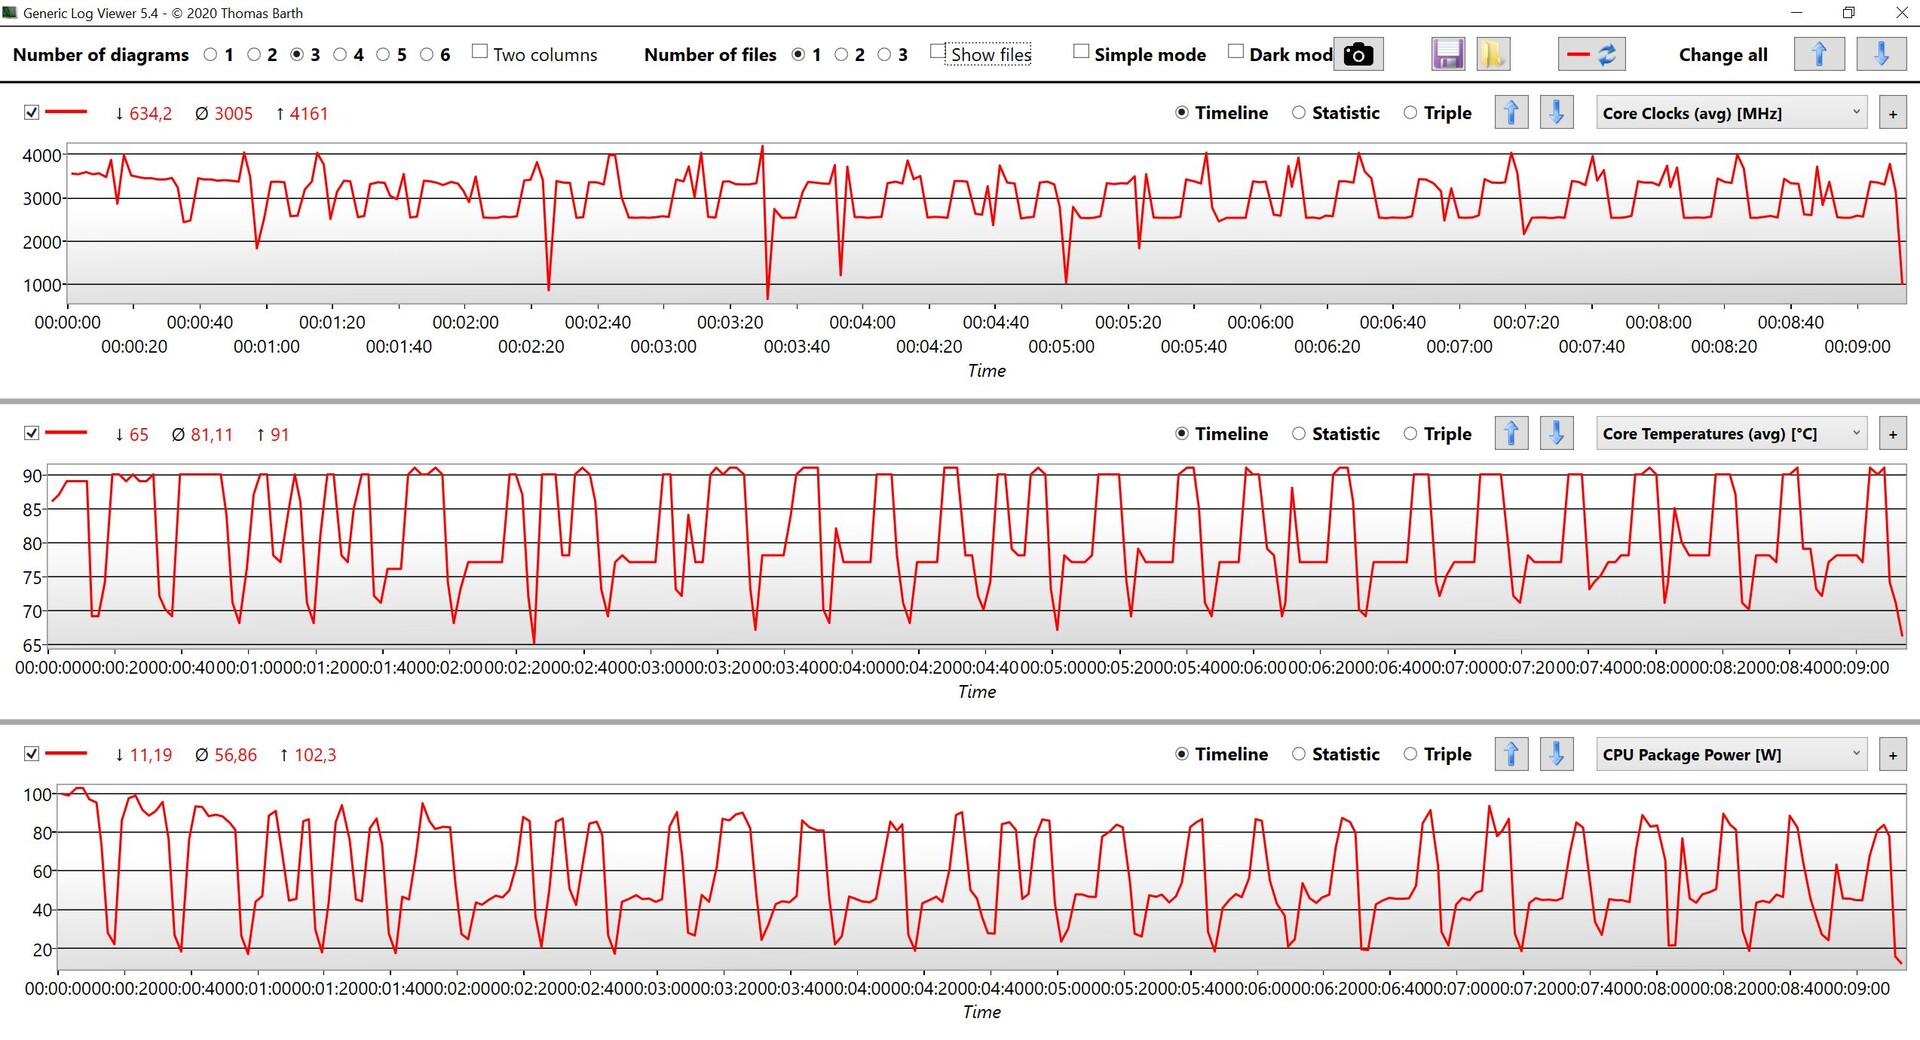
Stealth 14 Studio配备了英特尔目前最重要的处理器--酷睿i7-13700H处理器。 酷睿i7-13700H- 专为多媒体和游戏笔记本电脑设计。它有6个快速性能核心和8个效率核心,这意味着它可以同时处理总共20个线程。与前代产品相比,它仅有轻微改进,包括涡轮时钟频率略有提高。由于该处理器能耗很高,其功耗表现非常出色。我们测得的峰值功耗为115瓦,而在连续负载期间,笔记本电脑的功耗仍略高于80瓦--尽管我们测得了一些波动。在单核测试中,笔记本电脑的性能没有达到我们的预期。
在电池使用期间,其多核性能大大降低,因为处理器的最大功耗仅为35瓦--导致33%左右的功耗不足。更多CPU基准测试请访问Mobile Processors - Benchmark List 。
Cinebench R15 Multi continuous test
Cinebench R23: Multi Core | Single Core
Cinebench R20: CPU (Multi Core) | CPU (Single Core)
Cinebench R15: CPU Multi 64Bit | CPU Single 64Bit
Blender: v2.79 BMW27 CPU
7-Zip 18.03: 7z b 4 | 7z b 4 -mmt1
Geekbench 5.5: Multi-Core | Single-Core
HWBOT x265 Benchmark v2.2: 4k Preset
LibreOffice : 20 Documents To PDF
R Benchmark 2.5: Overall mean
| CPU Performance rating | |
| Average of class Gaming | |
| Asus ROG Flow Z13 GZ301ZE | |
| Acer Predator Triton 300 SE | |
| Alienware x14 i7 RTX 3060 | |
| Gigabyte Aero 14 OLED BMF | |
| MSI Stealth 14 Studio A13V | |
| Average Intel Core i7-13700H | |
| Schenker Vision 14 2022 RTX 3050 Ti | |
| Razer Blade 14 Ryzen 9 6900HX | |
| Cinebench R23 / Multi Core | |
| Average of class Gaming (10488 - 42661, n=107, last 2 years) | |
| MSI Stealth 14 Studio A13V | |
| Acer Predator Triton 300 SE | |
| Alienware x14 i7 RTX 3060 | |
| Asus ROG Flow Z13 GZ301ZE | |
| Average Intel Core i7-13700H (5890 - 20034, n=29) | |
| Schenker Vision 14 2022 RTX 3050 Ti | |
| Gigabyte Aero 14 OLED BMF | |
| Razer Blade 14 Ryzen 9 6900HX | |
| Cinebench R23 / Single Core | |
| Average of class Gaming (1166 - 2415, n=107, last 2 years) | |
| Asus ROG Flow Z13 GZ301ZE | |
| Acer Predator Triton 300 SE | |
| Gigabyte Aero 14 OLED BMF | |
| Average Intel Core i7-13700H (1323 - 1914, n=29) | |
| Alienware x14 i7 RTX 3060 | |
| Schenker Vision 14 2022 RTX 3050 Ti | |
| MSI Stealth 14 Studio A13V | |
| Razer Blade 14 Ryzen 9 6900HX | |
| Cinebench R20 / CPU (Multi Core) | |
| Average of class Gaming (4029 - 16433, n=106, last 2 years) | |
| MSI Stealth 14 Studio A13V | |
| Acer Predator Triton 300 SE | |
| Alienware x14 i7 RTX 3060 | |
| Average Intel Core i7-13700H (2322 - 7674, n=29) | |
| Schenker Vision 14 2022 RTX 3050 Ti | |
| Asus ROG Flow Z13 GZ301ZE | |
| Razer Blade 14 Ryzen 9 6900HX | |
| Gigabyte Aero 14 OLED BMF | |
| Cinebench R20 / CPU (Single Core) | |
| Average of class Gaming (442 - 913, n=106, last 2 years) | |
| Asus ROG Flow Z13 GZ301ZE | |
| Acer Predator Triton 300 SE | |
| Gigabyte Aero 14 OLED BMF | |
| Schenker Vision 14 2022 RTX 3050 Ti | |
| Average Intel Core i7-13700H (508 - 741, n=29) | |
| Alienware x14 i7 RTX 3060 | |
| MSI Stealth 14 Studio A13V | |
| Razer Blade 14 Ryzen 9 6900HX | |
| Cinebench R15 / CPU Multi 64Bit | |
| Average of class Gaming (1578 - 6330, n=105, last 2 years) | |
| Asus ROG Flow Z13 GZ301ZE | |
| MSI Stealth 14 Studio A13V | |
| Alienware x14 i7 RTX 3060 | |
| Gigabyte Aero 14 OLED BMF | |
| Average Intel Core i7-13700H (905 - 2982, n=29) | |
| Acer Predator Triton 300 SE | |
| Razer Blade 14 Ryzen 9 6900HX | |
| Schenker Vision 14 2022 RTX 3050 Ti | |
| Cinebench R15 / CPU Single 64Bit | |
| Average of class Gaming (188.8 - 350, n=106, last 2 years) | |
| Asus ROG Flow Z13 GZ301ZE | |
| Acer Predator Triton 300 SE | |
| Gigabyte Aero 14 OLED BMF | |
| Schenker Vision 14 2022 RTX 3050 Ti | |
| Average Intel Core i7-13700H (213 - 278, n=29) | |
| Alienware x14 i7 RTX 3060 | |
| Razer Blade 14 Ryzen 9 6900HX | |
| MSI Stealth 14 Studio A13V | |
| Blender / v2.79 BMW27 CPU | |
| Schenker Vision 14 2022 RTX 3050 Ti | |
| Gigabyte Aero 14 OLED BMF | |
| Average Intel Core i7-13700H (169 - 555, n=29) | |
| Alienware x14 i7 RTX 3060 | |
| Razer Blade 14 Ryzen 9 6900HX | |
| Asus ROG Flow Z13 GZ301ZE | |
| Acer Predator Triton 300 SE | |
| MSI Stealth 14 Studio A13V | |
| Average of class Gaming (79 - 330, n=104, last 2 years) | |
| 7-Zip 18.03 / 7z b 4 | |
| Average of class Gaming (33491 - 148086, n=105, last 2 years) | |
| MSI Stealth 14 Studio A13V | |
| Alienware x14 i7 RTX 3060 | |
| Acer Predator Triton 300 SE | |
| Asus ROG Flow Z13 GZ301ZE | |
| Razer Blade 14 Ryzen 9 6900HX | |
| Average Intel Core i7-13700H (27322 - 76344, n=29) | |
| Gigabyte Aero 14 OLED BMF | |
| Schenker Vision 14 2022 RTX 3050 Ti | |
| 7-Zip 18.03 / 7z b 4 -mmt1 | |
| Average of class Gaming (4199 - 7436, n=105, last 2 years) | |
| Asus ROG Flow Z13 GZ301ZE | |
| Gigabyte Aero 14 OLED BMF | |
| Average Intel Core i7-13700H (4825 - 6238, n=29) | |
| Razer Blade 14 Ryzen 9 6900HX | |
| Schenker Vision 14 2022 RTX 3050 Ti | |
| Alienware x14 i7 RTX 3060 | |
| Acer Predator Triton 300 SE | |
| MSI Stealth 14 Studio A13V | |
| Geekbench 5.5 / Multi-Core | |
| Average of class Gaming (6460 - 28263, n=105, last 2 years) | |
| Asus ROG Flow Z13 GZ301ZE | |
| Alienware x14 i7 RTX 3060 | |
| MSI Stealth 14 Studio A13V | |
| Acer Predator Triton 300 SE | |
| Average Intel Core i7-13700H (6165 - 14215, n=29) | |
| Schenker Vision 14 2022 RTX 3050 Ti | |
| Gigabyte Aero 14 OLED BMF | |
| Razer Blade 14 Ryzen 9 6900HX | |
| Geekbench 5.5 / Single-Core | |
| Average of class Gaming (986 - 2474, n=105, last 2 years) | |
| Asus ROG Flow Z13 GZ301ZE | |
| Gigabyte Aero 14 OLED BMF | |
| Acer Predator Triton 300 SE | |
| Alienware x14 i7 RTX 3060 | |
| Average Intel Core i7-13700H (1362 - 1919, n=29) | |
| Schenker Vision 14 2022 RTX 3050 Ti | |
| MSI Stealth 14 Studio A13V | |
| Razer Blade 14 Ryzen 9 6900HX | |
| HWBOT x265 Benchmark v2.2 / 4k Preset | |
| Average of class Gaming (11.5 - 44.4, n=105, last 2 years) | |
| Acer Predator Triton 300 SE | |
| MSI Stealth 14 Studio A13V | |
| Razer Blade 14 Ryzen 9 6900HX | |
| Alienware x14 i7 RTX 3060 | |
| Asus ROG Flow Z13 GZ301ZE | |
| Average Intel Core i7-13700H (6.72 - 21.2, n=29) | |
| Gigabyte Aero 14 OLED BMF | |
| Schenker Vision 14 2022 RTX 3050 Ti | |
| LibreOffice / 20 Documents To PDF | |
| MSI Stealth 14 Studio A13V | |
| Razer Blade 14 Ryzen 9 6900HX | |
| Average of class Gaming (33.2 - 88.8, n=105, last 2 years) | |
| Average Intel Core i7-13700H (31.3 - 62.4, n=29) | |
| Schenker Vision 14 2022 RTX 3050 Ti | |
| Asus ROG Flow Z13 GZ301ZE | |
| Acer Predator Triton 300 SE | |
| Gigabyte Aero 14 OLED BMF | |
| Alienware x14 i7 RTX 3060 | |
| R Benchmark 2.5 / Overall mean | |
| MSI Stealth 14 Studio A13V | |
| Razer Blade 14 Ryzen 9 6900HX | |
| Average Intel Core i7-13700H (0.4308 - 0.607, n=29) | |
| Schenker Vision 14 2022 RTX 3050 Ti | |
| Alienware x14 i7 RTX 3060 | |
| Gigabyte Aero 14 OLED BMF | |
| Acer Predator Triton 300 SE | |
| Average of class Gaming (0.3439 - 0.759, n=106, last 2 years) | |
| Asus ROG Flow Z13 GZ301ZE | |
* ... smaller is better
AIDA64: FP32 Ray-Trace | FPU Julia | CPU SHA3 | CPU Queen | FPU SinJulia | FPU Mandel | CPU AES | CPU ZLib | FP64 Ray-Trace | CPU PhotoWorxx
| Performance rating | |
| Average of class Gaming | |
| Razer Blade 14 Ryzen 9 6900HX | |
| Acer Predator Triton 300 SE | |
| MSI Stealth 14 Studio A13V | |
| Gigabyte Aero 14 OLED BMF | |
| Average Intel Core i7-13700H | |
| Alienware x14 i7 RTX 3060 | |
| Schenker Vision 14 2022 RTX 3050 Ti | |
| Asus ROG Flow Z13 GZ301ZE | |
| AIDA64 / FP32 Ray-Trace | |
| Average of class Gaming (10227 - 85542, n=105, last 2 years) | |
| MSI Stealth 14 Studio A13V | |
| Razer Blade 14 Ryzen 9 6900HX | |
| Acer Predator Triton 300 SE | |
| Average Intel Core i7-13700H (4986 - 18908, n=29) | |
| Gigabyte Aero 14 OLED BMF | |
| Schenker Vision 14 2022 RTX 3050 Ti | |
| Alienware x14 i7 RTX 3060 | |
| Asus ROG Flow Z13 GZ301ZE | |
| AIDA64 / FPU Julia | |
| Average of class Gaming (51376 - 238426, n=105, last 2 years) | |
| Razer Blade 14 Ryzen 9 6900HX | |
| MSI Stealth 14 Studio A13V | |
| Acer Predator Triton 300 SE | |
| Average Intel Core i7-13700H (25360 - 92359, n=29) | |
| Gigabyte Aero 14 OLED BMF | |
| Schenker Vision 14 2022 RTX 3050 Ti | |
| Alienware x14 i7 RTX 3060 | |
| Asus ROG Flow Z13 GZ301ZE | |
| AIDA64 / CPU SHA3 | |
| Average of class Gaming (2180 - 10115, n=105, last 2 years) | |
| MSI Stealth 14 Studio A13V | |
| Acer Predator Triton 300 SE | |
| Razer Blade 14 Ryzen 9 6900HX | |
| Average Intel Core i7-13700H (1339 - 4224, n=29) | |
| Gigabyte Aero 14 OLED BMF | |
| Alienware x14 i7 RTX 3060 | |
| Schenker Vision 14 2022 RTX 3050 Ti | |
| Asus ROG Flow Z13 GZ301ZE | |
| AIDA64 / CPU Queen | |
| Average of class Gaming (49785 - 173351, n=90, last 2 years) | |
| Acer Predator Triton 300 SE | |
| Gigabyte Aero 14 OLED BMF | |
| MSI Stealth 14 Studio A13V | |
| Asus ROG Flow Z13 GZ301ZE | |
| Razer Blade 14 Ryzen 9 6900HX | |
| Alienware x14 i7 RTX 3060 | |
| Average Intel Core i7-13700H (59324 - 107159, n=29) | |
| Schenker Vision 14 2022 RTX 3050 Ti | |
| AIDA64 / FPU SinJulia | |
| Average of class Gaming (4424 - 33636, n=105, last 2 years) | |
| Razer Blade 14 Ryzen 9 6900HX | |
| MSI Stealth 14 Studio A13V | |
| Acer Predator Triton 300 SE | |
| Alienware x14 i7 RTX 3060 | |
| Asus ROG Flow Z13 GZ301ZE | |
| Average Intel Core i7-13700H (4800 - 11050, n=29) | |
| Gigabyte Aero 14 OLED BMF | |
| Schenker Vision 14 2022 RTX 3050 Ti | |
| AIDA64 / FPU Mandel | |
| Average of class Gaming (25115 - 128721, n=105, last 2 years) | |
| Razer Blade 14 Ryzen 9 6900HX | |
| MSI Stealth 14 Studio A13V | |
| Acer Predator Triton 300 SE | |
| Average Intel Core i7-13700H (12321 - 45118, n=29) | |
| Gigabyte Aero 14 OLED BMF | |
| Schenker Vision 14 2022 RTX 3050 Ti | |
| Alienware x14 i7 RTX 3060 | |
| Asus ROG Flow Z13 GZ301ZE | |
| AIDA64 / CPU AES | |
| Razer Blade 14 Ryzen 9 6900HX | |
| Acer Predator Triton 300 SE | |
| Gigabyte Aero 14 OLED BMF | |
| Average of class Gaming (39258 - 247074, n=105, last 2 years) | |
| Alienware x14 i7 RTX 3060 | |
| Asus ROG Flow Z13 GZ301ZE | |
| MSI Stealth 14 Studio A13V | |
| Average Intel Core i7-13700H (28769 - 151254, n=29) | |
| Schenker Vision 14 2022 RTX 3050 Ti | |
| AIDA64 / CPU ZLib | |
| Average of class Gaming (574 - 2531, n=105, last 2 years) | |
| MSI Stealth 14 Studio A13V | |
| Acer Predator Triton 300 SE | |
| Alienware x14 i7 RTX 3060 | |
| Schenker Vision 14 2022 RTX 3050 Ti | |
| Average Intel Core i7-13700H (389 - 1215, n=29) | |
| Asus ROG Flow Z13 GZ301ZE | |
| Razer Blade 14 Ryzen 9 6900HX | |
| Gigabyte Aero 14 OLED BMF | |
| AIDA64 / FP64 Ray-Trace | |
| Average of class Gaming (5509 - 45446, n=105, last 2 years) | |
| MSI Stealth 14 Studio A13V | |
| Razer Blade 14 Ryzen 9 6900HX | |
| Acer Predator Triton 300 SE | |
| Average Intel Core i7-13700H (2540 - 10135, n=29) | |
| Gigabyte Aero 14 OLED BMF | |
| Schenker Vision 14 2022 RTX 3050 Ti | |
| Alienware x14 i7 RTX 3060 | |
| Asus ROG Flow Z13 GZ301ZE | |
| AIDA64 / CPU PhotoWorxx | |
| Gigabyte Aero 14 OLED BMF | |
| Acer Predator Triton 300 SE | |
| Alienware x14 i7 RTX 3060 | |
| Average of class Gaming (12271 - 89891, n=105, last 2 years) | |
| Asus ROG Flow Z13 GZ301ZE | |
| Average Intel Core i7-13700H (12872 - 52727, n=29) | |
| MSI Stealth 14 Studio A13V | |
| Schenker Vision 14 2022 RTX 3050 Ti | |
| Razer Blade 14 Ryzen 9 6900HX | |
系统性能
尽管我们的测试设备在合成基准测试中仅取得了平均成绩,但主观上(毫不奇怪),该组件在性能方面给我们留下了深刻印象。在测试过程中,我们没有发现任何问题。
CrossMark: Overall | Productivity | Creativity | Responsiveness
| PCMark 10 / Score | |
| Average of class Gaming (5828 - 12414, n=93, last 2 years) | |
| Acer Predator Triton 300 SE | |
| Razer Blade 14 Ryzen 9 6900HX | |
| Gigabyte Aero 14 OLED BMF | |
| Average Intel Core i7-13700H, NVIDIA GeForce RTX 4050 Laptop GPU (6822 - 7556, n=7) | |
| Alienware x14 i7 RTX 3060 | |
| MSI Stealth 14 Studio A13V | |
| Schenker Vision 14 2022 RTX 3050 Ti | |
| Asus ROG Flow Z13 GZ301ZE | |
| PCMark 10 / Essentials | |
| Gigabyte Aero 14 OLED BMF | |
| Acer Predator Triton 300 SE | |
| Razer Blade 14 Ryzen 9 6900HX | |
| Average Intel Core i7-13700H, NVIDIA GeForce RTX 4050 Laptop GPU (10283 - 11549, n=7) | |
| Asus ROG Flow Z13 GZ301ZE | |
| Average of class Gaming (8810 - 11935, n=97, last 2 years) | |
| Schenker Vision 14 2022 RTX 3050 Ti | |
| Alienware x14 i7 RTX 3060 | |
| MSI Stealth 14 Studio A13V | |
| PCMark 10 / Productivity | |
| Average of class Gaming (6845 - 25323, n=95, last 2 years) | |
| Acer Predator Triton 300 SE | |
| Asus ROG Flow Z13 GZ301ZE | |
| Alienware x14 i7 RTX 3060 | |
| Gigabyte Aero 14 OLED BMF | |
| Average Intel Core i7-13700H, NVIDIA GeForce RTX 4050 Laptop GPU (8368 - 9836, n=7) | |
| Razer Blade 14 Ryzen 9 6900HX | |
| Schenker Vision 14 2022 RTX 3050 Ti | |
| MSI Stealth 14 Studio A13V | |
| PCMark 10 / Digital Content Creation | |
| Average of class Gaming (7602 - 19954, n=95, last 2 years) | |
| Razer Blade 14 Ryzen 9 6900HX | |
| Acer Predator Triton 300 SE | |
| MSI Stealth 14 Studio A13V | |
| Average Intel Core i7-13700H, NVIDIA GeForce RTX 4050 Laptop GPU (9527 - 10643, n=7) | |
| Alienware x14 i7 RTX 3060 | |
| Gigabyte Aero 14 OLED BMF | |
| Schenker Vision 14 2022 RTX 3050 Ti | |
| Asus ROG Flow Z13 GZ301ZE | |
| CrossMark / Overall | |
| Asus ROG Flow Z13 GZ301ZE | |
| Average of class Gaming (1366 - 2409, n=94, last 2 years) | |
| Acer Predator Triton 300 SE | |
| Alienware x14 i7 RTX 3060 | |
| Gigabyte Aero 14 OLED BMF | |
| MSI Stealth 14 Studio A13V | |
| Average Intel Core i7-13700H, NVIDIA GeForce RTX 4050 Laptop GPU (1205 - 1937, n=9) | |
| Schenker Vision 14 2022 RTX 3050 Ti | |
| CrossMark / Productivity | |
| Asus ROG Flow Z13 GZ301ZE | |
| Acer Predator Triton 300 SE | |
| Average of class Gaming (1386 - 2254, n=94, last 2 years) | |
| Alienware x14 i7 RTX 3060 | |
| Gigabyte Aero 14 OLED BMF | |
| Average Intel Core i7-13700H, NVIDIA GeForce RTX 4050 Laptop GPU (1158 - 1877, n=9) | |
| MSI Stealth 14 Studio A13V | |
| Schenker Vision 14 2022 RTX 3050 Ti | |
| CrossMark / Creativity | |
| Average of class Gaming (1343 - 2786, n=94, last 2 years) | |
| Asus ROG Flow Z13 GZ301ZE | |
| Acer Predator Triton 300 SE | |
| Alienware x14 i7 RTX 3060 | |
| Gigabyte Aero 14 OLED BMF | |
| MSI Stealth 14 Studio A13V | |
| Average Intel Core i7-13700H, NVIDIA GeForce RTX 4050 Laptop GPU (1293 - 2044, n=9) | |
| Schenker Vision 14 2022 RTX 3050 Ti | |
| CrossMark / Responsiveness | |
| Asus ROG Flow Z13 GZ301ZE | |
| Acer Predator Triton 300 SE | |
| Alienware x14 i7 RTX 3060 | |
| Gigabyte Aero 14 OLED BMF | |
| Average of class Gaming (1226 - 2334, n=94, last 2 years) | |
| Average Intel Core i7-13700H, NVIDIA GeForce RTX 4050 Laptop GPU (1097 - 1929, n=9) | |
| MSI Stealth 14 Studio A13V | |
| Schenker Vision 14 2022 RTX 3050 Ti | |
| PCMark 10 Score | 6924 points | |
Help | ||
| AIDA64 / Memory Copy | |
| Gigabyte Aero 14 OLED BMF | |
| Alienware x14 i7 RTX 3060 | |
| Asus ROG Flow Z13 GZ301ZE | |
| Acer Predator Triton 300 SE | |
| Average of class Gaming (21750 - 129946, n=105, last 2 years) | |
| Average Intel Core i7-13700H (24334 - 78081, n=29) | |
| MSI Stealth 14 Studio A13V | |
| Razer Blade 14 Ryzen 9 6900HX | |
| Schenker Vision 14 2022 RTX 3050 Ti | |
| AIDA64 / Memory Read | |
| Gigabyte Aero 14 OLED BMF | |
| Alienware x14 i7 RTX 3060 | |
| Acer Predator Triton 300 SE | |
| Average of class Gaming (22956 - 118858, n=105, last 2 years) | |
| Asus ROG Flow Z13 GZ301ZE | |
| MSI Stealth 14 Studio A13V | |
| Average Intel Core i7-13700H (23681 - 79656, n=29) | |
| Razer Blade 14 Ryzen 9 6900HX | |
| Schenker Vision 14 2022 RTX 3050 Ti | |
| AIDA64 / Memory Write | |
| Gigabyte Aero 14 OLED BMF | |
| Average of class Gaming (22297 - 135096, n=105, last 2 years) | |
| Average Intel Core i7-13700H (22986 - 99898, n=29) | |
| Alienware x14 i7 RTX 3060 | |
| Acer Predator Triton 300 SE | |
| Asus ROG Flow Z13 GZ301ZE | |
| Razer Blade 14 Ryzen 9 6900HX | |
| MSI Stealth 14 Studio A13V | |
| Schenker Vision 14 2022 RTX 3050 Ti | |
| AIDA64 / Memory Latency | |
| Alienware x14 i7 RTX 3060 | |
| Average of class Gaming (75.3 - 259, n=105, last 2 years) | |
| Asus ROG Flow Z13 GZ301ZE | |
| Acer Predator Triton 300 SE | |
| Average Intel Core i7-13700H (82.4 - 136.8, n=29) | |
| Gigabyte Aero 14 OLED BMF | |
| Schenker Vision 14 2022 RTX 3050 Ti | |
| MSI Stealth 14 Studio A13V | |
| Razer Blade 14 Ryzen 9 6900HX | |
* ... smaller is better
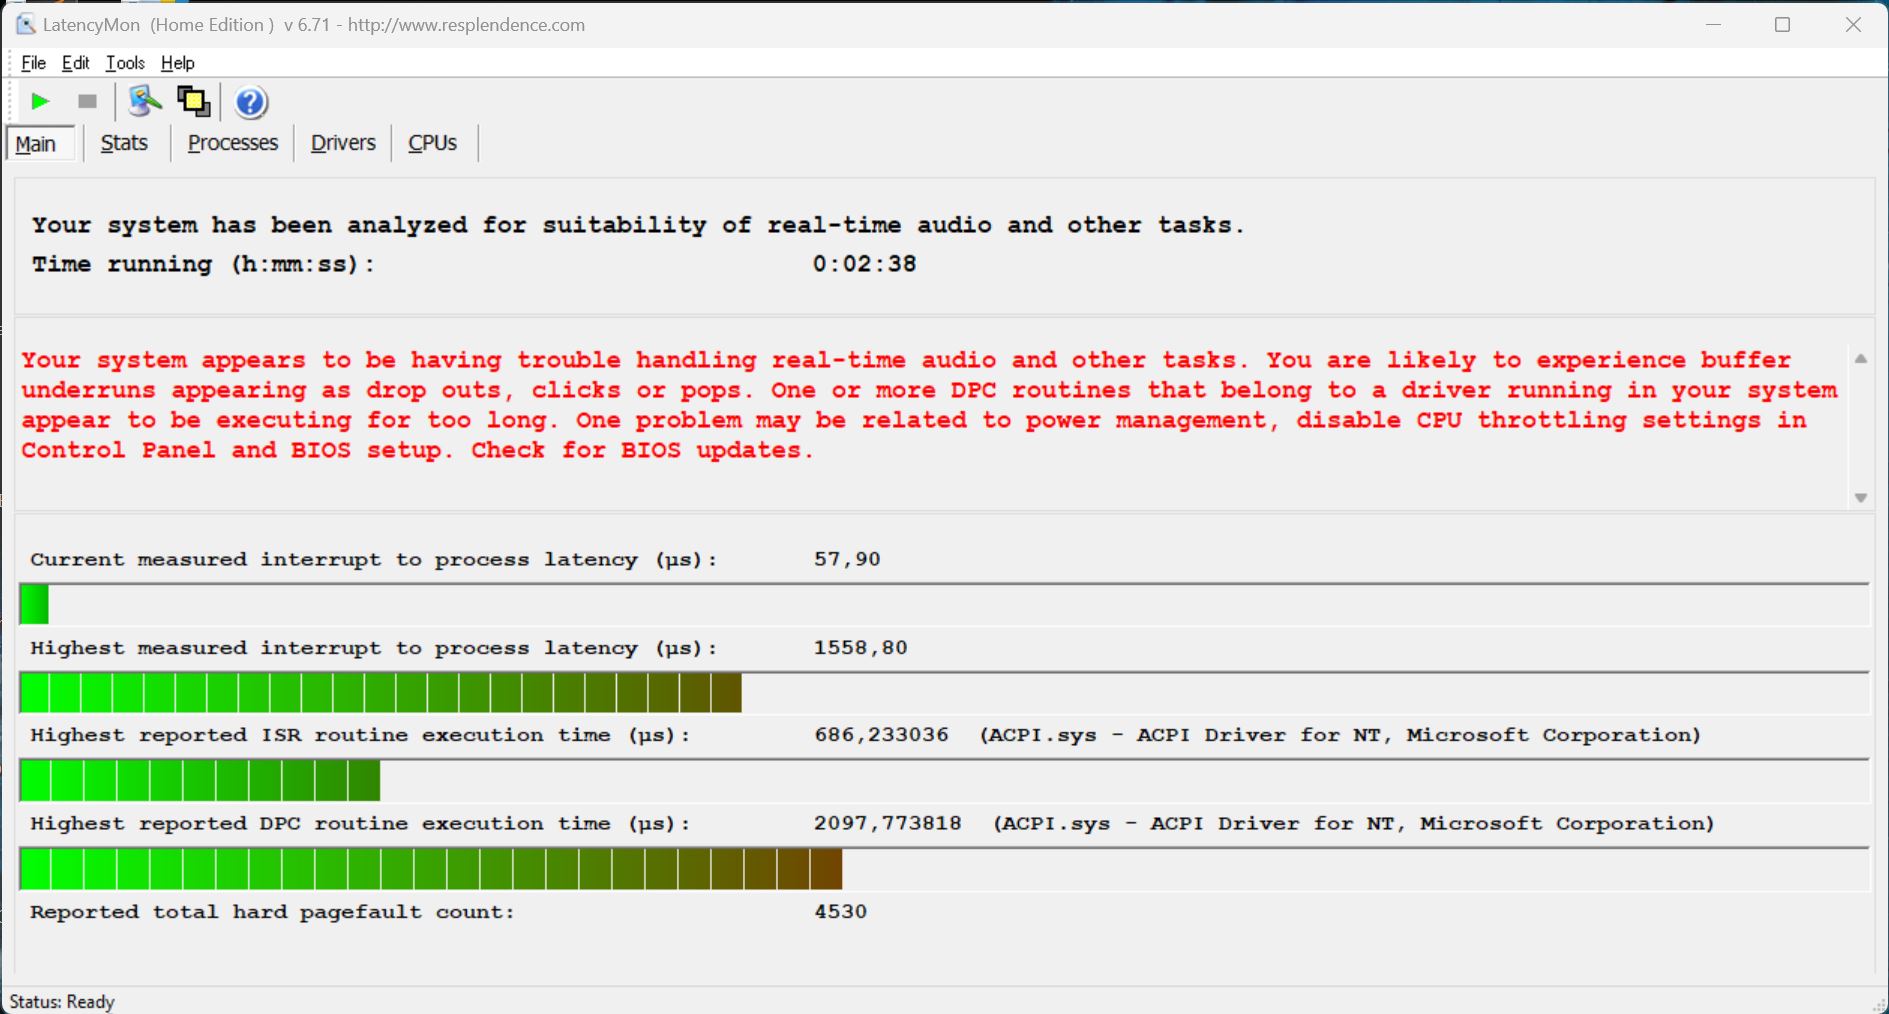
DPC延迟
我们的测试设备仅部分适用于当前BIOS版本的实时音频用途,因为我们的标准化延迟测试(上网、4K YouTube播放、CPU负载)发现了一些小问题。
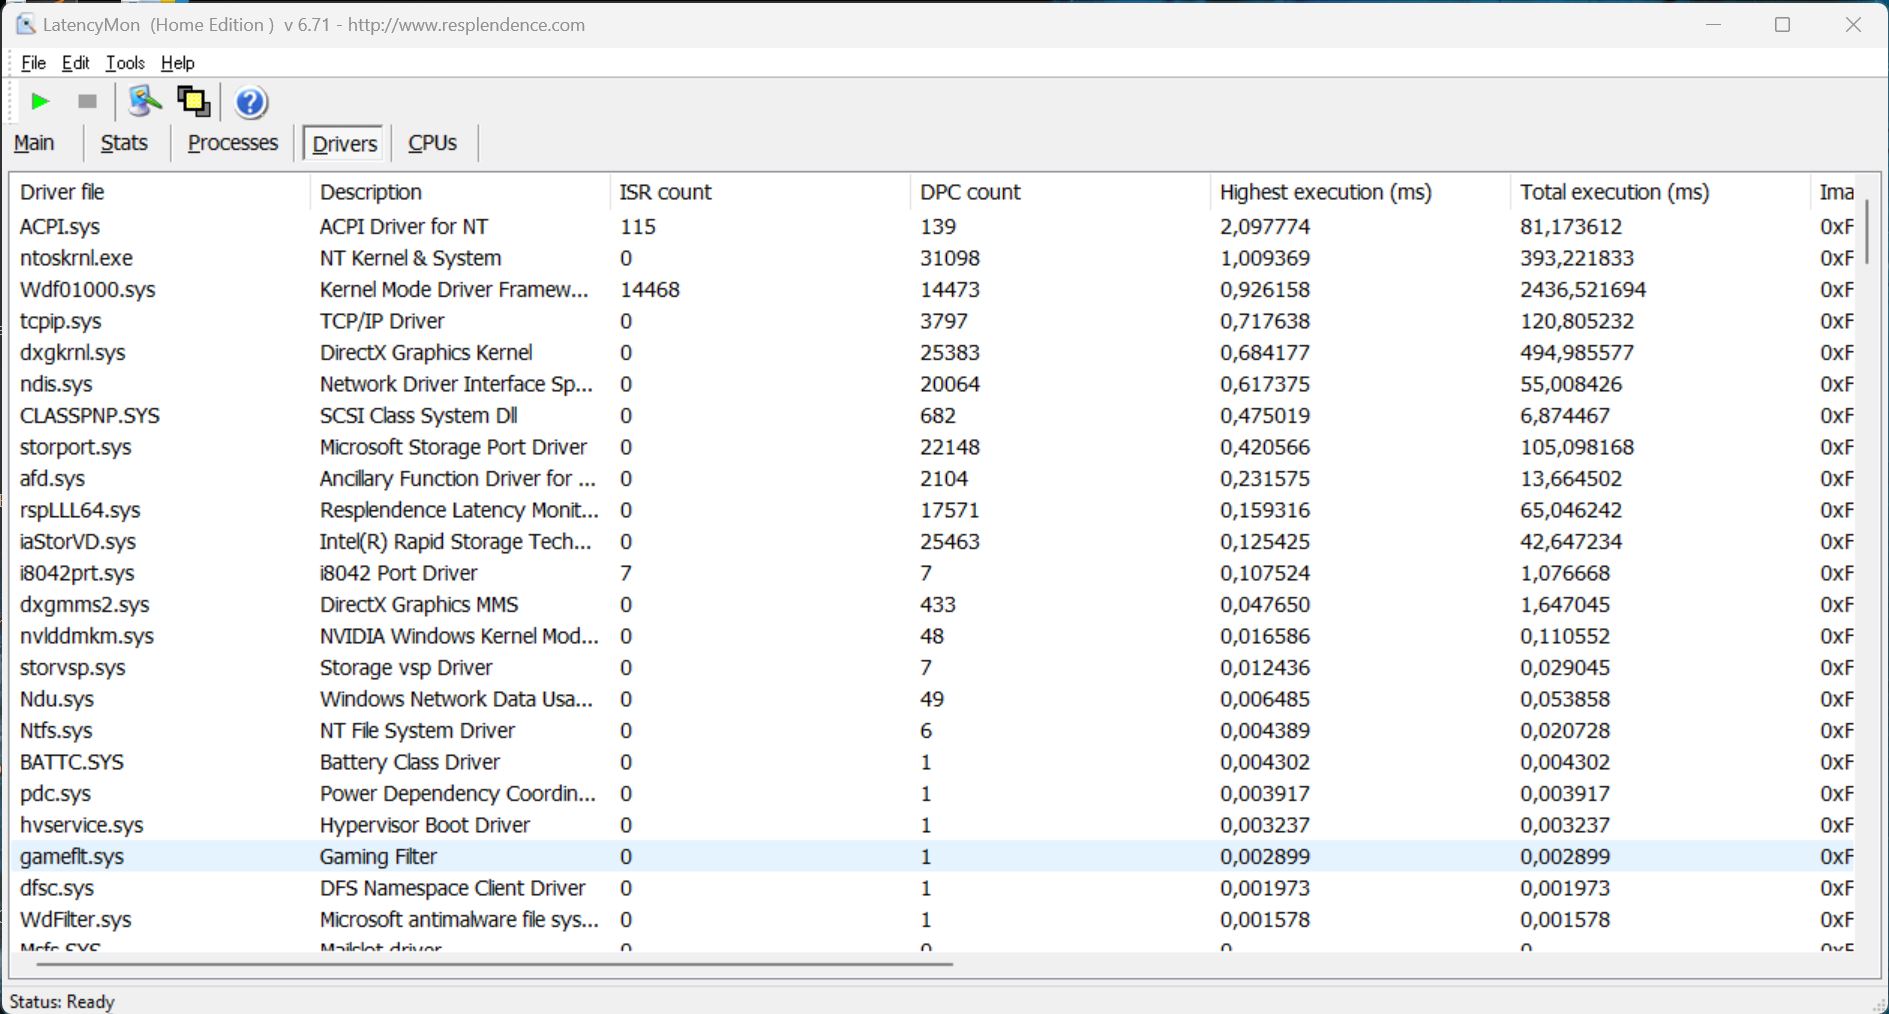
| DPC Latencies / LatencyMon - interrupt to process latency (max), Web, Youtube, Prime95 | |
| Acer Predator Triton 300 SE | |
| Gigabyte Aero 14 OLED BMF | |
| MSI Stealth 14 Studio A13V | |
| Asus ROG Flow Z13 GZ301ZE | |
| Razer Blade 14 Ryzen 9 6900HX | |
| Alienware x14 i7 RTX 3060 | |
| Schenker Vision 14 2022 RTX 3050 Ti | |
* ... smaller is better
存储设备
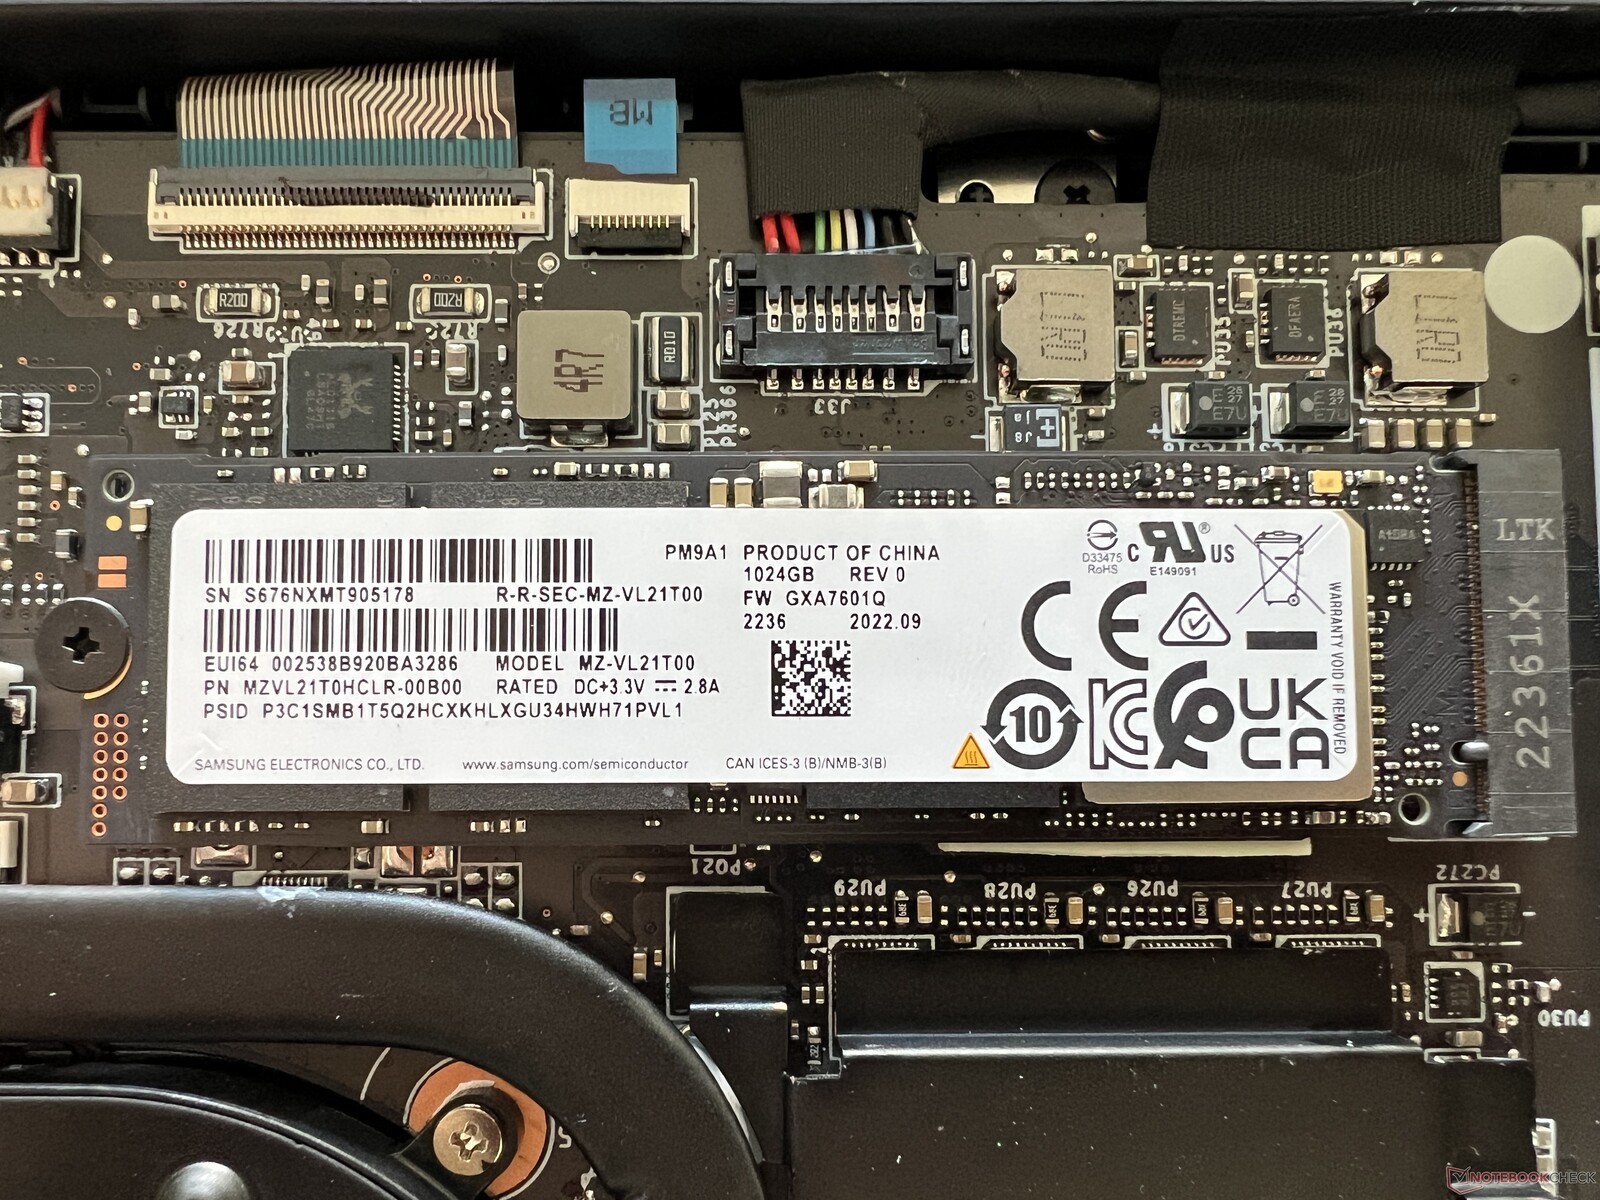
我们的测试样品配备了1-TB版本的三星PM9A1。这是一款快速的PCIe 4.0硬盘,在我们的基准测试中传输速率相当不错,最高可达7 GB/s--不过,其性能并不稳定。几分钟后,固态硬盘的性能下降了约50%,这在日常使用中并不明显。固态硬盘紧靠散热管的事实肯定不利于固态硬盘的温度。更多固态硬盘基准测试这里.

* ... smaller is better
Reading continuous performance: DiskSpd Read Loop, Queue Depth 8
显卡 -GeForce RTX 4050 笔记本电脑
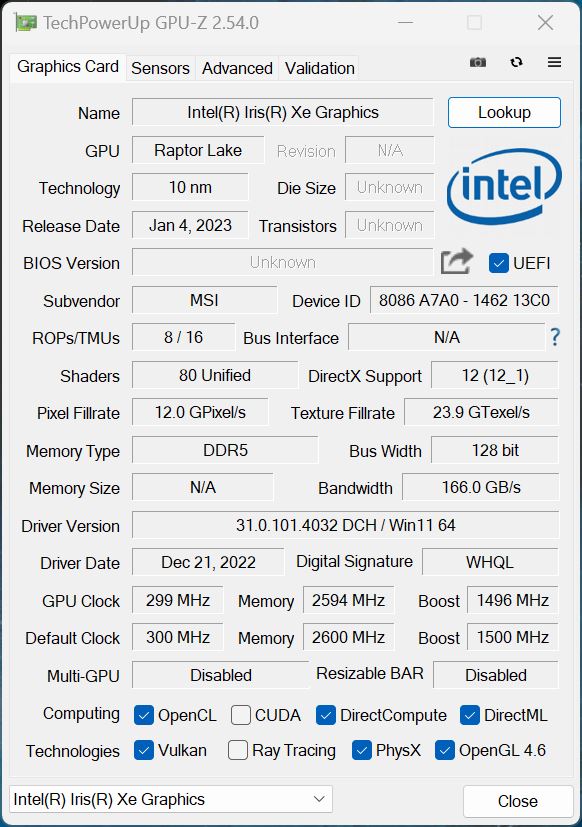
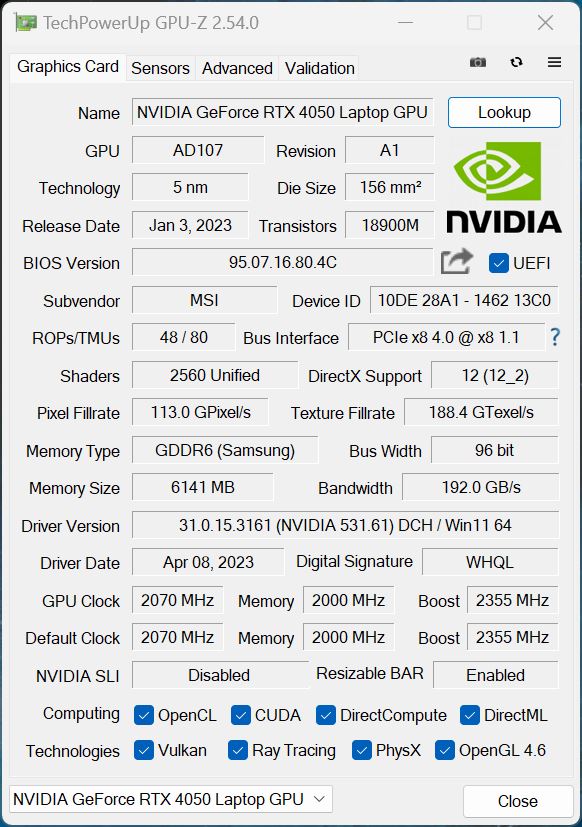
如前所述,Stealth 14 Studio可能有一个MUX控制,您可以完全停用集成的GPU,但是,这需要重新启动,在日常使用中可能会在某些时候变得恼人。我们更希望看到Nvidia的Advanced Optimus技术。因此,我们只能通过Optimus切换显卡。笔记本电脑GeForce RTX 4050笔记本电脑是Nvidia新推出的中端GPU,与当前许多其他多媒体笔记本电脑(TGP大多在40 - 50瓦之间)相比,它使用的是最快的变体之一,TGP为90瓦。
因此,该笔记本电脑的基准测试结果也相当不错,与RTX 3060的宏碁掠夺者 Triton 300 SE.我们还将配备RTX 4060和RTX 4070笔记本电脑和 RTX 4070 笔记本电脑,这些笔记本电脑在我们的比较中具有类似的 TGP 值,因此我们能够更好地了解 Stealth 14 Studio 中速度更快的型号的性能如何。一般来说,您可以期待图形性能提高 20 - 35 %。
在连续负载下,图形性能保持稳定,但在电池使用期间,GPU仅消耗35瓦特,这意味着如果您没有连接到插座,GPU性能平均下降约35%。更多GPU基准测试请参见我们的 技术部分.
| 3DMark 11 Performance | 26475 points | |
| 3DMark Cloud Gate Standard Score | 48584 points | |
| 3DMark Fire Strike Score | 19121 points | |
| 3DMark Time Spy Score | 7845 points | |
Help | ||
| Blender / v3.3 Classroom OPTIX/RTX | |
| Schenker Vision 14 2022 RTX 3050 Ti | |
| Acer Predator Triton 300 SE | |
| Gigabyte Aero 14 OLED BMF | |
| Average NVIDIA GeForce RTX 4050 Laptop GPU (25 - 37, n=40) | |
| MSI Stealth 14 Studio A13V | |
| Average of class Gaming (9 - 32, n=106, last 2 years) | |
| Blender / v3.3 Classroom CUDA | |
| Schenker Vision 14 2022 RTX 3050 Ti | |
| Gigabyte Aero 14 OLED BMF | |
| Acer Predator Triton 300 SE | |
| Average NVIDIA GeForce RTX 4050 Laptop GPU (47 - 68, n=39) | |
| Average of class Gaming (15 - 228, n=106, last 2 years) | |
| Blender / v3.3 Classroom CPU | |
| Schenker Vision 14 2022 RTX 3050 Ti | |
| Gigabyte Aero 14 OLED BMF | |
| Average NVIDIA GeForce RTX 4050 Laptop GPU (243 - 907, n=40) | |
| Acer Predator Triton 300 SE | |
| MSI Stealth 14 Studio A13V | |
| Average of class Gaming (122 - 565, n=102, last 2 years) | |
* ... smaller is better
游戏性能
Stealth 14 Studio的实际游戏性能领先于其竞争对手技嘉Aero 14,后者也配备了RTX 4050笔记本电脑。反过来,旧的RTX 3060(例如碁碁碁碁碁碁碁碁碁碁碁碁碁x14,宏碁Triton 300 SE)在玩游戏时优势明显。当然,更快的GPU也有同样的优势RTX 4060笔记本电脑和RTX 4070笔记本电脑.一般来说,您可以使用RTX 4050笔记本电脑以QHD格式流畅地玩大多数游戏--只有少数更复杂的游戏可能需要您降低细节/分辨率设置或使用DLSS等上采样技术(如果游戏支持)。光线追踪也是如此,否则RTX 4050笔记本电脑的性能将不够强大。此外,您必须注意到,特别是在更高分辨率下,笔记本电脑的6GB显存并不完全面向未来。与纯GPU测试相同,Stealth 14 Studio的游戏性能在较长时间内也完全保持稳定。
| F1 2021 - 1920x1080 Ultra High Preset + Raytracing AA:T AF:16x | |
| MSI Katana 17 B13VFK (874931) | |
| Asus Zenbook Pro 14 OLED UX6404VI (874931) | |
| MSI Stealth 14 Studio A13V (874931) | |
| Average NVIDIA GeForce RTX 4050 Laptop GPU (70.7 - 119.5, n=7) | |
| Alienware x14 i7 RTX 3060 | |
| Schenker Vision 14 2022 RTX 3050 Ti (874931) | |
| Asus ROG Flow Z13 GZ301ZE (843175) | |
| F1 22 - 1920x1080 Ultra High Preset AA:T AF:16x | |
| Razer Blade 14 RTX 4070 (959964) | |
| Average of class Gaming (40.1 - 121.2, n=4, last 2 years) | |
| Asus Zenbook Pro 14 OLED UX6404VI (959964) | |
| MSI Katana 17 B13VFK (946728) | |
| MSI Stealth 14 Studio A13V (959964) | |
| Average NVIDIA GeForce RTX 4050 Laptop GPU (10.9 - 56.4, n=24) | |
| Gigabyte Aero 14 OLED BMF (959964) | |
| Schenker Vision 14 2022 RTX 3050 Ti (923650) | |
| Call of Duty Modern Warfare 2 2022 - 1920x1080 Extreme Quality Preset AA:T2X Filmic SM | |
| Razer Blade 14 RTX 4070 | |
| MSI Katana 17 B13VFK | |
| MSI Stealth 14 Studio A13V | |
| Average NVIDIA GeForce RTX 4050 Laptop GPU (54 - 77, n=3) | |
Witcher 3 FPS diagram
| low | med. | high | ultra | QHD | 4K | |
|---|---|---|---|---|---|---|
| GTA V (2015) | 161.7 | 142.4 | 55.9 | 55.7 | ||
| The Witcher 3 (2015) | 168.5 | 121.7 | 76.7 | |||
| Dota 2 Reborn (2015) | 172.1 | 157.1 | 142.8 | 135.3 | 101.2 | |
| Final Fantasy XV Benchmark (2018) | 180.2 | 116.2 | 82 | 59.7 | ||
| X-Plane 11.11 (2018) | 141.6 | 124.7 | 97.8 | |||
| Strange Brigade (2018) | 277 | 191.9 | 145.3 | 123.1 | 79.8 | |
| Shadow of the Tomb Raider (2018) | 102 | 95 | 86 | 60 | ||
| F1 2021 (2021) | 323 | 245 | 194.5 | 105.4 | 74.3 | |
| Cyberpunk 2077 1.6 (2022) | 72.78 | 60.72 | 57.77 | 37.66 | ||
| F1 22 (2022) | 156.5 | 149.6 | 133.6 | 48.4 | 29.9 | |
| Call of Duty Modern Warfare 2 2022 (2022) | 101 | 75 | 70 | 47 |
排放 - 蒸汽室,成功率中等
噪声排放
笔记本电脑的散热系统由一个大型蒸发腔和两个风扇组成,在日常使用中特别恼人。在低负载状态下,有时甚至在空闲模式下,我们注意到呼呼的噪音几乎达到34 dB(A),您肯定能听到。有时,我们甚至注意到风扇启动时的短时峰值超过40 dB(A),这完全没有必要。在负载情况下,Extreme Performance模式的噪音最大,达到了51 dB(A)--尽管我们在平衡模式下测得的47 dB(A)也并不安静。我们强烈建议在游戏时佩戴耳机。我们没有注意到任何其他电子噪音。
| 使用 | 静音 | 平衡 | 极限性能 |
|---|---|---|---|
| 3DMark 06 | 36.6 dB(A) | 42.2 dB(A) | 42.2 dB(A) |
| Witcher 3 | 42.2 dB(A) | 47.3 dB(A) | 51 dB(A) |
| 压力测试 | 42.2 dB(A) | 47.3 dB(A) | 51 dB(A) |
Noise level
| Idle |
| 25.3 / 25 / 33.7 dB(A) |
| Load |
| 42.2 / 51 dB(A) |
 | ||
30 dB silent 40 dB(A) audible 50 dB(A) loud |
||
min: | ||
| MSI Stealth 14 Studio A13V GeForce RTX 4050 Laptop GPU, i7-13700H, Samsung PM9A1 MZVL21T0HCLR | Gigabyte Aero 14 OLED BMF GeForce RTX 4050 Laptop GPU, i7-13700H, Gigabyte AG470S1TB-SI B10 | Schenker Vision 14 2022 RTX 3050 Ti GeForce RTX 3050 Ti Laptop GPU, i7-12700H, Samsung SSD 980 Pro 1TB MZ-V8P1T0BW | Asus ROG Flow Z13 GZ301ZE GeForce RTX 3050 Ti Laptop GPU, i9-12900H, Micron 2450 1TB MTFDKBK1T0TFK | Alienware x14 i7 RTX 3060 GeForce RTX 3060 Laptop GPU, i7-12700H, WDC PC SN810 1TB | Razer Blade 14 Ryzen 9 6900HX GeForce RTX 3070 Ti Laptop GPU, R9 6900HX, Samsung PM9A1 MZVL21T0HCLR | Acer Predator Triton 300 SE GeForce RTX 3060 Laptop GPU, i9-12900H, Micron 3400 1TB MTFDKBA1T0TFH | |
|---|---|---|---|---|---|---|---|
| Noise | 5% | 5% | 11% | 2% | 15% | -2% | |
| off / environment * (dB) | 25.3 | 24 5% | 24.4 4% | 24.5 3% | 24.7 2% | 23.3 8% | 23.8 6% |
| Idle Minimum * (dB) | 25.3 | 24 5% | 24.4 4% | 24.5 3% | 24.7 2% | 23.3 8% | 23.8 6% |
| Idle Average * (dB) | 25 | 24 4% | 24.4 2% | 24.5 2% | 24.7 1% | 23.3 7% | 23.8 5% |
| Idle Maximum * (dB) | 33.7 | 35.71 -6% | 27.8 18% | 24.5 27% | 30.9 8% | 23.3 31% | 30.6 9% |
| Load Average * (dB) | 42.2 | 43.3 -3% | 41 3% | 40 5% | 34.7 18% | 44.2 -5% | |
| Witcher 3 ultra * (dB) | 51 | 40.22 21% | 48.2 5% | 41 20% | 51.5 -1% | 42.1 17% | 60.1 -18% |
| Load Maximum * (dB) | 51 | 51.93 -2% | 48.8 4% | 41 20% | 51.5 -1% | 42.1 17% | 60 -18% |
* ... smaller is better
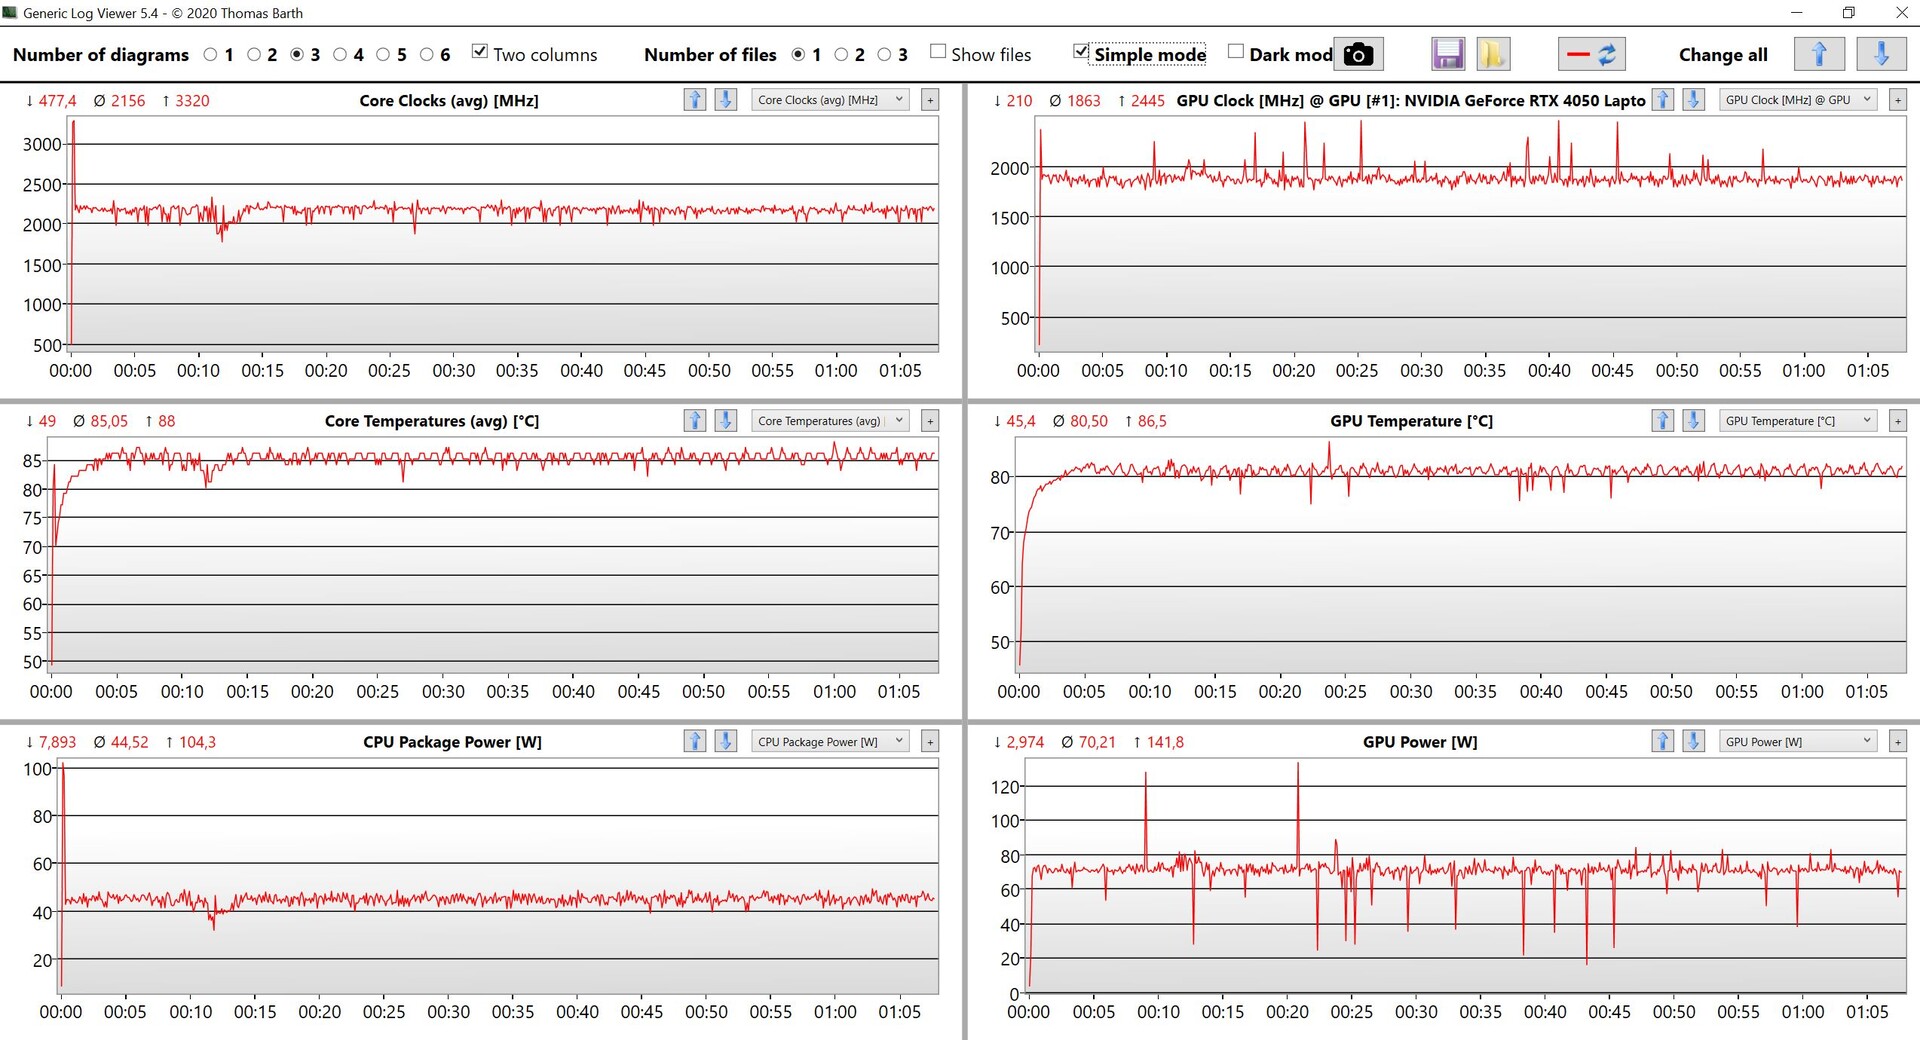
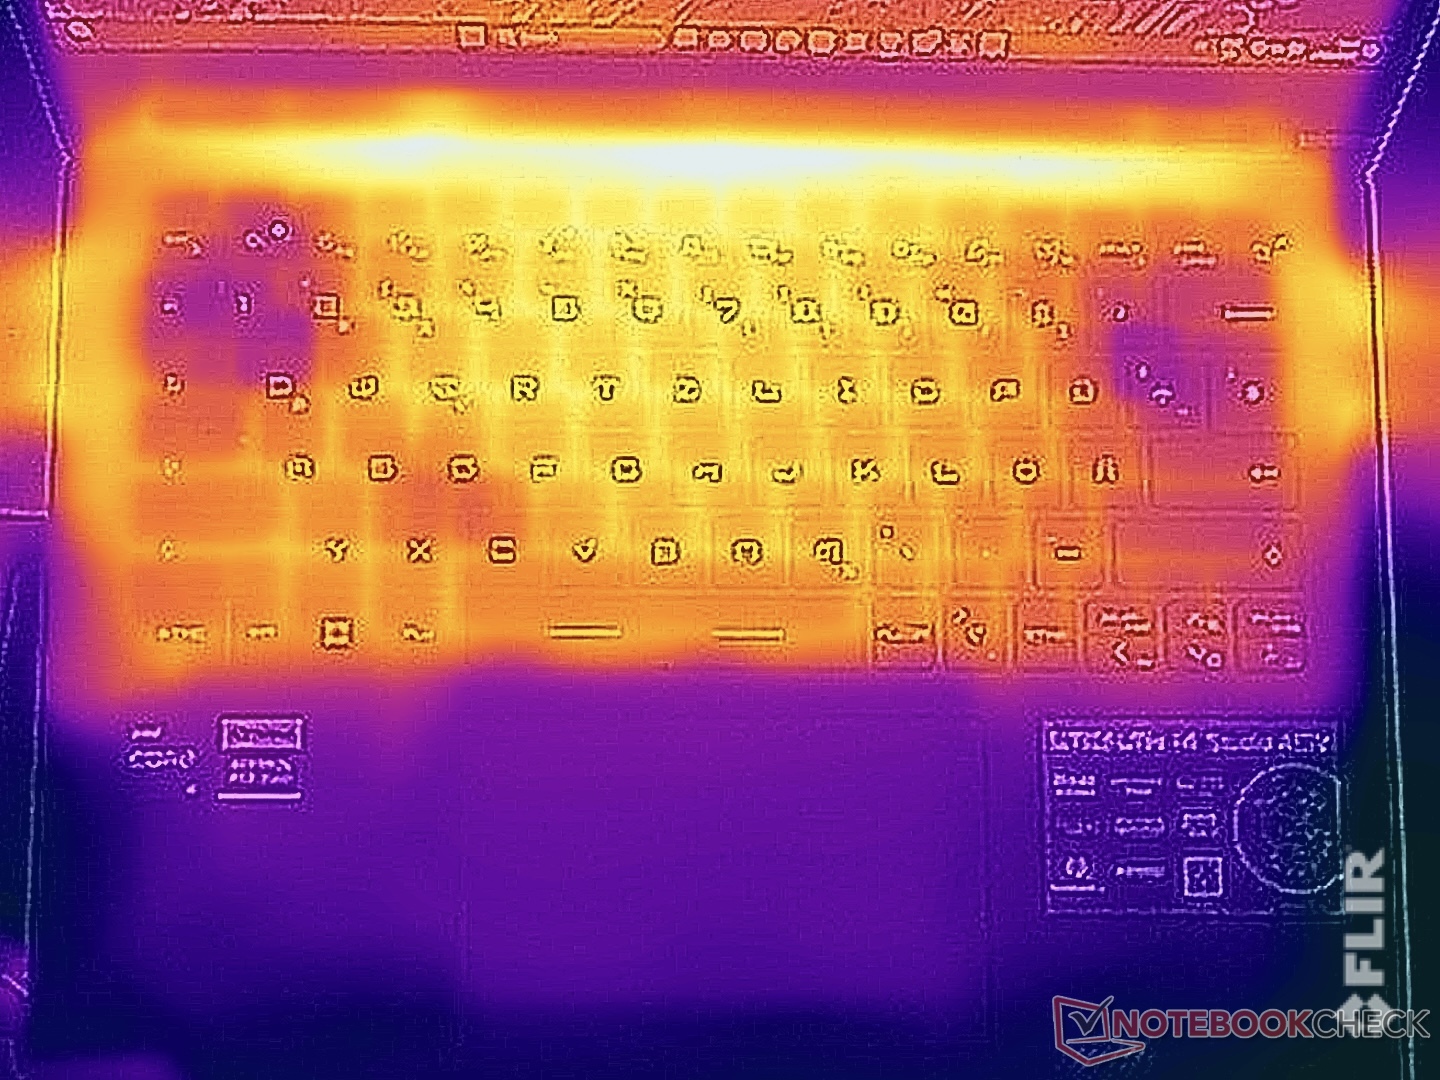
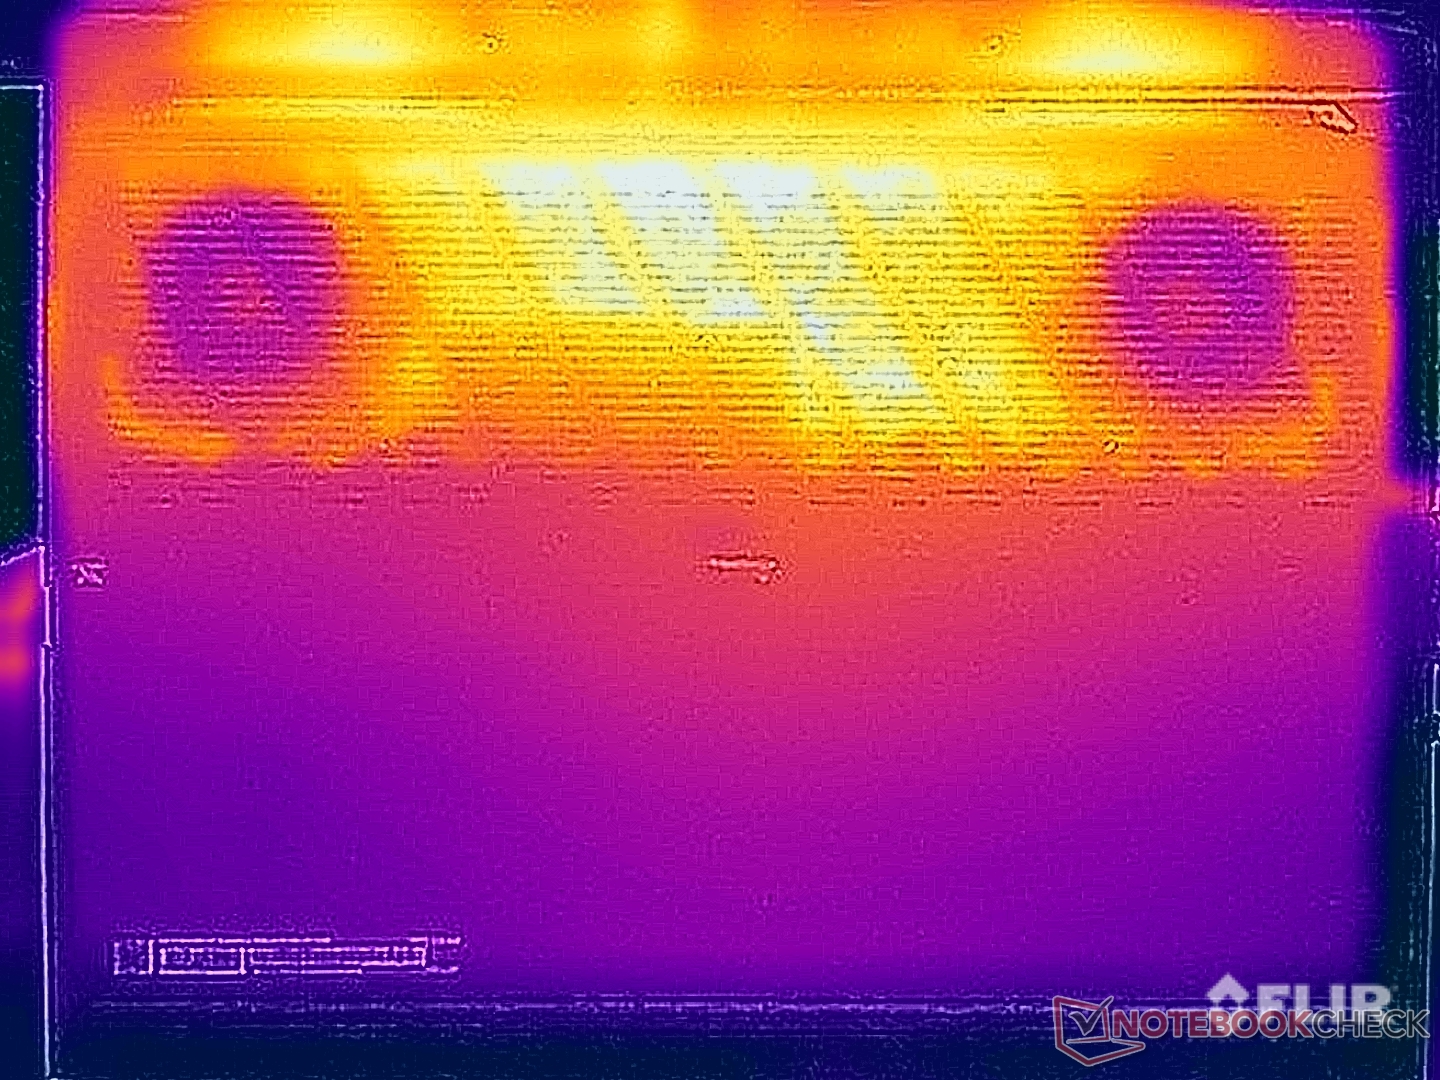
温度
我们已经注意到 Stealth 14 Studio 在闲置状态下会变得相当热,尤其是设备底部。在简单的日常工作中,您仍然可以舒适地将笔记本电脑放在大腿上。当设备处于较大负载或开始游戏时,您可能应该避免这样做,因为它很快就会开始变得不舒服。我们在设备底部测得的温度超过55 °C。甚至键盘也发热,温度高达45 °C,这在玩游戏时肯定能感觉到,而且时间长了之后,会开始有点不舒服。
在压力测试过程中,CPU和GPU的功率分别为45瓦和70瓦,这意味着笔记本电脑的散热功率为115瓦。压力测试结束后,我们注意到性能没有下降。
(-) The maximum temperature on the upper side is 46.9 °C / 116 F, compared to the average of 40.4 °C / 105 F, ranging from 21.2 to 68.8 °C for the class Gaming.
(-) The bottom heats up to a maximum of 56.1 °C / 133 F, compared to the average of 43.2 °C / 110 F
(+) In idle usage, the average temperature for the upper side is 29.7 °C / 85 F, compared to the device average of 33.9 °C / 93 F.
(-) Playing The Witcher 3, the average temperature for the upper side is 38.3 °C / 101 F, compared to the device average of 33.9 °C / 93 F.
(+) The palmrests and touchpad are cooler than skin temperature with a maximum of 27.5 °C / 81.5 F and are therefore cool to the touch.
(±) The average temperature of the palmrest area of similar devices was 28.8 °C / 83.8 F (+1.3 °C / 2.3 F).
| MSI Stealth 14 Studio A13V Intel Core i7-13700H, NVIDIA GeForce RTX 4050 Laptop GPU | Gigabyte Aero 14 OLED BMF Intel Core i7-13700H, NVIDIA GeForce RTX 4050 Laptop GPU | Schenker Vision 14 2022 RTX 3050 Ti Intel Core i7-12700H, NVIDIA GeForce RTX 3050 Ti Laptop GPU | Asus ROG Flow Z13 GZ301ZE Intel Core i9-12900H, NVIDIA GeForce RTX 3050 Ti Laptop GPU | Alienware x14 i7 RTX 3060 Intel Core i7-12700H, NVIDIA GeForce RTX 3060 Laptop GPU | Razer Blade 14 Ryzen 9 6900HX AMD Ryzen 9 6900HX, NVIDIA GeForce RTX 3070 Ti Laptop GPU | Acer Predator Triton 300 SE Intel Core i9-12900H, NVIDIA GeForce RTX 3060 Laptop GPU | |
|---|---|---|---|---|---|---|---|
| Heat | 17% | 9% | 13% | 16% | 7% | 17% | |
| Maximum Upper Side * (°C) | 46.9 | 42 10% | 48.4 -3% | 45.3 3% | 51.3 -9% | 40.6 13% | 43 8% |
| Maximum Bottom * (°C) | 56.1 | 52 7% | 57.1 -2% | 48.3 14% | 44.4 21% | 42.6 24% | 46.4 17% |
| Idle Upper Side * (°C) | 33.8 | 26 23% | 28.1 17% | 29.2 14% | 27.2 20% | 38 -12% | 28.2 17% |
| Idle Bottom * (°C) | 37.9 | 27 29% | 29 23% | 30 21% | 26.6 30% | 37 2% | 28.4 25% |
* ... smaller is better
扬声器
微星科技為Stealth 14 Studio配備了4個喇叭,包括Nahimic Audio軟體。该软件提供了不同的配置文件,可以进一步调整(例如更多的低音或更明显的人声),我们绝对推荐使用该软件。总而言之,我们注意到了良好的效果,绝对好于对比设备--微星笔记本电脑唯一无法接近的设备是一些拥有非常好的音响系统的多媒体笔记本电脑。不幸的是,该笔记本的扬声器并不适合玩游戏,因为笔记本的风扇声音太大,几乎淹没了所有声音。
MSI Stealth 14 Studio A13V audio analysis
(±) | speaker loudness is average but good (81 dB)
Bass 100 - 315 Hz
(±) | reduced bass - on average 11.2% lower than median
(+) | bass is linear (6.7% delta to prev. frequency)
Mids 400 - 2000 Hz
(+) | balanced mids - only 1.6% away from median
(+) | mids are linear (2.9% delta to prev. frequency)
Highs 2 - 16 kHz
(±) | higher highs - on average 5.3% higher than median
(±) | linearity of highs is average (7.5% delta to prev. frequency)
Overall 100 - 16.000 Hz
(+) | overall sound is linear (11.9% difference to median)
Compared to same class
» 12% of all tested devices in this class were better, 4% similar, 84% worse
» The best had a delta of 6%, average was 18%, worst was 132%
Compared to all devices tested
» 9% of all tested devices were better, 2% similar, 89% worse
» The best had a delta of 4%, average was 23%, worst was 134%
Acer Predator Triton 300 SE audio analysis
(±) | speaker loudness is average but good (79.9 dB)
Bass 100 - 315 Hz
(±) | reduced bass - on average 10.3% lower than median
(±) | linearity of bass is average (9.7% delta to prev. frequency)
Mids 400 - 2000 Hz
(±) | higher mids - on average 5% higher than median
(+) | mids are linear (4% delta to prev. frequency)
Highs 2 - 16 kHz
(±) | higher highs - on average 5.5% higher than median
(±) | linearity of highs is average (7.6% delta to prev. frequency)
Overall 100 - 16.000 Hz
(±) | linearity of overall sound is average (15.1% difference to median)
Compared to same class
» 32% of all tested devices in this class were better, 6% similar, 62% worse
» The best had a delta of 6%, average was 18%, worst was 132%
Compared to all devices tested
» 21% of all tested devices were better, 4% similar, 75% worse
» The best had a delta of 4%, average was 23%, worst was 134%
电源管理
耗电量
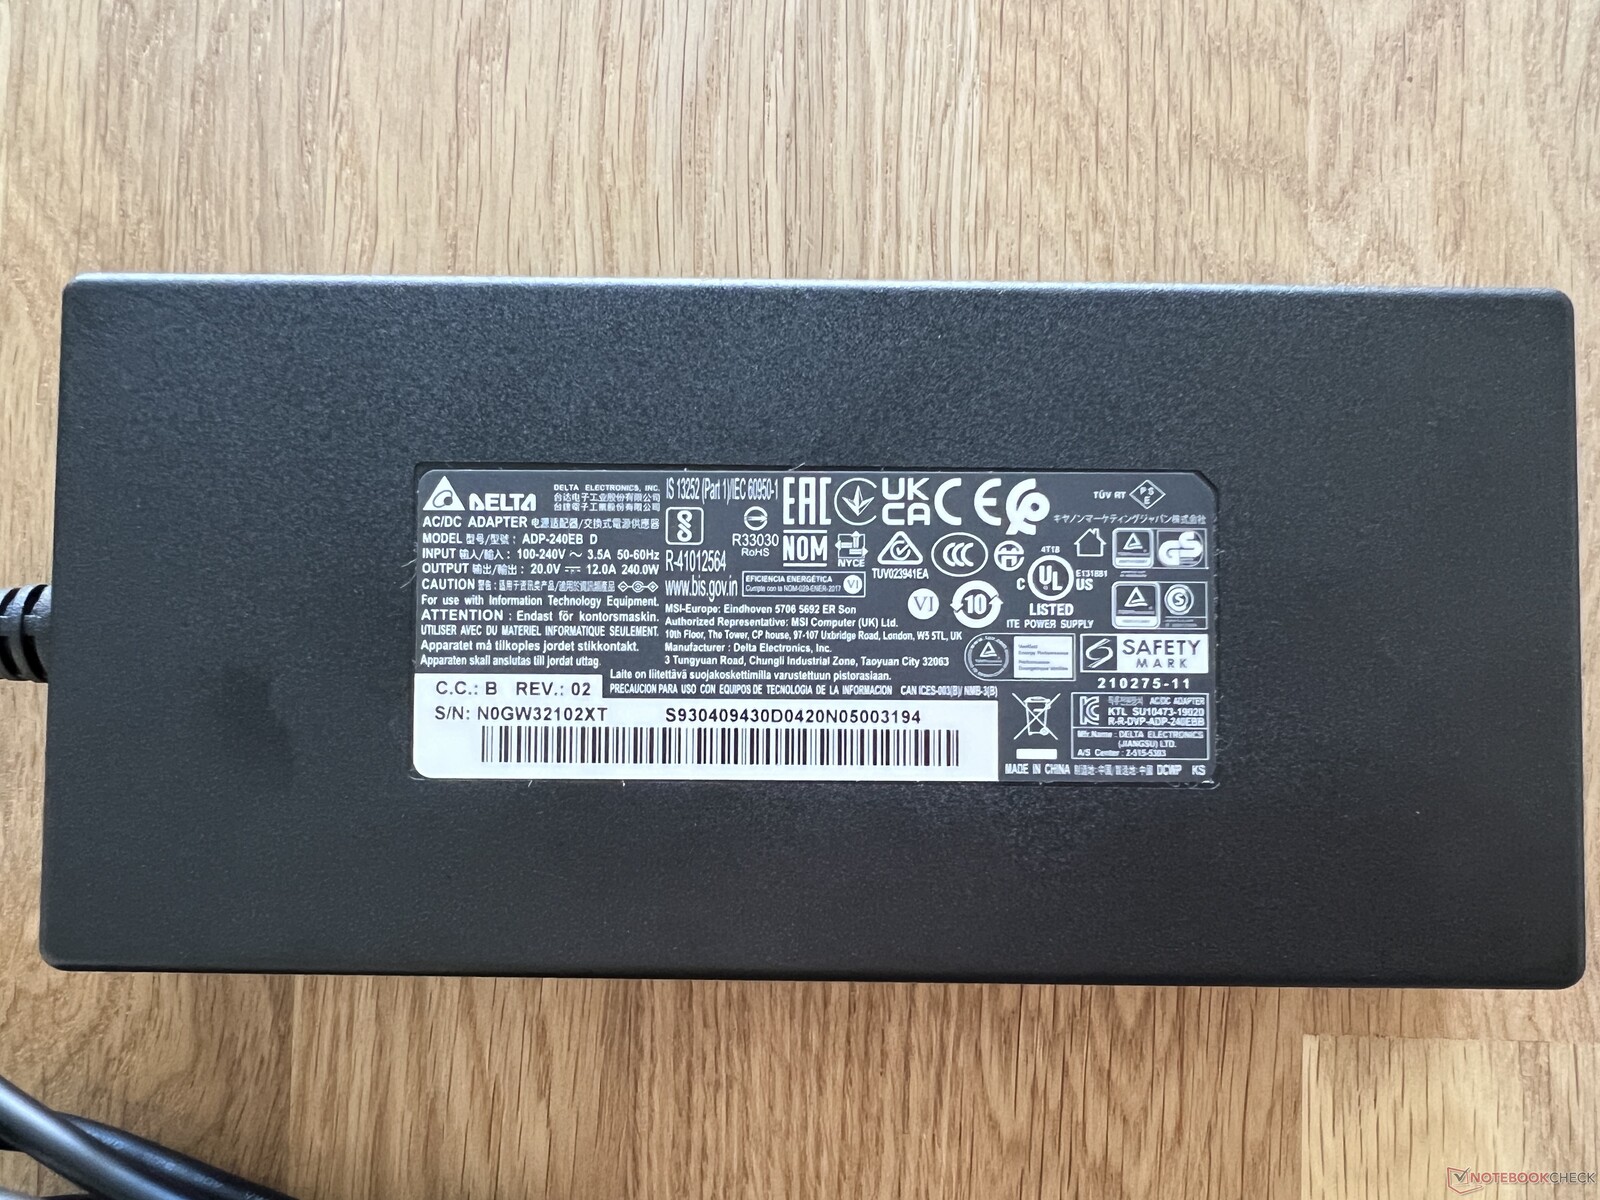
特别是在空闲模式下,我们对该设备在图形切换时的耗电量之大感到惊讶。与竞争对手相比,我们在这方面明显处于劣势。在全亮度模式下,我们测得空闲模式下的功耗约为20瓦,这对于一款亮度为400 cd/m²的14英寸紧凑型设备来说是非常高的。微星笔记本电脑在游戏过程中的耗电量也很大;制造商确实需要考虑一下这个问题。在压力测试中,我们测得的最大功率为200瓦,但很快就降到了150瓦左右。因此,提供的240瓦电源完全够用,甚至可能有点太强大了。
| Off / Standby | |
| Idle | |
| Load |
|
Key:
min: | |
| MSI Stealth 14 Studio A13V i7-13700H, GeForce RTX 4050 Laptop GPU, Samsung PM9A1 MZVL21T0HCLR, IPS, 2560x1600, 14" | Gigabyte Aero 14 OLED BMF i7-13700H, GeForce RTX 4050 Laptop GPU, Gigabyte AG470S1TB-SI B10, OLED, 2880x1800, 14" | Schenker Vision 14 2022 RTX 3050 Ti i7-12700H, GeForce RTX 3050 Ti Laptop GPU, Samsung SSD 980 Pro 1TB MZ-V8P1T0BW, IPS, 2880x1800, 14" | Asus ROG Flow Z13 GZ301ZE i9-12900H, GeForce RTX 3050 Ti Laptop GPU, Micron 2450 1TB MTFDKBK1T0TFK, IPS, 1920x1200, 13.4" | Alienware x14 i7 RTX 3060 i7-12700H, GeForce RTX 3060 Laptop GPU, WDC PC SN810 1TB, IPS, 1920x1080, 14" | Razer Blade 14 Ryzen 9 6900HX R9 6900HX, GeForce RTX 3070 Ti Laptop GPU, Samsung PM9A1 MZVL21T0HCLR, IPS, 2560x1440, 14" | Acer Predator Triton 300 SE i9-12900H, GeForce RTX 3060 Laptop GPU, Micron 3400 1TB MTFDKBA1T0TFH, OLED, 2880x1800, 14" | Average NVIDIA GeForce RTX 4050 Laptop GPU | Average of class Gaming | |
|---|---|---|---|---|---|---|---|---|---|
| Power Consumption | 41% | 35% | 34% | 24% | -15% | 9% | 8% | -19% | |
| Idle Minimum * (Watt) | 10.4 | 7.4 29% | 7.5 28% | 8.8 15% | 7.9 24% | 10.2 2% | 7.6 27% | 9.95 ? 4% | 13 ? -25% |
| Idle Average * (Watt) | 19.1 | 8.3 57% | 10.4 46% | 12.1 37% | 11.1 42% | 26 -36% | 12.3 36% | 15.8 ? 17% | 19 ? 1% |
| Idle Maximum * (Watt) | 19.4 | 8.7 55% | 11.4 41% | 12.7 35% | 11.8 39% | 26.7 -38% | 17.6 9% | 20.1 ? -4% | 24.6 ? -27% |
| Load Average * (Watt) | 95.9 | 76 21% | 83.3 13% | 72.3 25% | 107.4 -12% | 89.3 7% | 111 -16% | 88 ? 8% | 110.7 ? -15% |
| Witcher 3 ultra * (Watt) | 141.6 | 70 51% | 92.7 35% | 77.3 45% | 111 22% | 158.7 -12% | 117.1 17% | ||
| Load Maximum * (Watt) | 203 | 132 35% | 110.3 46% | 103.1 49% | 140.4 31% | 227.5 -12% | 245.8 -21% | 176.3 ? 13% | 259 ? -28% |
* ... smaller is better
Power consumption Witcher 3 / stress test
Power consumption with external monitor
运行时间
尽管微星笔记本电脑的电池容量为72瓦时,但即使在60-Hz模式下,其运行时间也不是特别理想。在150 cd/m²的适应亮度下(即测试样本亮度的36%),我们的WLAN测试在6个多小时后结束。在240 Hz模式下,测试甚至没有持续5个小时。当我们使用笔记本电脑的全亮度重复测试时,在60赫兹下仅持续了5小时,在240赫兹下仅持续了4小时。即使在150 cd/m²和60 Hz下进行视频测试,也仅持续了6.5个多小时。对于一款拥有相对较大电池和图形切换功能的14英寸紧凑型设备来说,这样的结果令人失望。设备充满电需要大约2小时,45分钟后可达到75%的电量。笔记本电脑还可以通过USB-C接口进行充电。
| MSI Stealth 14 Studio A13V i7-13700H, GeForce RTX 4050 Laptop GPU, 72 Wh | Gigabyte Aero 14 OLED BMF i7-13700H, GeForce RTX 4050 Laptop GPU, 63 Wh | Schenker Vision 14 2022 RTX 3050 Ti i7-12700H, GeForce RTX 3050 Ti Laptop GPU, 99.8 Wh | Asus ROG Flow Z13 GZ301ZE i9-12900H, GeForce RTX 3050 Ti Laptop GPU, 56 Wh | Alienware x14 i7 RTX 3060 i7-12700H, GeForce RTX 3060 Laptop GPU, 80 Wh | Razer Blade 14 Ryzen 9 6900HX R9 6900HX, GeForce RTX 3070 Ti Laptop GPU, 62 Wh | Acer Predator Triton 300 SE i9-12900H, GeForce RTX 3060 Laptop GPU, 76 Wh | Average of class Gaming | |
|---|---|---|---|---|---|---|---|---|
| Battery runtime | 23% | 68% | -7% | 17% | 42% | 3% | 21% | |
| H.264 (h) | 6.6 | 11.1 68% | 6 -9% | 9.4 42% | 8.32 ? 26% | |||
| WiFi v1.3 (h) | 6.3 | 7.6 21% | 10.1 60% | 5.6 -11% | 8.9 41% | 9.5 51% | 6.2 -2% | 7.11 ? 13% |
| Load (h) | 1.2 | 1.5 25% | 2.1 75% | 1.2 0% | 0.8 -33% | 1.6 33% | 1.3 8% | 1.502 ? 25% |
| Reader / Idle (h) | 11.3 | 12.2 | 8.1 | 8.27 ? | ||||
| Witcher 3 ultra (h) | 0.8 | 0.8 |
Pros
Cons
評論 - MSI Stealth 14 Studio給人的印象好壞參半

微星Stealth 14 Studio是为游戏玩家和创意用户打造的一款功能强大而又小巧的笔记本电脑。在我们的测试过程中,我们注意到了一些负面因素,这对于一款售价1699.99美元的笔记本电脑来说是个问题。首先,该设备 "仅 "配备了小尺寸的RTX 4050笔记本电脑没有Advanced Optimus--这样的性能对于这个价格来说根本不够。虽然其功率输出理论上不错,但在日常使用中,散热系统并没有给我们留下深刻印象。风扇在最大负载下的噪音是意料之中的,但让我们感到困惑的是,为什么风扇的运转声总是那么大--在使用较弱的电源模式时,我们甚至注意到了超过40 dB(A)的噪音峰值。在使用笔记本电脑时,这简直就是碍事。一般来说,它的功耗也很高(尽管有图形切换功能),这反过来也会缩短运行时间。
这款笔记本电脑的外壳也给我们留下了复杂的印象--与其极其稳定的底座相比,屏幕盖子可能会被扭得很厉害,您必须非常小心,以免造成任何永久性损坏。键盘方面也有一些不足之处。虽然它的独立按键照明很不错(尽管控制软件并不直观),但它的按键升降非常浅,总的来说,它有一种摇摇欲坠的感觉。
微星Stealth 14 Studio希望成为一款为游戏玩家和创意用户提供卓越性能的完美紧凑型全能产品。不幸的是,虽然它的游戏性能不错,但这款笔记本电脑有太多的缺陷,比如恼人的风扇、平庸的键盘和灵活的显示屏盖子。对于1699.99美元的价格来说,这根本不够。
该设备的显示屏也是一把双刃剑,它具有反应速度快、240Hz刷新率和色彩准确度高等优点。另一方面,它的黑值却相当高。这导致黑色内容被描绘成更多的深灰色,对比度水平并不总是太高。当然,这只是最高级别的抱怨,但总的来说,它只是主观上看起来不如OLED或甚至非常好的IPS/微型LED面板。最后,微星笔记本电脑有太多的缺点--考虑到其高昂的价格--我们无法自信地推荐它。
价格和供货情况
微星Stealth 14 Studio可在百思买购买,售价1699.99美元。
MSI Stealth 14 Studio A13V
- 07/12/2023 v7 (old)
Andreas Osthoff
Transparency
The selection of devices to be reviewed is made by our editorial team. The test sample was provided to the author as a loan by the manufacturer or retailer for the purpose of this review. The lender had no influence on this review, nor did the manufacturer receive a copy of this review before publication. There was no obligation to publish this review. As an independent media company, Notebookcheck is not subjected to the authority of manufacturers, retailers or publishers.
This is how Notebookcheck is testing
Every year, Notebookcheck independently reviews hundreds of laptops and smartphones using standardized procedures to ensure that all results are comparable. We have continuously developed our test methods for around 20 years and set industry standards in the process. In our test labs, high-quality measuring equipment is utilized by experienced technicians and editors. These tests involve a multi-stage validation process. Our complex rating system is based on hundreds of well-founded measurements and benchmarks, which maintains objectivity. Further information on our test methods can be found here.
Price comparison

