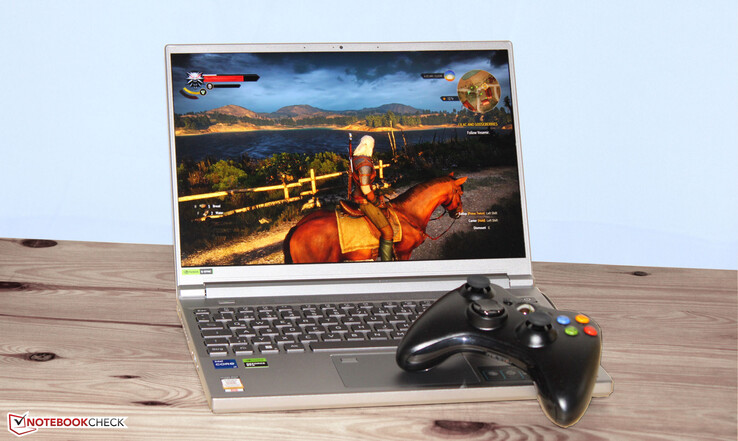
Acer Predator Triton 14 评论:配备明亮显示屏和 RTX 4050 的 14 英寸游戏笔记本电脑
这款小巧的游戏笔记本电脑代表了当前的技术水平:Raptor Lake、Ada Lovelace、LPDDR5、PCIe 4 和 Thunderbolt 4。在这里,我们所面对的是已经评测过的宏碁掠夺者 Triton 300 SE 的几乎完全相同的后继机。 宏碁掠夺者 Triton 300 SE.与之竞争的设备有 雷蛇刀锋 14、微星 Stealth 14 Studio A13V,以及技嘉 Aero 14 OLED BMF,以及Apple MacBook Pro 14 2023 M2 Pro 入门版和华硕 ROG Zephyrus G14 GA402RJ.
潜在的竞争对手比较
Rating | Date | Model | Weight | Height | Size | Resolution | Price |
|---|---|---|---|---|---|---|---|
| 87.3 % v7 (old) | 07 / 2023 | Acer Predator Triton 14 PT14-51 i7-13700H, GeForce RTX 4050 Laptop GPU | 1.7 kg | 19.81 mm | 14.00" | 2560x1600 | |
| 88.7 % v7 (old) | 06 / 2023 | Razer Blade 14 RTX 4070 R9 7940HS, GeForce RTX 4070 Laptop GPU | 1.8 kg | 17.99 mm | 14.00" | 2560x1600 | |
| 86.4 % v7 (old) | 10 / 2022 | Asus ROG Zephyrus G14 GA402RJ R7 6800HS, Radeon RX 6700S | 1.7 kg | 19.5 mm | 14.00" | 2560x1600 | |
| 85.4 % v7 (old) | 07 / 2023 | MSI Stealth 14 Studio A13V i7-13700H, GeForce RTX 4050 Laptop GPU | 1.7 kg | 19 mm | 14.00" | 2560x1600 | |
| 89.4 % v7 (old) | 05 / 2023 | Gigabyte Aero 14 OLED BMF i7-13700H, GeForce RTX 4050 Laptop GPU | 1.4 kg | 17 mm | 14.00" | 2880x1800 | |
| 93.4 % v7 (old) | 03 / 2023 | Apple MacBook Pro 14 2023 M2 Pro Entry M2 Pro 10-Core, M2 Pro 16-Core GPU | 1.6 kg | 15.5 mm | 14.20" | 3024x1964 |
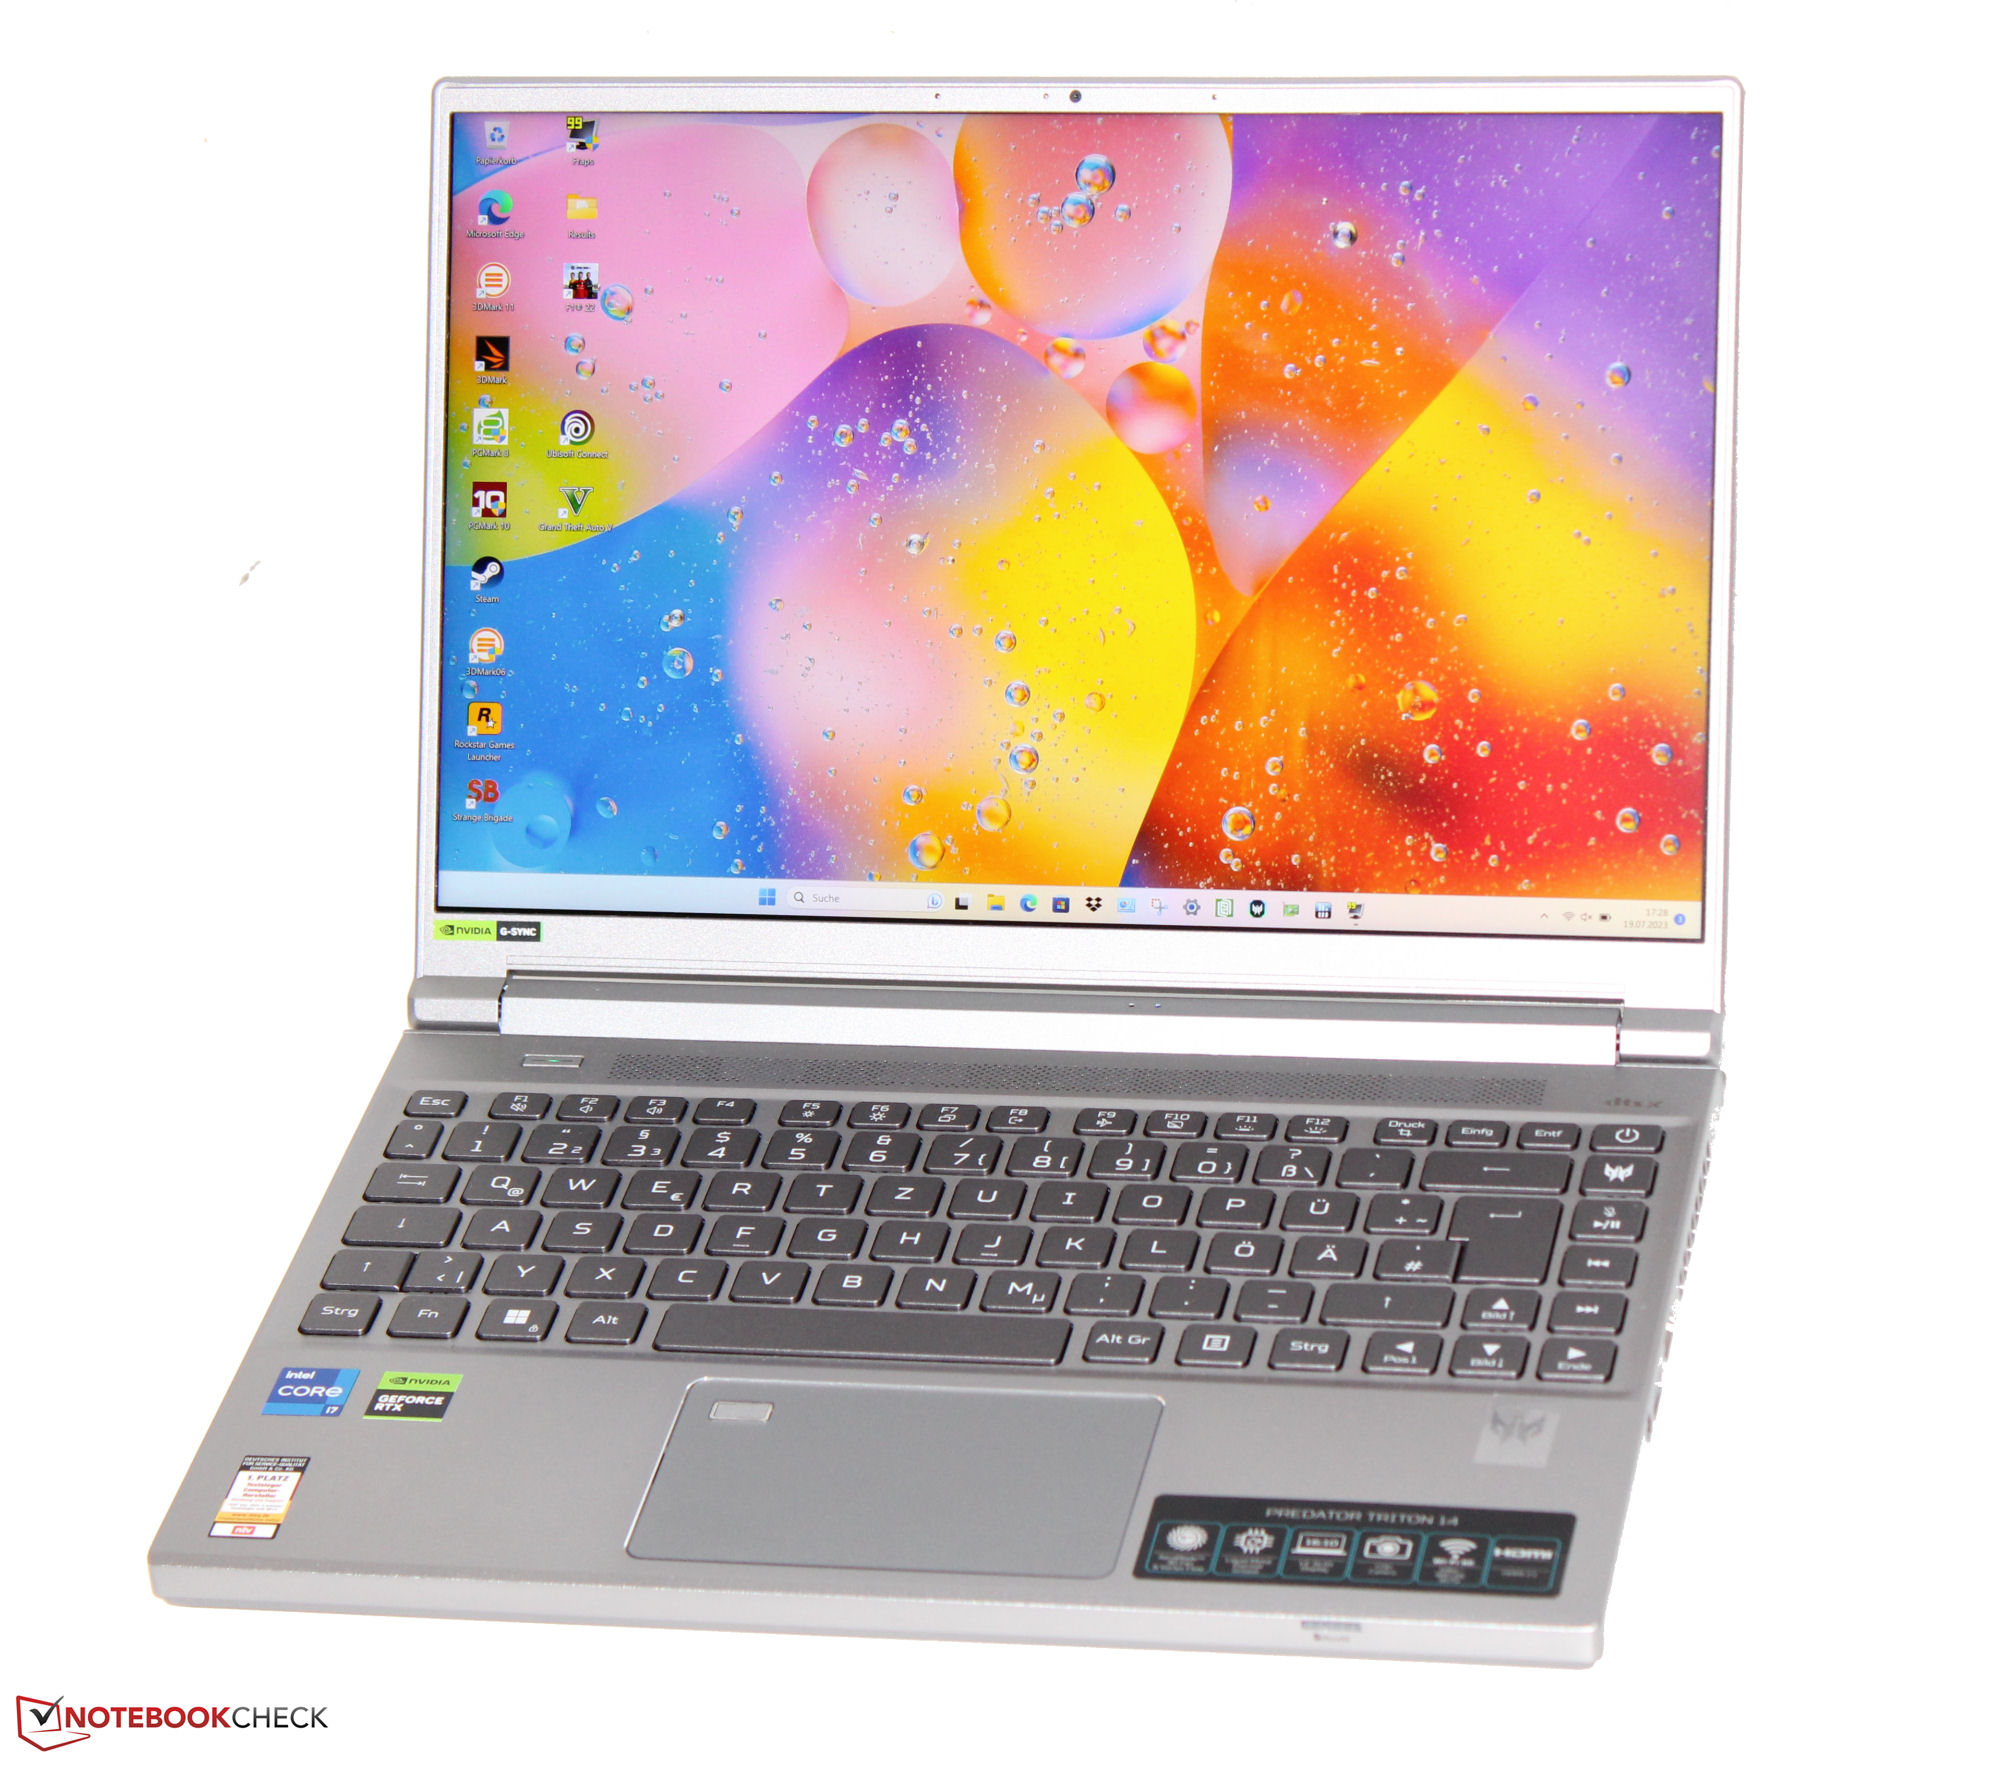
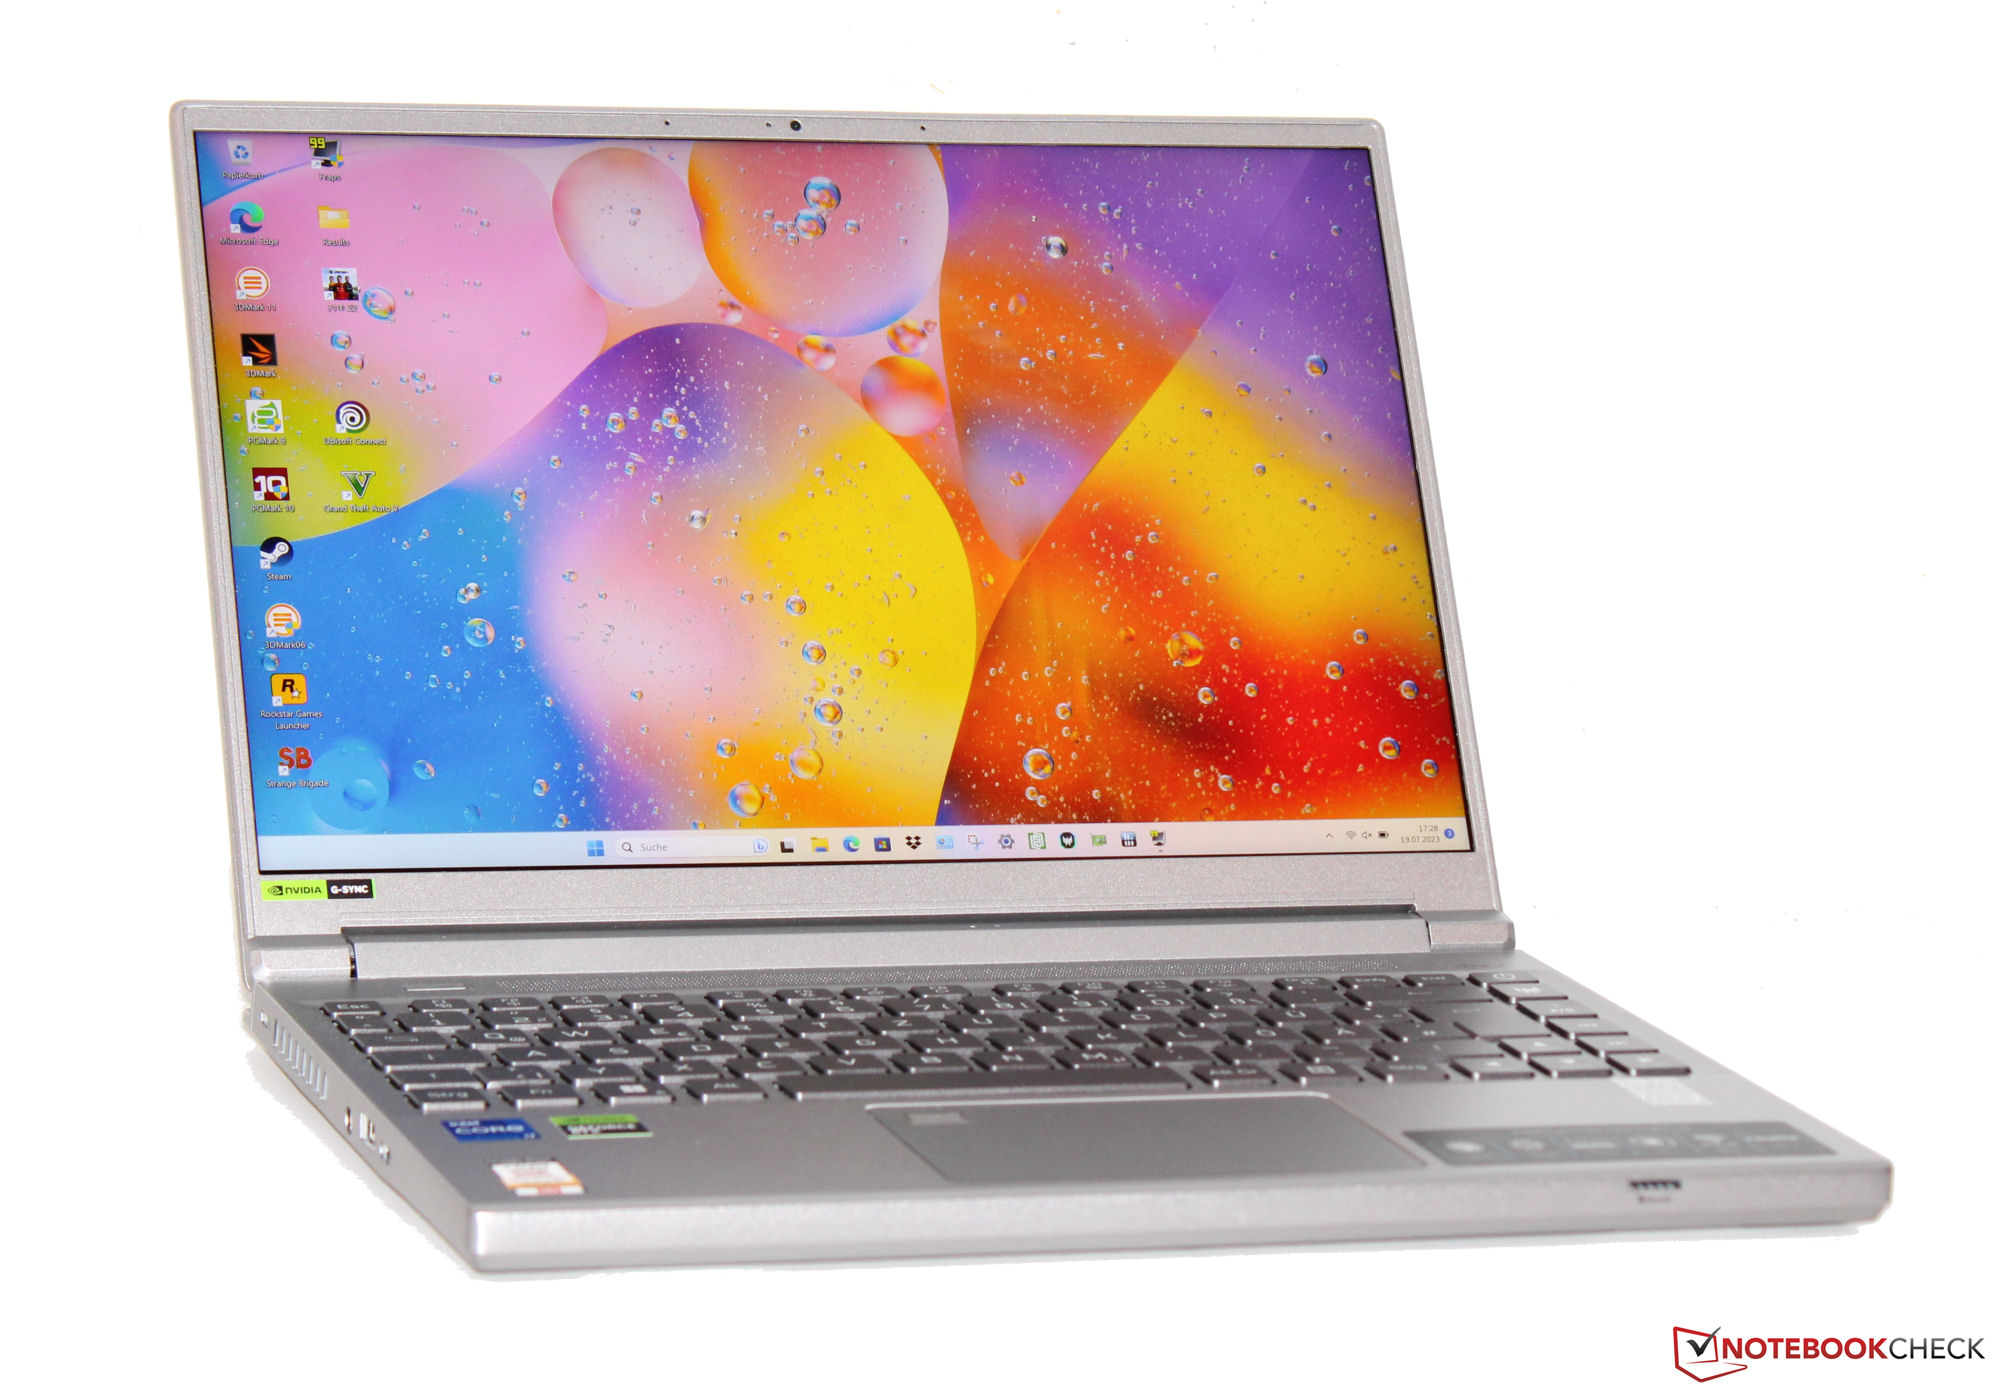
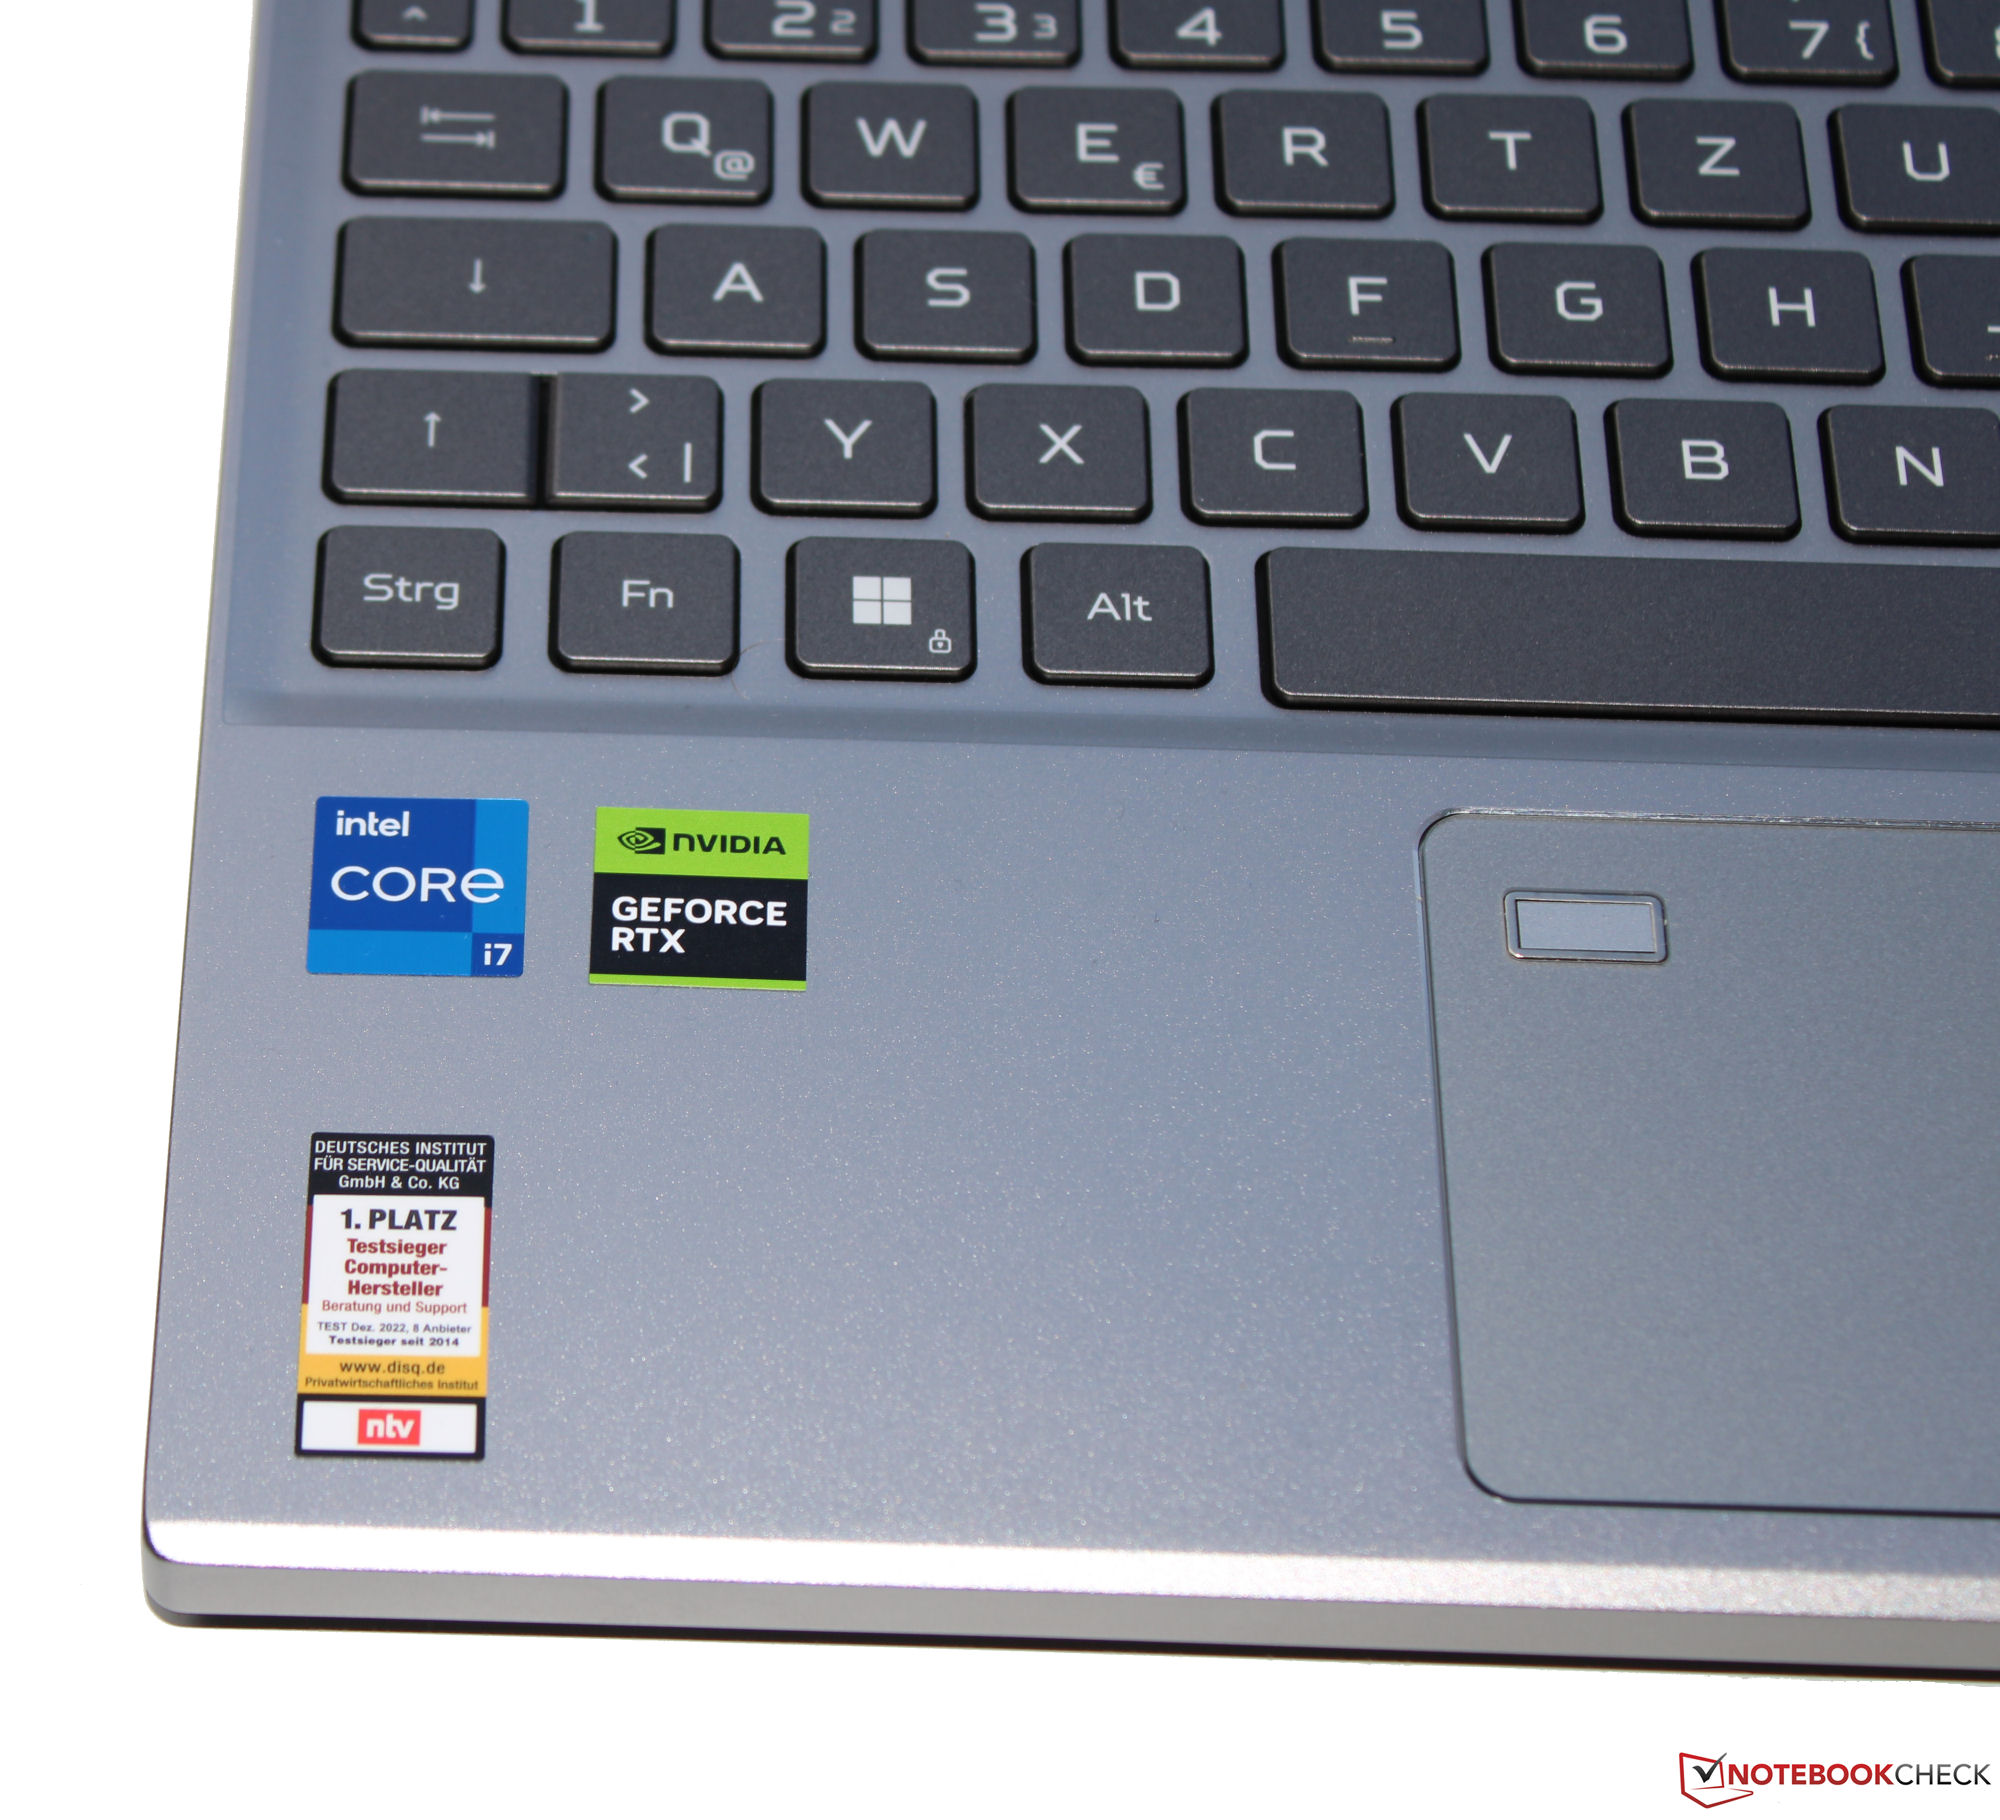
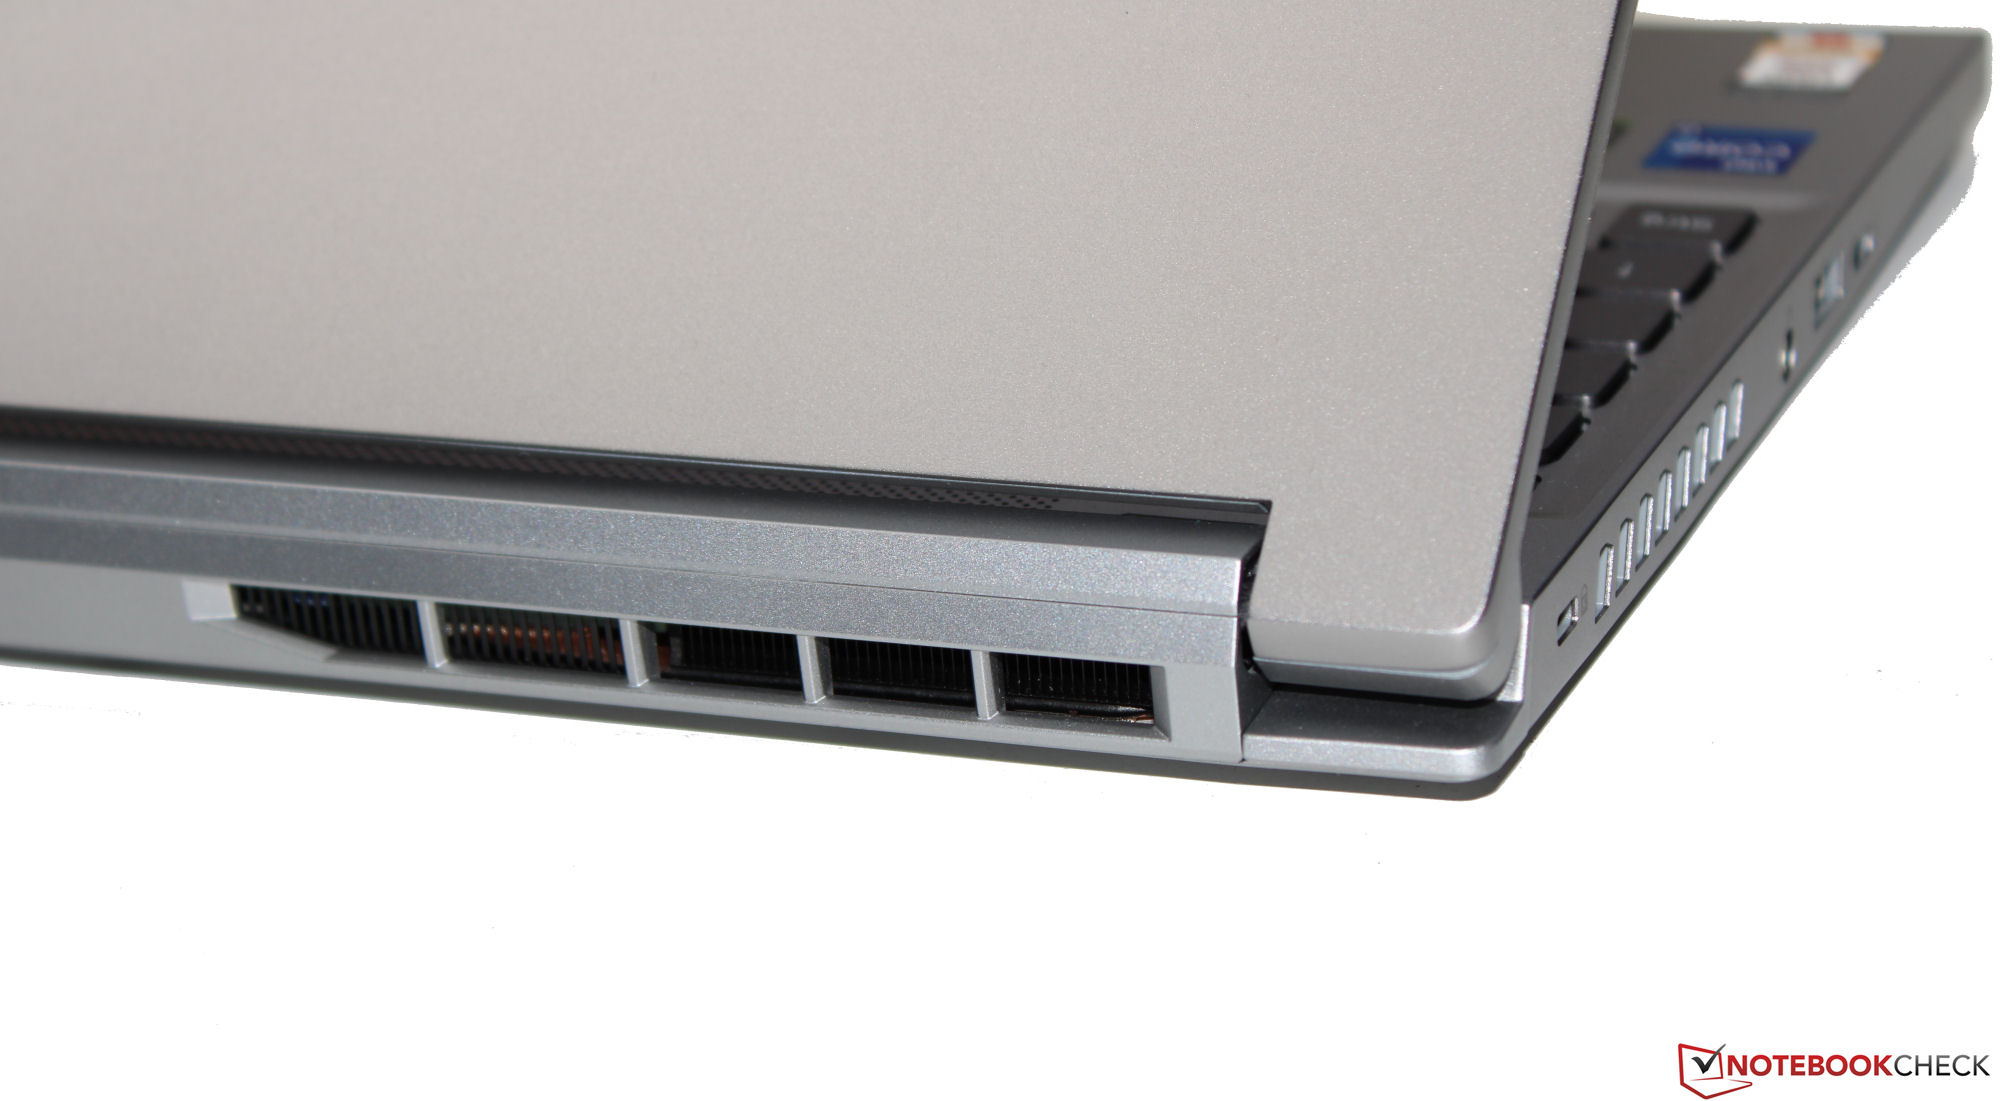
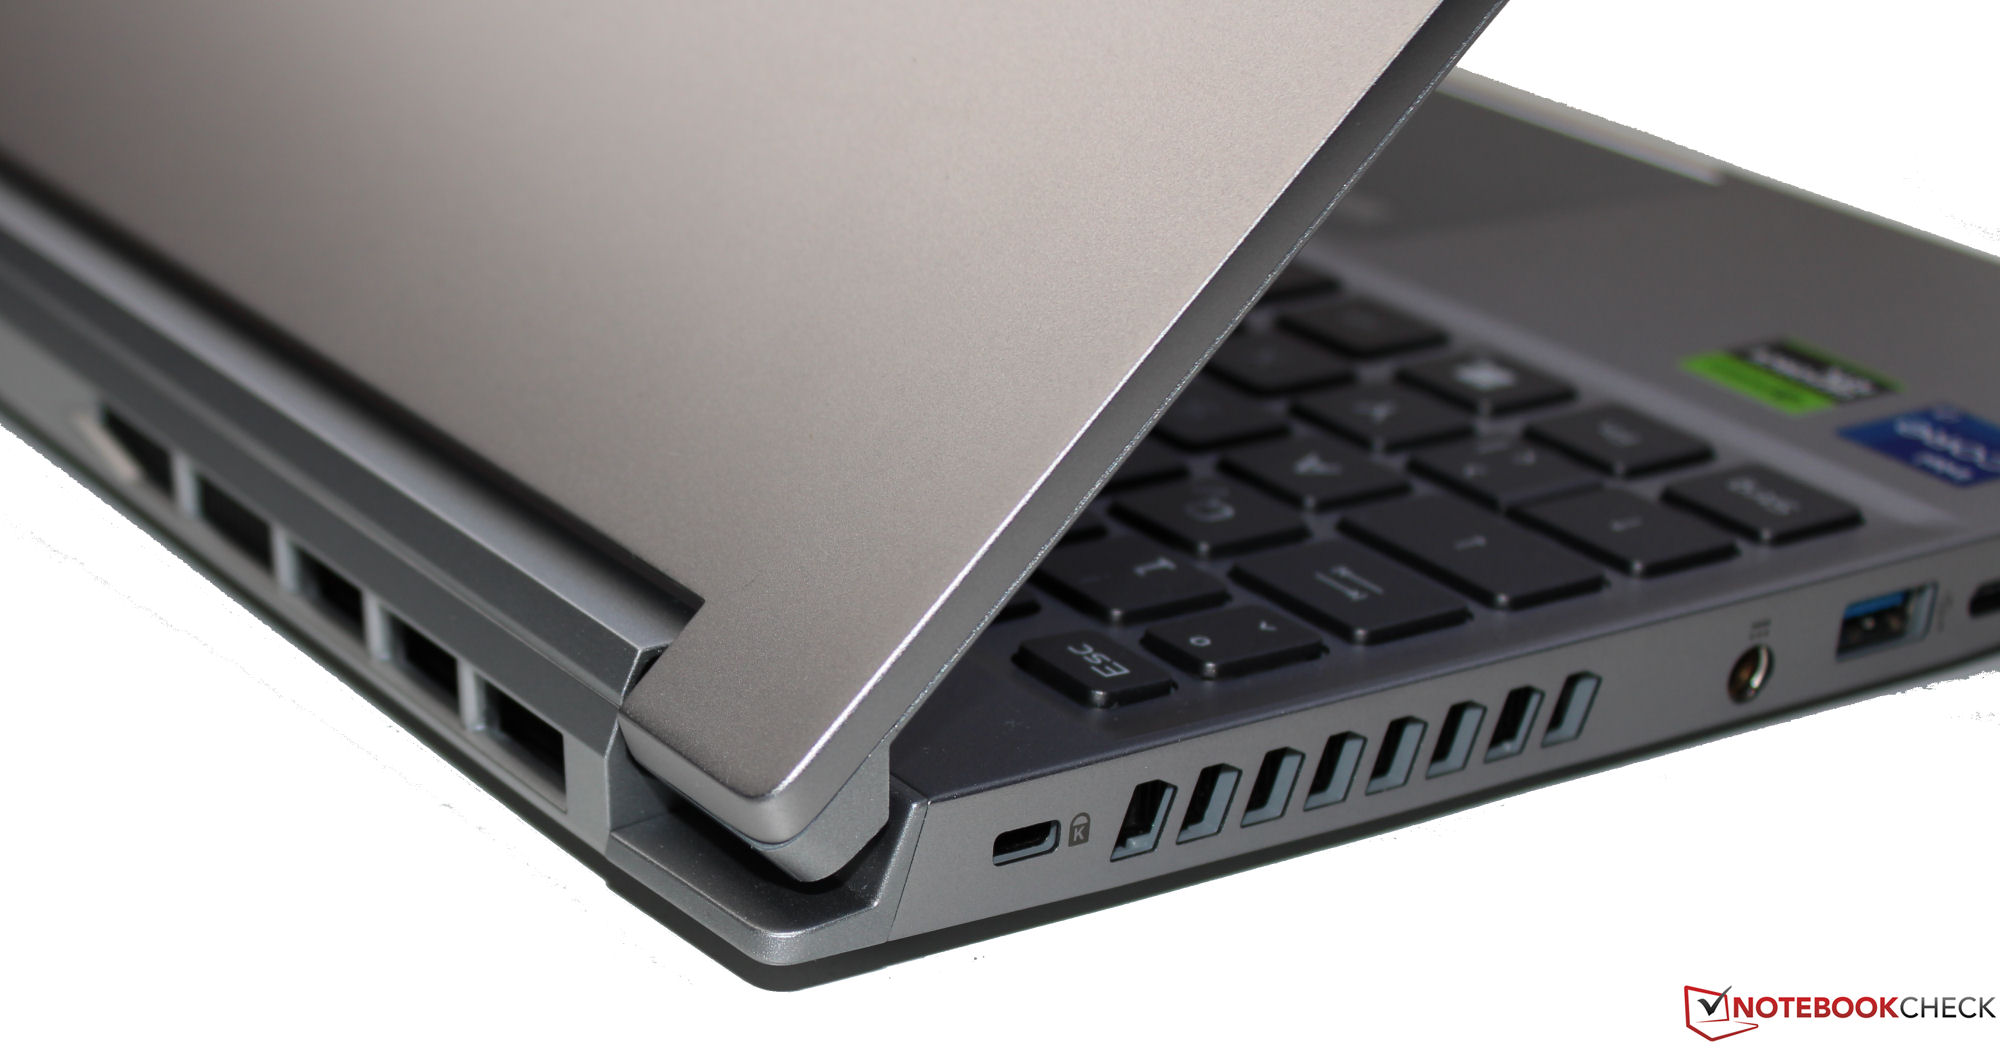
机箱 - 宏碁为 Triton 配备了金属机箱
这款笔记本电脑的技术采用银灰色金属外壳。宏碁选择了光滑的哑光表面。这款小巧的电脑没有任何引人注目的设计元素,这意味着它也可以作为一款办公笔记本电脑。同样,它也没有奢华的 LED 灯条。除了按键照明外,掌托上还有一个小的发光掠夺者标志,使色彩更加丰富。
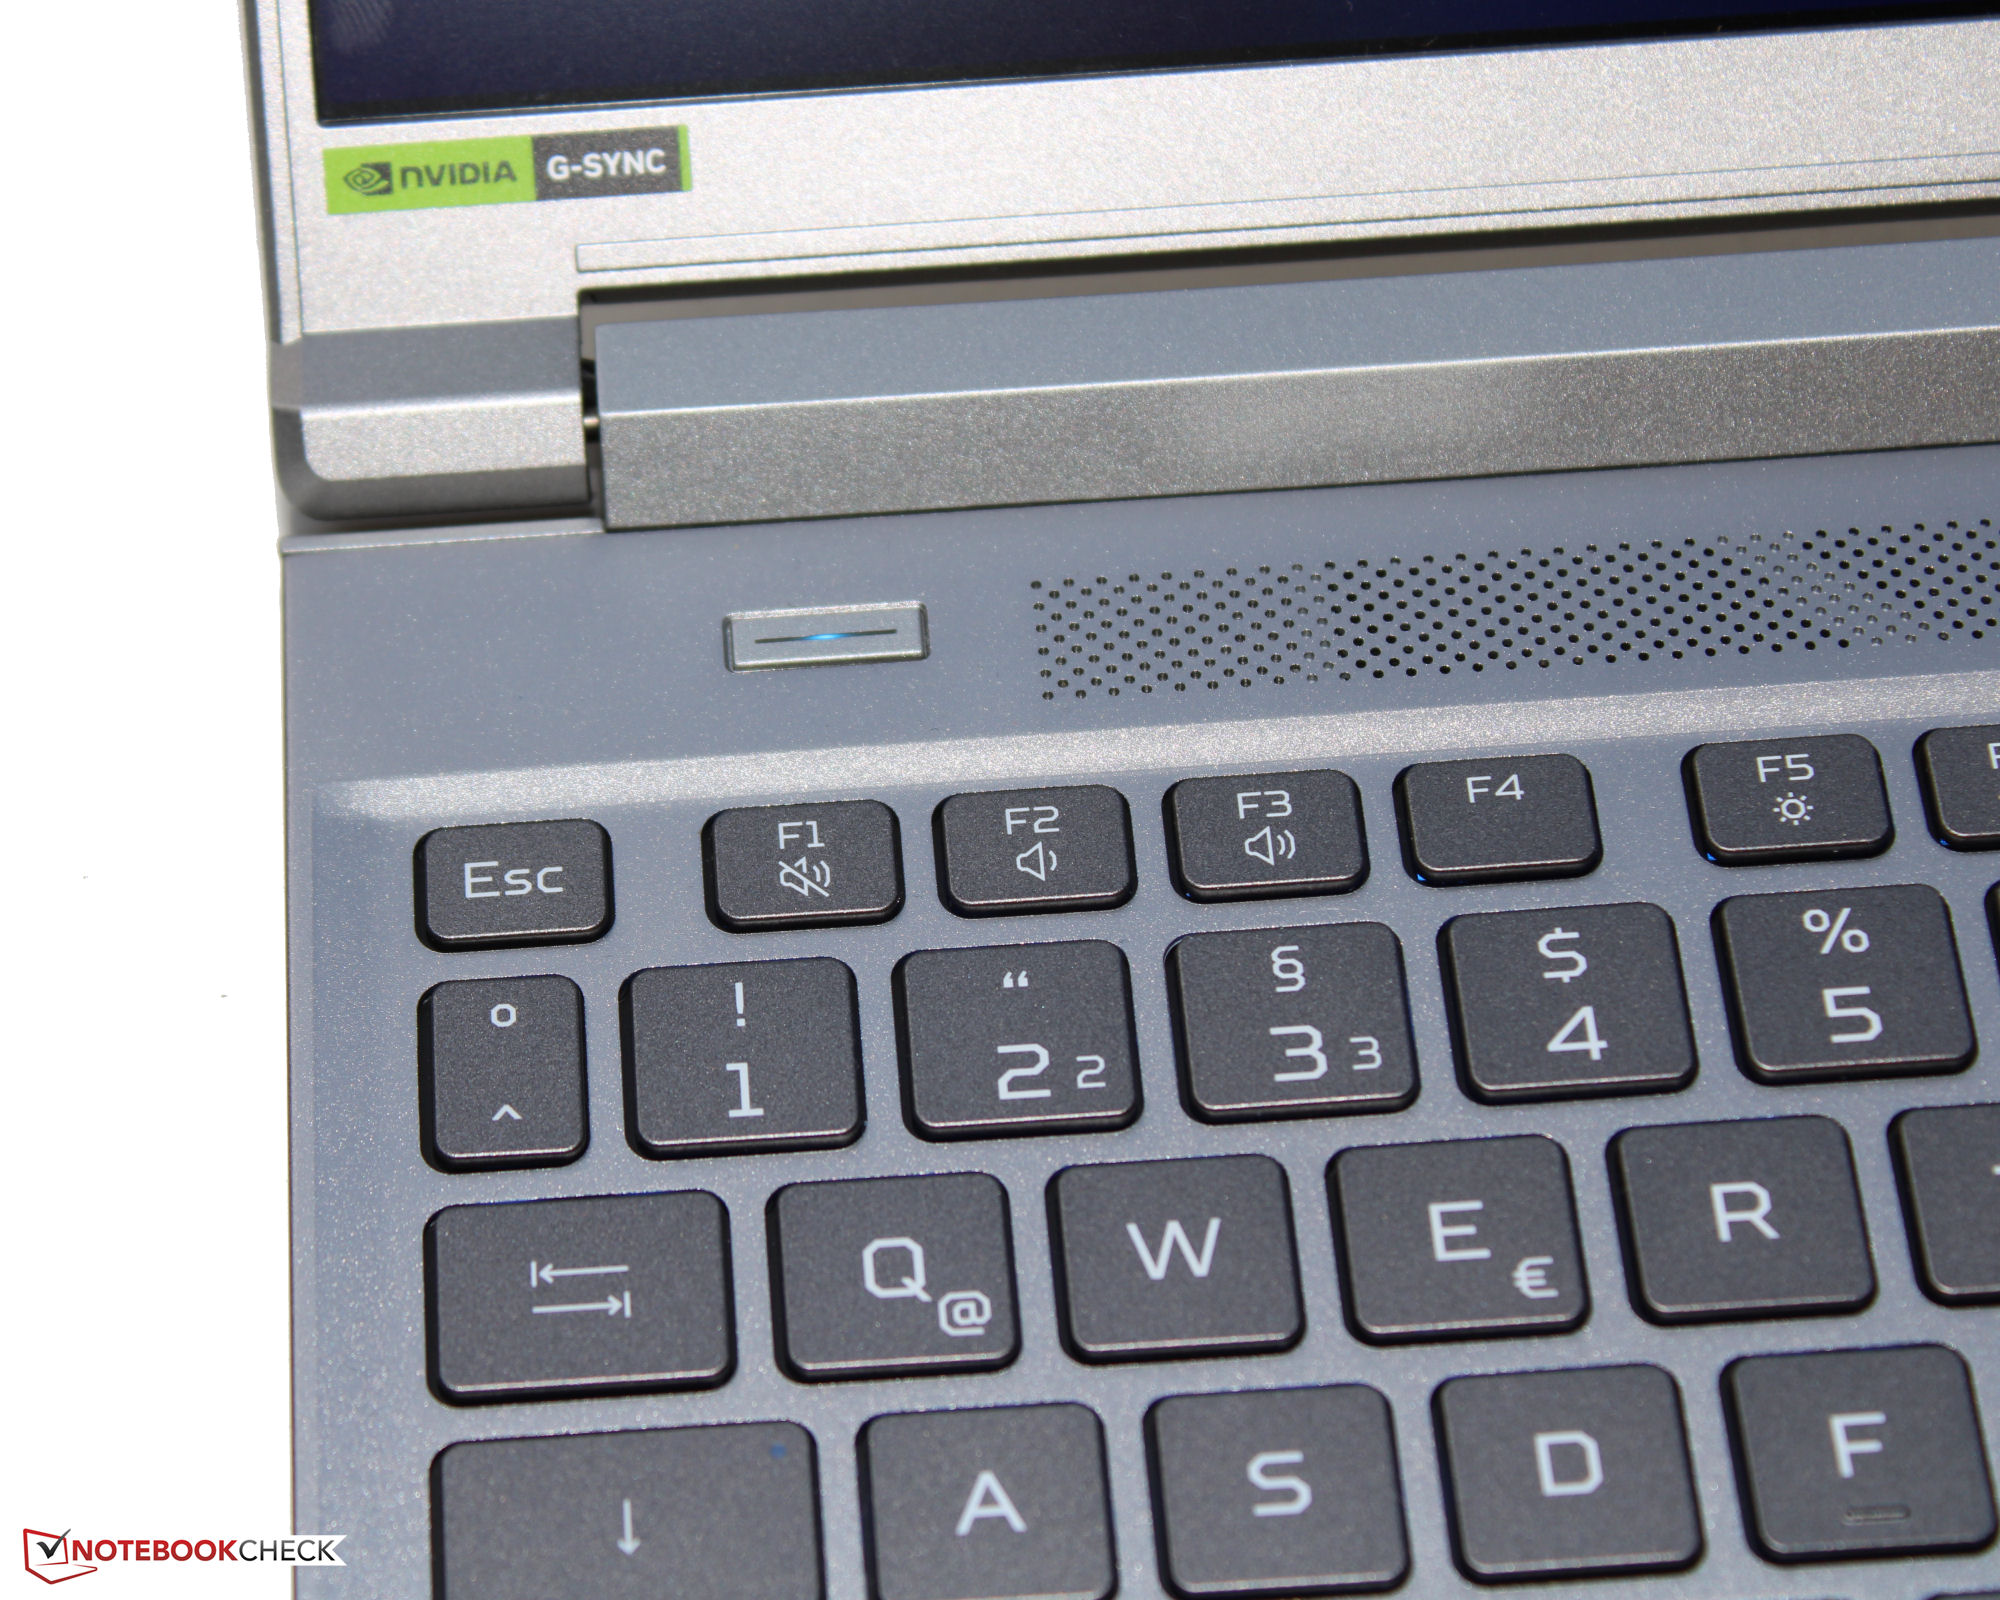
Triton 确实有制造缺陷的迹象。缝隙尺寸正确,没有多余的材料突出。底座和盖子可以轻微扭曲,但都在可接受的范围内。对盖子后部施加压力不会导致任何图像失真。铰链将盖子牢牢固定,最大开启角度约为 175 度。单手即可打开设备。
在尺寸方面,大多数同类产品之间并无太大差别。微星微星隐形 14 Studio A13V是个例外:它比竞争对手占用更多空间。在重量方面,宏碁笔记本电脑处于中间位置。
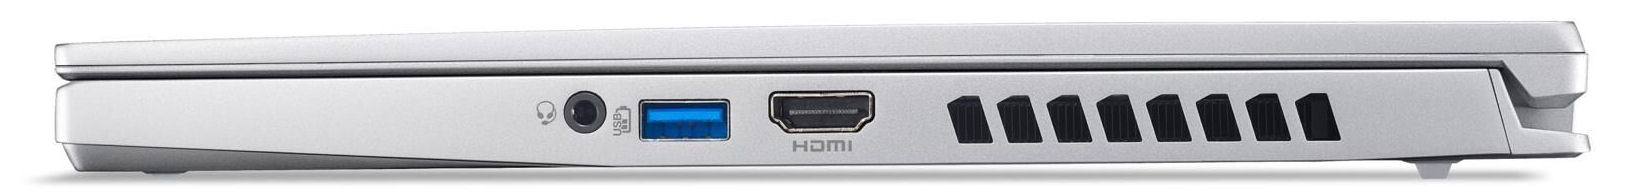
功能 - PT14 提供雷电 4
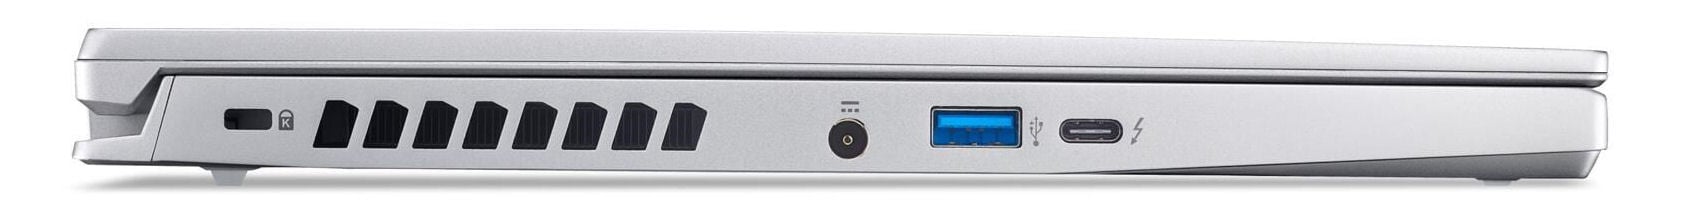
端口选择相当有限:PT14 可以使用两个 USB-A 端口(USB 3.2 Gen 2)和一个 USB-C 端口(Thunderbolt 4)。USB-C 端口支持 Power Delivery,并能输出 Displayport 信号。总共有两个视频输出接口(HDMI 2.1、DP)。一个音频插孔完善了整套设备。
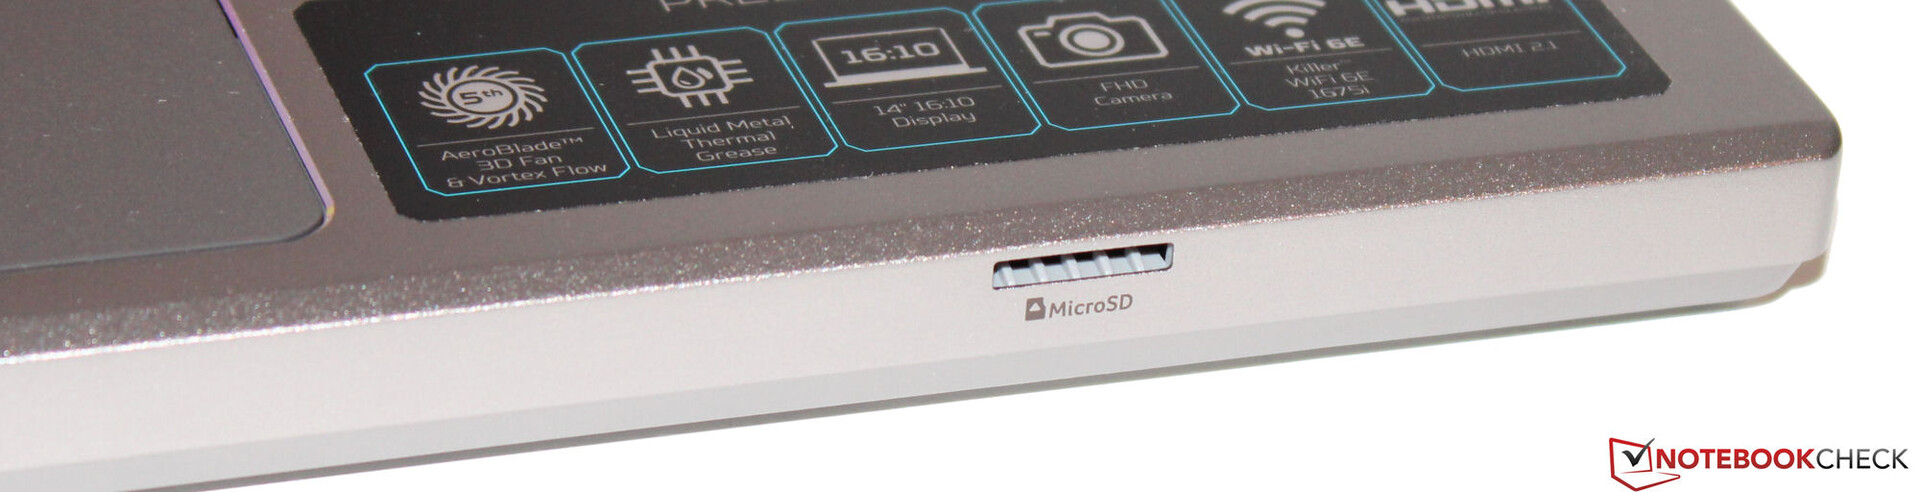
SD 读卡器
MicroSD 存储卡读卡器(参考卡:AV PRO microSD 128 GB V60)属于速度最慢的型号,其最大传输速度为 19 MB/s(传输 250 个 jpg 图像文件,每个约 5 MB)和 26 MB/s(复制大数据块)。
| SD Card Reader | |
| average JPG Copy Test (av. of 3 runs) | |
| Gigabyte Aero 14 OLED BMF | |
| Asus ROG Zephyrus G14 GA402RJ (AV PRO microSD 128 GB V60) | |
| Average of class Gaming (20.9 - 210, n=54, last 2 years) | |
| Acer Predator Triton 14 PT14-51 (AV PRO microSD 128 GB V60) | |
| maximum AS SSD Seq Read Test (1GB) | |
| Gigabyte Aero 14 OLED BMF | |
| Asus ROG Zephyrus G14 GA402RJ (AV PRO microSD 128 GB V60) | |
| Average of class Gaming (25.5 - 261, n=51, last 2 years) | |
| Acer Predator Triton 14 PT14-51 (AV PRO microSD 128 GB V60) | |
交流
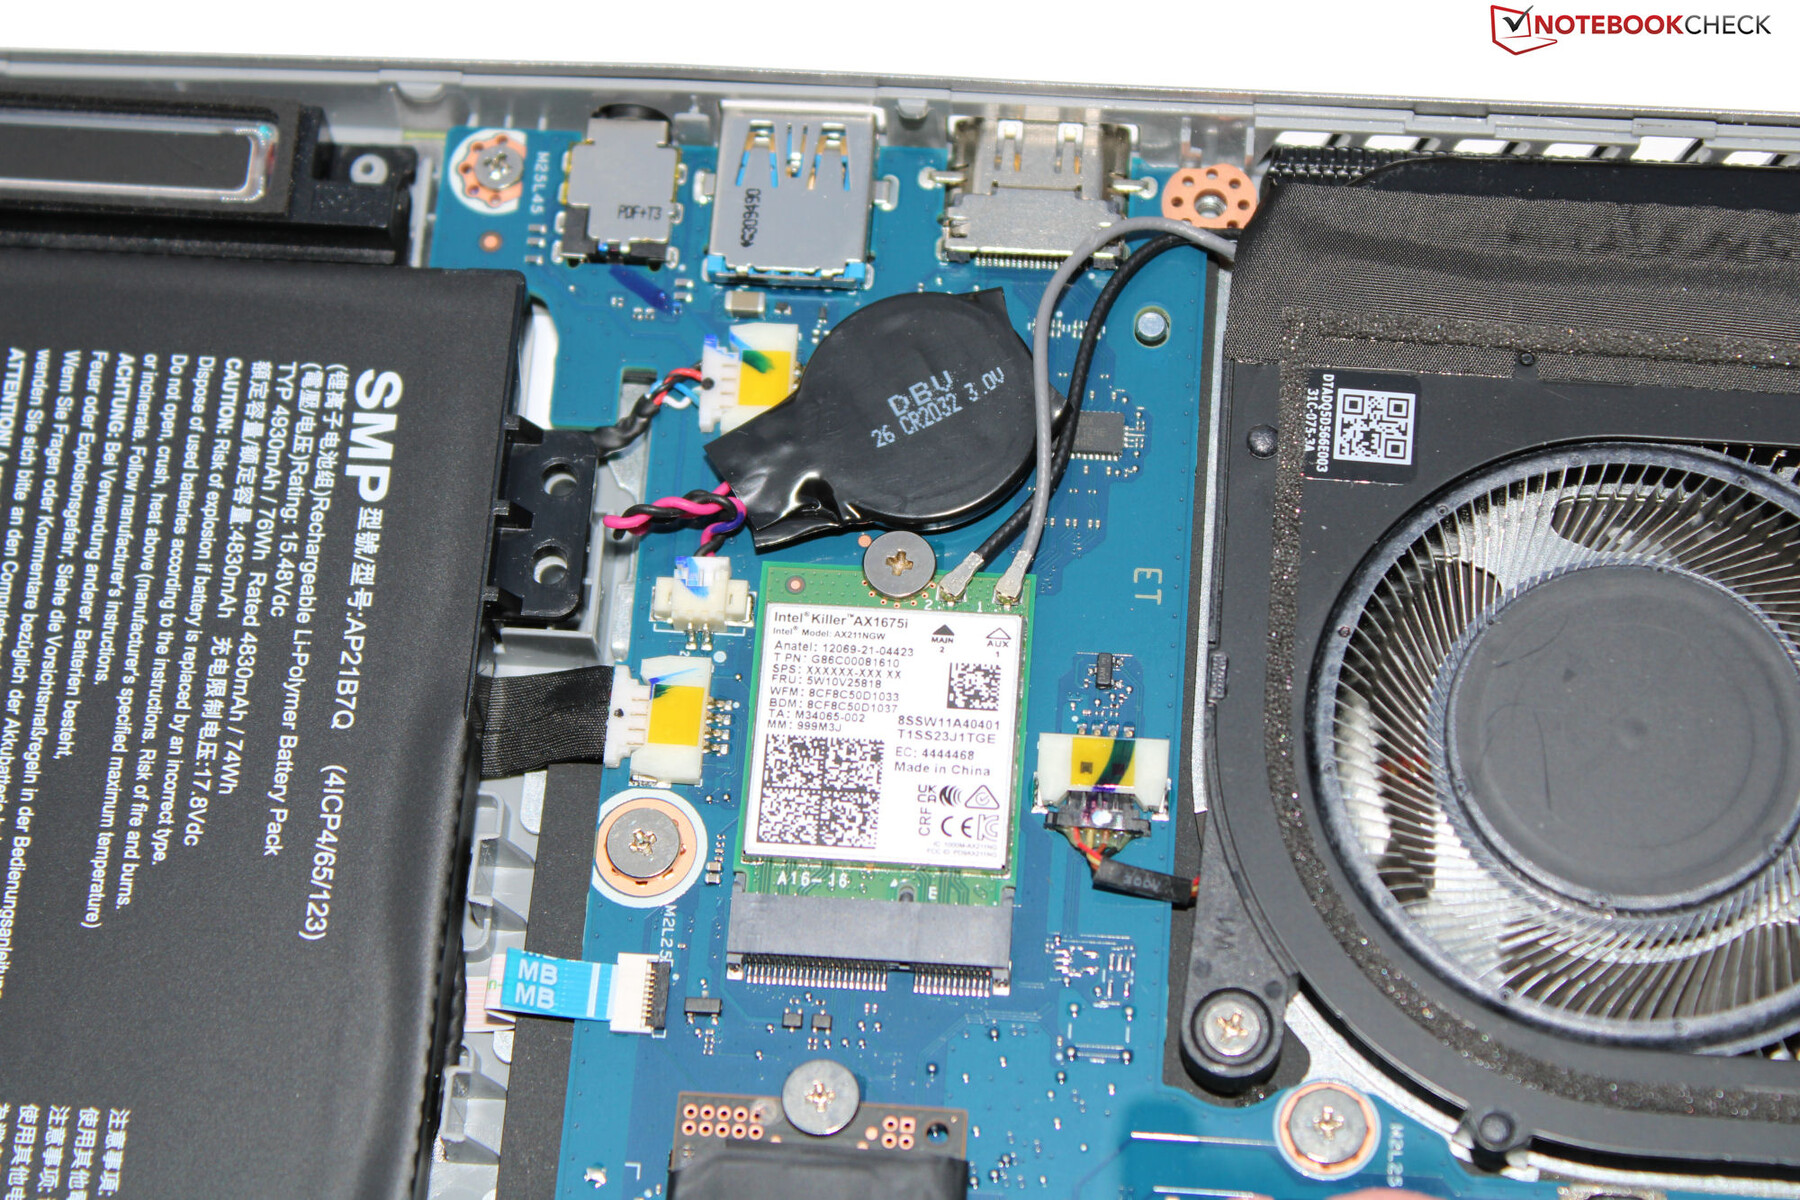
在最佳条件下(附近没有 Wi-Fi 设备,笔记本电脑和服务器电脑之间距离较短),可以实现极快的 Wi-Fi 数据传输速度。笔记本电脑板载有 Wi-Fi 6E 芯片(Killer AX1675i)。没有以太网端口。
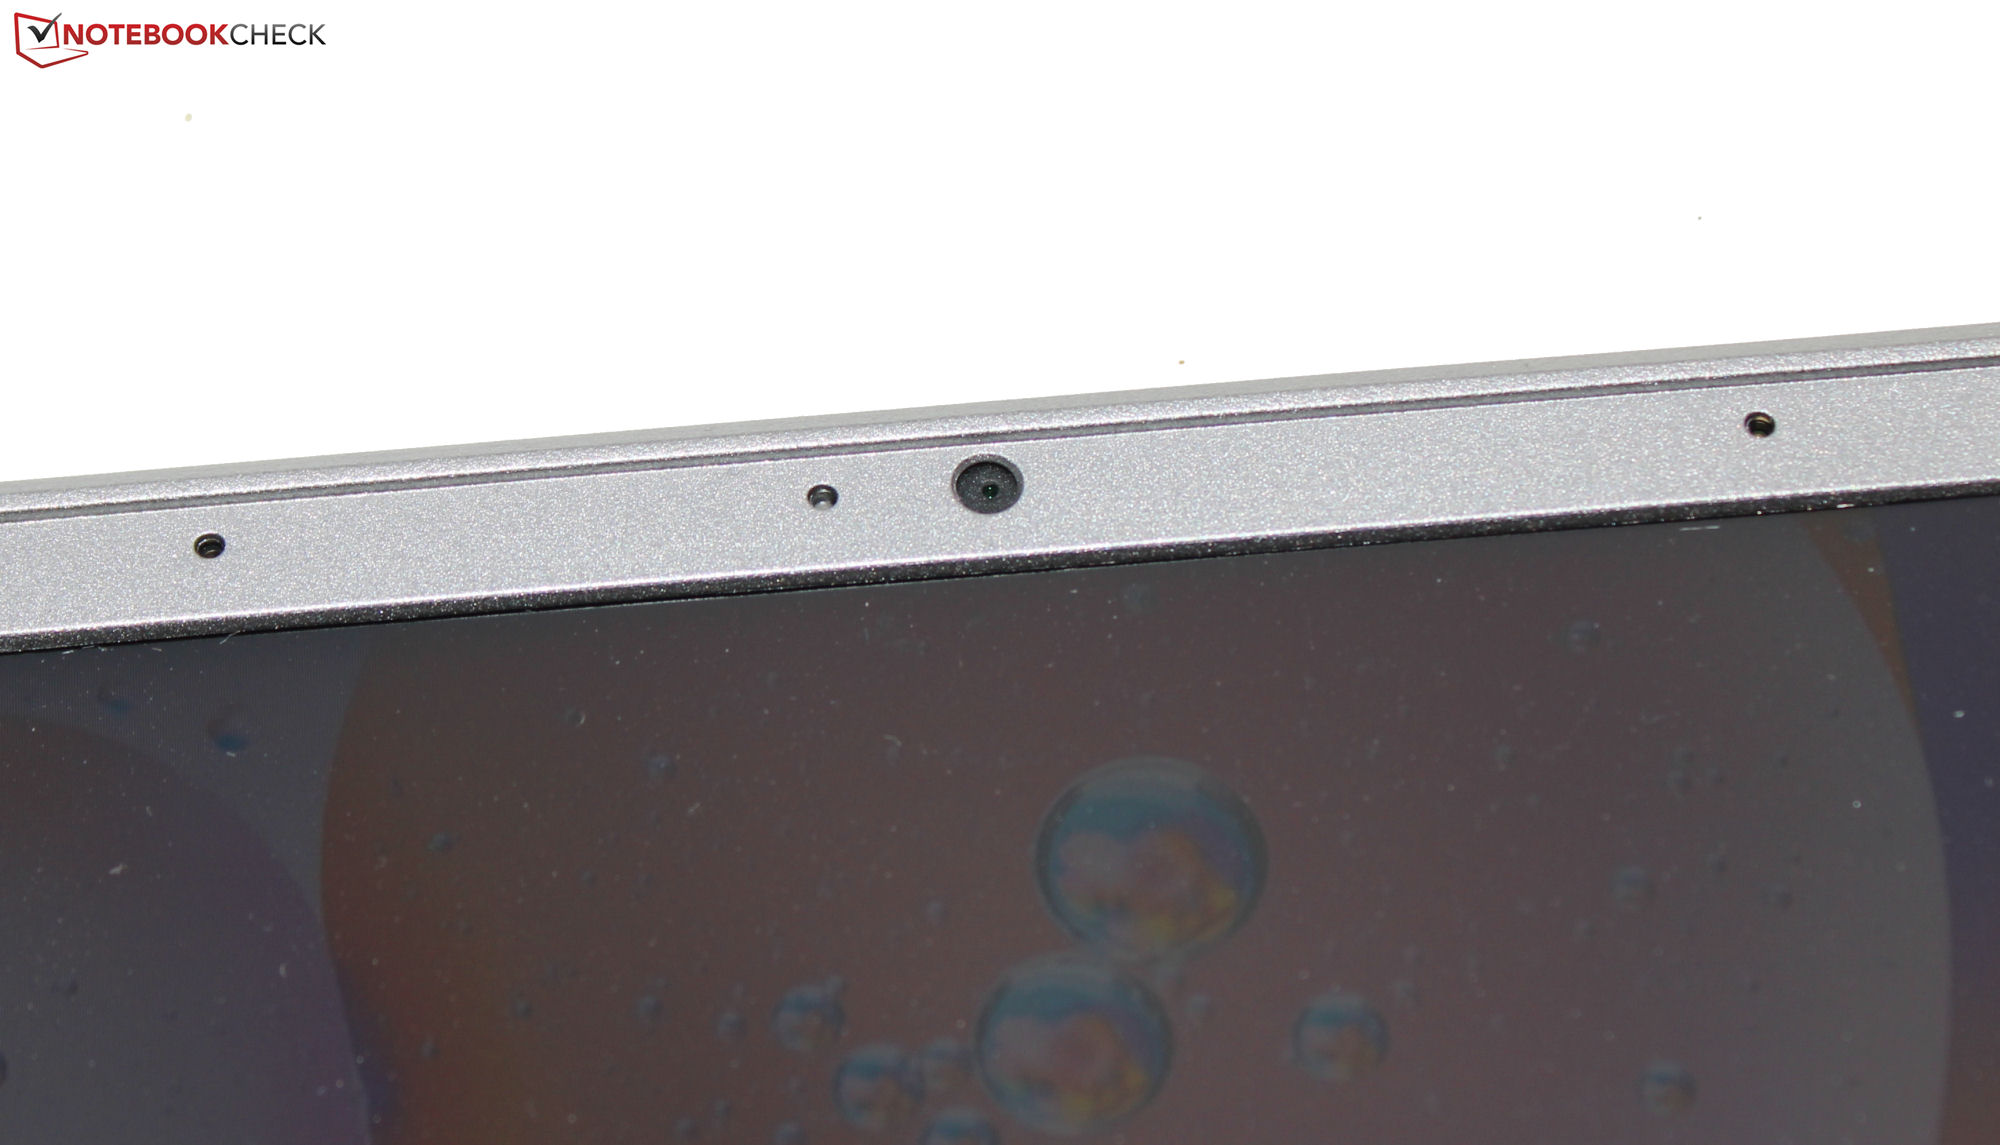
网络摄像头
网络摄像头(210 万像素,最大 1,920 x 1,080 像素)没有配备机械快门。不过,就质量而言,它无法在竞争中脱颖而出。它在色彩精确度方面表现不佳,色彩偏离了目标值。


配件
除了常规文件(快速入门指南和保修信息)外,笔记本电脑没有附带其他配件。
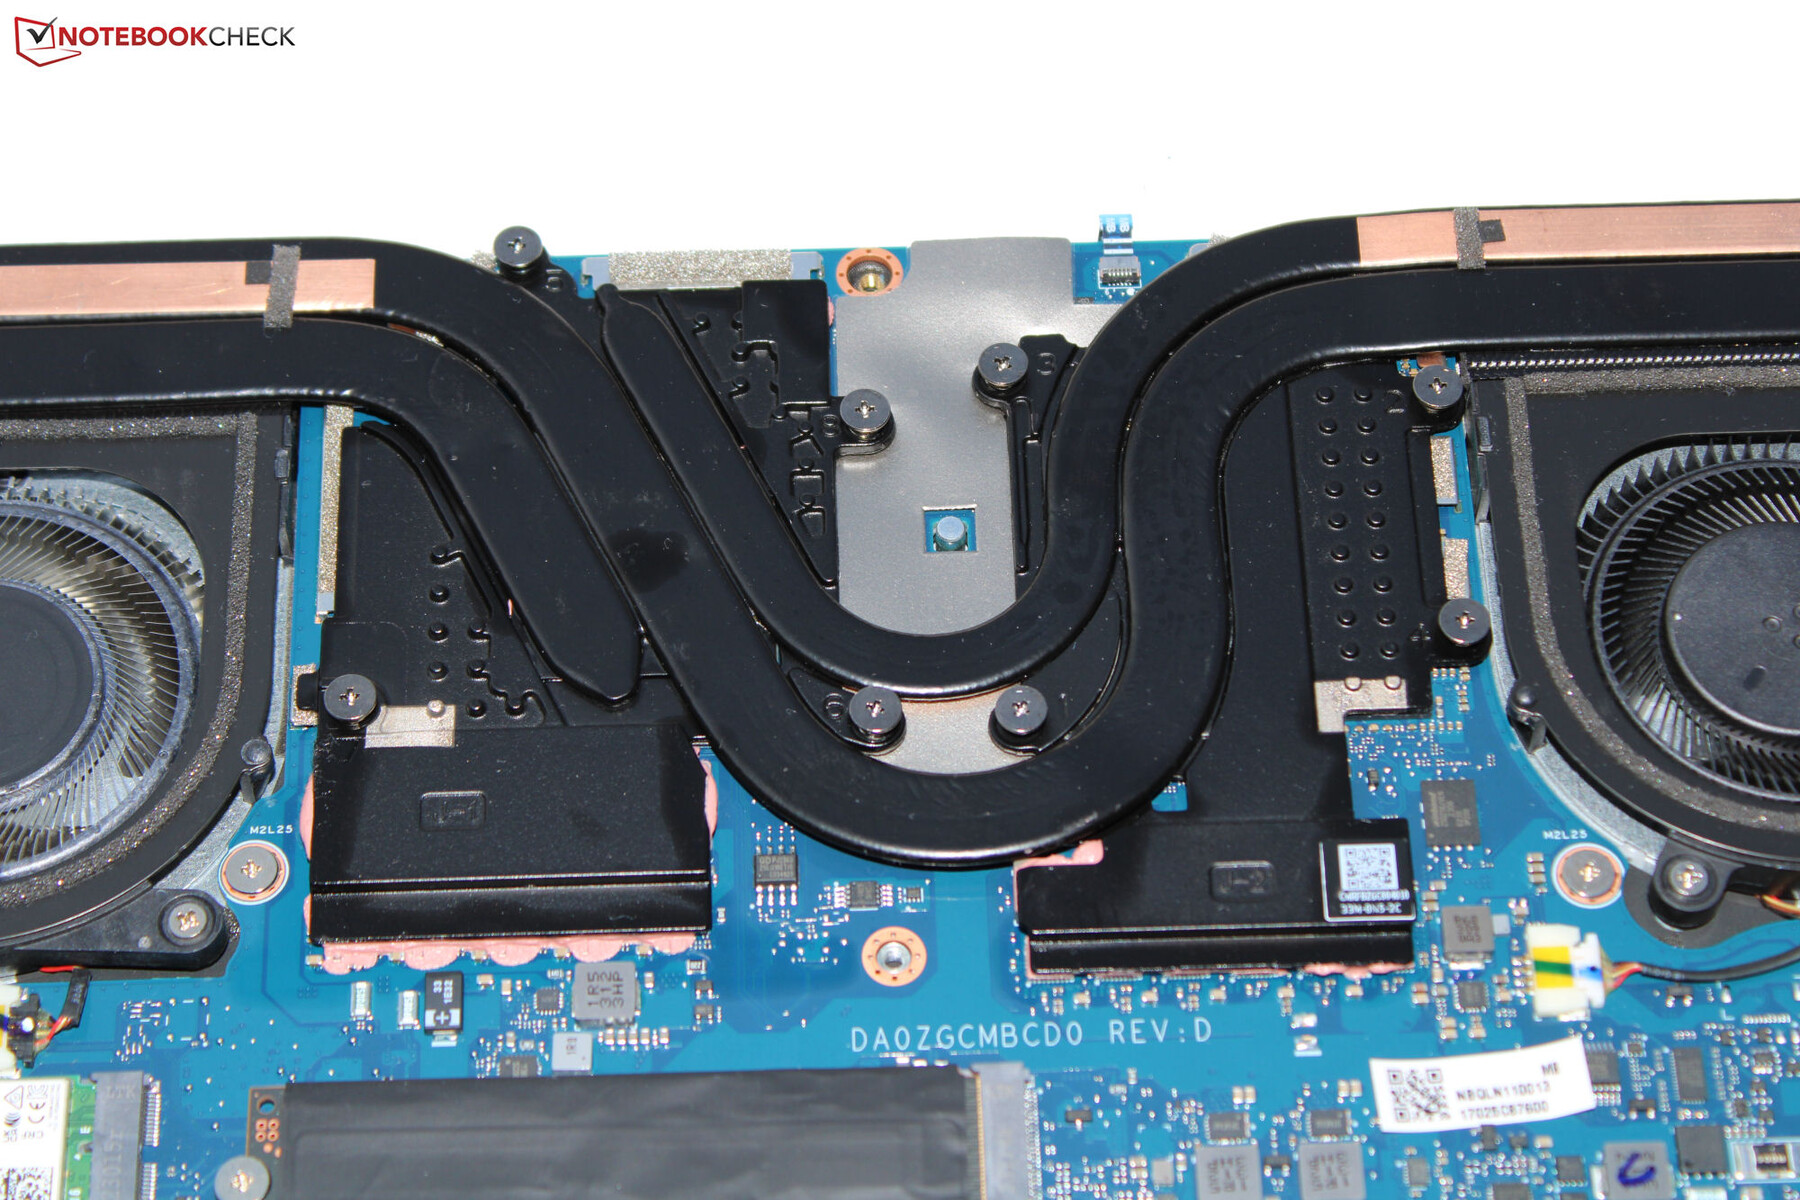
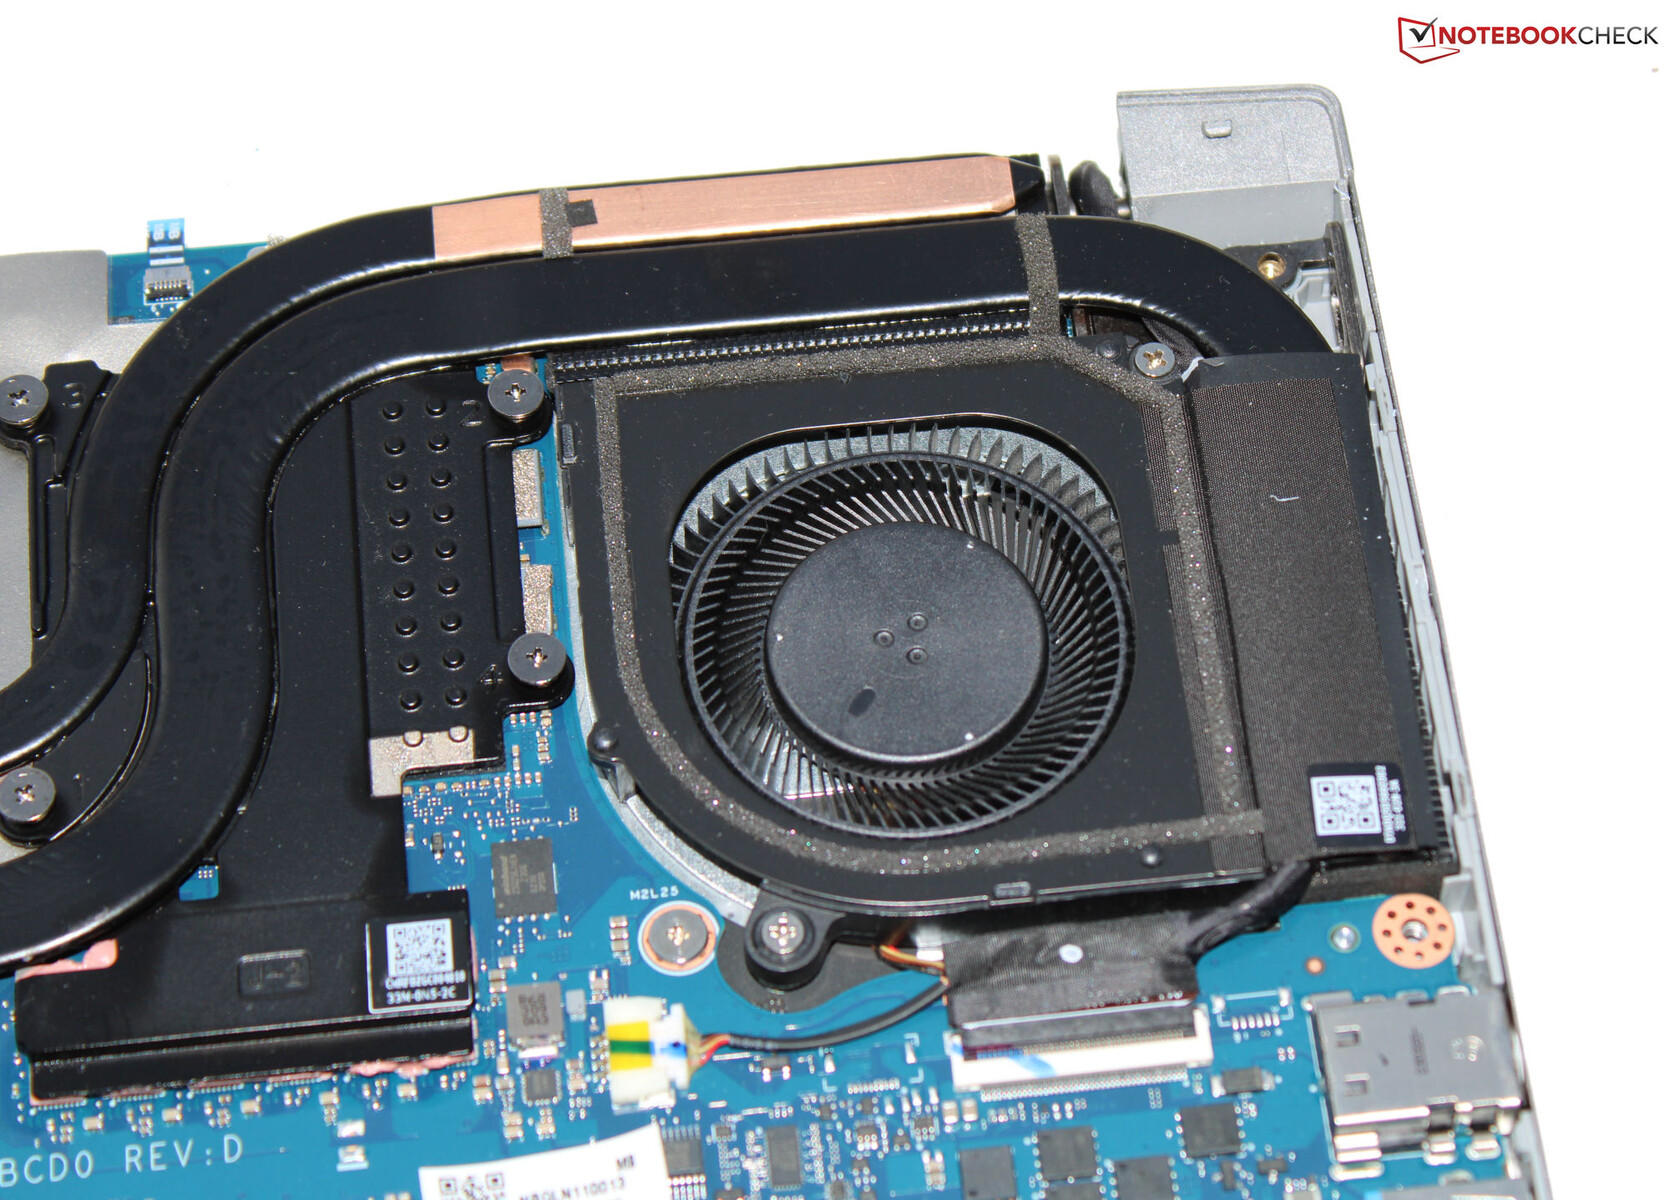
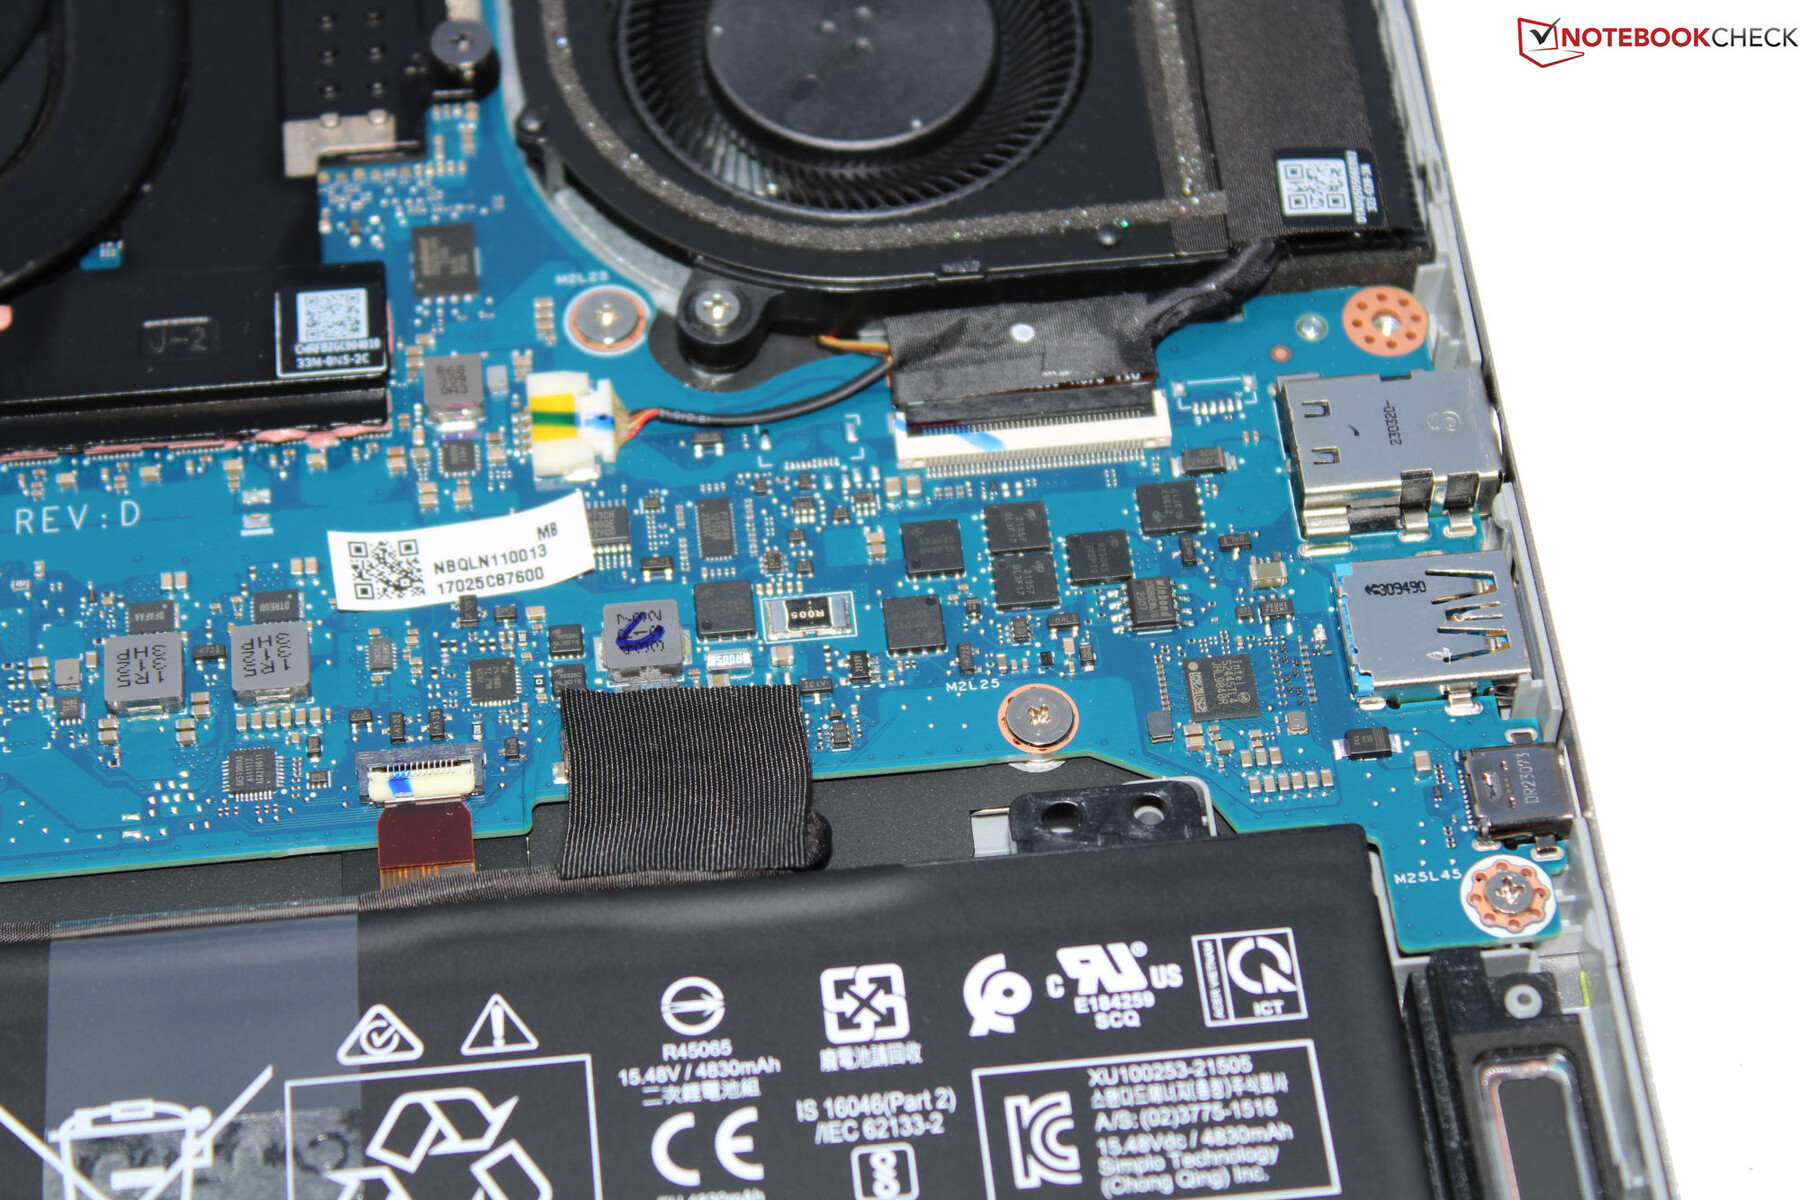
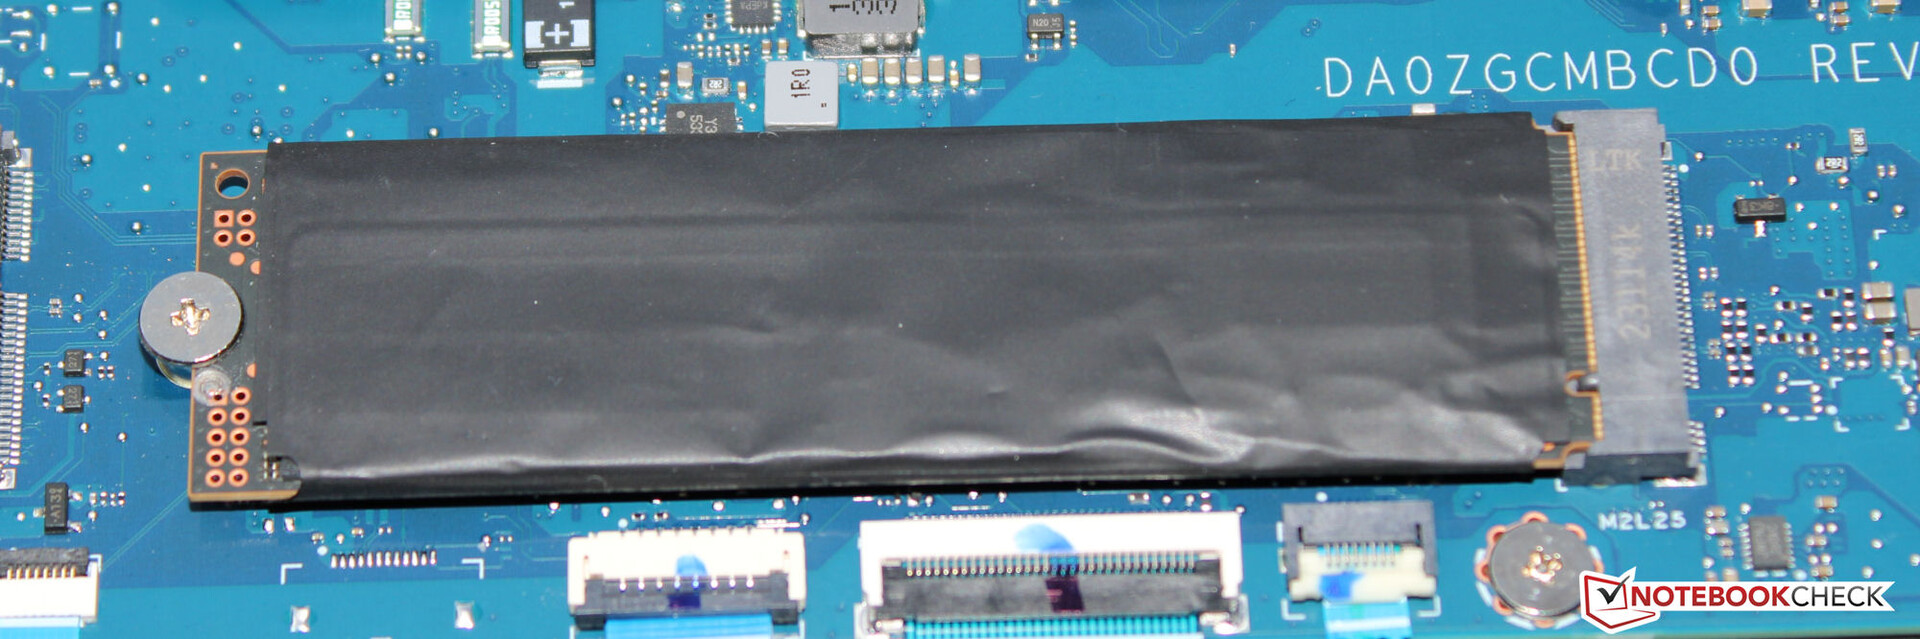
维护
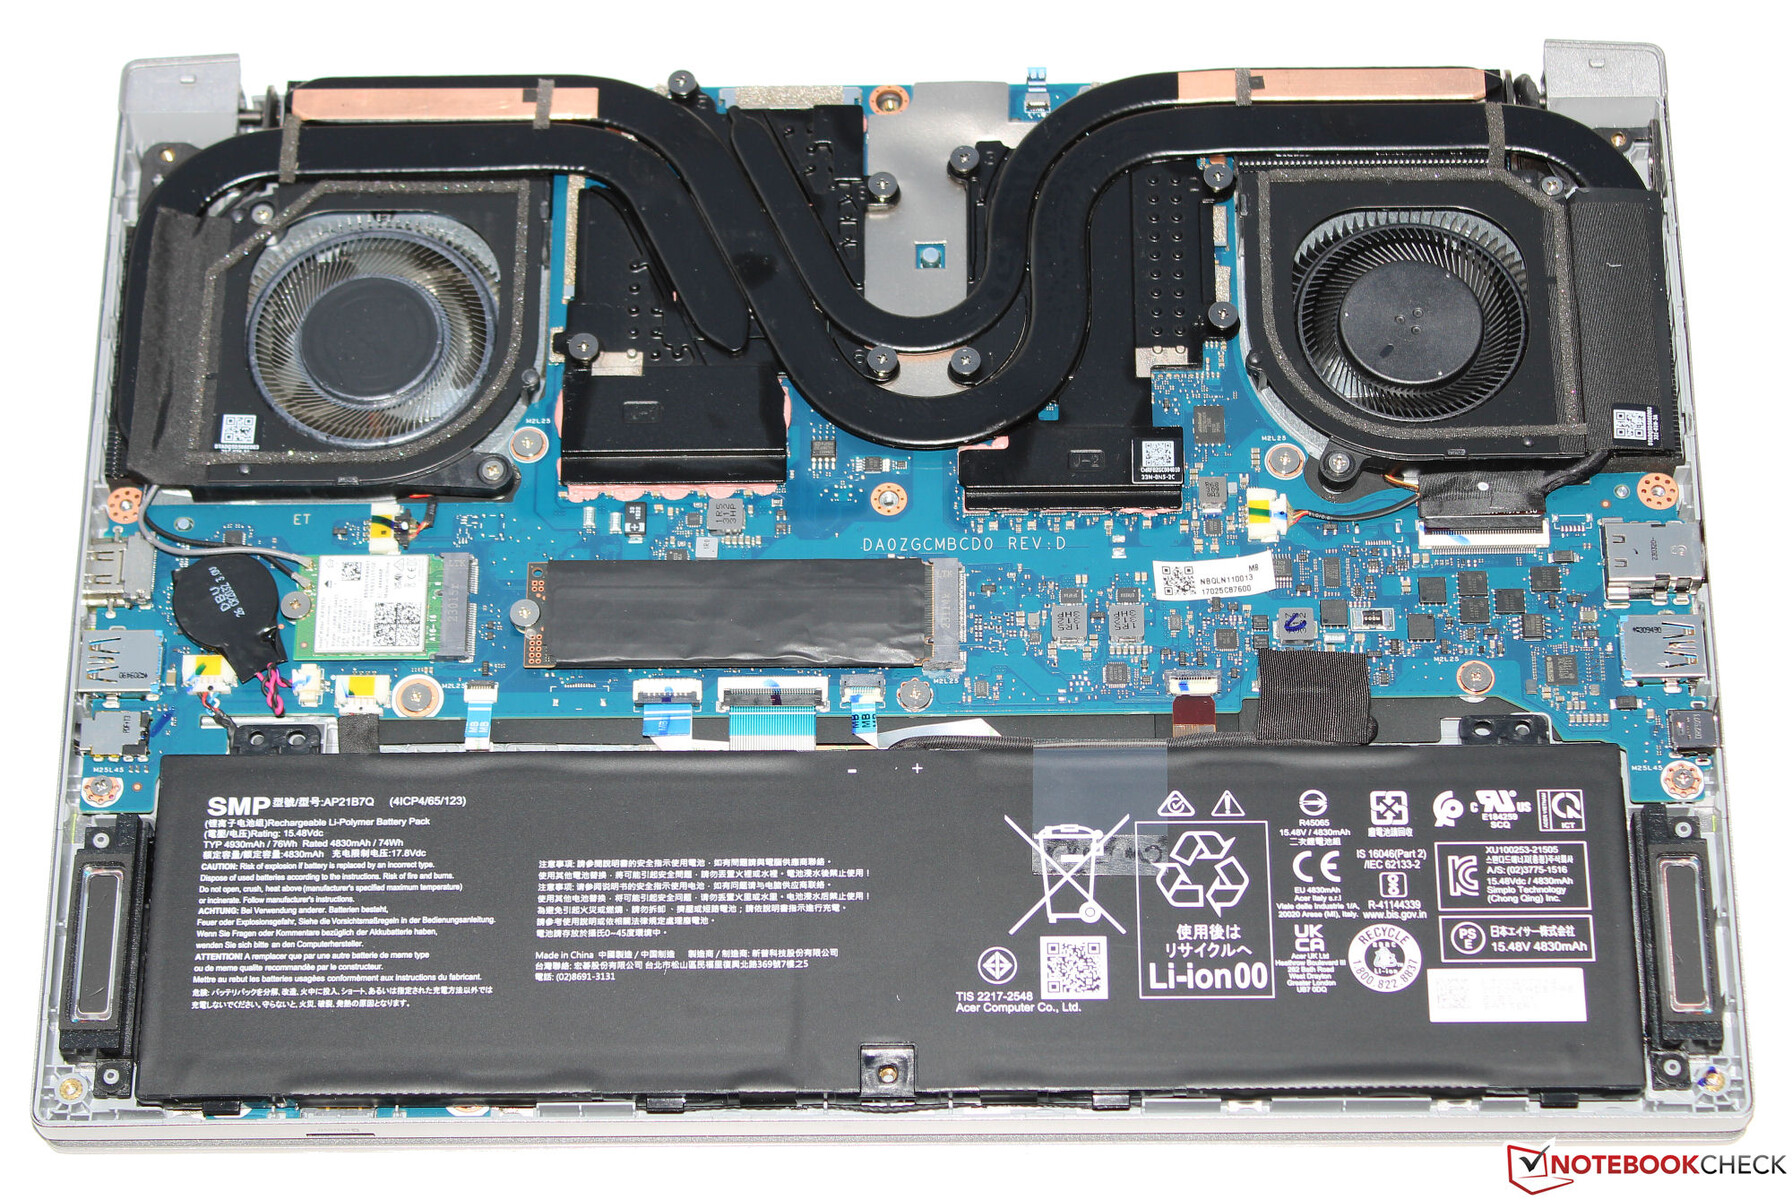
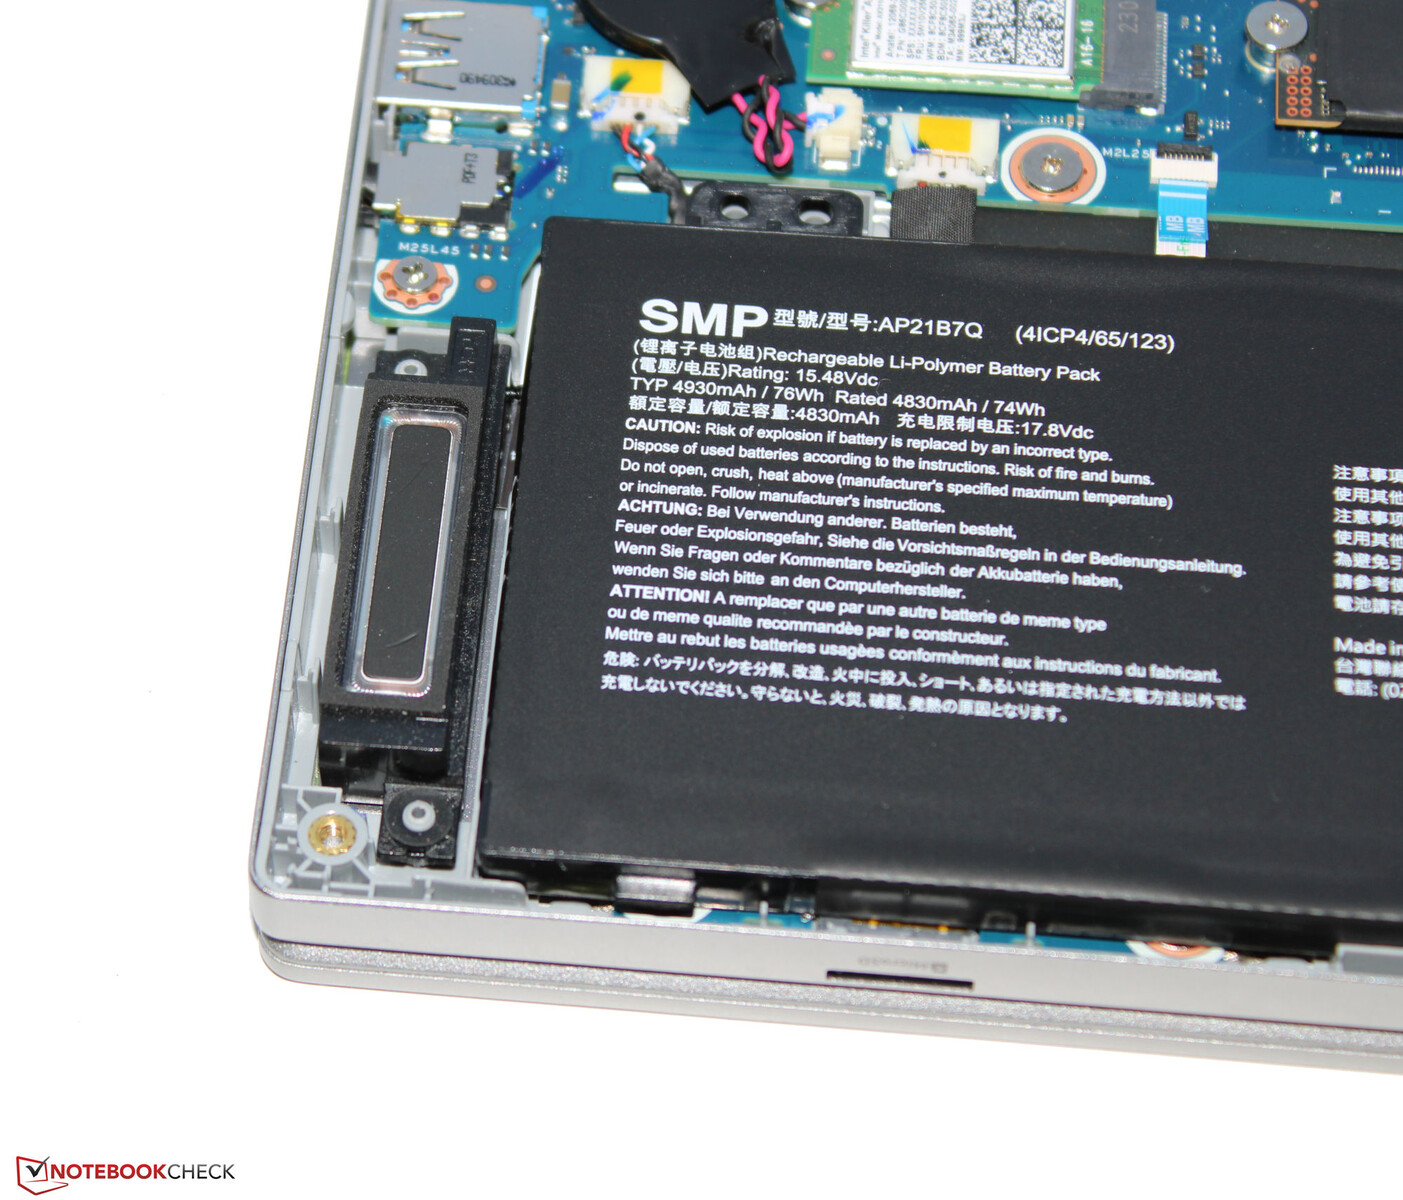
卸下设备底座上的所有螺丝后,可以用拨子弹取下下部外壳。这样就可以接触到固态硬盘(PCIe 4,M.2 2280)、BIOS 电池、Wi-Fi 模块、风扇、扬声器和电池。
保修
宏碁为这款 14 英寸设备提供两年保修。将保修期延长至三年需要近 100 美元。
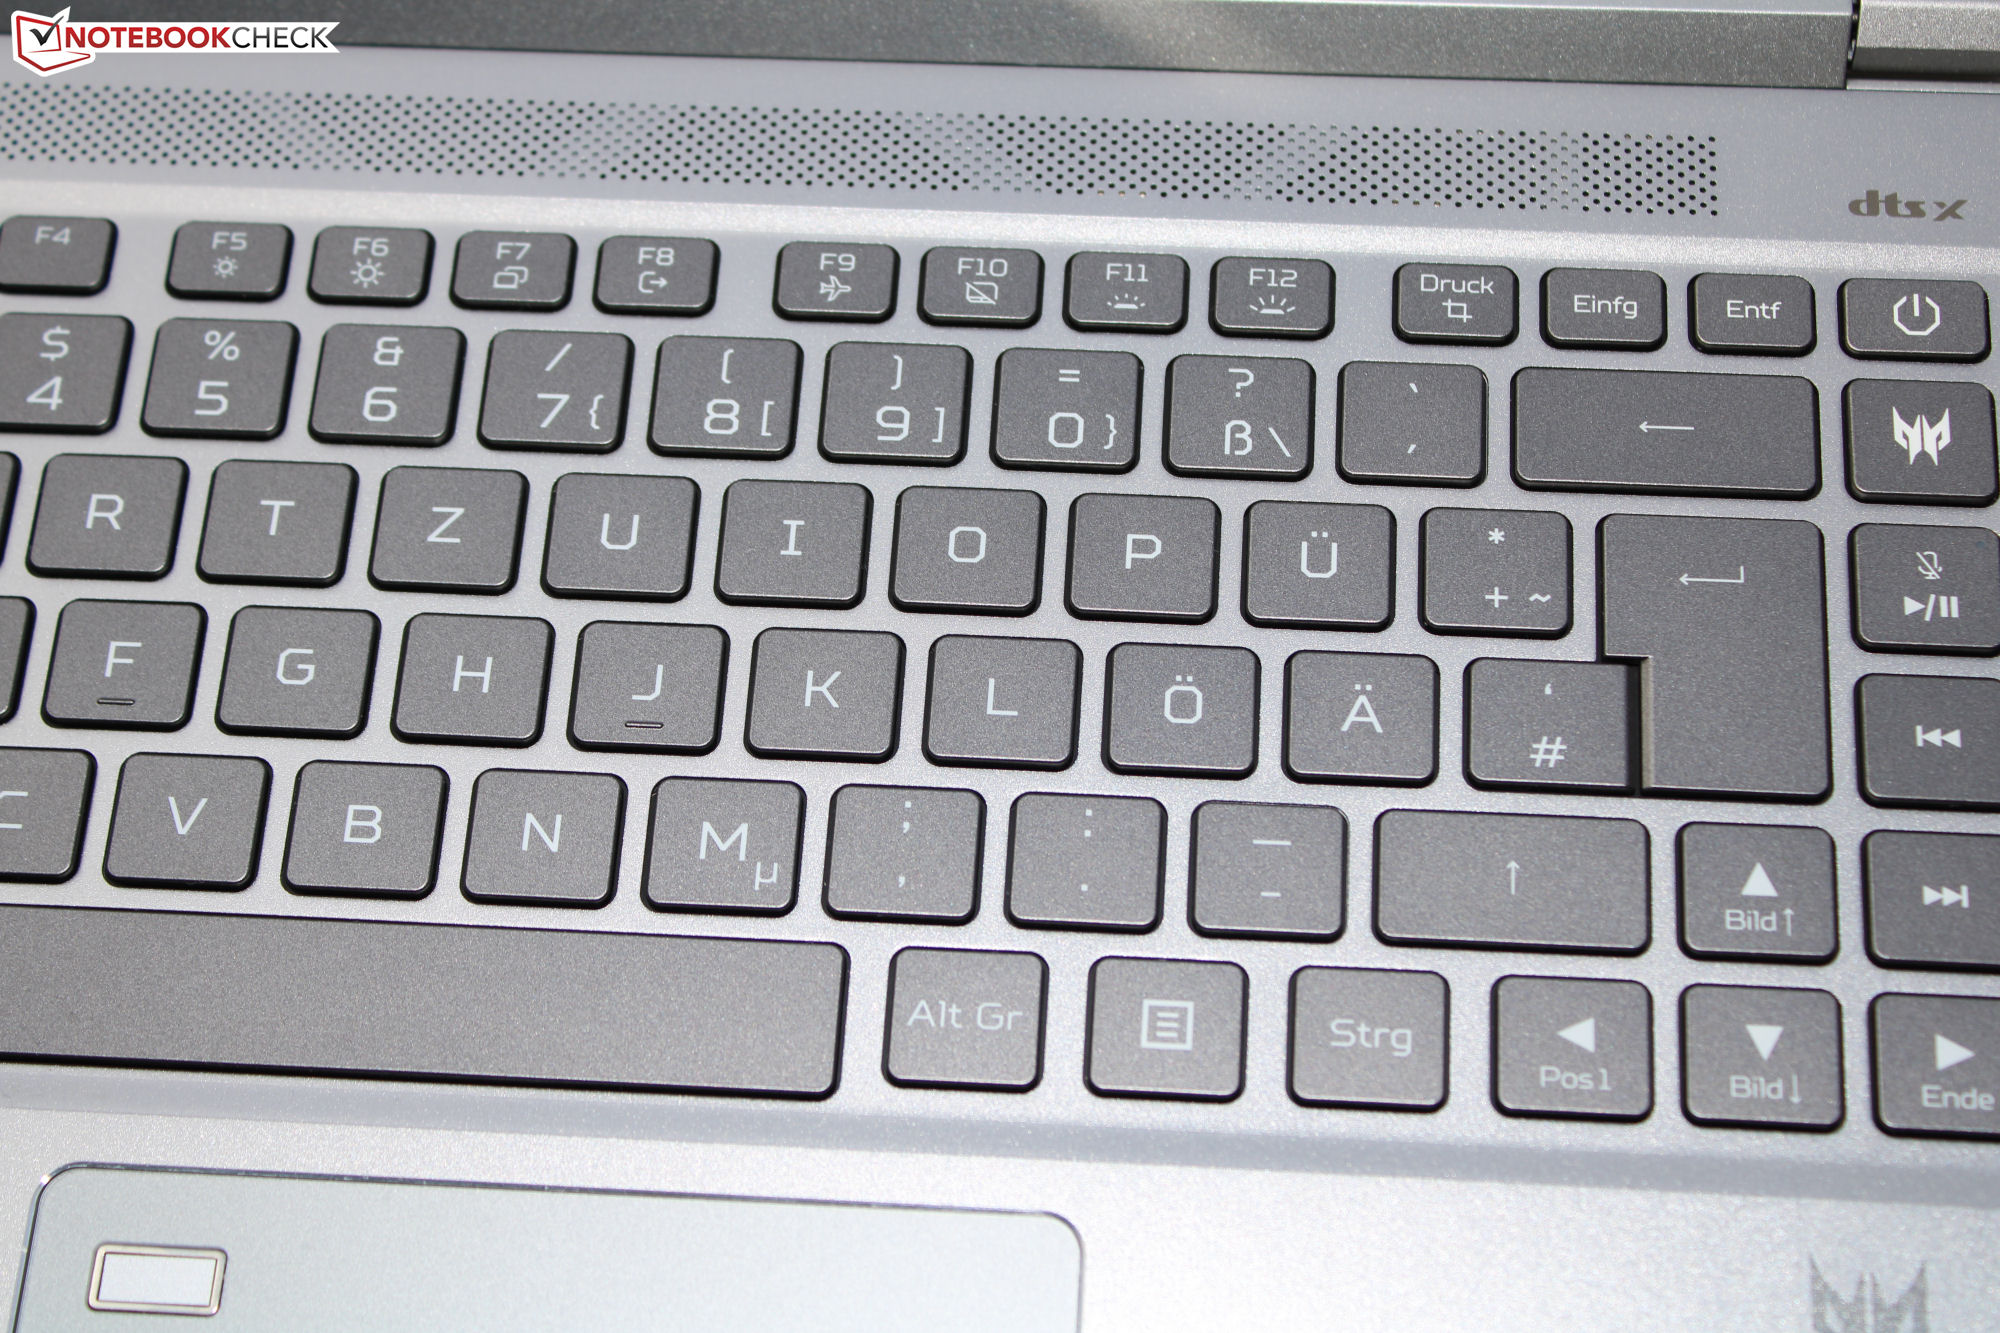
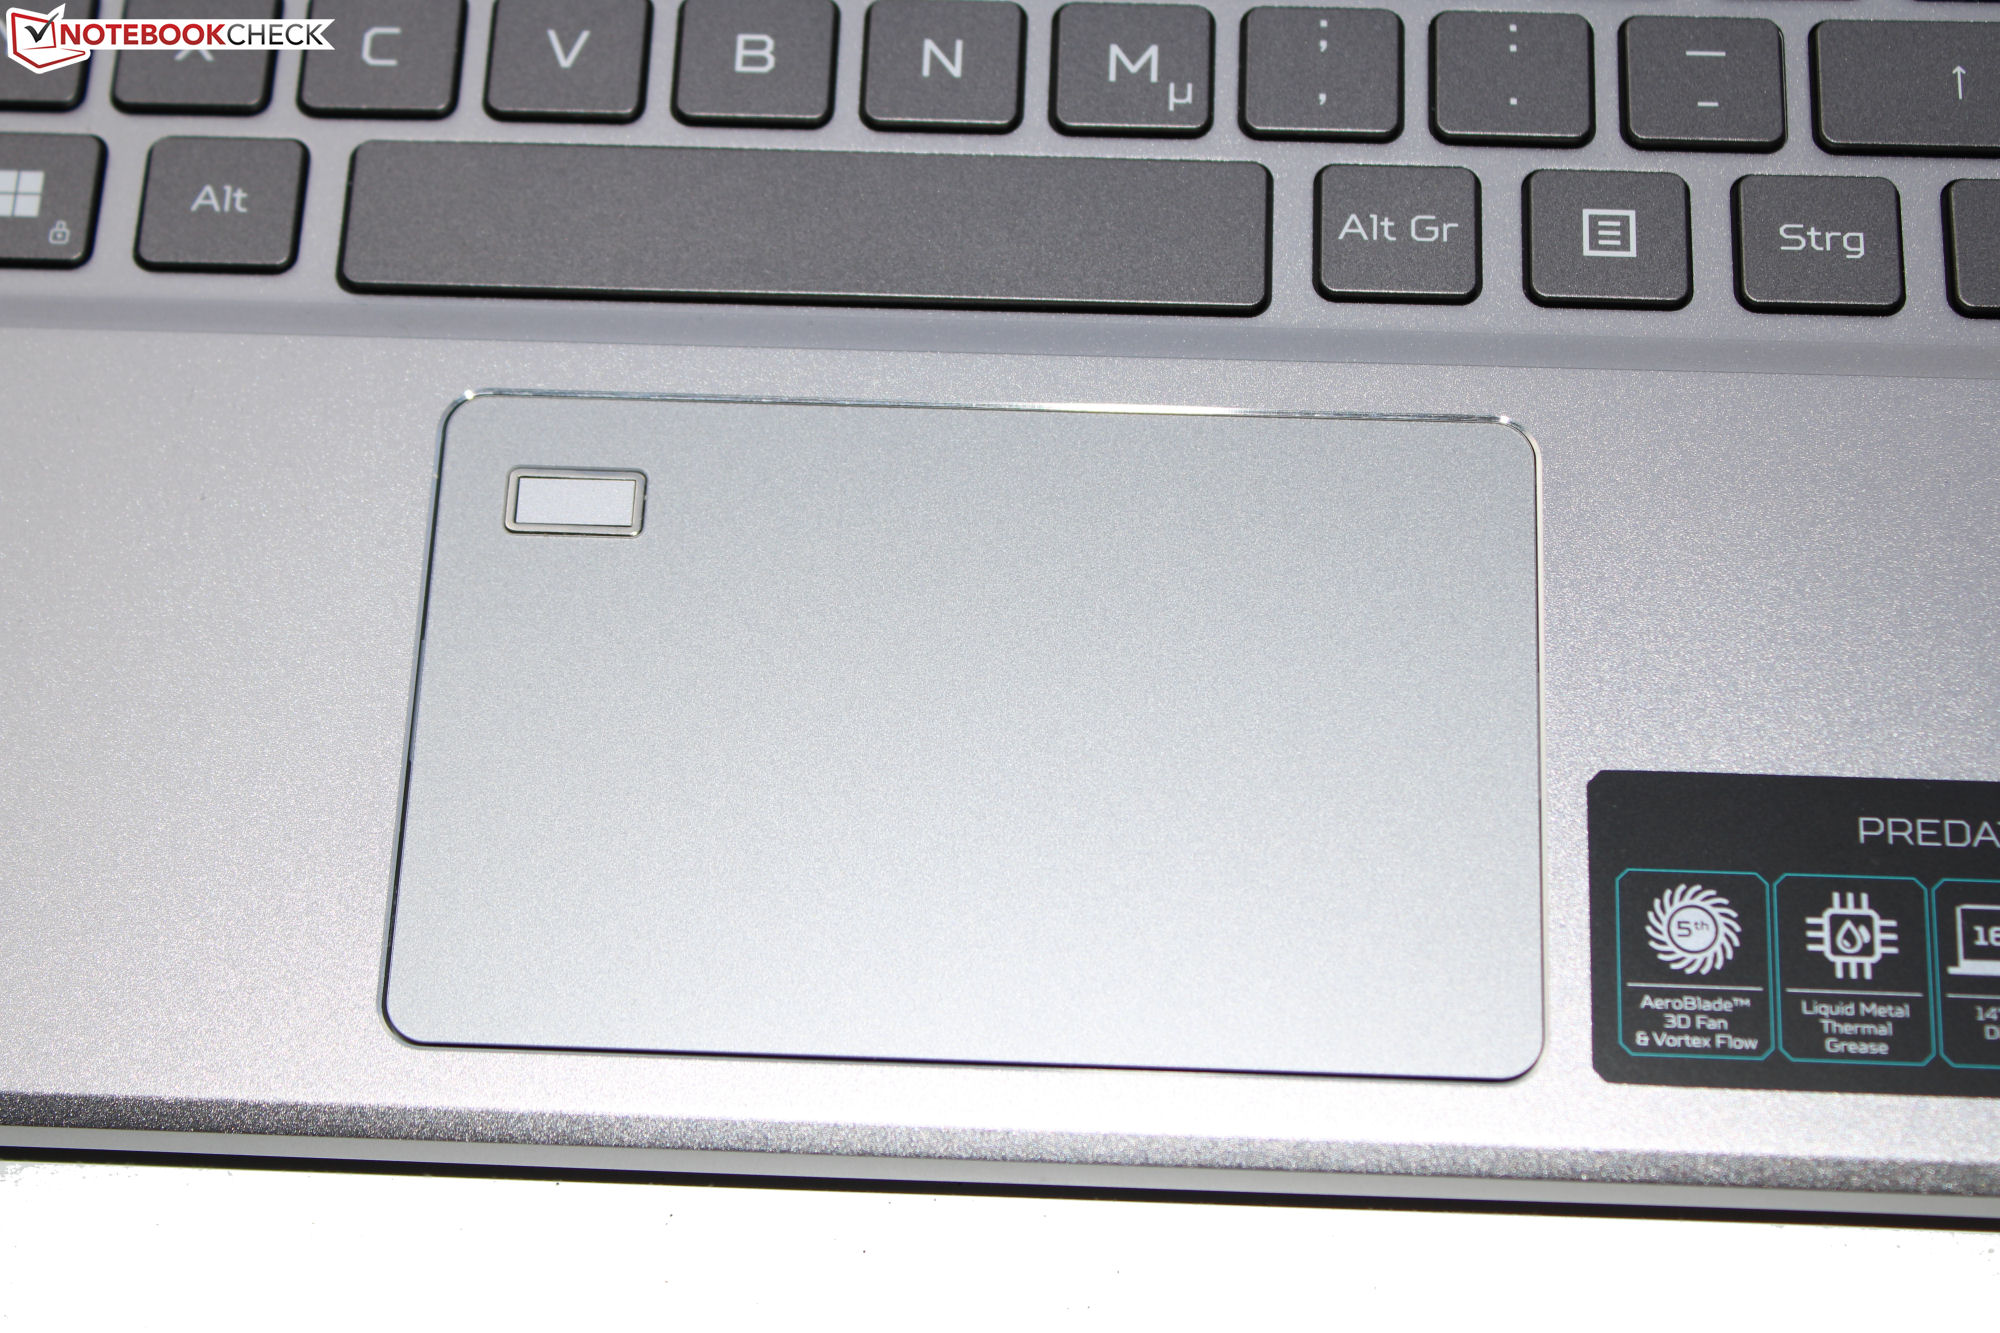
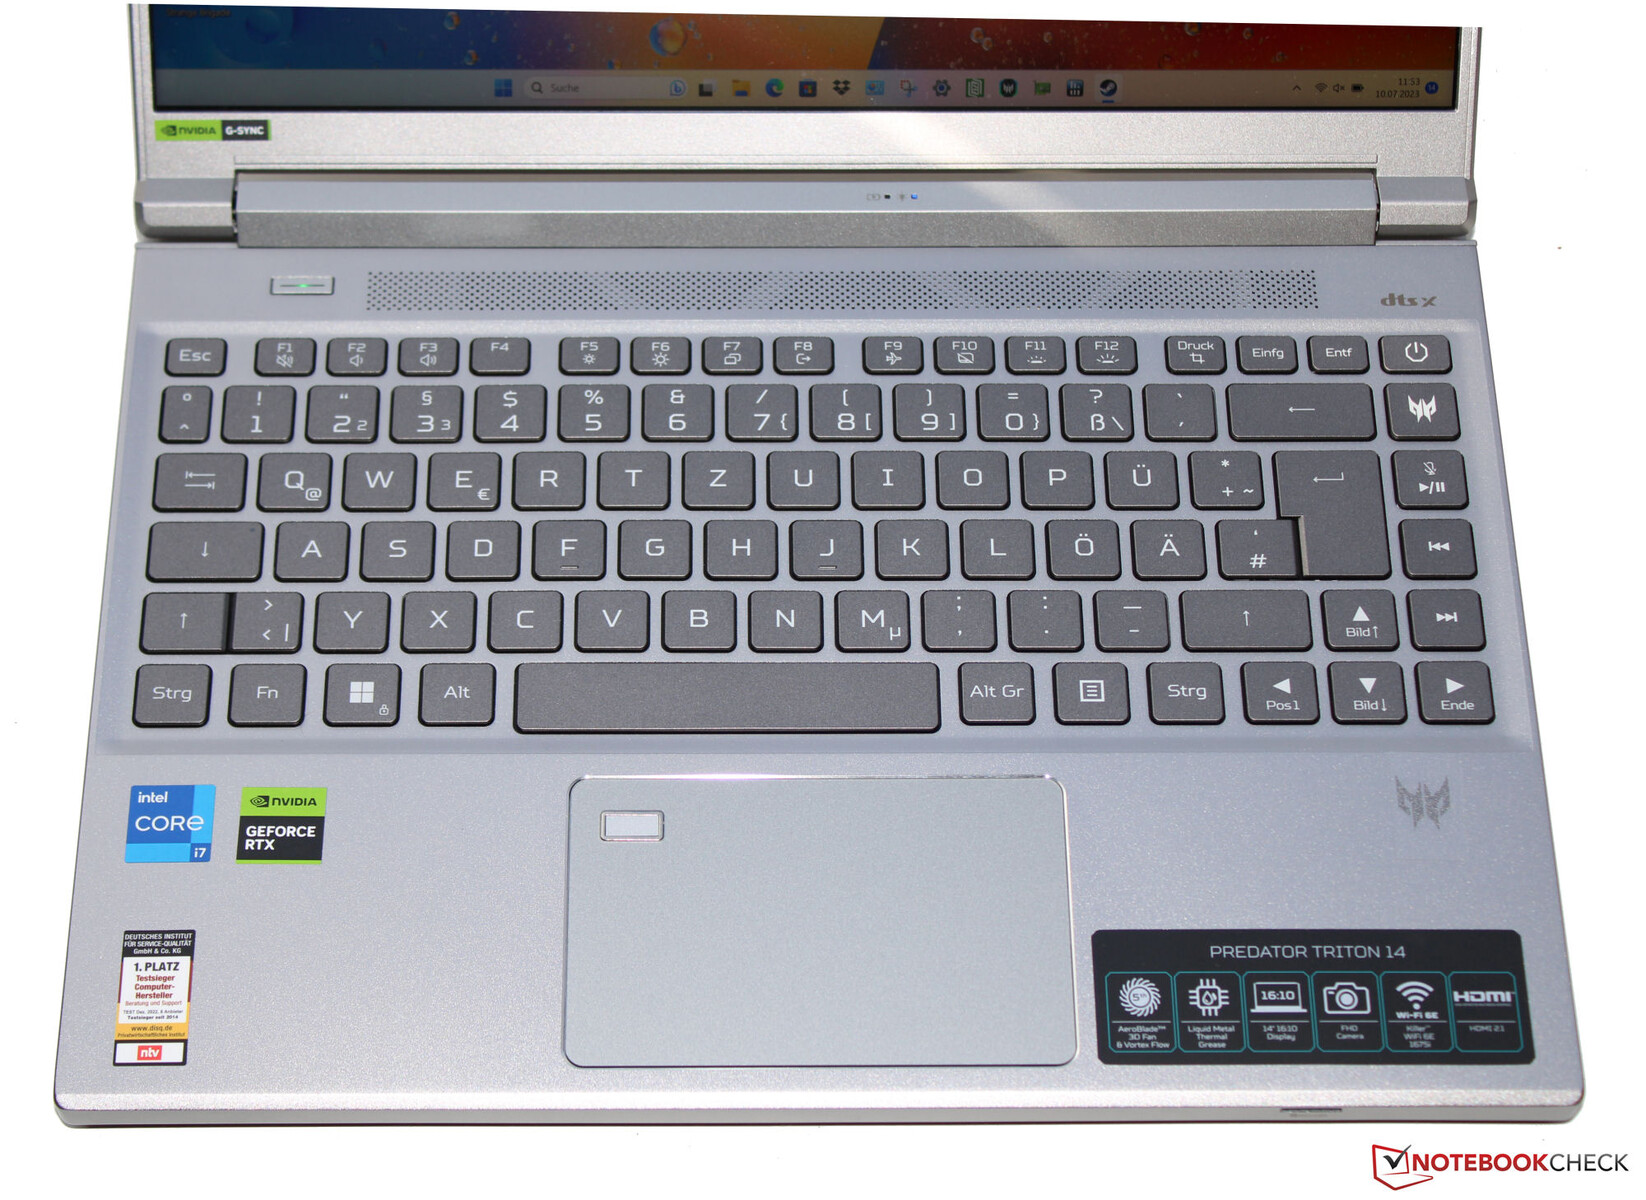
输入设备 - Acer Predator 配备 RGB 按键照明功能
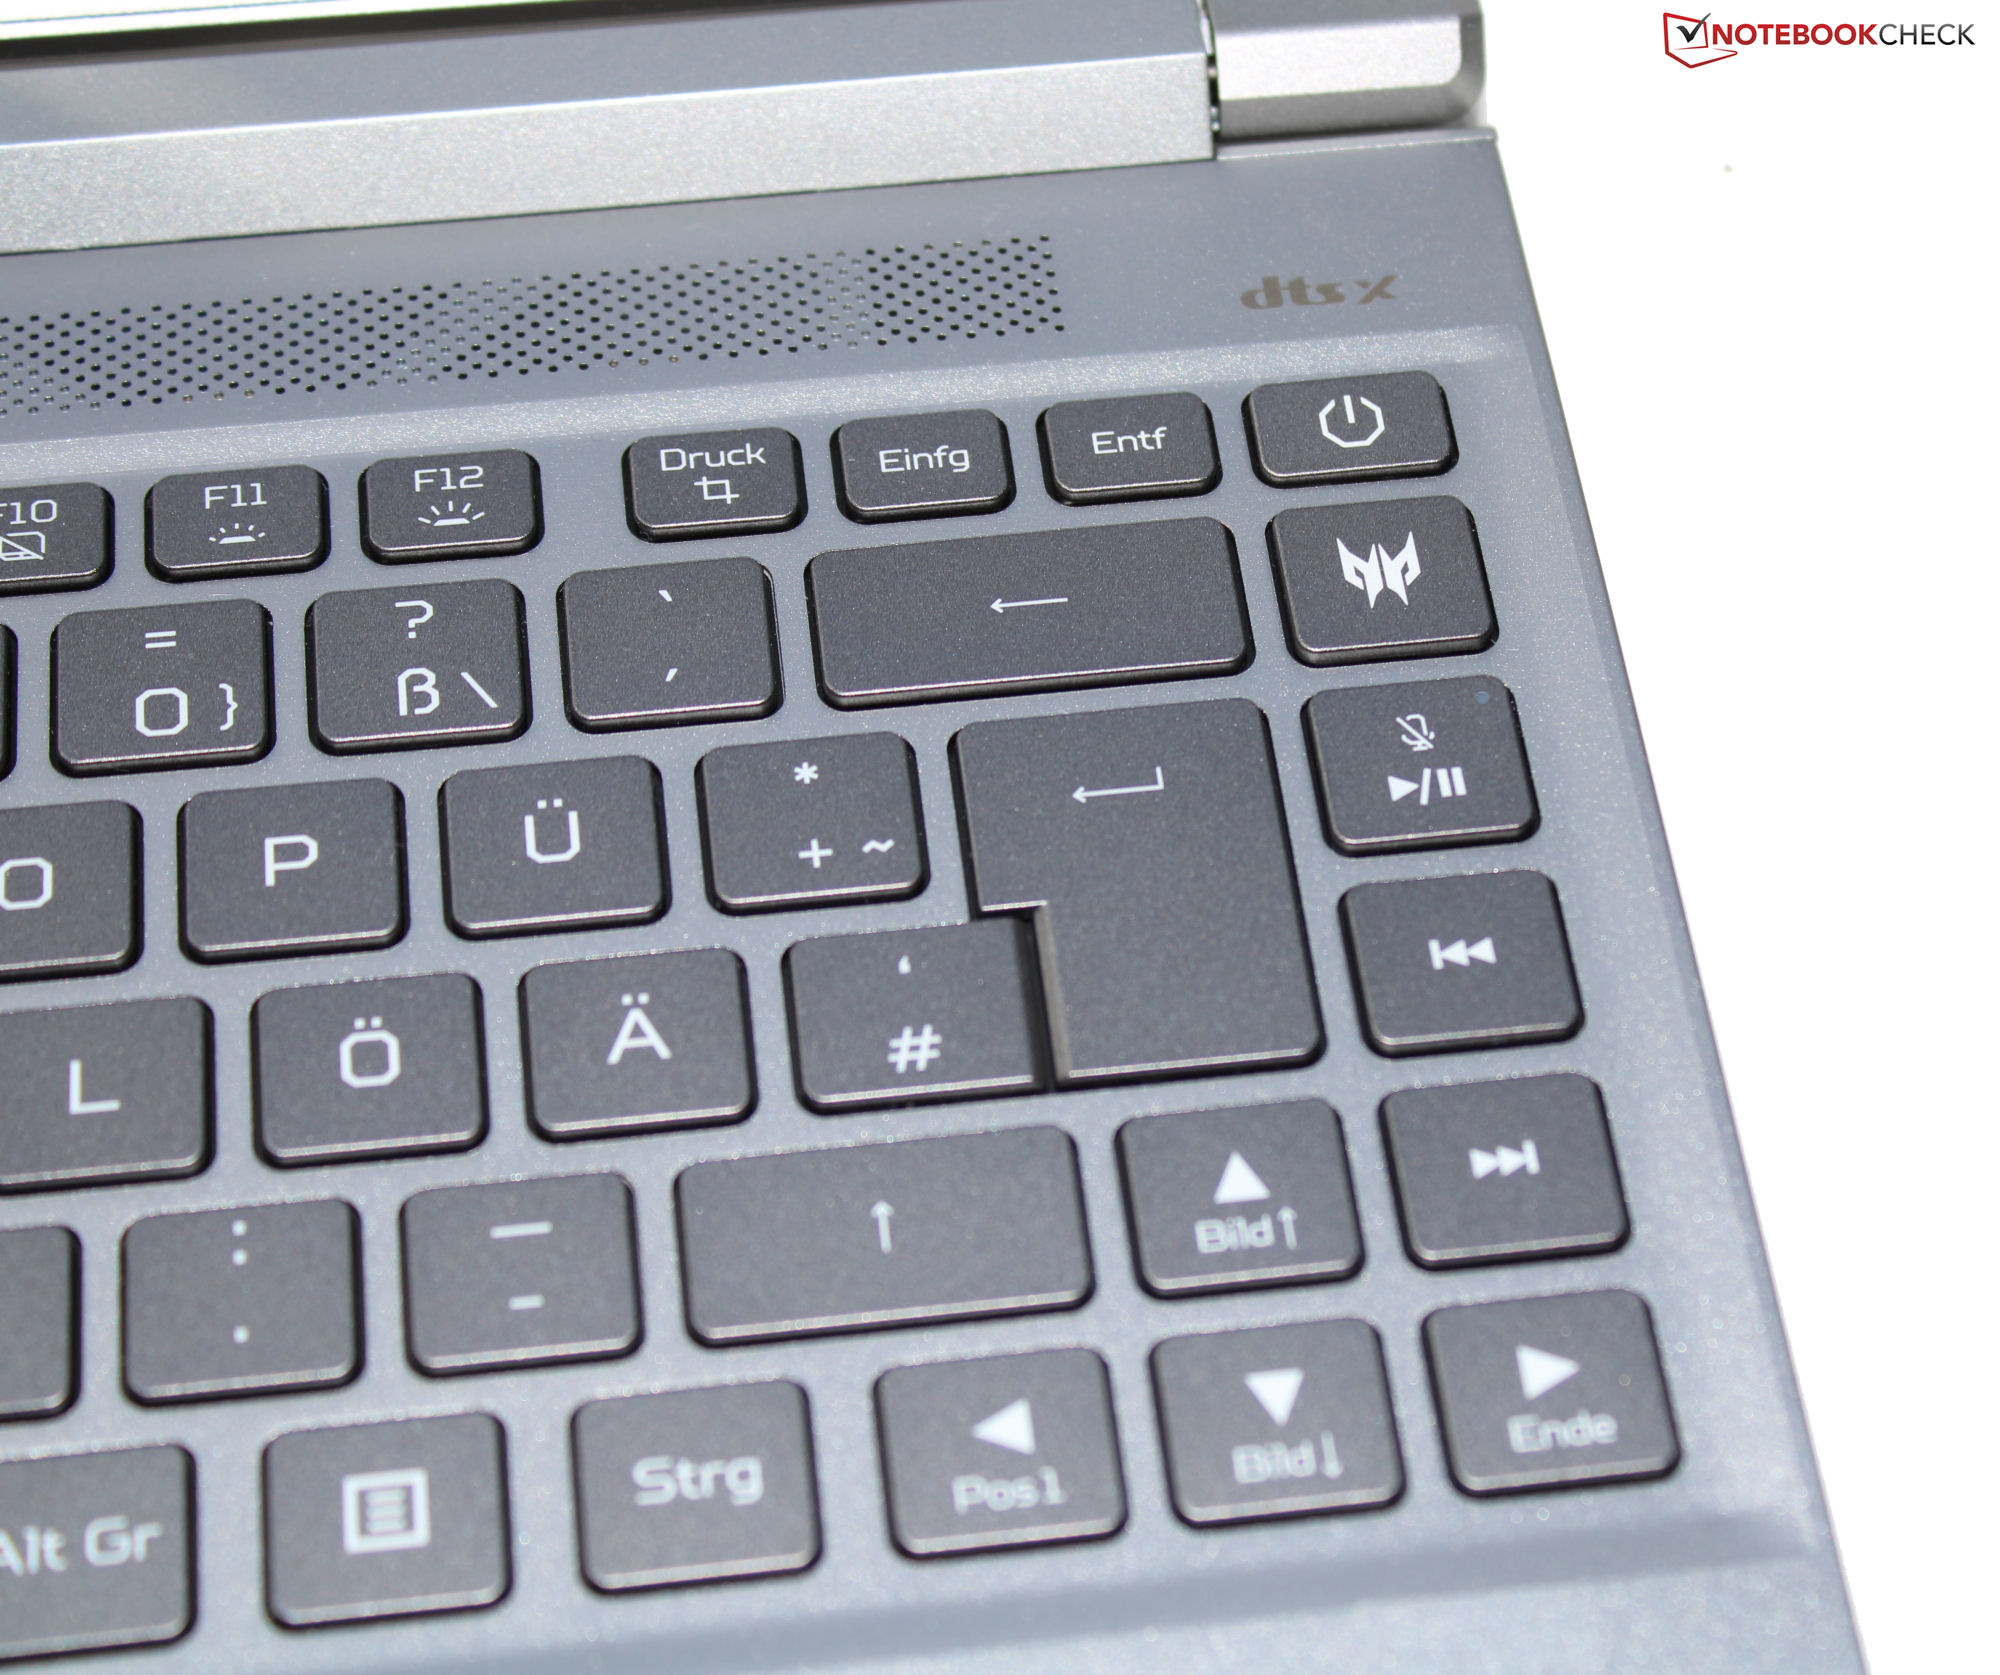
键盘
Chiclet 键盘的按键扁平光滑(RGB 灯光),键程短、按压点清晰、按键阻力小。键入时,键盘不会晃动。不错:四个方向键都是正常大小。总的来说,宏碁提供了一款适合日常使用的键盘。
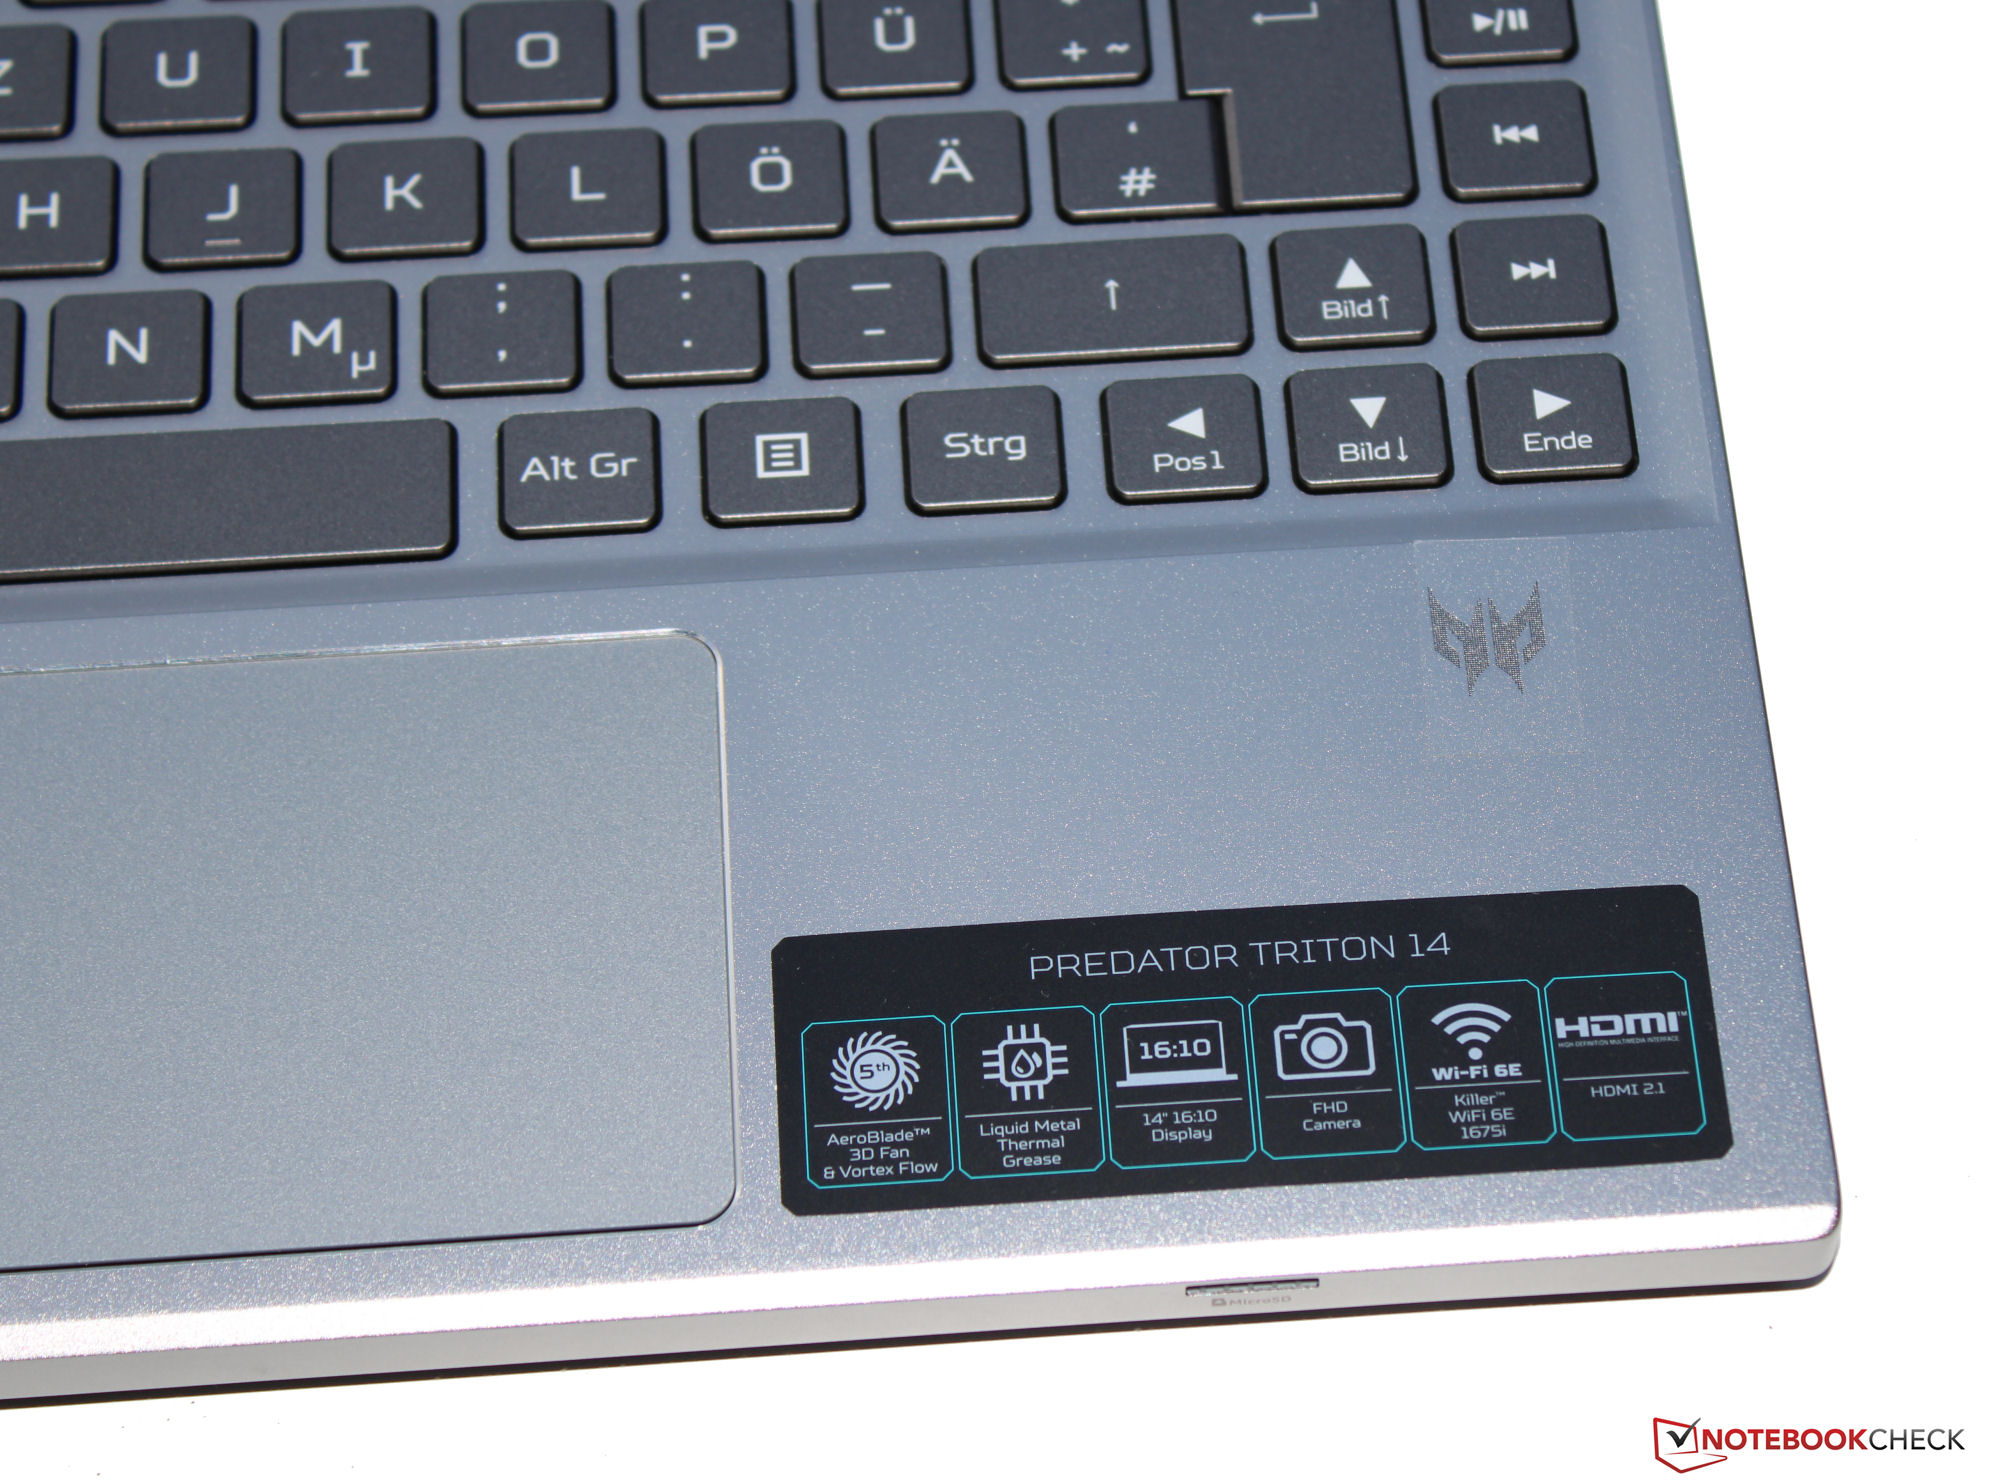
触摸板
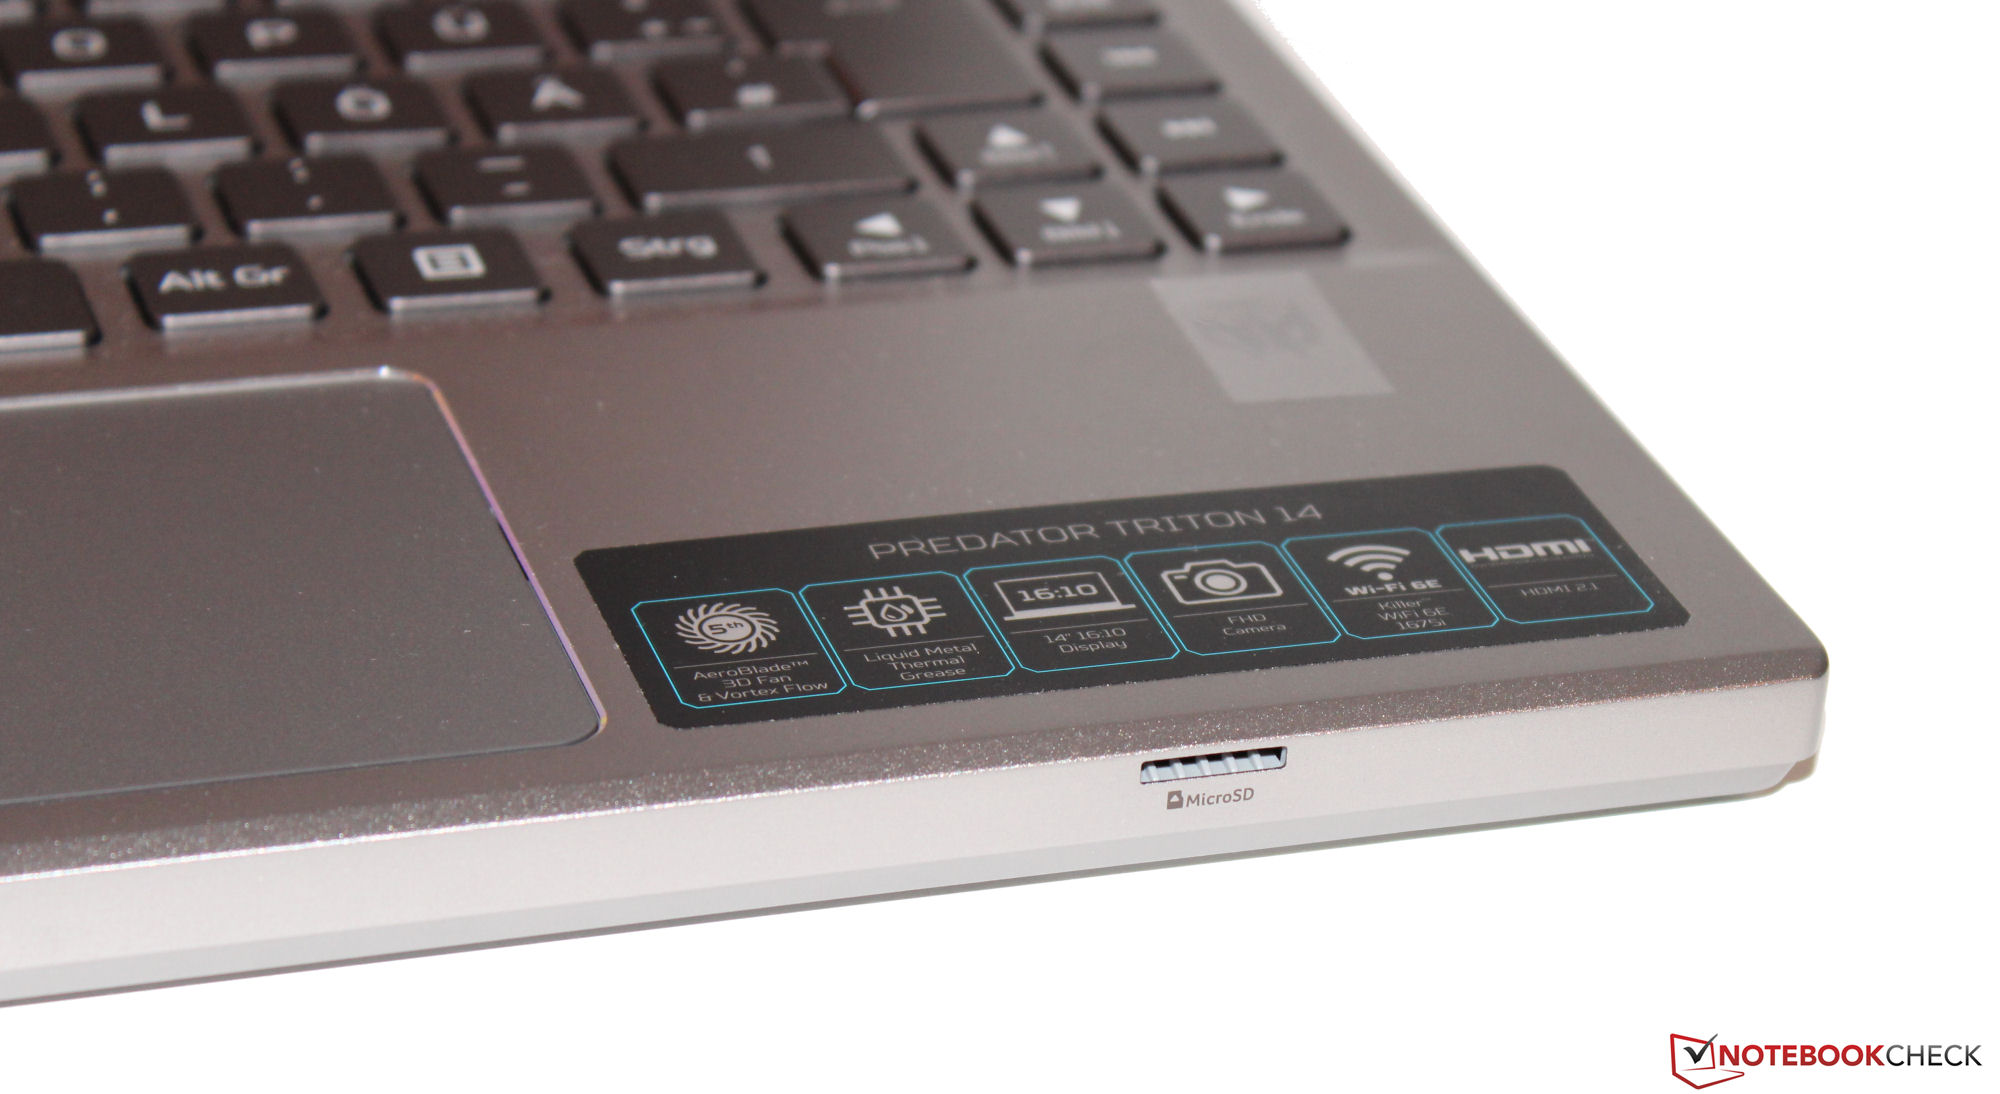
鼠标的另一种形式是具有多点触控功能的 Clickpad(约 10.5 x 6.5 厘米),用户的手指可以毫不费力地在其上滑动。它的行程短,压力点清晰明确。
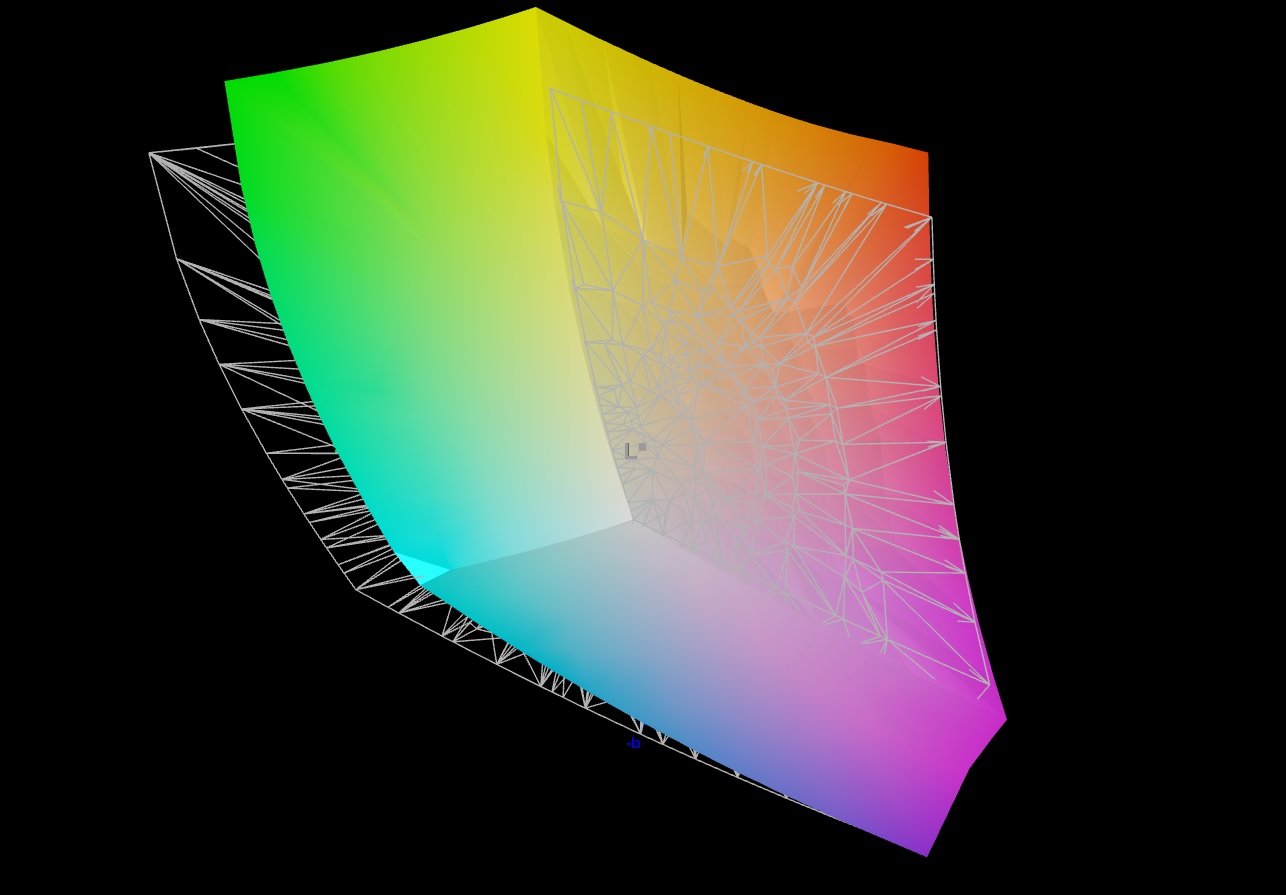
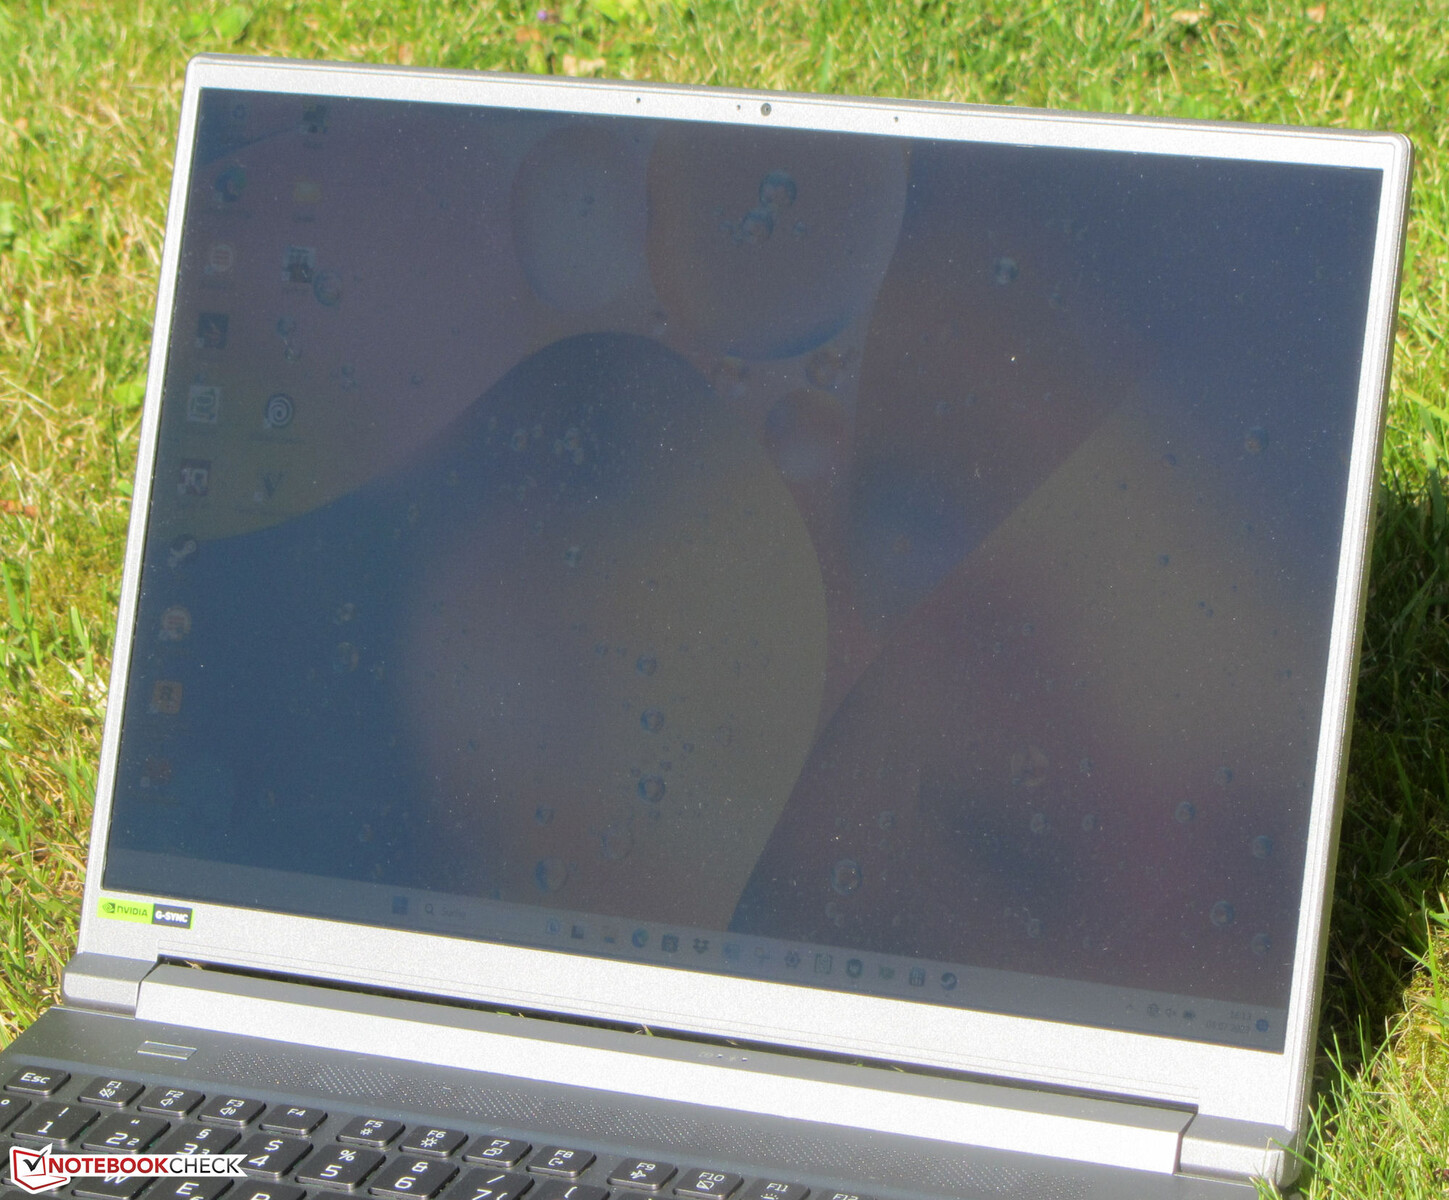
显示屏 - 非常明亮,色彩覆盖范围达到 DCI P3
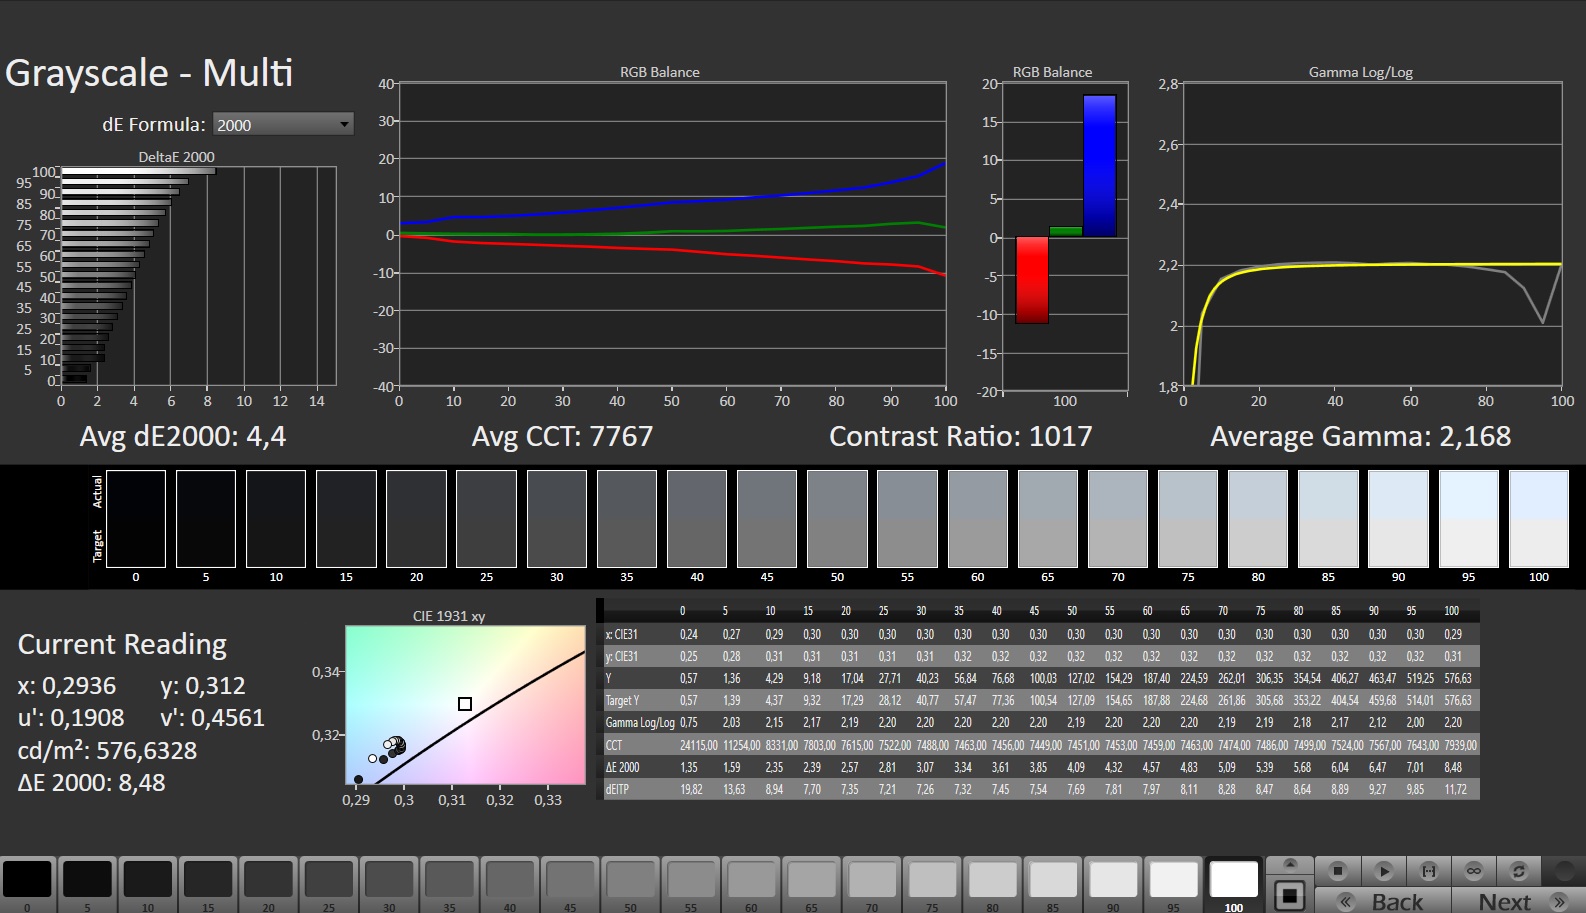
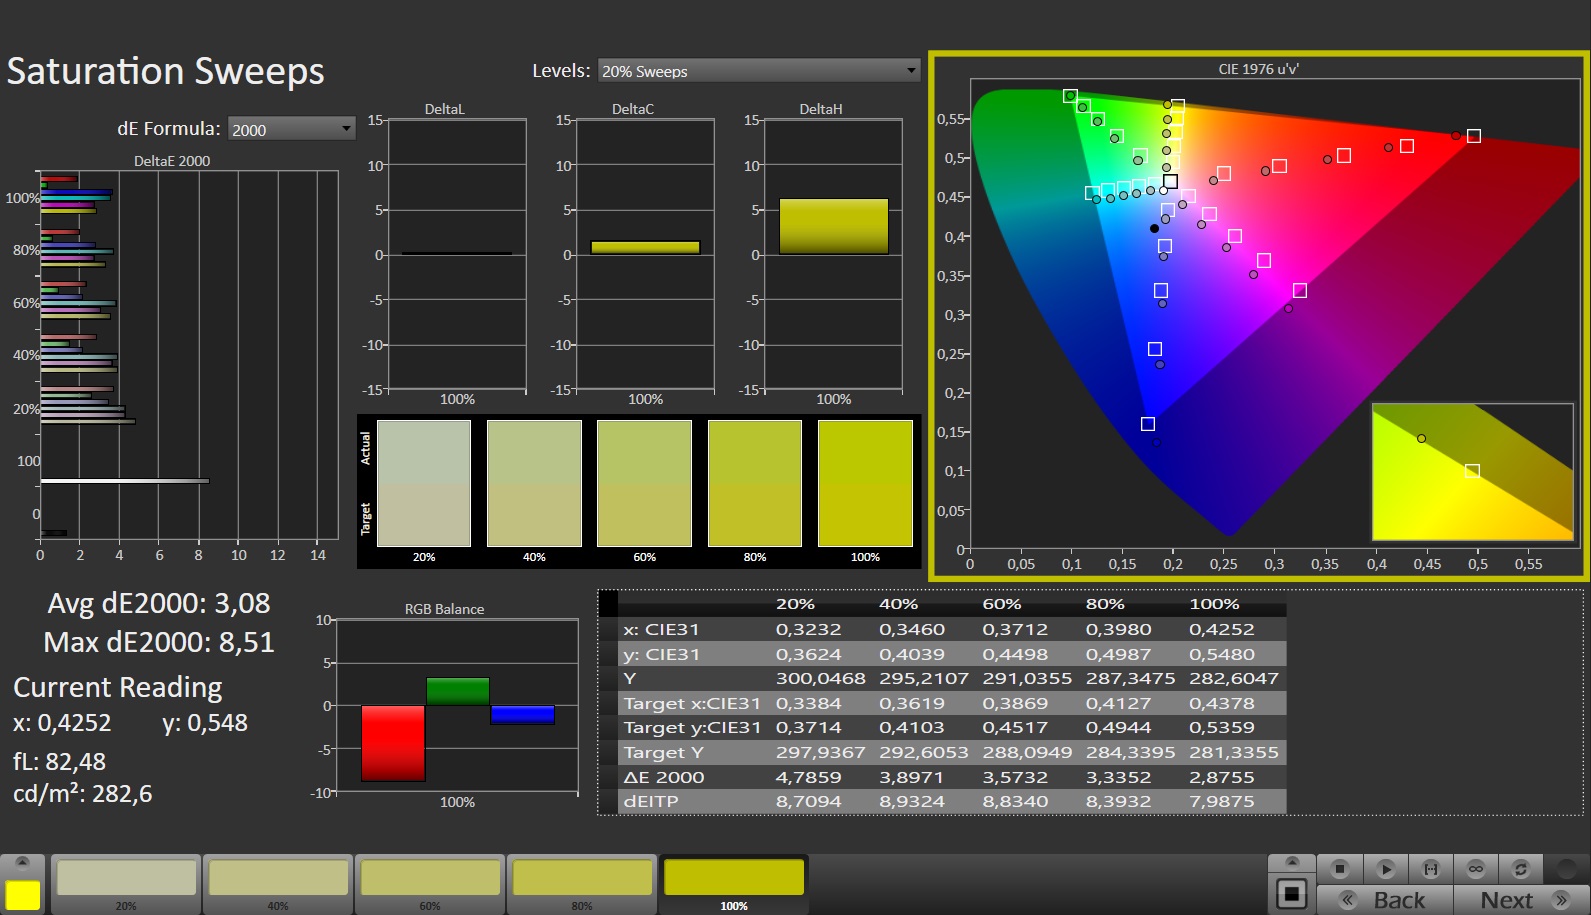
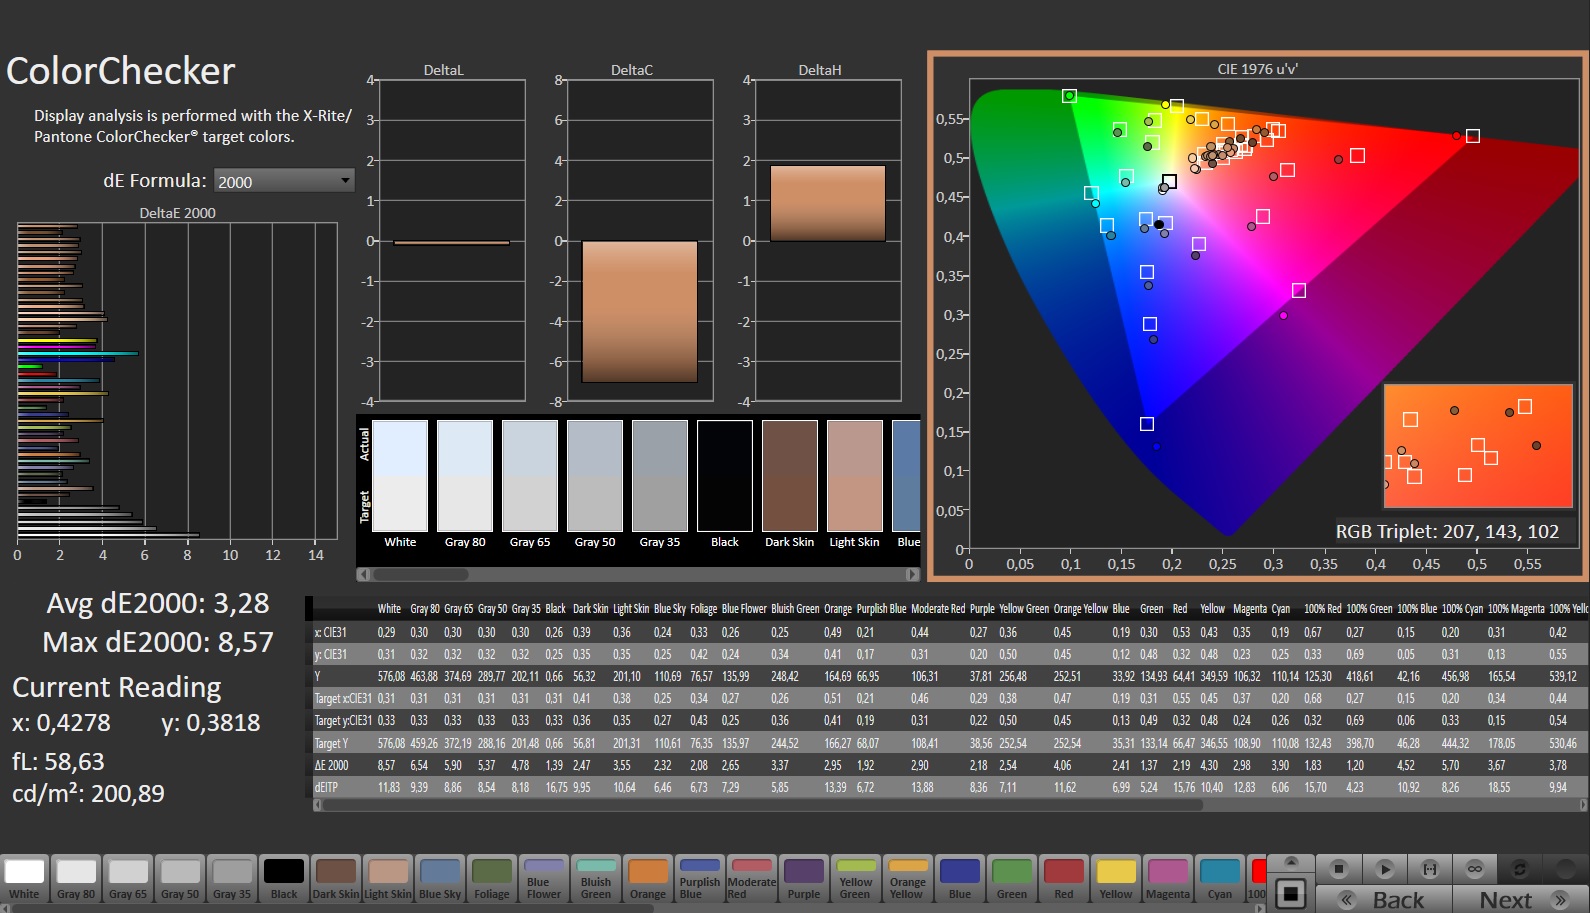
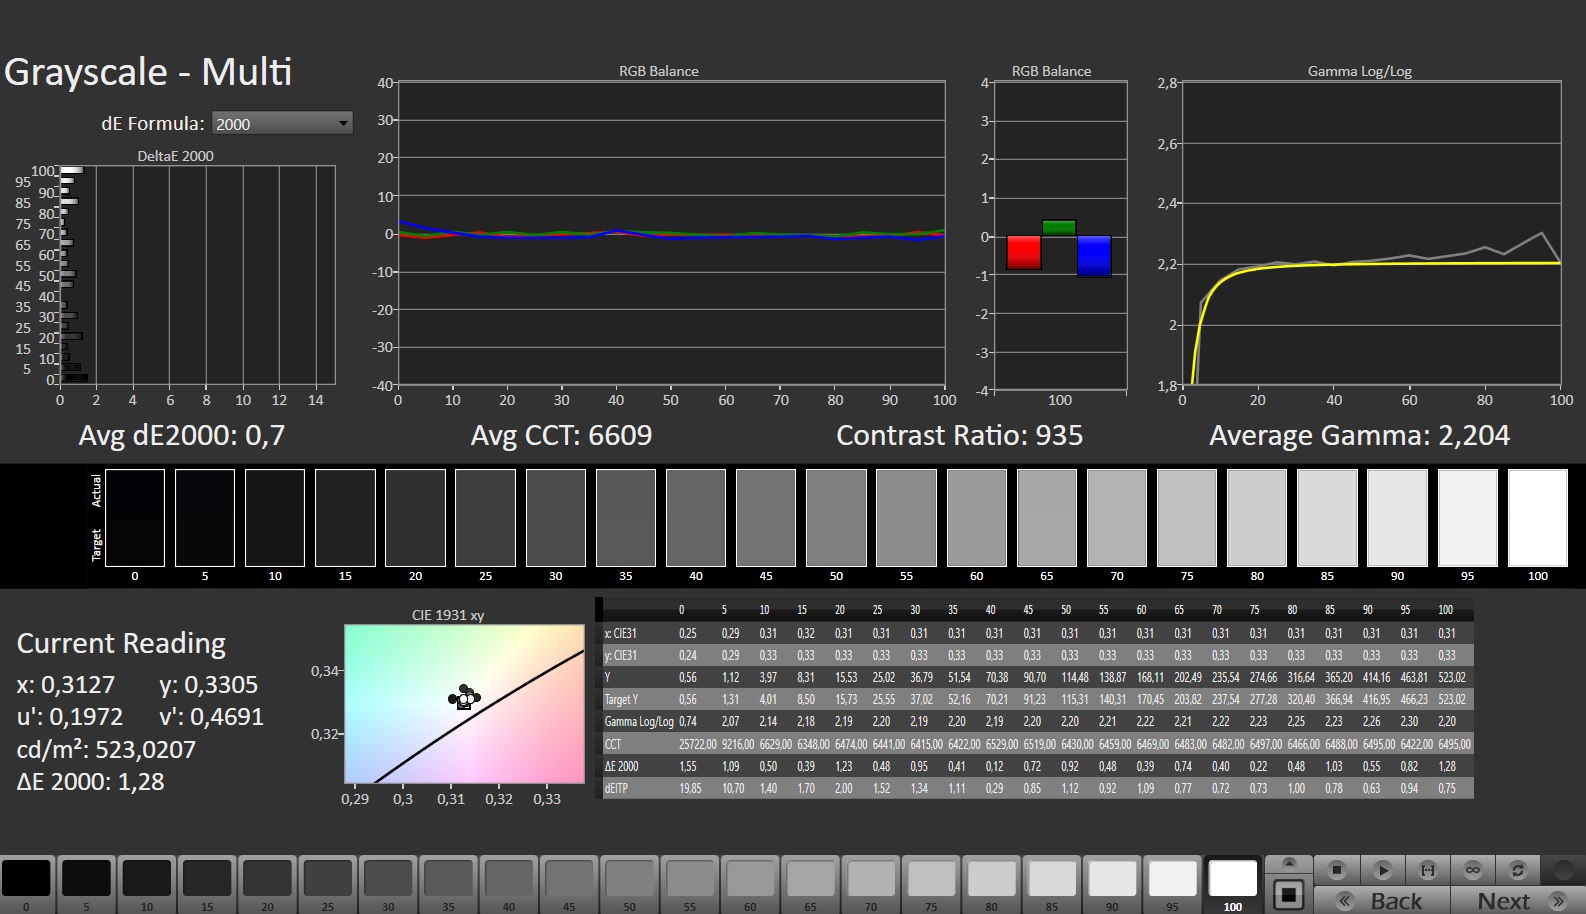
宏碁为其 Predator 配备了 14 英寸显示屏(2560 x 1600 像素),宽高比为 16:10,适合工作使用。从好的方面看,它支持 G-Sync,没有 PWM 闪烁,响应时间短,亮度高达(516.2 cd/m²)。对比度(944:1)与目标值(> 1.000:1)相差甚远。
另一款迷你 LED 显示屏(2,560 x 1,600 像素)的对比度应该会更高,并通过了 DisplayHDR 600 认证。
| |||||||||||||||||||||||||
Brightness Distribution: 88 %
Center on Battery: 547 cd/m²
Contrast: 977:1 (Black: 0.56 cd/m²)
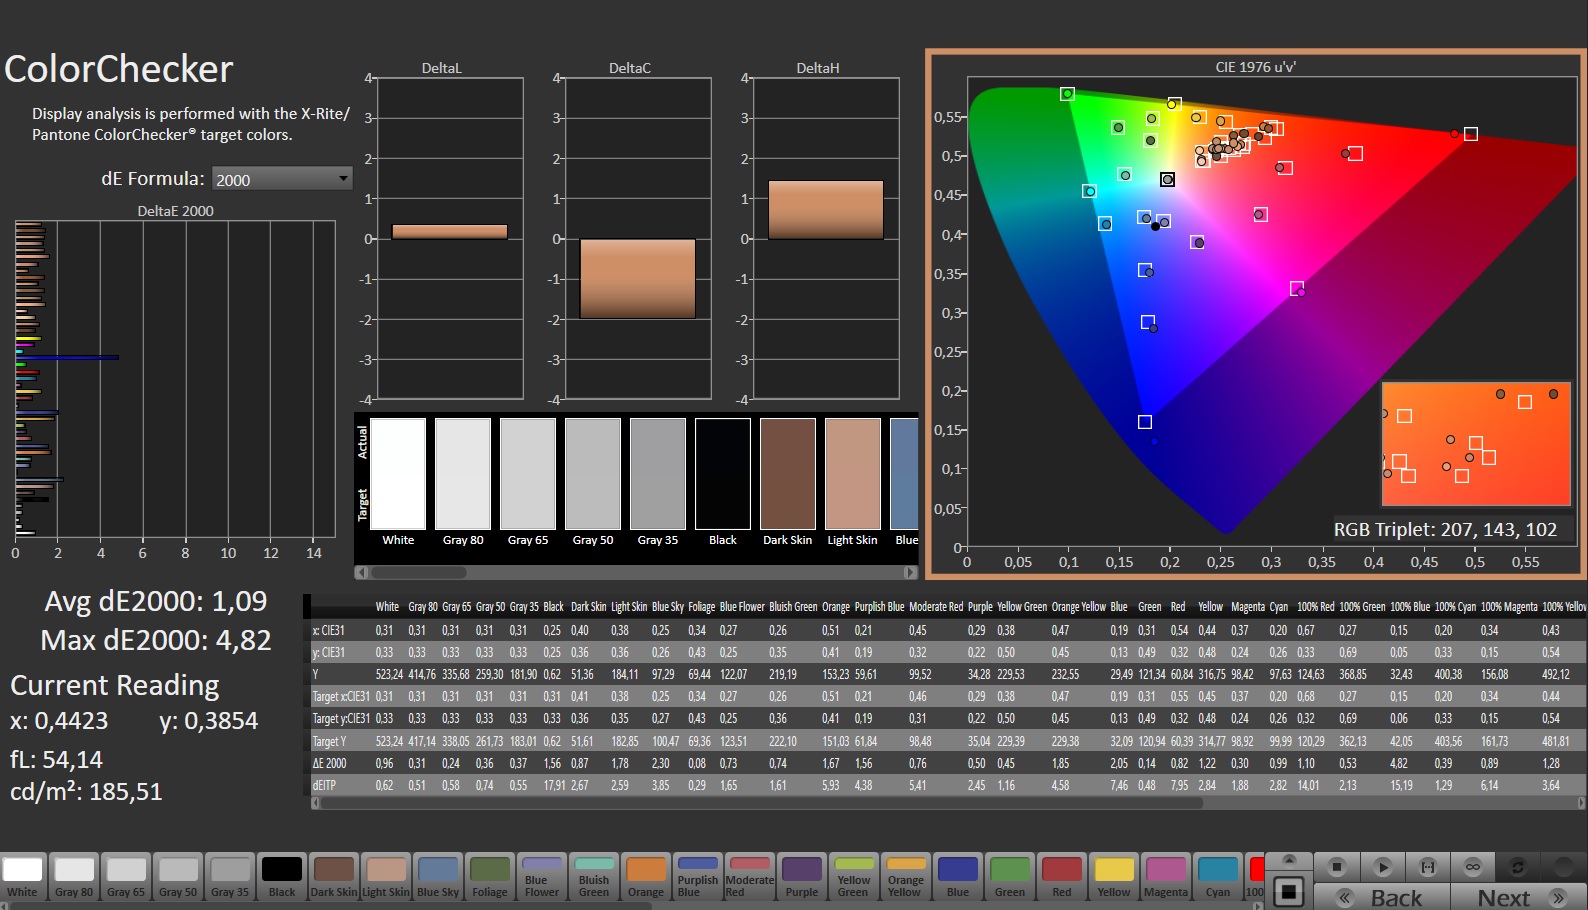
ΔE ColorChecker Calman: 3.28 | ∀{0.5-29.43 Ø4.71}
calibrated: 1.09
ΔE Greyscale Calman: 4.4 | ∀{0.09-98 Ø4.96}
85.5% AdobeRGB 1998 (Argyll 3D)
99.9% sRGB (Argyll 3D)
96.9% Display P3 (Argyll 3D)
Gamma: 2.168
CCT: 7767 K
| Acer Predator Triton 14 PT14-51 BOE NE140QDM-NY1, IPS, 2560x1600, 14" | Razer Blade 14 RTX 4070 AU Optronics B140QAN06.U, IPS, 2560x1600, 14" | Asus ROG Zephyrus G14 GA402RJ BOEhydis NE140QDM-NX1, IPS, 2560x1600, 14" | MSI Stealth 14 Studio A13V B140QAN06.T, IPS, 2560x1600, 14" | Gigabyte Aero 14 OLED BMF Samsung SDC4192 (ATNA40YK14-0), OLED, 2880x1800, 14" | Apple MacBook Pro 14 2023 M2 Pro Entry Mini-LED, 3024x1964, 14.2" | |
|---|---|---|---|---|---|---|
| Display | 0% | 0% | -0% | 2% | ||
| Display P3 Coverage (%) | 96.9 | 97.3 0% | 97.6 1% | 96.2 -1% | 99.8 3% | |
| sRGB Coverage (%) | 99.9 | 99.8 0% | 99.9 0% | 99.6 0% | 100 0% | |
| AdobeRGB 1998 Coverage (%) | 85.5 | 85.3 0% | 85.6 0% | 85.3 0% | 88.7 4% | |
| Response Times | -9% | 21% | 32% | 72% | ||
| Response Time Grey 50% / Grey 80% * (ms) | 15.1 ? | 11.9 ? 21% | 8.3 ? 45% | 5.5 ? 64% | 2.4 ? 84% | |
| Response Time Black / White * (ms) | 5.8 ? | 8 ? -38% | 6 ? -3% | 5.8 ? -0% | 2.4 ? 59% | |
| PWM Frequency (Hz) | 26191 ? | 300 | ||||
| Screen | 3% | 12% | 9% | 70% | ||
| Brightness middle (cd/m²) | 547 | 559.3 2% | 500 -9% | 419 -23% | 423 -23% | |
| Brightness (cd/m²) | 516 | 560 9% | 470 -9% | 402 -22% | 427 -17% | |
| Brightness Distribution (%) | 88 | 88 0% | 85 -3% | 89 1% | 98 11% | |
| Black Level * (cd/m²) | 0.56 | 0.44 21% | 0.42 25% | 0.43 23% | 0.1 82% | |
| Contrast (:1) | 977 | 1271 30% | 1190 22% | 974 0% | 4230 333% | |
| Colorchecker dE 2000 * | 3.28 | 4.44 -35% | 2.45 25% | 2.3 30% | 0.55 83% | |
| Colorchecker dE 2000 max. * | 8.57 | 9.3 -9% | 5.34 38% | 5.8 32% | 1.15 87% | |
| Colorchecker dE 2000 calibrated * | 1.09 | 0.39 64% | 1.2 -10% | 0.9 17% | 1.15 -6% | |
| Greyscale dE 2000 * | 4.4 | 6.8 -55% | 3.1 30% | 3.3 25% | 0.69 84% | |
| Gamma | 2.168 101% | 2.3 96% | 2.213 99% | 2.14 103% | 2.42 91% | |
| CCT | 7767 84% | 6242 104% | 7251 90% | 6550 99% | 6479 100% | |
| Total Average (Program / Settings) | -2% /
1% | 11% /
11% | 14% /
10% | 48% /
56% |
* ... smaller is better
开箱后,屏幕的色彩还原效果不错:偏差约为 3.3,与目标值(DeltaE < 3)相差无几。校准后,该值降至 1.1,并确保灰度平衡。色彩准确:该面板完全再现了 sRGB 和 DCI P3 色彩空间,AdobeRGB 空间的再现率为 86%。竞争对手的屏幕也是如此。
我们创建了自己的色彩配置文件,可以下载使用。在 "显示 "收件箱中可以找到相关链接。


Display Response Times
| ↔ Response Time Black to White | ||
|---|---|---|
| 5.8 ms ... rise ↗ and fall ↘ combined | ↗ 2.1 ms rise | 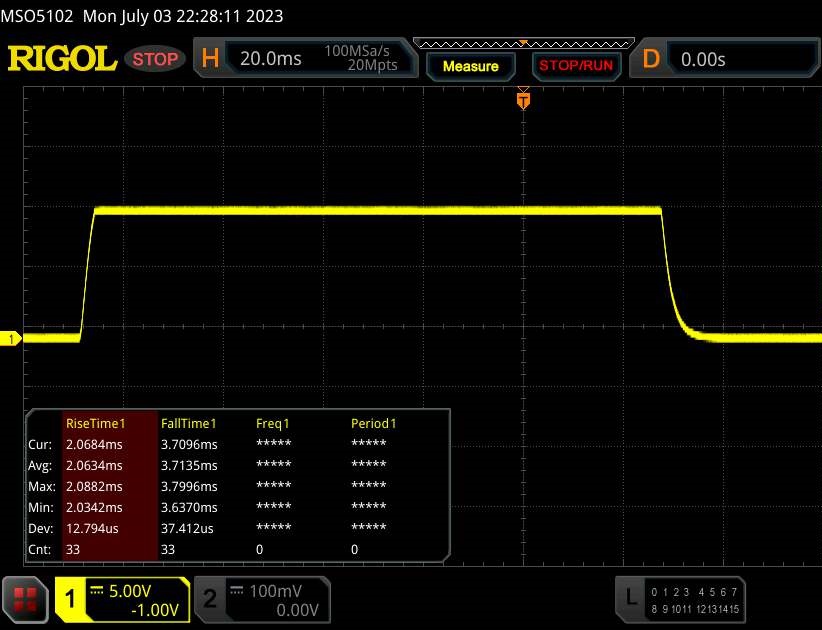 |
| ↘ 3.7 ms fall | ||
| The screen shows very fast response rates in our tests and should be very well suited for fast-paced gaming. In comparison, all tested devices range from 0.1 (minimum) to 240 (maximum) ms. » 18 % of all devices are better. This means that the measured response time is better than the average of all tested devices (19.8 ms). | ||
| ↔ Response Time 50% Grey to 80% Grey | ||
| 15.1 ms ... rise ↗ and fall ↘ combined | ↗ 6.8 ms rise | 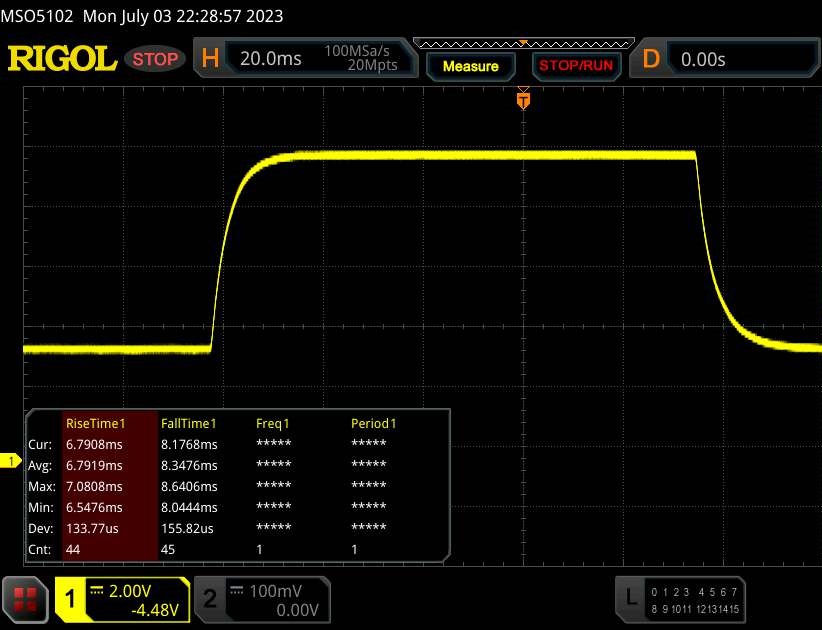 |
| ↘ 8.3 ms fall | ||
| The screen shows good response rates in our tests, but may be too slow for competitive gamers. In comparison, all tested devices range from 0.165 (minimum) to 636 (maximum) ms. » 29 % of all devices are better. This means that the measured response time is better than the average of all tested devices (31 ms). | ||
Screen Flickering / PWM (Pulse-Width Modulation)
| Screen flickering / PWM not detected | 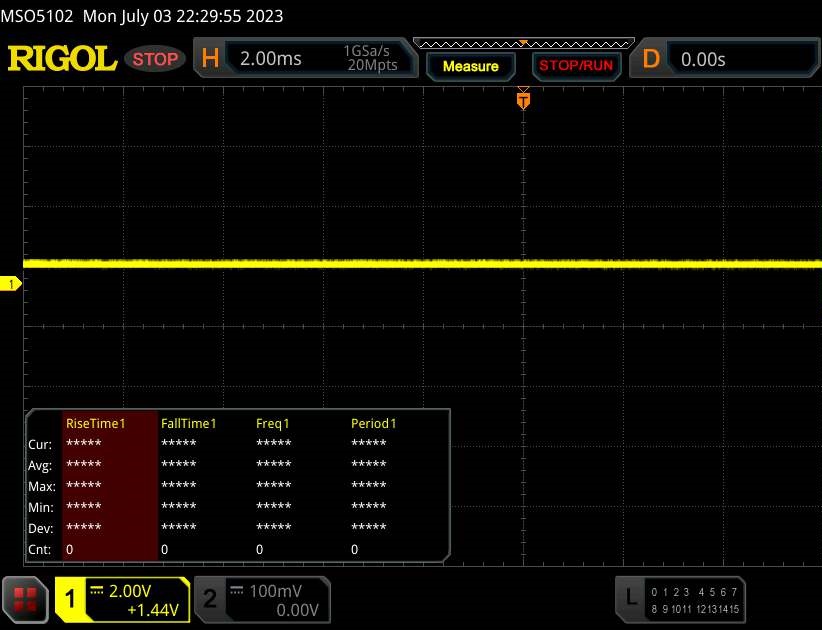 | ||
In comparison: 52 % of all tested devices do not use PWM to dim the display. If PWM was detected, an average of 7754 (minimum: 5 - maximum: 343500) Hz was measured. | |||
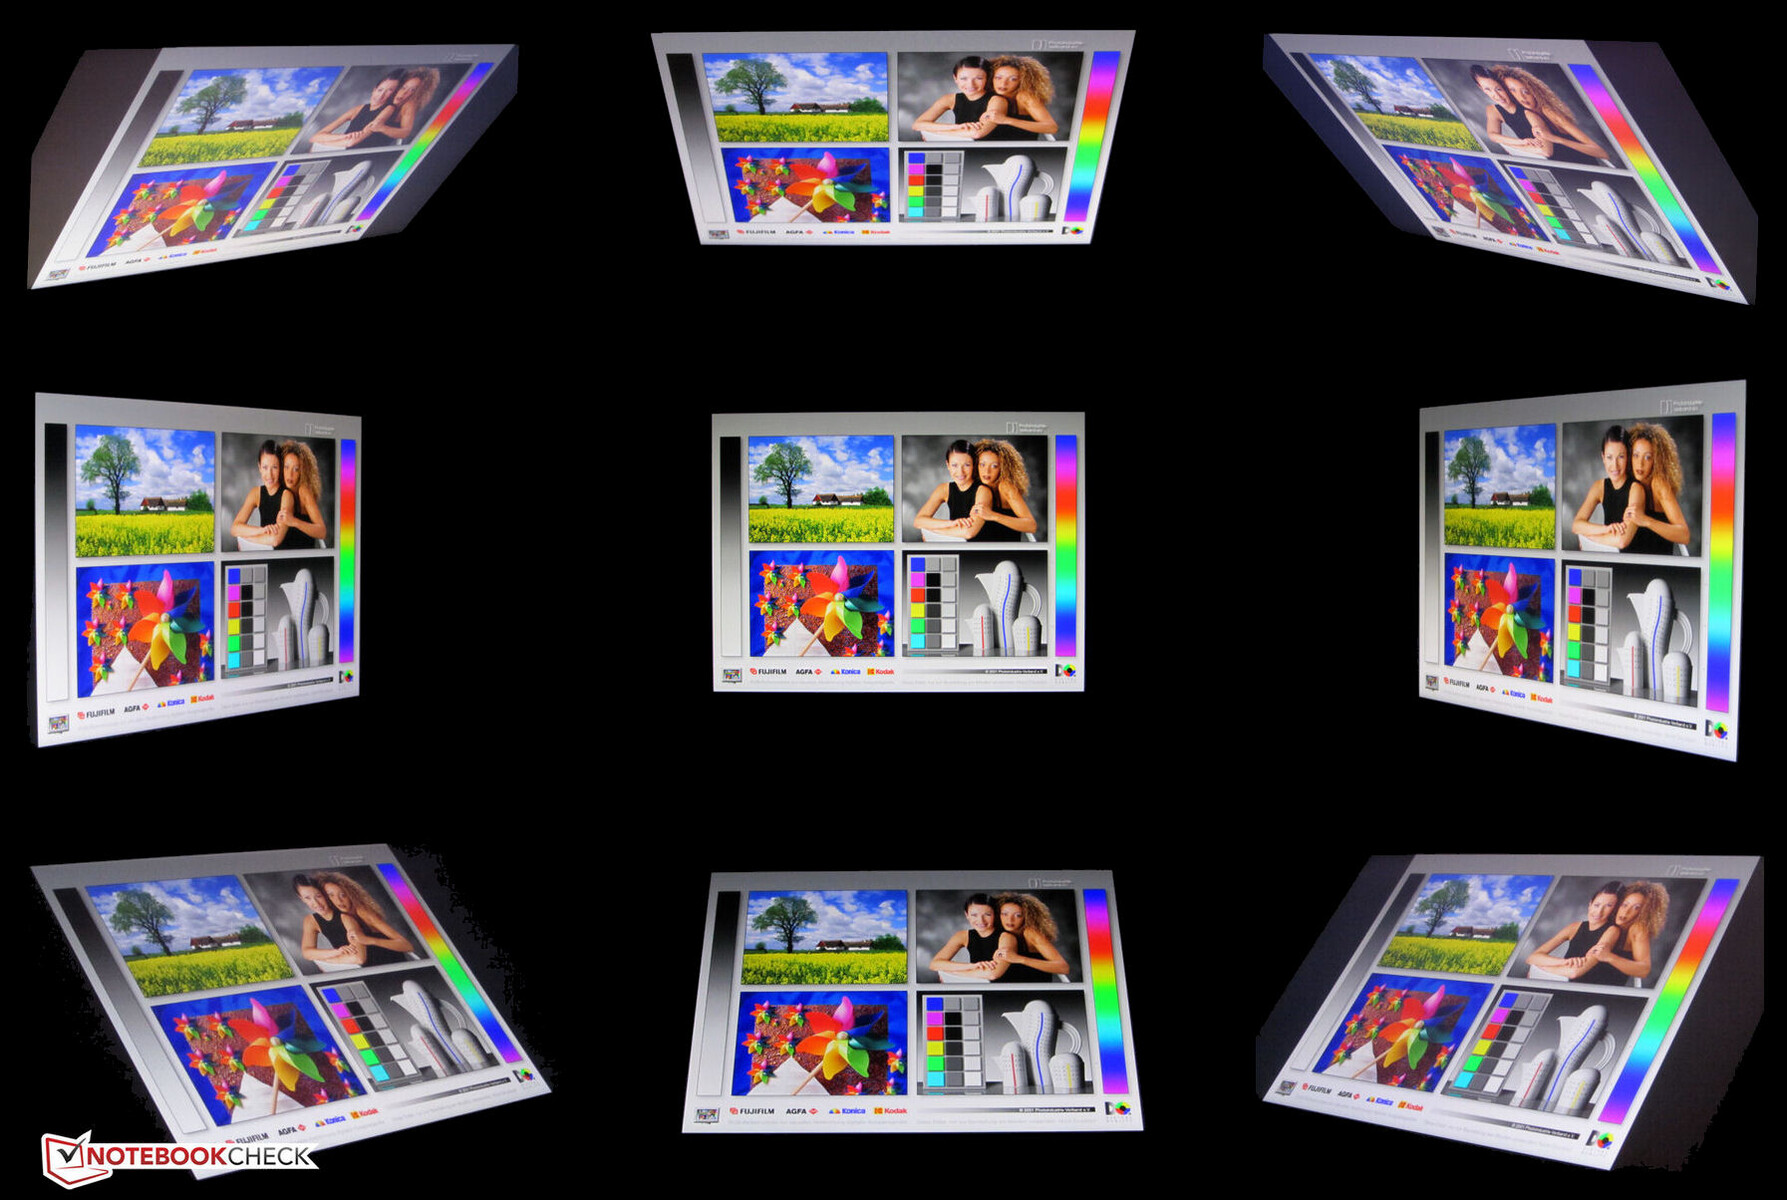
IPS 面板具有稳定的视角,在任何位置都清晰可辨。由于显示屏亮度高,在室外也能观看。
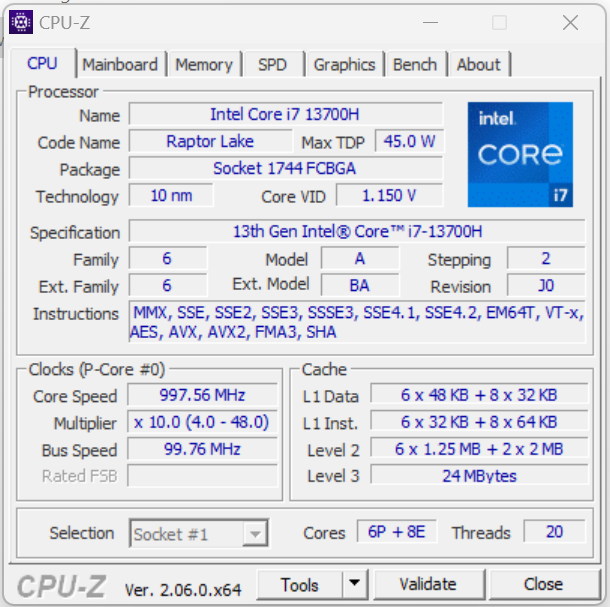
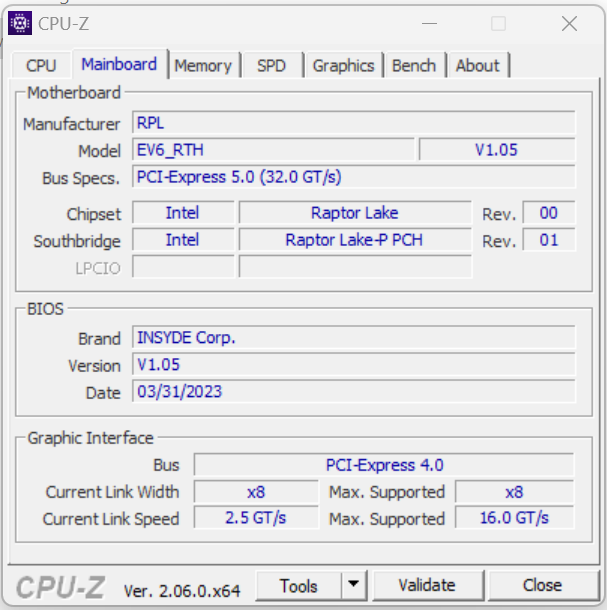
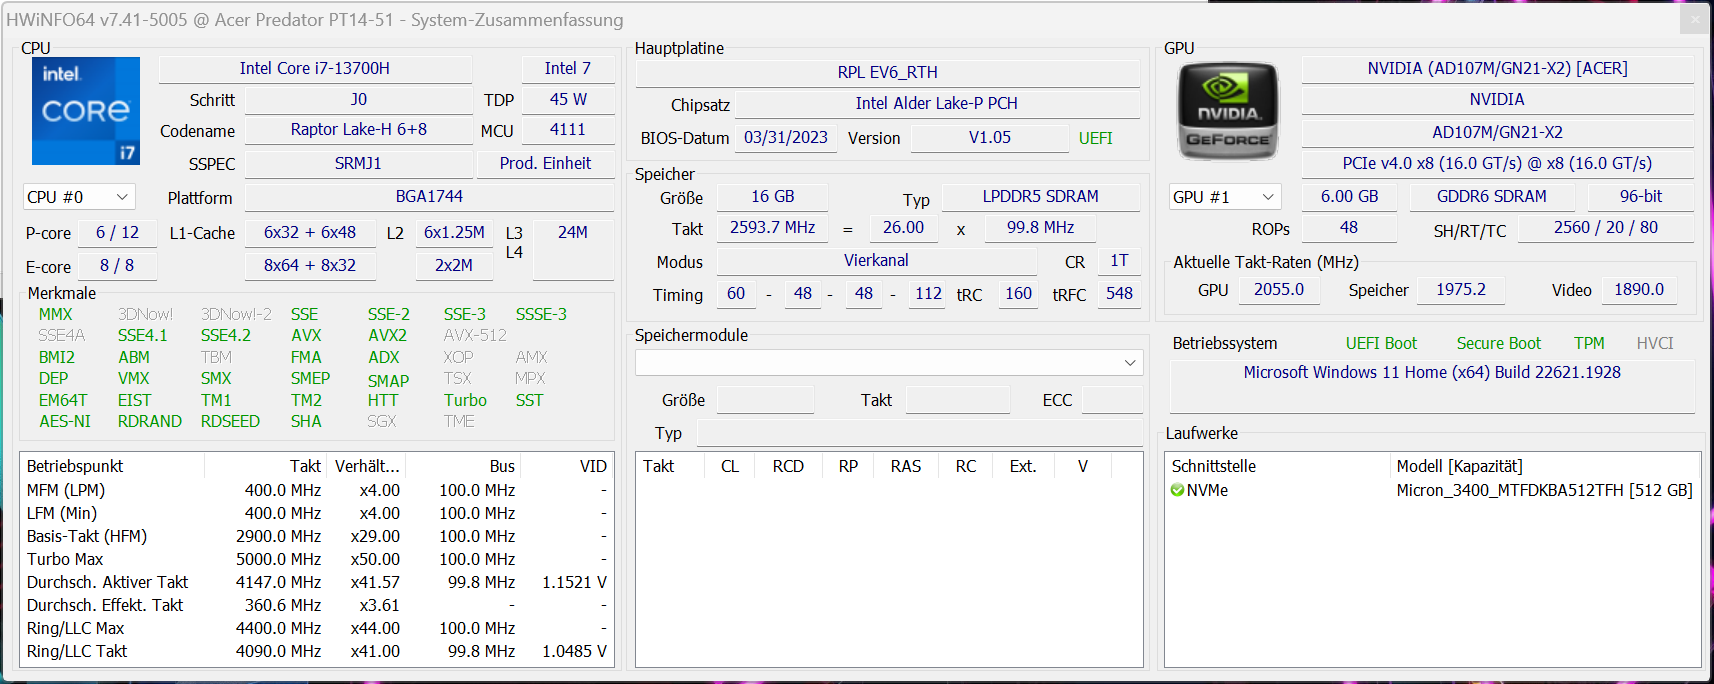
性能 - Raptor Lake 和 Ada Lovelace 为宏碁笔记本电脑提供动力
凭借 Predator Triton 14,宏碁推出了一款专为游戏和渲染设计的 14 英寸笔记本电脑。配置酷睿 i7-13700H和 GeForce RTX 4050提供了必要的计算能力。性能更强的机型配备了 GeForce RTX 4070。
测试条件
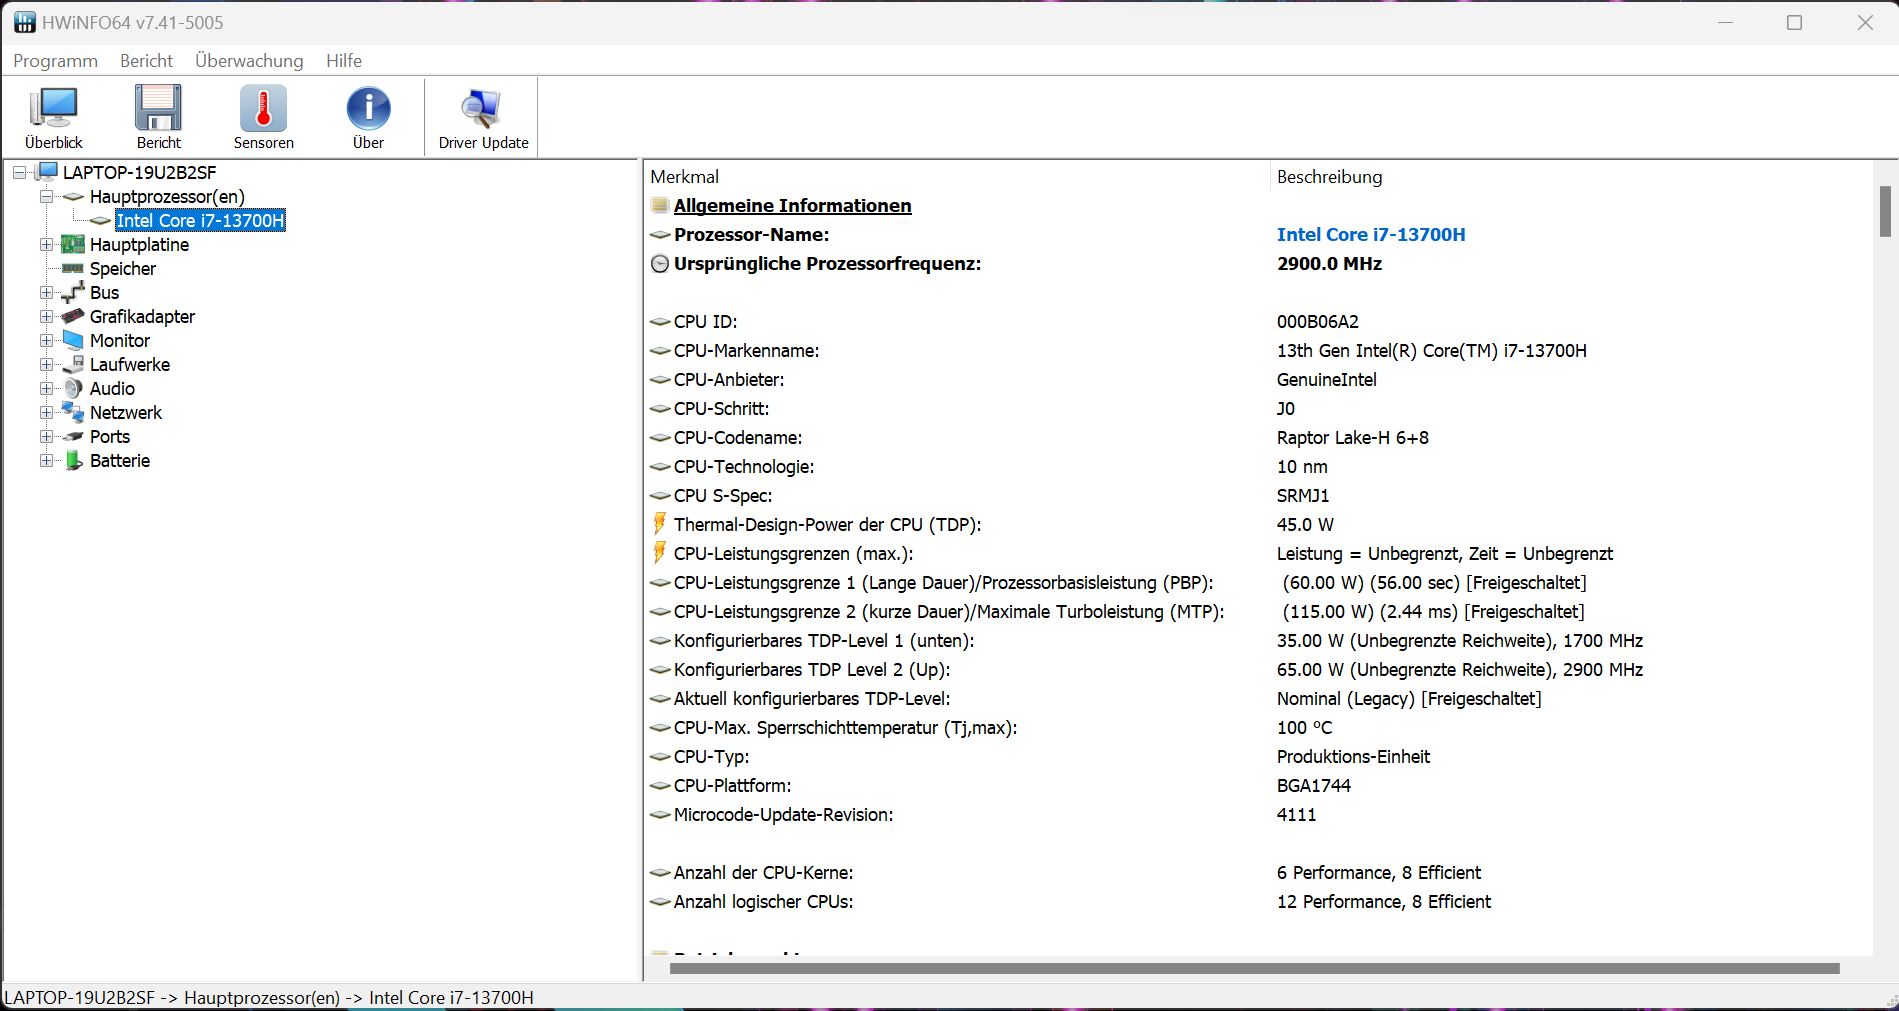
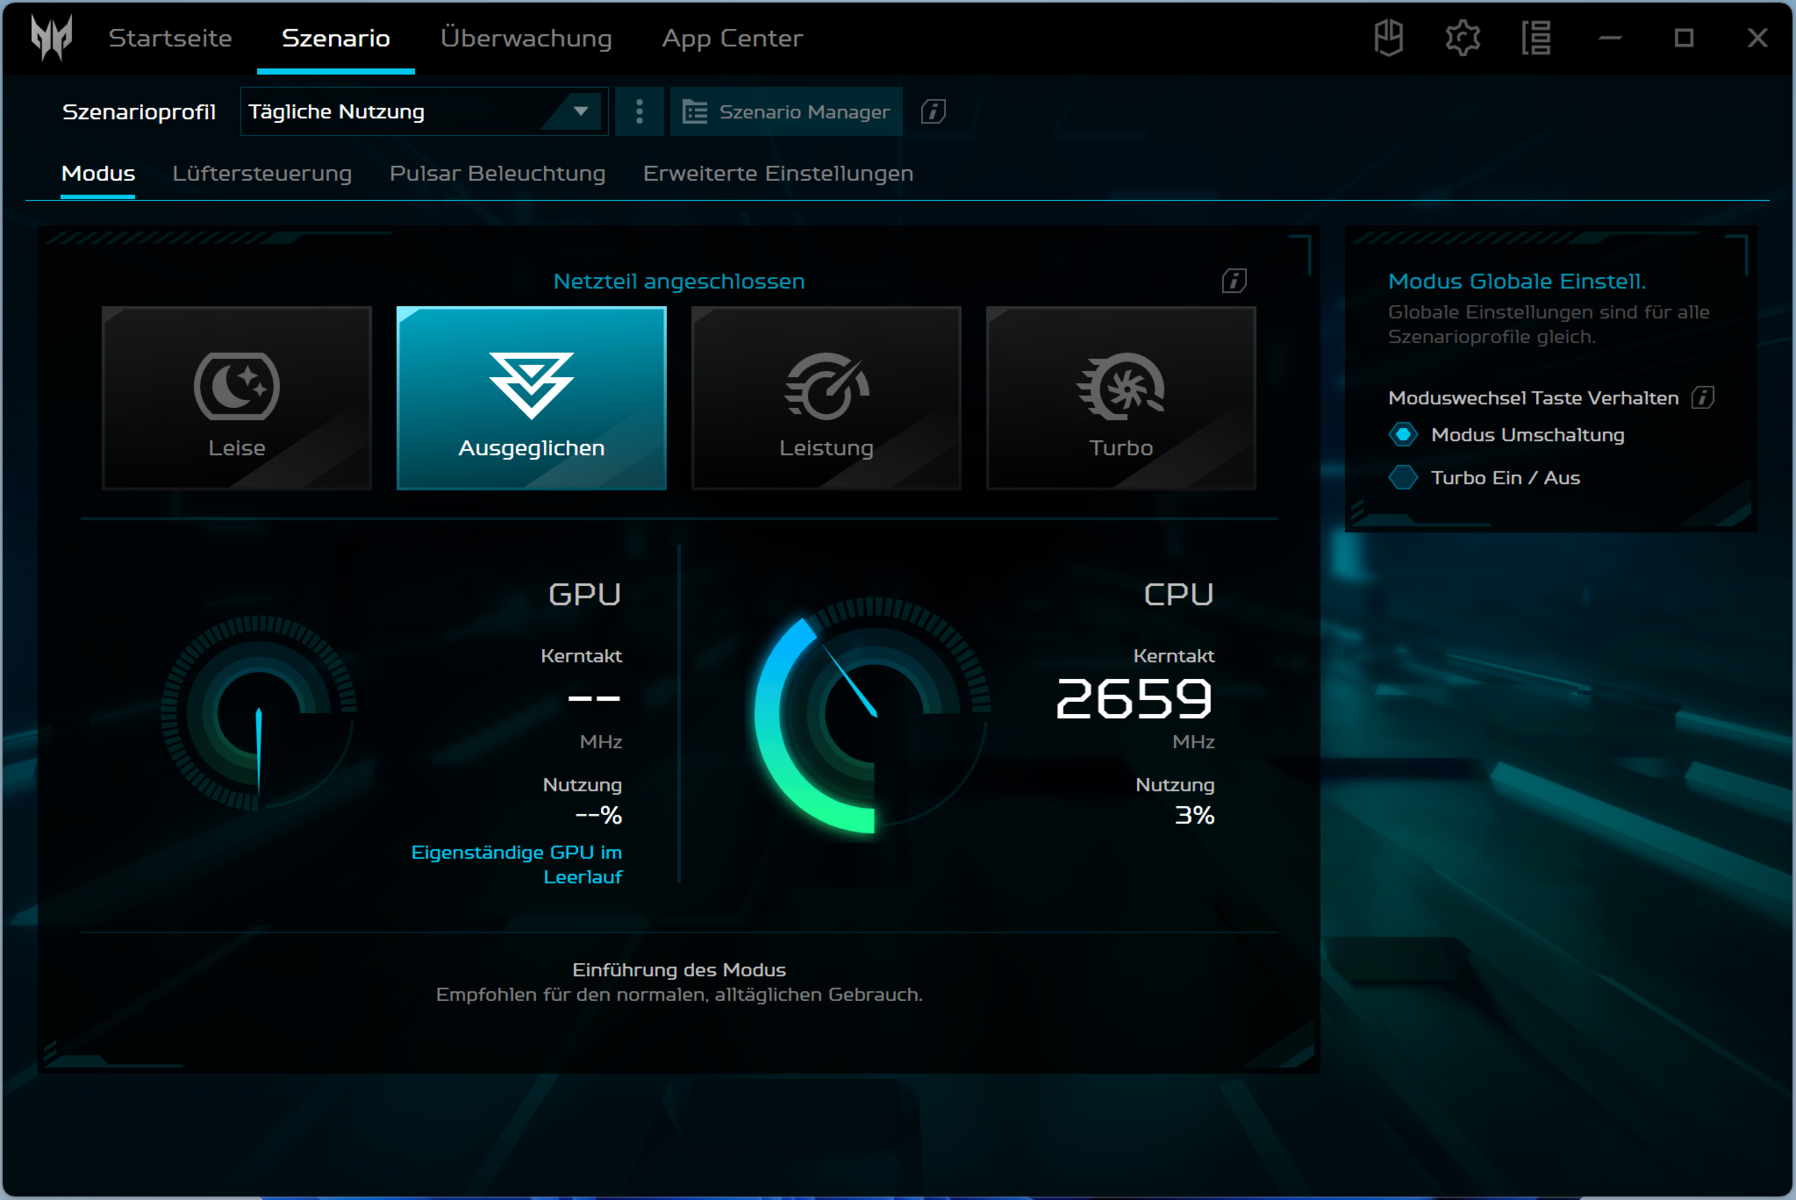
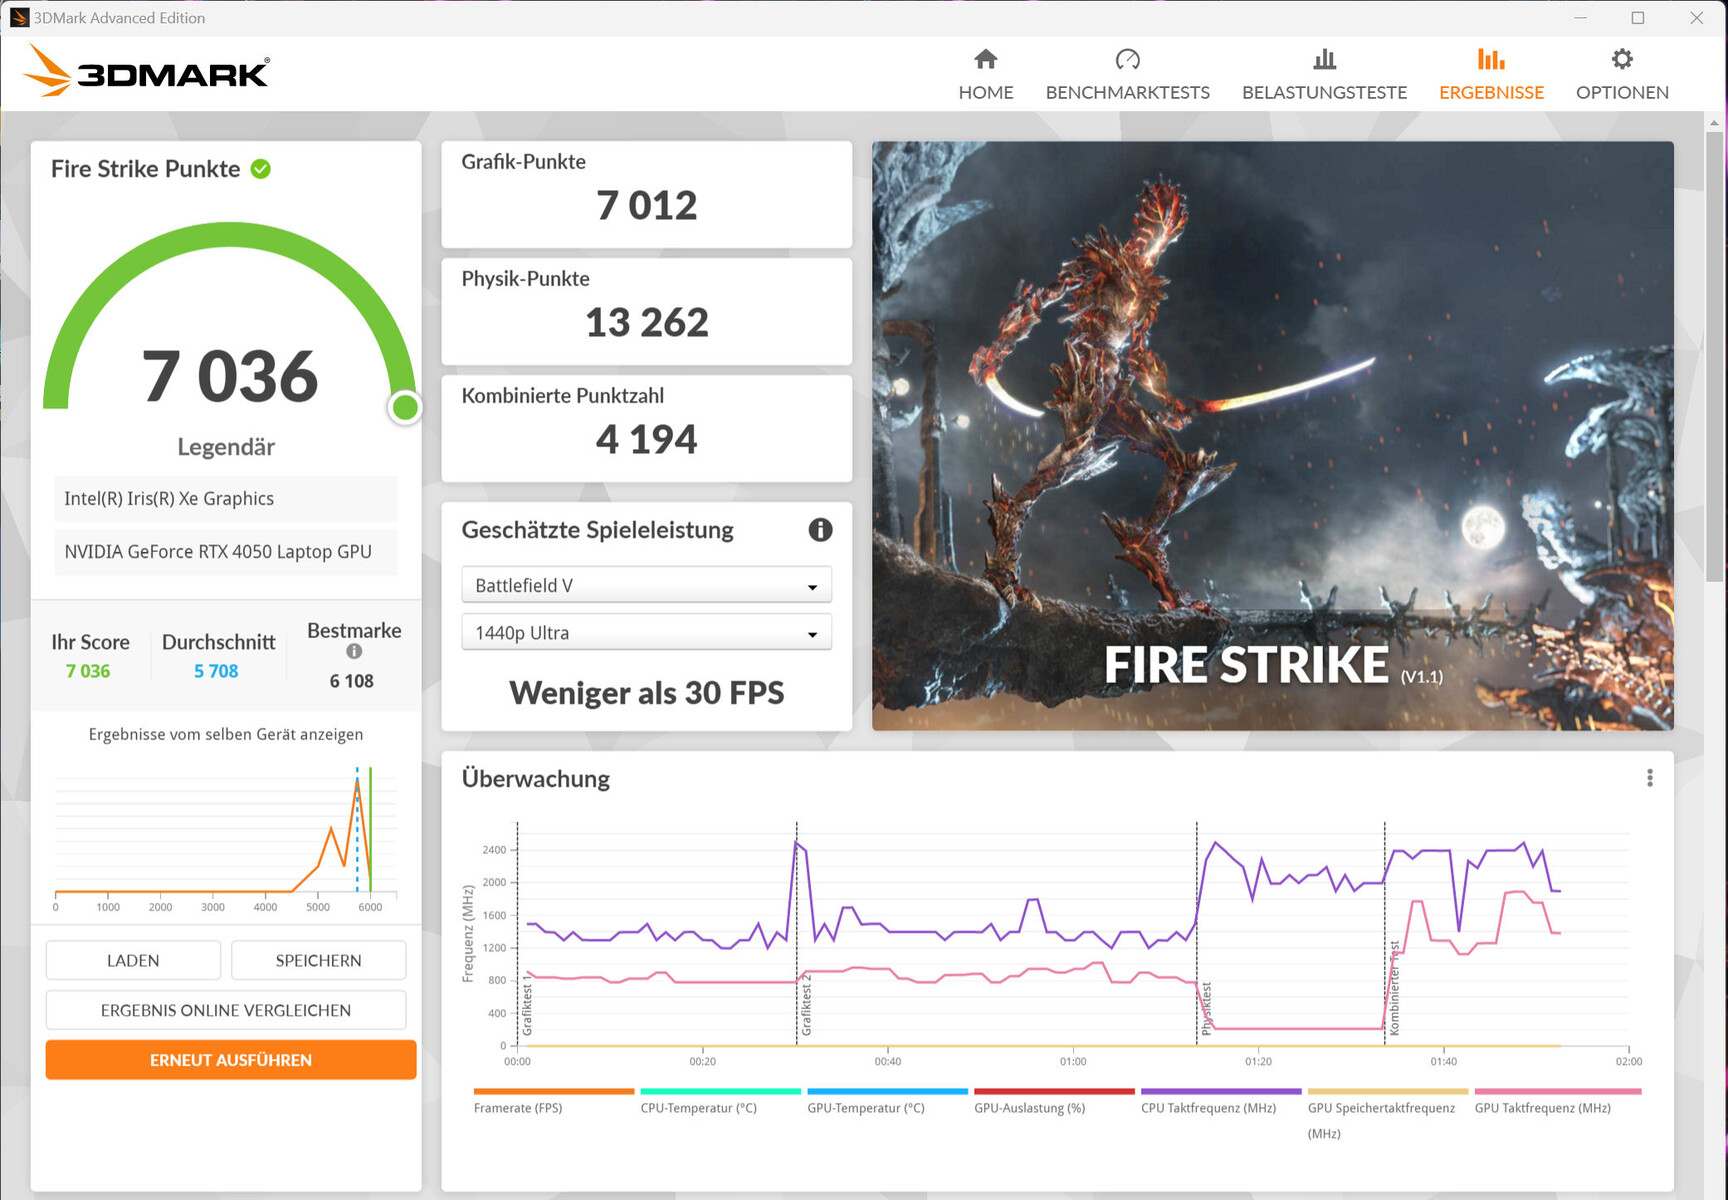
笔记本电脑提供六种制造商特定的系统模式--四种在主电源运行模式下,两种在电池模式下(见表)。我们使用的是 "平衡"(基准测试)和 "环保"(电池测试)模式。而 "Turbo "和 "Performance "只有在插入墙壁时才可用(电池电量大于 30%)。
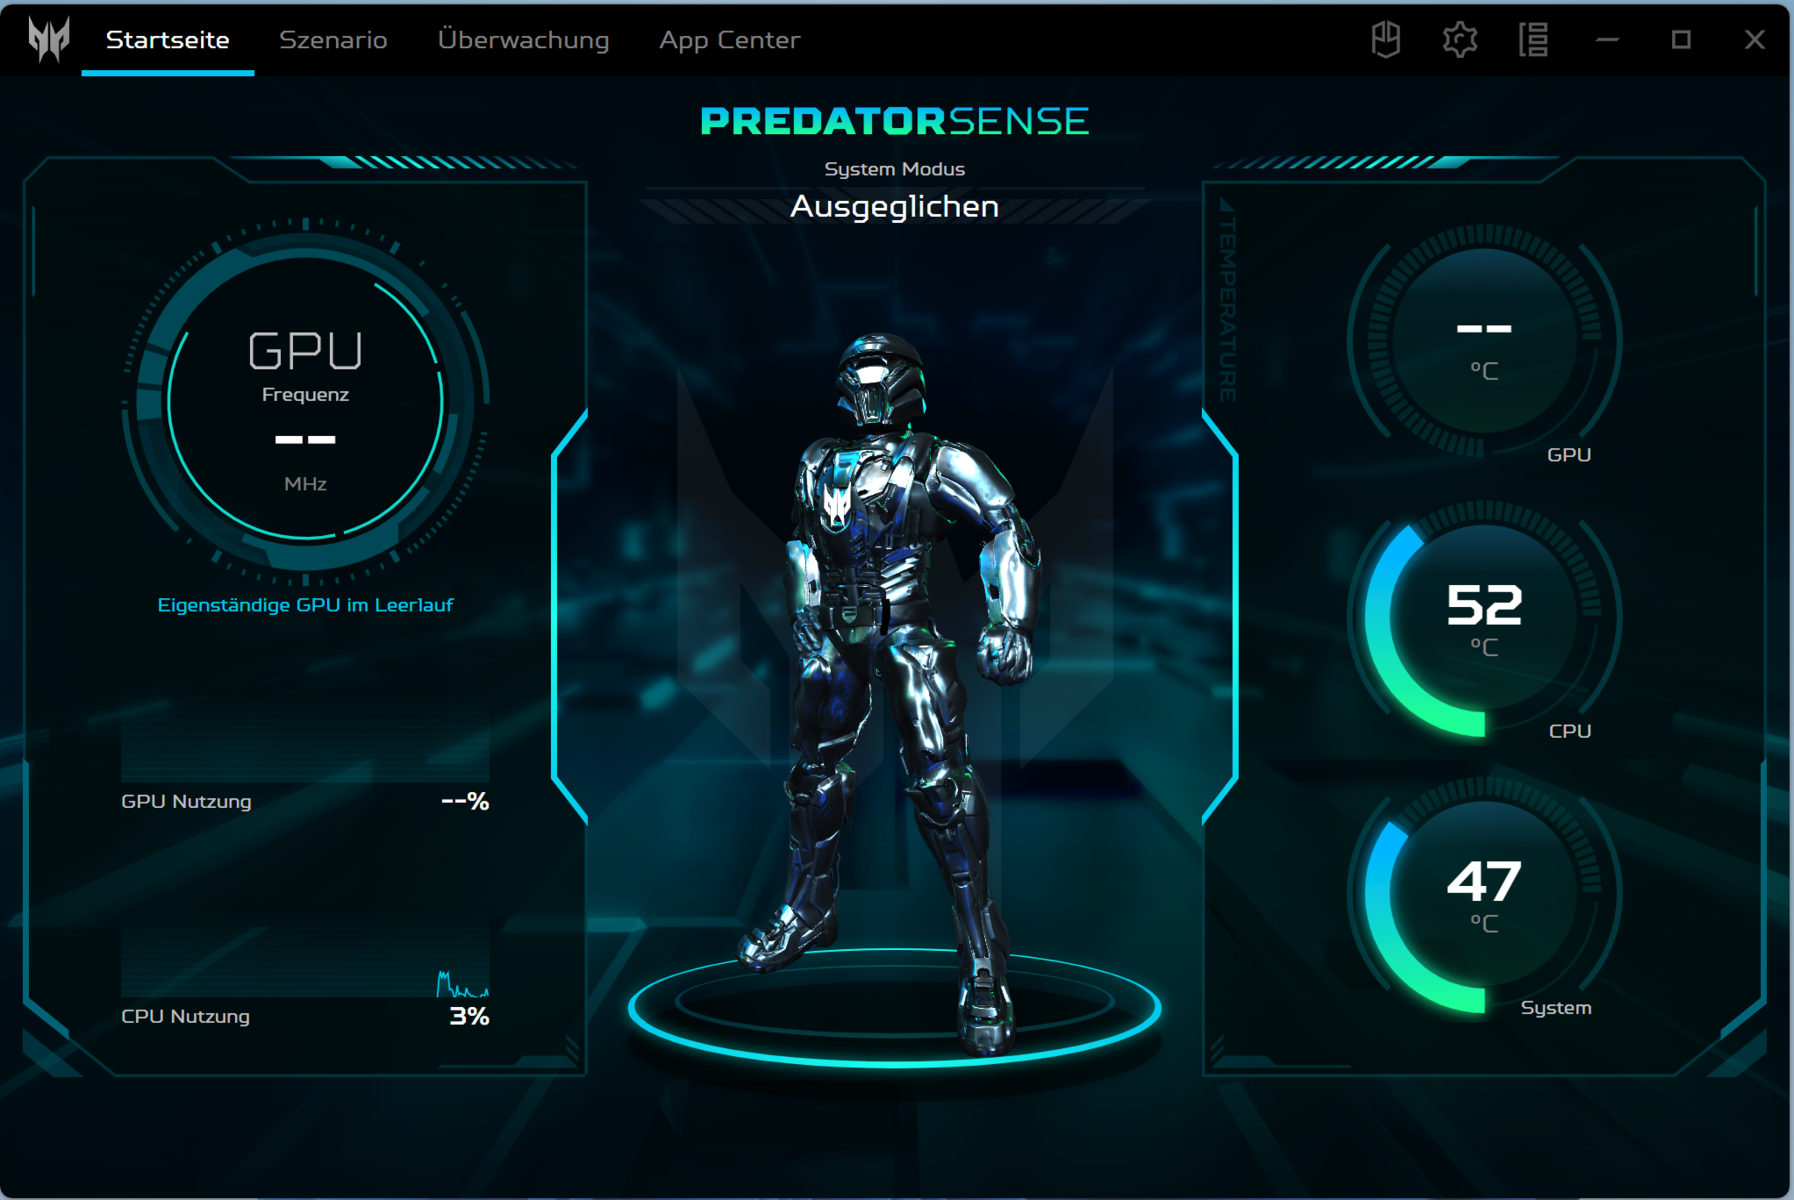
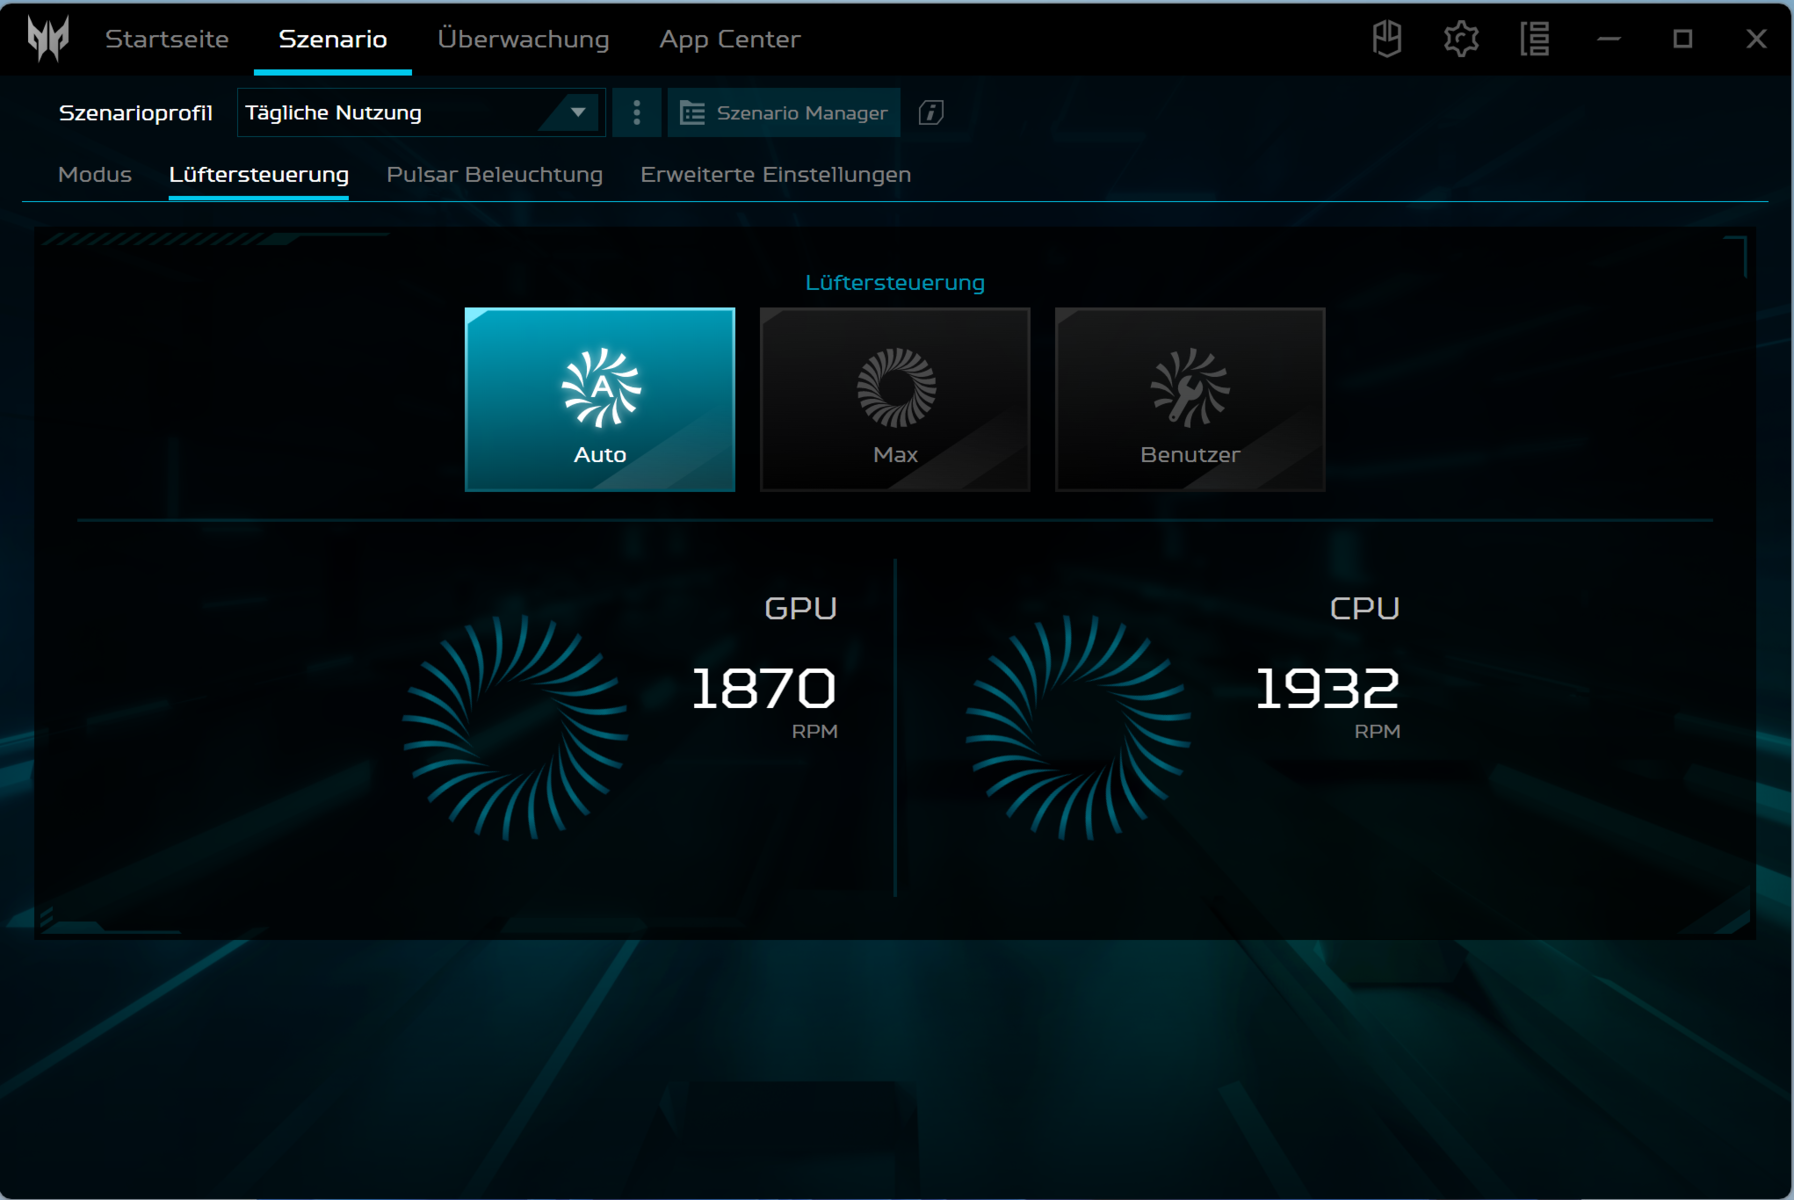
键盘上方的一个按键负责在不同模式之间快速切换。此外,还可以通过 PredatorSense 软件(笔记本电脑的控制中心)进行切换。LED 显示屏显示当前模式。
| Turbo | Performance | Balanced | Quiet | Balanced (Battery) | Eco (Battery) | |
|---|---|---|---|---|---|---|
| 功率限制 1 (HWInfo) | 80 瓦 | 75 瓦 | 60 瓦 | 50 瓦 | 60 瓦 | 25 瓦 |
| 功率限制 2 (HWInfo) | 115 瓦 | 115 瓦 | 115 瓦 | 115 瓦 | 115 瓦 | 30 瓦 |
| 噪音 (Witcher 3) | 56 dB(A) | 53 dB(A) | 43 dB(A) | 36 dB(A) | - | - |
| 性能 (Witcher 3) | ~86 fps | ~83 fps | ~82 fps | ~58 fps | - | - |

处理器
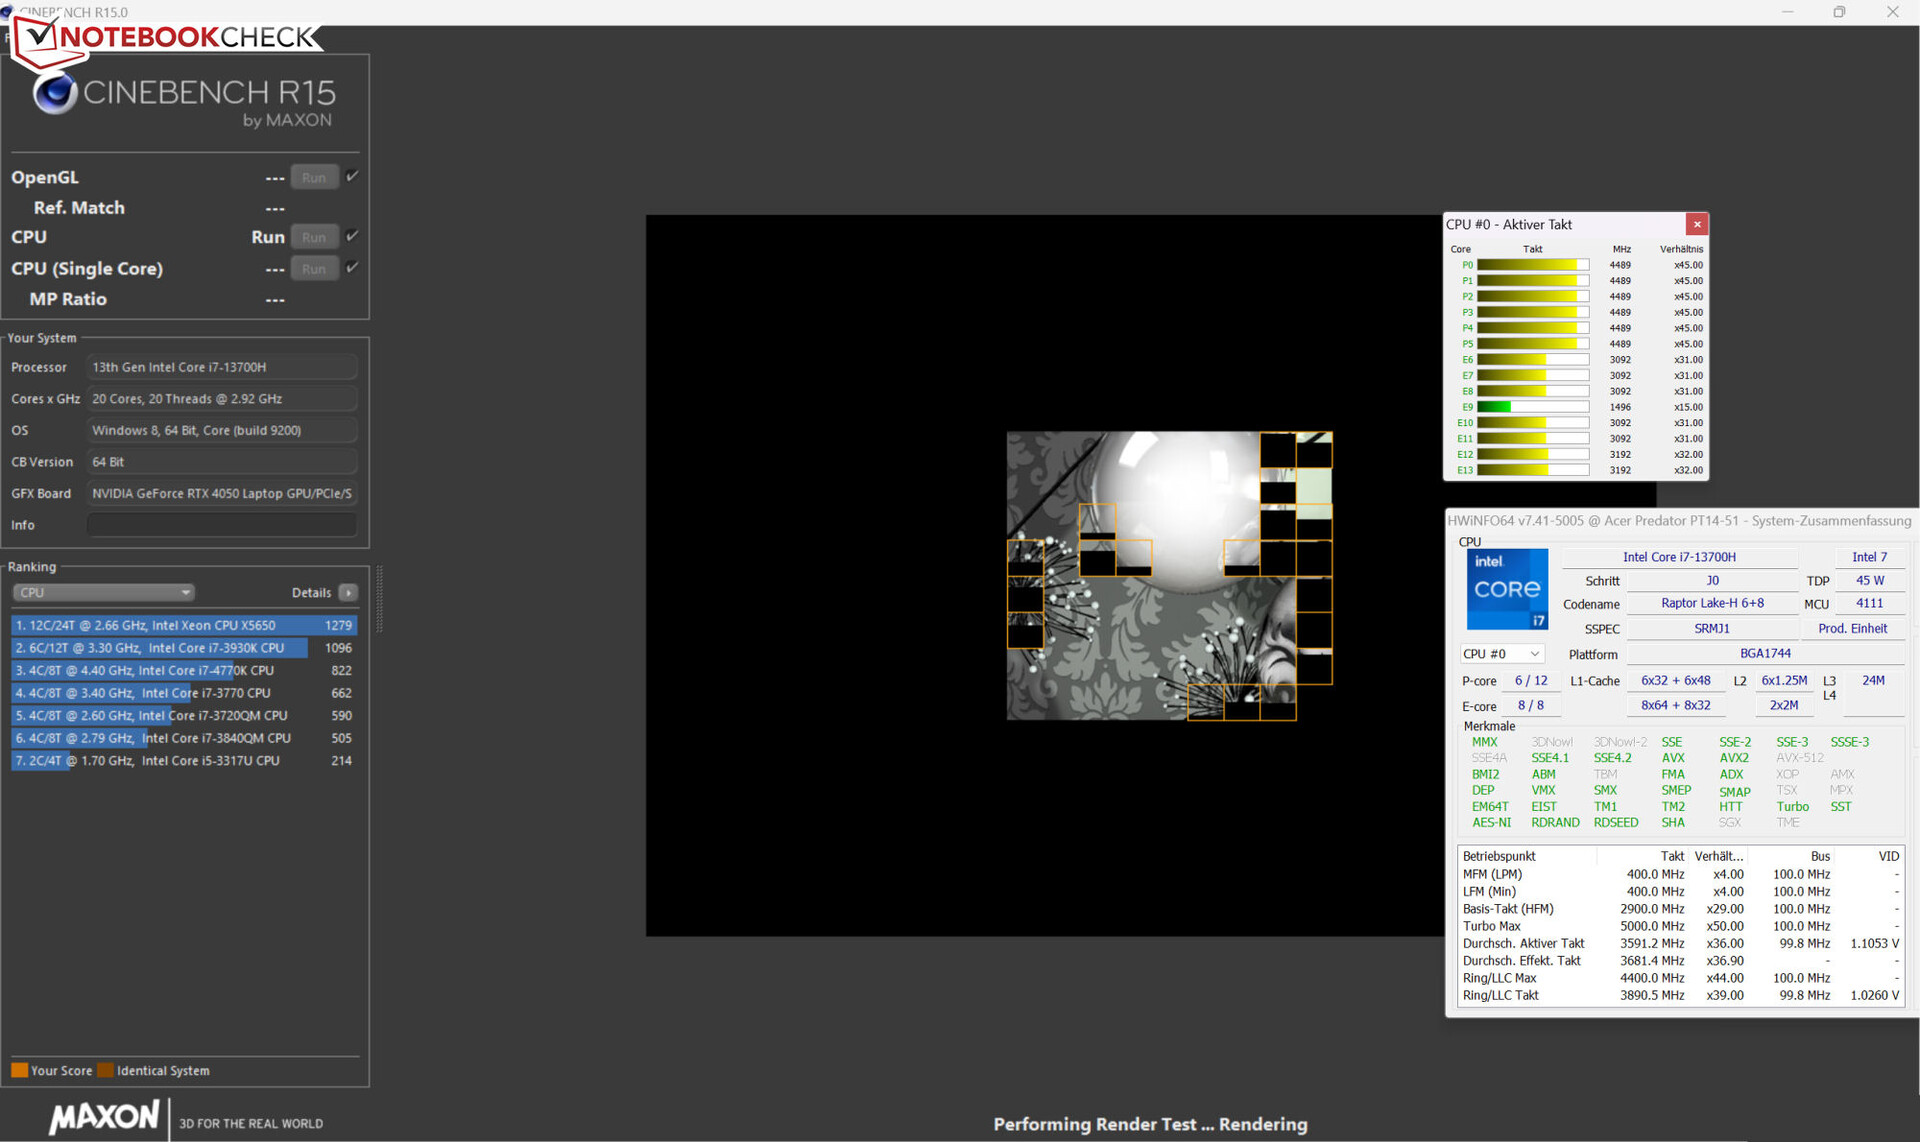
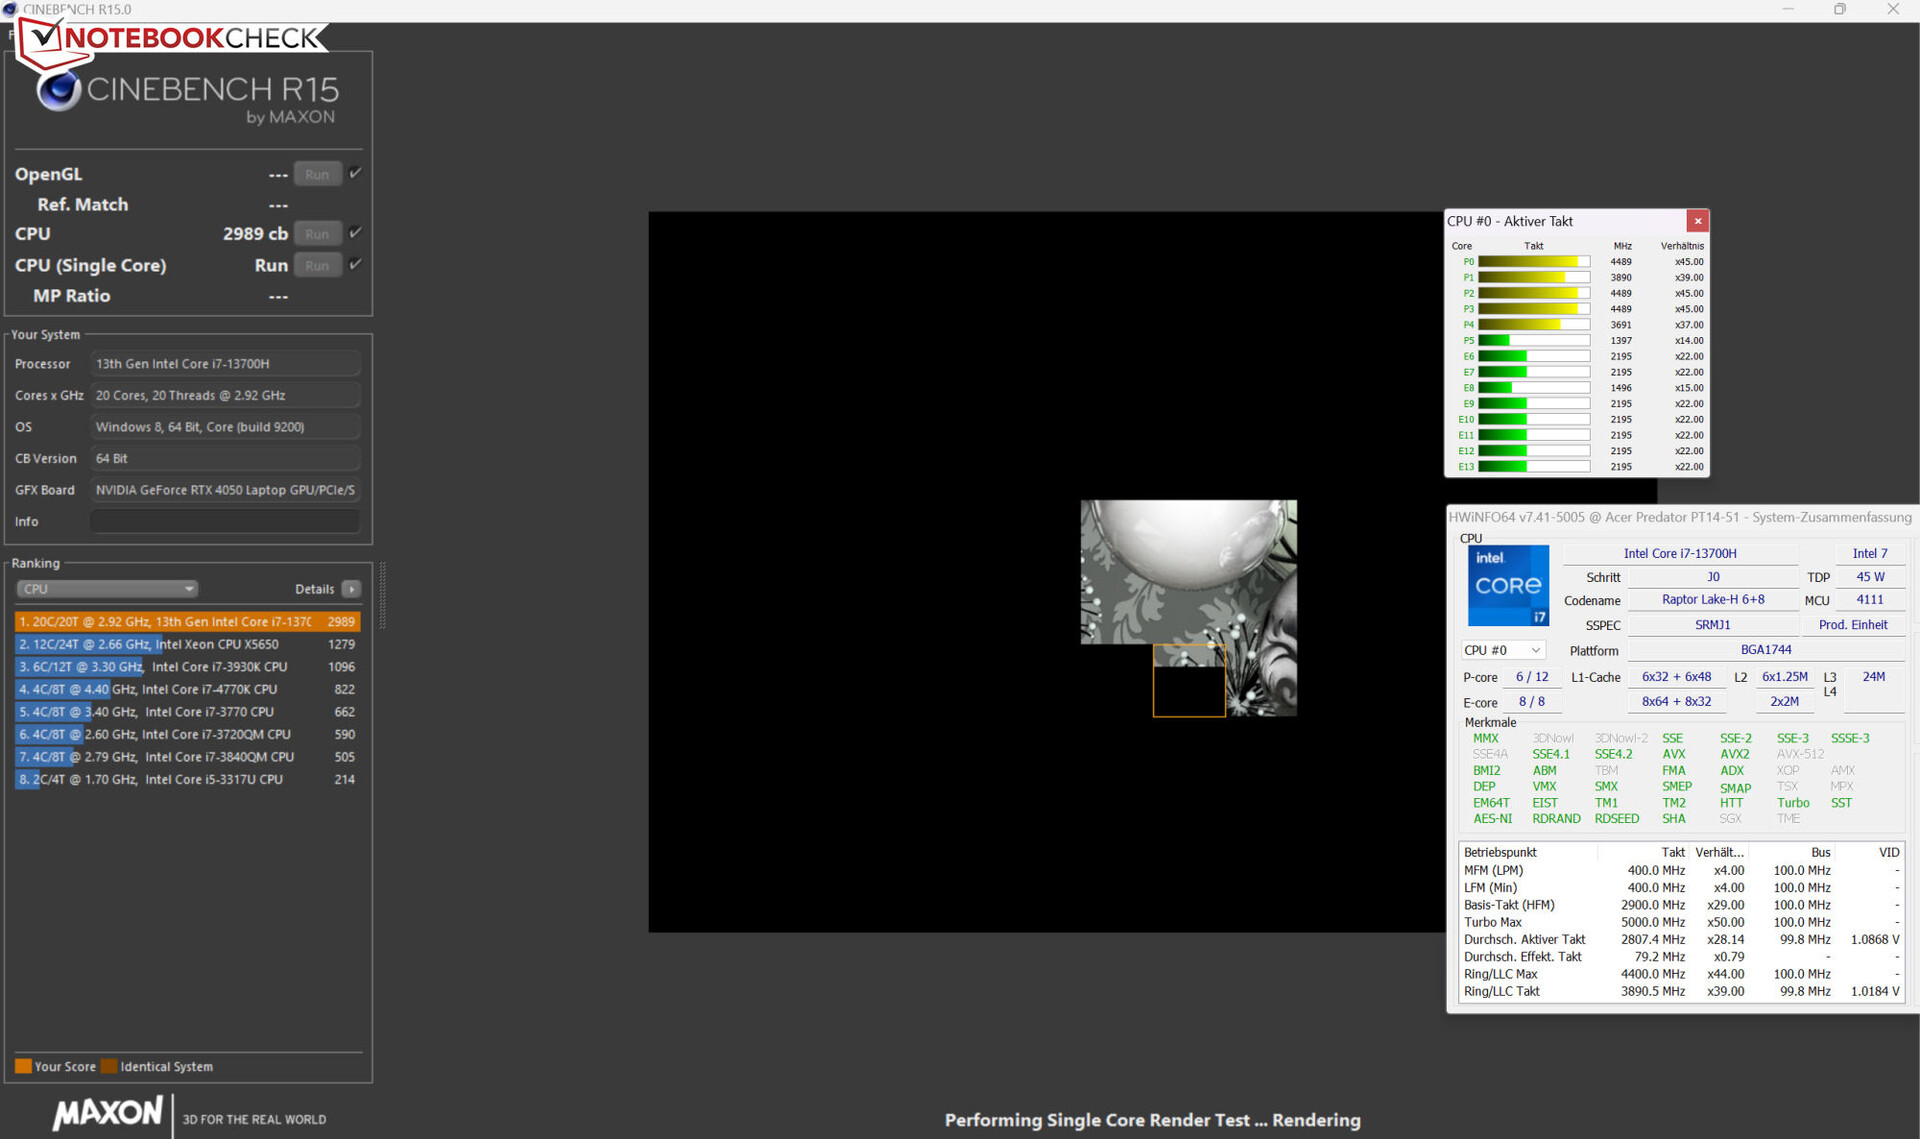
处理器Core-i7-13700H处理器(Raptor Lake)由 8 个效率内核(无超线程,1.8 至 3.7 GHz)和 6 个性能内核(超线程,2.4 至 5 GHz)组成。总共有 20 个逻辑 CPU 内核。
无论选择哪种性能模式,基准测试结果都高于典型 CPU 的平均水平。在电池模式下,相关单线程性能(179 分)的下降幅度小于多线程性能(992 分)。
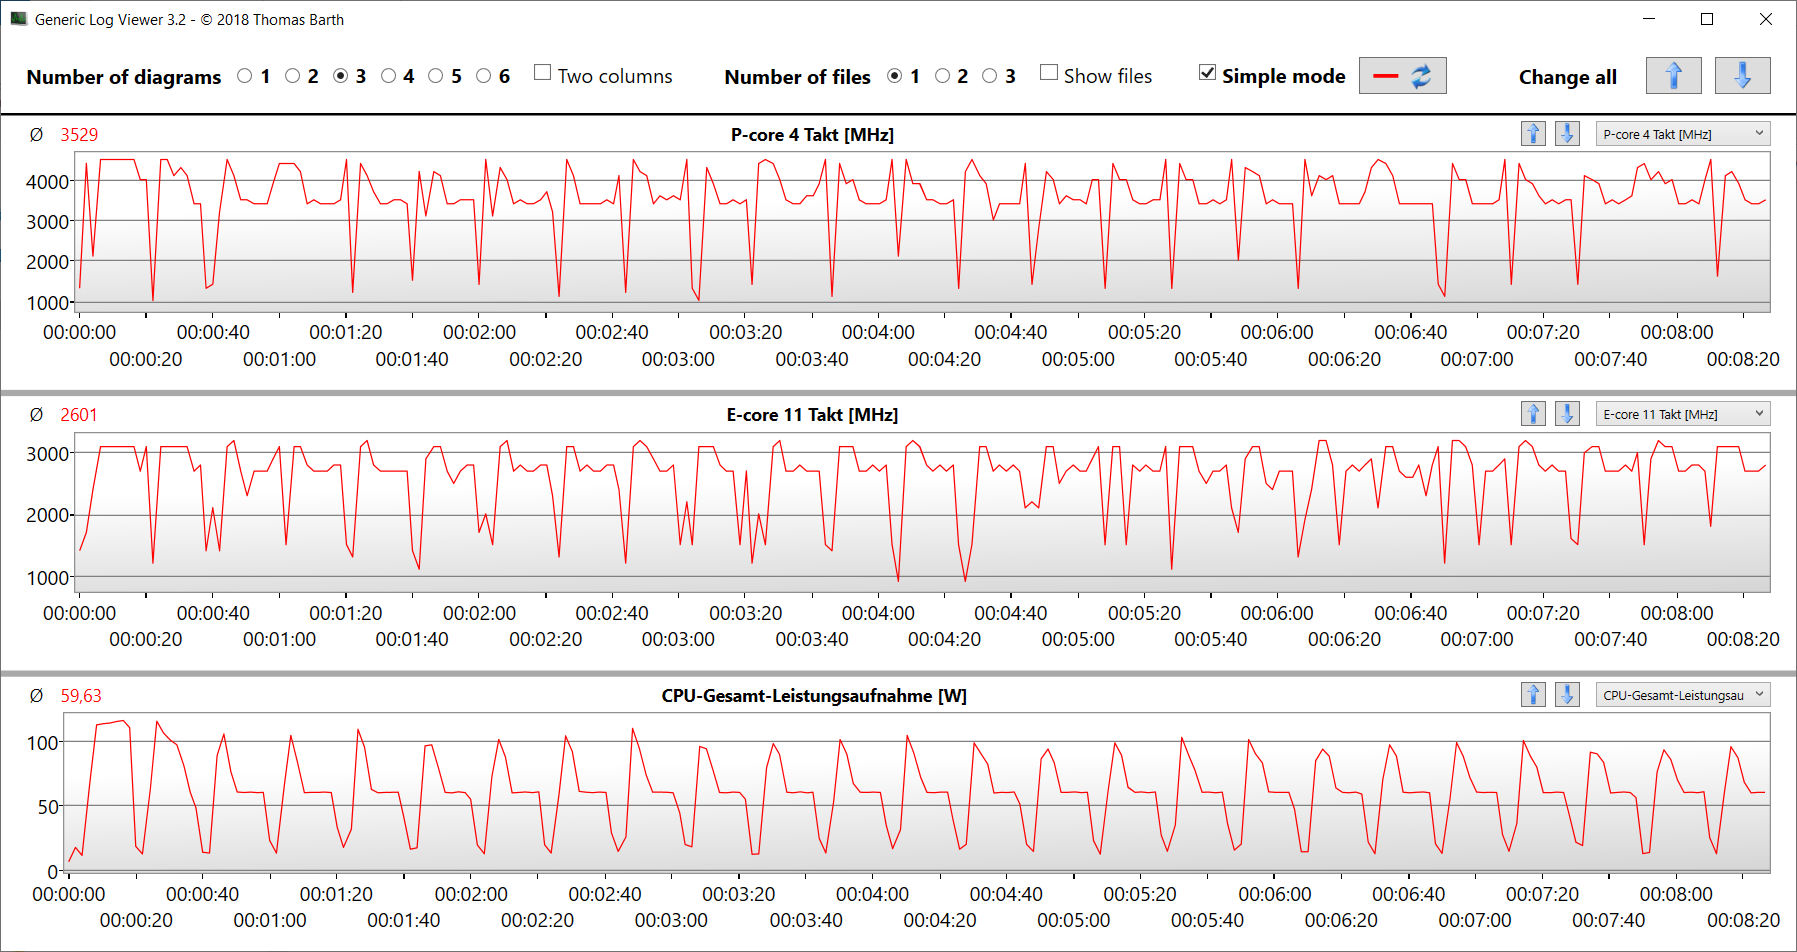
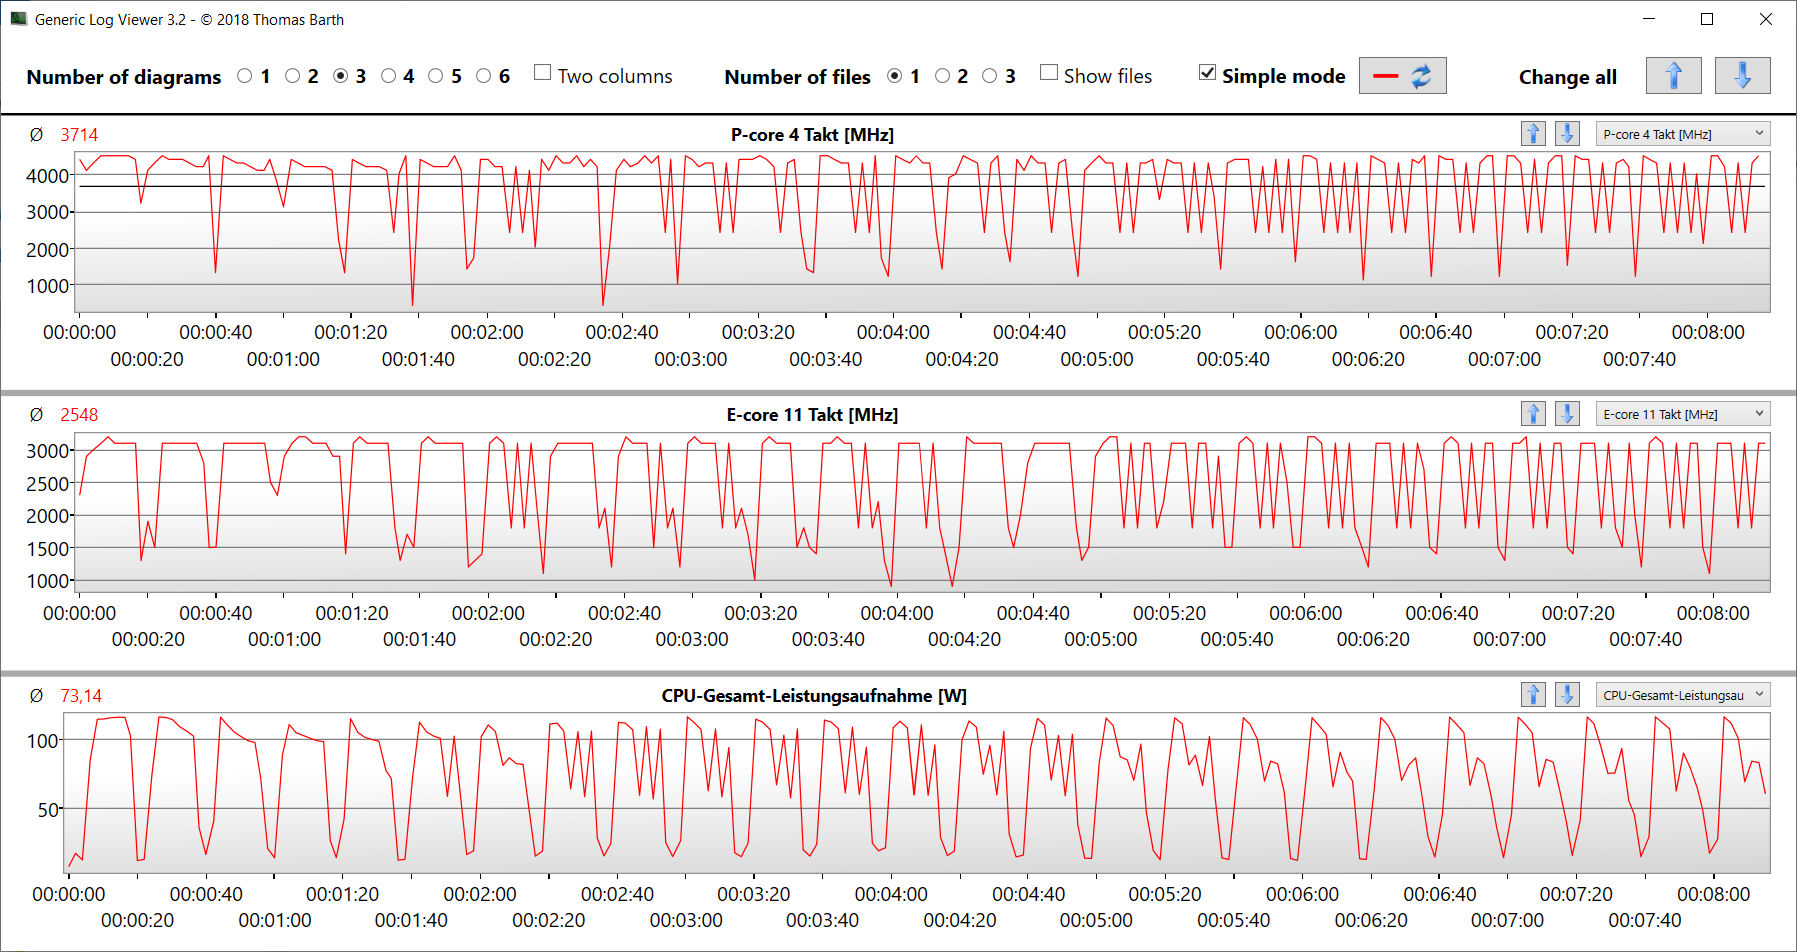
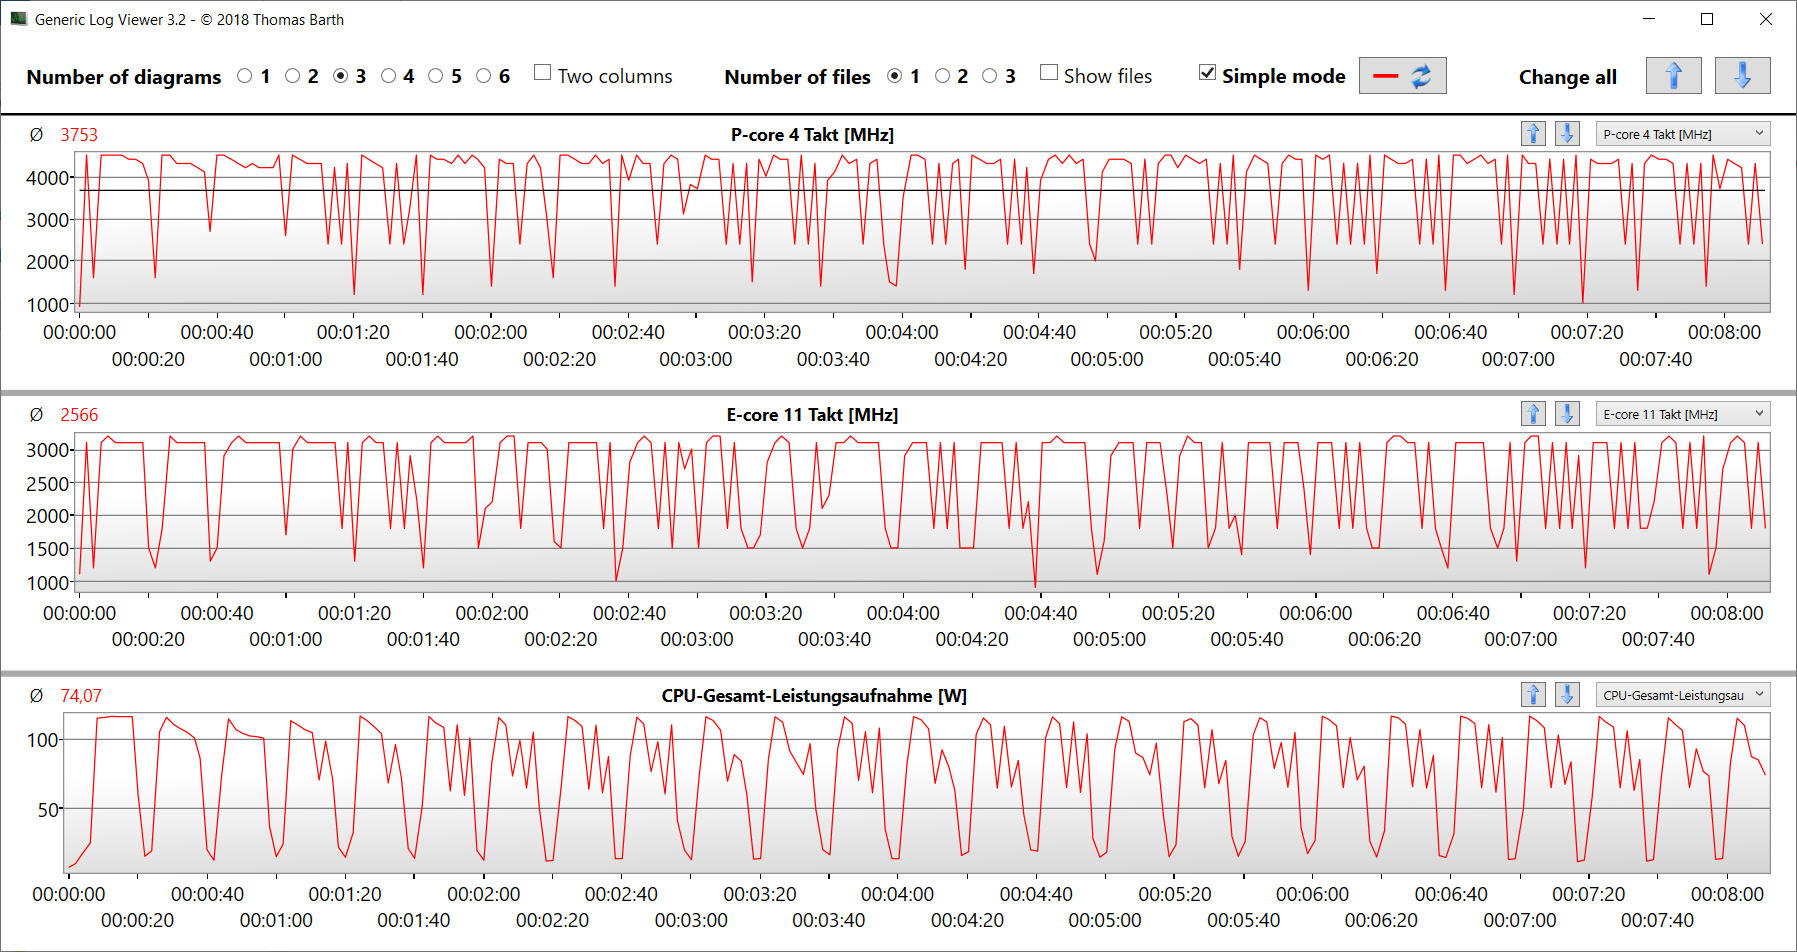
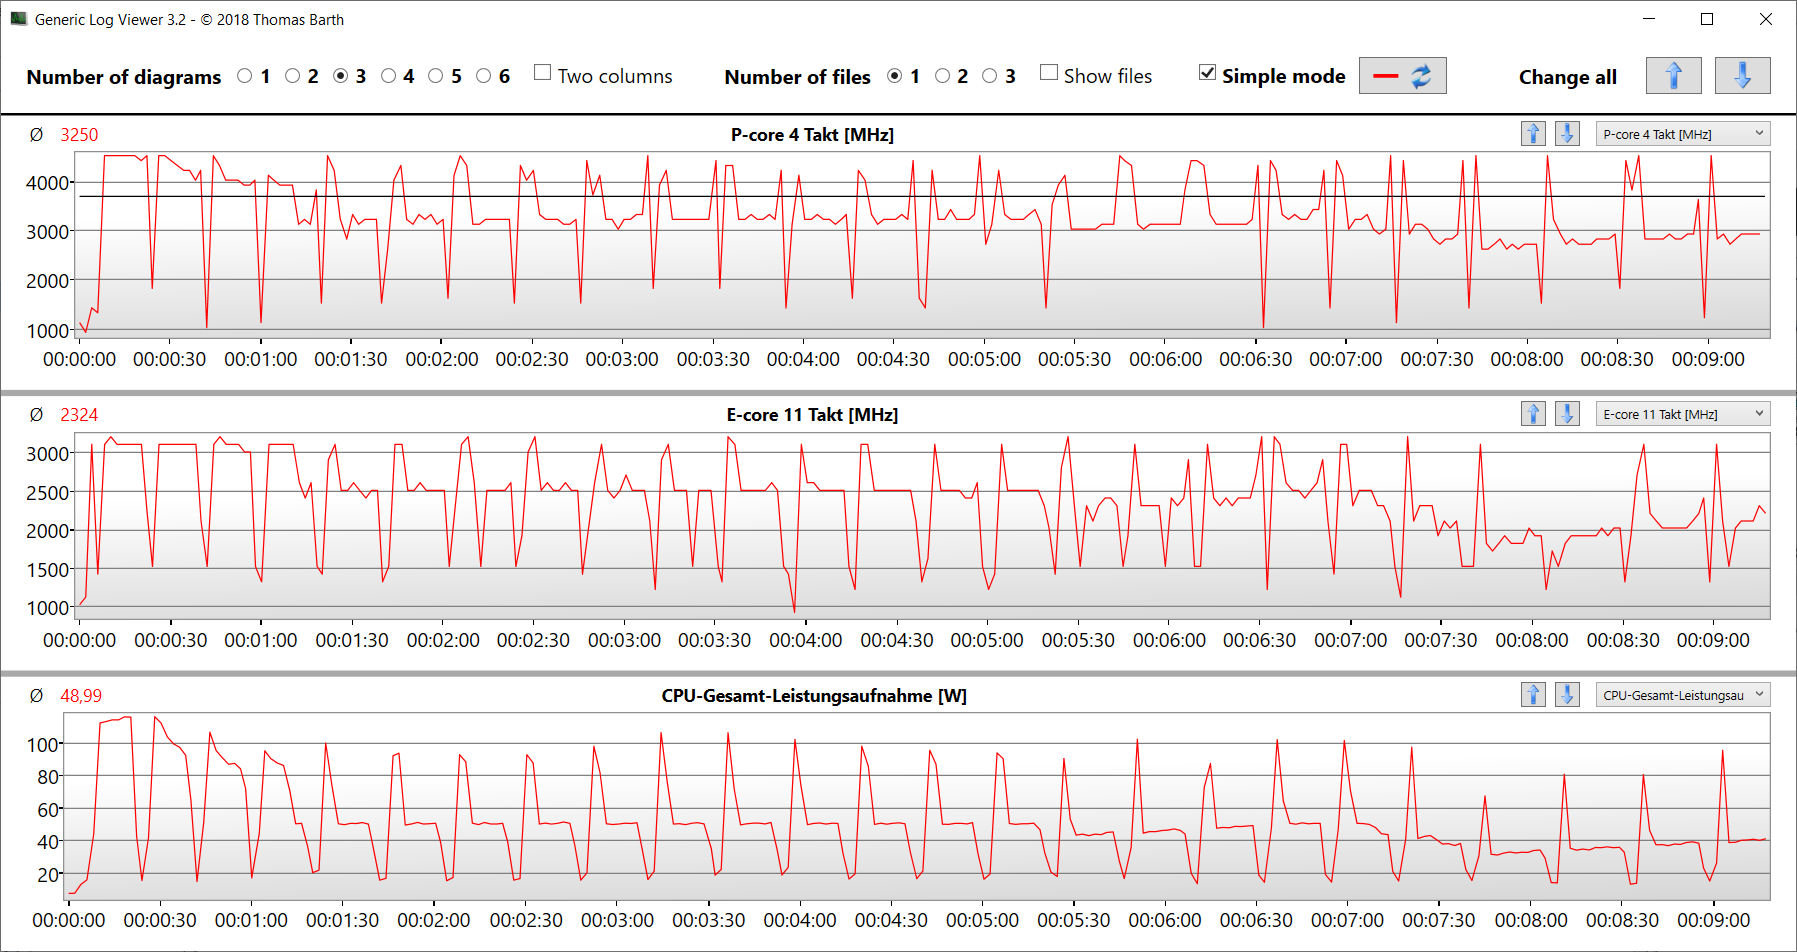
在连续多线程负载下(CB15 循环),涡轮时钟速度从第一次运行到第三次运行都会下降。随后,速度保持稳定。而 "Turbo "配置文件可确保最低限度的更高结果。一般来说,模式之间的差异非常小。
Cinebench R15 Multi Continuous Test
* ... smaller is better
AIDA64: FP32 Ray-Trace | FPU Julia | CPU SHA3 | CPU Queen | FPU SinJulia | FPU Mandel | CPU AES | CPU ZLib | FP64 Ray-Trace | CPU PhotoWorxx
| Performance rating | |
| Average of class Gaming | |
| Razer Blade 14 RTX 4070 | |
| Acer Predator Triton 14 PT14-51 | |
| MSI Stealth 14 Studio A13V | |
| Asus ROG Zephyrus G14 GA402RJ | |
| Gigabyte Aero 14 OLED BMF | |
| Average Intel Core i7-13700H | |
| AIDA64 / FP32 Ray-Trace | |
| Average of class Gaming (10227 - 85542, n=105, last 2 years) | |
| Razer Blade 14 RTX 4070 | |
| MSI Stealth 14 Studio A13V | |
| Acer Predator Triton 14 PT14-51 | |
| Average Intel Core i7-13700H (4986 - 18908, n=29) | |
| Asus ROG Zephyrus G14 GA402RJ | |
| Gigabyte Aero 14 OLED BMF | |
| AIDA64 / FPU Julia | |
| Average of class Gaming (51376 - 238426, n=105, last 2 years) | |
| Razer Blade 14 RTX 4070 | |
| Asus ROG Zephyrus G14 GA402RJ | |
| Acer Predator Triton 14 PT14-51 | |
| MSI Stealth 14 Studio A13V | |
| Average Intel Core i7-13700H (25360 - 92359, n=29) | |
| Gigabyte Aero 14 OLED BMF | |
| AIDA64 / CPU SHA3 | |
| Average of class Gaming (2180 - 10115, n=105, last 2 years) | |
| Razer Blade 14 RTX 4070 | |
| Acer Predator Triton 14 PT14-51 | |
| MSI Stealth 14 Studio A13V | |
| Average Intel Core i7-13700H (1339 - 4224, n=29) | |
| Gigabyte Aero 14 OLED BMF | |
| Asus ROG Zephyrus G14 GA402RJ | |
| AIDA64 / CPU Queen | |
| Razer Blade 14 RTX 4070 | |
| Average of class Gaming (49785 - 173351, n=90, last 2 years) | |
| Gigabyte Aero 14 OLED BMF | |
| MSI Stealth 14 Studio A13V | |
| Asus ROG Zephyrus G14 GA402RJ | |
| Acer Predator Triton 14 PT14-51 | |
| Average Intel Core i7-13700H (59324 - 107159, n=29) | |
| AIDA64 / FPU SinJulia | |
| Razer Blade 14 RTX 4070 | |
| Average of class Gaming (4424 - 33636, n=105, last 2 years) | |
| Asus ROG Zephyrus G14 GA402RJ | |
| MSI Stealth 14 Studio A13V | |
| Acer Predator Triton 14 PT14-51 | |
| Average Intel Core i7-13700H (4800 - 11050, n=29) | |
| Gigabyte Aero 14 OLED BMF | |
| AIDA64 / FPU Mandel | |
| Average of class Gaming (25115 - 128721, n=105, last 2 years) | |
| Razer Blade 14 RTX 4070 | |
| Asus ROG Zephyrus G14 GA402RJ | |
| MSI Stealth 14 Studio A13V | |
| Acer Predator Triton 14 PT14-51 | |
| Average Intel Core i7-13700H (12321 - 45118, n=29) | |
| Gigabyte Aero 14 OLED BMF | |
| AIDA64 / CPU AES | |
| Acer Predator Triton 14 PT14-51 | |
| Asus ROG Zephyrus G14 GA402RJ | |
| Gigabyte Aero 14 OLED BMF | |
| Average of class Gaming (39258 - 247074, n=105, last 2 years) | |
| Razer Blade 14 RTX 4070 | |
| MSI Stealth 14 Studio A13V | |
| Average Intel Core i7-13700H (28769 - 151254, n=29) | |
| AIDA64 / CPU ZLib | |
| Average of class Gaming (574 - 2531, n=105, last 2 years) | |
| Acer Predator Triton 14 PT14-51 | |
| Razer Blade 14 RTX 4070 | |
| MSI Stealth 14 Studio A13V | |
| Average Intel Core i7-13700H (389 - 1215, n=29) | |
| Gigabyte Aero 14 OLED BMF | |
| Asus ROG Zephyrus G14 GA402RJ | |
| AIDA64 / FP64 Ray-Trace | |
| Average of class Gaming (5509 - 45446, n=105, last 2 years) | |
| Razer Blade 14 RTX 4070 | |
| MSI Stealth 14 Studio A13V | |
| Acer Predator Triton 14 PT14-51 | |
| Average Intel Core i7-13700H (2540 - 10135, n=29) | |
| Asus ROG Zephyrus G14 GA402RJ | |
| Gigabyte Aero 14 OLED BMF | |
| AIDA64 / CPU PhotoWorxx | |
| Gigabyte Aero 14 OLED BMF | |
| Acer Predator Triton 14 PT14-51 | |
| Average of class Gaming (12271 - 89891, n=105, last 2 years) | |
| Average Intel Core i7-13700H (12872 - 52727, n=29) | |
| MSI Stealth 14 Studio A13V | |
| Razer Blade 14 RTX 4070 | |
| Asus ROG Zephyrus G14 GA402RJ | |
系统性能
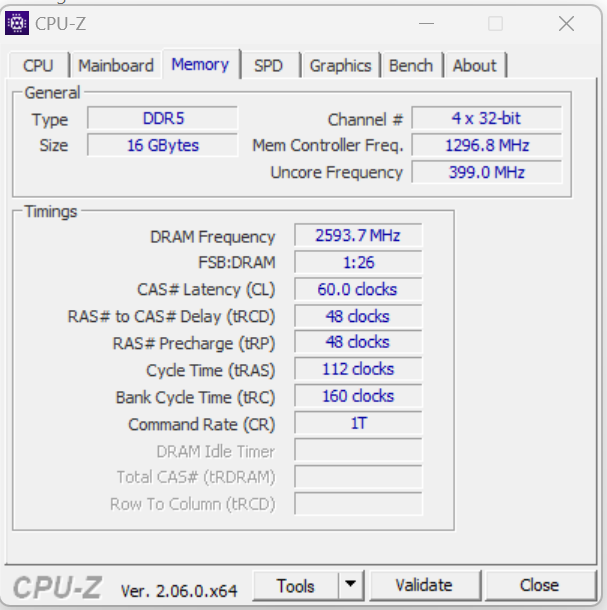
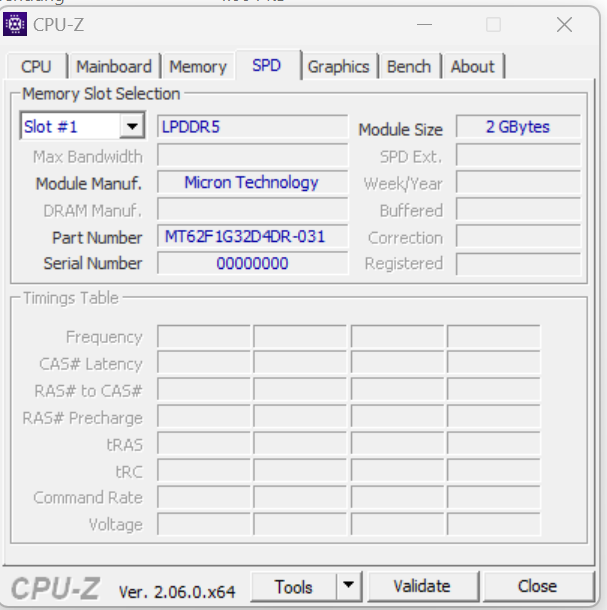
运行流畅的系统有足够的能力满足渲染和游戏等高要求应用的需要--良好的 PC Mark 测试结果证实了这一点。内存的传输速率在 LPDDR5 6000 内存的正常范围内。
CrossMark: Overall | Productivity | Creativity | Responsiveness
| PCMark 10 / Score | |
| Average of class Gaming (5828 - 12414, n=93, last 2 years) | |
| Razer Blade 14 RTX 4070 | |
| Acer Predator Triton 14 PT14-51 | |
| Asus ROG Zephyrus G14 GA402RJ | |
| Gigabyte Aero 14 OLED BMF | |
| Average Intel Core i7-13700H, NVIDIA GeForce RTX 4050 Laptop GPU (6822 - 7556, n=7) | |
| MSI Stealth 14 Studio A13V | |
| PCMark 10 / Essentials | |
| Gigabyte Aero 14 OLED BMF | |
| Razer Blade 14 RTX 4070 | |
| Average Intel Core i7-13700H, NVIDIA GeForce RTX 4050 Laptop GPU (10283 - 11549, n=7) | |
| Average of class Gaming (8810 - 11935, n=97, last 2 years) | |
| Acer Predator Triton 14 PT14-51 | |
| MSI Stealth 14 Studio A13V | |
| Asus ROG Zephyrus G14 GA402RJ | |
| PCMark 10 / Productivity | |
| Average of class Gaming (6845 - 25323, n=95, last 2 years) | |
| Razer Blade 14 RTX 4070 | |
| Acer Predator Triton 14 PT14-51 | |
| Asus ROG Zephyrus G14 GA402RJ | |
| Gigabyte Aero 14 OLED BMF | |
| Average Intel Core i7-13700H, NVIDIA GeForce RTX 4050 Laptop GPU (8368 - 9836, n=7) | |
| MSI Stealth 14 Studio A13V | |
| PCMark 10 / Digital Content Creation | |
| Average of class Gaming (7602 - 19954, n=95, last 2 years) | |
| Razer Blade 14 RTX 4070 | |
| Asus ROG Zephyrus G14 GA402RJ | |
| Acer Predator Triton 14 PT14-51 | |
| MSI Stealth 14 Studio A13V | |
| Average Intel Core i7-13700H, NVIDIA GeForce RTX 4050 Laptop GPU (9527 - 10643, n=7) | |
| Gigabyte Aero 14 OLED BMF | |
| CrossMark / Overall | |
| Average of class Gaming (1366 - 2409, n=94, last 2 years) | |
| Acer Predator Triton 14 PT14-51 | |
| Gigabyte Aero 14 OLED BMF | |
| Razer Blade 14 RTX 4070 | |
| Apple MacBook Pro 14 2023 M2 Pro Entry | |
| MSI Stealth 14 Studio A13V | |
| Average Intel Core i7-13700H, NVIDIA GeForce RTX 4050 Laptop GPU (1205 - 1937, n=9) | |
| CrossMark / Productivity | |
| Average of class Gaming (1386 - 2254, n=94, last 2 years) | |
| Gigabyte Aero 14 OLED BMF | |
| Razer Blade 14 RTX 4070 | |
| Acer Predator Triton 14 PT14-51 | |
| Average Intel Core i7-13700H, NVIDIA GeForce RTX 4050 Laptop GPU (1158 - 1877, n=9) | |
| MSI Stealth 14 Studio A13V | |
| Apple MacBook Pro 14 2023 M2 Pro Entry | |
| CrossMark / Creativity | |
| Average of class Gaming (1343 - 2786, n=94, last 2 years) | |
| Apple MacBook Pro 14 2023 M2 Pro Entry | |
| Acer Predator Triton 14 PT14-51 | |
| Razer Blade 14 RTX 4070 | |
| Gigabyte Aero 14 OLED BMF | |
| MSI Stealth 14 Studio A13V | |
| Average Intel Core i7-13700H, NVIDIA GeForce RTX 4050 Laptop GPU (1293 - 2044, n=9) | |
| CrossMark / Responsiveness | |
| Acer Predator Triton 14 PT14-51 | |
| Gigabyte Aero 14 OLED BMF | |
| Average of class Gaming (1226 - 2334, n=94, last 2 years) | |
| Average Intel Core i7-13700H, NVIDIA GeForce RTX 4050 Laptop GPU (1097 - 1929, n=9) | |
| Razer Blade 14 RTX 4070 | |
| MSI Stealth 14 Studio A13V | |
| Apple MacBook Pro 14 2023 M2 Pro Entry | |
| PCMark 8 Home Score Accelerated v2 | 5120 points | |
| PCMark 8 Work Score Accelerated v2 | 5617 points | |
| PCMark 10 Score | 7402 points | |
Help | ||
| AIDA64 / Memory Copy | |
| Gigabyte Aero 14 OLED BMF | |
| Acer Predator Triton 14 PT14-51 | |
| Average of class Gaming (21750 - 129946, n=105, last 2 years) | |
| Average Intel Core i7-13700H (24334 - 78081, n=29) | |
| Razer Blade 14 RTX 4070 | |
| MSI Stealth 14 Studio A13V | |
| Asus ROG Zephyrus G14 GA402RJ | |
| AIDA64 / Memory Read | |
| Gigabyte Aero 14 OLED BMF | |
| Average of class Gaming (22956 - 118858, n=105, last 2 years) | |
| MSI Stealth 14 Studio A13V | |
| Acer Predator Triton 14 PT14-51 | |
| Average Intel Core i7-13700H (23681 - 79656, n=29) | |
| Razer Blade 14 RTX 4070 | |
| Asus ROG Zephyrus G14 GA402RJ | |
| AIDA64 / Memory Write | |
| Gigabyte Aero 14 OLED BMF | |
| Acer Predator Triton 14 PT14-51 | |
| Razer Blade 14 RTX 4070 | |
| Average of class Gaming (22297 - 135096, n=105, last 2 years) | |
| Average Intel Core i7-13700H (22986 - 99898, n=29) | |
| Asus ROG Zephyrus G14 GA402RJ | |
| MSI Stealth 14 Studio A13V | |
| AIDA64 / Memory Latency | |
| Average of class Gaming (75.3 - 259, n=105, last 2 years) | |
| Acer Predator Triton 14 PT14-51 | |
| Average Intel Core i7-13700H (82.4 - 136.8, n=29) | |
| Gigabyte Aero 14 OLED BMF | |
| Asus ROG Zephyrus G14 GA402RJ | |
| Razer Blade 14 RTX 4070 | |
| MSI Stealth 14 Studio A13V | |
* ... smaller is better
DPC 延迟
标准延迟监控器测试(上网冲浪、4K 视频播放、Prime95 高负载)显示异常。该系统似乎不适合实时视频和音频编辑。未来的软件更新可能会改善或恶化问题。
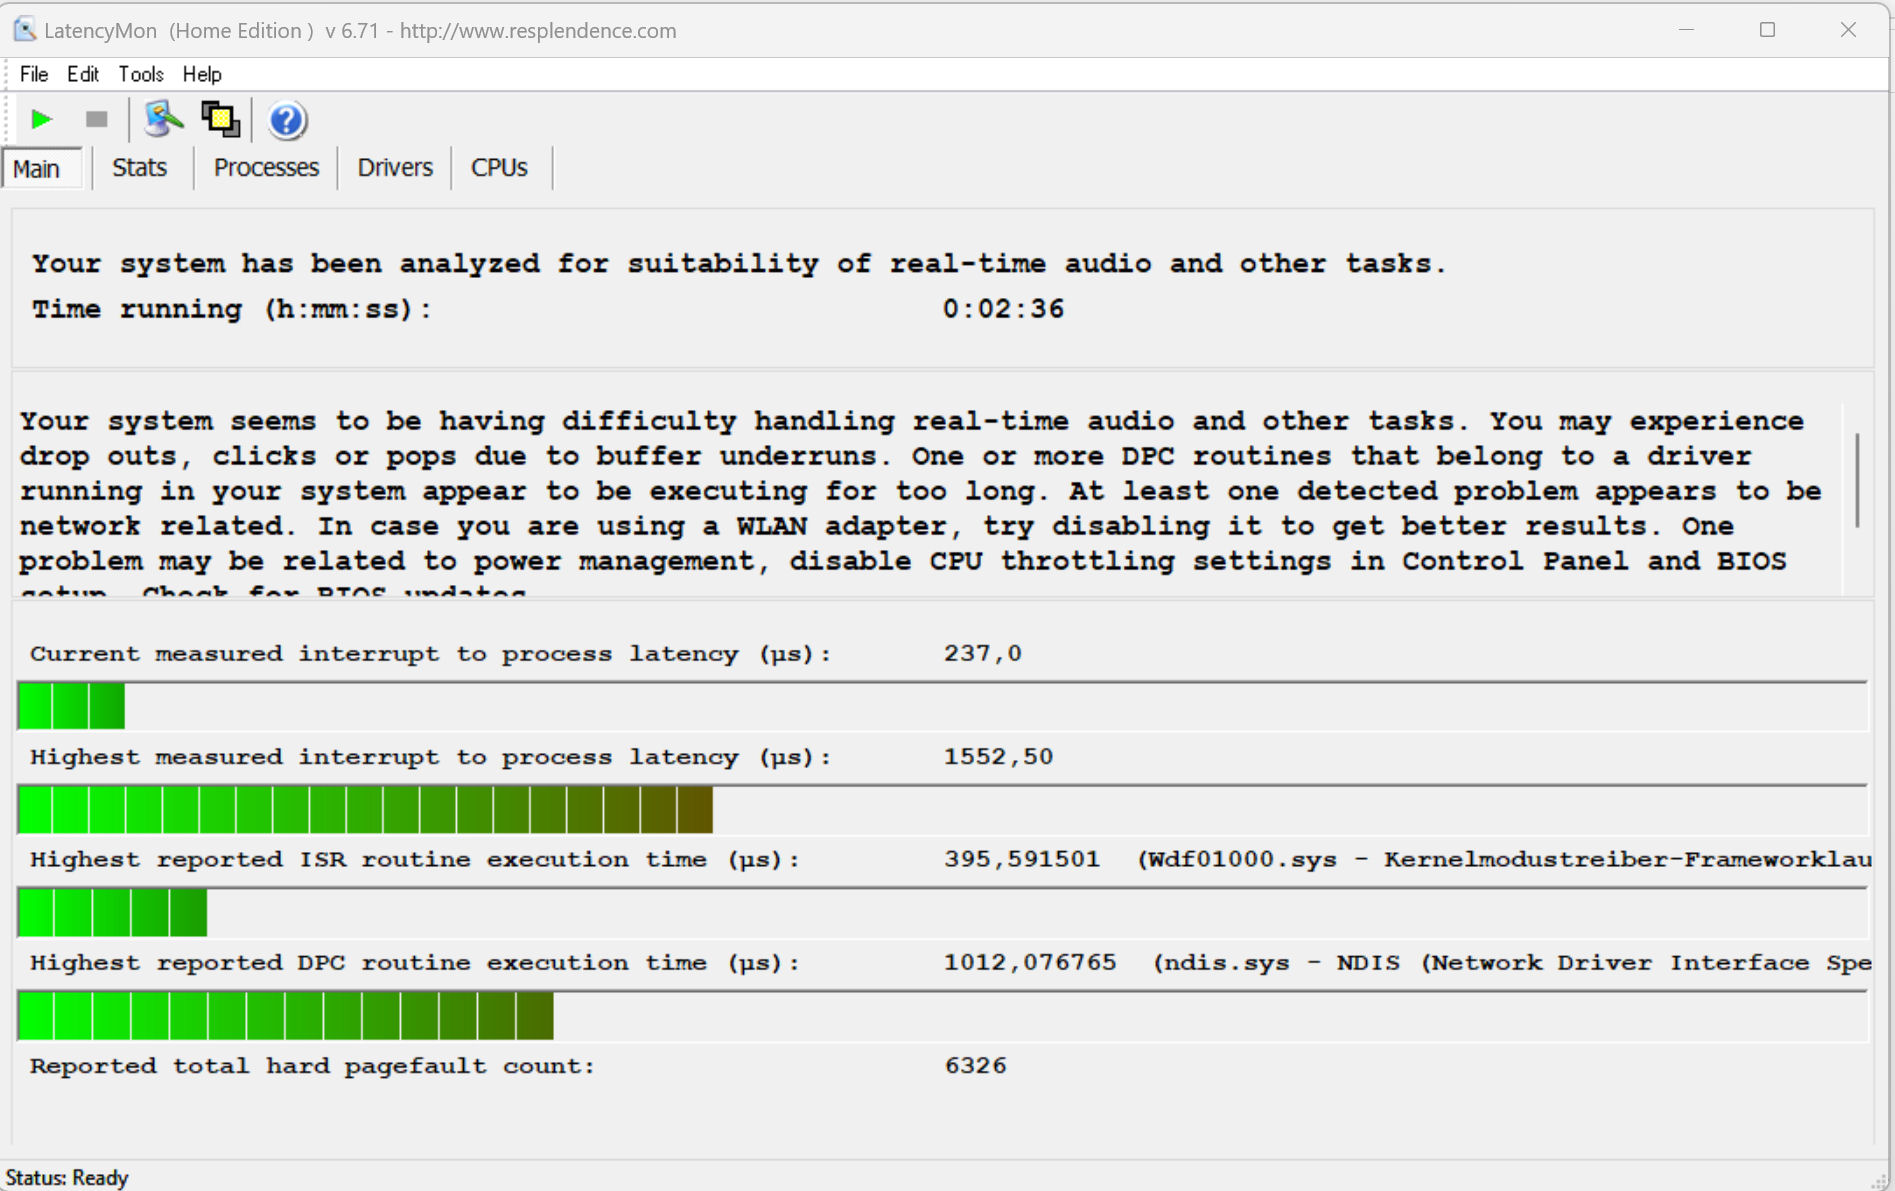
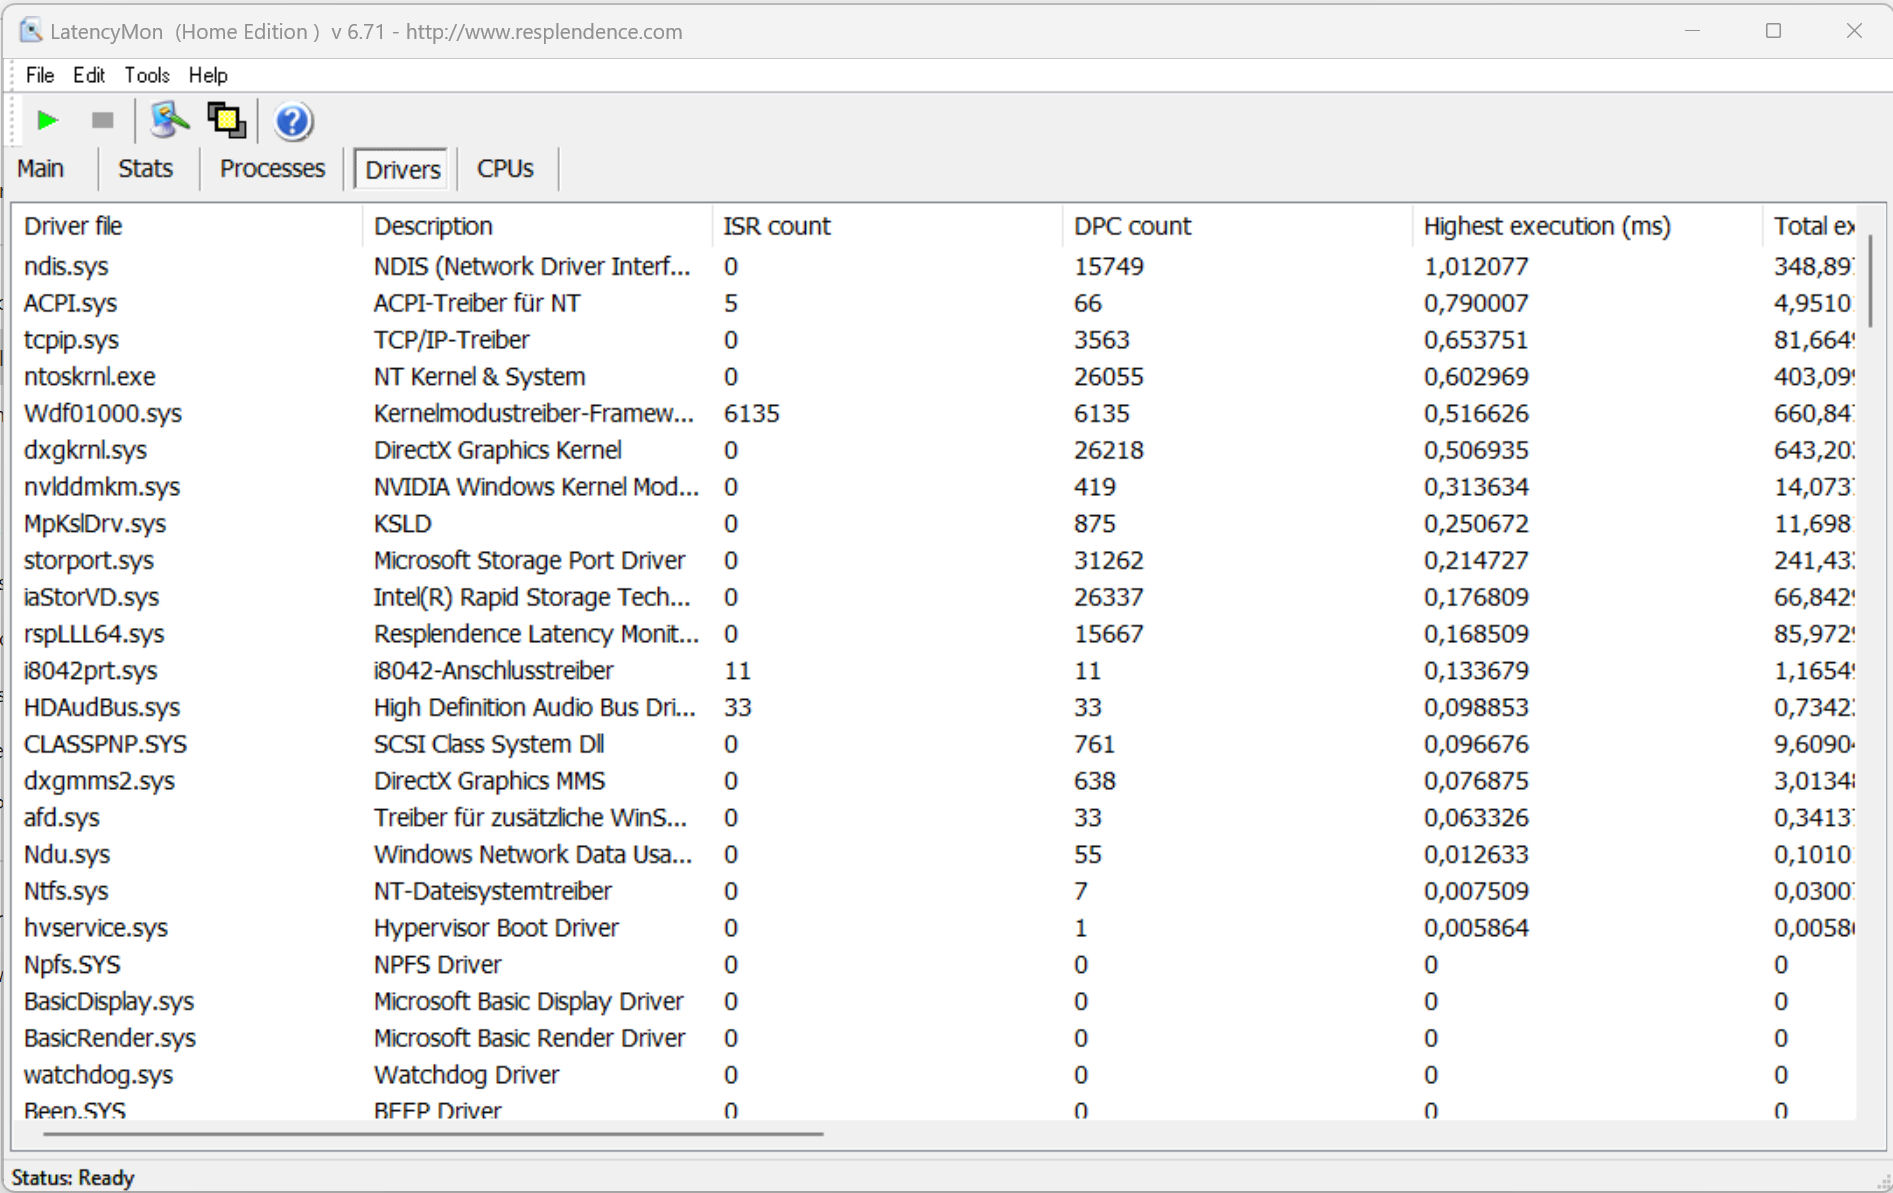
| DPC Latencies / LatencyMon - interrupt to process latency (max), Web, Youtube, Prime95 | |
| Gigabyte Aero 14 OLED BMF | |
| MSI Stealth 14 Studio A13V | |
| Acer Predator Triton 14 PT14-51 | |
| Asus ROG Zephyrus G14 GA402RJ | |
| Razer Blade 14 RTX 4070 | |
* ... smaller is better
大容量存储器
宏碁在存储方面的吝啬:所安装的 PCIe 4 固态硬盘(M.2 2280)容量仅为 512 GB,对于游戏笔记本电脑,尤其是这个价位的笔记本电脑来说是远远不够的。美光固态硬盘非常不错,但传输速度并不突出。缺点:在 DiskSpd 循环过程中,由于热节流会导致性能下降。没有额外的存储介质空间。

* ... smaller is better
Continuous Performance Read: DiskSpd Read Loop, Queue Depth 8
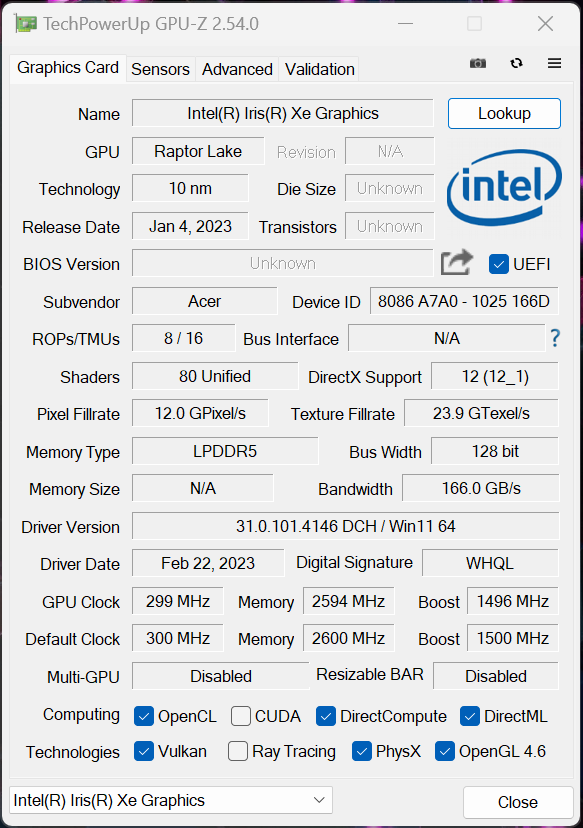
图形卡
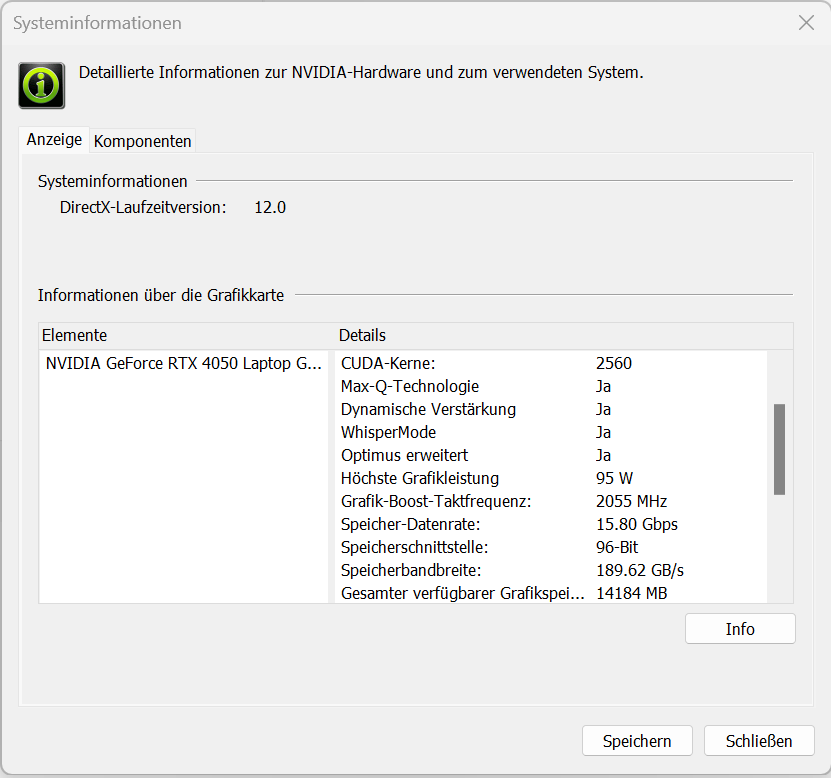
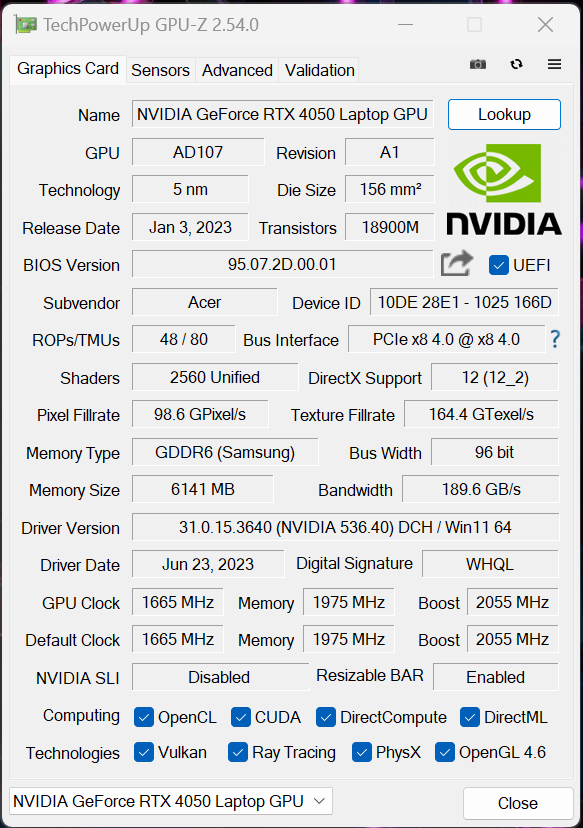
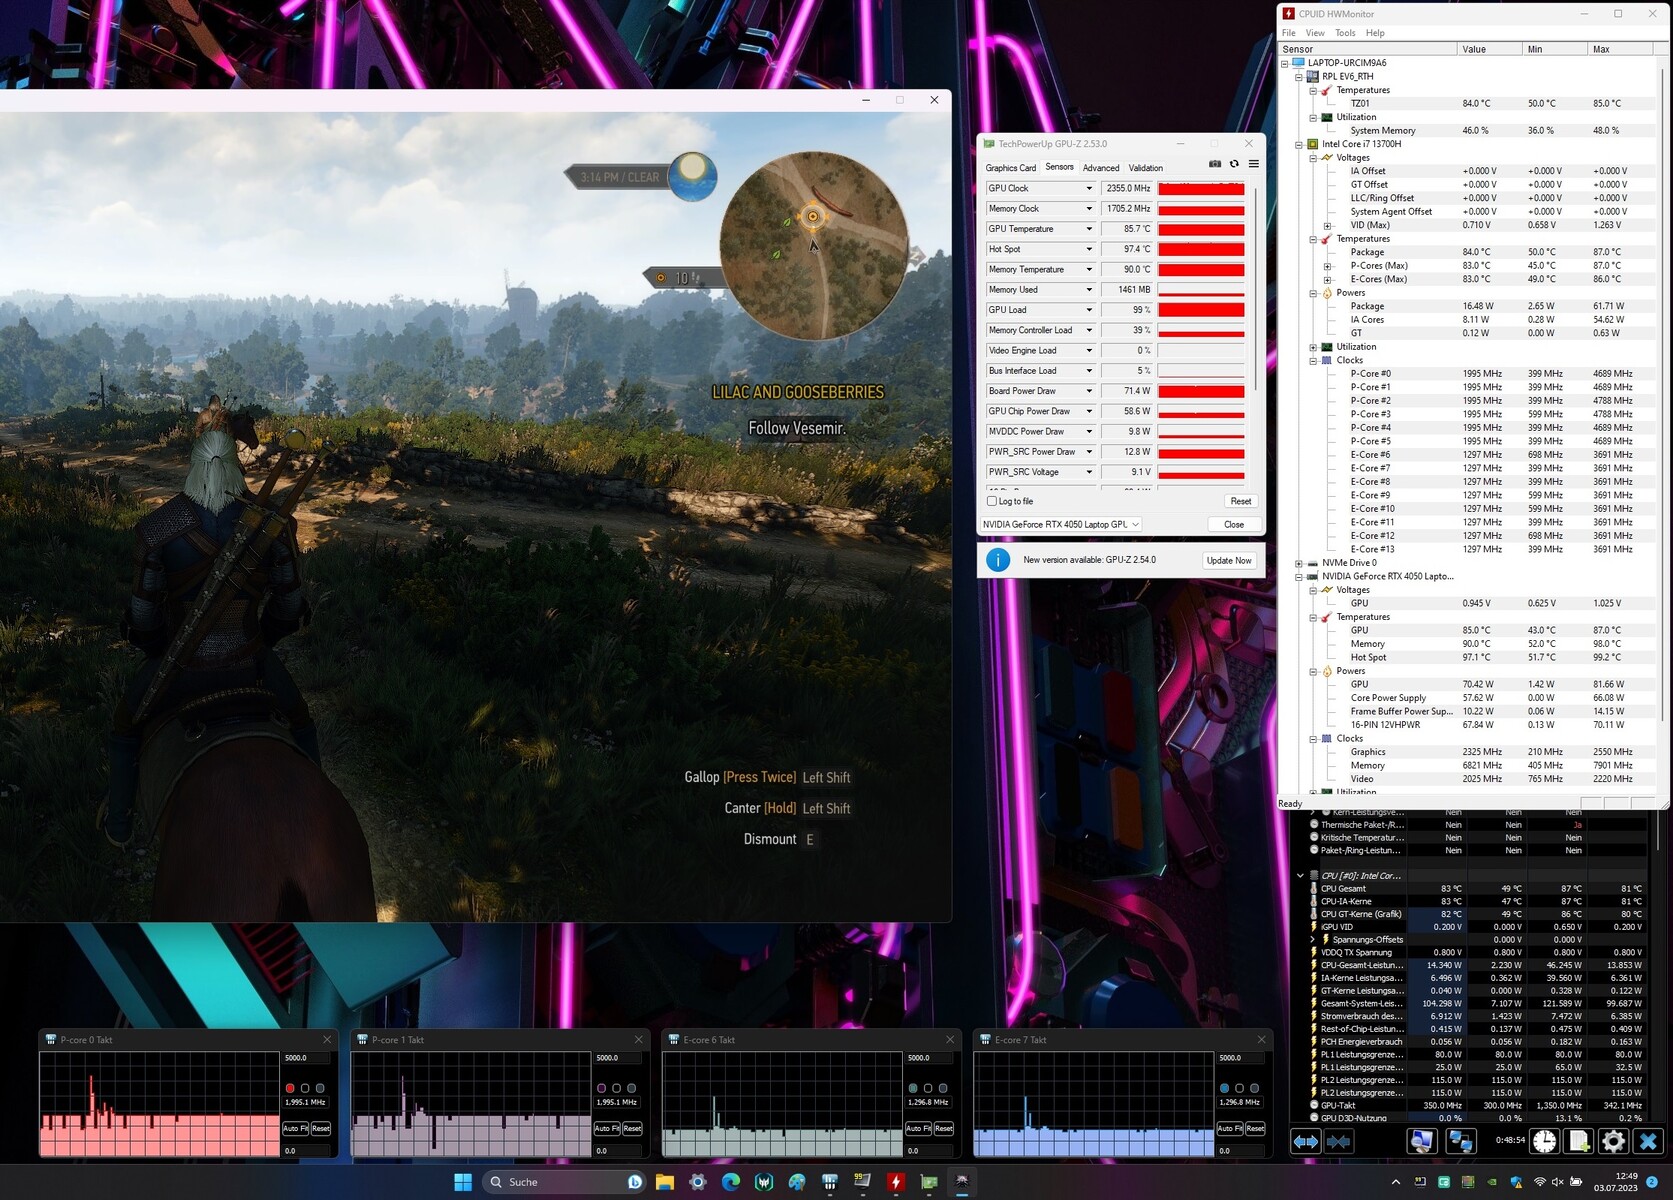
......(英文GeForce RTX 4050笔记本电脑 GPU 提供 2,560 个着色器、96 位宽总线和快速 GDDR6 内存(6,144 MB)。宏碁将最大 TGP 设置为 95 瓦。根据Witcher 3 测试,TGP 没有达到最大值。
基准测试结果高于 RTX 4050 的平均水平。不过,在使用 "静音 "模式时,这并不适用。通过GeForce GPU 直接输出视频不会提高性能,在 dGPU 和 Optimus 之间切换不需要重启 - 支持高级 Optimus。
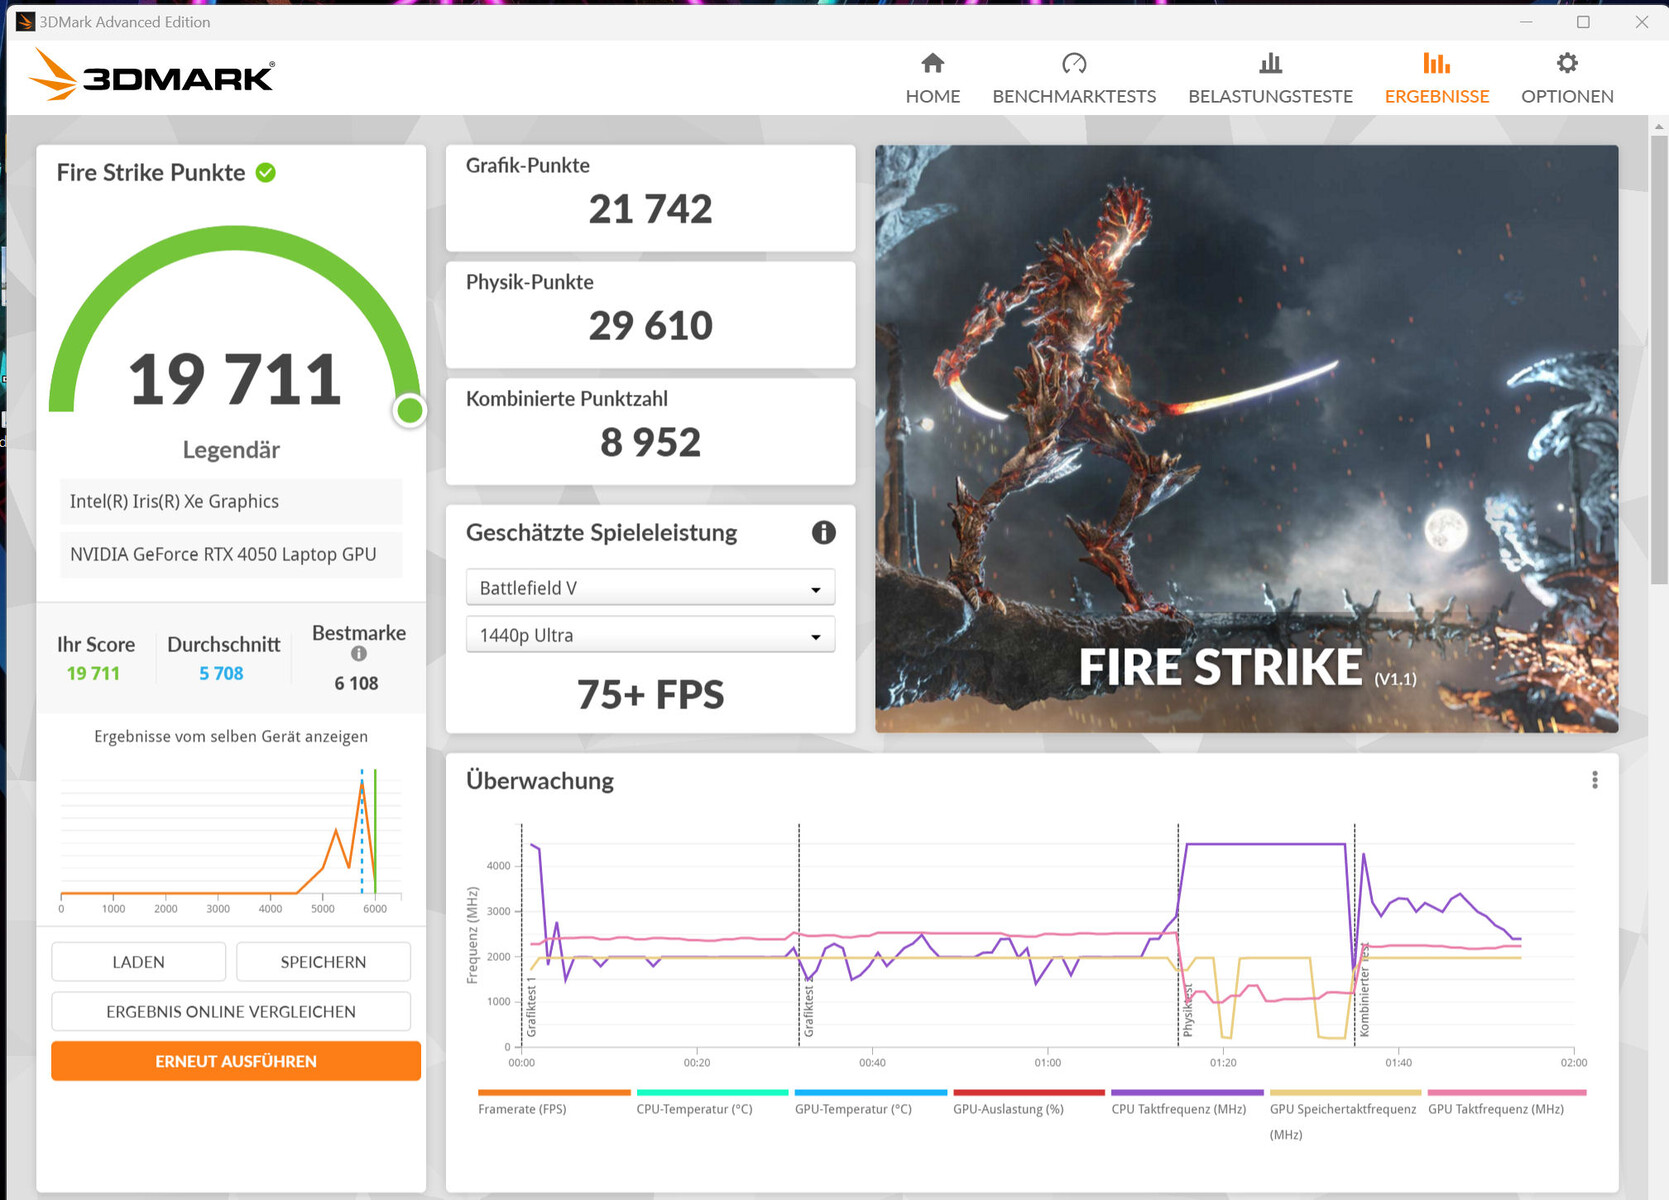

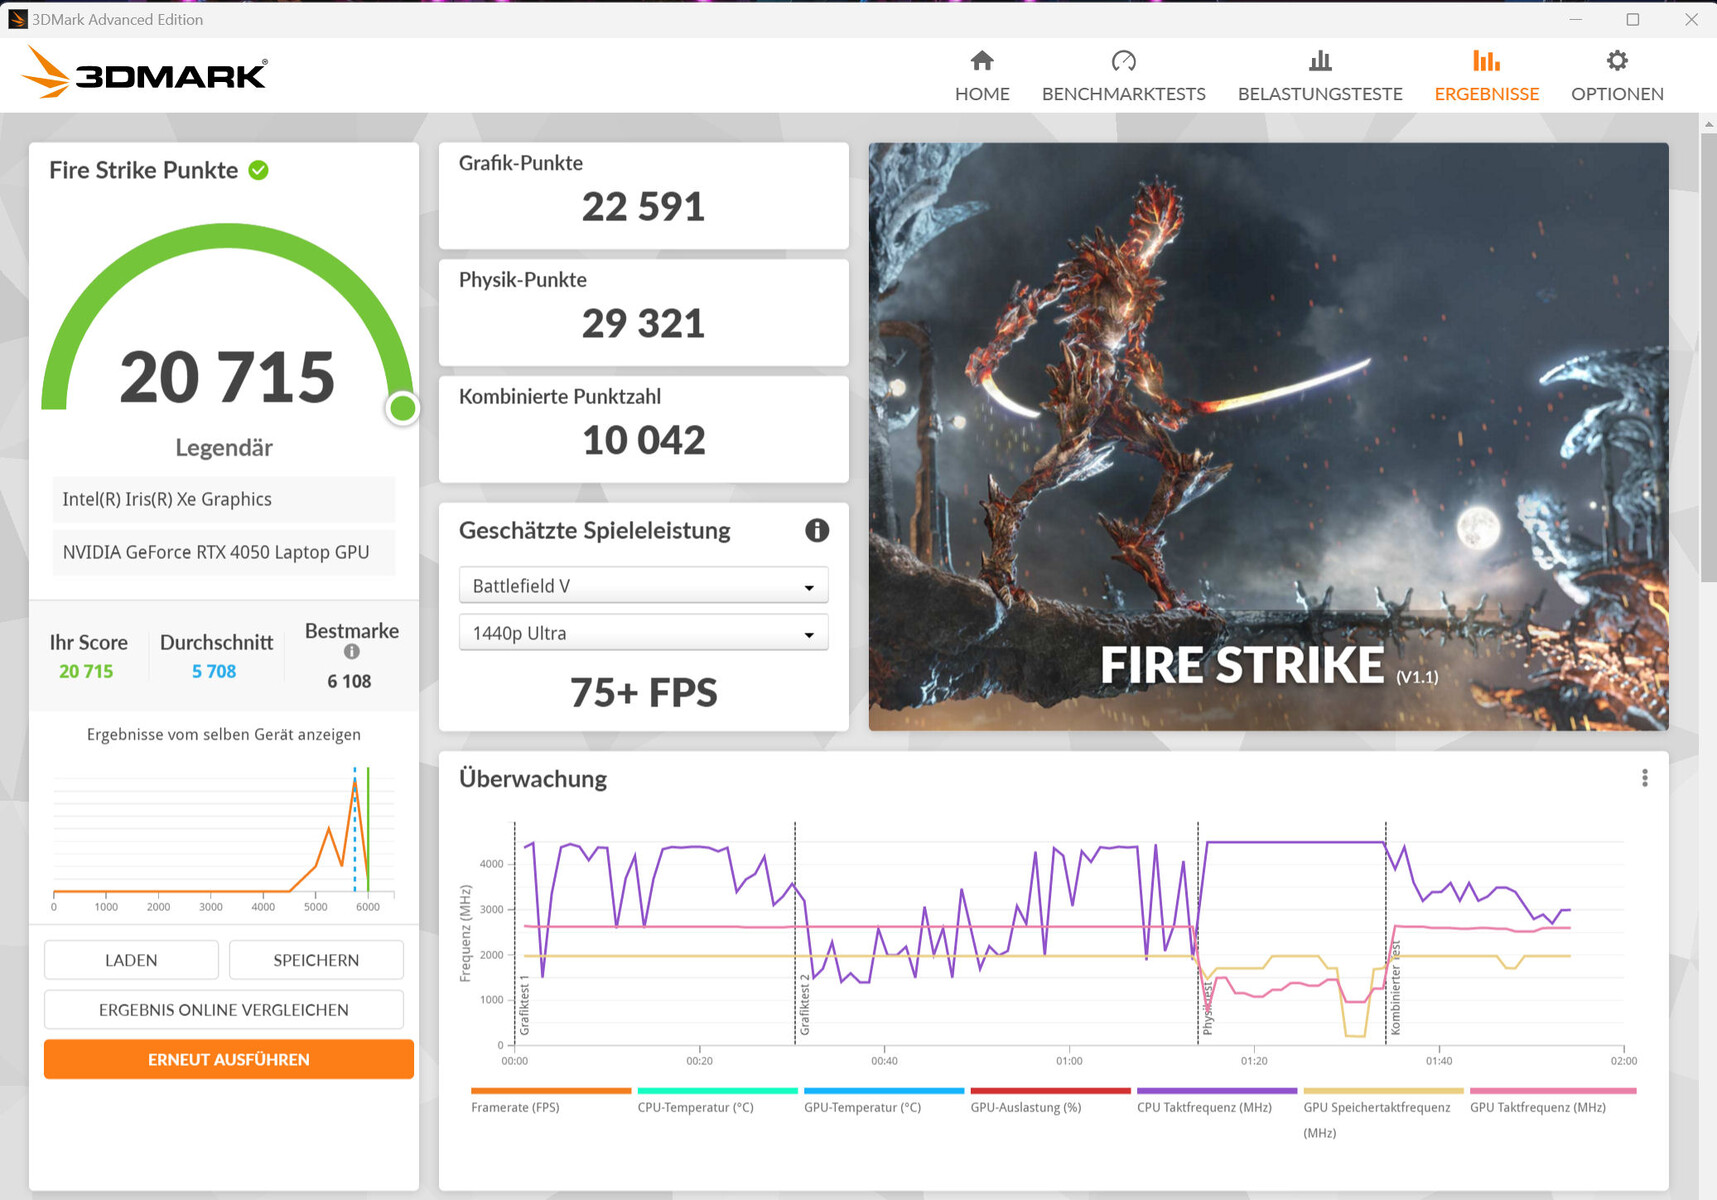

| 3DMark 06 Standard Score | 52667 points | |
| 3DMark 11 Performance | 27364 points | |
| 3DMark Cloud Gate Standard Score | 61034 points | |
| 3DMark Fire Strike Score | 19711 points | |
| 3DMark Time Spy Score | 8580 points | |
Help | ||
| Geekbench 6.7 - GPU OpenCL | |
| Average of class Gaming (67235 - 253130, n=103, last 2 years) | |
| Acer Predator Triton 14 PT14-51 | |
| Average NVIDIA GeForce RTX 4050 Laptop GPU (60815 - 86892, n=21) | |
* ... smaller is better
游戏性能
Predator 的硬件适用于高至最高设置下的全高清游戏。不过,屏幕的最大分辨率(2,560 x 1,600 像素)有时也能在较低设置下发挥优势。我们测得的帧率高于 RTX 4050 的平均帧率。
| The Last of Us - 1920x1080 Ultra Preset | |
| Razer Blade 14 RTX 4070 | |
| Average NVIDIA GeForce RTX 4050 Laptop GPU (35.7 - 50.2, n=3) | |
| Acer Predator Triton 14 PT14-51 | |
| Gigabyte Aero 14 OLED BMF | |
| The Callisto Protocol | |
| 2560x1440 Ultra Preset (without FSR Upscaling) | |
| Acer Predator Triton 14 PT14-51 | |
| Average NVIDIA GeForce RTX 4050 Laptop GPU (29.5 - 46.7, n=3) | |
| 1920x1080 Ultra Preset (without FSR Upscaling) | |
| Acer Predator Triton 14 PT14-51 | |
| Average NVIDIA GeForce RTX 4050 Laptop GPU (41.4 - 63.1, n=3) | |
| 1920x1080 Ultra Preset (without FSR Upscaling) + Full Ray-Tracing | |
| Acer Predator Triton 14 PT14-51 | |
| Average NVIDIA GeForce RTX 4050 Laptop GPU (31 - 49.9, n=3) | |
| Star Wars Jedi Survivor | |
| 1920x1080 Epic Preset | |
| Average NVIDIA GeForce RTX 4050 Laptop GPU (48.4 - 56, n=7) | |
| Medion Erazer Scout E20 | |
| Acer Predator Triton 14 PT14-51 | |
| 2560x1440 Epic Preset | |
| Average NVIDIA GeForce RTX 4050 Laptop GPU (30.4 - 35, n=4) | |
| Acer Predator Triton 14 PT14-51 | |
| 1920x1080 Epic Preset + Ray Tracing | |
| Average NVIDIA GeForce RTX 4050 Laptop GPU (38.6 - 42, n=4) | |
| Medion Erazer Scout E20 | |
| Acer Predator Triton 14 PT14-51 | |
| F1 23 | |
| 1920x1080 Ultra High Preset AA:T AF:16x | |
| Average NVIDIA GeForce RTX 4050 Laptop GPU (25.7 - 60.8, n=14) | |
| Acer Predator Triton 14 PT14-51 | |
| 2560x1440 Ultra High Preset AA:T AF:16x | |
| Average NVIDIA GeForce RTX 4050 Laptop GPU (16.7 - 40.8, n=11) | |
| Acer Predator Triton 14 PT14-51 | |
| Dead Island 2 | |
| 2560x1440 Ultra Preset AA:High T | |
| Average NVIDIA GeForce RTX 4050 Laptop GPU (61.8 - 76.5, n=2) | |
| Acer Predator Triton 14 PT14-51 | |
| 1920x1080 Ultra Preset AA:High T | |
| Medion Erazer Scout E20 | |
| Average NVIDIA GeForce RTX 4050 Laptop GPU (90.9 - 133.5, n=3) | |
| Acer Predator Triton 14 PT14-51 | |
为了检查帧频是否在较长时间内保持稳定,我们以 FullHD 分辨率和最高质量设置运行Witcher 3 游戏约 60 分钟。游戏角色没有移动,我们也没有发现帧频下降。
Witcher 3 FPS diagram
| low | med. | high | ultra | QHD | |
|---|---|---|---|---|---|
| The Witcher 3 (2015) | 393.7 | 253.3 | 149.7 | 80.1 | |
| Dota 2 Reborn (2015) | 159.4 | 141.8 | 132.6 | 127.2 | |
| Final Fantasy XV Benchmark (2018) | 183 | 110.5 | 79.2 | 58.2 | |
| X-Plane 11.11 (2018) | 138.1 | 128.6 | 100.2 | ||
| Far Cry 5 (2018) | 174 | 131 | 122 | 113 | 79 |
| Strange Brigade (2018) | 467 | 194.8 | 159.4 | 137 | 94.9 |
| F1 22 (2022) | 210 | 194.4 | 147.2 | 48.5 | 31 |
| The Callisto Protocol (2022) | 119 | 96 | 93.3 | 63.1 | 46.7 |
| The Last of Us (2023) | 82.2 | 67.4 | 56.2 | 42.8 | |
| Dead Island 2 (2023) | 201 | 171.8 | 125.9 | 90.9 | 61.8 |
| Star Wars Jedi Survivor (2023) | 60.6 | 54.6 | 51.6 | 48.4 | 30.4 |
| F1 23 (2023) | 197.9 | 194.8 | 139.8 | 40.5 | 31 |
排放 - Acer 笔记本电脑可以安静运行
噪音排放
在日常使用中(办公室、互联网......),无论选择何种模式,Triton 通常都能安静运行。噪音水平最高可达 56 dB(A)("Turbo")和 53 dB(A)("Performance")。我们使用了 "平衡 "模式,记录到的噪音为 43 dB(A)。总体而言,使用 "静音 "模式可以降低噪音,但性能下降相对较小。
Noise level
| Idle |
| 27 / 29 / 31 dB(A) |
| Load |
| 42 / 45 dB(A) |
 | ||
30 dB silent 40 dB(A) audible 50 dB(A) loud |
||
min: | ||
| Acer Predator Triton 14 PT14-51 i7-13700H, GeForce RTX 4050 Laptop GPU | Razer Blade 14 RTX 4070 R9 7940HS, GeForce RTX 4070 Laptop GPU | Asus ROG Zephyrus G14 GA402RJ R7 6800HS, Radeon RX 6700S | MSI Stealth 14 Studio A13V i7-13700H, GeForce RTX 4050 Laptop GPU | Gigabyte Aero 14 OLED BMF i7-13700H, GeForce RTX 4050 Laptop GPU | Apple MacBook Pro 14 2023 M2 Pro Entry M2 Pro 10-Core, M2 Pro 16-Core GPU | |
|---|---|---|---|---|---|---|
| Noise | 6% | 2% | -3% | 1% | 16% | |
| off / environment * (dB) | 25 | 22.7 9% | 25 -0% | 25.3 -1% | 24 4% | 23.6 6% |
| Idle Minimum * (dB) | 27 | 23.4 13% | 25 7% | 25.3 6% | 24 11% | 23.6 13% |
| Idle Average * (dB) | 29 | 23.4 19% | 26 10% | 25 14% | 24 17% | 23.6 19% |
| Idle Maximum * (dB) | 31 | 23.4 25% | 29 6% | 33.7 -9% | 35.71 -15% | 23.6 24% |
| Load Average * (dB) | 42 | 33 21% | 45 -7% | 42.2 -0% | 24.2 42% | |
| Witcher 3 ultra * (dB) | 43 | 51.8 -20% | 43 -0% | 51 -19% | 40.22 6% | |
| Load Maximum * (dB) | 45 | 55.6 -24% | 45 -0% | 51 -13% | 51.93 -15% | 47.5 -6% |
* ... smaller is better
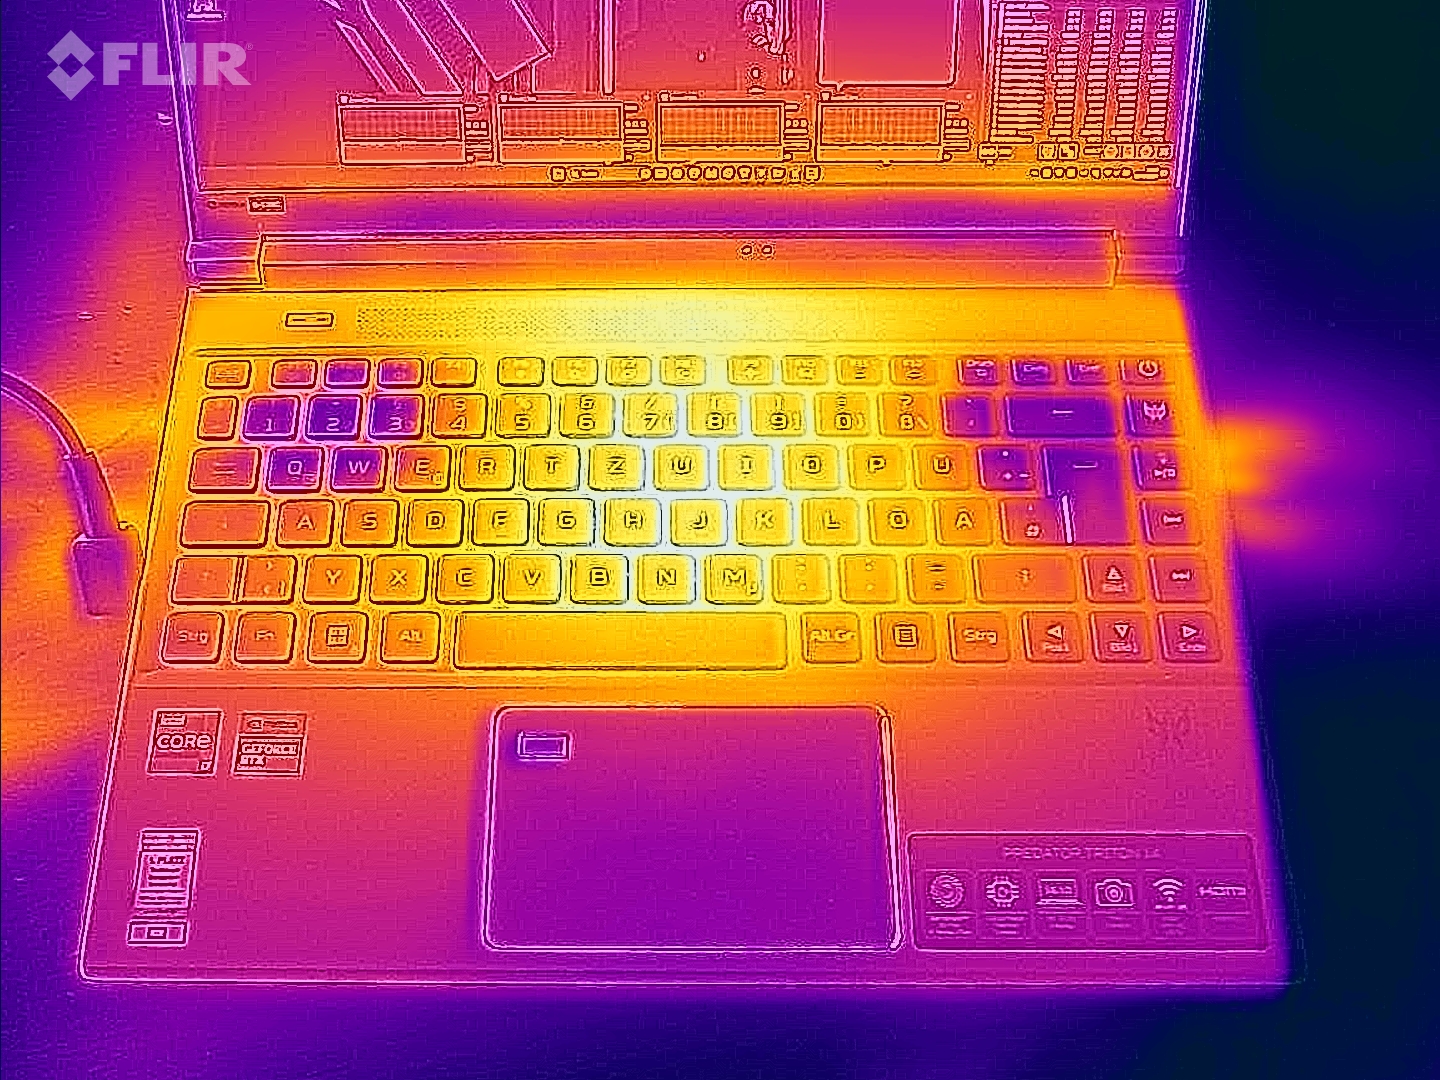
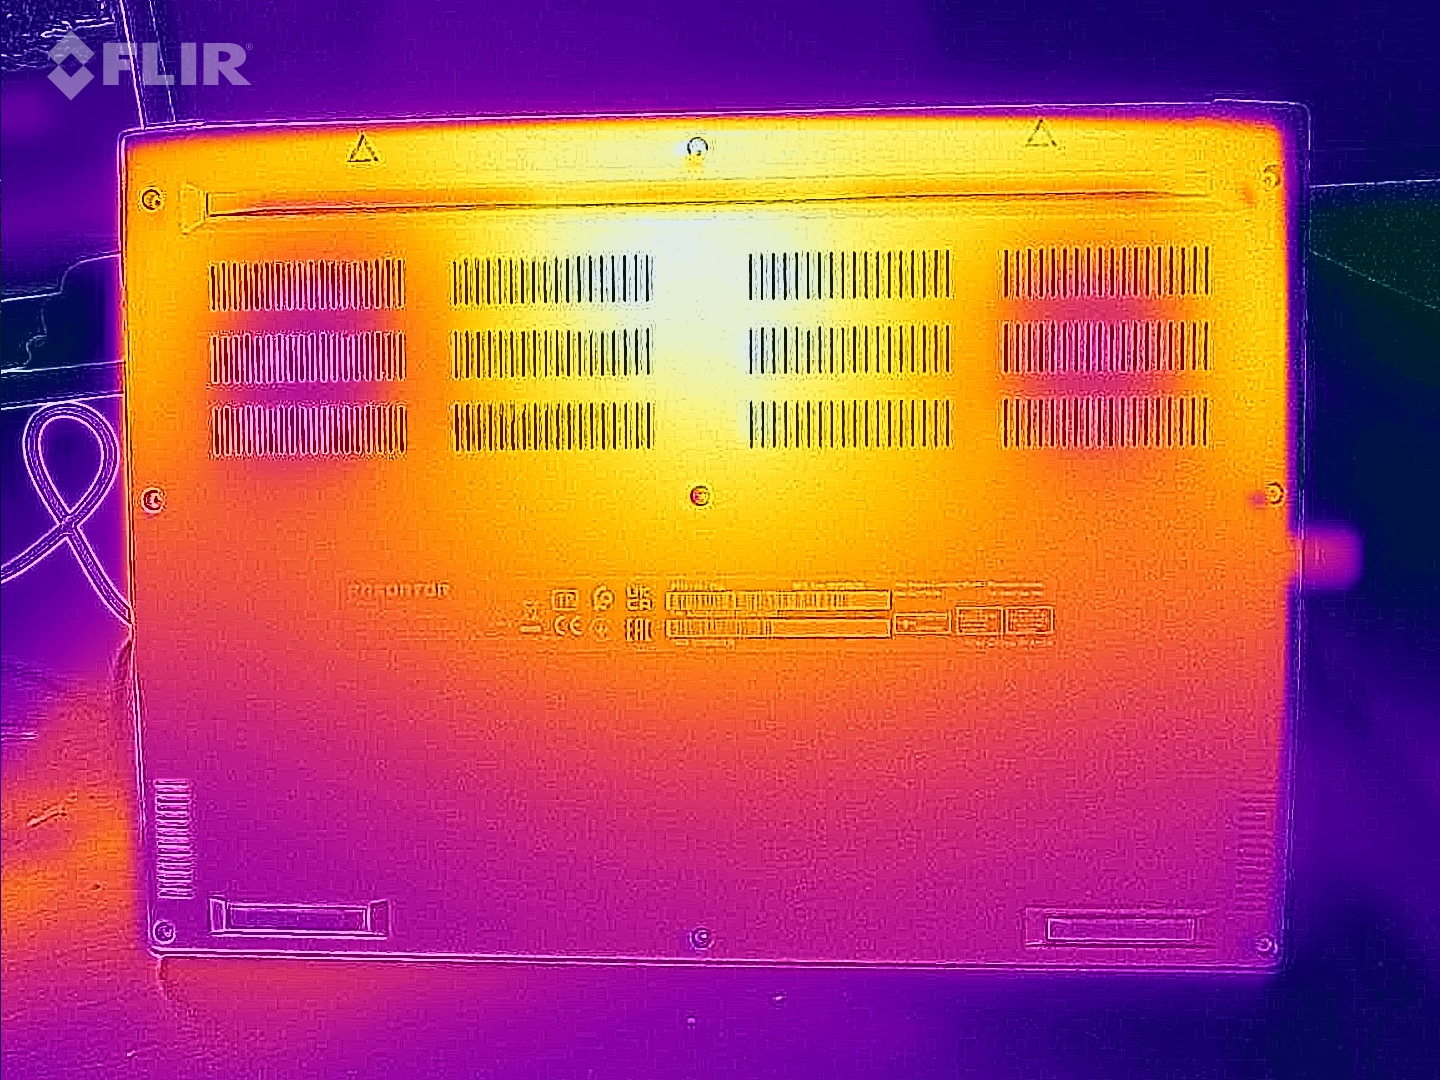
温度
在负载情况下,笔记本电脑会明显发热。在几个测量点,我们记录到的温度在 50 至 56 °C 之间。在日常使用中,这些数据都处于绿色区域。
(-) The maximum temperature on the upper side is 54 °C / 129 F, compared to the average of 40.4 °C / 105 F, ranging from 21.2 to 68.8 °C for the class Gaming.
(-) The bottom heats up to a maximum of 56 °C / 133 F, compared to the average of 43.2 °C / 110 F
(+) In idle usage, the average temperature for the upper side is 29.1 °C / 84 F, compared to the device average of 33.9 °C / 93 F.
(-) Playing The Witcher 3, the average temperature for the upper side is 46.7 °C / 116 F, compared to the device average of 33.9 °C / 93 F.
(-) The palmrests and touchpad can get very hot to the touch with a maximum of 41 °C / 105.8 F.
(-) The average temperature of the palmrest area of similar devices was 28.8 °C / 83.8 F (-12.2 °C / -22 F).
| Acer Predator Triton 14 PT14-51 Intel Core i7-13700H, NVIDIA GeForce RTX 4050 Laptop GPU | Razer Blade 14 RTX 4070 AMD Ryzen 9 7940HS, NVIDIA GeForce RTX 4070 Laptop GPU | Asus ROG Zephyrus G14 GA402RJ AMD Ryzen 7 6800HS, AMD Radeon RX 6700S | MSI Stealth 14 Studio A13V Intel Core i7-13700H, NVIDIA GeForce RTX 4050 Laptop GPU | Gigabyte Aero 14 OLED BMF Intel Core i7-13700H, NVIDIA GeForce RTX 4050 Laptop GPU | Apple MacBook Pro 14 2023 M2 Pro Entry Apple M2 Pro 10-Core, Apple M2 Pro 16-Core GPU | |
|---|---|---|---|---|---|---|
| Heat | 11% | -7% | -5% | 15% | 24% | |
| Maximum Upper Side * (°C) | 54 | 37.4 31% | 53 2% | 46.9 13% | 42 22% | 47 13% |
| Maximum Bottom * (°C) | 56 | 35.2 37% | 54 4% | 56.1 -0% | 52 7% | 42.8 24% |
| Idle Upper Side * (°C) | 31 | 33.2 -7% | 34 -10% | 33.8 -9% | 26 16% | 22.3 28% |
| Idle Bottom * (°C) | 31 | 36.2 -17% | 38 -23% | 37.9 -22% | 27 13% | 21.7 30% |
* ... smaller is better
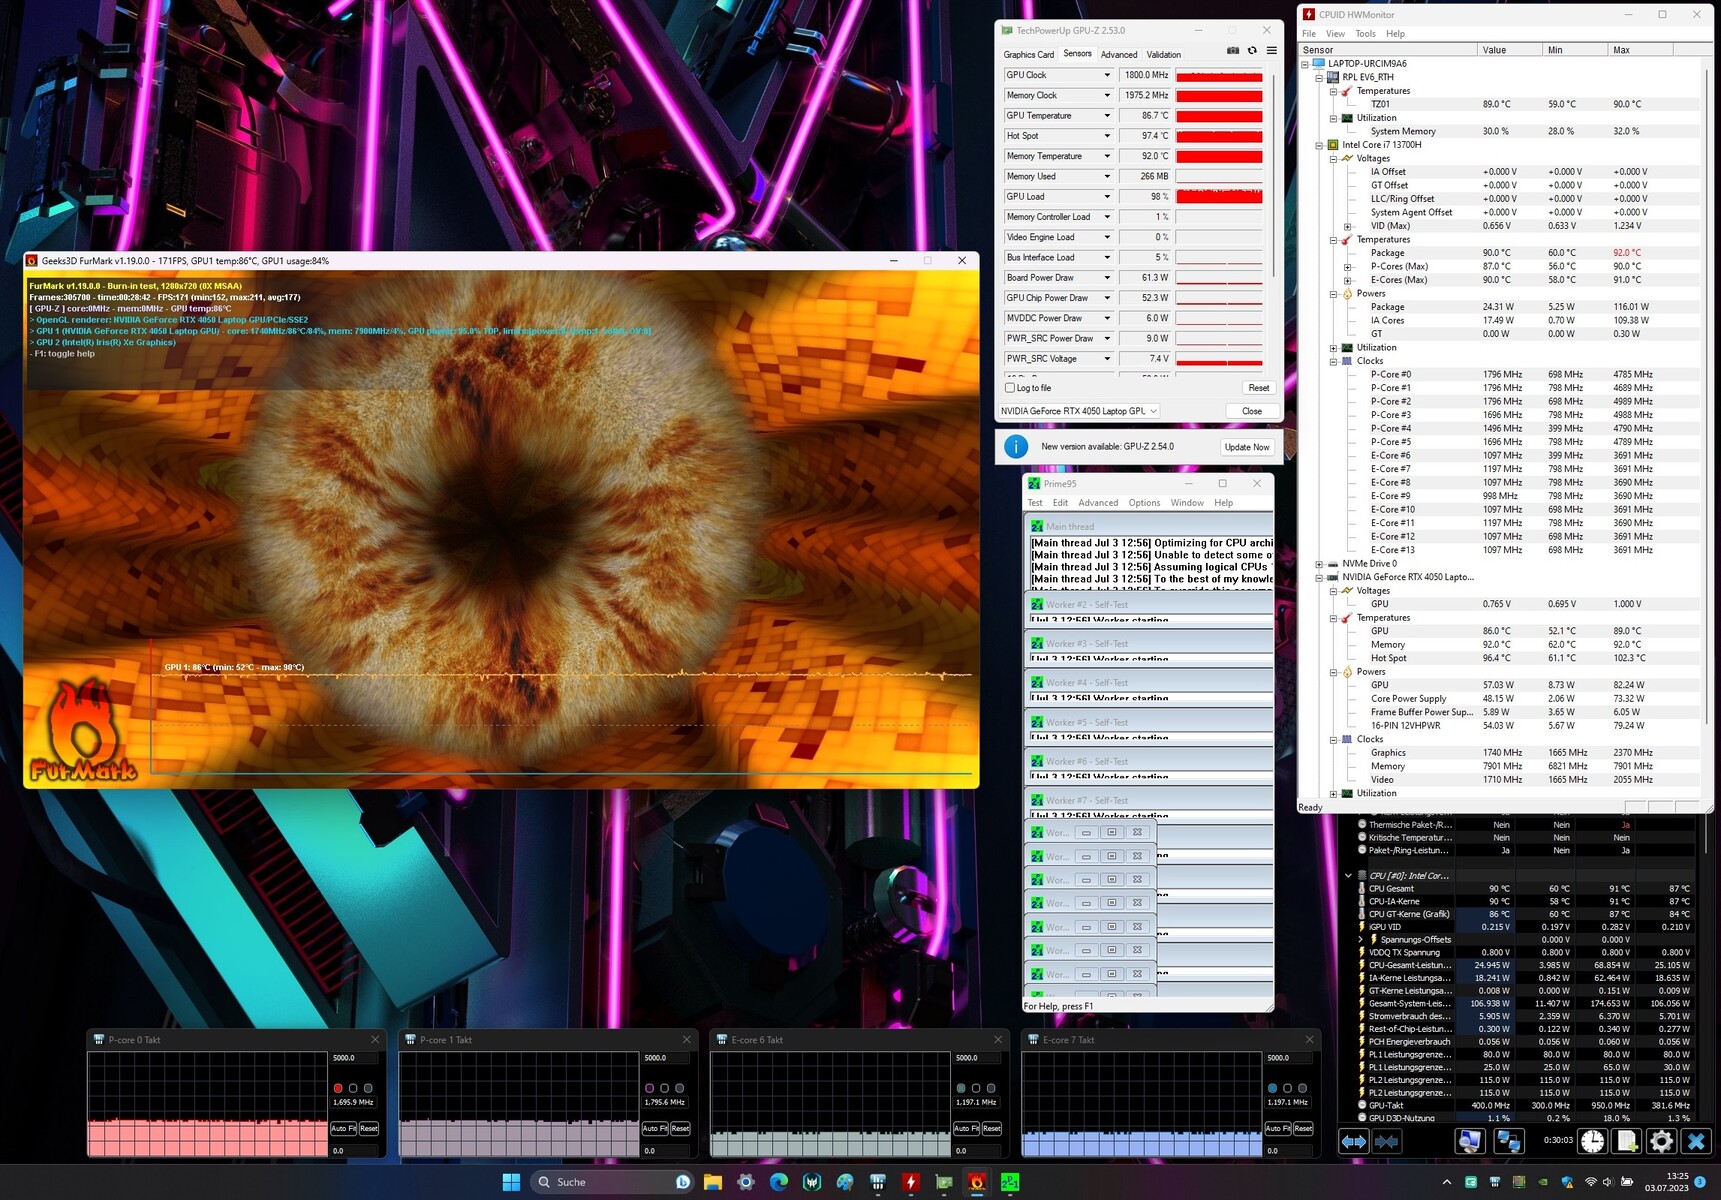
压力测试
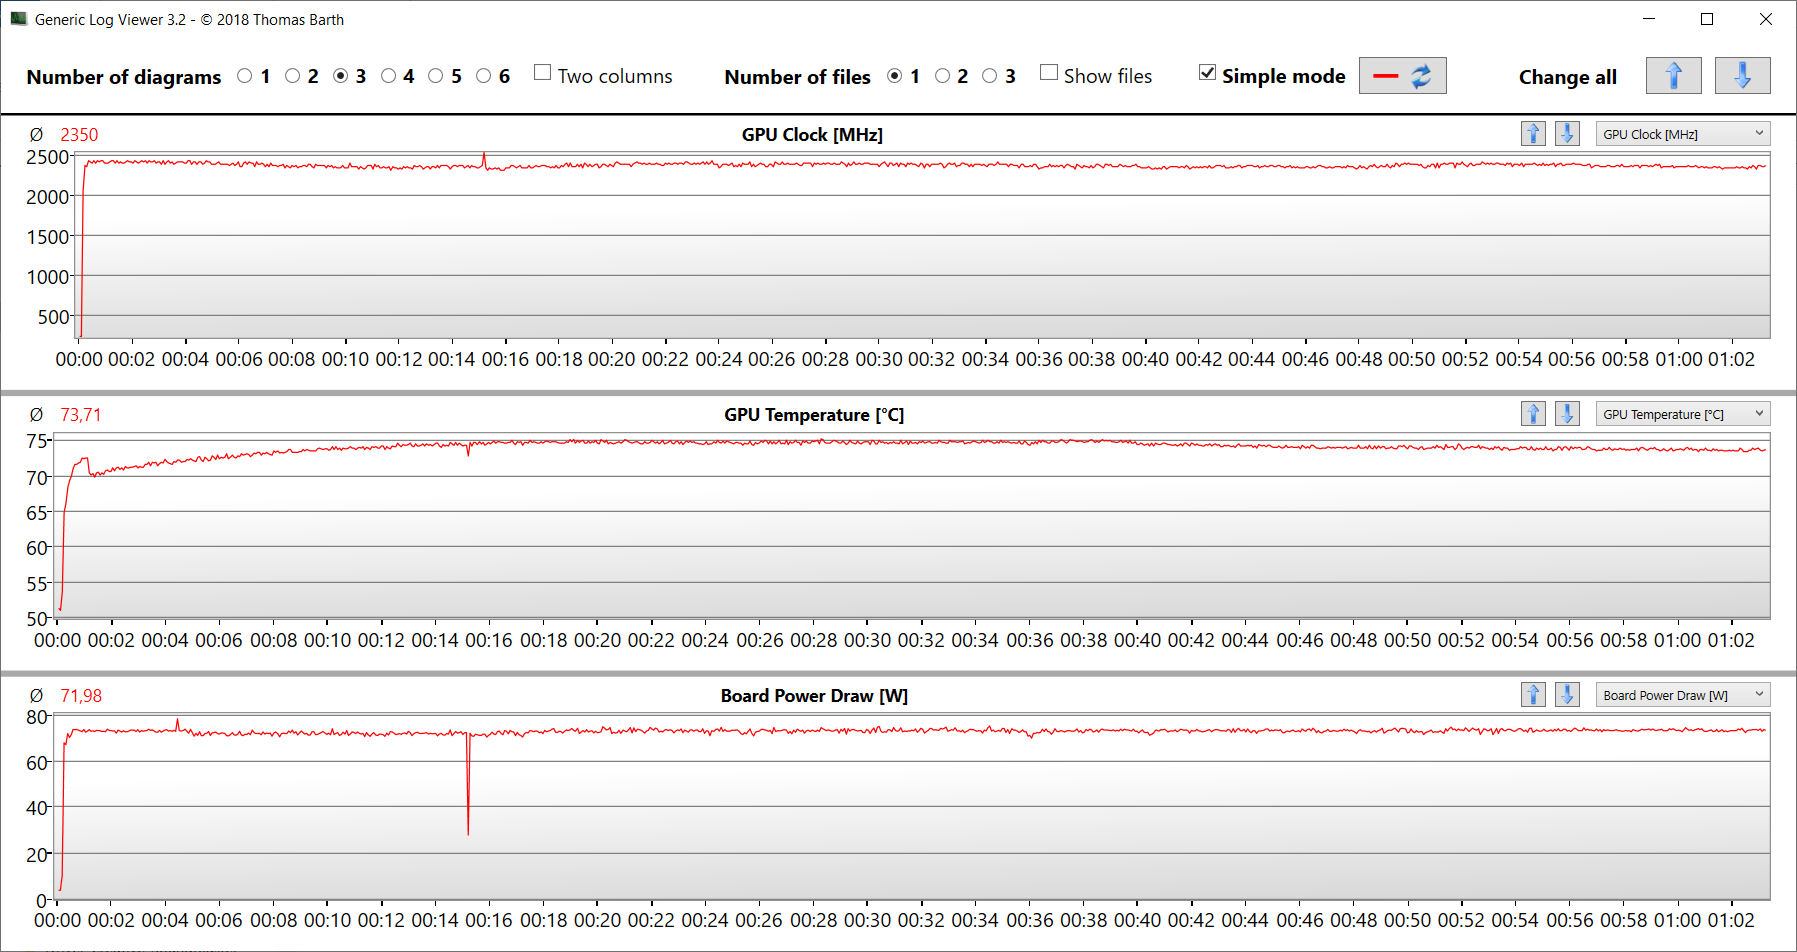
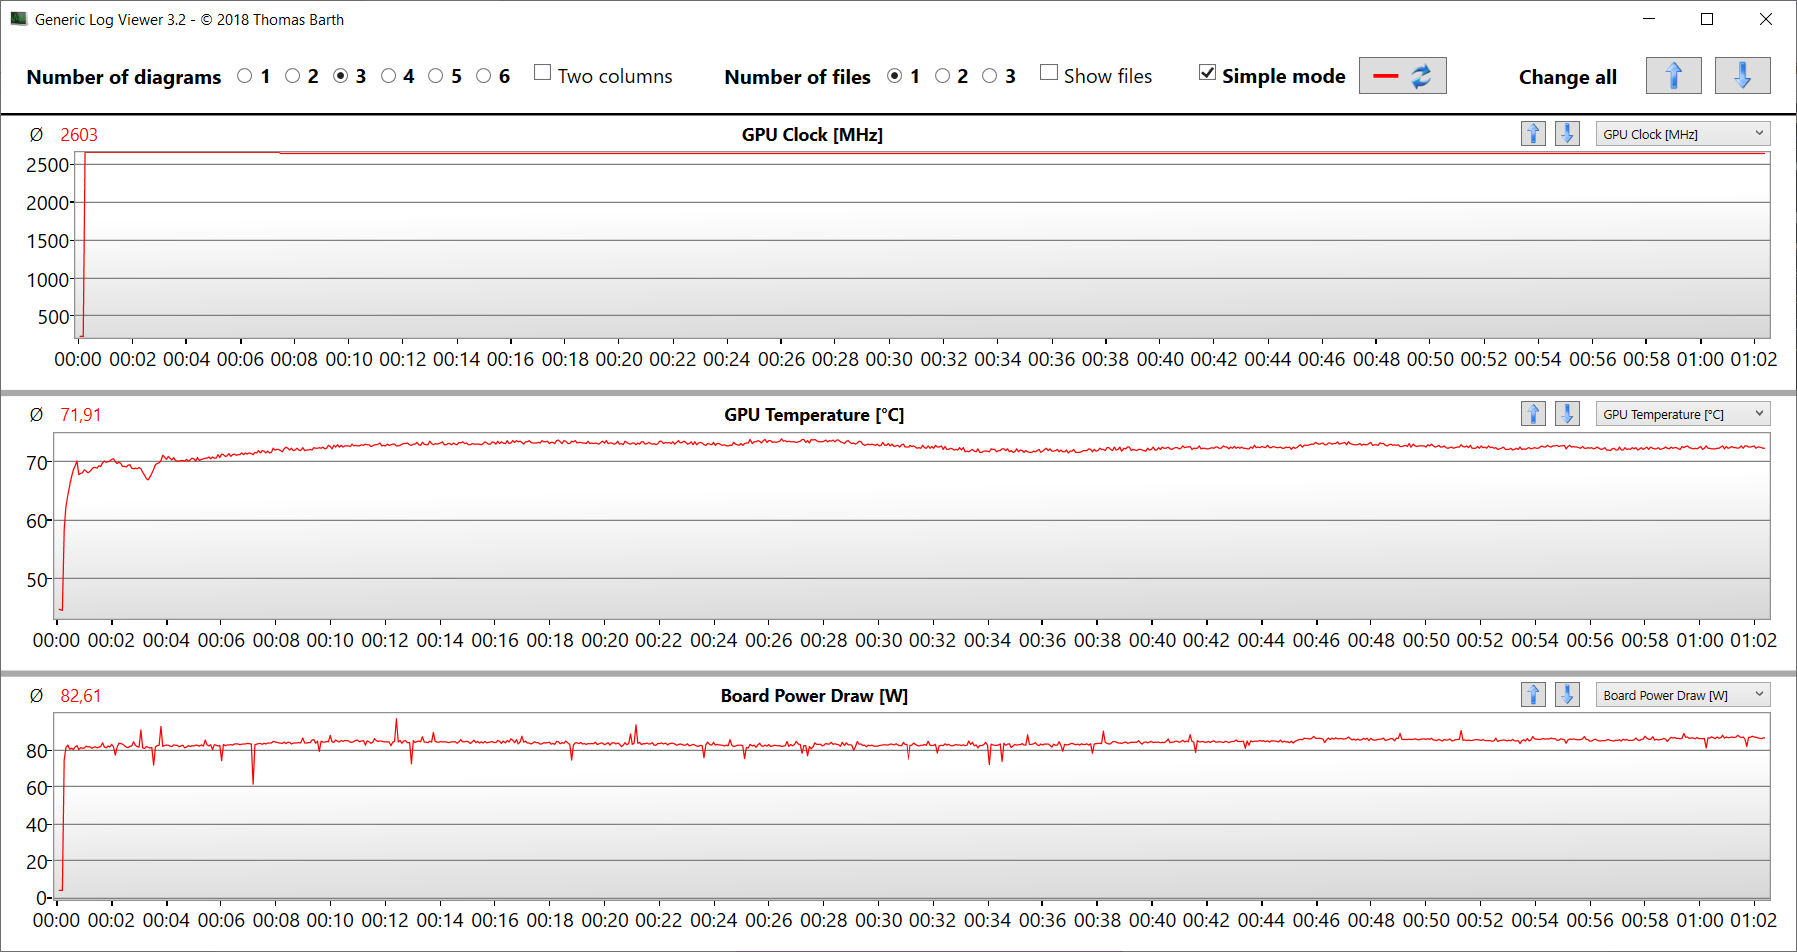
压力测试(Prime95 和 Furmark 连续运行)是一种极端情况,用于检验系统在满负荷情况下的稳定性。CPU 时钟速度最初从 4.4 GHz 降至 4.5 GHz(P)和 3.1 GHz(E),然后逐渐从 2.1 GHz 降至 2.2 GHz(P)和 1.3 GHz(E)。GPU 时钟速度从 1,800 MHz 降至 1,750 MHz。
发言人
立体声扬声器产生的音效很不错,大部分都没有低音。使用耳机或外置扬声器可以获得更好的音频体验。
Acer Predator Triton 14 PT14-51 audio analysis
(±) | speaker loudness is average but good (80 dB)
Bass 100 - 315 Hz
(-) | nearly no bass - on average 18% lower than median
(±) | linearity of bass is average (11.8% delta to prev. frequency)
Mids 400 - 2000 Hz
(+) | balanced mids - only 3.7% away from median
(+) | mids are linear (4% delta to prev. frequency)
Highs 2 - 16 kHz
(+) | balanced highs - only 2.9% away from median
(±) | linearity of highs is average (7.2% delta to prev. frequency)
Overall 100 - 16.000 Hz
(±) | linearity of overall sound is average (15.4% difference to median)
Compared to same class
» 34% of all tested devices in this class were better, 7% similar, 59% worse
» The best had a delta of 6%, average was 18%, worst was 132%
Compared to all devices tested
» 23% of all tested devices were better, 4% similar, 73% worse
» The best had a delta of 4%, average was 23%, worst was 134%
Razer Blade 14 RTX 4070 audio analysis
(+) | speakers can play relatively loud (82.7 dB)
Bass 100 - 315 Hz
(-) | nearly no bass - on average 15.9% lower than median
(±) | linearity of bass is average (12.3% delta to prev. frequency)
Mids 400 - 2000 Hz
(+) | balanced mids - only 4.3% away from median
(+) | mids are linear (3.1% delta to prev. frequency)
Highs 2 - 16 kHz
(±) | higher highs - on average 6.2% higher than median
(+) | highs are linear (5.5% delta to prev. frequency)
Overall 100 - 16.000 Hz
(±) | linearity of overall sound is average (16.7% difference to median)
Compared to same class
» 43% of all tested devices in this class were better, 10% similar, 47% worse
» The best had a delta of 6%, average was 18%, worst was 132%
Compared to all devices tested
» 29% of all tested devices were better, 7% similar, 64% worse
» The best had a delta of 4%, average was 23%, worst was 134%
能源管理 - 宏碁电脑的耐力水平相当不错
耗电量
电脑的耗电量没有任何异常。对于所安装的硬件而言,测试结果属于正常范围。压力测试和Witcher 3 测试均在功耗下降或恒定的情况下进行。电源(230 瓦)的大小绰绰有余。
| Off / Standby | |
| Idle | |
| Load |
|
Key:
min: | |
| Acer Predator Triton 14 PT14-51 i7-13700H, GeForce RTX 4050 Laptop GPU | Razer Blade 14 RTX 4070 R9 7940HS, GeForce RTX 4070 Laptop GPU | Asus ROG Zephyrus G14 GA402RJ R7 6800HS, Radeon RX 6700S | MSI Stealth 14 Studio A13V i7-13700H, GeForce RTX 4050 Laptop GPU | Gigabyte Aero 14 OLED BMF i7-13700H, GeForce RTX 4050 Laptop GPU | Apple MacBook Pro 14 2023 M2 Pro Entry M2 Pro 10-Core, M2 Pro 16-Core GPU | Average NVIDIA GeForce RTX 4050 Laptop GPU | Average of class Gaming | |
|---|---|---|---|---|---|---|---|---|
| Power Consumption | -30% | -10% | -4% | 40% | 52% | 9% | -17% | |
| Idle Minimum * (Watt) | 12 | 19.5 -63% | 12 -0% | 10.4 13% | 7.4 38% | 2.5 79% | 9.95 ? 17% | 13 ? -8% |
| Idle Average * (Watt) | 14 | 24.7 -76% | 18 -29% | 19.1 -36% | 8.3 41% | 12.1 14% | 15.8 ? -13% | 19 ? -36% |
| Idle Maximum * (Watt) | 26 | 27 -4% | 26 -0% | 19.4 25% | 8.7 67% | 12.3 53% | 20.1 ? 23% | 24.6 ? 5% |
| Load Average * (Watt) | 88 | 83.2 5% | 88 -0% | 95.9 -9% | 76 14% | 49.8 43% | 88 ? -0% | 110.7 ? -26% |
| Witcher 3 ultra * (Watt) | 114.9 | 165.8 -44% | 157.7 -37% | 141.6 -23% | 70 39% | 46.6 59% | ||
| Load Maximum * (Watt) | 213 | 204.5 4% | 194 9% | 203 5% | 132 38% | 71.4 66% | 176.3 ? 17% | 259 ? -22% |
* ... smaller is better
Power consumption Witcher 3 / stress test
Power consumption with an external monitor
电池寿命
在 Wi-Fi 测试(借助脚本加载网站)和视频测试(循环播放 Big Buck Bunny 短片(H.264 编码,FHD))中,这款 14 英寸设备的运行时间分别为 5 小时 2 分钟和 8 小时 59 分钟。在这两项测试中,笔记本电脑的节能功能均被关闭,显示屏亮度被调至约 150 cd/m²。此外,视频测试是在关闭无线电模块的情况下进行的。
| Acer Predator Triton 14 PT14-51 i7-13700H, GeForce RTX 4050 Laptop GPU, 76.3 Wh | Razer Blade 14 RTX 4070 R9 7940HS, GeForce RTX 4070 Laptop GPU, 68 Wh | Asus ROG Zephyrus G14 GA402RJ R7 6800HS, Radeon RX 6700S, 76 Wh | MSI Stealth 14 Studio A13V i7-13700H, GeForce RTX 4050 Laptop GPU, 72 Wh | Gigabyte Aero 14 OLED BMF i7-13700H, GeForce RTX 4050 Laptop GPU, 63 Wh | Apple MacBook Pro 14 2023 M2 Pro Entry M2 Pro 10-Core, M2 Pro 16-Core GPU, 70 Wh | Average of class Gaming | |
|---|---|---|---|---|---|---|---|
| Battery runtime | -14% | 104% | -11% | 12% | 120% | -2% | |
| Reader / Idle (h) | 11.2 | 8.6 -23% | 11.3 1% | 8.27 ? -26% | |||
| H.264 (h) | 9 | 6.6 -27% | 16.4 82% | 8.32 ? -8% | |||
| WiFi v1.3 (h) | 5 | 6.2 24% | 10.2 104% | 6.3 26% | 7.6 52% | 12.9 158% | 7.11 ? 42% |
| Load (h) | 1.8 | 1 -44% | 1.2 -33% | 1.5 -17% | 1.502 ? -17% |
Pros
Cons
结论 - 紧凑型动力装置
这款 14 英寸笔记本电脑的主要应用领域应该是渲染和游戏。酷睿 i7-13700H 和GeForce RTX 4050 提供了必要的动力,两款芯片都能以稳定的高时钟速度运行。如果需要更强的图形处理能力,宏碁还提供GeForce RTX 4070 变体。
14 英寸机身,超强计算能力:凭借 Predator Triton 14,宏碁推出了一款强劲的笔记本电脑。
这款笔记本电脑的发热很明显,而且会产生相当大的噪音。我们主要使用了 "平衡 "系统模式,它确保了只有适度的背景噪音,而性能损失相对较小。
总体而言,16:10 显示屏(2560 x 1600 像素、IPS、165 Hz、G-Sync)令人印象深刻。其亮度高、DCI P3 覆盖范围广是它的亮点。此外,它的电池实际运行时间为 5 至 9 小时。正面:电池可通过 USB-C 主适配器充电(最小 65 瓦,20 V)。支持 Power Delivery。这意味着,无论您走到哪里,都无需使用专有的电源供应器(230 瓦)。
Predator 的弱点主要在于存储:固态硬盘容量小(512 GB),没有额外的固态硬盘空间,焊接内存无法扩展,读卡器运行速度非常慢。总之,这个价位的笔记本电脑应该有更高的要求。
你可以选择微星隐形 14 Studio A13V.它配备了相同的 CPU 和 GPU,比 Predator 性能更强一些,而且还配备了两个内存组。不过,它的售价约为 2000 美元,并不是最便宜的设备之一。
价格和供应情况
宏碁笔记本电脑的评测机型目前在亚马逊上的售价为 1,440 美元。
Acer Predator Triton 14 PT14-51
- 07/24/2023 v7 (old)
Sascha Mölck
Transparency
The selection of devices to be reviewed is made by our editorial team. The test sample was provided to the author as a loan by the manufacturer or retailer for the purpose of this review. The lender had no influence on this review, nor did the manufacturer receive a copy of this review before publication. There was no obligation to publish this review. As an independent media company, Notebookcheck is not subjected to the authority of manufacturers, retailers or publishers.
This is how Notebookcheck is testing
Every year, Notebookcheck independently reviews hundreds of laptops and smartphones using standardized procedures to ensure that all results are comparable. We have continuously developed our test methods for around 20 years and set industry standards in the process. In our test labs, high-quality measuring equipment is utilized by experienced technicians and editors. These tests involve a multi-stage validation process. Our complex rating system is based on hundreds of well-founded measurements and benchmarks, which maintains objectivity. Further information on our test methods can be found here.
Price comparison

