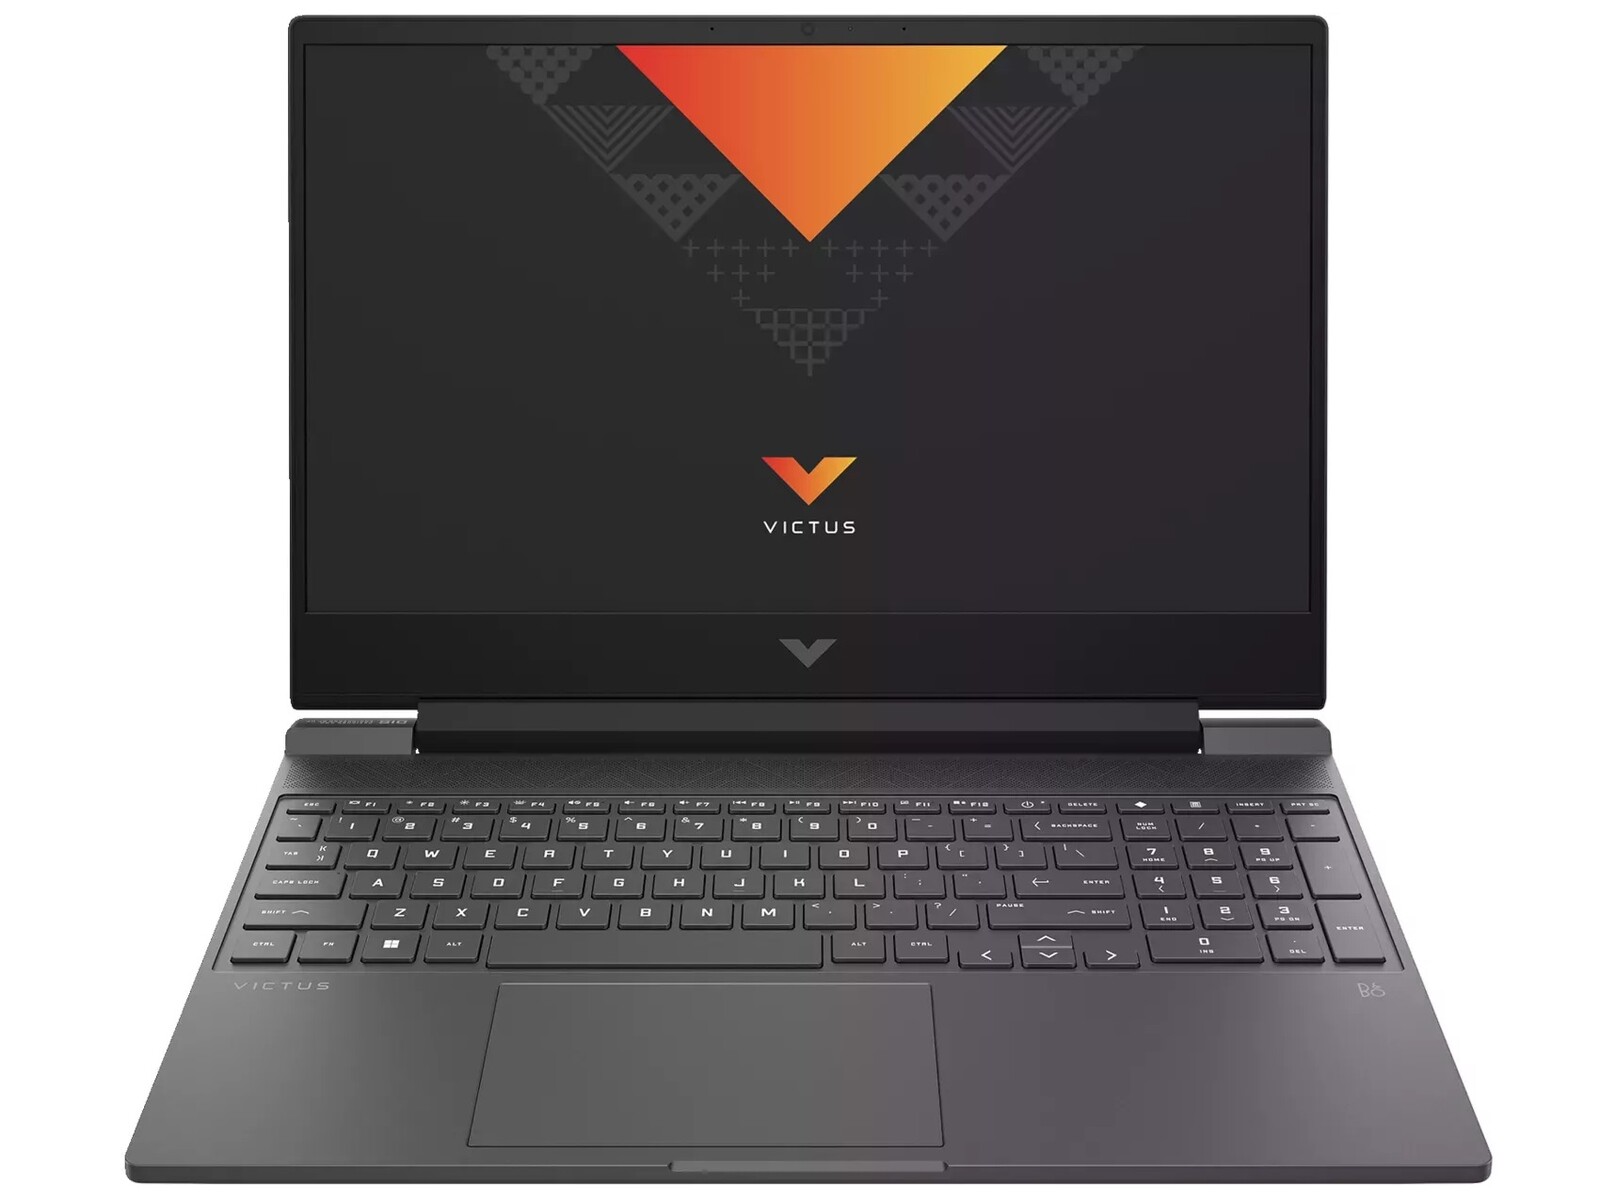
惠普 Victus 15 游戏笔记本电脑评测:Raptor Lake 和 Ada Lovelace

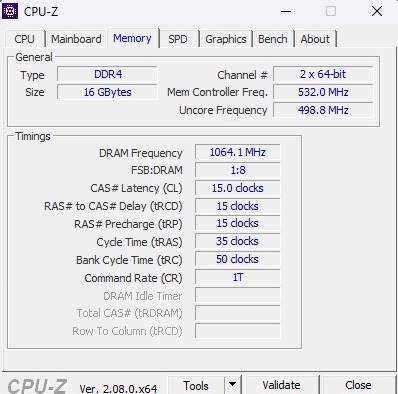
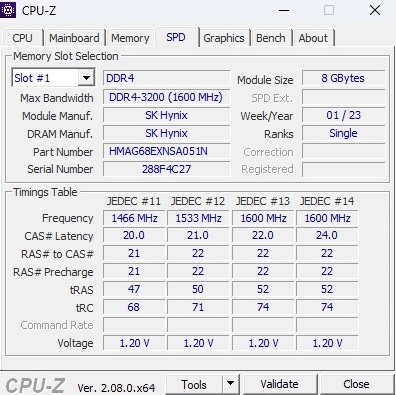
虽然高档笔记本电脑的价格逐年上涨,但 2024 年的经济型笔记本电脑市场却有大量令人兴奋的产品。例如,售价不到 1000 美元的 Victus 15-fa1057ng。与众多竞争对手不同的是,它配备了GeForce RTX 4050 和 6GB GDDR6 VRAM。辅以 酷睿 i5-13500H处理器(12 核 16 线程)、16 GB DDR4-3,200 内存(2x 8 GB SO-DIMM)和 512 GB PCIe M.2 固态硬盘。处理视觉输出的是一块哑光 144 Hz 全高清 IPS 显示屏,尽管它被指定为 250 尼特和 45% NTSC - 我们认为这些值已经过时,即使对于预算部门来说也是如此。软件包中的操作系统是 Windows 11 Home(也有搭载 FreeDOS 的廉价版)。
Victus 15 的竞争对手包括其他配备 RTX 4050 和最新 CPU 的游戏笔记本电脑,如 戴尔 G15 5530以及 宏碁 Nitro V 15 ANV15-51或 华硕 TUF A15 FA507表中列出了所有这些产品的对比。
由于机箱与前代 前代采用 酷睿 i7-12700H和 GeForce RTX 3050 Ti本文将简要介绍其外壳、功能和输入设备类别。
潜在的竞争对手比较
Rating | Date | Model | Weight | Height | Size | Resolution | Price |
|---|---|---|---|---|---|---|---|
| 84 % v7 (old) | 02 / 2024 | HP Victus 15-fa1057ng i5-13500H, GeForce RTX 4050 Laptop GPU | 2.3 kg | 24 mm | 15.60" | 1920x1080 | |
| 81 % v7 (old) | 01 / 2023 | HP Victus 15 fa0020nr i7-12700H, GeForce RTX 3050 Ti Laptop GPU | 2.3 kg | 23.6 mm | 15.60" | 1920x1080 | |
| 84.7 % v7 (old) | 01 / 2024 | Dell G15 5530, i5-13450HX RTX 4050 i5-13450HX, GeForce RTX 4050 Laptop GPU | 2.7 kg | 27 mm | 15.60" | 1920x1080 | |
| 82.8 % v7 (old) | 01 / 2024 | Acer Nitro V 15 ANV15-51-582S i5-13420H, GeForce RTX 4050 Laptop GPU | 2.1 kg | 23.5 mm | 15.60" | 1920x1080 | |
| 86.3 % v7 (old) | 06 / 2023 | Asus TUF A15 FA507 R7 7735HS, GeForce RTX 4050 Laptop GPU | 2.2 kg | 24.9 mm | 15.60" | 1920x1080 |
案例
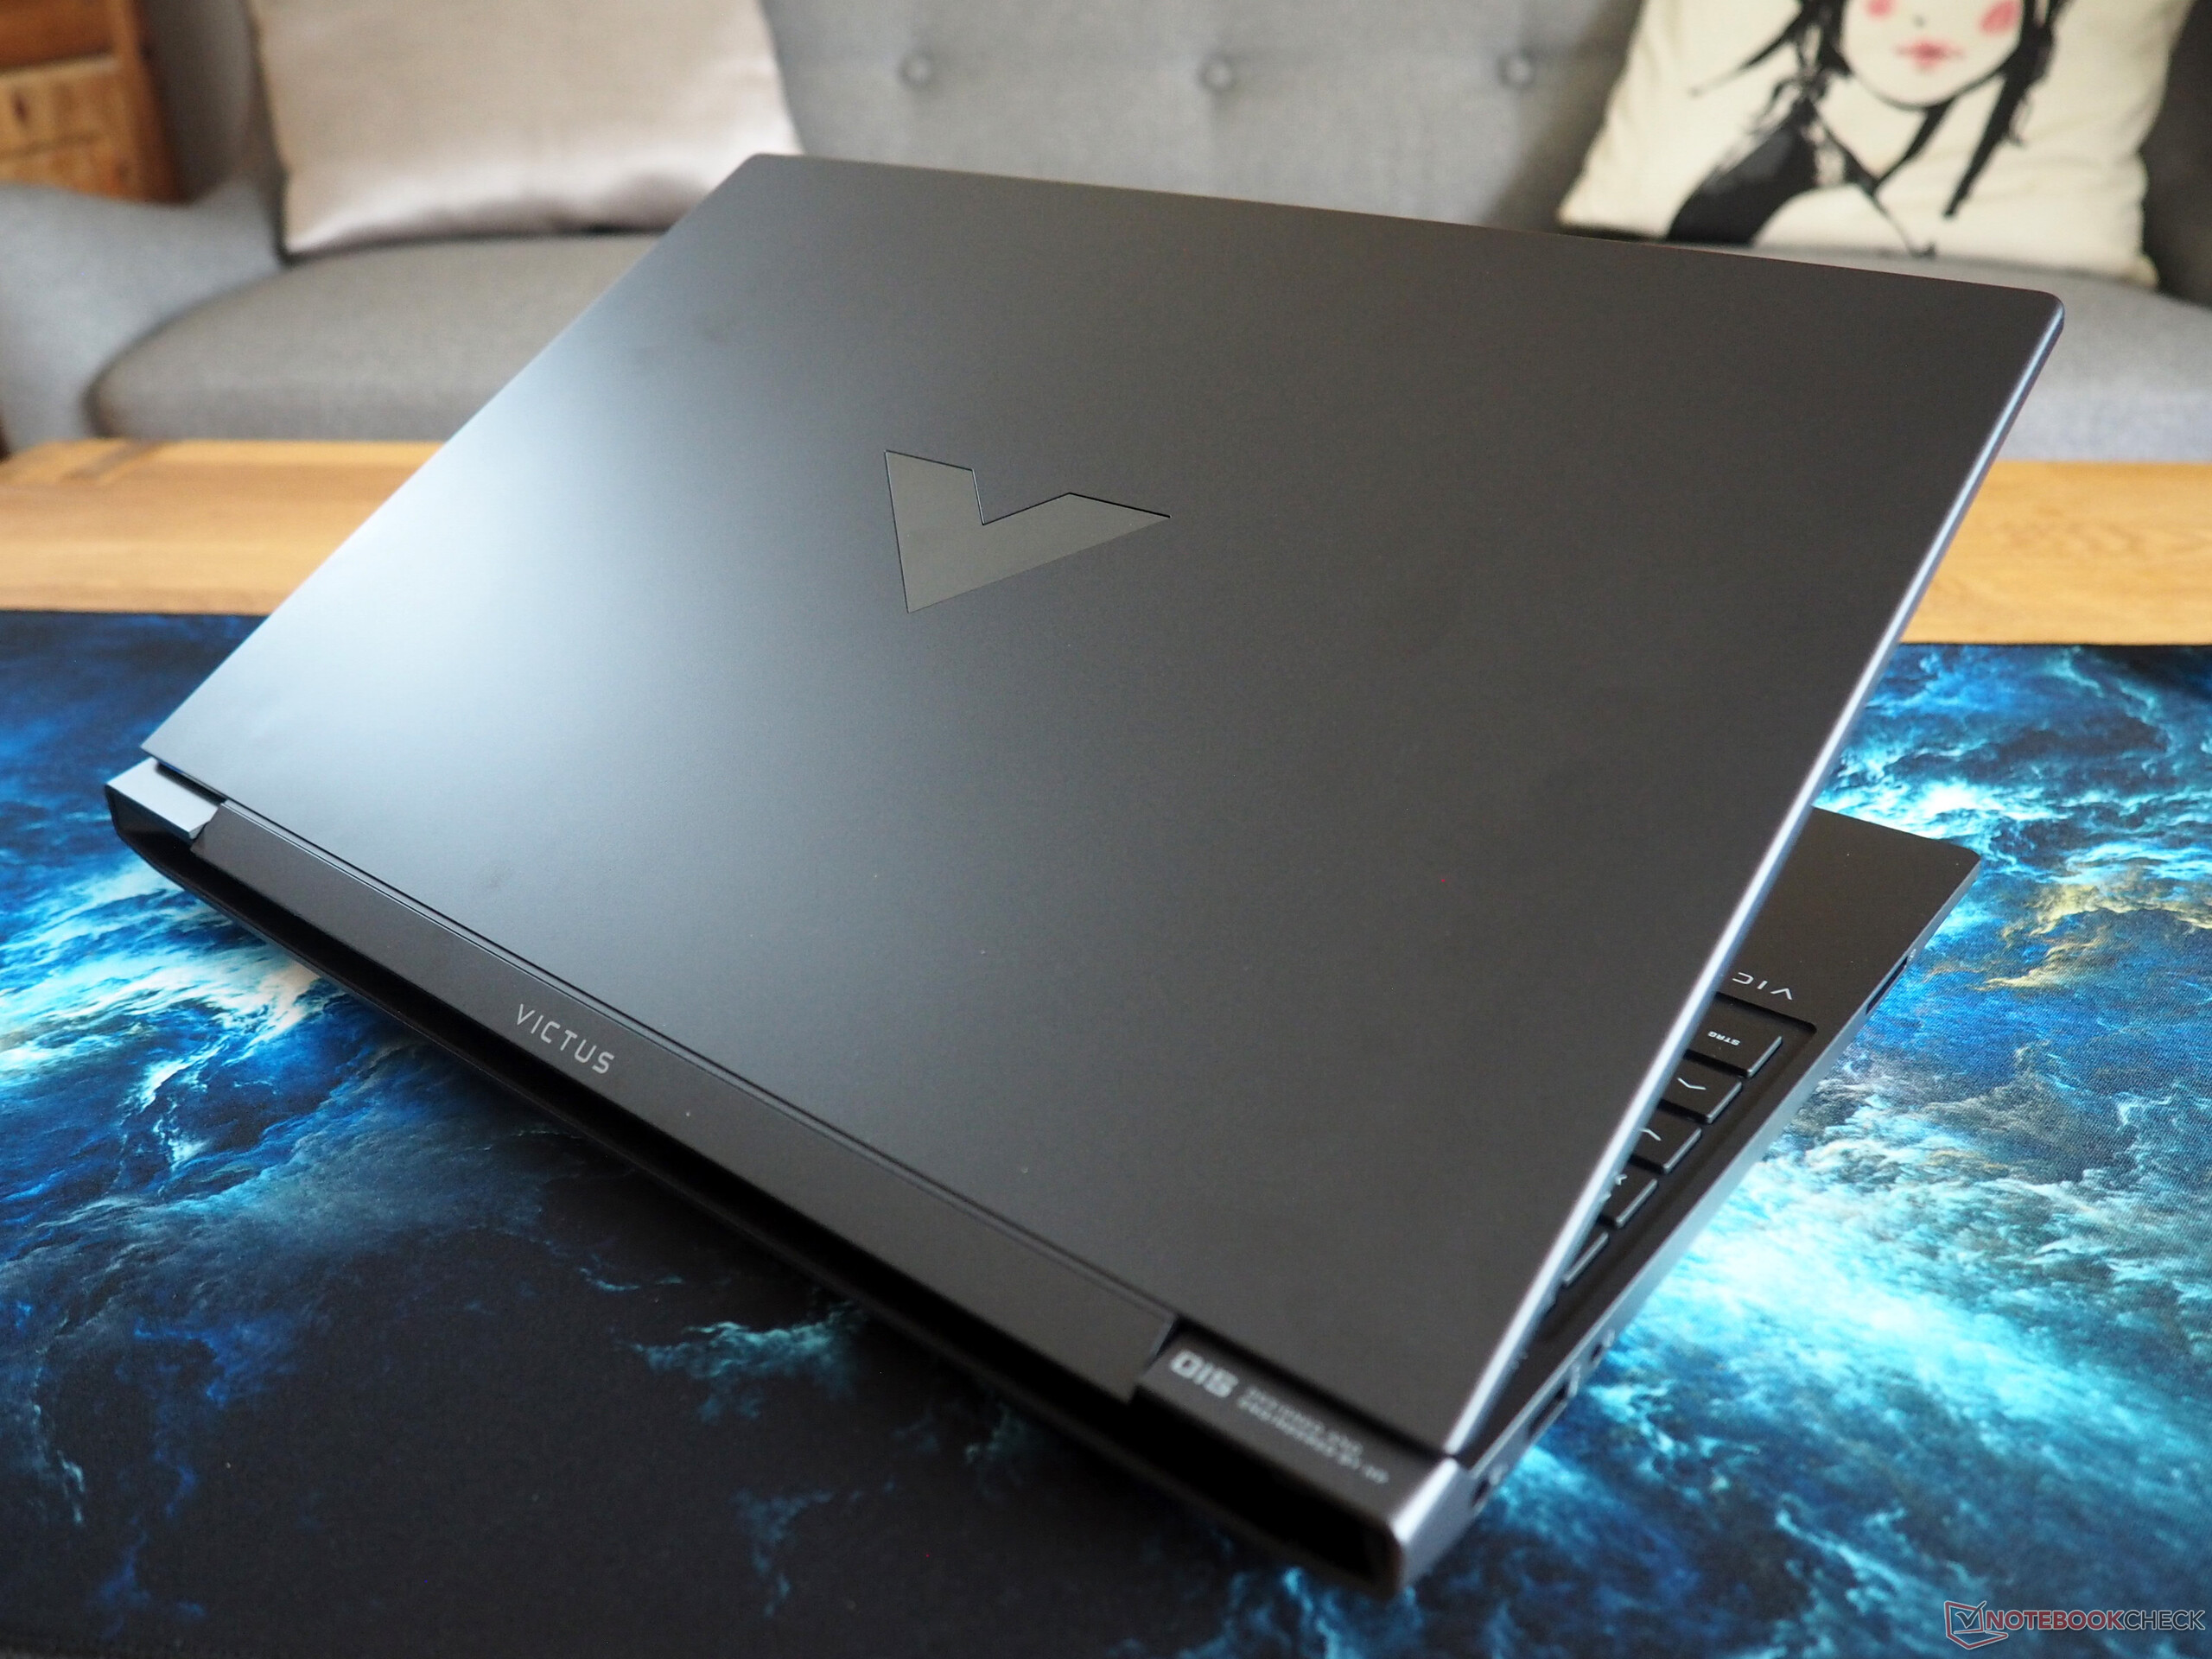
客户收到的是一个坚固的塑料外壳,这在这个价位的产品中很常见,不过它在某些地方可能会发出一些响声,而且缺乏高级的声音和感觉。重新设计或优化铰链可能会有好处。整体稳定性相似。最明显的是,当施加较大压力时,掌托可能会大幅弯曲。Victus 15 外形美观,结合了精巧而有趣的设计特点。尺寸和重量在平均范围内,但与竞争对手相比并不特别突出。
连接性
连接范围引起了不同的反应。虽然读卡器的缺失值得注意,但惠普在当代 USB 端口上却做出了妥协。可用的 USB 端口(2 个 Type-A、1 个 Type-C 和 DisplayPort)速度被限制在 5 Gbit/s。幸运的是,HDMI 端口被生产商指定为 2.1 版本。此外,还有一个音频接口和一个 RJ45 端口(仅限于 1 Gbit LAN,而不是 2.5)。由于大部分接口都位于机箱后半部,因此使用鼠标并不困难。
SD 读卡器
读卡器的速度属于中等水平。在传输多张 jpg 图像时,我们录得了 80 MB/s 的可靠速度。
| SD Card Reader - average JPG Copy Test (av. of 3 runs) | |
| Average of class Gaming (20.9 - 210, n=54, last 2 years) | |
| HP Victus 15-fa1057ng (AV PRO microSD 128 GB V60) | |
| HP Victus 15 fa0020nr (Toshiba Exceria Pro SDXC 64 GB UHS-II) | |
交流
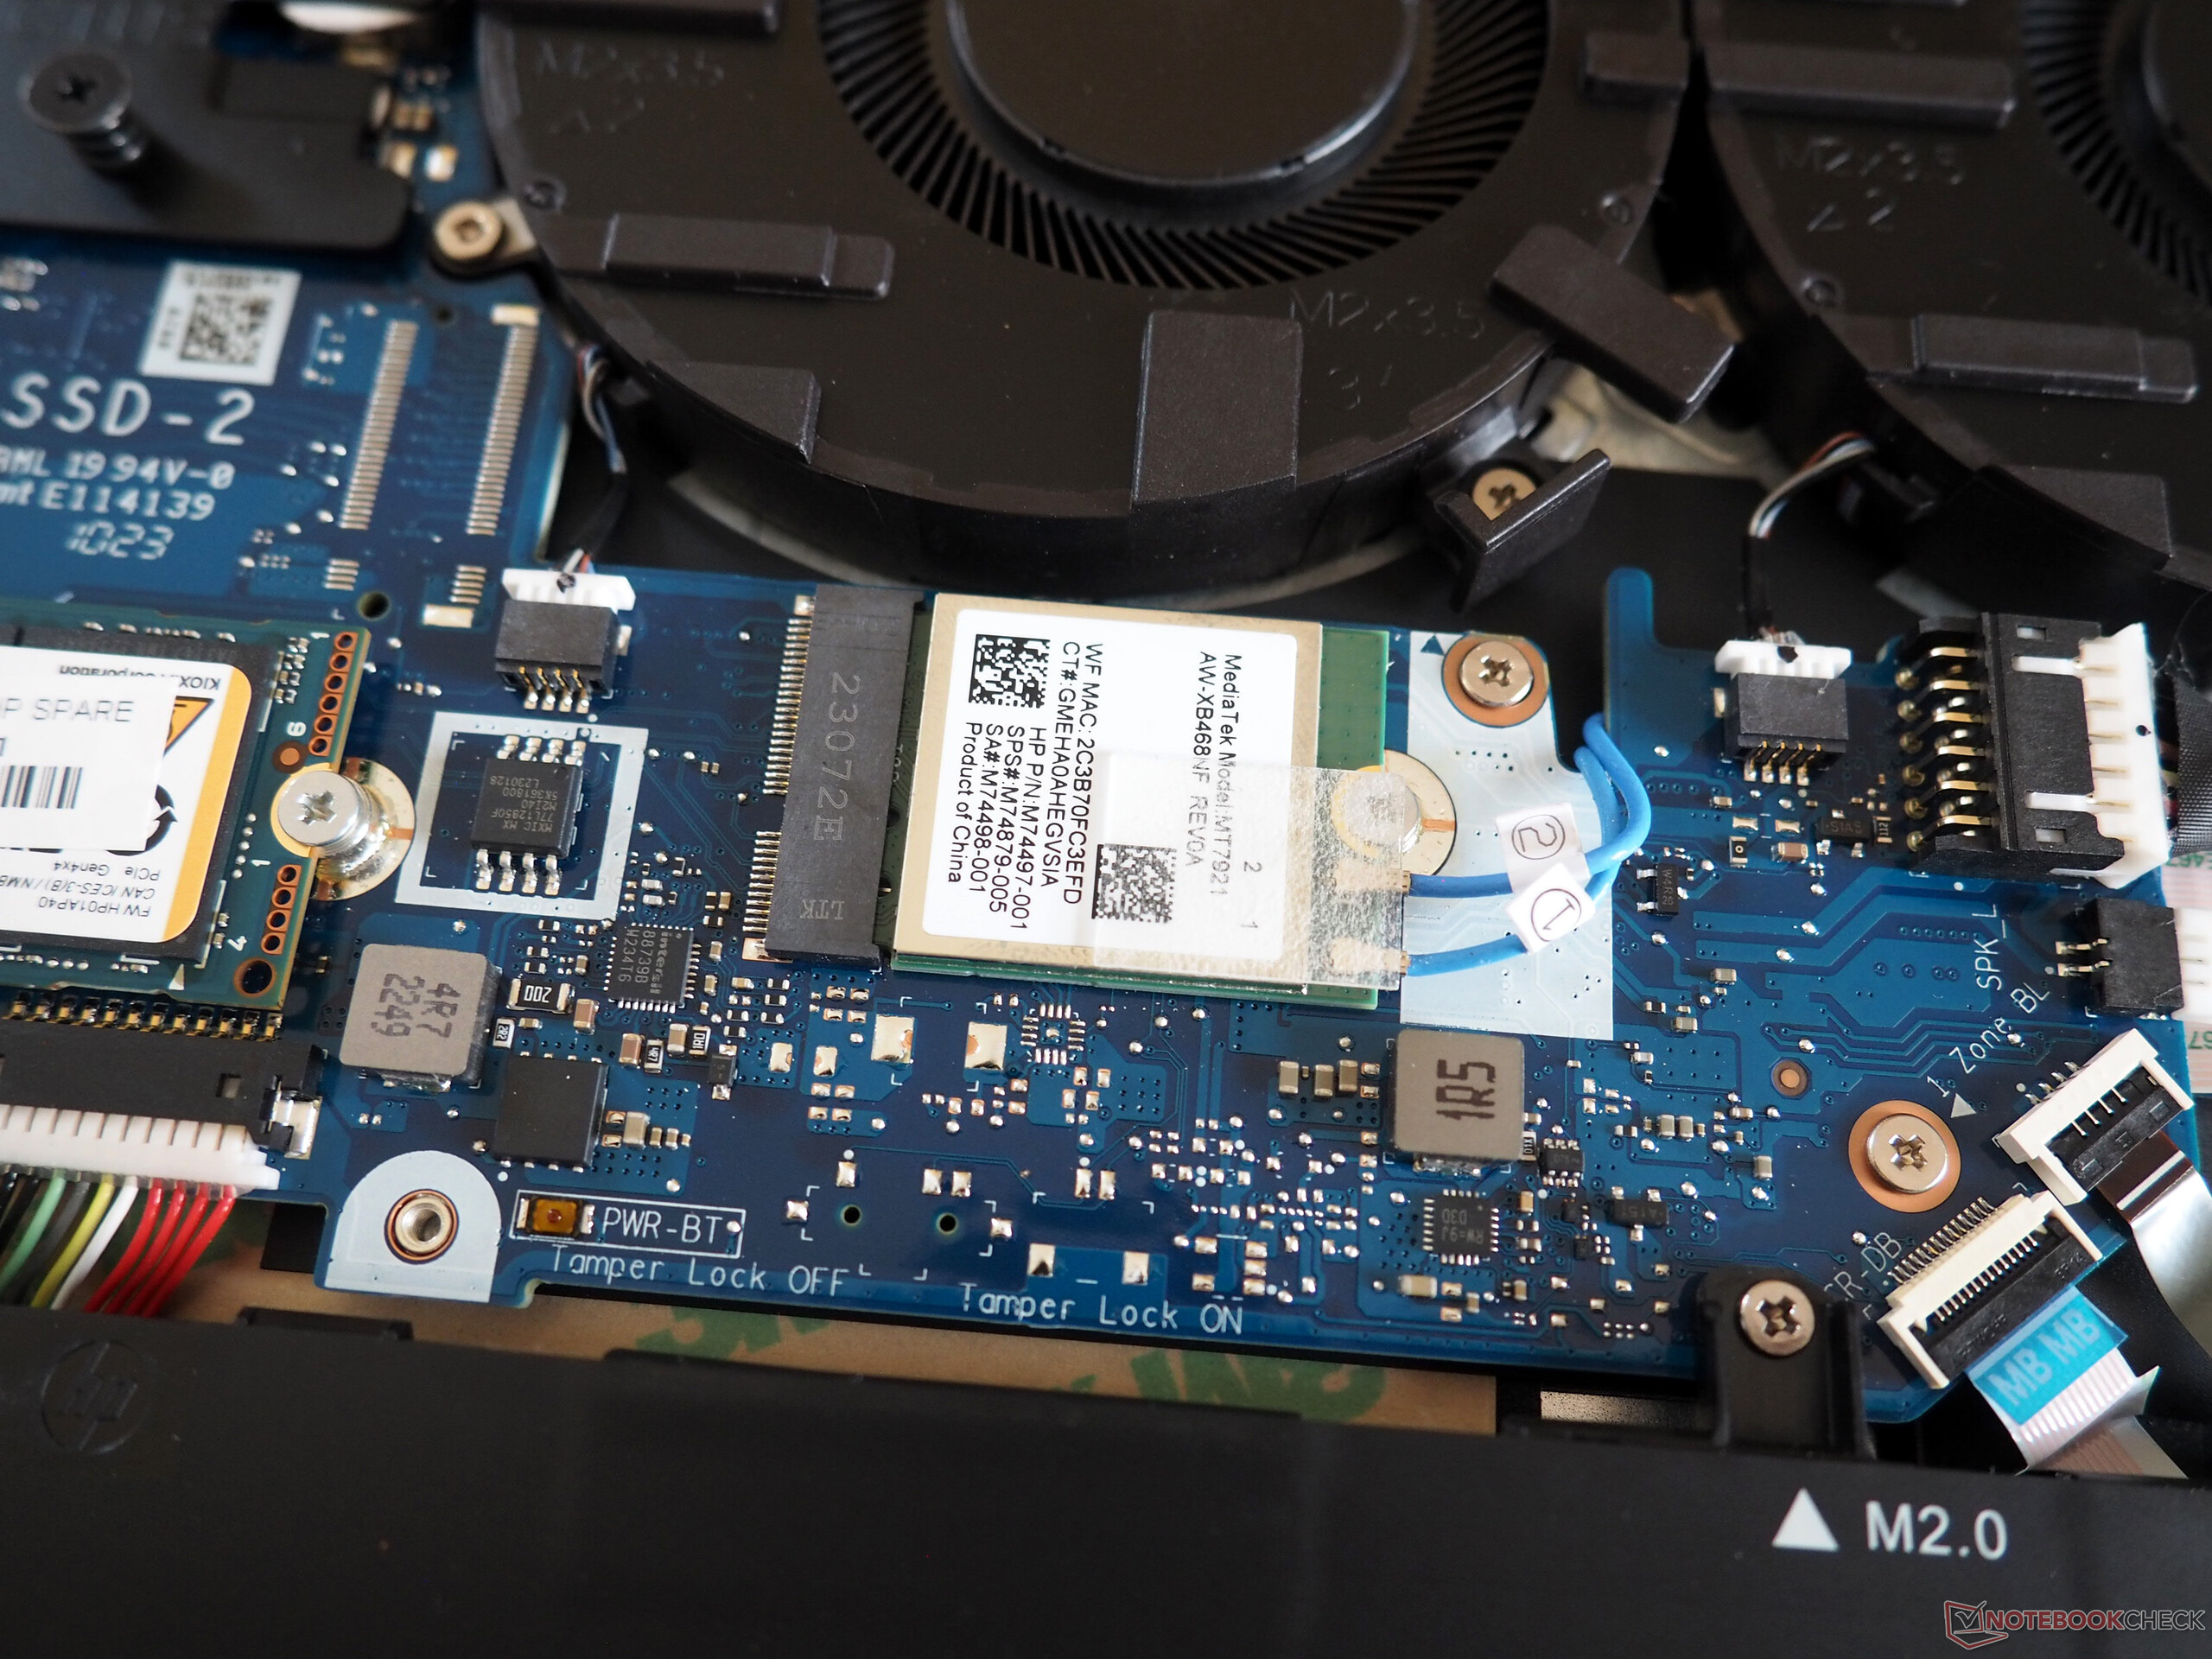
Wi-Fi 性能略显不足。在距离参考路由器 3.28 英尺的范围测试中,集成的联发科模块在同类产品中排名最后。
网络摄像头
720p 网络摄像头的性能并不出众,还有改进的余地,尤其是在图像清晰度方面。


配件
笔记本电脑随附几本信息手册和一个不太笨重的 200 瓦电源装置。
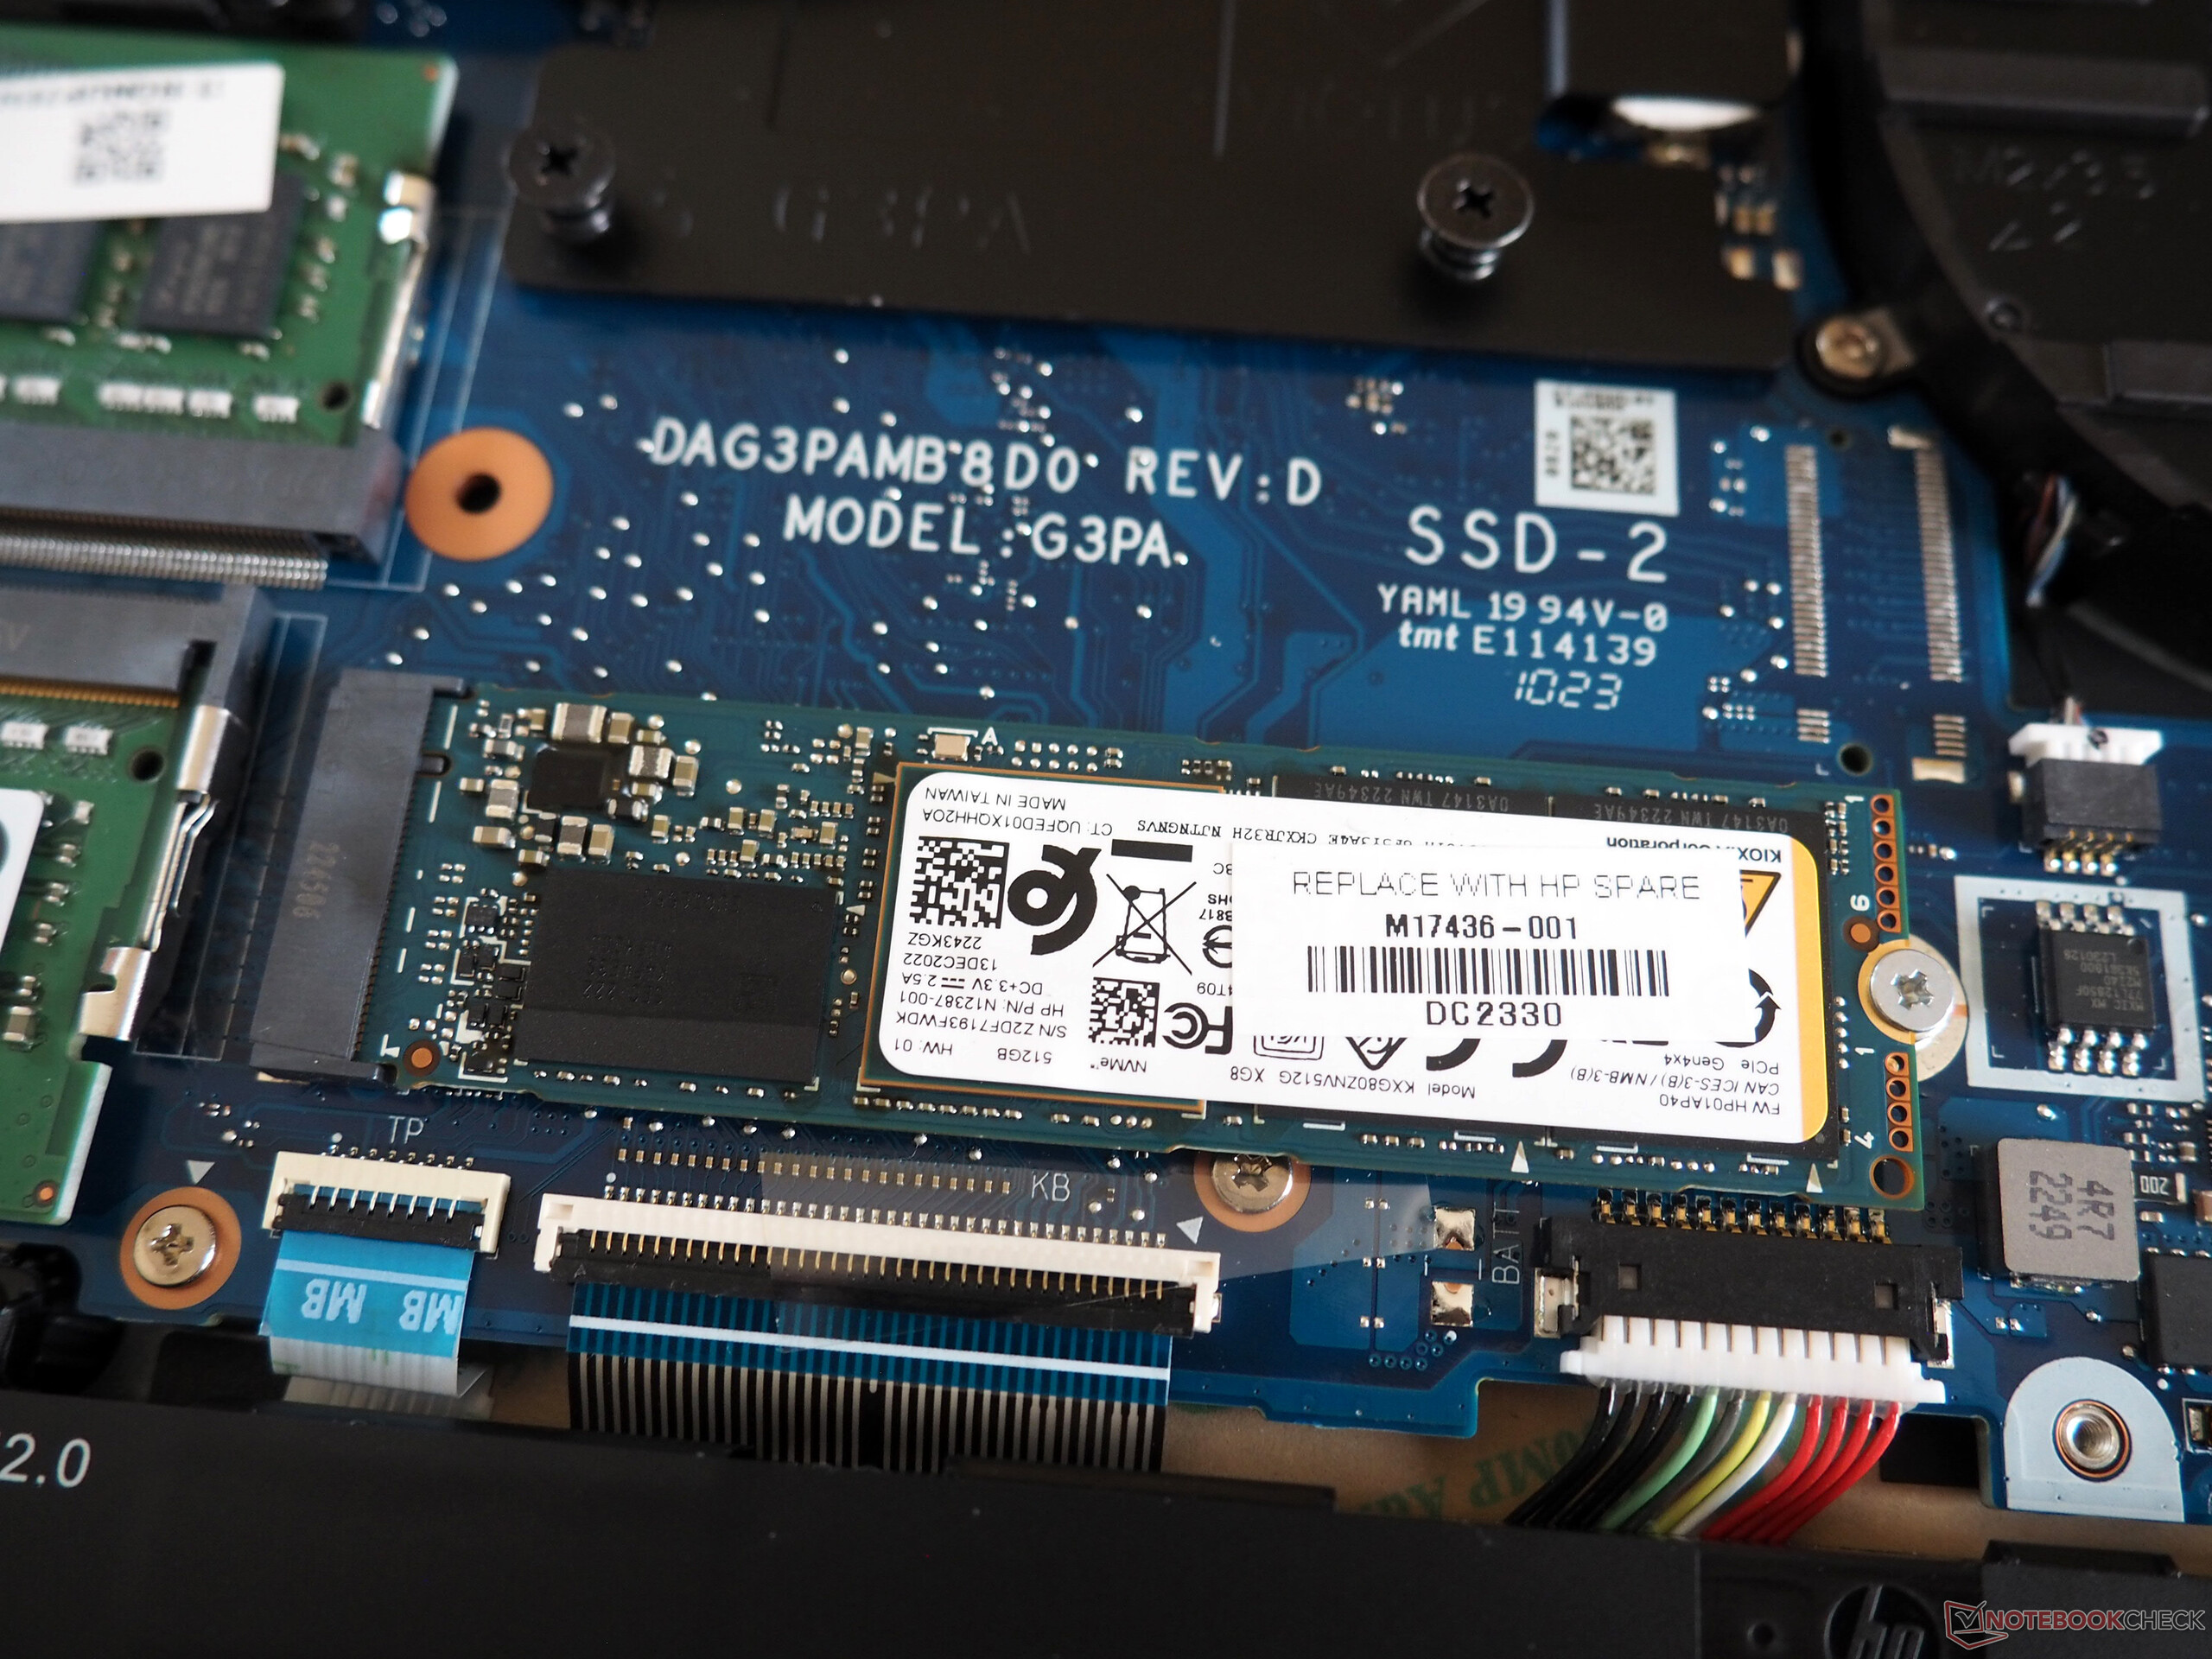
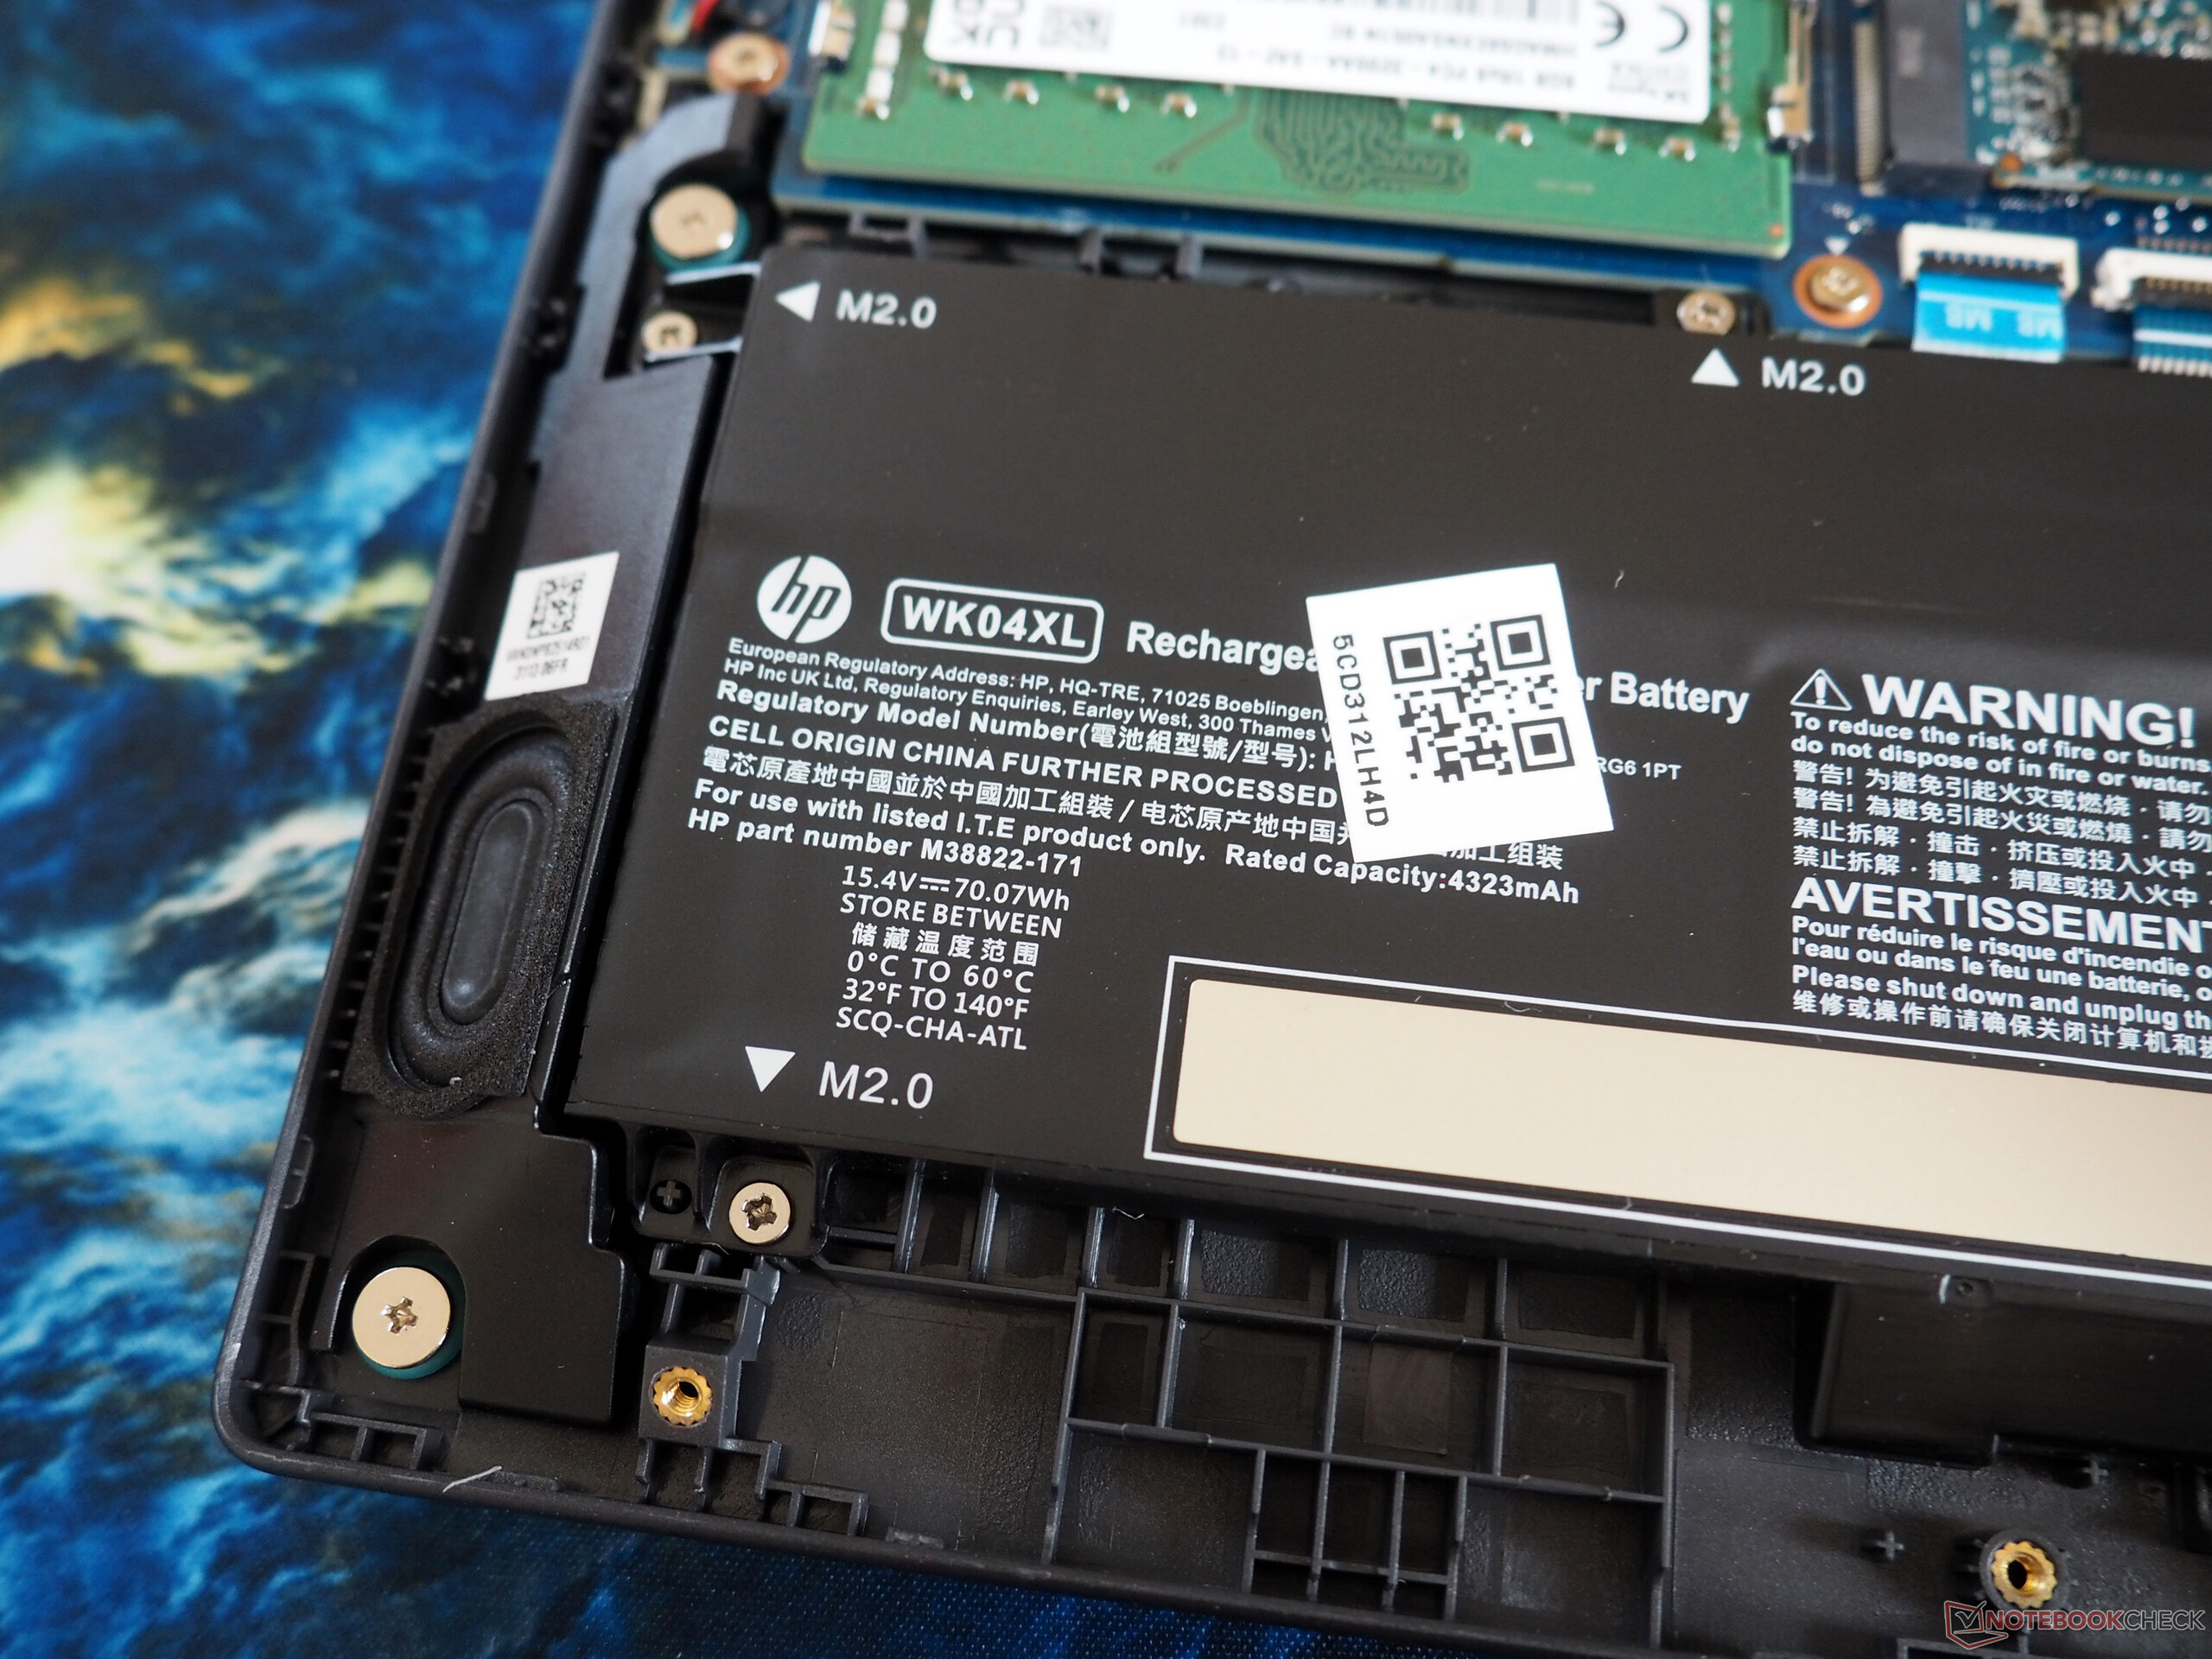
维护
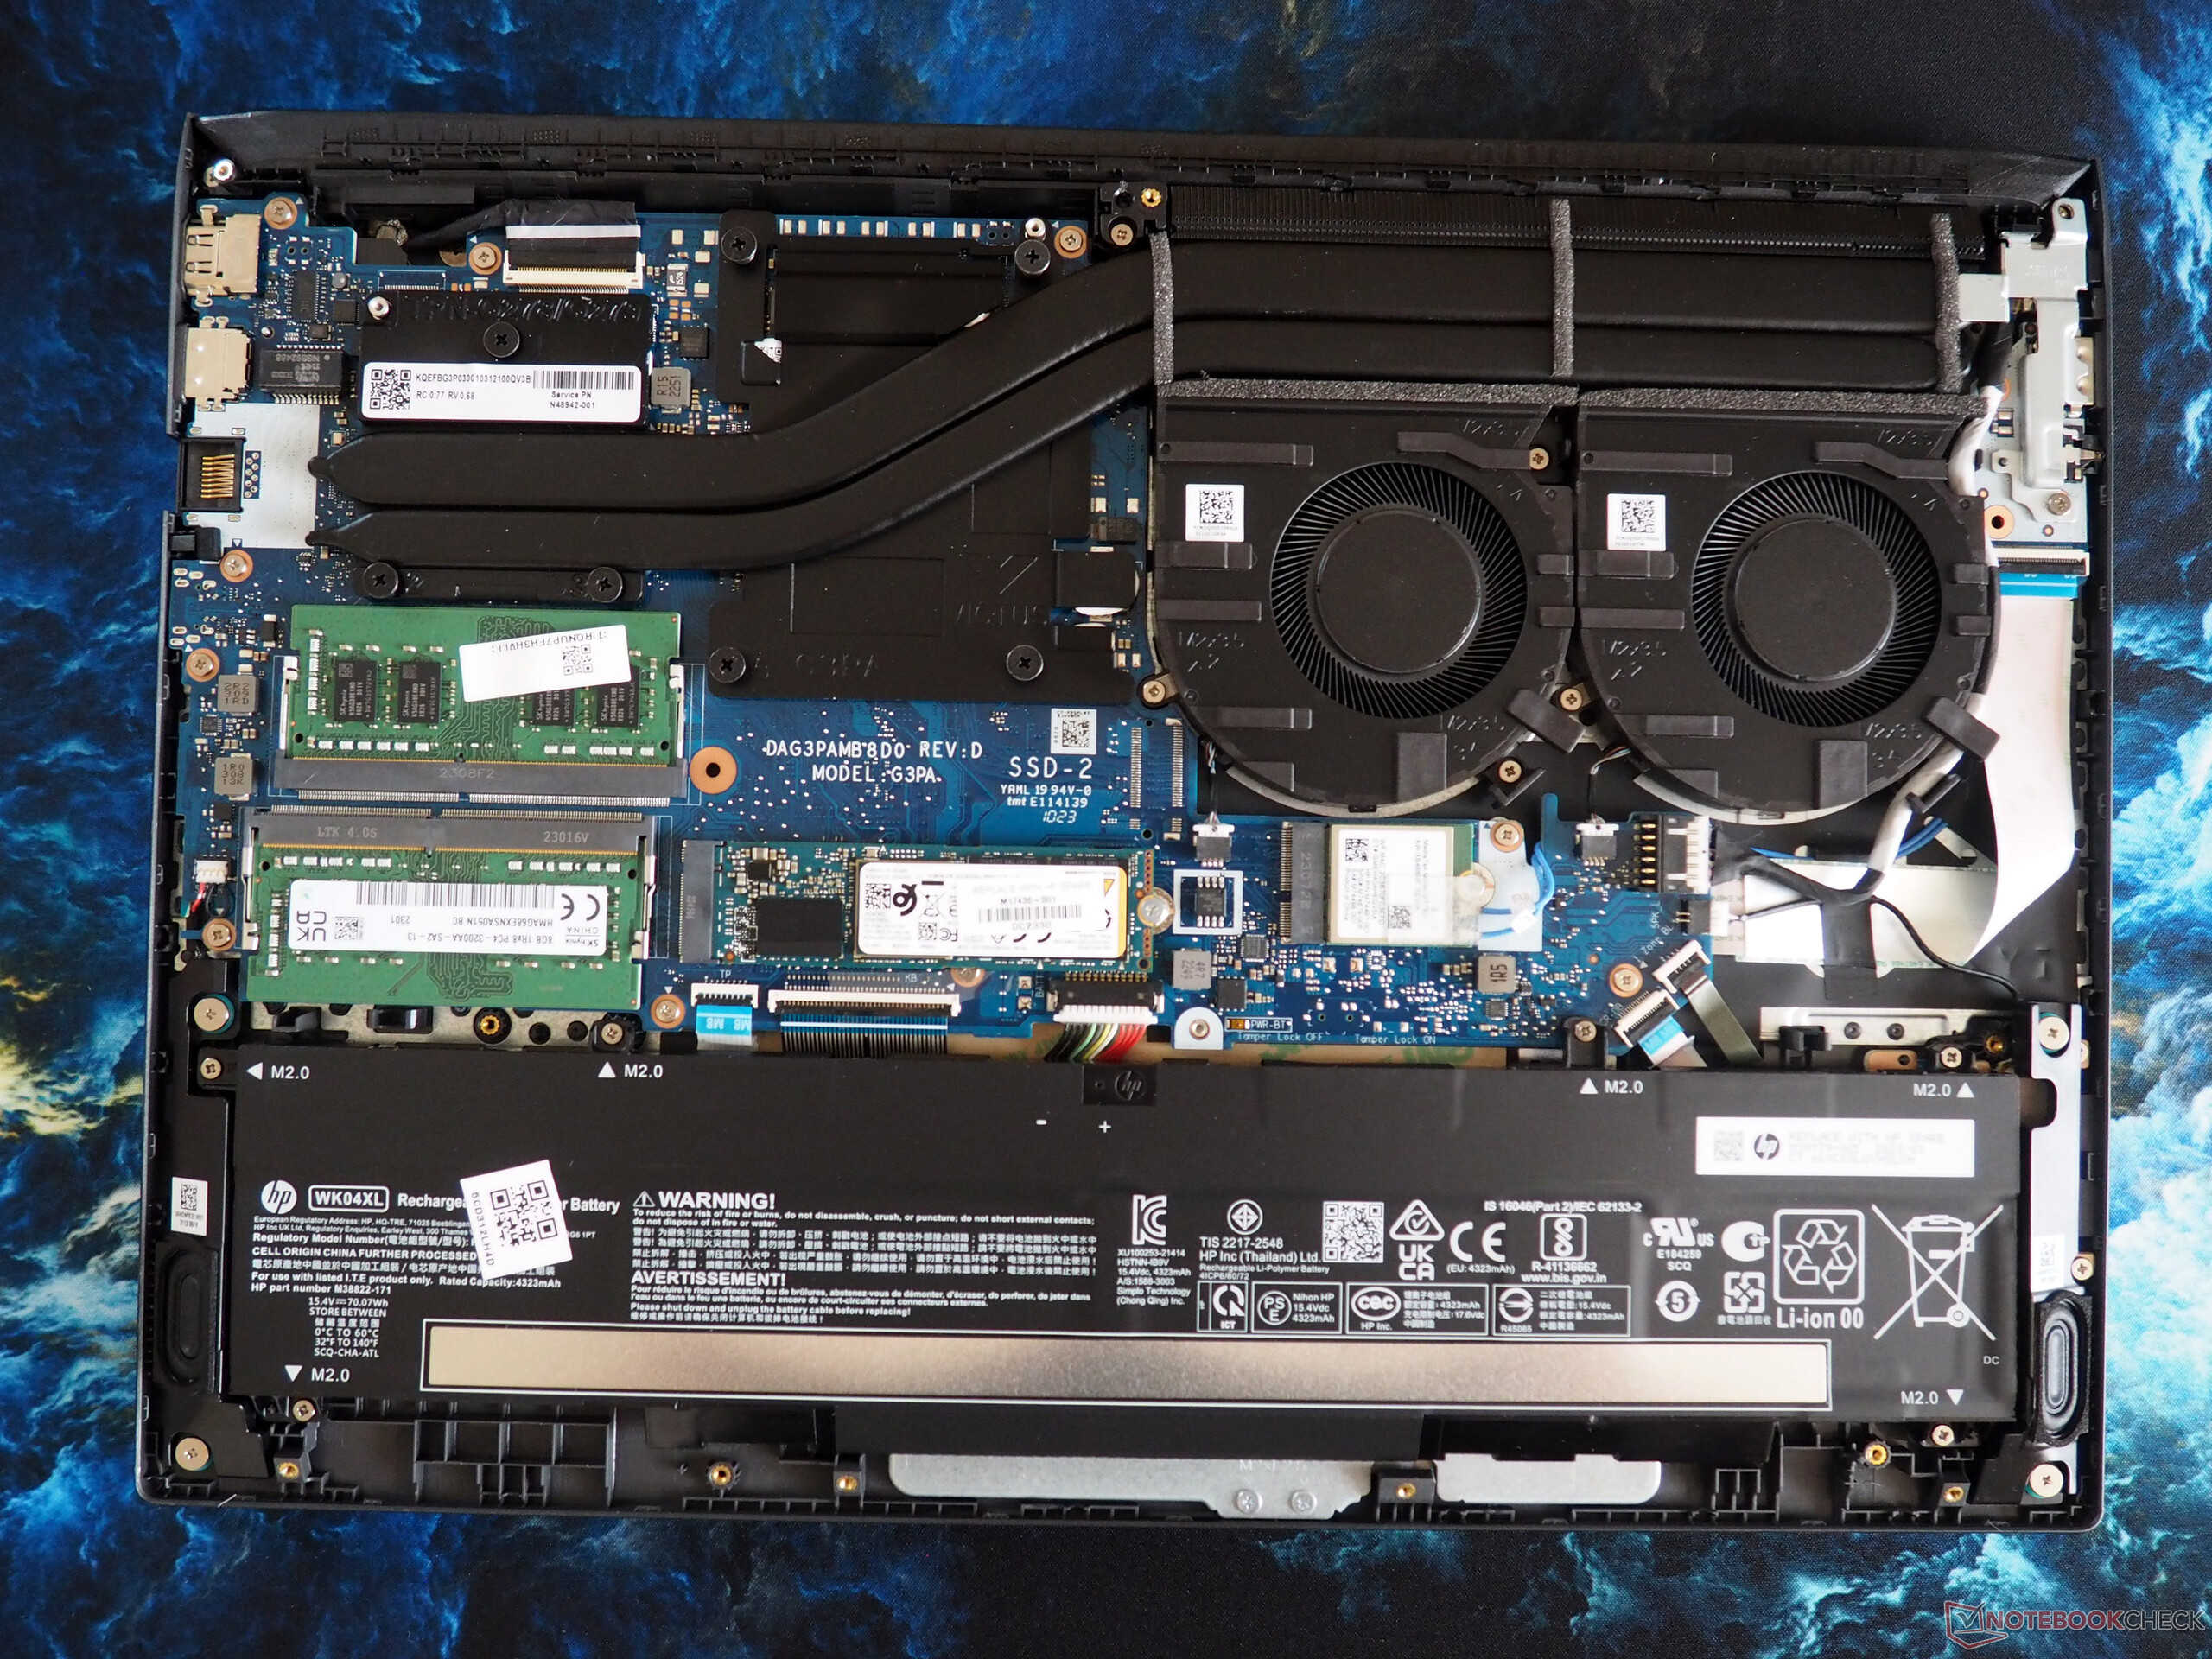
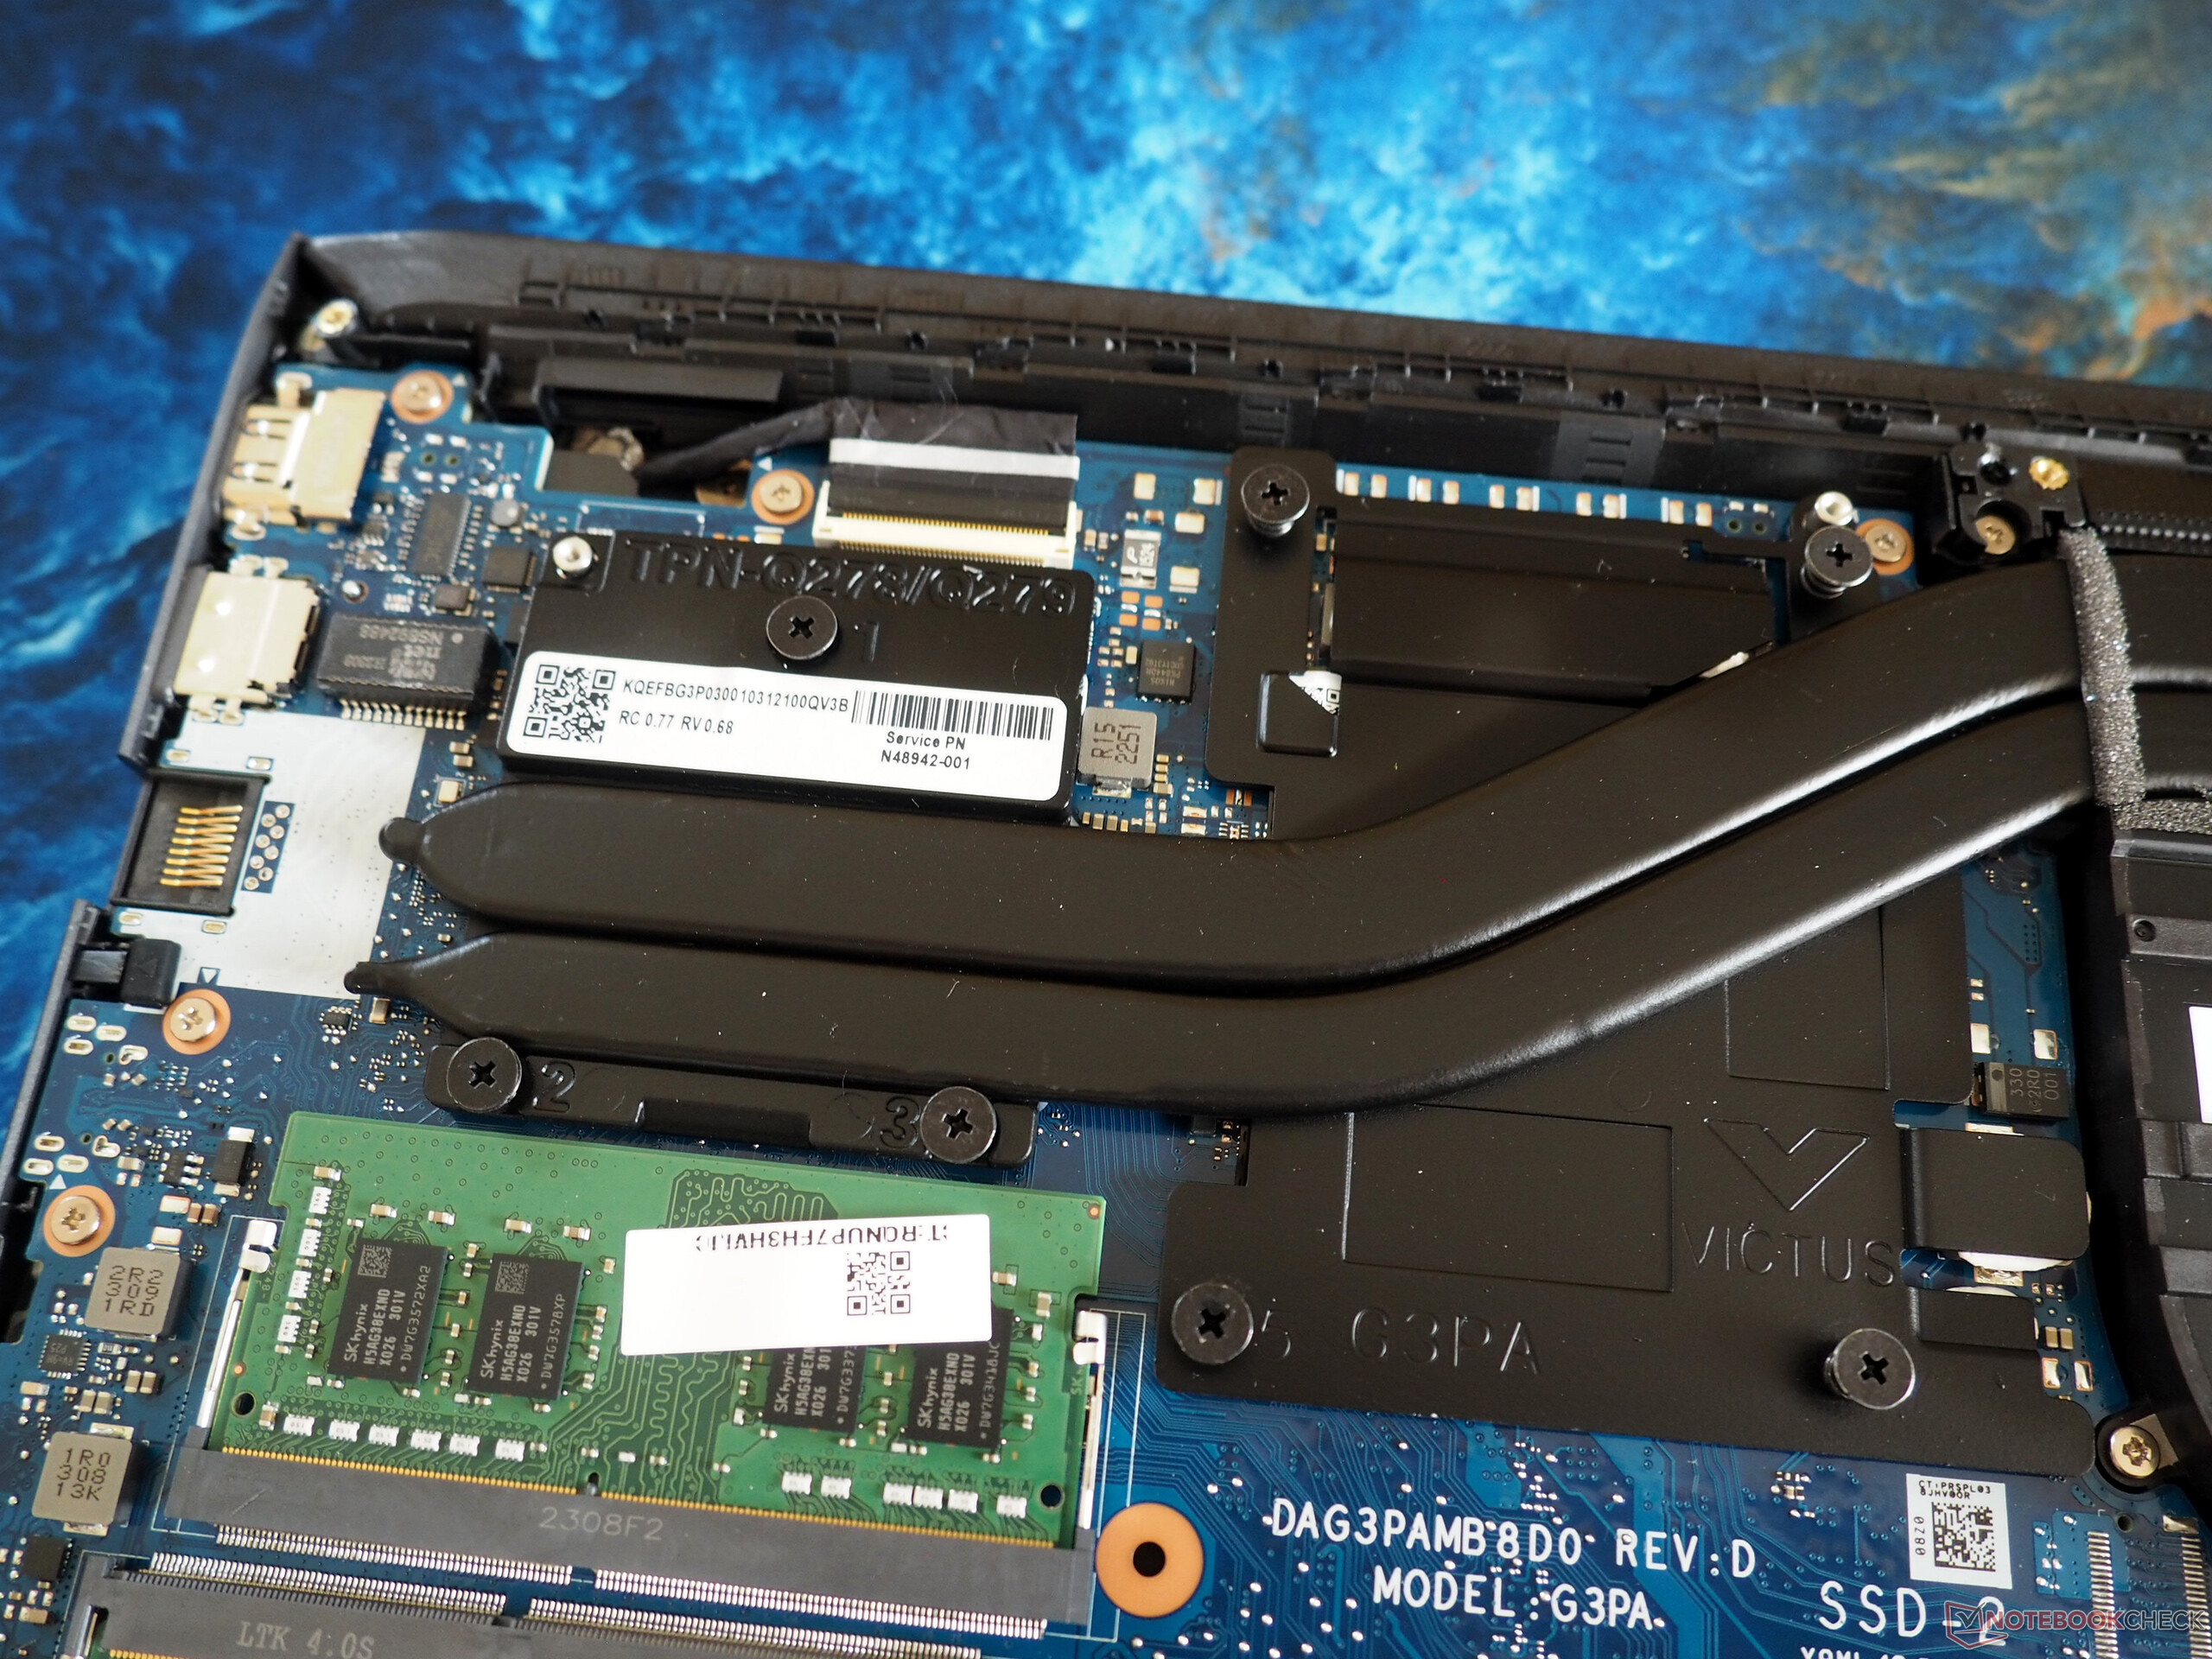
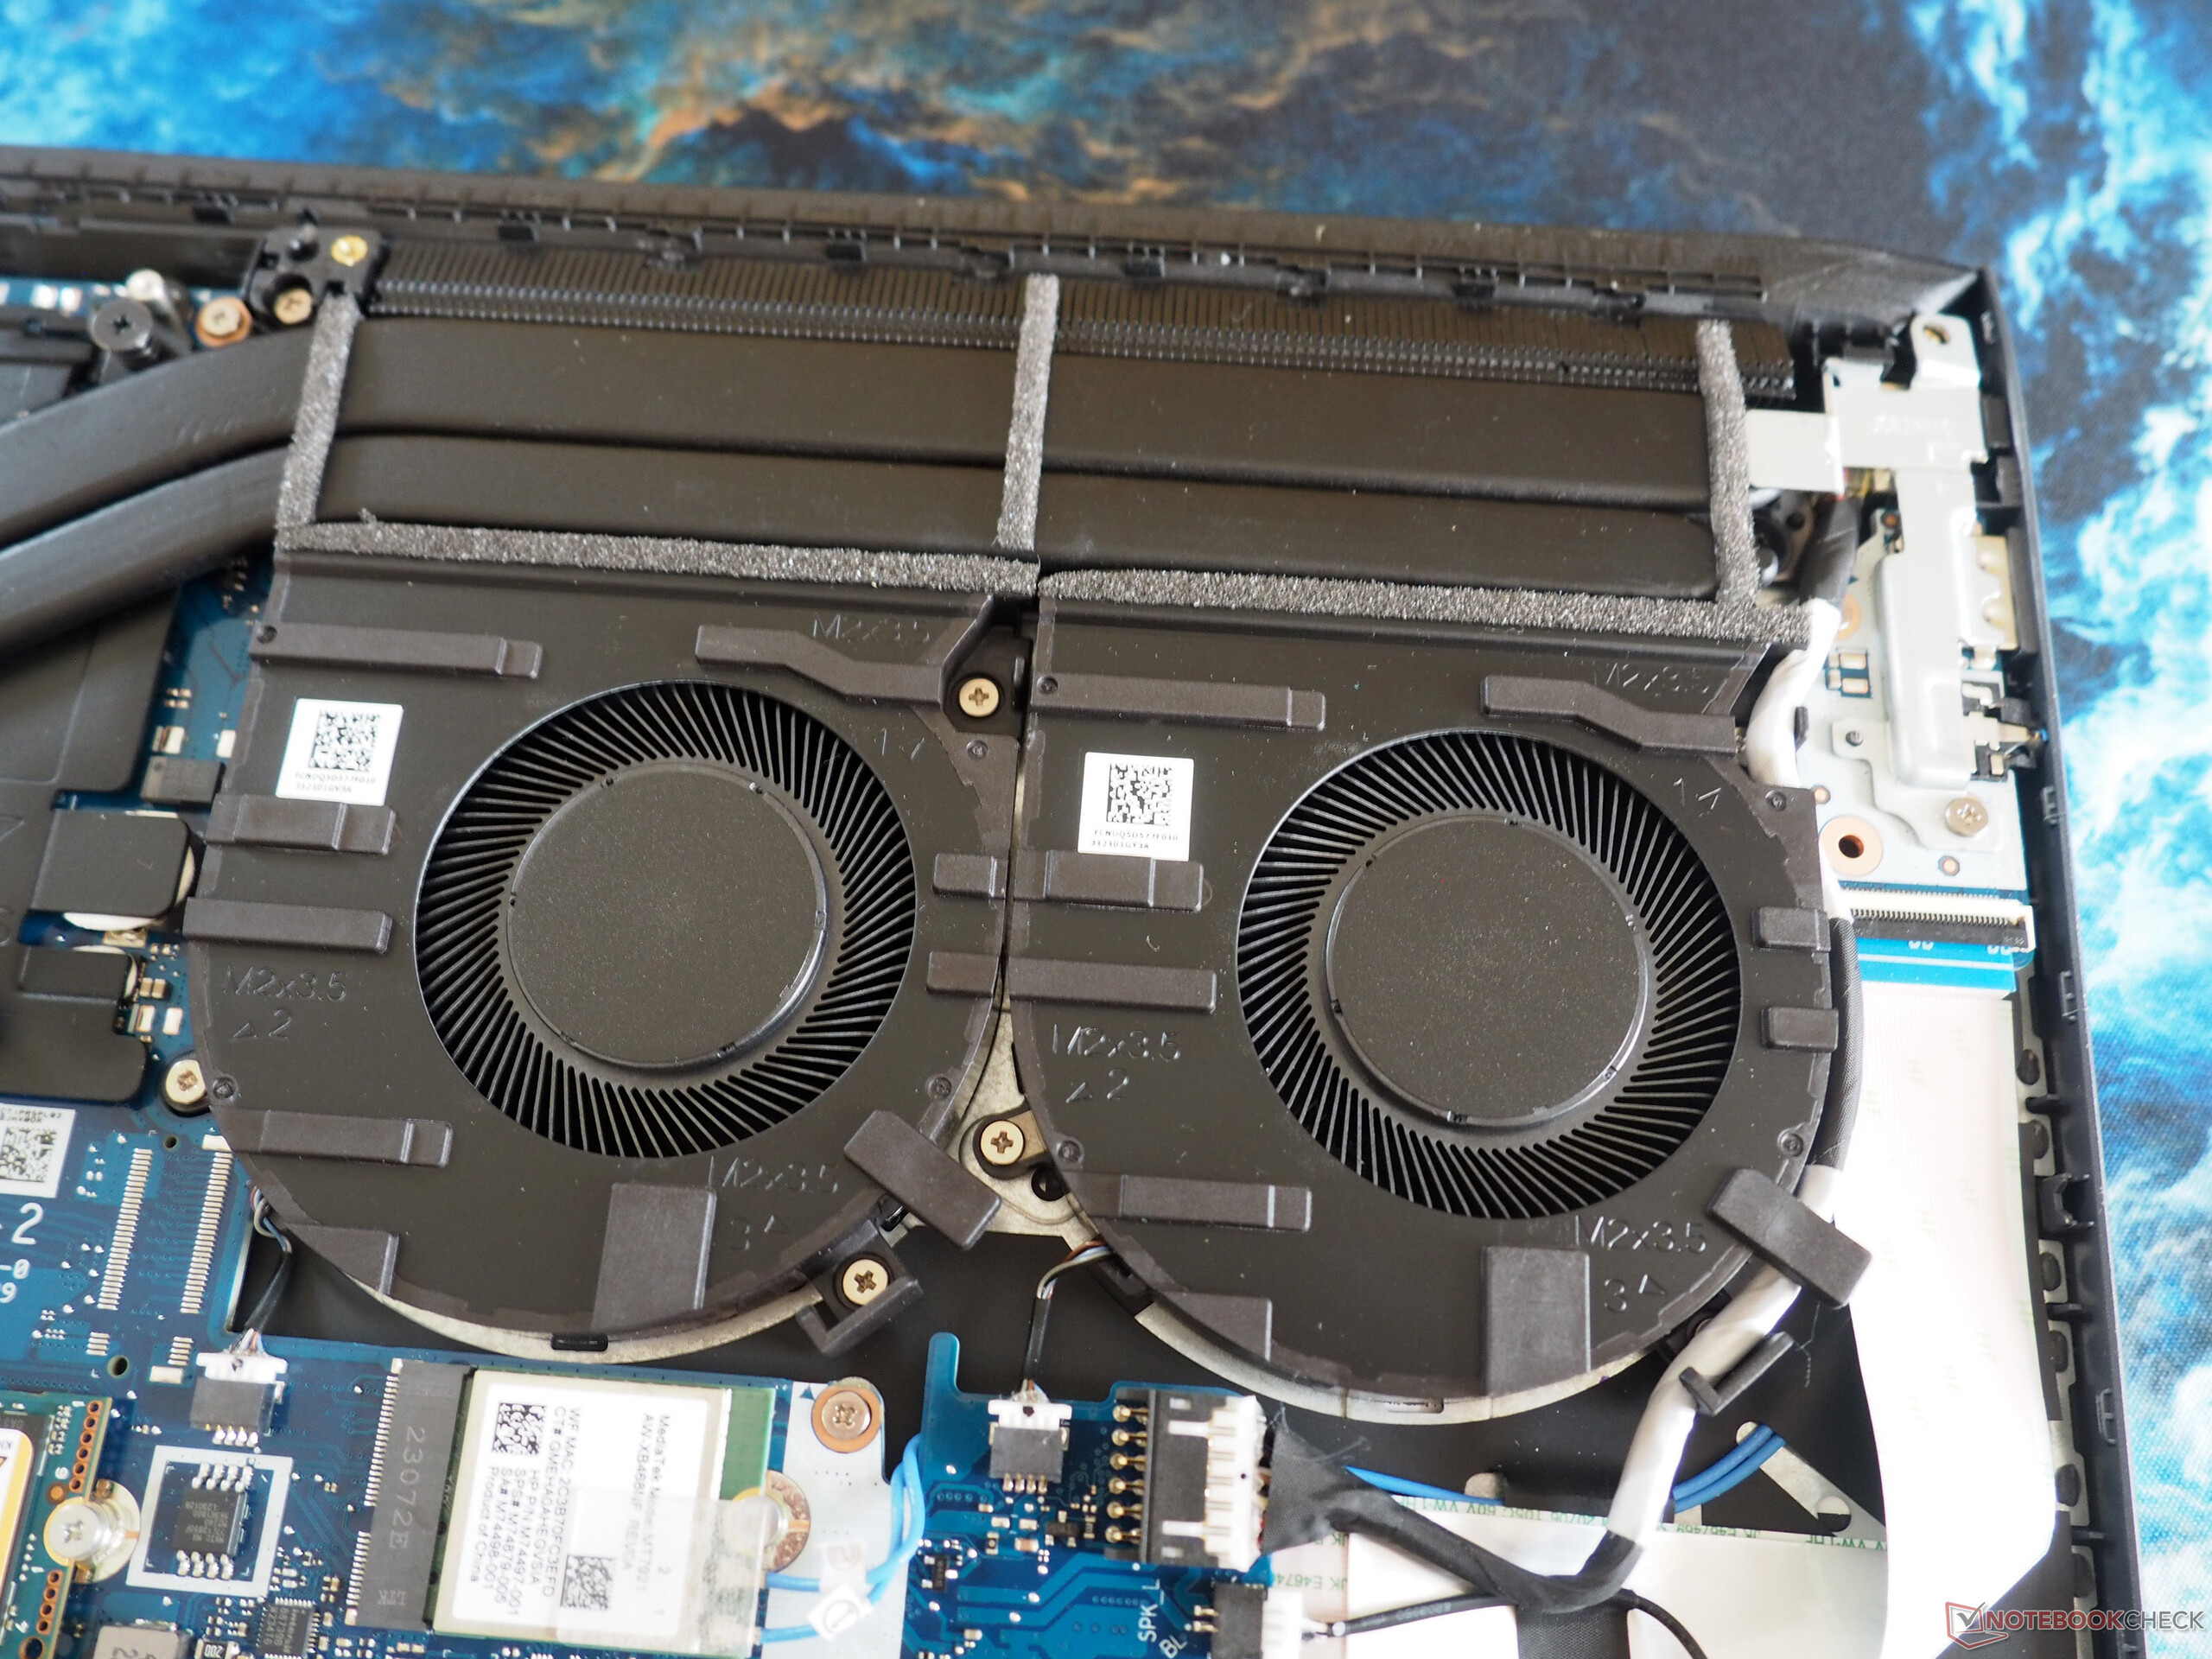
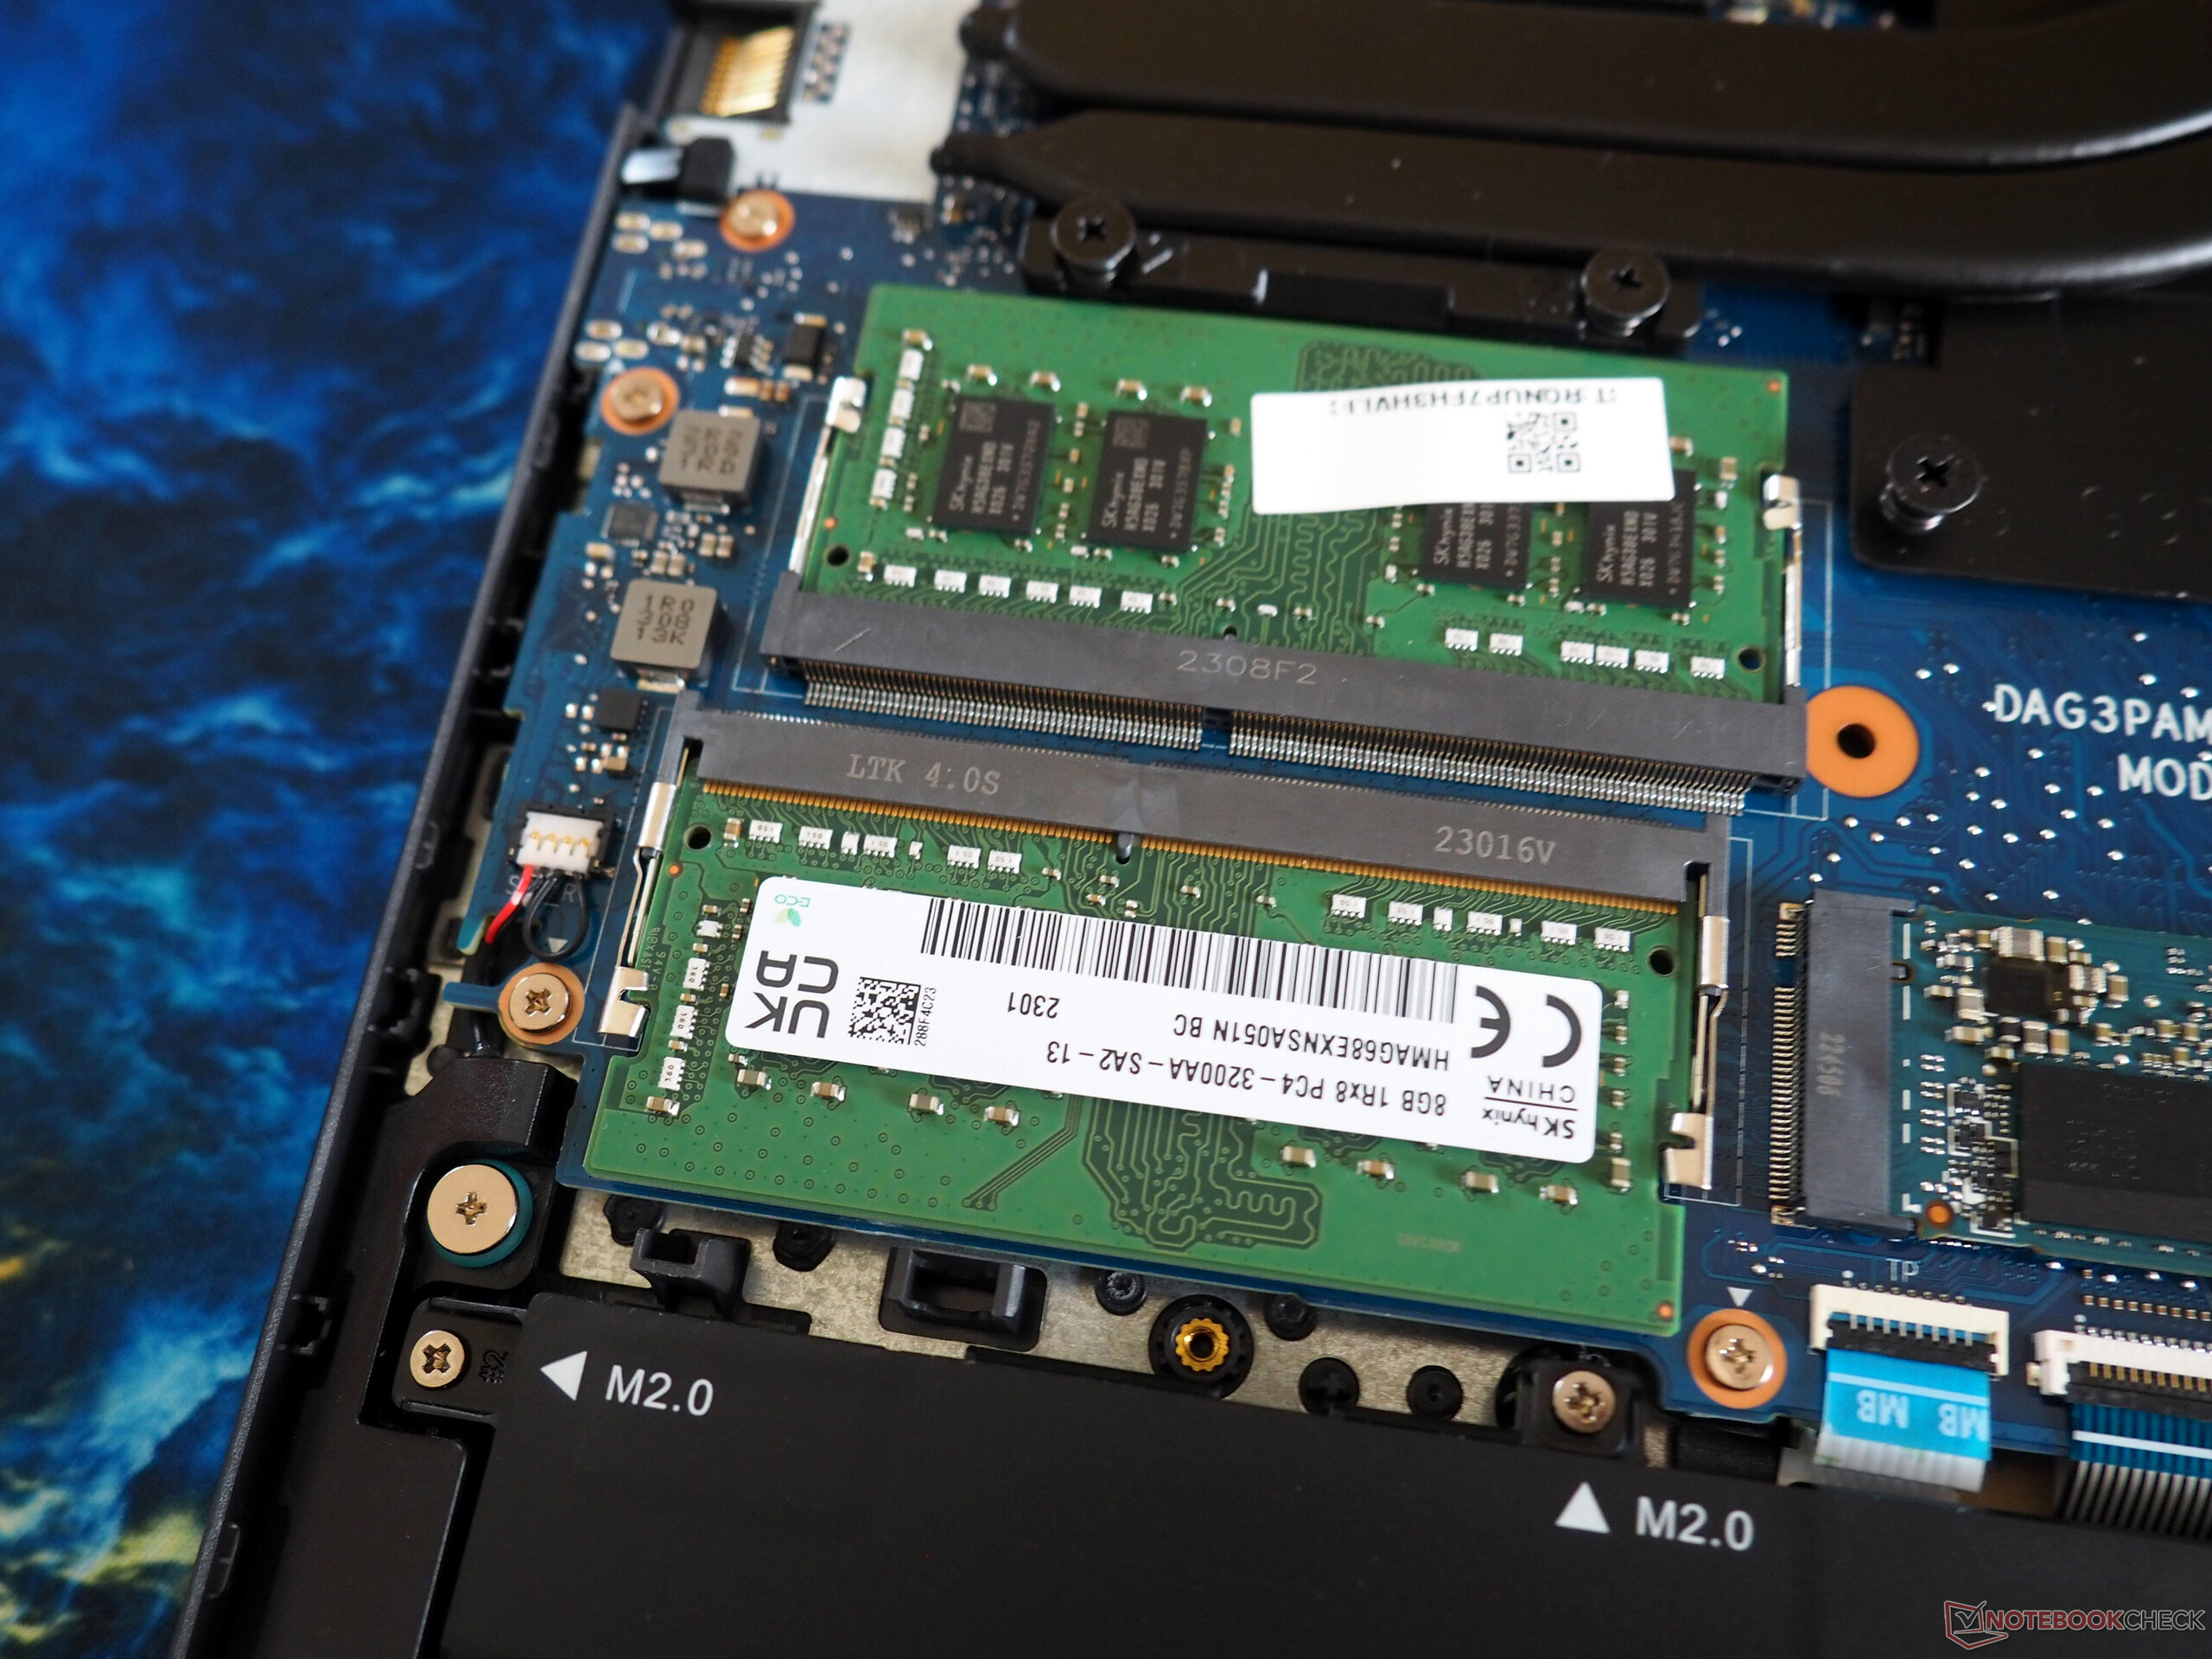
维护时需要小心谨慎。虽然底板上的十字螺丝可以较快地拆卸下来,但松开固定夹却有些困难,即使使用合适的工具也是如此。图片显示的是外壳的内部结构,所有重要部件都可以接触到。
保修
保修期只有 12 个月。
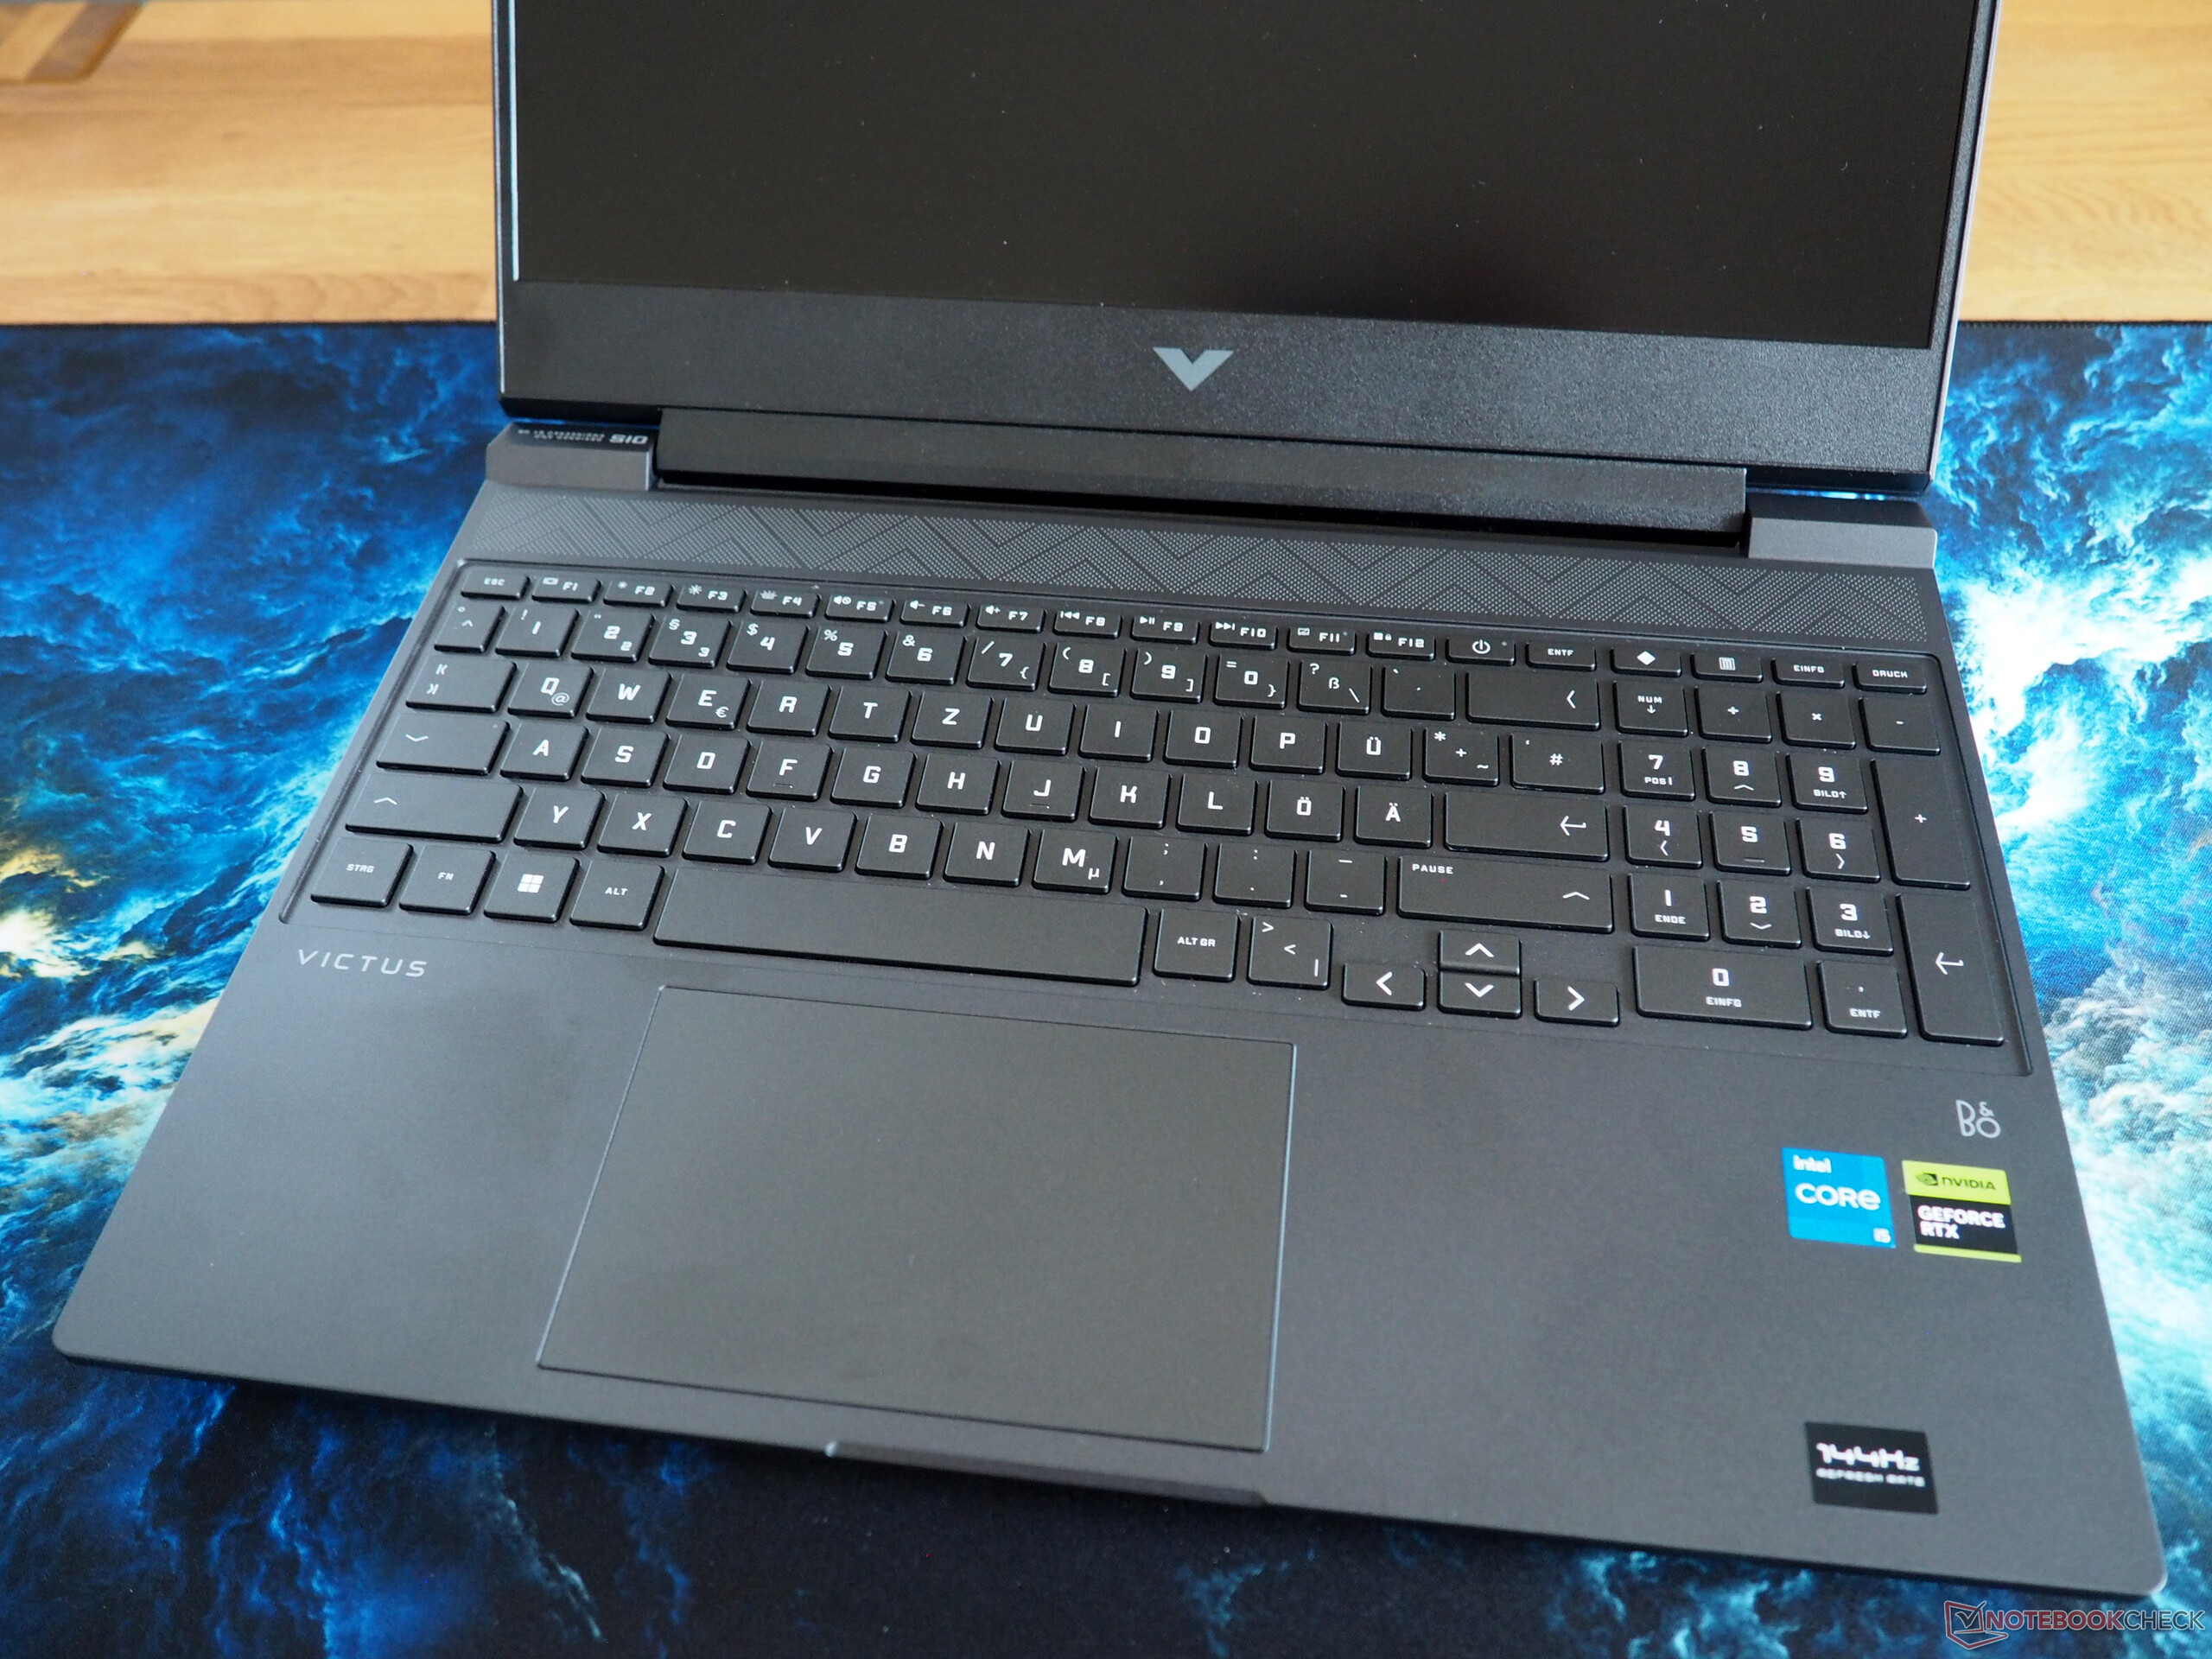
输入设备
键盘
在键盘方面,布局需要一些调整。紧凑的方向箭头和 F 行的非传统排列(电源按钮不在外缘,Ins 和 Del 不相邻等)也可能会引起一些人的注意。尽管如此,键盘还是提供了令人满意的键入体验。白色照明只有两种设置:开或关,亮度不可调。
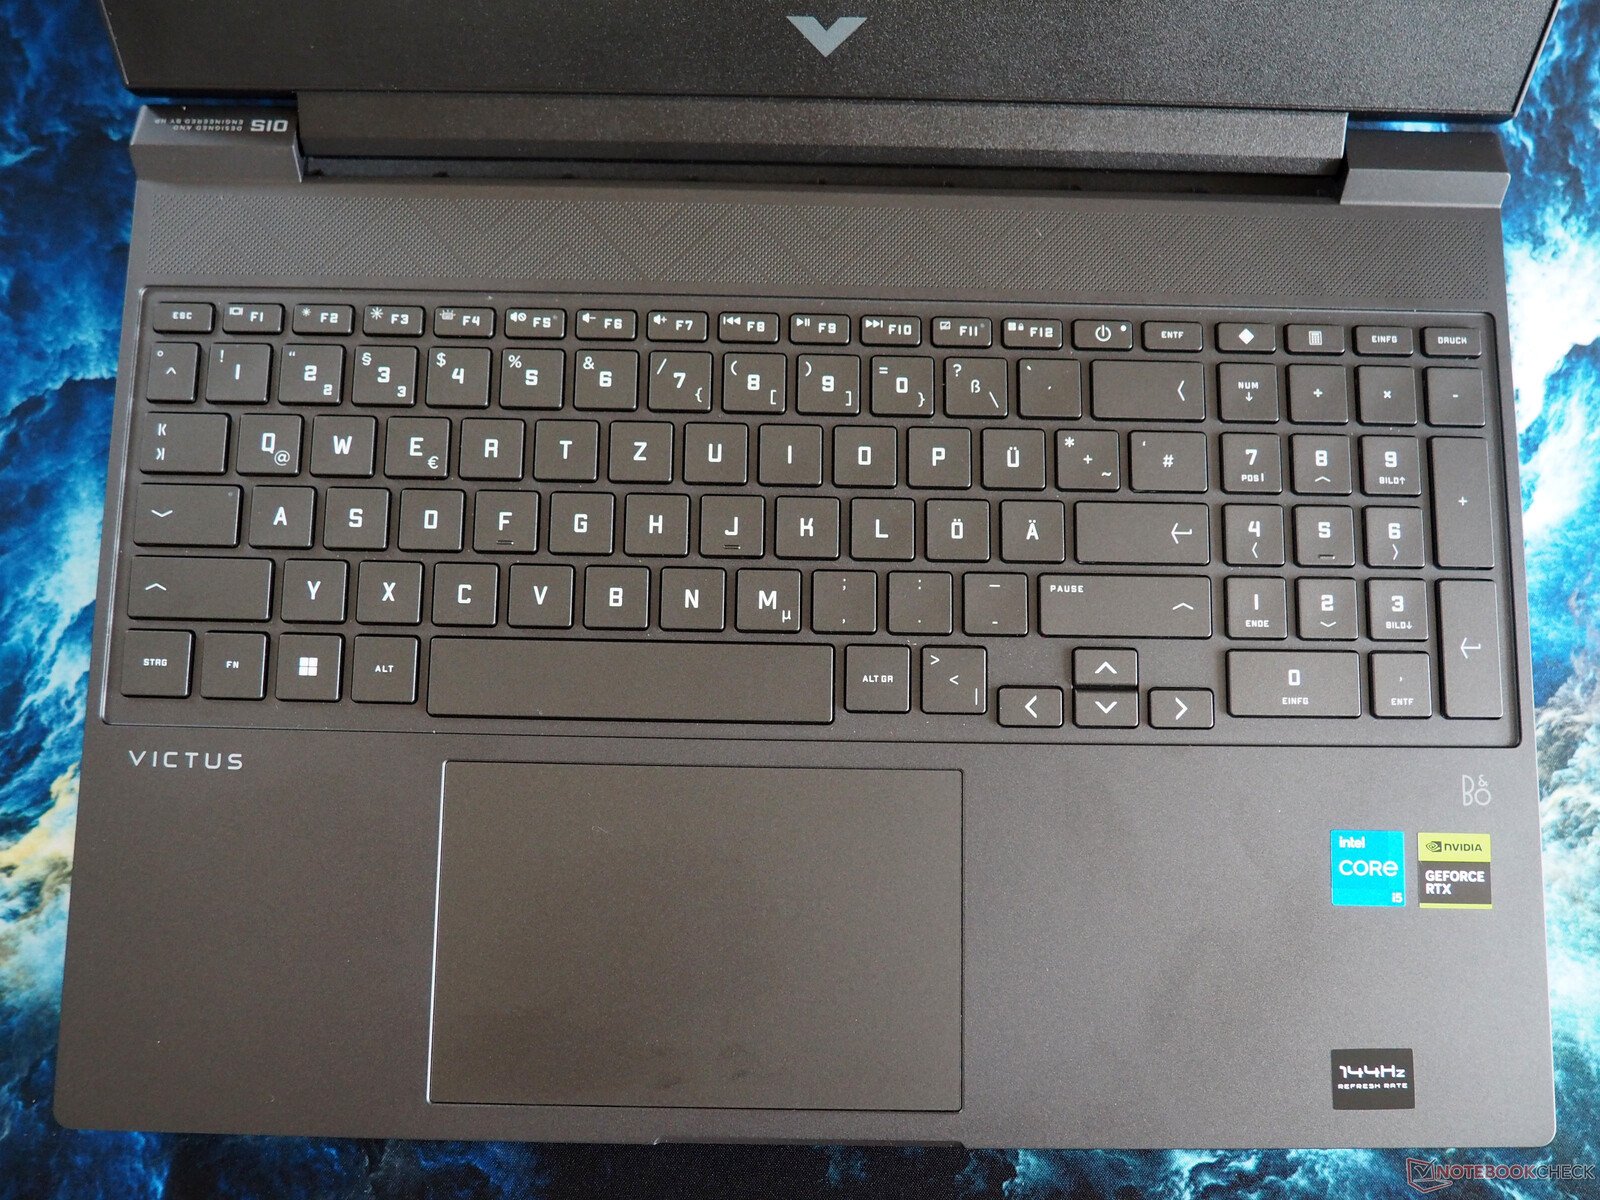
触摸板
触摸板的质量与竞争产品相当。点击表面的滑动性能和功能既不差,也不是特别好。手势支持方面也没有明显问题。触摸板的尺寸约为 4.92 x 3.15 英寸,大小适中。
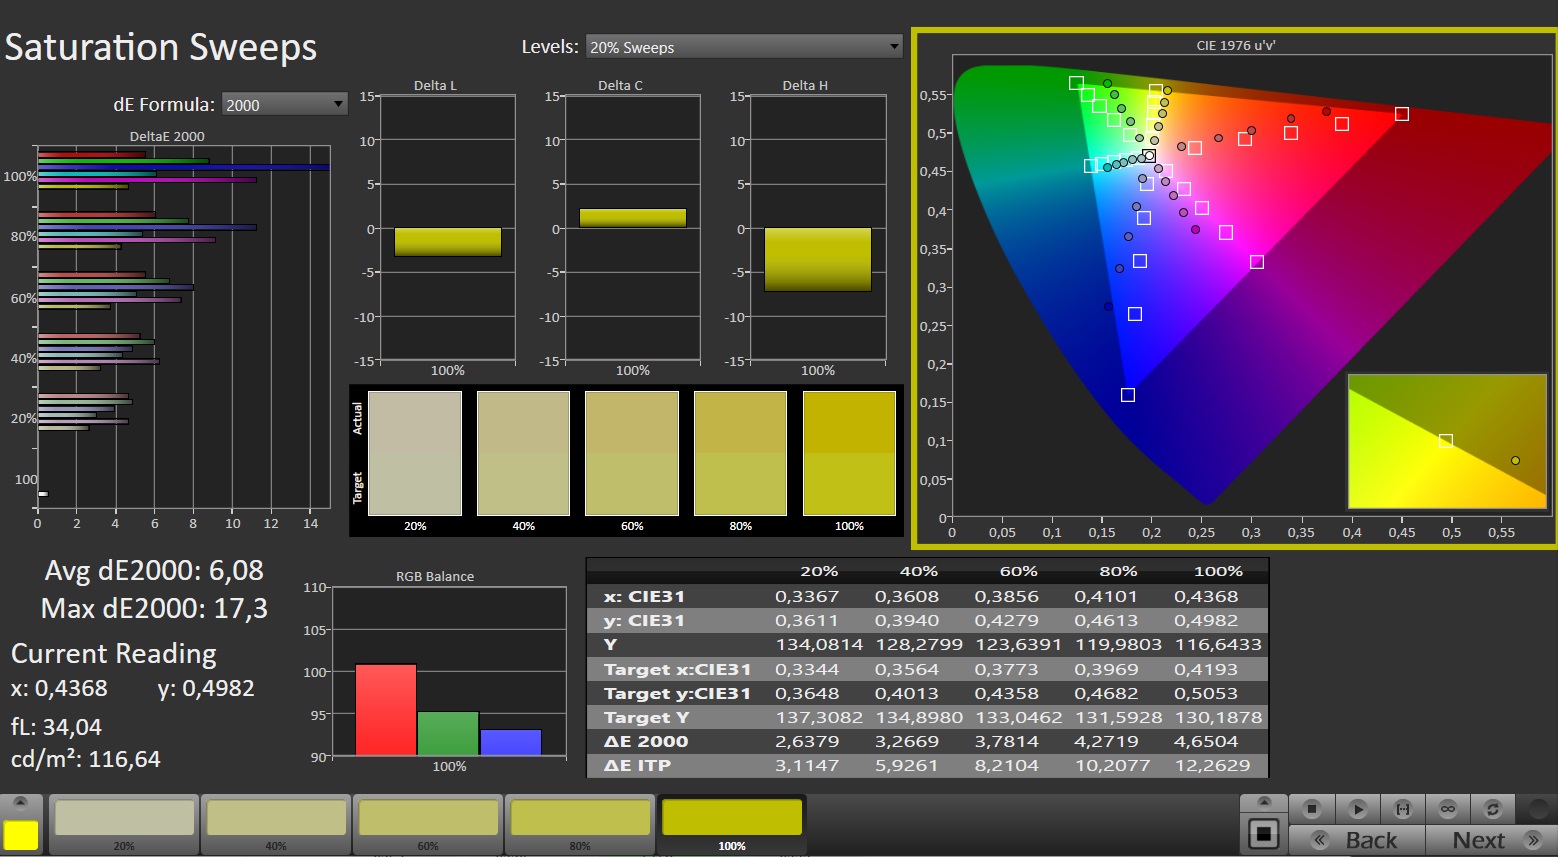
显示屏
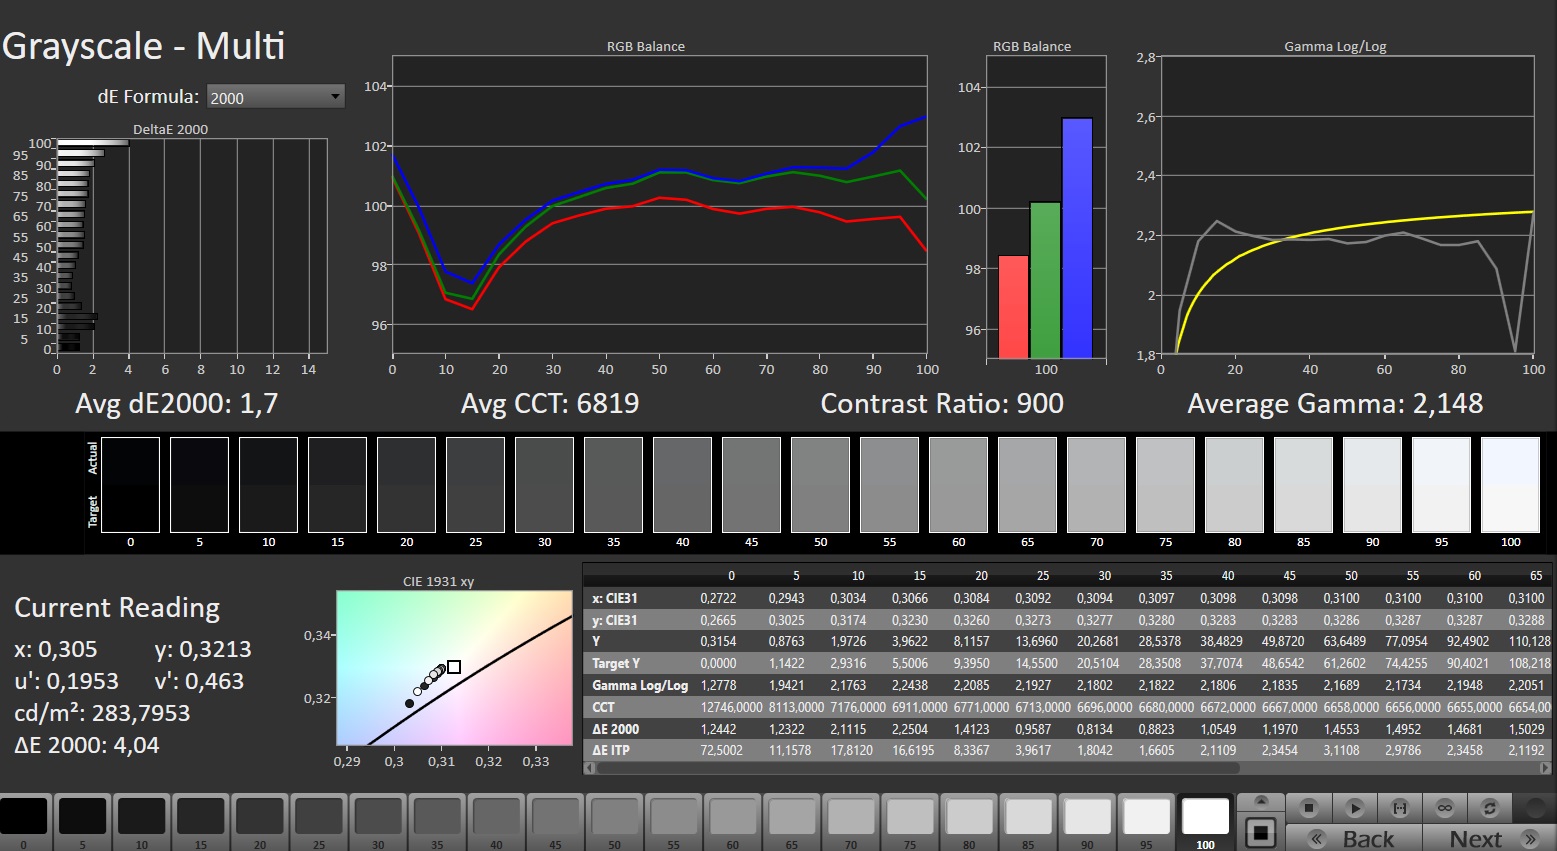
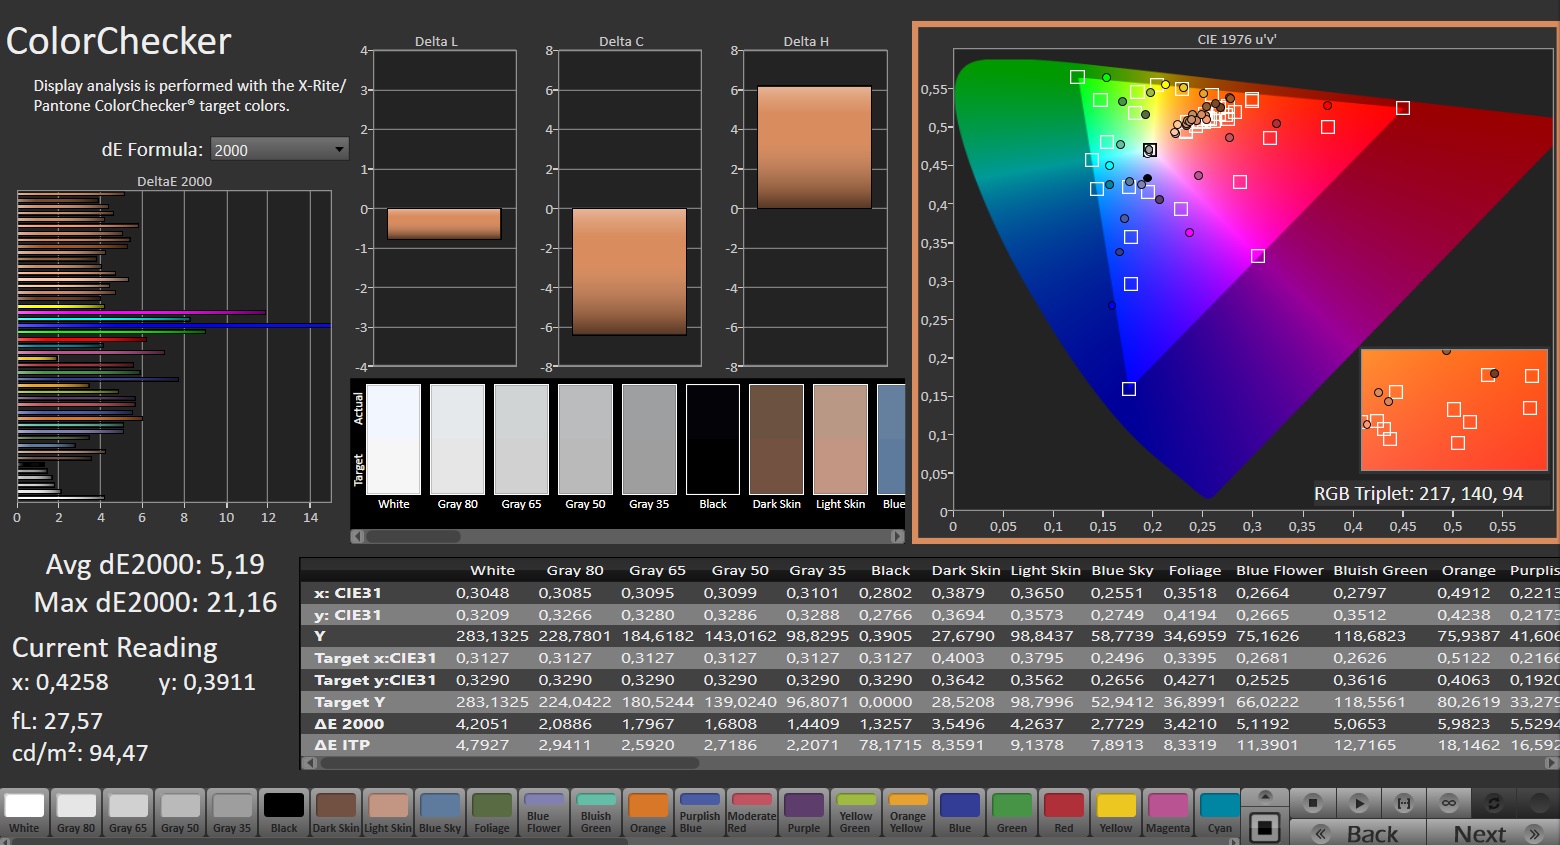
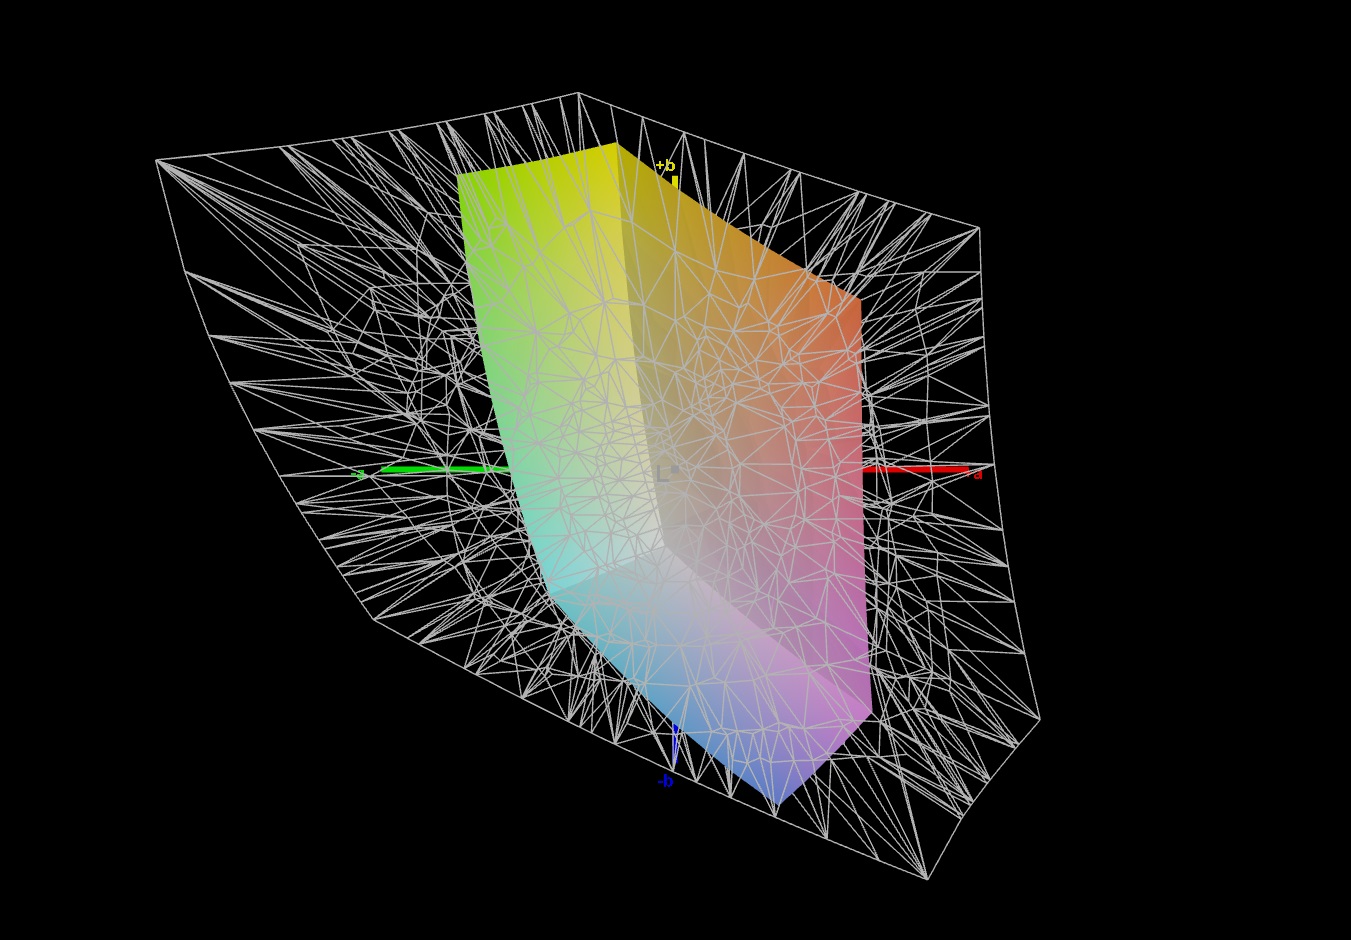
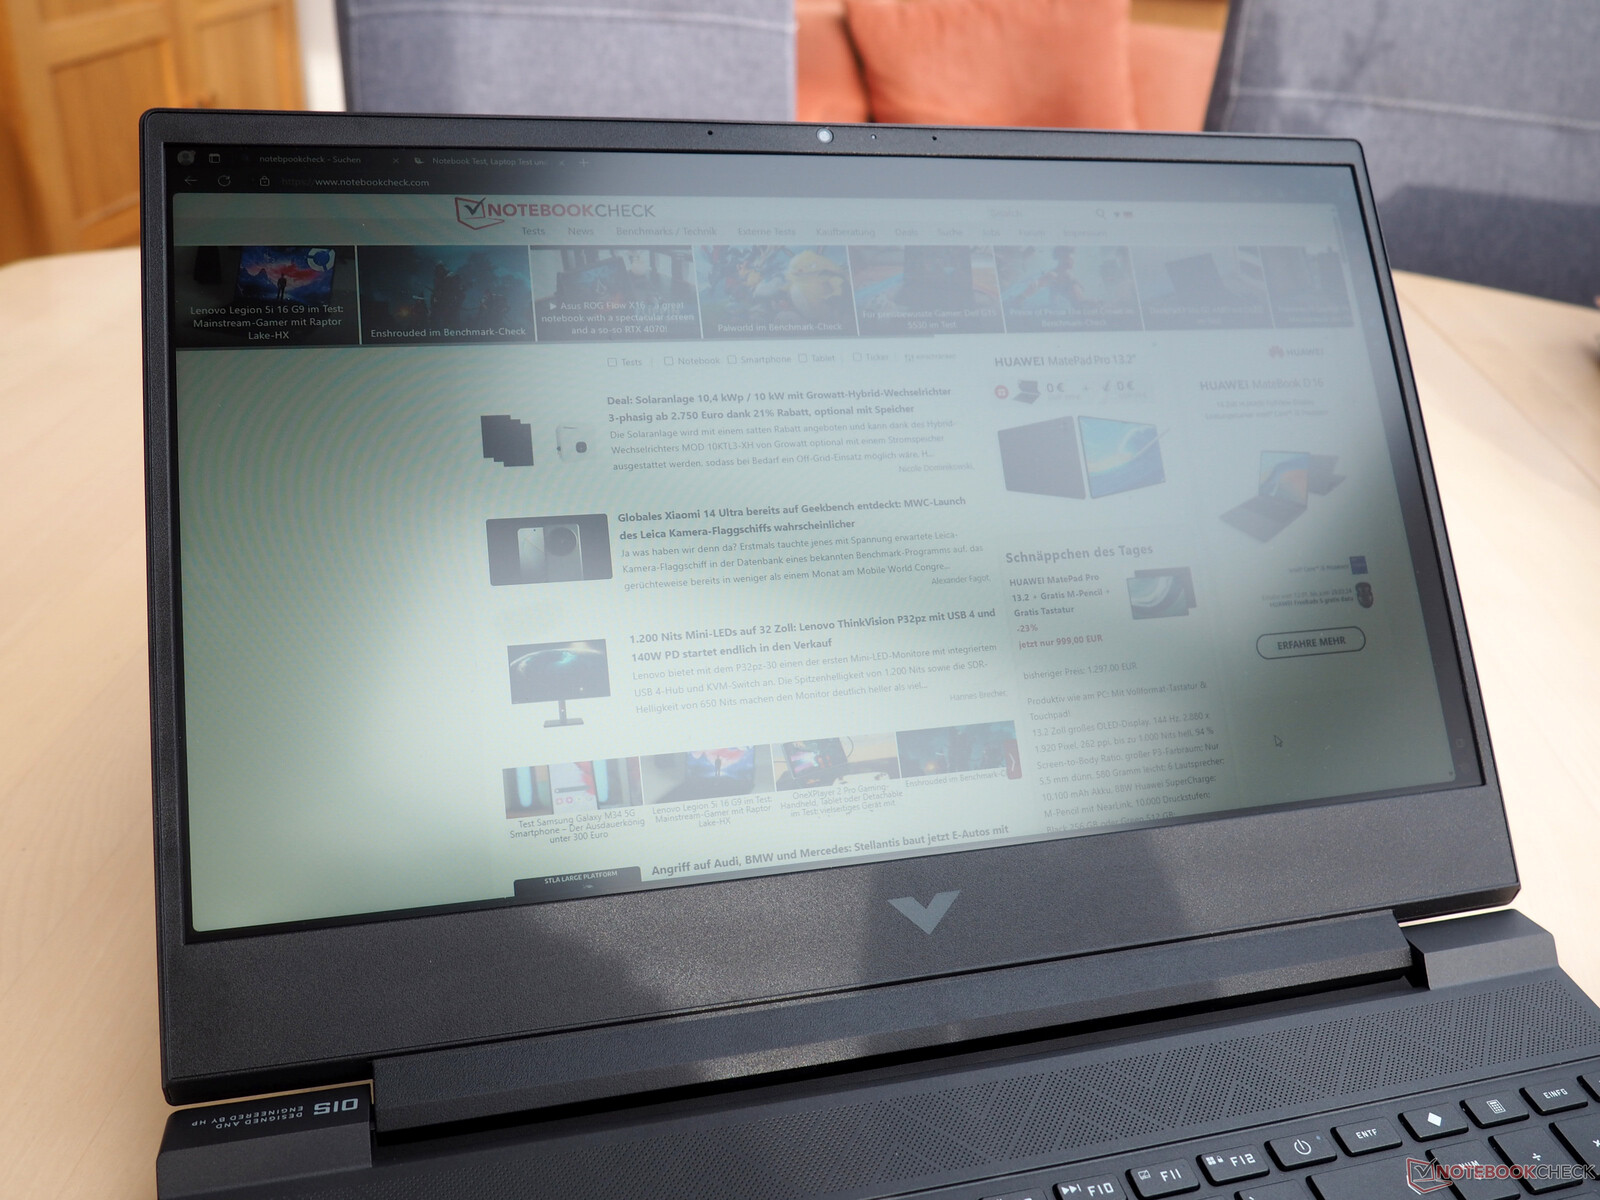
显示效果不佳是最大的缺点。虽然黑度(0.28 cd/m²)和对比度(975:1)还算不错,但亮度还有待提高。即使在室内,249 cd/m² 的平均亮度也会造成问题。Victus 15 完全不适合在户外使用。
| |||||||||||||||||||||||||
Brightness Distribution: 84 %
Center on Battery: 273 cd/m²
Contrast: 975:1 (Black: 0.28 cd/m²)
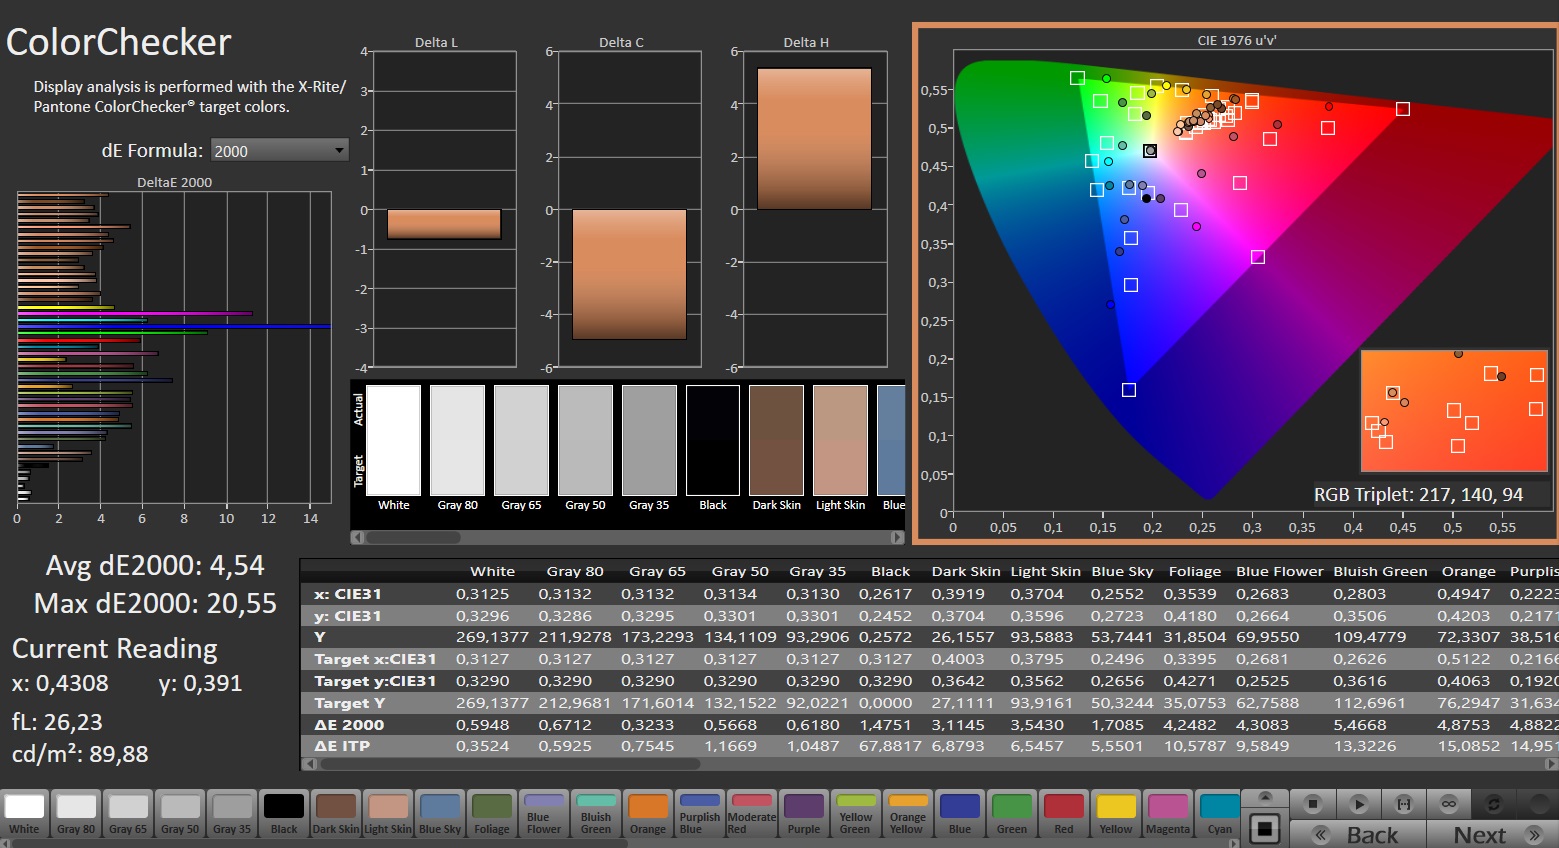
ΔE ColorChecker Calman: 5.19 | ∀{0.5-29.43 Ø4.71}
calibrated: 4.54
ΔE Greyscale Calman: 1.7 | ∀{0.09-98 Ø4.96}
40.5% AdobeRGB 1998 (Argyll 3D)
57.9% sRGB (Argyll 3D)
39.2% Display P3 (Argyll 3D)
Gamma: 2.148
CCT: 6819 K
| HP Victus 15-fa1057ng BOE094D, IPS, 1920x1080, 15.6" | HP Victus 15 fa0020nr CMN1521, IPS, 1920x1080, 15.6" | Dell G15 5530, i5-13450HX RTX 4050 BOEhydis NV15NY9 (Dell 18PJX), IPS, 1920x1080, 15.6" | Acer Nitro V 15 ANV15-51-582S LG LP156WFJ-SPB4 (LGD0742), IPS, 1920x1080, 15.6" | Asus TUF A15 FA507 N156HMA-GA1, IPS, 1920x1080, 15.6" | |
|---|---|---|---|---|---|
| Display | 7% | 76% | 3% | 66% | |
| Display P3 Coverage (%) | 39.2 | 42 7% | 71.1 81% | 40 2% | 64.9 66% |
| sRGB Coverage (%) | 57.9 | 62.7 8% | 99.3 72% | 60 4% | 96.5 67% |
| AdobeRGB 1998 Coverage (%) | 40.5 | 43.4 7% | 71.4 76% | 41.4 2% | 66.6 64% |
| Response Times | -58% | 62% | -51% | -28% | |
| Response Time Grey 50% / Grey 80% * (ms) | 23.8 ? | 35.2 ? -48% | 8.5 ? 64% | 34.2 ? -44% | 30.4 ? -28% |
| Response Time Black / White * (ms) | 16.3 ? | 27.2 ? -67% | 6.7 ? 59% | 25.8 ? -58% | 20.8 ? -28% |
| PWM Frequency (Hz) | |||||
| Screen | 8% | 13% | -17% | 34% | |
| Brightness middle (cd/m²) | 273 | 284.3 4% | 389 42% | 292 7% | 288 5% |
| Brightness (cd/m²) | 249 | 262 5% | 374 50% | 263 6% | 271 9% |
| Brightness Distribution (%) | 84 | 87 4% | 89 6% | 80 -5% | 91 8% |
| Black Level * (cd/m²) | 0.28 | 0.17 39% | 0.35 -25% | 0.25 11% | 0.17 39% |
| Contrast (:1) | 975 | 1672 71% | 1111 14% | 1168 20% | 1694 74% |
| Colorchecker dE 2000 * | 5.19 | 4.52 13% | 3.08 41% | 7.15 -38% | 1.9 63% |
| Colorchecker dE 2000 max. * | 21.16 | 18.67 12% | 5.44 74% | 15.51 27% | 3.3 84% |
| Colorchecker dE 2000 calibrated * | 4.54 | 1.55 66% | 1.17 74% | 4.13 9% | 0.9 80% |
| Greyscale dE 2000 * | 1.7 | 4.1 -141% | 4.4 -159% | 4.9 -188% | 2.7 -59% |
| Gamma | 2.148 102% | 2.3 96% | 2.409 91% | 2.014 109% | 2.32 95% |
| CCT | 6819 95% | 6529 100% | 6350 102% | 7178 91% | 6535 99% |
| Total Average (Program / Settings) | -14% /
-1% | 50% /
34% | -22% /
-18% | 24% /
32% |
* ... smaller is better
这款 15 英寸设备在色彩空间方面饱受批评。58% 的 sRGB 色彩空间造成的结果是画面乏善可陈,限制了电影、图片和游戏的视觉吸引力。一些竞争对手,如戴尔 G15 或华硕 TUF A15,在这方面的表现要好得多。
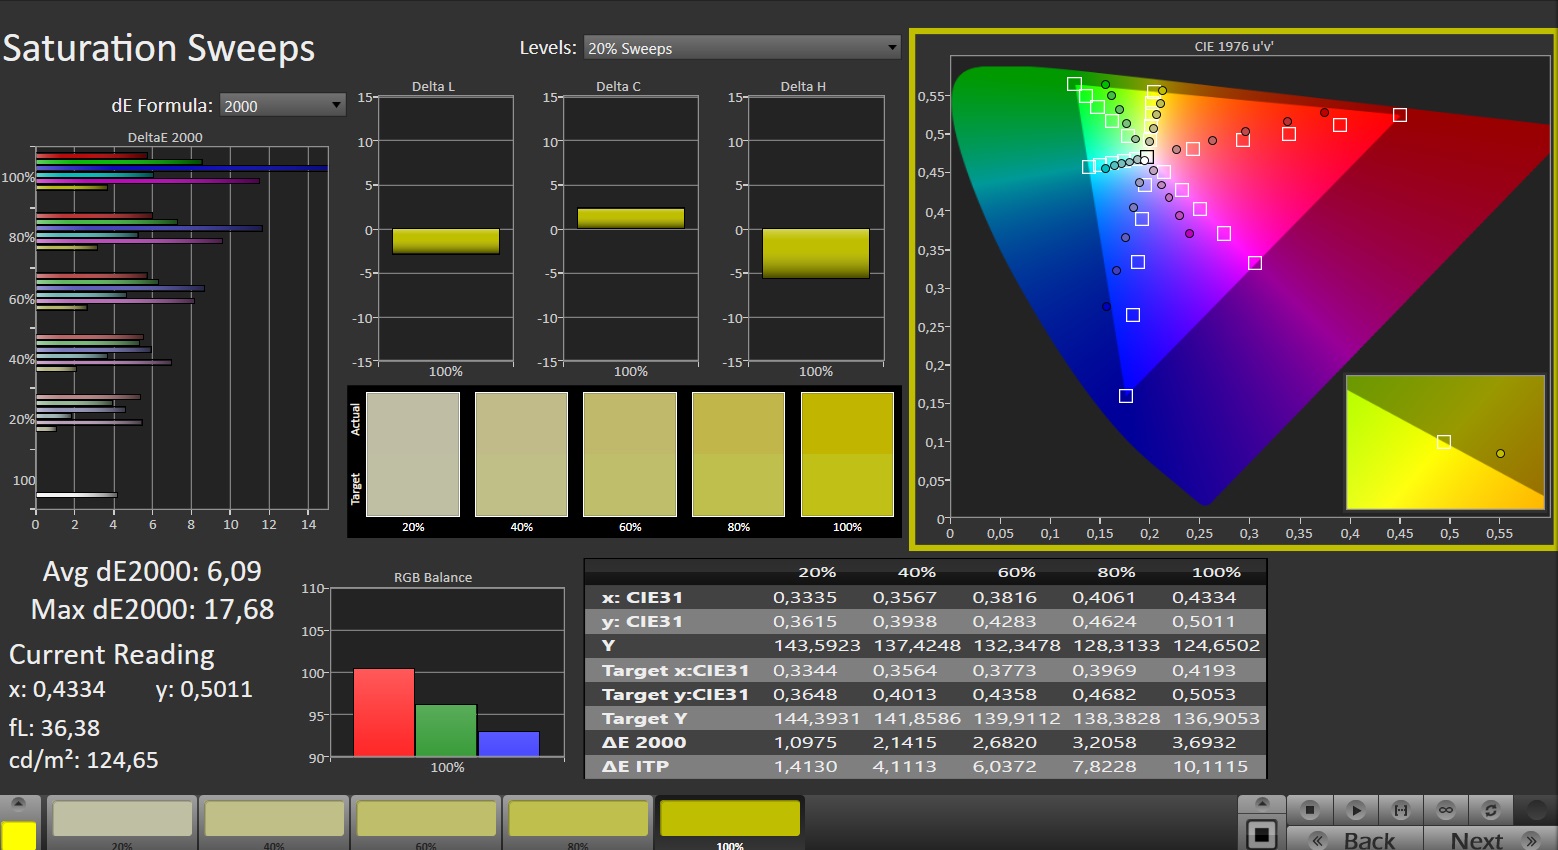
同时,视角稳定性和响应时间也符合典型的 IPS 标准。
Display Response Times
| ↔ Response Time Black to White | ||
|---|---|---|
| 16.3 ms ... rise ↗ and fall ↘ combined | ↗ 7.6 ms rise | 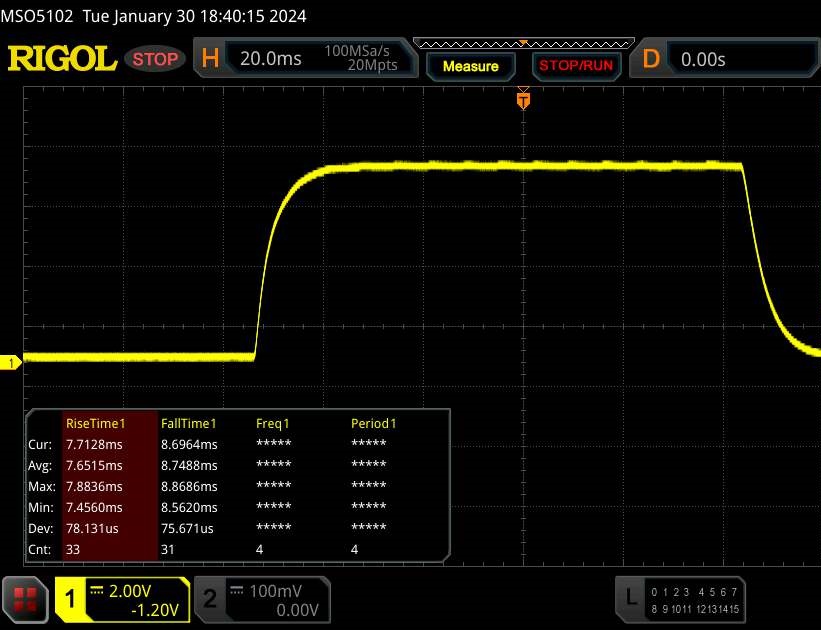 |
| ↘ 8.7 ms fall | ||
| The screen shows good response rates in our tests, but may be too slow for competitive gamers. In comparison, all tested devices range from 0.1 (minimum) to 240 (maximum) ms. » 38 % of all devices are better. This means that the measured response time is better than the average of all tested devices (19.8 ms). | ||
| ↔ Response Time 50% Grey to 80% Grey | ||
| 23.8 ms ... rise ↗ and fall ↘ combined | ↗ 11.1 ms rise | 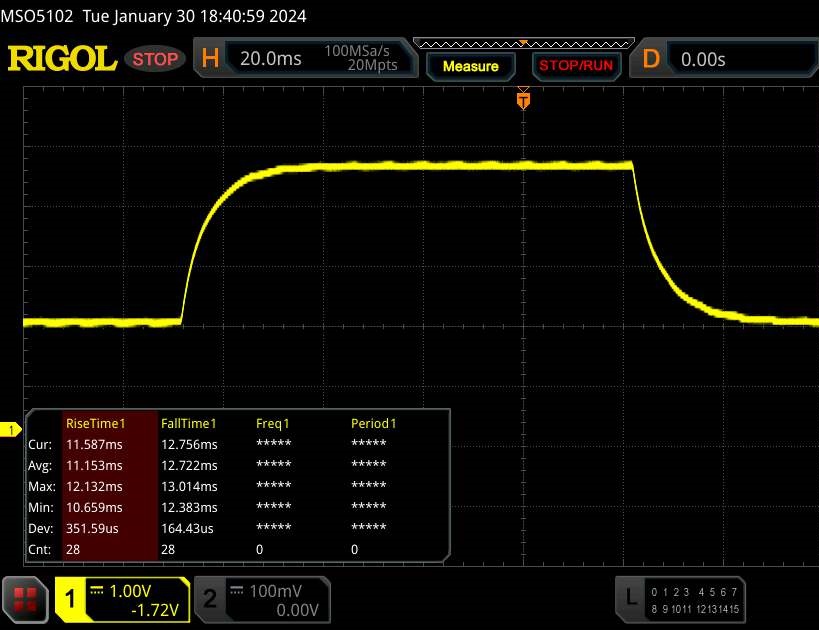 |
| ↘ 12.7 ms fall | ||
| The screen shows good response rates in our tests, but may be too slow for competitive gamers. In comparison, all tested devices range from 0.165 (minimum) to 636 (maximum) ms. » 35 % of all devices are better. This means that the measured response time is better than the average of all tested devices (31 ms). | ||
Screen Flickering / PWM (Pulse-Width Modulation)
| Screen flickering / PWM not detected | 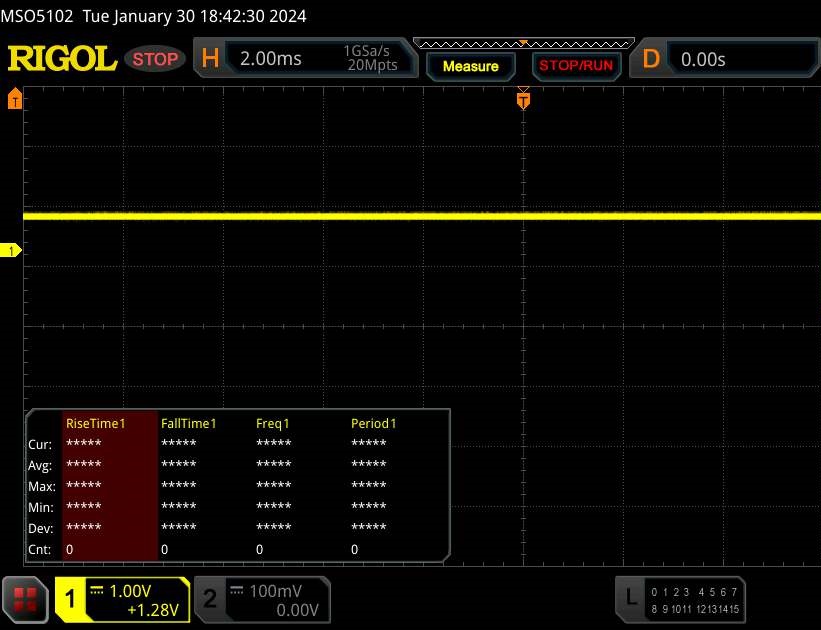 | ||
In comparison: 52 % of all tested devices do not use PWM to dim the display. If PWM was detected, an average of 7754 (minimum: 5 - maximum: 343500) Hz was measured. | |||
性能
在这种配置下,Victus 15 显然是一款中端笔记本电脑。虽然 16 GB 内存目前足以满足游戏需求,但仅有的 512 GB 固态硬盘很快就会变得拥挤不堪,尤其是 15 英寸机型没有提供第二个 M.2 插槽。
测试条件
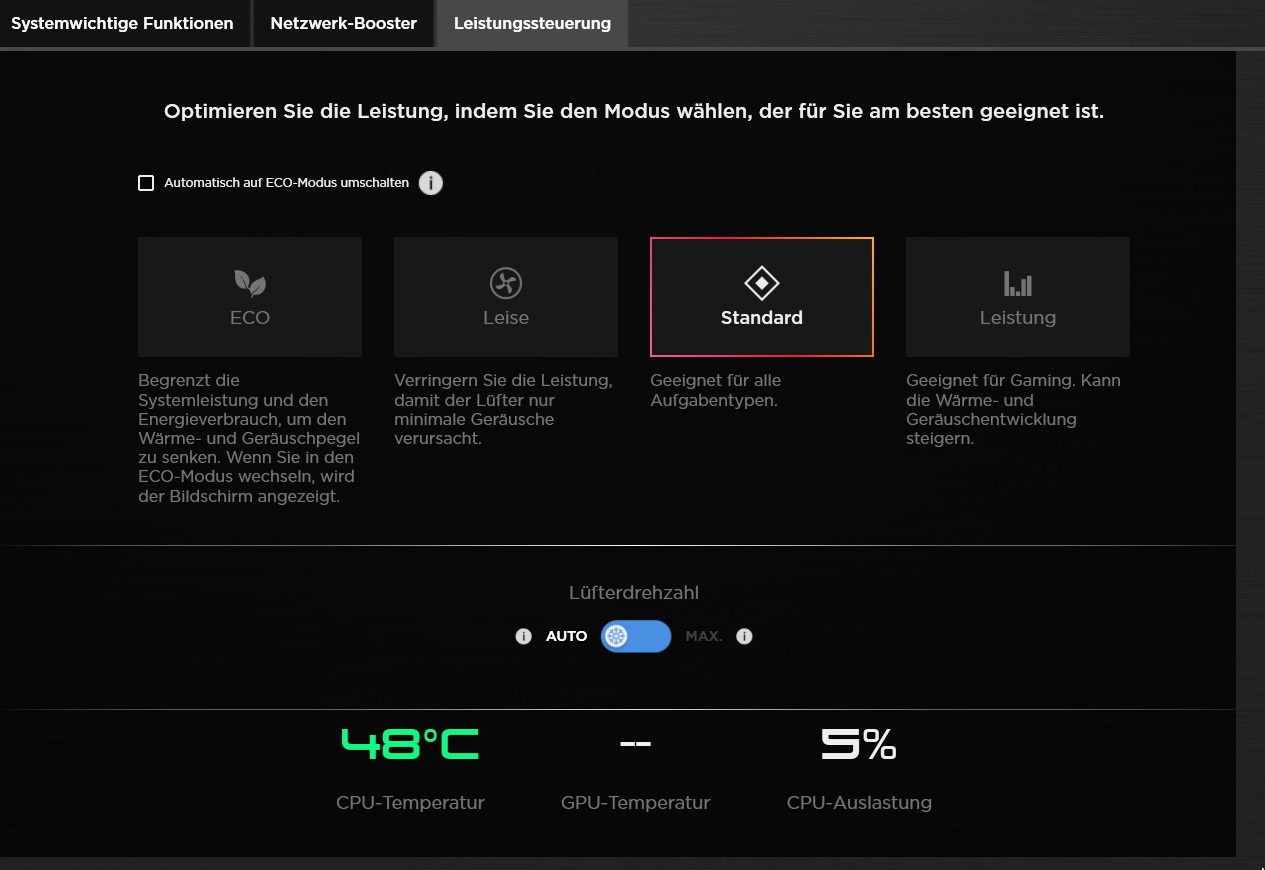
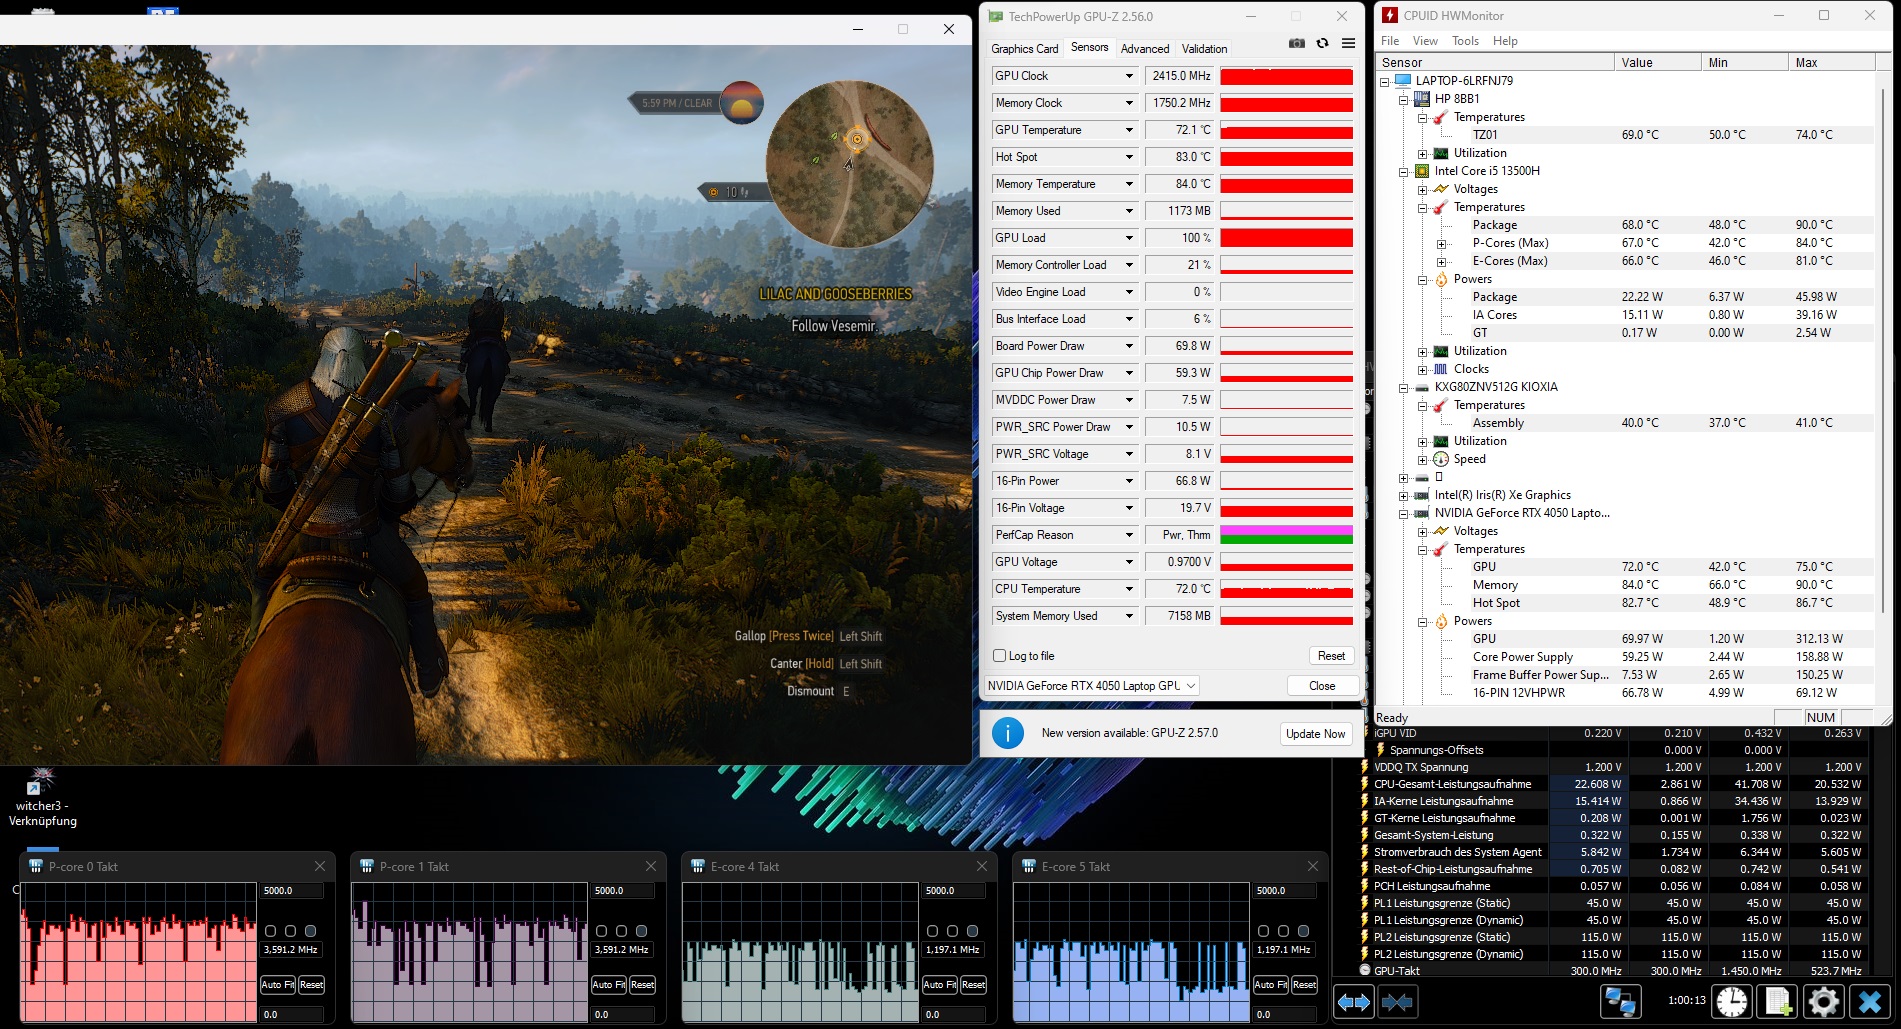
Omen Gaming Hub 可让用户影响系统行为。各种电源控制模式不仅会影响音量,还会影响性能(见表)。我们的测试都是在 "标准 "模式下进行的,因为 "性能 "模式下的帧率提升往往与噪音的增加不成比例。有趣的是,在测试设备上,尽管 FPS 数值较低,但 "安静 "模式的噪音排放始终高于 "标准 "模式。
| Witcher 3 (FHD/Ultra) Eco | Quiet | Standard | 性能 | |
| 噪音 | 36 dB(A) 46 dB(A) 42 dB(A) 48 dB(A) | |||
| 性能 | 60 fps 锁定 54 fps 78 fps 80 fps |
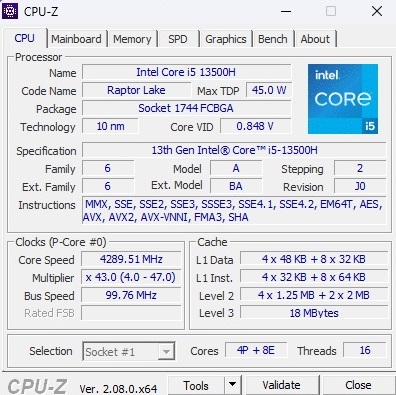
处理器
酷睿 i5-13500H 属于英特尔 Raptor Lake 系列产品,具有四个带超线程的性能核心和八个不带超线程的效率核心。在基准测试结果中,它的速度介于宏碁 Nitro V 15 的 酷睿 i5-13420H和戴尔 G15 的 酷睿 i5-13450HX.其 Ryzen 7 7735HSRyzen 7735HS 的初始性能大致相当,但在循环测试中,Core i5 失分较多,性能也不太稳定。将其与前代产品进行比较有些不公平,因为老款 Victus 的酷睿 i7 更多属于高端产品。
Cinebench R15 Multi continuous test
| CPU Performance rating - Percent | |
| Average of class Gaming | |
| Dell G15 5530, i5-13450HX RTX 4050 | |
| Average Intel Core i5-13500H | |
| HP Victus 15 fa0020nr -2! | |
| Asus TUF A15 FA507 -2! | |
| Acer Nitro V 15 ANV15-51-582S | |
| HP Victus 15-fa1057ng -4! | |
* ... smaller is better
AIDA64: FP32 Ray-Trace | FPU Julia | CPU SHA3 | CPU Queen | FPU SinJulia | FPU Mandel | CPU AES | CPU ZLib | FP64 Ray-Trace | CPU PhotoWorxx
| Performance rating | |
| Average of class Gaming | |
| Asus TUF A15 FA507 | |
| Dell G15 5530, i5-13450HX RTX 4050 | |
| Average Intel Core i5-13500H | |
| HP Victus 15 fa0020nr | |
| HP Victus 15-fa1057ng | |
| Acer Nitro V 15 ANV15-51-582S | |
| AIDA64 / FP32 Ray-Trace | |
| Average of class Gaming (10227 - 85542, n=105, last 2 years) | |
| Dell G15 5530, i5-13450HX RTX 4050 | |
| Asus TUF A15 FA507 | |
| Average Intel Core i5-13500H (11081 - 15390, n=6) | |
| HP Victus 15 fa0020nr | |
| HP Victus 15-fa1057ng | |
| Acer Nitro V 15 ANV15-51-582S | |
| AIDA64 / FPU Julia | |
| Average of class Gaming (51376 - 238426, n=105, last 2 years) | |
| Asus TUF A15 FA507 | |
| Dell G15 5530, i5-13450HX RTX 4050 | |
| Average Intel Core i5-13500H (56813 - 74251, n=6) | |
| HP Victus 15 fa0020nr | |
| Acer Nitro V 15 ANV15-51-582S | |
| HP Victus 15-fa1057ng | |
| AIDA64 / CPU SHA3 | |
| Average of class Gaming (2180 - 10115, n=105, last 2 years) | |
| Dell G15 5530, i5-13450HX RTX 4050 | |
| Asus TUF A15 FA507 | |
| Average Intel Core i5-13500H (2621 - 3623, n=6) | |
| HP Victus 15 fa0020nr | |
| Acer Nitro V 15 ANV15-51-582S | |
| HP Victus 15-fa1057ng | |
| AIDA64 / CPU Queen | |
| Average of class Gaming (49785 - 173351, n=90, last 2 years) | |
| Asus TUF A15 FA507 | |
| HP Victus 15 fa0020nr | |
| Dell G15 5530, i5-13450HX RTX 4050 | |
| Average Intel Core i5-13500H (77835 - 85727, n=6) | |
| HP Victus 15-fa1057ng | |
| Acer Nitro V 15 ANV15-51-582S | |
| AIDA64 / FPU SinJulia | |
| Average of class Gaming (4424 - 33636, n=105, last 2 years) | |
| Asus TUF A15 FA507 | |
| Dell G15 5530, i5-13450HX RTX 4050 | |
| HP Victus 15 fa0020nr | |
| Average Intel Core i5-13500H (7249 - 8086, n=6) | |
| HP Victus 15-fa1057ng | |
| Acer Nitro V 15 ANV15-51-582S | |
| AIDA64 / FPU Mandel | |
| Average of class Gaming (25115 - 128721, n=105, last 2 years) | |
| Asus TUF A15 FA507 | |
| Dell G15 5530, i5-13450HX RTX 4050 | |
| Average Intel Core i5-13500H (27820 - 38336, n=6) | |
| HP Victus 15 fa0020nr | |
| HP Victus 15-fa1057ng | |
| Acer Nitro V 15 ANV15-51-582S | |
| AIDA64 / CPU AES | |
| Average of class Gaming (39258 - 247074, n=105, last 2 years) | |
| Acer Nitro V 15 ANV15-51-582S | |
| Average Intel Core i5-13500H (62657 - 120493, n=6) | |
| Dell G15 5530, i5-13450HX RTX 4050 | |
| Asus TUF A15 FA507 | |
| HP Victus 15-fa1057ng | |
| HP Victus 15 fa0020nr | |
| AIDA64 / CPU ZLib | |
| Average of class Gaming (574 - 2531, n=105, last 2 years) | |
| Dell G15 5530, i5-13450HX RTX 4050 | |
| HP Victus 15-fa1057ng | |
| Average Intel Core i5-13500H (782 - 992, n=6) | |
| HP Victus 15 fa0020nr | |
| Acer Nitro V 15 ANV15-51-582S | |
| Asus TUF A15 FA507 | |
| AIDA64 / FP64 Ray-Trace | |
| Average of class Gaming (5509 - 45446, n=105, last 2 years) | |
| Dell G15 5530, i5-13450HX RTX 4050 | |
| Asus TUF A15 FA507 | |
| Average Intel Core i5-13500H (5955 - 8495, n=6) | |
| HP Victus 15 fa0020nr | |
| HP Victus 15-fa1057ng | |
| Acer Nitro V 15 ANV15-51-582S | |
| AIDA64 / CPU PhotoWorxx | |
| Average of class Gaming (12271 - 89891, n=105, last 2 years) | |
| Dell G15 5530, i5-13450HX RTX 4050 | |
| Average Intel Core i5-13500H (20212 - 37618, n=6) | |
| Asus TUF A15 FA507 | |
| HP Victus 15-fa1057ng | |
| Acer Nitro V 15 ANV15-51-582S | |
| HP Victus 15 fa0020nr | |
系统性能
在系统性能方面,竞争对手几乎没有共同之处。在所有情况下,PCMark 10 的总体得分都非常接近,但在内存速度方面的差异更为明显。
CrossMark: Overall | Productivity | Creativity | Responsiveness
WebXPRT 3: Overall
WebXPRT 4: Overall
Mozilla Kraken 1.1: Total
| PCMark 10 / Score | |
| Average of class Gaming (5828 - 12414, n=93, last 2 years) | |
| Asus TUF A15 FA507 | |
| Average Intel Core i5-13500H, NVIDIA GeForce RTX 4050 Laptop GPU (6812 - 7228, n=2) | |
| Dell G15 5530, i5-13450HX RTX 4050 | |
| HP Victus 15 fa0020nr | |
| HP Victus 15-fa1057ng | |
| Acer Nitro V 15 ANV15-51-582S | |
| PCMark 10 / Essentials | |
| Average of class Gaming (8810 - 11935, n=97, last 2 years) | |
| Asus TUF A15 FA507 | |
| HP Victus 15 fa0020nr | |
| Average Intel Core i5-13500H, NVIDIA GeForce RTX 4050 Laptop GPU (9521 - 10019, n=2) | |
| Dell G15 5530, i5-13450HX RTX 4050 | |
| HP Victus 15-fa1057ng | |
| Acer Nitro V 15 ANV15-51-582S | |
| PCMark 10 / Productivity | |
| Average of class Gaming (6845 - 25323, n=95, last 2 years) | |
| Asus TUF A15 FA507 | |
| HP Victus 15 fa0020nr | |
| Average Intel Core i5-13500H, NVIDIA GeForce RTX 4050 Laptop GPU (8890 - 8968, n=2) | |
| HP Victus 15-fa1057ng | |
| Dell G15 5530, i5-13450HX RTX 4050 | |
| Acer Nitro V 15 ANV15-51-582S | |
| PCMark 10 / Digital Content Creation | |
| Average of class Gaming (7602 - 19954, n=95, last 2 years) | |
| Average Intel Core i5-13500H, NVIDIA GeForce RTX 4050 Laptop GPU (10134 - 11405, n=2) | |
| Dell G15 5530, i5-13450HX RTX 4050 | |
| Asus TUF A15 FA507 | |
| HP Victus 15-fa1057ng | |
| HP Victus 15 fa0020nr | |
| Acer Nitro V 15 ANV15-51-582S | |
| CrossMark / Overall | |
| Average of class Gaming (1366 - 2409, n=94, last 2 years) | |
| Average Intel Core i5-13500H, NVIDIA GeForce RTX 4050 Laptop GPU (n=1) | |
| HP Victus 15 fa0020nr | |
| Asus TUF A15 FA507 | |
| CrossMark / Productivity | |
| Average of class Gaming (1386 - 2254, n=94, last 2 years) | |
| Average Intel Core i5-13500H, NVIDIA GeForce RTX 4050 Laptop GPU (n=1) | |
| HP Victus 15 fa0020nr | |
| Asus TUF A15 FA507 | |
| CrossMark / Creativity | |
| Average of class Gaming (1343 - 2786, n=94, last 2 years) | |
| Average Intel Core i5-13500H, NVIDIA GeForce RTX 4050 Laptop GPU (n=1) | |
| HP Victus 15 fa0020nr | |
| Asus TUF A15 FA507 | |
| CrossMark / Responsiveness | |
| Average Intel Core i5-13500H, NVIDIA GeForce RTX 4050 Laptop GPU (n=1) | |
| Average of class Gaming (1226 - 2334, n=94, last 2 years) | |
| HP Victus 15 fa0020nr | |
| Asus TUF A15 FA507 | |
| WebXPRT 3 / Overall | |
| Average of class Gaming (220 - 532, n=98, last 2 years) | |
| HP Victus 15 fa0020nr | |
| Asus TUF A15 FA507 | |
| Dell G15 5530, i5-13450HX RTX 4050 | |
| Dell G15 5530, i5-13450HX RTX 4050 | |
| HP Victus 15-fa1057ng | |
| Average Intel Core i5-13500H, NVIDIA GeForce RTX 4050 Laptop GPU (267 - 267, n=2) | |
| Acer Nitro V 15 ANV15-51-582S | |
| WebXPRT 4 / Overall | |
| Average of class Gaming (165 - 354, n=98, last 2 years) | |
| HP Victus 15 fa0020nr | |
| Acer Nitro V 15 ANV15-51-582S | |
| Average Intel Core i5-13500H, NVIDIA GeForce RTX 4050 Laptop GPU (n=1) | |
| Asus TUF A15 FA507 | |
| Mozilla Kraken 1.1 / Total | |
| Asus TUF A15 FA507 | |
| Acer Nitro V 15 ANV15-51-582S | |
| HP Victus 15-fa1057ng | |
| Average Intel Core i5-13500H, NVIDIA GeForce RTX 4050 Laptop GPU (530 - 545, n=2) | |
| HP Victus 15 fa0020nr | |
| Dell G15 5530, i5-13450HX RTX 4050 | |
| Dell G15 5530, i5-13450HX RTX 4050 | |
| Average of class Gaming (391 - 590, n=100, last 2 years) | |
* ... smaller is better
| PCMark 10 Score | 6812 points | |
Help | ||
| AIDA64 / Memory Copy | |
| Average of class Gaming (21750 - 129946, n=105, last 2 years) | |
| Dell G15 5530, i5-13450HX RTX 4050 | |
| Average Intel Core i5-13500H (36916 - 57830, n=6) | |
| Asus TUF A15 FA507 | |
| HP Victus 15-fa1057ng | |
| HP Victus 15 fa0020nr | |
| Acer Nitro V 15 ANV15-51-582S | |
| AIDA64 / Memory Read | |
| Average of class Gaming (22956 - 118858, n=105, last 2 years) | |
| Dell G15 5530, i5-13450HX RTX 4050 | |
| Average Intel Core i5-13500H (41676 - 65633, n=6) | |
| Asus TUF A15 FA507 | |
| HP Victus 15 fa0020nr | |
| HP Victus 15-fa1057ng | |
| Acer Nitro V 15 ANV15-51-582S | |
| AIDA64 / Memory Write | |
| Average of class Gaming (22297 - 135096, n=105, last 2 years) | |
| Dell G15 5530, i5-13450HX RTX 4050 | |
| Asus TUF A15 FA507 | |
| Average Intel Core i5-13500H (36826 - 60523, n=6) | |
| HP Victus 15-fa1057ng | |
| HP Victus 15 fa0020nr | |
| Acer Nitro V 15 ANV15-51-582S | |
| AIDA64 / Memory Latency | |
| Average of class Gaming (75.3 - 259, n=105, last 2 years) | |
| Dell G15 5530, i5-13450HX RTX 4050 | |
| Average Intel Core i5-13500H (86.2 - 96.1, n=6) | |
| Acer Nitro V 15 ANV15-51-582S | |
| HP Victus 15-fa1057ng | |
| Asus TUF A15 FA507 | |
| HP Victus 15 fa0020nr | |
* ... smaller is better
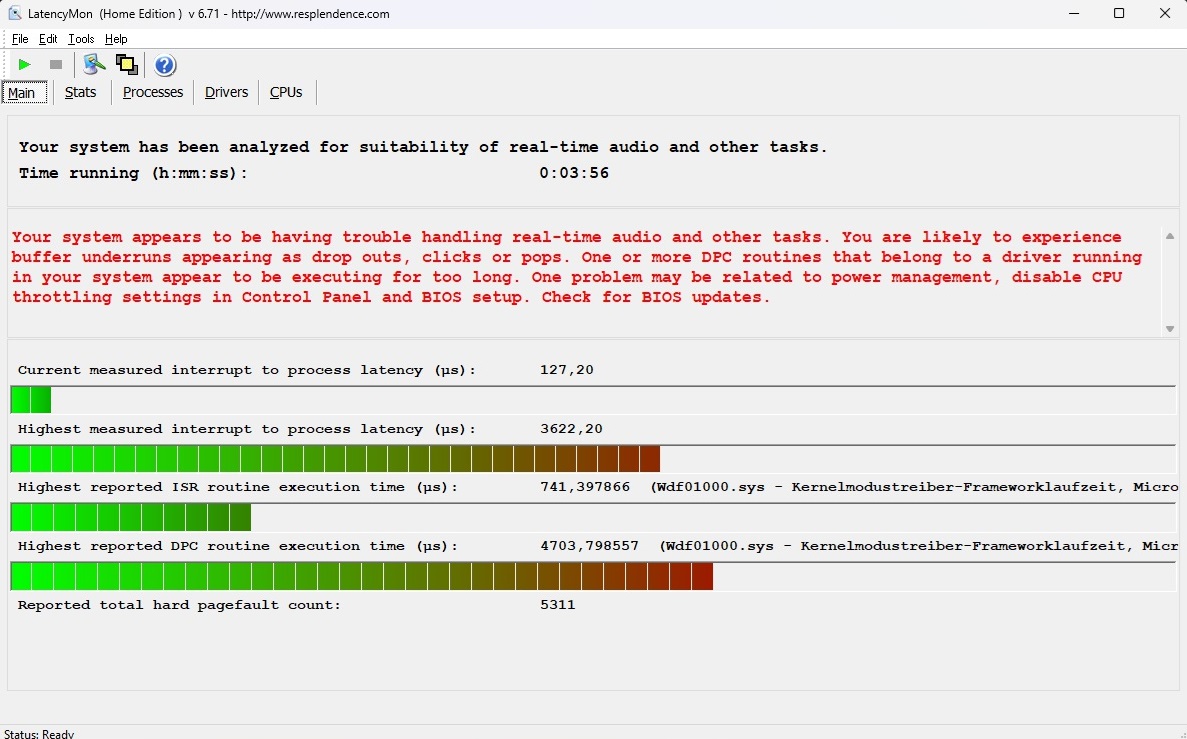
DPC 延迟
如果您打算使用该系统进行实时音频和视频编辑,您可能需要考虑其他选择。根据 LatencyMon 工具,出厂状态下的延迟非常适中,这可能会导致某些任务出现问题。
| DPC Latencies / LatencyMon - interrupt to process latency (max), Web, Youtube, Prime95 | |
| HP Victus 15-fa1057ng | |
| Dell G15 5530, i5-13450HX RTX 4050 | |
| HP Victus 15 fa0020nr | |
| Acer Nitro V 15 ANV15-51-582S | |
* ... smaller is better
存储设备
固态硬盘的冷却效果也不理想。虽然安装的 Kioxia 硬盘在最初几次运行中取得了值得称赞的结果,但随着时间的推移,它出现了明显的节流现象,这在我们的循环测试中得到了证明。

* ... smaller is better
Reading continuous performance: DiskSpd Read Loop, Queue Depth 8
图形卡
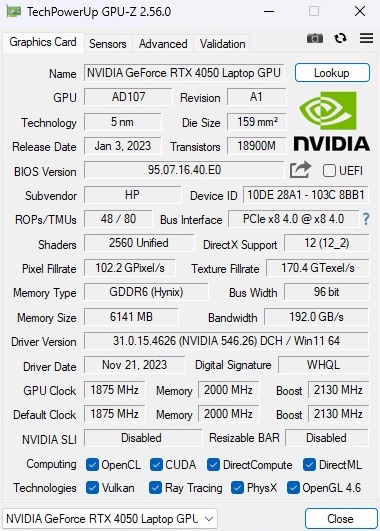
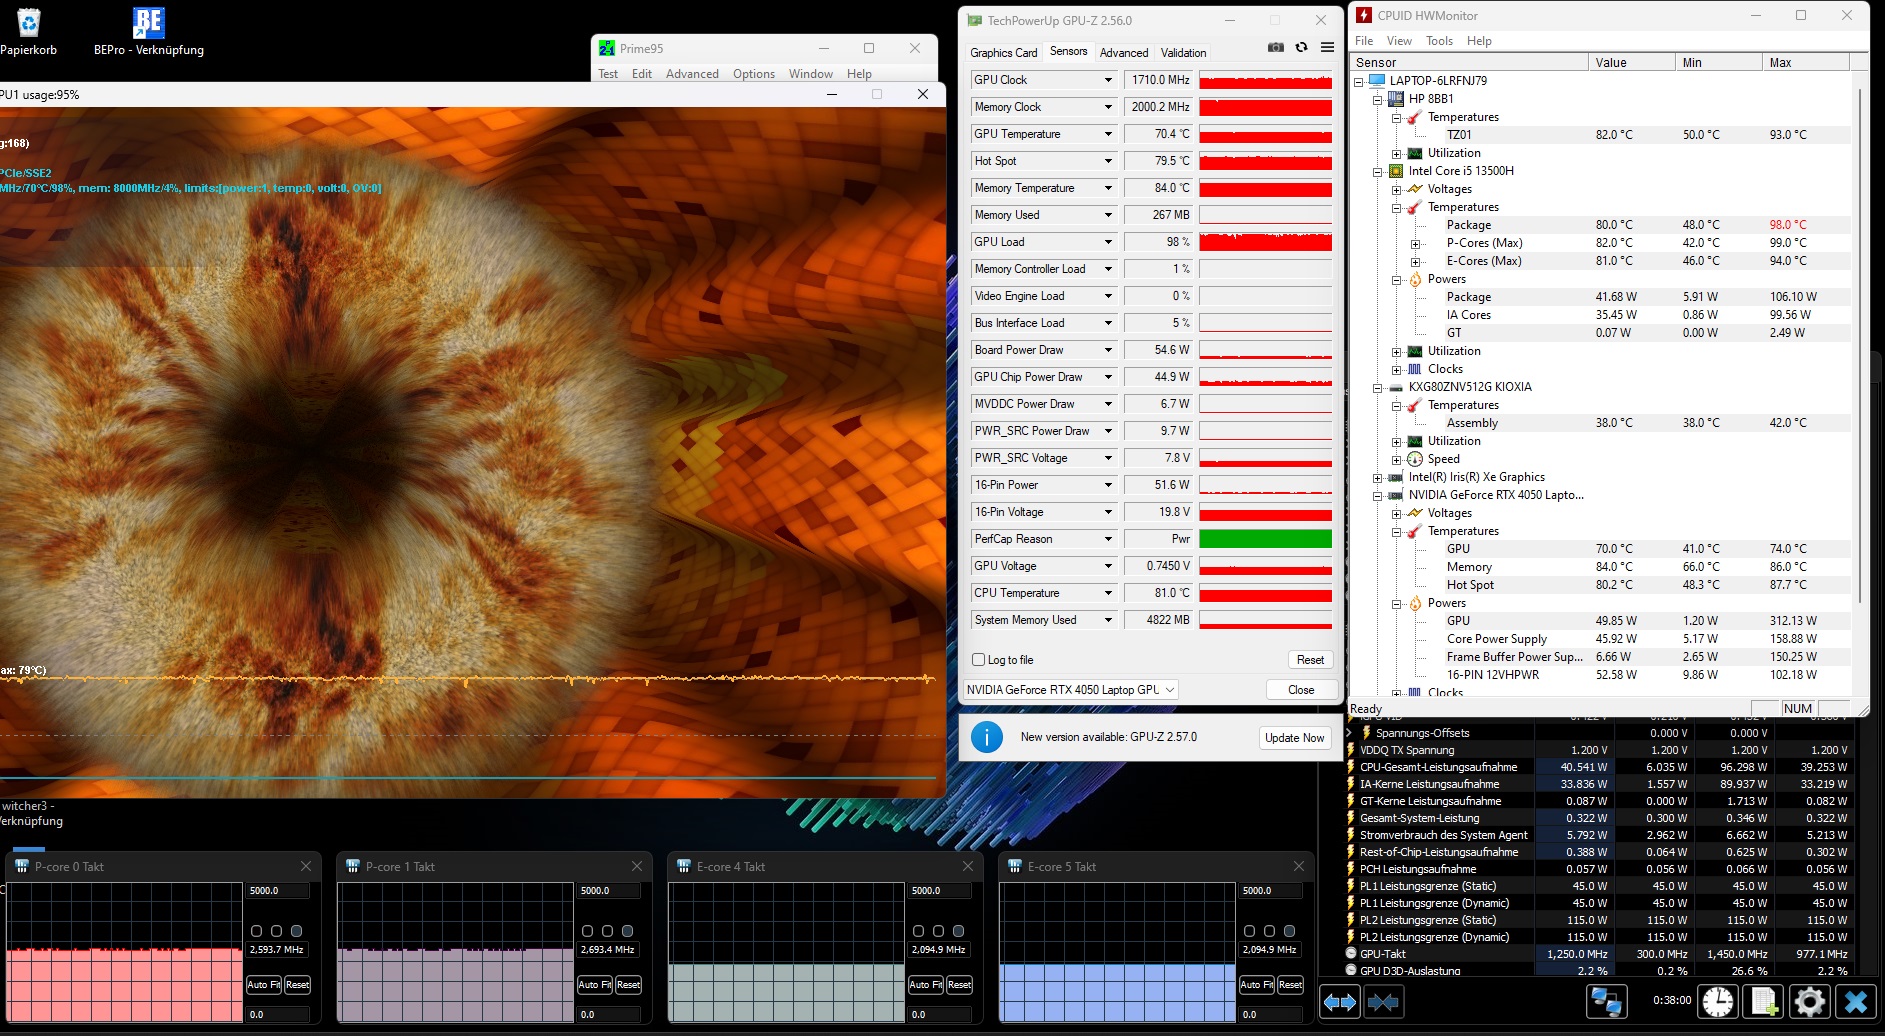
目前 Nvidia 显卡的性能在很大程度上取决于所选的 TDP。惠普为 Victus 15 选择了 75 瓦(包括动态升压),这对于 RTX 4050 来说相对较低,但在许多基准测试中仅得到有限的反映。总体而言,3D 性能符合该显卡的平均水平。RTX 4050 的未来表现不太乐观,因为 6GB VRAM 和 96 位接口已经成为限制高要求游戏的因素。
| 3DMark 11 Performance | 25418 points | |
| 3DMark Ice Storm Standard Score | 189586 points | |
| 3DMark Cloud Gate Standard Score | 55024 points | |
| 3DMark Fire Strike Score | 19211 points | |
| 3DMark Time Spy Score | 8149 points | |
Help | ||
* ... smaller is better
游戏性能
不过,Victus 15 的速度足够快,在原始分辨率为 1,920 x 1,080 的高至最高设置下,可以流畅运行当前的大多数游戏。它仅在个别情况下面临挑战,例如 笼罩.事实上,RTX 4050 的最大 TDP 为 75 瓦,与 TGP 更高的笔记本电脑相比,并没有任何明显的影响,这与合成测试类似。
| The Witcher 3 - 1920x1080 Ultra Graphics & Postprocessing (HBAO+) | |
| Average of class Gaming (104.7 - 240, n=7, last 2 years) | |
| Dell G15 5530, i5-13450HX RTX 4050 | |
| Asus TUF A15 FA507 | |
| Acer Nitro V 15 ANV15-51-582S | |
| HP Victus 15-fa1057ng | |
| Average NVIDIA GeForce RTX 4050 Laptop GPU (18.5 - 94.7, n=40) | |
| HP Victus 15 fa0020nr | |
| Enshrouded - 1920x1080 Max. Quality AA:FX | |
| Medion Erazer Scout E20 | |
| Average NVIDIA GeForce RTX 4050 Laptop GPU (37.3 - 37.7, n=2) | |
| HP Victus 15-fa1057ng | |
| Average of class Gaming (n=1last 2 years) | |
| Palworld - 1920x1080 Epic Preset AA:TSR | |
| Medion Erazer Scout E20 | |
| Average NVIDIA GeForce RTX 4050 Laptop GPU (71.9 - 74.9, n=2) | |
| HP Victus 15-fa1057ng | |
| Average of class Gaming (n=1last 2 years) | |
| Prince of Persia The Lost Crown - 1920x1080 Ultra Preset AA:SM | |
| Medion Erazer Scout E20 | |
| Average of class Gaming (337 - 357, n=5, last 2 years) | |
| Average NVIDIA GeForce RTX 4050 Laptop GPU (349 - 353, n=2) | |
| HP Victus 15-fa1057ng | |
我们测试了 3D 性能在较长时间内的表现,特别是在角色扮演游戏 60 分钟内的表现。 游戏Witcher 3(全高清/超高清)。帧速率长期保持相当稳定。
Witcher 3 FPS diagram
| low | med. | high | ultra | |
|---|---|---|---|---|
| GTA V (2015) | 172.4 | 160.7 | 89.1 | |
| The Witcher 3 (2015) | 78 | |||
| Dota 2 Reborn (2015) | 159.7 | 141.1 | 130.7 | 122.5 |
| Final Fantasy XV Benchmark (2018) | 105.1 | 80.3 | ||
| X-Plane 11.11 (2018) | 113 | 101.1 | 81.5 | |
| Strange Brigade (2018) | 197.1 | 159 | 139.1 | |
| Prince of Persia The Lost Crown (2024) | 352 | 350 | 349 | |
| Palworld (2024) | 93.3 | 72.5 | 71.9 | |
| Enshrouded (2024) | 45.8 | 45.1 | 37.3 |
排放量
系统噪音
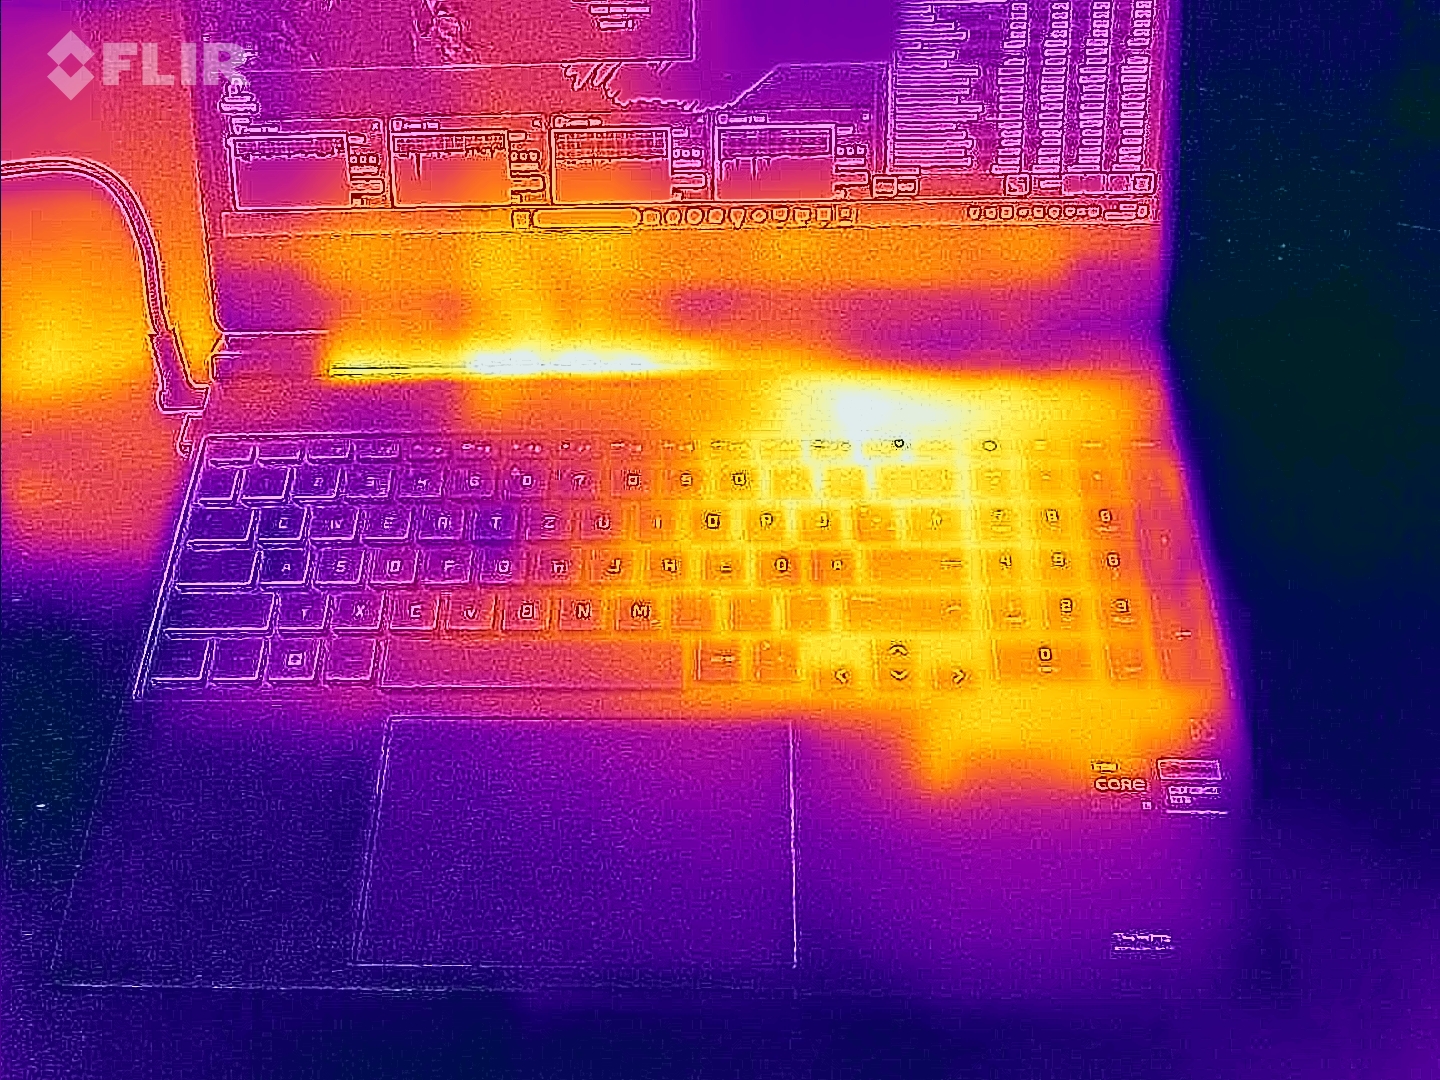
我们认为噪音发展符合预期。在 "标准 "模式下,这款 15 英寸笔记本电脑的噪音为 29-31 分贝(空闲)和 40-48 分贝(负载),既不是非常安静,也不是非常响亮,而是达到了中等水平,即使不戴耳机,大多数买家也能接受。
Noise level
| Idle |
| 29 / 30 / 31 dB(A) |
| Load |
| 40 / 48 dB(A) |
 | ||
30 dB silent 40 dB(A) audible 50 dB(A) loud |
||
min: | ||
| HP Victus 15-fa1057ng GeForce RTX 4050 Laptop GPU, i5-13500H | HP Victus 15 fa0020nr GeForce RTX 3050 Ti Laptop GPU, i7-12700H | Dell G15 5530, i5-13450HX RTX 4050 GeForce RTX 4050 Laptop GPU, i5-13450HX | Acer Nitro V 15 ANV15-51-582S GeForce RTX 4050 Laptop GPU, i5-13420H | Asus TUF A15 FA507 GeForce RTX 4050 Laptop GPU, R7 7735HS | |
|---|---|---|---|---|---|
| Noise | 7% | 4% | -4% | 15% | |
| off / environment * (dB) | 25 | 24.8 1% | 25 -0% | 25 -0% | 23.3 7% |
| Idle Minimum * (dB) | 29 | 26.2 10% | 25 14% | 25 14% | 23.3 20% |
| Idle Average * (dB) | 30 | 29.2 3% | 26 13% | 29 3% | 23.3 22% |
| Idle Maximum * (dB) | 31 | 29.4 5% | 30 3% | 30 3% | 23.3 25% |
| Load Average * (dB) | 40 | 29.9 25% | 38 5% | 49 -23% | 29.6 26% |
| Witcher 3 ultra * (dB) | 42 | 41.1 2% | 44 -5% | 49 -17% | 43 -2% |
| Load Maximum * (dB) | 48 | 45.5 5% | 50 -4% | 51 -6% | 43 10% |
* ... smaller is better
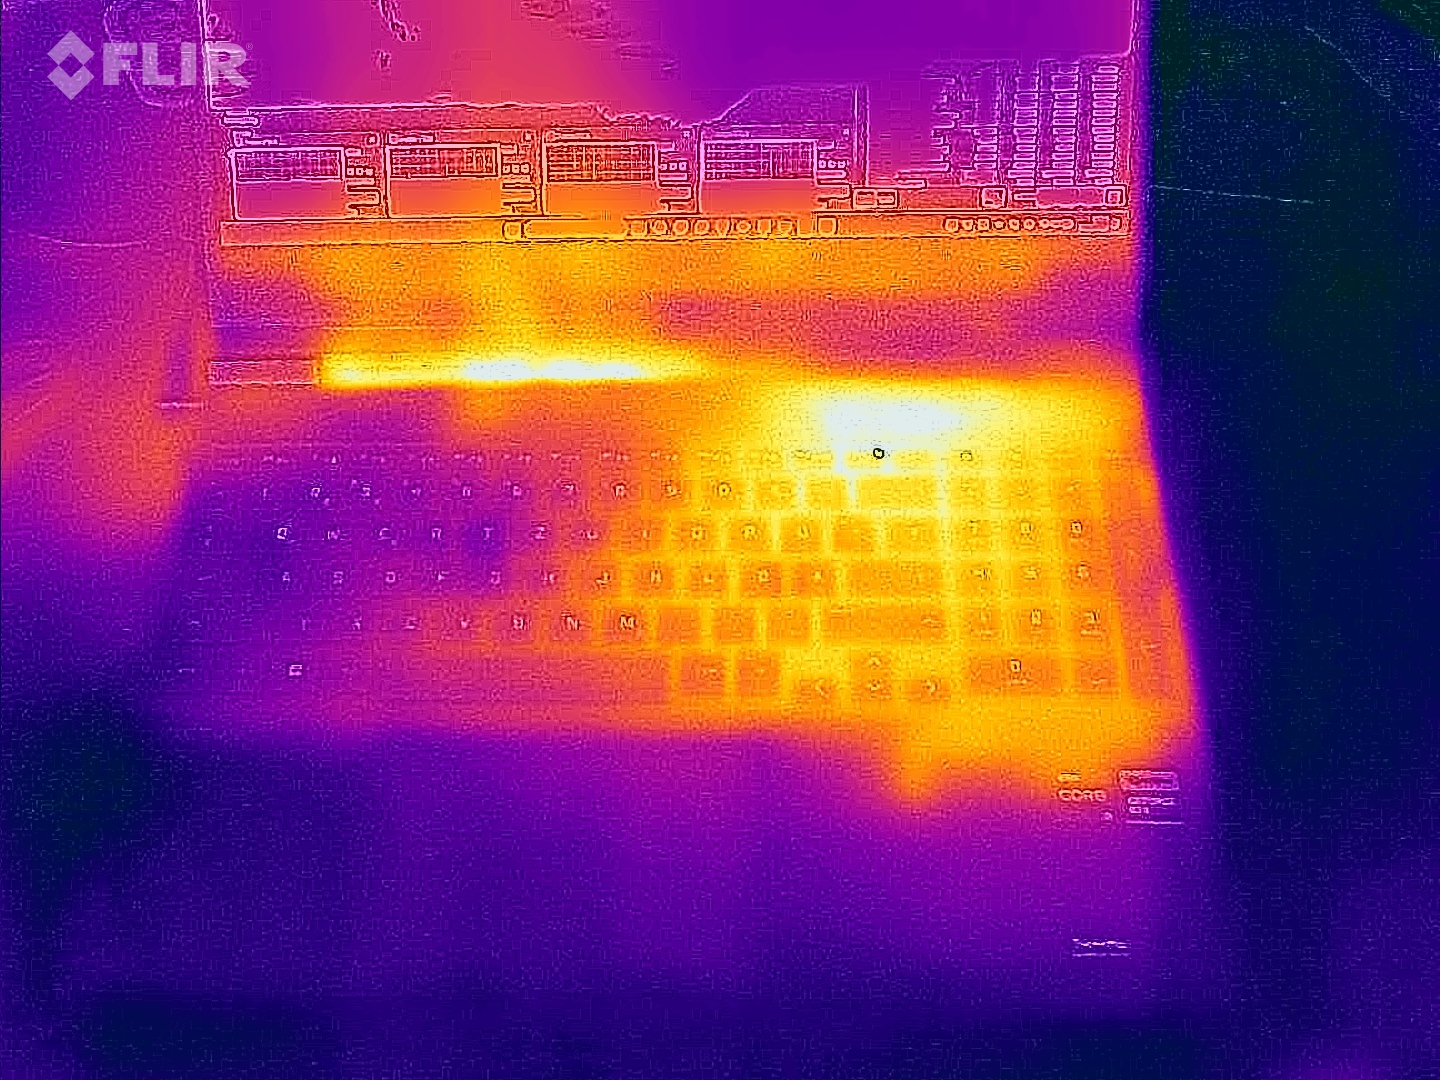
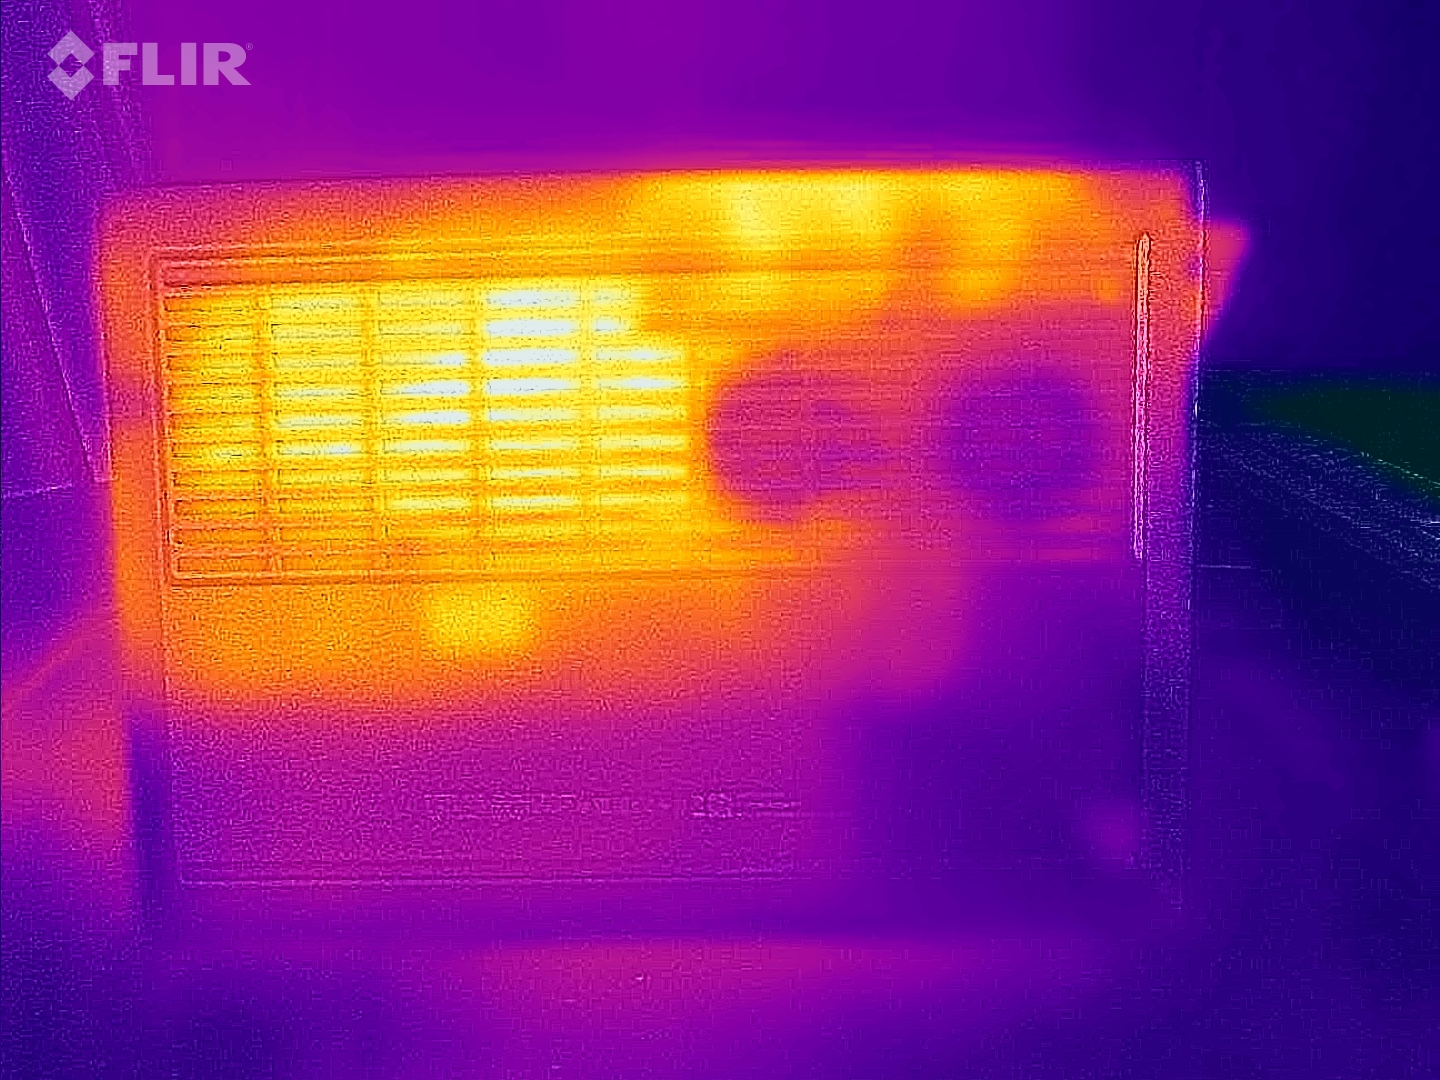
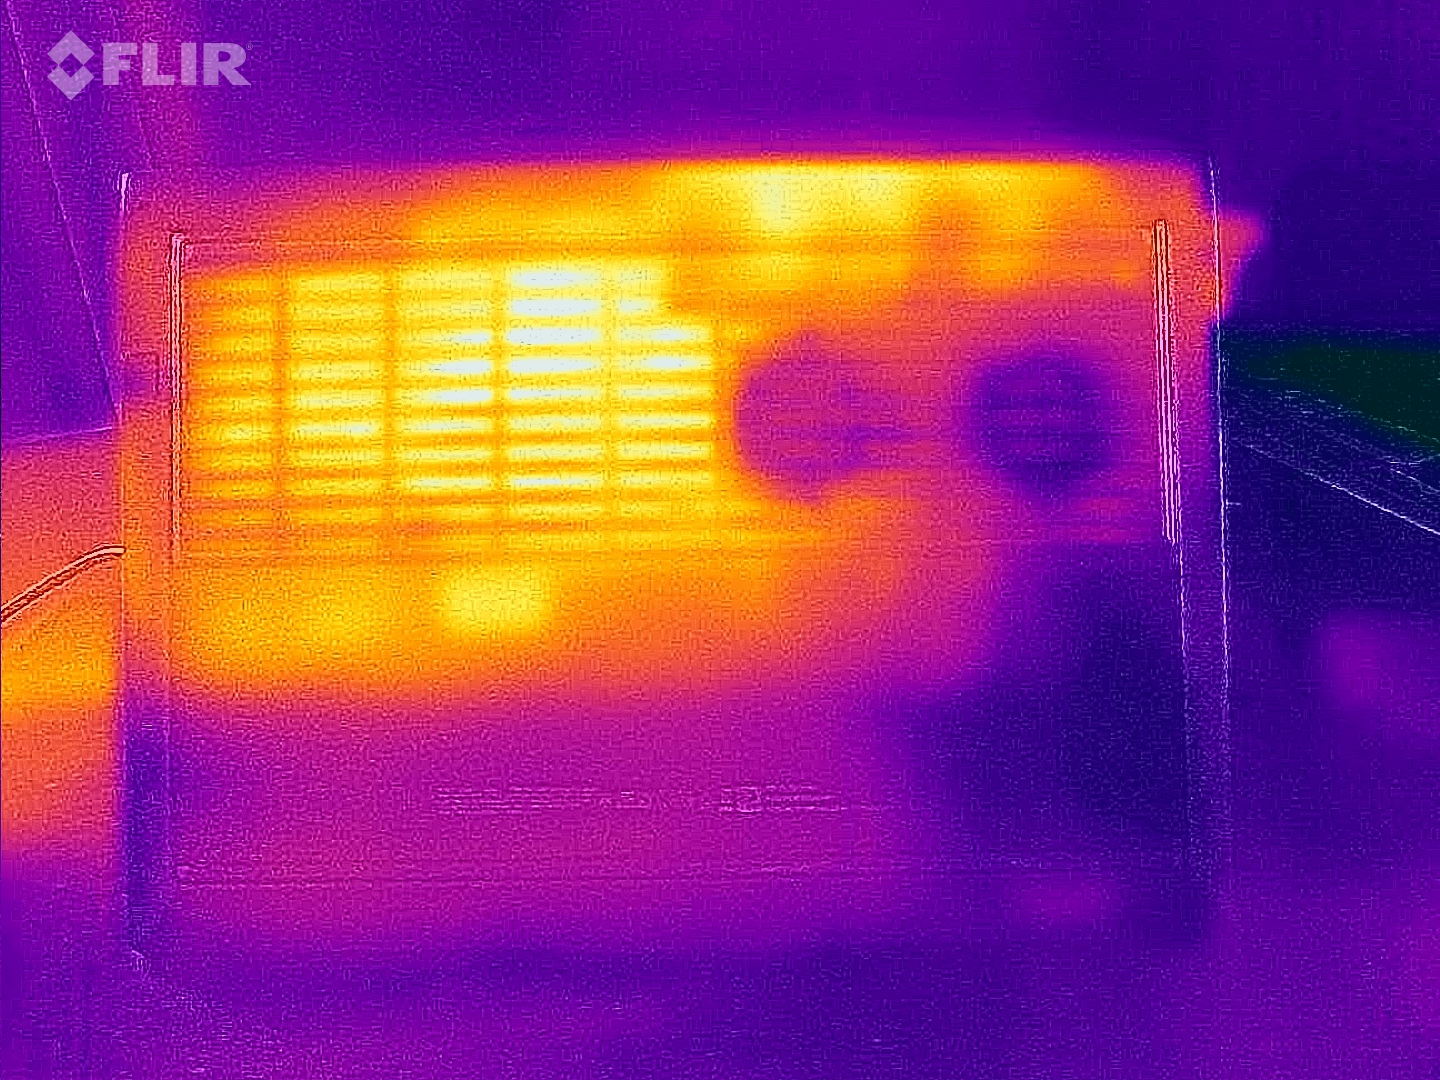
温度
机箱温度出奇地低。即使使用 Furmark 和 Prime95 工具进行了一小时的压力测试,机箱温度也仅为 107.6 °F。 这意味着 Victus 15 可以在游戏时轻松地放在腿上。在某些情况下,竞争对手的温度明显更高。
(±) The maximum temperature on the upper side is 42 °C / 108 F, compared to the average of 40.4 °C / 105 F, ranging from 21.2 to 68.8 °C for the class Gaming.
(±) The bottom heats up to a maximum of 42 °C / 108 F, compared to the average of 43.2 °C / 110 F
(+) In idle usage, the average temperature for the upper side is 23.6 °C / 74 F, compared to the device average of 33.9 °C / 93 F.
(±) Playing The Witcher 3, the average temperature for the upper side is 33.8 °C / 93 F, compared to the device average of 33.9 °C / 93 F.
(+) The palmrests and touchpad are reaching skin temperature as a maximum (33 °C / 91.4 F) and are therefore not hot.
(-) The average temperature of the palmrest area of similar devices was 28.8 °C / 83.8 F (-4.2 °C / -7.6 F).
| HP Victus 15-fa1057ng GeForce RTX 4050 Laptop GPU, i5-13500H | HP Victus 15 fa0020nr GeForce RTX 3050 Ti Laptop GPU, i7-12700H | Dell G15 5530, i5-13450HX RTX 4050 GeForce RTX 4050 Laptop GPU, i5-13450HX | Acer Nitro V 15 ANV15-51-582S GeForce RTX 4050 Laptop GPU, i5-13420H | Asus TUF A15 FA507 GeForce RTX 4050 Laptop GPU, R7 7735HS | |
|---|---|---|---|---|---|
| Heat | 10% | -30% | -14% | -13% | |
| Maximum Upper Side * (°C) | 42 | 37.2 11% | 58 -38% | 46 -10% | 48.9 -16% |
| Maximum Bottom * (°C) | 42 | 35.4 16% | 57 -36% | 48 -14% | 44.6 -6% |
| Idle Upper Side * (°C) | 24 | 22.4 7% | 30 -25% | 27 -13% | 27.1 -13% |
| Idle Bottom * (°C) | 24 | 22.6 6% | 29 -21% | 28 -17% | 27.5 -15% |
* ... smaller is better
压力测试
这些组件没有带来令人不快的意外。在长时间满负荷运行后,CPU 稳定在约 176 °F,而 GPU 则保持在平均 158 °F,在这种情况下也是完全可以接受的。
发言人
如果可能,应连接耳机或外置扬声器来欣赏媒体。Victus 15 的 2.0 音频系统在音频分析中仅获得了中等分数,在低音重现和最大音量方面存在明显不足。
HP Victus 15-fa1057ng audio analysis
(±) | speaker loudness is average but good (79 dB)
Bass 100 - 315 Hz
(-) | nearly no bass - on average 26.2% lower than median
(±) | linearity of bass is average (12.8% delta to prev. frequency)
Mids 400 - 2000 Hz
(+) | balanced mids - only 1.7% away from median
(+) | mids are linear (4.1% delta to prev. frequency)
Highs 2 - 16 kHz
(+) | balanced highs - only 3% away from median
(+) | highs are linear (3.7% delta to prev. frequency)
Overall 100 - 16.000 Hz
(±) | linearity of overall sound is average (18.4% difference to median)
Compared to same class
» 59% of all tested devices in this class were better, 9% similar, 32% worse
» The best had a delta of 6%, average was 18%, worst was 132%
Compared to all devices tested
» 41% of all tested devices were better, 8% similar, 51% worse
» The best had a delta of 4%, average was 23%, worst was 134%
HP Victus 15 fa0020nr audio analysis
(±) | speaker loudness is average but good (81 dB)
Bass 100 - 315 Hz
(-) | nearly no bass - on average 24.6% lower than median
(±) | linearity of bass is average (12.8% delta to prev. frequency)
Mids 400 - 2000 Hz
(+) | balanced mids - only 2.5% away from median
(+) | mids are linear (3.4% delta to prev. frequency)
Highs 2 - 16 kHz
(+) | balanced highs - only 3.7% away from median
(+) | highs are linear (4.9% delta to prev. frequency)
Overall 100 - 16.000 Hz
(±) | linearity of overall sound is average (19.7% difference to median)
Compared to same class
» 69% of all tested devices in this class were better, 6% similar, 25% worse
» The best had a delta of 6%, average was 18%, worst was 132%
Compared to all devices tested
» 50% of all tested devices were better, 7% similar, 43% worse
» The best had a delta of 4%, average was 23%, worst was 134%
能源管理
耗电量
适中的功耗值得赞赏。考虑到现有性能,5-9 瓦的空闲功耗和 72-176 瓦的负载功耗是合理的。电源装置尺寸适中。
| Off / Standby | |
| Idle | |
| Load |
|
Key:
min: | |
| HP Victus 15-fa1057ng i5-13500H, GeForce RTX 4050 Laptop GPU | HP Victus 15 fa0020nr i7-12700H, GeForce RTX 3050 Ti Laptop GPU | Dell G15 5530, i5-13450HX RTX 4050 i5-13450HX, GeForce RTX 4050 Laptop GPU | Acer Nitro V 15 ANV15-51-582S i5-13420H, GeForce RTX 4050 Laptop GPU | Asus TUF A15 FA507 R7 7735HS, GeForce RTX 4050 Laptop GPU | Average of class Gaming | |
|---|---|---|---|---|---|---|
| Power Consumption | -18% | -21% | 9% | -14% | -77% | |
| Idle Minimum * (Watt) | 5 | 5.1 -2% | 2 60% | 7 -40% | 8 -60% | 13 ? -160% |
| Idle Average * (Watt) | 9 | 15.1 -68% | 12 -33% | 8 11% | 12.1 -34% | 19 ? -111% |
| Idle Maximum * (Watt) | 22 | 18.9 14% | 27 -23% | 11 50% | 12.5 43% | 24.6 ? -12% |
| Load Average * (Watt) | 72 | 114.5 -59% | 100 -39% | 76 -6% | 74.9 -4% | 110.7 ? -54% |
| Witcher 3 ultra * (Watt) | 113 | 113.9 -1% | 161.9 -43% | 98.2 13% | 136.6 -21% | |
| Load Maximum * (Watt) | 176 | 165.8 6% | 262 -49% | 136 23% | 185 -5% | 259 ? -47% |
* ... smaller is better
Power consumption Witcher 3 / stress test
Power consumption with external monitor
运行时间
这款 15 英寸笔记本电脑在运行时间方面也不落后于竞争对手--相反。在我们的 WLAN 测试中,惠普的新产品在亮度降低到 150 cd/m² 的情况下持续了约 7.5 小时,这对于一款游戏笔记本来说是个不错的结果。由于一个错误,前代产品的数值可能要差很多。
| HP Victus 15-fa1057ng i5-13500H, GeForce RTX 4050 Laptop GPU, 70 Wh | HP Victus 15 fa0020nr i7-12700H, GeForce RTX 3050 Ti Laptop GPU, 70 Wh | Dell G15 5530, i5-13450HX RTX 4050 i5-13450HX, GeForce RTX 4050 Laptop GPU, 86 Wh | Acer Nitro V 15 ANV15-51-582S i5-13420H, GeForce RTX 4050 Laptop GPU, 57 Wh | Asus TUF A15 FA507 R7 7735HS, GeForce RTX 4050 Laptop GPU, 90 Wh | Average of class Gaming | |
|---|---|---|---|---|---|---|
| Battery runtime | -72% | -5% | 25% | 56% | -5% | |
| WiFi v1.3 (h) | 7.5 | 2.1 -72% | 7.1 -5% | 9.4 25% | 11.7 56% | 7.11 ? -5% |
| Reader / Idle (h) | 2.6 | 21.5 | 8.27 ? | |||
| Load (h) | 1.1 | 1.7 | 1 | 1.502 ? | ||
| H.264 (h) | 12.5 | 8.32 ? |
Pros
Cons
判决
Victus 15-fa1057ng 是一款典型的经济型游戏笔记本电脑,主要面向注重价格的游戏玩家。
塑料外壳虽然没有体现出高品质的工艺,但与输入设备一样可靠地履行了自己的职责。硬件与全高清分辨率配合得很好,为大多数游戏提供了不错的游戏体验,尽管 144 Hz 显示屏没有得到充分利用。来自 酷睿 i5-13500H和 GeForce RTX 4050仍在可控范围内。
一个优势是电池续航时间大大延长。
不过,用户必须接受色彩准确度和亮度有限的显示屏。对于那些优先考虑图像质量的用户来说,类似戴尔 G15 5530 或华硕 TUF A15 FA507 这样价格相近的替代品可能值得考虑。因此,改进显示质量将是继任者的一大进步。
价格和供应情况
惠普 Victus 15 配备了酷睿 i5-13500H,在各大在线零售商(如亚马逊)的售价约为 690 美元。
HP Victus 15-fa1057ng
- 01/31/2024 v7 (old)
Florian Glaser
Transparency
The selection of devices to be reviewed is made by our editorial team. The test sample was provided to the author as a loan by the manufacturer or retailer for the purpose of this review. The lender had no influence on this review, nor did the manufacturer receive a copy of this review before publication. There was no obligation to publish this review. As an independent media company, Notebookcheck is not subjected to the authority of manufacturers, retailers or publishers.
This is how Notebookcheck is testing
Every year, Notebookcheck independently reviews hundreds of laptops and smartphones using standardized procedures to ensure that all results are comparable. We have continuously developed our test methods for around 20 years and set industry standards in the process. In our test labs, high-quality measuring equipment is utilized by experienced technicians and editors. These tests involve a multi-stage validation process. Our complex rating system is based on hundreds of well-founded measurements and benchmarks, which maintains objectivity. Further information on our test methods can be found here.
Price comparison

