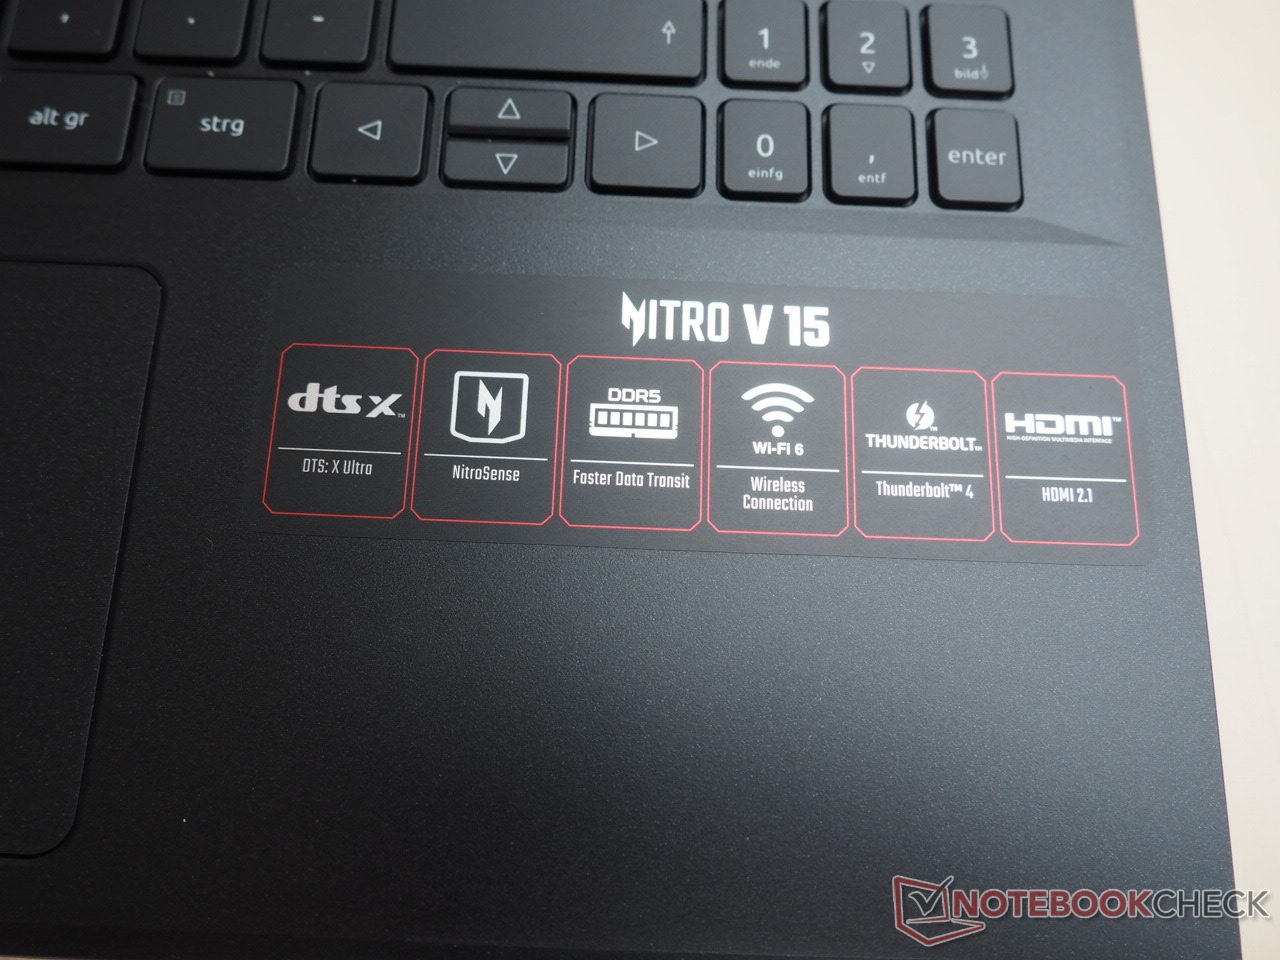
宏碁 Nitro V 15 ANV15-51 评测:配备 RTX 4050 的经济型游戏笔记本电脑
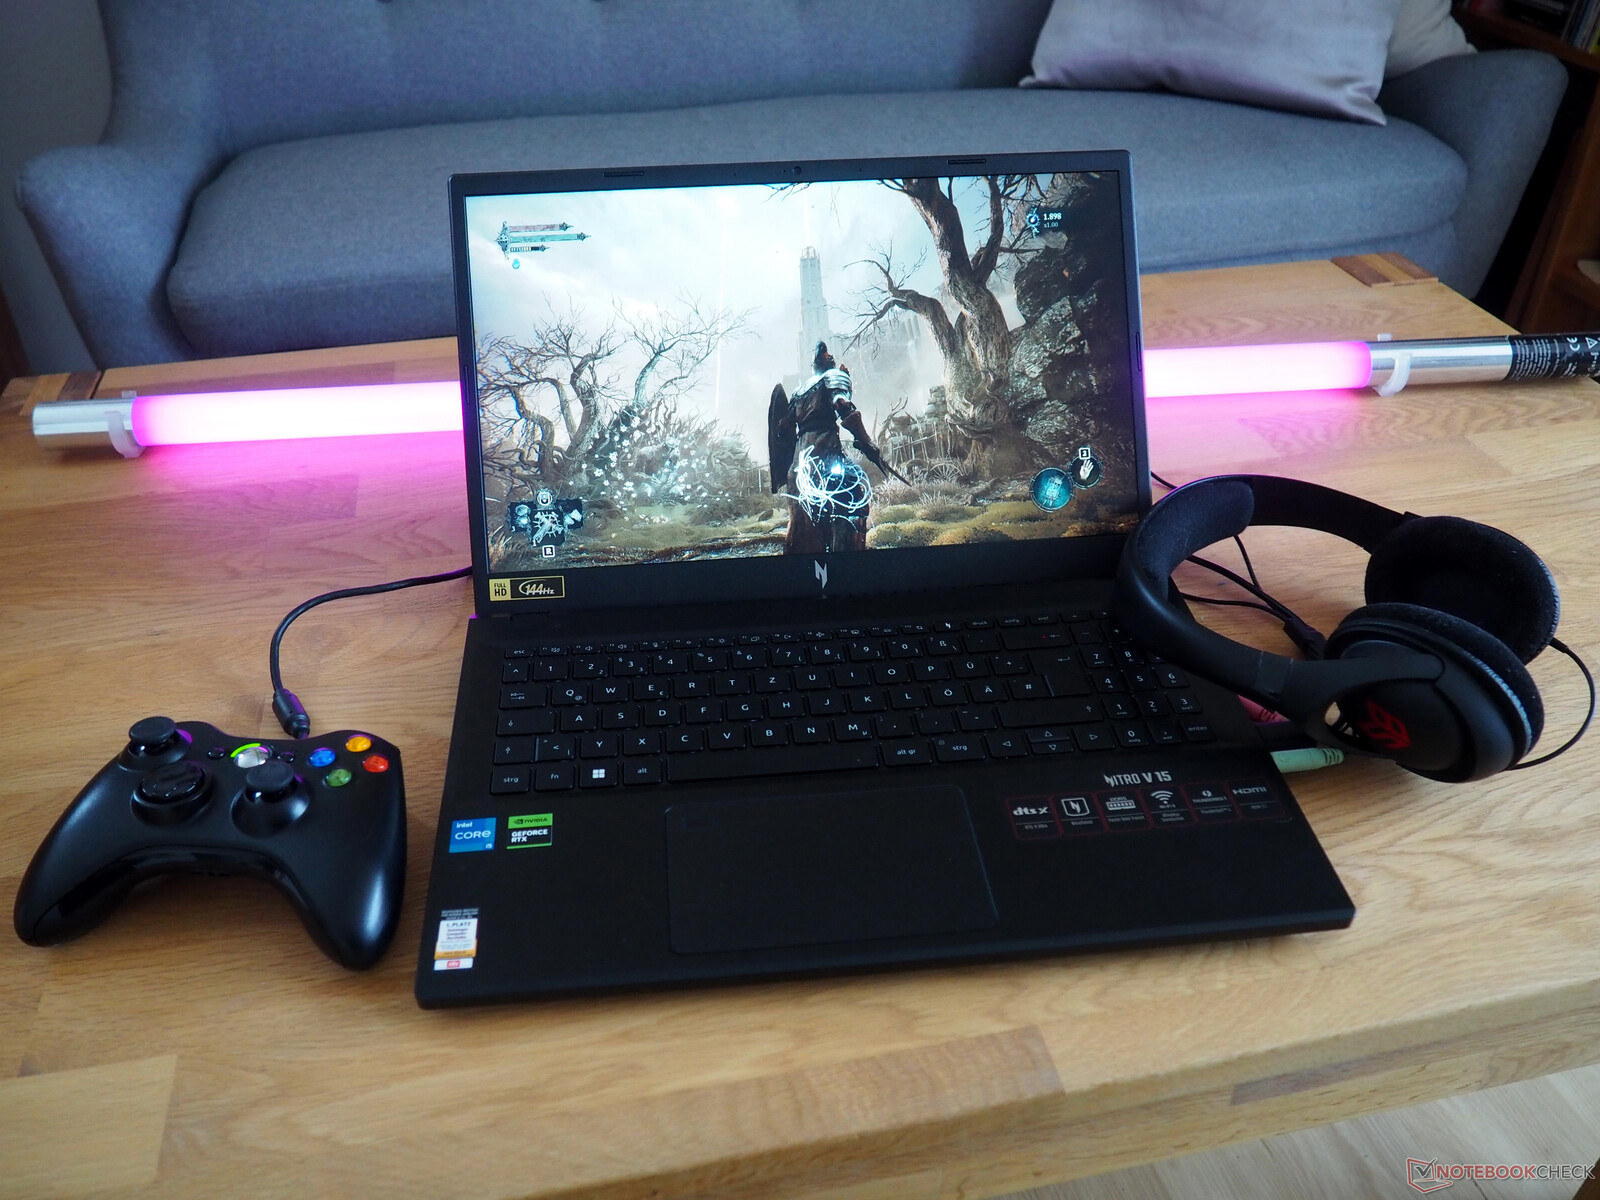
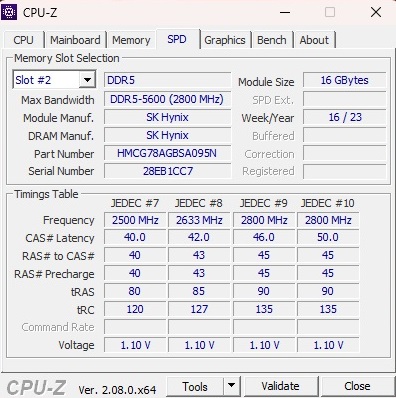
Nitro V 15 目前在德国有两种主要型号。本次评测的基本型号售价约为 900 欧元(980 美元),配备了 酷睿 i5-13420H(12线程)和512 GB固态硬盘。 酷睿 i7-13620H(16 线程)和 1 TB 硬盘。两种型号都配置了相同的 16 GB DDR5 内存和专用的 GeForce RTX 4050.它们还使用了哑光 IPS 显示屏,具有常见的全高清分辨率(1,920 x 1,080)和 144Hz 能力。
Nitro V 15 的竞争对手是其他配备GeForce RTX 4050 的 15 英寸经济型游戏笔记本电脑,如 Medion Erazer Crawler E40、联想 联想LOQ 15IRH8华硕 TUF A15 FA507和 申克 XMG Apex 15 Late 23所有这些产品都列在下表中,以供比较。
潜在的竞争对手比较
Rating | Date | Model | Weight | Height | Size | Resolution | Price |
|---|---|---|---|---|---|---|---|
| 82.8 % v7 (old) | 01 / 2024 | Acer Nitro V 15 ANV15-51-582S i5-13420H, GeForce RTX 4050 Laptop GPU | 2.1 kg | 23.5 mm | 15.60" | 1920x1080 | |
| 85.4 % v7 (old) | 12 / 2023 | Medion Erazer Crawler E40 - MD 62518 i5-13500H, GeForce RTX 4050 Laptop GPU | 2.3 kg | 28 mm | 15.60" | 1920x1080 | |
| 85.9 % v7 (old) | 10 / 2023 | Lenovo LOQ 15IRH8 Core i7 i7-13620H, GeForce RTX 4050 Laptop GPU | 2.4 kg | 25.2 mm | 15.60" | 2560x1440 | |
| 86.3 % v7 (old) | 06 / 2023 | Asus TUF A15 FA507 R7 7735HS, GeForce RTX 4050 Laptop GPU | 2.2 kg | 24.9 mm | 15.60" | 1920x1080 | |
| 86.2 % v7 (old) | 10 / 2023 | Schenker XMG Apex 15 (Late 23) R7 7840HS, GeForce RTX 4050 Laptop GPU | 2.2 kg | 26.7 mm | 15.60" | 2560x1440 |
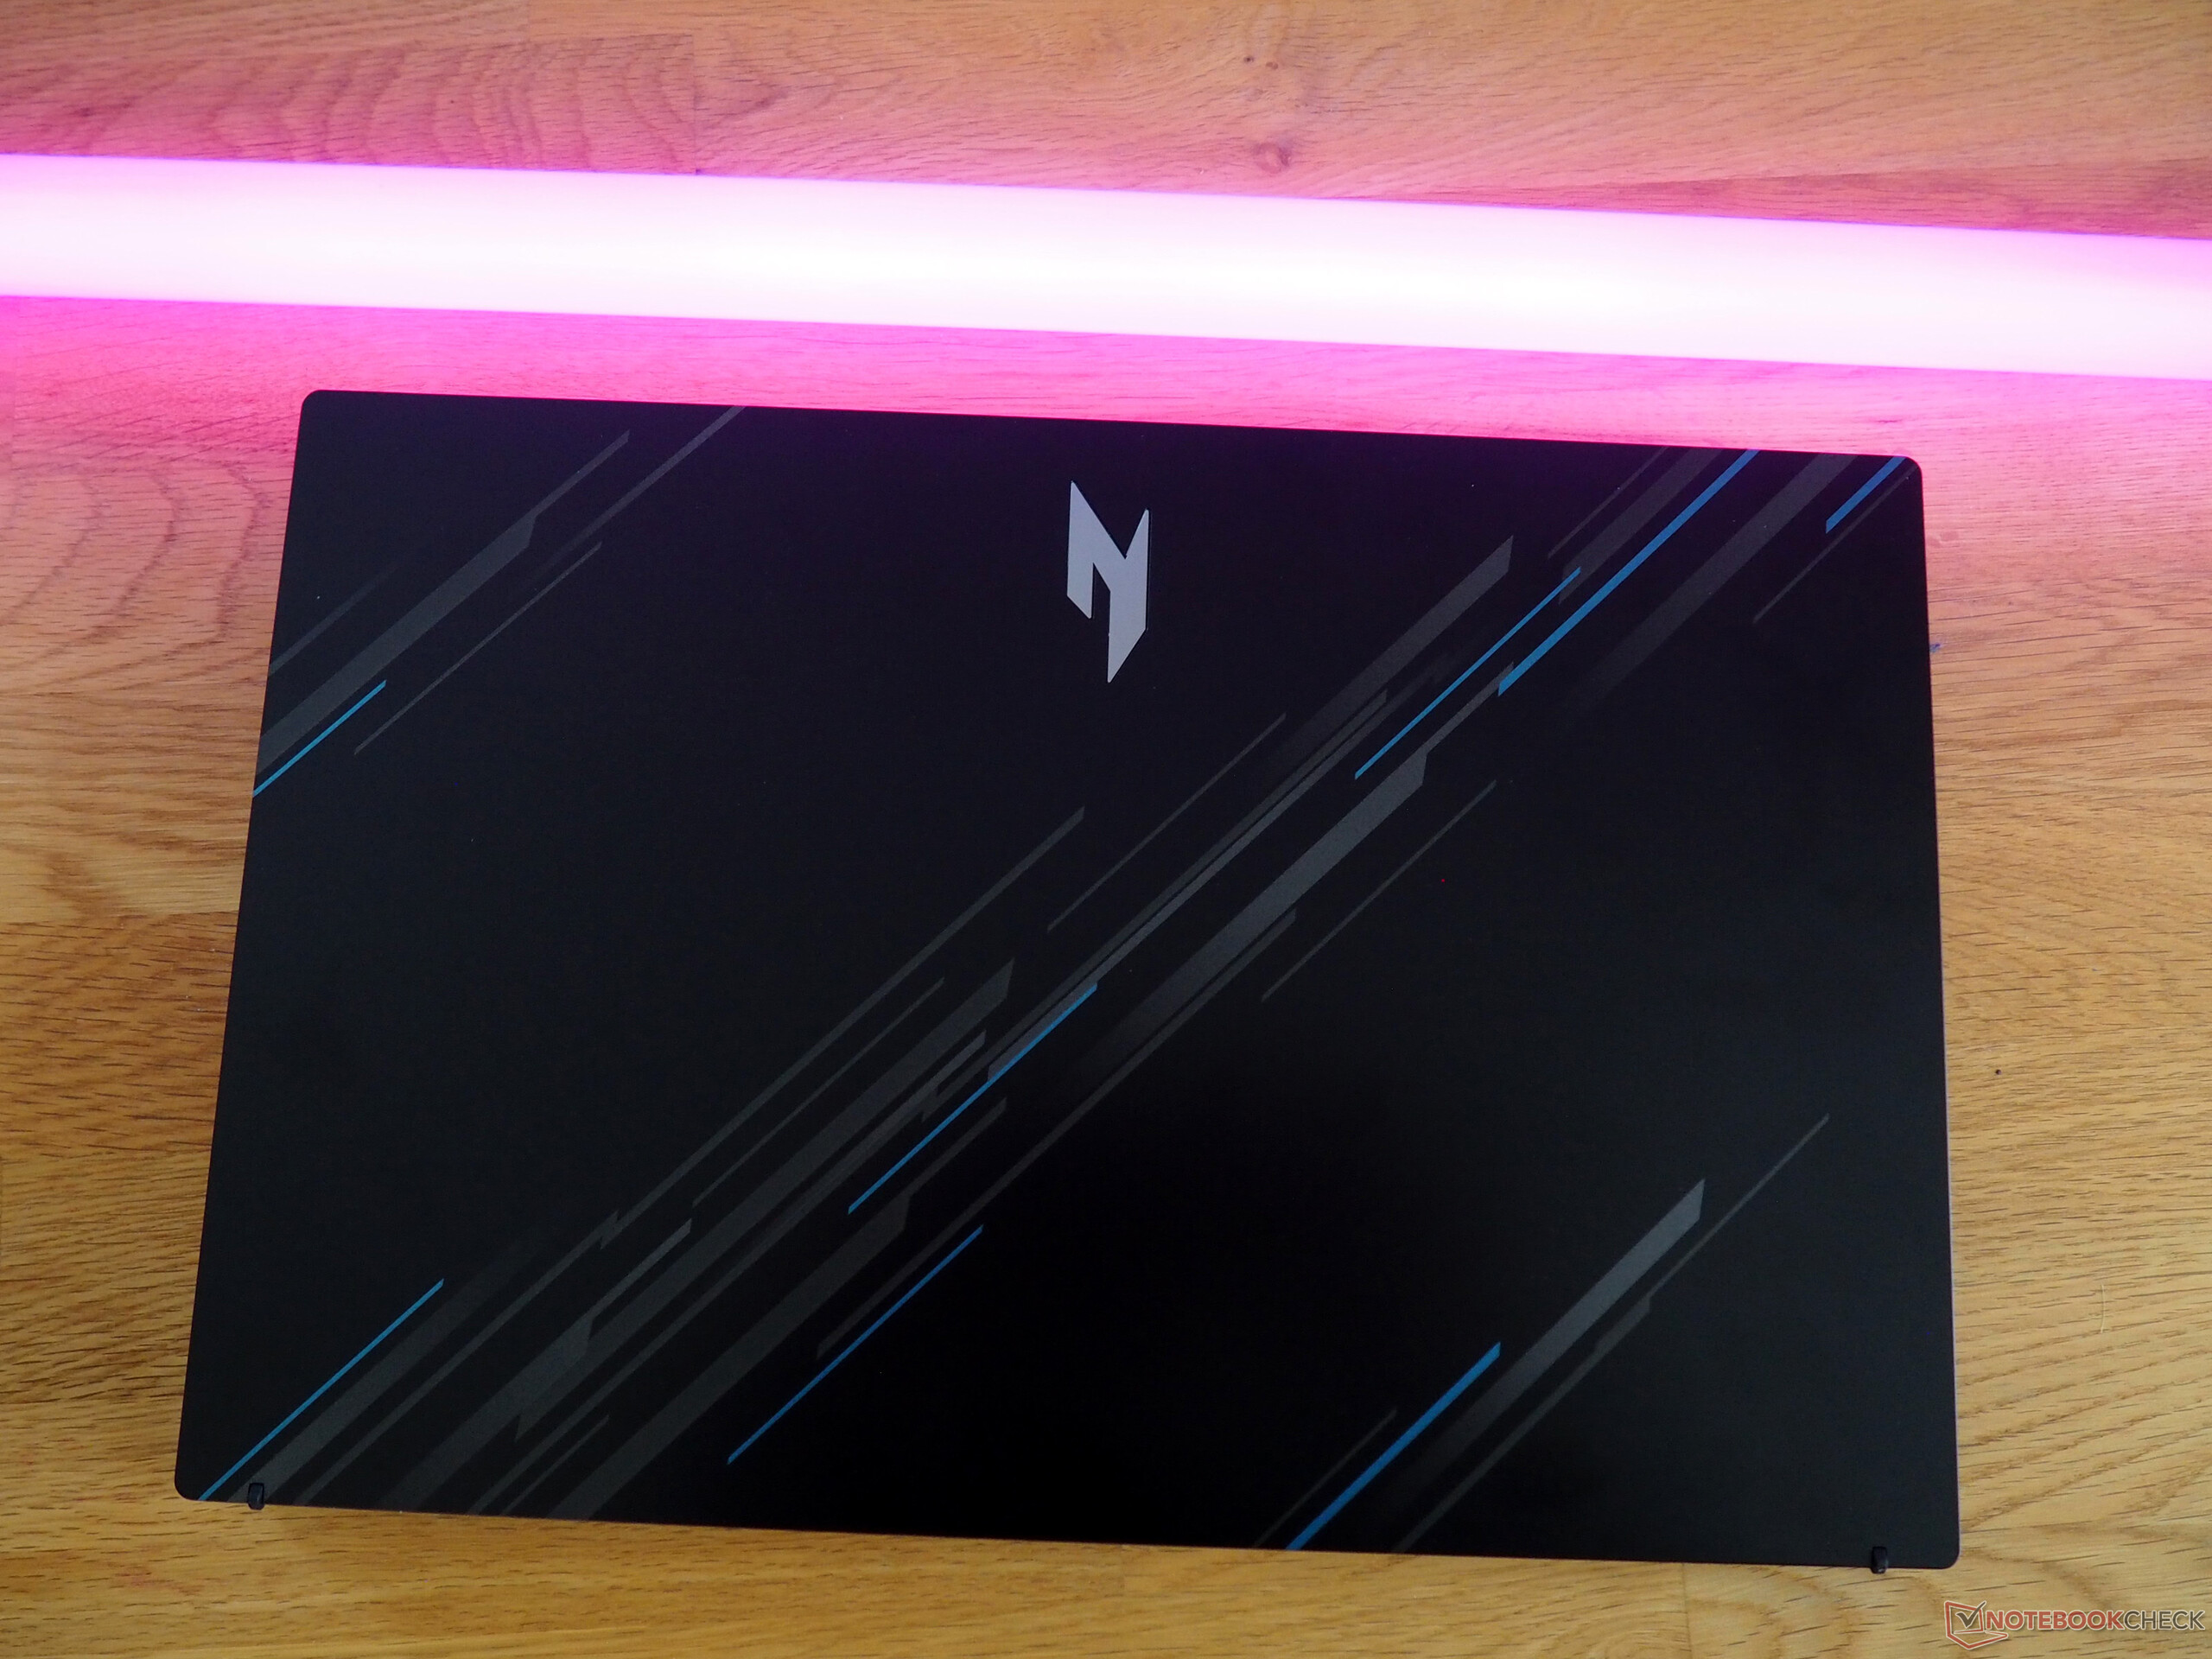
案例
V 15 外形美观。尤其是盖子上的灰蓝色设计,让人耳目一新。不过,你不应该对机箱的质量抱有太高期望。与许多其他同价位的设备一样,买家只能选择略显单薄且不太结实的塑料机身。至少,这款 15 英寸笔记本电脑拥有整洁的外观和坚固的最大开启角度(约 140°),尽管其铰链可以更坚硬一些,不那么 "摇摆不定"。
Nitro 最大的优势之一是重量适中:约 2.1 千克(4.6 磅)的重量是我们比较过的设备中最轻的(竞争对手的重量在 2.2 至 2.4 千克,或 4.8 至 6.2 磅之间)。由于外形纤巧,该设备看起来也不笨重。
规格
接口
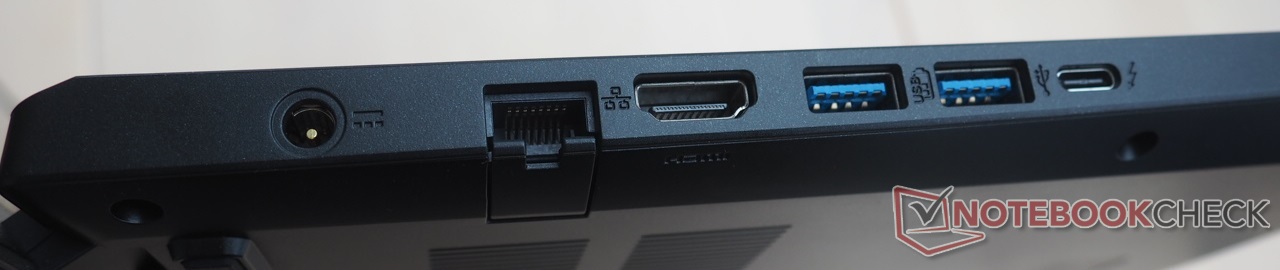
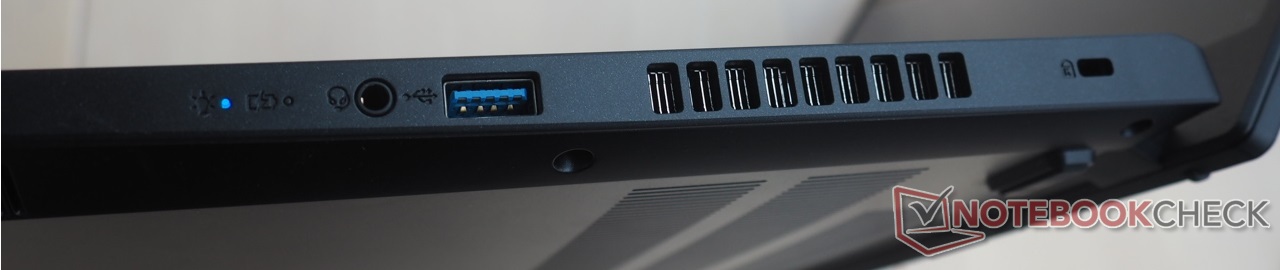
如果忽略读卡器的缺失,那么端口的选择可以说是足够了。虽然我们希望能多看到一个 USB-C 端口,但三个 USB-A 3.0 端口和一个 Thunderbolt 4 端口对于一款经济型游戏笔记本电脑来说还是不错的。Nitro V 15 还配备了一个折叠式以太网端口、一个 HDMI 2.1 输出端口、一个音频插孔和一个 Kensington 插槽。整个设备的接口分布相当合理。尽管如此,有些接口还是可以稍微靠后一些,这样使用鼠标会更方便。
连接性
Wi-Fi 性能充其量只能算一般。内置的英特尔无线模块(Wi-Fi 6 AX203)在收发数据时并不能提供一流的性能,但我们获得的速度相当稳定。
网络摄像头
同样,笔记本电脑也只有一个不起眼的标准网络摄像头。正如笔记本电脑网络摄像头经常出现的问题一样,图像不够清晰,色彩不够准确。


配件
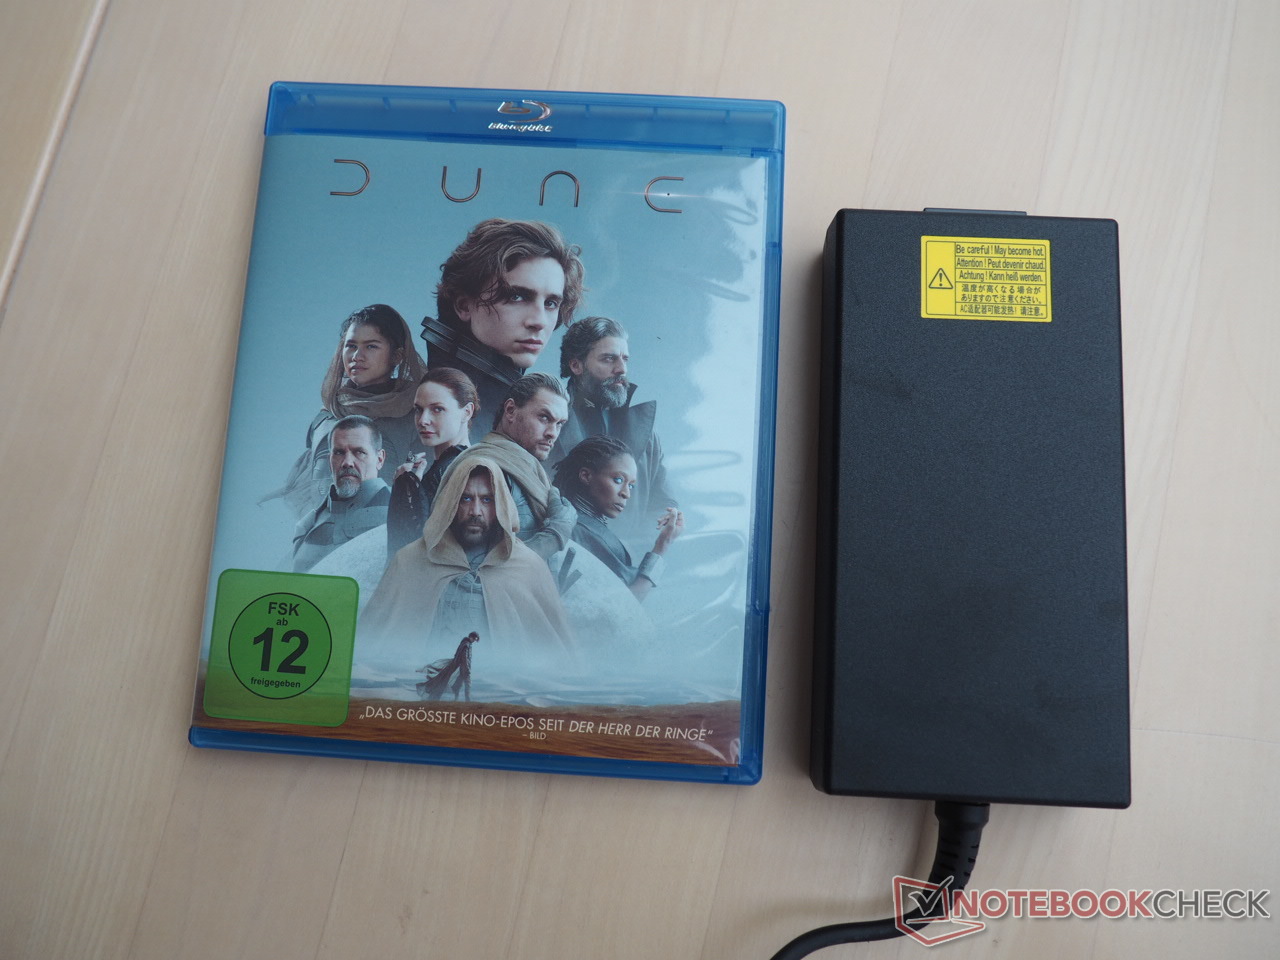
除了一堆文件外,你还会在包装盒中发现一个小巧轻便的 135 瓦交流适配器。
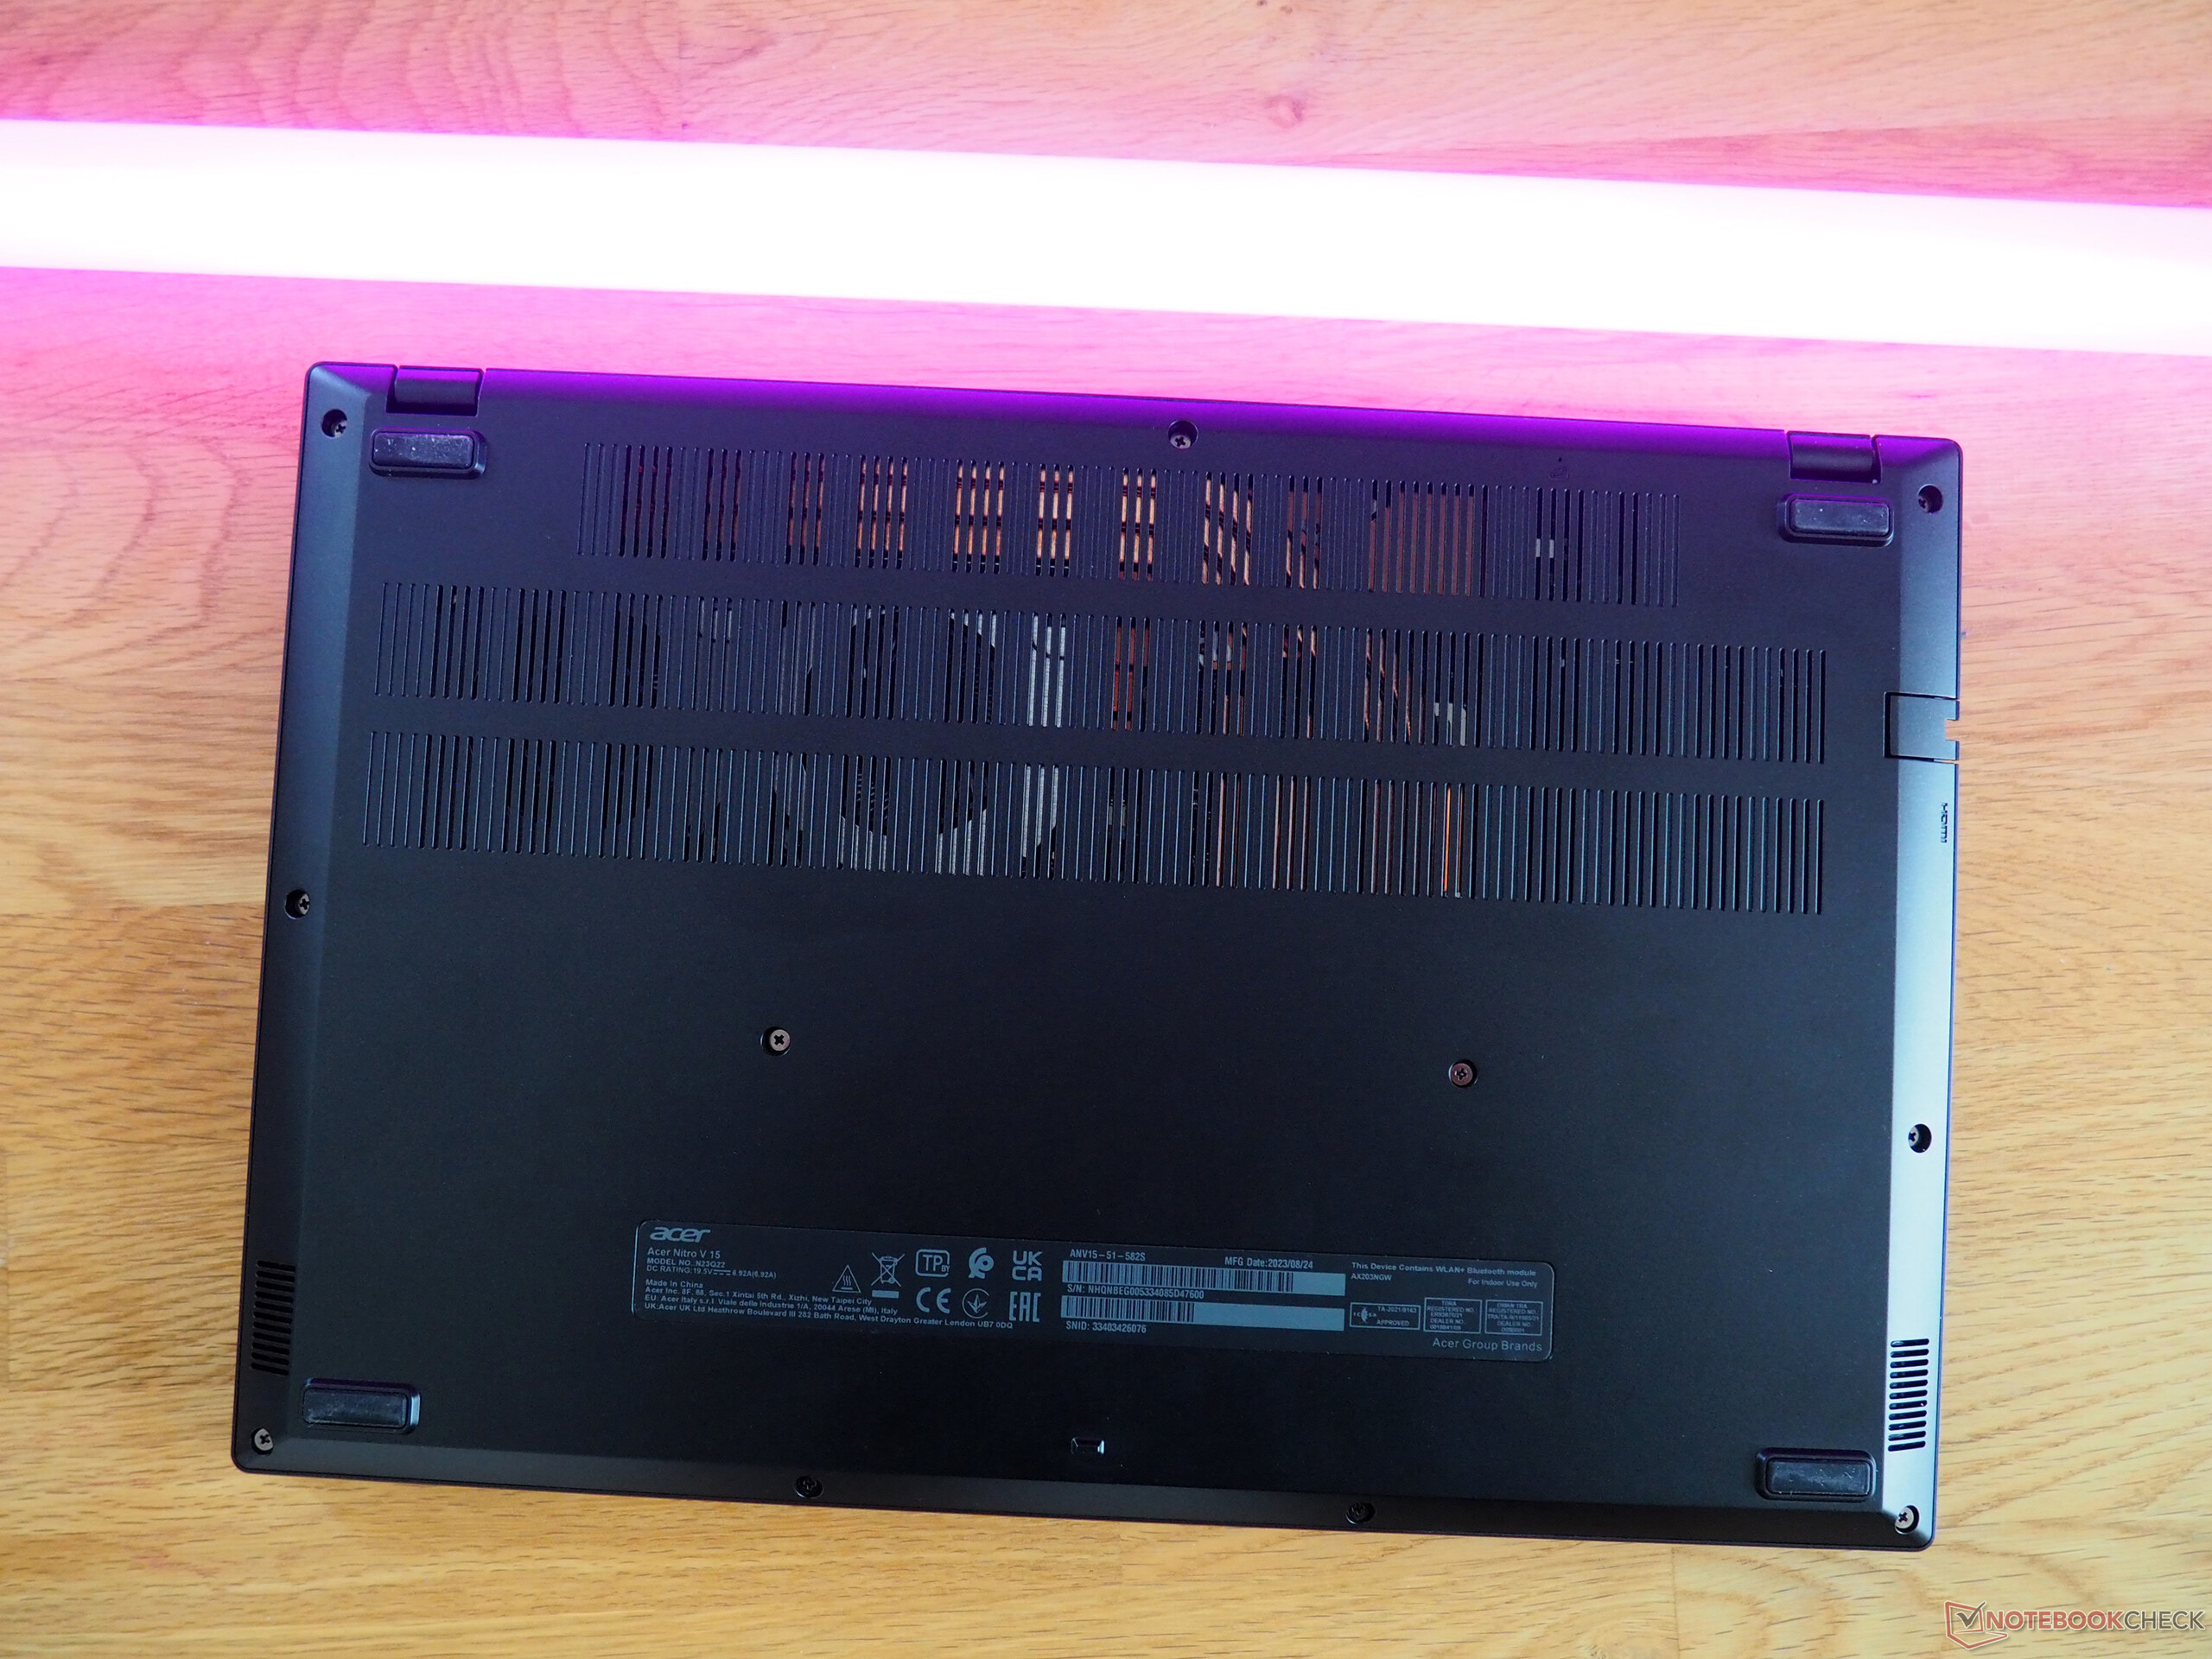
维护
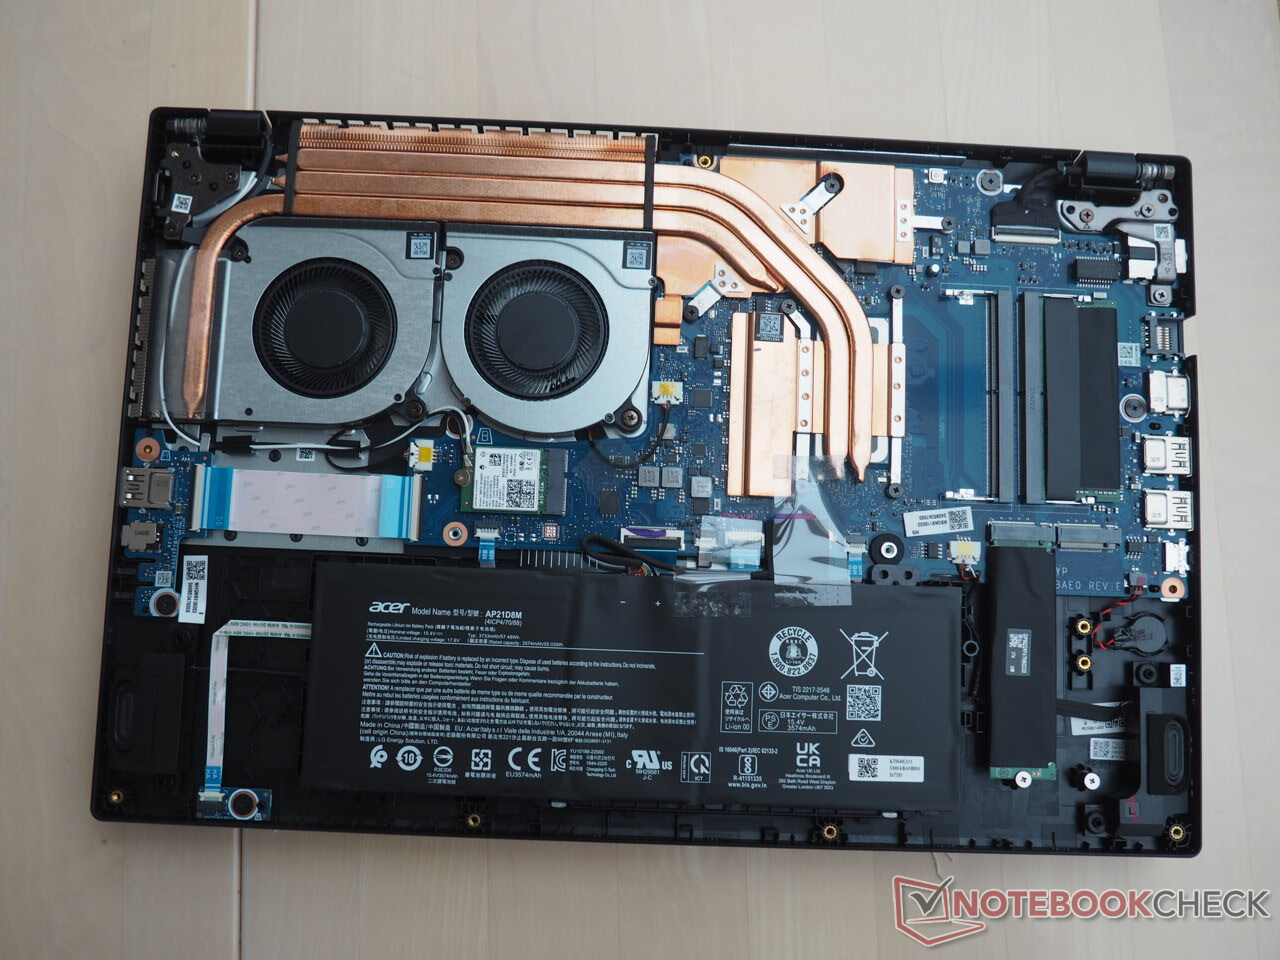
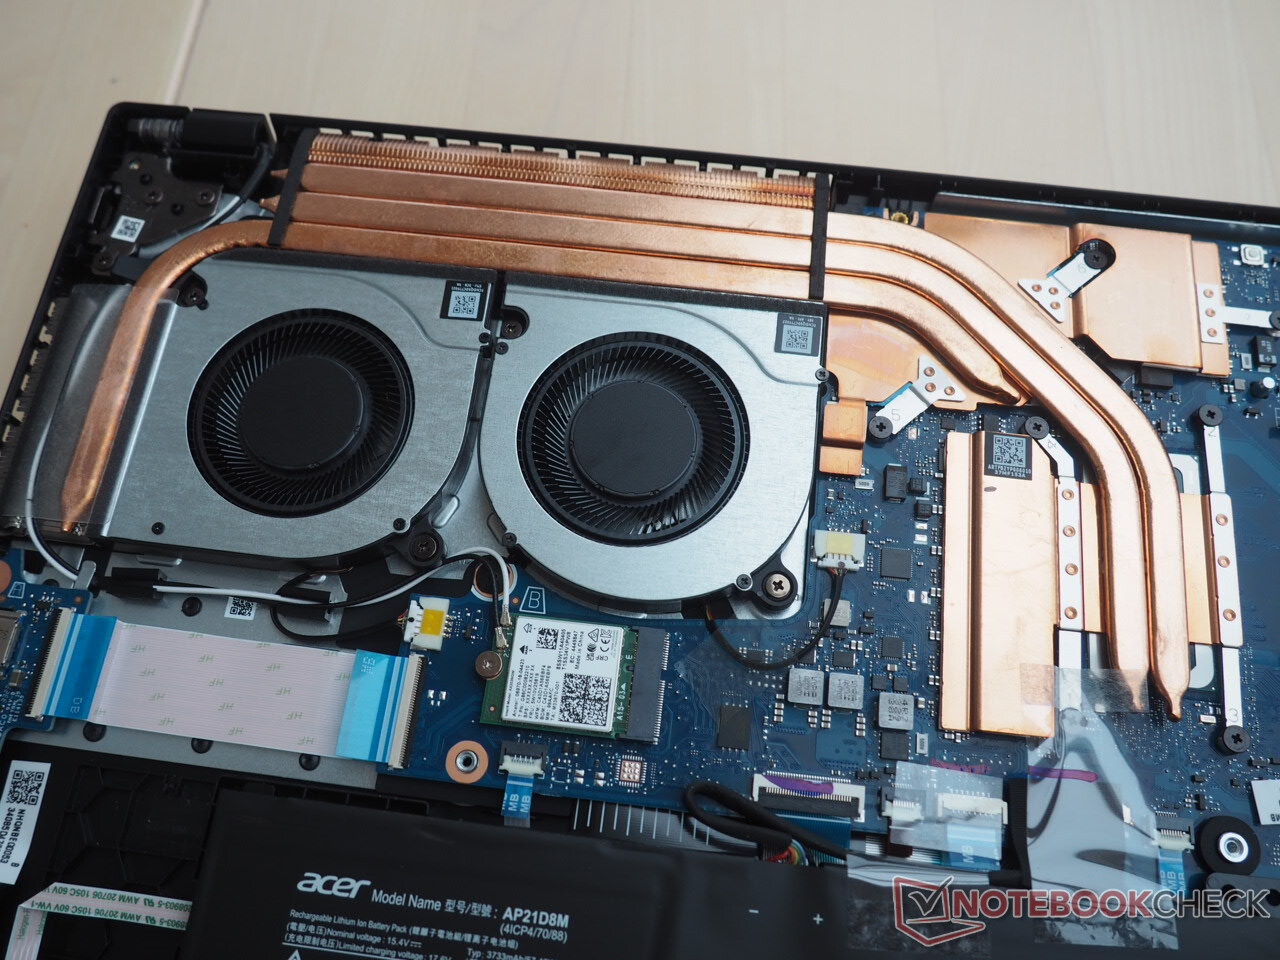
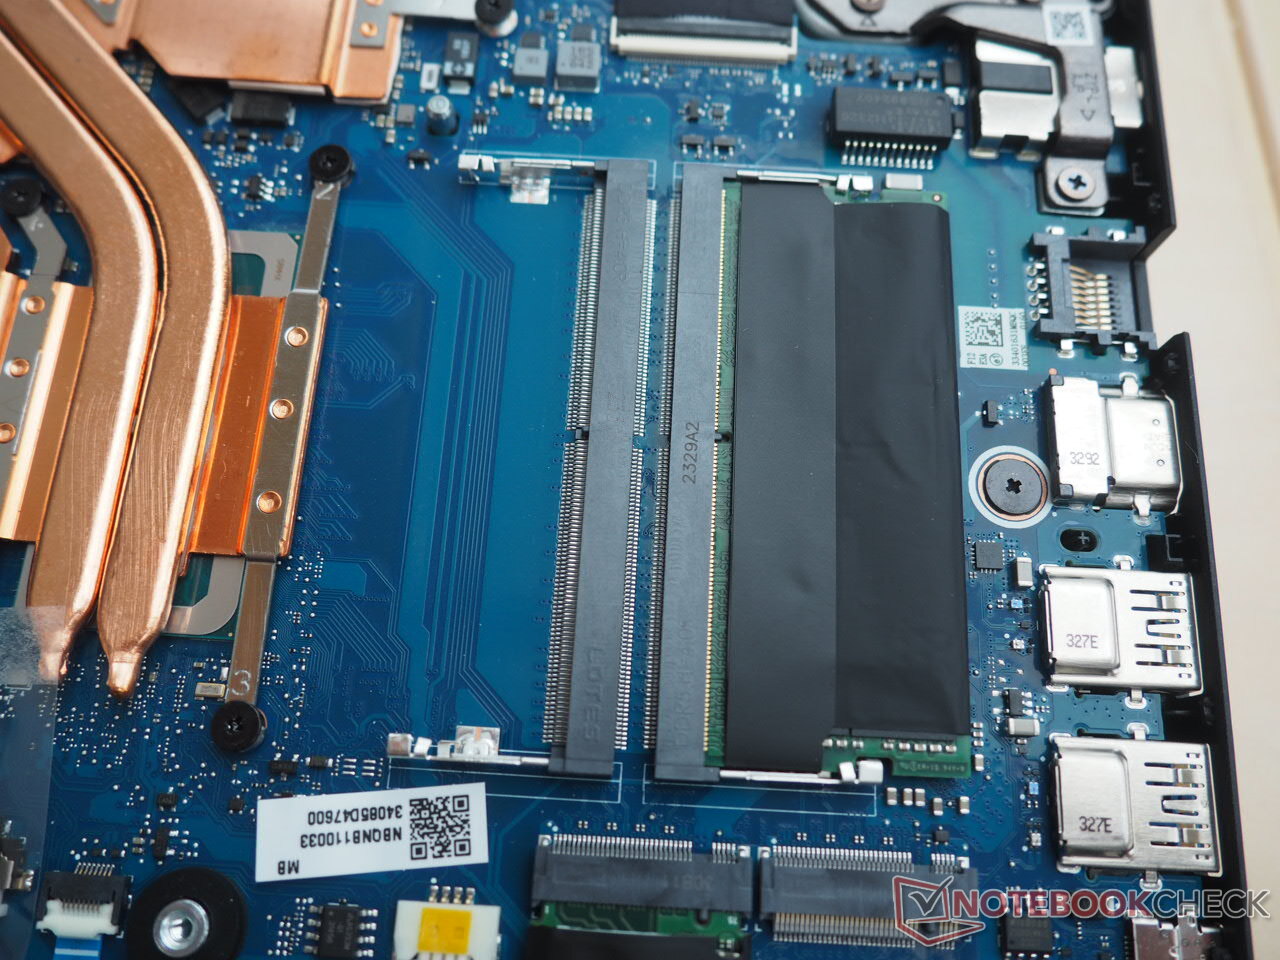
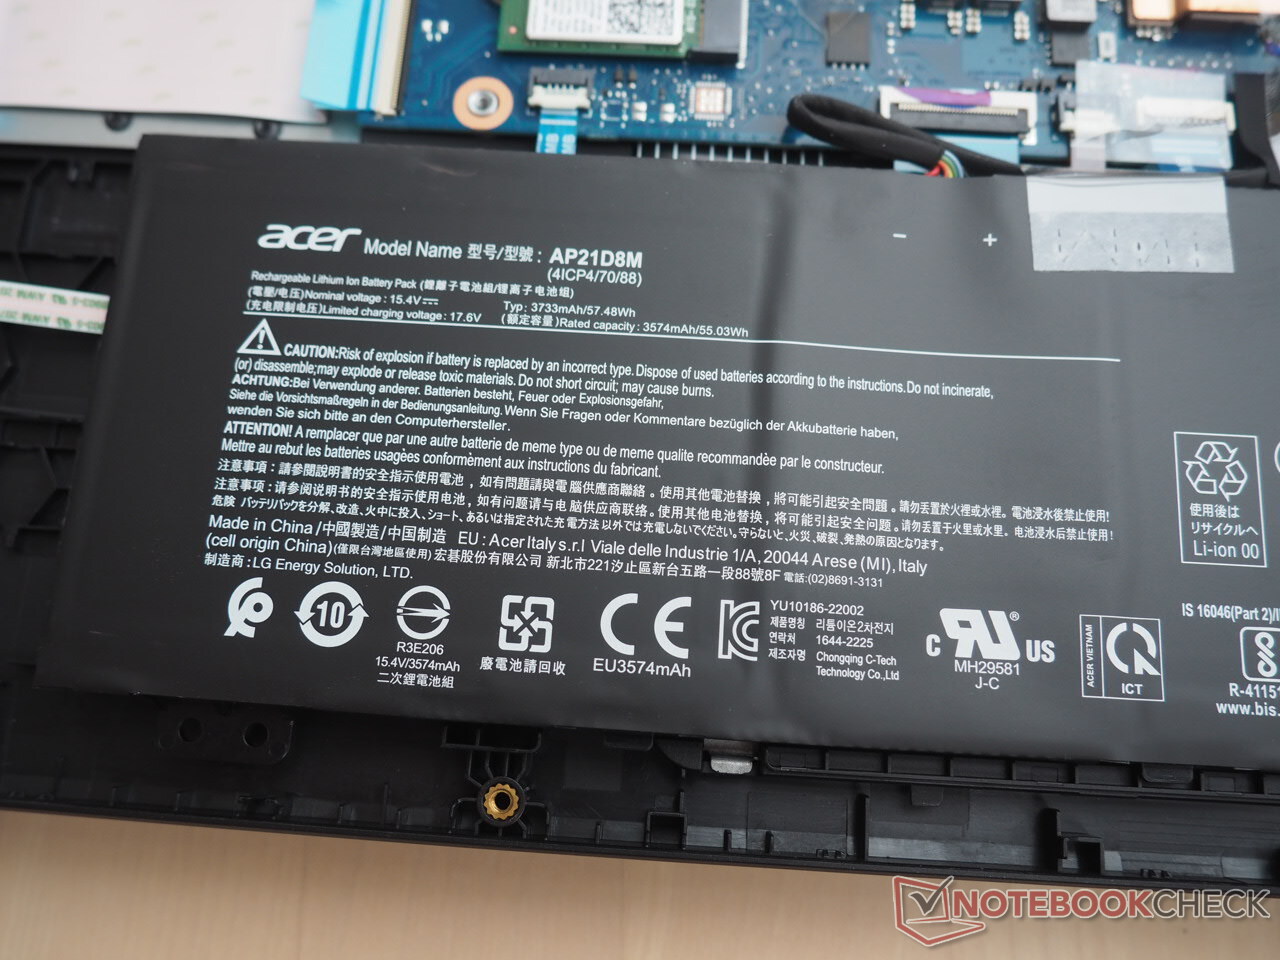
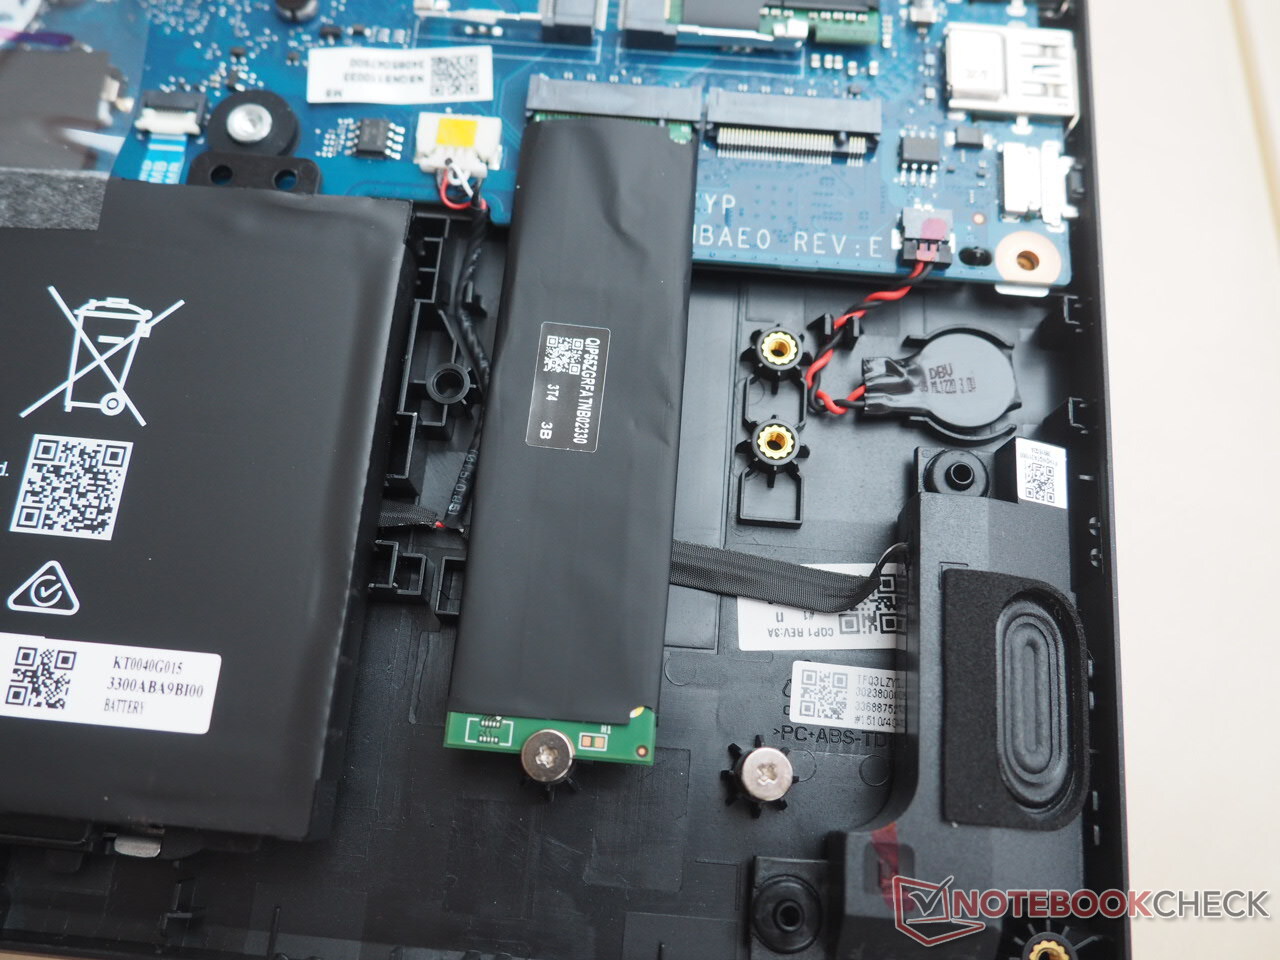
Nitro 的一个优点是便于维修。尽管卸下 11 颗外壳螺丝后,底盖仍被牢牢固定,但一旦进入 15 英寸笔记本内部,就能看到一个空闲的 M.2 插槽和一个空内存插槽(见照片)。虽然我们评测机型的单内存配置在某些情况下会对性能产生负面影响。需要注意的一点是:电池没有拧紧,理论上在打开笔记本电脑时可能会从机箱中掉落。
保修
宏碁在德国为 Nitro V 15 提供两年保修。不过,保修期可能因地区而异。
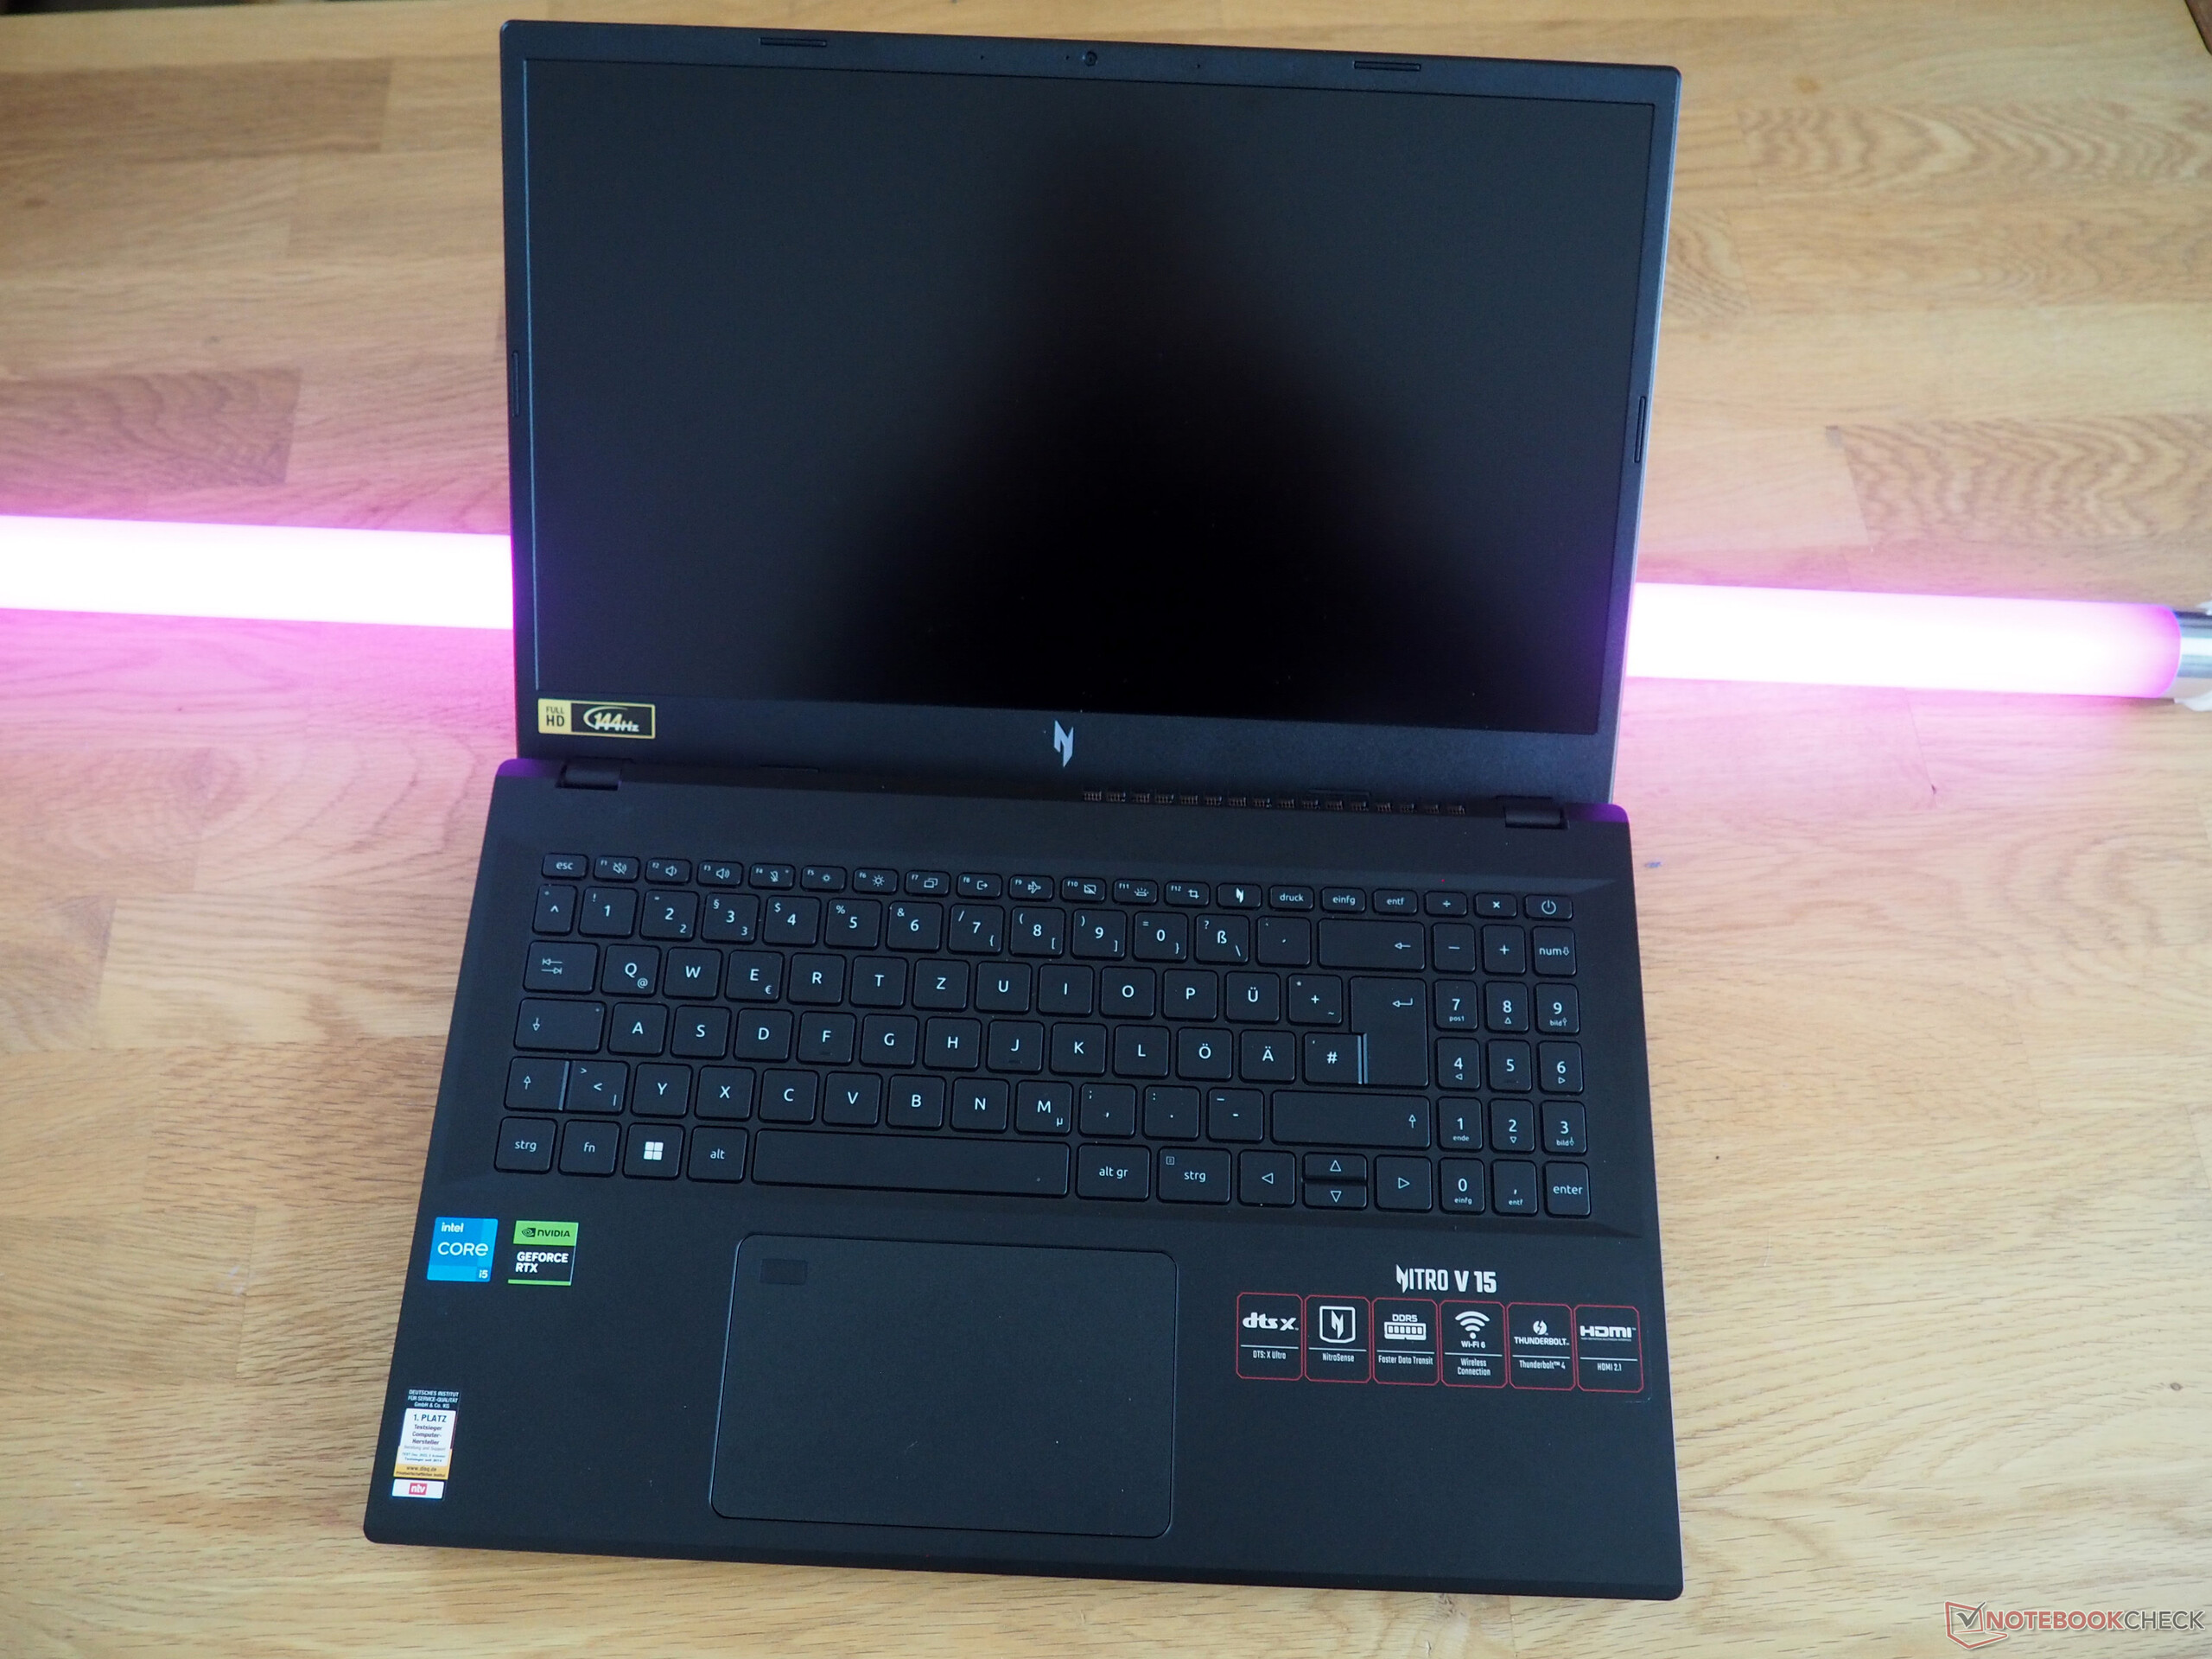
输入设备
键盘
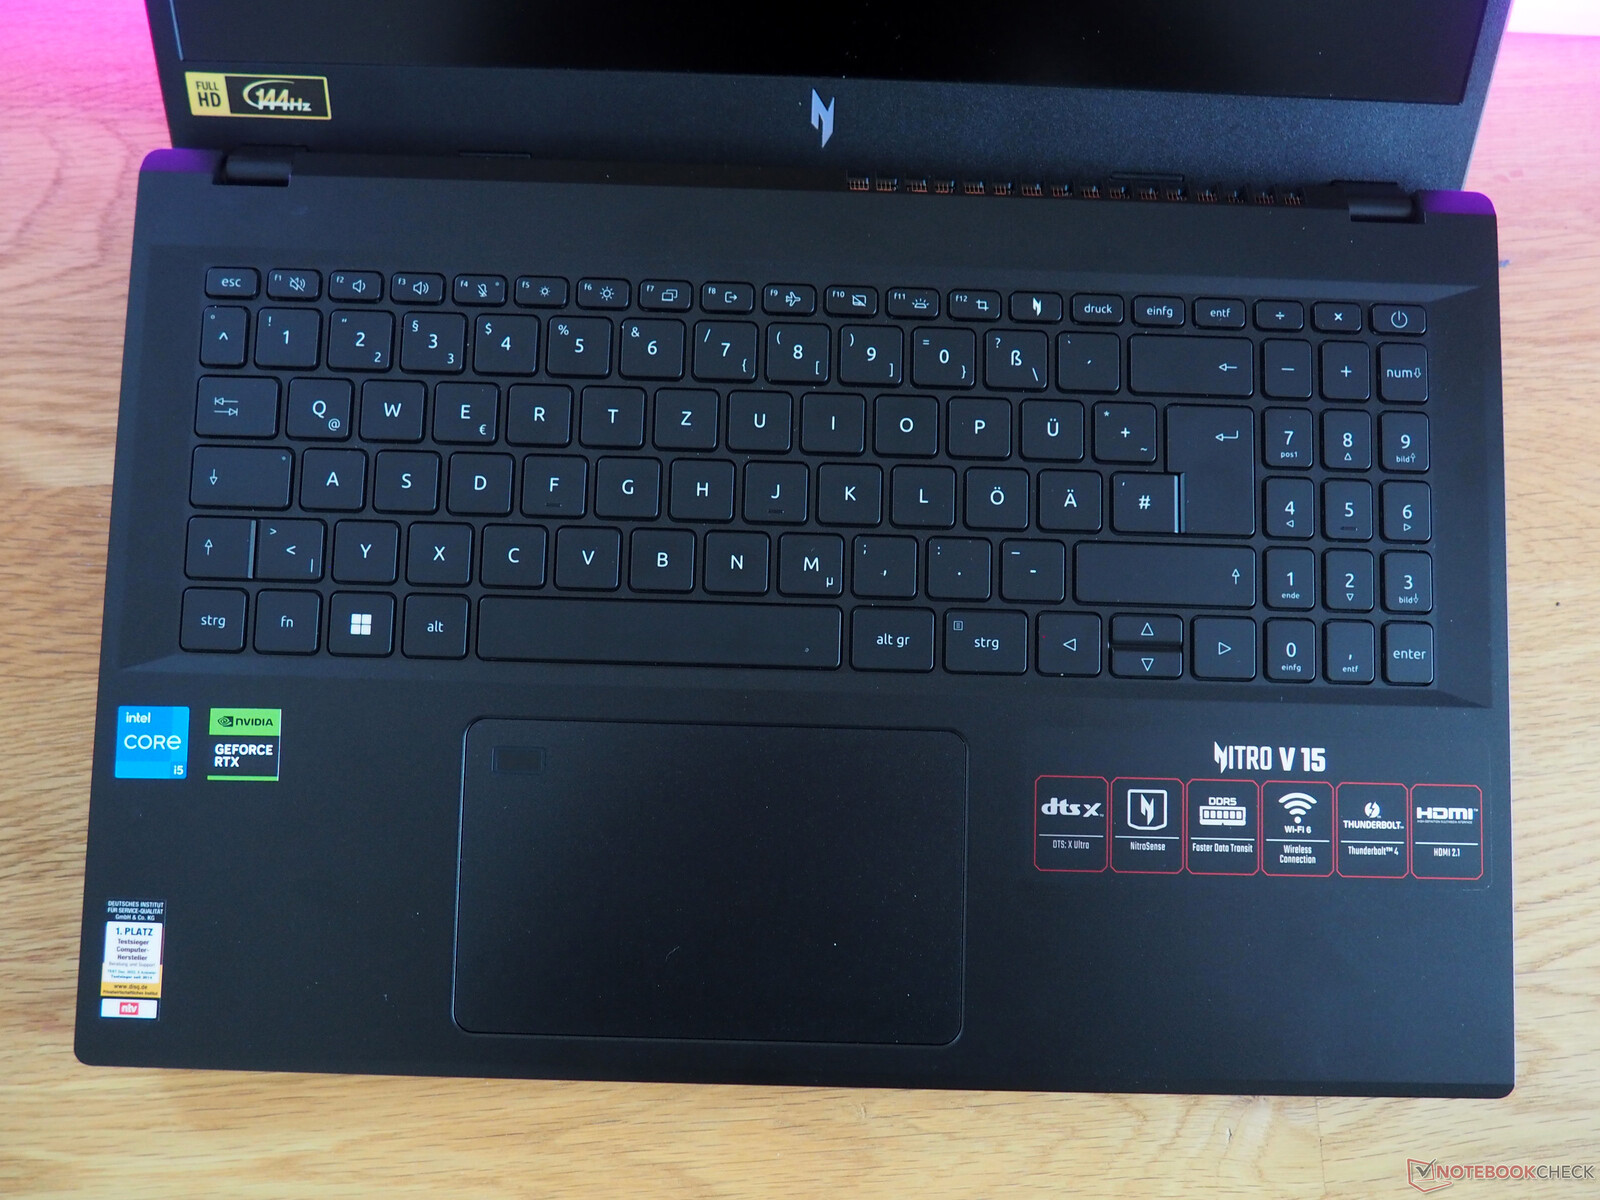
输入设备既不糟糕,也不出色。与大多数使用传统键盘的笔记本电脑类似,由于缺乏触觉反馈,在 Nitro 上打字感觉有点糊。宏碁还可以在布局方面做得更好。例如,有足够的空间放置标准的四栏数字键盘,而不是三栏。同样令人遗憾的是,方向键并不出色,几乎不适合游戏,电源键也没有单独设置。功能键几乎微不足道也无济于事。值得一提的优点包括可调节亮度的白色背光和用于打开调音软件(NitroSense)的专用按钮。
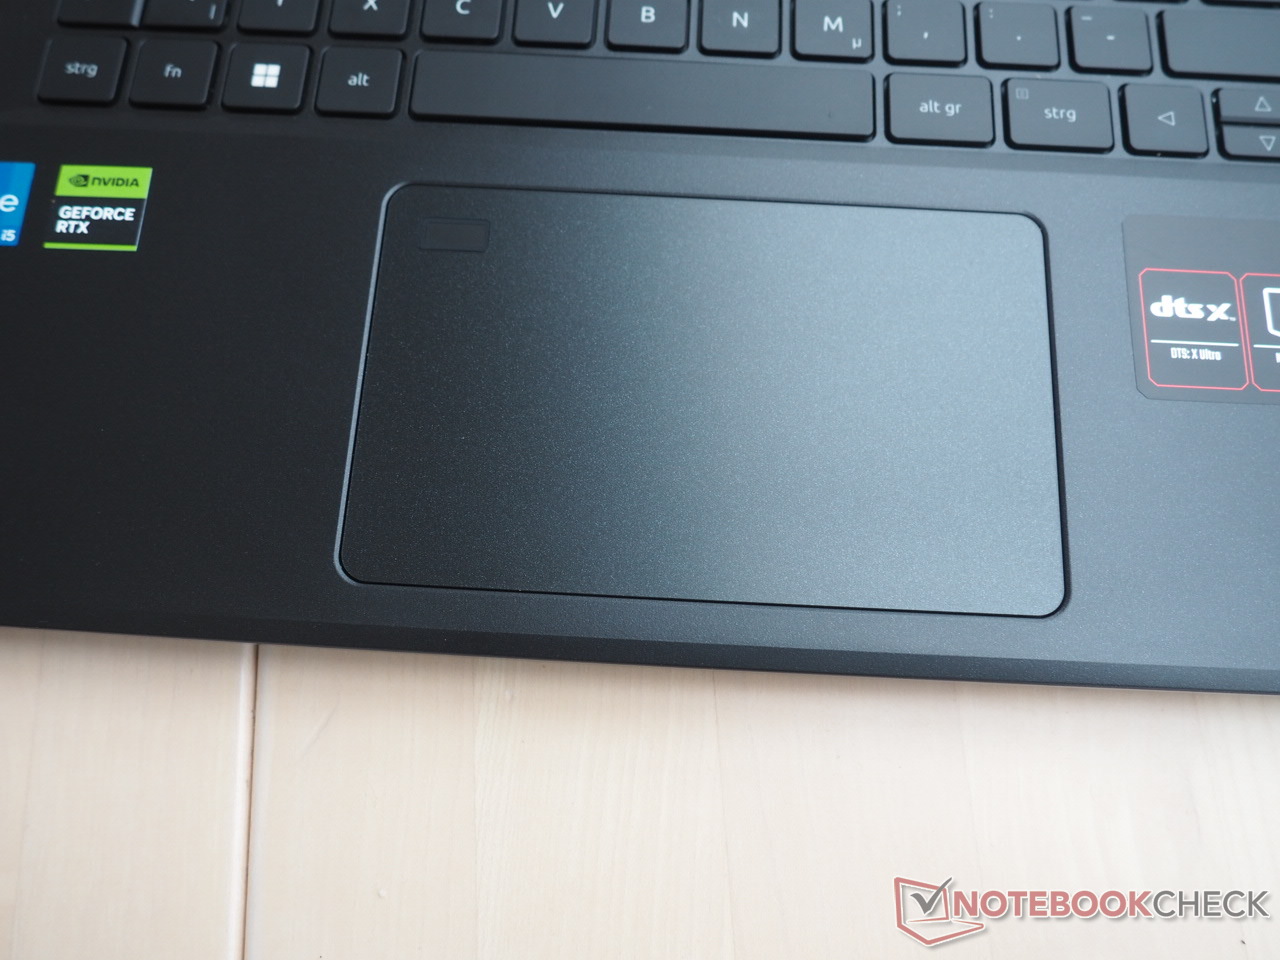
触摸板
触摸板左上角的内置指纹扫描仪非常引人注目。鼠标替代品的质量也相当一般。精确度和流畅度还算合理,没有达到令人惊叹的程度。多点触控支持和点击表面的手感也类似。遗憾的是,根据按压触控板的力度,触控板容易发出响声。
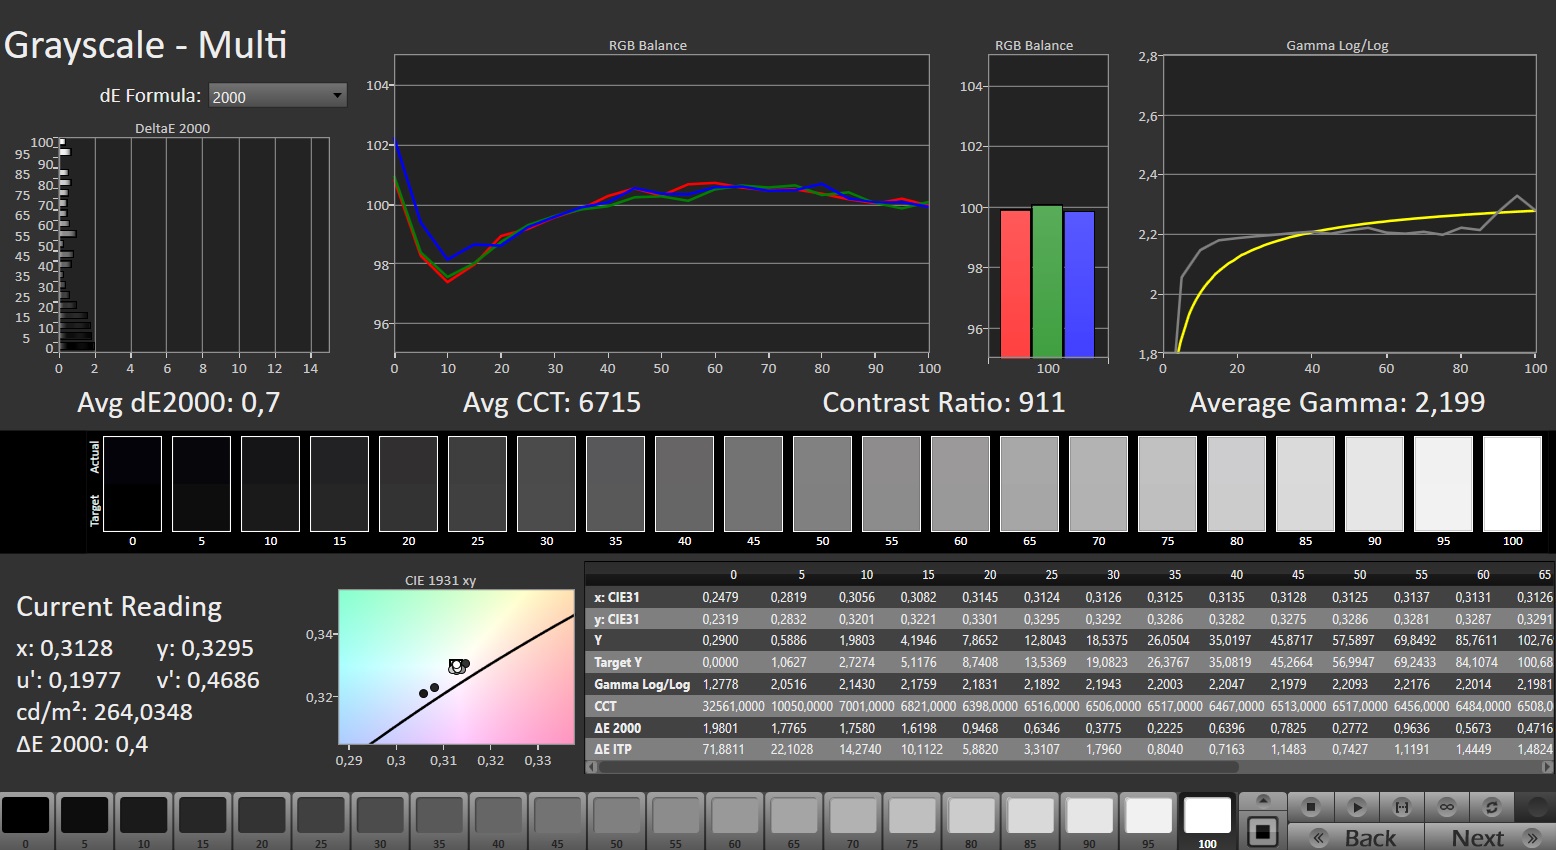
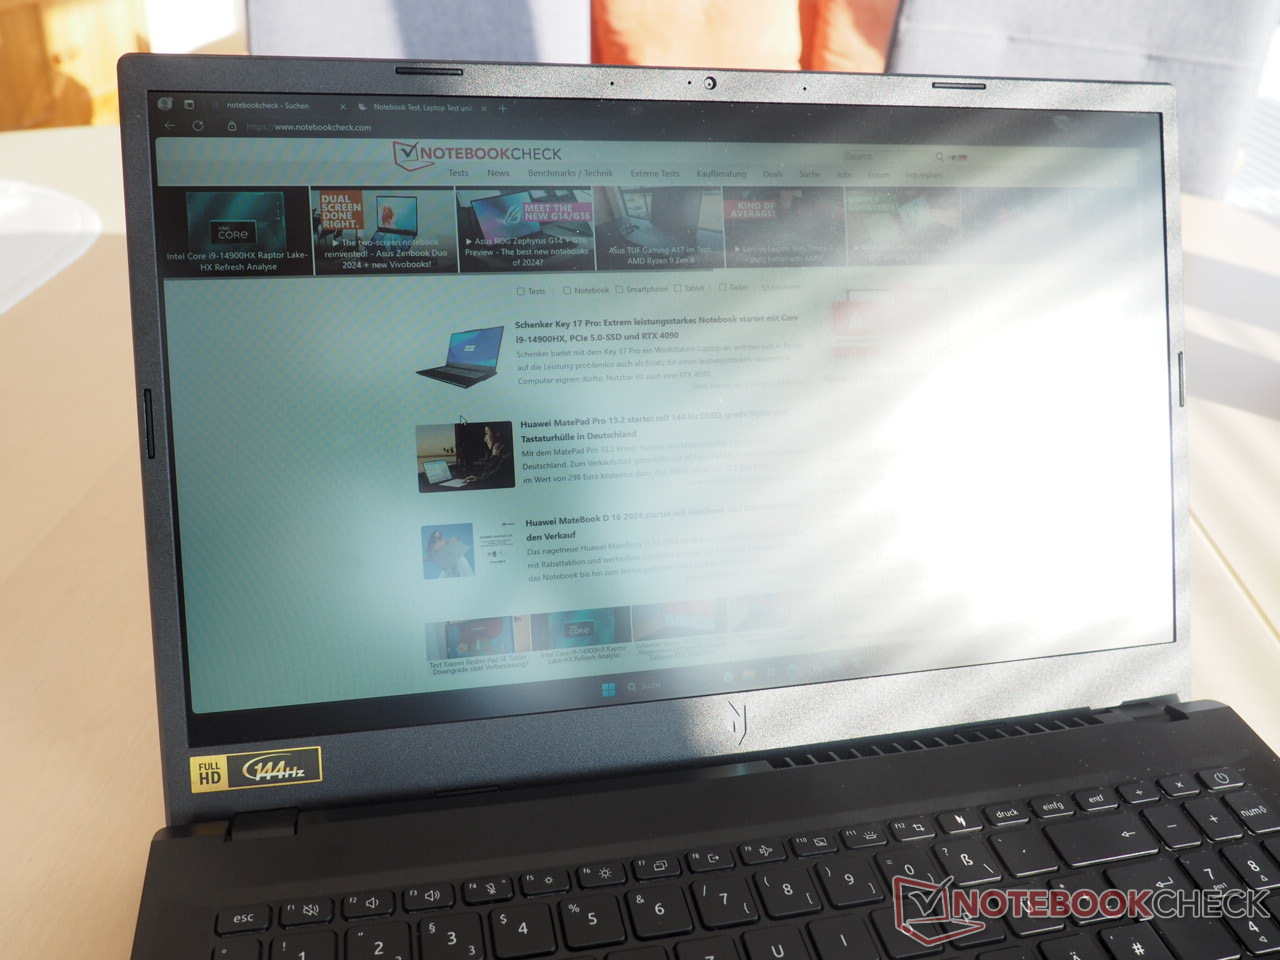
显示屏
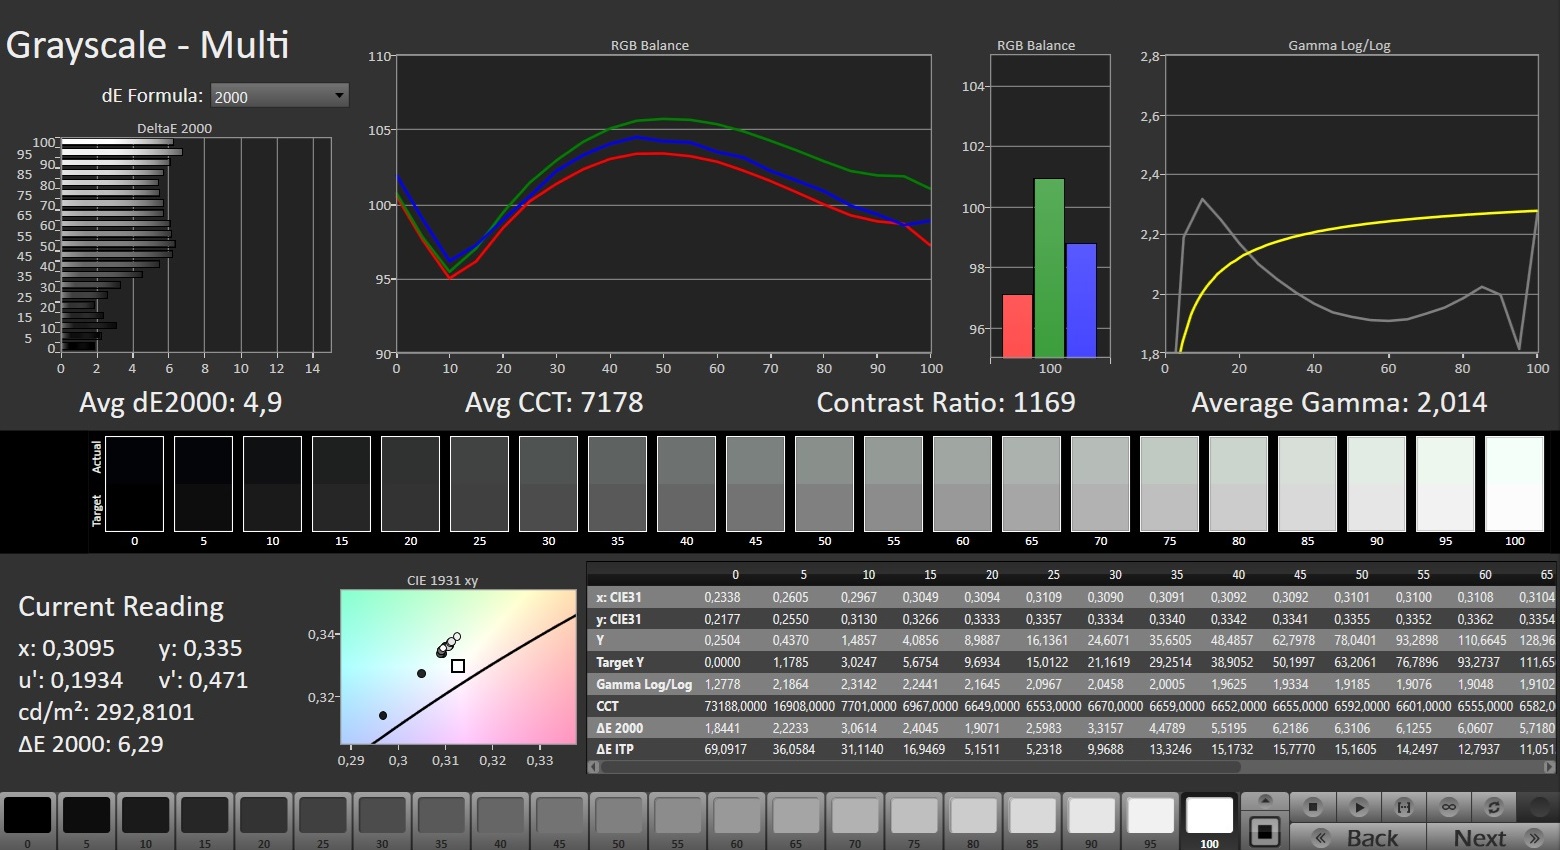
Nitro V 15 的低质量显示屏是其最大的弱点之一。乍一看,它的显示效果并不令人失望:0.25 cd/m² 的黑度和 1168:1 的对比度与竞争对手或典型的 IPS 面板相差无几。可视角度也是如此。
| |||||||||||||||||||||||||
Brightness Distribution: 80 %
Center on Battery: 292 cd/m²
Contrast: 1168:1 (Black: 0.25 cd/m²)
ΔE ColorChecker Calman: 7.15 | ∀{0.5-29.43 Ø4.71}
calibrated: 4.13
ΔE Greyscale Calman: 4.9 | ∀{0.09-98 Ø4.96}
41.4% AdobeRGB 1998 (Argyll 3D)
60% sRGB (Argyll 3D)
40% Display P3 (Argyll 3D)
Gamma: 2.014
CCT: 7178 K
| Acer Nitro V 15 ANV15-51-582S LG LP156WFJ-SPB4 (LGD0742), IPS, 1920x1080, 15.6" | Medion Erazer Crawler E40 - MD 62518 BOE HF NV156FHM-N4G, IPS, 1920x1080, 15.6" | Lenovo LOQ 15IRH8 Core i7 BOE CQ NE156QHM-NY4, IPS, 2560x1440, 15.6" | Asus TUF A15 FA507 N156HMA-GA1, IPS, 1920x1080, 15.6" | Schenker XMG Apex 15 (Late 23) BOE CQ NE156QHM-NY2, IPS, 2560x1440, 15.6" | |
|---|---|---|---|---|---|
| Display | 52% | 64% | 61% | 66% | |
| Display P3 Coverage (%) | 40 | 61.4 54% | 66.3 66% | 64.9 62% | 67.5 69% |
| sRGB Coverage (%) | 60 | 89.7 50% | 96.6 61% | 96.5 61% | 97.6 63% |
| AdobeRGB 1998 Coverage (%) | 41.4 | 63.2 53% | 67.7 64% | 66.6 61% | 68.9 66% |
| Response Times | 70% | 76% | 15% | 64% | |
| Response Time Grey 50% / Grey 80% * (ms) | 34.2 ? | 8 ? 77% | 5 ? 85% | 30.4 ? 11% | 13.2 ? 61% |
| Response Time Black / White * (ms) | 25.8 ? | 9.6 ? 63% | 8.41 ? 67% | 20.8 ? 19% | 8.8 ? 66% |
| PWM Frequency (Hz) | |||||
| Screen | 17% | 23% | 41% | 24% | |
| Brightness middle (cd/m²) | 292 | 364 25% | 373 28% | 288 -1% | 336 15% |
| Brightness (cd/m²) | 263 | 351 33% | 365 39% | 271 3% | 307 17% |
| Brightness Distribution (%) | 80 | 91 14% | 90 13% | 91 14% | 77 -4% |
| Black Level * (cd/m²) | 0.25 | 0.43 -72% | 0.33 -32% | 0.17 32% | 0.38 -52% |
| Contrast (:1) | 1168 | 847 -27% | 1130 -3% | 1694 45% | 884 -24% |
| Colorchecker dE 2000 * | 7.15 | 3.98 44% | 4.19 41% | 1.9 73% | 1.96 73% |
| Colorchecker dE 2000 max. * | 15.51 | 6.38 59% | 8.47 45% | 3.3 79% | 5.07 67% |
| Colorchecker dE 2000 calibrated * | 4.13 | 1.36 67% | 1.07 74% | 0.9 78% | 1.27 69% |
| Greyscale dE 2000 * | 4.9 | 4.39 10% | 5 -2% | 2.7 45% | 2.3 53% |
| Gamma | 2.014 109% | 2.58 85% | 1.93 114% | 2.32 95% | 2.017 109% |
| CCT | 7178 91% | 7316 89% | 7520 86% | 6535 99% | 6644 98% |
| Total Average (Program / Settings) | 46% /
32% | 54% /
39% | 39% /
42% | 51% /
39% |
* ... smaller is better
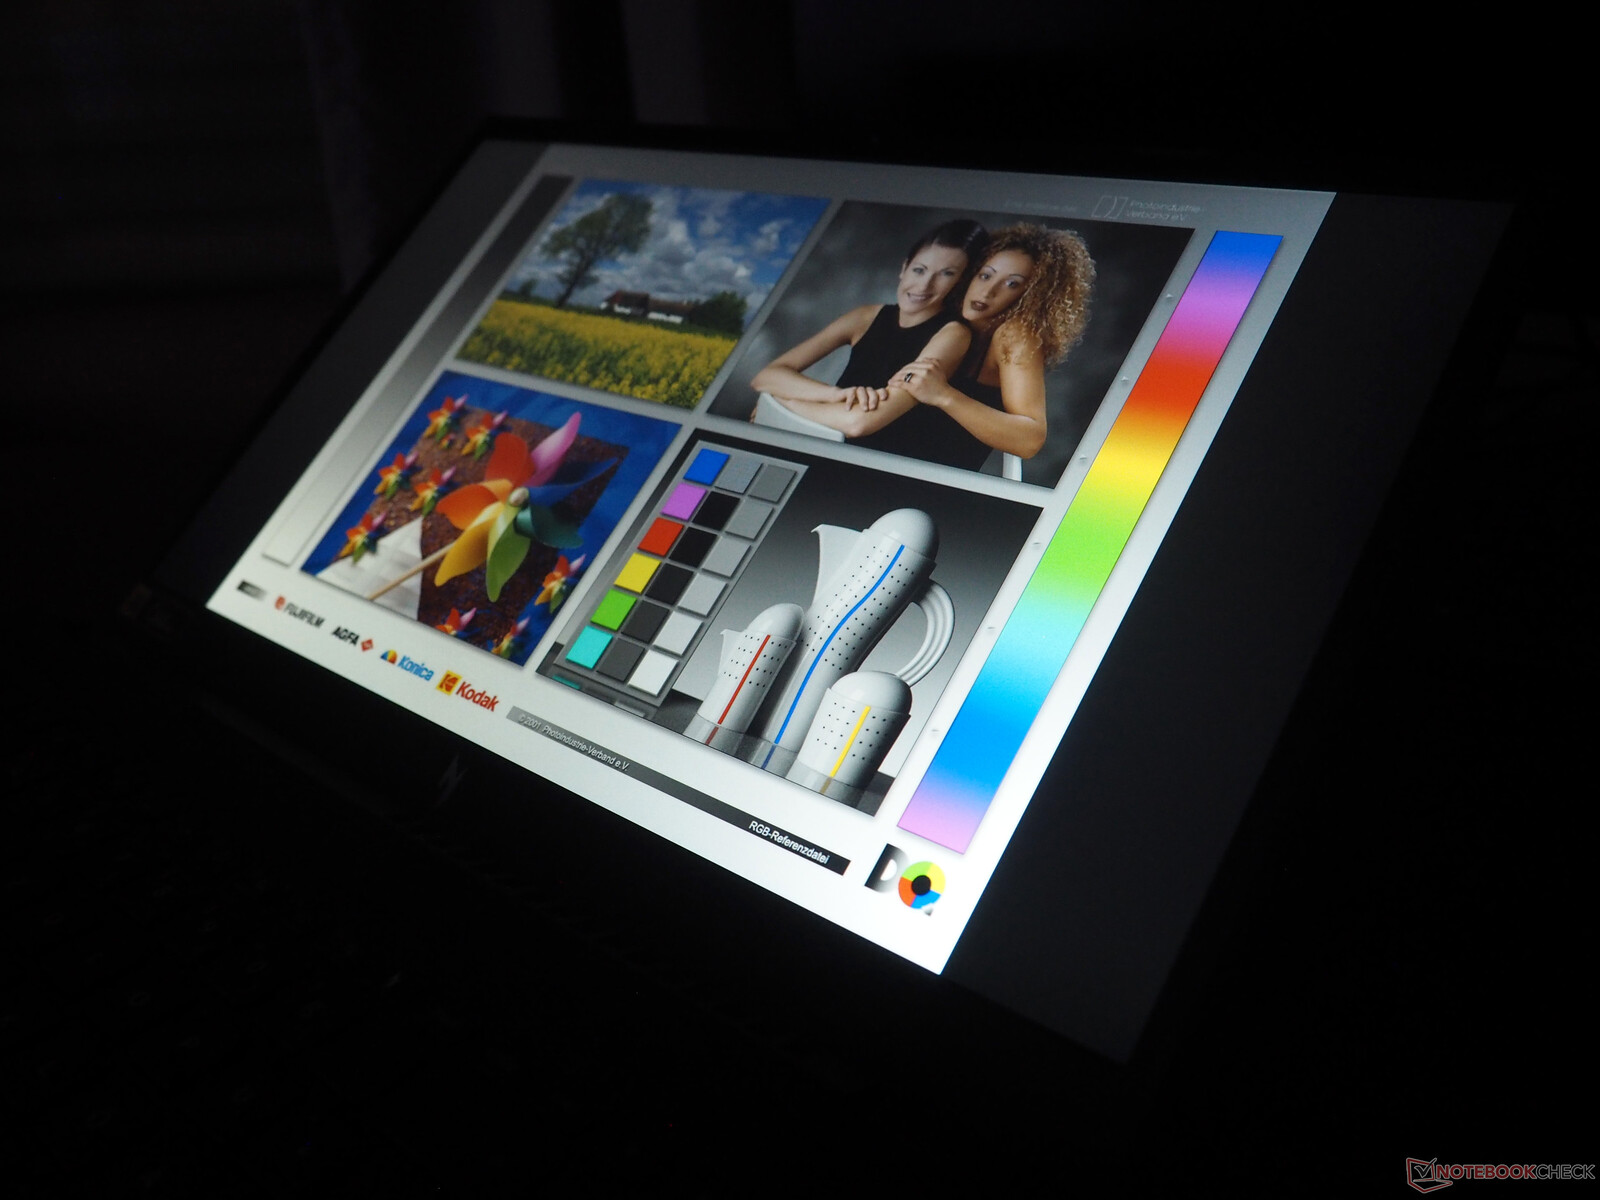
但仔细观察后,你会发现它还存在一些不足。首先,263 cd/m² 的平均峰值亮度只能满足室内使用;在室外环境中,这款 15 英寸笔记本电脑的亮度完全不理想。
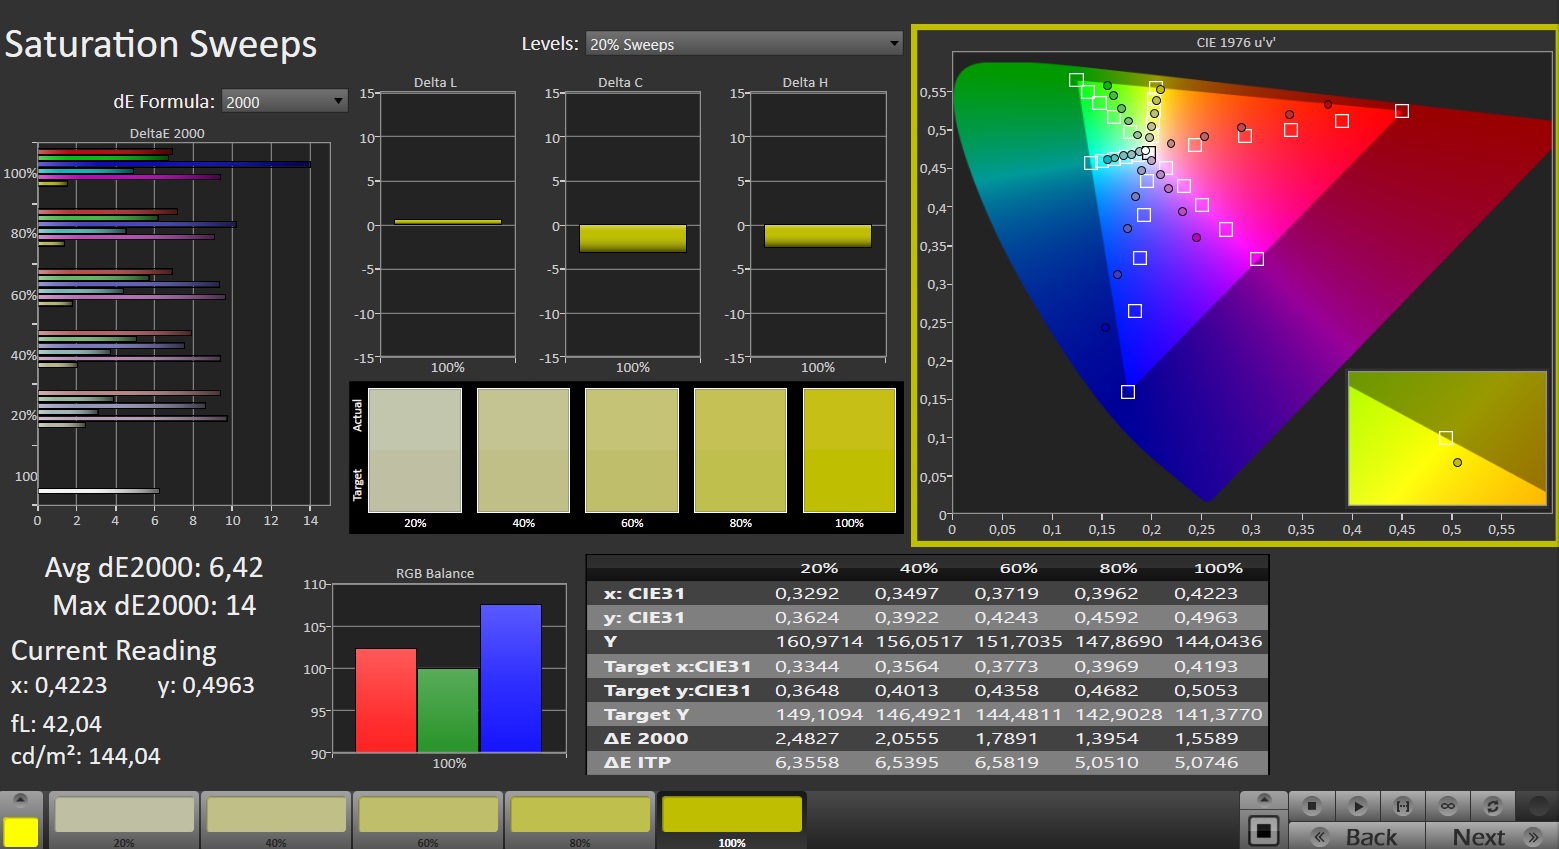
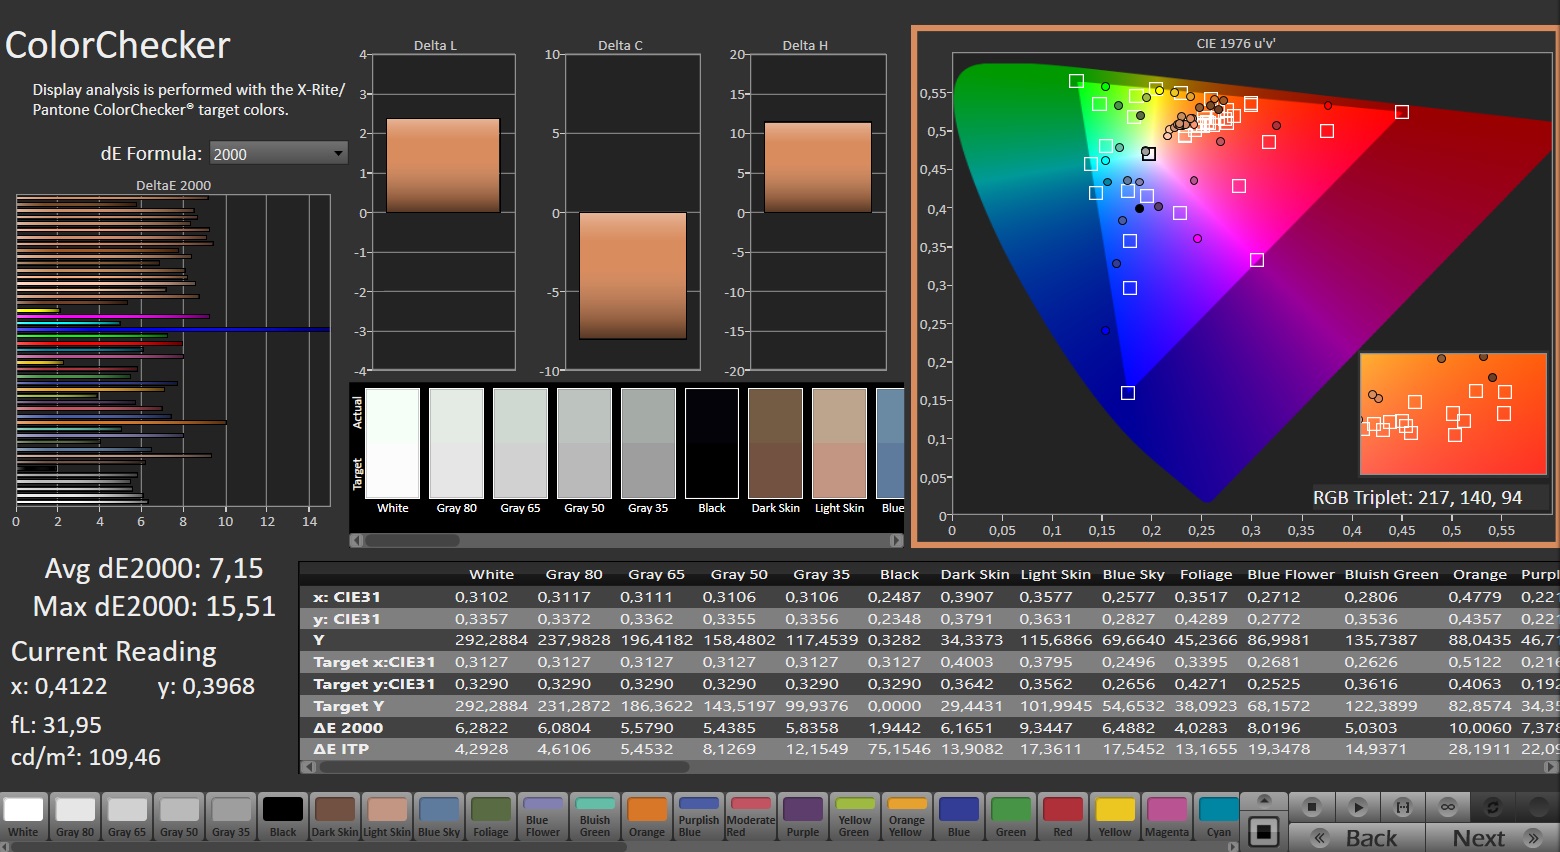
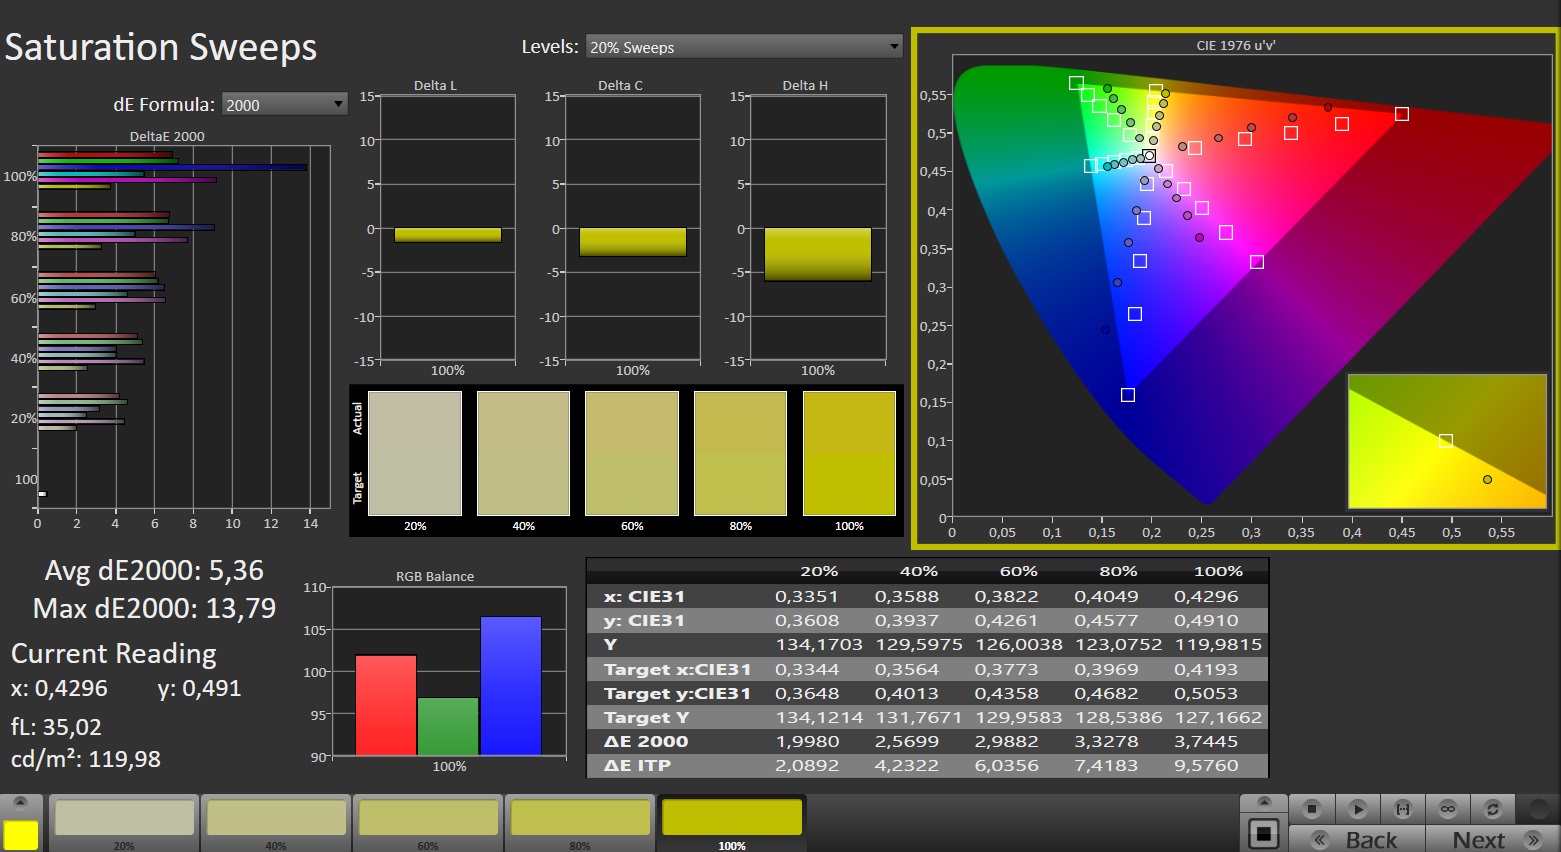
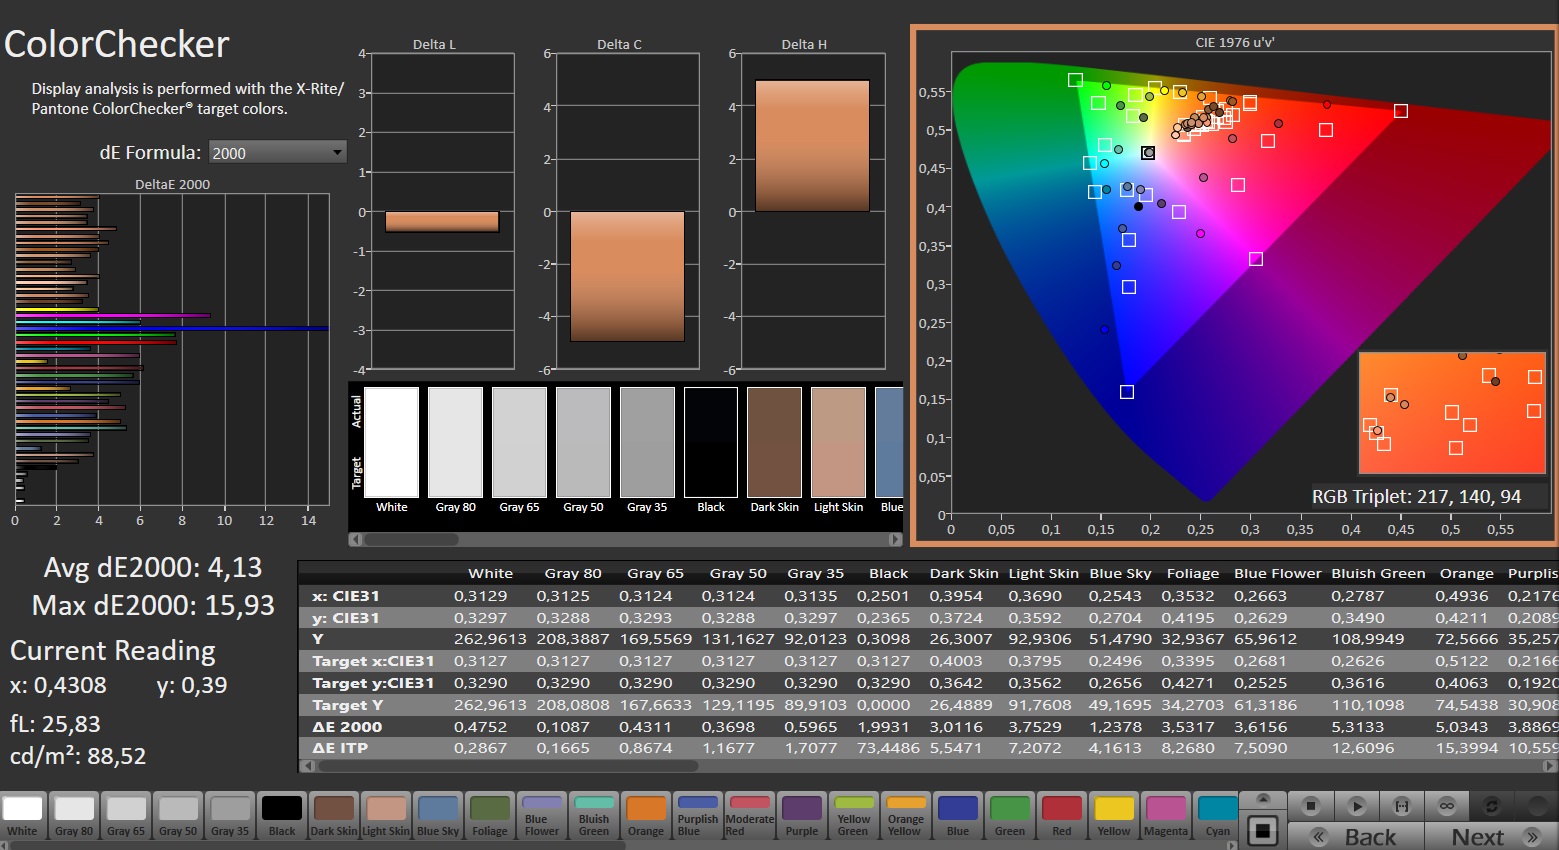
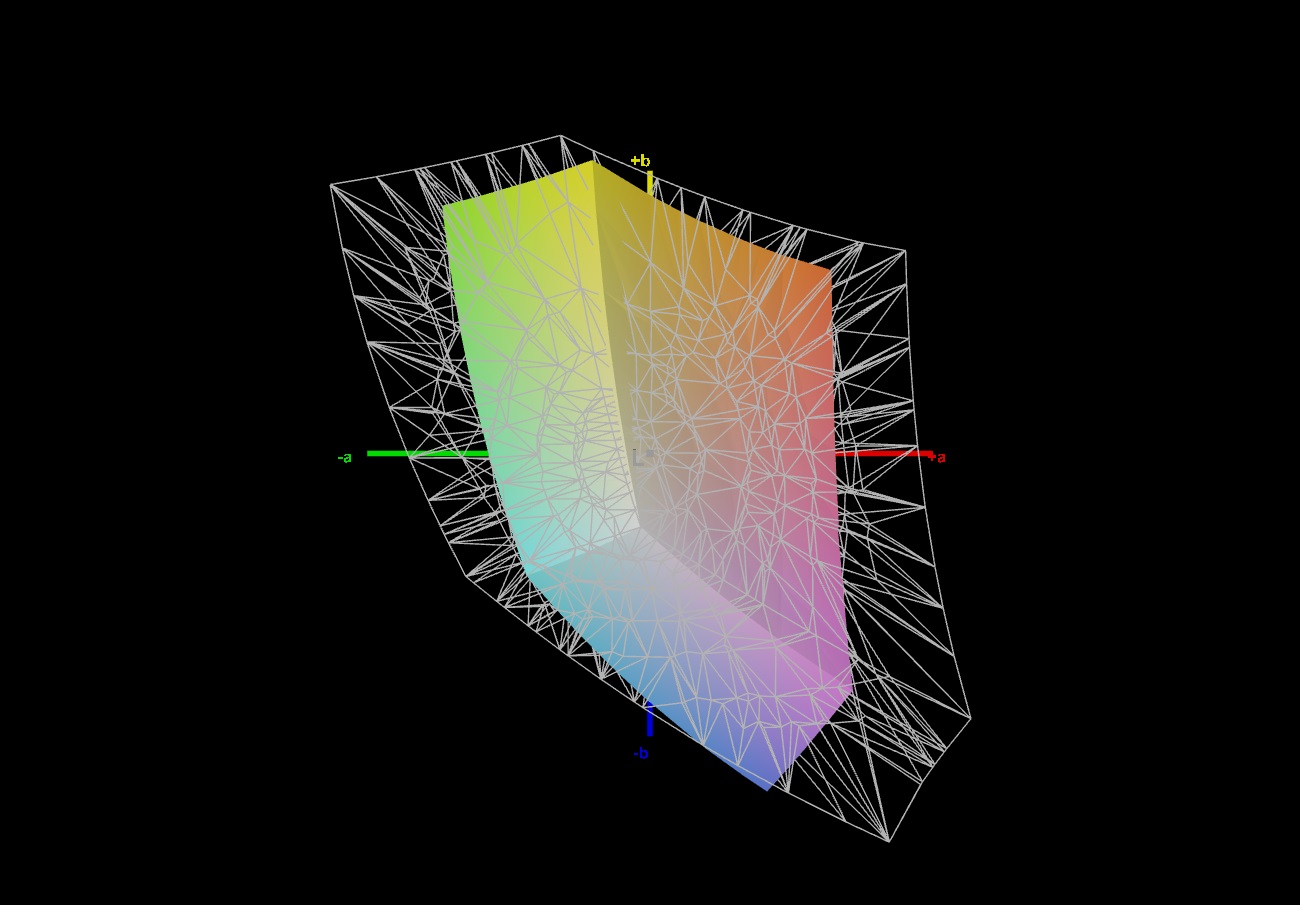
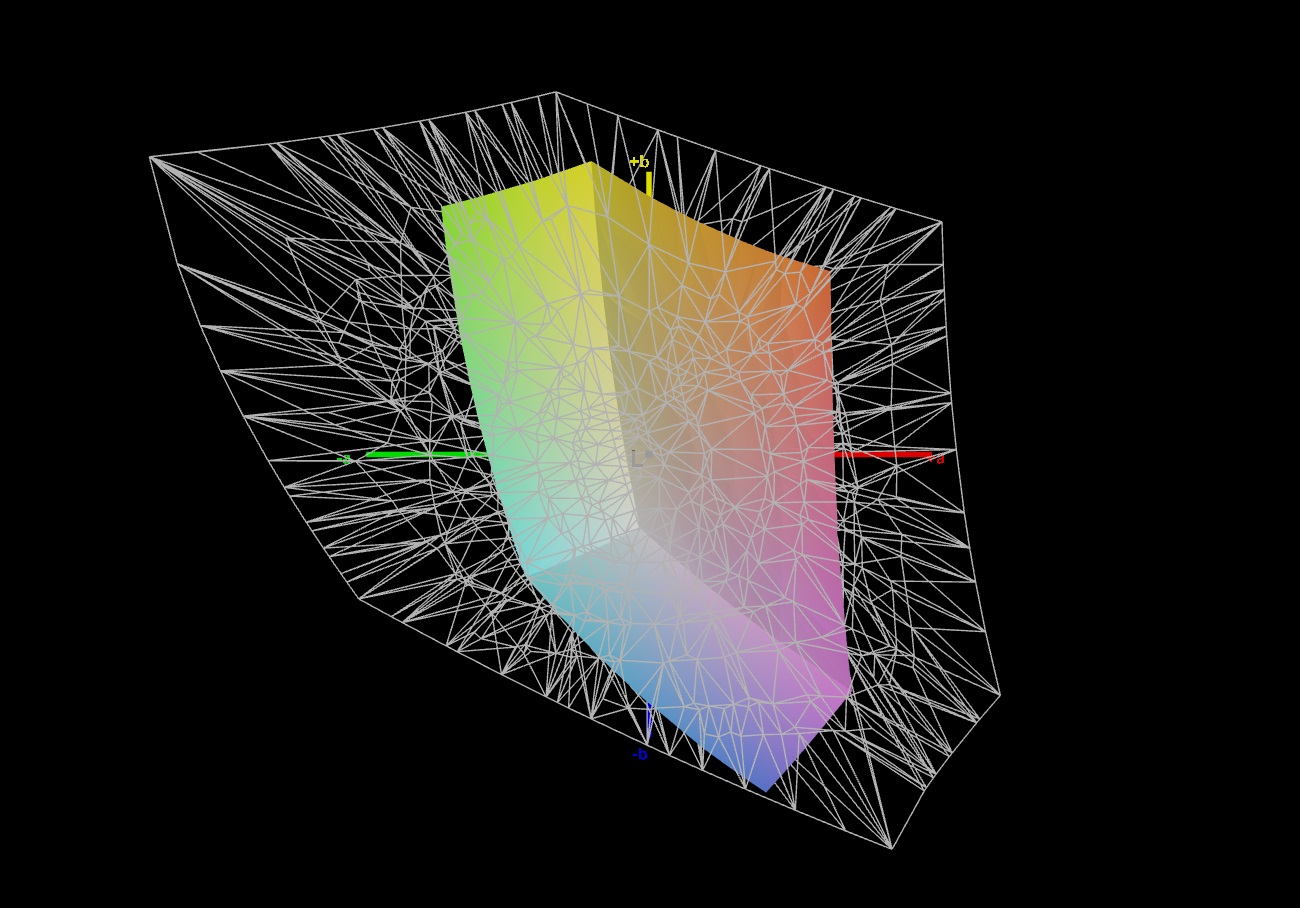
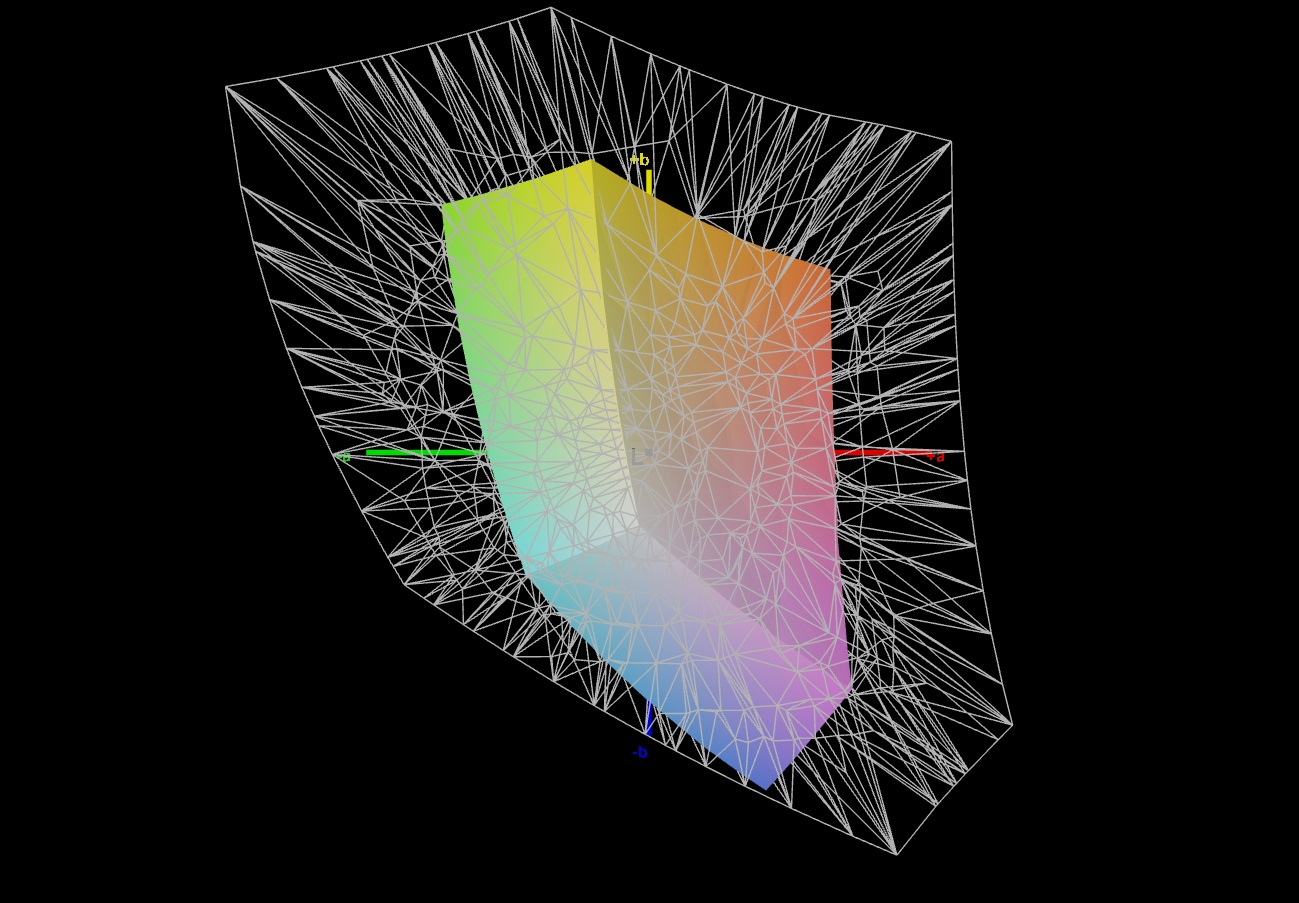
Nitro V 15 的色彩覆盖范围也非常有限:60% 的 sRGB 和大约 40% 的 AdobeRGB 以及 DCI-P3 覆盖范围在 2024 年是不可能实现的,即使是对于一款经济型游戏笔记本电脑来说也是如此。
竞争对手展示了如何做得更好。Acer Nitro 在色彩准确度和响应时间方面也是最后一名。
Display Response Times
| ↔ Response Time Black to White | ||
|---|---|---|
| 25.8 ms ... rise ↗ and fall ↘ combined | ↗ 13.8 ms rise | 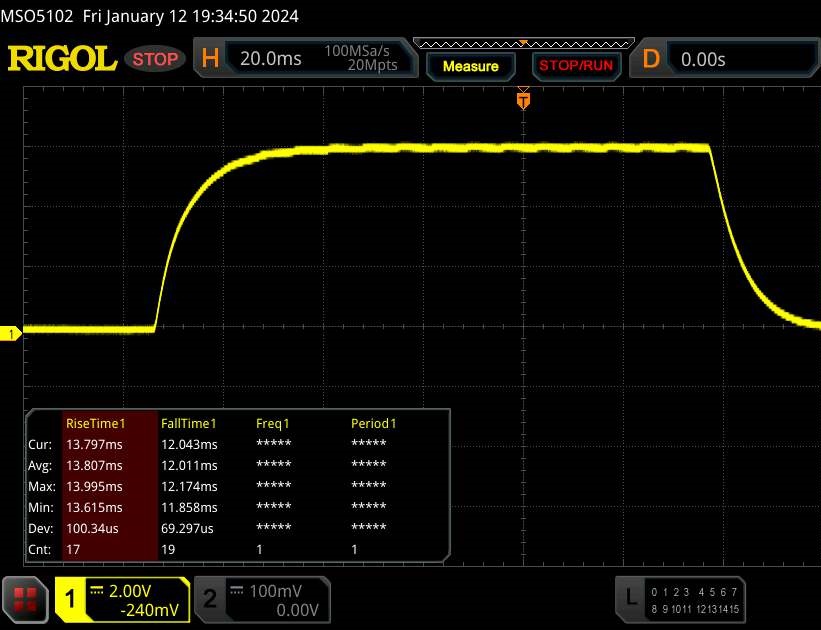 |
| ↘ 12 ms fall | ||
| The screen shows relatively slow response rates in our tests and may be too slow for gamers. In comparison, all tested devices range from 0.1 (minimum) to 240 (maximum) ms. » 62 % of all devices are better. This means that the measured response time is worse than the average of all tested devices (19.8 ms). | ||
| ↔ Response Time 50% Grey to 80% Grey | ||
| 34.2 ms ... rise ↗ and fall ↘ combined | ↗ 15.8 ms rise | 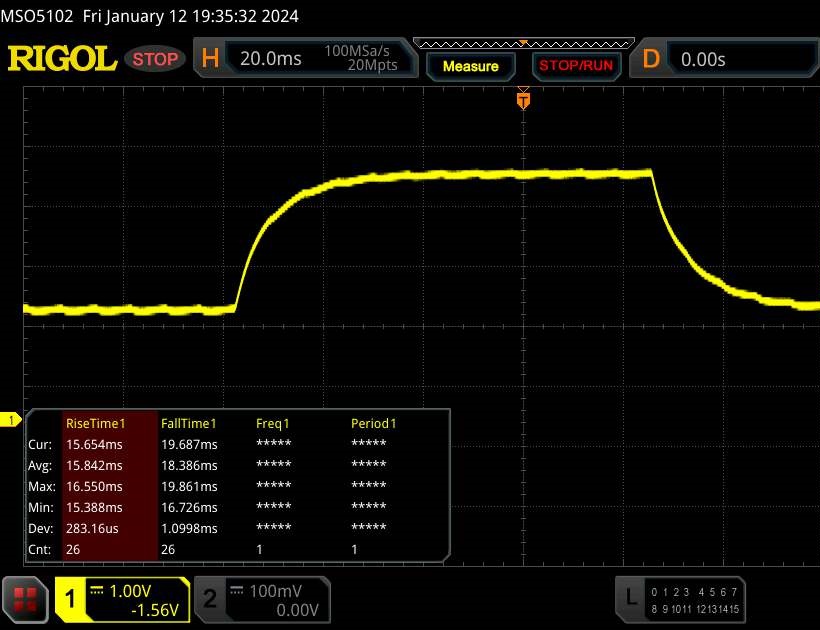 |
| ↘ 18.4 ms fall | ||
| The screen shows slow response rates in our tests and will be unsatisfactory for gamers. In comparison, all tested devices range from 0.165 (minimum) to 636 (maximum) ms. » 48 % of all devices are better. This means that the measured response time is worse than the average of all tested devices (31 ms). | ||
Screen Flickering / PWM (Pulse-Width Modulation)
| Screen flickering / PWM not detected |  | ||
In comparison: 52 % of all tested devices do not use PWM to dim the display. If PWM was detected, an average of 7757 (minimum: 5 - maximum: 343500) Hz was measured. | |||
性能
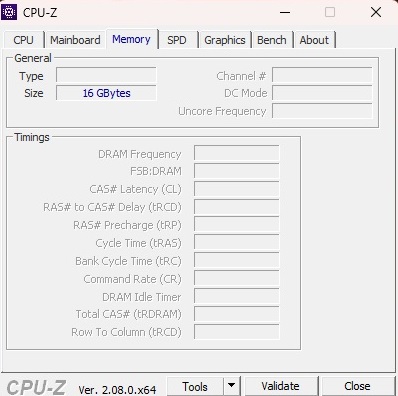
就 CPU 和 GPU 性能而言,Nitro V 15 属于中端设备。考虑到笔记本电脑的价格,16 GB 内存相当合理,但固态硬盘容量仅为 512 GB,略显不足。
测试条件
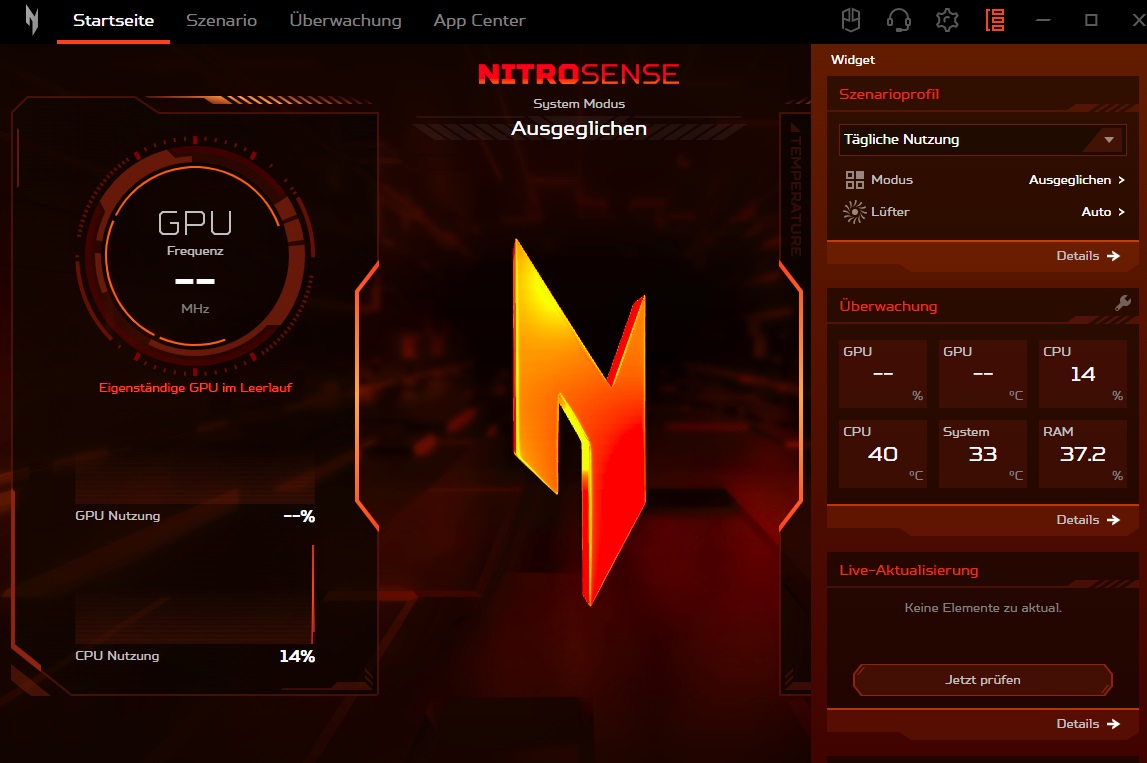
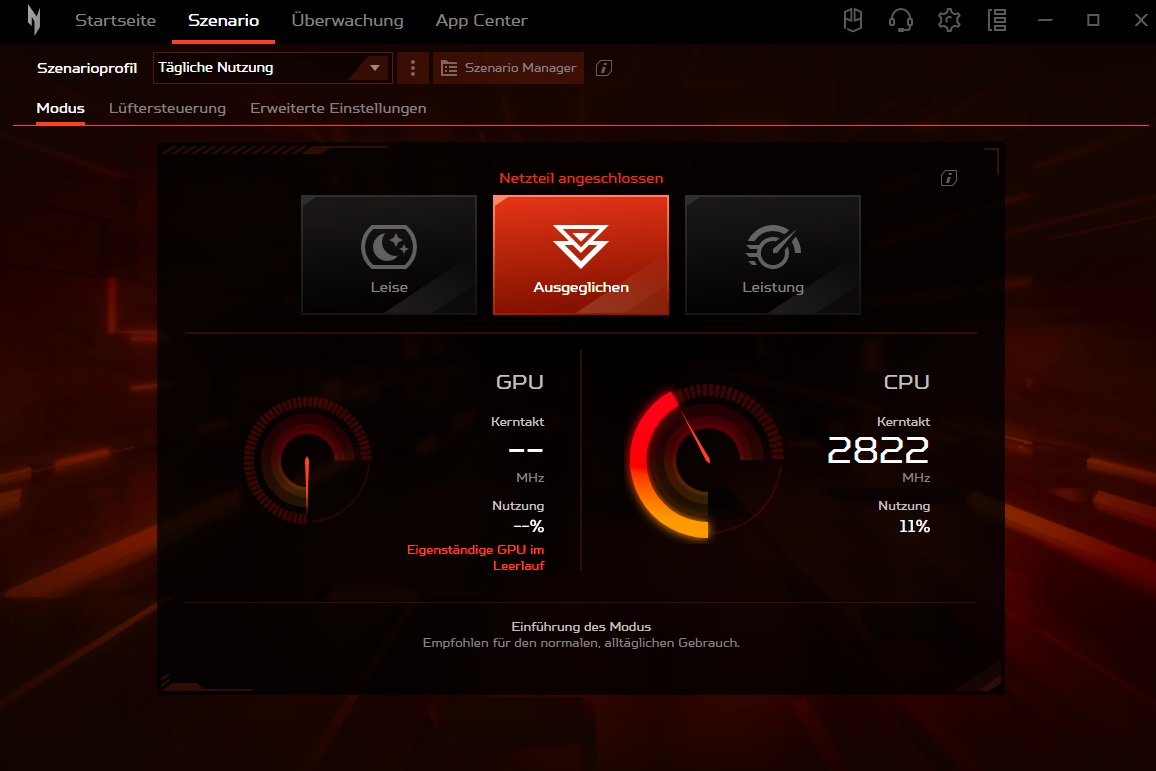
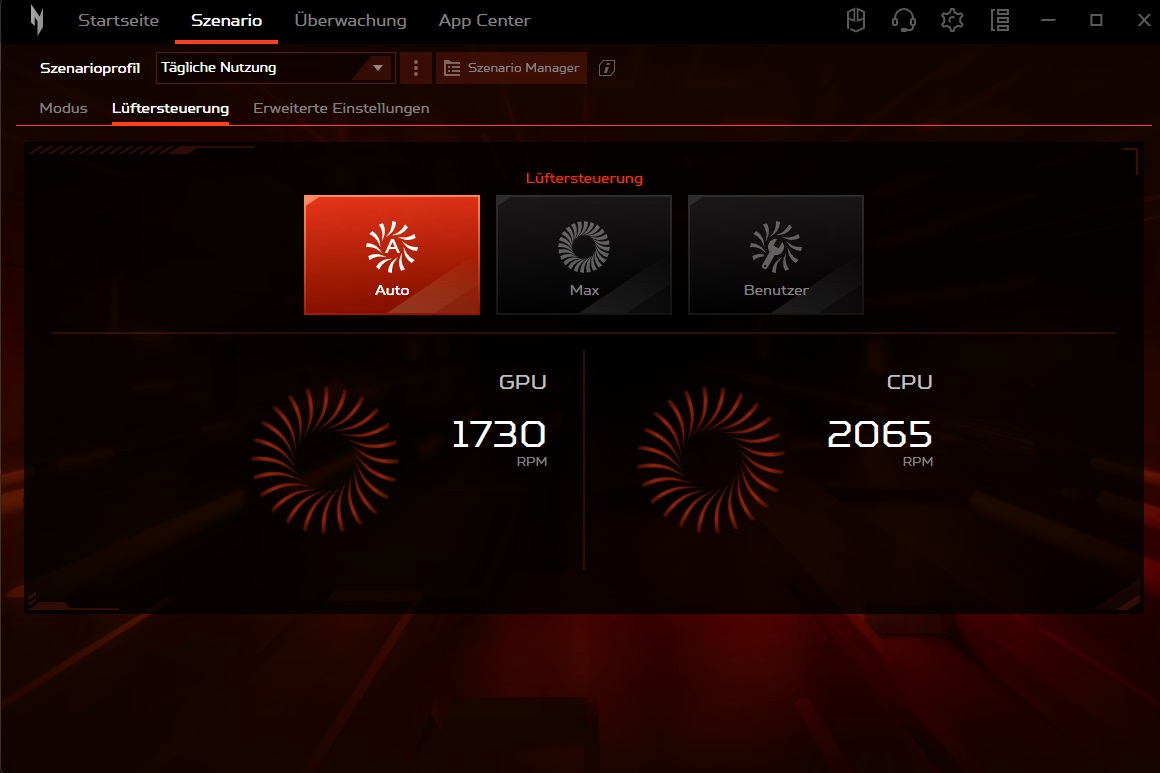
通过预装的 NitroSense 应用程序,用户可以调整各种系统设置。在实际使用中,"情景 "选项卡尤其有趣。它允许你调整电源计划("模式 "菜单)和风扇行为("风扇控制 "菜单)。我们的测量是在平衡模式和自动风扇控制下进行的,因为在性能模式下,笔记本电脑的运行声音要大得多,但速度并不快。
| NitroSense | Quiet | Balanced | 性能 |
| CPU PL1 (HWiNFO) | 35 W | 45 W | 55 W |
| CPU PL2 (HWiNFO) | 64 W | 115 W | 115 W |
| 噪音 (Witcher 3, FHD/Ultra) | 37 dB(A) | 49 dB(A) | 59 dB(A) |
| 性能 (Witcher 3, FHD/Ultra) | ~62 FPS | ~78 FPS | ~82 FPS |
处理器
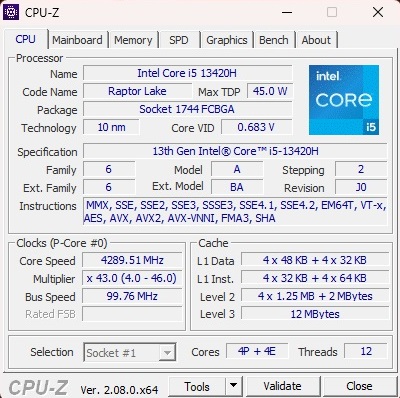
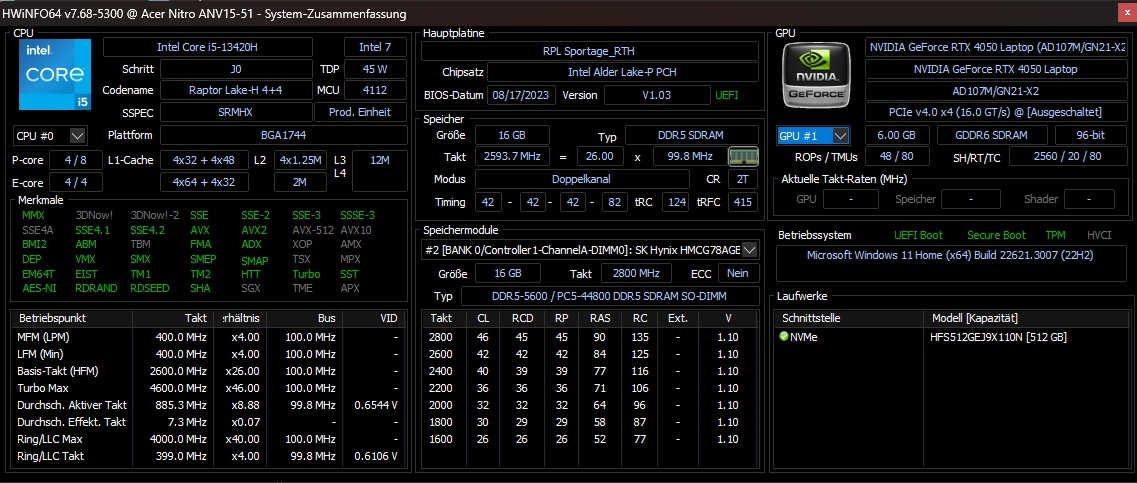
酷睿 i5-13420H 是英特尔猛禽湖(Raptor Lake)系列(10 纳米)中的一款处理器,拥有四个性能核心(带超线程技术)和四个效率核心(不带超线程技术)。在我们的基准测试中,该处理器的性能不仅超过了其价格更高的同类产品 酷睿 i5-13500H和酷睿 i7-13620H,而且还被 AMD 竞争对手击败 Ryzen 7 7735HS和 Ryzen 7 7840HS.尽管如此,CPU 的性能对于游戏来说还是绰绰有余的,因为我们知道,大多数游戏都需要 GPU 的支持。
Cinebench R15 Multi Sustained Load
* ... smaller is better
AIDA64: FP32 Ray-Trace | FPU Julia | CPU SHA3 | CPU Queen | FPU SinJulia | FPU Mandel | CPU AES | CPU ZLib | FP64 Ray-Trace | CPU PhotoWorxx
| Performance rating | |
| Average of class Gaming | |
| Schenker XMG Apex 15 (Late 23) | |
| Asus TUF A15 FA507 | |
| Medion Erazer Crawler E40 - MD 62518 | |
| Lenovo LOQ 15IRH8 Core i7 | |
| Acer Nitro V 15 ANV15-51-582S | |
| Average Intel Core i5-13420H | |
| AIDA64 / FP32 Ray-Trace | |
| Average of class Gaming (10227 - 85542, n=105, last 2 years) | |
| Schenker XMG Apex 15 (Late 23) | |
| Asus TUF A15 FA507 | |
| Medion Erazer Crawler E40 - MD 62518 | |
| Acer Nitro V 15 ANV15-51-582S | |
| Lenovo LOQ 15IRH8 Core i7 | |
| Average Intel Core i5-13420H (7922 - 12134, n=5) | |
| AIDA64 / FPU Julia | |
| Average of class Gaming (51376 - 238426, n=105, last 2 years) | |
| Schenker XMG Apex 15 (Late 23) | |
| Asus TUF A15 FA507 | |
| Medion Erazer Crawler E40 - MD 62518 | |
| Lenovo LOQ 15IRH8 Core i7 | |
| Acer Nitro V 15 ANV15-51-582S | |
| Average Intel Core i5-13420H (40587 - 59715, n=5) | |
| AIDA64 / CPU SHA3 | |
| Average of class Gaming (2180 - 10115, n=105, last 2 years) | |
| Schenker XMG Apex 15 (Late 23) | |
| Medion Erazer Crawler E40 - MD 62518 | |
| Asus TUF A15 FA507 | |
| Acer Nitro V 15 ANV15-51-582S | |
| Lenovo LOQ 15IRH8 Core i7 | |
| Average Intel Core i5-13420H (1724 - 2634, n=5) | |
| AIDA64 / CPU Queen | |
| Average of class Gaming (49785 - 173351, n=90, last 2 years) | |
| Schenker XMG Apex 15 (Late 23) | |
| Asus TUF A15 FA507 | |
| Medion Erazer Crawler E40 - MD 62518 | |
| Lenovo LOQ 15IRH8 Core i7 | |
| Average Intel Core i5-13420H (69803 - 74956, n=5) | |
| Acer Nitro V 15 ANV15-51-582S | |
| AIDA64 / FPU SinJulia | |
| Schenker XMG Apex 15 (Late 23) | |
| Average of class Gaming (4424 - 33636, n=105, last 2 years) | |
| Asus TUF A15 FA507 | |
| Medion Erazer Crawler E40 - MD 62518 | |
| Lenovo LOQ 15IRH8 Core i7 | |
| Acer Nitro V 15 ANV15-51-582S | |
| Average Intel Core i5-13420H (5485 - 6644, n=5) | |
| AIDA64 / FPU Mandel | |
| Average of class Gaming (25115 - 128721, n=105, last 2 years) | |
| Schenker XMG Apex 15 (Late 23) | |
| Asus TUF A15 FA507 | |
| Medion Erazer Crawler E40 - MD 62518 | |
| Lenovo LOQ 15IRH8 Core i7 | |
| Acer Nitro V 15 ANV15-51-582S | |
| Average Intel Core i5-13420H (19684 - 30163, n=5) | |
| AIDA64 / CPU AES | |
| Schenker XMG Apex 15 (Late 23) | |
| Average of class Gaming (39258 - 247074, n=105, last 2 years) | |
| Acer Nitro V 15 ANV15-51-582S | |
| Asus TUF A15 FA507 | |
| Medion Erazer Crawler E40 - MD 62518 | |
| Average Intel Core i5-13420H (35531 - 93100, n=5) | |
| Lenovo LOQ 15IRH8 Core i7 | |
| AIDA64 / CPU ZLib | |
| Average of class Gaming (574 - 2531, n=105, last 2 years) | |
| Schenker XMG Apex 15 (Late 23) | |
| Medion Erazer Crawler E40 - MD 62518 | |
| Lenovo LOQ 15IRH8 Core i7 | |
| Acer Nitro V 15 ANV15-51-582S | |
| Average Intel Core i5-13420H (509 - 746, n=5) | |
| Asus TUF A15 FA507 | |
| AIDA64 / FP64 Ray-Trace | |
| Average of class Gaming (5509 - 45446, n=105, last 2 years) | |
| Schenker XMG Apex 15 (Late 23) | |
| Asus TUF A15 FA507 | |
| Medion Erazer Crawler E40 - MD 62518 | |
| Lenovo LOQ 15IRH8 Core i7 | |
| Acer Nitro V 15 ANV15-51-582S | |
| Average Intel Core i5-13420H (4283 - 6627, n=5) | |
| AIDA64 / CPU PhotoWorxx | |
| Average of class Gaming (12271 - 89891, n=105, last 2 years) | |
| Medion Erazer Crawler E40 - MD 62518 | |
| Schenker XMG Apex 15 (Late 23) | |
| Lenovo LOQ 15IRH8 Core i7 | |
| Asus TUF A15 FA507 | |
| Acer Nitro V 15 ANV15-51-582S | |
| Average Intel Core i5-13420H (12330 - 37044, n=5) | |
系统性能
Nitro V 15 在系统性能方面也无法与竞争对手相提并论,不过在 PCMark 10 中的差距没有 CPU 测试中那么大。
CrossMark: Overall | Productivity | Creativity | Responsiveness
WebXPRT 3: Overall
WebXPRT 4: Overall
Mozilla Kraken 1.1: Total
| PCMark 10 / Score | |
| Average of class Gaming (5828 - 12414, n=93, last 2 years) | |
| Schenker XMG Apex 15 (Late 23) | |
| Lenovo LOQ 15IRH8 Core i7 | |
| Medion Erazer Crawler E40 - MD 62518 | |
| Asus TUF A15 FA507 | |
| Acer Nitro V 15 ANV15-51-582S | |
| Average Intel Core i5-13420H, NVIDIA GeForce RTX 4050 Laptop GPU (n=1) | |
| PCMark 10 / Essentials | |
| Lenovo LOQ 15IRH8 Core i7 | |
| Schenker XMG Apex 15 (Late 23) | |
| Average of class Gaming (8810 - 11935, n=97, last 2 years) | |
| Asus TUF A15 FA507 | |
| Medion Erazer Crawler E40 - MD 62518 | |
| Acer Nitro V 15 ANV15-51-582S | |
| Average Intel Core i5-13420H, NVIDIA GeForce RTX 4050 Laptop GPU (n=1) | |
| PCMark 10 / Productivity | |
| Average of class Gaming (6845 - 25323, n=95, last 2 years) | |
| Schenker XMG Apex 15 (Late 23) | |
| Lenovo LOQ 15IRH8 Core i7 | |
| Asus TUF A15 FA507 | |
| Medion Erazer Crawler E40 - MD 62518 | |
| Acer Nitro V 15 ANV15-51-582S | |
| Average Intel Core i5-13420H, NVIDIA GeForce RTX 4050 Laptop GPU (n=1) | |
| PCMark 10 / Digital Content Creation | |
| Average of class Gaming (7602 - 19954, n=95, last 2 years) | |
| Lenovo LOQ 15IRH8 Core i7 | |
| Schenker XMG Apex 15 (Late 23) | |
| Medion Erazer Crawler E40 - MD 62518 | |
| Asus TUF A15 FA507 | |
| Acer Nitro V 15 ANV15-51-582S | |
| Average Intel Core i5-13420H, NVIDIA GeForce RTX 4050 Laptop GPU (n=1) | |
| CrossMark / Overall | |
| Average of class Gaming (1366 - 2409, n=94, last 2 years) | |
| Lenovo LOQ 15IRH8 Core i7 | |
| Medion Erazer Crawler E40 - MD 62518 | |
| Schenker XMG Apex 15 (Late 23) | |
| Asus TUF A15 FA507 | |
| CrossMark / Productivity | |
| Average of class Gaming (1386 - 2254, n=94, last 2 years) | |
| Lenovo LOQ 15IRH8 Core i7 | |
| Medion Erazer Crawler E40 - MD 62518 | |
| Schenker XMG Apex 15 (Late 23) | |
| Asus TUF A15 FA507 | |
| CrossMark / Creativity | |
| Average of class Gaming (1343 - 2786, n=94, last 2 years) | |
| Lenovo LOQ 15IRH8 Core i7 | |
| Schenker XMG Apex 15 (Late 23) | |
| Medion Erazer Crawler E40 - MD 62518 | |
| Asus TUF A15 FA507 | |
| CrossMark / Responsiveness | |
| Lenovo LOQ 15IRH8 Core i7 | |
| Medion Erazer Crawler E40 - MD 62518 | |
| Average of class Gaming (1226 - 2334, n=94, last 2 years) | |
| Schenker XMG Apex 15 (Late 23) | |
| Asus TUF A15 FA507 | |
| WebXPRT 3 / Overall | |
| Average of class Gaming (220 - 532, n=98, last 2 years) | |
| Schenker XMG Apex 15 (Late 23) | |
| Asus TUF A15 FA507 | |
| Lenovo LOQ 15IRH8 Core i7 | |
| Medion Erazer Crawler E40 - MD 62518 | |
| Acer Nitro V 15 ANV15-51-582S | |
| Average Intel Core i5-13420H, NVIDIA GeForce RTX 4050 Laptop GPU (n=1) | |
| WebXPRT 4 / Overall | |
| Average of class Gaming (165 - 354, n=98, last 2 years) | |
| Lenovo LOQ 15IRH8 Core i7 | |
| Acer Nitro V 15 ANV15-51-582S | |
| Average Intel Core i5-13420H, NVIDIA GeForce RTX 4050 Laptop GPU (n=1) | |
| Medion Erazer Crawler E40 - MD 62518 | |
| Asus TUF A15 FA507 | |
| Mozilla Kraken 1.1 / Total | |
| Asus TUF A15 FA507 | |
| Acer Nitro V 15 ANV15-51-582S | |
| Average Intel Core i5-13420H, NVIDIA GeForce RTX 4050 Laptop GPU (n=1) | |
| Medion Erazer Crawler E40 - MD 62518 | |
| Schenker XMG Apex 15 (Late 23) | |
| Lenovo LOQ 15IRH8 Core i7 | |
| Average of class Gaming (391 - 590, n=100, last 2 years) | |
* ... smaller is better
| PCMark 10 Score | 6569 points | |
Help | ||
| AIDA64 / Memory Copy | |
| Average of class Gaming (21750 - 129946, n=105, last 2 years) | |
| Schenker XMG Apex 15 (Late 23) | |
| Medion Erazer Crawler E40 - MD 62518 | |
| Lenovo LOQ 15IRH8 Core i7 | |
| Asus TUF A15 FA507 | |
| Acer Nitro V 15 ANV15-51-582S | |
| Average Intel Core i5-13420H (22003 - 59609, n=5) | |
| AIDA64 / Memory Read | |
| Average of class Gaming (22956 - 118858, n=105, last 2 years) | |
| Medion Erazer Crawler E40 - MD 62518 | |
| Lenovo LOQ 15IRH8 Core i7 | |
| Schenker XMG Apex 15 (Late 23) | |
| Asus TUF A15 FA507 | |
| Acer Nitro V 15 ANV15-51-582S | |
| Average Intel Core i5-13420H (23499 - 68085, n=5) | |
| AIDA64 / Memory Write | |
| Schenker XMG Apex 15 (Late 23) | |
| Average of class Gaming (22297 - 135096, n=105, last 2 years) | |
| Medion Erazer Crawler E40 - MD 62518 | |
| Asus TUF A15 FA507 | |
| Lenovo LOQ 15IRH8 Core i7 | |
| Acer Nitro V 15 ANV15-51-582S | |
| Average Intel Core i5-13420H (21429 - 62529, n=5) | |
| AIDA64 / Memory Latency | |
| Lenovo LOQ 15IRH8 Core i7 | |
| Average of class Gaming (75.3 - 259, n=105, last 2 years) | |
| Average Intel Core i5-13420H (90.2 - 103.6, n=5) | |
| Medion Erazer Crawler E40 - MD 62518 | |
| Acer Nitro V 15 ANV15-51-582S | |
| Schenker XMG Apex 15 (Late 23) | |
| Asus TUF A15 FA507 | |
* ... smaller is better
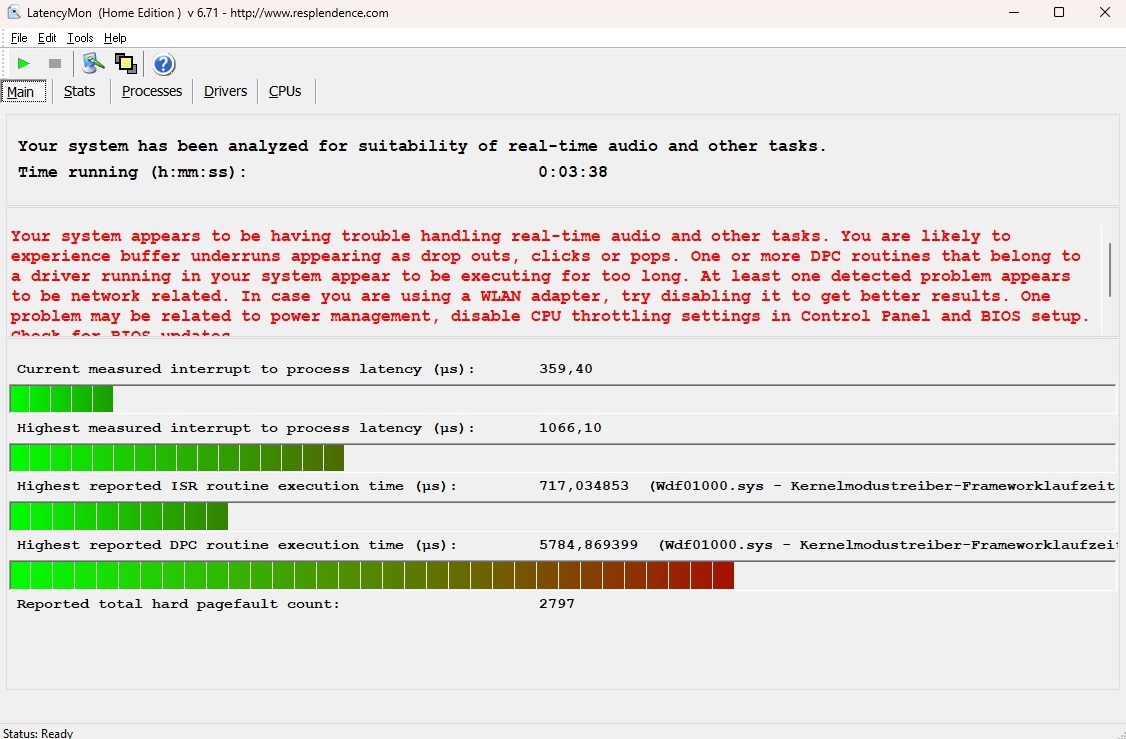
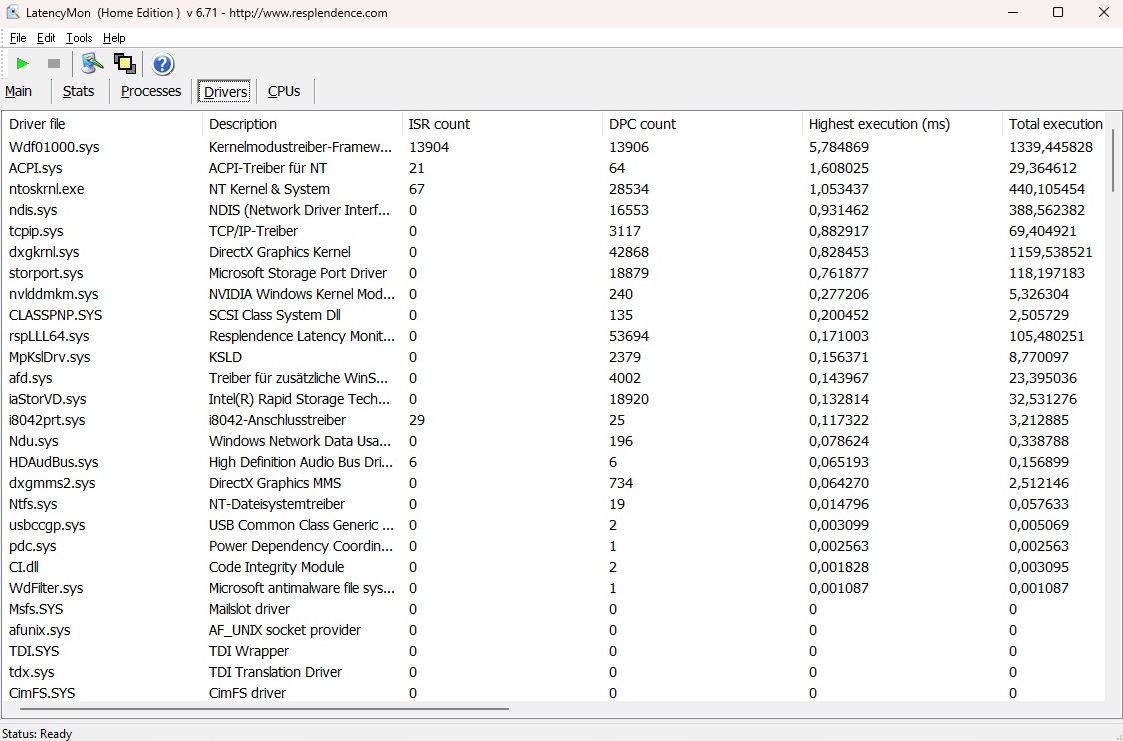
DPC 延迟
LatencyMon 指出,Nitro V 15 只适合部分对延迟敏感的应用,如实时音频和视频编辑。不过,这个问题影响到许多笔记本电脑,只与某些用户有关。
| DPC Latencies / LatencyMon - interrupt to process latency (max), Web, Youtube, Prime95 | |
| Acer Nitro V 15 ANV15-51-582S | |
| Medion Erazer Crawler E40 - MD 62518 | |
| Lenovo LOQ 15IRH8 Core i7 | |
| Schenker XMG Apex 15 (Late 23) | |
* ... smaller is better
大容量存储器
我们评测设备中的M.2存储硬盘由SK hynix制造,对于NVMe设备来说,它能提供稳定的读写性能。不过,与联想LOQ LOQ 15IRH8的固态硬盘类似,它在持续负载下也会出现一定程度的性能下降和波动。

* ... smaller is better
Sustained Load Read: DiskSpd Read Loop, Queue Depth 8
图形卡
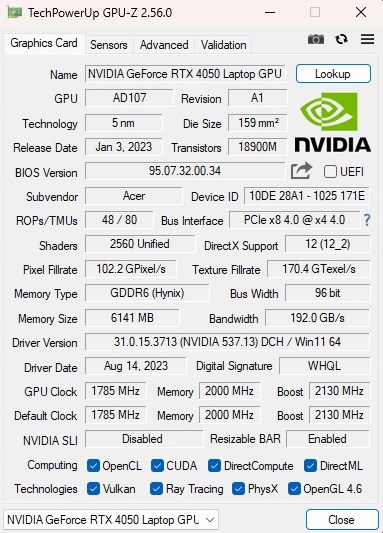
虽然竞争对手在合成图形基准测试中的成绩略胜一筹,但 Nitro V 15 中的 RTX 4050 仍能提供与我们从该 GPU 中看到的平均水平相近的性能。阿达-拉芙蕾丝一代的中端型号可提供 2,560 个着色单元,但显存配置并不特别宽裕,只有 6 GB GDDR6 VRAM 和 96 位接口。宏碁将 TGP 设置为 75 瓦(60 瓦加 15 瓦 Dynamic Boost),这对于 RTX 4050 来说已经相当低了。
| 3DMark 11 Performance | 24506 points | |
| 3DMark Ice Storm Standard Score | 133723 points | |
| 3DMark Cloud Gate Standard Score | 50705 points | |
| 3DMark Fire Strike Score | 18795 points | |
| 3DMark Time Spy Score | 7944 points | |
Help | ||
* ... smaller is better
游戏性能
| The Witcher 3 - 1920x1080 Ultra Graphics & Postprocessing (HBAO+) | |
| Average of class Gaming (104.7 - 240, n=7, last 2 years) | |
| Lenovo LOQ 15IRH8 Core i7 | |
| Schenker XMG Apex 15 (Late 23) | |
| Asus TUF A15 FA507 | |
| Medion Erazer Crawler E40 - MD 62518 | |
| Acer Nitro V 15 ANV15-51-582S | |
| Average NVIDIA GeForce RTX 4050 Laptop GPU (18.5 - 94.7, n=40) | |
| Avatar Frontiers of Pandora - 1920x1080 Ultra Preset AA:T | |
| Average of class Gaming (n=1last 2 years) | |
| Medion Erazer Scout E20 | |
| Acer Nitro V 15 ANV15-51-582S | |
| Average NVIDIA GeForce RTX 4050 Laptop GPU (35 - 35, n=2) | |
| The Finals - 1920x1080 Epic Preset | |
| Medion Erazer Scout E20 | |
| Average NVIDIA GeForce RTX 4050 Laptop GPU (91.8 - 99.2, n=2) | |
| Acer Nitro V 15 ANV15-51-582S | |
| Average of class Gaming (n=1last 2 years) | |
| EA Sports WRC - 1920x1080 Ultra Preset AA:Epic AF:16x | |
| Medion Erazer Scout E20 | |
| Average NVIDIA GeForce RTX 4050 Laptop GPU (61 - 67.3, n=2) | |
| Acer Nitro V 15 ANV15-51-582S | |
| Average of class Gaming (n=1last 2 years) | |
| Assassin's Creed Mirage - 1920x1080 Ultra High Preset (Adaptive Quality Off) | |
| XMG Focus 15 E23 | |
| Average NVIDIA GeForce RTX 4050 Laptop GPU (63 - 70, n=2) | |
| Acer Nitro V 15 ANV15-51-582S | |
| Ready or Not - 1920x1080 Epic Preset | |
| Medion Erazer Scout E20 | |
| Average NVIDIA GeForce RTX 4050 Laptop GPU (95.1 - 107.1, n=2) | |
| Acer Nitro V 15 ANV15-51-582S | |
| Lords of the Fallen - 1920x1080 Ultra Preset | |
| XMG Focus 15 E23 | |
| Average NVIDIA GeForce RTX 4050 Laptop GPU (27.3 - 32.1, n=2) | |
| Acer Nitro V 15 ANV15-51-582S | |
| Counter-Strike 2 - 1920x1080 Very High Preset | |
| Average of class Gaming (26.2 - 275, n=5, last 2 years) | |
| Medion Erazer Scout E20 | |
| Average NVIDIA GeForce RTX 4050 Laptop GPU (80.9 - 110.2, n=2) | |
| Acer Nitro V 15 ANV15-51-582S | |
| Total War Pharaoh - 1920x1080 Ultra Preset | |
| Average of class Gaming (42.9 - 161.4, n=2, last 2 years) | |
| XMG Focus 15 E23 | |
| Average NVIDIA GeForce RTX 4050 Laptop GPU (59.7 - 101, n=3) | |
| Acer Nitro V 15 ANV15-51-582S | |
在稳定性测试中,我们没有遇到任何重大问题(运行 的Witcher 3以全高清/超高清模式运行一小时)。虽然帧速率在测试过程中略有下降,但并没有出现任何异常的性能下降或类似情况。
Witcher 3 FPS chart
| low | med. | high | ultra | |
|---|---|---|---|---|
| GTA V (2015) | 177.3 | 158.2 | 86.9 | |
| The Witcher 3 (2015) | 78 | |||
| Dota 2 Reborn (2015) | 153.7 | 143.6 | 136.5 | 120.3 |
| Final Fantasy XV Benchmark (2018) | 104.3 | 76.5 | ||
| X-Plane 11.11 (2018) | 114.3 | 94.5 | 77 | |
| Far Cry 5 (2018) | 128 | 118 | 102 | |
| Strange Brigade (2018) | 189.5 | 155.2 | 135.2 | |
| Counter-Strike 2 (2023) | 127 | 112.4 | 80.9 | |
| Assassin's Creed Mirage (2023) | 89 | 84 | 63 | |
| Total War Pharaoh (2023) | 147 | 84.1 | 59.7 | |
| Lords of the Fallen (2023) | 54.1 | 38.6 | 27.3 | |
| EA Sports WRC (2023) | 71.2 | 66.6 | 61 | |
| Avatar Frontiers of Pandora (2023) | 55 | 47 | 35 | |
| The Finals (2023) | 130.2 | 113.7 | 91.8 | |
| Ready or Not (2023) | 148.3 | 134.2 | 95.1 |
排放量
噪音排放
与产生的热量相比,Nitro V 15 在运行 3D 应用程序时的噪音过大。我们在游戏过程中(平衡模式)测得的噪音约为 49 dB(A),可以清楚地听到,可能会对某些用户造成困扰。尽管如此,这款笔记本电脑在这方面与竞争对手并无太大区别。空闲时,内部的两个风扇要么完全静止不动,要么以 29 到 30 dB(A) 的中等噪音水平运行。
Noise level
| Idle |
| 25 / 29 / 30 dB(A) |
| Load |
| 49 / 51 dB(A) |
 | ||
30 dB silent 40 dB(A) audible 50 dB(A) loud |
||
min: | ||
| Acer Nitro V 15 ANV15-51-582S GeForce RTX 4050 Laptop GPU, i5-13420H | Medion Erazer Crawler E40 - MD 62518 GeForce RTX 4050 Laptop GPU, i5-13500H | Lenovo LOQ 15IRH8 Core i7 GeForce RTX 4050 Laptop GPU, i7-13620H | Asus TUF A15 FA507 GeForce RTX 4050 Laptop GPU, R7 7735HS | Schenker XMG Apex 15 (Late 23) GeForce RTX 4050 Laptop GPU, R7 7840HS | |
|---|---|---|---|---|---|
| Noise | 4% | -0% | 18% | 3% | |
| off / environment * (dB) | 25 | 23 8% | 23.69 5% | 23.3 7% | 24 4% |
| Idle Minimum * (dB) | 25 | 23 8% | 29.03 -16% | 23.3 7% | 25 -0% |
| Idle Average * (dB) | 29 | 23 21% | 29.03 -0% | 23.3 20% | 29 -0% |
| Idle Maximum * (dB) | 30 | 28.02 7% | 29.03 3% | 23.3 22% | 33 -10% |
| Load Average * (dB) | 49 | 50.21 -2% | 48.7 1% | 29.6 40% | 36 27% |
| Witcher 3 ultra * (dB) | 49 | 51.46 -5% | 48.5 1% | 43 12% | 48 2% |
| Load Maximum * (dB) | 51 | 56.79 -11% | 48.7 5% | 43 16% | 53 -4% |
* ... smaller is better
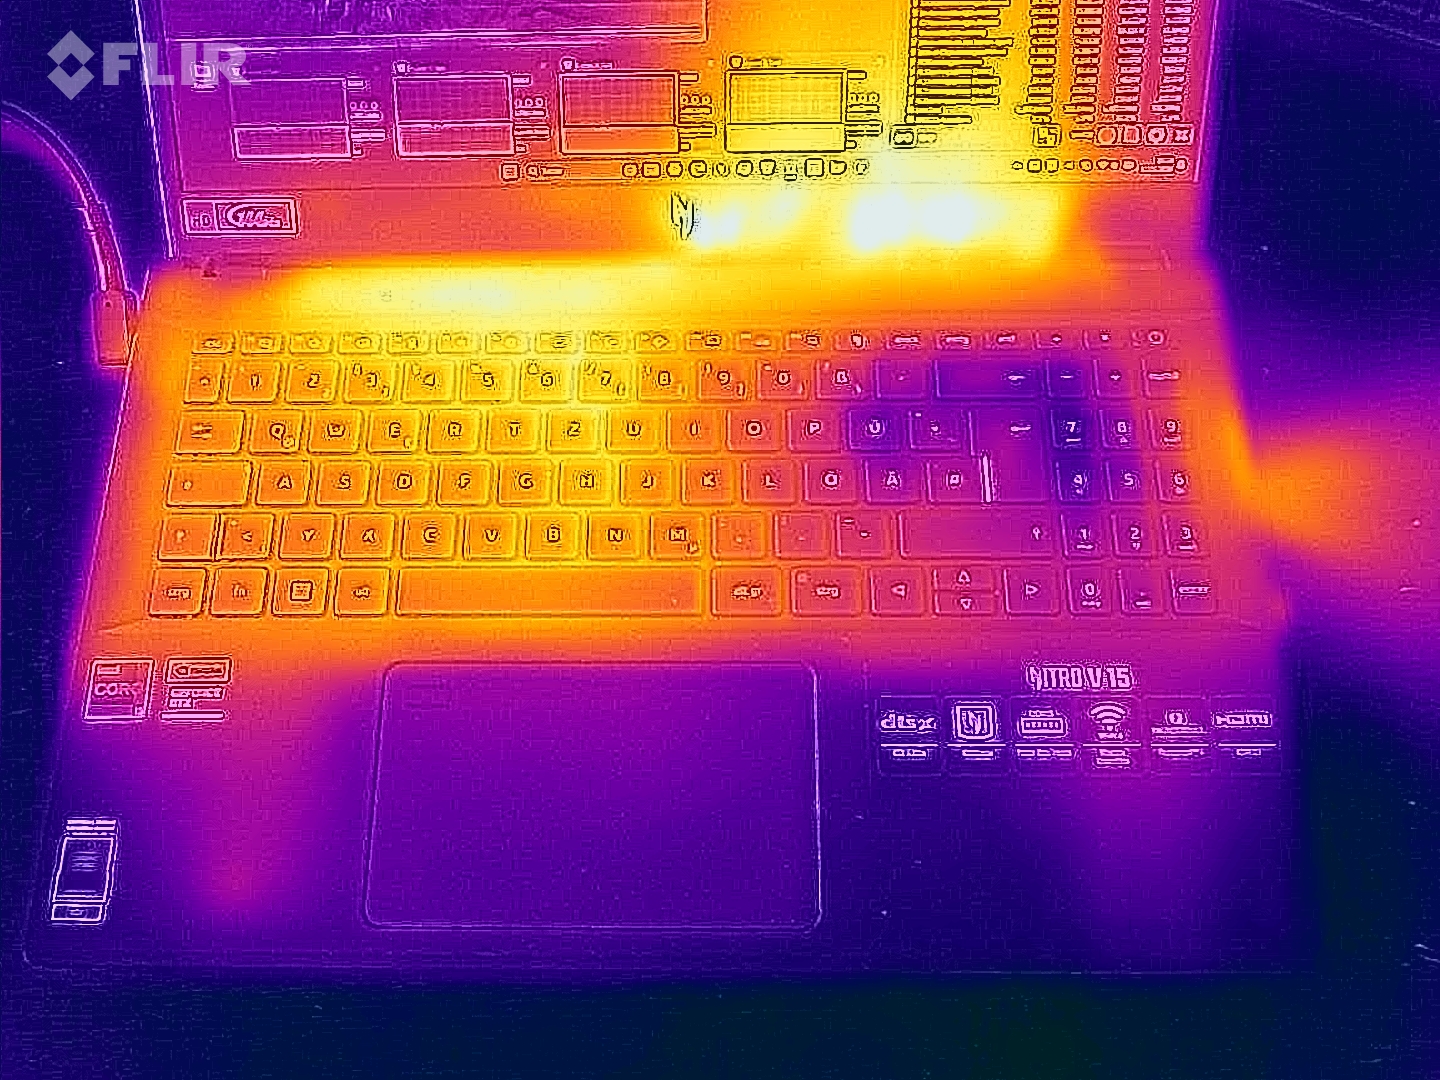
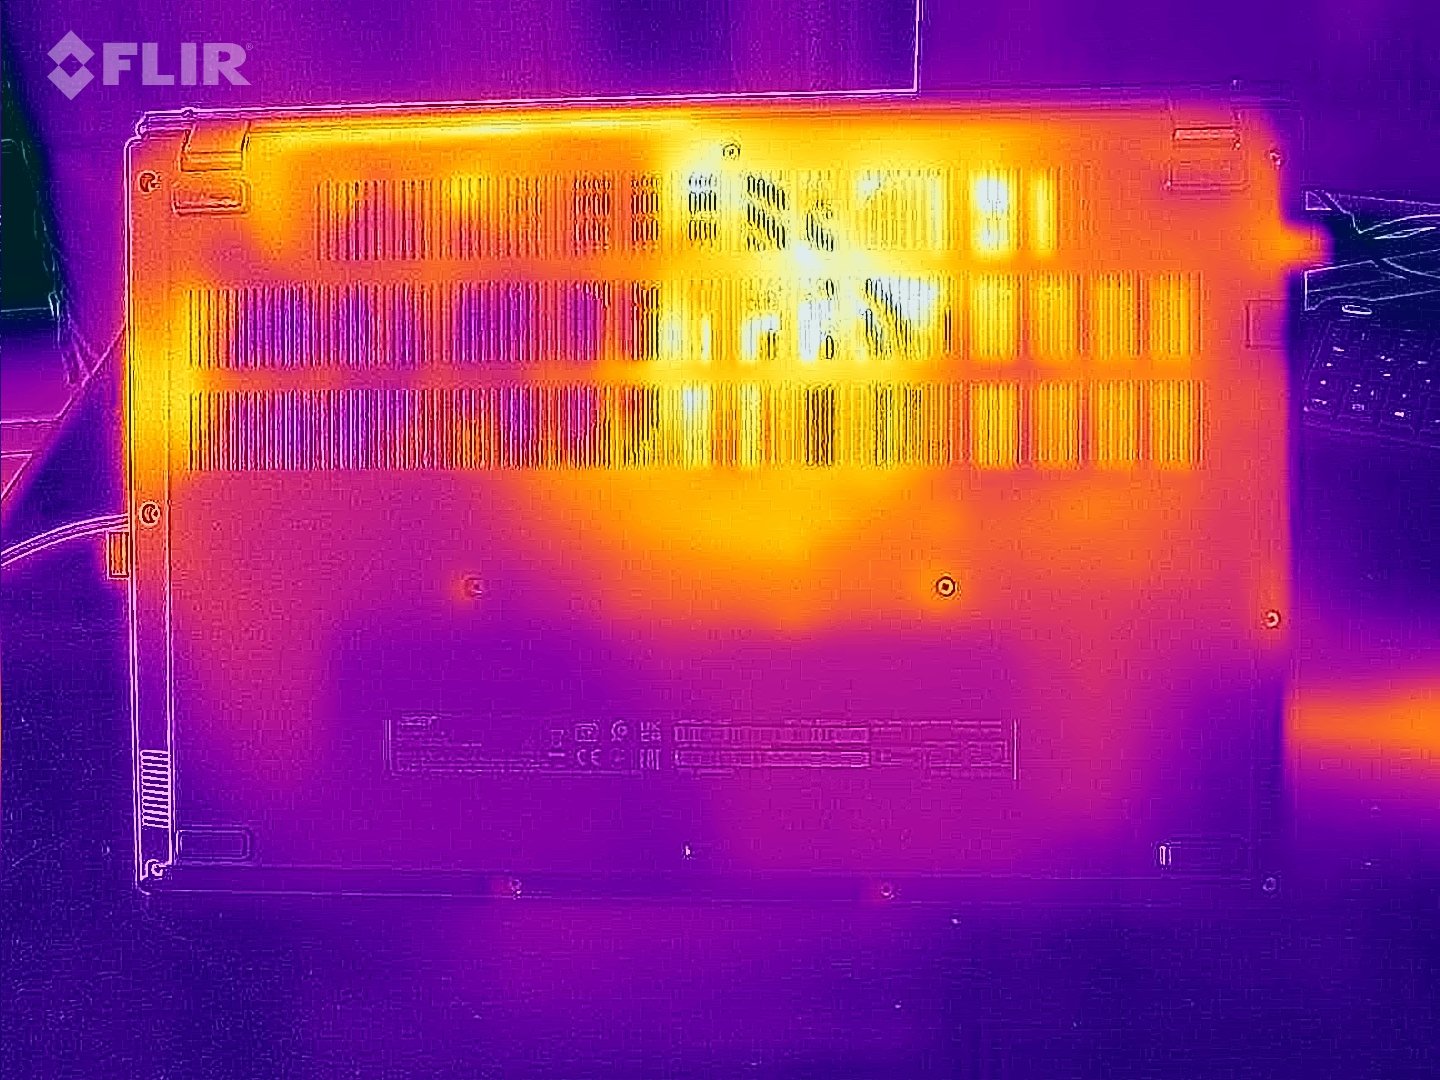
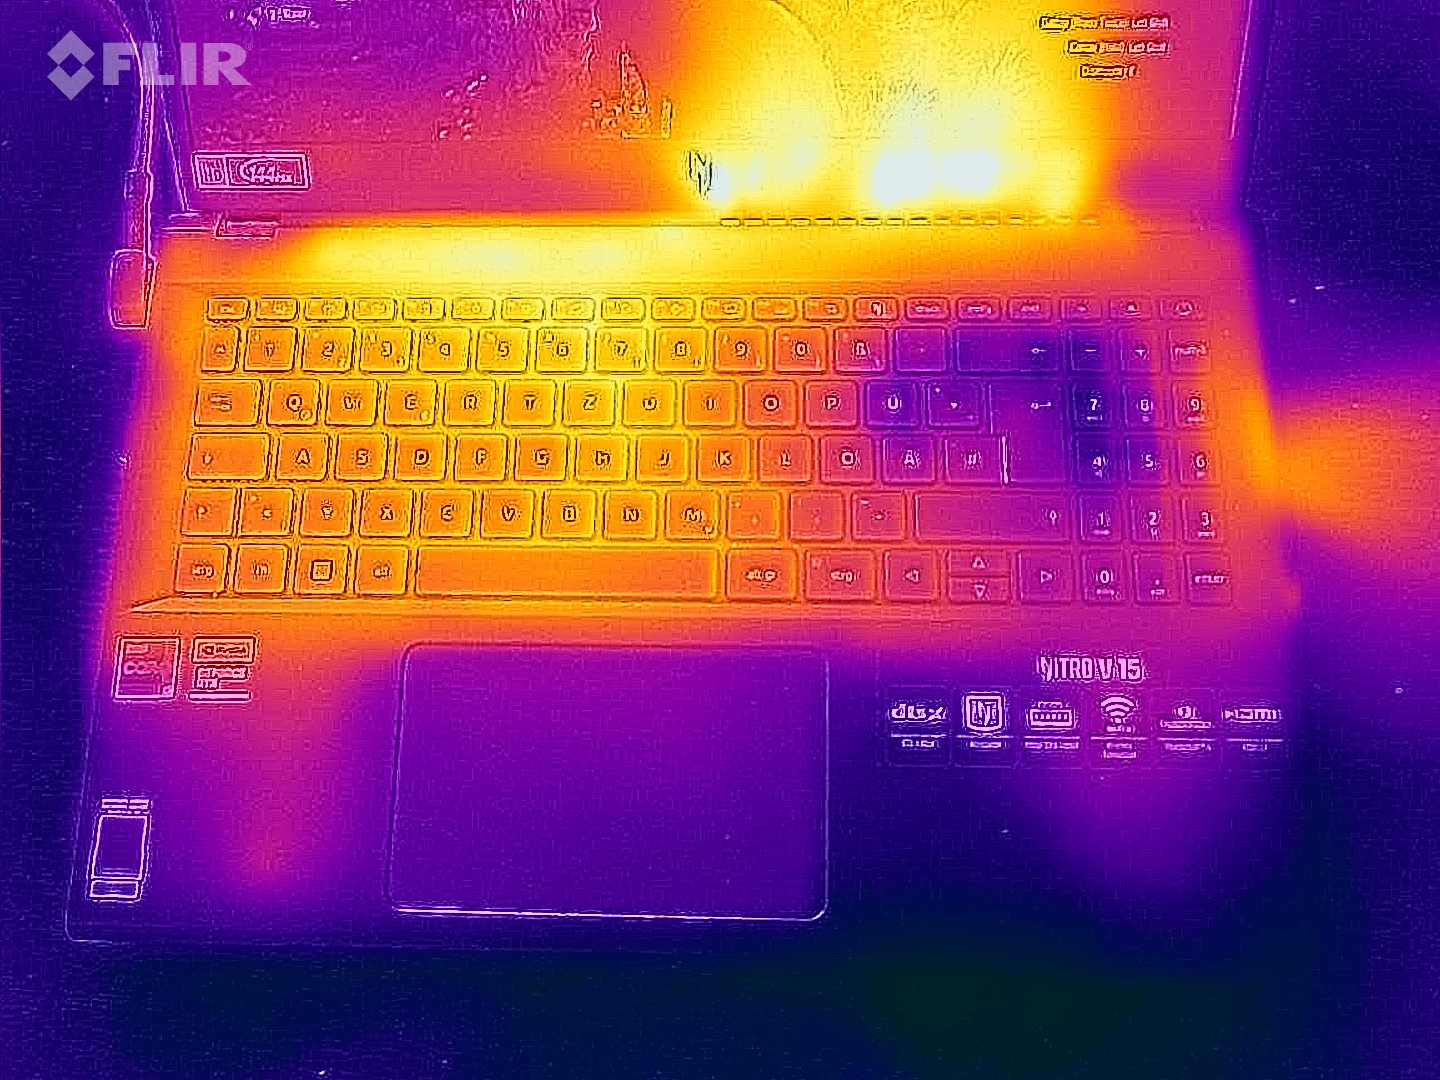
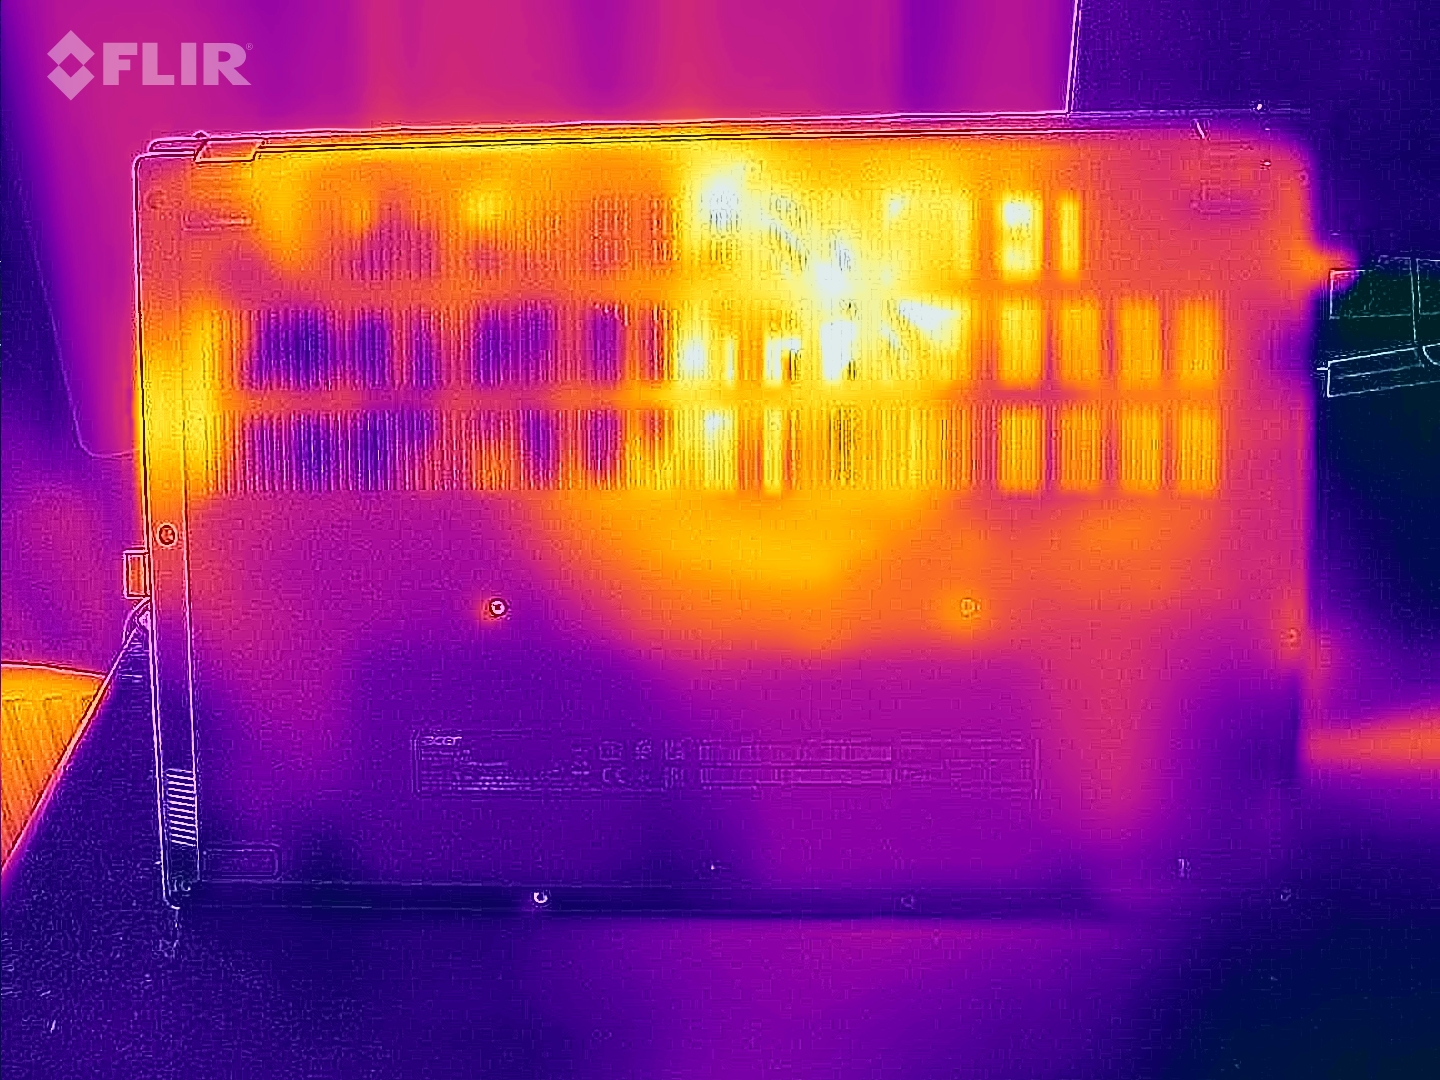
温度
Nitro V 15 的温度并不高。即使经过 60 分钟的压力测试(运行 FurMark 和 Prime95),笔记本电脑的表面温度仍然低于 50°C (122°F)。整个机箱在空闲时保持良好的冷却状态--我们的温度计仅报告了 22 至 28°C 之间的温度(71.6 至 82.4°F)。
(-) The maximum temperature on the upper side is 46 °C / 115 F, compared to the average of 40.4 °C / 105 F, ranging from 21.2 to 68.8 °C for the class Gaming.
(-) The bottom heats up to a maximum of 48 °C / 118 F, compared to the average of 43.2 °C / 110 F
(+) In idle usage, the average temperature for the upper side is 25.1 °C / 77 F, compared to the device average of 33.9 °C / 93 F.
(-) Playing The Witcher 3, the average temperature for the upper side is 39.4 °C / 103 F, compared to the device average of 33.9 °C / 93 F.
(±) The palmrests and touchpad can get very hot to the touch with a maximum of 36 °C / 96.8 F.
(-) The average temperature of the palmrest area of similar devices was 28.8 °C / 83.8 F (-7.2 °C / -13 F).
| Acer Nitro V 15 ANV15-51-582S GeForce RTX 4050 Laptop GPU, i5-13420H | Medion Erazer Crawler E40 - MD 62518 GeForce RTX 4050 Laptop GPU, i5-13500H | Lenovo LOQ 15IRH8 Core i7 GeForce RTX 4050 Laptop GPU, i7-13620H | Asus TUF A15 FA507 GeForce RTX 4050 Laptop GPU, R7 7735HS | Schenker XMG Apex 15 (Late 23) GeForce RTX 4050 Laptop GPU, R7 7840HS | |
|---|---|---|---|---|---|
| Heat | 14% | -20% | 1% | -13% | |
| Maximum Upper Side * (°C) | 46 | 36 22% | 46.4 -1% | 48.9 -6% | 52 -13% |
| Maximum Bottom * (°C) | 48 | 36 25% | 59.2 -23% | 44.6 7% | 47 2% |
| Idle Upper Side * (°C) | 27 | 26 4% | 34.4 -27% | 27.1 -0% | 33 -22% |
| Idle Bottom * (°C) | 28 | 27 4% | 36.2 -29% | 27.5 2% | 33 -18% |
* ... smaller is better
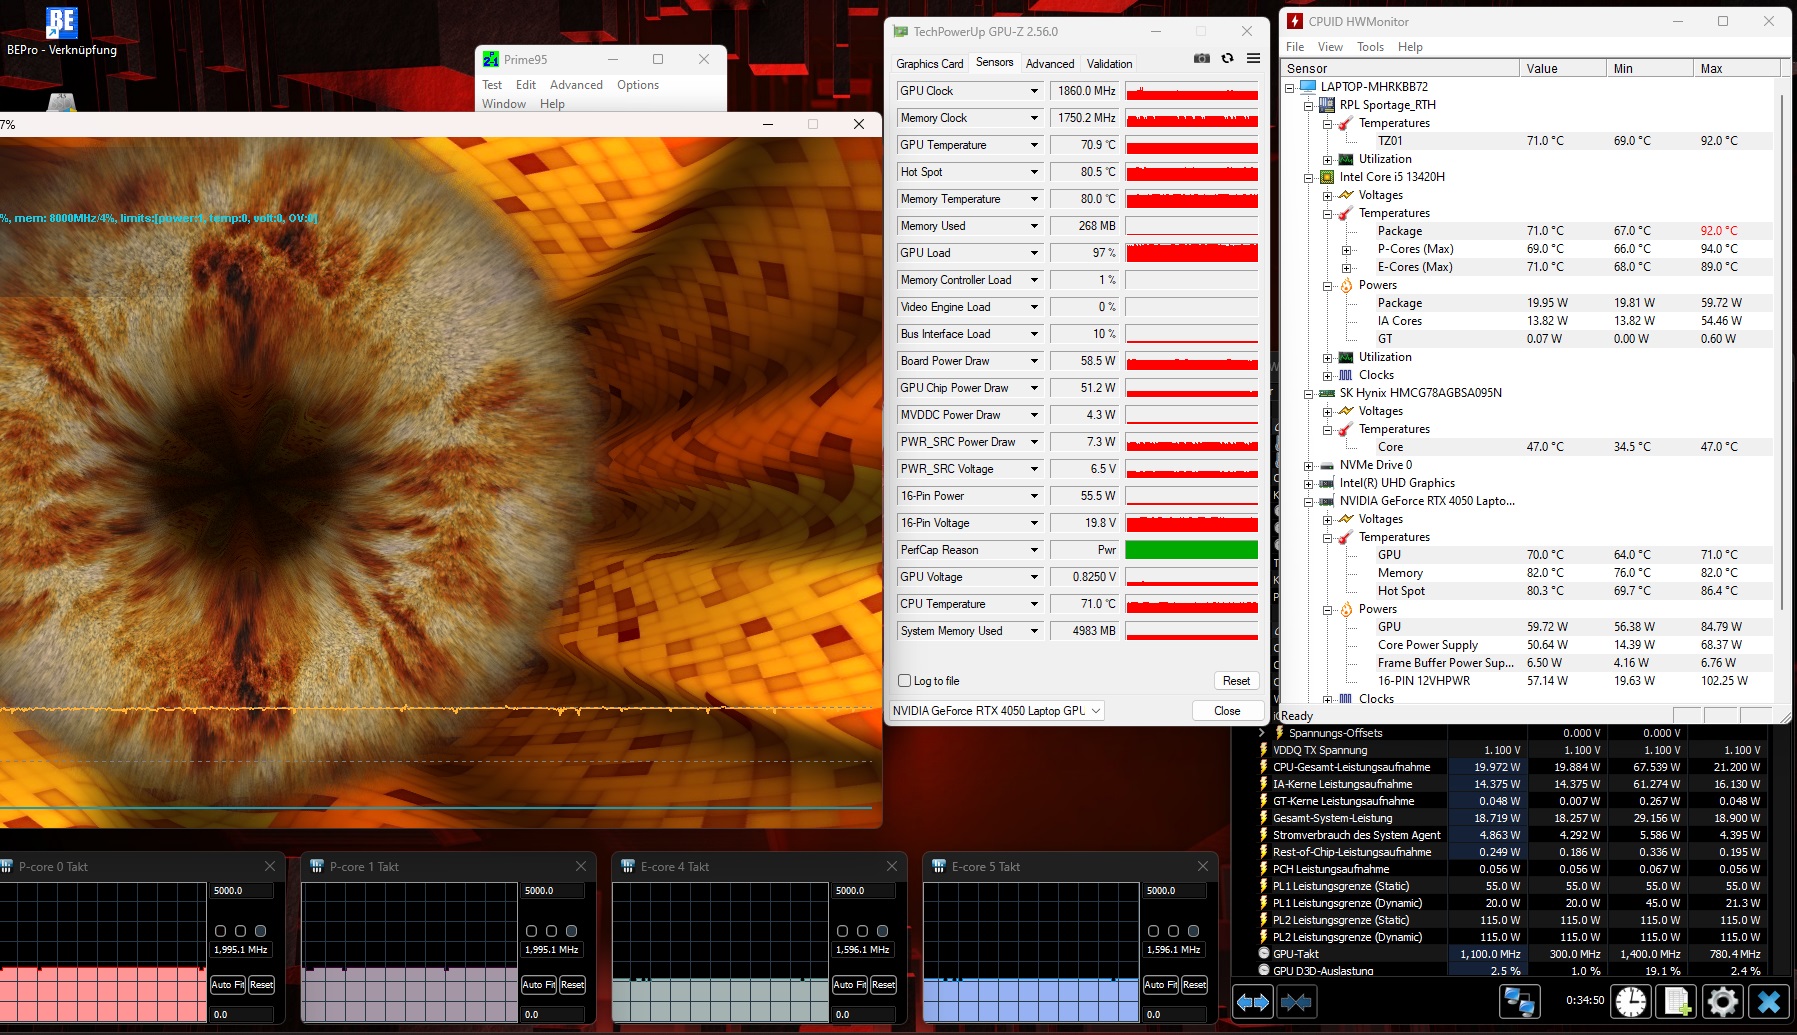
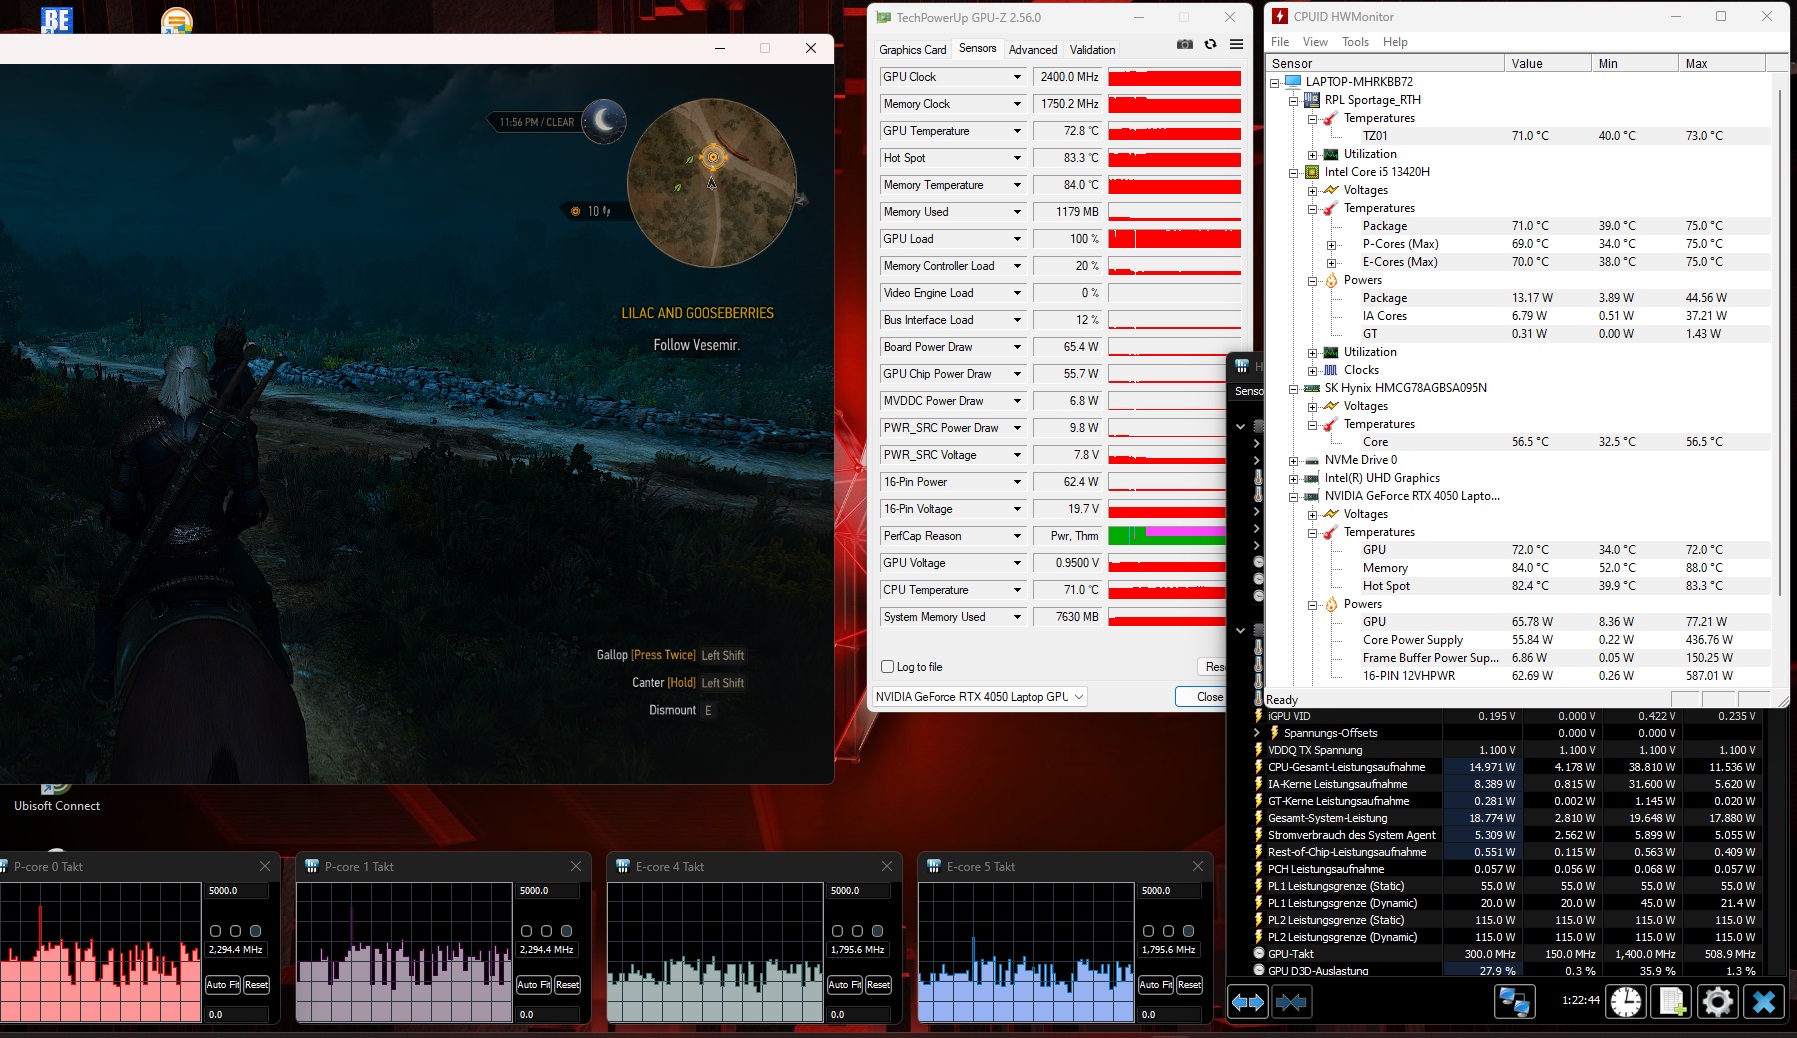
压力测试
笔记本电脑的部件在满负荷运行时也不会过热。CPU 和 GPU 的平均运行温度为 71°C(159.8°F),这是一个相对较好的数值,无需担心或批评。60 分钟的Witcher 3 测试也得出了类似的结果。
发言人
作为一款笔记本电脑,Nitro V 15 的音效还算不错,但低音不足的情况也时有发生。不过,83 分贝(A)的最大音量还是相当不错的。
Acer Nitro V 15 ANV15-51-582S audio analysis
(+) | speakers can play relatively loud (83 dB)
Bass 100 - 315 Hz
(-) | nearly no bass - on average 26.5% lower than median
(±) | linearity of bass is average (13.9% delta to prev. frequency)
Mids 400 - 2000 Hz
(+) | balanced mids - only 3.2% away from median
(+) | mids are linear (4.2% delta to prev. frequency)
Highs 2 - 16 kHz
(+) | balanced highs - only 1.6% away from median
(+) | highs are linear (3.3% delta to prev. frequency)
Overall 100 - 16.000 Hz
(±) | linearity of overall sound is average (15.9% difference to median)
Compared to same class
» 38% of all tested devices in this class were better, 7% similar, 56% worse
» The best had a delta of 6%, average was 18%, worst was 132%
Compared to all devices tested
» 25% of all tested devices were better, 5% similar, 70% worse
» The best had a delta of 4%, average was 23%, worst was 134%
Asus TUF A15 FA507 audio analysis
(±) | speaker loudness is average but good (79.3 dB)
Bass 100 - 315 Hz
(±) | reduced bass - on average 13.7% lower than median
(+) | bass is linear (6.2% delta to prev. frequency)
Mids 400 - 2000 Hz
(±) | higher mids - on average 7.6% higher than median
(±) | linearity of mids is average (7.3% delta to prev. frequency)
Highs 2 - 16 kHz
(+) | balanced highs - only 2.1% away from median
(±) | linearity of highs is average (7.5% delta to prev. frequency)
Overall 100 - 16.000 Hz
(±) | linearity of overall sound is average (17.2% difference to median)
Compared to same class
» 47% of all tested devices in this class were better, 11% similar, 42% worse
» The best had a delta of 6%, average was 18%, worst was 132%
Compared to all devices tested
» 32% of all tested devices were better, 8% similar, 60% worse
» The best had a delta of 4%, average was 23%, worst was 134%
电源管理
耗电量
部分得益于图形切换功能,15 英寸笔记本电脑的耗电量相当低。在我们的对比中,它的耗电量最低,空闲时仅为 7 至 11 瓦,在 3D 应用程序中为 76 至 136 瓦。比较中的其他一些设备耗电量要大得多。
| Off / Standby | |
| Idle | |
| Load |
|
Key:
min: | |
| Acer Nitro V 15 ANV15-51-582S GeForce RTX 4050 Laptop GPU, i5-13420H | Medion Erazer Crawler E40 - MD 62518 GeForce RTX 4050 Laptop GPU, i5-13500H | Lenovo LOQ 15IRH8 Core i7 GeForce RTX 4050 Laptop GPU, i7-13620H | Asus TUF A15 FA507 GeForce RTX 4050 Laptop GPU, R7 7735HS | Schenker XMG Apex 15 (Late 23) GeForce RTX 4050 Laptop GPU, R7 7840HS | Average of class Gaming | |
|---|---|---|---|---|---|---|
| Power Consumption | -50% | -107% | -26% | -20% | -97% | |
| Idle Minimum * (Watt) | 7 | 10 -43% | 18.52 -165% | 8 -14% | 6 14% | 13 ? -86% |
| Idle Average * (Watt) | 8 | 15.3 -91% | 22.54 -182% | 12.1 -51% | 11 -38% | 19 ? -138% |
| Idle Maximum * (Watt) | 11 | 15.5 -41% | 29.79 -171% | 12.5 -14% | 14 -27% | 24.6 ? -124% |
| Load Average * (Watt) | 76 | 88 -16% | 94.5 -24% | 74.9 1% | 65 14% | 110.7 ? -46% |
| Witcher 3 ultra * (Watt) | 98.2 | 155 -58% | 154.4 -57% | 136.6 -39% | 136.5 -39% | |
| Load Maximum * (Watt) | 136 | 202.47 -49% | 190.4 -40% | 185 -36% | 195 -43% | 259 ? -90% |
* ... smaller is better
Power consumption Witcher 3 / Stresstest
Power consumption with external monitor
电池寿命
相反,尽管 Nitro V 15 的电池容量只有 57 瓦时,但它的电池续航时间却非常长。在我们的 Wi-Fi 测试中(亮度降低到 150 cd/m²),宏碁笔记本电脑的续航时间大约为 9.5 小时,这在同类笔记本电脑中是非常可观的。
| Acer Nitro V 15 ANV15-51-582S i5-13420H, GeForce RTX 4050 Laptop GPU, 57 Wh | Medion Erazer Crawler E40 - MD 62518 i5-13500H, GeForce RTX 4050 Laptop GPU, 54 Wh | Lenovo LOQ 15IRH8 Core i7 i7-13620H, GeForce RTX 4050 Laptop GPU, 60 Wh | Asus TUF A15 FA507 R7 7735HS, GeForce RTX 4050 Laptop GPU, 90 Wh | Schenker XMG Apex 15 (Late 23) R7 7840HS, GeForce RTX 4050 Laptop GPU, 62.32 Wh | Average of class Gaming | |
|---|---|---|---|---|---|---|
| Battery runtime | -43% | -37% | -9% | -30% | -33% | |
| Reader / Idle (h) | 21.5 | 8.4 -61% | 8.27 ? -62% | |||
| WiFi v1.3 (h) | 9.4 | 4.1 -56% | 5.9 -37% | 11.7 24% | 7.1 -24% | 7.11 ? -24% |
| Load (h) | 1.7 | 1.2 -29% | 1 -41% | 1.6 -6% | 1.502 ? -12% | |
| H.264 (h) | 3.9 | 6.1 | 12.5 | 8.3 | 8.32 ? |
Pros
Cons
判决
在我们的测试过程中,宏碁 Nitro V 15 的优点和缺点都很明显。
虽然这款笔记本电脑拥有时尚的设计、相对紧凑的机身和令人印象深刻的电池续航时间,但它的显示屏还没有达到当今的标准(尤其是在色彩覆盖范围和亮度方面)。
酷睿 i5-13420H 和GeForce RTX 4050 的性能与售价约 1,000 欧元(1,085 美元)的笔记本电脑大致相当。
对价格有敏感认识的游戏玩家将获得坚实的游戏平台,至少在全高清条件下能够产生可用的帧率。
方便的是,这款笔记本电脑有一个空闲的内存插槽和第二个 M.2 插槽,可用于未来的升级。由于采用了 Thunderbolt 4,端口选择也与时俱进,不过在某些地方仍有改进的余地。
评测中提到的竞争对手,如Lenovo LOQ 15IRH8 和Asus TUF A15 FA507 ,由于其显示屏更出色,因此综合得分略高。
价格和供应情况
配备酷睿 i5-13420H 和GeForce RTX 4050 的宏碁 Nitro V 15 ANV15-51-582S 在多家在线商店(如notebooksbilliger.de)有售,价格约为 900 欧元。在美国亚马逊上,配备速度更快的酷睿 i7-13620H 的型号售价约为 950 美元。.
Acer Nitro V 15 ANV15-51-582S
- 01/16/2024 v7 (old)
Florian Glaser
Transparency
The selection of devices to be reviewed is made by our editorial team. The test sample was provided to the author as a loan by the manufacturer or retailer for the purpose of this review. The lender had no influence on this review, nor did the manufacturer receive a copy of this review before publication. There was no obligation to publish this review. As an independent media company, Notebookcheck is not subjected to the authority of manufacturers, retailers or publishers.
This is how Notebookcheck is testing
Every year, Notebookcheck independently reviews hundreds of laptops and smartphones using standardized procedures to ensure that all results are comparable. We have continuously developed our test methods for around 20 years and set industry standards in the process. In our test labs, high-quality measuring equipment is utilized by experienced technicians and editors. These tests involve a multi-stage validation process. Our complex rating system is based on hundreds of well-founded measurements and benchmarks, which maintains objectivity. Further information on our test methods can be found here.
Price comparison

