Notebookcheck Logo

AMD Radeon R2 (Mullins/Beema/Carrizo-L)

AMD Radeon R2 (Mullins/Beema/Carrizo-L)

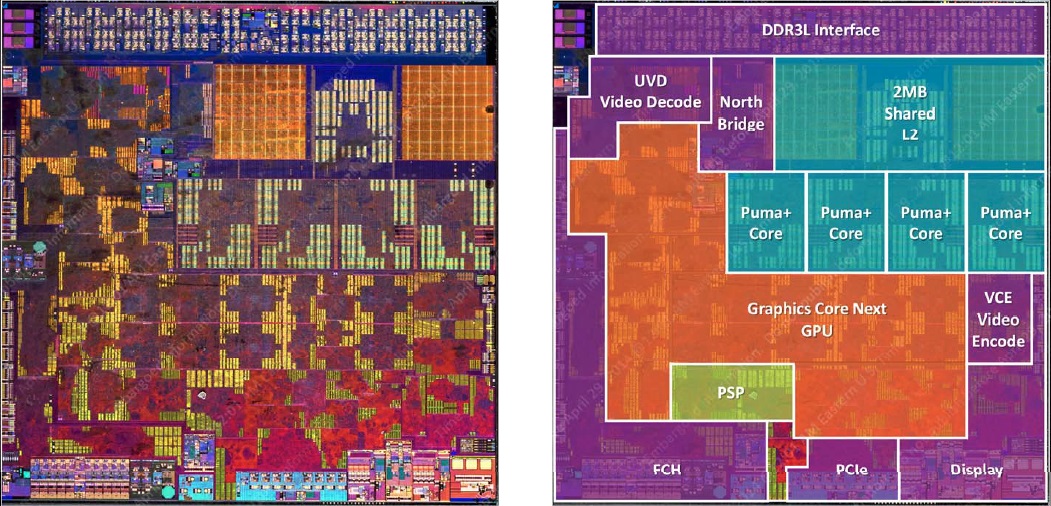
AMD Radeon R2是一款支持DirectX 11.2的集成显卡,使用于一部分AMD APU中(例如E1-6010,E2-6110和E1 Micro-6200T)。它提供了128个着色核心和两个运算单元,基于GCN架构。在Mullins处理器中的版本主频最高可达300MHz,在Beema处理器中最高可达500MHz。这款显卡没有独立的显存,需要使用系统内存(根据型号不同支持单通道DDR3L-1066/1333/1600)。 借助它的UVD芯片,这款显卡可以支持最高4K分辨率的视频硬解码。另外,它还集成了一个特别的视频编码器,名叫VCE。视频信号可以通过VGA,DVI,HDMI 1.4a和DisplayPort 1.2最多输出到两个外接显示器上。 Radeon R2的性能根据处理器型号的不同有很大的差异,主要由于差别很大的主频。在最快的型号中,它的性能接近于Radeon HD 8330,较慢的版本中则接近于Radeon HD 8210。通常情况下,只有较老或者要求很低的游戏如魔兽世界可以流畅运行。

Radeon R Series

Radeon R5 (Beema/Carrizo-L) 128 @ 0.85 GHz64 Bit
Radeon R4 (Beema) 128 @ 0.8 GHz64 Bit
Radeon R3 (Mullins/Beema) 128 @ 0.35 - 0.69 GHz64 Bit
Radeon R2 (Mullins/Beema/Carrizo-L) 128 @ 0.3 - 0.6 GHz64 Bit
Radeon R6 (Mullins) 128 @ 0.5 GHz64 Bit
CodenameBeema/Mullins
ArchitectureGCN 1.1
Pipelines128 - unified
Core Speed300 - 600 (Boost) MHz
Memory Bus Width64 Bit
Shared Memoryyes
APIDirectX 12 (FL 12_0), Shader 5.0
technology28 nm
Date of Announcement29.04.2014
CPU in Radeon R2 (Mullins/Beema/Carrizo-L)GPU Base SpeedGPU Boost / Turbo
AMD E2-71104 x 1800 MHz, 12-15 W? MHz600 MHz
AMD E2-61104 x 1500 MHz, 15 W? MHz500 MHz
AMD E1 Micro-6200T2 x 1000 MHz, 3.95 W? MHz300 MHz
AMD E1-60102 x 1350 MHz, 10 W260 MHz350 MHz
min. - max.260 - ? MHz300 - 600 MHz

Benchmarks

Performance Rating - 3DMark 11 + Fire Strike + Time Spy
0.2 pt (1%)
AMD Radeon HD 8180
0.06605 -61%
...
0.1301 -23%
AMD Radeon HD 8240
0.1332 -22%
0.1449 -15%
0.149 -12%
AMD Radeon HD 8280
0.1494 -12%
0.1562 -8%
AMD Radeon HD 8330
0.1599 -6%
Intel HD Graphics (Haswell)
0.1651 -3%
0.1651 -3%
AMD Radeon R2 (Mullins/Beema/Carrizo-L)
0.1699
AMD Radeon HD 8350G
0.1767 4%
AMD Radeon HD 8400
0.1827 8%
0.1859 9%
0.1911 12%
Intel HD Graphics 4200
0.1966 16%
Intel UHD Graphics 600
0.1972 16%
AMD Radeon R4 (Kaveri)
0.1975 16%
0.2 18%
Intel UHD Graphics 605
0.2068 22%
...
21.1 12319%
max:
33.3 19500%
0%
100%
3DMark - 3DMark Cloud Gate Score
min: 1319     avg: 1981     median: 1980.5 (2%)     max: 2642 Points
3DMark - 3DMark Cloud Gate Graphics
min: 2207     avg: 2650     median: 2650 (1%)     max: 3093 Points
3DMark - 3DMark Fire Strike Standard Score
min: 276     avg: 350.5     median: 350.5 (1%)     max: 425 Points
3DMark - 3DMark Fire Strike Standard Graphics
min: 295     avg: 373     median: 373 (0%)     max: 451 Points
3DMark - 3DMark Ice Storm Graphics
min: 22359     avg: 26820     median: 23669 (3%)     max: 34433 Points
3DMark 11 - 3DM11 Performance Score
min: 371     avg: 494.7     median: 434.5 (1%)     max: 693 Points
3DMark 11 - 3DM11 Performance GPU
min: 395     avg: 471.7     median: 397 (0%)     max: 623 Points
171.8 -64%
...
Intel HD Graphics (Braswell)
389.9 -17%
415 -12%
415.3 -12%
AMD Radeon HD 8250
422.5 -10%
AMD Radeon HD 8240
427.5 -9%
443 -6%
453 -4%
467 -1%
469.1 -1%
AMD Radeon R2 (Mullins/Beema/Carrizo-L)
471.7
478.6 1%
Intel HD Graphics (Haswell)
479.6 2%
492 4%
AMD Radeon HD 8280
496 5%
499.8 6%
513 9%
519 10%
522 11%
522 11%
...
59943 12608%
max:
106023 22377%
0%
100%
3DMark Vantage
3DM Vant. Perf. total +
3DMark Vantage - 3DM Vant. Perf. total
1178 Points (0%)
3DM Vant. Perf. GPU no PhysX +
3DMark Vantage - 3DM Vant. Perf. GPU no PhysX
1091 Points (1%)
ATI Radeon HD 3200
62 -94%
...
NVIDIA GeForce G210M
942 -14%
945 -13%
962 -12%
972 -11%
997 -9%
ATI Mobility Radeon HD 3670
1027 -6%
NVIDIA GeForce 9650M GT
1054 -3%
1072 -2%
1090 0%
AMD Radeon R2 (Mullins/Beema/Carrizo-L)
1091
AMD Radeon HD 8250
1113 2%
1144 5%
1186 9%
NVIDIA GeForce 9600M GT
1192 9%
AMD Radeon HD 8240
1247 14%
1282 18%
1295 19%
Intel HD Graphics (Braswell)
1328 22%
1331 22%
...
132443 12040%
max:
170928 15567%
0%
100%
3DMark 06 3DMark 06 - Standard 1280x1024 +
3DMark 06
min: 2425     avg: 3242     median: 3242 (4%)     max: 4059 Points
Unigine Heaven 2.1 - Heaven 2.1 high
5.1 fps (1%)
0.6 -88%
...
1 -80%
1.2 -76%
1.5 -71%
2.5 -51%
Intel HD Graphics (Bay Trail)
2.767 -46%
AMD Radeon HD 8610G
4.3 -16%
Intel HD Graphics (Braswell)
4.9 -4%
5 -2%
5.1 0%
AMD Radeon R2 (Mullins/Beema/Carrizo-L)
5.1
5.3 4%
5.4 6%
5.4 6%
5.45 7%
5.5 8%
5.7 12%
Intel HD Graphics (Cherry Trail)
5.7 12%
6.2 22%
6.7 31%
...
532 10331%
0%
100%
Cinebench R10 Cinebench R10 Shading (32bit) +
Cinebench R10 - Cinebench R10 Shading (32bit)
min: 1501     avg: 2029     median: 1616 (1%)     max: 2971 points
Cinebench R11.5 Cinebench R11.5 OpenGL 64 Bit +
Cinebench R11.5 - Cinebench R11.5 OpenGL 64 Bit
min: 8.89     avg: 11.4     median: 11.4 (4%)     max: 13.9 fps
Cinebench R15
Cinebench R15 OpenGL 64 Bit +
Cinebench R15 - Cinebench R15 OpenGL 64 Bit
min: 7.95     avg: 10.7     median: 9.5 (1%)     max: 14.7 fps
Cinebench R15 OpenGL Ref. Match 64 Bit +
Cinebench R15 - Cinebench R15 OpenGL Ref. Match 64 Bit
98 % (98%)
GFXBench 3.1 - GFXBench Manhattan ES 3.1 Offscreen
12.7 fps (0%)
GFXBench 3.0 - GFXBench 3.0 Manhattan Offscreen
14 fps (1%)
GFXBench (DX / GLBenchmark) 2.7
GFXBench T-Rex HD Offscreen C24Z16 +
GFXBench (DX / GLBenchmark) 2.7 - GFXBench T-Rex HD Offscreen C24Z16
min: 29     avg: 36     median: 36 (0%)     max: 43 fps
LuxMark v2.0 64Bit - LuxMark v2.0 Room GPU
min: 37     avg: 51     median: 51 (0%)     max: 65 Samples/s
LuxMark v2.0 64Bit - LuxMark v2.0 Sala GPU
min: 71     avg: 89     median: 89 (0%)     max: 107 Samples/s
ComputeMark v2.1 - ComputeMark v2.1 Result
min: 254     avg: 340.5     median: 340.5 (0%)     max: 427 points
- Range of benchmark values for this graphics card
- Average benchmark values for this graphics card
* Smaller numbers mean a higher performance

Game Benchmarks

The following benchmarks stem from our benchmarks of review laptops. The performance depends on the used graphics memory, clock rate, processor, system settings, drivers, and operating systems. So the results don't have to be representative for all laptops with this GPU. For detailed information on the benchmark results, click on the fps number.

FIFA 16

FIFA 16

2015
low 1280x720
22.6  fps    + Compare
high 1366x768
14.8  fps    + Compare
» The benchmarks indicate that the game is not playable in the tested settings.
low 1366x768
27.7  fps    + Compare
med. 1366x768
18.8  fps    + Compare
» The benchmarks indicate that the game is not playable in the tested settings.
low 1024x768
48.4  fps    + Compare
med. 1366x768
15  fps    + Compare
» With all tested laptops playable in detail settings low.
low 1024x768
22.4  fps    + Compare
med. 1366x768
15.6  fps    + Compare
» The benchmarks indicate that the game is not playable in the tested settings.
F1 2014

F1 2014

2014
low 1024x768
37  fps    + Compare
med. 1366x768
26  fps    + Compare
» With all tested laptops playable in detail settings low.
Sims 4

Sims 4

2014
low 1024x768
78.7  fps    + Compare
med. 1366x768
23.7  fps    + Compare
» With all tested laptops playable in detail settings low.
low 1024x768
12.5 55.9 ~ 34 fps    + Compare
med. 1366x768
23.5  fps    + Compare
» The benchmarks indicate that the game is not playable in the tested settings.
low 1280x720
16.9 19 ~ 18 fps    + Compare
med. 1366x768
9.6 10.1 ~ 10 fps    + Compare
high 1366x768
8.9  fps    + Compare
» The benchmarks indicate that the game is not playable in the tested settings.
low 1024x768
17.1 30.8 ~ 24 fps    + Compare
med. 1366x768
9.8 16.2 ~ 13 fps    + Compare
high 1366x768
12.2  fps    + Compare
» The benchmarks indicate that the game is not playable in the tested settings.
low 1024x768
43.6  fps    + Compare
med. 1366x768
34.5  fps    + Compare
» With all tested laptops playable in detail settings low.
low 1024x768
22.5  fps    + Compare
» The benchmarks indicate that the game is not playable in the tested settings.
Anno 2070

Anno 2070

2011
low 1024x768
25.2  fps    + Compare
med. 1366x768
11.9  fps    + Compare
» The benchmarks indicate that the game is not playable in the tested settings.
low 1024x768
27.1  fps    + Compare
med. 1360x768
12.4  fps    + Compare
» The benchmarks indicate that the game is not playable in the tested settings.
World of Warcraft

World of Warcraft

2005
low 800x600
30.6  fps    + Compare
med. 1024x768
27.8  fps    + Compare
high 1280x1024
7  fps    + Compare
» The benchmarks indicate that the game is not playable in the tested settings.
lowmed.highultraQHD4K
FIFA 1622.614.8
World of Warships27.718.8
Dirt Rally48.415
Battlefield Hardline22.415.6
F1 20143726
Sims 478.723.7
GRID: Autosport3423.5
BioShock Infinite18108.9
Tomb Raider241312.2
Counter-Strike: GO43.634.5
Diablo III22.5
Anno 207025.211.9
StarCraft 227.112.4
World of Warcraft30.627.87
< 30 fps
< 60 fps
< 120 fps
≥ 120 fps
8
5
1
11
1

4


For more games that might be playable and a list of all games and graphics cards visit our Gaming List

v1.26
log 15. 05:23:06

#0 no ids found in url (should be separated by "_") +0s ... 0s

#1 not redirecting to Ajax server +0s ... 0s

#2 did not recreate cache, as it is less than 5 days old! Created at Wed, 13 Mar 2024 05:40:26 +0100 +0.001s ... 0.001s

#3 no comparison url found in template nbc.compare_page_1 needed +0.039s ... 0.04s

#4 no comparison url found in template nbc.compare_page_1 needed +0s ... 0.041s

#5 no comparison url found in template nbc.compare_page_1 needed +0s ... 0.041s

#6 no comparison url found in template nbc.compare_page_1 needed +0s ... 0.041s

#7 composed specs +0s ... 0.041s

#8 did output specs +0s ... 0.041s

#9 start showIntegratedCPUs +0s ... 0.041s

#10 getting avg benchmarks for device 5498 +0.027s ... 0.069s

#11 got single benchmarks 5498 +0.021s ... 0.089s

#12 got avg benchmarks for devices +0s ... 0.089s

#13 min, max, avg, median took s +0.438s ... 0.528s

#14 before gaming benchmark output +0s ... 0.528s

#15 Got 35 rows for game benchmarks. +0.004s ... 0.532s

#16 composed SQL query for gamebenchmarks +0s ... 0.532s

#17 got data and put it in $dataArray +0.011s ... 0.543s

#18 benchmarks composed for output. +0.381s ... 0.924s

#19 no comparison url found in template nbc.compare_page_1 needed +0.003s ... 0.927s

#20 return log +0s ... 0.927s

Notebook reviews with AMD Radeon R2 (Mullins/Beema/Carrizo-L) graphics card

Asus D540YA-XO540T: AMD E1-6010, 15.60", 2 kg
  External Review » Asus D540YA-XO540T

HP 15-bw042ns: unknown, 15.60", 2.1 kg
  External Review » HP 15-bw042ns

Lenovo Ideapad 110-15ACL-80TJ004XRK: AMD E1-7010, 15.60", 2.6 kg
  External Review » Lenovo Ideapad 110-15ACL-80TJ004XRK

Asus A540YA-DM329T: AMD E2-7110, 15.60", 2 kg
  External Review » Asus A540YA-DM329T

HP 17-y018ns: AMD E2-7110, 17.30", 2.7 kg
  External Review » HP 17-y018ns

HP 15-ba023ns: AMD E2-7110, 15.60", 2 kg
  External Review » HP 15-ba023ns

Asus F540YA-XX078T: AMD E1-7010, 15.60", 2 kg
  External Review » Asus F540YA-XX078T

HP 255 G5-W4M78EA: AMD E2-7110, 15.60", 2 kg
  External Review » HP 255 G5-W4M78EA

HP 14-an013nr: AMD E2-7110, 14.00", 1.8 kg
  External Review » HP 14-an013nr

HP 15-ba010nr: AMD E2-7110, 15.60", 2.1 kg
  External Review » HP 15-ba010nr

HP Compaq 15-h015ng: AMD E1-6010, 15.60", 2.2 kg
  External Review » HP Compaq 15-h015ng

Please share our article, every link counts!

» Comparison of GPUs
Detailed list of all laptop GPUs sorted by class and performance.

» Benchmark List
Sort and restrict laptop GPUs based on performance in synthetic benchmarks.

» Notebook Gaming List
Playable games for each graphics card and their average FPS results.

Class 0

Arc A380

Class 1

GeForce RTX 2080 Super Mobile

Class 2

M1 Max 32-Core GPU *
GeForce RTX 2070 Super Mobile
M1 Max 24-Core GPU *
Quadro RTX 5000 Max-Q
Radeon RX 5700M *
GeForce GTX 1080 Mobile
Quadro RTX 4000 (Laptop)
M1 Pro 16-Core GPU *
Radeon PRO W6600M *
GeForce RTX 2070 Super Max-Q
Quadro RTX 4000 Max-Q *
M1 Pro 14-Core GPU *
Quadro P5200
Quadro RTX 3000 Max-Q *
Quadro P4200
Quadro P5000 Max-Q *
GeForce GTX 980 (Laptop)
Quadro P4000
Quadro P4000 Max-Q
Quadro P3200
Radeon RX 580X (Laptop) *
Radeon RX 580 (Laptop)
Radeon Pro 5300M
Radeon RX 5300M
Quadro P3000 Max-Q *
Quadro T2000 Max-Q *
Radeon Pro WX 7100 *
Radeon RX 570X (Laptop) *
Radeon RX 570 (Laptop) *
Radeon RX 470 (Laptop) *
Quadro T1000 Max-Q *

Class 3

Vega M GH
Quadro M5000M
GeForce GTX 1050 Ti Mobile
Radeon 680M
Quadro P2000
Quadro P2000 Max-Q
Quadro M4000M
T500 Laptop GPU *
Radeon R9 M395X
GeForce GTX 1050 Ti Max-Q *
Radeon Pro Vega 16
WX Vega M GL
Radeon R9 M485X
Quadro M3000M
FirePro W7170M
Radeon R9 M395
GeForce GTX 1050 Max-Q *
Radeon 660M
Radeon Pro WX 4150 *
Radeon RX 560X (Laptop)
Radeon RX 560 (Laptop)
Radeon RX 460 (Laptop)
Quadro P1000
Radeon R9 M390
Xe MAX
Radeon Pro 560X
Radeon Pro 560
Radeon Pro 460
Radeon Pro WX 4130 *
GeForce GTX 960M
Quadro P620 *
Radeon RX 550X (Laptop)
Radeon Pro WX 3200 *
Radeon Pro 555X
Radeon Pro 555
Radeon Pro 455
Quadro P600
Quadro M2000M
Radeon RX 540X *
Radeon Pro WX 2100 *
Radeon Pro WX 3100 *
GeForce GTX 950M
Radeon Pro 450
Radeon 630
Radeon 540X *
Radeon R9 M385X
Quadro P520
Quadro M1000M
GeForce 945M
Quadro P500 *
Iris Plus Graphics G7 (Ice Lake 64 EU) *
Vega 10 *
Iris Pro Graphics 580
FirePro W5170M *
Radeon R9 M370X
Vega 9
FirePro W5130M
UHD Graphics Xe G4 48EUs *
UHD Graphics 32EUs
UHD Graphics Xe 32EUs (Tiger Lake-H) *
UHD Graphics 750
Vega 7
Radeon R7 M465
Iris Pro Graphics 6200
Vega 8
GeForce 940M
Iris Plus Graphics G4 (Ice Lake 48 EU)
Quadro M600M
FirePro W4190M
Radeon R9 M375
Radeon R7 M445
Iris Plus Graphics 650
Iris Graphics 550
Radeon 625
Vega 6 *
Iris Plus Graphics 640
Iris Graphics 540
UHD Graphics 24EUs (Alder Lake-N) *
Radeon R7 M360
GeForce 920M
Radeon 620
Radeon R7 M340
Radeon 610
Radeon 610M *
Vega 6 *
UHD Graphics G1 (Ice Lake 32 EU)
UHD Graphics Xe 16EUs (Tiger Lake-H) *
HD Graphics 530
Radeon R5 (Bristol Ridge)
Adreno 690 *
Adreno 685 *
Adreno 680 *
Radeon R5 M330
GeForce 910M
HD Graphics 520

Class 4

UHD Graphics 730
Radeon R5 M320 *
Radeon R5 M315 *
Radeon R5 M420 *
Vega 2 *
UHD Graphics 617
UHD Graphics 615
HD Graphics 515
UHD Graphics 610
HD Graphics 510
UHD Graphics 605
Radeon R4 (Stoney Ridge)
Radeon R2 (Stoney Ridge)
HD Graphics (Broadwell)
UHD Graphics 600
HD Graphics (Braswell)

Class 5

* Approximate position of the graphics adapter

> Notebookcheck中文版(NBC中国) > FAQ / 小提示/ 技术参数 > 移动显示芯片——基准测试成绩列表 > AMD Radeon R2 (Mullins/Beema)
Klaus Hinum (Update: 2016-01-26)