结论:1 千克重的商务笔记本电脑,游戏性能卓越
与 Lunar Lake 和 Arrow Lake 相比,Panther Lake 在图形性能和每瓦 GPU 性能方面实现了跨时代的飞跃。它可以在与 Arrow Lake-H 类似的功耗包络线下运行,同时在 1 千克的 14 英寸笔记本电脑上提供类似于GeForce RTX 4050 的性能。此外,CPU 还继承了 Lunar Lake 的许多优点,包括电池寿命长和 NPU 性能强。AMD Strix Halo 系统,如 14 英寸 HP ZBook Ultra G1a等 AMD Strix Halo 系统速度更快,但它们的功耗也高于 Panther Lake-X 系列。
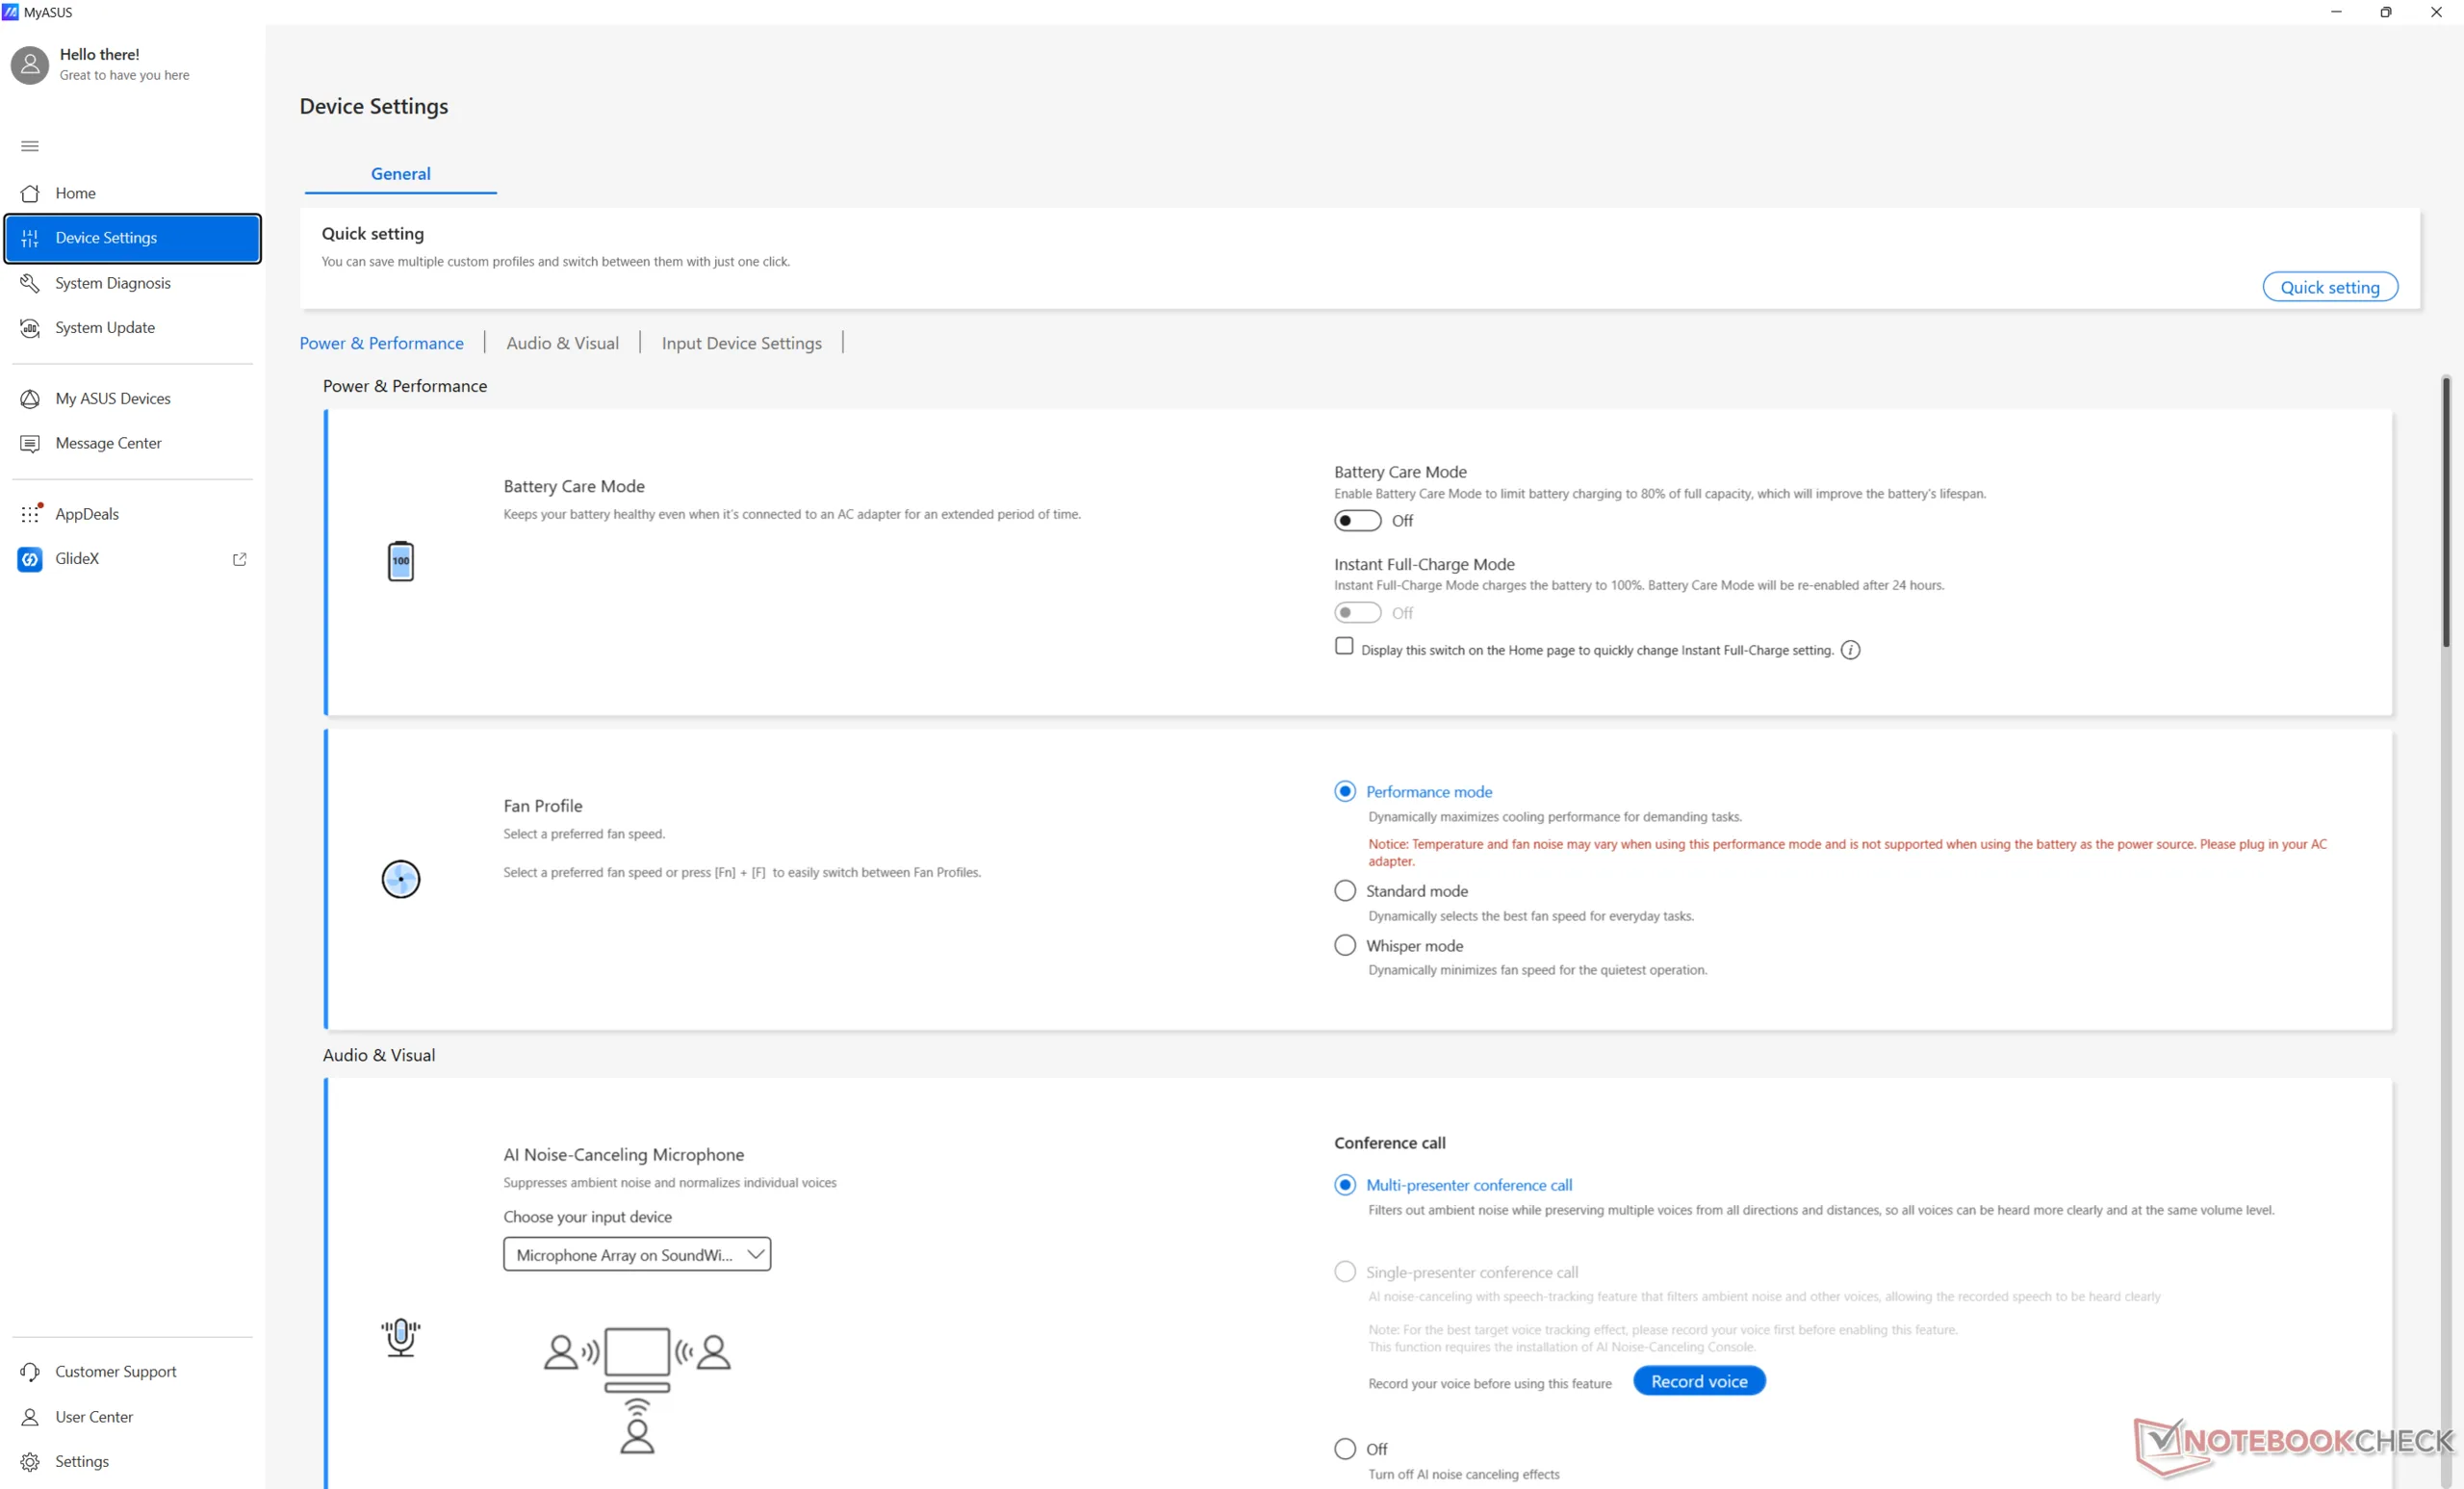
华硕的一个显著缺点是,它必须插上电源才能发挥处理器的最大性能。否则,系统将在较低的 TDP 上限下运行,从而导致性能下降。大多数集成显卡的老款笔记本电脑在使用电池供电时不会出现这种情况。
至于笔记本电脑本身,触觉点击板可能过于敏感,而哑光 OLED 比常见的亮光面板颗粒感更明显。不过,某些商务用户可能会因为该系统整体令人印象深刻的便携性和性能潜力而放弃这些缺点。
Pros
Cons
价格和供应情况
配备 Panther Lake 处理器的 ExpertBook Ultra 预计将于 2026 年第二季度发货。截至发稿时,华硕尚未公布任何价格。
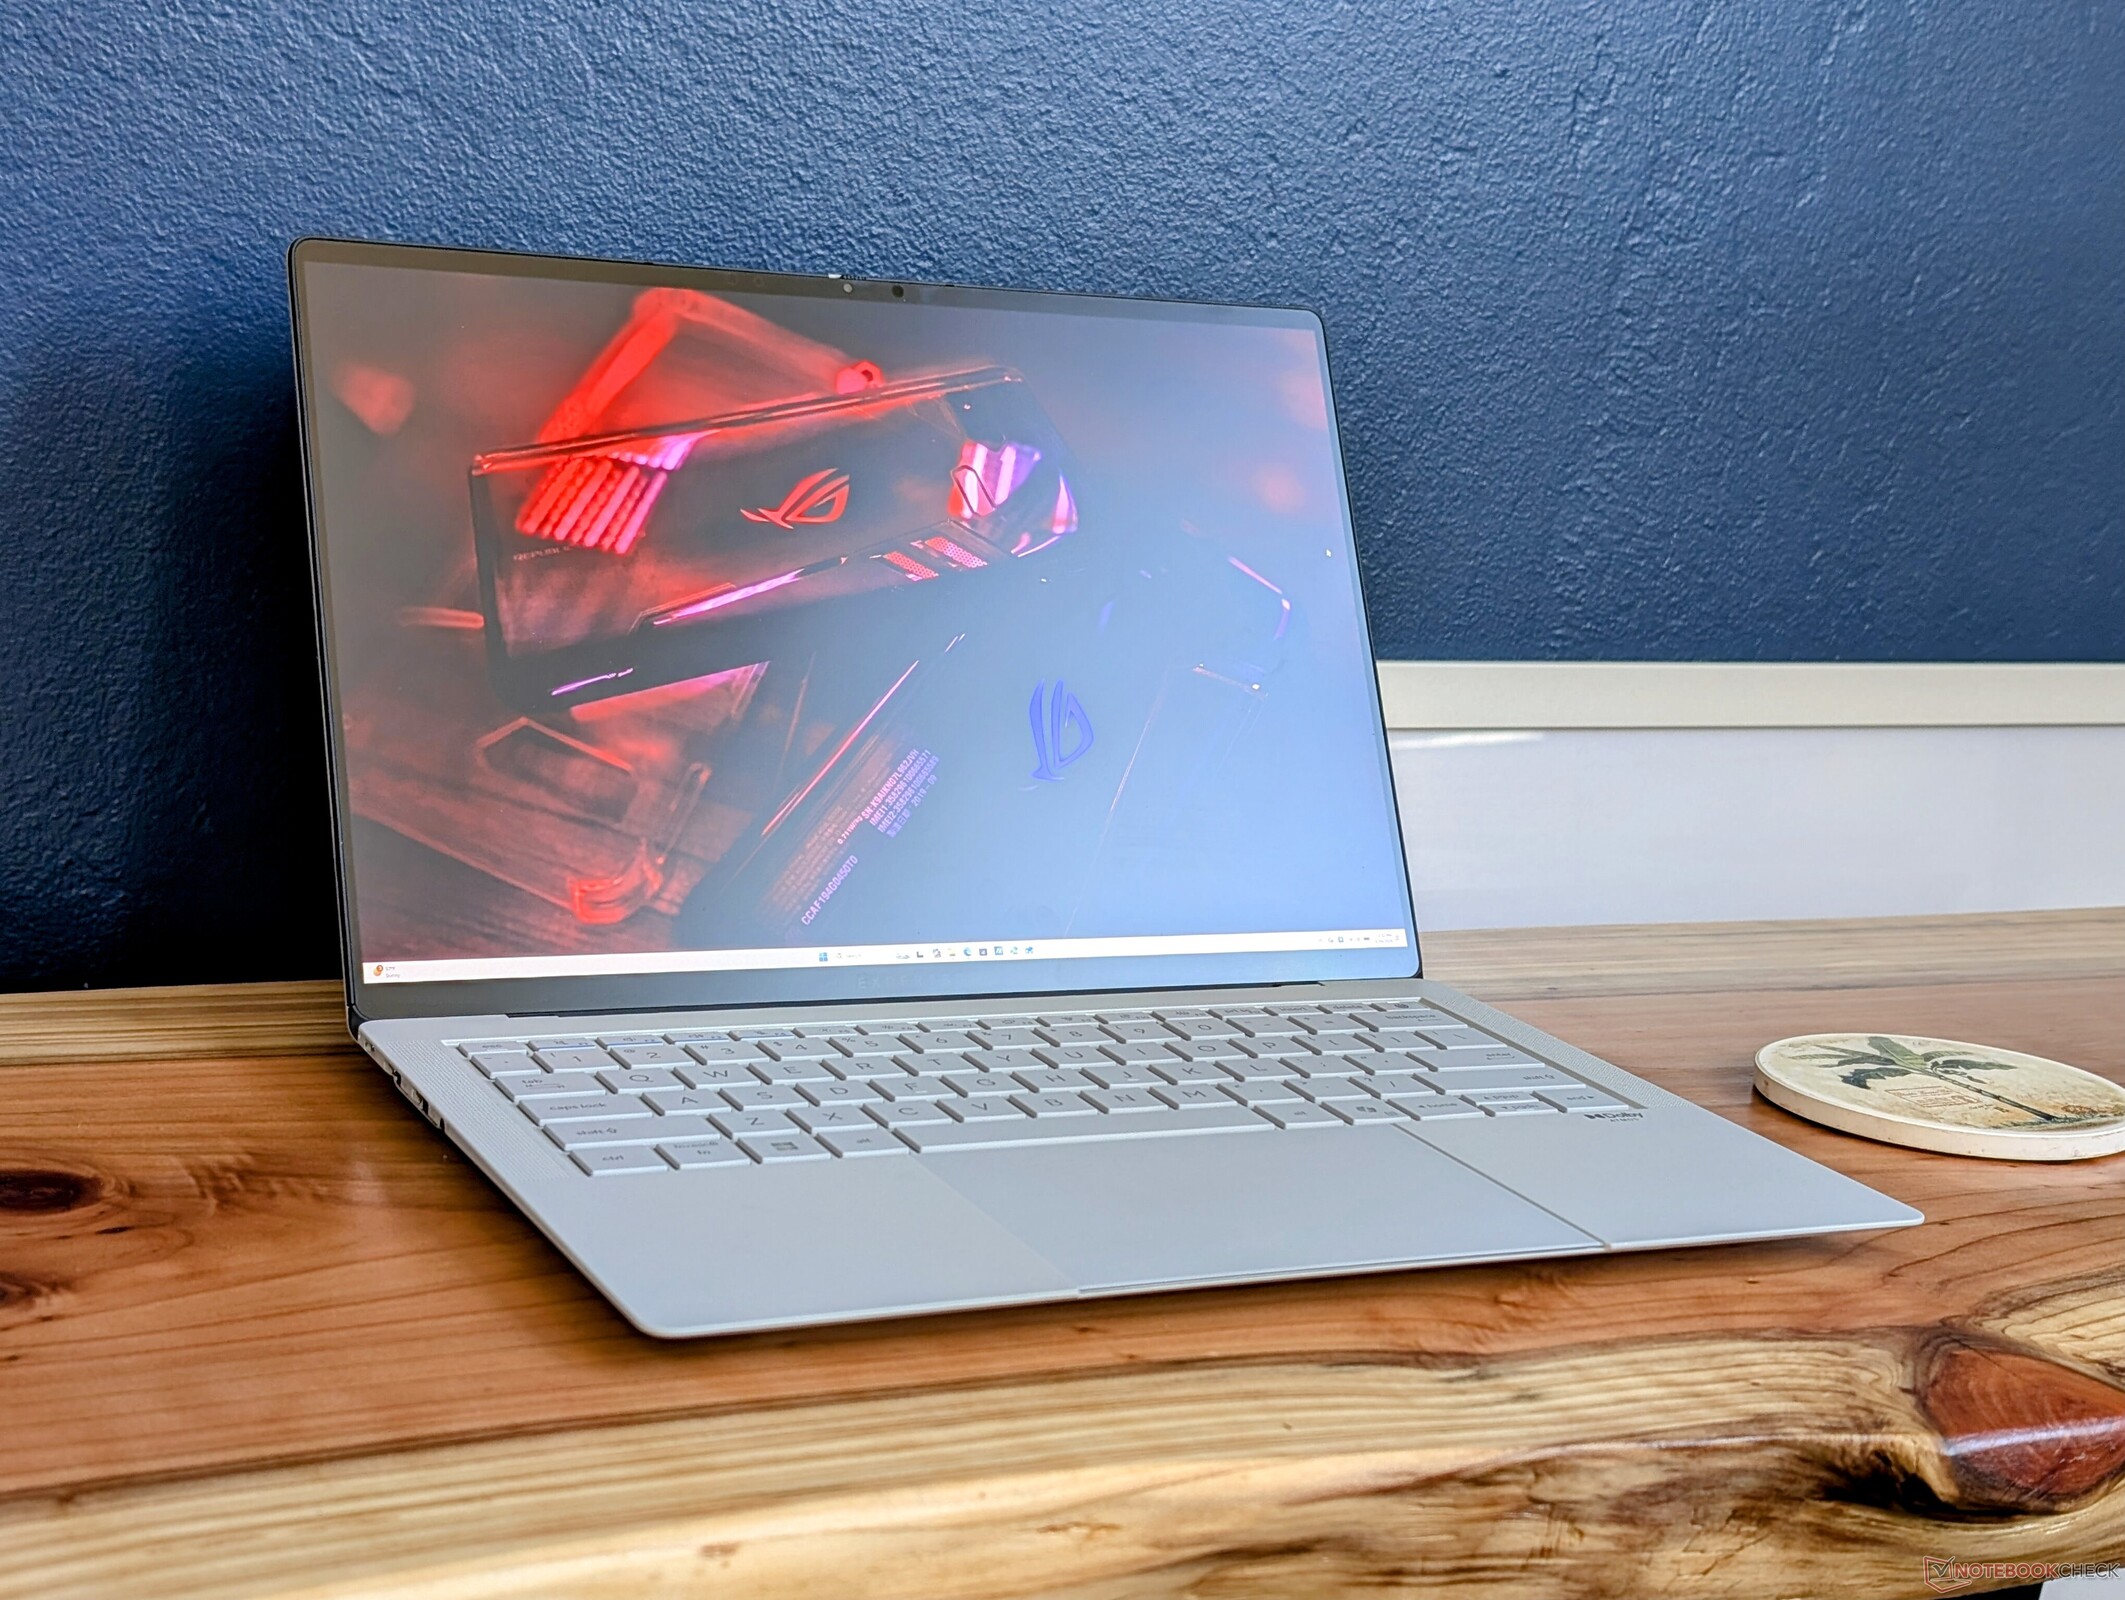
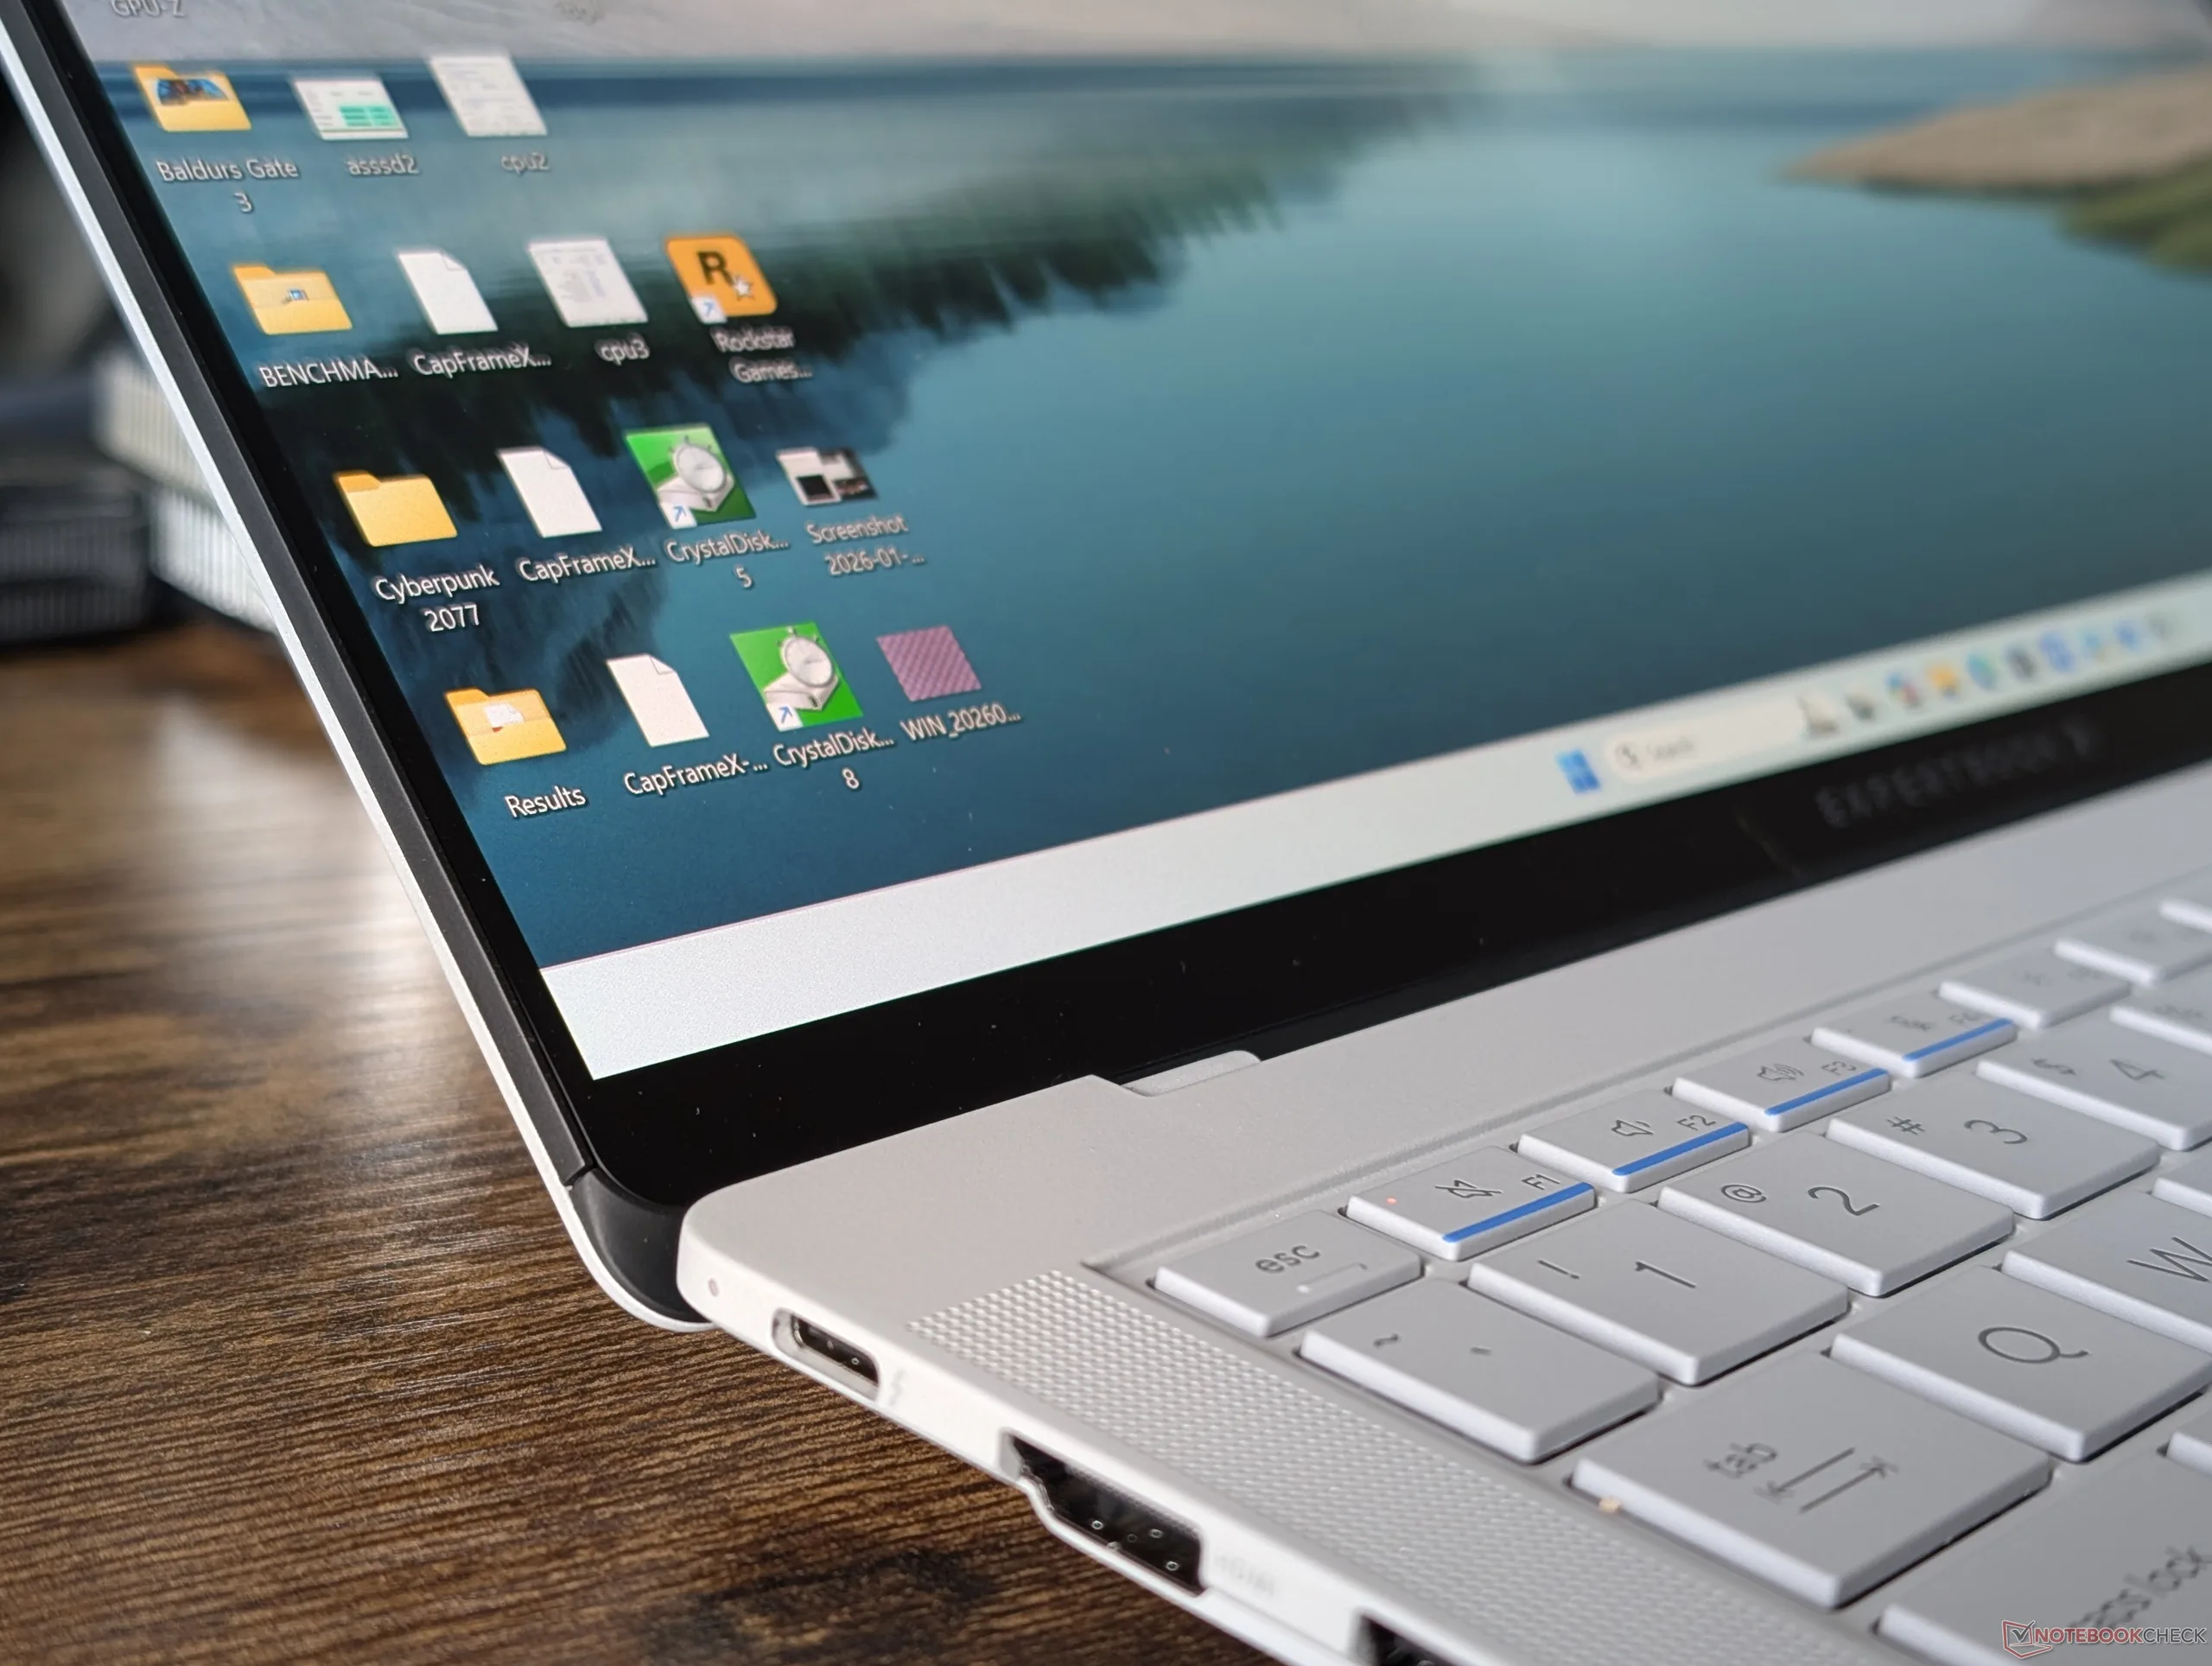
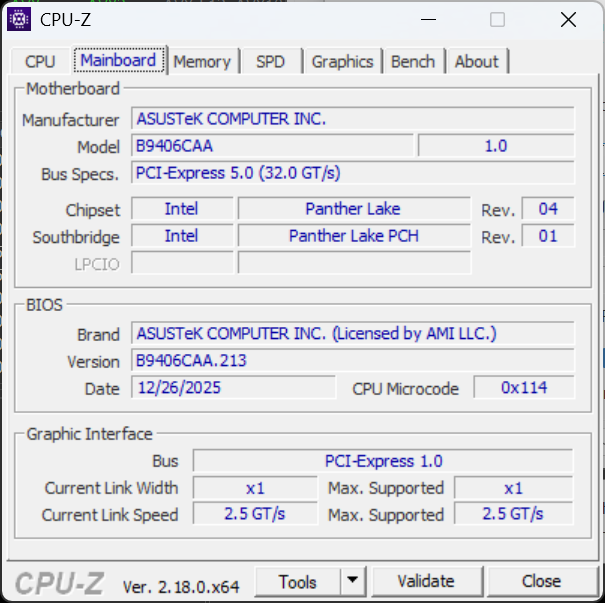
几周前刚刚在 CES 2026 上亮相的 ExpertBook Ultra 是华硕新推出的 14 英寸旗舰商务笔记本电脑,采用超轻包装,配备了全新功能。该机型是首批广泛采用英特尔最新 Panther Lake-H 平台的笔记本电脑之一。
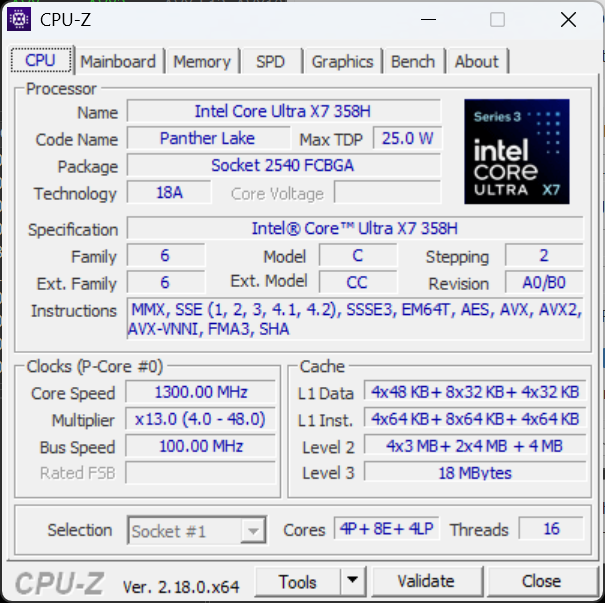
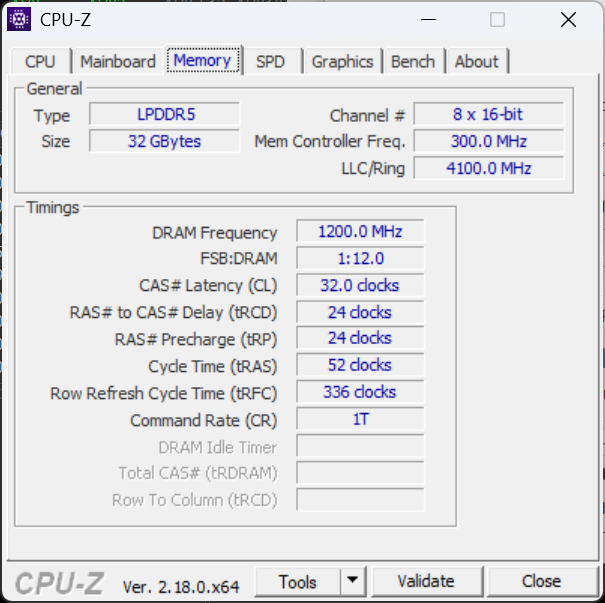
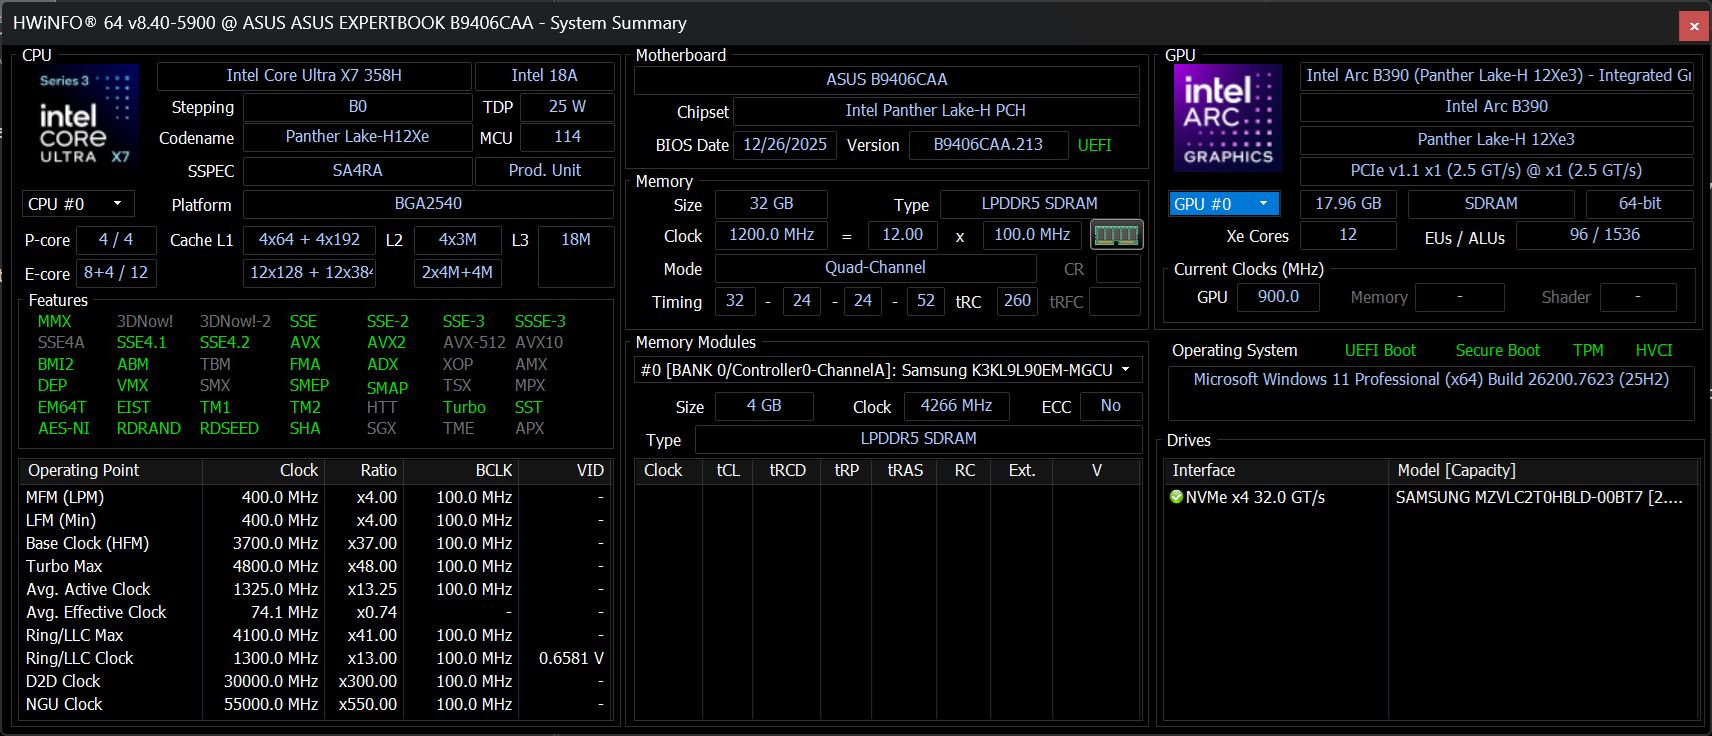
我们的测试机配备了 Core Ultra X7 358H CPU 和 32 GB 焊接 LPDDR5X 内存,而更高端的机型则配备了 Core Ultra X9 388H,内存容量增加了一倍。所有美国配置均包括相同的串联 OLED 2880 x 1800 120 Hz 雾面触摸屏和集成的 Arc B390 图形处理器。有晨曦灰和喷气雾两种颜色可供选择。
该领域的竞争对手包括其他轻薄型 14 英寸商务笔记本电脑,如来自 联想 ThinkPad T14s 系列, 戴尔 Pro 14 Premium 系列或 惠普 EliteBook Ultra 14 系列.
更多华硕评测:
规格
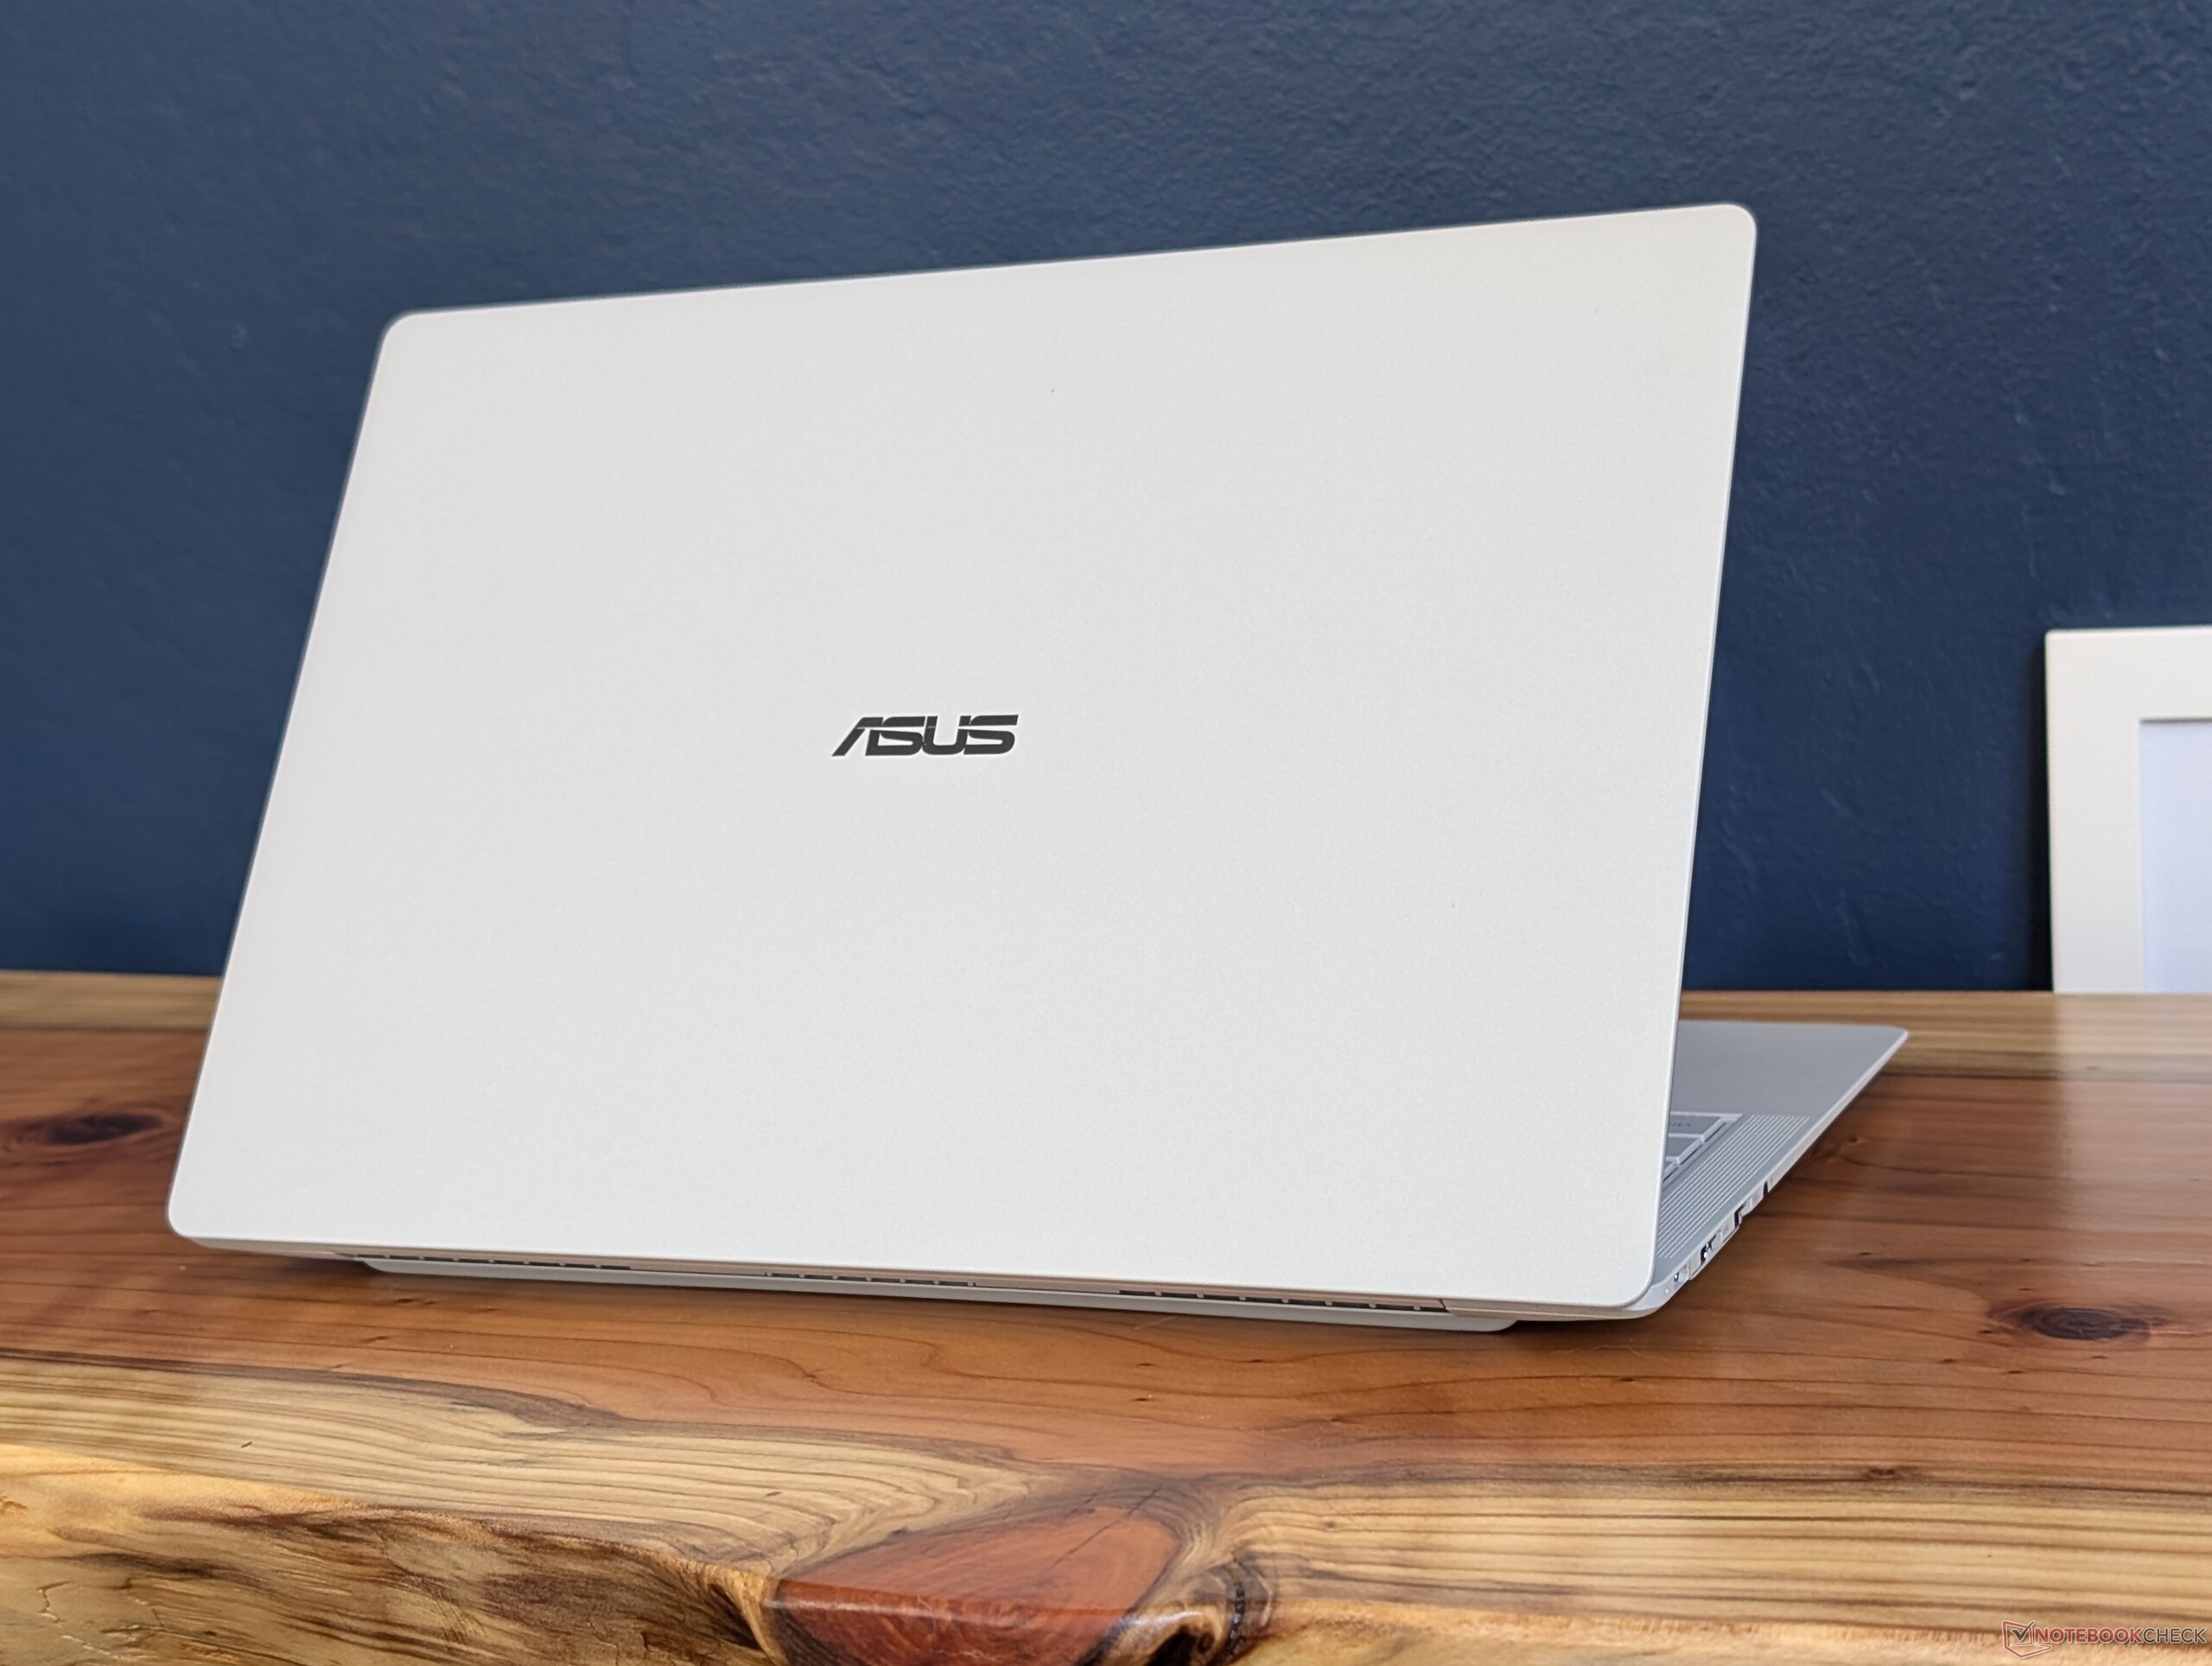
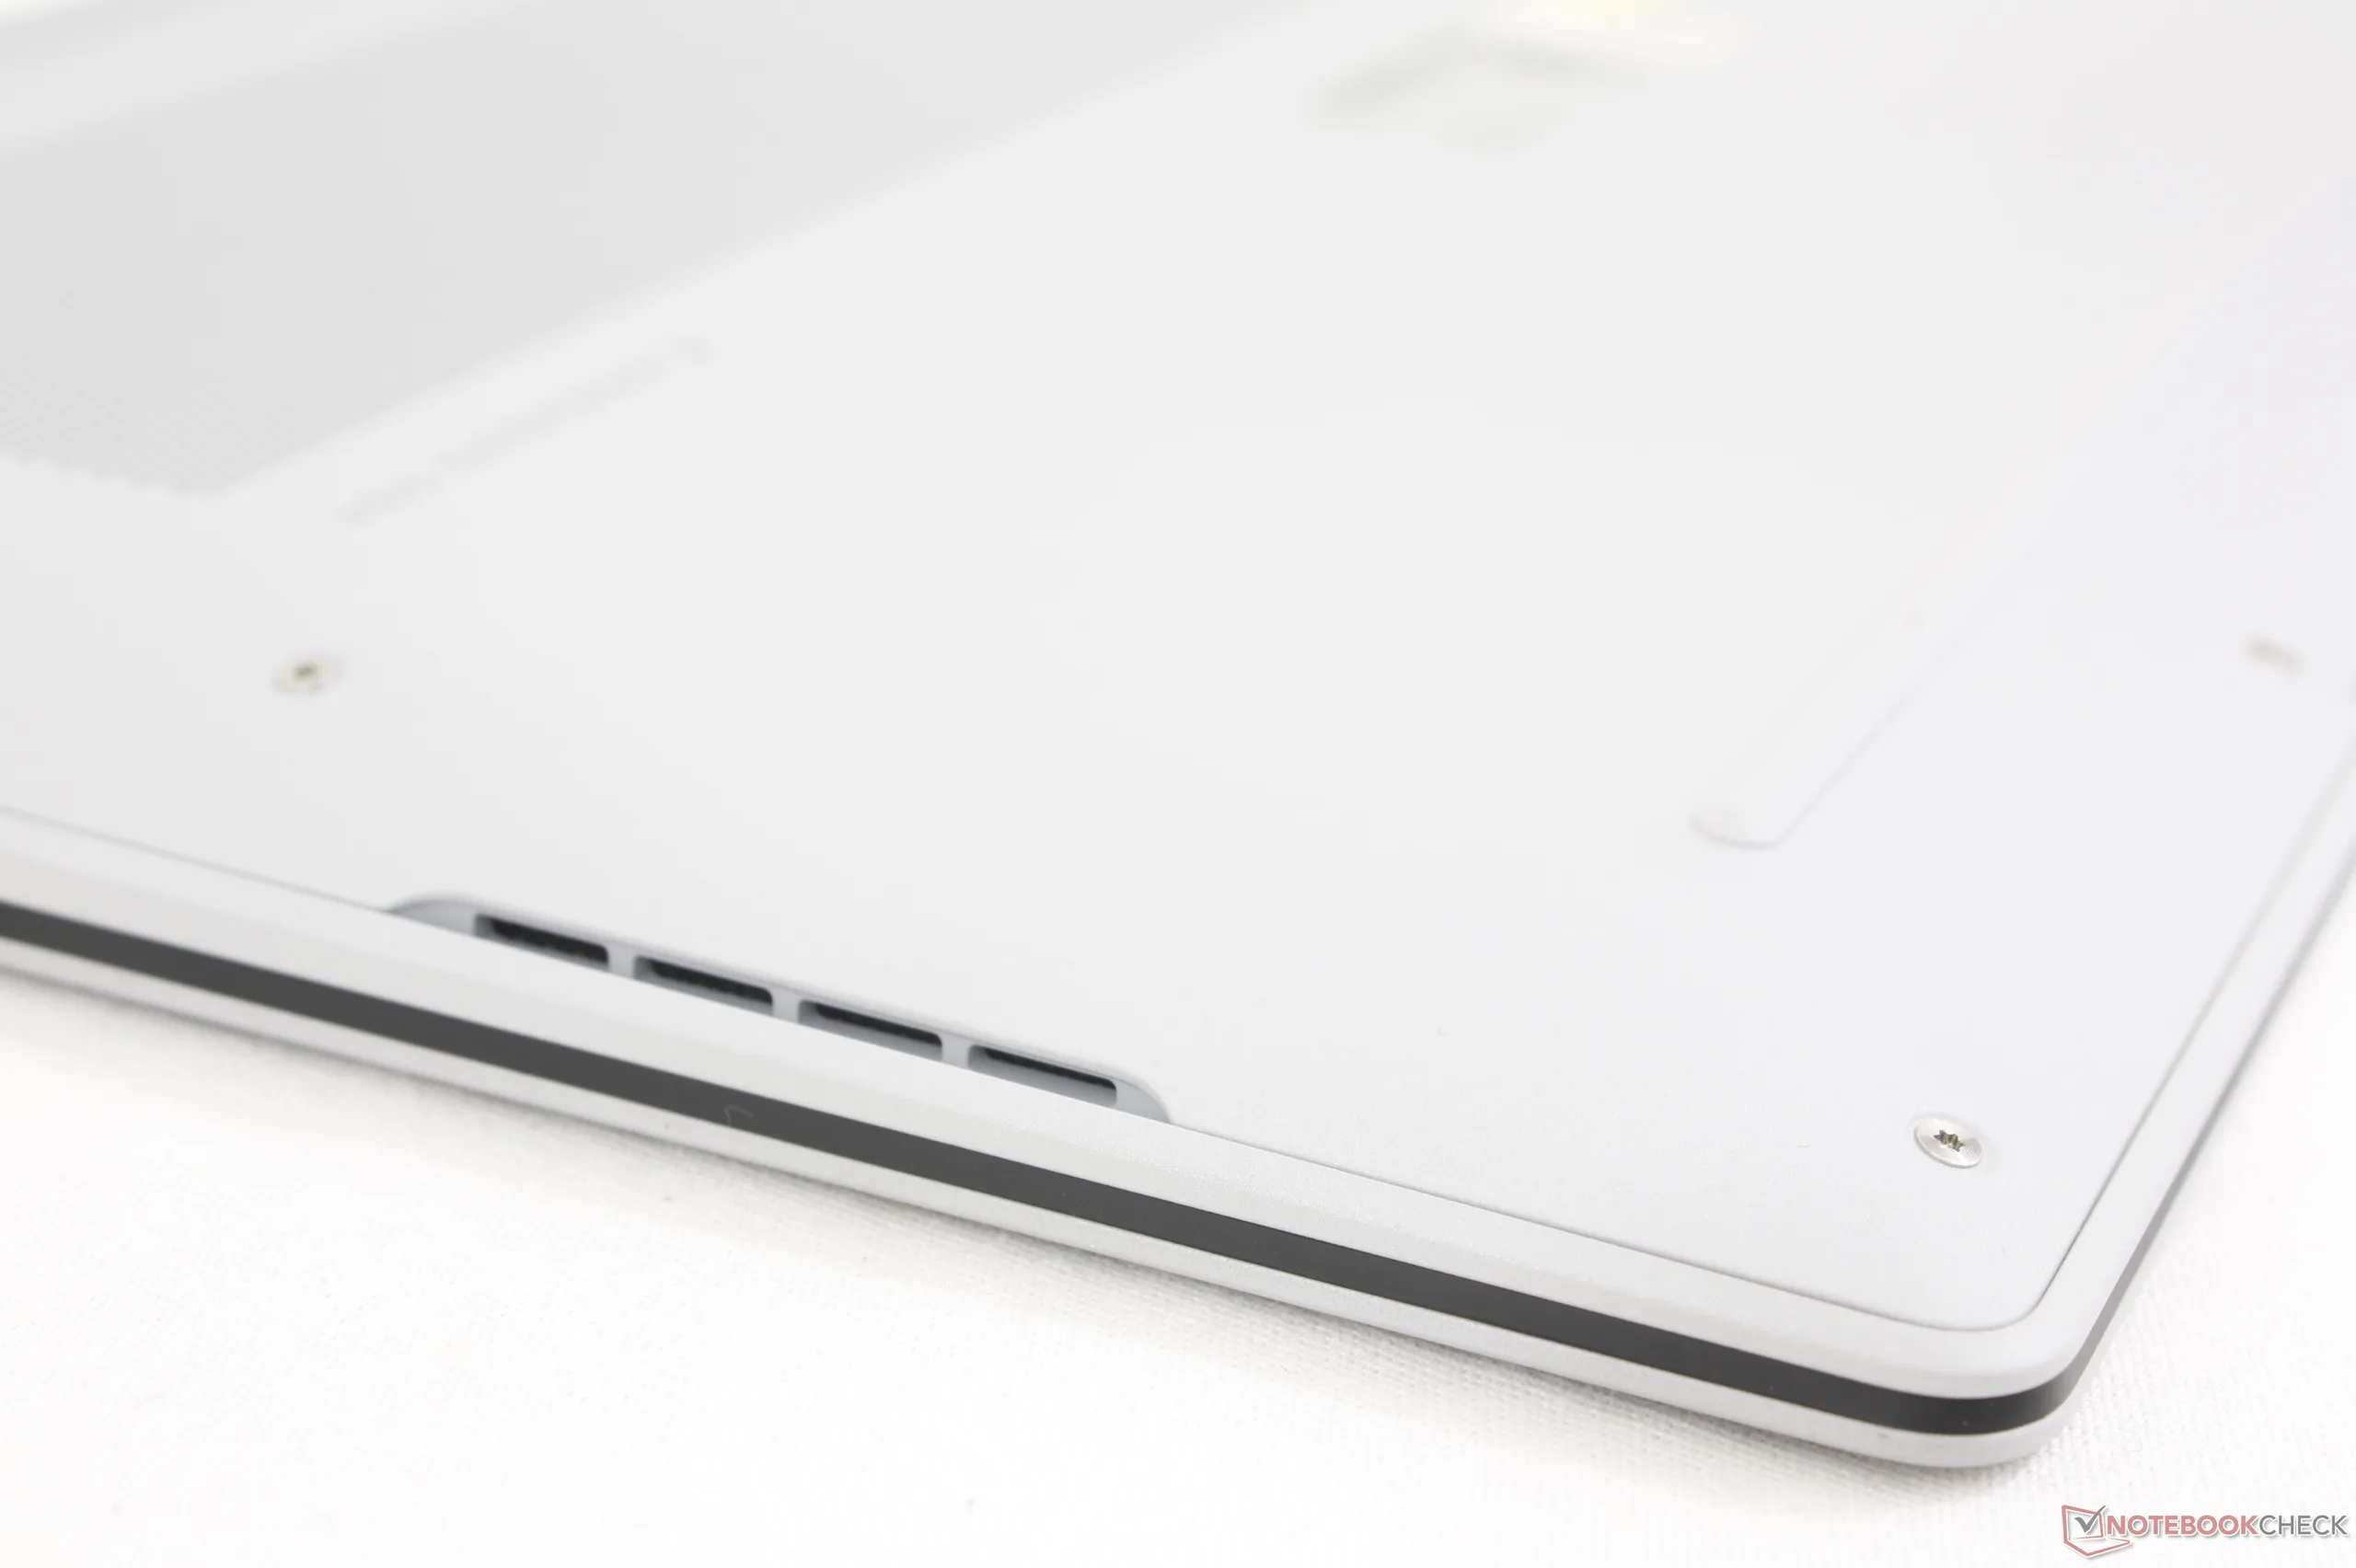
外壳 - 带有纳米陶瓷涂层的 CNC 镁铝合金
除了迷人的外观,ExpertBook Ultra 机箱的独特之处还在于它采用了 9H "纳米陶瓷 "涂层,与大多数其他高端笔记本电脑的普通金属拉丝合金相比,能更有效地防止划痕和指纹。从质感上看,它的磨砂表面较为粗糙,略带颗粒感,与其他产品的超光滑和闪亮光泽形成鲜明对比。通过 MIL-STD 810H 认证后,机箱的刚性得到了很好的保持,只是底座和盖子的弯曲度略有增加。 雷蛇刀锋 14.
铰链刚度太弱,因为只要抬起系统就会导致显示屏后退。华硕表示,这个问题将在该机型面向消费者时得到解决。
显示屏底部边缘集成了一个名为 ExpertLumi 的白色灯条。不过,该 LED 灯在发布之初纯粹是为了美观,因为它除了在开机和登录时发光外没有其他作用。
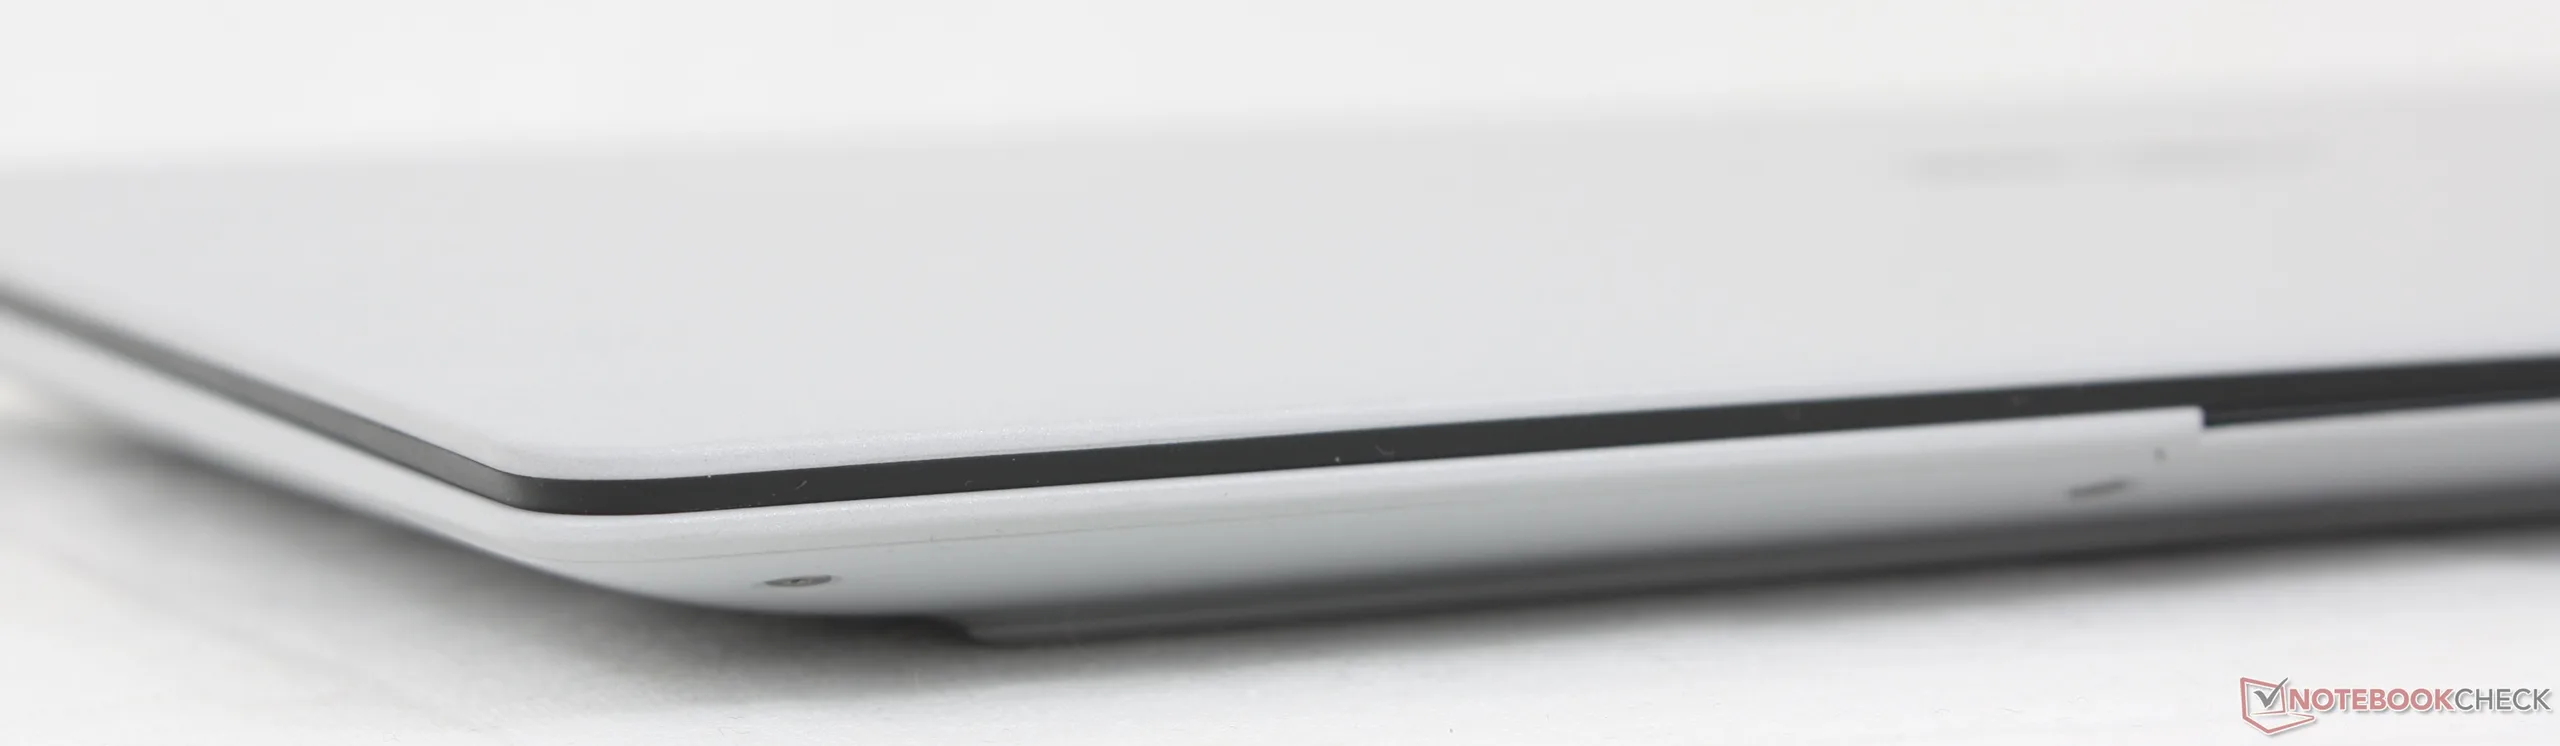
这款华硕笔记本电脑不仅是首批采用 Panther Lake 技术的笔记本电脑之一,而且还是 14 英寸笔记本电脑中最轻的机型之一,仅重 1.1 千克。更轻薄的竞争对手包括 EliteBook Ultra G1i 14或 三星Galaxy Book5 Pro 14但它们也都比华硕稍重一些。
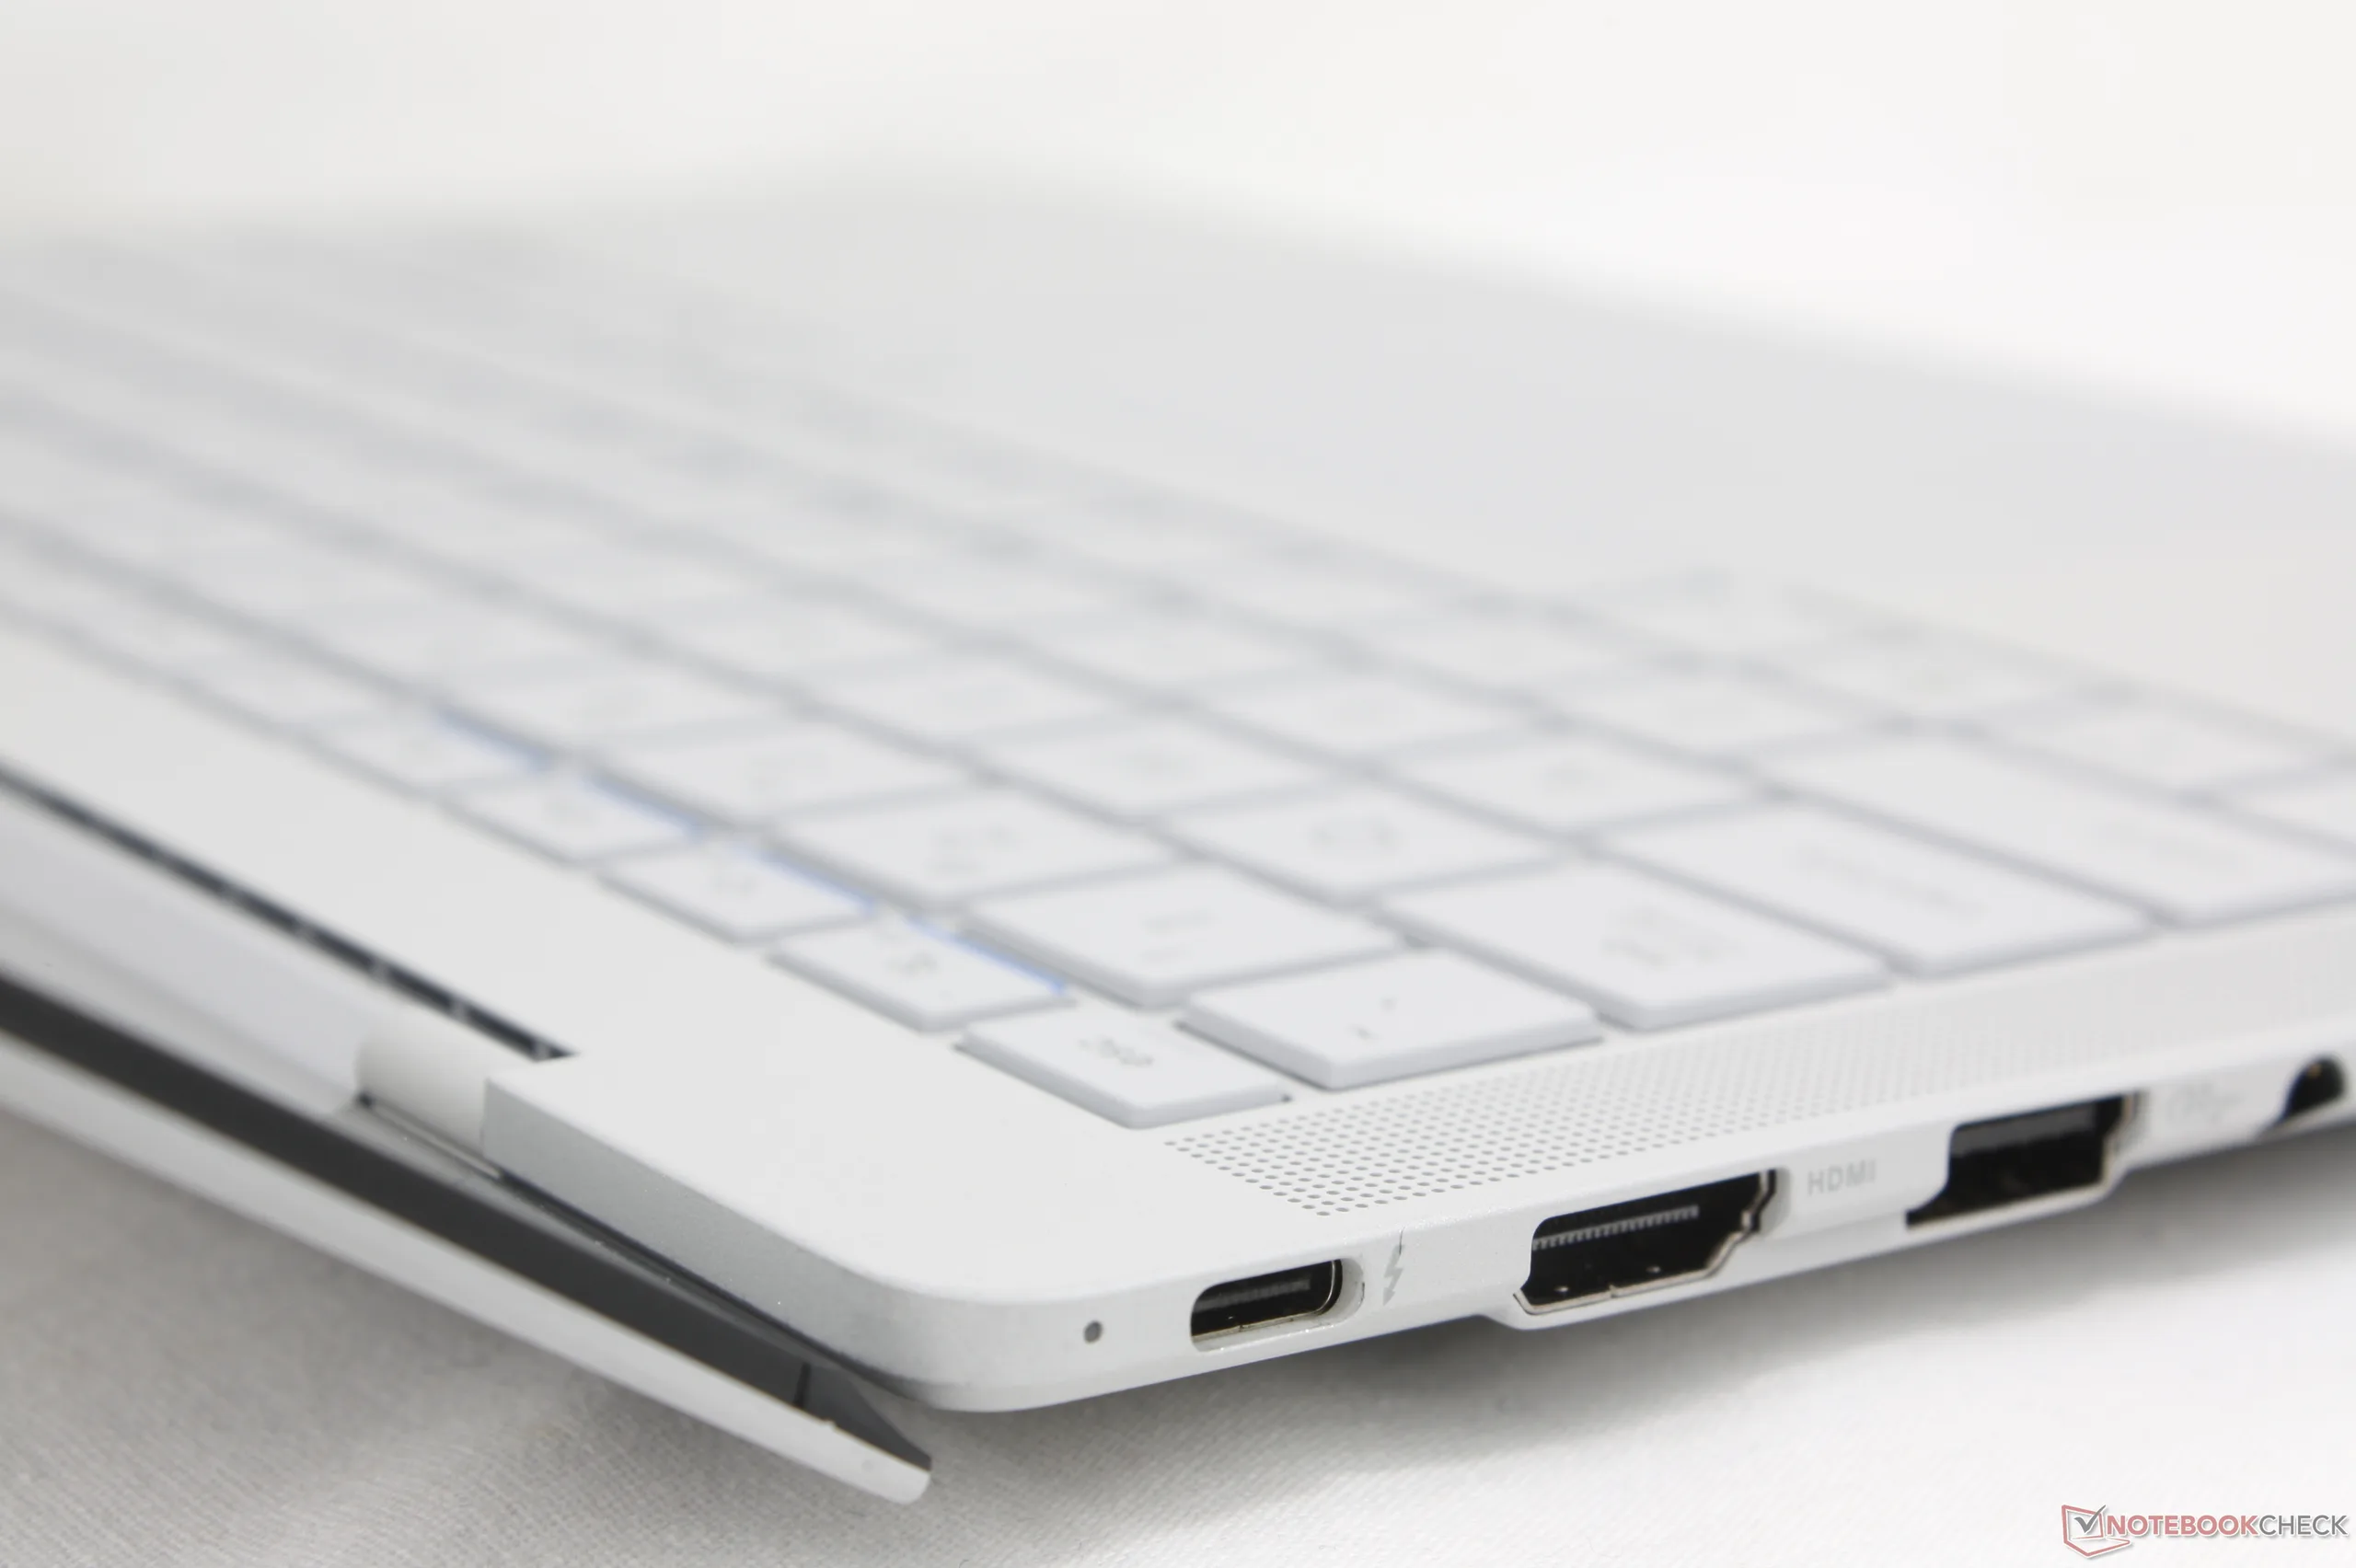
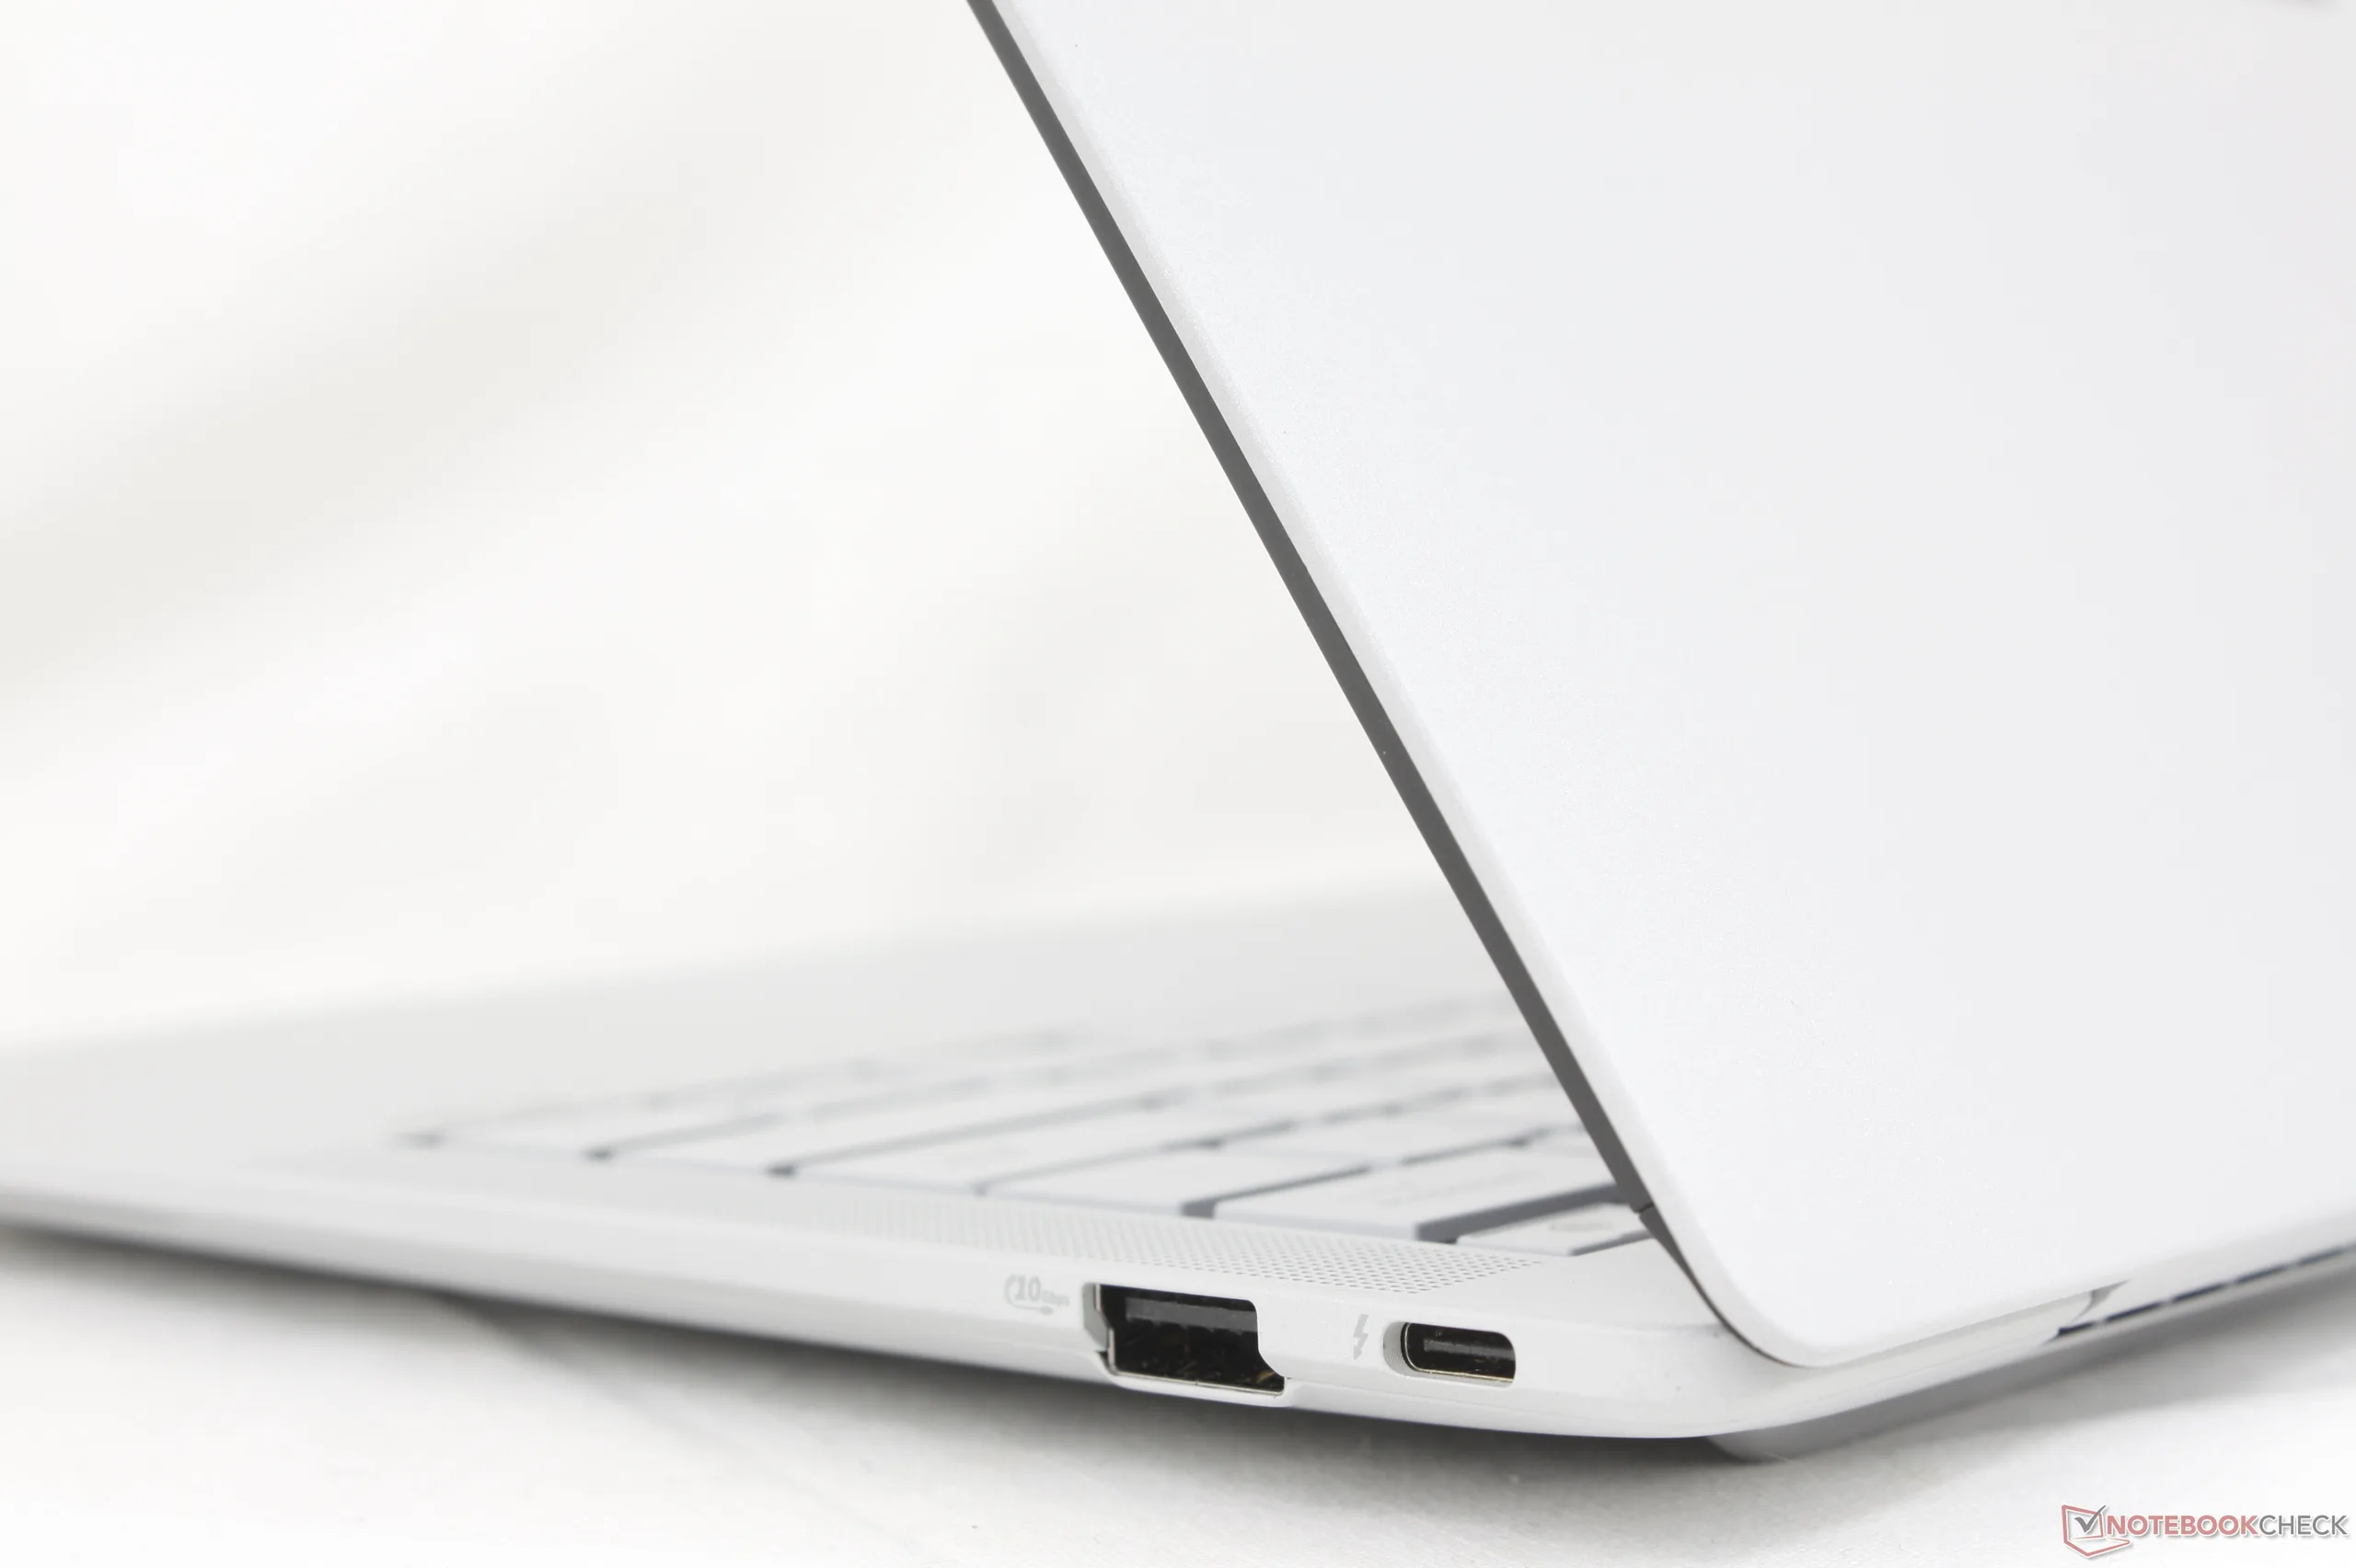
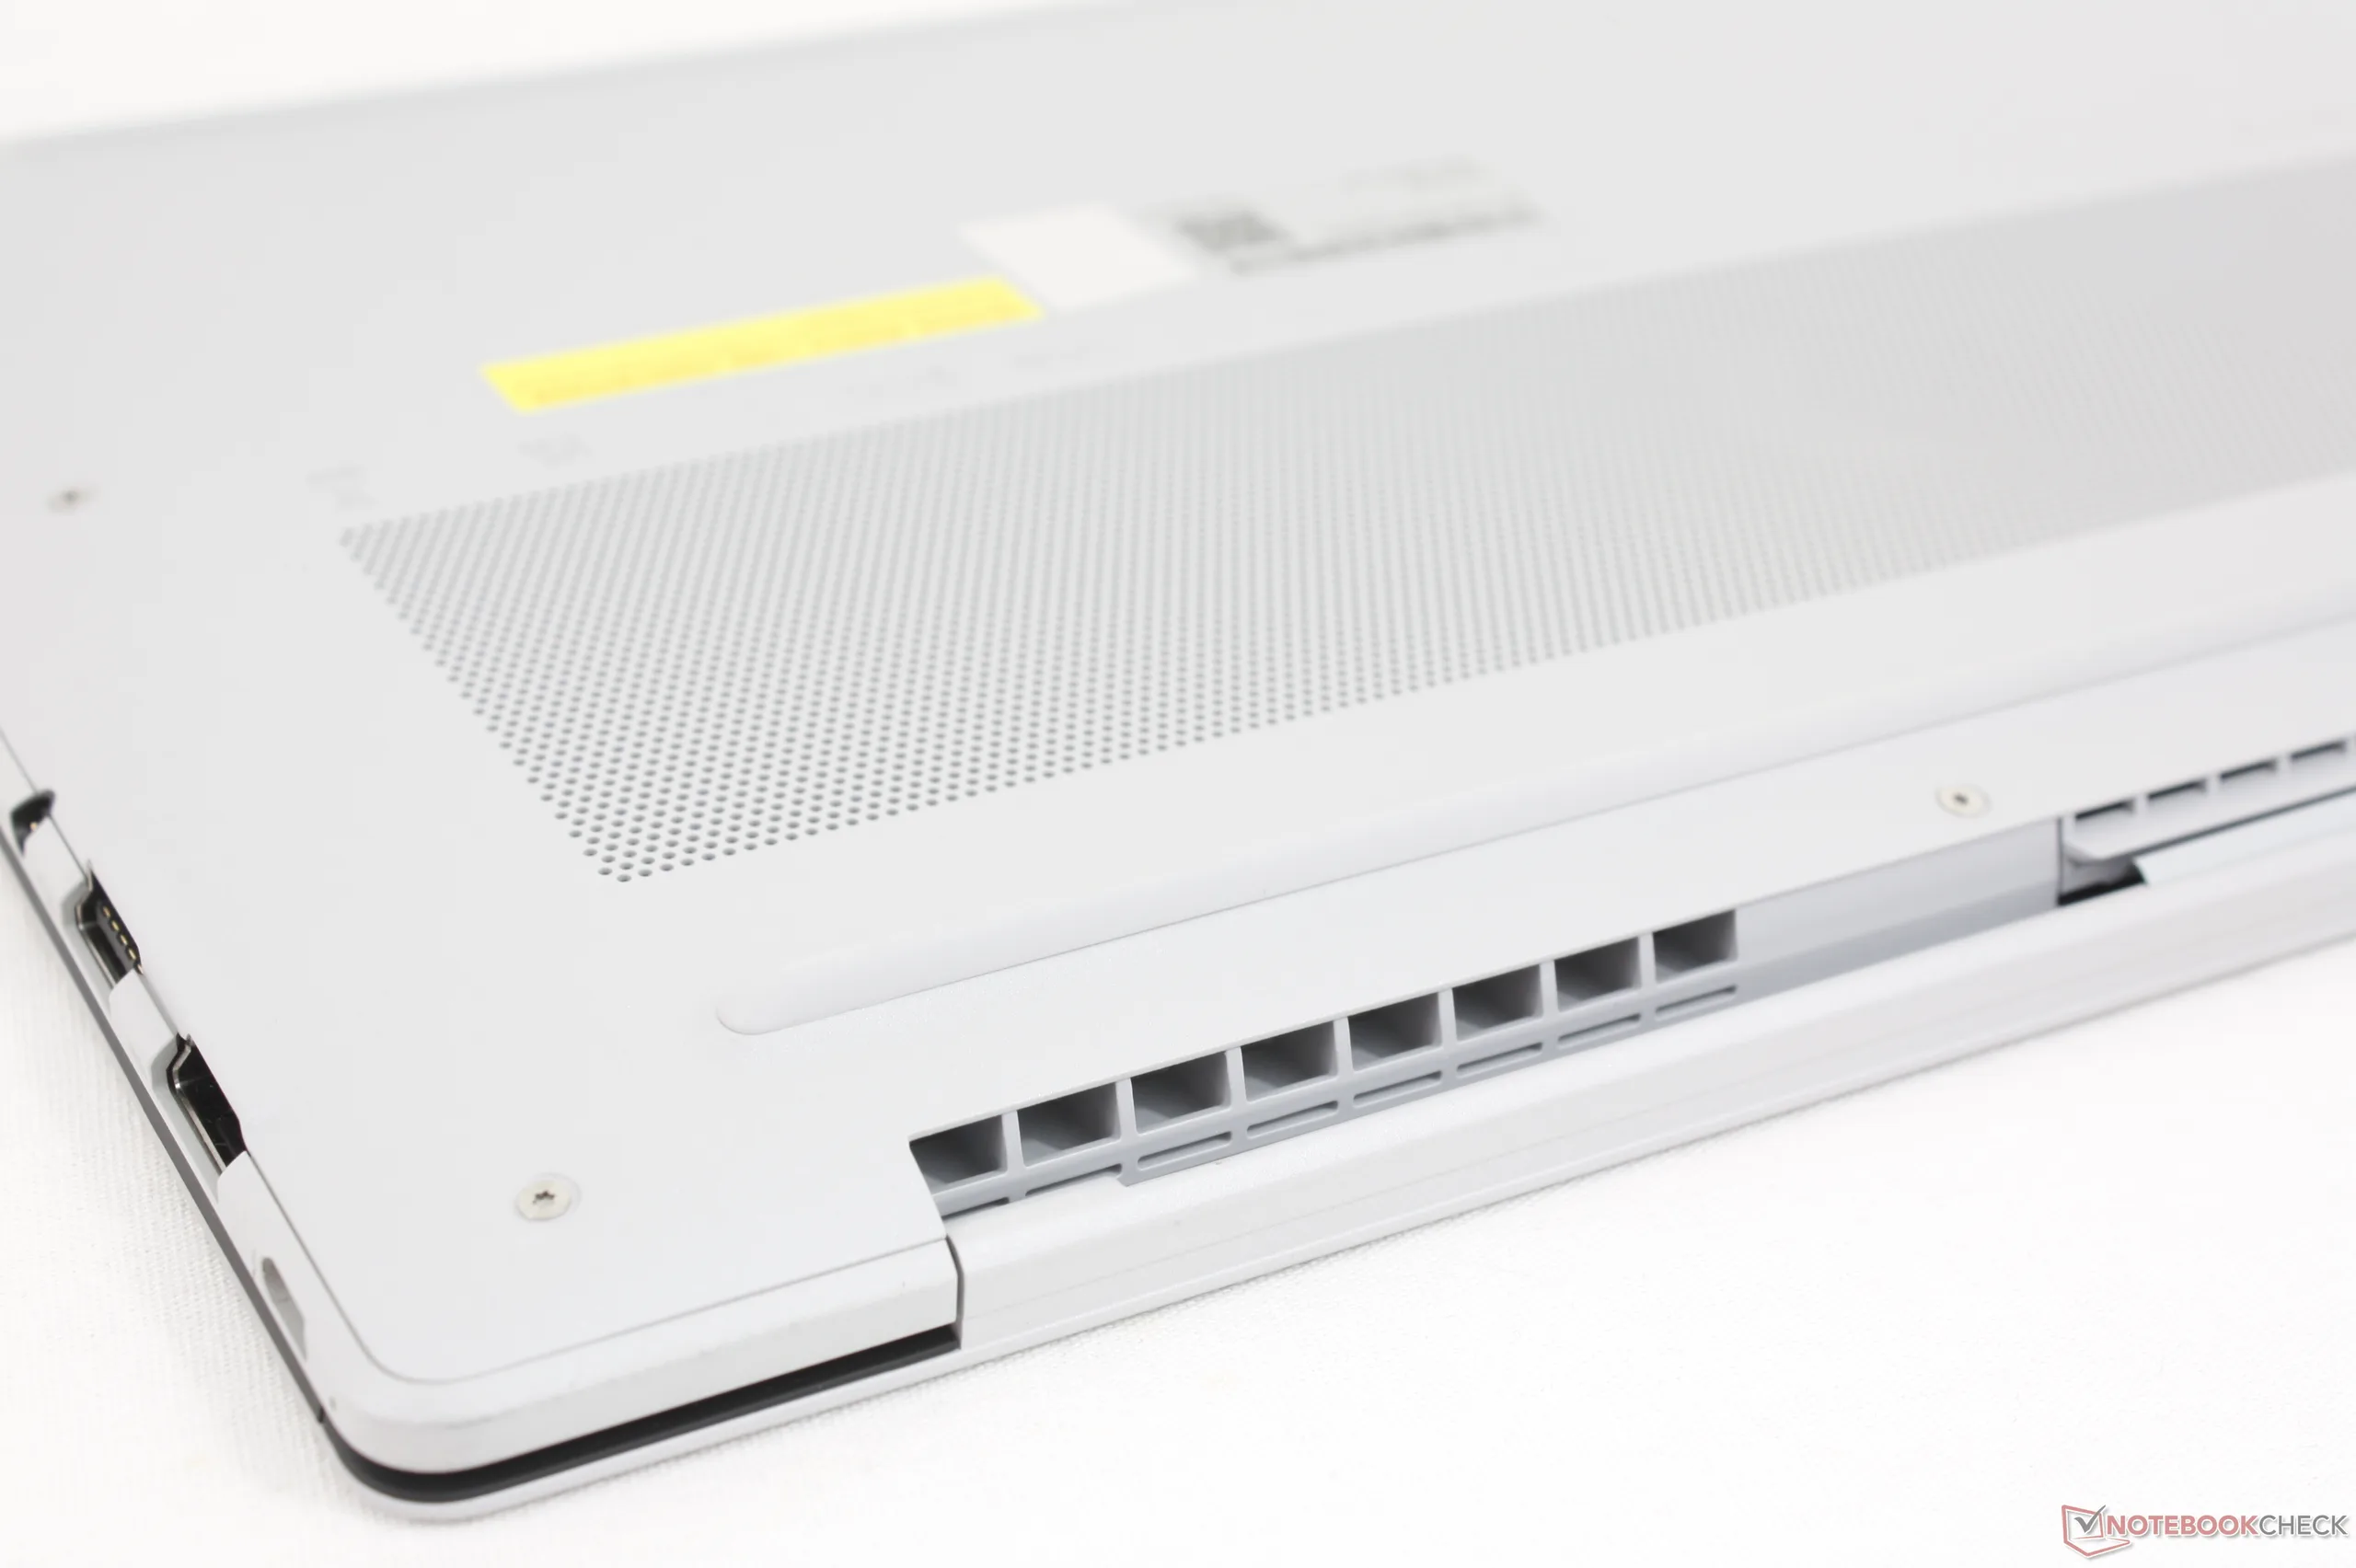
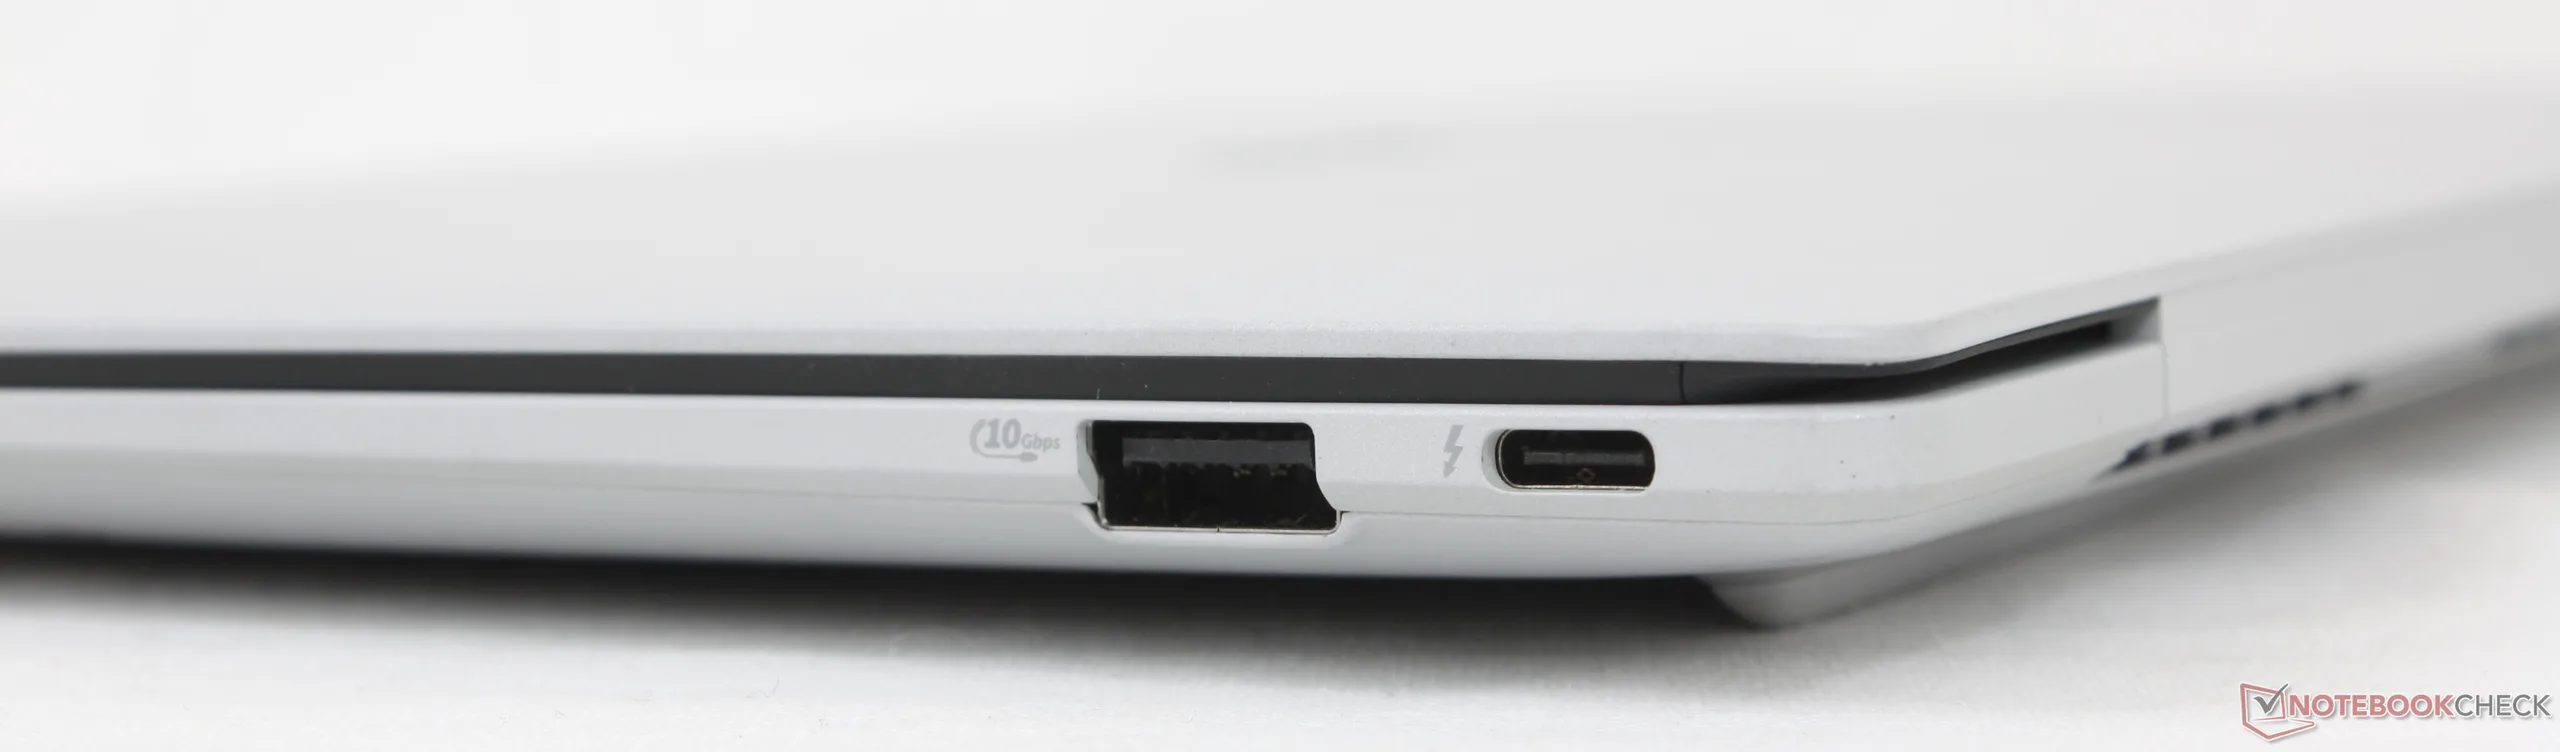
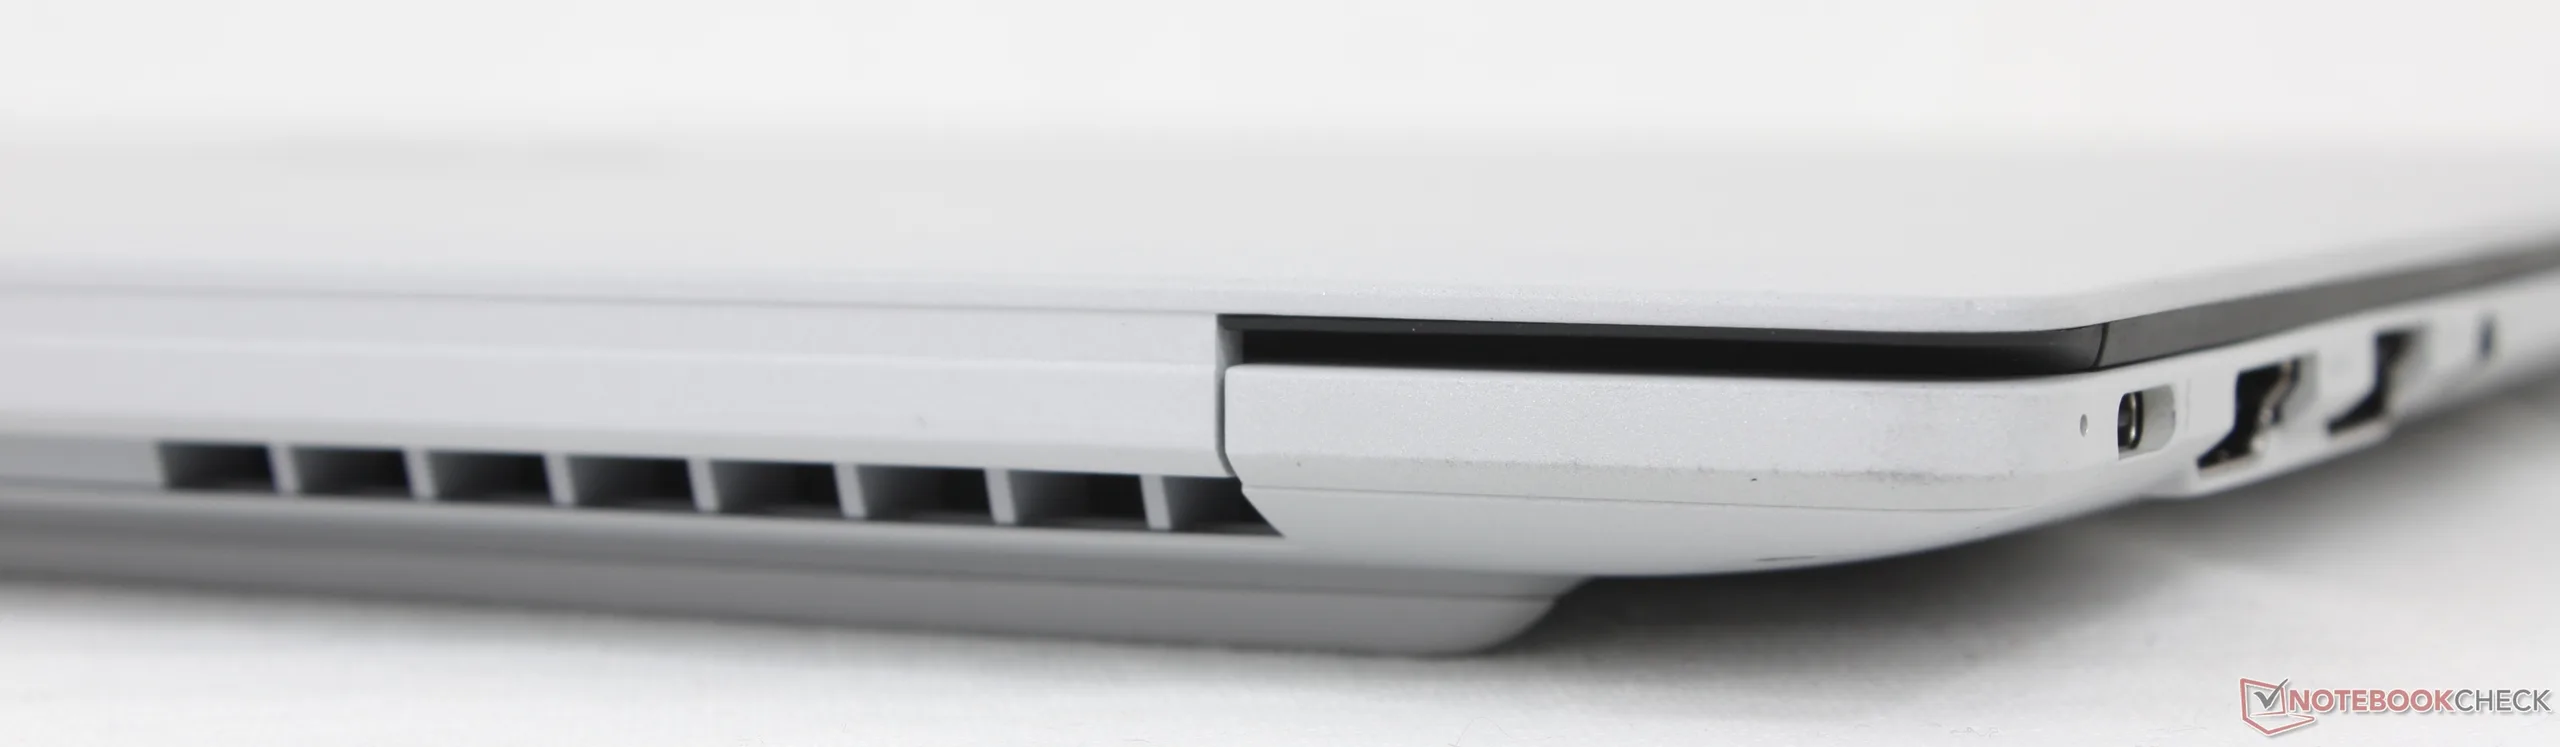
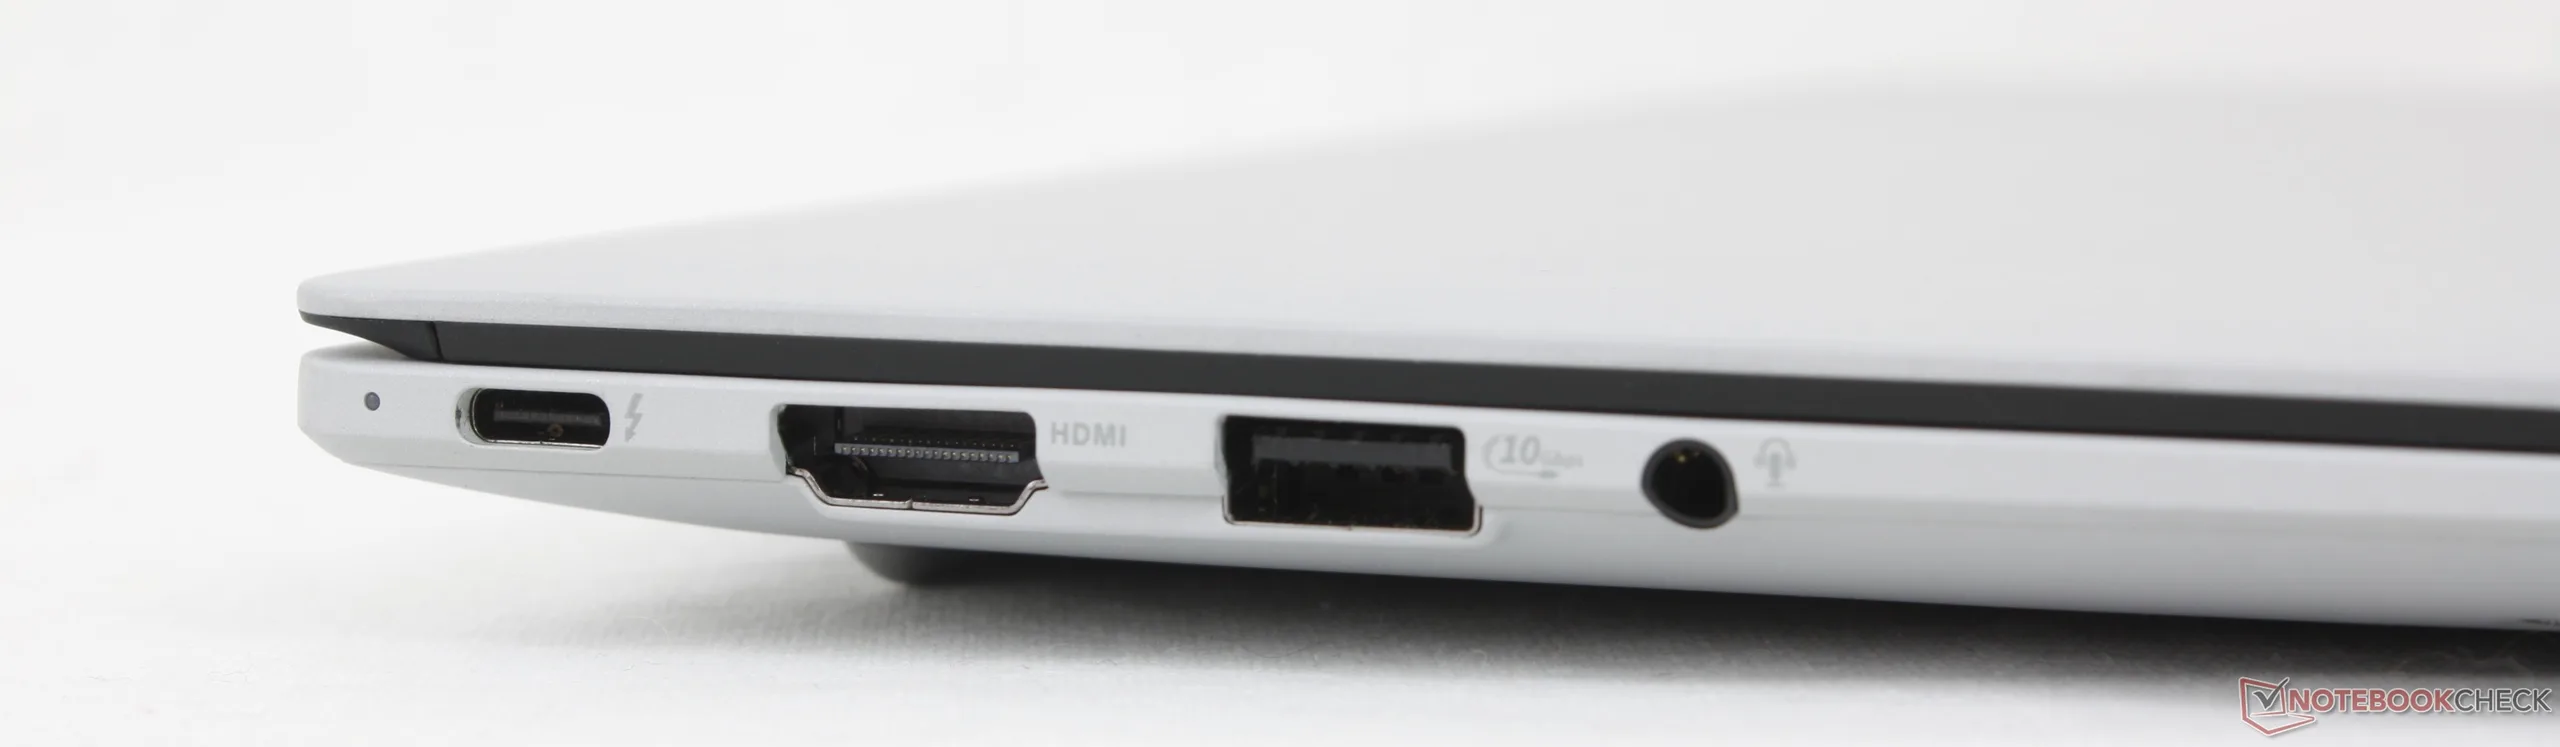
连接性
端口选项与 ThinkPad T14s 第 6 代尽管没有智能卡选项。不过,华硕的两个 USB-C 端口分布在系统的左右边缘,充电更方便,我们对此表示赞赏。相比之下,上述 ThinkPad 的两个 USB-C 端口只在左侧边缘。
交流
网络摄像头


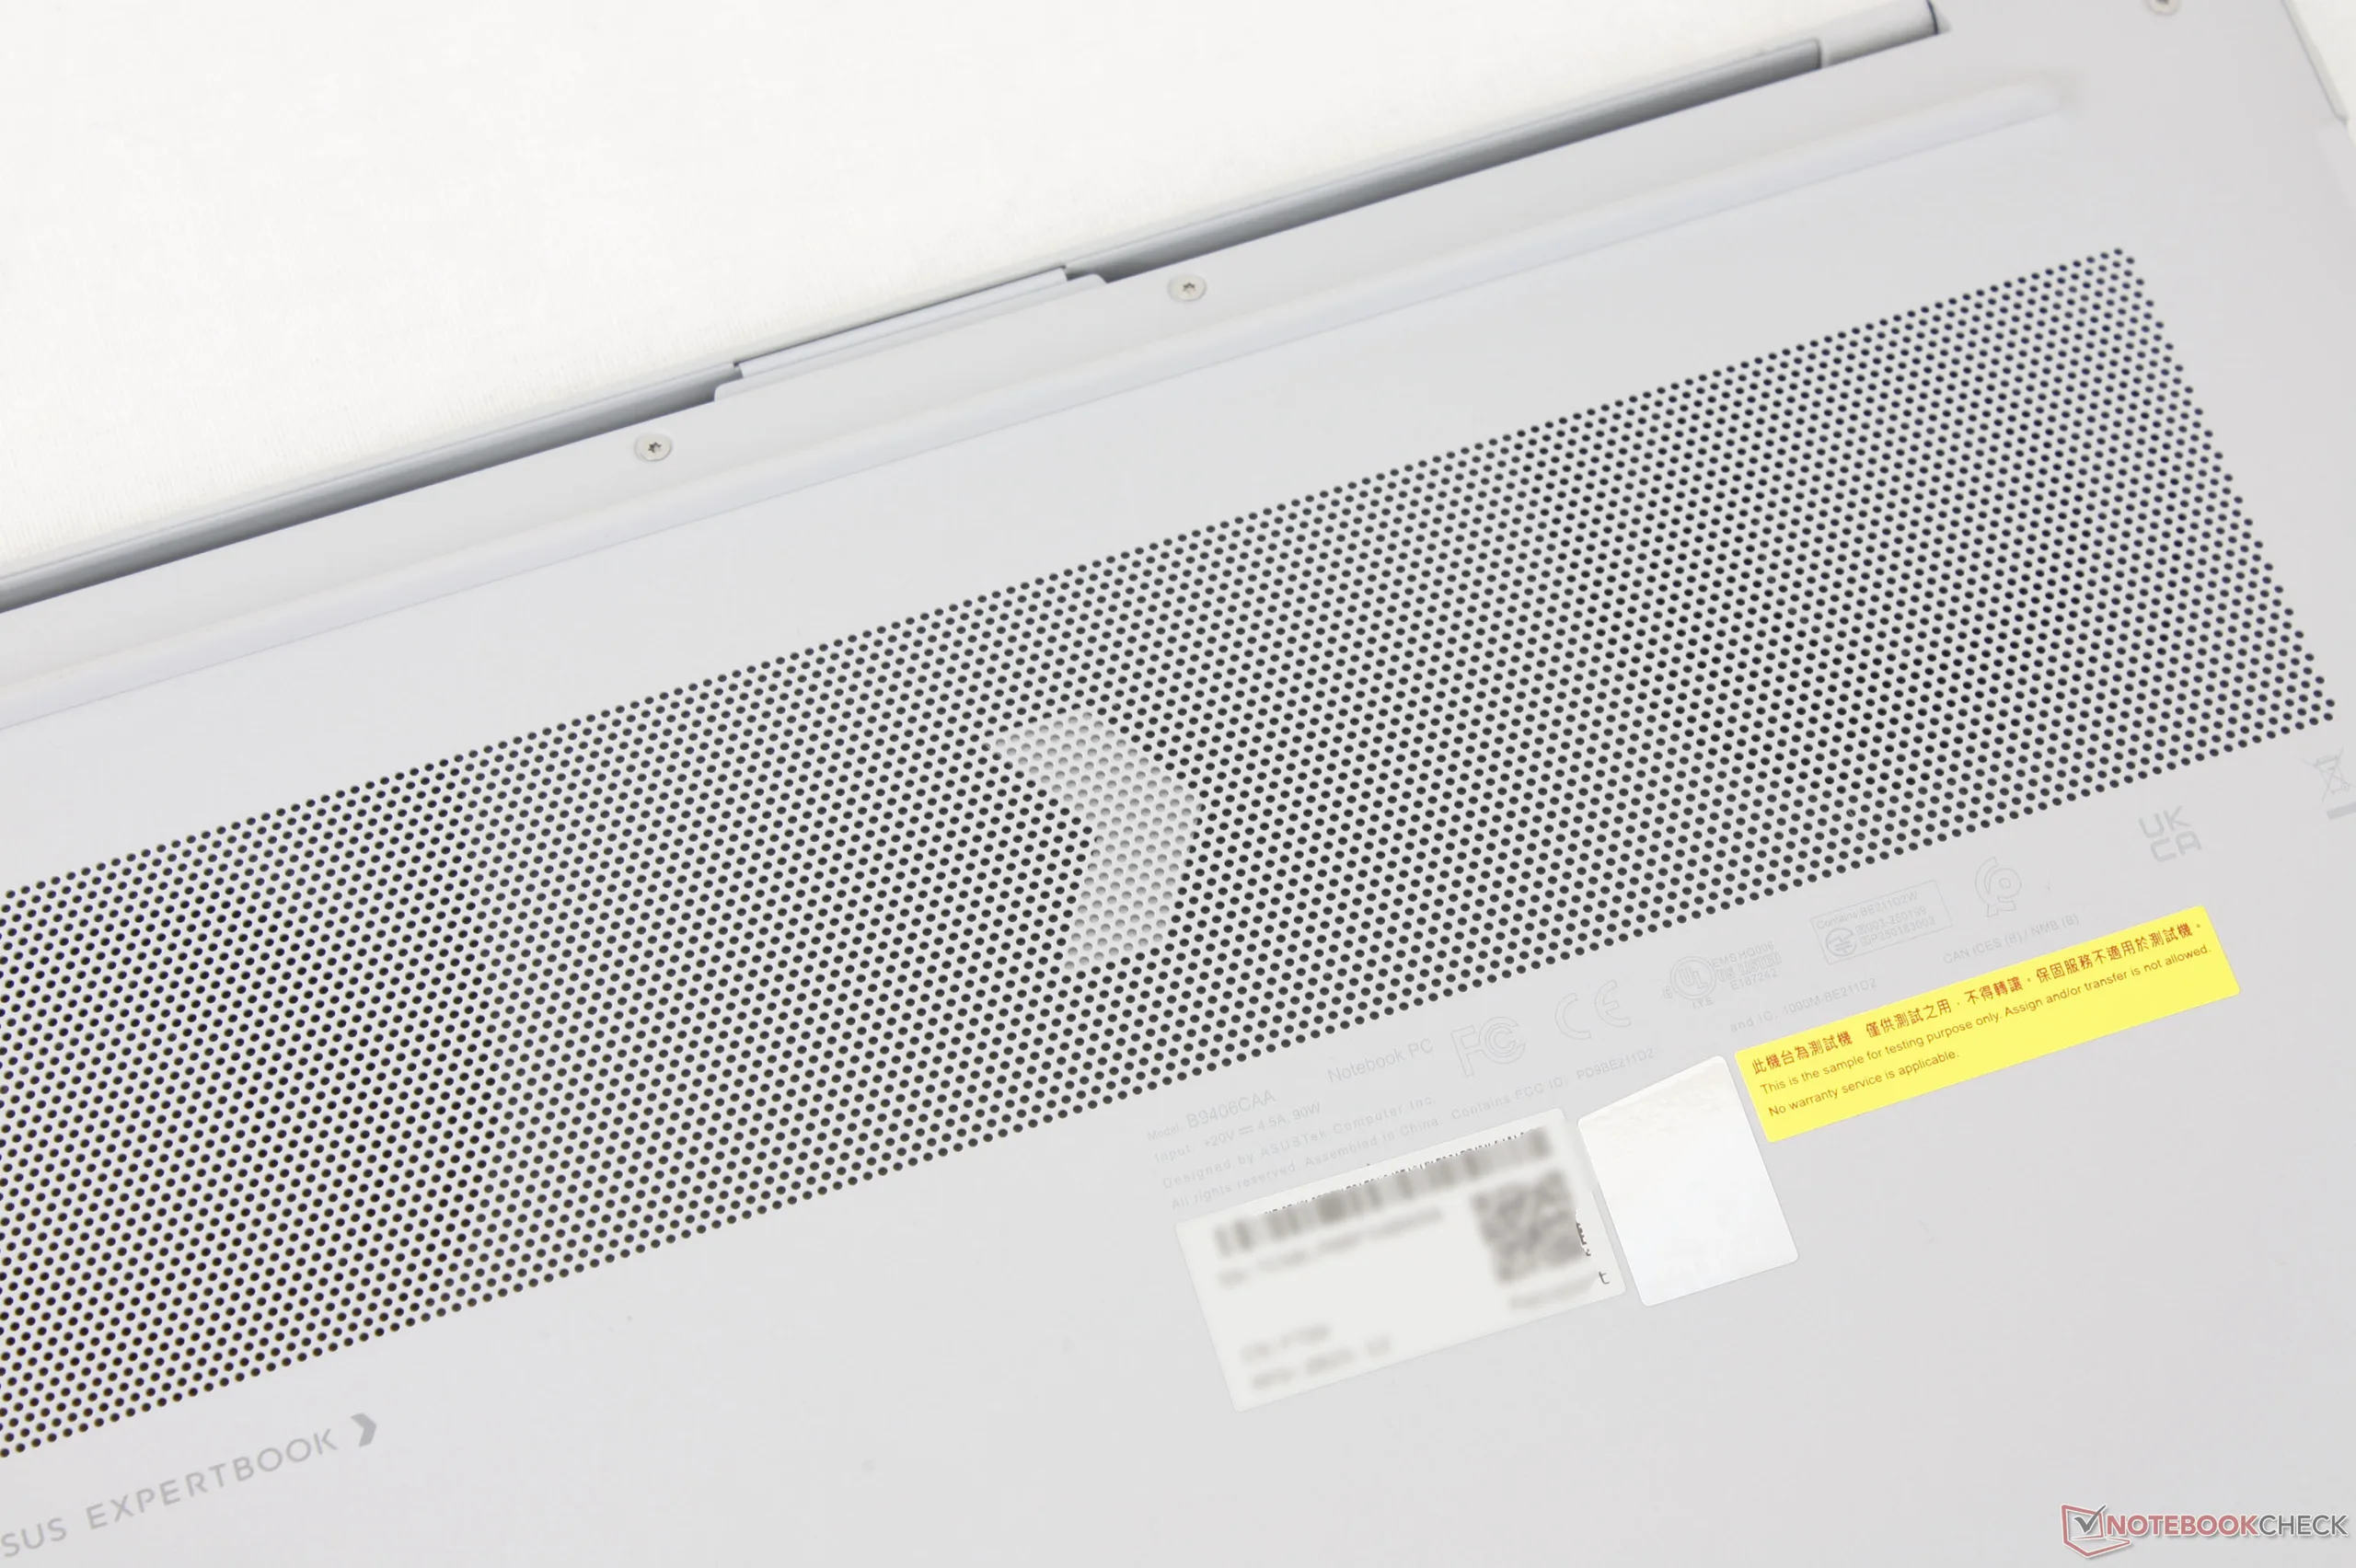
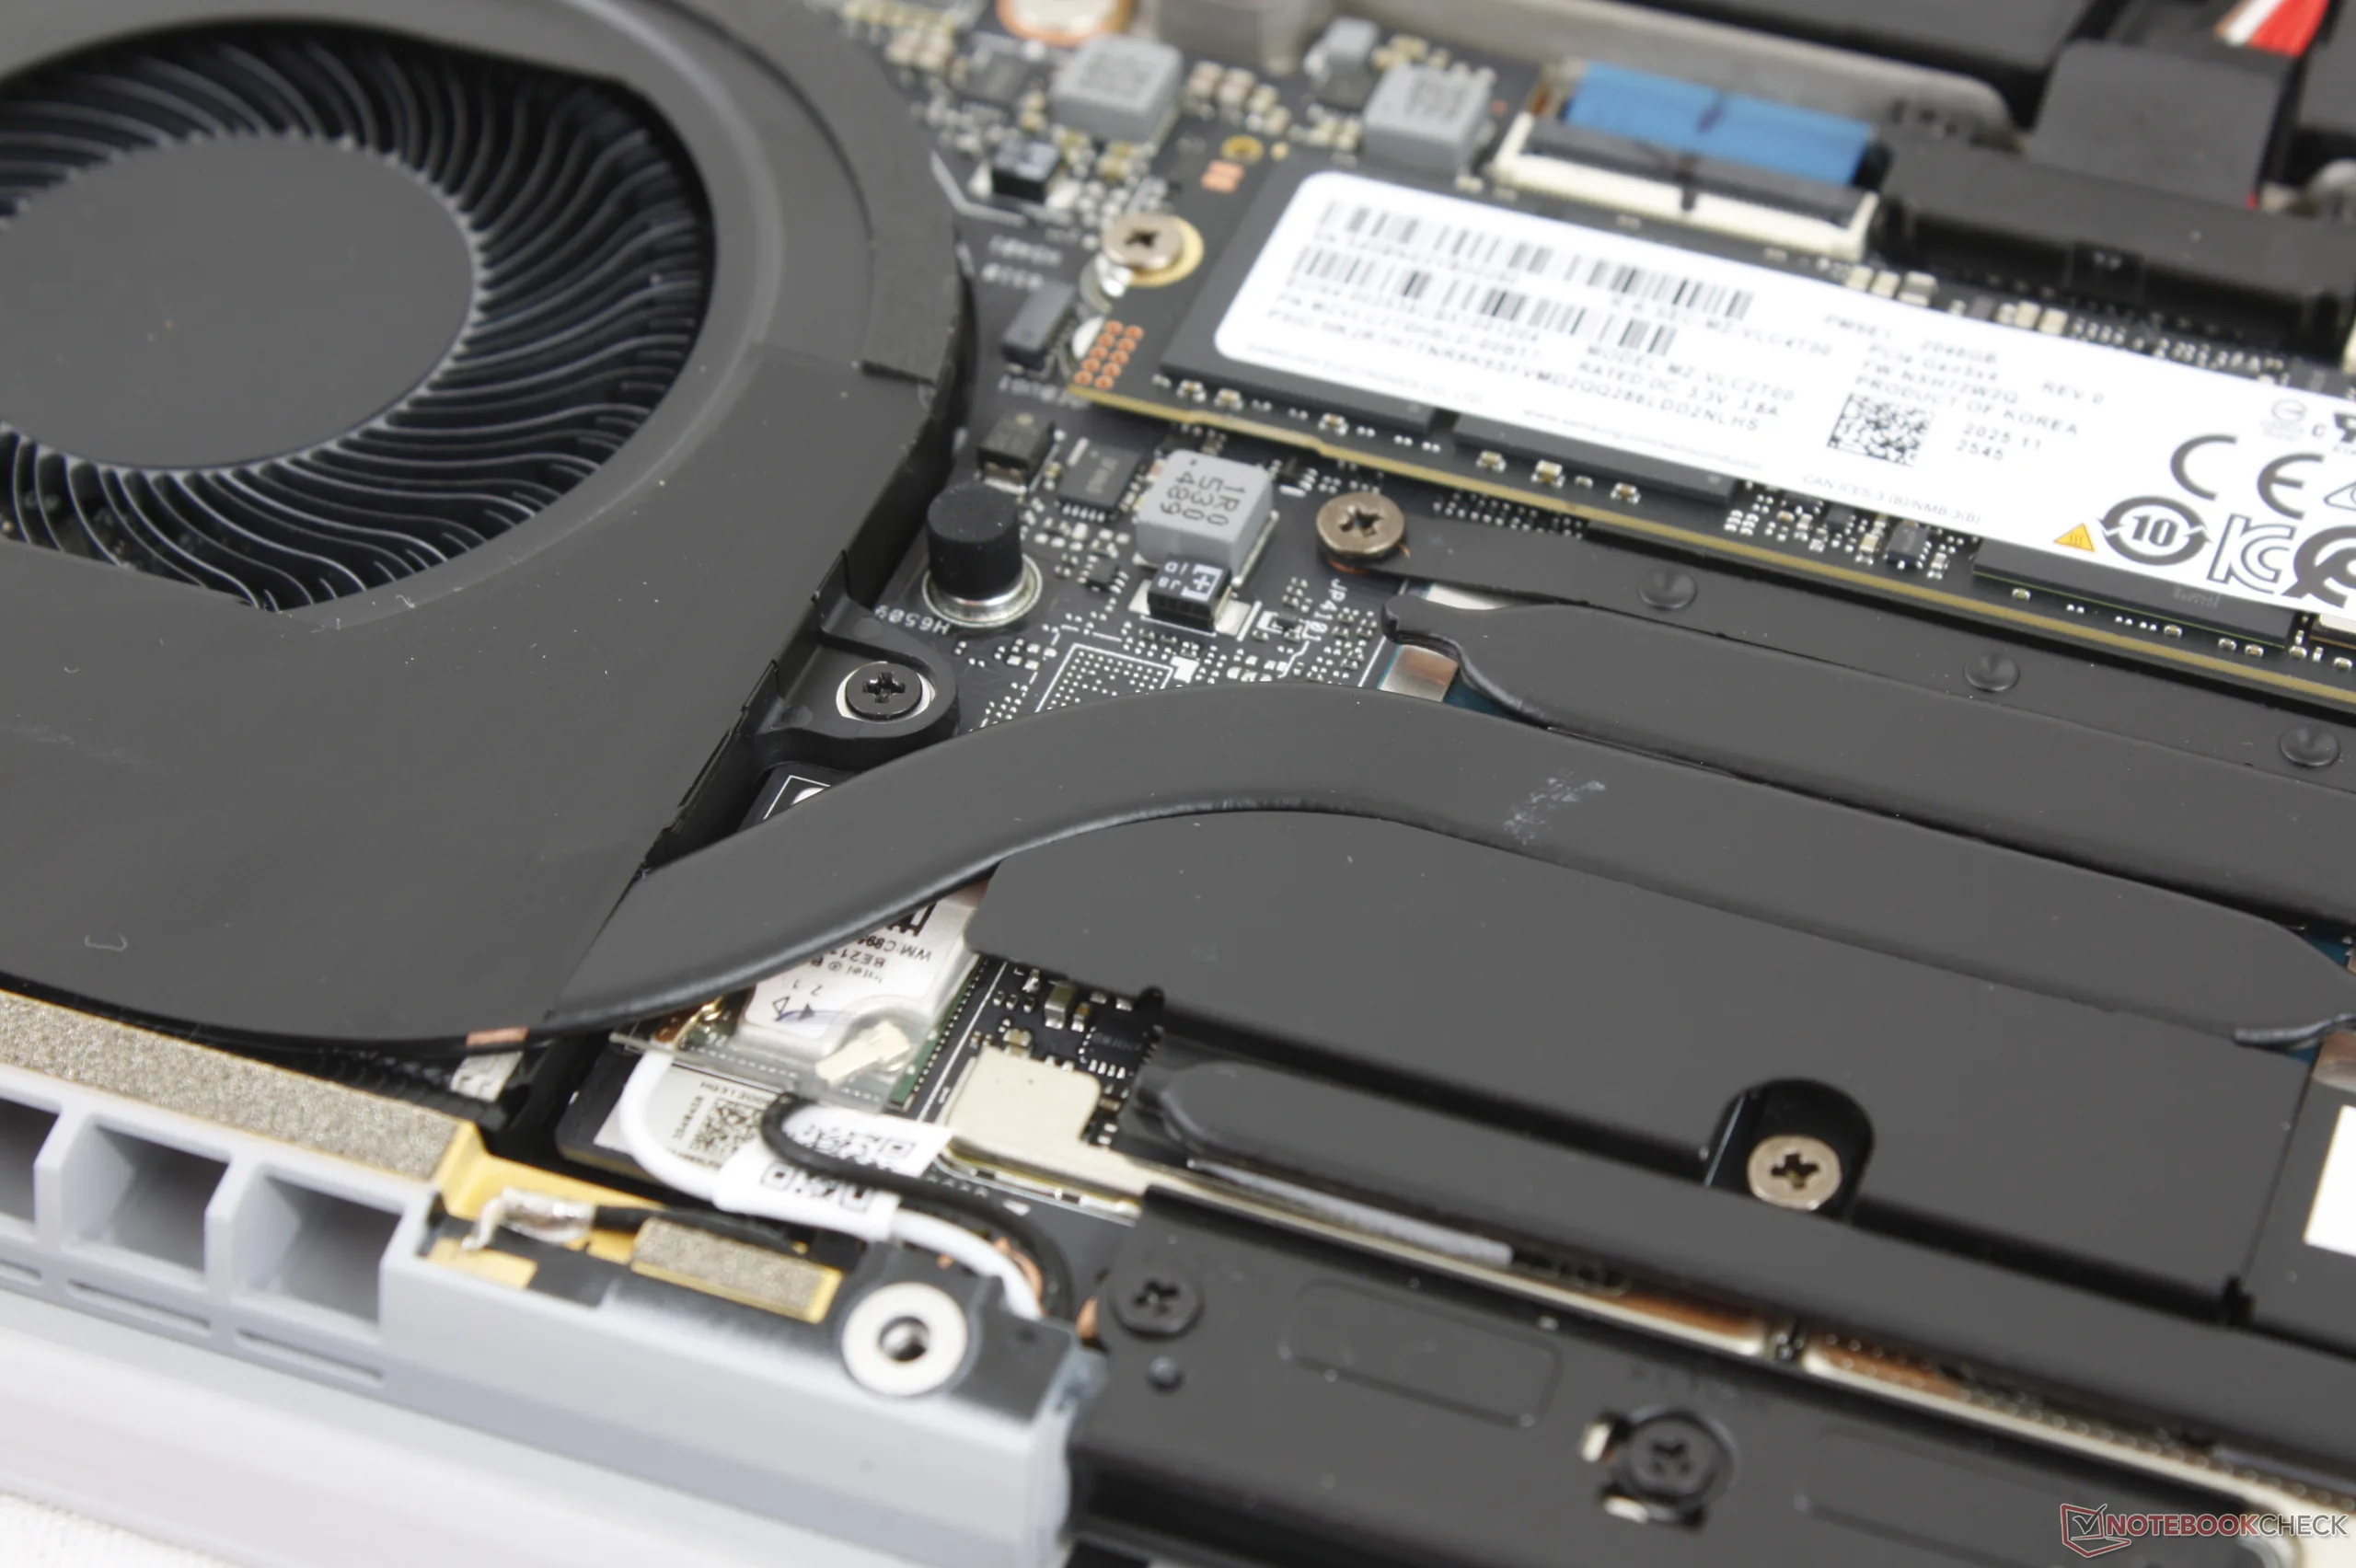
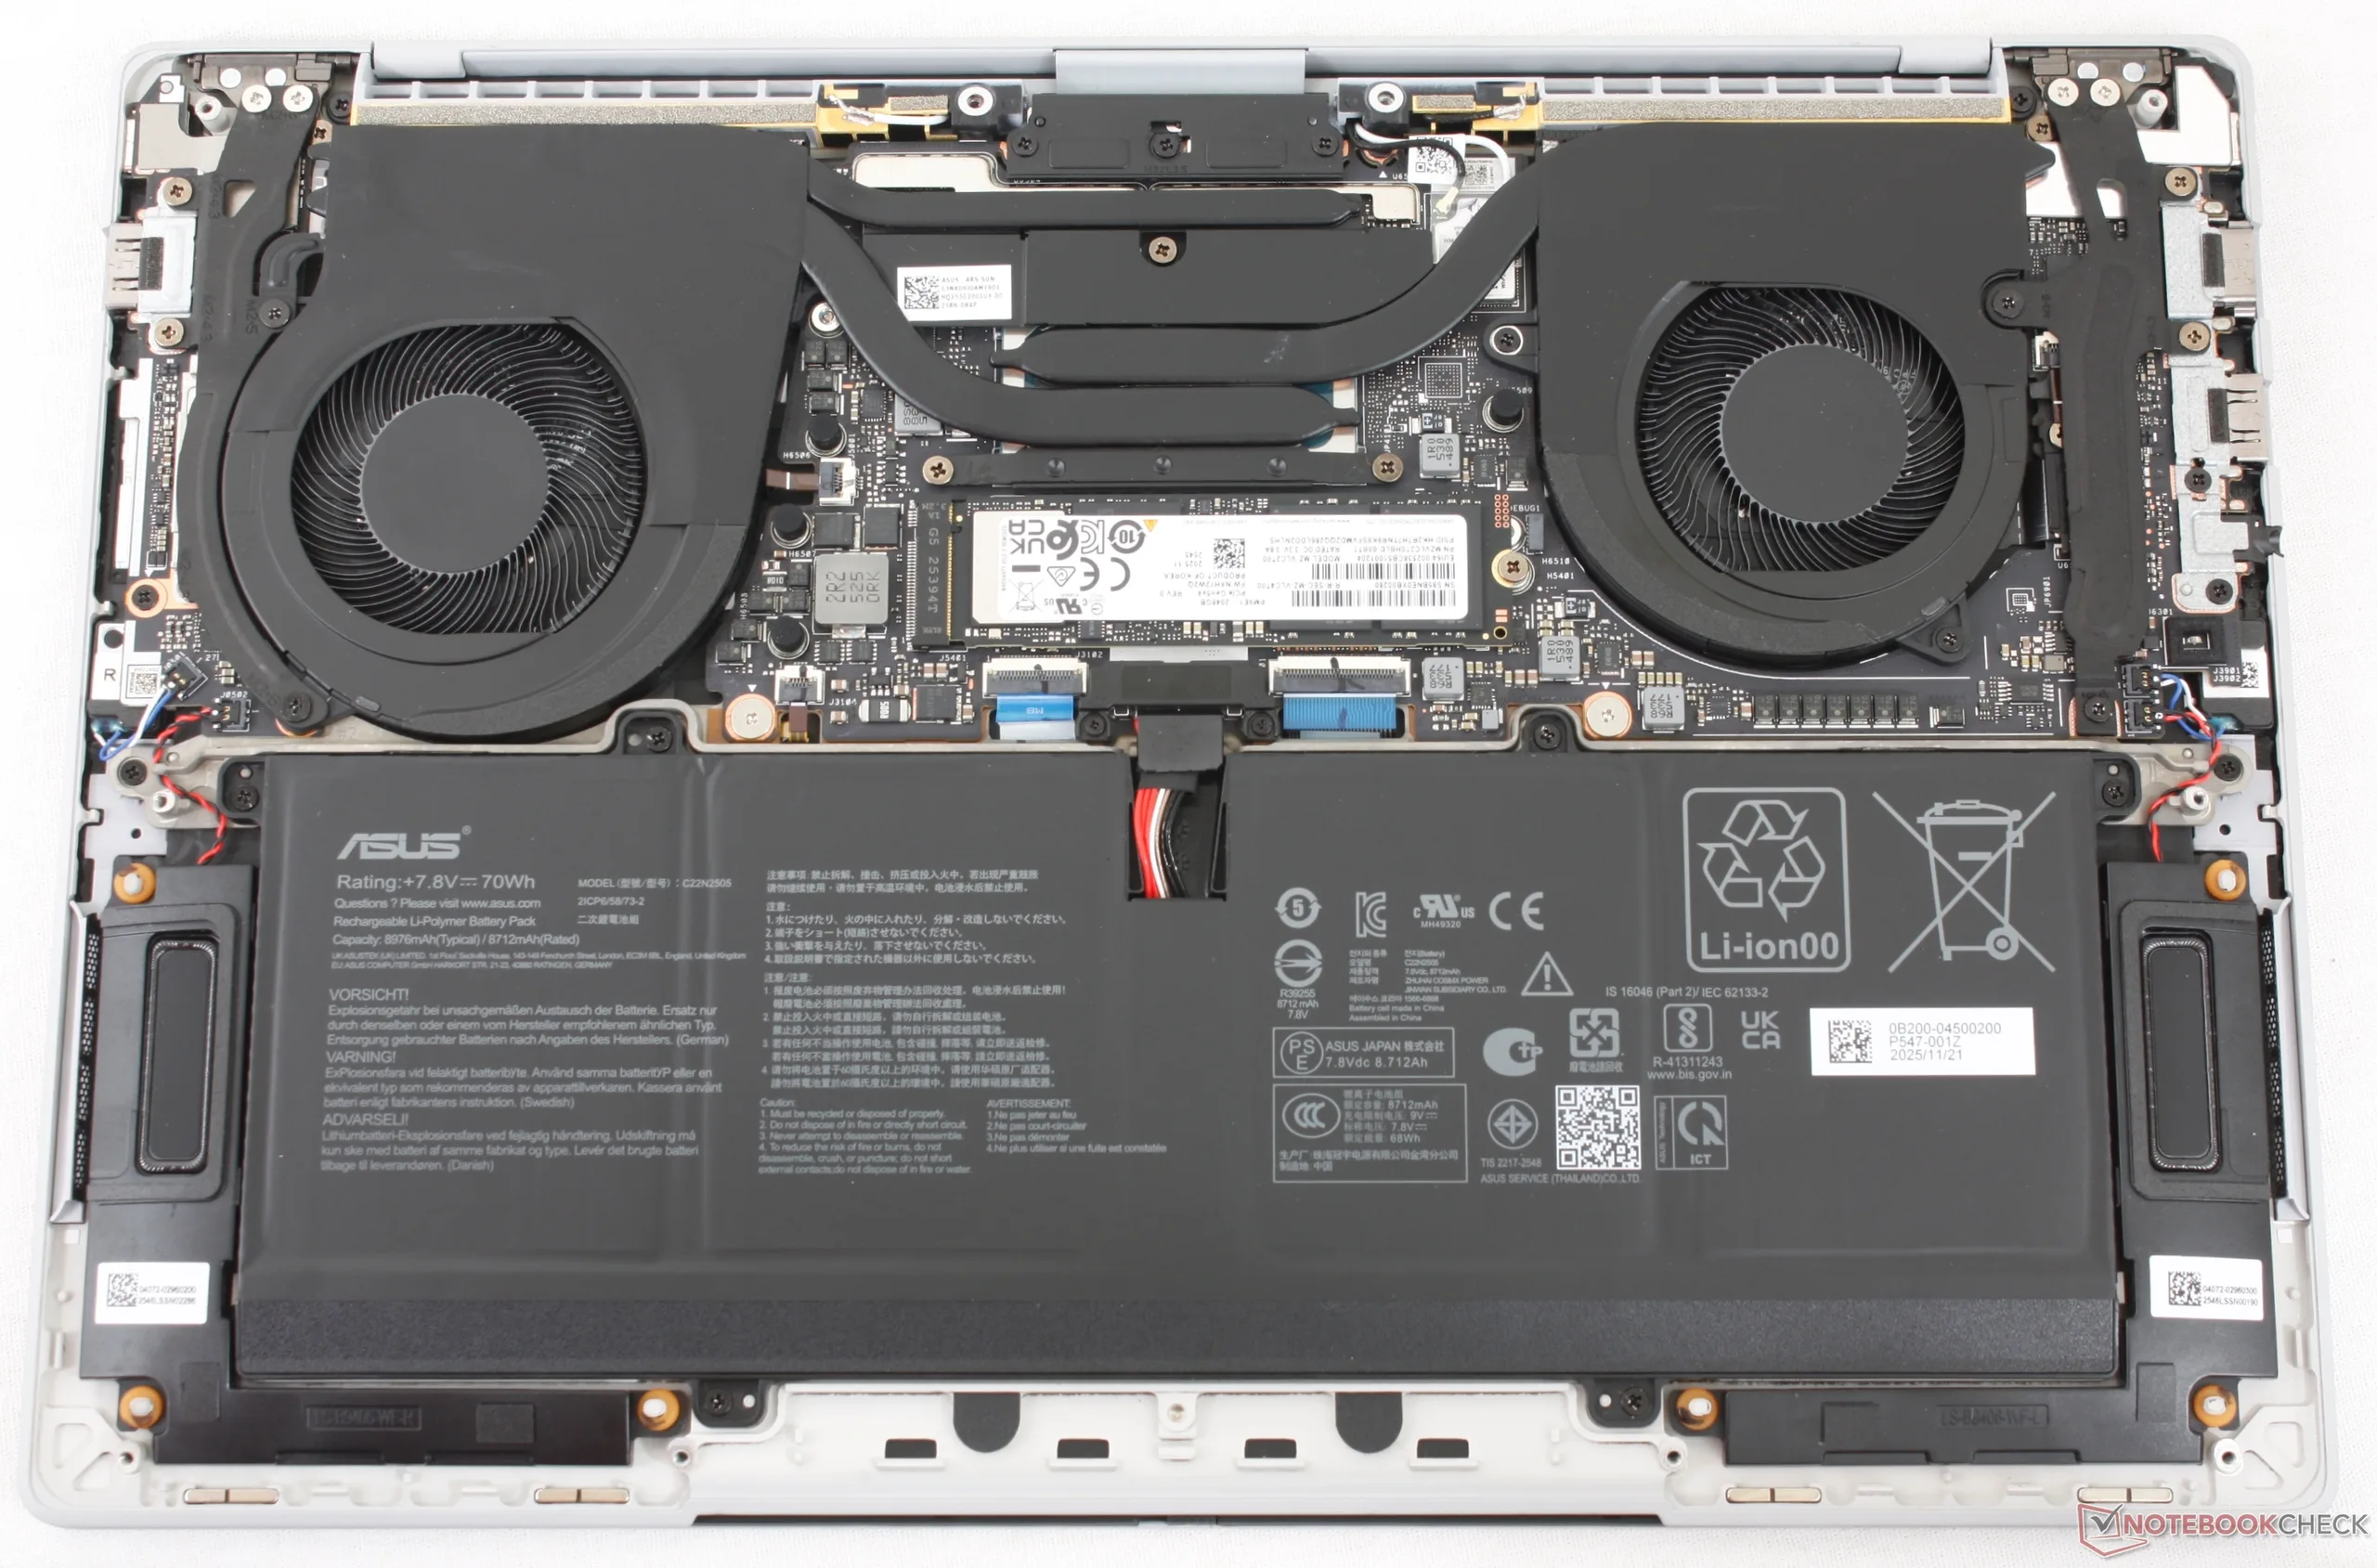
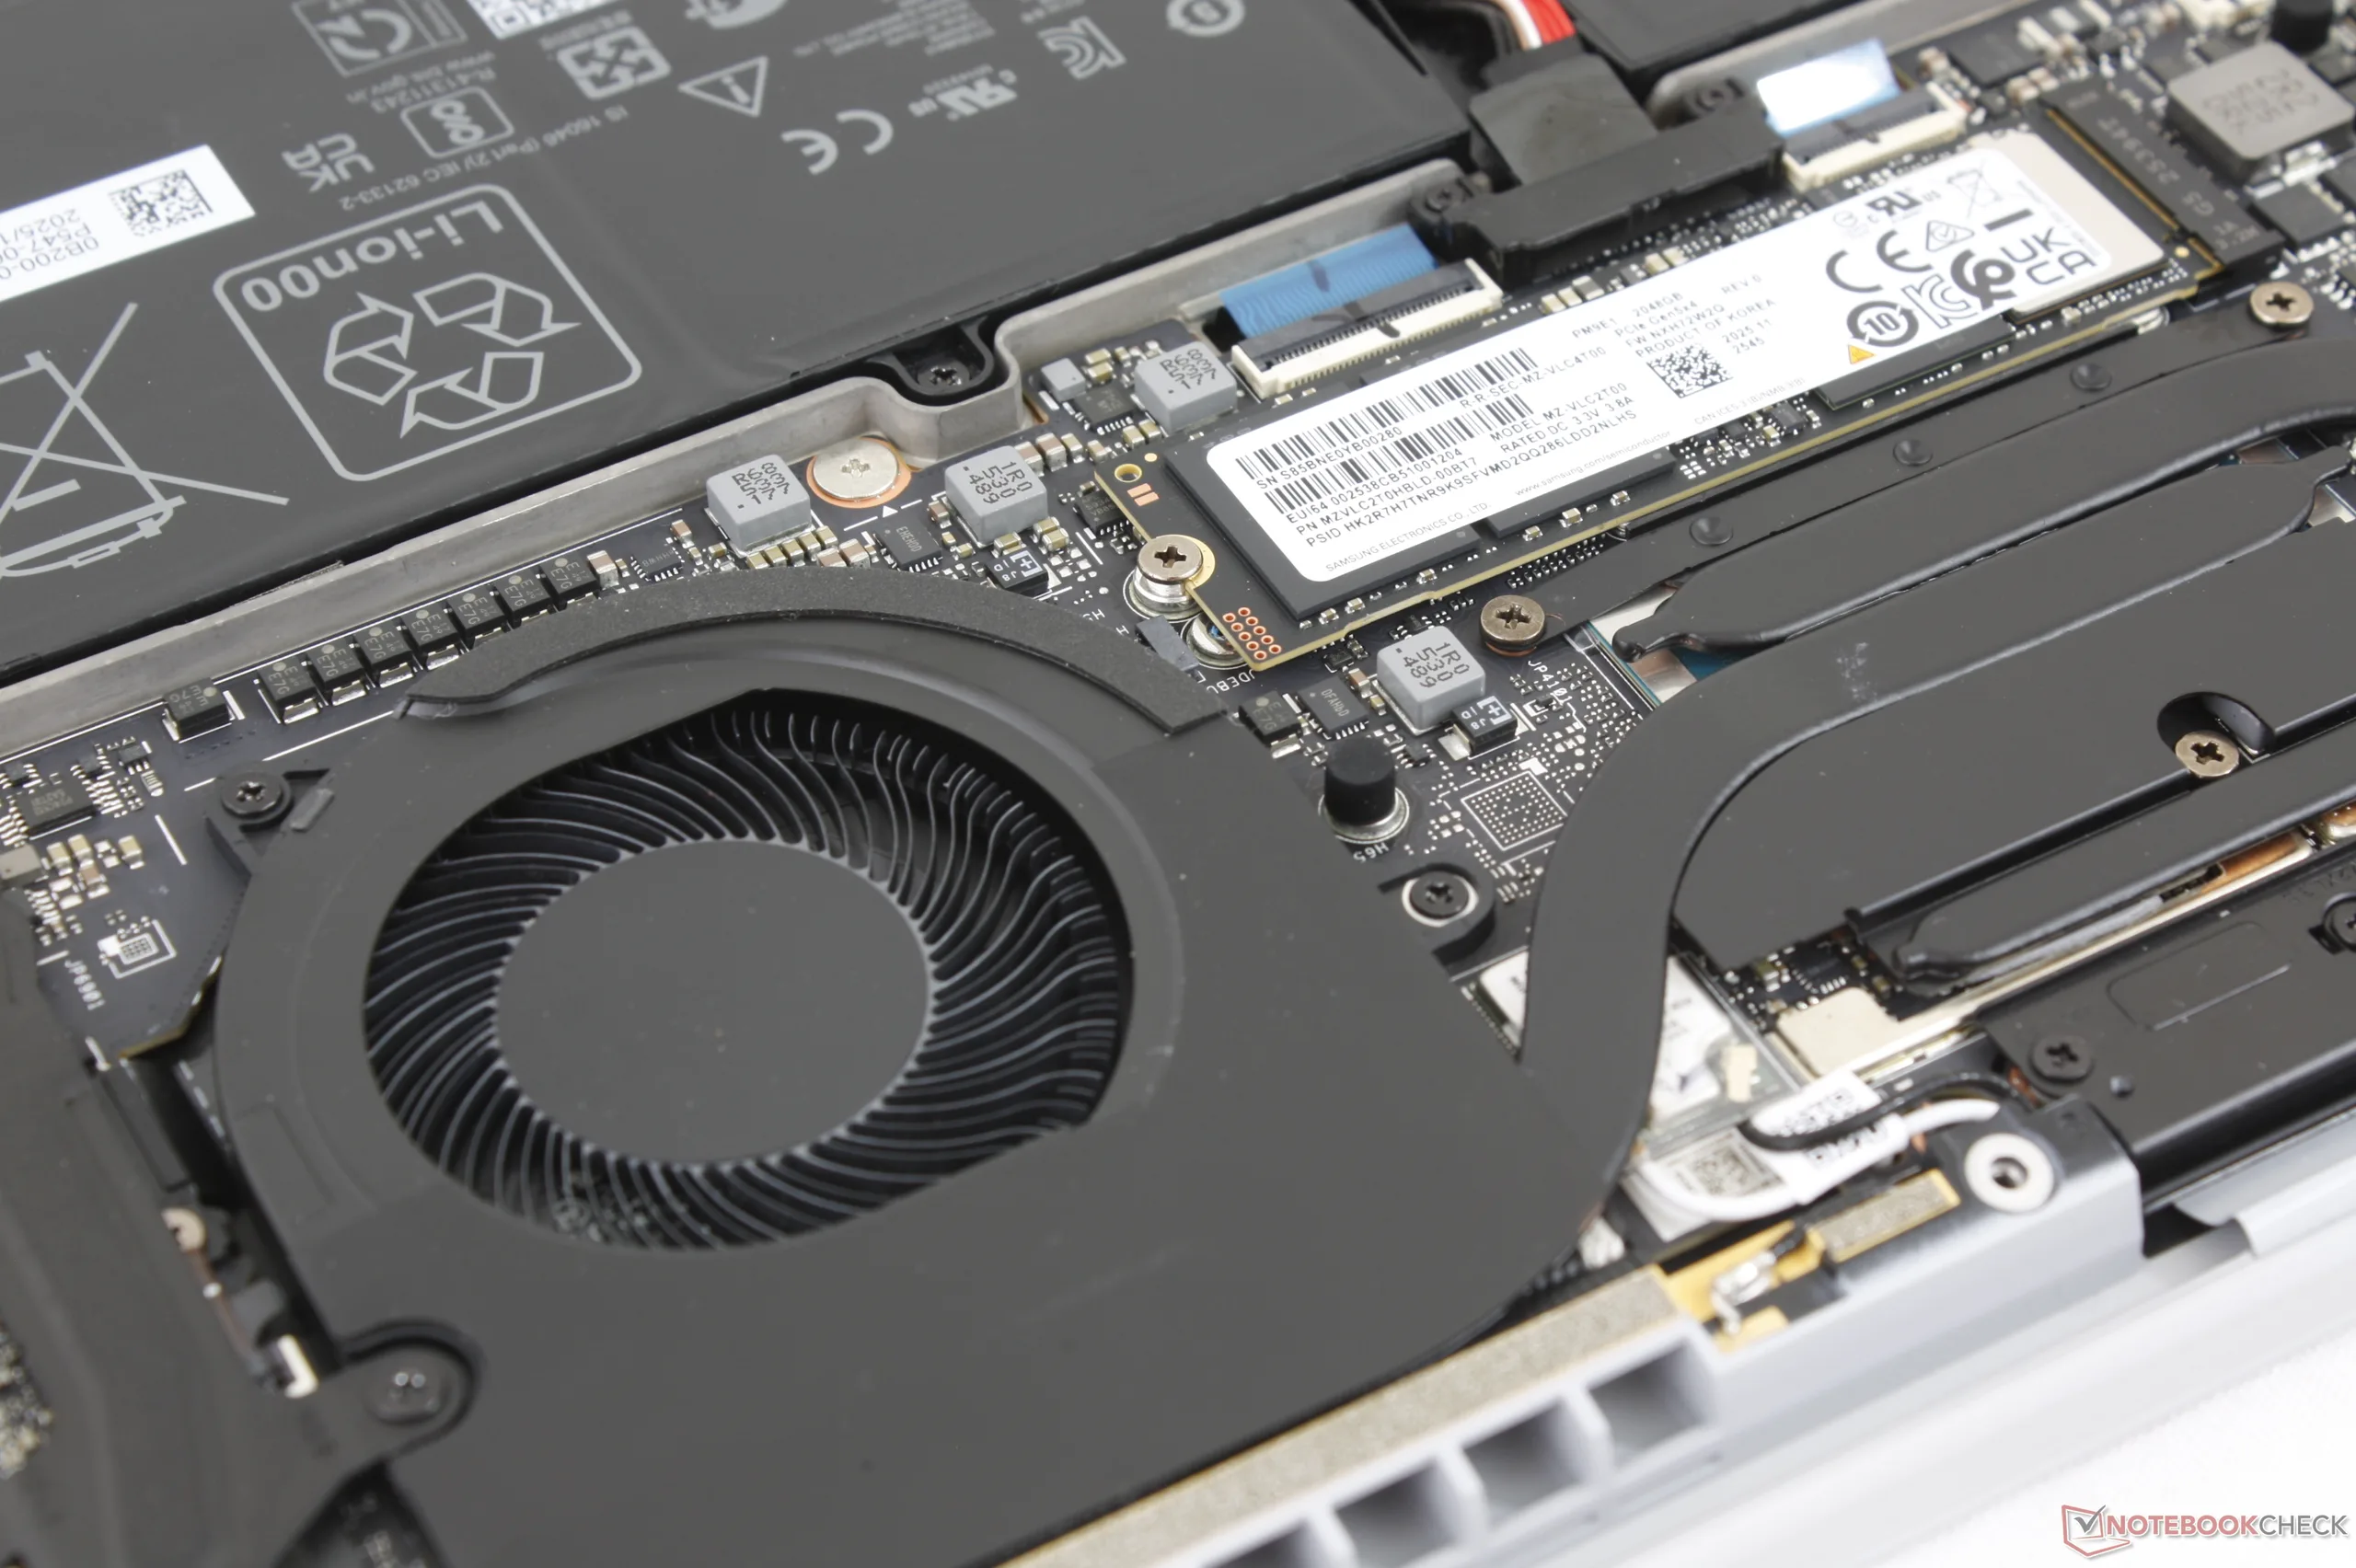
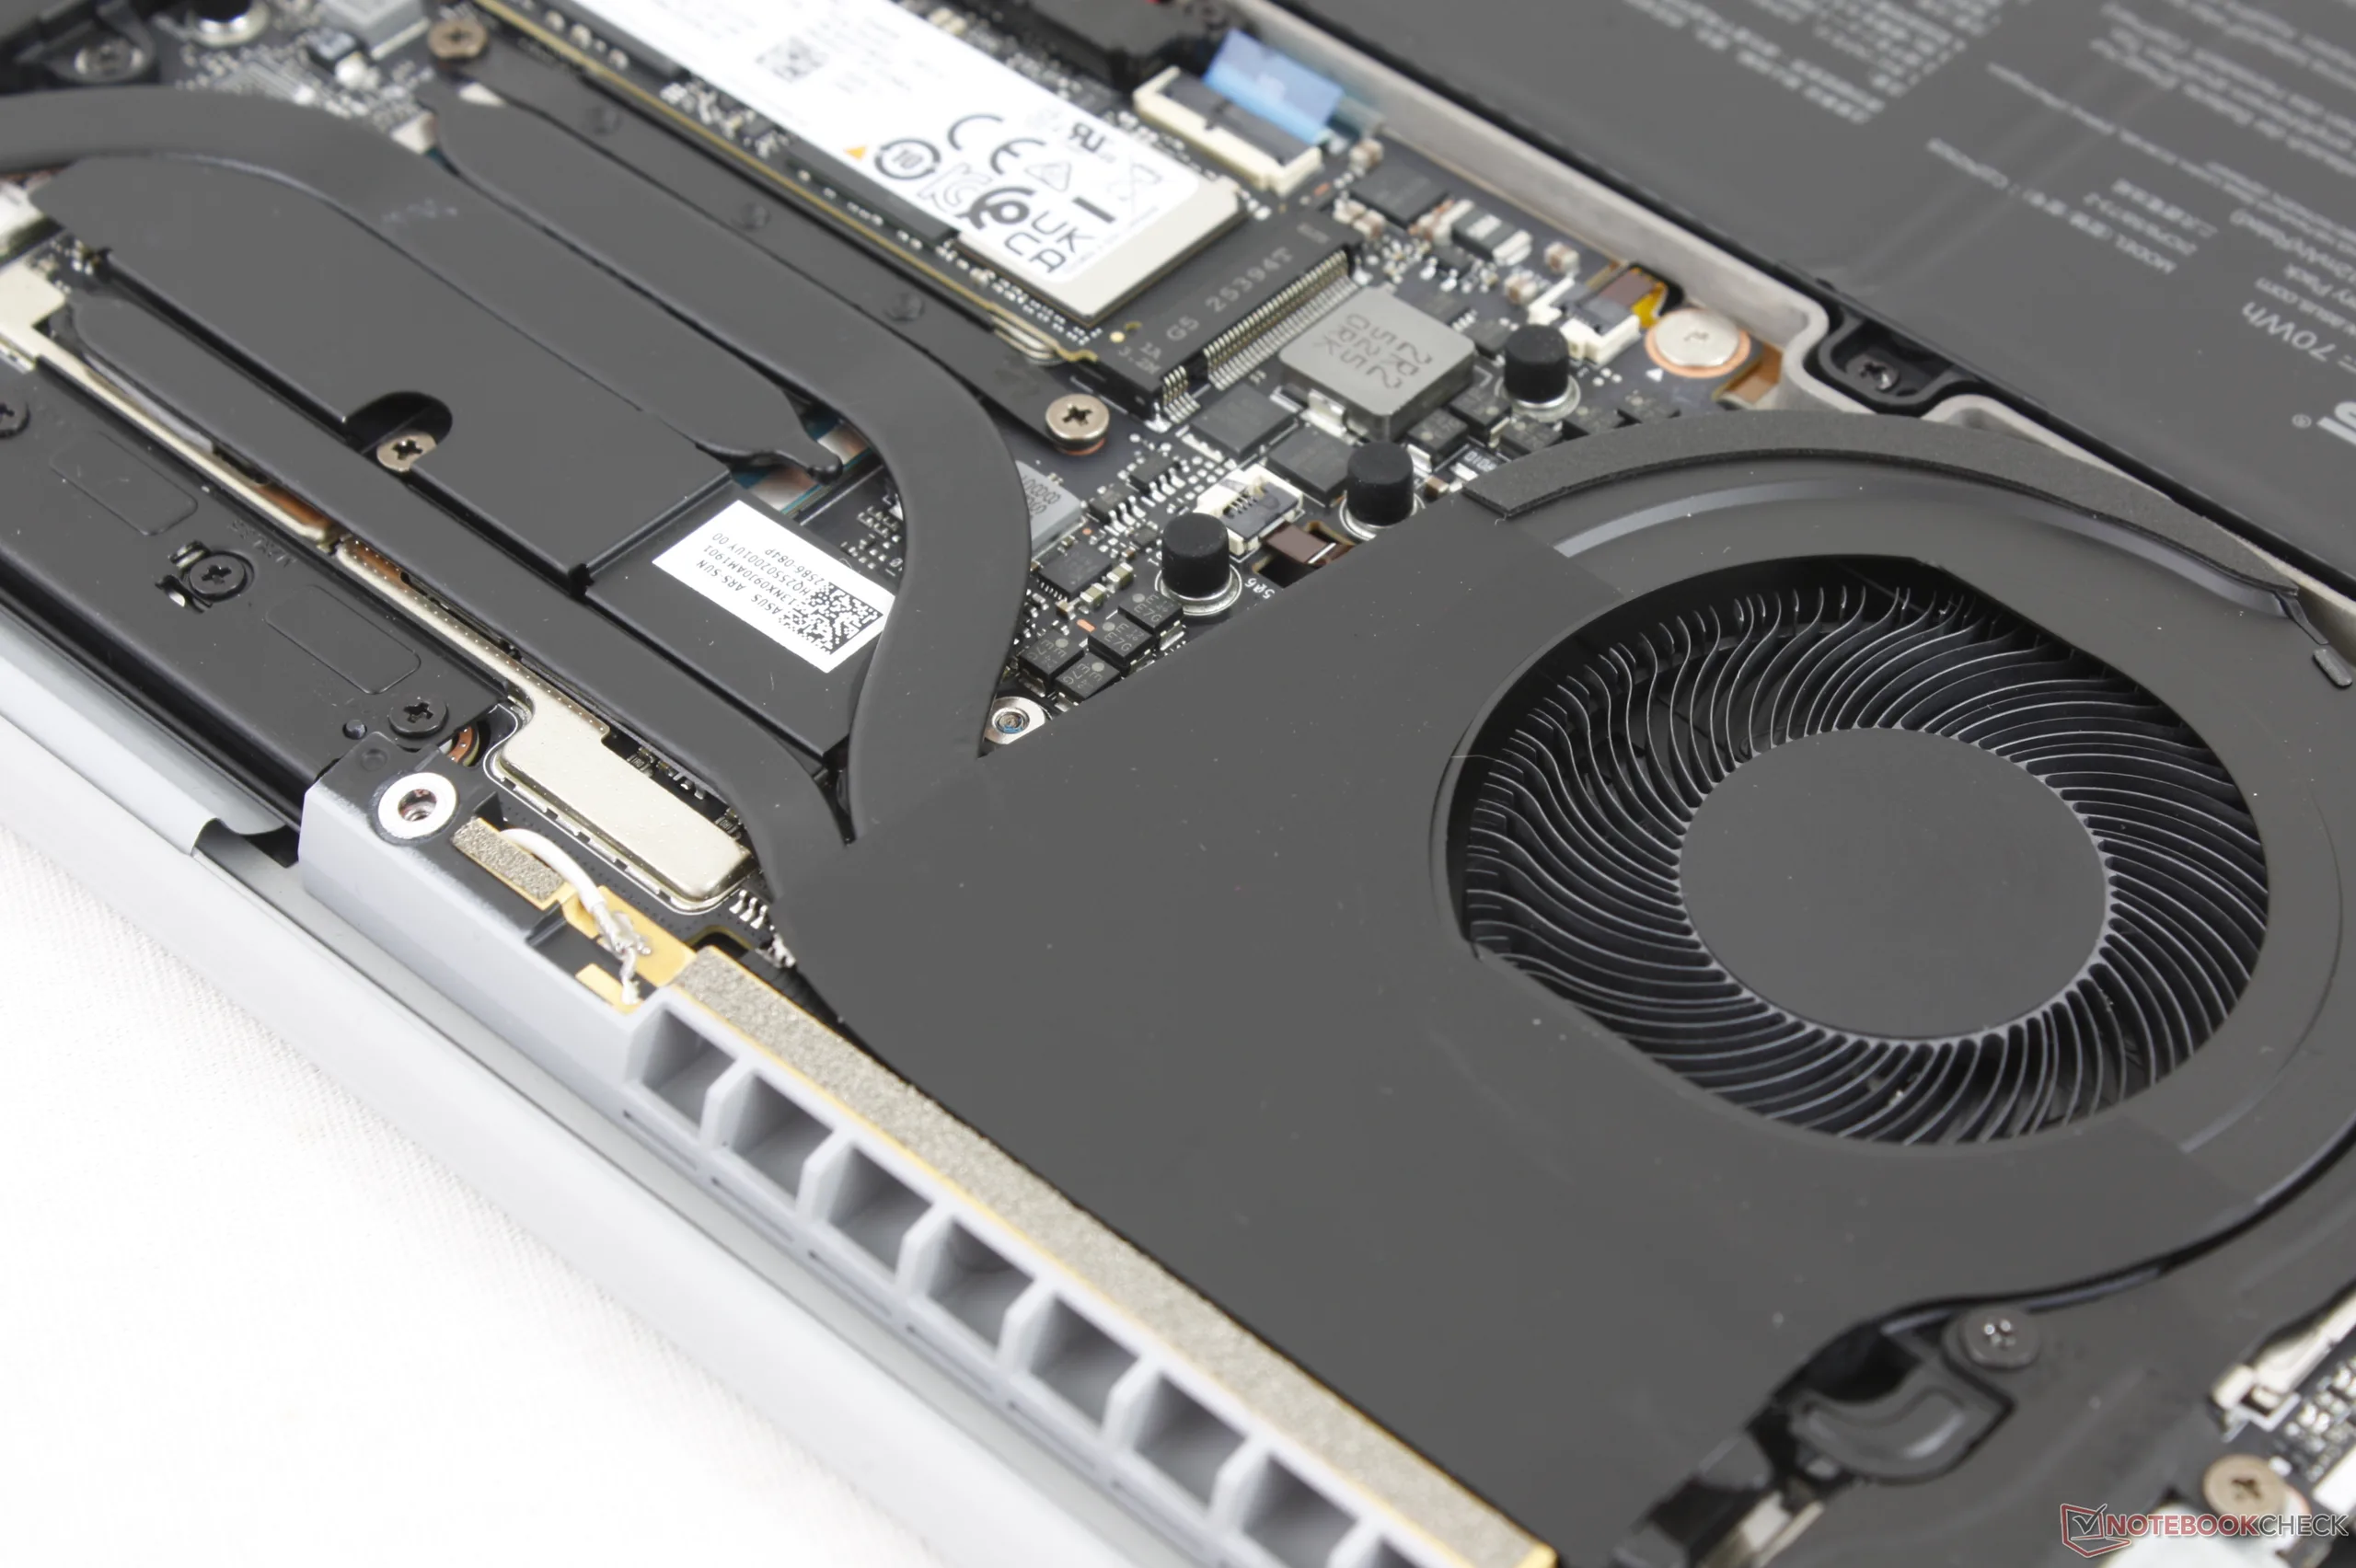
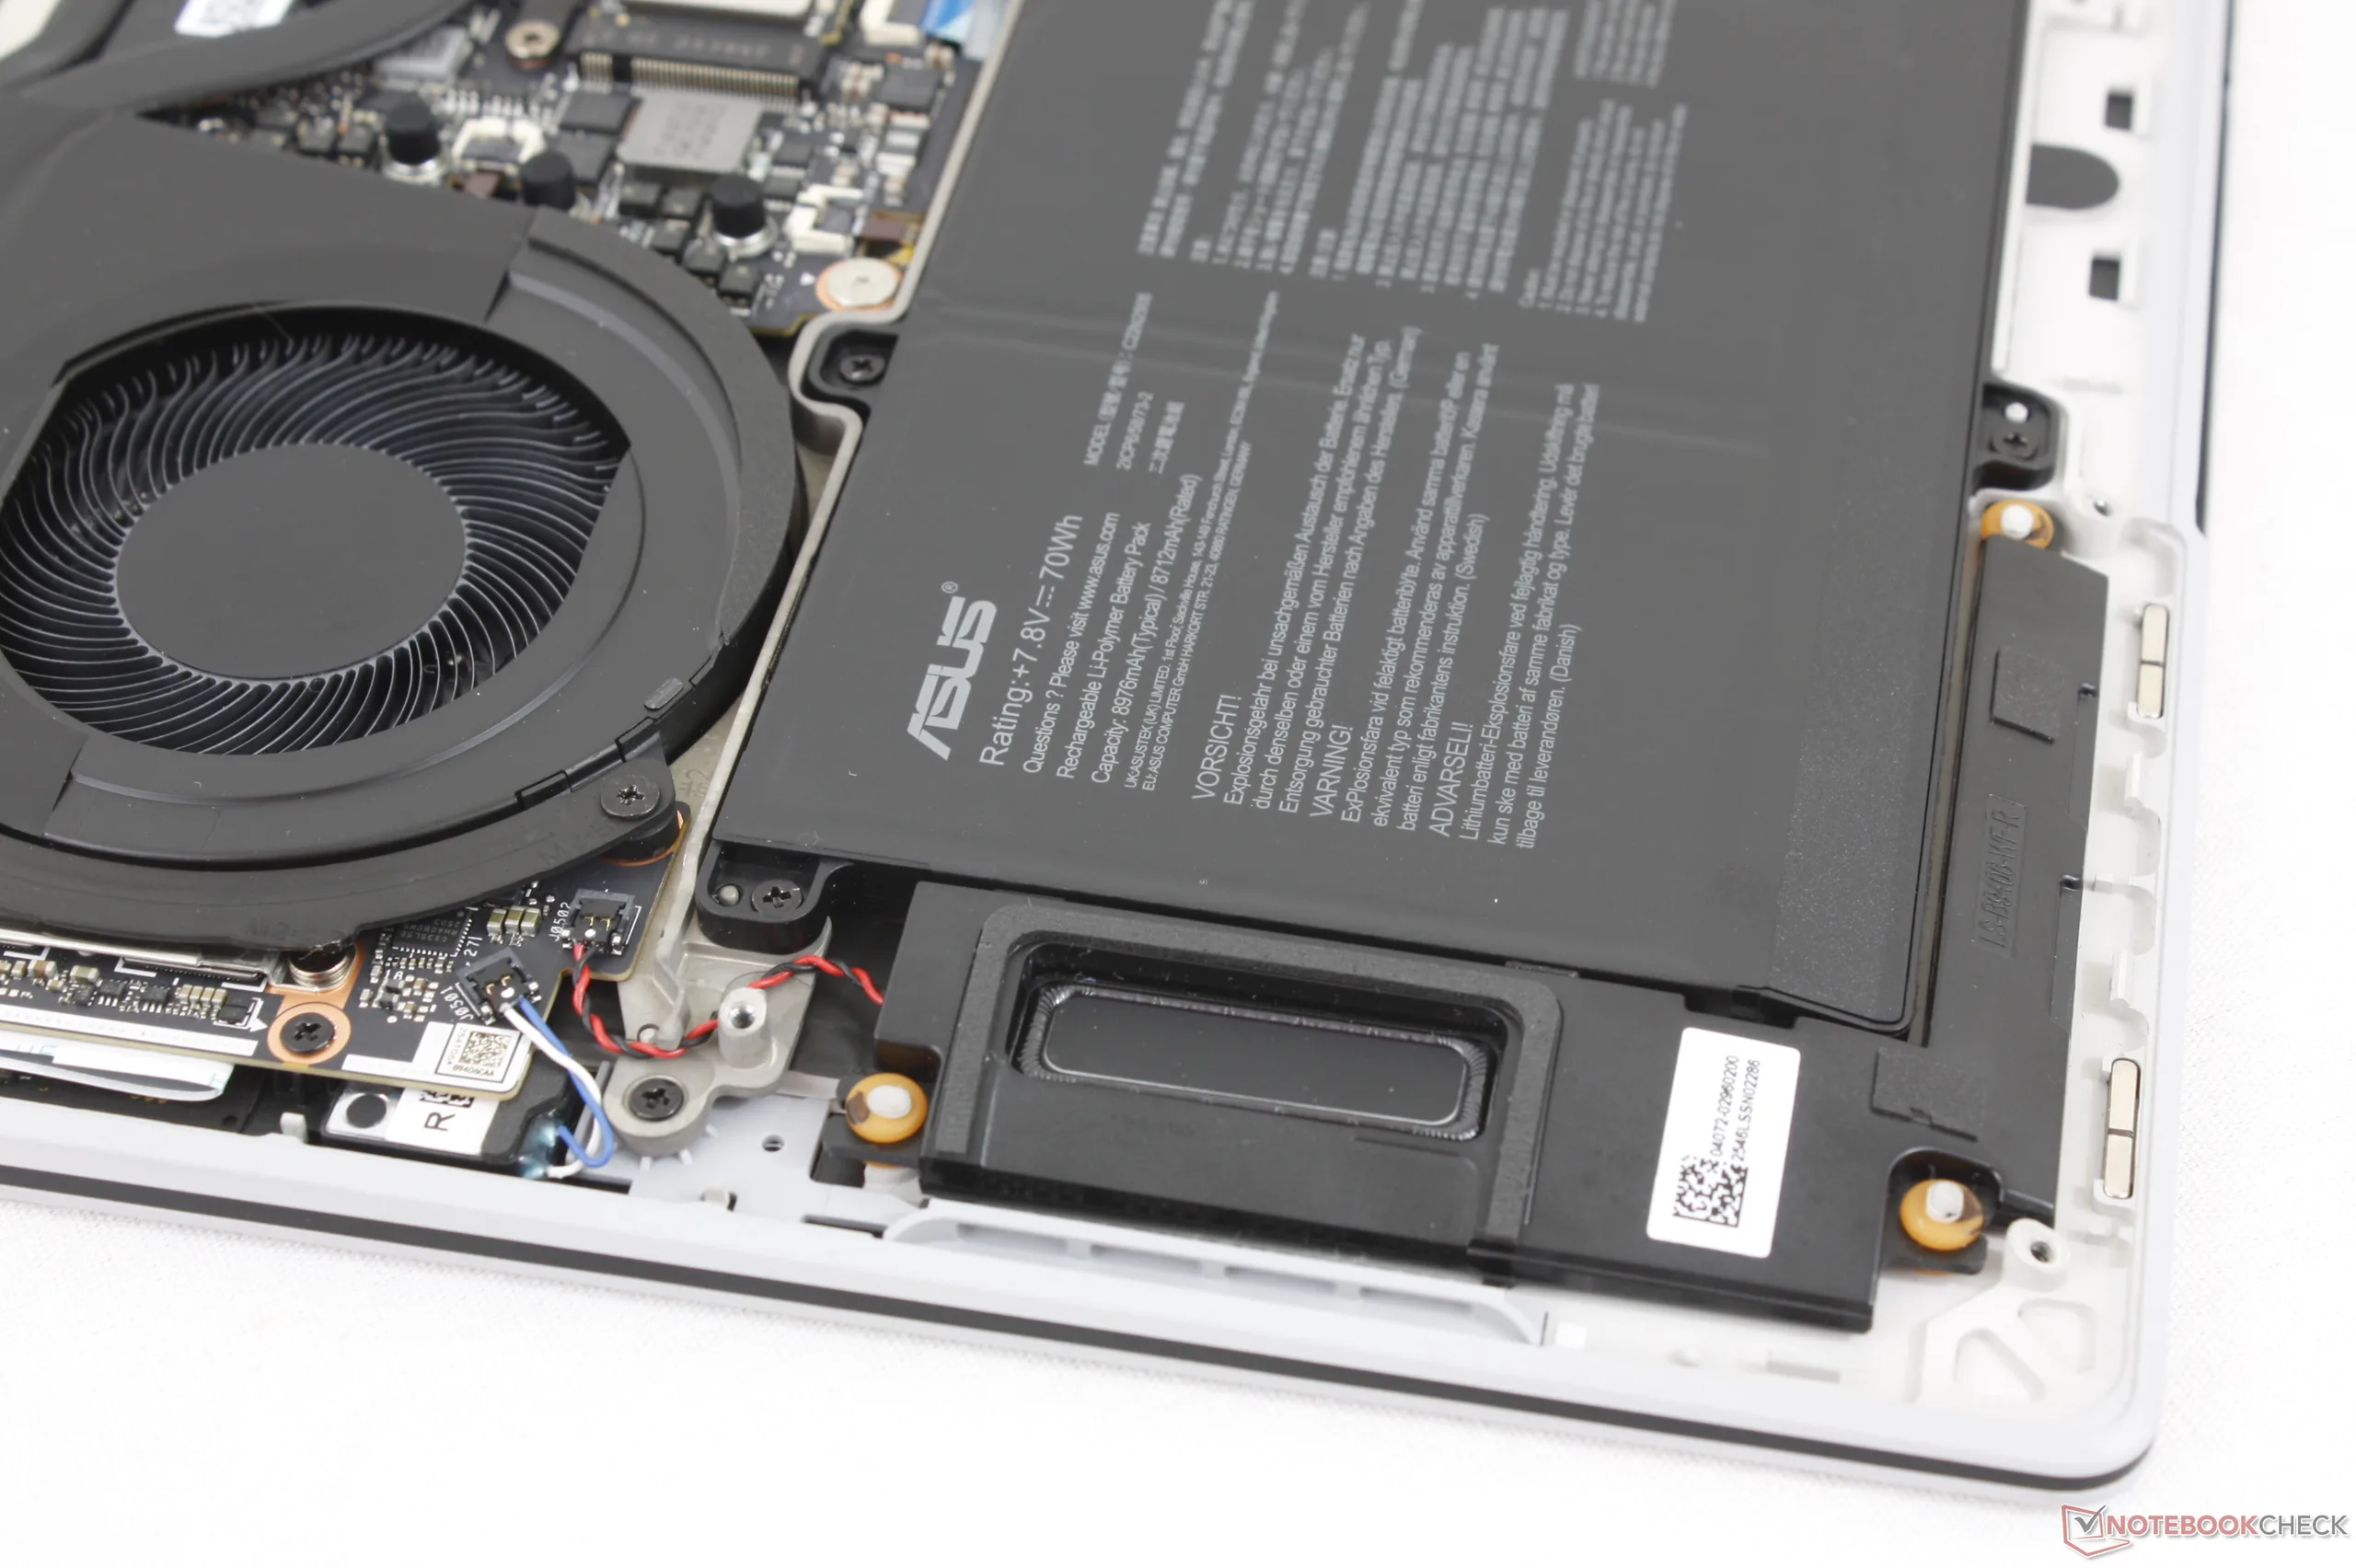
维护
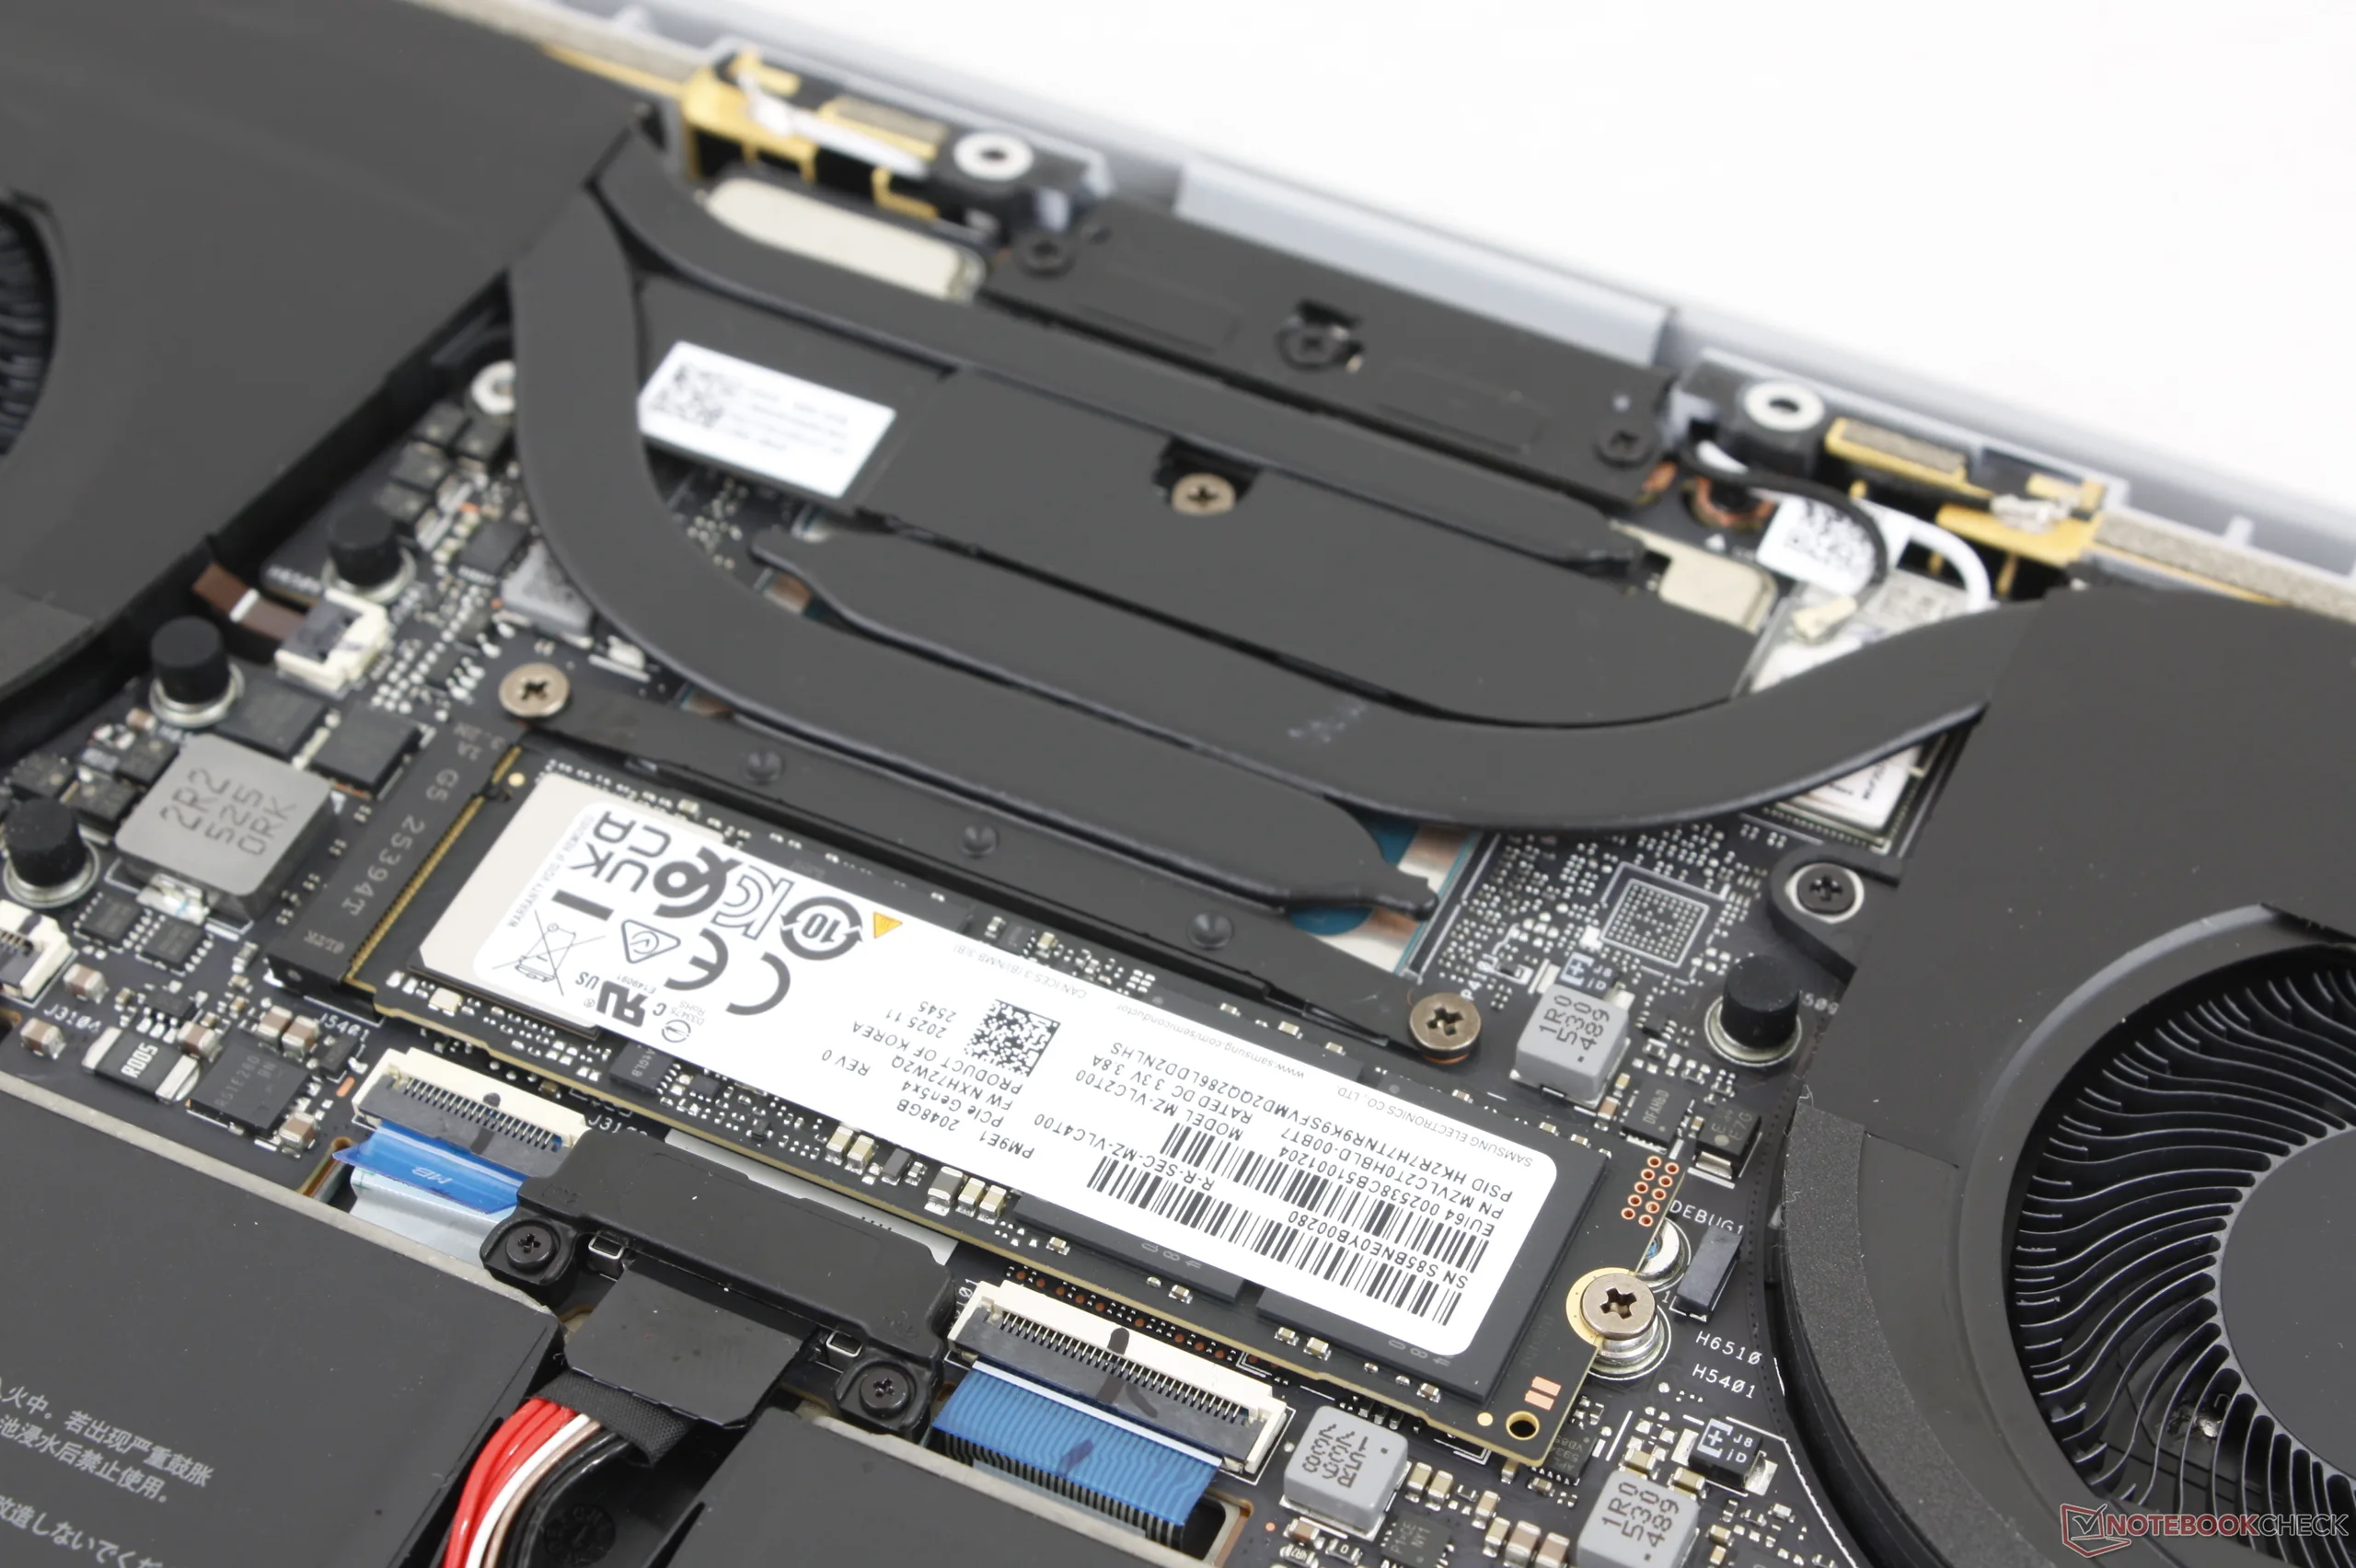
底板由 10 颗 T5 Torx 螺钉固定,维修相对方便。不过,由于内存模块是焊接的,而且只为单个 M.2 2280 SSD 留出了空间,因此升级受到了限制。
可持续性
该机型使用了 90% 的可回收镁铝合金、多达 35% 的塑料(用于键帽和边框)以及 100% 的可回收稀土金属。包装几乎全部采用纸张和纸板,交流适配器采用塑料包装。
配件和保修
零售包装盒内除了交流适配器和文件外,没有任何其他附件。如果在美国购买,制造商提供三年有限保修。
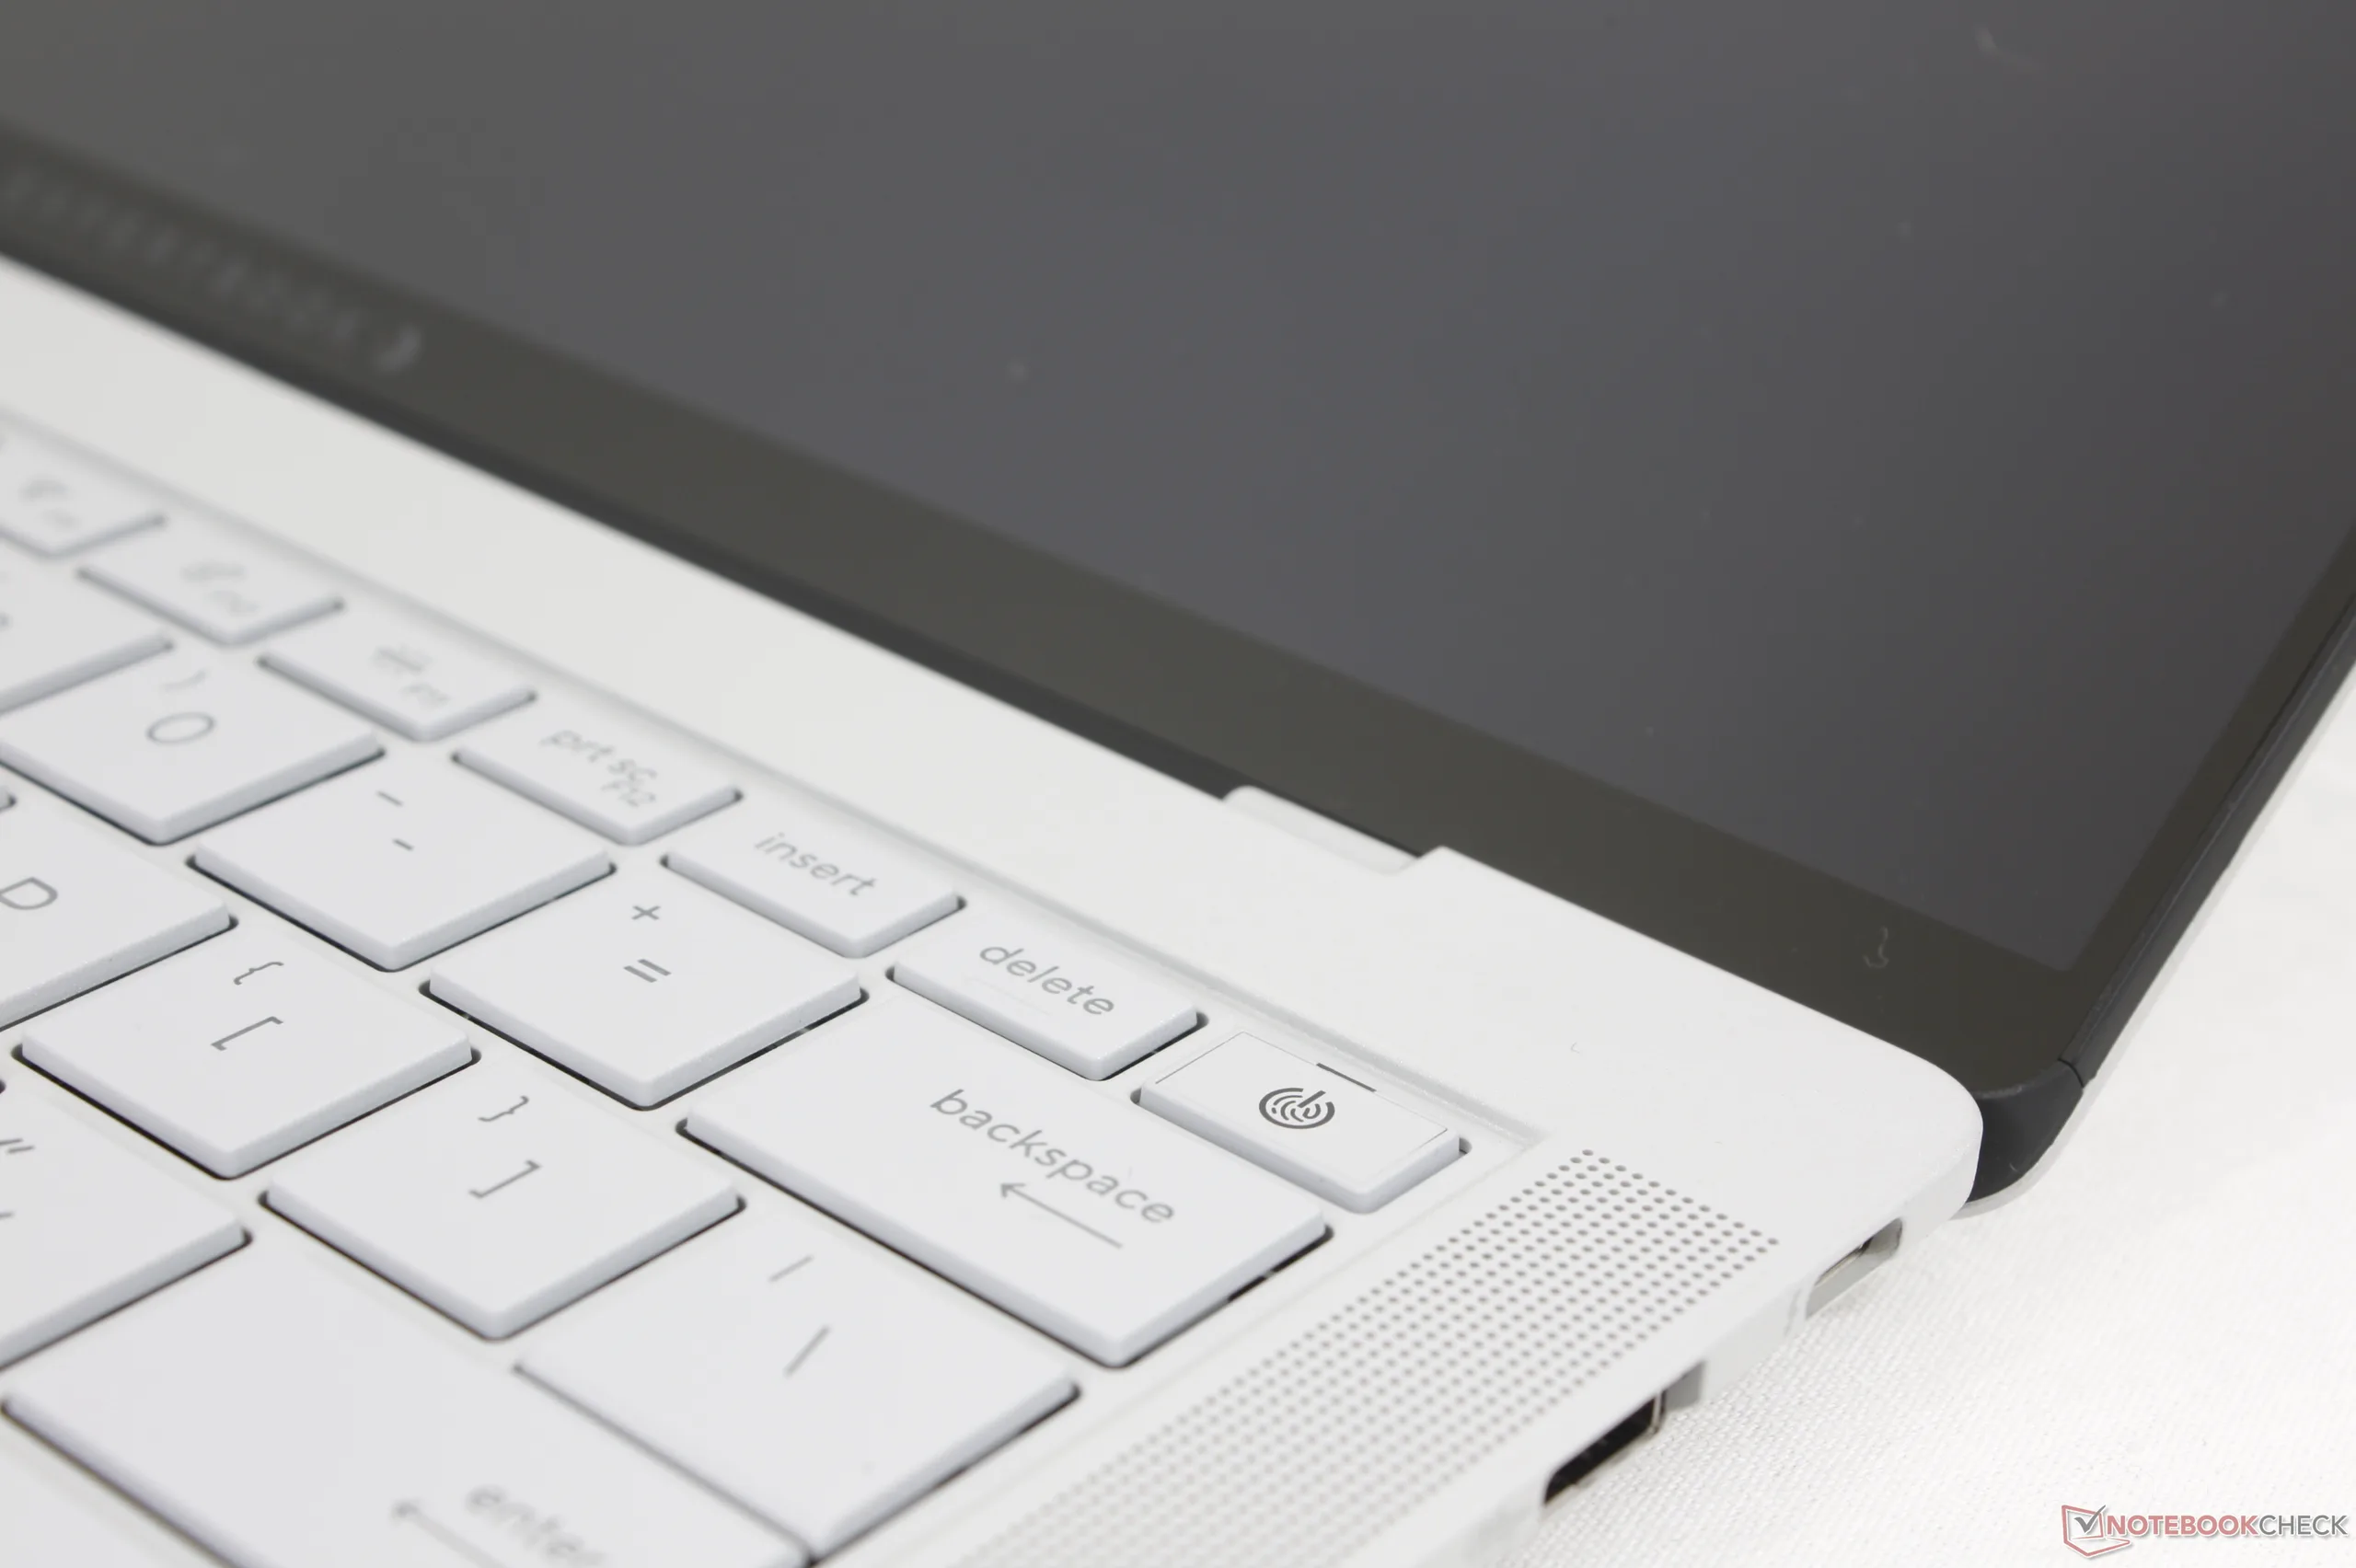
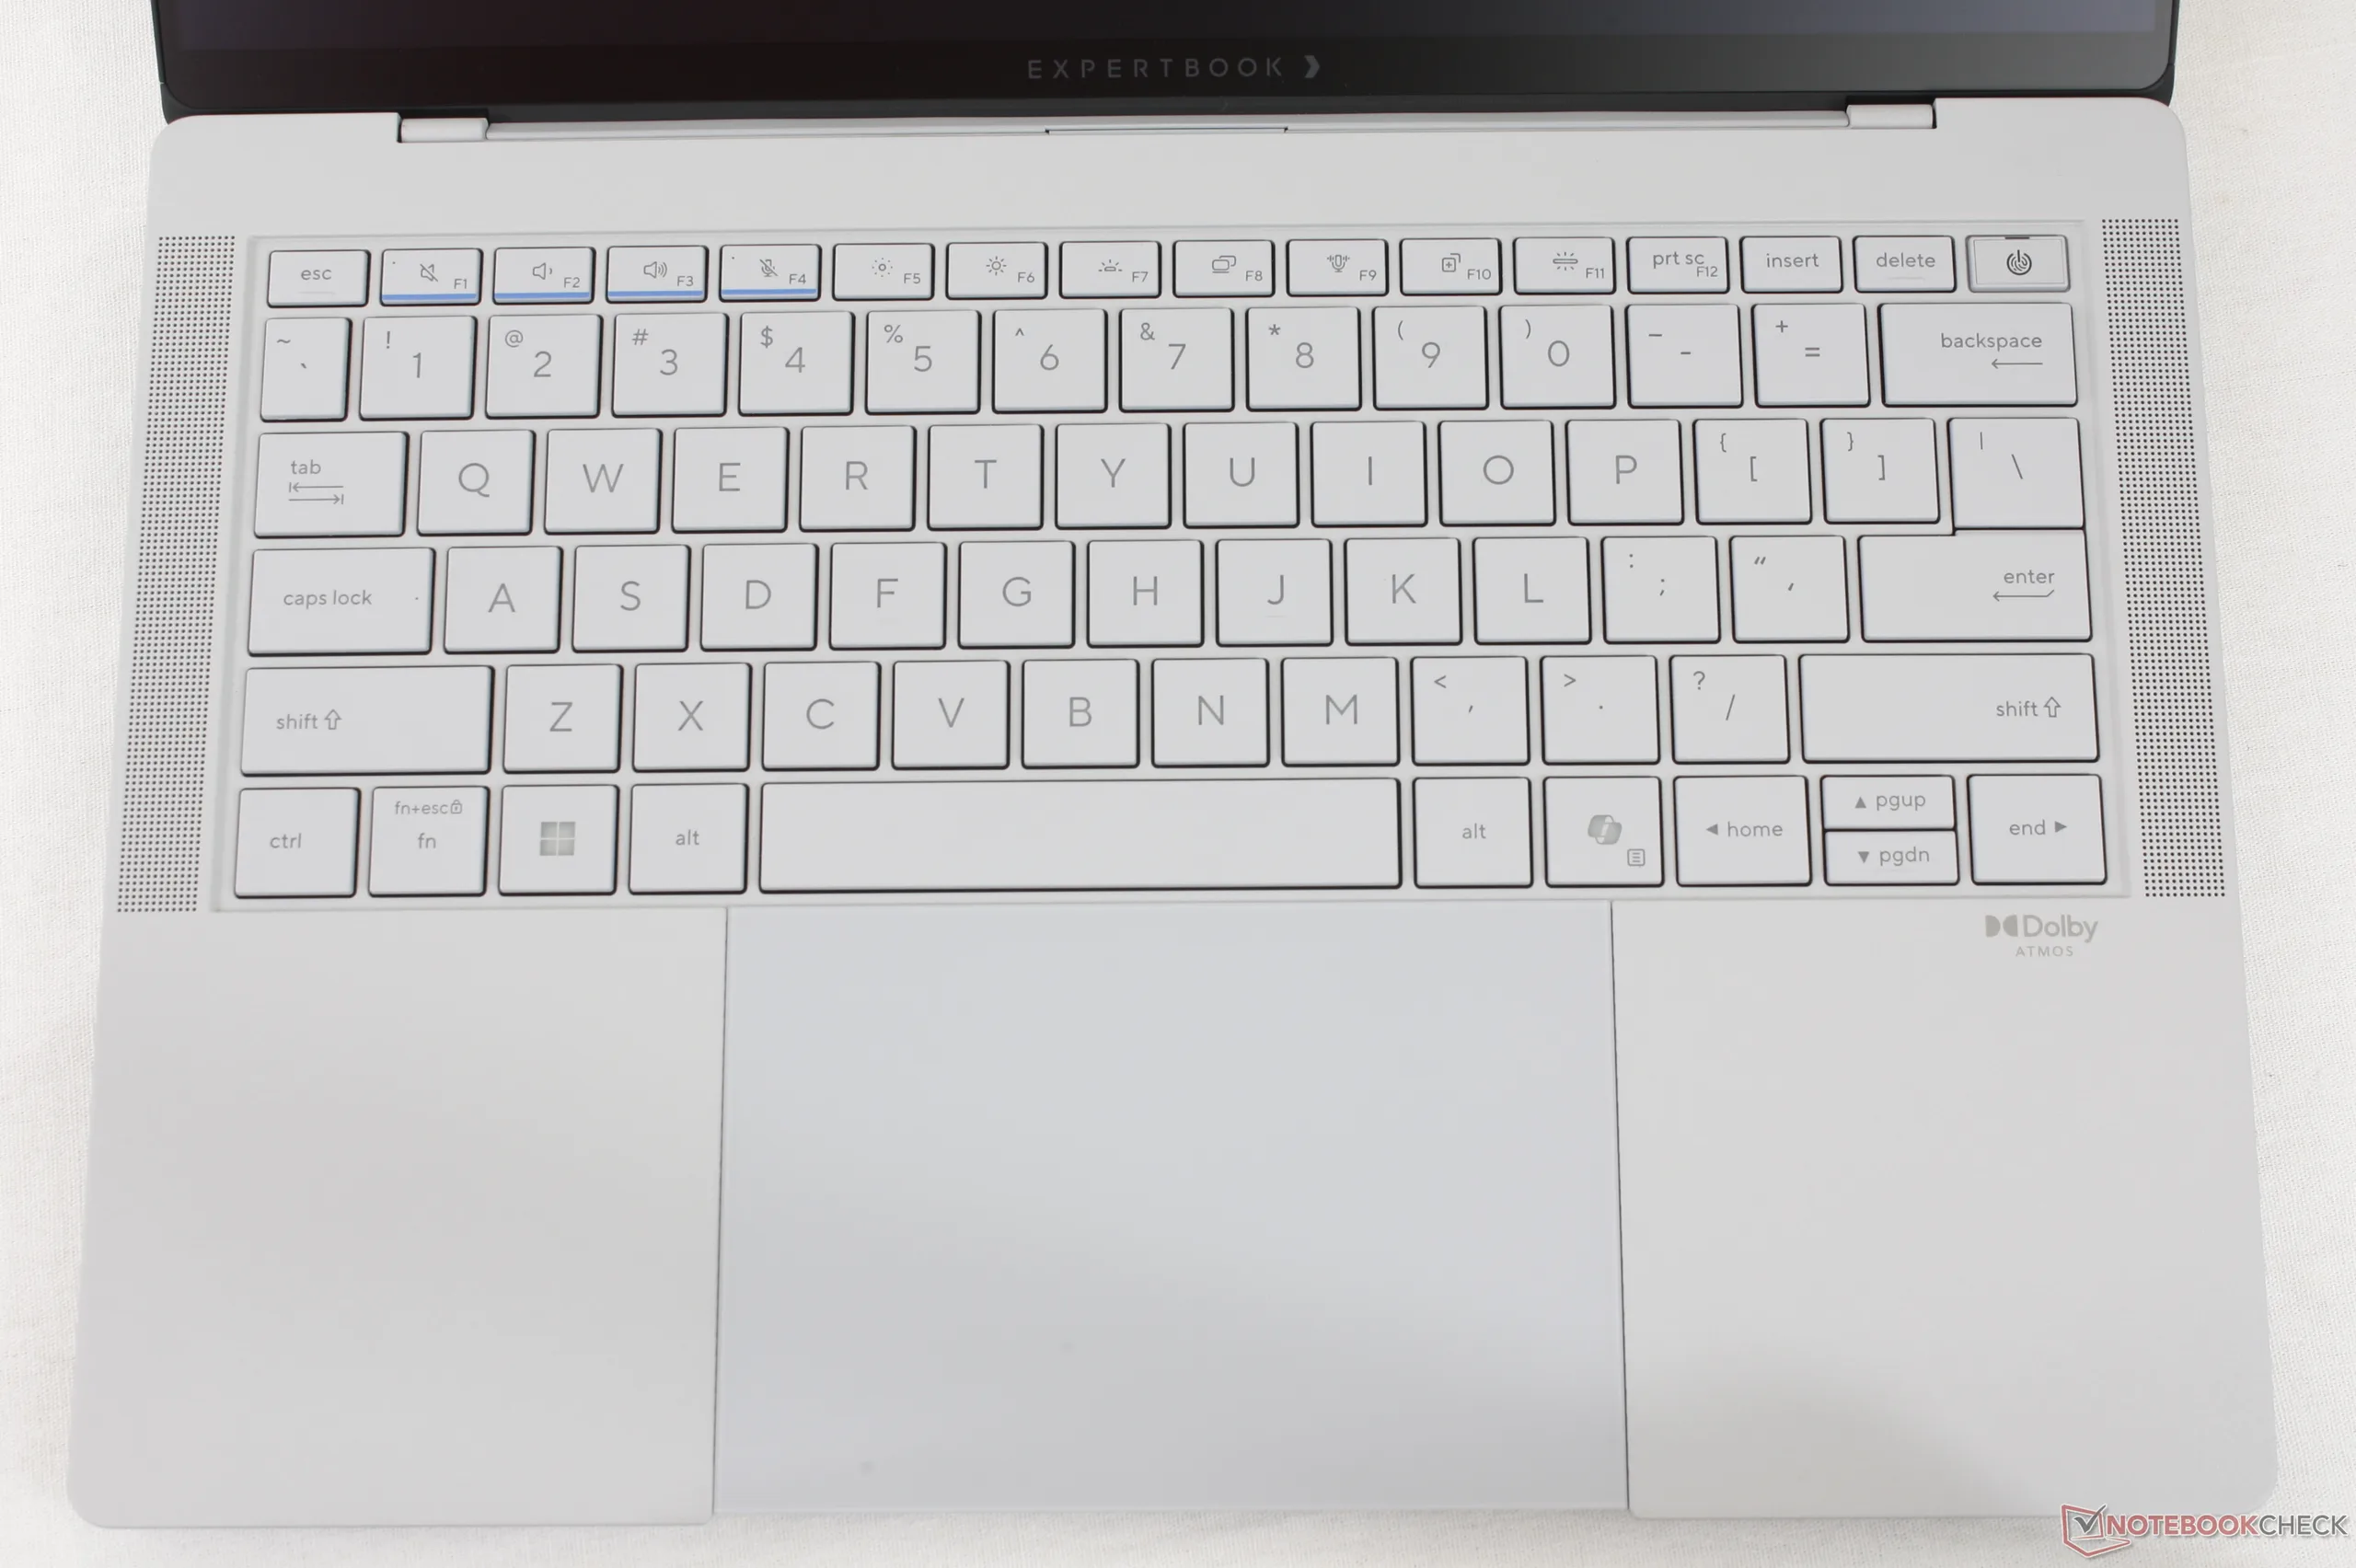
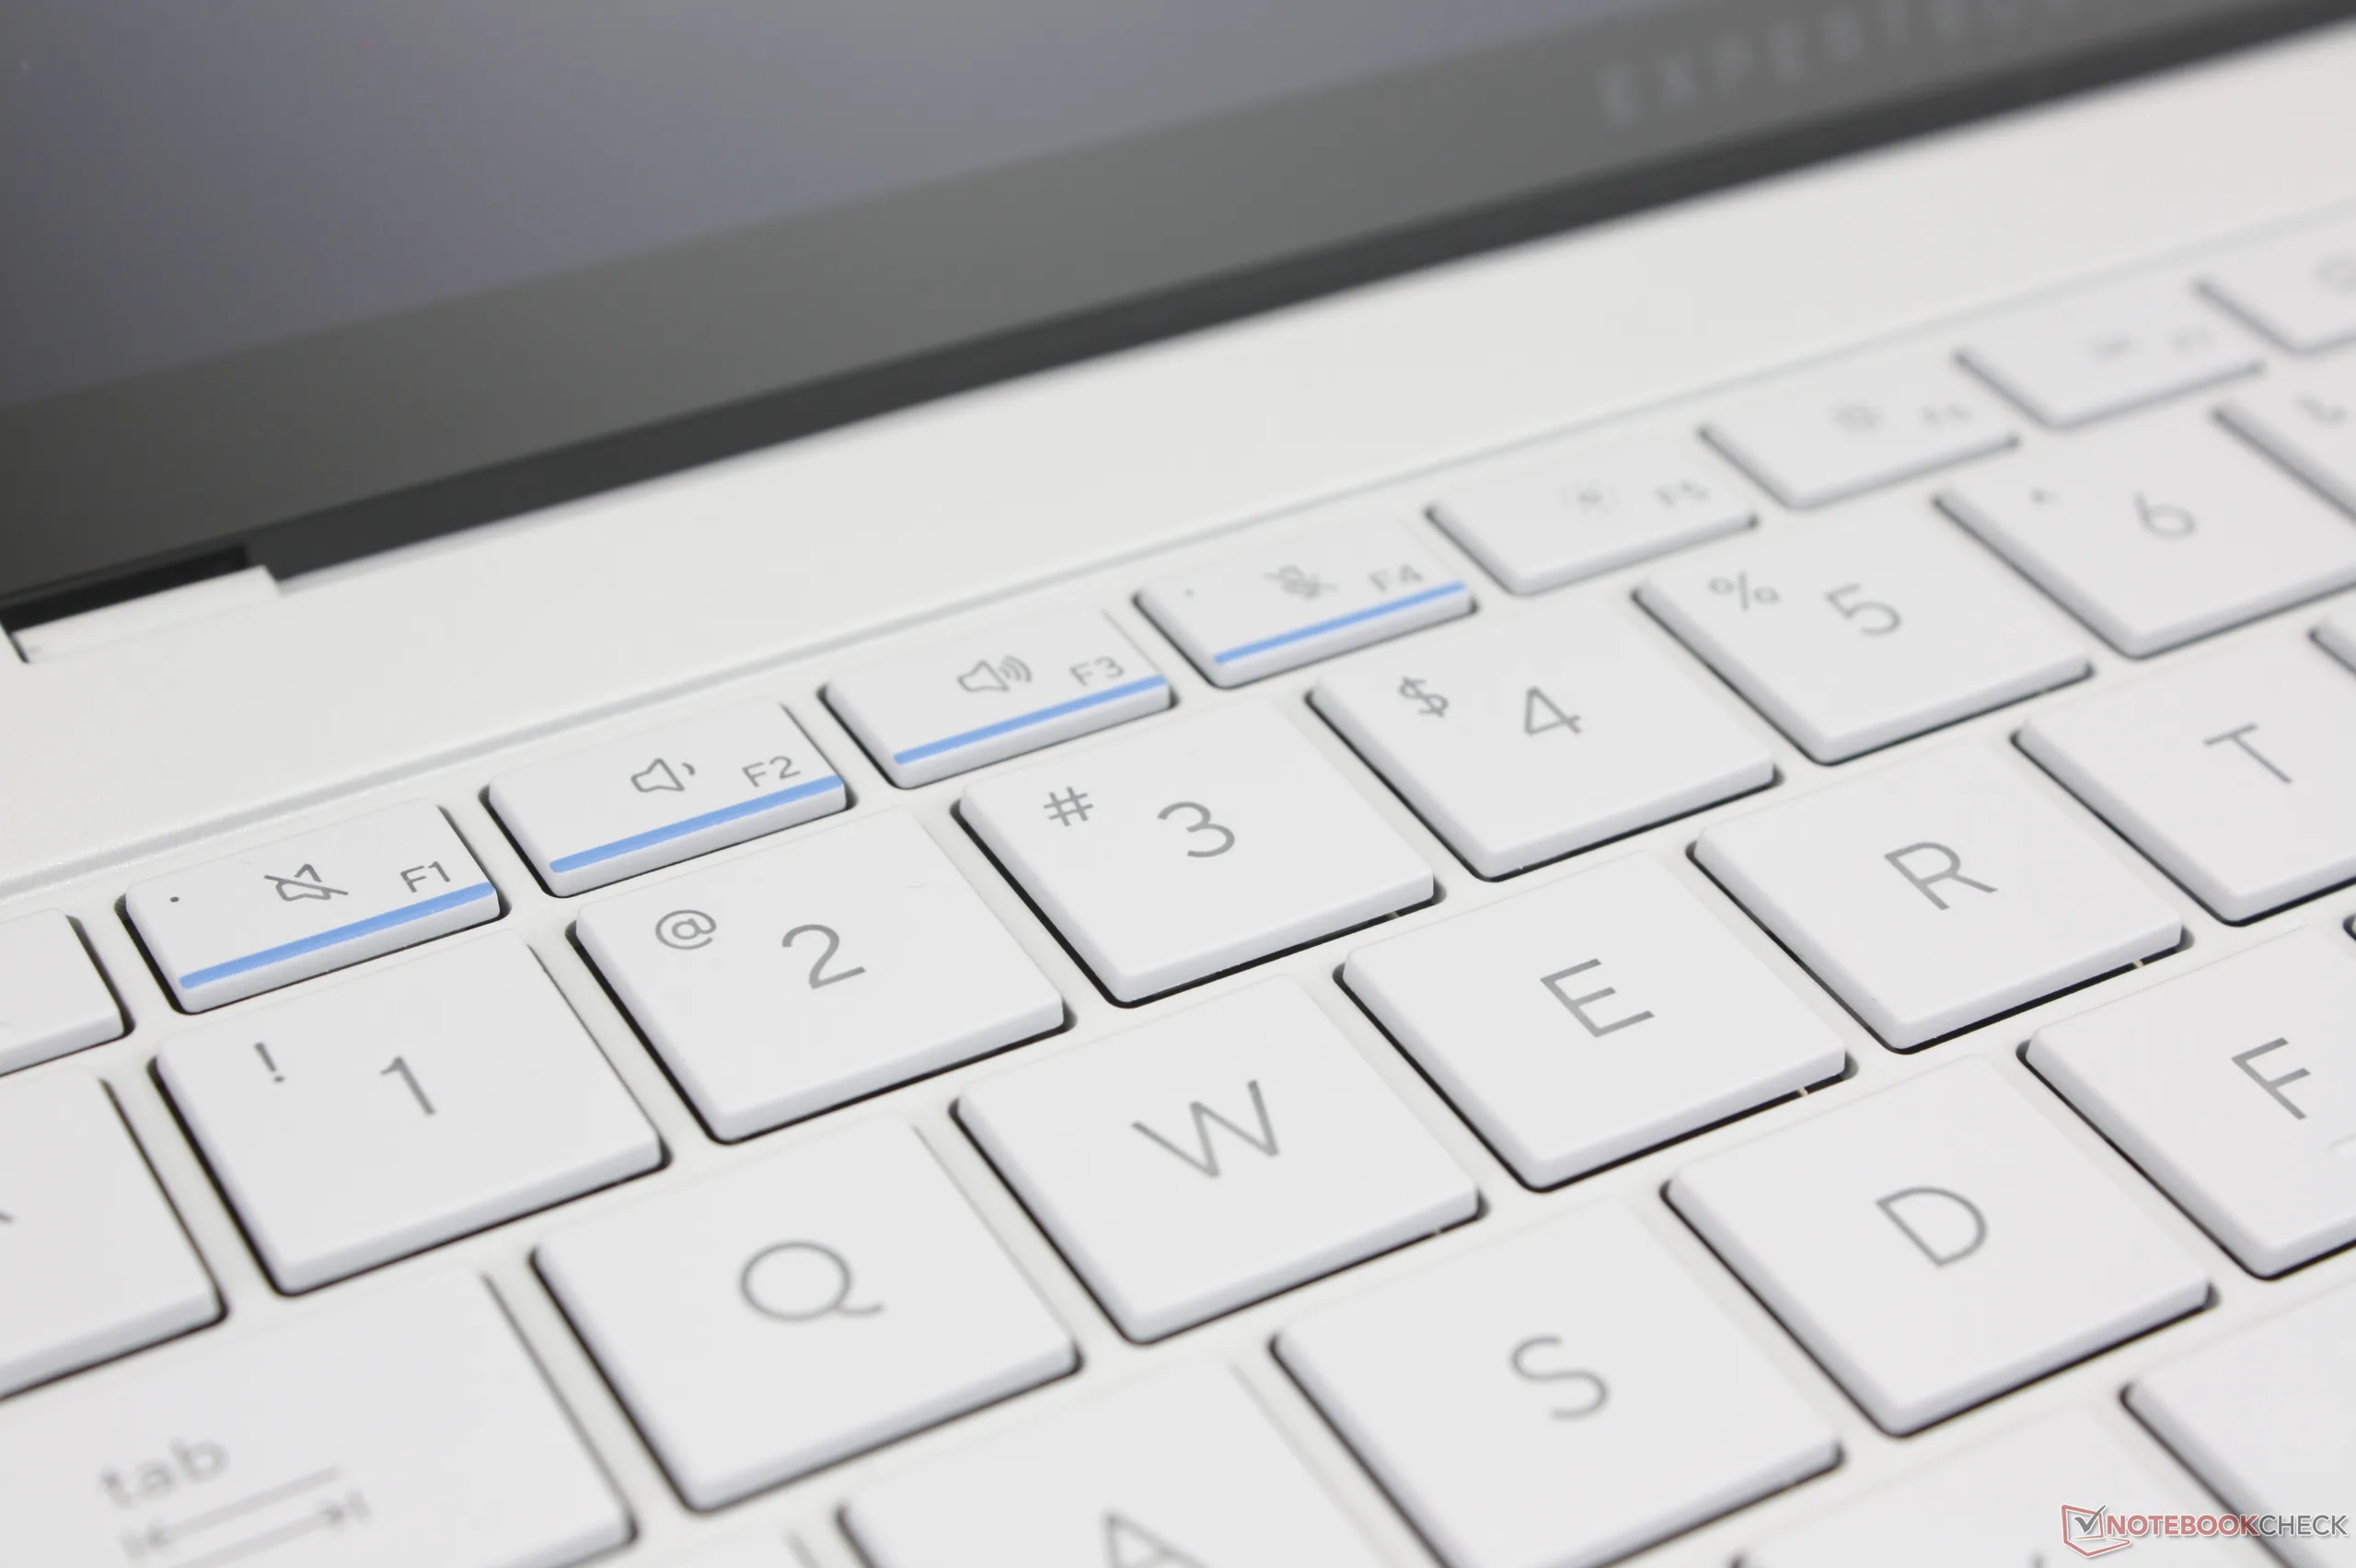
输入设备 - 过度敏感的点击板
键盘
按键行程为 1.5 毫米,对打字者来说反馈力度适中。即便如此,空格键和回车键的反馈力度仍需加强,因为与 ThinkPad 或 EliteBook 上的同类按键相比,它们给人的感觉相当轻。
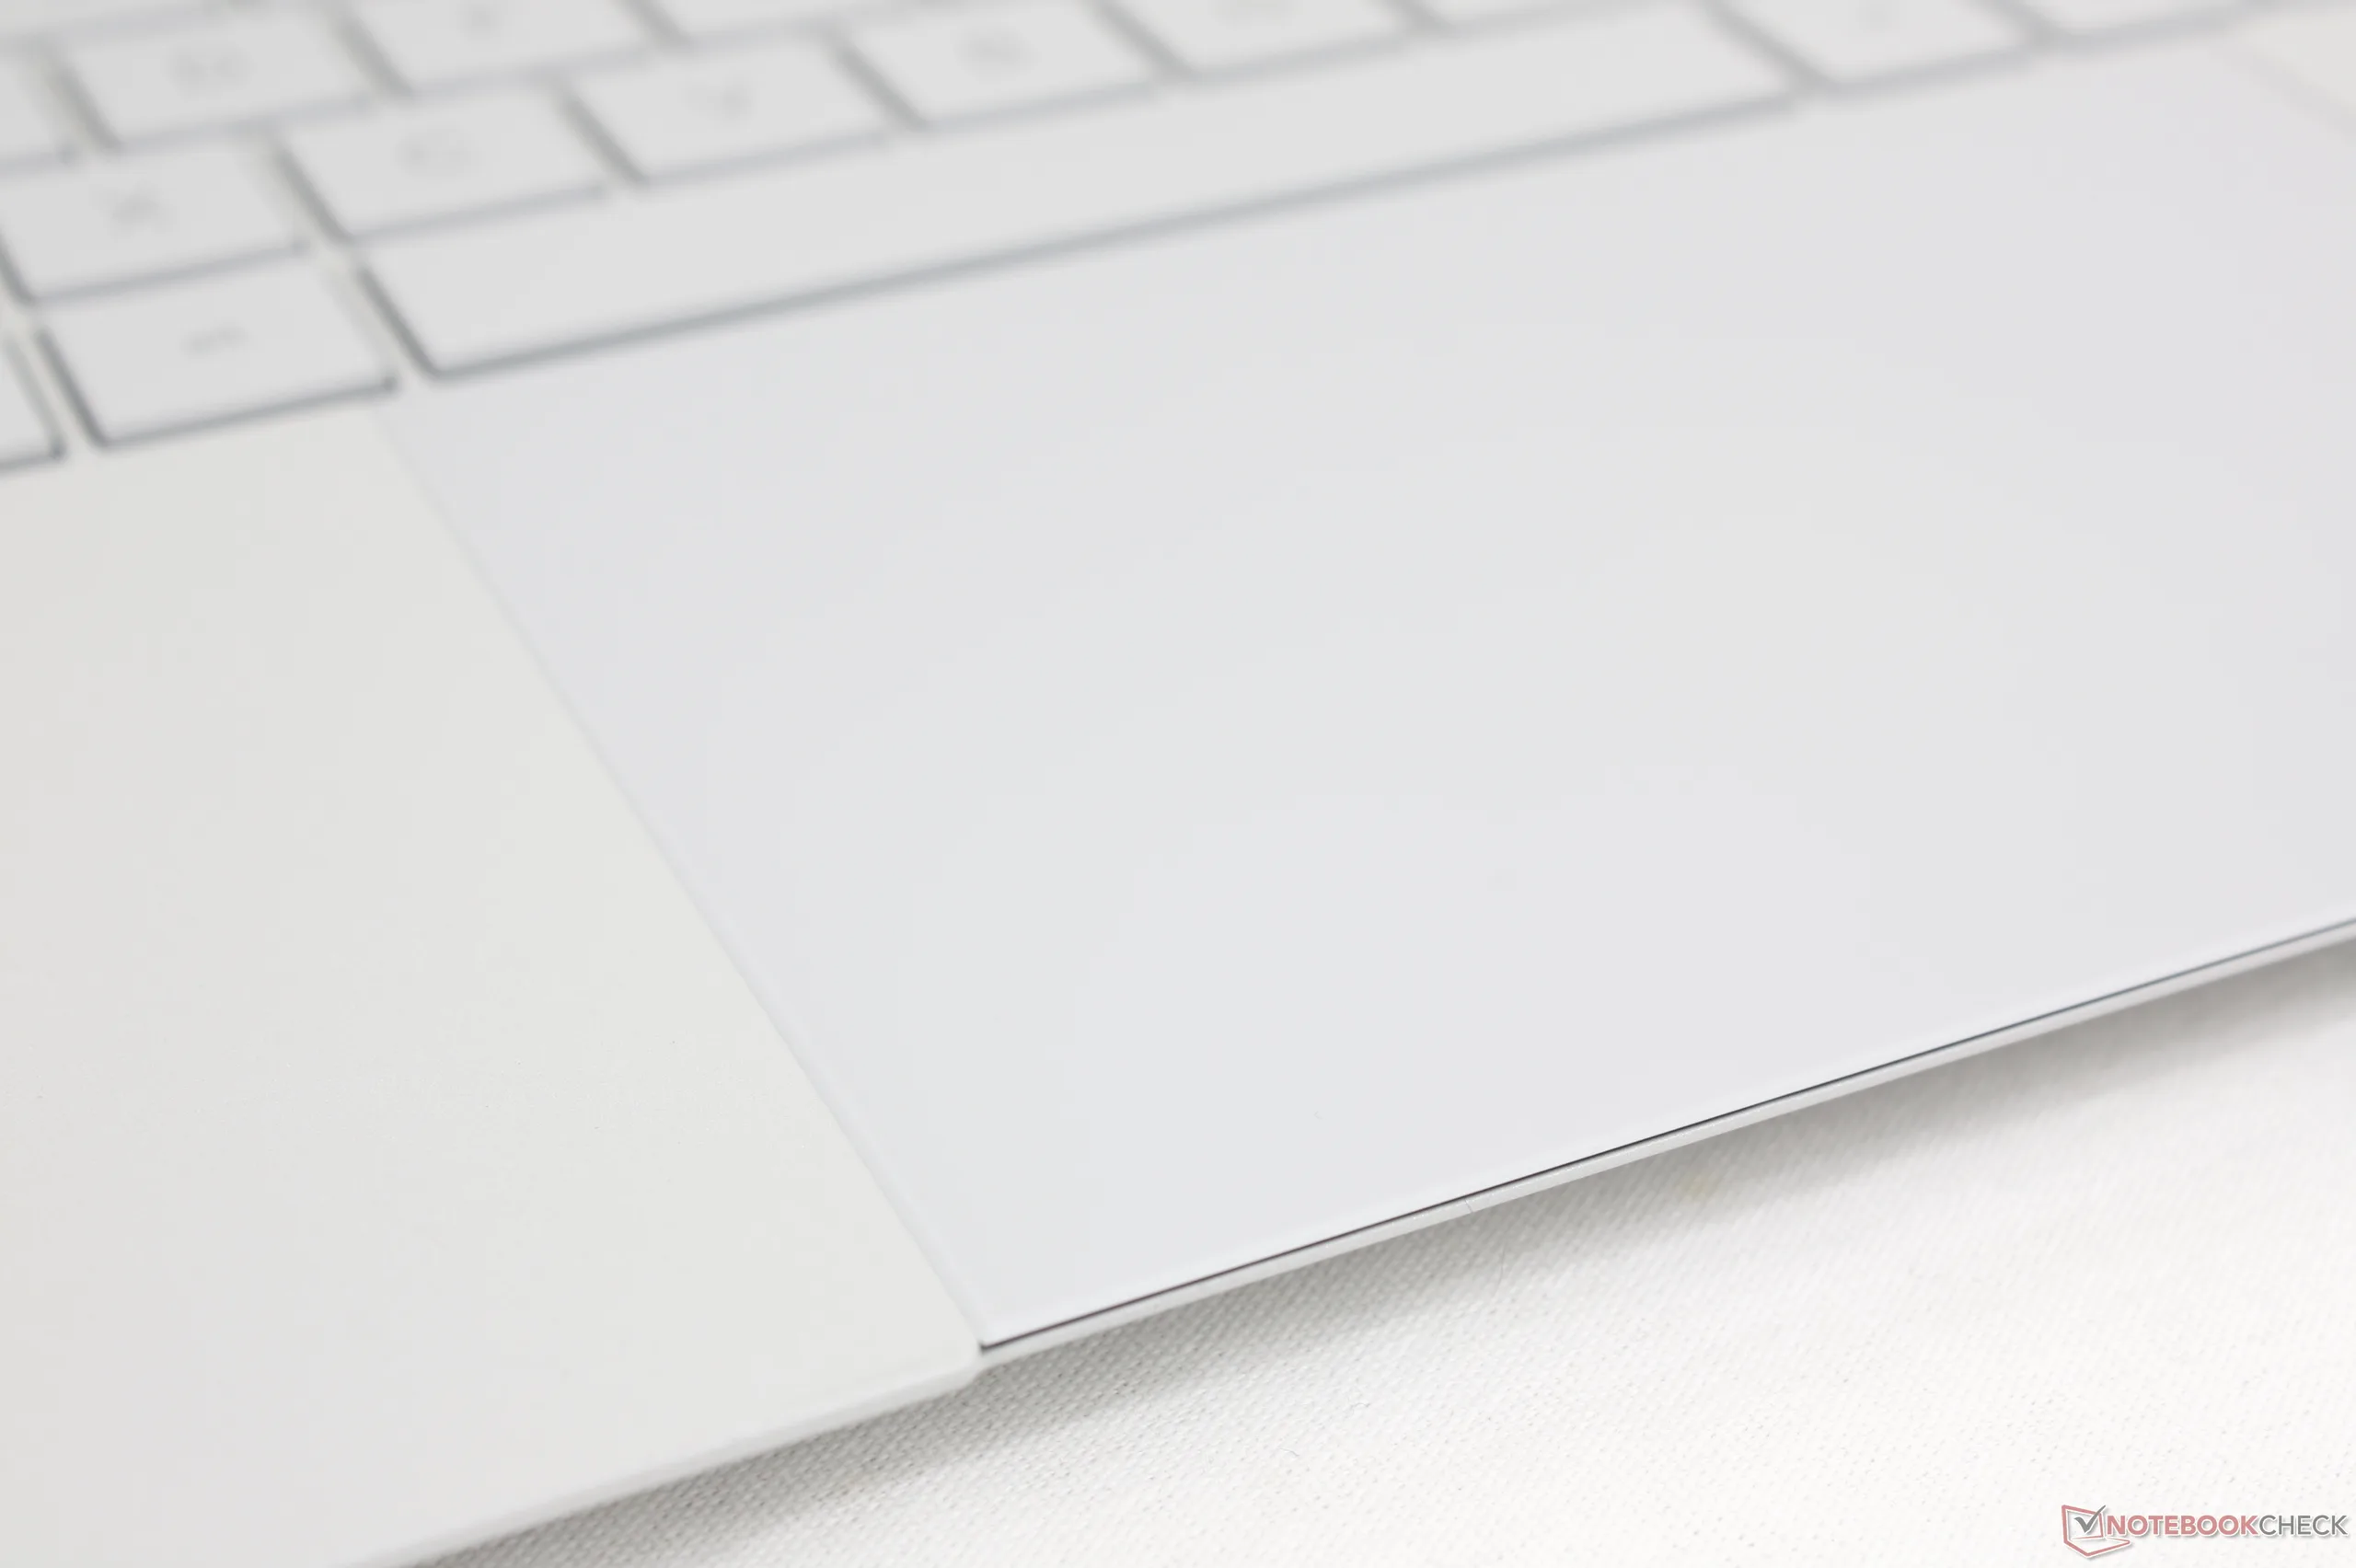
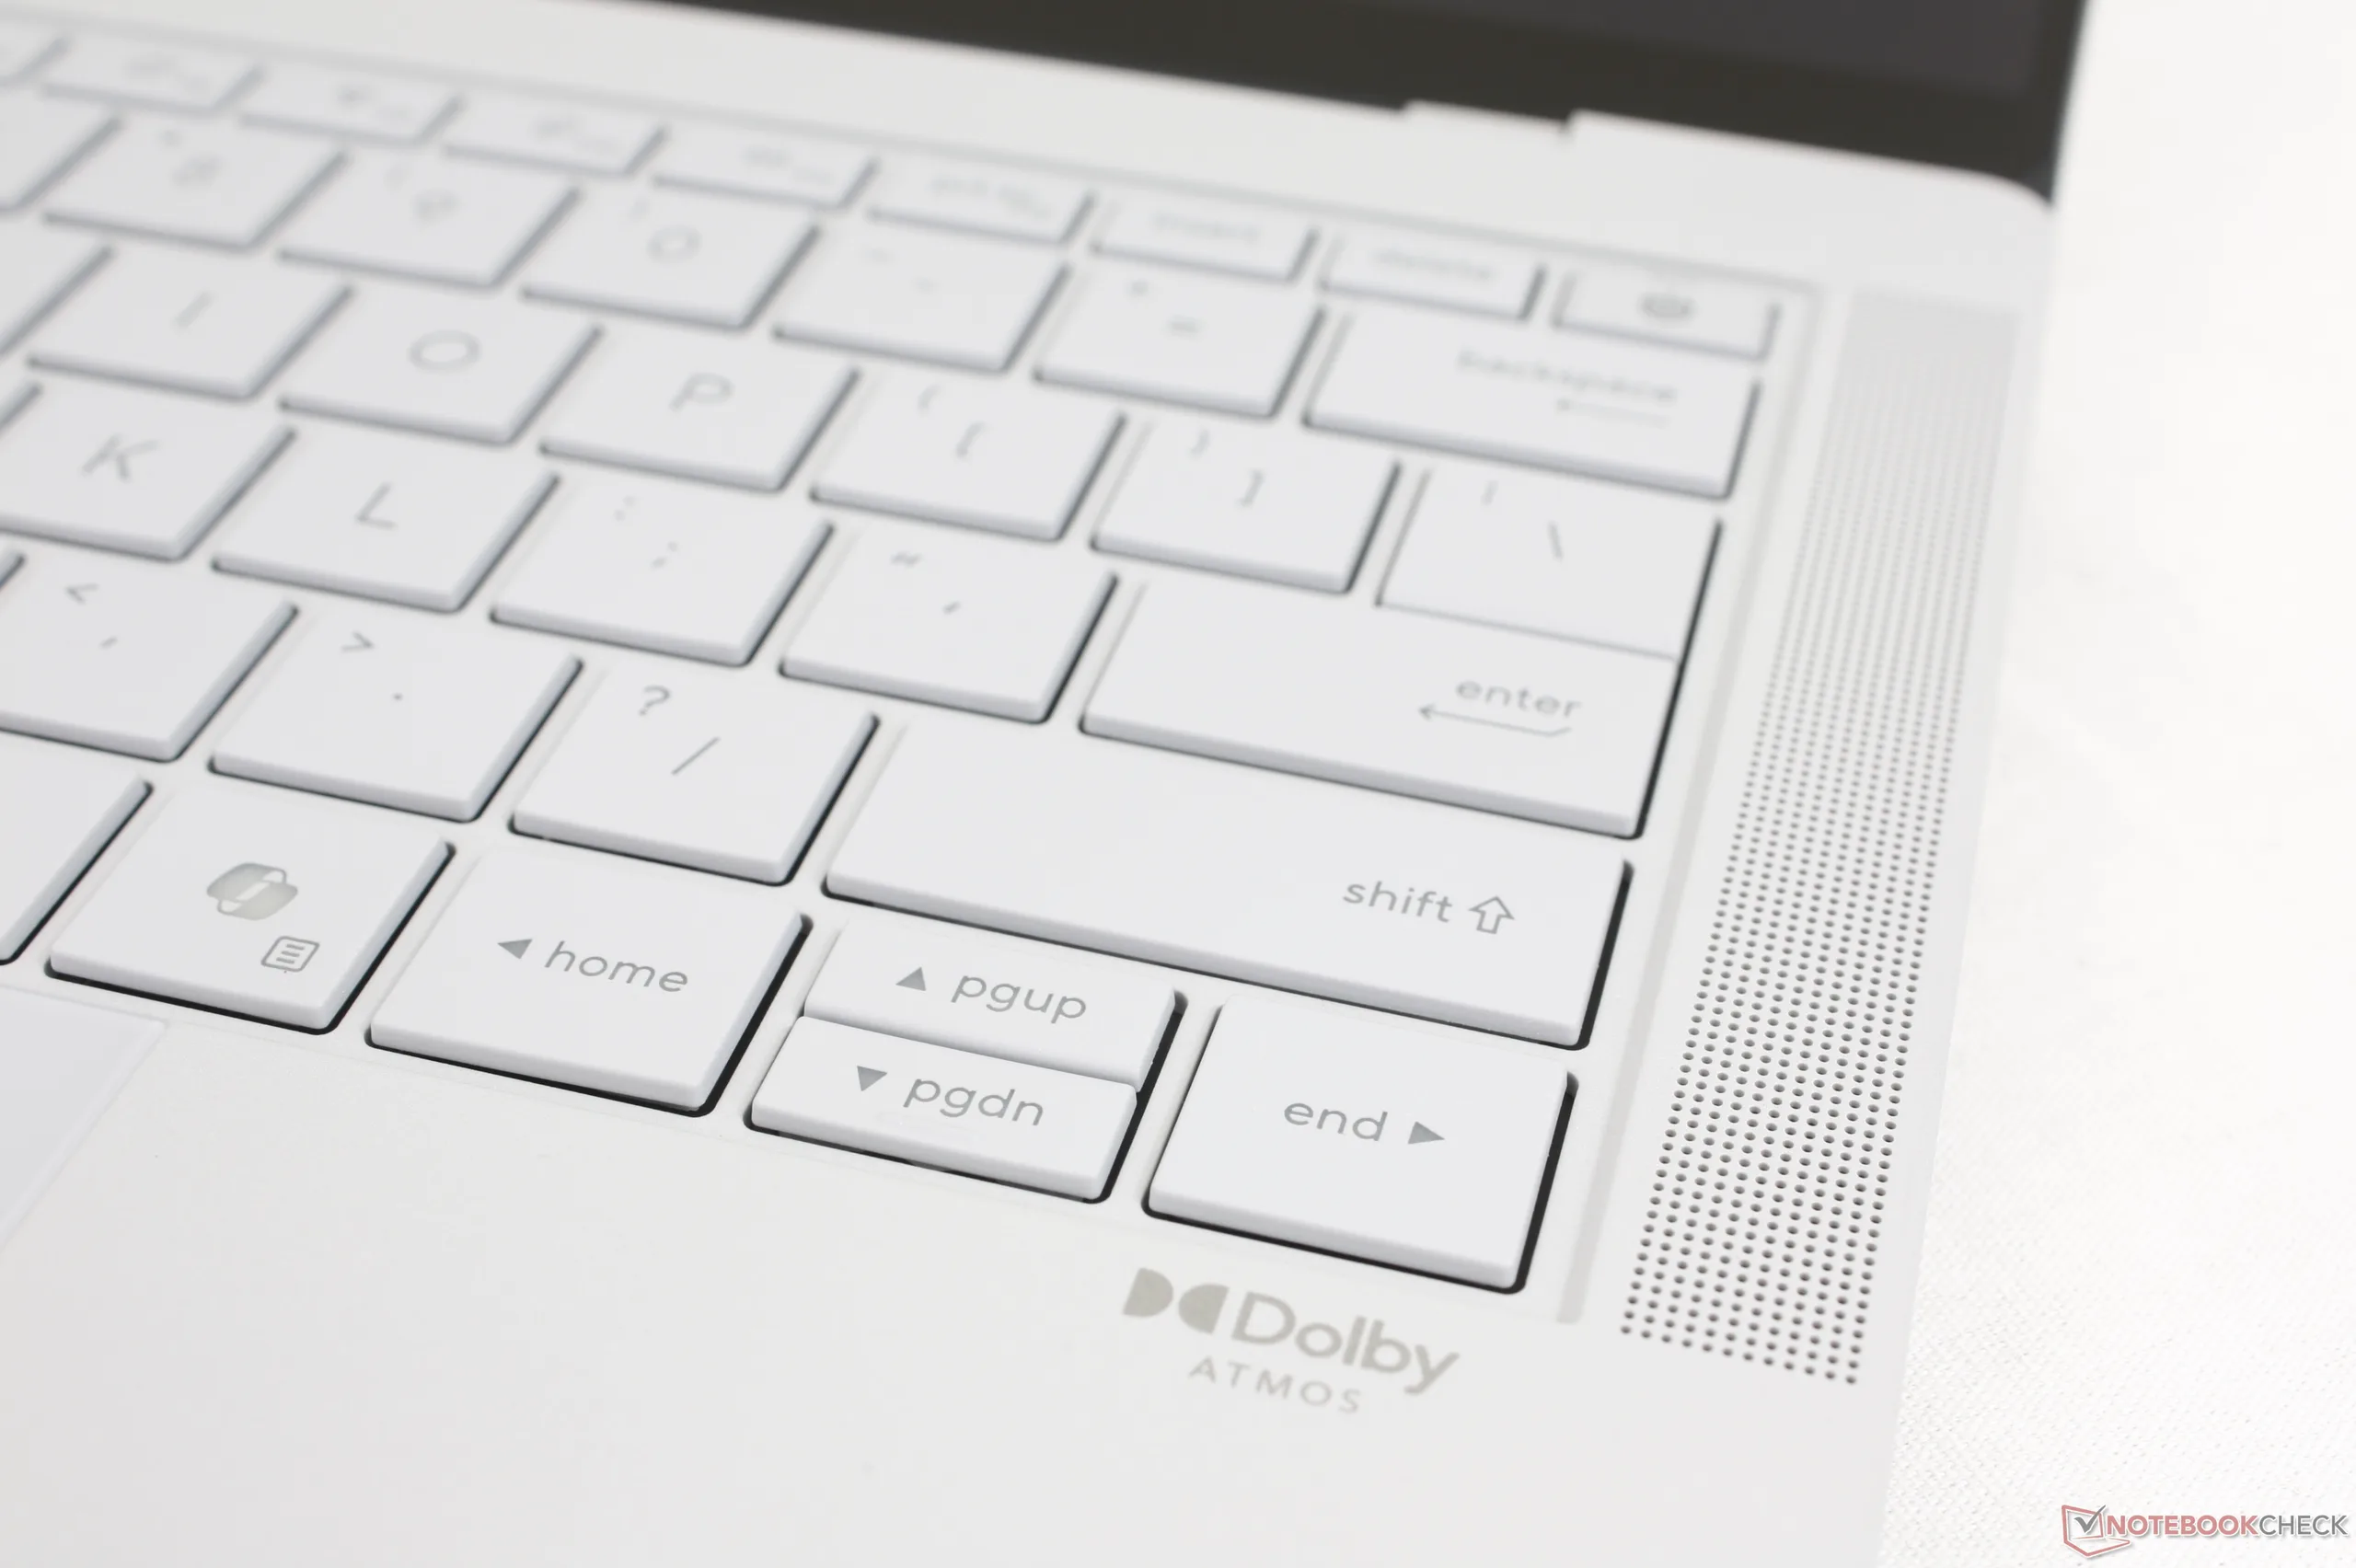
触摸板
虽然点击板的尺寸为 12.8 x 8.8 厘米,大小适中,但点击时的触觉反馈非常微弱,手感难以令人满意。此外,与大多数其他笔记本电脑不同的是,点击板的前缘完全与机身前缘齐平,这意味着在我们的使用体验中,意外点击或移动的情况更为常见。
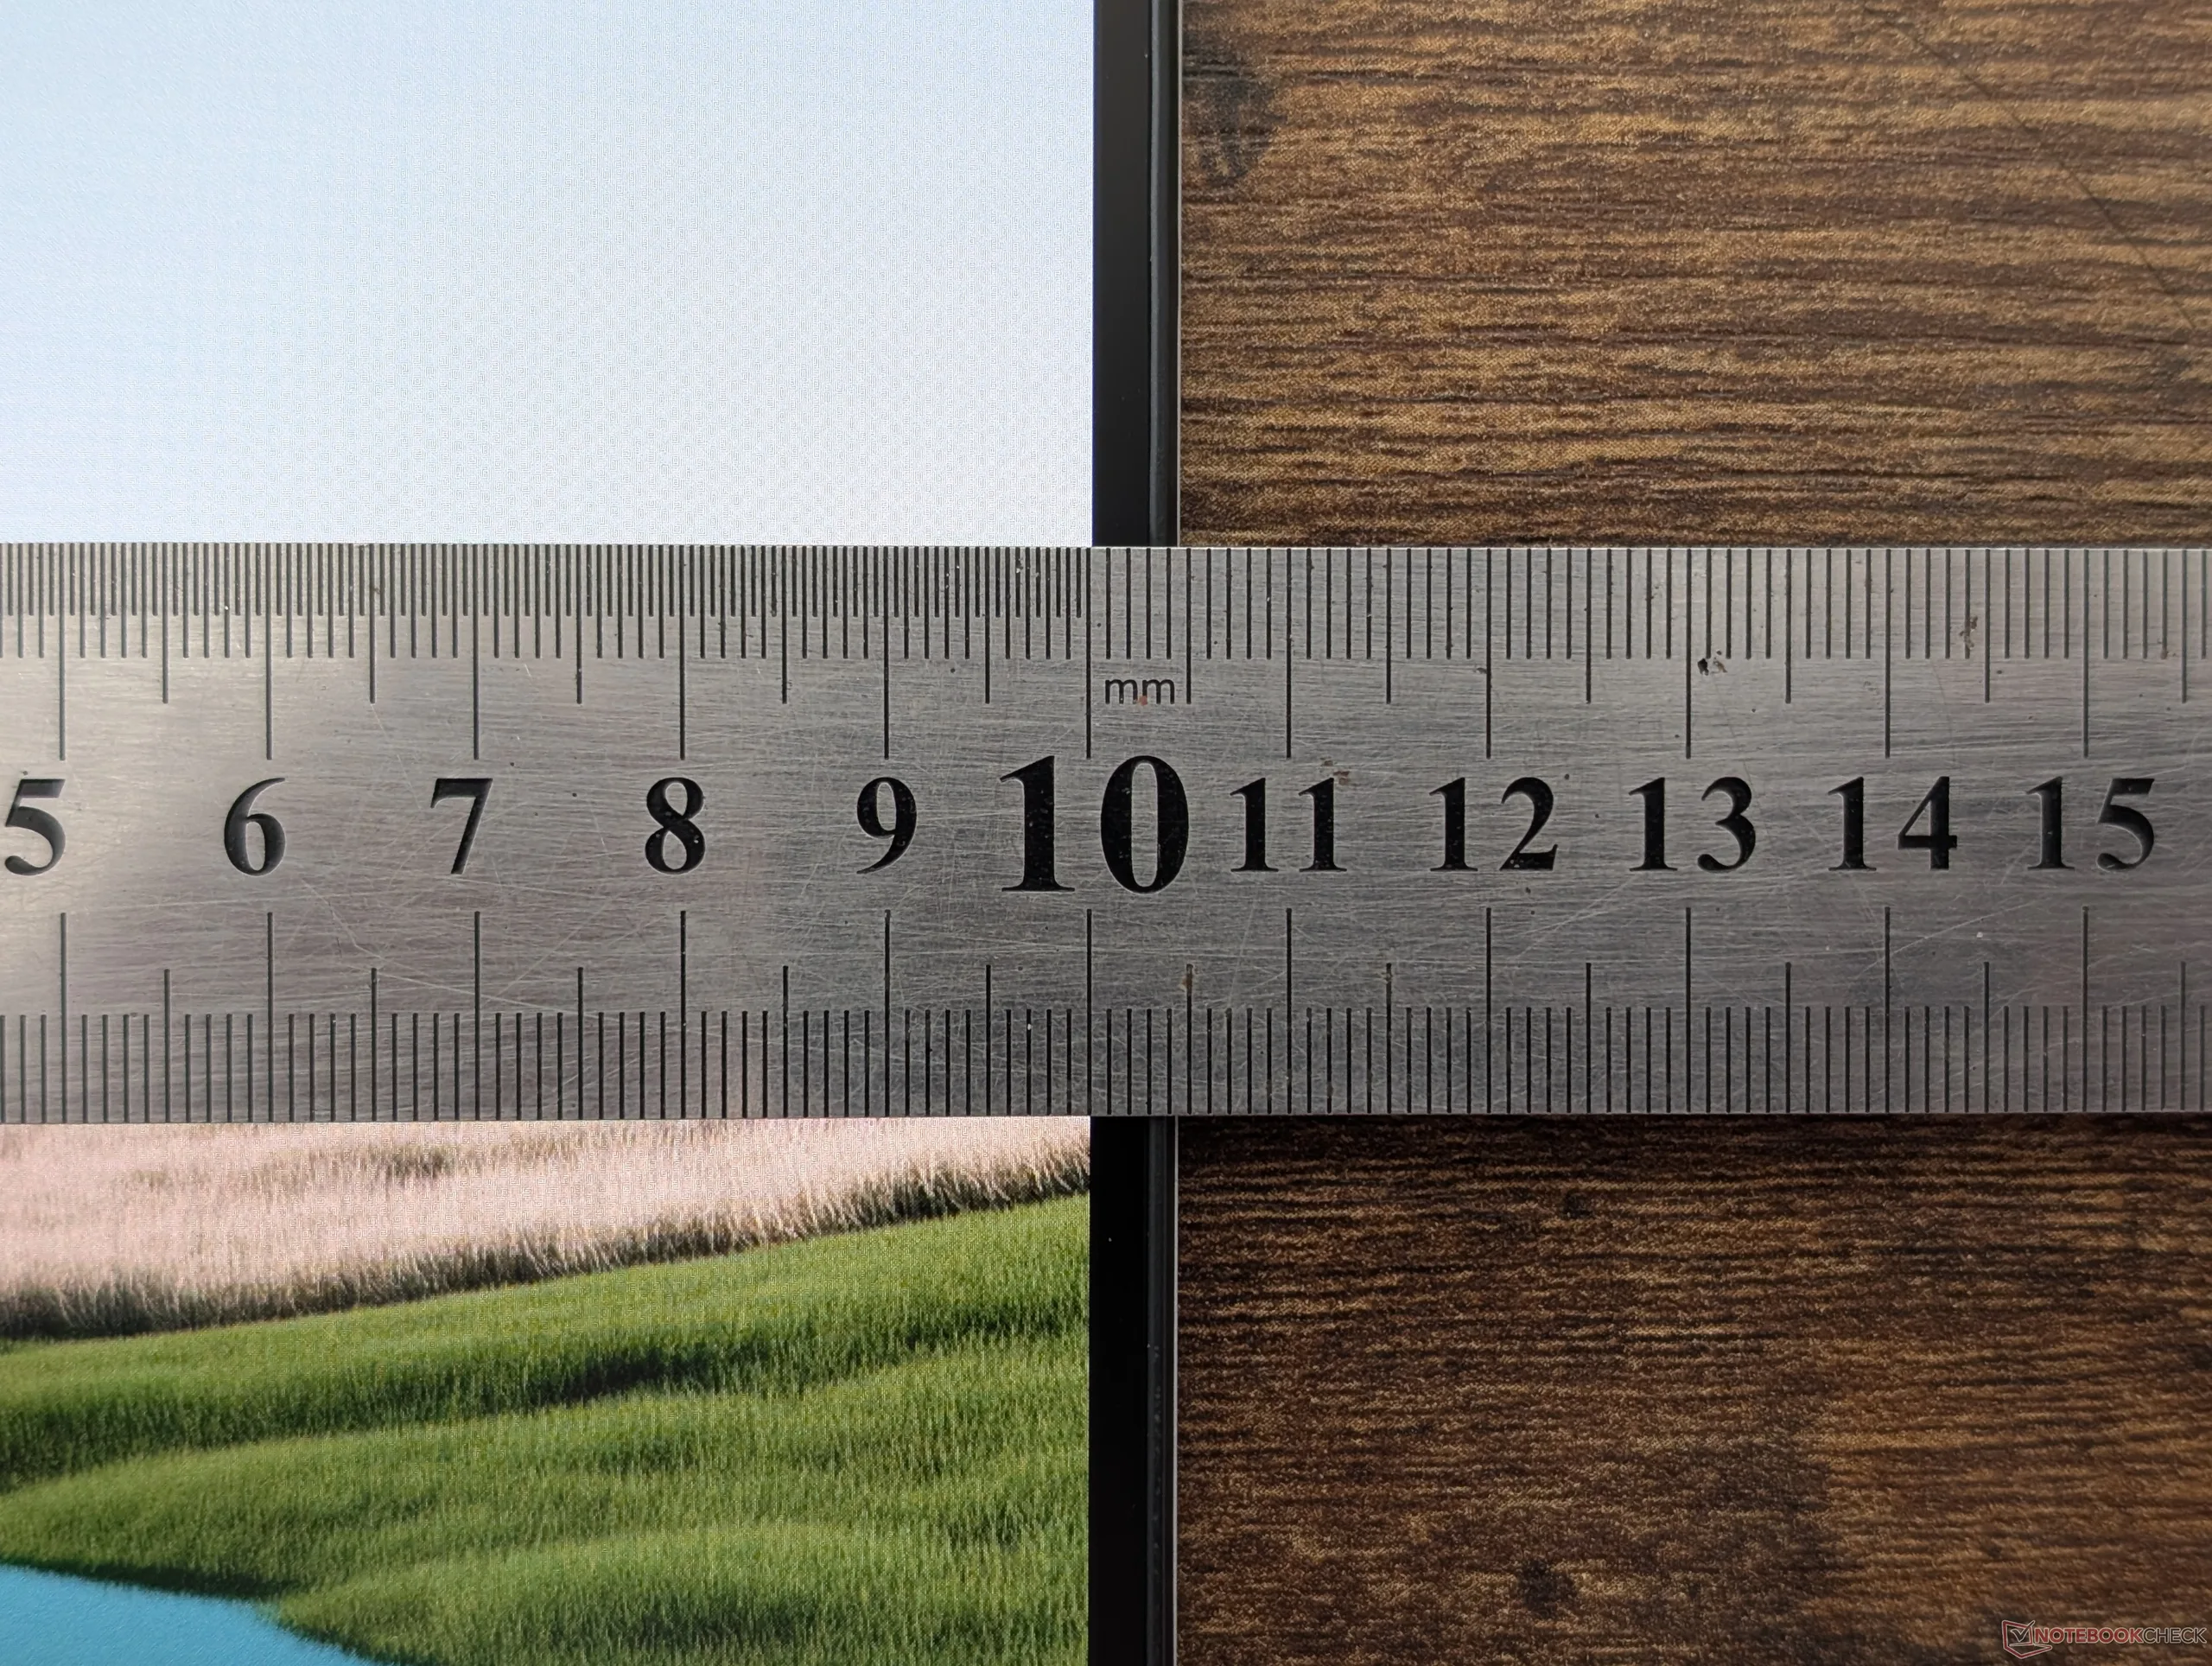
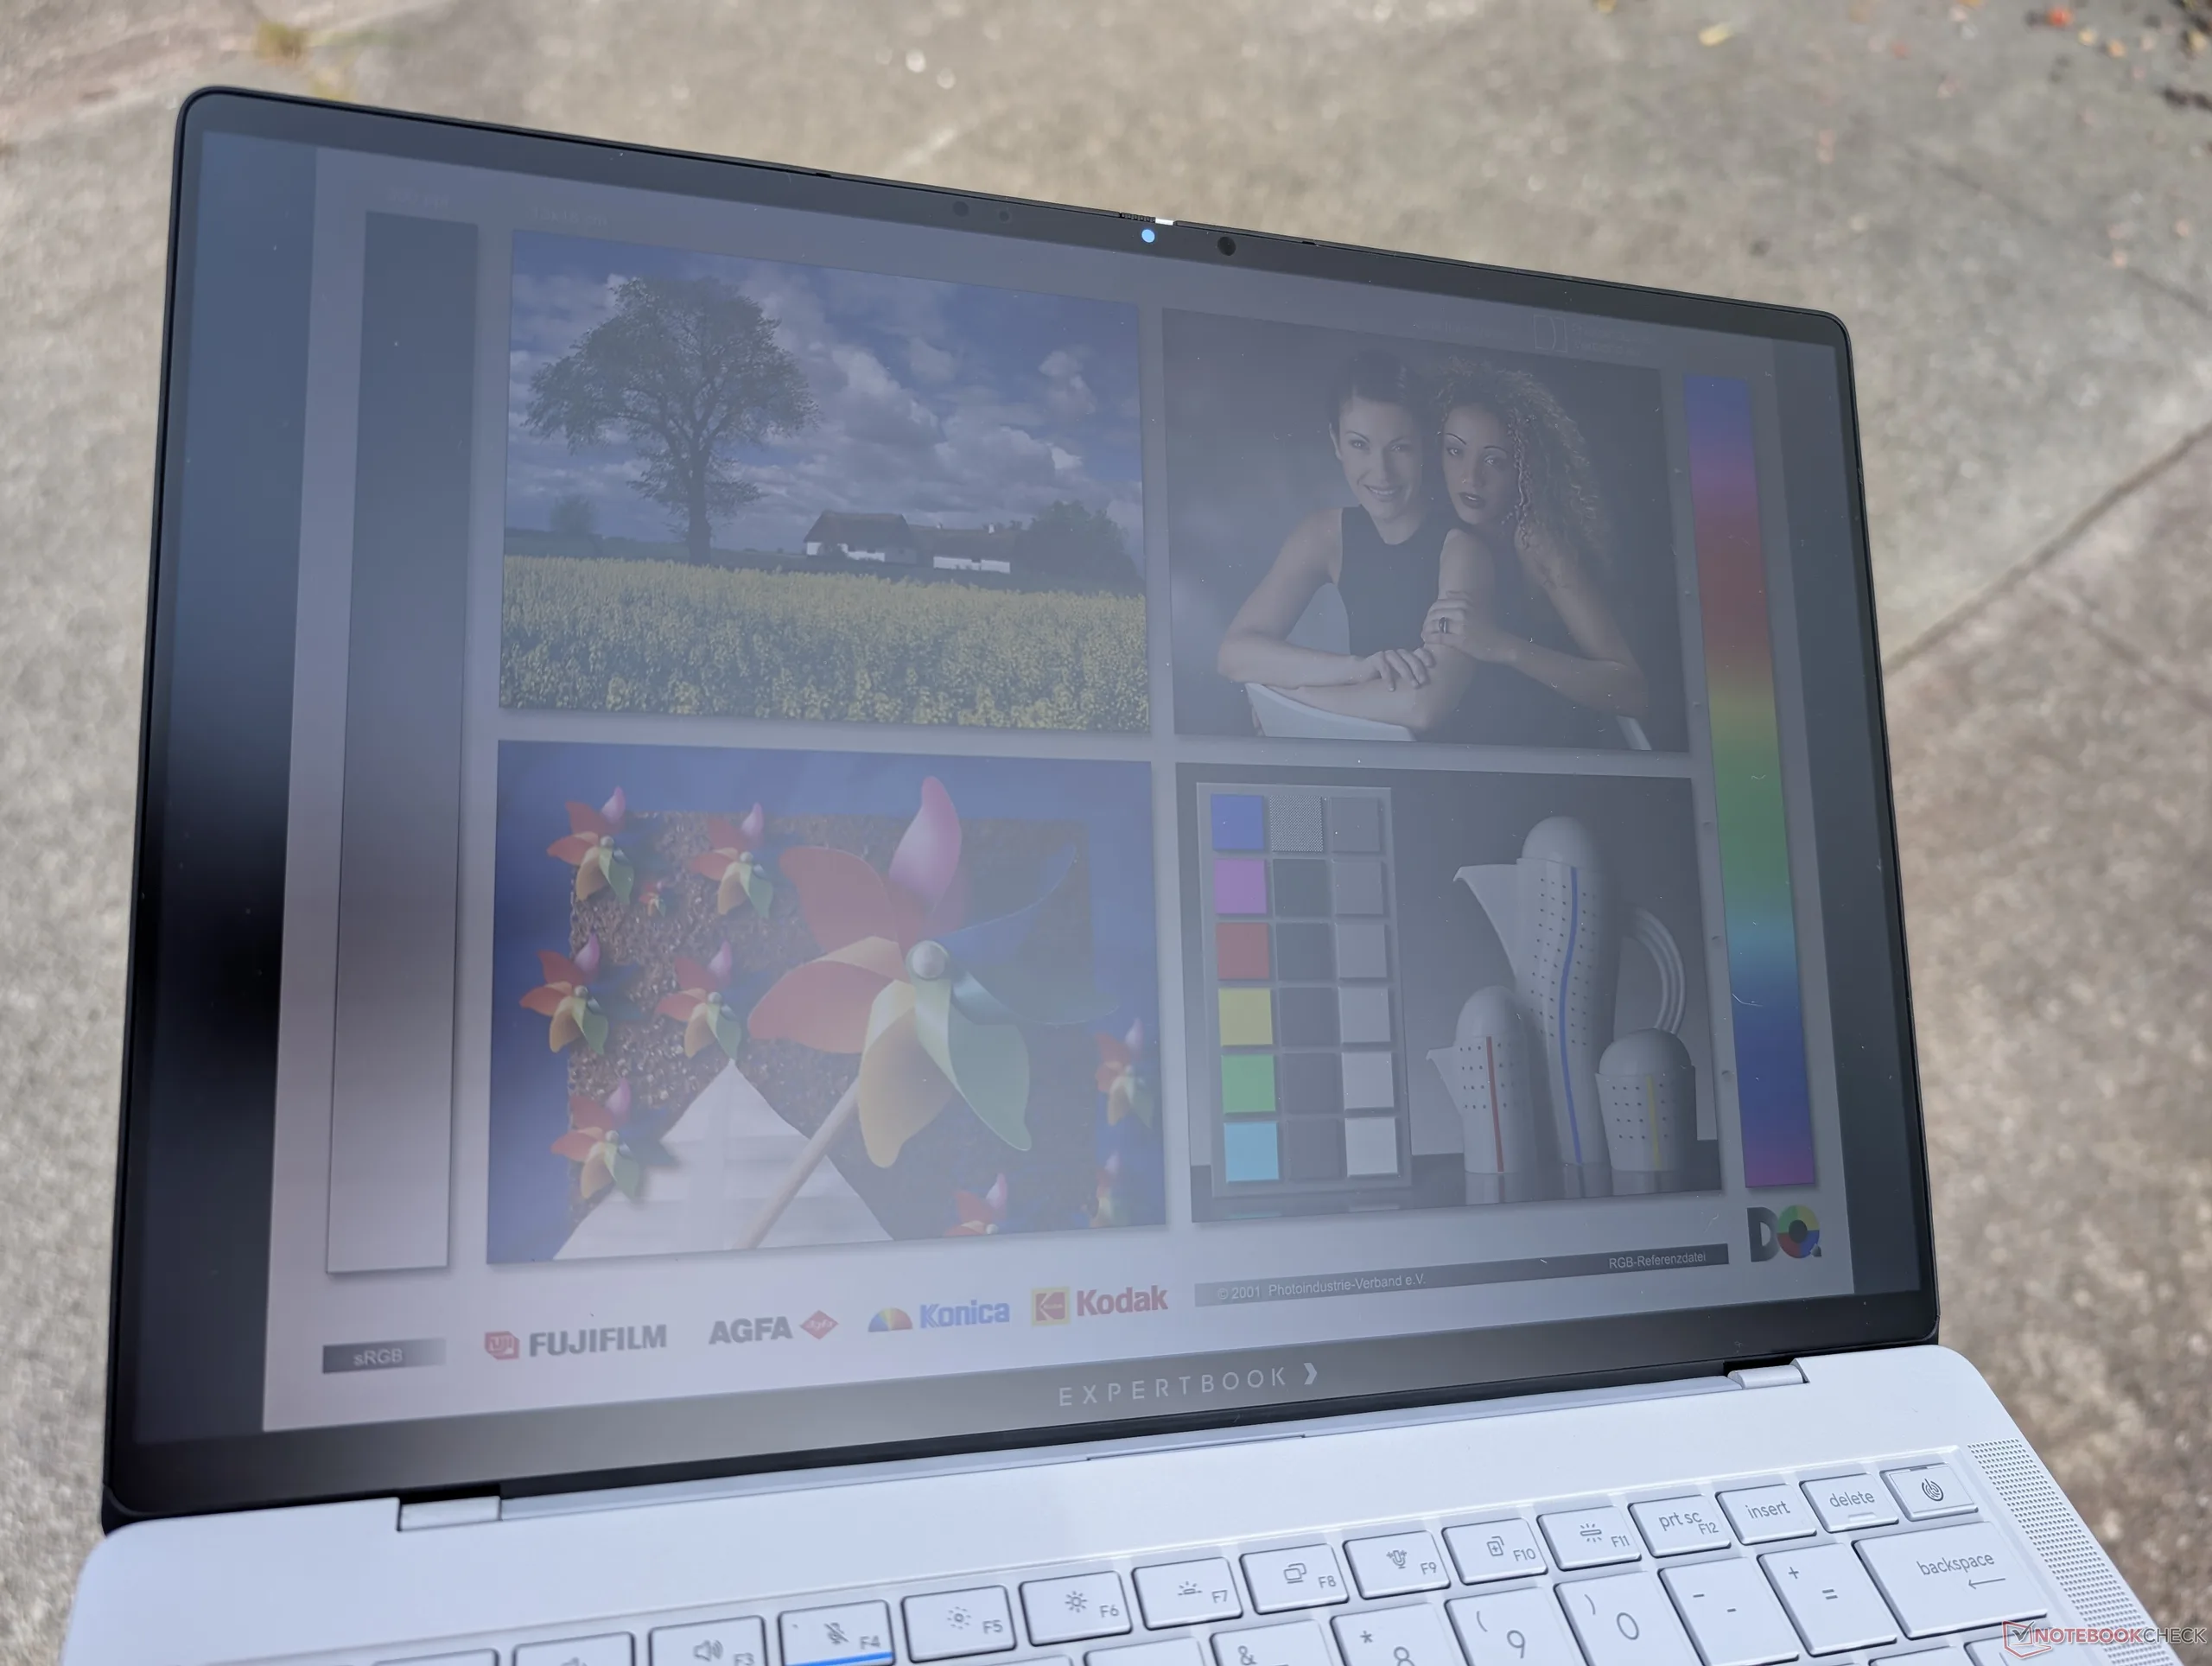
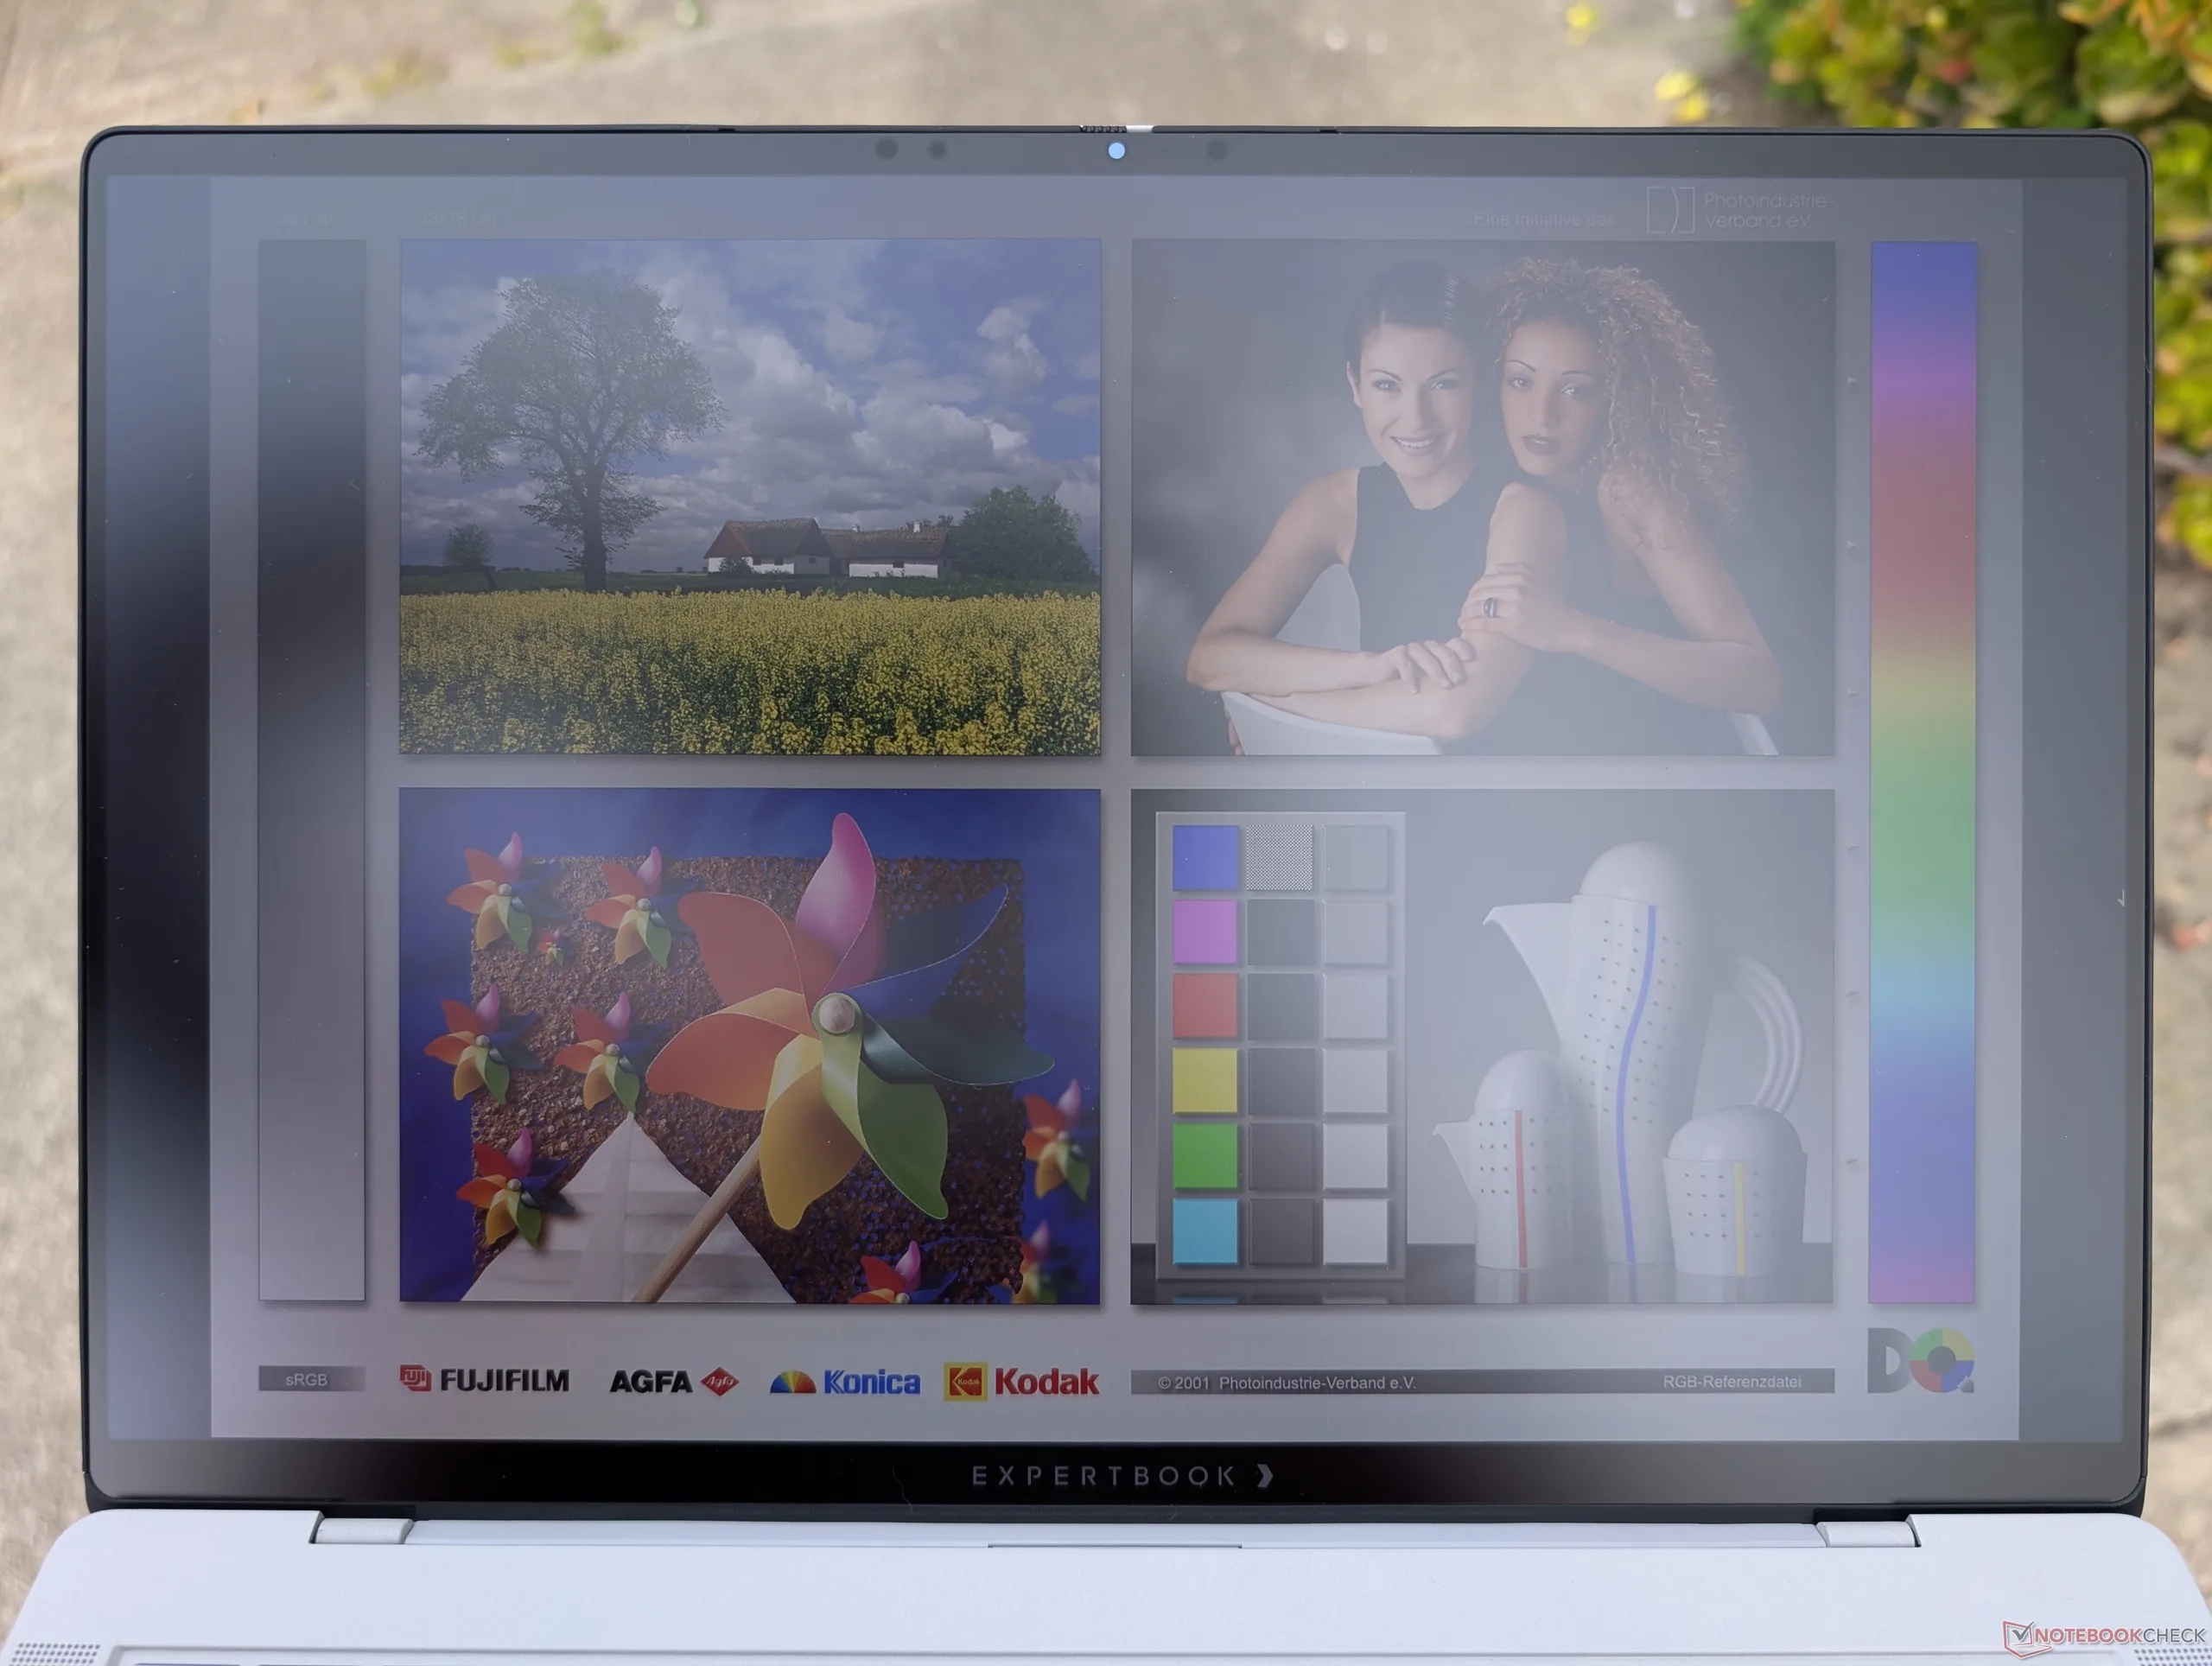
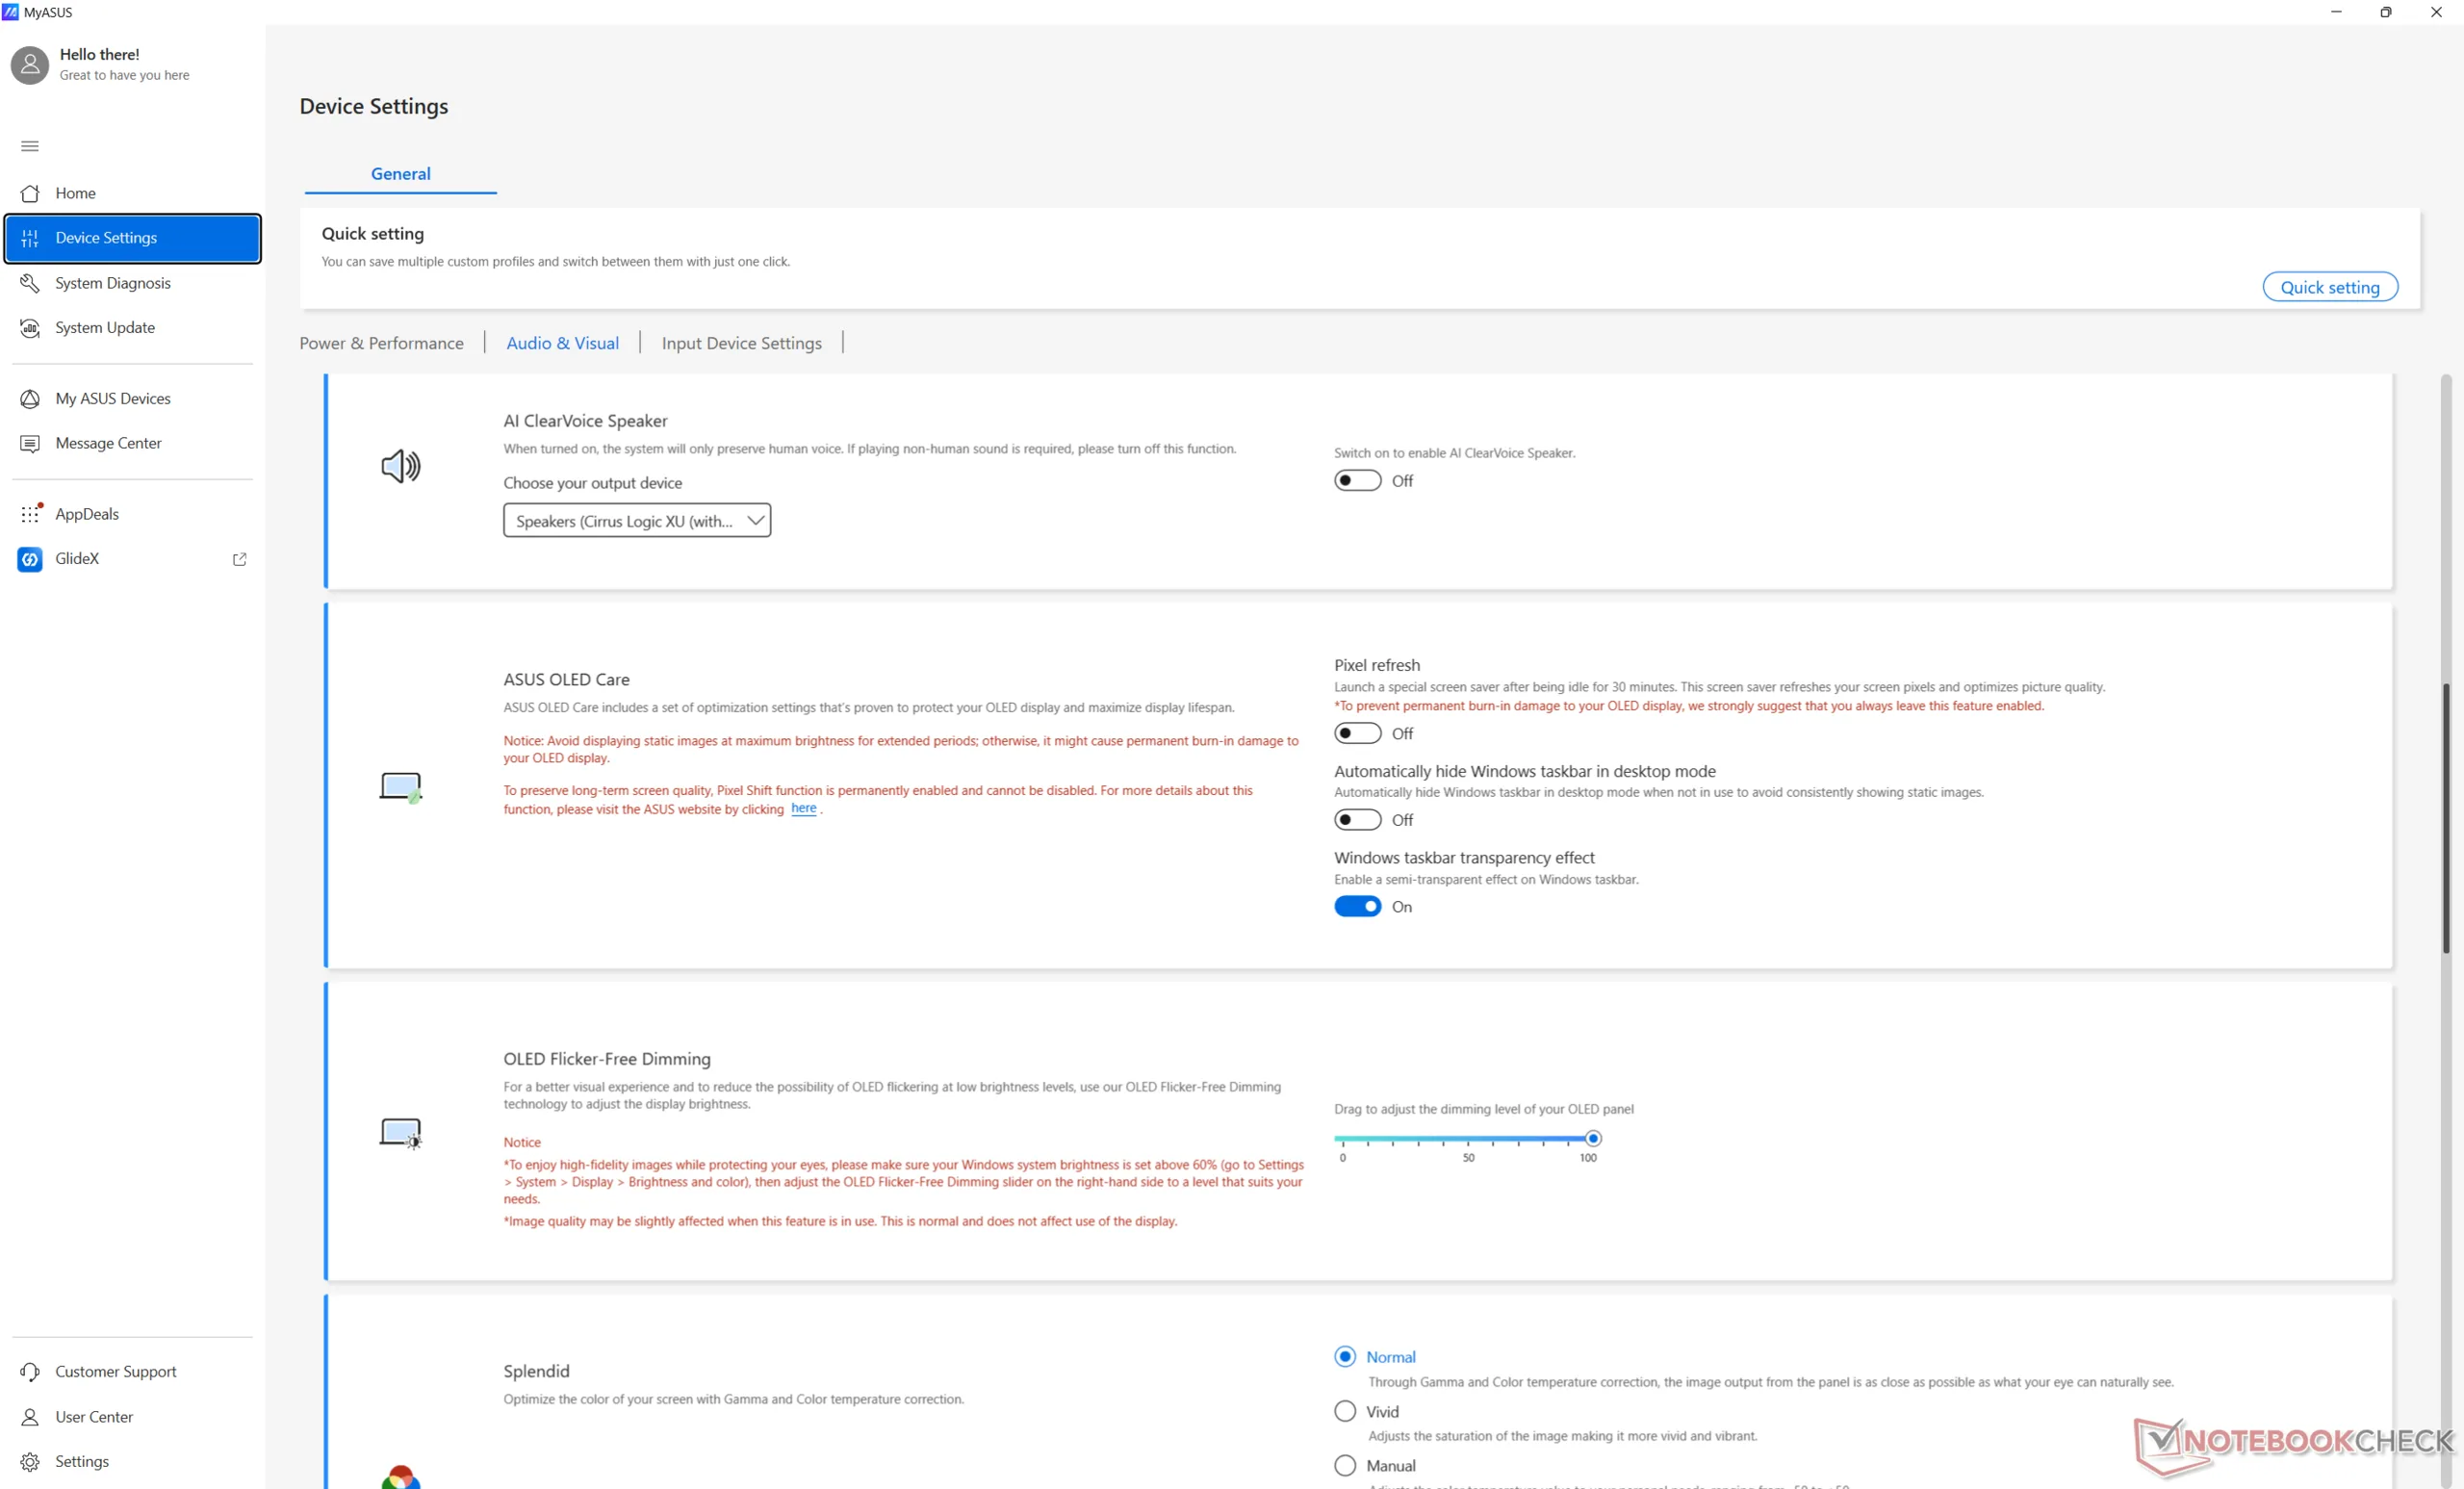
显示屏 - 串联式 OLED、VRR、HDR 和哑光康宁大猩猩玻璃
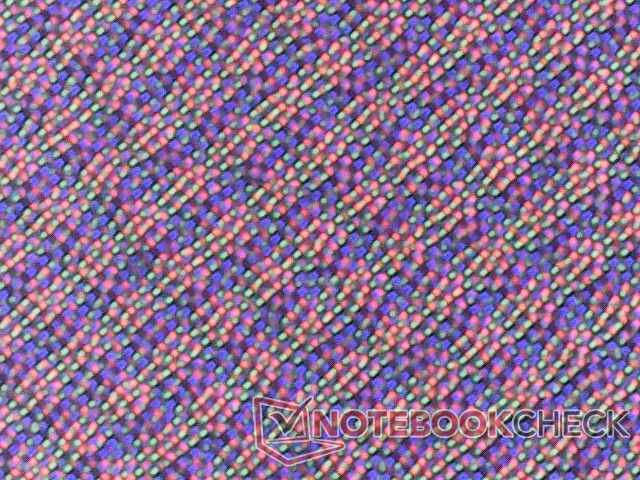
与标准 OLED 相比,串联 OLED 的一个关键优势是亮度更高。事实上,我们在 HDR 模式下测得的最高亮度为 1403 尼特,而大多数其他笔记本电脑的 OLED 显示屏最高亮度仅为一半或更低。更高的亮度加上 OLED 以深黑色著称,ExpertBook Ultra 上的 HDR 内容更加生动。在默认的 SDR 模式下,最大亮度被限制在 600 尼特。
遗憾的是,与大多数用户习惯的典型亮面 OLED 面板相比,该机型采用的哑光大猩猩玻璃覆盖层会产生明显的颗粒感。
| |||||||||||||||||||||||||
Brightness Distribution: 96 %
Center on Battery: 600.5 cd/m²
Contrast: ∞:1 (Black: 0 cd/m²)
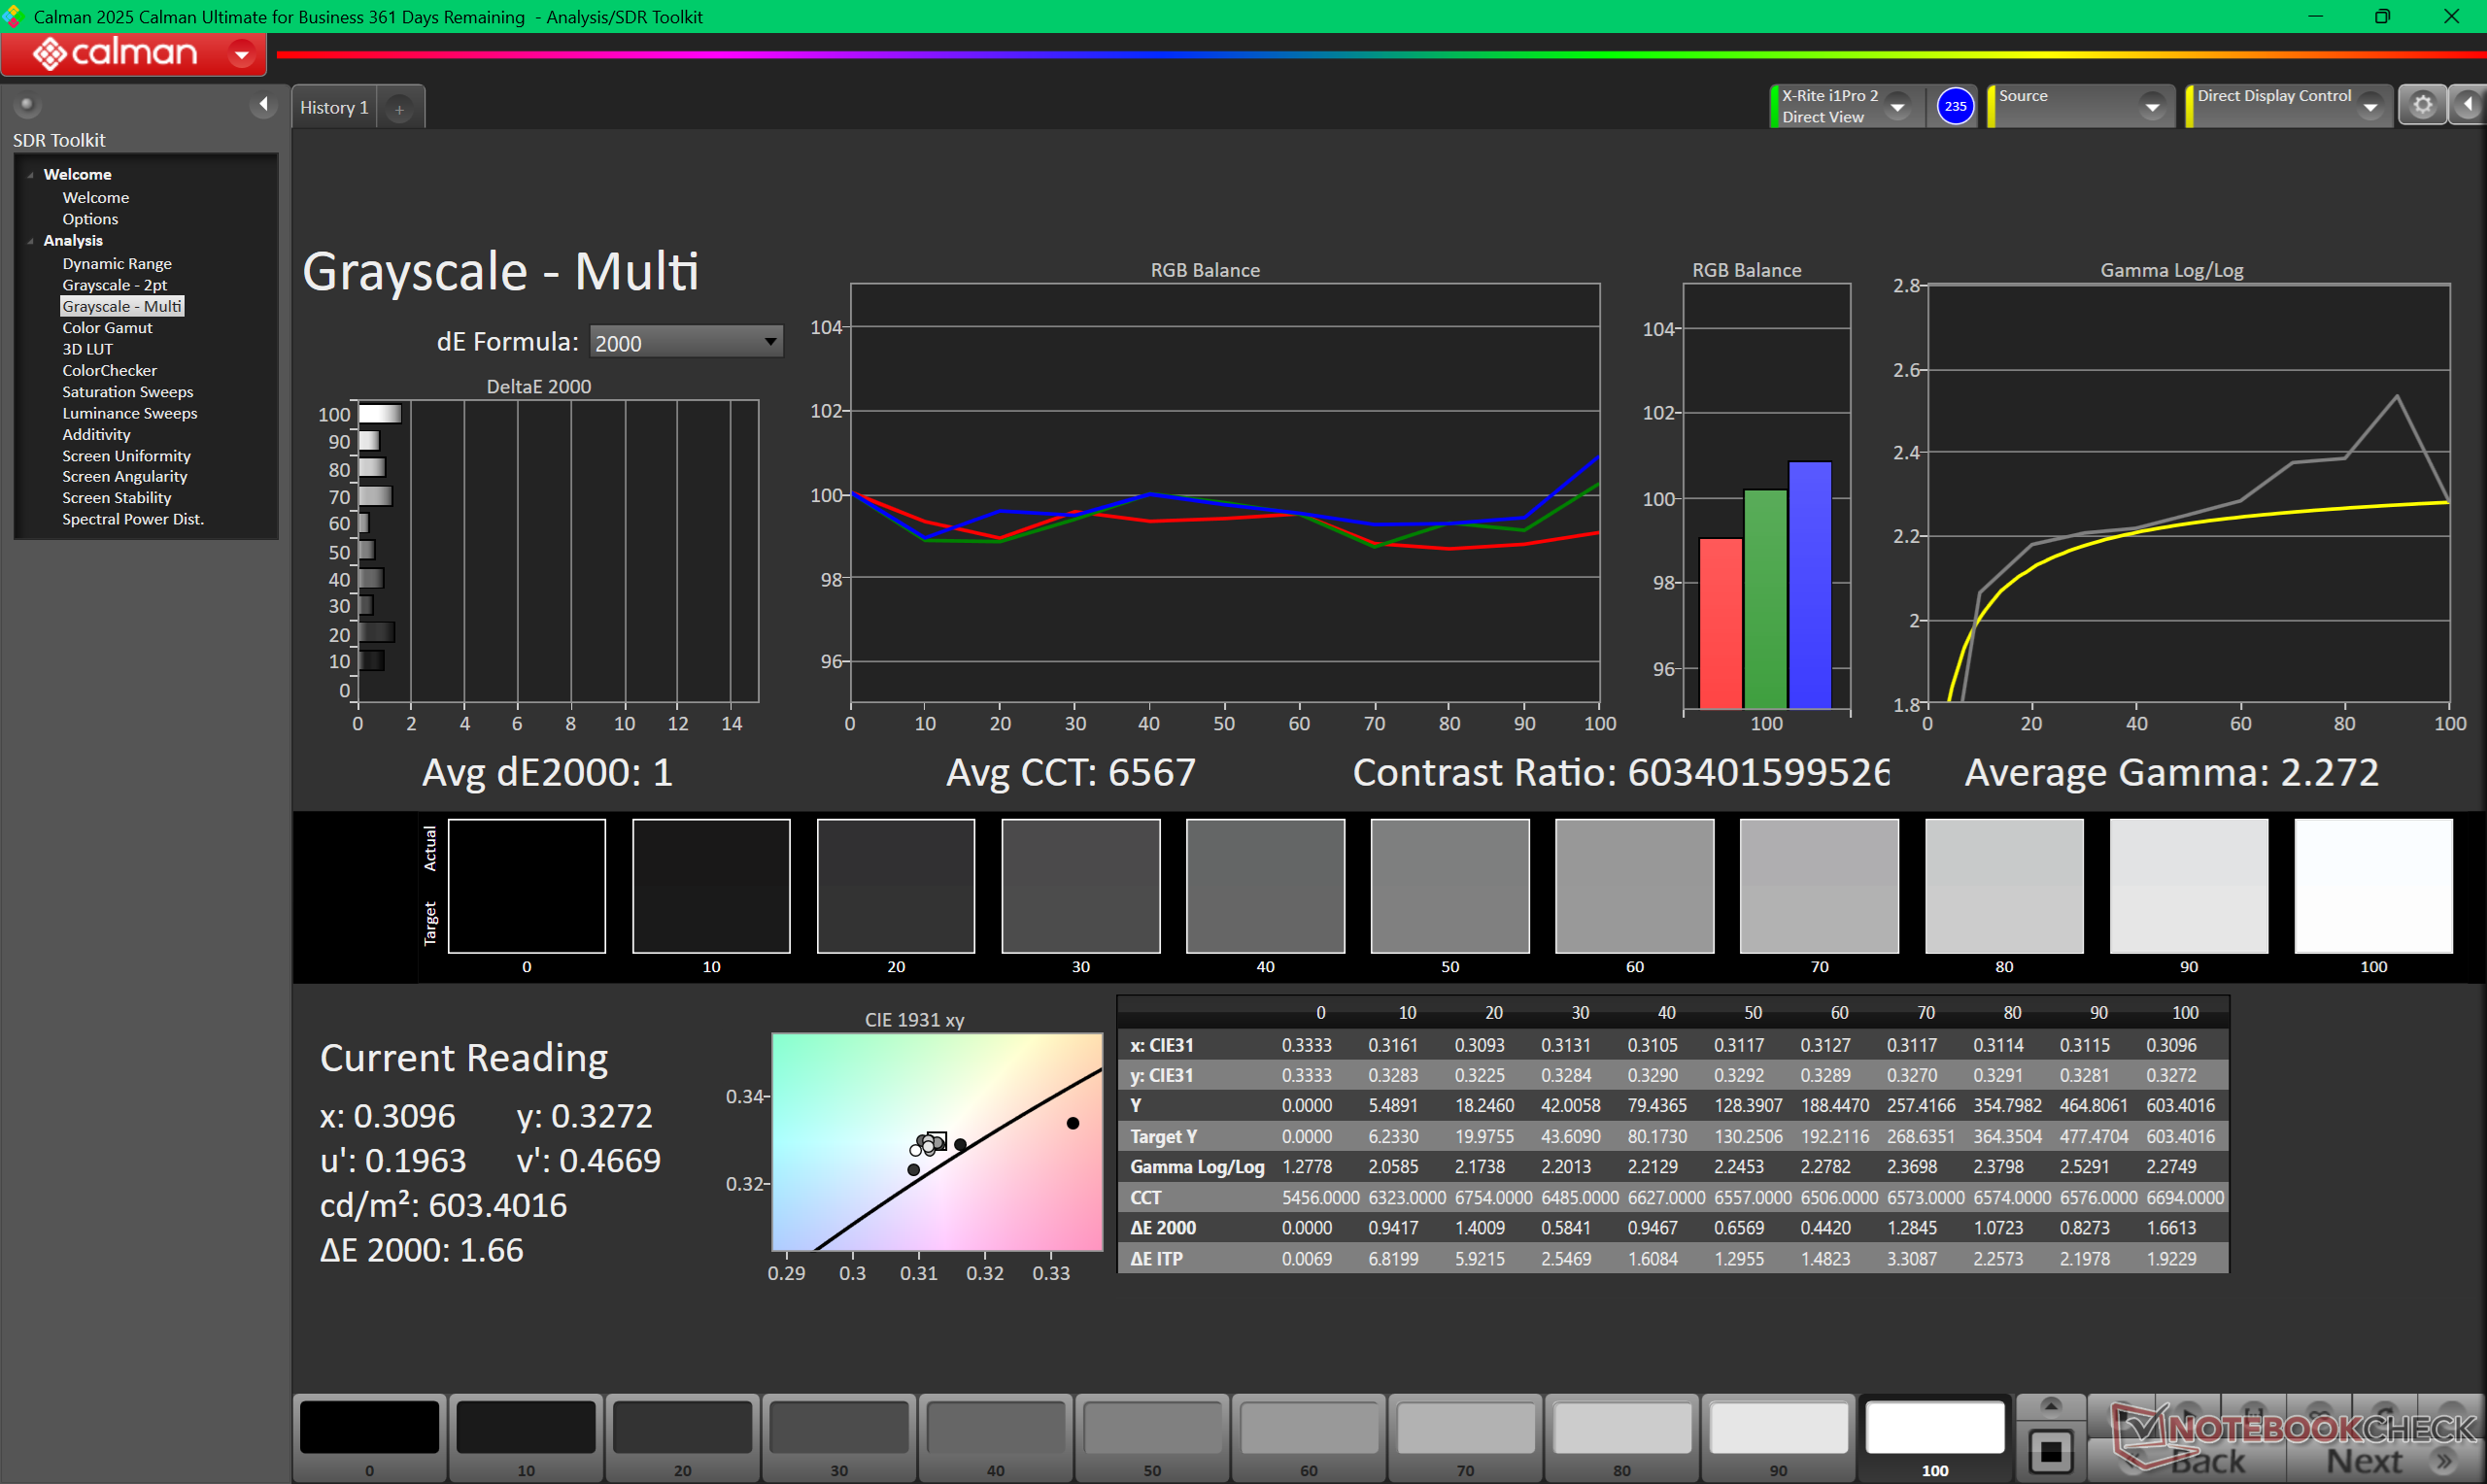
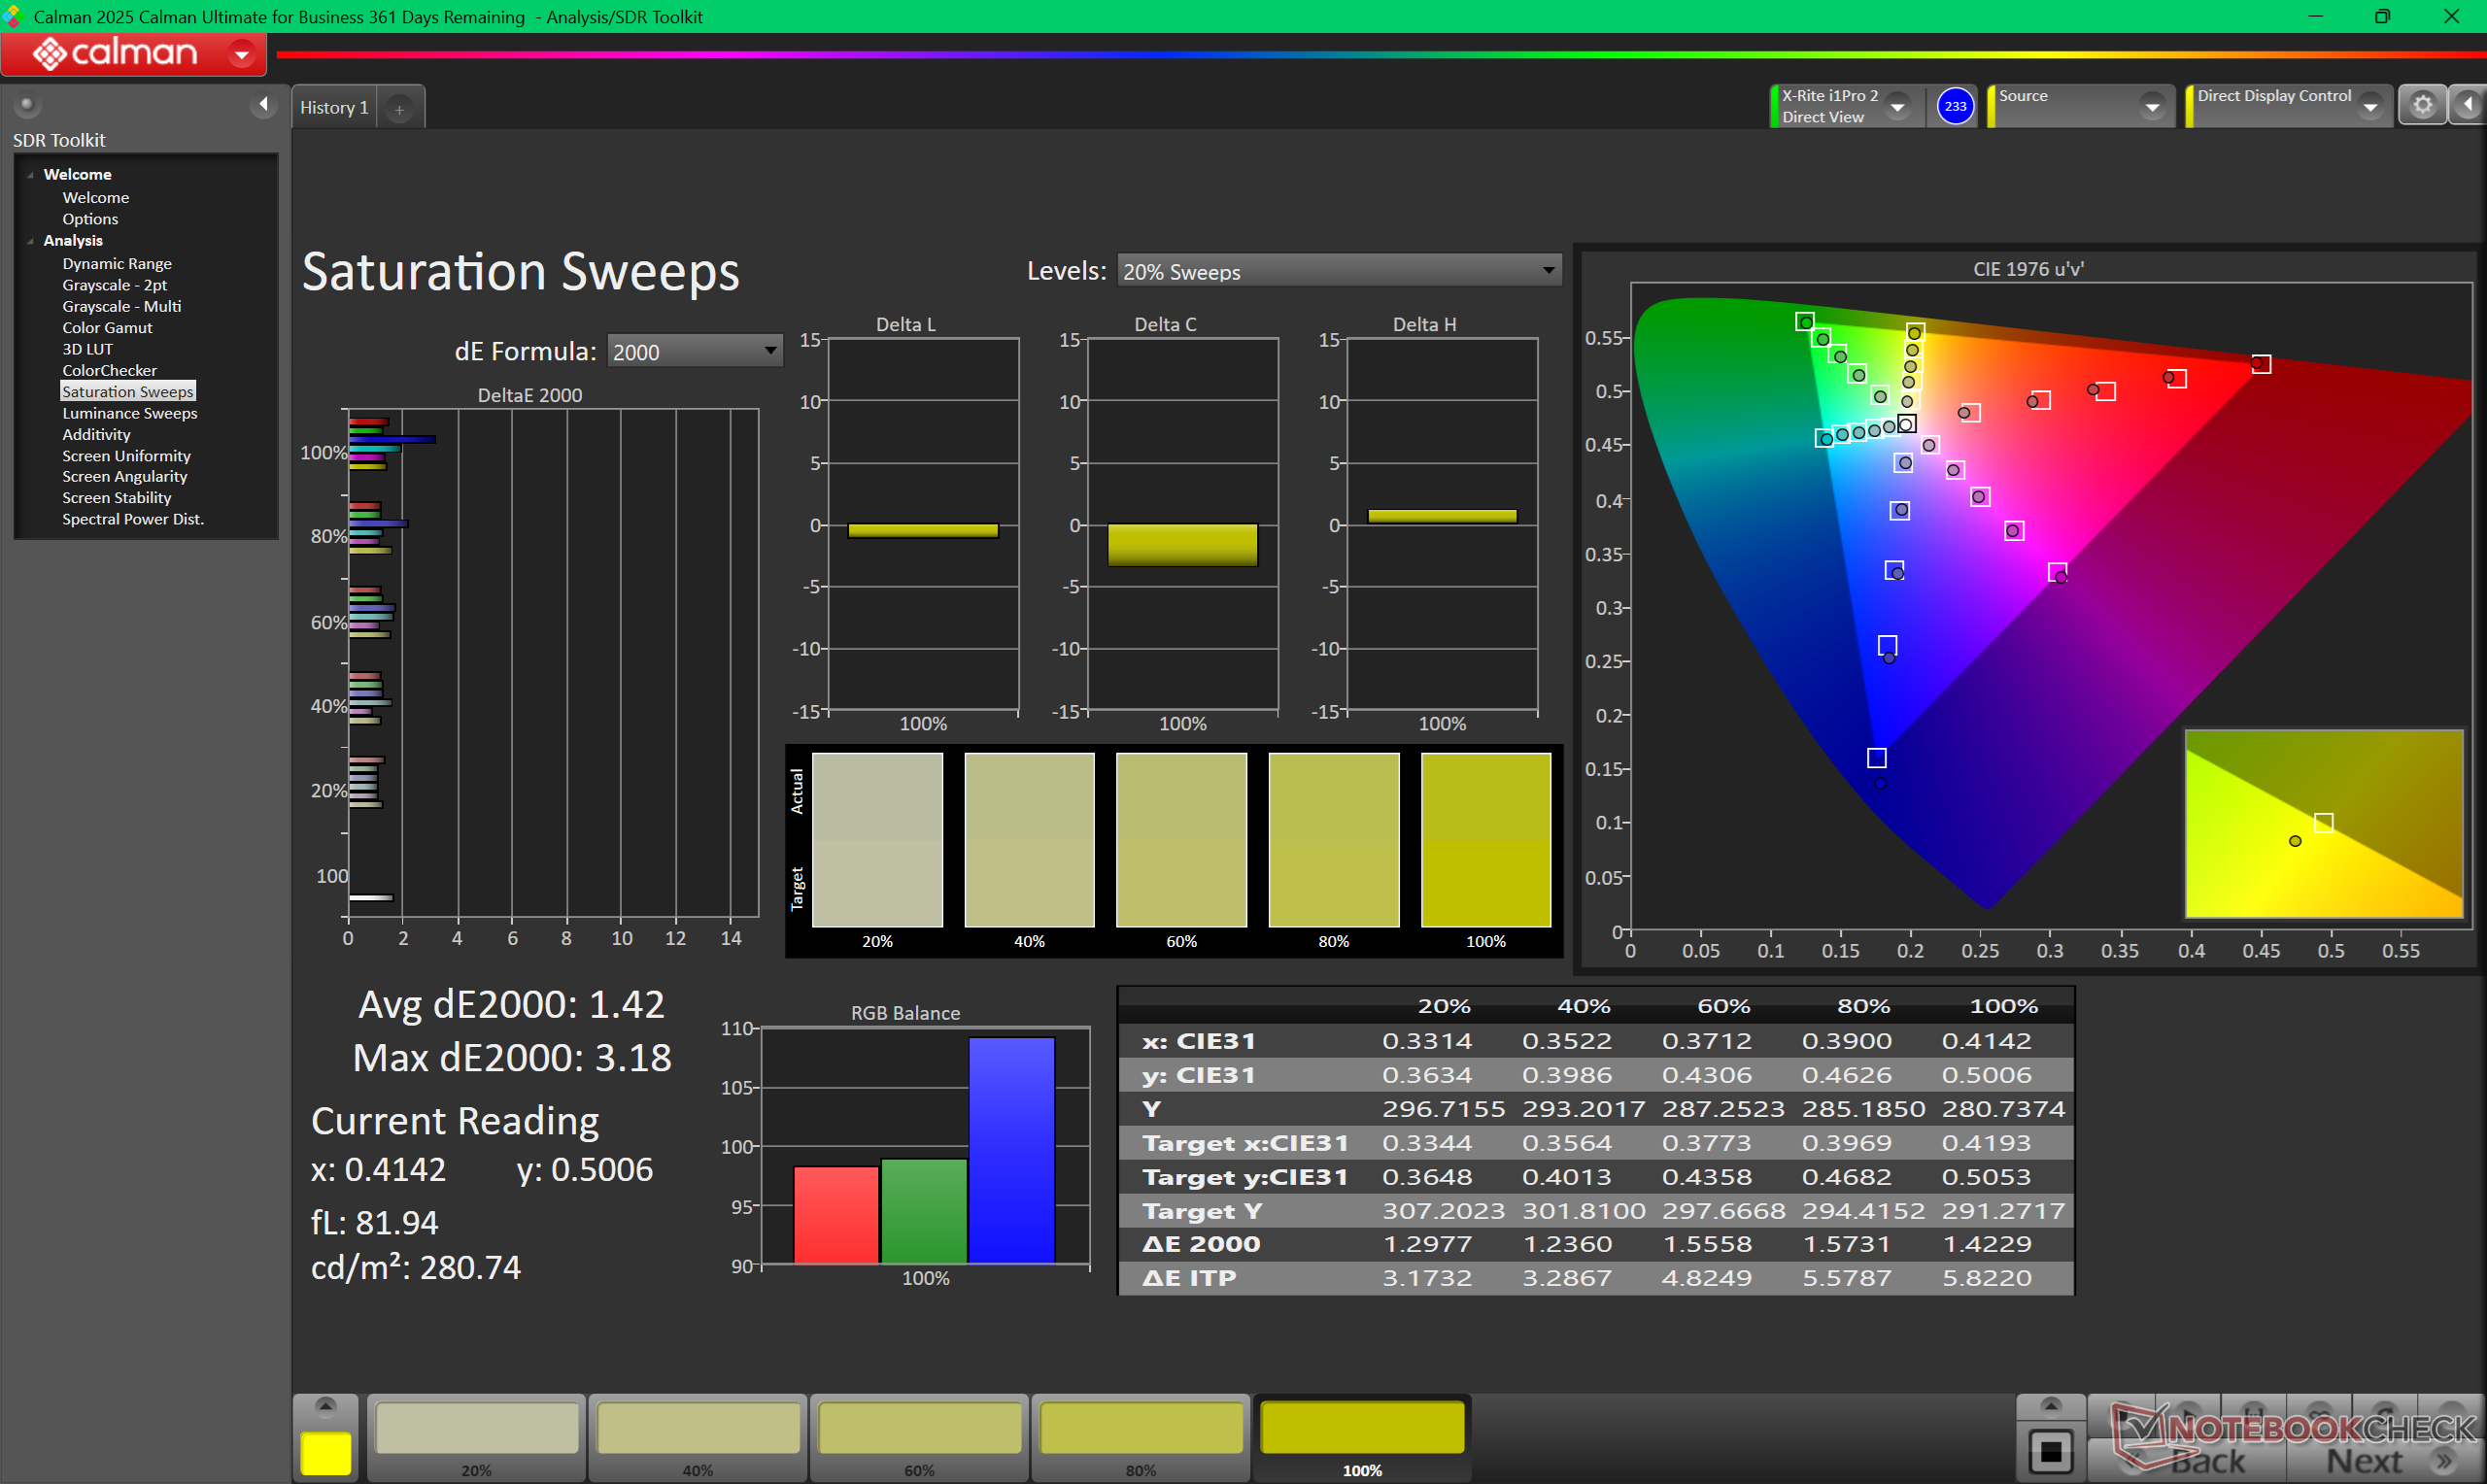
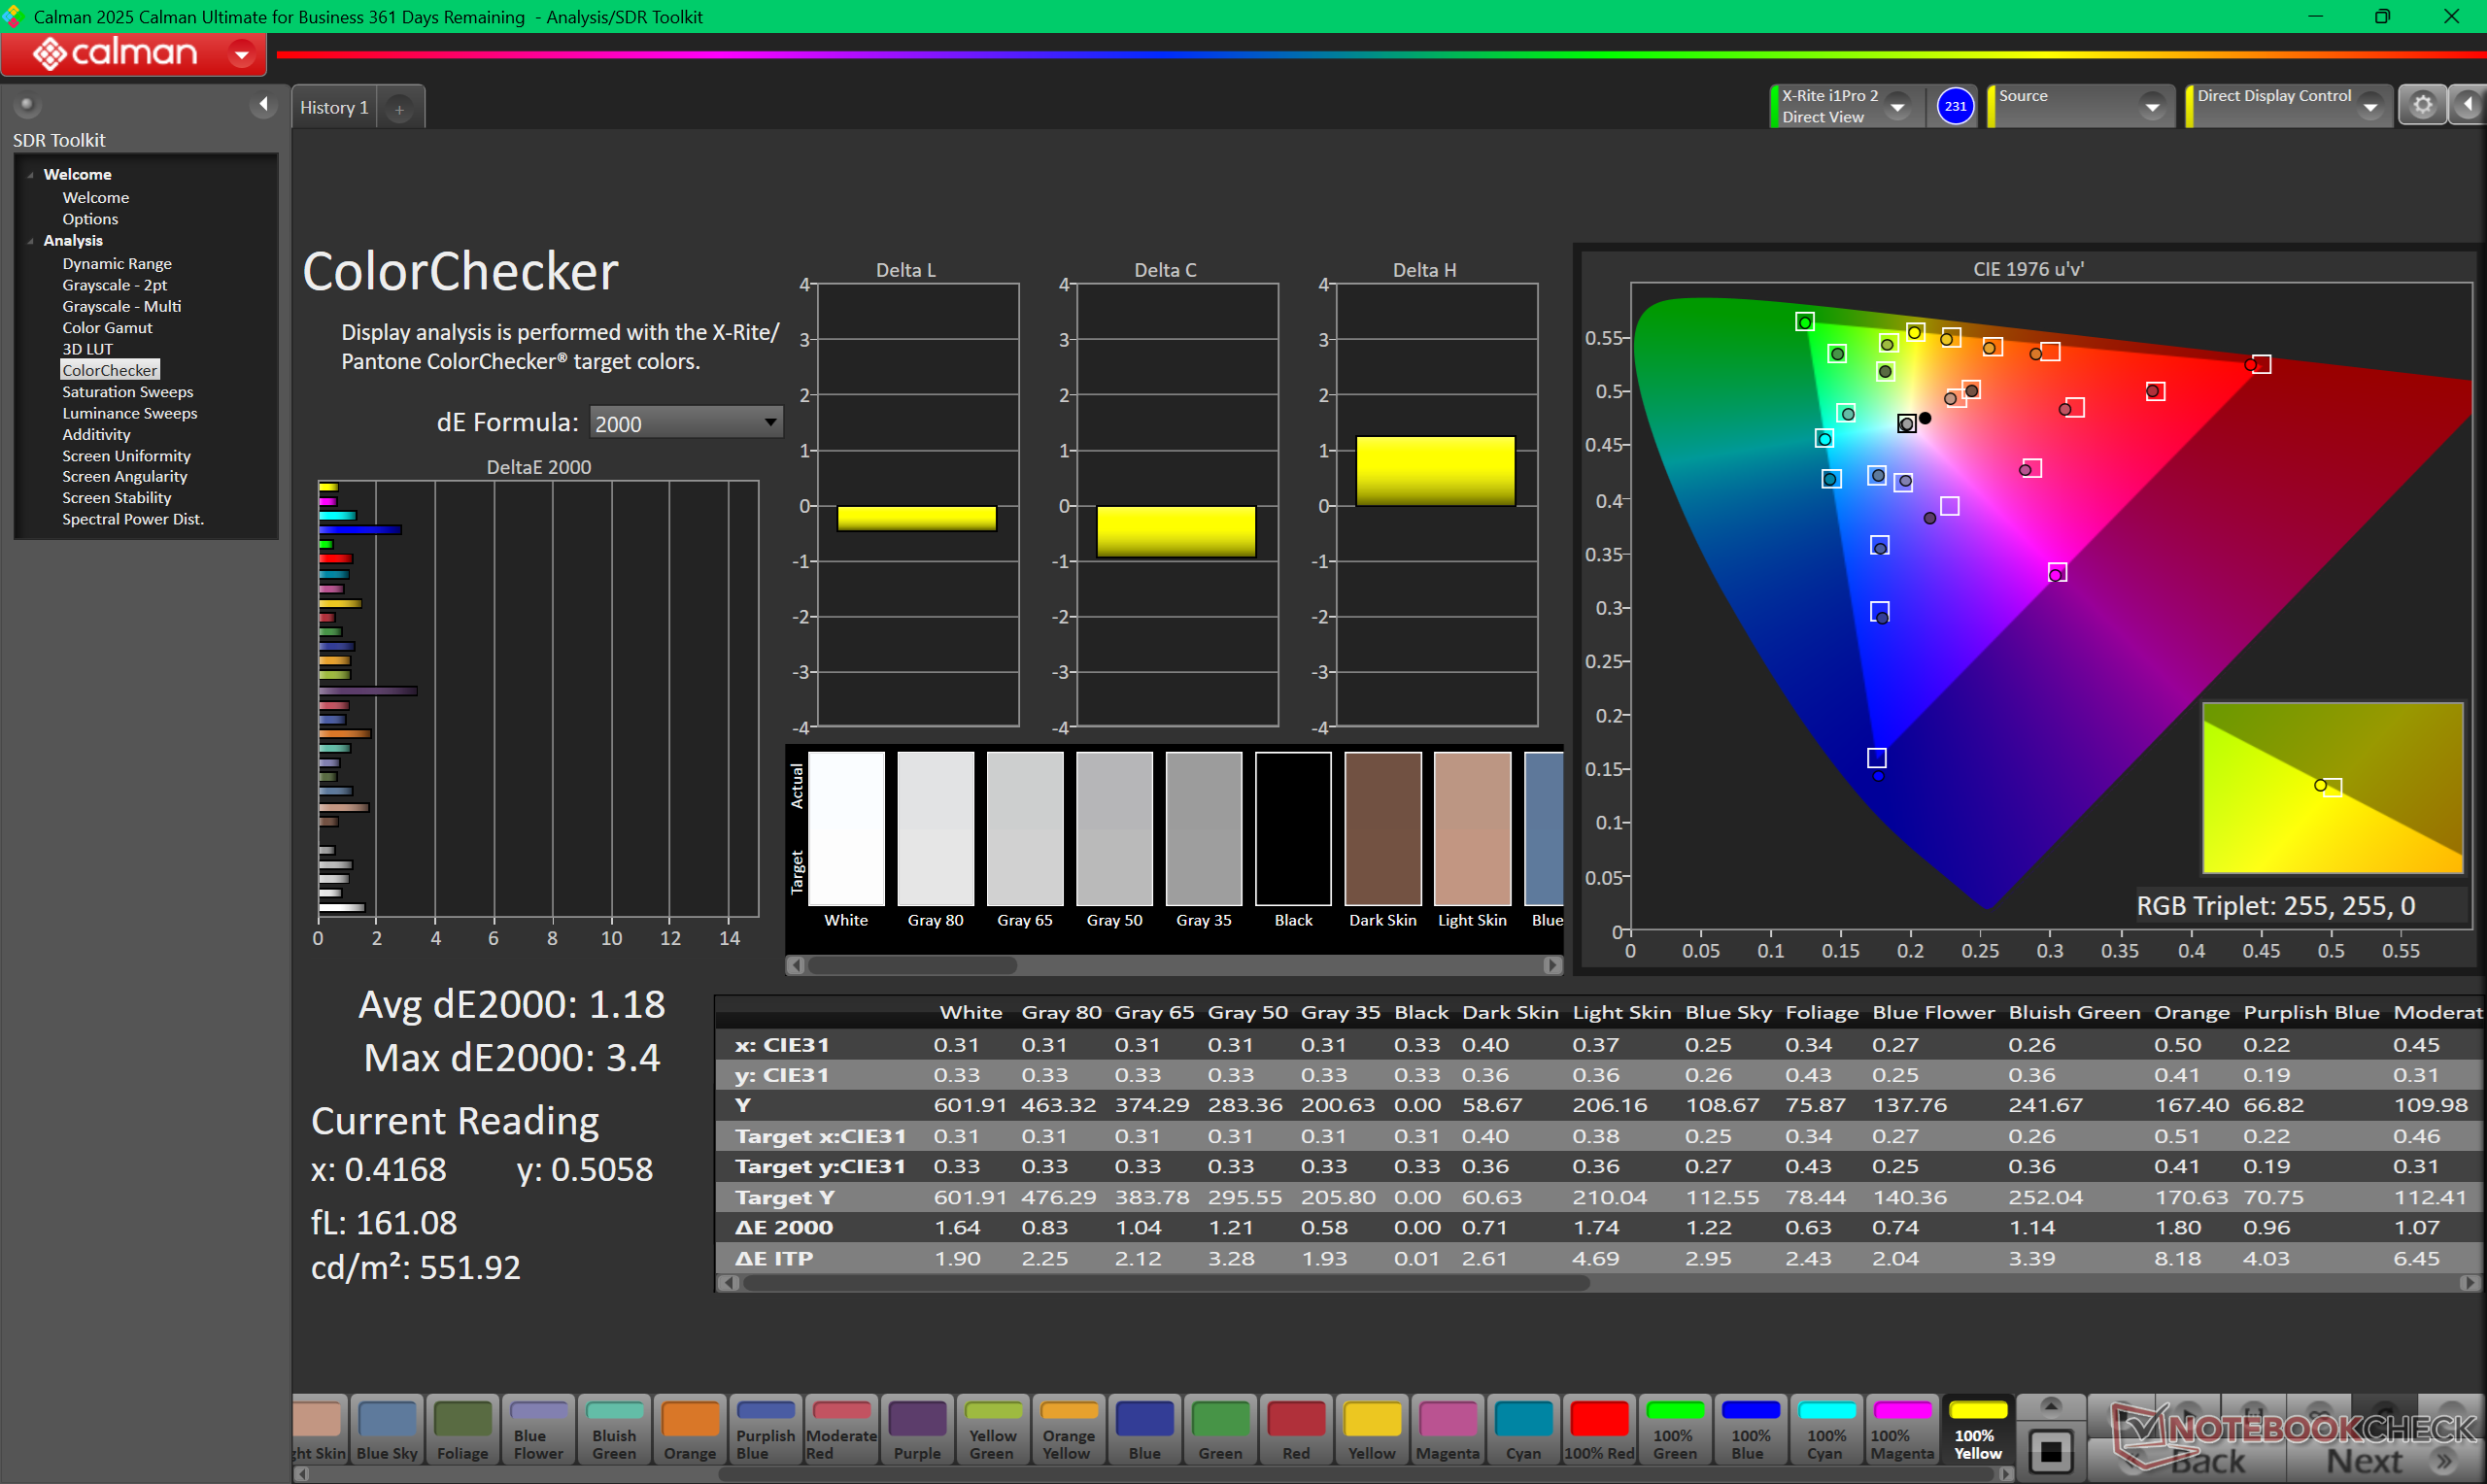
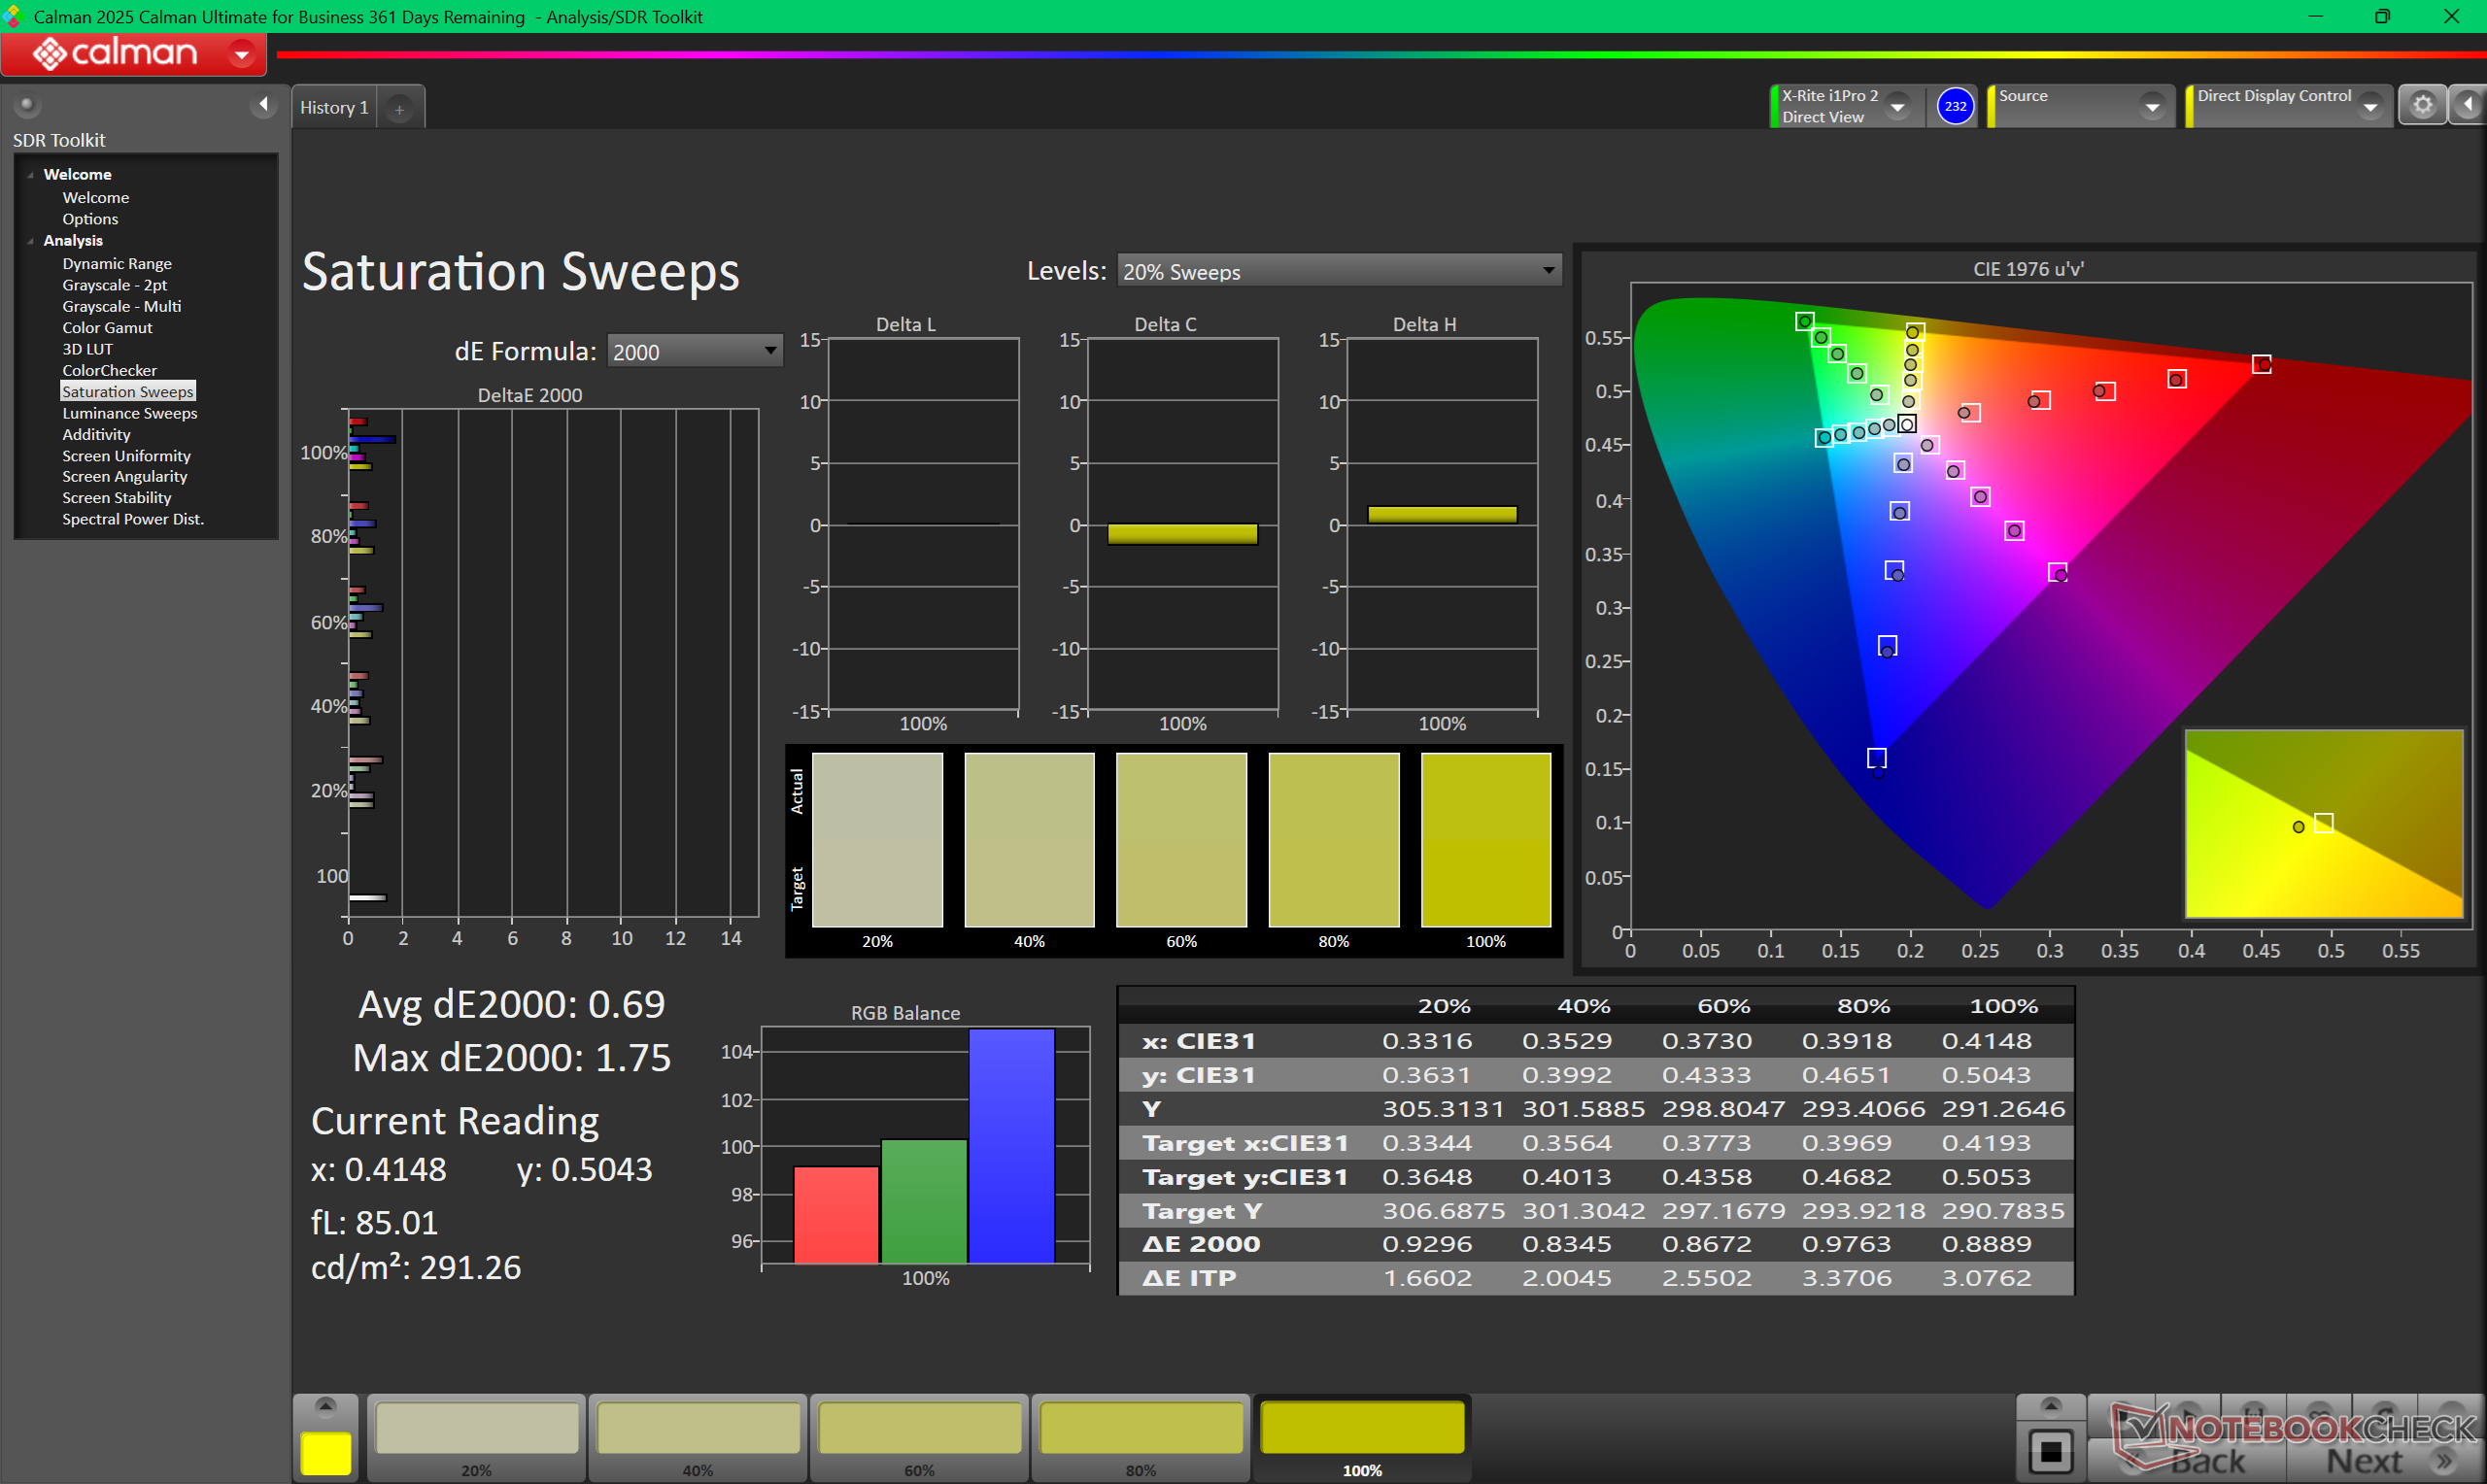
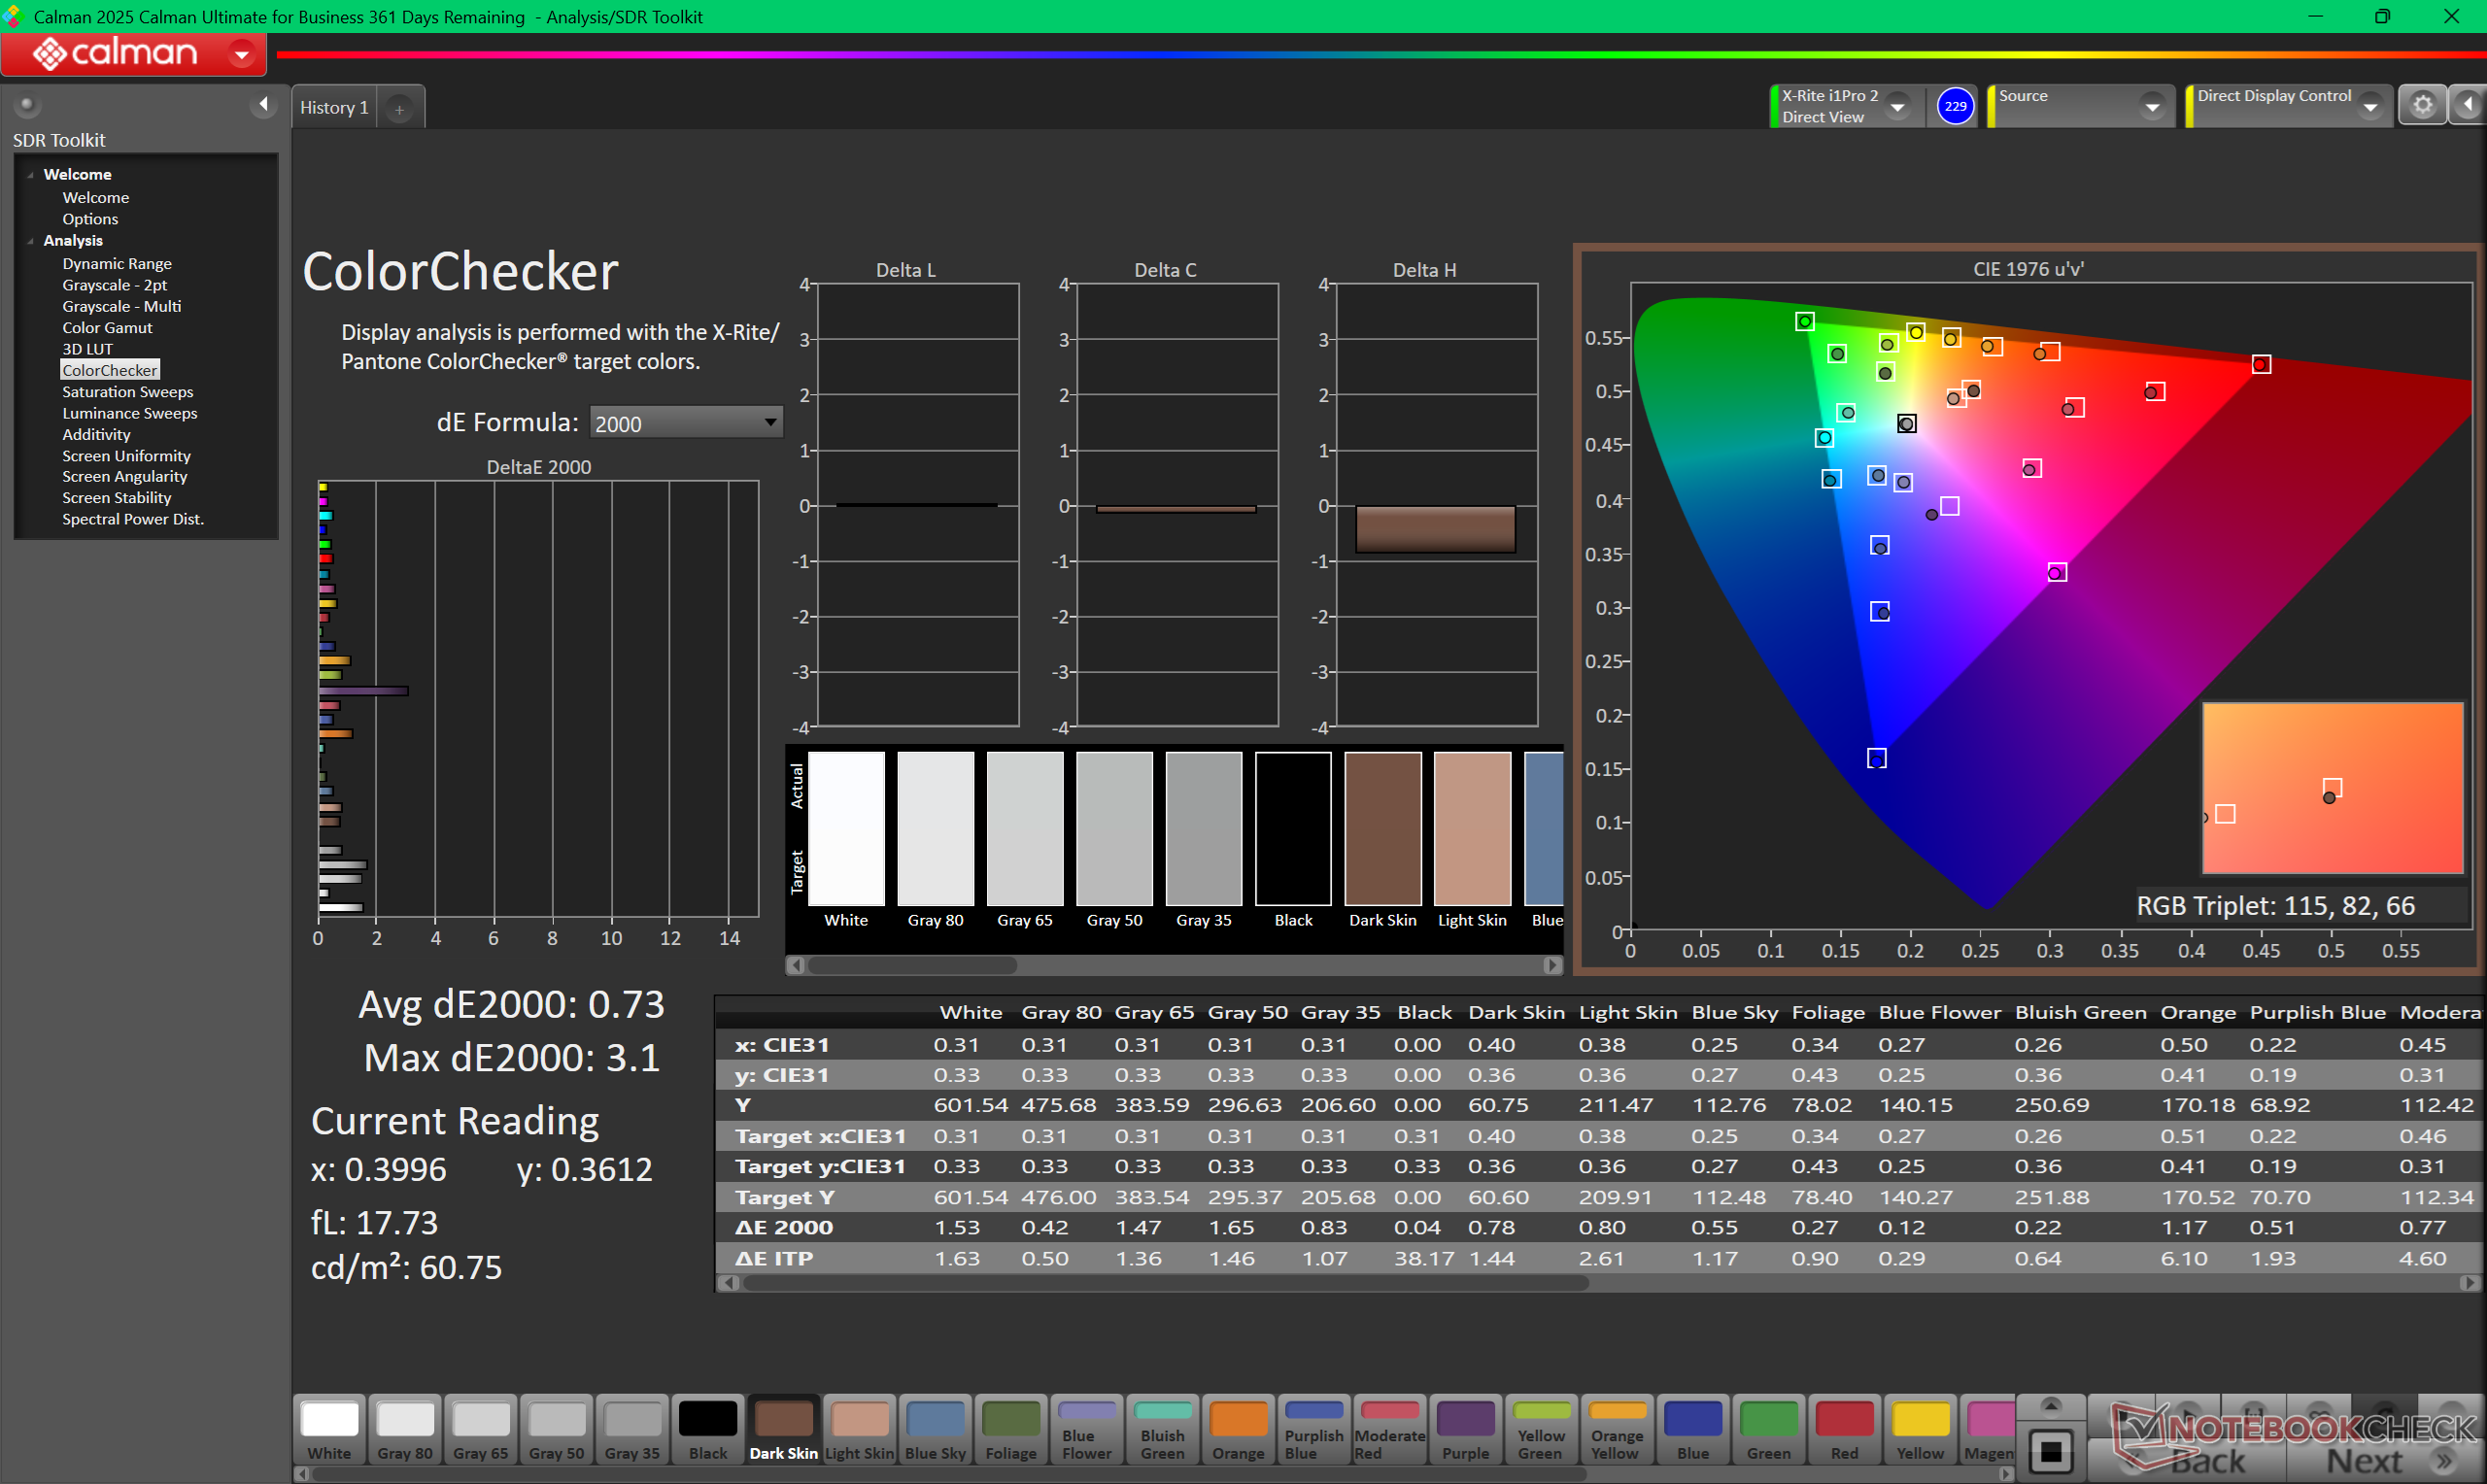
ΔE ColorChecker Calman: 1.18 | ∀{0.5-29.43 Ø4.71}
calibrated: 0.73
ΔE Greyscale Calman: 1 | ∀{0.09-98 Ø4.96}
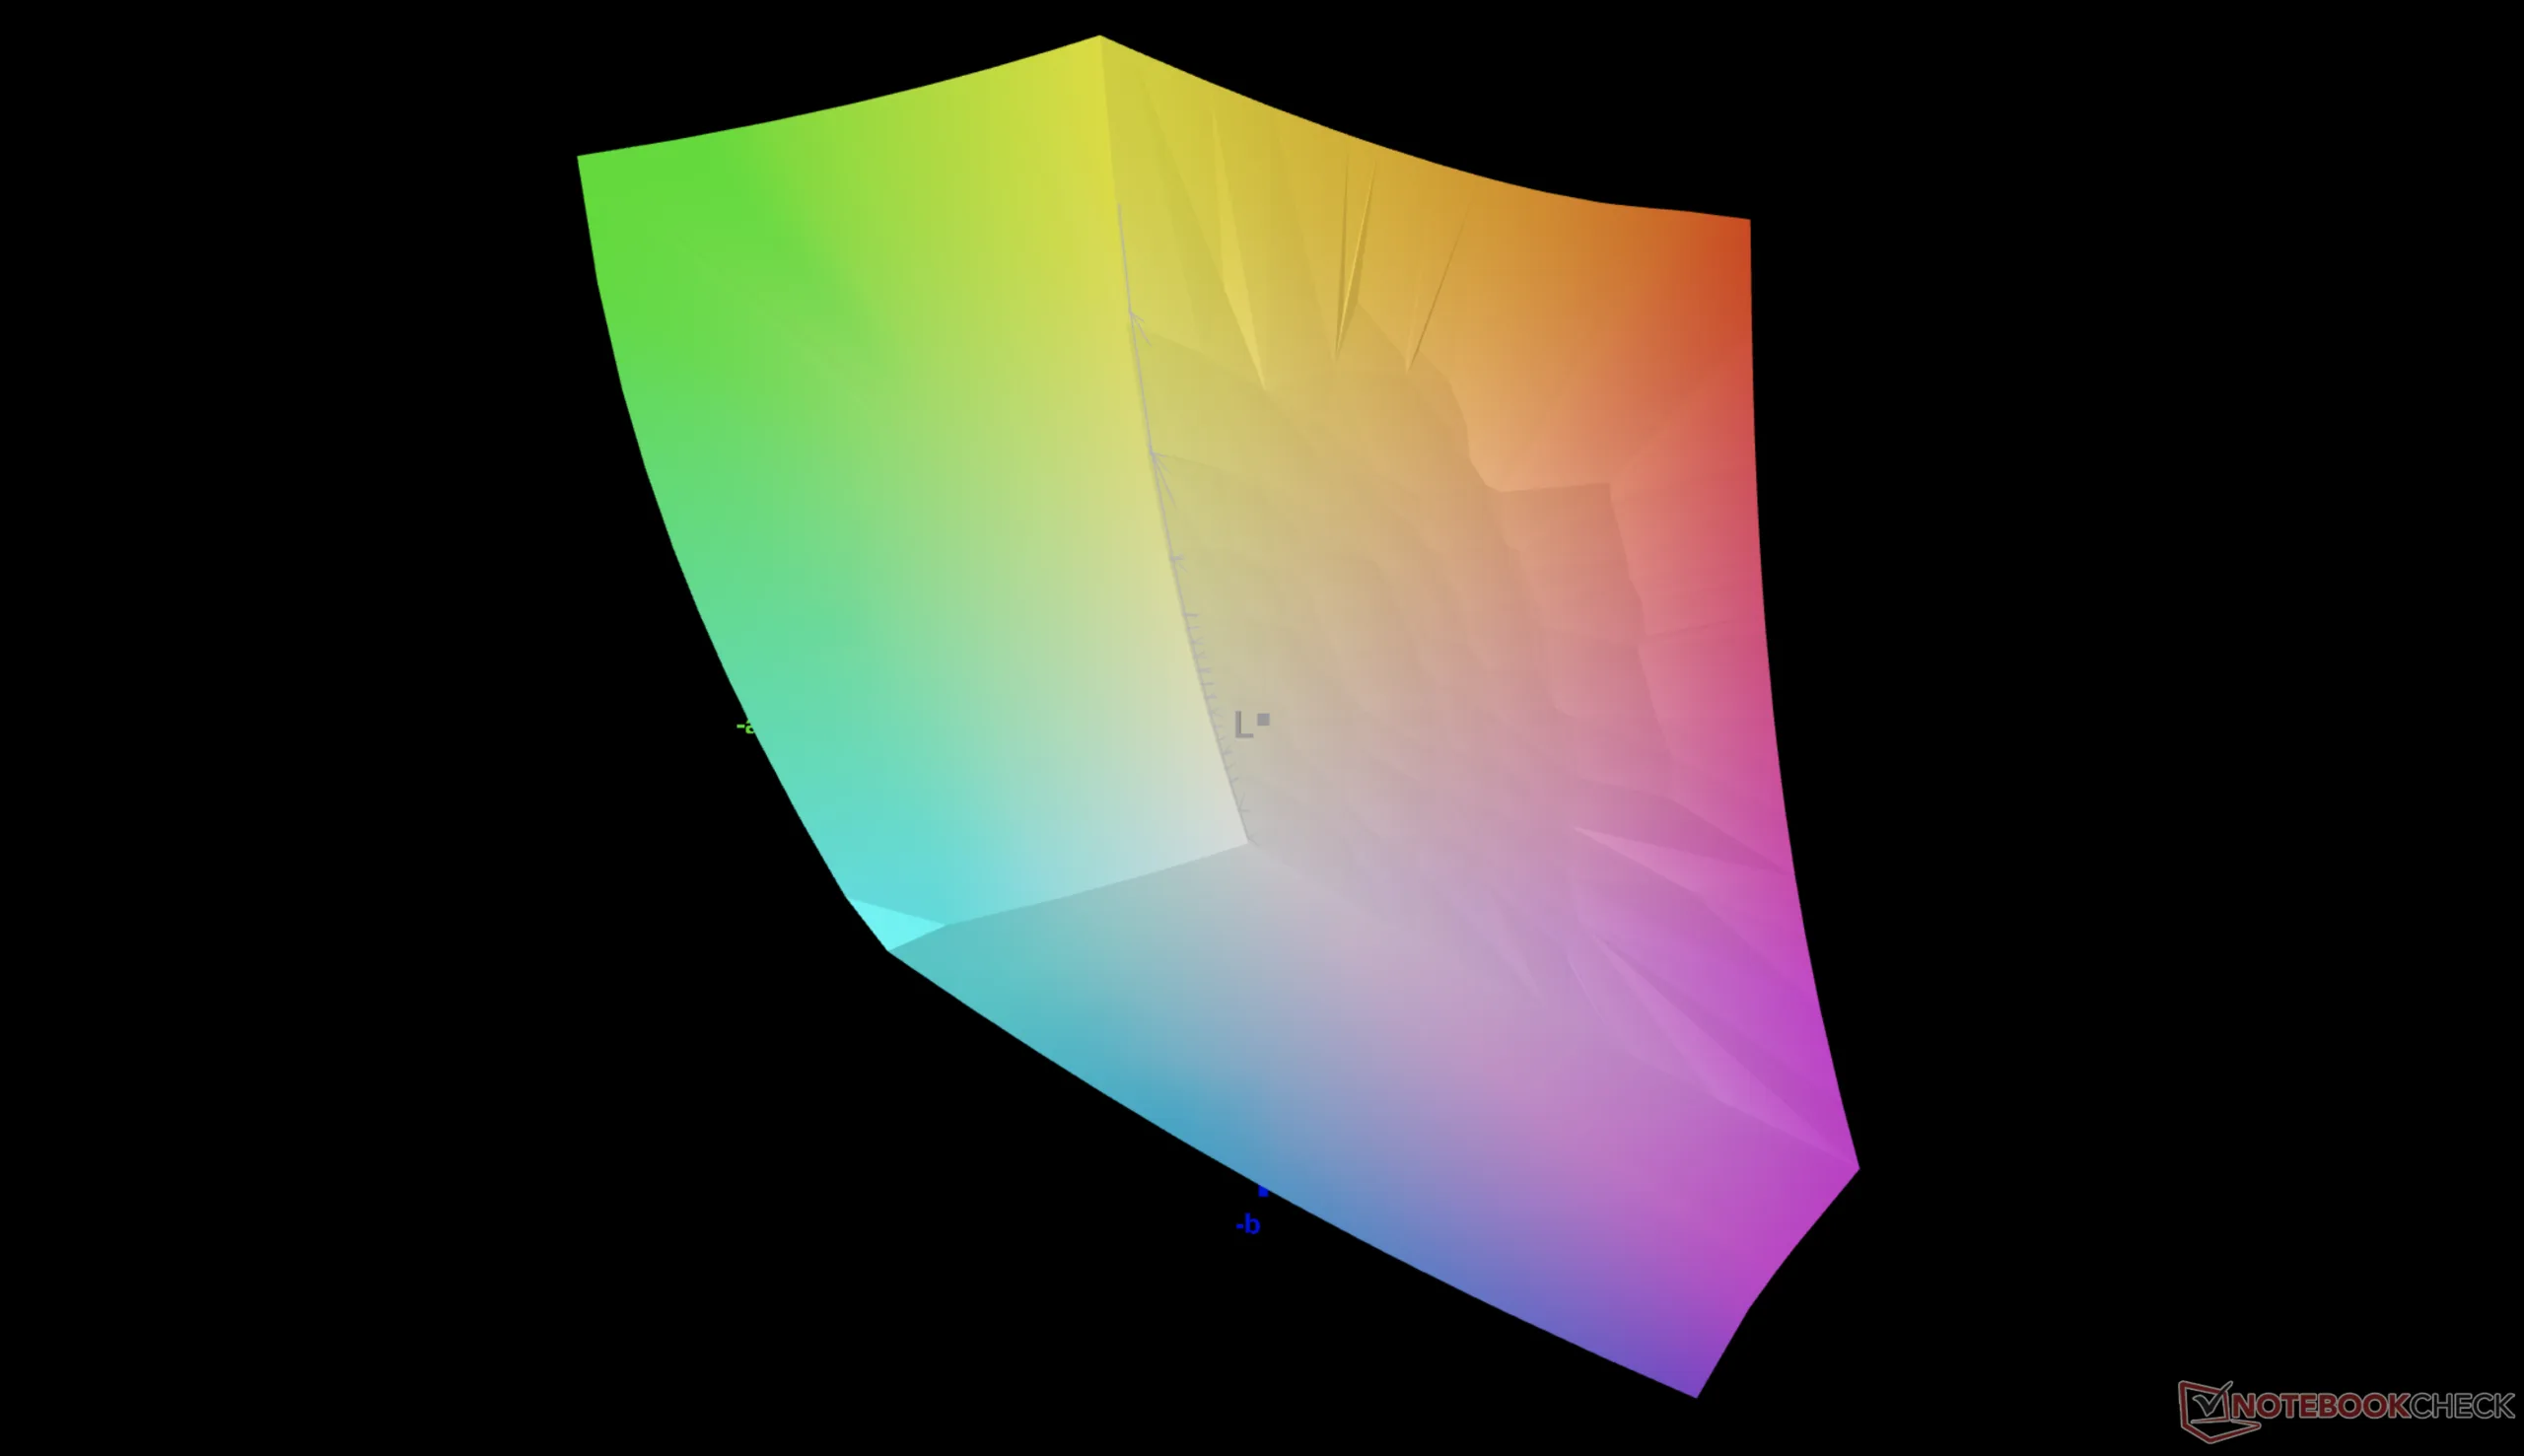
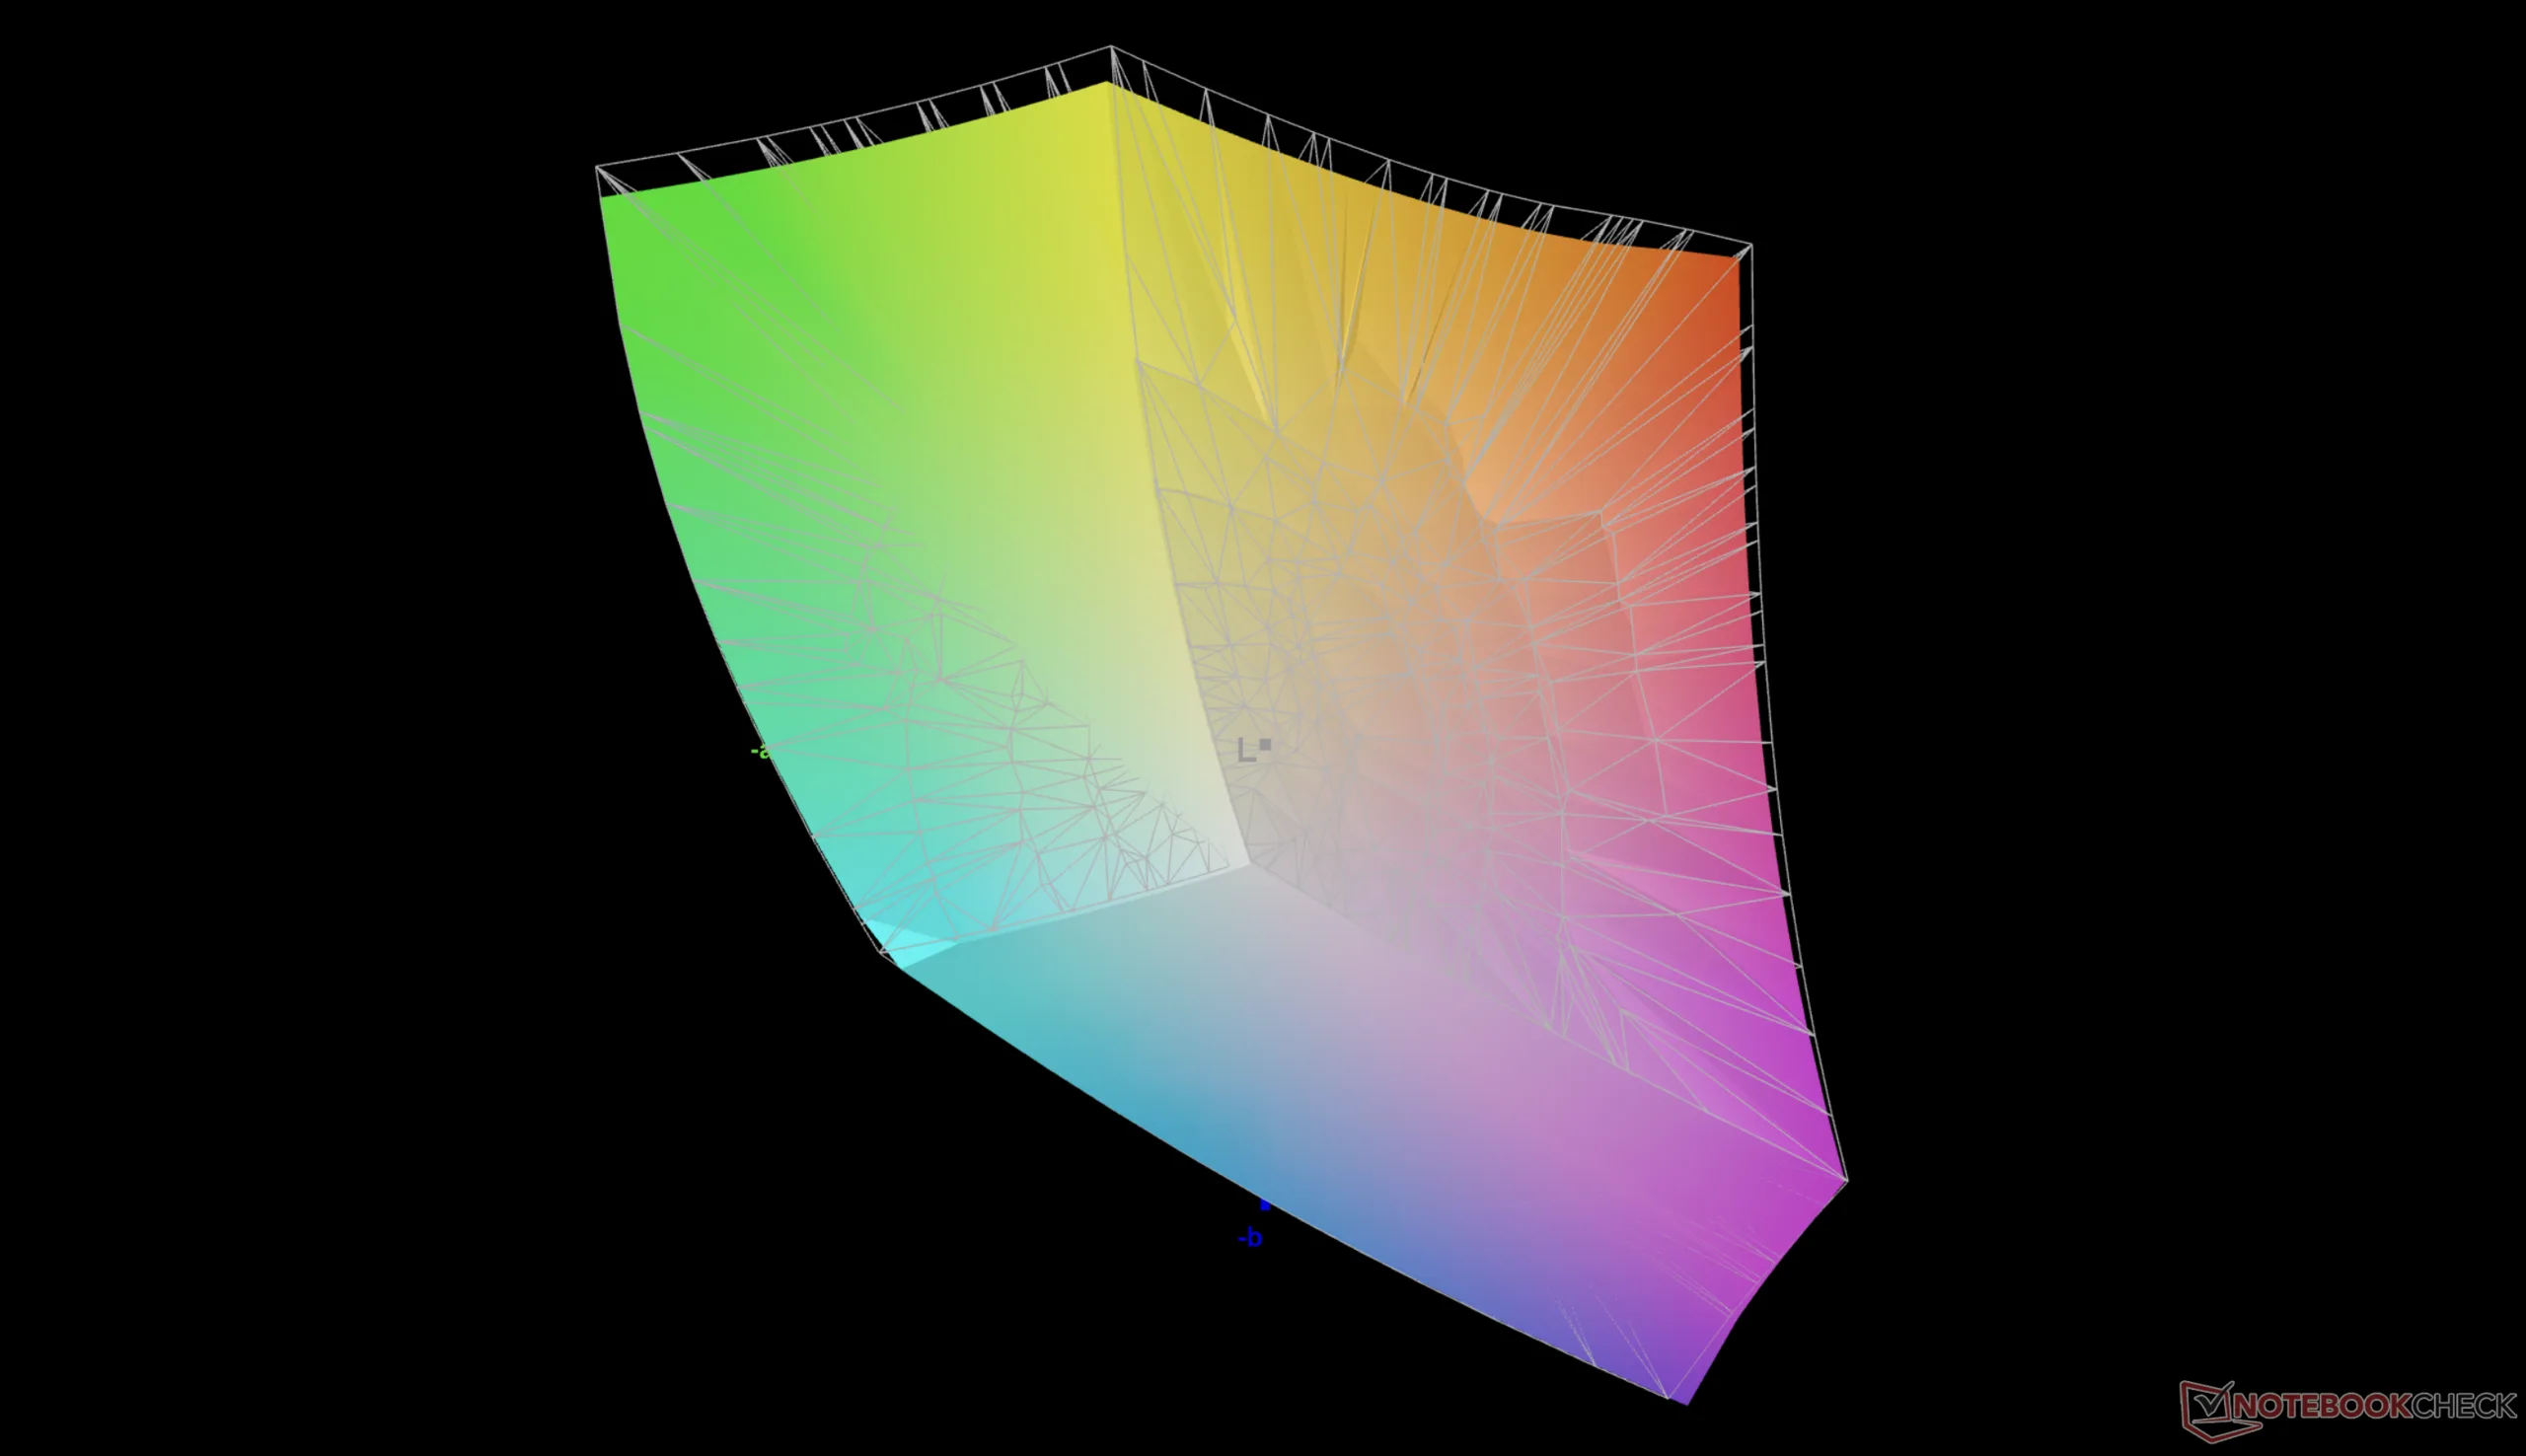
86.7% AdobeRGB 1998 (Argyll 3D)
100% sRGB (Argyll 3D)
96.2% Display P3 (Argyll 3D)
Gamma: 2.27
CCT: 6567 K
| Asus ExpertBook Ultra B9406CAA Samsung ATNA40LE01-0, OLED, 2880x1800, 14", 120 Hz | Dell Pro 14 Plus PB14255 GH77W LP140WU4, IPS LED, 1920x1200, 14", 60 Hz | Asus ExpertBook PM3406 MNE007QS3-6, IPS, 1920x1200, 14", 60 Hz | Lenovo ThinkPad P14s Gen 6 21QT0012GE TL145MDXP02, IPS LED, 3072x1920, 14.5", 120 Hz | Samsung Galaxy Book5 Pro 14 940XHA ATNA40CU07-0, OLED, 2880x1800, 14", 120 Hz | HP EliteBook Ultra G1i 14 SDC41AA, OLED, 2880x1800, 14", 120 Hz | |
|---|---|---|---|---|---|---|
| Display | -53% | -51% | 1% | 5% | 6% | |
| Display P3 Coverage (%) | 96.2 | 37.5 -61% | 39.3 -59% | 98.3 2% | 99.9 4% | 99.7 4% |
| sRGB Coverage (%) | 100 | 56.3 -44% | 58.1 -42% | 100 0% | 100 0% | 100 0% |
| AdobeRGB 1998 Coverage (%) | 86.7 | 38.8 -55% | 40.6 -53% | 86.5 0% | 95.7 10% | 98 13% |
| Response Times | -2931% | -2748% | -2962% | -73% | -3% | |
| Response Time Grey 50% / Grey 80% * (ms) | 0.71 ? | 27.1 ? -3717% | 27.6 ? -3787% | 28.3 ? -3886% | 0.83 ? -17% | 0.74 ? -4% |
| Response Time Black / White * (ms) | 0.94 ? | 21.1 ? -2145% | 17 ? -1709% | 20.1 ? -2038% | 0.69 ? 27% | 0.7 ? 26% |
| PWM Frequency (Hz) | 968.8 ? | 240 ? | 480 ? | |||
| PWM Amplitude * (%) | 20 | 66 -230% | 26 -30% | |||
| Screen | -242% | -215% | -60% | -55% | -60% | |
| Brightness middle (cd/m²) | 600.5 | 315 -48% | 320 -47% | 546 -9% | 400 -33% | 392 -35% |
| Brightness (cd/m²) | 612 | 295 -52% | 310 -49% | 502 -18% | 402 -34% | 378 -38% |
| Brightness Distribution (%) | 96 | 87 -9% | 93 -3% | 88 -8% | 99 3% | 95 -1% |
| Black Level * (cd/m²) | 0.25 | 0.26 | 0.4 | |||
| Colorchecker dE 2000 * | 1.18 | 6 -408% | 5.1 -332% | 3.1 -163% | 2.1 -78% | 2.4 -103% |
| Colorchecker dE 2000 max. * | 3.4 | 15.2 -347% | 18.1 -432% | 6.1 -79% | 3.3 3% | 6.6 -94% |
| Colorchecker dE 2000 calibrated * | 0.73 | 5.1 -599% | 4.9 -571% | 1.6 -119% | ||
| Greyscale dE 2000 * | 1 | 3.3 -230% | 1.7 -70% | 1.8 -80% | 2.3 -130% | 1.9 -90% |
| Gamma | 2.27 97% | 2.02 109% | 2.21 100% | 2.16 102% | 2.26 97% | 2.21 100% |
| CCT | 6567 99% | 6140 106% | 6398 102% | 6824 95% | 6795 96% | 6463 101% |
| Contrast (:1) | 1260 | 1231 | 1365 | |||
| Total Average (Program / Settings) | -1075% /
-643% | -1005% /
-596% | -1007% /
-571% | -41% /
-46% | -19% /
-29% |
* ... smaller is better

Display Response Times
| ↔ Response Time Black to White | ||
|---|---|---|
| 0.94 ms ... rise ↗ and fall ↘ combined | ↗ 0.49 ms rise | 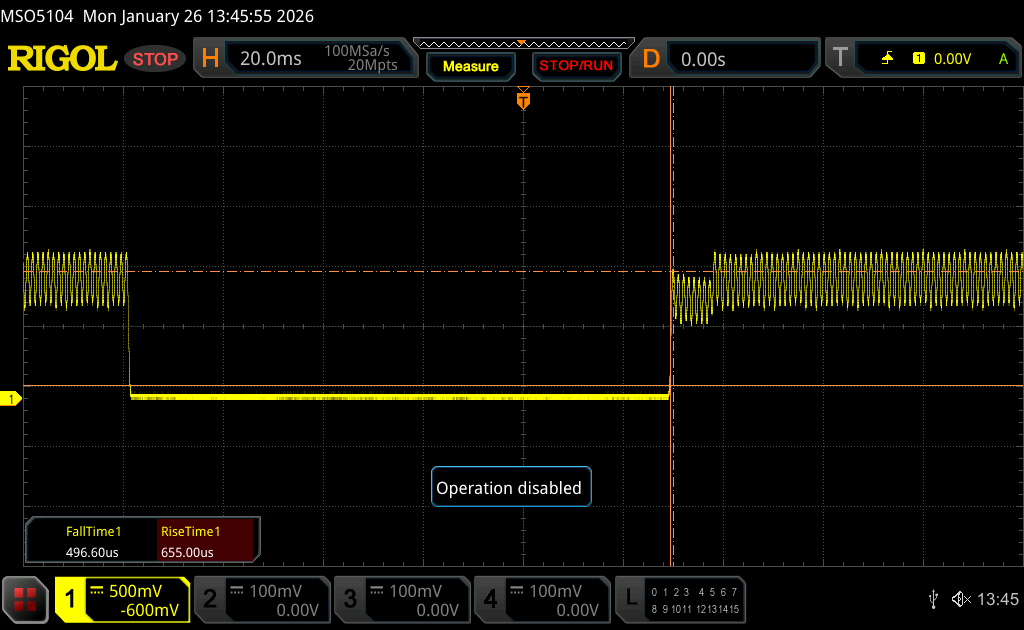 |
| ↘ 0.45 ms fall | ||
| The screen shows very fast response rates in our tests and should be very well suited for fast-paced gaming. In comparison, all tested devices range from 0.1 (minimum) to 240 (maximum) ms. » 3 % of all devices are better. This means that the measured response time is better than the average of all tested devices (19.8 ms). | ||
| ↔ Response Time 50% Grey to 80% Grey | ||
| 0.71 ms ... rise ↗ and fall ↘ combined | ↗ 0.38 ms rise | 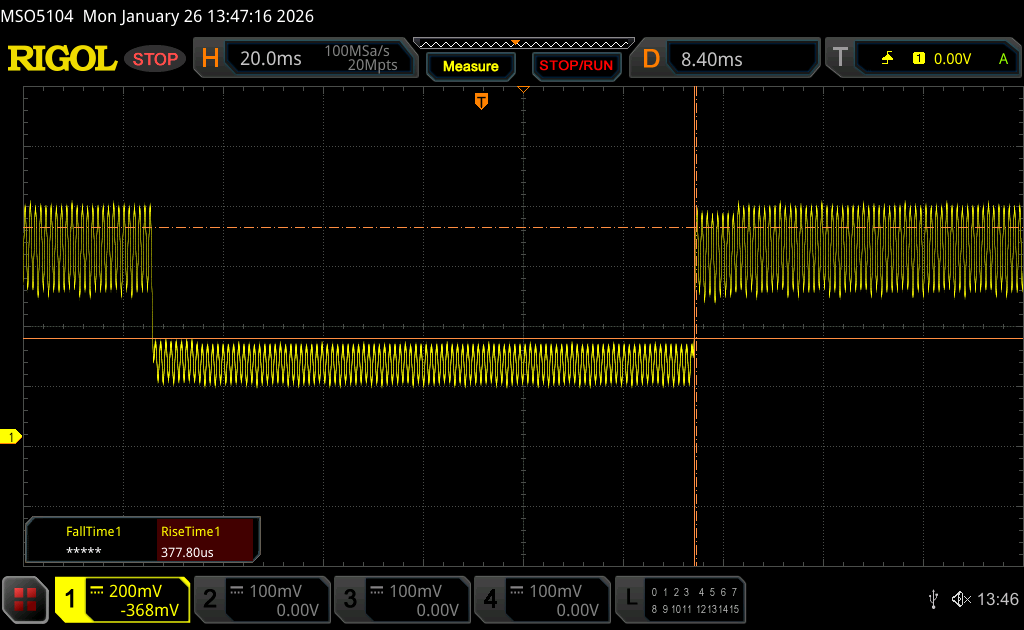 |
| ↘ 0.33 ms fall | ||
| The screen shows very fast response rates in our tests and should be very well suited for fast-paced gaming. In comparison, all tested devices range from 0.165 (minimum) to 636 (maximum) ms. » 2 % of all devices are better. This means that the measured response time is better than the average of all tested devices (31 ms). | ||
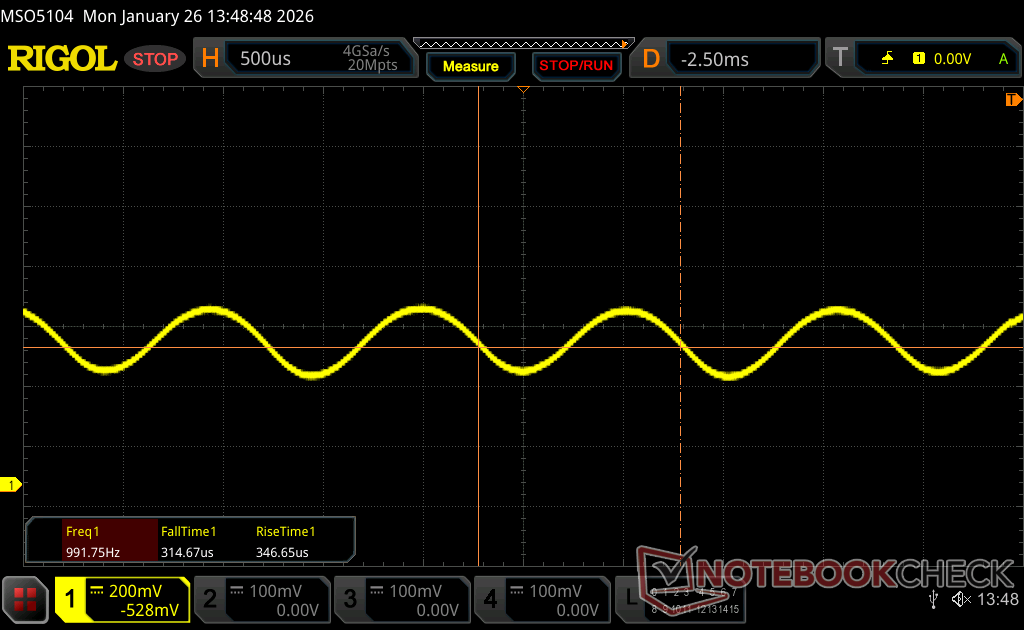
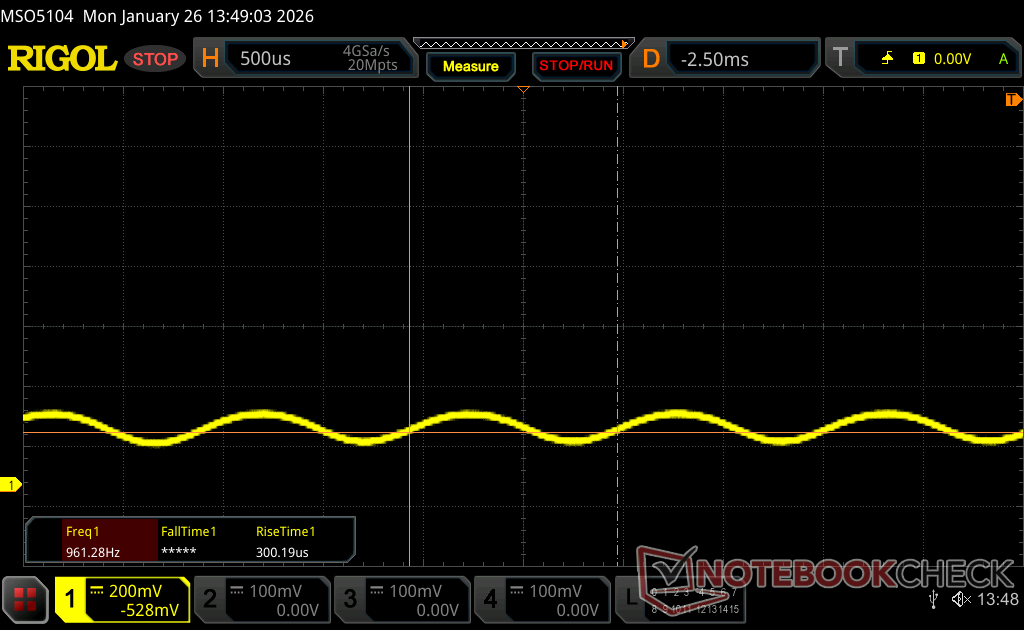
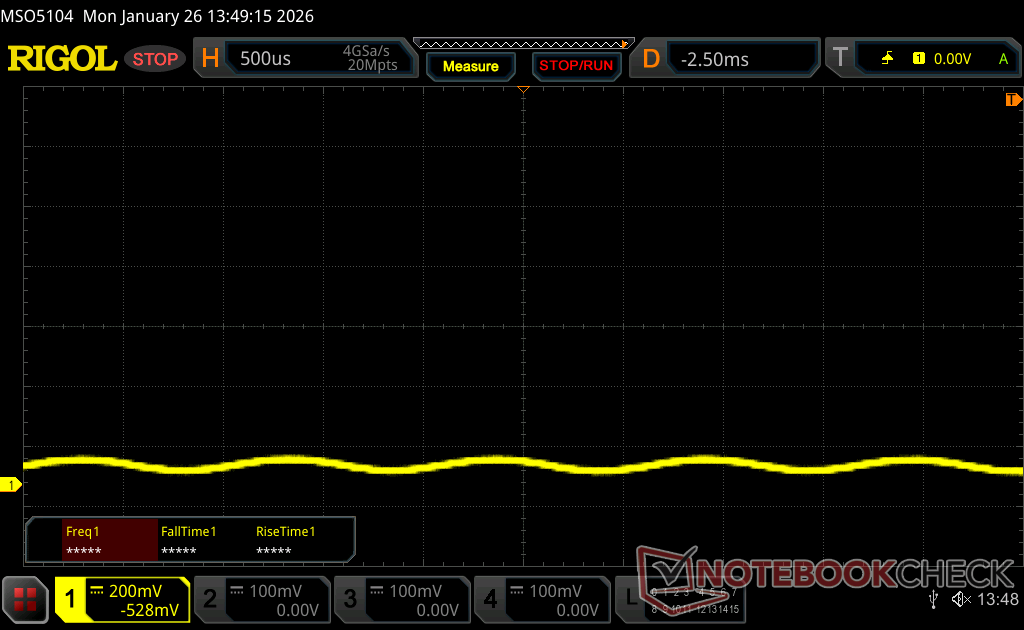
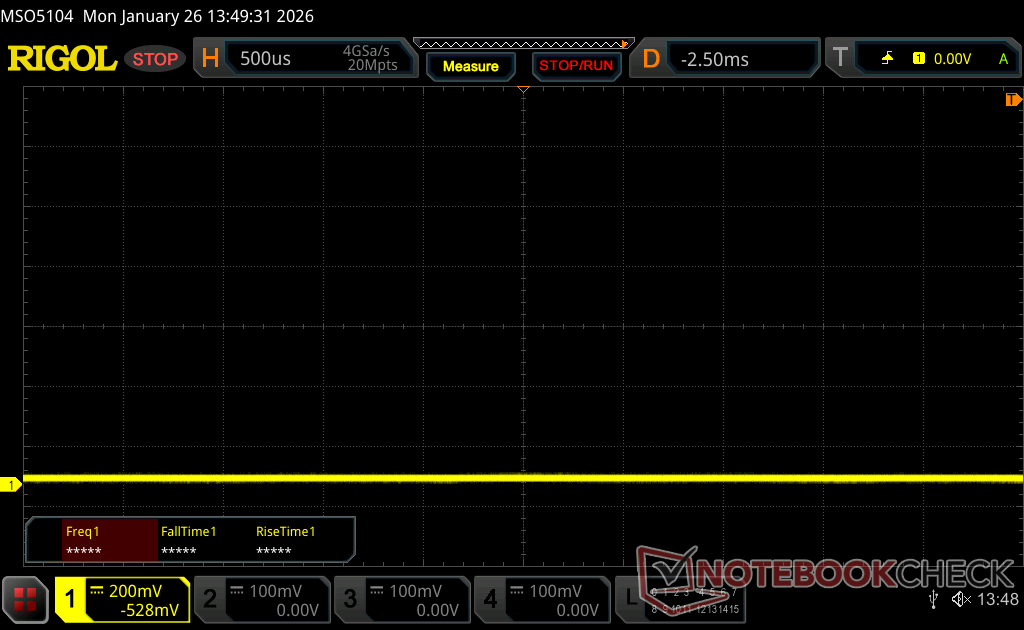
Screen Flickering / PWM (Pulse-Width Modulation)
| Screen flickering / PWM detected | 968.8 Hz Amplitude: 20 % | ≤ 100 % brightness setting | 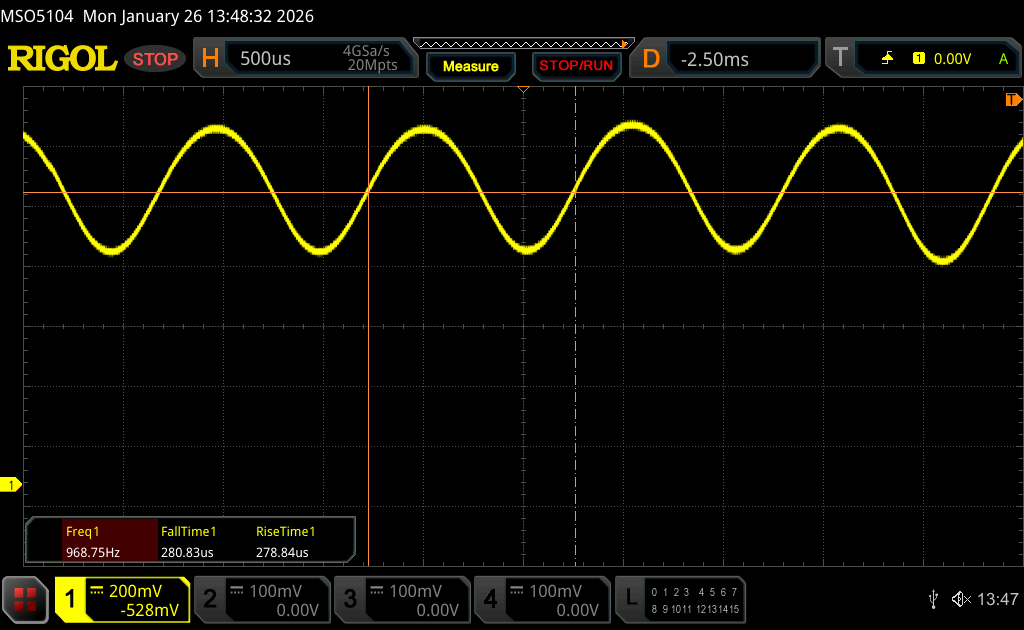 |
The display backlight flickers at 968.8 Hz (worst case, e.g., utilizing PWM) Flickering detected at a brightness setting of 100 % and below. There should be no flickering or PWM above this brightness setting. The frequency of 968.8 Hz is quite high, so most users sensitive to PWM should not notice any flickering. In comparison: 52 % of all tested devices do not use PWM to dim the display. If PWM was detected, an average of 7754 (minimum: 5 - maximum: 343500) Hz was measured. | |||
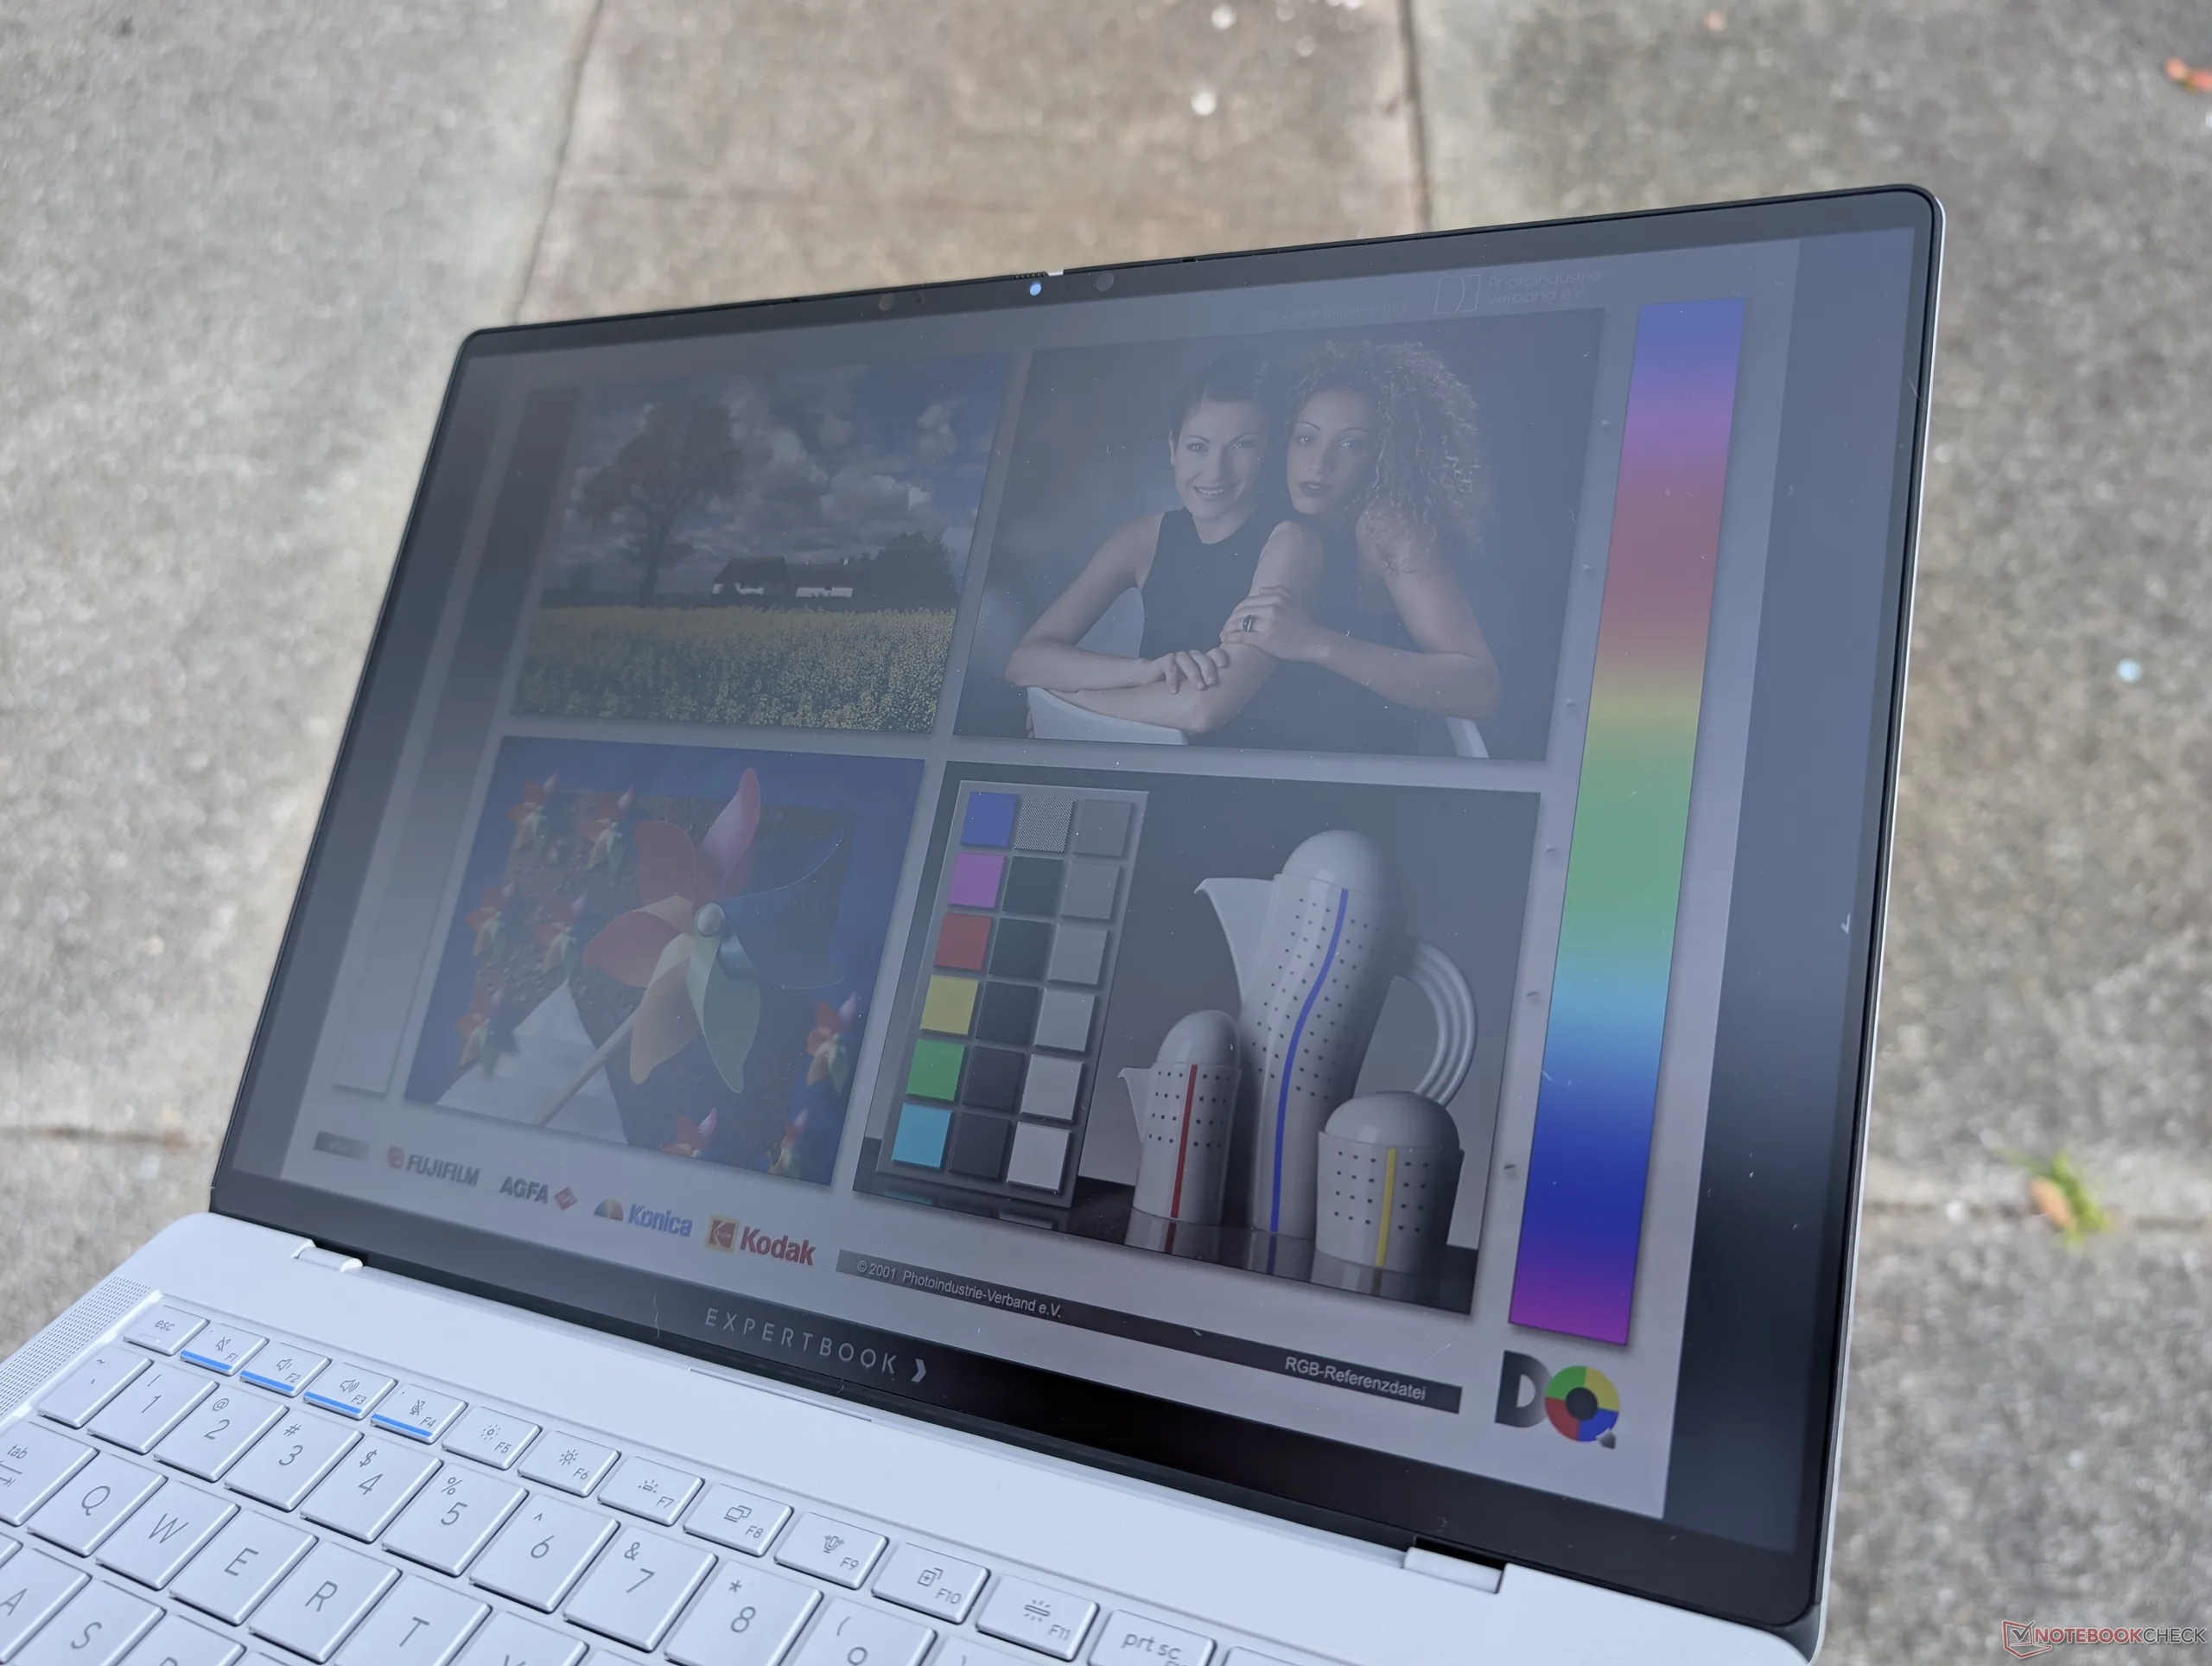
尽管有哑光覆盖层,但室外能见度一般,因为在阴天,颜色仍然会显得模糊或暗淡。
性能 - 变相的游戏笔记本电脑
测试条件
在运行以下基准测试之前,我们将 Windows 和 MyAsus 设为性能模式。
处理器
CPU 原始性能 酷睿至尊 X7 358H几乎与去年的箭湖-H 酷睿至尊 7 265H或比更常见的 酷睿至尊 7 255H.虽然这听起来并不令人印象深刻,但 iGPU 性能、NPU 性能和功耗方面的提升却更为显著,我们在下面的章节中将用数字来说明这一点。
如下图所示,ThinkPad P14s Gen 6 的处理器性能随着时间的推移相对稳定,只是波动幅度比酷睿 Ultra 7 265H 稍大。
竞争对手 Ryzen AI 9 HX 370在多线程负载时仍能快 20% 左右,适合希望最大限度发挥原始处理能力的用户。
Cinebench R15 多回路运行
Cinebench R23: Multi Core | Single Core
Cinebench R20: CPU (Multi Core) | CPU (Single Core)
Cinebench R15: CPU Multi 64Bit | CPU Single 64Bit
Blender: v2.79 BMW27 CPU
7-Zip 18.03: 7z b 4 | 7z b 4 -mmt1
Geekbench 6.7: Multi-Core | Single-Core
Geekbench 5.5: Multi-Core | Single-Core
HWBOT x265 Benchmark v2.2: 4k Preset
LibreOffice : 20 Documents To PDF
R Benchmark 2.5: Overall mean
* ... smaller is better
AIDA64: FP32 Ray-Trace | FPU Julia | CPU SHA3 | CPU Queen | FPU SinJulia | FPU Mandel | CPU AES | CPU ZLib | FP64 Ray-Trace | CPU PhotoWorxx
| Performance rating | |
| Asus ExpertBook PM3406 | |
| Lenovo ThinkPad P14s Gen 6 21QT0012GE | |
| Dell Pro 14 Plus PB14255 GH77W | |
| Average Intel Core Ultra X7 358H | |
| Asus ExpertBook Ultra B9406CAA | |
| Samsung Galaxy Book5 Pro 14 940XHA | |
| HP EliteBook Ultra G1i 14 | |
| AIDA64 / FP32 Ray-Trace | |
| Asus ExpertBook PM3406 | |
| Lenovo ThinkPad P14s Gen 6 21QT0012GE | |
| Dell Pro 14 Plus PB14255 GH77W | |
| Average Intel Core Ultra X7 358H (12221 - 18710, n=10) | |
| Asus ExpertBook Ultra B9406CAA | |
| Samsung Galaxy Book5 Pro 14 940XHA | |
| HP EliteBook Ultra G1i 14 | |
| AIDA64 / FPU Julia | |
| Lenovo ThinkPad P14s Gen 6 21QT0012GE | |
| Asus ExpertBook PM3406 | |
| Average Intel Core Ultra X7 358H (29930 - 96559, n=10) | |
| Dell Pro 14 Plus PB14255 GH77W | |
| Samsung Galaxy Book5 Pro 14 940XHA | |
| HP EliteBook Ultra G1i 14 | |
| Asus ExpertBook Ultra B9406CAA | |
| AIDA64 / CPU SHA3 | |
| Lenovo ThinkPad P14s Gen 6 21QT0012GE | |
| Asus ExpertBook Ultra B9406CAA | |
| Average Intel Core Ultra X7 358H (3910 - 4955, n=10) | |
| Asus ExpertBook PM3406 | |
| Dell Pro 14 Plus PB14255 GH77W | |
| Samsung Galaxy Book5 Pro 14 940XHA | |
| HP EliteBook Ultra G1i 14 | |
| AIDA64 / CPU Queen | |
| Asus ExpertBook PM3406 | |
| Dell Pro 14 Plus PB14255 GH77W | |
| Lenovo ThinkPad P14s Gen 6 21QT0012GE | |
| Average Intel Core Ultra X7 358H (63425 - 63827, n=2) | |
| Asus ExpertBook Ultra B9406CAA | |
| HP EliteBook Ultra G1i 14 | |
| Samsung Galaxy Book5 Pro 14 940XHA | |
| AIDA64 / FPU SinJulia | |
| Asus ExpertBook PM3406 | |
| Dell Pro 14 Plus PB14255 GH77W | |
| Lenovo ThinkPad P14s Gen 6 21QT0012GE | |
| Average Intel Core Ultra X7 358H (4735 - 7038, n=10) | |
| Asus ExpertBook Ultra B9406CAA | |
| HP EliteBook Ultra G1i 14 | |
| Samsung Galaxy Book5 Pro 14 940XHA | |
| AIDA64 / FPU Mandel | |
| Lenovo ThinkPad P14s Gen 6 21QT0012GE | |
| Asus ExpertBook PM3406 | |
| Average Intel Core Ultra X7 358H (14716 - 50766, n=10) | |
| Dell Pro 14 Plus PB14255 GH77W | |
| Samsung Galaxy Book5 Pro 14 940XHA | |
| HP EliteBook Ultra G1i 14 | |
| Asus ExpertBook Ultra B9406CAA | |
| AIDA64 / CPU AES | |
| Asus ExpertBook PM3406 | |
| Lenovo ThinkPad P14s Gen 6 21QT0012GE | |
| Dell Pro 14 Plus PB14255 GH77W | |
| Average Intel Core Ultra X7 358H (5127 - 68737, n=10) | |
| HP EliteBook Ultra G1i 14 | |
| Samsung Galaxy Book5 Pro 14 940XHA | |
| Asus ExpertBook Ultra B9406CAA | |
| AIDA64 / CPU ZLib | |
| Lenovo ThinkPad P14s Gen 6 21QT0012GE | |
| Asus ExpertBook Ultra B9406CAA | |
| Average Intel Core Ultra X7 358H (932 - 1179, n=10) | |
| Asus ExpertBook PM3406 | |
| Dell Pro 14 Plus PB14255 GH77W | |
| HP EliteBook Ultra G1i 14 | |
| Samsung Galaxy Book5 Pro 14 940XHA | |
| AIDA64 / FP64 Ray-Trace | |
| Asus ExpertBook PM3406 | |
| Lenovo ThinkPad P14s Gen 6 21QT0012GE | |
| Dell Pro 14 Plus PB14255 GH77W | |
| Average Intel Core Ultra X7 358H (6506 - 9612, n=10) | |
| Asus ExpertBook Ultra B9406CAA | |
| Samsung Galaxy Book5 Pro 14 940XHA | |
| HP EliteBook Ultra G1i 14 | |
| AIDA64 / CPU PhotoWorxx | |
| Average Intel Core Ultra X7 358H (30538 - 88533, n=10) | |
| HP EliteBook Ultra G1i 14 | |
| Samsung Galaxy Book5 Pro 14 940XHA | |
| Lenovo ThinkPad P14s Gen 6 21QT0012GE | |
| Dell Pro 14 Plus PB14255 GH77W | |
| Asus ExpertBook Ultra B9406CAA | |
| Asus ExpertBook PM3406 | |
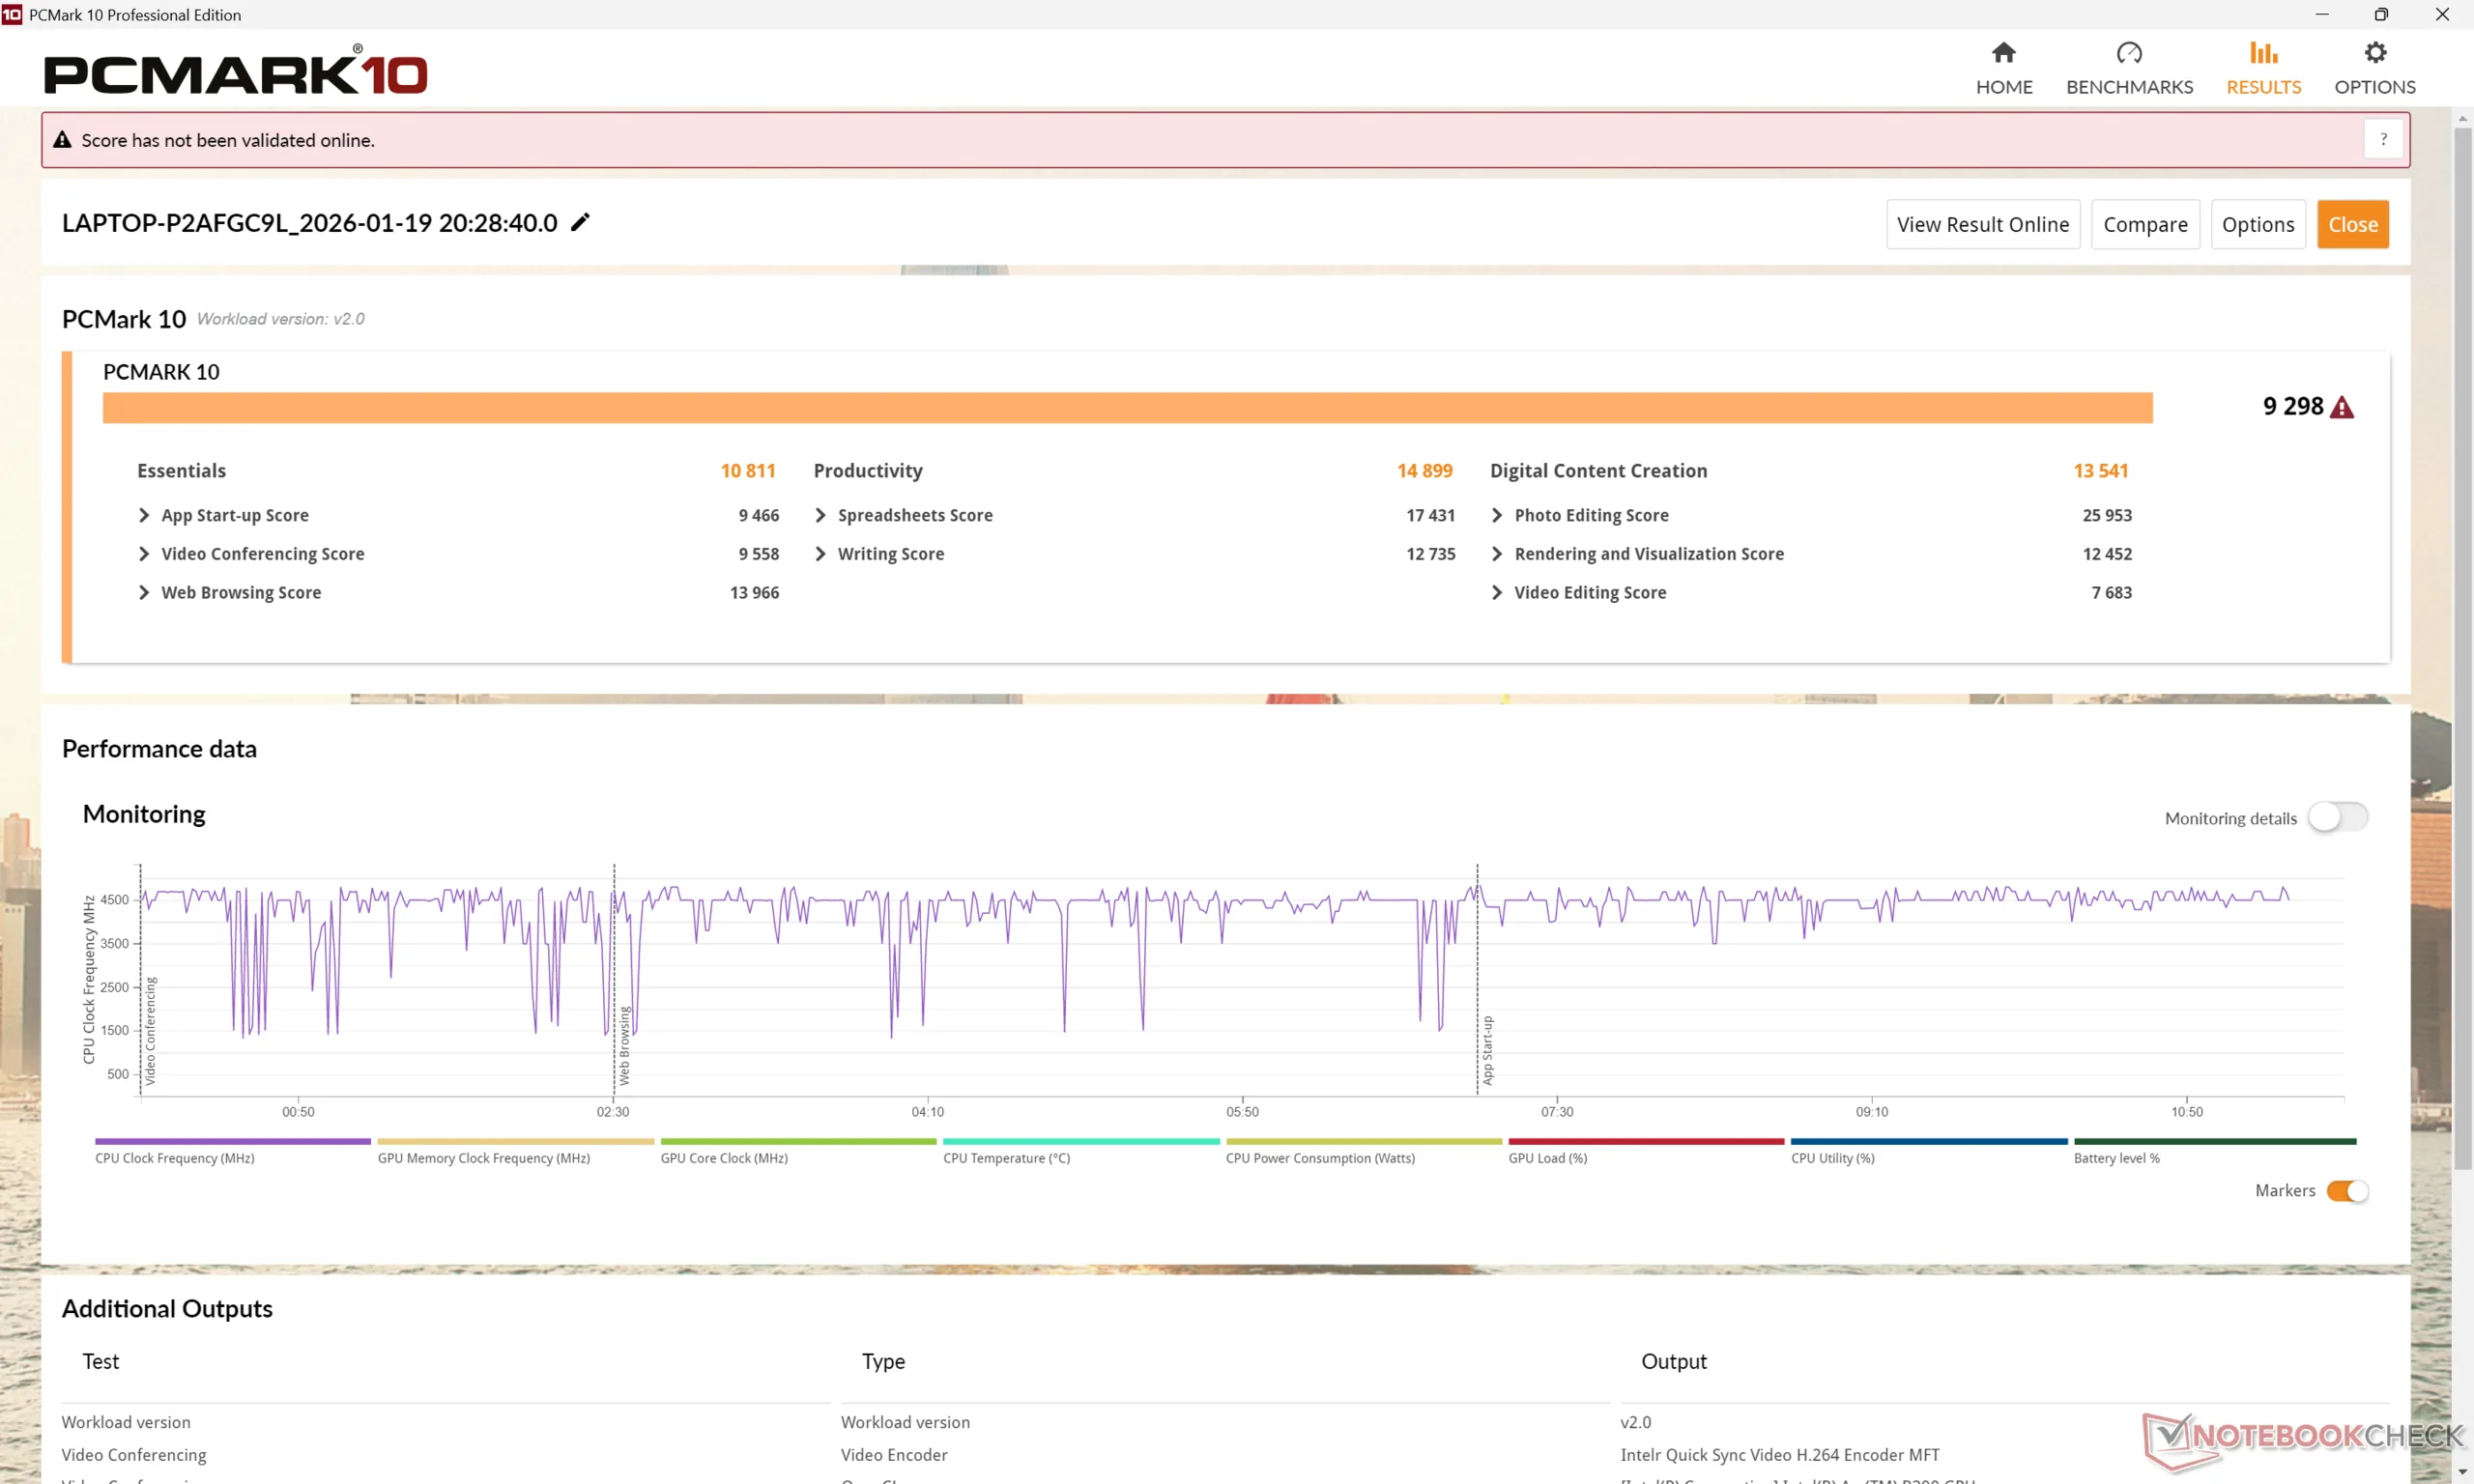
系统性能
PCMark 10 分数比其他大多数使用集成显卡的 14 英寸笔记本电脑都要高,尤其是在 GPU 功能强大的 "数字内容创建 "子测试中。
PCMark 10: Score | Essentials | Productivity | Digital Content Creation
CrossMark: Overall | Productivity | Creativity | Responsiveness
WebXPRT 3: Overall
WebXPRT 4: Overall
Mozilla Kraken 1.1: Total
Geekbench AI: Quantized GPU 1.7 | Half Precision GPU 1.7 | Single Precision GPU 1.7
| PCMark 10 / Score | |
| Asus ExpertBook Ultra B9406CAA | |
| Asus ExpertBook PM3406 | |
| HP EliteBook Ultra G1i 14 | |
| Lenovo ThinkPad P14s Gen 6 21QT0012GE | |
| Dell Pro 14 Plus PB14255 GH77W | |
| Samsung Galaxy Book5 Pro 14 940XHA | |
| CrossMark / Overall | |
| Asus ExpertBook Ultra B9406CAA | |
| Lenovo ThinkPad P14s Gen 6 21QT0012GE | |
| Dell Pro 14 Plus PB14255 GH77W | |
| HP EliteBook Ultra G1i 14 | |
| Samsung Galaxy Book5 Pro 14 940XHA | |
| Asus ExpertBook PM3406 | |
| WebXPRT 3 / Overall | |
| Lenovo ThinkPad P14s Gen 6 21QT0012GE | |
| Dell Pro 14 Plus PB14255 GH77W | |
| Asus ExpertBook Ultra B9406CAA | |
| HP EliteBook Ultra G1i 14 | |
| Samsung Galaxy Book5 Pro 14 940XHA | |
| Asus ExpertBook PM3406 | |
| WebXPRT 4 / Overall | |
| Lenovo ThinkPad P14s Gen 6 21QT0012GE | |
| HP EliteBook Ultra G1i 14 | |
| Asus ExpertBook Ultra B9406CAA | |
| Samsung Galaxy Book5 Pro 14 940XHA | |
| Asus ExpertBook PM3406 | |
| Dell Pro 14 Plus PB14255 GH77W | |
| Geekbench AI / Quantized GPU 1.7 | |
| Asus ExpertBook Ultra B9406CAA | |
| Samsung Galaxy Book5 Pro 14 940XHA | |
| Geekbench AI / Half Precision GPU 1.7 | |
| Asus ExpertBook Ultra B9406CAA | |
| Samsung Galaxy Book5 Pro 14 940XHA | |
| Geekbench AI / Single Precision GPU 1.7 | |
| Asus ExpertBook Ultra B9406CAA | |
| Samsung Galaxy Book5 Pro 14 940XHA | |
* ... smaller is better
| PCMark 10 Score | 9298 points | |
Help | ||
| AIDA64 / Memory Copy | |
| Average Intel Core Ultra X7 358H (102745 - 132135, n=9) | |
| HP EliteBook Ultra G1i 14 | |
| Samsung Galaxy Book5 Pro 14 940XHA | |
| Dell Pro 14 Plus PB14255 GH77W | |
| Lenovo ThinkPad P14s Gen 6 21QT0012GE | |
| Asus ExpertBook PM3406 | |
| AIDA64 / Memory Read | |
| Asus ExpertBook Ultra B9406CAA | |
| Average Intel Core Ultra X7 358H (97755 - 120727, n=10) | |
| HP EliteBook Ultra G1i 14 | |
| Samsung Galaxy Book5 Pro 14 940XHA | |
| Lenovo ThinkPad P14s Gen 6 21QT0012GE | |
| Dell Pro 14 Plus PB14255 GH77W | |
| Asus ExpertBook PM3406 | |
| AIDA64 / Memory Write | |
| Average Intel Core Ultra X7 358H (105712 - 134998, n=10) | |
| Asus ExpertBook Ultra B9406CAA | |
| HP EliteBook Ultra G1i 14 | |
| Samsung Galaxy Book5 Pro 14 940XHA | |
| Dell Pro 14 Plus PB14255 GH77W | |
| Lenovo ThinkPad P14s Gen 6 21QT0012GE | |
| Asus ExpertBook PM3406 | |
| AIDA64 / Memory Latency | |
| Lenovo ThinkPad P14s Gen 6 21QT0012GE | |
| Dell Pro 14 Plus PB14255 GH77W | |
| HP EliteBook Ultra G1i 14 | |
| Samsung Galaxy Book5 Pro 14 940XHA | |
| Asus ExpertBook PM3406 | |
| Average Intel Core Ultra X7 358H (84.1 - 103.3, n=10) | |
* ... smaller is better
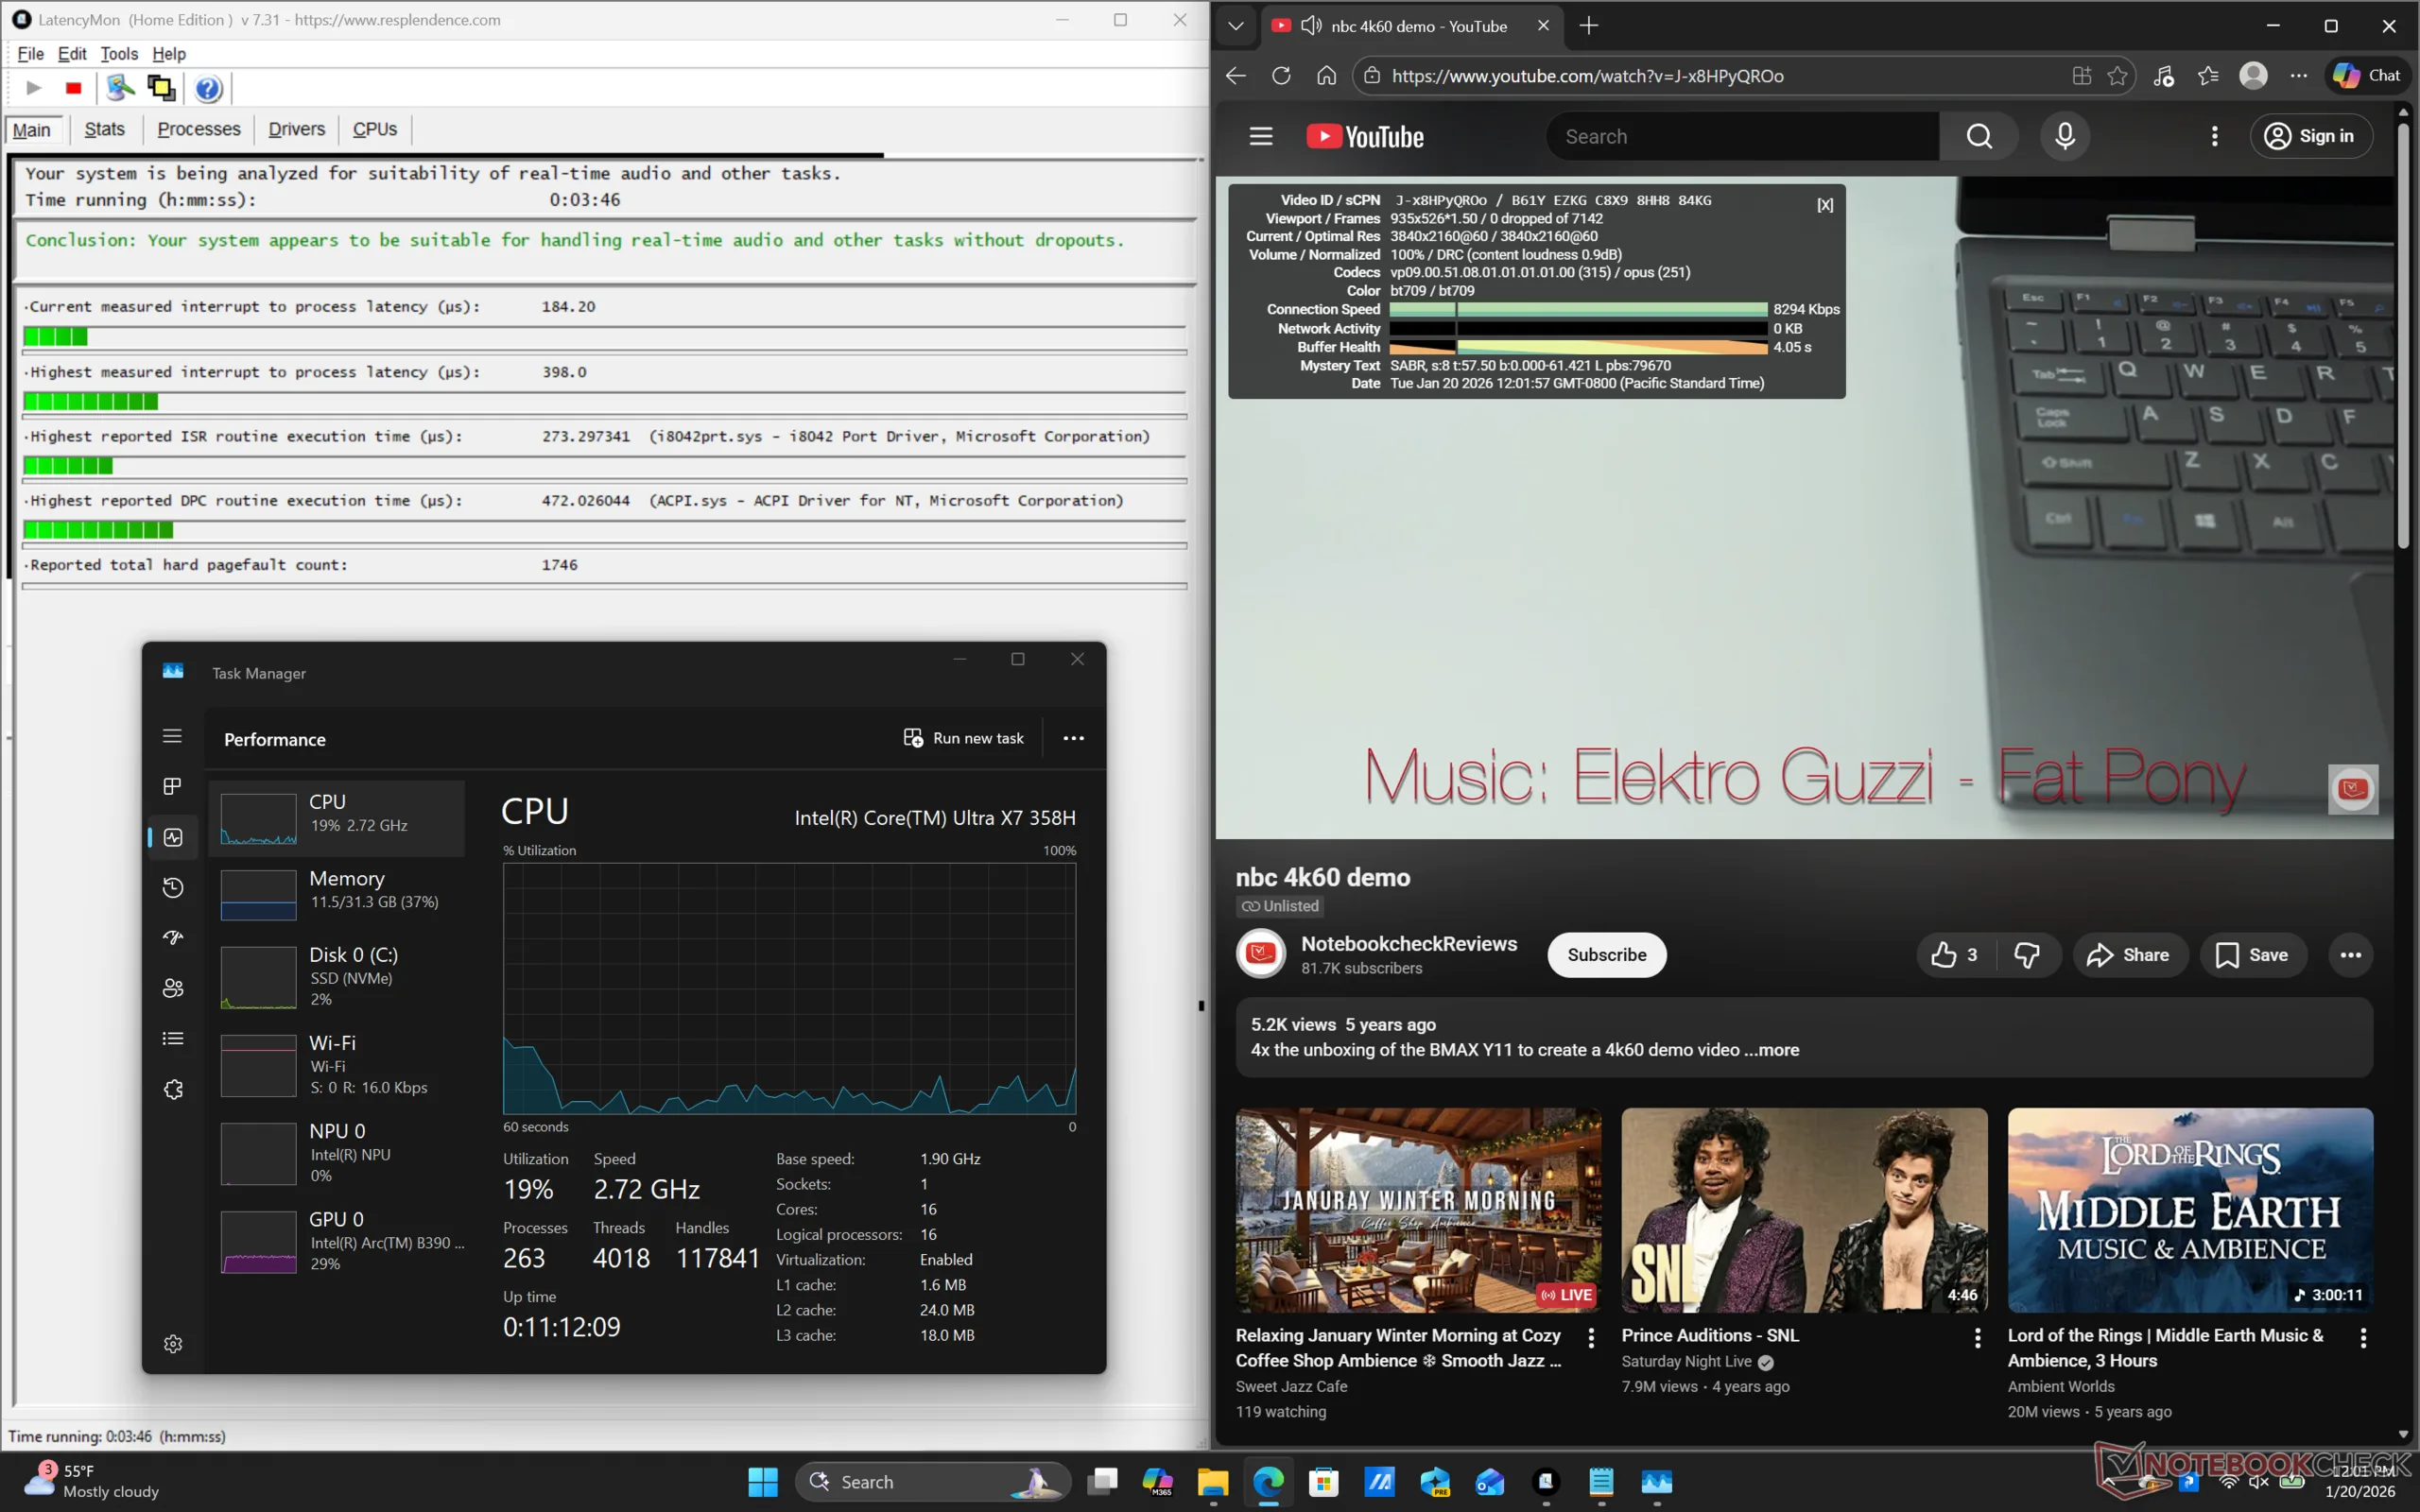
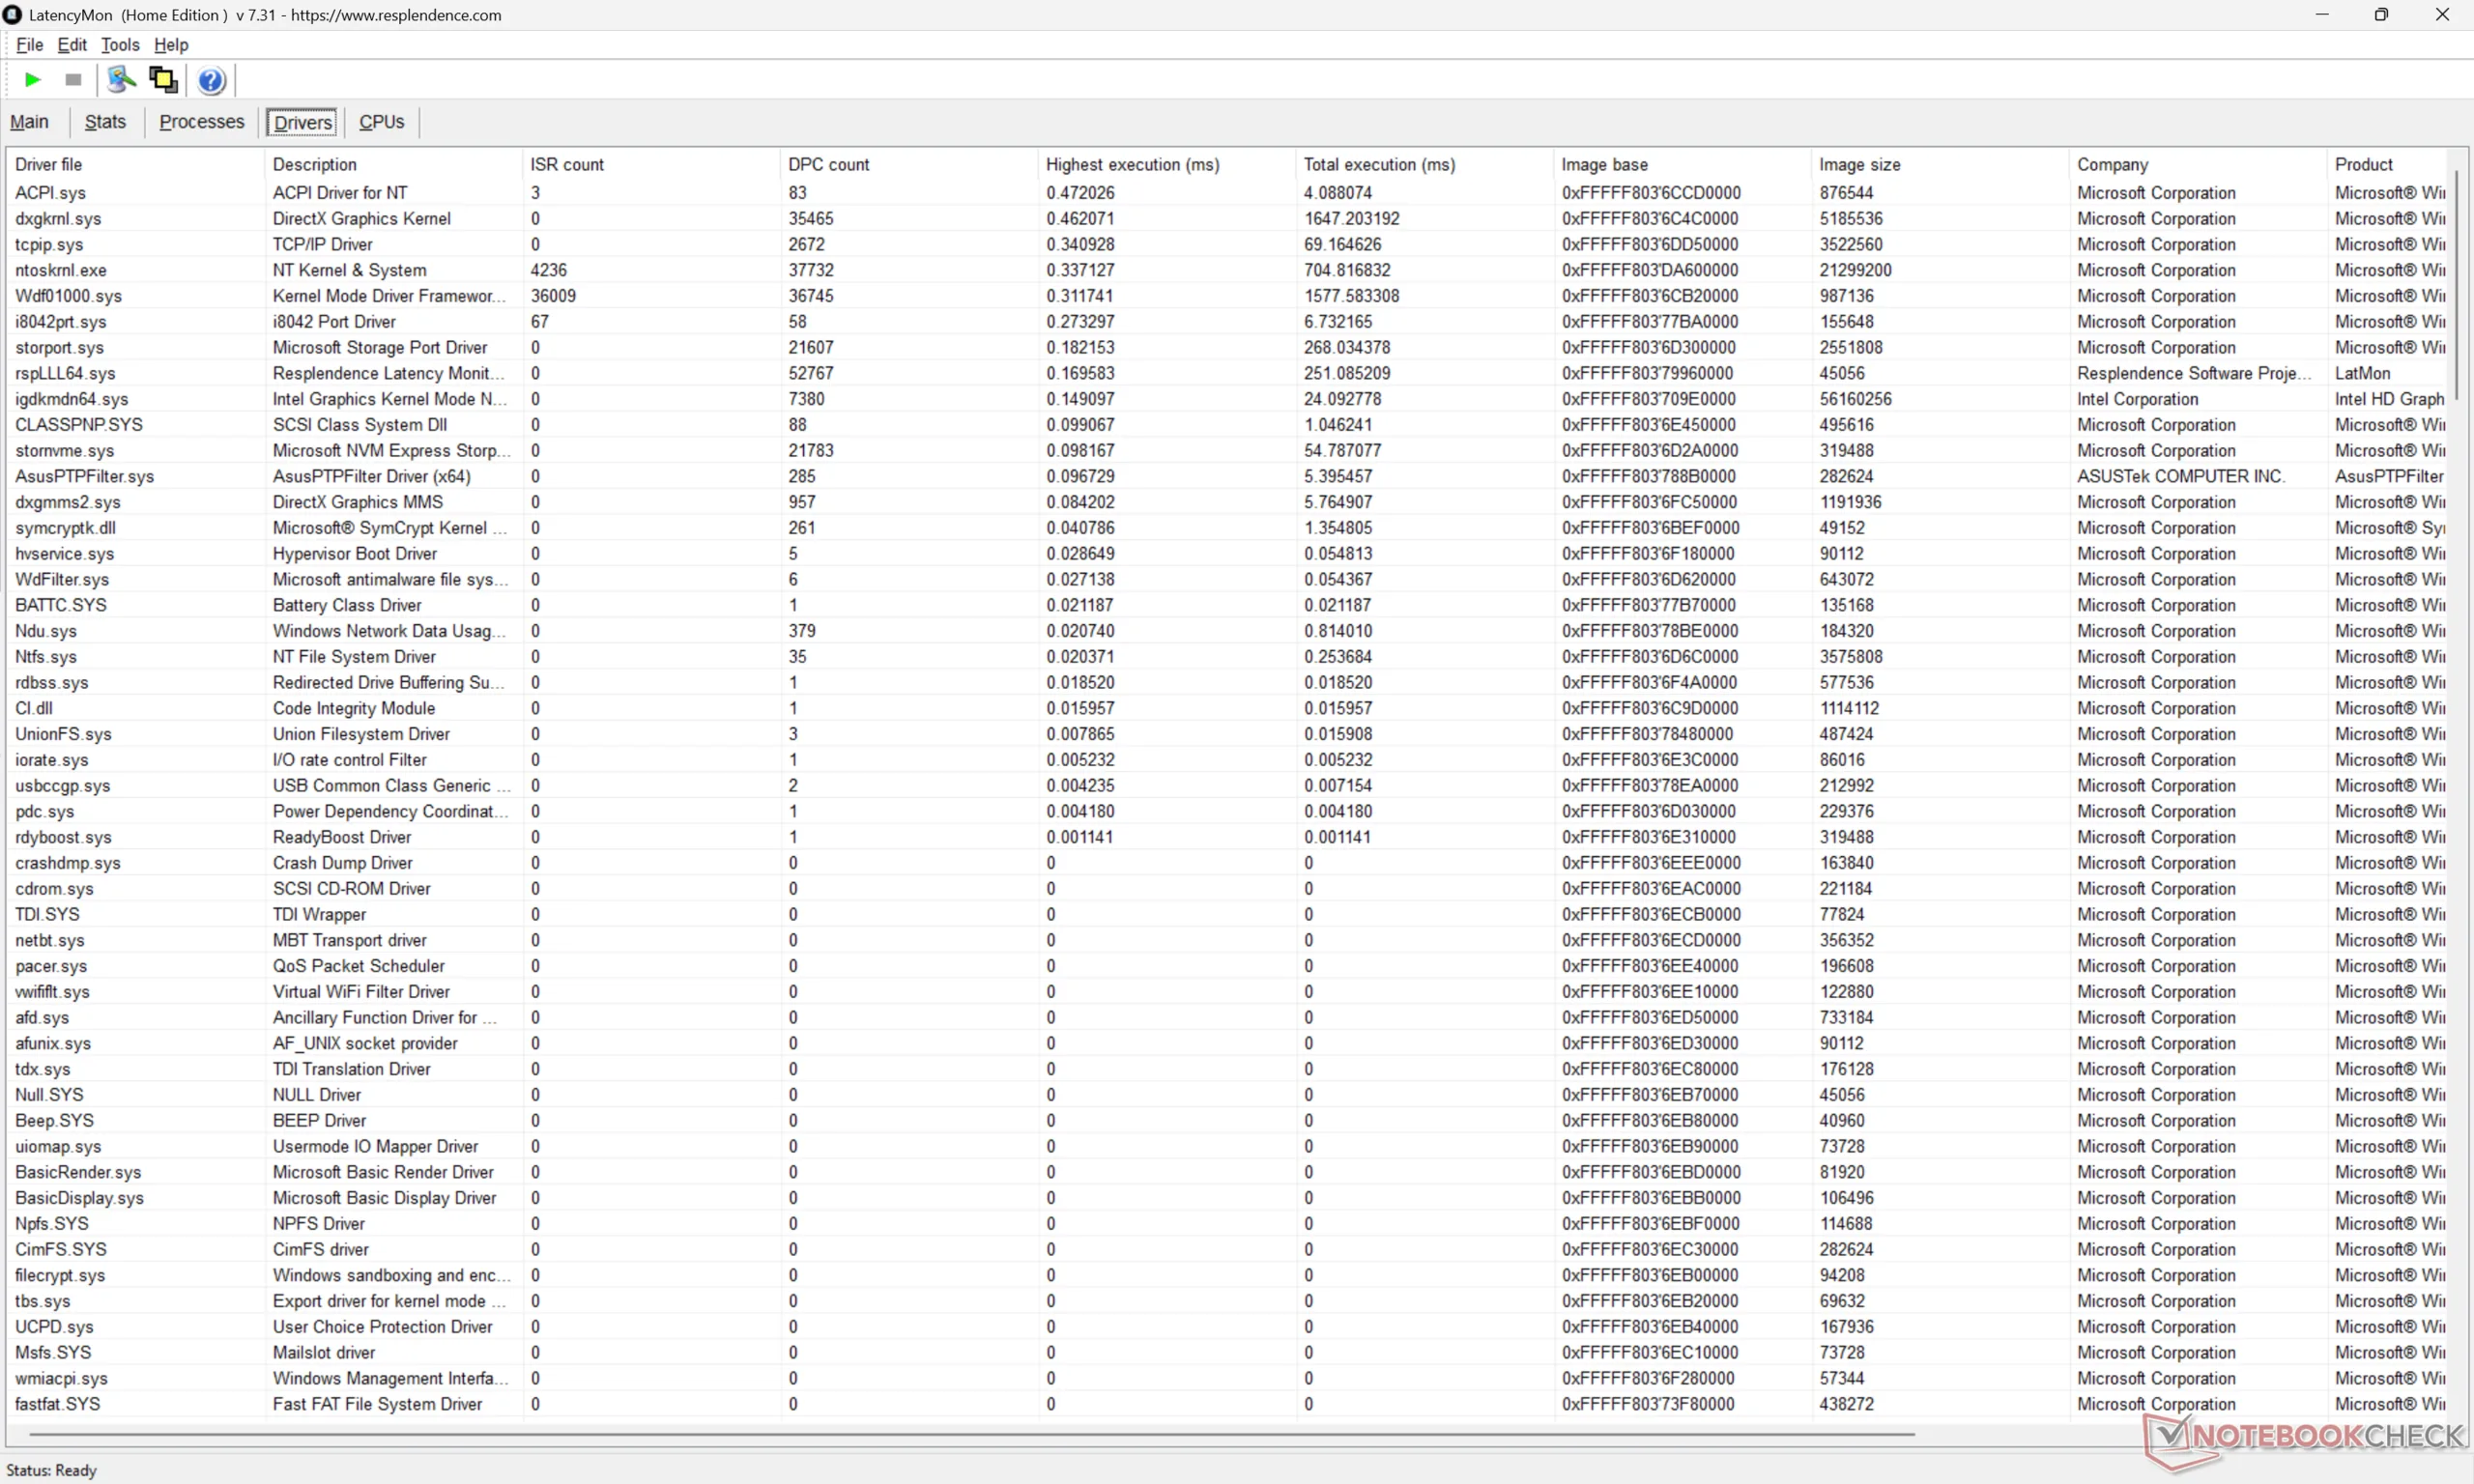
DPC 延迟
LatencyMon 显示,在播放 4K60 视频内容时,没有出现 DPC 问题和丢帧现象。
| DPC Latencies / LatencyMon - interrupt to process latency (max), Web, Youtube, Prime95 | |
| Asus ExpertBook PM3406 | |
| Dell Pro 14 Plus PB14255 GH77W | |
| Samsung Galaxy Book5 Pro 14 940XHA | |
| Lenovo ThinkPad P14s Gen 6 21QT0012GE | |
| HP EliteBook Ultra G1i 14 | |
| Asus ExpertBook Ultra B9406CAA | |
* ... smaller is better
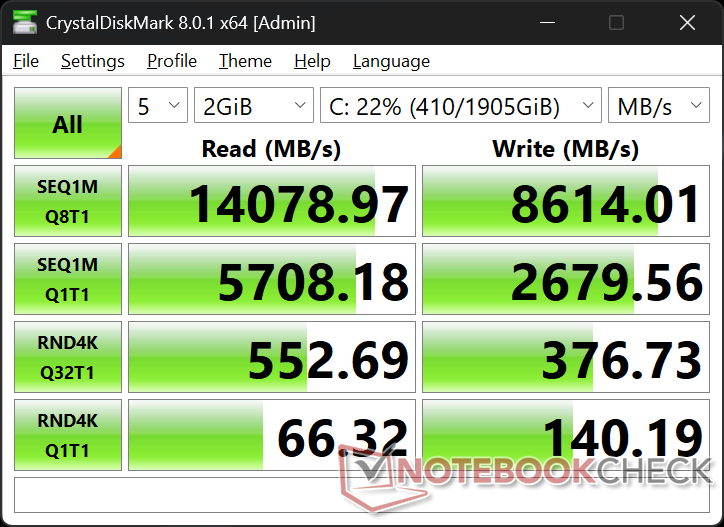
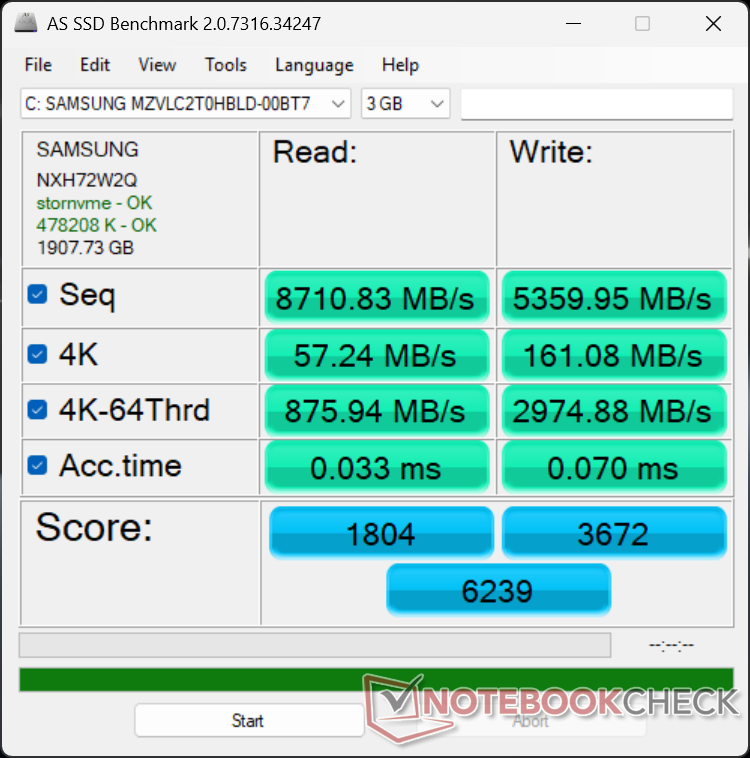
存储设备 - PCIe5 NVMe 固态硬盘
我们的测试机配备了 2 TB 三星 MZVLC2T0HBLDPCIe5 x4 NVMe 固态硬盘,传输速率最高可达 14000 MB/s。但如下图所示,这一传输速率只能维持一分钟左右,然后就会下降到 5000 MB/s 的范围。即便如此,尽管出现了节流,但整体性能仍然快于大多数 PCIe4 硬盘。

* ... smaller is better
磁盘节流DiskSpd 读取循环,队列深度 8
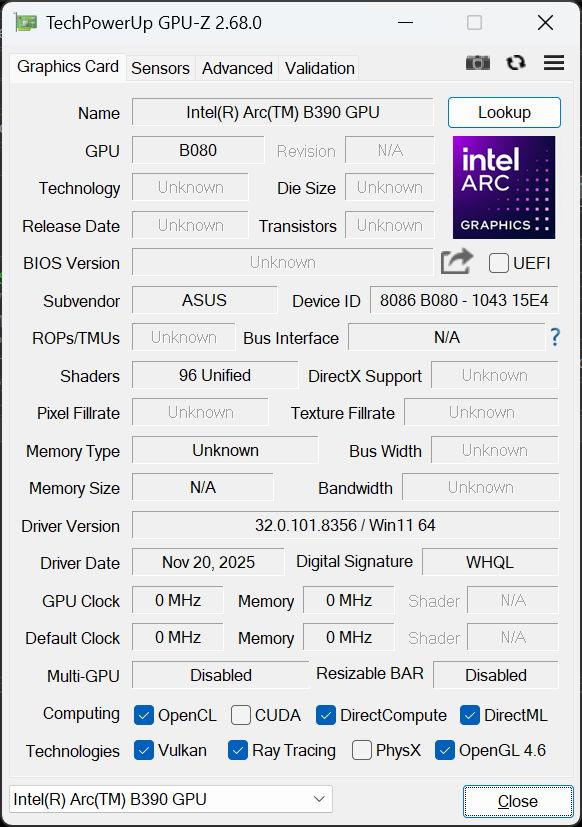
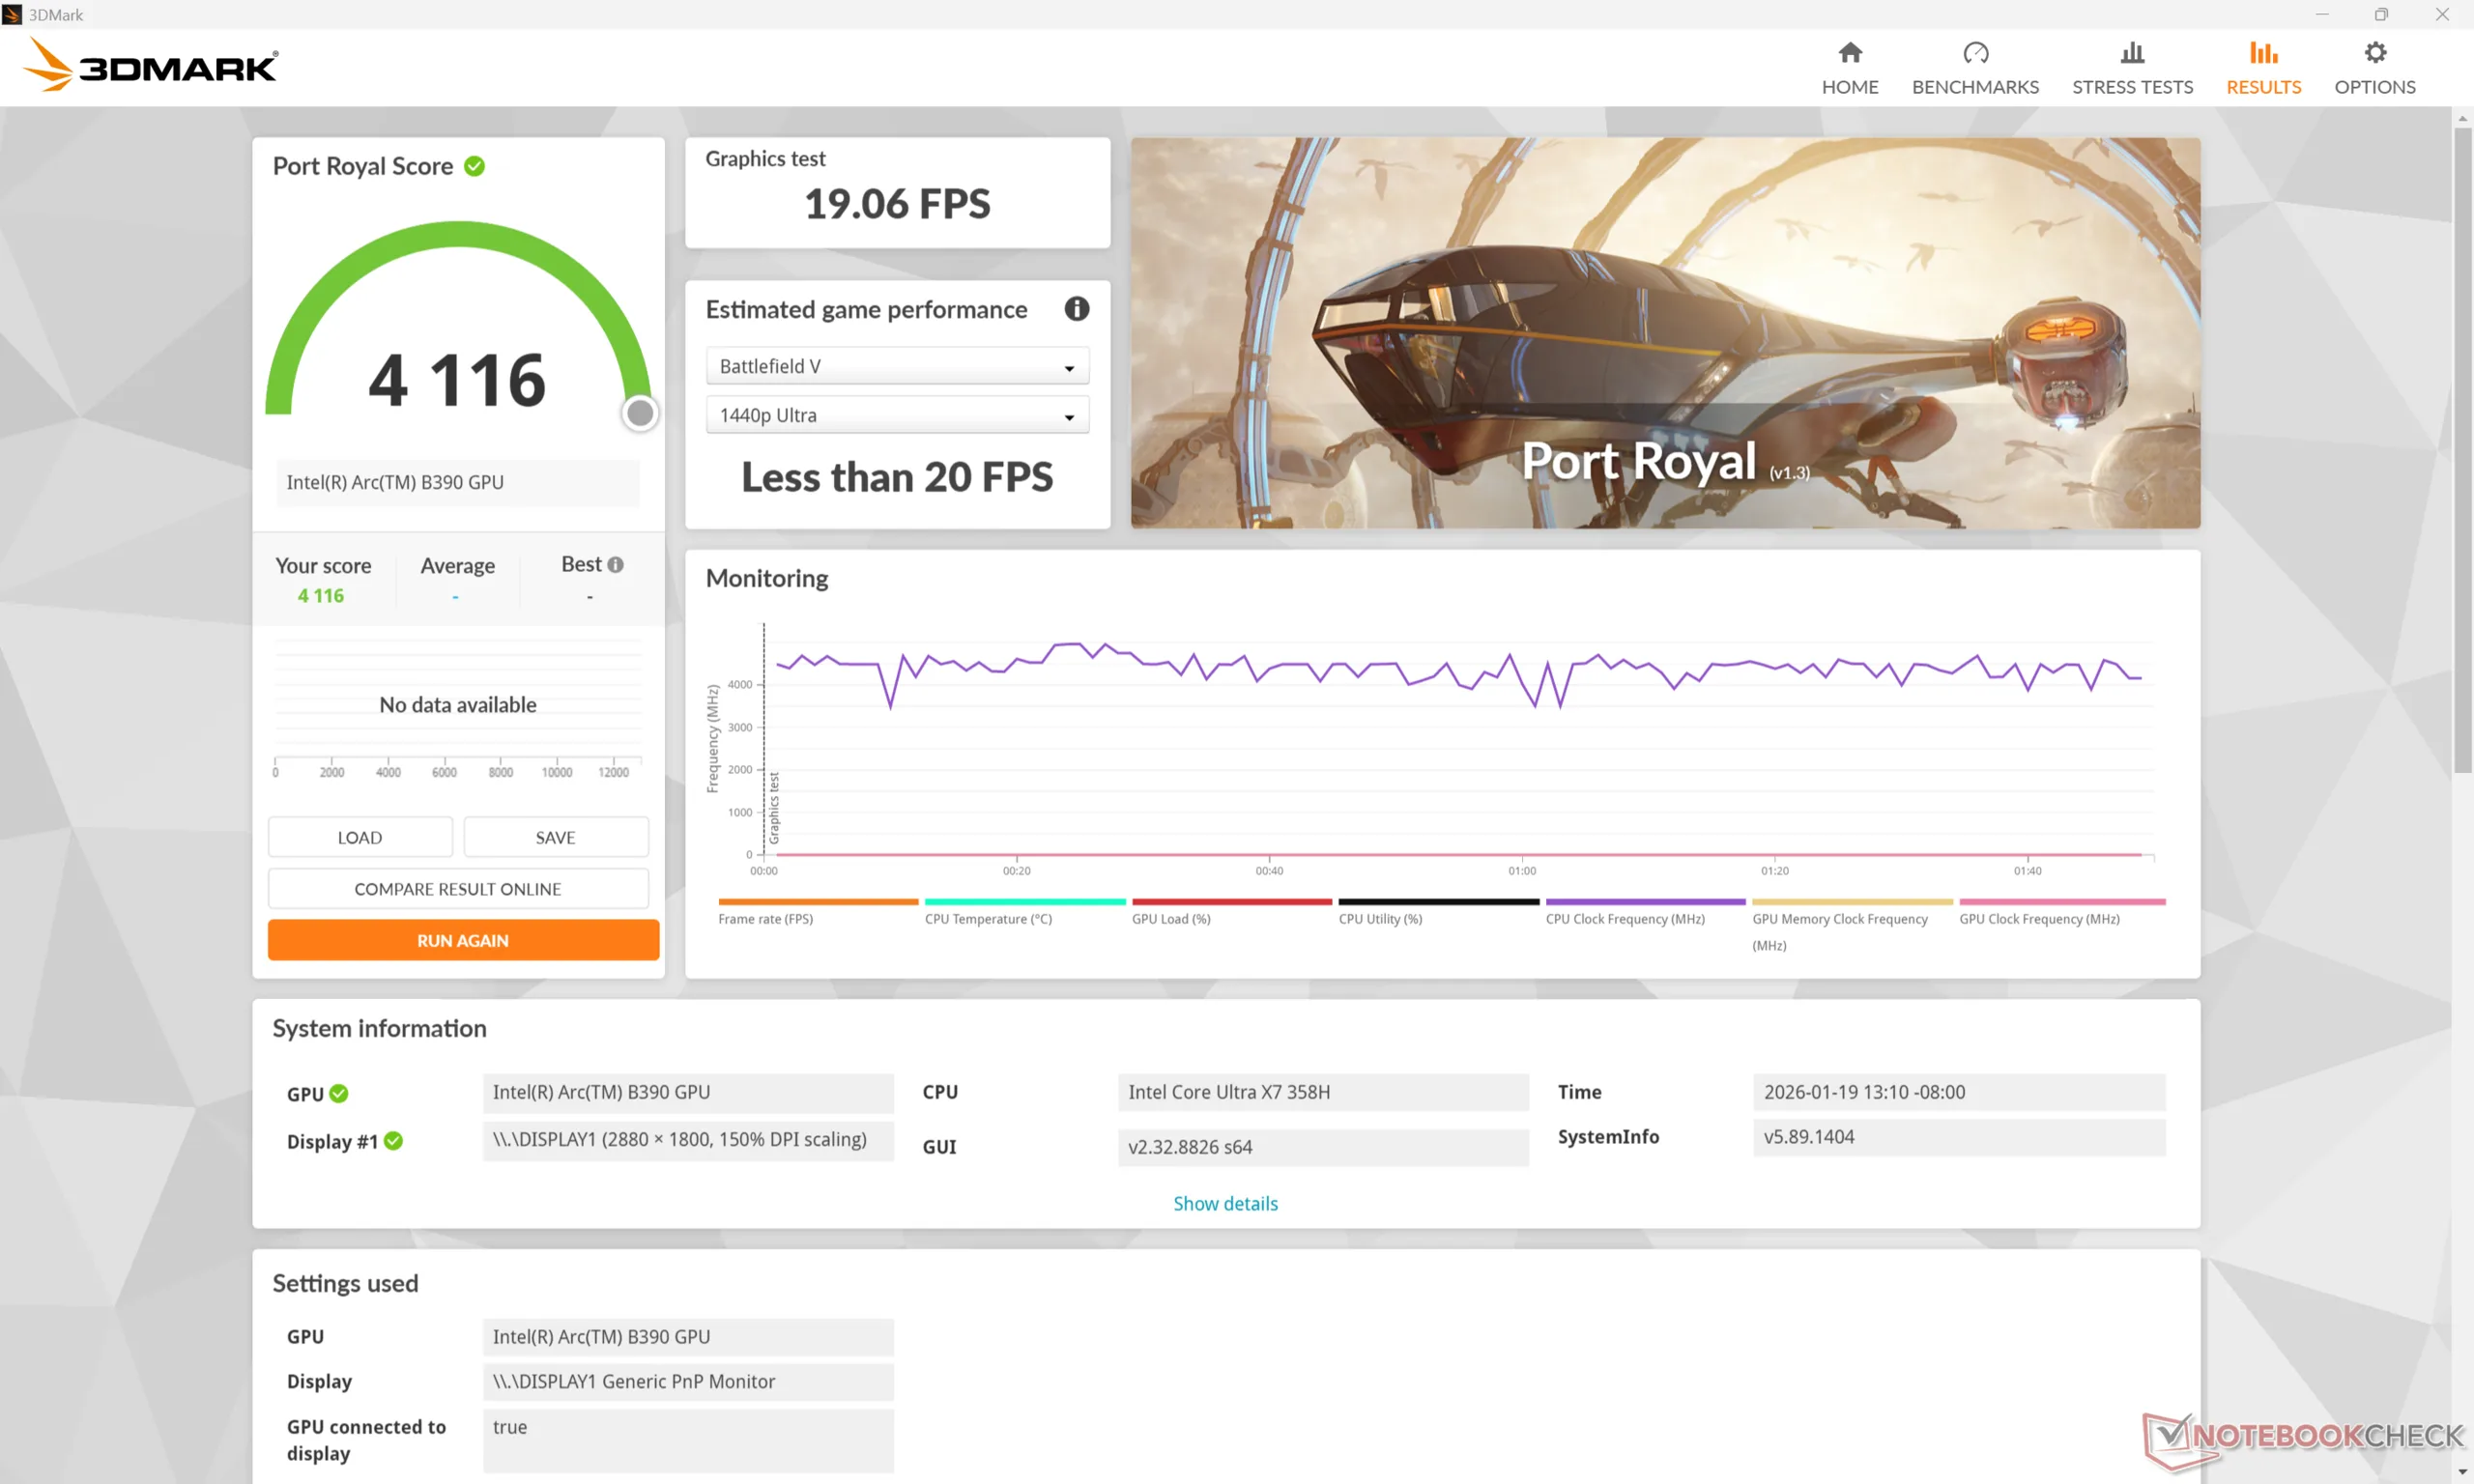
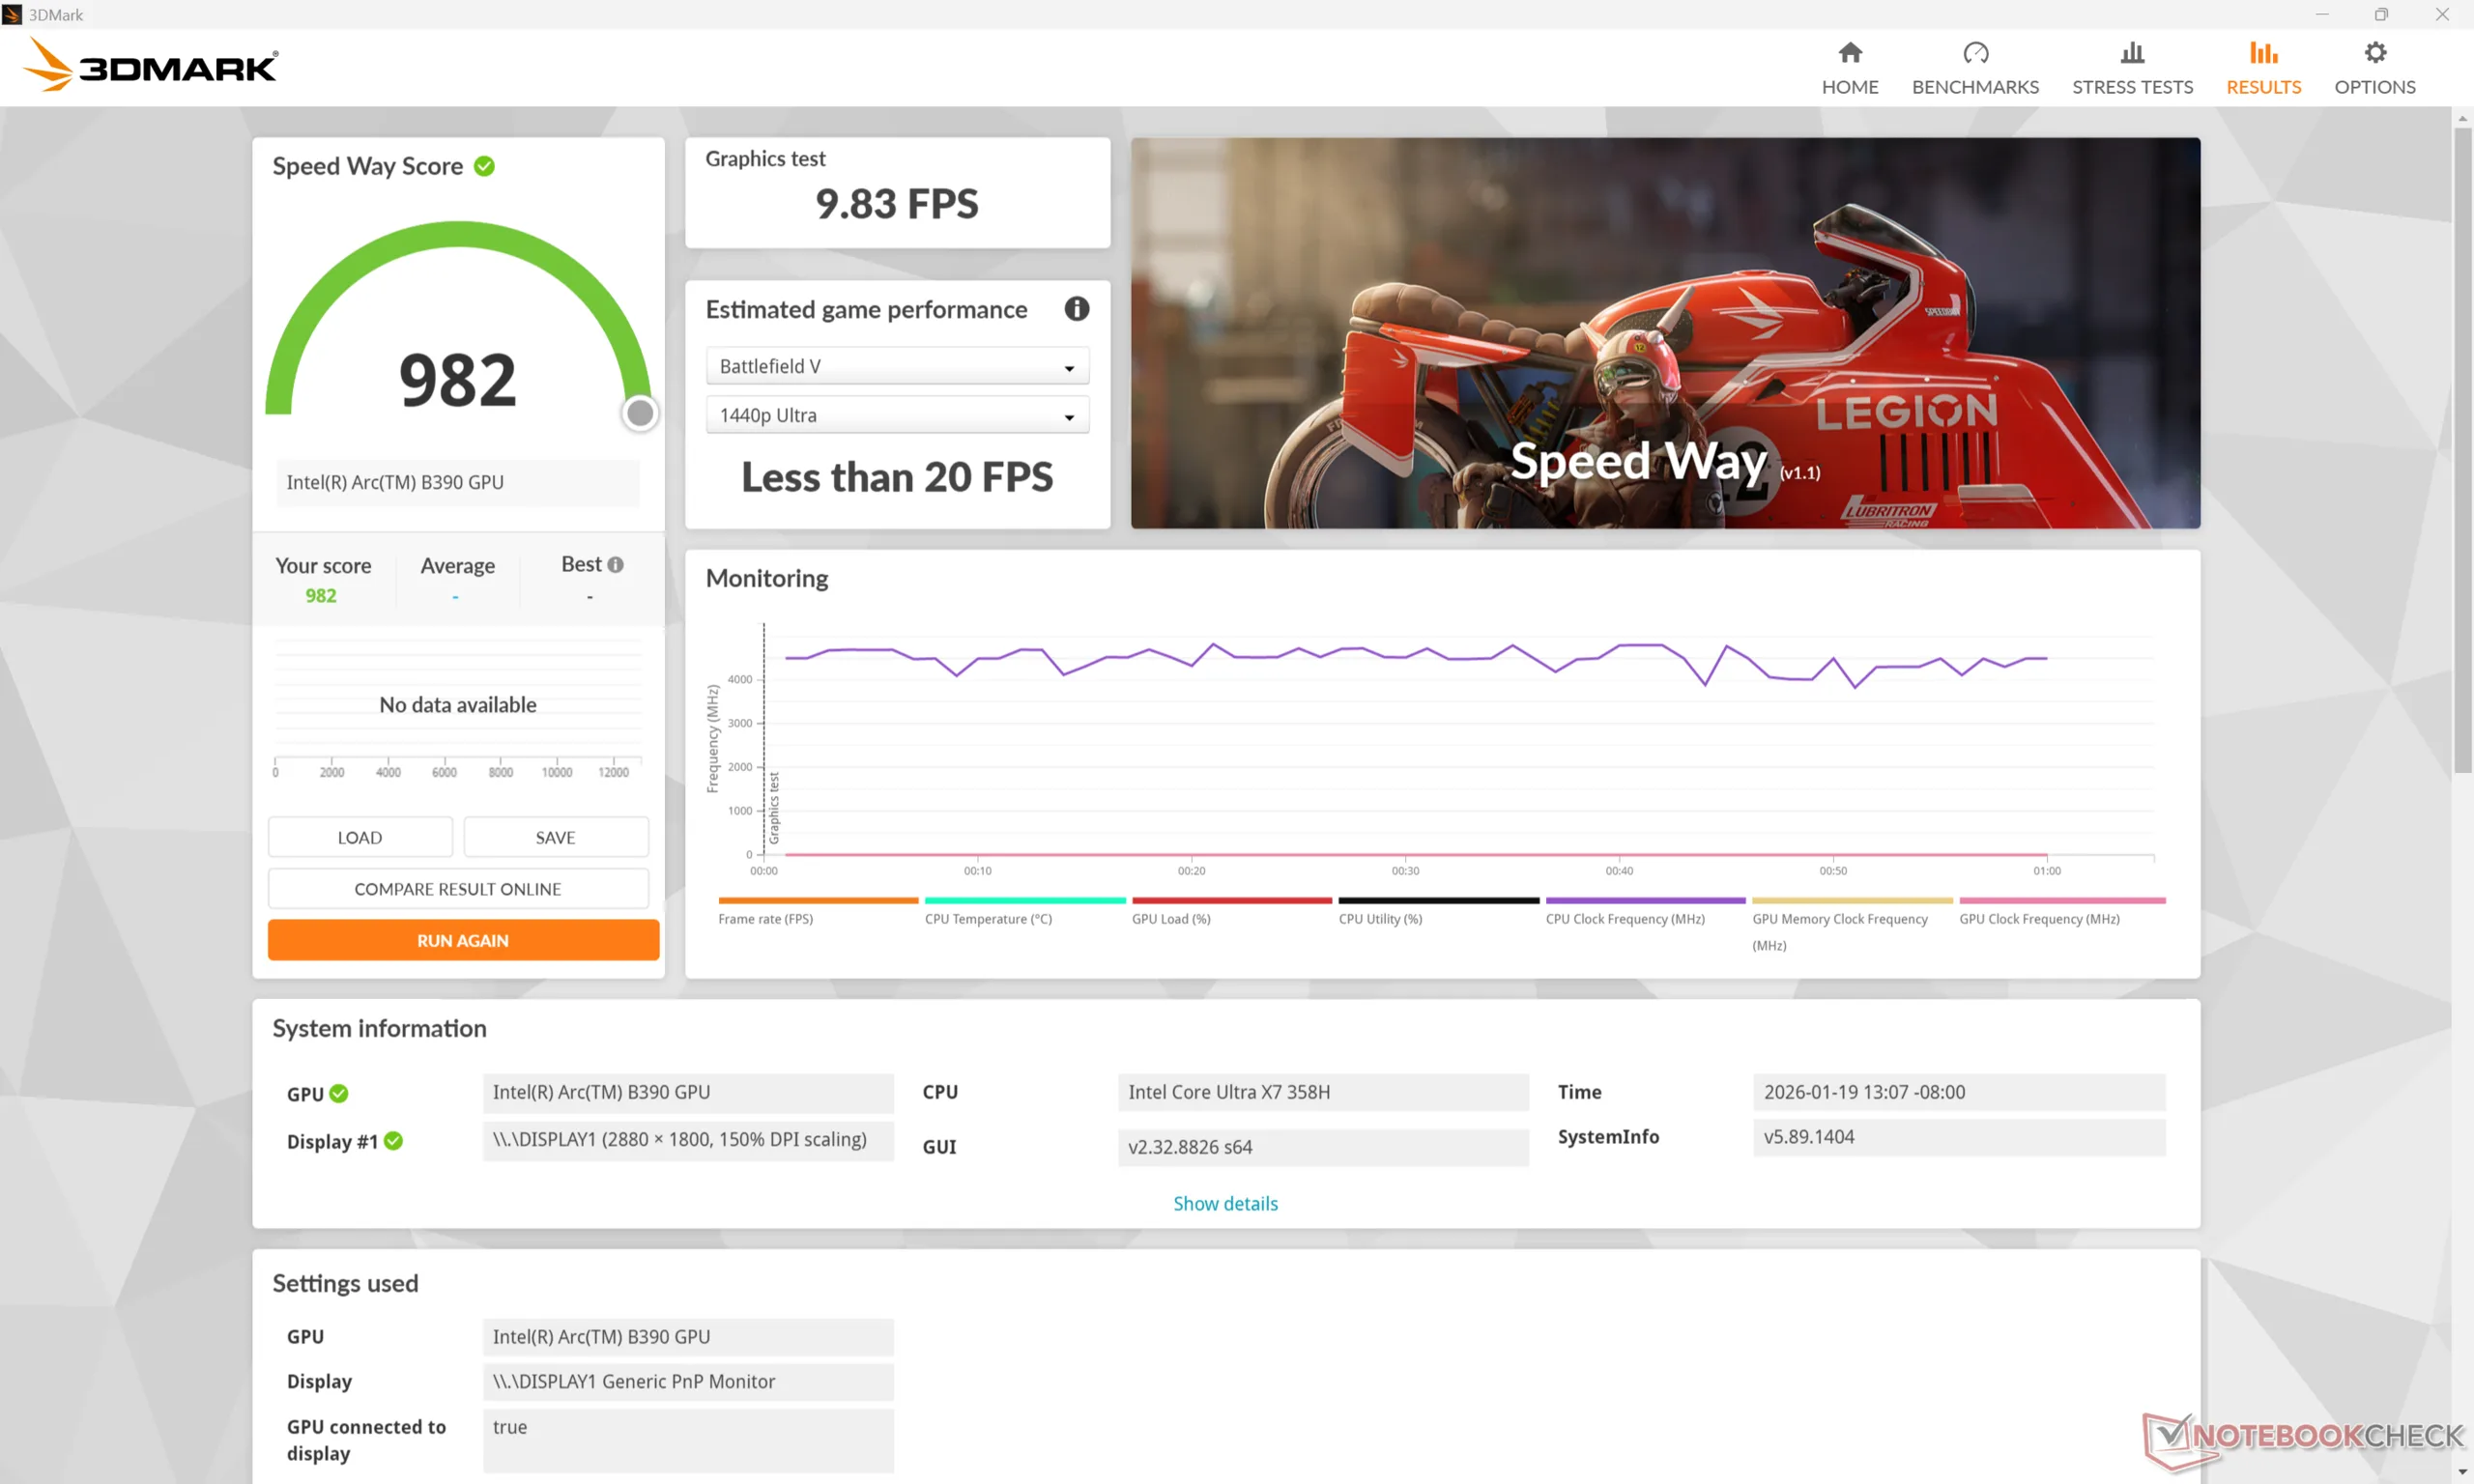
图形处理器性能--令人惊讶的游戏性能
集成的 Arc B390比以前的 Arc 140T, Arc 140V或竞争对手 Radeon 890M根据 3DMark 基准测试,B390 的性能最多可提升 80%。这一跃升幅度如此之大,以至于 B390 与独立的 GeForce RTX 4050在相同的合成游戏基准测试中仅落后 10%至 15%。
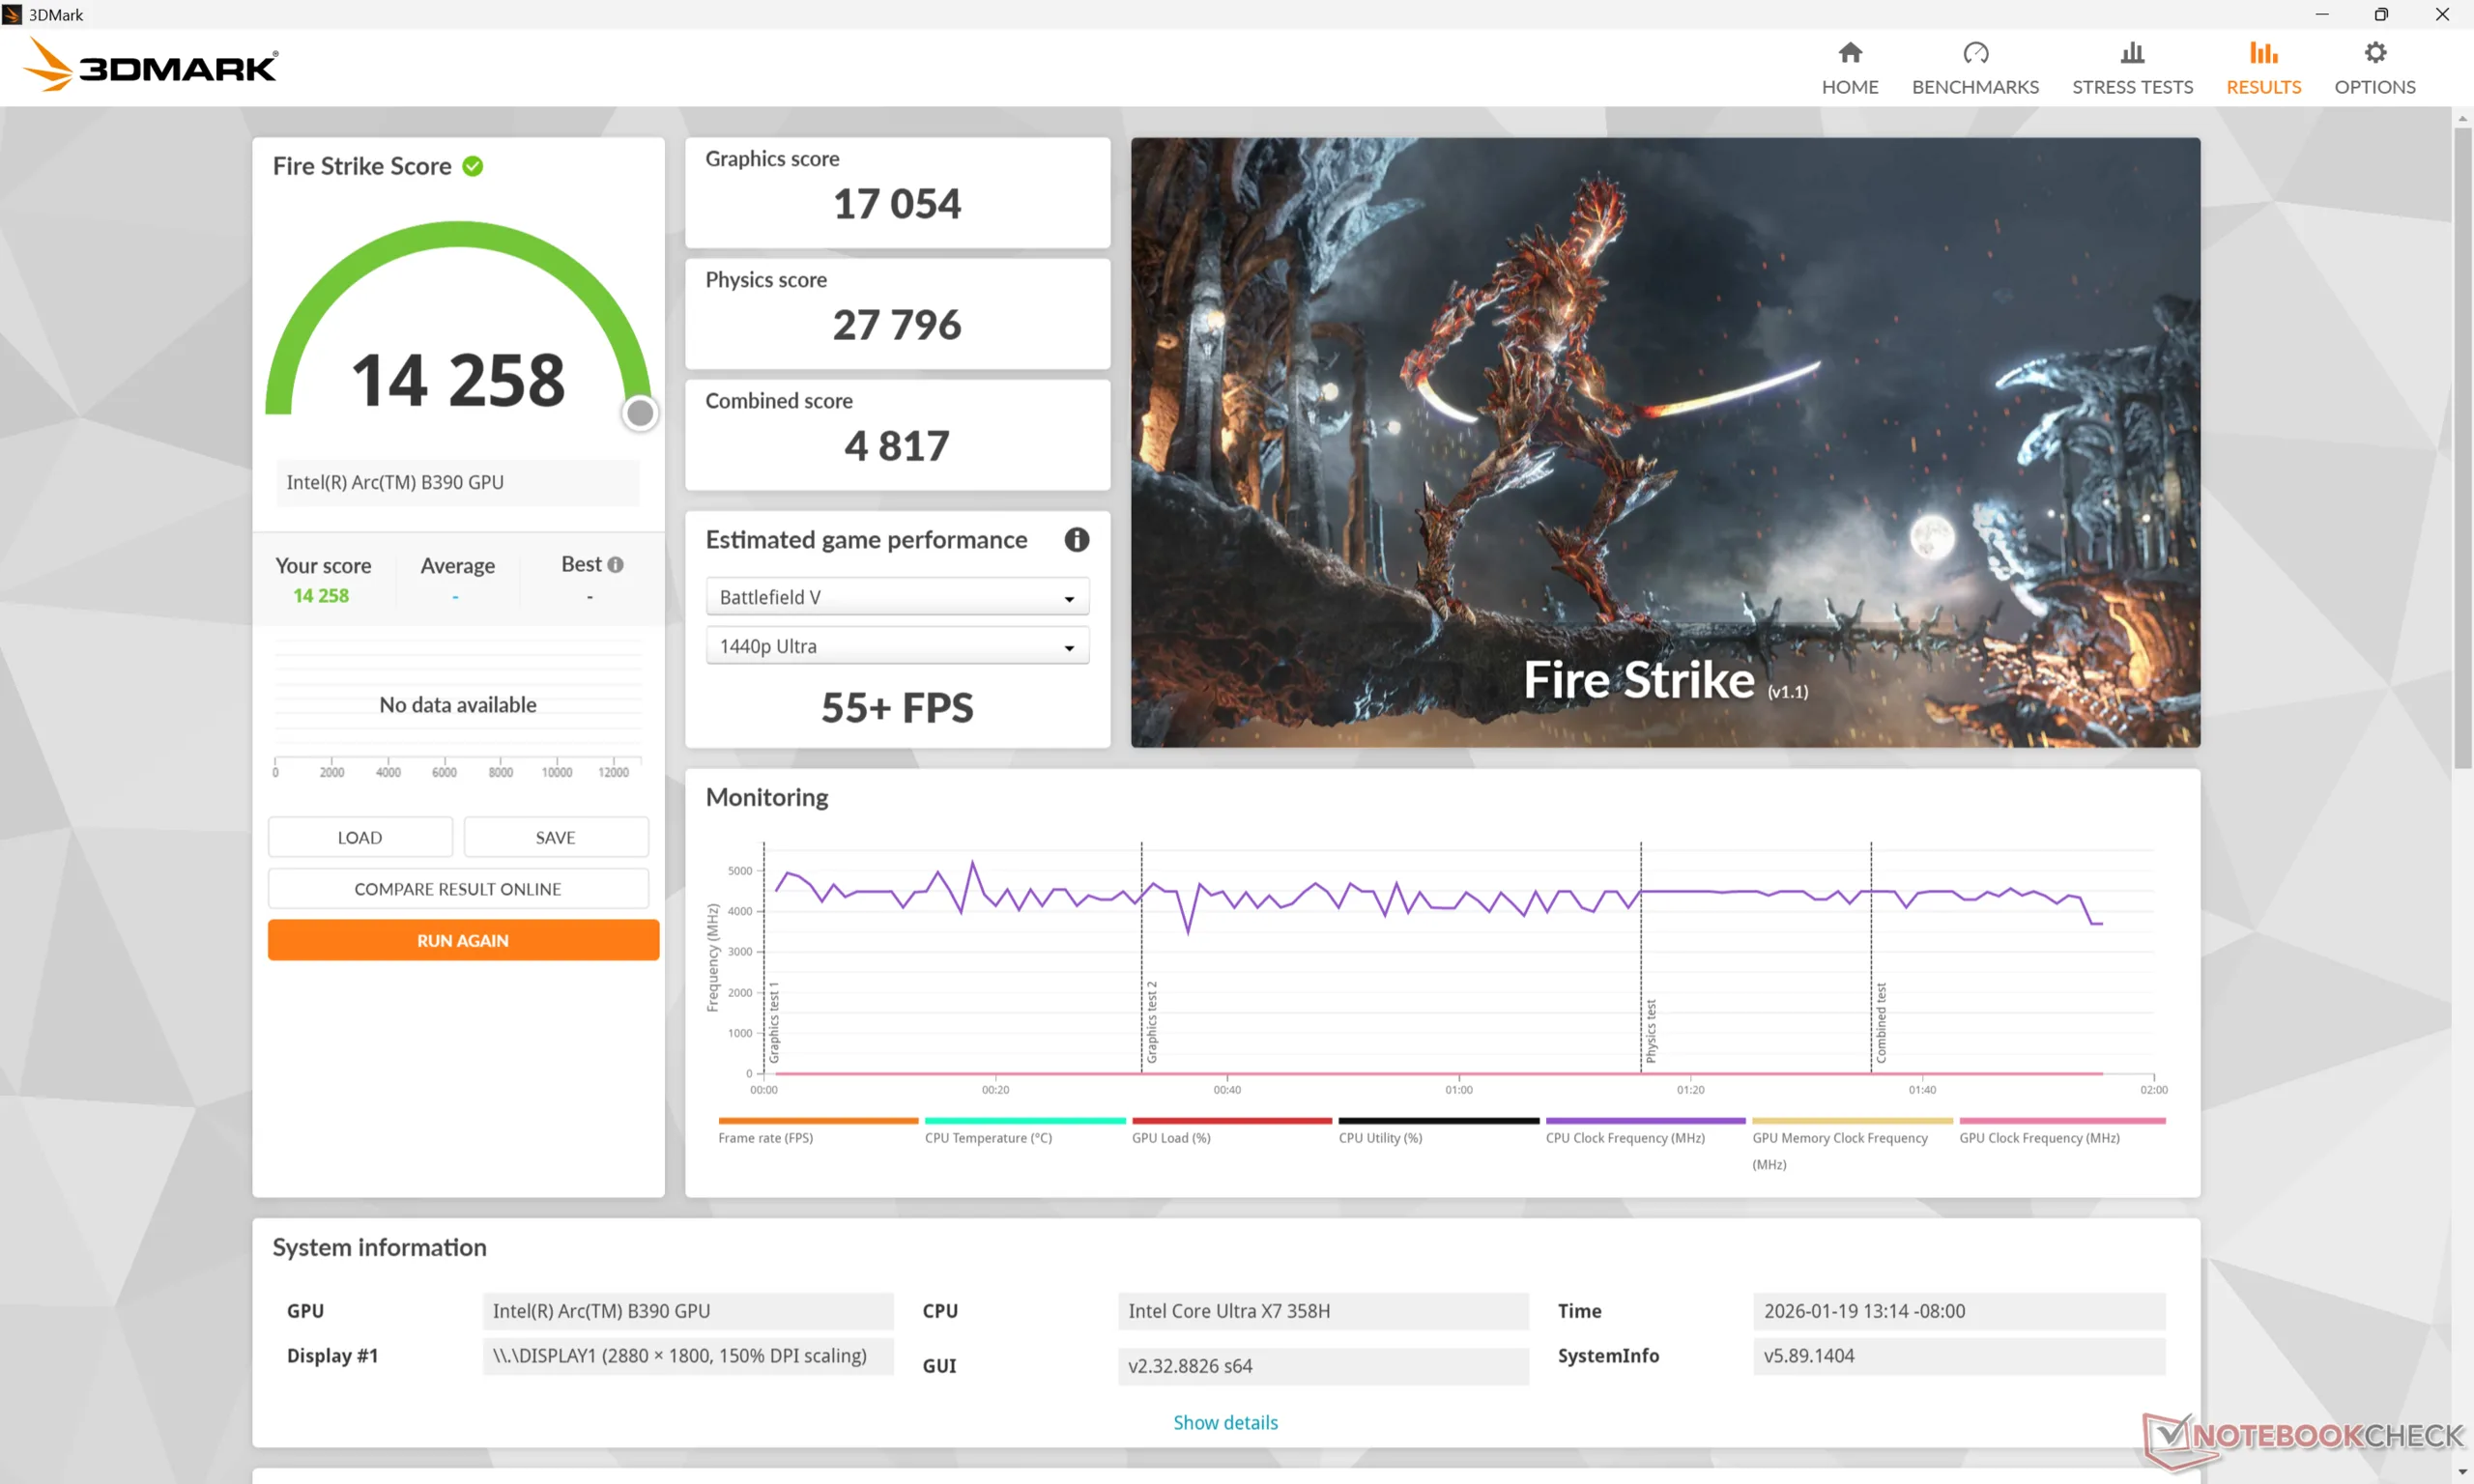
在平衡模式而非性能模式下运行会对整体性能产生相当大的影响,正如我们下面的Fire Strike 结果表所示。
| 电源配置文件 | 图形分数 | 物理得分 | 综合得分 |
| 性能模式(45 瓦以上) | 17054 | 27796 | 4817 |
| 平衡模式(25 瓦以上) | 14823 (-13%) | 22613 (-19%) | 3813 (-21%) |
| 电池供电 | 14912 (-13%) | 22146 (-20%) | 4236 (-12%) |
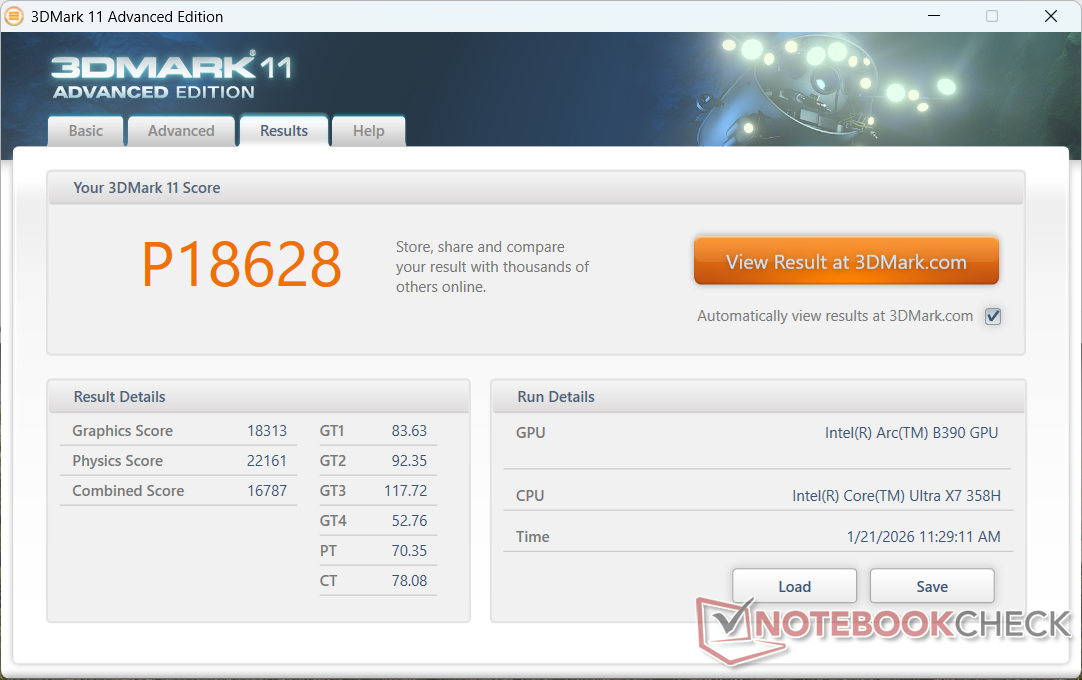
| 3DMark 11 Performance | 18628 points | |
| 3DMark Cloud Gate Standard Score | 44565 points | |
| 3DMark Fire Strike Score | 14258 points | |
| 3DMark Time Spy Score | 7270 points | |
Help | ||
* ... smaller is better
游戏性能
虽然 B890 并非游戏机,但其强大的性能足以在 1080p 中等设置下运行《赛博朋克 2077》等要求苛刻的游戏,在应用任何 AI 升频或帧生成功能之前,平均帧数为 63 FPS。黑色神话悟空传》也能在 1080p 中等设置下以 35 FPS 的平均帧数运行。
| GTA V - 1920x1080 Highest AA:4xMSAA + FX AF:16x | |
| Lenovo Yoga Pro 7 14IMH9, RTX 4050 | |
| Lenovo ThinkPad P14s Gen 6 21QT0012GE | |
| Asus ExpertBook Ultra B9406CAA | |
| HP EliteBook Ultra G1i 14 | |
| Samsung Galaxy Book5 Pro 14 940XHA | |
| Asus ExpertBook PM3406 | |
| Strange Brigade - 1920x1080 ultra AA:ultra AF:16 | |
| Lenovo Yoga Pro 7 14IMH9, RTX 4050 | |
| Asus ExpertBook Ultra B9406CAA | |
| HP EliteBook Ultra G1i 14 | |
| Samsung Galaxy Book5 Pro 14 940XHA | |
| Asus ExpertBook PM3406 | |
| Black Myth: Wukong | |
| 1280x720 low TSR 100 | |
| HP ZBook Ultra G1a 14 | |
| Average Intel Arc B390 12 Xe3 Panther Lake iGPU (51 - 71, n=3) | |
| Asus ExpertBook Ultra B9406CAA | |
| 1920x1080 low TSR 100 | |
| HP ZBook Ultra G1a 14 | |
| Asus ExpertBook Ultra B9406CAA | |
| Average Intel Arc B390 12 Xe3 Panther Lake iGPU (43 - 47, n=3) | |
| 1920x1080 medium TSR 100 | |
| HP ZBook Ultra G1a 14 | |
| Average Intel Arc B390 12 Xe3 Panther Lake iGPU (34 - 37, n=3) | |
| Asus ExpertBook Ultra B9406CAA | |
| 1920x1080 high TSR 100 | |
| HP ZBook Ultra G1a 14 | |
| Asus ExpertBook Ultra B9406CAA | |
| Average Intel Arc B390 12 Xe3 Panther Lake iGPU (26 - 29, n=3) | |
| 1920x1080 cinematic TSR 100 | |
| HP ZBook Ultra G1a 14 | |
| Asus ExpertBook Ultra B9406CAA | |
| Average Intel Arc B390 12 Xe3 Panther Lake iGPU (14 - 16, n=3) | |
| 2560x1440 cinematic TSR 100 | |
| HP ZBook Ultra G1a 14 | |
| Asus ExpertBook Ultra B9406CAA | |
| Average Intel Arc B390 12 Xe3 Panther Lake iGPU (11 - 11, n=2) | |
| ARC Raiders | |
| 1920x1080 Low Preset | |
| Asus ExpertBook Ultra B9406CAA | |
| HP ZBook Ultra G1a 14 | |
| Average Intel Arc B390 12 Xe3 Panther Lake iGPU (104.3 - 176.7, n=3) | |
| 1920x1080 Medium Preset AA:TSR | |
| HP ZBook Ultra G1a 14 | |
| Asus ExpertBook Ultra B9406CAA | |
| Average Intel Arc B390 12 Xe3 Panther Lake iGPU (57 - 58.1, n=3) | |
| 1920x1080 High Preset AA:TSR | |
| HP ZBook Ultra G1a 14 | |
| Average Intel Arc B390 12 Xe3 Panther Lake iGPU (42.4 - 43.8, n=3) | |
| Asus ExpertBook Ultra B9406CAA | |
| 1920x1080 Epic Preset + Epic Raytracing AA:TSR | |
| HP ZBook Ultra G1a 14 | |
| Asus ExpertBook Ultra B9406CAA | |
| Average Intel Arc B390 12 Xe3 Panther Lake iGPU (28 - 30.4, n=3) | |
| 2560x1440 Epic Preset + Epic Raytracing AA:TSR | |
| HP ZBook Ultra G1a 14 | |
| Asus ExpertBook Ultra B9406CAA | |
| Average Intel Arc B390 12 Xe3 Panther Lake iGPU (19.2 - 20.9, n=3) | |
赛博朋克 2077》超 FPS 图表
| low | med. | high | ultra | QHD | |
|---|---|---|---|---|---|
| GTA V (2015) | 179.4 | 173 | 111.9 | 45.3 | 31.5 |
| Dota 2 Reborn (2015) | 119.8 | 92.6 | 103.5 | 102.5 | |
| Final Fantasy XV Benchmark (2018) | 134.5 | 76.1 | 55.4 | 41 | |
| X-Plane 11.11 (2018) | 58.5 | 45.5 | 39.7 | ||
| Strange Brigade (2018) | 388 | 132.7 | 107.6 | 99.5 | 72.3 |
| Baldur's Gate 3 (2023) | 71.4 | 60.8 | 54.3 | 53.4 | 37.8 |
| Cyberpunk 2077 (2023) | 77.7 | 63.1 | 53.8 | 47.2 | 28.3 |
| F1 24 (2024) | 146.3 | 135 | 104.3 | 38 | 25.2 |
| Black Myth: Wukong (2024) | 45 | 35 | 28 | 15 | 11 |
| ARC Raiders (2025) | 176.7 | 57.5 | 42.5 | 29.4 | 20.1 |
排放量
系统噪音
尽管 ExpertBook Ultra 使用的是 H 系列处理器,但在运行中低负荷时,风扇噪音表现得更像 U 系列笔记本电脑。然而,当运行游戏等要求较高的负载时,风扇噪音最高可达 40 dB(A),这在 H 系列系统中更为典型。
请注意,在平衡模式下运行游戏时,风扇噪音将稳定在 31.8 dB(A),而在性能模式下则为 42.8 dB(A)。如上所述,较低的噪音会影响性能。
Noise level
| Idle |
| 23.4 / 23.4 / 23.4 dB(A) |
| Load |
| 28.6 / 45.2 dB(A) |
 | ||
30 dB silent 40 dB(A) audible 50 dB(A) loud |
||
min: | ||
| Asus ExpertBook Ultra B9406CAA Ultra X7 358H, Arc B390 Panther Lake iGPU | Dell Pro 14 Plus PB14255 GH77W Ryzen AI 7 PRO 350, Radeon 860M | Asus ExpertBook PM3406 Ryzen AI 7 350, Radeon 860M | Lenovo ThinkPad P14s Gen 6 21QT0012GE Ultra 7 265H, RTX PRO 500 Blackwell Generation Laptop | Samsung Galaxy Book5 Pro 14 940XHA Core Ultra 5 226V, Arc 130V | HP EliteBook Ultra G1i 14 Core Ultra 7 258V, Arc 140V | |
|---|---|---|---|---|---|---|
| Noise | -2% | -5% | -15% | 1% | 7% | |
| off / environment * (dB) | 22.9 | 24.9 -9% | 25.7 -12% | 25.1 -10% | 25.1 -10% | 23.9 -4% |
| Idle Minimum * (dB) | 23.4 | 24.9 -6% | 25.7 -10% | 25.1 -7% | 25.1 -7% | 23.9 -2% |
| Idle Average * (dB) | 23.4 | 24.9 -6% | 25.7 -10% | 25.1 -7% | 25.1 -7% | 23.9 -2% |
| Idle Maximum * (dB) | 23.4 | 27.6 -18% | 25.7 -10% | 29.4 -26% | 25.1 -7% | 23.9 -2% |
| Load Average * (dB) | 28.6 | 29.3 -2% | 33.6 -17% | 42.3 -48% | 29.3 -2% | 28.4 1% |
| Cyberpunk 2077 ultra * (dB) | 42.8 | 37.5 12% | 39.1 9% | 45.4 -6% | 33.1 23% | 31.5 26% |
| Load Maximum * (dB) | 45.2 | 37.5 17% | 39.1 13% | 45.5 -1% | 38.7 14% | 31.5 30% |
* ... smaller is better
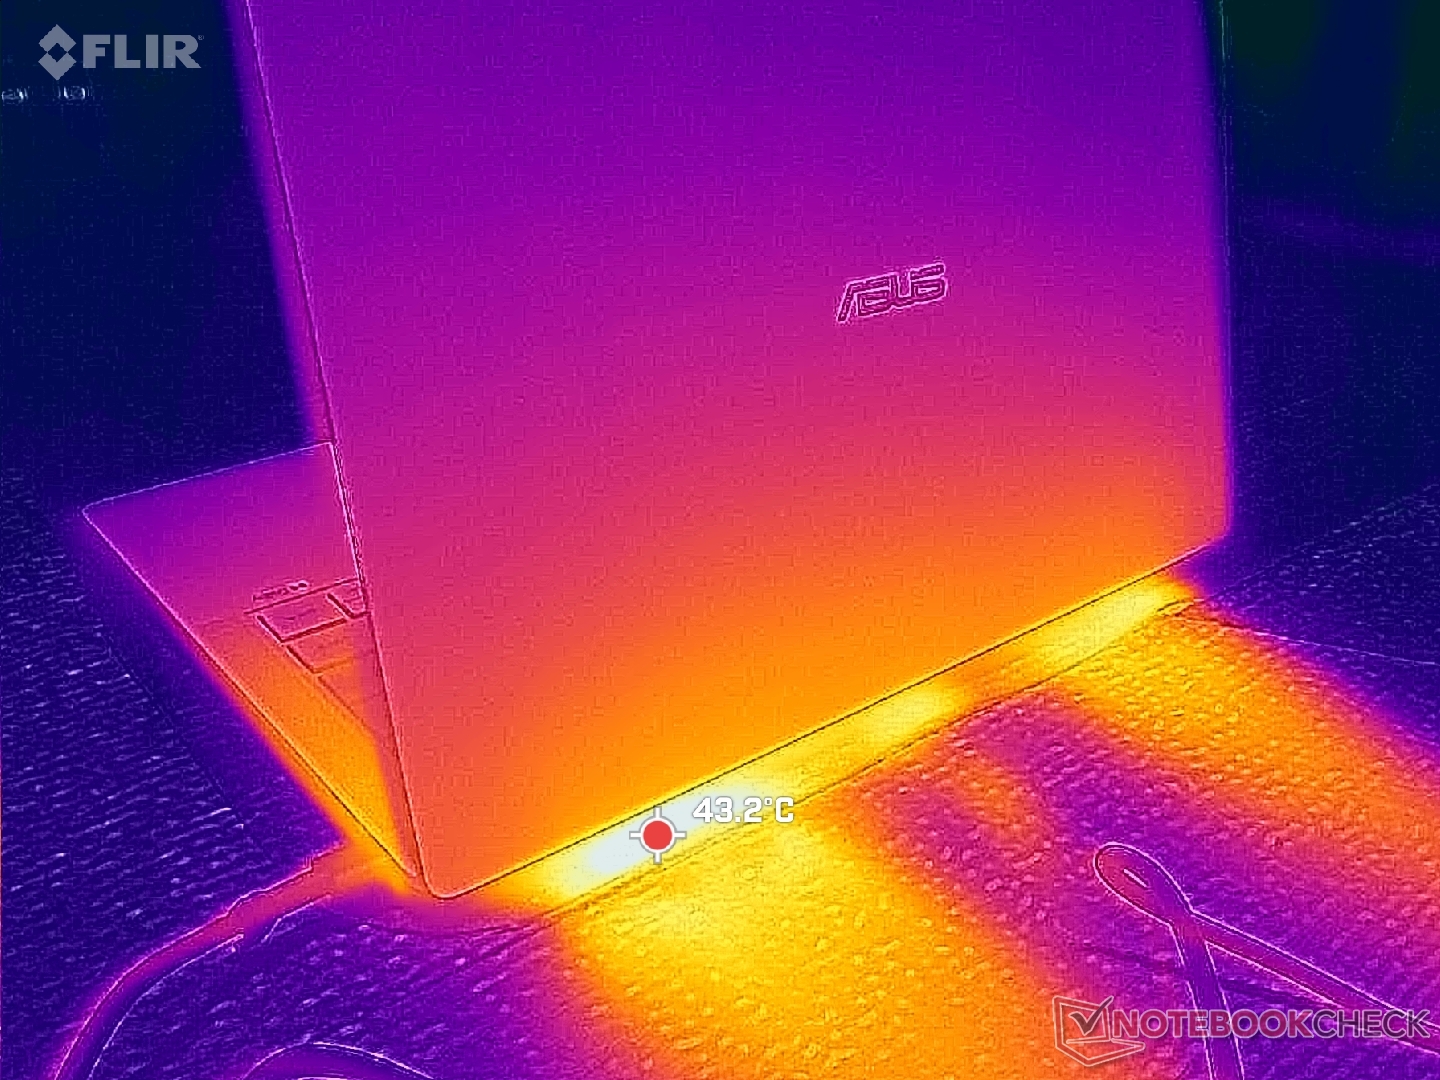
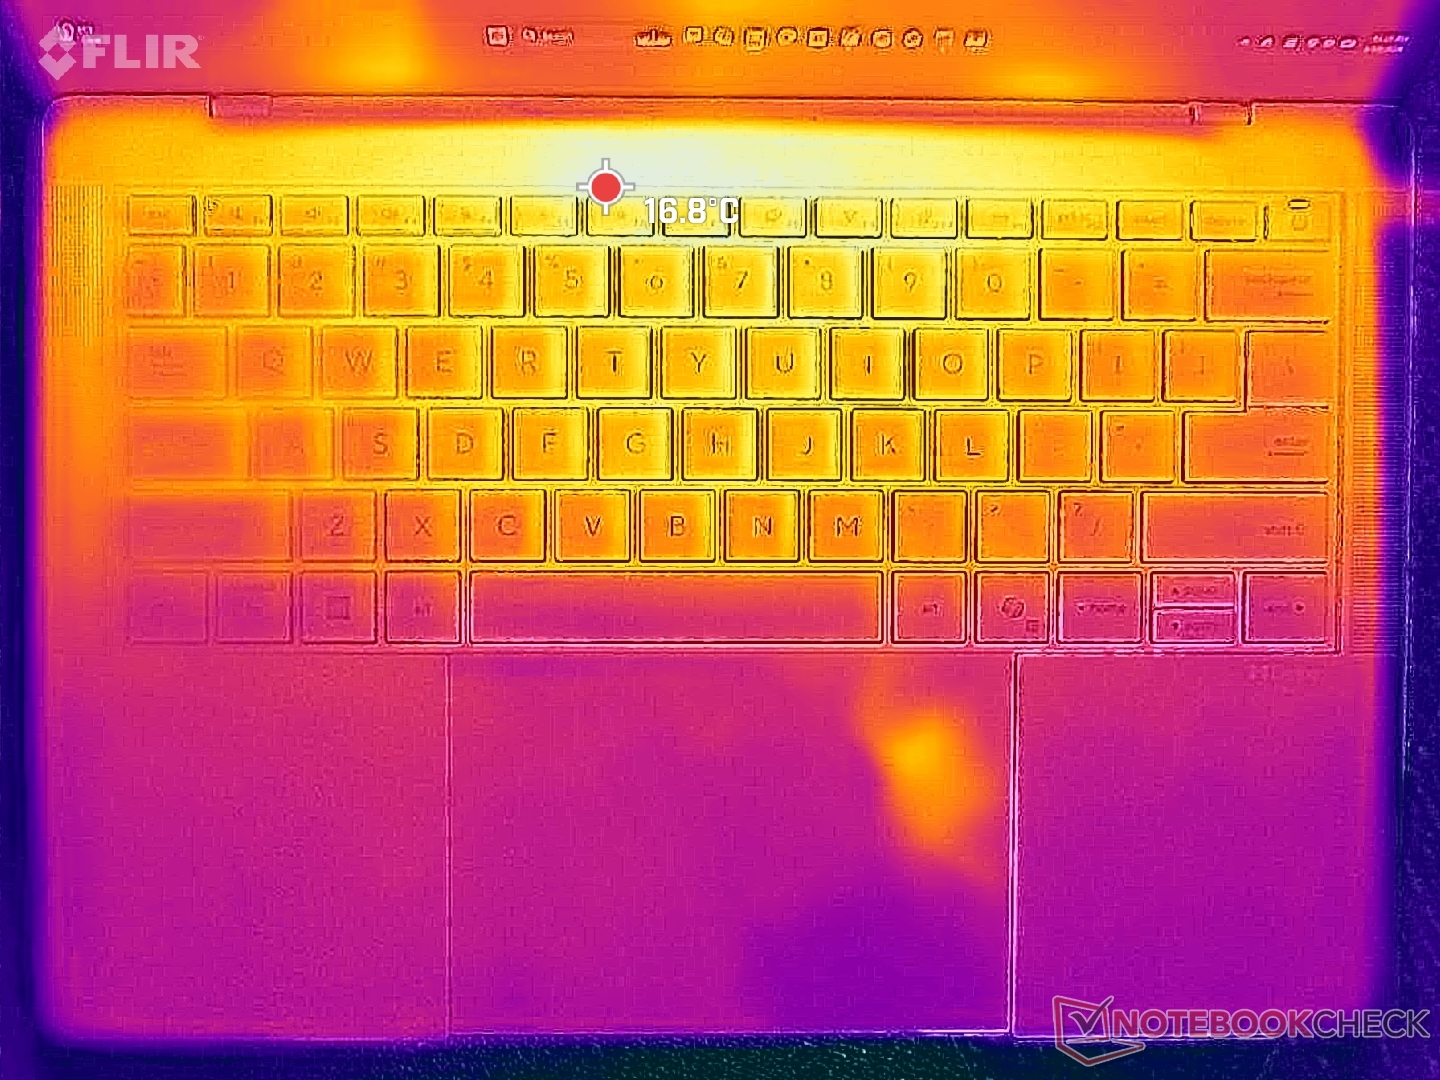
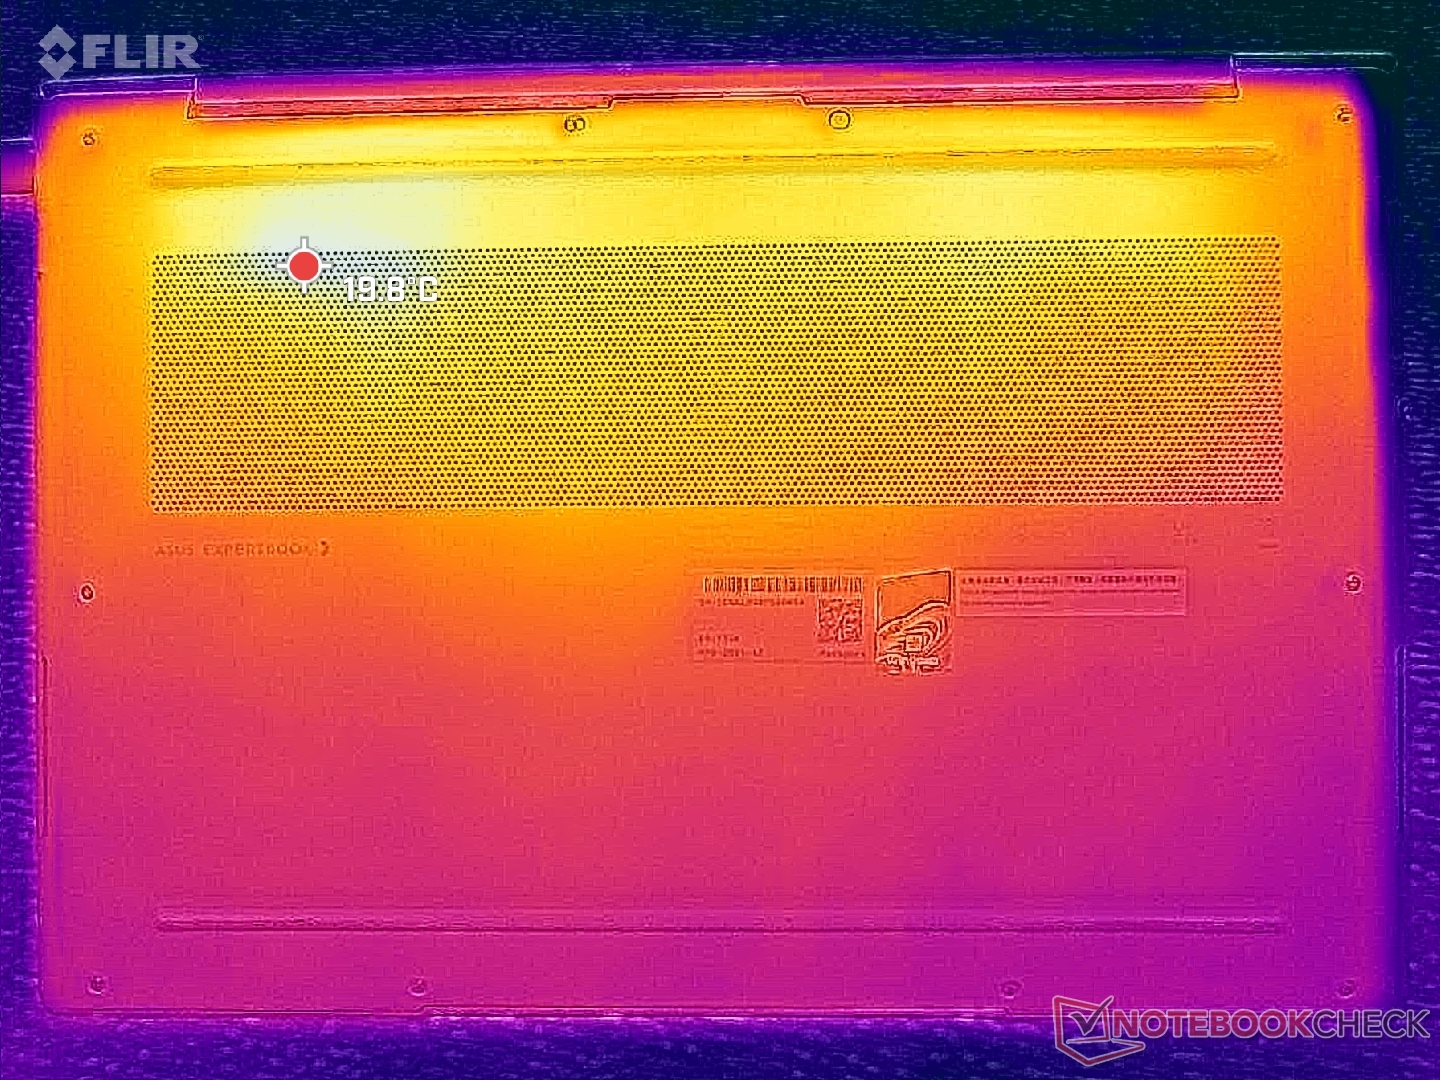
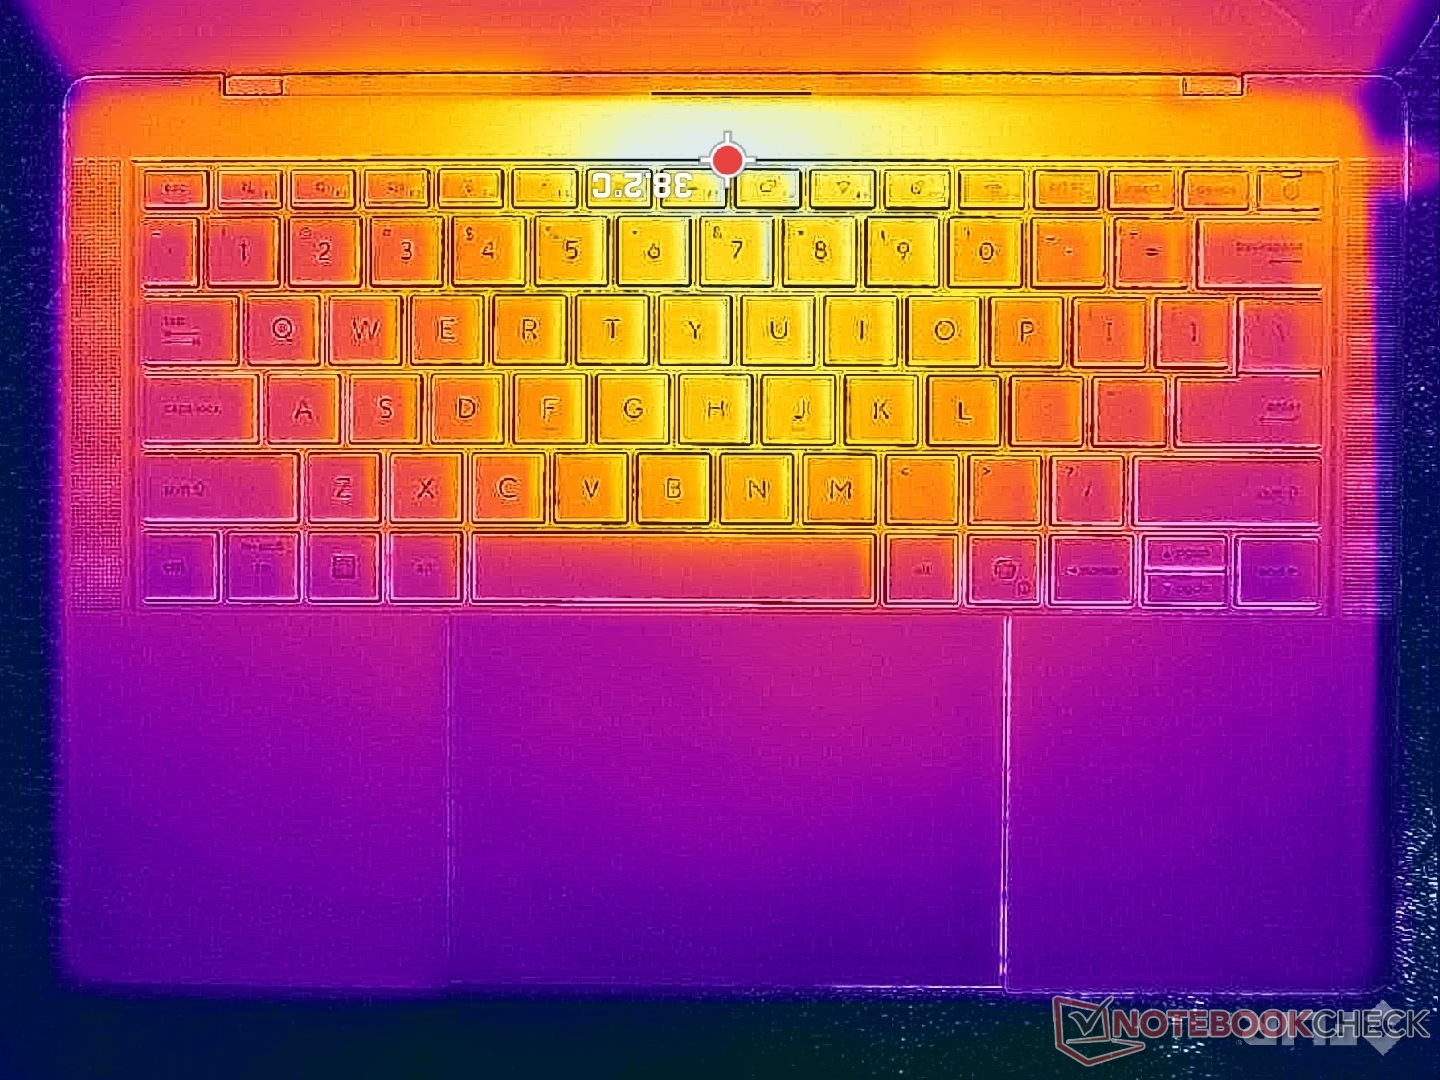
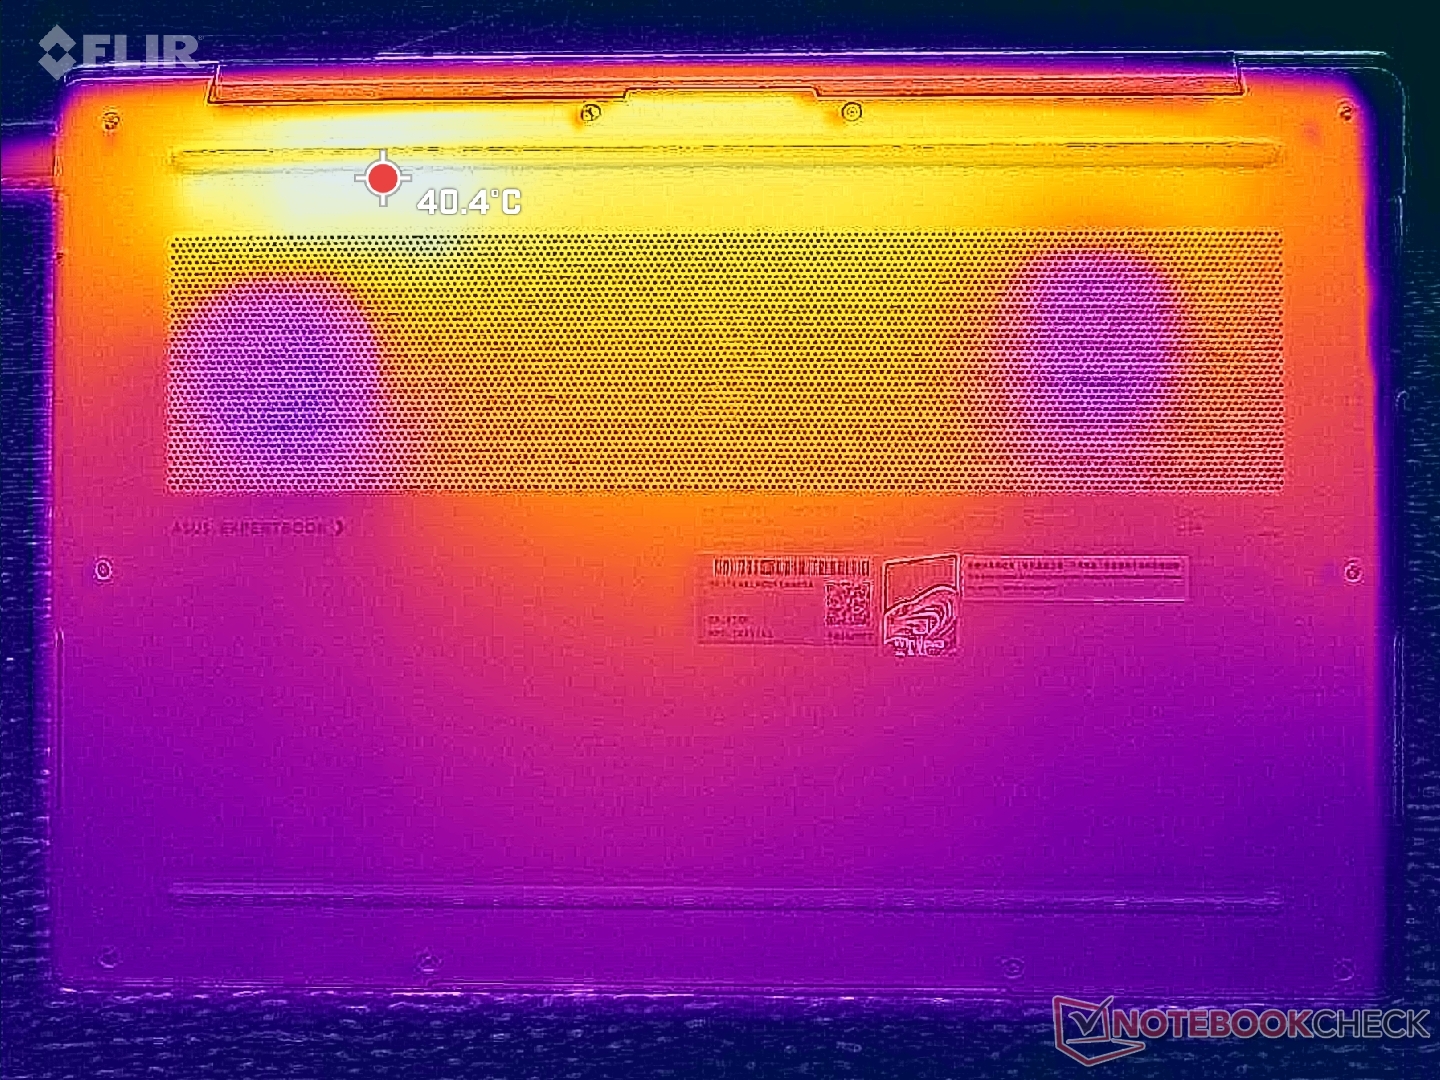
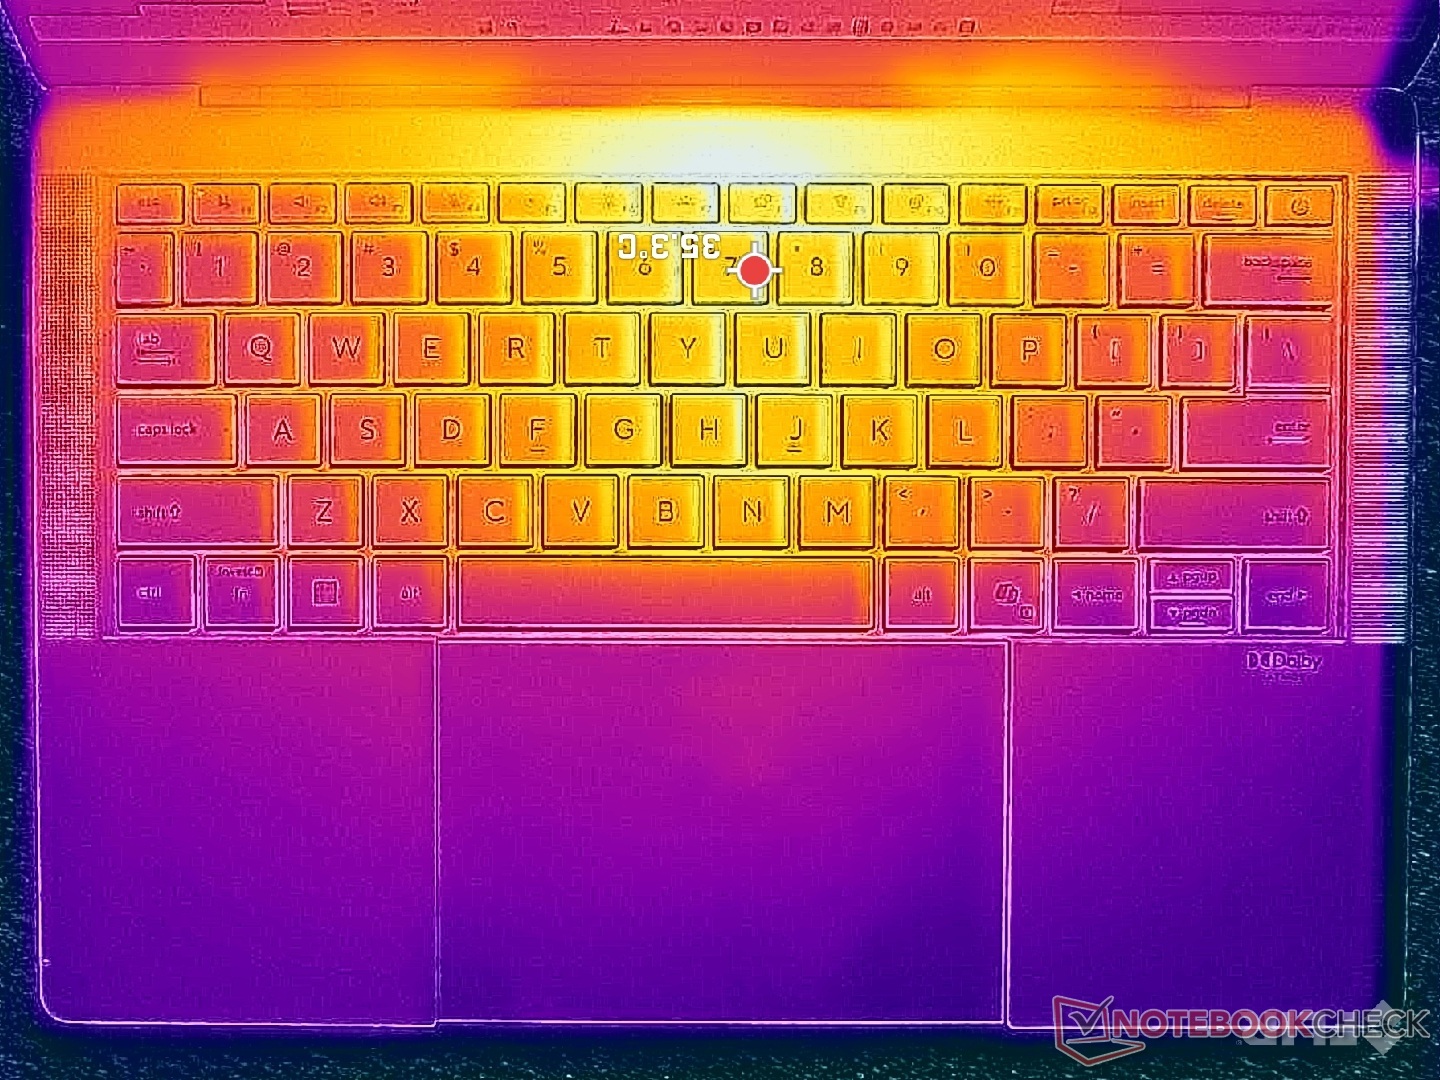
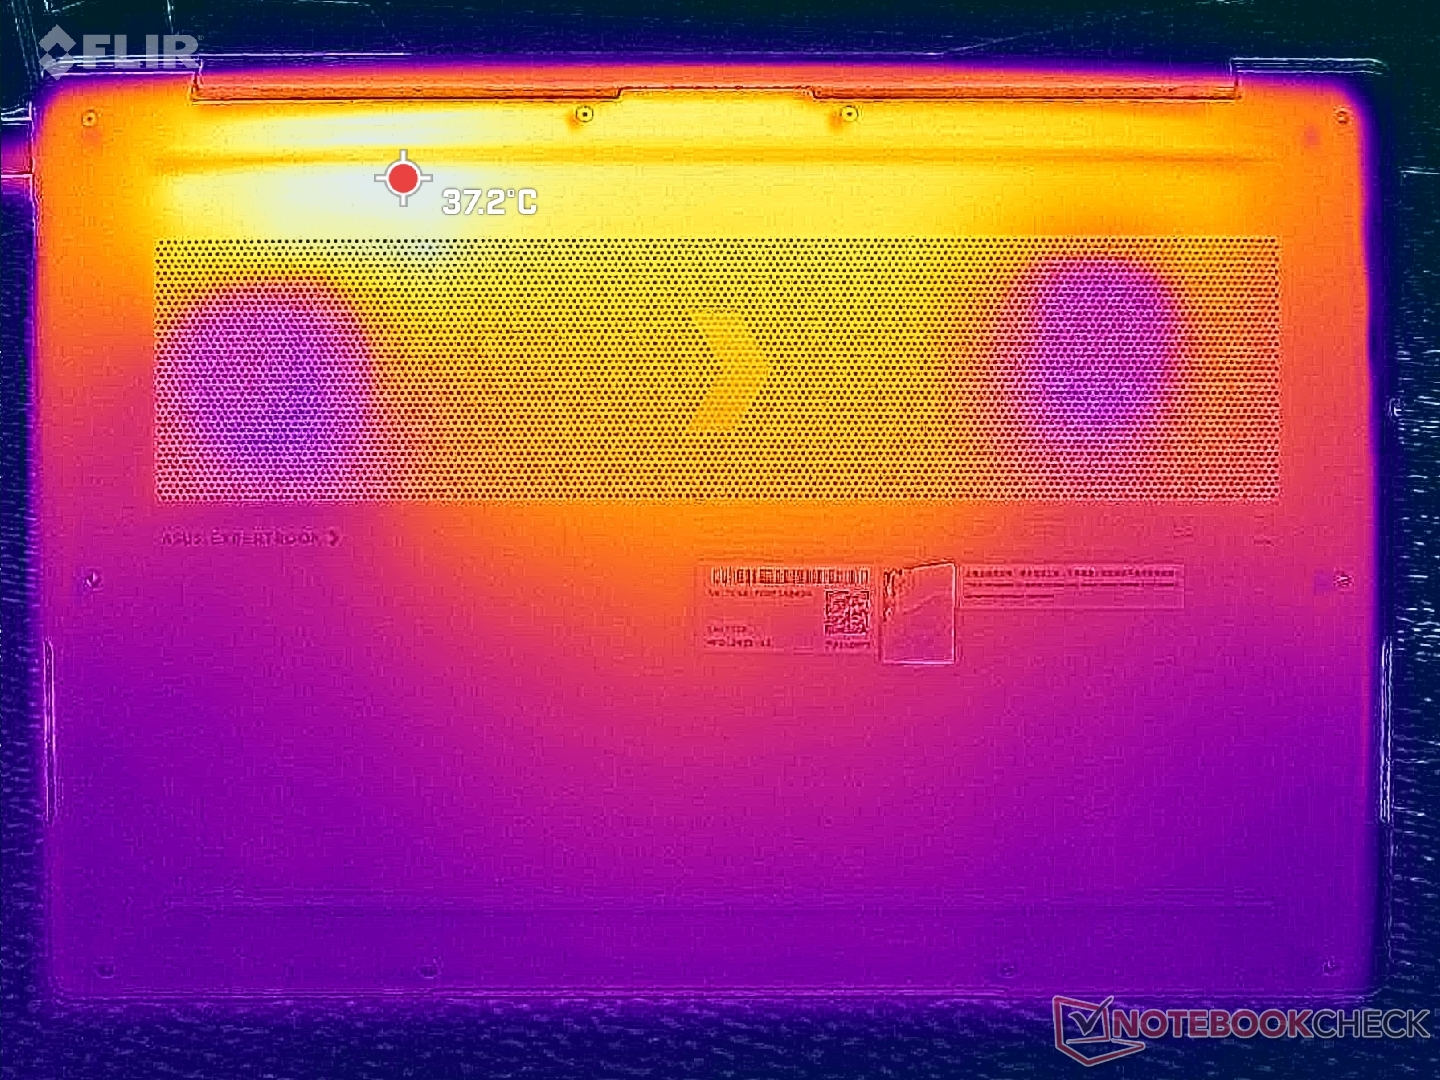
温度
由于采用了底部冷却解决方案,表面温度梯度大致对称。当长时间运行高负荷负载时,键盘中心和底板上的热点温度可高达 41 C,比 HP EliteBook Ultra G1i 14 的温度略低。 惠普 EliteBook Ultra G1i 14的温度略低。
(+) The maximum temperature on the upper side is 38.6 °C / 101 F, compared to the average of 34.3 °C / 94 F, ranging from 21.2 to 62.5 °C for the class Office.
(+) The bottom heats up to a maximum of 38.4 °C / 101 F, compared to the average of 36.8 °C / 98 F
(+) In idle usage, the average temperature for the upper side is 23 °C / 73 F, compared to the device average of 29.5 °C / 85 F.
(+) 3: The average temperature for the upper side is 31.8 °C / 89 F, compared to the average of 29.5 °C / 85 F for the class Office.
(+) The palmrests and touchpad are cooler than skin temperature with a maximum of 26.6 °C / 79.9 F and are therefore cool to the touch.
(±) The average temperature of the palmrest area of similar devices was 27.5 °C / 81.5 F (+0.9 °C / 1.6 F).
| Asus ExpertBook Ultra B9406CAA Ultra X7 358H, Arc B390 Panther Lake iGPU | Dell Pro 14 Plus PB14255 GH77W Ryzen AI 7 PRO 350, Radeon 860M | Asus ExpertBook PM3406 Ryzen AI 7 350, Radeon 860M | Lenovo ThinkPad T14s Gen 6 Intel Core Ultra 5 228V, Arc 130V | Samsung Galaxy Book5 Pro 14 940XHA Core Ultra 5 226V, Arc 130V | HP EliteBook Ultra G1i 14 Core Ultra 7 258V, Arc 140V | |
|---|---|---|---|---|---|---|
| Heat | -9% | -4% | -9% | -6% | 0% | |
| Maximum Upper Side * (°C) | 38.6 | 38.1 1% | 39.8 -3% | 42.6 -10% | 41.4 -7% | 37.9 2% |
| Maximum Bottom * (°C) | 38.4 | 40.1 -4% | 40.8 -6% | 41.6 -8% | 44.6 -16% | 44.3 -15% |
| Idle Upper Side * (°C) | 24.6 | 28.9 -17% | 26 -6% | 27.1 -10% | 24.9 -1% | 23.3 5% |
| Idle Bottom * (°C) | 26 | 29.6 -14% | 26.3 -1% | 27.6 -6% | 25.5 2% | 23.6 9% |
* ... smaller is better
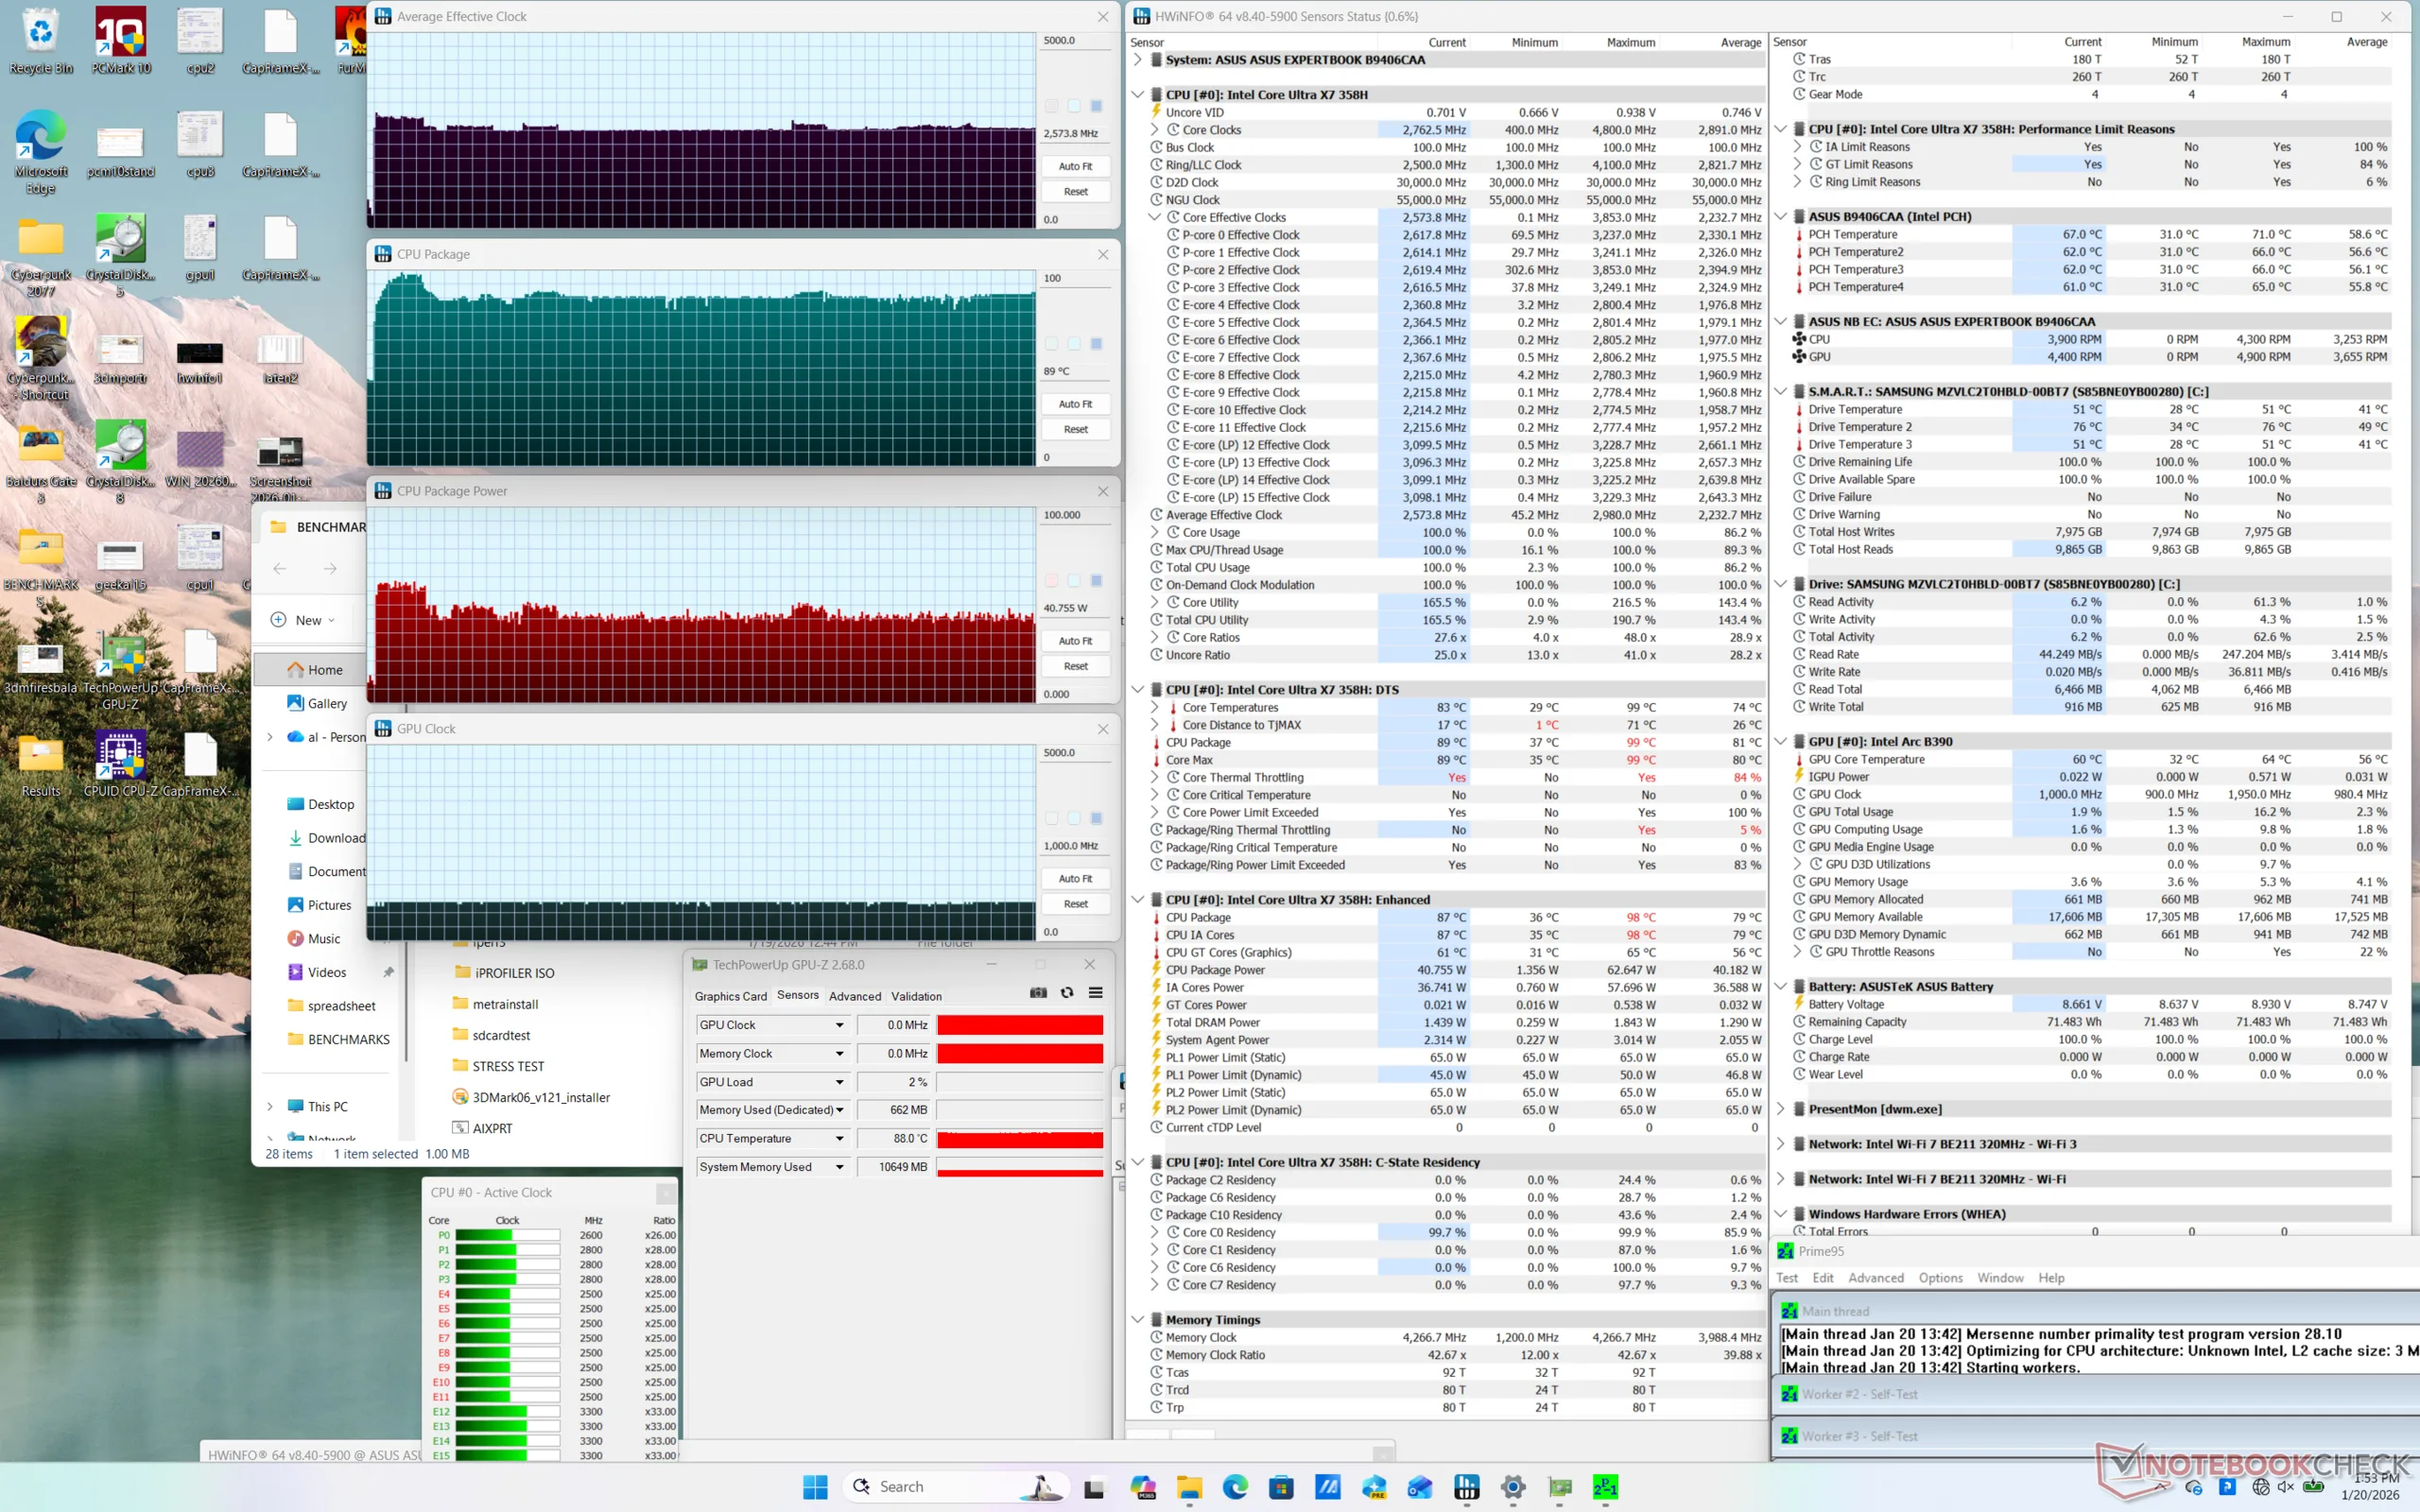
压力测试
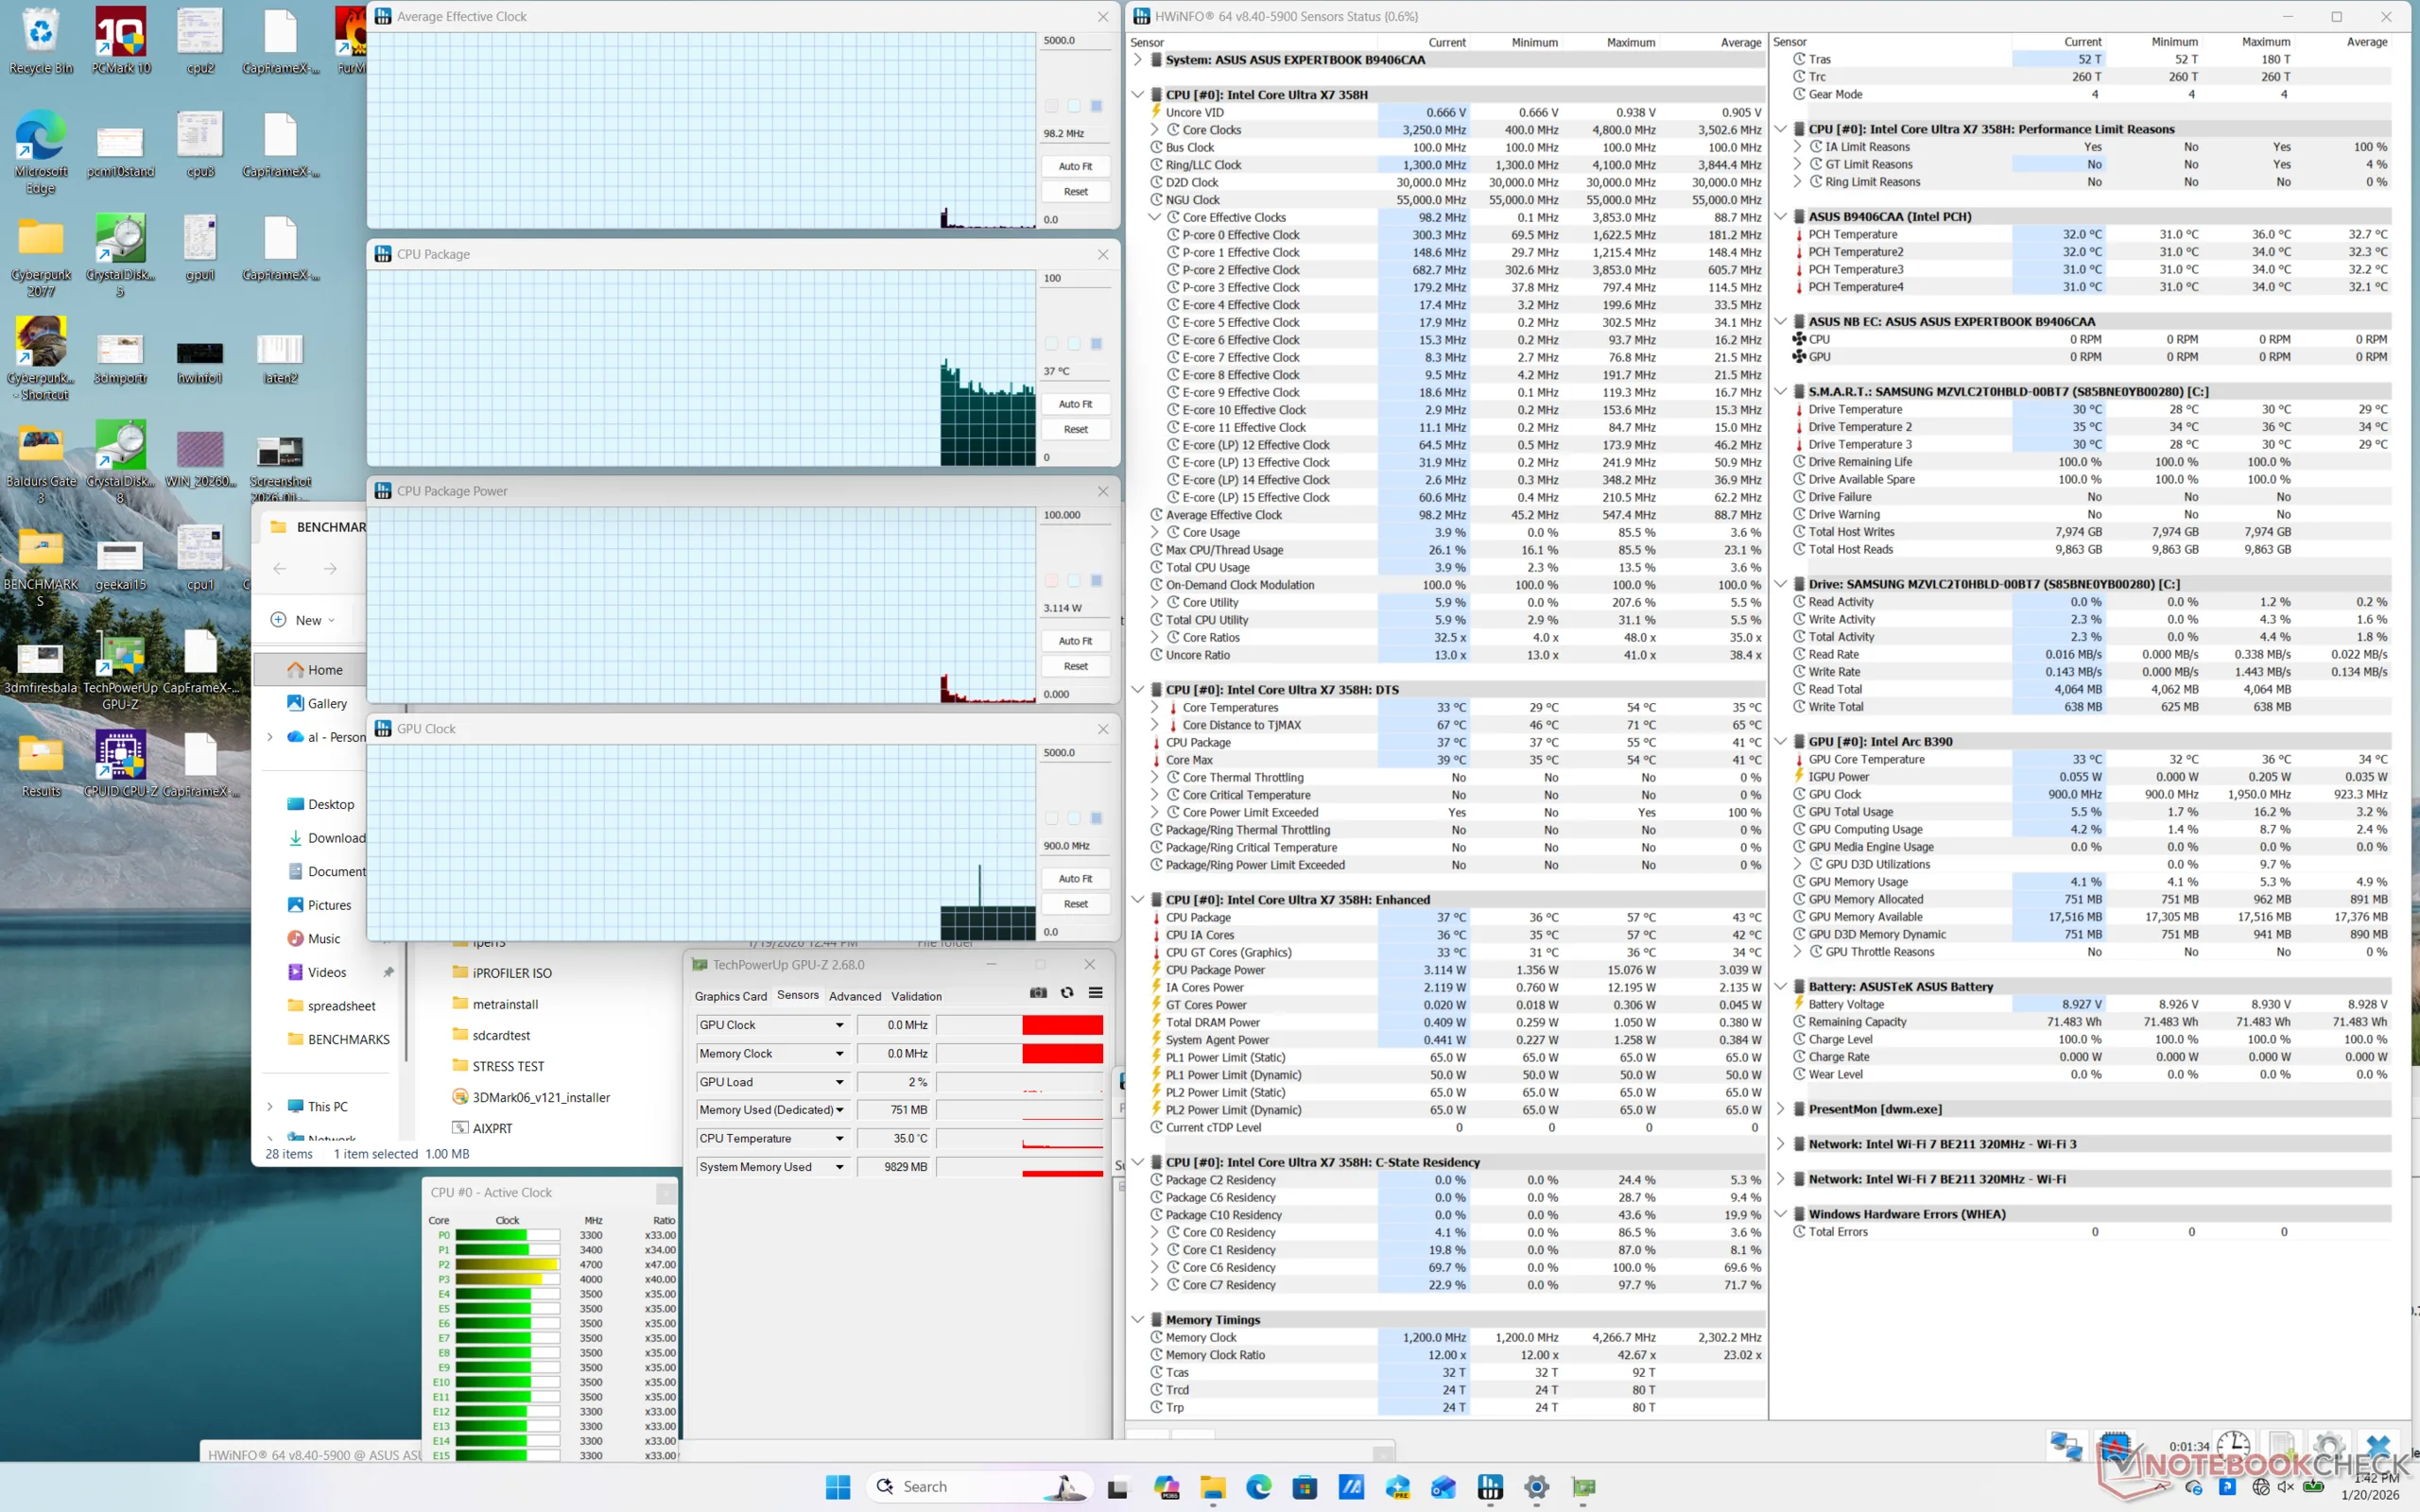
在启动 Prime95 压力测试时,CPU 的主频将升至 2.8 GHz,功耗为 62 W,大约一分钟后核心温度达到 98 C。此后,CPU 性能将降至 2.6 GHz,以维持较易管理的内核温度和功耗(分别为 85 C 和 48 W)。因此,最大 Turbo Boost 性能只能维持有限的时间。
在性能模式下运行《赛博朋克 2077》 时,GPU 时钟频率和温度将分别稳定在 2500 MHz 和 88 C,而设置为平衡模式时仅为 2050 MHz 和 59 C。因此,在需要额外马力的时候,你会希望在性能模式下运行。不过,性能模式下的 88 摄氏度温度比我们希望的要高,因为竞争产品的温度比我们希望的要低。 HP EliteBook X G1a 14在类似条件下,温度会稳定在 70 摄氏度左右。
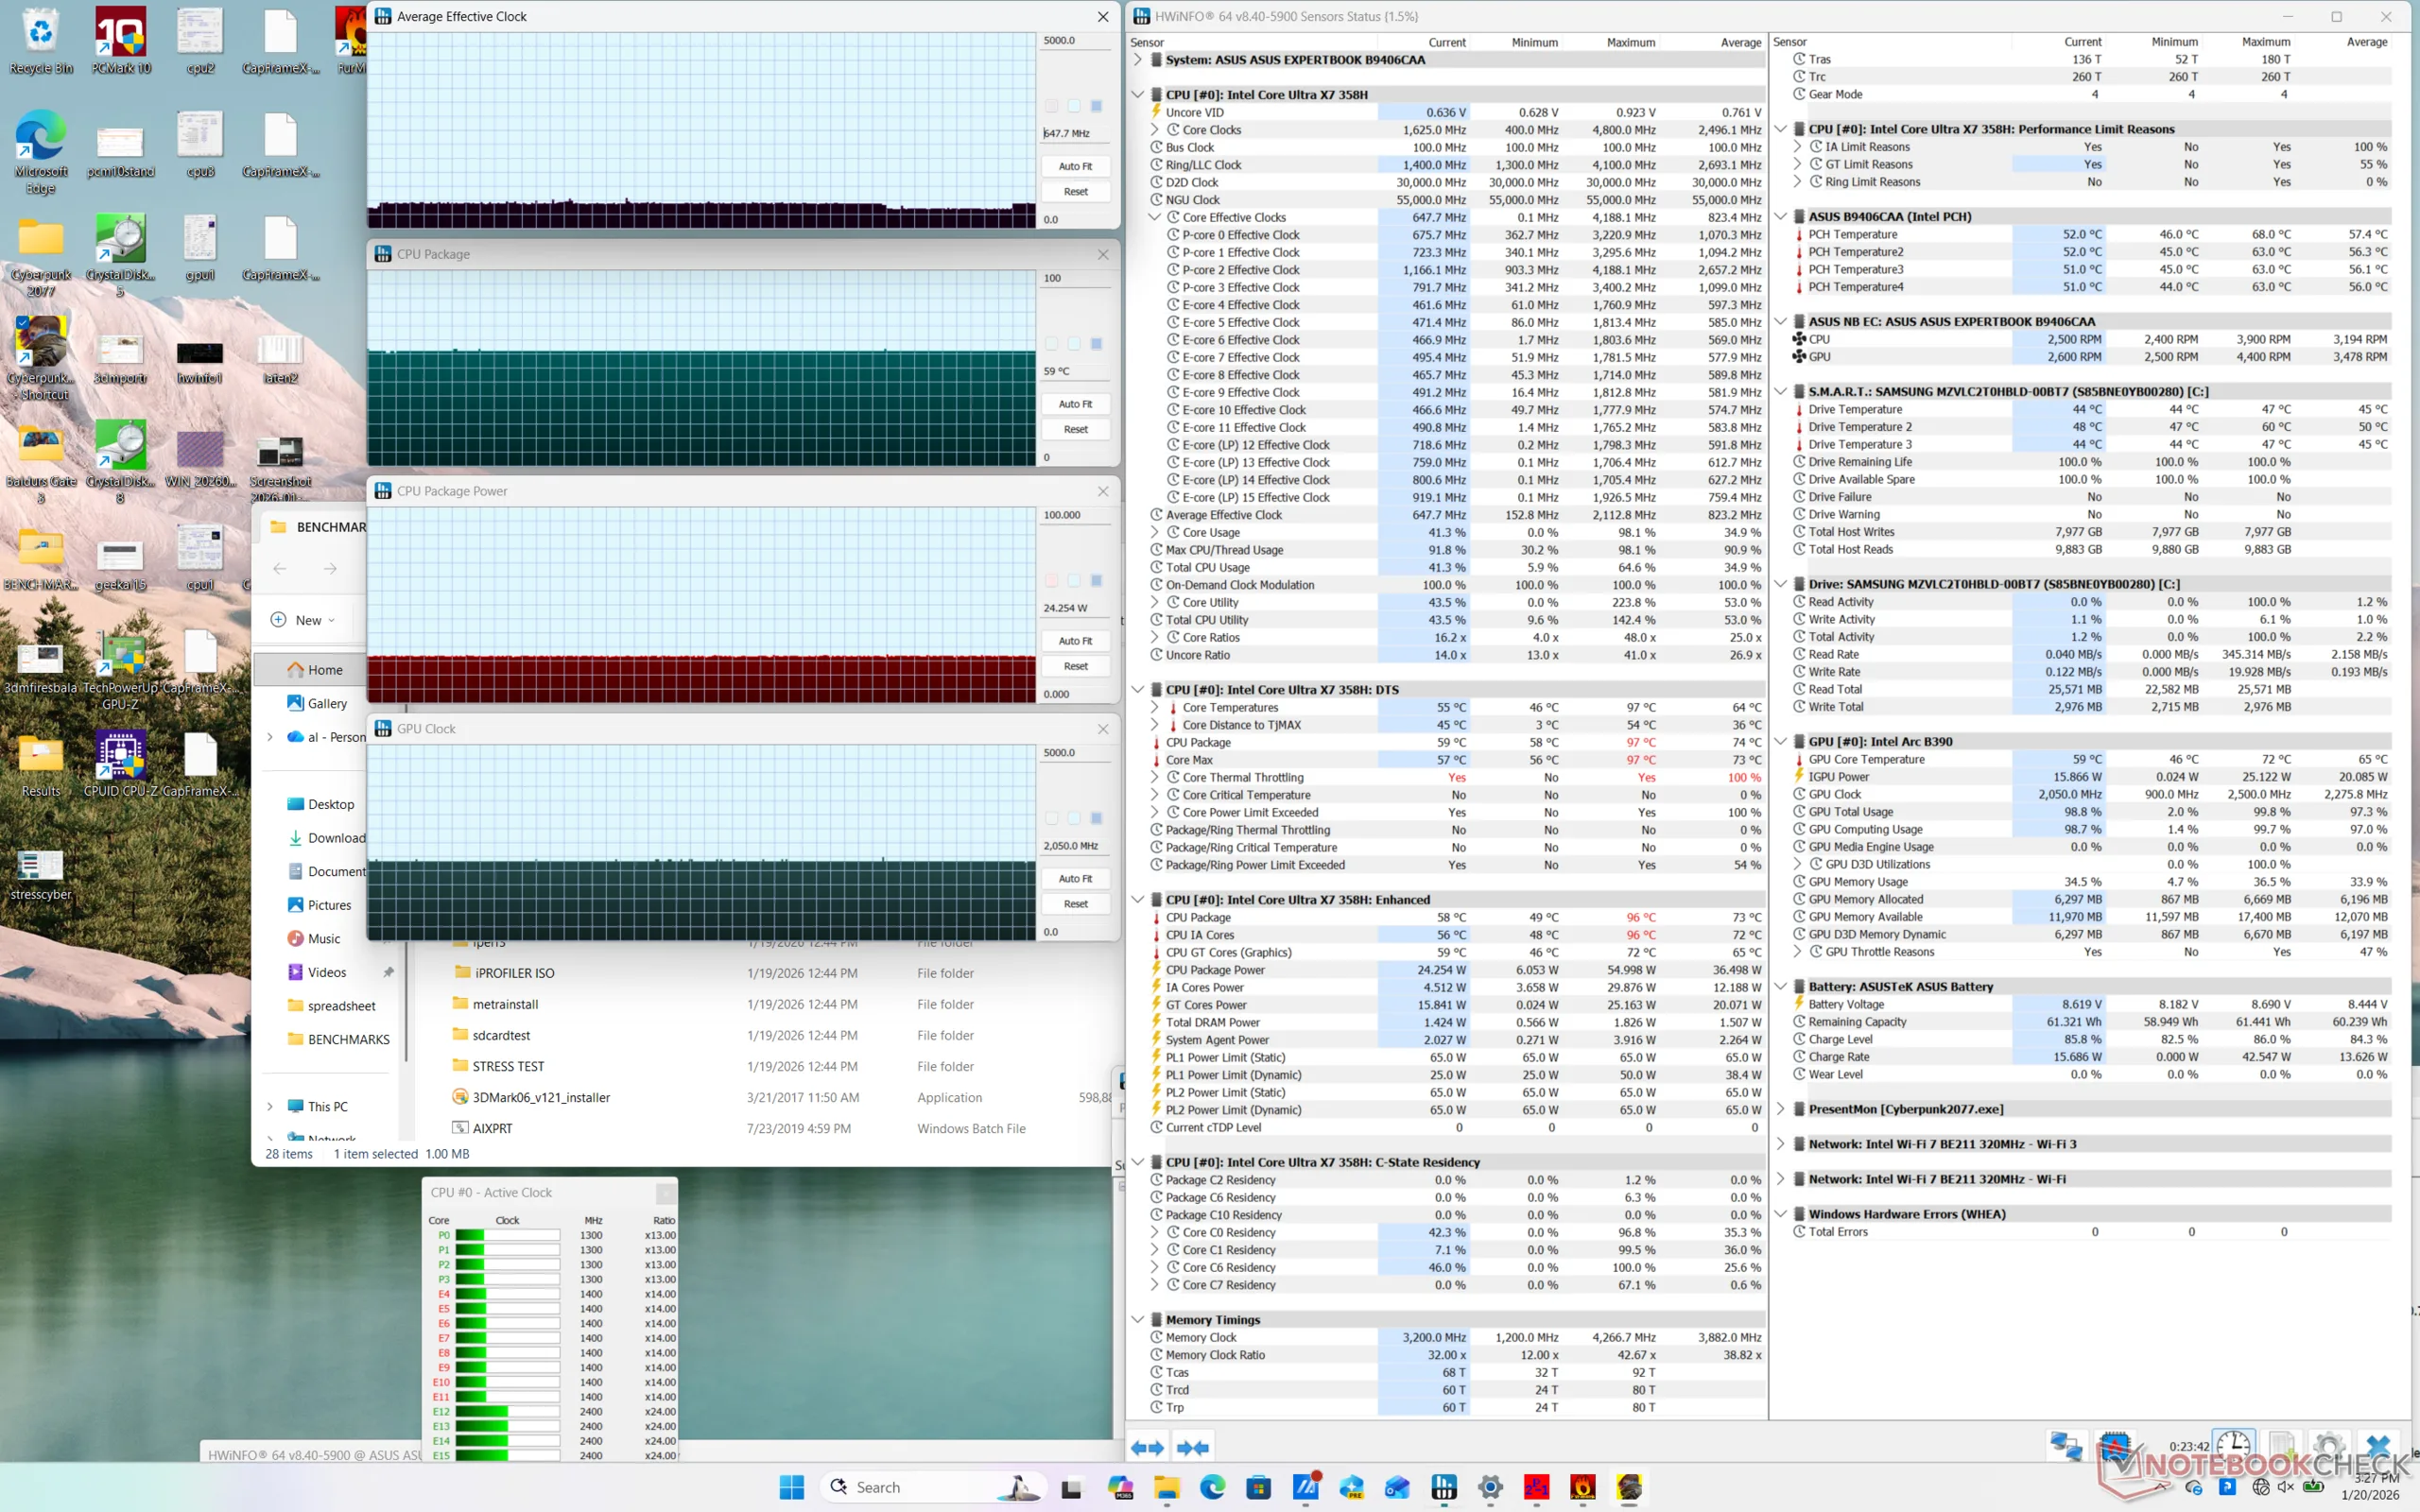
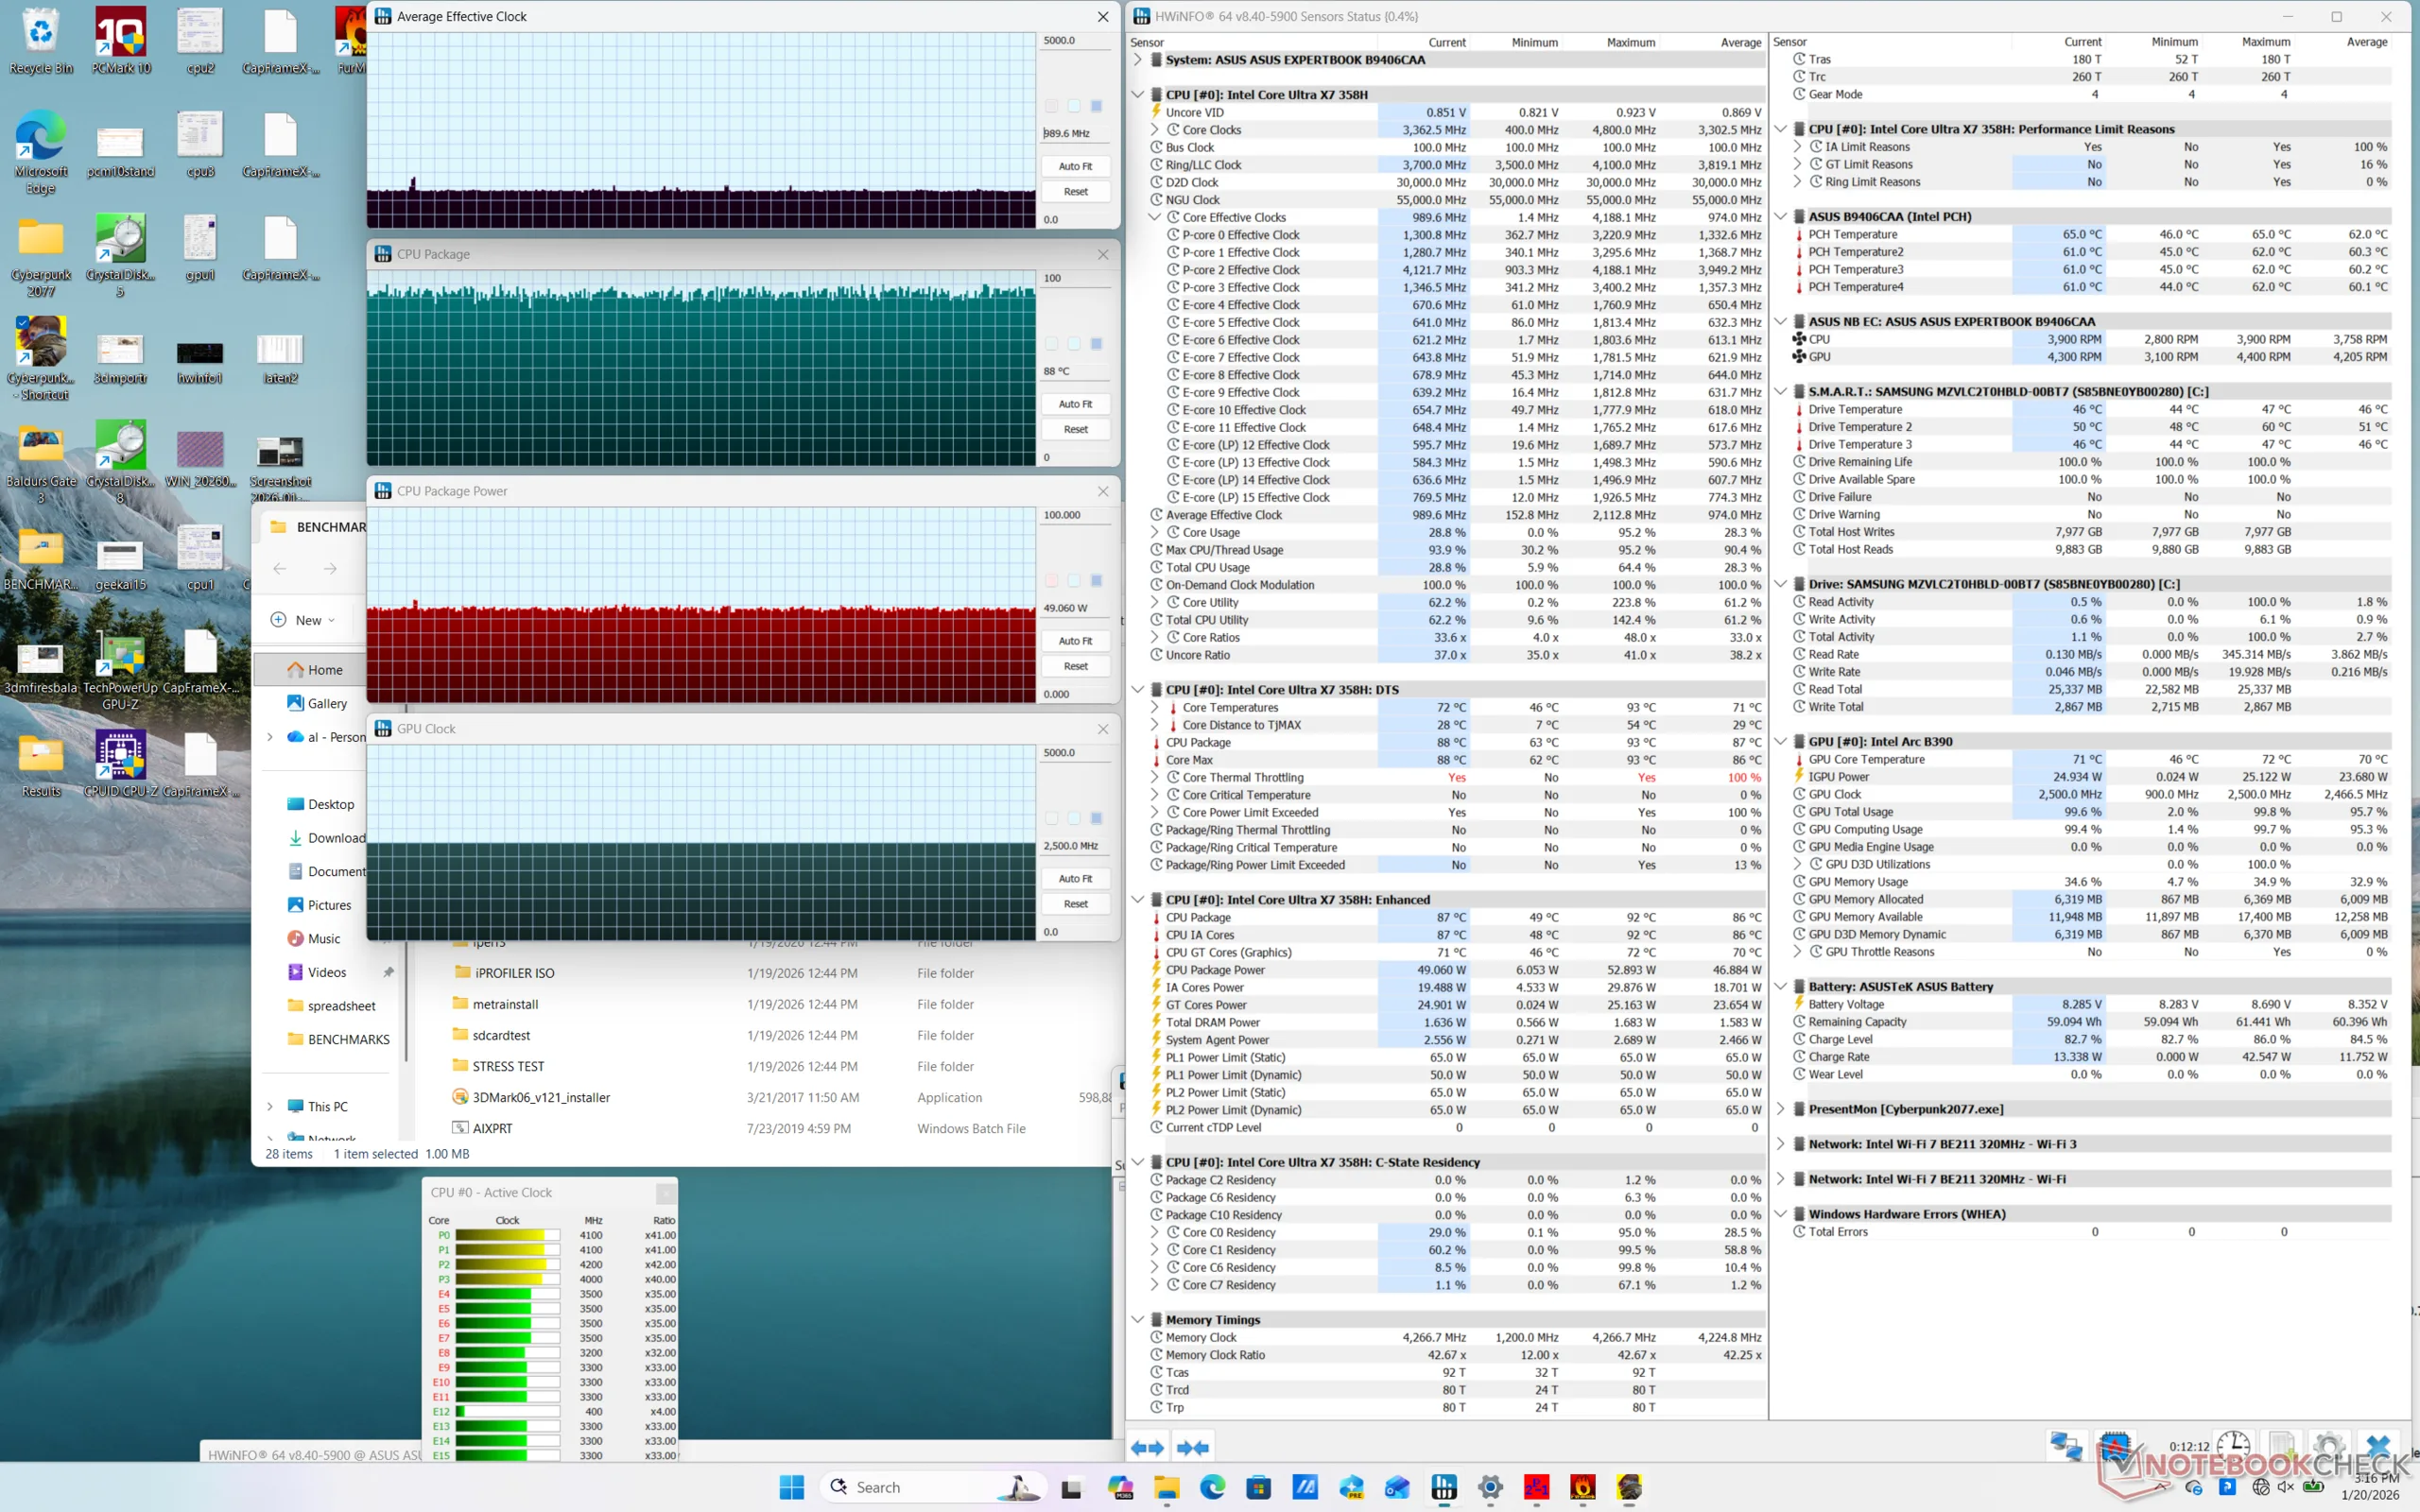
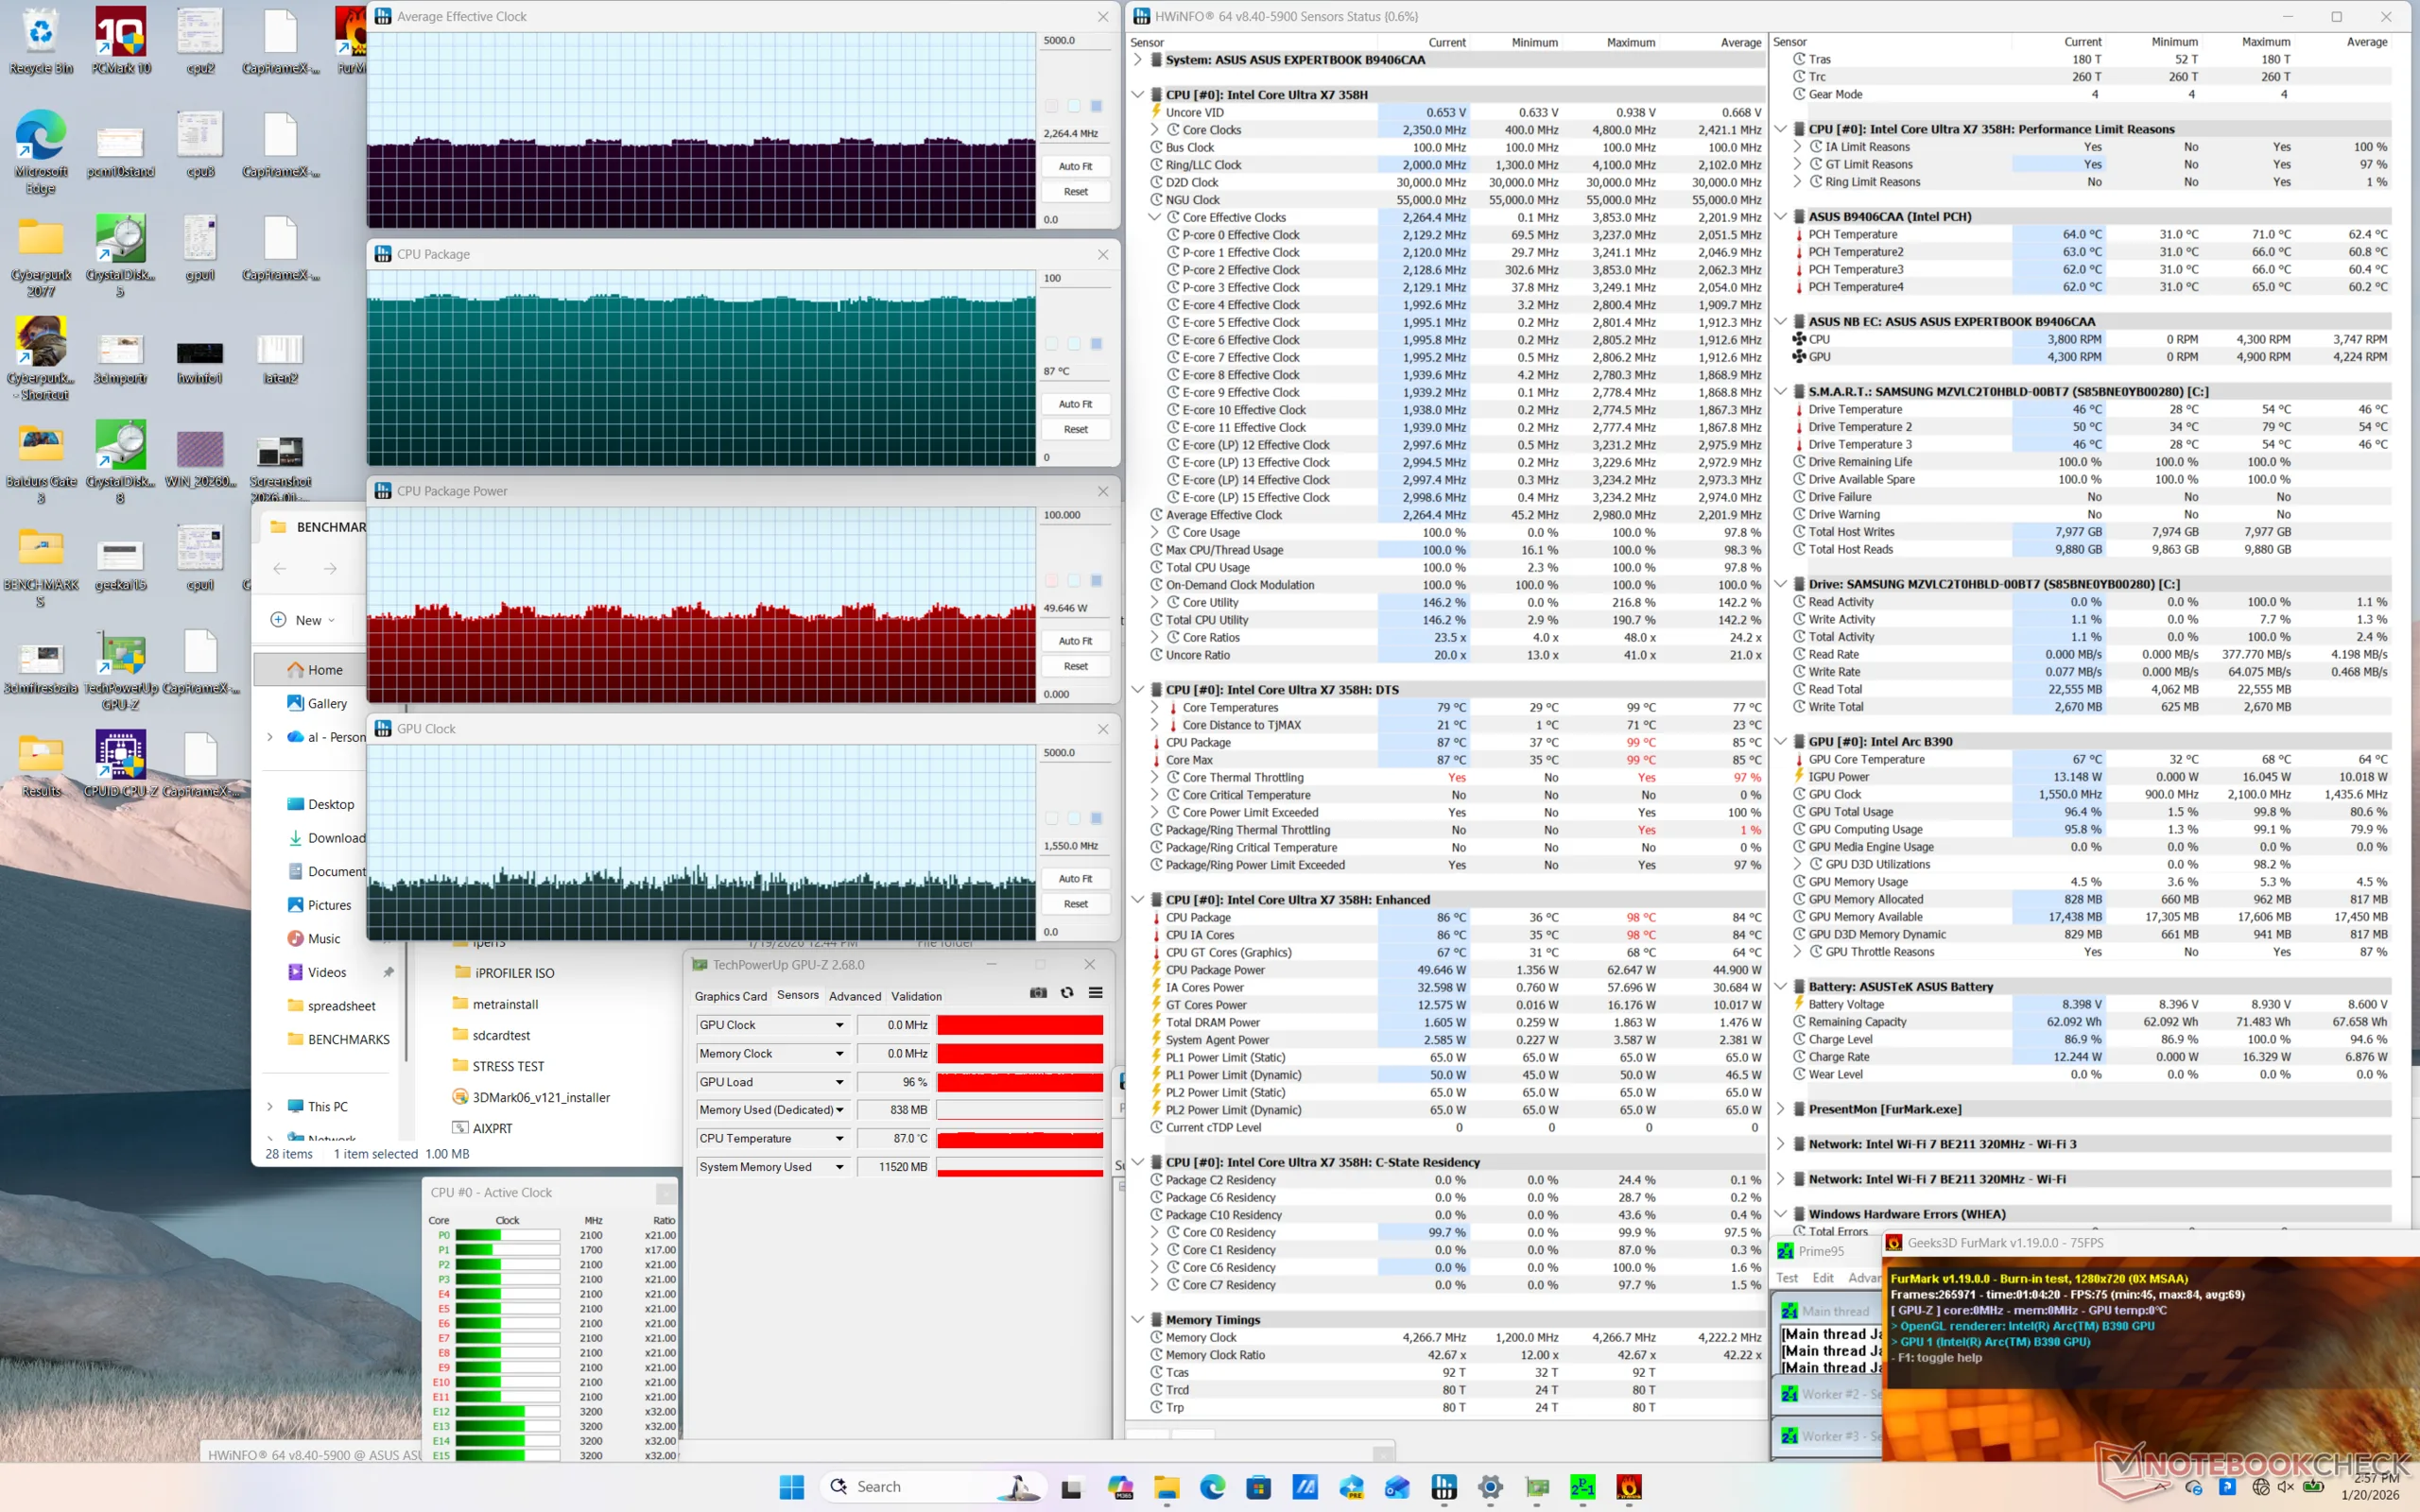
| CPU 时钟 (GHz) | GPU 时钟 (MHz) | CPU 平均温度 (°C) | |
| 系统闲置 | -- | -- | 37 |
| Prime95 压力 | 2.6 | 1000 | 89 |
| Prime95 + FurMark Stress | ~2.2 | ~1550 | 87 |
| 赛博朋克 2077》压力(平衡模式) | 0.6 | 2050 | 59 |
| 赛博朋克 2077》压力(性能模式) | 1.0 | 2500 | 88 |
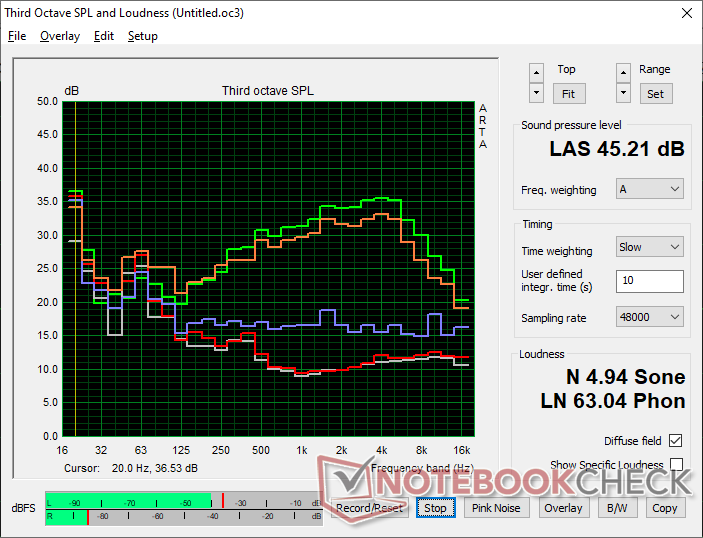
发言人
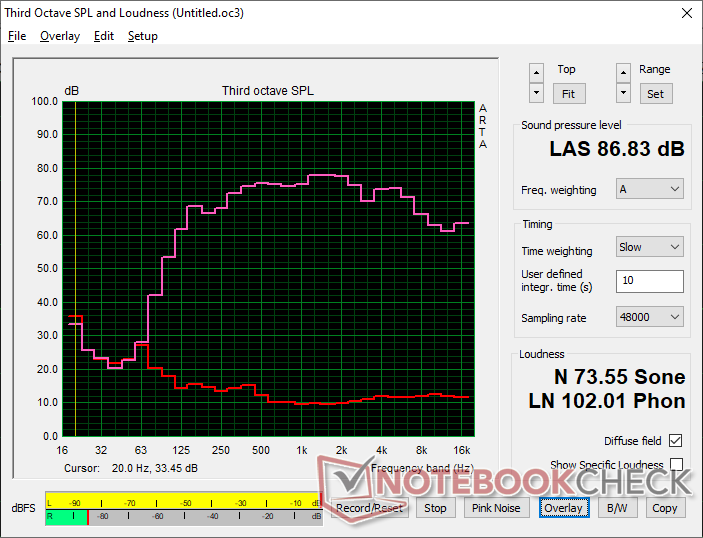
Asus ExpertBook Ultra B9406CAA audio analysis
(+) | speakers can play relatively loud (86.8 dB)
Bass 100 - 315 Hz
(±) | reduced bass - on average 8.4% lower than median
(±) | linearity of bass is average (9.3% delta to prev. frequency)
Mids 400 - 2000 Hz
(+) | balanced mids - only 2.5% away from median
(+) | mids are linear (1.5% delta to prev. frequency)
Highs 2 - 16 kHz
(+) | balanced highs - only 3.7% away from median
(+) | highs are linear (5.2% delta to prev. frequency)
Overall 100 - 16.000 Hz
(+) | overall sound is linear (8.5% difference to median)
Compared to same class
» 0% of all tested devices in this class were better, 0% similar, 99% worse
» The best had a delta of 7%, average was 21%, worst was 53%
Compared to all devices tested
» 2% of all tested devices were better, 1% similar, 97% worse
» The best had a delta of 4%, average was 23%, worst was 134%
Apple MacBook Pro 16 2021 M1 Pro audio analysis
(+) | speakers can play relatively loud (84.7 dB)
Bass 100 - 315 Hz
(+) | good bass - only 3.8% away from median
(+) | bass is linear (5.2% delta to prev. frequency)
Mids 400 - 2000 Hz
(+) | balanced mids - only 1.3% away from median
(+) | mids are linear (2.1% delta to prev. frequency)
Highs 2 - 16 kHz
(+) | balanced highs - only 1.9% away from median
(+) | highs are linear (2.7% delta to prev. frequency)
Overall 100 - 16.000 Hz
(+) | overall sound is linear (4.6% difference to median)
Compared to same class
» 0% of all tested devices in this class were better, 0% similar, 100% worse
» The best had a delta of 5%, average was 17%, worst was 45%
Compared to all devices tested
» 0% of all tested devices were better, 0% similar, 100% worse
» The best had a delta of 4%, average was 23%, worst was 134%
能源管理
耗电量
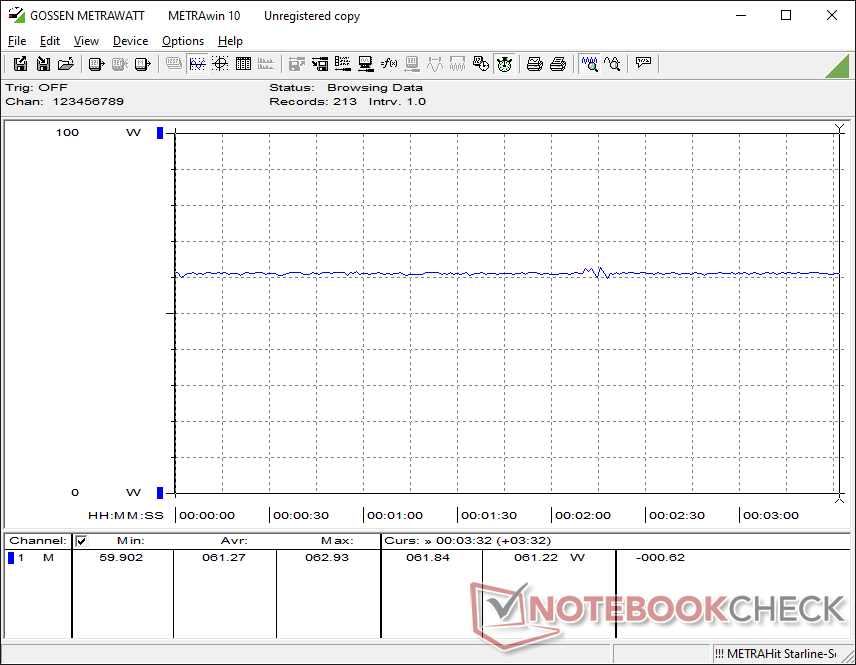
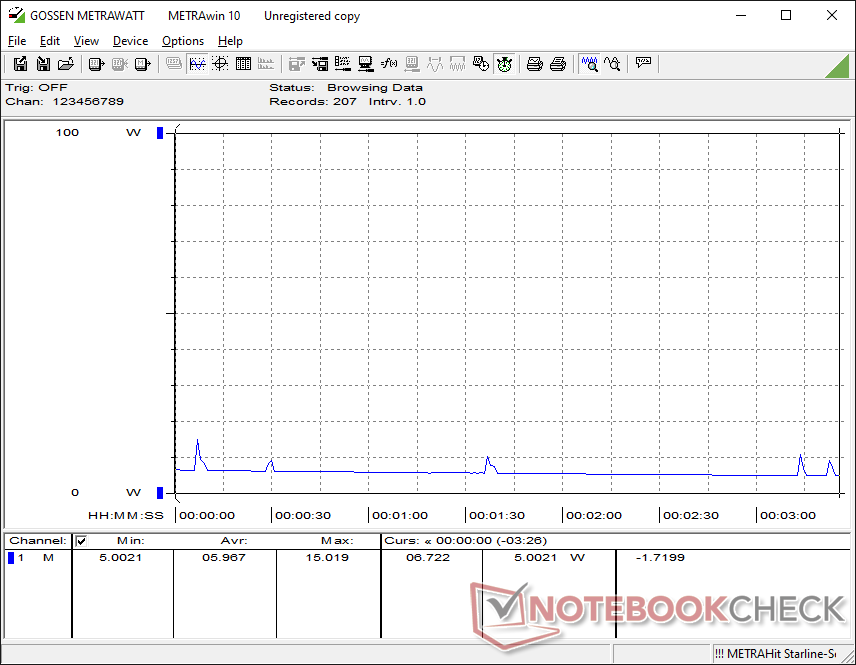
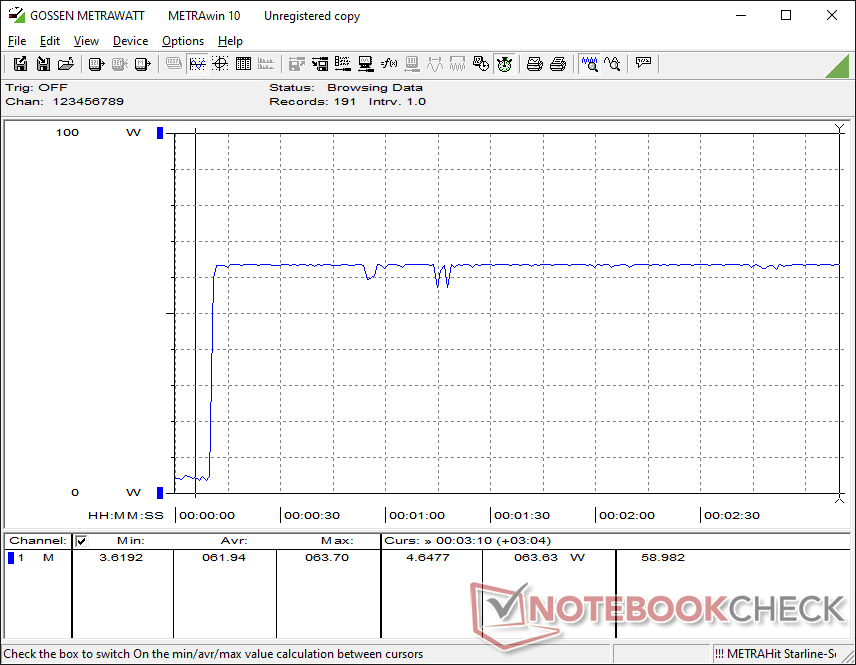
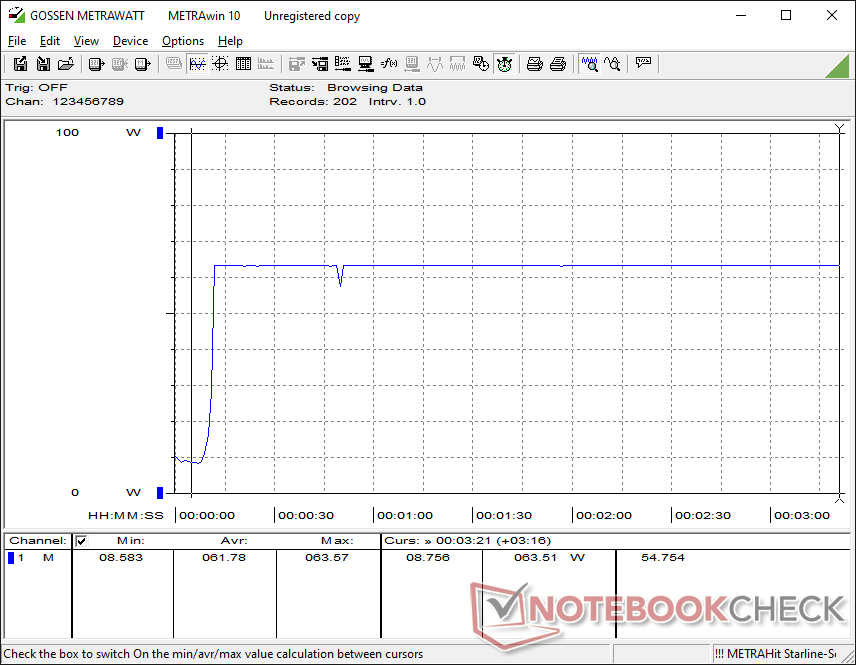
总体功耗与搭载Ryzen AI 9的联想ThinkPad P14s Gen 6十分相似,但有一些重要的观察结果。首先,运行《赛博朋克 2077》时,华硕的功耗约为 61 瓦,而联想的功耗为 56 瓦,尽管 Arc B890 在图形处理方面的性能快达 80%,每瓦性能优势明显。但另一方面,运行 Prime95 时的平均功耗为 64 瓦,而联想的功耗为 55 瓦,这表明在 CPU 每瓦性能方面的差异相对较小。
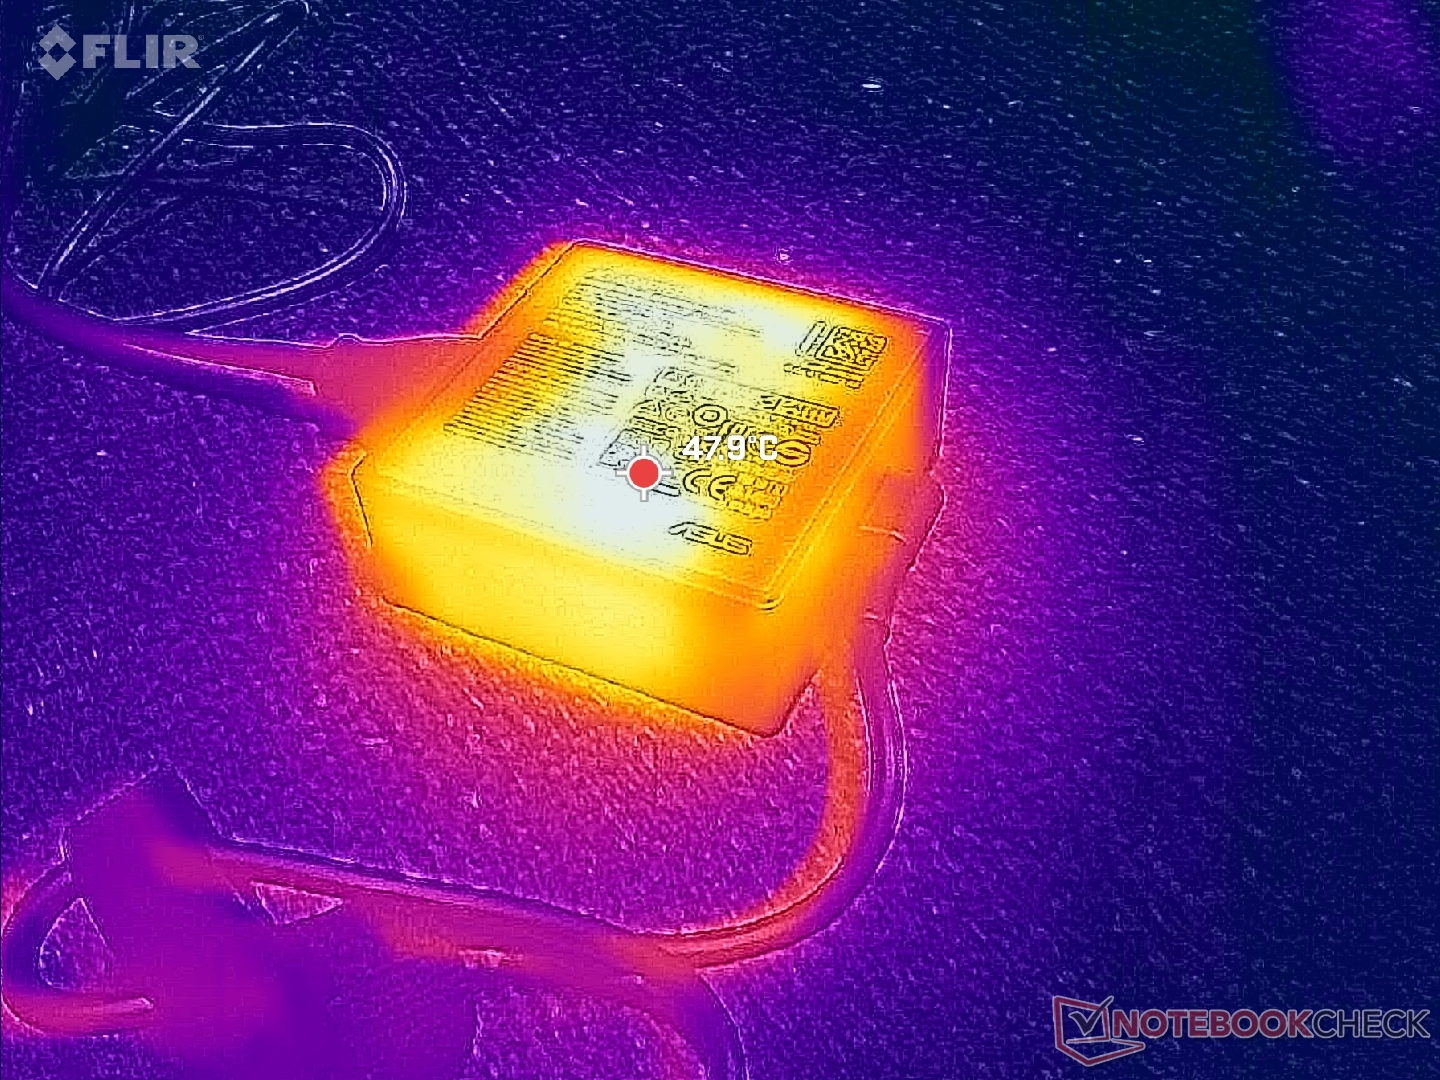
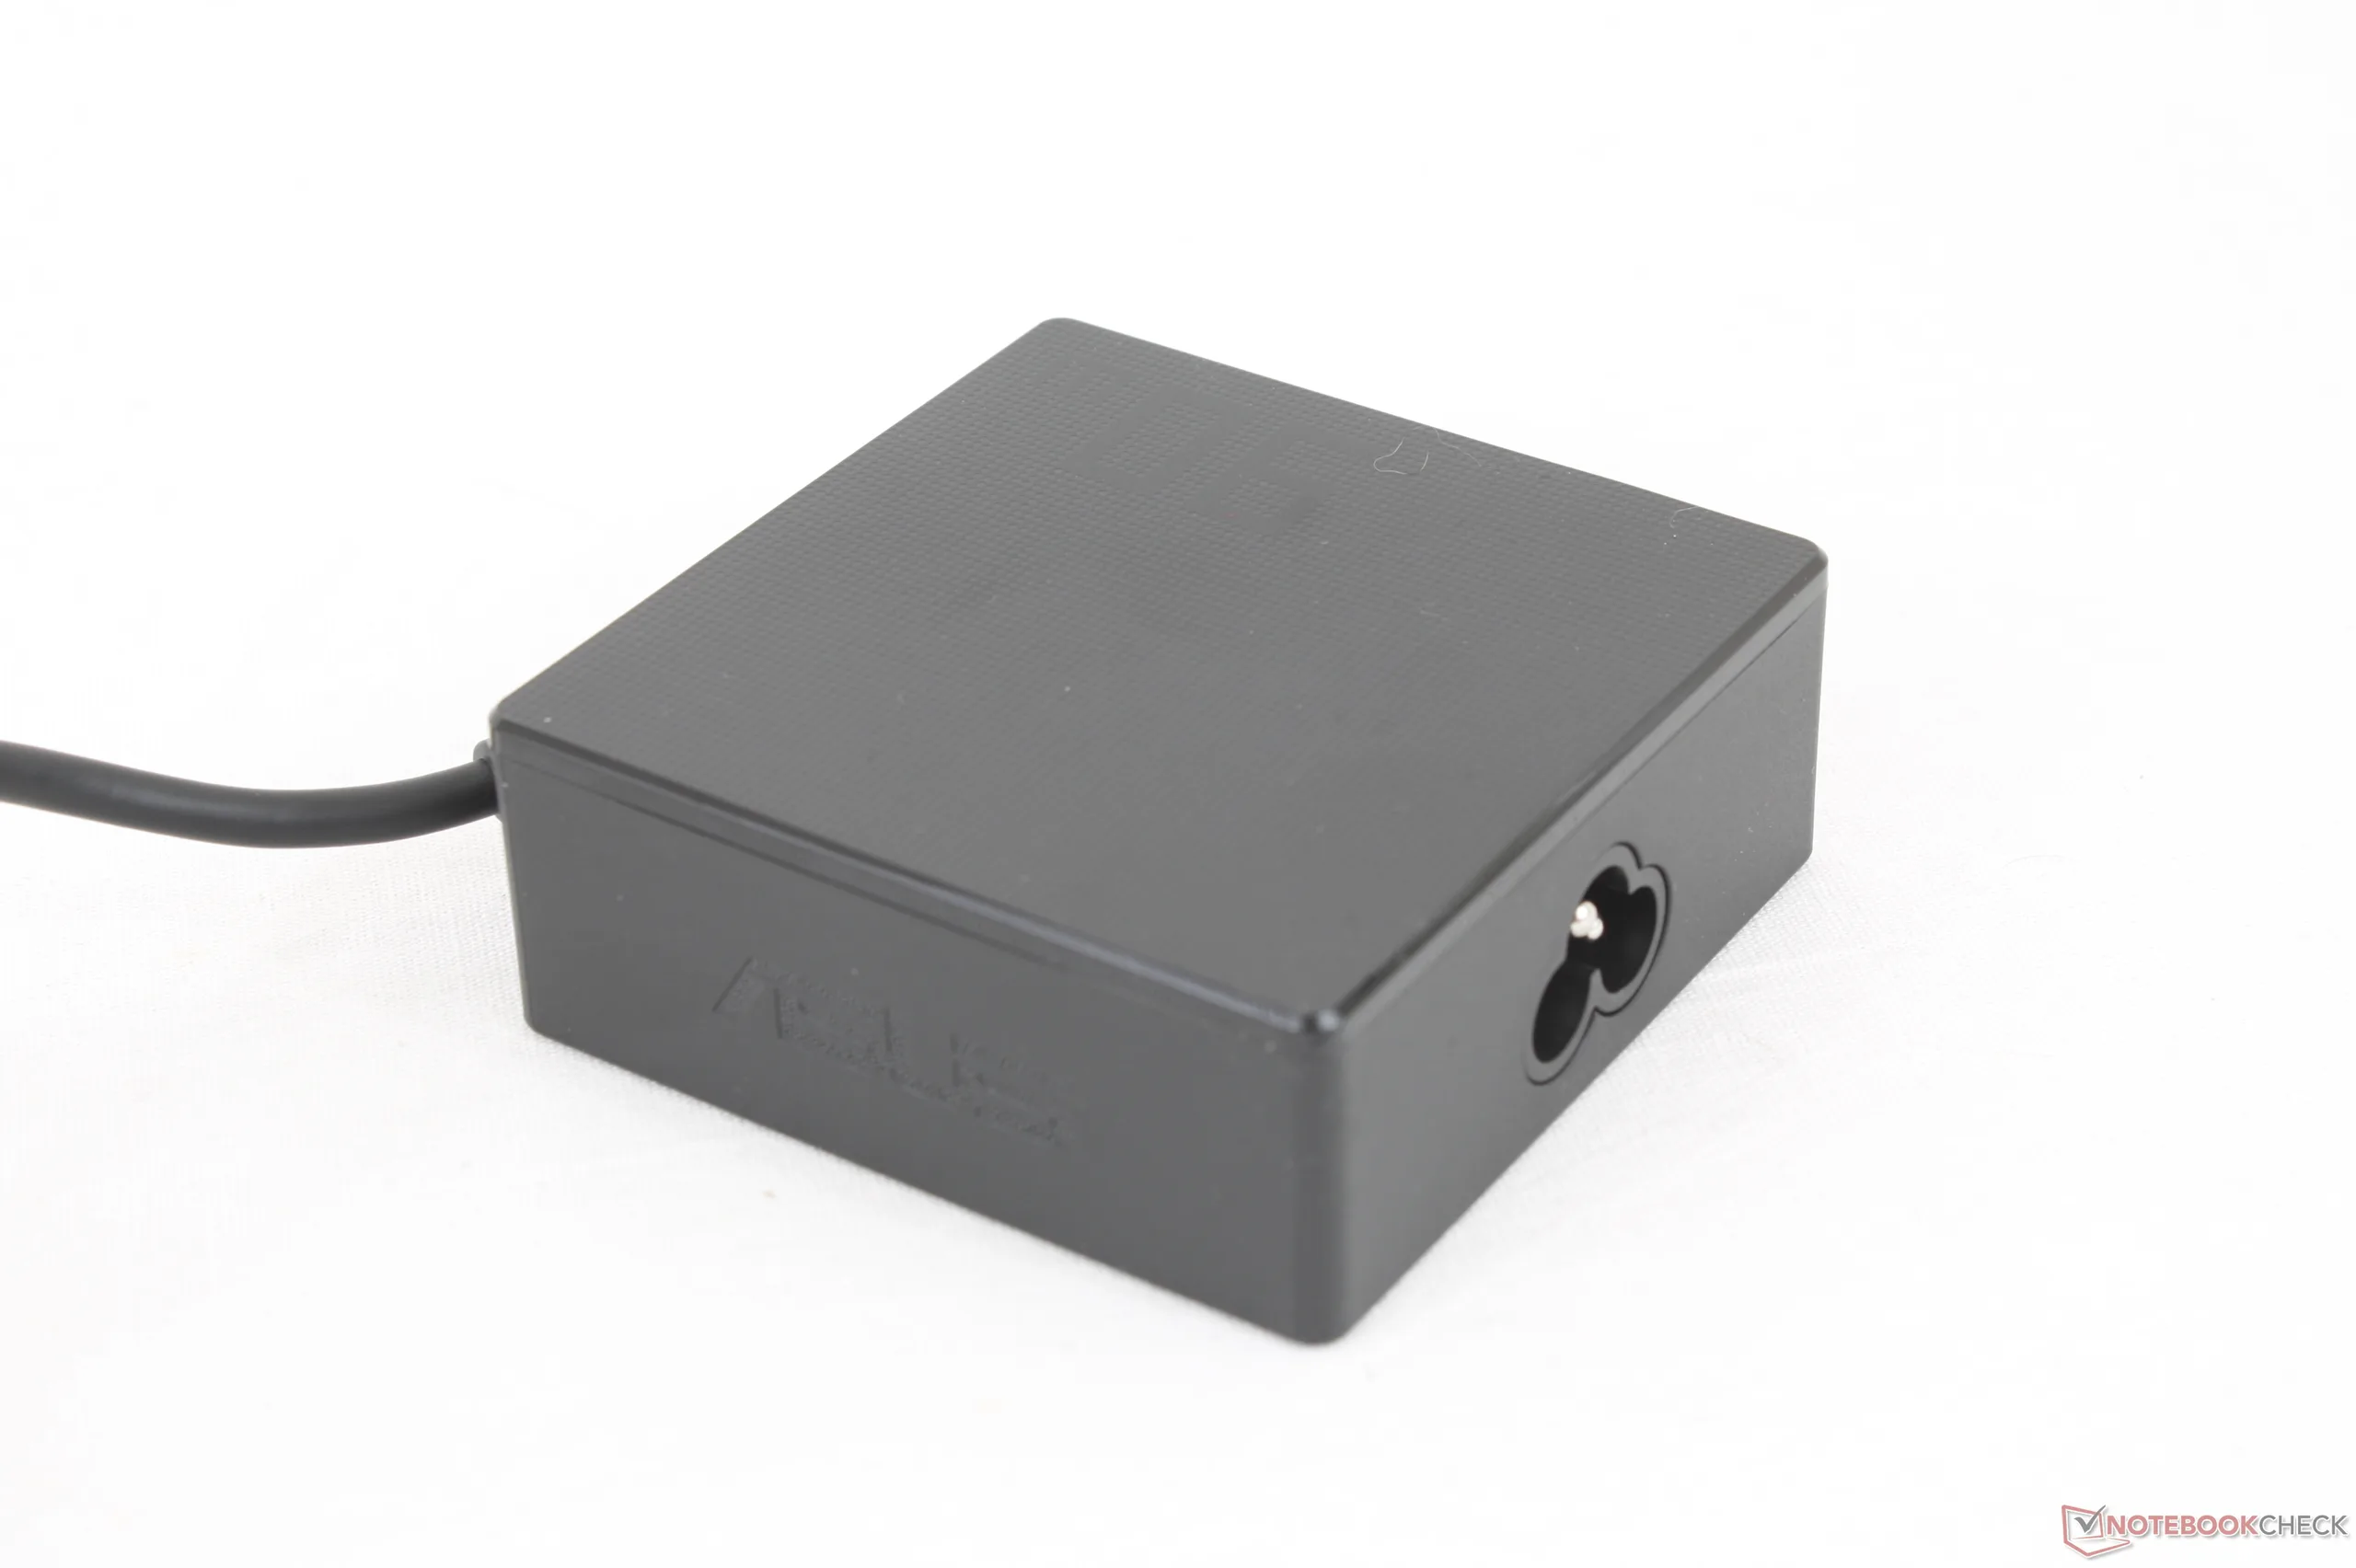
在使用附带的 90 瓦 USB-C AC 适配器时,CPU 满负荷运行时的总功耗峰值略低于 65 瓦。
| Off / Standby | |
| Idle | |
| Load |
|
Key:
min: | |
| Asus ExpertBook Ultra B9406CAA Ultra X7 358H, Arc B390 Panther Lake iGPU, Samsung PM9E1 MZVLC2T0HBLD, OLED, 2880x1800, 14" | Dell Pro 14 Plus PB14255 GH77W Ryzen AI 7 PRO 350, Radeon 860M, Micron 2500 1TB MTFDKBA1T0QGN, IPS LED, 1920x1200, 14" | Asus ExpertBook PM3406 Ryzen AI 7 350, Radeon 860M, Western Digital PC SN5000S SDEQNSJ-512G-1002, IPS, 1920x1200, 14" | Lenovo ThinkPad T14s Gen 6 Intel Core Ultra 5 228V, Arc 130V, SK hynix PCB01 HFS001TFM9X179N GL, IPS LED, 1920x1200, 14" | Samsung Galaxy Book5 Pro 14 940XHA Core Ultra 5 226V, Arc 130V, Samsung PM9C1 MZVL8512HELU, OLED, 2880x1800, 14" | HP EliteBook Ultra G1i 14 Core Ultra 7 258V, Arc 140V, Kioxia XG8 KXG80ZNV1T02, OLED, 2880x1800, 14" | |
|---|---|---|---|---|---|---|
| Power Consumption | -9% | -15% | 15% | 8% | 7% | |
| Idle Minimum * (Watt) | 3.5 | 3.7 -6% | 3.2 9% | 3 14% | 3.7 -6% | 3.7 -6% |
| Idle Average * (Watt) | 4 | 7.3 -83% | 6.1 -53% | 4.7 -18% | 5.2 -30% | 5.4 -35% |
| Idle Maximum * (Watt) | 5.3 | 8.5 -60% | 6.9 -30% | 5.4 -2% | 5.4 -2% | 5.7 -8% |
| Load Average * (Watt) | 43.7 | 37.4 14% | 56.4 -29% | 31.8 27% | 26.2 40% | 39.4 10% |
| Cyberpunk 2077 ultra * (Watt) | 61.3 | 35.9 41% | 64.9 -6% | 38.7 37% | 47.4 23% | 35.3 42% |
| Cyberpunk 2077 ultra external monitor * (Watt) | 61.4 | 40.3 34% | 45.3 26% | 37.1 40% | 42.7 30% | 32.4 47% |
| Load Maximum * (Watt) | 63.4 | 64.6 -2% | 76.1 -20% | 58.9 7% | 63.5 -0% | 62.9 1% |
* ... smaller is better
功耗 赛博朋克/压力测试
外部显示器功耗
电池寿命
虽然 70 Wh 的容量在 14 英寸大小的同类产品中很普通,但电池续航时间却一点也不普通。在自动关机前,华硕的 WLAN 实际浏览时间可超过 16 小时,比许多其他子笔记本电脑(包括该公司自己的 AMD 笔记本电脑)要长几个小时。 专家本 PM3406.
| Asus ExpertBook Ultra B9406CAA Ultra X7 358H, Arc B390 Panther Lake iGPU, 70 Wh | Dell Pro 14 Plus PB14255 GH77W Ryzen AI 7 PRO 350, Radeon 860M, 55 Wh | Asus ExpertBook PM3406 Ryzen AI 7 350, Radeon 860M, 70 Wh | Lenovo ThinkPad P14s Gen 6 21QT0012GE Ultra 7 265H, RTX PRO 500 Blackwell Generation Laptop, 75 Wh | Samsung Galaxy Book5 Pro 14 940XHA Core Ultra 5 226V, Arc 130V, 63 Wh | HP EliteBook Ultra G1i 14 Core Ultra 7 258V, Arc 140V, 64 Wh | |
|---|---|---|---|---|---|---|
| Battery runtime | -27% | -13% | -38% | -37% | -25% | |
| WiFi v1.3 (h) | 16.1 | 11.8 -27% | 14 -13% | 10 -38% | 10.1 -37% | 12 -25% |
| Load (h) | 1.8 | 2 |
笔记本检查评级
顶级轻型商务笔记本电脑,具有令人印象深刻的单位体积性能,但混合输入设备和哑光 OLED 触摸屏。
Asus ExpertBook Ultra B9406CAA
- 01/26/2026 v8
Allen Ngo
 Total Sustainability Score:
 潜在竞争对手比较
Image | Model / Review | Price | Weight | Height | Display |
|---|---|---|---|---|---|
1. 87.6%  | Asus ExpertBook Ultra B9406CAA Intel Core Ultra X7 358H ⎘ Intel Arc B390 12 Xe3 Panther Lake iGPU ⎘ 32 GB Memory, 2048 GB SSD | Amazon: | 1.1 kg | 15.9 mm | 14.00" 2880x1800 243 PPI OLED |
2. 84.5%  | Dell Pro 14 Plus PB14255 GH77W AMD Ryzen AI 7 PRO 350 ⎘ AMD Radeon 860M ⎘ 32 GB Memory, 1024 GB SSD | Amazon: List Price: 1630 Euro | 1.6 kg | 22 mm | 14.00" 1920x1200 162 PPI IPS LED |
3. 84.7%  | Asus ExpertBook PM3406 AMD Ryzen AI 7 350 ⎘ AMD Radeon 860M ⎘ 16 GB Memory, 512 GB SSD | Amazon: List Price: 979€ | 1.4 kg | 17.9 mm | 14.00" 1920x1200 162 PPI IPS |
4. 85.3%  | Lenovo ThinkPad P14s Gen 6 21QT0012GE Intel Core Ultra 7 265H ⎘ NVIDIA RTX PRO 500 Blackwell Generation Laptop ⎘ 64 GB Memory, 2048 GB SSD | Amazon: List Price: 2760 Euro | 1.7 kg | 23 mm | 14.50" 3072x1920 250 PPI IPS LED |
5. 86.9%  | Samsung Galaxy Book5 Pro 14 940XHA Intel Core Ultra 5 226V ⎘ Intel Arc Graphics 130V ⎘ 16 GB Memory, 512 GB SSD | Amazon: List Price: 1699€ | 1.2 kg | 11.6 mm | 14.00" 2880x1800 243 PPI OLED |
6. 89.6%  | HP EliteBook Ultra G1i 14 Intel Core Ultra 7 258V ⎘ Intel Arc Graphics 140V ⎘ 32 GB Memory, 1024 GB SSD | Amazon: List Price: 2349€ | 1.2 kg | 12.1 mm | 14.00" 2880x1800 243 PPI OLED |
Transparency
The selection of devices to be reviewed is made by our editorial team. The test sample was provided to the author as a loan by the manufacturer or retailer for the purpose of this review. The lender had no influence on this review, nor did the manufacturer receive a copy of this review before publication. There was no obligation to publish this review. As an independent media company, Notebookcheck is not subjected to the authority of manufacturers, retailers or publishers.
This is how Notebookcheck is testing
Every year, Notebookcheck independently reviews hundreds of laptops and smartphones using standardized procedures to ensure that all results are comparable. We have continuously developed our test methods for around 20 years and set industry standards in the process. In our test labs, high-quality measuring equipment is utilized by experienced technicians and editors. These tests involve a multi-stage validation process. Our complex rating system is based on hundreds of well-founded measurements and benchmarks, which maintains objectivity. Further information on our test methods can be found here.

