结论 - 微星迄今最薄、最专业的笔记本电脑
就像从 2025 戴尔 16 Premium到 2026 XPS 16一样,2026 Prestige 16 比 2025 Prestige 16 更精简、更时尚、更高效。 2025 威望 16.这在很大程度上是因为采用了英特尔 Panther Lake X7 处理器,每瓦性能比上一代产品有了显著提升。鉴于微星比其他大多数采用类似处理器的 16 英寸笔记本电脑更薄,GPU 性能尤其令人印象深刻。
除了 CPU 之外,微星今年还引入了从端口到显示屏的重大变化。大多数变化都是飞跃性的,包括 120 Hz OLED 面板和更专业的美学设计,但端口的减少和电池的缩小则让人喜忧参半。核心温度比竞争对手更高,而 65 W USB-C AC 适配器在某些条件下会影响 Turbo Boost 性能和充电速度。
如果用户不介意系统稍厚稍重,那么 XPS 16 将是一个很好的选择,因为它提供了分辨率更高的触摸屏和网络摄像头,但端口选项较少,电池续航时间较短。与此同时,采用 AMD 技术的 华硕 Zenbook S16更轻、更小,CPU 性能和面板选项与之相似,但风扇声音更大,图形性能更差。根据您的具体需求,一种机型可能比另一种机型更好。
Pros
Cons
价格和供应情况
截至发稿时,微星 Prestige 16 AI+ C3MTG Clamshell 尚未广泛上市。不过,Prestige 16 Flip AI+ C3MTG现已发货,起价 2150 美元。
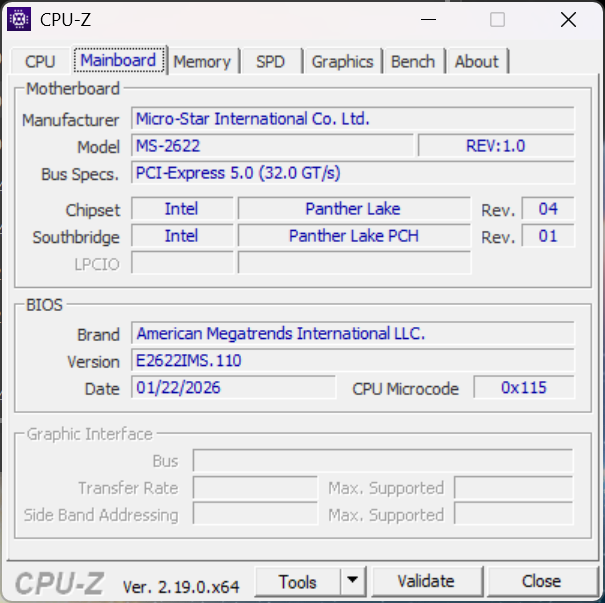
Prestige 16 AI+ C3MG Clamshell 是 在 CES 2026 上亮相同时亮相的还有一系列其他 Prestige 型号,它们都配备了英特尔 Panther Lake CPU。与去年采用箭湖处理器的机型相比,最新的 Prestige 16 经过了全面重新设计,用户体验焕然一新。
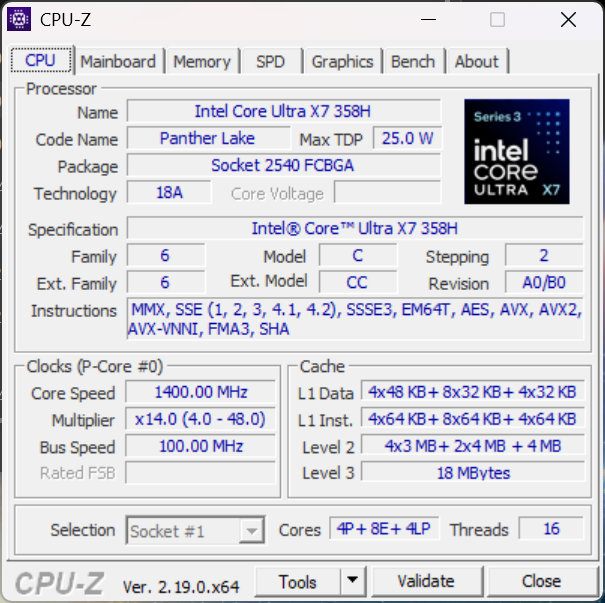
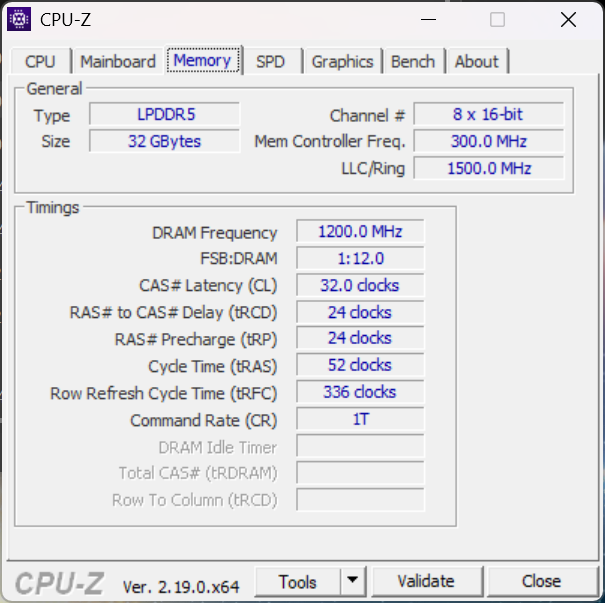
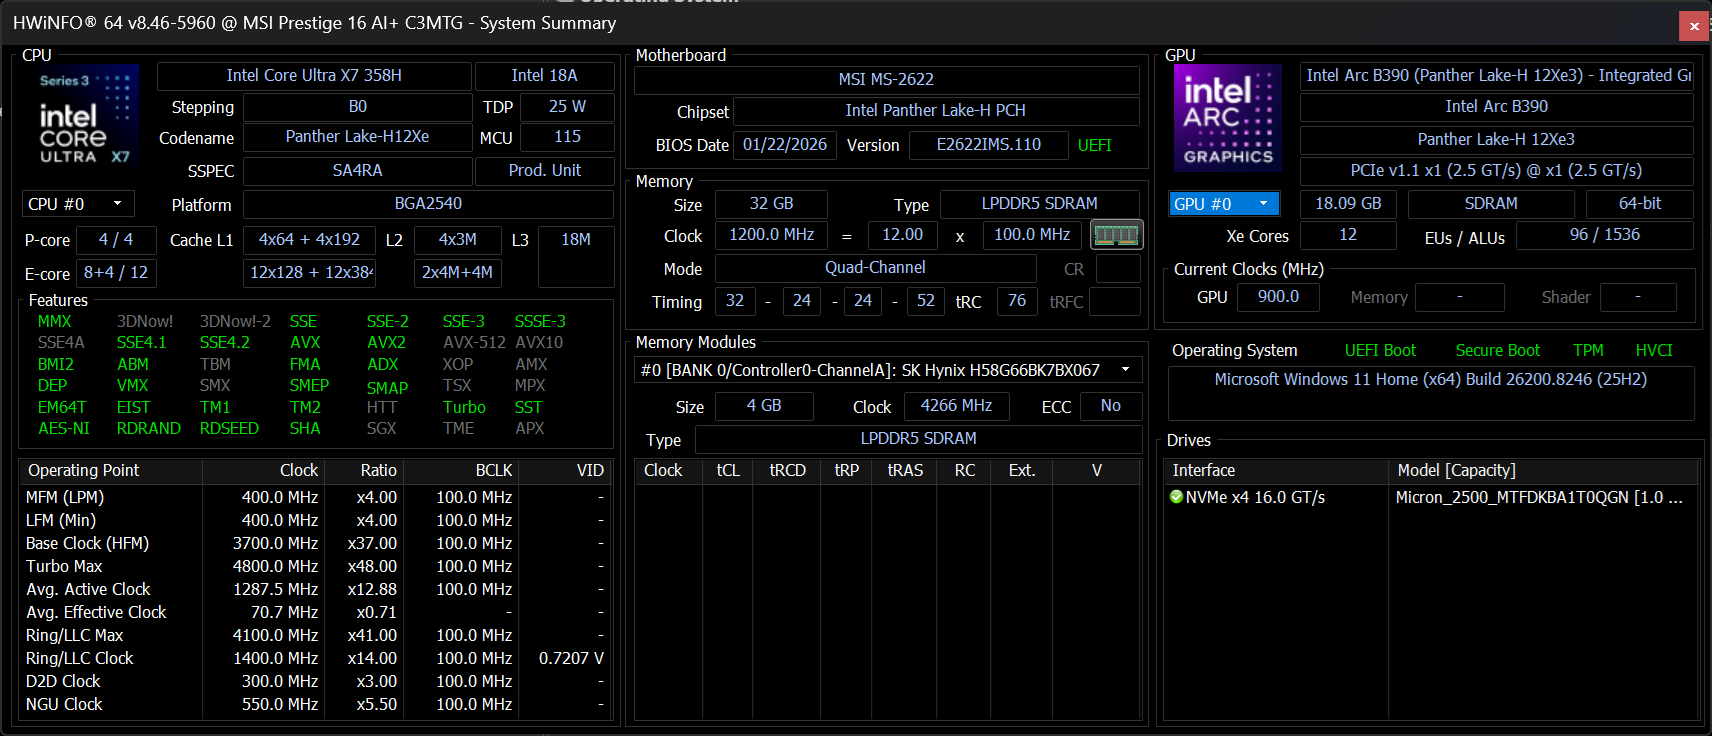
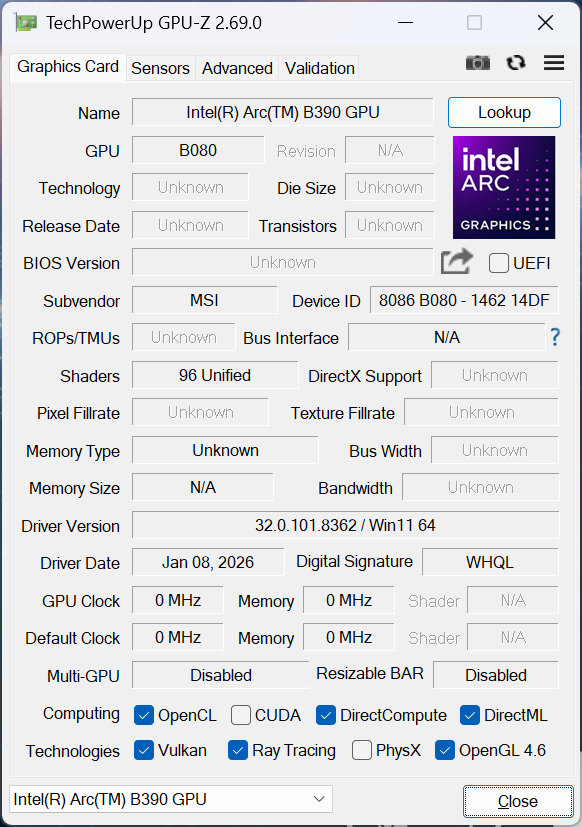
我们的测试机配置了 Core Ultra X7 358H CPU、32 GB 内存和 1800p OLED 触摸屏,售价约为 2100 美元。其他型号可能会配备 Core Ultra X9 388H,但 1800p OLED 和 Arc B390 GPU 保持不变。
竞争机型包括其他高端消费类笔记本电脑,如 戴尔 XPS 16, 联想 Pro 9i 16 Aura或 华硕 ZenBook S16系列。此外,还有一款配备 360 度铰链的可折叠版本,名为 Prestige 16 Flip AI+ C3MG。
更多微星评论:
规格
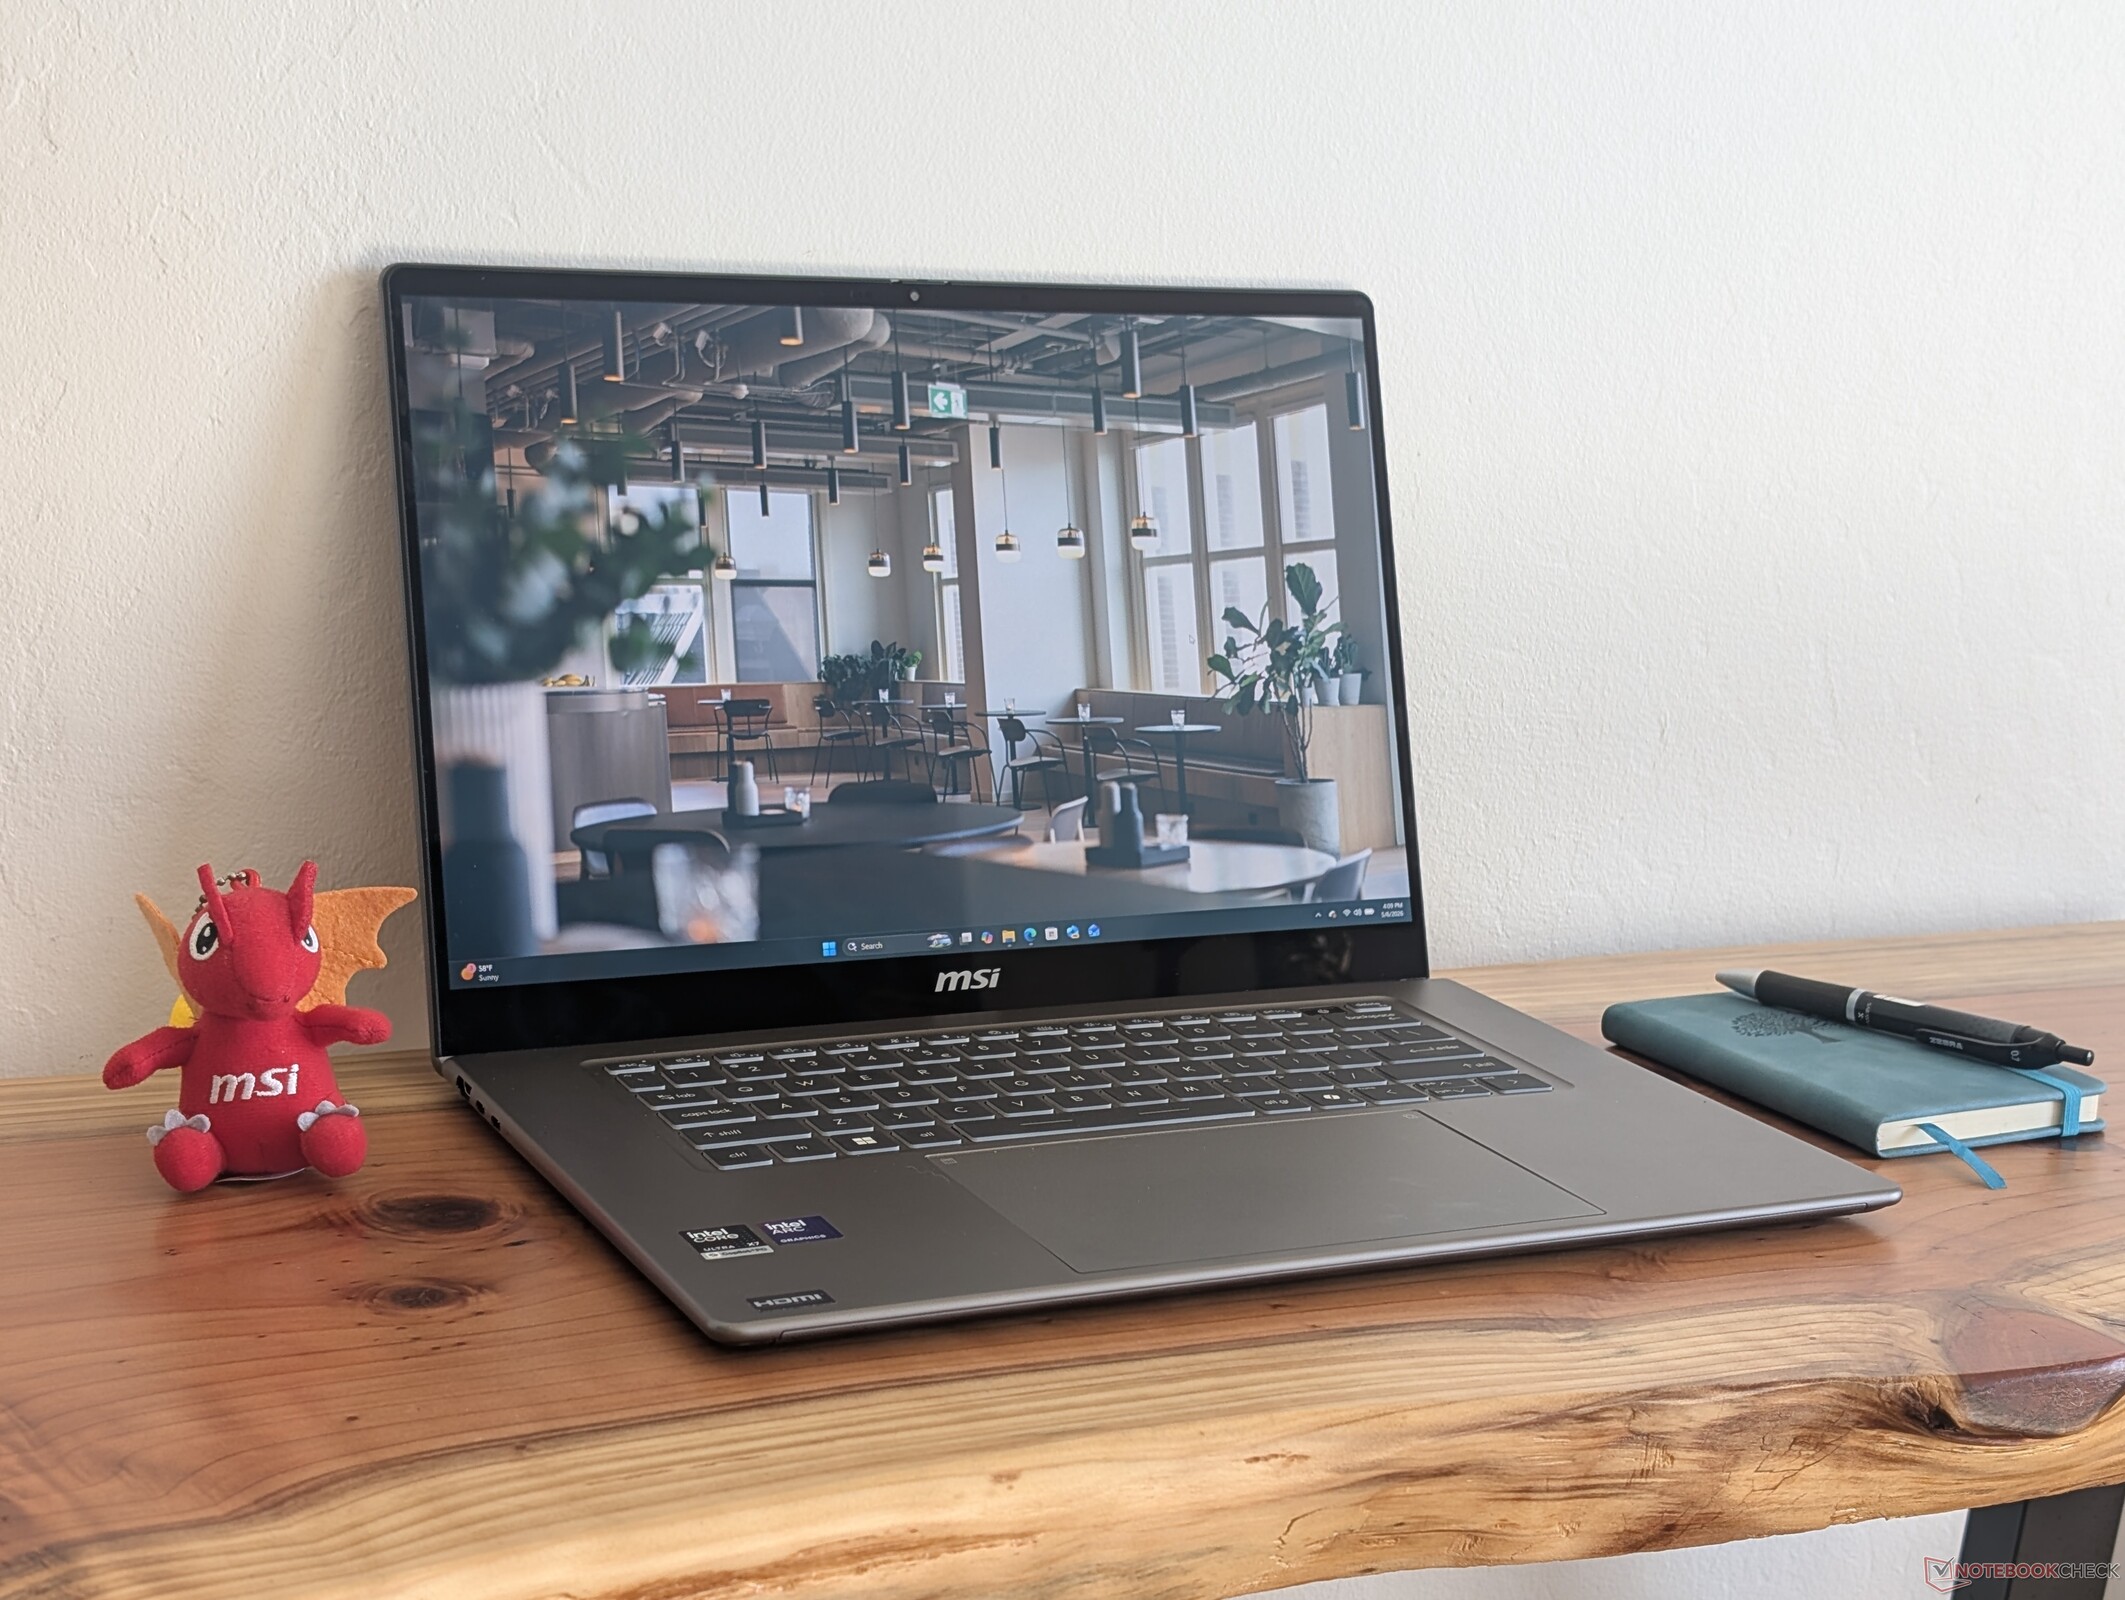
案例
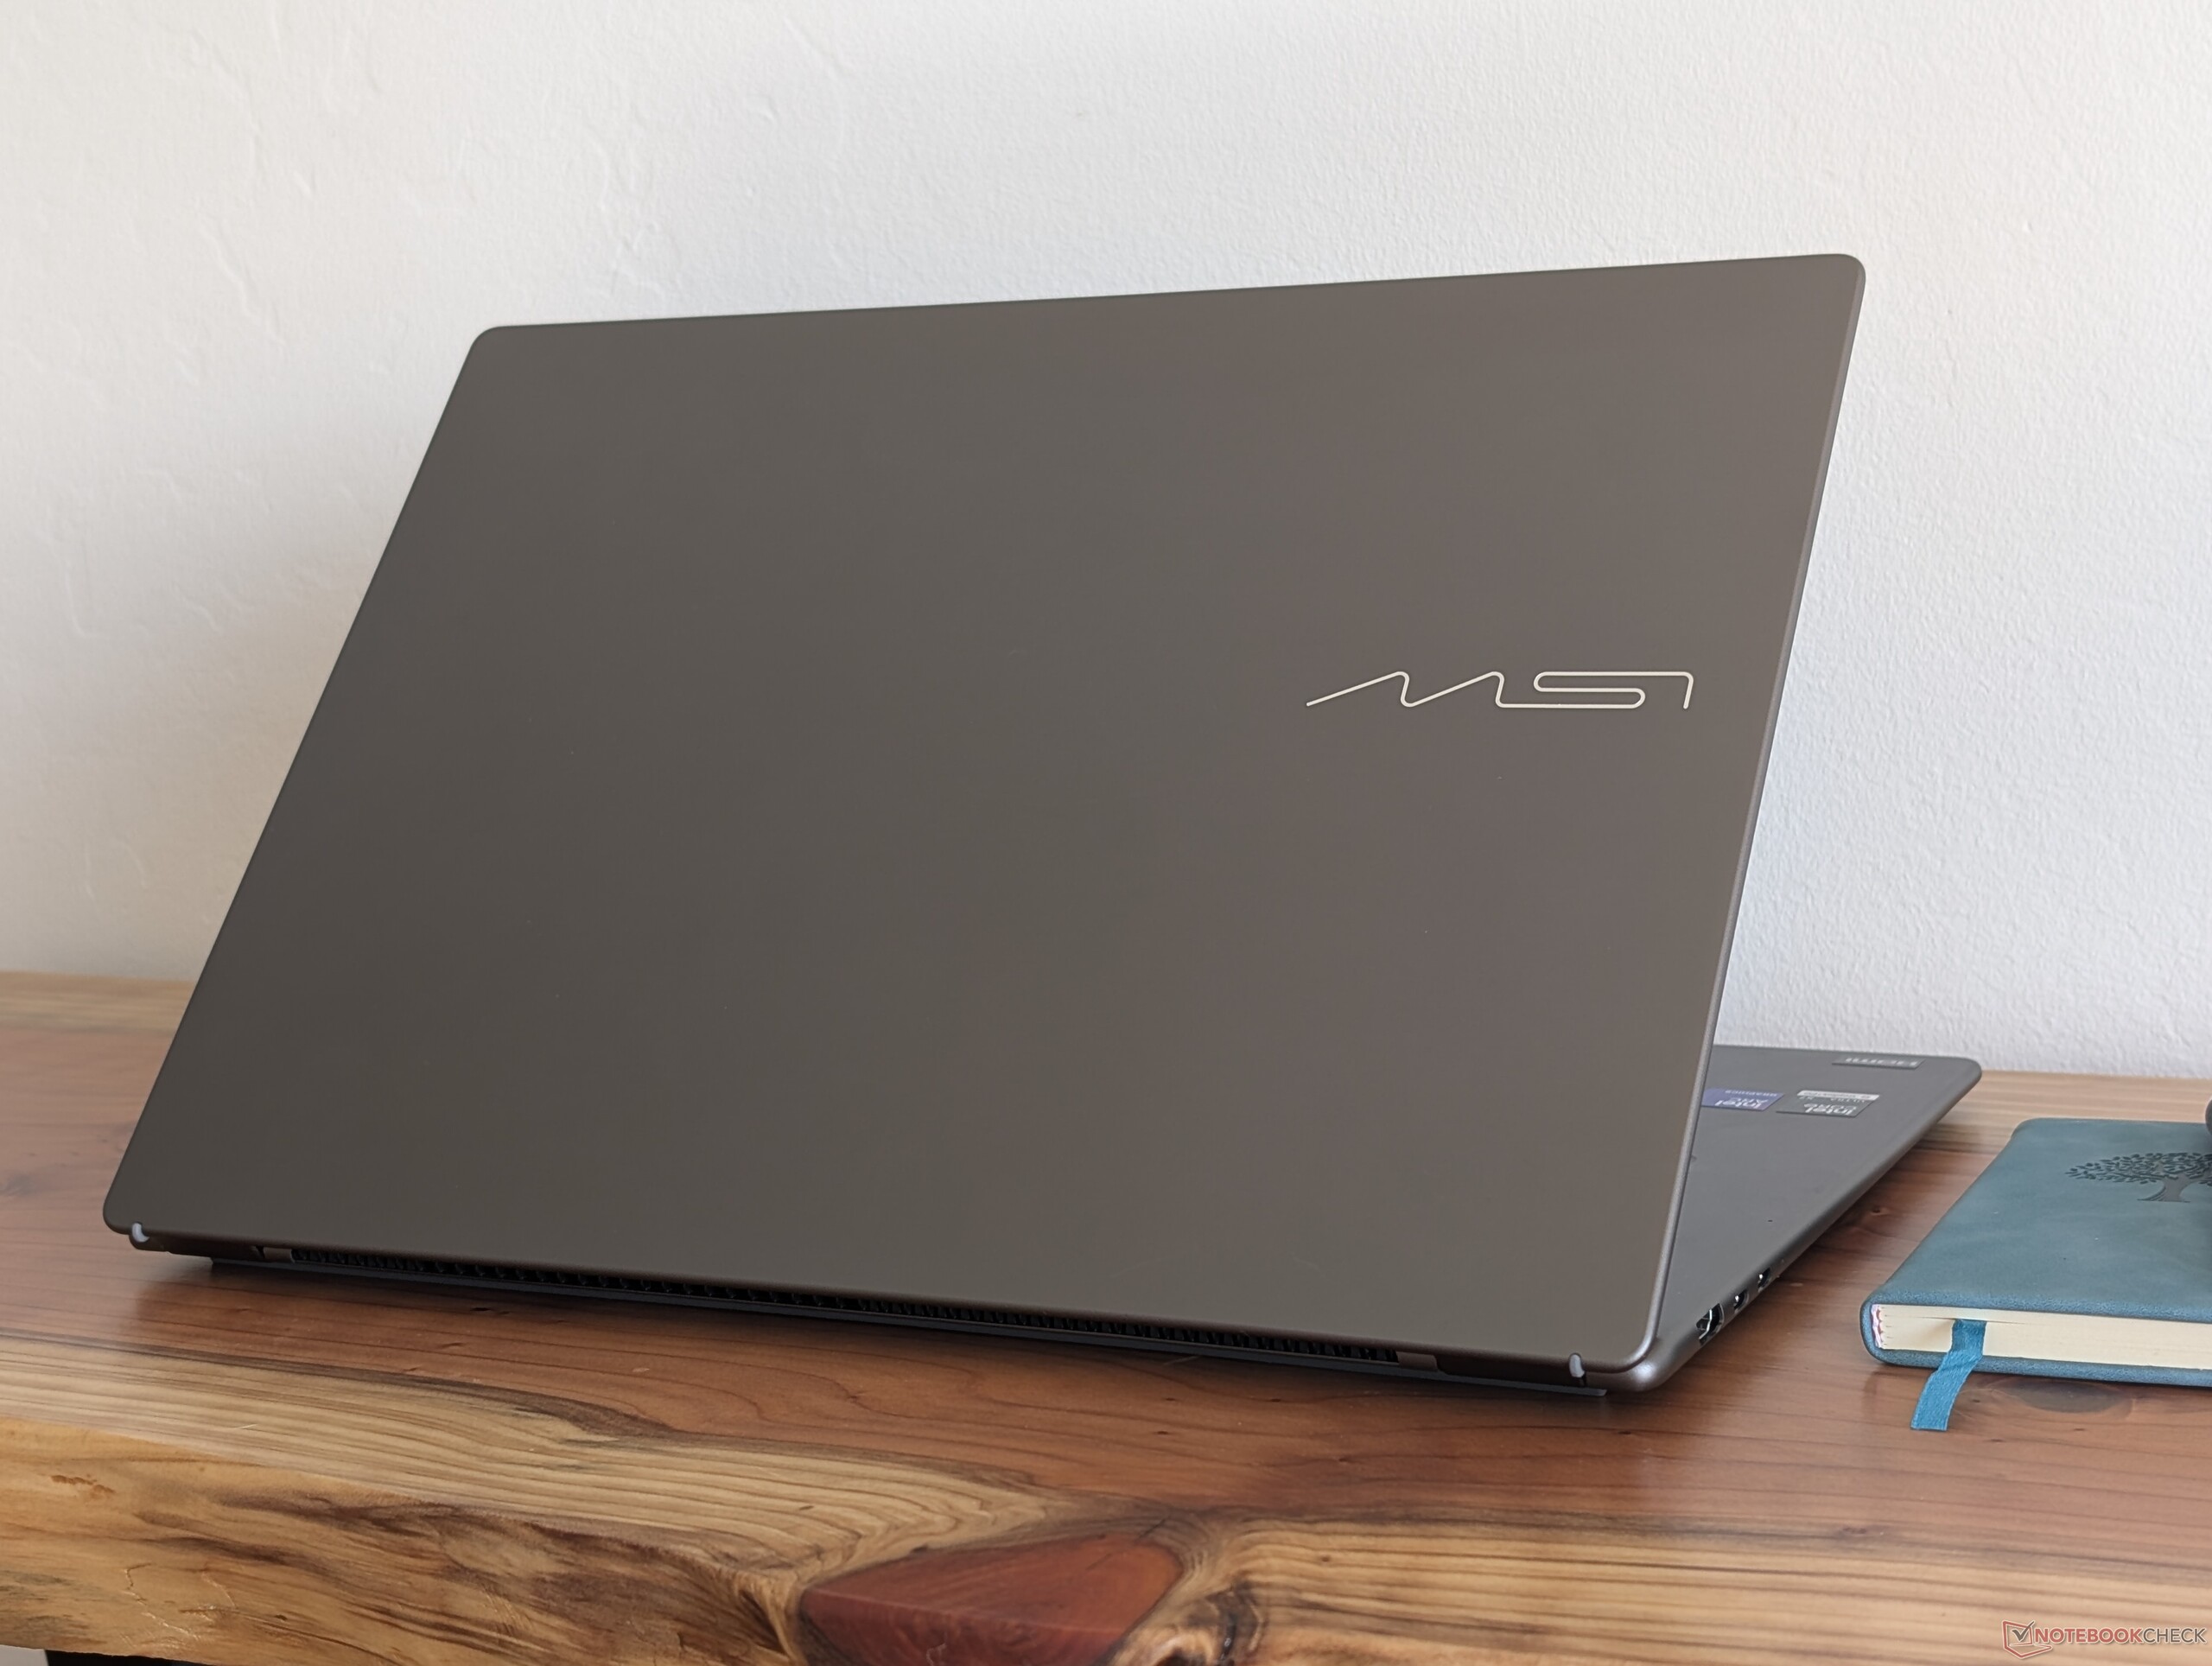
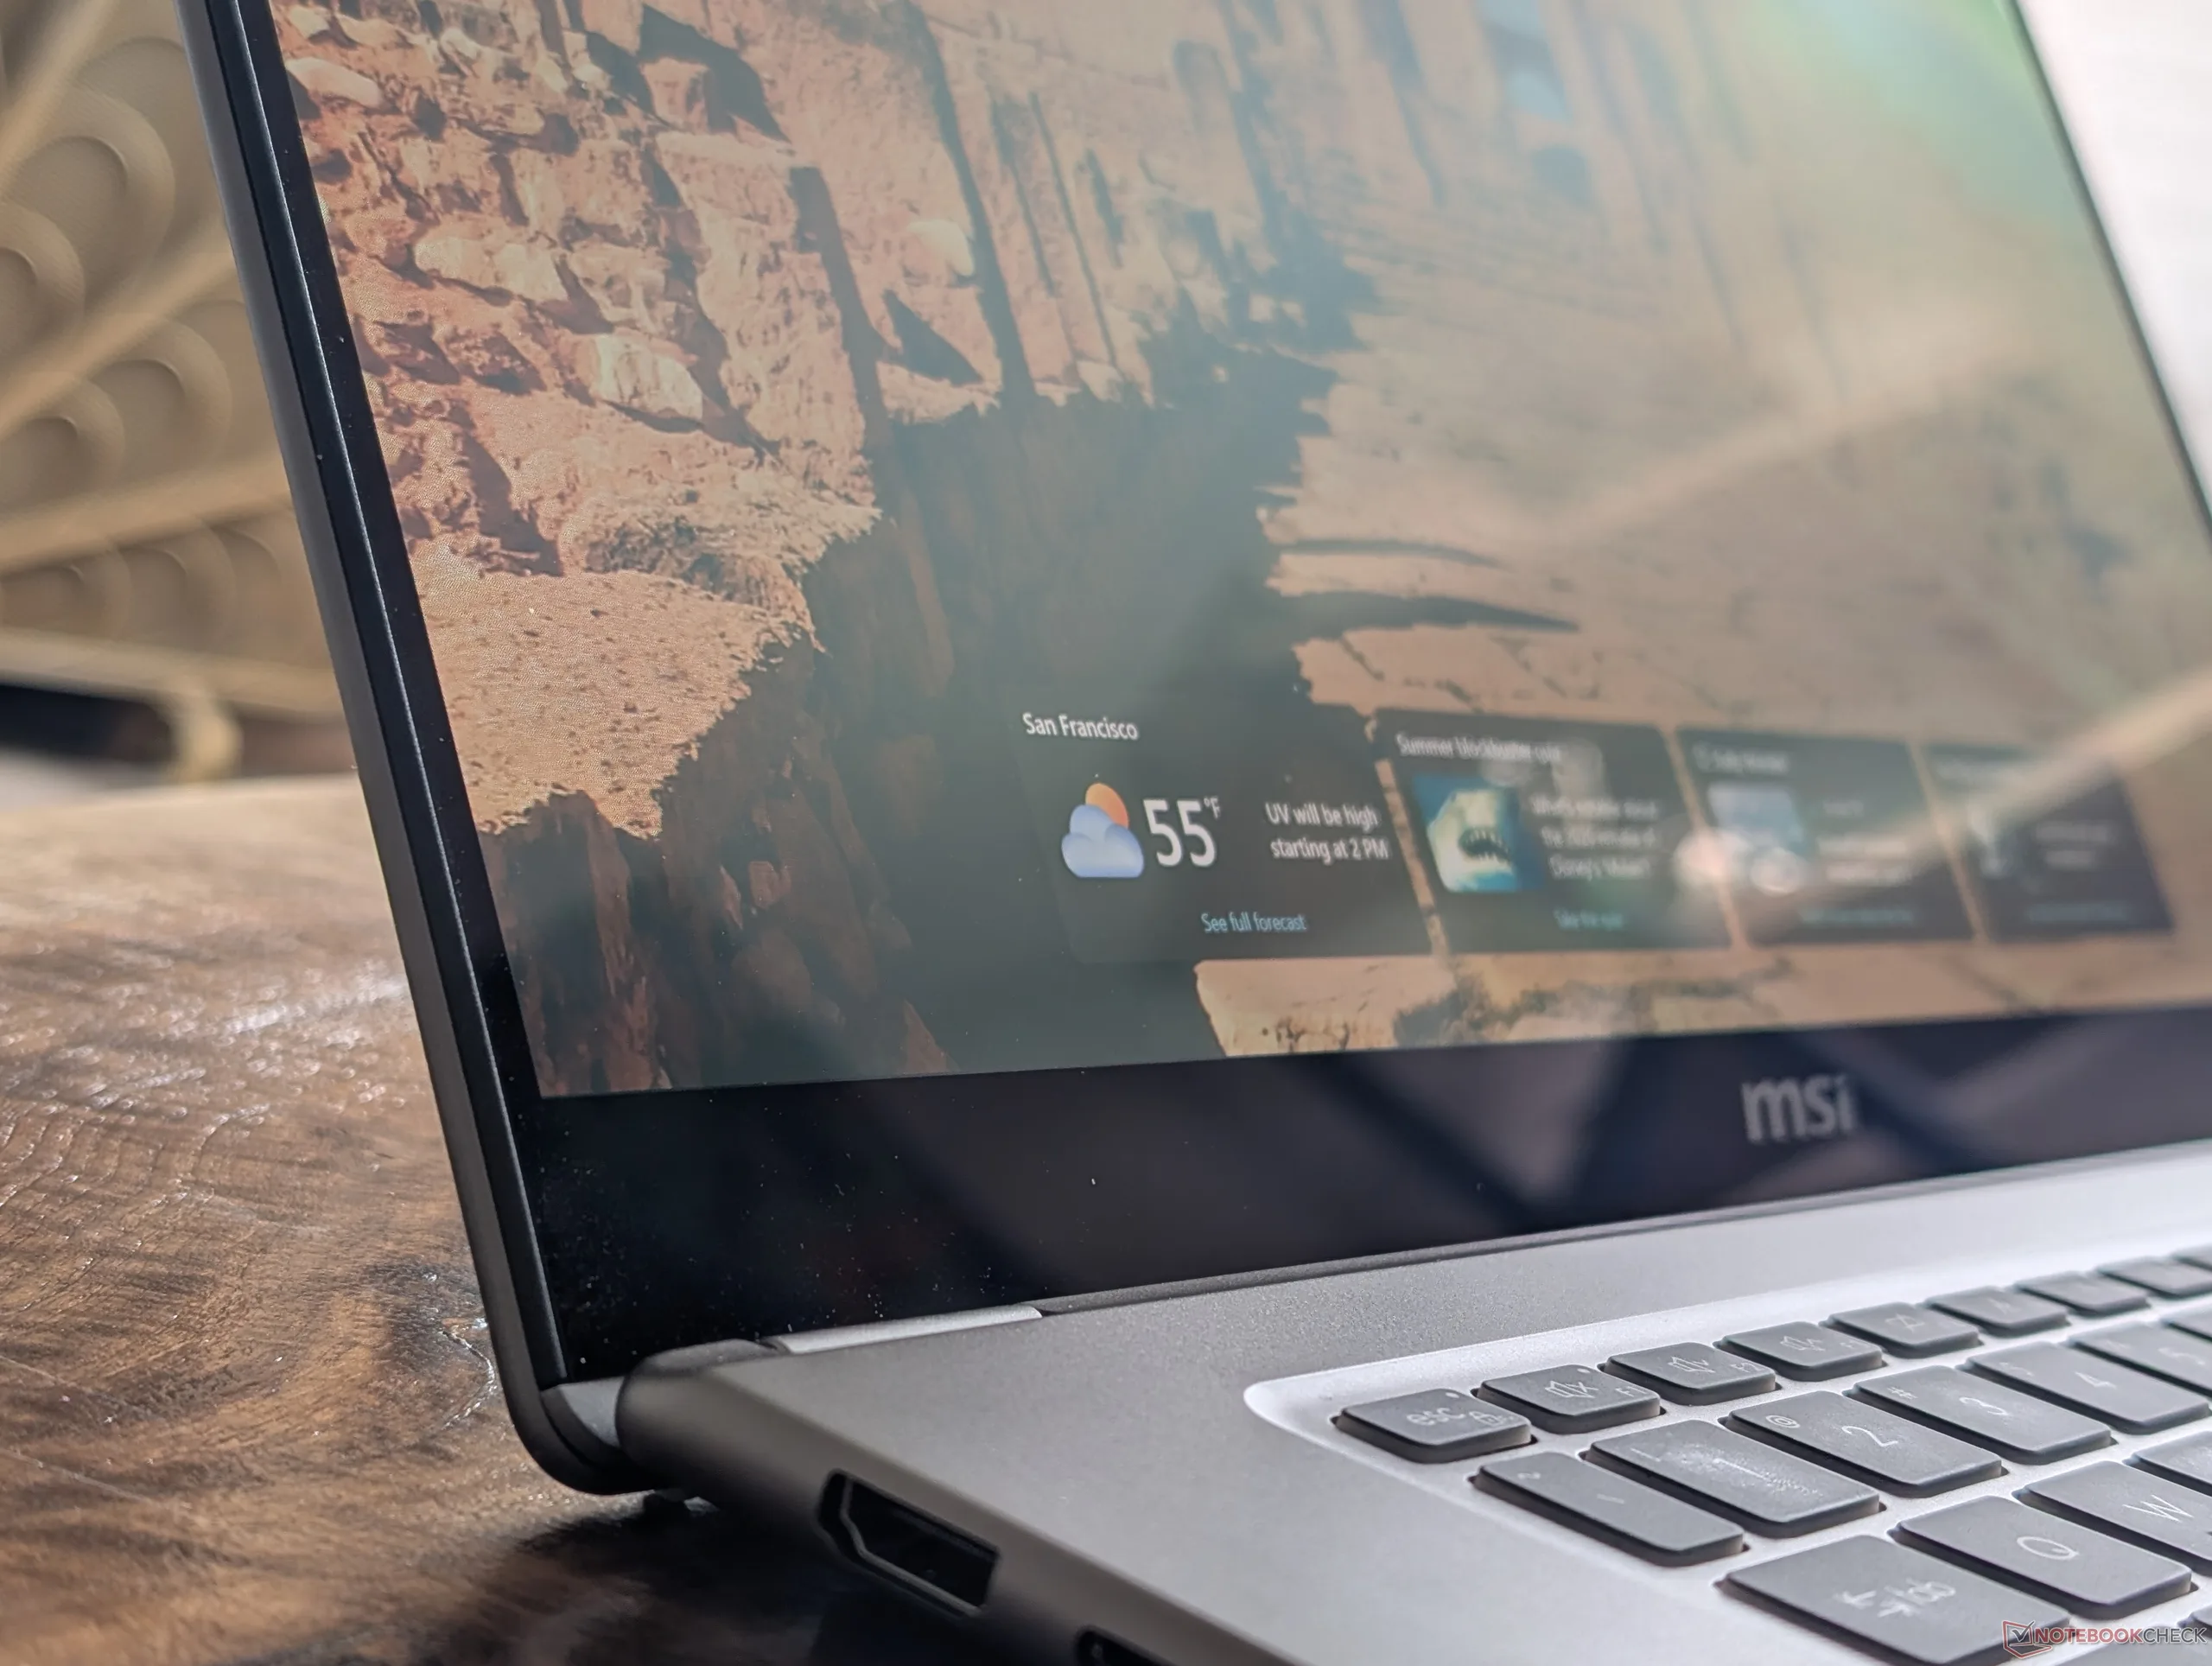
铝合金机身变得更薄,棱角和表面线条更少,给人更专业的感觉。事实上,与旧机型相比,2026 Prestige 16 可以说更有品位,但又不会显得过于乏味或过于简约。
尽管与更厚的 XPS 16 或联想 Pro 9i 16 Aura 相比略有弯曲,但机箱刚性很强。
从 2026 Prestige 系列开始,微星今年还在外盖上引入了更新的徽标。据制造商称,在不久的将来,这种花哨的激光雕刻可能会出现在更多的顶级商务机型上,以便更好地将它们与微星以游戏为中心的解决方案区分开来。
该系统明显比去年的设计更薄,但重量几乎没有变化,手感更绵密。它的重量介于 XPS 16 和 ZenBook S16 之间,占地面积略大于两者。

连接性
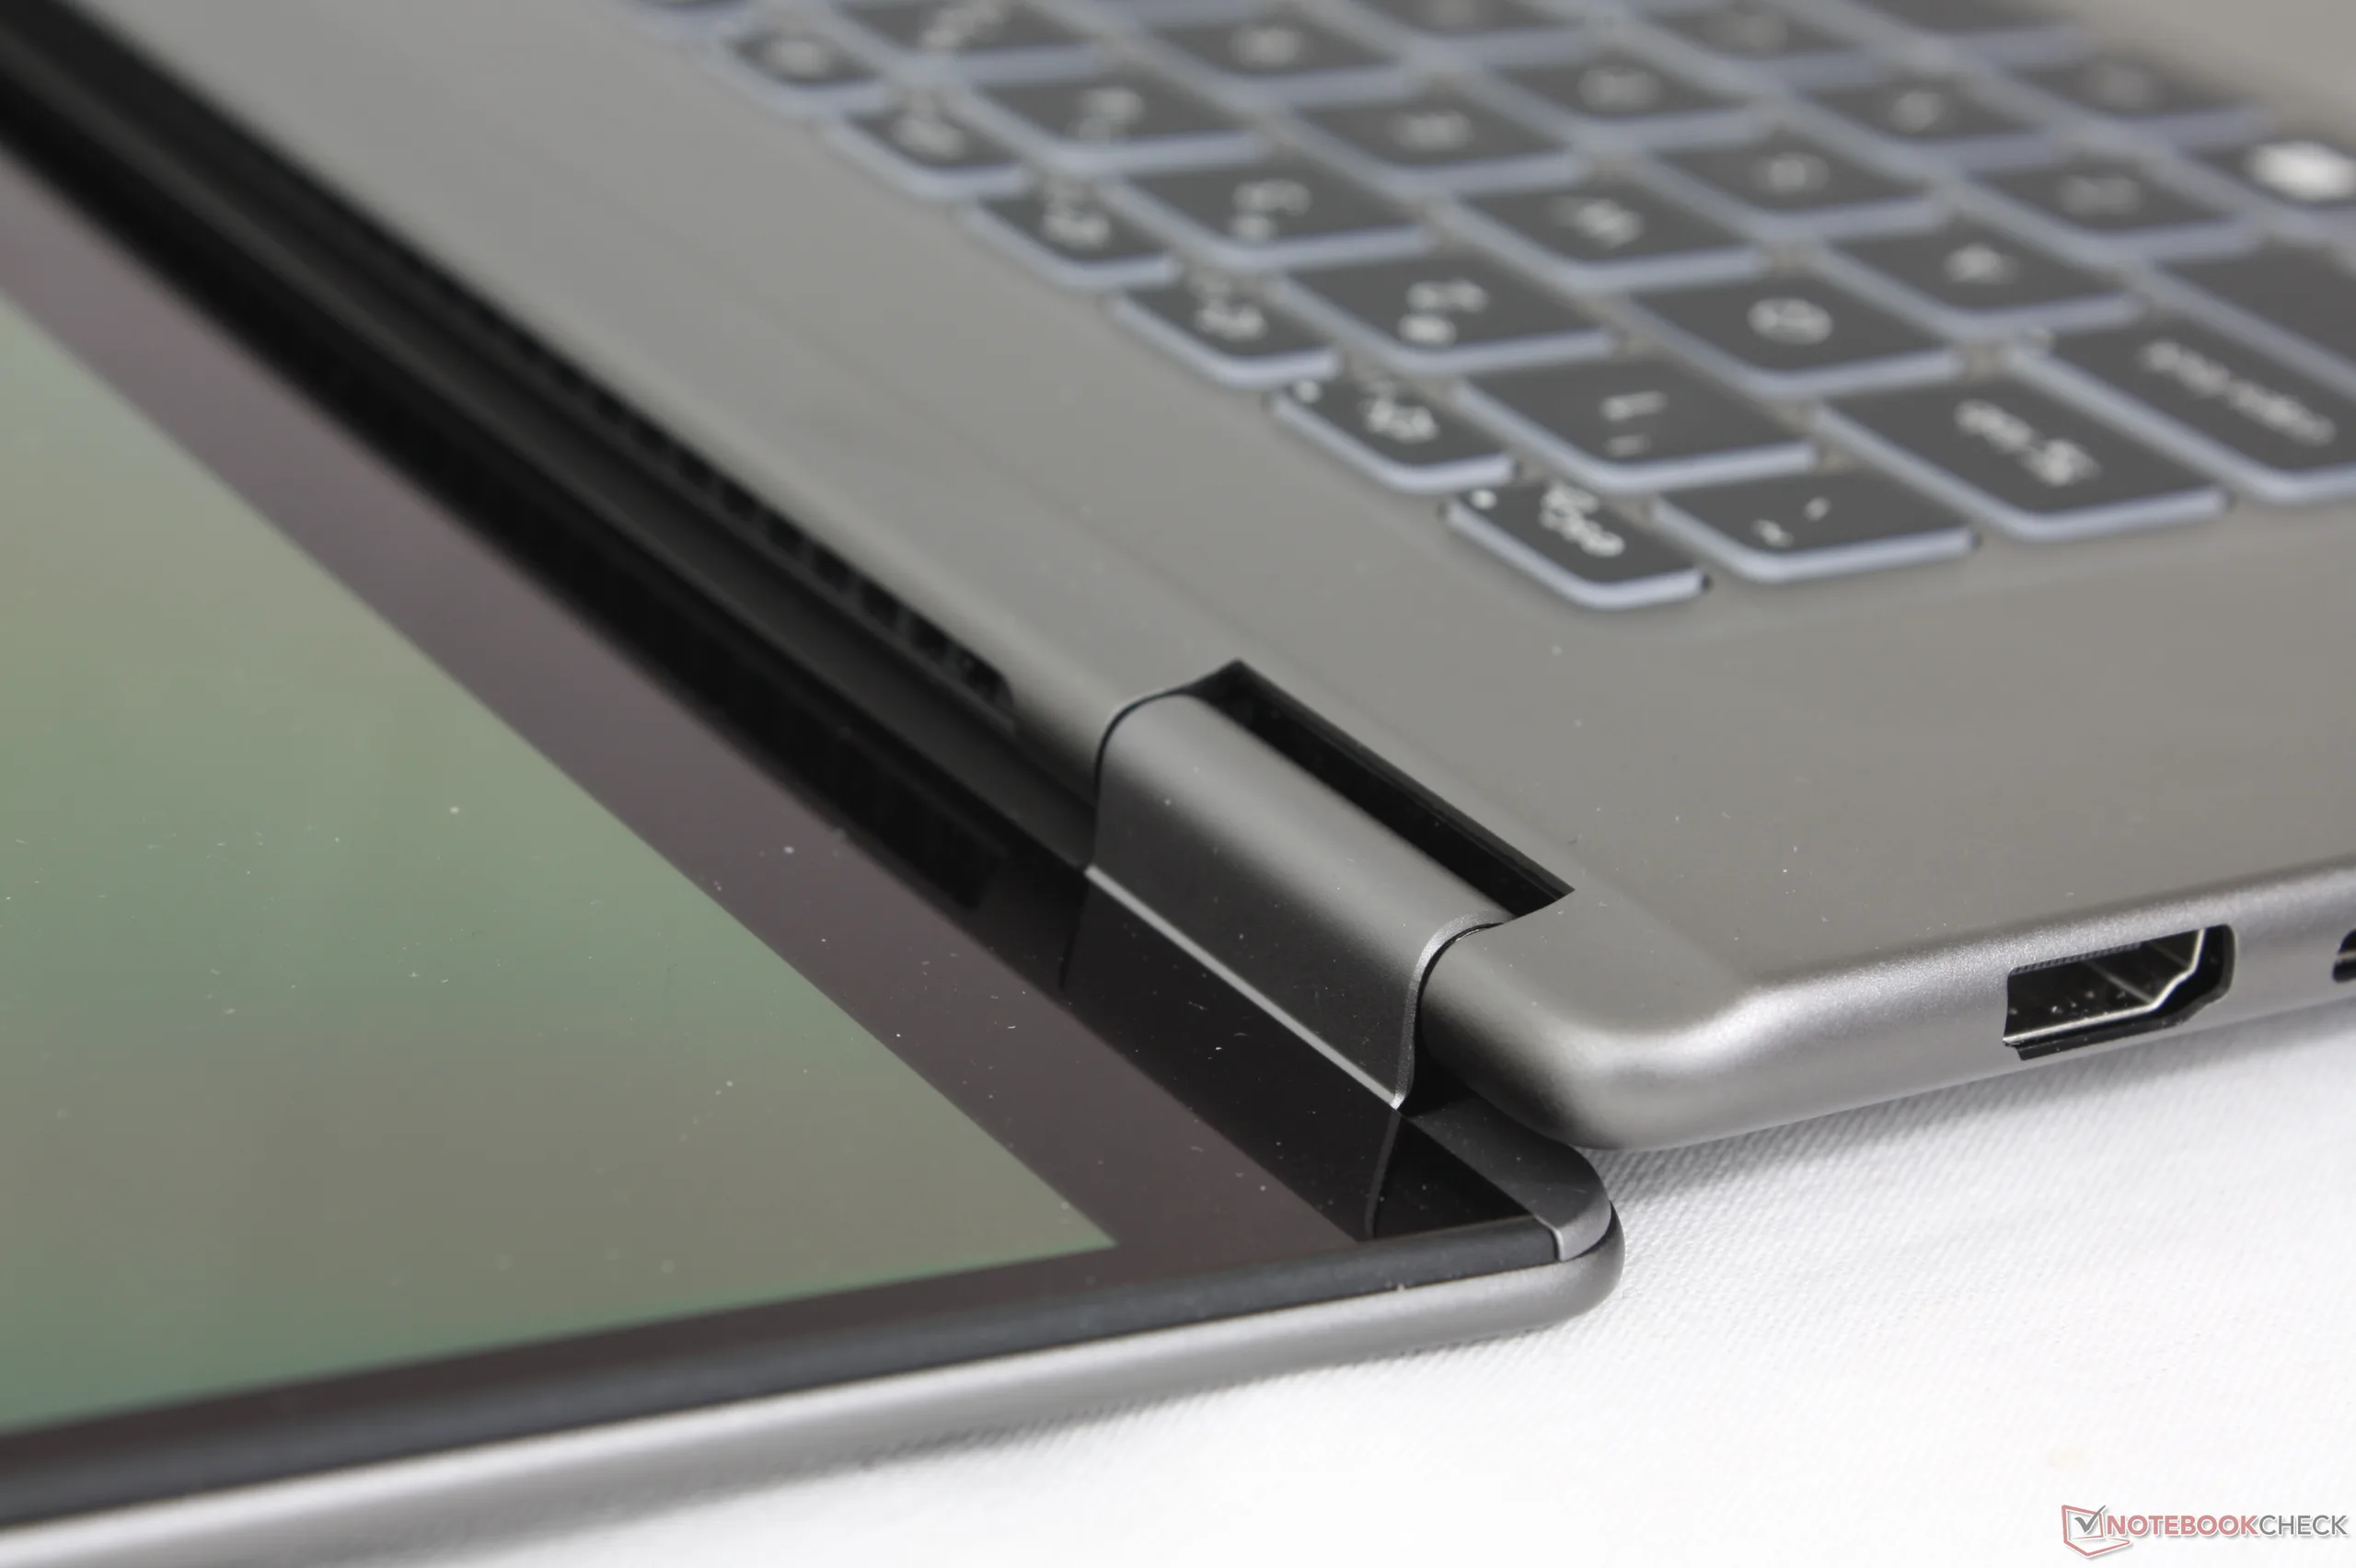
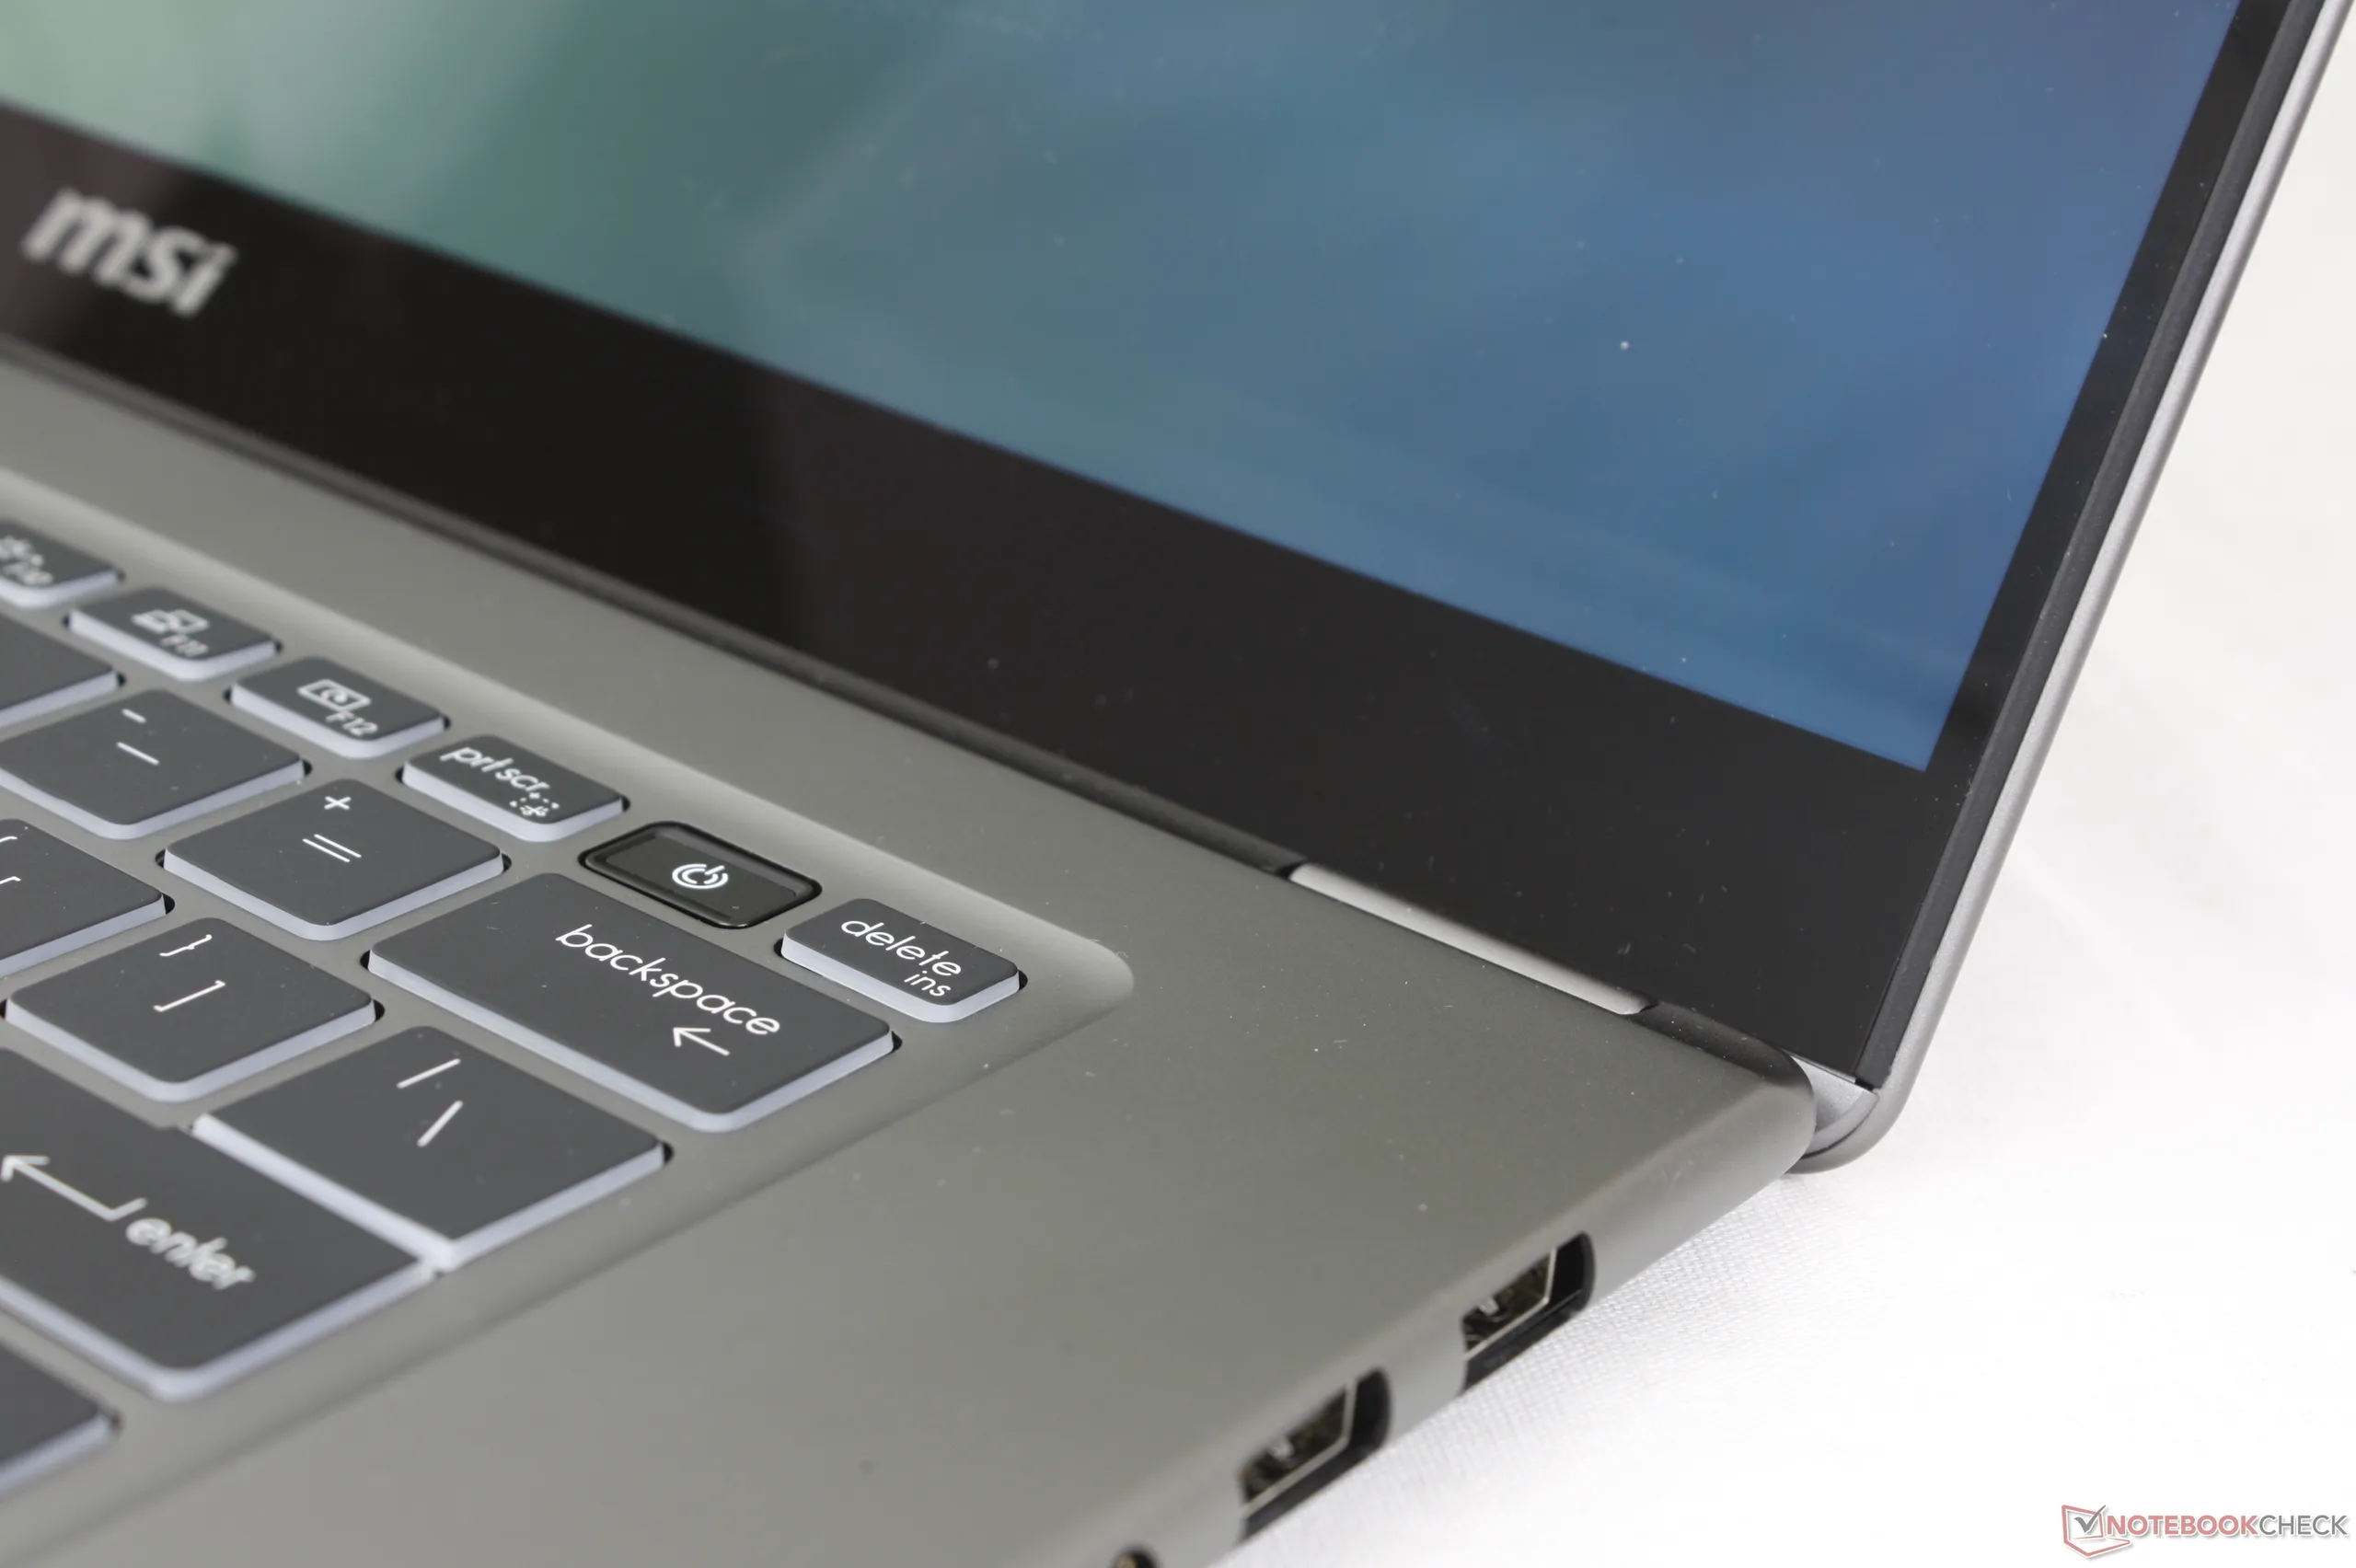
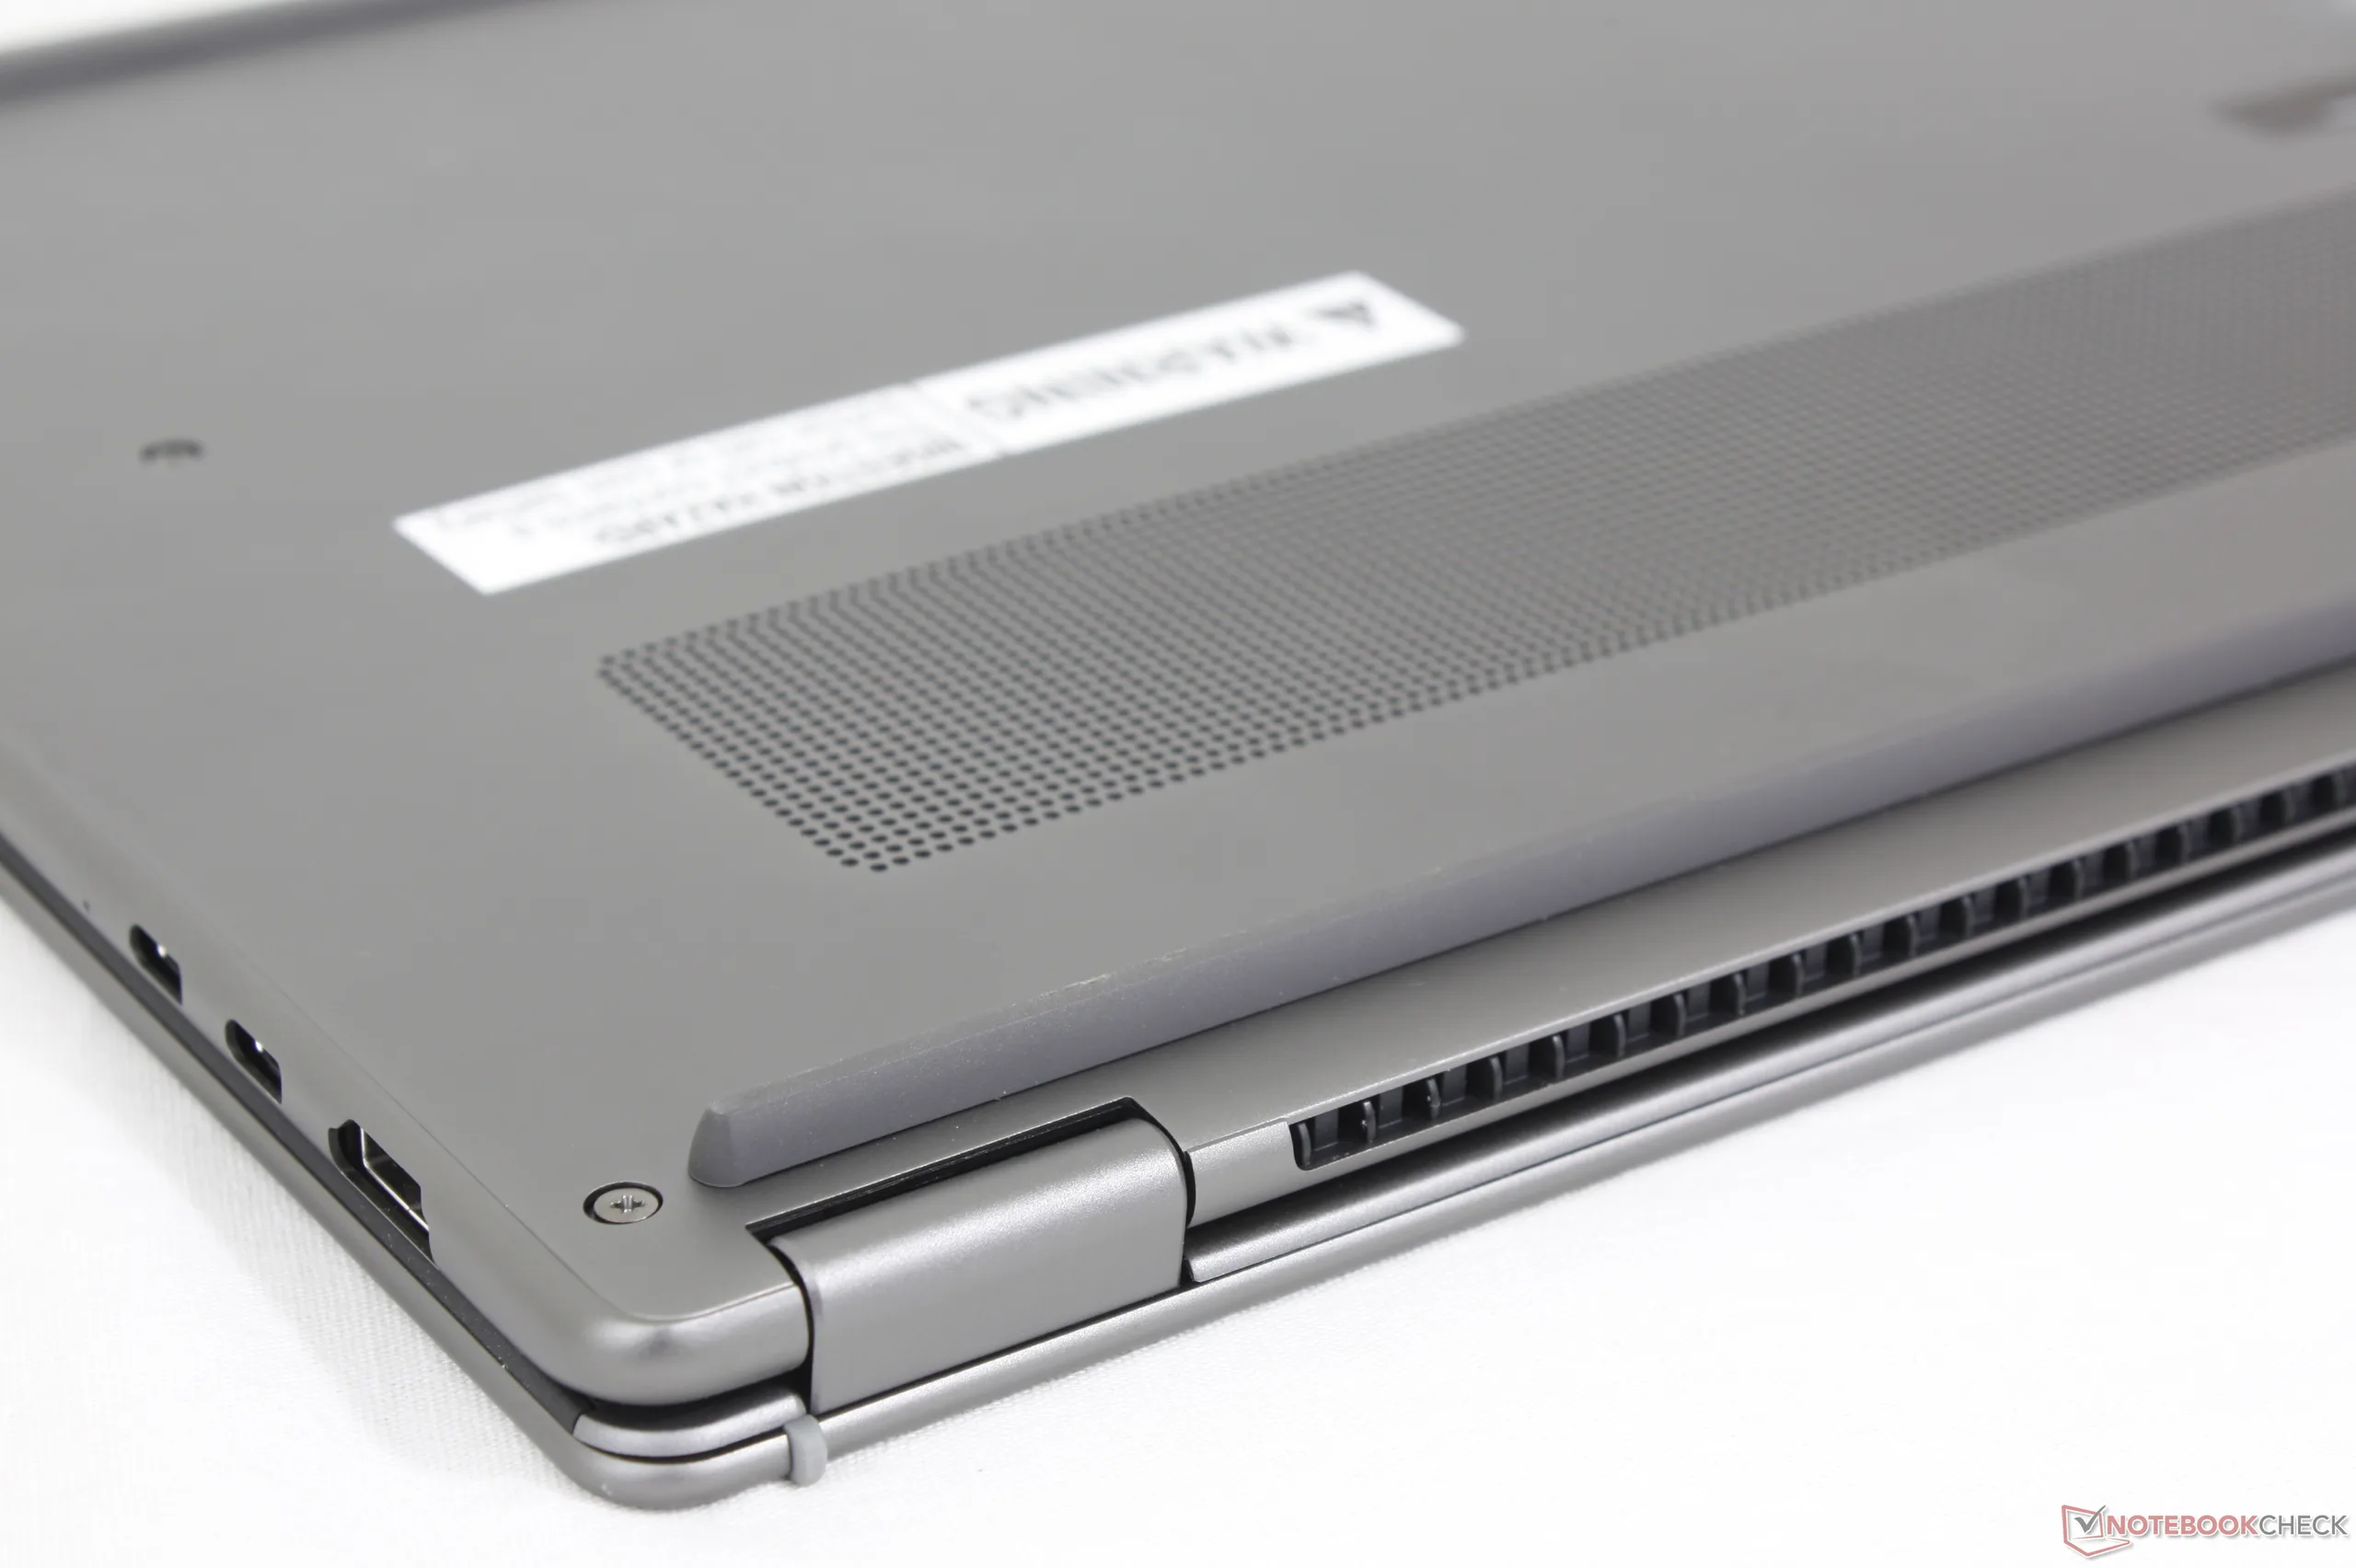
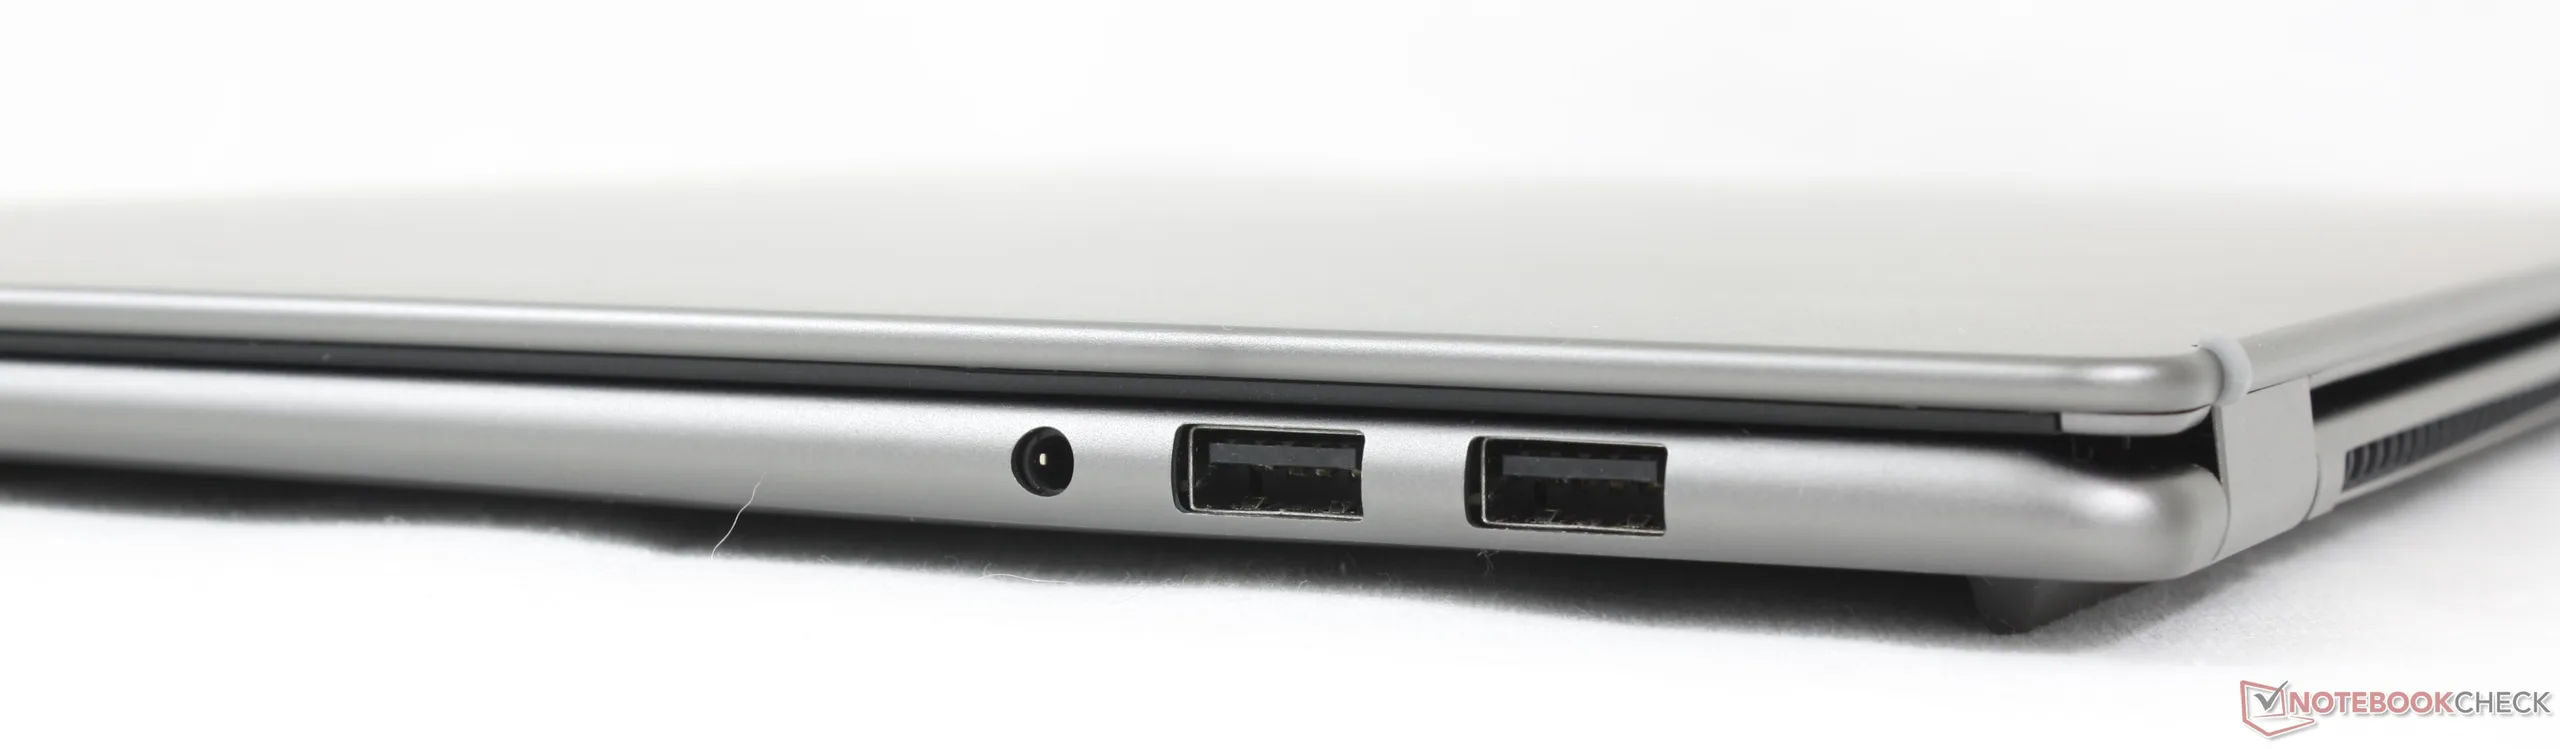
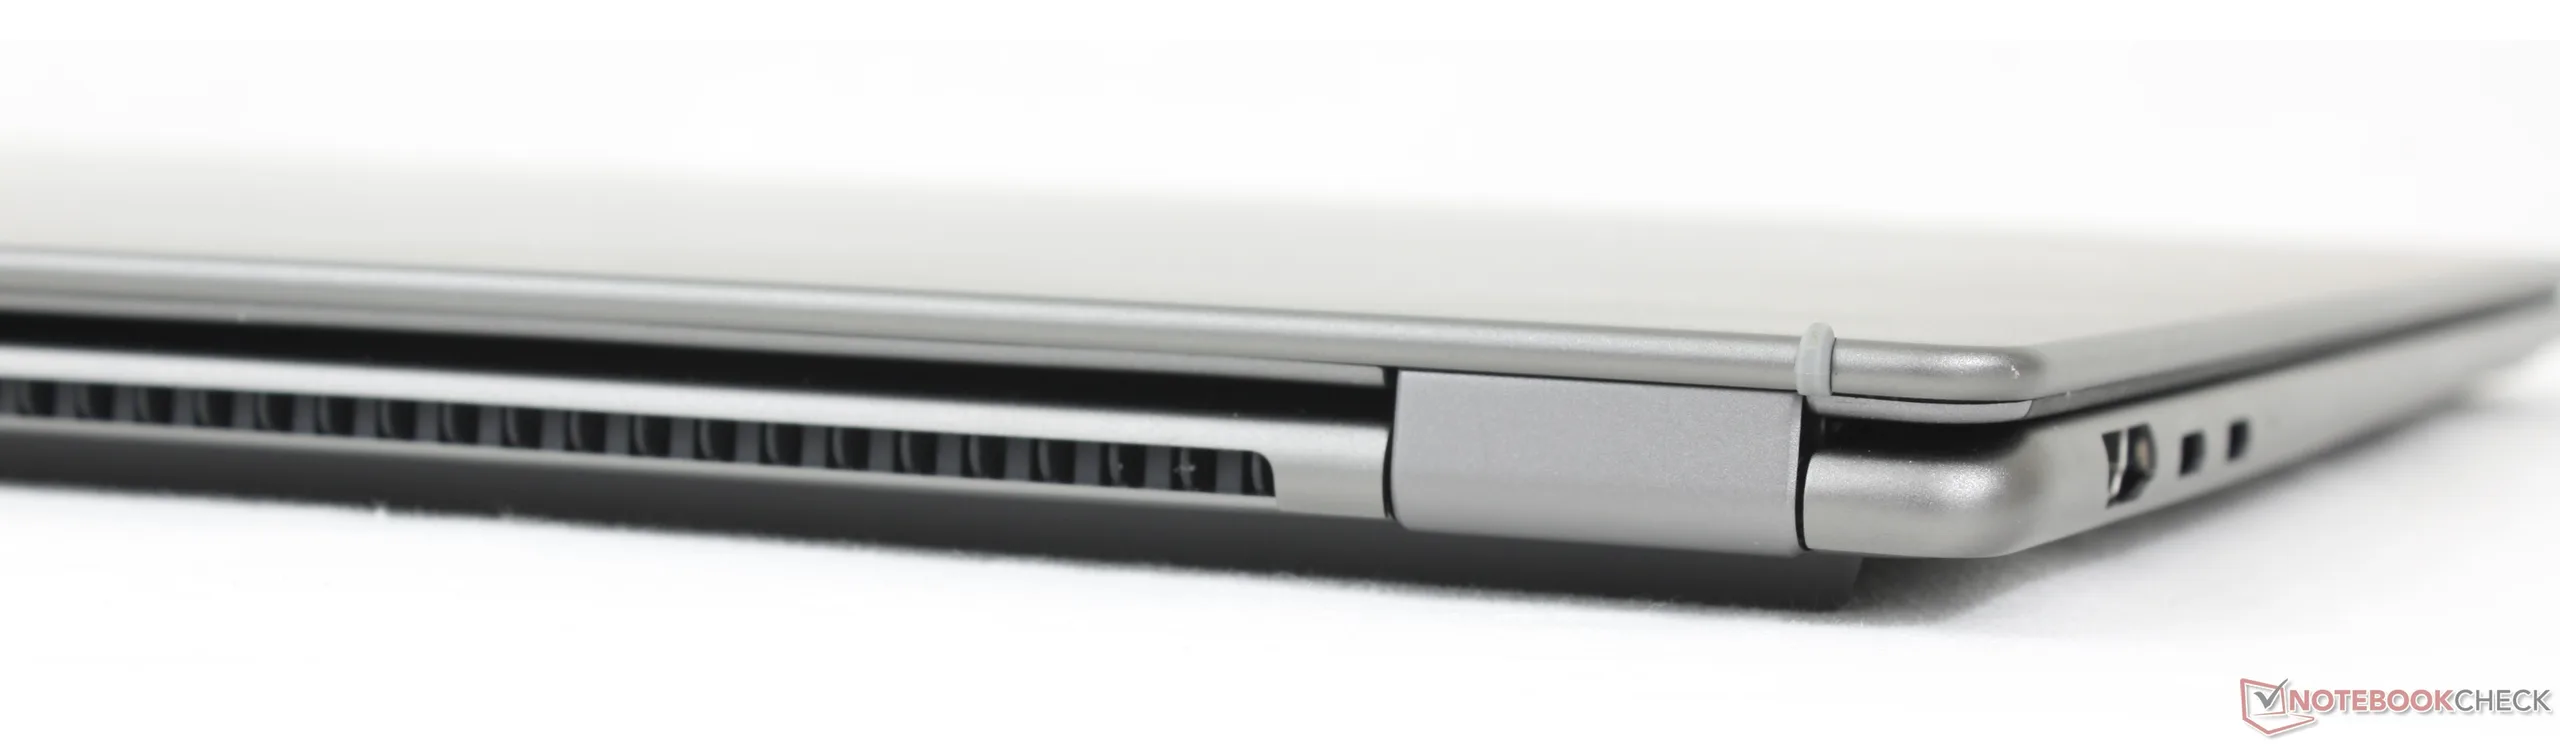
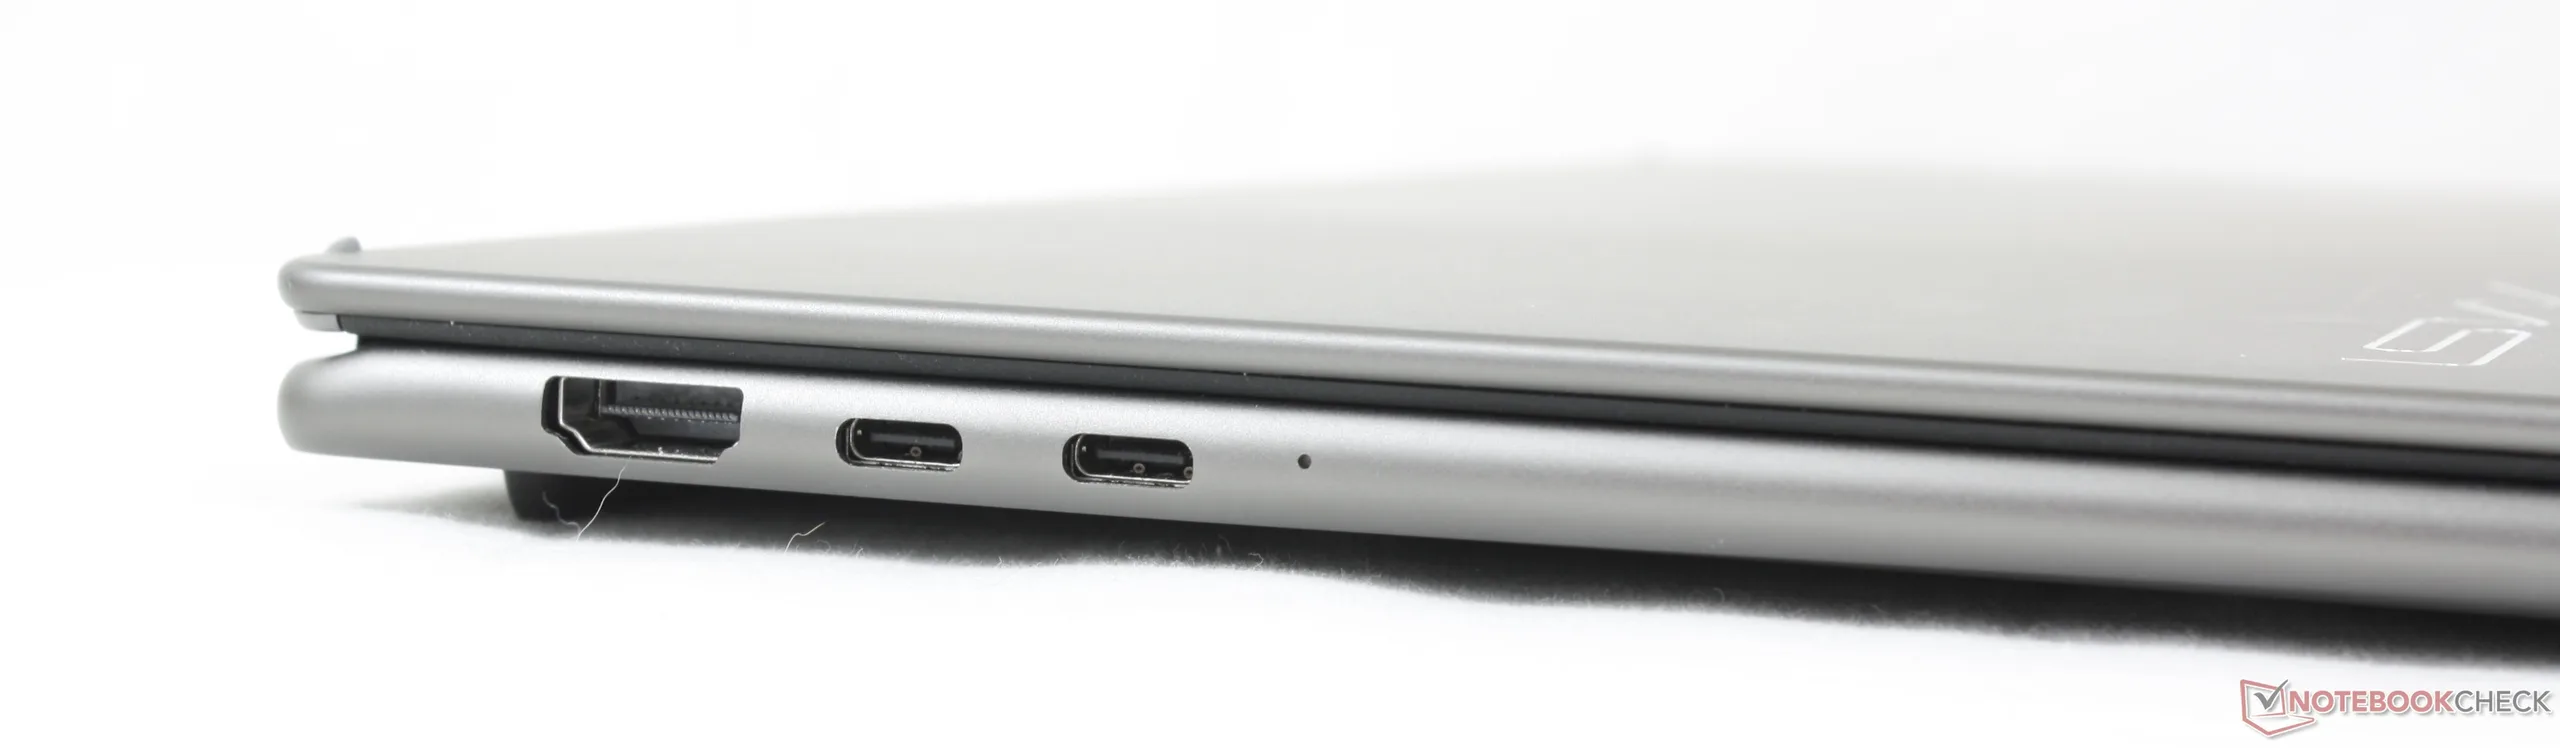
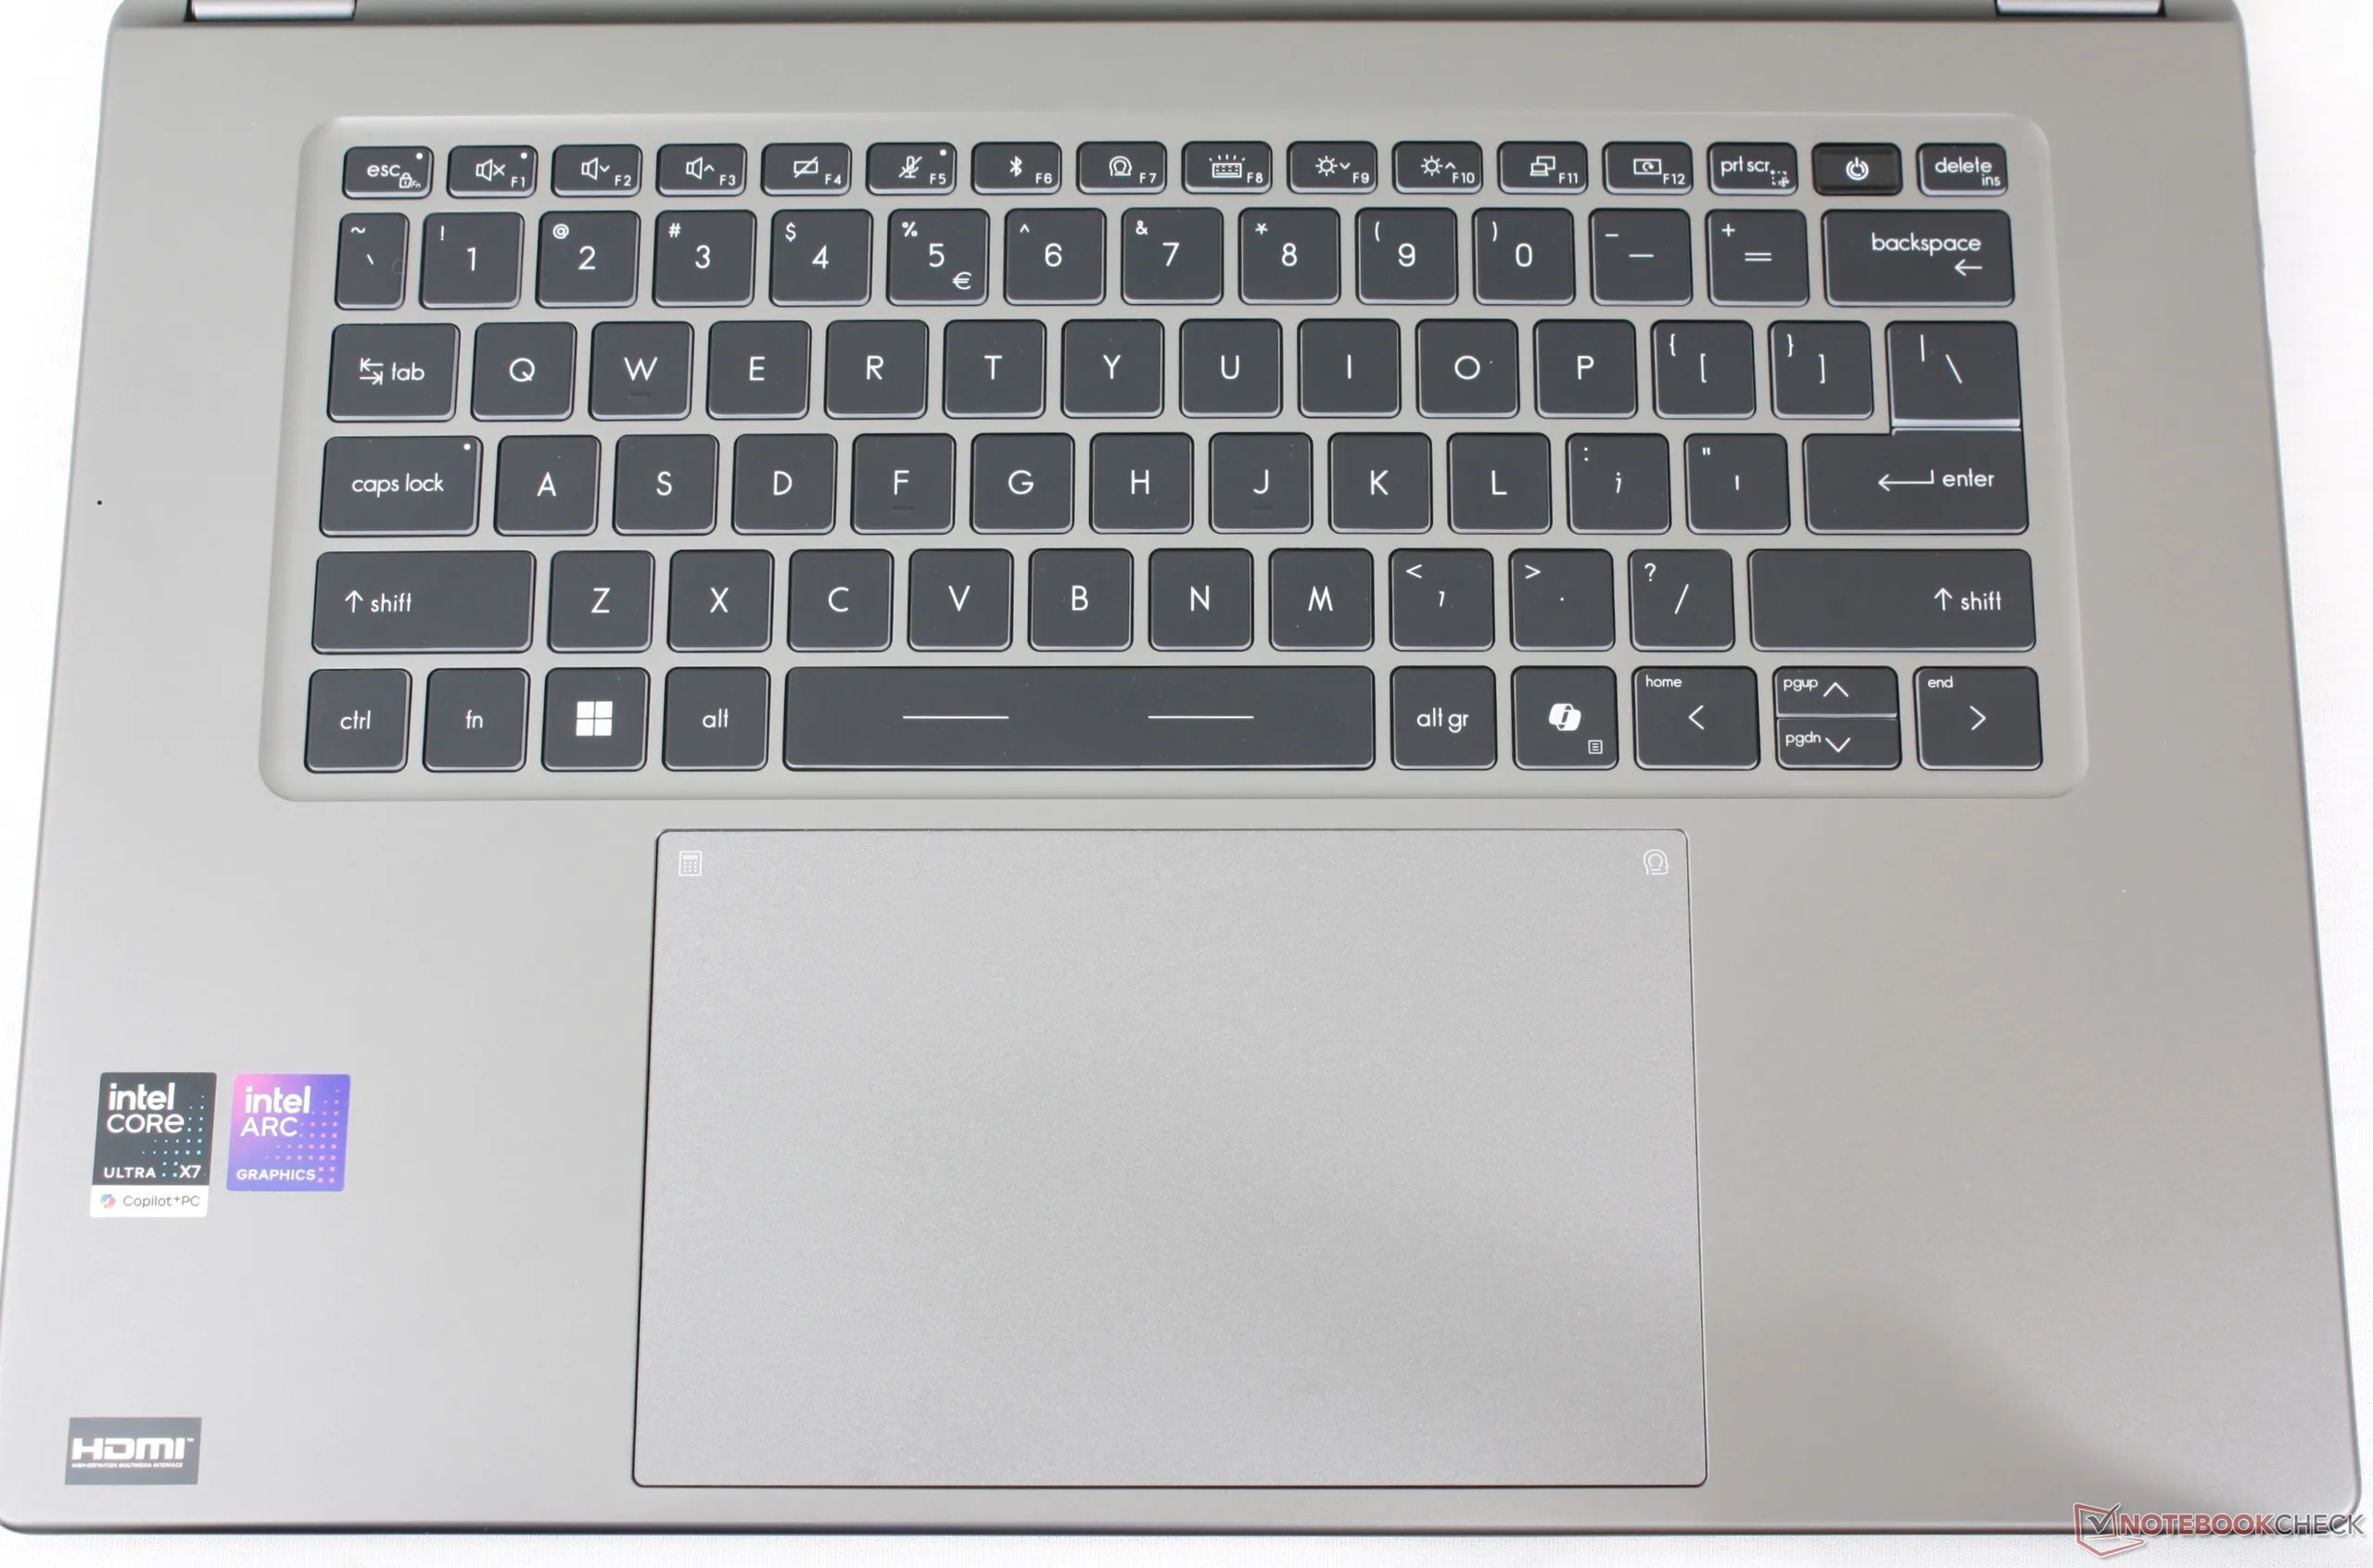
与 2025 型号相比,端口选项有所变化。微星取消了 RJ-45 端口、SD 读卡器和 Kensington 锁,同时增加了第二个 USB-A 端口。根据用户的喜好,这些变化可谓喜忧参半。
由于 USB-C 充电仅限于系统的左侧,因此端口位置也可能会更好。

交流
网络摄像头
200 万像素网络摄像头标配红外和物理隐私快门。


维护
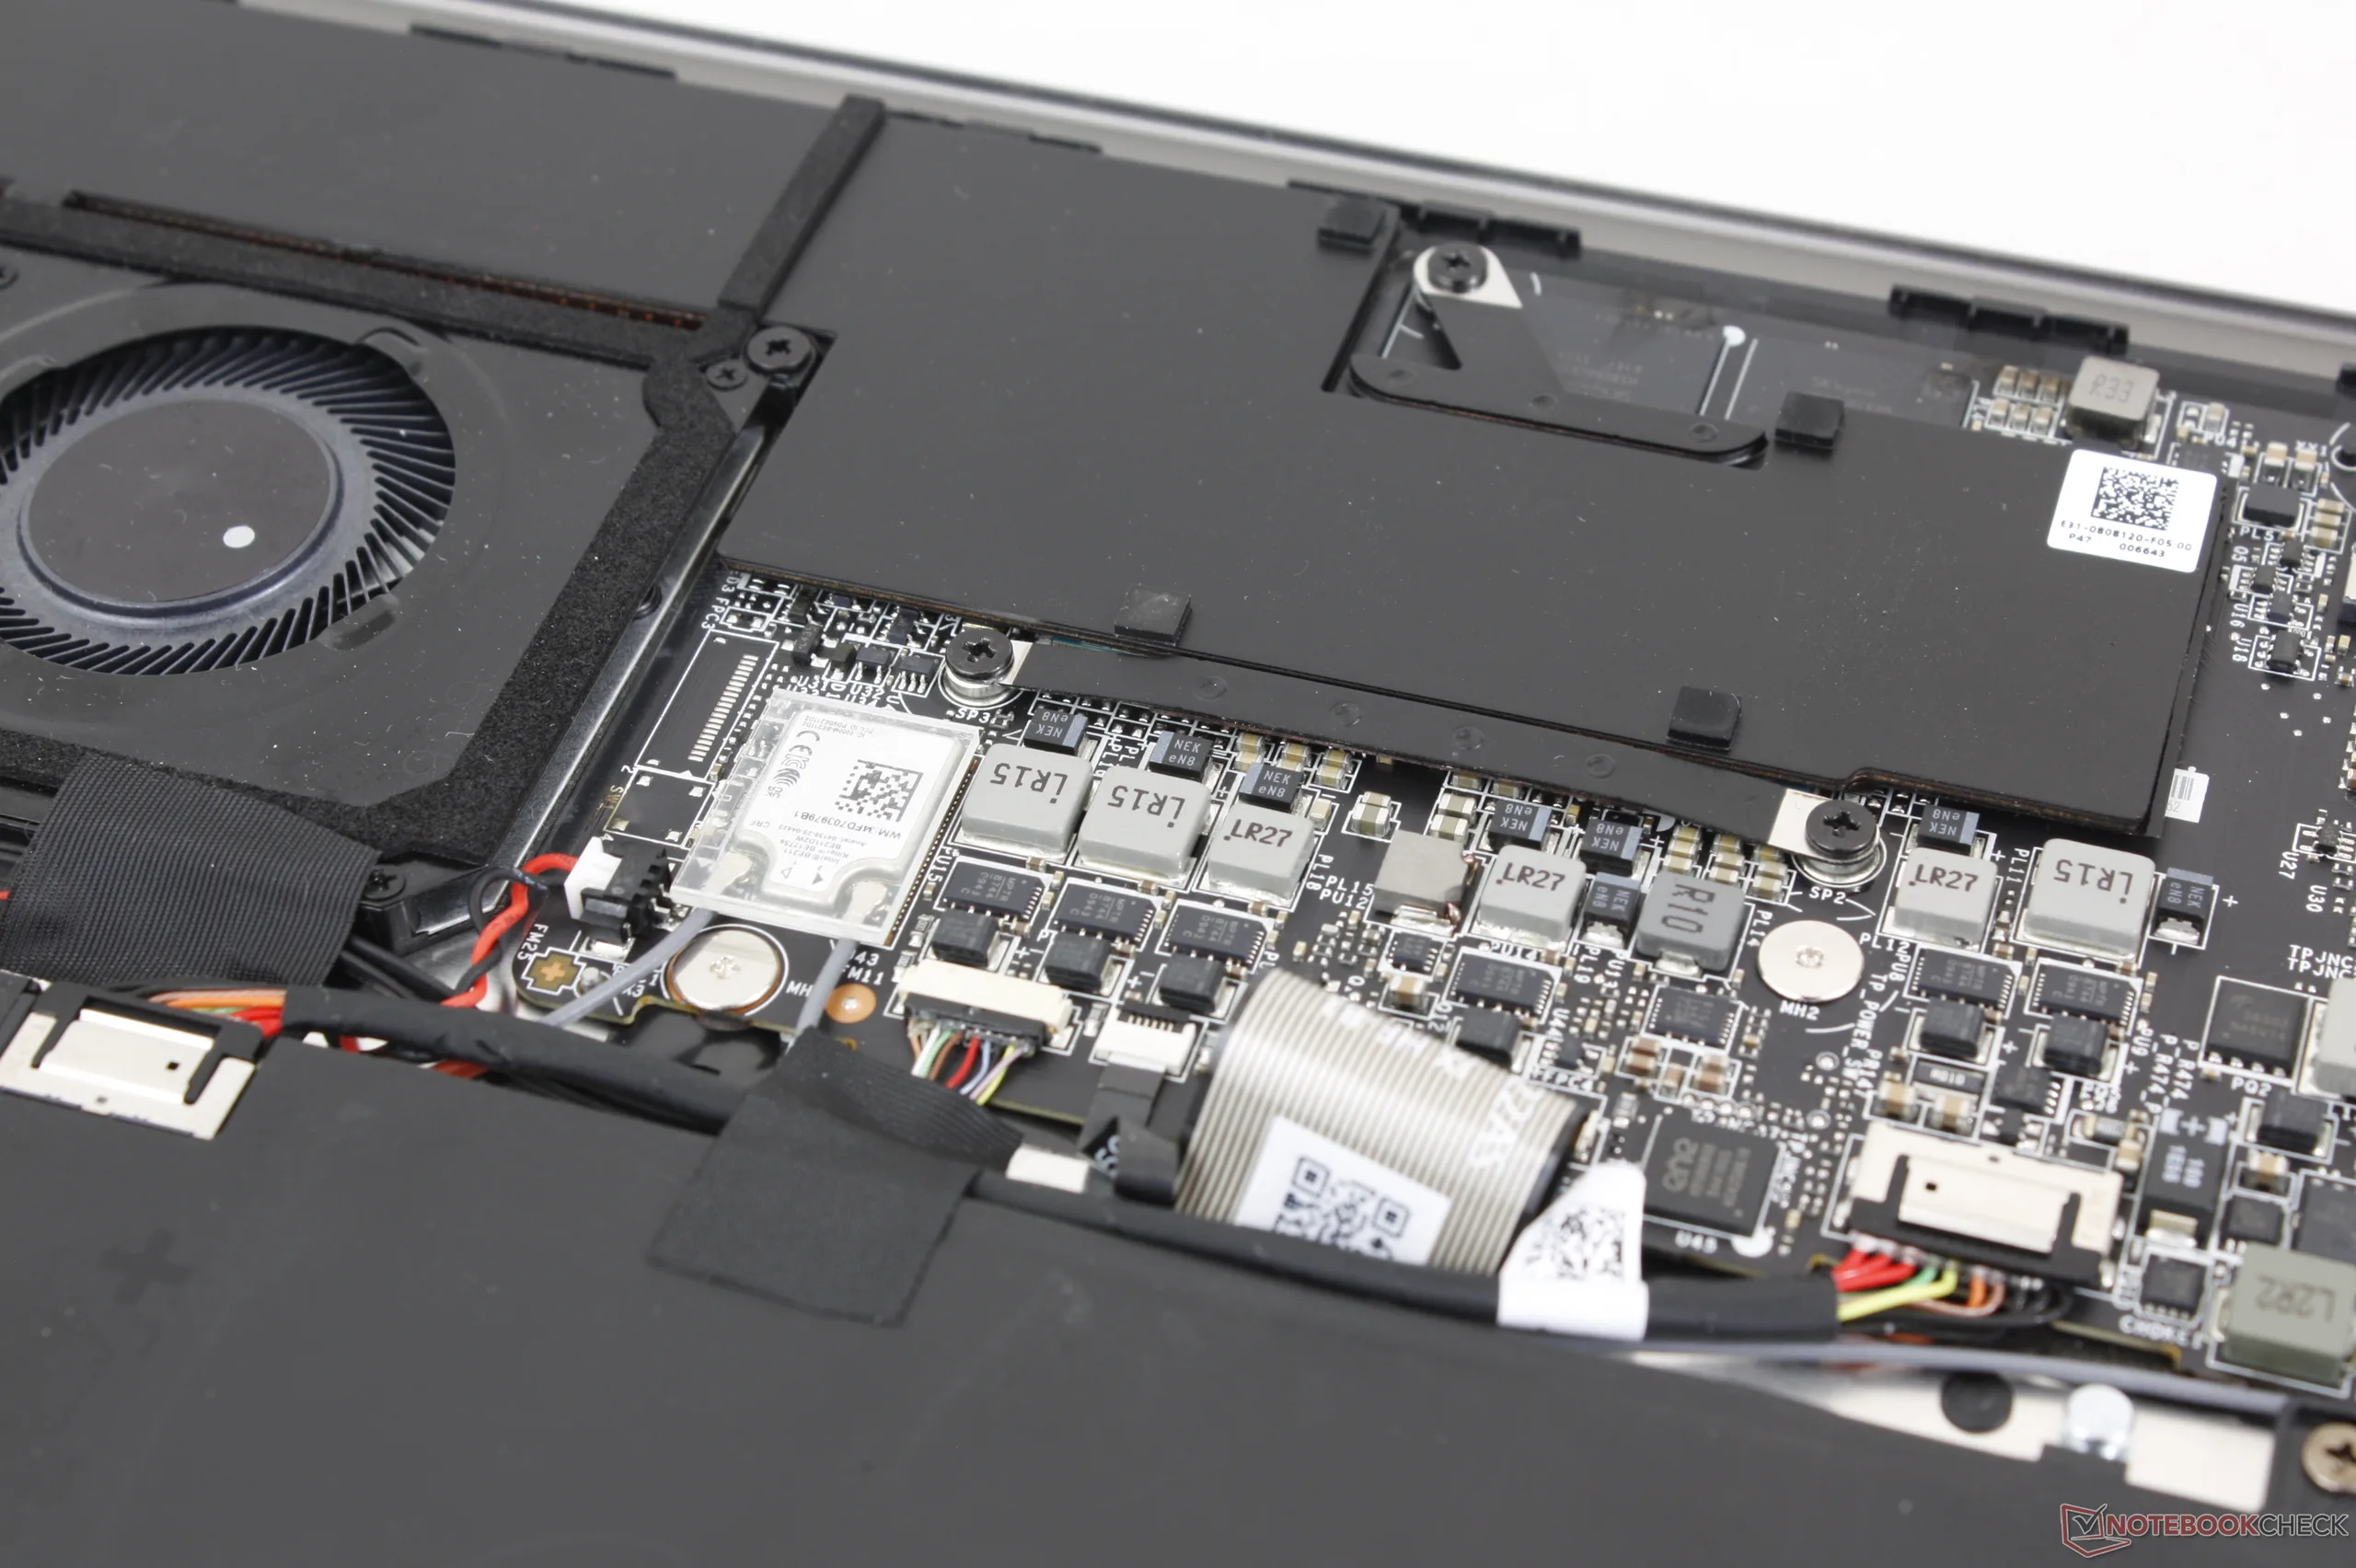
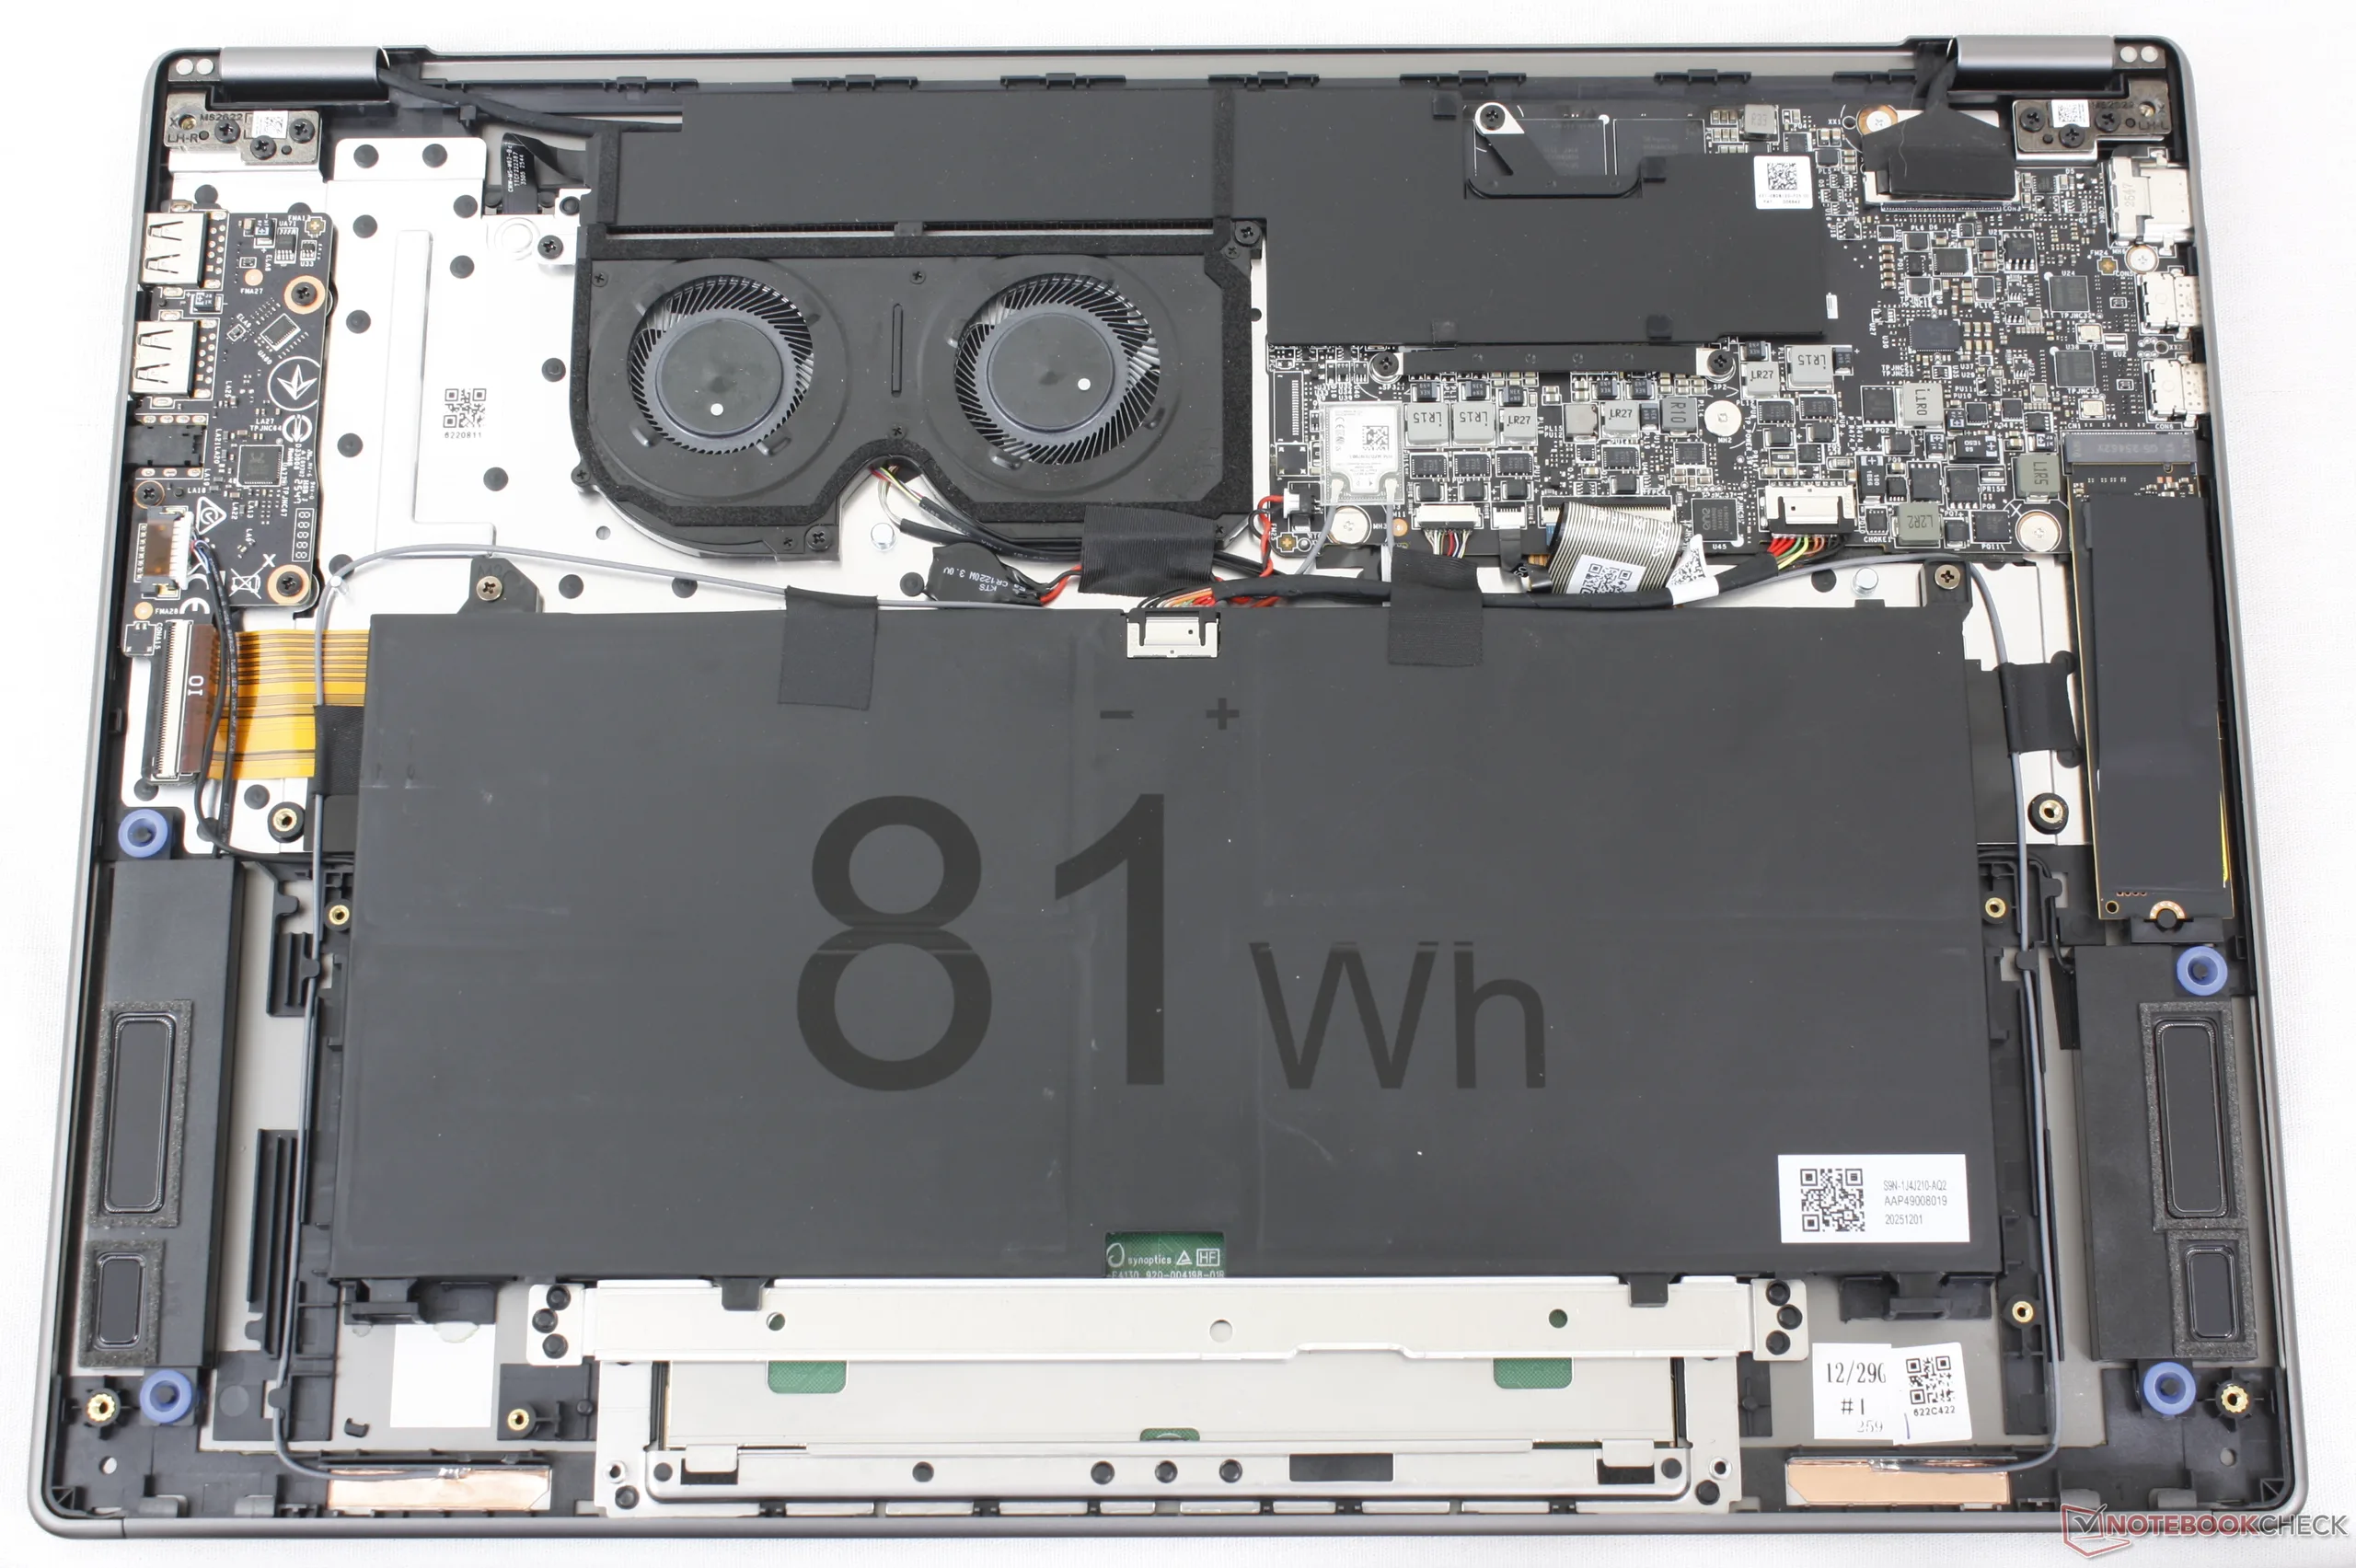
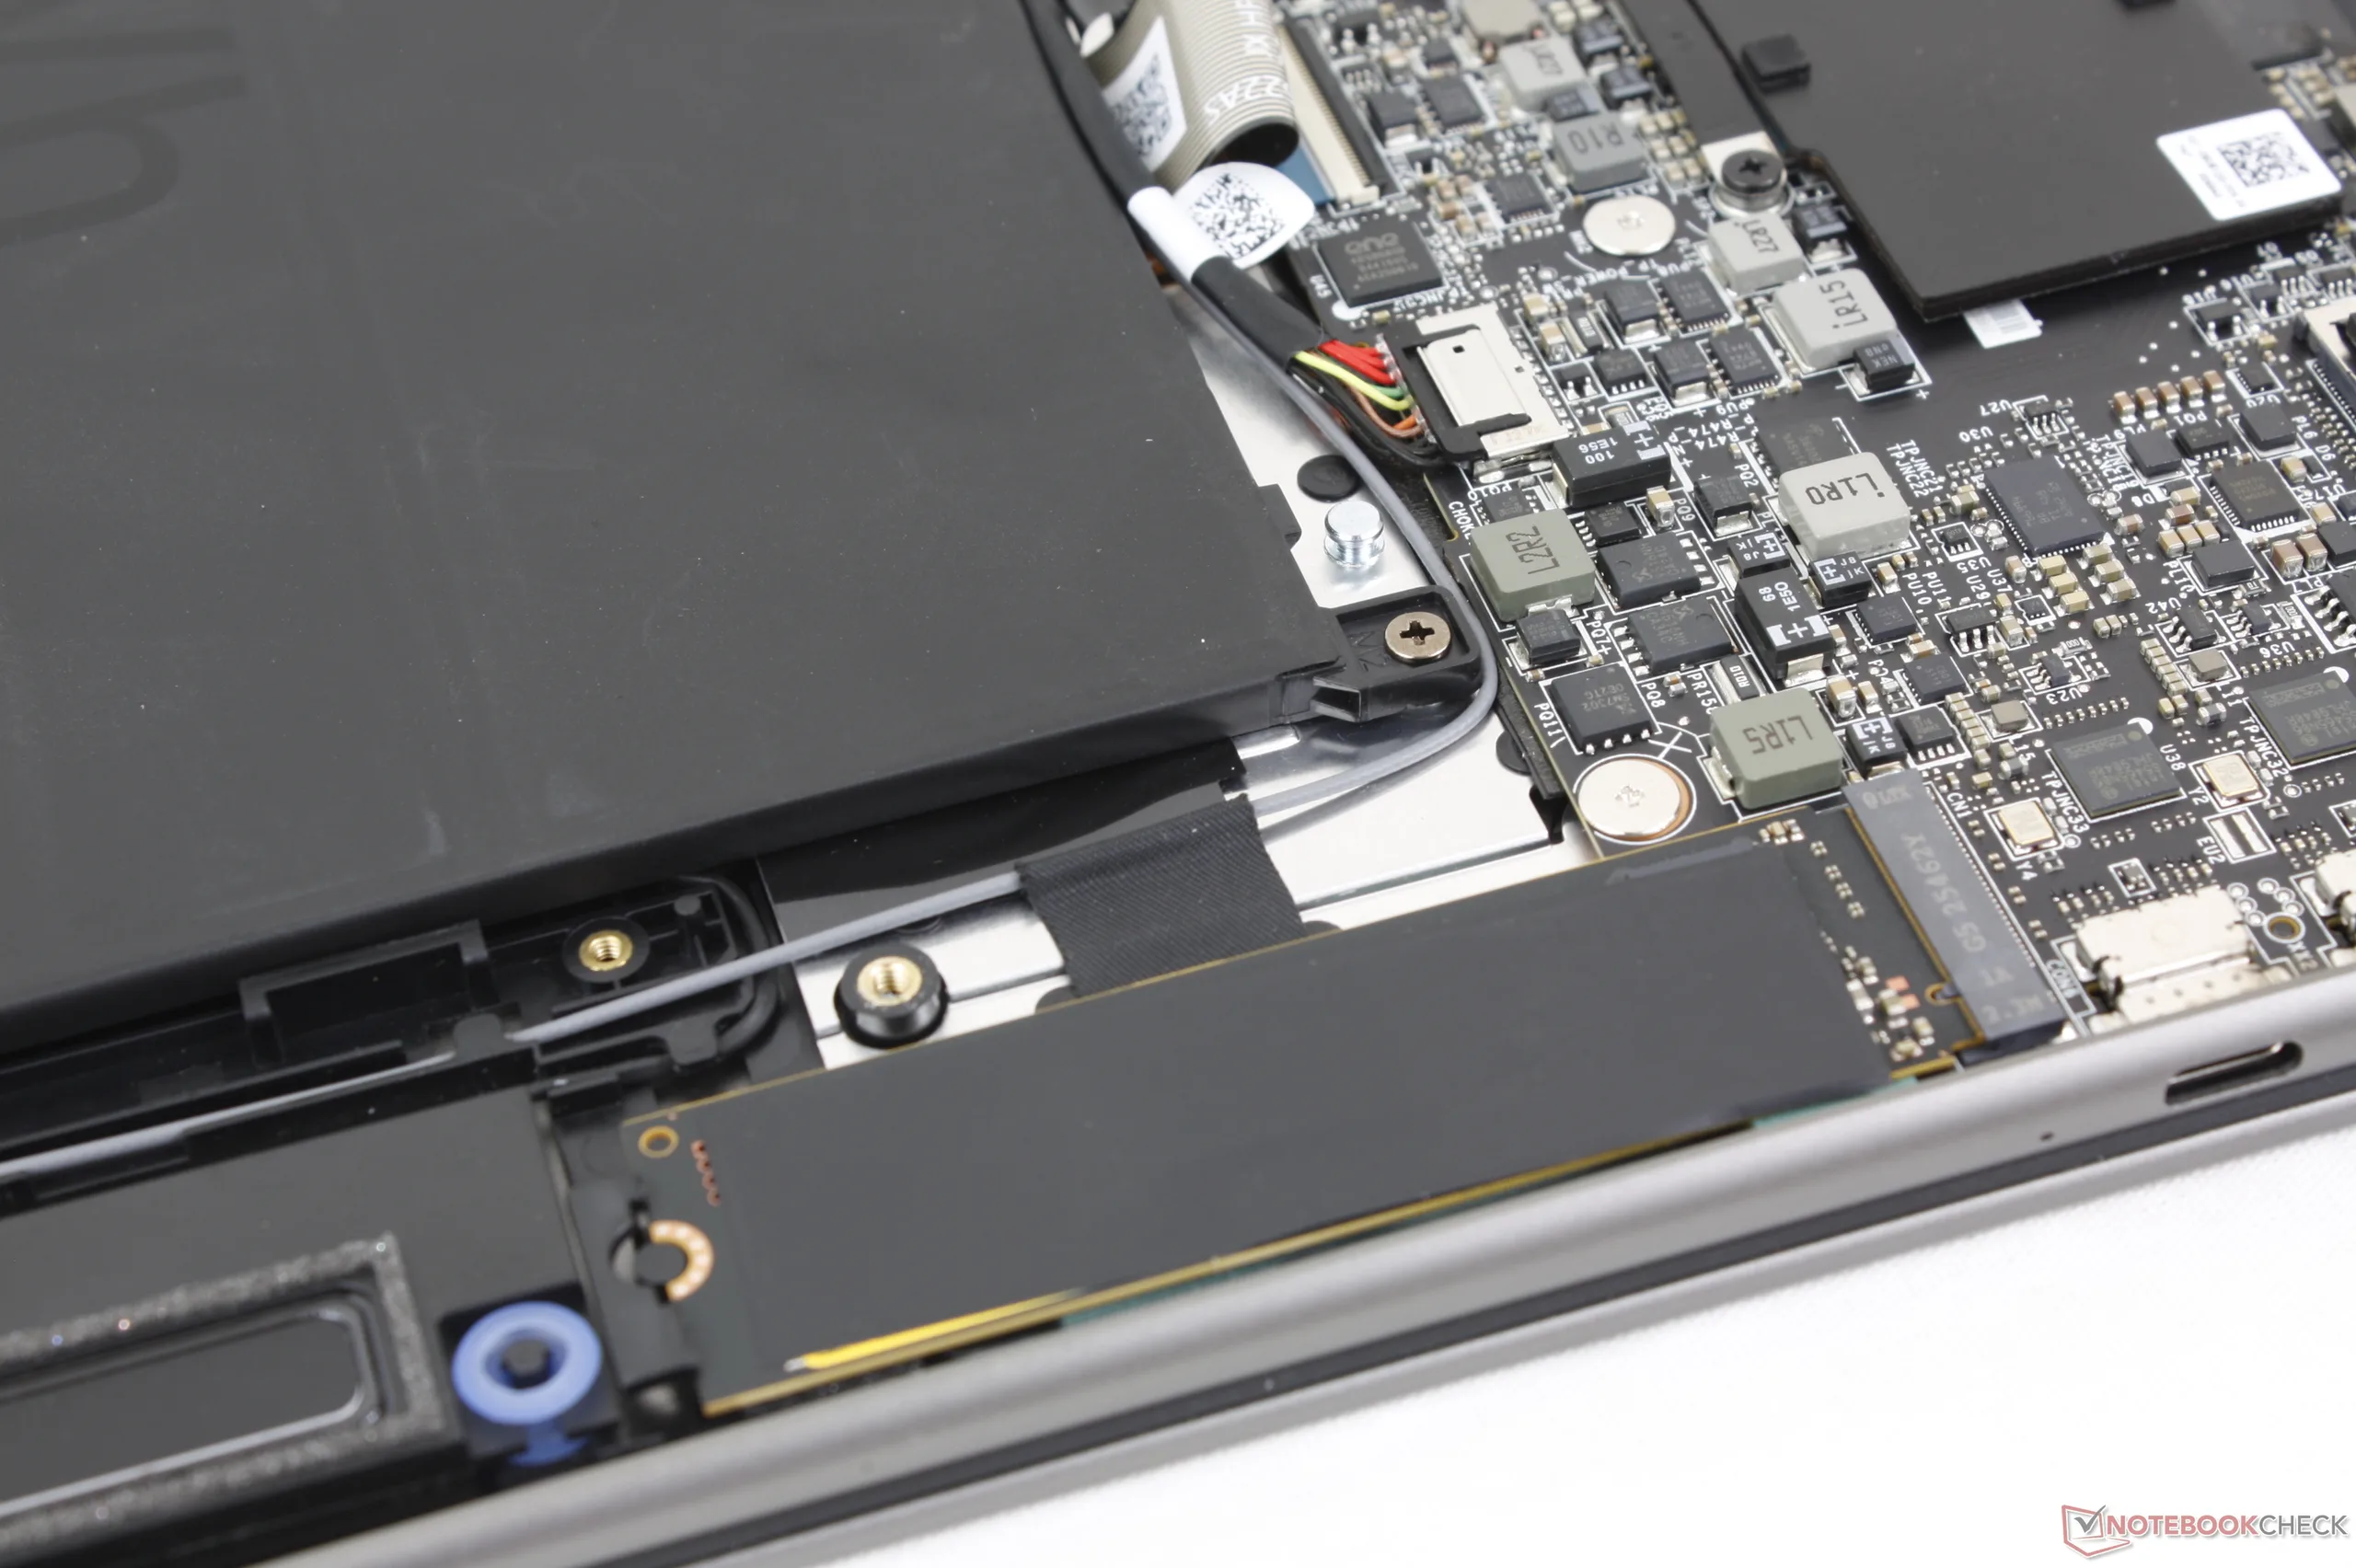
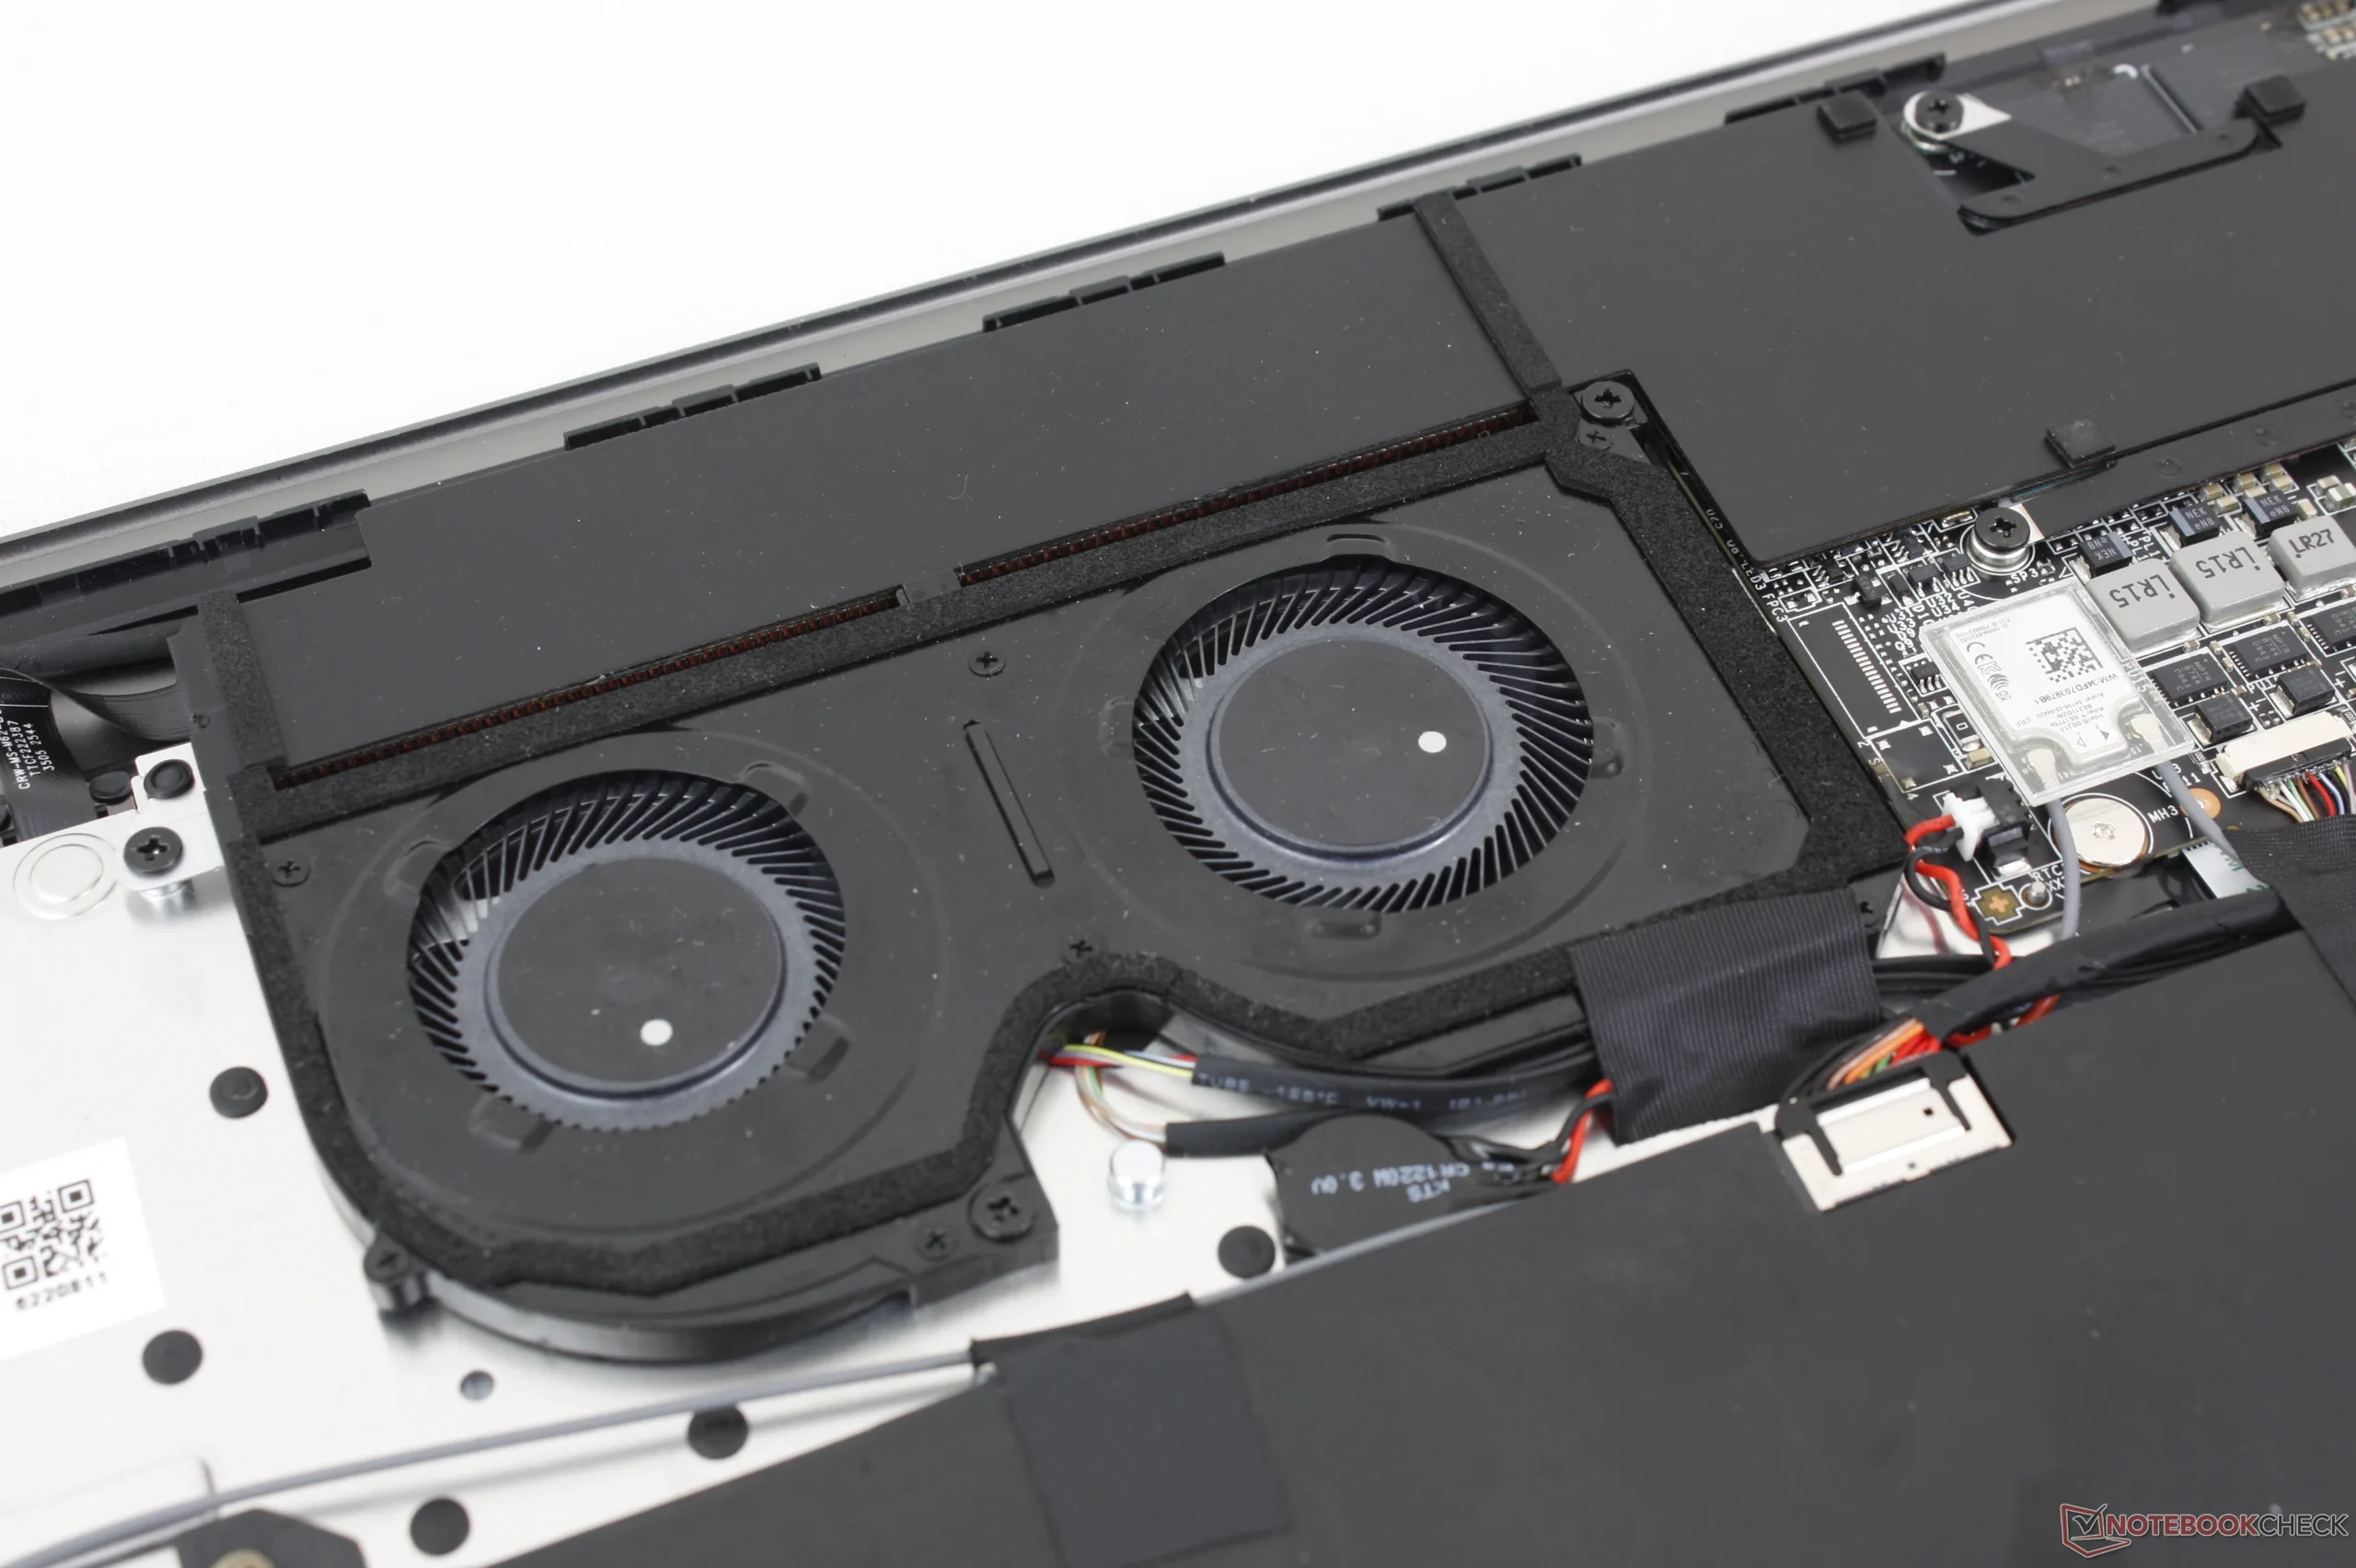
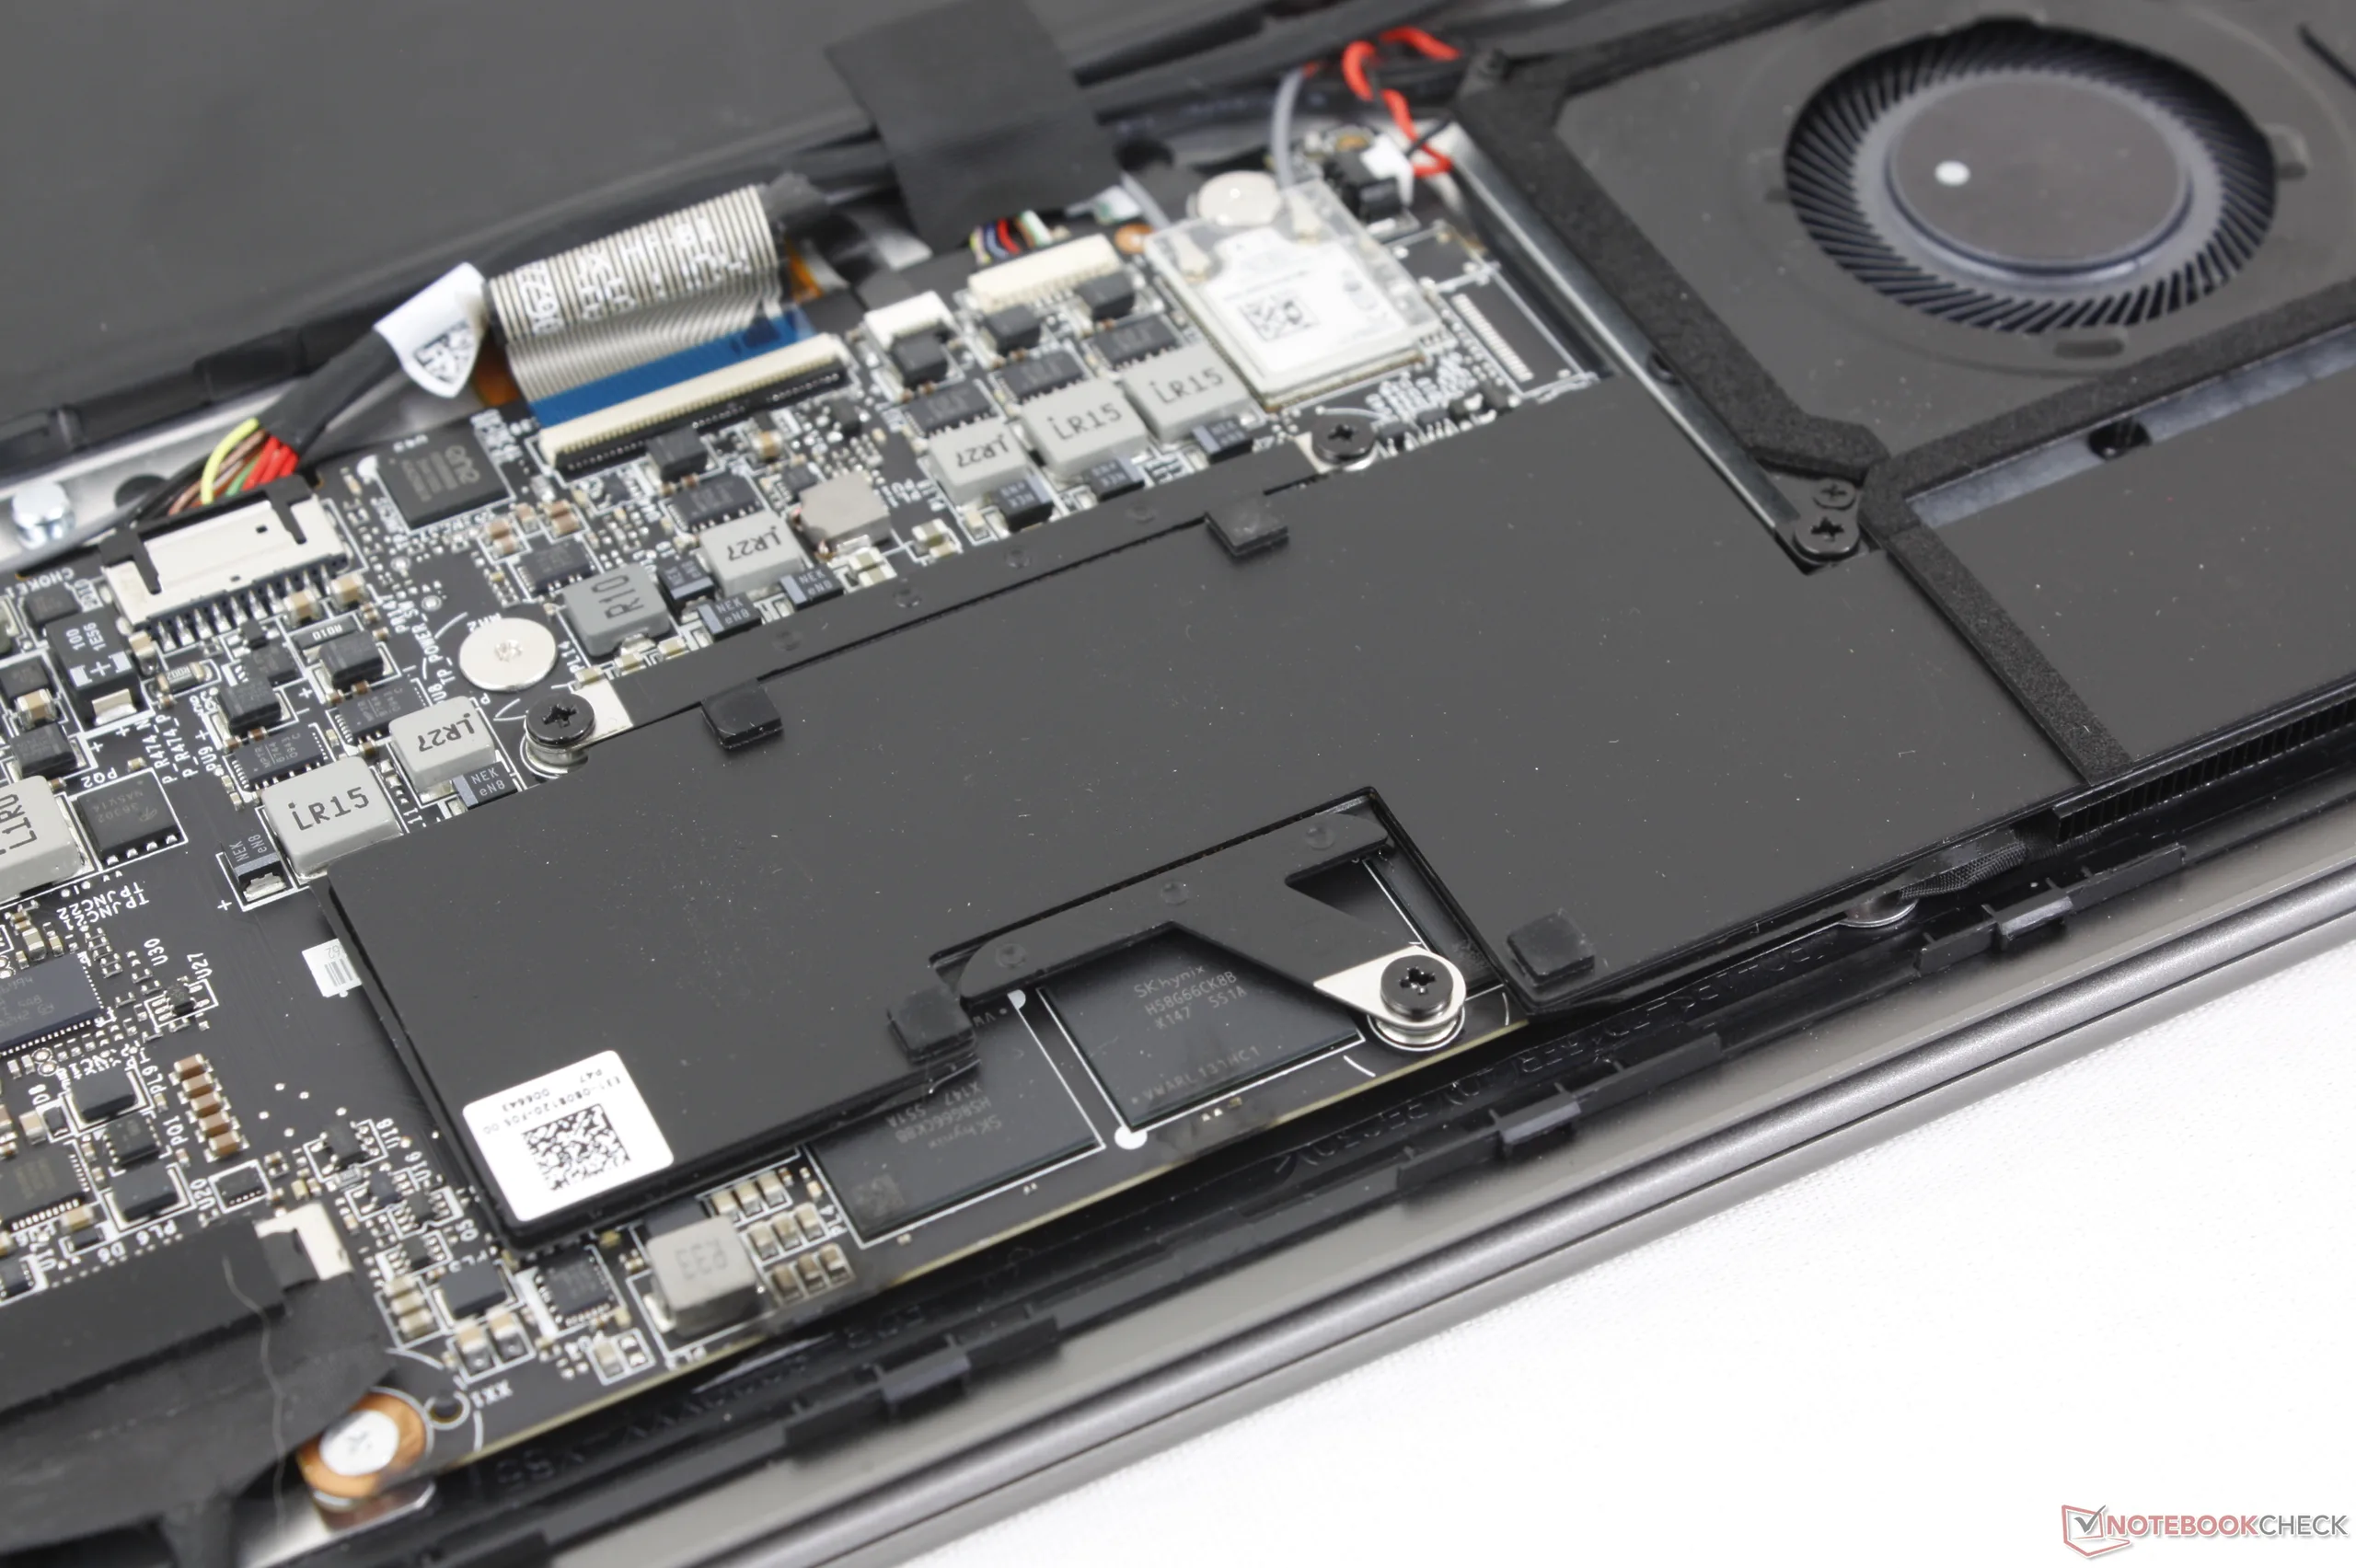
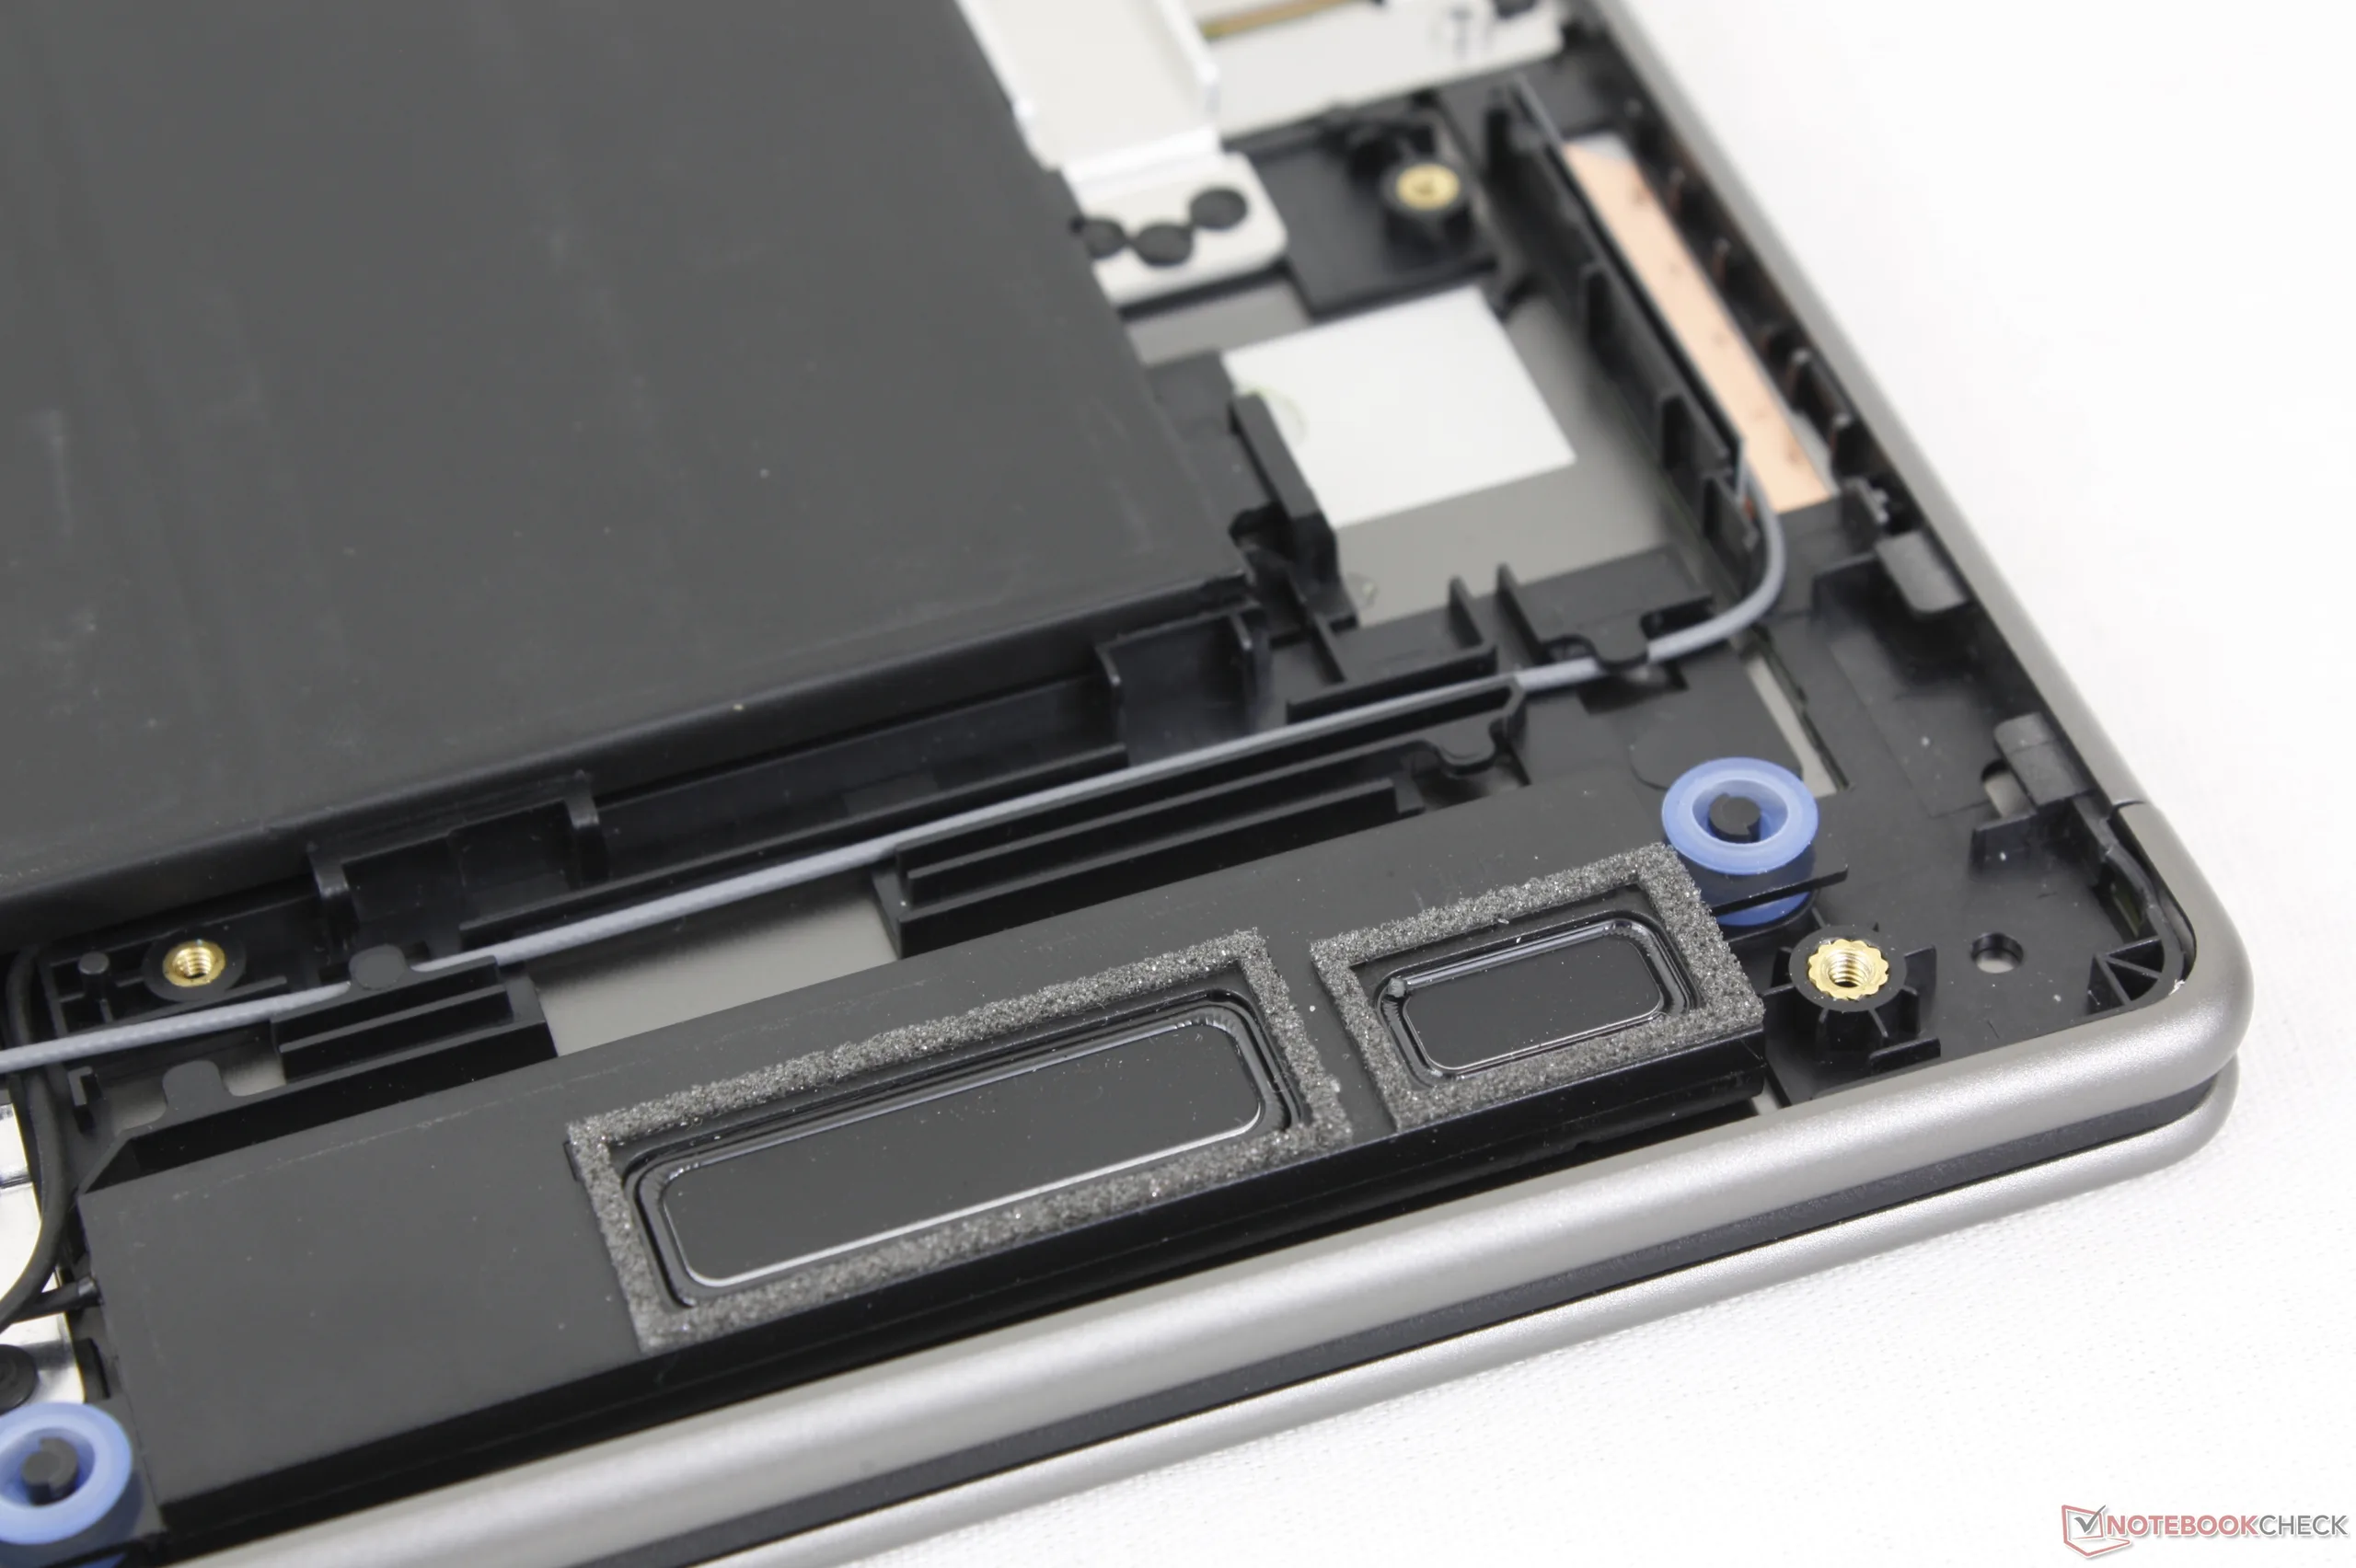
只需一把十字螺丝刀和锋利的边缘,就能轻松拆卸底部面板。如下图所示,主板与 2025 型号相比进行了全面修改。最明显的是,该型号现在只支持一个 M.2 固态硬盘,而不是两个,同时电池容量也有所缩减,这可能是为了减轻重量。

可持续性
制造商没有明确说明在生产过程中使用了回收材料。同时,该产品的包装通过了 FSC 认证,由纸张和塑料组成。
配件和保修
包装盒内除了交流适配器和文件外,没有其他附件。如果在美国购买,制造商通常提供一年有限保修。
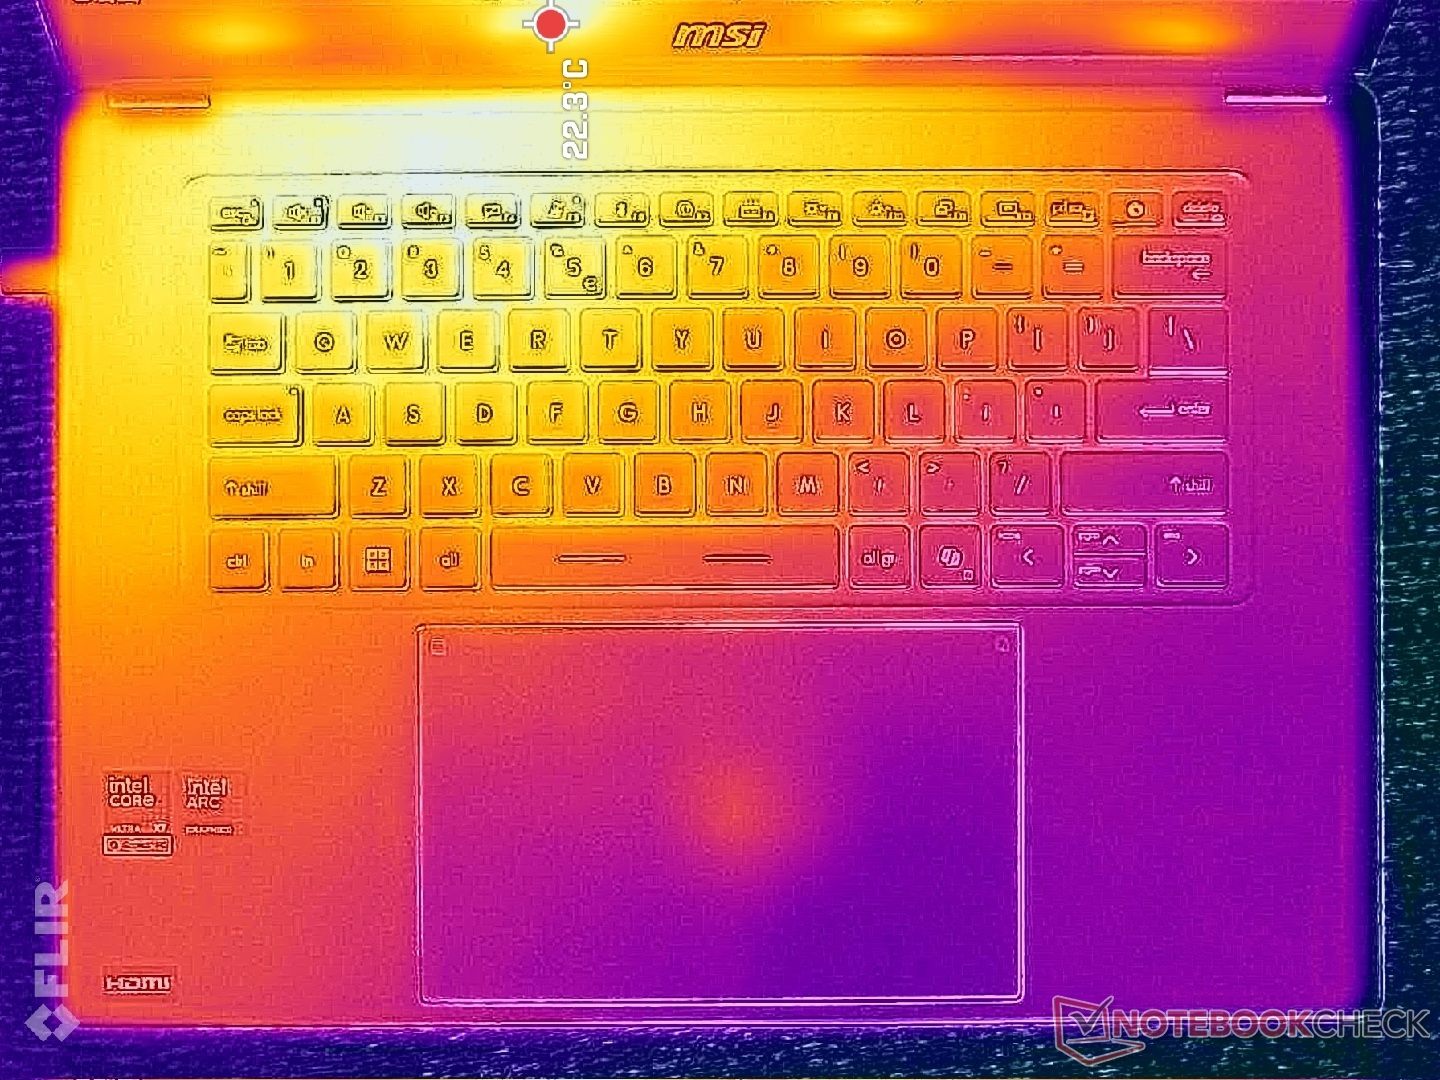
输入设备
键盘
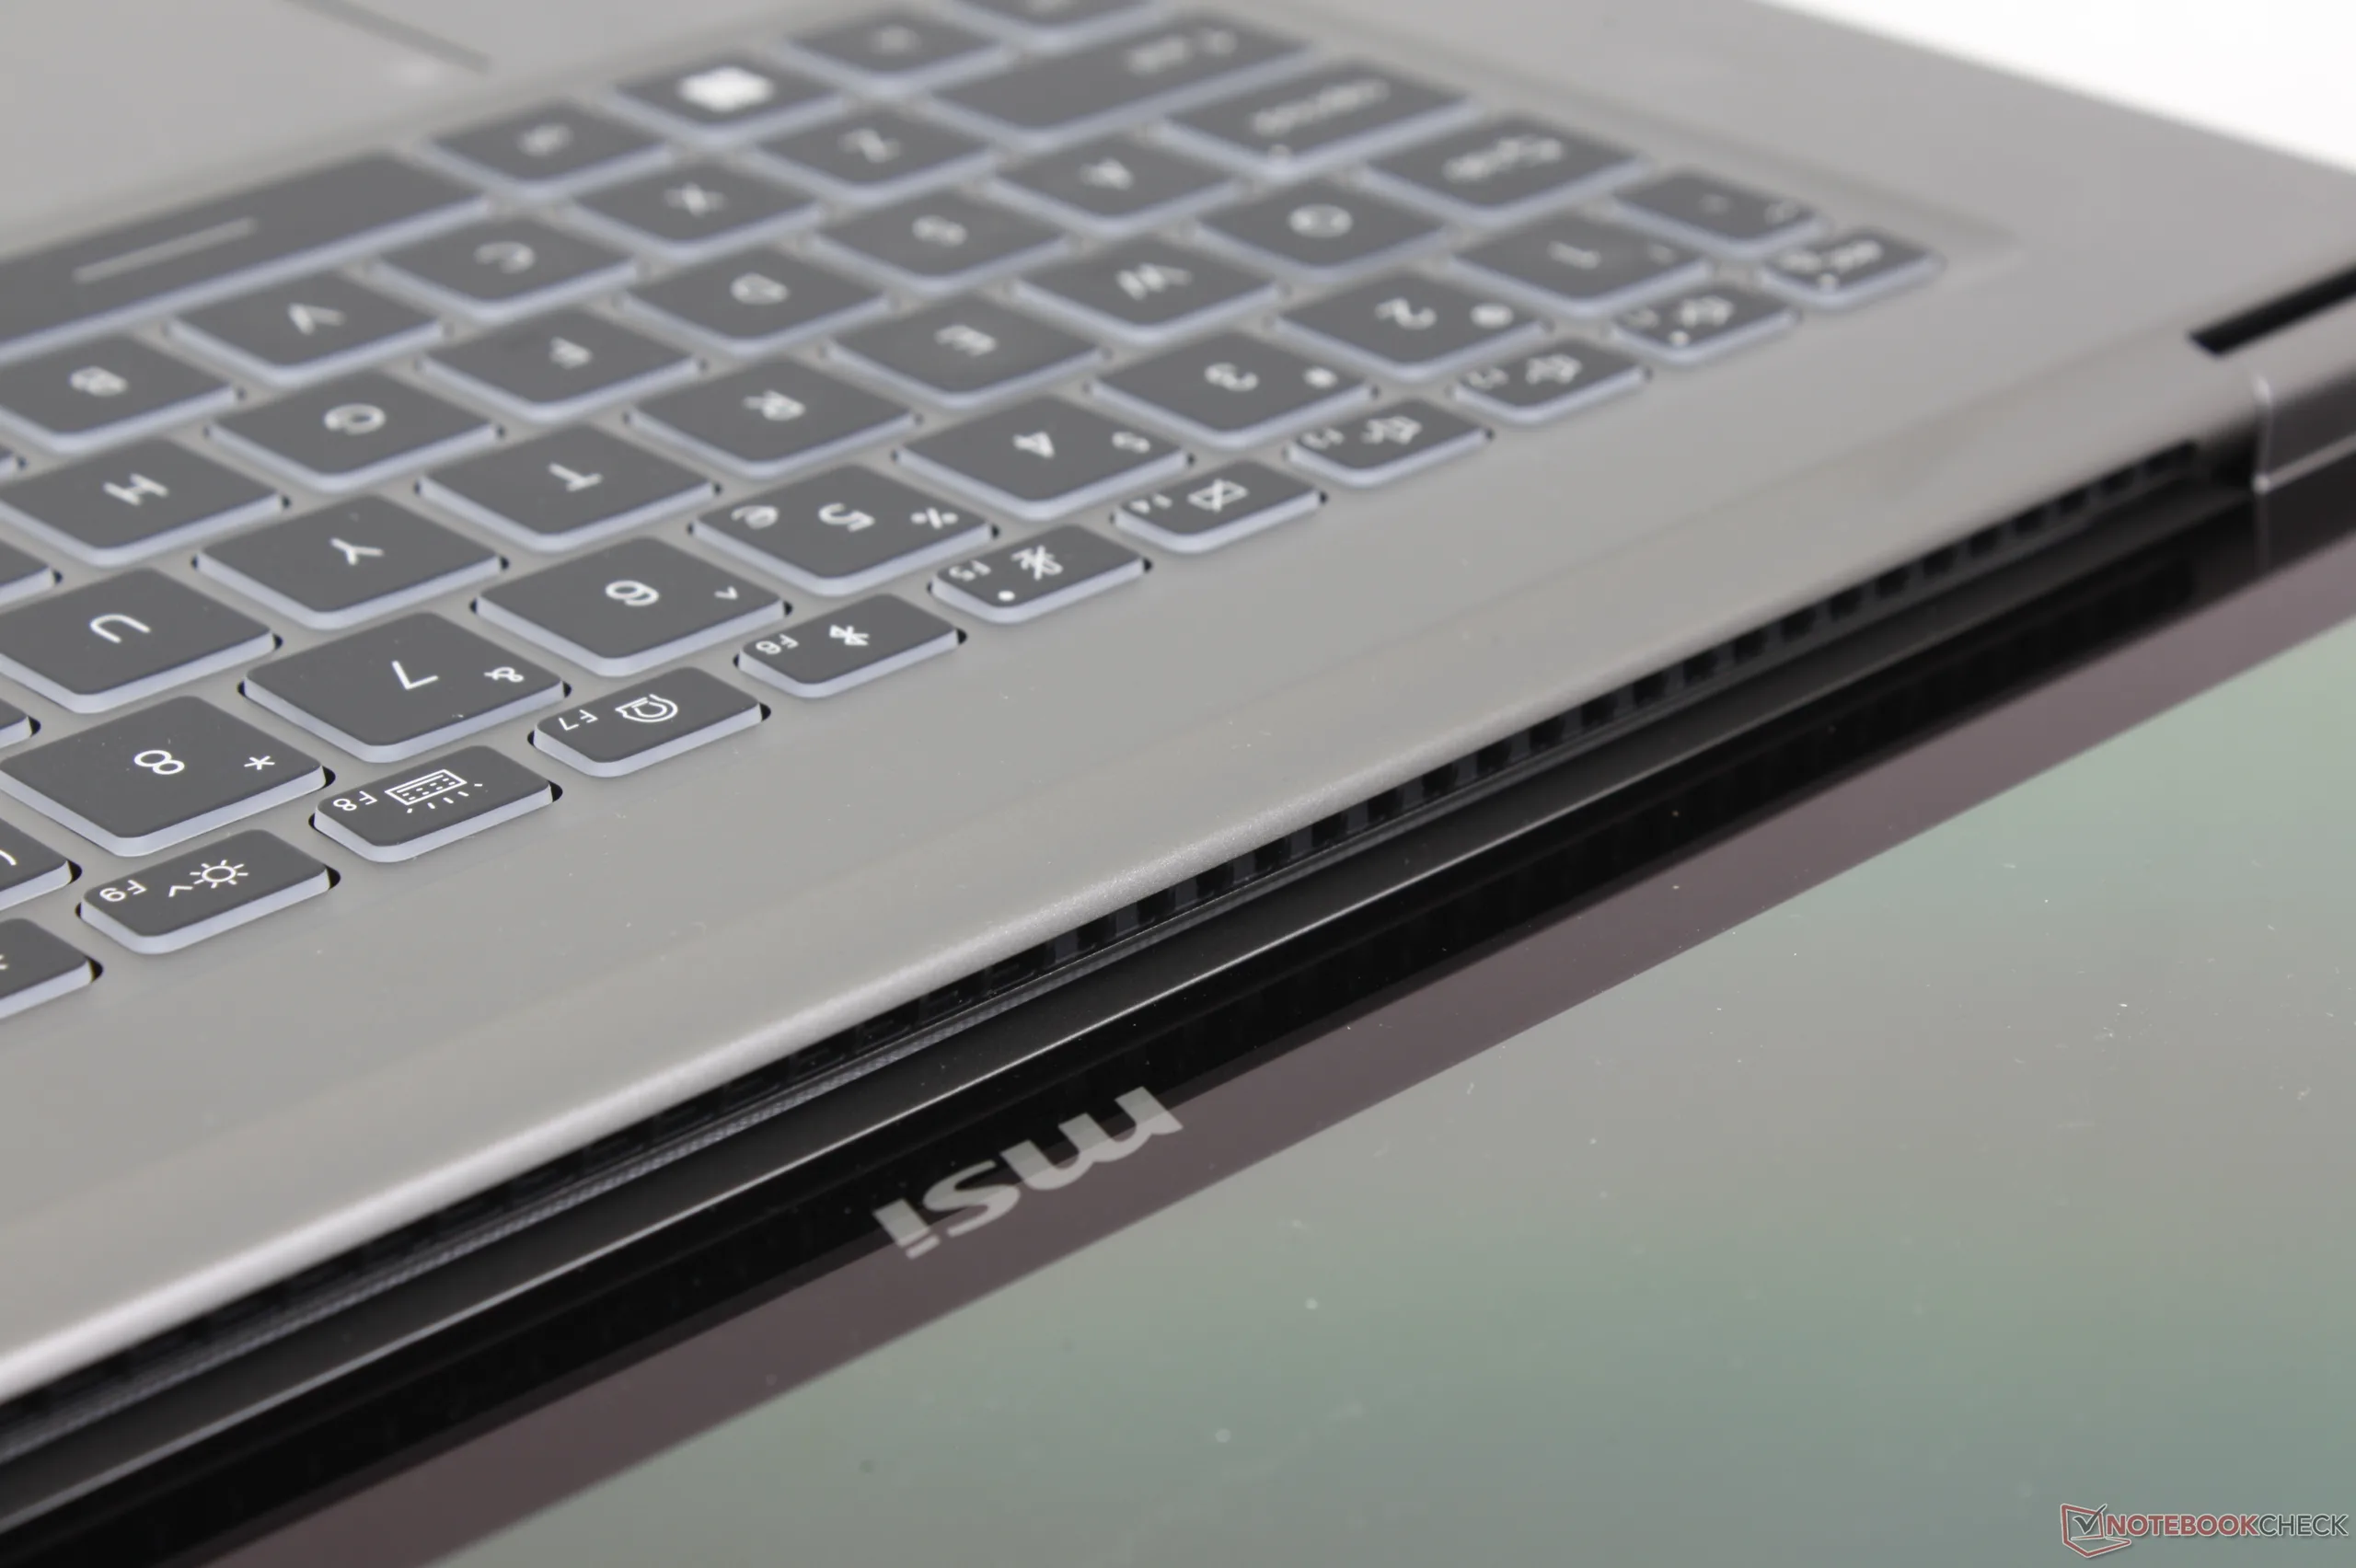
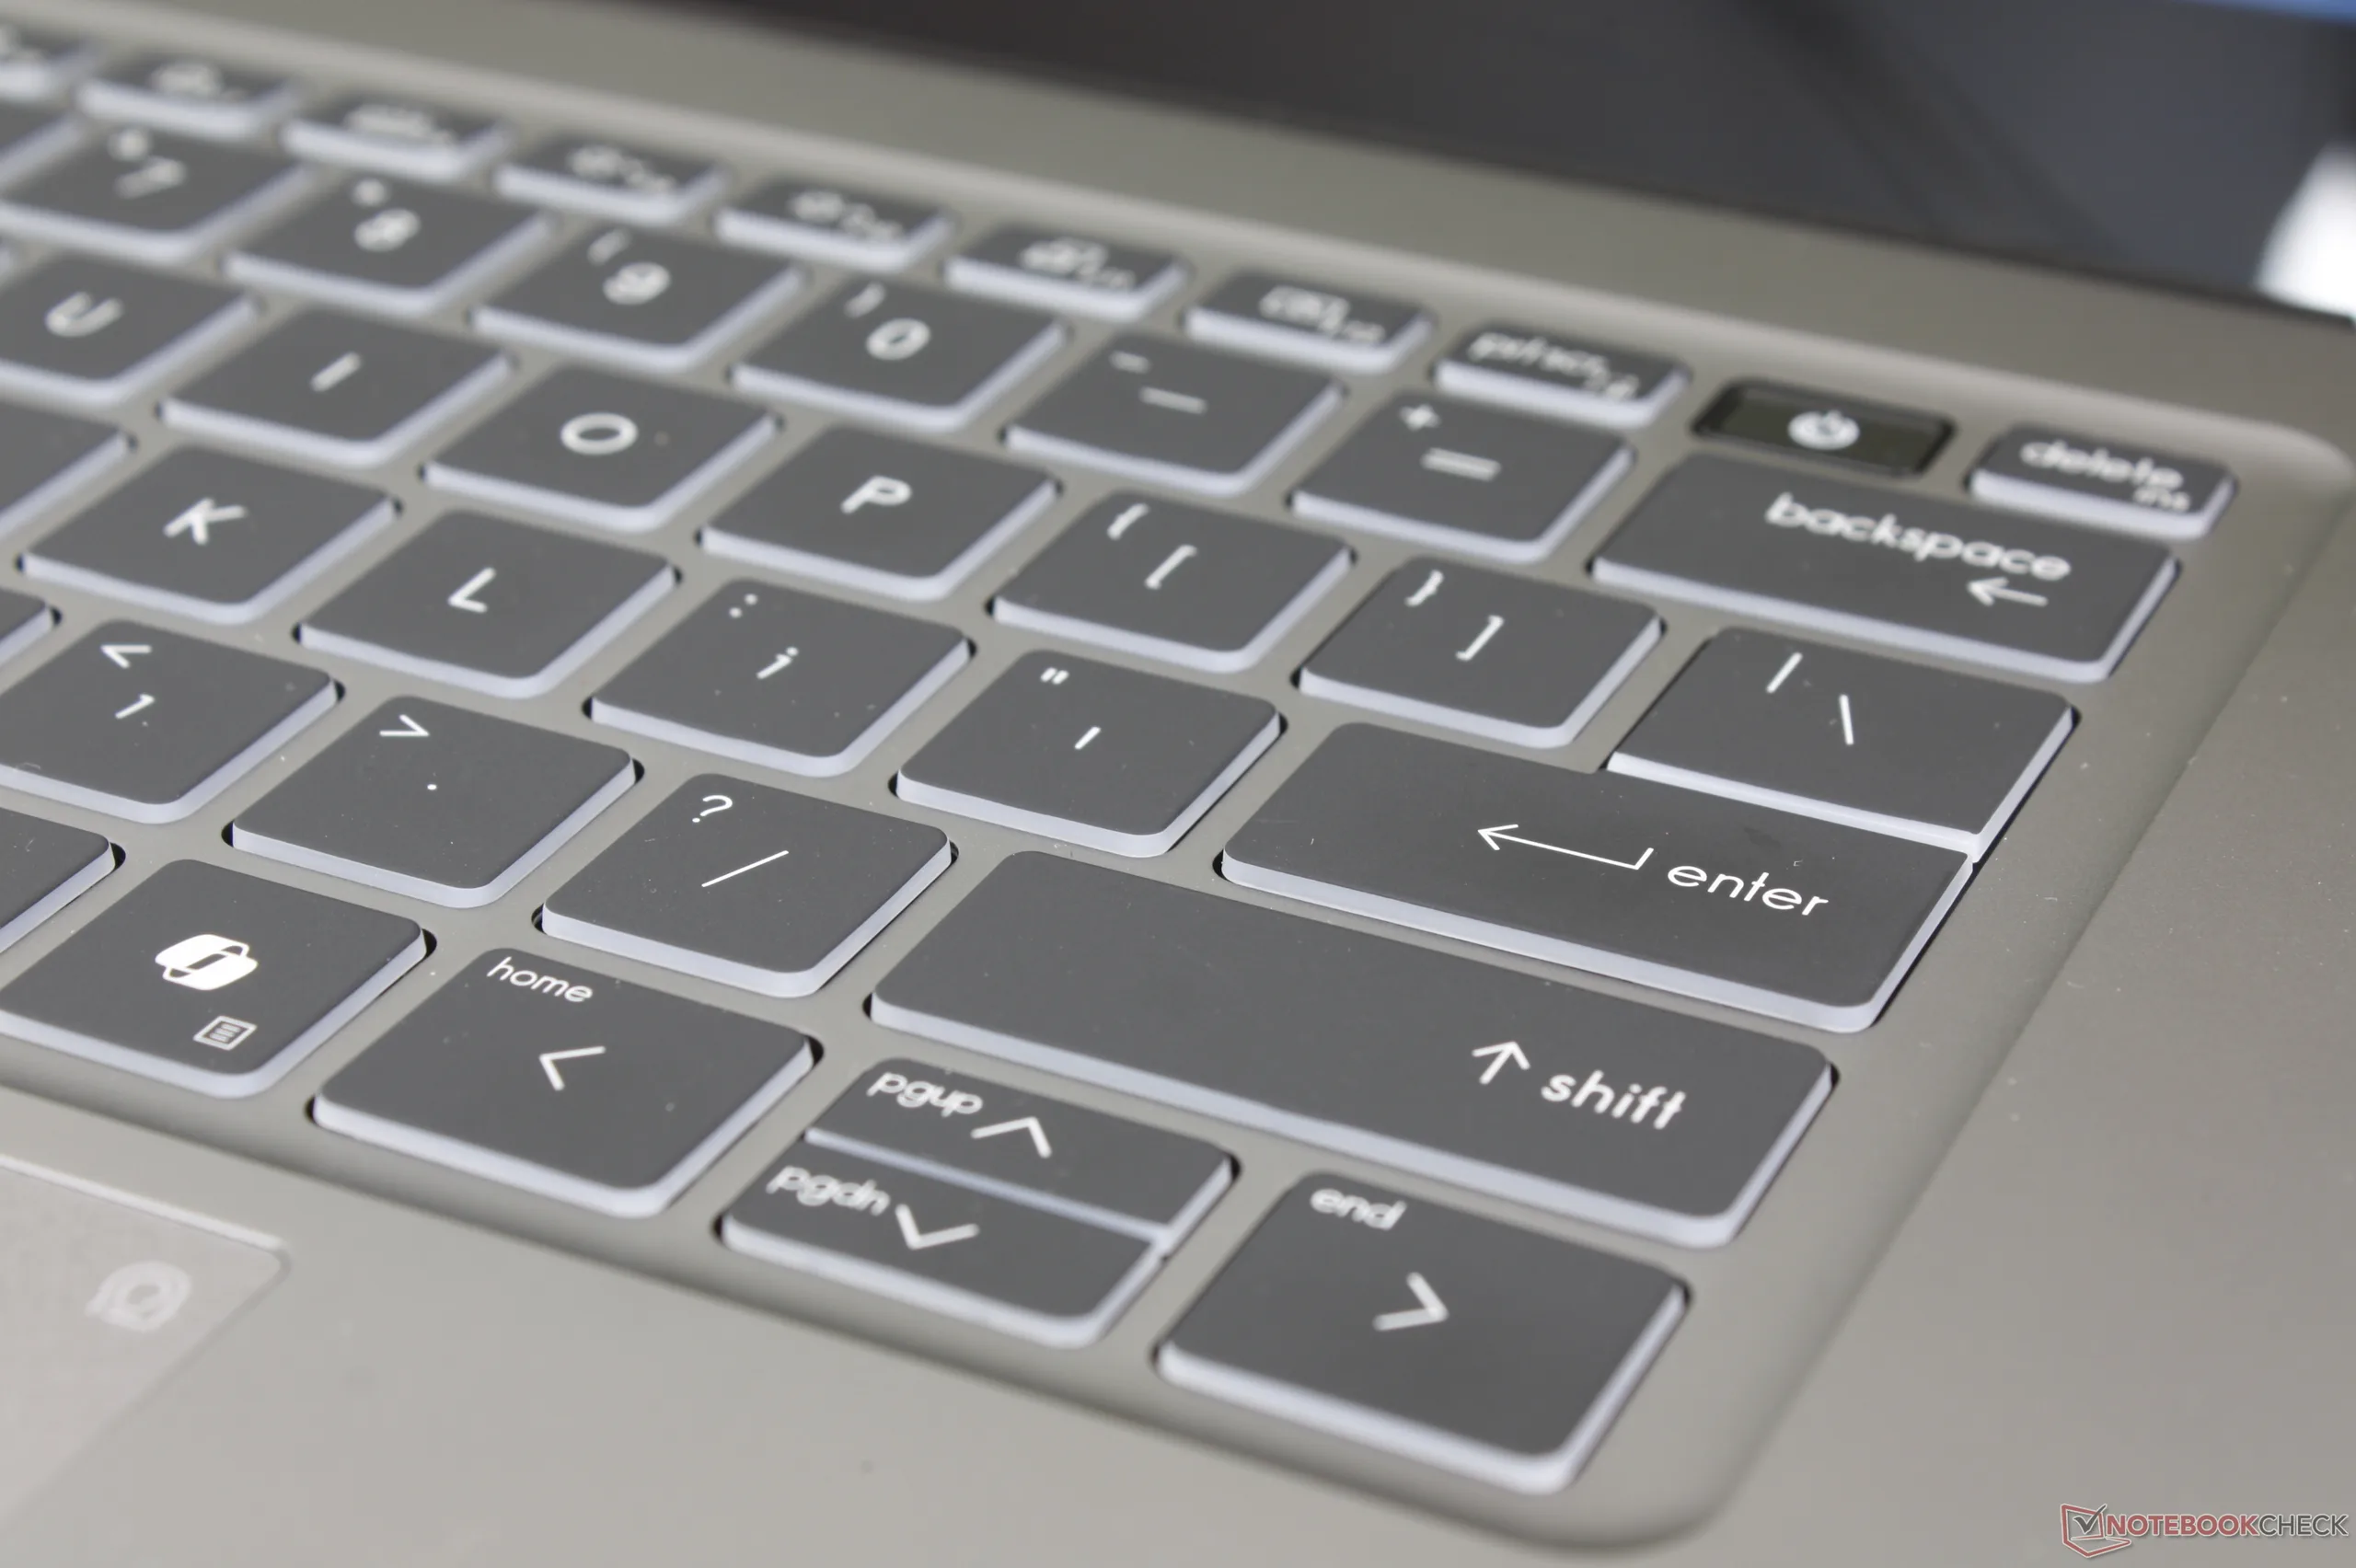
无论好坏,数字键盘现在都不见了。与 Thinkpad T 系列或 EliteBook 系列的经典办公笔记本电脑相比,它的键入体验更轻盈,键程更浅。在便宜得多的 Venture 16例如,在 Venture 16 上打字的感觉与在顶级 Prestige 系列上打字的感觉差不多。虽然微星已经完成了新款 Prestige 机箱的整体设计,但它的键盘还没有跟上。
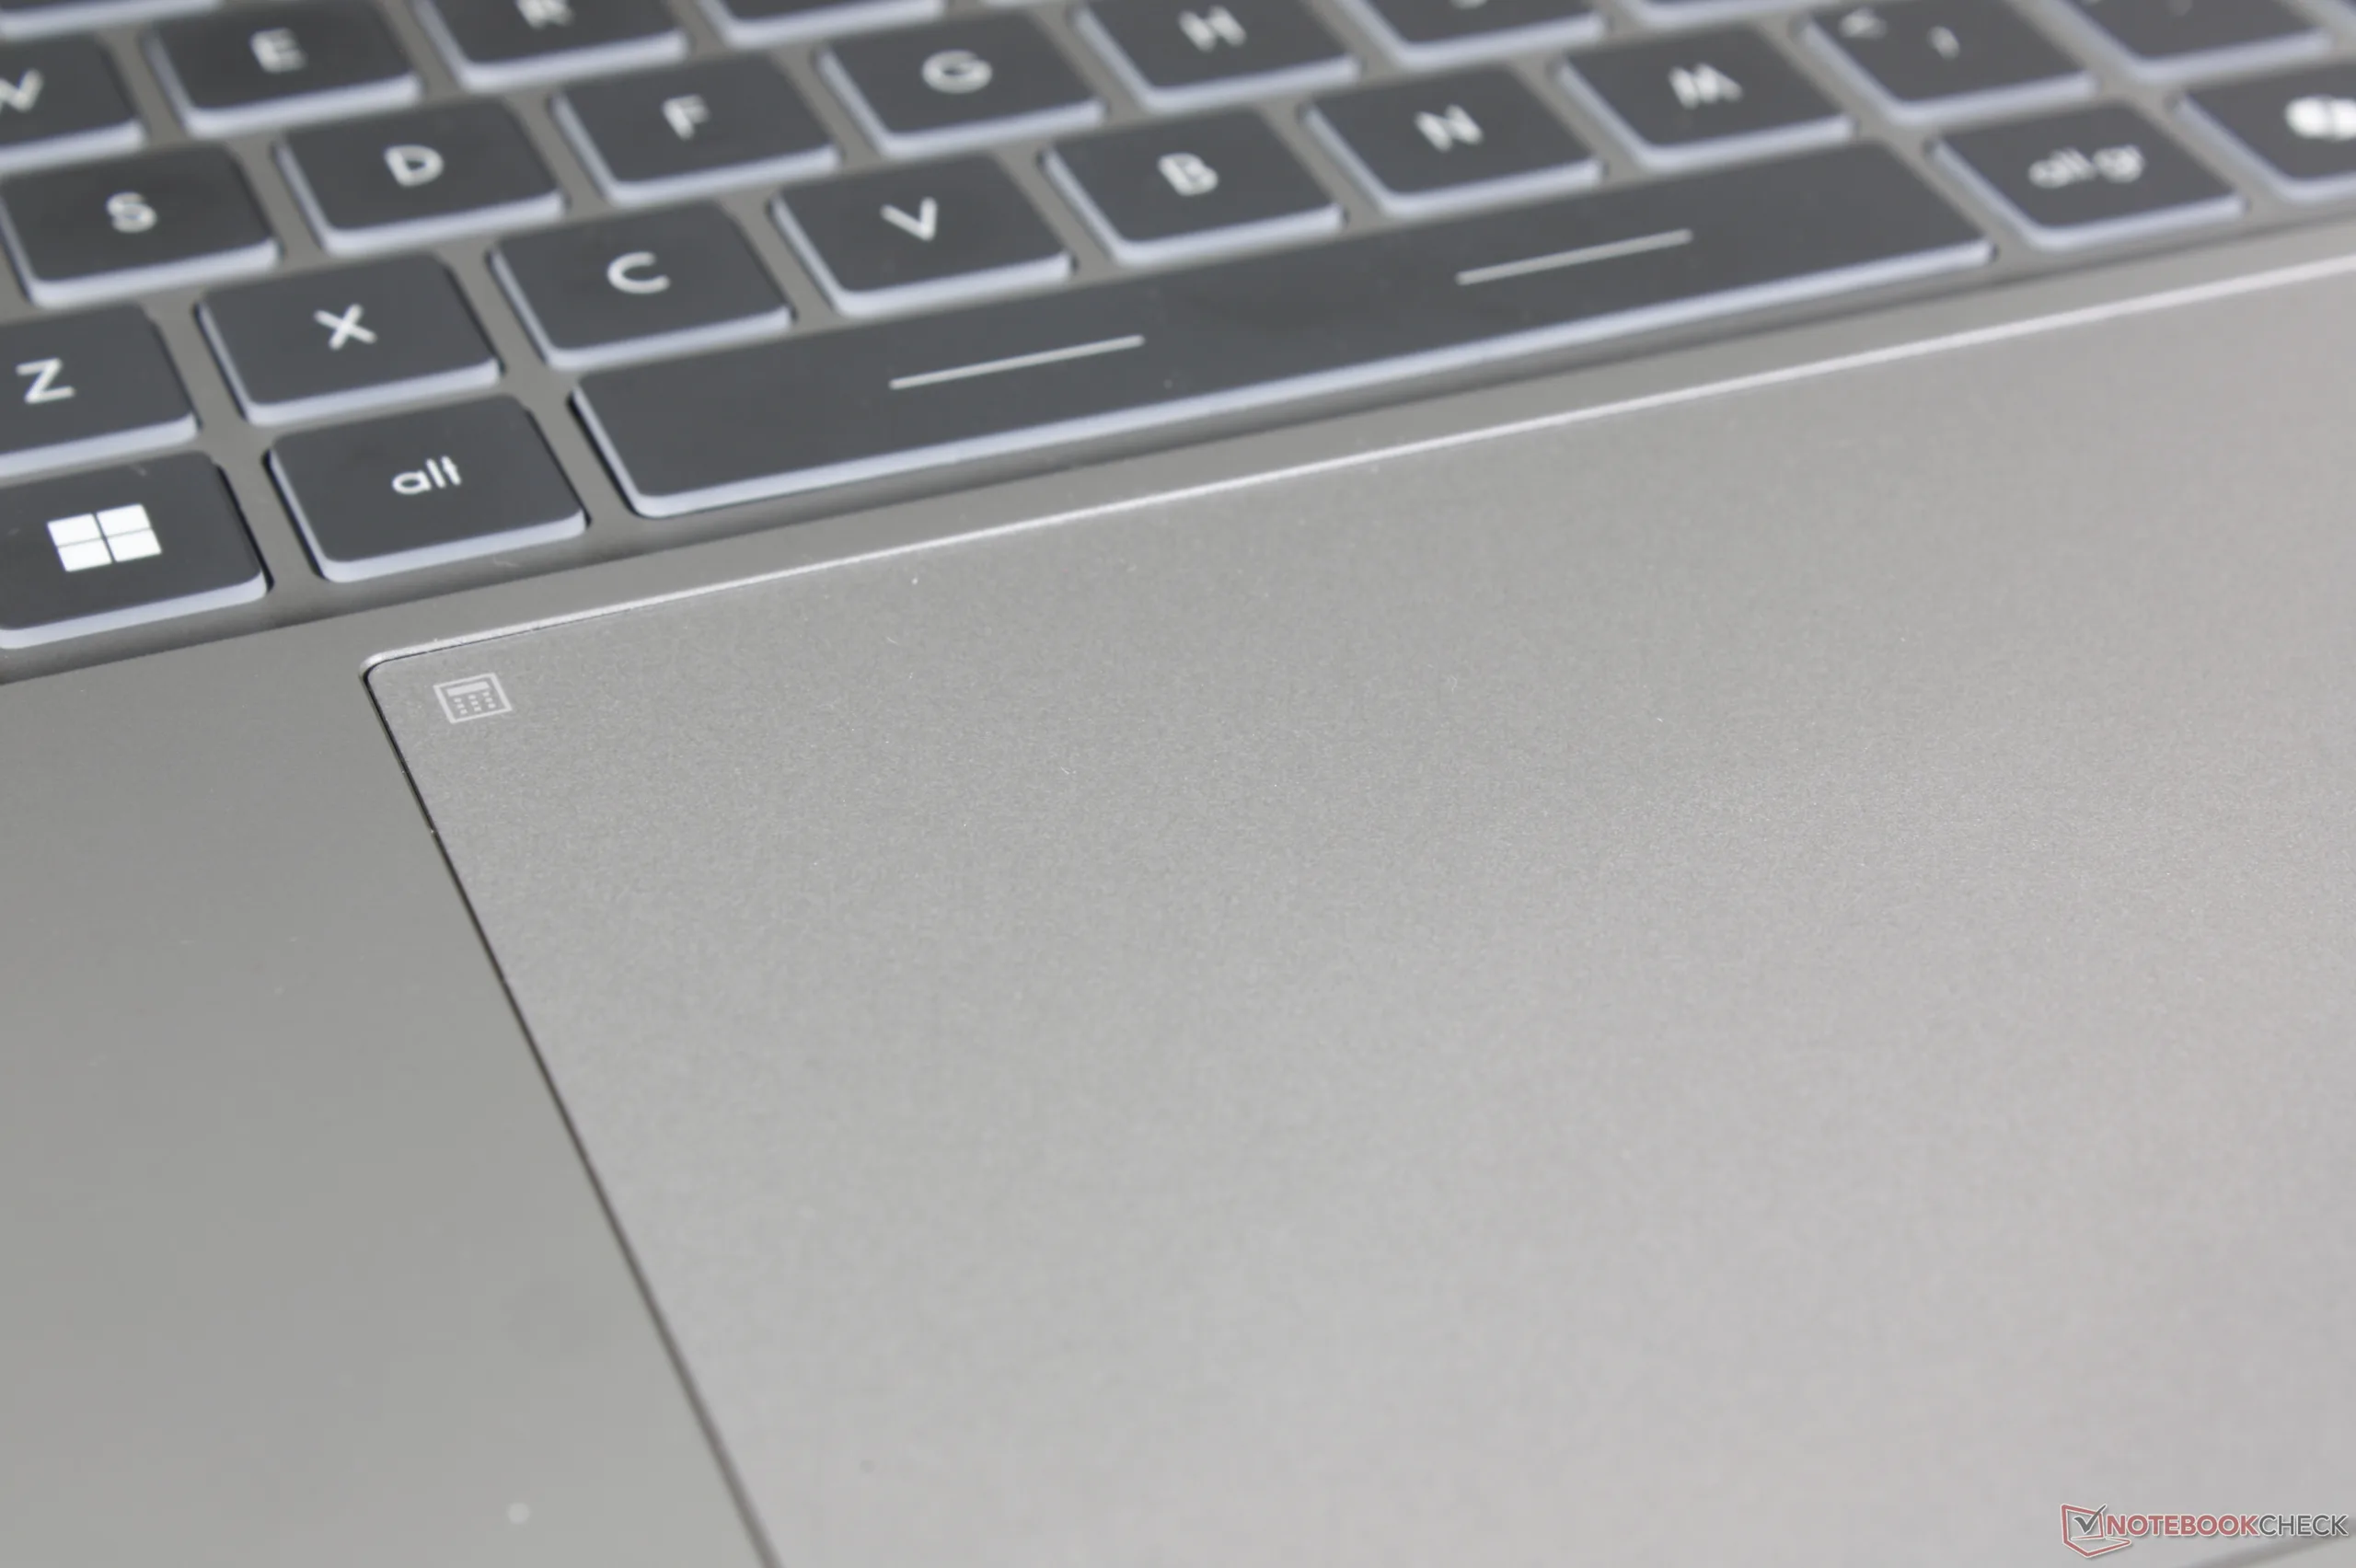
触摸板
点击板的尺寸从 15 x 9 厘米增大到 16 x 10 厘米。无论滑行速度如何,牵引力都平稳准确,但点击时的反馈仍然相对较弱。点击时也只有在靠近底部两个角的地方比较舒服,因为那里的点击板表面更容易凹陷。

显示屏
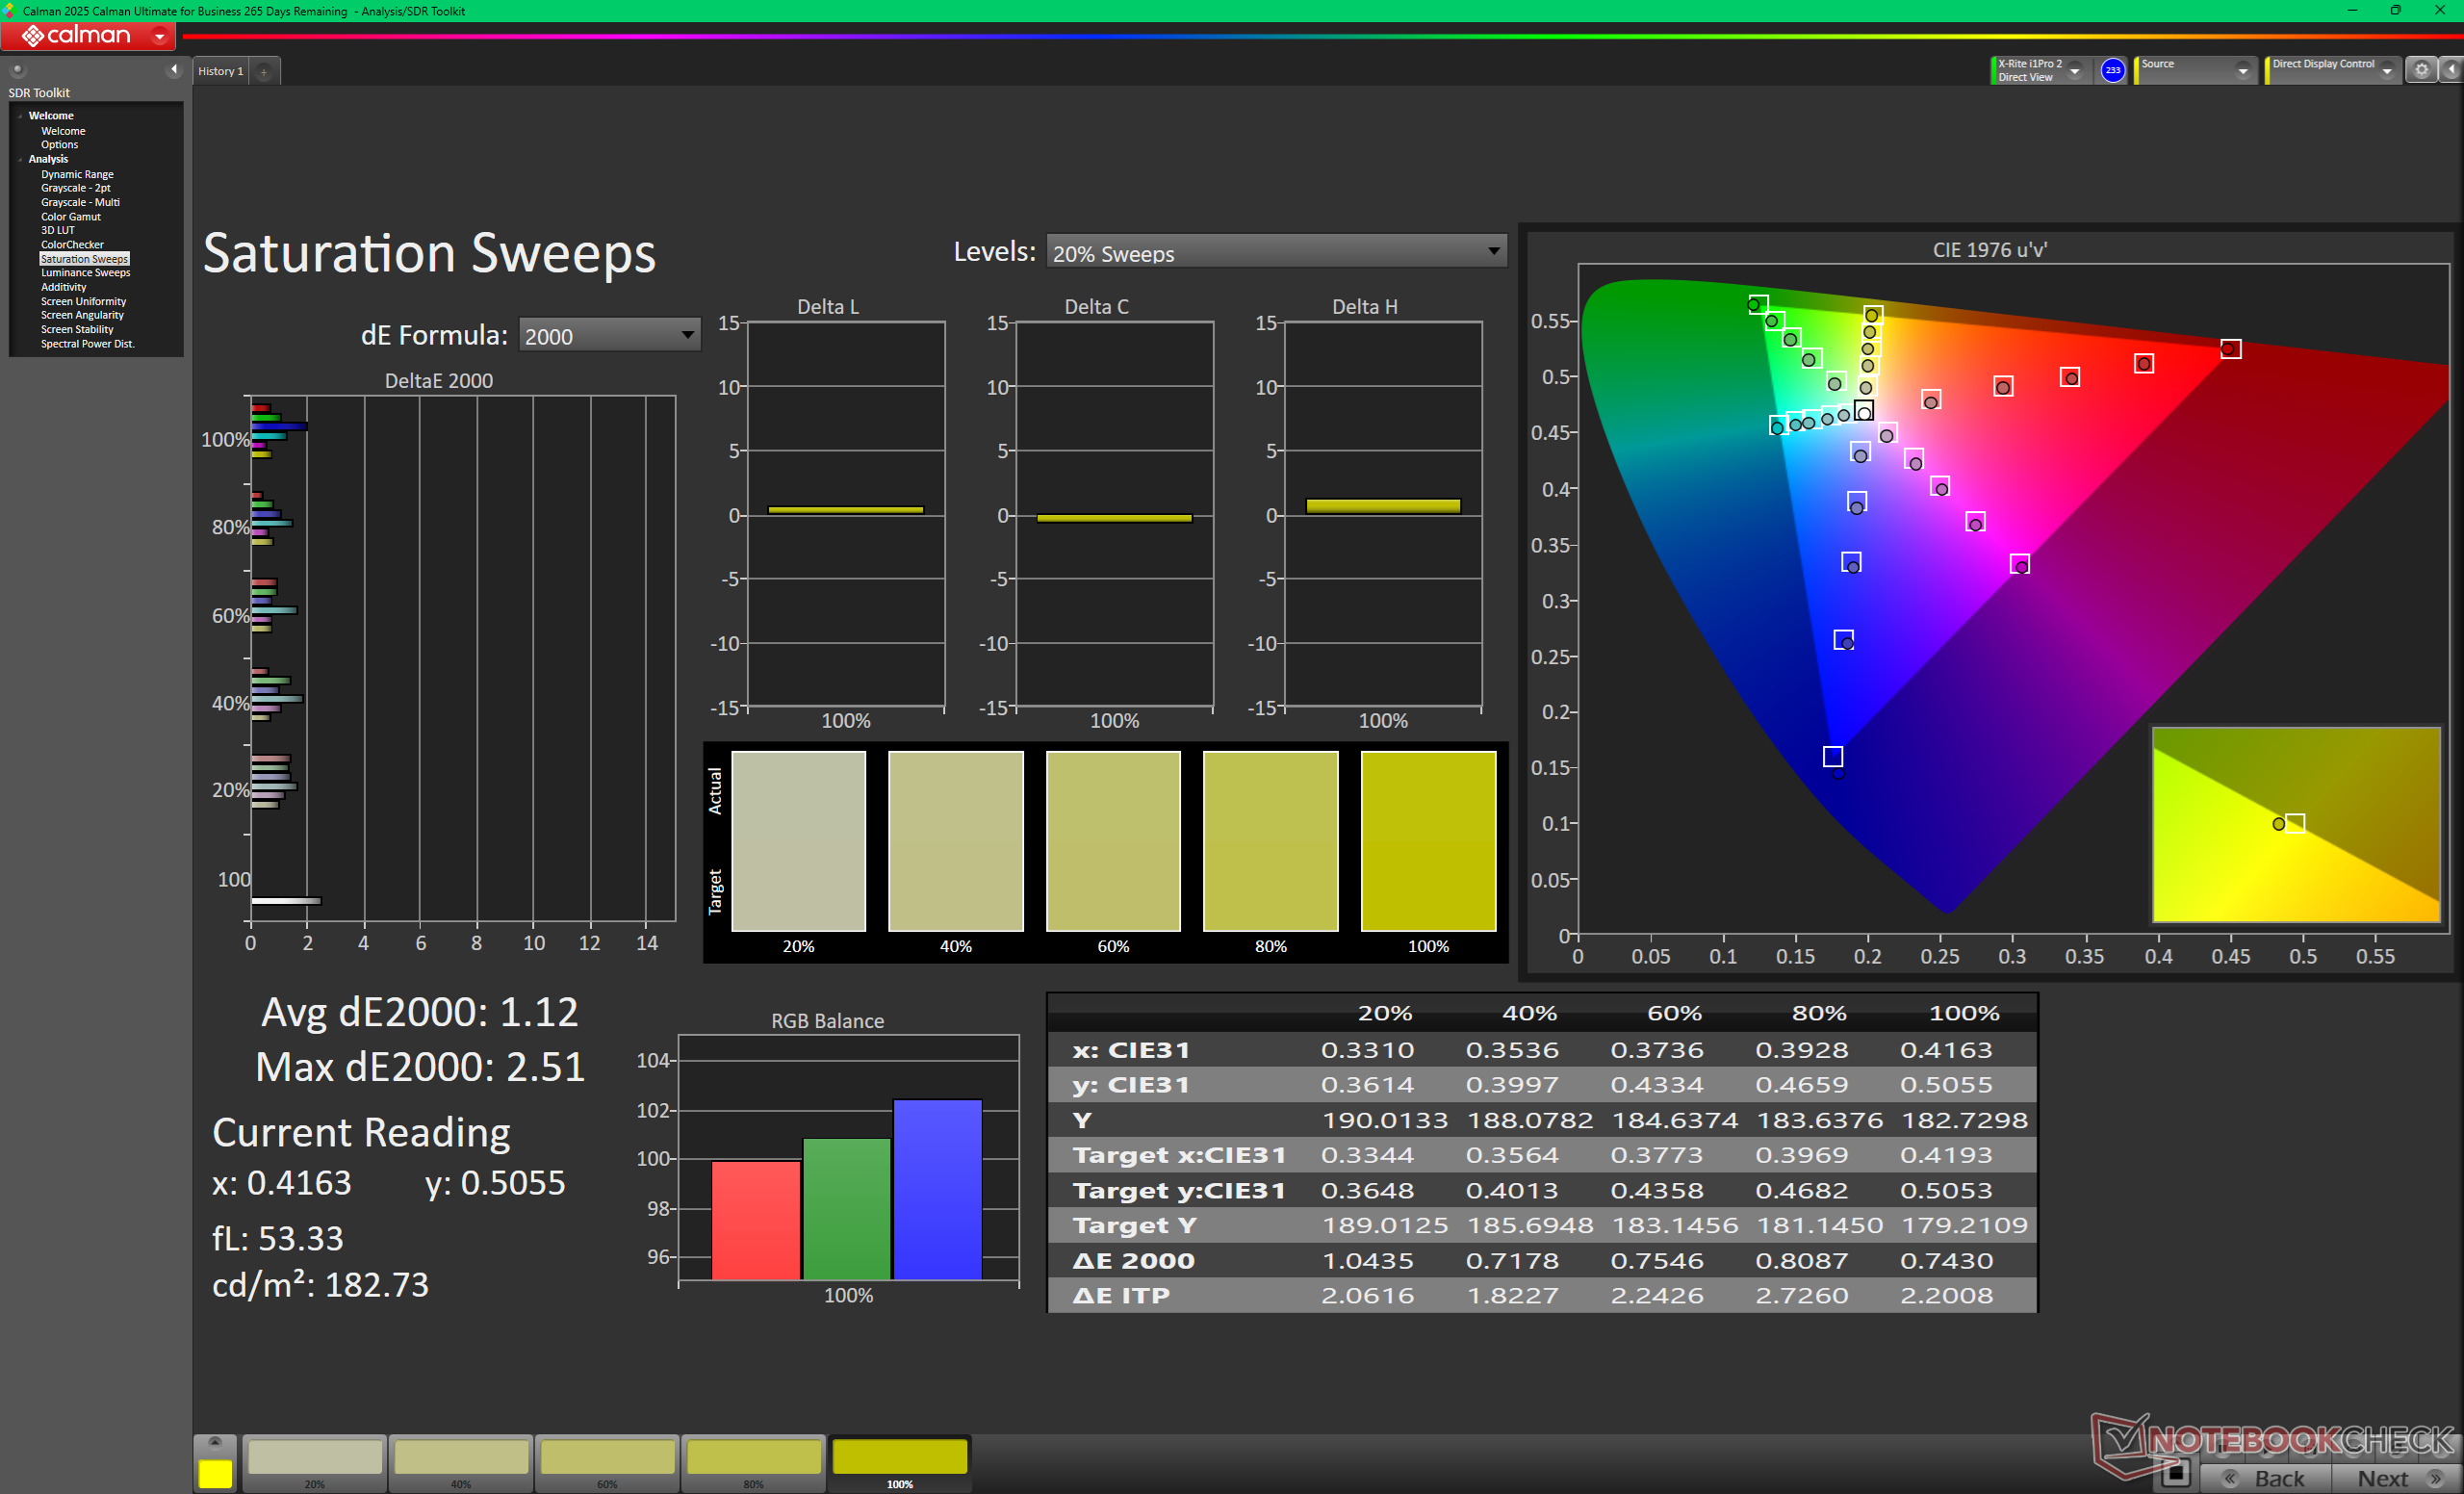
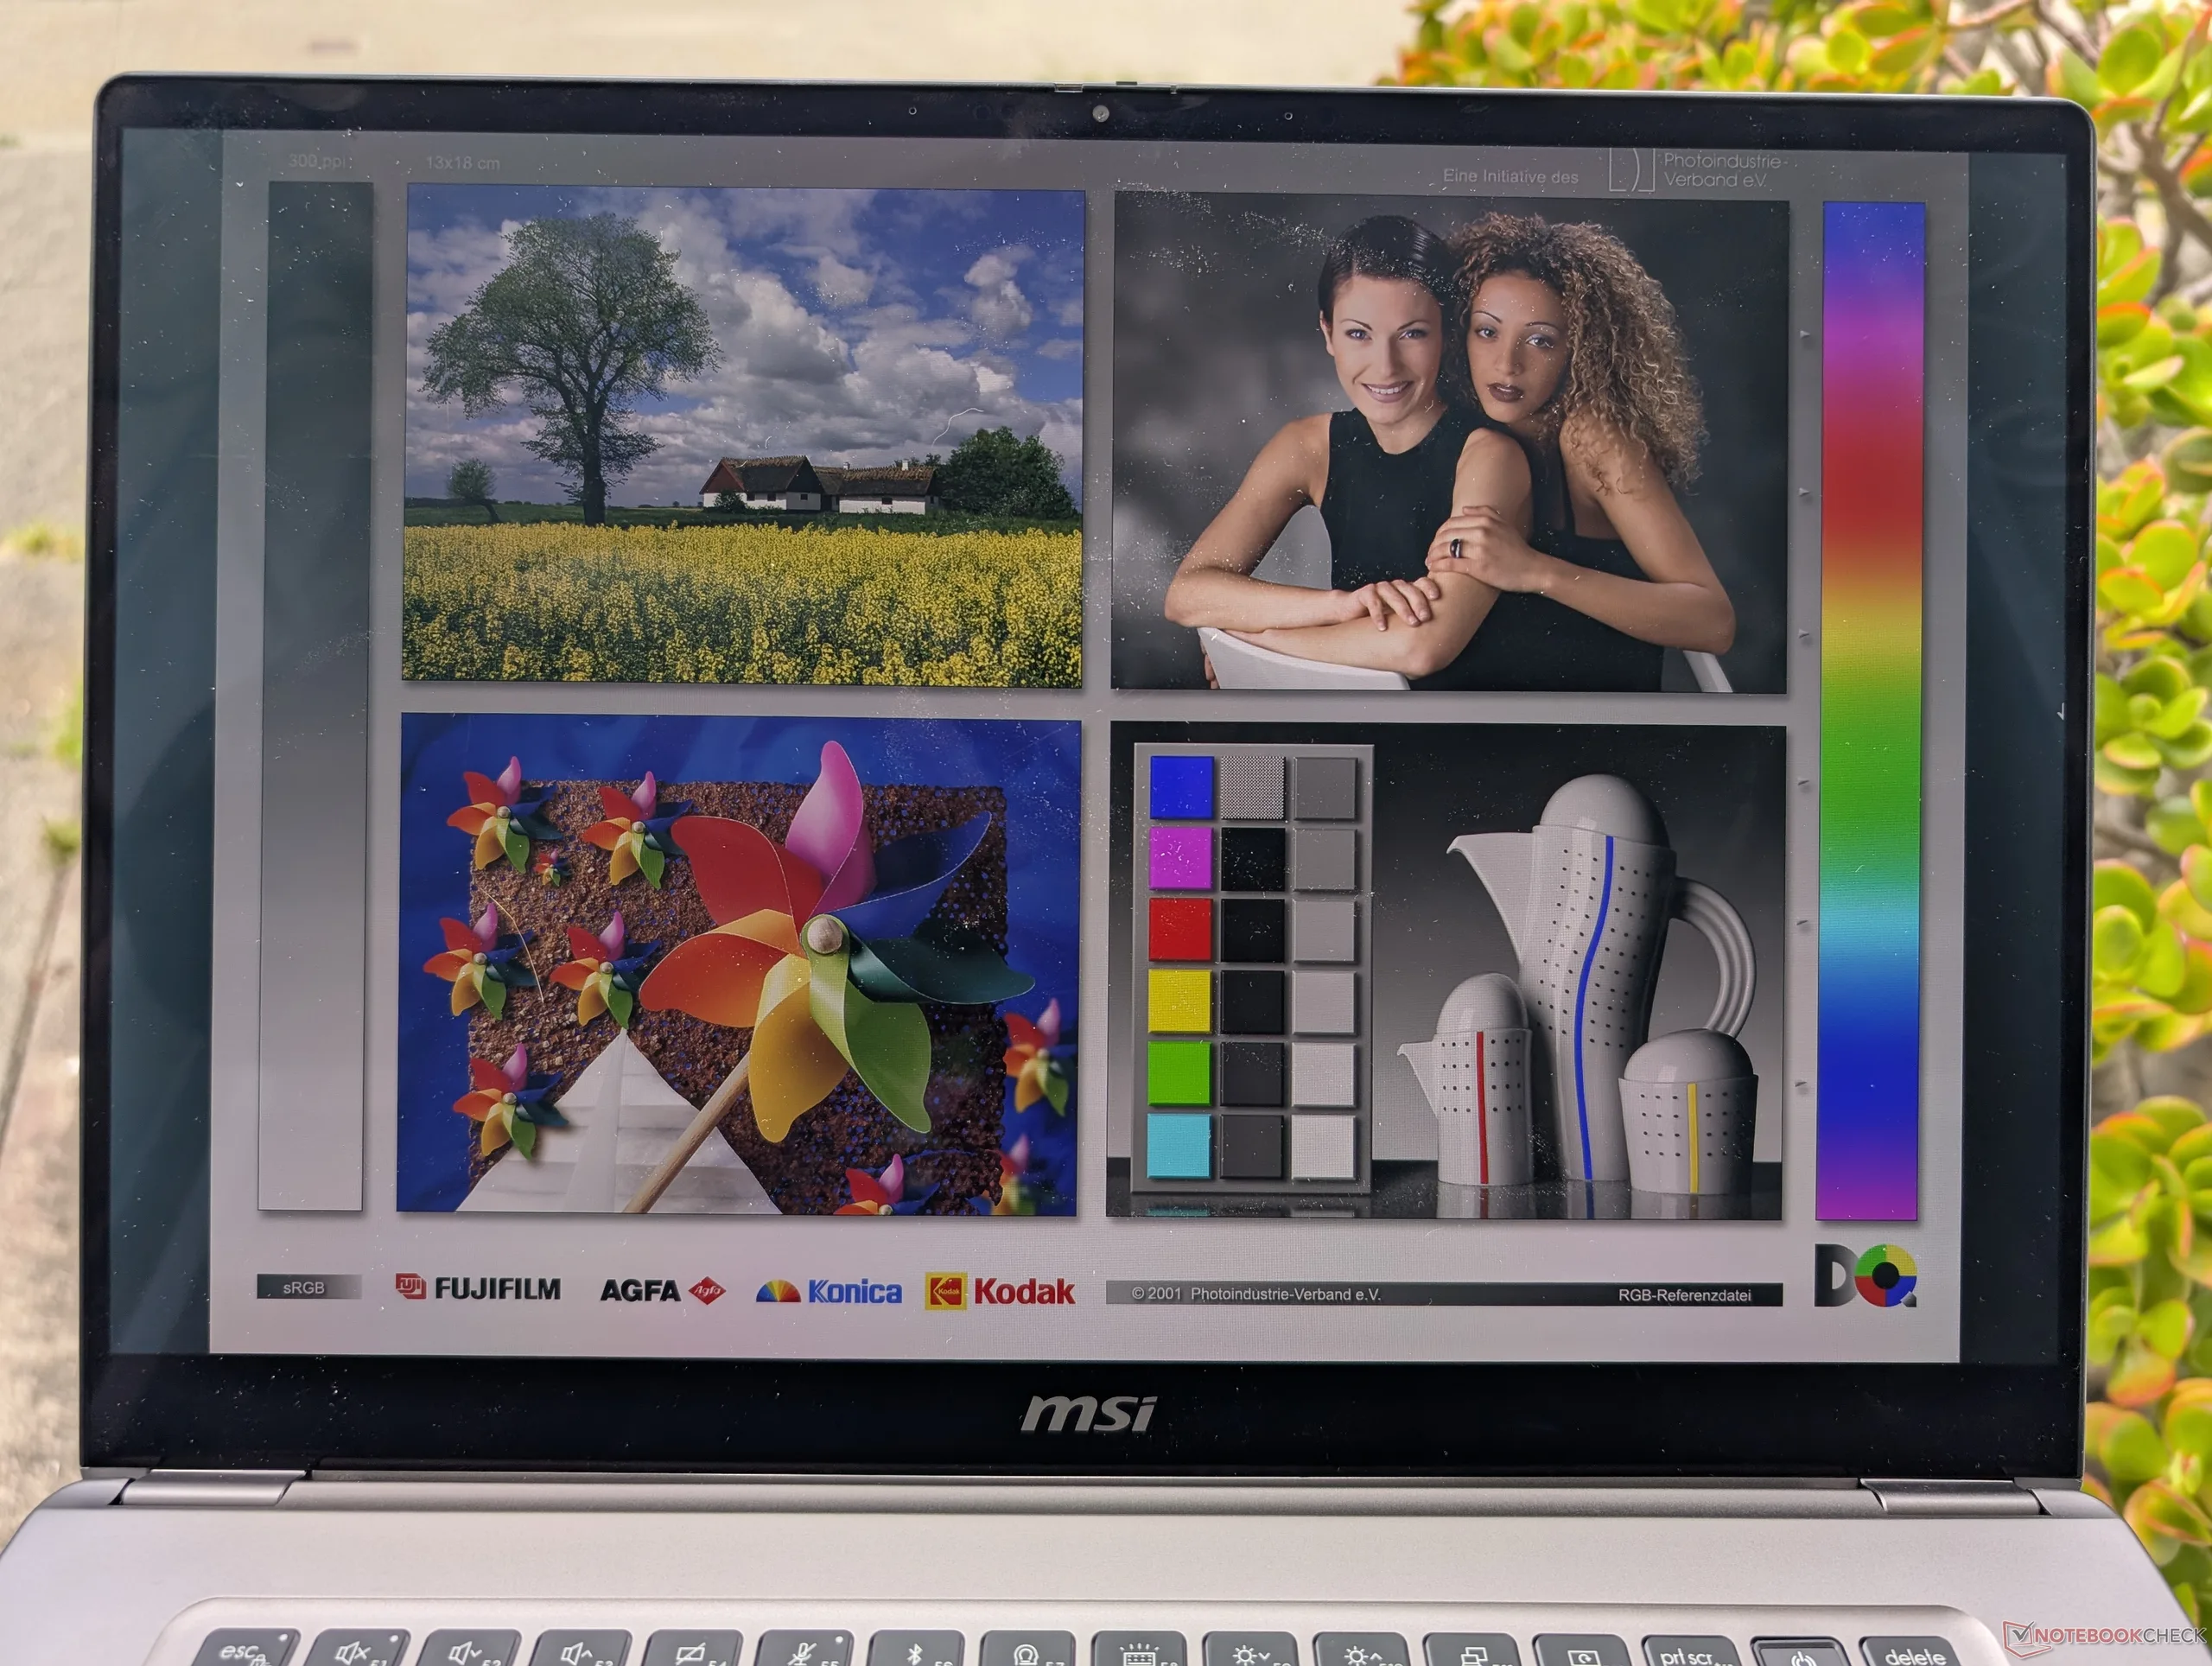
三星 ATNA60CL11-0 OLED 面板与 ZenBook S16 上的 ATNA60CL10-0 面板非常相似。 ZenBook S16.120 Hz 的刷新率和 1800p 的原始分辨率比去年机型的 IPS 面板有所改进。事实上,没有更多的 IPS 面板可供选择,这使得 Prestige 16 系列完全属于发烧级产品。
亮度虽然依然出色,但比 2025 Prestige 16 的 IPS 显示屏要暗一些。我们的测试显示,在 SDR 模式和 HDR 模式下,最大亮度分别只有 383 尼特和 422 尼特,而去年的型号为 471 尼特。某些配置支持 DisplayHDR1000,可以获得更亮的最大亮度,但我们的测试设备不在其中。
| |||||||||||||||||||||||||
Brightness Distribution: 98 %
Center on Battery: 375 cd/m²
Contrast: ∞:1 (Black: 0 cd/m²)
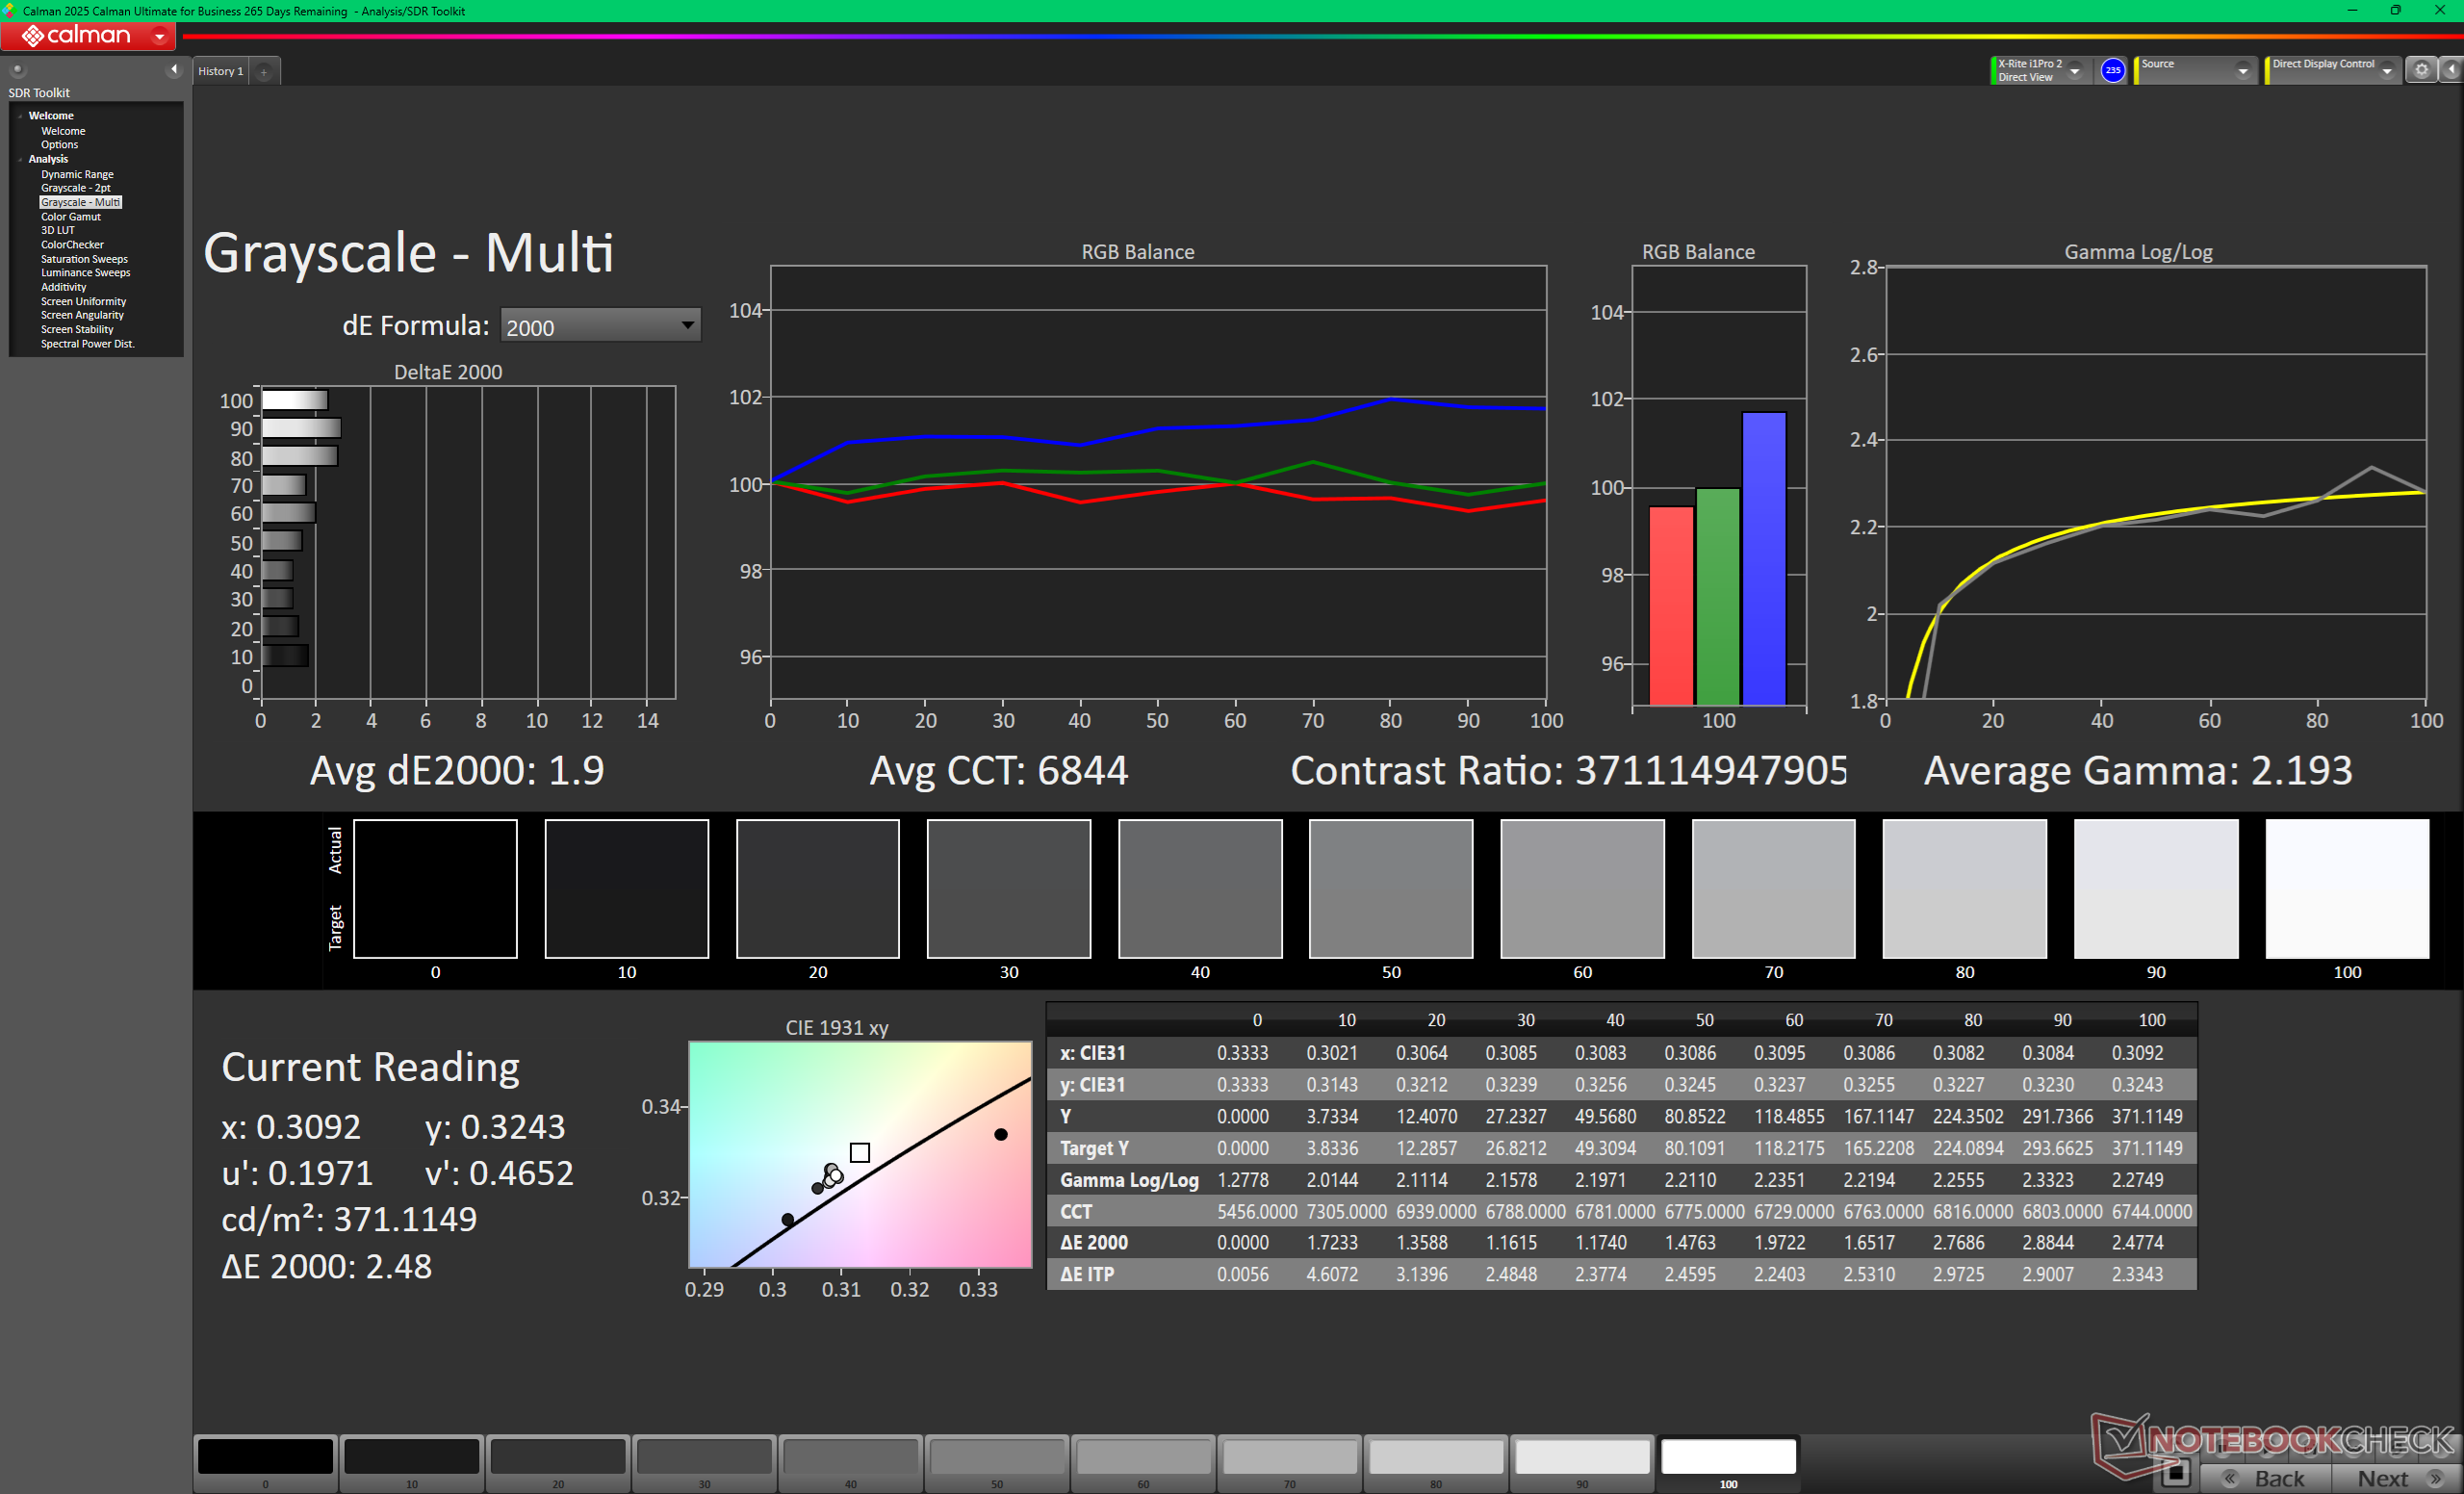
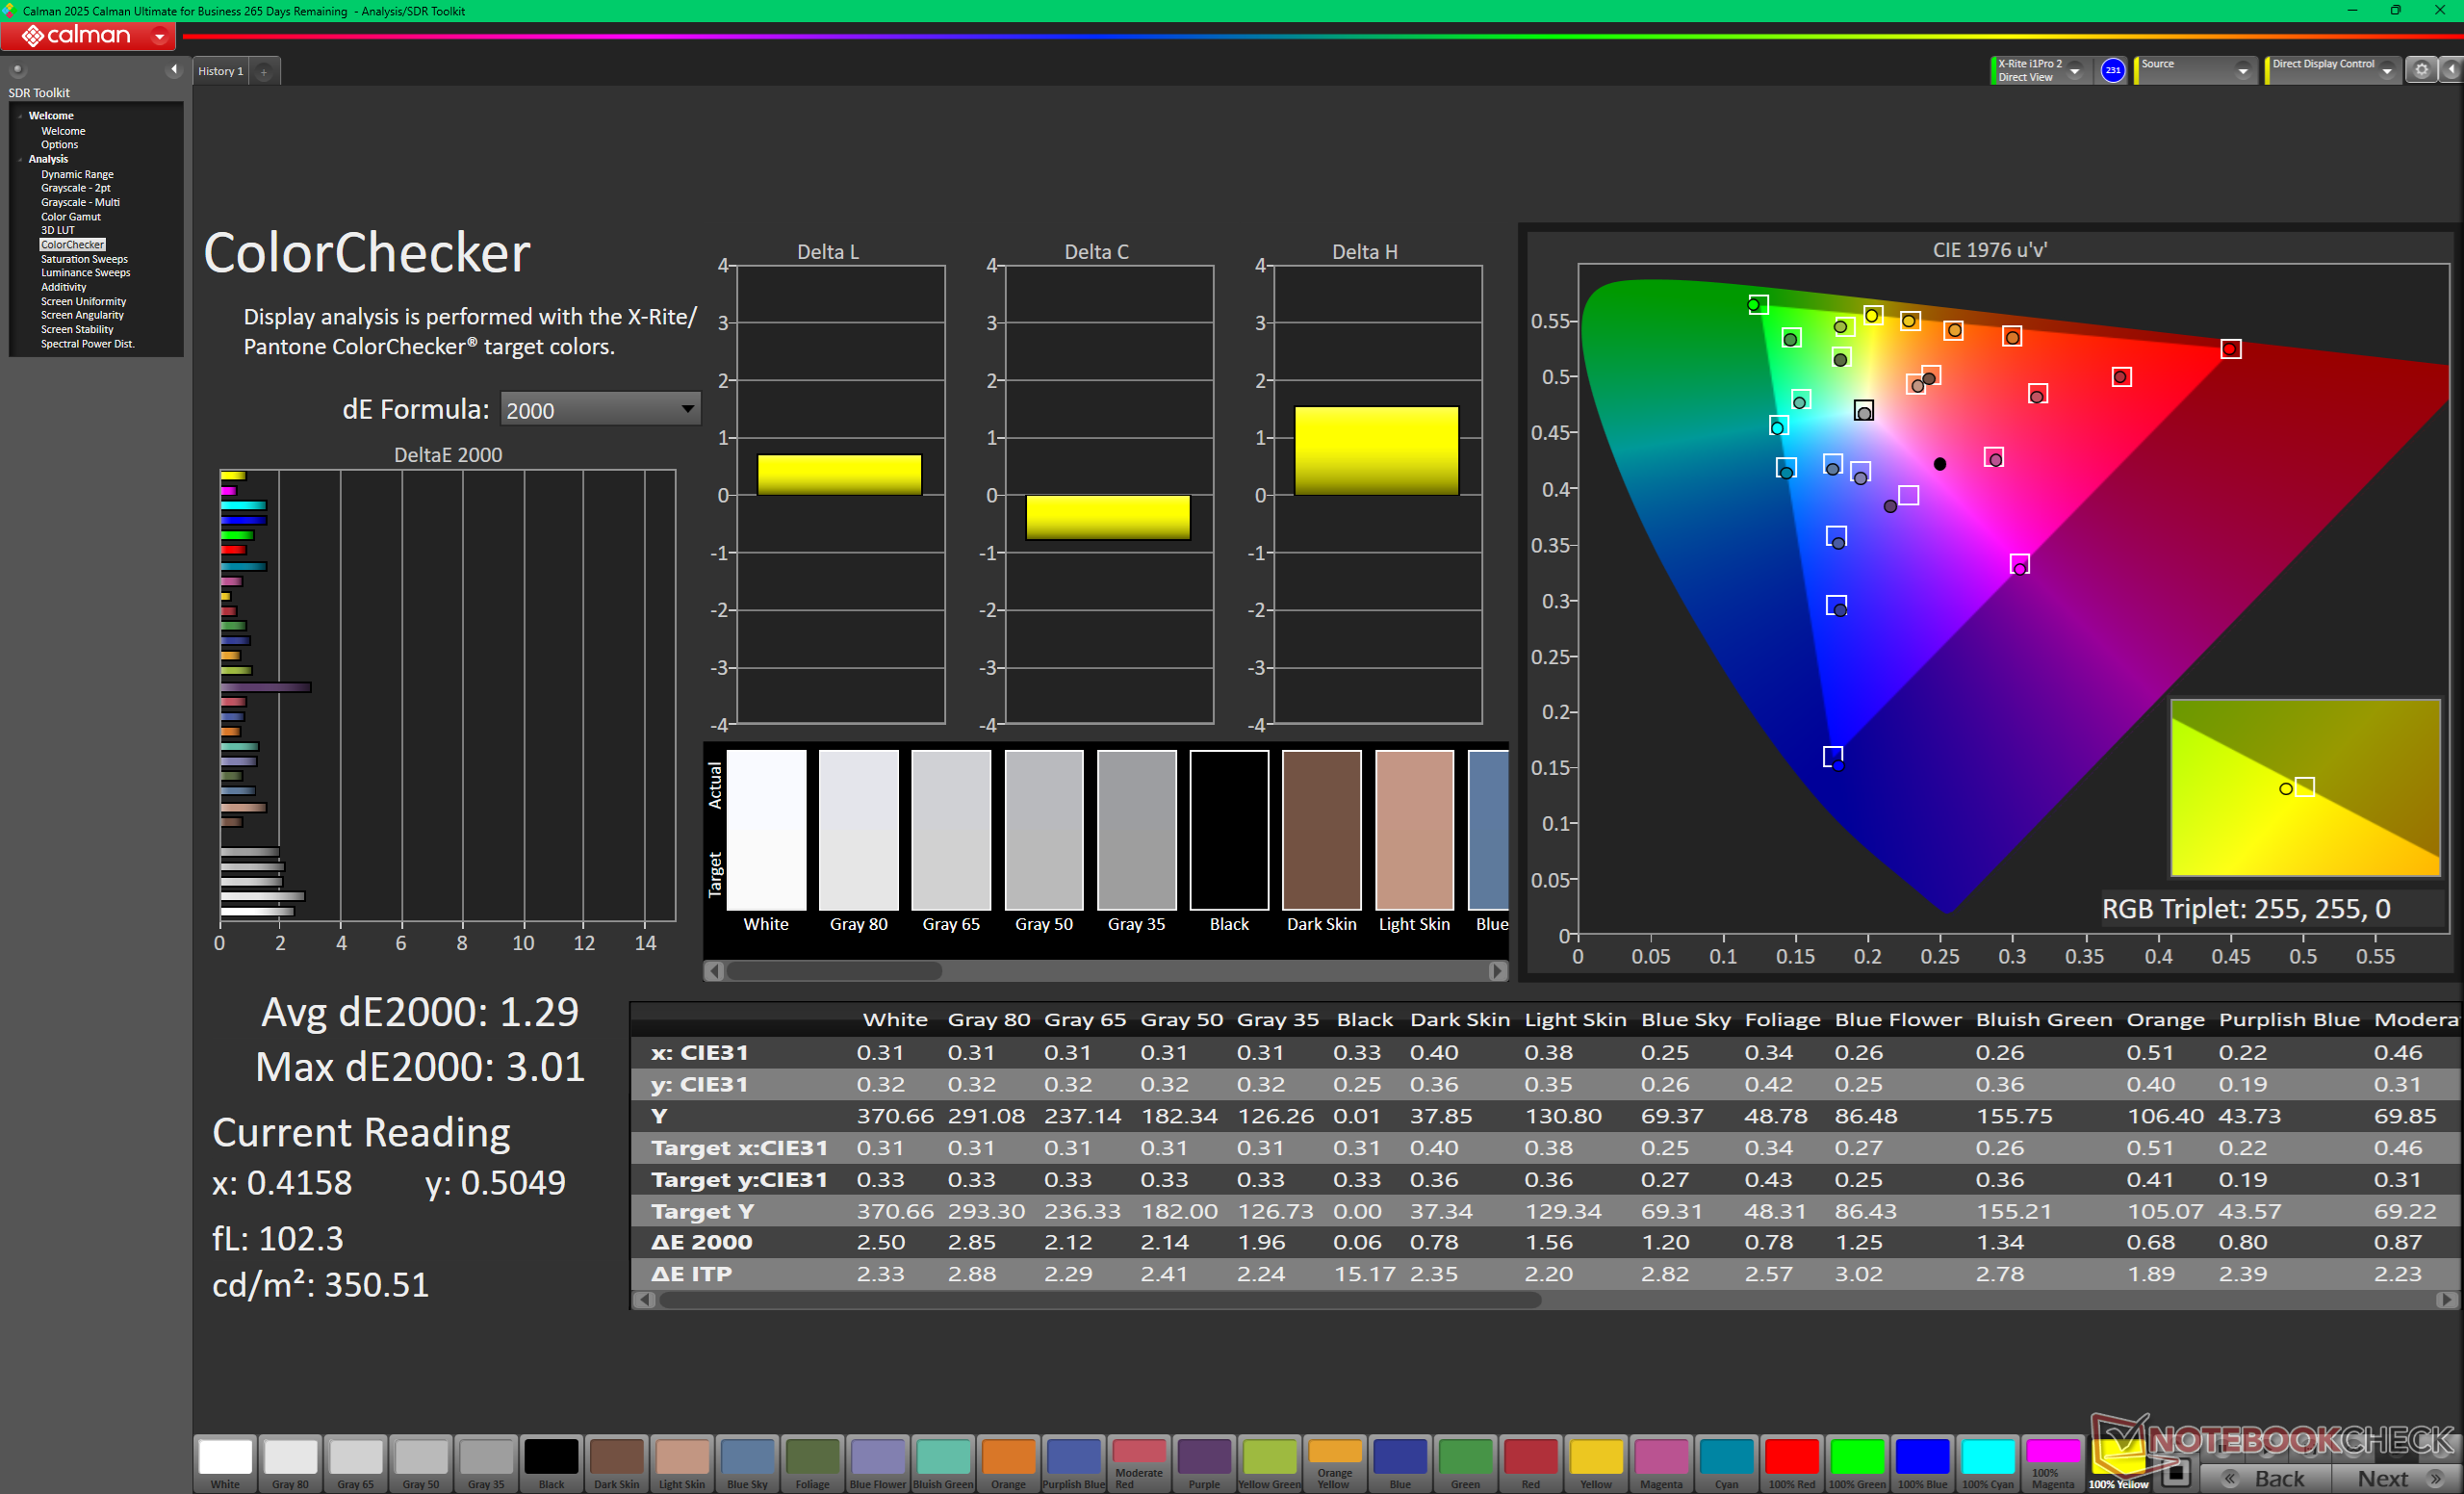
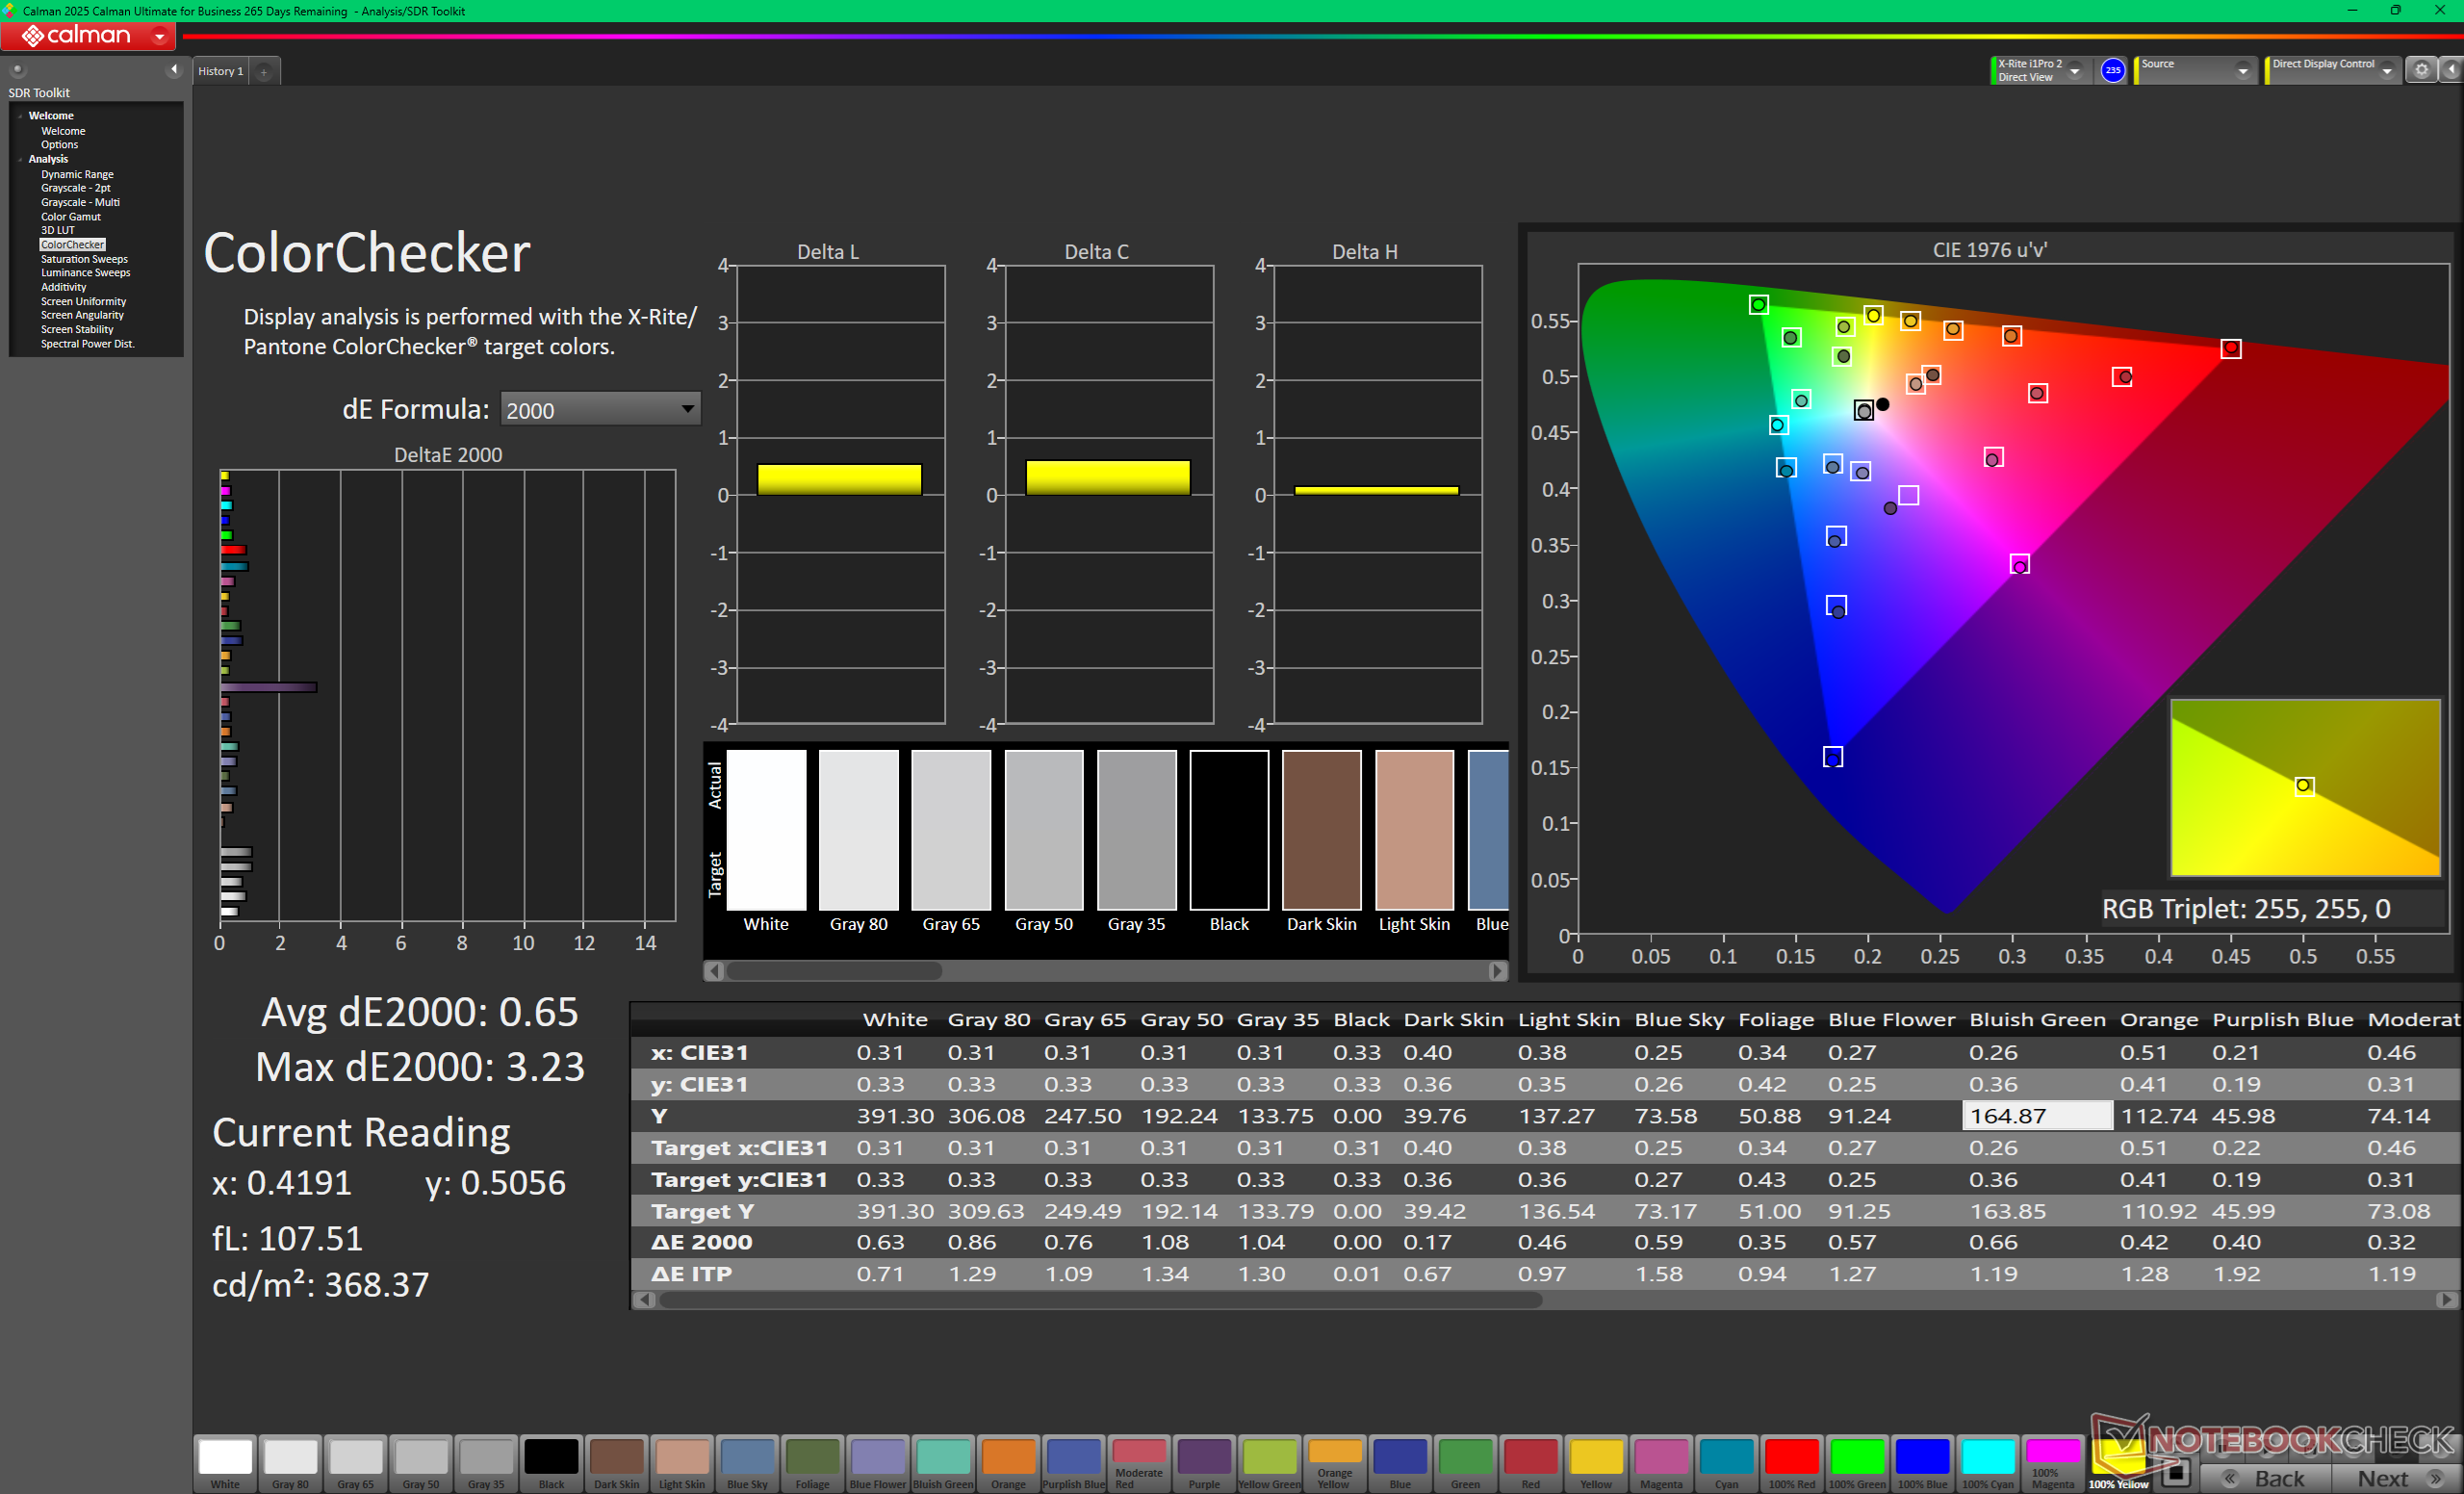
ΔE ColorChecker Calman: 1.29 | ∀{0.5-29.43 Ø4.73}
calibrated: 0.65
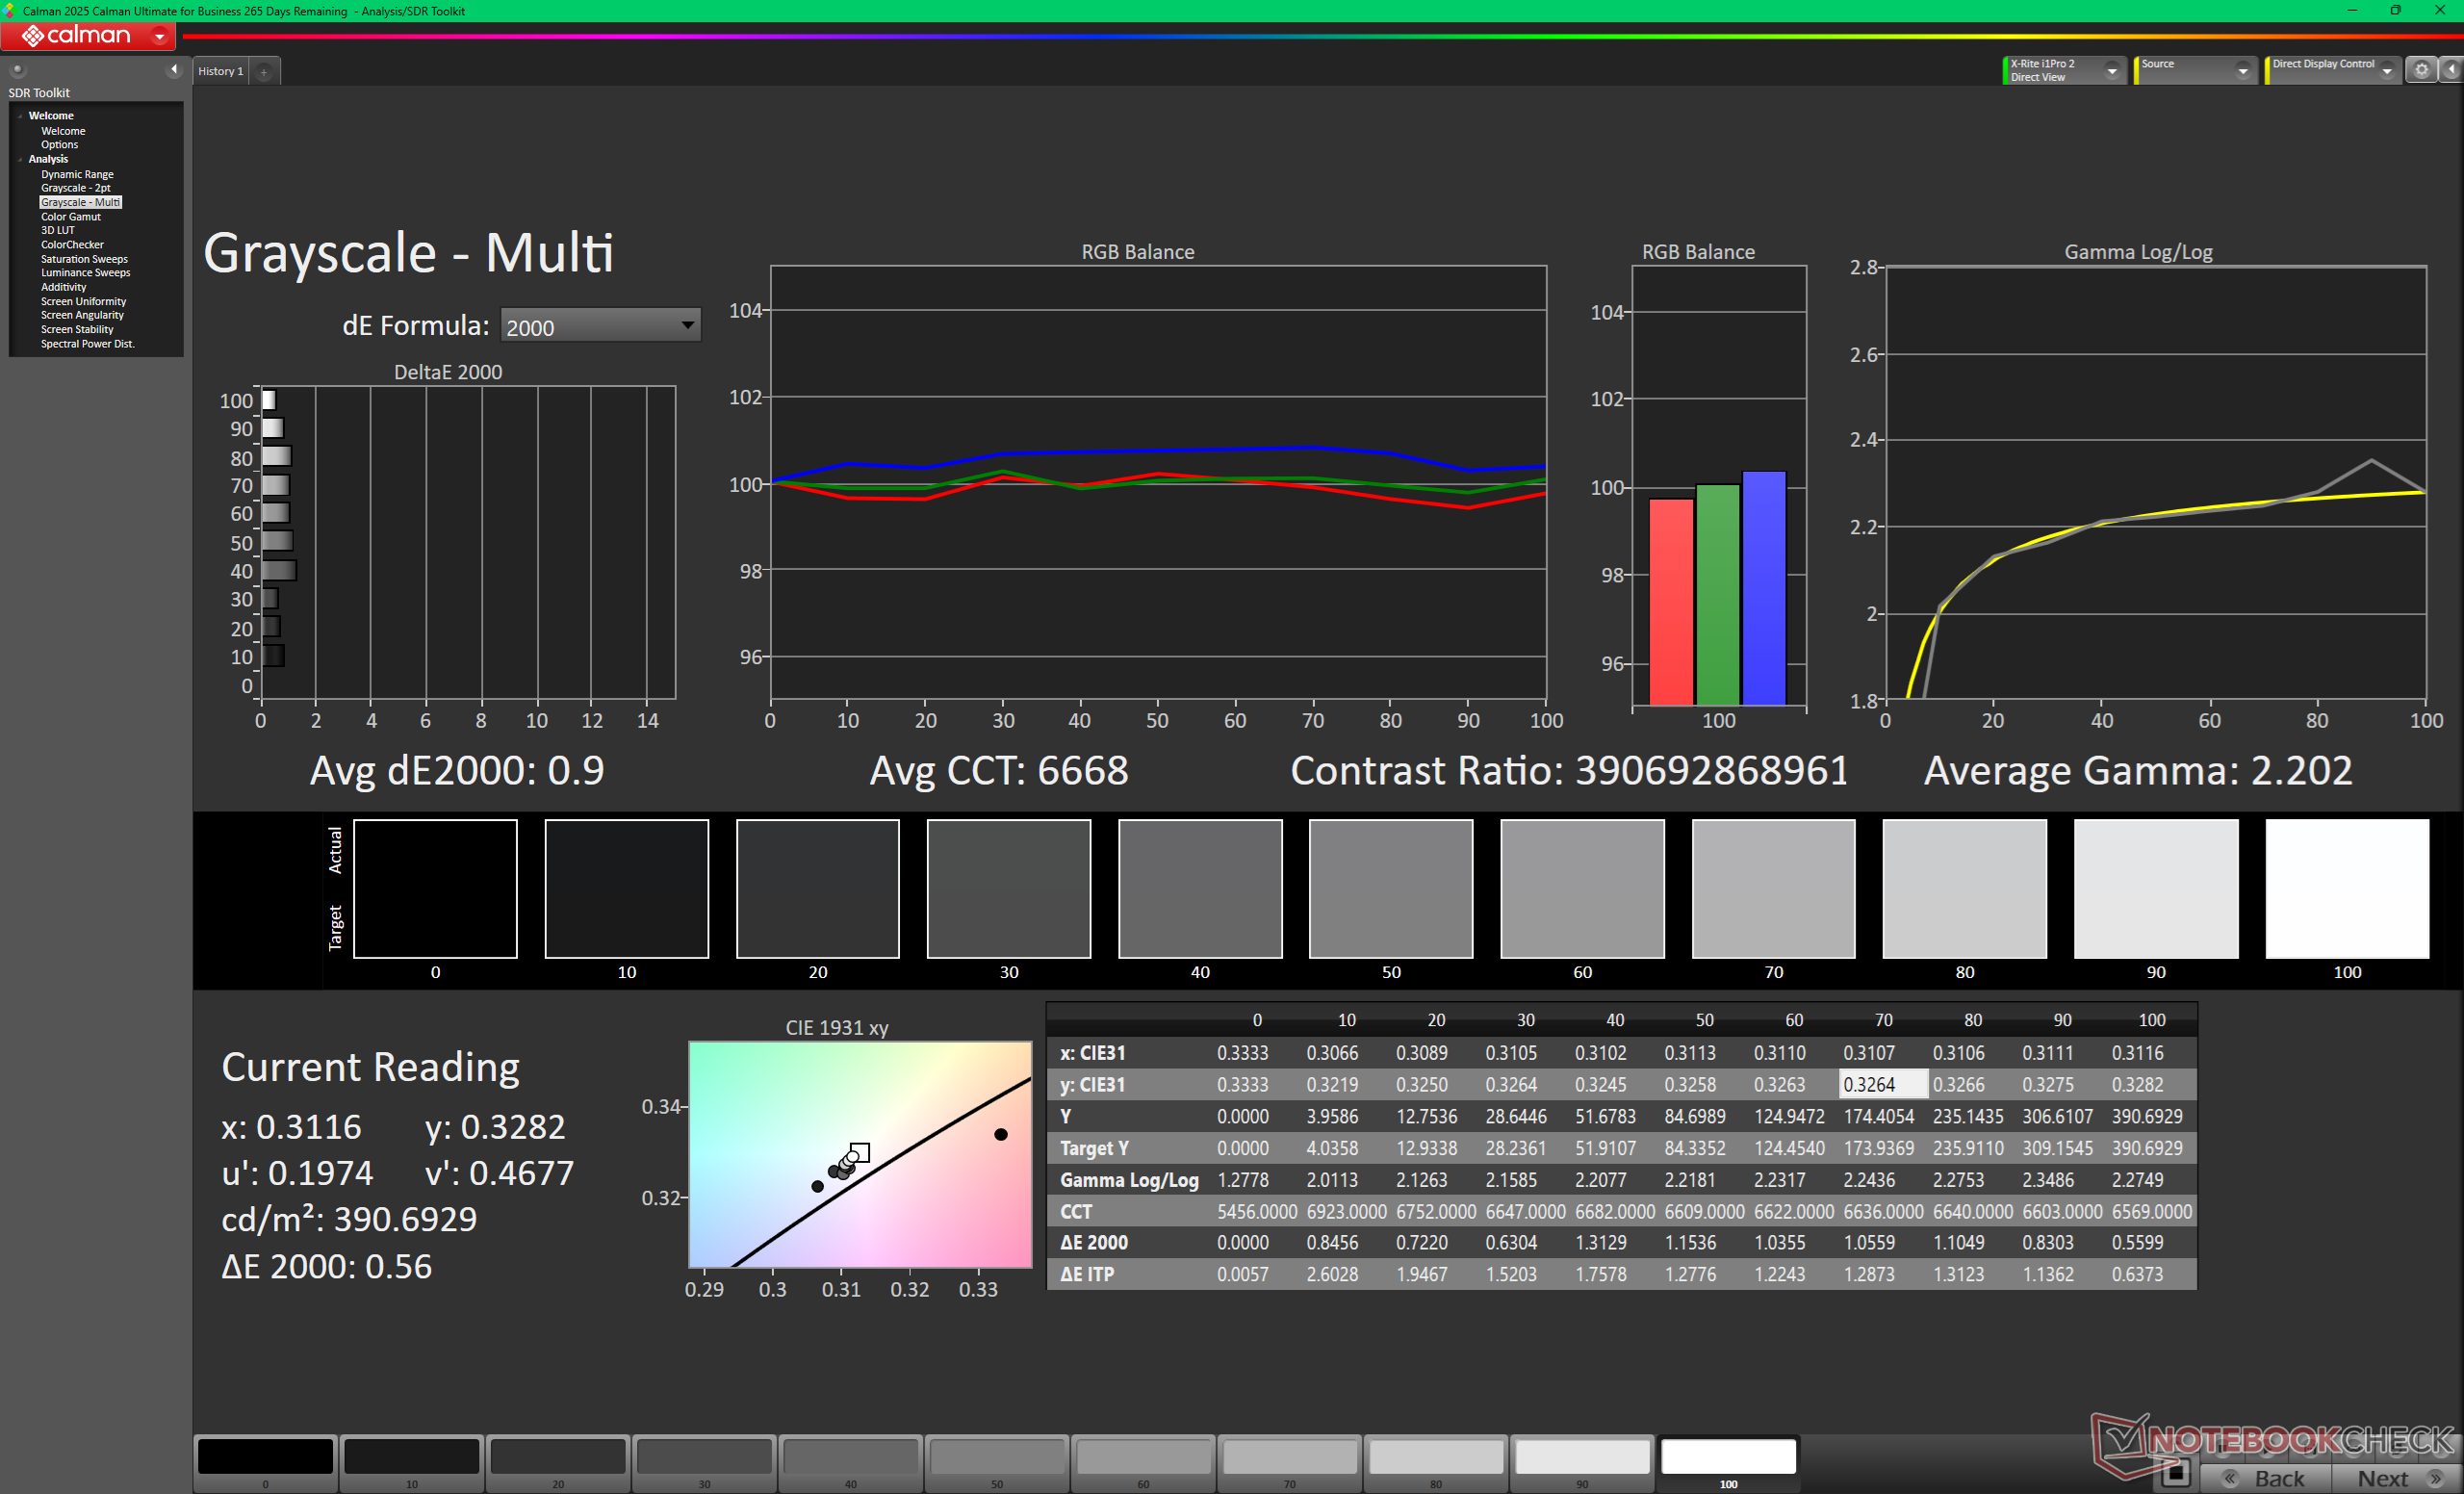
ΔE Greyscale Calman: 1.9 | ∀{0.09-98 Ø4.97}
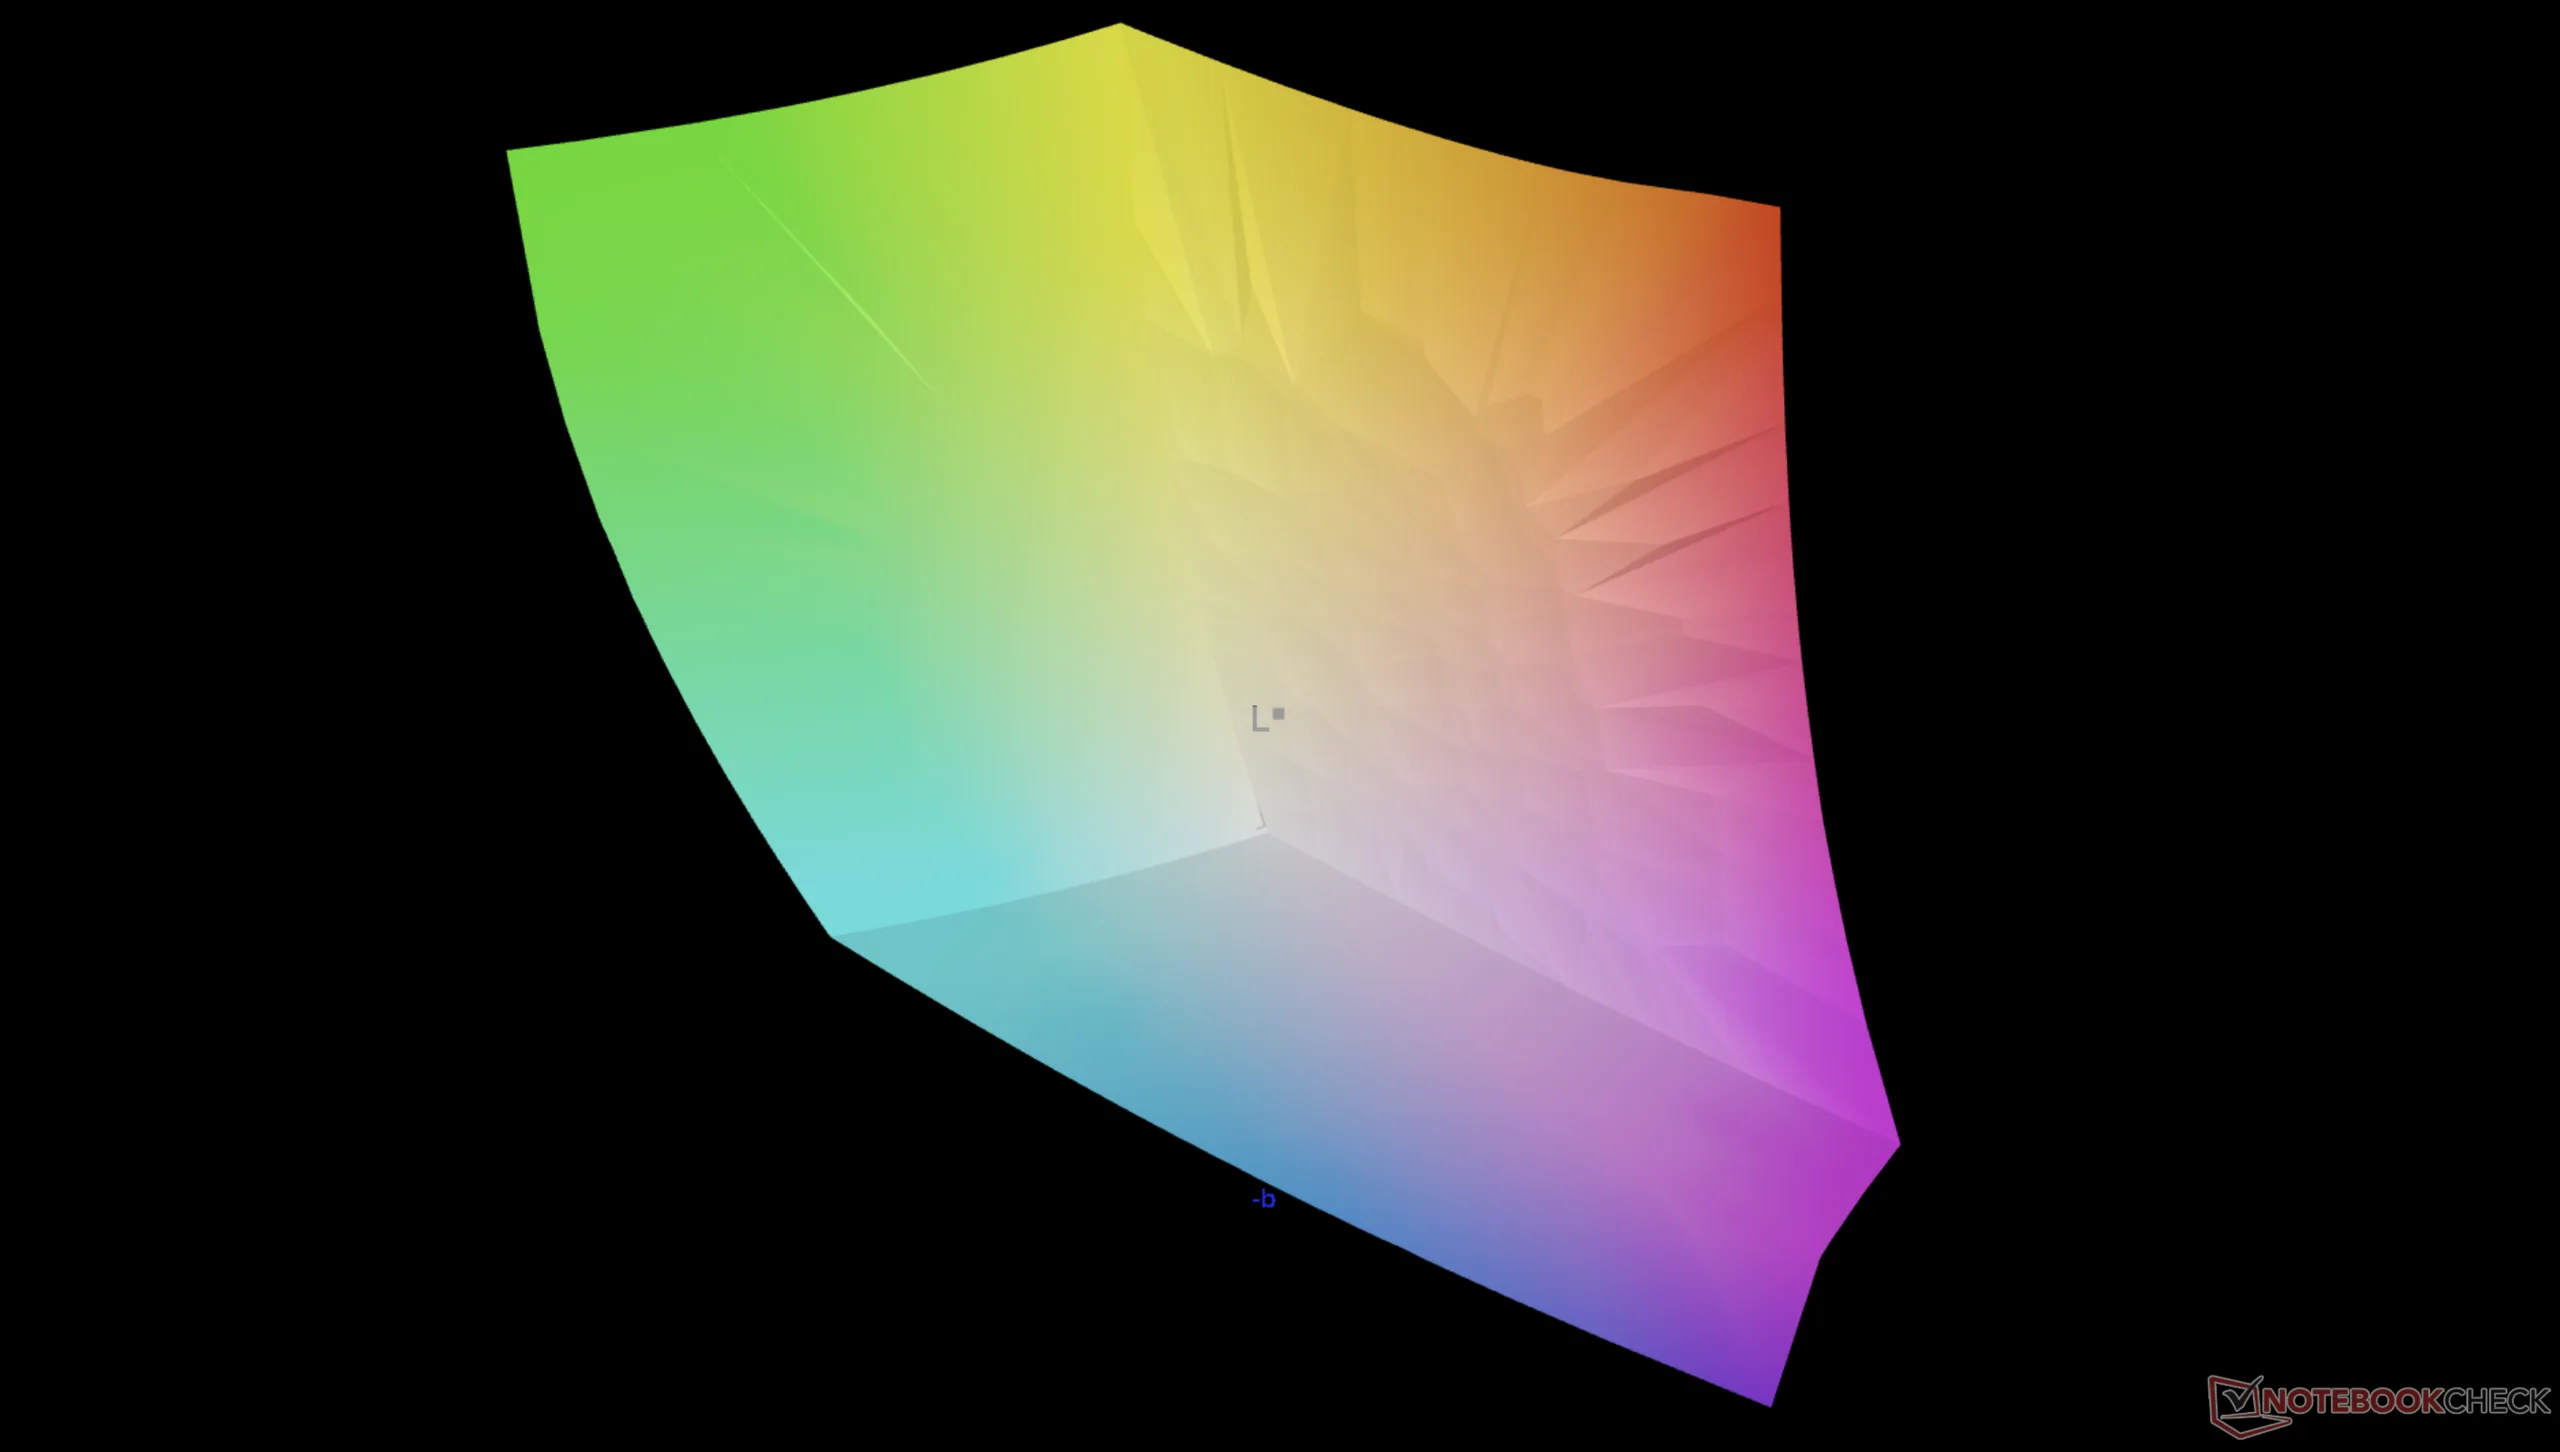
98% AdobeRGB 1998 (Argyll 3D)
100% sRGB (Argyll 3D)
99.8% Display P3 (Argyll 3D)
Gamma: 2.19
CCT: 6844 K
| MSI Prestige 16 AI C3MTG Samsung ATNA60CL11-0, OLED, 2880x1800, 16", 120 Hz | MSI Prestige 16 AI Evo B2HMG B160QAN03_R, IPS, 2560x1600, 16", 60 Hz | Dell XPS 16 Core Ultra X7 358H LG Philips 160WV1, OLED, 3200x2000, 16", 120 Hz | Asus ZenBook S16 UM5606GA ATNA60HR07-0, OLED, 2880x1800, 16", 120 Hz | Lenovo ThinkBook 16 G7+ AMD LEN160-3.2K, IPS, 3200x2000, 16", 165 Hz | HP Envy x360 2-in-1 16-ad0097nr Samsung SDC41A6, OLED, 2880x1800, 16", 120 Hz | |
|---|---|---|---|---|---|---|
| Display | -6% | -1% | -1% | -5% | -1% | |
| Display P3 Coverage (%) | 99.8 | 96.4 -3% | 99.5 0% | 99.8 0% | 96.3 -4% | 99.6 0% |
| sRGB Coverage (%) | 100 | 99.7 0% | 100 0% | 100 0% | 100 0% | 100 0% |
| AdobeRGB 1998 Coverage (%) | 98 | 84.3 -14% | 96.5 -2% | 94 -4% | 86.9 -11% | 96.5 -2% |
| Response Times | -4924% | -21% | -80% | -1241% | -8% | |
| Response Time Grey 50% / Grey 80% * (ms) | 0.71 ? | 51.5 ? -7154% | 0.65 ? 8% | 1.27 ? -79% | 13.9 ? -1858% | 0.8 ? -13% |
| Response Time Black / White * (ms) | 0.87 ? | 24.3 ? -2693% | 0.87 ? -0% | 0.43 ? 51% | 6.3 ? -624% | 0.89 ? -2% |
| PWM Frequency (Hz) | 460.46 ? | 240.2 ? | 960 ? | 491.8 ? | ||
| PWM Amplitude * (%) | 18 | 31 -72% | 56 -211% | |||
| Screen | -153% | -50% | 12% | -9% | -48% | |
| Brightness middle (cd/m²) | 375 | 471 26% | 395.4 5% | 465 24% | 422 13% | 399.4 7% |
| Brightness (cd/m²) | 380 | 455 20% | 392 3% | 466 23% | 403 6% | 405 7% |
| Brightness Distribution (%) | 98 | 92 -6% | 95 -3% | 99 1% | 93 -5% | 98 0% |
| Black Level * (cd/m²) | 0.2 | 0.3 | ||||
| Colorchecker dE 2000 * | 1.29 | 5.8 -350% | 3.69 -186% | 1 22% | 1.7 -32% | 4.05 -214% |
| Colorchecker dE 2000 max. * | 3.01 | 10.8 -259% | 7.94 -164% | 3 -0% | 3.4 -13% | 6.69 -122% |
| Colorchecker dE 2000 calibrated * | 0.65 | 1.9 -192% | 0.68 -5% | 0.7 -8% | 1.02 -57% | |
| Greyscale dE 2000 * | 1.9 | 7.8 -311% | 1.9 -0% | 1.9 -0% | 2.4 -26% | 1.1 42% |
| Gamma | 2.19 100% | 2.07 106% | 2.28 96% | 2.19 100% | 2.19 100% | 2.27 97% |
| CCT | 6844 95% | 7262 90% | 6274 104% | 6458 101% | 6989 93% | 6419 101% |
| Contrast (:1) | 2355 | 1407 | ||||
| Total Average (Program / Settings) | -1694% /
-911% | -24% /
-32% | -23% /
-14% | -418% /
-214% | -19% /
-30% |
* ... smaller is better
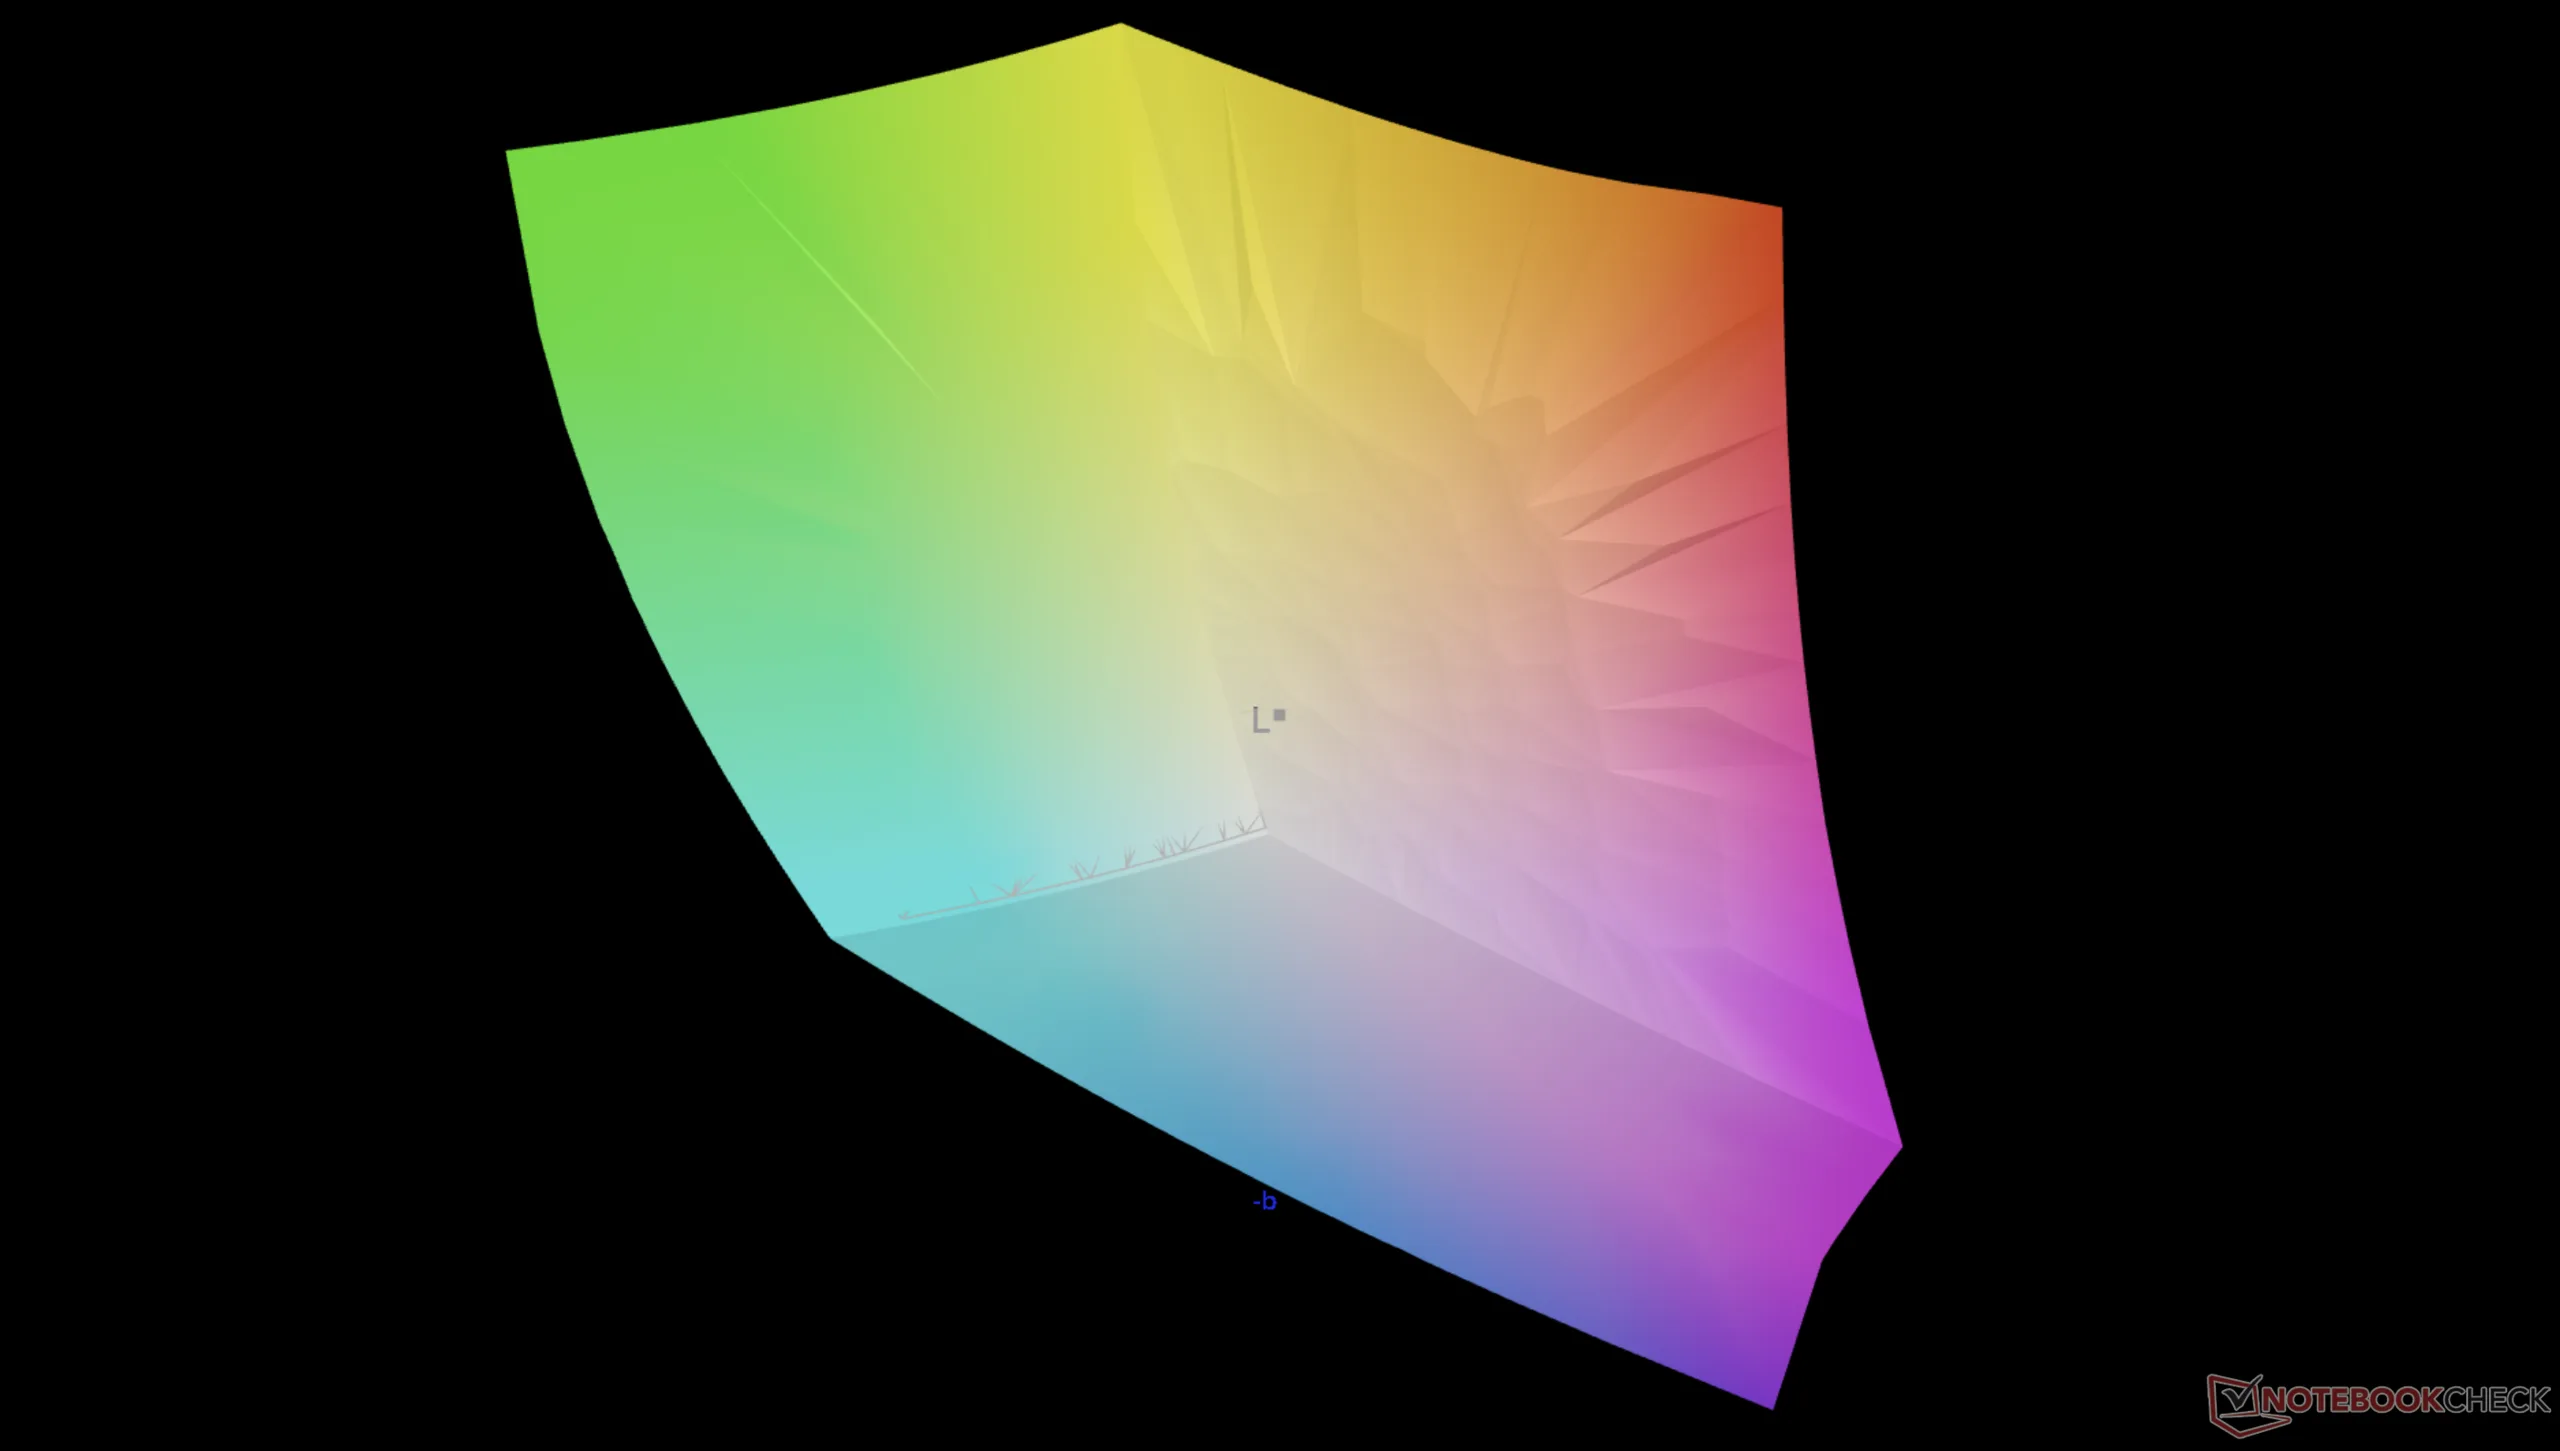
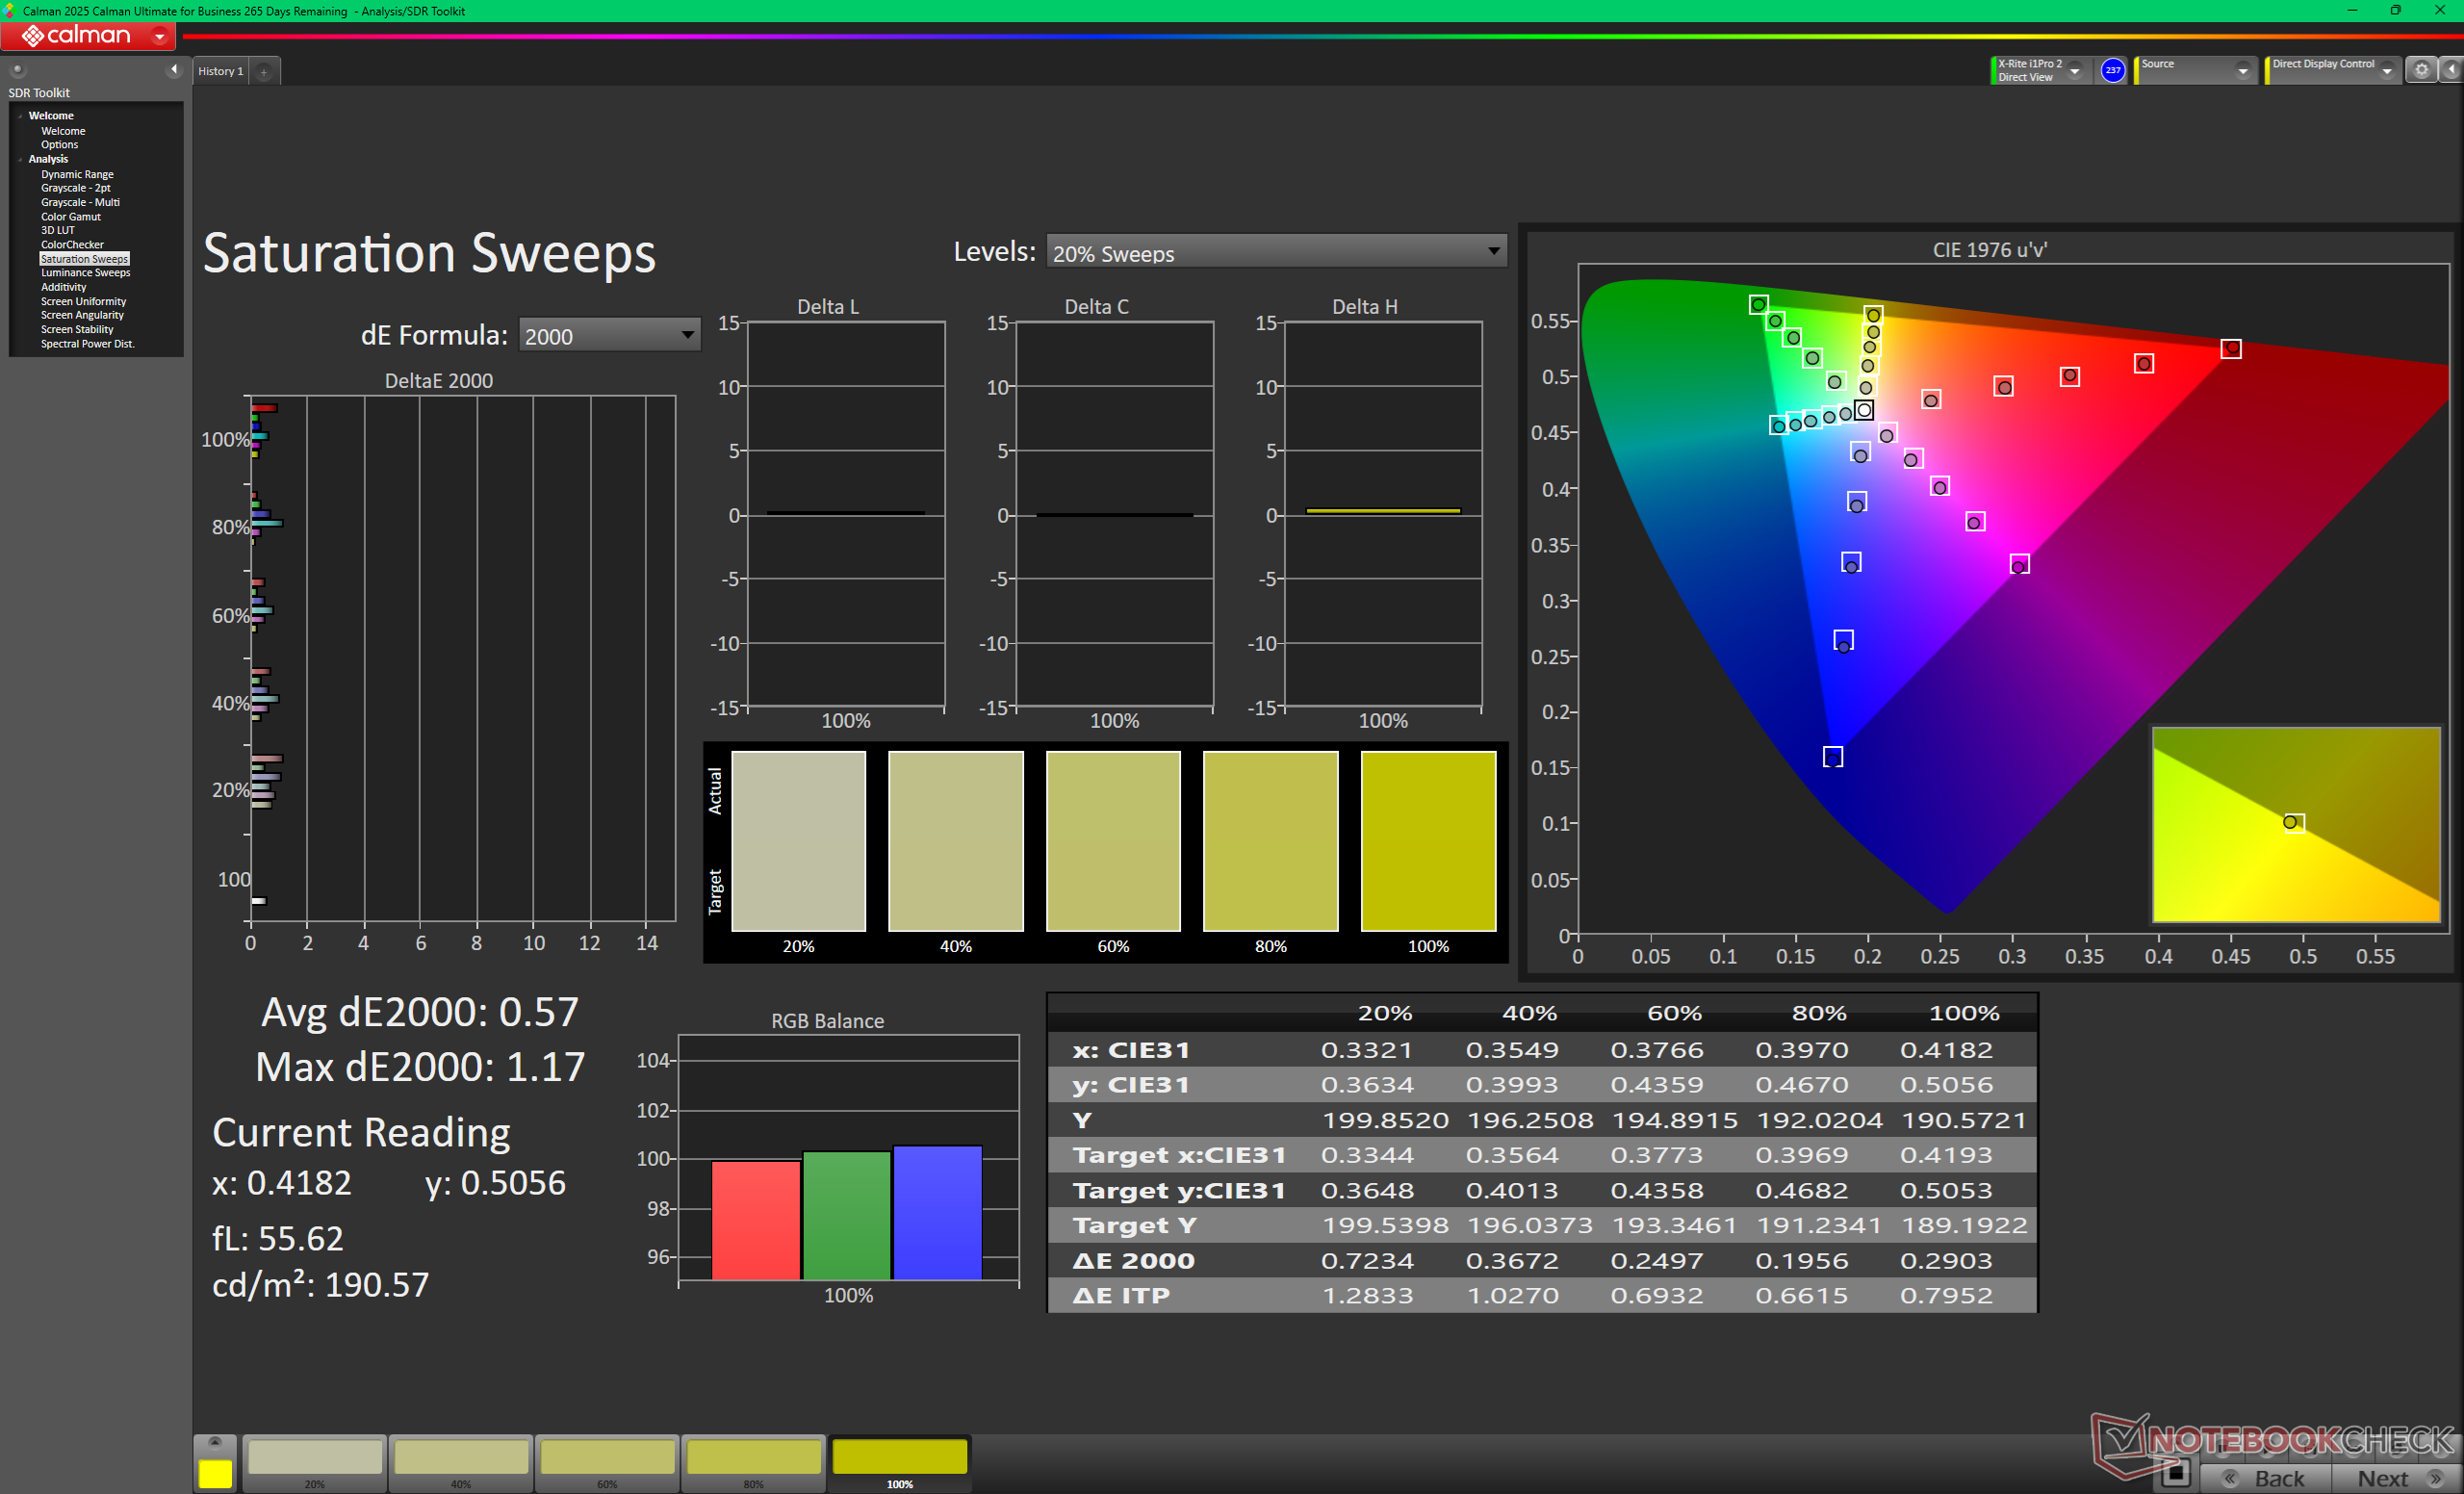
尽管 OLED 显示屏支持完整的 P3 色彩,但系统已预设并校准为 sRGB。在进行任何校准之前,平均灰度值和色彩 deltaE 值已经非常精确,分别仅为 1.9 和 1.29。
Display Response Times
| ↔ Response Time Black to White | ||
|---|---|---|
| 0.87 ms ... rise ↗ and fall ↘ combined | ↗ 0.41 ms rise |  |
| ↘ 0.46 ms fall | ||
| The screen shows very fast response rates in our tests and should be very well suited for fast-paced gaming. In comparison, all tested devices range from 0.1 (minimum) to 240 (maximum) ms. » 3 % of all devices are better. This means that the measured response time is better than the average of all tested devices (19.9 ms). | ||
| ↔ Response Time 50% Grey to 80% Grey | ||
| 0.71 ms ... rise ↗ and fall ↘ combined | ↗ 0.38 ms rise |  |
| ↘ 0.33 ms fall | ||
| The screen shows very fast response rates in our tests and should be very well suited for fast-paced gaming. In comparison, all tested devices range from 0.165 (minimum) to 636 (maximum) ms. » 2 % of all devices are better. This means that the measured response time is better than the average of all tested devices (31.1 ms). | ||
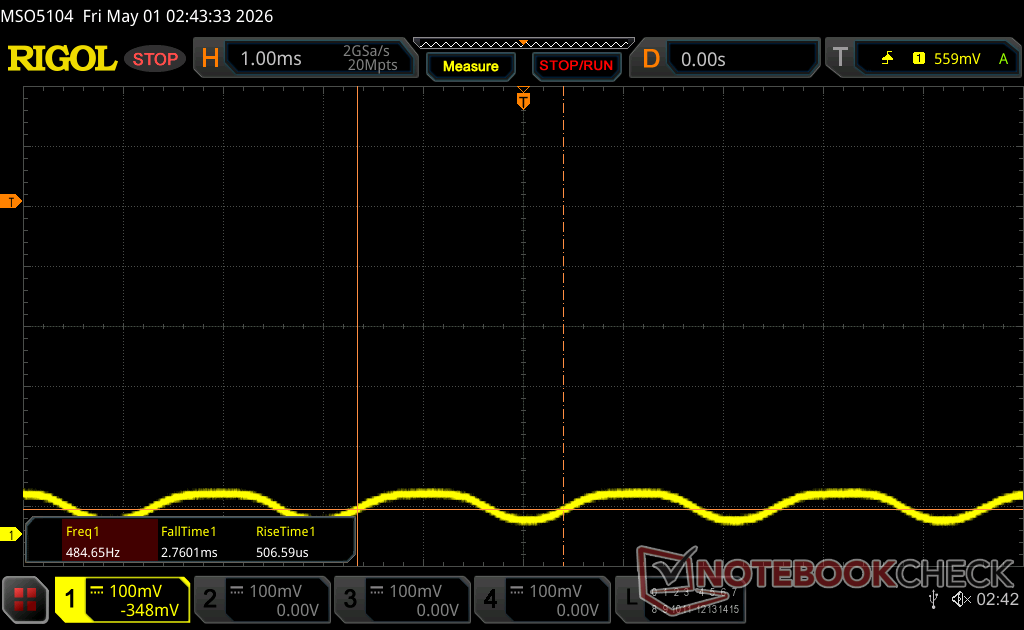
Screen Flickering / PWM (Pulse-Width Modulation)
| Screen flickering / PWM detected | 460.46 Hz Amplitude: 18 % | ≤ 100 % brightness setting | 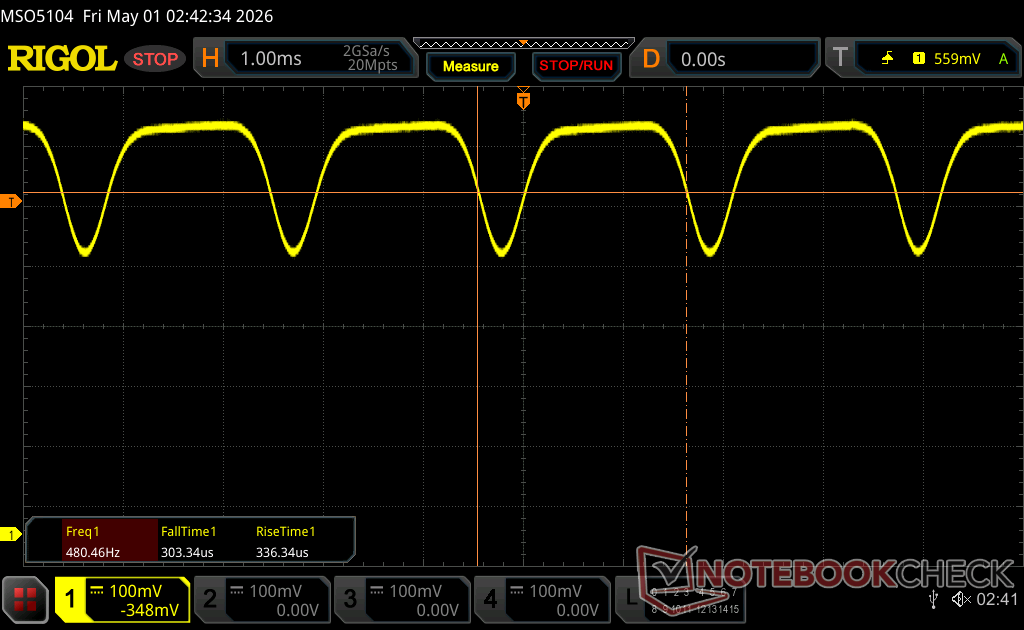 |
The display backlight flickers at 460.46 Hz (worst case, e.g., utilizing PWM) Flickering detected at a brightness setting of 100 % and below. There should be no flickering or PWM above this brightness setting. The frequency of 460.46 Hz is relatively high, so most users sensitive to PWM should not notice any flickering. However, there are reports that some users are still sensitive to PWM at 500 Hz and above, so be aware. In comparison: 52 % of all tested devices do not use PWM to dim the display. If PWM was detected, an average of 7801 (minimum: 5 - maximum: 343500) Hz was measured. | |||


性能
测试条件
在运行以下基准测试之前,我们将 MSI Center S 和 Windows 设置为性能模式。
处理器
核心 Ultra X7 358H 酷睿至尊 X7 358H性能比 Core Ultra 9 285H更稳定。当 Turbo Boost 最有效时,后者的速度最多可提高 10%,而当 Turbo Boost 稳定下来后,情况则恰恰相反。在循环运行 CineBench R15 xT 时可以看到,2025 Prestige 16 仅在最初的一分钟左右速度较快,之后就被我们的 2026 Prestige 16 超越。
升级到 酷睿至尊 X9 388H根据我们使用华硕 ZenBook Duo UX8407AA 的情况,多线程性能有望提高 10%。
Cinebench R15 多回路运行
Cinebench R23: Multi Core | Single Core
Cinebench R20: CPU (Multi Core) | CPU (Single Core)
Cinebench R15: CPU Multi 64Bit | CPU Single 64Bit
Blender: v2.79 BMW27 CPU
7-Zip 18.03: 7z b 4 | 7z b 4 -mmt1
Geekbench 6.7: Multi-Core | Single-Core
Geekbench 5.5: Multi-Core | Single-Core
HWBOT x265 Benchmark v2.2: 4k Preset
LibreOffice : 20 Documents To PDF
R Benchmark 2.5: Overall mean
* ... smaller is better
AIDA64: FP32 Ray-Trace | FPU Julia | CPU SHA3 | CPU Queen | FPU SinJulia | FPU Mandel | CPU AES | CPU ZLib | FP64 Ray-Trace | CPU PhotoWorxx | CPU CheckMate
| Performance rating | |
| Asus ZenBook S16 UM5606GA -1! | |
| Lenovo ThinkBook 16 G7+ AMD -1! | |
| Dell XPS 16 Core Ultra X7 358H -1! | |
| HP Envy x360 2-in-1 16-ad0097nr -1! | |
| MSI Prestige 16 AI C3MTG -1! | |
| MSI Prestige 16 AI Evo B2HMG -1! | |
| Average Intel Core Ultra X7 358H | |
| AIDA64 / FP32 Ray-Trace | |
| Lenovo ThinkBook 16 G7+ AMD (v6.92.6600) | |
| Asus ZenBook S16 UM5606GA (v6.92.6600) | |
| HP Envy x360 2-in-1 16-ad0097nr (v6.92.6600) | |
| MSI Prestige 16 AI Evo B2HMG (v6.92.6600) | |
| MSI Prestige 16 AI C3MTG (v8.20.8100) | |
| Dell XPS 16 Core Ultra X7 358H (v8.20.8100) | |
| Average Intel Core Ultra X7 358H (12221 - 17932, n=8) | |
| AIDA64 / FPU Julia | |
| Lenovo ThinkBook 16 G7+ AMD (v6.92.6600) | |
| Asus ZenBook S16 UM5606GA (v6.92.6600) | |
| MSI Prestige 16 AI Evo B2HMG (v6.92.6600) | |
| HP Envy x360 2-in-1 16-ad0097nr (v6.92.6600) | |
| MSI Prestige 16 AI C3MTG (v8.20.8100) | |
| Dell XPS 16 Core Ultra X7 358H (v8.20.8100) | |
| Average Intel Core Ultra X7 358H (29930 - 95525, n=8) | |
| AIDA64 / CPU SHA3 | |
| Lenovo ThinkBook 16 G7+ AMD (v6.92.6600) | |
| Asus ZenBook S16 UM5606GA (v6.92.6600) | |
| Average Intel Core Ultra X7 358H (3910 - 4911, n=8) | |
| MSI Prestige 16 AI Evo B2HMG (v6.92.6600) | |
| Dell XPS 16 Core Ultra X7 358H (v8.20.8100) | |
| MSI Prestige 16 AI C3MTG (v8.20.8100) | |
| HP Envy x360 2-in-1 16-ad0097nr (v6.92.6600) | |
| AIDA64 / CPU Queen | |
| HP Envy x360 2-in-1 16-ad0097nr (v6.92.6600) | |
| Asus ZenBook S16 UM5606GA (v6.92.6600) | |
| Lenovo ThinkBook 16 G7+ AMD (v6.92.6600) | |
| MSI Prestige 16 AI Evo B2HMG (v6.92.6600) | |
| Average Intel Core Ultra X7 358H (63425 - 63827, n=2) | |
| AIDA64 / FPU SinJulia | |
| Lenovo ThinkBook 16 G7+ AMD (v6.92.6600) | |
| Asus ZenBook S16 UM5606GA (v6.92.6600) | |
| HP Envy x360 2-in-1 16-ad0097nr (v6.92.6600) | |
| MSI Prestige 16 AI Evo B2HMG (v6.92.6600) | |
| Dell XPS 16 Core Ultra X7 358H (v8.20.8100) | |
| MSI Prestige 16 AI C3MTG (v8.20.8100) | |
| Average Intel Core Ultra X7 358H (4735 - 7038, n=8) | |
| AIDA64 / FPU Mandel | |
| Lenovo ThinkBook 16 G7+ AMD (v6.92.6600) | |
| Asus ZenBook S16 UM5606GA (v6.92.6600) | |
| MSI Prestige 16 AI Evo B2HMG (v6.92.6600) | |
| HP Envy x360 2-in-1 16-ad0097nr (v6.92.6600) | |
| Dell XPS 16 Core Ultra X7 358H (v8.20.8100) | |
| MSI Prestige 16 AI C3MTG (v8.20.8100) | |
| Average Intel Core Ultra X7 358H (14716 - 50734, n=8) | |
| AIDA64 / CPU AES | |
| Asus ZenBook S16 UM5606GA (v6.92.6600) | |
| HP Envy x360 2-in-1 16-ad0097nr (v6.92.6600) | |
| Lenovo ThinkBook 16 G7+ AMD (v6.92.6600) | |
| MSI Prestige 16 AI Evo B2HMG (v6.92.6600) | |
| MSI Prestige 16 AI C3MTG (v8.20.8100) | |
| Dell XPS 16 Core Ultra X7 358H (v8.20.8100) | |
| Average Intel Core Ultra X7 358H (5127 - 67510, n=8) | |
| AIDA64 / CPU ZLib | |
| Lenovo ThinkBook 16 G7+ AMD (v6.92.6600) | |
| Asus ZenBook S16 UM5606GA (v6.92.6600) | |
| Average Intel Core Ultra X7 358H (932 - 1179, n=8) | |
| MSI Prestige 16 AI Evo B2HMG (v6.92.6600) | |
| MSI Prestige 16 AI C3MTG (v8.20.8100) | |
| Dell XPS 16 Core Ultra X7 358H (v8.20.8100) | |
| HP Envy x360 2-in-1 16-ad0097nr (v6.92.6600) | |
| AIDA64 / FP64 Ray-Trace | |
| Lenovo ThinkBook 16 G7+ AMD (v6.92.6600) | |
| Asus ZenBook S16 UM5606GA (v6.92.6600) | |
| HP Envy x360 2-in-1 16-ad0097nr (v6.92.6600) | |
| MSI Prestige 16 AI Evo B2HMG (v6.92.6600) | |
| MSI Prestige 16 AI C3MTG (v8.20.8100) | |
| Dell XPS 16 Core Ultra X7 358H (v8.20.8100) | |
| Average Intel Core Ultra X7 358H (6506 - 9447, n=8) | |
| AIDA64 / CPU PhotoWorxx | |
| Dell XPS 16 Core Ultra X7 358H (v8.20.8100) | |
| MSI Prestige 16 AI C3MTG (v8.20.8100) | |
| Average Intel Core Ultra X7 358H (30538 - 88154, n=8) | |
| MSI Prestige 16 AI Evo B2HMG (v6.92.6600) | |
| Asus ZenBook S16 UM5606GA (v6.92.6600) | |
| Lenovo ThinkBook 16 G7+ AMD (v6.92.6600) | |
| HP Envy x360 2-in-1 16-ad0097nr (v6.92.6600) | |
| AIDA64 / CPU CheckMate | |
| Average Intel Core Ultra X7 358H (4187 - 4475, n=7) | |
| Dell XPS 16 Core Ultra X7 358H (v8.20.8100) | |
| MSI Prestige 16 AI C3MTG (v8.20.8100) | |
系统性能
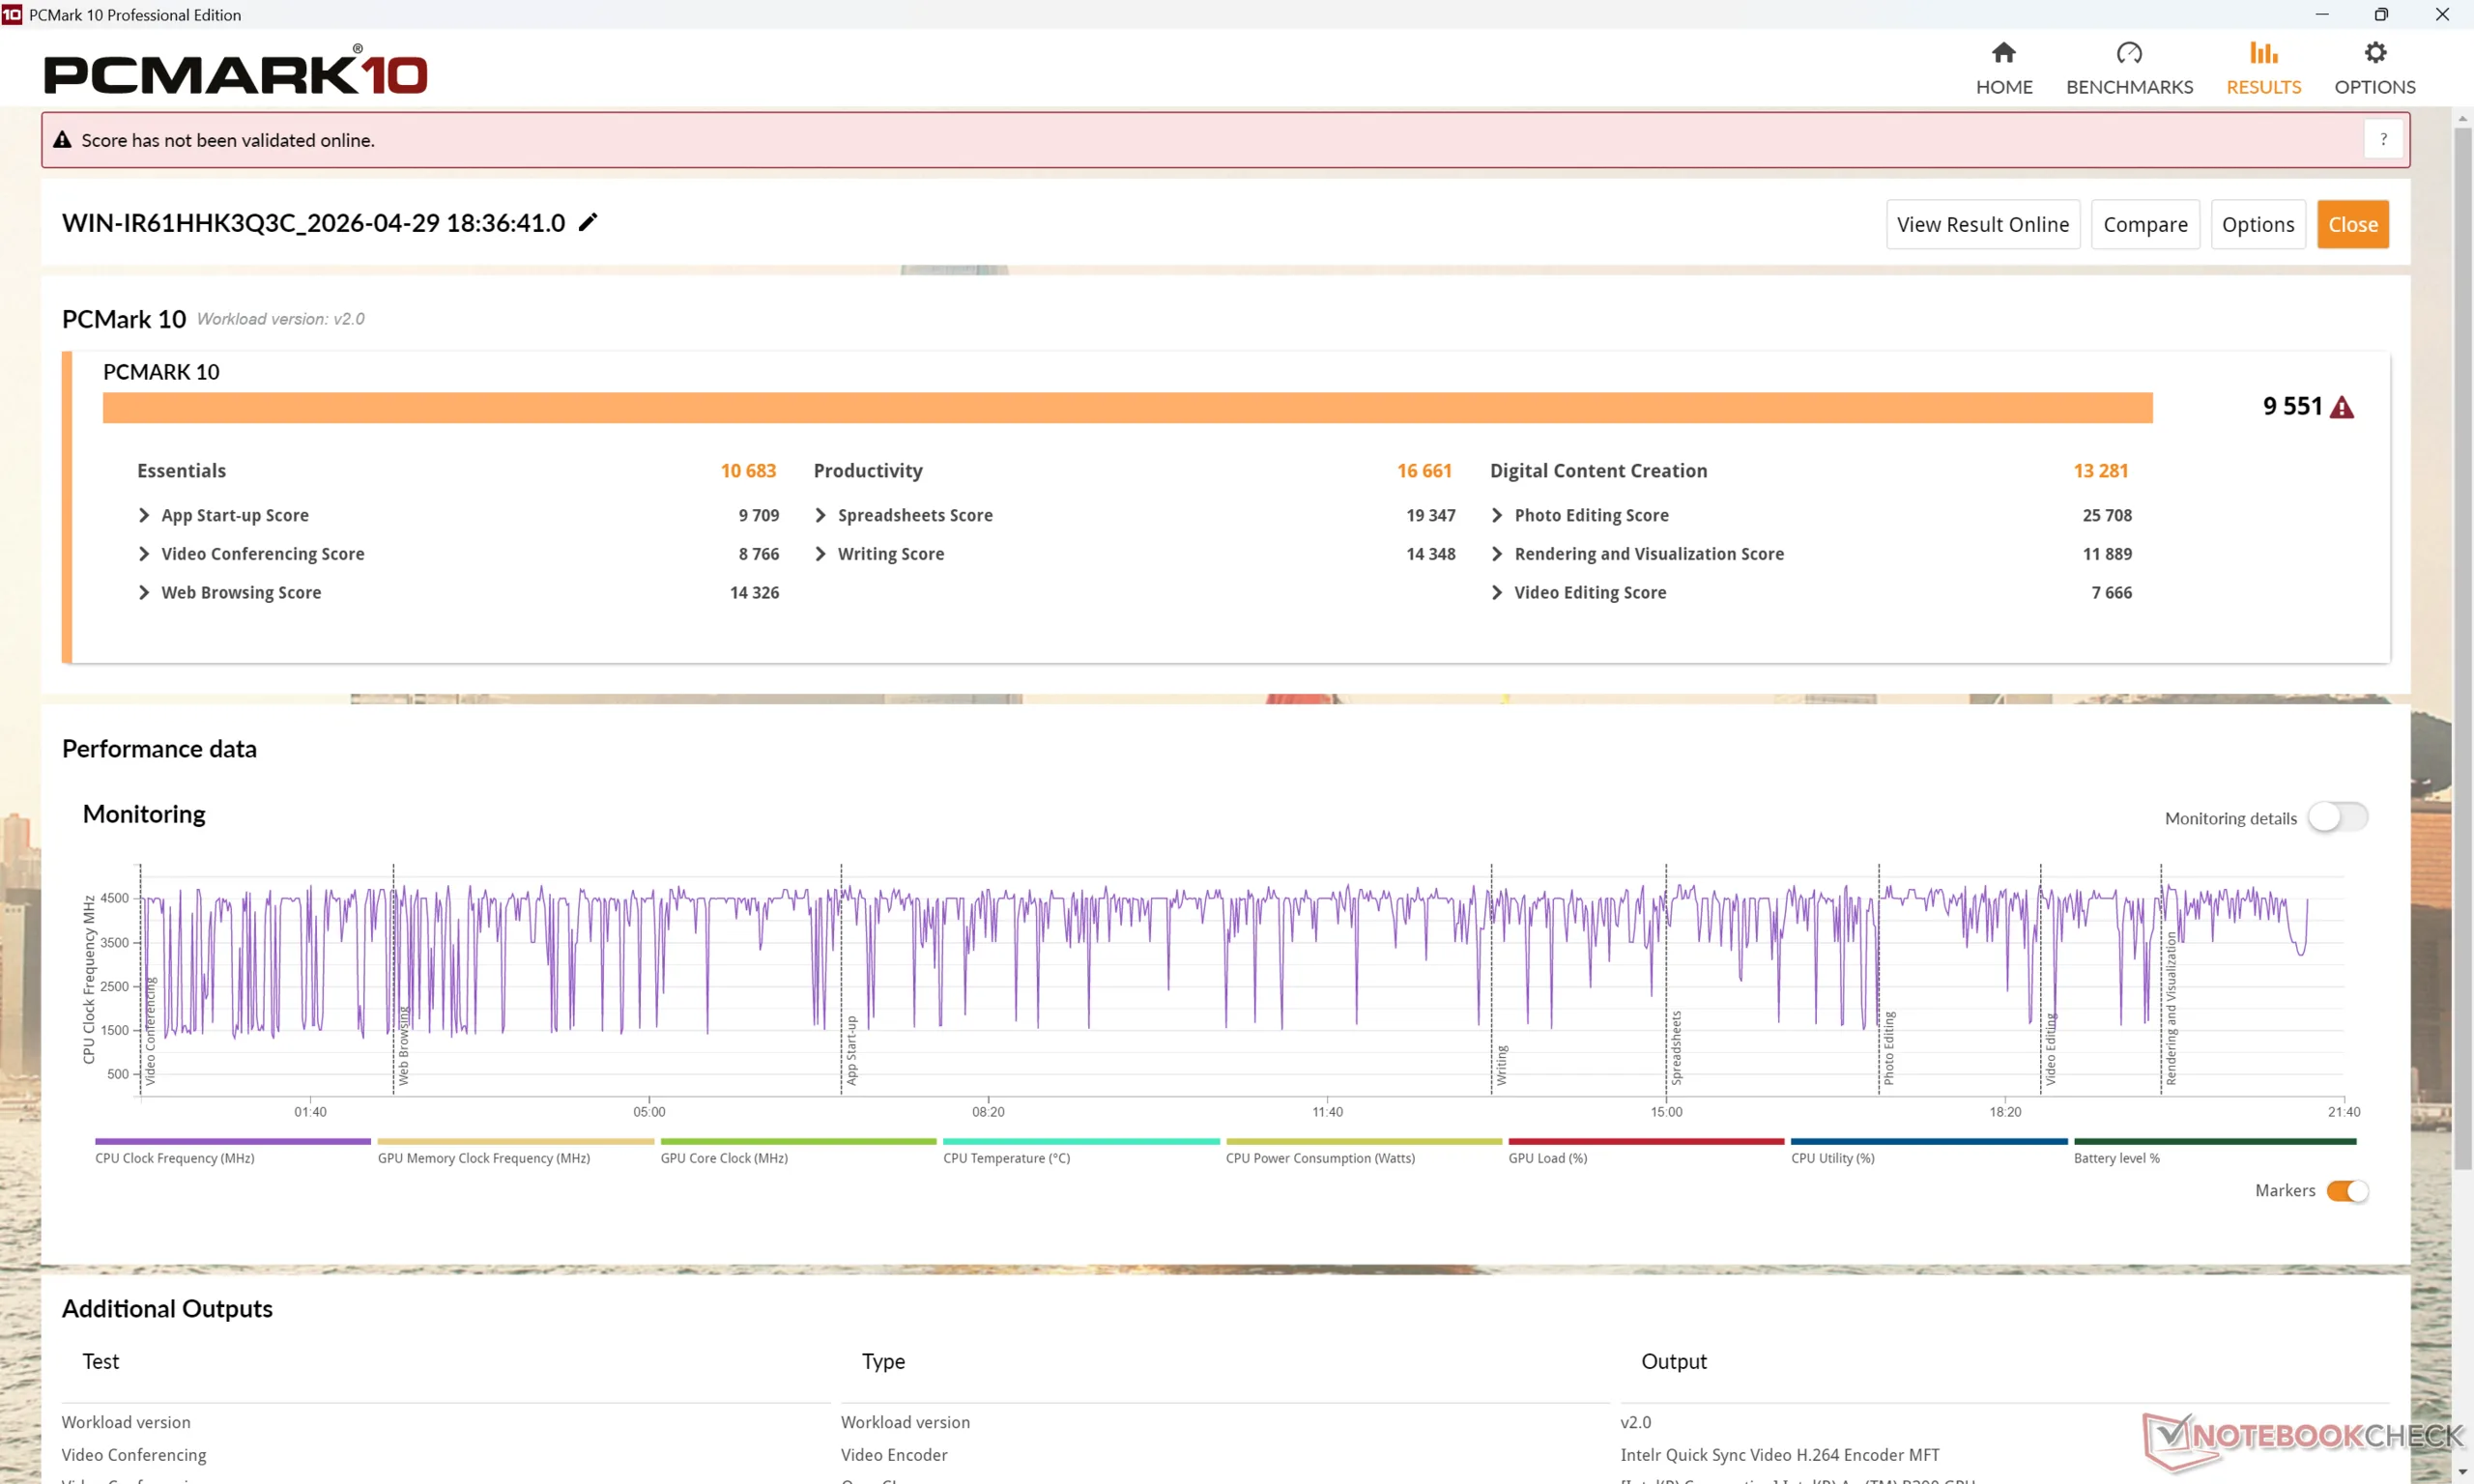
PCMark 10: Score | Essentials | Productivity | Digital Content Creation
CrossMark: Overall | Productivity | Creativity | Responsiveness
WebXPRT 3: Overall
WebXPRT 4: Overall
Mozilla Kraken 1.1: Total
Geekbench AI: Quantized GPU 1.7 | Half Precision GPU 1.7 | Single Precision GPU 1.7
| Performance rating | |
| Dell XPS 16 Core Ultra X7 358H | |
| MSI Prestige 16 AI C3MTG | |
| Average Intel Core Ultra X7 358H, Intel Arc B390 12 Xe3 Panther Lake iGPU | |
| MSI Prestige 16 AI Evo B2HMG -3! | |
| Asus ZenBook S16 UM5606GA -3! | |
| Lenovo ThinkBook 16 G7+ AMD -3! | |
| HP Envy x360 2-in-1 16-ad0097nr -3! | |
| PCMark 10 / Score | |
| Dell XPS 16 Core Ultra X7 358H | |
| MSI Prestige 16 AI C3MTG | |
| Average Intel Core Ultra X7 358H, Intel Arc B390 12 Xe3 Panther Lake iGPU (8834 - 9880, n=8) | |
| Asus ZenBook S16 UM5606GA | |
| MSI Prestige 16 AI Evo B2HMG | |
| Lenovo ThinkBook 16 G7+ AMD | |
| HP Envy x360 2-in-1 16-ad0097nr | |
| PCMark 10 / Essentials | |
| MSI Prestige 16 AI Evo B2HMG | |
| Dell XPS 16 Core Ultra X7 358H | |
| Average Intel Core Ultra X7 358H, Intel Arc B390 12 Xe3 Panther Lake iGPU (10282 - 11263, n=7) | |
| MSI Prestige 16 AI C3MTG | |
| Lenovo ThinkBook 16 G7+ AMD | |
| HP Envy x360 2-in-1 16-ad0097nr | |
| Asus ZenBook S16 UM5606GA | |
| PCMark 10 / Productivity | |
| MSI Prestige 16 AI C3MTG | |
| Dell XPS 16 Core Ultra X7 358H | |
| Asus ZenBook S16 UM5606GA | |
| Average Intel Core Ultra X7 358H, Intel Arc B390 12 Xe3 Panther Lake iGPU (13908 - 16780, n=7) | |
| Lenovo ThinkBook 16 G7+ AMD | |
| HP Envy x360 2-in-1 16-ad0097nr | |
| MSI Prestige 16 AI Evo B2HMG | |
| PCMark 10 / Digital Content Creation | |
| Dell XPS 16 Core Ultra X7 358H | |
| Average Intel Core Ultra X7 358H, Intel Arc B390 12 Xe3 Panther Lake iGPU (13082 - 13893, n=7) | |
| MSI Prestige 16 AI C3MTG | |
| MSI Prestige 16 AI Evo B2HMG | |
| Lenovo ThinkBook 16 G7+ AMD | |
| Asus ZenBook S16 UM5606GA | |
| HP Envy x360 2-in-1 16-ad0097nr | |
| CrossMark / Overall | |
| MSI Prestige 16 AI Evo B2HMG | |
| Dell XPS 16 Core Ultra X7 358H | |
| MSI Prestige 16 AI C3MTG | |
| Average Intel Core Ultra X7 358H, Intel Arc B390 12 Xe3 Panther Lake iGPU (1884 - 2119, n=8) | |
| Lenovo ThinkBook 16 G7+ AMD | |
| Asus ZenBook S16 UM5606GA | |
| HP Envy x360 2-in-1 16-ad0097nr | |
| CrossMark / Productivity | |
| MSI Prestige 16 AI Evo B2HMG | |
| Dell XPS 16 Core Ultra X7 358H | |
| MSI Prestige 16 AI C3MTG | |
| Average Intel Core Ultra X7 358H, Intel Arc B390 12 Xe3 Panther Lake iGPU (1678 - 1928, n=8) | |
| Asus ZenBook S16 UM5606GA | |
| HP Envy x360 2-in-1 16-ad0097nr | |
| Lenovo ThinkBook 16 G7+ AMD | |
| CrossMark / Creativity | |
| Dell XPS 16 Core Ultra X7 358H | |
| MSI Prestige 16 AI C3MTG | |
| Average Intel Core Ultra X7 358H, Intel Arc B390 12 Xe3 Panther Lake iGPU (2241 - 2529, n=8) | |
| MSI Prestige 16 AI Evo B2HMG | |
| Lenovo ThinkBook 16 G7+ AMD | |
| Asus ZenBook S16 UM5606GA | |
| HP Envy x360 2-in-1 16-ad0097nr | |
| CrossMark / Responsiveness | |
| MSI Prestige 16 AI Evo B2HMG | |
| Dell XPS 16 Core Ultra X7 358H | |
| Average Intel Core Ultra X7 358H, Intel Arc B390 12 Xe3 Panther Lake iGPU (1560 - 1837, n=8) | |
| MSI Prestige 16 AI C3MTG | |
| HP Envy x360 2-in-1 16-ad0097nr | |
| Lenovo ThinkBook 16 G7+ AMD | |
| Asus ZenBook S16 UM5606GA | |
| WebXPRT 3 / Overall | |
| MSI Prestige 16 AI Evo B2HMG | |
| MSI Prestige 16 AI C3MTG | |
| Average Intel Core Ultra X7 358H, Intel Arc B390 12 Xe3 Panther Lake iGPU (293 - 338, n=8) | |
| Lenovo ThinkBook 16 G7+ AMD | |
| Dell XPS 16 Core Ultra X7 358H | |
| HP Envy x360 2-in-1 16-ad0097nr | |
| Asus ZenBook S16 UM5606GA | |
| WebXPRT 4 / Overall | |
| MSI Prestige 16 AI Evo B2HMG | |
| MSI Prestige 16 AI C3MTG | |
| Dell XPS 16 Core Ultra X7 358H | |
| Average Intel Core Ultra X7 358H, Intel Arc B390 12 Xe3 Panther Lake iGPU (278 - 305, n=7) | |
| Lenovo ThinkBook 16 G7+ AMD | |
| HP Envy x360 2-in-1 16-ad0097nr | |
| Asus ZenBook S16 UM5606GA | |
| Mozilla Kraken 1.1 / Total | |
| HP Envy x360 2-in-1 16-ad0097nr | |
| Asus ZenBook S16 UM5606GA | |
| MSI Prestige 16 AI C3MTG | |
| Average Intel Core Ultra X7 358H, Intel Arc B390 12 Xe3 Panther Lake iGPU (445 - 460, n=8) | |
| Dell XPS 16 Core Ultra X7 358H | |
| Lenovo ThinkBook 16 G7+ AMD | |
| MSI Prestige 16 AI Evo B2HMG | |
| Geekbench AI / Quantized GPU 1.7 | |
| Dell XPS 16 Core Ultra X7 358H | |
| MSI Prestige 16 AI C3MTG | |
| Average Intel Core Ultra X7 358H, Intel Arc B390 12 Xe3 Panther Lake iGPU (6908 - 8011, n=6) | |
| Geekbench AI / Half Precision GPU 1.7 | |
| MSI Prestige 16 AI C3MTG | |
| Dell XPS 16 Core Ultra X7 358H | |
| Average Intel Core Ultra X7 358H, Intel Arc B390 12 Xe3 Panther Lake iGPU (16188 - 21963, n=6) | |
| Geekbench AI / Single Precision GPU 1.7 | |
| MSI Prestige 16 AI C3MTG | |
| Dell XPS 16 Core Ultra X7 358H | |
| Average Intel Core Ultra X7 358H, Intel Arc B390 12 Xe3 Panther Lake iGPU (9783 - 12255, n=6) | |
* ... smaller is better
| PCMark 10 Score | 9551 points | |
Help | ||
| AIDA64 / Memory Copy | |
| Dell XPS 16 Core Ultra X7 358H | |
| MSI Prestige 16 AI C3MTG | |
| Average Intel Core Ultra X7 358H (102745 - 132135, n=7) | |
| MSI Prestige 16 AI Evo B2HMG | |
| Asus ZenBook S16 UM5606GA | |
| Lenovo ThinkBook 16 G7+ AMD | |
| HP Envy x360 2-in-1 16-ad0097nr | |
| AIDA64 / Memory Read | |
| Dell XPS 16 Core Ultra X7 358H | |
| Average Intel Core Ultra X7 358H (97755 - 118888, n=8) | |
| MSI Prestige 16 AI C3MTG | |
| Asus ZenBook S16 UM5606GA | |
| Lenovo ThinkBook 16 G7+ AMD | |
| MSI Prestige 16 AI Evo B2HMG | |
| HP Envy x360 2-in-1 16-ad0097nr | |
| AIDA64 / Memory Write | |
| Dell XPS 16 Core Ultra X7 358H | |
| Average Intel Core Ultra X7 358H (105984 - 134998, n=8) | |
| MSI Prestige 16 AI C3MTG | |
| Asus ZenBook S16 UM5606GA | |
| Lenovo ThinkBook 16 G7+ AMD | |
| HP Envy x360 2-in-1 16-ad0097nr | |
| MSI Prestige 16 AI Evo B2HMG | |
| AIDA64 / Memory Latency | |
| MSI Prestige 16 AI Evo B2HMG | |
| HP Envy x360 2-in-1 16-ad0097nr | |
| Lenovo ThinkBook 16 G7+ AMD | |
| Asus ZenBook S16 UM5606GA | |
| MSI Prestige 16 AI C3MTG | |
| Dell XPS 16 Core Ultra X7 358H | |
| Average Intel Core Ultra X7 358H (84.6 - 101.9, n=8) | |
* ... smaller is better
DPC 延迟
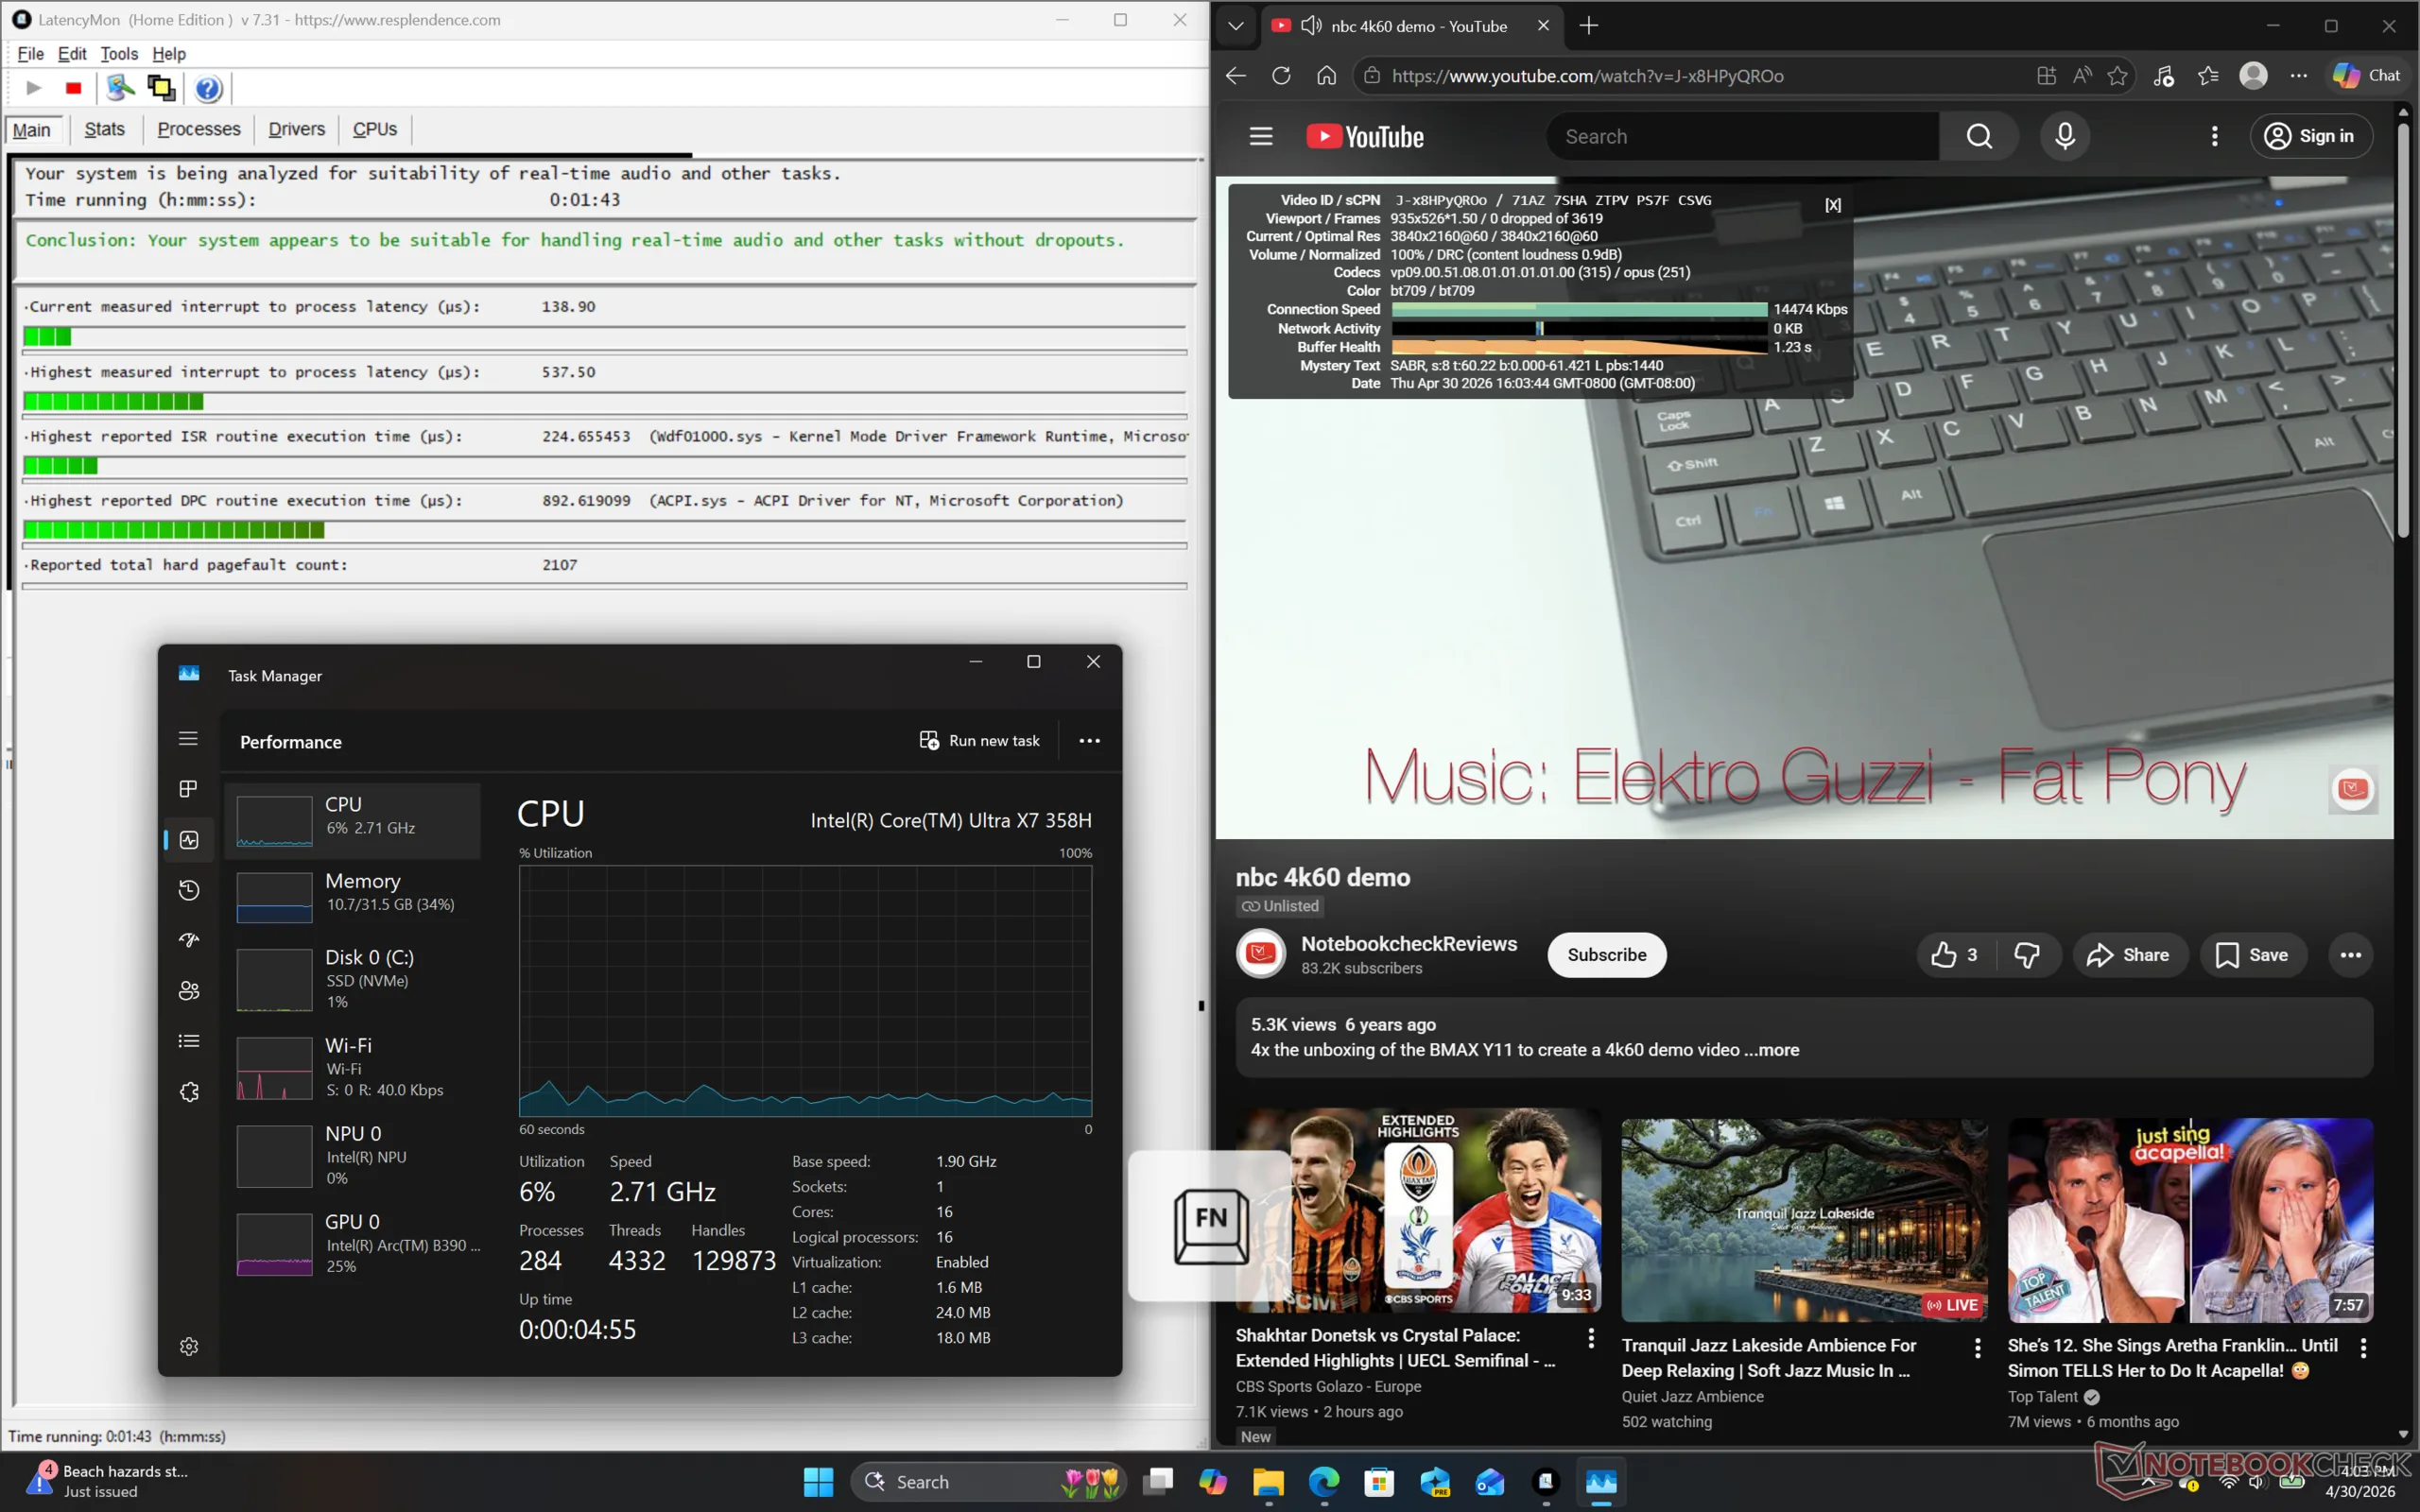
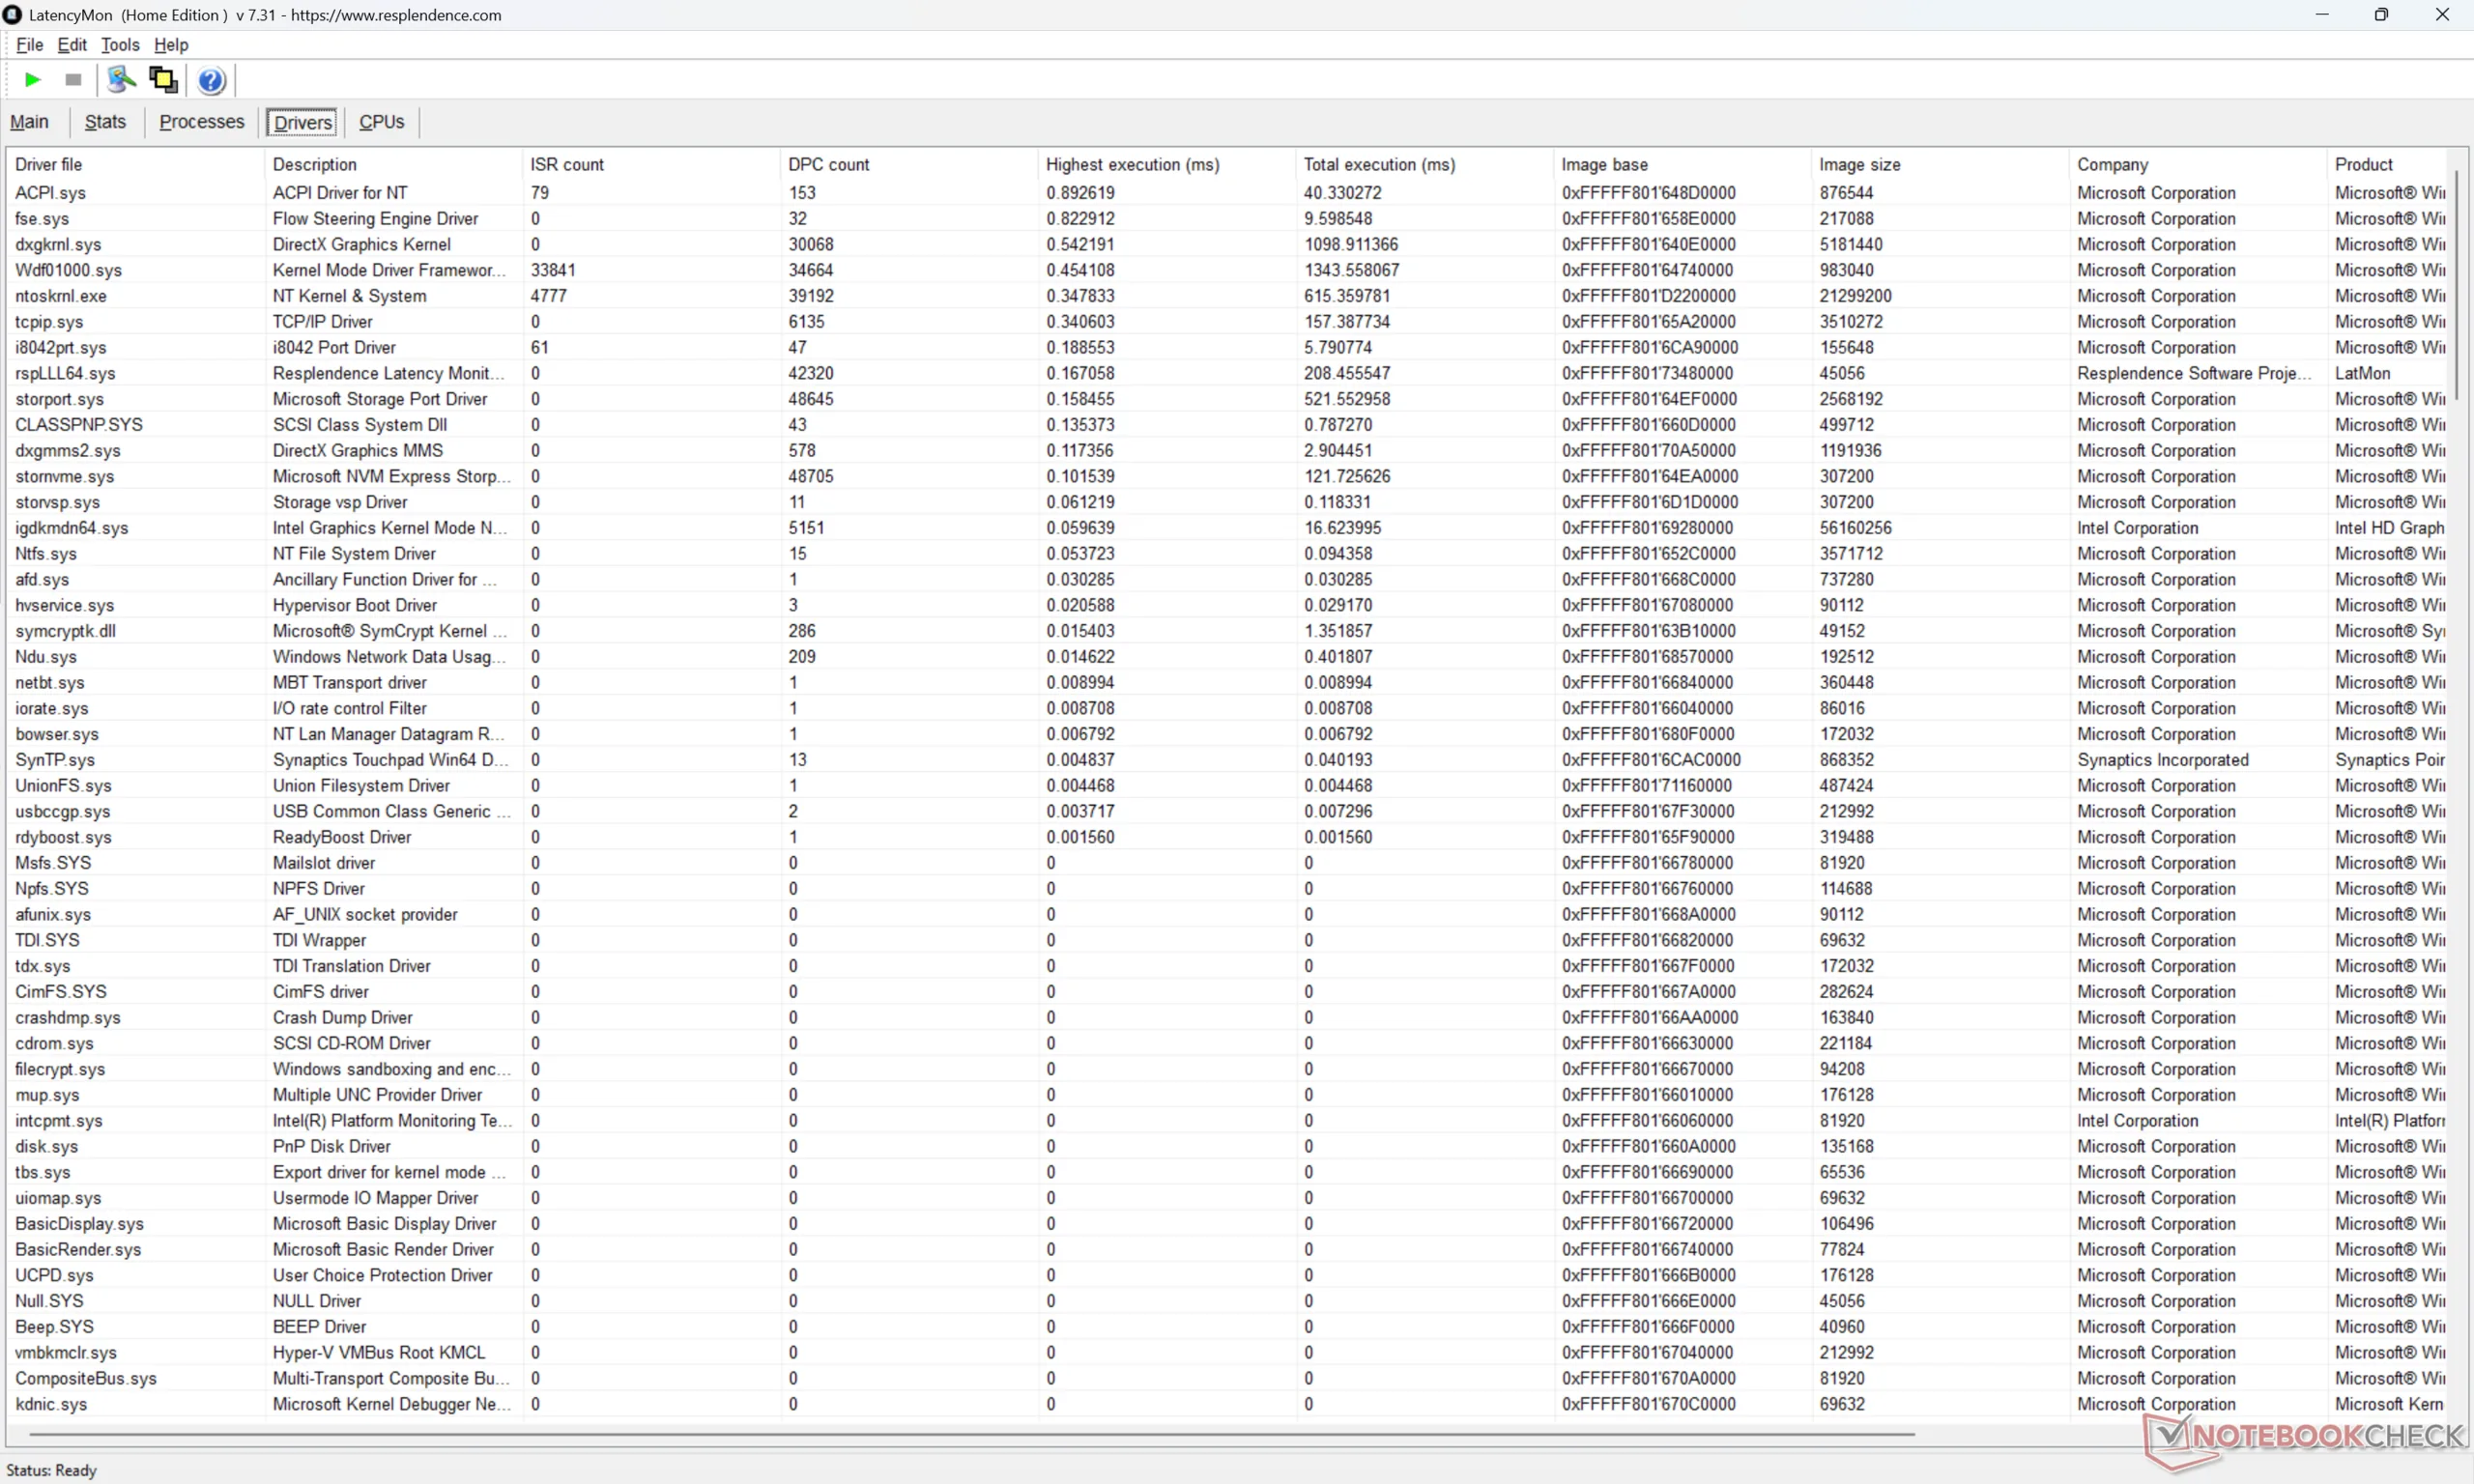
| DPC Latencies / LatencyMon - interrupt to process latency (max), Web, Youtube, Prime95 | |
| MSI Prestige 16 AI Evo B2HMG | |
| HP Envy x360 2-in-1 16-ad0097nr | |
| Lenovo ThinkBook 16 G7+ AMD | |
| Asus ZenBook S16 UM5606GA | |
| MSI Prestige 16 AI C3MTG | |
| Dell XPS 16 Core Ultra X7 358H | |
* ... smaller is better
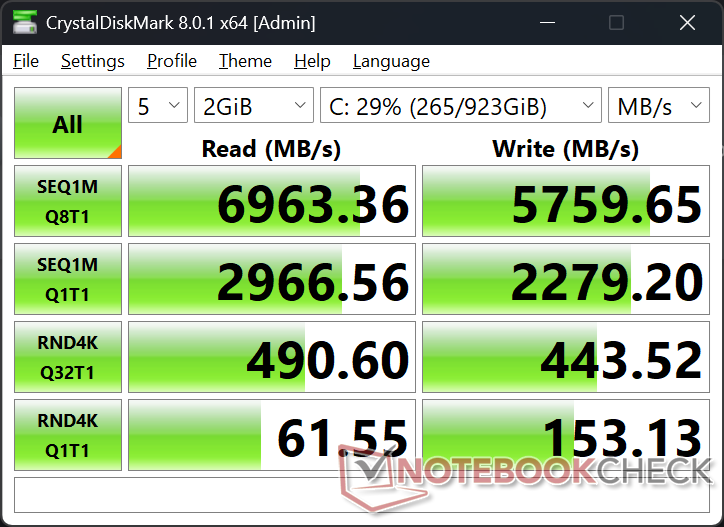
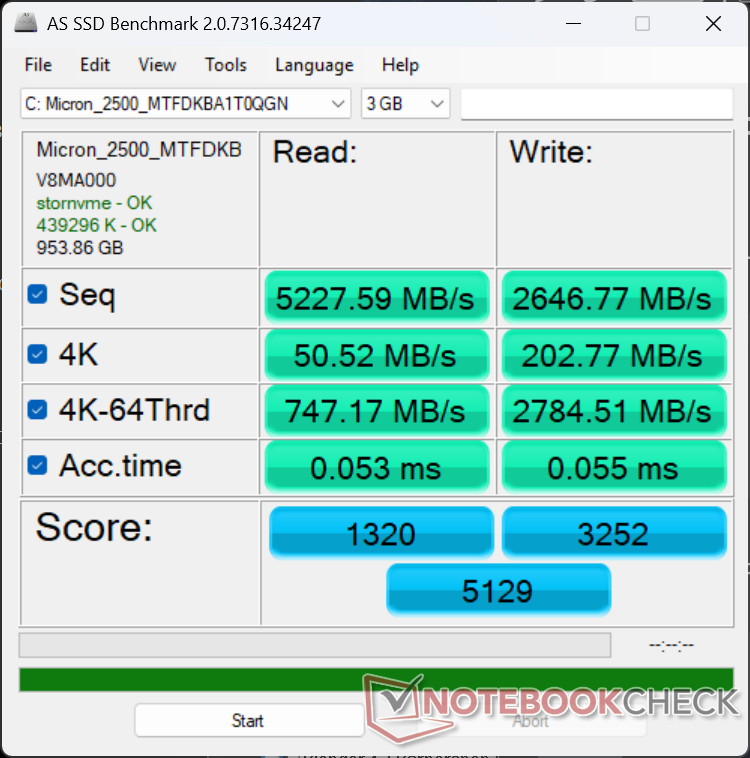
存储设备
我们的测试设备配备了相同的 1 TB 美光 2500PCIe4 x4 NVMe 固态硬盘,性能水平与去年的型号相似,没有明显的节流现象。没有更多的辅助 M.2 固态硬盘支持,这似乎是较新的 16 英寸笔记本电脑(如 XPS 16 或 华硕 Zenbook S16.

* ... smaller is better
磁盘节流DiskSpd 读取循环,队列深度 8
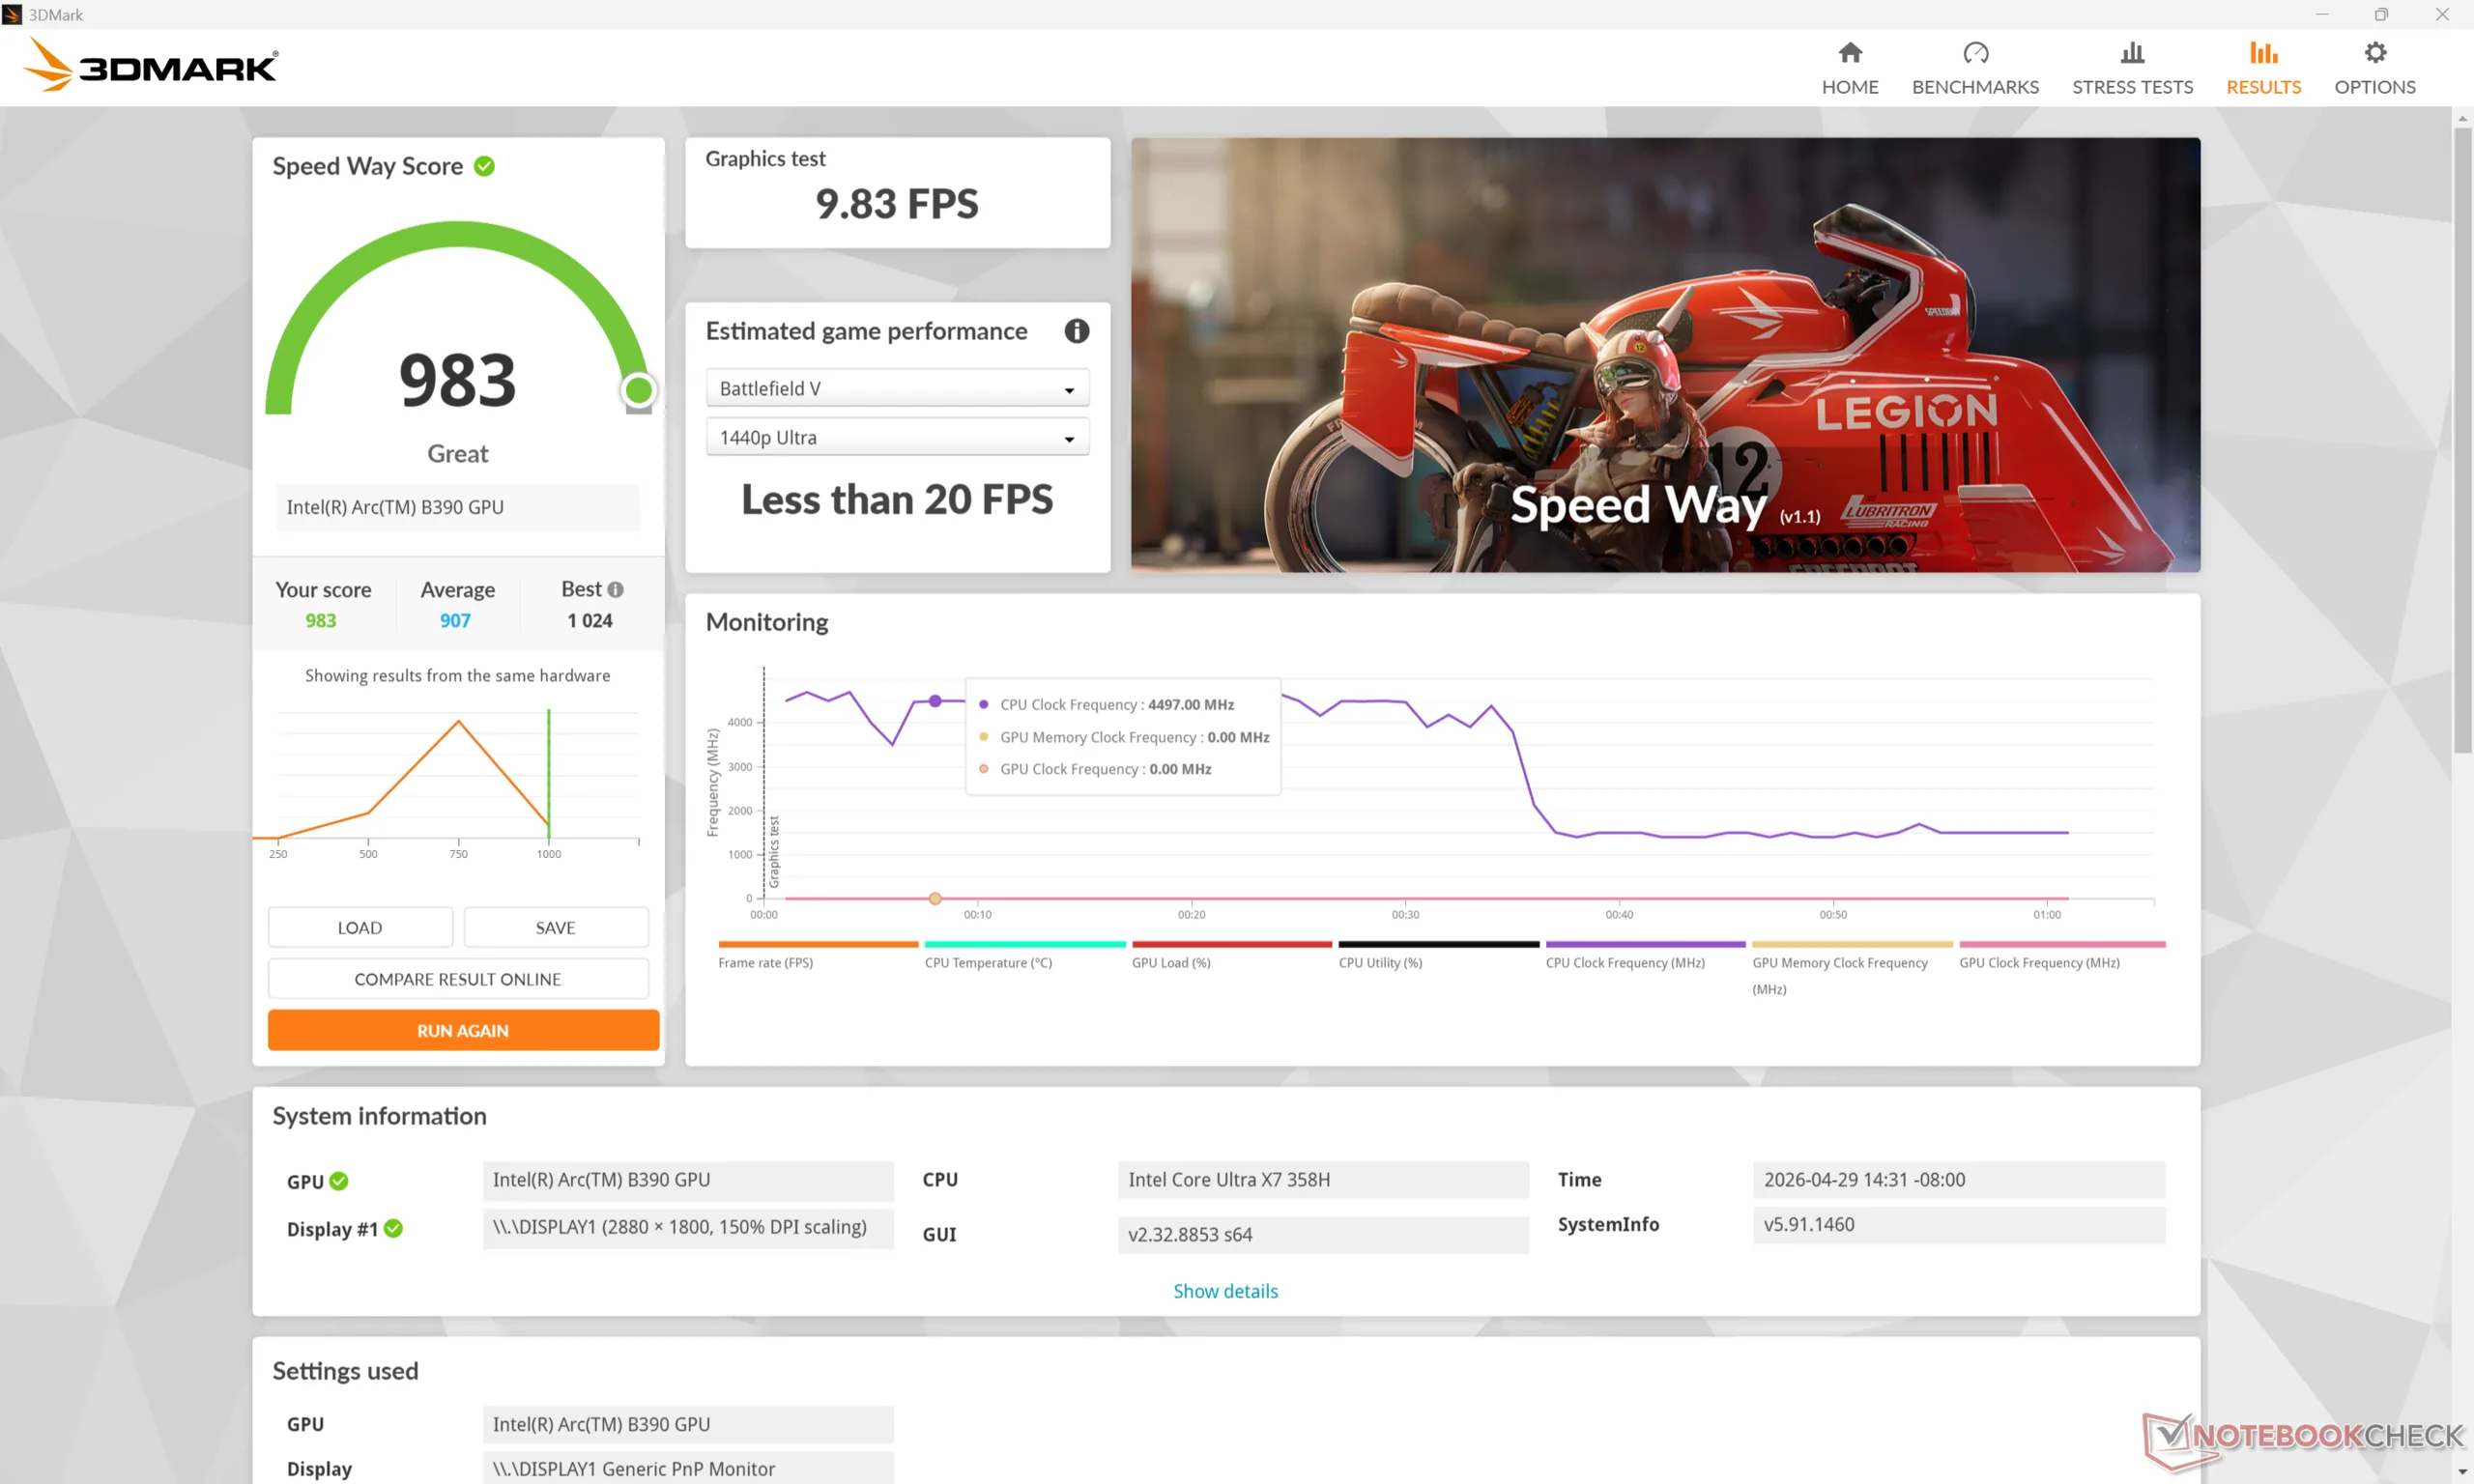
图形处理器性能
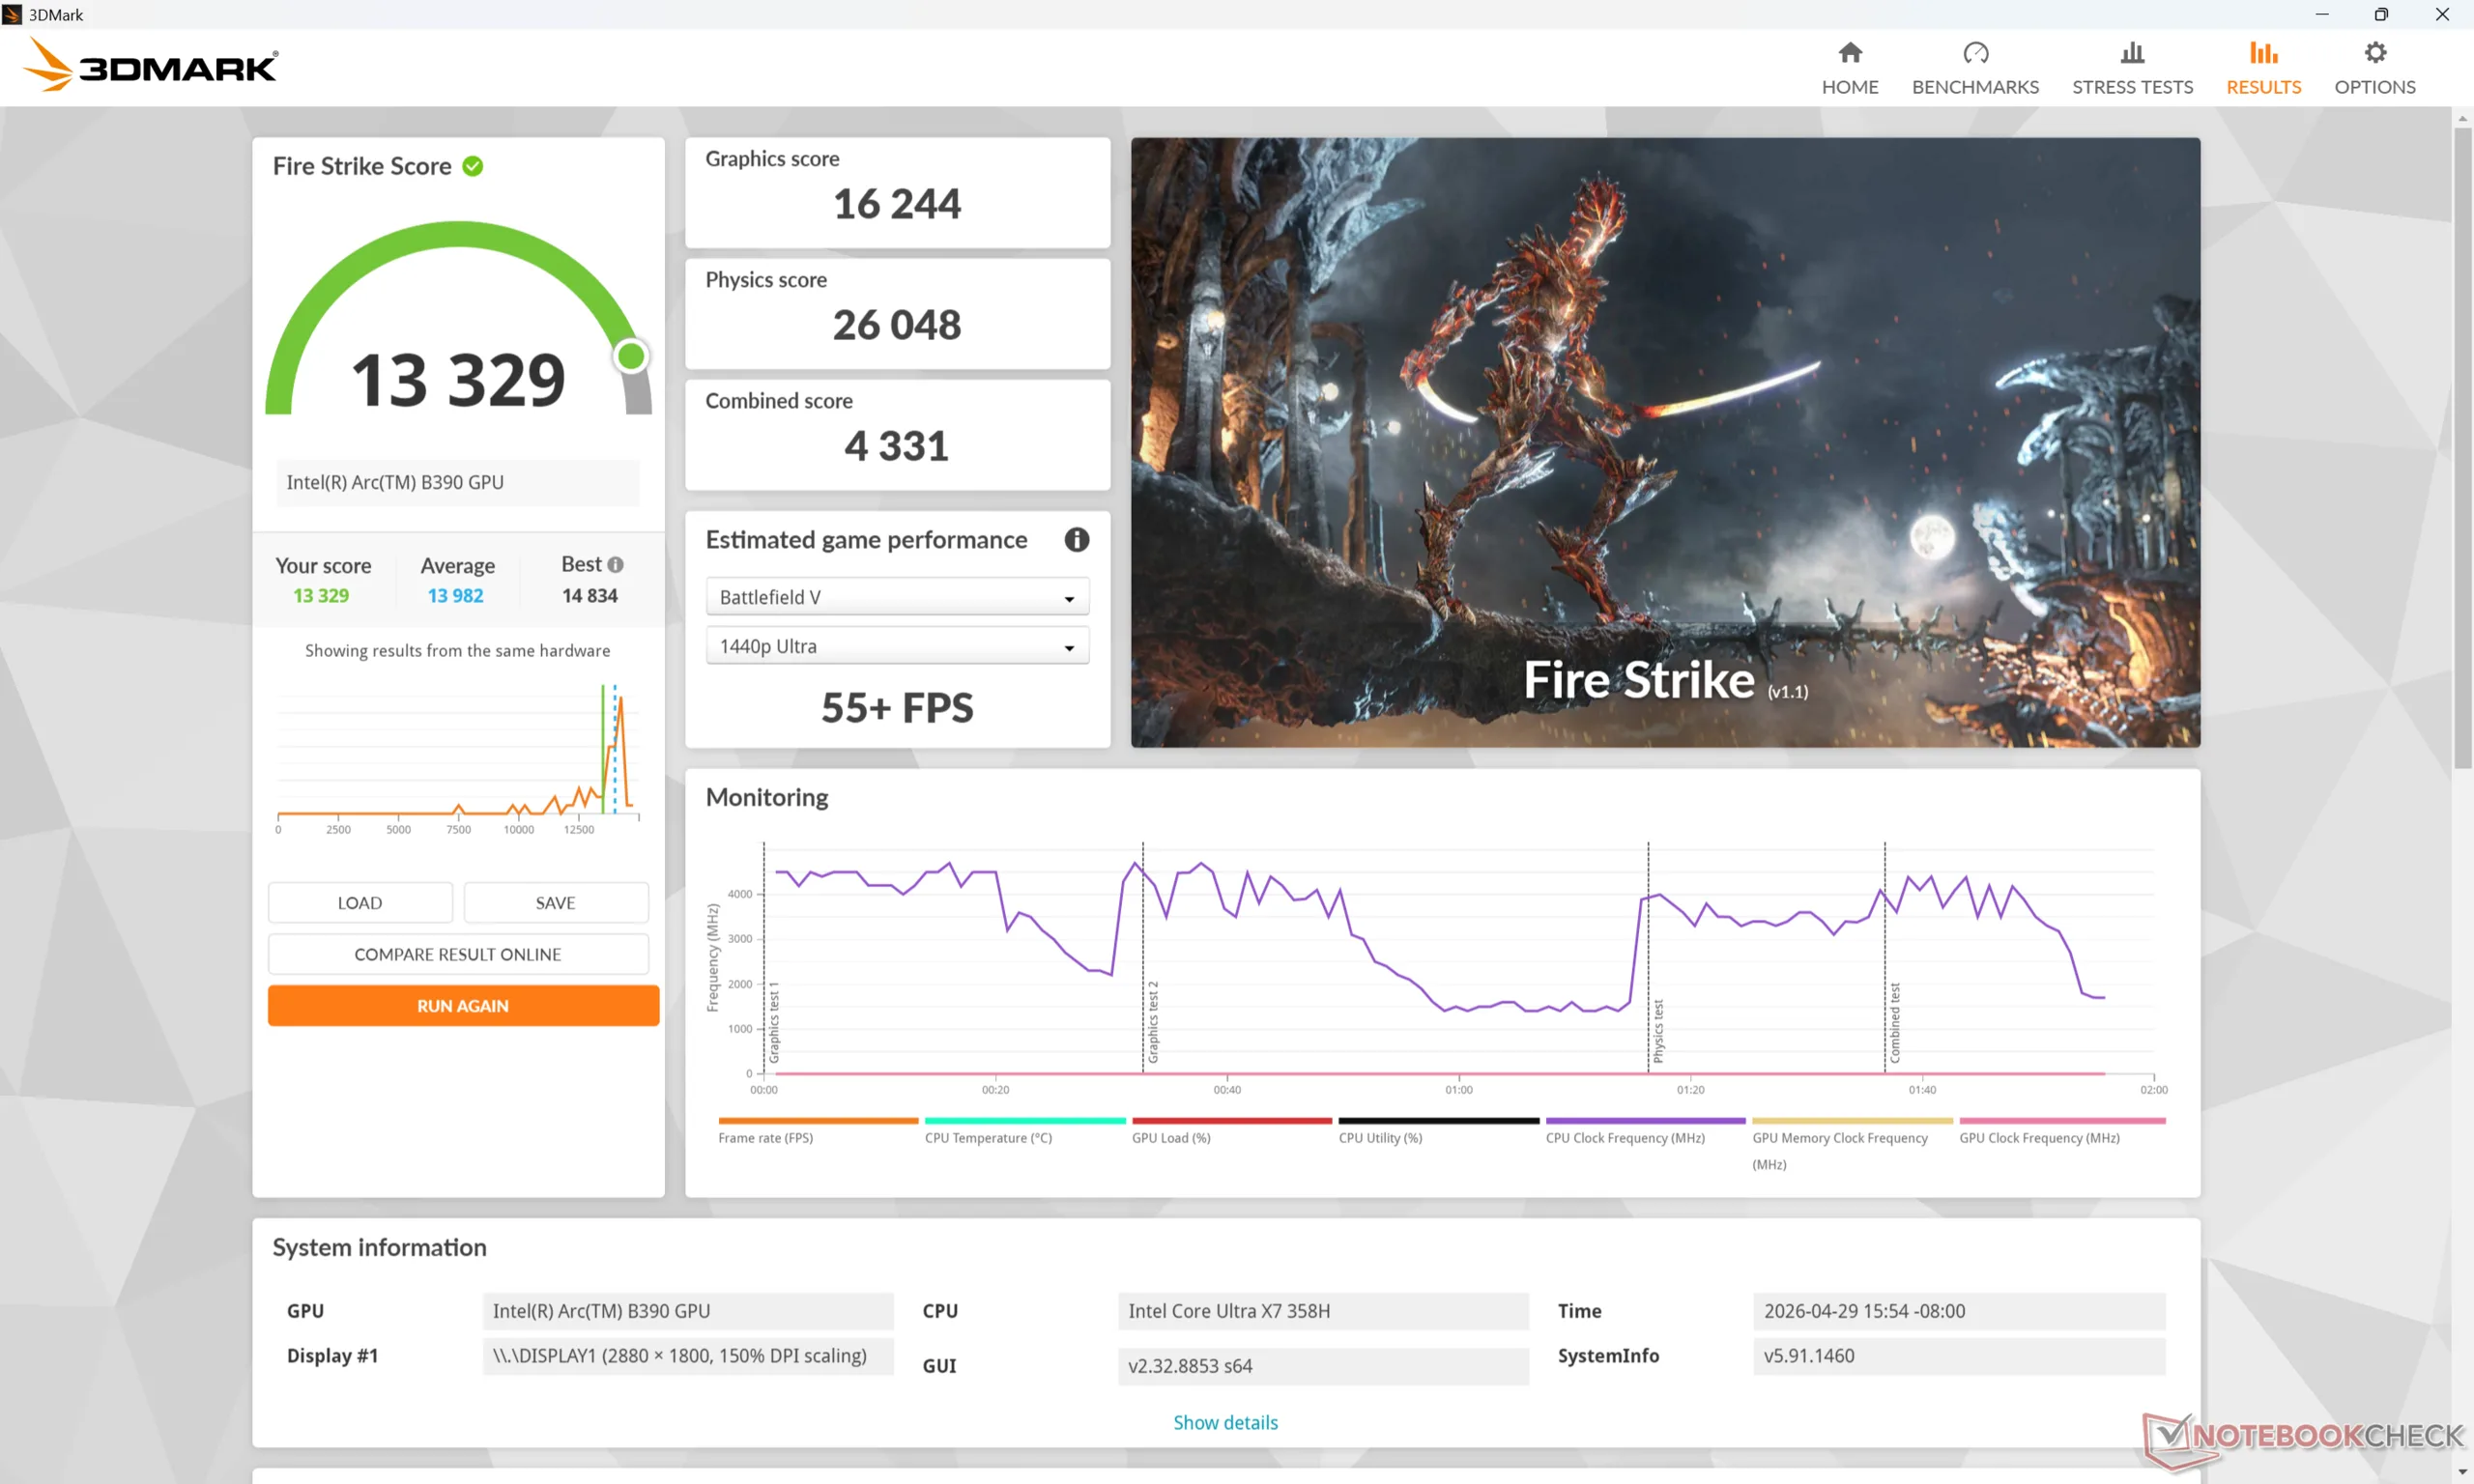
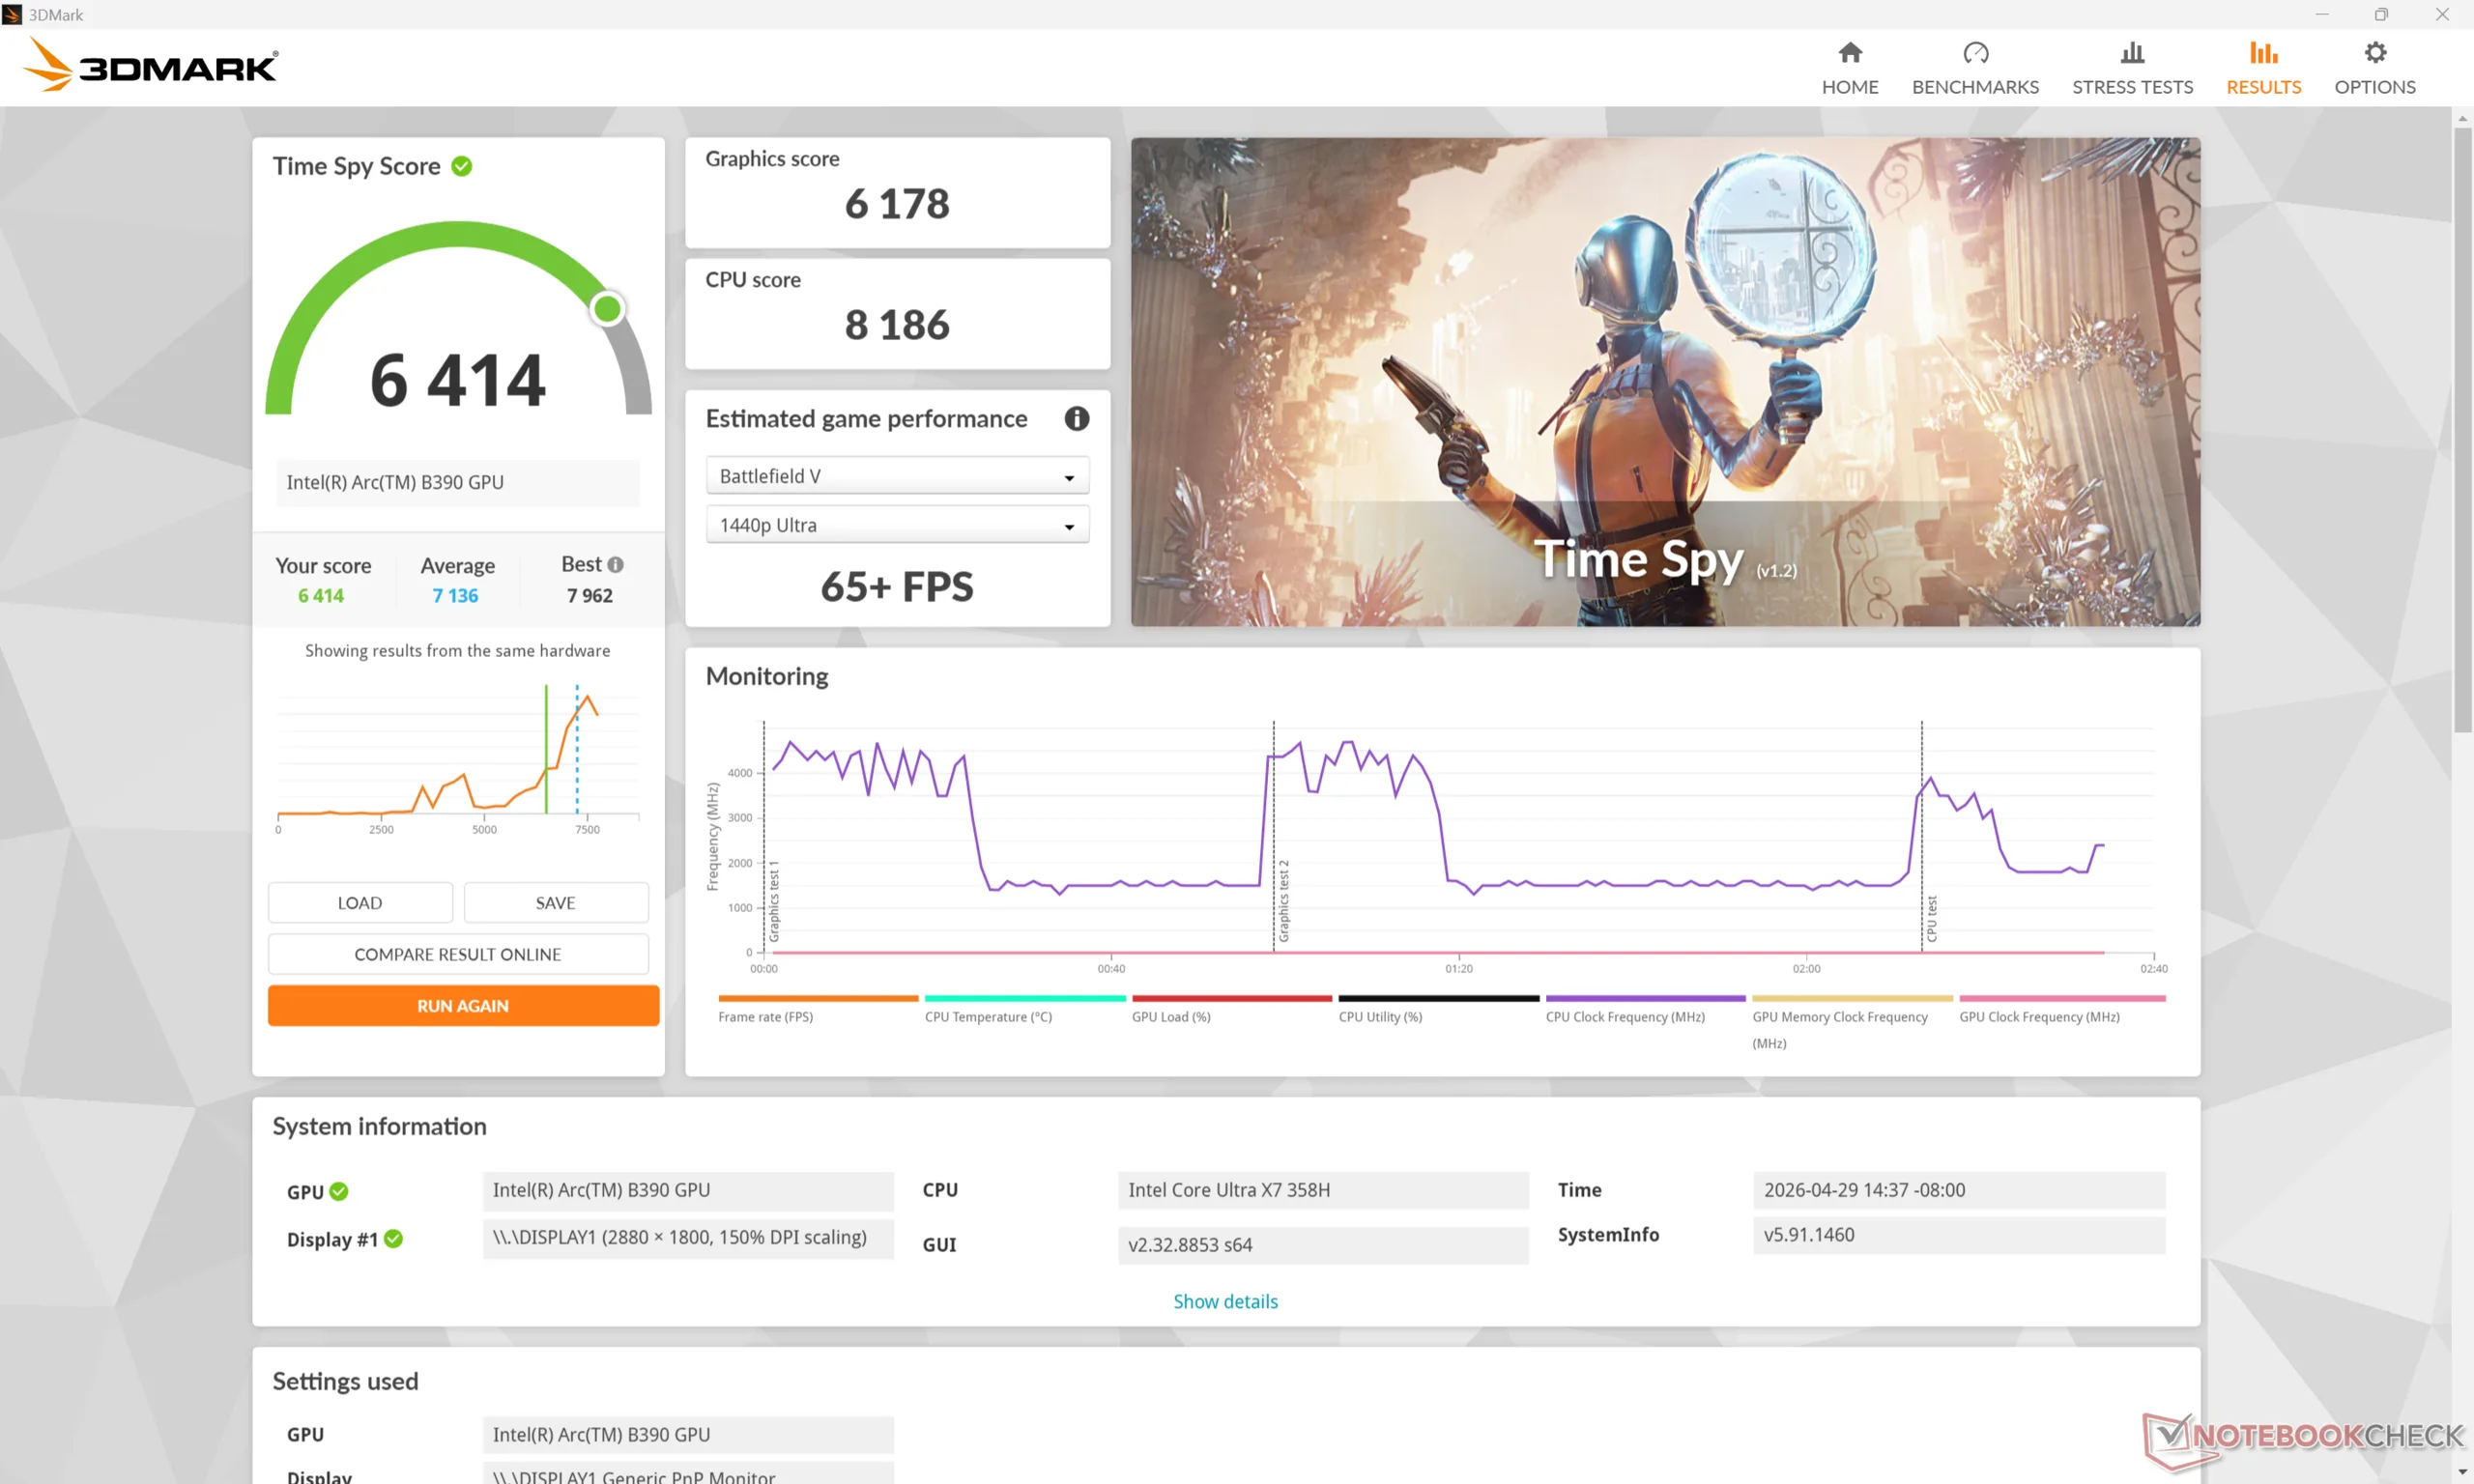
与其他同类 PC 相比,Arc B390 的图形性能达到了我们预期的水平。 Arc B390图形处理器的性能达到了我们的预期水平,甚至略低几个百分点。Arc B390 的速度明显快于 Arc 140T快了 50% 至 80%,这也是我们升级到 Panther Lake 的最大原因之一。
在平衡模式而非性能模式下运行,性能会受到比预期更严重的影响,最高可达 25%,如下表Fire Strike 结果所示。这将随之影响风扇噪音和游戏性能,下面的章节将对此进行说明。
| 电源配置文件 | 图形分数 | 物理得分 | 综合得分 |
| 性能模式 | 16244 | 26048 | 4331 |
| 均衡模式 | 15684 (-3%) | 19912 (-24%) | 4476 (-0%) |
| 电池电量 | 16481 (-0%) | 20729 (-20%) | 4794 (-0%) |
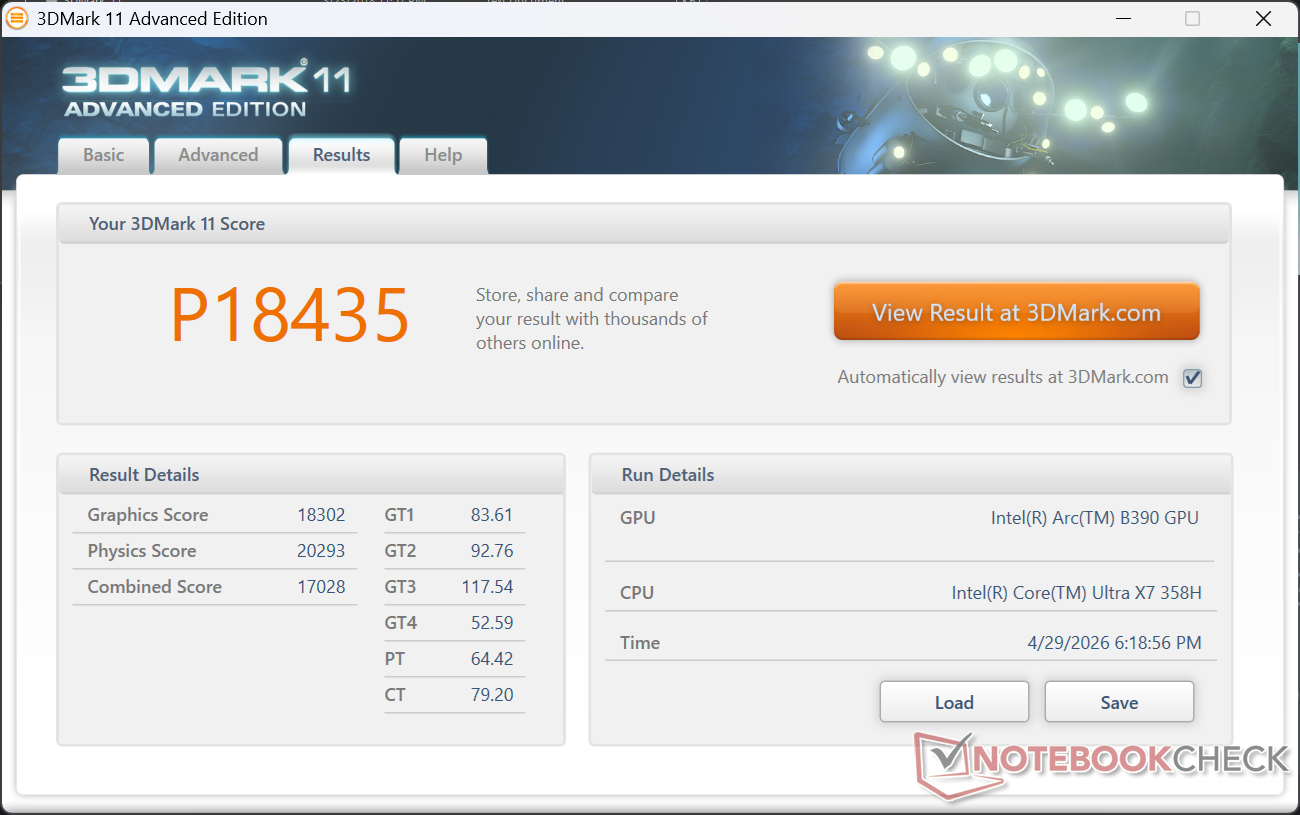
| 3DMark 11 Performance | 18435 points | |
| 3DMark Cloud Gate Standard Score | 35193 points | |
| 3DMark Fire Strike Score | 13329 points | |
| 3DMark Time Spy Score | 6414 points | |
Help | ||
* ... smaller is better
游戏性能
虽然 Arc B390 并非主要用于游戏,但它完全有能力以合适的 1080p 设置和帧率运行要求最苛刻的游戏。例如,《赛博朋克 2077》在 1080p 超高设置下的平均帧率为 45 FPS,然后才进行任何 XeSS 升频。
内置显示屏不支持 G-Sync。
| Performance rating - Percent | |
| MSI Prestige 16 AI C3MTG | |
| Dell XPS 16 Core Ultra X7 358H | |
| Lenovo ThinkBook 16 G7+ AMD | |
| Asus ZenBook S16 UM5606GA | |
| MSI Prestige 16 AI Evo B2HMG | |
| HP Envy x360 2-in-1 16-ad0097nr -1! | |
| Cyberpunk 2077 - 1920x1080 Ultra Preset (FSR off) | |
| Dell XPS 16 Core Ultra X7 358H | |
| MSI Prestige 16 AI C3MTG | |
| MSI Prestige 16 AI Evo B2HMG | |
| Lenovo ThinkBook 16 G7+ AMD | |
| Asus ZenBook S16 UM5606GA | |
| HP Envy x360 2-in-1 16-ad0097nr | |
| Baldur's Gate 3 - 1920x1080 Ultra Preset AA:T | |
| Dell XPS 16 Core Ultra X7 358H | |
| MSI Prestige 16 AI C3MTG | |
| Lenovo ThinkBook 16 G7+ AMD | |
| Asus ZenBook S16 UM5606GA | |
| MSI Prestige 16 AI Evo B2HMG | |
| HP Envy x360 2-in-1 16-ad0097nr | |
| GTA V - 1920x1080 Highest AA:4xMSAA + FX AF:16x | |
| Dell XPS 16 Core Ultra X7 358H | |
| MSI Prestige 16 AI C3MTG | |
| Lenovo ThinkBook 16 G7+ AMD | |
| Asus ZenBook S16 UM5606GA | |
| MSI Prestige 16 AI Evo B2HMG | |
| Final Fantasy XV Benchmark - 1920x1080 High Quality | |
| Dell XPS 16 Core Ultra X7 358H | |
| MSI Prestige 16 AI C3MTG | |
| Lenovo ThinkBook 16 G7+ AMD | |
| MSI Prestige 16 AI Evo B2HMG | |
| Asus ZenBook S16 UM5606GA | |
| HP Envy x360 2-in-1 16-ad0097nr | |
| Strange Brigade - 1920x1080 ultra AA:ultra AF:16 | |
| Dell XPS 16 Core Ultra X7 358H | |
| MSI Prestige 16 AI C3MTG | |
| MSI Prestige 16 AI Evo B2HMG | |
| Lenovo ThinkBook 16 G7+ AMD | |
| Asus ZenBook S16 UM5606GA | |
| HP Envy x360 2-in-1 16-ad0097nr | |
| Dota 2 Reborn - 1920x1080 ultra (3/3) best looking | |
| MSI Prestige 16 AI C3MTG | |
| Dell XPS 16 Core Ultra X7 358H | |
| Lenovo ThinkBook 16 G7+ AMD | |
| Asus ZenBook S16 UM5606GA | |
| MSI Prestige 16 AI Evo B2HMG | |
| HP Envy x360 2-in-1 16-ad0097nr | |
| X-Plane 11.11 - 1920x1080 high (fps_test=3) | |
| Lenovo ThinkBook 16 G7+ AMD | |
| Asus ZenBook S16 UM5606GA | |
| MSI Prestige 16 AI C3MTG | |
| Dell XPS 16 Core Ultra X7 358H | |
| MSI Prestige 16 AI Evo B2HMG | |
| HP Envy x360 2-in-1 16-ad0097nr | |
赛博朋克 2077》超 FPS 图表
| low | med. | high | ultra | |
|---|---|---|---|---|
| GTA V (2015) | 174.7 | 164.7 | 97.9 | 43 |
| Dota 2 Reborn (2015) | 122.1 | 98.4 | 104.3 | 111.8 |
| Final Fantasy XV Benchmark (2018) | 124.3 | 73.9 | 53.4 | |
| X-Plane 11.11 (2018) | 61.7 | 52.4 | 44.5 | |
| Strange Brigade (2018) | 304 | 118.7 | 98.5 | 88.5 |
| Baldur's Gate 3 (2023) | 69.4 | 58.5 | 52.6 | 51.7 |
| Cyberpunk 2077 (2023) | 77.2 | 62.3 | 53.8 | 44.8 |
| F1 24 (2024) | 144.9 | 135.3 | 104.3 | 37.4 |
排放量
系统噪音
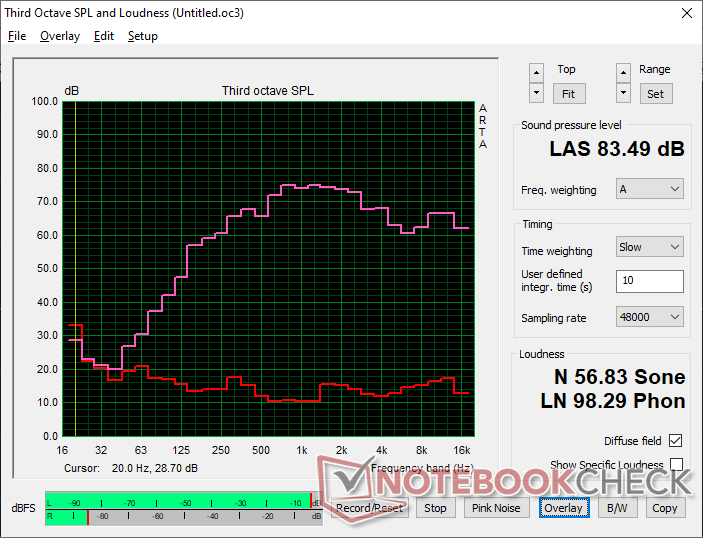
散热解决方案比 XPS 16 小得多,这也是两款机型核心温度差异明显的原因。虽然微星的风扇在需要升温之前可以保持更长时间的安静,但在一段时间过后,它们还是会在相似的最大值上趋于稳定。例如,在性能模式下运行《赛博朋克 2077》时,风扇噪音稳定在 41 dB(A),而戴尔为 42 dB(A)。
需要注意的是,如果使用平衡模式而不是性能模式进行游戏,风扇噪音会明显降低。在这种情况下,风扇的最高噪音将略低于 30 dB(A),根据用户的偏好,上述 20% 的性能损失可能是合理的。
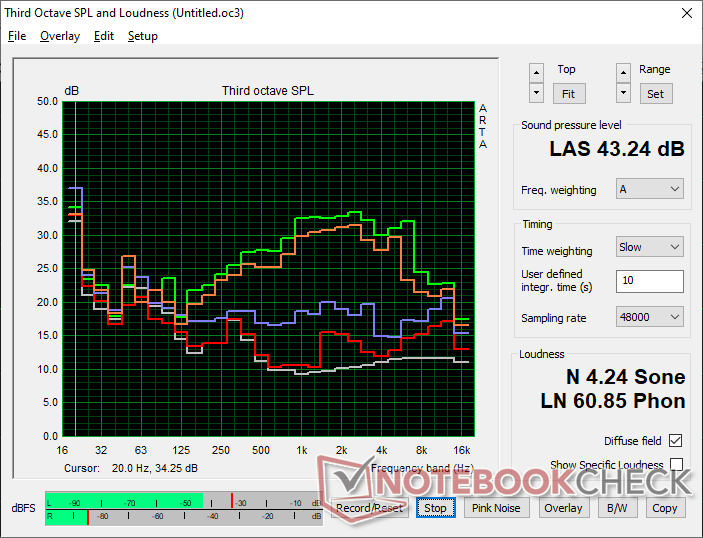
Noise level
| Idle |
| 23.3 / 23.3 / 25.9 dB(A) |
| Load |
| 30.1 / 44.7 dB(A) |
 | ||
30 dB silent 40 dB(A) audible 50 dB(A) loud |
||
min: | ||
| MSI Prestige 16 AI C3MTG Ultra X7 358H, Arc B390 Panther Lake iGPU | MSI Prestige 16 AI Evo B2HMG Ultra 9 285H, Arc 140T | Dell XPS 16 Core Ultra X7 358H Ultra X7 358H, Arc B390 Panther Lake iGPU | Asus ZenBook S16 UM5606GA Ryzen AI 9 465, Radeon 880M | Lenovo ThinkBook 16 G7+ AMD Ryzen AI 9 365, Radeon 880M | HP Envy x360 2-in-1 16-ad0097nr R7 8840HS, Radeon 780M | |
|---|---|---|---|---|---|---|
| Noise | -4% | -4% | -15% | -3% | 6% | |
| off / environment * (dB) | 23.1 | 23.6 -2% | 23.3 -1% | 24.9 -8% | 24.5 -6% | 22.9 1% |
| Idle Minimum * (dB) | 23.3 | 23.6 -1% | 23.4 -0% | 24.9 -7% | 24.5 -5% | 23 1% |
| Idle Average * (dB) | 23.3 | 23.6 -1% | 23.4 -0% | 24.9 -7% | 24.5 -5% | 23 1% |
| Idle Maximum * (dB) | 25.9 | 26.2 -1% | 25.8 -0% | 24.9 4% | 25.9 -0% | 23 11% |
| Load Average * (dB) | 30.1 | 37.1 -23% | 38 -26% | 45.7 -52% | 36.2 -20% | 23.8 21% |
| Cyberpunk 2077 ultra * (dB) | 40.8 | 42.1 -3% | 38.1 7% | 49 -20% | 40.1 2% | |
| Load Maximum * (dB) | 44.7 | 42.1 6% | 48.6 -9% | 50.4 -13% | 40.1 10% | 43.8 2% |
| Witcher 3 ultra * (dB) | 43.8 |
* ... smaller is better
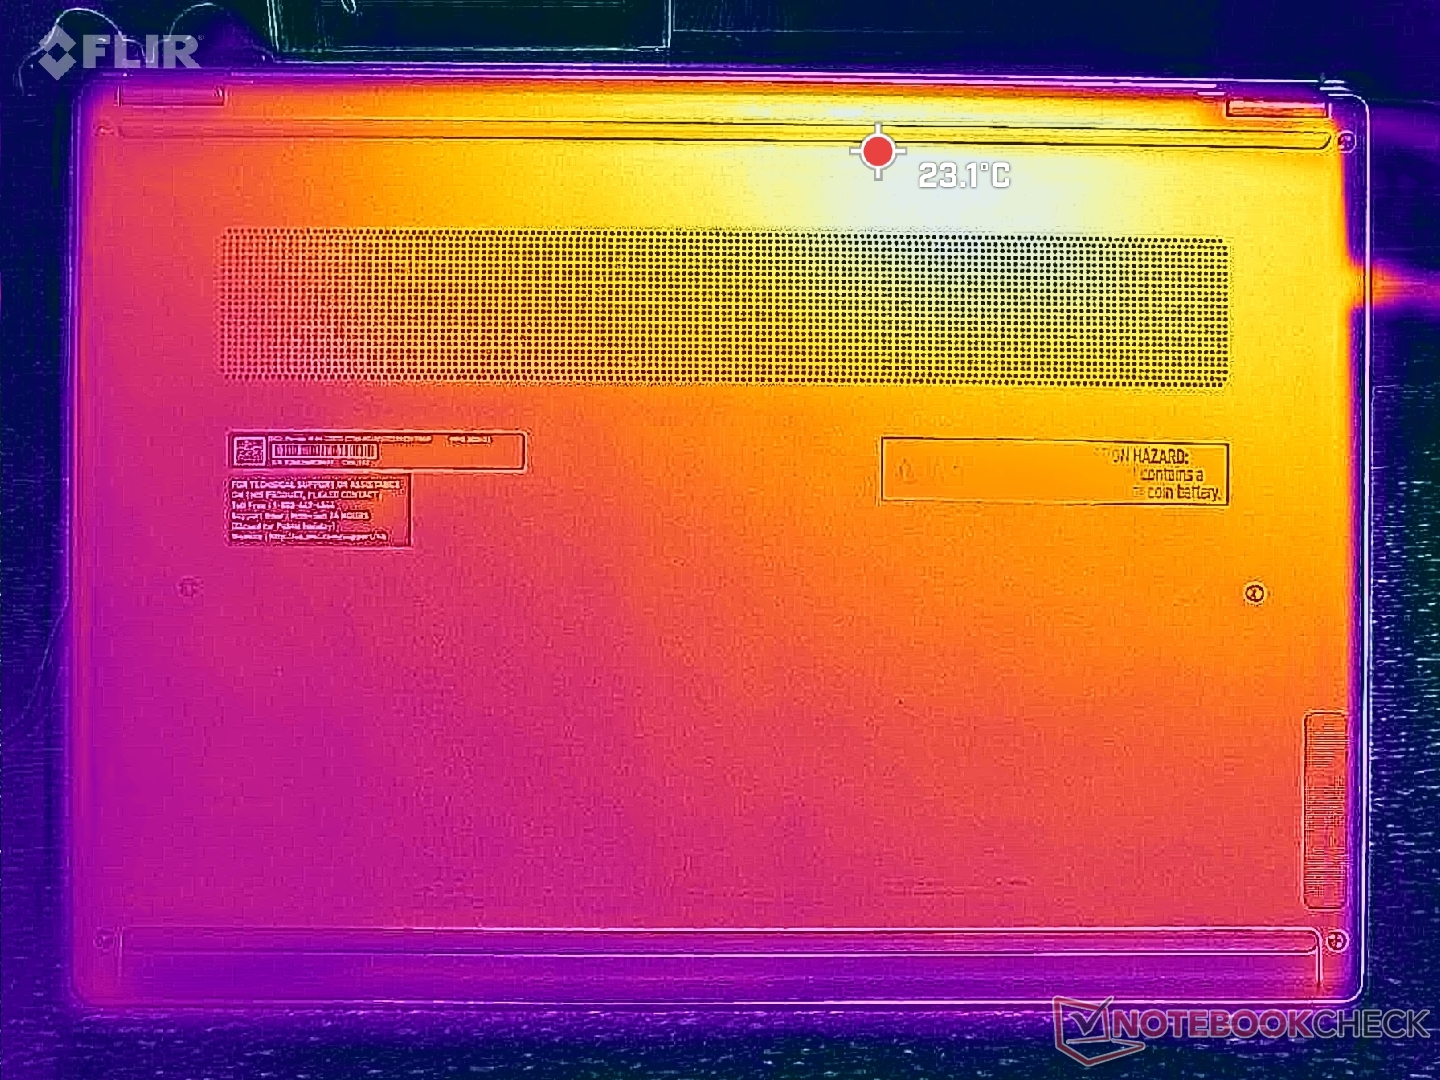
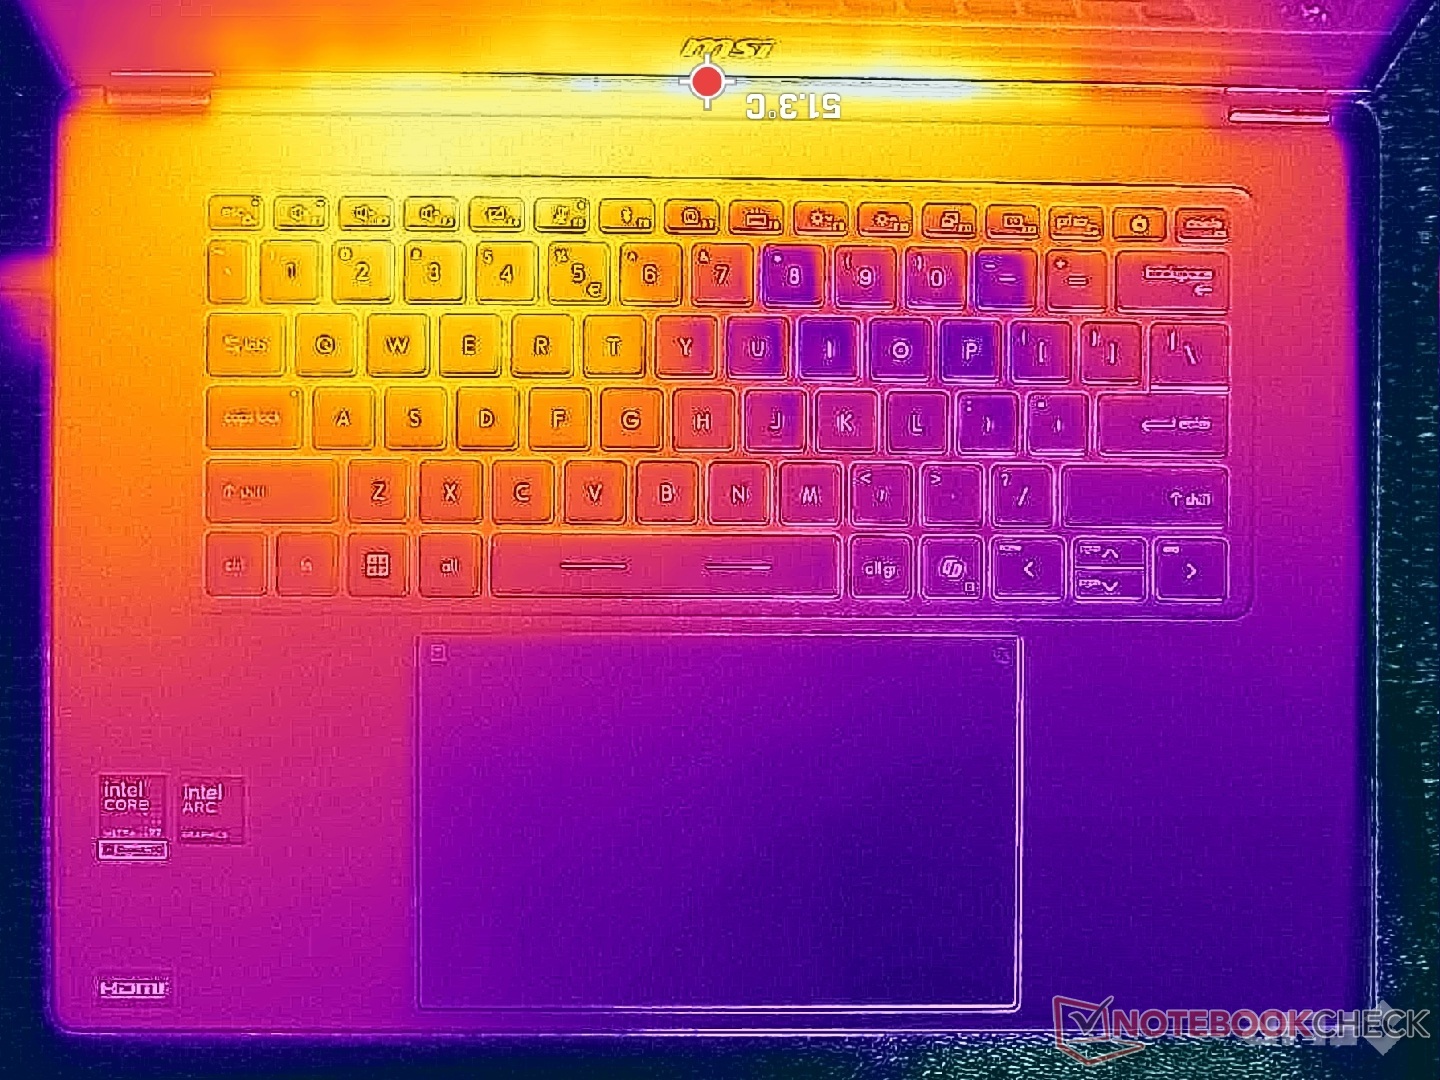
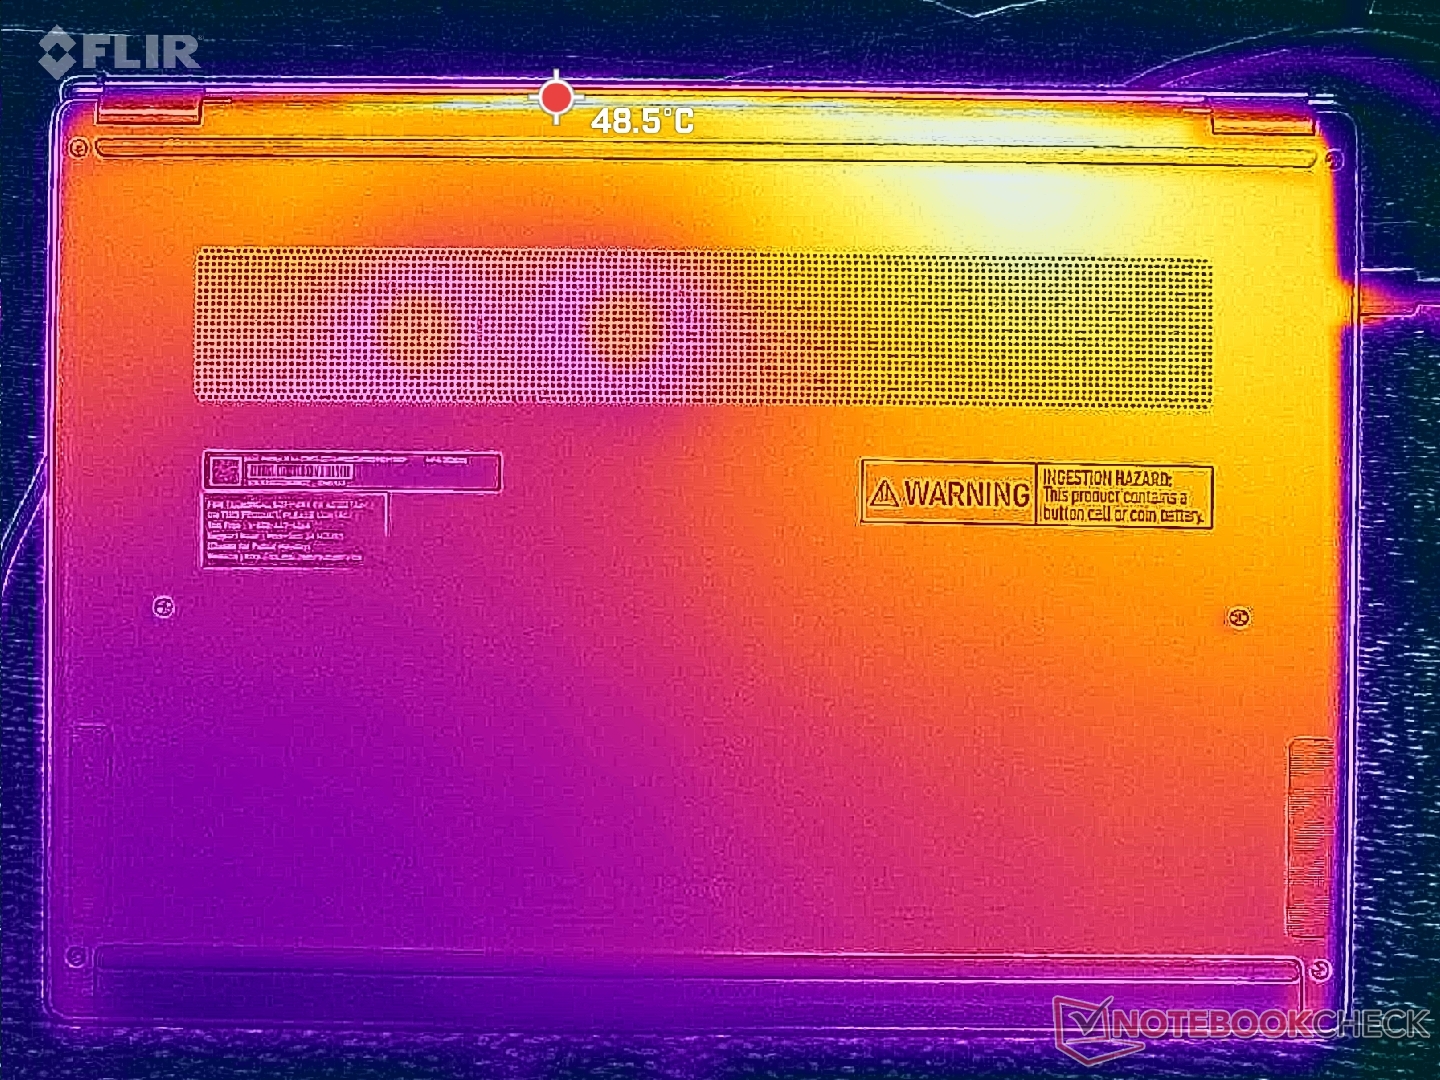
温度
表面温度比上一代产品有所提高。2025 年的 Prestige 16 最高温度可达 47 摄氏度至 52 摄氏度,而新一代产品的最高温度为 40 摄氏度至 47 摄氏度。
即便如此,机身表面温度仍高于同类产品 XPS 16相比,XPS 16 的表面温度仍然较高,因为在 XPS 16 上,无论哪一面的热点温度都只有 41 摄氏度,平均温度较低。
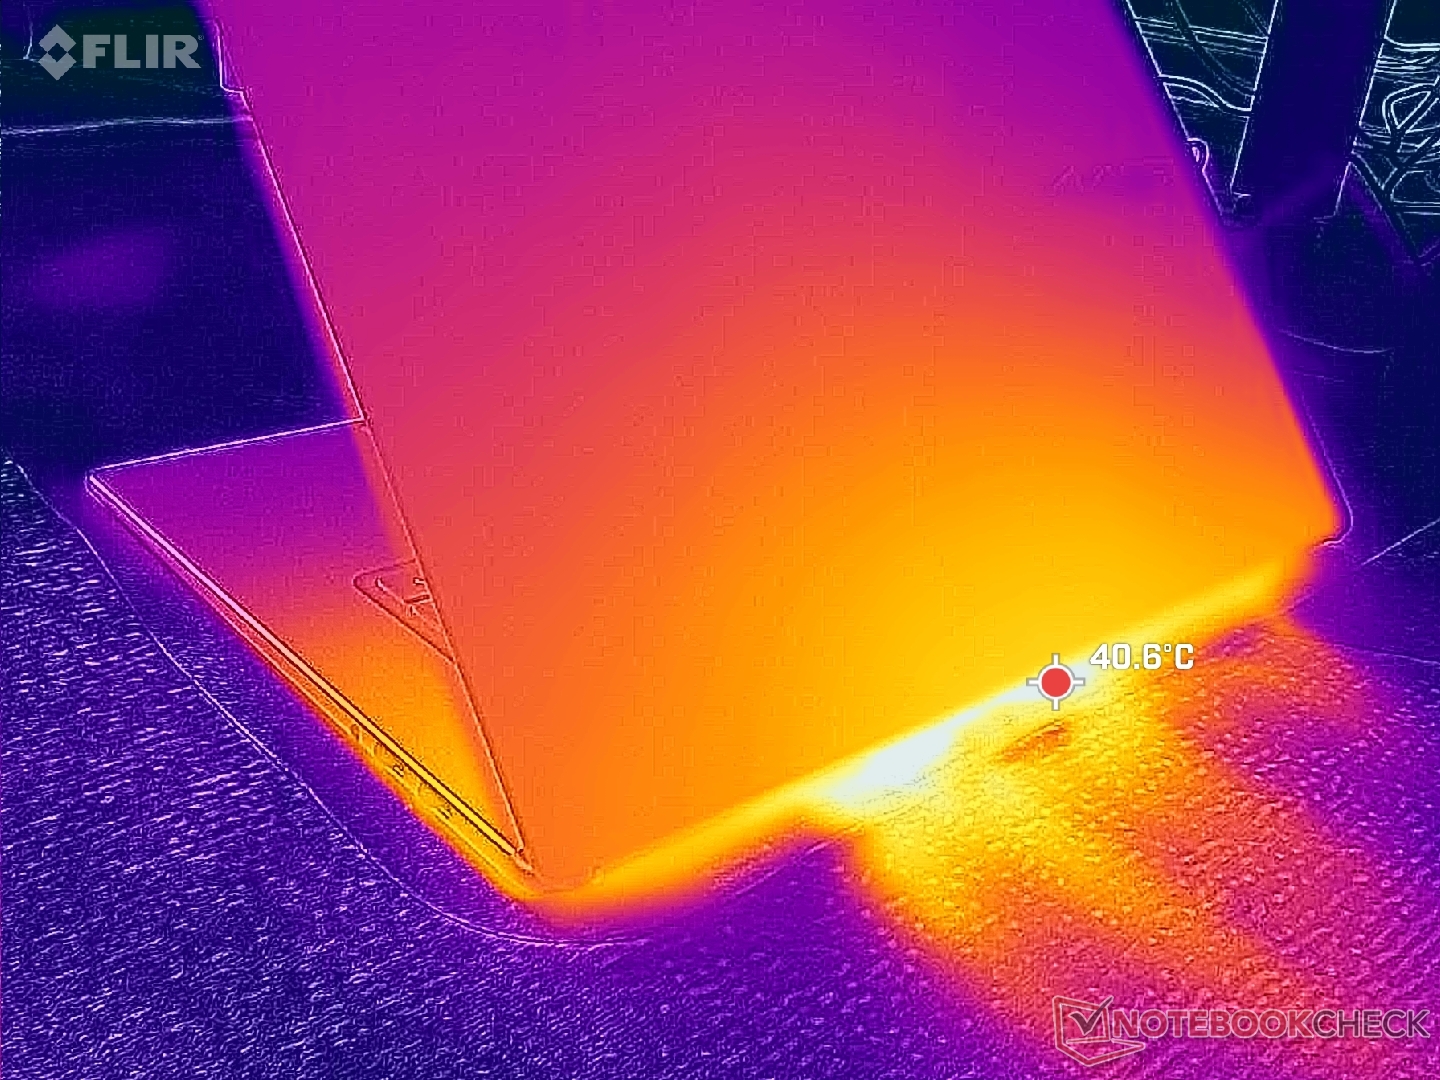
(-) The maximum temperature on the upper side is 47 °C / 117 F, compared to the average of 36.8 °C / 98 F, ranging from 21 to 71 °C for the class Multimedia.
(±) The bottom heats up to a maximum of 40 °C / 104 F, compared to the average of 39.1 °C / 102 F
(+) In idle usage, the average temperature for the upper side is 24.8 °C / 77 F, compared to the device average of 31.3 °C / 88 F.
(+) The palmrests and touchpad are cooler than skin temperature with a maximum of 30.4 °C / 86.7 F and are therefore cool to the touch.
(±) The average temperature of the palmrest area of similar devices was 28.7 °C / 83.7 F (-1.7 °C / -3 F).
| MSI Prestige 16 AI C3MTG Ultra X7 358H, Arc B390 Panther Lake iGPU | MSI Prestige 16 AI Evo B2HMG Ultra 9 285H, Arc 140T | Dell XPS 16 Core Ultra X7 358H Ultra X7 358H, Arc B390 Panther Lake iGPU | Asus ZenBook S16 UM5606GA Ryzen AI 9 465, Radeon 880M | Lenovo ThinkBook 16 G7+ AMD Ryzen AI 9 365, Radeon 880M | HP Envy x360 2-in-1 16-ad0097nr R7 8840HS, Radeon 780M | |
|---|---|---|---|---|---|---|
| Heat | -5% | 11% | -1% | 9% | -3% | |
| Maximum Upper Side * (°C) | 47 | 48.1 -2% | 40.6 14% | 43.4 8% | 38.2 19% | 42.6 9% |
| Maximum Bottom * (°C) | 40 | 51.6 -29% | 39.8 1% | 46.2 -16% | 37.9 5% | 47.8 -19% |
| Idle Upper Side * (°C) | 27.4 | 25.9 5% | 23.2 15% | 26.5 3% | 25.4 7% | 27.4 -0% |
| Idle Bottom * (°C) | 27.4 | 25.2 8% | 23.8 13% | 27 1% | 25.7 6% | 27.8 -1% |
* ... smaller is better
压力测试
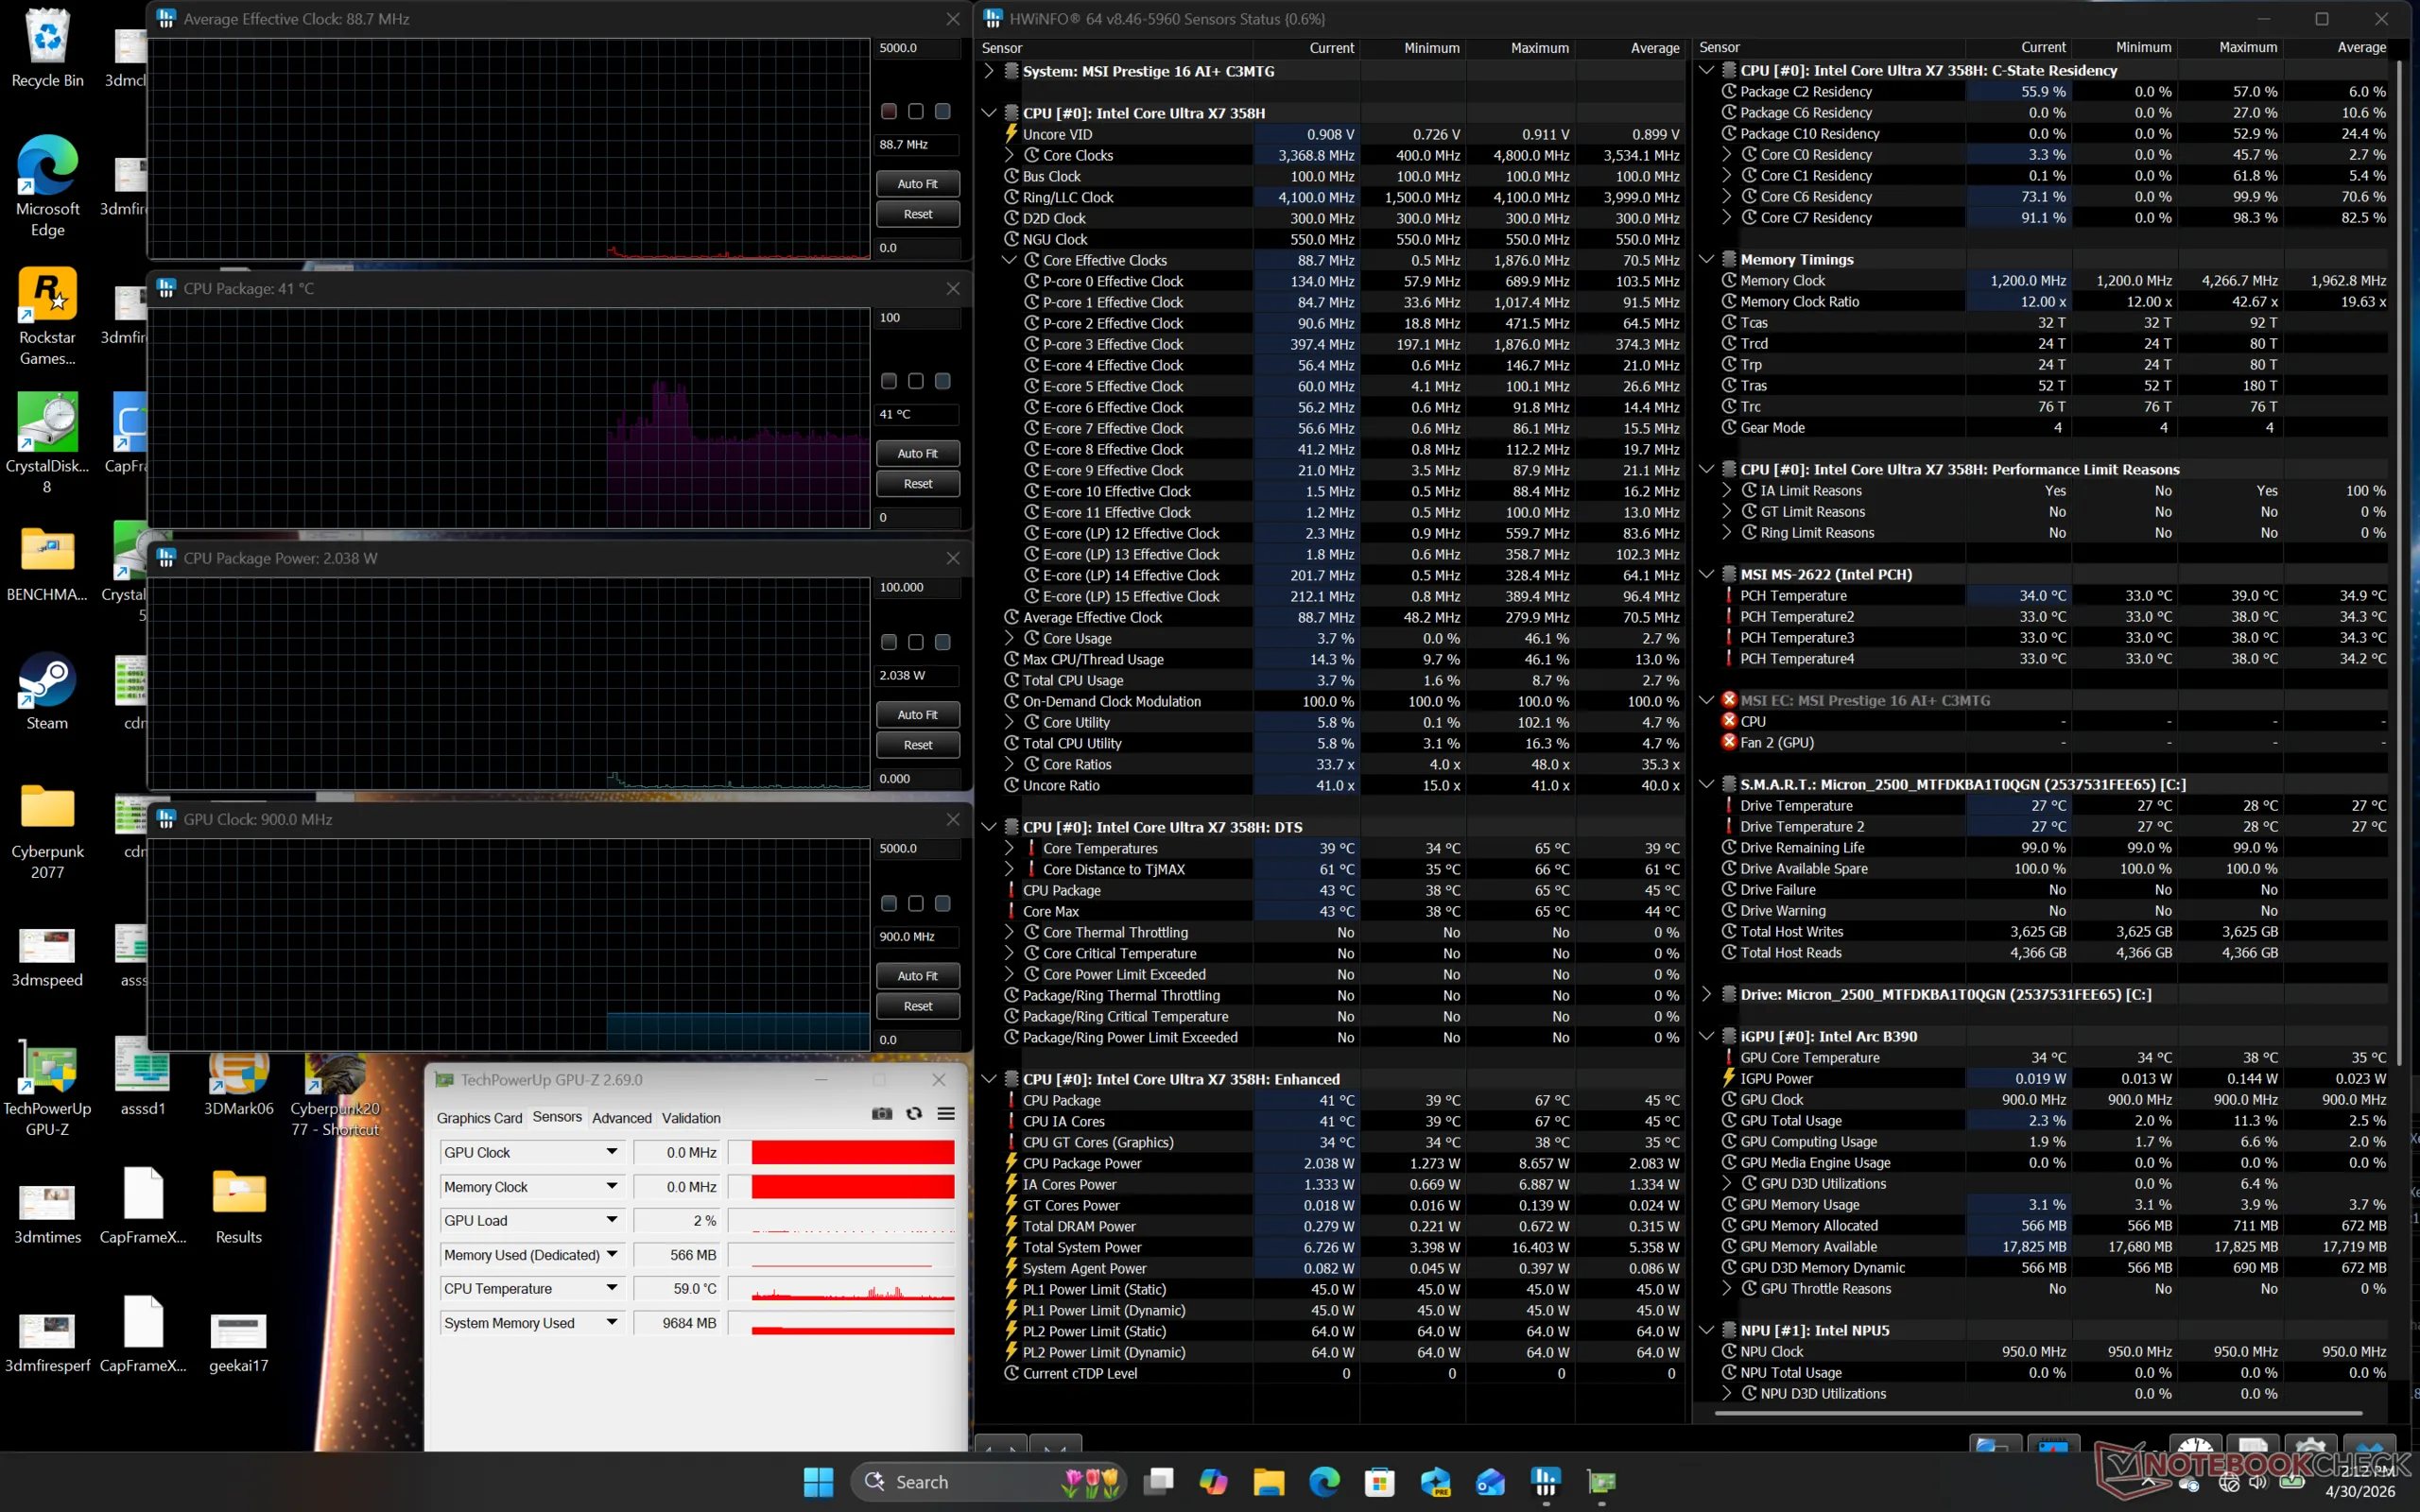
在运行 Prime95 压力模式时,CPU 会提升到 3 GHz、64 W 和 97 C,然后迅速下降到 2.3 GHz 和 39 W,以保持稳定的 90 C 核心温度。结果比我们在 XPS 16 上使用完全相同的 CPU 所记录的温度要高,相比之下,XPS 16 的核心温度仅稳定在 78 C。
在性能模式下运行《赛博朋克 2077》以体现游戏压力时,GPU 将稳定在 2500 MHz、38 W 和 86 C,比上述戴尔产品的温度高出 20 C 以上。将系统调低至平衡模式会导致 GPU 在 1220 MHz 至 1850 MHz 和 16 W 至 26 W 之间循环,这与上述较慢的图形性能和较低的风扇噪音相一致。
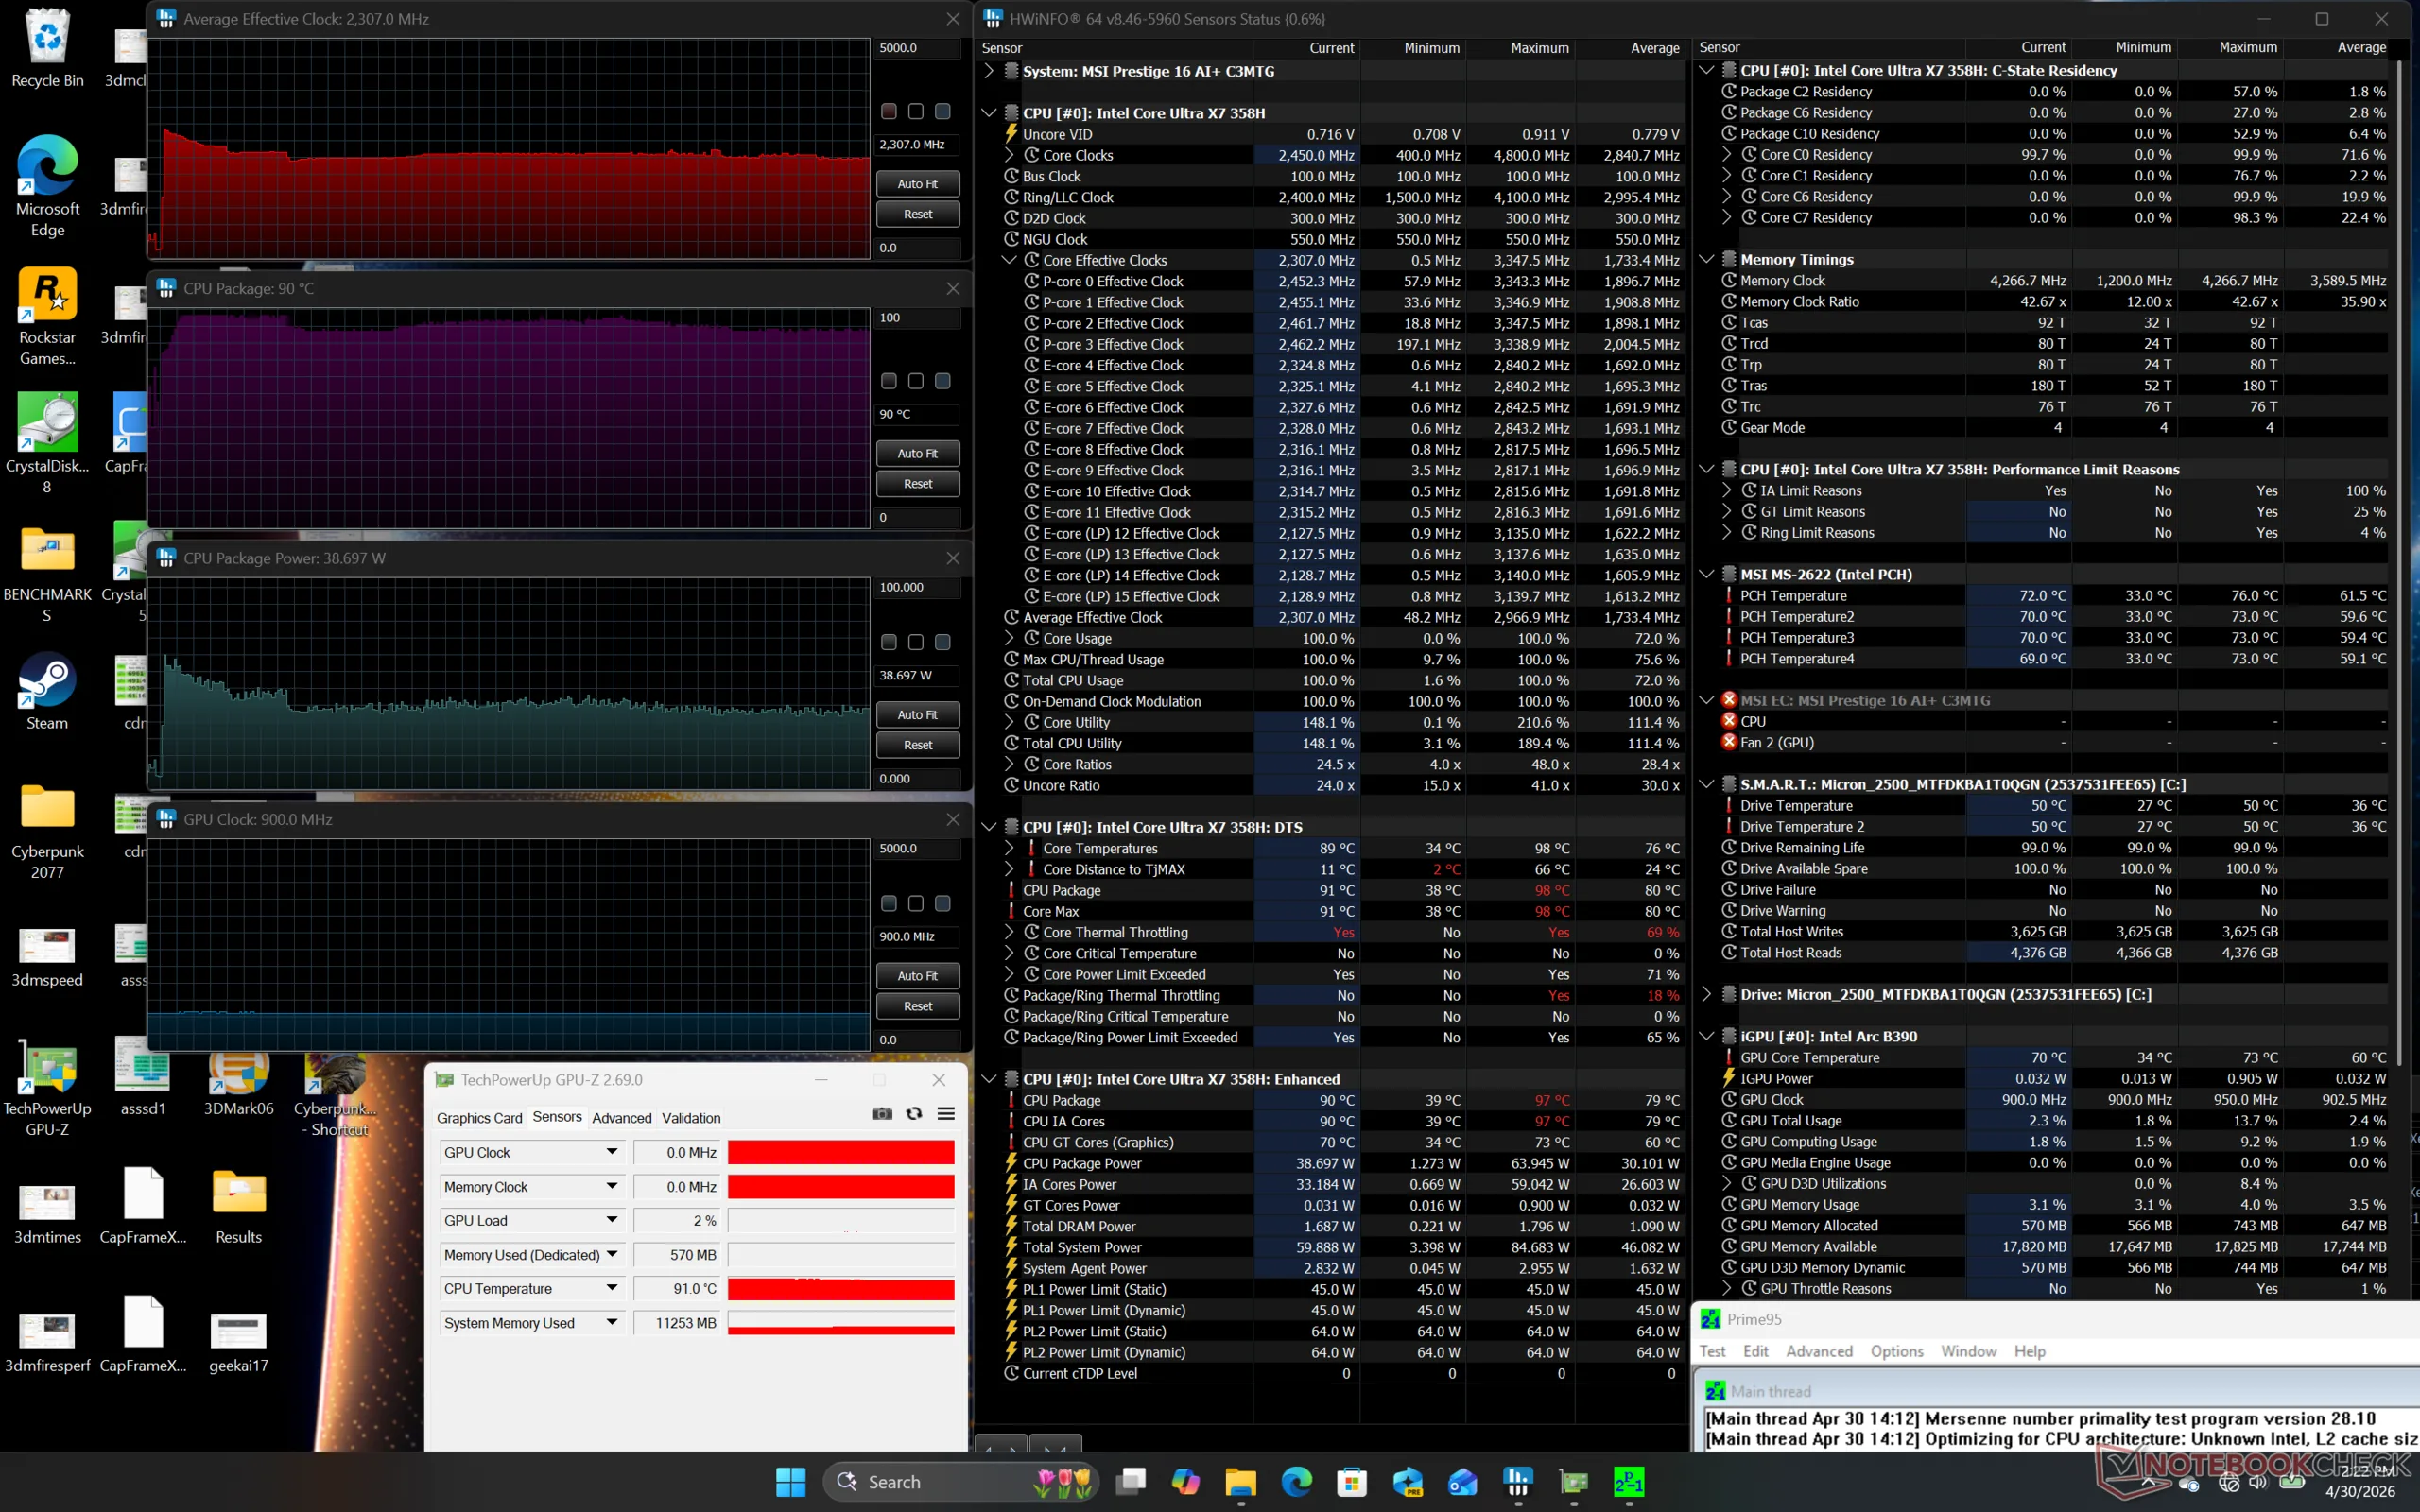
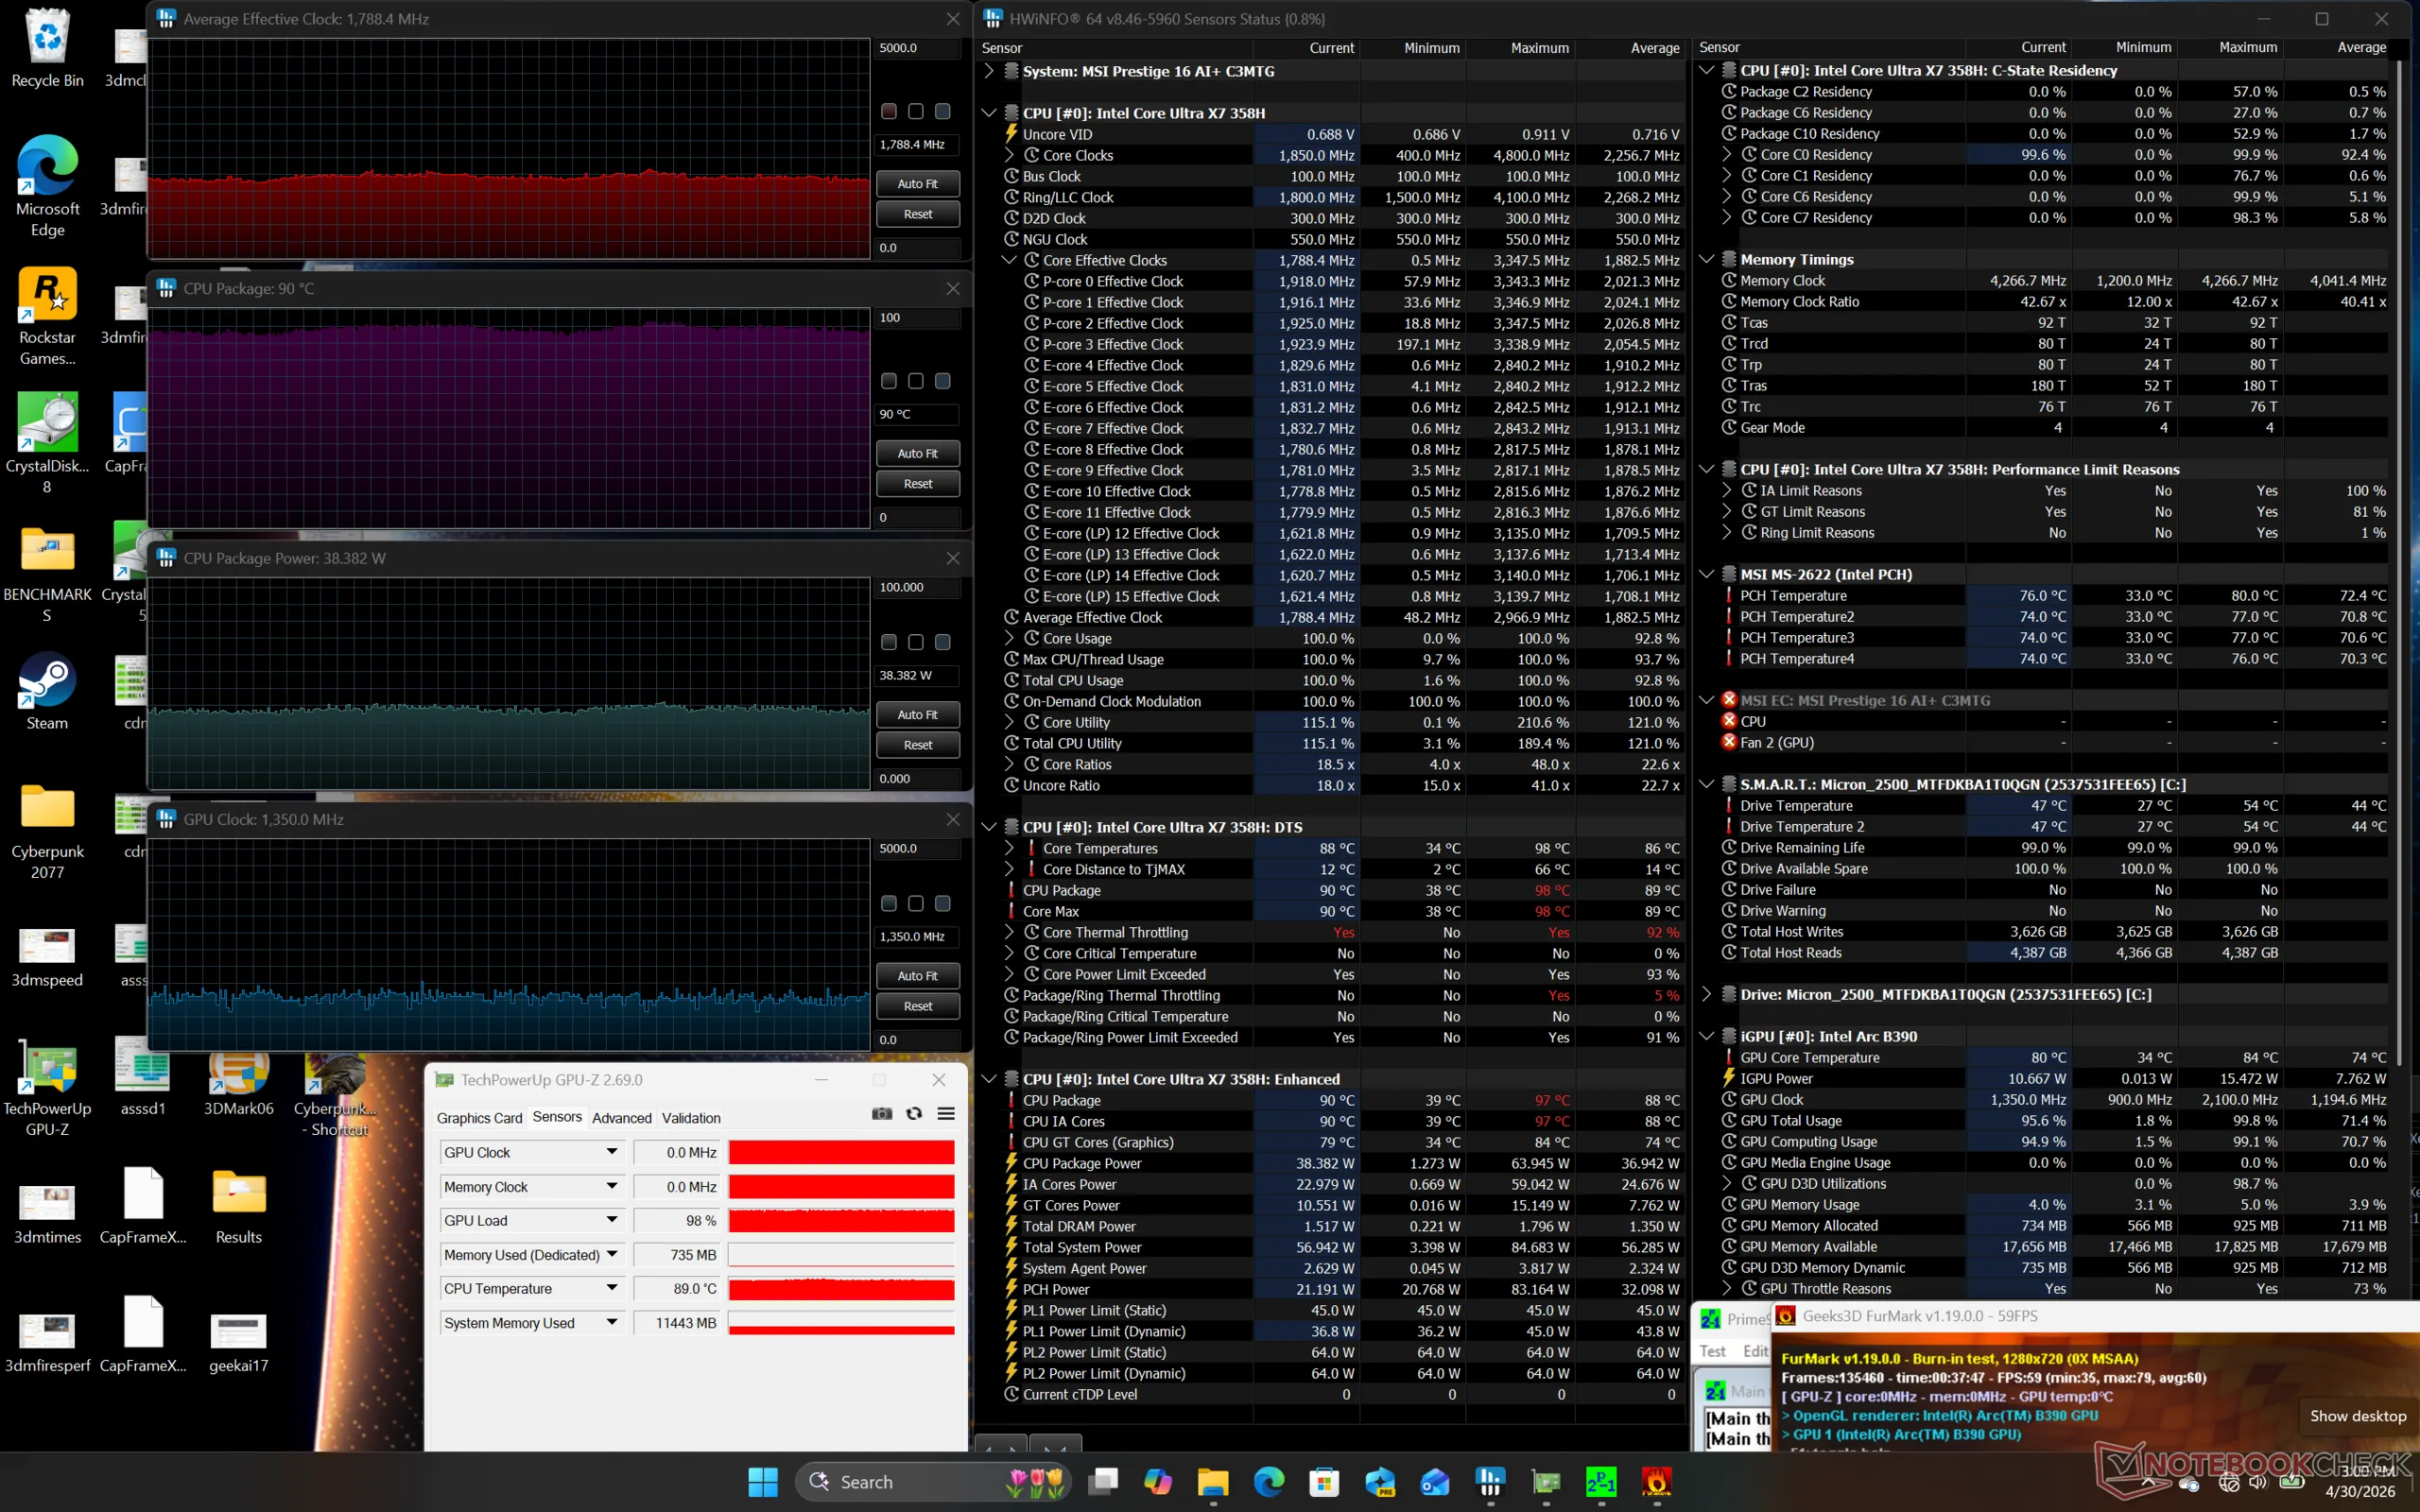
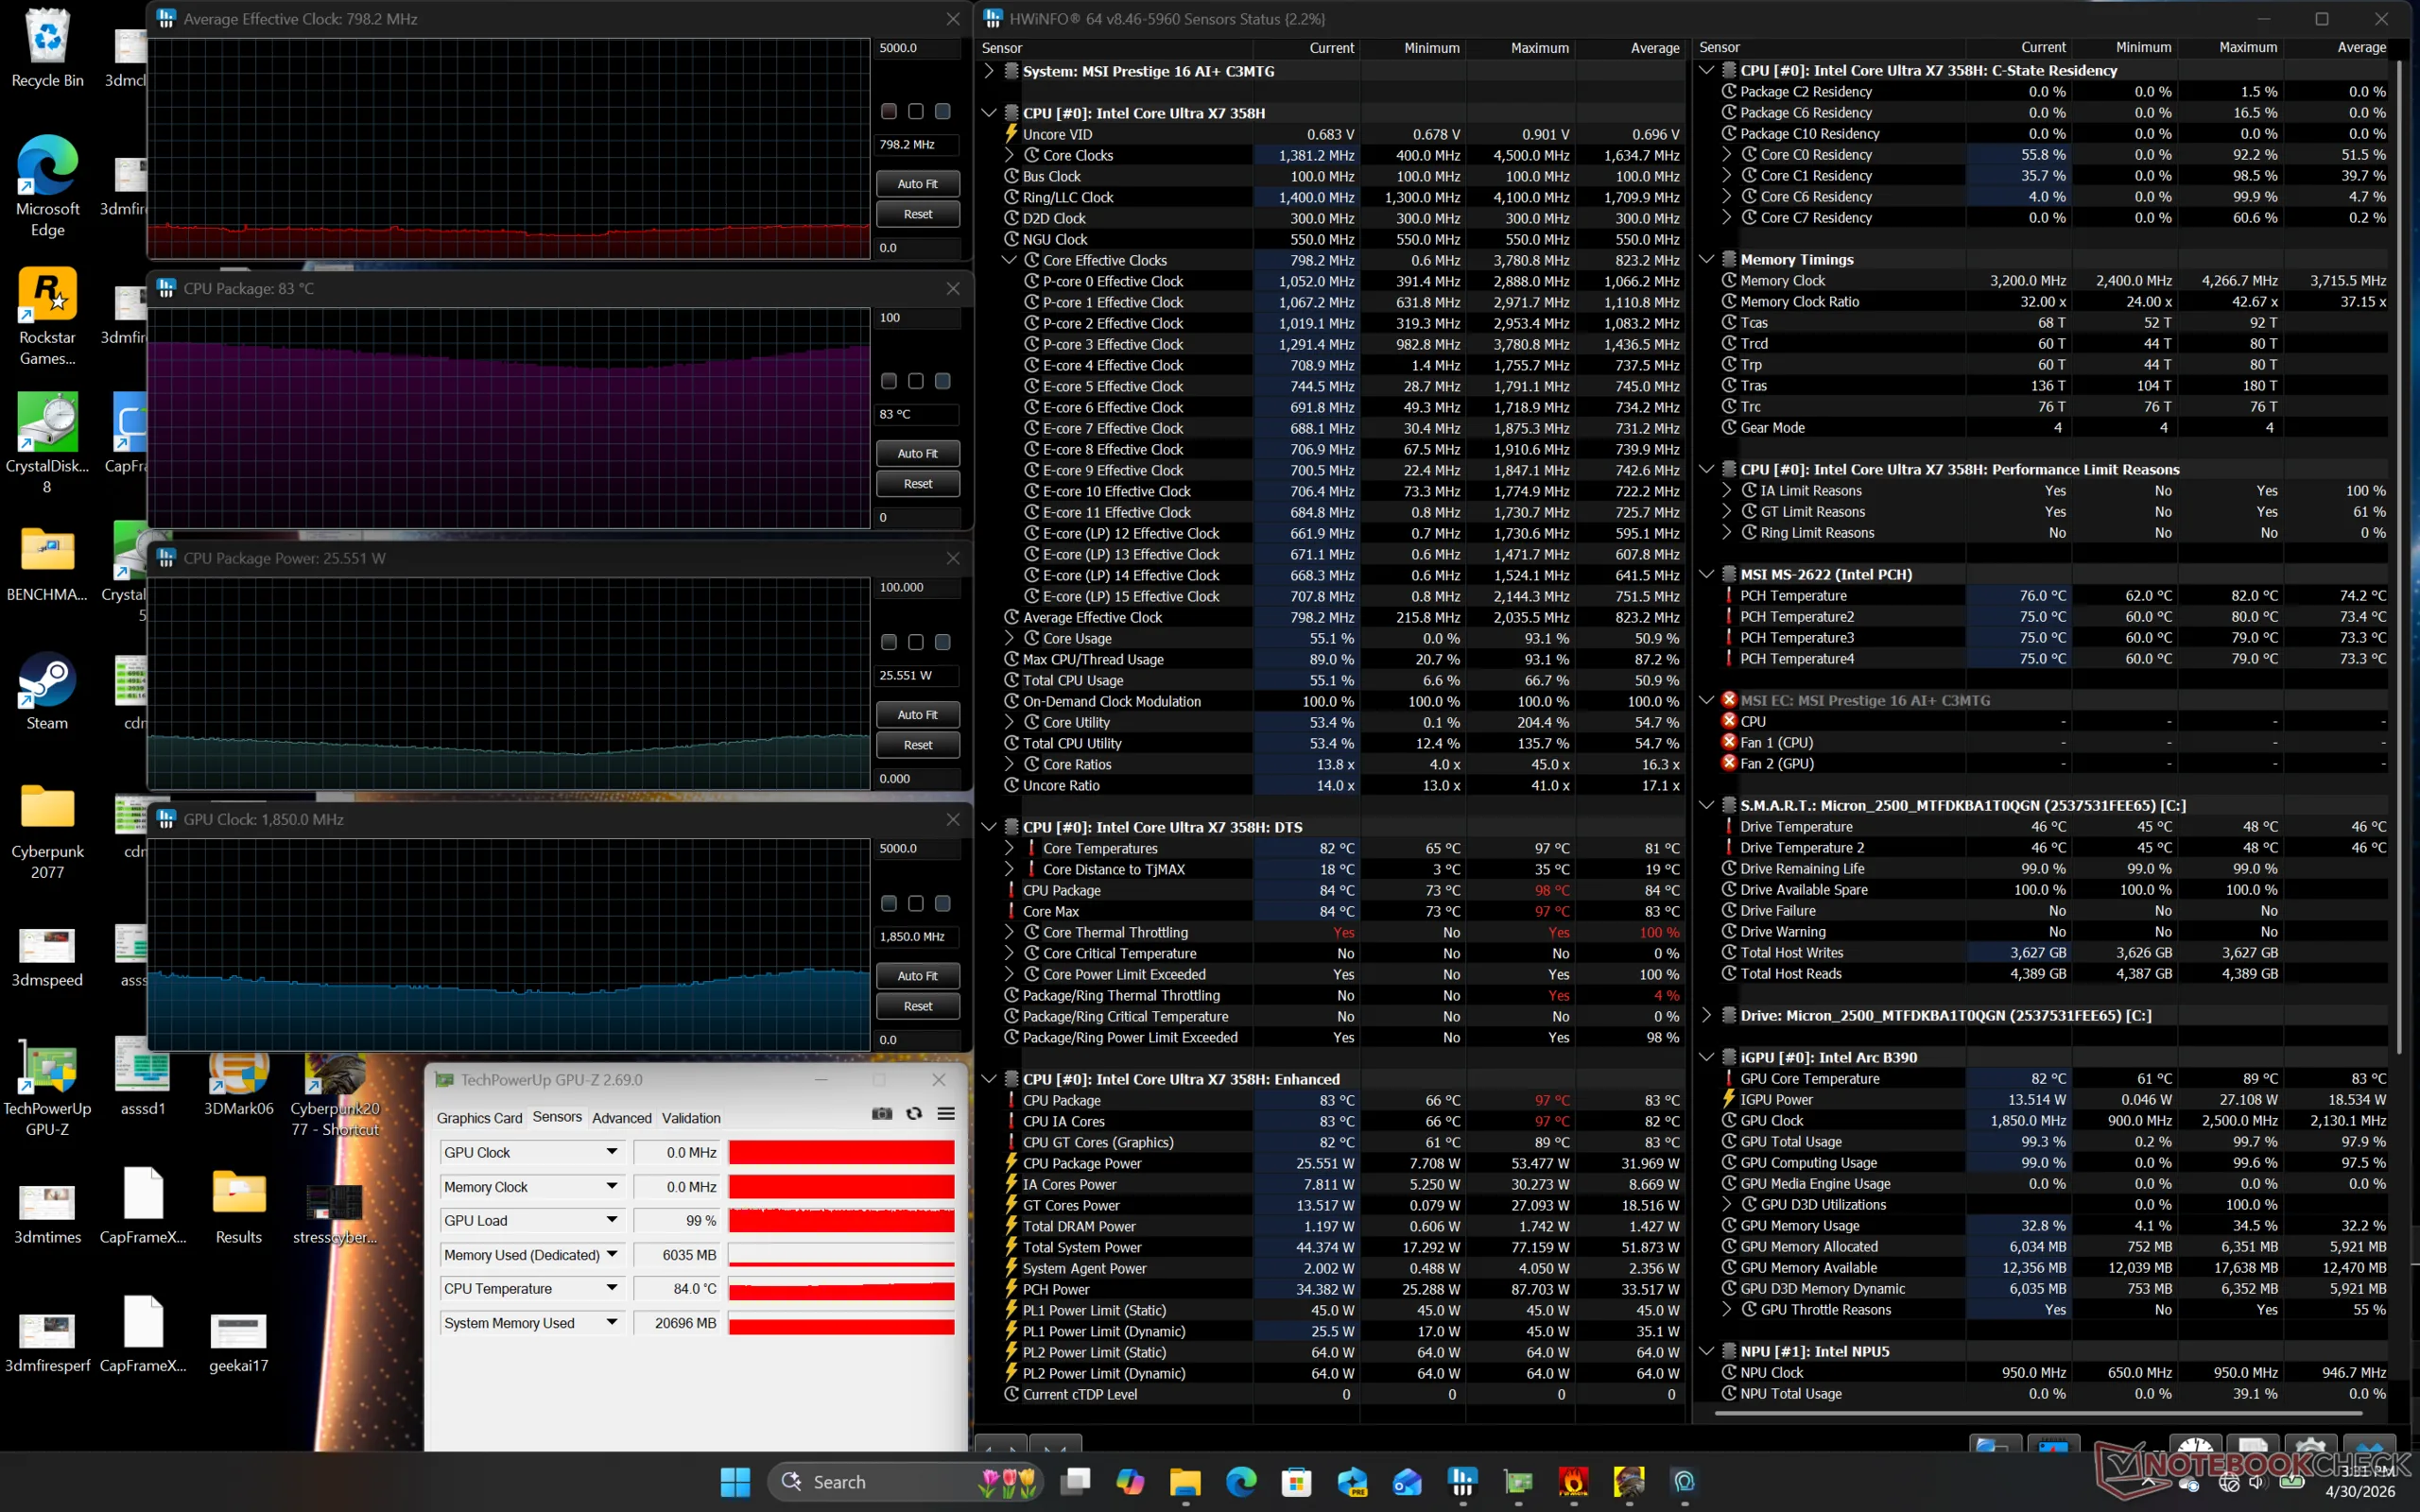
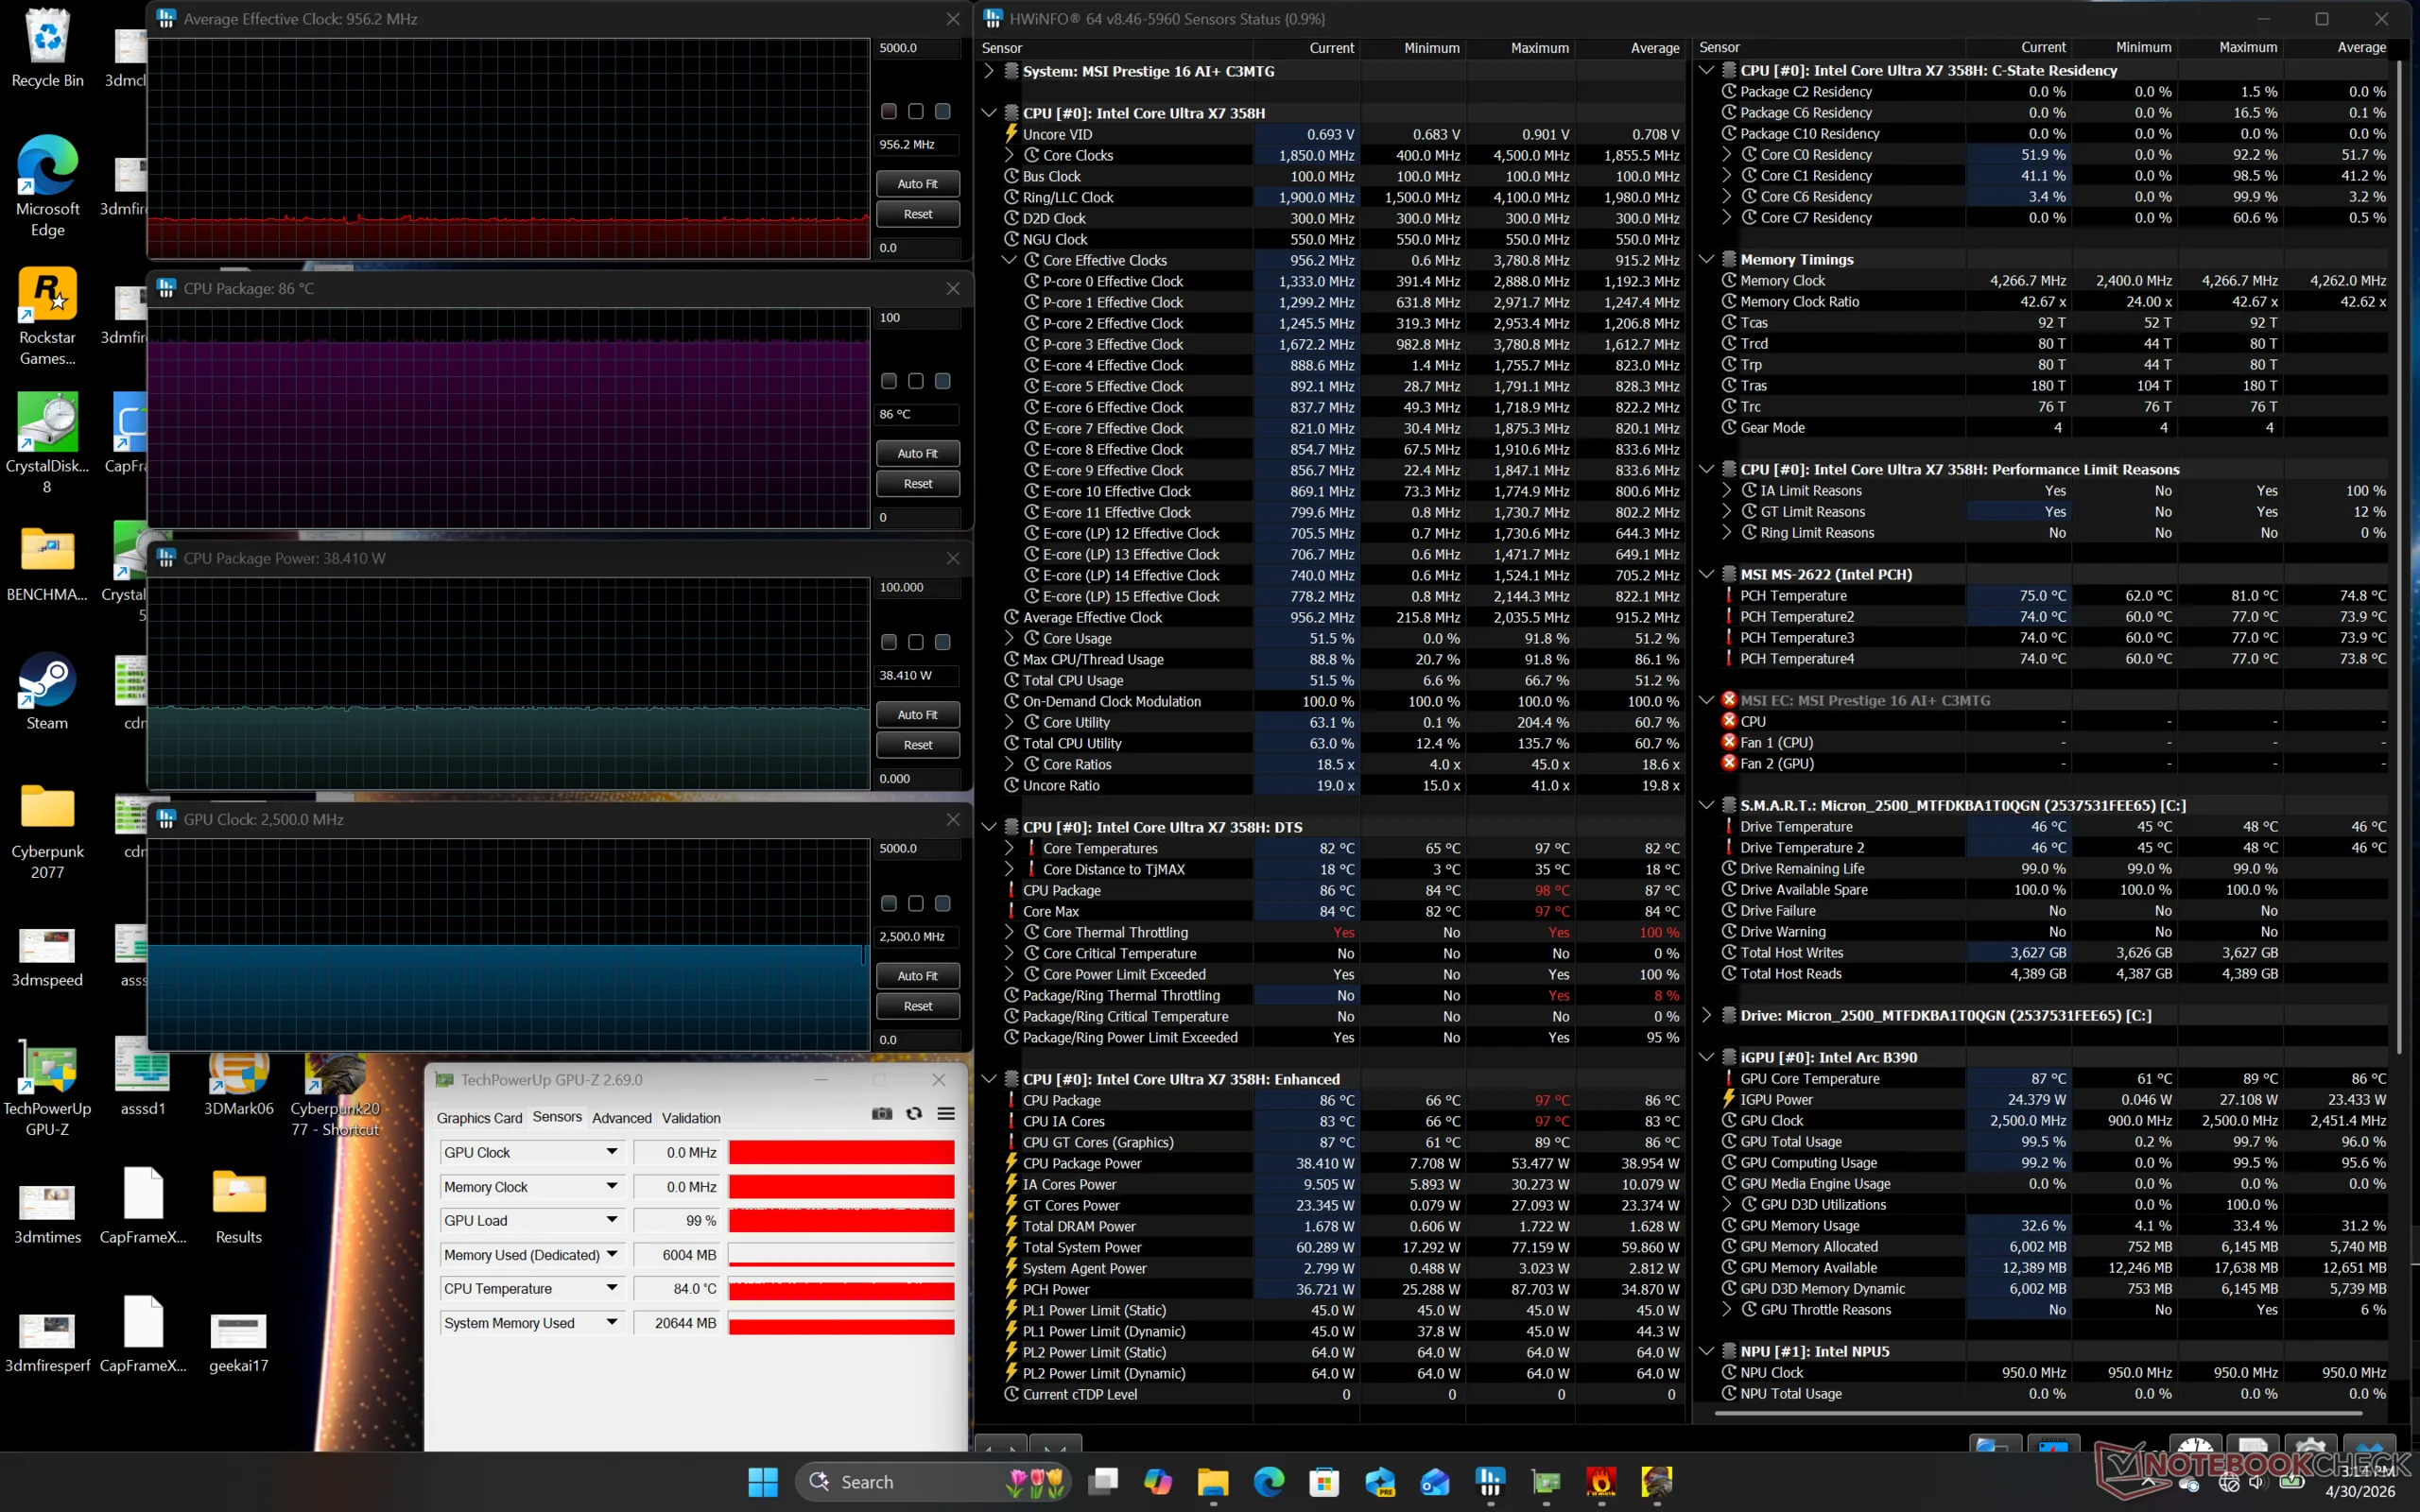
| CPU 平均时钟 (GHz) | GPU 时钟 (MHz) | CPU 平均温度 (°C) | |
| 系统闲置 | -- | 900 | 41 |
| Prime95 压力 | 2.3 | -- | 90 |
| Prime95 + FurMark Stress | 1.8 | ~1350 | 90 |
| 赛博朋克 2077》压力(平衡模式) | 0.8 | 1220 - 1850 | 83 |
| 赛博朋克 2077》压力(性能模式) | 1.0 | 2500 | 86 |
发言人
MSI Prestige 16 AI C3MTG audio analysis
(+) | speakers can play relatively loud (83.5 dB)
Bass 100 - 315 Hz
(±) | reduced bass - on average 11.2% lower than median
(±) | linearity of bass is average (9% delta to prev. frequency)
Mids 400 - 2000 Hz
(±) | higher mids - on average 5.9% higher than median
(+) | mids are linear (4% delta to prev. frequency)
Highs 2 - 16 kHz
(+) | balanced highs - only 3.3% away from median
(+) | highs are linear (5.4% delta to prev. frequency)
Overall 100 - 16.000 Hz
(+) | overall sound is linear (12.8% difference to median)
Compared to same class
» 24% of all tested devices in this class were better, 5% similar, 71% worse
» The best had a delta of 5%, average was 17%, worst was 45%
Compared to all devices tested
» 12% of all tested devices were better, 3% similar, 85% worse
» The best had a delta of 4%, average was 24%, worst was 134%
Apple MacBook Pro 16 2021 M1 Pro audio analysis
(+) | speakers can play relatively loud (84.7 dB)
Bass 100 - 315 Hz
(+) | good bass - only 3.8% away from median
(+) | bass is linear (5.2% delta to prev. frequency)
Mids 400 - 2000 Hz
(+) | balanced mids - only 1.3% away from median
(+) | mids are linear (2.1% delta to prev. frequency)
Highs 2 - 16 kHz
(+) | balanced highs - only 1.9% away from median
(+) | highs are linear (2.7% delta to prev. frequency)
Overall 100 - 16.000 Hz
(+) | overall sound is linear (4.6% difference to median)
Compared to same class
» 0% of all tested devices in this class were better, 0% similar, 100% worse
» The best had a delta of 5%, average was 17%, worst was 45%
Compared to all devices tested
» 0% of all tested devices were better, 0% similar, 100% worse
» The best had a delta of 4%, average was 24%, worst was 134%
能源管理
耗电量
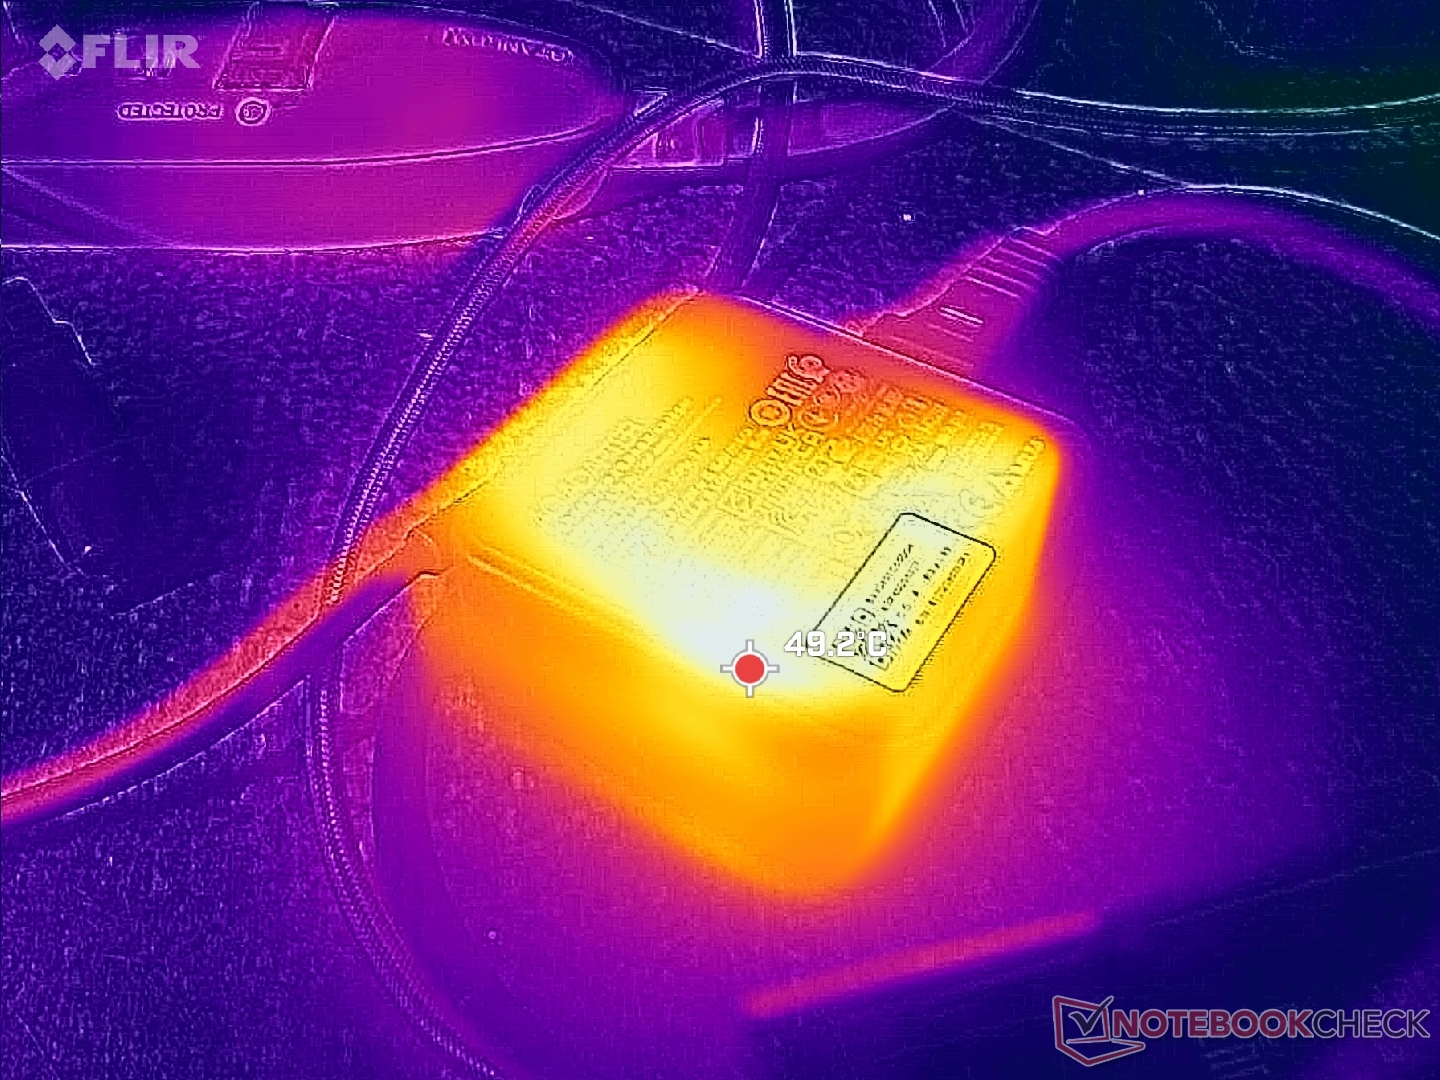
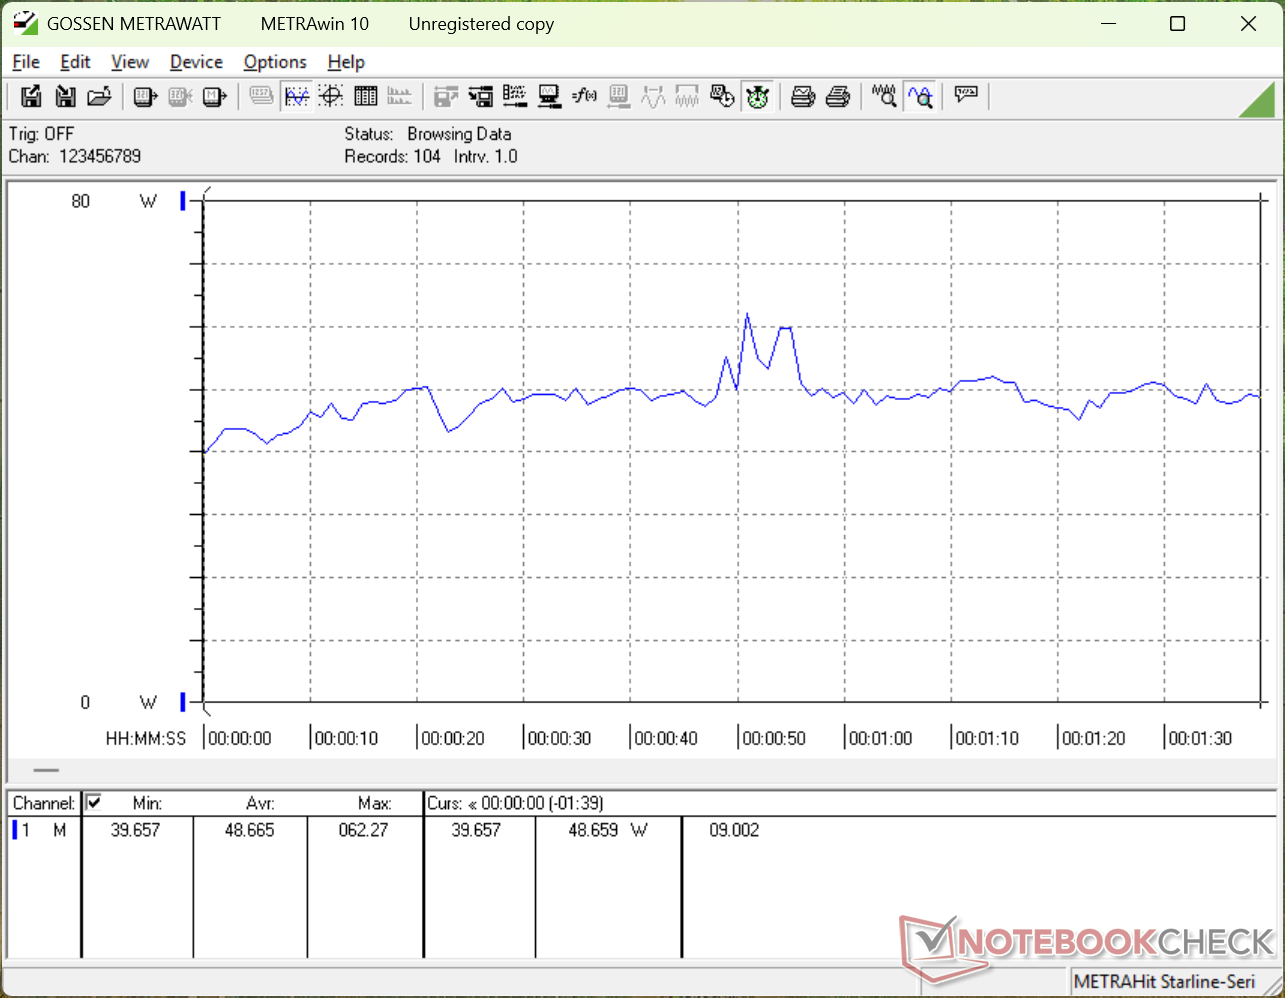
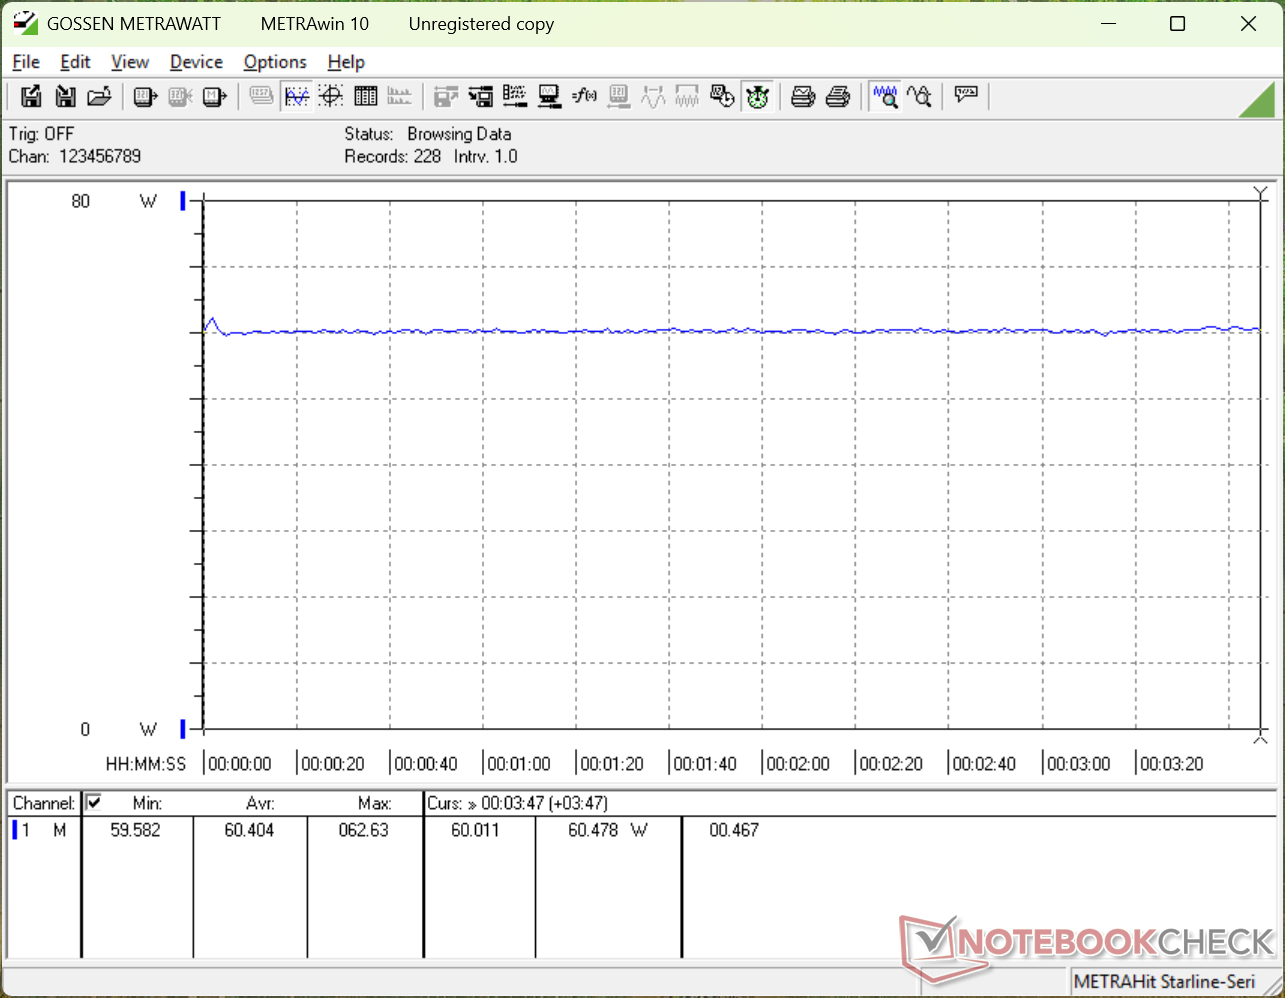
该机型配备了一个较小的 65 W USB-C AC 适配器(约 6.5 x 6.5 x 3.0 厘米),而不是 2025 机型配备的 100 W 适配器。尽管如此,如下图所示,两款产品的总体功耗相当接近。在图形处理方面,新型 Prestige 16 的每瓦性能大幅提升,速度提高了 80%,而功耗几乎相同。
使用较小的 65 瓦交流适配器的后果是 Turbo Boost 性能降低。例如,在运行 Prime95 时,2025 Prestige 16 的暂时耗电量高达 103 W,而我们的 2026 Prestige 16 仅为 66 W。因此,在 Turbo Boost 最有效的压力测试开始后的一分钟左右,旧机型的 CPU 原始性能会略高于新机型。
请注意,如果同时运行高负载,充电速度会明显减慢,因为 65 W AC 适配器的功率可能不足;仅运行《赛博朋克 2077》一项的耗电量就已超过 60 W。
| Off / Standby | |
| Idle | |
| Load |
|
Key:
min: | |
| MSI Prestige 16 AI C3MTG Ultra X7 358H, Arc B390 Panther Lake iGPU, Micron 2500 1TB MTFDKBA1T0QGN, OLED, 2880x1800, 16" | MSI Prestige 16 AI Evo B2HMG Ultra 9 285H, Arc 140T, Micron 2500 1TB MTFDKBA1T0QGN, IPS, 2560x1600, 16" | Dell XPS 16 Core Ultra X7 358H Ultra X7 358H, Arc B390 Panther Lake iGPU, , OLED, 3200x2000, 16" | Asus ZenBook S16 UM5606GA Ryzen AI 9 465, Radeon 880M, SanDisk PC SN5100S, OLED, 2880x1800, 16" | Lenovo ThinkBook 16 G7+ AMD Ryzen AI 9 365, Radeon 880M, Samsung PM9C1a MZAL81T0HDLB, IPS, 3200x2000, 16" | HP Envy x360 2-in-1 16-ad0097nr R7 8840HS, Radeon 780M, KIOXIA BG5 KBG50ZNV1T02, OLED, 2880x1800, 16" | |
|---|---|---|---|---|---|---|
| Power Consumption | -22% | -0% | -2% | -55% | -10% | |
| Idle Minimum * (Watt) | 3.3 | 4.4 -33% | 4 -21% | 3.7 -12% | 6.4 -94% | 5 -52% |
| Idle Average * (Watt) | 7.4 | 9.2 -24% | 4.4 41% | 7.4 -0% | 14.1 -91% | 6.2 16% |
| Idle Maximum * (Watt) | 13 | 9.5 27% | 10.2 22% | 9.5 27% | 14.3 -10% | 14.7 -13% |
| Load Average * (Watt) | 48.7 | 66.9 -37% | 44.2 9% | 57.9 -19% | 83.4 -71% | 49.9 -2% |
| Cyberpunk 2077 ultra * (Watt) | 60.4 | 68.8 -14% | 62.6 -4% | 58.5 3% | 79.8 -32% | |
| Cyberpunk 2077 ultra external monitor * (Watt) | 60.4 | 67.4 -12% | 62.4 -3% | 57 6% | 77.5 -28% | |
| Load Maximum * (Watt) | 64.8 | 102.9 -59% | 94.6 -46% | 76.9 -19% | 102.9 -59% | 65 -0% |
| Witcher 3 ultra * (Watt) | 54.5 |
* ... smaller is better
功耗 赛博朋克/压力测试
外部显示器功耗
电池寿命
今年的运行时间较短,部分原因是电池组较小(99 Wh 对 81 Wh),以及从 IPS 转向 OLED。不过,系统其他方面的增效略微抵消了这一影响。我们能够记录的 WLAN 运行时间接近 13 小时,比 2025 年的机型缩短了 3 到 4 小时。
| MSI Prestige 16 AI C3MTG Ultra X7 358H, Arc B390 Panther Lake iGPU, 81 Wh | MSI Prestige 16 AI Evo B2HMG Ultra 9 285H, Arc 140T, 99.9 Wh | Dell XPS 16 Core Ultra X7 358H Ultra X7 358H, Arc B390 Panther Lake iGPU, 70 Wh | Asus ZenBook S16 UM5606GA Ryzen AI 9 465, Radeon 880M, 83 Wh | Lenovo ThinkBook 16 G7+ AMD Ryzen AI 9 365, Radeon 880M, 85 Wh | HP Envy x360 2-in-1 16-ad0097nr R7 8840HS, Radeon 780M, 68 Wh | |
|---|---|---|---|---|---|---|
| Battery runtime | 31% | -18% | 4% | -14% | -39% | |
| WiFi v1.3 (h) | 12.6 | 16.5 31% | 10.3 -18% | 13.1 4% | 10.8 -14% | 7.7 -39% |
| H.264 (h) | 20.8 | 13.9 | ||||
| Load (h) | 2.4 | 1.9 | ||||
| Reader / Idle (h) | 15.6 |
笔记本检查评级
2026 微星 Prestige 16 是搭载英特尔 Panther Lake 处理器的最薄专业笔记本电脑之一,但在网络摄像头分辨率、显示屏选项和集成端口方面,竞争对手的竞争非常激烈。
MSI Prestige 16 AI C3MTG
- 05/07/2026 v8
Allen Ngo
 Total Sustainability Score:
 潜在竞争对手比较
Image | Model / Review | Price | Weight | Height | Display |
|---|---|---|---|---|---|
1. 86.4%  | MSI Prestige 16 AI C3MTG Intel Core Ultra X7 358H ⎘ Intel Arc B390 12 Xe3 Panther Lake iGPU ⎘ 32 GB Memory, 1024 GB SSD | Amazon: List Price: 2100 USD | 1.6 kg | 13.9 mm | 16.00" 2880x1800 212 PPI OLED |
2. 82.8%  | MSI Prestige 16 AI Evo B2HMG Intel Core Ultra 9 285H ⎘ Intel Arc Graphics 140T ⎘ 32 GB Memory, 1024 GB SSD | Amazon: 1. $1,479.00 MSI Prestige 16 AI+ Evo 16" ... 2. $1,397.87 MSI Prestige 14 AI+ EVO PRE1... 3. $1,199.00 msi Prestige A16 AI+ (2025) ... | 1.6 kg | 18.95 mm | 16.00" 2560x1600 189 PPI IPS |
3. 87.2%  | Dell XPS 16 Core Ultra X7 358H Intel Core Ultra X7 358H ⎘ Intel Arc B390 12 Xe3 Panther Lake iGPU ⎘ 32 GB Memory | Amazon: 1. $2,599.00 Dell Premium 16 (XPS 16 2025... 2. $1,977.99 Dell Premium 16 (Previously ... 3. $2,599.00 Dell Premium 16 (XPS 16 2025... List Price: 2350 USD | 1.7 kg | 14.62 mm | 16.00" 3200x2000 236 PPI OLED |
4. 86.6%  | Asus ZenBook S16 UM5606GA AMD Ryzen AI 9 465 ⎘ AMD Radeon 880M ⎘ 32 GB Memory, 1024 GB SSD | Amazon: List Price: 1799€ | 1.5 kg | 12.9 mm | 16.00" 2880x1800 212 PPI OLED |
5. 86.6%  | Lenovo ThinkBook 16 G7+ AMD AMD Ryzen AI 9 365 ⎘ AMD Radeon 880M ⎘ 32 GB Memory, 1024 GB SSD | Amazon: 1. $999.95 Lenovo ThinkBook 16 G7 Busin... 2. $1,199.99 Lenovo ThinkBook 16 G7 Busin... 3. $979.95 Oemgenuine Lenovo ThinkBook ... List Price: 1399€ | 1.9 kg | 16.9 mm | 16.00" 3200x2000 236 PPI IPS |
6. 87.2% v7 (old)  | HP Envy x360 2-in-1 16-ad0097nr AMD Ryzen 7 8840HS ⎘ AMD Radeon 780M ⎘ 16 GB Memory, 1024 GB SSD | Amazon: 1. $149.99 Replacement for HP Envy x360... 2. $256.99 Replacement for HP Envy x360... 3. $695.00 HP Envy x360 2-in-1 Laptop, ... List Price: 1300 USD | 1.8 kg | 18.3 mm | 16.00" 2880x1800 212 PPI OLED |
Transparency
The selection of devices to be reviewed is made by our editorial team. The test sample was provided to the author as a loan by the manufacturer or retailer for the purpose of this review. The lender had no influence on this review, nor did the manufacturer receive a copy of this review before publication. There was no obligation to publish this review. As an independent media company, Notebookcheck is not subjected to the authority of manufacturers, retailers or publishers.
This is how Notebookcheck is testing
Every year, Notebookcheck independently reviews hundreds of laptops and smartphones using standardized procedures to ensure that all results are comparable. We have continuously developed our test methods for around 20 years and set industry standards in the process. In our test labs, high-quality measuring equipment is utilized by experienced technicians and editors. These tests involve a multi-stage validation process. Our complex rating system is based on hundreds of well-founded measurements and benchmarks, which maintains objectivity. Further information on our test methods can be found here.

