结论--该系列迄今为止最大的变化
2022 XPS 修订版 2022 XPS 改版是该系列的一个转折点,其许多新功能在 XPS 的老粉丝中反响不一。2026 年的最新改版解决了许多批评意见,在人体工程学方面进行了重大改进。机身更加坚固,触摸式功能键不见了,点击板更容易看清,网络摄像头的像素也超过了 1080p,可与大多数竞争对手媲美。维修稍显困难,但考虑到新设计给人的感觉更加坚固,10 瓦扬声器的音量也更大,这只是一个很小的代价。
性能方面,Panther Lake 为 XPS 14 系列创造了奇迹,因为它与GeForce RTX 4050 相当接近,却没有额外的重量或功耗要求。即使是游戏玩家也会发现,对于集成 GPU 而言,Arc B390 非常强大。
XPS 14 还有几个方面可以改进。例如,相机快门仍然缺失,MicroSD 插槽的缺失也是内容创作者的一大心病。Turbo Boost 性能和 HDR 支持都弱于竞争对手,如 华硕 ExpertBook Ultra而相对较软的按键反馈对于打字员来说可能并不理想。同样令人遗憾的是,新款 XPS 14 的屏幕尺寸比旧款小了半英寸,从而减少了屏幕空间。
尽管如此,新款 XPS 14 仍是迄今为止该系列最精致的改款产品,比起 2025 戴尔 14 Premium.
Pros
Cons
- $1,795.49Dell XPS 14 Premium Laptop DA14250-14.5-inch Touch 3.2K OLED 48-120Hz Display, Intel Core Ultra 7 255H, Intel Arc Graphics, 32GB Memory, 1TB SSD, Backlit English Keyboard with Fingerprint Reader
- $2,049.00Dell XPS 14 9440 14.5" Notebook - Full HD Plus - Intel Core Ultra 7 155H - Intel Evo Platform - 16 GB - 512 GB SSD - English Keyboard - Platinum
- $2,099.99Dell XPS 16 9640 Laptop | Intel Core Ultra 7 155H CPU | NVIDIA GeForce RTX 4050 | 16.3" WUXGA (1920 x 1200) | 16GB DDR5 RAM | 2TB PCIe SSD + 512GB External | Win 11 | Backlit Keyboard
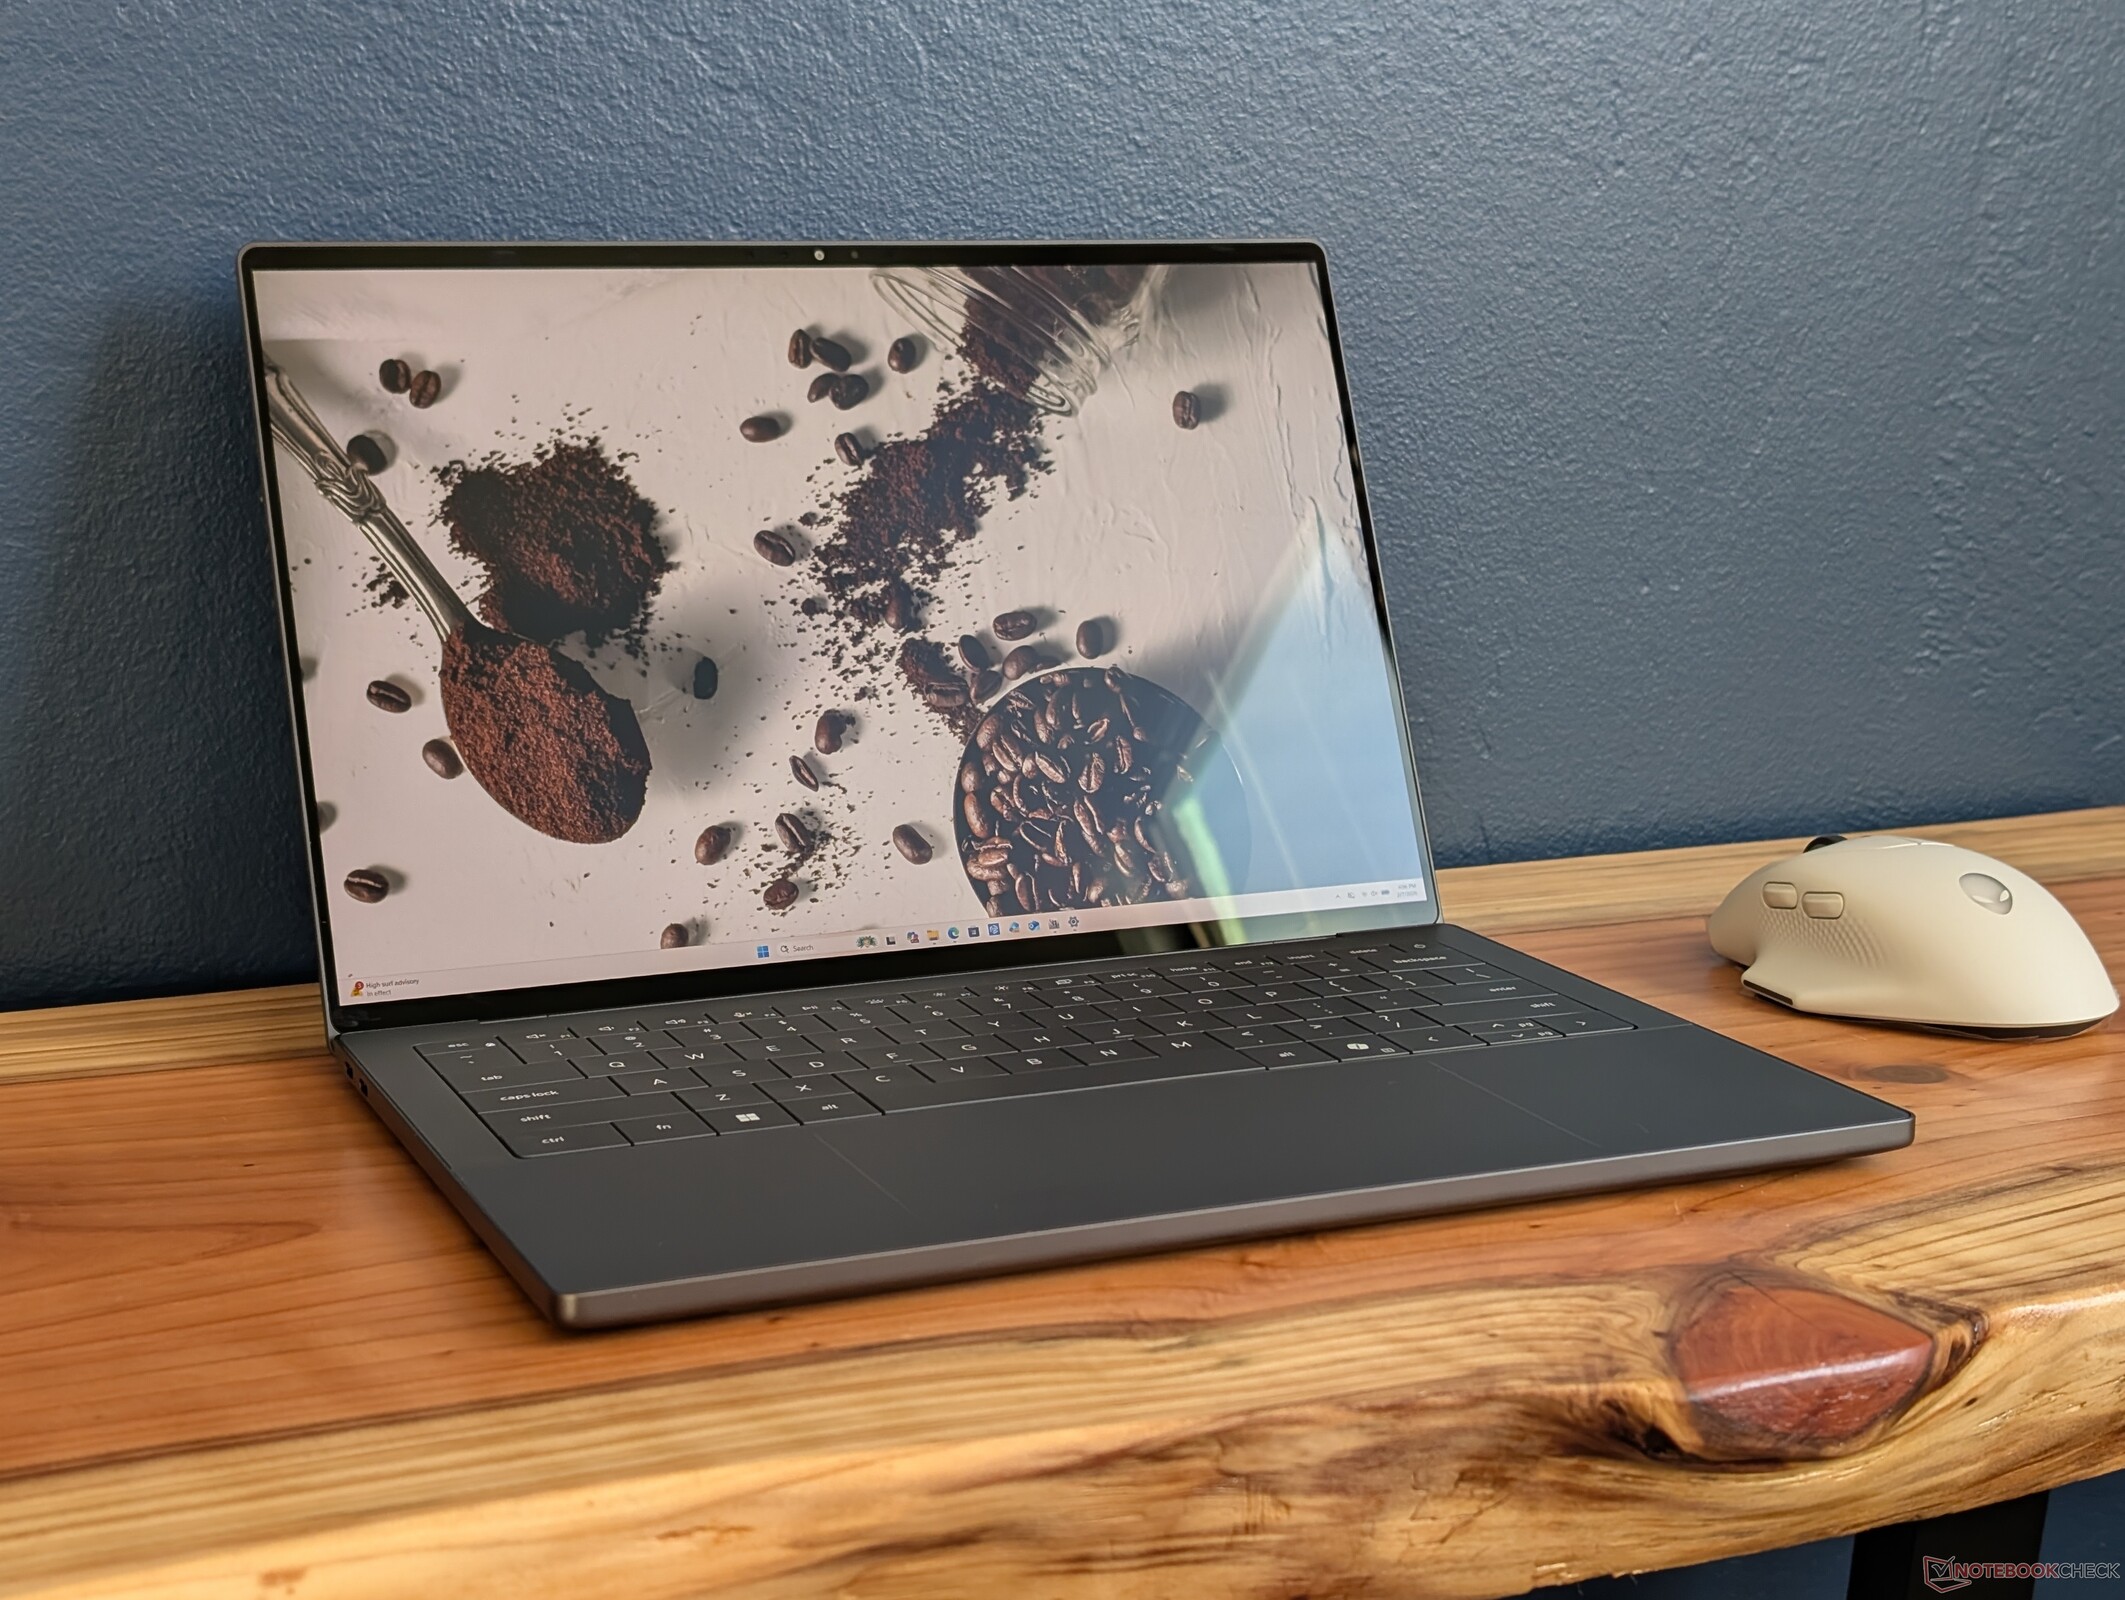
在经历了令人困惑的一年之后 的一年之后之后,戴尔又推出了搭载英特尔最新 Panther Lake CPU 平台的 2026 XPS 14。与上一代 2025 戴尔 14 Premium 或 2024 XPS 14 系列相比,该机型采用了全新的外观设计。
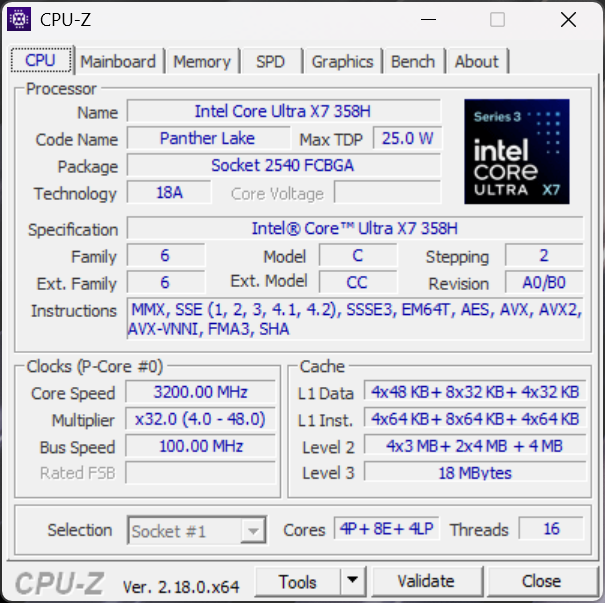
我们的测试机为中间配置,配备酷睿 Ultra X7 358H CPU 和 2.8K OLED 触摸屏,售价约为 2200 美元。较低端的 SKU 配备 Core Ultra 5 325 和 2K 非触摸显示屏,而最高端的 SKU 包括 Core Ultra X9 388H。
XPS 14 的替代产品包括其他消费级超薄笔记本,如 华硕 ExpertBook Ultra, 惠普 EliteBook X G1i 14 AI, 联想 Yoga Pro 7 14IAH10.
更多戴尔评论:
规格
案例 - 适当的演变
重新设计的机身已在我们最初的预览视频中进行了广泛介绍,如下所示。从外观上看,最显著的变化是前缘和侧缘变得更加平整,不再是锥形。因此,前缘与后缘一样厚,这与 MacBook Pro或 雷蛇刀锋的设计.
从美学角度看,系统上的标识也发生了变化;2025 型号上的 "Dell "和 "XPS "标识分别位于顶盖和底盖上,而现在 "Dell "标识位于底盖上,"XPS "标识位于顶盖上。
与之前的设计相比,2026 机型同时变得更薄、更轻,但仍能给人一种更致密、更坚硬的感觉,尤其是正面边缘。不过,这种差异在很大程度上是因为屏幕尺寸从 14.5 英寸变为 14.0 英寸。尽管如此,它还是比竞争对手如 惠普 EliteBook X G1i 14或 专家本 Ultra各重 200 至 300 克。


连接性
去年设计的三个 USB-C Thunderbolt 4 端口又回来了。遗憾的是,由于读卡器被取消,SD 卡用户的体验大打折扣。


交流

网络摄像头
尽管戴尔 14 Premium 的像素从 200 万大幅提升到 800 万,但仍然没有物理隐私快门。


维护
与之前的设计相比,维修程序有所不同,难度也略有增加。卸下底部的四颗 T5 螺钉后,必须用锋利的边缘小心地将键盘面板与底座分离,以露出主板组件。
如需官方维修指南,请访问。.

可持续性
该系统的顶盖和底盖使用了 75% 的可回收铝,电池使用了 50% 的可回收钴,键帽使用了 90% 的可回收钢,OLED 触摸屏 SKU 使用了 10% 的可回收玻璃,PCB 部分使用了 100% 的可回收铜。包装本身完全可回收,不含塑料。
配件和保修
包装盒内除了交流适配器和文件外,没有其他附件。如果在美国购买,制造商通常提供一年有限保修。
输入设备 - 不再有触摸按钮!
键盘
新款 XPS 14 解决了旧款键盘和点击板设计的某些问题。最明显的是省去了顶排的触摸感应键,而采用了更传统的按键,如 戴尔 Pro 13 Premium.按键行程和反馈与去年的零格布局相似,我们发现它比戴尔 Pro 13 Premium 的按键更浅、更软。 联想 ThinkPad T14或惠普 EliteBook 14 系列的按键更浅更软。
触摸板
虽然去年设计的无缝点击板相当宽敞,但它缺乏视觉边界,因此很难知道触摸感应表面从哪里开始或从哪里结束。新款 XPS 14 沿点击板(约 15.2 x 7.5 厘米)两侧增加了细微的蚀刻,提高了可用性,同时又不会造成视觉干扰。不过,触觉反馈还可以更强、更悦耳,但至少不会像我们体验过的 ExpertBook Ultra 的触觉点击板那样过于敏感。 专家本 Ultra.


显示屏
有以下两种显示选项:
- 1920 x 1200,非触摸屏,哑光,500 nits,100% sRGB,IPS,1 - 120 Hz
- 2880 x 1800,触摸屏,亮面,500 尼特,100% DCI-P3,OLED,20 - 120 赫兹
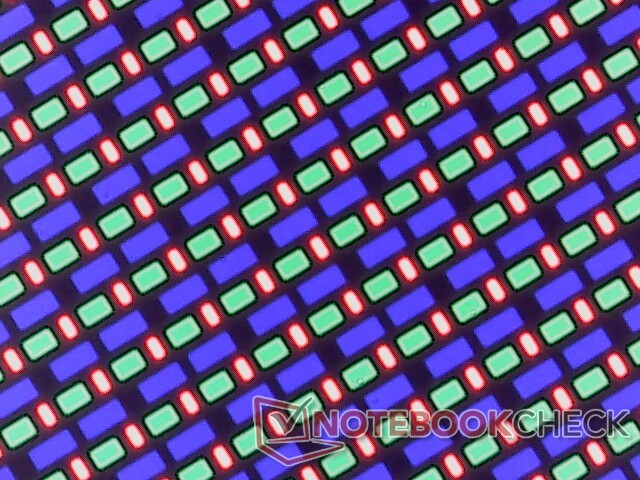
XPS 14 采用了更为传统的大猩猩玻璃 3 光面 OLED 显示屏,与 ExpertBook Ultra 的大猩猩玻璃 Victus 雾面串联 OLED 显示屏形成鲜明对比。这里的 OLED 屏幕绝对没有华硕的颗粒感,但最大 HDR 亮度最多只有一半,对 HDR 的支持较弱。
戴尔将 OLED 供应商从去年的三星换成了 2026 年改款的 LG 飞利浦。除了尺寸不同(14 英寸对 14.5 英寸),两款面板的核心属性非常相似


| |||||||||||||||||||||||||
Brightness Distribution: 96 %
Center on Battery: 393.8 cd/m²
Contrast: ∞:1 (Black: 0 cd/m²)
ΔE ColorChecker Calman: 1.27 | ∀{0.5-29.43 Ø4.73}
calibrated: 0.71
ΔE Greyscale Calman: 2 | ∀{0.09-98 Ø4.97}
98.2% AdobeRGB 1998 (Argyll 3D)
100% sRGB (Argyll 3D)
99.7% Display P3 (Argyll 3D)
Gamma: 2.19
CCT: 6379 K
| Dell XPS 14 Core Ultra X7 358H LG Philips 140WT2, OLED, 2880x1800, 14", 120 Hz | Dell 14 Premium Samsung 145FB02, OLED, 3200x2000, 14.5", 120 Hz | Dell XPS 14 2024 OLED SDC41A2, OLED, 3200x2000, 14.5", 120 Hz | Asus ExpertBook Ultra B9406CAA Samsung ATNA40LE01-0, OLED, 2880x1800, 14", 120 Hz | Lenovo Yoga Pro 7 14IAH10 LEN145WQ+, OLED, 3000x1876, 14.5", 120 Hz | HP EliteBook X G1i 14 AI IPS, 1920x1200, 14", 60 Hz | |
|---|---|---|---|---|---|---|
| Display | -4% | -4% | -5% | -1% | -20% | |
| HDR Peak Brightness (cd/m²) | 1104 | |||||
| Display P3 Coverage (%) | 99.7 | 99.3 0% | 98.5 -1% | 96.2 -4% | 99.5 0% | 69.9 -30% |
| sRGB Coverage (%) | 100 | 100 0% | 100 0% | 100 0% | 99.4 -1% | 98.4 -2% |
| AdobeRGB 1998 Coverage (%) | 98.2 | 87.2 -11% | 87.2 -11% | 86.7 -12% | 95.5 -3% | 71.6 -27% |
| Response Times | 11% | 16% | 15% | 37% | -4079% | |
| Response Time Grey 50% / Grey 80% * (ms) | 0.75 ? | 0.72 ? 4% | 0.7 ? 7% | 0.71 ? 5% | 0.63 ? 16% | 42.3 ? -5540% |
| Response Time Black / White * (ms) | 1.03 ? | 0.96 ? 7% | 0.77 ? 25% | 0.94 ? 9% | 0.54 ? 48% | 28 ? -2618% |
| PWM Frequency (Hz) | 240.62 ? | 475 | 480 | 968.8 ? | 120 ? | |
| PWM Amplitude * (%) | 29 | 23 21% | 20 31% | 15 48% | ||
| Screen | -61% | -12% | 23% | 33% | -33% | |
| Brightness middle (cd/m²) | 393.8 | 349.3 -11% | 351 -11% | 600.5 52% | 497 26% | 487.5 24% |
| Brightness (cd/m²) | 389 | 352 -10% | 353 -9% | 612 57% | 500 29% | 469 21% |
| Brightness Distribution (%) | 96 | 98 2% | 97 1% | 96 0% | 96 0% | 91 -5% |
| Black Level * (cd/m²) | 0.26 | |||||
| Colorchecker dE 2000 * | 1.27 | 3.47 -173% | 1.7 -34% | 1.18 7% | 0.7 45% | 2.37 -87% |
| Colorchecker dE 2000 max. * | 3.35 | 7.38 -120% | 2.2 34% | 3.4 -1% | 1.7 49% | 5.77 -72% |
| Colorchecker dE 2000 calibrated * | 0.71 | 1.3 -83% | 0.8 -13% | 0.73 -3% | 0.86 -21% | |
| Greyscale dE 2000 * | 2 | 2.6 -30% | 3.1 -55% | 1 50% | 1 50% | 3.8 -90% |
| Gamma | 2.19 100% | 2.22 99% | 2.12 104% | 2.27 97% | 2.22 99% | 2.14 103% |
| CCT | 6379 102% | 6758 96% | 6616 98% | 6567 99% | 6404 101% | 6540 99% |
| Contrast (:1) | 1875 | |||||
| Total Average (Program / Settings) | -18% /
-31% | 0% /
-6% | 11% /
15% | 23% /
26% | -1377% /
-704% |
* ... smaller is better


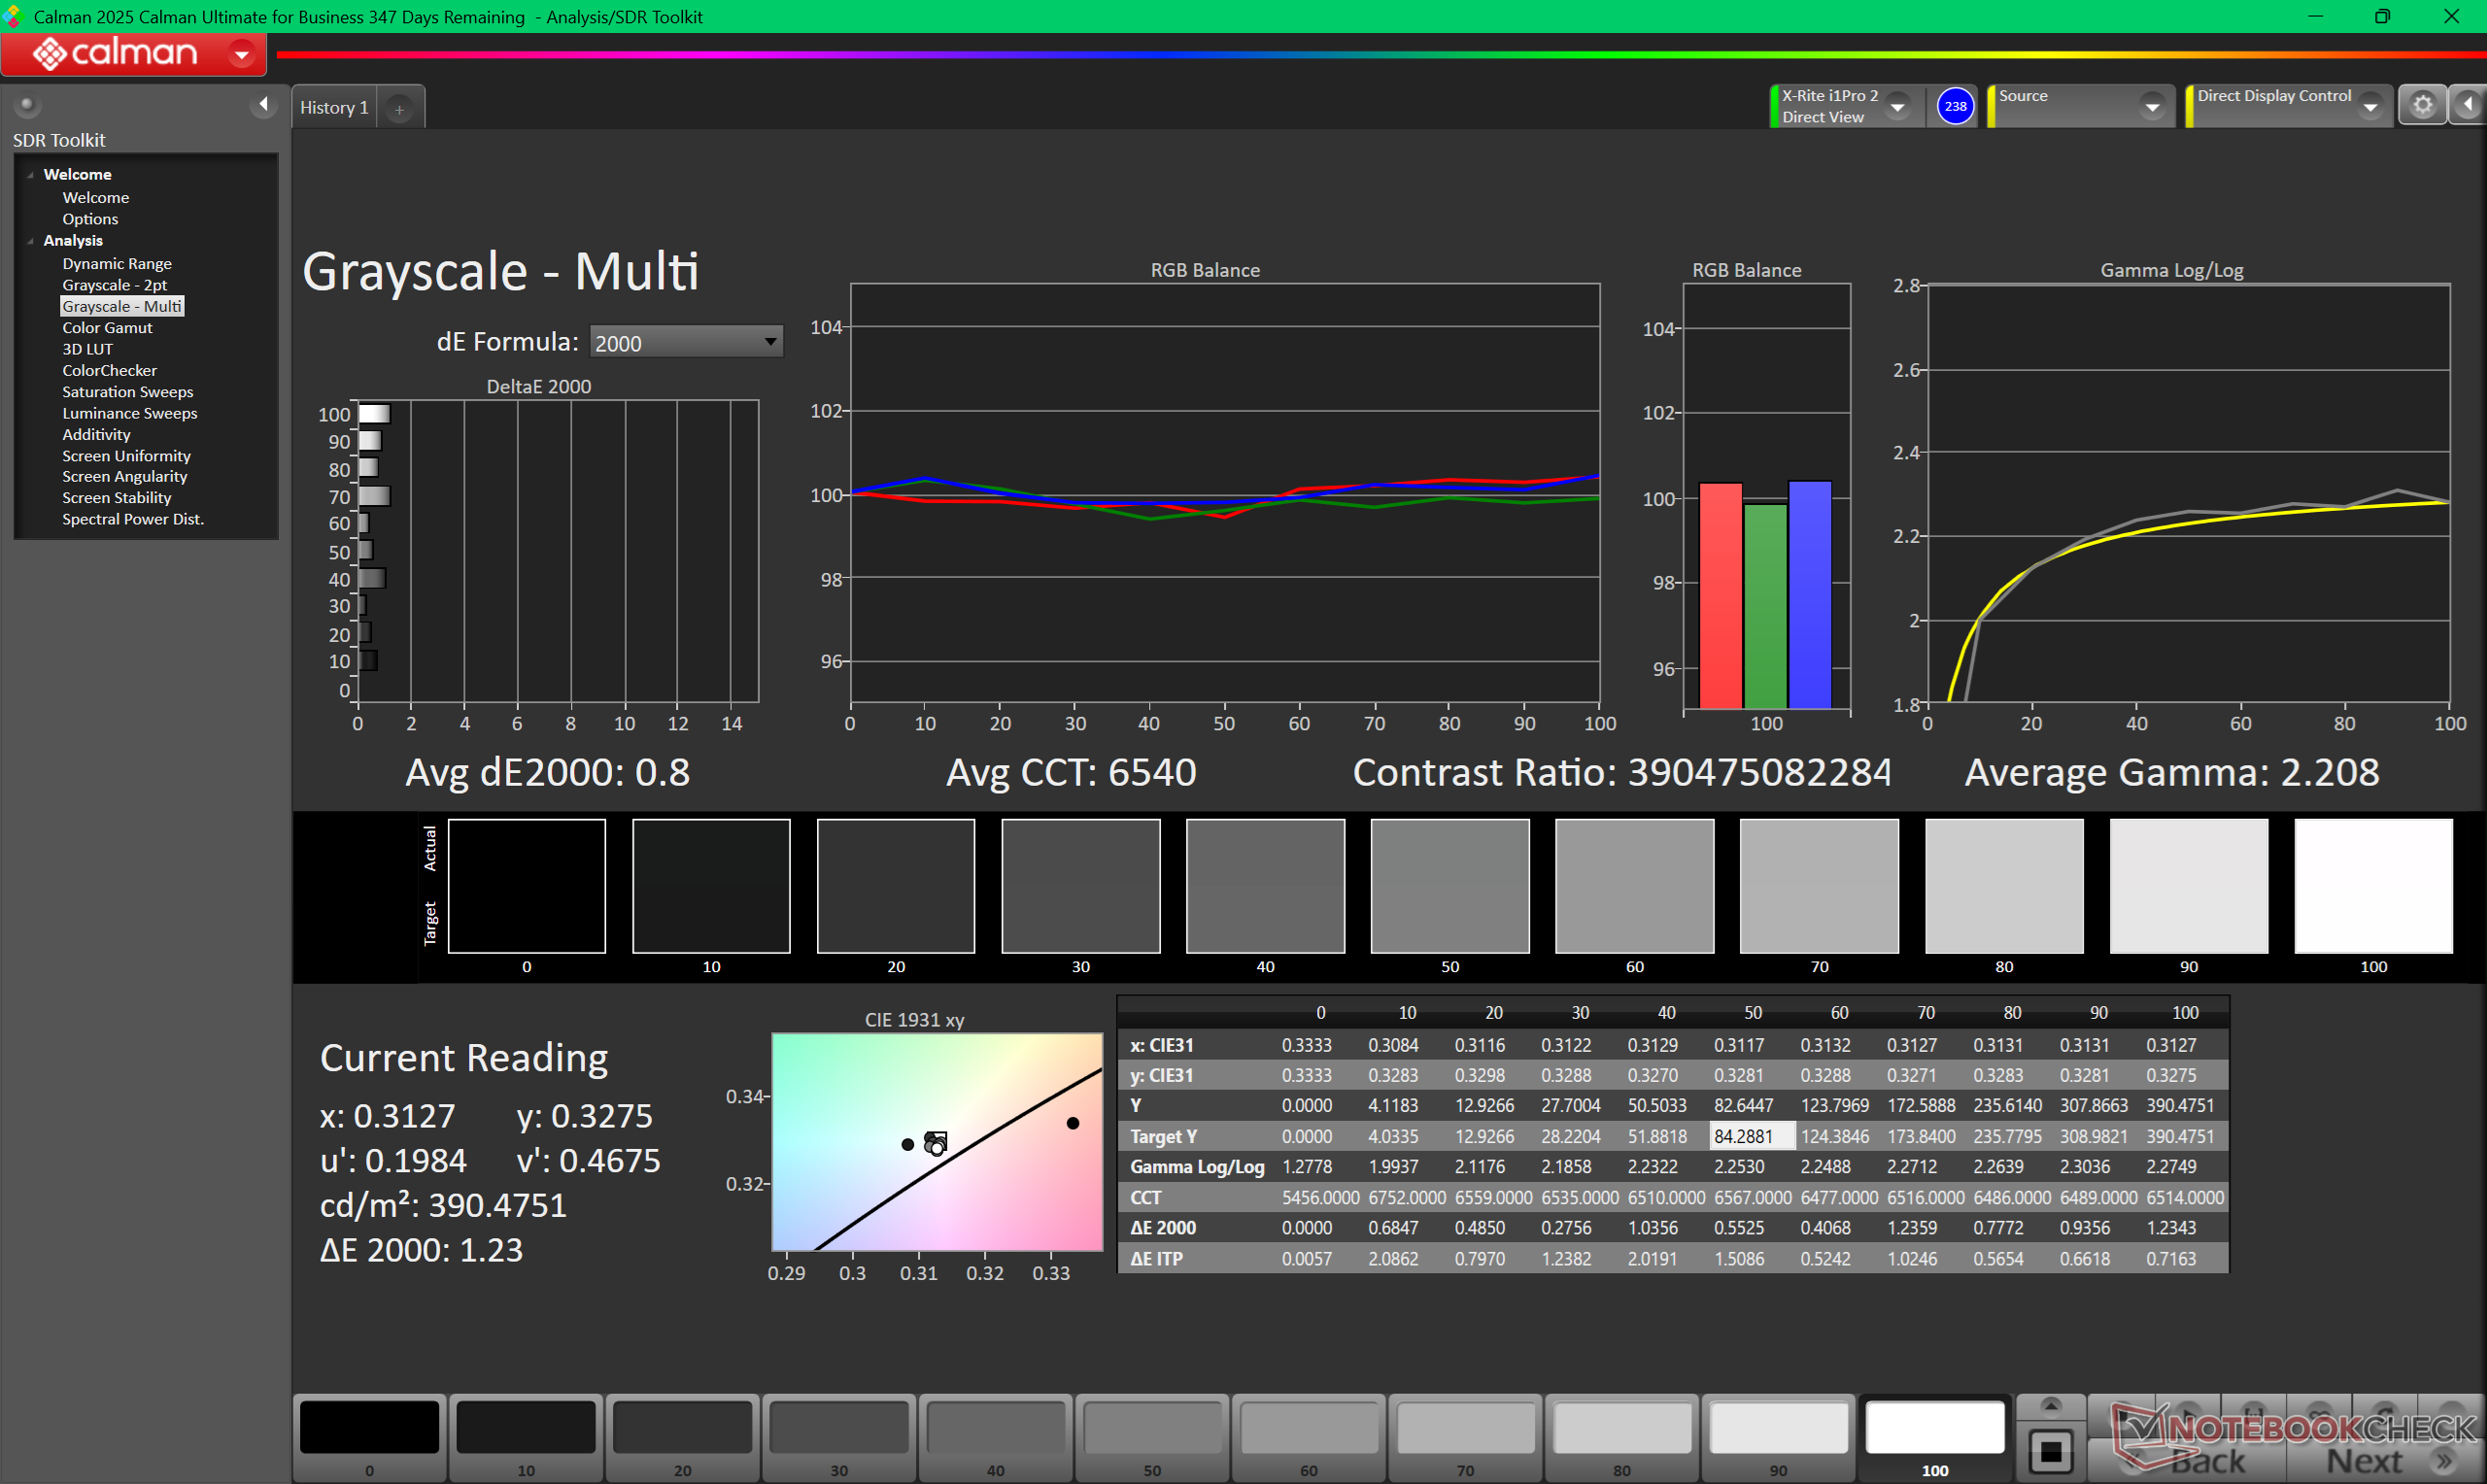
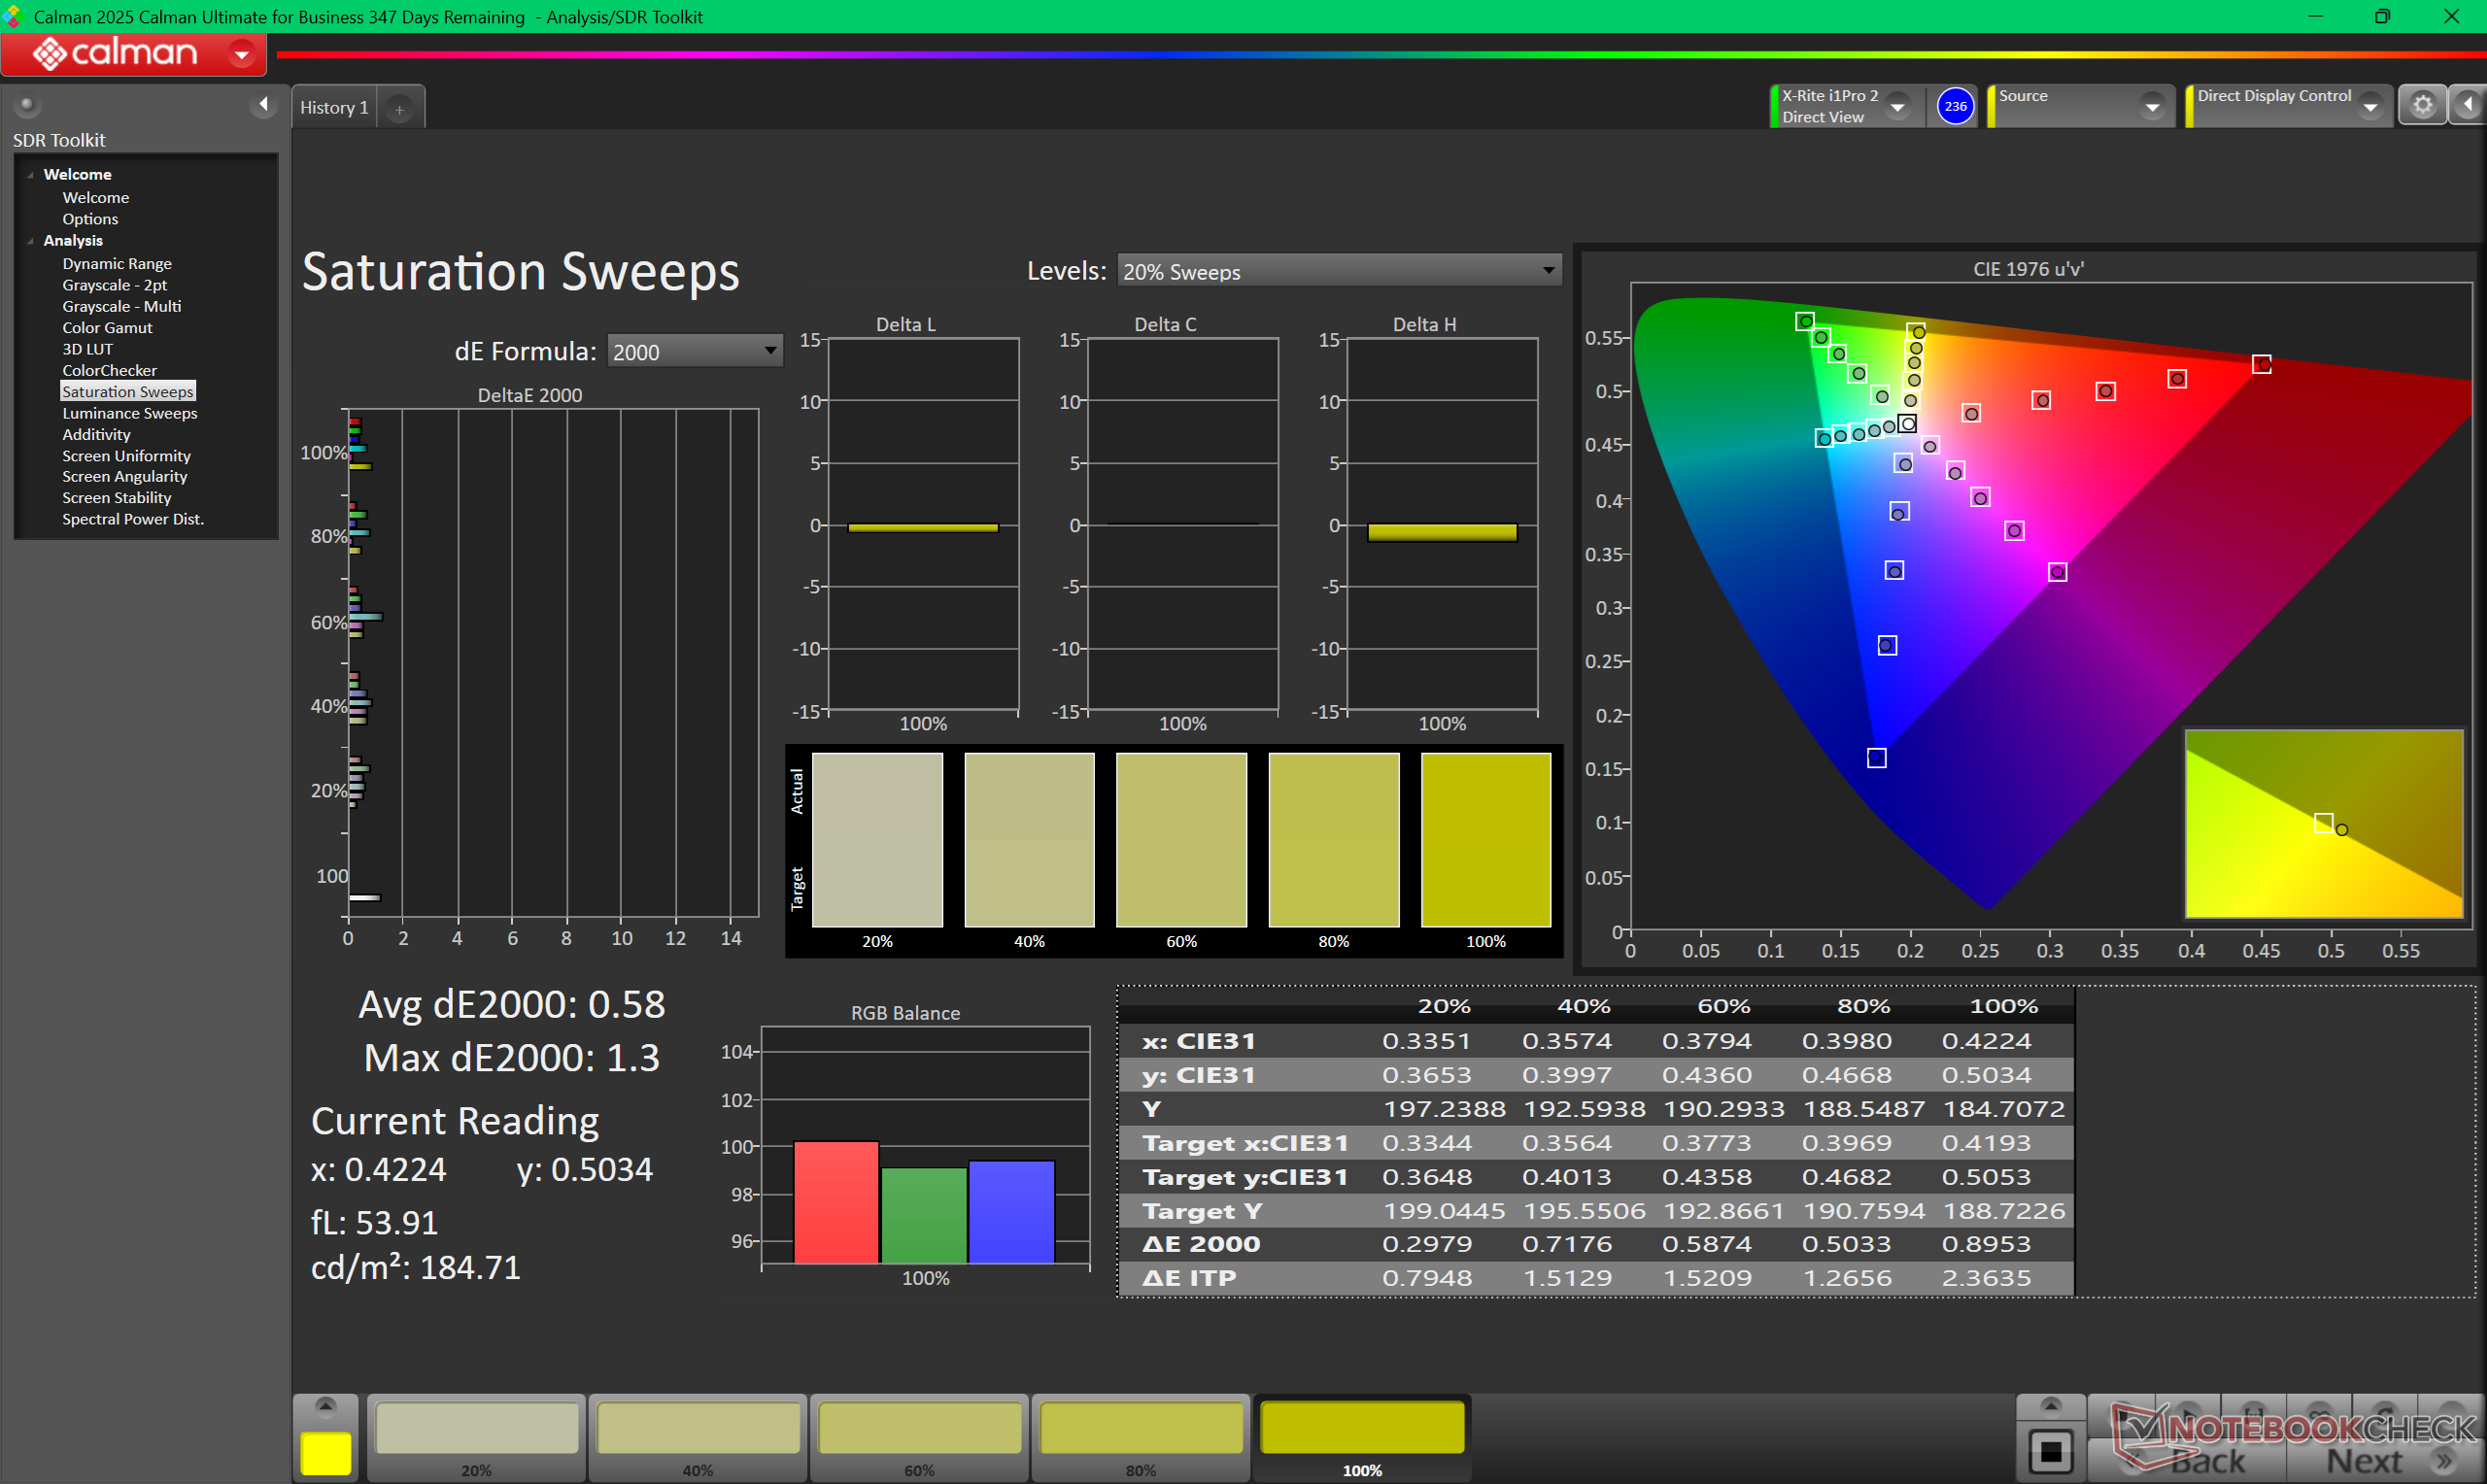
显示器出厂时校准良好,平均灰度和色彩 deltaE 值为 2 或更低。用我们的色差计进一步校准面板,只能稍微改善色彩。


Display Response Times
| ↔ Response Time Black to White | ||
|---|---|---|
| 1.03 ms ... rise ↗ and fall ↘ combined | ↗ 0.53 ms rise | 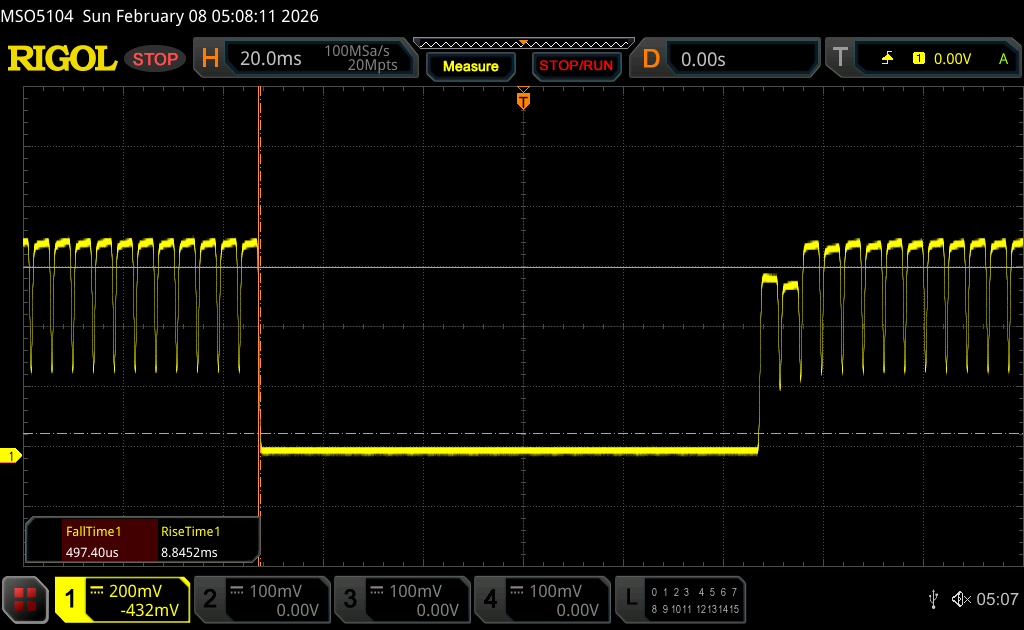 |
| ↘ 0.5 ms fall | ||
| The screen shows very fast response rates in our tests and should be very well suited for fast-paced gaming. In comparison, all tested devices range from 0.1 (minimum) to 240 (maximum) ms. » 4 % of all devices are better. This means that the measured response time is better than the average of all tested devices (19.9 ms). | ||
| ↔ Response Time 50% Grey to 80% Grey | ||
| 0.75 ms ... rise ↗ and fall ↘ combined | ↗ 0.43 ms rise | 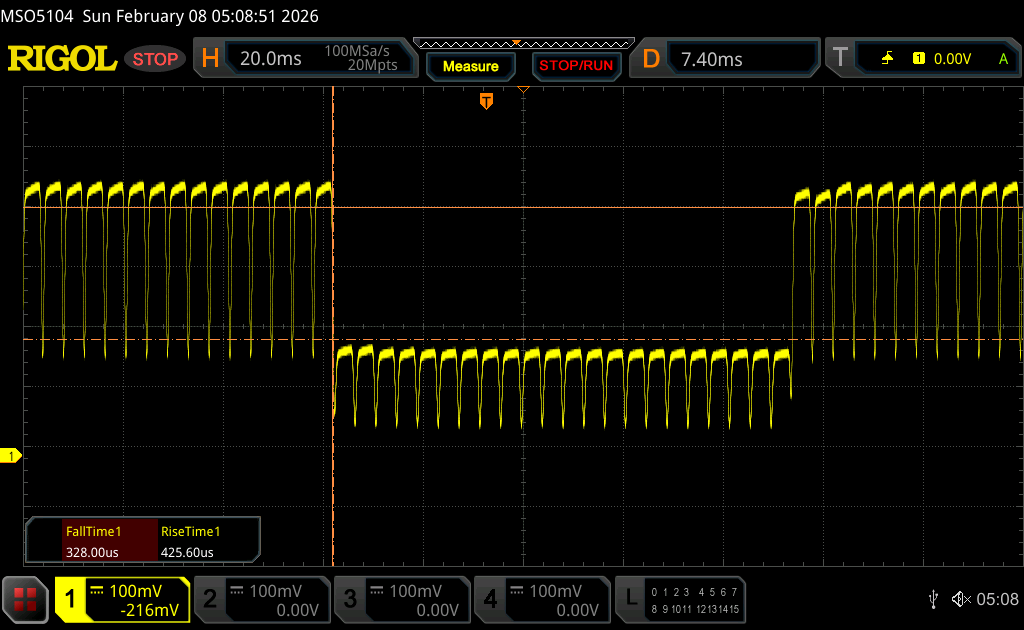 |
| ↘ 0.32 ms fall | ||
| The screen shows very fast response rates in our tests and should be very well suited for fast-paced gaming. In comparison, all tested devices range from 0.165 (minimum) to 636 (maximum) ms. » 2 % of all devices are better. This means that the measured response time is better than the average of all tested devices (31.1 ms). | ||
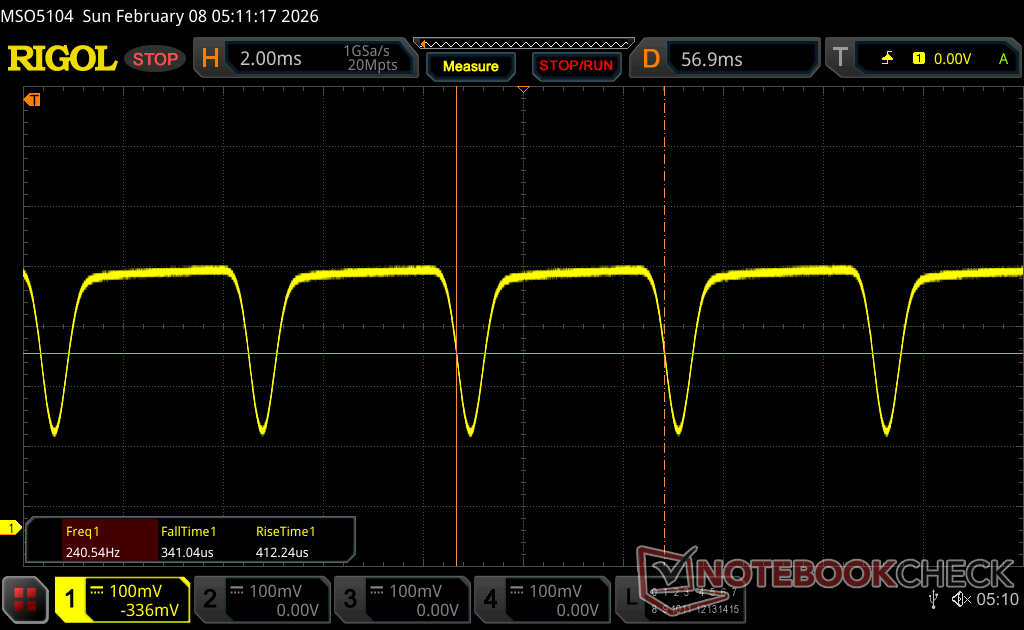
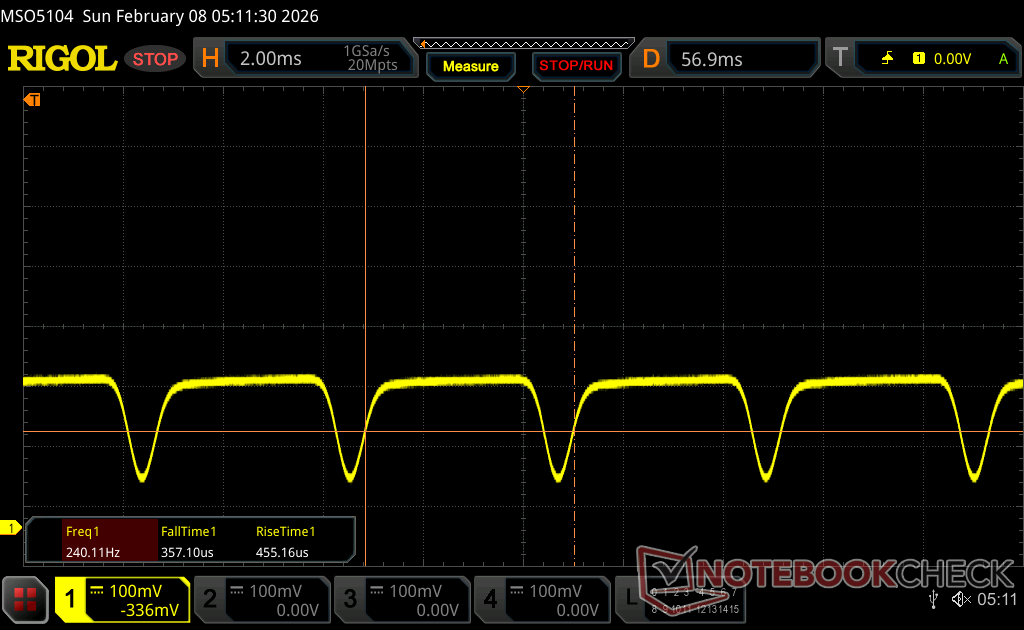
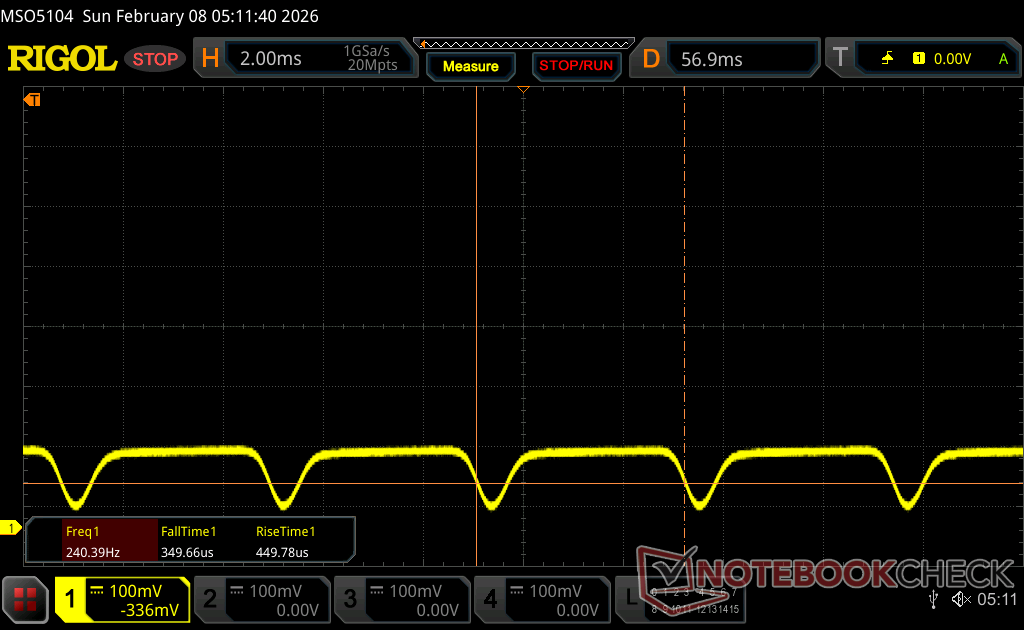
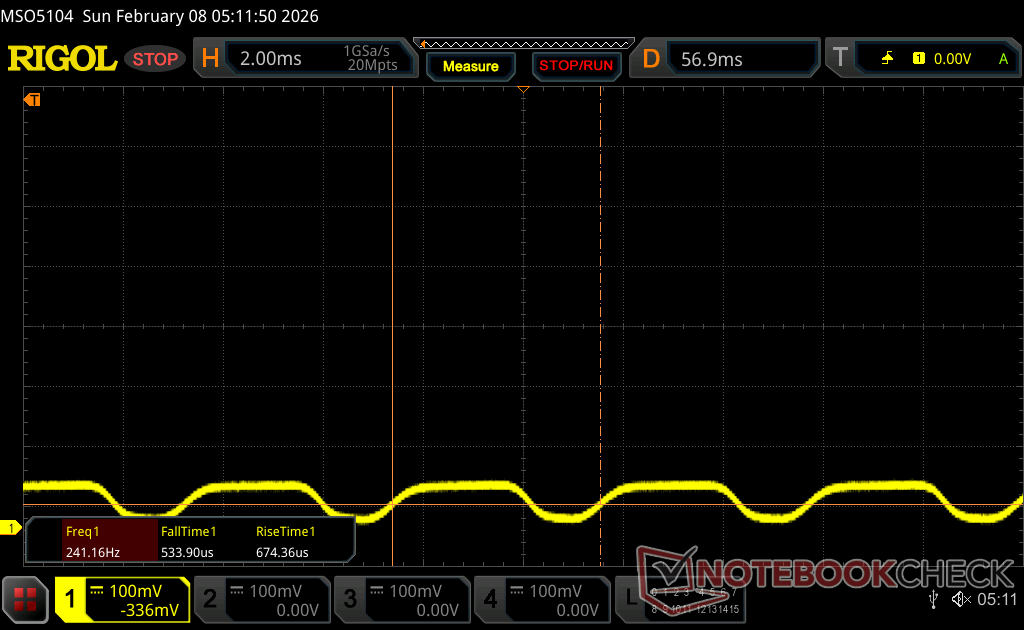
Screen Flickering / PWM (Pulse-Width Modulation)
| Screen flickering / PWM detected | 240.62 Hz Amplitude: 29 % | ≤ 100 % brightness setting | 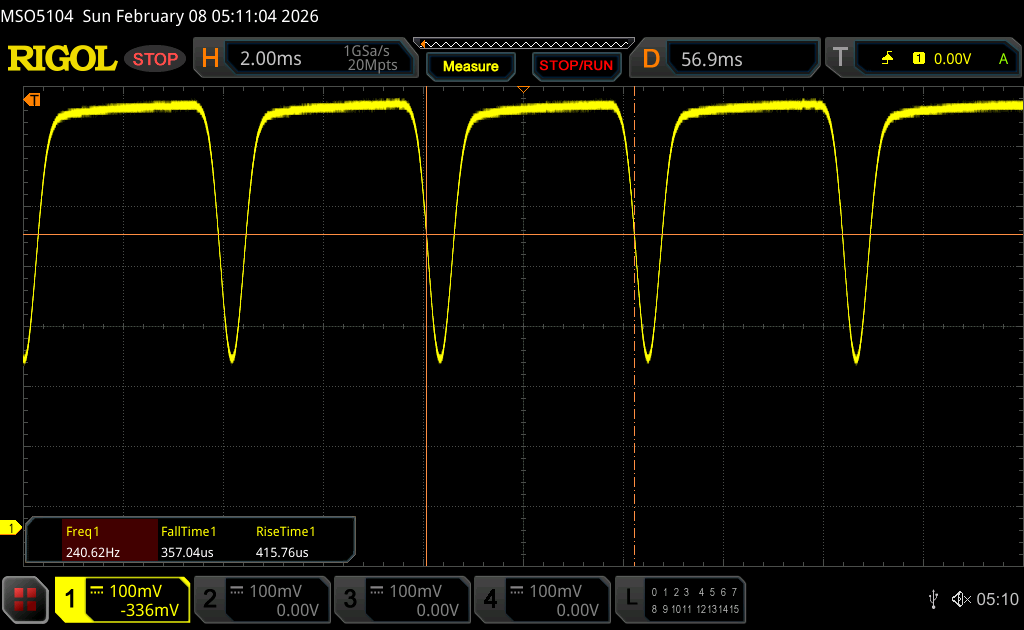 |
The display backlight flickers at 240.62 Hz (worst case, e.g., utilizing PWM) Flickering detected at a brightness setting of 100 % and below. There should be no flickering or PWM above this brightness setting. The frequency of 240.62 Hz is relatively low, so sensitive users will likely notice flickering and experience eyestrain at the stated brightness setting and below. In comparison: 52 % of all tested devices do not use PWM to dim the display. If PWM was detected, an average of 7794 (minimum: 5 - maximum: 343500) Hz was measured. | |||
在阴凉处的室外能见度还不错,但在光线较强的环境下,能见度就太暗,反光也太强了。


性能 - 黑豹湖助推器
测试条件
在运行以下基准测试之前,我们将 Windows 和戴尔优化大师设置为性能模式。
处理器
中央处理器的原始性能在 5% 以内。 酷睿至尊 7 255H去年戴尔 14 Premium 的平均水平,因此现有用户不应指望在这方面有任何显著提升。此外,如下图所示,在循环运行 CineBench R15 xT 时,多线程性能会降低 25%。华硕 ExpertBook Ultra 配备了相同的 Core Ultra X7 358HCPU 的华硕 ExpertBook Ultra 可明显降低运行速度。
升级到最高端的 酷睿至尊 X9 388H根据我们使用华硕 ZenBook Duo 的情况,升级到最高端的 Core Ultra X9 388H CPU 预计只能将性能提高 5% 到 10%。
Cinebench R15 多回路运行
Cinebench R23: Multi Core | Single Core
Cinebench R20: CPU (Multi Core) | CPU (Single Core)
Cinebench R15: CPU Multi 64Bit | CPU Single 64Bit
Blender: v2.79 BMW27 CPU
7-Zip 18.03: 7z b 4 | 7z b 4 -mmt1
Geekbench 6.7: Multi-Core | Single-Core
Geekbench 5.5: Multi-Core | Single-Core
HWBOT x265 Benchmark v2.2: 4k Preset
LibreOffice : 20 Documents To PDF
R Benchmark 2.5: Overall mean
* ... smaller is better
AIDA64: FP32 Ray-Trace | FPU Julia | CPU SHA3 | CPU Queen | FPU SinJulia | FPU Mandel | CPU AES | CPU ZLib | FP64 Ray-Trace | CPU PhotoWorxx
| Performance rating | |
| Lenovo Yoga Pro 7 14IAH10 | |
| Dell XPS 14 Core Ultra X7 358H | |
| Average Intel Core Ultra X7 358H | |
| Dell XPS 14 2024 OLED | |
| HP EliteBook X G1i 14 AI | |
| Asus ExpertBook Ultra B9406CAA | |
| AIDA64 / FP32 Ray-Trace | |
| Lenovo Yoga Pro 7 14IAH10 | |
| Average Intel Core Ultra X7 358H (12221 - 17932, n=8) | |
| Dell XPS 14 Core Ultra X7 358H | |
| HP EliteBook X G1i 14 AI | |
| Asus ExpertBook Ultra B9406CAA | |
| Dell XPS 14 2024 OLED | |
| AIDA64 / FPU Julia | |
| Lenovo Yoga Pro 7 14IAH10 | |
| Average Intel Core Ultra X7 358H (29930 - 95525, n=8) | |
| Dell XPS 14 Core Ultra X7 358H | |
| Dell XPS 14 2024 OLED | |
| HP EliteBook X G1i 14 AI | |
| Asus ExpertBook Ultra B9406CAA | |
| AIDA64 / CPU SHA3 | |
| Lenovo Yoga Pro 7 14IAH10 | |
| Asus ExpertBook Ultra B9406CAA | |
| Average Intel Core Ultra X7 358H (3910 - 4911, n=8) | |
| Dell XPS 14 Core Ultra X7 358H | |
| Dell XPS 14 2024 OLED | |
| HP EliteBook X G1i 14 AI | |
| AIDA64 / CPU Queen | |
| Dell XPS 14 2024 OLED | |
| Lenovo Yoga Pro 7 14IAH10 | |
| Dell XPS 14 Core Ultra X7 358H | |
| Average Intel Core Ultra X7 358H (63425 - 63827, n=2) | |
| Asus ExpertBook Ultra B9406CAA | |
| HP EliteBook X G1i 14 AI | |
| AIDA64 / FPU SinJulia | |
| Lenovo Yoga Pro 7 14IAH10 | |
| Dell XPS 14 2024 OLED | |
| Dell XPS 14 Core Ultra X7 358H | |
| Average Intel Core Ultra X7 358H (4735 - 7038, n=8) | |
| Asus ExpertBook Ultra B9406CAA | |
| HP EliteBook X G1i 14 AI | |
| AIDA64 / FPU Mandel | |
| Lenovo Yoga Pro 7 14IAH10 | |
| Average Intel Core Ultra X7 358H (14716 - 50734, n=8) | |
| Dell XPS 14 Core Ultra X7 358H | |
| HP EliteBook X G1i 14 AI | |
| Dell XPS 14 2024 OLED | |
| Asus ExpertBook Ultra B9406CAA | |
| AIDA64 / CPU AES | |
| Lenovo Yoga Pro 7 14IAH10 | |
| Dell XPS 14 Core Ultra X7 358H | |
| Dell XPS 14 2024 OLED | |
| Average Intel Core Ultra X7 358H (5127 - 67510, n=8) | |
| HP EliteBook X G1i 14 AI | |
| Asus ExpertBook Ultra B9406CAA | |
| AIDA64 / CPU ZLib | |
| Lenovo Yoga Pro 7 14IAH10 | |
| Asus ExpertBook Ultra B9406CAA | |
| Dell XPS 14 Core Ultra X7 358H | |
| Average Intel Core Ultra X7 358H (932 - 1179, n=8) | |
| Dell XPS 14 2024 OLED | |
| HP EliteBook X G1i 14 AI | |
| AIDA64 / FP64 Ray-Trace | |
| Lenovo Yoga Pro 7 14IAH10 | |
| Average Intel Core Ultra X7 358H (6506 - 9447, n=8) | |
| Dell XPS 14 Core Ultra X7 358H | |
| HP EliteBook X G1i 14 AI | |
| Asus ExpertBook Ultra B9406CAA | |
| Dell XPS 14 2024 OLED | |
| AIDA64 / CPU PhotoWorxx | |
| Dell XPS 14 Core Ultra X7 358H | |
| Average Intel Core Ultra X7 358H (30538 - 88154, n=8) | |
| Lenovo Yoga Pro 7 14IAH10 | |
| HP EliteBook X G1i 14 AI | |
| Dell XPS 14 2024 OLED | |
| Asus ExpertBook Ultra B9406CAA | |
系统性能
PCMark 分数是所有采用集成显卡的子笔记本中最高的。特别是其生产力和数字内容创建子测试成绩,比上一代机型有了显著提高。

PCMark 10: Score | Essentials | Productivity | Digital Content Creation
CrossMark: Overall | Productivity | Creativity | Responsiveness
WebXPRT 3: Overall
WebXPRT 4: Overall
Mozilla Kraken 1.1: Total
Geekbench AI: Single Precision GPU 1.7 | Half Precision GPU 1.7 | Quantized GPU 1.7
| Performance rating | |
| Dell XPS 14 Core Ultra X7 358H | |
| Average Intel Core Ultra X7 358H, Intel Arc B390 12 Xe3 Panther Lake iGPU | |
| Asus ExpertBook Ultra B9406CAA | |
| Lenovo Yoga Pro 7 14IAH10 -3! | |
| HP EliteBook X G1i 14 AI | |
| Dell XPS 14 2024 OLED -3! | |
| Dell 14 Premium | |
| PCMark 10 / Score | |
| Dell XPS 14 Core Ultra X7 358H | |
| Average Intel Core Ultra X7 358H, Intel Arc B390 12 Xe3 Panther Lake iGPU (8834 - 9880, n=8) | |
| Asus ExpertBook Ultra B9406CAA | |
| Lenovo Yoga Pro 7 14IAH10 | |
| HP EliteBook X G1i 14 AI | |
| Dell 14 Premium | |
| Dell XPS 14 2024 OLED | |
| PCMark 10 / Essentials | |
| Dell XPS 14 Core Ultra X7 358H | |
| Average Intel Core Ultra X7 358H, Intel Arc B390 12 Xe3 Panther Lake iGPU (10282 - 11263, n=7) | |
| Lenovo Yoga Pro 7 14IAH10 | |
| Asus ExpertBook Ultra B9406CAA | |
| Dell 14 Premium | |
| HP EliteBook X G1i 14 AI | |
| Dell XPS 14 2024 OLED | |
| PCMark 10 / Productivity | |
| Dell XPS 14 Core Ultra X7 358H | |
| Average Intel Core Ultra X7 358H, Intel Arc B390 12 Xe3 Panther Lake iGPU (13908 - 16780, n=7) | |
| Asus ExpertBook Ultra B9406CAA | |
| HP EliteBook X G1i 14 AI | |
| Lenovo Yoga Pro 7 14IAH10 | |
| Dell XPS 14 2024 OLED | |
| Dell 14 Premium | |
| PCMark 10 / Digital Content Creation | |
| Dell XPS 14 Core Ultra X7 358H | |
| Average Intel Core Ultra X7 358H, Intel Arc B390 12 Xe3 Panther Lake iGPU (13082 - 13893, n=7) | |
| Asus ExpertBook Ultra B9406CAA | |
| Lenovo Yoga Pro 7 14IAH10 | |
| Dell 14 Premium | |
| HP EliteBook X G1i 14 AI | |
| Dell XPS 14 2024 OLED | |
| CrossMark / Overall | |
| Average Intel Core Ultra X7 358H, Intel Arc B390 12 Xe3 Panther Lake iGPU (1884 - 2119, n=8) | |
| Lenovo Yoga Pro 7 14IAH10 | |
| Dell XPS 14 Core Ultra X7 358H | |
| Asus ExpertBook Ultra B9406CAA | |
| Dell XPS 14 2024 OLED | |
| HP EliteBook X G1i 14 AI | |
| Dell 14 Premium | |
| CrossMark / Productivity | |
| Lenovo Yoga Pro 7 14IAH10 | |
| Average Intel Core Ultra X7 358H, Intel Arc B390 12 Xe3 Panther Lake iGPU (1678 - 1928, n=8) | |
| Dell XPS 14 Core Ultra X7 358H | |
| Asus ExpertBook Ultra B9406CAA | |
| HP EliteBook X G1i 14 AI | |
| Dell XPS 14 2024 OLED | |
| Dell 14 Premium | |
| CrossMark / Creativity | |
| Average Intel Core Ultra X7 358H, Intel Arc B390 12 Xe3 Panther Lake iGPU (2241 - 2529, n=8) | |
| Dell XPS 14 Core Ultra X7 358H | |
| Lenovo Yoga Pro 7 14IAH10 | |
| Asus ExpertBook Ultra B9406CAA | |
| Dell XPS 14 2024 OLED | |
| HP EliteBook X G1i 14 AI | |
| Dell 14 Premium | |
| CrossMark / Responsiveness | |
| Average Intel Core Ultra X7 358H, Intel Arc B390 12 Xe3 Panther Lake iGPU (1560 - 1837, n=8) | |
| Asus ExpertBook Ultra B9406CAA | |
| Lenovo Yoga Pro 7 14IAH10 | |
| Dell XPS 14 Core Ultra X7 358H | |
| Dell XPS 14 2024 OLED | |
| HP EliteBook X G1i 14 AI | |
| Dell 14 Premium | |
| WebXPRT 3 / Overall | |
| Dell XPS 14 Core Ultra X7 358H | |
| Lenovo Yoga Pro 7 14IAH10 | |
| Average Intel Core Ultra X7 358H, Intel Arc B390 12 Xe3 Panther Lake iGPU (293 - 338, n=8) | |
| HP EliteBook X G1i 14 AI | |
| Asus ExpertBook Ultra B9406CAA | |
| Dell 14 Premium | |
| Dell XPS 14 2024 OLED | |
| WebXPRT 4 / Overall | |
| Lenovo Yoga Pro 7 14IAH10 | |
| Dell XPS 14 Core Ultra X7 358H | |
| Average Intel Core Ultra X7 358H, Intel Arc B390 12 Xe3 Panther Lake iGPU (278 - 305, n=7) | |
| HP EliteBook X G1i 14 AI | |
| Asus ExpertBook Ultra B9406CAA | |
| Dell 14 Premium | |
| Dell XPS 14 2024 OLED | |
| Mozilla Kraken 1.1 / Total | |
| Dell XPS 14 2024 OLED | |
| Dell 14 Premium | |
| HP EliteBook X G1i 14 AI | |
| Average Intel Core Ultra X7 358H, Intel Arc B390 12 Xe3 Panther Lake iGPU (445 - 460, n=8) | |
| Asus ExpertBook Ultra B9406CAA | |
| Dell XPS 14 Core Ultra X7 358H | |
| Lenovo Yoga Pro 7 14IAH10 | |
| Geekbench AI / Single Precision GPU 1.7 | |
| Asus ExpertBook Ultra B9406CAA | |
| Dell XPS 14 Core Ultra X7 358H | |
| Average Intel Core Ultra X7 358H, Intel Arc B390 12 Xe3 Panther Lake iGPU (9783 - 12255, n=6) | |
| HP EliteBook X G1i 14 AI | |
| Dell 14 Premium | |
| Geekbench AI / Half Precision GPU 1.7 | |
| Asus ExpertBook Ultra B9406CAA | |
| Average Intel Core Ultra X7 358H, Intel Arc B390 12 Xe3 Panther Lake iGPU (16188 - 21963, n=6) | |
| Dell XPS 14 Core Ultra X7 358H | |
| HP EliteBook X G1i 14 AI | |
| Dell 14 Premium | |
| Geekbench AI / Quantized GPU 1.7 | |
| Asus ExpertBook Ultra B9406CAA | |
| Dell XPS 14 Core Ultra X7 358H | |
| Average Intel Core Ultra X7 358H, Intel Arc B390 12 Xe3 Panther Lake iGPU (6908 - 8011, n=6) | |
| HP EliteBook X G1i 14 AI | |
| Dell 14 Premium | |
* ... smaller is better
| PCMark 10 Score | 9880 points | |
Help | ||
| AIDA64 / Memory Copy | |
| Dell XPS 14 Core Ultra X7 358H | |
| Average Intel Core Ultra X7 358H (102745 - 132135, n=7) | |
| Lenovo Yoga Pro 7 14IAH10 | |
| HP EliteBook X G1i 14 AI | |
| Dell XPS 14 2024 OLED | |
| AIDA64 / Memory Read | |
| Asus ExpertBook Ultra B9406CAA | |
| Dell XPS 14 Core Ultra X7 358H | |
| Average Intel Core Ultra X7 358H (97755 - 118888, n=8) | |
| Dell XPS 14 2024 OLED | |
| Lenovo Yoga Pro 7 14IAH10 | |
| HP EliteBook X G1i 14 AI | |
| AIDA64 / Memory Write | |
| Dell XPS 14 Core Ultra X7 358H | |
| Average Intel Core Ultra X7 358H (105984 - 134998, n=8) | |
| Asus ExpertBook Ultra B9406CAA | |
| HP EliteBook X G1i 14 AI | |
| Lenovo Yoga Pro 7 14IAH10 | |
| Dell XPS 14 2024 OLED | |
| AIDA64 / Memory Latency | |
| Dell XPS 14 2024 OLED | |
| Lenovo Yoga Pro 7 14IAH10 | |
| HP EliteBook X G1i 14 AI | |
| Dell XPS 14 Core Ultra X7 358H | |
| Average Intel Core Ultra X7 358H (84.6 - 101.9, n=8) | |
* ... smaller is better
DPC 延迟
在播放 4K60 视频内容时,LatencyMon 只报告了轻微的 DPC 问题,没有出现丢帧现象。


| DPC Latencies / LatencyMon - interrupt to process latency (max), Web, Youtube, Prime95 | |
| Dell 14 Premium | |
| Dell XPS 14 2024 OLED | |
| Lenovo Yoga Pro 7 14IAH10 | |
| Dell XPS 14 Core Ultra X7 358H | |
| HP EliteBook X G1i 14 AI | |
| Asus ExpertBook Ultra B9406CAA | |
* ... smaller is better
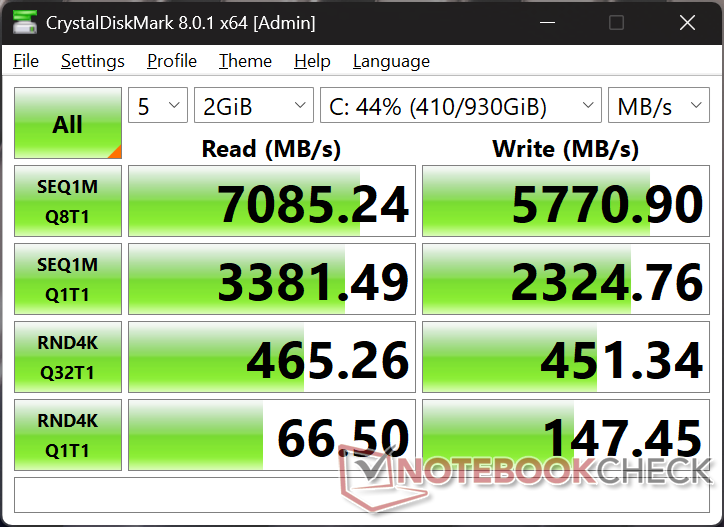
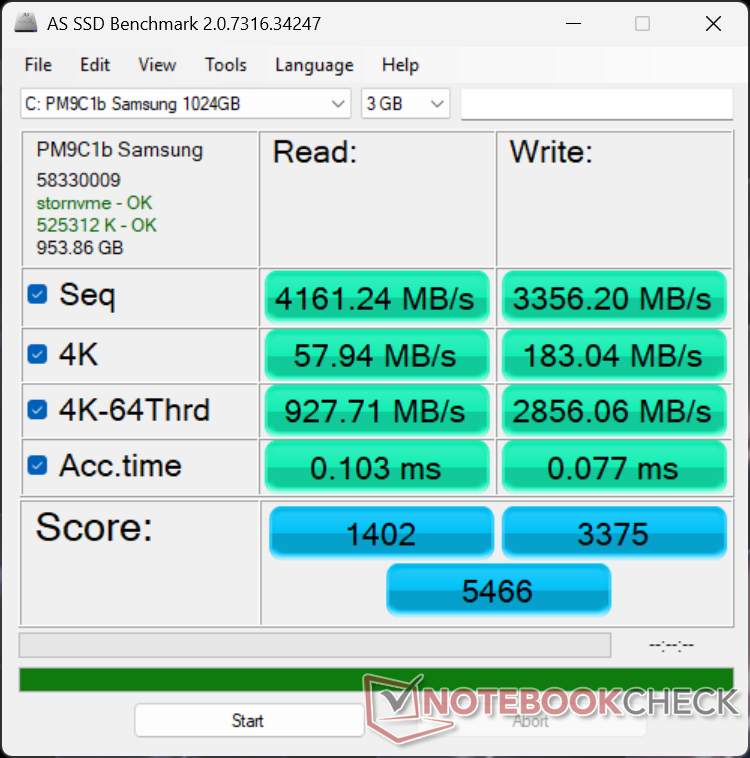
存储设备
三星 PM9C1b PCIe4 x4 NVMe 固态硬盘的传输速率可达 7000 MB/s,没有任何节流问题,比戴尔 14 Premium 中的 Kioxia 硬盘略快。


| Drive Performance rating - Percent | |
| Asus ExpertBook Ultra B9406CAA | |
| Lenovo Yoga Pro 7 14IAH10 | |
| Dell XPS 14 Core Ultra X7 358H | |
| Dell XPS 14 2024 OLED | |
| Dell 14 Premium | |
| HP EliteBook X G1i 14 AI | |
* ... smaller is better
磁盘节流DiskSpd 读取循环,队列深度 8
图形处理器性能
集成的 电弧 B390是 2026 XPS 14 的一大亮点。与 Arc 140T 相比,性能有了巨大的提升。 弧形 140T相比,2025 款戴尔 14 Premium 中的 Arc 140T 性能大幅提升,甚至可以媲美或超越配备专用 GeForce RTX 4050 显卡.3DMark 分数大约是 Arc 140T 的 2 倍,比 RTX 4050 高出 25% 到 40%。不过,在专业渲染操作方面,Nvidia GPU 的 CUDA 内核仍然要快大约 35%。
遗憾的是,如下表Fire Strike 所示,使用电池供电对性能的影响微乎其微。如果设置为 "平衡 "模式,而不是 "性能 "模式,性能差距可能会更大。
| 电源配置文件 | 图形分数 | 物理得分 | 综合得分 |
| 性能模式 | 17324 | 25143 | 4879 |
| 均衡模式 | 14560 (-16%) | 21811 (-13%) | 4073 (-17%) |
| 电池电量 | 15875 (-8%) | 27090 (-8%) | 4578 (-6%) |
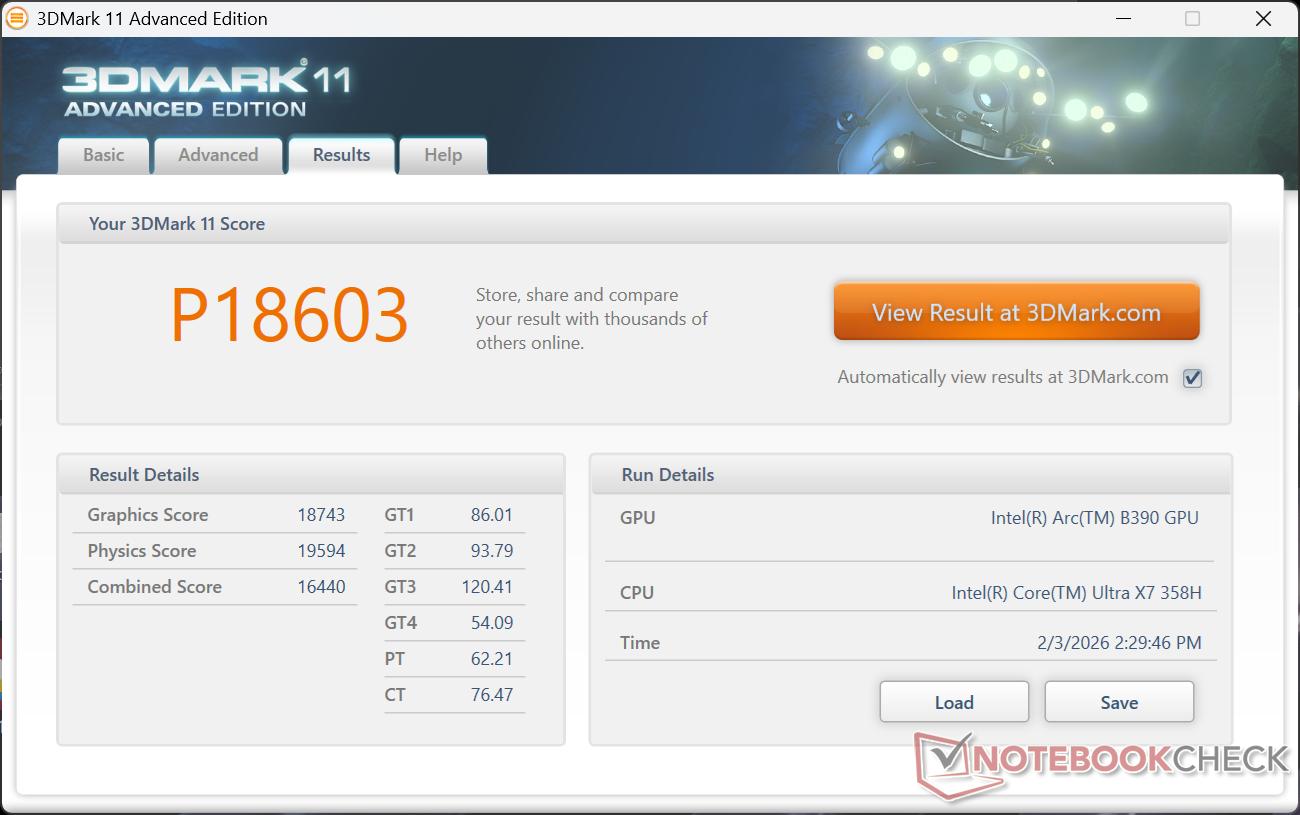


| 3DMark 11 Performance | 18603 points | |
| 3DMark Cloud Gate Standard Score | 48038 points | |
| 3DMark Fire Strike Score | 14336 points | |
| 3DMark Time Spy Score | 7546 points | |
Help | ||
* ... smaller is better
游戏性能
虽然新款 XPS 14 并非游戏笔记本电脑,但它可以在适当的 1080p 设置下运行《黑色神话悟空传》等要求较高的游戏。需要注意的是,尽管我们的合成 3DMark 分数表明差距更大,但整体游戏性能与搭载 RTX 4050 的 XPS 14 相比,平均差距只有 10%。
| Performance rating - Percent | |
| Dell XPS 14 2024 OLED | |
| Asus ExpertBook Ultra B9406CAA | |
| Dell XPS 14 Core Ultra X7 358H | |
| HP EliteBook X G1i 14 AI | |
| Lenovo Yoga Pro 7 14IAH10 | |
| Dell 14 Premium | |
| Cyberpunk 2077 - 1920x1080 Ultra Preset (FSR off) | |
| Asus ExpertBook Ultra B9406CAA | |
| Dell XPS 14 Core Ultra X7 358H | |
| Dell XPS 14 2024 OLED | |
| HP EliteBook X G1i 14 AI | |
| Lenovo Yoga Pro 7 14IAH10 | |
| Dell 14 Premium | |
| Baldur's Gate 3 - 1920x1080 Ultra Preset AA:T | |
| Asus ExpertBook Ultra B9406CAA | |
| Dell XPS 14 Core Ultra X7 358H | |
| Dell XPS 14 2024 OLED | |
| HP EliteBook X G1i 14 AI | |
| Lenovo Yoga Pro 7 14IAH10 | |
| Dell 14 Premium | |
| GTA V - 1920x1080 Highest AA:4xMSAA + FX AF:16x | |
| Dell XPS 14 2024 OLED | |
| Asus ExpertBook Ultra B9406CAA | |
| Dell XPS 14 Core Ultra X7 358H | |
| HP EliteBook X G1i 14 AI | |
| Lenovo Yoga Pro 7 14IAH10 | |
| Dell 14 Premium | |
| Final Fantasy XV Benchmark - 1920x1080 High Quality | |
| Asus ExpertBook Ultra B9406CAA | |
| Dell XPS 14 Core Ultra X7 358H | |
| Dell XPS 14 2024 OLED | |
| HP EliteBook X G1i 14 AI | |
| Dell 14 Premium | |
| Lenovo Yoga Pro 7 14IAH10 | |
| Strange Brigade - 1920x1080 ultra AA:ultra AF:16 | |
| Asus ExpertBook Ultra B9406CAA | |
| Dell XPS 14 Core Ultra X7 358H | |
| Dell XPS 14 2024 OLED | |
| Lenovo Yoga Pro 7 14IAH10 | |
| HP EliteBook X G1i 14 AI | |
| Dell 14 Premium | |
| Dota 2 Reborn - 1920x1080 ultra (3/3) best looking | |
| Dell XPS 14 Core Ultra X7 358H | |
| Dell XPS 14 2024 OLED | |
| Asus ExpertBook Ultra B9406CAA | |
| HP EliteBook X G1i 14 AI | |
| Lenovo Yoga Pro 7 14IAH10 | |
| Dell 14 Premium | |
| X-Plane 11.11 - 1920x1080 high (fps_test=3) | |
| Dell XPS 14 2024 OLED | |
| Dell 14 Premium | |
| Dell XPS 14 Core Ultra X7 358H | |
| Asus ExpertBook Ultra B9406CAA | |
| Lenovo Yoga Pro 7 14IAH10 | |
| HP EliteBook X G1i 14 AI | |
赛博朋克 2077》超 FPS 图表
| low | med. | high | ultra | QHD | |
|---|---|---|---|---|---|
| GTA V (2015) | 176.7 | 171 | 98.2 | 43.3 | 30.9 |
| Dota 2 Reborn (2015) | 135 | 95.4 | 107.6 | 105.4 | |
| Final Fantasy XV Benchmark (2018) | 123.5 | 73.7 | 52.8 | 39 | |
| X-Plane 11.11 (2018) | 59.7 | 47.1 | 40.3 | ||
| Strange Brigade (2018) | 384 | 138.6 | 103.3 | 95.1 | 71.7 |
| Baldur's Gate 3 (2023) | 64.3 | 55.4 | 49 | 48.7 | 34.9 |
| Cyberpunk 2077 (2023) | 68.6 | 56.2 | 46.9 | 40.9 | 24.7 |
| F1 24 (2024) | 145.9 | 132.2 | 100.7 | 36.2 | 23.8 |
| Black Myth: Wukong (2024) | 43 | 34 | 26 | 14 | 11 |
| ARC Raiders (2025) | 104.3 | 57 | 42.4 | 28 | 19.2 |
排放量
系统噪音
与去年的机型相比,新款 XPS 14 可以保持更长时间的安静。例如,在运行 3DMark 06 时,风扇噪音在第一个基准场景结束时会稳定在 34 dB(A),而老款箭湖机型则为 39 dB(A)。除此之外,风扇噪音上限仍在 45 分贝(A)左右,与以前相差无几。


Noise level
| Idle |
| 23.3 / 23.3 / 23.3 dB(A) |
| Load |
| 34 / 45.7 dB(A) |
 | ||
30 dB silent 40 dB(A) audible 50 dB(A) loud |
||
min: | ||
| Dell XPS 14 Core Ultra X7 358H Ultra X7 358H, Arc B390 Panther Lake iGPU | Dell 14 Premium Ultra 7 255H, Arc 140T | Dell XPS 14 2024 OLED Ultra 7 155H, GeForce RTX 4050 Laptop GPU | Asus ExpertBook Ultra B9406CAA Ultra X7 358H, Arc B390 Panther Lake iGPU | Lenovo Yoga Pro 7 14IAH10 Ultra 9 285H, Arc 140T | HP EliteBook X G1i 14 AI Core Ultra 7 268V, Arc 140V | |
|---|---|---|---|---|---|---|
| Noise | -3% | -8% | 3% | -11% | -10% | |
| off / environment * (dB) | 22.9 | 23 -0% | 24.3 -6% | 22.9 -0% | 24.5 -7% | 28.2 -23% |
| Idle Minimum * (dB) | 23.3 | 23.2 -0% | 24.3 -4% | 23.4 -0% | 24.5 -5% | 28.4 -22% |
| Idle Average * (dB) | 23.3 | 24 -3% | 26.5 -14% | 23.4 -0% | 24.5 -5% | 28.4 -22% |
| Idle Maximum * (dB) | 23.3 | 24.7 -6% | 28.5 -22% | 23.4 -0% | 24.5 -5% | 28.8 -24% |
| Load Average * (dB) | 34 | 39 -15% | 37 -9% | 28.6 16% | 46.9 -38% | 33.5 1% |
| Cyberpunk 2077 ultra * (dB) | 43.5 | 43 1% | 42.8 2% | 46.9 -8% | 39.1 10% | |
| Load Maximum * (dB) | 45.7 | 44.9 2% | 43.3 5% | 45.2 1% | 48.7 -7% | 40.4 12% |
| Witcher 3 ultra * (dB) | 39.1 |
* ... smaller is better
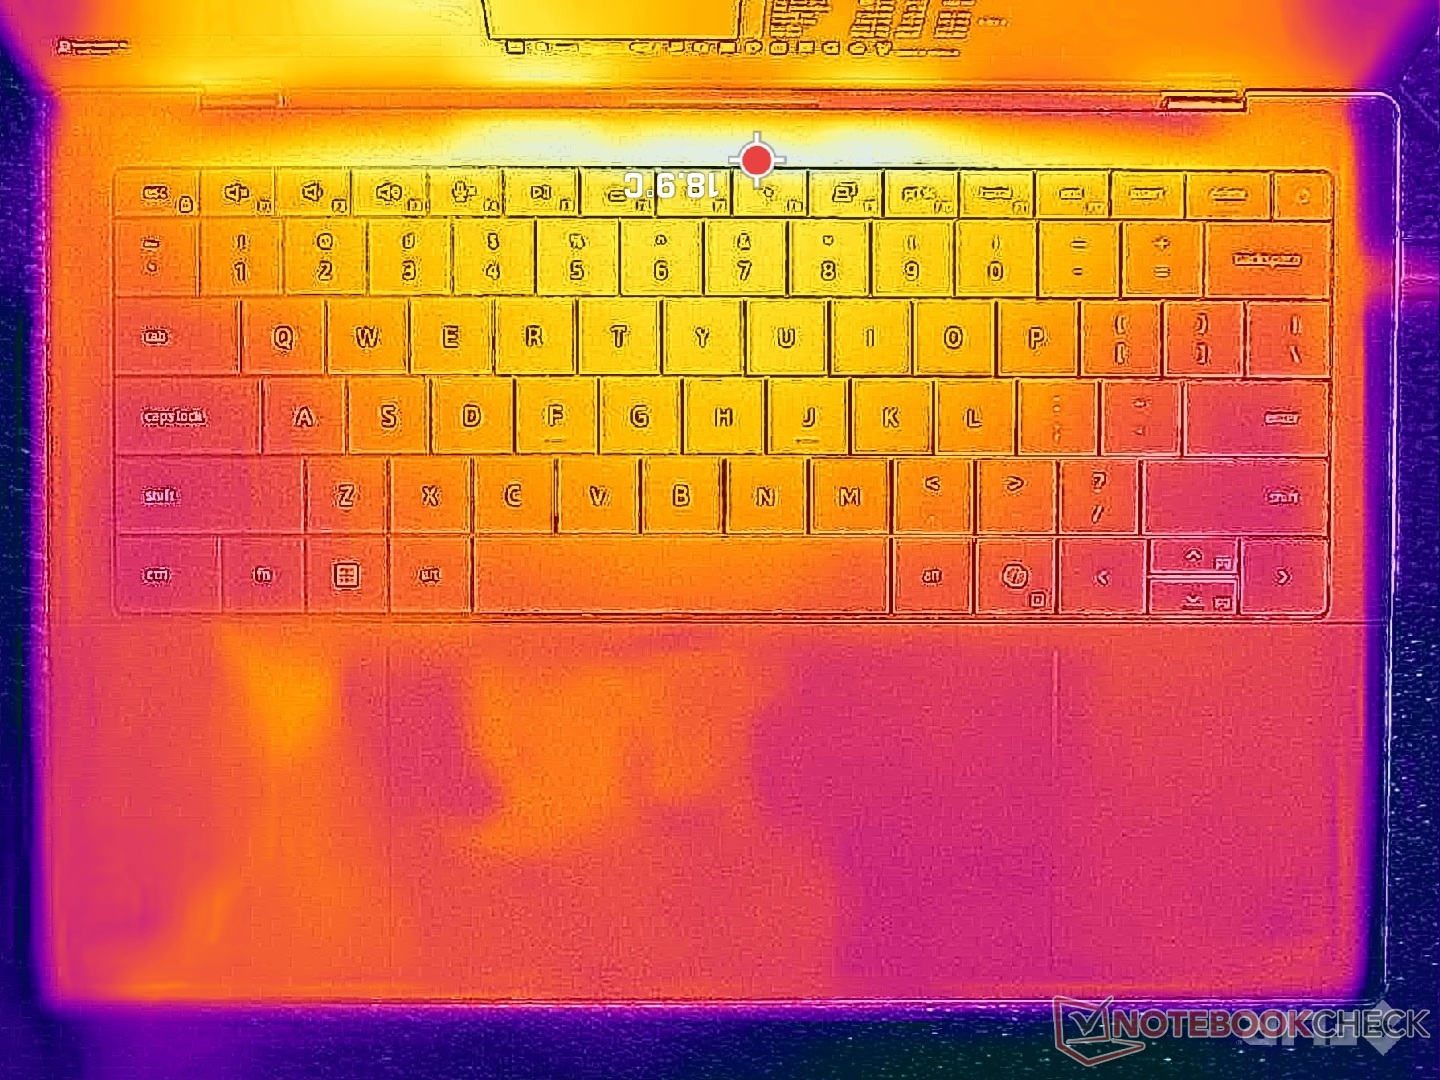
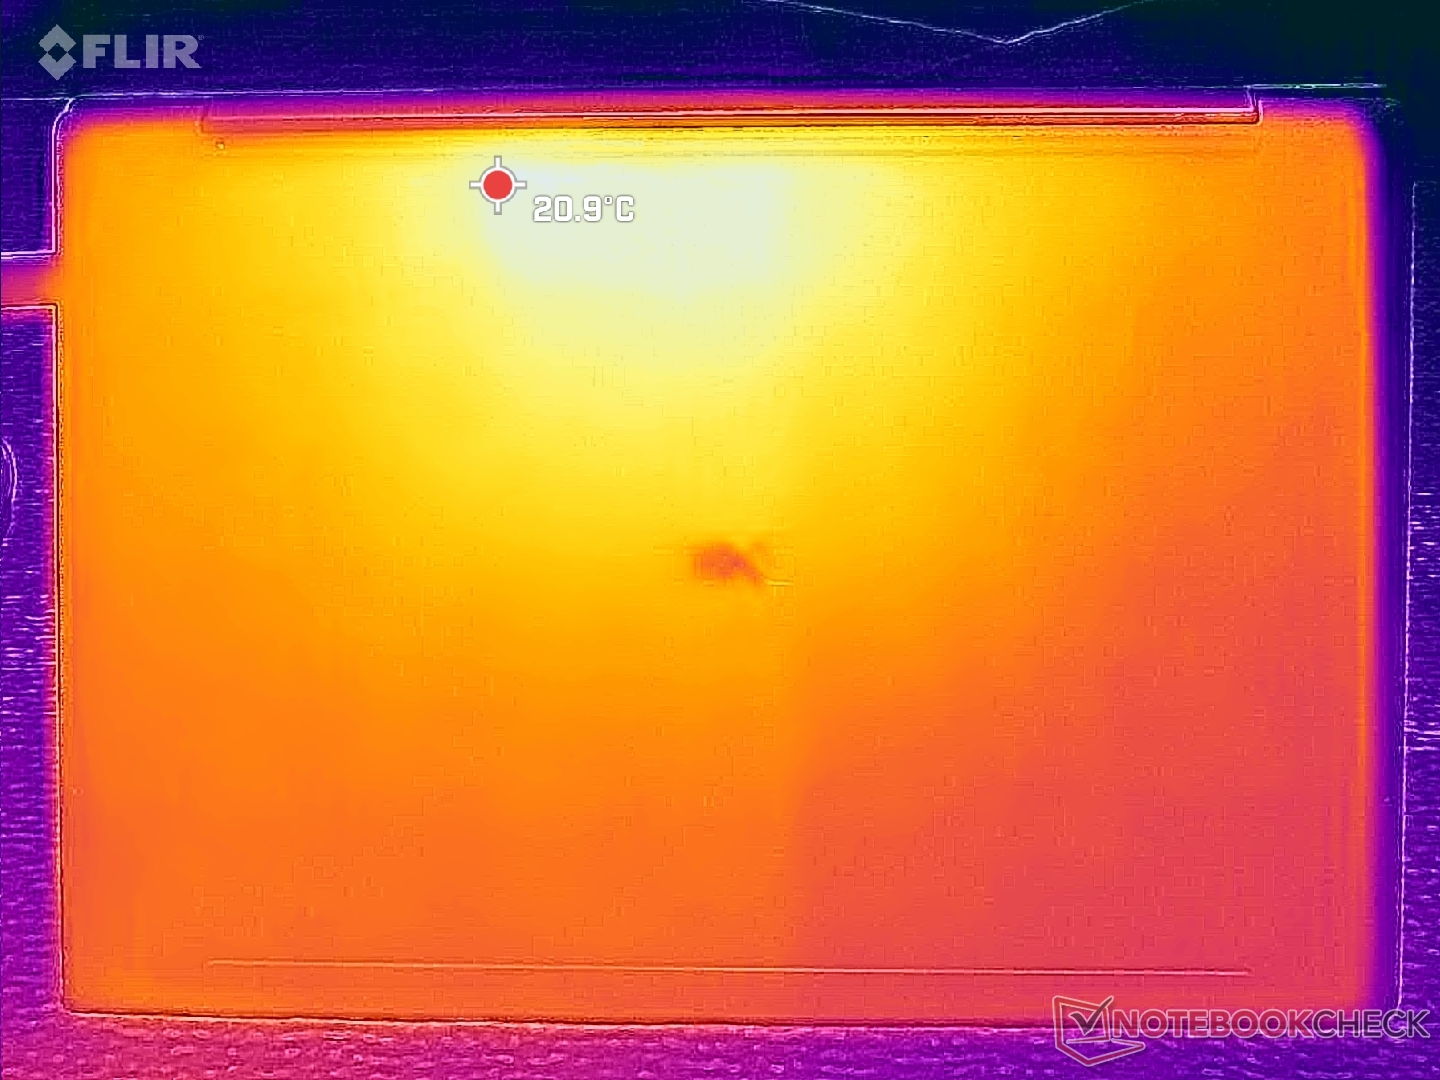
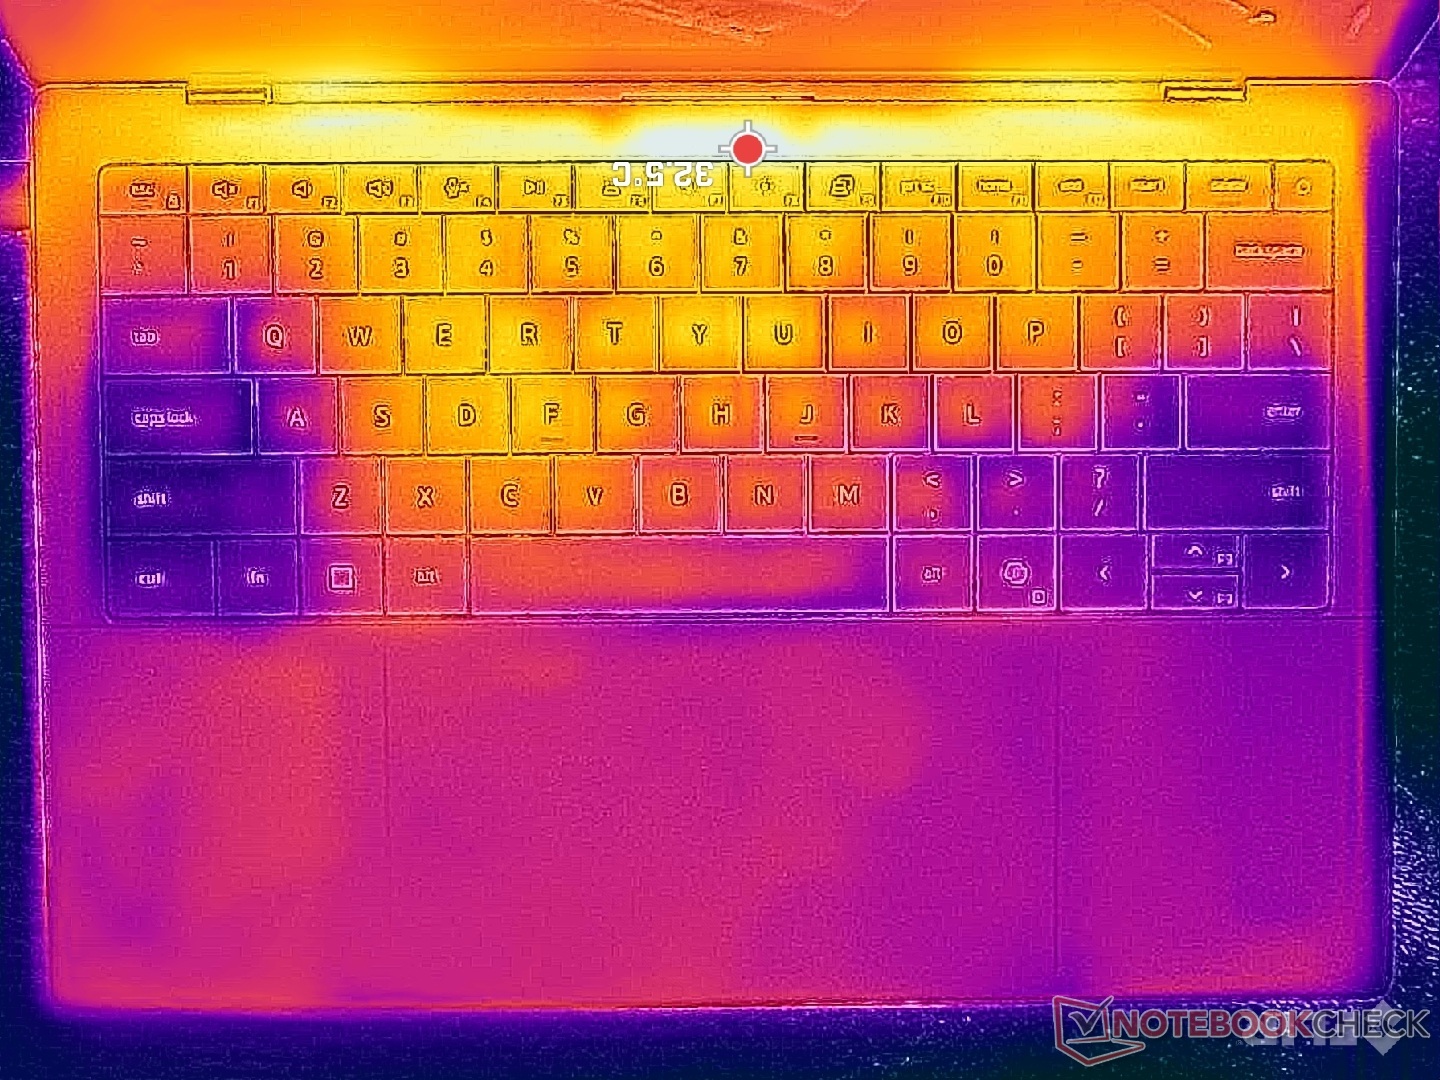
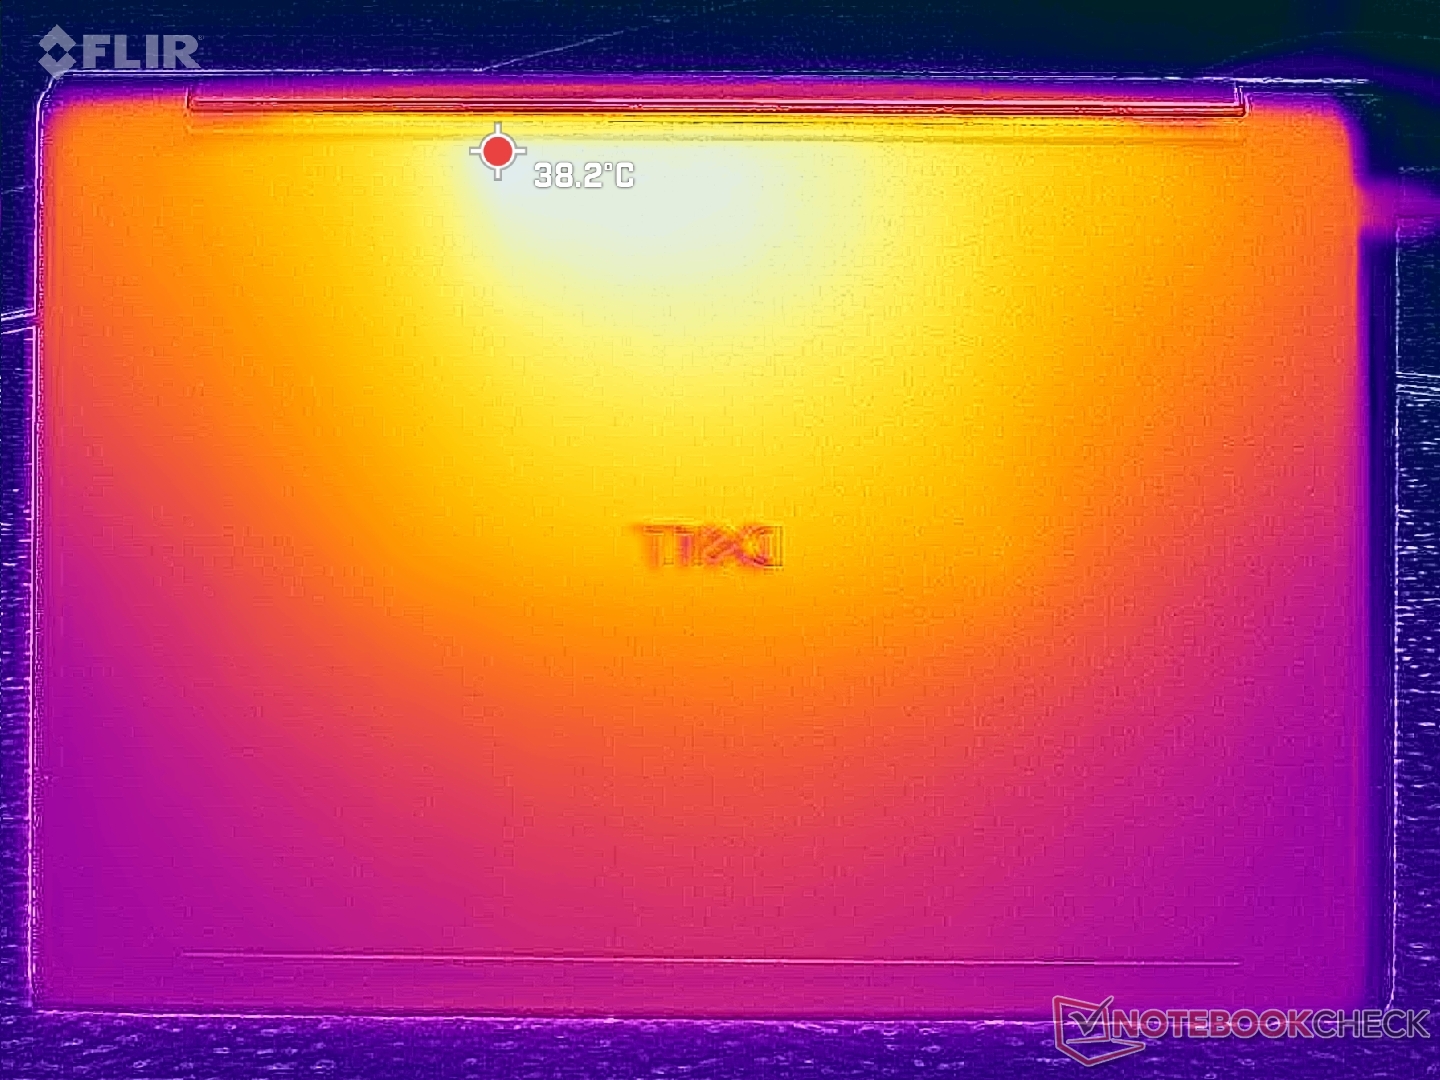
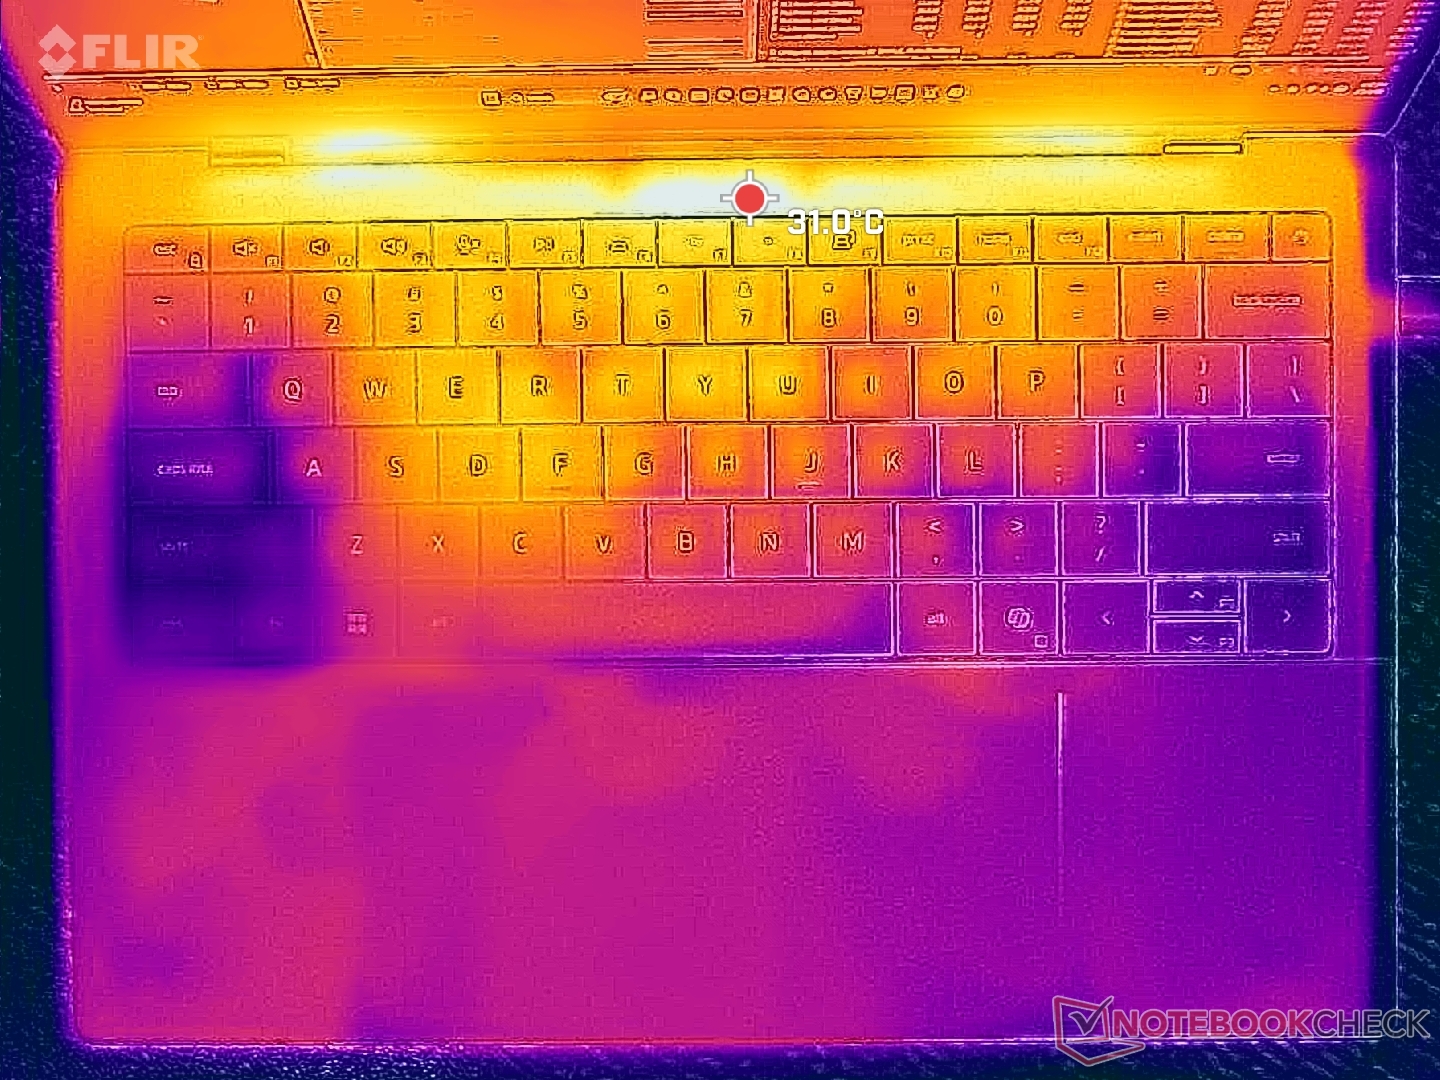
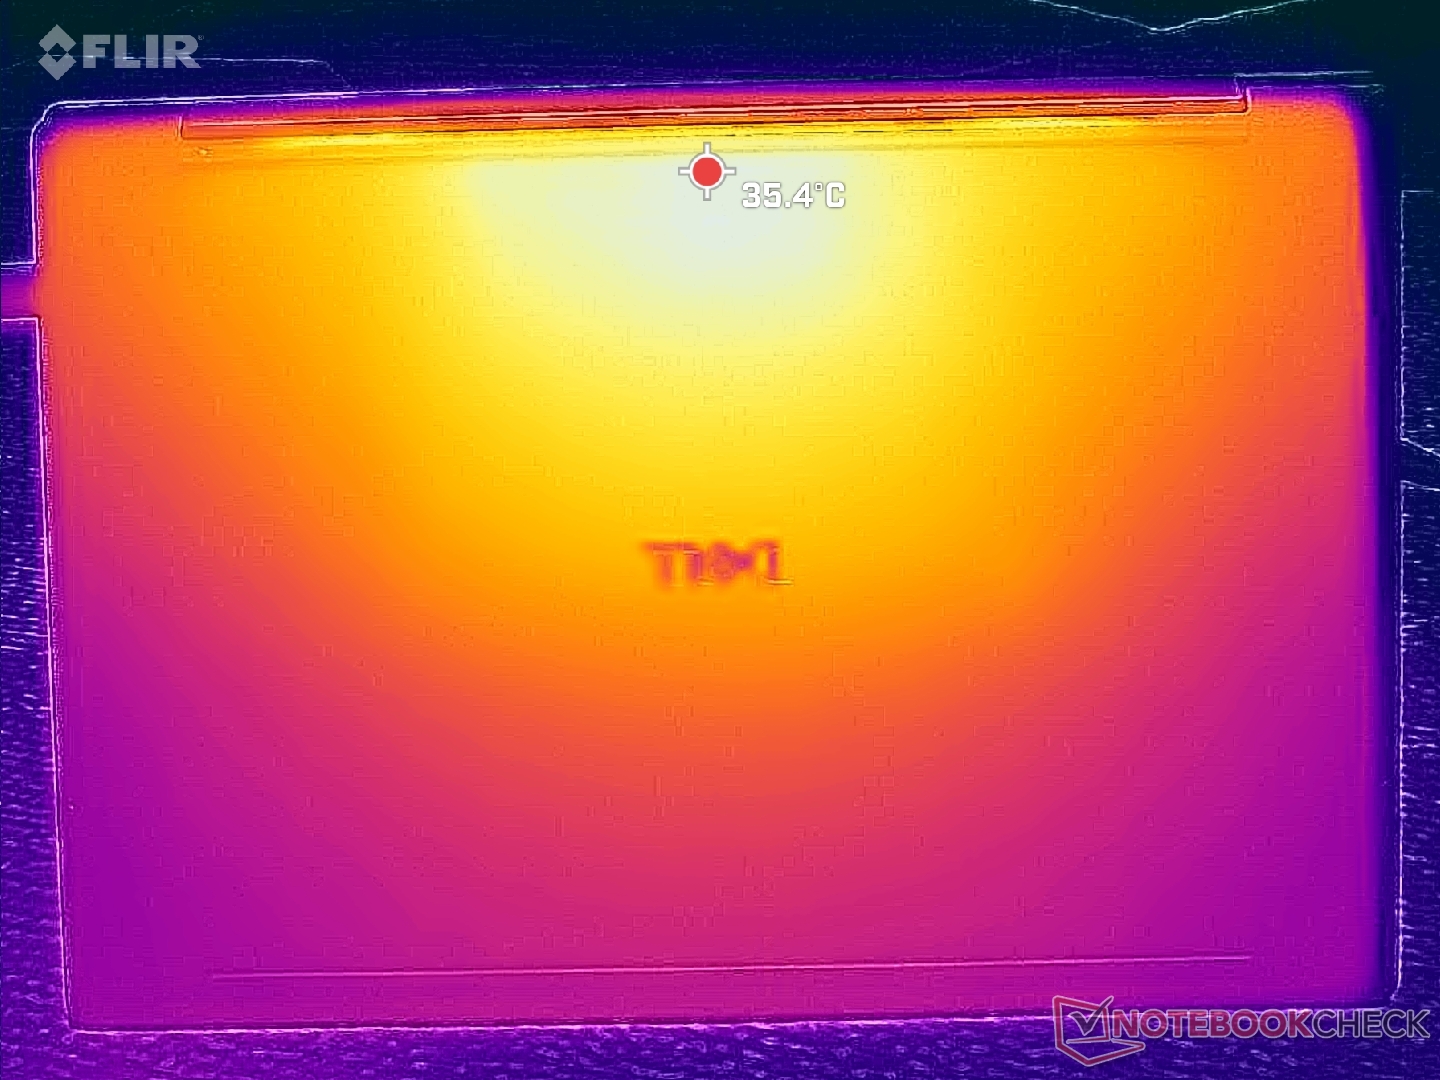
温度
表面温度比我们在 2025 戴尔 14 Premium 上记录的温度略高,尤其是在运行要求较高的负载时,底部(D 盖)的温度更高。热点温度将达到 36 摄氏度至 39 摄氏度,而去年的设计温度为 34 摄氏度。其他方面的差异微乎其微,在使用过程中也不会因为温度过高而分心。
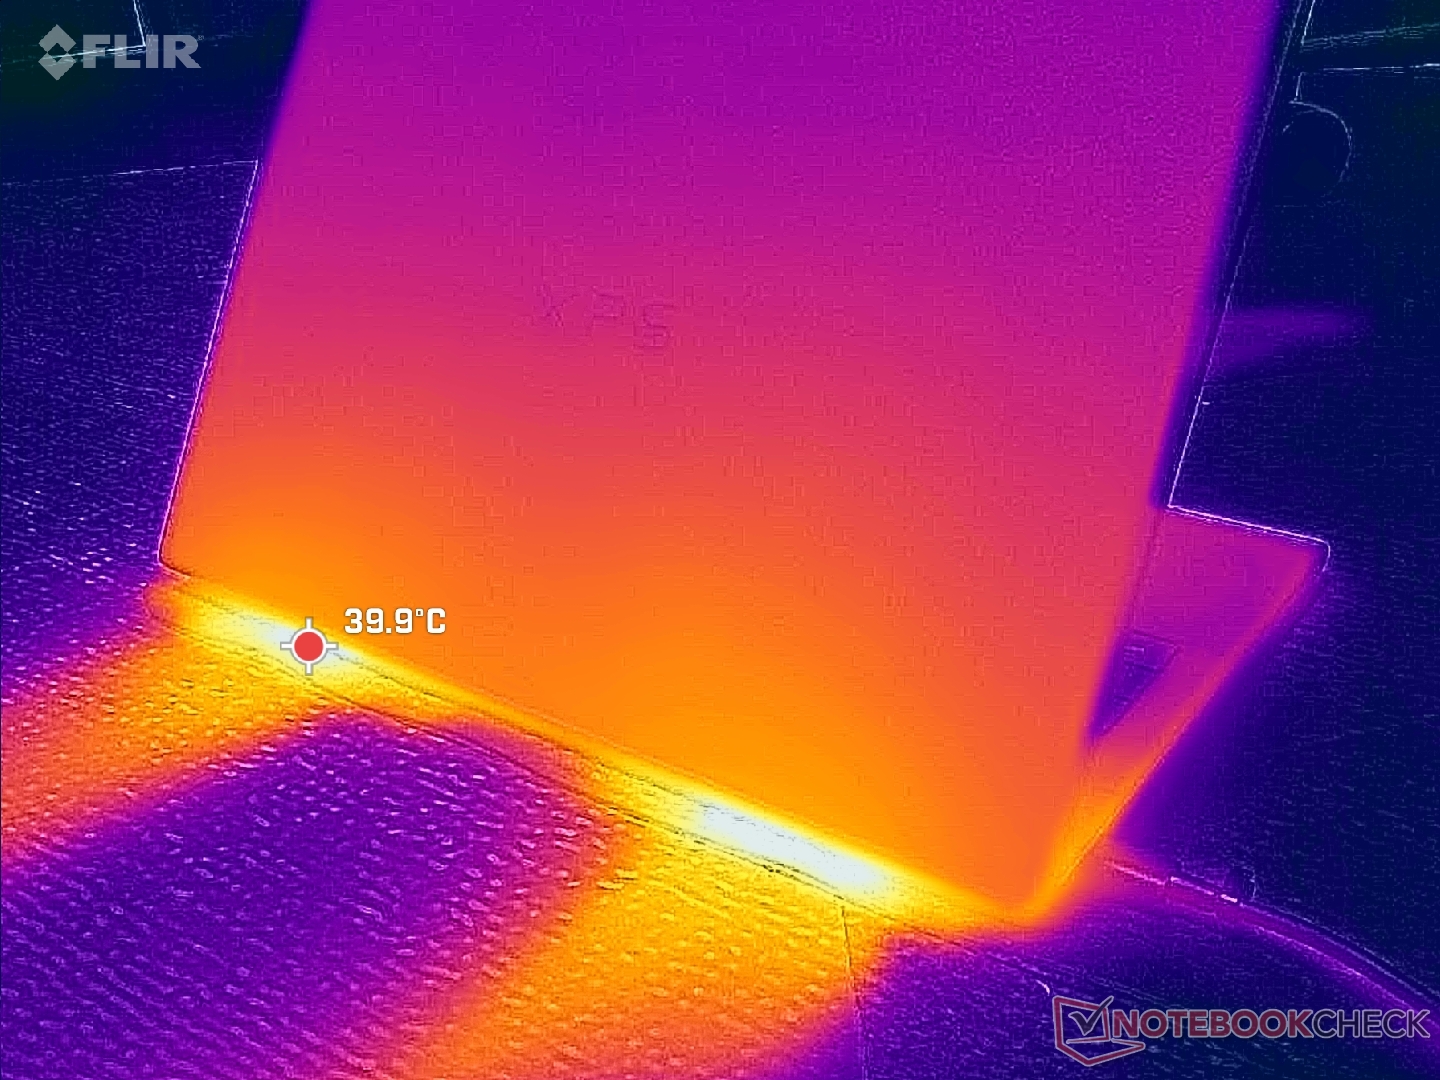
(+) The maximum temperature on the upper side is 34 °C / 93 F, compared to the average of 36.8 °C / 98 F, ranging from 21 to 71 °C for the class Multimedia.
(+) The bottom heats up to a maximum of 35.8 °C / 96 F, compared to the average of 39.1 °C / 102 F
(+) In idle usage, the average temperature for the upper side is 24.6 °C / 76 F, compared to the device average of 31.3 °C / 88 F.
(+) 3: The average temperature for the upper side is 30.1 °C / 86 F, compared to the average of 31.3 °C / 88 F for the class Multimedia.
(+) The palmrests and touchpad are cooler than skin temperature with a maximum of 31.2 °C / 88.2 F and are therefore cool to the touch.
(-) The average temperature of the palmrest area of similar devices was 28.7 °C / 83.7 F (-2.5 °C / -4.5 F).
| Dell XPS 14 Core Ultra X7 358H Ultra X7 358H, Arc B390 Panther Lake iGPU | Dell 14 Premium Ultra 7 255H, Arc 140T | Dell XPS 14 2024 OLED Ultra 7 155H, GeForce RTX 4050 Laptop GPU | Asus ExpertBook Ultra B9406CAA Ultra X7 358H, Arc B390 Panther Lake iGPU | Lenovo Yoga Pro 7 14IAH10 Ultra 9 285H, Arc 140T | HP EliteBook X G1i 14 AI Core Ultra 7 268V, Arc 140V | |
|---|---|---|---|---|---|---|
| Heat | 2% | -12% | -4% | -8% | 5% | |
| Maximum Upper Side * (°C) | 34 | 33 3% | 40.5 -19% | 38.6 -14% | 38.1 -12% | 35 -3% |
| Maximum Bottom * (°C) | 35.8 | 33.6 6% | 42.6 -19% | 38.4 -7% | 36.5 -2% | 33.4 7% |
| Idle Upper Side * (°C) | 25.6 | 26.4 -3% | 26.9 -5% | 24.6 4% | 28.2 -10% | 23.8 7% |
| Idle Bottom * (°C) | 26.4 | 25.6 3% | 27.8 -5% | 26 2% | 28.8 -9% | 24.2 8% |
* ... smaller is better
压力测试

在运行 Prime95 压力测试时,CPU 会提升至 3 GHz、69 W 和 100 C,大约 30 秒后最终降至 2 GHz、30 W 和 74 C。因此,Turbo Boost 的持续性受到了限制,这与上文 CineBench R15 的观察结果相符。相比之下,同样的 CPU 在 ExpertBook Ultra将稳定在更高的 48 W,以获得更快的处理器性能。
在运行《赛博朋克 2077》时,GPU 时钟频率和温度将稳定在 2000 MHz 和 63 C,而上述华硕产品即使设置为超高性能模式,也会稳定在 2500 MHz 和 88 C。


| CPU 平均时钟 (GHz) | GPU 时钟 (MHz) | CPU 平均温度 (°C) | |
| 系统闲置 | -- | -- | 41 |
| Prime95 压力 | 2.0 | -- | 74 |
| Prime95 + FurMark Stress | 1.5 | 1350 | 67 |
| 赛博朋克 2077》压力(性能模式) | 0.8 | 2000 | 63 |
| 赛博朋克 2077》压力(平衡模式) | 0.8 | 1950 | 62 |
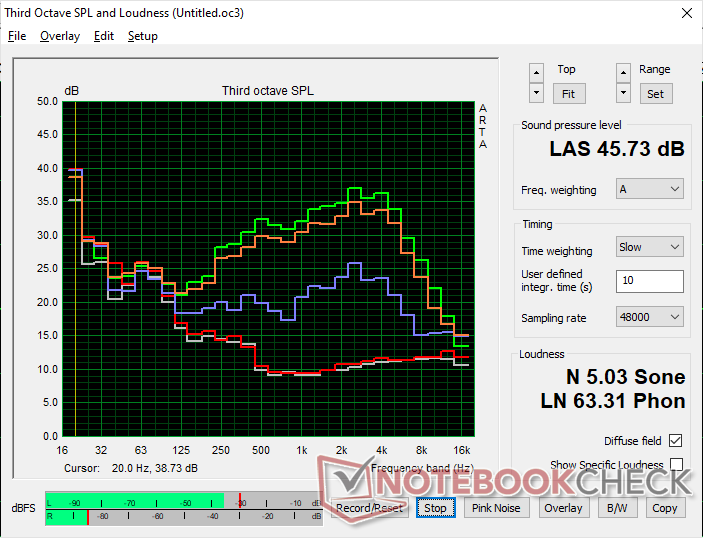
发言人
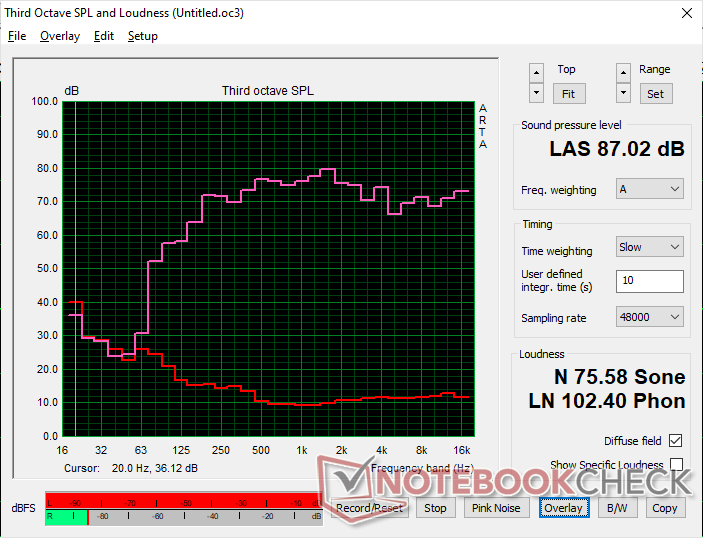

Dell XPS 14 Core Ultra X7 358H audio analysis
(+) | speakers can play relatively loud (87 dB)
Bass 100 - 315 Hz
(±) | reduced bass - on average 7.6% lower than median
(+) | bass is linear (5.9% delta to prev. frequency)
Mids 400 - 2000 Hz
(+) | balanced mids - only 3.2% away from median
(+) | mids are linear (3.6% delta to prev. frequency)
Highs 2 - 16 kHz
(+) | balanced highs - only 3.3% away from median
(+) | highs are linear (5.8% delta to prev. frequency)
Overall 100 - 16.000 Hz
(+) | overall sound is linear (7.3% difference to median)
Compared to same class
» 6% of all tested devices in this class were better, 1% similar, 94% worse
» The best had a delta of 5%, average was 17%, worst was 45%
Compared to all devices tested
» 1% of all tested devices were better, 0% similar, 99% worse
» The best had a delta of 4%, average was 24%, worst was 134%
Apple MacBook Pro 16 2021 M1 Pro audio analysis
(+) | speakers can play relatively loud (84.7 dB)
Bass 100 - 315 Hz
(+) | good bass - only 3.8% away from median
(+) | bass is linear (5.2% delta to prev. frequency)
Mids 400 - 2000 Hz
(+) | balanced mids - only 1.3% away from median
(+) | mids are linear (2.1% delta to prev. frequency)
Highs 2 - 16 kHz
(+) | balanced highs - only 1.9% away from median
(+) | highs are linear (2.7% delta to prev. frequency)
Overall 100 - 16.000 Hz
(+) | overall sound is linear (4.6% difference to median)
Compared to same class
» 0% of all tested devices in this class were better, 0% similar, 100% worse
» The best had a delta of 5%, average was 17%, worst was 45%
Compared to all devices tested
» 0% of all tested devices were better, 0% similar, 100% worse
» The best had a delta of 4%, average was 24%, worst was 134%
能源管理
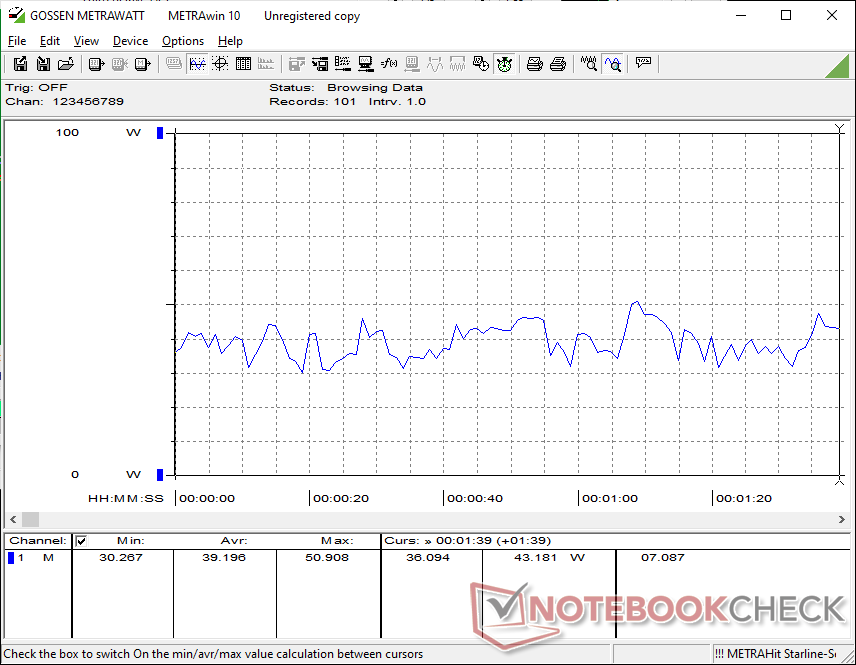
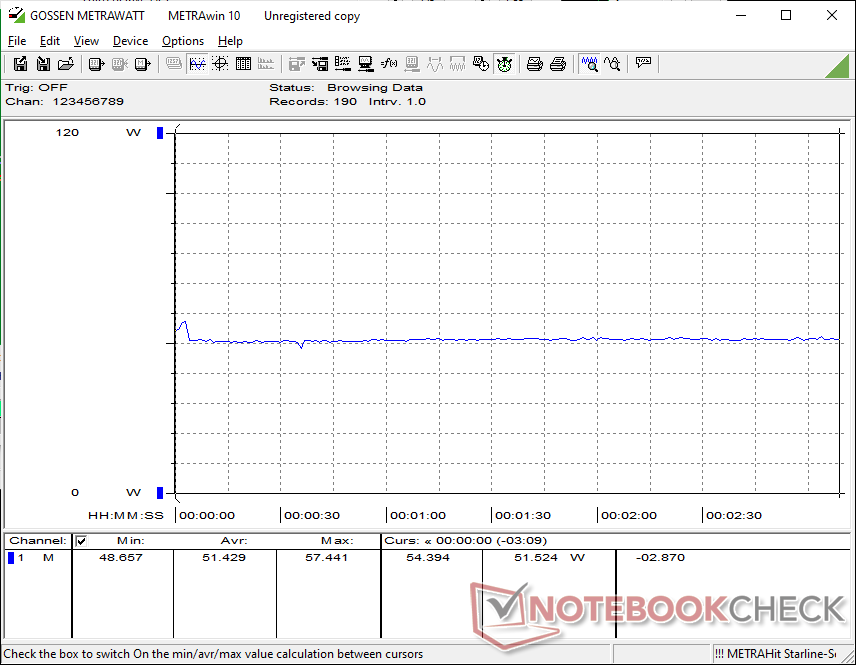
耗电量
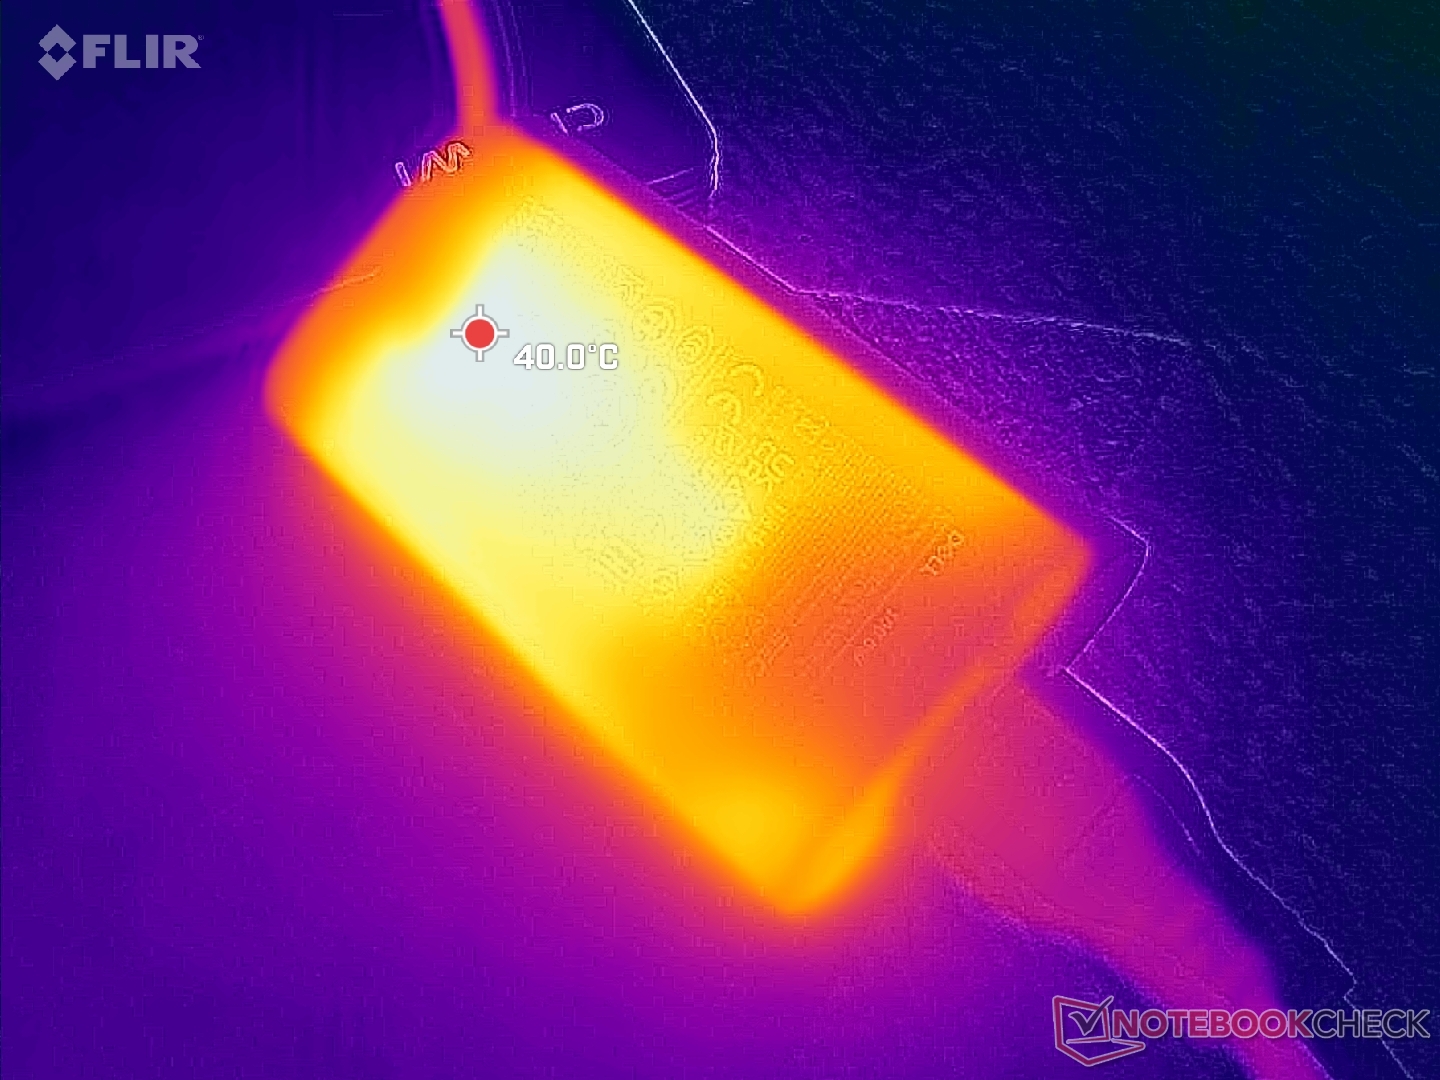
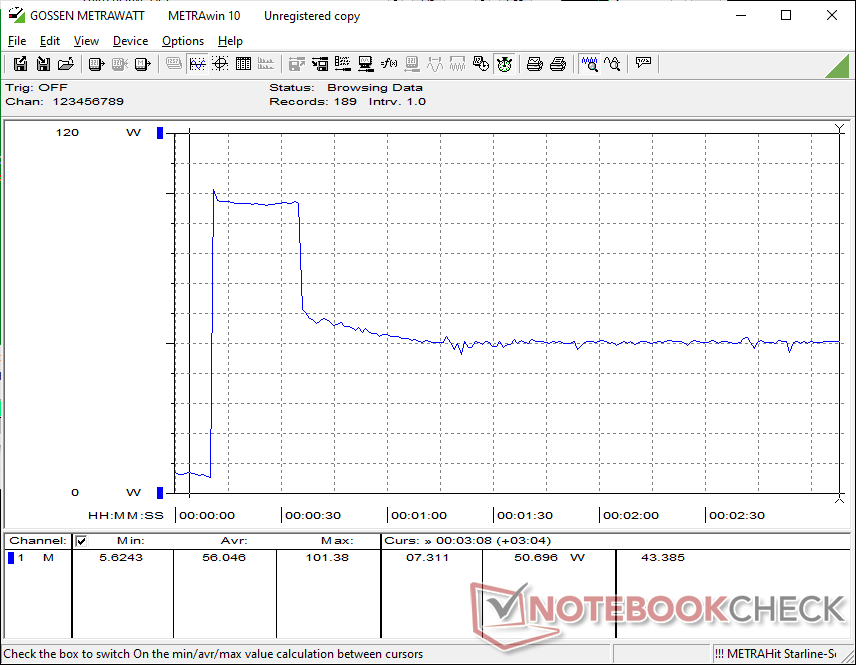
每瓦图形性能是 2026 XPS 14 的最大优势之一,这要归功于 Panther Lake。以运行《赛博朋克 2077》为例,其要求与 2025 XPS 14 大致相同,但性能却提高了约 80%,同比有显著提升。不过,与去年的酷睿 7 255H 相比,CPU 每瓦性能的提升相对较小。
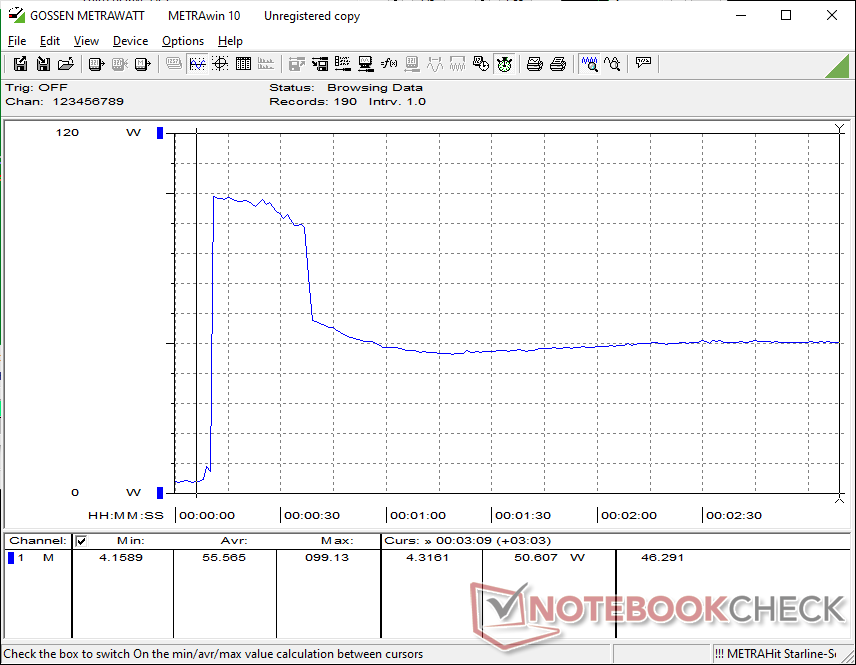
当 CPU 处于满负荷工作状态时,我们可以通过小型(约 10.2 x 5.5 x 2.2 厘米)100 W USB-C 交流适配器记录到 102 W 的临时最大功耗,远高于 2025 XPS 14 在类似条件下的功耗。较高的功率上限体现了 Panther Lake-H 与 Arrow Lake-H 相比更高的 Turbo Boost 上限。
| Off / Standby | |
| Idle | |
| Load |
|
Key:
min: | |
| Dell XPS 14 Core Ultra X7 358H Ultra X7 358H, Arc B390 Panther Lake iGPU, Samsung PM9C1b MZVL81T0HFLB-00BH1, OLED, 2880x1800, 14" | Dell 14 Premium Ultra 7 255H, Arc 140T, Kioxia BG6 KBG6AZNV1T02, OLED, 3200x2000, 14.5" | Dell XPS 14 2024 OLED Ultra 7 155H, GeForce RTX 4050 Laptop GPU, Samsung PM9A1 MZVL21T0HCLR, OLED, 3200x2000, 14.5" | Asus ExpertBook Ultra B9406CAA Ultra X7 358H, Arc B390 Panther Lake iGPU, Samsung PM9E1 MZVLC2T0HBLD, OLED, 2880x1800, 14" | Lenovo Yoga Pro 7 14IAH10 Ultra 9 285H, Arc 140T, WD PC SN7100S SDFPMSL-1T00-1101, OLED, 3000x1876, 14.5" | HP EliteBook X G1i 14 AI Core Ultra 7 268V, Arc 140V, Kioxia XG8 KXG80ZNV512G, IPS, 1920x1200, 14" | |
|---|---|---|---|---|---|---|
| Power Consumption | -20% | -88% | 1% | -73% | 12% | |
| Idle Minimum * (Watt) | 3.1 | 4.4 -42% | 8.1 -161% | 3.5 -13% | 7.9 -155% | 2.5 19% |
| Idle Average * (Watt) | 3.6 | 6.1 -69% | 9.9 -175% | 4 -11% | 10.5 -192% | 5.4 -50% |
| Idle Maximum * (Watt) | 10 | 13.7 -37% | 10.4 -4% | 5.3 47% | 10.8 -8% | 5.8 42% |
| Load Average * (Watt) | 39.2 | 53.8 -37% | 75.6 -93% | 43.7 -11% | 64 -63% | 36.9 6% |
| Cyberpunk 2077 ultra * (Watt) | 51.4 | 50.7 1% | 61.3 -19% | 76.3 -48% | 48.5 6% | |
| Cyberpunk 2077 ultra external monitor * (Watt) | 51.2 | 46.5 9% | 61.4 -20% | 72.6 -42% | 44.9 12% | |
| Load Maximum * (Watt) | 101.4 | 62.7 38% | 107.1 -6% | 63.4 37% | 103.2 -2% | 54.6 46% |
| Witcher 3 ultra * (Watt) | 65.6 |
* ... smaller is better
功耗 赛博朋克/压力测试
外部显示器功耗
电池寿命

在平衡模式下,无线局域网的运行时间将近 17 个小时,这与我们在配置类似的 ExpertBook Ultra 上记录的时间非常接近。不过,需要注意的是,Windows VRR 默认的固定刷新率为 120 Hz,但并未自动启用;手动启用后,刷新率将降至 20 Hz(静态时),运行时间可能会更长。
使用随附的交流适配器从空载充电到满载需要 1.5 到 2 个小时。
| Dell XPS 14 Core Ultra X7 358H Ultra X7 358H, Arc B390 Panther Lake iGPU, 70 Wh | Dell 14 Premium Ultra 7 255H, Arc 140T, 69.5 Wh | Dell XPS 14 2024 OLED Ultra 7 155H, GeForce RTX 4050 Laptop GPU, 69.5 Wh | Asus ExpertBook Ultra B9406CAA Ultra X7 358H, Arc B390 Panther Lake iGPU, 70 Wh | Lenovo Yoga Pro 7 14IAH10 Ultra 9 285H, Arc 140T, 84 Wh | HP EliteBook X G1i 14 AI Core Ultra 7 268V, Arc 140V, 68 Wh | |
|---|---|---|---|---|---|---|
| Battery runtime | -36% | -54% | -4% | -39% | 10% | |
| WiFi v1.3 (h) | 16.8 | 10.8 -36% | 7.8 -54% | 16.1 -4% | 10.3 -39% | 18.5 10% |
| H.264 (h) | 10.6 | |||||
| Load (h) | 1.3 |
笔记本检查评级
2026 XPS 14 与上一代设计相比有了很大改进,特别是在每瓦性能方面,但可维护性受到了一点影响。
Dell XPS 14 Core Ultra X7 358H
- 02/07/2026 v8
Allen Ngo
 Total Sustainability Score:
 潜在竞争对手比较
Image | Model / Review | Price | Weight | Height | Display |
|---|---|---|---|---|---|
1. 87.4%  | Dell XPS 14 Core Ultra X7 358H Intel Core Ultra X7 358H ⎘ Intel Arc B390 12 Xe3 Panther Lake iGPU ⎘ 32 GB Memory, 1000 GB SSD | Amazon: 1. $1,795.49 Dell XPS 14 Premium Laptop D... 2. $2,049.00 Dell XPS 14 9440 14.5" Noteb... 3. $2,099.99 Dell XPS 16 9640 Laptop | In... List Price: 2200 USD | 1.4 kg | 14.62 mm | 14.00" 2880x1800 243 PPI OLED |
2. 82.5%  | Dell 14 Premium Intel Core Ultra 7 255H ⎘ Intel Arc Graphics 140T ⎘ 32 GB Memory, 1024 GB SSD | Amazon: List Price: 1950 USD | 1.7 kg | 18 mm | 14.50" 3200x2000 260 PPI OLED |
3. 86.3% v7 (old)  | Dell XPS 14 2024 OLED Intel Core Ultra 7 155H ⎘ NVIDIA GeForce RTX 4050 Laptop GPU ⎘ 32 GB Memory, 1024 GB SSD | Amazon: List Price: 2949€ | 1.8 kg | 19 mm | 14.50" 3200x2000 260 PPI OLED |
4. 87.6%  | Asus ExpertBook Ultra B9406CAA Intel Core Ultra X7 358H ⎘ Intel Arc B390 12 Xe3 Panther Lake iGPU ⎘ 32 GB Memory, 2048 GB SSD | Amazon: | 1.1 kg | 15.9 mm | 14.00" 2880x1800 243 PPI OLED |
5. 87.3%  | Lenovo Yoga Pro 7 14IAH10 Intel Core Ultra 9 285H ⎘ Intel Arc Graphics 140T ⎘ 32 GB Memory, 1024 GB SSD | Amazon: List Price: 1500€ | 1.6 kg | 18.9 mm | 14.50" 3000x1876 244 PPI OLED |
6. 85.1%  | HP EliteBook X G1i 14 AI Intel Core Ultra 7 268V ⎘ Intel Arc Graphics 140V ⎘ 32 GB Memory, 512 GB SSD | Amazon: List Price: 3300 USD | 1.2 kg | 15 mm | 14.00" 1920x1200 162 PPI IPS |
Transparency
The selection of devices to be reviewed is made by our editorial team. The test sample was provided to the author as a loan by the manufacturer or retailer for the purpose of this review. The lender had no influence on this review, nor did the manufacturer receive a copy of this review before publication. There was no obligation to publish this review. As an independent media company, Notebookcheck is not subjected to the authority of manufacturers, retailers or publishers.
This is how Notebookcheck is testing
Every year, Notebookcheck independently reviews hundreds of laptops and smartphones using standardized procedures to ensure that all results are comparable. We have continuously developed our test methods for around 20 years and set industry standards in the process. In our test labs, high-quality measuring equipment is utilized by experienced technicians and editors. These tests involve a multi-stage validation process. Our complex rating system is based on hundreds of well-founded measurements and benchmarks, which maintains objectivity. Further information on our test methods can be found here.

