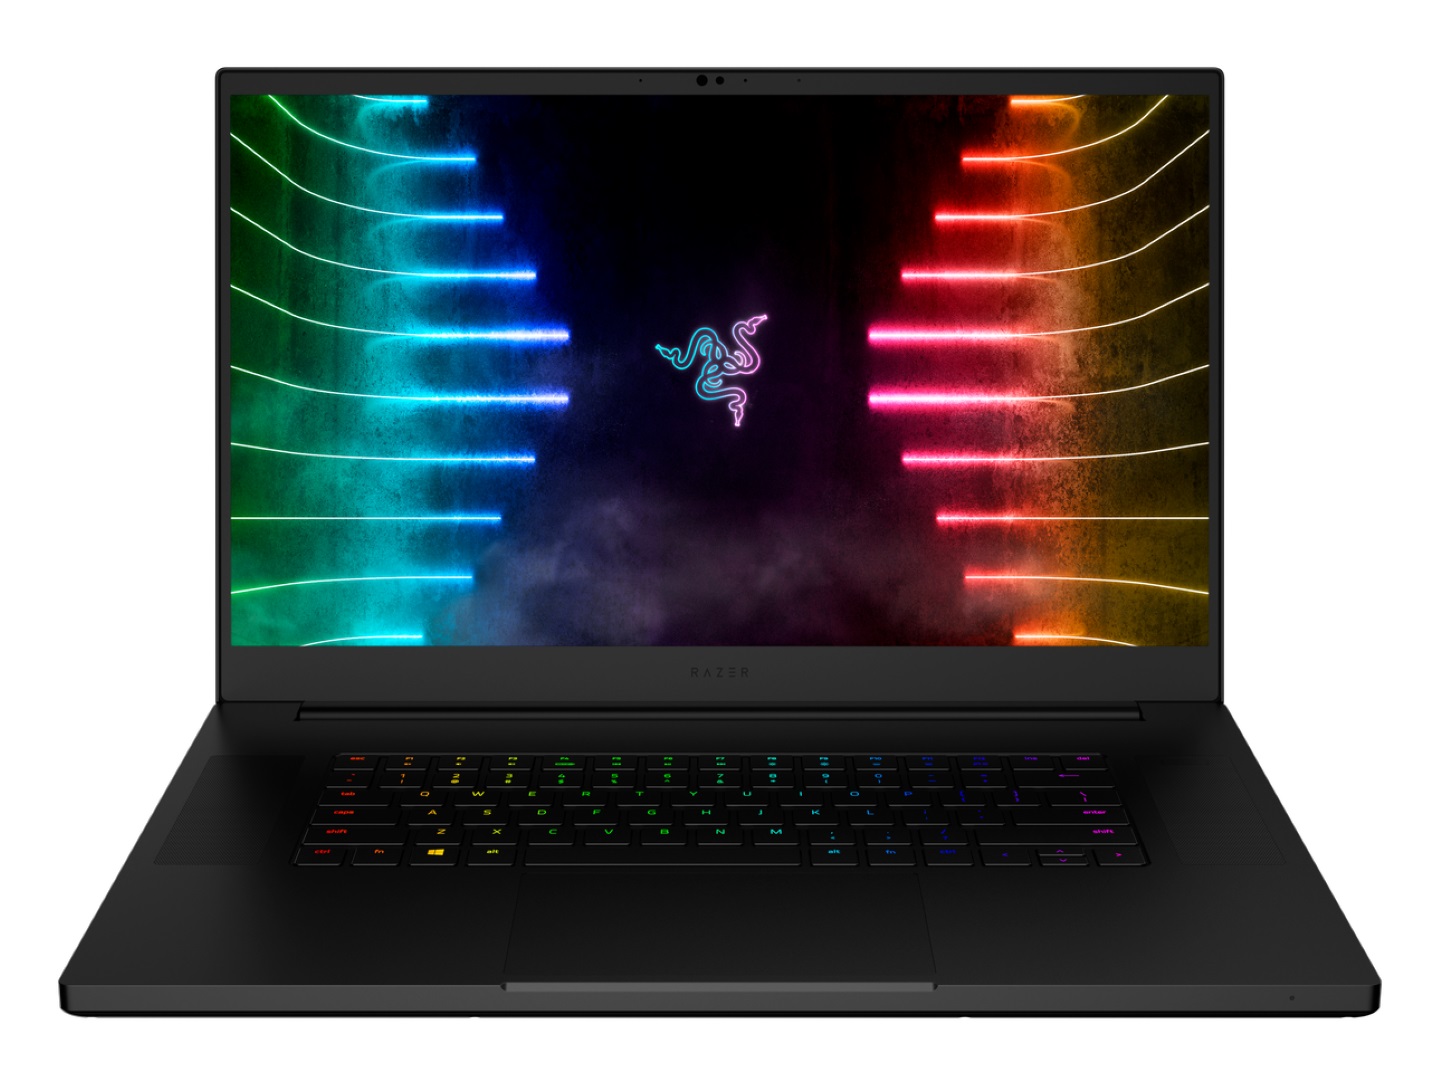
Razer Blade 17笔记本电脑回顾。现在有130 W TGPGeForce RTX图形
Razer总是在新的CPU和GPU出现时迅速跳上它们。结果往往是非常好的,有明显的基因对基因的收益,而其他时候则是平淡的。这 Ice Lake Blade Stealth例如,事实证明,它比更便宜的 Whiskey Lake-U版本它应该被取代。值得庆幸的是,这个最新的17.3英寸刀锋机型没有这样的问题。
2021年的Blade 17继承了Blade Pro 17,去掉了 "Pro",并在其中加入了新的英特尔11代Tiger Lake-H处理器。GPU和显示器也分别从100 W TGP和300 Hz升级到130 W TGP和360 Hz。机箱设计和物理特征在其他方面与最初的2019年型号相同,后者推出了第九代Coffee Lake-H处理器和图灵GPU。
刀片17的替代品包括其他高端超薄游戏笔记本电脑,如 微星GS76, 华硕Zephyrus S17, 宏碁掠夺者Triton, 或 技嘉Aero或 Aorus 系列。我们的确切配置目前以2799美元的价格发货。
更多Razer评论。
potential competitors in comparison
Rating | Date | Model | Weight | Height | Size | Resolution | Price |
|---|---|---|---|---|---|---|---|
| 89.4 % v7 (old) | 09 / 2021 | Razer Blade 17 RTX 3070 i7-11800H, GeForce RTX 3070 Laptop GPU | 2.8 kg | 19.9 mm | 17.30" | 1920x1080 | |
| 90.1 % v7 (old) | 08 / 2021 | Asus ROG Zephyrus S17 GX703HSD i9-11900H, GeForce RTX 3080 Laptop GPU | 2.8 kg | 19.9 mm | 17.30" | 2560x1440 | |
| 86.2 % v7 (old) | 09 / 2021 | MSI GS76 Stealth 11UH i9-11900H, GeForce RTX 3080 Laptop GPU | 2.4 kg | 20 mm | 17.30" | 3840x2160 | |
| 82 % v7 (old) | Acer Nitro 5 AN517-41-R9S5 R7 5800H, GeForce RTX 3080 Laptop GPU | 2.7 kg | 24.9 mm | 17.30" | 1920x1080 | ||
| 88 % v7 (old) | 09 / 2021 | Gigabyte Aero 17 HDR YD i9-11980HK, GeForce RTX 3080 Laptop GPU | 2.8 kg | 22 mm | 17.30" | 3840x2160 | |
| 87.8 % v7 (old) | 09 / 2021 | Maingear Vector Pro MG-VCP17 i7-11800H, GeForce RTX 3080 Laptop GPU | 2.3 kg | 19.81 mm | 17.30" | 2560x1440 |
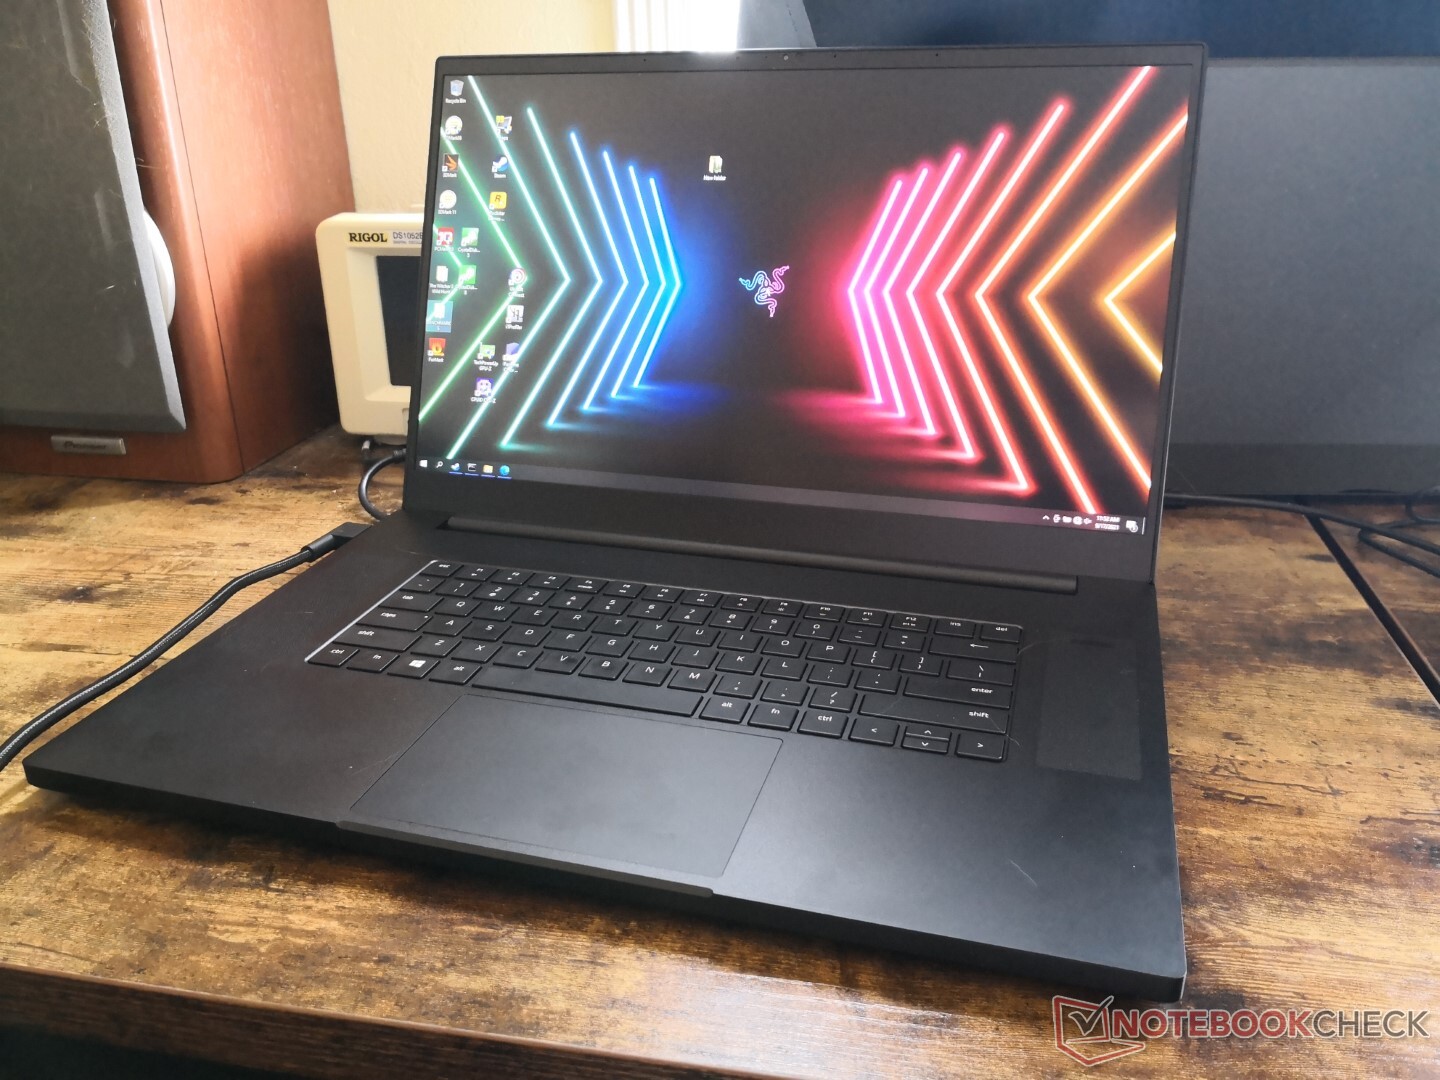
案例 - 内部变化
同年的升级都是内部的,因为外部骨架没有变化。主要的更新包括。
- 第11代英特尔Tiger Lake-H CPU(最高为Core i9),以取代去年的第10代Comet Lake-H
- 130 W TGPGeForce RTX GPU,取代去年的100 W选项
- 1080p(210万像素)网络摄像头,而去年的型号为720p(100万像素)。
- 兼容Thunderbolt 4,而不是只有Thunderbolt 3
- 支持两个PCIe4 NVMe SSD,而不是只有PCIe3
- 新的显示选项包括360赫兹刷新率,而不是300赫兹
- 支持Wi-Fi 6E的英特尔AX210,取代去年的AX200/201
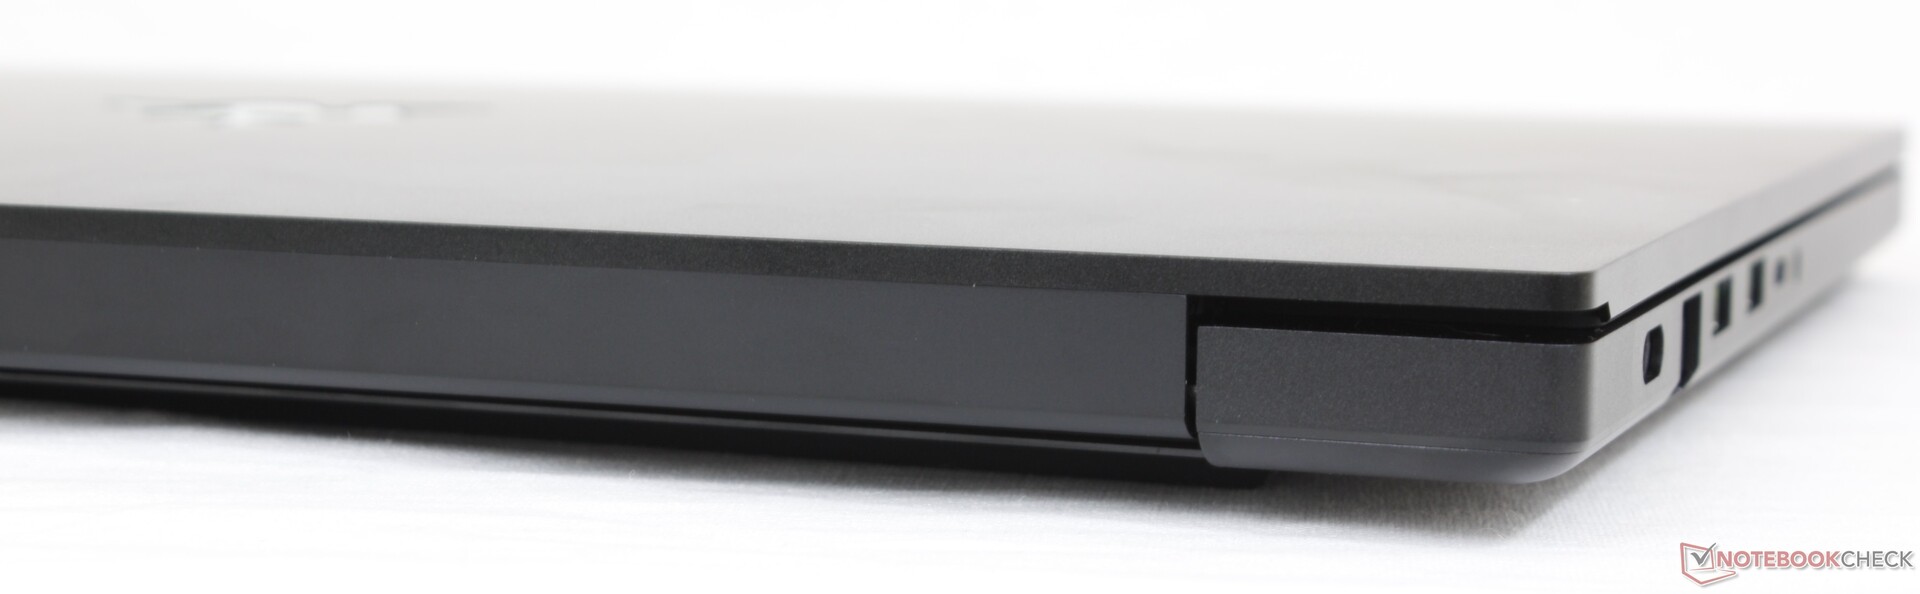
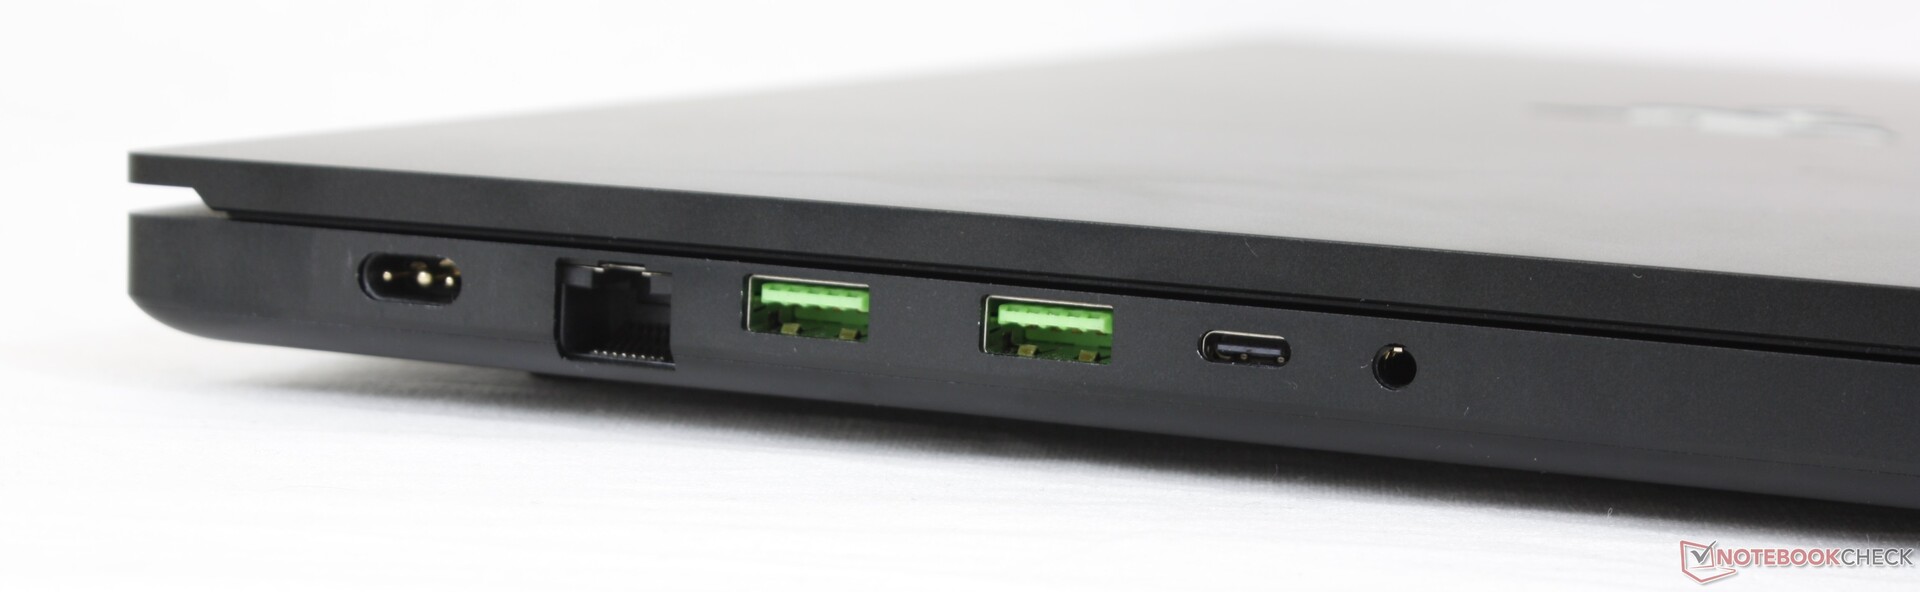
连接性 - 现在有了Thunderbolt 4
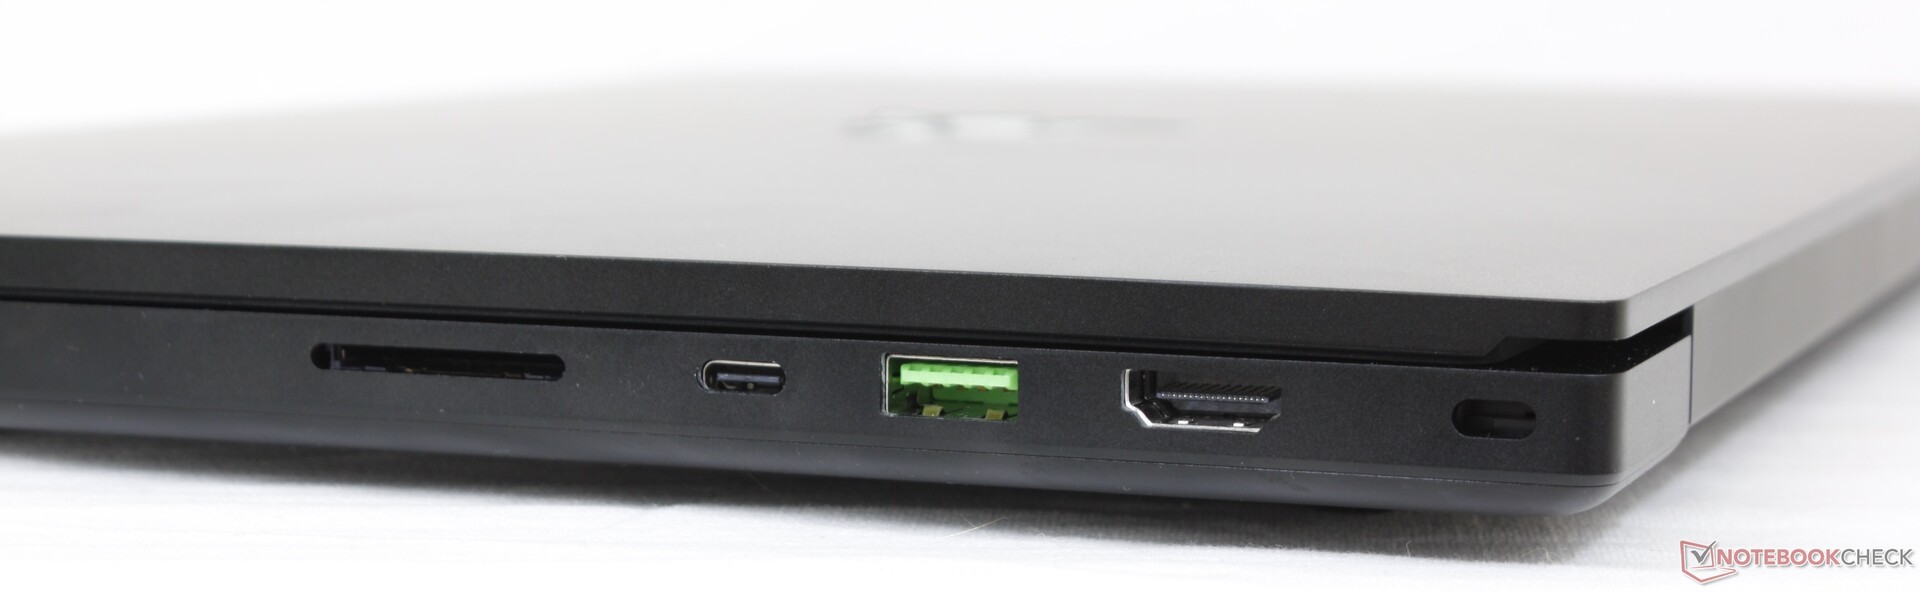
SD卡阅读器
| SD Card Reader | |
| average JPG Copy Test (av. of 3 runs) | |
| Razer Blade 17 RTX 3070 (AV Pro V60) | |
| MSI GS76 Stealth 11UH (AV PRO microSD 128 GB V60) | |
| Gigabyte Aero 17 HDR YD (AV PRO microSD 128 GB V60) | |
| Asus ROG Zephyrus S17 GX703HSD | |
| Maingear Vector Pro MG-VCP17 (AV Pro V60) | |
| maximum AS SSD Seq Read Test (1GB) | |
| Asus ROG Zephyrus S17 GX703HSD | |
| MSI GS76 Stealth 11UH (AV PRO microSD 128 GB V60) | |
| Razer Blade 17 RTX 3070 (AV Pro V60) | |
| Gigabyte Aero 17 HDR YD (AV PRO microSD 128 GB V60) | |
| Maingear Vector Pro MG-VCP17 (AV Pro V60) | |
通信 - Wi-Fi 6E现在是标准配置
对于大多数用户来说,Wi-Fi 6E的性能与现有的Wi-Fi 6笔记本电脑相同,因为用户需要一个Wi-Fi 6E路由器来利用其所有的好处。当与我们的Netgear RAX200测试路由器配对时,传输率保持稳定,与去年的Wi-Fi 6模型相比基本没有变化。
网络摄像头 - 1080p而不是720p
正如我们下面的对比图片所示,这次的相机确实更清晰。然而,色彩准确性似乎没有任何改善或恶化。网络摄像头快门继续缺失。

 GeForce RTX 3080 Laptop GPU, i7-10875H, Samsung PM981a MZVLB1T0HBLR")
 GeForce RTX 3080 Laptop GPU, i7-10875H, Samsung PM981a MZVLB1T0HBLR")


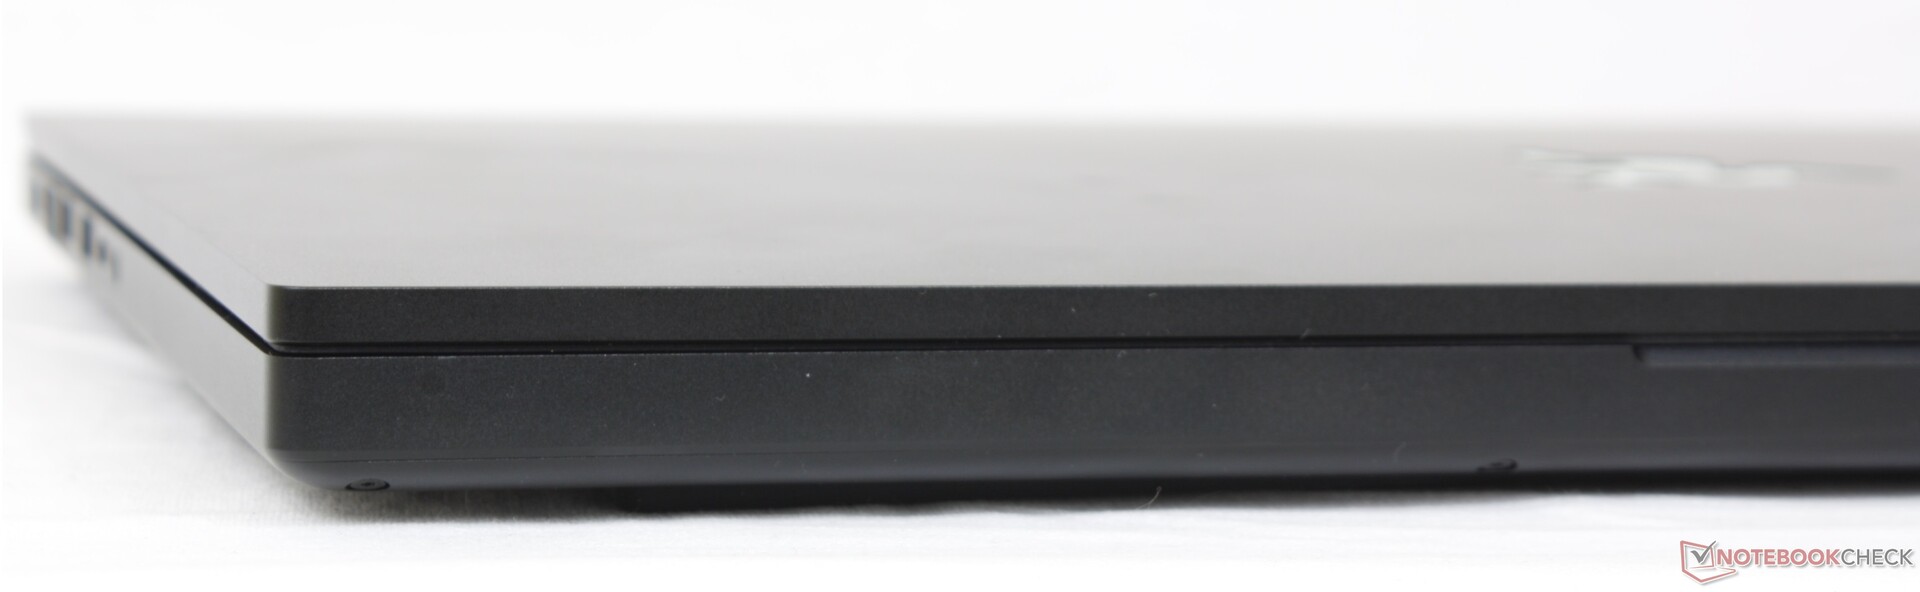
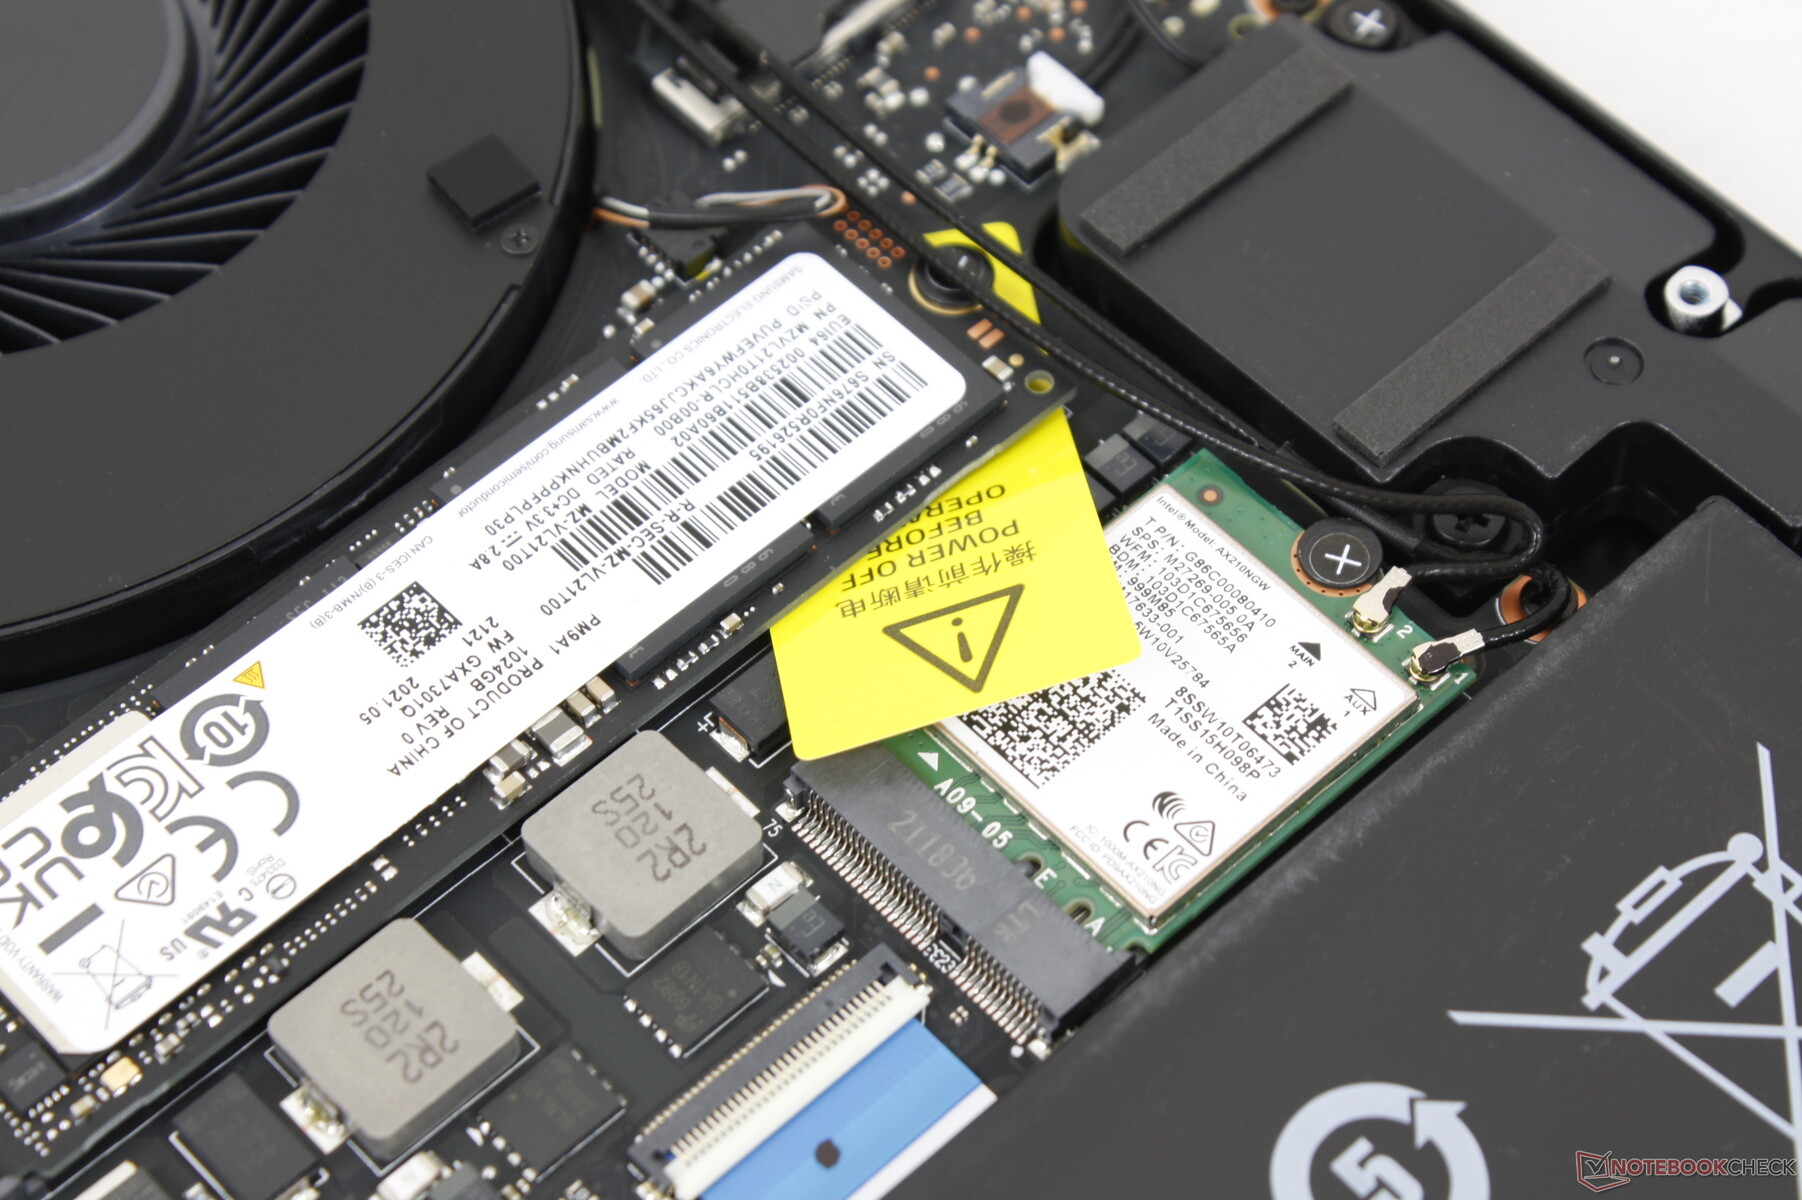
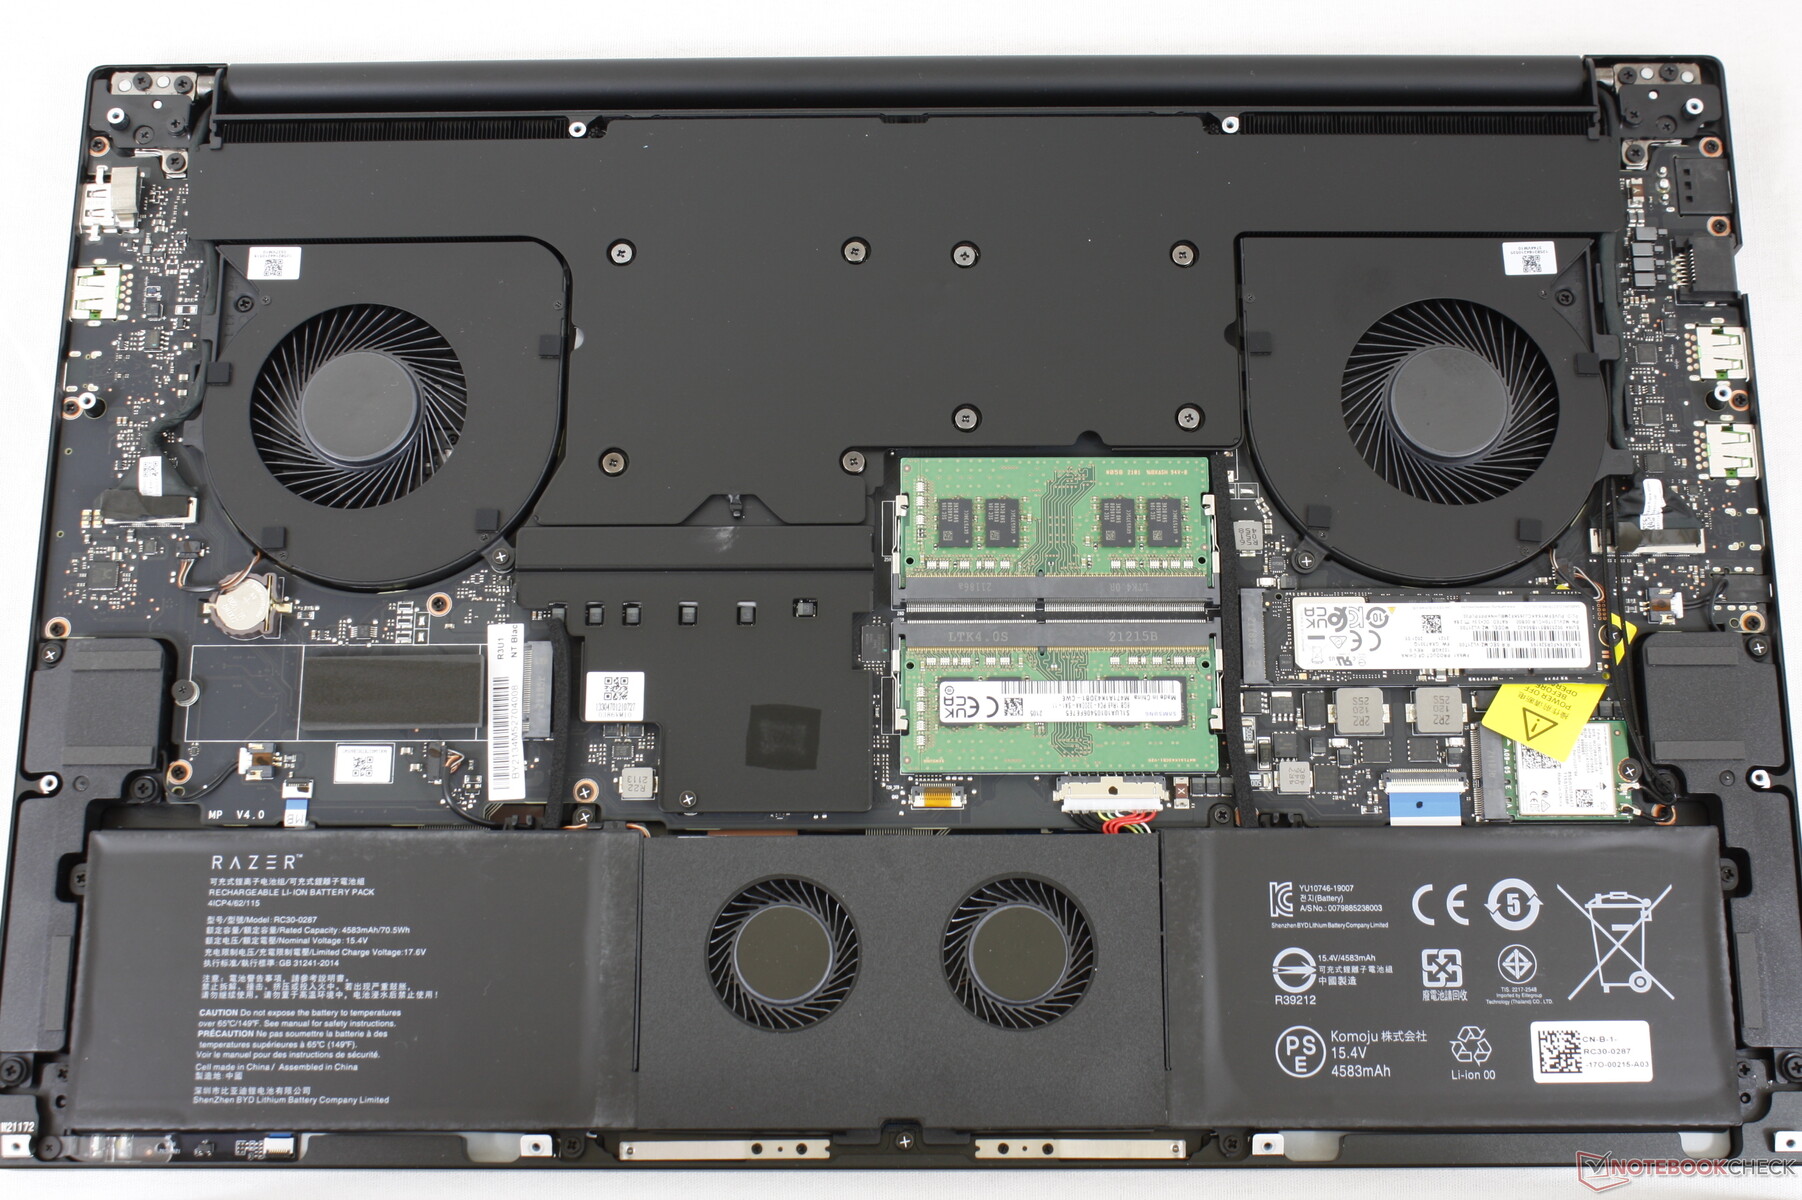
维护
与Blade Pro相比,Blade 17上的螺丝位置有一些轻微的变化。否则,其他大部分东西似乎都是相同的。
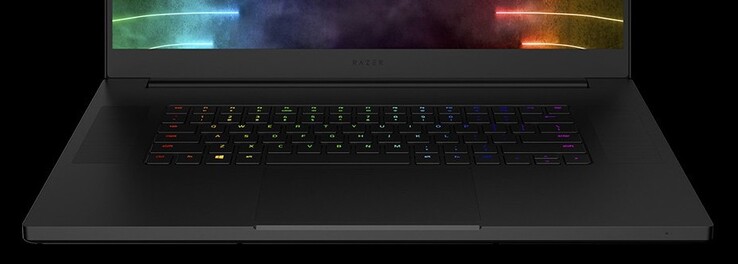
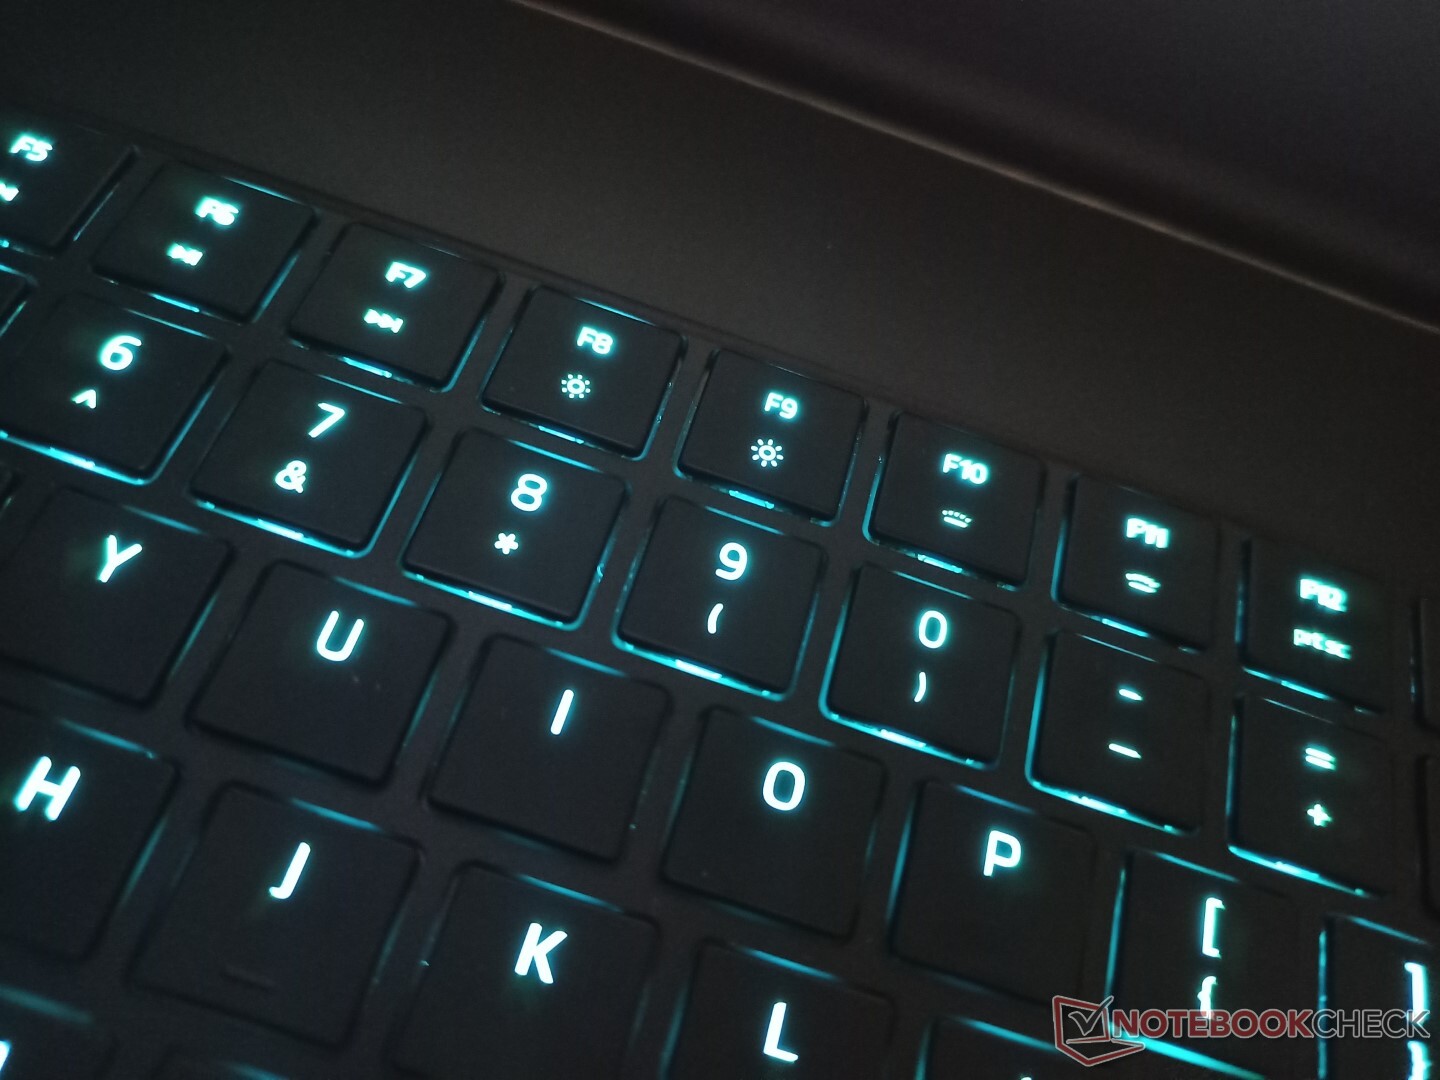
输入设备
在我们的美国设备上,所有的键盘按键和符号都被点亮。我们怀疑,由于Razer没有对机箱进行外部改动,一些符号可能在海外的型号上还没有被点亮。
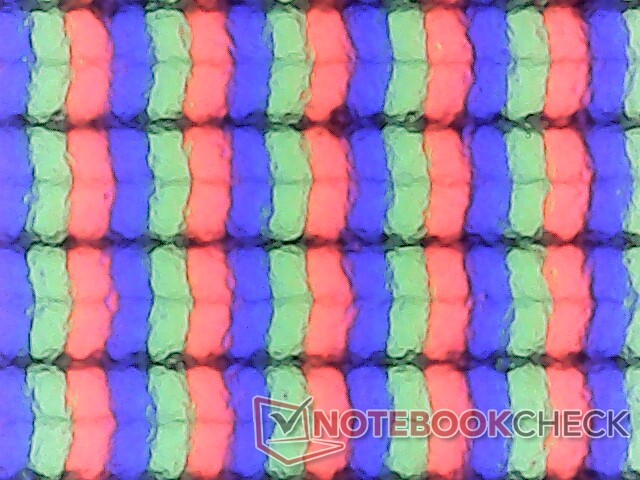
显示 - 超平滑的360赫兹
Razer在其Blade 17上使用了相同的1080p 360 Hz AU Optronics B173HAN05.4 IPS面板,因为华硕在其Blade 17上使用了Strix Scar 17 G733QS.因此,这两款笔记本电脑的观看体验非常相似。这种特殊的面板提供了全sRGB覆盖,具有非常快的响应时间和令人尊敬的近1000:1的对比度,对编辑和游戏都有好处。它的属性几乎与去年Blade Pro上的300赫兹夏普面板相同,这意味着用户实际上只是为那稍快的刷新率买单。
其他显示选项包括165赫兹1440p(QHD),全sRGB覆盖,以及光面4K触摸屏,全AdobeRGB覆盖。后者预计也会比我们的360赫兹选项更亮(约400尼特与约300尼特)。
| |||||||||||||||||||||||||
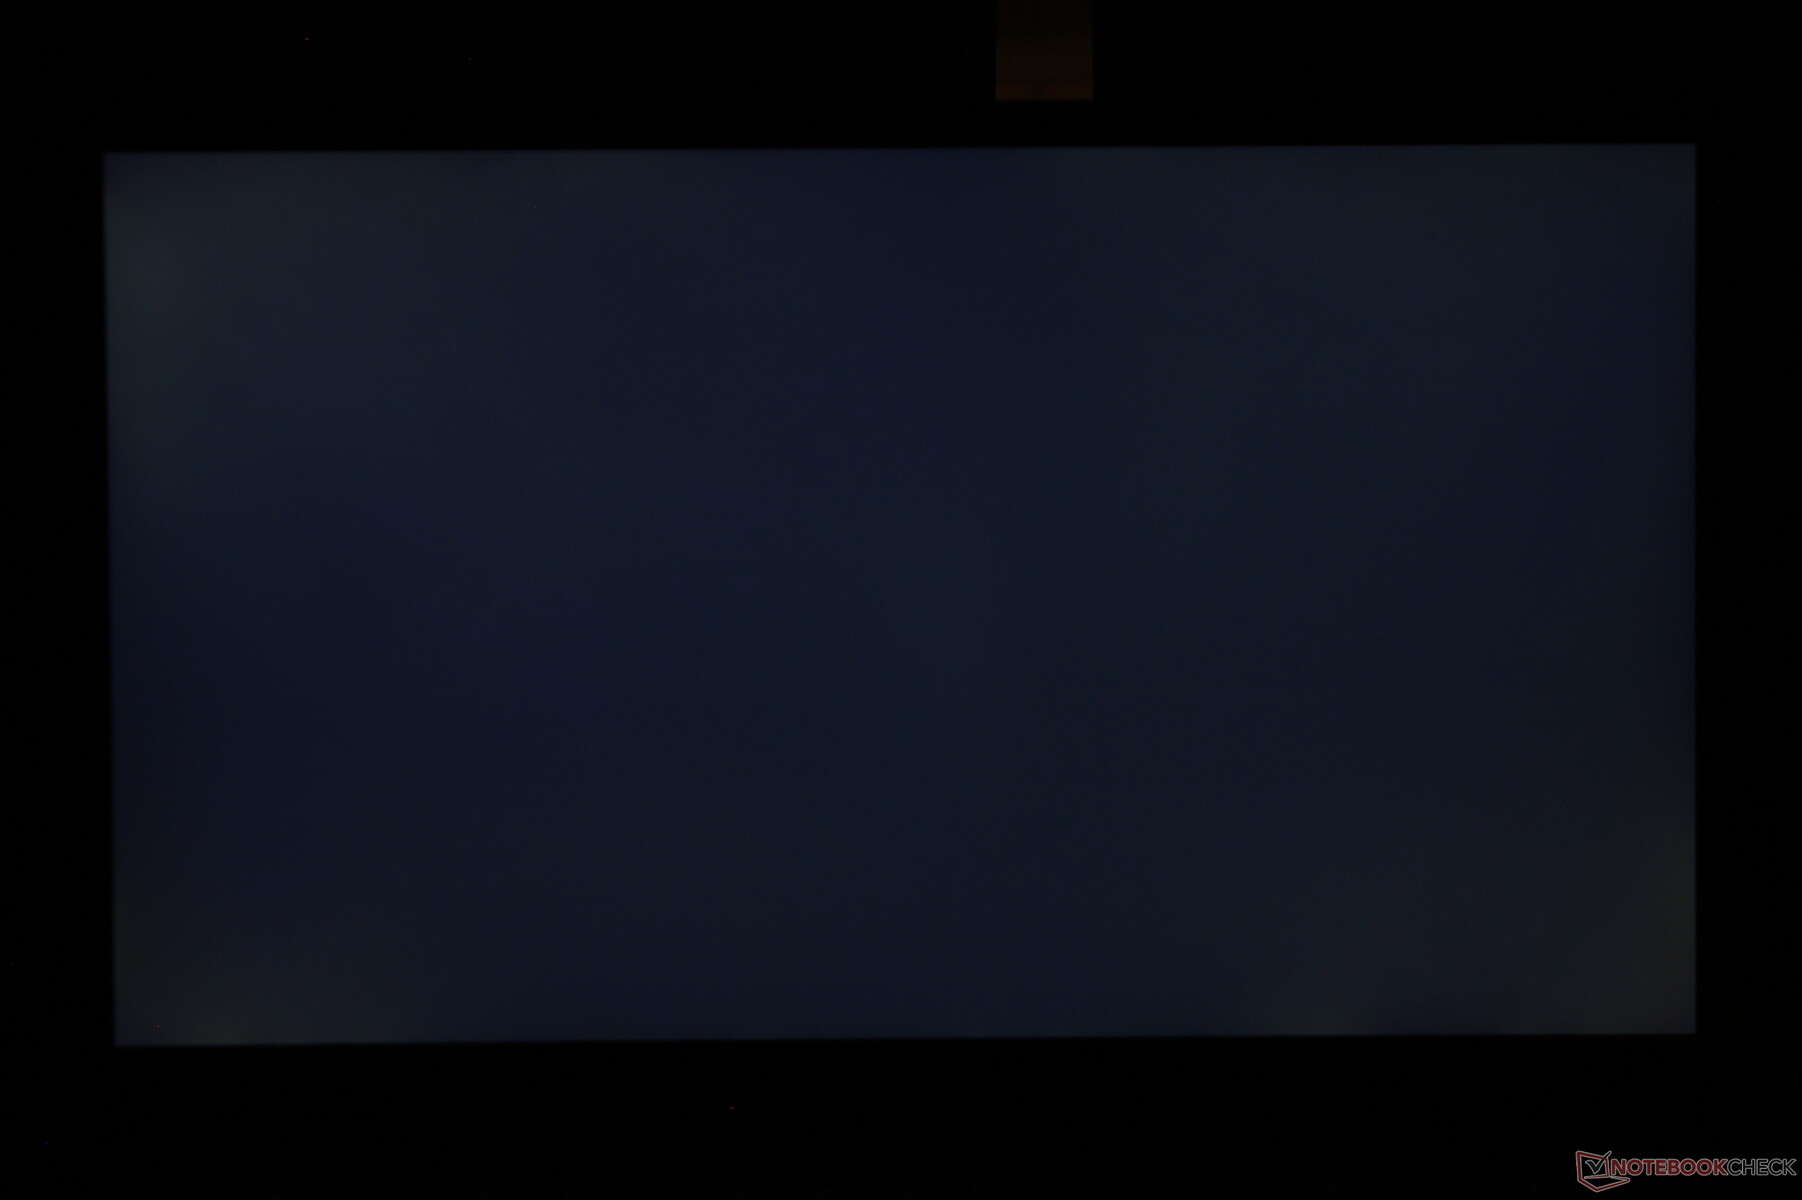
Brightness Distribution: 91 %
Center on Battery: 323.3 cd/m²
Contrast: 980:1 (Black: 0.33 cd/m²)
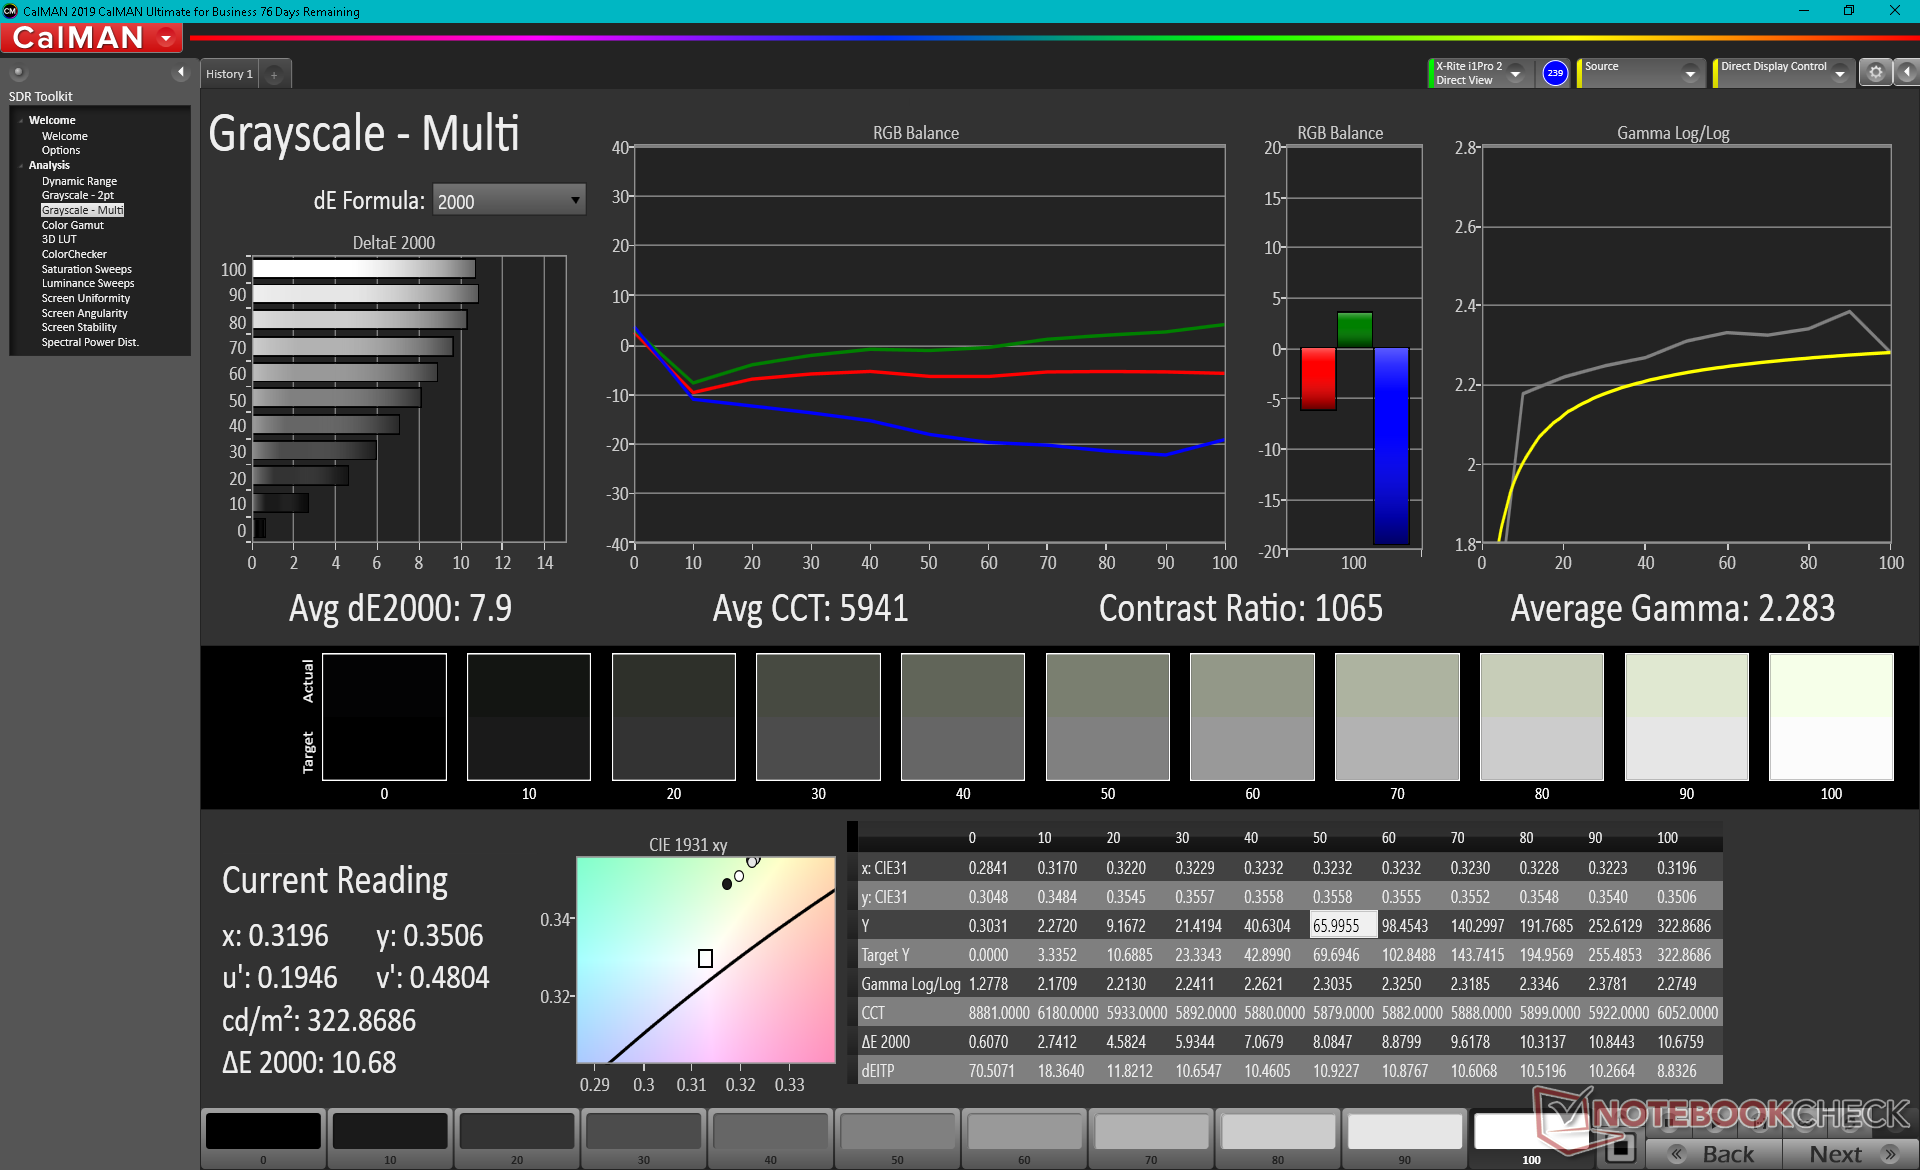
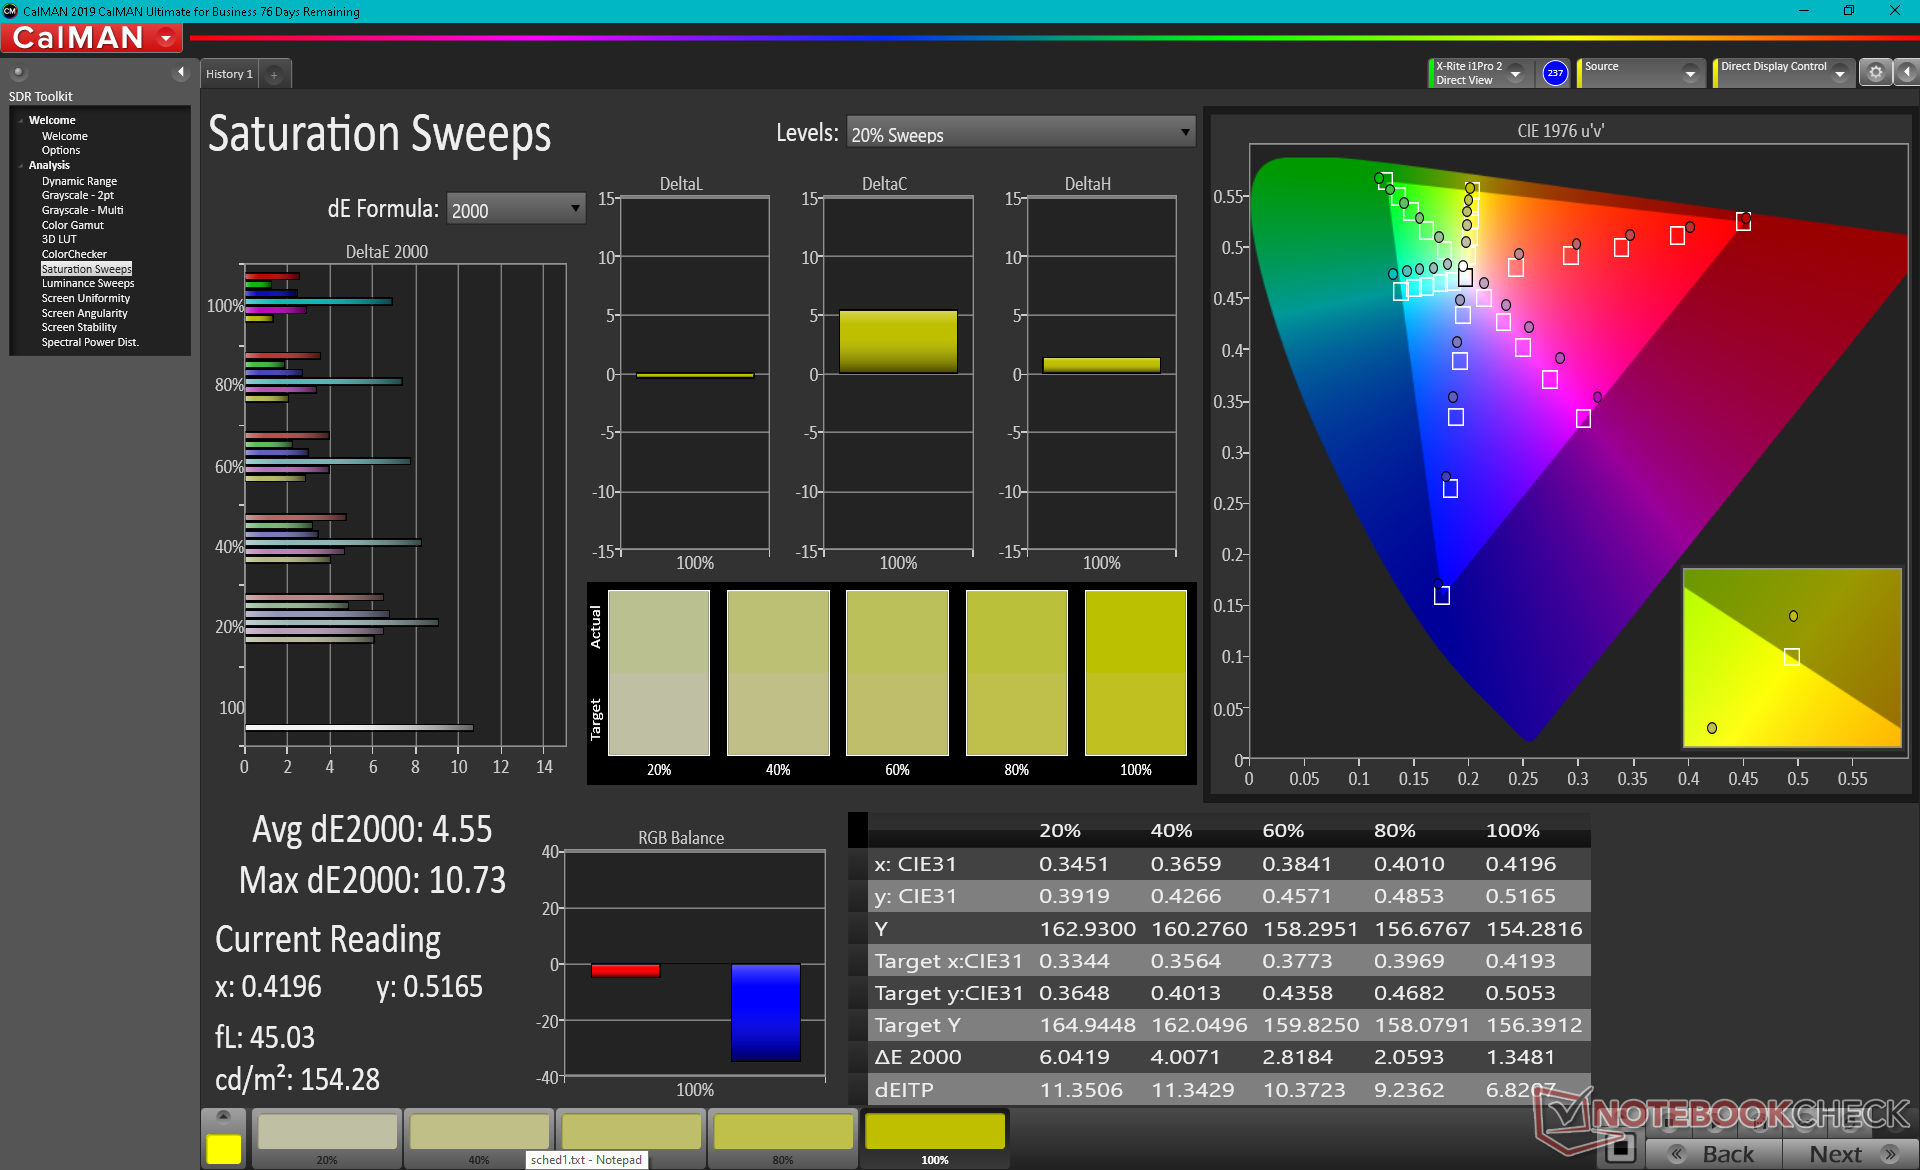
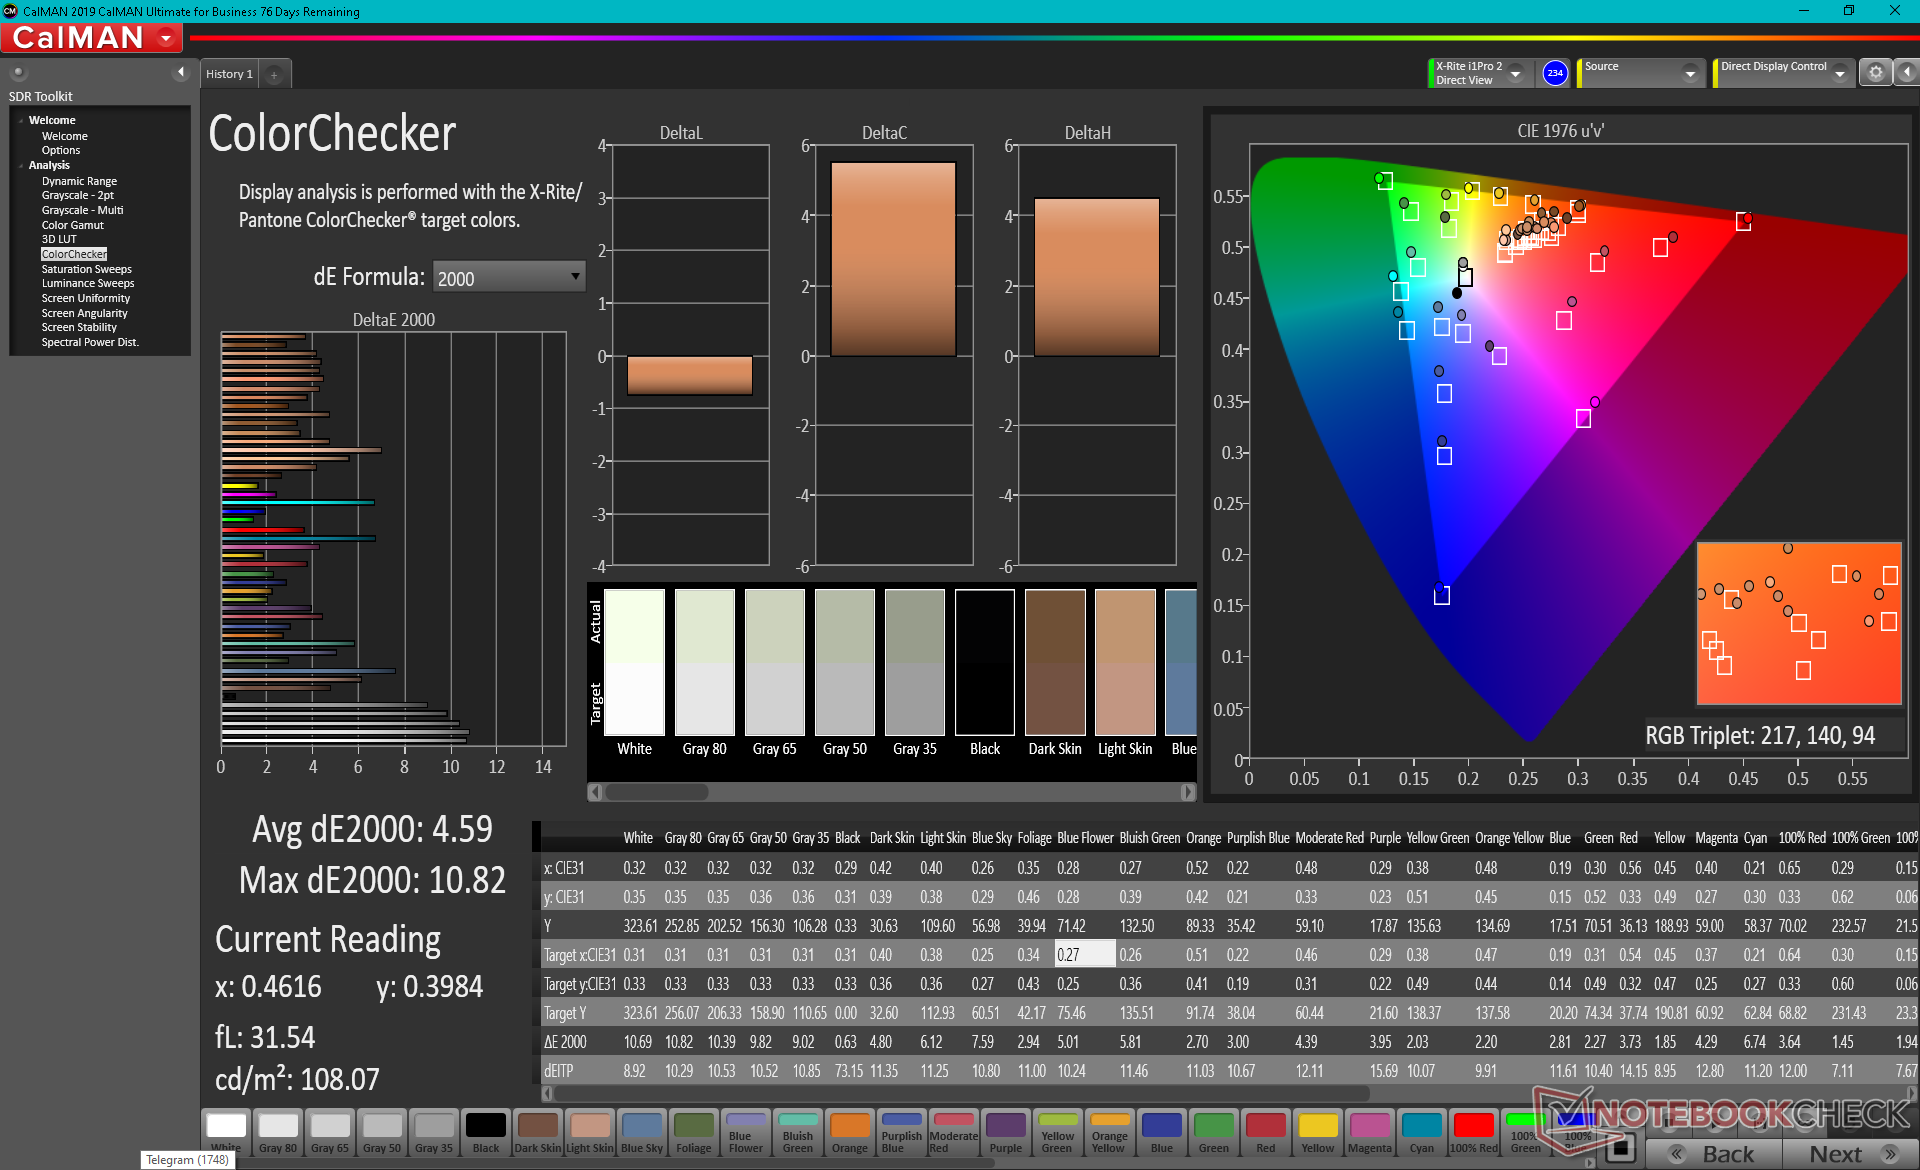
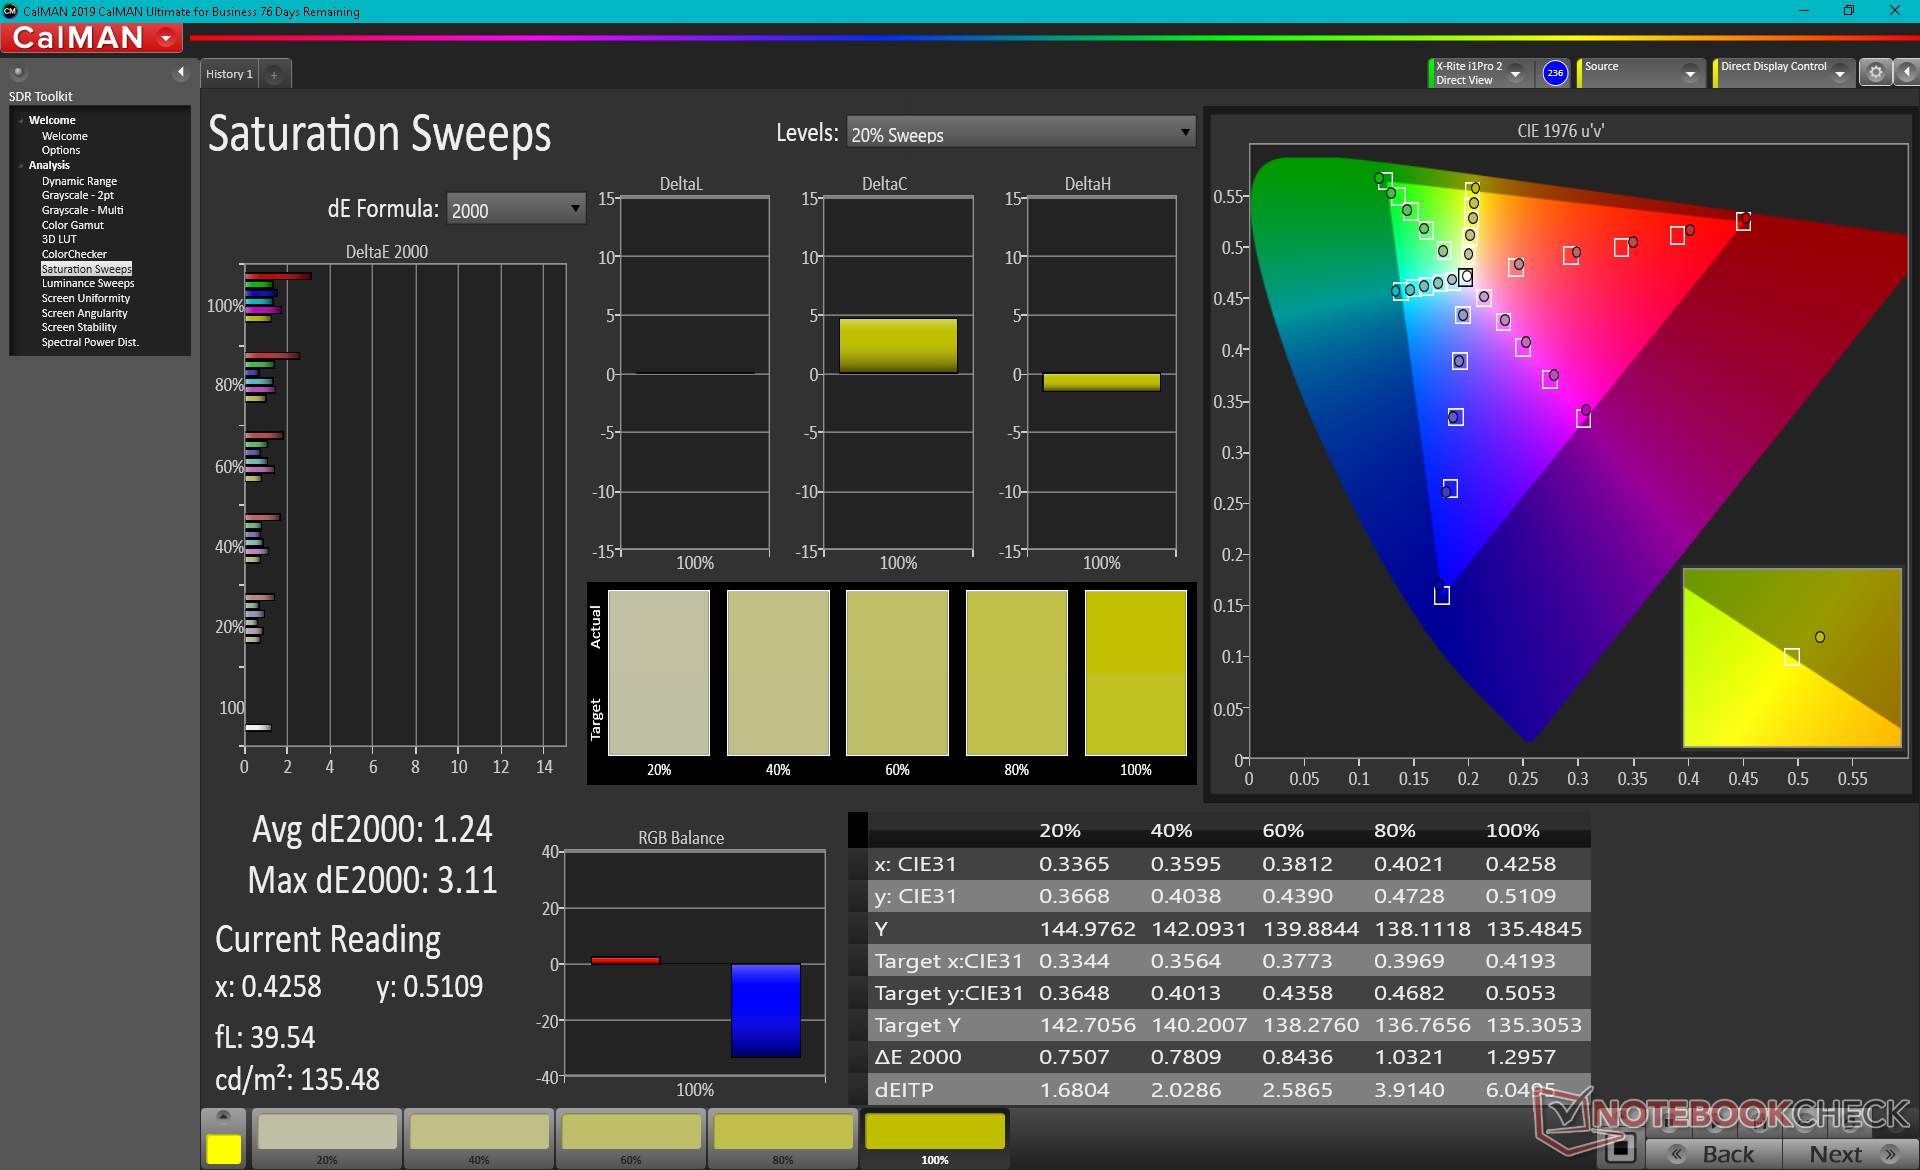
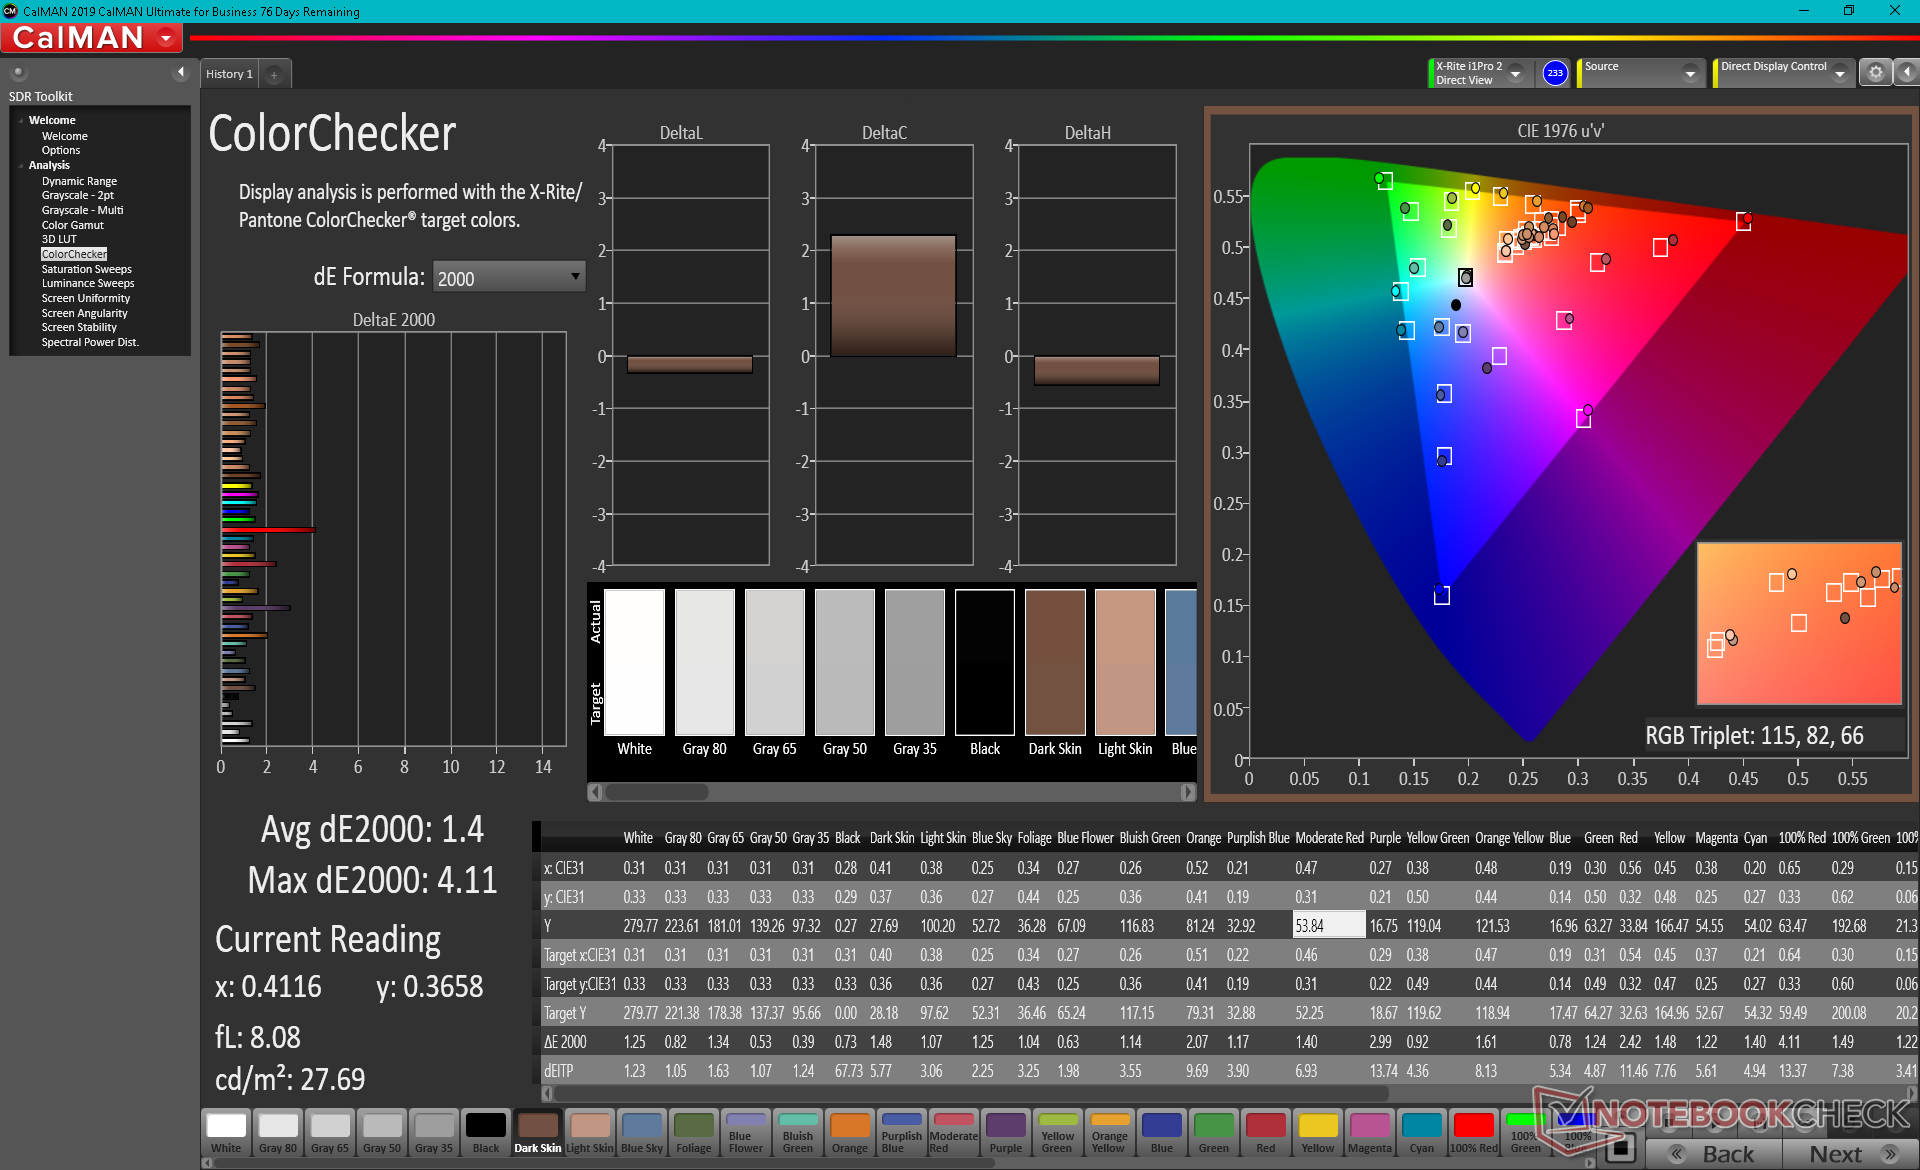
ΔE ColorChecker Calman: 4.59 | ∀{0.5-29.43 Ø4.71}
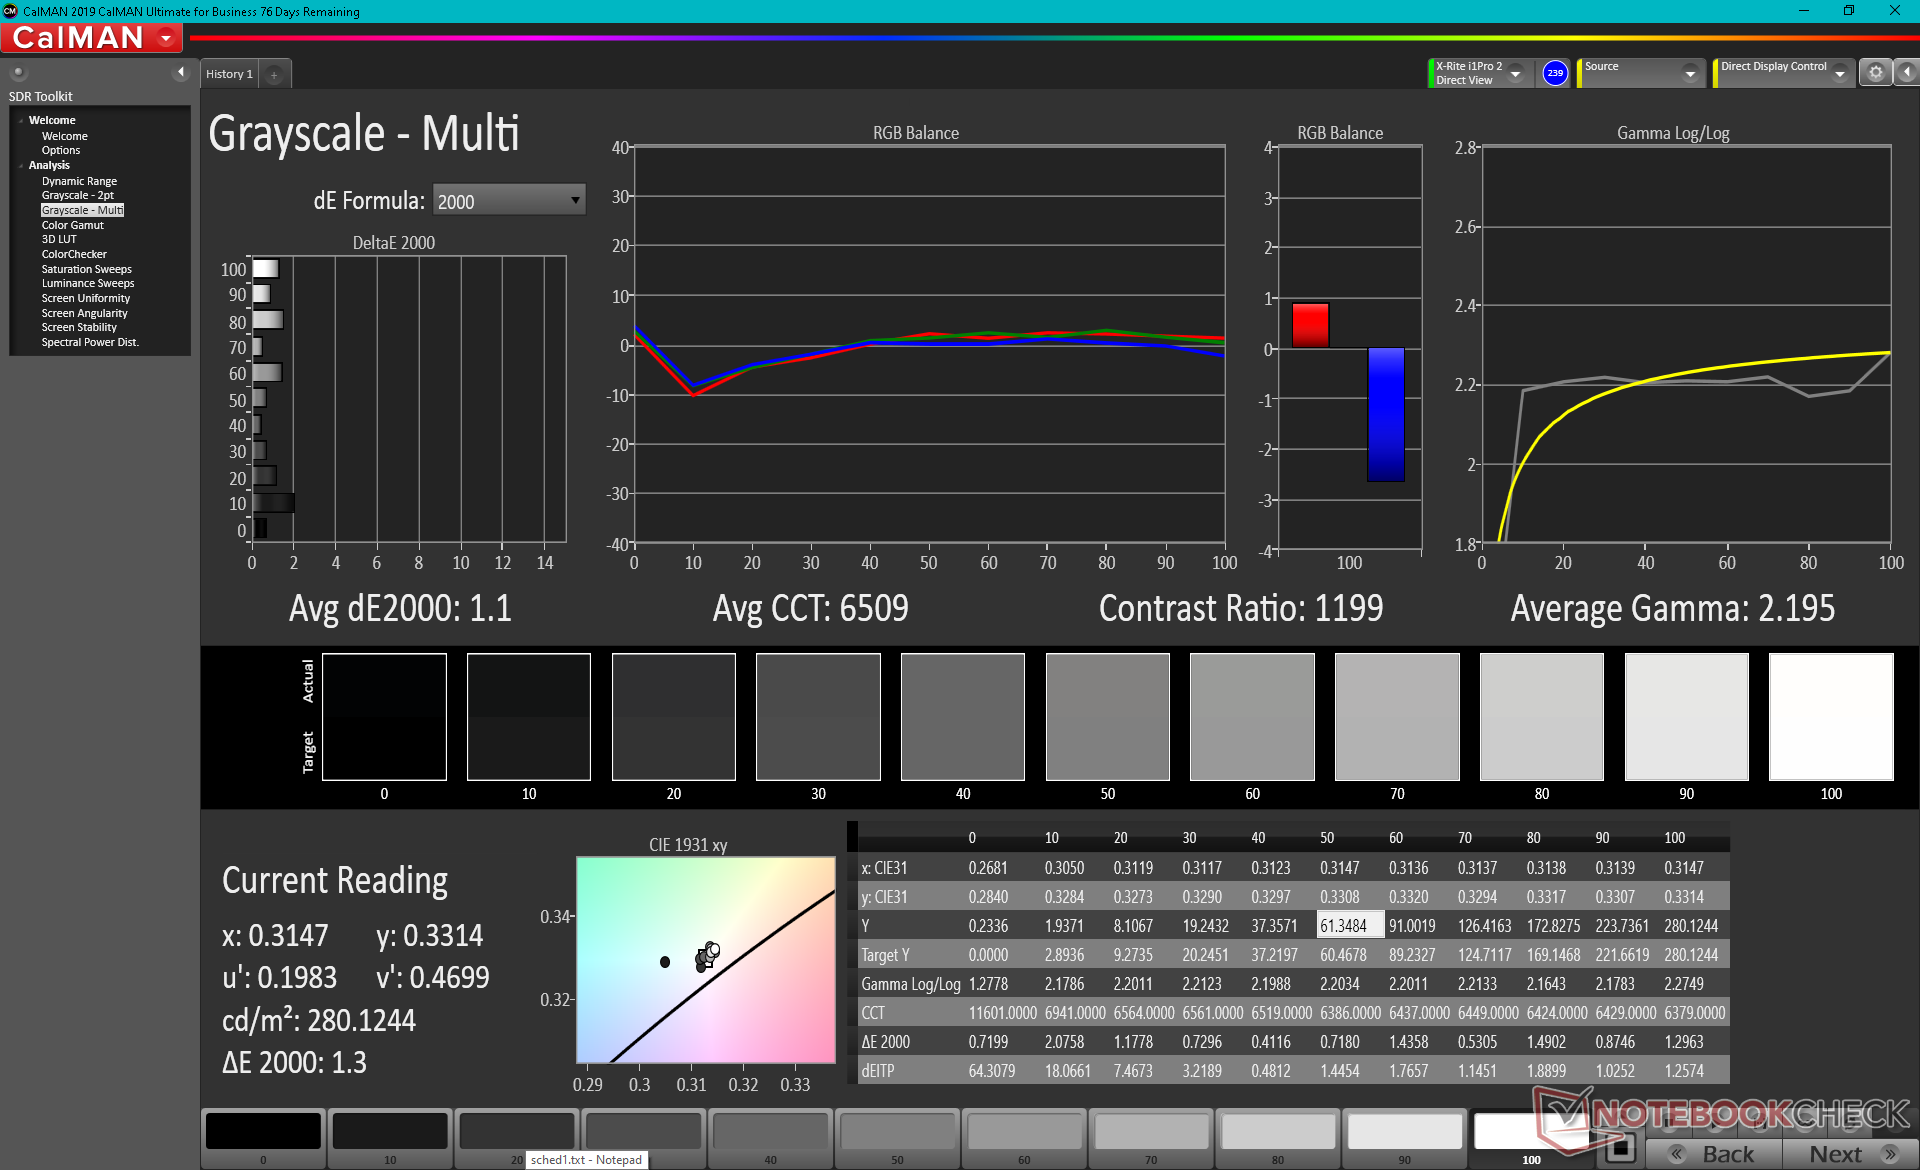
calibrated: 1.4
ΔE Greyscale Calman: 7.9 | ∀{0.09-98 Ø4.96}
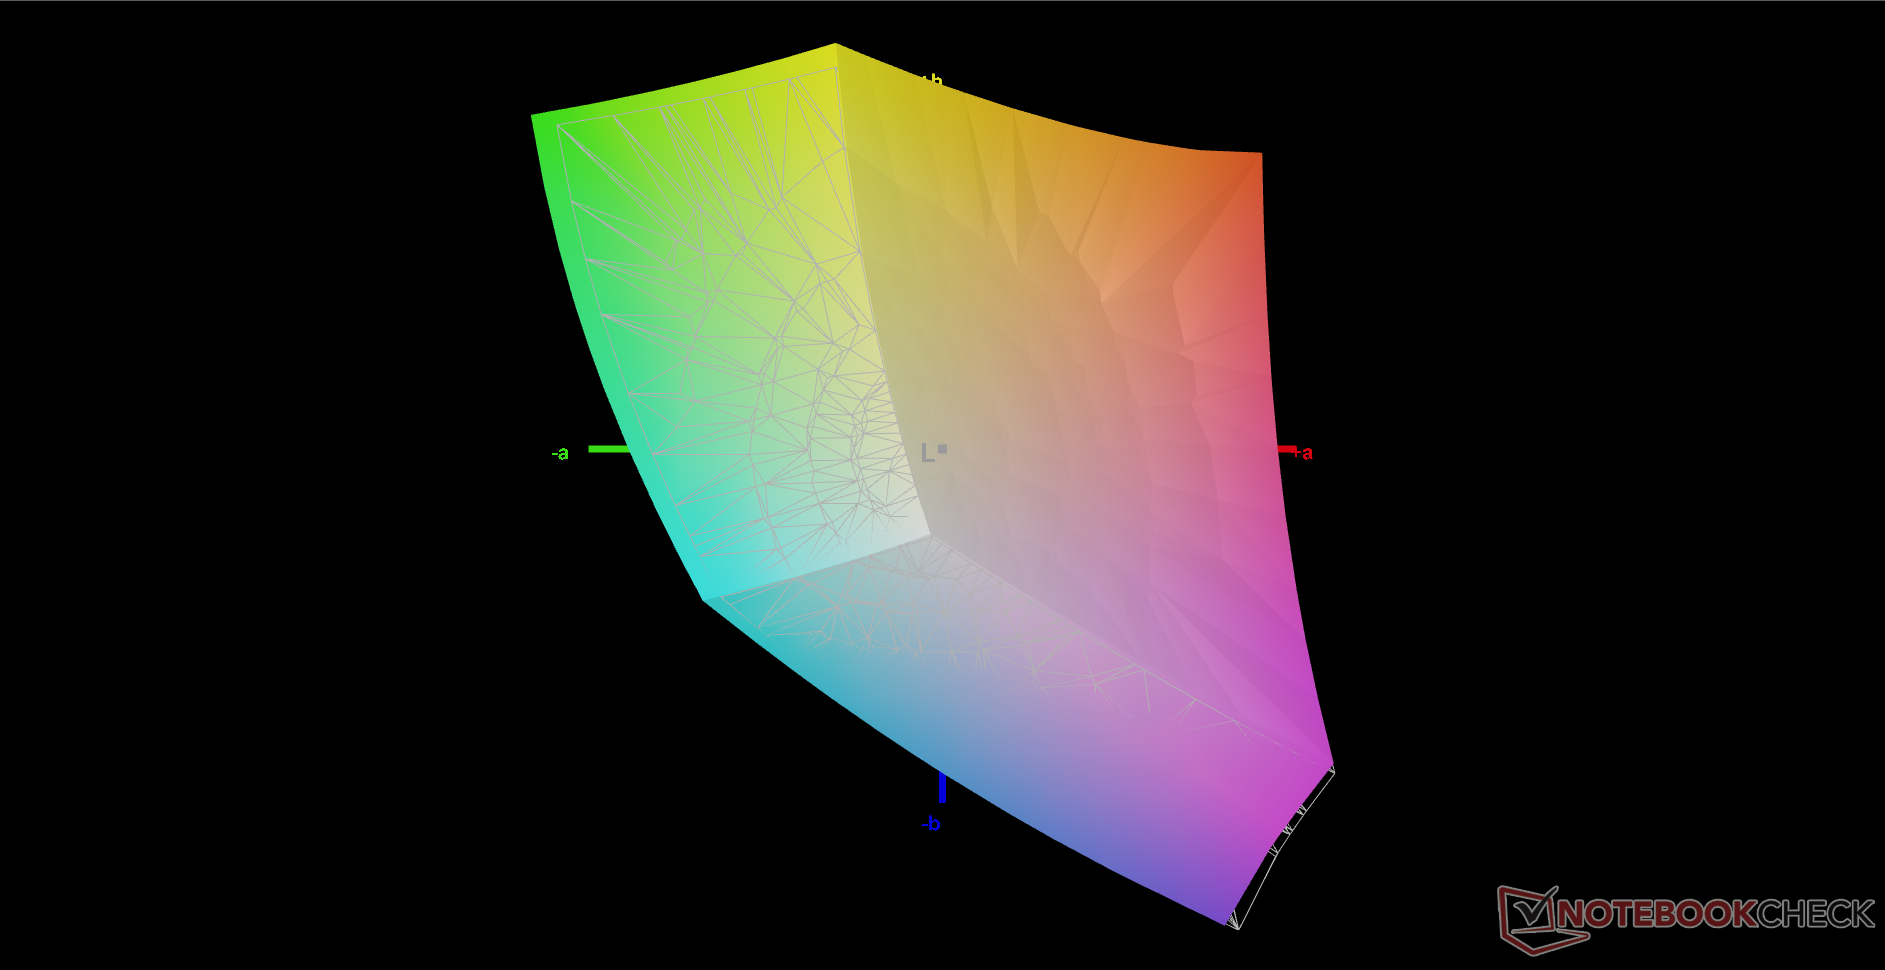
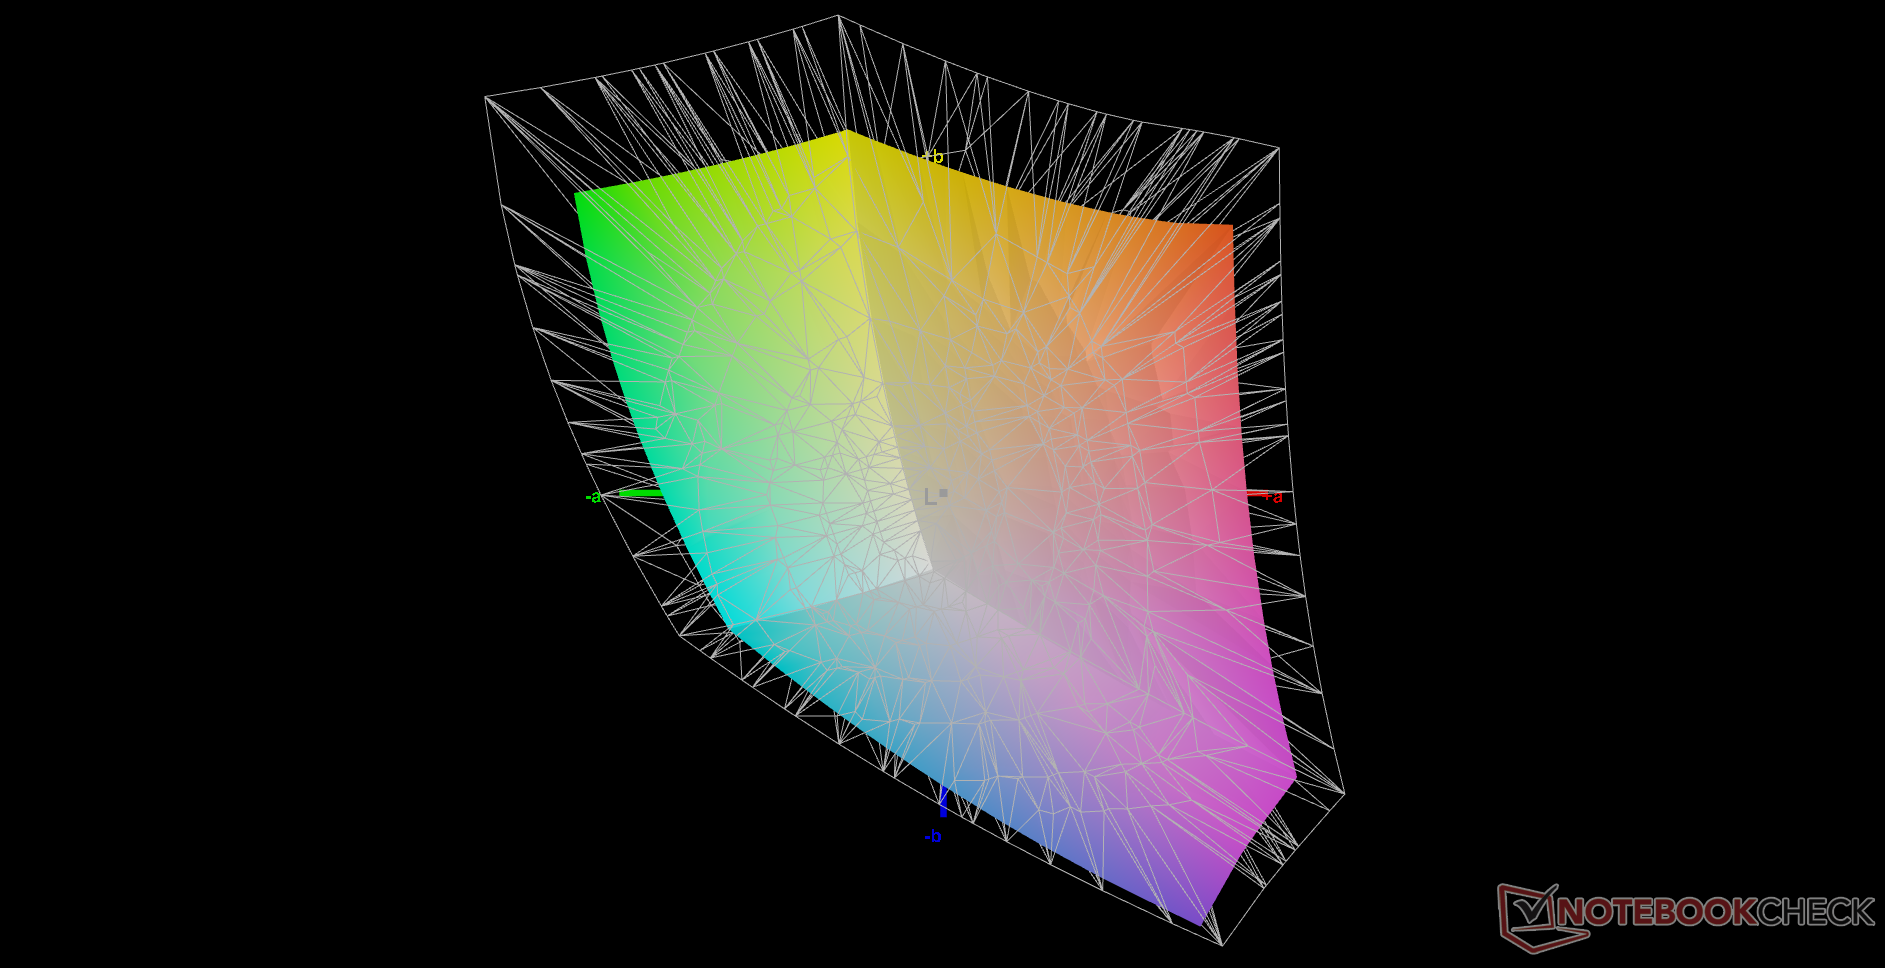
73.6% AdobeRGB 1998 (Argyll 3D)
98.8% sRGB (Argyll 3D)
71.7% Display P3 (Argyll 3D)
Gamma: 2.28
CCT: 5941 K
| Razer Blade 17 RTX 3070 AU Optronics B173HAN05.4, IPS, 17.3", 1920x1080 | Asus ROG Zephyrus S17 GX703HSD BOE099D (BOE CQ NE173QHM-NY3), IPS, 17.3", 2560x1440 | MSI GS76 Stealth 11UH AUO B173ZAN06.1 (AUODE95), IPS, 17.3", 3840x2160 | Acer Nitro 5 AN517-41-R9S5 BOE NV173FHM-NX4, IPS, 17.3", 1920x1080 | Gigabyte Aero 17 HDR YD AU Optronics AUO329B, IPS, 17.3", 3840x2160 | Maingear Vector Pro MG-VCP17 BOE NE173QHM-NY2, IPS, 17.3", 2560x1440 | |
|---|---|---|---|---|---|---|
| Display | 15% | -9% | -47% | 19% | -1% | |
| Display P3 Coverage (%) | 71.7 | 94.2 31% | 63 -12% | 36.7 -49% | 86.9 21% | 70.7 -1% |
| sRGB Coverage (%) | 98.8 | 98.7 0% | 94.8 -4% | 55.3 -44% | 100 1% | 99.4 1% |
| AdobeRGB 1998 Coverage (%) | 73.6 | 84.4 15% | 65 -12% | 37.9 -49% | 99.6 35% | 71.7 -3% |
| Response Times | -3% | -42% | -194% | -667% | -154% | |
| Response Time Grey 50% / Grey 80% * (ms) | 4.2 ? | 4.8 -14% | 8.8 ? -110% | 18 ? -329% | 52 ? -1138% | 15.6 ? -271% |
| Response Time Black / White * (ms) | 8.8 ? | 8 9% | 6.4 ? 27% | 14 ? -59% | 26 ? -195% | 12 ? -36% |
| PWM Frequency (Hz) | ||||||
| Screen | 11% | 30% | -0% | 46% | 16% | |
| Brightness middle (cd/m²) | 323.3 | 322 0% | 474 47% | 307 -5% | 488 51% | 389.7 21% |
| Brightness (cd/m²) | 315 | 288 -9% | 454 44% | 264 -16% | 467 48% | 363 15% |
| Brightness Distribution (%) | 91 | 72 -21% | 88 -3% | 76 -16% | 86 -5% | 84 -8% |
| Black Level * (cd/m²) | 0.33 | 0.3 9% | 0.46 -39% | 0.24 27% | 0.33 -0% | 0.47 -42% |
| Contrast (:1) | 980 | 1073 9% | 1030 5% | 1279 31% | 1479 51% | 829 -15% |
| Colorchecker dE 2000 * | 4.59 | 3.05 34% | 1.5 67% | 5.61 -22% | 1.23 73% | 1.93 58% |
| Colorchecker dE 2000 max. * | 10.82 | 5.23 52% | 5.59 48% | 18.29 -69% | 2.94 73% | 6.84 37% |
| Colorchecker dE 2000 calibrated * | 1.4 | 1.92 -37% | 0.86 39% | 0.77 45% | 1.31 6% | |
| Greyscale dE 2000 * | 7.9 | 3.11 61% | 2.8 65% | 2.63 67% | 1.5 81% | 2.4 70% |
| Gamma | 2.28 96% | 2.13 103% | 2.158 102% | 2.37 93% | 2.169 101% | 2.12 104% |
| CCT | 5941 109% | 6553 99% | 6597 99% | 6852 95% | 6614 98% | 6658 98% |
| Color Space (Percent of AdobeRGB 1998) (%) | 84 | 35 | 99 | |||
| Color Space (Percent of sRGB) (%) | 99 | 55 | 99 | |||
| Total Average (Program / Settings) | 8% /
10% | -7% /
12% | -80% /
-41% | -201% /
-61% | -46% /
-12% |
* ... smaller is better
色彩空间涵盖了100%的sRGB,正如制造商所宣传的那样。然而,如果要完全覆盖AdobeRGB,用户将不得不考虑4K选项。
该显示器开箱即需要校准。色温太暖,平均灰度和色彩deltaE值分别为7.9和4.59。虽然没有什么可怕的,但我们肯定对一台零售价近3000美元的高端游戏笔记本电脑有更高的期望。一旦我们自己校准了面板,灰度和颜色将明显改善,平均deltaE值分别小于2,正如我们下面的Calman结果所示。
Display Response Times
| ↔ Response Time Black to White | ||
|---|---|---|
| 8.8 ms ... rise ↗ and fall ↘ combined | ↗ 4.4 ms rise | 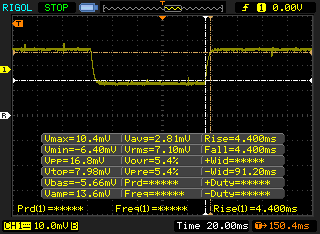 |
| ↘ 4.4 ms fall | ||
| The screen shows fast response rates in our tests and should be suited for gaming. In comparison, all tested devices range from 0.1 (minimum) to 240 (maximum) ms. » 25 % of all devices are better. This means that the measured response time is better than the average of all tested devices (19.8 ms). | ||
| ↔ Response Time 50% Grey to 80% Grey | ||
| 4.2 ms ... rise ↗ and fall ↘ combined | ↗ 1.6 ms rise | 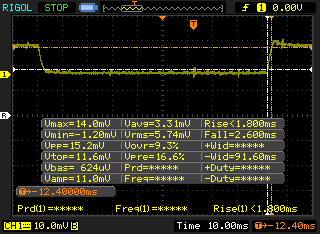 |
| ↘ 2.6 ms fall | ||
| The screen shows very fast response rates in our tests and should be very well suited for fast-paced gaming. In comparison, all tested devices range from 0.165 (minimum) to 636 (maximum) ms. » 16 % of all devices are better. This means that the measured response time is better than the average of all tested devices (30.9 ms). | ||
Screen Flickering / PWM (Pulse-Width Modulation)
| Screen flickering / PWM not detected | 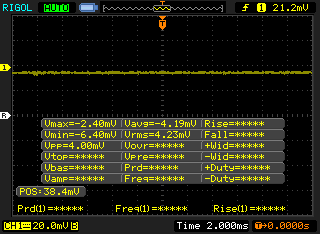 | ||
In comparison: 52 % of all tested devices do not use PWM to dim the display. If PWM was detected, an average of 7744 (minimum: 5 - maximum: 343500) Hz was measured. | |||
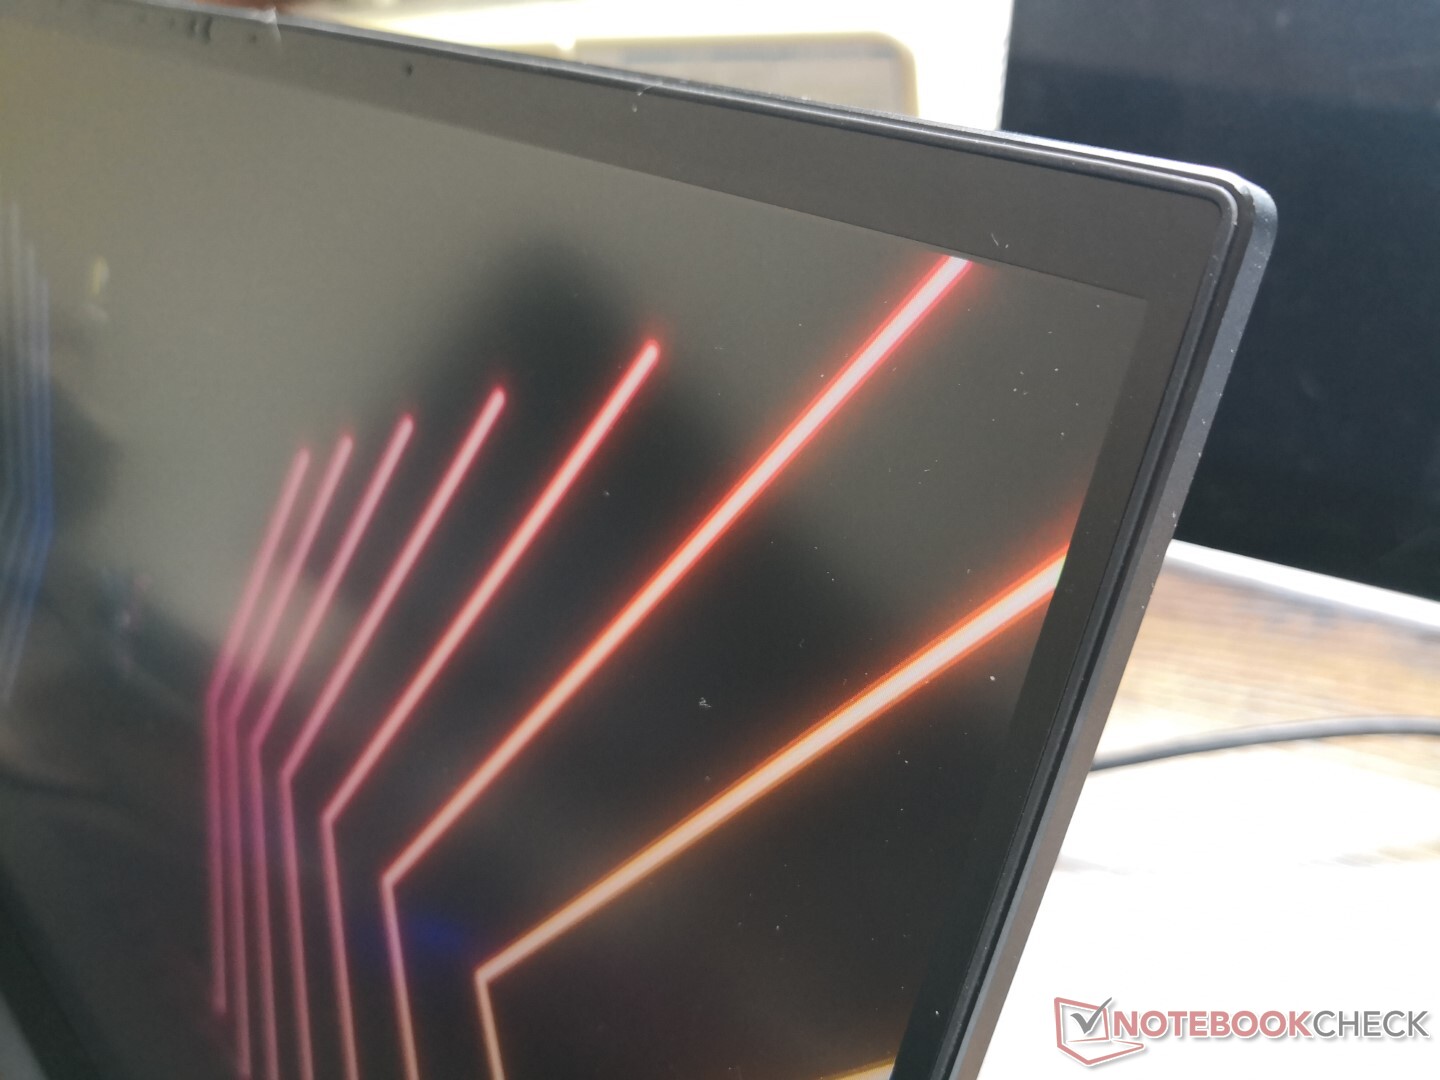
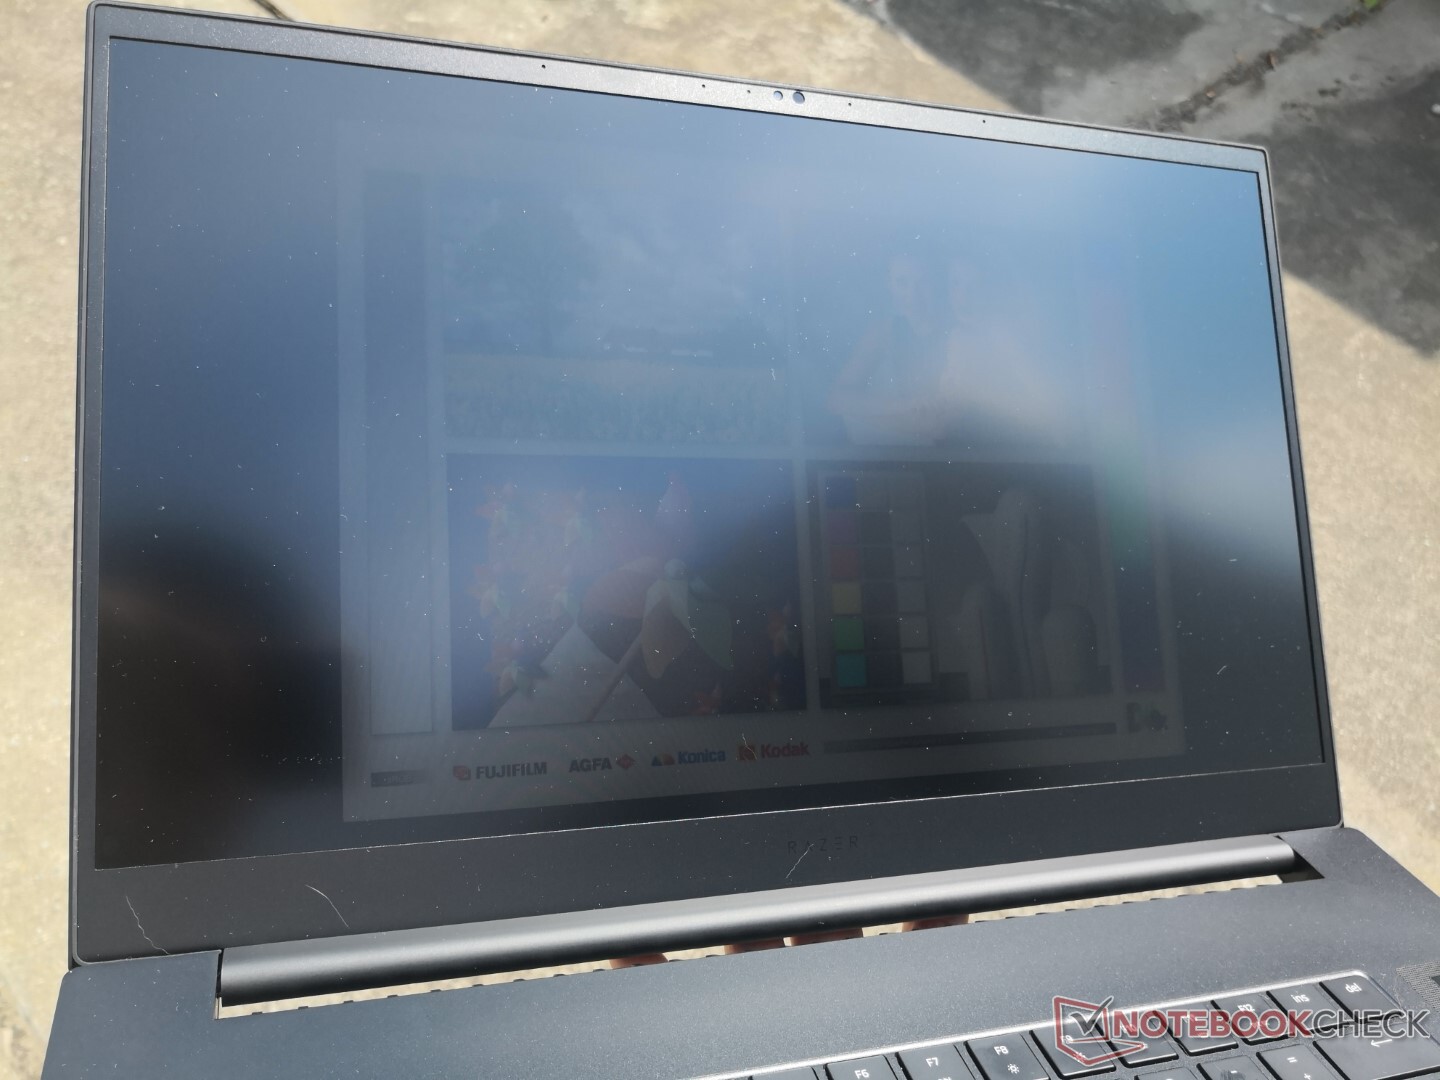
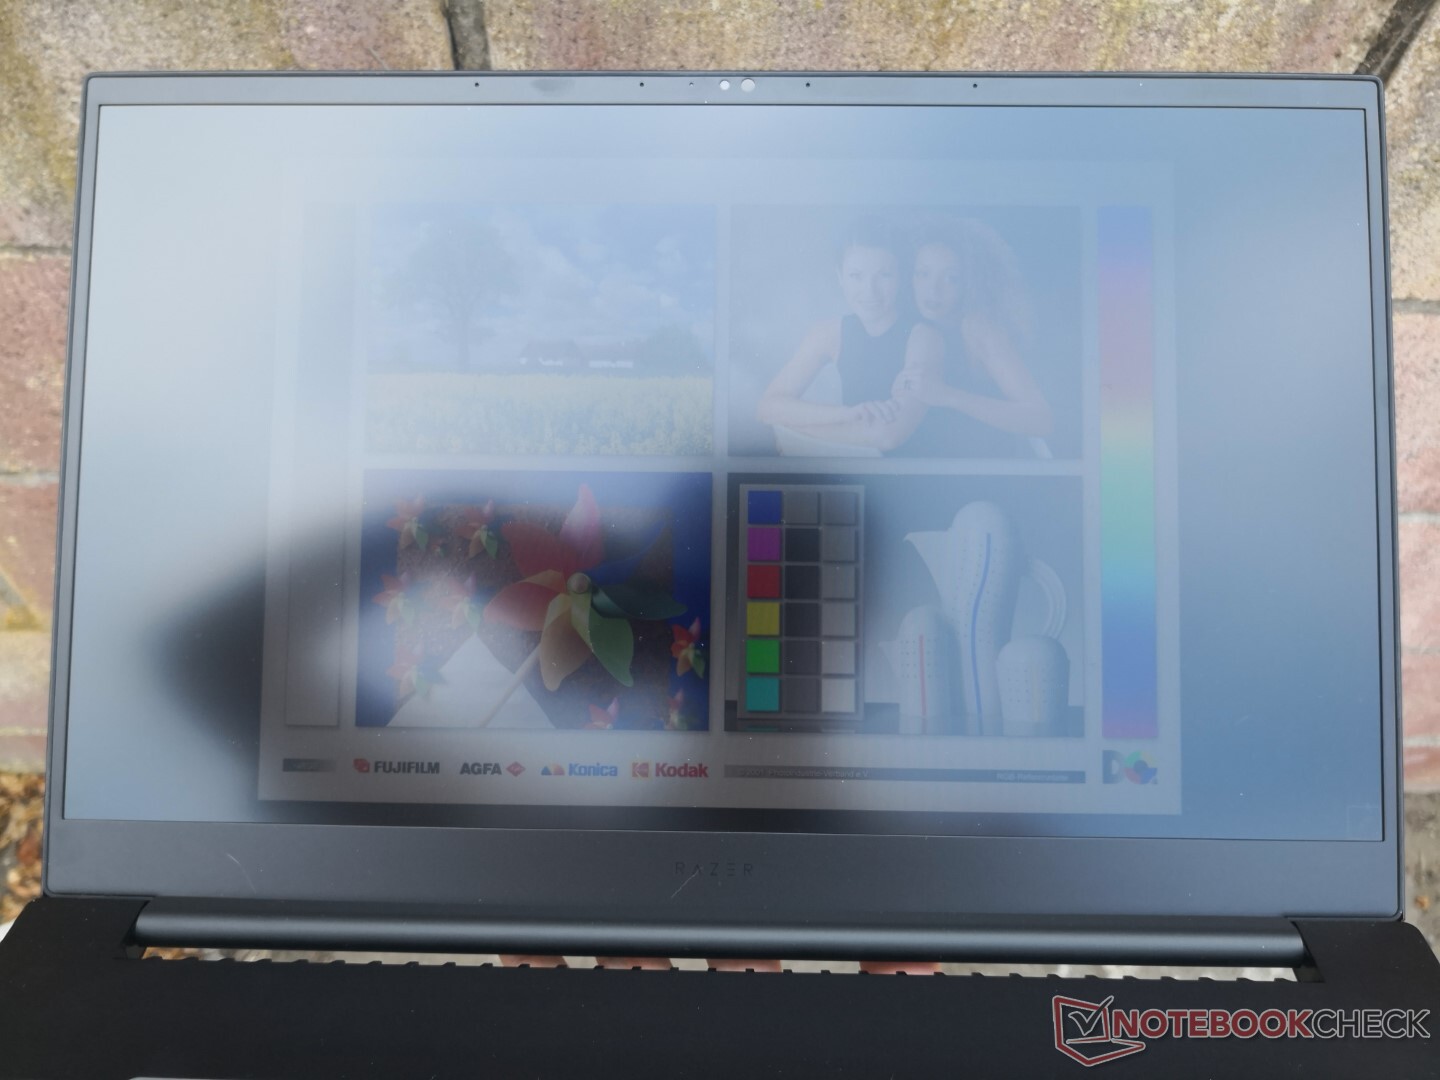
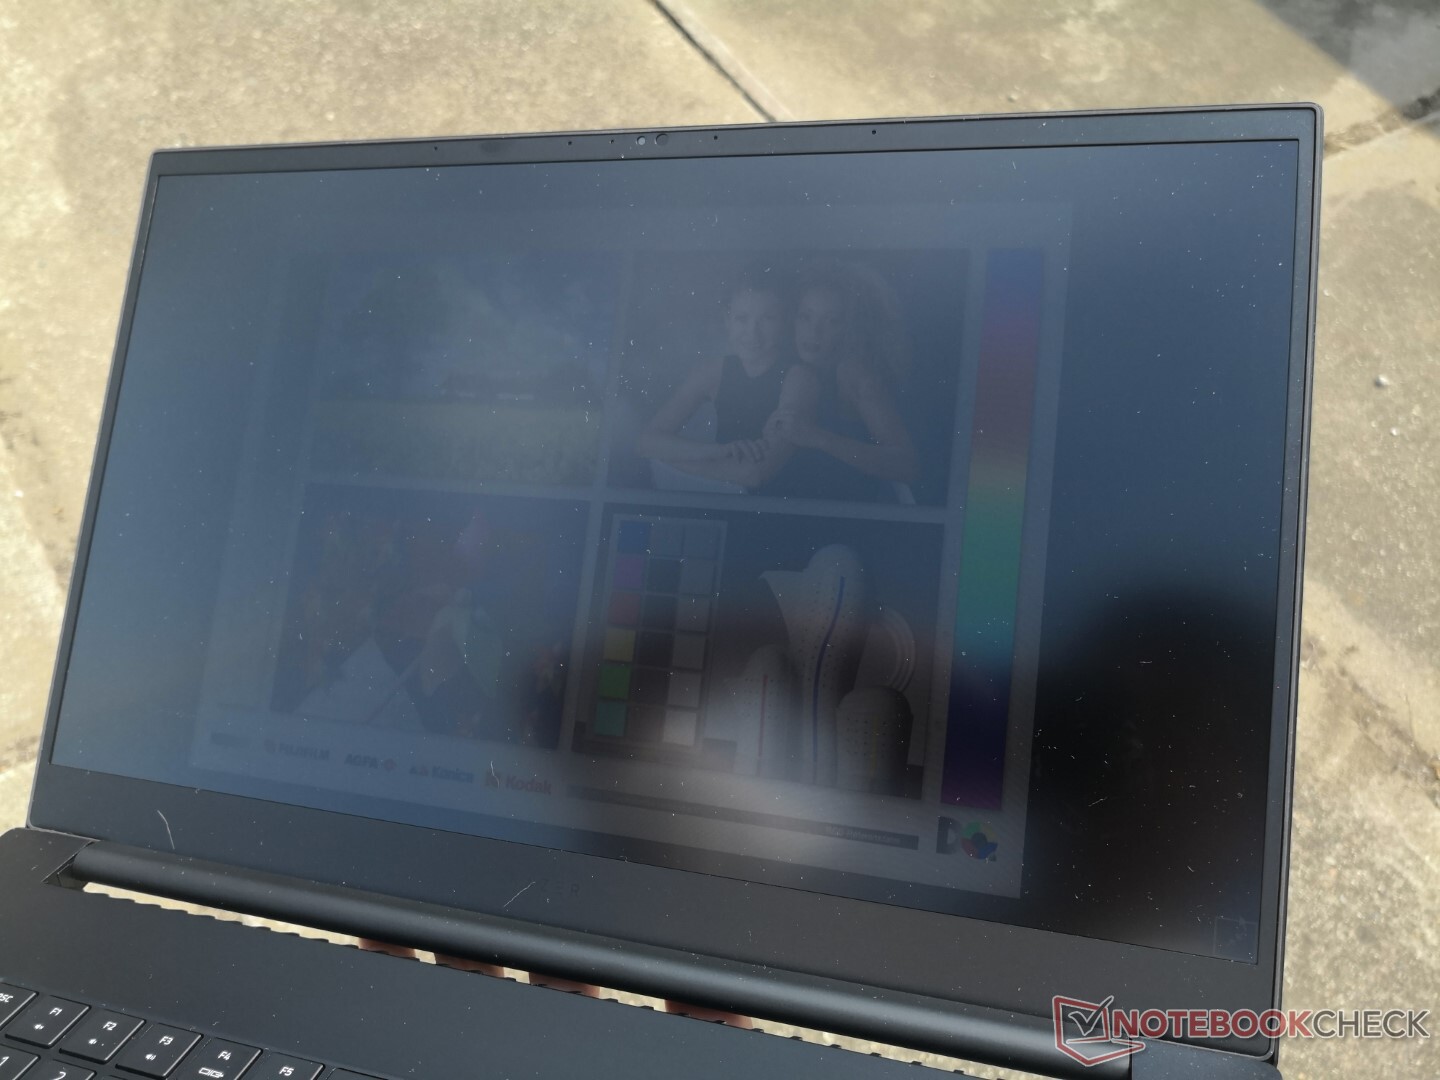
户外能见度与去年的机型相比没有变化,因为对比度和最大亮度仍然几乎相同。4K触摸屏选项可能会更亮,但用户也必须考虑到其光泽覆盖层带来的眩光增加。

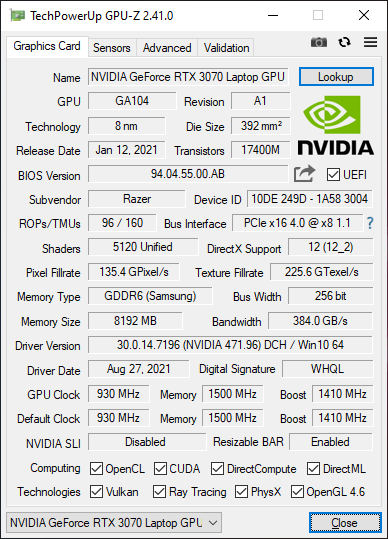
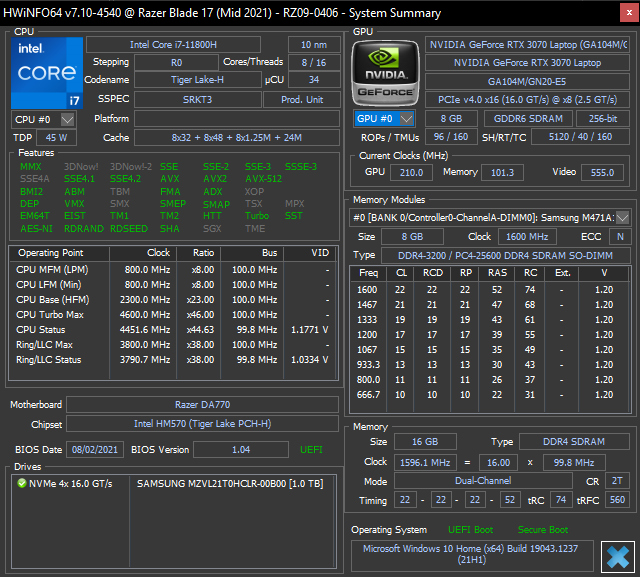
性能 - 130 W TGPGeForce RTX显卡
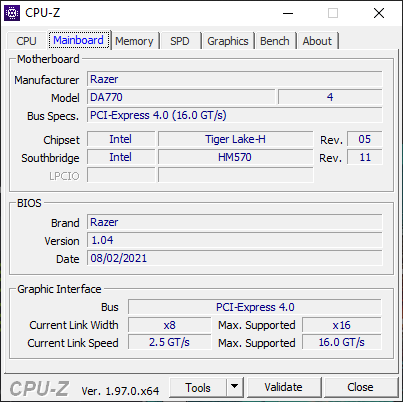
用户现在可以选择第11代Tiger Lake-H 酷睿i7-11800H或 酷睿i9-11900H来取代去年的第十代彗星湖-H选项。除了明显的性能提升外,新的CPU还原生支持PCIe4和Thunderbolt4连接。可调整栏、动态提升2.0和WhisperMode 2.0都得到支持。
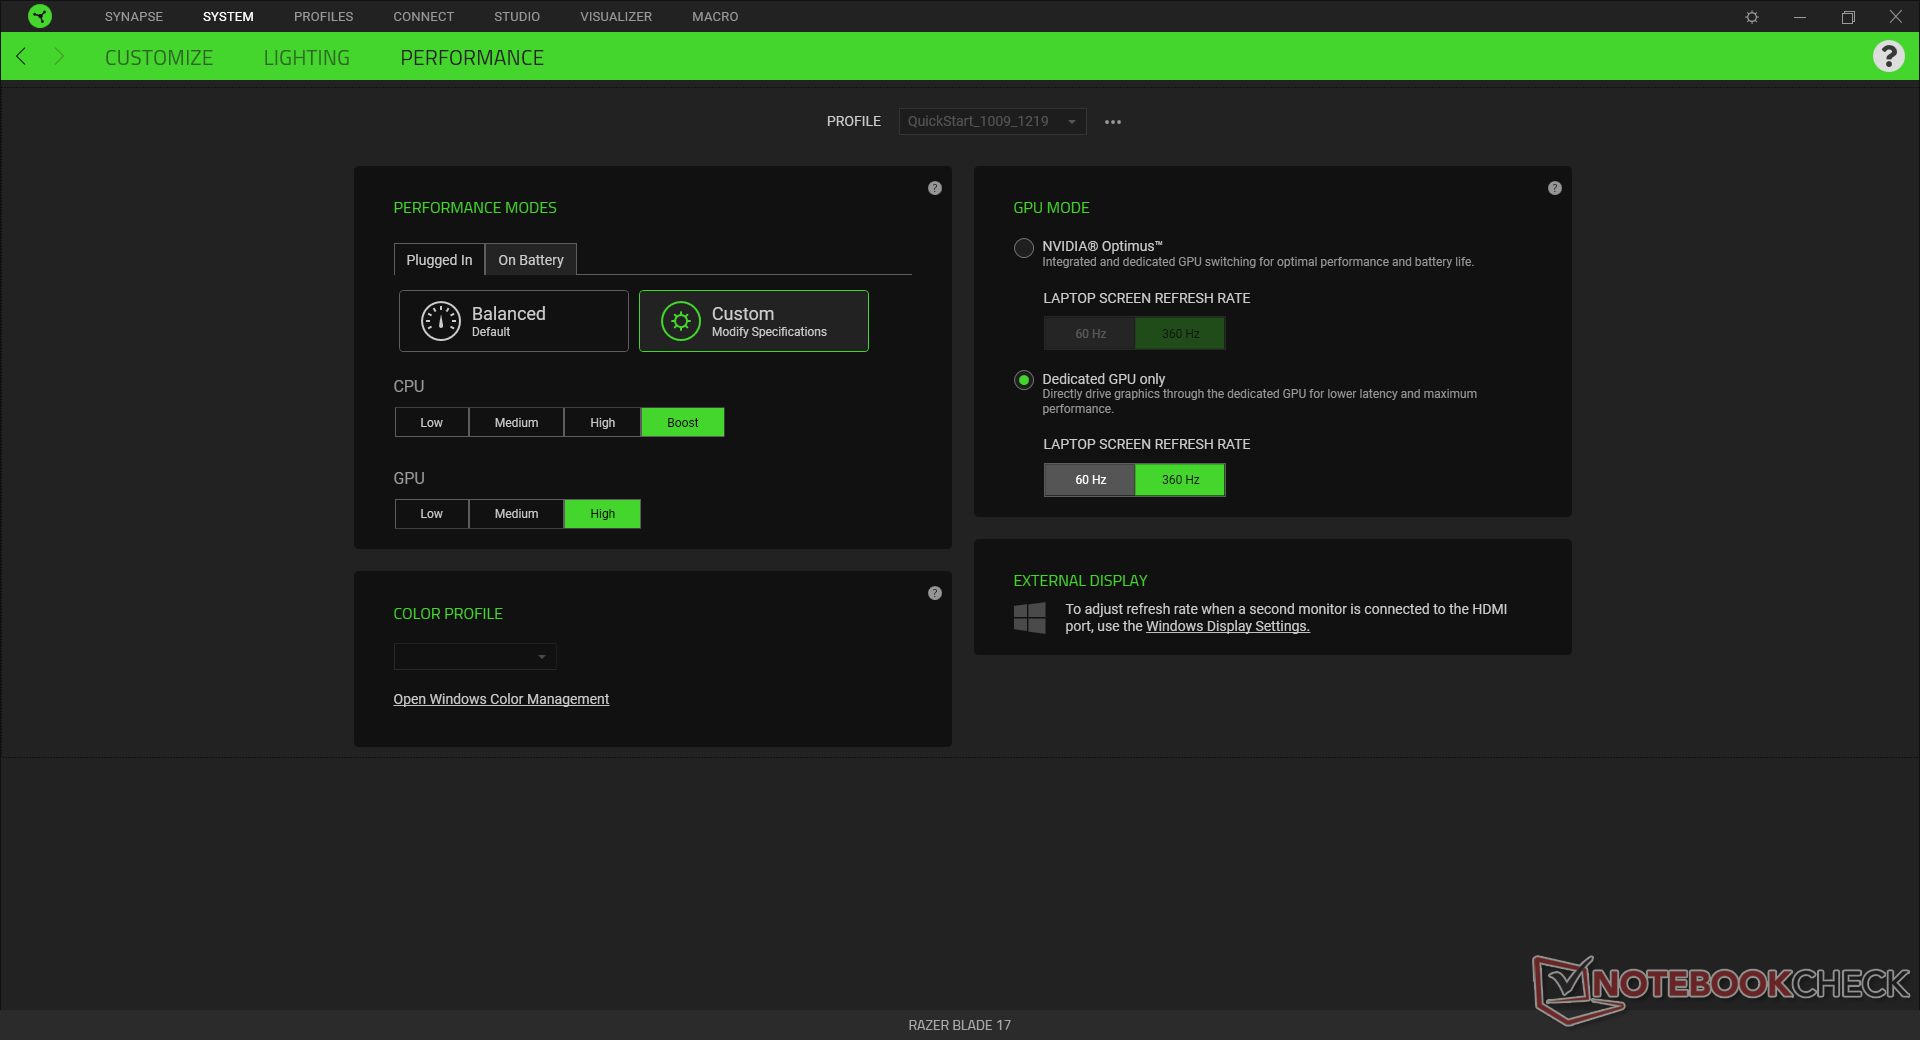
不支持高级优化(或优化2.0),这意味着用户仍需通过雷蛇软件在dGPU和iGPU之间手动切换和重新启动。如果在Optimus模式下运行,预计会对性能产生小的影响。我们建议用户熟悉Razer Central,因为重要的定制和性能选项在这里可以找到。
处理器 - 没有AMD...暂时没有
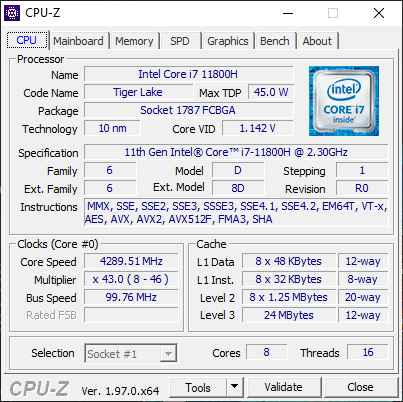
我们的酷睿i7-11800H是一个很好的升级,从 酷睿i7-10875H去年的Blade Pro上发现的。特别是多线程性能提高了25%至40%,最终与竞争性的Zen 2或Zen 3 CPU,如 Ryzen 7 5800H.根据我们对其他酷睿i9-11900H笔记本电脑的经验,升级到酷睿i9-10900H预计只会带来5%到10%的原始性能提升,如 微星GS76 Stealth.
值得注意的是 Ryzen 9 5900HX中的 刀片14在多线程性能方面与我们的i7-11800H并驾齐驱,而在单线程性能方面则落后约15%至20%。
Cinebench R15 Multi Loop
Cinebench R23: Multi Core | Single Core
Cinebench R15: CPU Multi 64Bit | CPU Single 64Bit
Blender: v2.79 BMW27 CPU
7-Zip 18.03: 7z b 4 -mmt1 | 7z b 4
Geekbench 5.5: Single-Core | Multi-Core
HWBOT x265 Benchmark v2.2: 4k Preset
LibreOffice : 20 Documents To PDF
R Benchmark 2.5: Overall mean
| Cinebench R20 / CPU (Multi Core) | |
| Gigabyte Aero 17 HDR YD | |
| Asus ROG Strix G17 G713QE-RB74 | |
| MSI GS76 Stealth 11UH | |
| Razer Blade 14 Ryzen 9 RTX 3070 | |
| Razer Blade 17 RTX 3070 | |
| MSI Alpha 17 A4DEK | |
| Average Intel Core i7-11800H (2498 - 5408, n=50) | |
| Alienware m17 R4 | |
| MSI GE76 Raider 10UH | |
| MSI GE75 9SG | |
| Razer Blade Pro 17 RTX 2070 Max-Q 300 Hz | |
| Razer Blade Pro 17 4K UHD 120 Hz | |
| Cinebench R20 / CPU (Single Core) | |
| MSI GS76 Stealth 11UH | |
| Gigabyte Aero 17 HDR YD | |
| Razer Blade 17 RTX 3070 | |
| Average Intel Core i7-11800H (520 - 586, n=47) | |
| Asus ROG Strix G17 G713QE-RB74 | |
| Alienware m17 R4 | |
| MSI Alpha 17 A4DEK | |
| Razer Blade Pro 17 RTX 2070 Max-Q 300 Hz | |
| MSI GE76 Raider 10UH | |
| Razer Blade 14 Ryzen 9 RTX 3070 | |
| MSI GE75 9SG | |
| Razer Blade Pro 17 4K UHD 120 Hz | |
| Cinebench R23 / Multi Core | |
| MSI GS76 Stealth 11UH | |
| Asus ROG Strix G17 G713QE-RB74 | |
| Razer Blade 14 Ryzen 9 RTX 3070 | |
| Razer Blade 17 RTX 3070 | |
| Average Intel Core i7-11800H (6508 - 14088, n=48) | |
| Alienware m17 R4 | |
| MSI GE76 Raider 10UH | |
| Cinebench R23 / Single Core | |
| MSI GS76 Stealth 11UH | |
| Razer Blade 17 RTX 3070 | |
| Average Intel Core i7-11800H (1386 - 1522, n=45) | |
| Asus ROG Strix G17 G713QE-RB74 | |
| Alienware m17 R4 | |
| Razer Blade 14 Ryzen 9 RTX 3070 | |
| MSI GE76 Raider 10UH | |
| Cinebench R15 / CPU Multi 64Bit | |
| MSI GS76 Stealth 11UH | |
| Gigabyte Aero 17 HDR YD | |
| Razer Blade 14 Ryzen 9 RTX 3070 | |
| Asus ROG Strix G17 G713QE-RB74 | |
| MSI Alpha 17 A4DEK | |
| Razer Blade 17 RTX 3070 | |
| Average Intel Core i7-11800H (1342 - 2173, n=50) | |
| Alienware m17 R4 | |
| MSI GE75 9SG | |
| MSI GE76 Raider 10UH | |
| Razer Blade Pro 17 RTX 2070 Max-Q 300 Hz | |
| Razer Blade Pro 17 4K UHD 120 Hz | |
| Cinebench R15 / CPU Single 64Bit | |
| MSI GS76 Stealth 11UH | |
| Gigabyte Aero 17 HDR YD | |
| Asus ROG Strix G17 G713QE-RB74 | |
| Razer Blade 17 RTX 3070 | |
| Average Intel Core i7-11800H (201 - 231, n=46) | |
| Alienware m17 R4 | |
| Razer Blade Pro 17 RTX 2070 Max-Q 300 Hz | |
| Razer Blade 14 Ryzen 9 RTX 3070 | |
| MSI GE76 Raider 10UH | |
| MSI Alpha 17 A4DEK | |
| MSI GE75 9SG | |
| Razer Blade Pro 17 4K UHD 120 Hz | |
| Blender / v2.79 BMW27 CPU | |
| Razer Blade Pro 17 RTX 2070 Max-Q 300 Hz | |
| MSI GE75 9SG | |
| Average Intel Core i7-11800H (217 - 454, n=46) | |
| MSI GE76 Raider 10UH | |
| Razer Blade 17 RTX 3070 | |
| MSI Alpha 17 A4DEK | |
| Razer Blade 14 Ryzen 9 RTX 3070 | |
| MSI GS76 Stealth 11UH | |
| Alienware m17 R4 | |
| Asus ROG Strix G17 G713QE-RB74 | |
| Gigabyte Aero 17 HDR YD | |
| 7-Zip 18.03 / 7z b 4 -mmt1 | |
| Gigabyte Aero 17 HDR YD | |
| MSI GS76 Stealth 11UH | |
| Asus ROG Strix G17 G713QE-RB74 | |
| Average Intel Core i7-11800H (5138 - 5732, n=46) | |
| Razer Blade 17 RTX 3070 | |
| Alienware m17 R4 | |
| Razer Blade Pro 17 RTX 2070 Max-Q 300 Hz | |
| MSI GE76 Raider 10UH | |
| MSI GE75 9SG | |
| Razer Blade 14 Ryzen 9 RTX 3070 | |
| MSI Alpha 17 A4DEK | |
| 7-Zip 18.03 / 7z b 4 | |
| Gigabyte Aero 17 HDR YD | |
| Asus ROG Strix G17 G713QE-RB74 | |
| MSI GS76 Stealth 11UH | |
| Razer Blade 17 RTX 3070 | |
| Razer Blade 14 Ryzen 9 RTX 3070 | |
| MSI Alpha 17 A4DEK | |
| Alienware m17 R4 | |
| Average Intel Core i7-11800H (33718 - 56758, n=46) | |
| MSI GE75 9SG | |
| MSI GE76 Raider 10UH | |
| Razer Blade Pro 17 RTX 2070 Max-Q 300 Hz | |
| Geekbench 5.5 / Single-Core | |
| MSI GS76 Stealth 11UH | |
| Gigabyte Aero 17 HDR YD | |
| Average Intel Core i7-11800H (1429 - 1625, n=40) | |
| Alienware m17 R4 | |
| Razer Blade Pro 17 RTX 2070 Max-Q 300 Hz | |
| MSI GE76 Raider 10UH | |
| MSI Alpha 17 A4DEK | |
| Geekbench 5.5 / Multi-Core | |
| Gigabyte Aero 17 HDR YD | |
| MSI GS76 Stealth 11UH | |
| Average Intel Core i7-11800H (4655 - 9851, n=40) | |
| Alienware m17 R4 | |
| MSI Alpha 17 A4DEK | |
| MSI GE76 Raider 10UH | |
| Razer Blade Pro 17 RTX 2070 Max-Q 300 Hz | |
| HWBOT x265 Benchmark v2.2 / 4k Preset | |
| Gigabyte Aero 17 HDR YD | |
| Razer Blade 14 Ryzen 9 RTX 3070 | |
| Razer Blade 17 RTX 3070 | |
| MSI GS76 Stealth 11UH | |
| Asus ROG Strix G17 G713QE-RB74 | |
| Alienware m17 R4 | |
| Average Intel Core i7-11800H (7.38 - 17.4, n=46) | |
| MSI GE76 Raider 10UH | |
| MSI Alpha 17 A4DEK | |
| MSI GE75 9SG | |
| LibreOffice / 20 Documents To PDF | |
| MSI Alpha 17 A4DEK | |
| Razer Blade 14 Ryzen 9 RTX 3070 | |
| Razer Blade Pro 17 RTX 2070 Max-Q 300 Hz | |
| Asus ROG Strix G17 G713QE-RB74 | |
| Alienware m17 R4 | |
| MSI GS76 Stealth 11UH | |
| MSI GE76 Raider 10UH | |
| Average Intel Core i7-11800H (38.6 - 59.9, n=45) | |
| Razer Blade 17 RTX 3070 | |
| Gigabyte Aero 17 HDR YD | |
| R Benchmark 2.5 / Overall mean | |
| Razer Blade 14 Ryzen 9 RTX 3070 | |
| MSI GE76 Raider 10UH | |
| MSI Alpha 17 A4DEK | |
| Alienware m17 R4 | |
| Average Intel Core i7-11800H (0.548 - 0.615, n=46) | |
| Razer Blade 17 RTX 3070 | |
| Gigabyte Aero 17 HDR YD | |
| MSI GS76 Stealth 11UH | |
| Asus ROG Strix G17 G713QE-RB74 | |
* ... smaller is better
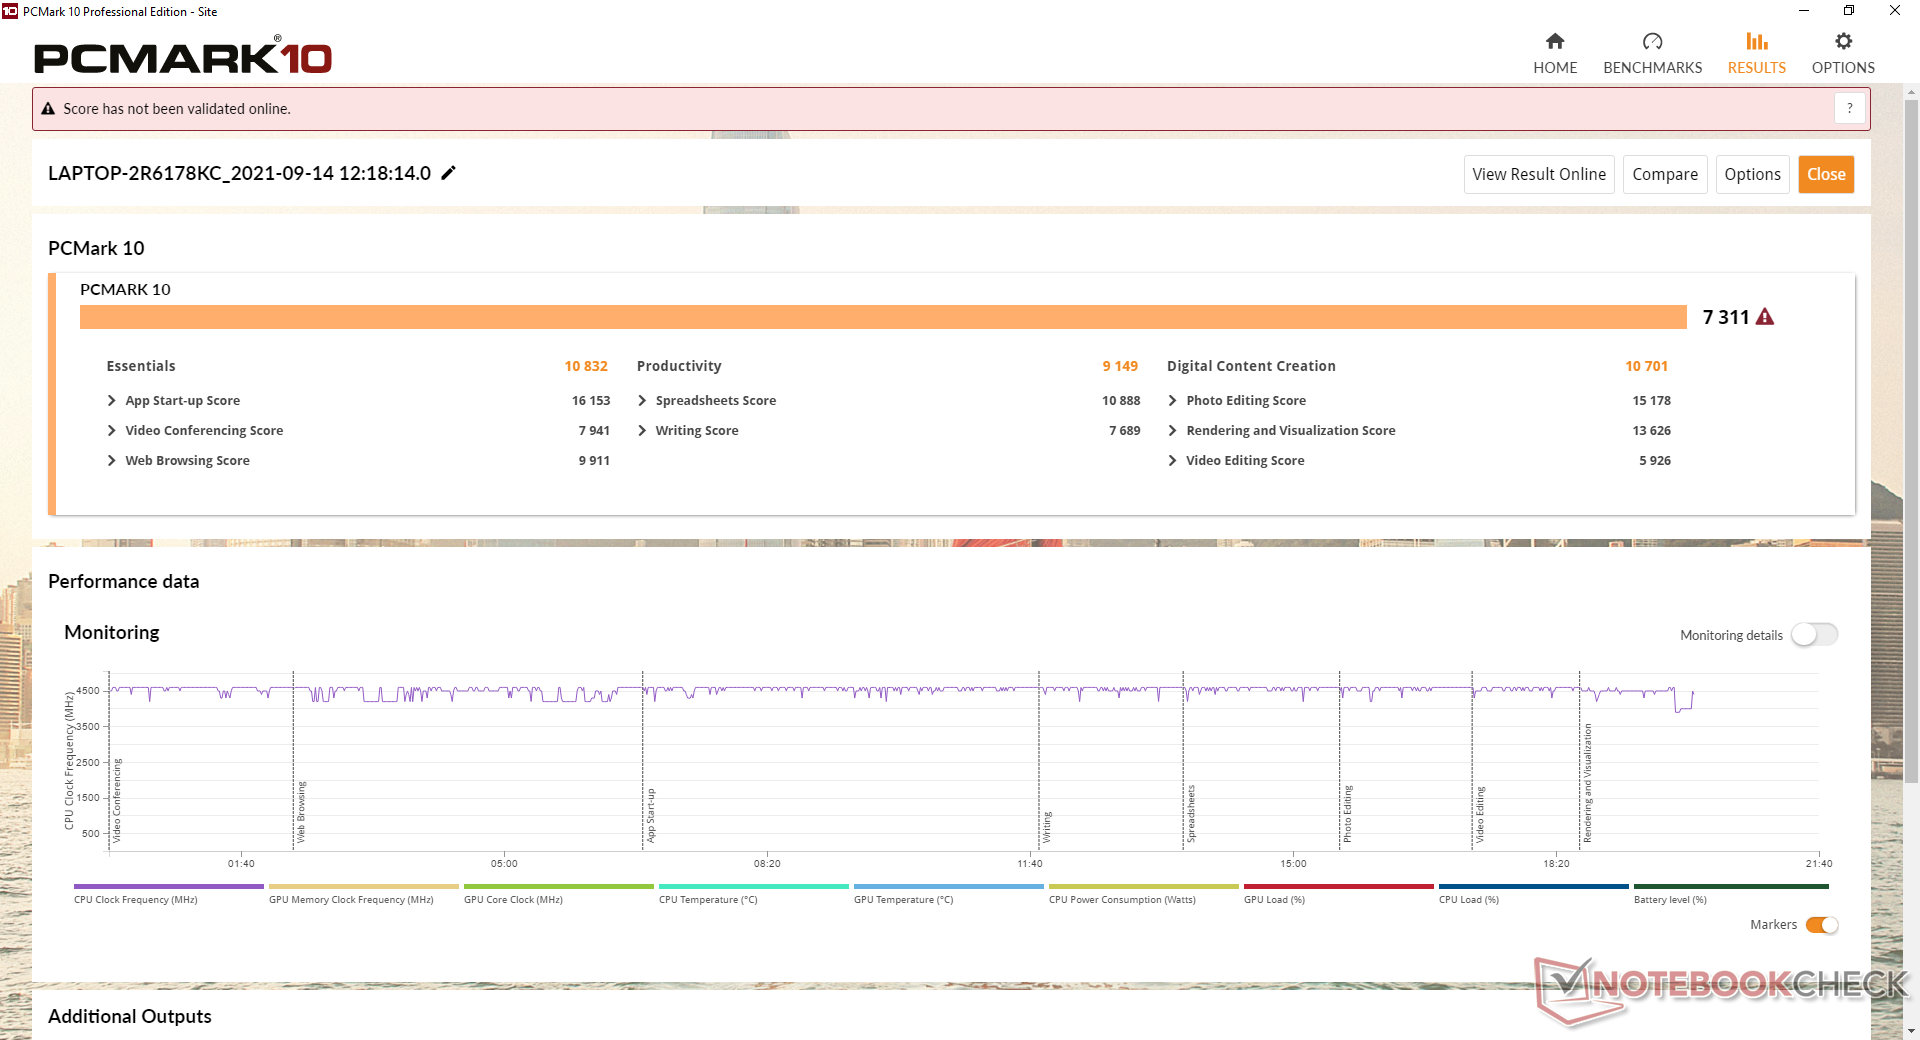
系统性能
PCMark 10得分明显高于我们过去测试过的任何Blade Pro笔记本电脑。这一飞跃可以部分归功于Tiger Lake-H芯片组原生支持的PCIe4 NVMe固态硬盘和多线程CPU性能的提升。
| PCMark 10 / Score | |
| Razer Blade 17 RTX 3070 | |
| Average Intel Core i7-11800H, NVIDIA GeForce RTX 3070 Laptop GPU (6126 - 7311, n=11) | |
| Razer Blade Pro 17 2021 (QHD Touch) | |
| Razer Blade Pro 17 RTX 2070 Max-Q 300 Hz | |
| Razer Blade Pro 17 4K UHD 120 Hz | |
| Razer Blade Pro 17 RTX 2080 Max-Q | |
| Razer Blade Pro 17 RTX 2060 | |
| PCMark 10 / Essentials | |
| Razer Blade 17 RTX 3070 | |
| Average Intel Core i7-11800H, NVIDIA GeForce RTX 3070 Laptop GPU (9248 - 10832, n=11) | |
| Razer Blade Pro 17 4K UHD 120 Hz | |
| Razer Blade Pro 17 2021 (QHD Touch) | |
| Razer Blade Pro 17 RTX 2070 Max-Q 300 Hz | |
| Razer Blade Pro 17 RTX 2080 Max-Q | |
| Razer Blade Pro 17 RTX 2060 | |
| PCMark 10 / Productivity | |
| Razer Blade 17 RTX 3070 | |
| Average Intel Core i7-11800H, NVIDIA GeForce RTX 3070 Laptop GPU (8571 - 9669, n=11) | |
| Razer Blade Pro 17 2021 (QHD Touch) | |
| Razer Blade Pro 17 RTX 2070 Max-Q 300 Hz | |
| Razer Blade Pro 17 RTX 2060 | |
| Razer Blade Pro 17 RTX 2080 Max-Q | |
| Razer Blade Pro 17 4K UHD 120 Hz | |
| PCMark 10 / Digital Content Creation | |
| Razer Blade 17 RTX 3070 | |
| Average Intel Core i7-11800H, NVIDIA GeForce RTX 3070 Laptop GPU (7627 - 10851, n=11) | |
| Razer Blade Pro 17 2021 (QHD Touch) | |
| Razer Blade Pro 17 4K UHD 120 Hz | |
| Razer Blade Pro 17 RTX 2070 Max-Q 300 Hz | |
| Razer Blade Pro 17 RTX 2080 Max-Q | |
| Razer Blade Pro 17 RTX 2060 | |
| PCMark 10 Score | 7311 points | |
Help | ||
DPC延时
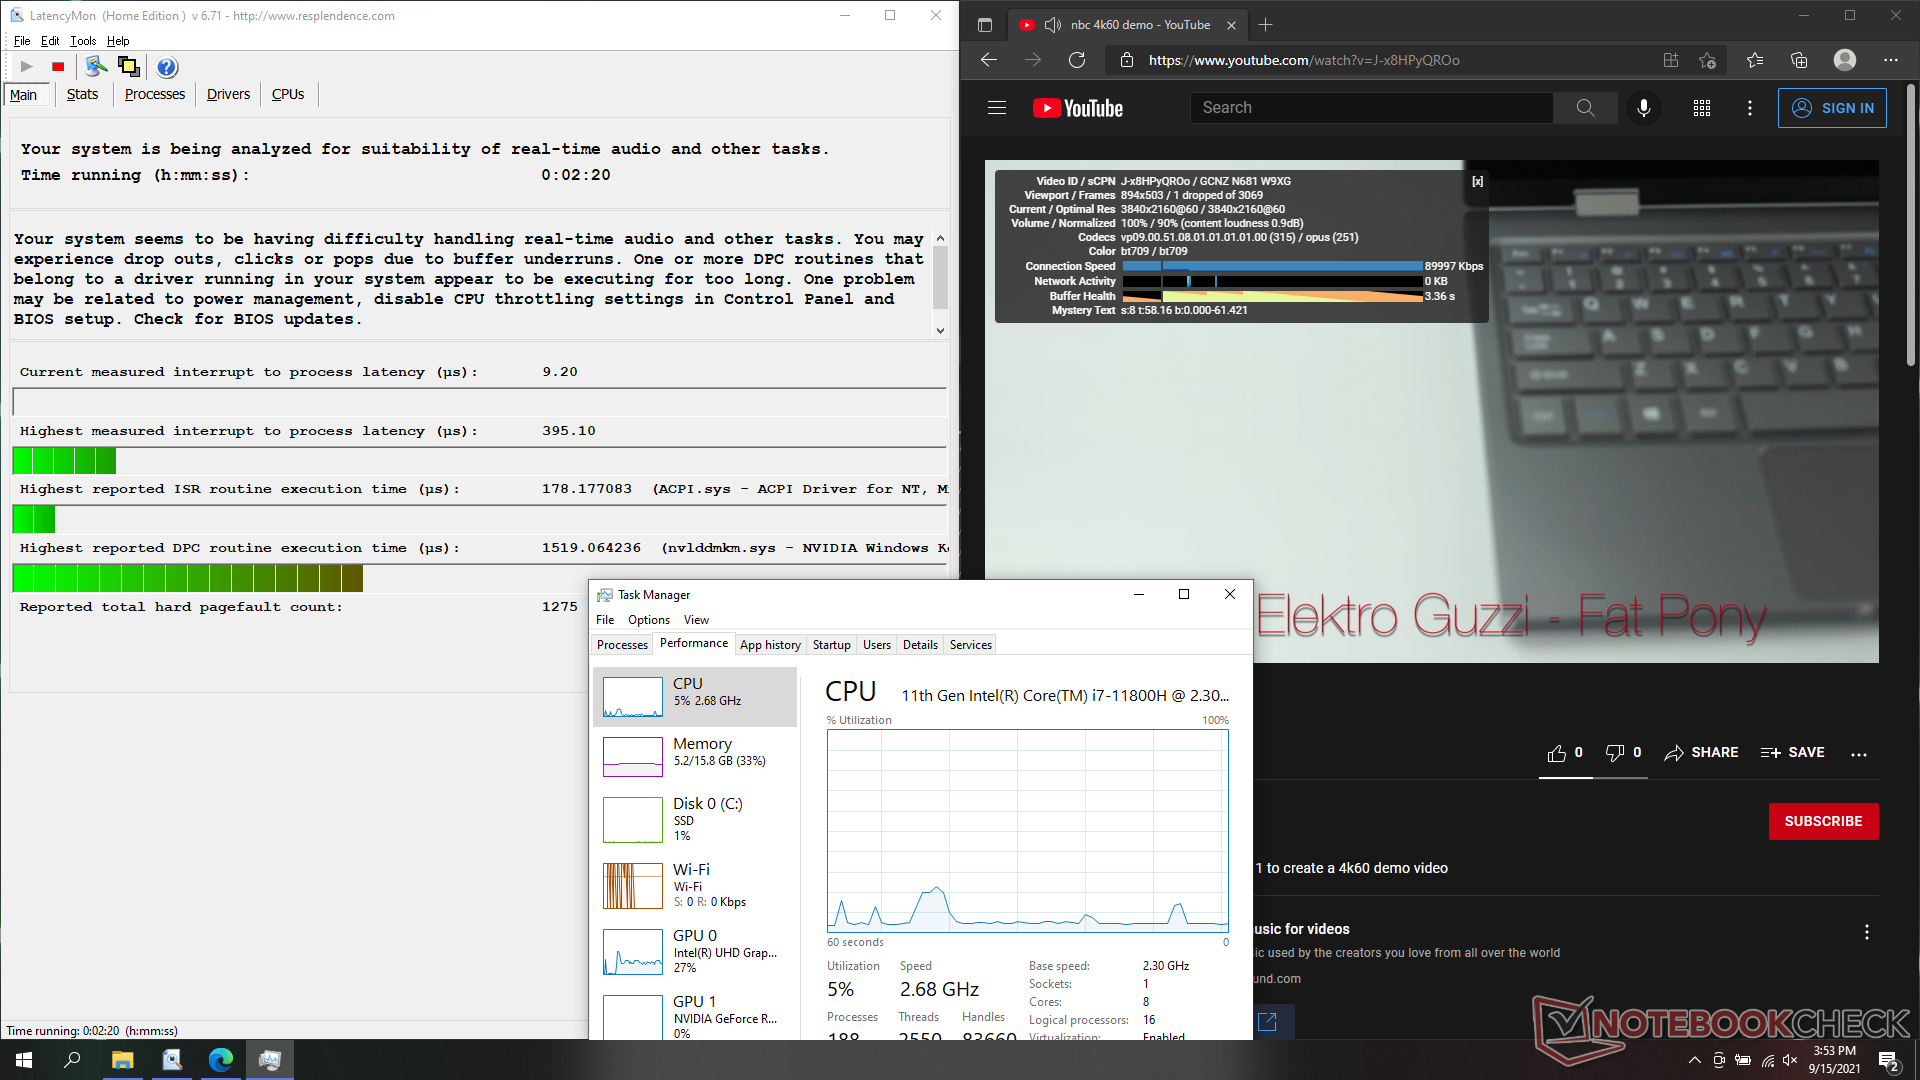
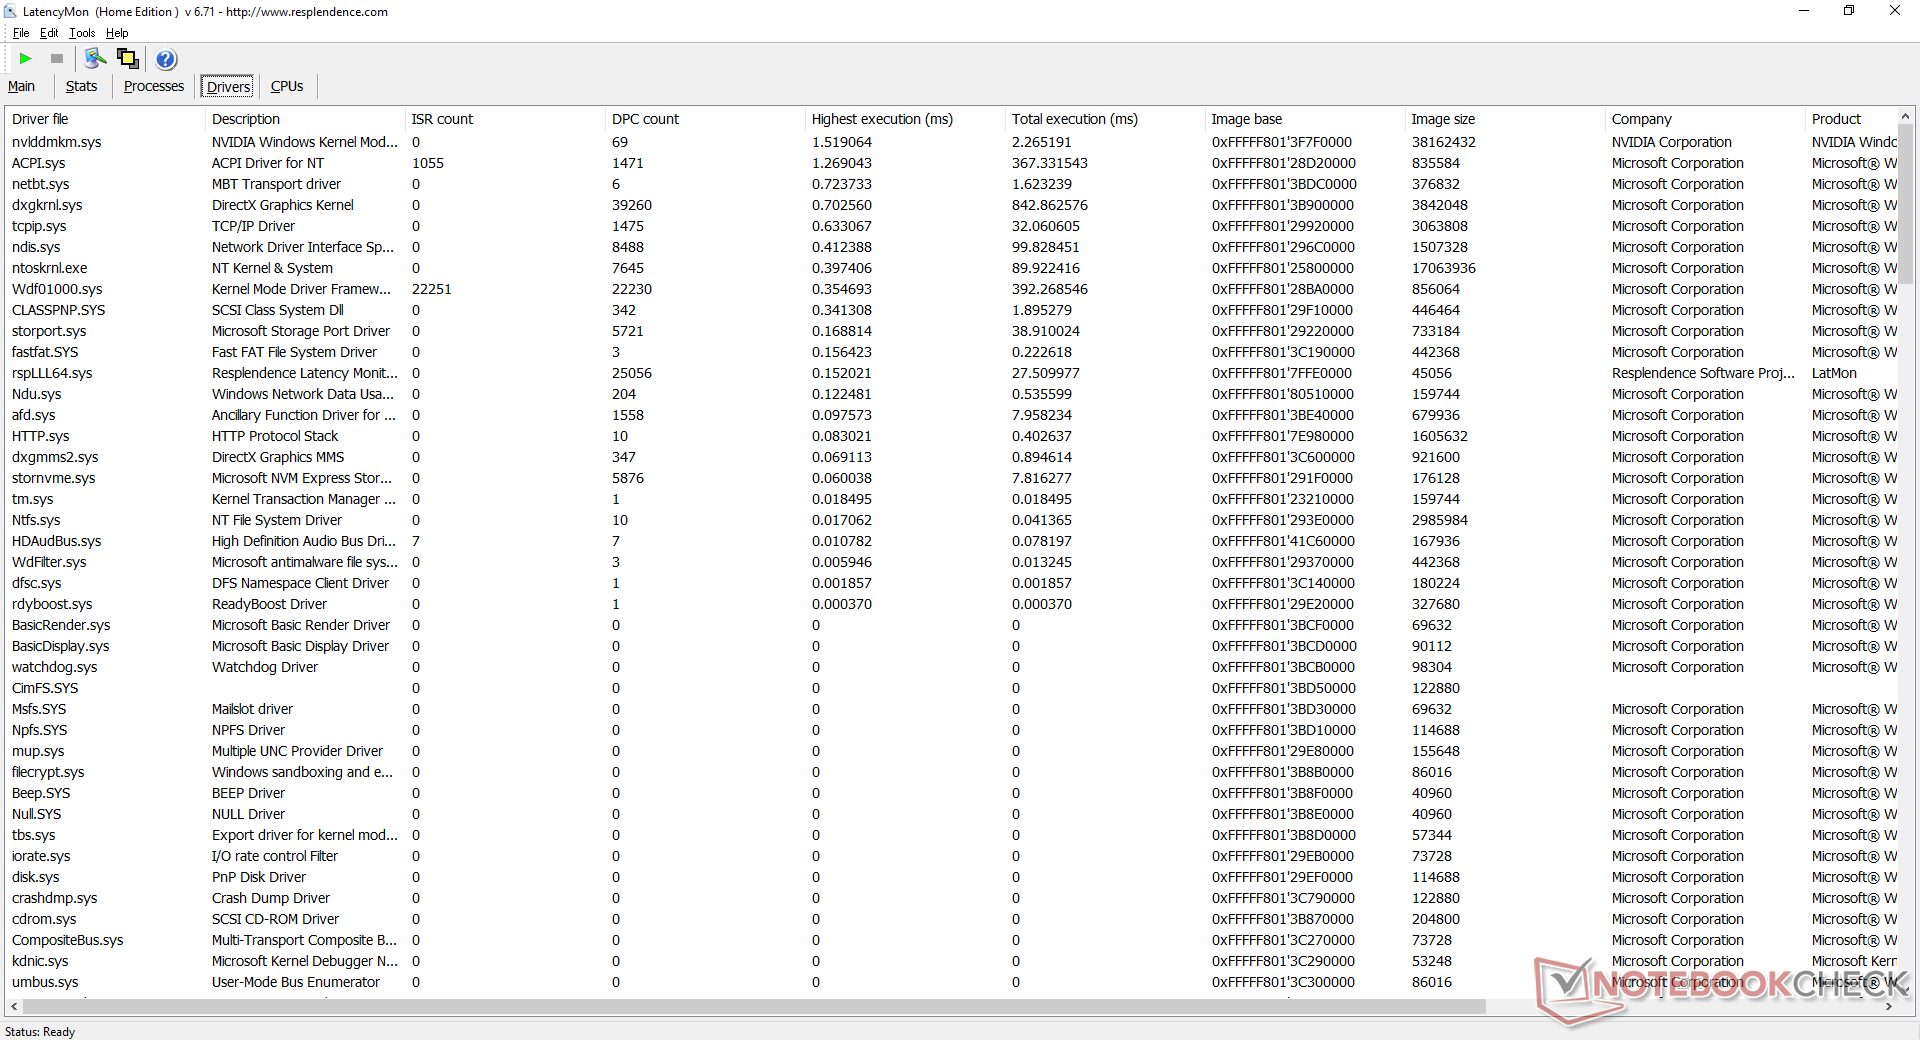
LatencyMon显示,在我们的主页上打开多个浏览器标签或运行Prime95压力时,有轻微的DPC延时问题。在我们的测试过程中,以60 FPS的速度播放4K视频是顺畅的,只有一个丢帧。
| DPC Latencies / LatencyMon - interrupt to process latency (max), Web, Youtube, Prime95 | |
| Gigabyte Aero 17 HDR YD | |
| Asus ROG Zephyrus S17 GX703HSD | |
| MSI GS76 Stealth 11UH | |
| Acer Nitro 5 AN517-41-R9S5 | |
| Maingear Vector Pro MG-VCP17 | |
| Razer Blade 17 RTX 3070 | |
* ... smaller is better
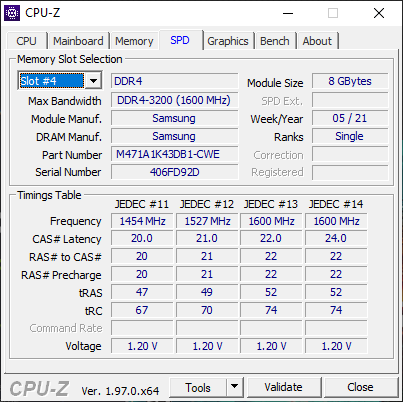
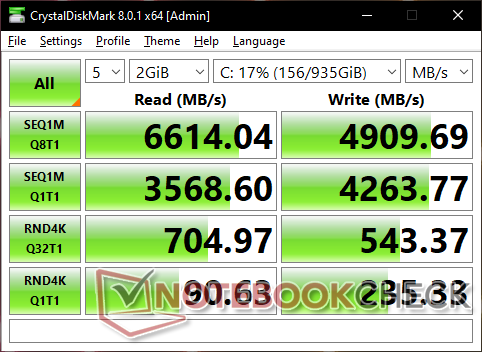
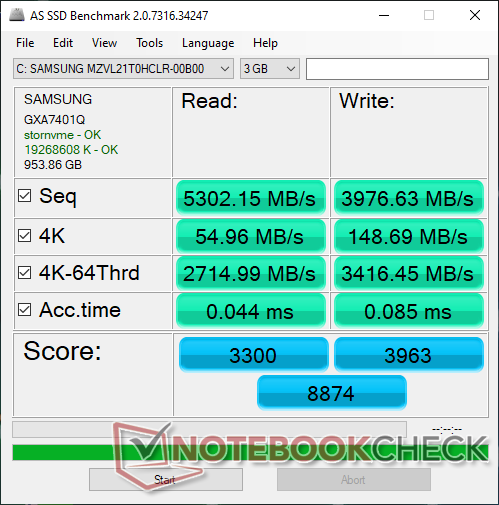
存储设备 - 支持PCIe4
Razer再次坚持用三星来满足其PCIe4 NVMe SSD的需求。1TB的 PM9A1驱动器在几乎所有方面都比去年的型号的PM981a快得多。用户可以像以前一样最多安装两个驱动器。
| Razer Blade 17 RTX 3070 Samsung PM9A1 MZVL21T0HCLR | Razer Blade Pro 17 2021 (QHD Touch) Samsung PM981a MZVLB1T0HBLR | Asus ROG Zephyrus S17 GX703HSD Samsung PM9A1 MZVL22T0HBLB | MSI GS76 Stealth 11UH Samsung PM9A1 MZVL22T0HBLB | Acer Nitro 5 AN517-41-R9S5 SK Hynix BC711 1TB HFM001TD3JX016N | Gigabyte Aero 17 HDR YD Samsung PM9A1 MZVL2512HCJQ | |
|---|---|---|---|---|---|---|
| AS SSD | -35% | 14% | 5% | -21% | 4% | |
| Seq Read (MB/s) | 5302 | 2068 -61% | 5085 -4% | 5408 2% | 2974 -44% | 5438 3% |
| Seq Write (MB/s) | 3977 | 2047 -49% | 4434 11% | 3863 -3% | 2733 -31% | 3904 -2% |
| 4K Read (MB/s) | 55 | 47.85 -13% | 80.3 46% | 52.7 -4% | 55.7 1% | 56.2 2% |
| 4K Write (MB/s) | 148.7 | 87.4 -41% | 214.7 44% | 153.1 3% | 134 -10% | 165.8 11% |
| 4K-64 Read (MB/s) | 2715 | 1932 -29% | 2573 -5% | 2692 -1% | 1854 -32% | 2489 -8% |
| 4K-64 Write (MB/s) | 3416 | 2017 -41% | 2972 -13% | 3414 0% | 2165 -37% | 3480 2% |
| Access Time Read * (ms) | 0.044 | 0.055 -25% | 0.018 59% | 0.046 -5% | 0.054 -23% | |
| Access Time Write * (ms) | 0.085 | 0.128 -51% | 0.02 76% | 0.027 68% | 0.028 67% | 0.026 69% |
| Score Read (Points) | 3300 | 2187 -34% | 3161 -4% | 3285 0% | 2207 -33% | 3089 -6% |
| Score Write (Points) | 3963 | 2309 -42% | 3631 -8% | 3953 0% | 2573 -35% | 4036 2% |
| Score Total (Points) | 8874 | 5612 -37% | 8380 -6% | 8830 0% | 5899 -34% | 8620 -3% |
| Copy ISO MB/s (MB/s) | 2710 | 2400 -11% | 3239 20% | 2260 -17% | ||
| Copy Program MB/s (MB/s) | 1114 | 684 -39% | 899 -19% | 677 -39% | ||
| Copy Game MB/s (MB/s) | 2095 | 1629 -22% | 2171 4% | 1493 -29% | ||
| CrystalDiskMark 5.2 / 6 | -43% | 3% | 1% | -36% | 3% | |
| Write 4K (MB/s) | 233.5 | 123.5 -47% | 244.2 5% | 230.7 -1% | 133.4 -43% | 230.4 -1% |
| Read 4K (MB/s) | 90.1 | 45.96 -49% | 89.8 0% | 87.9 -2% | 64.7 -28% | 91.6 2% |
| Write Seq (MB/s) | 4263 | 1861 -56% | 4300 1% | 2934 -31% | 4216 -1% | |
| Read Seq (MB/s) | 4468 | 1584 -65% | 4392 -2% | 2364 -47% | 4543 2% | |
| Write 4K Q32T1 (MB/s) | 538 | 466.4 -13% | 607 13% | 582 8% | 438.4 -19% | 667 24% |
| Read 4K Q32T1 (MB/s) | 703 | 566 -19% | 658 -6% | 730 4% | 516 -27% | 728 4% |
| Write Seq Q32T1 (MB/s) | 5097 | 2981 -42% | 5270 3% | 5152 1% | 3083 -40% | 5043 -1% |
| Read Seq Q32T1 (MB/s) | 7065 | 3260 -54% | 7091 0% | 7094 0% | 3584 -49% | 6821 -3% |
| Write 4K Q8T8 (MB/s) | 2270 | |||||
| Read 4K Q8T8 (MB/s) | 2490 | |||||
| Total Average (Program / Settings) | -39% /
-38% | 9% /
11% | 3% /
4% | -29% /
-27% | 4% /
4% |
* ... smaller is better

Disk Throttling: DiskSpd Read Loop, Queue Depth 8
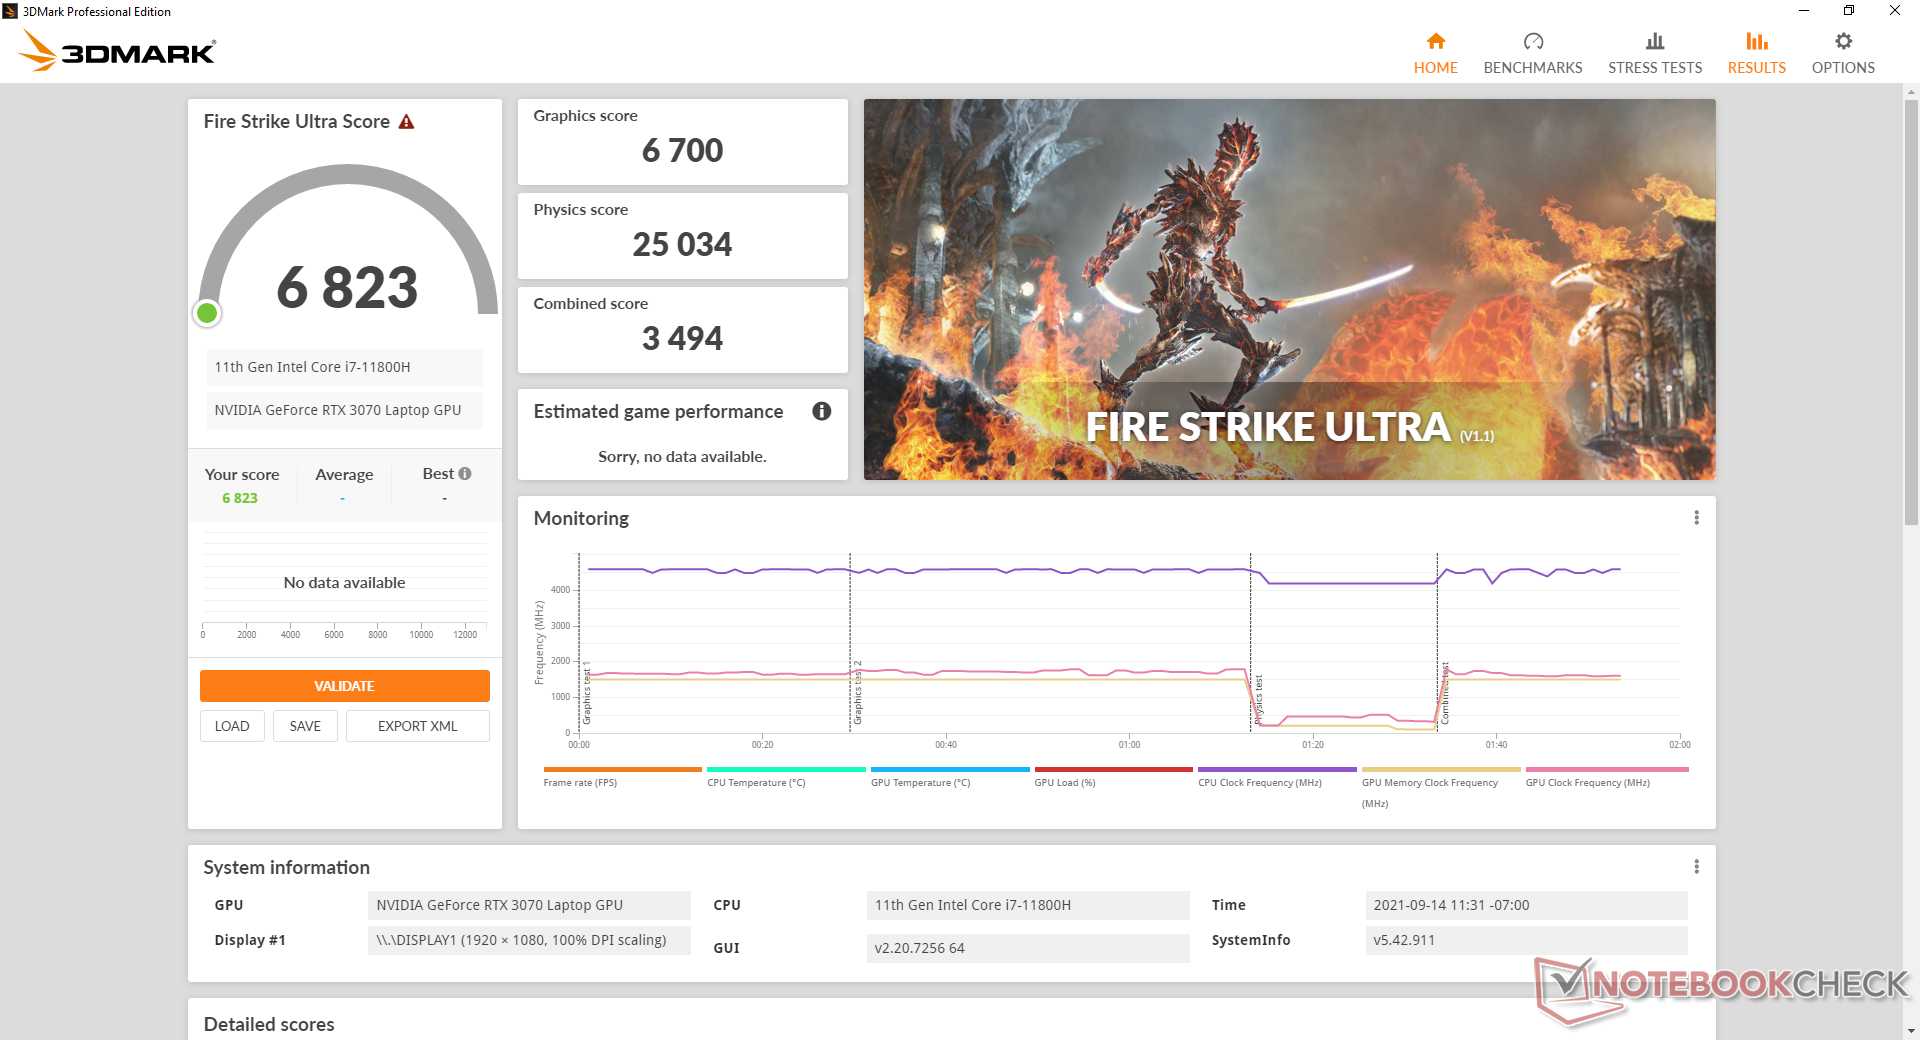
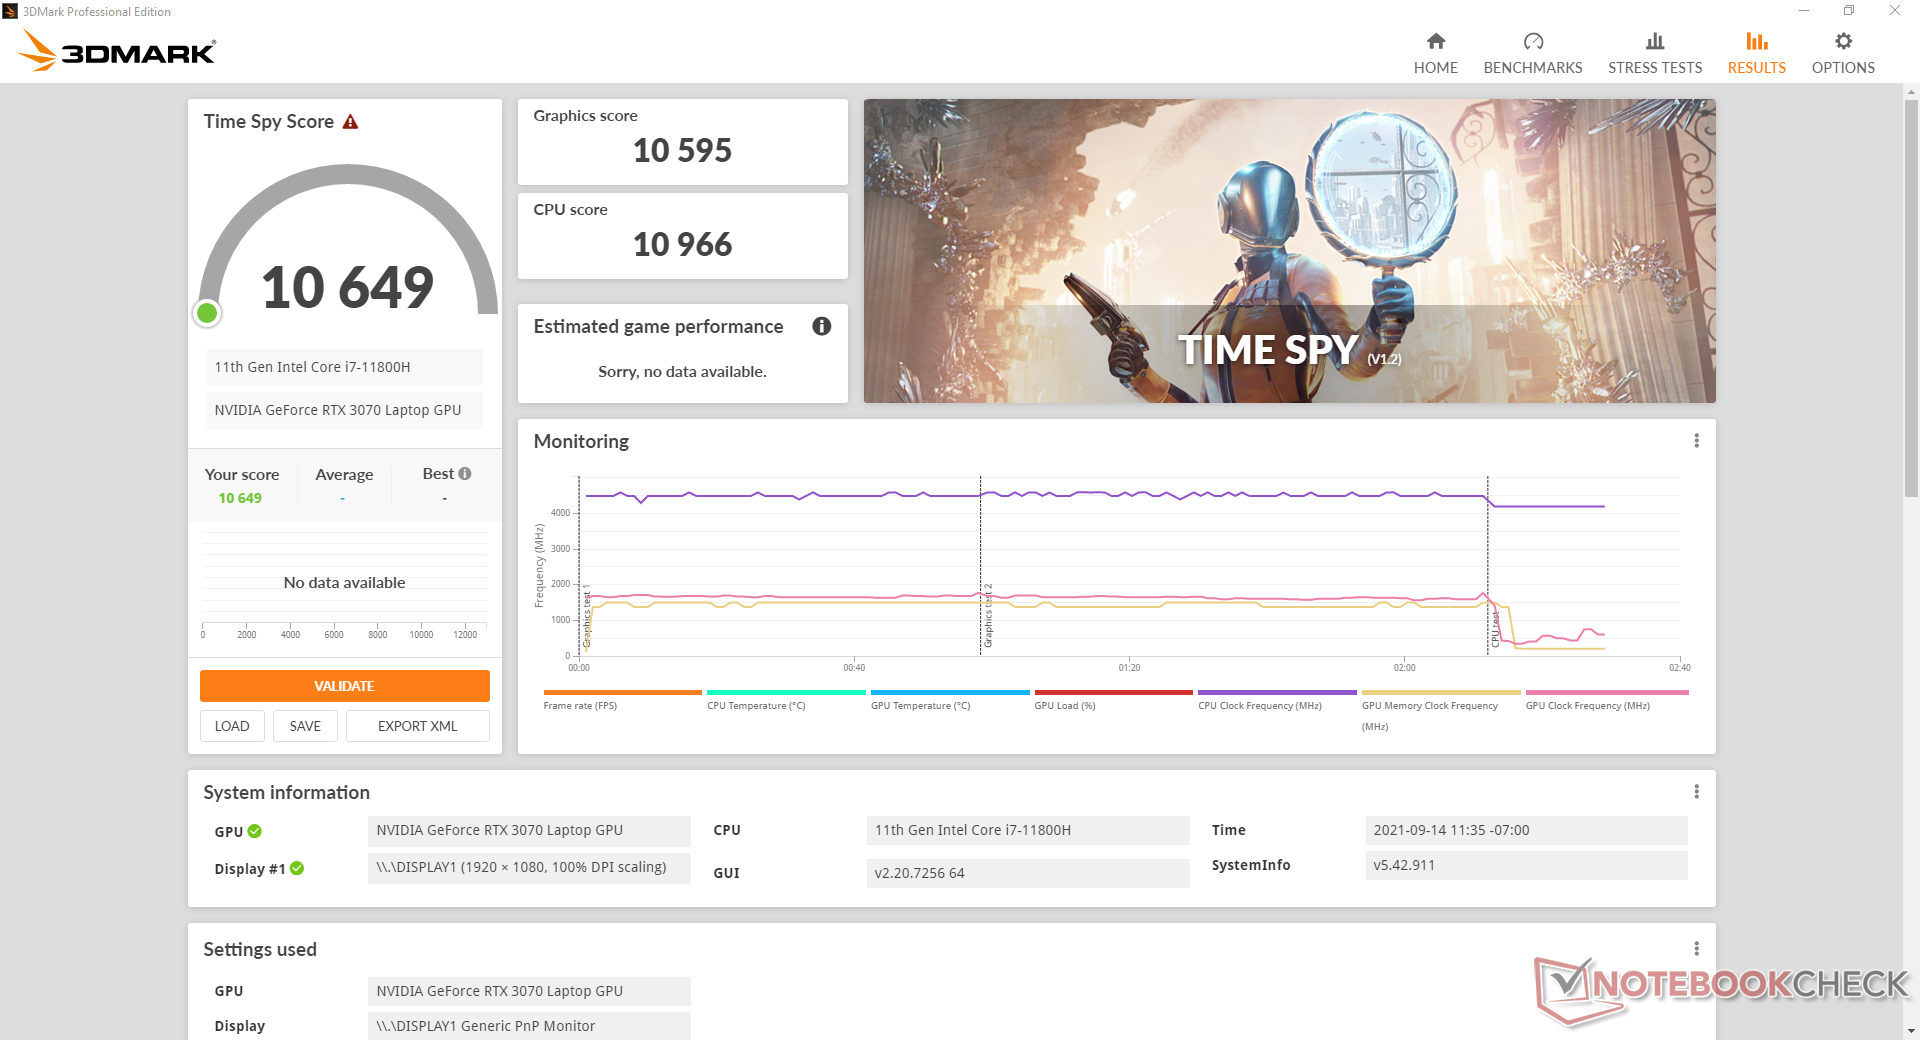
GPU性能 - 比100W的GeForce RTX 3080稍快一些
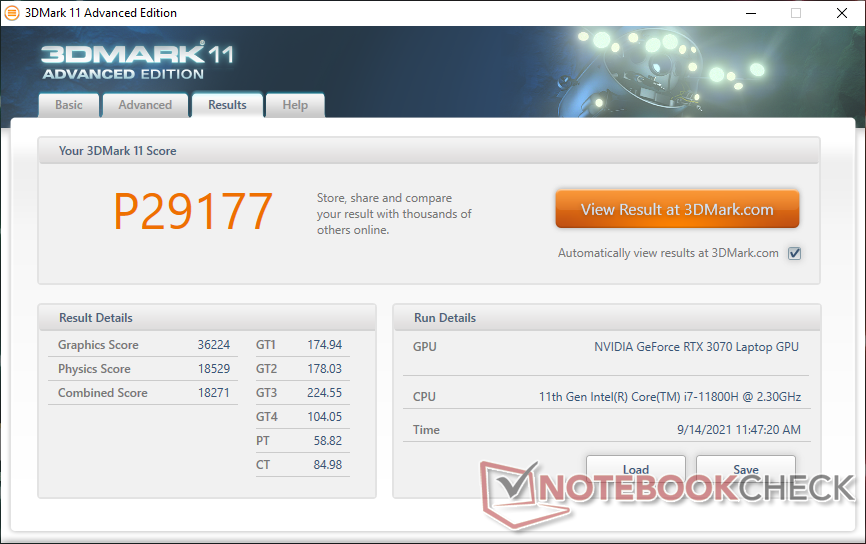
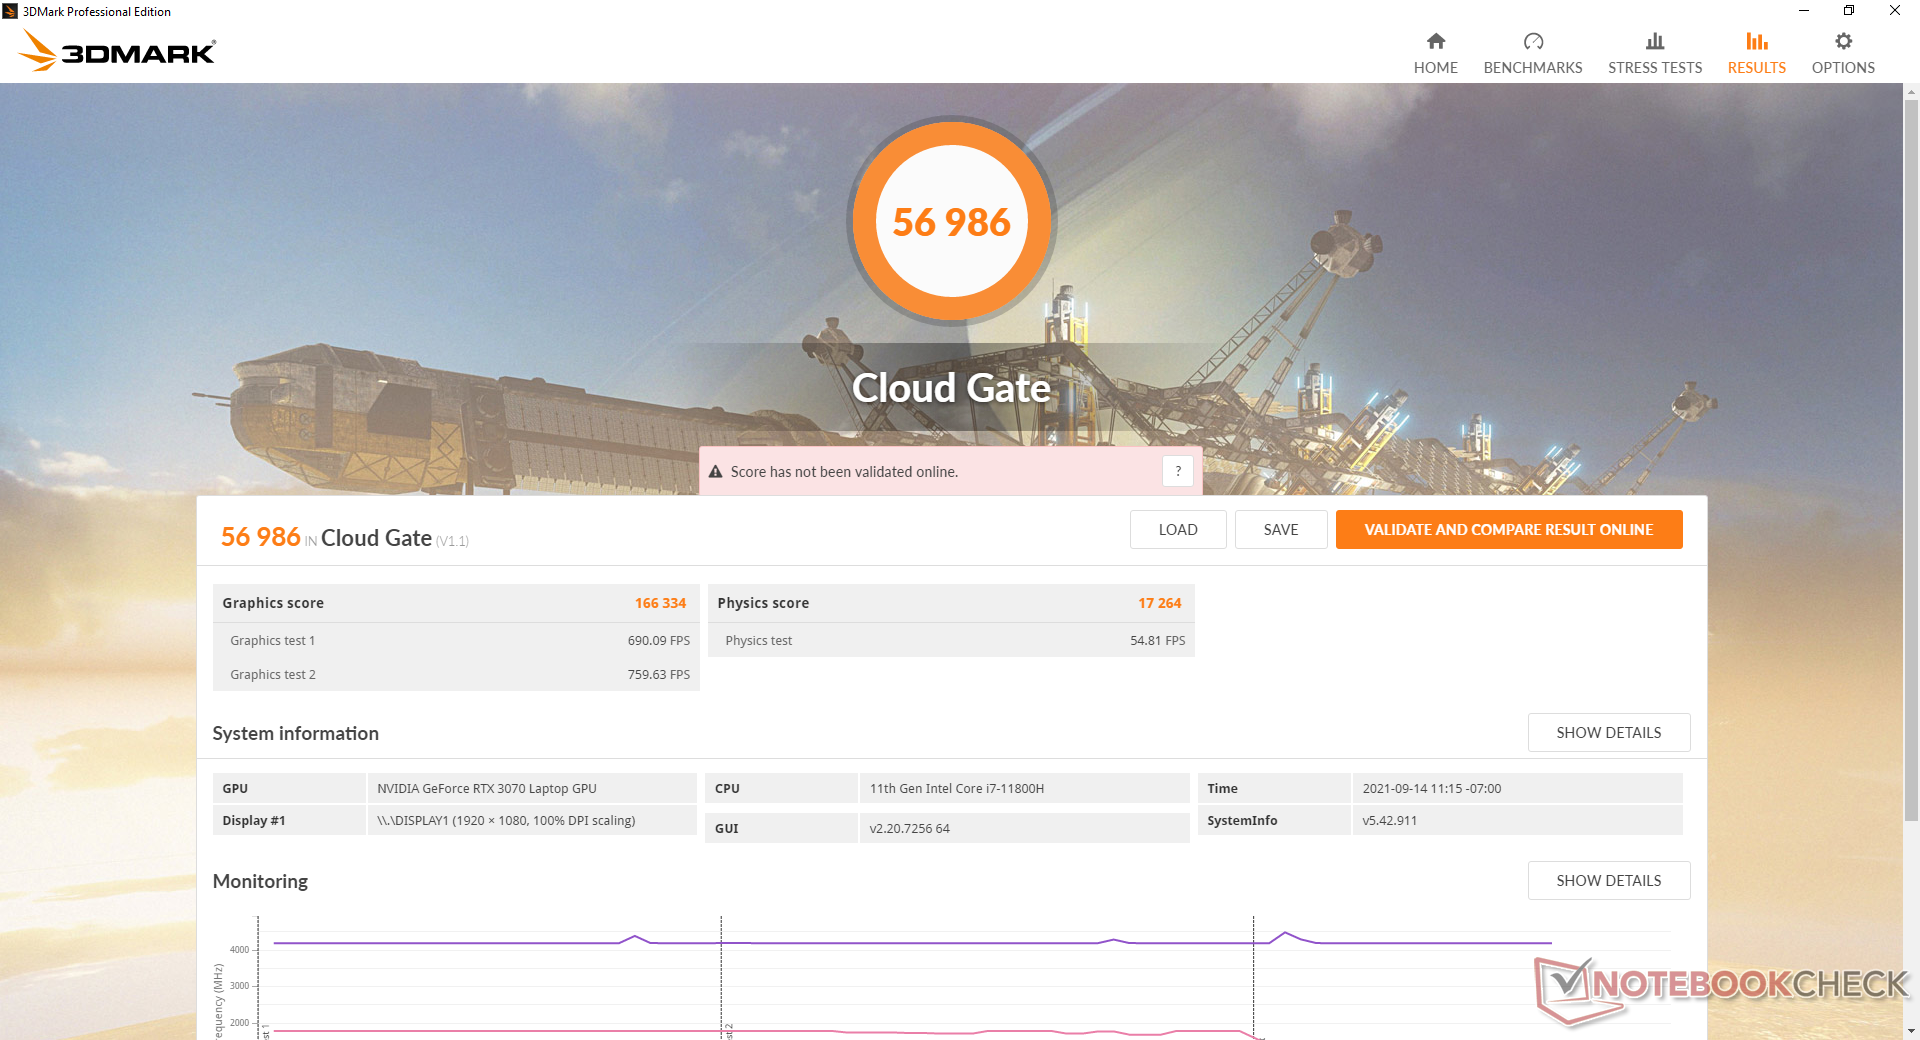
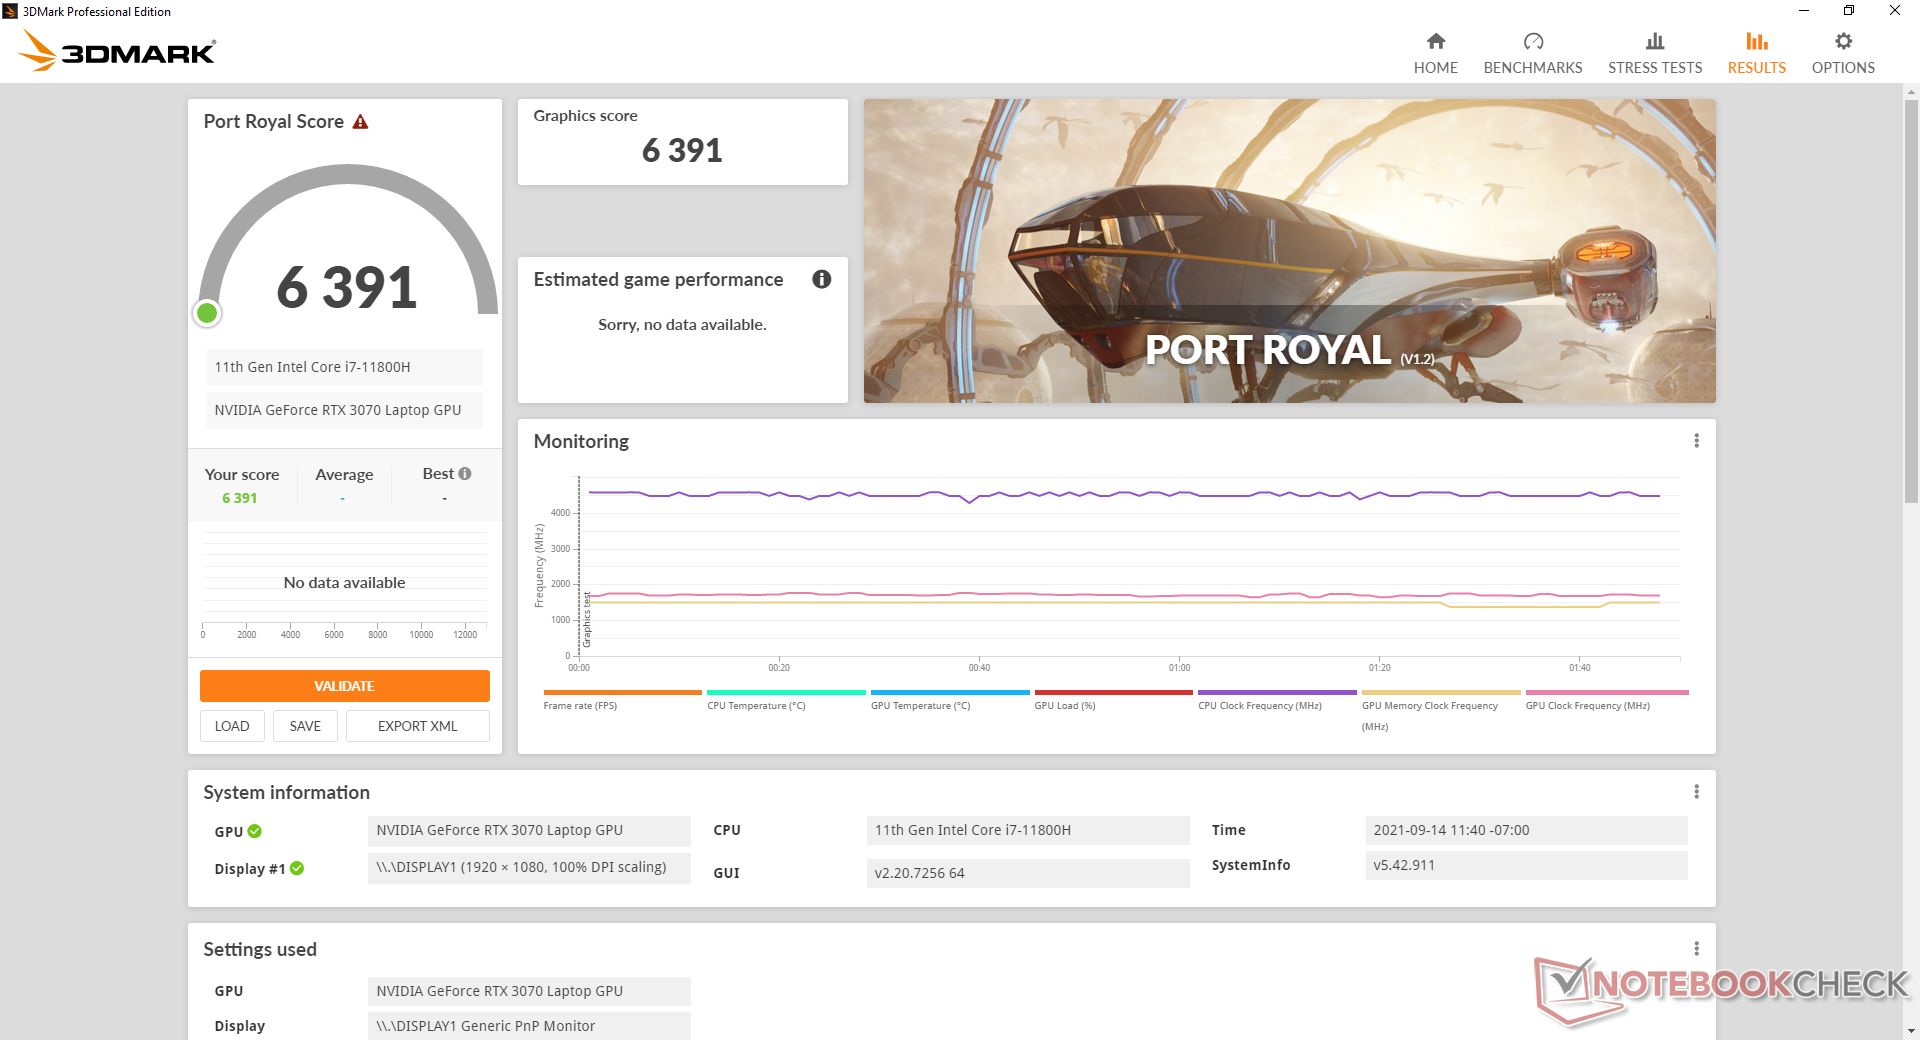
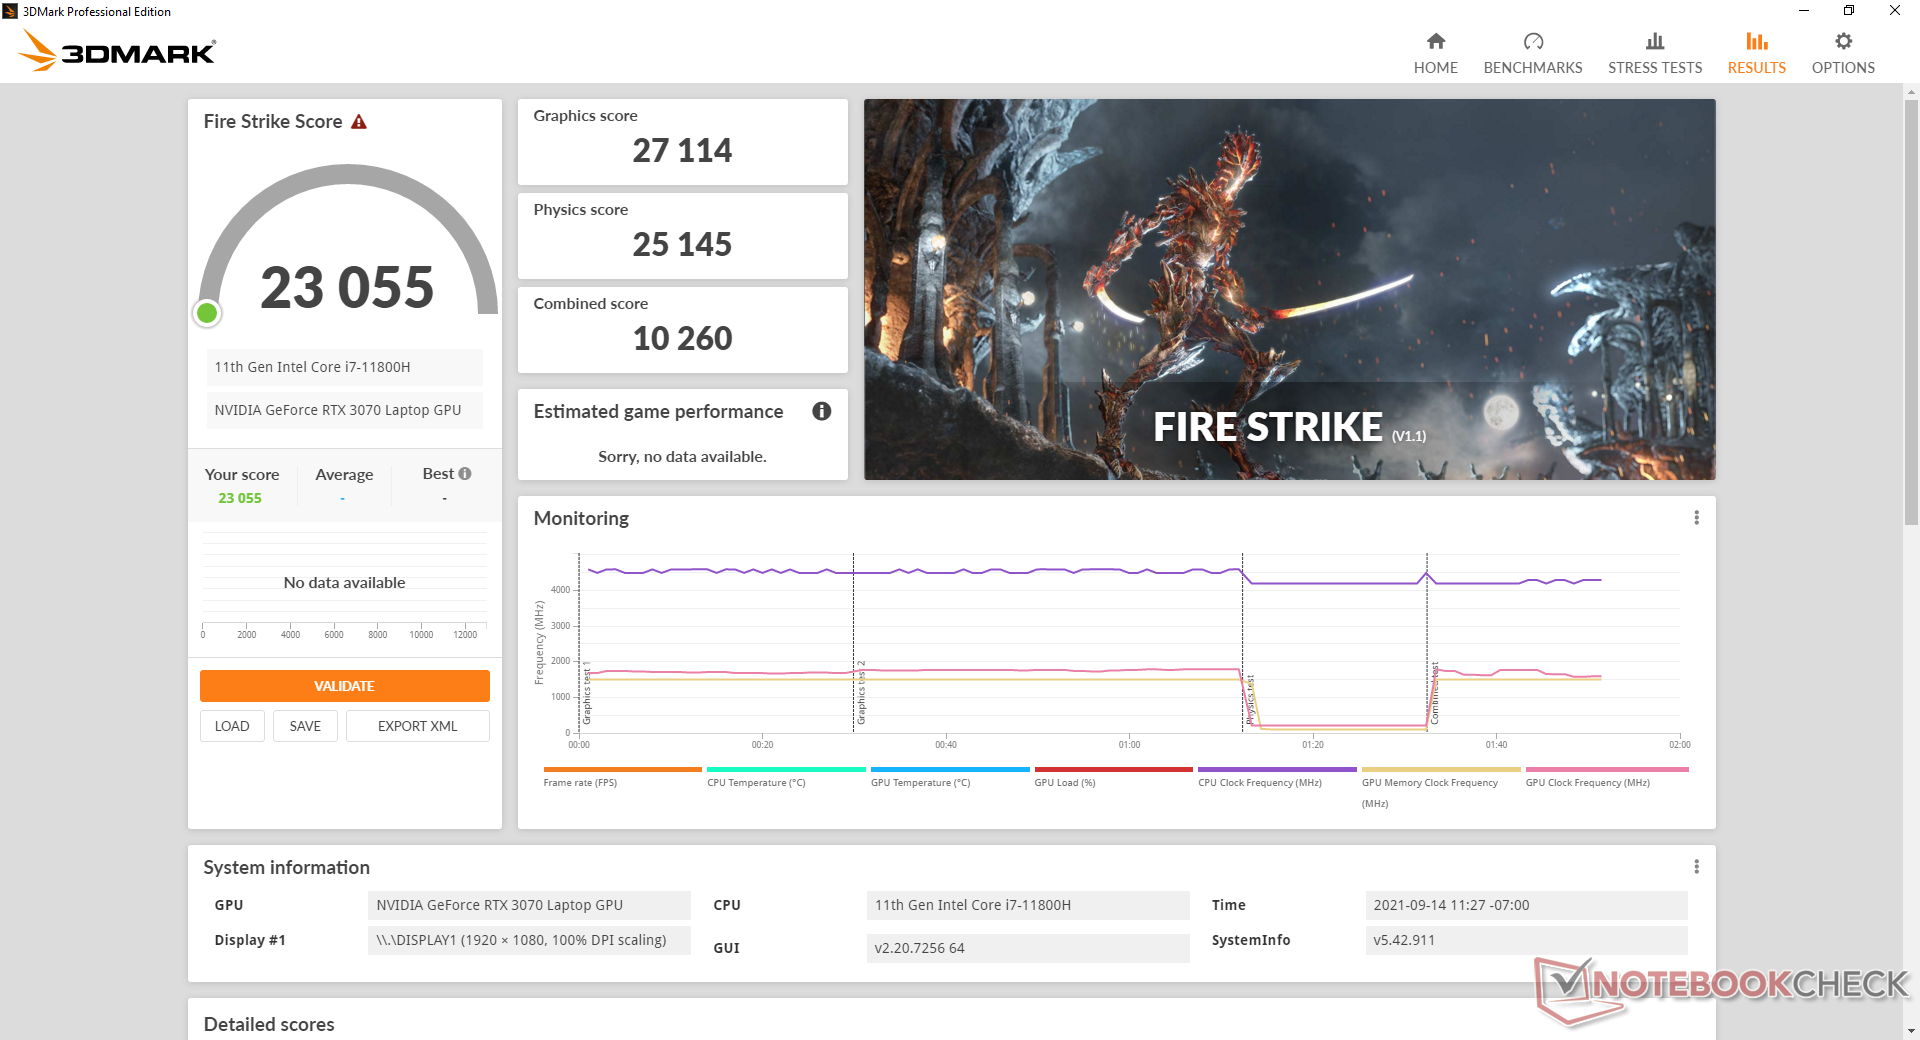
图形性能非常好,3DMark结果比我们数据库中配备相同RTX 3070的普通笔记本电脑快10%至15%。 同样的RTX 3070GPU。事实上,原始性能基本上与去年的 Blade Pro RTX 3080SKU。然而,它仍然明显慢于 "适当的 "桌面RTX 3080,这更像是一个 Nvidia的事情而不是Razer的事情.
升级到Blade 17 RTX 3080 SKU可能会带来非常小的性能优势,比我们的RTX 3070 SKU只有几个百分点,根据我们的经验,,到目前为止至少有十几台其他RTX 3080笔记本电脑 。用户还应该记住,帧率不一定需要达到360 FPS ,以便利用360 Hz显示器的好处。
| 3DMark 11 | |
| 1280x720 Performance GPU | |
| MSI GeForce RTX 3080 Gaming X Trio | |
| Razer Blade Pro 17 2021 (QHD Touch) | |
| Razer Blade 17 RTX 3070 | |
| Average NVIDIA GeForce RTX 3070 Laptop GPU (12535 - 38275, n=54) | |
| Razer Blade Pro 17 RTX 2080 Max-Q | |
| Razer Blade Pro 17 4K UHD 120 Hz | |
| Razer Blade Pro 17 RTX 2070 Max-Q 300 Hz | |
| Razer Blade Pro 2017 | |
| Razer Blade Pro 17 RTX 2060 | |
| Razer Blade Pro RZ09-0220 | |
| 1280x720 Performance Combined | |
| MSI GeForce RTX 3080 Gaming X Trio | |
| Razer Blade 17 RTX 3070 | |
| Razer Blade Pro 17 2021 (QHD Touch) | |
| Razer Blade Pro 17 RTX 2070 Max-Q 300 Hz | |
| Average NVIDIA GeForce RTX 3070 Laptop GPU (3715 - 22517, n=53) | |
| Razer Blade Pro 17 4K UHD 120 Hz | |
| Razer Blade Pro 17 RTX 2060 | |
| Razer Blade Pro 17 RTX 2080 Max-Q | |
| Razer Blade Pro 2017 | |
| Razer Blade Pro RZ09-0220 | |
| 3DMark 11 Performance | 29177 points | |
| 3DMark Cloud Gate Standard Score | 56986 points | |
| 3DMark Fire Strike Score | 23055 points | |
| 3DMark Time Spy Score | 10649 points | |
Help | ||
| Final Fantasy XV Benchmark | |
| 1280x720 Lite Quality | |
| Razer Blade 17 RTX 3070 | |
| Gigabyte Aero 17 HDR YD | |
| Maingear Vector Pro MG-VCP17 | |
| Razer Blade Pro 17 2021 (QHD Touch) | |
| Acer Nitro 5 AN517-41-R9S5 | |
| Average NVIDIA GeForce RTX 3070 Laptop GPU (137 - 207, n=30) | |
| 1920x1080 Standard Quality | |
| Asus ROG Zephyrus S17 GX703HSD | |
| Maingear Vector Pro MG-VCP17 | |
| Razer Blade Pro 17 2021 (QHD Touch) | |
| Razer Blade 17 RTX 3070 | |
| Gigabyte Aero 17 HDR YD | |
| Average NVIDIA GeForce RTX 3070 Laptop GPU (67 - 144, n=32) | |
| Acer Nitro 5 AN517-41-R9S5 | |
| 1920x1080 High Quality | |
| Razer Blade Pro 17 2021 (QHD Touch) | |
| Maingear Vector Pro MG-VCP17 | |
| Razer Blade 17 RTX 3070 | |
| Gigabyte Aero 17 HDR YD | |
| MSI GS76 Stealth 11UH | |
| Average NVIDIA GeForce RTX 3070 Laptop GPU (27.9 - 107, n=49) | |
| Acer Nitro 5 AN517-41-R9S5 | |
Witcher 3 FPS Chart
| low | med. | high | ultra | |
|---|---|---|---|---|
| GTA V (2015) | 185 | 180 | 173 | 108 |
| The Witcher 3 (2015) | 460.9 | 312.7 | 204.8 | 100.6 |
| Dota 2 Reborn (2015) | 171 | 155 | 149 | 140 |
| Final Fantasy XV Benchmark (2018) | 195 | 136 | 103 | |
| X-Plane 11.11 (2018) | 142 | 125 | 98.4 | |
| Far Cry 5 (2018) | 149 | 138 | 131 | 122 |
| Strange Brigade (2018) | 522 | 261 | 212 | 186 |
Emissions — Still Loud when Gaming
系统噪音
风扇噪音比有四个独立风扇的游戏笔记本预期的要小,因为在浏览网页或网上冲浪时,风扇往往尽可能地空转。然而,当在手动涡轮模式下进行游戏时,风扇噪音可高达56 dB(A),比大多数其他游戏笔记本电脑的噪音要大。点击板下面的小风扇的音调也比大多数其他风扇高,这使得它们难以被忽视。
在默认的平衡模式下,而不是手动的涡轮模式下,游戏时的风扇噪音最高只有43.5 dB(A)。当然,用户将牺牲性能来换取更低的风扇噪音。
在我们的设备上有一些非常轻微的电子噪音或线圈啸叫,只有在把耳朵放在键盘按键附近时才会变得明显。
| Razer Blade 17 RTX 3070 GeForce RTX 3070 Laptop GPU, i7-11800H, Samsung PM9A1 MZVL21T0HCLR | Asus ROG Zephyrus S17 GX703HSD GeForce RTX 3080 Laptop GPU, i9-11900H, Samsung PM9A1 MZVL22T0HBLB | MSI GS76 Stealth 11UH GeForce RTX 3080 Laptop GPU, i9-11900H, Samsung PM9A1 MZVL22T0HBLB | Acer Nitro 5 AN517-41-R9S5 GeForce RTX 3080 Laptop GPU, R7 5800H, SK Hynix BC711 1TB HFM001TD3JX016N | Gigabyte Aero 17 HDR YD GeForce RTX 3080 Laptop GPU, i9-11980HK, Samsung PM9A1 MZVL2512HCJQ | Maingear Vector Pro MG-VCP17 GeForce RTX 3080 Laptop GPU, i7-11800H, Samsung PM9A1 MZVL21T0HCLR | |
|---|---|---|---|---|---|---|
| Noise | 6% | -8% | -4% | -19% | 1% | |
| off / environment * (dB) | 24.2 | 23 5% | 24 1% | 26 -7% | 25 -3% | 23.8 2% |
| Idle Minimum * (dB) | 24.7 | 23 7% | 24 3% | 26 -5% | 30 -21% | 23.9 3% |
| Idle Average * (dB) | 24.7 | 23 7% | 25 -1% | 28 -13% | 32 -30% | 23.9 3% |
| Idle Maximum * (dB) | 24.7 | 23 7% | 42 -70% | 41 -66% | 23.9 3% | |
| Load Average * (dB) | 44.3 | 41 7% | 46 -4% | 41.6 6% | 43 3% | 38 14% |
| Witcher 3 ultra * (dB) | 56.3 | 45 20% | 48 15% | 51 9% | 55.9 1% | |
| Load Maximum * (dB) | 47.7 | 52 -9% | 48 -1% | 48.6 -2% | 59 -24% | 55.9 -17% |
* ... smaller is better
Noise level
| Idle |
| 24.7 / 24.7 / 24.7 dB(A) |
| Load |
| 44.3 / 47.7 dB(A) |
 | ||
30 dB silent 40 dB(A) audible 50 dB(A) loud |
||
min: | ||
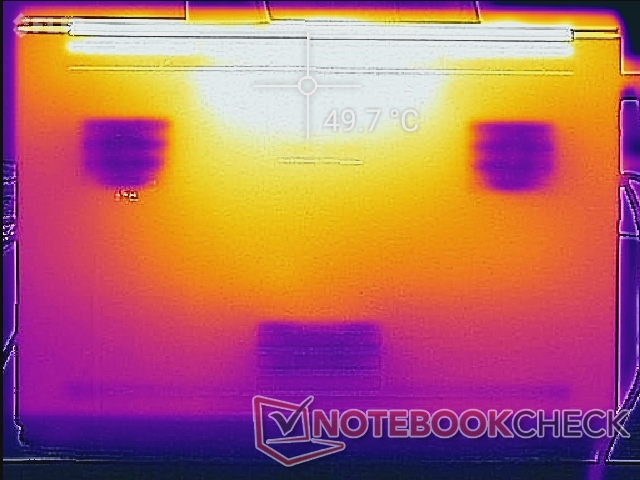
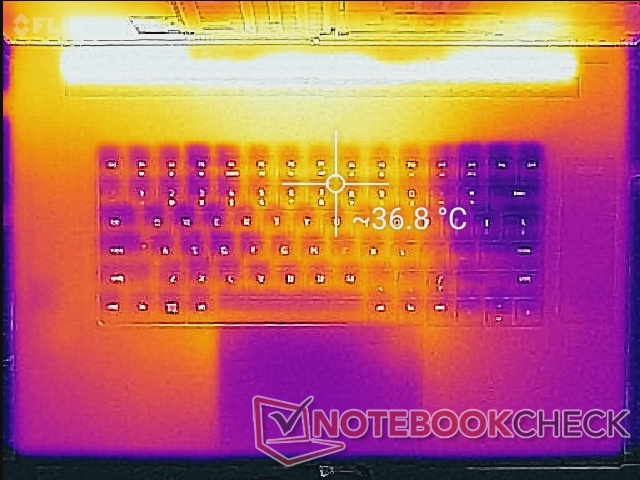
温度
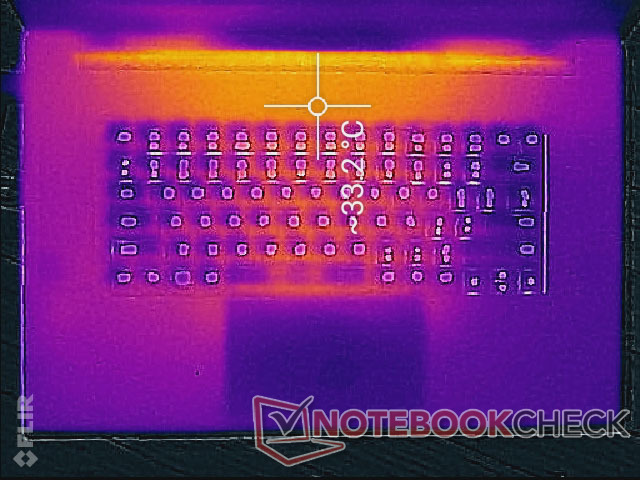
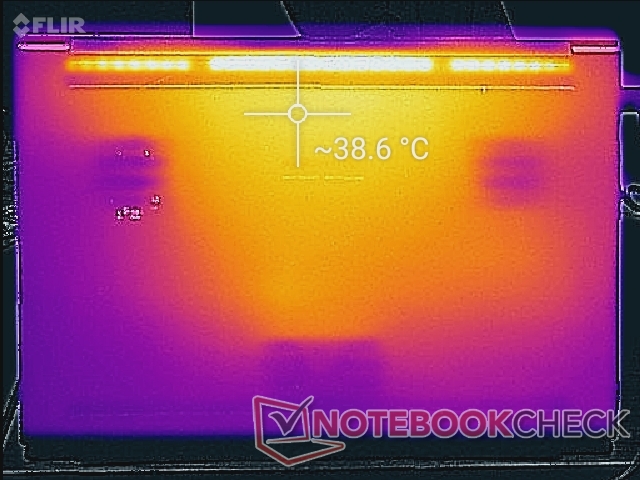
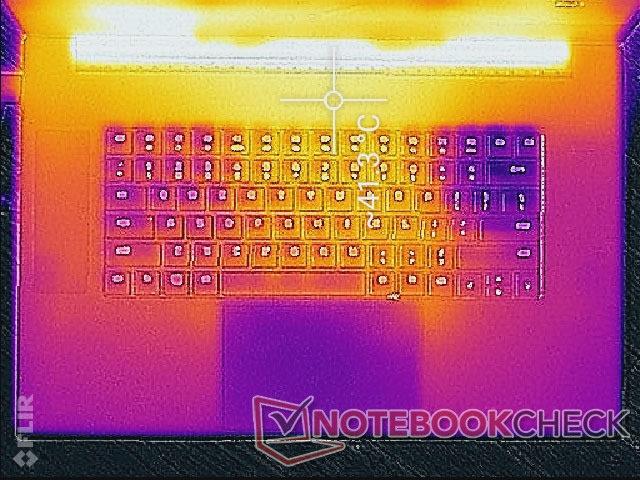
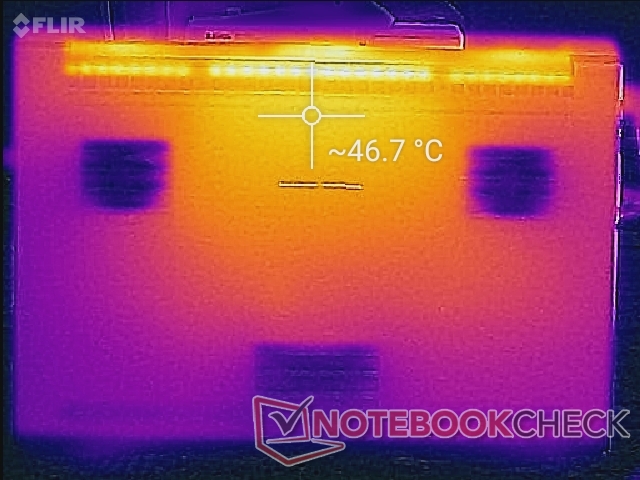
刀片17的表面温度是合理的,部分原因是它有四个独立的风扇,而大多数其他笔记本电脑上只有两个。顶部和底部的热点可以分别达到41摄氏度和49摄氏度以上,相比之下,华硕Zephyrus S17的温度为59摄氏度或53摄氏度。 华硕Zephyrus S17.即使与华硕Zephyrus S17相比,掌托的温度也没有那么高。 刀片15.
闲置时的表面温度仍然偏高,因为风扇在工作负荷低时往往会闲置。底部热点的温度可以达到39摄氏度,而上述华硕则为35摄氏度。
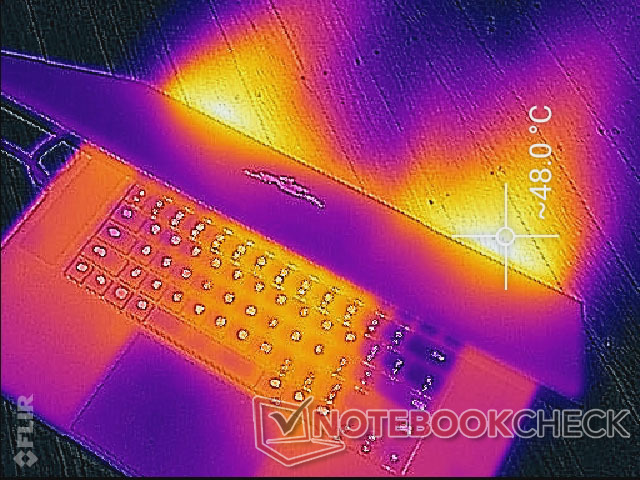
(±) The maximum temperature on the upper side is 41 °C / 106 F, compared to the average of 40.4 °C / 105 F, ranging from 21.2 to 68.8 °C for the class Gaming.
(-) The bottom heats up to a maximum of 47.2 °C / 117 F, compared to the average of 43.2 °C / 110 F
(+) In idle usage, the average temperature for the upper side is 29.9 °C / 86 F, compared to the device average of 33.9 °C / 93 F.
(±) Playing The Witcher 3, the average temperature for the upper side is 33.2 °C / 92 F, compared to the device average of 33.9 °C / 93 F.
(+) The palmrests and touchpad are reaching skin temperature as a maximum (33 °C / 91.4 F) and are therefore not hot.
(-) The average temperature of the palmrest area of similar devices was 28.8 °C / 83.8 F (-4.2 °C / -7.6 F).
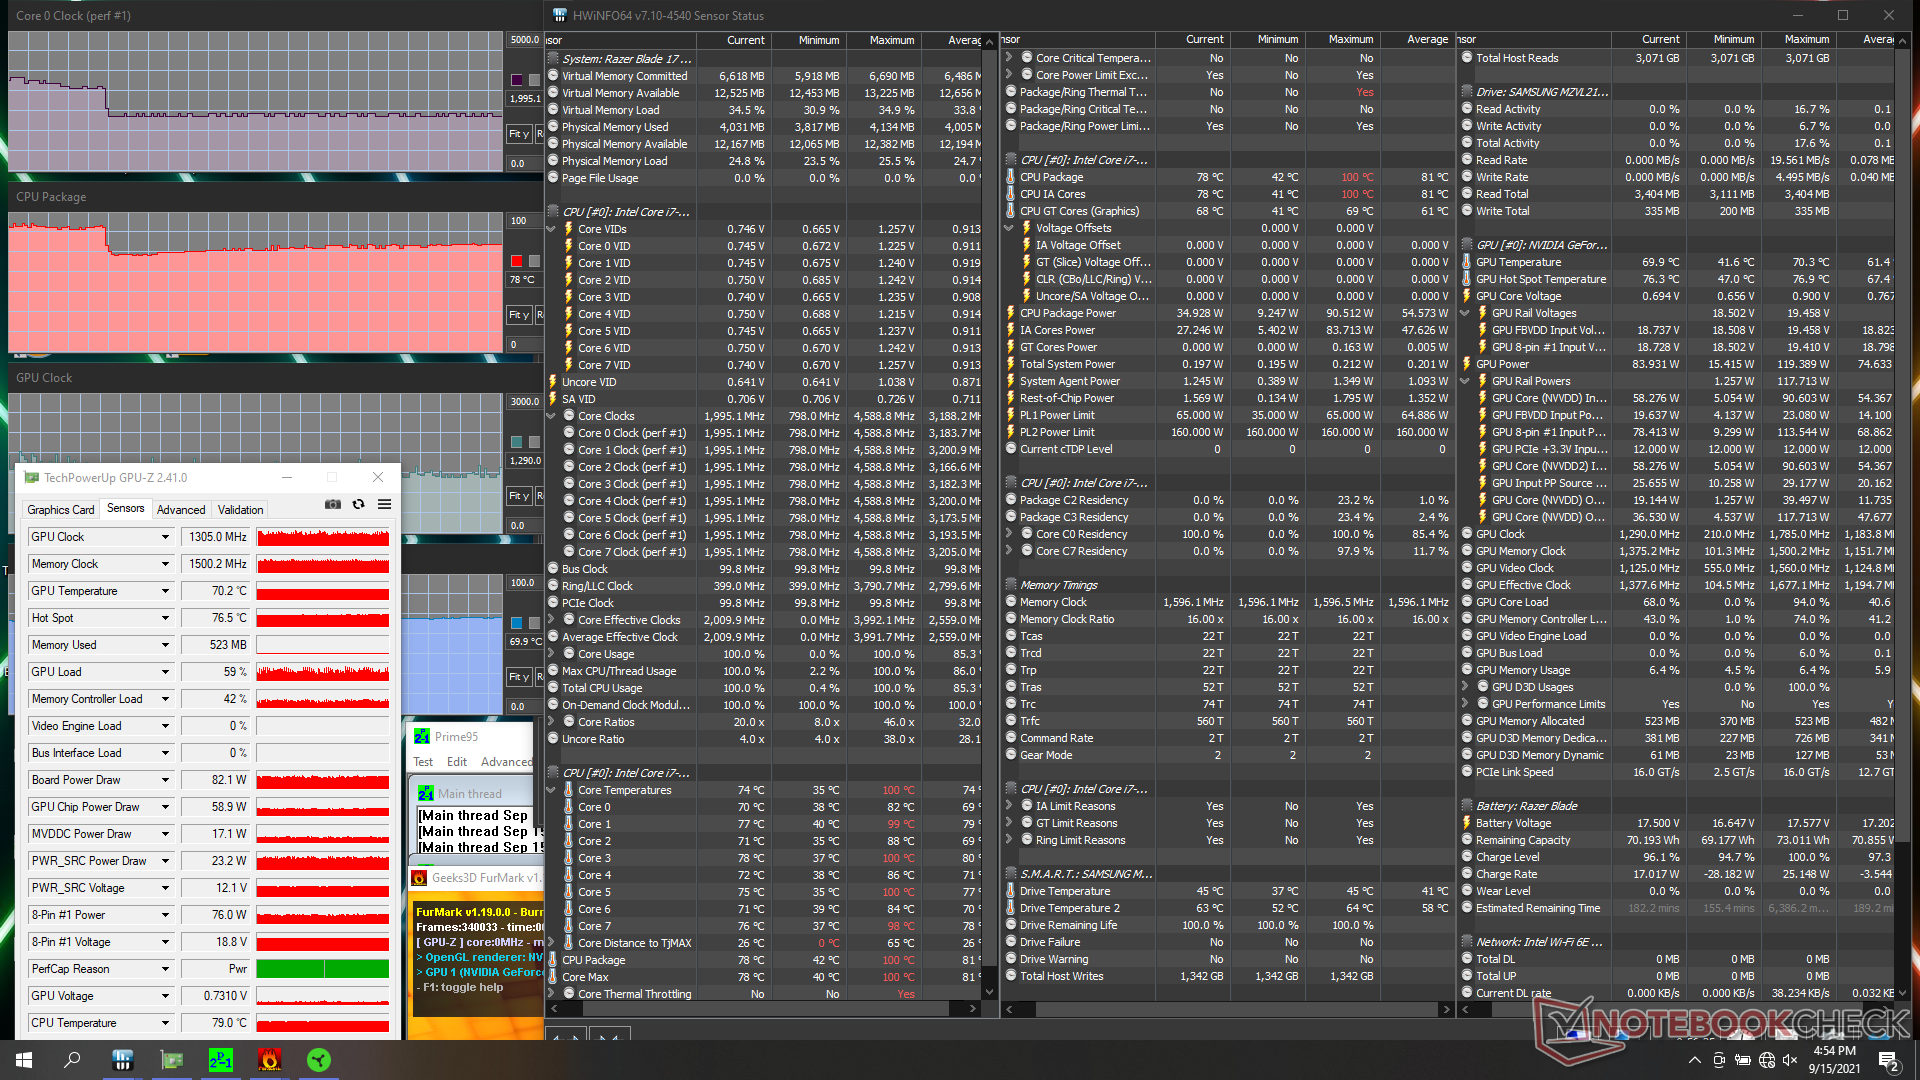
压力测试
当在Prime95的Turbo模式下受压时,CPU会在20秒内提升到3.9GHz,然后下降到3.5GHz,最后是2.9GHz,以保持78C的核心温度。虽然不是很糟糕,但当100%的利用率时,处理器不能长时间维持较快的时钟速率,这太糟糕了。
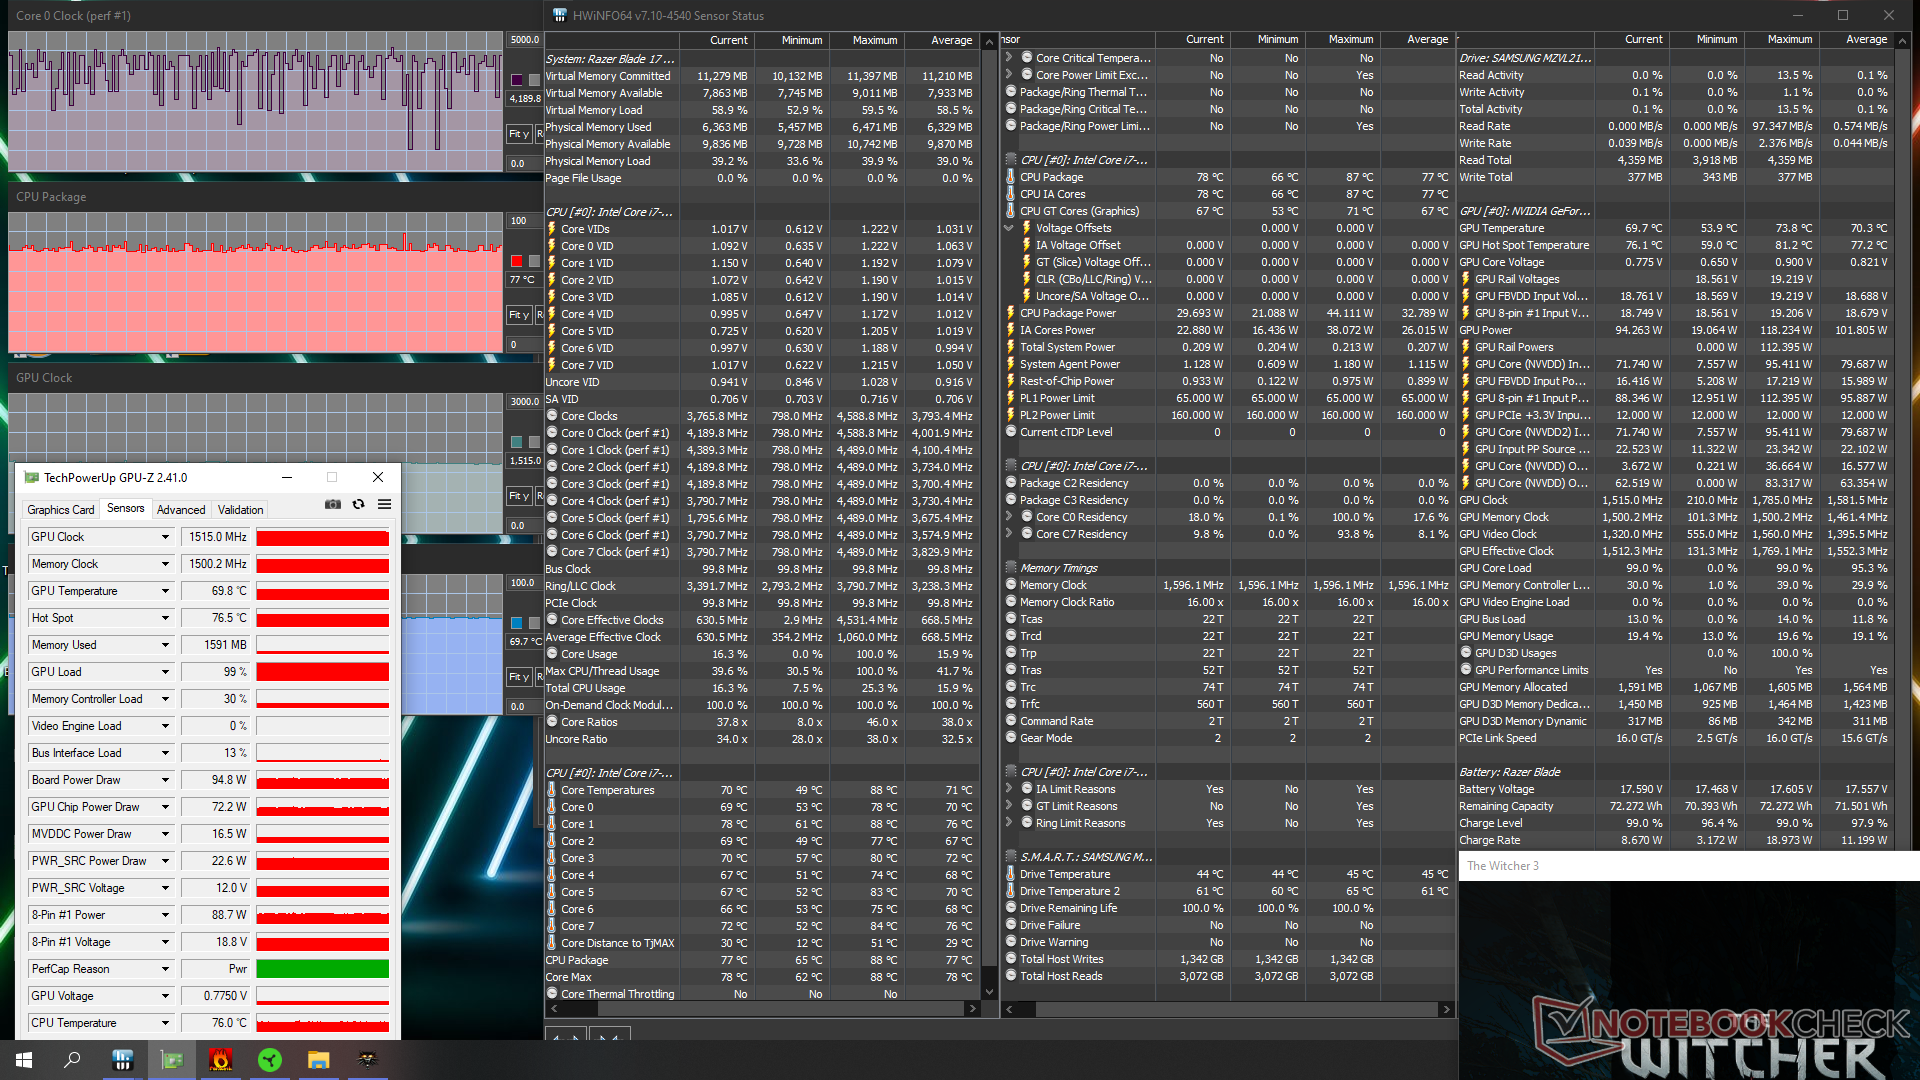
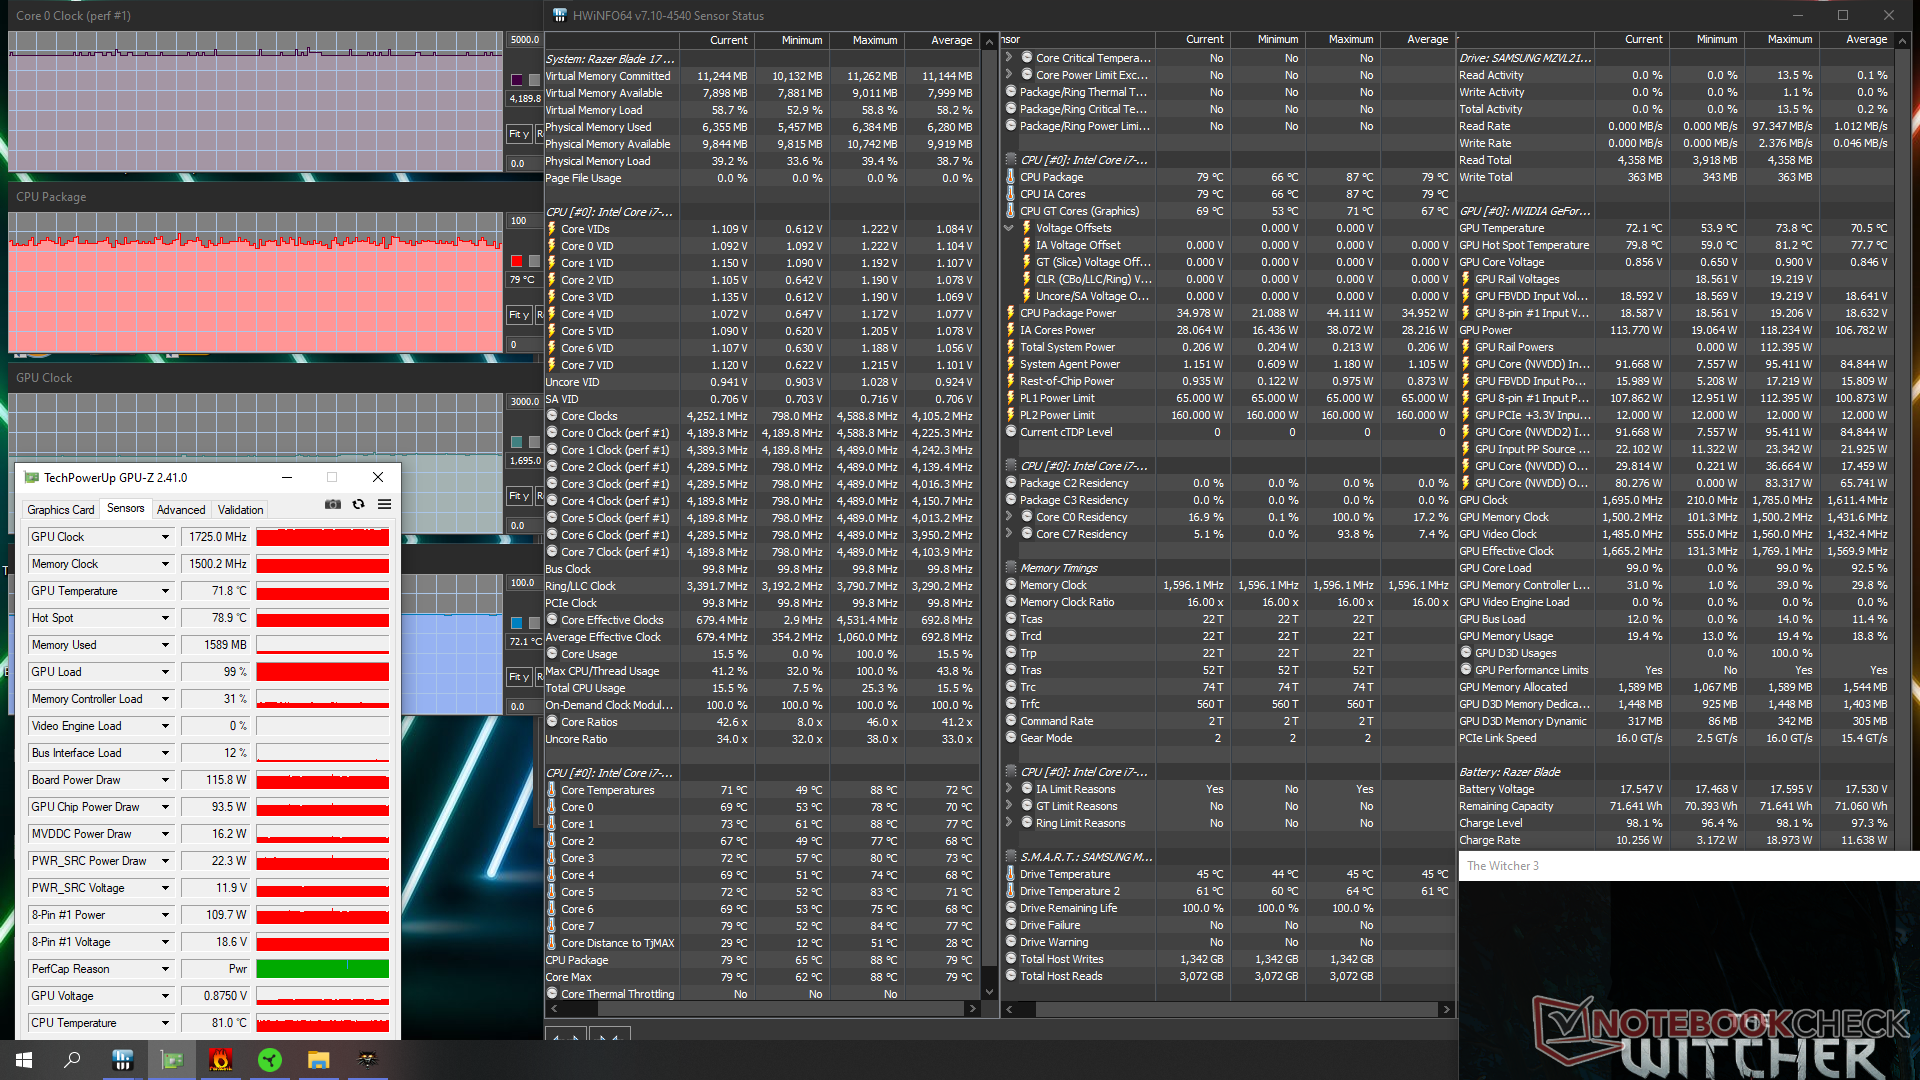
运行 Witcher 3在Turbo模式下,GPU时钟速率稳定在1725MHz,主板功耗为116W,而如果不在Turbo模式下,只有1515MHz和95W。然而,内存时钟和GPU温度将保持不变,而如果不作进一步的调整,130W的功耗似乎是无法实现的。因此,用户应该通过Razer Central软件启用手动涡轮增压模式,以便从笔记本电脑中榨取更多的图形性能。
有趣的是,与旧版Blade Pro RTX 3080相比,Blade 17的CPU和GPU温度更高。运行 Witcher 3我们怀疑这可能是由于较新的Blade 17的CPU PL2(160 W对120 W)和TGP(130 W对100 W)目标较高。
用电池供电运行将限制性能,因为Turbo模式变得不可用。在电池上进行的3DMark 11测试将返回物理和图形分数,分别为6377和11738分,而在主电源上则为18529和36224分。
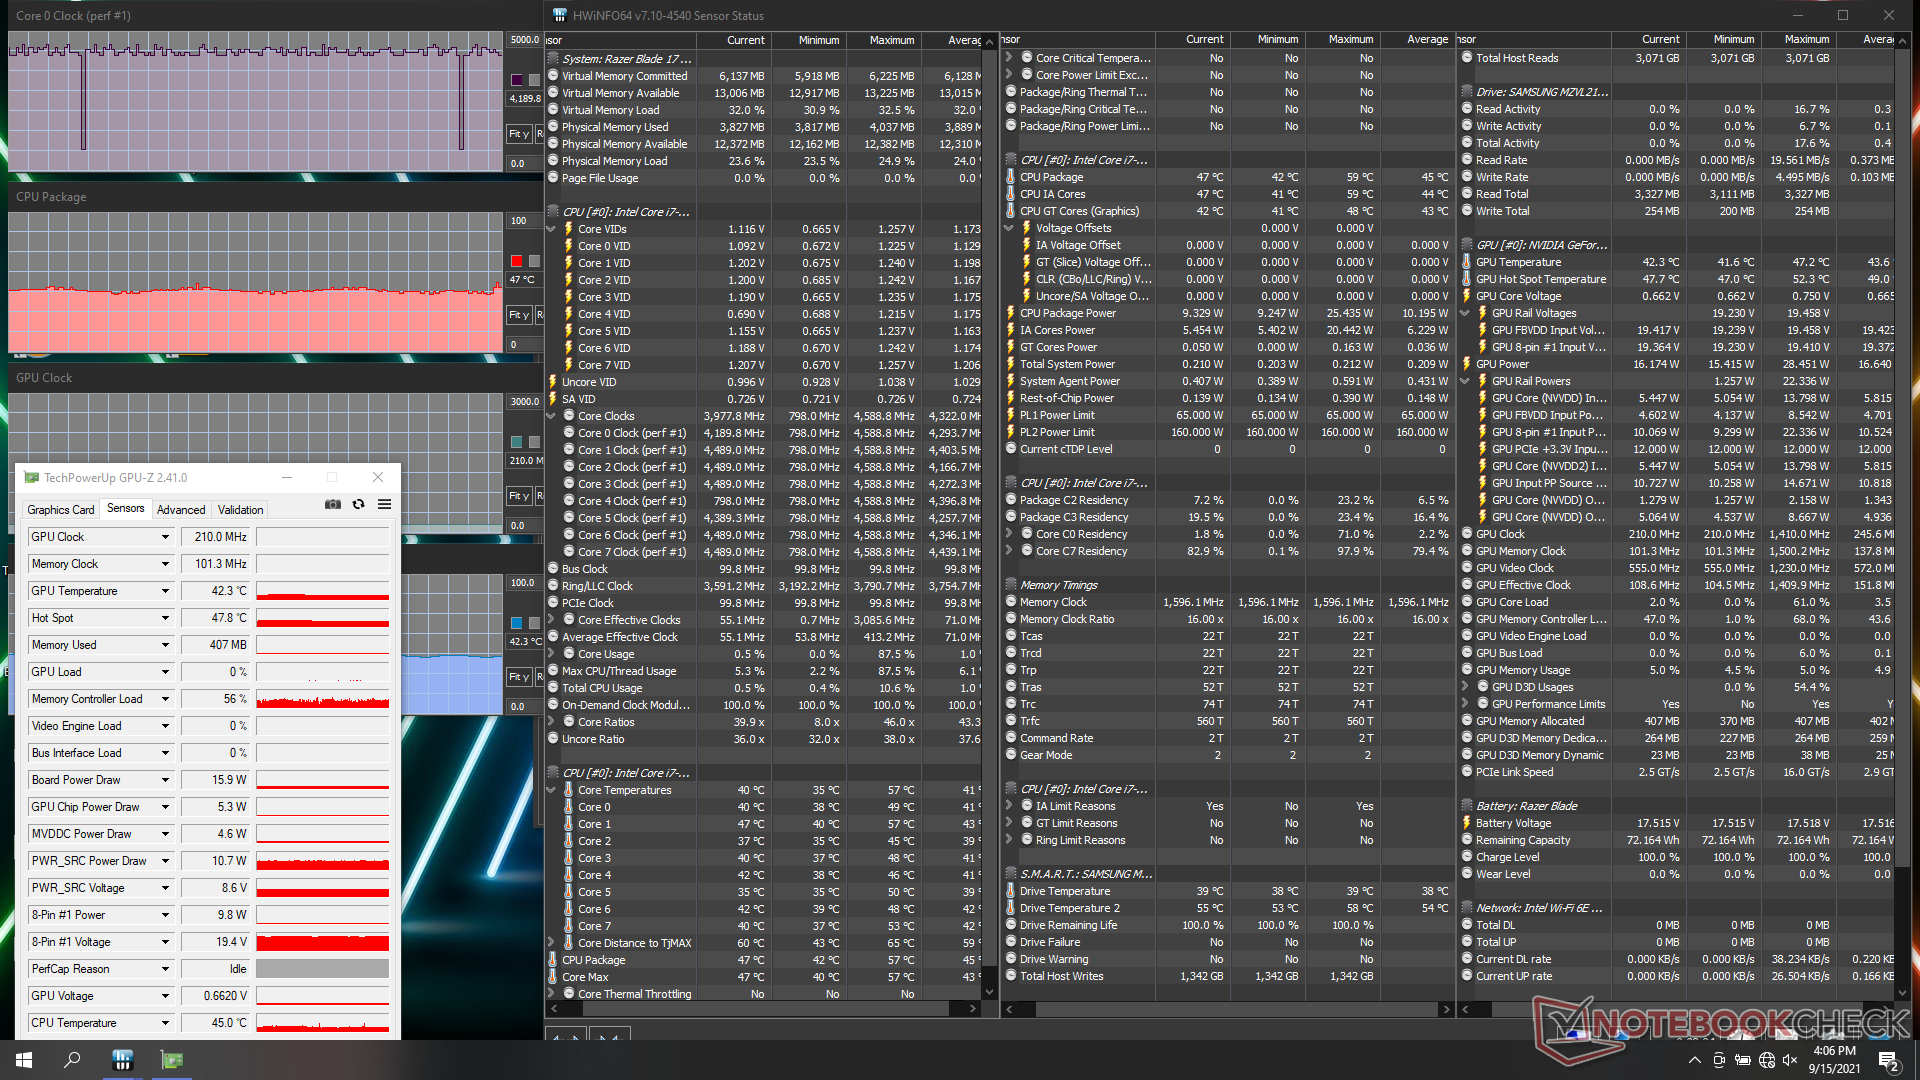
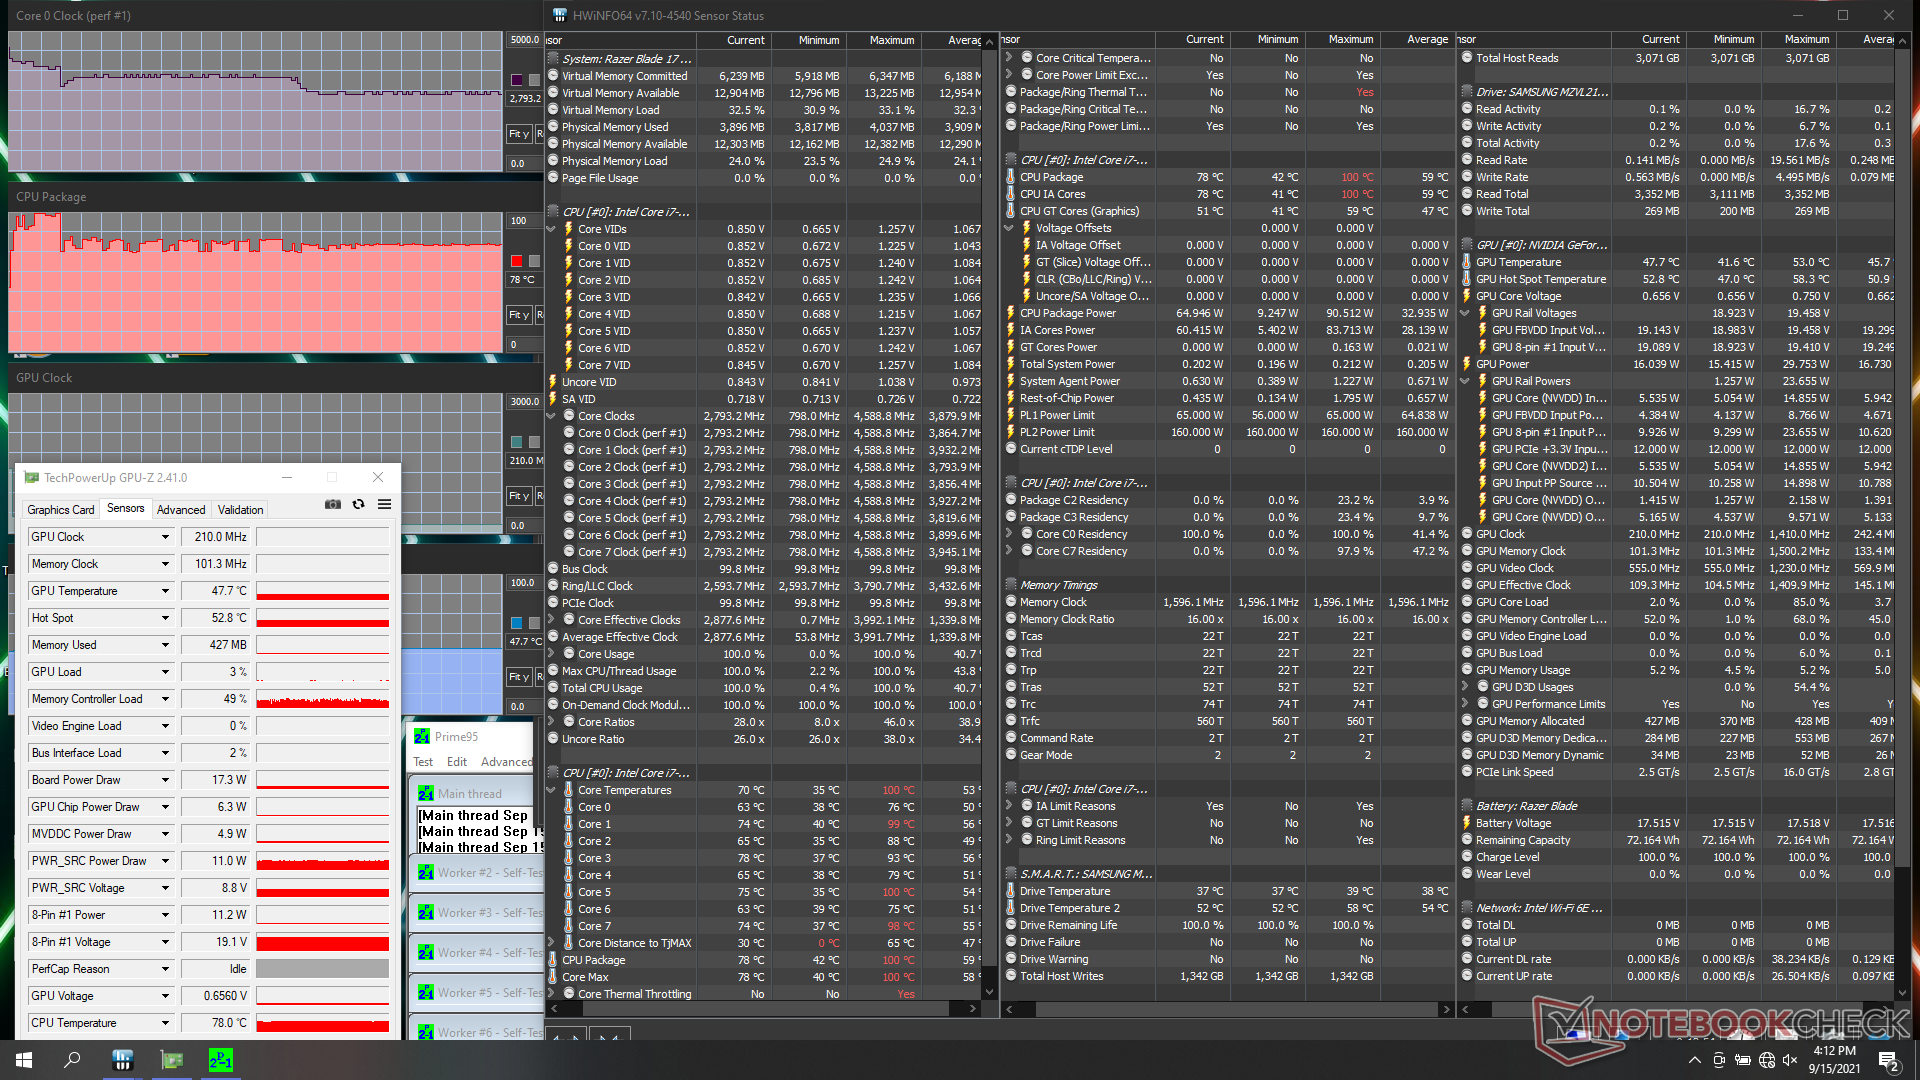
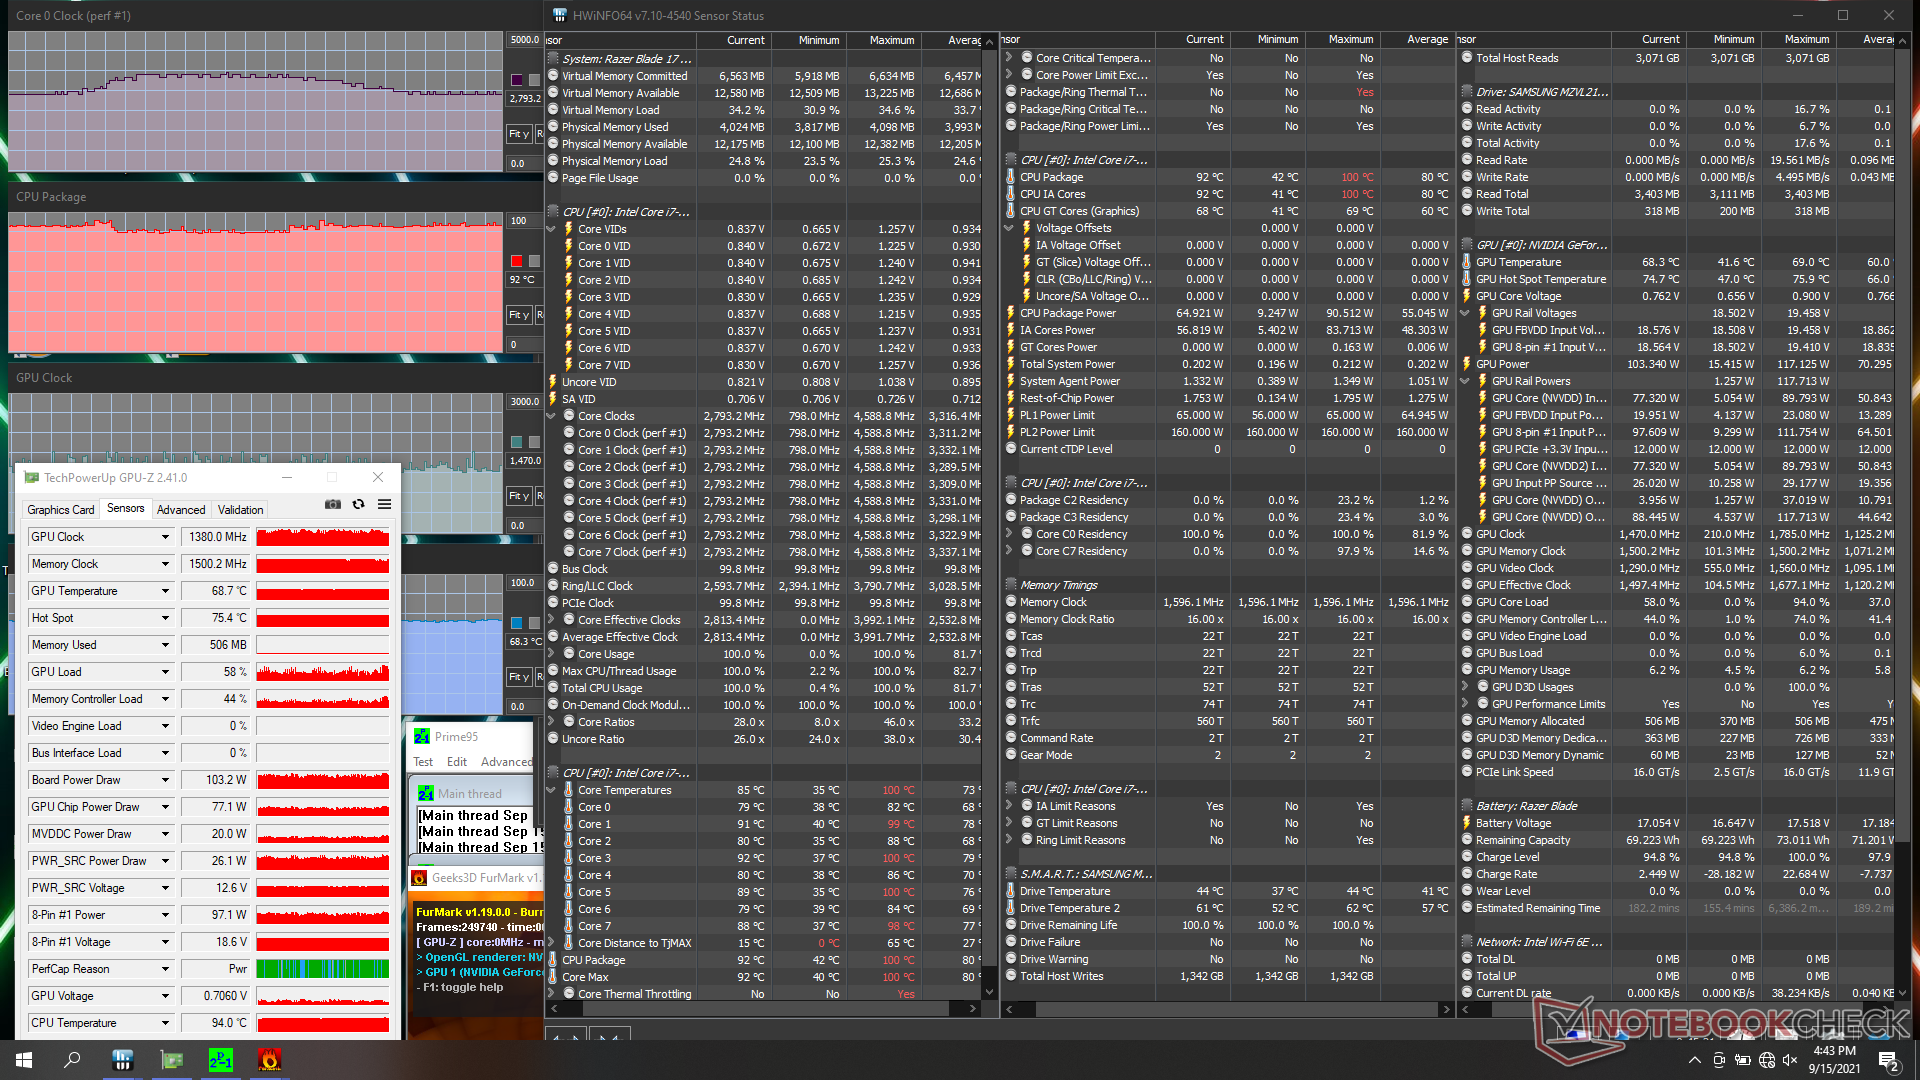
| CPU时钟(GHz) | GPU时钟(MHz) | CPU平均温度(℃) | GPU平均温度(℃) | |
| 系统空闲 | -- | -- | 46 | 42 |
| Prime95压力(涡轮开启) | 2.8 | -- | 78 | 48 |
| Prime95 + FurMark压力(Turbo关闭) | 2.0 | 1305 | 78 | 70 |
| 淘宝网上有很多卖家,他们的产品都是在淘宝网上销售的,而不是在淘宝网上销售的。 | ||||
| Witcher 3 Stress (Turbo off) | ~1.8 - 4.2 | 1515 | 77 | 70 |
| Witcher 3 Stress (Turbo on) | 4.2 | 1725 | 79 | 72 |
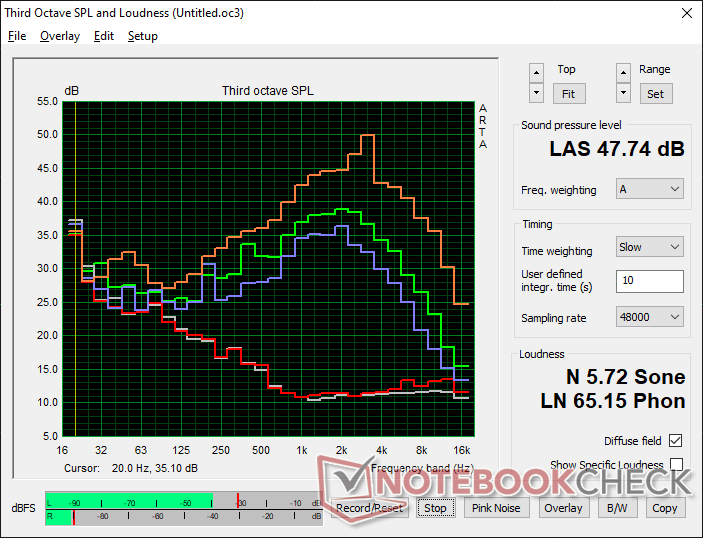
发言人

Razer Blade 17 RTX 3070 audio analysis
(+) | speakers can play relatively loud (86.8 dB)
Bass 100 - 315 Hz
(-) | nearly no bass - on average 23.4% lower than median
(±) | linearity of bass is average (11.6% delta to prev. frequency)
Mids 400 - 2000 Hz
(+) | balanced mids - only 2.4% away from median
(+) | mids are linear (2.1% delta to prev. frequency)
Highs 2 - 16 kHz
(+) | balanced highs - only 2.7% away from median
(+) | highs are linear (5.1% delta to prev. frequency)
Overall 100 - 16.000 Hz
(+) | overall sound is linear (13.6% difference to median)
Compared to same class
» 20% of all tested devices in this class were better, 7% similar, 73% worse
» The best had a delta of 6%, average was 18%, worst was 132%
Compared to all devices tested
» 15% of all tested devices were better, 4% similar, 82% worse
» The best had a delta of 4%, average was 23%, worst was 134%
Apple MacBook 12 (Early 2016) 1.1 GHz audio analysis
(+) | speakers can play relatively loud (83.6 dB)
Bass 100 - 315 Hz
(±) | reduced bass - on average 11.3% lower than median
(±) | linearity of bass is average (14.2% delta to prev. frequency)
Mids 400 - 2000 Hz
(+) | balanced mids - only 2.4% away from median
(+) | mids are linear (5.5% delta to prev. frequency)
Highs 2 - 16 kHz
(+) | balanced highs - only 2% away from median
(+) | highs are linear (4.5% delta to prev. frequency)
Overall 100 - 16.000 Hz
(+) | overall sound is linear (10.2% difference to median)
Compared to same class
» 7% of all tested devices in this class were better, 2% similar, 90% worse
» The best had a delta of 5%, average was 18%, worst was 53%
Compared to all devices tested
» 5% of all tested devices were better, 1% similar, 94% worse
» The best had a delta of 4%, average was 23%, worst was 134%
Energy Management
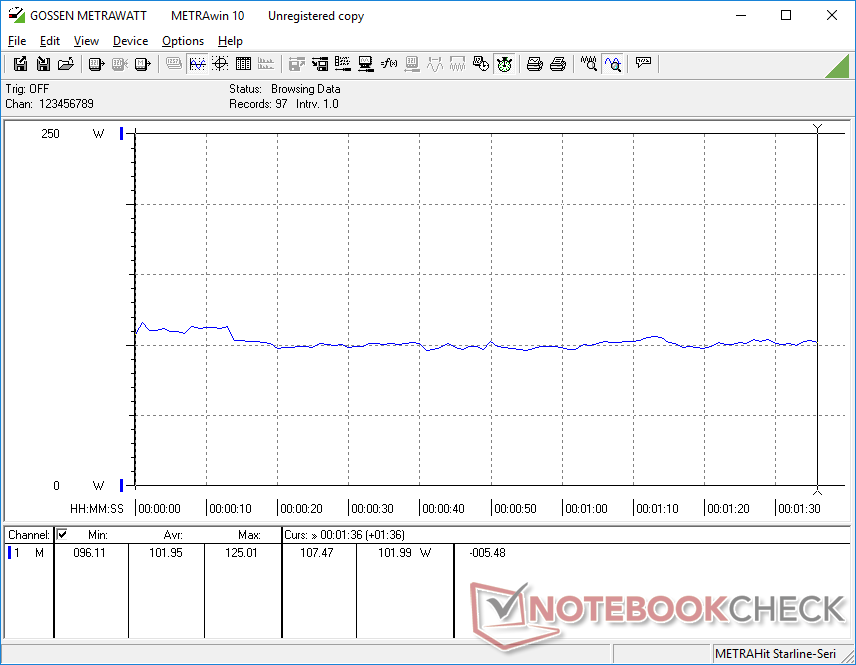
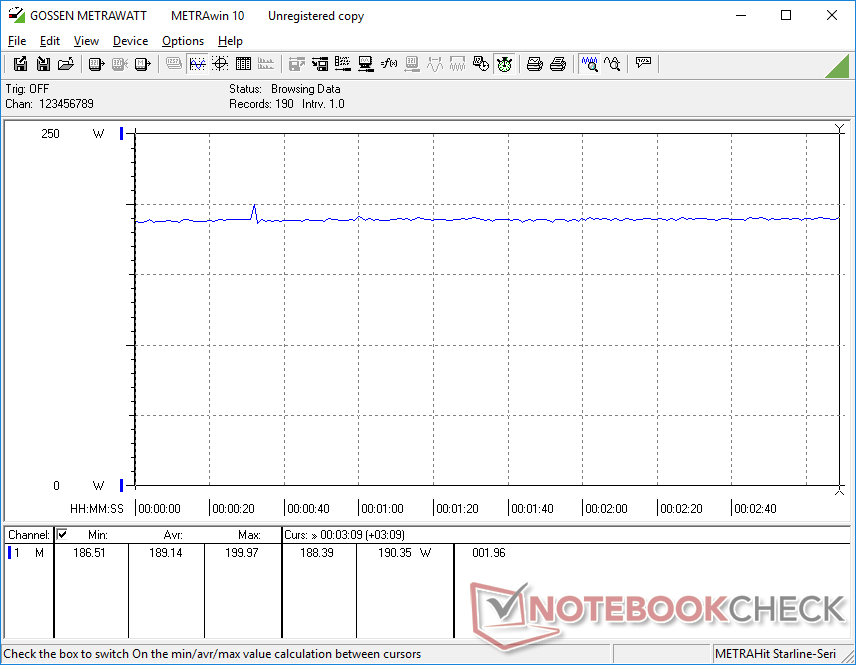
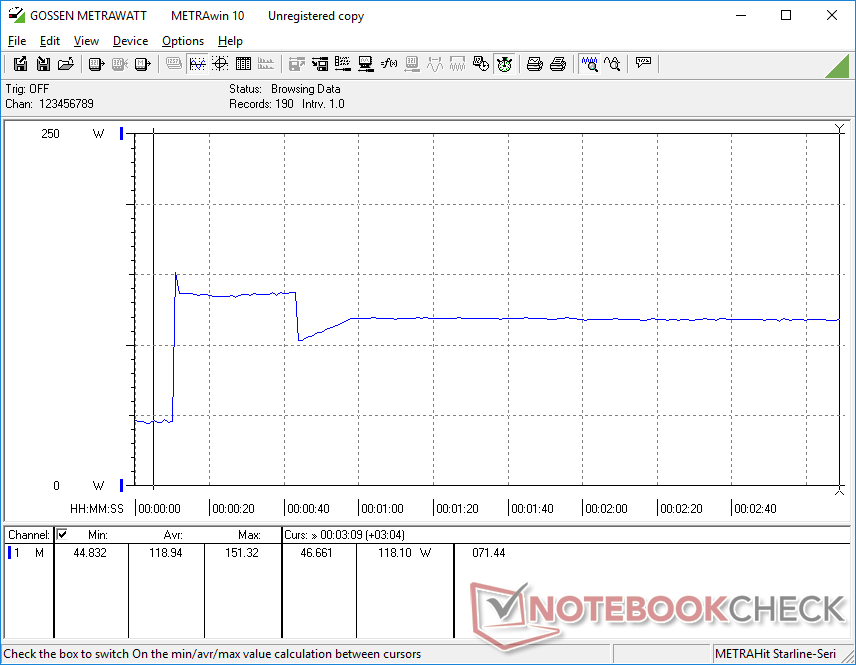
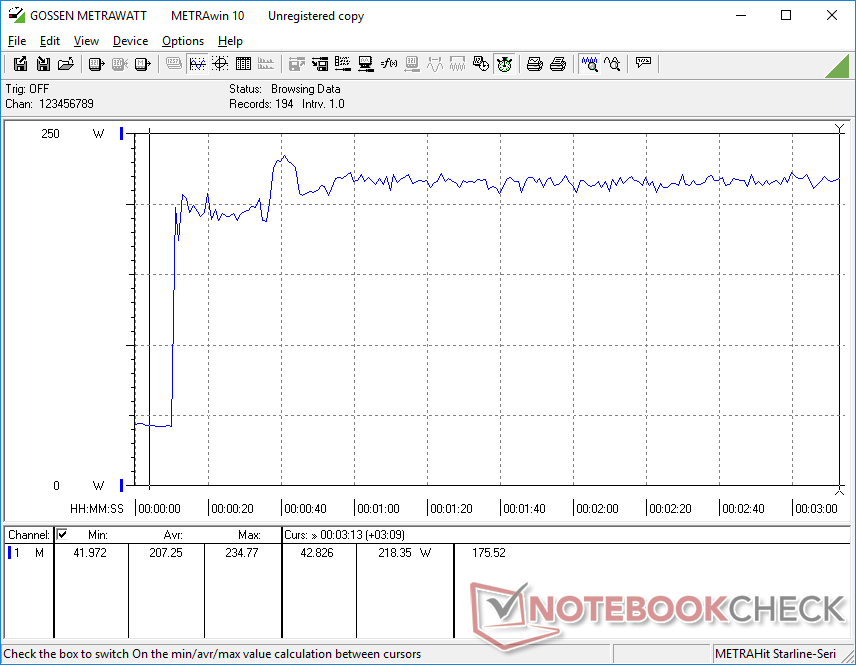
消耗功率
一般来说,Blade 17比旧的Blade Pro型号更耗电,甚至包括带有4K显示屏的Blade Pro RTX 3080。运行 Witcher 3例如,在我们的Blade 17上消耗189瓦,而在Blade Pro RTX 3080或Blade Pro RTX 2070上消耗158瓦。也许不是巧合,这一差异几乎等于目标TGP水平的差异;旧的Blade Pro型号的目标是100 W TGP,而较新的Blade 17的目标是130 W。不幸的是,功耗增加20%并不一定意味着旧的2021年初Blade Pro和较新的Blade 17之间的图形性能增加20%。
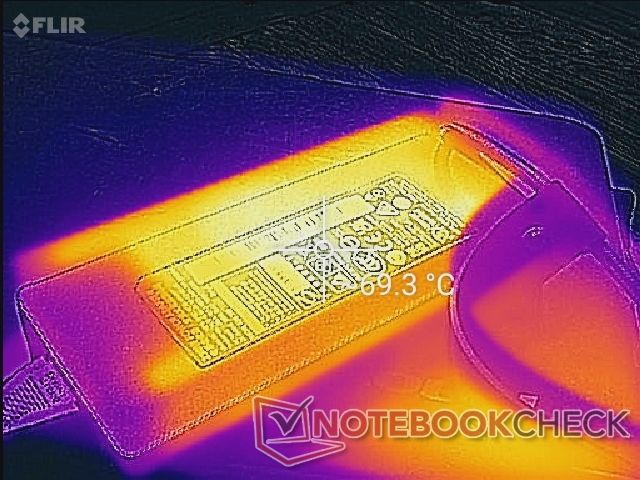
我们能够从中等大小(约17 x 7 x 2.5厘米)的230瓦交流适配器中记录到235瓦的最大功耗。 因此,在运行压力大的负载时,充电速度会明显减慢。
| Off / Standby | |
| Idle | |
| Load |
|
Key:
min: | |
| Razer Blade 17 RTX 3070 i7-11800H, GeForce RTX 3070 Laptop GPU, Samsung PM9A1 MZVL21T0HCLR, IPS, 1920x1080, 17.3" | Razer Blade Pro 17 2021 (QHD Touch) i7-10875H, GeForce RTX 3080 Laptop GPU, Samsung PM981a MZVLB1T0HBLR, IPS, 3840x2160, 17.3" | Razer Blade Pro 17 RTX 2070 Max-Q 300 Hz i7-10875H, GeForce RTX 2070 Max-Q, Lite-On CA5-8D512, IPS, 1920x1080, 17.3" | Razer Blade Pro 17 4K UHD 120 Hz i7-9750H, GeForce RTX 2080 Max-Q, Samsung SSD PM981 MZVLB1T0HALR, IPS, 3840x2160, 17.3" | Razer Blade Pro 17 RTX 2060 i7-9750H, GeForce RTX 2060 Mobile, Samsung SSD PM981 MZVLB512HAJQ, IPS, 1920x1080, 17.3" | Razer Blade Pro 17 RTX 2080 Max-Q i7-9750H, GeForce RTX 2080 Max-Q, Samsung SSD PM981 MZVLB512HAJQ, IPS, 1920x1080, 17.3" | |
|---|---|---|---|---|---|---|
| Power Consumption | 12% | 8% | -20% | 16% | 17% | |
| Idle Minimum * (Watt) | 20.9 | 15.2 27% | 19.6 6% | 34.2 -64% | 16 23% | 16.2 22% |
| Idle Average * (Watt) | 25.1 | 20.3 19% | 21.7 14% | 37.2 -48% | 21.7 14% | 20.4 19% |
| Idle Maximum * (Watt) | 45 | 37.3 17% | 36.1 20% | 50 -11% | 26.1 42% | 26.1 42% |
| Load Average * (Watt) | 102 | 114.9 -13% | 115.6 -13% | 106.1 -4% | 105.6 -4% | 96.5 5% |
| Witcher 3 ultra * (Watt) | 189 | 158.4 16% | 157 17% | 178.7 5% | 161.8 14% | 182.9 3% |
| Load Maximum * (Watt) | 234.8 | 223.7 5% | 219.9 6% | 223.6 5% | 225.3 4% | 214.3 9% |
* ... smaller is better
Power Consumption Witcher 3 / Stresstest
电池寿命 - 对于17.3英寸的游戏机来说还不错
电池容量与Blade Pro相同,因此尽管原生刷新率较高,运行时间也基本没有变化。在Optimus激活的情况下,我们能够在平衡模式下挤出超过5小时的WLAN使用时间。
使用附带的交流适配器,从空电到满电大约需要1.5小时。通过USB-C充电,如使用 Razer USB-C GaN充电器将需要更长的时间。
| Razer Blade 17 RTX 3070 i7-11800H, GeForce RTX 3070 Laptop GPU, 70 Wh | Asus ROG Zephyrus S17 GX703HSD i9-11900H, GeForce RTX 3080 Laptop GPU, 90 Wh | MSI GS76 Stealth 11UH i9-11900H, GeForce RTX 3080 Laptop GPU, 99.9 Wh | Acer Nitro 5 AN517-41-R9S5 R7 5800H, GeForce RTX 3080 Laptop GPU, 57.5 Wh | Gigabyte Aero 17 HDR YD i9-11980HK, GeForce RTX 3080 Laptop GPU, 99 Wh | Maingear Vector Pro MG-VCP17 i7-11800H, GeForce RTX 3080 Laptop GPU, 91 Wh | |
|---|---|---|---|---|---|---|
| Battery runtime | 62% | 19% | 10% | -6% | 33% | |
| Reader / Idle (h) | 6.7 | 9.9 48% | ||||
| WiFi v1.3 (h) | 5.2 | 7.5 44% | 6.4 23% | 5.7 10% | 5.6 8% | 6.9 33% |
| Load (h) | 1.5 | 2.7 80% | 1.3 -13% | 1.2 -20% | ||
| Witcher 3 ultra (h) | 1 |
Pros
Cons
结论 - 巨大的CPU提升和轻微的GPU提升
虽然更新到130瓦的图形可能听起来比100瓦的图形有巨大的提升,但现实世界的性能水平只是稍微好一点,因为我们仍然在同一安培系列的Nvidia GPU中工作。在这种情况下,我们的130 W RTX 3070基本上与彗星湖-H Blade Pro上的100 W RTX 3080持平。我们能够在手动Turbo模式下挤出恒定的~115 W GPU板功耗,而在默认的平衡模式下只有~95 W,这意味着如果用户希望最大限度地利用系统,必须记得激活Turbo模式并忍受最大的风扇噪音。
最大的收获在于处理器的性能,从第十代英特尔到第十一代英特尔的跃升更令人印象深刻,尤其是2020年刀片专业版中的酷睿i7-10875H表现略差。CPU的更新自然带来了对PCIe4和Thunderbolt4的支持,这进一步保证了系统的未来性。
经过两年的持续更新,17.3英寸的刀片现在感觉比以往任何时候都更精致,比2019年最初推出时更容易推荐。
尽管2019年的机箱可能很光滑,但除了简单的性能之外,它还可以使用一些实际的物理更新。戴尔刚刚推出了Alienware x17 ,配备了Cherry机械按键,相比之下,Blade 17的按键感觉很经济。缺少网络摄像头快门的问题也越来越难以忽视,点击板下面的两个高音调风扇应该在不影响气流的情况下得到解决。
价格和可用性
多个Blade 17 SKU是,现在可在百思买购买,价格为2499美元及以上。在撰写本文时,其他零售商如亚马逊还没有提供这些产品。请记住,最新机型只是 "Blade 17",而不是 "Blade Pro 17",后者将是旧机型的名称。
Razer Blade 17 RTX 3070
- 09/21/2021 v7 (old)
Allen Ngo
Price comparison

