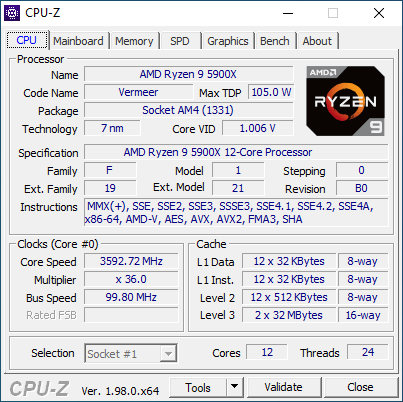
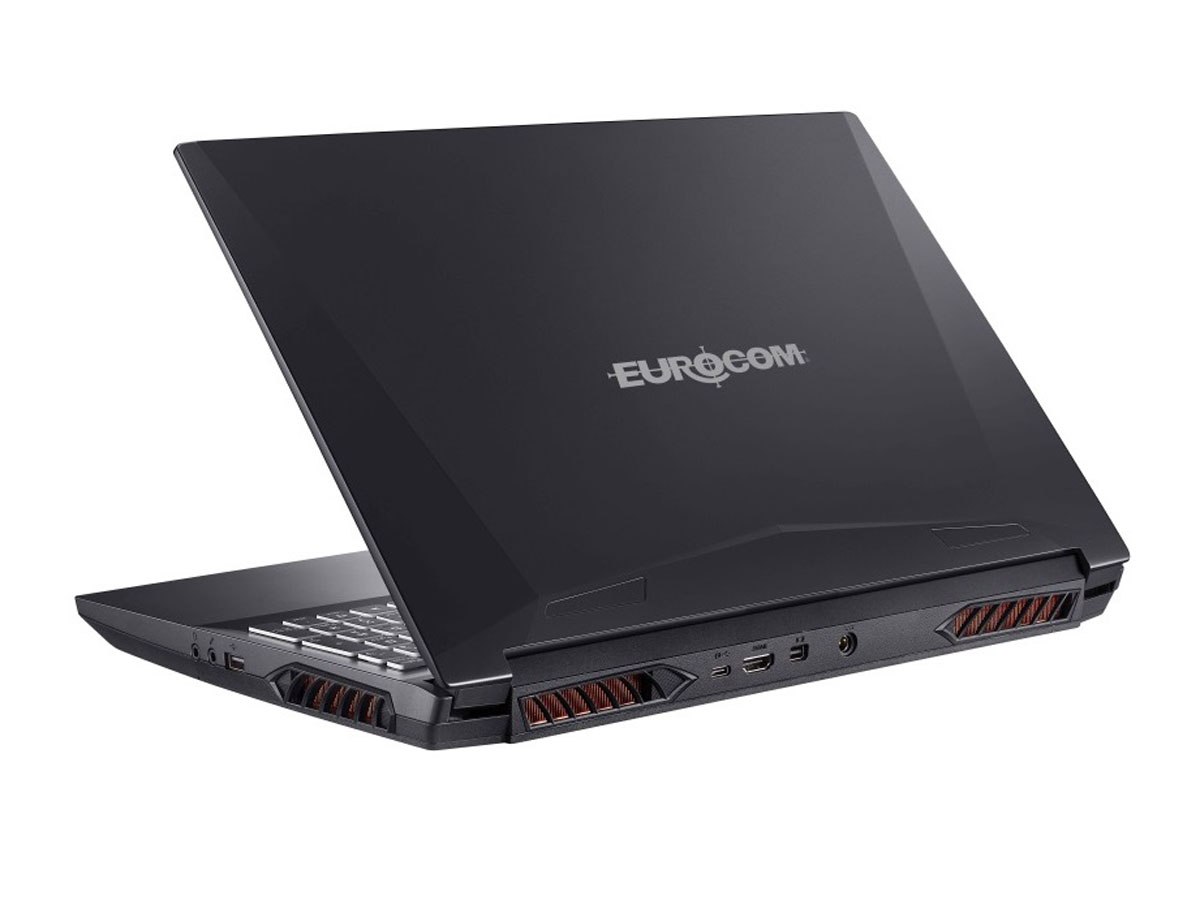
在笔记本电脑上运行AMD Ryzen 9 5900X。Eurocom Nightsky ARX15回顾
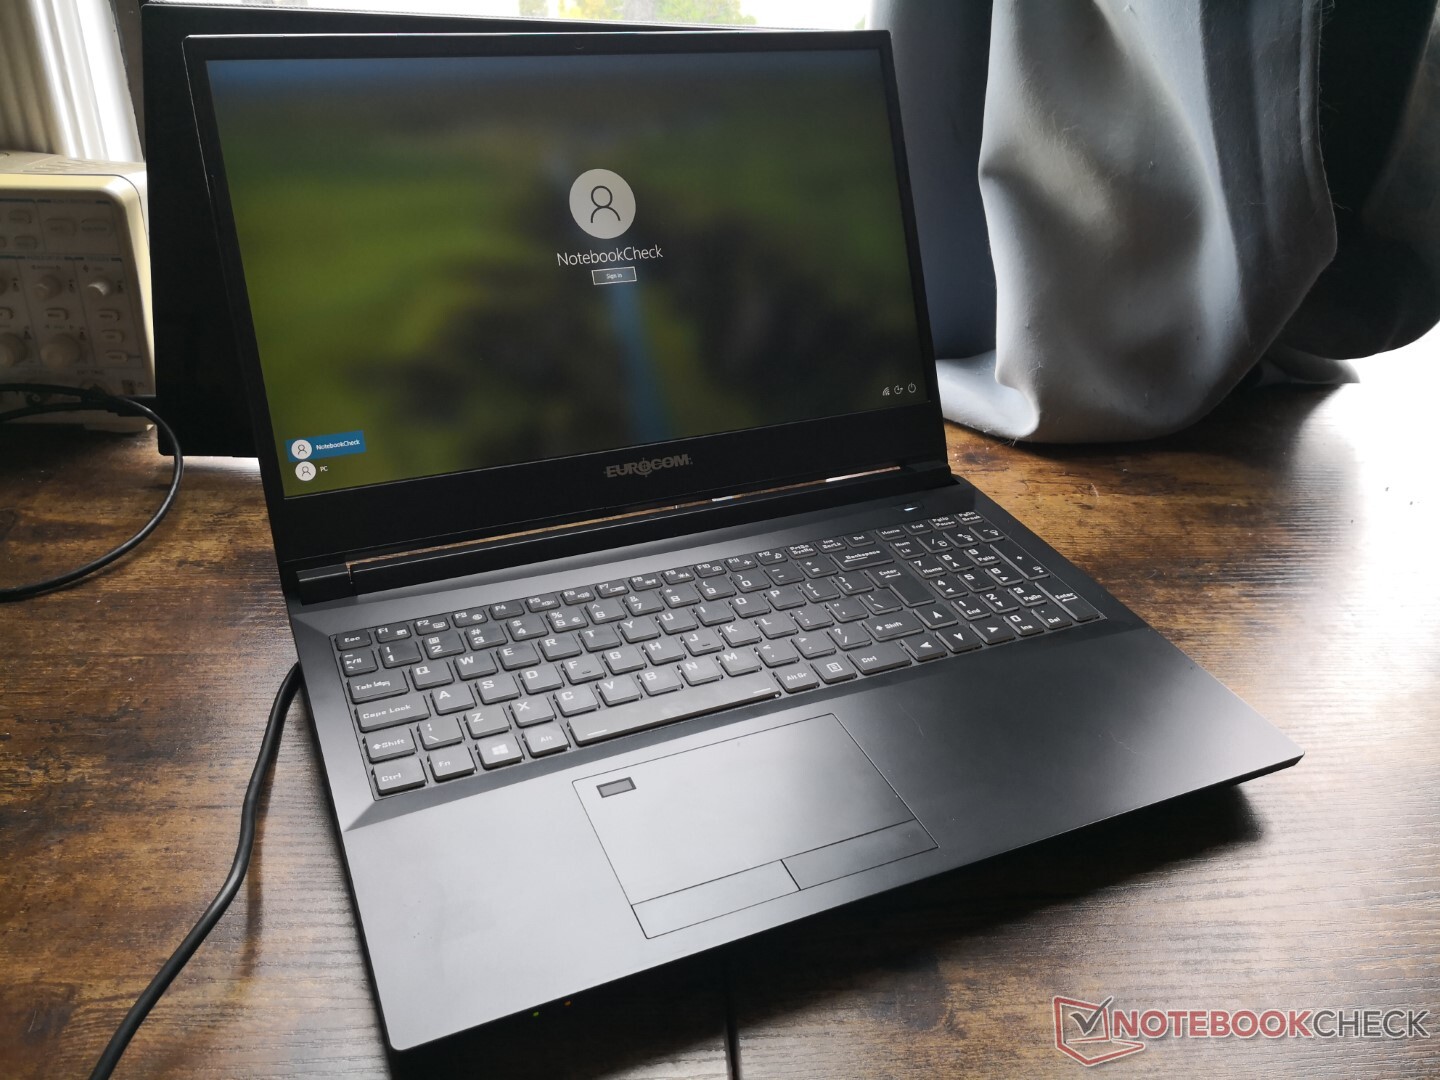
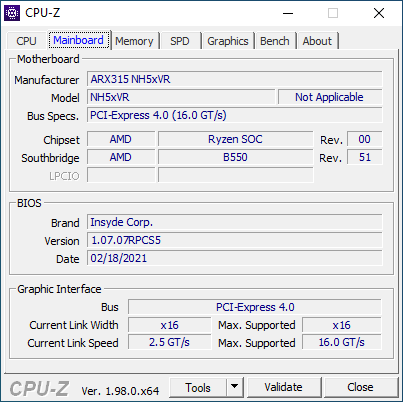
不要与Nightsky RX15混淆,Nightsky ARX15采用了台式AMD CPU和不同于英特尔同行的底盘。仅仅是它的纸张规格就应该使ARX15成为你在原始CPU性能方面可以买到的最快的15.6英寸笔记本电脑之一。我们评测的配置售价约为3400美元,根据存储空间的不同,价格会更低或更高。
关于Nightsky ARX15的其他信息可以在其官方网页这里 。底盘基于Clevo NH57AF1,因此用户会发现Eurocom Nightsky ARX15和Schenker XMG Apex 15之间有许多相似之处 。
更多Eurocom评论。
Potential Competitors in Comparison
Rating | Date | Model | Weight | Height | Size | Resolution | Price |
|---|---|---|---|---|---|---|---|
| 83 % v7 (old) | 01 / 2022 | Eurocom Nightsky ARX315 R9 5900X, GeForce RTX 3070 Laptop GPU | 2.6 kg | 32.5 mm | 15.60" | 1920x1080 | |
| 84.1 % v7 (old) | 01 / 2022 | Gigabyte A5 X1 R9 5900HX, GeForce RTX 3070 Laptop GPU | 2.2 kg | 25.3 mm | 15.60" | 1920x1080 | |
| 81.4 % v7 (old) | 12 / 2021 | Medion Erazer Deputy P25 R7 5800H, GeForce RTX 3060 Laptop GPU | 2.3 kg | 26 mm | 15.60" | 1920x1080 | |
| 82.9 % v7 (old) | 10 / 2021 | MSI Delta 15 A5EFK R9 5900HX, Radeon RX 6700M | 2 kg | 19 mm | 15.60" | 1920x1080 | |
| 84.4 % v7 (old) | 11 / 2021 | Schenker XMG Apex 15 NH57E PS R7 5800H, GeForce RTX 3060 Laptop GPU | 2.1 kg | 29 mm | 15.60" | 1920x1080 | |
| 84.6 % v7 (old) | 12 / 2020 | MSI GE66 Raider 10SFS i9-10980HK, GeForce RTX 2070 Super Mobile | 2.4 kg | 23 mm | 15.60" | 1920x1080 |
案例
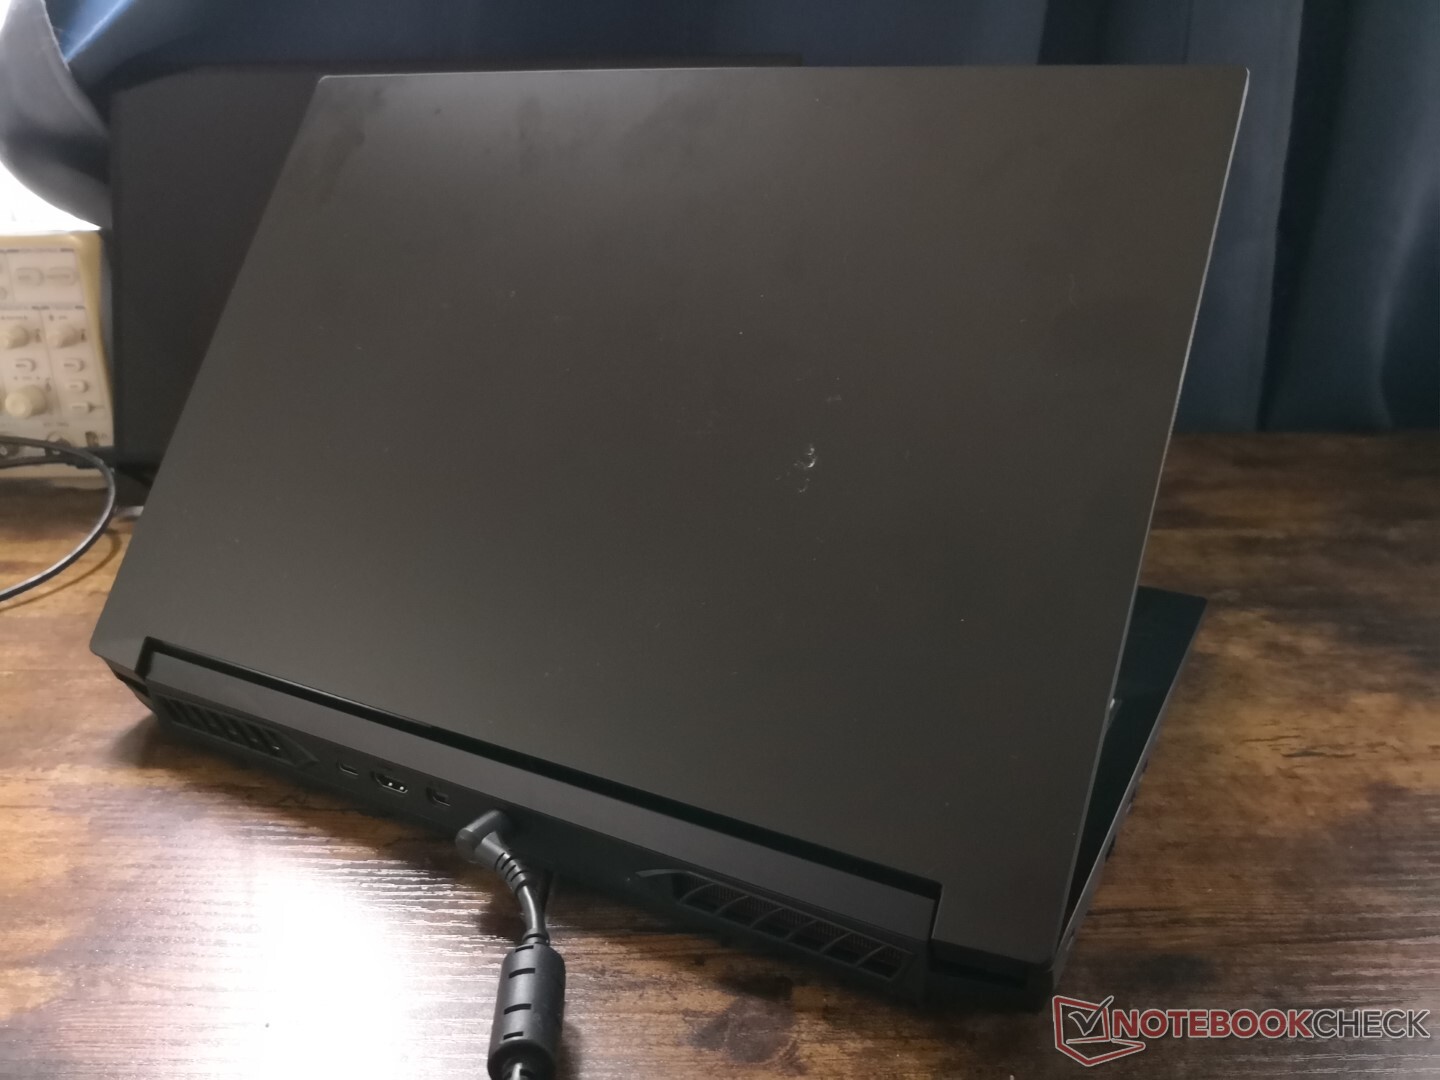
相对于其他采用更传统的移动H系列CPU的15.6英寸游戏笔记本,如微星GE66 或华硕ROG Strix G15 ,该机箱仍然较大和较重。我们对这款机箱的印象是 兴科Apex 15这里适用于Nightsky ARX15。
连接性
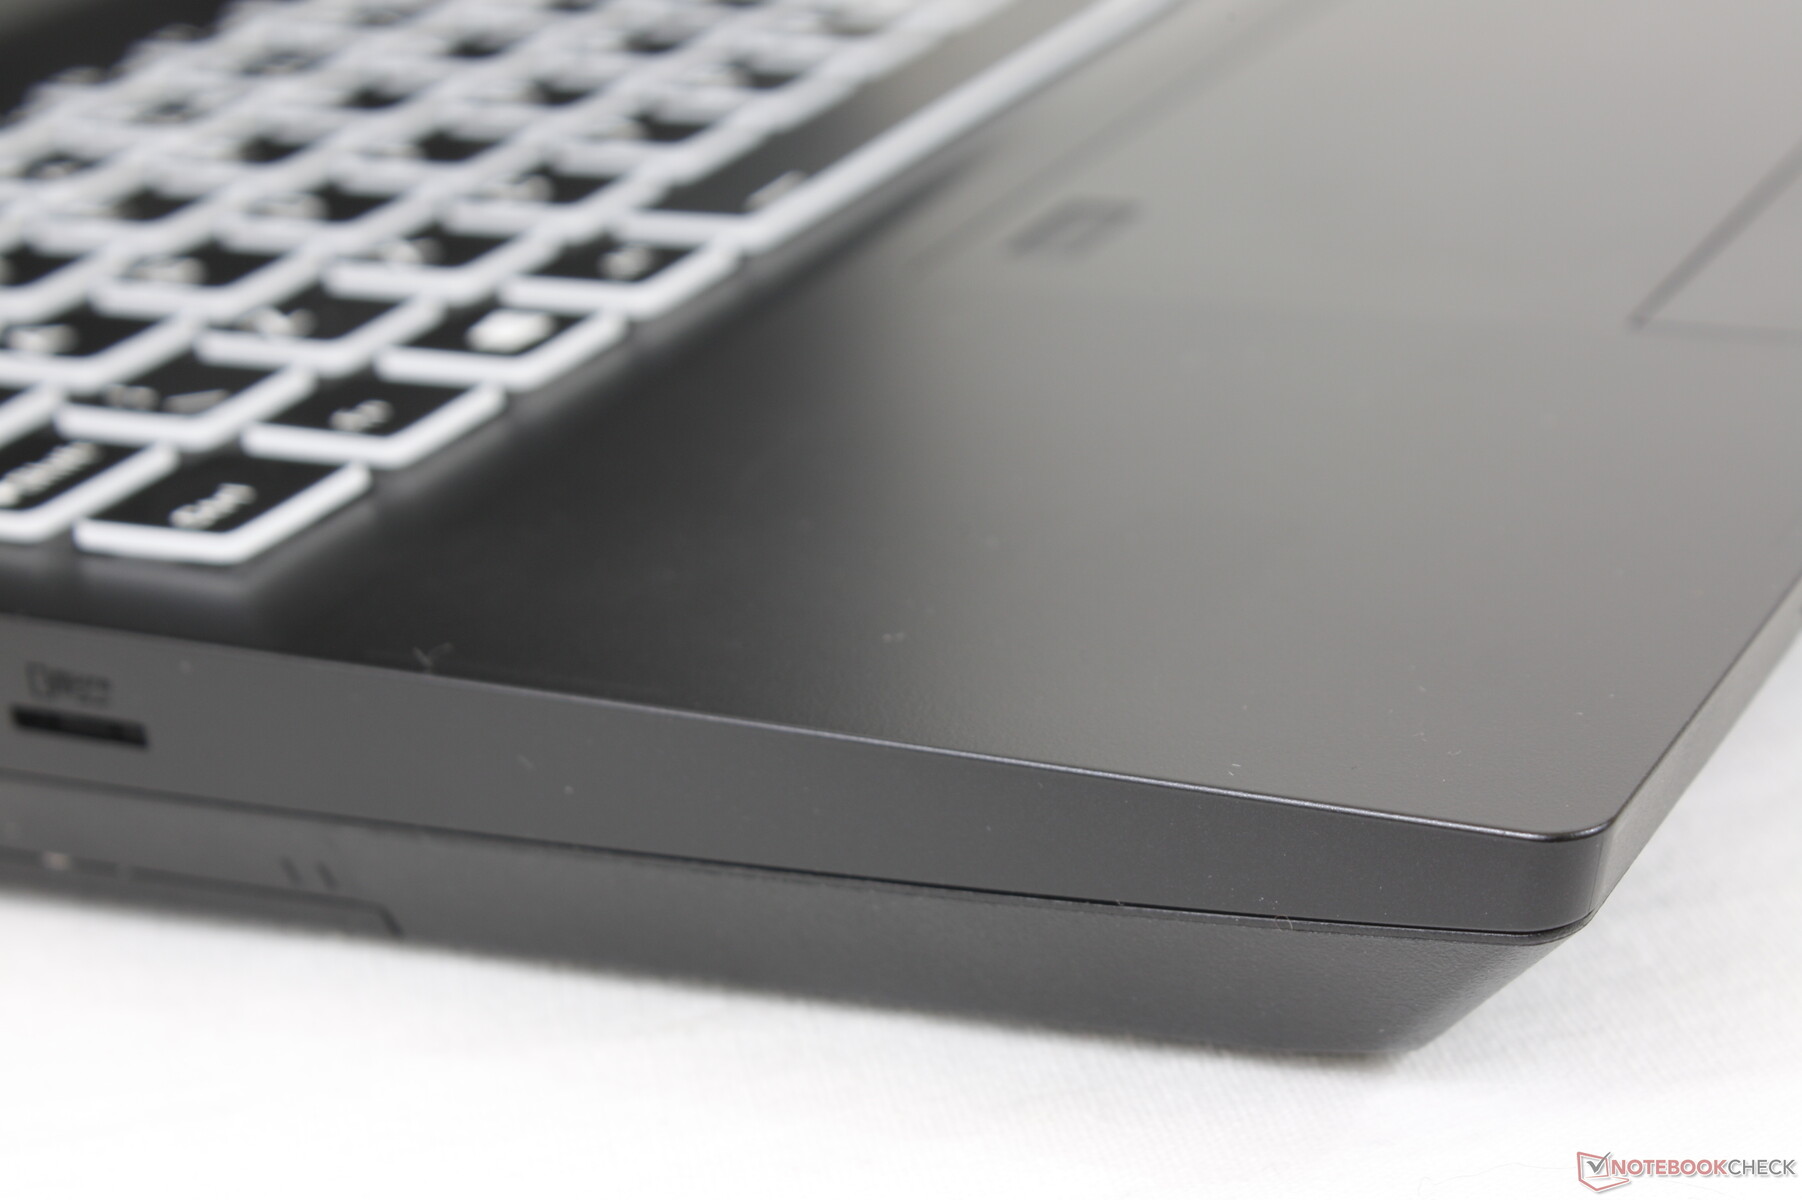
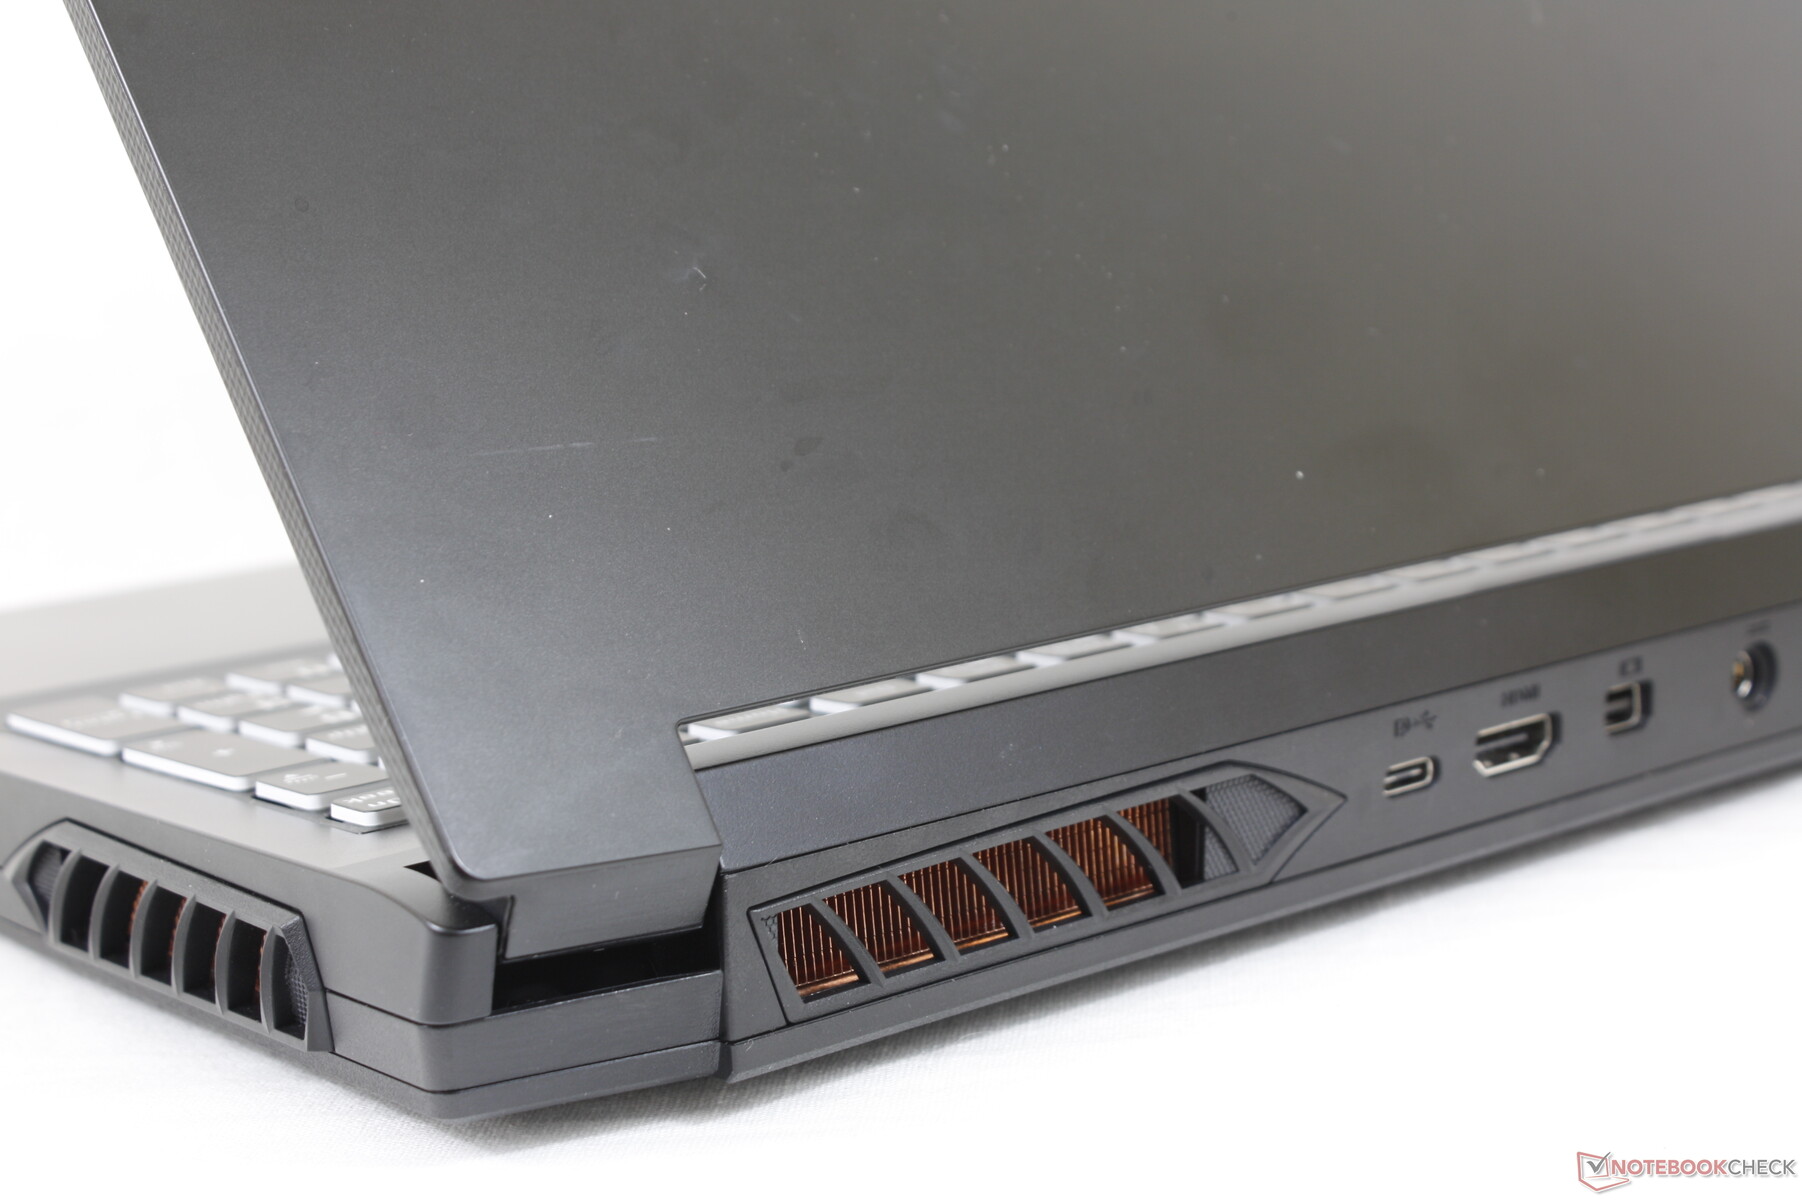
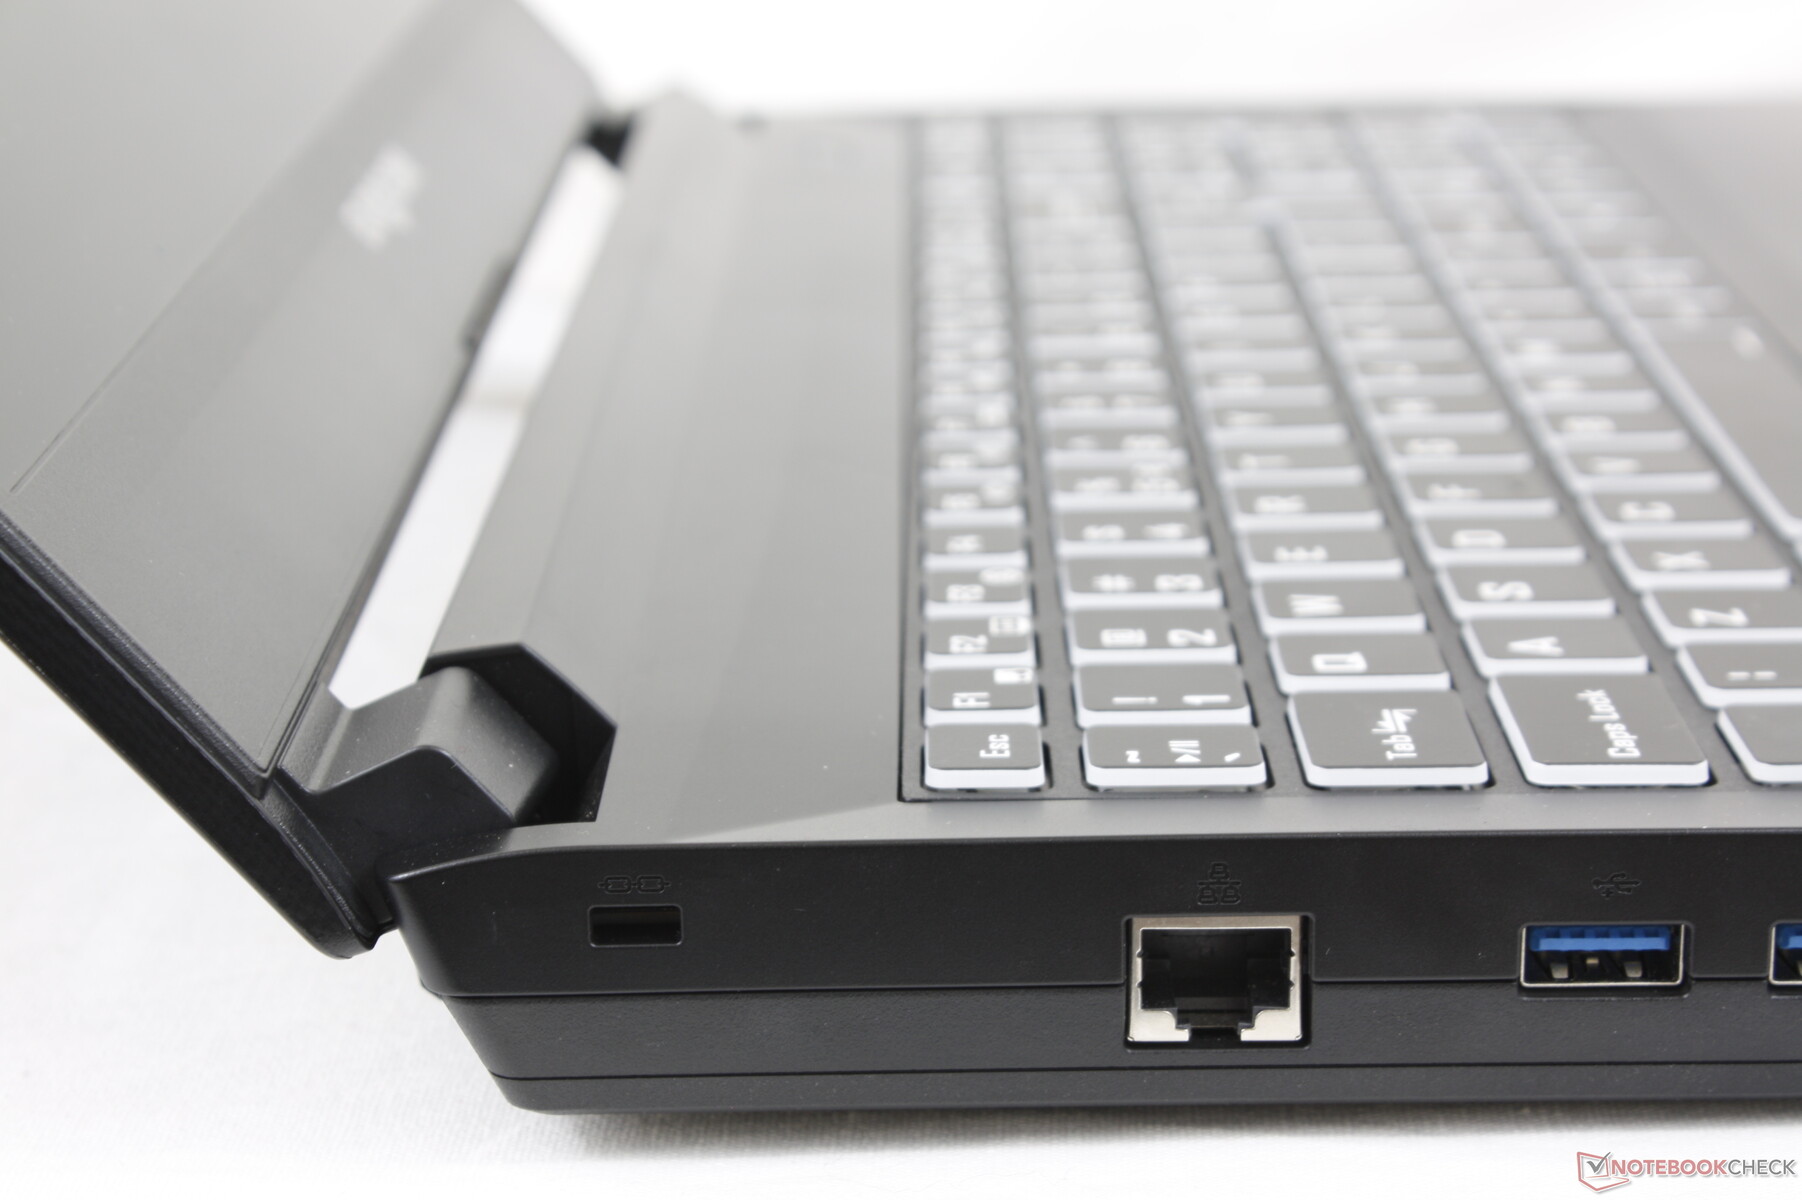
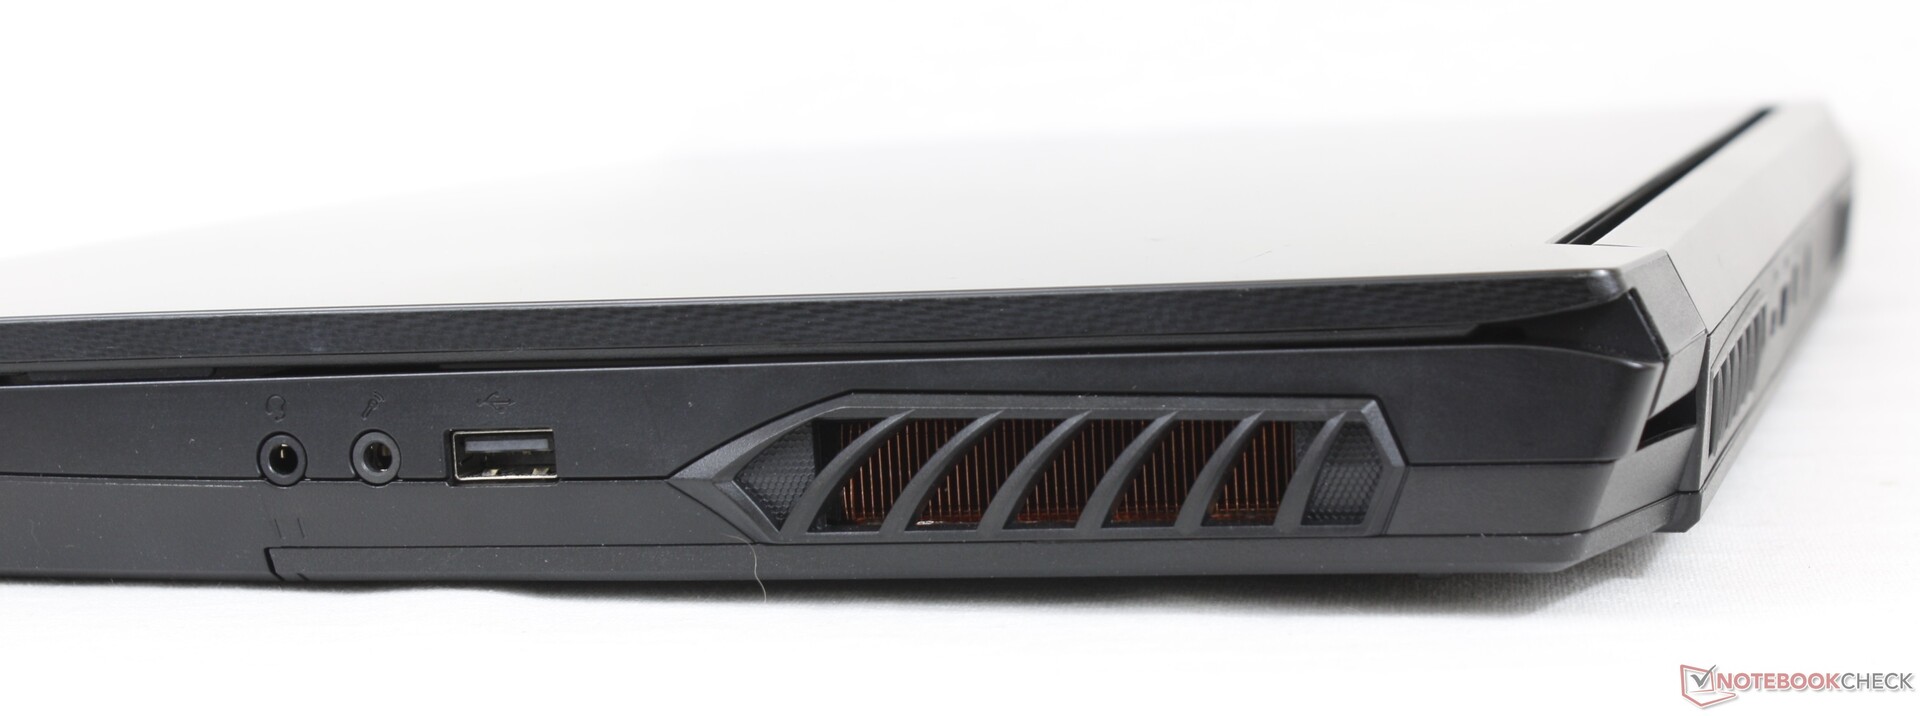
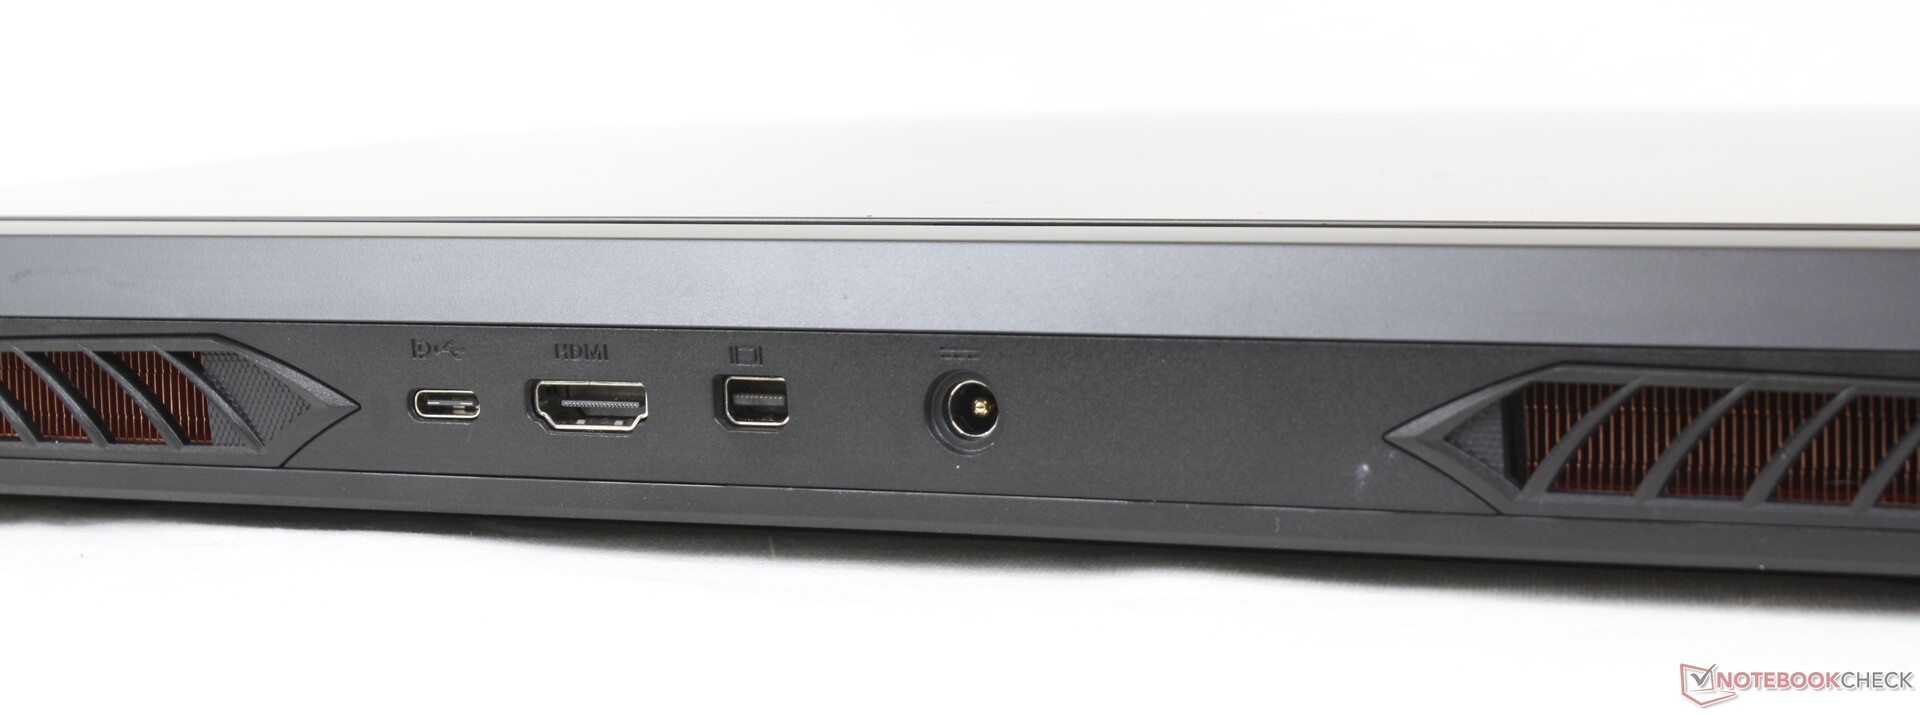
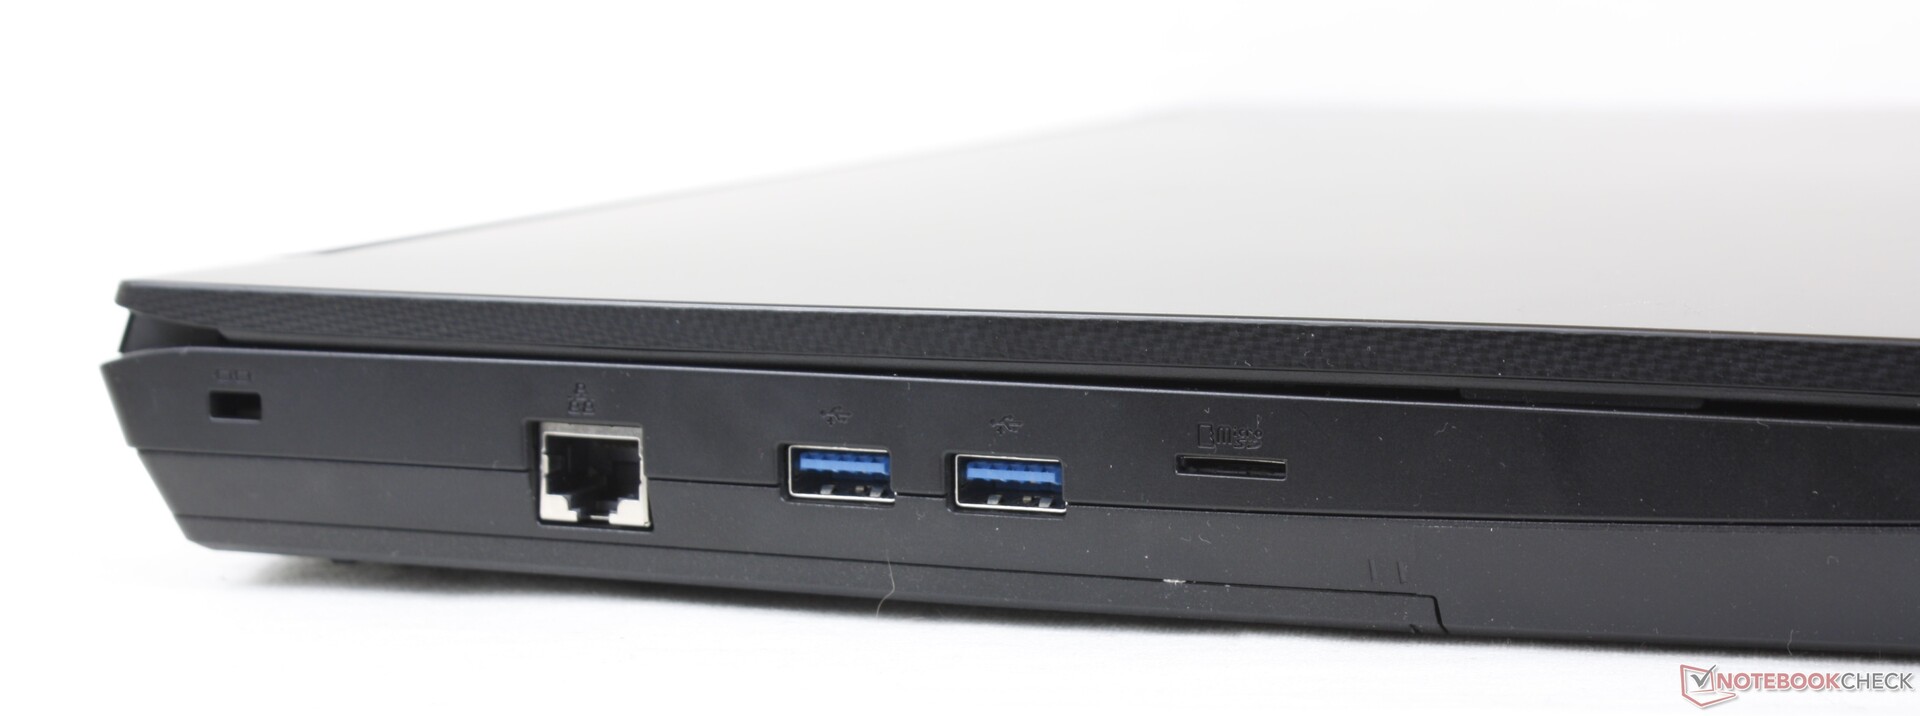
与RX15相比,这里的端口选项较少。例如,只有一个USB-C端口,而不是两个,而且它不支持Thunderbolt或Power Delivery。相比之下,大多数微星、华硕和Alienware笔记本电脑都有通过USB-C充电的选项。
SD卡阅读器
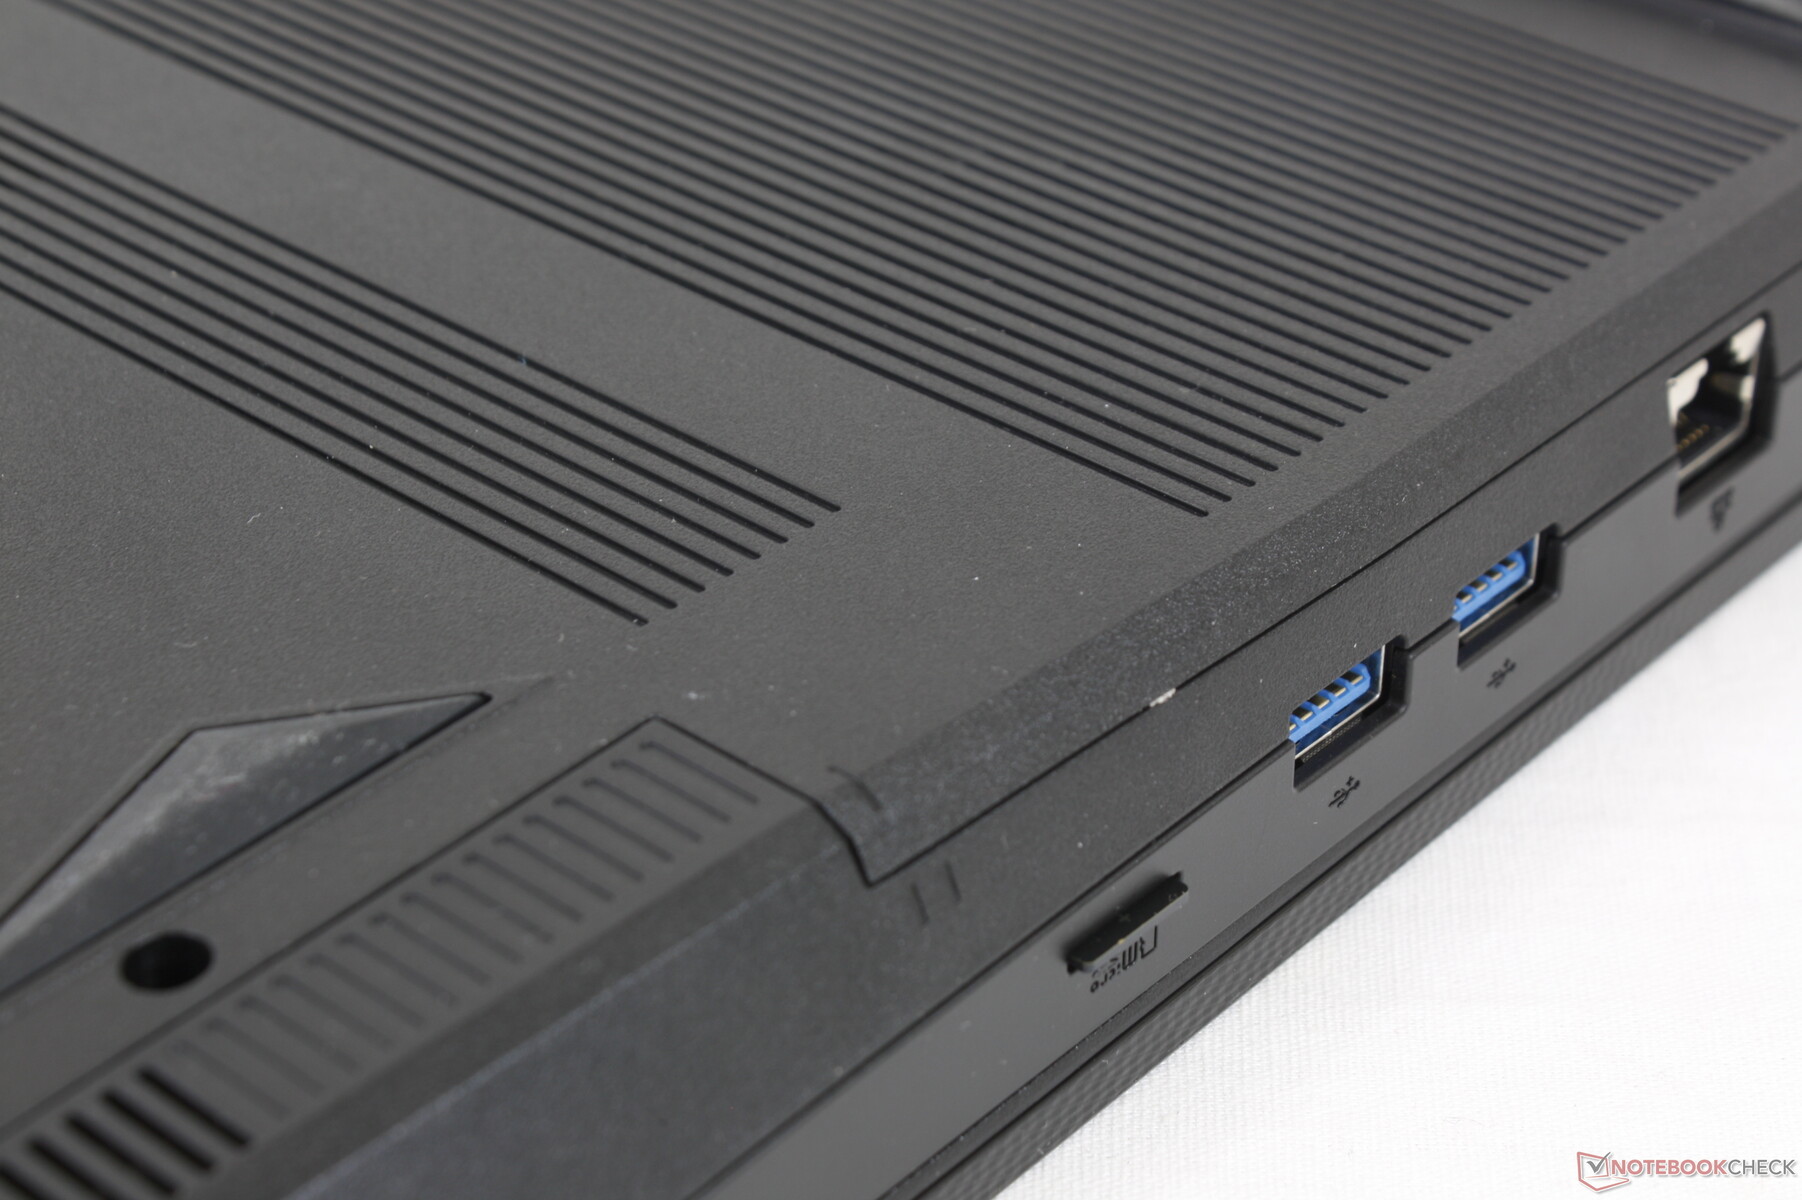
集成的MicroSD读卡器的传输速度还不错,但相对于该系统的价格来说,仍然令人失望。将1GB的图片从我们的UHS-II测试卡移动到桌面需要大约15秒,而在微星GE66 Raider 10SFSA上,这个时间还不到一半。微星GE66 Raider 10SFS.
| SD Card Reader | |
| average JPG Copy Test (av. of 3 runs) | |
| MSI GE66 Raider 10SFS (Toshiba Exceria Pro SDXC 64 GB UHS-II) | |
| Eurocom Nightsky ARX315 (AV Pro V60) | |
| maximum AS SSD Seq Read Test (1GB) | |
| MSI GE66 Raider 10SFS (Toshiba Exceria Pro SDXC 64 GB UHS-II) | |
| Eurocom Nightsky ARX315 (AV Pro V60) | |
沟通
网络摄像头
该系统配备了一个720p的网络摄像头,而Eurocom Sky X4C则配备了一个分辨率更高的1080p网络摄像头。没有隐私快门或红外摄像头。相反,有一个Fn键可以通过电子方式禁用摄像头。


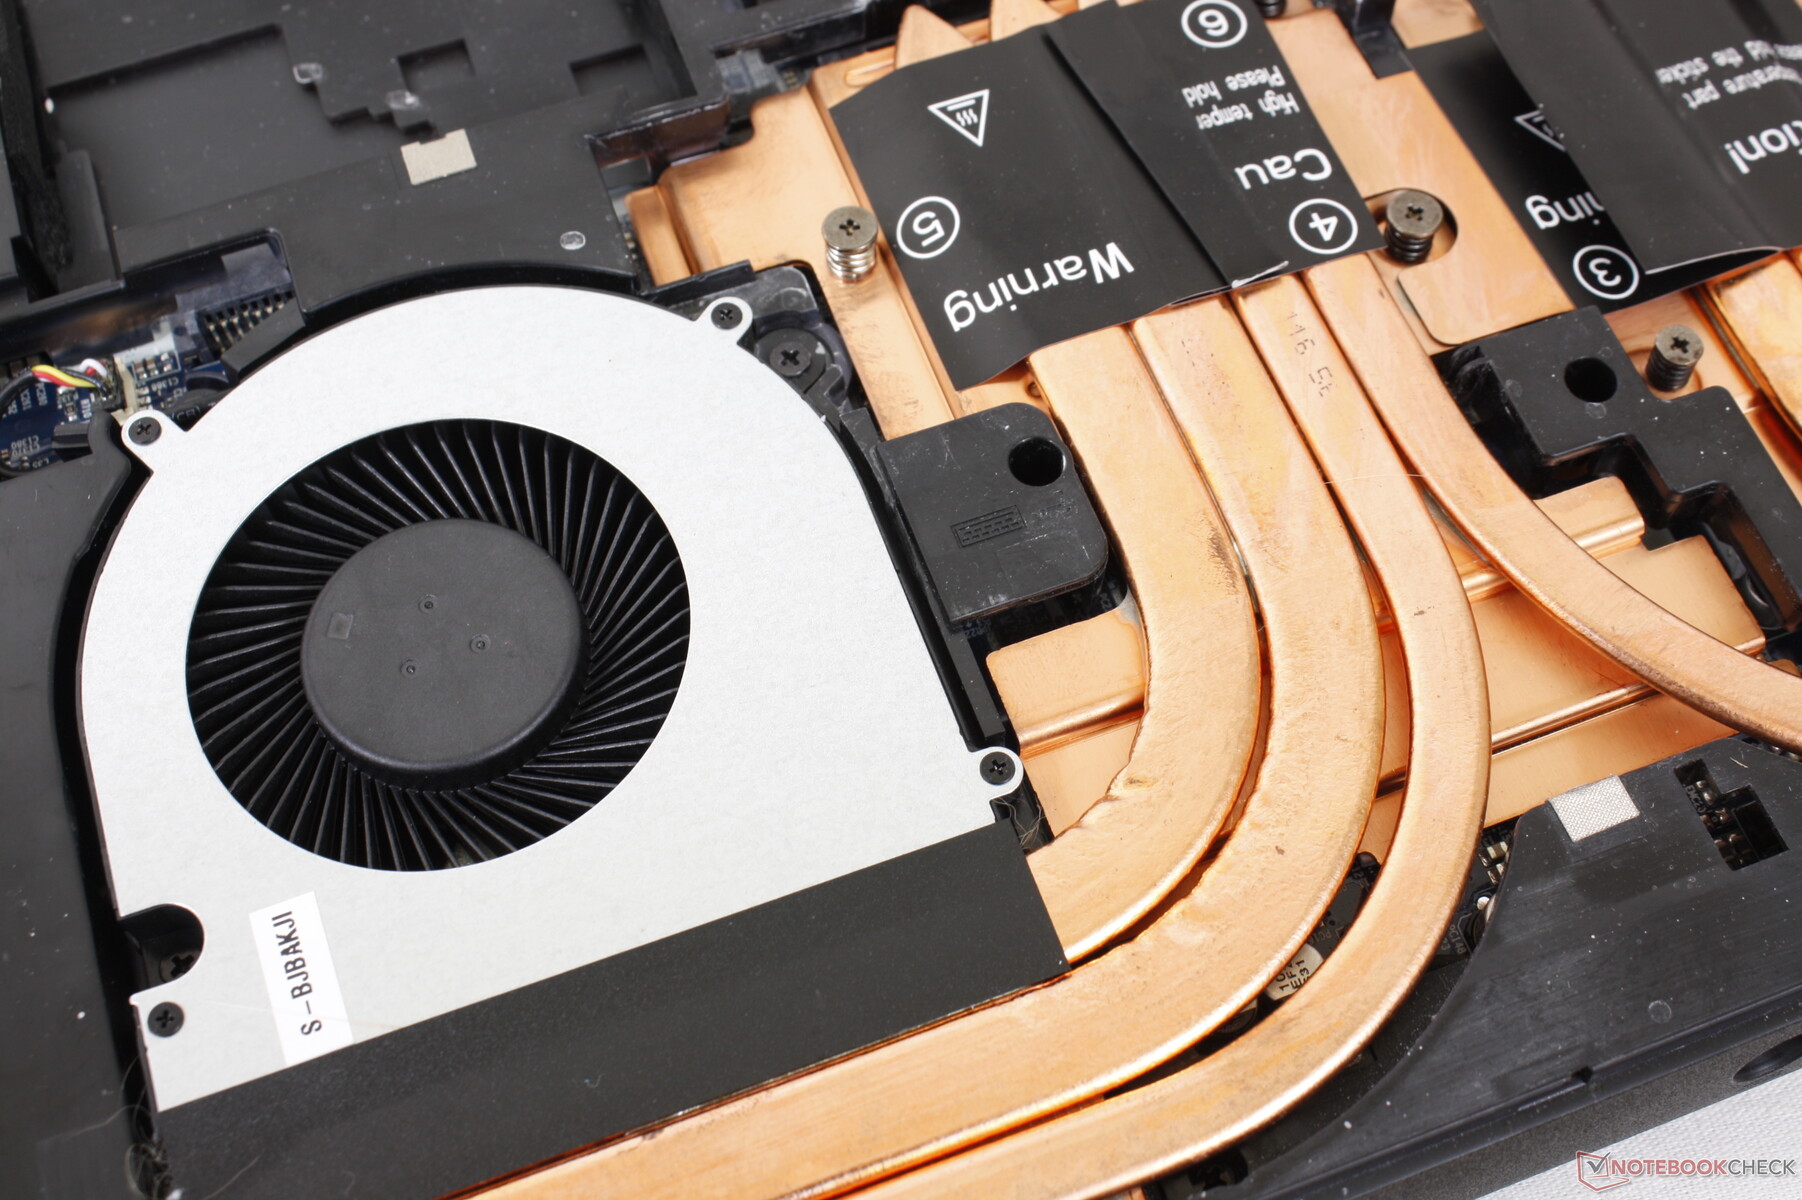
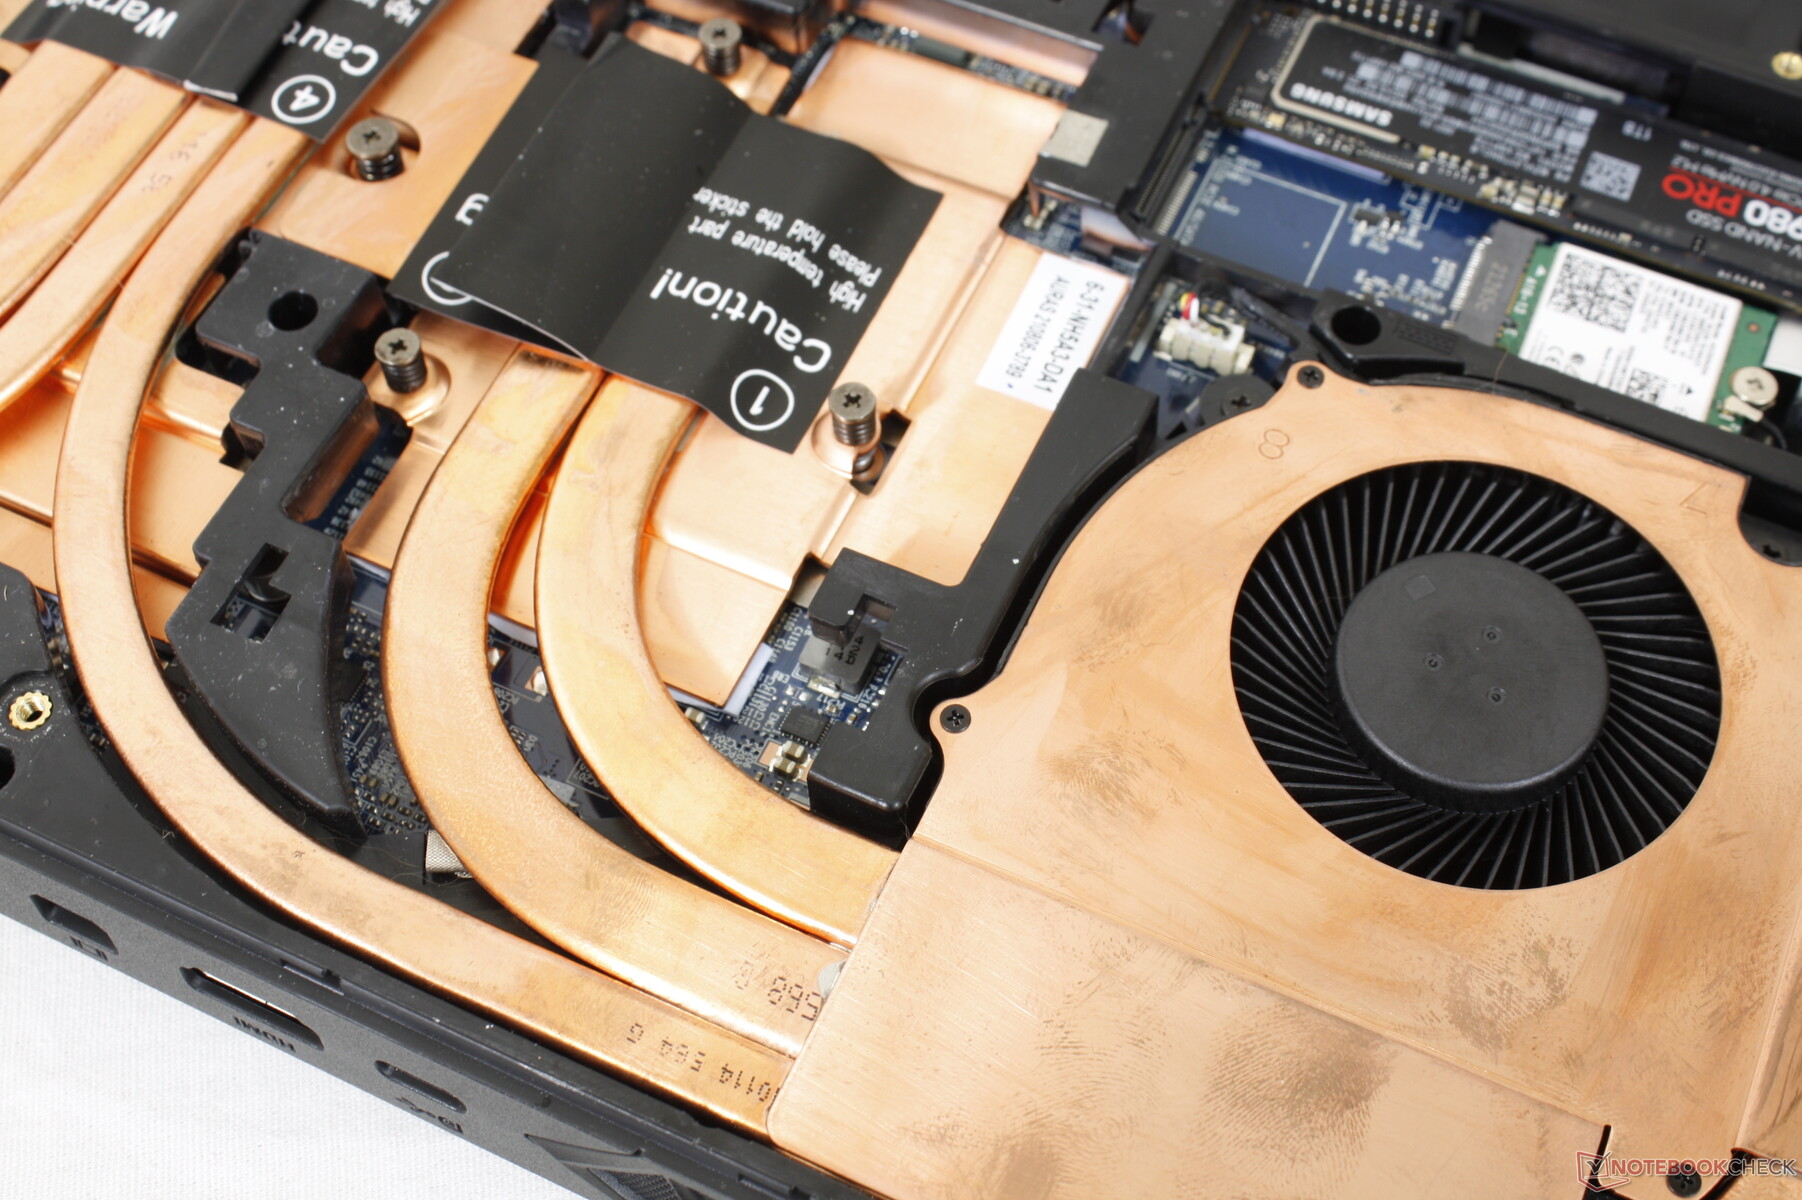
维护
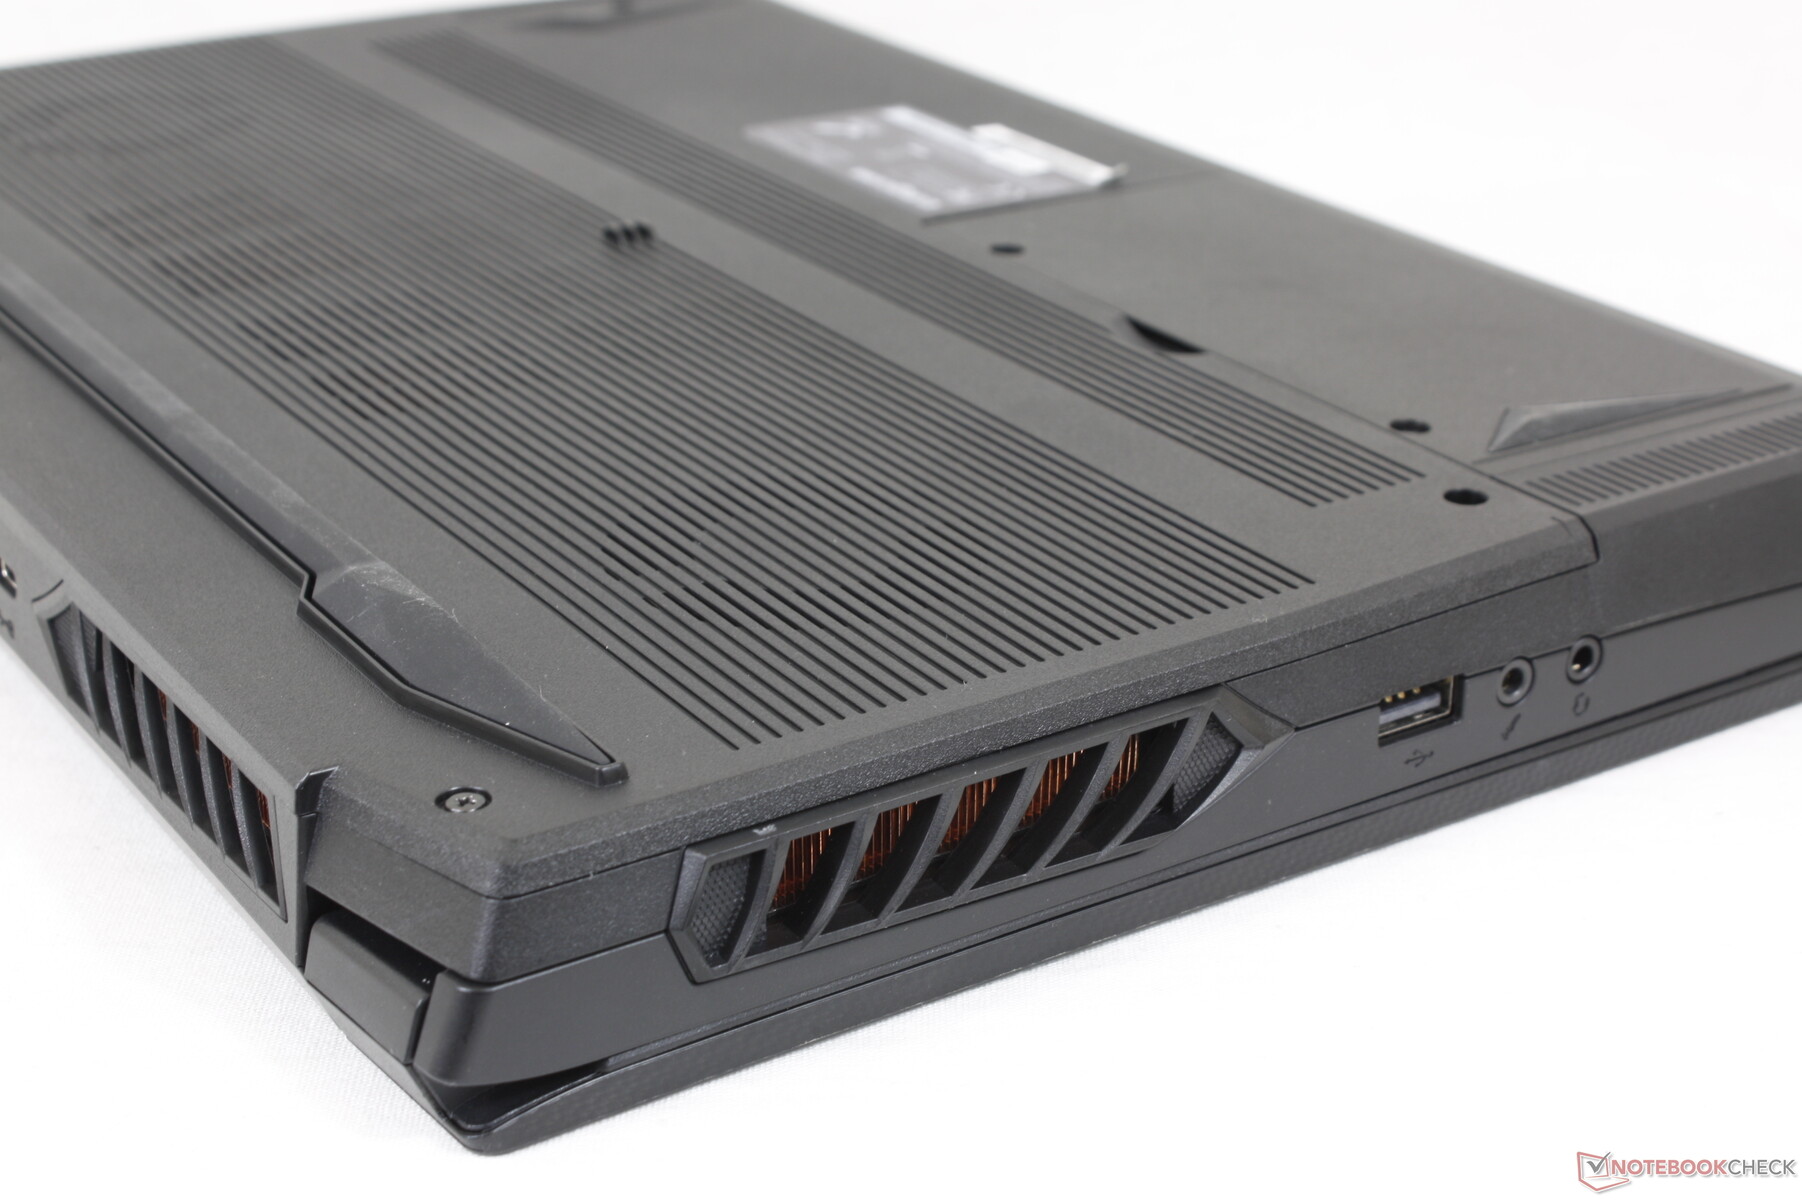
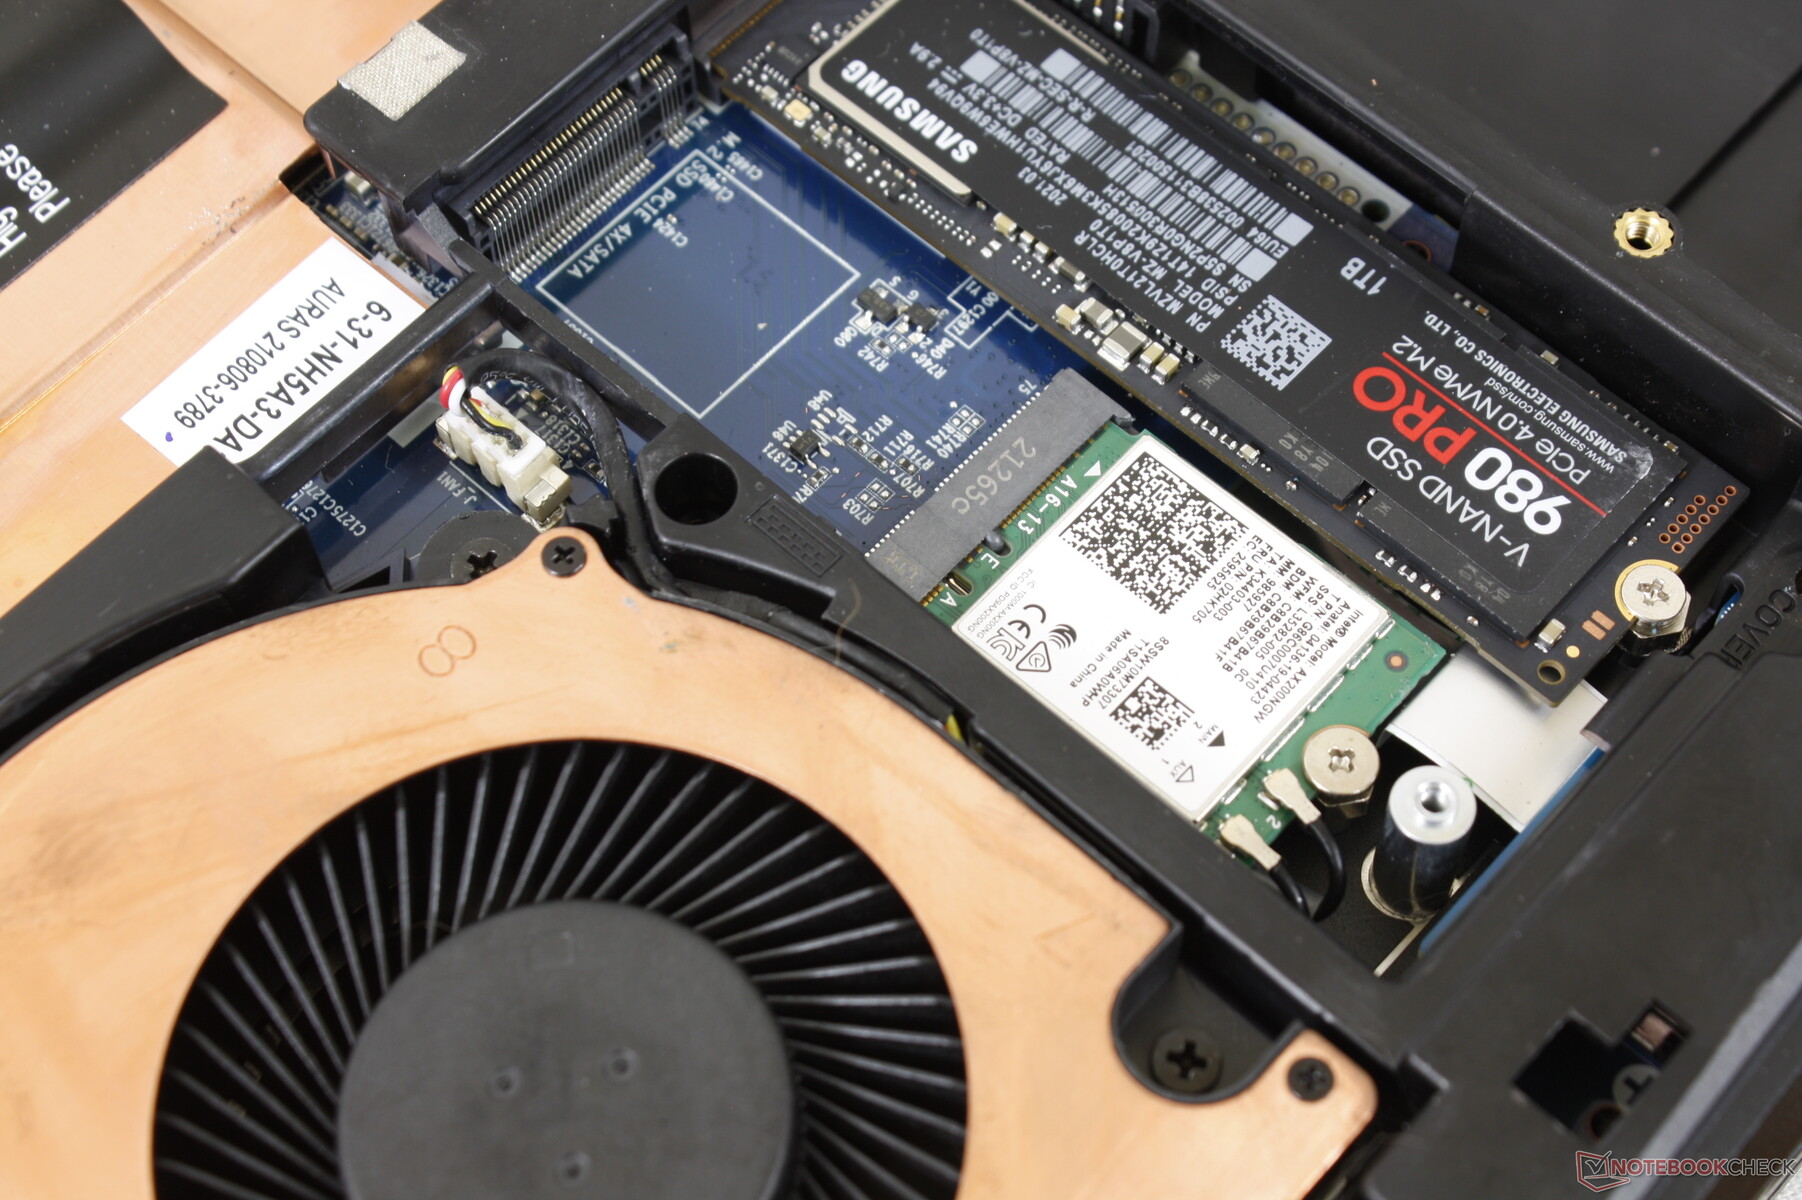
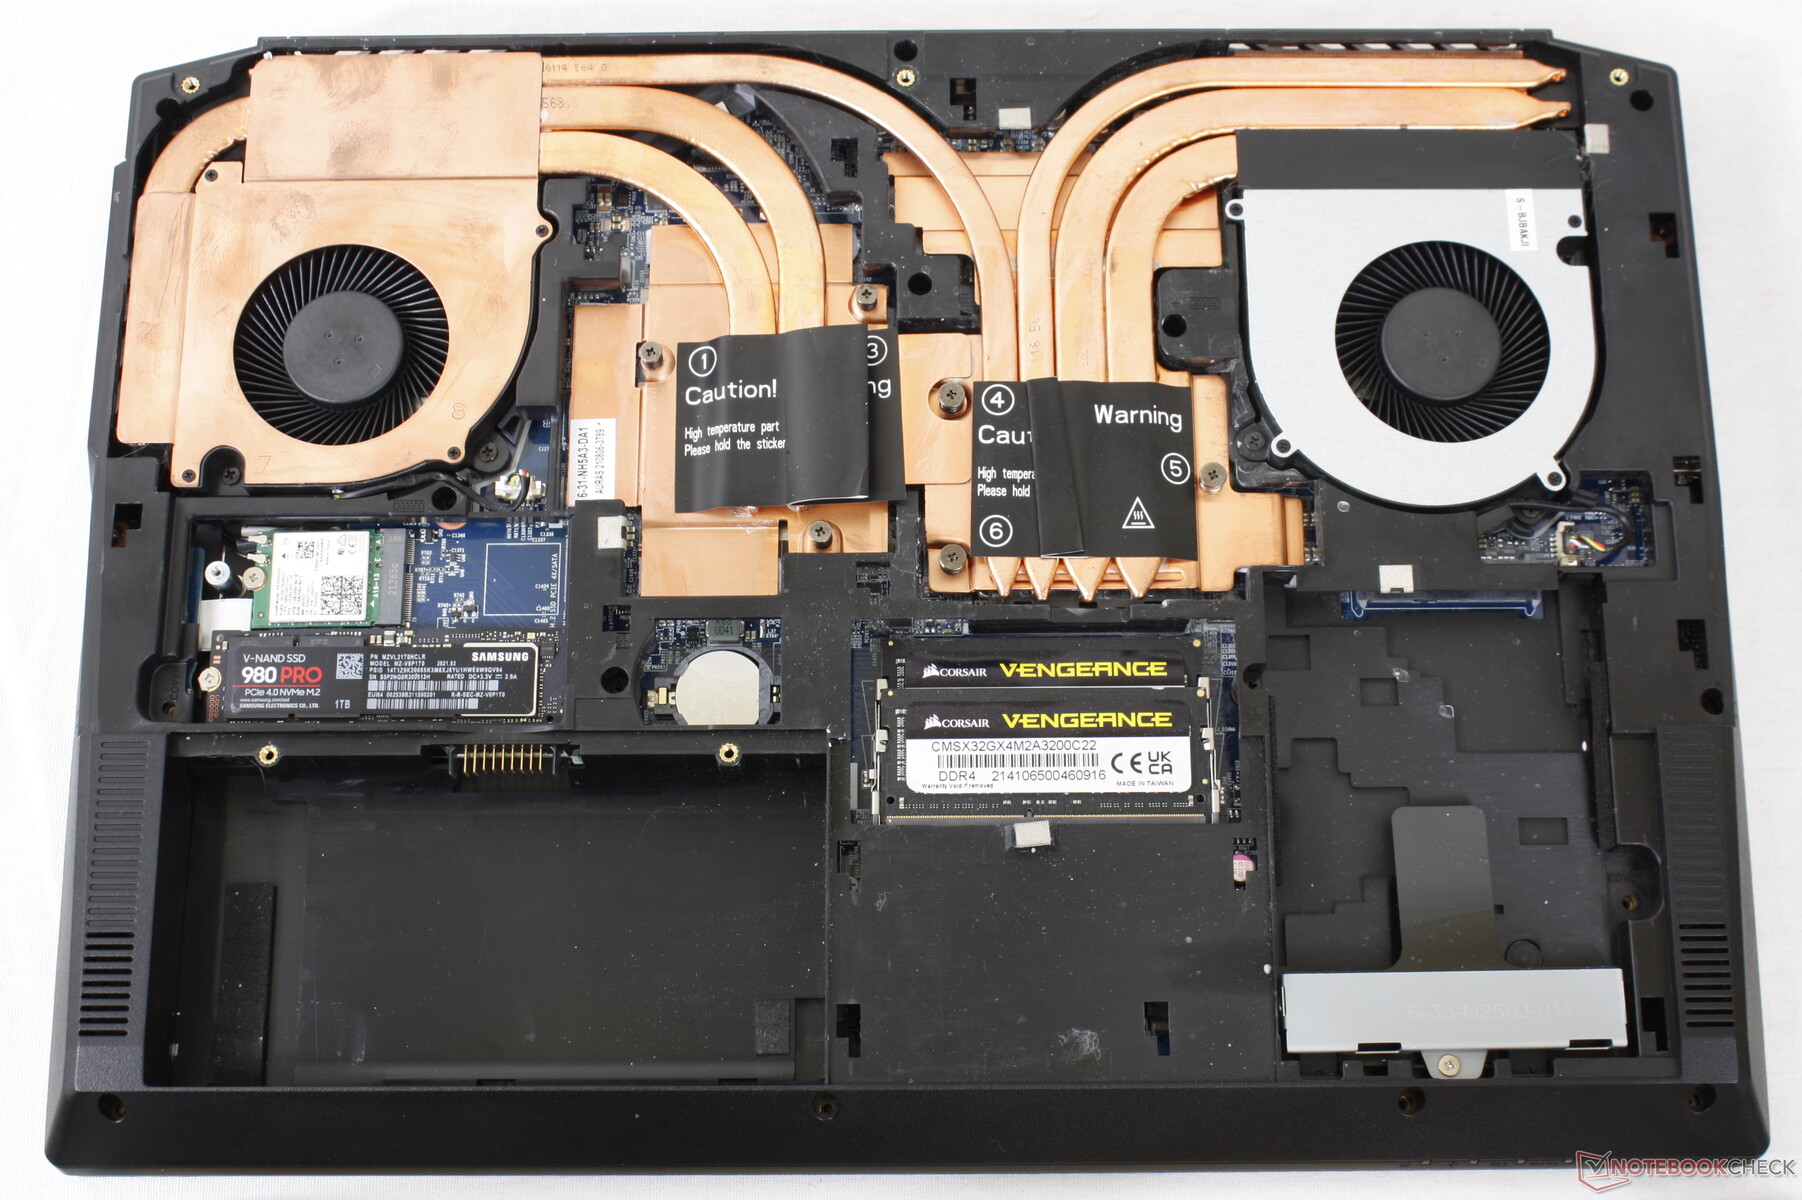
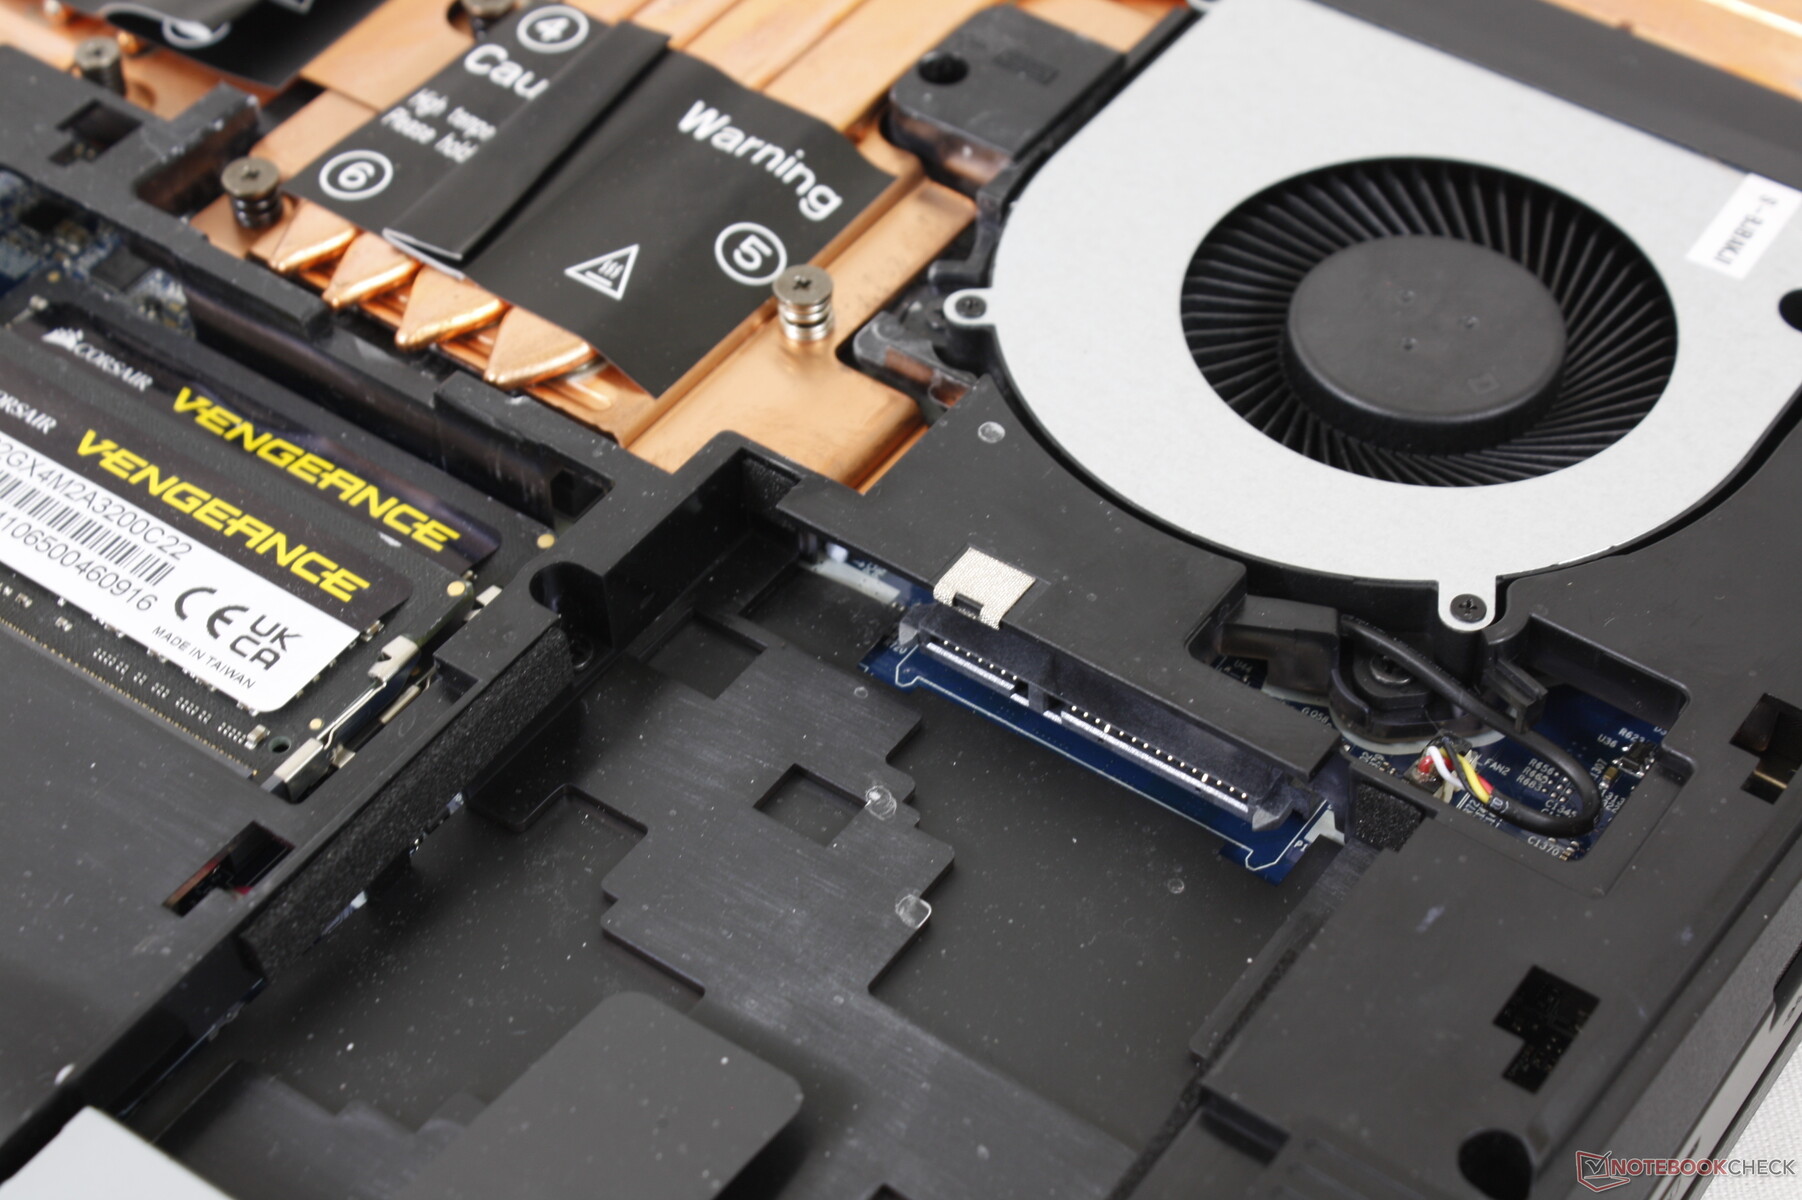
卸下五颗飞利浦螺钉后,底部面板很容易弹出。用户可以直接接触到所有的常用部件,包括两个DDR4 SODIMM插槽和三个存储托架。
配件和保修
零售包装盒包括一份手册、驱动盘、Windows 10 USB驱动器、额外的螺丝、SSD导热垫和两支0.6g导热膏针筒。标准的一年有限保修期适用,可选择延长至3年。
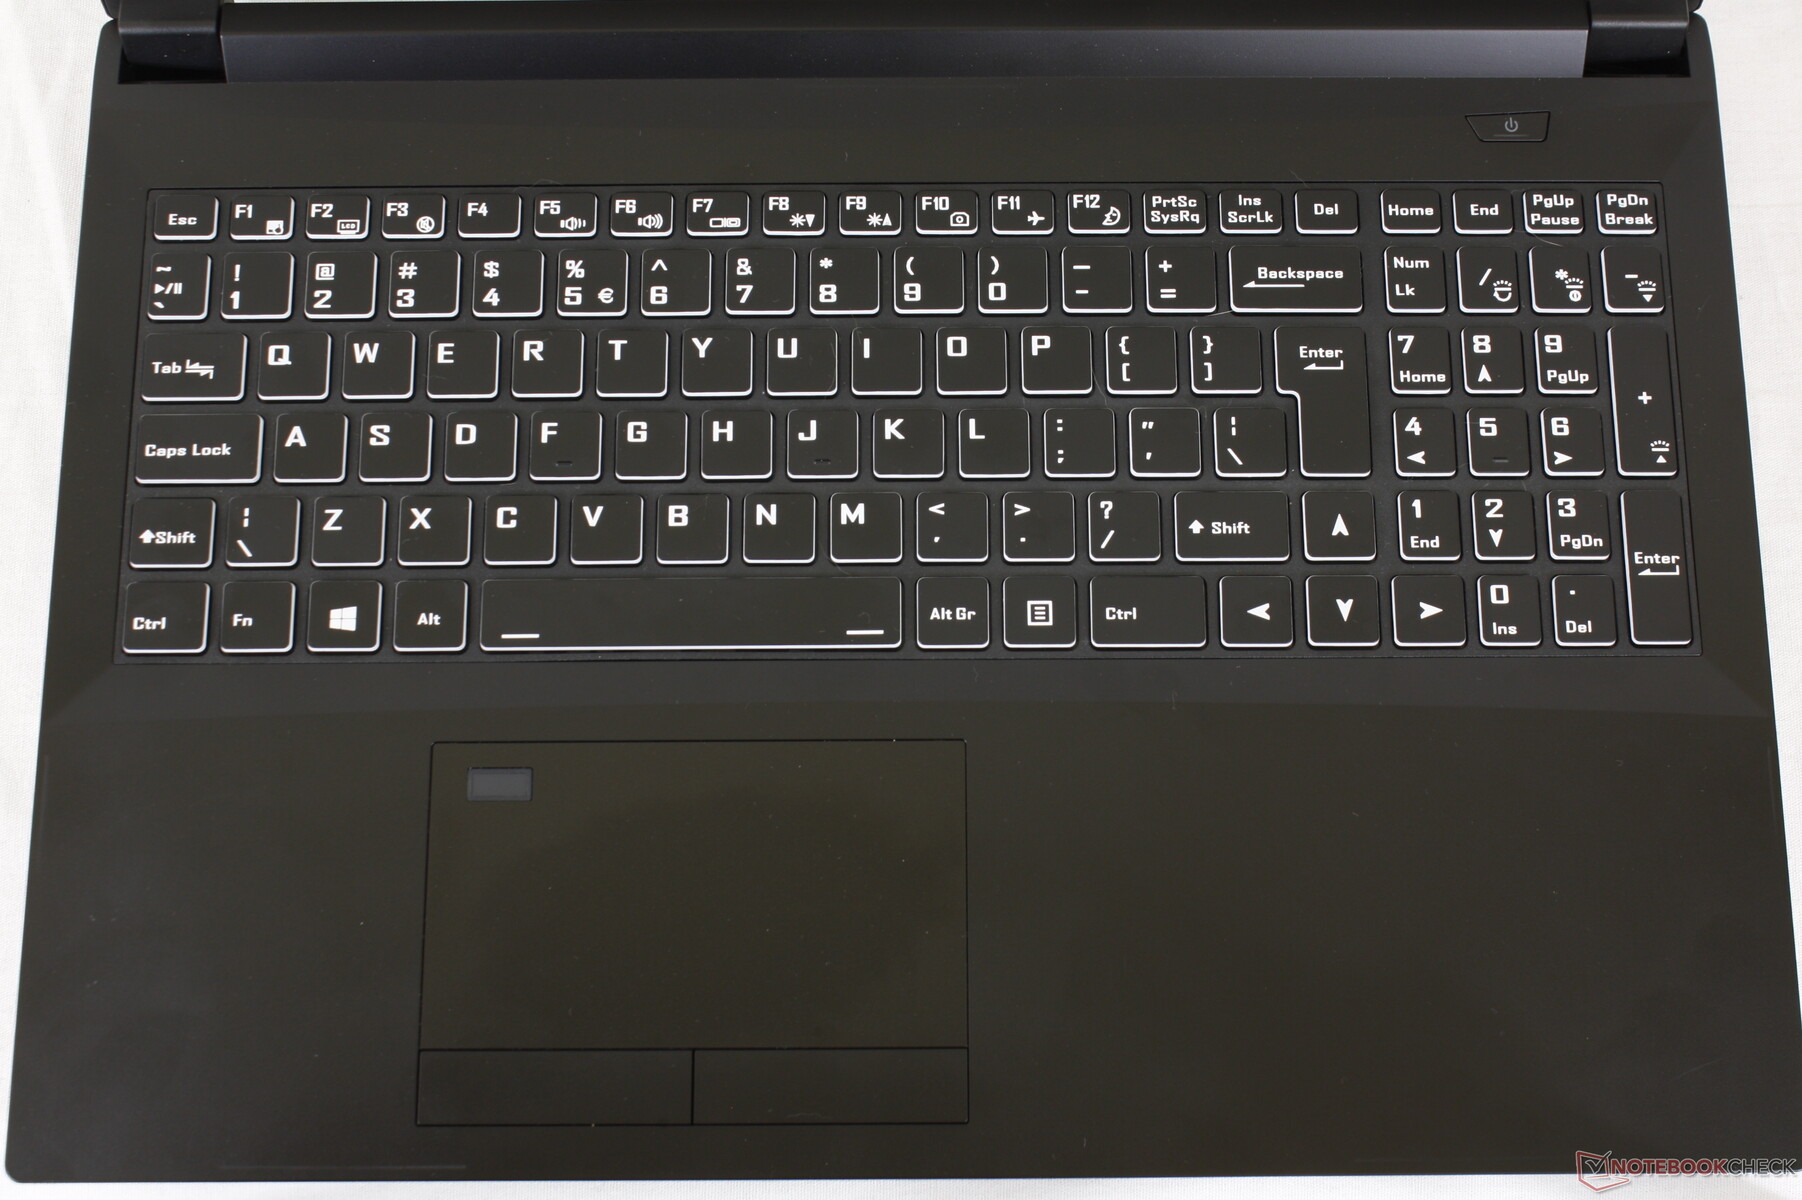
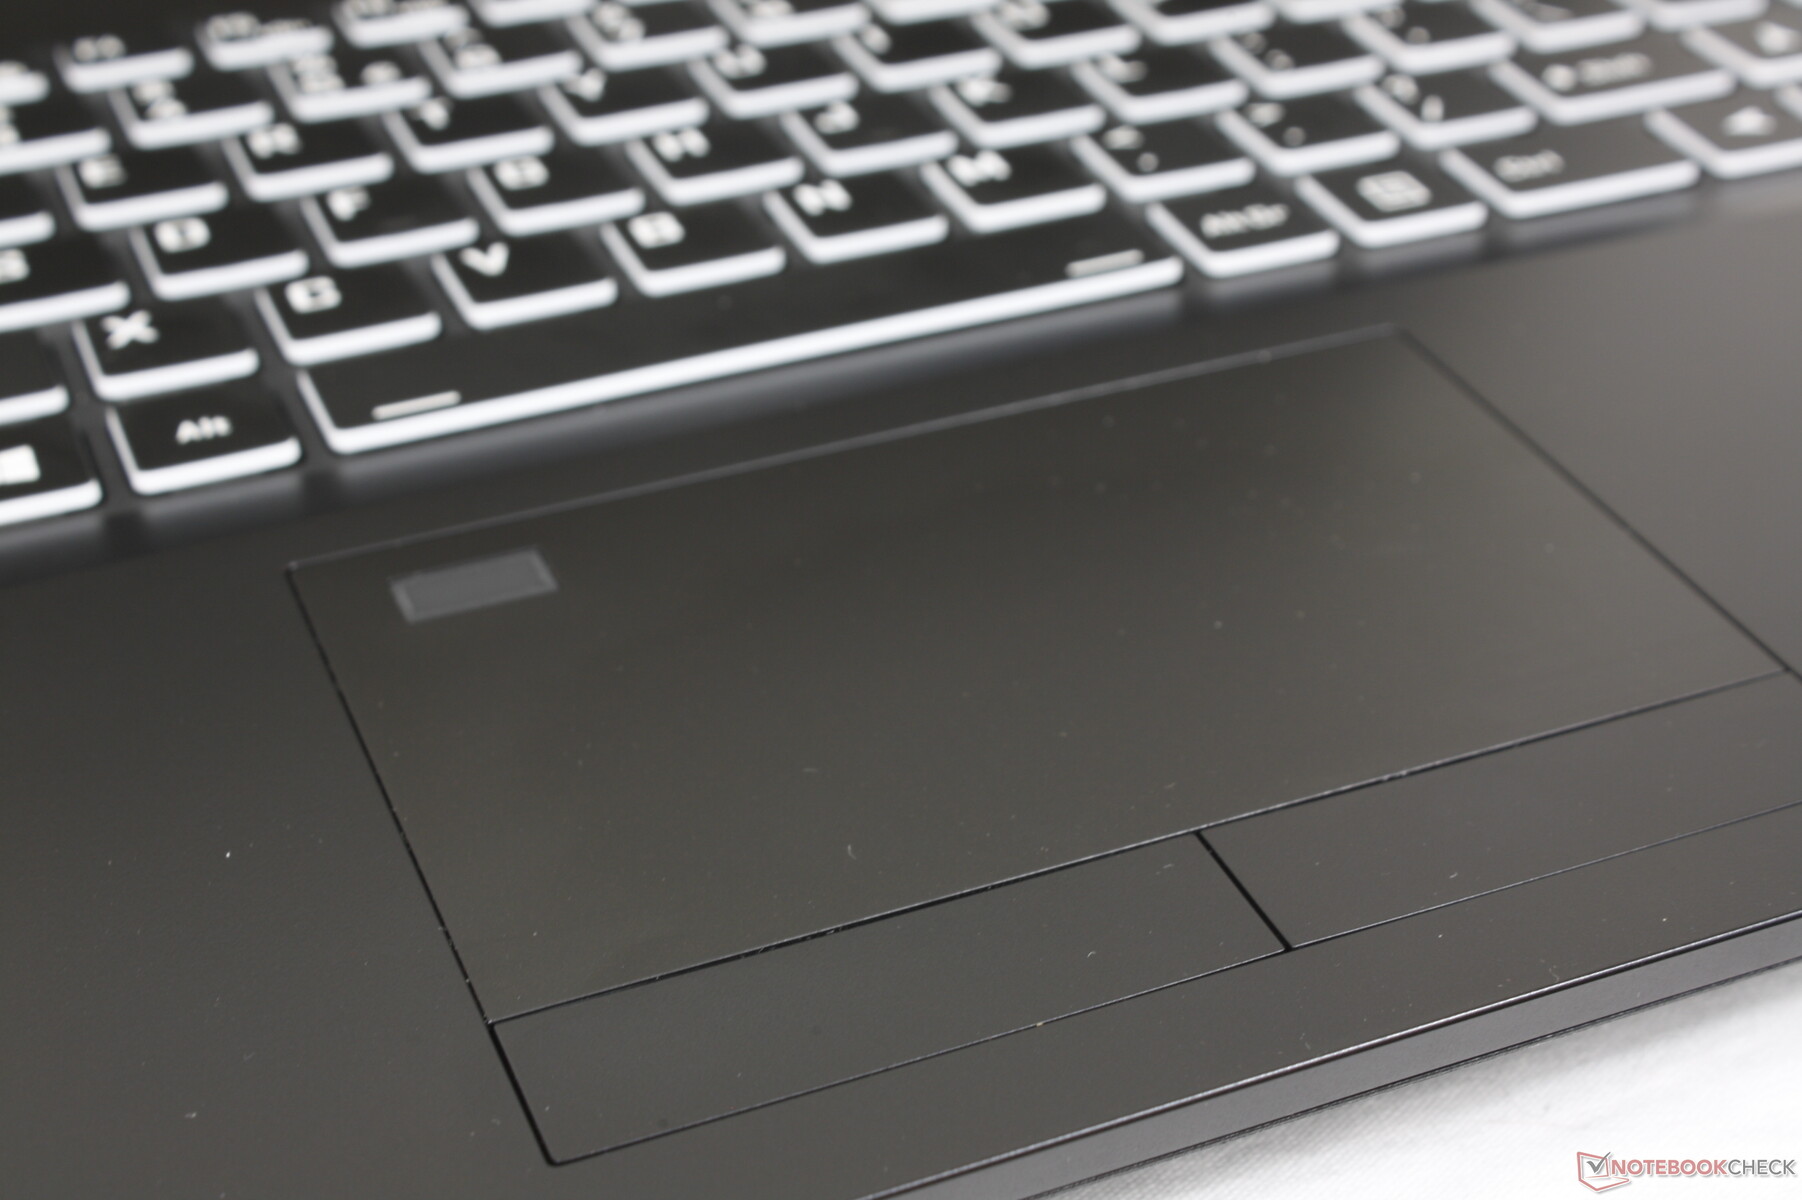
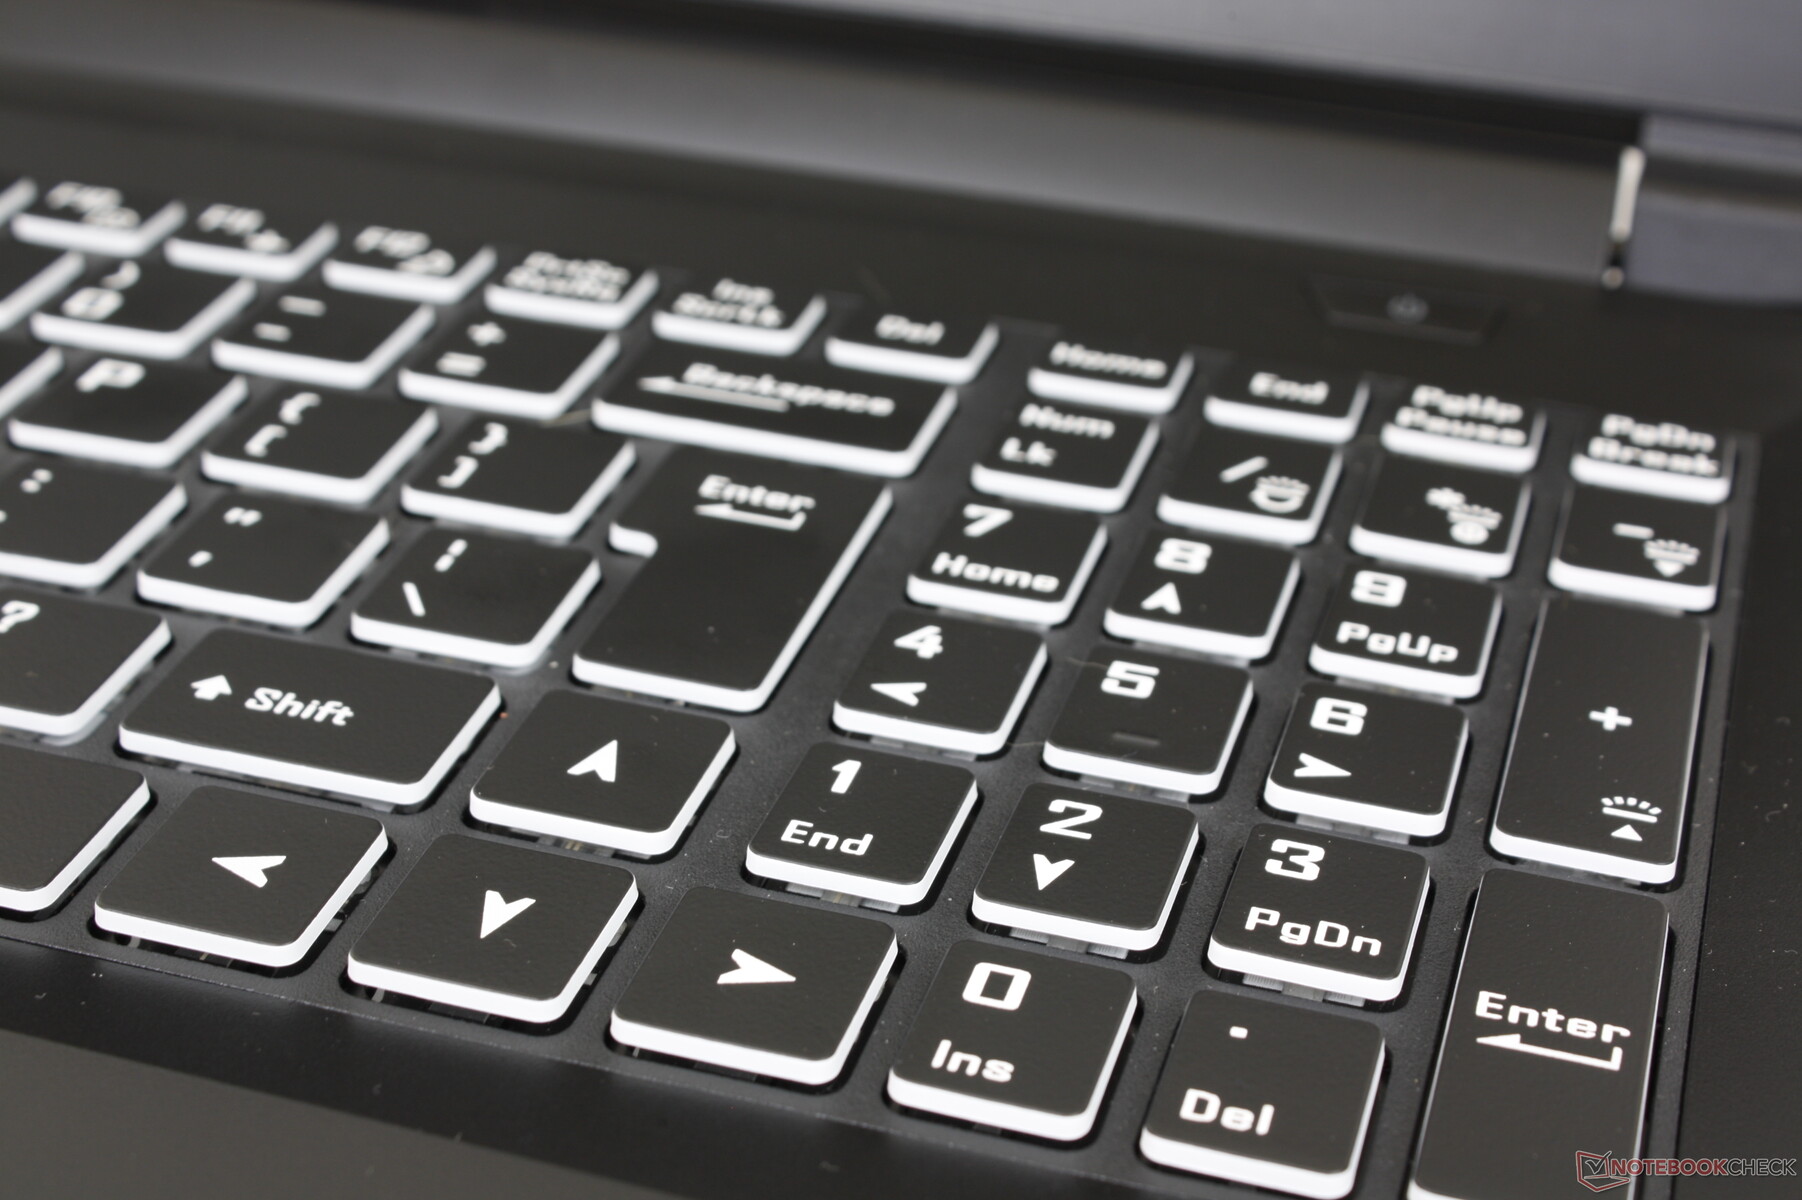
输入设备

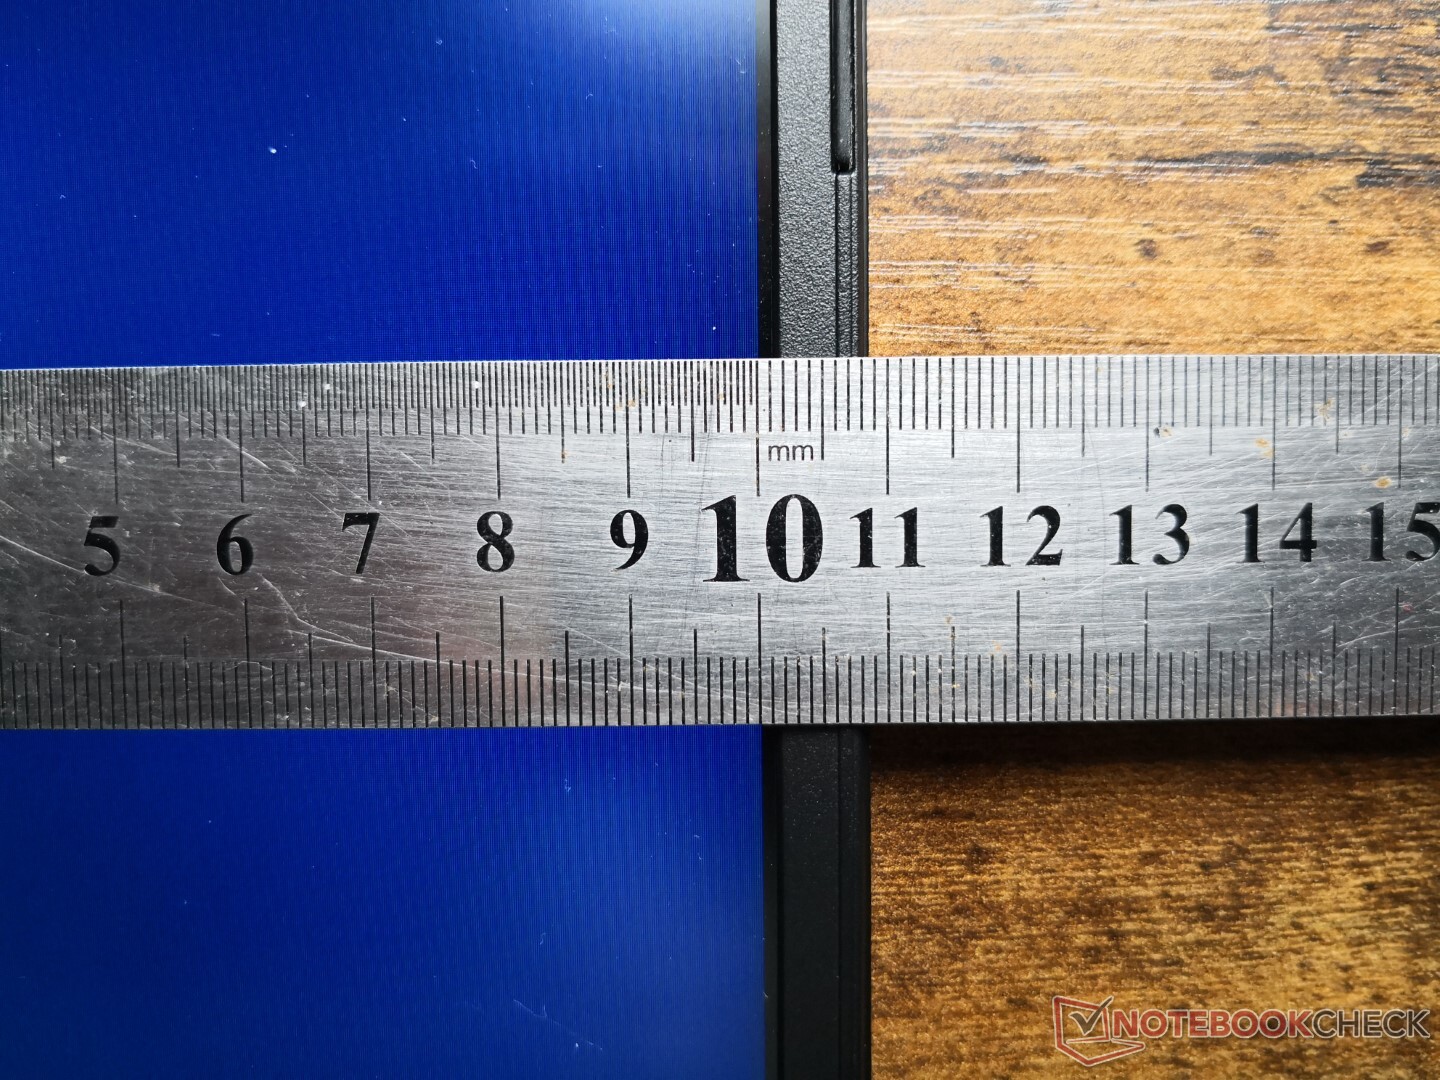
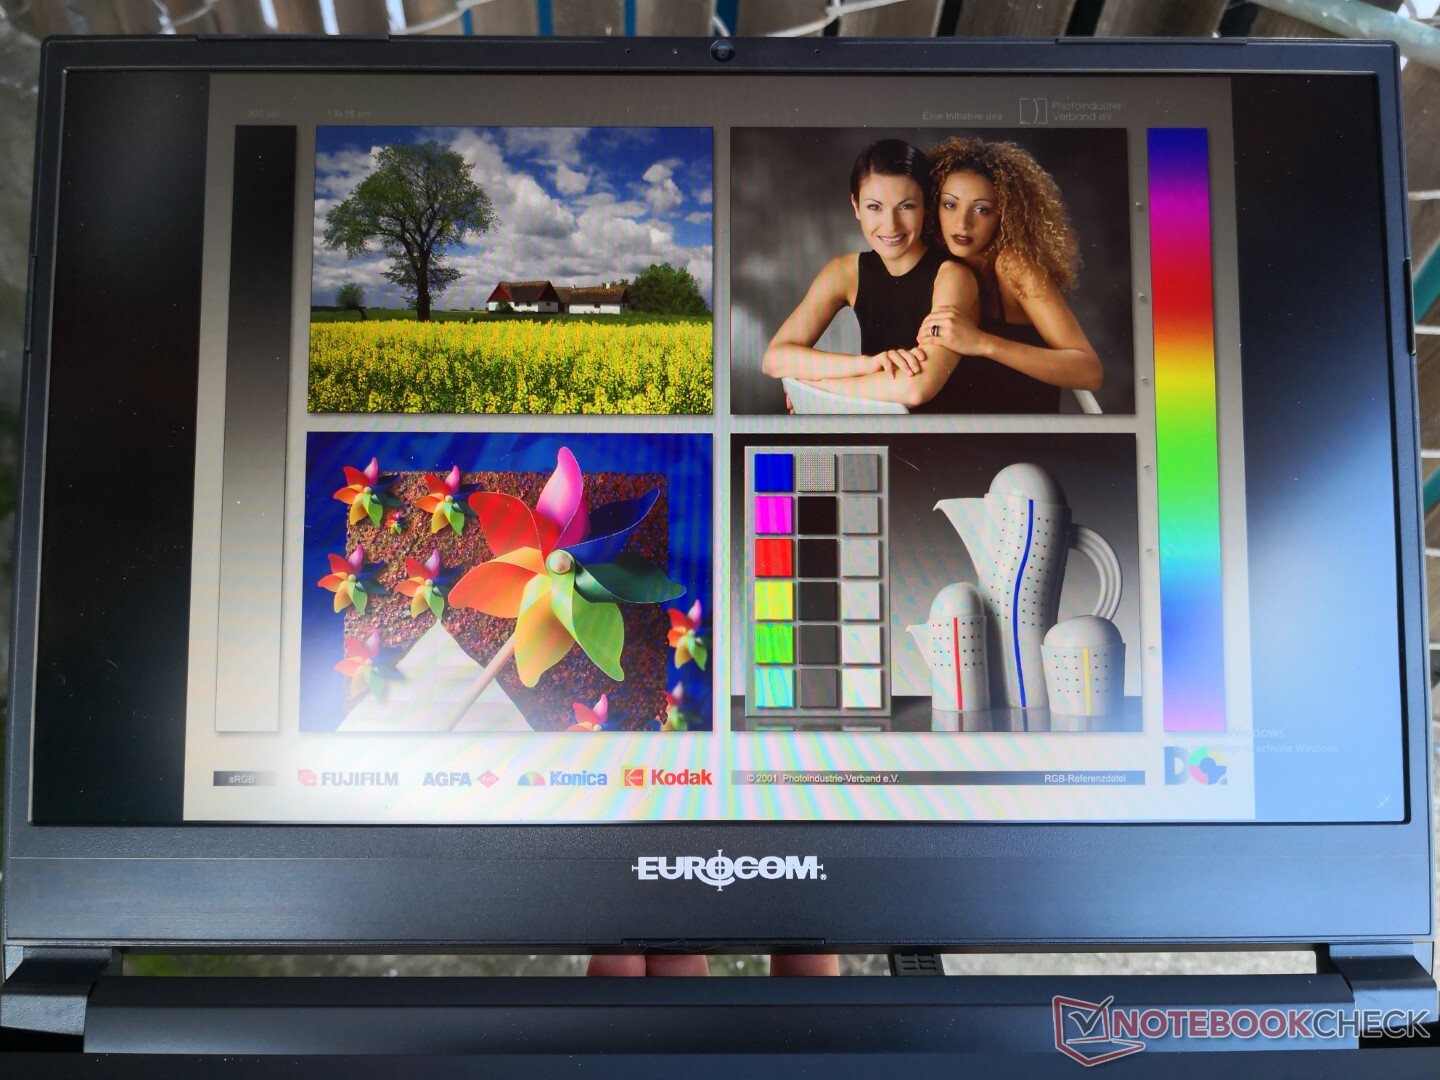
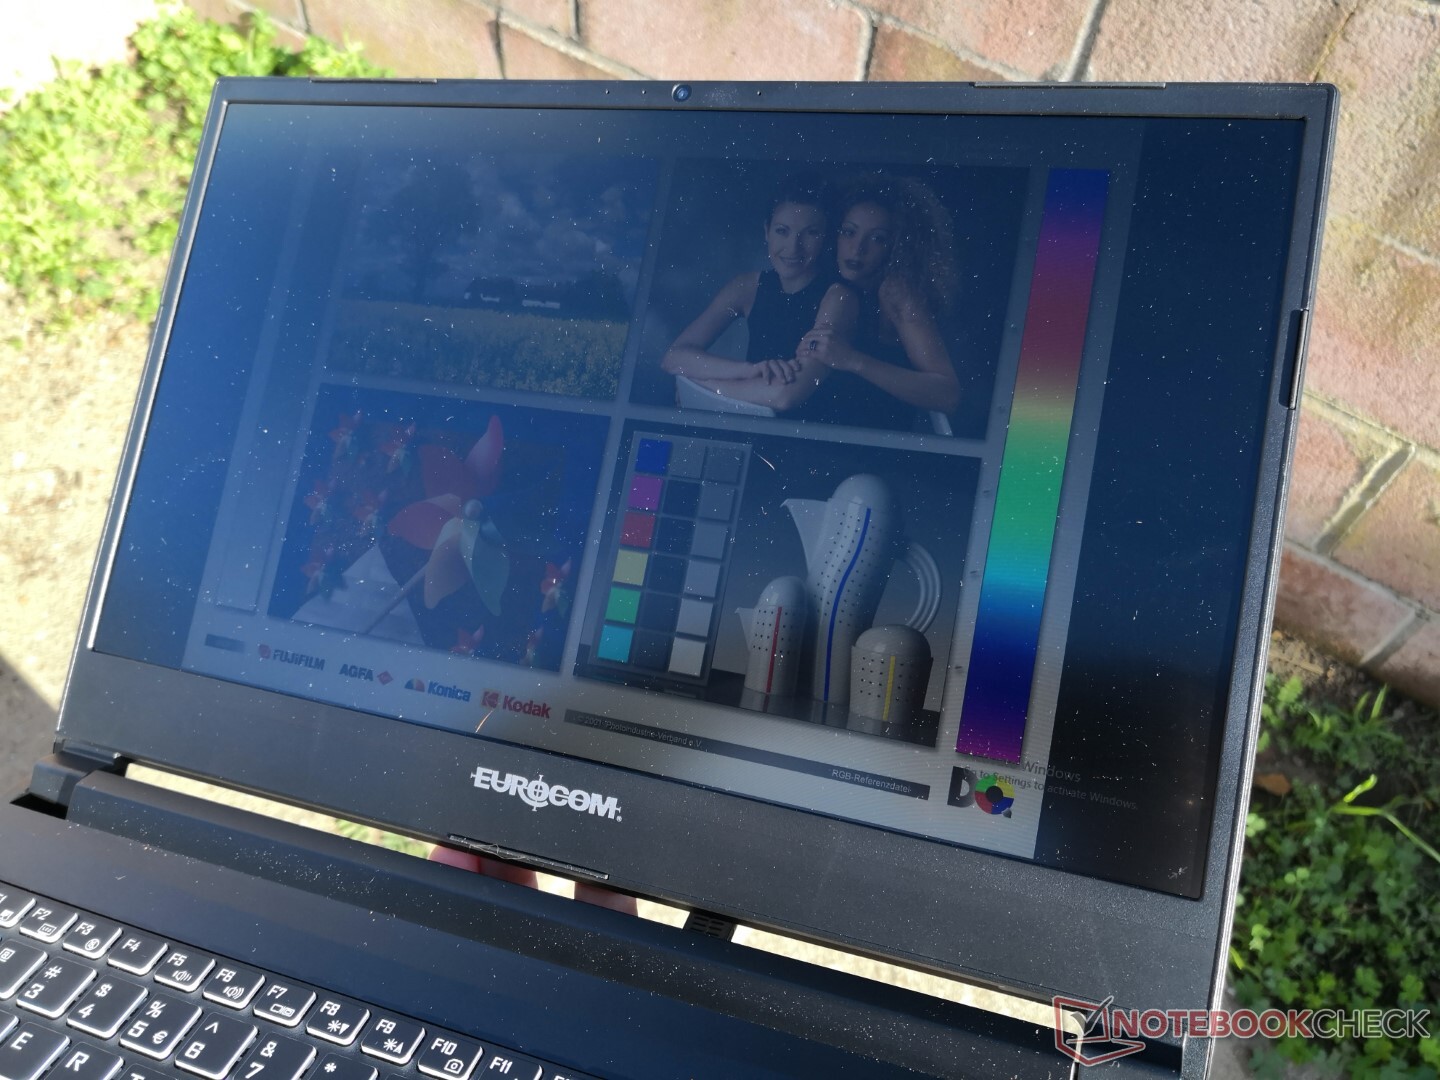
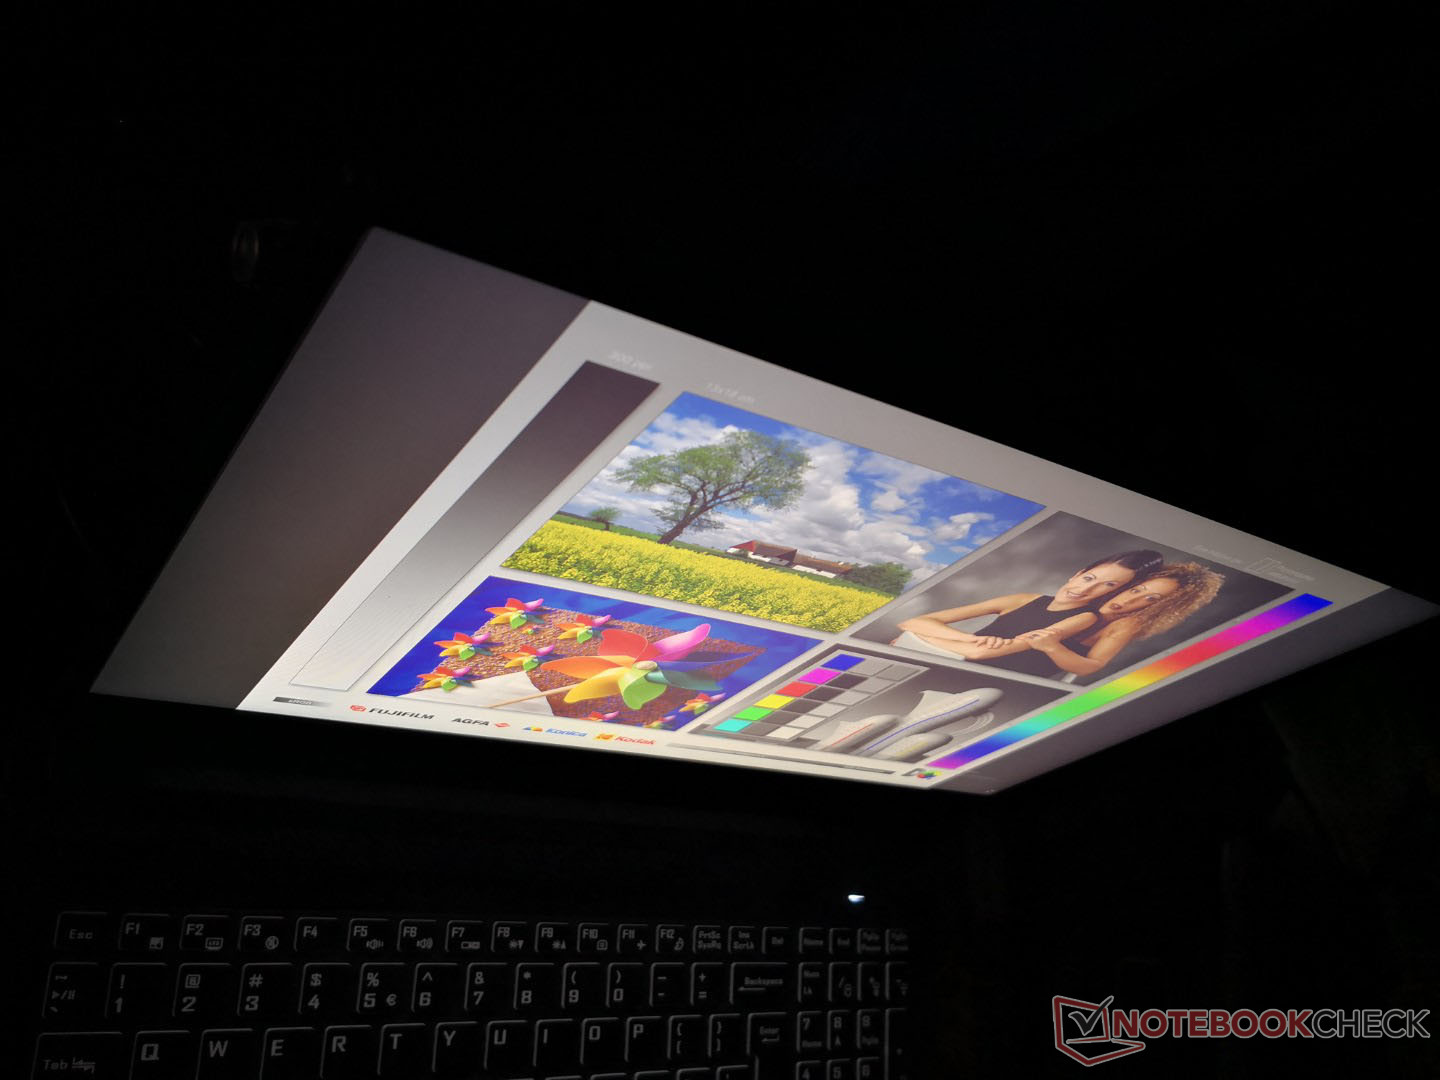
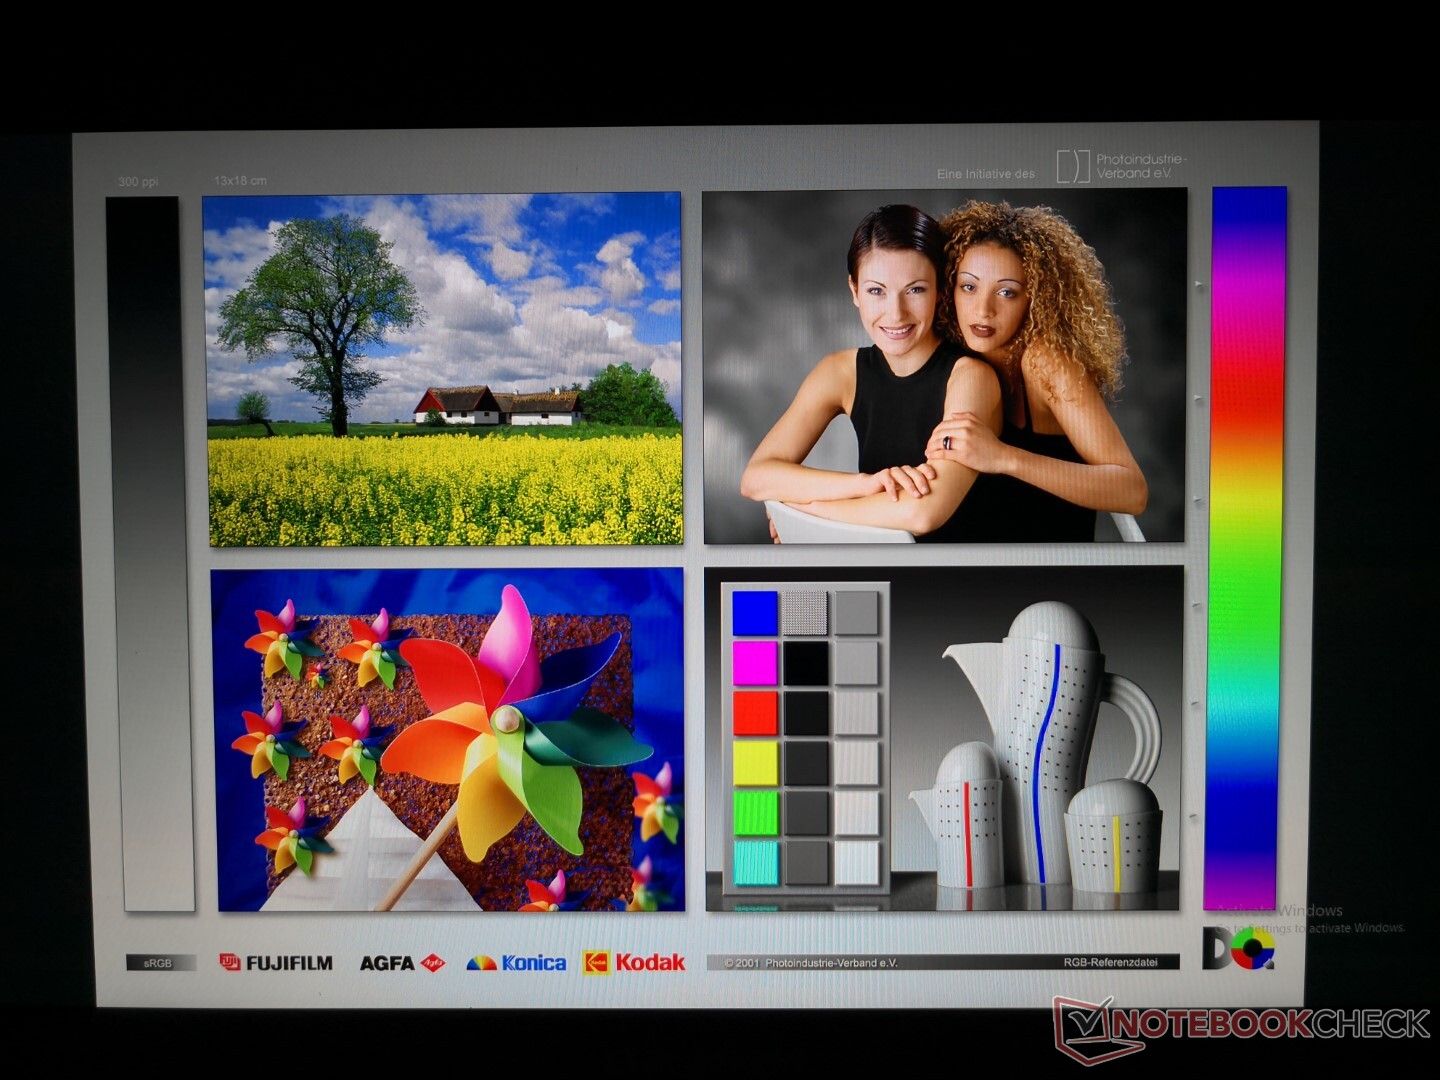
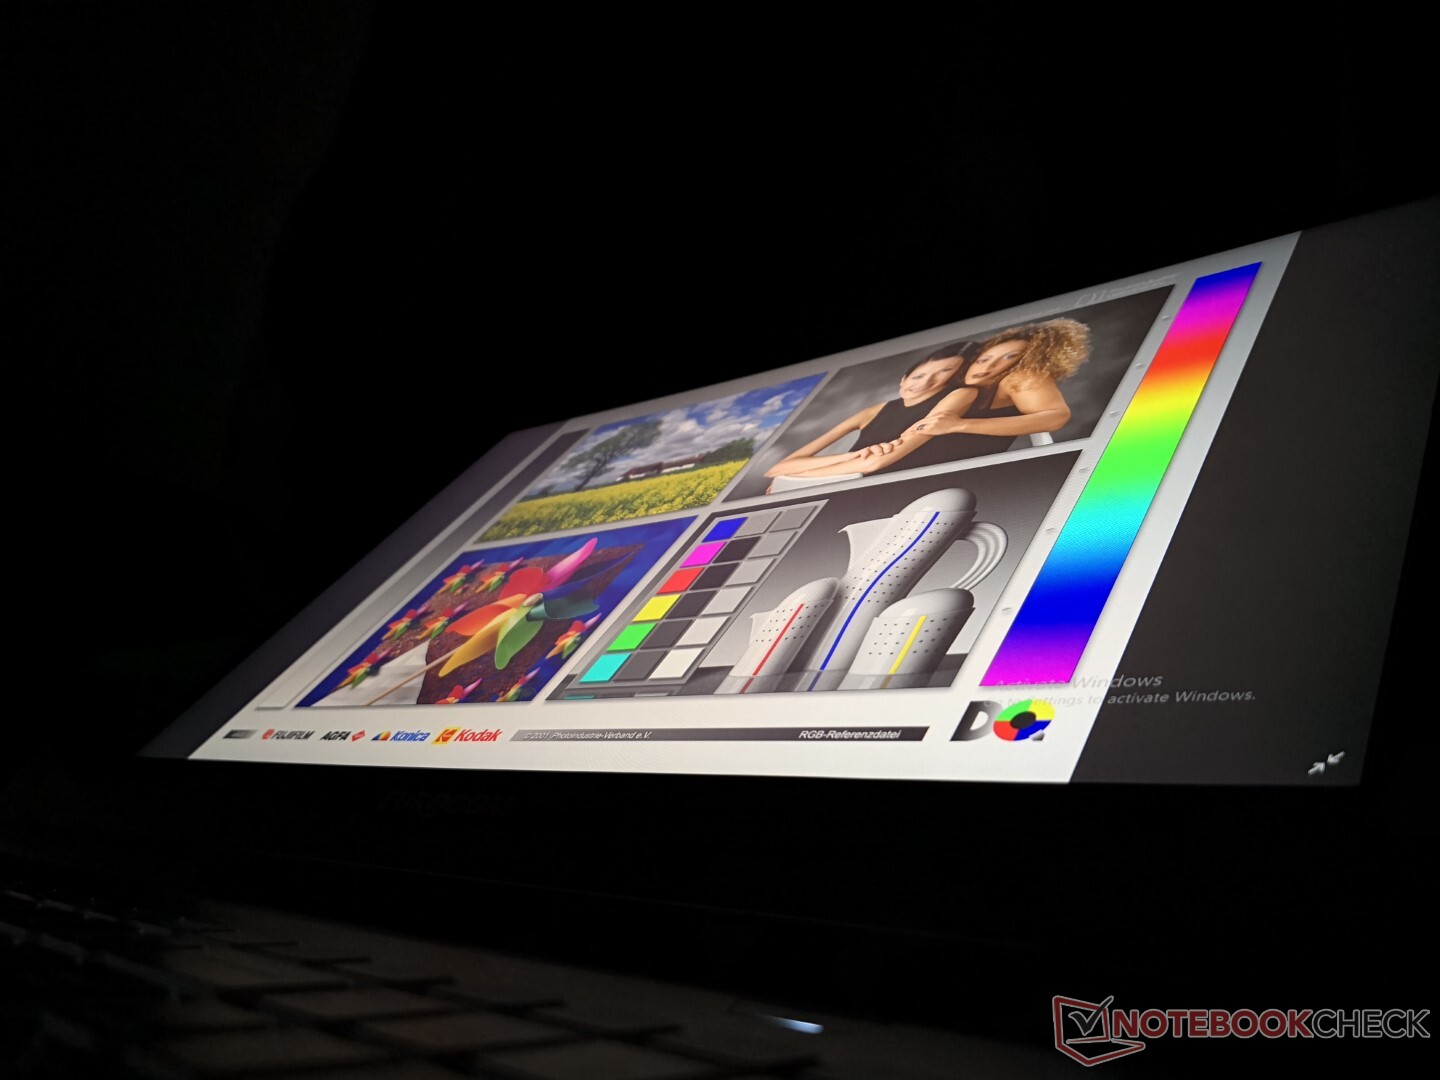
显示
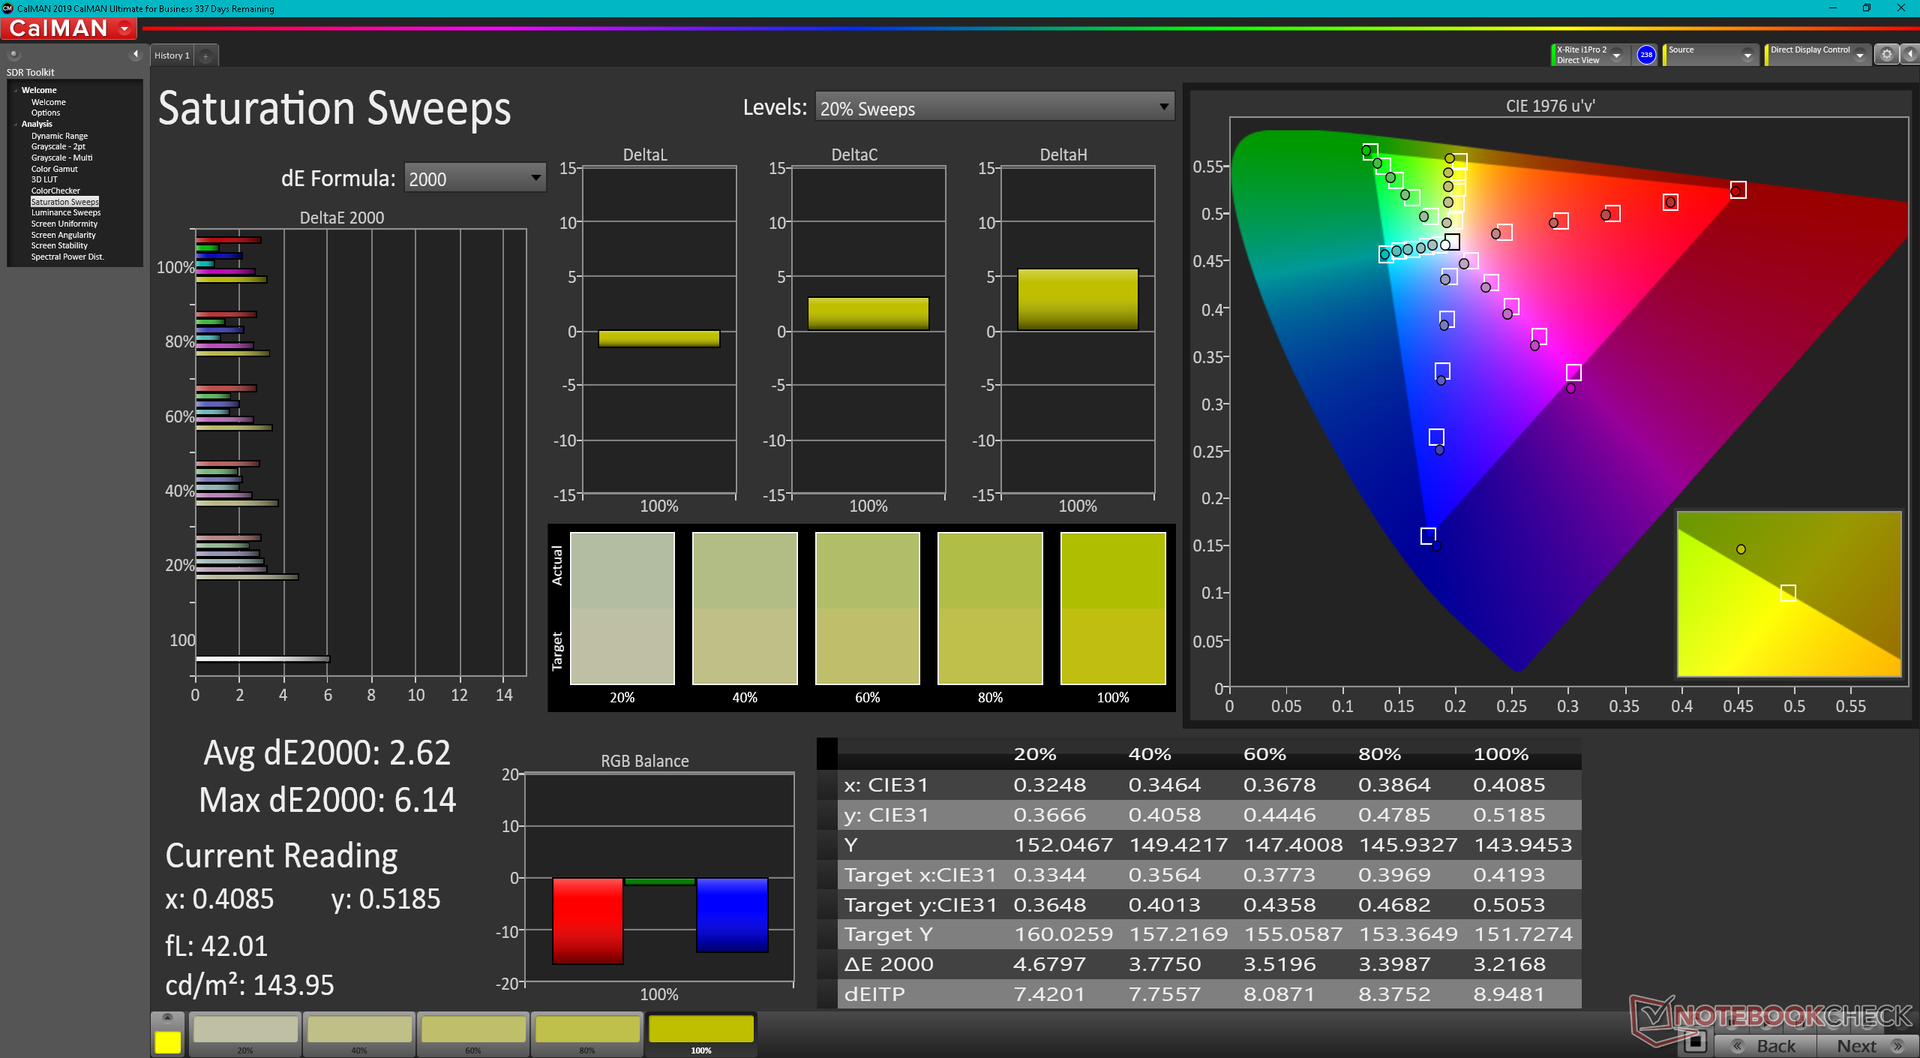
夜空ARX15使用了非常相似的夏普LQ156M1JW03 IPS面板,与微星GE66或Delta 15上的面板一样。 三角洲15.因此,这三款机型的观看体验几乎是相同的,它们的原始刷新率为240赫兹,对比度约为1000:1,全sRGB覆盖,响应时间快,甚至还有类似的脉宽调制频率。这是一款具有优秀属性的高端面板,即使其色彩和对比度不能完全达到OLED面板的水平。

| |||||||||||||||||||||||||
Brightness Distribution: 90 %
Center on Battery: 312.8 cd/m²
Contrast: 1117:1 (Black: 0.28 cd/m²)
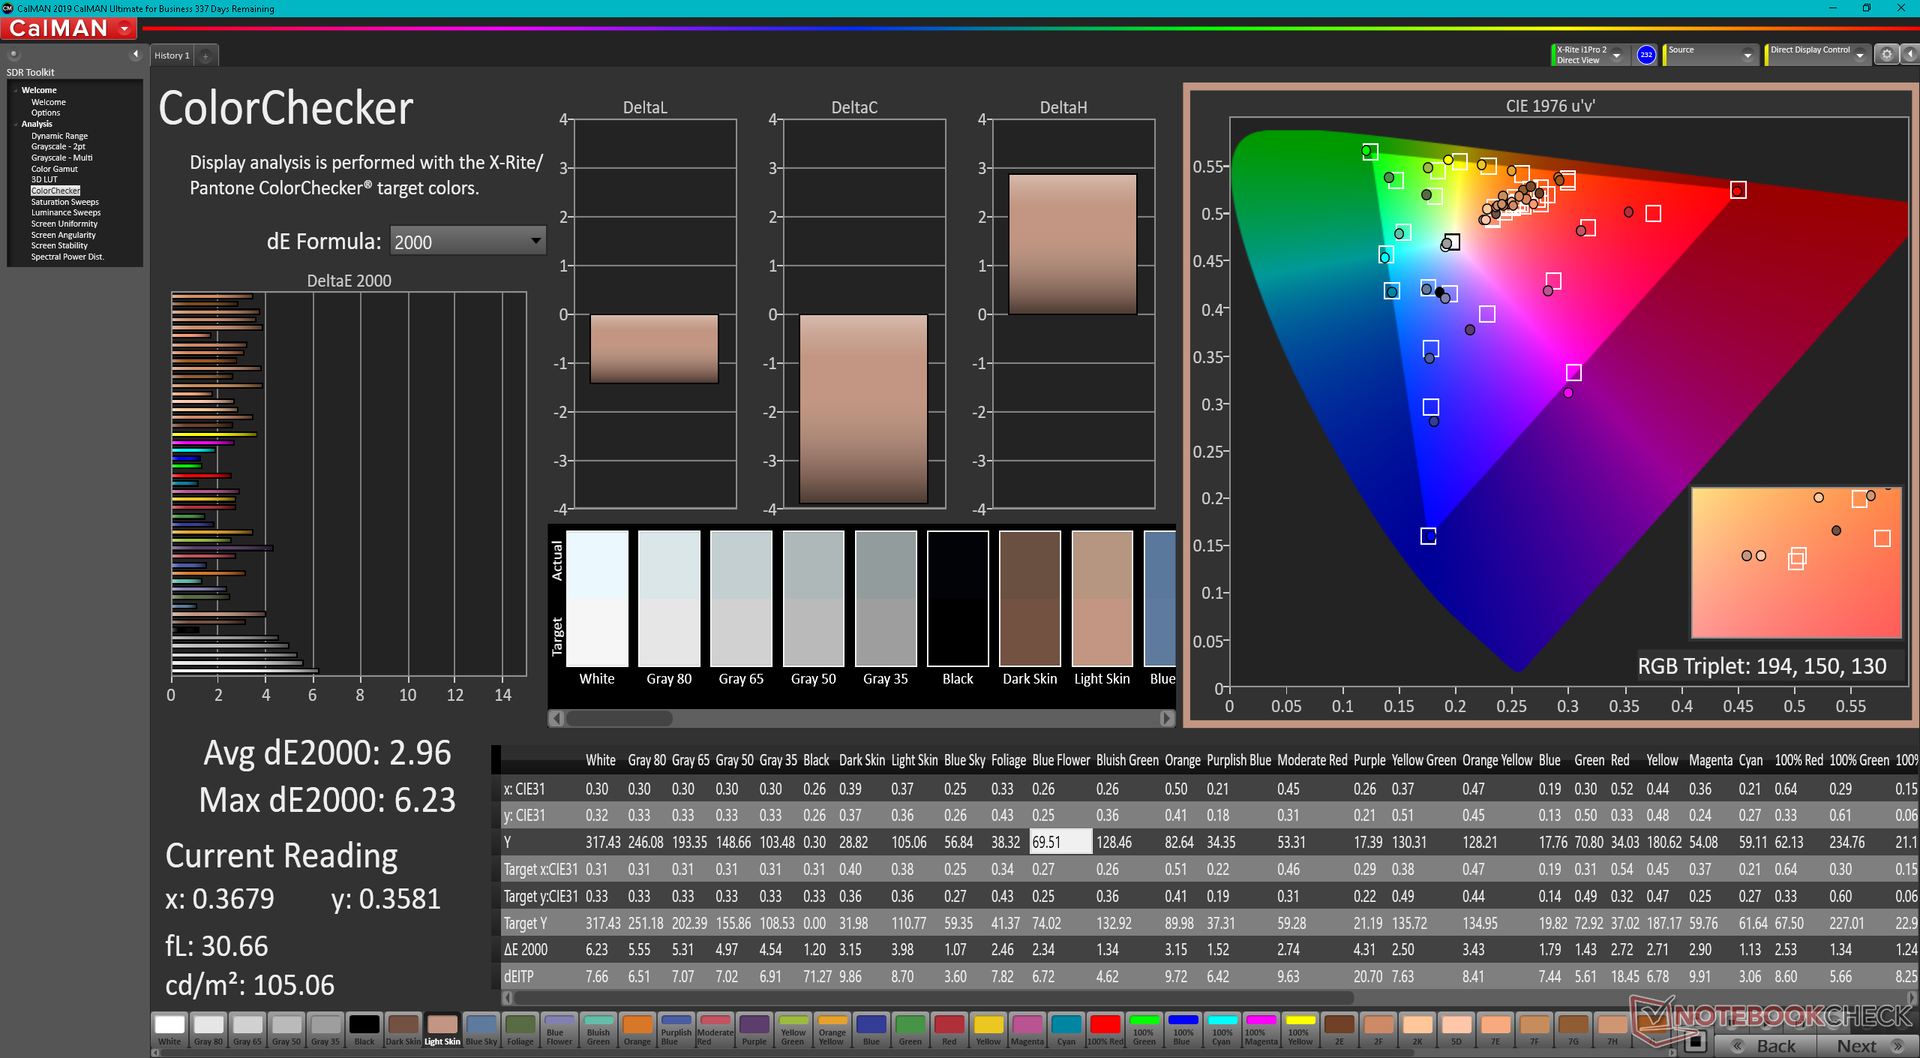
ΔE ColorChecker Calman: 2.96 | ∀{0.5-29.43 Ø4.72}
ΔE Greyscale Calman: 4.2 | ∀{0.09-98 Ø4.97}
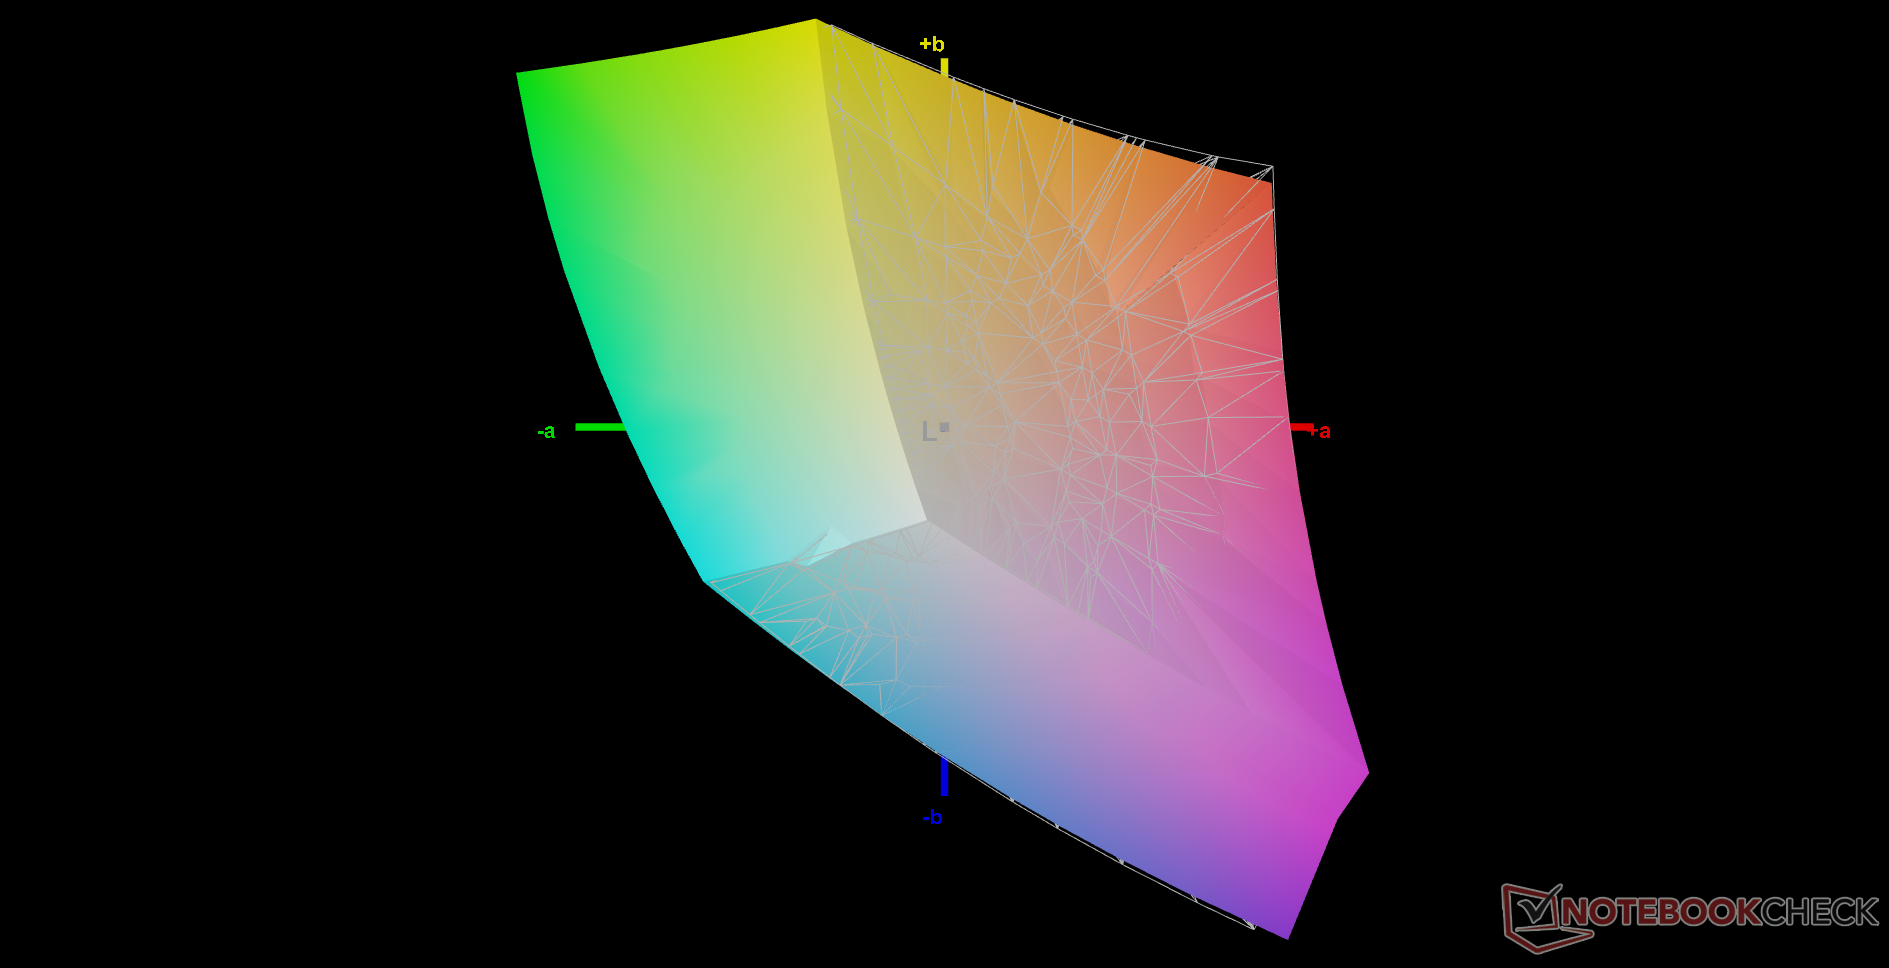
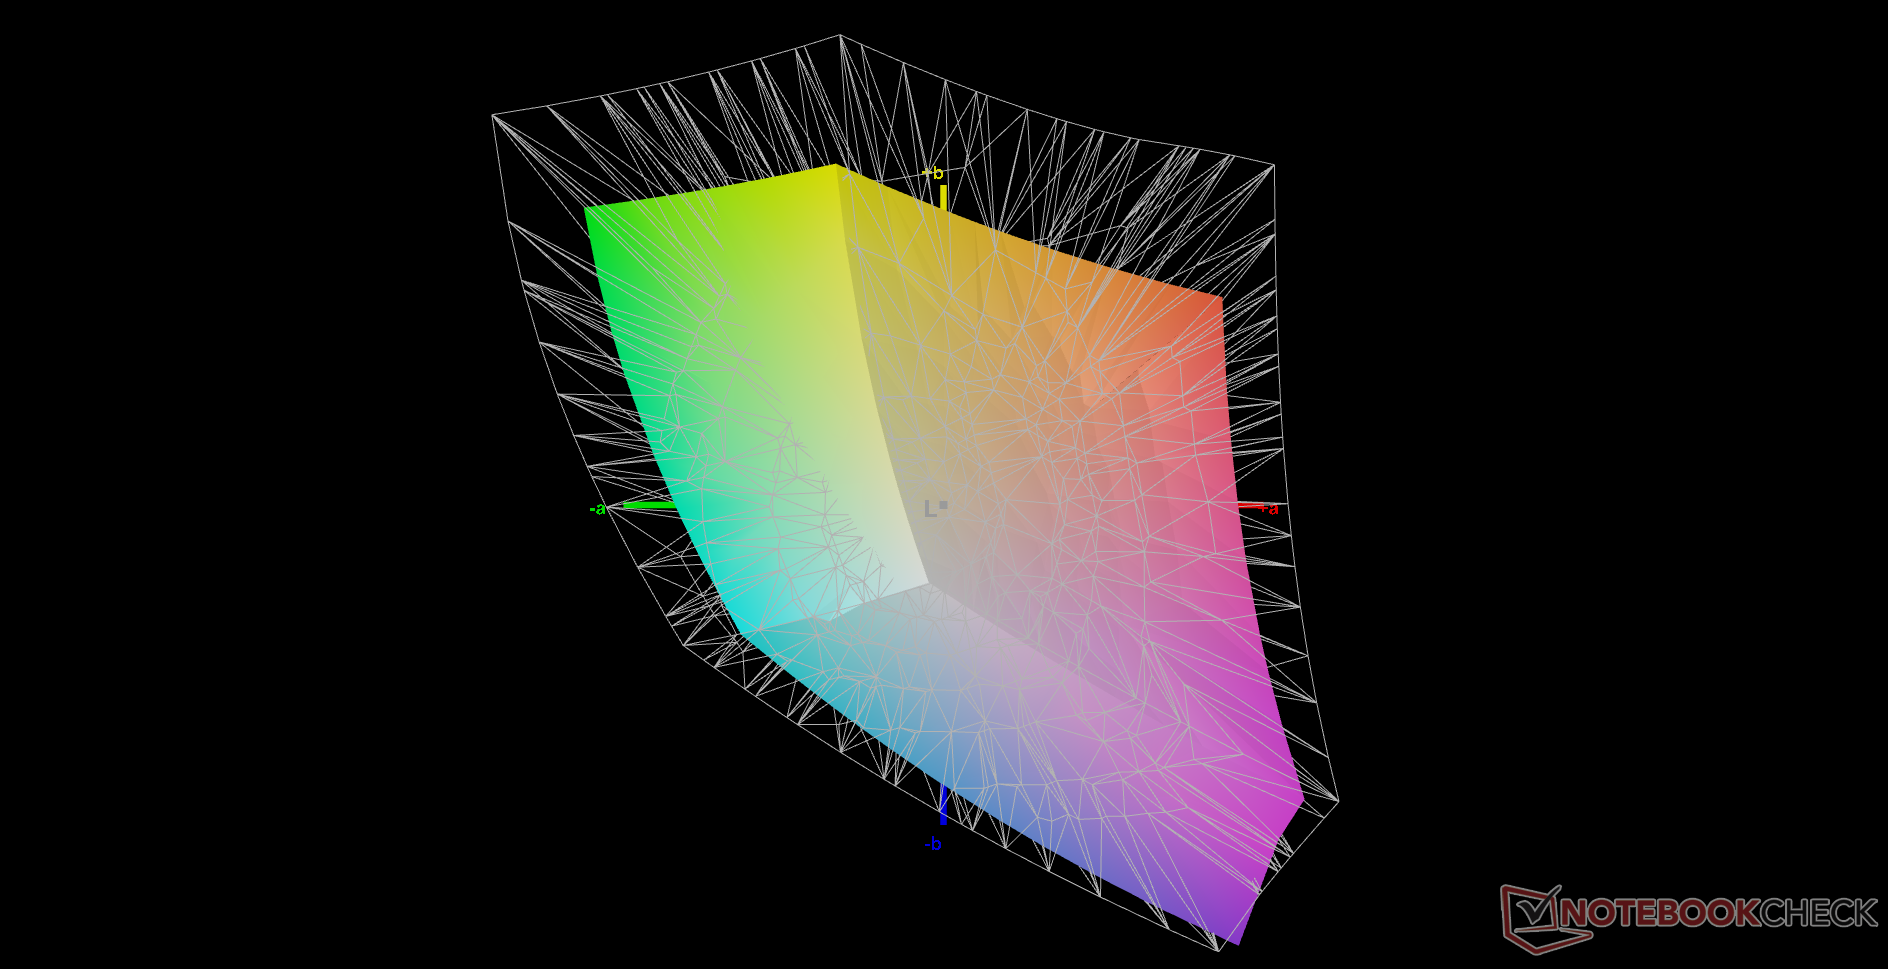
73.7% AdobeRGB 1998 (Argyll 3D)
99.7% sRGB (Argyll 3D)
67.9% Display P3 (Argyll 3D)
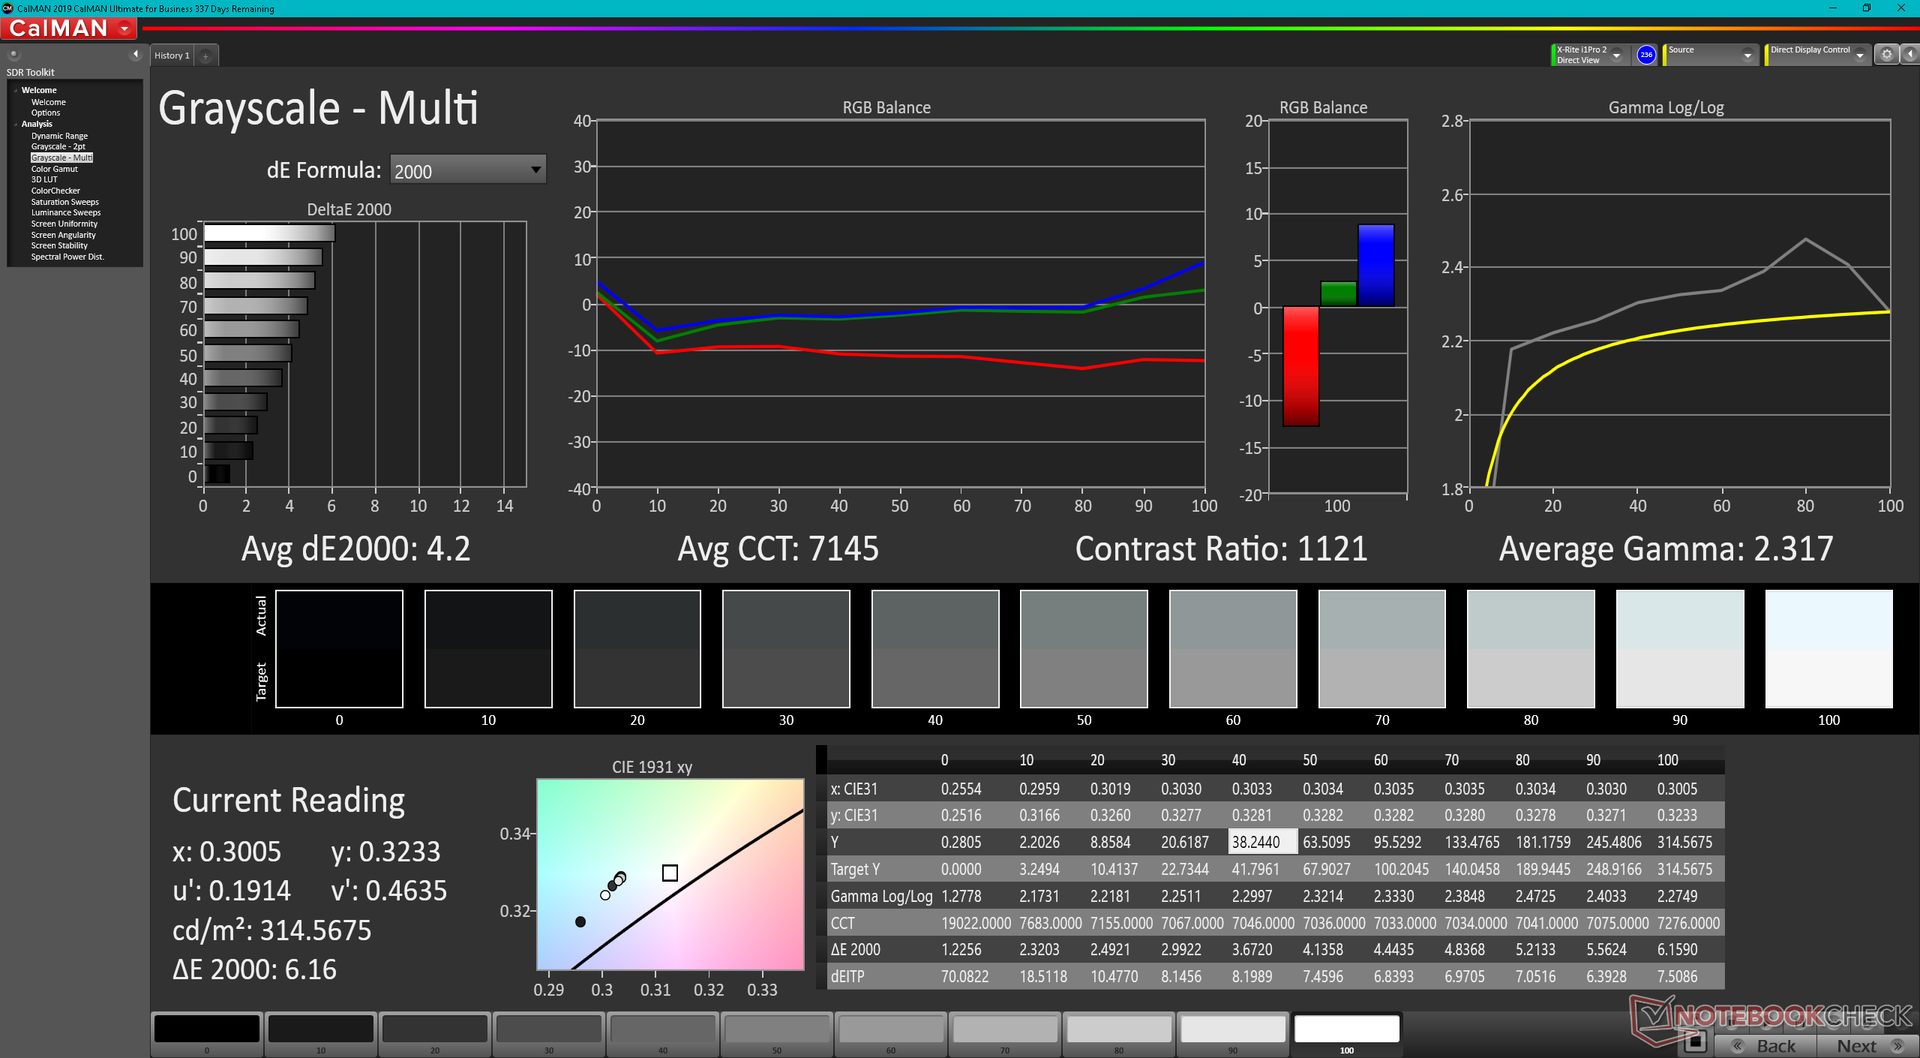
Gamma: 2.32
CCT: 7145 K
| Eurocom Nightsky ARX315 Sharp LQ156M1JW03, IPS, 1920x1080, 15.6" | Gigabyte A5 X1 AU Optronics B156HAN12.0, IPS, 1920x1080, 15.6" | Medion Erazer Deputy P25 Panda LM156LF-2F03, IPS, 1920x1080, 15.6" | MSI Delta 15 A5EFK LQ156M1JW03 (SHP155D), IPS-Level, 1920x1080, 15.6" | Schenker XMG Apex 15 NH57E PS LG Philips LGD0625 (LP156WFG-SPB3), IPS, 1920x1080, 15.6" | MSI GE66 Raider 10SFS Sharp LQ156M1JW03 (SHP14C5), IPS-Level, 1920x1080, 15.6" | |
|---|---|---|---|---|---|---|
| Display | -1% | -42% | -4% | -7% | -2% | |
| Display P3 Coverage (%) | 67.9 | 69.6 3% | 39.7 -42% | 66.5 -2% | 64.5 -5% | 68 0% |
| sRGB Coverage (%) | 99.7 | 98.6 -1% | 59.7 -40% | 97.8 -2% | 95.9 -4% | 99 -1% |
| AdobeRGB 1998 Coverage (%) | 73.7 | 70.8 -4% | 41.1 -44% | 67.6 -8% | 65.8 -11% | 69.8 -5% |
| Response Times | 34% | -169% | 12% | -2% | -1% | |
| Response Time Grey 50% / Grey 80% * (ms) | 15.2 ? | 4.8 ? 68% | 40.4 ? -166% | 12.8 ? 16% | 15 1% | 16.4 ? -8% |
| Response Time Black / White * (ms) | 11.2 ? | 11.2 ? -0% | 30.4 ? -171% | 10.4 ? 7% | 11.6 -4% | 10.4 ? 7% |
| PWM Frequency (Hz) | 23150 ? | 23580 ? | 23580 ? | |||
| Screen | -7% | -25% | -12% | -7% | 21% | |
| Brightness middle (cd/m²) | 312.8 | 335 7% | 283 -10% | 291 -7% | 393 26% | 291 -7% |
| Brightness (cd/m²) | 294 | 325 11% | 266 -10% | 266 -10% | 353 20% | 278 -5% |
| Brightness Distribution (%) | 90 | 90 0% | 85 -6% | 88 -2% | 83 -8% | 91 1% |
| Black Level * (cd/m²) | 0.28 | 0.4 -43% | 0.2 29% | 0.36 -29% | 0.47 -68% | 0.25 11% |
| Contrast (:1) | 1117 | 838 -25% | 1415 27% | 808 -28% | 836 -25% | 1164 4% |
| Colorchecker dE 2000 * | 2.96 | 2.63 11% | 5.32 -80% | 2.98 -1% | 2.84 4% | 1.19 60% |
| Colorchecker dE 2000 max. * | 6.23 | 7.71 -24% | 17.68 -184% | 7.59 -22% | 7.15 -15% | 3.04 51% |
| Greyscale dE 2000 * | 4.2 | 4 5% | 2.9 31% | 4.2 -0% | 3.73 11% | 1.9 55% |
| Gamma | 2.32 95% | 2.129 103% | 2.062 107% | 2.293 96% | 2.53 87% | 2.216 99% |
| CCT | 7145 91% | 7434 87% | 7167 91% | 7624 85% | 7312 89% | 7018 93% |
| Colorchecker dE 2000 calibrated * | 0.97 | 3.94 | 0.91 | 0.67 | ||
| Color Space (Percent of AdobeRGB 1998) (%) | 70 | |||||
| Color Space (Percent of sRGB) (%) | 92 | |||||
| Total Average (Program / Settings) | 9% /
1% | -79% /
-51% | -1% /
-7% | -5% /
-6% | 6% /
13% |
* ... smaller is better
色温比预期的要低,这影响了色彩准确性和整体Delta E值。Eurocom将亲自对显示器进行校准,但需要额外收费。我们建议对显示器进行校准,以便更好地利用面板的全部sRGB覆盖。
Display Response Times
| ↔ Response Time Black to White | ||
|---|---|---|
| 11.2 ms ... rise ↗ and fall ↘ combined | ↗ 6 ms rise | 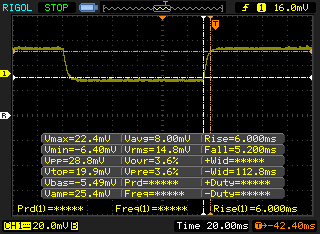 |
| ↘ 5.2 ms fall | ||
| The screen shows good response rates in our tests, but may be too slow for competitive gamers. In comparison, all tested devices range from 0.1 (minimum) to 240 (maximum) ms. » 30 % of all devices are better. This means that the measured response time is better than the average of all tested devices (19.8 ms). | ||
| ↔ Response Time 50% Grey to 80% Grey | ||
| 15.2 ms ... rise ↗ and fall ↘ combined | ↗ 7.6 ms rise | 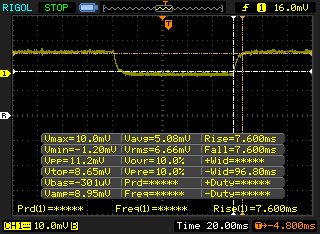 |
| ↘ 7.6 ms fall | ||
| The screen shows good response rates in our tests, but may be too slow for competitive gamers. In comparison, all tested devices range from 0.165 (minimum) to 636 (maximum) ms. » 29 % of all devices are better. This means that the measured response time is better than the average of all tested devices (31 ms). | ||
Screen Flickering / PWM (Pulse-Width Modulation)
| Screen flickering / PWM detected | 23150 Hz | ≤ 34 % brightness setting | 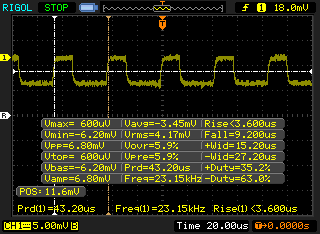 |
The display backlight flickers at 23150 Hz (worst case, e.g., utilizing PWM) Flickering detected at a brightness setting of 34 % and below. There should be no flickering or PWM above this brightness setting. The frequency of 23150 Hz is quite high, so most users sensitive to PWM should not notice any flickering. In comparison: 52 % of all tested devices do not use PWM to dim the display. If PWM was detected, an average of 7778 (minimum: 5 - maximum: 343500) Hz was measured. | |||
业绩
测试条件
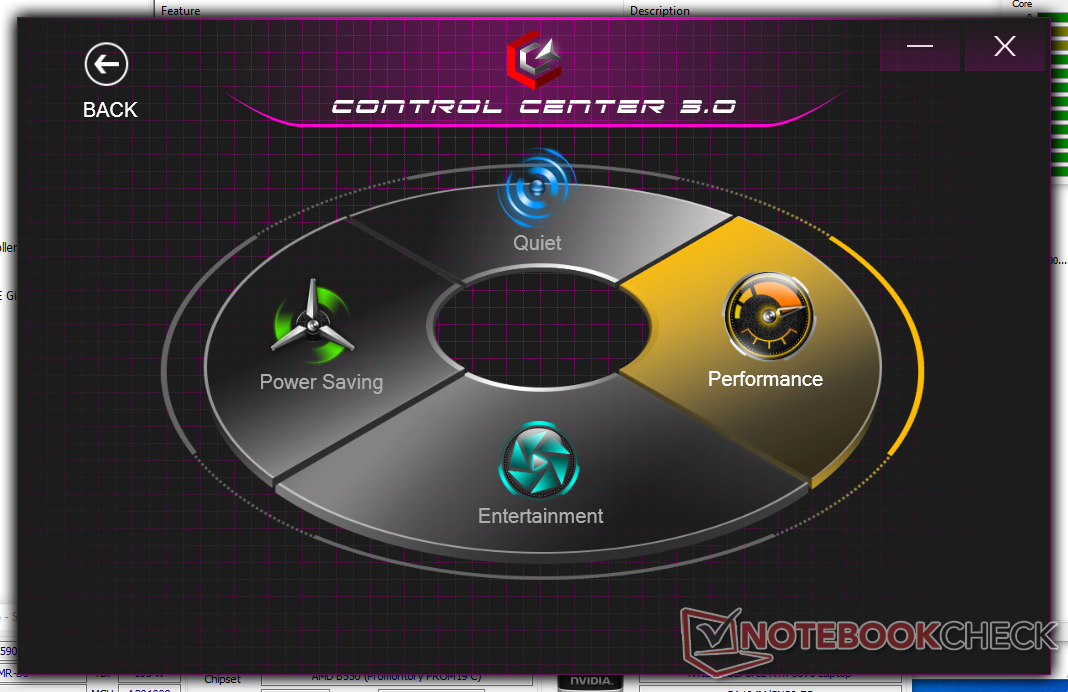
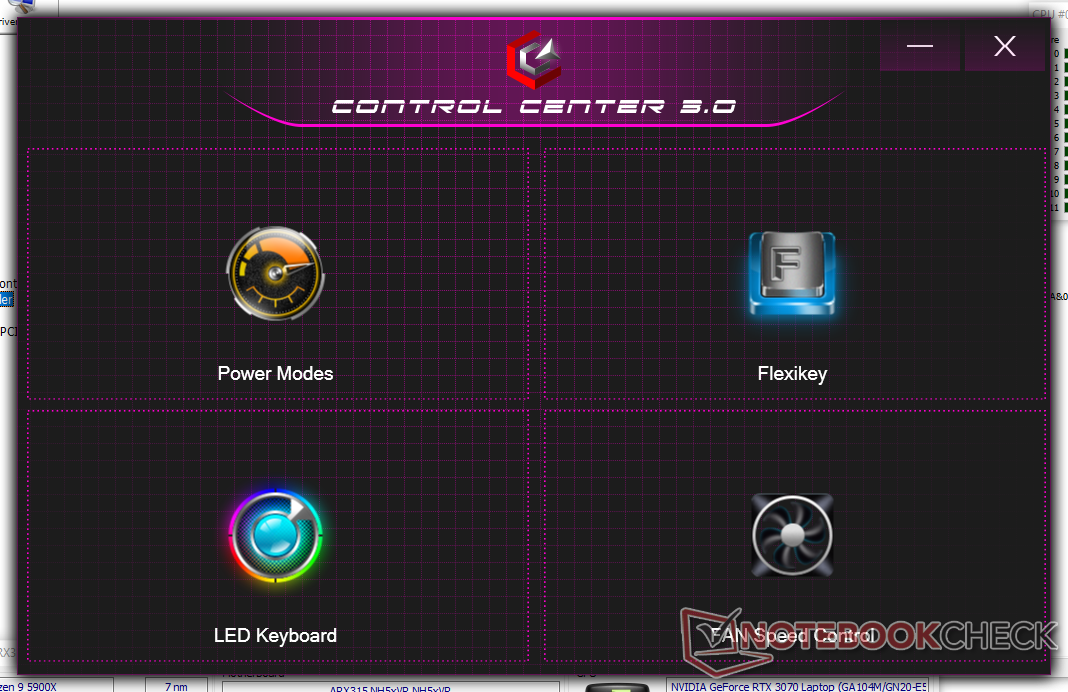
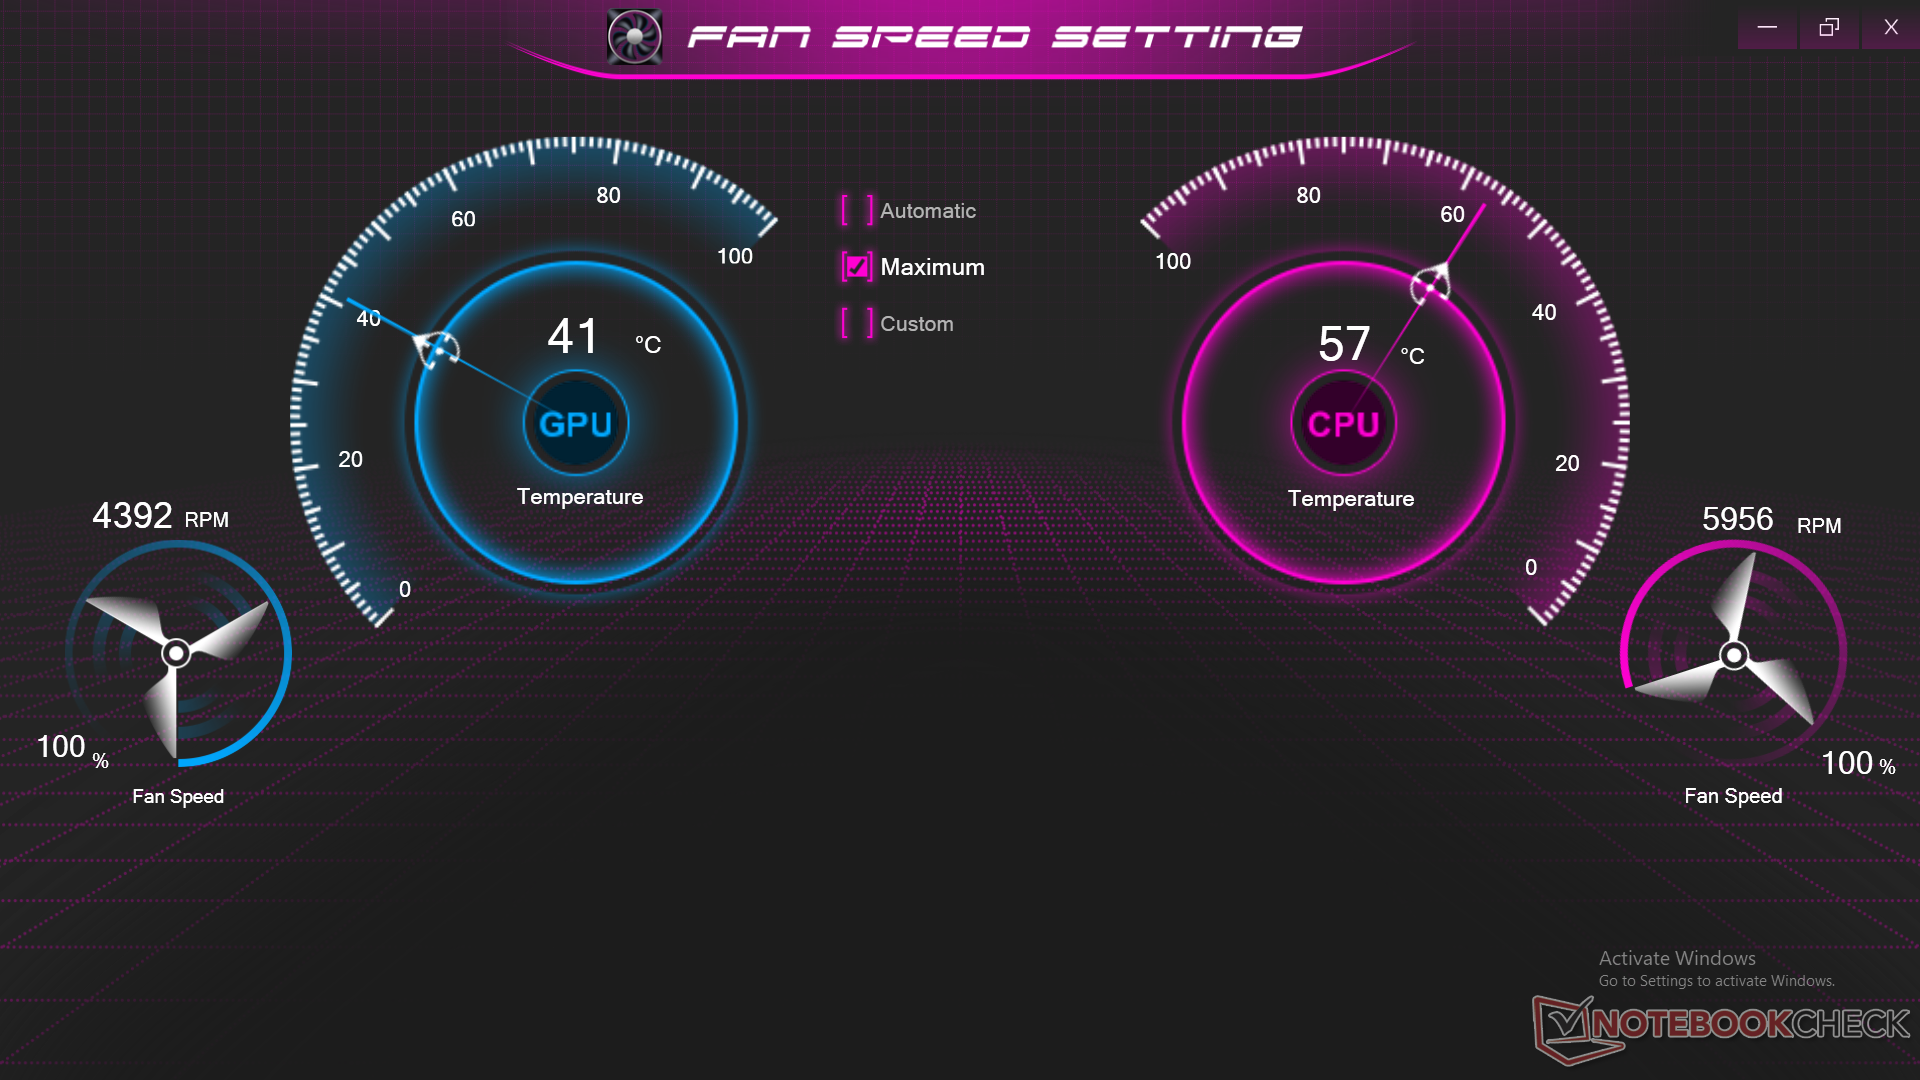
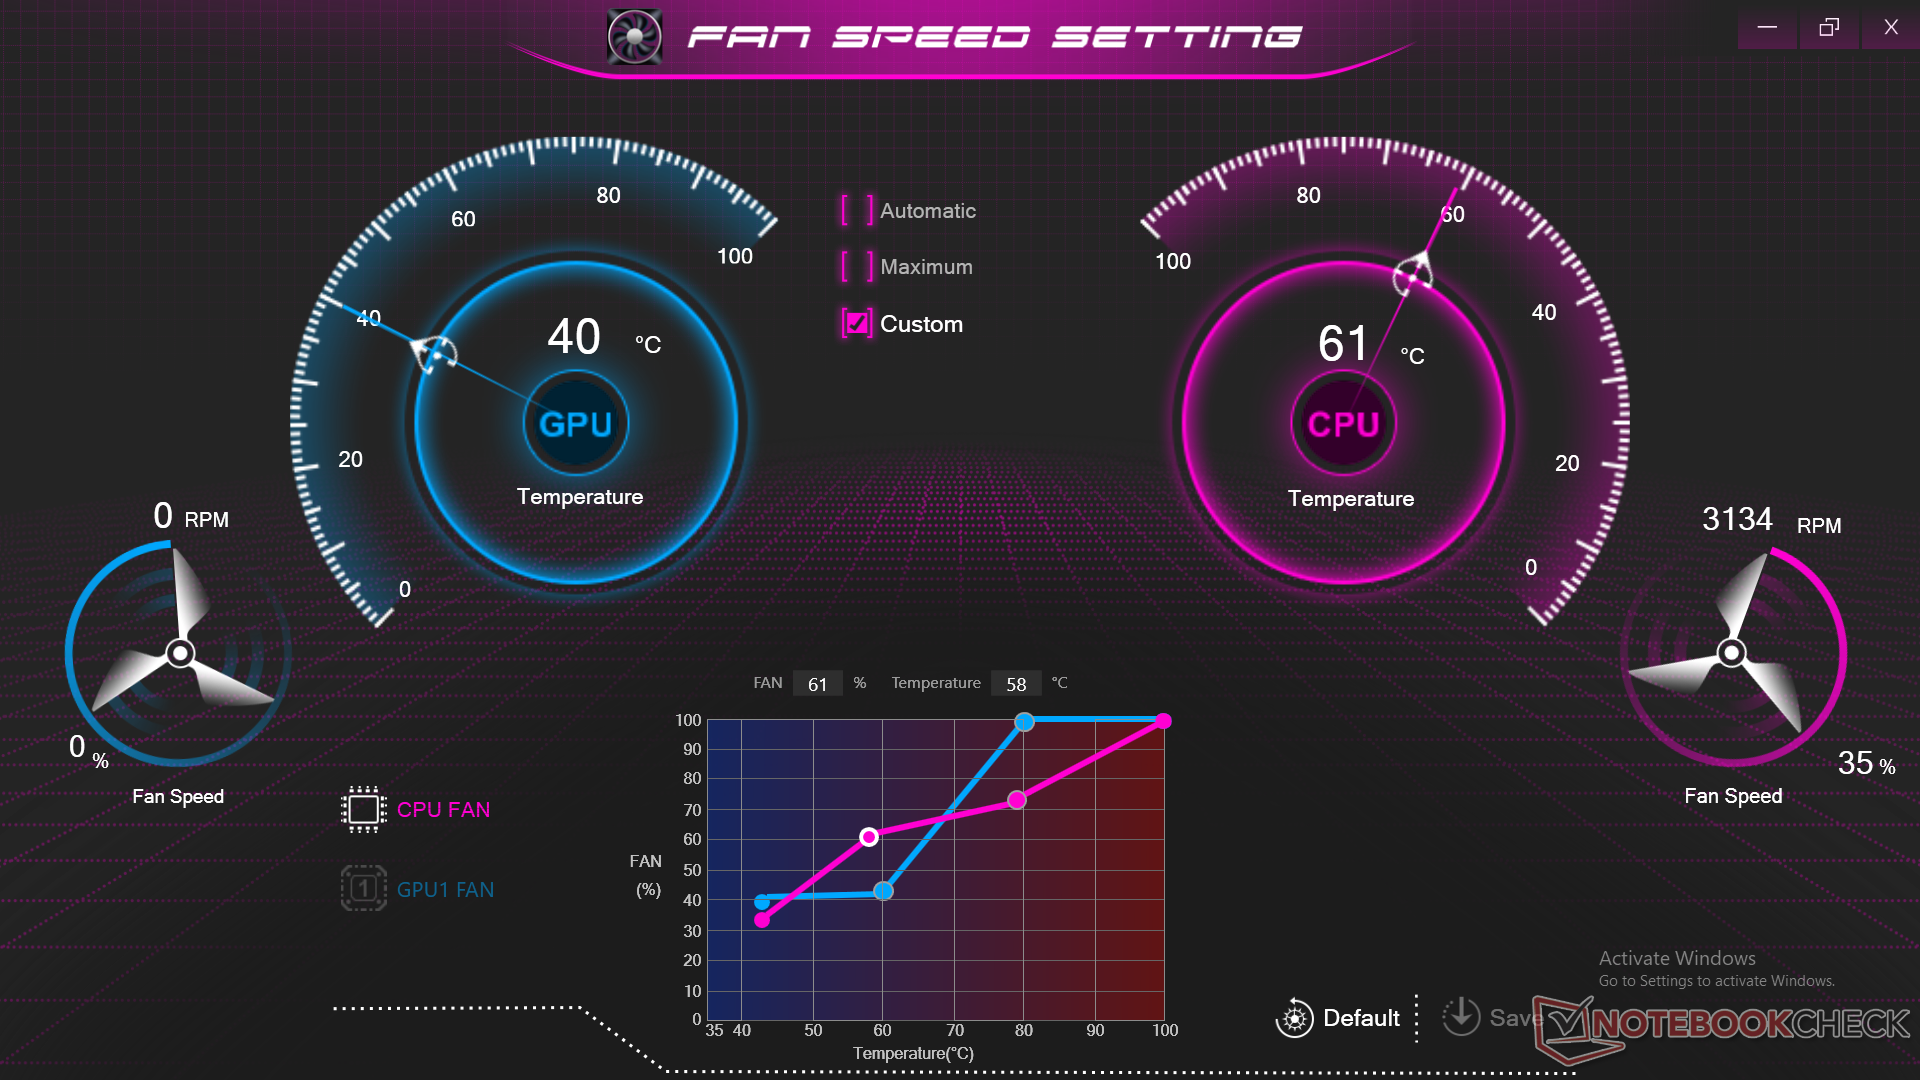
我们的设备通过Windows设置为高性能模式,并通过控制中心3.0设置为激活最大风扇模式的性能模式,以获得原始OEM设置的最高得分。我们建议用户熟悉控制中心软件,因为许多辅助功能都可以在这里进行切换。
处理器
与我们的台式机Ryzen 9 5900X相比,多线程性能是令人失望的。 桌面Ryzen 9 5900X参考。我们的Eurocom Ryzen 9 5900X始终慢了约30%至40%,以更符合移动的 Ryzen 9 5900HX.
Cinebench R15 Multi Loop
Cinebench R23: Multi Core | Single Core
Cinebench R20: CPU (Multi Core) | CPU (Single Core)
Cinebench R15: CPU Multi 64Bit | CPU Single 64Bit
Blender: v2.79 BMW27 CPU
7-Zip 18.03: 7z b 4 | 7z b 4 -mmt1
Geekbench 5.5: Multi-Core | Single-Core
HWBOT x265 Benchmark v2.2: 4k Preset
LibreOffice : 20 Documents To PDF
R Benchmark 2.5: Overall mean
| CPU Performance rating | |
| Intel Core i9-12900K | |
| AMD Ryzen 9 5900X | |
| Eurocom Nightsky ARX315 | |
| Gigabyte A5 X1 | |
| Medion Erazer Deputy P25 | |
| Asus ROG Zephyrus G15 GA503Q | |
| Schenker XMG Core 15 Ampere | |
| Acer Nitro 5 AN515-45-R05E -2! | |
| Alienware m15 R4 RTX 3080 | |
| Razer Blade 15 Advanced Model Early 2021 | |
| Cinebench R23 / Multi Core | |
| Intel Core i9-12900K | |
| AMD Ryzen 9 5900X | |
| Gigabyte A5 X1 | |
| Eurocom Nightsky ARX315 | |
| Medion Erazer Deputy P25 | |
| Asus ROG Zephyrus G15 GA503Q | |
| Schenker XMG Core 15 Ampere | |
| Alienware m15 R4 RTX 3080 | |
| Razer Blade 15 Advanced Model Early 2021 | |
| Cinebench R23 / Single Core | |
| Intel Core i9-12900K | |
| AMD Ryzen 9 5900X | |
| Eurocom Nightsky ARX315 | |
| Gigabyte A5 X1 | |
| Asus ROG Zephyrus G15 GA503Q | |
| Medion Erazer Deputy P25 | |
| Schenker XMG Core 15 Ampere | |
| Alienware m15 R4 RTX 3080 | |
| Razer Blade 15 Advanced Model Early 2021 | |
| Cinebench R20 / CPU (Multi Core) | |
| Intel Core i9-12900K | |
| AMD Ryzen 9 5900X | |
| Gigabyte A5 X1 | |
| Eurocom Nightsky ARX315 | |
| Medion Erazer Deputy P25 | |
| Asus ROG Zephyrus G15 GA503Q | |
| Schenker XMG Core 15 Ampere | |
| Alienware m15 R4 RTX 3080 | |
| Acer Nitro 5 AN515-45-R05E | |
| Acer Nitro 5 AN515-45-R05E | |
| Razer Blade 15 Advanced Model Early 2021 | |
| Cinebench R20 / CPU (Single Core) | |
| Intel Core i9-12900K | |
| AMD Ryzen 9 5900X | |
| Eurocom Nightsky ARX315 | |
| Gigabyte A5 X1 | |
| Asus ROG Zephyrus G15 GA503Q | |
| Medion Erazer Deputy P25 | |
| Acer Nitro 5 AN515-45-R05E | |
| Acer Nitro 5 AN515-45-R05E | |
| Schenker XMG Core 15 Ampere | |
| Alienware m15 R4 RTX 3080 | |
| Razer Blade 15 Advanced Model Early 2021 | |
| Cinebench R15 / CPU Multi 64Bit | |
| Intel Core i9-12900K | |
| AMD Ryzen 9 5900X | |
| Eurocom Nightsky ARX315 | |
| Gigabyte A5 X1 | |
| Medion Erazer Deputy P25 | |
| Asus ROG Zephyrus G15 GA503Q | |
| Schenker XMG Core 15 Ampere | |
| Alienware m15 R4 RTX 3080 | |
| Acer Nitro 5 AN515-45-R05E | |
| Razer Blade 15 Advanced Model Early 2021 | |
| Cinebench R15 / CPU Single 64Bit | |
| Intel Core i9-12900K | |
| AMD Ryzen 9 5900X | |
| Eurocom Nightsky ARX315 | |
| Gigabyte A5 X1 | |
| Medion Erazer Deputy P25 | |
| Acer Nitro 5 AN515-45-R05E | |
| Asus ROG Zephyrus G15 GA503Q | |
| Razer Blade 15 Advanced Model Early 2021 | |
| Alienware m15 R4 RTX 3080 | |
| Schenker XMG Core 15 Ampere | |
| Blender / v2.79 BMW27 CPU | |
| Razer Blade 15 Advanced Model Early 2021 | |
| Acer Nitro 5 AN515-45-R05E | |
| Alienware m15 R4 RTX 3080 | |
| Schenker XMG Core 15 Ampere | |
| Asus ROG Zephyrus G15 GA503Q | |
| Medion Erazer Deputy P25 | |
| Gigabyte A5 X1 | |
| Eurocom Nightsky ARX315 | |
| AMD Ryzen 9 5900X | |
| Intel Core i9-12900K | |
| 7-Zip 18.03 / 7z b 4 | |
| Intel Core i9-12900K | |
| AMD Ryzen 9 5900X | |
| Eurocom Nightsky ARX315 | |
| Gigabyte A5 X1 | |
| Asus ROG Zephyrus G15 GA503Q | |
| Medion Erazer Deputy P25 | |
| Schenker XMG Core 15 Ampere | |
| Alienware m15 R4 RTX 3080 | |
| Acer Nitro 5 AN515-45-R05E | |
| Razer Blade 15 Advanced Model Early 2021 | |
| 7-Zip 18.03 / 7z b 4 -mmt1 | |
| AMD Ryzen 9 5900X | |
| Intel Core i9-12900K | |
| Eurocom Nightsky ARX315 | |
| Gigabyte A5 X1 | |
| Asus ROG Zephyrus G15 GA503Q | |
| Medion Erazer Deputy P25 | |
| Alienware m15 R4 RTX 3080 | |
| Razer Blade 15 Advanced Model Early 2021 | |
| Acer Nitro 5 AN515-45-R05E | |
| Schenker XMG Core 15 Ampere | |
| Geekbench 5.5 / Multi-Core | |
| Intel Core i9-12900K | |
| AMD Ryzen 9 5900X | |
| Eurocom Nightsky ARX315 | |
| Gigabyte A5 X1 | |
| Schenker XMG Core 15 Ampere | |
| Asus ROG Zephyrus G15 GA503Q | |
| Alienware m15 R4 RTX 3080 | |
| Medion Erazer Deputy P25 | |
| Razer Blade 15 Advanced Model Early 2021 | |
| Acer Nitro 5 AN515-45-R05E | |
| Geekbench 5.5 / Single-Core | |
| Intel Core i9-12900K | |
| AMD Ryzen 9 5900X | |
| Eurocom Nightsky ARX315 | |
| Gigabyte A5 X1 | |
| Medion Erazer Deputy P25 | |
| Asus ROG Zephyrus G15 GA503Q | |
| Acer Nitro 5 AN515-45-R05E | |
| Alienware m15 R4 RTX 3080 | |
| Razer Blade 15 Advanced Model Early 2021 | |
| Schenker XMG Core 15 Ampere | |
| HWBOT x265 Benchmark v2.2 / 4k Preset | |
| Intel Core i9-12900K | |
| AMD Ryzen 9 5900X | |
| Eurocom Nightsky ARX315 | |
| Gigabyte A5 X1 | |
| Medion Erazer Deputy P25 | |
| Asus ROG Zephyrus G15 GA503Q | |
| Schenker XMG Core 15 Ampere | |
| Alienware m15 R4 RTX 3080 | |
| Acer Nitro 5 AN515-45-R05E | |
| Razer Blade 15 Advanced Model Early 2021 | |
| LibreOffice / 20 Documents To PDF | |
| Alienware m15 R4 RTX 3080 | |
| Gigabyte A5 X1 | |
| Schenker XMG Core 15 Ampere | |
| Medion Erazer Deputy P25 | |
| Razer Blade 15 Advanced Model Early 2021 | |
| Acer Nitro 5 AN515-45-R05E | |
| Asus ROG Zephyrus G15 GA503Q | |
| AMD Ryzen 9 5900X | |
| Eurocom Nightsky ARX315 | |
| Intel Core i9-12900K | |
| R Benchmark 2.5 / Overall mean | |
| Alienware m15 R4 RTX 3080 | |
| Razer Blade 15 Advanced Model Early 2021 | |
| Schenker XMG Core 15 Ampere | |
| Acer Nitro 5 AN515-45-R05E | |
| Asus ROG Zephyrus G15 GA503Q | |
| Medion Erazer Deputy P25 | |
| Gigabyte A5 X1 | |
| Eurocom Nightsky ARX315 | |
| AMD Ryzen 9 5900X | |
| Intel Core i9-12900K | |
* ... smaller is better
AIDA64: FP32 Ray-Trace | FPU Julia | CPU SHA3 | CPU Queen | FPU SinJulia | FPU Mandel | CPU AES | CPU ZLib | FP64 Ray-Trace | CPU PhotoWorxx
| Performance rating | |
| Average AMD Ryzen 9 5900X | |
| Eurocom Nightsky ARX315 | |
| Gigabyte A5 X1 | |
| MSI Delta 15 A5EFK | |
| Schenker XMG Apex 15 NH57E PS | |
| Medion Erazer Deputy P25 | |
| MSI GE66 Raider 10SFS | |
| AIDA64 / FP32 Ray-Trace | |
| Average AMD Ryzen 9 5900X (3069 - 24659, n=15) | |
| Gigabyte A5 X1 | |
| MSI Delta 15 A5EFK | |
| Medion Erazer Deputy P25 | |
| Schenker XMG Apex 15 NH57E PS | |
| Eurocom Nightsky ARX315 | |
| MSI GE66 Raider 10SFS | |
| AIDA64 / FPU Julia | |
| Average AMD Ryzen 9 5900X (18567 - 155529, n=15) | |
| Gigabyte A5 X1 | |
| Medion Erazer Deputy P25 | |
| MSI Delta 15 A5EFK | |
| Schenker XMG Apex 15 NH57E PS | |
| Eurocom Nightsky ARX315 | |
| MSI GE66 Raider 10SFS | |
| AIDA64 / CPU SHA3 | |
| Average AMD Ryzen 9 5900X (629 - 5329, n=15) | |
| Gigabyte A5 X1 | |
| MSI Delta 15 A5EFK | |
| Schenker XMG Apex 15 NH57E PS | |
| Medion Erazer Deputy P25 | |
| Eurocom Nightsky ARX315 | |
| MSI GE66 Raider 10SFS | |
| AIDA64 / CPU Queen | |
| Eurocom Nightsky ARX315 | |
| Average AMD Ryzen 9 5900X (15371 - 138889, n=15) | |
| MSI Delta 15 A5EFK | |
| Gigabyte A5 X1 | |
| Schenker XMG Apex 15 NH57E PS | |
| Medion Erazer Deputy P25 | |
| MSI GE66 Raider 10SFS | |
| AIDA64 / FPU SinJulia | |
| Eurocom Nightsky ARX315 | |
| Average AMD Ryzen 9 5900X (2137 - 19465, n=15) | |
| Gigabyte A5 X1 | |
| MSI Delta 15 A5EFK | |
| Schenker XMG Apex 15 NH57E PS | |
| Medion Erazer Deputy P25 | |
| MSI GE66 Raider 10SFS | |
| AIDA64 / FPU Mandel | |
| Average AMD Ryzen 9 5900X (10291 - 85469, n=15) | |
| Gigabyte A5 X1 | |
| MSI Delta 15 A5EFK | |
| Medion Erazer Deputy P25 | |
| Schenker XMG Apex 15 NH57E PS | |
| Eurocom Nightsky ARX315 | |
| MSI GE66 Raider 10SFS | |
| AIDA64 / CPU AES | |
| Average AMD Ryzen 9 5900X (24327 - 212390, n=15) | |
| Eurocom Nightsky ARX315 | |
| Gigabyte A5 X1 | |
| MSI Delta 15 A5EFK | |
| Schenker XMG Apex 15 NH57E PS | |
| Medion Erazer Deputy P25 | |
| MSI GE66 Raider 10SFS | |
| AIDA64 / CPU ZLib | |
| Average AMD Ryzen 9 5900X (150.9 - 1345, n=15) | |
| Eurocom Nightsky ARX315 | |
| Gigabyte A5 X1 | |
| MSI Delta 15 A5EFK | |
| Schenker XMG Apex 15 NH57E PS | |
| Medion Erazer Deputy P25 | |
| MSI GE66 Raider 10SFS | |
| AIDA64 / FP64 Ray-Trace | |
| Average AMD Ryzen 9 5900X (1518 - 13196, n=15) | |
| Gigabyte A5 X1 | |
| MSI Delta 15 A5EFK | |
| Medion Erazer Deputy P25 | |
| Schenker XMG Apex 15 NH57E PS | |
| MSI GE66 Raider 10SFS | |
| Eurocom Nightsky ARX315 | |
| AIDA64 / CPU PhotoWorxx | |
| Average AMD Ryzen 9 5900X (11451 - 32849, n=15) | |
| MSI GE66 Raider 10SFS | |
| Eurocom Nightsky ARX315 | |
| MSI Delta 15 A5EFK | |
| Schenker XMG Apex 15 NH57E PS | |
| Gigabyte A5 X1 | |
| Medion Erazer Deputy P25 | |
系统性能
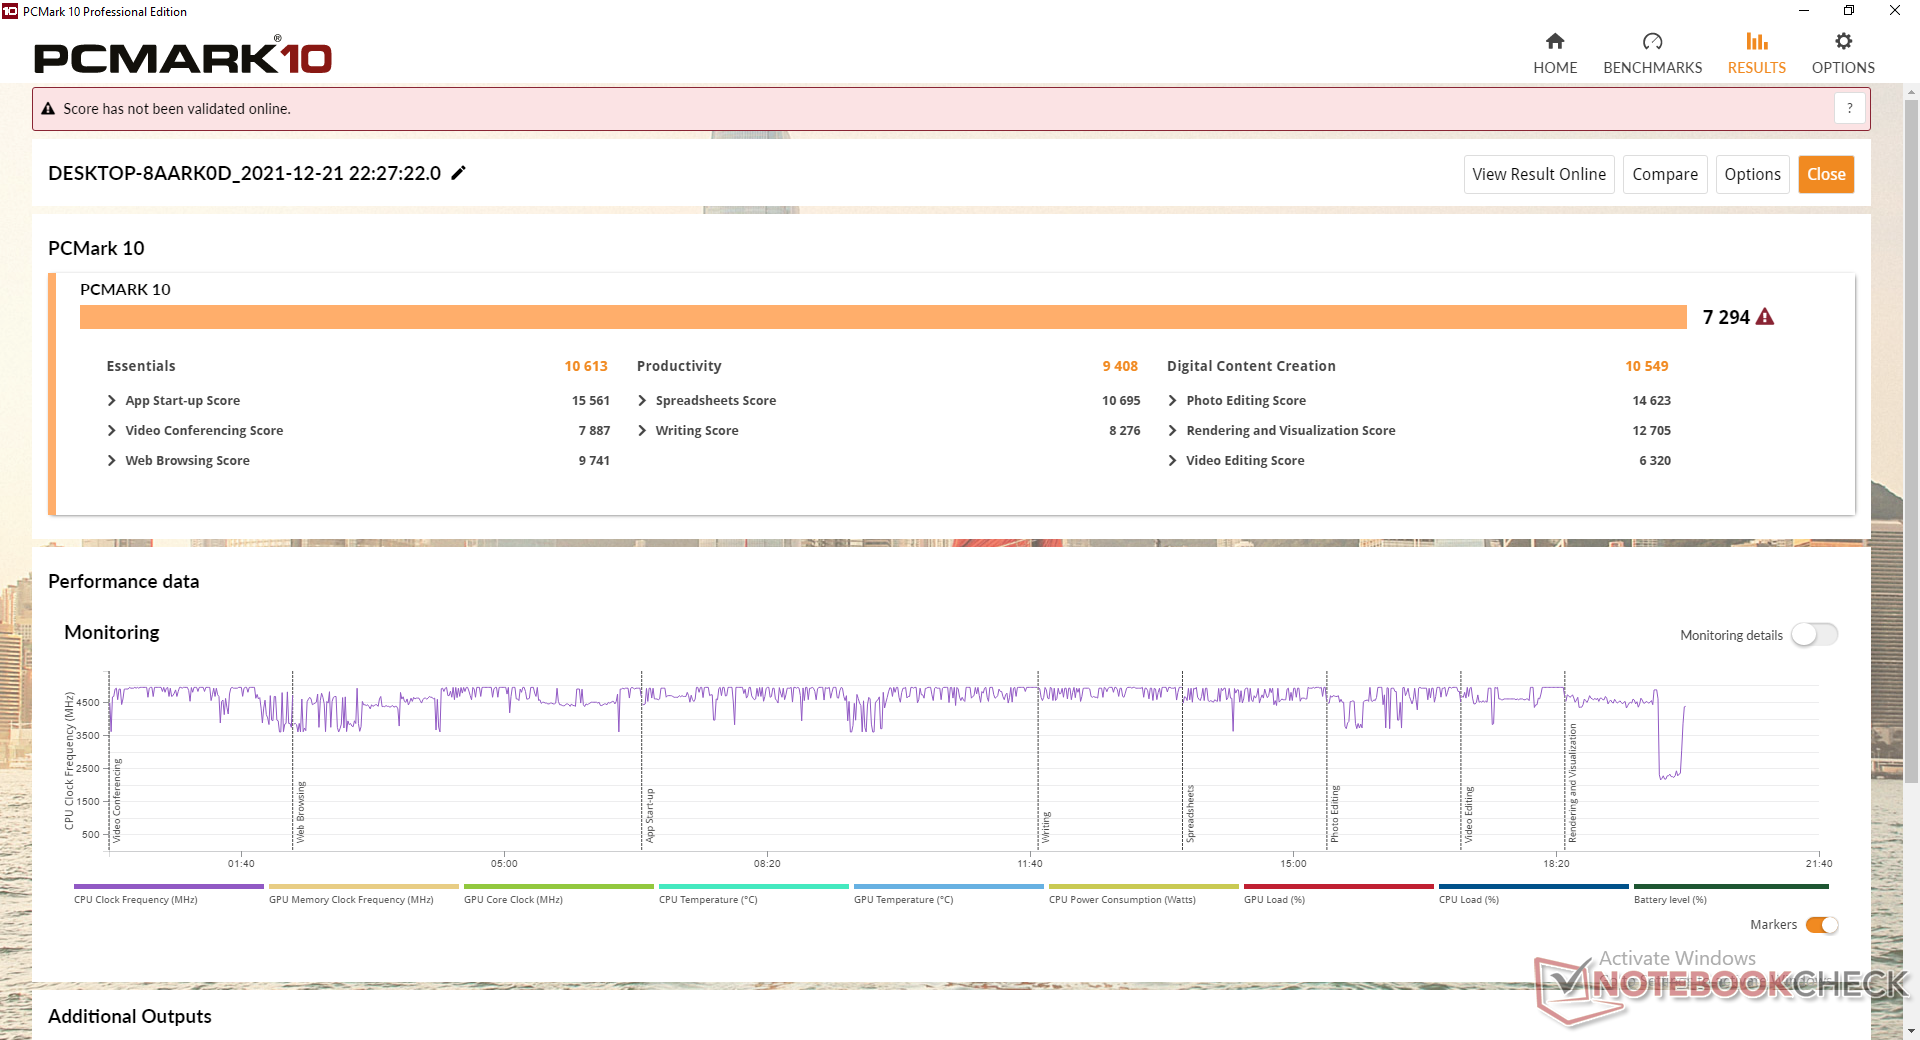
PCMark 10的分数非常好,与微星Delta 15相当。 然而,我们不建议将控制中心设置为省电模式或静音模式,因为系统性能会变慢到爬行。简单的浏览或操作系统导航将变得非常滞后,鼠标光标不断跳动和跳帧。用户应该保持在娱乐模式或性能模式下,以获得更流畅的体验。
此外,系统从睡眠中醒来需要异常长的时间。典型的笔记本电脑或超极本需要不到几秒钟的时间,而我们的Eurocom总是需要10秒以上的时间。
| PCMark 10 / Score | |
| MSI Delta 15 A5EFK | |
| Eurocom Nightsky ARX315 | |
| Gigabyte A5 X1 | |
| Schenker XMG Apex 15 NH57E PS | |
| Medion Erazer Deputy P25 | |
| MSI GE66 Raider 10SFS | |
| PCMark 10 / Essentials | |
| Eurocom Nightsky ARX315 | |
| MSI Delta 15 A5EFK | |
| Gigabyte A5 X1 | |
| Schenker XMG Apex 15 NH57E PS | |
| Medion Erazer Deputy P25 | |
| MSI GE66 Raider 10SFS | |
| PCMark 10 / Productivity | |
| MSI Delta 15 A5EFK | |
| Eurocom Nightsky ARX315 | |
| Gigabyte A5 X1 | |
| Medion Erazer Deputy P25 | |
| Schenker XMG Apex 15 NH57E PS | |
| MSI GE66 Raider 10SFS | |
| PCMark 10 / Digital Content Creation | |
| MSI Delta 15 A5EFK | |
| Eurocom Nightsky ARX315 | |
| Gigabyte A5 X1 | |
| Schenker XMG Apex 15 NH57E PS | |
| Medion Erazer Deputy P25 | |
| MSI GE66 Raider 10SFS | |
| PCMark 10 Score | 7294 points | |
Help | ||
| AIDA64 / Memory Copy | |
| Average AMD Ryzen 9 5900X (31315 - 72008, n=15) | |
| Schenker XMG Apex 15 NH57E PS | |
| MSI Delta 15 A5EFK | |
| Gigabyte A5 X1 | |
| Eurocom Nightsky ARX315 | |
| MSI GE66 Raider 10SFS | |
| Medion Erazer Deputy P25 | |
| AIDA64 / Memory Read | |
| Average AMD Ryzen 9 5900X (32972 - 70692, n=15) | |
| Schenker XMG Apex 15 NH57E PS | |
| Gigabyte A5 X1 | |
| MSI Delta 15 A5EFK | |
| Eurocom Nightsky ARX315 | |
| MSI GE66 Raider 10SFS | |
| Medion Erazer Deputy P25 | |
| AIDA64 / Memory Write | |
| Average AMD Ryzen 9 5900X (21619 - 57070, n=15) | |
| MSI GE66 Raider 10SFS | |
| Eurocom Nightsky ARX315 | |
| Schenker XMG Apex 15 NH57E PS | |
| MSI Delta 15 A5EFK | |
| Gigabyte A5 X1 | |
| Medion Erazer Deputy P25 | |
| AIDA64 / Memory Latency | |
| Medion Erazer Deputy P25 | |
| Schenker XMG Apex 15 NH57E PS | |
| MSI Delta 15 A5EFK | |
| Gigabyte A5 X1 | |
| Average AMD Ryzen 9 5900X (58.4 - 107.6, n=15) | |
| Eurocom Nightsky ARX315 | |
| MSI GE66 Raider 10SFS | |
* ... smaller is better
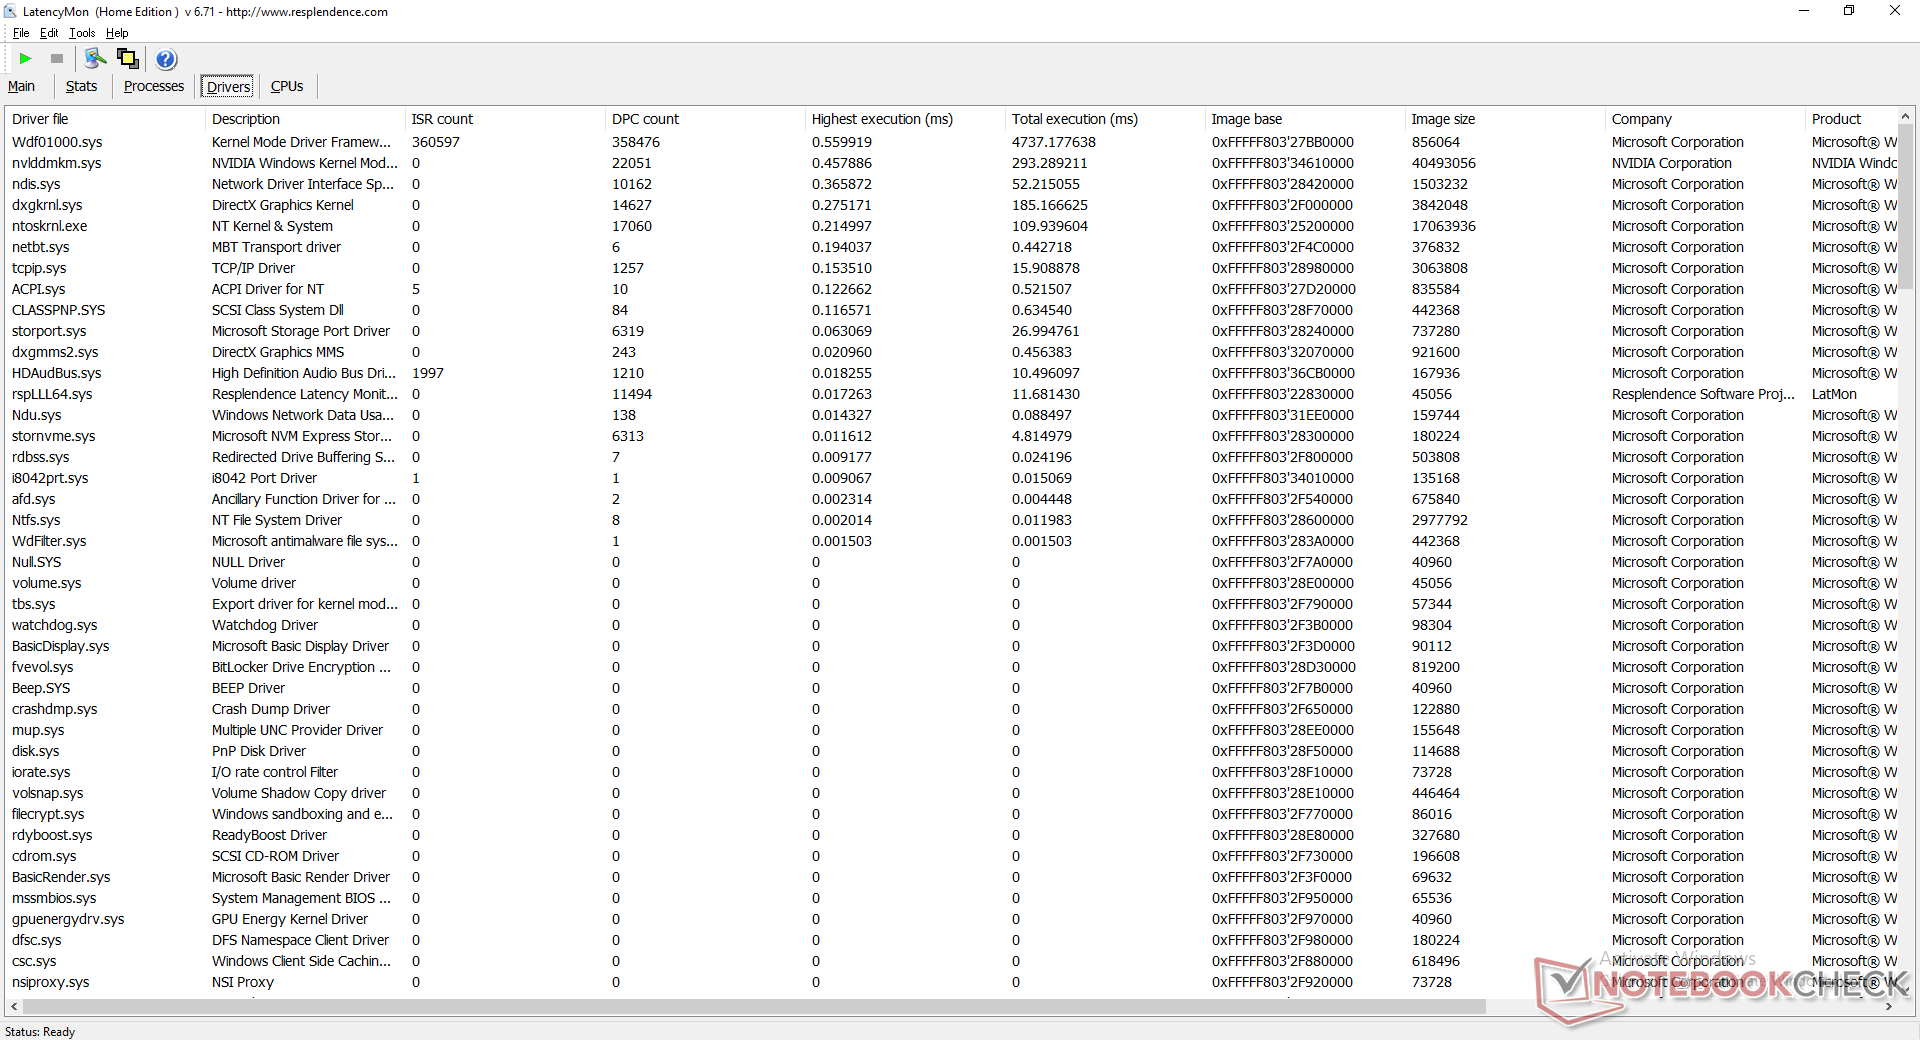
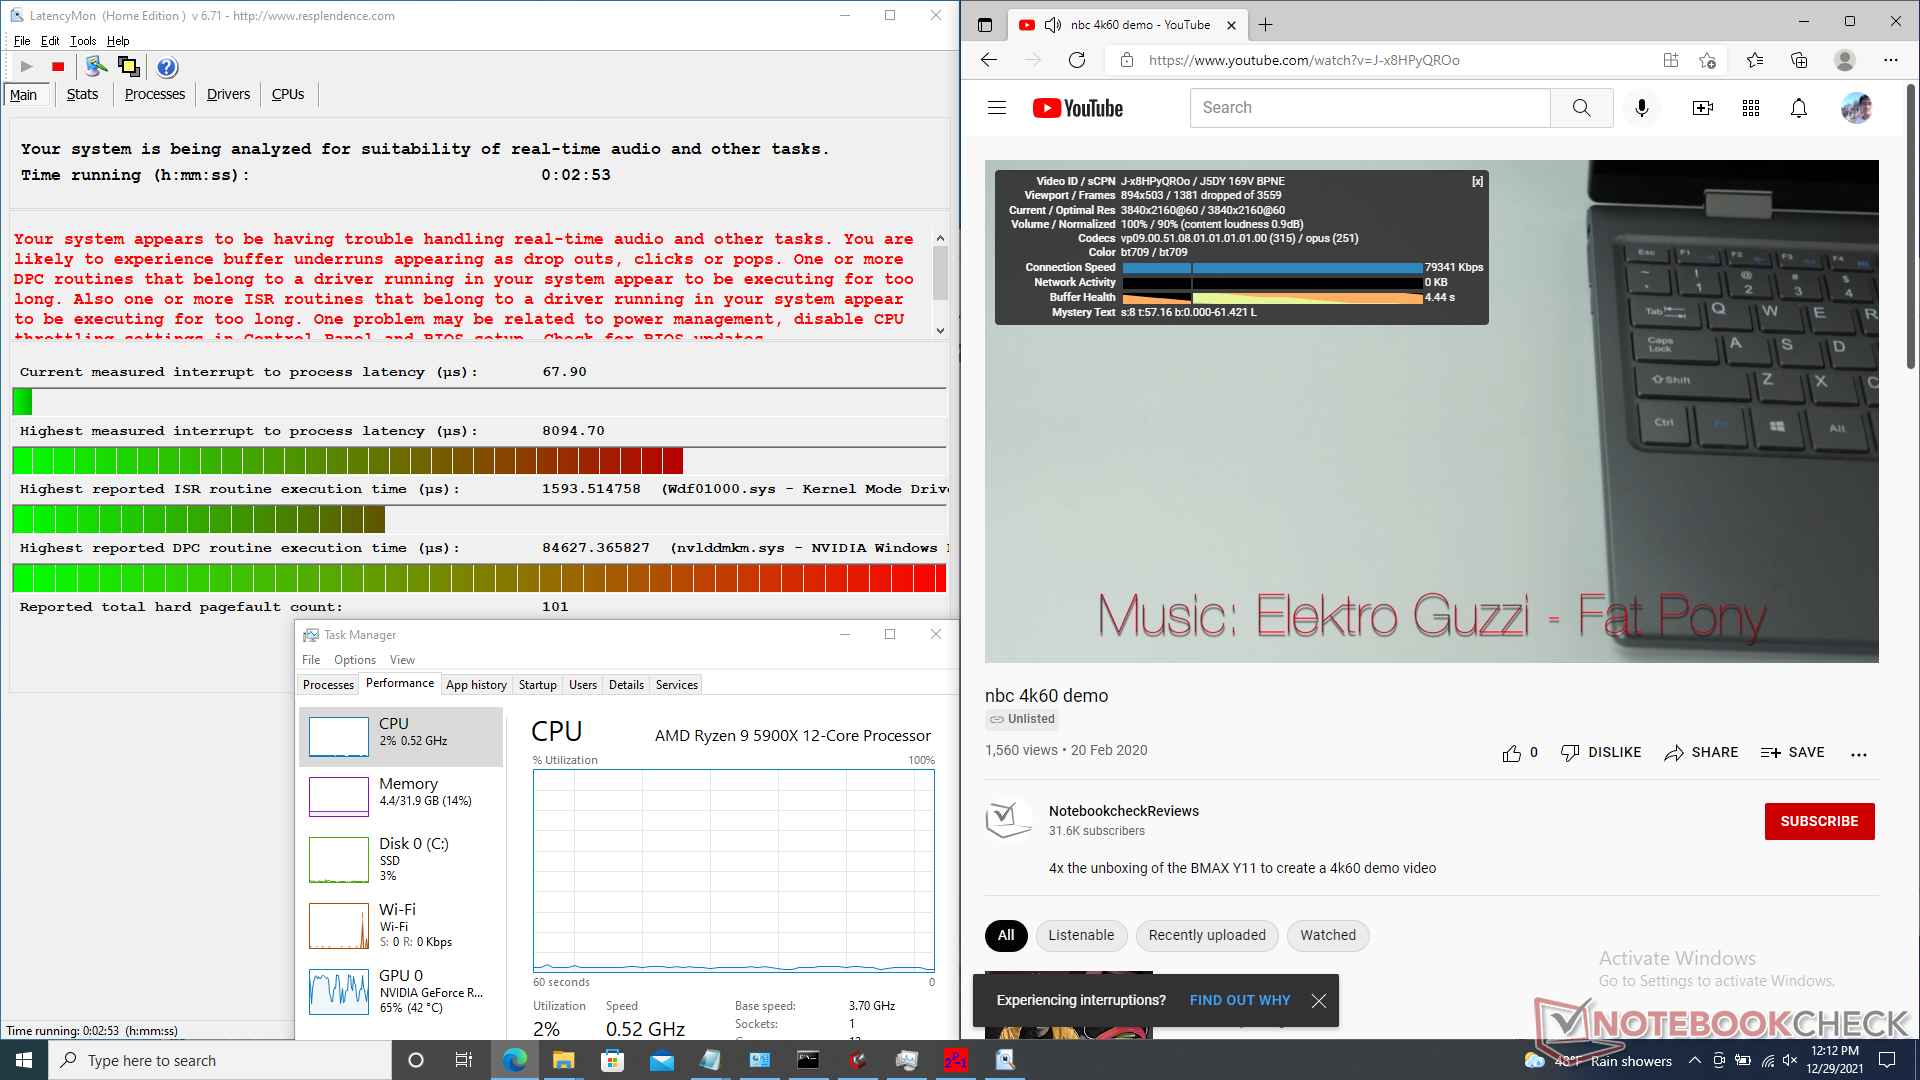
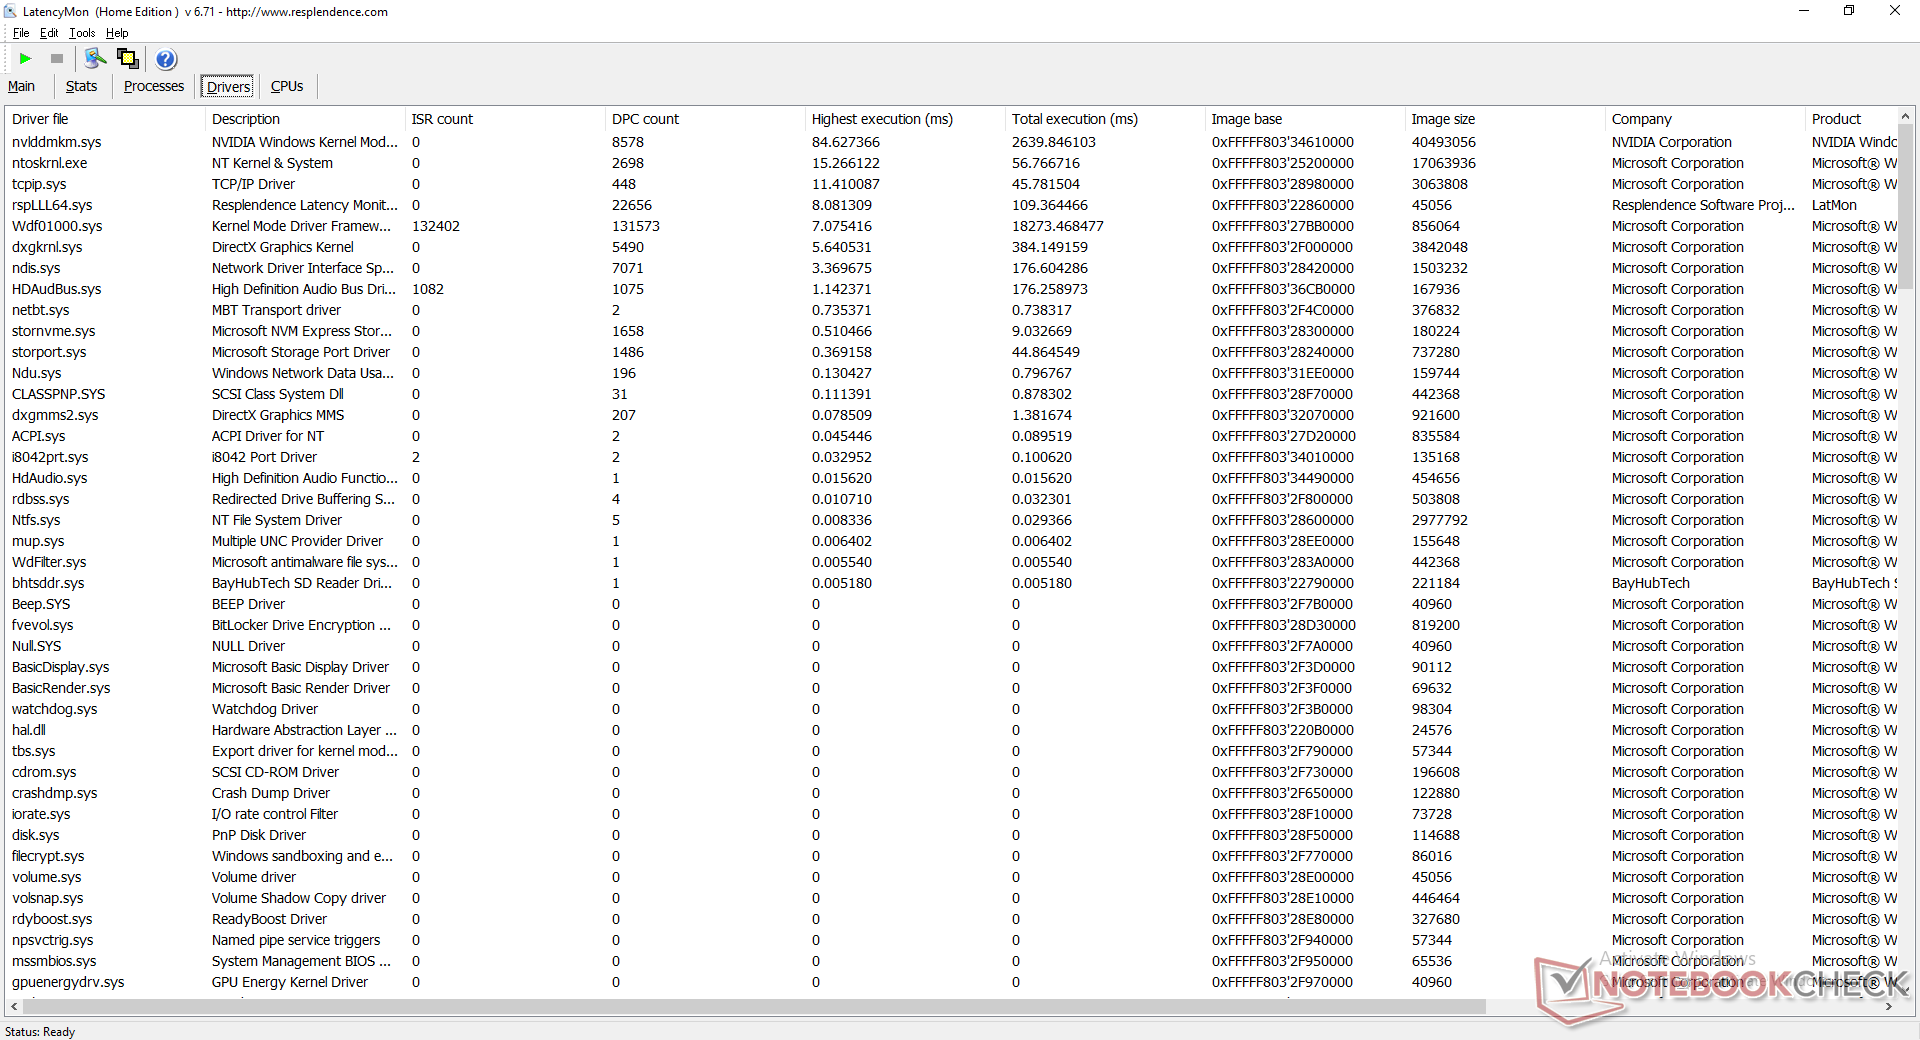
DPC延时
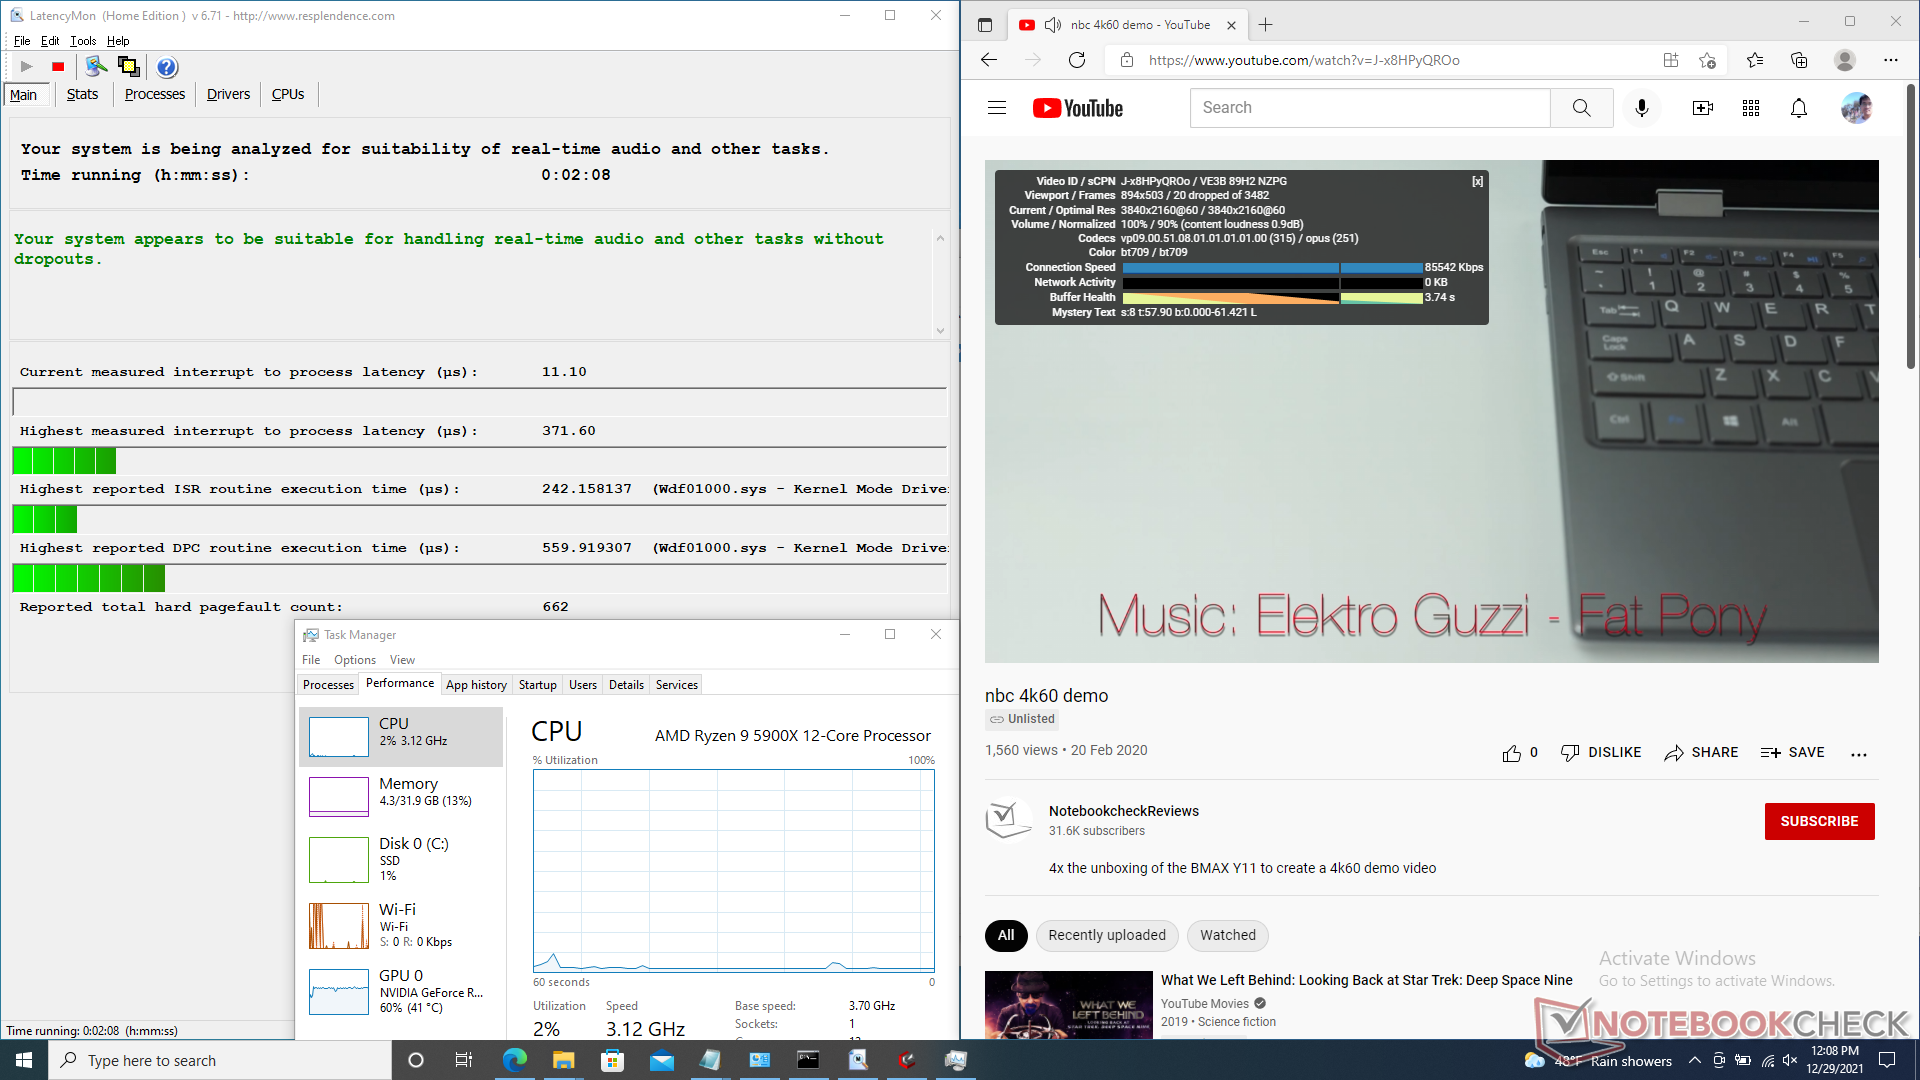
在娱乐模式或性能模式下运行时,没有延迟问题。不幸的是,如果在省电模式或安静模式下运行,情况就会发生逆转。我们长达1分钟的4K60测试视频在省电或安静模式下会有超过1500个丢帧,而在娱乐或性能模式下只有20个丢帧。
| DPC Latencies / LatencyMon - interrupt to process latency (max), Web, Youtube, Prime95 | |
| MSI Delta 15 A5EFK | |
| Medion Erazer Deputy P25 | |
| Schenker XMG Apex 15 NH57E PS | |
| MSI GE66 Raider 10SFS | |
| Gigabyte A5 X1 | |
| Eurocom Nightsky ARX315 | |
* ... smaller is better
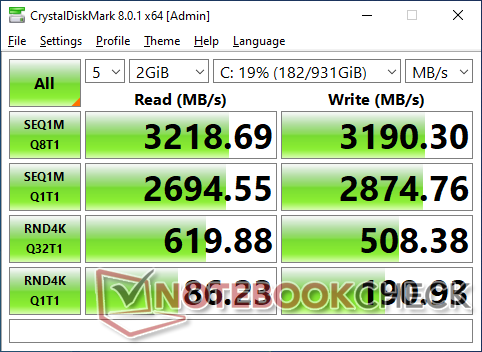
存储设备
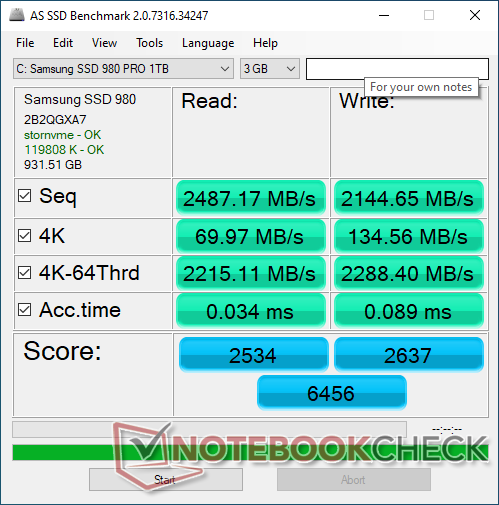
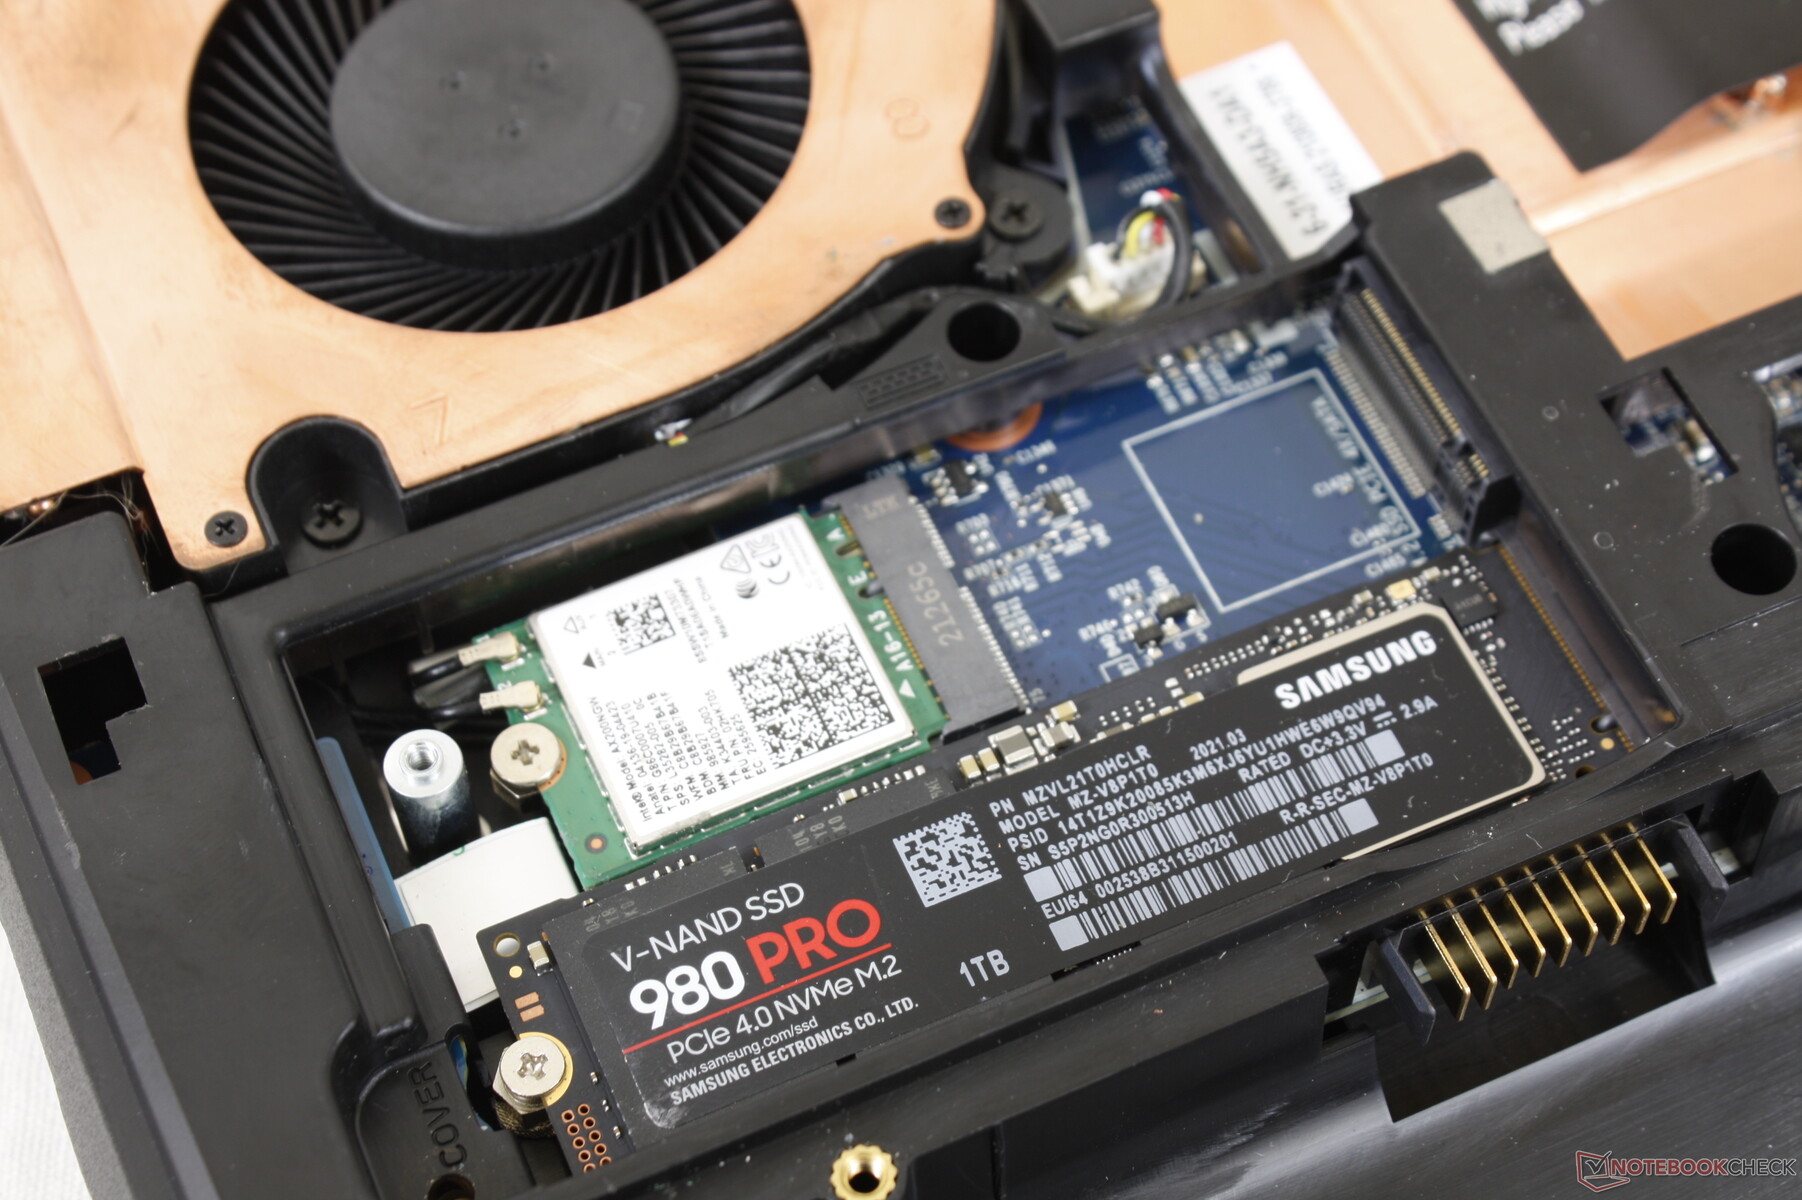
Eurocom提供了广泛的NVMe SSD选择,范围从250GB到8TB。我们的设备已经配置了三星SSD 980 Pro这是一款PCIe4 x4 NVMe固态硬盘,其传输速率高达7000 MB/s。不幸的是,Nightsky ARX15上的M.2插槽只有PCIe3 x4,因此传输速率将慢得多,最高可达3200 MB/s。你可能想为自己节省一些现金,只配置价格较低的PCIe3驱动器,因为主板不能完全发挥价格较高的PCIe4驱动器的性能优势。

* ... smaller is better
Disk Throttling: DiskSpd Read Loop, Queue Depth 8
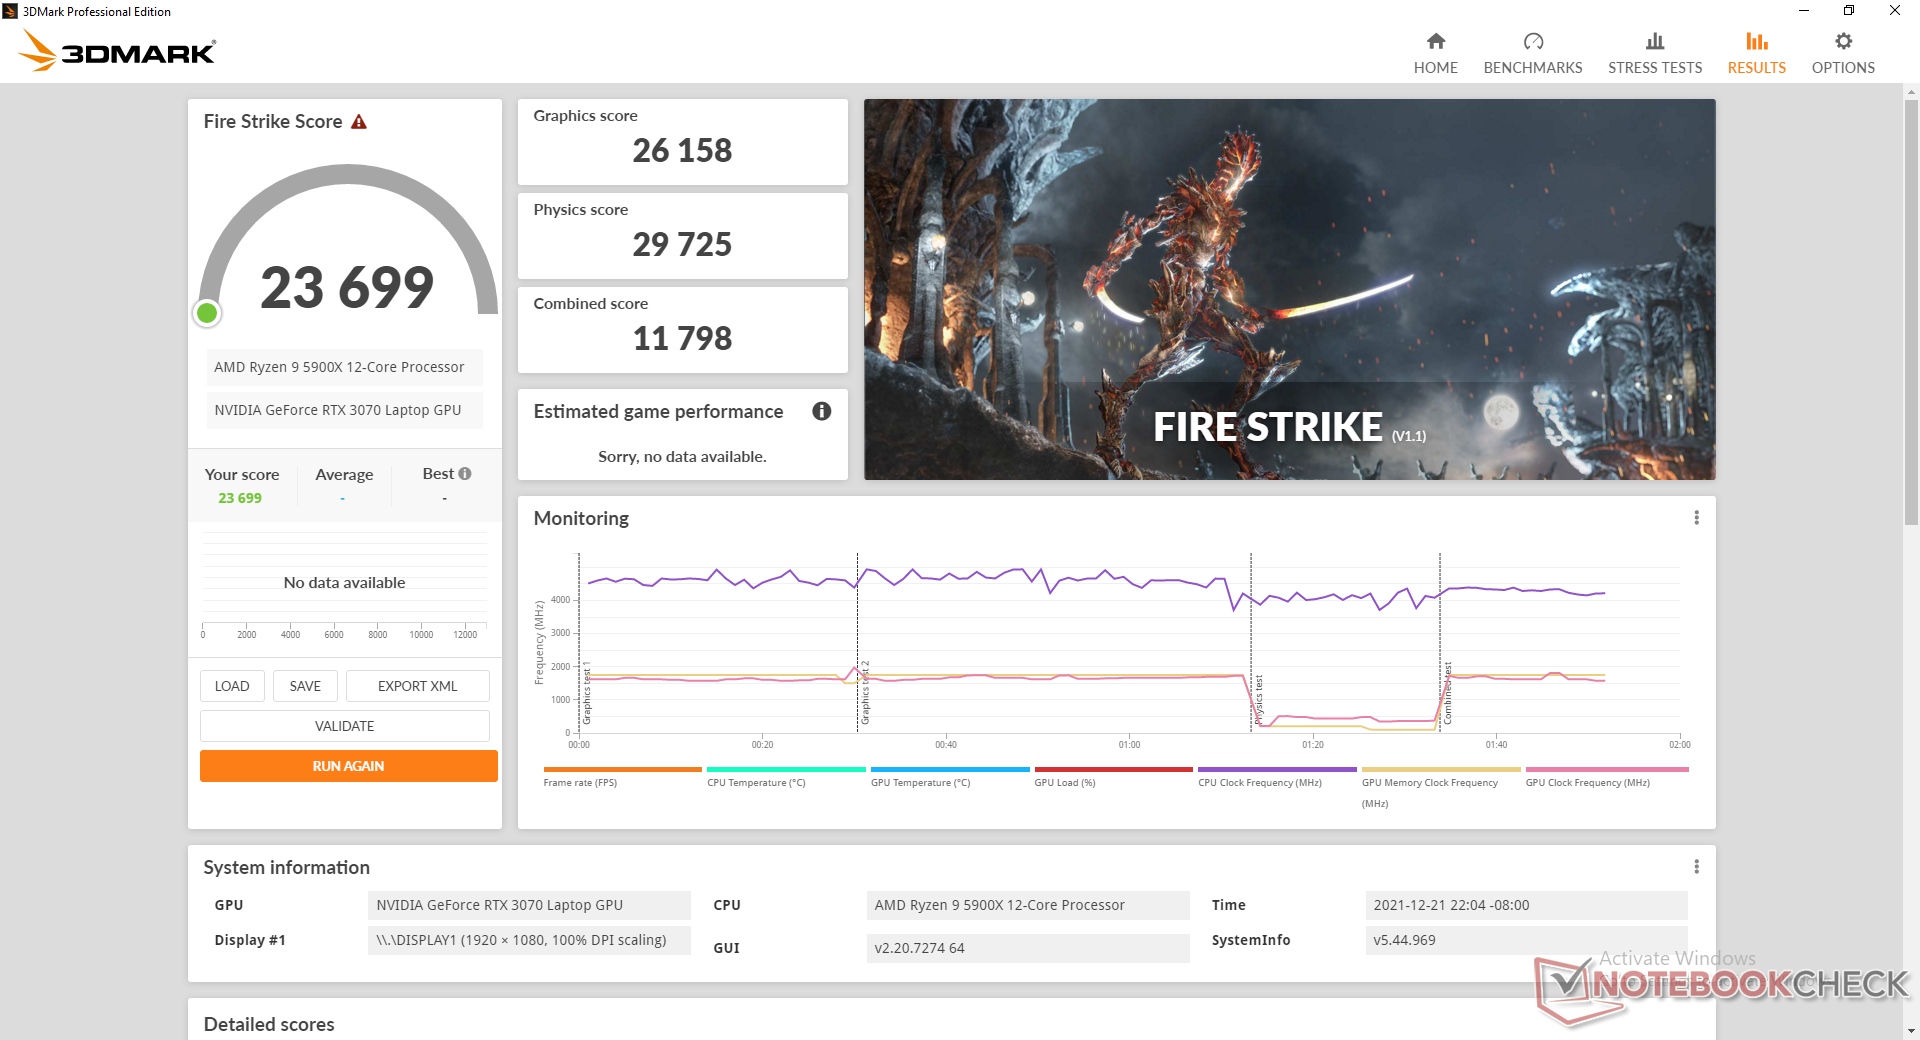
GPU性能
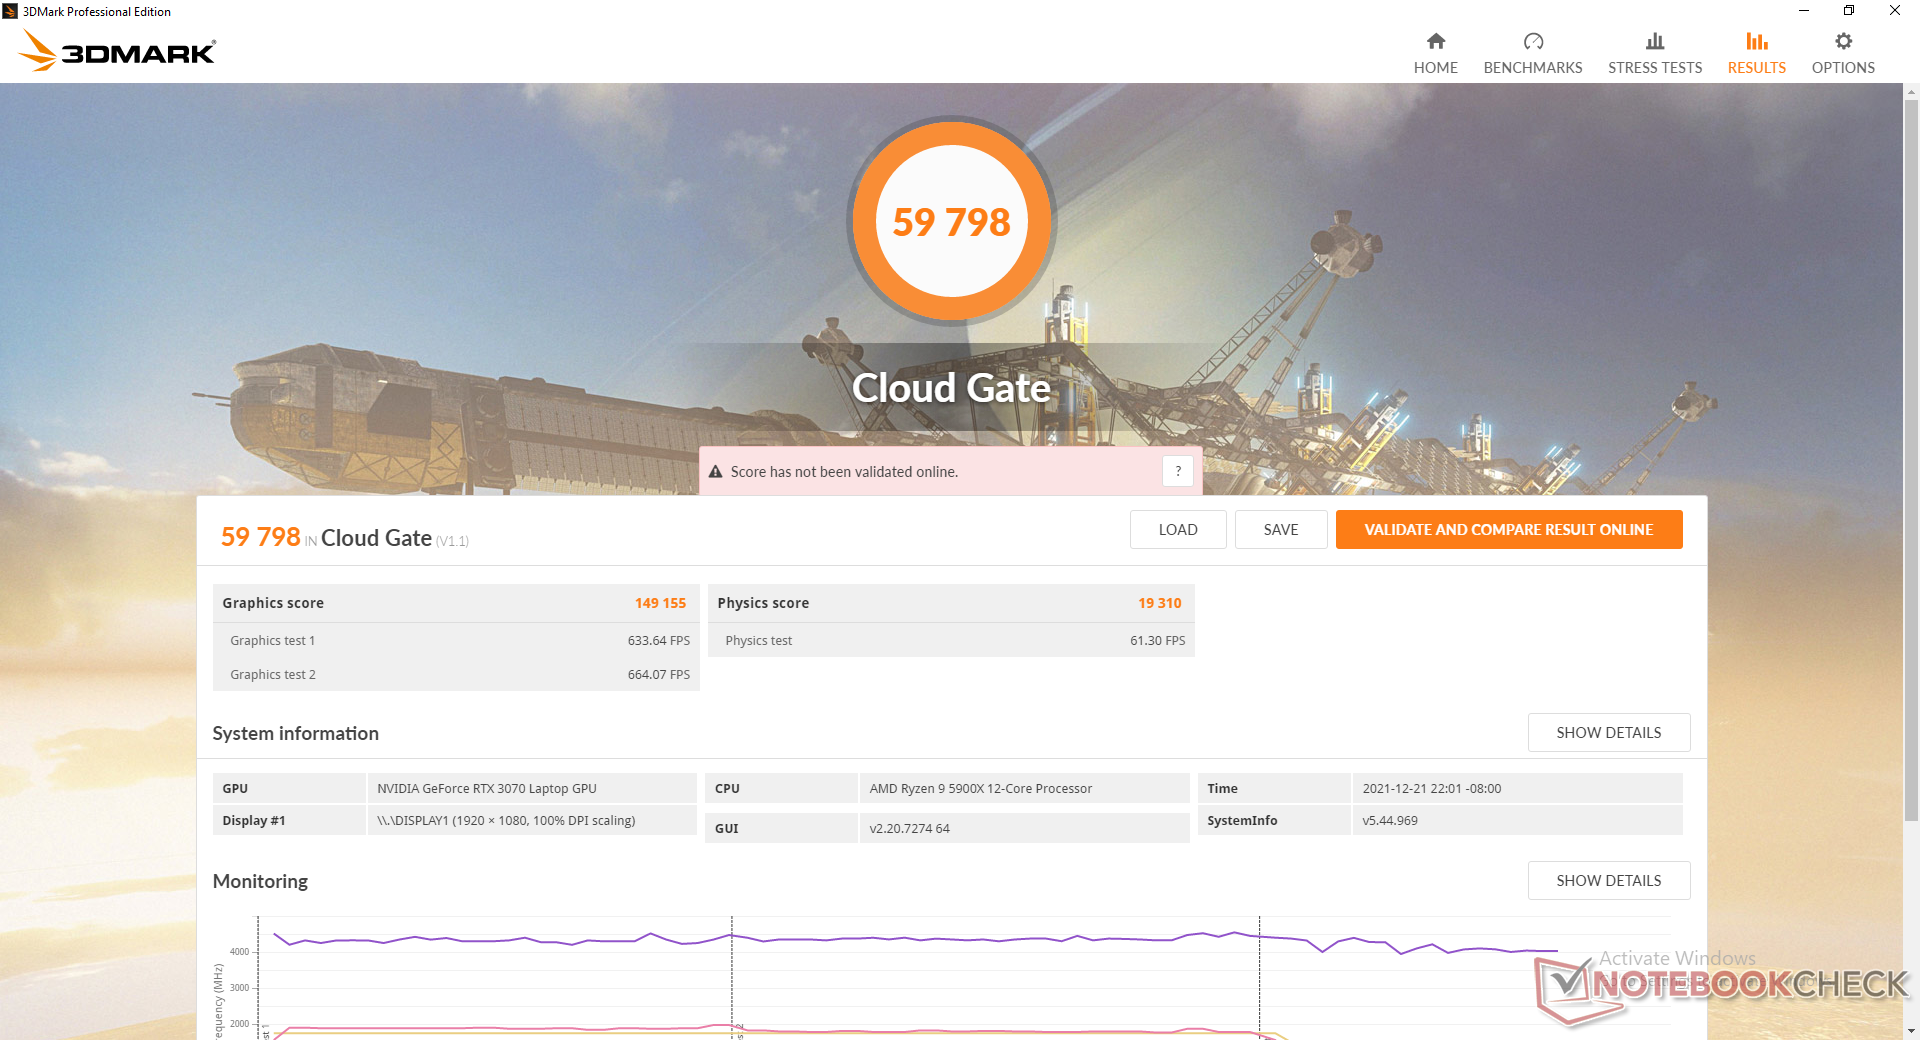
115 W TGP 移动GeForce RTX 3070相对于其他具有相同GPU的笔记本电脑,它的表现是我们所期望的。如果在最大风扇模式下运行,似乎没有GPU的性能优势。
主显示器上不支持G-Sync,也没有高级优化功能。
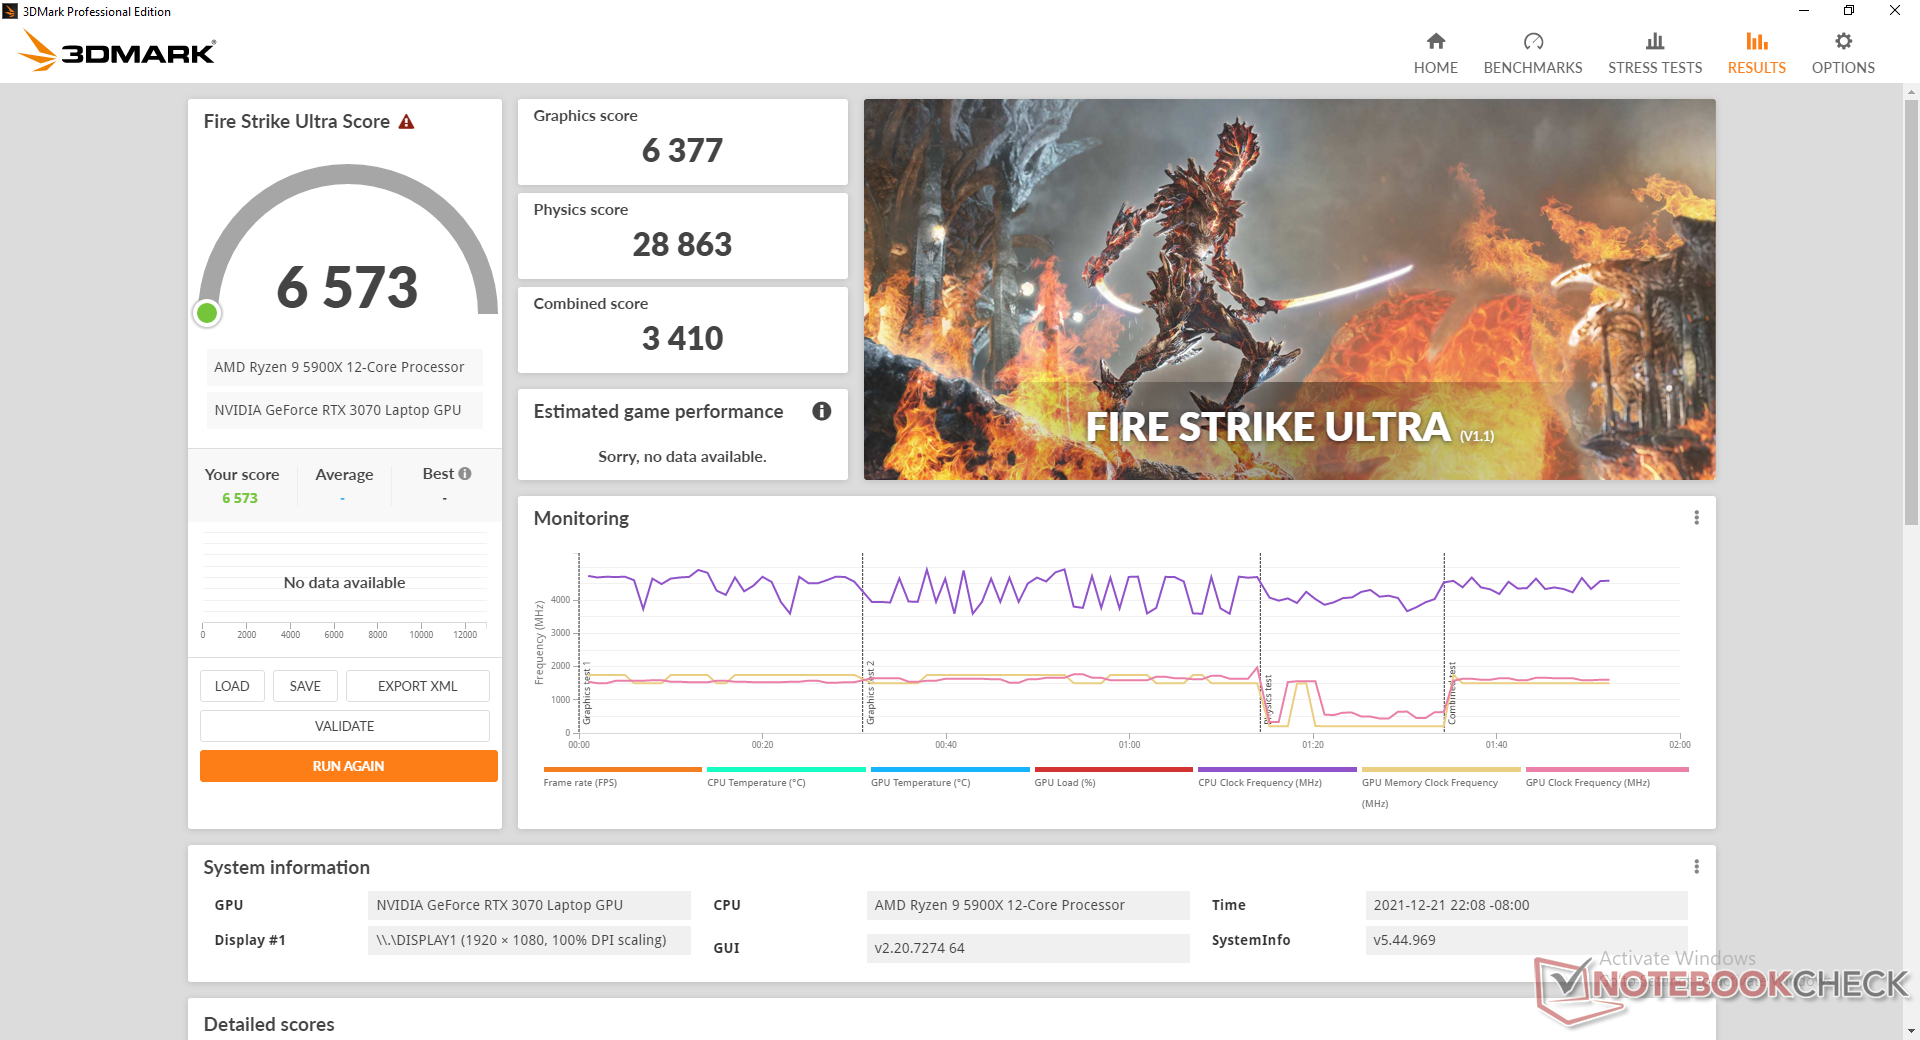
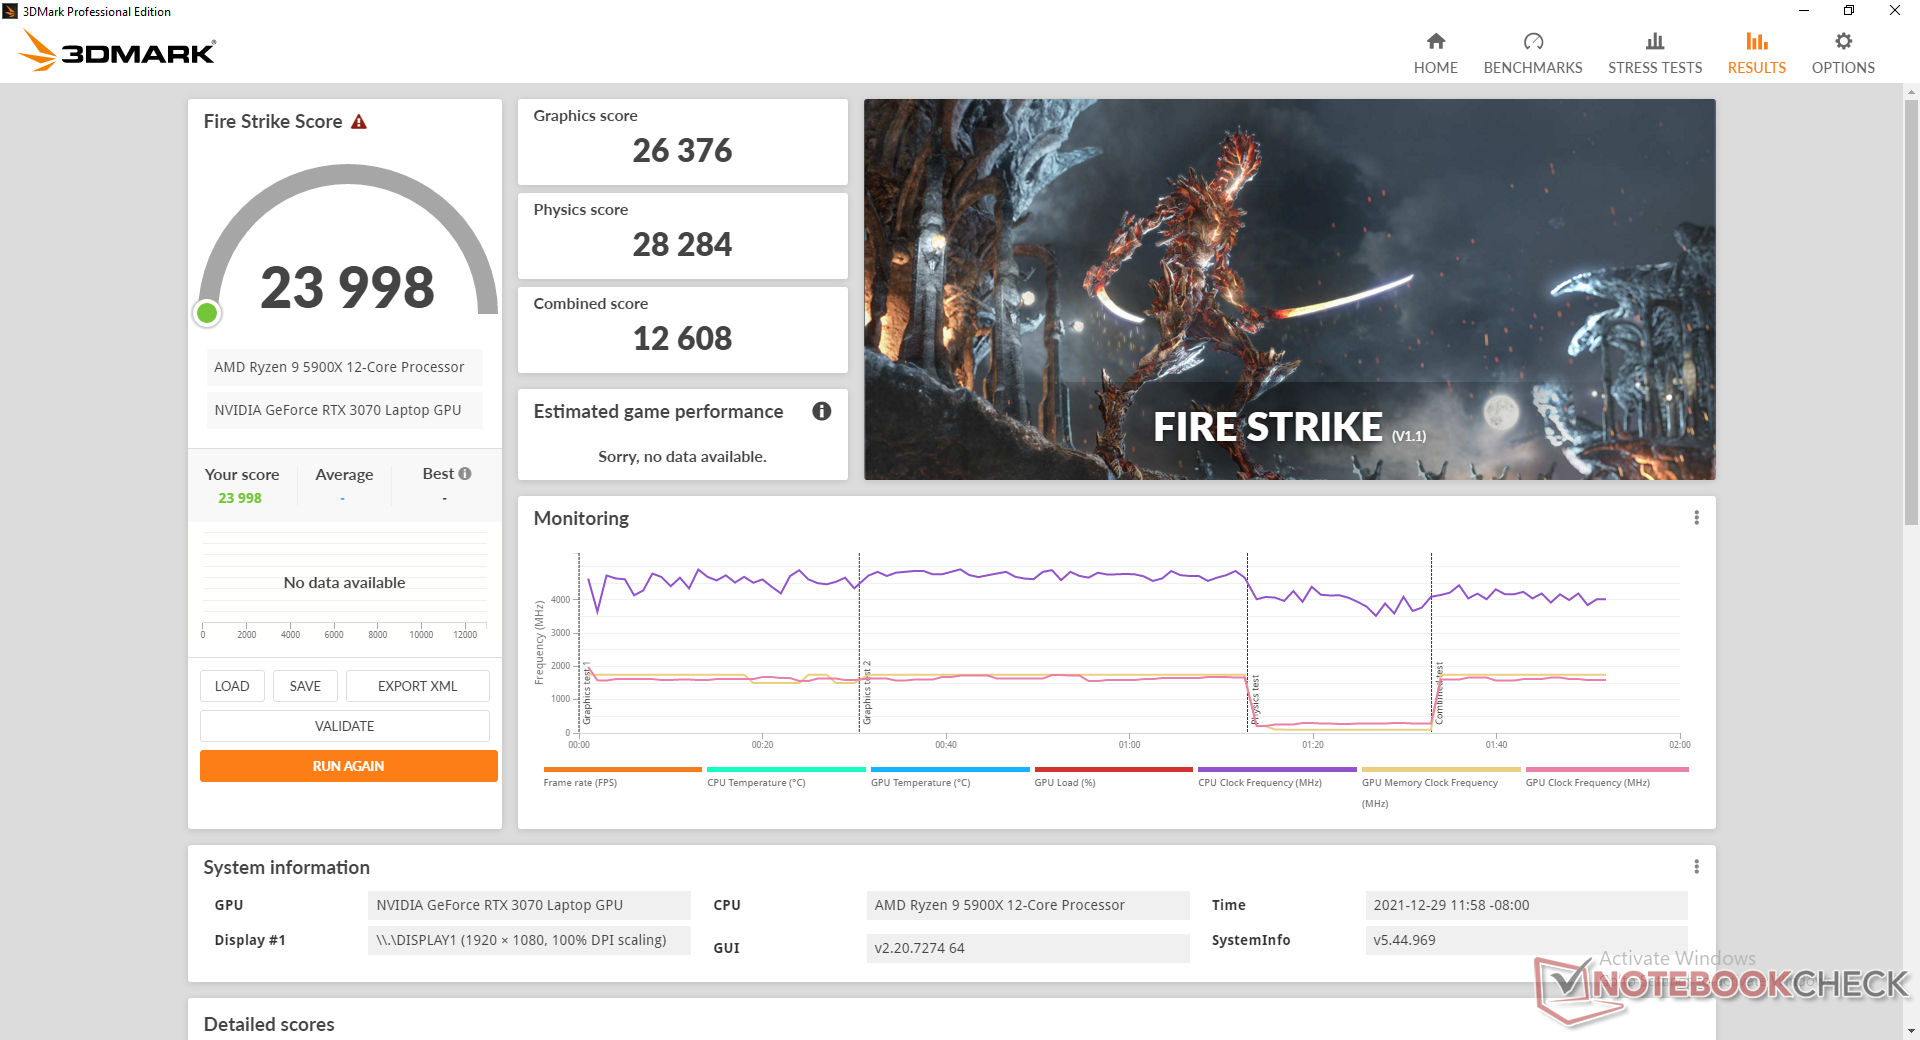
| 3DMark | |
| 1920x1080 Fire Strike Graphics | |
| MSI GeForce RTX 3080 Gaming X Trio | |
| Zotac Gaming GeForce RTX 3070 Twin Edge | |
| Alienware m15 R4 RTX 3080 | |
| Gigabyte A5 X1 | |
| Eurocom Nightsky ARX315 | |
| Razer Blade 15 Advanced Model Early 2021 | |
| Average NVIDIA GeForce RTX 3070 Laptop GPU (7178 - 29128, n=52) | |
| Asus ROG Zephyrus G15 GA503Q | |
| Schenker XMG Core 15 Ampere | |
| Acer Nitro 5 AN515-45-R05E | |
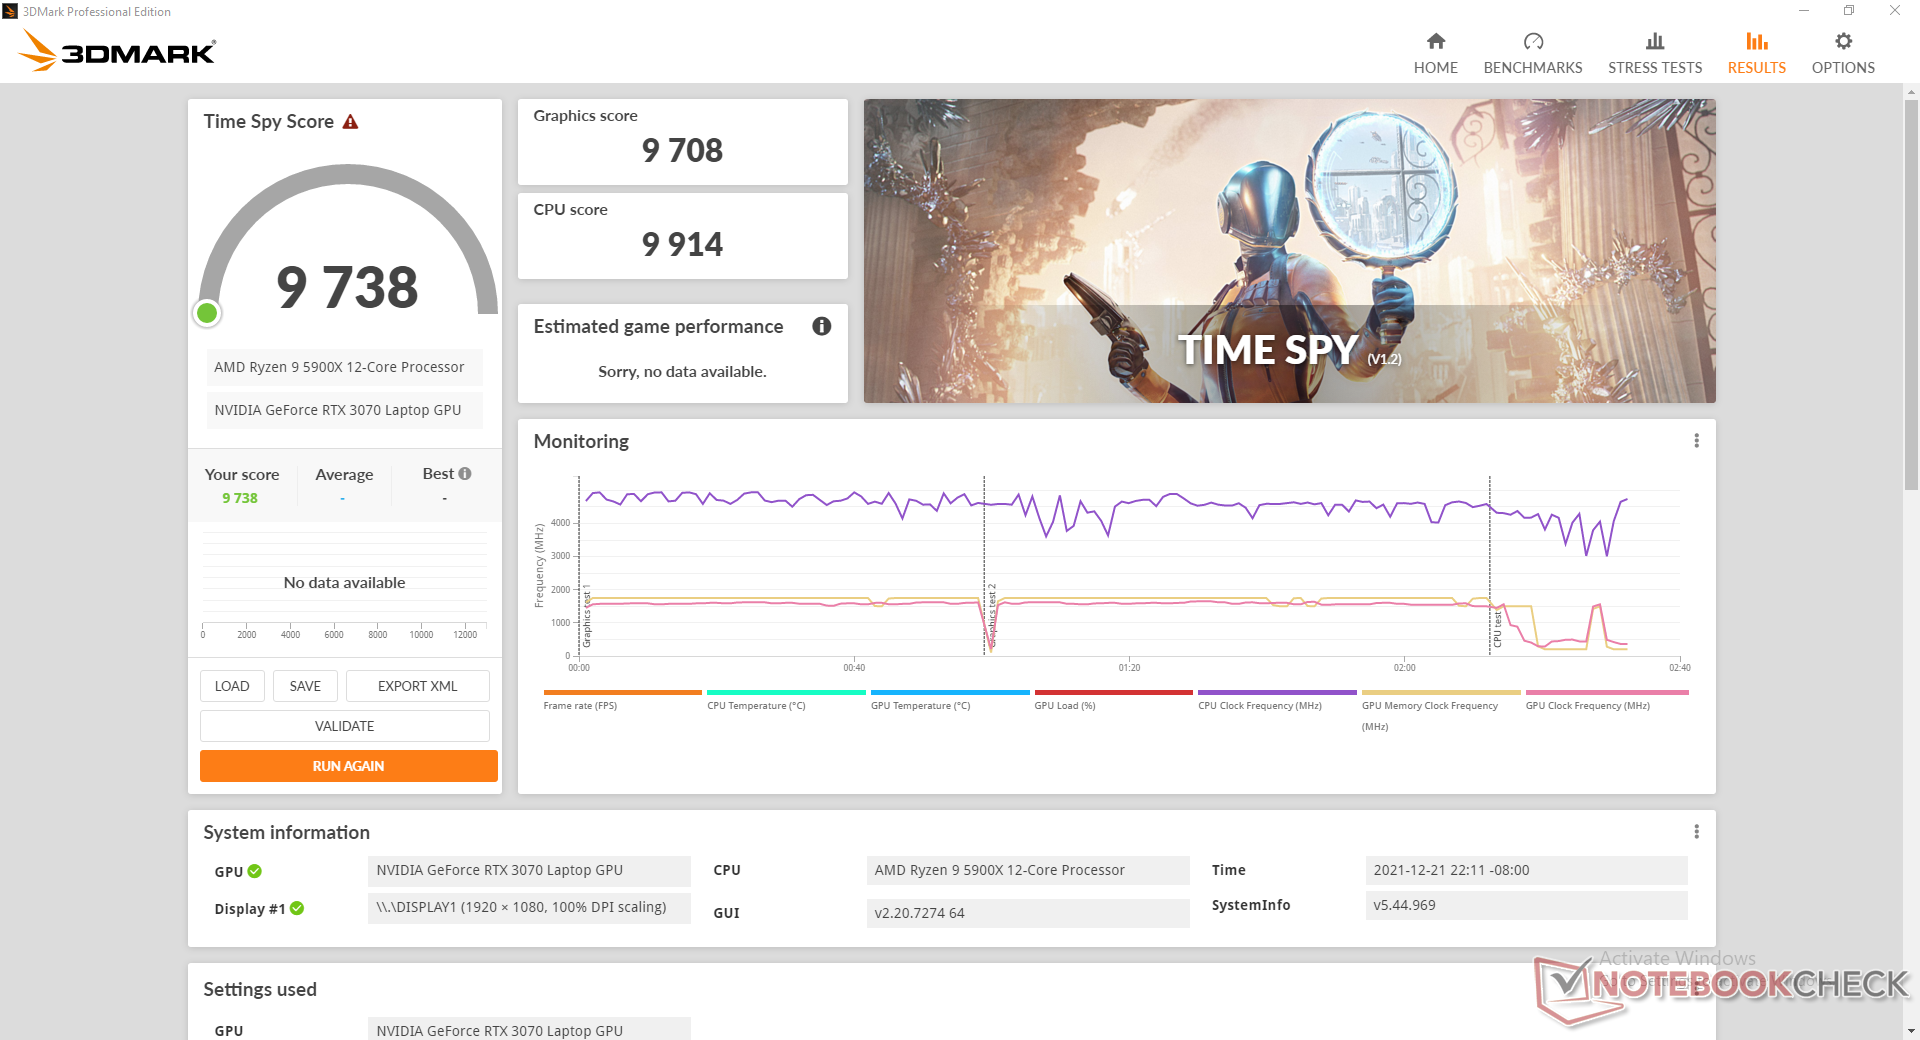
| 2560x1440 Time Spy Graphics | |
| MSI GeForce RTX 3080 Gaming X Trio | |
| Zotac Gaming GeForce RTX 3070 Twin Edge | |
| Alienware m15 R4 RTX 3080 | |
| Gigabyte A5 X1 | |
| Eurocom Nightsky ARX315 | |
| Asus ROG Zephyrus G15 GA503Q | |
| Average NVIDIA GeForce RTX 3070 Laptop GPU (2644 - 11019, n=53) | |
| Razer Blade 15 Advanced Model Early 2021 | |
| Schenker XMG Core 15 Ampere | |
| Acer Nitro 5 AN515-45-R05E | |
| 2560x1440 Time Spy Score | |
| MSI GeForce RTX 3080 Gaming X Trio | |
| Zotac Gaming GeForce RTX 3070 Twin Edge | |
| Alienware m15 R4 RTX 3080 | |
| Gigabyte A5 X1 | |
| Eurocom Nightsky ARX315 | |
| Asus ROG Zephyrus G15 GA503Q | |
| Average NVIDIA GeForce RTX 3070 Laptop GPU (2952 - 10872, n=54) | |
| Razer Blade 15 Advanced Model Early 2021 | |
| Schenker XMG Core 15 Ampere | |
| Acer Nitro 5 AN515-45-R05E | |
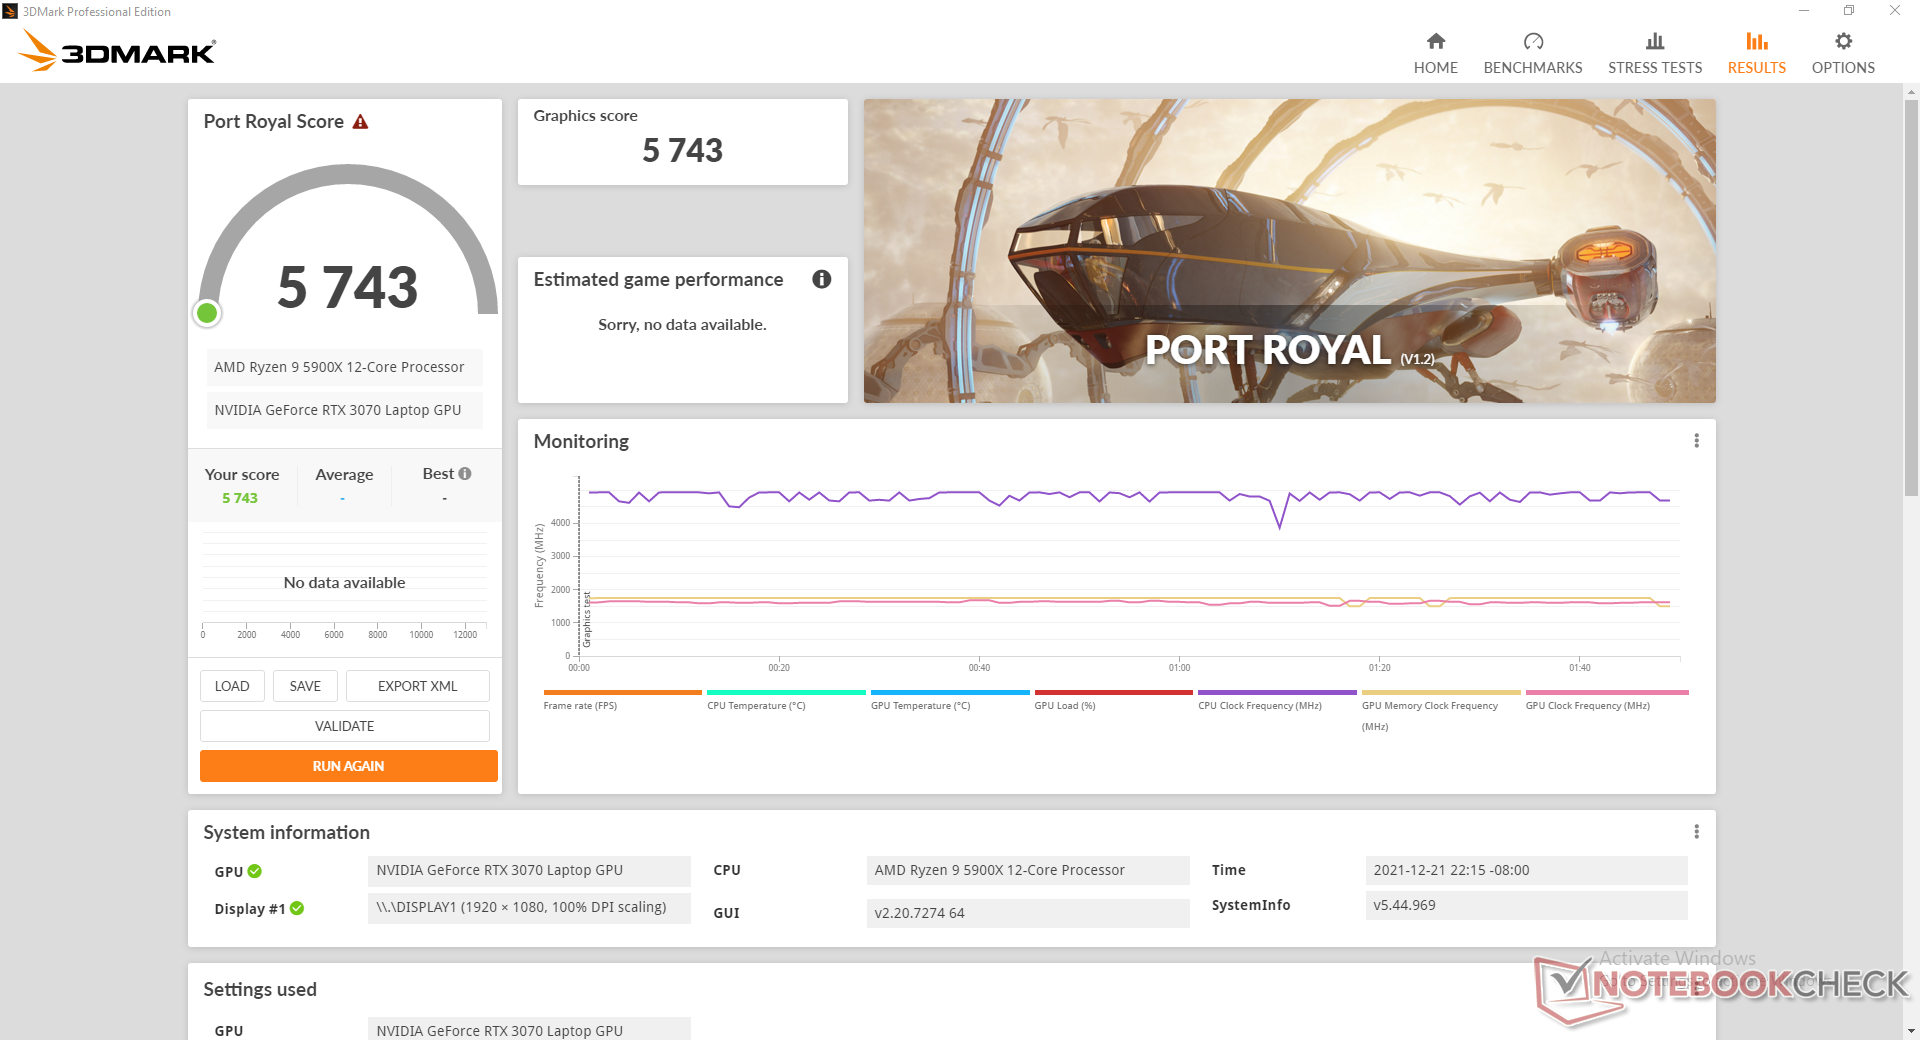
| 2560x1440 Port Royal Graphics | |
| MSI GeForce RTX 3080 Gaming X Trio | |
| Zotac Gaming GeForce RTX 3070 Twin Edge | |
| Asus ROG Zephyrus G15 GA503Q | |
| Eurocom Nightsky ARX315 | |
| Average NVIDIA GeForce RTX 3070 Laptop GPU (1640 - 6542, n=39) | |
| Razer Blade 15 Advanced Model Early 2021 | |
| Schenker XMG Core 15 Ampere | |
| 3DMark 11 - 1280x720 Performance GPU | |
| MSI GeForce RTX 3080 Gaming X Trio | |
| Zotac Gaming GeForce RTX 3070 Twin Edge | |
| Alienware m15 R4 RTX 3080 | |
| Eurocom Nightsky ARX315 | |
| Gigabyte A5 X1 | |
| Razer Blade 15 Advanced Model Early 2021 | |
| Average NVIDIA GeForce RTX 3070 Laptop GPU (12535 - 38275, n=54) | |
| Schenker XMG Core 15 Ampere | |
| 3DMark 11 Performance | 29688 points | |
| 3DMark Cloud Gate Standard Score | 59798 points | |
| 3DMark Fire Strike Score | 23699 points | |
| 3DMark Time Spy Score | 9738 points | |
Help | ||
| Final Fantasy XV Benchmark | |
| 1280x720 Lite Quality | |
| Eurocom Nightsky ARX315 | |
| Gigabyte A5 X1 | |
| Average NVIDIA GeForce RTX 3070 Laptop GPU (137 - 207, n=30) | |
| MSI GeForce RTX 3080 Gaming X Trio | |
| 1920x1080 Standard Quality | |
| Eurocom Nightsky ARX315 | |
| MSI GeForce RTX 3080 Gaming X Trio | |
| Gigabyte A5 X1 | |
| Average NVIDIA GeForce RTX 3070 Laptop GPU (67 - 144, n=32) | |
| 1920x1080 High Quality | |
| MSI GeForce RTX 3080 Gaming X Trio | |
| Eurocom Nightsky ARX315 | |
| Gigabyte A5 X1 | |
| Average NVIDIA GeForce RTX 3070 Laptop GPU (27.9 - 107, n=49) | |
| The Witcher 3 | |
| 1024x768 Low Graphics & Postprocessing | |
| Zotac Gaming GeForce RTX 3070 Twin Edge | |
| Eurocom Nightsky ARX315 | |
| MSI GeForce RTX 3080 Gaming X Trio | |
| Average NVIDIA GeForce RTX 3070 Laptop GPU (209 - 672, n=31) | |
| Alienware m15 R4 RTX 3080 | |
| Razer Blade 15 Advanced Model Early 2021 | |
| Gigabyte A5 X1 | |
| Schenker XMG Core 15 Ampere | |
| 1366x768 Medium Graphics & Postprocessing | |
| Zotac Gaming GeForce RTX 3070 Twin Edge | |
| MSI GeForce RTX 3080 Gaming X Trio | |
| Eurocom Nightsky ARX315 | |
| Alienware m15 R4 RTX 3080 | |
| Razer Blade 15 Advanced Model Early 2021 | |
| Gigabyte A5 X1 | |
| Average NVIDIA GeForce RTX 3070 Laptop GPU (169.6 - 339, n=31) | |
| Schenker XMG Core 15 Ampere | |
| 1920x1080 High Graphics & Postprocessing (Nvidia HairWorks Off) | |
| MSI GeForce RTX 3080 Gaming X Trio | |
| Zotac Gaming GeForce RTX 3070 Twin Edge | |
| Zotac Gaming GeForce RTX 3070 Twin Edge | |
| Alienware m15 R4 RTX 3080 | |
| Eurocom Nightsky ARX315 | |
| Gigabyte A5 X1 | |
| Razer Blade 15 Advanced Model Early 2021 | |
| Average NVIDIA GeForce RTX 3070 Laptop GPU (122.1 - 207, n=34) | |
| Asus ROG Zephyrus G15 GA503Q | |
| Schenker XMG Core 15 Ampere | |
| Acer Nitro 5 AN515-45-R05E | |
| Acer Nitro 5 AN515-45-R05E | |
| 1920x1080 Ultra Graphics & Postprocessing (HBAO+) | |
| MSI GeForce RTX 3080 Gaming X Trio | |
| Zotac Gaming GeForce RTX 3070 Twin Edge | |
| Alienware m15 R4 RTX 3080 | |
| Gigabyte A5 X1 | |
| Eurocom Nightsky ARX315 | |
| Razer Blade 15 Advanced Model Early 2021 | |
| Average NVIDIA GeForce RTX 3070 Laptop GPU (34.9 - 109, n=52) | |
| Asus ROG Zephyrus G15 GA503Q | |
| Schenker XMG Core 15 Ampere | |
| Acer Nitro 5 AN515-45-R05E | |
| X-Plane 11.11 | |
| 1280x720 low (fps_test=1) | |
| MSI GeForce RTX 3080 Gaming X Trio | |
| Eurocom Nightsky ARX315 | |
| Alienware m15 R4 RTX 3080 | |
| Average NVIDIA GeForce RTX 3070 Laptop GPU (15.3 - 152.8, n=61) | |
| Razer Blade 15 Advanced Model Early 2021 | |
| Asus ROG Zephyrus G15 GA503Q | |
| Gigabyte A5 X1 | |
| Acer Nitro 5 AN515-45-R05E | |
| Schenker XMG Core 15 Ampere | |
| 1920x1080 med (fps_test=2) | |
| MSI GeForce RTX 3080 Gaming X Trio | |
| Eurocom Nightsky ARX315 | |
| Alienware m15 R4 RTX 3080 | |
| Average NVIDIA GeForce RTX 3070 Laptop GPU (13.7 - 144.7, n=61) | |
| Razer Blade 15 Advanced Model Early 2021 | |
| Gigabyte A5 X1 | |
| Asus ROG Zephyrus G15 GA503Q | |
| Acer Nitro 5 AN515-45-R05E | |
| Schenker XMG Core 15 Ampere | |
| 1920x1080 high (fps_test=3) | |
| MSI GeForce RTX 3080 Gaming X Trio | |
| Eurocom Nightsky ARX315 | |
| Alienware m15 R4 RTX 3080 | |
| Average NVIDIA GeForce RTX 3070 Laptop GPU (12.4 - 118.8, n=61) | |
| Razer Blade 15 Advanced Model Early 2021 | |
| Gigabyte A5 X1 | |
| Asus ROG Zephyrus G15 GA503Q | |
| Acer Nitro 5 AN515-45-R05E | |
| Schenker XMG Core 15 Ampere | |
| Far Cry 5 | |
| 1280x720 Low Preset AA:T | |
| MSI GeForce RTX 3080 Gaming X Trio | |
| Eurocom Nightsky ARX315 | |
| Alienware m15 R4 RTX 3080 | |
| Average NVIDIA GeForce RTX 3070 Laptop GPU (123 - 176, n=25) | |
| Razer Blade 15 Advanced Model Early 2021 | |
| Gigabyte A5 X1 | |
| Schenker XMG Core 15 Ampere | |
| 1920x1080 Low Preset AA:T | |
| Eurocom Nightsky ARX315 | |
| Alienware m15 R4 RTX 3080 | |
| Average NVIDIA GeForce RTX 3070 Laptop GPU (108 - 163, n=18) | |
| Gigabyte A5 X1 | |
| Razer Blade 15 Advanced Model Early 2021 | |
| Schenker XMG Core 15 Ampere | |
| 1920x1080 Medium Preset AA:T | |
| MSI GeForce RTX 3080 Gaming X Trio | |
| Eurocom Nightsky ARX315 | |
| Alienware m15 R4 RTX 3080 | |
| Average NVIDIA GeForce RTX 3070 Laptop GPU (100 - 143, n=26) | |
| Gigabyte A5 X1 | |
| Razer Blade 15 Advanced Model Early 2021 | |
| Schenker XMG Core 15 Ampere | |
| 1920x1080 High Preset AA:T | |
| MSI GeForce RTX 3080 Gaming X Trio | |
| Eurocom Nightsky ARX315 | |
| Alienware m15 R4 RTX 3080 | |
| Average NVIDIA GeForce RTX 3070 Laptop GPU (93 - 137, n=26) | |
| Gigabyte A5 X1 | |
| Razer Blade 15 Advanced Model Early 2021 | |
| Schenker XMG Core 15 Ampere | |
| 1920x1080 Ultra Preset AA:T | |
| MSI GeForce RTX 3080 Gaming X Trio | |
| Eurocom Nightsky ARX315 | |
| Alienware m15 R4 RTX 3080 | |
| Average NVIDIA GeForce RTX 3070 Laptop GPU (89 - 140, n=36) | |
| Gigabyte A5 X1 | |
| Razer Blade 15 Advanced Model Early 2021 | |
| Schenker XMG Core 15 Ampere | |
| Acer Nitro 5 AN515-45-R05E | |
| Strange Brigade | |
| 1280x720 lowest AF:1 | |
| Eurocom Nightsky ARX315 | |
| MSI GeForce RTX 3080 Gaming X Trio | |
| Average NVIDIA GeForce RTX 3070 Laptop GPU (106.8 - 522, n=34) | |
| Gigabyte A5 X1 | |
| 1920x1080 medium AA:medium AF:4 | |
| MSI GeForce RTX 3080 Gaming X Trio | |
| Eurocom Nightsky ARX315 | |
| Average NVIDIA GeForce RTX 3070 Laptop GPU (44.1 - 279, n=35) | |
| Gigabyte A5 X1 | |
| 1920x1080 high AA:high AF:8 | |
| MSI GeForce RTX 3080 Gaming X Trio | |
| Eurocom Nightsky ARX315 | |
| Average NVIDIA GeForce RTX 3070 Laptop GPU (39.6 - 225, n=35) | |
| Gigabyte A5 X1 | |
| 1920x1080 ultra AA:ultra AF:16 | |
| MSI GeForce RTX 3080 Gaming X Trio | |
| Eurocom Nightsky ARX315 | |
| Gigabyte A5 X1 | |
| Average NVIDIA GeForce RTX 3070 Laptop GPU (36.2 - 194, n=46) | |
| Dota 2 Reborn | |
| 1280x720 min (0/3) fastest | |
| Eurocom Nightsky ARX315 | |
| Gigabyte A5 X1 | |
| Average NVIDIA GeForce RTX 3070 Laptop GPU (35.2 - 211, n=58) | |
| Asus ROG Zephyrus G15 GA503Q | |
| Alienware m15 R4 RTX 3080 | |
| Razer Blade 15 Advanced Model Early 2021 | |
| Acer Nitro 5 AN515-45-R05E | |
| MSI GeForce RTX 3080 Gaming X Trio | |
| Schenker XMG Core 15 Ampere | |
| 1366x768 med (1/3) | |
| Eurocom Nightsky ARX315 | |
| Gigabyte A5 X1 | |
| Asus ROG Zephyrus G15 GA503Q | |
| Average NVIDIA GeForce RTX 3070 Laptop GPU (31.5 - 183.8, n=58) | |
| Alienware m15 R4 RTX 3080 | |
| Razer Blade 15 Advanced Model Early 2021 | |
| Acer Nitro 5 AN515-45-R05E | |
| Schenker XMG Core 15 Ampere | |
| MSI GeForce RTX 3080 Gaming X Trio | |
| 1920x1080 high (2/3) | |
| Eurocom Nightsky ARX315 | |
| Alienware m15 R4 RTX 3080 | |
| Gigabyte A5 X1 | |
| Average NVIDIA GeForce RTX 3070 Laptop GPU (30.9 - 178, n=59) | |
| Asus ROG Zephyrus G15 GA503Q | |
| Razer Blade 15 Advanced Model Early 2021 | |
| Acer Nitro 5 AN515-45-R05E | |
| Schenker XMG Core 15 Ampere | |
| MSI GeForce RTX 3080 Gaming X Trio | |
| 1920x1080 ultra (3/3) best looking | |
| Eurocom Nightsky ARX315 | |
| Alienware m15 R4 RTX 3080 | |
| Gigabyte A5 X1 | |
| Average NVIDIA GeForce RTX 3070 Laptop GPU (26.9 - 163.9, n=58) | |
| Asus ROG Zephyrus G15 GA503Q | |
| Acer Nitro 5 AN515-45-R05E | |
| Schenker XMG Core 15 Ampere | |
| Razer Blade 15 Advanced Model Early 2021 | |
| MSI GeForce RTX 3080 Gaming X Trio | |
Witcher 3 FPS Chart
| low | med. | high | ultra | |
|---|---|---|---|---|
| GTA V (2015) | 185 | 182 | 175 | 114 |
| The Witcher 3 (2015) | 505 | 327.3 | 199 | 96.6 |
| Dota 2 Reborn (2015) | 211 | 180 | 178 | 158 |
| Final Fantasy XV Benchmark (2018) | 207 | 144 | 107 | |
| X-Plane 11.11 (2018) | 146 | 131 | 105 | |
| Far Cry 5 (2018) | 165 | 140 | 135 | 126 |
| Strange Brigade (2018) | 519 | 275 | 221 | 192 |
排放
系统噪音
风扇噪音取决于四个控制中心的电源配置文件设置。省电、安静、娱乐或性能。在前两种设置下,系统运行非常安静(~27.9 dB(A)),但是整体性能会受到很大影响,以至于系统会感觉像糖浆。同时,即使在性能模式下运行要求不高的负载,风扇噪音也会经常飙升至40.8分贝(A)。我们建议在娱乐模式下运行,因为它在系统性能和持续脉动的风扇之间提供了更好的平衡。
游戏将引起52至56 dB(A)之间的风扇噪音,与大多数其他高性能15.6英寸游戏笔记本电脑并无不同。当最大风扇模式被激活时,风扇噪音可以达到60多分贝(A)。
Noise level
| Idle |
| 25.9 / 27.9 / 40.8 dB(A) |
| Load |
| 55.2 / 60.3 dB(A) |
 | ||
30 dB silent 40 dB(A) audible 50 dB(A) loud |
||
min: | ||
| Eurocom Nightsky ARX315 GeForce RTX 3070 Laptop GPU, R9 5900X, Samsung SSD 980 Pro 1TB MZ-V8P1T0BW | Gigabyte A5 X1 GeForce RTX 3070 Laptop GPU, R9 5900HX, ADATA XPG SX8200 Pro (ASX8200PNP-512GT) | Medion Erazer Deputy P25 GeForce RTX 3060 Laptop GPU, R7 5800H, Phison E12S-512GB-Phison-SSD-BICS4 | MSI Delta 15 A5EFK Radeon RX 6700M, R9 5900HX, Micron 2210 MTFDHBA1T0QFD | Schenker XMG Apex 15 NH57E PS GeForce RTX 3060 Laptop GPU, R7 5800H, Samsung SSD 980 500GB (MZ-V8V500BW) | MSI GE66 Raider 10SFS GeForce RTX 2070 Super Mobile, i9-10980HK, WDC PC SN730 SDBPNTY-1T00 | |
|---|---|---|---|---|---|---|
| Noise | 1% | 2% | 5% | 15% | -8% | |
| off / environment * (dB) | 25.3 | 25 1% | 25 1% | 25 1% | 23 9% | 30 -19% |
| Idle Minimum * (dB) | 25.9 | 27 -4% | 27 -4% | 25 3% | 23 11% | 30 -16% |
| Idle Average * (dB) | 27.9 | 29 -4% | 29 -4% | 30 -8% | 23 18% | 35 -25% |
| Idle Maximum * (dB) | 40.8 | 32 22% | 31 24% | 40 2% | 26.4 35% | 44 -8% |
| Load Average * (dB) | 55.2 | 57 -3% | 57 -3% | 47 15% | 34.25 38% | 53 4% |
| Witcher 3 ultra * (dB) | 52.4 | 56 -7% | 56 -7% | 48 8% | 58.4 -11% | 53 -1% |
| Load Maximum * (dB) | 60.3 | 58 4% | 58 4% | 51 15% | 58.42 3% | 55 9% |
* ... smaller is better
温度
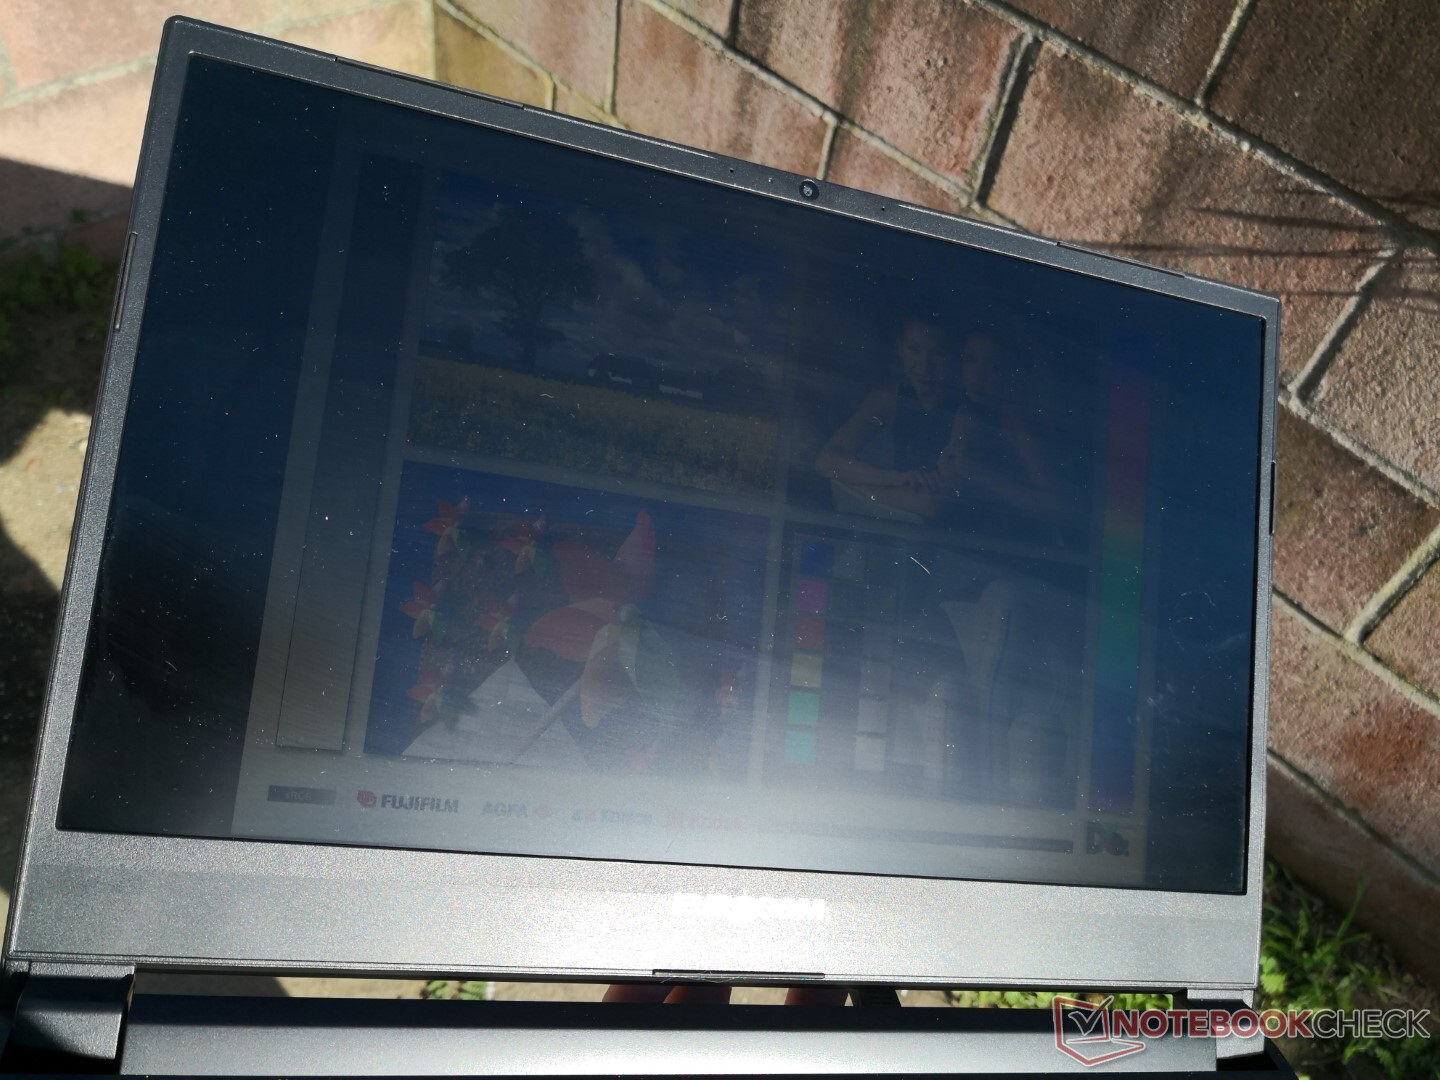
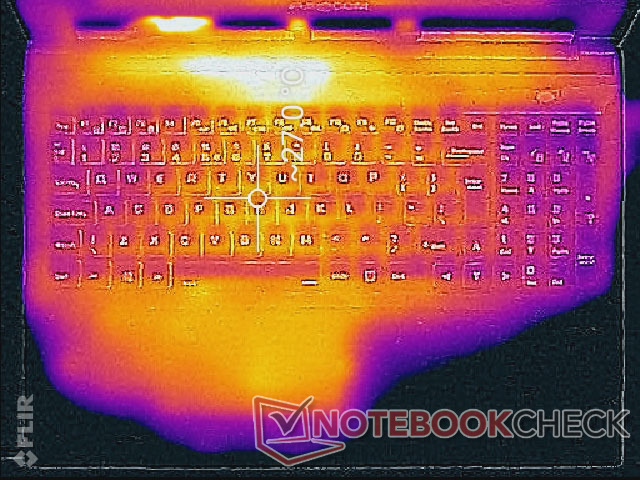
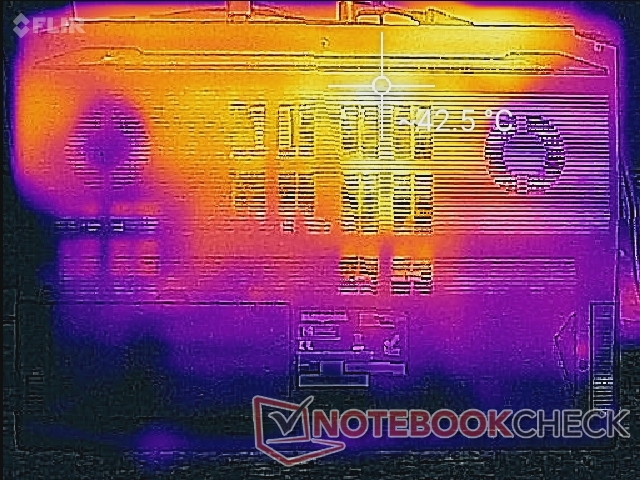
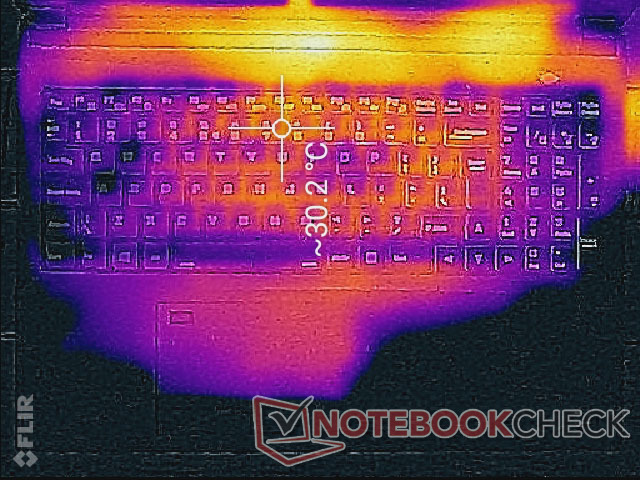
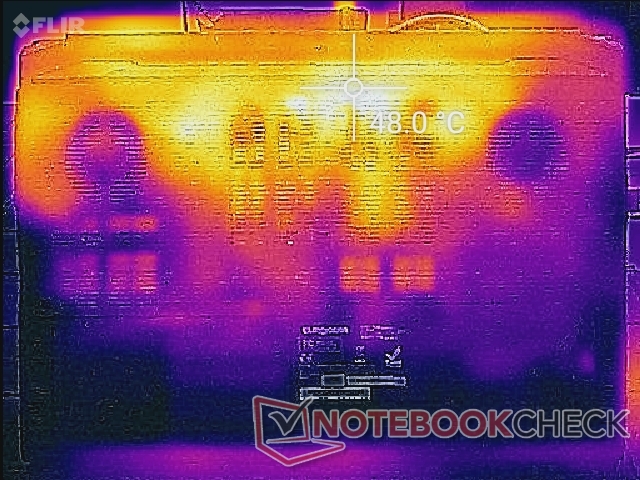
即使在省电模式或静音模式下空转,表面温度也很高,因为风扇噪音被推到了更安静的极限。顶部和底部的热点温度可分别达到27摄氏度和43摄氏度。因此,键盘按键总是很热,但值得庆幸的是,在运行高负载时,绝不会令人不舒服,因为响亮的风扇在控制表面温度方面做得很好。
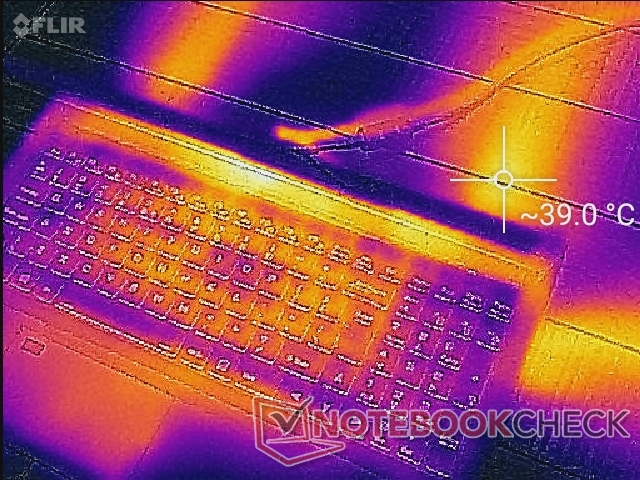
(+) The maximum temperature on the upper side is 36.2 °C / 97 F, compared to the average of 40.4 °C / 105 F, ranging from 21.2 to 68.8 °C for the class Gaming.
(-) The bottom heats up to a maximum of 49.6 °C / 121 F, compared to the average of 43.2 °C / 110 F
(+) In idle usage, the average temperature for the upper side is 27 °C / 81 F, compared to the device average of 33.9 °C / 93 F.
(+) The palmrests and touchpad are cooler than skin temperature with a maximum of 30 °C / 86 F and are therefore cool to the touch.
(±) The average temperature of the palmrest area of similar devices was 28.8 °C / 83.8 F (-1.2 °C / -2.2 F).
| Eurocom Nightsky ARX315 AMD Ryzen 9 5900X, NVIDIA GeForce RTX 3070 Laptop GPU | Gigabyte A5 X1 AMD Ryzen 9 5900HX, NVIDIA GeForce RTX 3070 Laptop GPU | Medion Erazer Deputy P25 AMD Ryzen 7 5800H, NVIDIA GeForce RTX 3060 Laptop GPU | MSI Delta 15 A5EFK AMD Ryzen 9 5900HX, AMD Radeon RX 6700M | Schenker XMG Apex 15 NH57E PS AMD Ryzen 7 5800H, NVIDIA GeForce RTX 3060 Laptop GPU | MSI GE66 Raider 10SFS Intel Core i9-10980HK, NVIDIA GeForce RTX 2070 Super Mobile | |
|---|---|---|---|---|---|---|
| Heat | 4% | 17% | -3% | 13% | -3% | |
| Maximum Upper Side * (°C) | 36.2 | 47 -30% | 37 -2% | 50 -38% | 36 1% | 49 -35% |
| Maximum Bottom * (°C) | 49.6 | 51 -3% | 40 19% | 55 -11% | 38 23% | 52 -5% |
| Idle Upper Side * (°C) | 32.6 | 27 17% | 27 17% | 31 5% | 31 5% | 30 8% |
| Idle Bottom * (°C) | 43.2 | 30 31% | 29 33% | 30 31% | 33 24% | 34 21% |
* ... smaller is better
压力测试
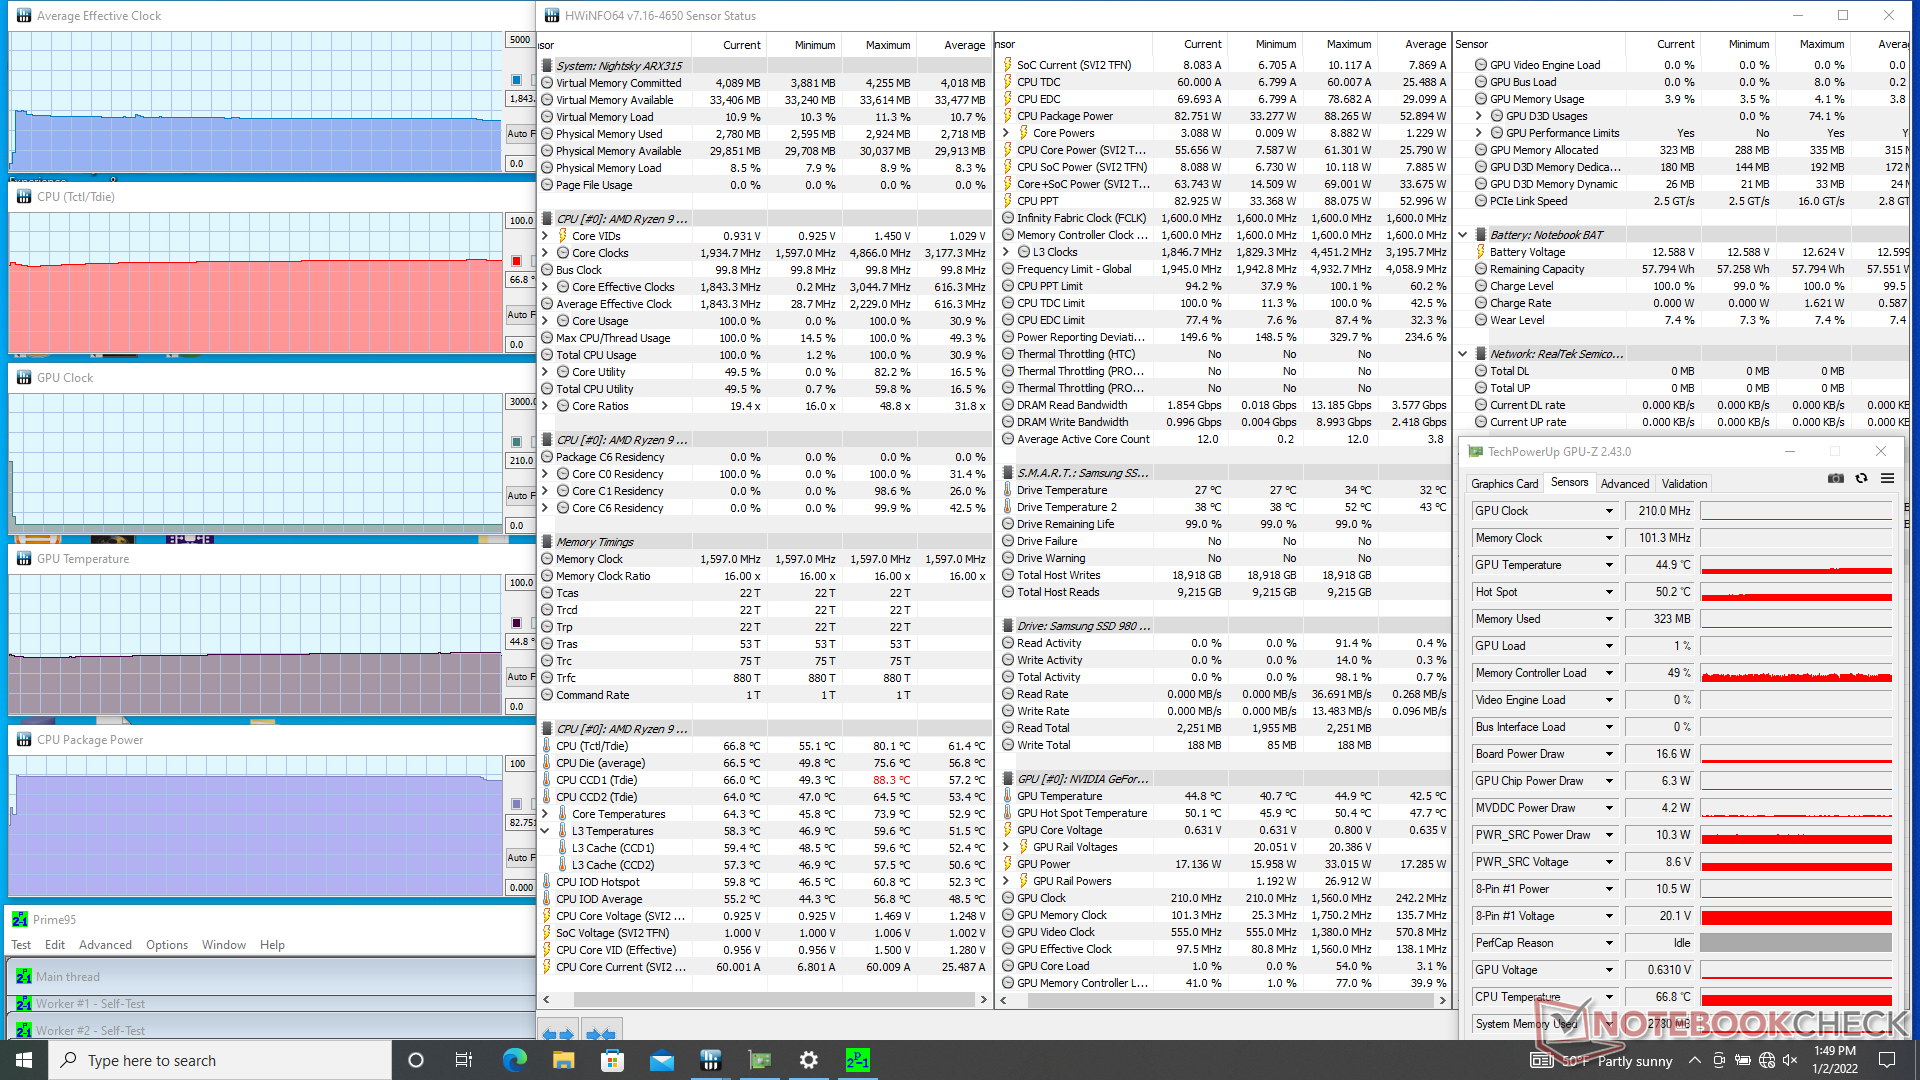
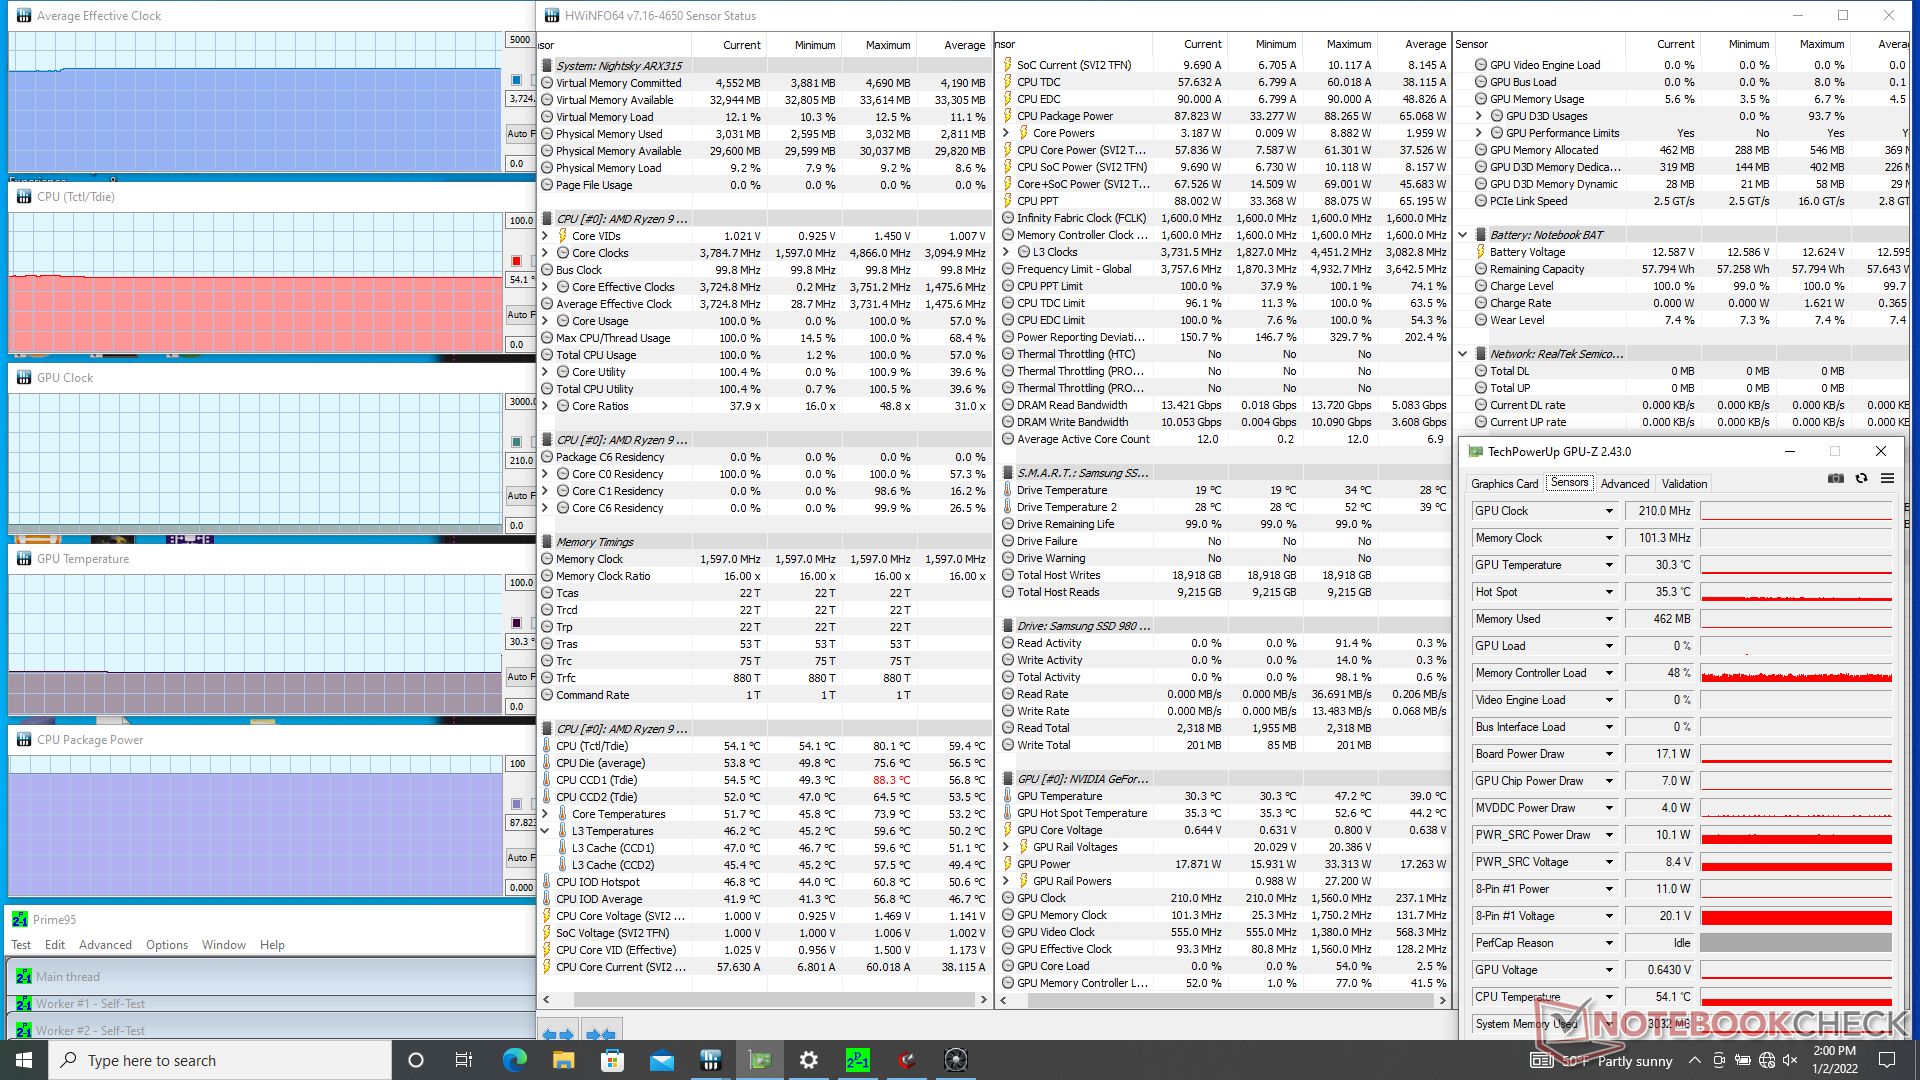
当运行Prime95,关闭最大风扇模式时,CPU将稳定在1.9GHz左右,核心温度为67C。相比之下,我们的Ryzen 9 5900X桌面参考将稳定在更高的4.5GHz时钟速率,当受到相同的Prime95条件时,这将解释我们上面提到的Eurocom的CPU基准测试结果慢于预期。幸运的是,如果需要的话,有足够的温度余量供最终用户超频使用,尽管代价是非常大的风扇噪音。在库存设置下,CPU封装功率将稳定在82瓦至88瓦的范围内。
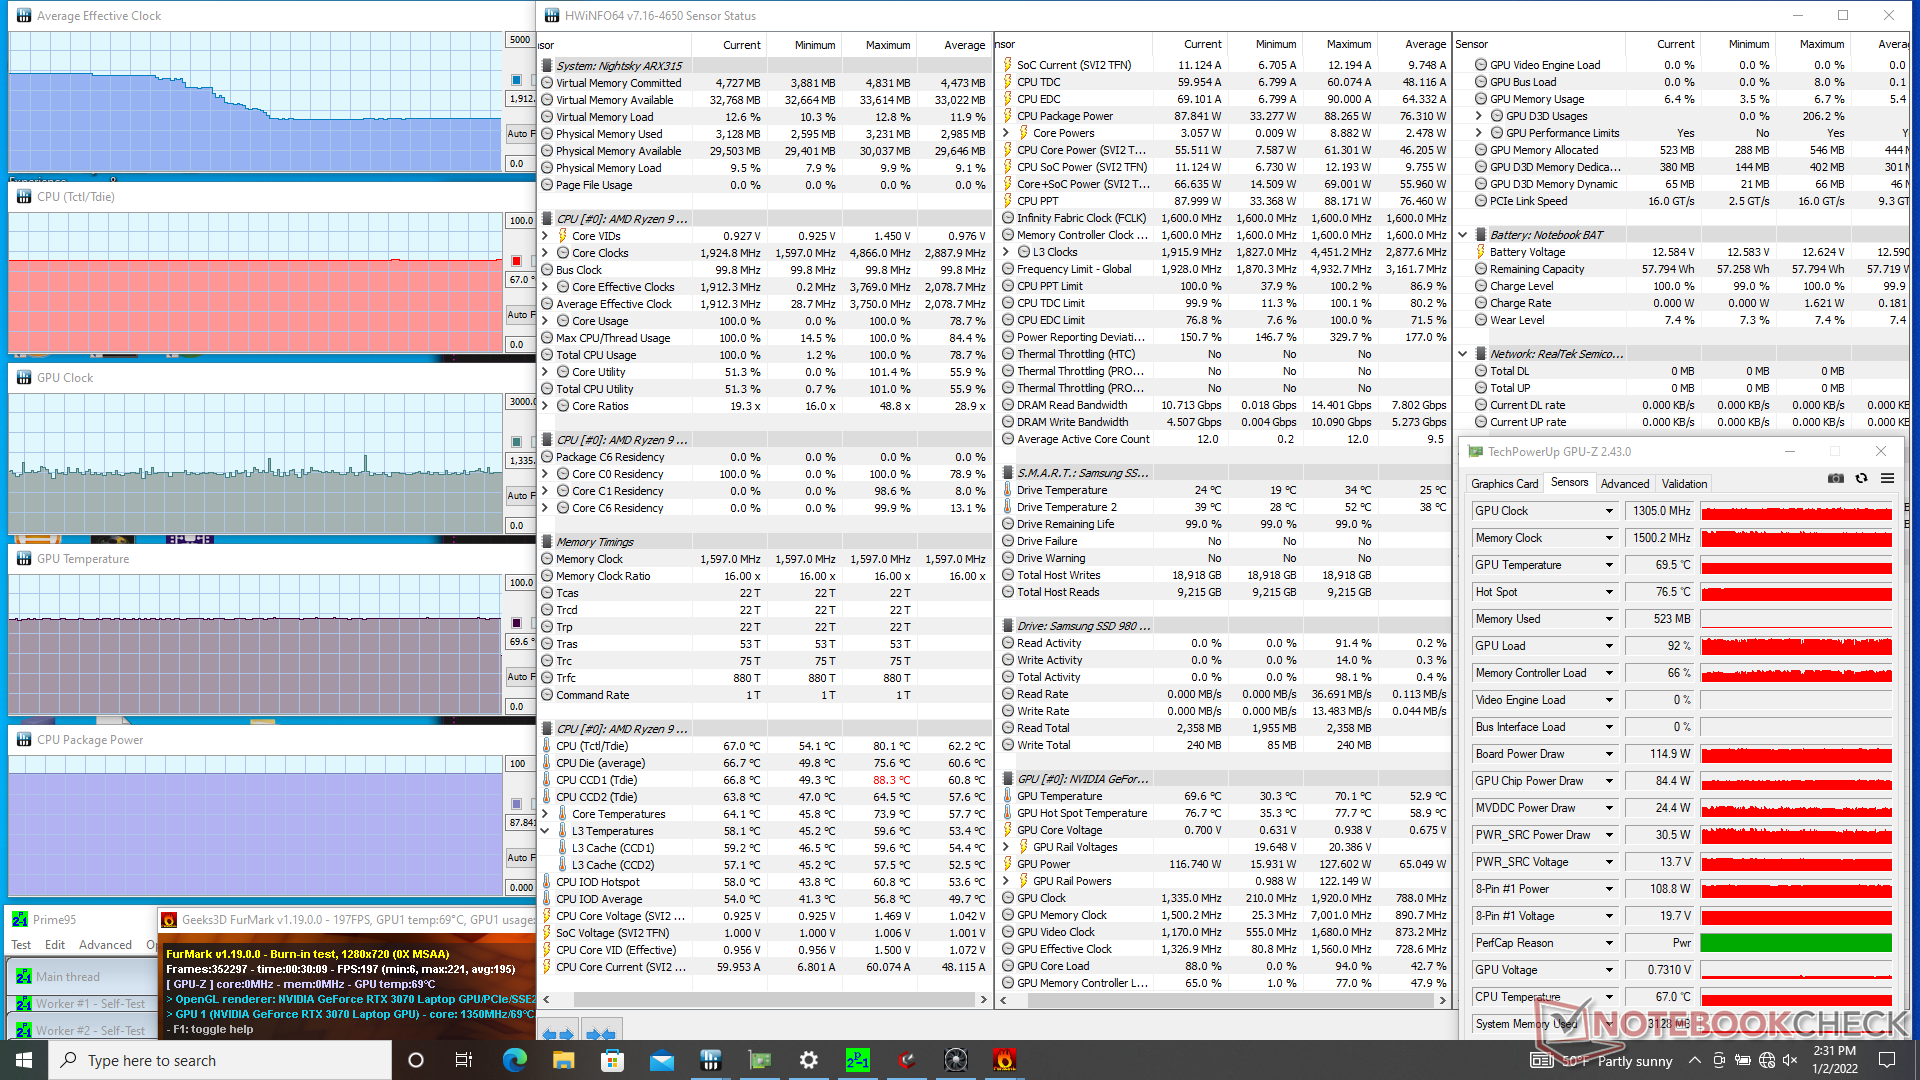
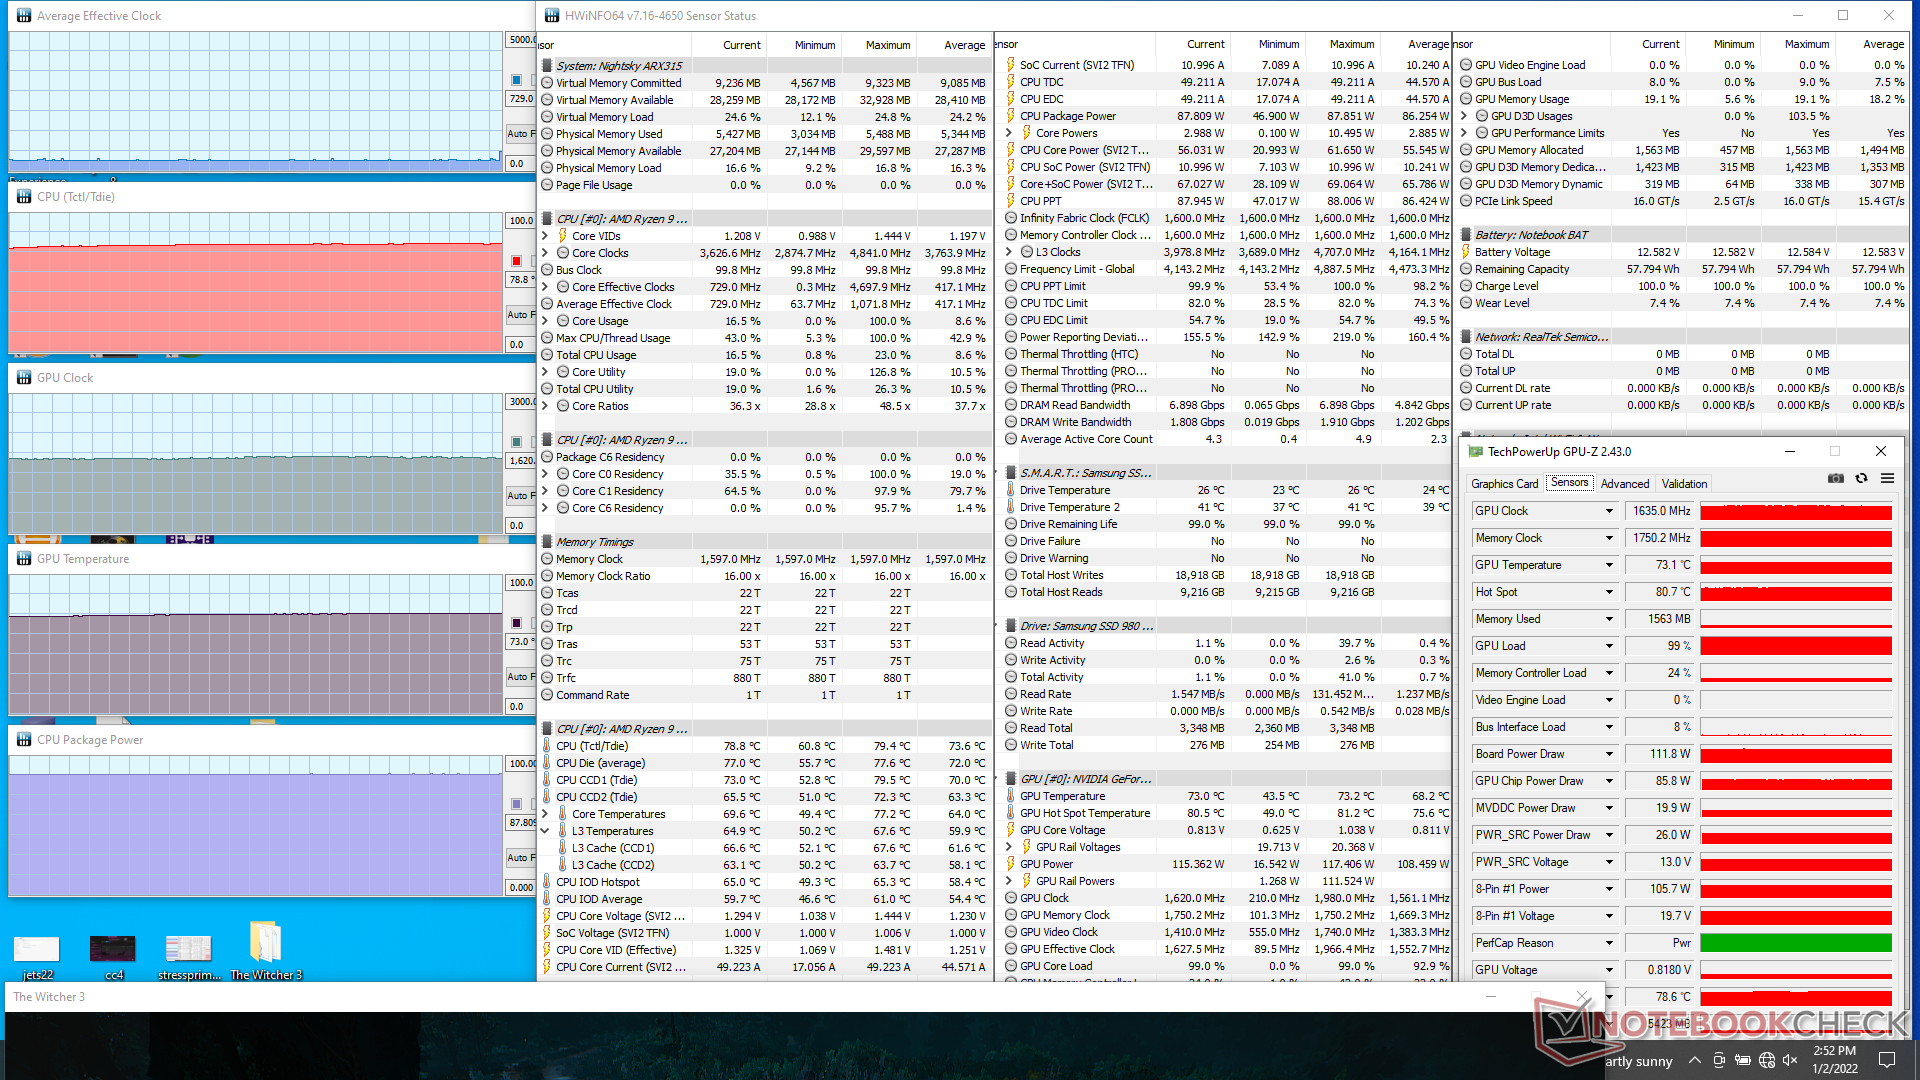
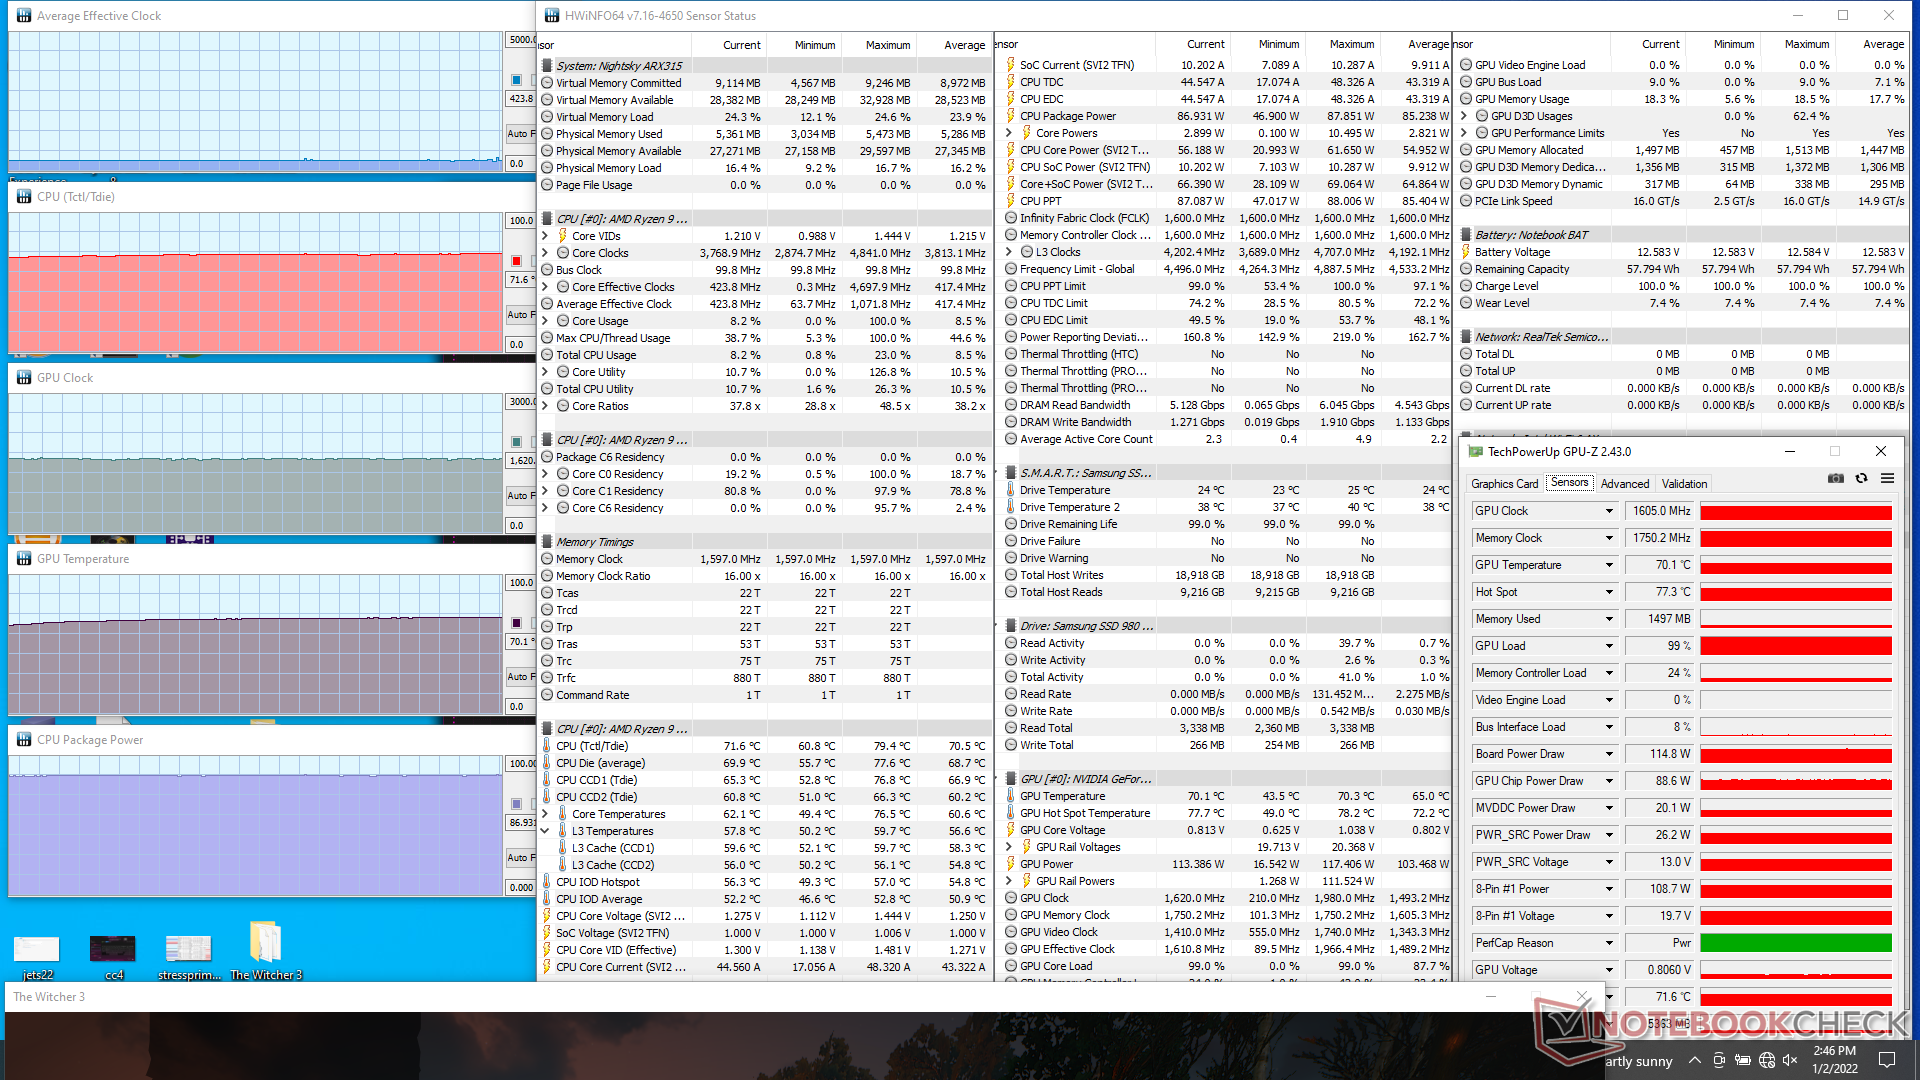
运行 Witcher 3在最大风扇模式下运行将导致稳定的GPU时钟速率和温度,分别为1605 MHz和70 C,而在华硕TUF Dash F15上为1365 MHz和74 C。华硕TUF Dash F15配备相同的GeForce RTX 3070 GPU。
用电池供电运行会限制性能。在电池上进行的3DMark 11测试将返回物理和图形分数,分别为3398和7357分,而在电源上则为19082和36118分。
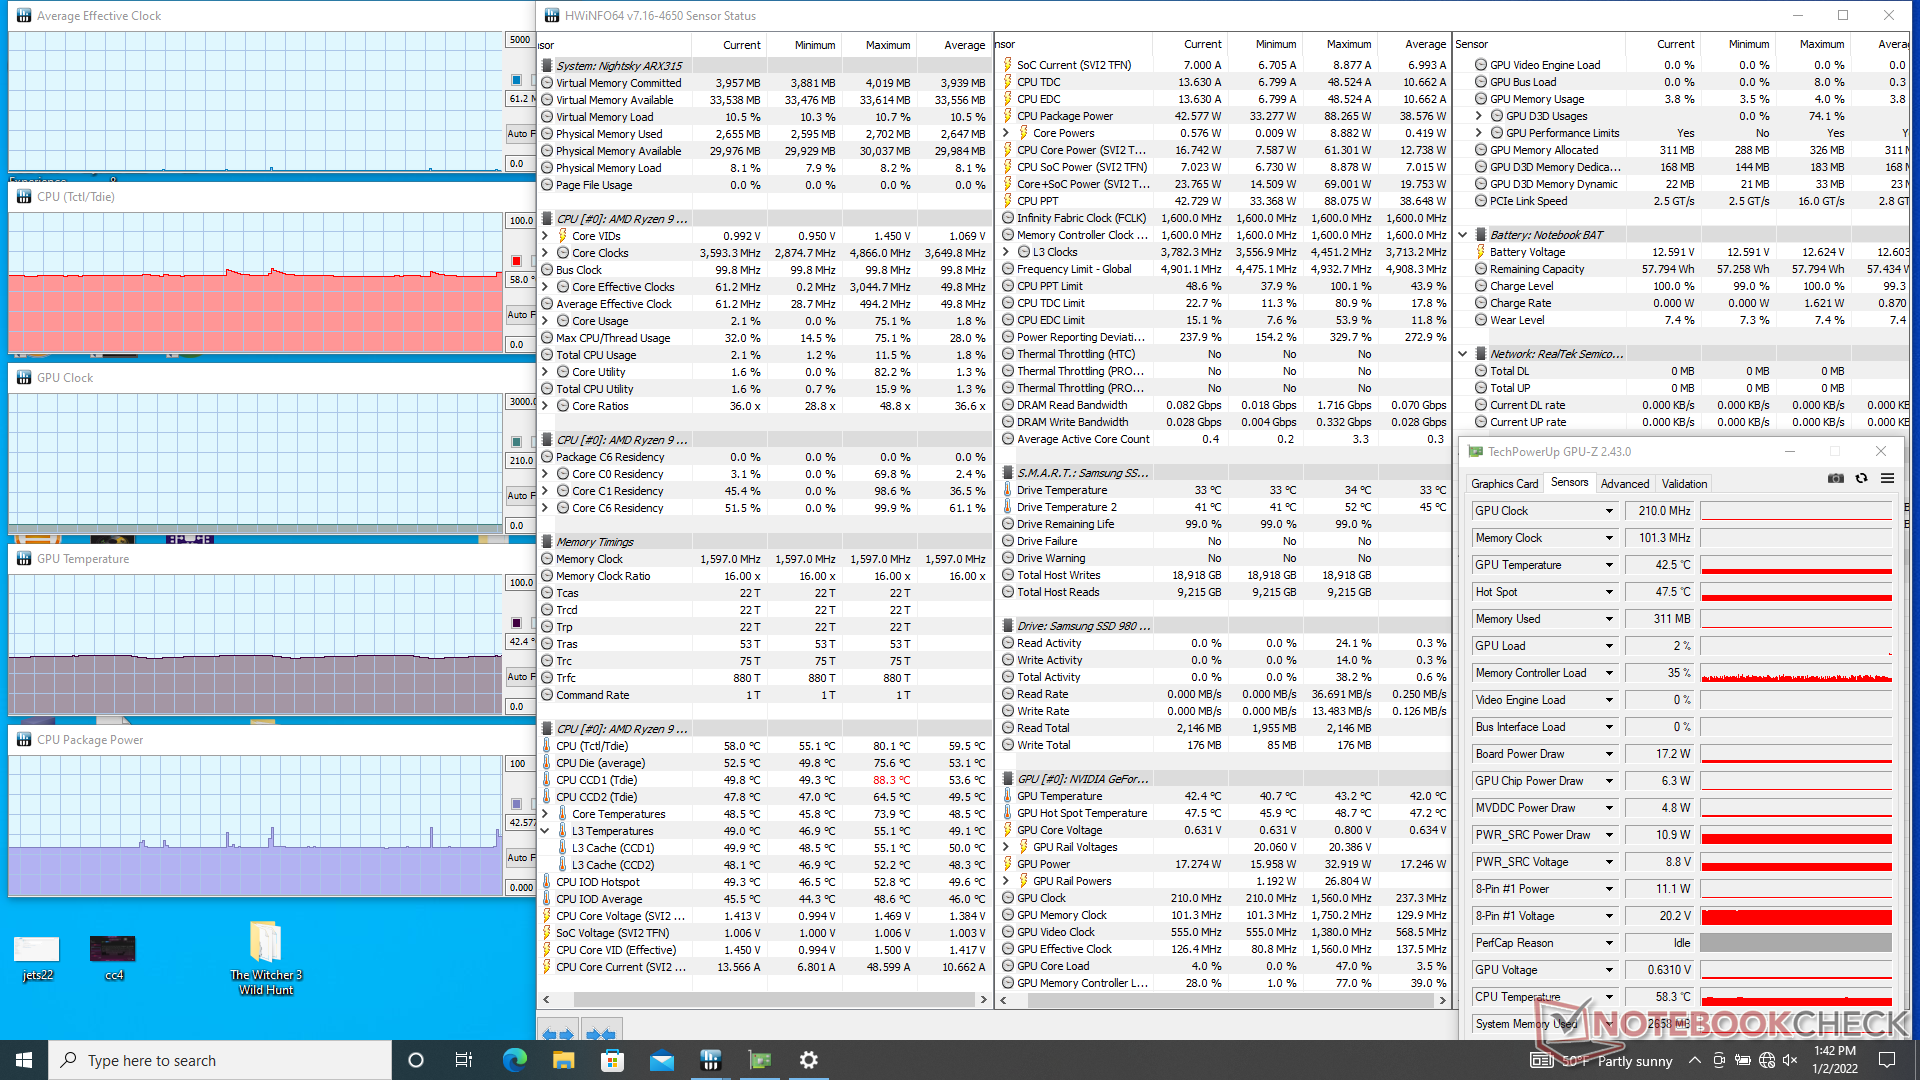
| CPU时钟(GHz) | GPU时钟(MHz) | CPU平均温度(℃) | GPU平均温度(℃) | |
| 系统空闲(关闭最大风扇模式) | -- | -- | 58 | 42 |
| Prime95压力(最大风扇模式关闭) | -- | 67 | 45 | |
| Prime95压力(最大风扇模式开启) | 3.8 | -- | 54 | 30 |
| Prime95 + FurMark压力(最大风扇模式开启) | 1.9 - 3.6 | 1305 | 67 | 70 |
| Witcher 3 压力(最大风扇模式关闭) | 0.8 | 1635 | 79 | 73 |
| Witcher 3 压力(最大风扇模式开启) | 0.4 | 1605 | 72 | 70 |
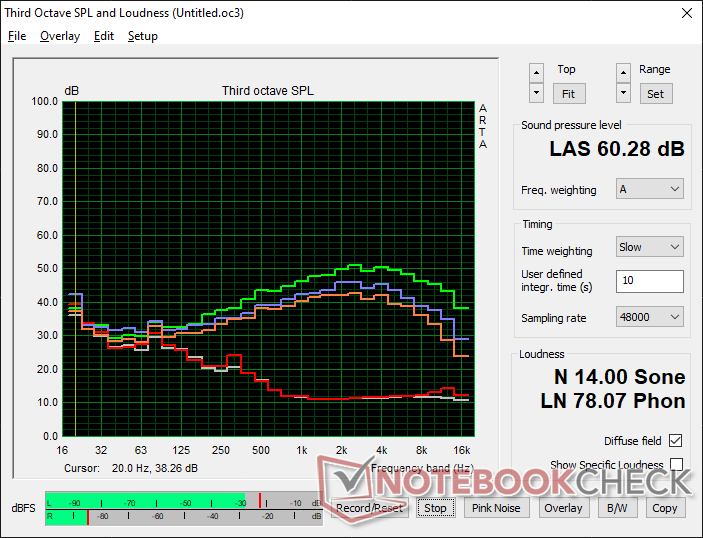
发言人
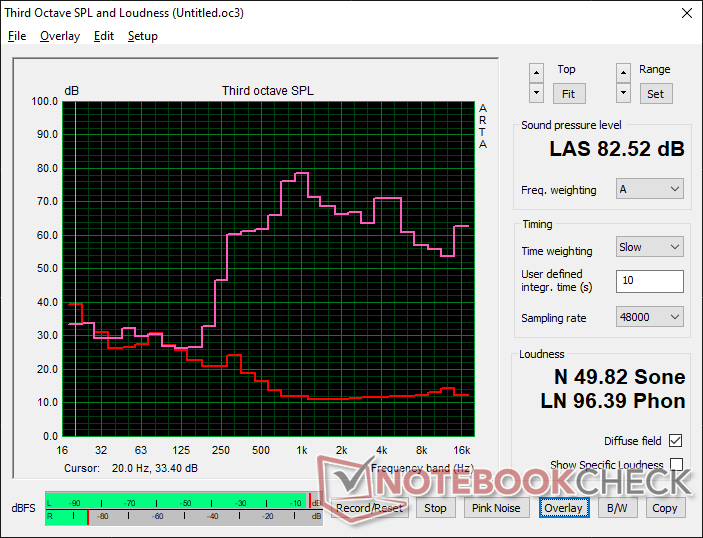
Eurocom Nightsky ARX315 audio analysis
(+) | speakers can play relatively loud (82.5 dB)
Bass 100 - 315 Hz
(-) | nearly no bass - on average 25.1% lower than median
(±) | linearity of bass is average (12.8% delta to prev. frequency)
Mids 400 - 2000 Hz
(±) | higher mids - on average 7.1% higher than median
(±) | linearity of mids is average (7.7% delta to prev. frequency)
Highs 2 - 16 kHz
(±) | higher highs - on average 5.2% higher than median
(±) | linearity of highs is average (7.7% delta to prev. frequency)
Overall 100 - 16.000 Hz
(±) | linearity of overall sound is average (23.2% difference to median)
Compared to same class
» 84% of all tested devices in this class were better, 4% similar, 11% worse
» The best had a delta of 6%, average was 18%, worst was 132%
Compared to all devices tested
» 69% of all tested devices were better, 5% similar, 25% worse
» The best had a delta of 4%, average was 24%, worst was 134%
Apple MacBook 12 (Early 2016) 1.1 GHz audio analysis
(+) | speakers can play relatively loud (83.6 dB)
Bass 100 - 315 Hz
(±) | reduced bass - on average 11.3% lower than median
(±) | linearity of bass is average (14.2% delta to prev. frequency)
Mids 400 - 2000 Hz
(+) | balanced mids - only 2.4% away from median
(+) | mids are linear (5.5% delta to prev. frequency)
Highs 2 - 16 kHz
(+) | balanced highs - only 2% away from median
(+) | highs are linear (4.5% delta to prev. frequency)
Overall 100 - 16.000 Hz
(+) | overall sound is linear (10.2% difference to median)
Compared to same class
» 7% of all tested devices in this class were better, 2% similar, 91% worse
» The best had a delta of 5%, average was 18%, worst was 53%
Compared to all devices tested
» 5% of all tested devices were better, 1% similar, 94% worse
» The best had a delta of 4%, average was 24%, worst was 134%
能源管理
消耗功率
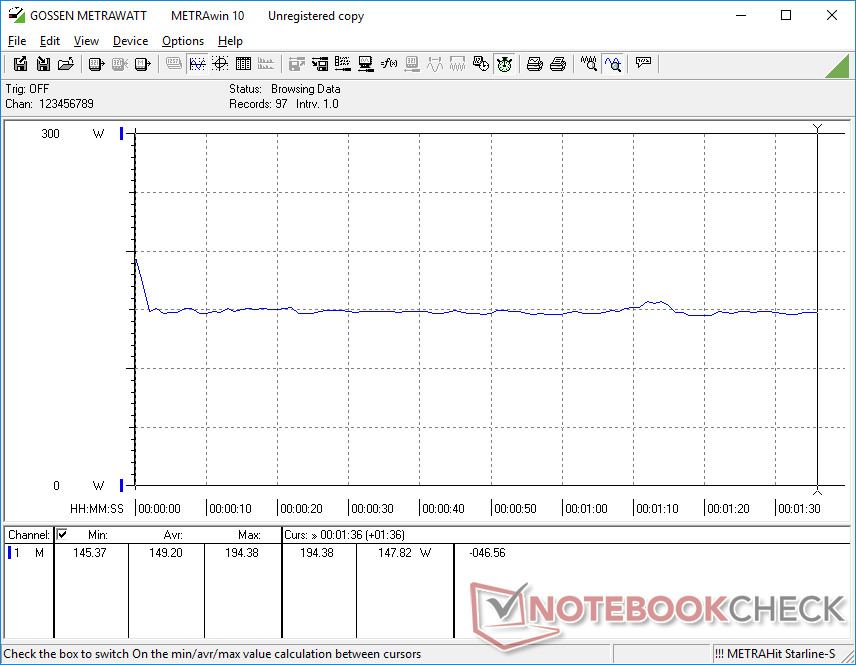
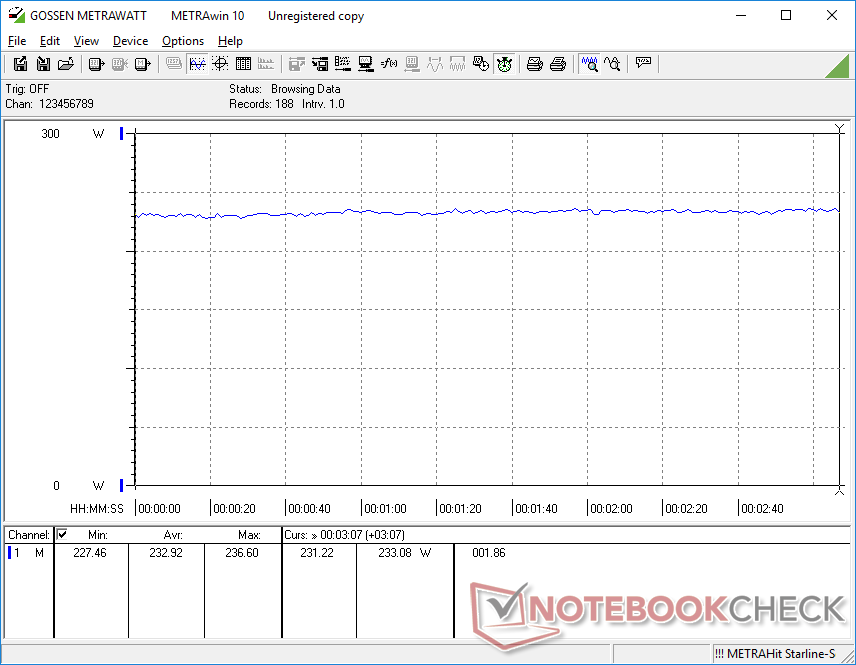
无论何种活动,功耗都非常高,这可能解释了下一节中电池寿命不佳的原因。仅仅在桌面上空转就会消耗55瓦到73瓦,而在老式的英特尔供电的Nightsky RX15上则是12瓦到35瓦。在运行更高的负载(如游戏)时,这个宽广的差距并没有缩小。Gigabyte A5 X1使用相同的RTX 3070 GPU,但使用移动Ryzen 9 5900HX CPU,在更重的负载下,需求比我们的Eurocom少25至30瓦。
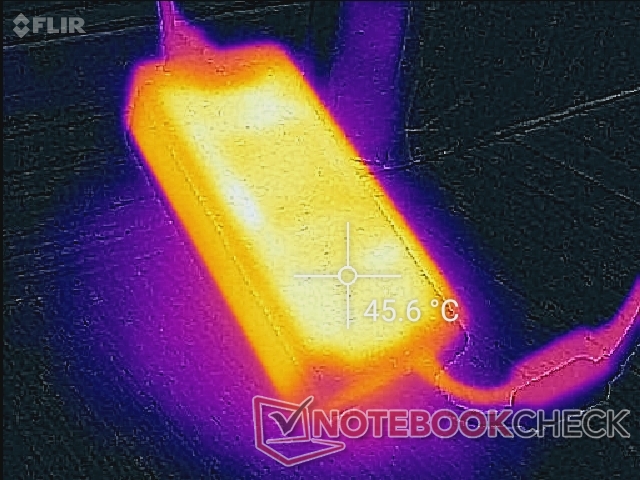
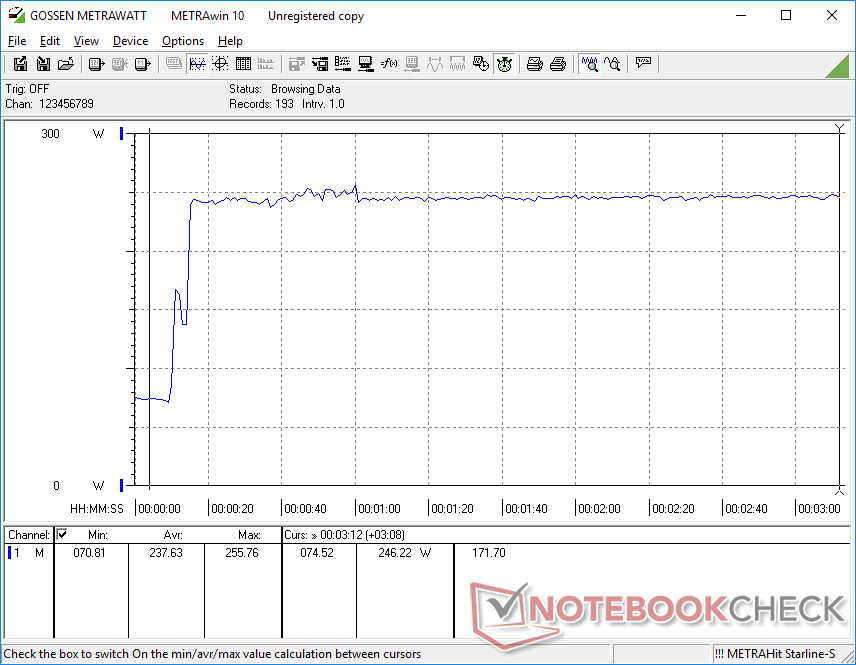
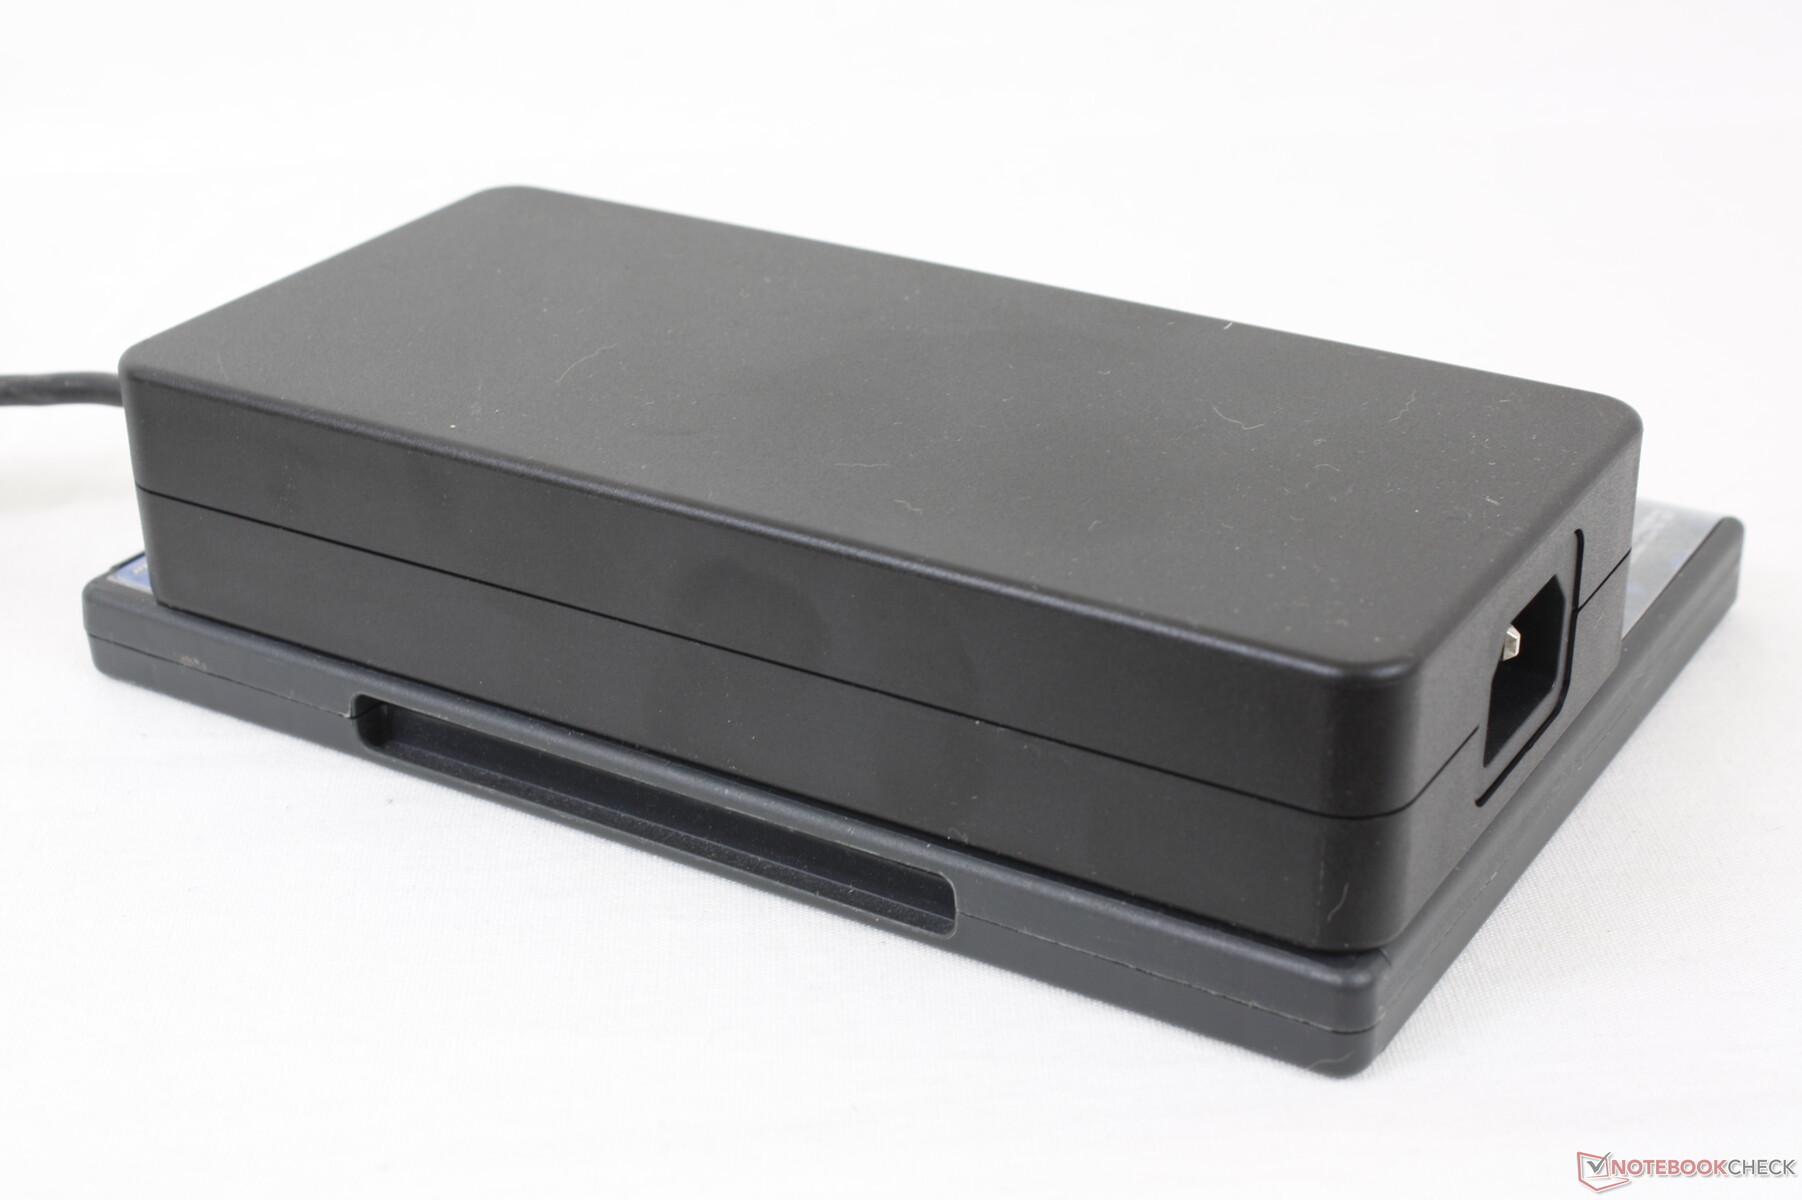
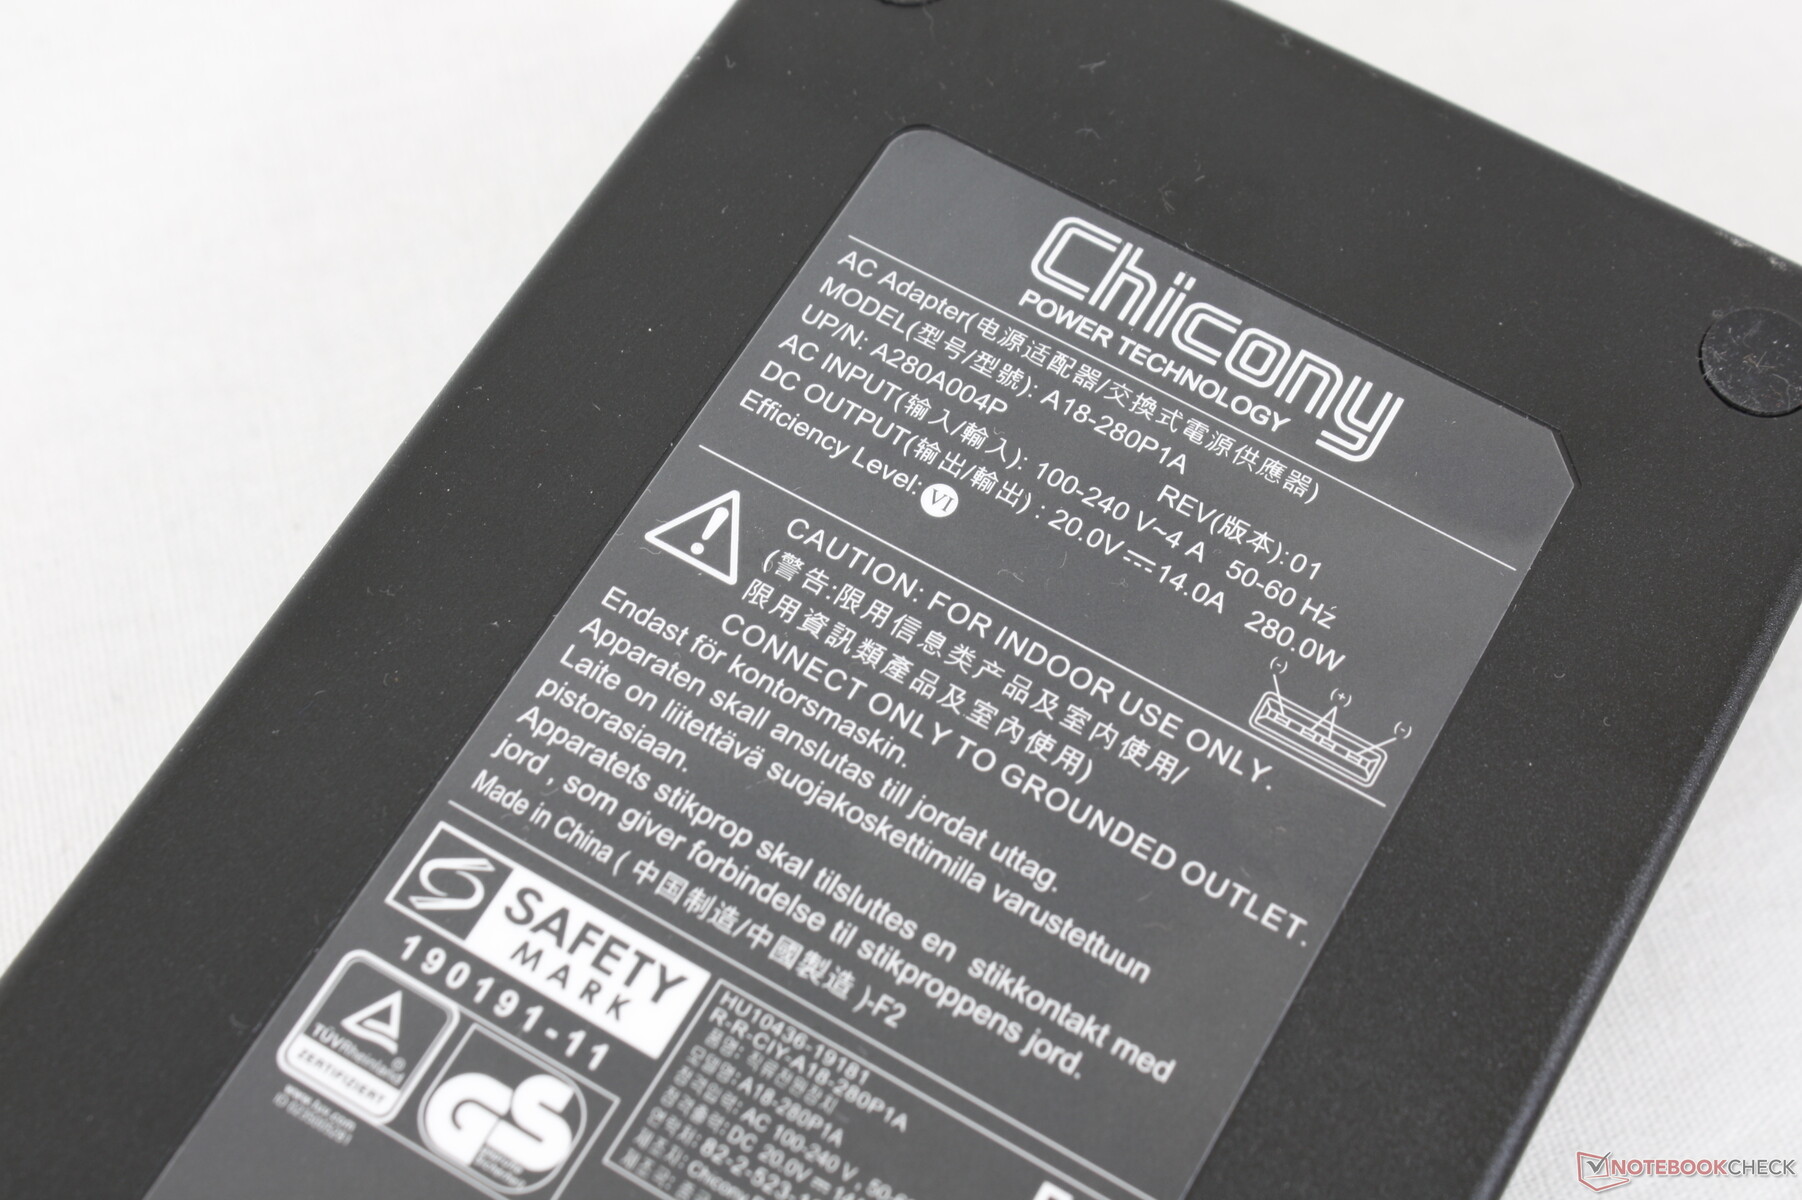
在同时运行Prime95和FurMark时,我们能够从大型(约18 x 8.5 x 3.5厘米)280瓦的交流适配器中记录到256瓦的最大功耗。
| Off / Standby | |
| Idle | |
| Load |
|
Key:
min: | |
| Eurocom Nightsky ARX315 R9 5900X, GeForce RTX 3070 Laptop GPU, Samsung SSD 980 Pro 1TB MZ-V8P1T0BW, IPS, 1920x1080, 15.6" | Gigabyte A5 X1 R9 5900HX, GeForce RTX 3070 Laptop GPU, ADATA XPG SX8200 Pro (ASX8200PNP-512GT), IPS, 1920x1080, 15.6" | Medion Erazer Deputy P25 R7 5800H, GeForce RTX 3060 Laptop GPU, Phison E12S-512GB-Phison-SSD-BICS4, IPS, 1920x1080, 15.6" | MSI Delta 15 A5EFK R9 5900HX, Radeon RX 6700M, Micron 2210 MTFDHBA1T0QFD, IPS-Level, 1920x1080, 15.6" | Schenker XMG Apex 15 NH57E PS R7 5800H, GeForce RTX 3060 Laptop GPU, Samsung SSD 980 500GB (MZ-V8V500BW), IPS, 1920x1080, 15.6" | MSI GE66 Raider 10SFS i9-10980HK, GeForce RTX 2070 Super Mobile, WDC PC SN730 SDBPNTY-1T00, IPS-Level, 1920x1080, 15.6" | |
|---|---|---|---|---|---|---|
| Power Consumption | 44% | 52% | 48% | 52% | 45% | |
| Idle Minimum * (Watt) | 55 | 10 82% | 8 85% | 10 82% | 10.5 81% | 6 89% |
| Idle Average * (Watt) | 68.2 | 12 82% | 11 84% | 18 74% | 15 78% | 14 79% |
| Idle Maximum * (Watt) | 72.5 | 16 78% | 16 78% | 25 66% | 17 77% | 25 66% |
| Load Average * (Watt) | 149.2 | 124 17% | 109 27% | 101 32% | 109 27% | 108 28% |
| Witcher 3 ultra * (Watt) | 233 | 204 12% | 183 21% | 187 20% | 186 20% | 195 16% |
| Load Maximum * (Watt) | 255.8 | 272 -6% | 211 18% | 217 15% | 186 27% | 280 -9% |
* ... smaller is better
Power Consumption Witcher 3 / Stresstest
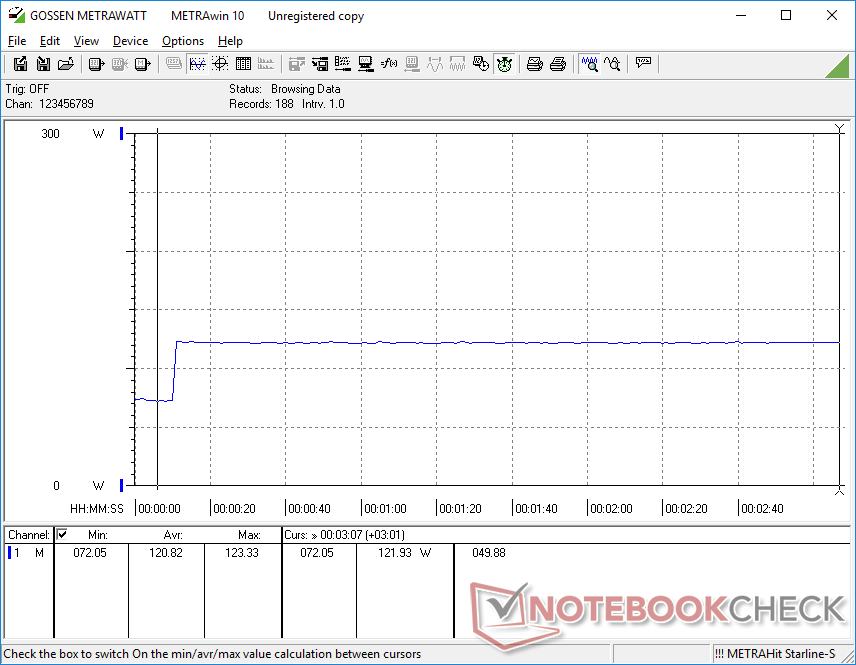
Power Consumption external Monitor
电池寿命
在平衡模式(或安静模式)下的运行时间非常差,以至于在简单地浏览网页时,将电池从空到满的时间要比放电的时间长很多(120分钟对61分钟)。与大多数其他笔记本电脑不同,该电池很容易拆卸,但与微星GE66等其他大型15.6英寸笔记本电脑相比,容量相当小,只有62Wh。
| Eurocom Nightsky ARX315 R9 5900X, GeForce RTX 3070 Laptop GPU, 62 Wh | Gigabyte A5 X1 R9 5900HX, GeForce RTX 3070 Laptop GPU, 48.96 Wh | Medion Erazer Deputy P25 R7 5800H, GeForce RTX 3060 Laptop GPU, 49 Wh | MSI Delta 15 A5EFK R9 5900HX, Radeon RX 6700M, 82 Wh | Schenker XMG Apex 15 NH57E PS R7 5800H, GeForce RTX 3060 Laptop GPU, 49 Wh | MSI GE66 Raider 10SFS i9-10980HK, GeForce RTX 2070 Super Mobile, 99.99 Wh | |
|---|---|---|---|---|---|---|
| Battery runtime | 540% | 570% | 690% | 550% | 510% | |
| WiFi v1.3 (h) | 1 | 6.4 540% | 6.7 570% | 7.9 690% | 6.5 550% | 6.1 510% |
| Reader / Idle (h) | 10.1 | 10.5 | 11.1 | 7.6 | ||
| H.264 (h) | 7.3 | 4.6 | ||||
| Load (h) | 1.3 | 1.1 | 1.6 | 1.4 | 1.8 |
Pros
Cons
判决书
有几个问题需要解决:非常缓慢的唤醒时间和设置为省电模式或静音模式时可怕的滞后性能。与成本低廉的标准超极本相比,Nightsky ARX15的这两项功能明显较慢。
对于那些希望利用Ryzen 9 5900X的最大潜力的人来说,不建议在库存设置下运行这个系统。与具有相同Ryzen 9 5900X的适当台式机相比,CPU性能将表现不佳,这意味着用户必须对我们的移动Ryzen 9 5900X进行超频,使其达到标准。我们的测试表明,确实有一些可用的空间,但由此产生的风扇噪音将非常大,可能会造成困扰。尽管如此,Eurocom仍然是为数不多的提供配备台式机CPU的笔记本电脑的公司之一,因为许多大型制造商如微星和 微星和Alienware 已经不太关注这种 "超级性能 "的笔记本电脑了。
价格和可用性
用户可以直接从制造商,配置Nightsky ARX15。.
Eurocom Nightsky ARX315
- 01/06/2022 v7 (old)
Allen Ngo
Price comparison

