惠普ZBook Studio 15 G8笔记本电脑评测。比以往更多的选择
顾名思义,惠普ZBook Studio 15 G8是ZBook Studio 15 G7的继任者,拥有更新的处理器和以前型号没有的新功能。新机型还取代了ZBook Create G7,后者与ZBook Studio G7的笔记本电脑基本相同,只是配备了GeForce ,而不是Quadro图形。因此,ZBook Studio G8整合并继承了两个较早的G7型号的所有配置,有一长串可配置的选项,从vPro到非vProTiger Lake-H CPU以及Quadro和GeForce GPU。
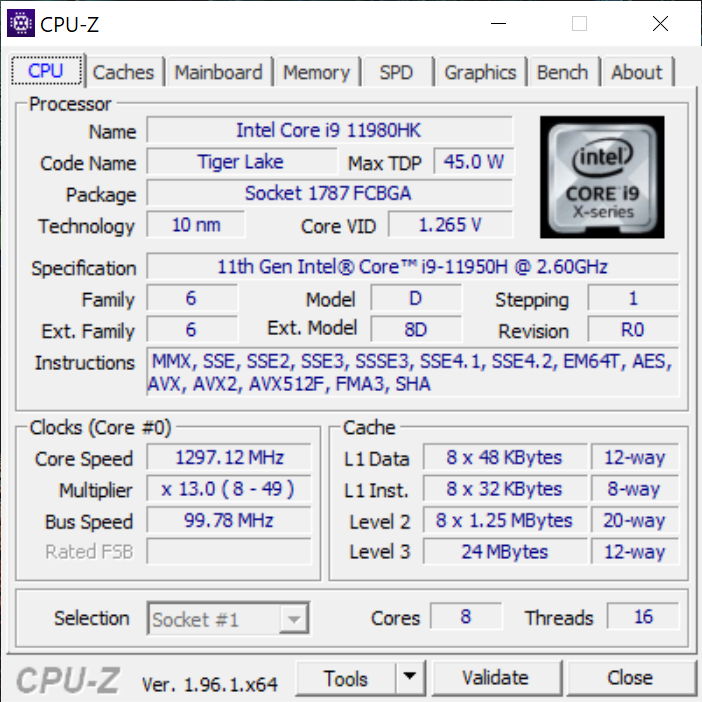
我们的测试装置是一个更高端的配置,配备了支持vPro的Core i9-11950H CPU、RTX 3070 GPU和4K OLED触摸屏,零售价约4200美元。配备酷睿i7-11800H、仅集成Iris Xe显卡、FHD显示屏或Quadro T1200显卡的较小SKU的售价要低得多。然而,没有Xeon选项。
直接的竞争对手包括其他以Core-H为动力的超薄移动工作站,如 微星WS66, Razer Blade 15 Studio, 华硕ProArt, 或 联想ThinkPad P15s.
更多惠普评论。
potential competitors in comparison
Rating | Date | Model | Weight | Height | Size | Resolution | Price |
|---|---|---|---|---|---|---|---|
| 87.8 % v7 (old) | 08 / 2021 | HP ZBook Studio 15 G8 i9-11950H, GeForce RTX 3070 Laptop GPU | 1.9 kg | 18 mm | 15.60" | 3840x2160 | |
| 83.8 % v7 (old) | HP ZBook Firefly 15 G8 2C9R7EA i7-1165G7, T500 Laptop GPU | 1.8 kg | 19.2 mm | 15.60" | 1920x1080 | ||
| 90.6 % v7 (old) | 02 / 2021 | HP ZBook Studio G7 i9-10885H, Quadro RTX 3000 Max-Q | 2 kg | 18 mm | 15.60" | 3840x2160 | |
| 87.8 % v7 (old) | 12 / 2020 | Dell Precision 7550 W-10885M, Quadro RTX 5000 Max-Q | 2.8 kg | 27.36 mm | 15.60" | 3840x2160 | |
| 85.3 % v7 (old) | Lenovo ThinkPad P15s Gen2-20W6000GGE i7-1165G7, T500 Laptop GPU | 1.9 kg | 19.1 mm | 15.60" | 3840x2160 | ||
| 83.1 % v7 (old) | Asus ProArt StudioBook Pro 15 W500G5T i7-9750H, Quadro RTX 5000 Max-Q | 2 kg | 18.9 mm | 15.60" | 3840x2160 |
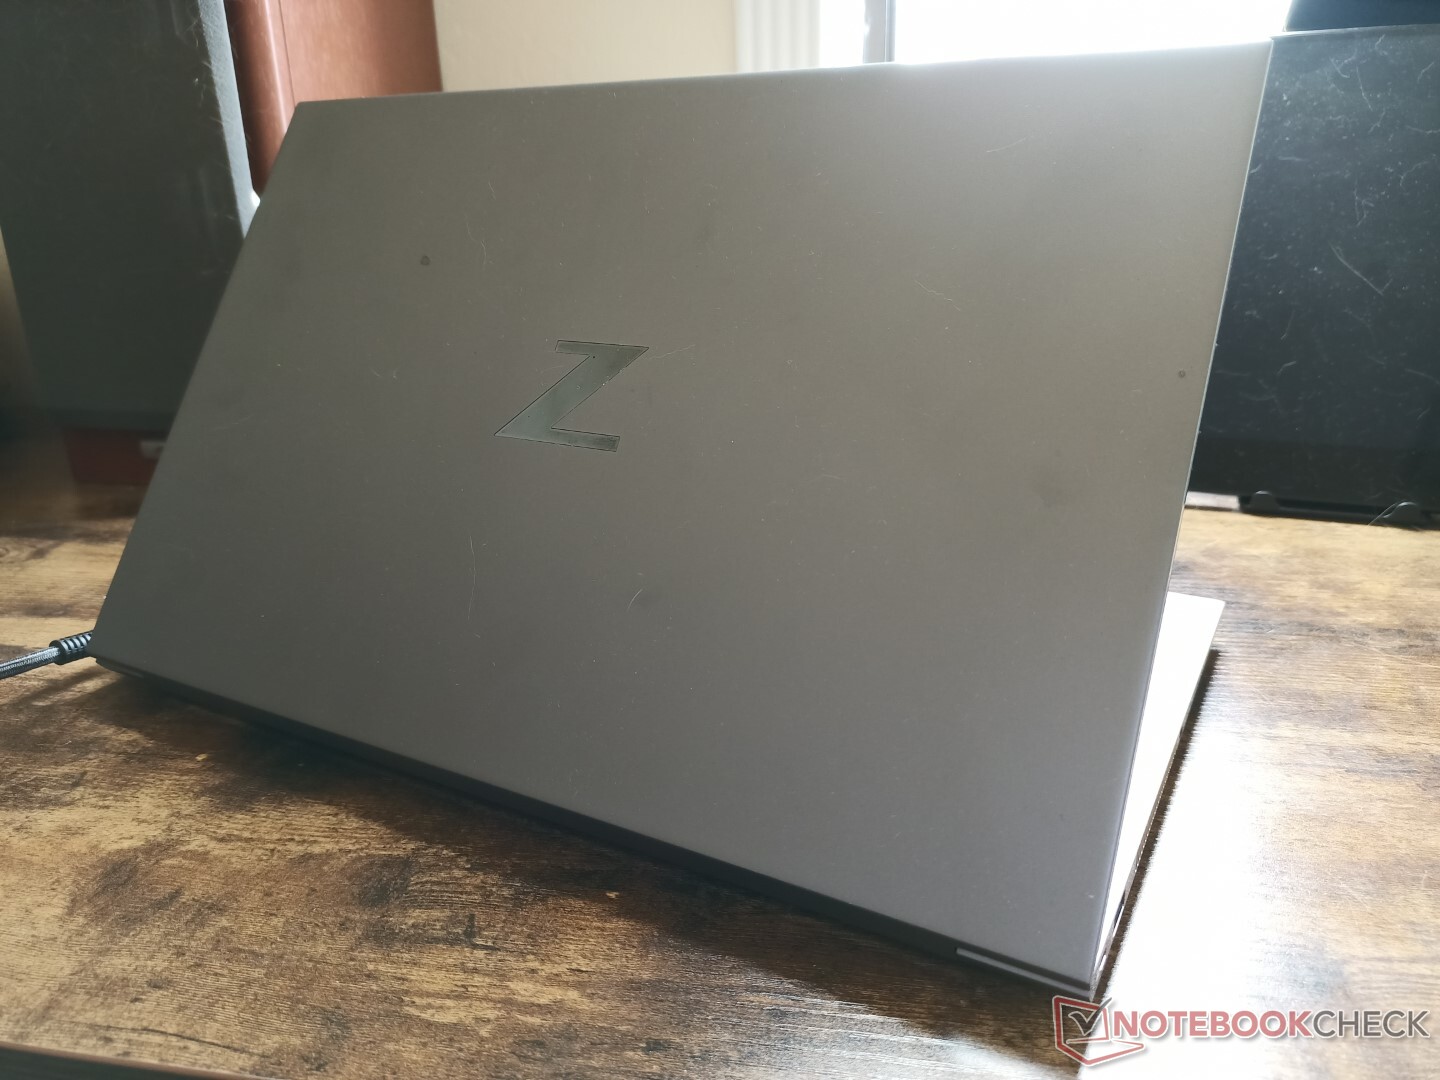
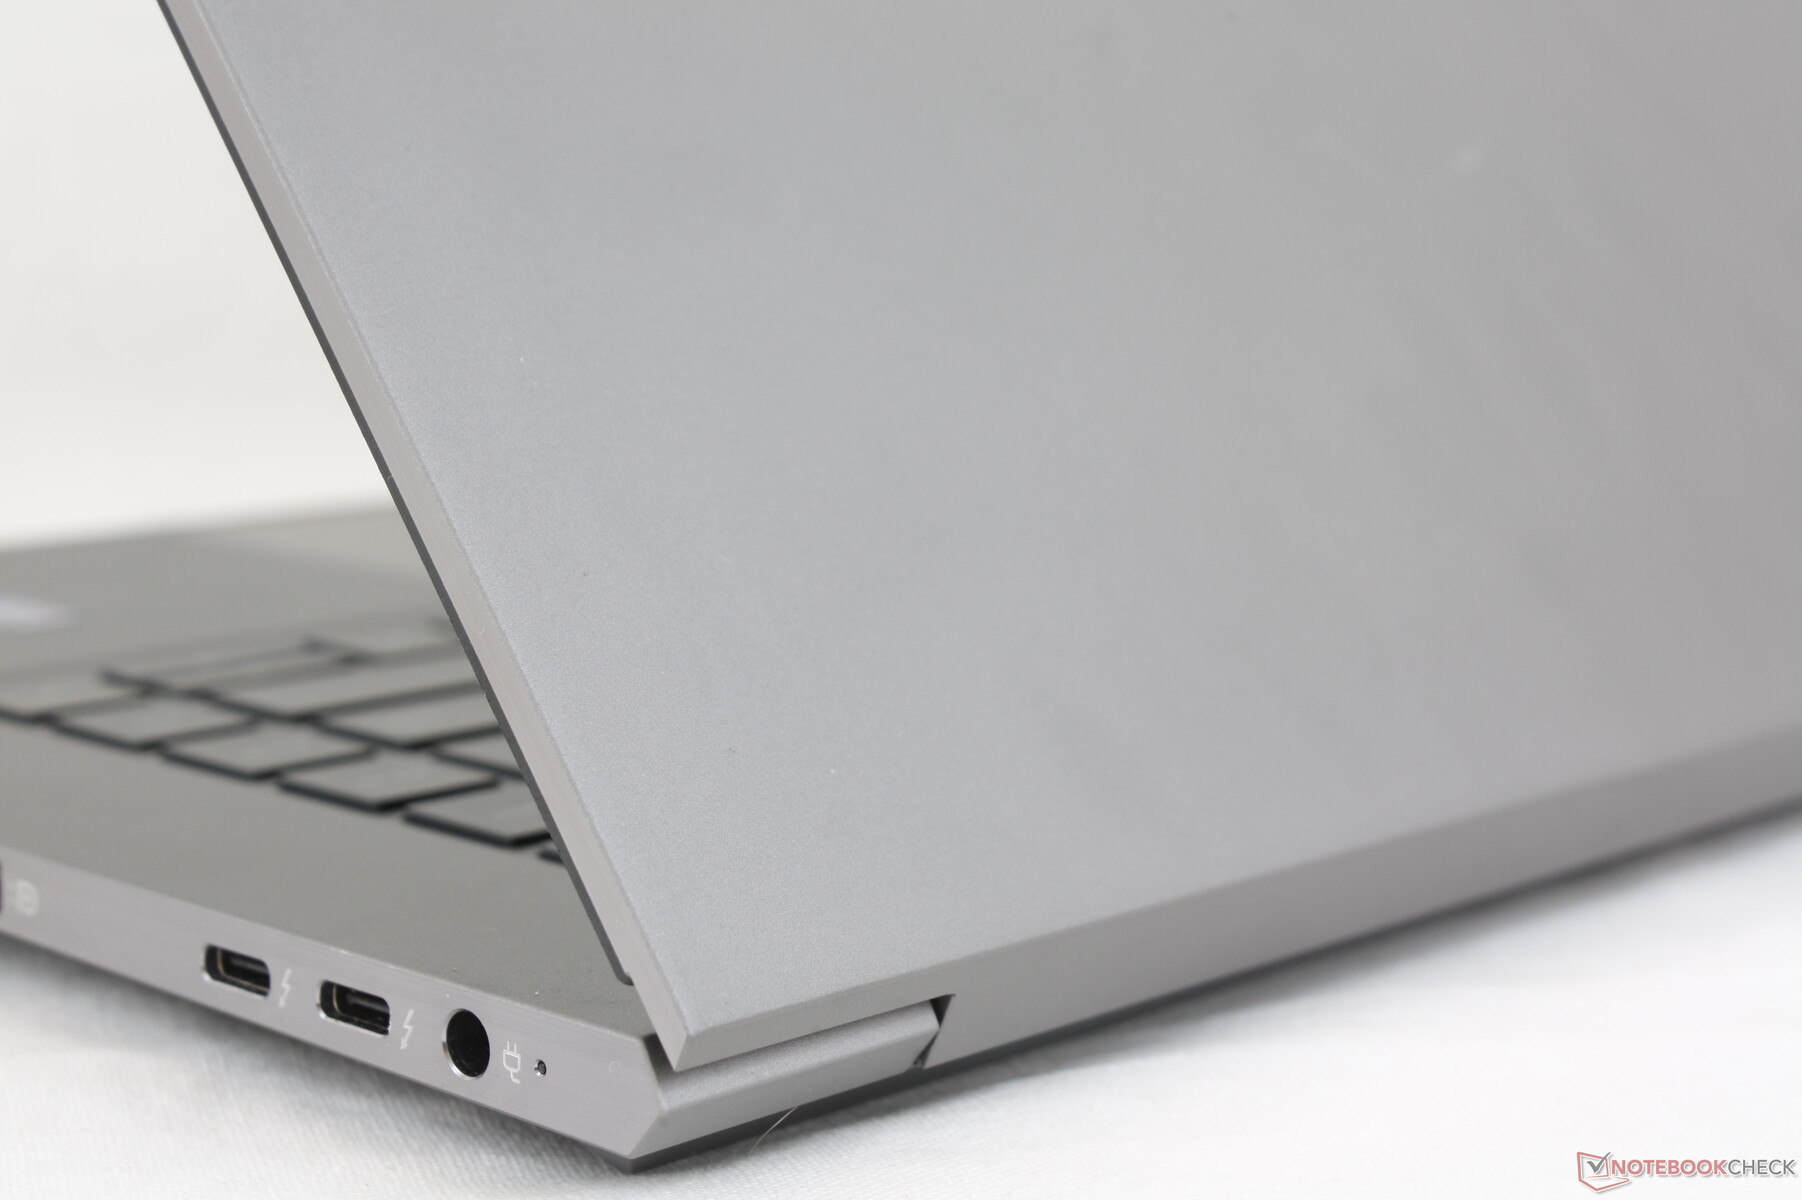
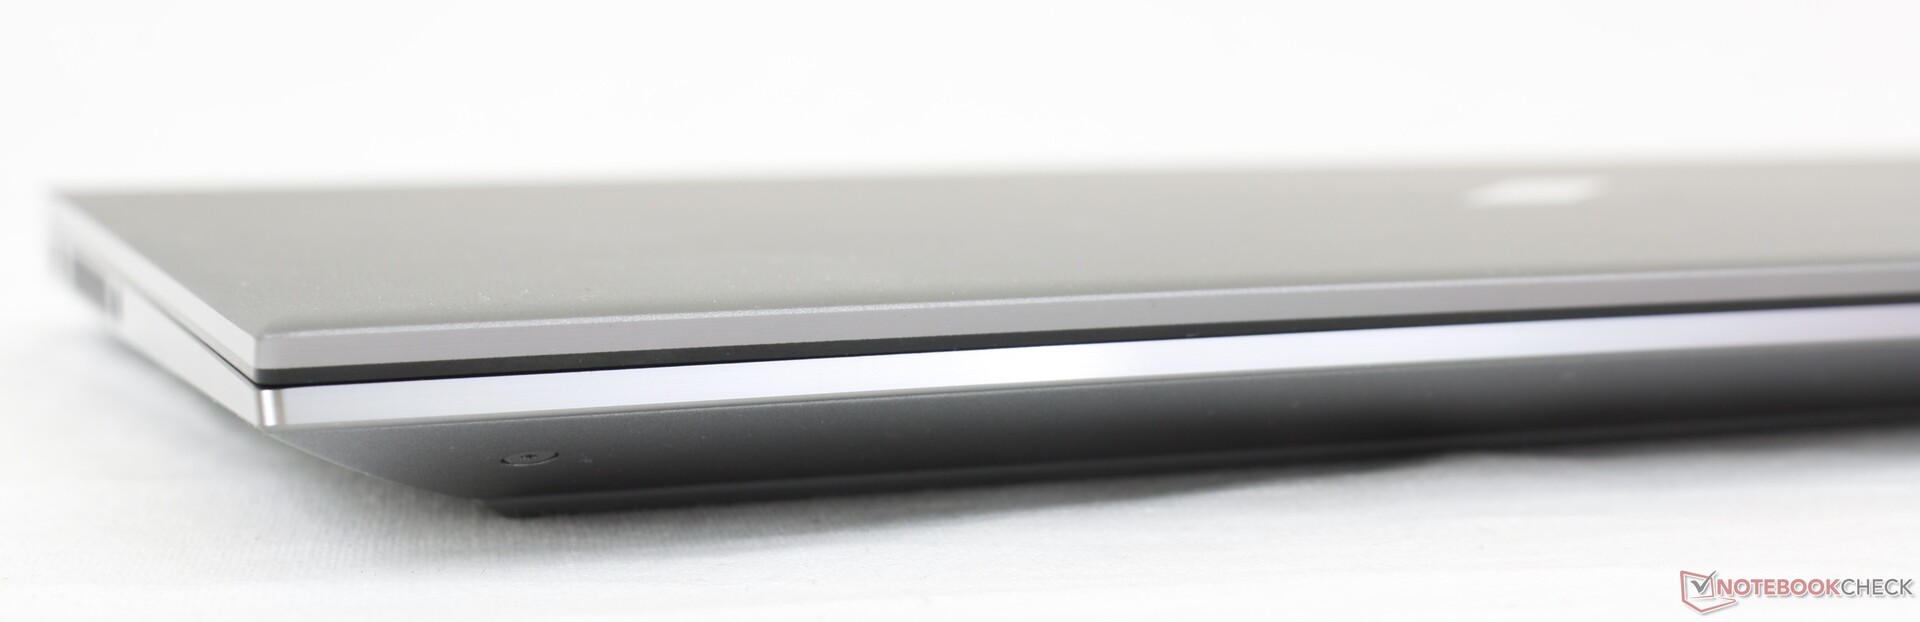
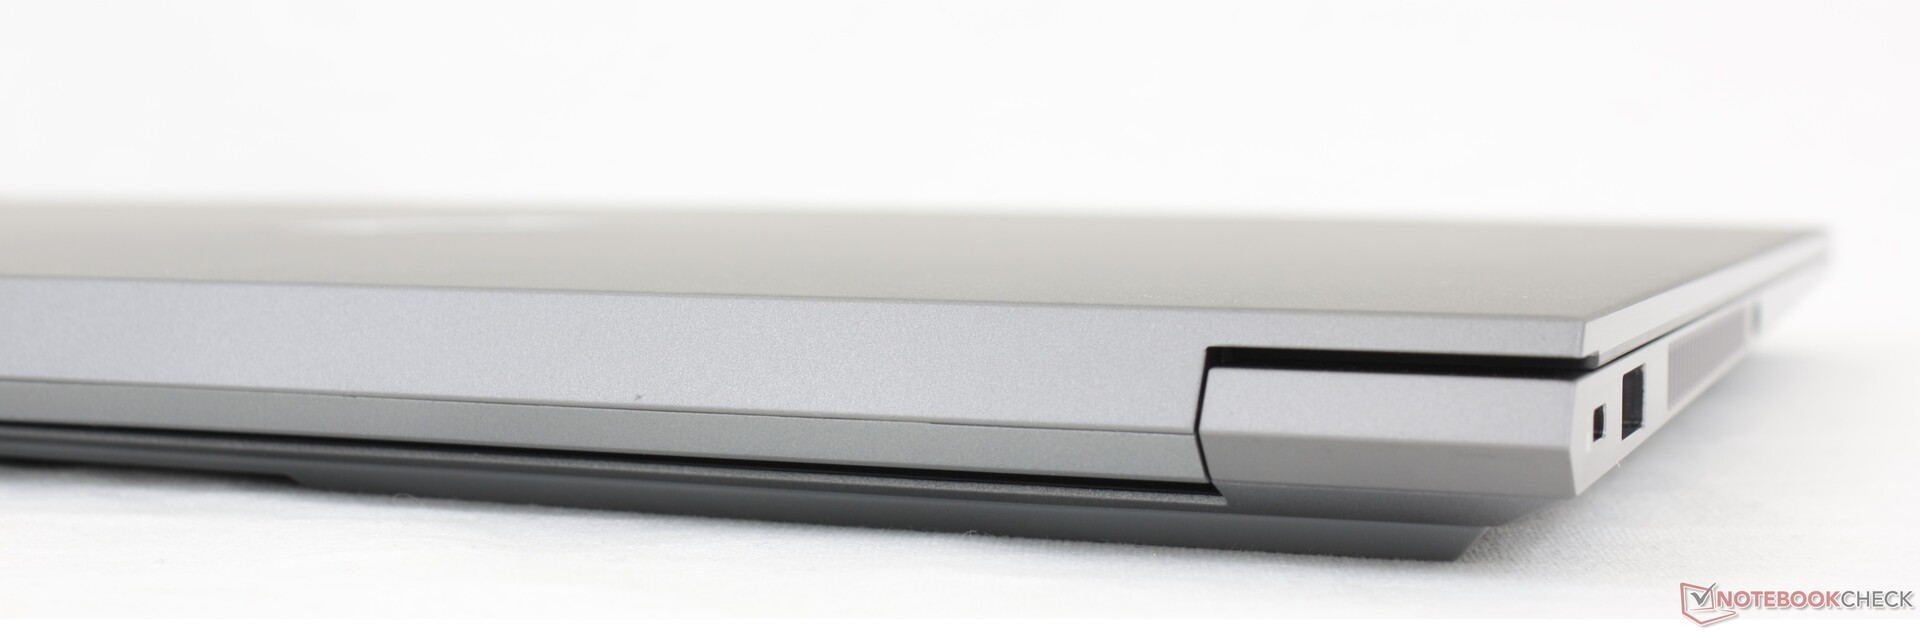
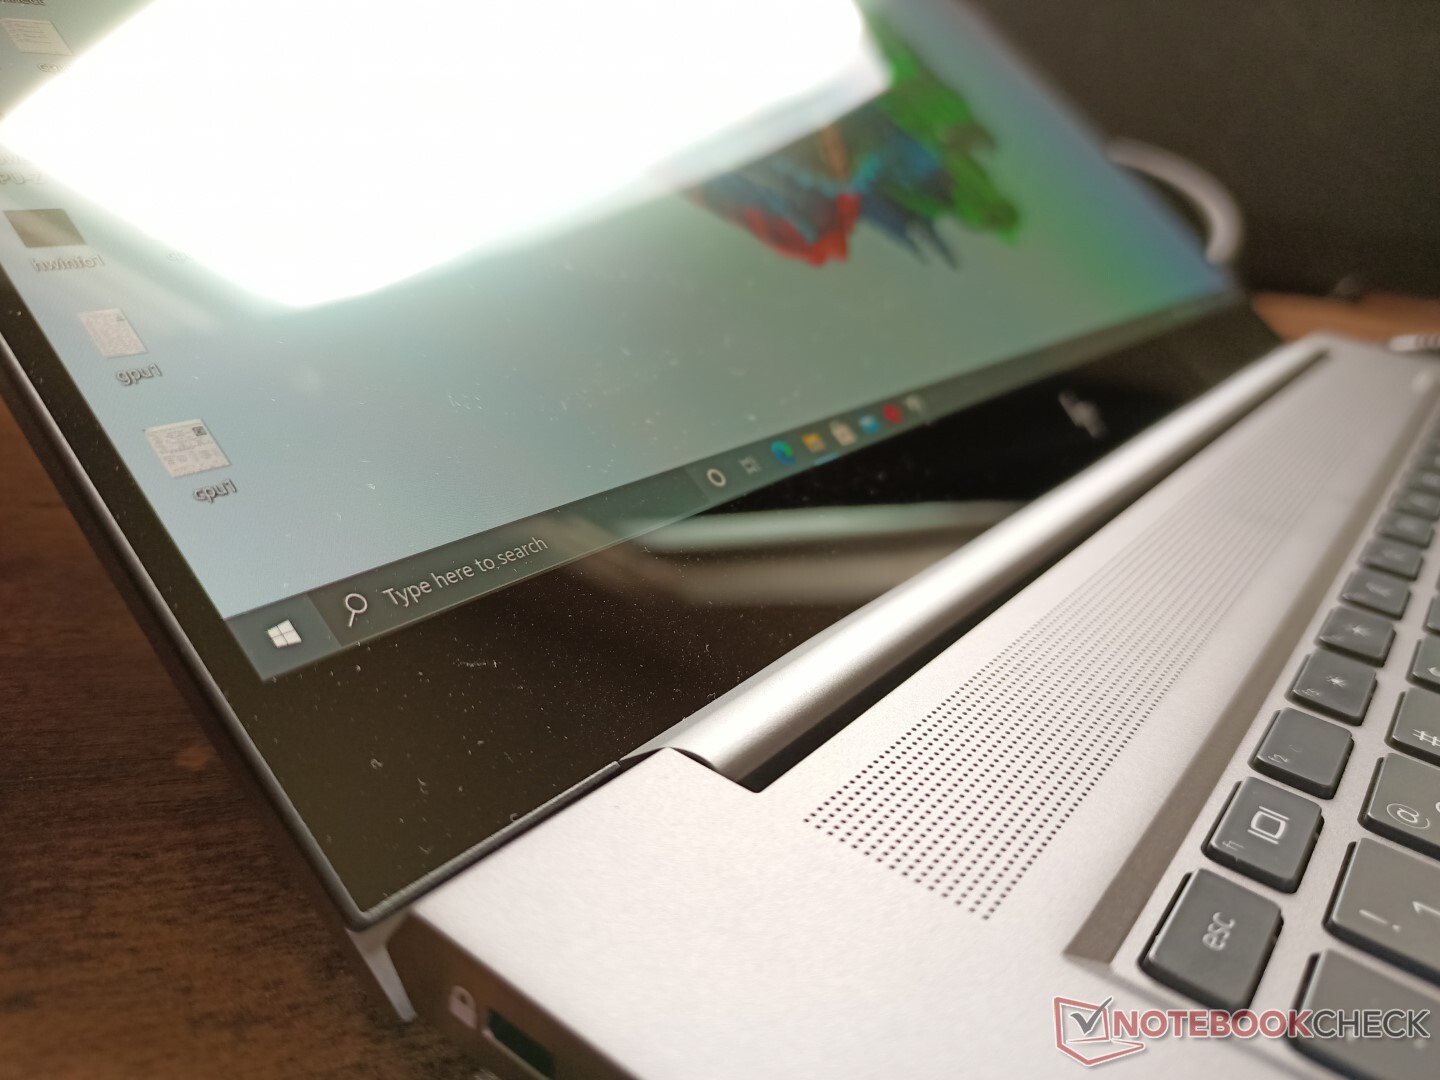
外壳 - 与ZBook 15 G7外观相同
惠普并没有改变外部机箱的设计,因此我们的 的原始评论ZBook Studio 15 G7的评论也适用于此。相反,变化是内部的,包括可选的每键RGB照明和修订的冷却解决方案,比去年的模型吸入更多空气。
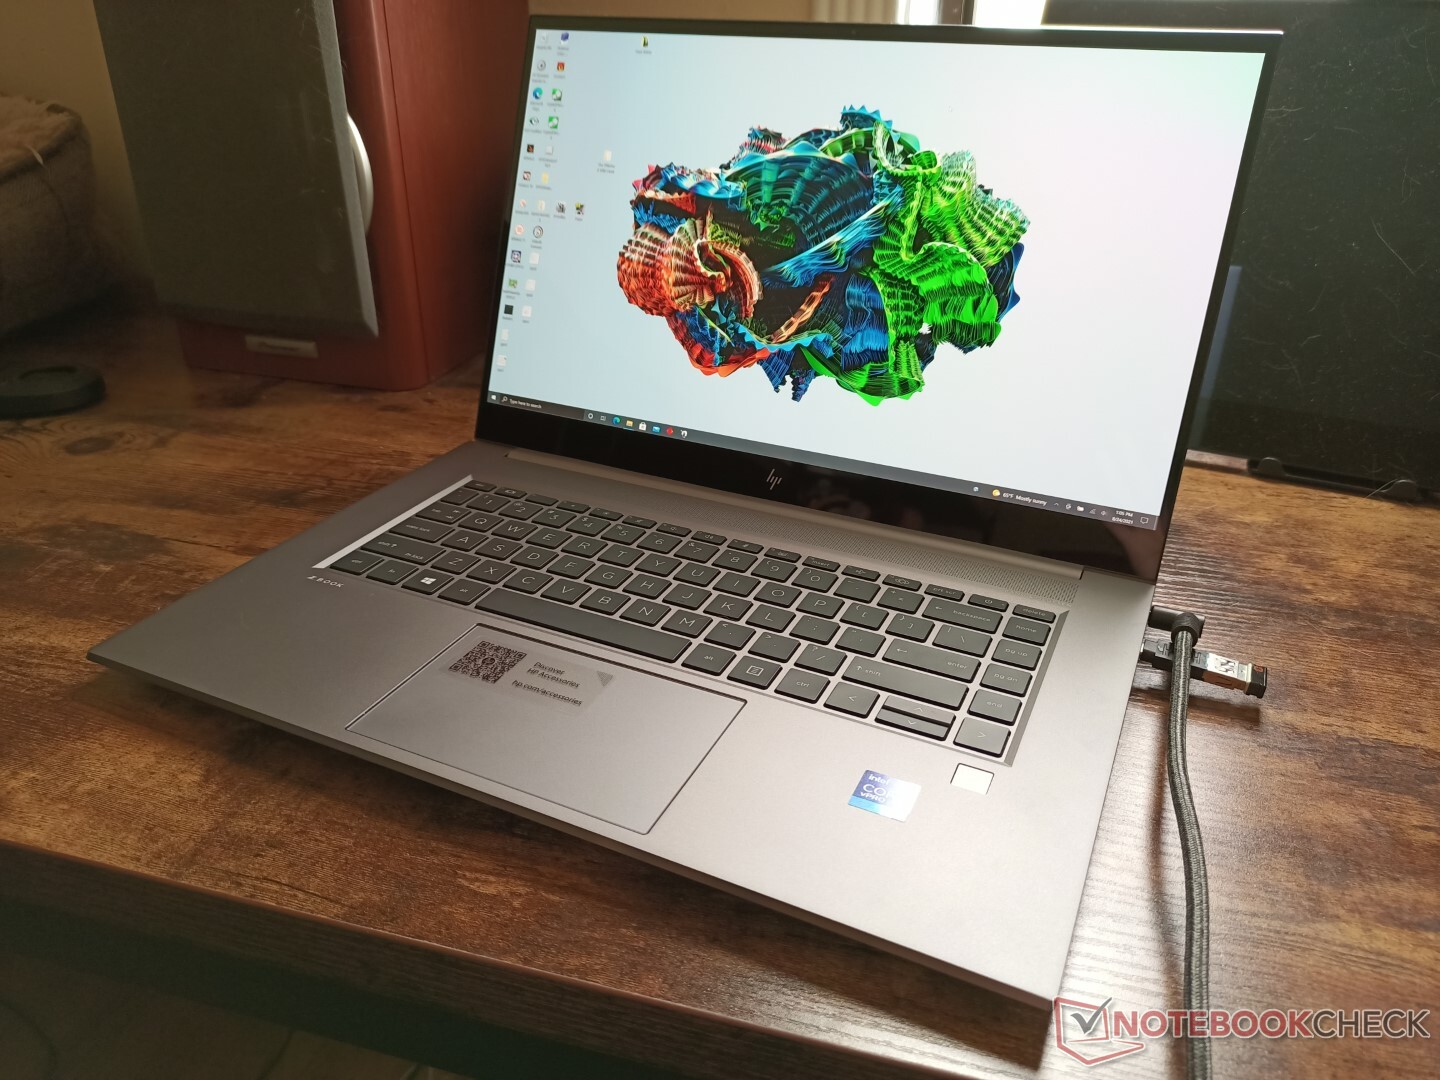
该机型尽管采用了 "老式 "的机箱设计,但仍然是采用Core-H系列CPU和GeForce/Quadro级图形的最小的15.6英寸工作站之一。它甚至比 ZBook Firefly G8它的内部设备比我们的ZBook Studio G8要慢。
值得注意的是,触摸屏SKU比非触摸屏SKU略微厚了百分之一英寸(0.70英寸对0.69英寸)。
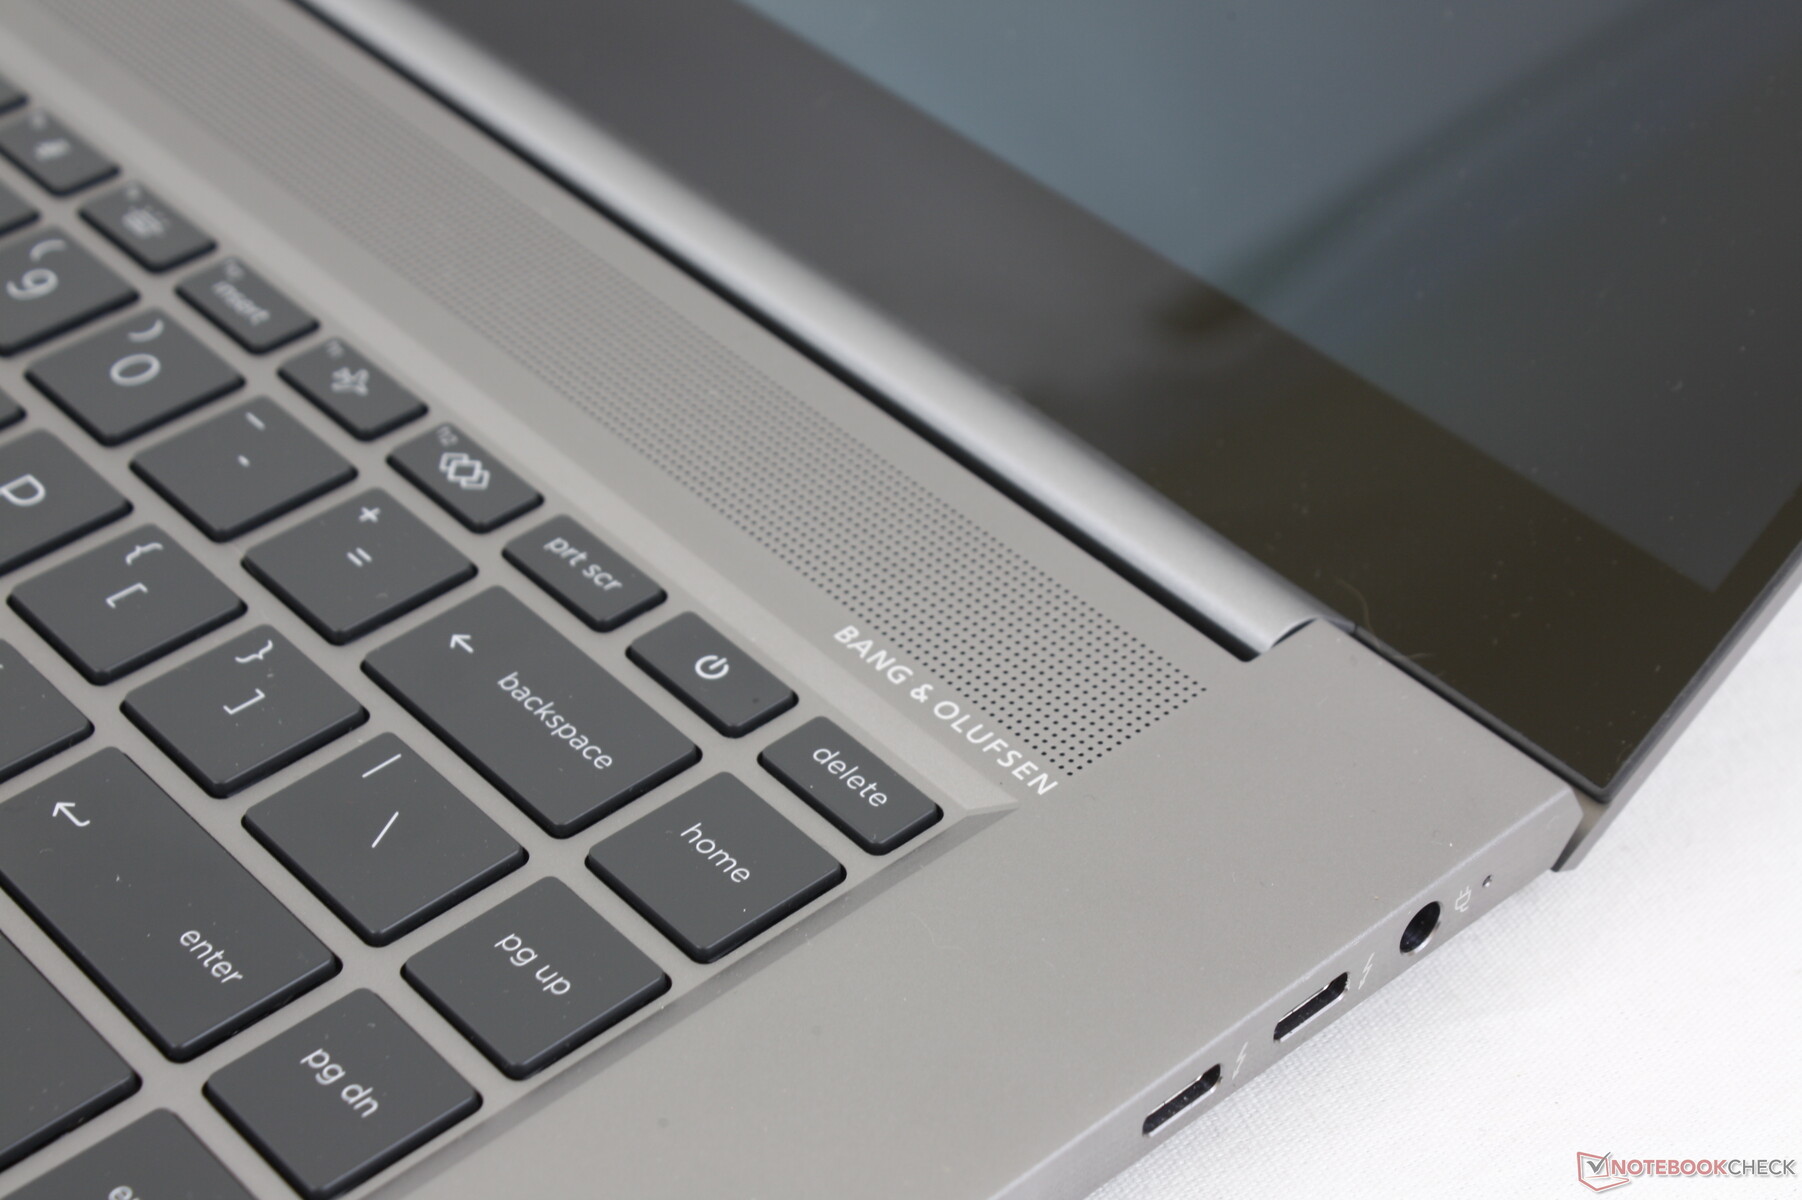
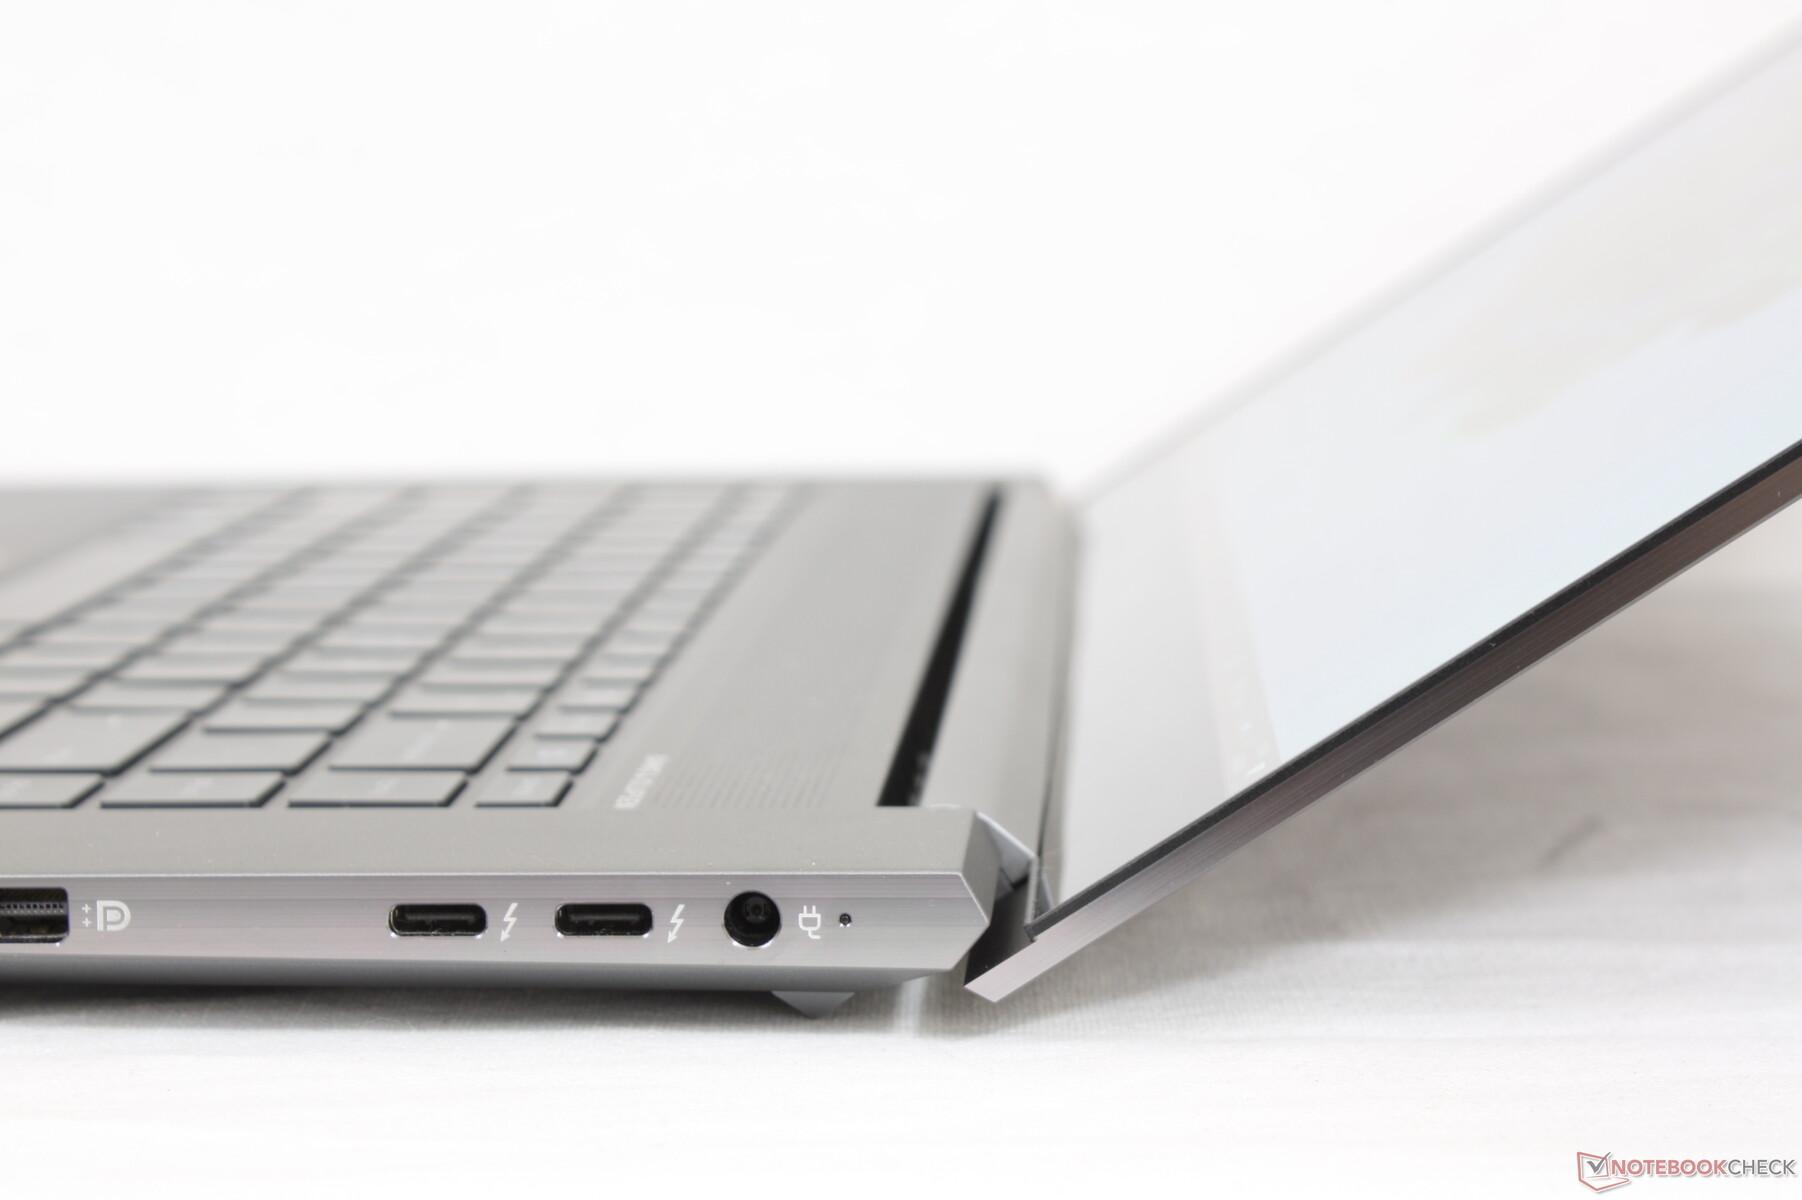
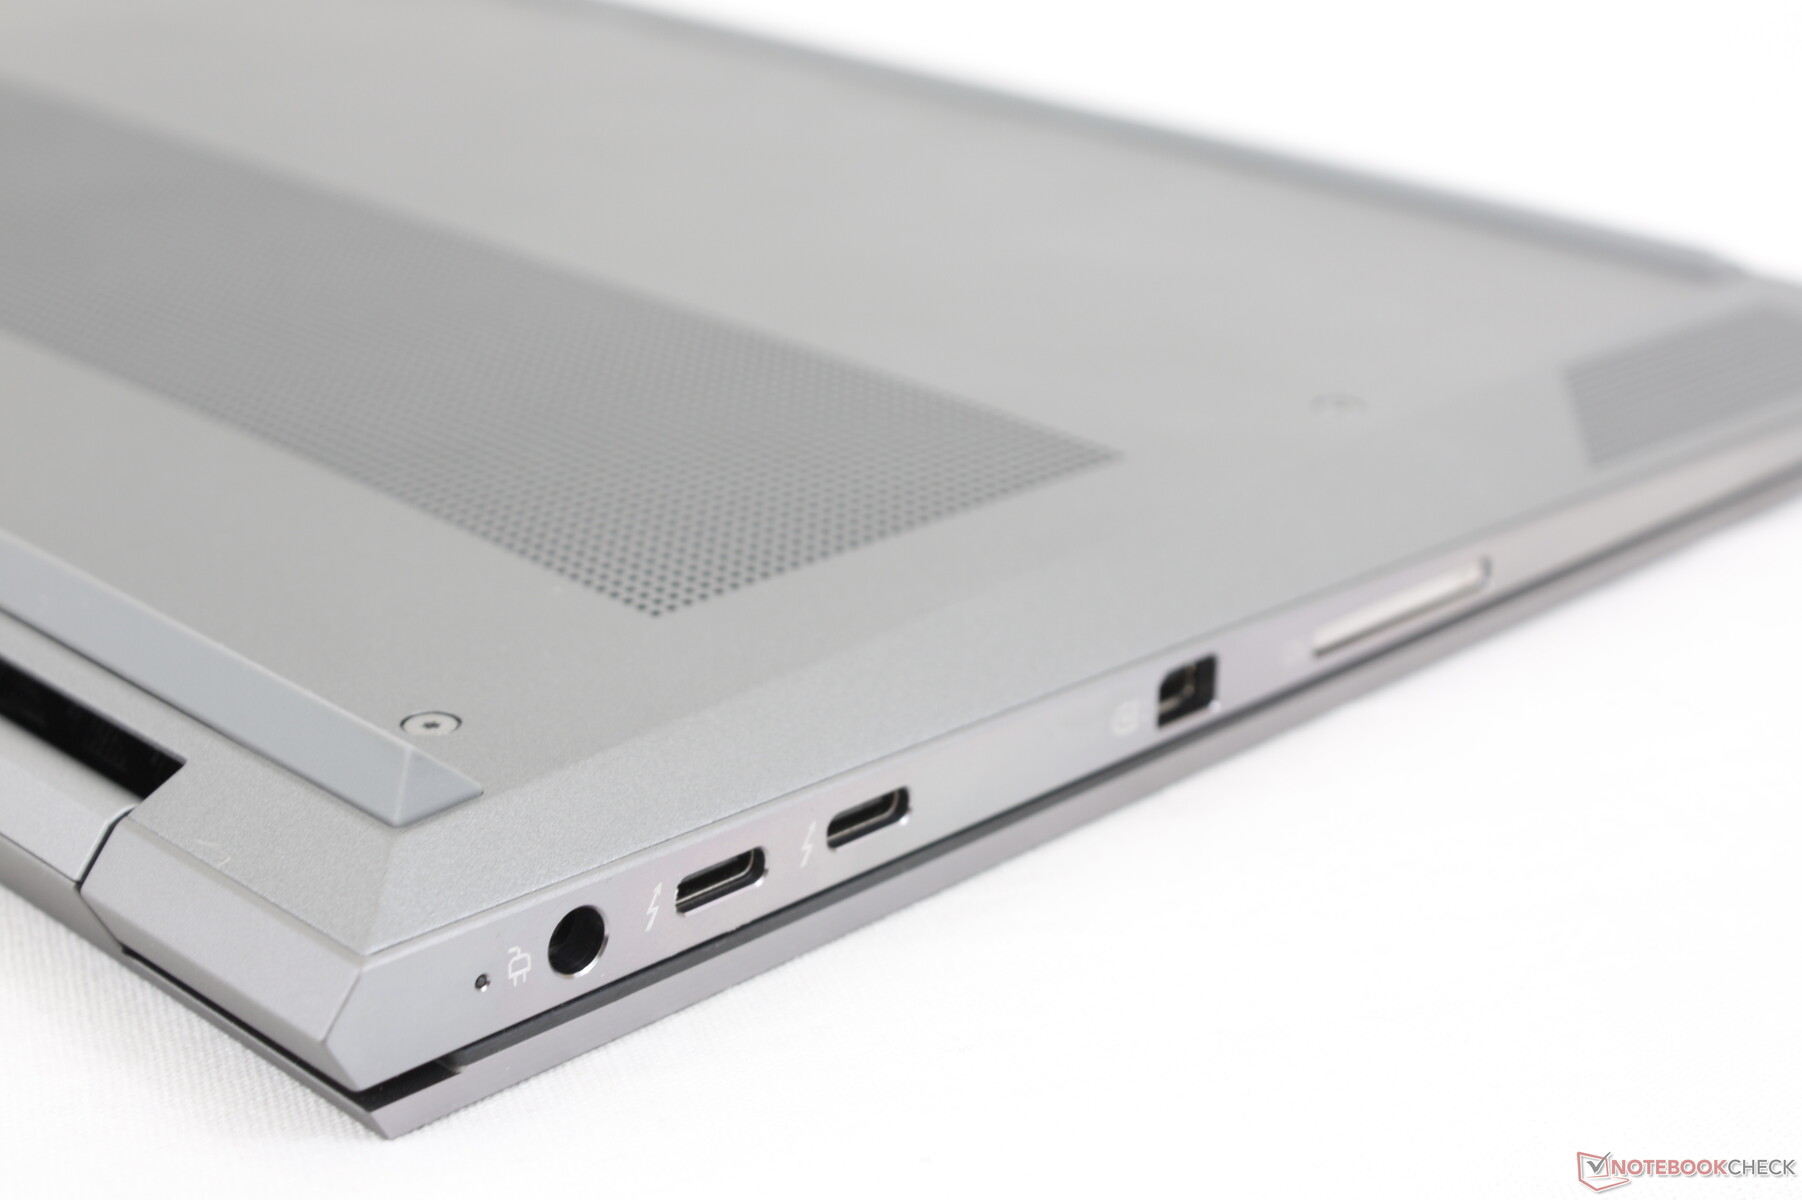
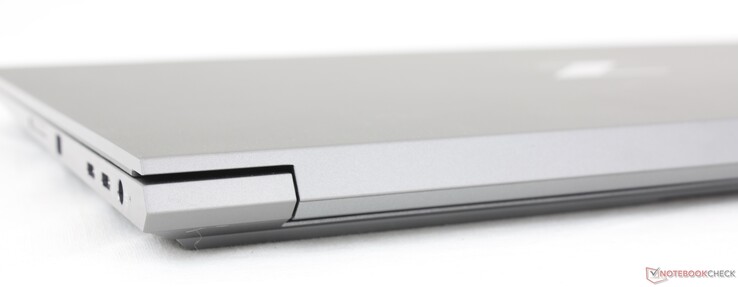
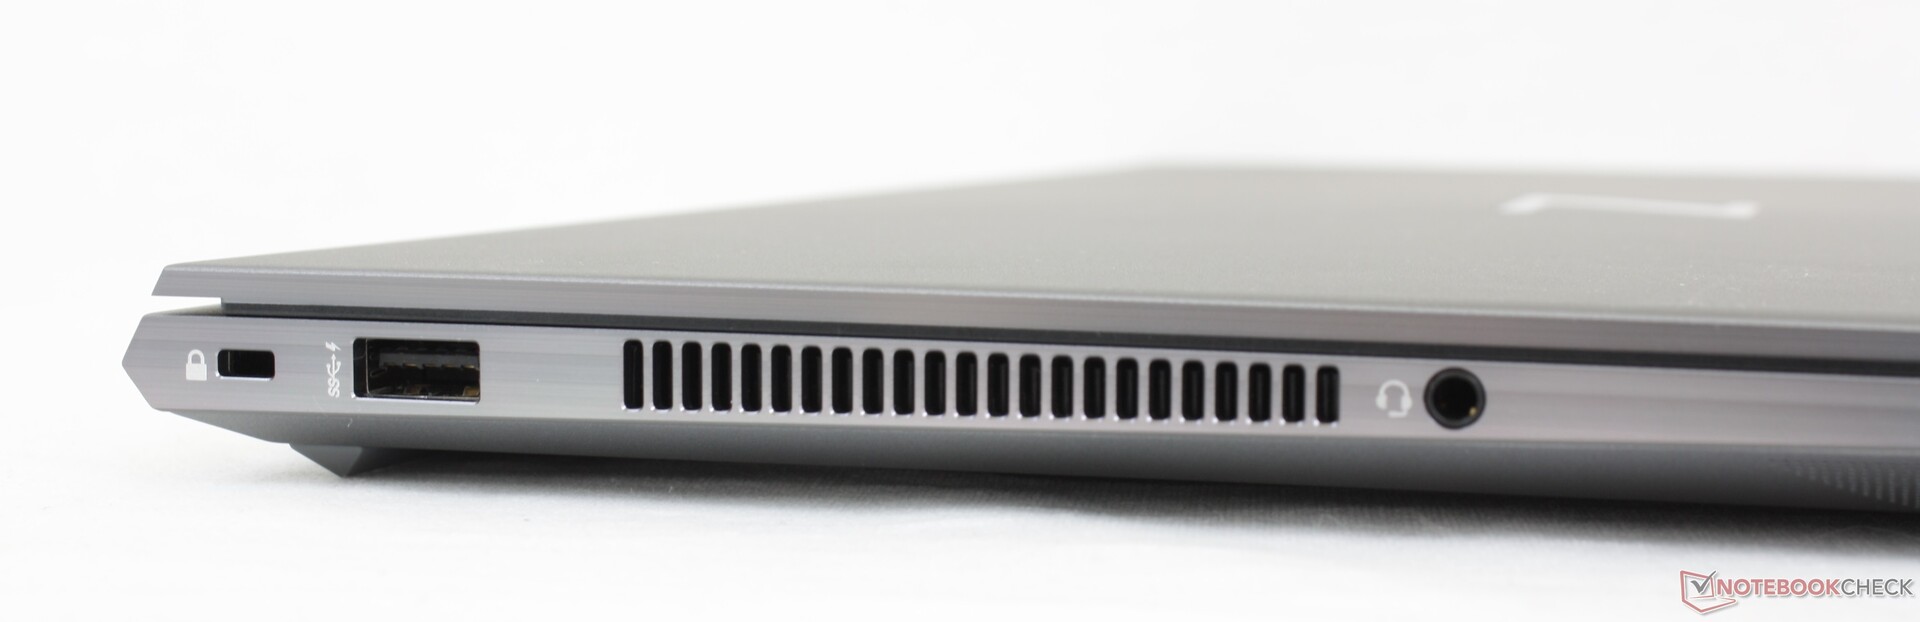
连接性 - 现在有了Thunderbolt 4
端口选择比在戴尔Precision 7550因为后者集成了ZBook Studio G8的所有功能,外加千兆RJ-45、HDMI和一个额外的USB-A端口。用户将不得不利用两个集成的Thunderbolt 4端口,以充分发挥惠普系统的对接能力。
端口定位在专有的AC适配器桶状端口和沿右边缘的两个USB-C端口之间有点紧张。较粗的电缆或USB-C设备可能会阻挡对邻近端口的访问。
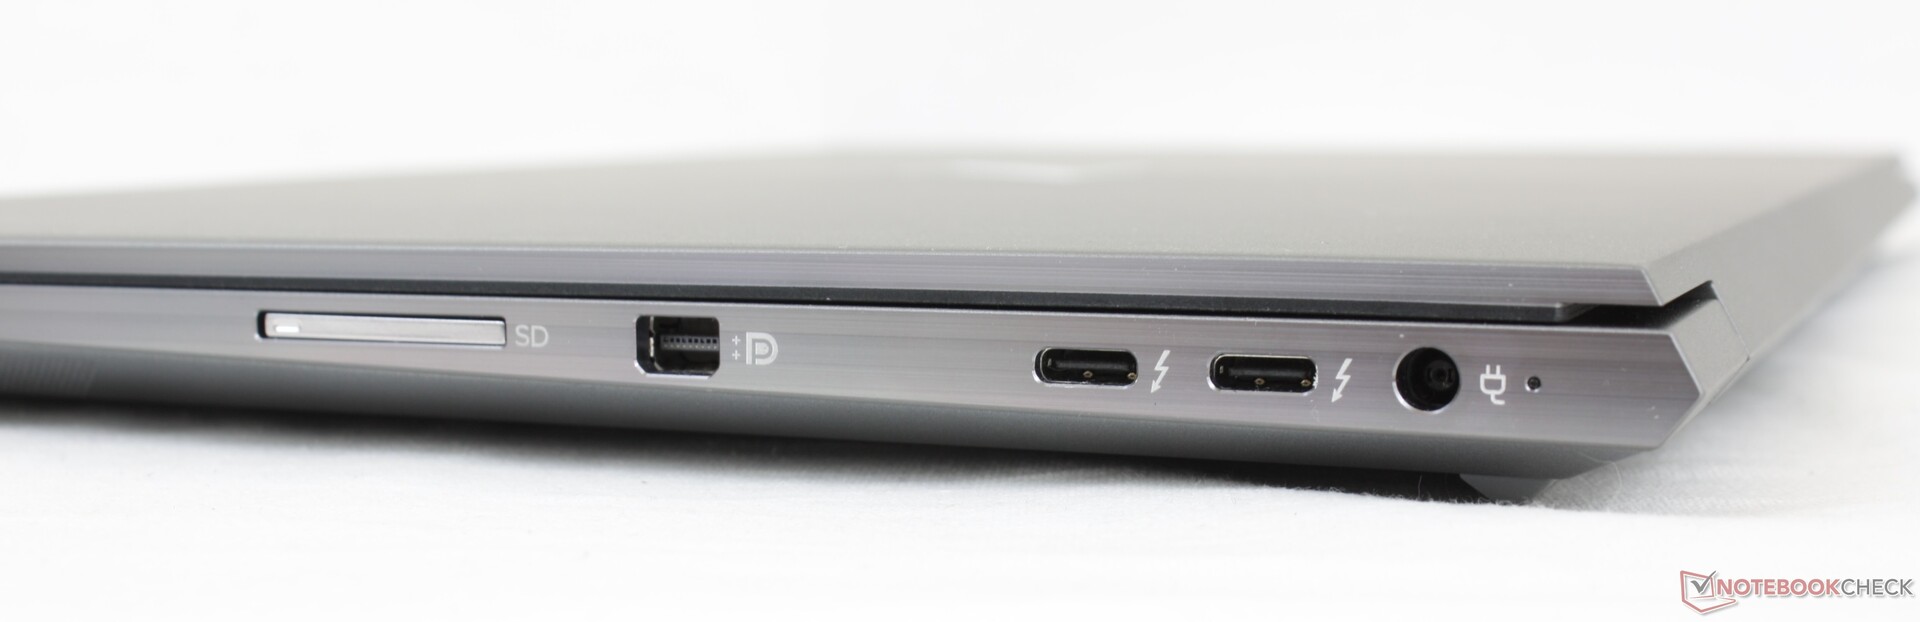
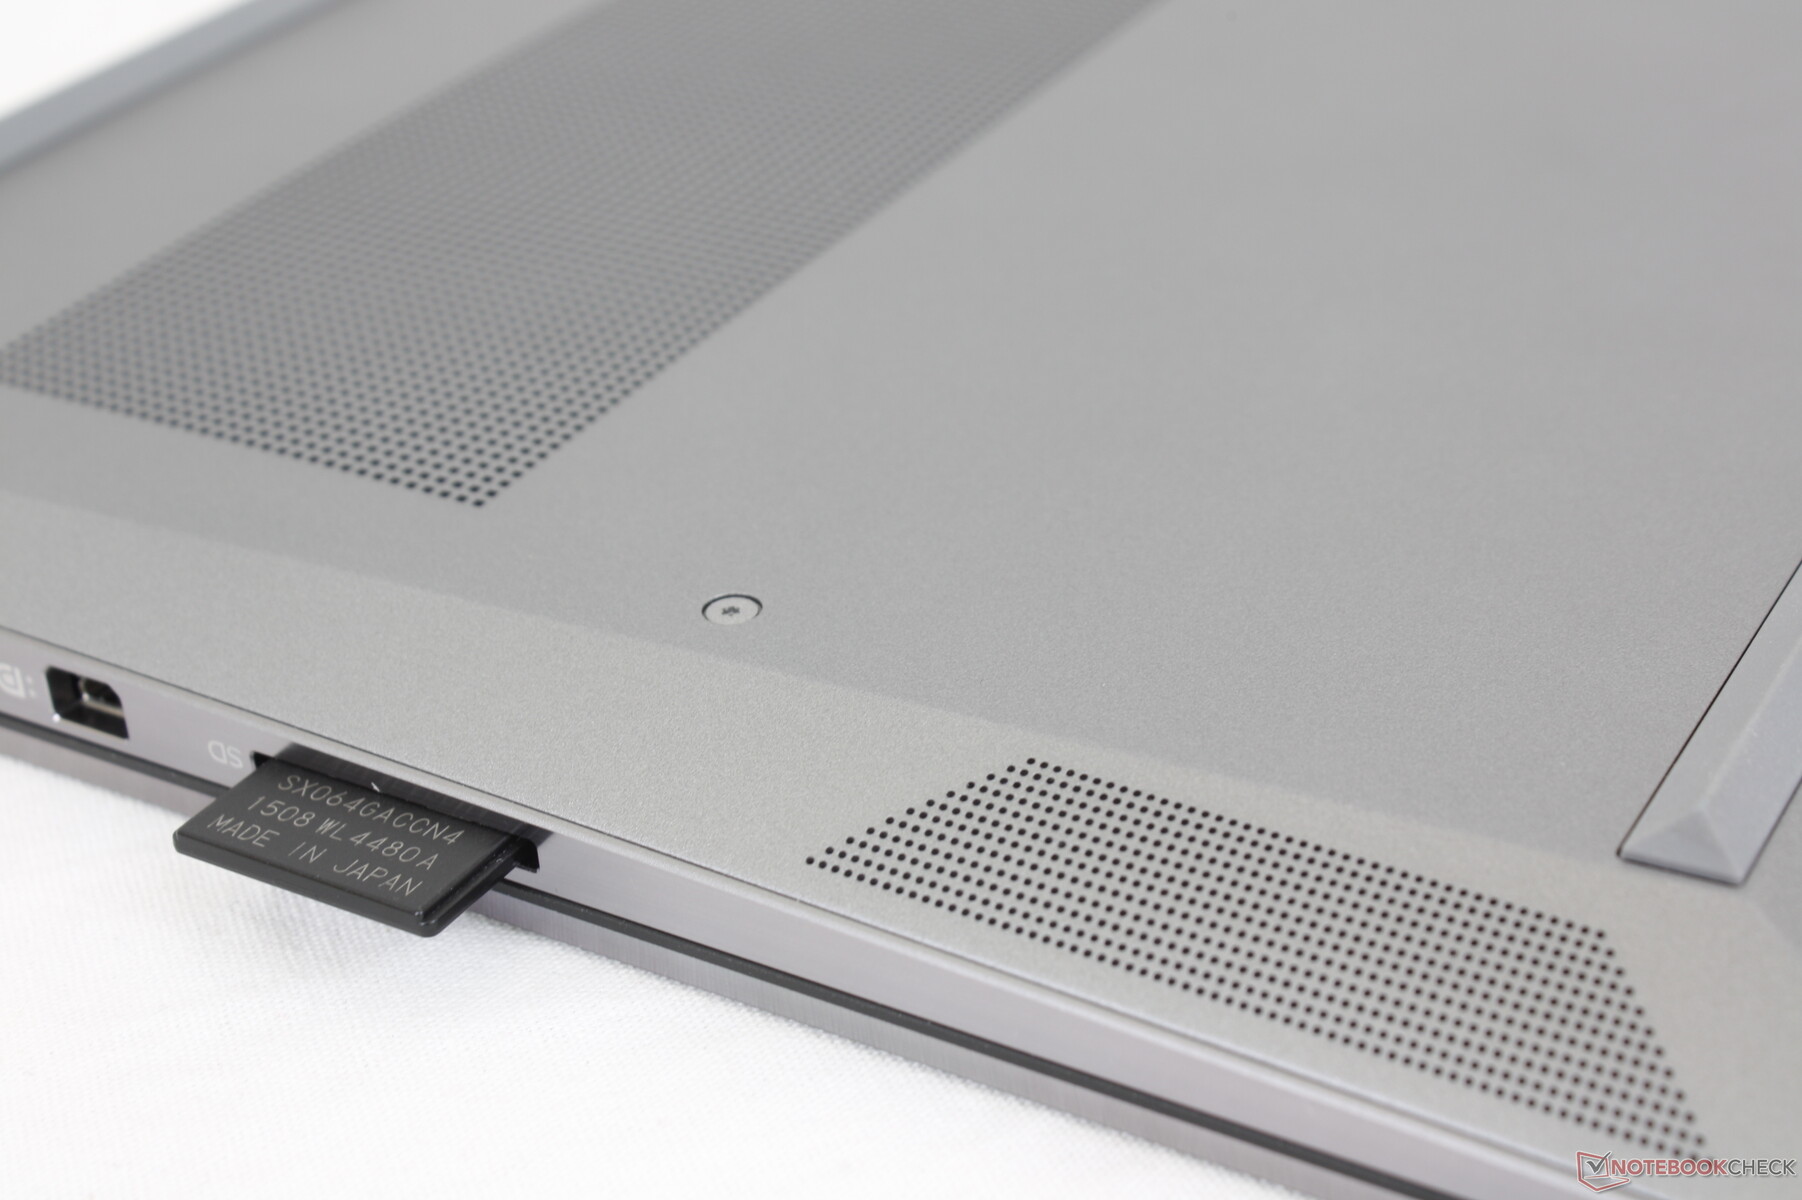
SD卡阅读器
惠普今年实际上已经降低了SD卡读卡器的档次。将1GB的图像从我们的UHS-II测试卡移动到桌面需要14秒左右,而ZBook Studio G7上的时间还不到一半。我们不知道为什么惠普会这样做,但这还是令人失望的,特别是对那些依赖读卡器的内容创作者来说。
| SD Card Reader | |
| average JPG Copy Test (av. of 3 runs) | |
| Dell Precision 7550 (Toshiba Exceria Pro SDXC 64 GB UHS-II) | |
| HP ZBook Studio G7 (AV Pro V60) | |
| HP ZBook Studio 15 G8 (AV Pro V60) | |
| Lenovo ThinkPad P15s Gen2-20W6000GGE (AV Pro V60) | |
| maximum AS SSD Seq Read Test (1GB) | |
| Dell Precision 7550 (Toshiba Exceria Pro SDXC 64 GB UHS-II) | |
| HP ZBook Studio G7 (AV Pro V60) | |
| Lenovo ThinkPad P15s Gen2-20W6000GGE (AV Pro V60) | |
| HP ZBook Studio 15 G8 (AV Pro V60) | |
沟通
英特尔AX201的标准配置是Wi-Fi 6和蓝牙5.2连接。当与我们的Netgear RAX200测试路由器配对时,两个方向的传输速率稳定在1400Mbps左右。
| Networking | |
| iperf3 transmit AX12 | |
| HP ZBook Studio 15 G8 | |
| Asus ProArt StudioBook Pro 15 W500G5T | |
| Lenovo ThinkPad P15s Gen2-20W6000GGE | |
| HP ZBook Firefly 15 G8 2C9R7EA | |
| HP ZBook Studio G7 | |
| Dell Precision 7550 | |
| iperf3 receive AX12 | |
| HP ZBook Studio G7 | |
| Lenovo ThinkPad P15s Gen2-20W6000GGE | |
| HP ZBook Firefly 15 G8 2C9R7EA | |
| HP ZBook Studio 15 G8 | |
| Asus ProArt StudioBook Pro 15 W500G5T | |
| Dell Precision 7550 | |
网络摄像头


安全问题
惠普有一整套软件和低级别的保护措施,包括Sure Click、Secure Erase、BIOSphere、Sure Start、Sure Run、Tamper Lock、可选的Sure View,以及在通常的指纹识别器和TPM之上的许多其他保护措施。然而,一个简单的网络摄像头快门公然缺失,我们认为这是惠普方面的一个巨大疏忽。
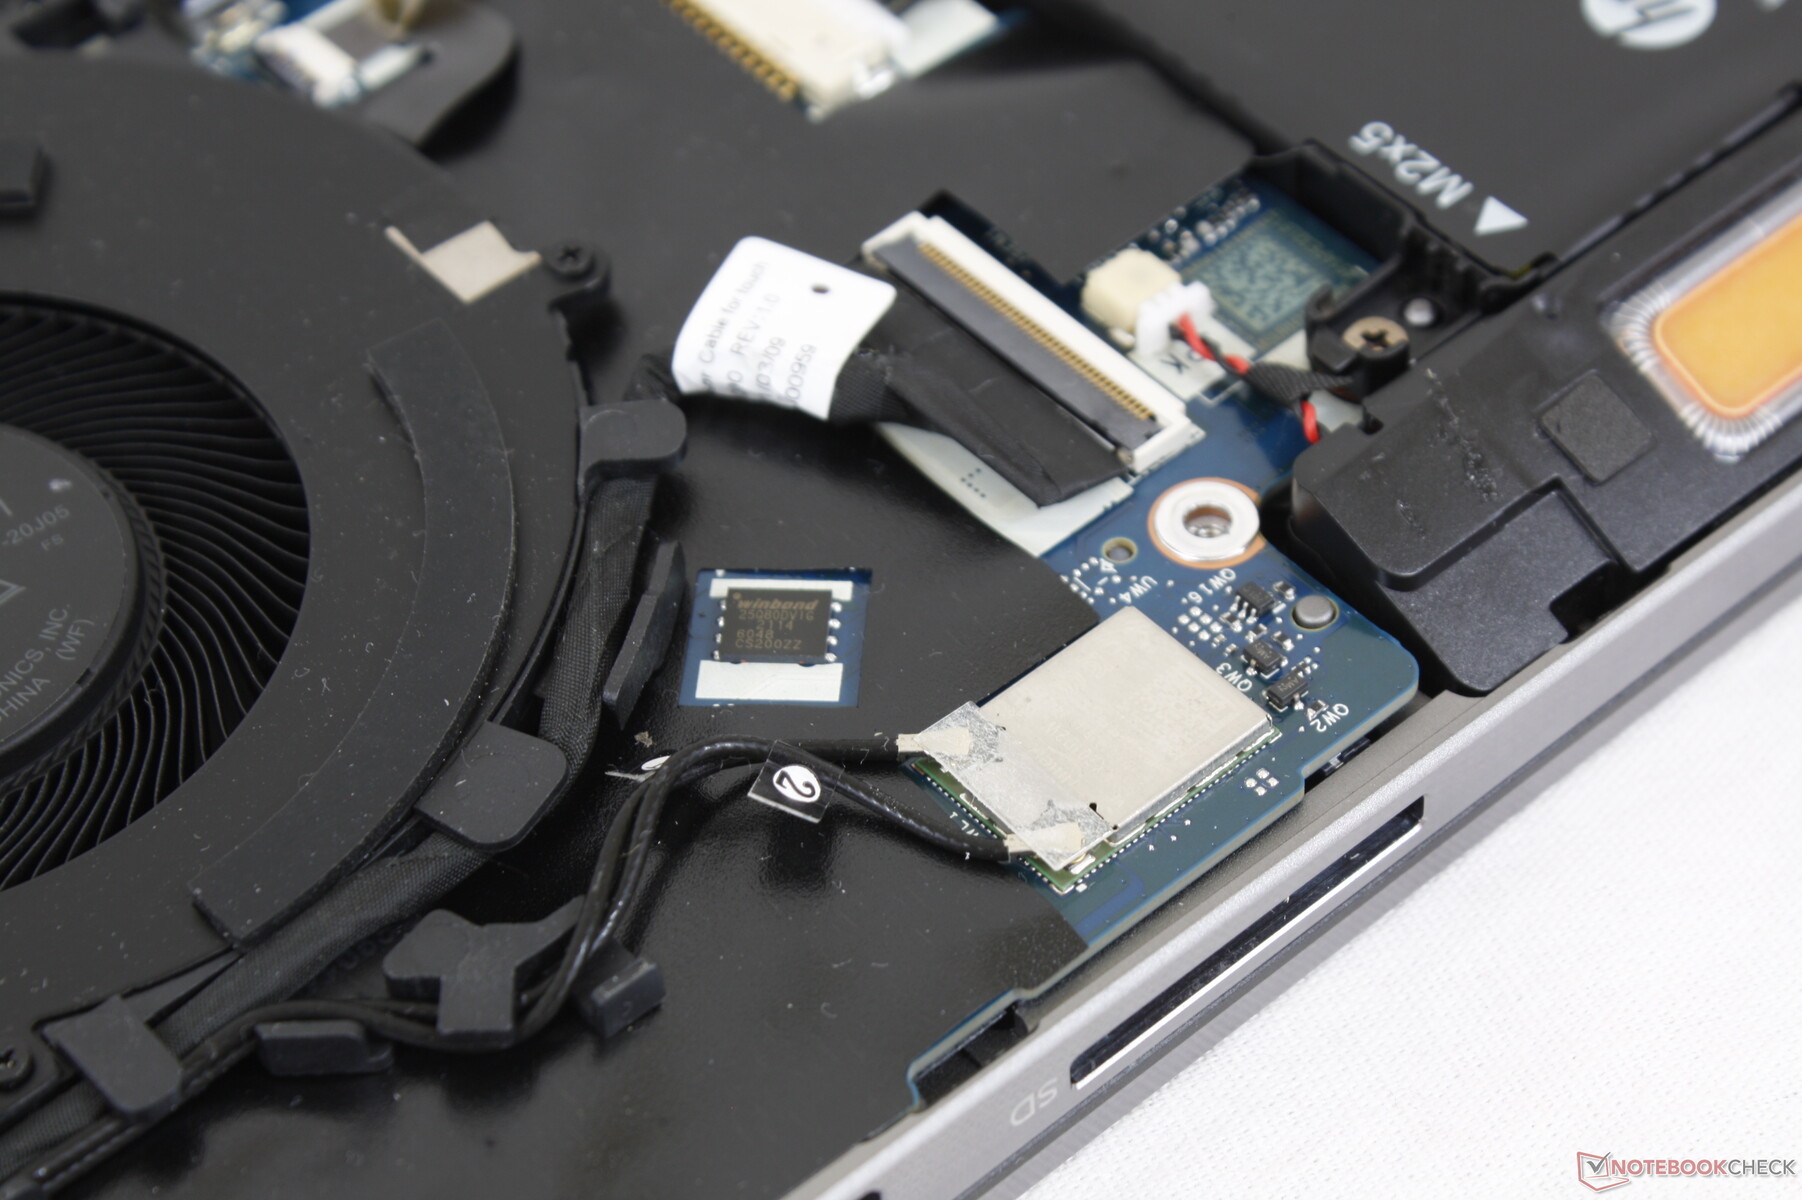
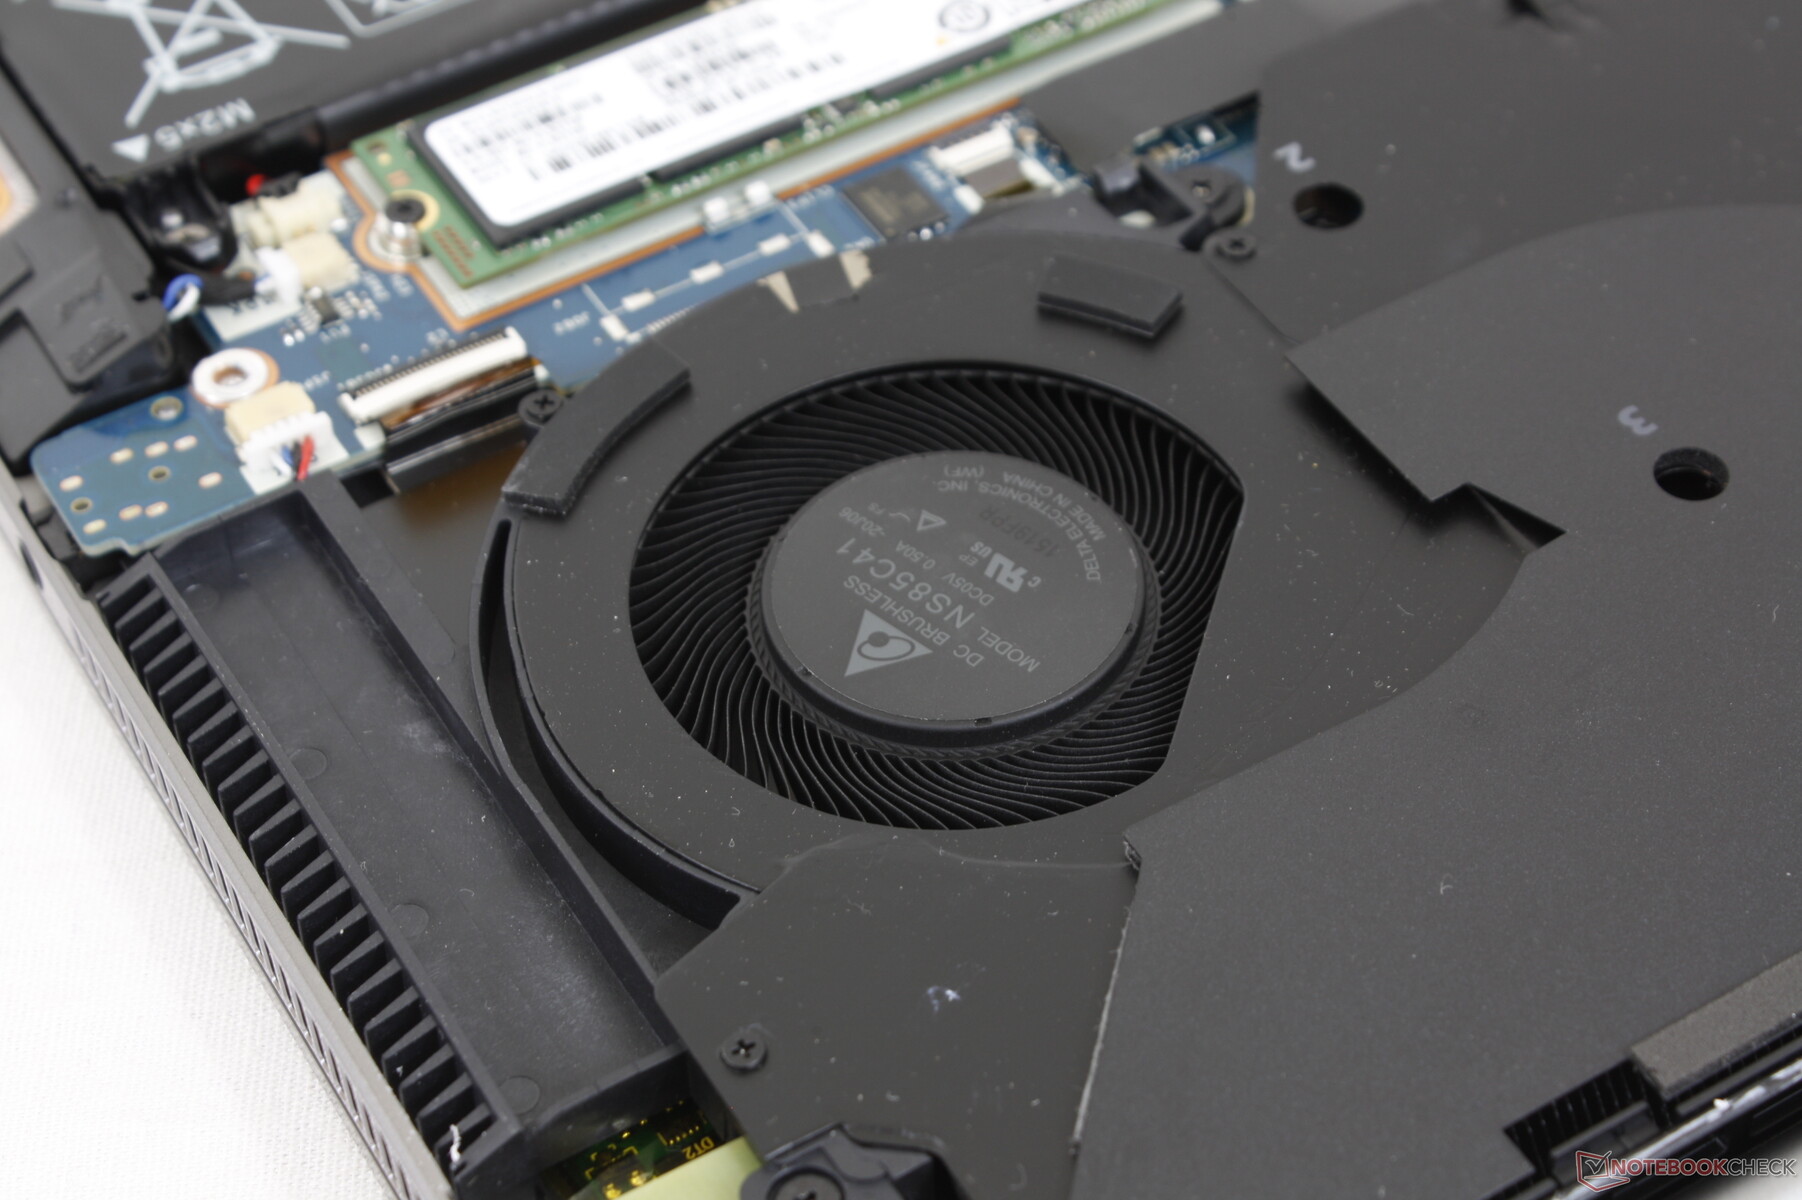
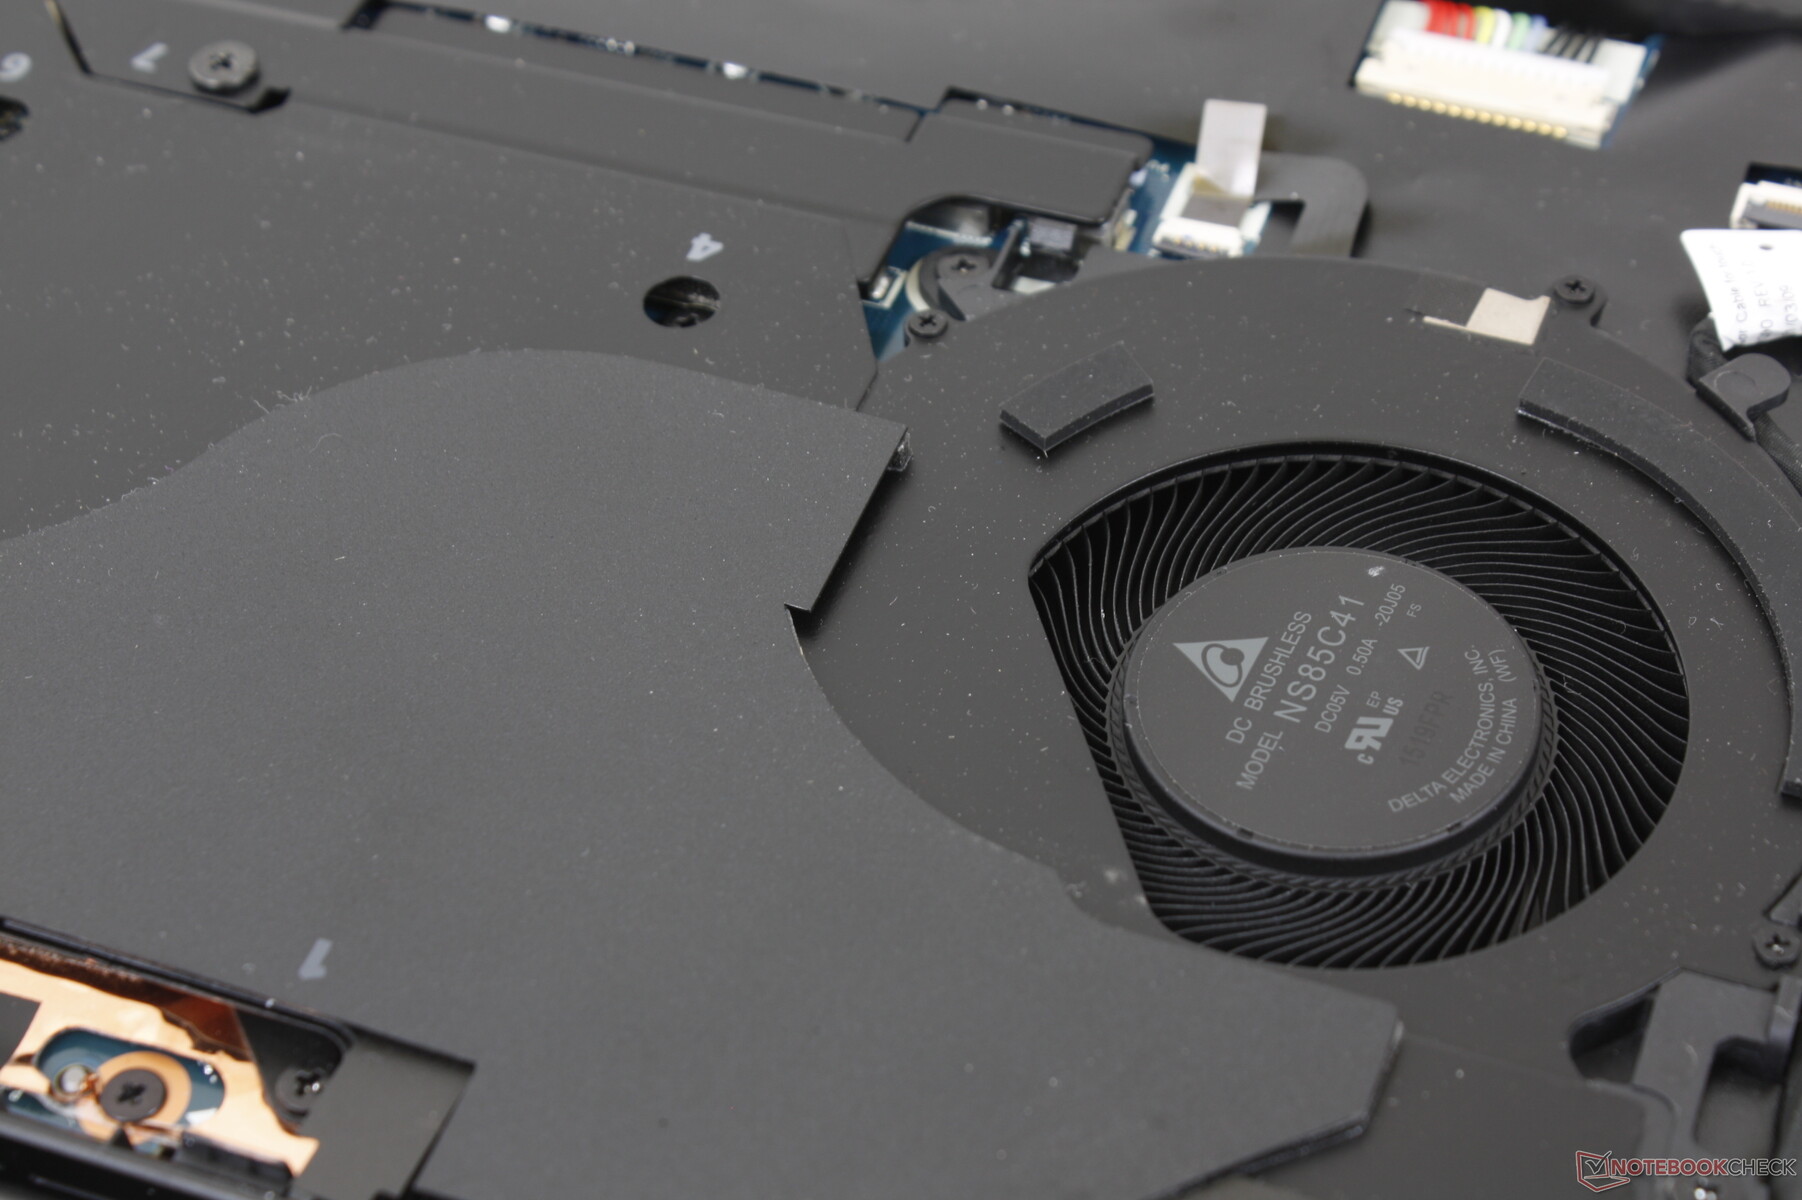
维护
底部面板需要一把飞利浦螺丝刀和锋利的边缘来撬开。然而,一旦进入内部,就没有什么可升级的了,因为内存和WLAN模块是焊接的。
配件和保修
零售包装盒中除了交流电适配器和文件外,没有任何额外的东西。基本的一年保修期是标准的,而不是高端工作站倾向于提供的两年或三年保修期,不需要额外费用。
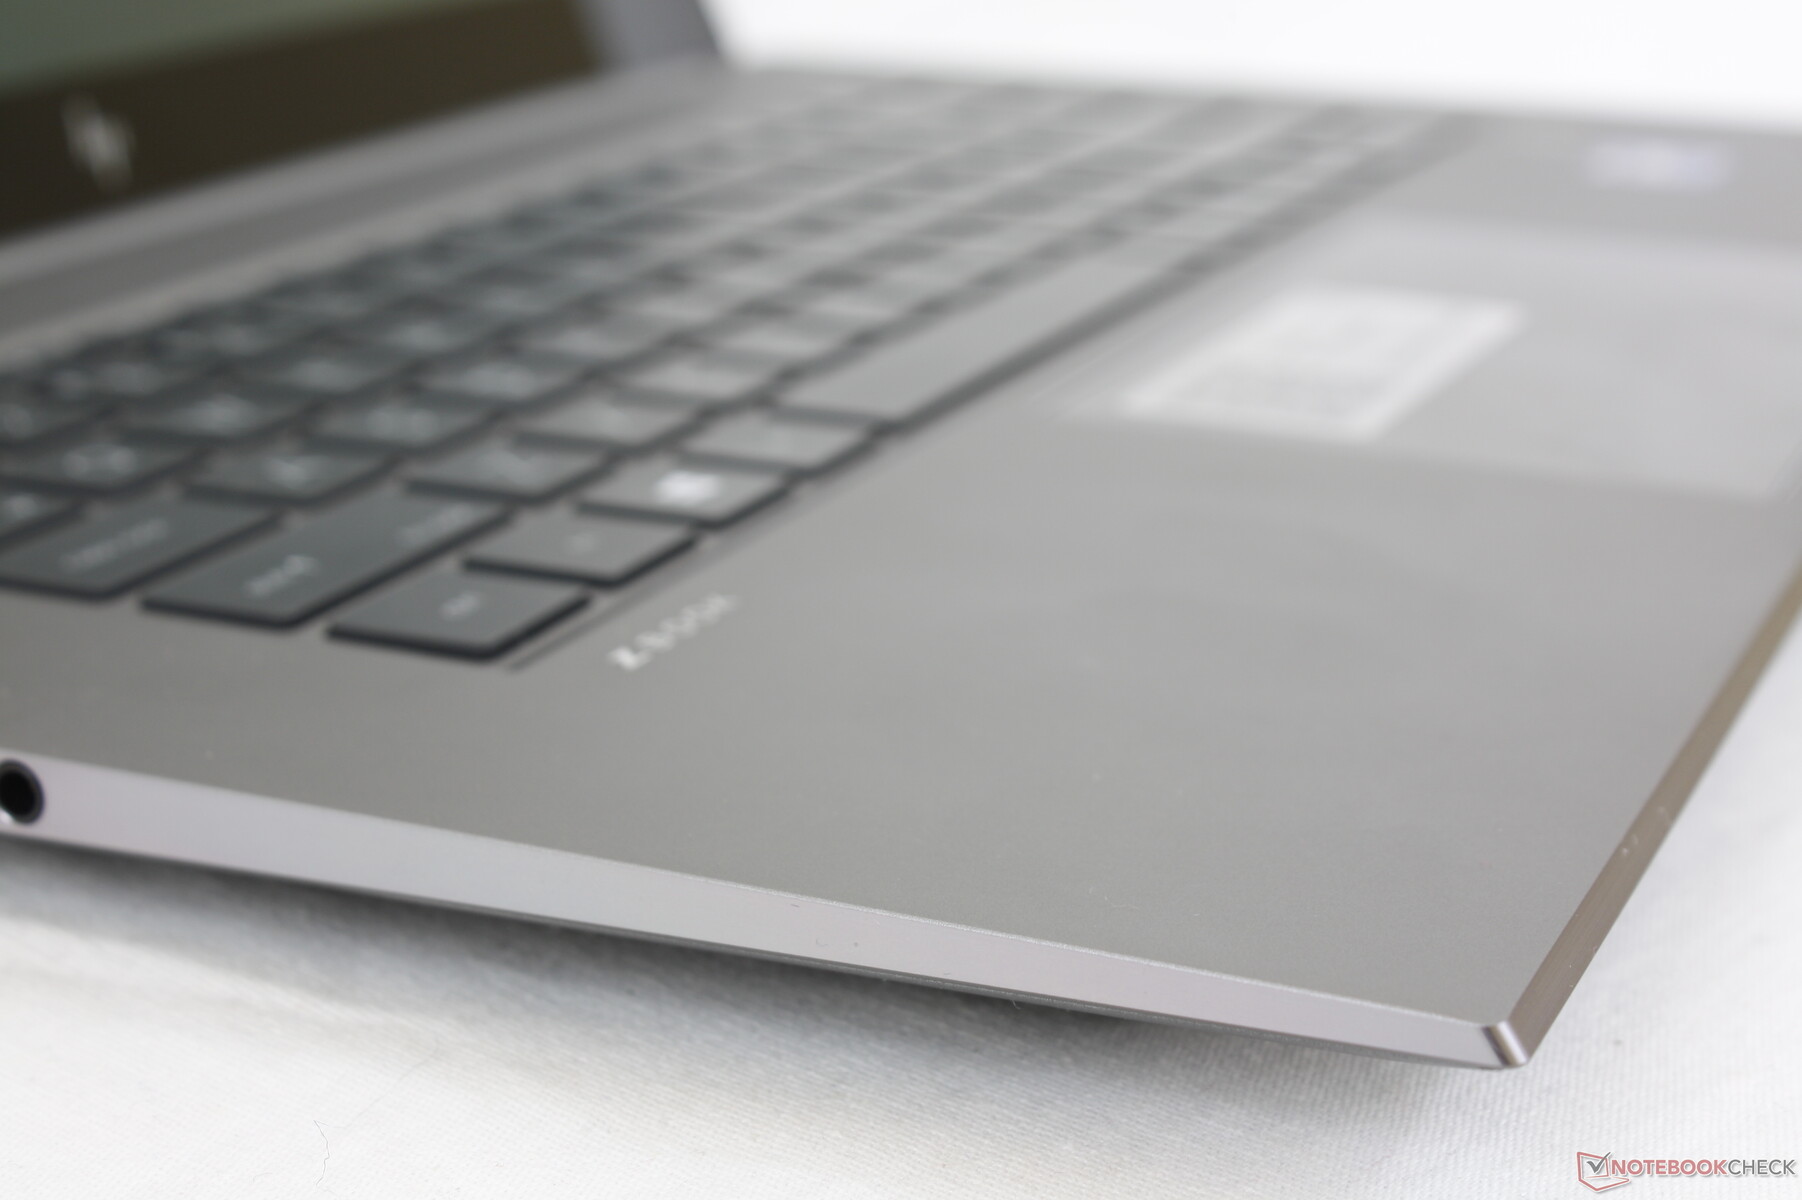
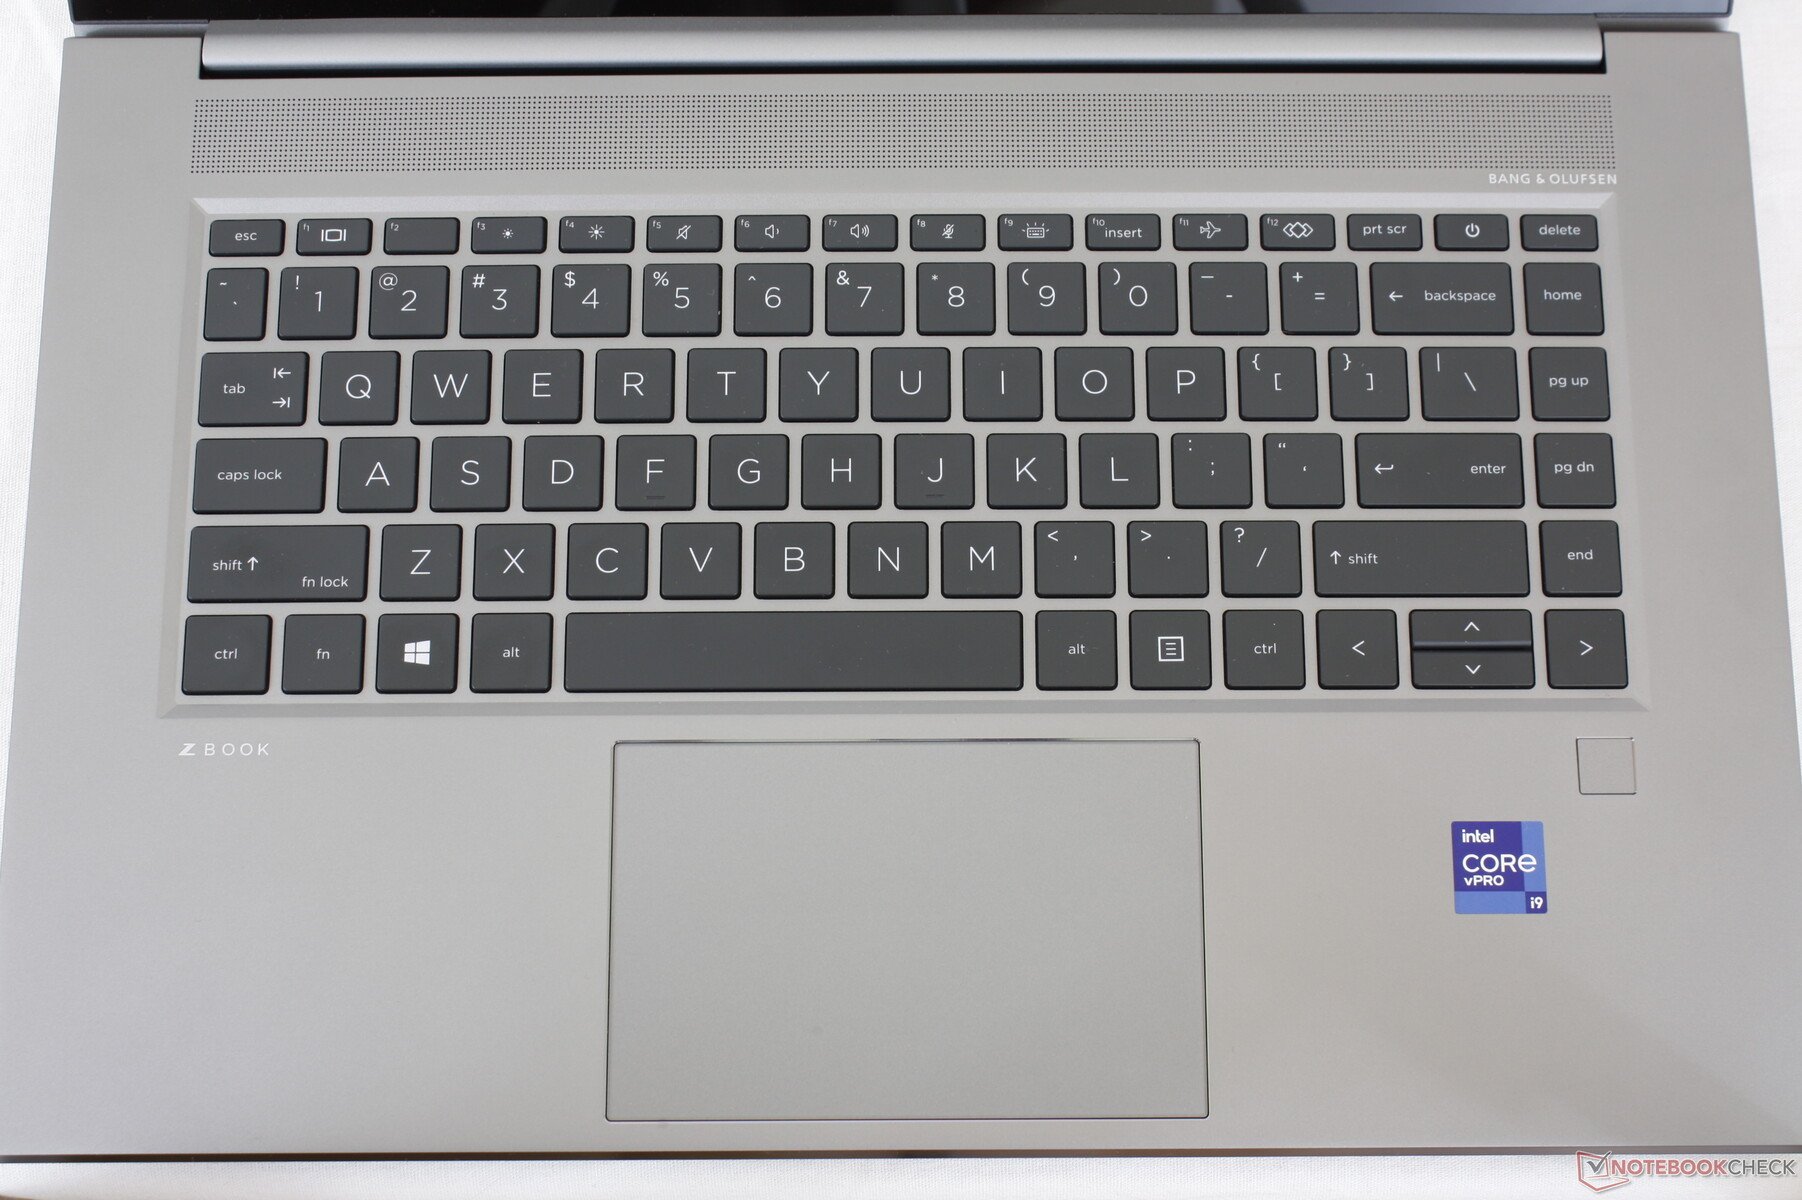
输入设备 - 我们怀念专用的鼠标键和TrackPoint
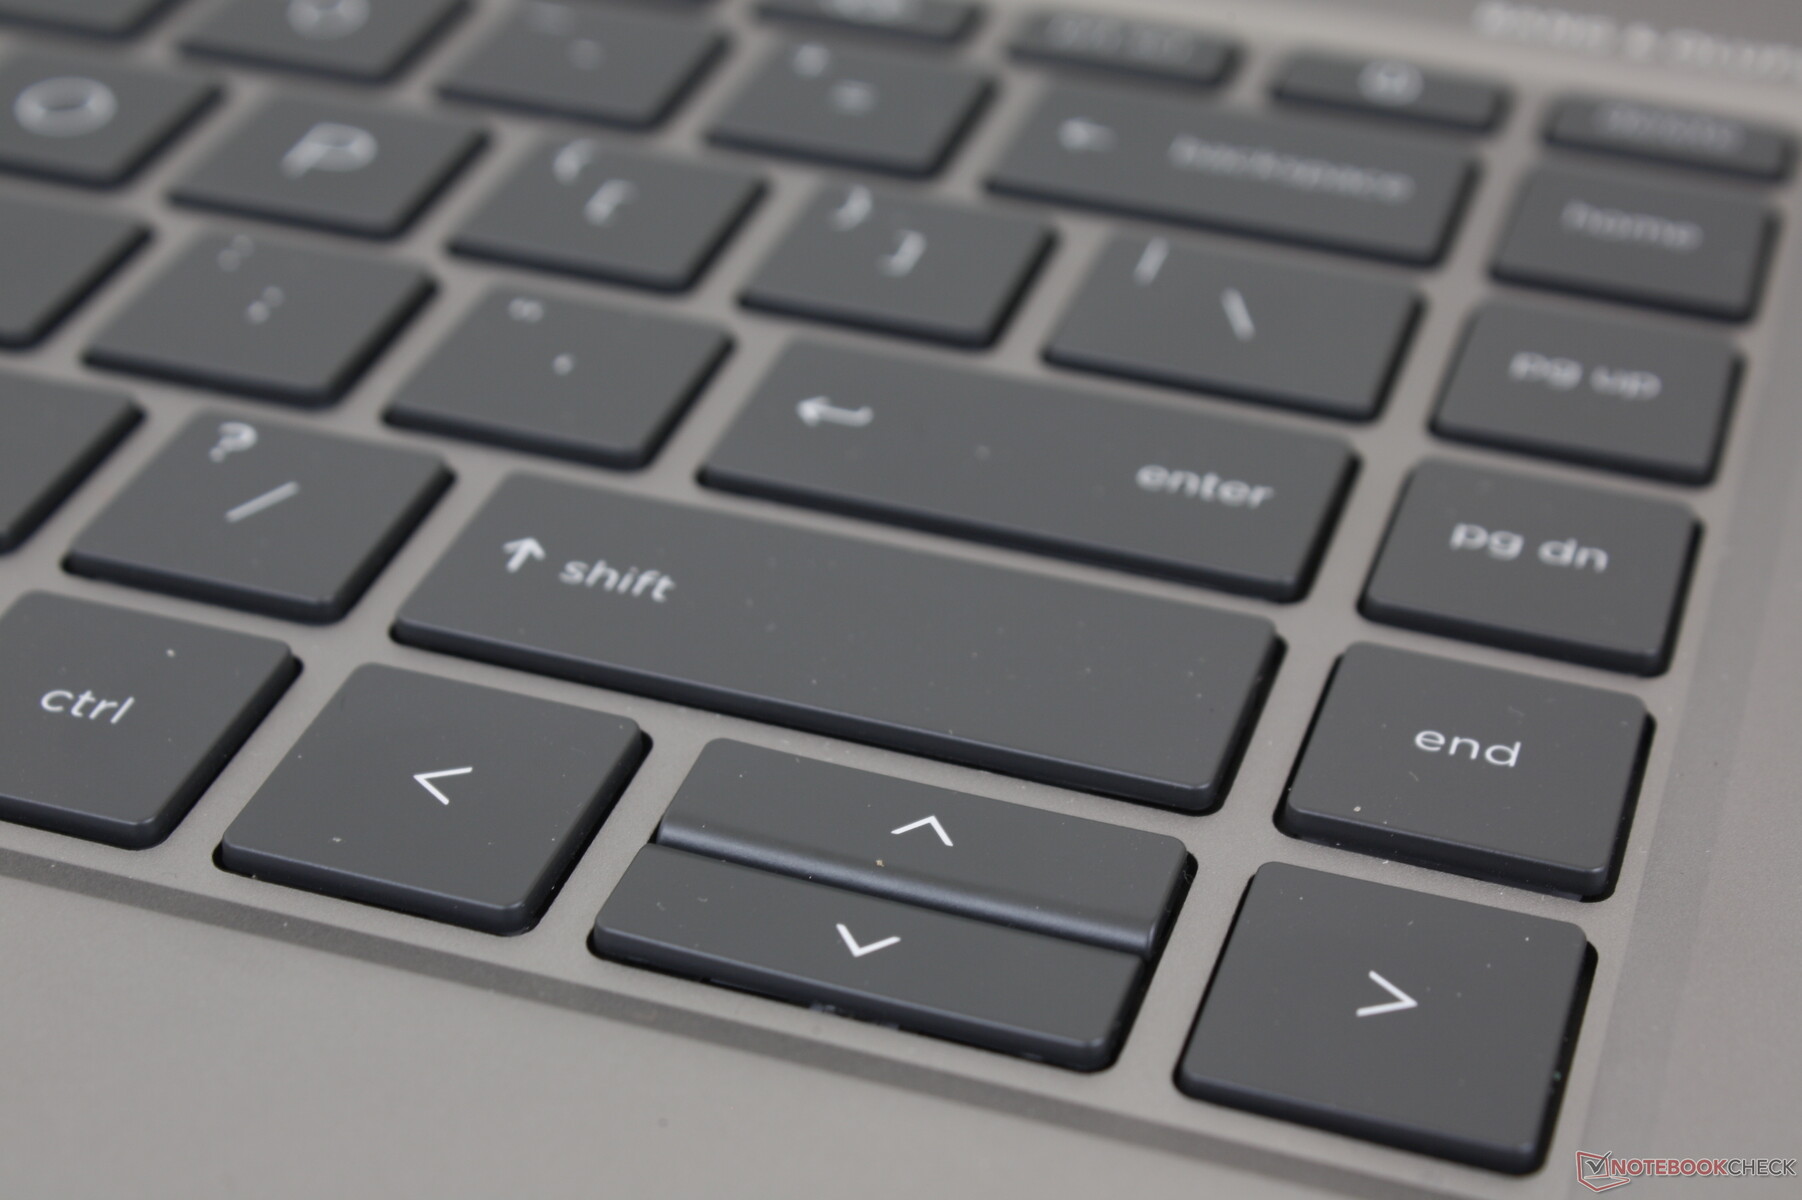
键盘
像Envy、Spectre、EliteBook或ZBook这样的高端惠普机型在笔记本电脑市场上有一些最好的键盘。他们的按键往往更清晰、更深,反馈更强,打字体验更令人满意。主要的缺点是,与微星WS66的较软和较安静的按键相比,按键的咔哒声比较大。 微星WS66或Razer Blade Studio相比,主要的缺点是按键声音较大。
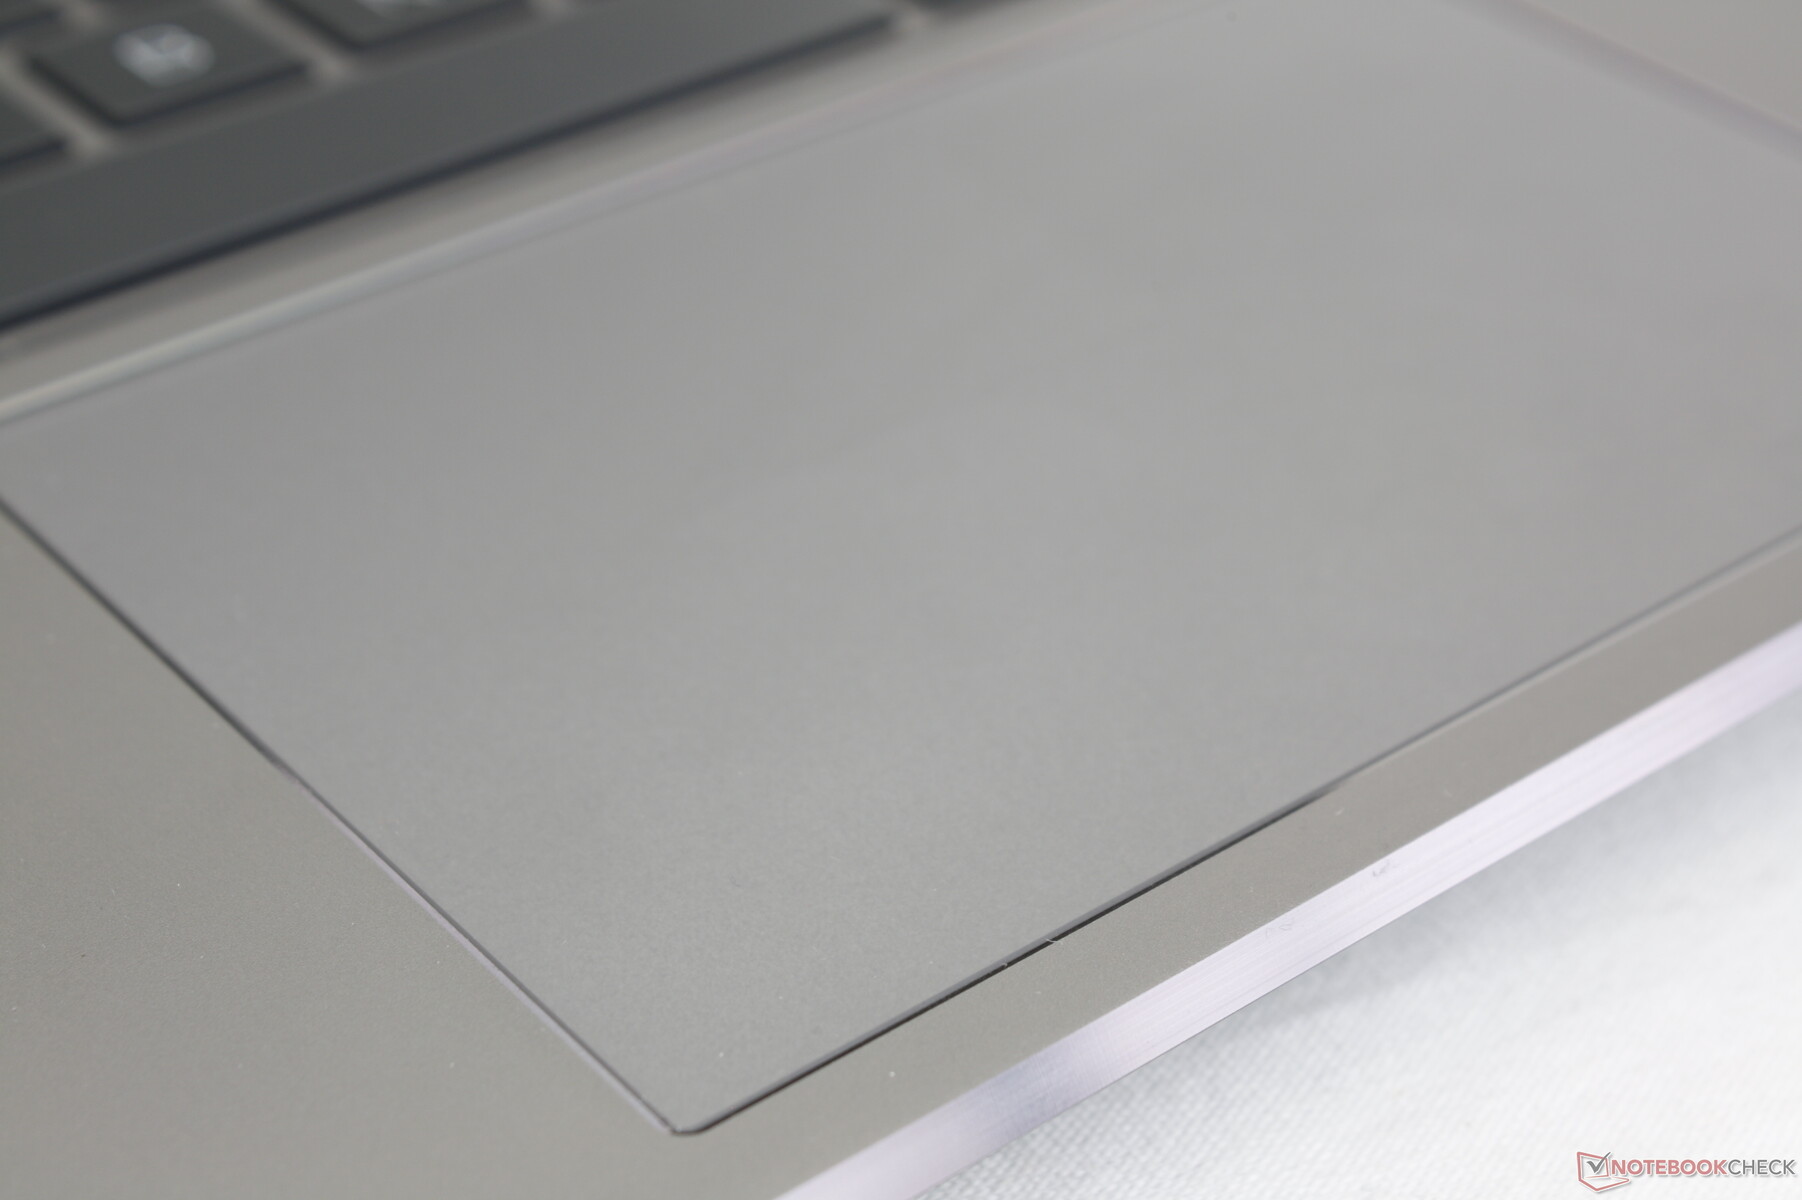
触摸板
平滑的点击板(11.5 x 7.3厘米)缺乏专用按钮,这与ZBook Firefly、ZBook Fury以及其他大多数传统移动工作站不同。尽管如此,点击板并不像Razer Blade Studio那样有弹性,可以实现更可靠的点击和多点触摸输入。

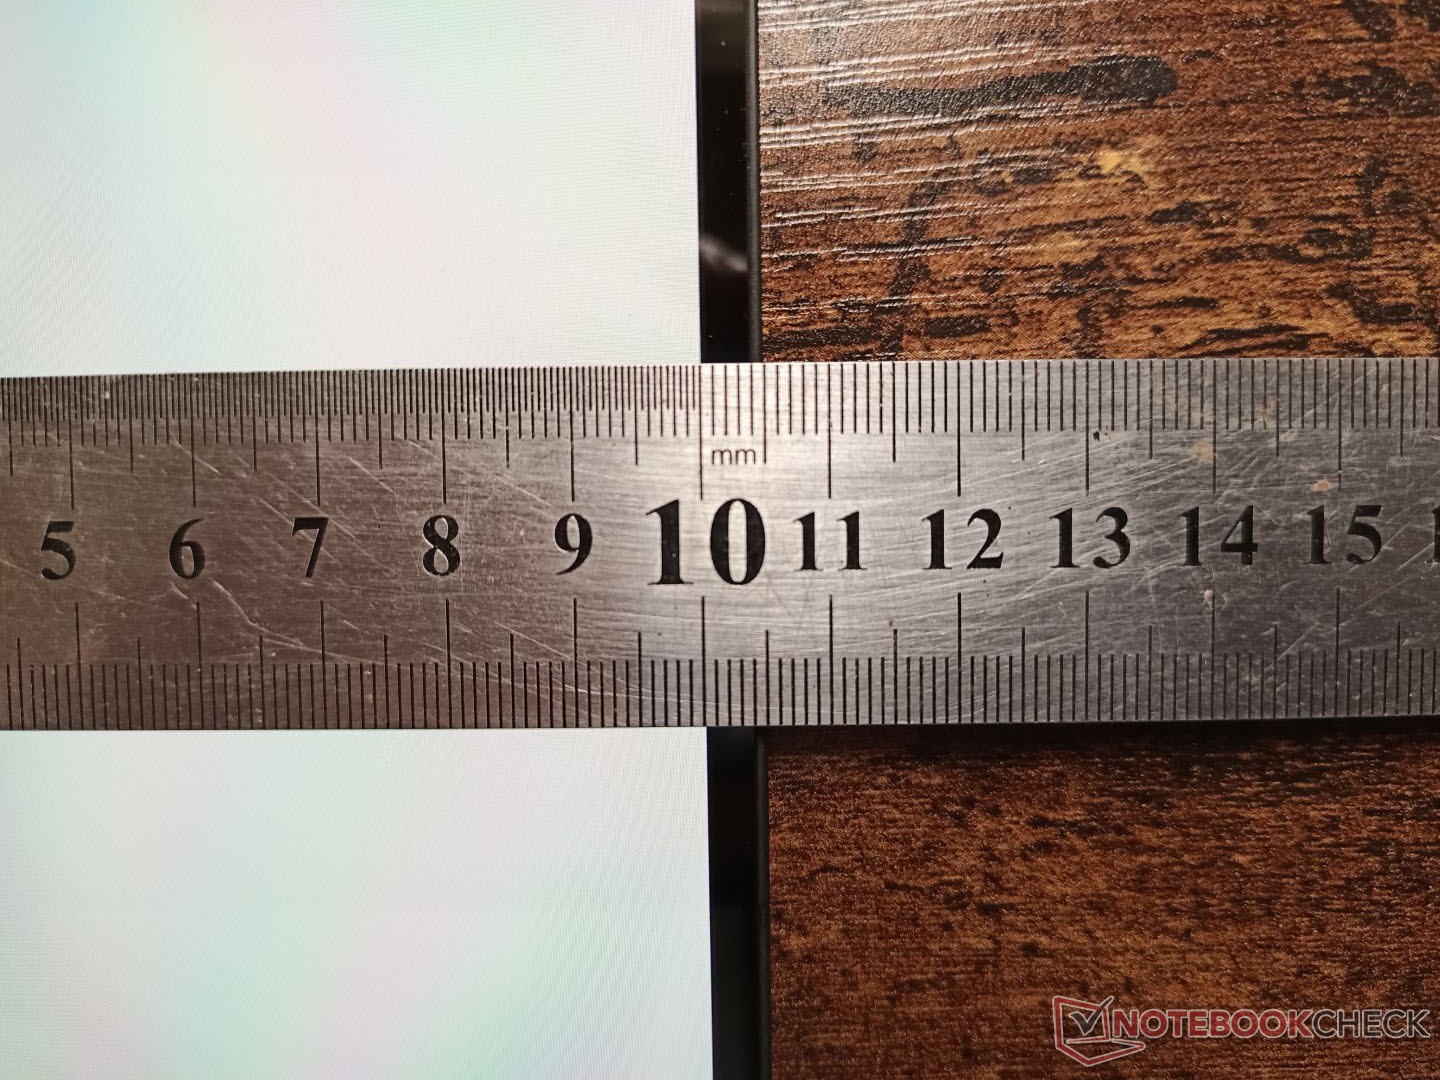
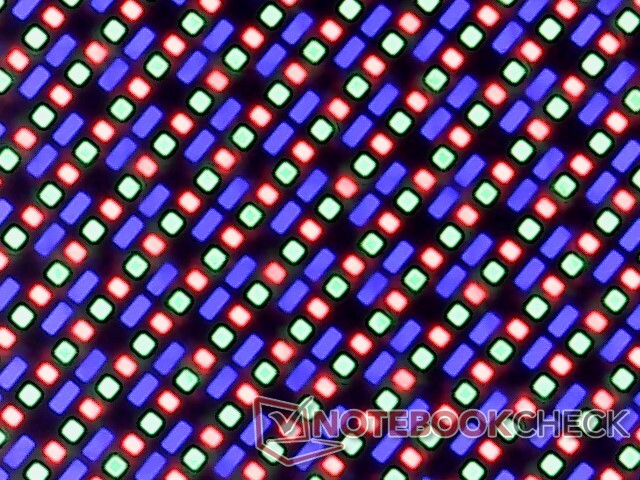
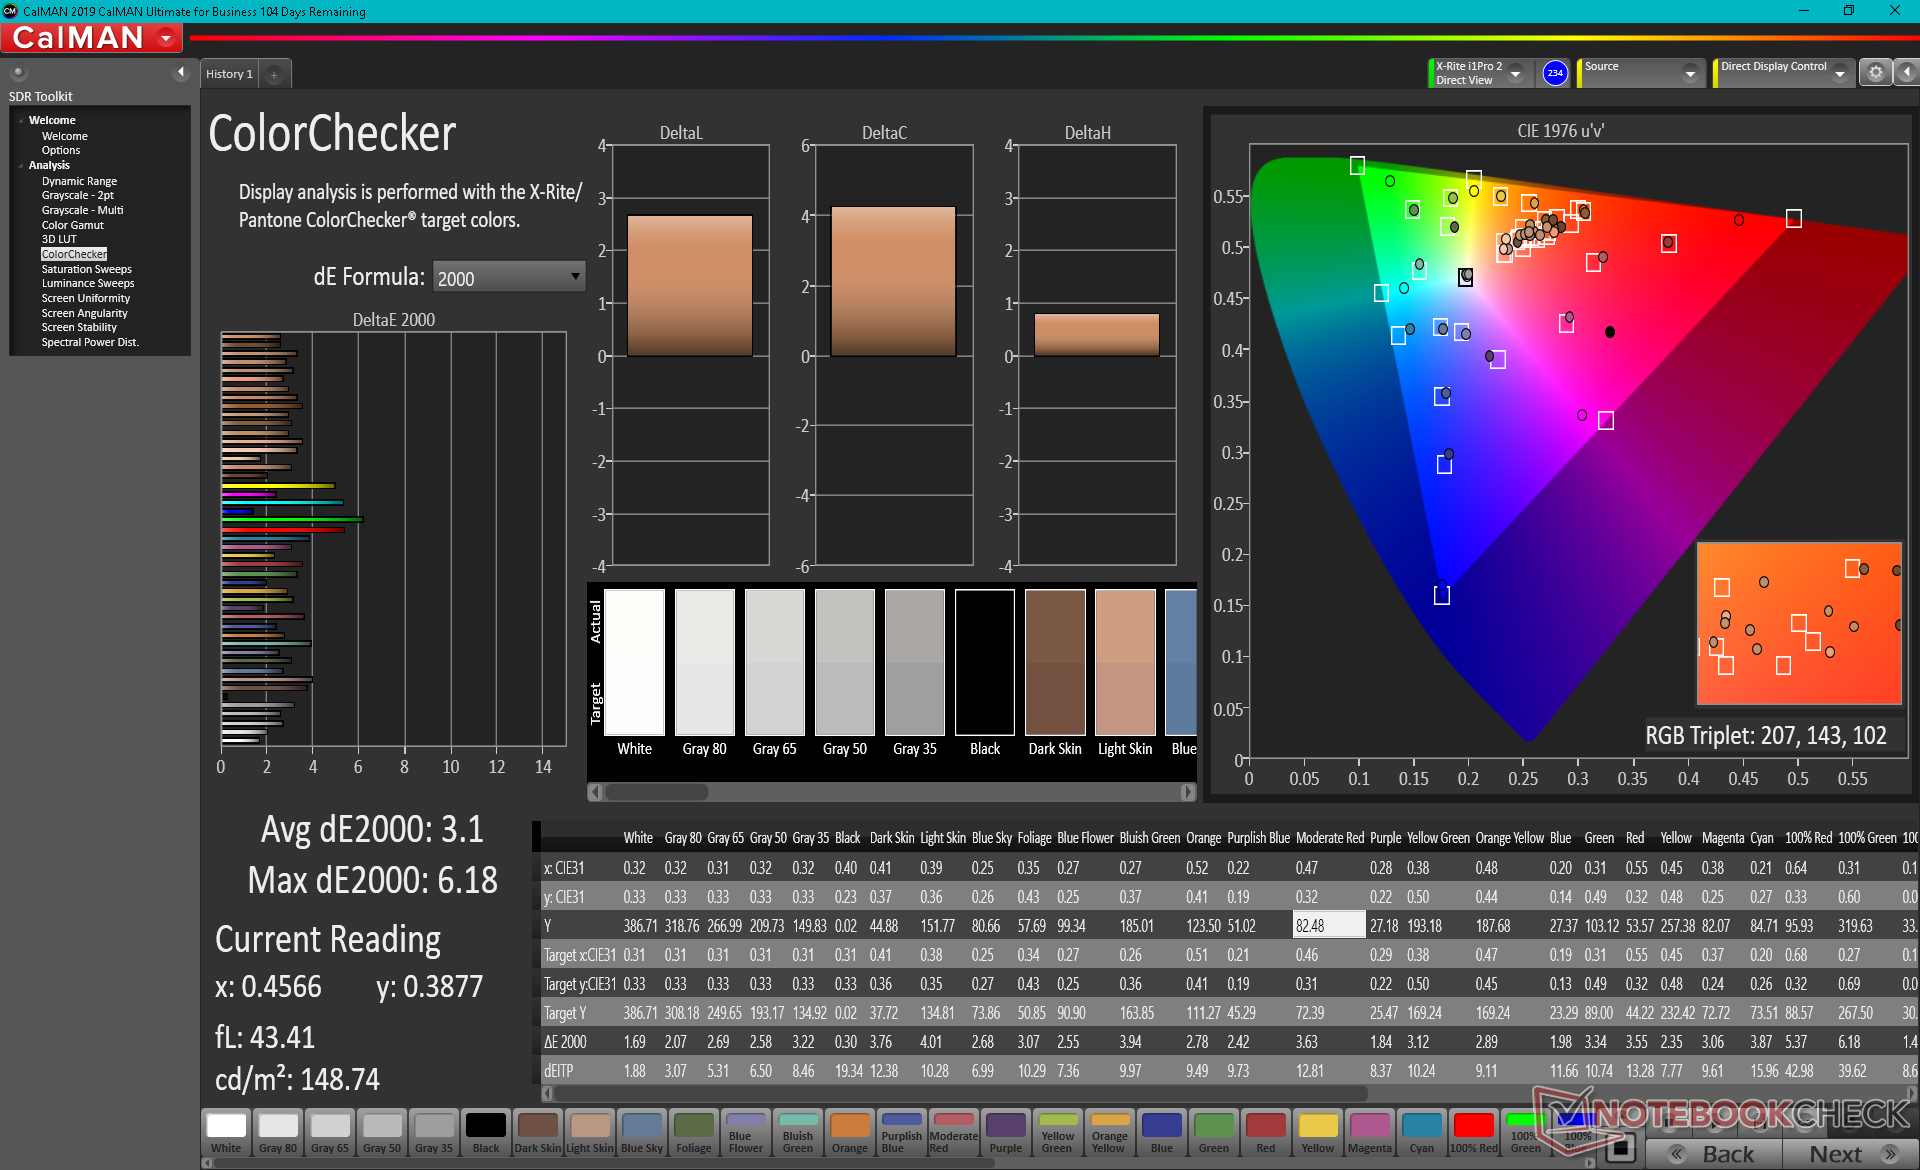
显示器 - OLED有一些缺点
惠普使用LG的4K IPS选项,而这个4K OLED选项则来自三星。OLED的最大优势是其完美的黑色水平,更广泛的色域,以及极快的黑白和灰度响应时间,以获得更生动的色彩和基本零重影。
另一方面,这种OLED面板的主要缺点是其400尼特的亮度,60赫兹的刷新率,脉宽调制的存在,以及比IPS更高的功耗。虽然400尼特在任何情况下都不暗淡,但它是这个模型的最暗淡的选择。同样,60赫兹的刷新率也不一定慢,但惠普只为IPS提供120赫兹。脉宽调制或屏幕闪烁的频率为240赫兹和59赫兹,亮度水平分别为0到52%和53%和99%,这可能会导致一些用户的眼睛疲劳。最后,较高的功耗是一个众所周知的事实 在此详细说明其他使用类似OLED技术的笔记本电脑。

| |||||||||||||||||||||||||
Brightness Distribution: 95 %
Center on Battery: 379.6 cd/m²
Contrast: ∞:1 (Black: 0 cd/m²)
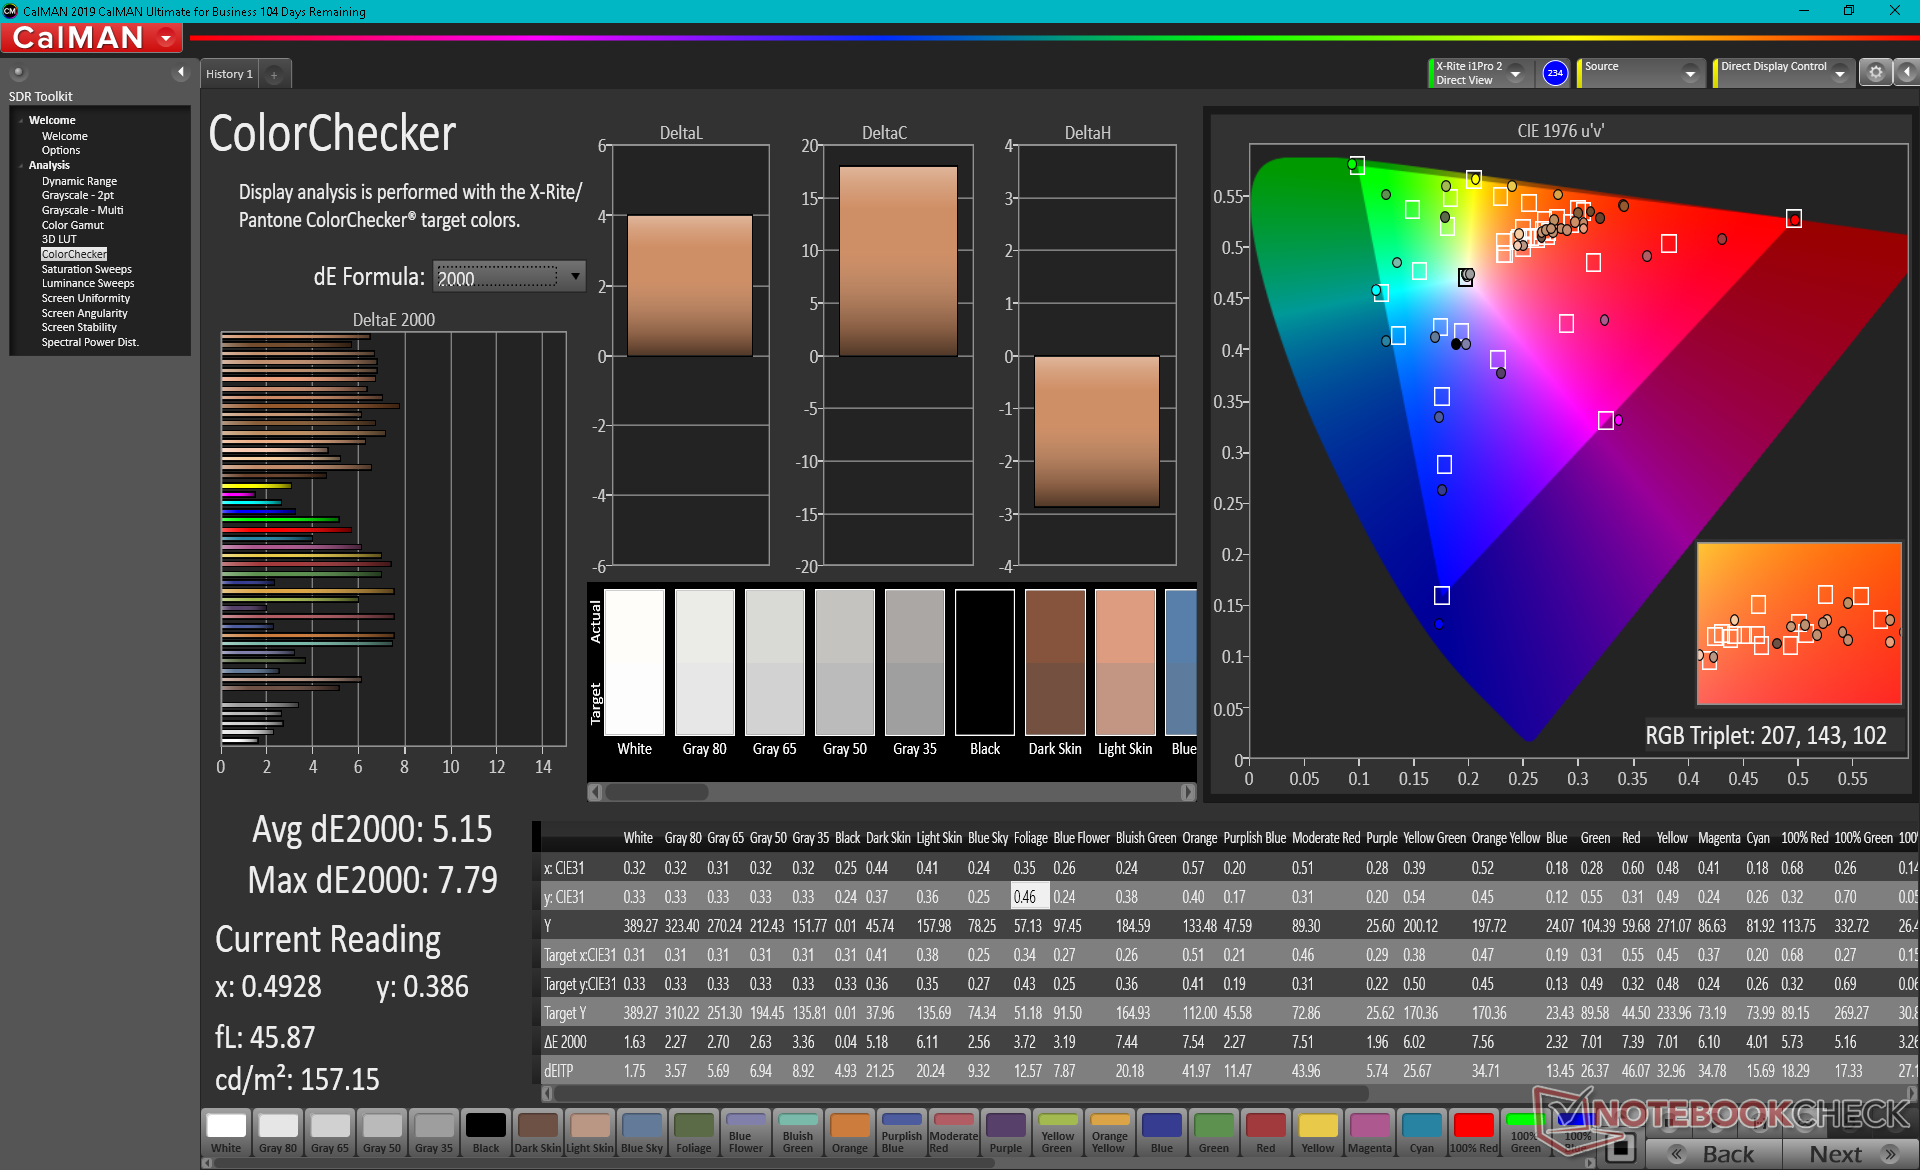
ΔE ColorChecker Calman: 5.15 | ∀{0.5-29.43 Ø4.73}
calibrated: 3.1
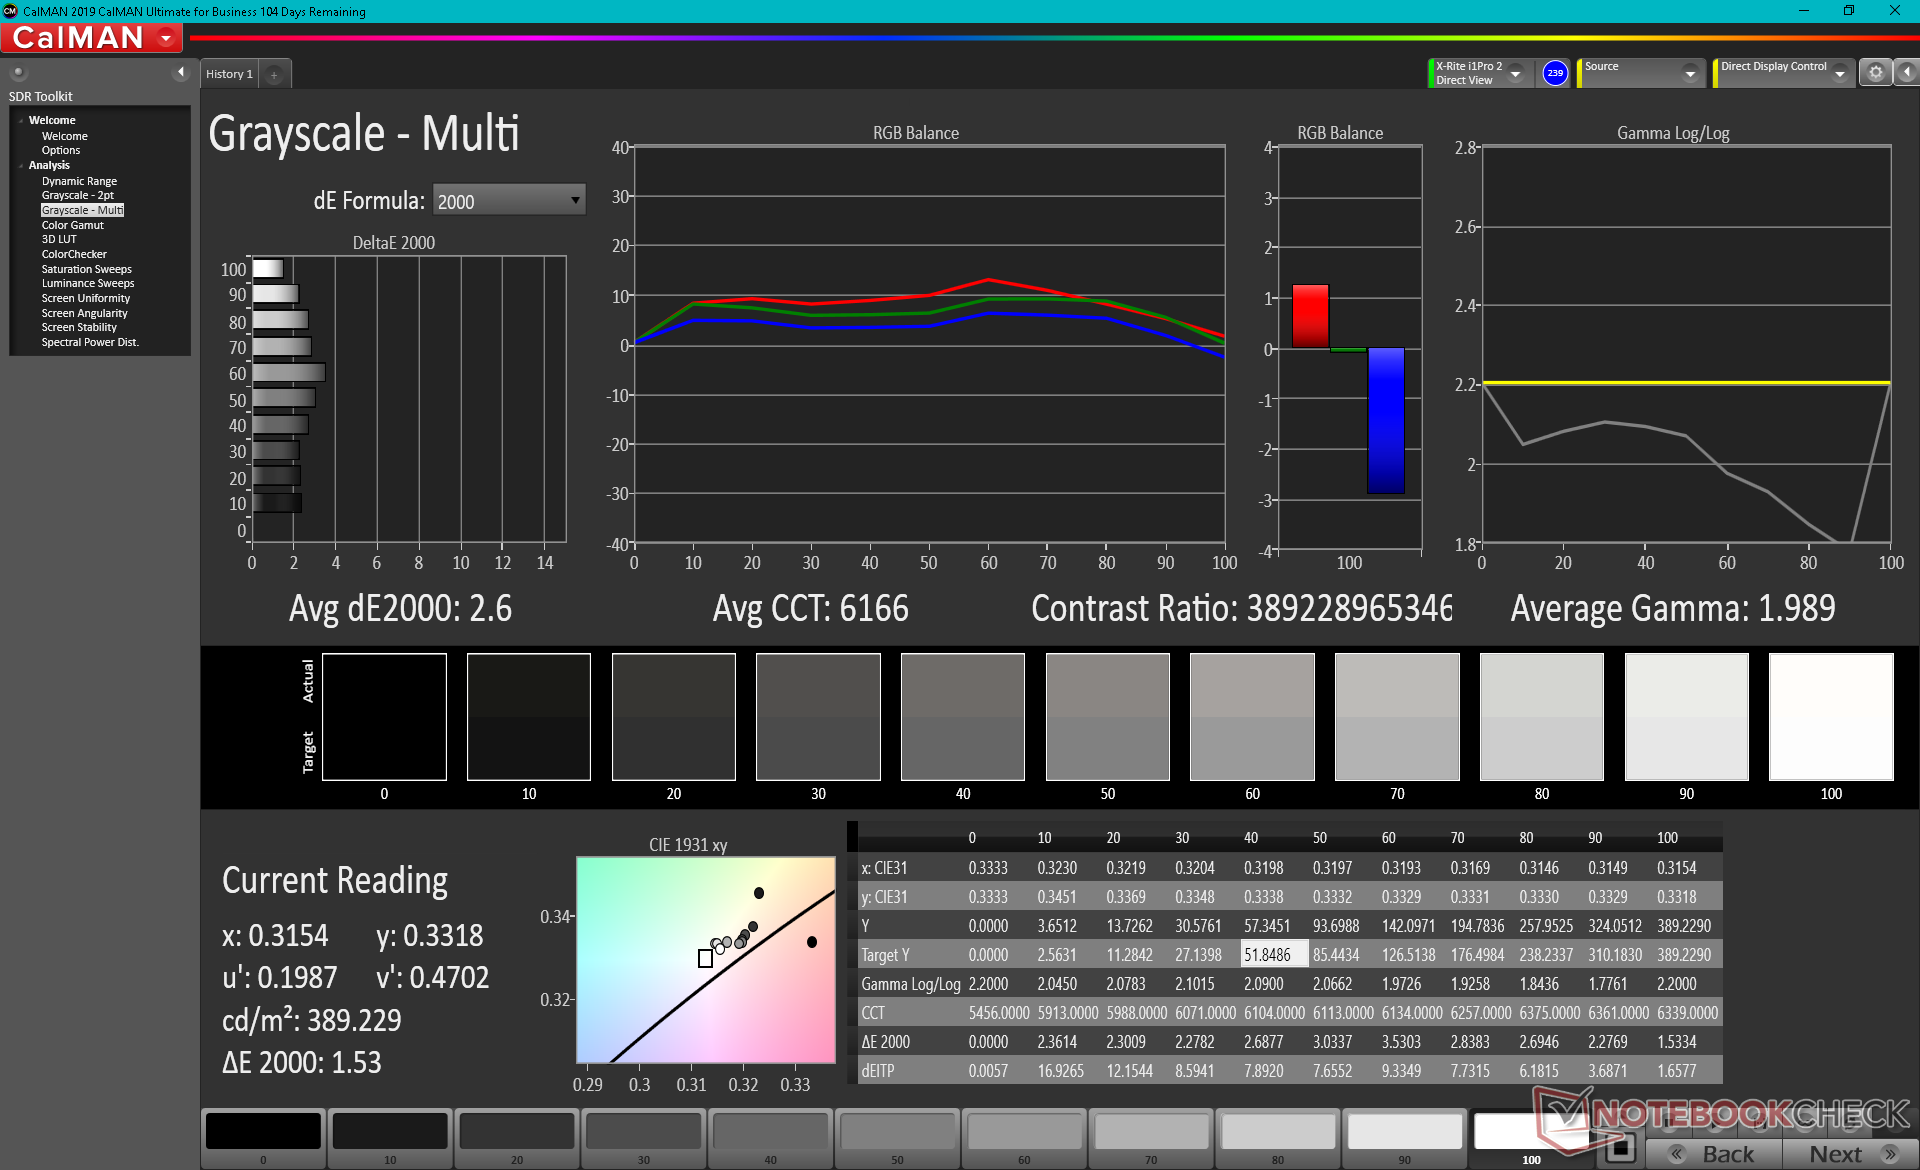
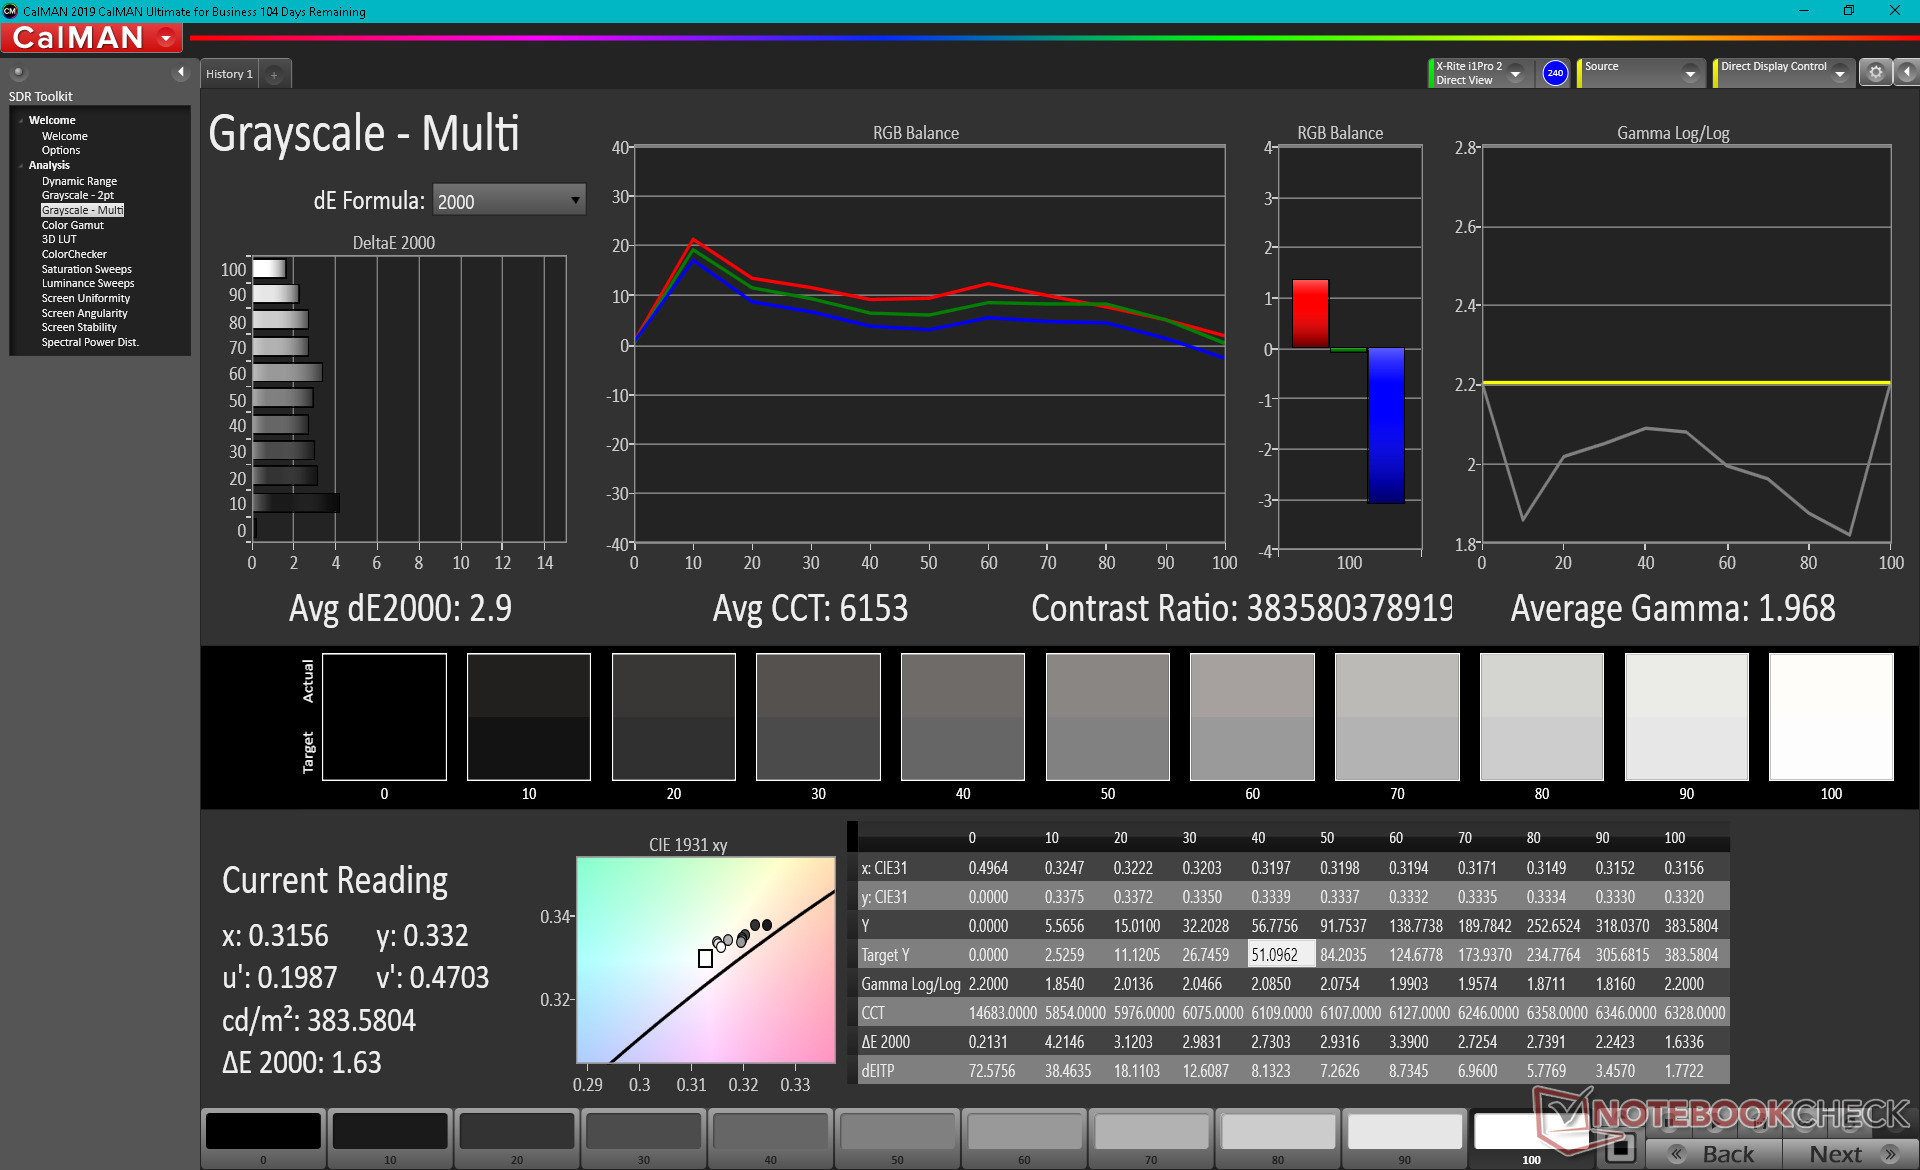
ΔE Greyscale Calman: 2.6 | ∀{0.09-98 Ø4.97}
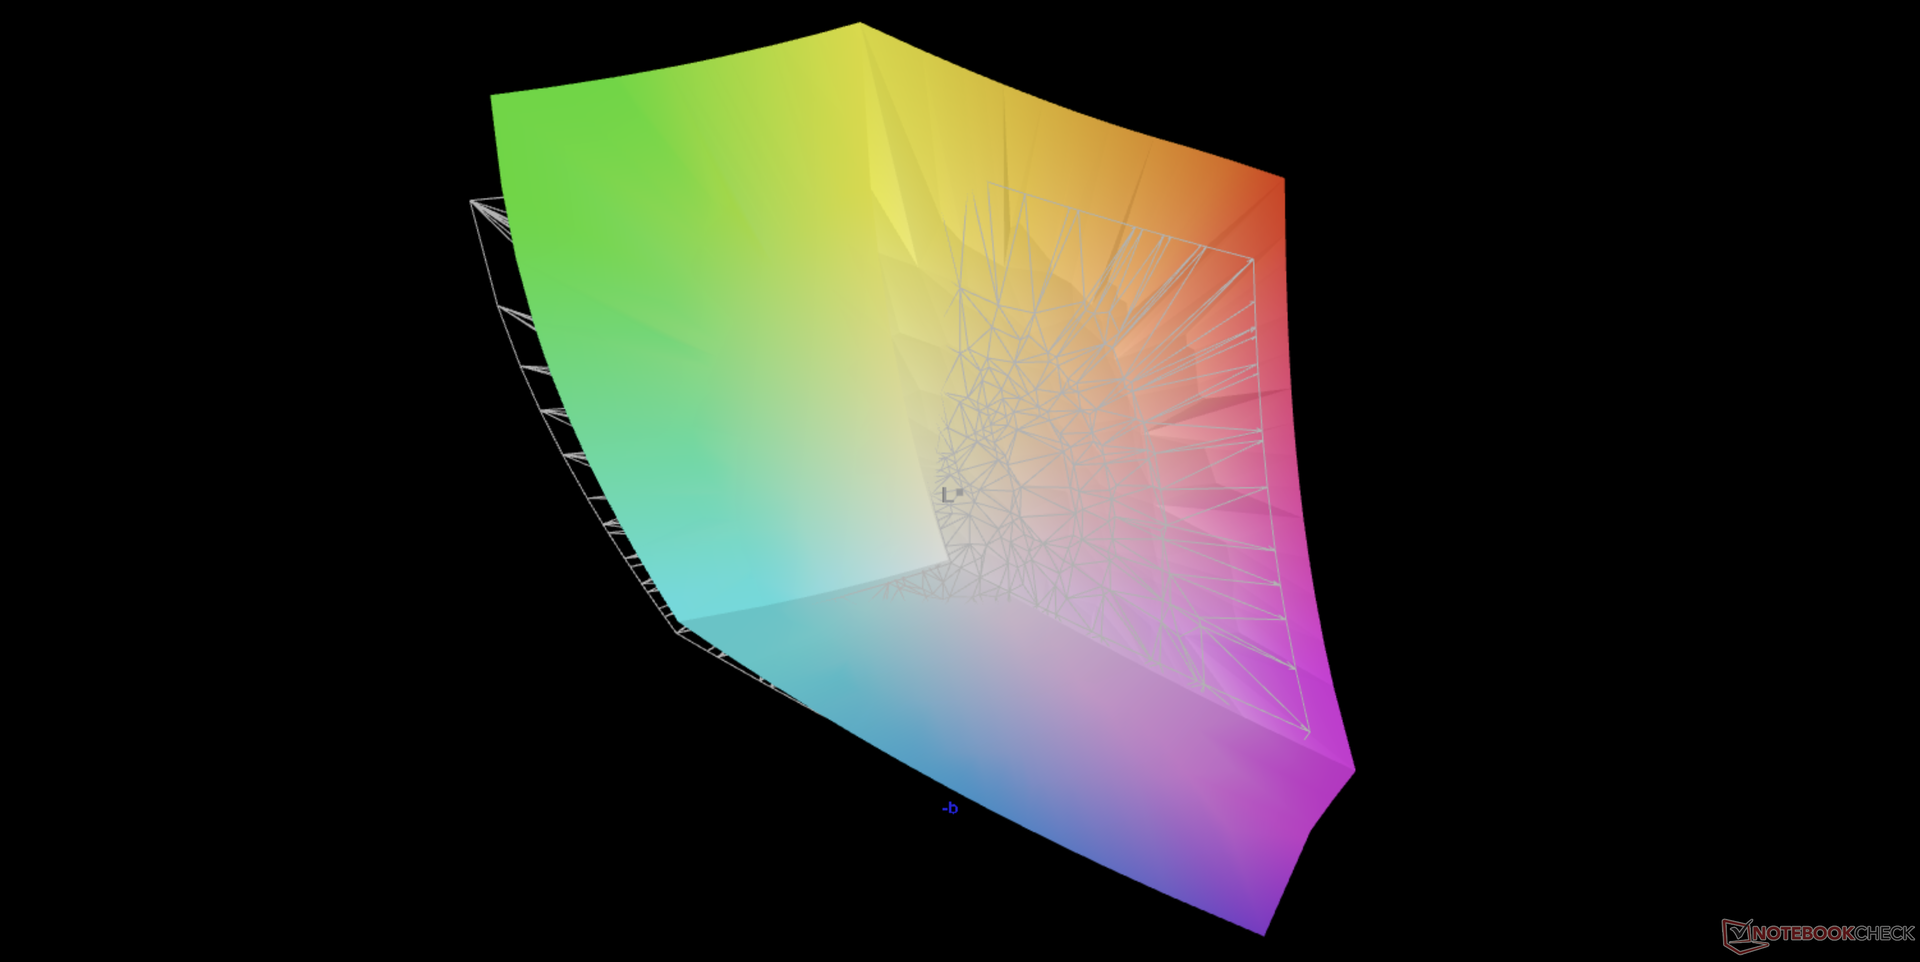
95.3% AdobeRGB 1998 (Argyll 3D)
100% sRGB (Argyll 3D)
99.9% Display P3 (Argyll 3D)
Gamma: 1.99
CCT: 6166 K
| HP ZBook Studio 15 G8 SDC4145, OLED, 15.6", 3840x2160 | HP ZBook Firefly 15 G8 2C9R7EA LGD069B, IPS, 15.6", 1920x1080 | HP ZBook Studio G7 LGD0661, IPS, 15.6", 3840x2160 | Dell Precision 7550 AU Optronics B156ZAN, IPS, 15.6", 3840x2160 | Lenovo ThinkPad P15s Gen2-20W6000GGE MNF601EA1-1, IPS LED, 15.6", 3840x2160 | |
|---|---|---|---|---|---|
| Display | -20% | -4% | -5% | -4% | |
| Display P3 Coverage (%) | 99.9 | 68.6 -31% | 98.2 -2% | 82.1 -18% | 84.5 -15% |
| sRGB Coverage (%) | 100 | 98.5 -1% | 99.9 0% | 99.6 0% | 98.7 -1% |
| AdobeRGB 1998 Coverage (%) | 95.3 | 70 -27% | 86.5 -9% | 96.8 2% | 97.8 3% |
| Response Times | -1733% | -1859% | -1675% | -1217% | |
| Response Time Grey 50% / Grey 80% * (ms) | 2.4 ? | 56 ? -2233% | 56.4 ? -2250% | 51.2 ? -2033% | 40 ? -1567% |
| Response Time Black / White * (ms) | 2.4 ? | 32 ? -1233% | 37.6 ? -1467% | 34 ? -1317% | 23.2 ? -867% |
| PWM Frequency (Hz) | 240.4 ? | ||||
| Screen | -30% | 59% | -11% | 57% | |
| Brightness middle (cd/m²) | 379.6 | 397 5% | 723 90% | 473.5 25% | 604 59% |
| Brightness (cd/m²) | 380 | 402 6% | 707 86% | 461 21% | 609 60% |
| Brightness Distribution (%) | 95 | 84 -12% | 92 -3% | 90 -5% | 91 -4% |
| Black Level * (cd/m²) | 0.13 | 0.35 | 0.55 | 0.34 | |
| Colorchecker dE 2000 * | 5.15 | 5.9 -15% | 1.4 73% | 4.8 7% | 0.9 83% |
| Colorchecker dE 2000 max. * | 7.79 | 9.4 -21% | 2.9 63% | 8.73 -12% | 2.6 67% |
| Colorchecker dE 2000 calibrated * | 3.1 | 1.1 65% | 0.5 84% | 3.08 1% | 0.8 74% |
| Greyscale dE 2000 * | 2.6 | 8.8 -238% | 2 23% | 5.6 -115% | 1.1 58% |
| Gamma | 1.99 111% | 2.47 89% | 2.14 103% | 2.34 94% | 2.15 102% |
| CCT | 6166 105% | 6416 101% | 6484 100% | 7549 86% | 6656 98% |
| Contrast (:1) | 3054 | 2066 | 861 | 1776 | |
| Color Space (Percent of AdobeRGB 1998) (%) | 63.7 | 77.3 | 86.4 | 84.5 | |
| Color Space (Percent of sRGB) (%) | 98.5 | 99.9 | 99.7 | 98.6 | |
| Total Average (Program / Settings) | -594% /
-311% | -601% /
-276% | -564% /
-287% | -388% /
-171% |
* ... smaller is better
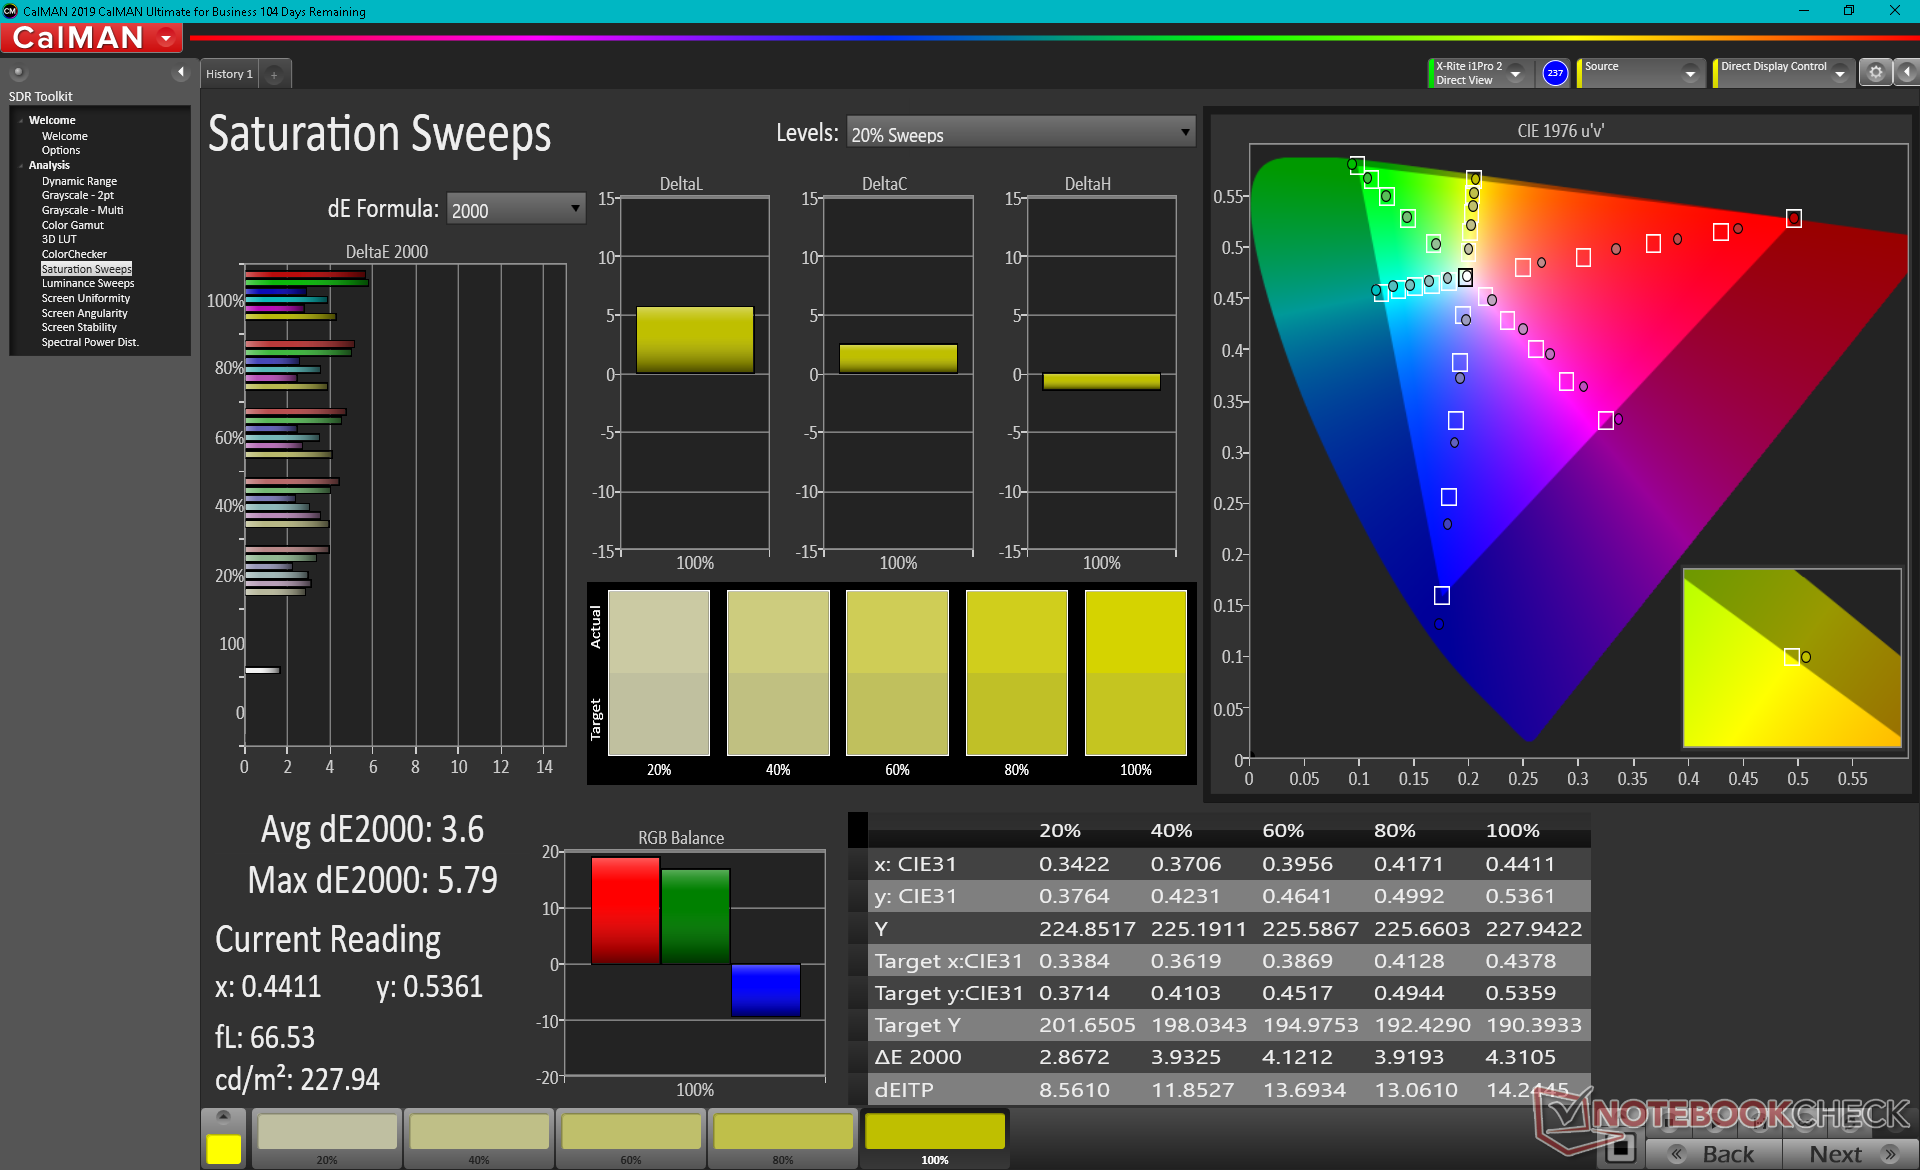
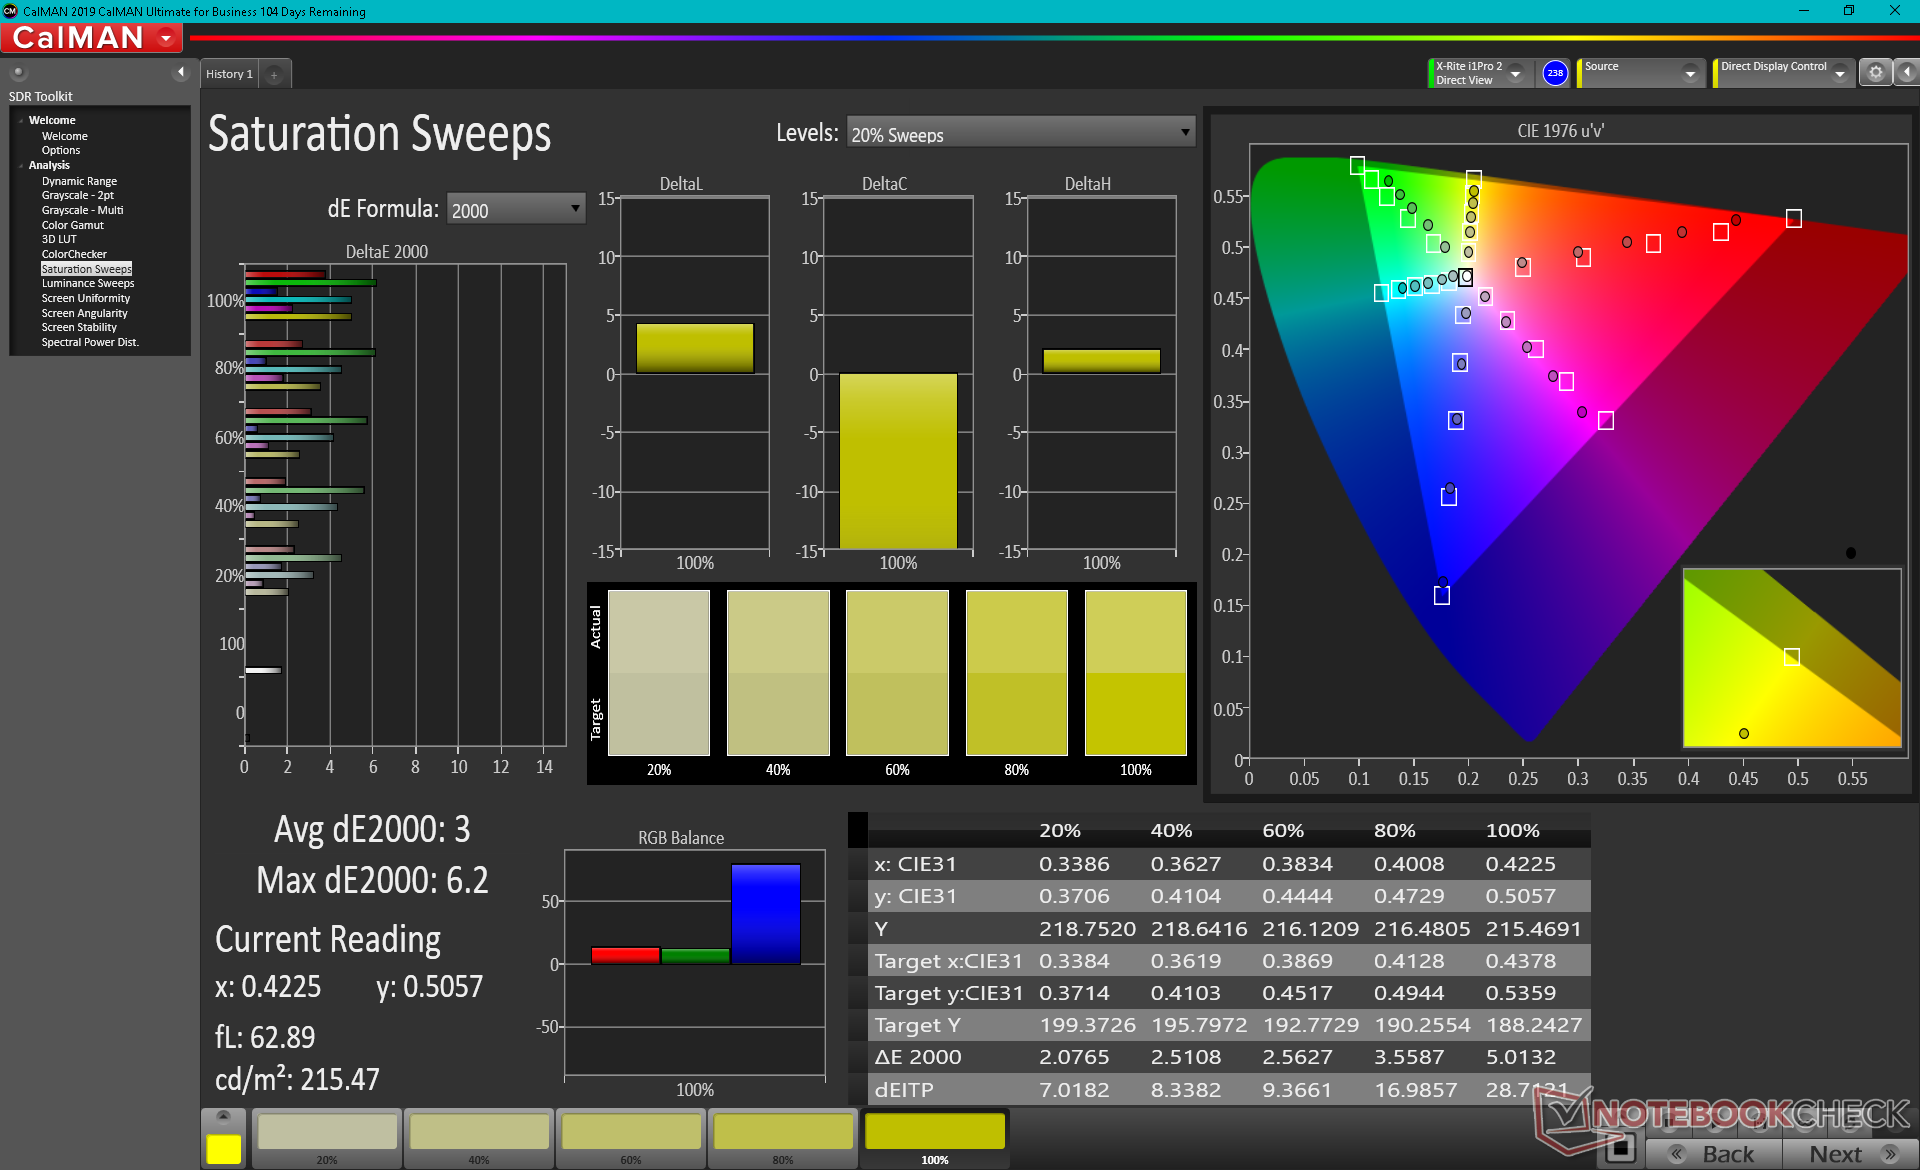
OLED通常比IPS提供更深的色彩,我们的ZBook Studio G8也不例外。用户将获得完整的DCI-P3覆盖,而不是大多数低分辨率1080p面板上的sRGB。

X-Rite色度计的测量结果显示,色温略微偏暖,约为6200K,而不是大多数其他针对sRGB的校准显示器上常见的6500K。与大多数戴尔Precision ,惠普在这里没有预装专门用于调整颜色的软件。
Display Response Times
| ↔ Response Time Black to White | ||
|---|---|---|
| 2.4 ms ... rise ↗ and fall ↘ combined | ↗ 1.1 ms rise | 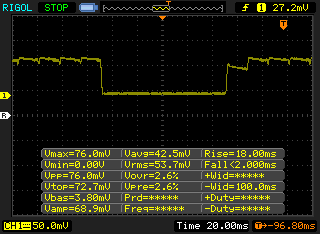 |
| ↘ 1.3 ms fall | ||
| The screen shows very fast response rates in our tests and should be very well suited for fast-paced gaming. In comparison, all tested devices range from 0.1 (minimum) to 240 (maximum) ms. » 12 % of all devices are better. This means that the measured response time is better than the average of all tested devices (19.9 ms). | ||
| ↔ Response Time 50% Grey to 80% Grey | ||
| 2.4 ms ... rise ↗ and fall ↘ combined | ↗ 1 ms rise | 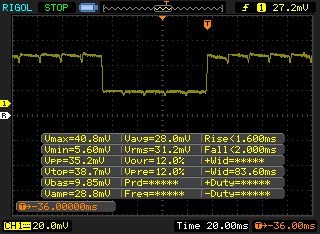 |
| ↘ 1.4 ms fall | ||
| The screen shows very fast response rates in our tests and should be very well suited for fast-paced gaming. In comparison, all tested devices range from 0.165 (minimum) to 636 (maximum) ms. » 11 % of all devices are better. This means that the measured response time is better than the average of all tested devices (31.1 ms). | ||
Screen Flickering / PWM (Pulse-Width Modulation)
| Screen flickering / PWM detected | 240.4 Hz | ≤ 52 % brightness setting | 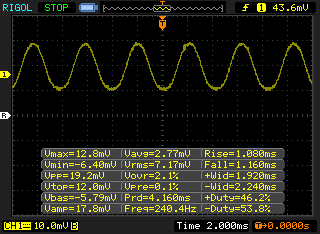 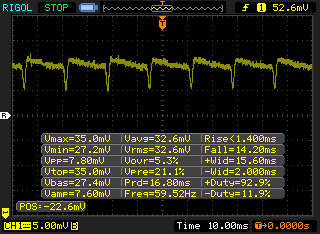 |
The display backlight flickers at 240.4 Hz (worst case, e.g., utilizing PWM) Flickering detected at a brightness setting of 52 % and below. There should be no flickering or PWM above this brightness setting. The frequency of 240.4 Hz is relatively low, so sensitive users will likely notice flickering and experience eyestrain at the stated brightness setting and below. In comparison: 52 % of all tested devices do not use PWM to dim the display. If PWM was detected, an average of 7791 (minimum: 5 - maximum: 343500) Hz was measured. | |||
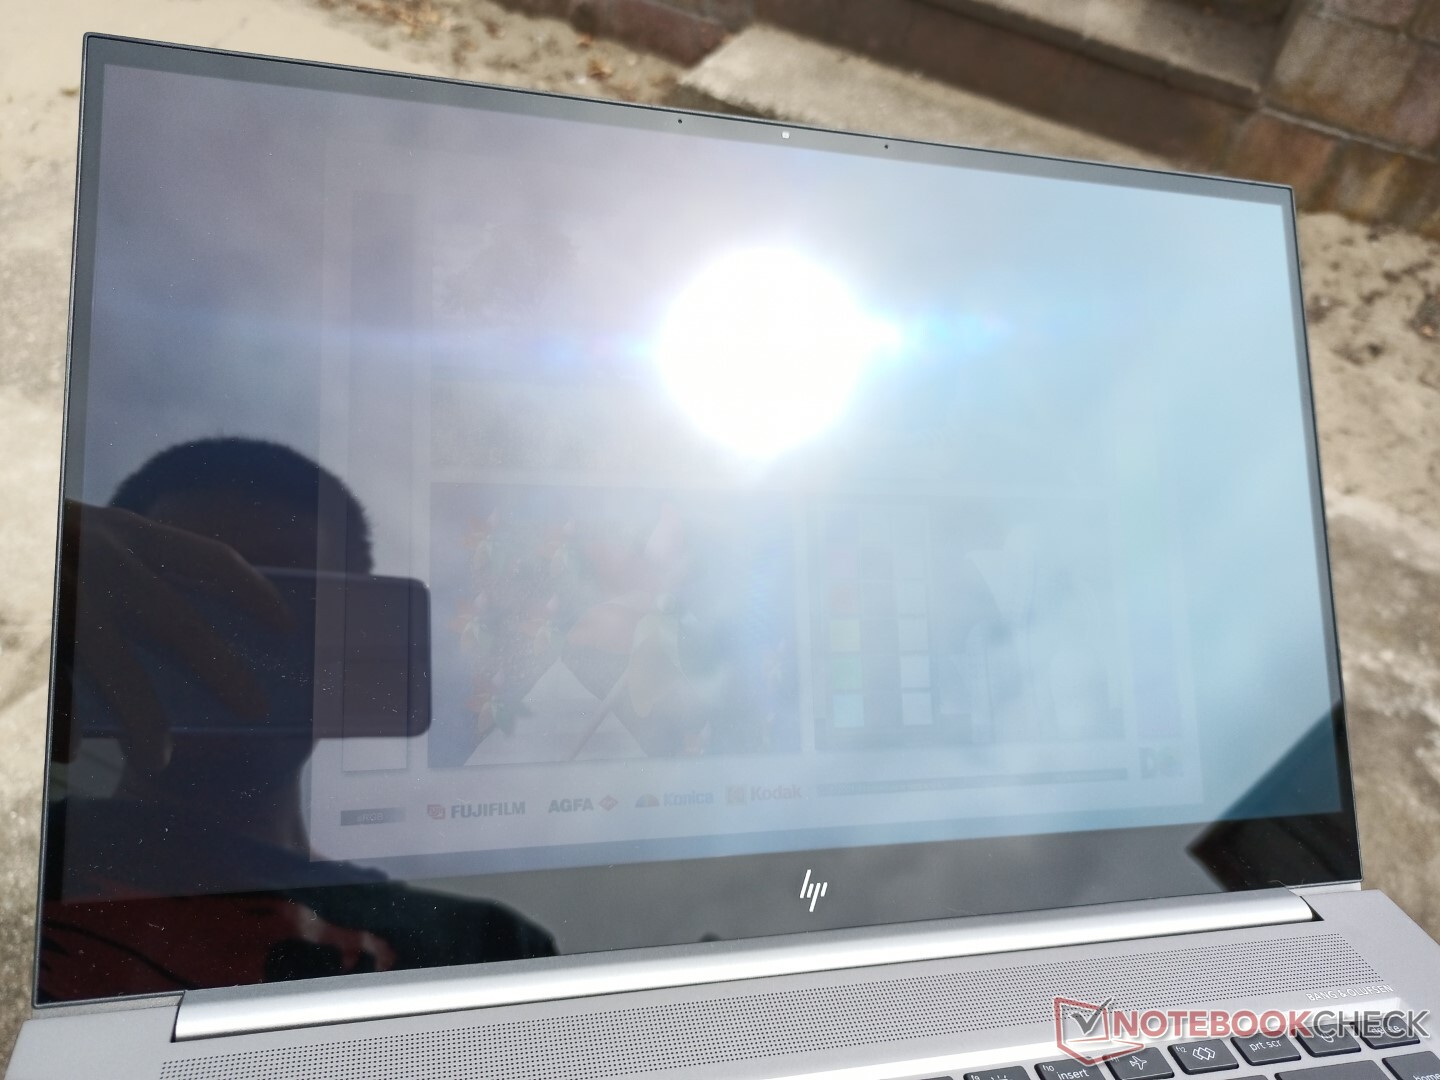
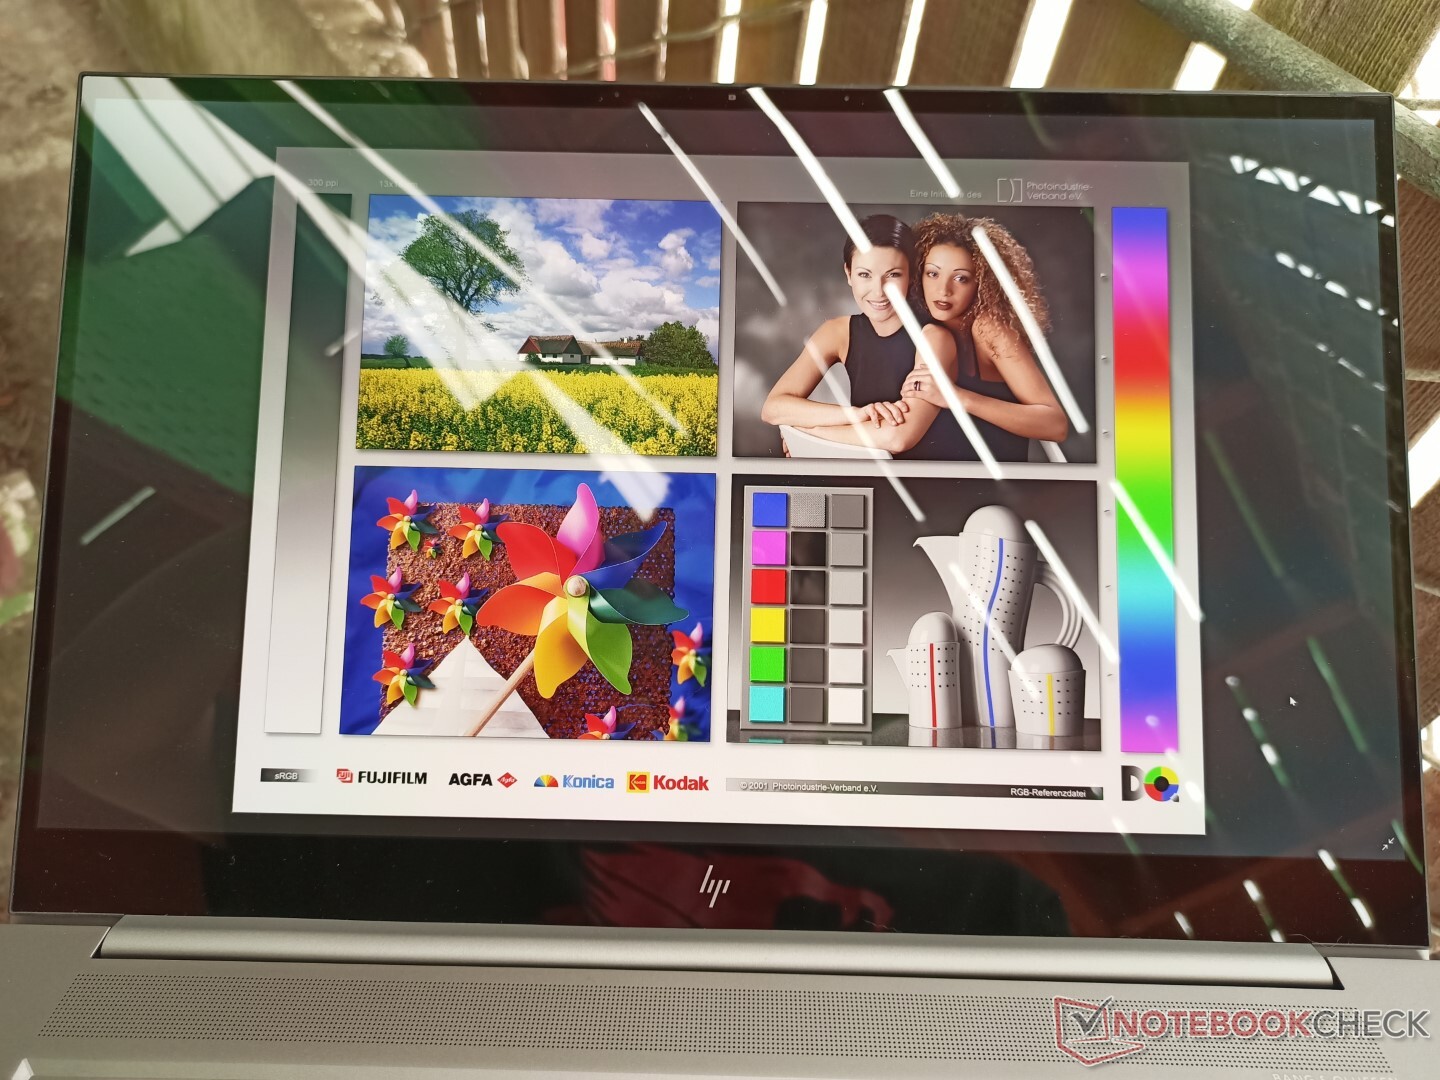
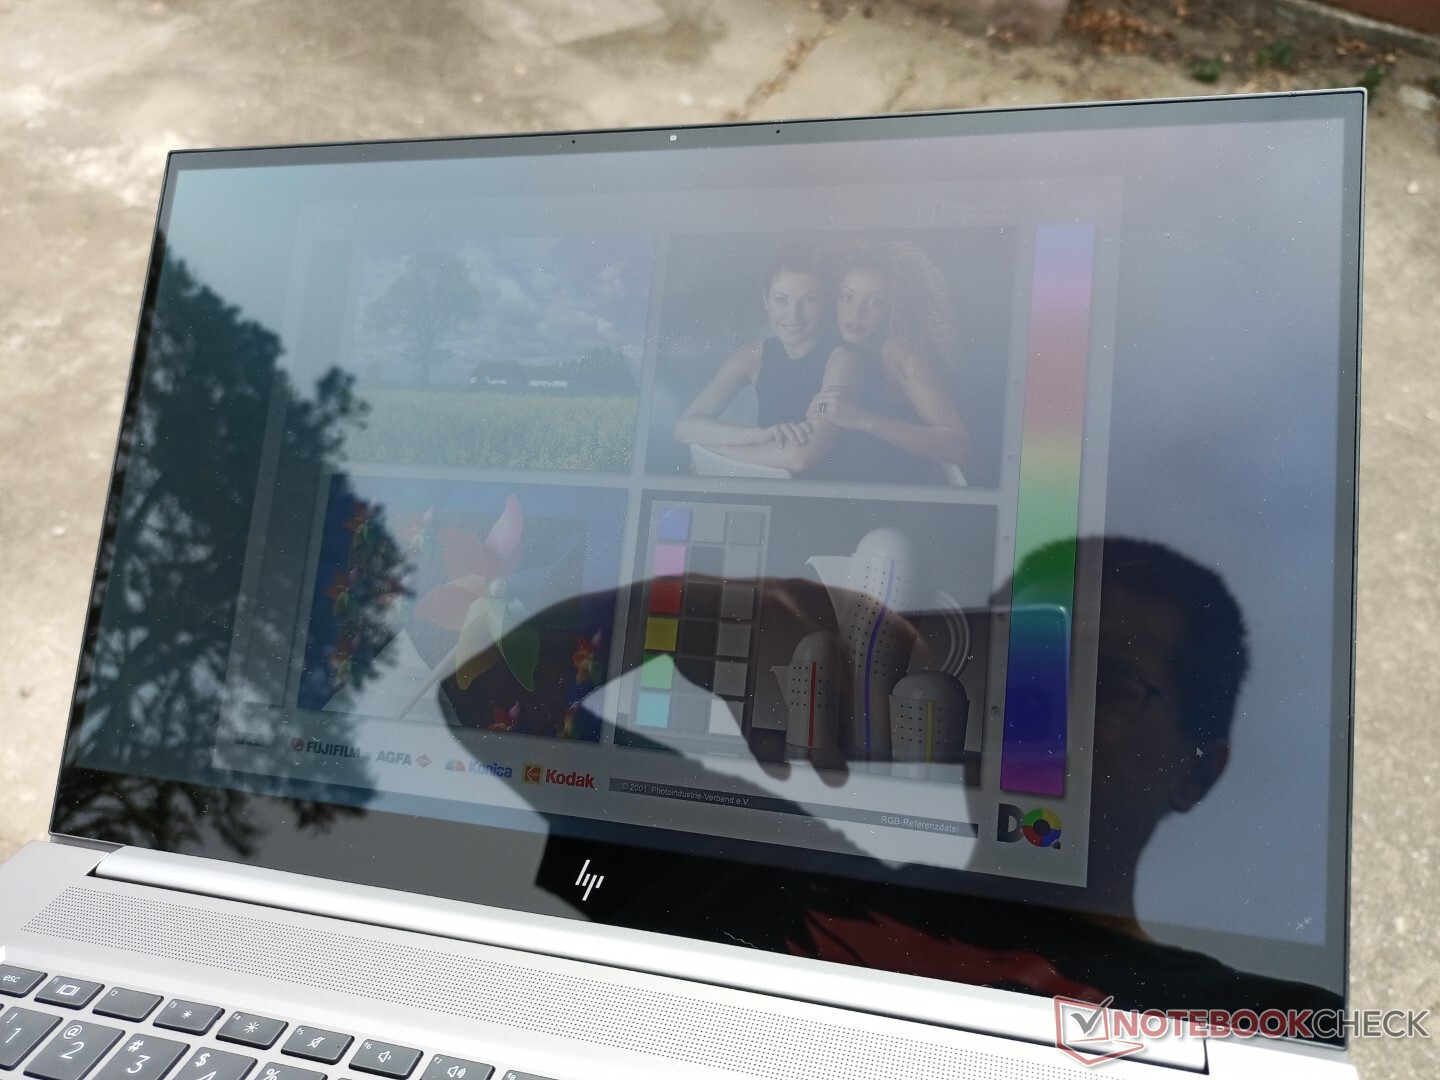
如下图所示,在户外使用时,光亮的覆盖层会造成明显的眩光。计划经常在户外使用笔记本电脑的用户应该考虑升级到1000尼特面板选项。根据我们对惠普1000尼特面板的经验,现实世界的最大亮度将接近700尼特,而不是1000尼特,这仍将比我们的基本400尼特面板亮近两倍。然而,只有FHD IPS面板可用于1000尼特的配置。
性能 - 有很多选择
处理器
正如预期的那样,CPU的性能略微低于酷睿i9-11900H由于支持vPro所需的性能开销。一代接一代,原始多线程性能比老式的 酷睿i9-10885H比老款ZBook Studio G7的Core i9-10885H快20%到25%。
在连续循环运行CineBench R15 xT时,性能的可持续性很稳定,没有大的下滑。
Cinebench R15 Multi Loop
Cinebench R23: Multi Core | Single Core
Cinebench R15: CPU Multi 64Bit | CPU Single 64Bit
Blender: v2.79 BMW27 CPU
7-Zip 18.03: 7z b 4 -mmt1 | 7z b 4
Geekbench 5.5: Single-Core | Multi-Core
HWBOT x265 Benchmark v2.2: 4k Preset
LibreOffice : 20 Documents To PDF
R Benchmark 2.5: Overall mean
| Cinebench R20 / CPU (Multi Core) | |
| Asus ROG Strix Scar 15 G533QS | |
| Asus ROG Zephyrus S17 GX703HSD | |
| Average Intel Core i9-11950H (4471 - 5000, n=4) | |
| HP ZBook Studio 15 G8 | |
| Asus TUF Gaming A15 FA506QR-AZ061T | |
| Schenker XMG Core 15 Ampere | |
| MSI WS66 10TMT-207US | |
| Dell XPS 15 9510 11800H RTX 3050 Ti OLED | |
| HP ZBook Studio G7 | |
| MSI GE65 Raider 9SF-049US | |
| Dell Precision 5550 P91F | |
| Apple MacBook Pro 15 2019 i9 Vega 20 | |
| Cinebench R20 / CPU (Single Core) | |
| Average Intel Core i9-11950H (610 - 632, n=4) | |
| HP ZBook Studio 15 G8 | |
| Asus ROG Zephyrus S17 GX703HSD | |
| Dell XPS 15 9510 11800H RTX 3050 Ti OLED | |
| Asus ROG Strix Scar 15 G533QS | |
| Asus TUF Gaming A15 FA506QR-AZ061T | |
| HP ZBook Studio G7 | |
| MSI WS66 10TMT-207US | |
| Dell Precision 5550 P91F | |
| Schenker XMG Core 15 Ampere | |
| Apple MacBook Pro 15 2019 i9 Vega 20 | |
| MSI GE65 Raider 9SF-049US | |
| Cinebench R23 / Multi Core | |
| Asus ROG Strix Scar 15 G533QS | |
| Asus ROG Zephyrus S17 GX703HSD | |
| Average Intel Core i9-11950H (12048 - 13113, n=4) | |
| HP ZBook Studio 15 G8 | |
| Schenker XMG Core 15 Ampere | |
| Dell XPS 15 9510 11800H RTX 3050 Ti OLED | |
| HP ZBook Studio G7 | |
| Cinebench R23 / Single Core | |
| Average Intel Core i9-11950H (1569 - 1633, n=4) | |
| Asus ROG Zephyrus S17 GX703HSD | |
| HP ZBook Studio 15 G8 | |
| Dell XPS 15 9510 11800H RTX 3050 Ti OLED | |
| Asus ROG Strix Scar 15 G533QS | |
| HP ZBook Studio G7 | |
| Schenker XMG Core 15 Ampere | |
| Cinebench R15 / CPU Multi 64Bit | |
| Asus ROG Strix Scar 15 G533QS | |
| Asus ROG Zephyrus S17 GX703HSD | |
| Dell XPS 15 9510 11800H RTX 3050 Ti OLED | |
| Dell XPS 15 9510 11800H RTX 3050 Ti OLED | |
| Asus TUF Gaming A15 FA506QR-AZ061T | |
| Average Intel Core i9-11950H (1827 - 2130, n=5) | |
| Schenker XMG Core 15 Ampere | |
| HP ZBook Studio 15 G8 | |
| HP ZBook Studio G7 | |
| MSI WS66 10TMT-207US | |
| MSI GE65 Raider 9SF-049US | |
| Dell Precision 5550 P91F | |
| Apple MacBook Pro 15 2019 i9 Vega 20 | |
| Cinebench R15 / CPU Single 64Bit | |
| Average Intel Core i9-11950H (236 - 249, n=4) | |
| Asus ROG Zephyrus S17 GX703HSD | |
| HP ZBook Studio 15 G8 | |
| Asus ROG Strix Scar 15 G533QS | |
| Asus TUF Gaming A15 FA506QR-AZ061T | |
| Dell XPS 15 9510 11800H RTX 3050 Ti OLED | |
| HP ZBook Studio G7 | |
| MSI WS66 10TMT-207US | |
| Dell Precision 5550 P91F | |
| MSI GE65 Raider 9SF-049US | |
| Schenker XMG Core 15 Ampere | |
| Apple MacBook Pro 15 2019 i9 Vega 20 | |
| Blender / v2.79 BMW27 CPU | |
| Dell Precision 5550 P91F | |
| Dell XPS 15 9510 11800H RTX 3050 Ti OLED | |
| HP ZBook Studio G7 | |
| MSI WS66 10TMT-207US | |
| Asus TUF Gaming A15 FA506QR-AZ061T | |
| HP ZBook Studio 15 G8 | |
| Average Intel Core i9-11950H (244 - 261, n=3) | |
| Schenker XMG Core 15 Ampere | |
| Asus ROG Strix Scar 15 G533QS | |
| Asus ROG Zephyrus S17 GX703HSD | |
| 7-Zip 18.03 / 7z b 4 -mmt1 | |
| Average Intel Core i9-11950H (5755 - 5919, n=3) | |
| Asus ROG Zephyrus S17 GX703HSD | |
| HP ZBook Studio 15 G8 | |
| HP ZBook Studio G7 | |
| Asus ROG Strix Scar 15 G533QS | |
| Asus TUF Gaming A15 FA506QR-AZ061T | |
| Dell XPS 15 9510 11800H RTX 3050 Ti OLED | |
| Dell Precision 5550 P91F | |
| MSI WS66 10TMT-207US | |
| Schenker XMG Core 15 Ampere | |
| 7-Zip 18.03 / 7z b 4 | |
| Asus ROG Strix Scar 15 G533QS | |
| Asus ROG Zephyrus S17 GX703HSD | |
| Asus TUF Gaming A15 FA506QR-AZ061T | |
| Schenker XMG Core 15 Ampere | |
| Average Intel Core i9-11950H (50050 - 51402, n=3) | |
| HP ZBook Studio 15 G8 | |
| MSI WS66 10TMT-207US | |
| HP ZBook Studio G7 | |
| Dell XPS 15 9510 11800H RTX 3050 Ti OLED | |
| Dell Precision 5550 P91F | |
| Geekbench 5.5 / Single-Core | |
| HP ZBook Studio 15 G8 | |
| Average Intel Core i9-11950H (1623 - 1702, n=3) | |
| Asus ROG Zephyrus S17 GX703HSD | |
| Dell XPS 15 9510 11800H RTX 3050 Ti OLED | |
| Asus TUF Gaming A15 FA506QR-AZ061T | |
| HP ZBook Studio G7 | |
| MSI WS66 10TMT-207US | |
| Dell Precision 5550 P91F | |
| Schenker XMG Core 15 Ampere | |
| Geekbench 5.5 / Multi-Core | |
| Asus ROG Zephyrus S17 GX703HSD | |
| Dell Precision 5550 P91F | |
| MSI WS66 10TMT-207US | |
| Dell XPS 15 9510 11800H RTX 3050 Ti OLED | |
| Schenker XMG Core 15 Ampere | |
| Average Intel Core i9-11950H (7286 - 8152, n=3) | |
| HP ZBook Studio G7 | |
| Asus TUF Gaming A15 FA506QR-AZ061T | |
| HP ZBook Studio 15 G8 | |
| HWBOT x265 Benchmark v2.2 / 4k Preset | |
| Asus ROG Zephyrus S17 GX703HSD | |
| Asus ROG Strix Scar 15 G533QS | |
| HP ZBook Studio 15 G8 | |
| Average Intel Core i9-11950H (13.8 - 14.5, n=4) | |
| Schenker XMG Core 15 Ampere | |
| Asus TUF Gaming A15 FA506QR-AZ061T | |
| MSI WS66 10TMT-207US | |
| HP ZBook Studio G7 | |
| Dell XPS 15 9510 11800H RTX 3050 Ti OLED | |
| Dell Precision 5550 P91F | |
| LibreOffice / 20 Documents To PDF | |
| HP ZBook Studio G7 | |
| Schenker XMG Core 15 Ampere | |
| Asus ROG Strix Scar 15 G533QS | |
| Asus TUF Gaming A15 FA506QR-AZ061T | |
| HP ZBook Studio 15 G8 | |
| Average Intel Core i9-11950H (38.6 - 53.2, n=4) | |
| Dell XPS 15 9510 11800H RTX 3050 Ti OLED | |
| Asus ROG Zephyrus S17 GX703HSD | |
| MSI WS66 10TMT-207US | |
| Dell Precision 5550 P91F | |
| R Benchmark 2.5 / Overall mean | |
| Dell Precision 5550 P91F | |
| MSI WS66 10TMT-207US | |
| Schenker XMG Core 15 Ampere | |
| Dell XPS 15 9510 11800H RTX 3050 Ti OLED | |
| HP ZBook Studio G7 | |
| HP ZBook Studio 15 G8 | |
| Average Intel Core i9-11950H (0.521 - 0.551, n=4) | |
| Asus ROG Zephyrus S17 GX703HSD | |
| Asus TUF Gaming A15 FA506QR-AZ061T | |
| Asus ROG Strix Scar 15 G533QS | |
* ... smaller is better
系统性能
| PCMark 10 / Score | |
| HP ZBook Studio 15 G8 | |
| Dell Precision 7550 | |
| HP ZBook Firefly 15 G8 2C9R7EA | |
| HP ZBook Studio G7 | |
| Lenovo ThinkPad P15s Gen2-20W6000GGE | |
| Asus ProArt StudioBook Pro 15 W500G5T | |
| PCMark 10 / Essentials | |
| HP ZBook Studio 15 G8 | |
| Dell Precision 7550 | |
| Lenovo ThinkPad P15s Gen2-20W6000GGE | |
| HP ZBook Firefly 15 G8 2C9R7EA | |
| Asus ProArt StudioBook Pro 15 W500G5T | |
| HP ZBook Studio G7 | |
| PCMark 10 / Productivity | |
| Lenovo ThinkPad P15s Gen2-20W6000GGE | |
| HP ZBook Firefly 15 G8 2C9R7EA | |
| HP ZBook Studio 15 G8 | |
| Dell Precision 7550 | |
| Asus ProArt StudioBook Pro 15 W500G5T | |
| HP ZBook Studio G7 | |
| PCMark 10 / Digital Content Creation | |
| HP ZBook Studio 15 G8 | |
| Dell Precision 7550 | |
| HP ZBook Studio G7 | |
| HP ZBook Firefly 15 G8 2C9R7EA | |
| Asus ProArt StudioBook Pro 15 W500G5T | |
| Lenovo ThinkPad P15s Gen2-20W6000GGE | |
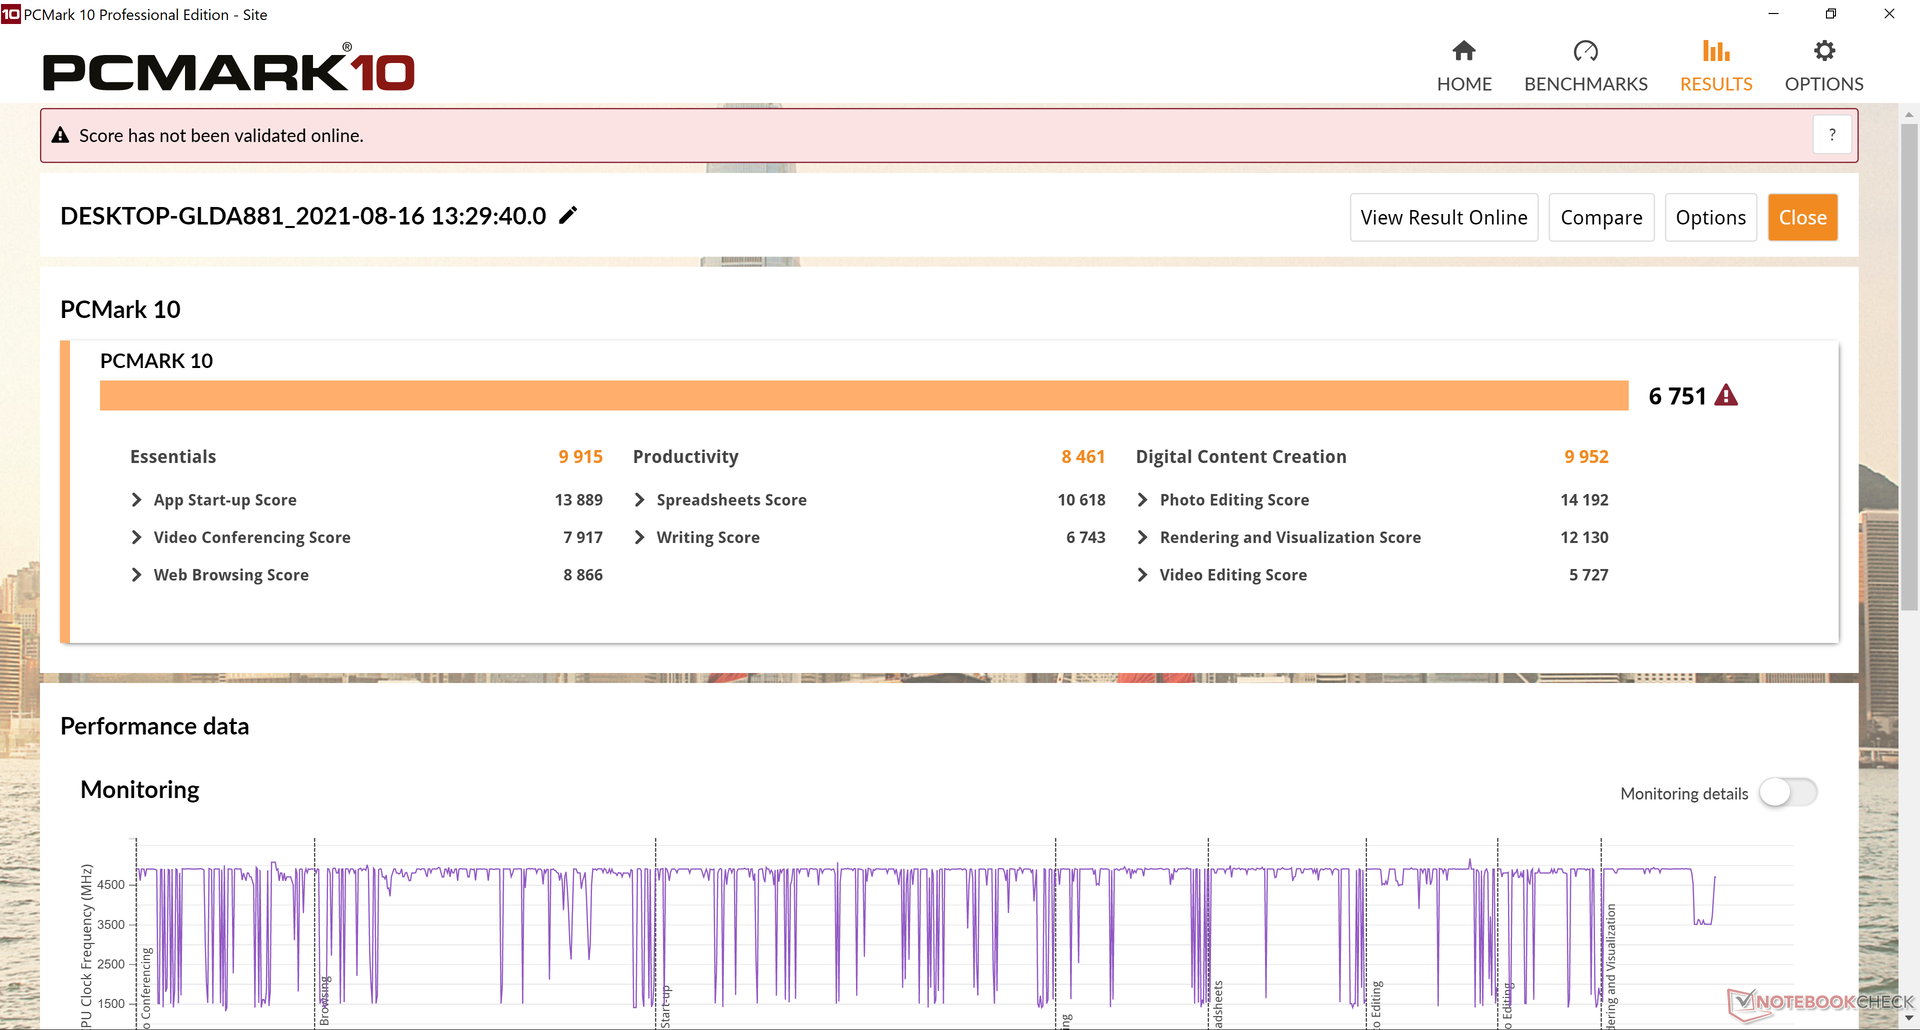
| PCMark 10 Score | 6751 points | |
Help | ||
DPC延时
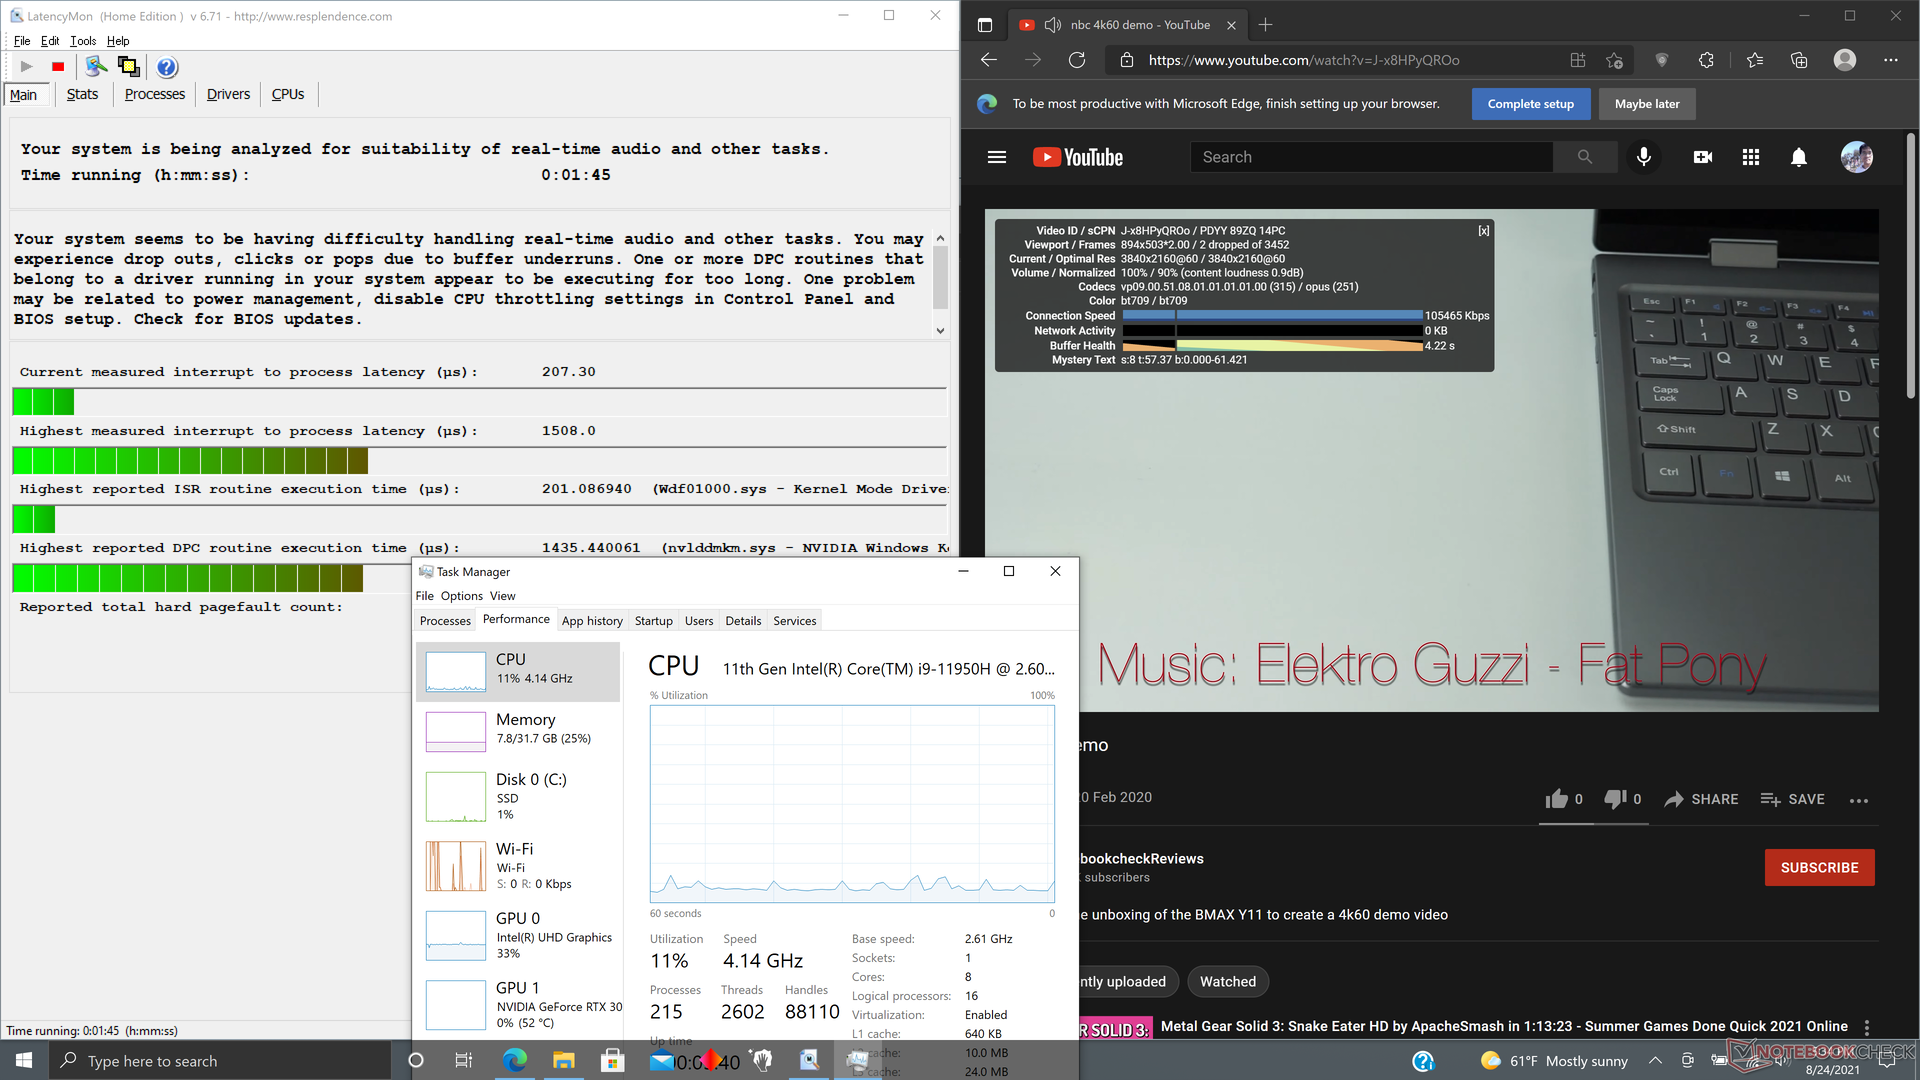
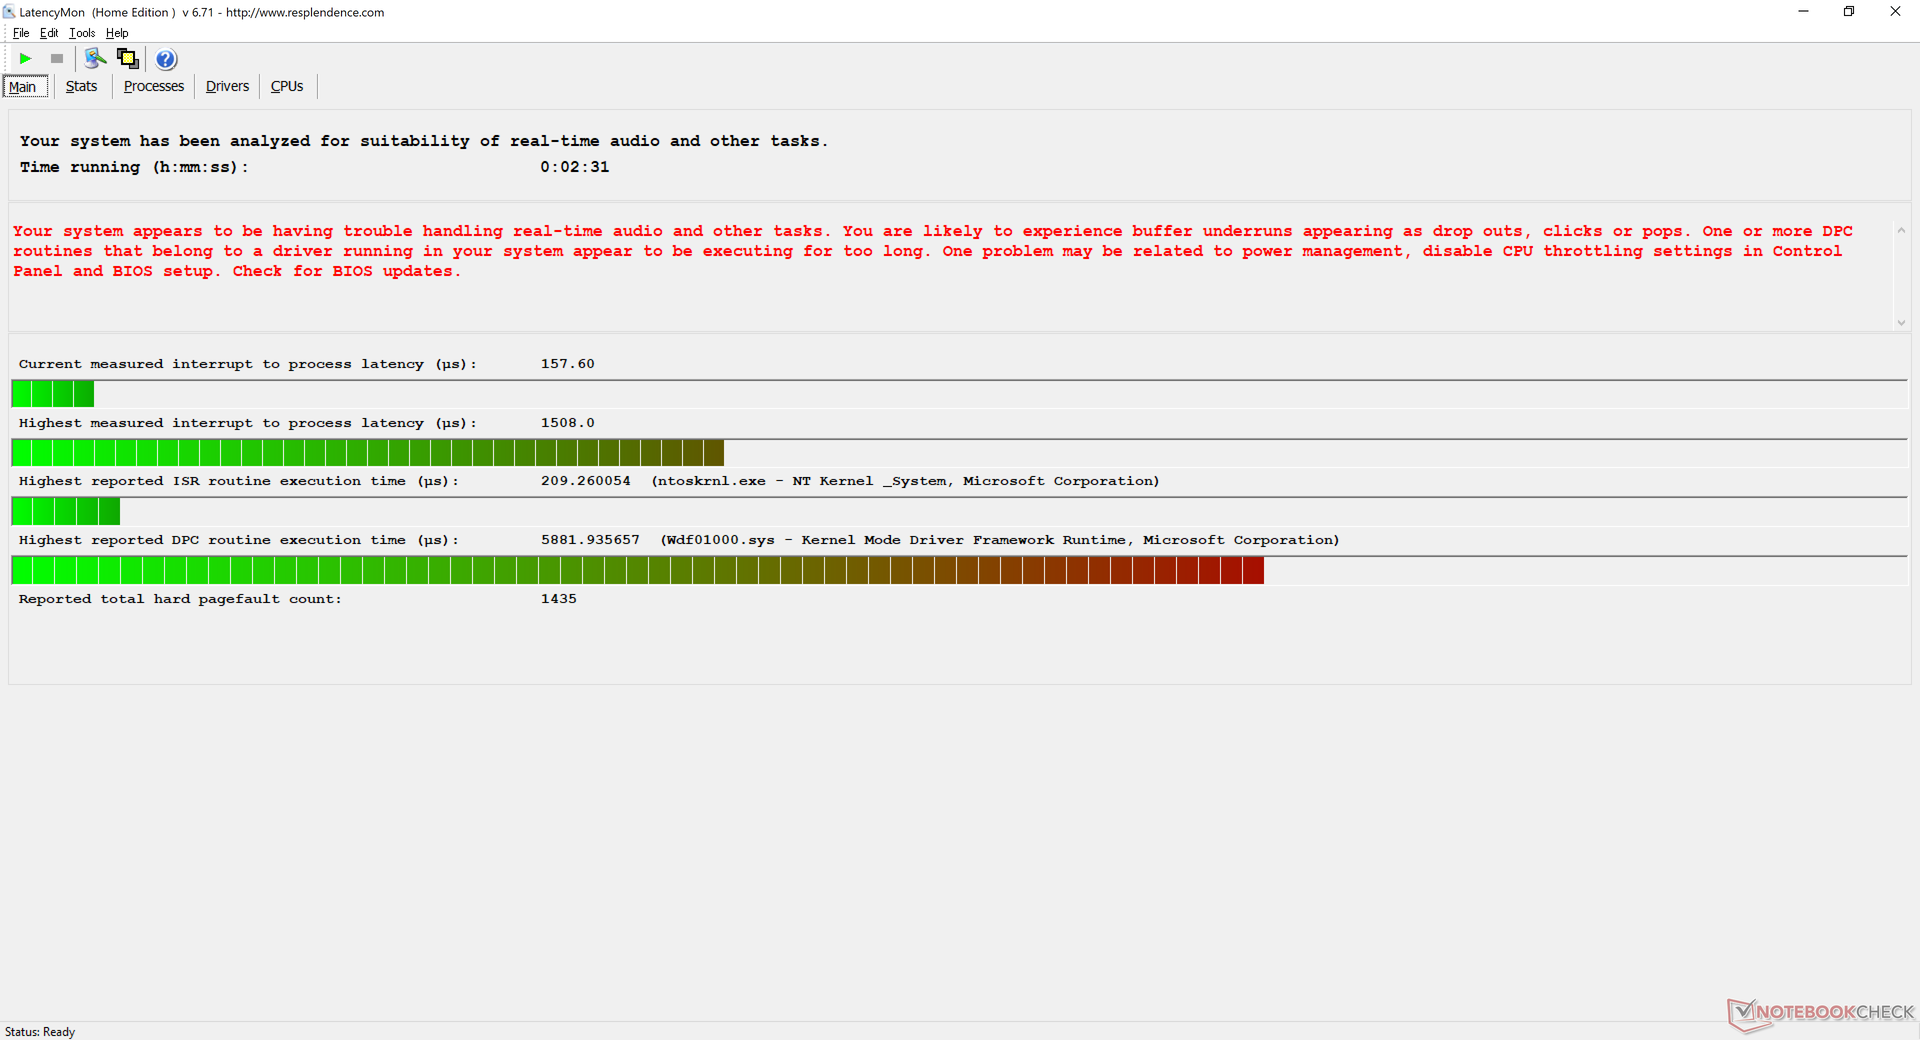
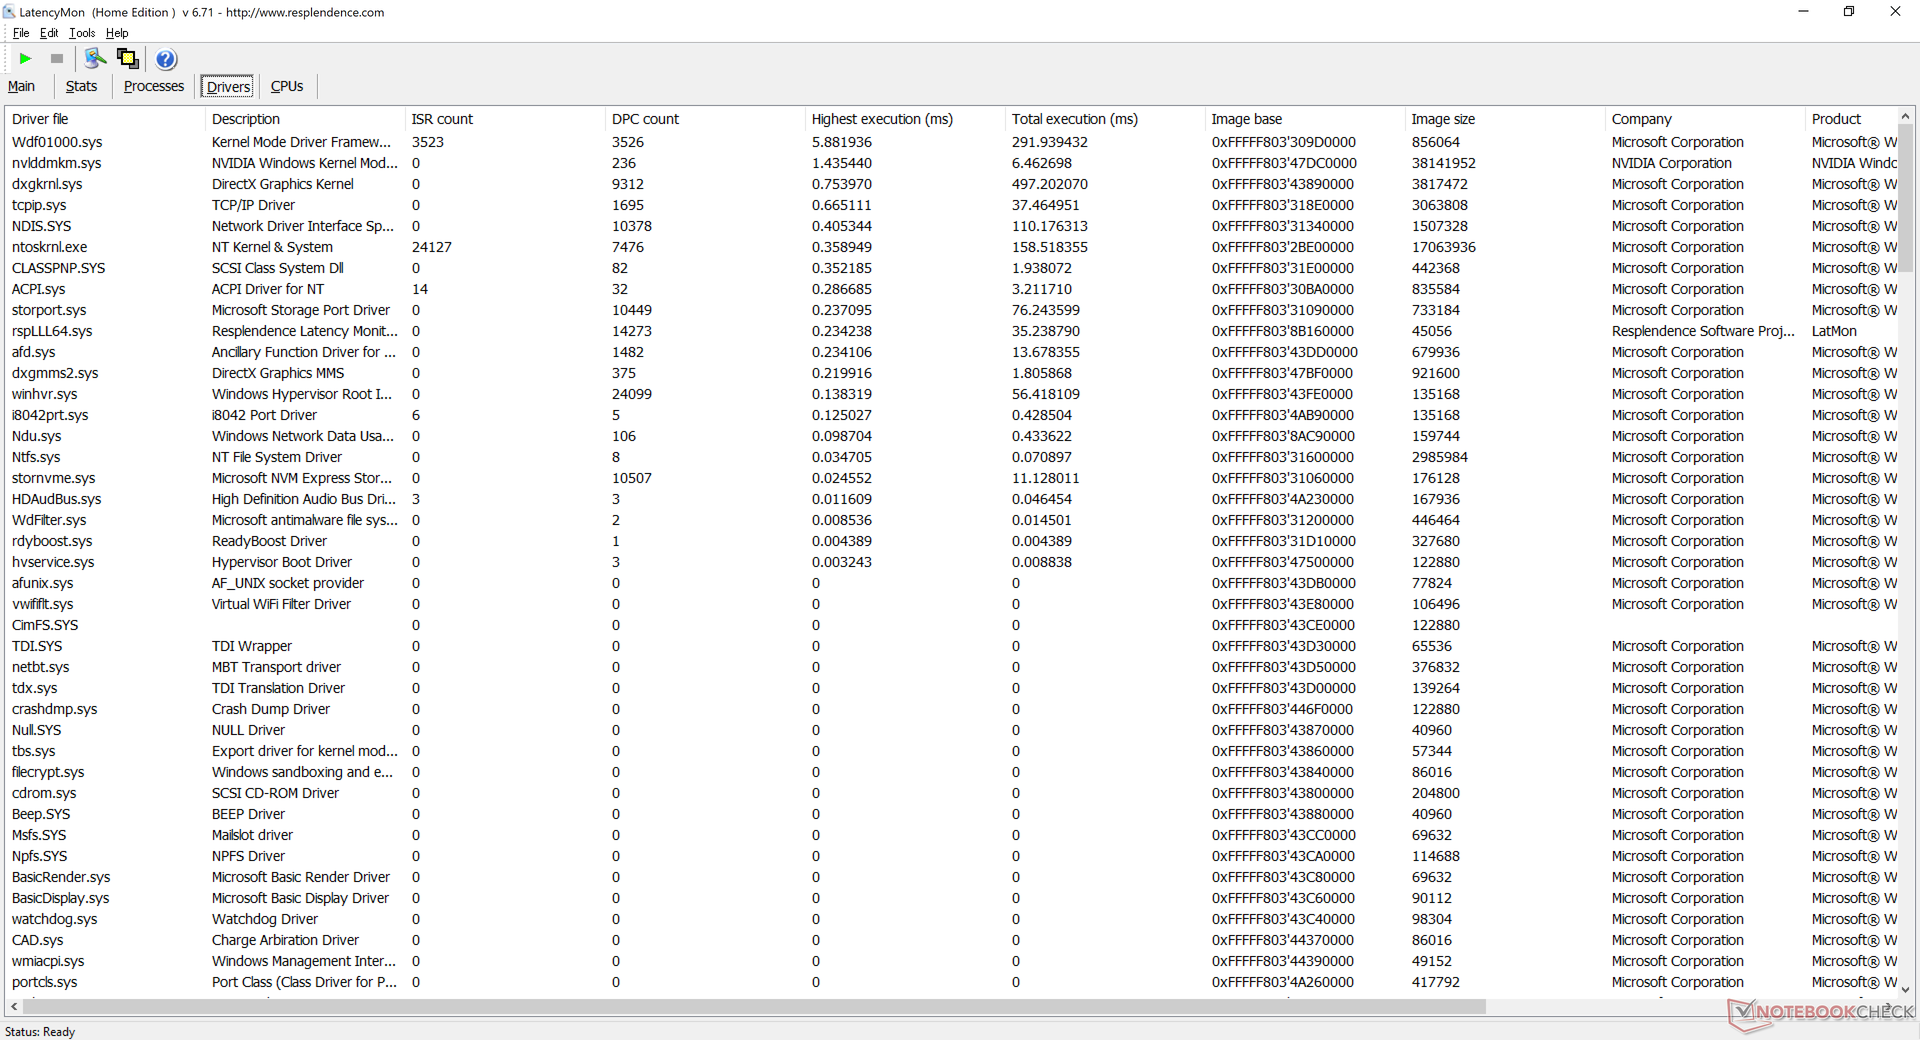
LatencyMon显示了在我们的主页上打开多个浏览器标签时的延迟问题,以及在运行Prime95压力时的延迟问题。在我们长达1分钟的测试视频中,以60FPS的速度播放4K视频非常流畅,只有2个丢帧。
| DPC Latencies / LatencyMon - interrupt to process latency (max), Web, Youtube, Prime95 | |
| Dell Precision 7550 | |
| HP ZBook Studio G7 | |
| Lenovo ThinkPad P15s Gen2-20W6000GGE | |
| Asus ProArt StudioBook Pro 15 W500G5T | |
| HP ZBook Studio 15 G8 | |
| HP ZBook Firefly 15 G8 2C9R7EA | |
* ... smaller is better
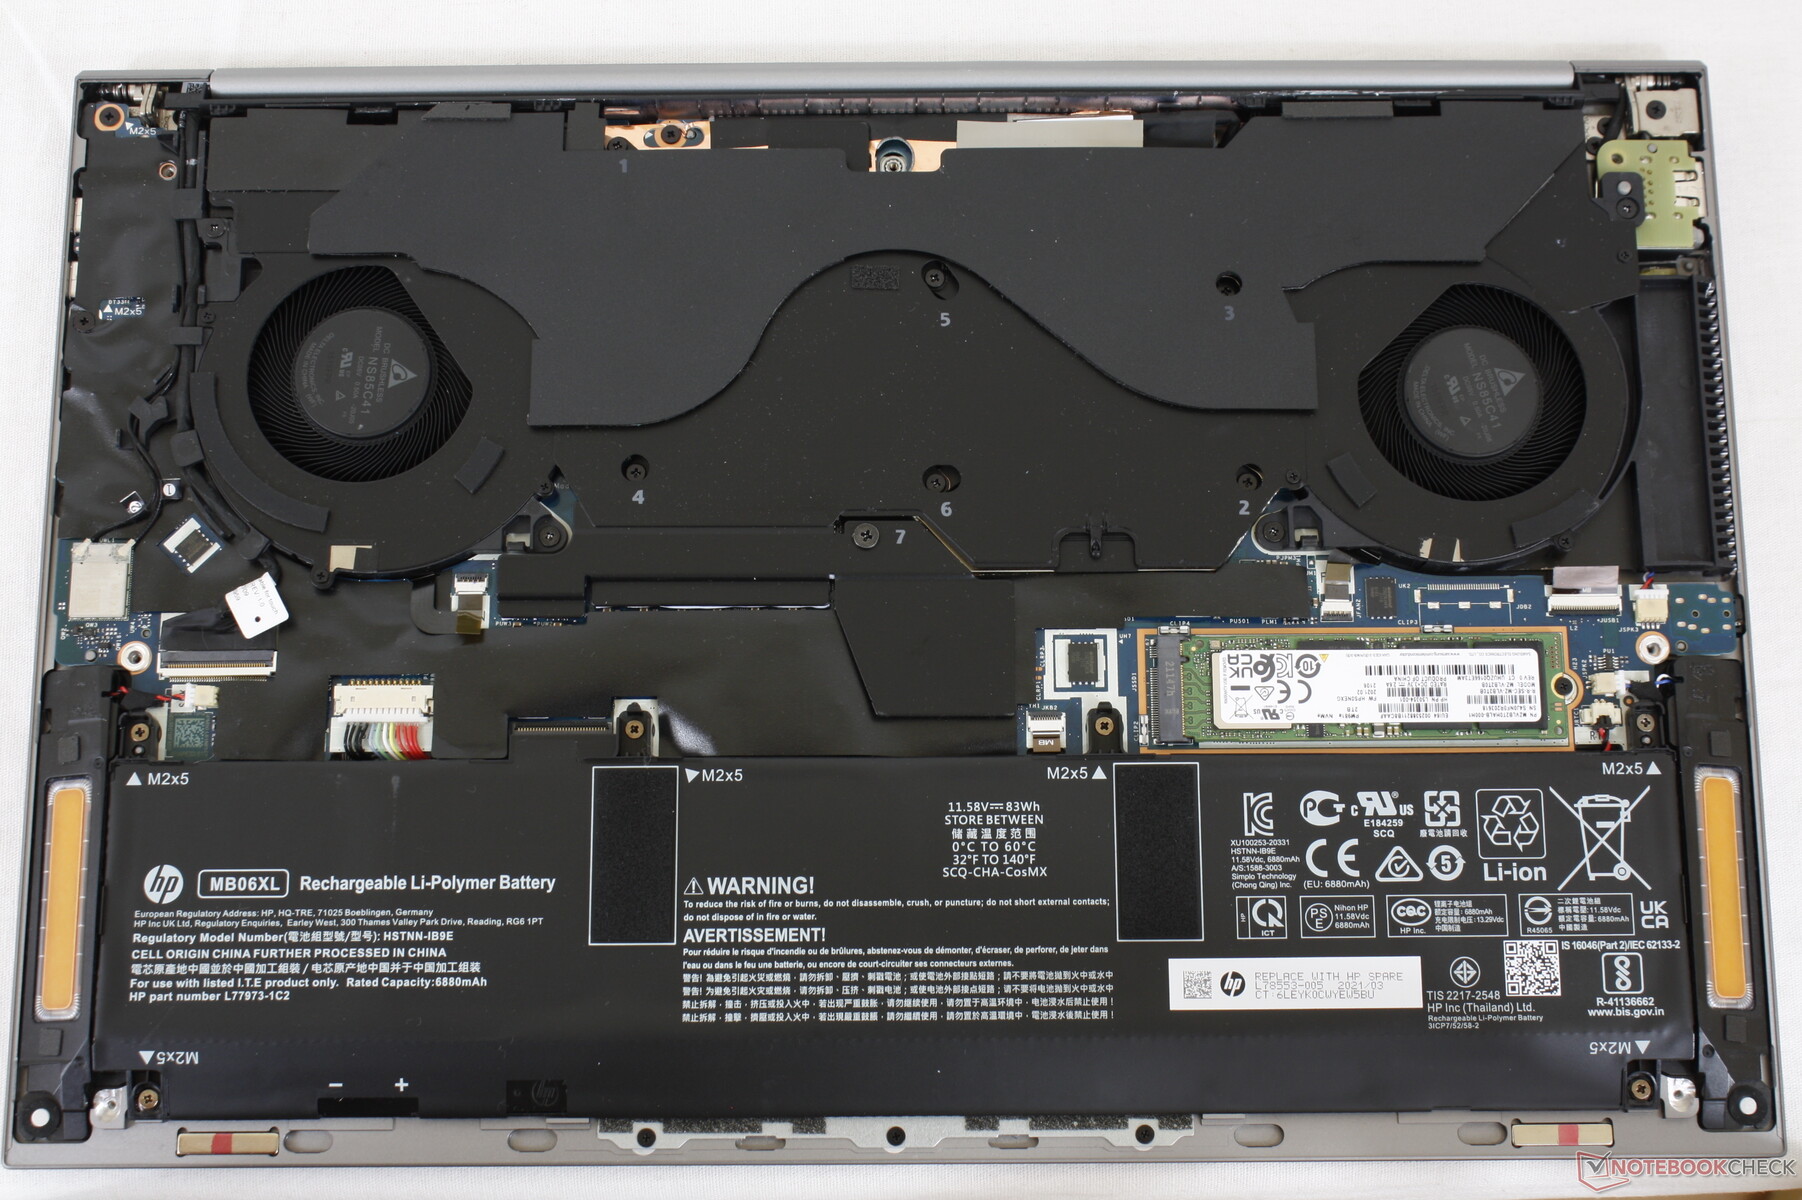
存储设备
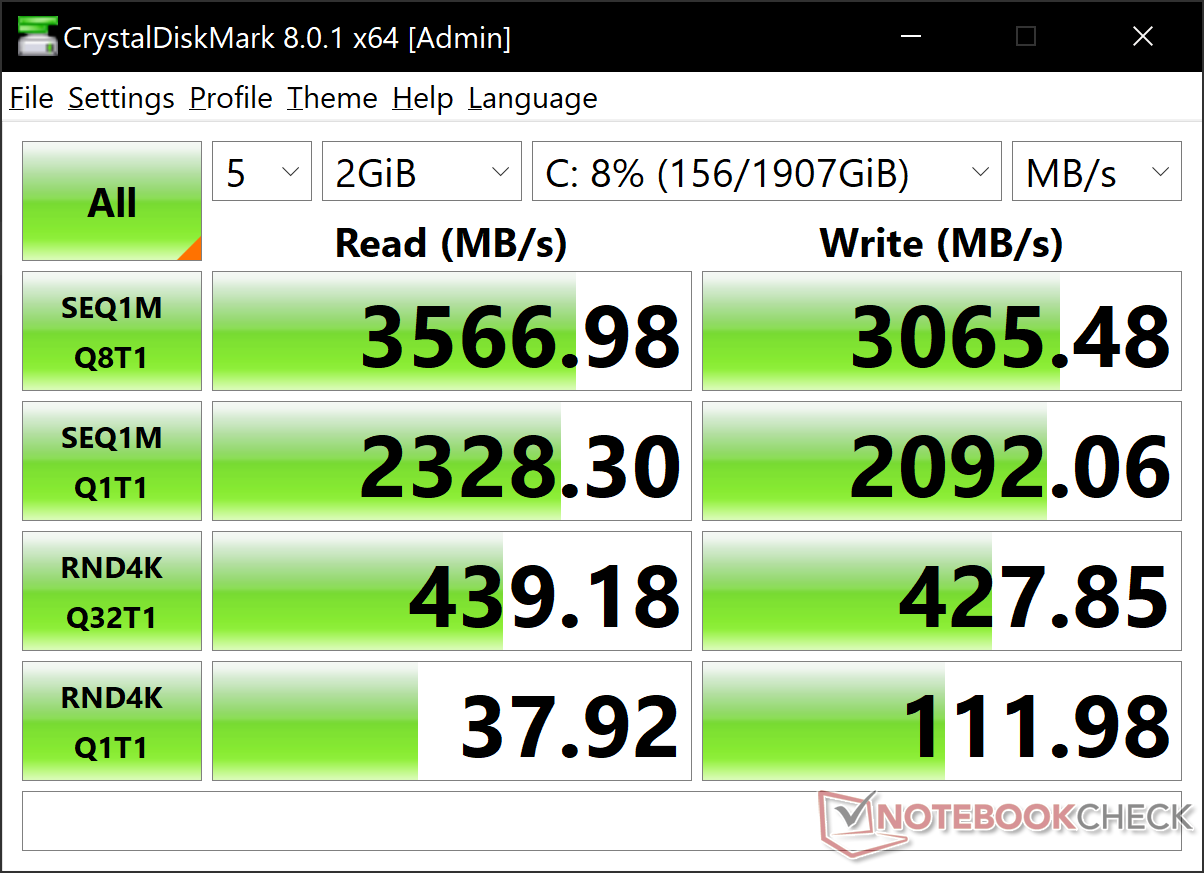
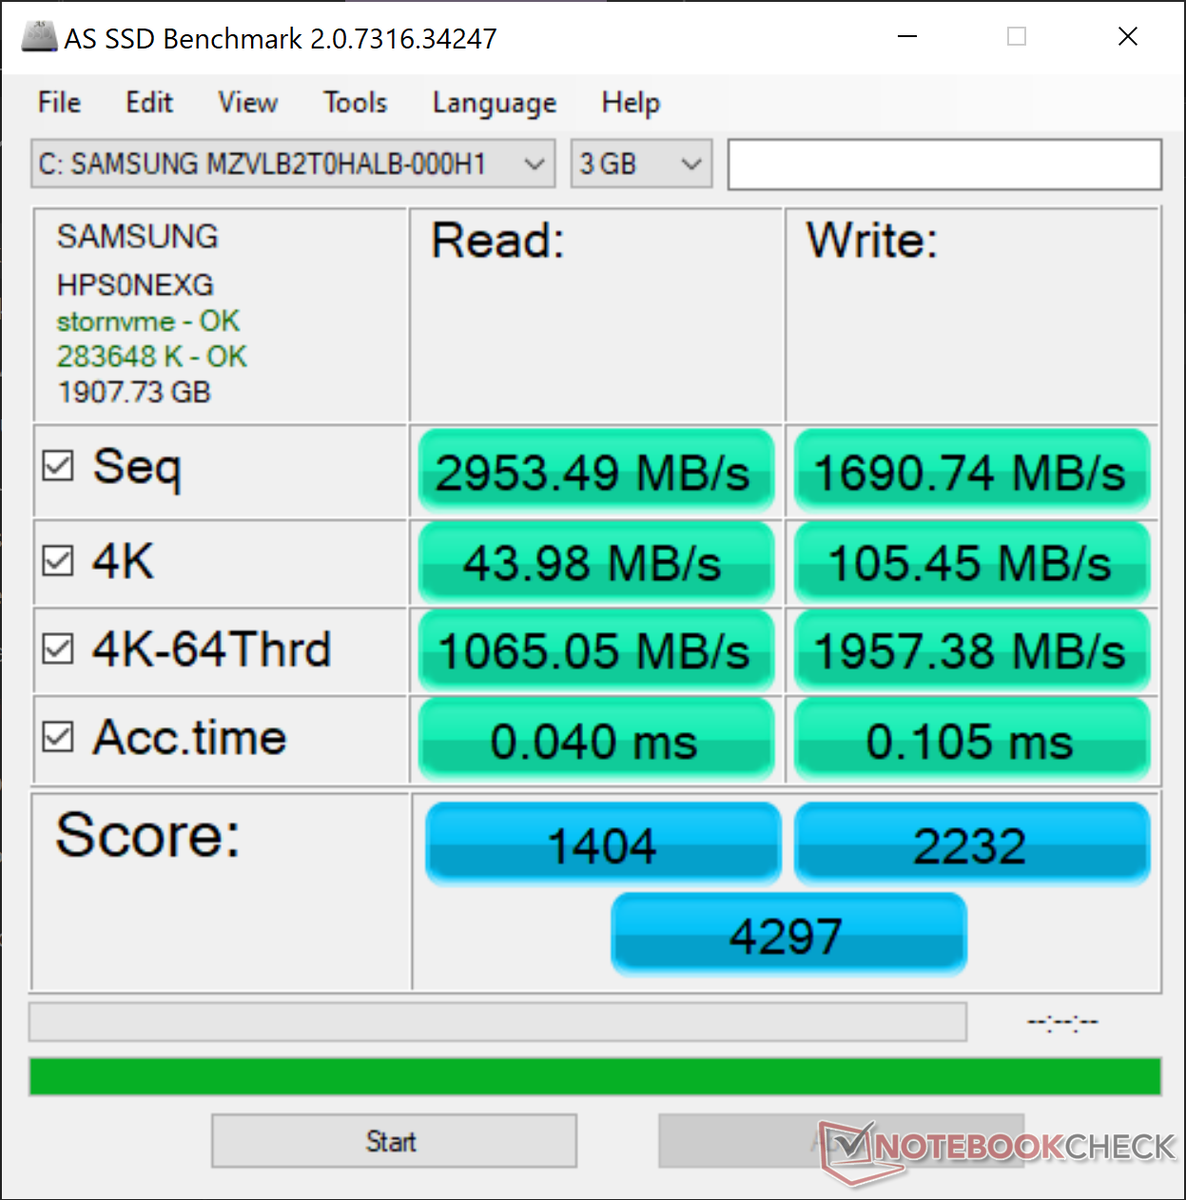
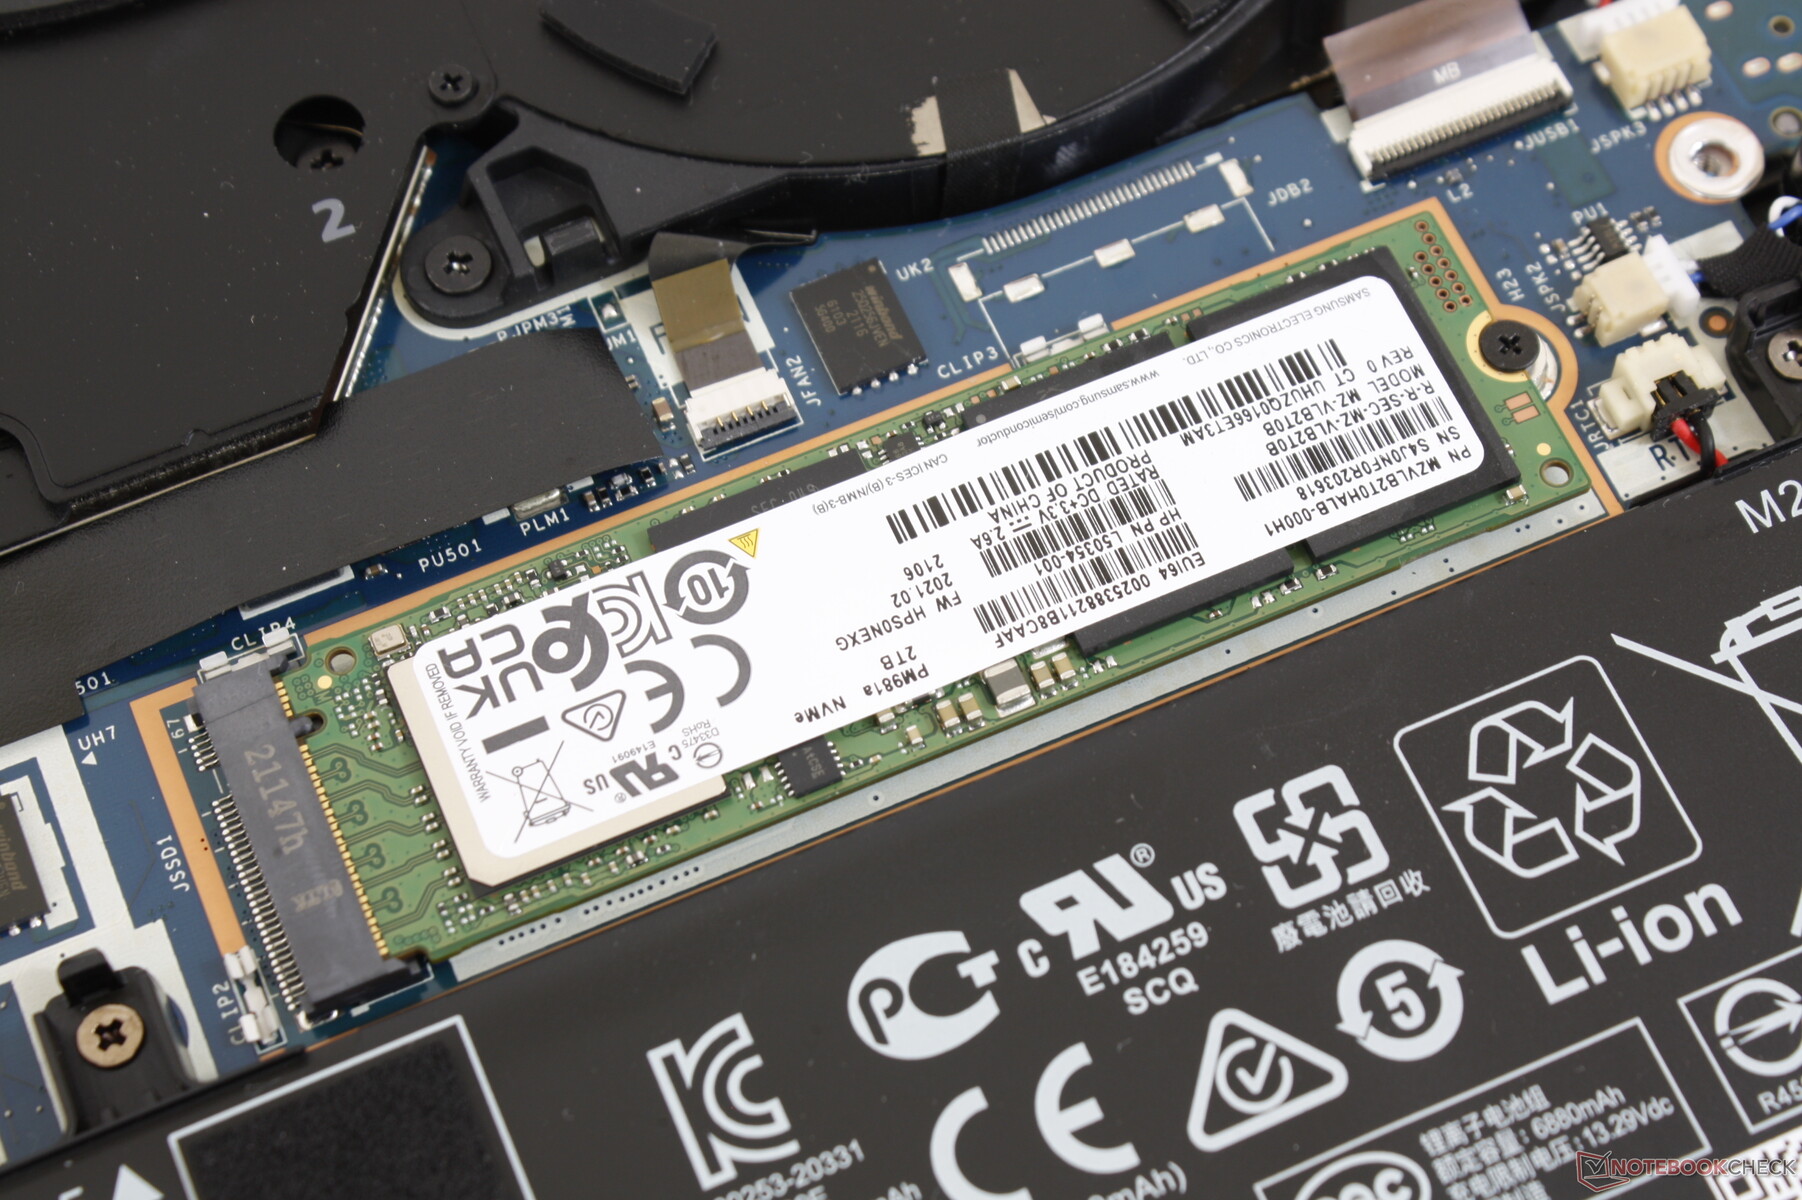
只有一个内部的M.2 2280 PCIe 3 x4插槽,没有辅助选项。虽然我们可以理解有限的可用空间,但至少可以看到升级到PCIe 4,特别是对于这样一个昂贵的系统来说,这将是一件好事。我们的特定测试单元配备了三星MZVLB2T0HALB,其快速连续读取和写入速率分别为3500MB/s和3000MB/s。惠普提供了可选的SED固态硬盘作为一个额外的安全层。
| HP ZBook Studio 15 G8 Samsung PM981a MZVLB2T0HALB | HP ZBook Firefly 15 G8 2C9R7EA Toshiba XG6 KXG60ZNV1T02 | HP ZBook Studio G7 Micron 2300 1TB MTFDHBA1T0TDV | Dell Precision 7550 SK Hynix PC601A NVMe 1TB | Lenovo ThinkPad P15s Gen2-20W6000GGE WDC PC SN720 SDAQNTW-1T00 | Asus ProArt StudioBook Pro 15 W500G5T Samsung SSD PM981 MZVLB1T0HALR | |
|---|---|---|---|---|---|---|
| AS SSD | -1% | -16% | -20% | 11% | 4% | |
| Seq Read (MB/s) | 2953 | 2599 -12% | 2548 -14% | 2028 -31% | 2796 -5% | 2702 -8% |
| Seq Write (MB/s) | 1691 | 1305 -23% | 1312 -22% | 1193 -29% | 2525 49% | 2348 39% |
| 4K Read (MB/s) | 43.98 | 49.65 13% | 45.38 3% | 42.31 -4% | 50.9 16% | 37.59 -15% |
| 4K Write (MB/s) | 105.4 | 128.1 22% | 83 -21% | 105.5 0% | 211.9 101% | 107.1 2% |
| 4K-64 Read (MB/s) | 1065 | 1157 9% | 935 -12% | 1128 6% | 1505 41% | 1491 40% |
| 4K-64 Write (MB/s) | 1957 | 1475 -25% | 2314 18% | 1537 -21% | 949 -52% | 1794 -8% |
| Access Time Read * (ms) | 0.04 | 0.057 -43% | 0.057 -43% | 0.069 -73% | 0.081 -103% | 0.046 -15% |
| Access Time Write * (ms) | 0.105 | 0.03 71% | 0.098 7% | 0.106 -1% | 0.019 82% | 0.034 68% |
| Score Read (Points) | 1404 | 1467 4% | 1235 -12% | 1373 -2% | 1835 31% | 1798 28% |
| Score Write (Points) | 2232 | 1734 -22% | 2528 13% | 1762 -21% | 1413 -37% | 2136 -4% |
| Score Total (Points) | 4297 | 3894 -9% | 4342 1% | 3801 -12% | 4177 -3% | 4835 13% |
| Copy ISO MB/s (MB/s) | 2474 | 3142 27% | 1768 -29% | 2302 -7% | ||
| Copy Program MB/s (MB/s) | 1074 | 126.1 -88% | 627 -42% | 564 -47% | ||
| Copy Game MB/s (MB/s) | 1929 | 477.4 -75% | 1477 -23% | 1336 -31% | ||
| CrystalDiskMark 5.2 / 6 | 1% | -9% | -8% | 22% | 106% | |
| Write 4K (MB/s) | 110.5 | 140.6 27% | 95.5 -14% | 121 10% | 237.6 115% | 1107 902% |
| Read 4K (MB/s) | 51.8 | 52.8 2% | 48.99 -5% | 42.16 -19% | 54.7 6% | 43.38 -16% |
| Write Seq (MB/s) | 2071 | 1844 -11% | 2001 -3% | 2150 4% | 2603 26% | 2387 15% |
| Read Seq (MB/s) | 2505 | 2108 -16% | 1600 -36% | 1755 -30% | 1889 -25% | 2431 -3% |
| Write 4K Q32T1 (MB/s) | 429.8 | 418 -3% | 410.2 -5% | 395.3 -8% | 505 17% | 340.7 -21% |
| Read 4K Q32T1 (MB/s) | 418.3 | 476.8 14% | 394.7 -6% | 381.8 -9% | 606 45% | 397.8 -5% |
| Write Seq Q32T1 (MB/s) | 3060 | 3064 0% | 3148 3% | 2730 -11% | 2795 -9% | 2390 -22% |
| Read Seq Q32T1 (MB/s) | 3539 | 3289 -7% | 3227 -9% | 3468 -2% | 3448 -3% | 3502 -1% |
| Total Average (Program / Settings) | 0% /
-0% | -13% /
-13% | -14% /
-16% | 17% /
15% | 55% /
41% |
* ... smaller is better

Disk Throttling: DiskSpd Read Loop, Queue Depth 8
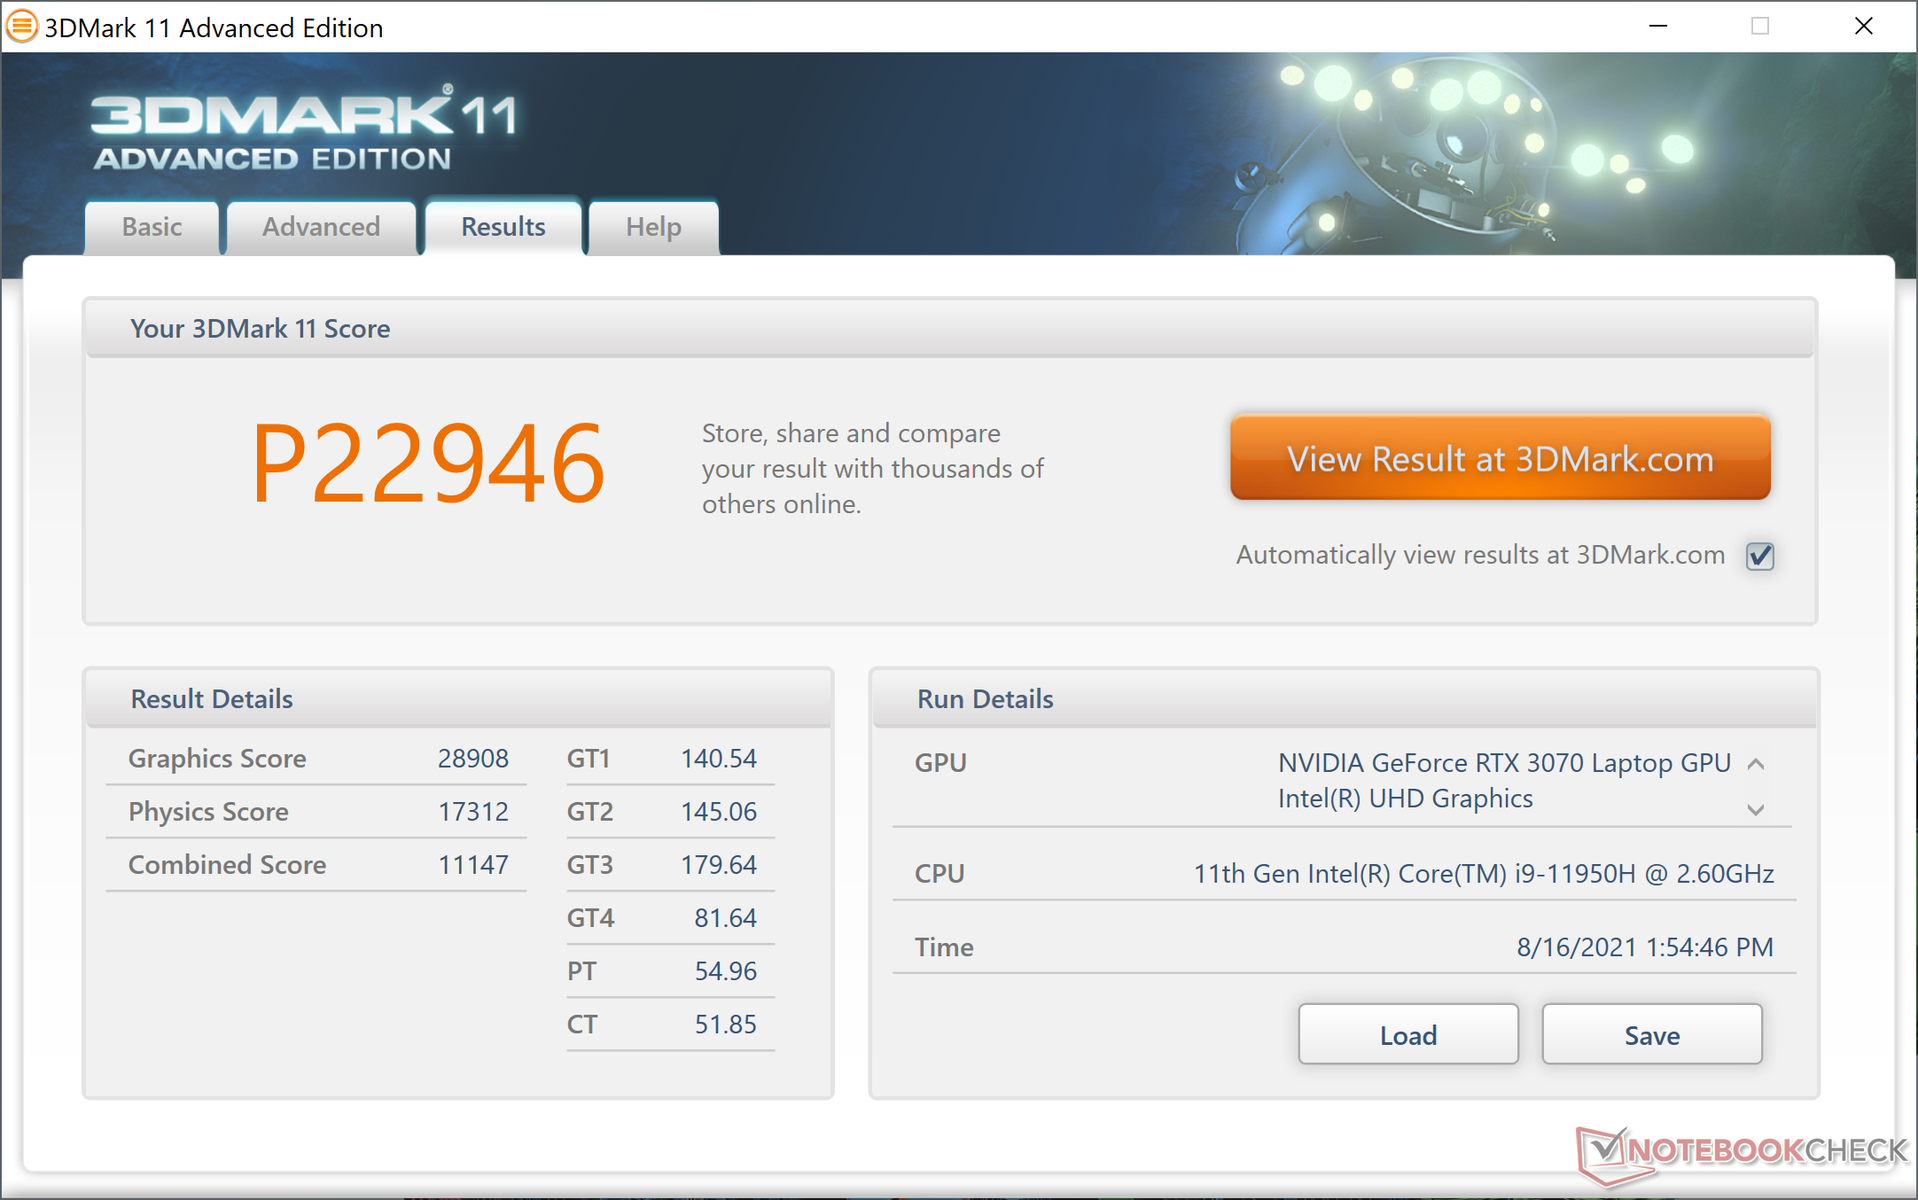
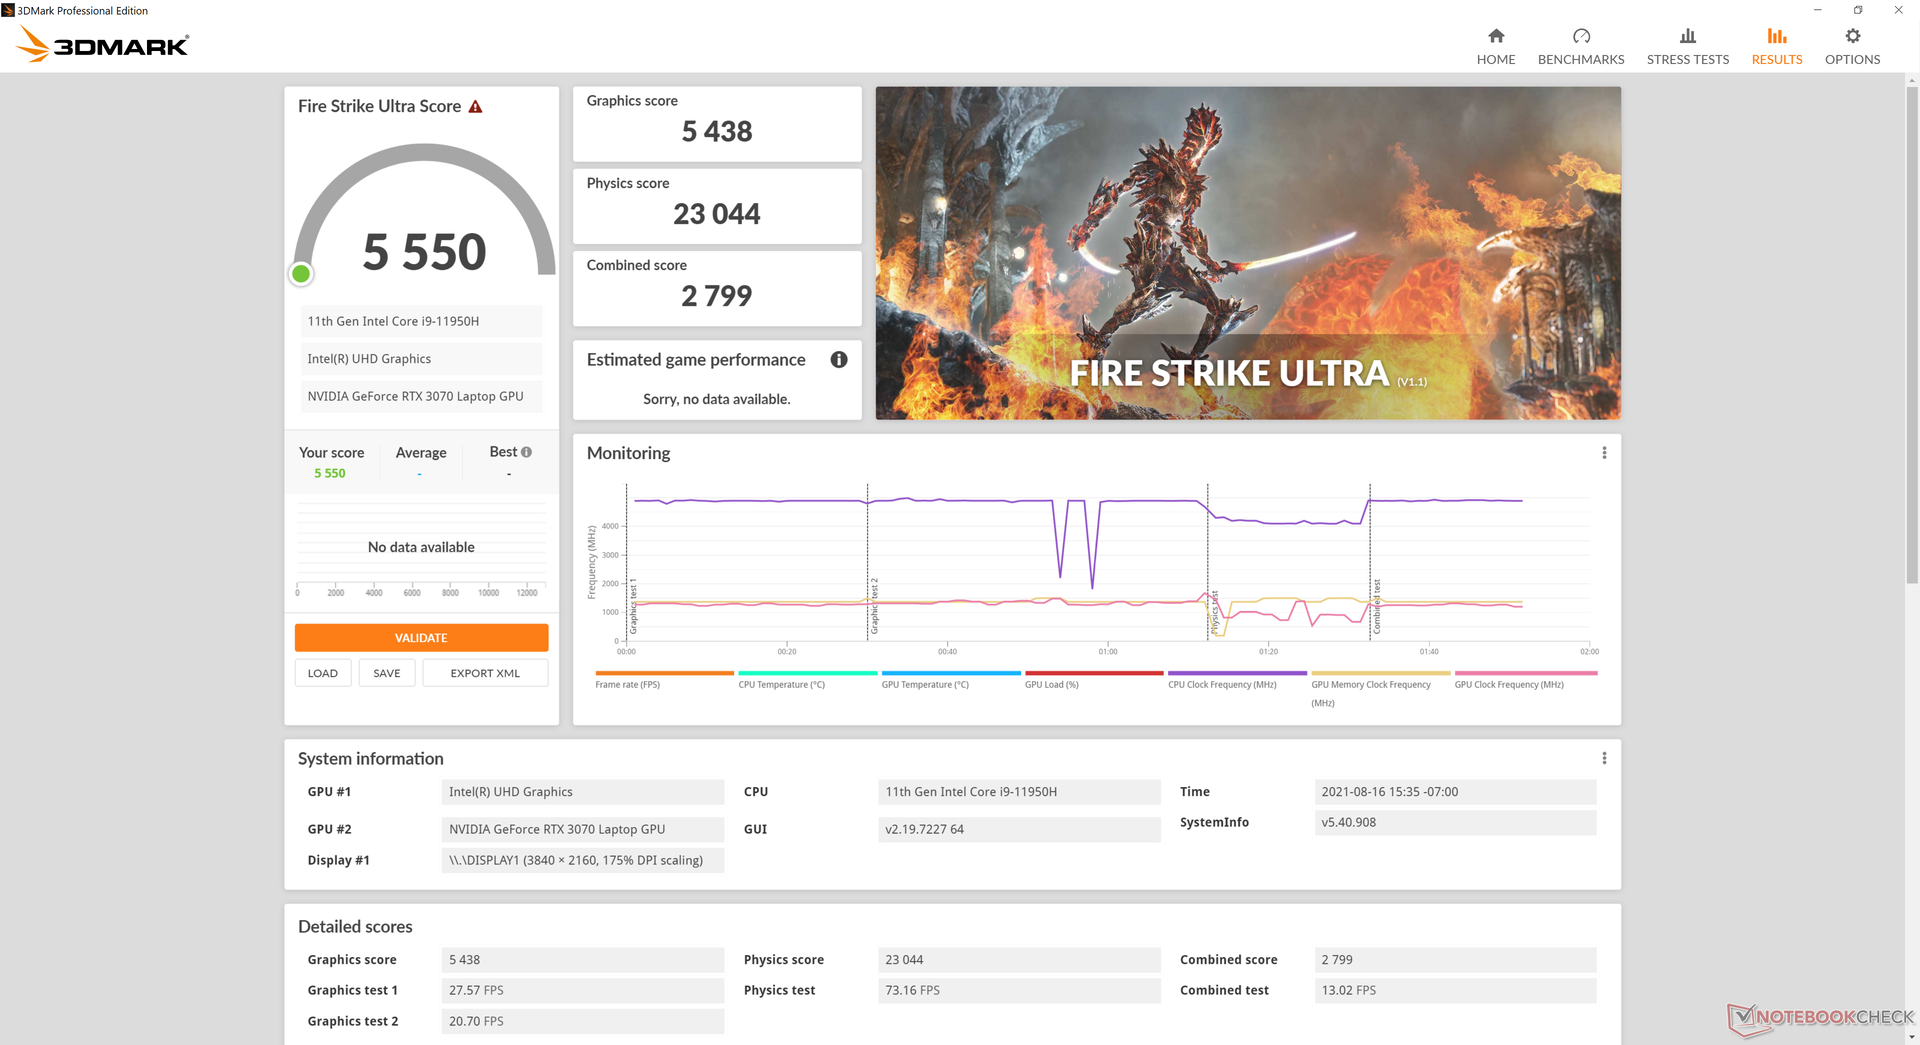
GPU性能 - 85 W TGP
图形性能比一般的RTX 3070慢10%至15%。 平均RTX 3070笔记本电脑慢10%到15%。这种差距足够大,甚至一些较老的 RTX 2070或 RTX 3060笔记本电脑,如申科XMG Core 15有时可以胜过我们价格较高的RTX 3070系统。这绝不是一台慢的笔记本电脑,但根据我们对其他几十个使用相同RTX 3070 GPU的系统的经验,它肯定可以更快。
用户可以将GeForce GPU换成Quadro RTX A3000或A4000,以最大限度地提高CAD、CGI和其他工作站特有的工作负载。

| 3DMark 11 | |
| 1280x720 Performance GPU | |
| Asus ROG Strix Scar 15 G533QS | |
| Average NVIDIA GeForce RTX 3070 Laptop GPU (12535 - 38275, n=54) | |
| HP ZBook Studio 15 G8 | |
| Schenker XMG Core 15 Ampere | |
| MSI WS66 10TMT-207US | |
| Dell Precision 7550 | |
| MSI GE65 Raider 9SF-049US | |
| HP ZBook Studio G7 | |
| Dell Inspiron 16 Plus 7610 | |
| Dell XPS 15 9510 11800H RTX 3050 Ti OLED | |
| Apple MacBook Pro 15 2019 i9 Vega 20 | |
| Dell Precision 5550 P91F | |
| HP ZBook Firefly 15 G8 2C9R7EA | |
| 1280x720 Performance Combined | |
| Asus ROG Strix Scar 15 G533QS | |
| MSI WS66 10TMT-207US | |
| MSI GE65 Raider 9SF-049US | |
| Average NVIDIA GeForce RTX 3070 Laptop GPU (3715 - 22517, n=53) | |
| HP ZBook Studio G7 | |
| Schenker XMG Core 15 Ampere | |
| Dell Inspiron 16 Plus 7610 | |
| Dell XPS 15 9510 11800H RTX 3050 Ti OLED | |
| Dell Precision 5550 P91F | |
| Dell Precision 7550 | |
| HP ZBook Studio 15 G8 | |
| Apple MacBook Pro 15 2019 i9 Vega 20 | |
| HP ZBook Firefly 15 G8 2C9R7EA | |
| 3DMark 11 Performance | 22946 points | |
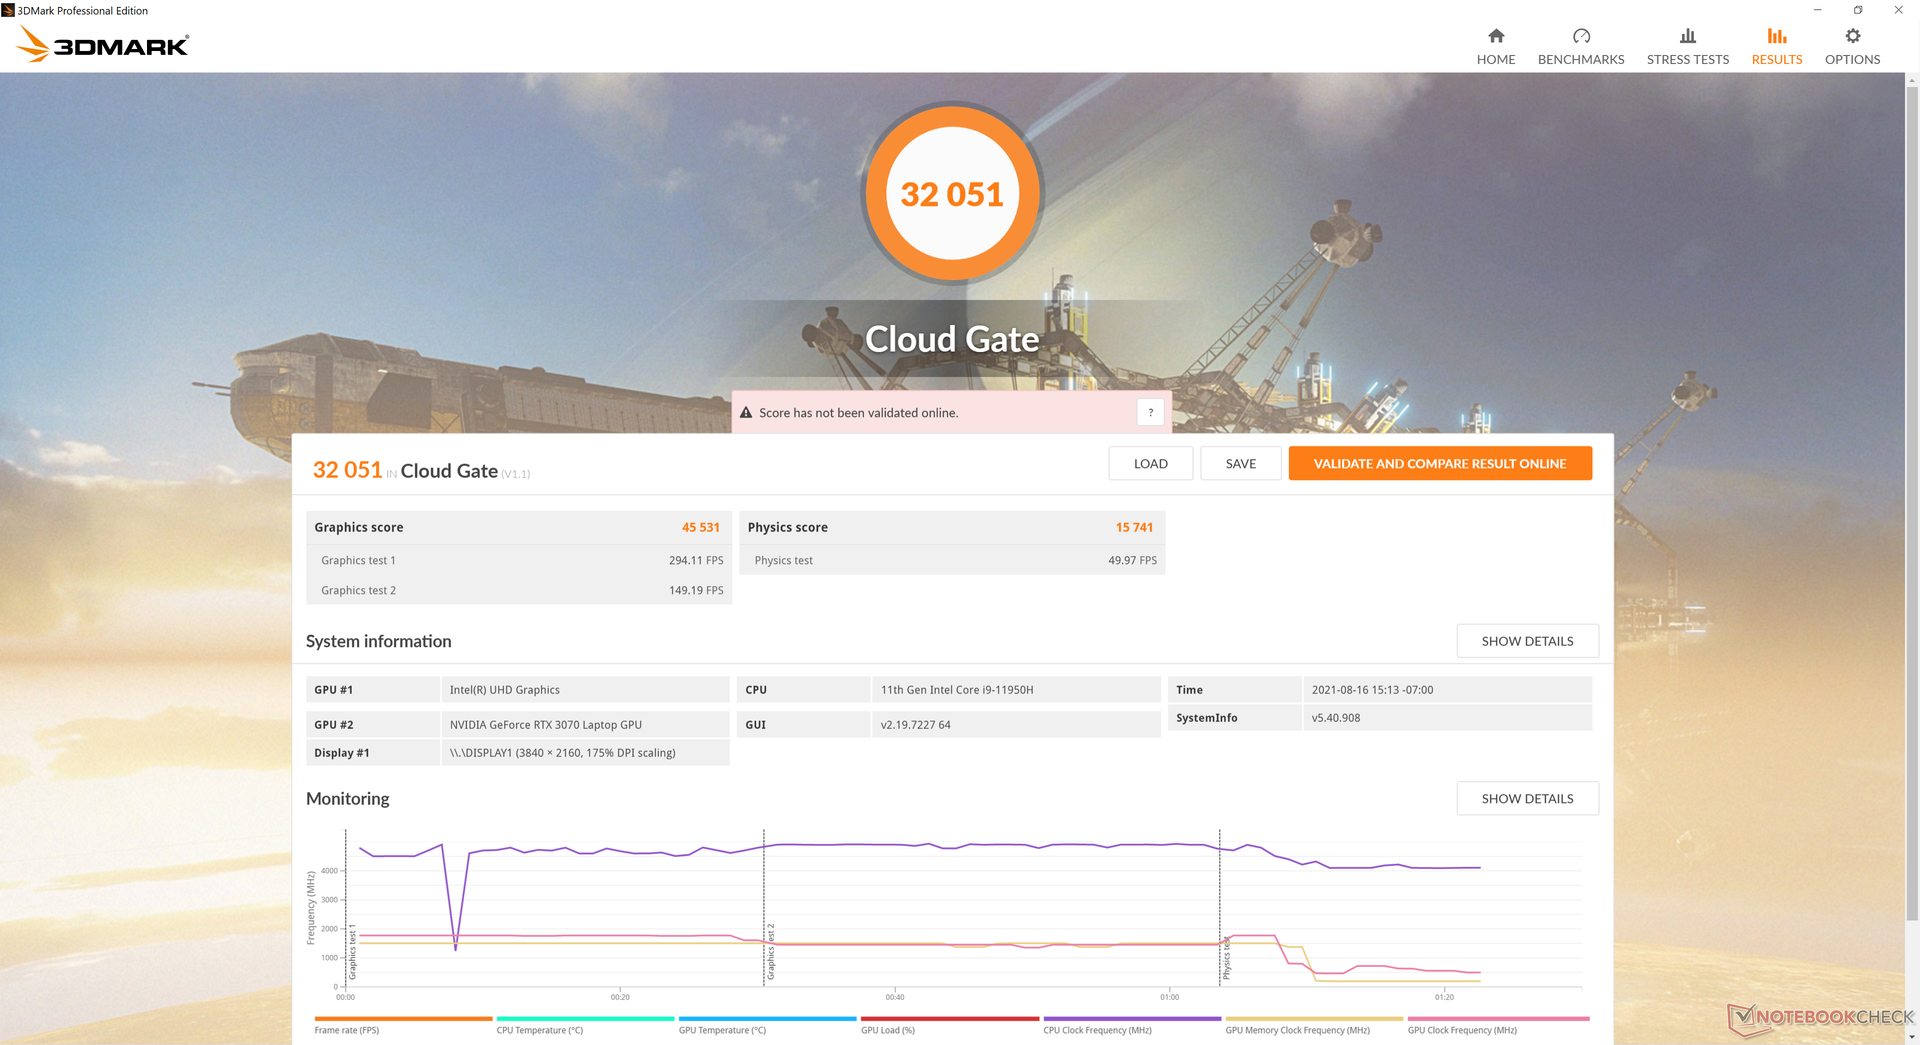
| 3DMark Cloud Gate Standard Score | 32051 points | |
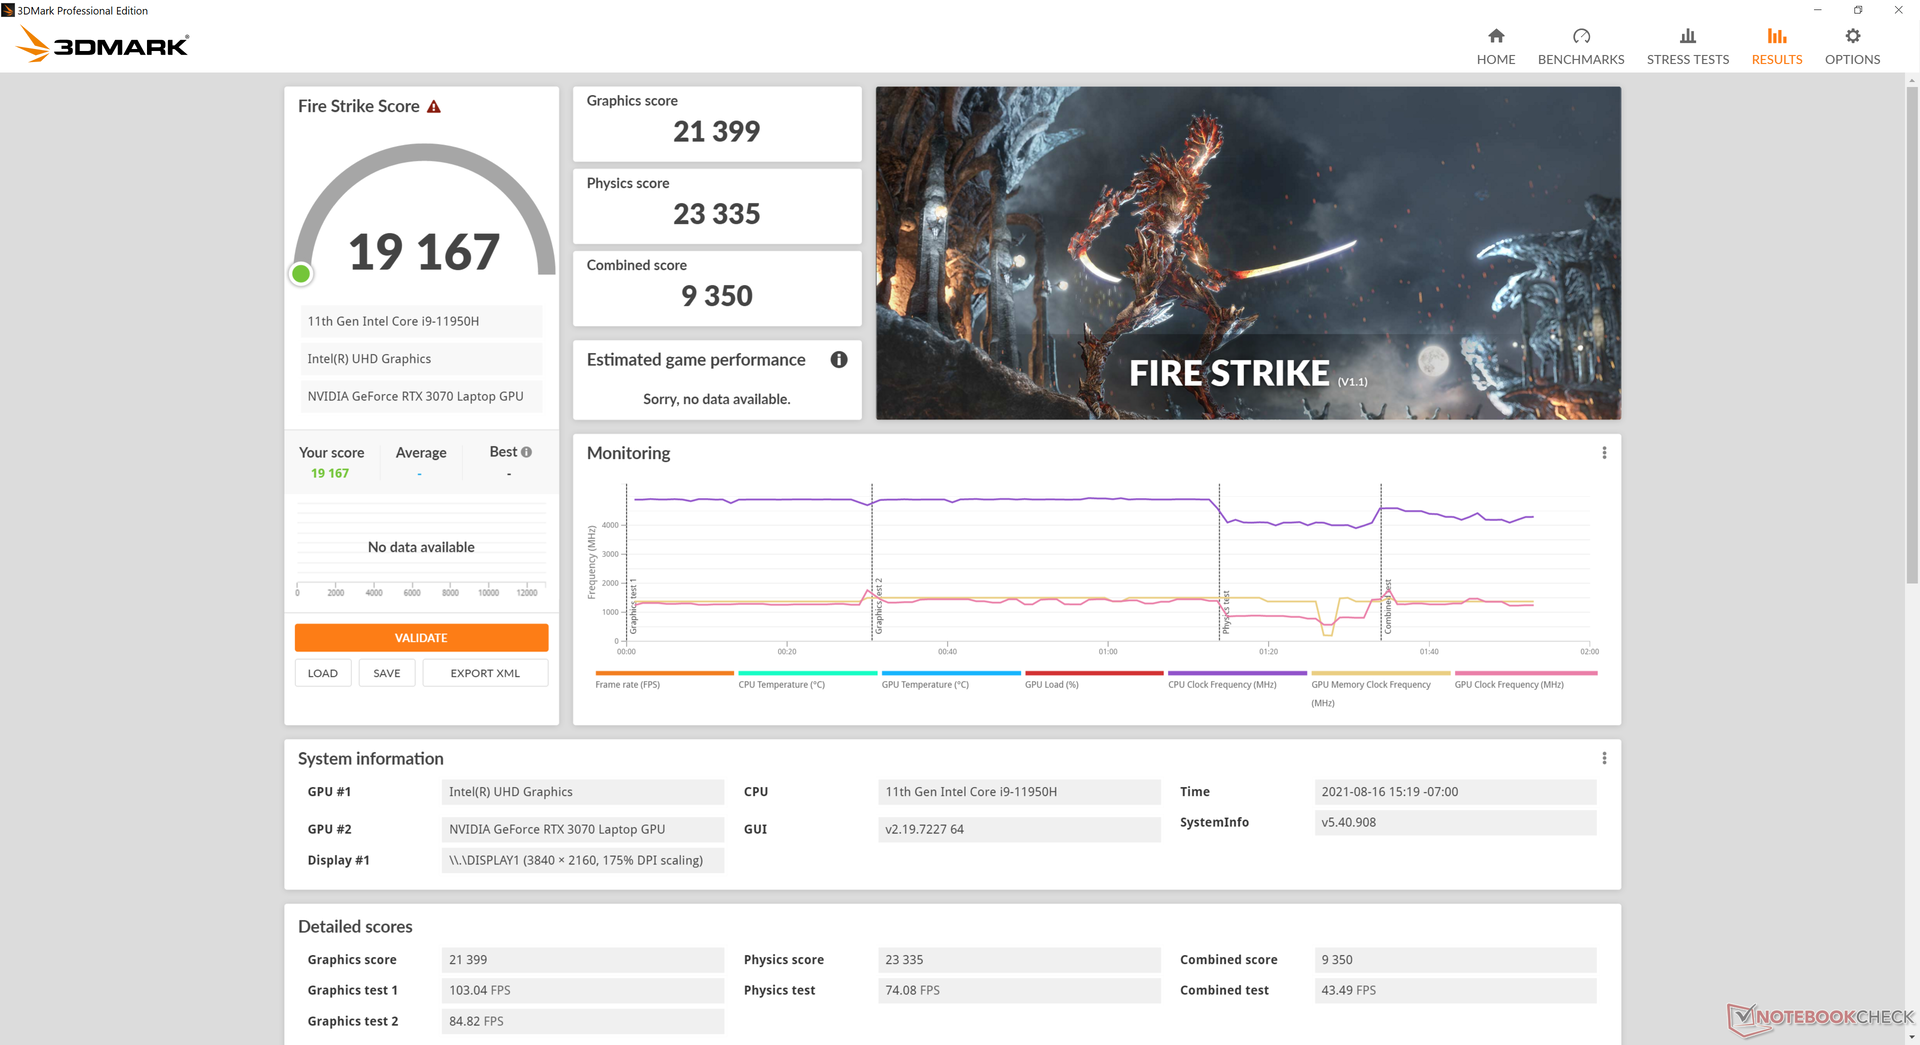
| 3DMark Fire Strike Score | 19167 points | |
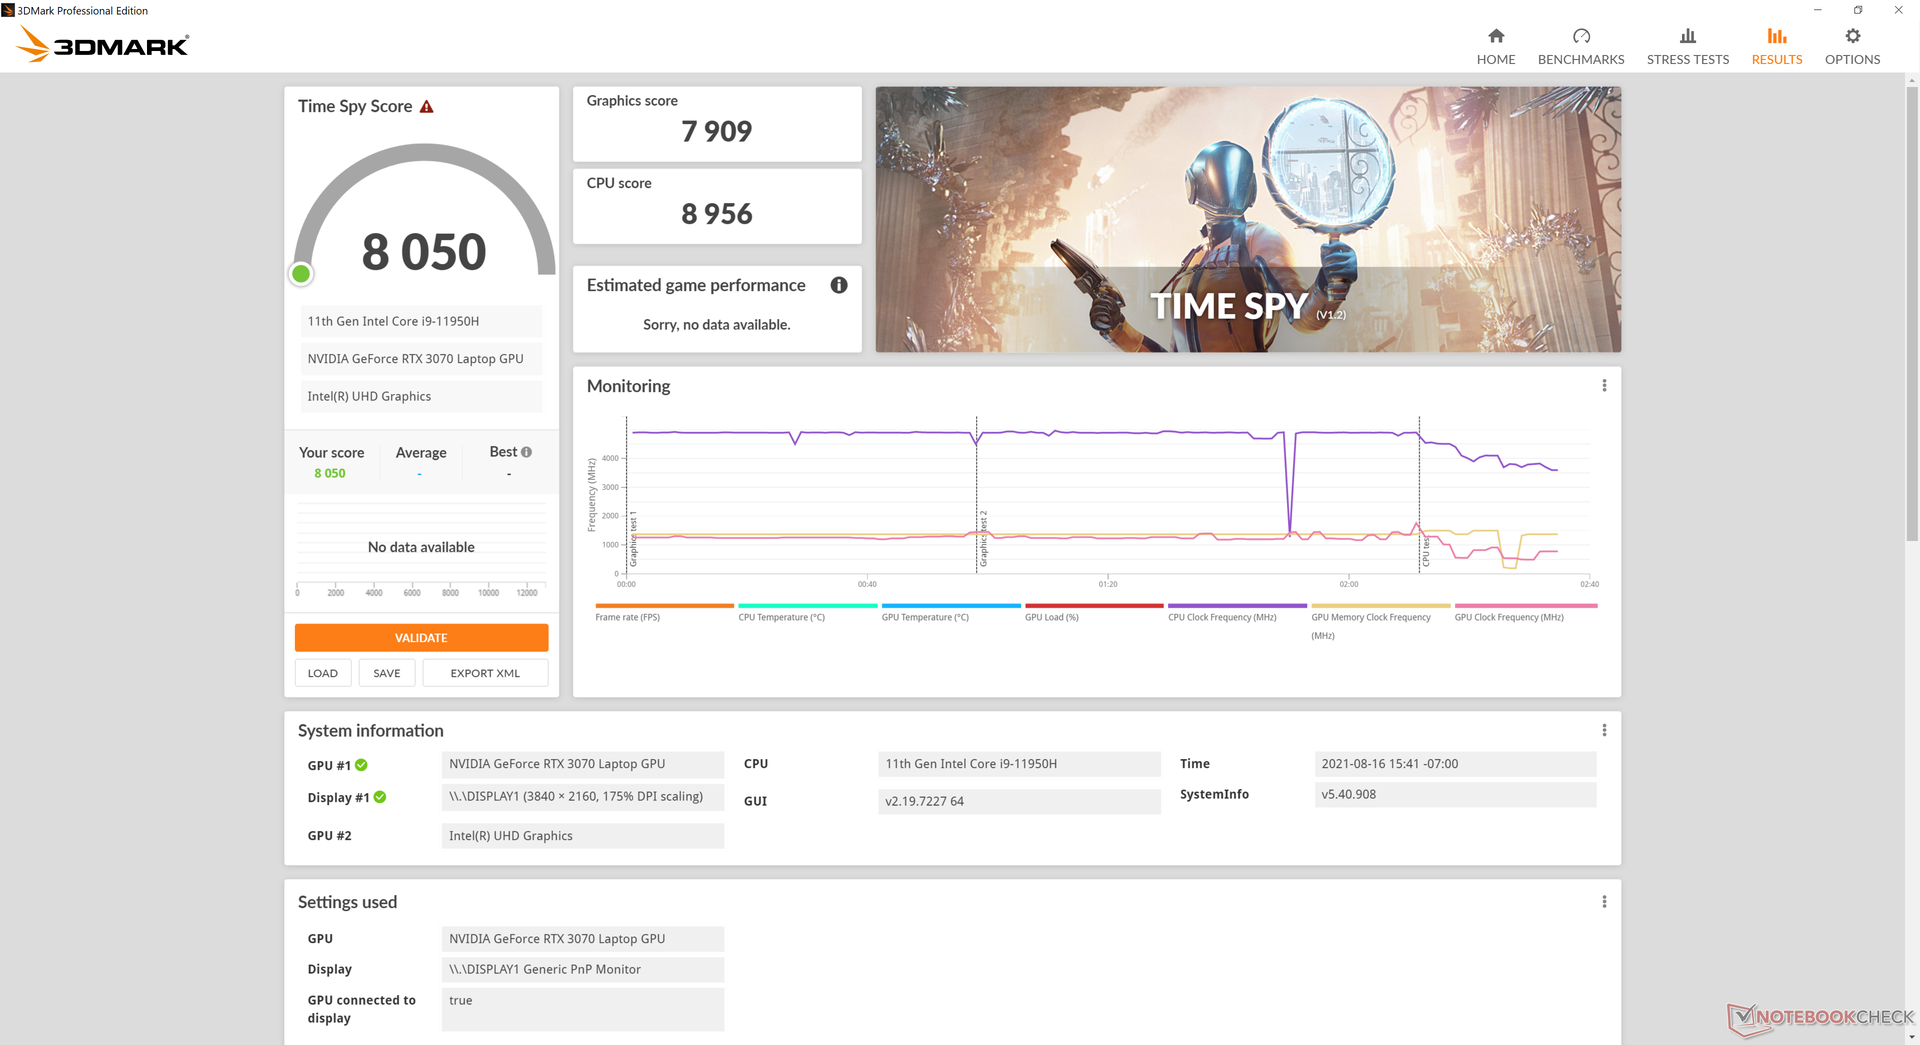
| 3DMark Time Spy Score | 8050 points | |
Help | ||
Witcher 3 FPS Chart
| low | med. | high | ultra | QHD | 4K | |
|---|---|---|---|---|---|---|
| The Witcher 3 (2015) | 365.9 | 252.2 | 154.2 | 81.5 | 40.3 | |
| Dota 2 Reborn (2015) | 162.5 | 144.1 | 135.8 | 116.3 | 93.1 | |
| Final Fantasy XV Benchmark (2018) | 144 | 104 | 78.5 | 61.3 | 36.2 | |
| X-Plane 11.11 (2018) | 120 | 104 | 83.5 | 54.4 | ||
| Far Cry 5 (2018) | 125 | 100 | 93 | 89 | 81 | 44 |
Emissions
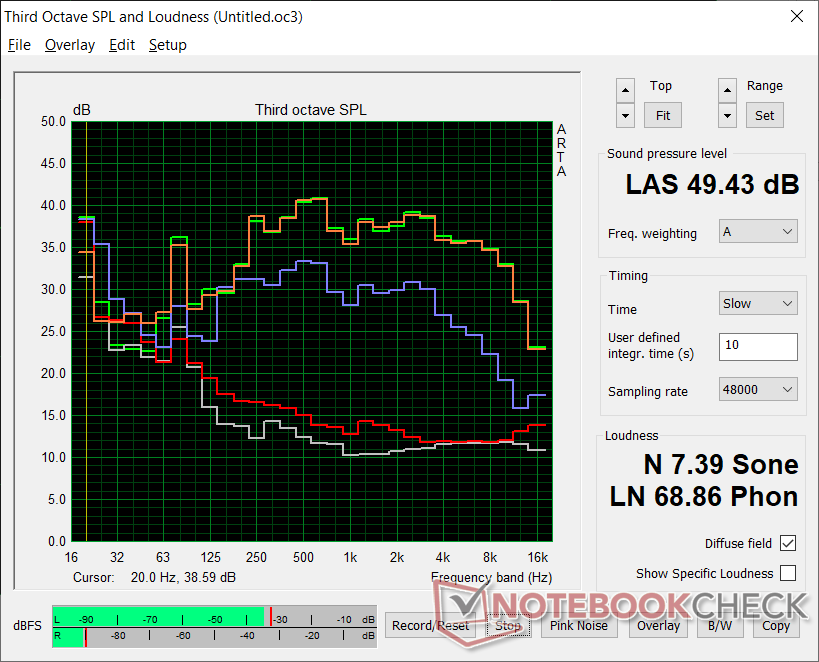
系统噪音--没有任何安静的感觉
将高性能的处理器塞进一个薄薄的机箱,将不可避免地导致风扇的噪音。在运行游戏或其他高负荷时,ZBook G8的噪音几乎达到50 dB(A),比包括Razer Blade 15 Studio和去年的ZBook Studio G7在内的竞争对手都要大。风扇从未真正闲置过,这意味着即使在没有运行任何应用程序的情况下在桌面上闲置也会有一点噪音。预计在要求不高的负载(如文字处理、视频流或浏览)中,可容忍的风扇噪音高达29.3 dB(A),背景为23.5 dB(A)。
| HP ZBook Studio 15 G8 GeForce RTX 3070 Laptop GPU, i9-11950H, Samsung PM981a MZVLB2T0HALB | HP ZBook Firefly 15 G8 2C9R7EA T500 Laptop GPU, i7-1165G7, Toshiba XG6 KXG60ZNV1T02 | HP ZBook Studio G7 Quadro RTX 3000 Max-Q, i9-10885H, Micron 2300 1TB MTFDHBA1T0TDV | Dell Precision 7550 Quadro RTX 5000 Max-Q, W-10885M, SK Hynix PC601A NVMe 1TB | Lenovo ThinkPad P15s Gen2-20W6000GGE T500 Laptop GPU, i7-1165G7, WDC PC SN720 SDAQNTW-1T00 | Asus ProArt StudioBook Pro 15 W500G5T Quadro RTX 5000 Max-Q, i7-9750H, Samsung SSD PM981 MZVLB1T0HALR | |
|---|---|---|---|---|---|---|
| Noise | 11% | 2% | -7% | 6% | -8% | |
| off / environment * (dB) | 23.5 | 24.1 -3% | 24.4 -4% | 25.8 -10% | 24.3 -3% | 25.2 -7% |
| Idle Minimum * (dB) | 25.3 | 24.1 5% | 24.4 4% | 25.8 -2% | 25.5 -1% | 27.9 -10% |
| Idle Average * (dB) | 25.3 | 24.1 5% | 24.4 4% | 25.8 -2% | 25.5 -1% | 27.9 -10% |
| Idle Maximum * (dB) | 25.3 | 27.1 -7% | 27.9 -10% | 25.9 -2% | 25.5 -1% | 27.9 -10% |
| Load Average * (dB) | 41.2 | 32.8 20% | 38.8 6% | 51.2 -24% | 35.65 13% | 47 -14% |
| Witcher 3 ultra * (dB) | 49.4 | 36.1 27% | 46.3 6% | 51.9 -5% | ||
| Load Maximum * (dB) | 49.4 | 36.1 27% | 46.3 6% | 51.9 -5% | 35.65 28% | 46.9 5% |
* ... smaller is better
Noise level
| Idle |
| 25.3 / 25.3 / 25.3 dB(A) |
| Load |
| 41.2 / 49.4 dB(A) |
 | ||
30 dB silent 40 dB(A) audible 50 dB(A) loud |
||
min: | ||
温度--温暖的掌托
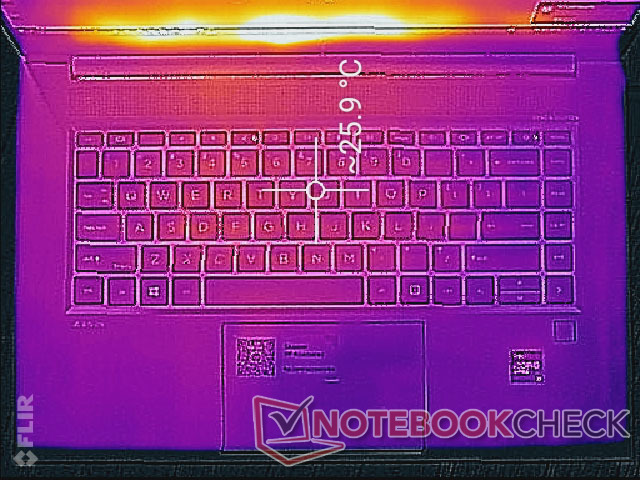
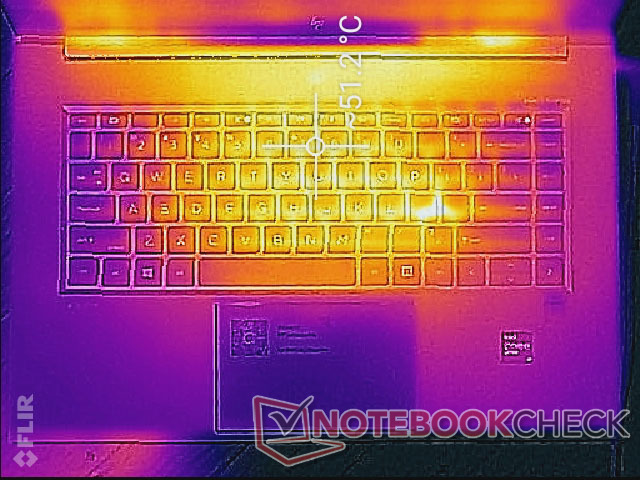
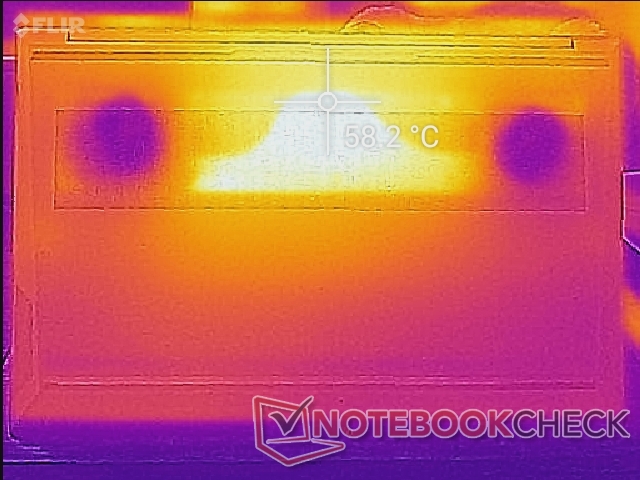
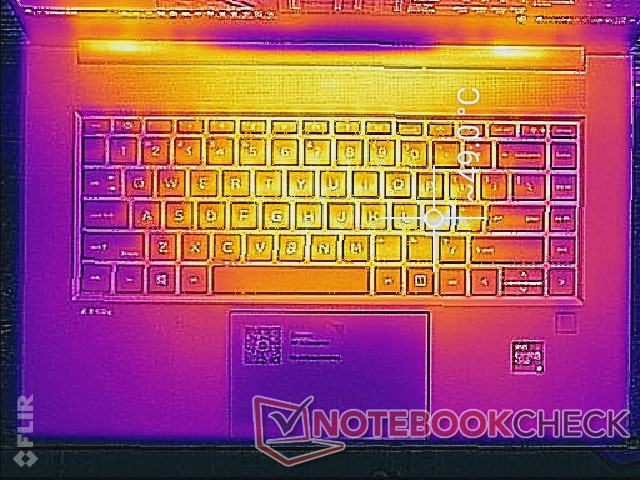
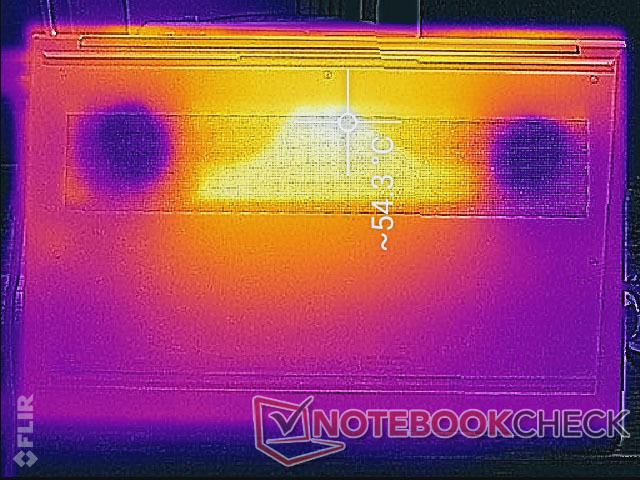
由于内部有对称的冷却解决方案,表面温度是对称的。热点在靠近键盘中心的地方,在高负荷运行时,温度可以达到51℃以上,而在键盘上则是49℃。 戴尔Precision 7550.由于金属底座的密集设计,掌托也会变得相当热,约为38℃。较高的温度对手来说并不难受,但它们肯定是明显的。
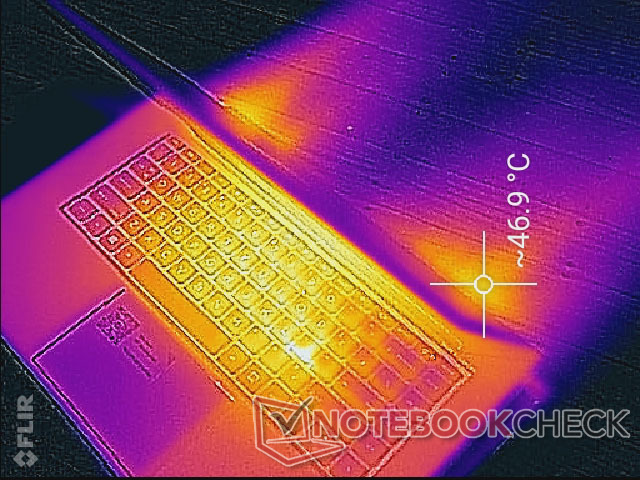
(-) The maximum temperature on the upper side is 49 °C / 120 F, compared to the average of 38.2 °C / 101 F, ranging from 22.2 to 69.8 °C for the class Workstation.
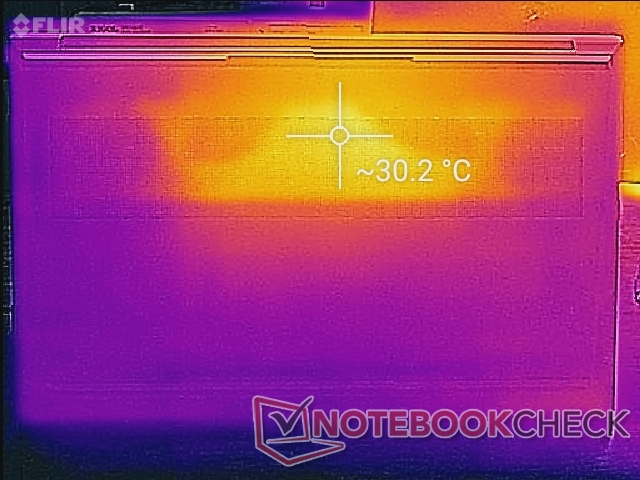
(-) The bottom heats up to a maximum of 54.2 °C / 130 F, compared to the average of 41.1 °C / 106 F
(+) In idle usage, the average temperature for the upper side is 25.4 °C / 78 F, compared to the device average of 32 °C / 90 F.
(-) Playing The Witcher 3, the average temperature for the upper side is 43.2 °C / 110 F, compared to the device average of 32 °C / 90 F.
(±) The palmrests and touchpad can get very hot to the touch with a maximum of 38.4 °C / 101.1 F.
(-) The average temperature of the palmrest area of similar devices was 27.8 °C / 82 F (-10.6 °C / -19.1 F).
压力测试
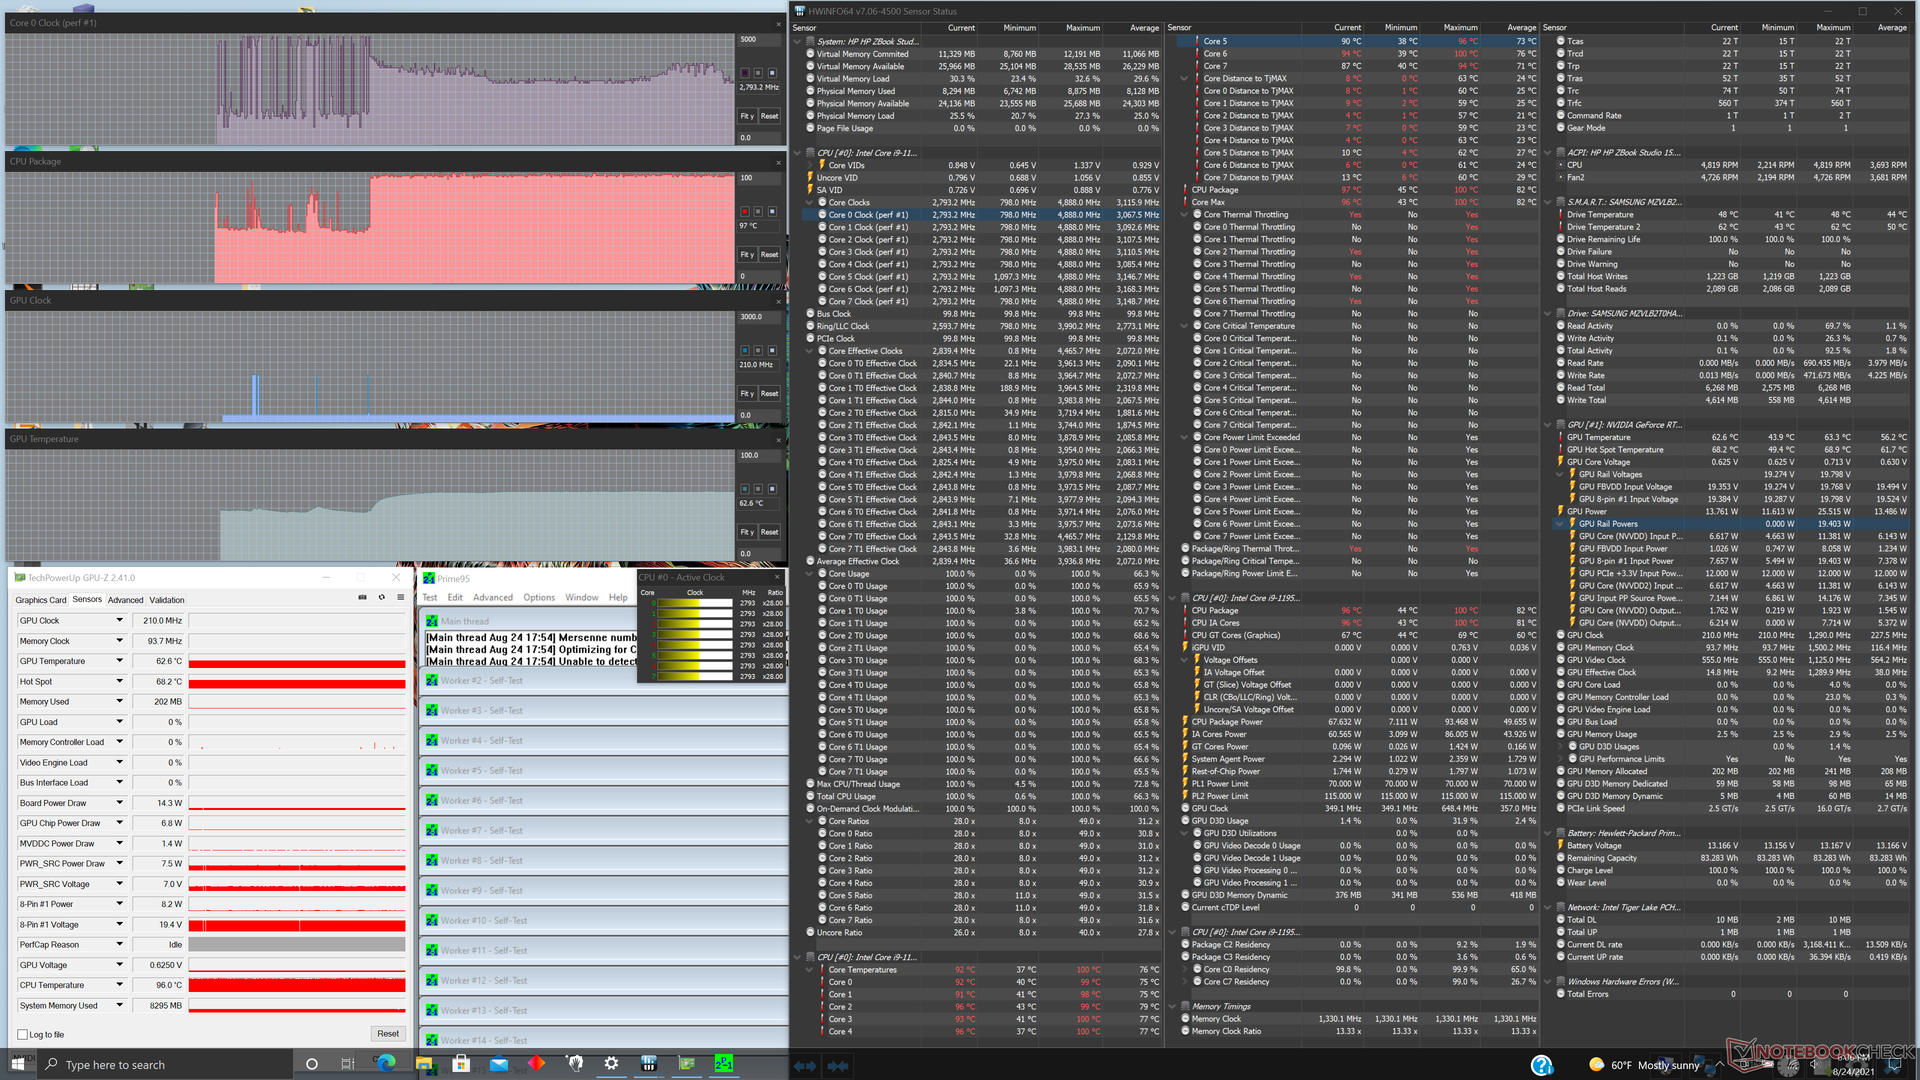
在Prime95压力下,CPU在达到97℃的核心温度之前,仅在最初的一两秒钟内就会提升到4GHz,然后时钟频率会稳定在2.8至3.3GHz的范围内,以防止核心温度上升得更高。在ZBook Fury 15 G7上运行同样的测试会显示类似的核心温度结果。
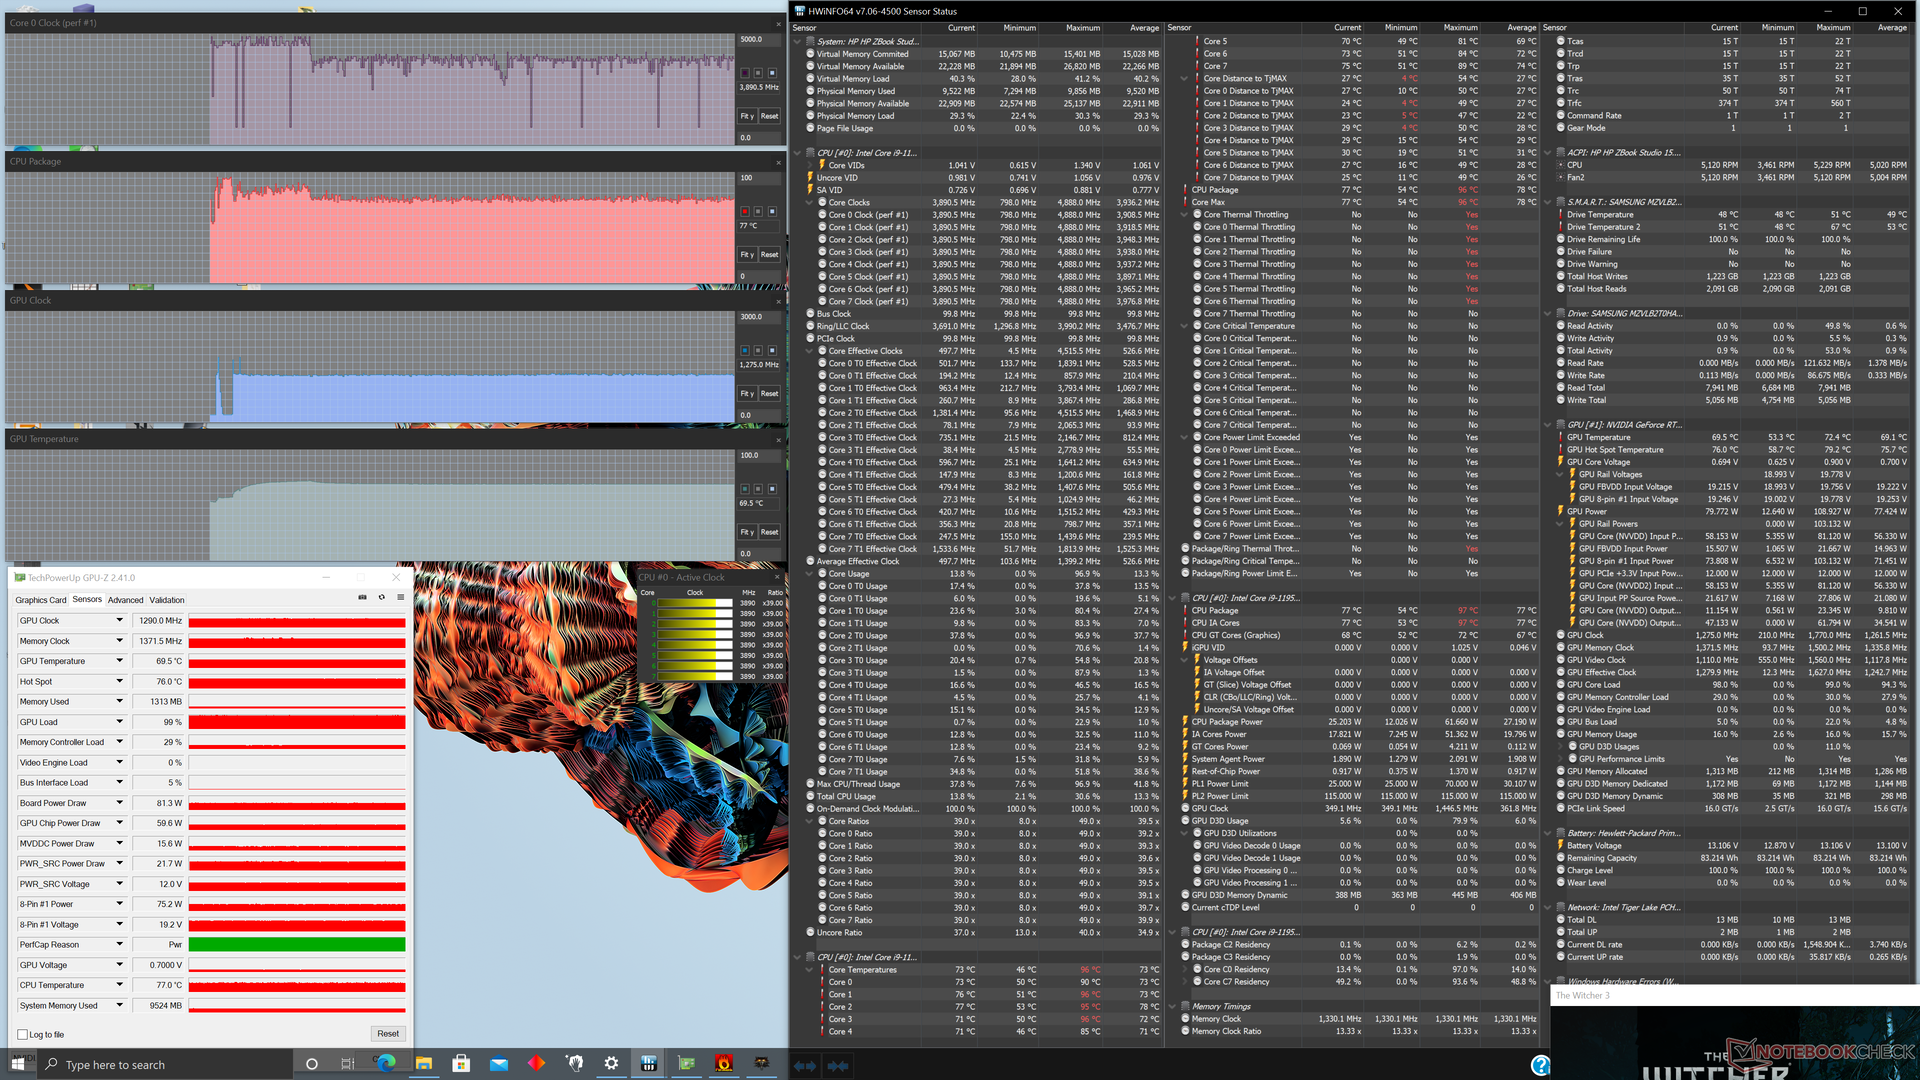
运行时,CPU和GPU将分别稳定在77℃和70℃。 Witcher 3这只是比我们在ZBook Fury 15 G7上观察到的温度稍低一些。 戴尔Precision 5750或ZBook Fury 15 G7上观察到的温度。
用电池供电运行将严重限制性能。在电池上进行的3DMark 11测试将返回物理和图形分数,分别为10388和9950,而在主电源上则为17312和28908分。
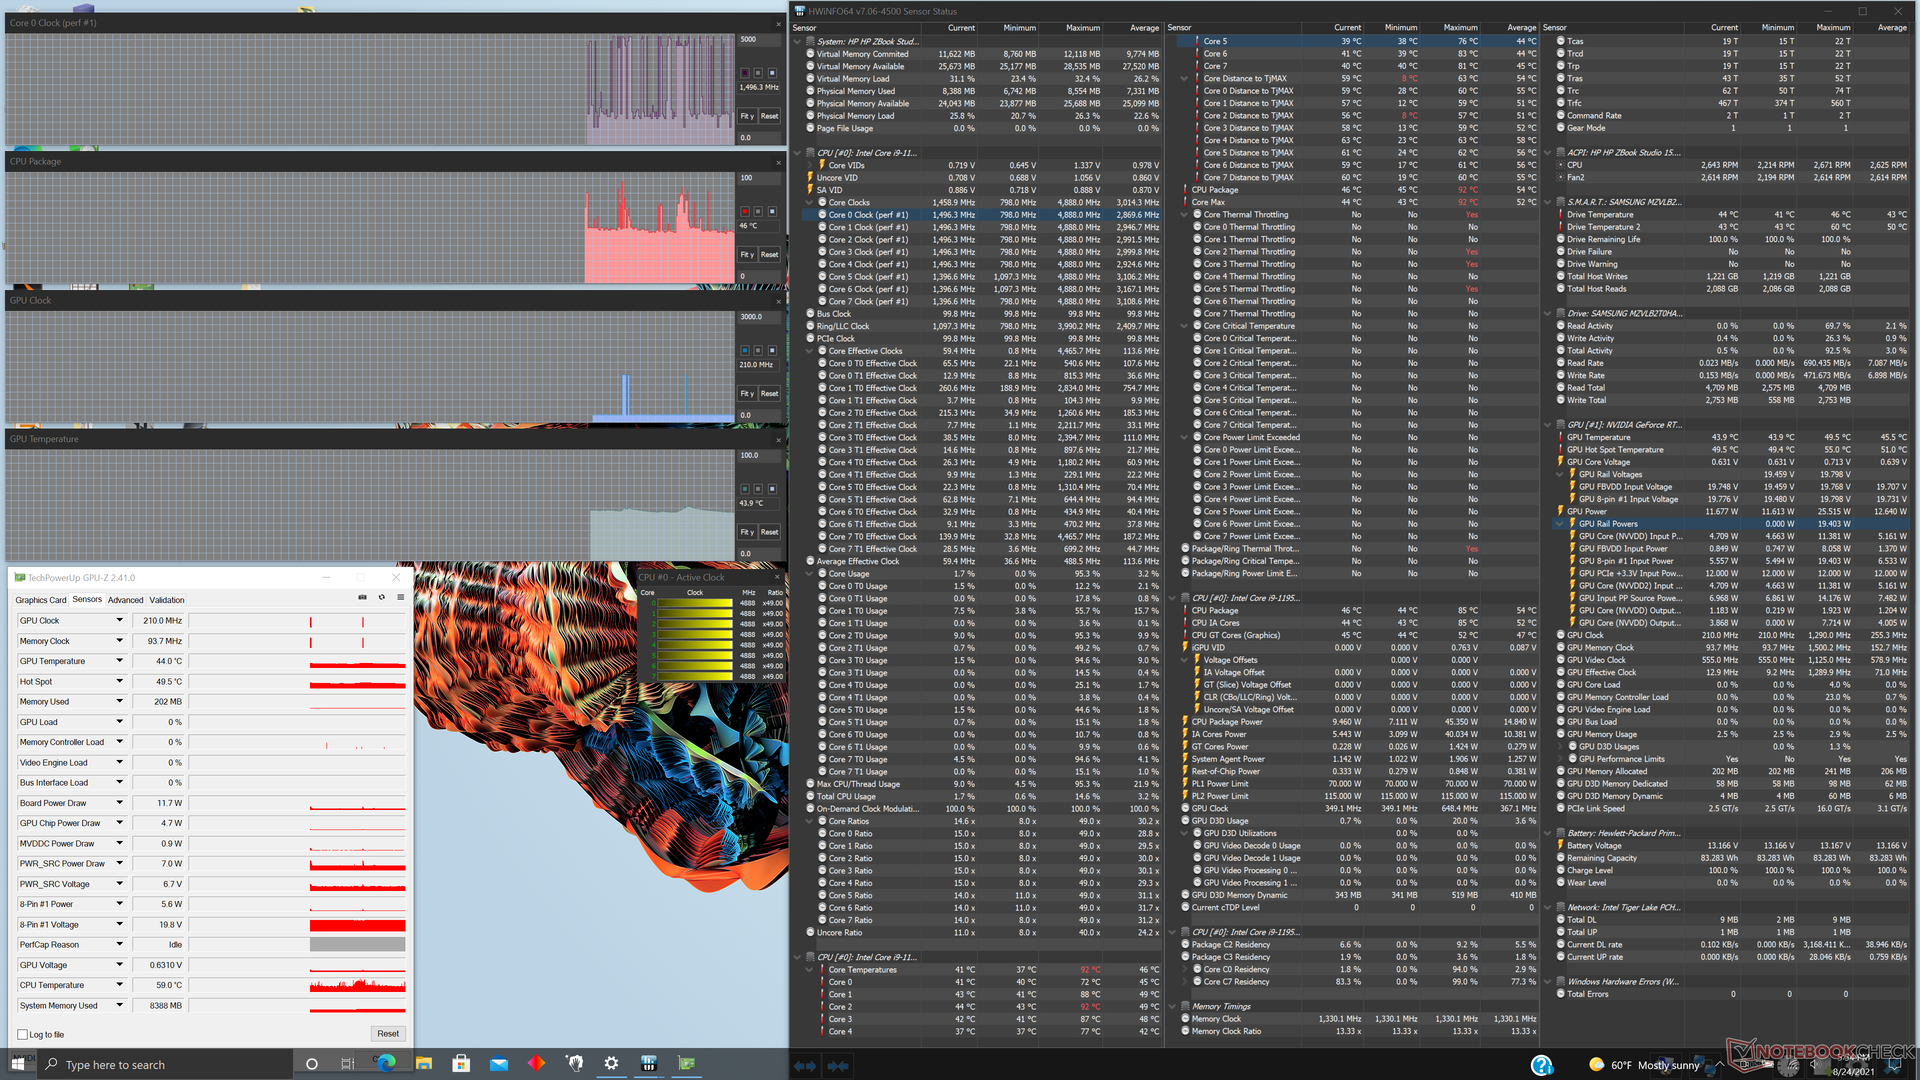
| CPU时钟(GHz) | GPU时钟(MHz) | CPU平均温度(℃) | GPU平均温度(℃) | |
| 系统空闲 | -- | -- | 46 | 44 |
| Prime95压力 | 2.8 - 3.3 | -- | 98 | 63 |
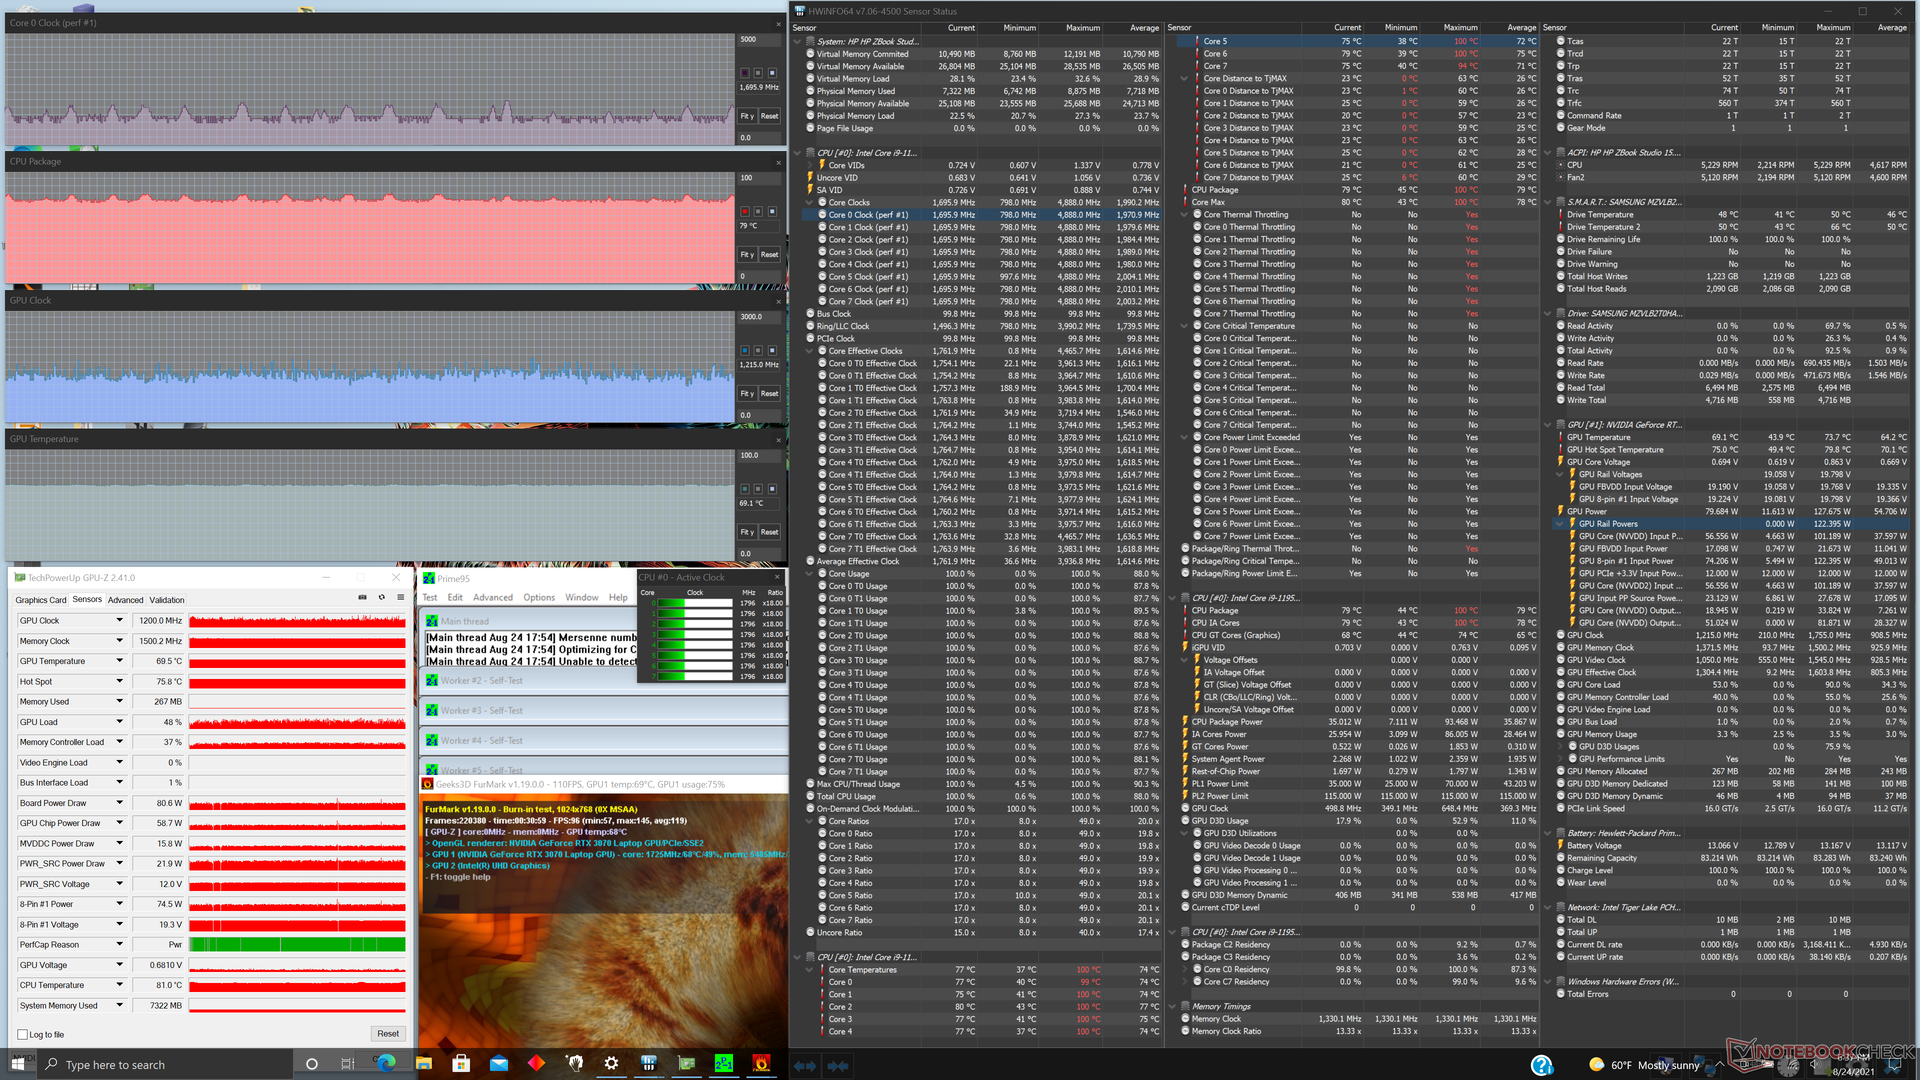
| Prime95 + FurMark压力 | 1.0 - 1.8 | 990 - 1695 | 73 - 81 | 69 |
| Witcher 3 Stress | ~3.8 | 1275 | 77 | 70 |
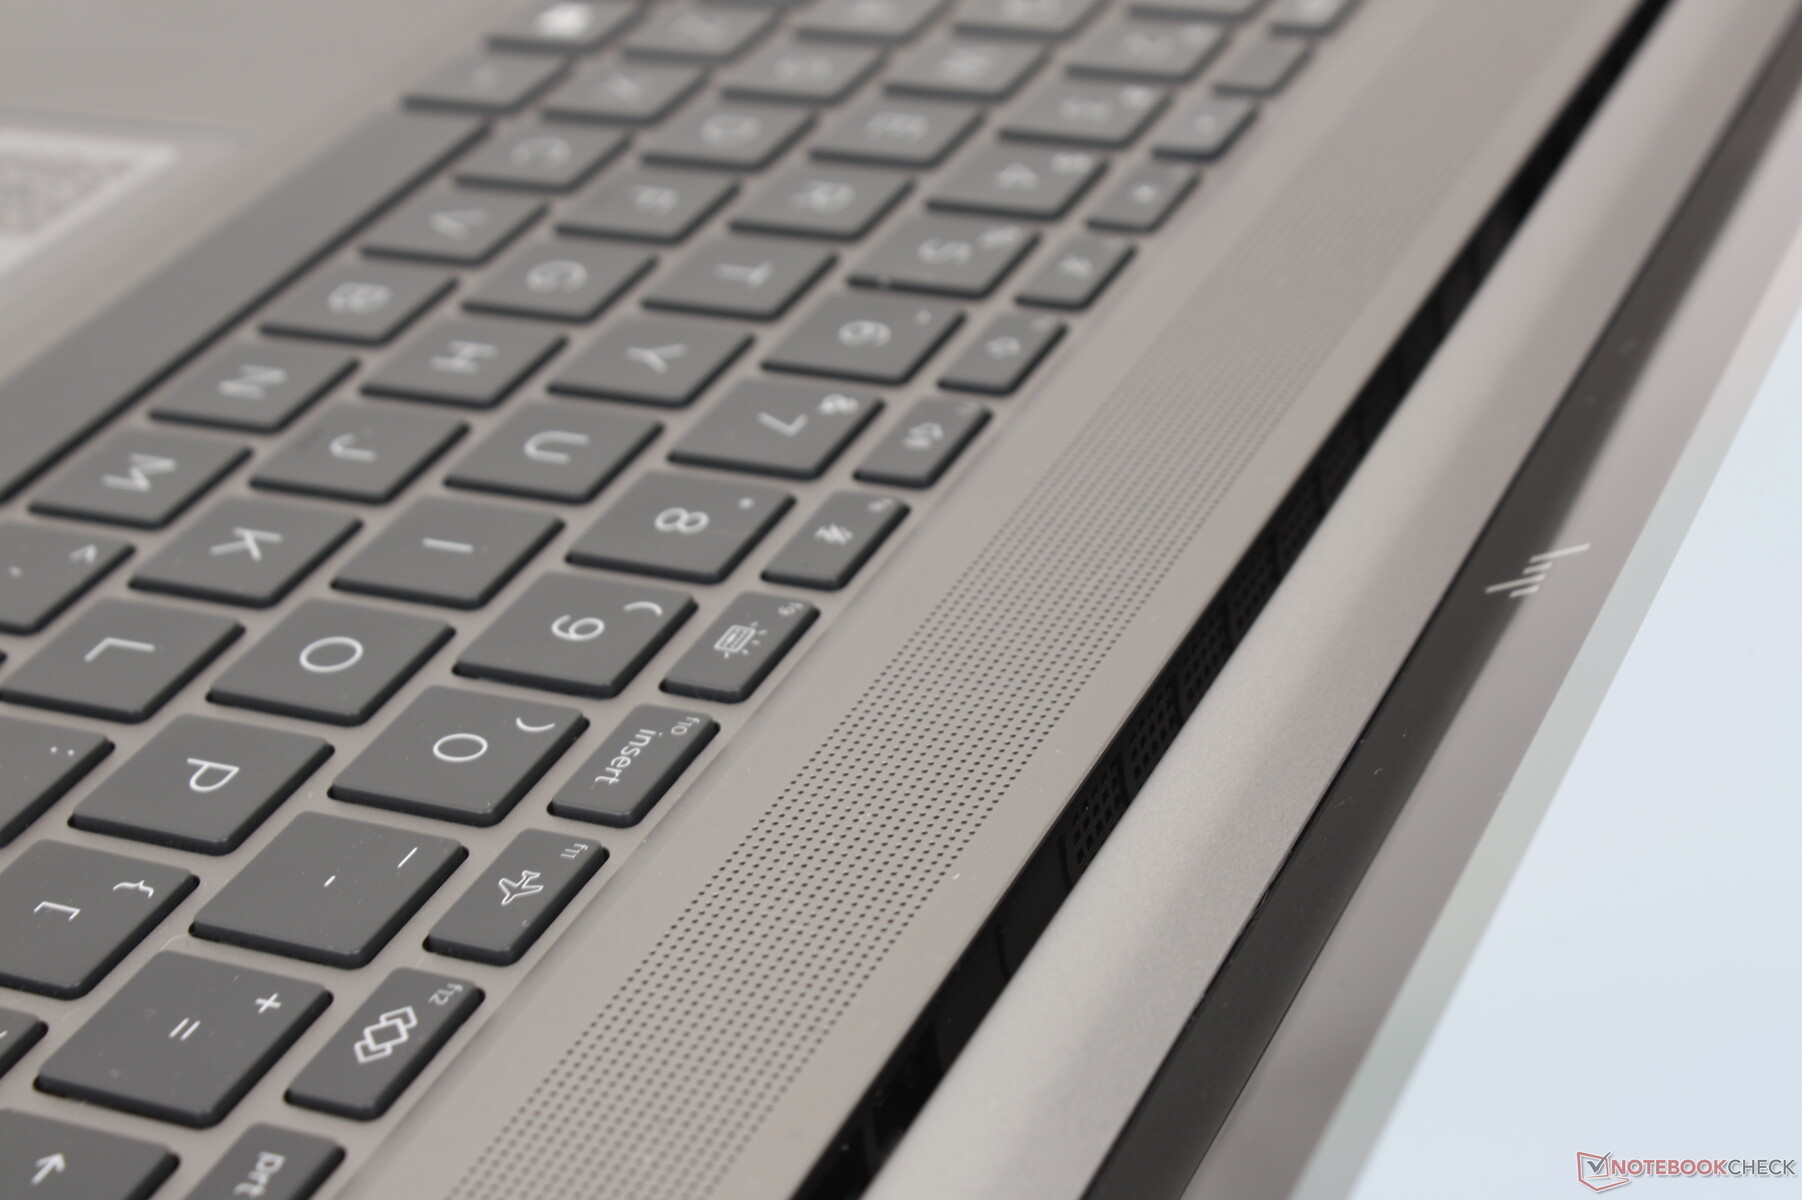
发言人
集成的四扬声器(2个高音扬声器+2个低音扬声器)提供了出色的声音,具有良好的平衡和体面的低音再现。其质量可以轻松通过像惠普Omen或微星GT系列型号的游戏或多媒体笔记本电脑。


HP ZBook Studio 15 G8 audio analysis
(+) | speakers can play relatively loud (85.1 dB)
Bass 100 - 315 Hz
(±) | reduced bass - on average 6% lower than median
(±) | linearity of bass is average (8.2% delta to prev. frequency)
Mids 400 - 2000 Hz
(+) | balanced mids - only 3.8% away from median
(+) | mids are linear (3.9% delta to prev. frequency)
Highs 2 - 16 kHz
(+) | balanced highs - only 3.4% away from median
(+) | highs are linear (6.5% delta to prev. frequency)
Overall 100 - 16.000 Hz
(+) | overall sound is linear (8% difference to median)
Compared to same class
» 1% of all tested devices in this class were better, 1% similar, 99% worse
» The best had a delta of 7%, average was 17%, worst was 35%
Compared to all devices tested
» 2% of all tested devices were better, 1% similar, 98% worse
» The best had a delta of 4%, average was 24%, worst was 134%
Apple MacBook 12 (Early 2016) 1.1 GHz audio analysis
(+) | speakers can play relatively loud (83.6 dB)
Bass 100 - 315 Hz
(±) | reduced bass - on average 11.3% lower than median
(±) | linearity of bass is average (14.2% delta to prev. frequency)
Mids 400 - 2000 Hz
(+) | balanced mids - only 2.4% away from median
(+) | mids are linear (5.5% delta to prev. frequency)
Highs 2 - 16 kHz
(+) | balanced highs - only 2% away from median
(+) | highs are linear (4.5% delta to prev. frequency)
Overall 100 - 16.000 Hz
(+) | overall sound is linear (10.2% difference to median)
Compared to same class
» 7% of all tested devices in this class were better, 2% similar, 91% worse
» The best had a delta of 5%, average was 18%, worst was 53%
Compared to all devices tested
» 5% of all tested devices were better, 1% similar, 94% worse
» The best had a delta of 4%, average was 24%, worst was 134%
Energy Management
消耗功率
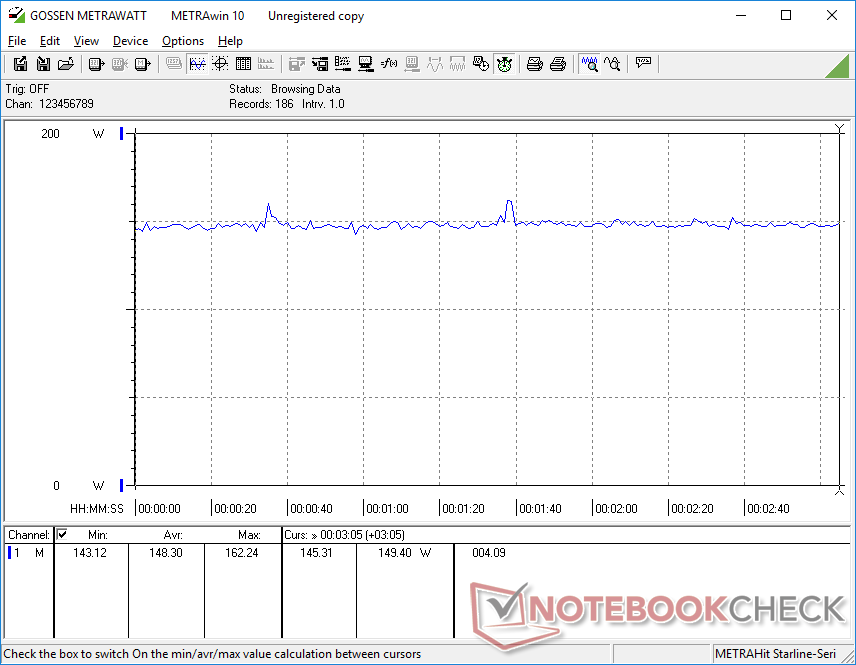
我们的配置比其他大多数15.6英寸的工作站耗费更多的电力,即使是在桌面上空转时,由于其OLED面板。我们已经 证明了OLED比典型的IPS明显更耗电,特别是在显示明亮的白色时。由于大多数在线内容都有白色背景,我们的OLED设备仅在最大亮度设置下空转就可以多消耗2倍或3倍的电力。
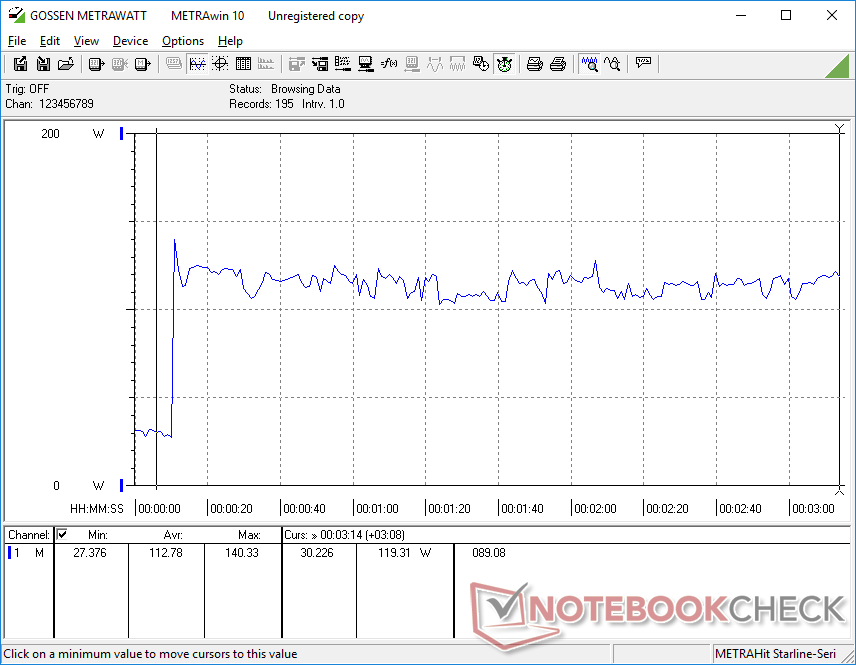
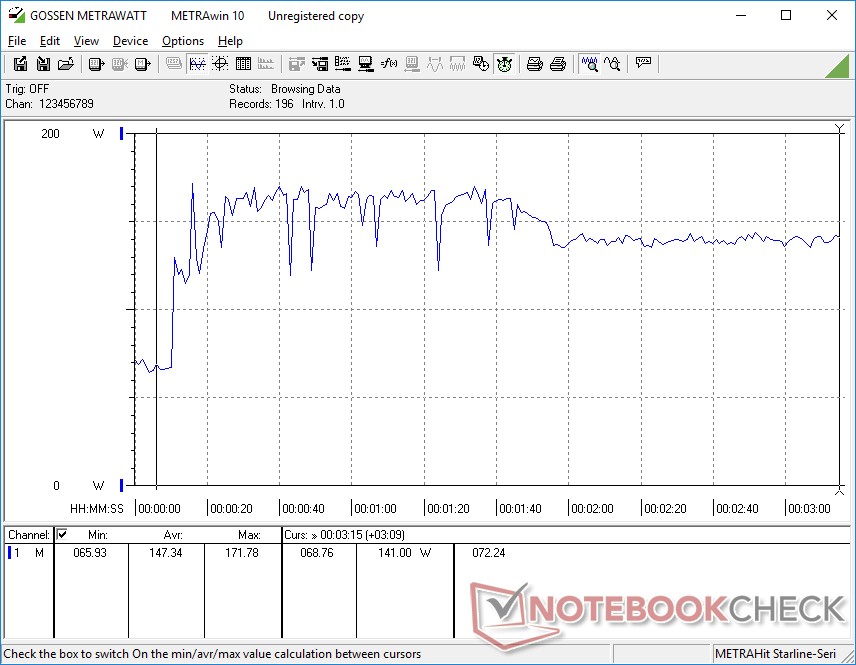
运行更高的负载,如游戏,将比搭载Quadro RTX 3000 Max-Q的ZBook G7多消耗约23%的电力。每瓦性能在我们较新的G8机型上仍然是优越的,因为原始的CPU性能和图形性能分别比原来高25%和50%。
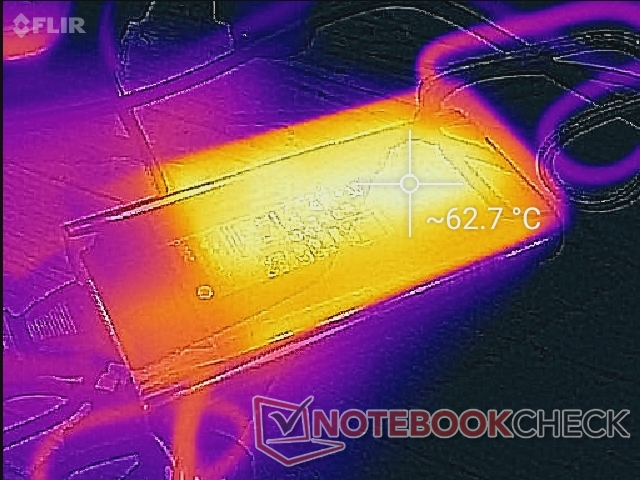
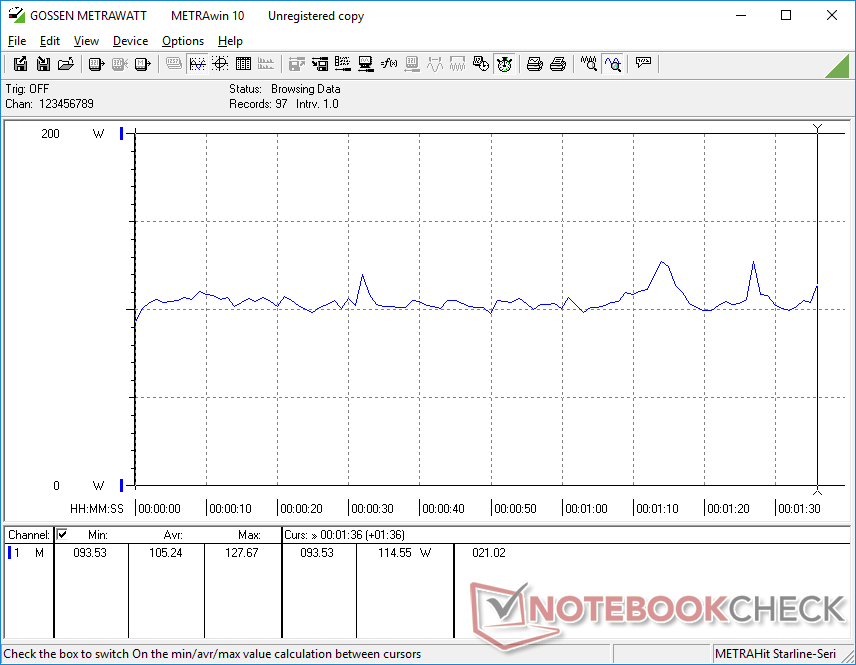
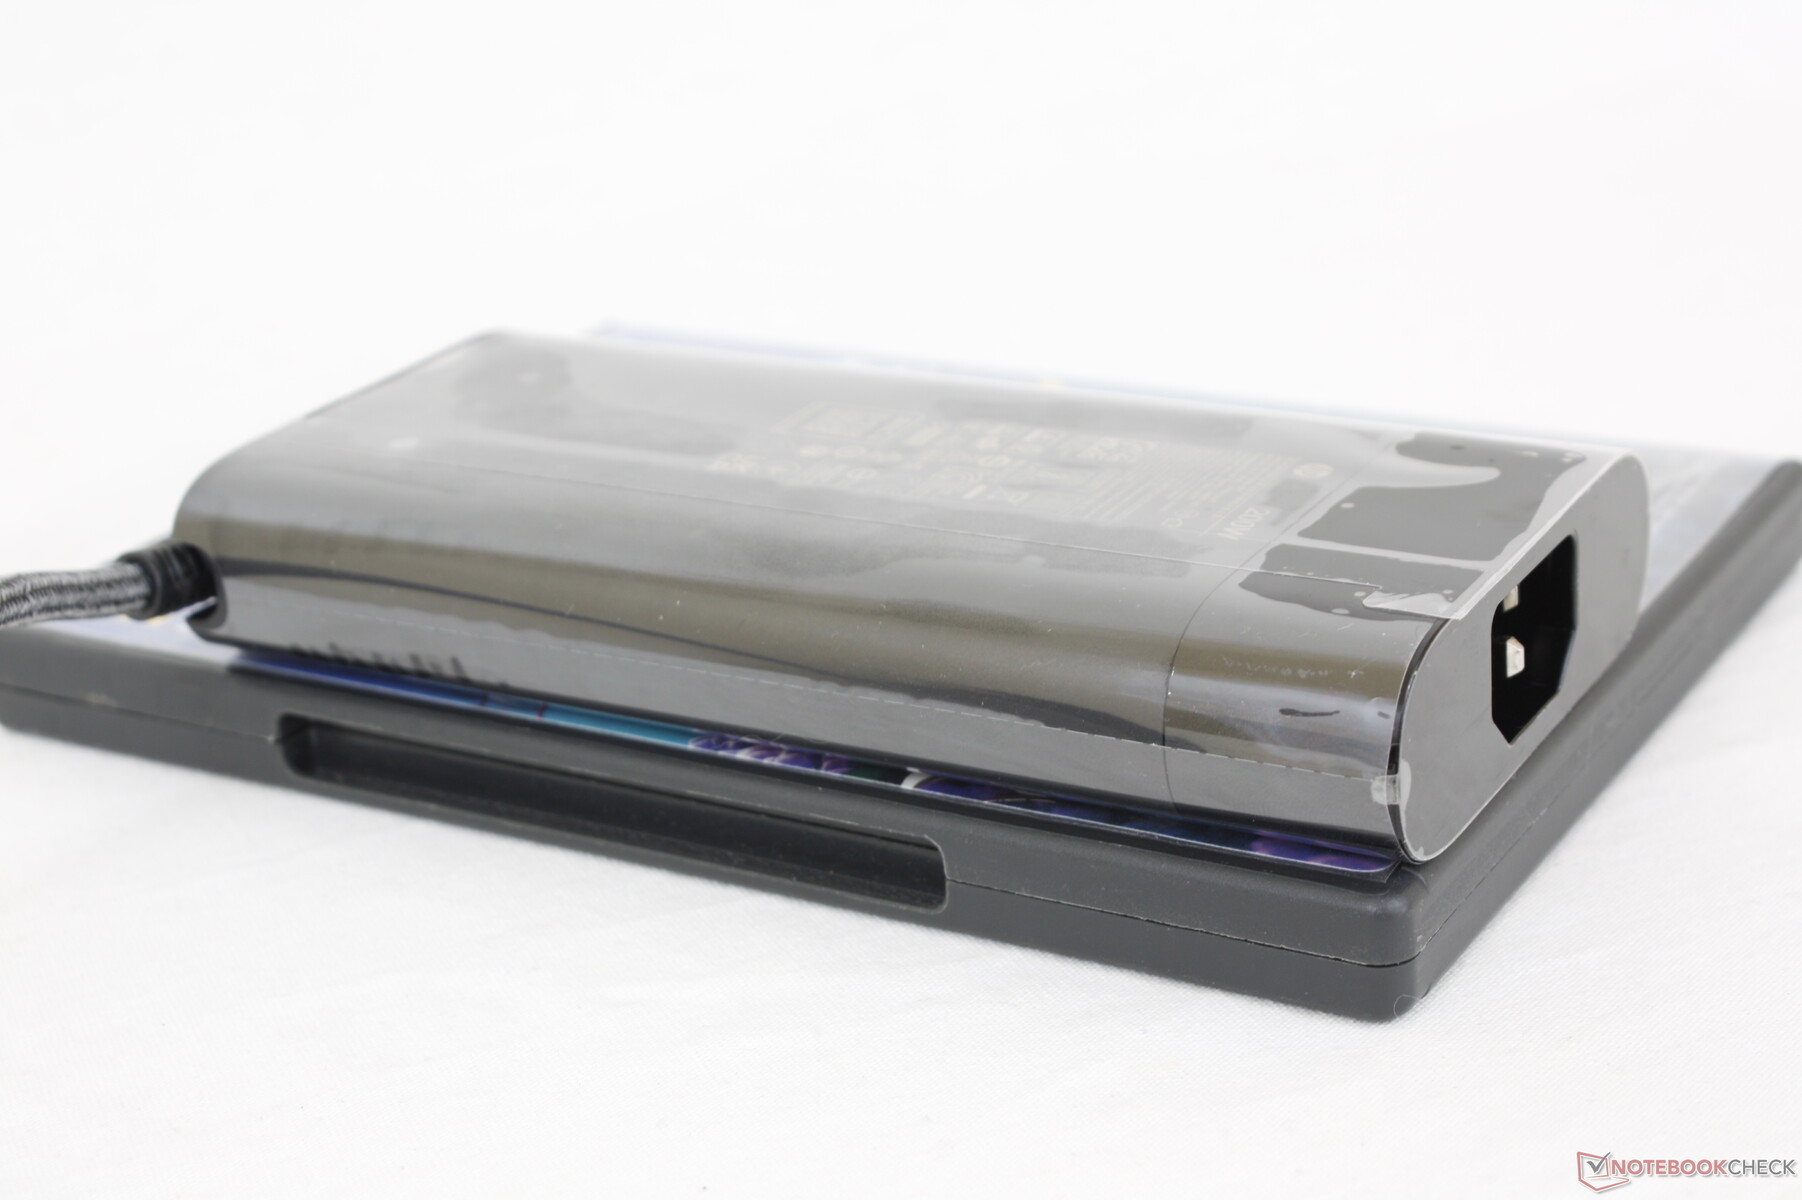
我们能够从中等大小(约15.3 x 7.5 x 2.4厘米)的200瓦交流适配器上记录到172瓦的最大功耗。该系统可以运行高负荷,并且仍然以体面的速度同时充电,这一点与早期版本的戴尔 57的不同。 早期版本的戴尔Precision 5750.如果只配置Iris Xe显卡,那么ZBook G8将配备一个较小的150W交流适配器。
| Off / Standby | |
| Idle | |
| Load |
|
Key:
min: | |
| HP ZBook Studio 15 G8 i9-11950H, GeForce RTX 3070 Laptop GPU, Samsung PM981a MZVLB2T0HALB, OLED, 3840x2160, 15.6" | HP ZBook Firefly 15 G8 2C9R7EA i7-1165G7, T500 Laptop GPU, Toshiba XG6 KXG60ZNV1T02, IPS, 1920x1080, 15.6" | HP ZBook Studio G7 i9-10885H, Quadro RTX 3000 Max-Q, Micron 2300 1TB MTFDHBA1T0TDV, IPS, 3840x2160, 15.6" | Dell Precision 7550 W-10885M, Quadro RTX 5000 Max-Q, SK Hynix PC601A NVMe 1TB, IPS, 3840x2160, 15.6" | Lenovo ThinkPad P15s Gen2-20W6000GGE i7-1165G7, T500 Laptop GPU, WDC PC SN720 SDAQNTW-1T00, IPS LED, 3840x2160, 15.6" | Asus ProArt StudioBook Pro 15 W500G5T i7-9750H, Quadro RTX 5000 Max-Q, Samsung SSD PM981 MZVLB1T0HALR, IPS, 3840x2160, 15.6" | |
|---|---|---|---|---|---|---|
| Power Consumption | 63% | 19% | 2% | 54% | 6% | |
| Idle Minimum * (Watt) | 11 | 3.3 70% | 5.5 50% | 8.2 25% | 5.8 47% | 11.6 -5% |
| Idle Average * (Watt) | 18.8 | 5.6 70% | 13.7 27% | 16.8 11% | 13.3 29% | 19 -1% |
| Idle Maximum * (Watt) | 31.7 | 8.7 73% | 16.6 48% | 24.4 23% | 15.6 51% | 20.6 35% |
| Load Average * (Watt) | 105.2 | 64.4 39% | 118.4 -13% | 131 -25% | 43.2 59% | 102 3% |
| Witcher 3 ultra * (Watt) | 148 | 53 64% | 120 19% | 156.6 -6% | 37.1 75% | |
| Load Maximum * (Watt) | 171.8 | 69 60% | 203.3 -18% | 201.8 -17% | 67.3 61% | 178 -4% |
* ... smaller is better
Power Consumption Witcher 3 / Stresstest
电池寿命--由于OLED的缘故更短
运行时间似乎比去年的ZBook Studio G7要短几个小时。我们只能获得超过6小时的实际WLAN使用时间,而G7即使设置为集成GPU,也有近8小时。G8上更耗电的OLED面板可能是造成电池寿命缩短的罪魁祸首。
值得庆幸的是,充电速度很快,从空电到满电大约需要90分钟。用户还可以通过USB-C给系统充电。
| HP ZBook Studio 15 G8 i9-11950H, GeForce RTX 3070 Laptop GPU, 83 Wh | HP ZBook Firefly 15 G8 2C9R7EA i7-1165G7, T500 Laptop GPU, 56 Wh | HP ZBook Studio G7 i9-10885H, Quadro RTX 3000 Max-Q, 83 Wh | Dell Precision 7550 W-10885M, Quadro RTX 5000 Max-Q, 95 Wh | Lenovo ThinkPad P15s Gen2-20W6000GGE i7-1165G7, T500 Laptop GPU, 57 Wh | Asus ProArt StudioBook Pro 15 W500G5T i7-9750H, Quadro RTX 5000 Max-Q, 76 Wh | |
|---|---|---|---|---|---|---|
| Battery runtime | 49% | 8% | -5% | 15% | -24% | |
| Reader / Idle (h) | 12.9 | 11.1 -14% | ||||
| WiFi v1.3 (h) | 6.2 | 10.5 69% | 7.8 26% | 8.9 44% | 7.7 24% | 4.7 -24% |
| Load (h) | 1.8 | 2.3 28% | 1.6 -11% | 1 -44% | 1.9 6% |
Pros
Cons
Verdict - Good CPU Gains, Uninspiring GPU Gains
目前,惠普有三种ZBook G8机型可供选择:ZBook Studio G8、ZBook Fury G8和 ZBook Firefly G8.厚重的Fury G8满足了传统工作站的空间要求,而轻薄的Firefly G8则使用ULV软件,具有更高的便携性。我们的ZBook Studio G8是为那些希望获得Core H系列性能而又不像Firefly那样笨重的用户提供的中间解决方案。
这种中间解决方案意味着放弃了Fury上的一些功能。ZBook Studio G8上缺少快速释放底板、数字键盘、鼠标按钮、TrackPoint、Xeon CPU、可升级ECC内存、网络摄像头快门等功能。如果需要这些功能,用户可能要考虑更厚的Fury型号。
可靠的ZBook Studio G8运行得很好,尽管它的设计只有一年历史,但看起来更棒。然而,GeForce RTX 3070是令人沮丧的,而与便宜的IPS选项相比,OLED面板有一些明显的缺点。
当与更直接的竞争对手如 微星WS66或 Razer Blade 15 Studio微星系统提供了Xeon选项,而两者都可以容纳两个M.2 SSD,而不是只有一个。在运行高负荷时,惠普的CPU温度也可能会低很多。即使是ZBook Studio G8也有比微星更好的制造质量,而且键盘也比这两个替代品更舒适。
价格和可用性
截至目前,ZBook Studio G8还没有在第三方零售渠道广泛销售。有兴趣的用户应该直接从惠普订购。那里有大量的可配置选项。我们的具体配置售价约为4200美元。
HP ZBook Studio 15 G8
- 08/31/2022 v7 (old)
Allen Ngo
Price comparison

