Minisforum NUCXi7台式电脑评论。超薄的游戏电脑与GeForce RTX 3070和Core i7-11800H

Minisforum在这个国家(德国)以迷你PC的系统制造商而闻名。然而,随着NUCX系列的推出,该制造商瞄准了一个稍微不同的目标用户群,通过该模型提供了一个全功能的游戏PC。这不是你通常的台式电脑,而是一台具有相当大的功率的超薄PC。它基于英特尔NUC-XI5笔记本主板,该主板也被用于笔记本电脑。
NUCX目前有两种基本配置,它们的CPU和GPU都有所不同。一方面,有MINISFORUM NUCXi5,它基于 英特尔酷睿i5-11400H与一个NvidiaGeForce RTX 3060 Laptop GPU,另一方面,MINISFORUM NUCXi7采用了英特尔酷睿i7-11800H在与一个 NvidiaGeForce RTX 3070 笔记本电脑GPU.就其价格而言,这两个型号的裸机系统分别从1199欧元(约合人民币1195元)和1449欧元(约合人民币1444元)开始。 我们的测试装置,一个带有16GB内存和512GB固态硬盘的NUCXi7,价格为1629欧元(约合人民币1623元),已经预装了Windows 11的专业版。
在本评论中,其他紧凑型台式电脑作为比较设备。为了反映GPU性能的直接比较,我们还在测试竞争对手的领域中包括了一台类似装备的游戏笔记本电脑。
潜在的竞争对手比较
Rating | Date | Model | Weight | Height | Price |
|---|---|---|---|---|---|
v7 (old) | 09 / 2022 | Minisforum NUCX i7 i7-11800H, GeForce RTX 3070 Laptop GPU | 2.4 kg | 393 mm | |
v (old) | 12 / 2021 | Intel Beast Canyon NUC i9-11900KB, GeForce RTX 3060 | 189 mm | ||
v (old) | Zotac Magnus One (ECM73070C) i7-10700, GeForce RTX 3070 | ||||
v (old) | 05 / 2022 | Zotac ZBOX Magnus EN173070C i7-11800H, GeForce RTX 3070 Laptop GPU | 1.8 kg | 62.2 mm | |
v (old) | 04 / 2022 | Intel Dragon Canyon NUC - RTX 3060 i9-12900, GeForce RTX 3060 | 189 mm | ||
v (old) | Zotac MEK Mini (RTX 2070 Super) i7-9700, GeForce RTX 2070 Super (Desktop) | ||||
| 83.2 % v7 (old) | 10 / 2021 | Gigabyte A7 X1 R9 5900HX, GeForce RTX 3070 Laptop GPU | 2.5 kg | 34 mm |
Minisforum NUCXi7的详细介绍
案例
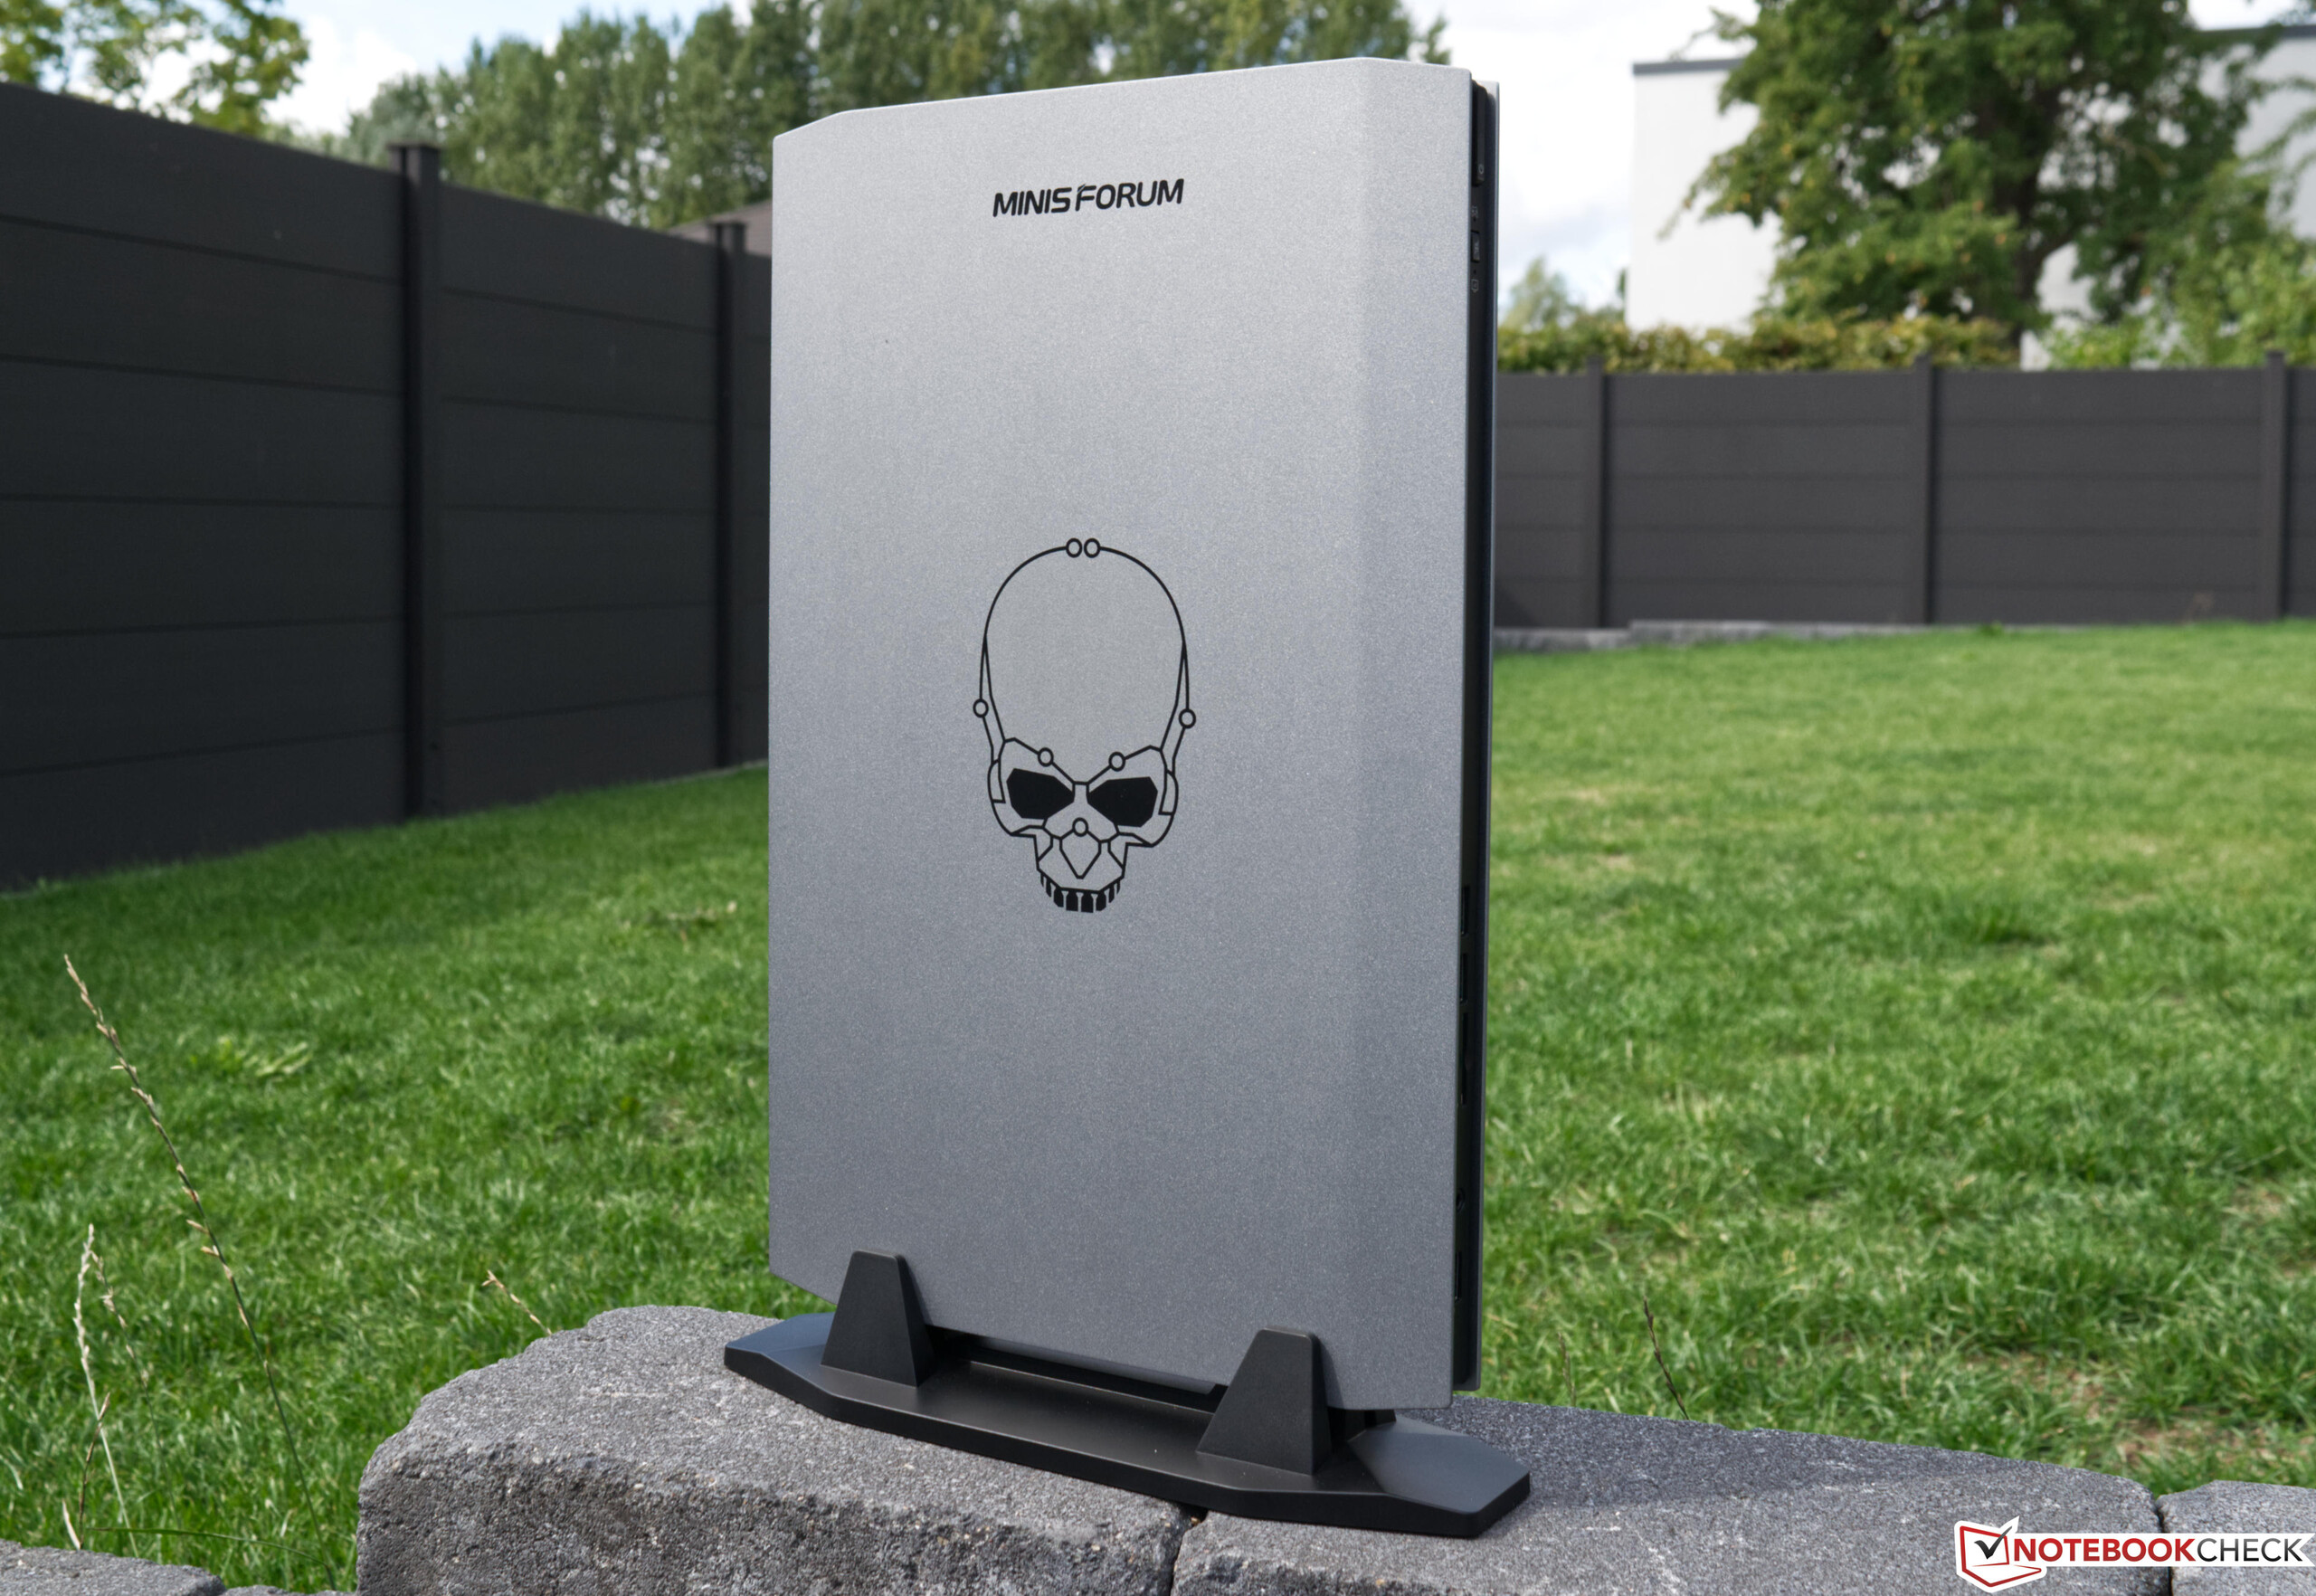
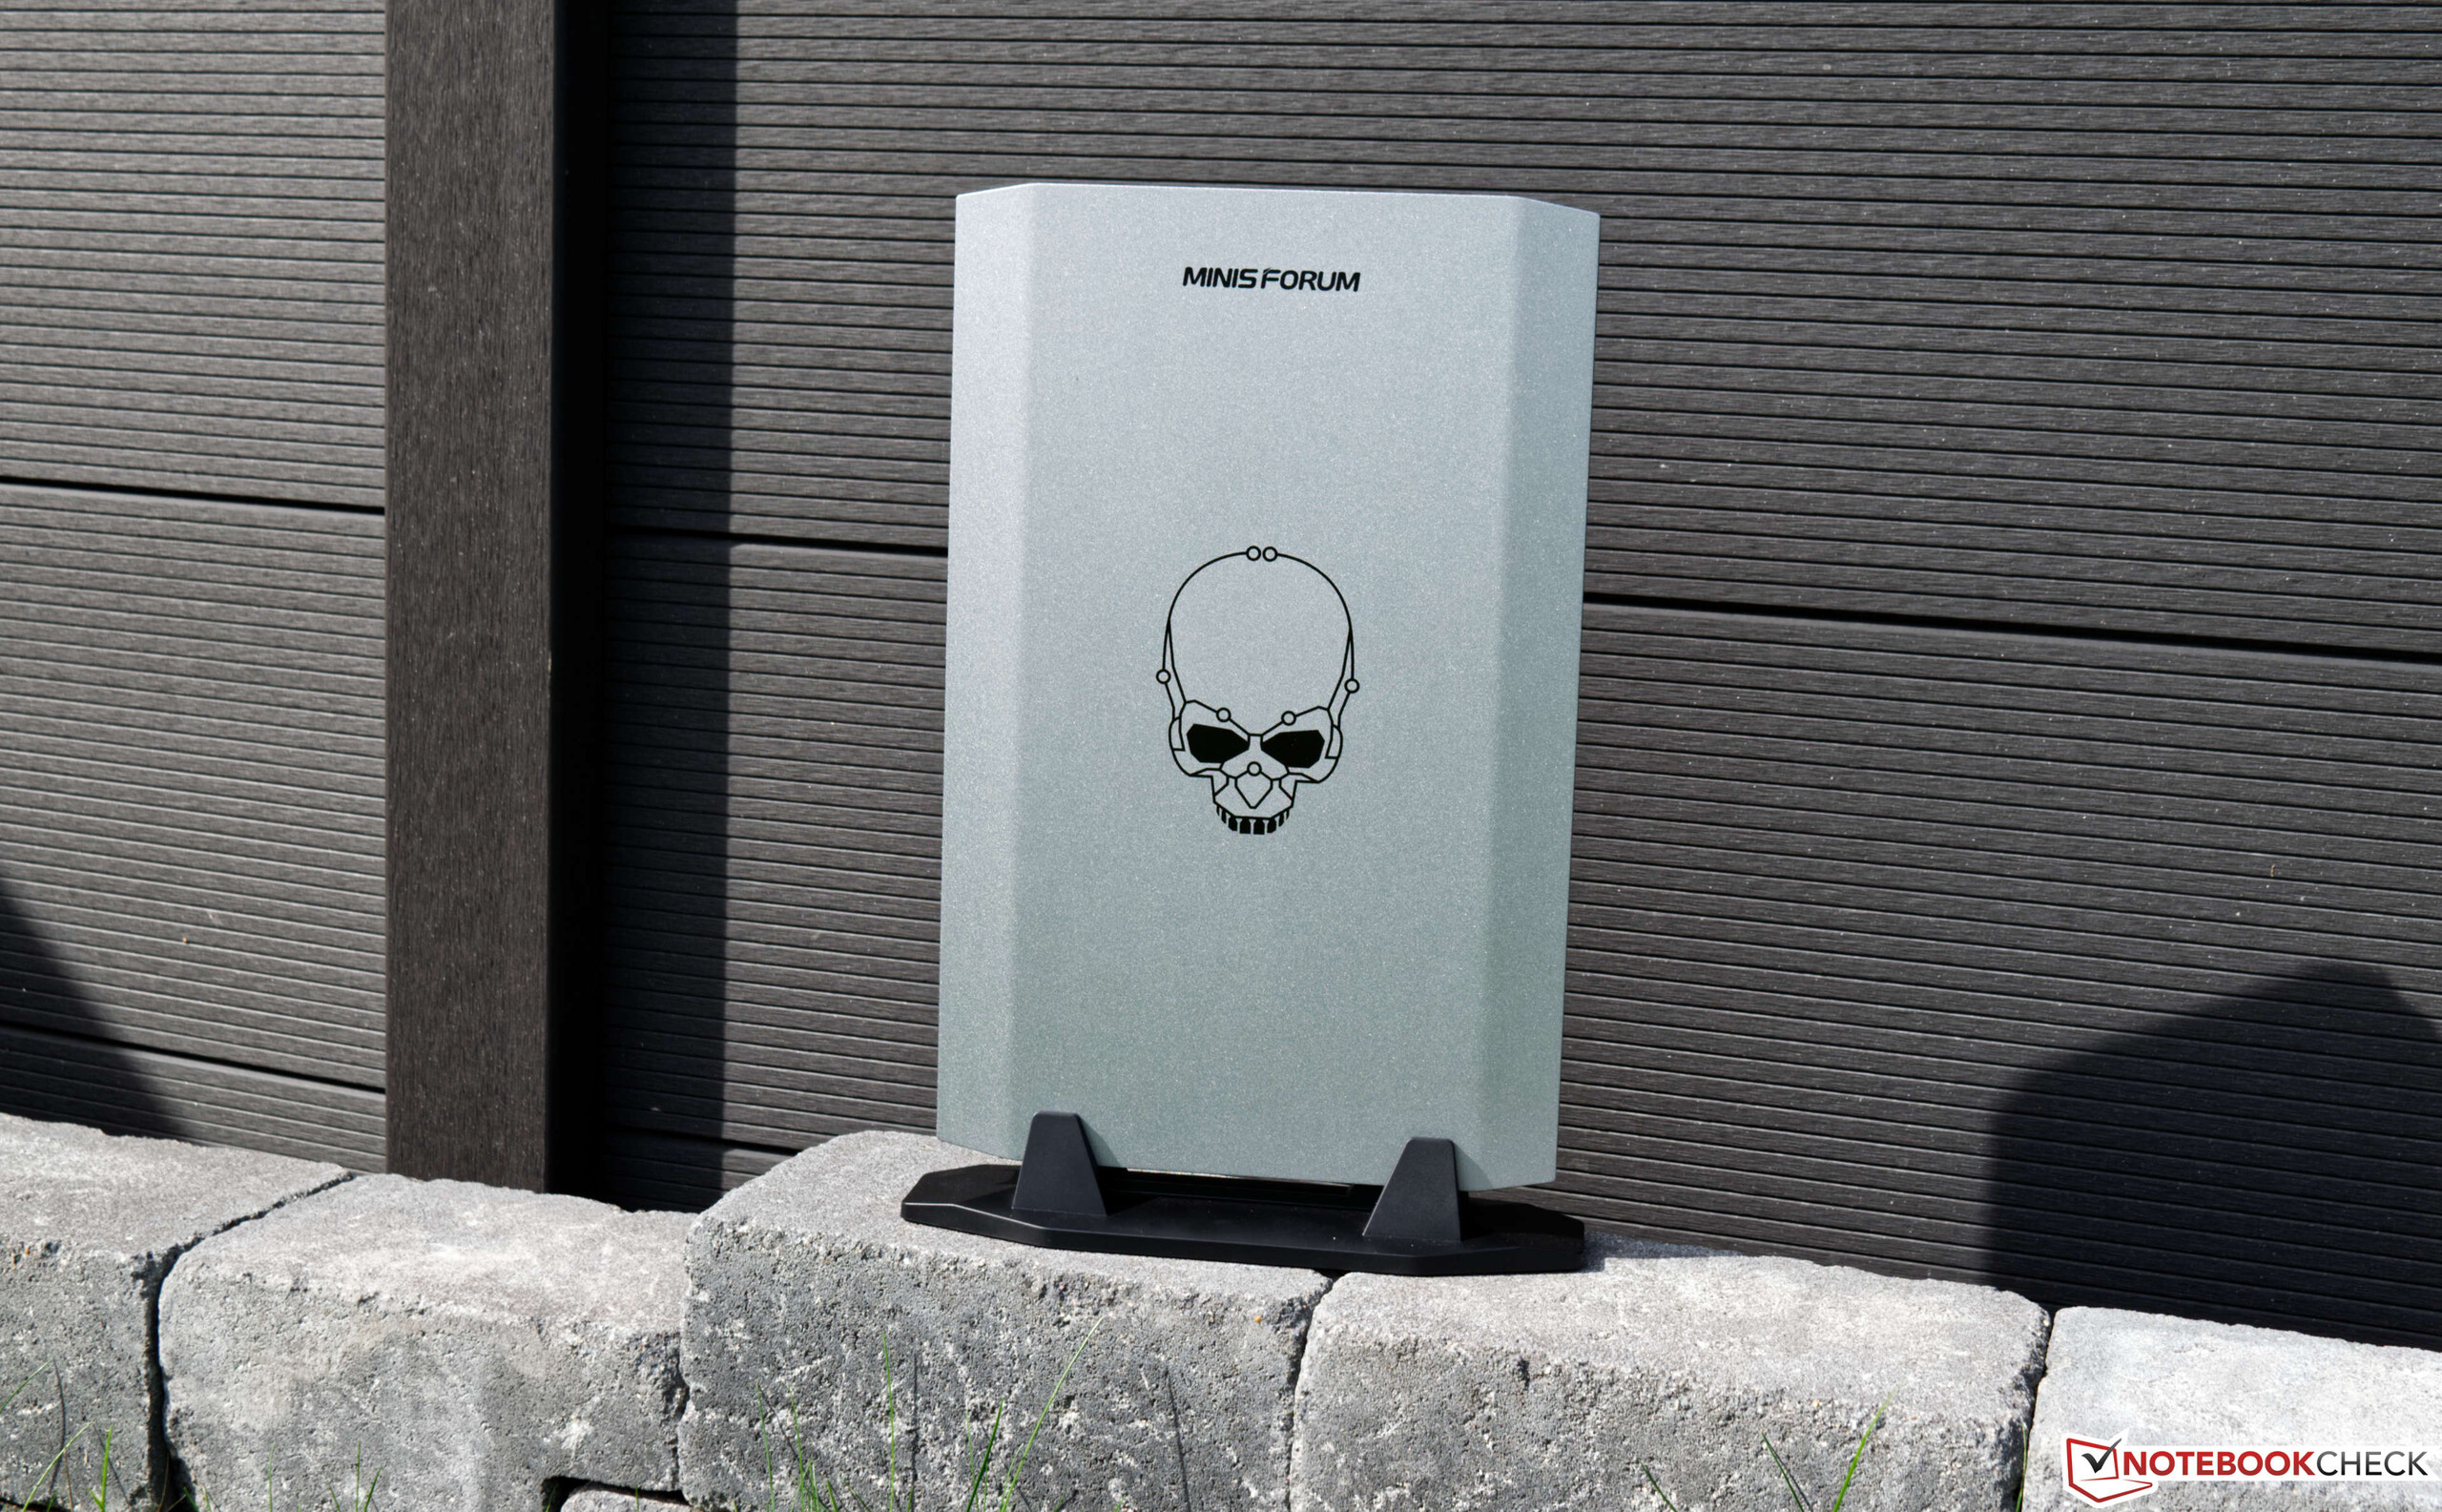
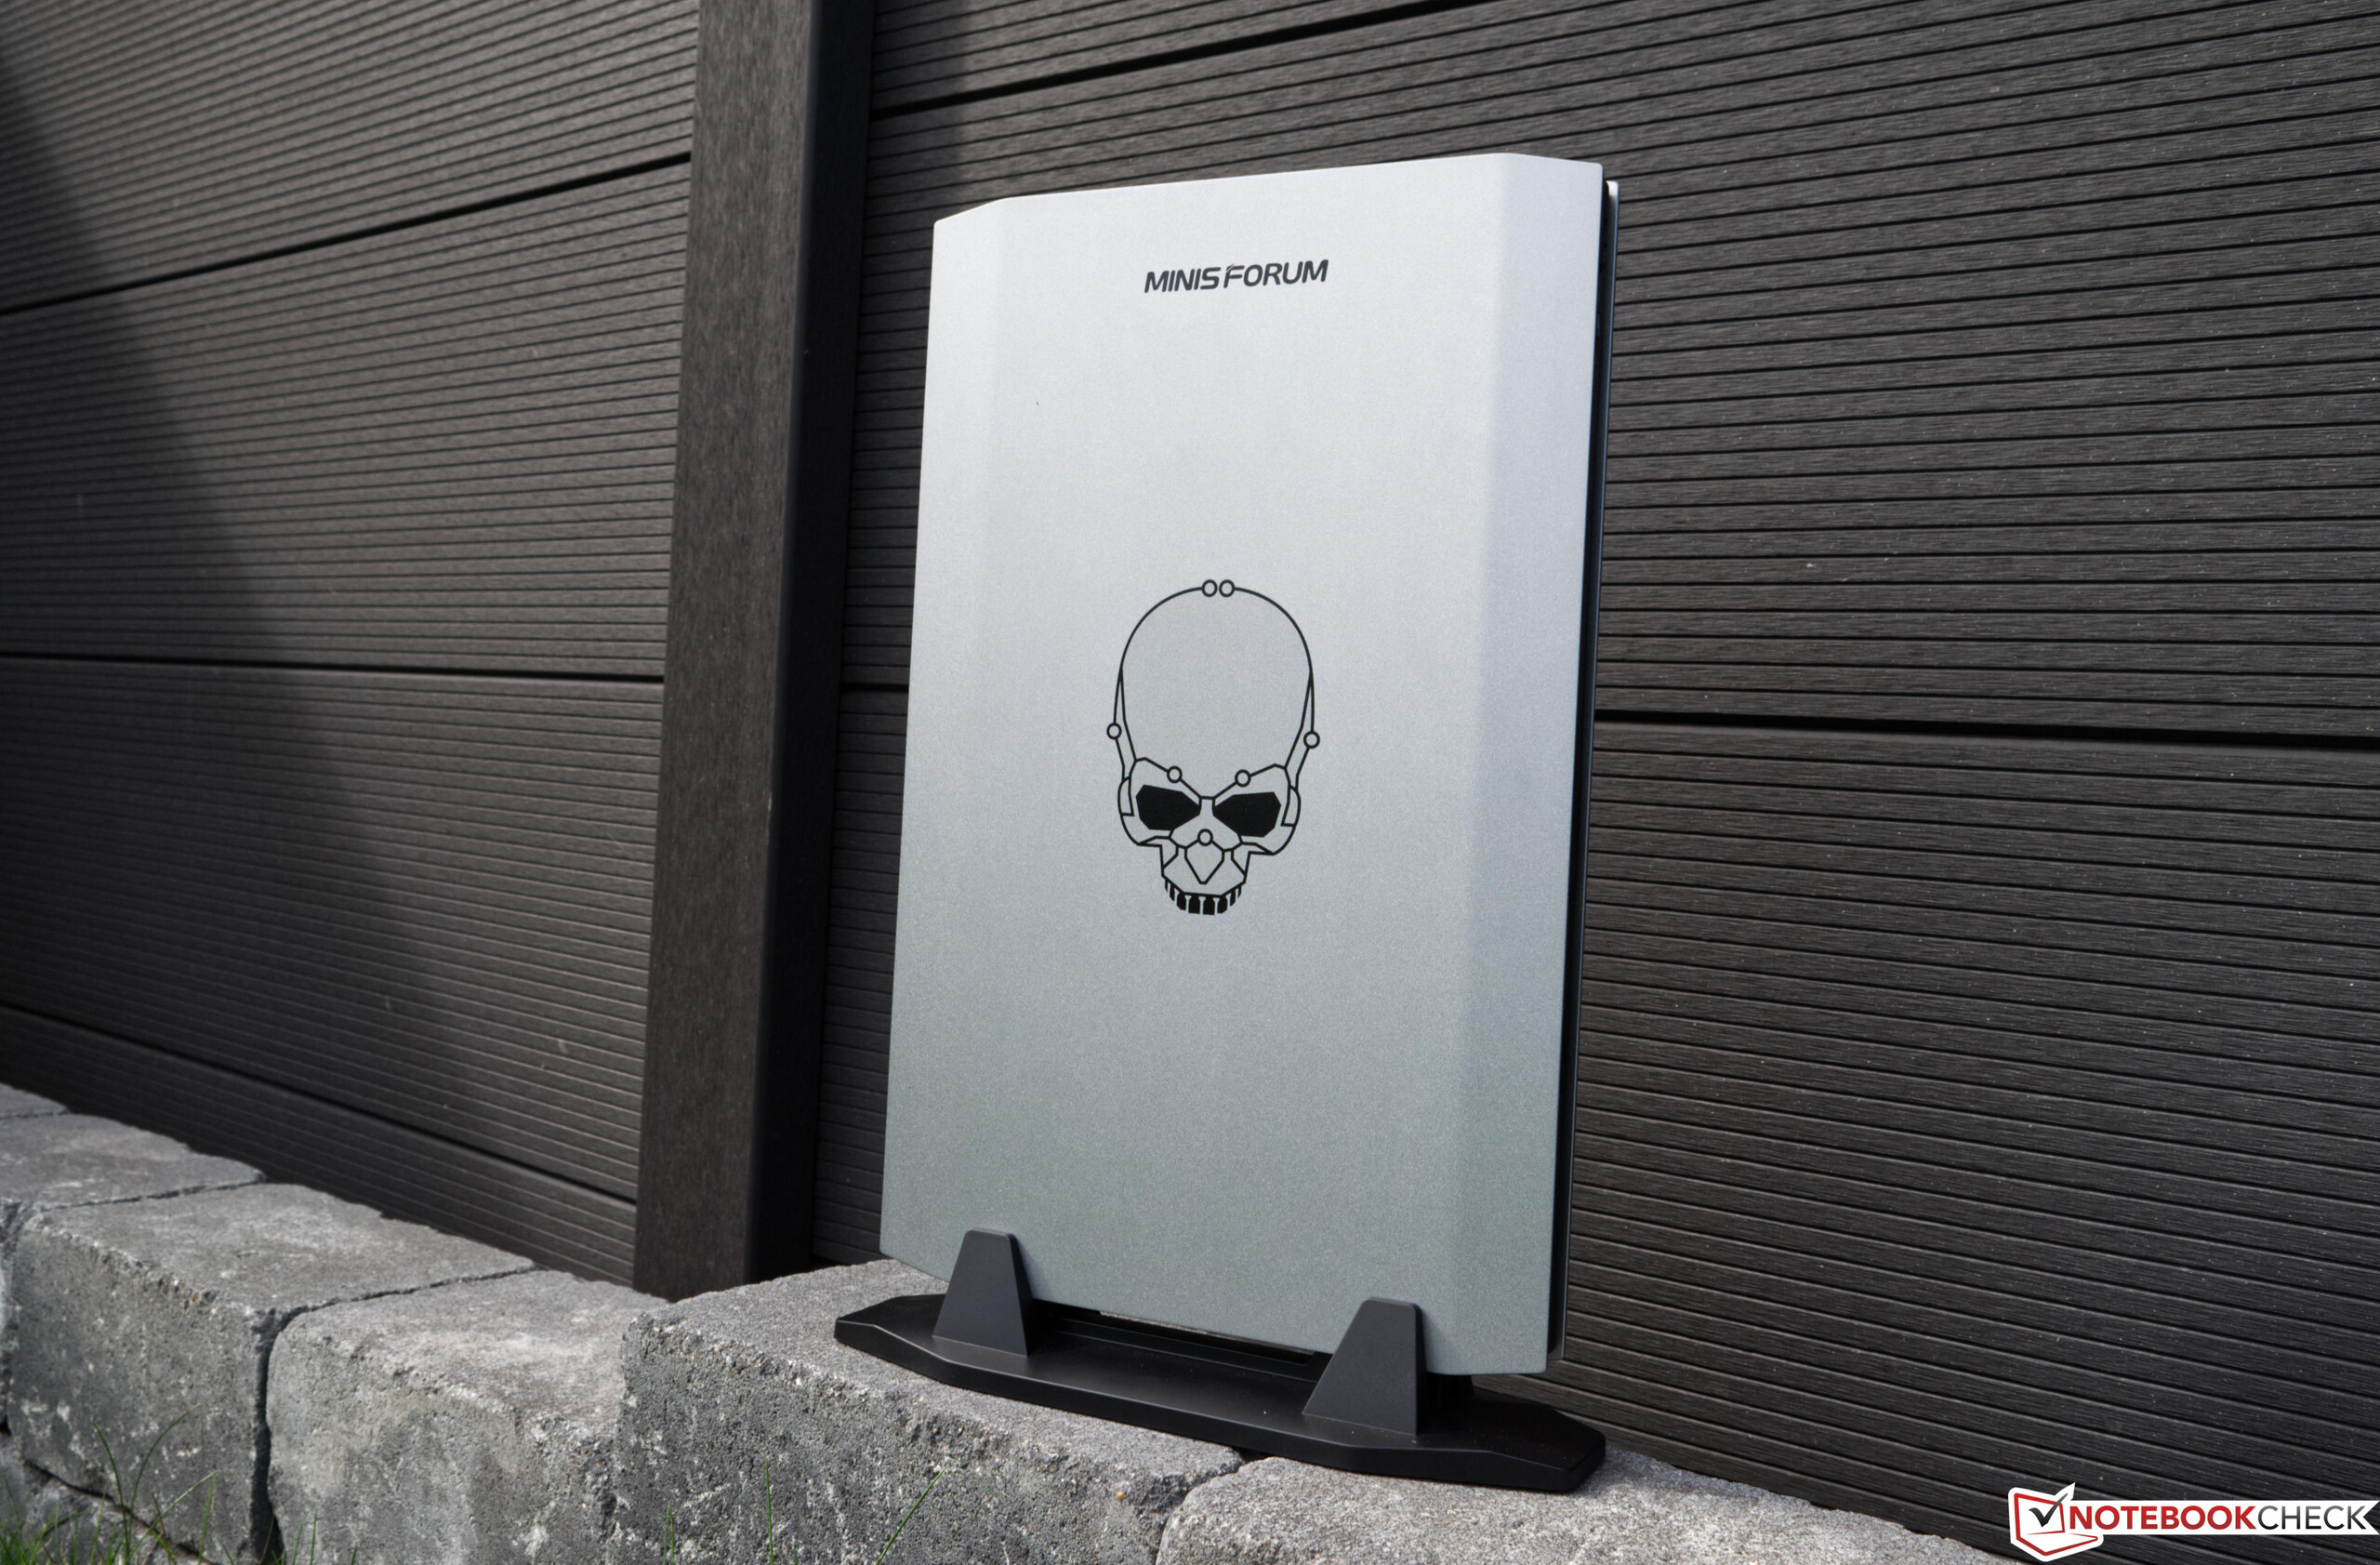
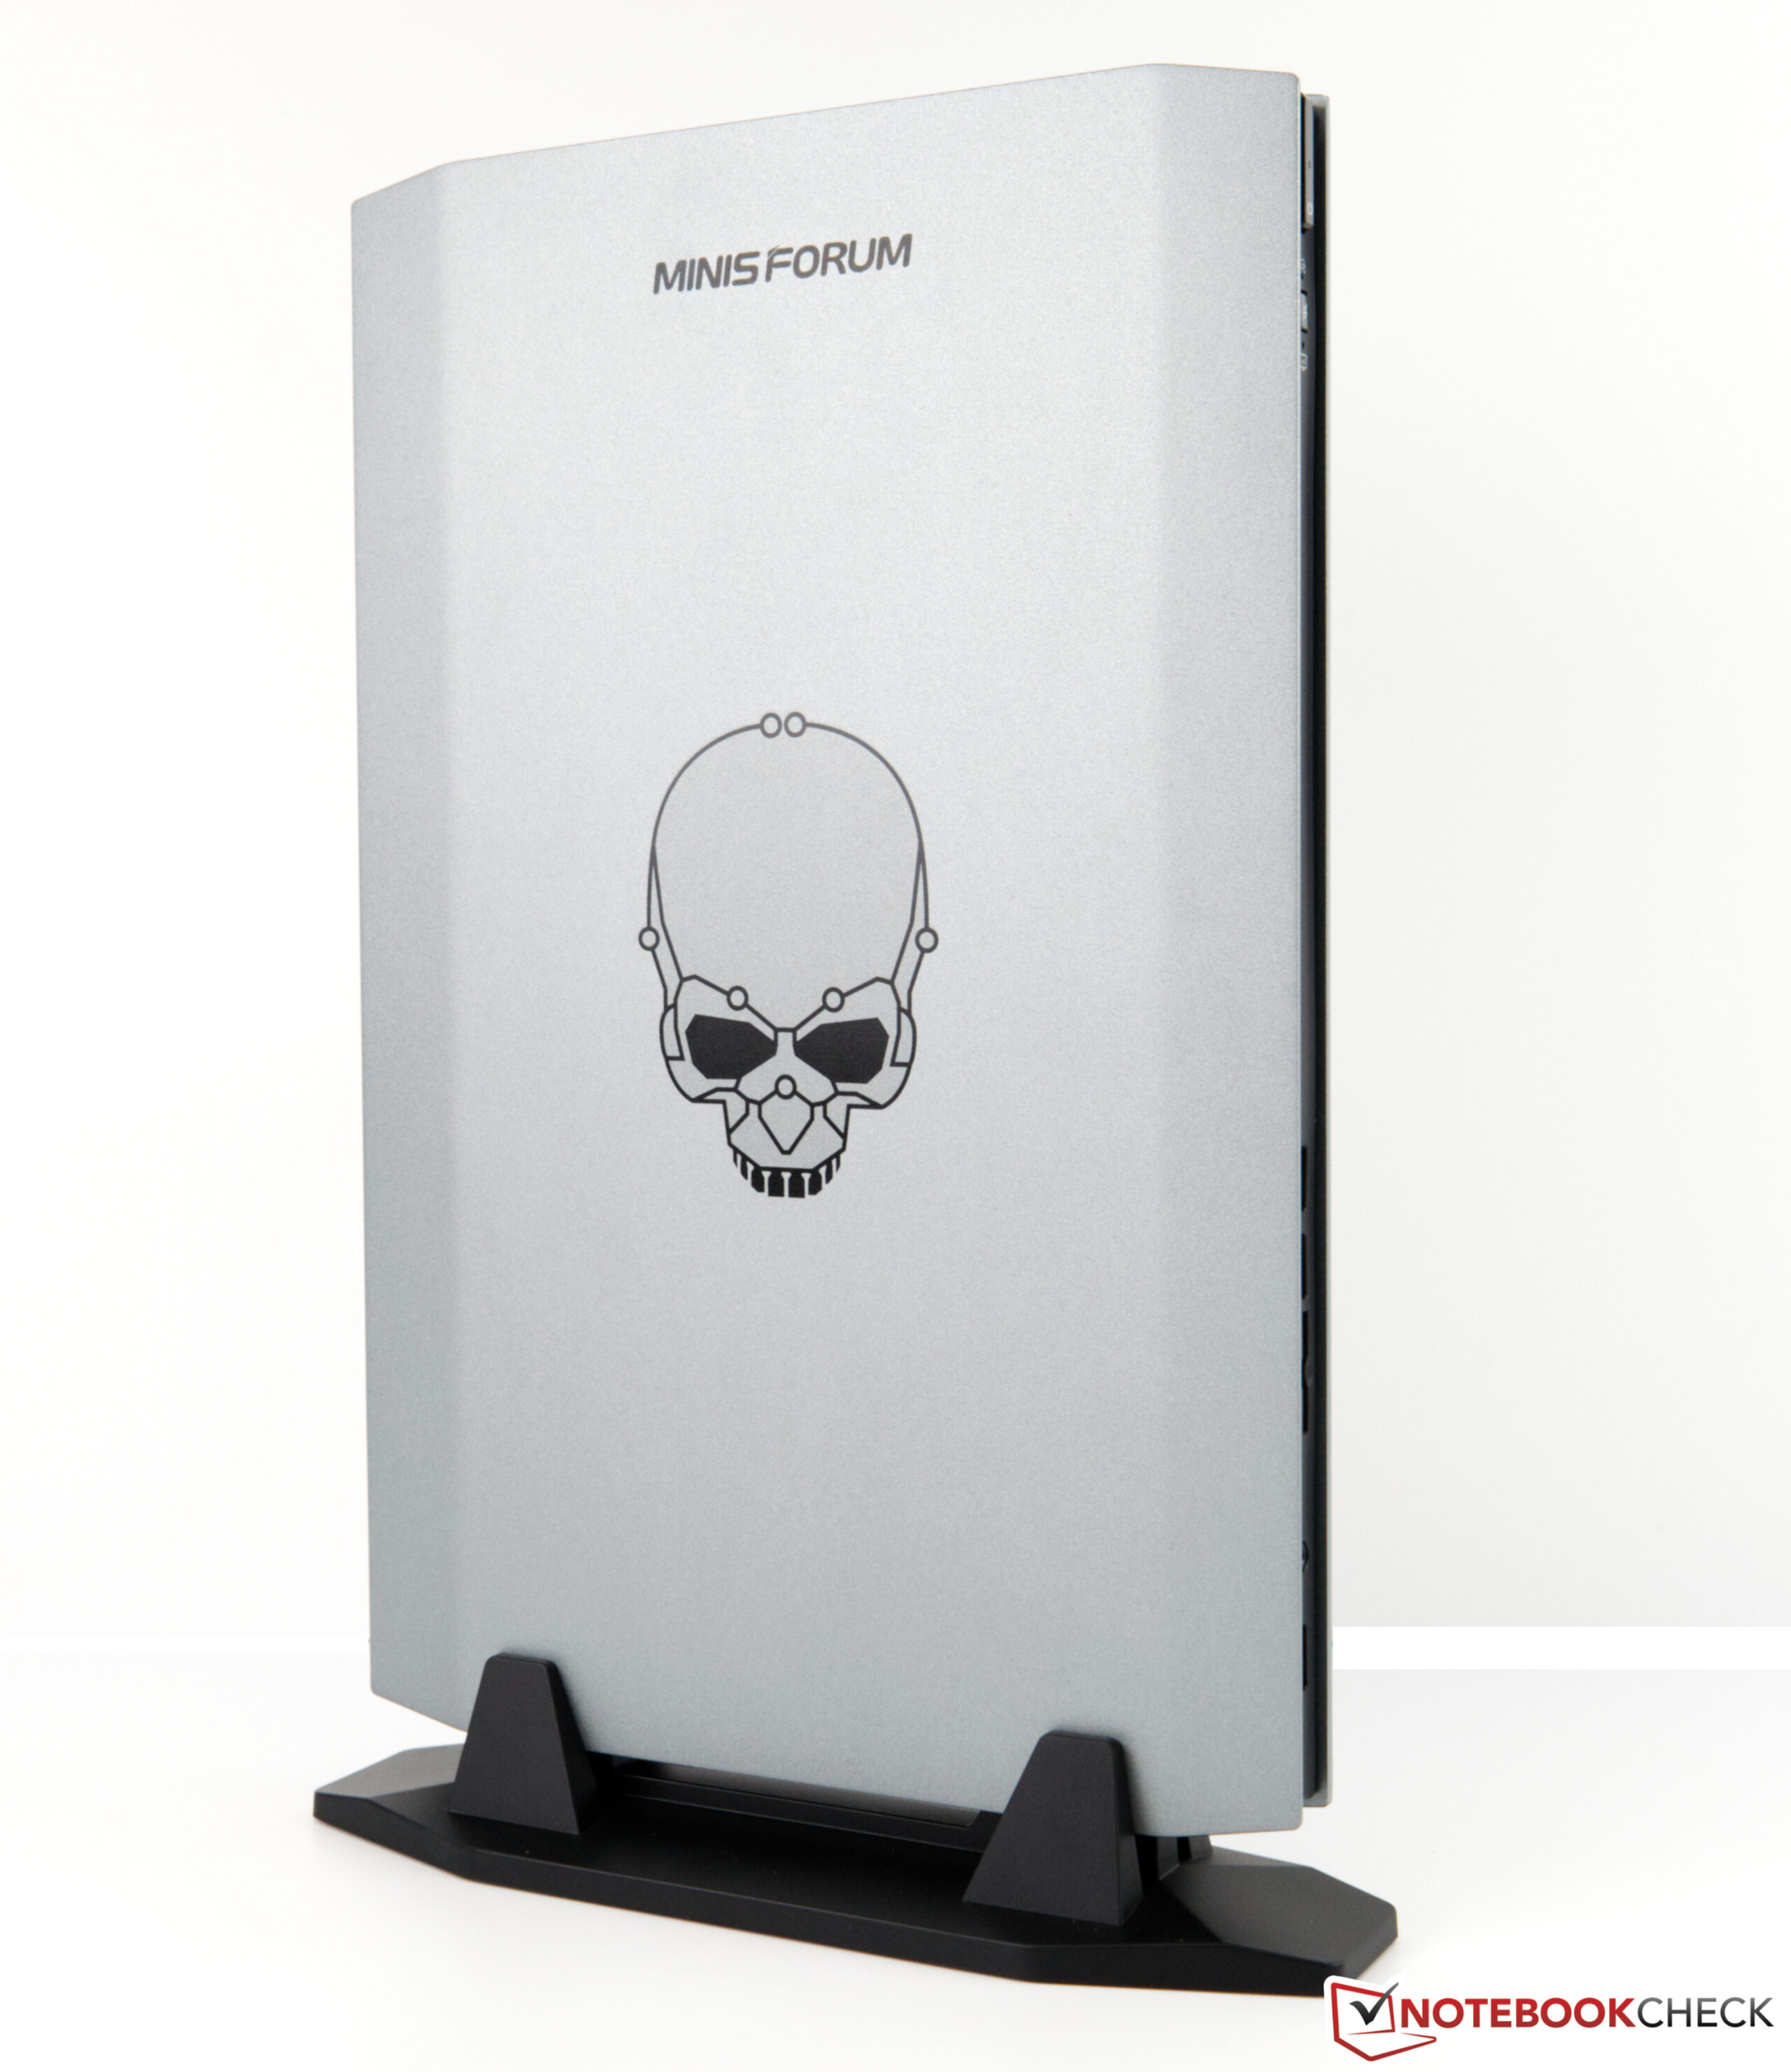
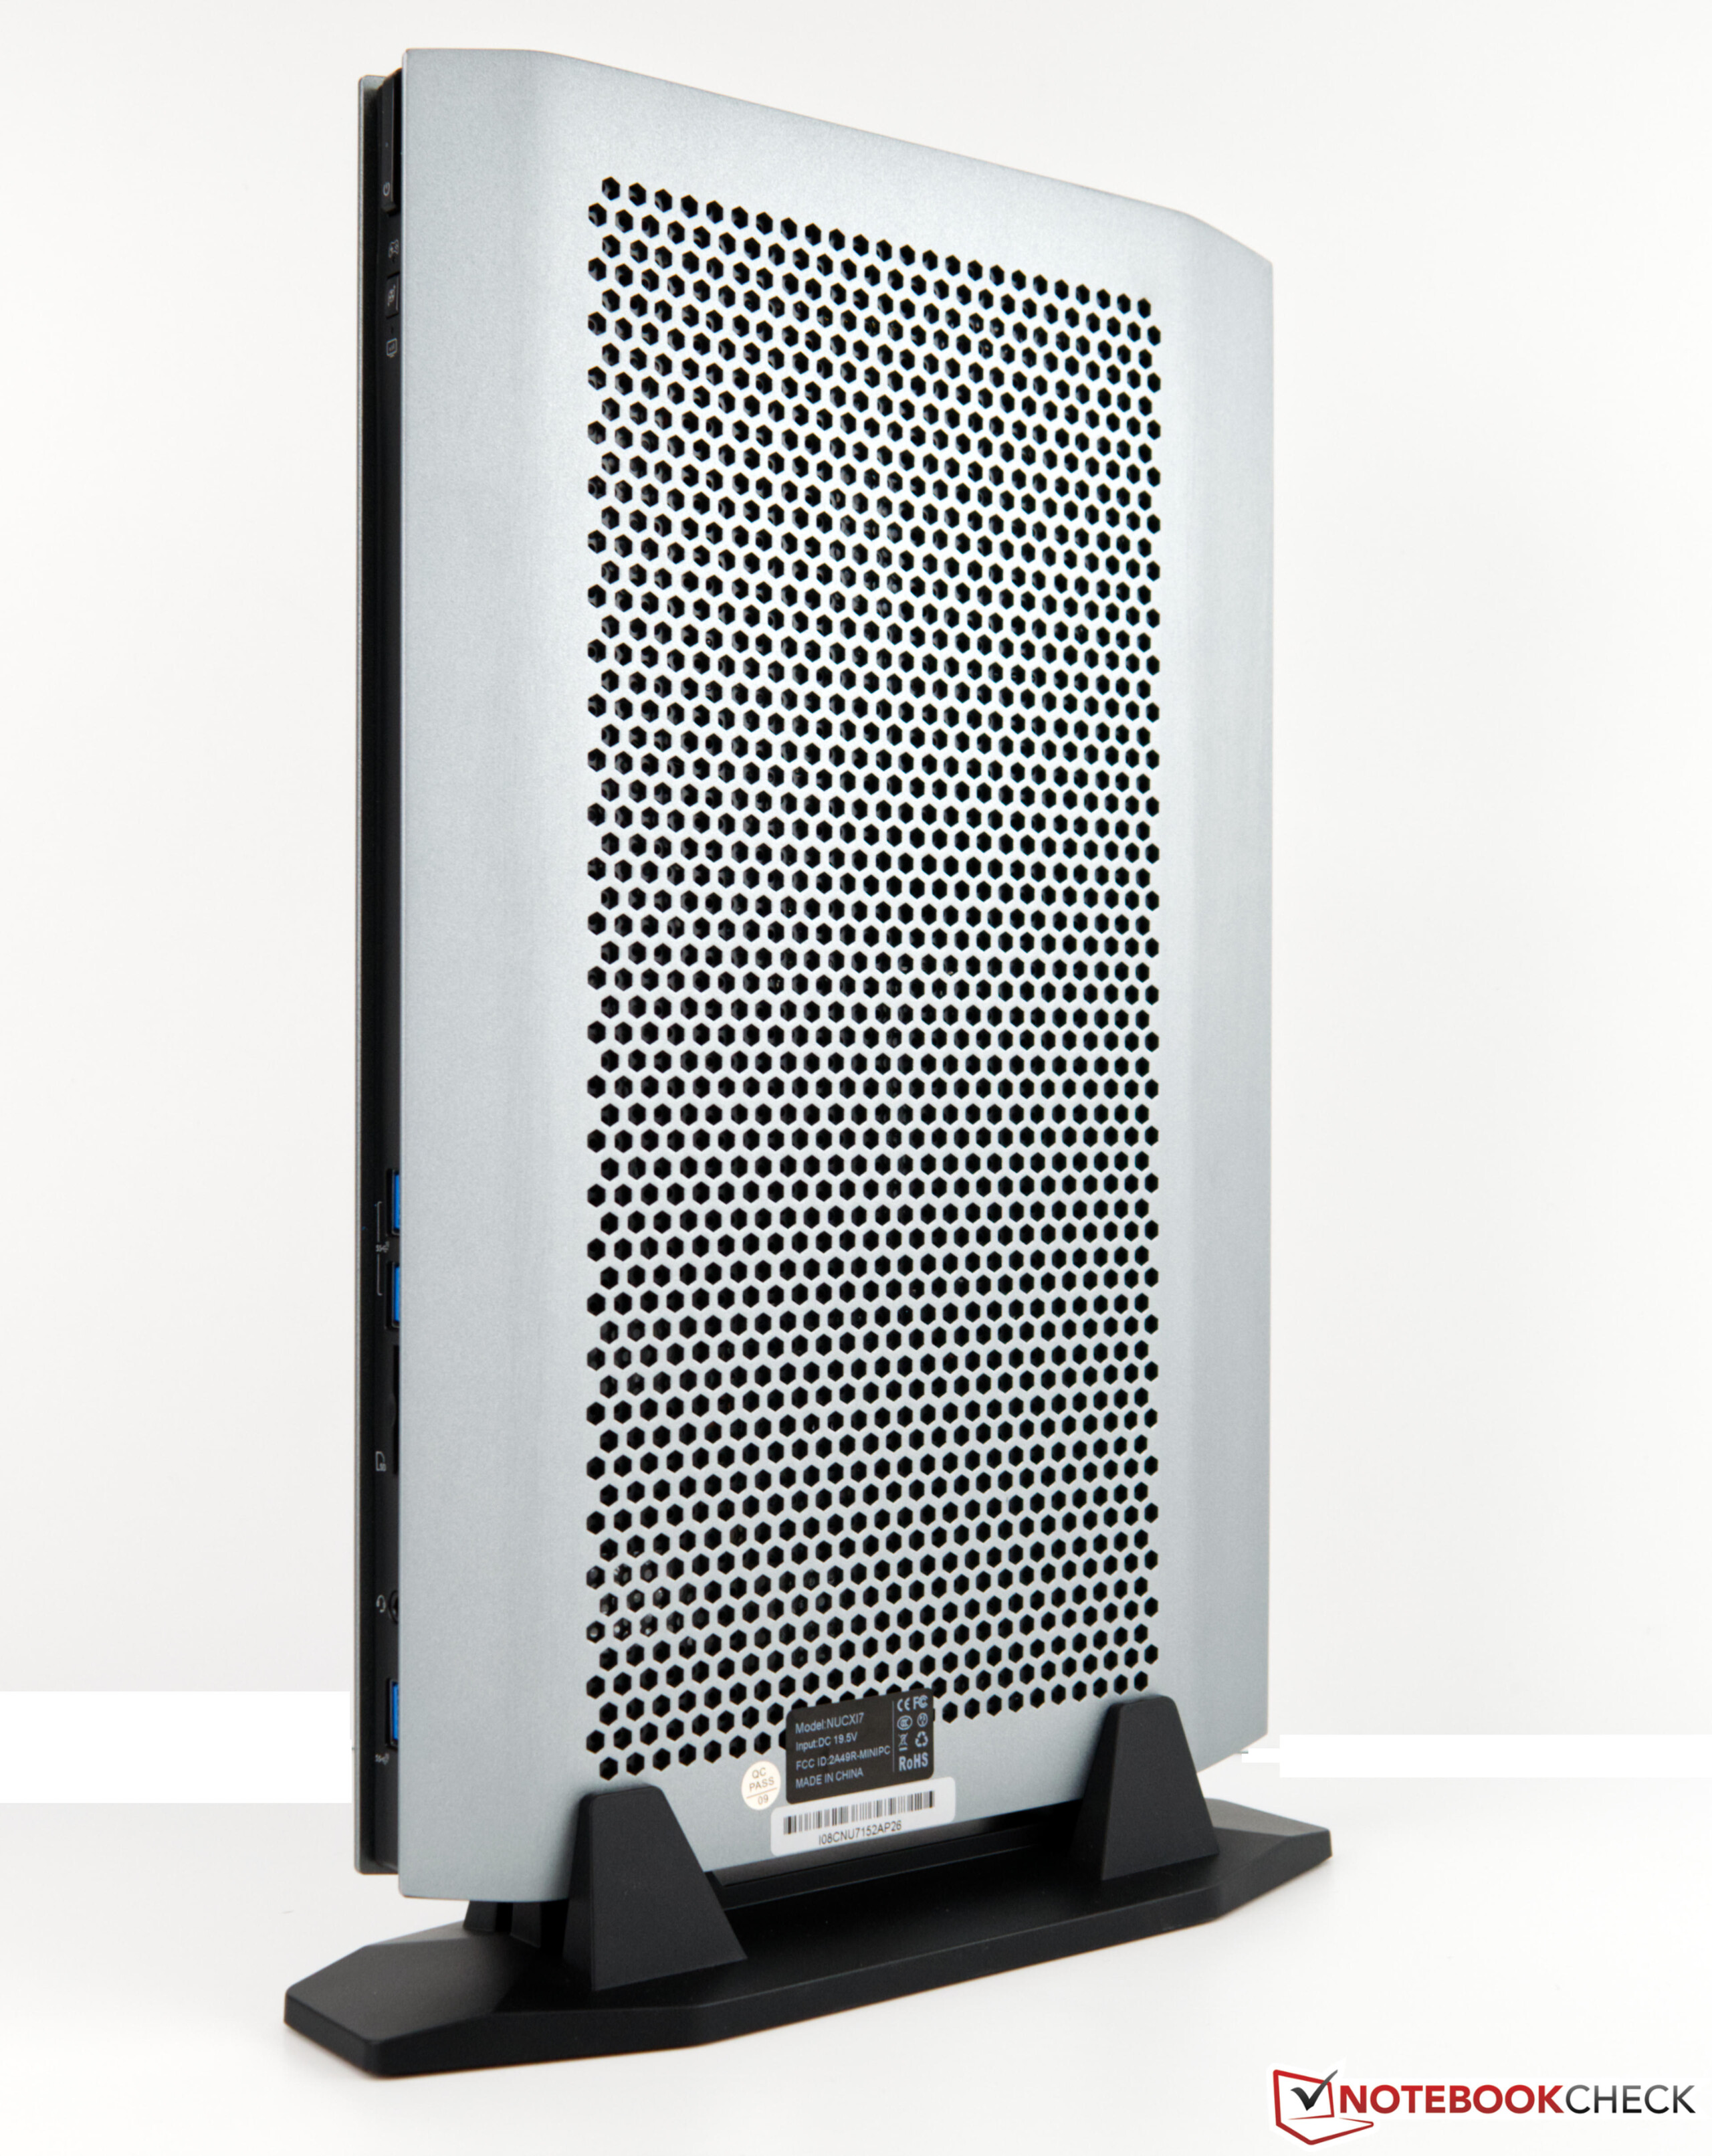
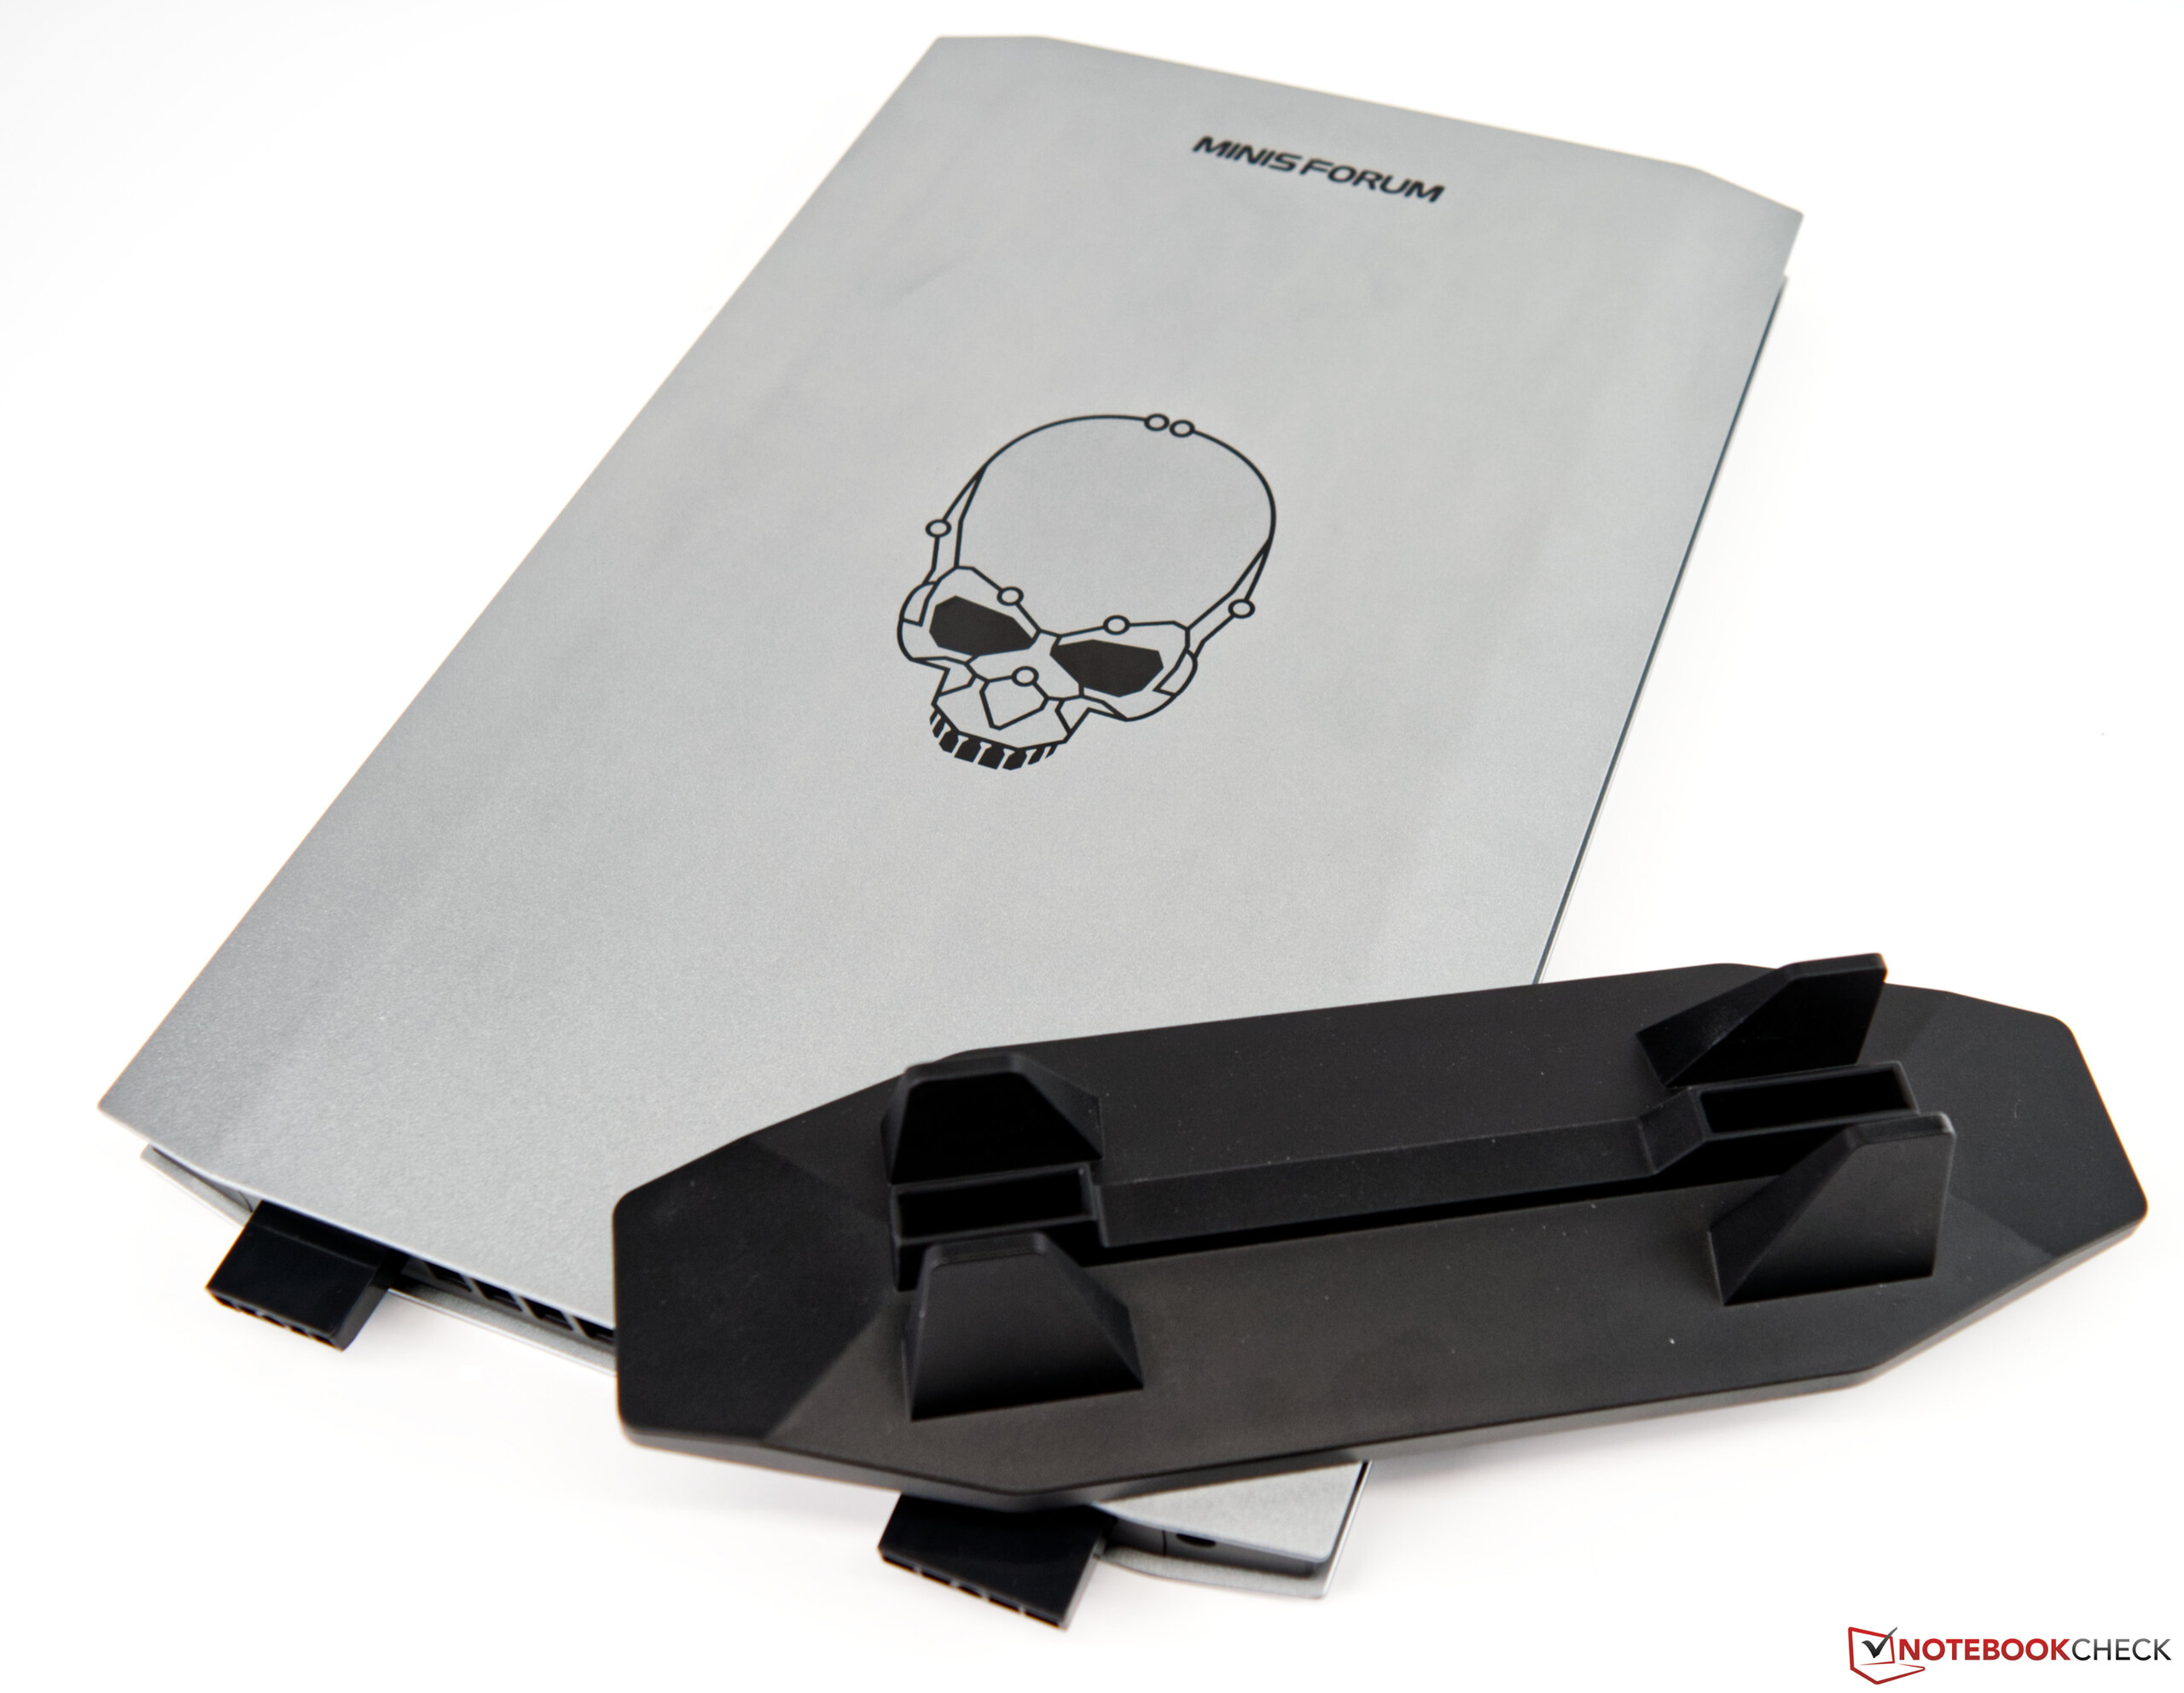
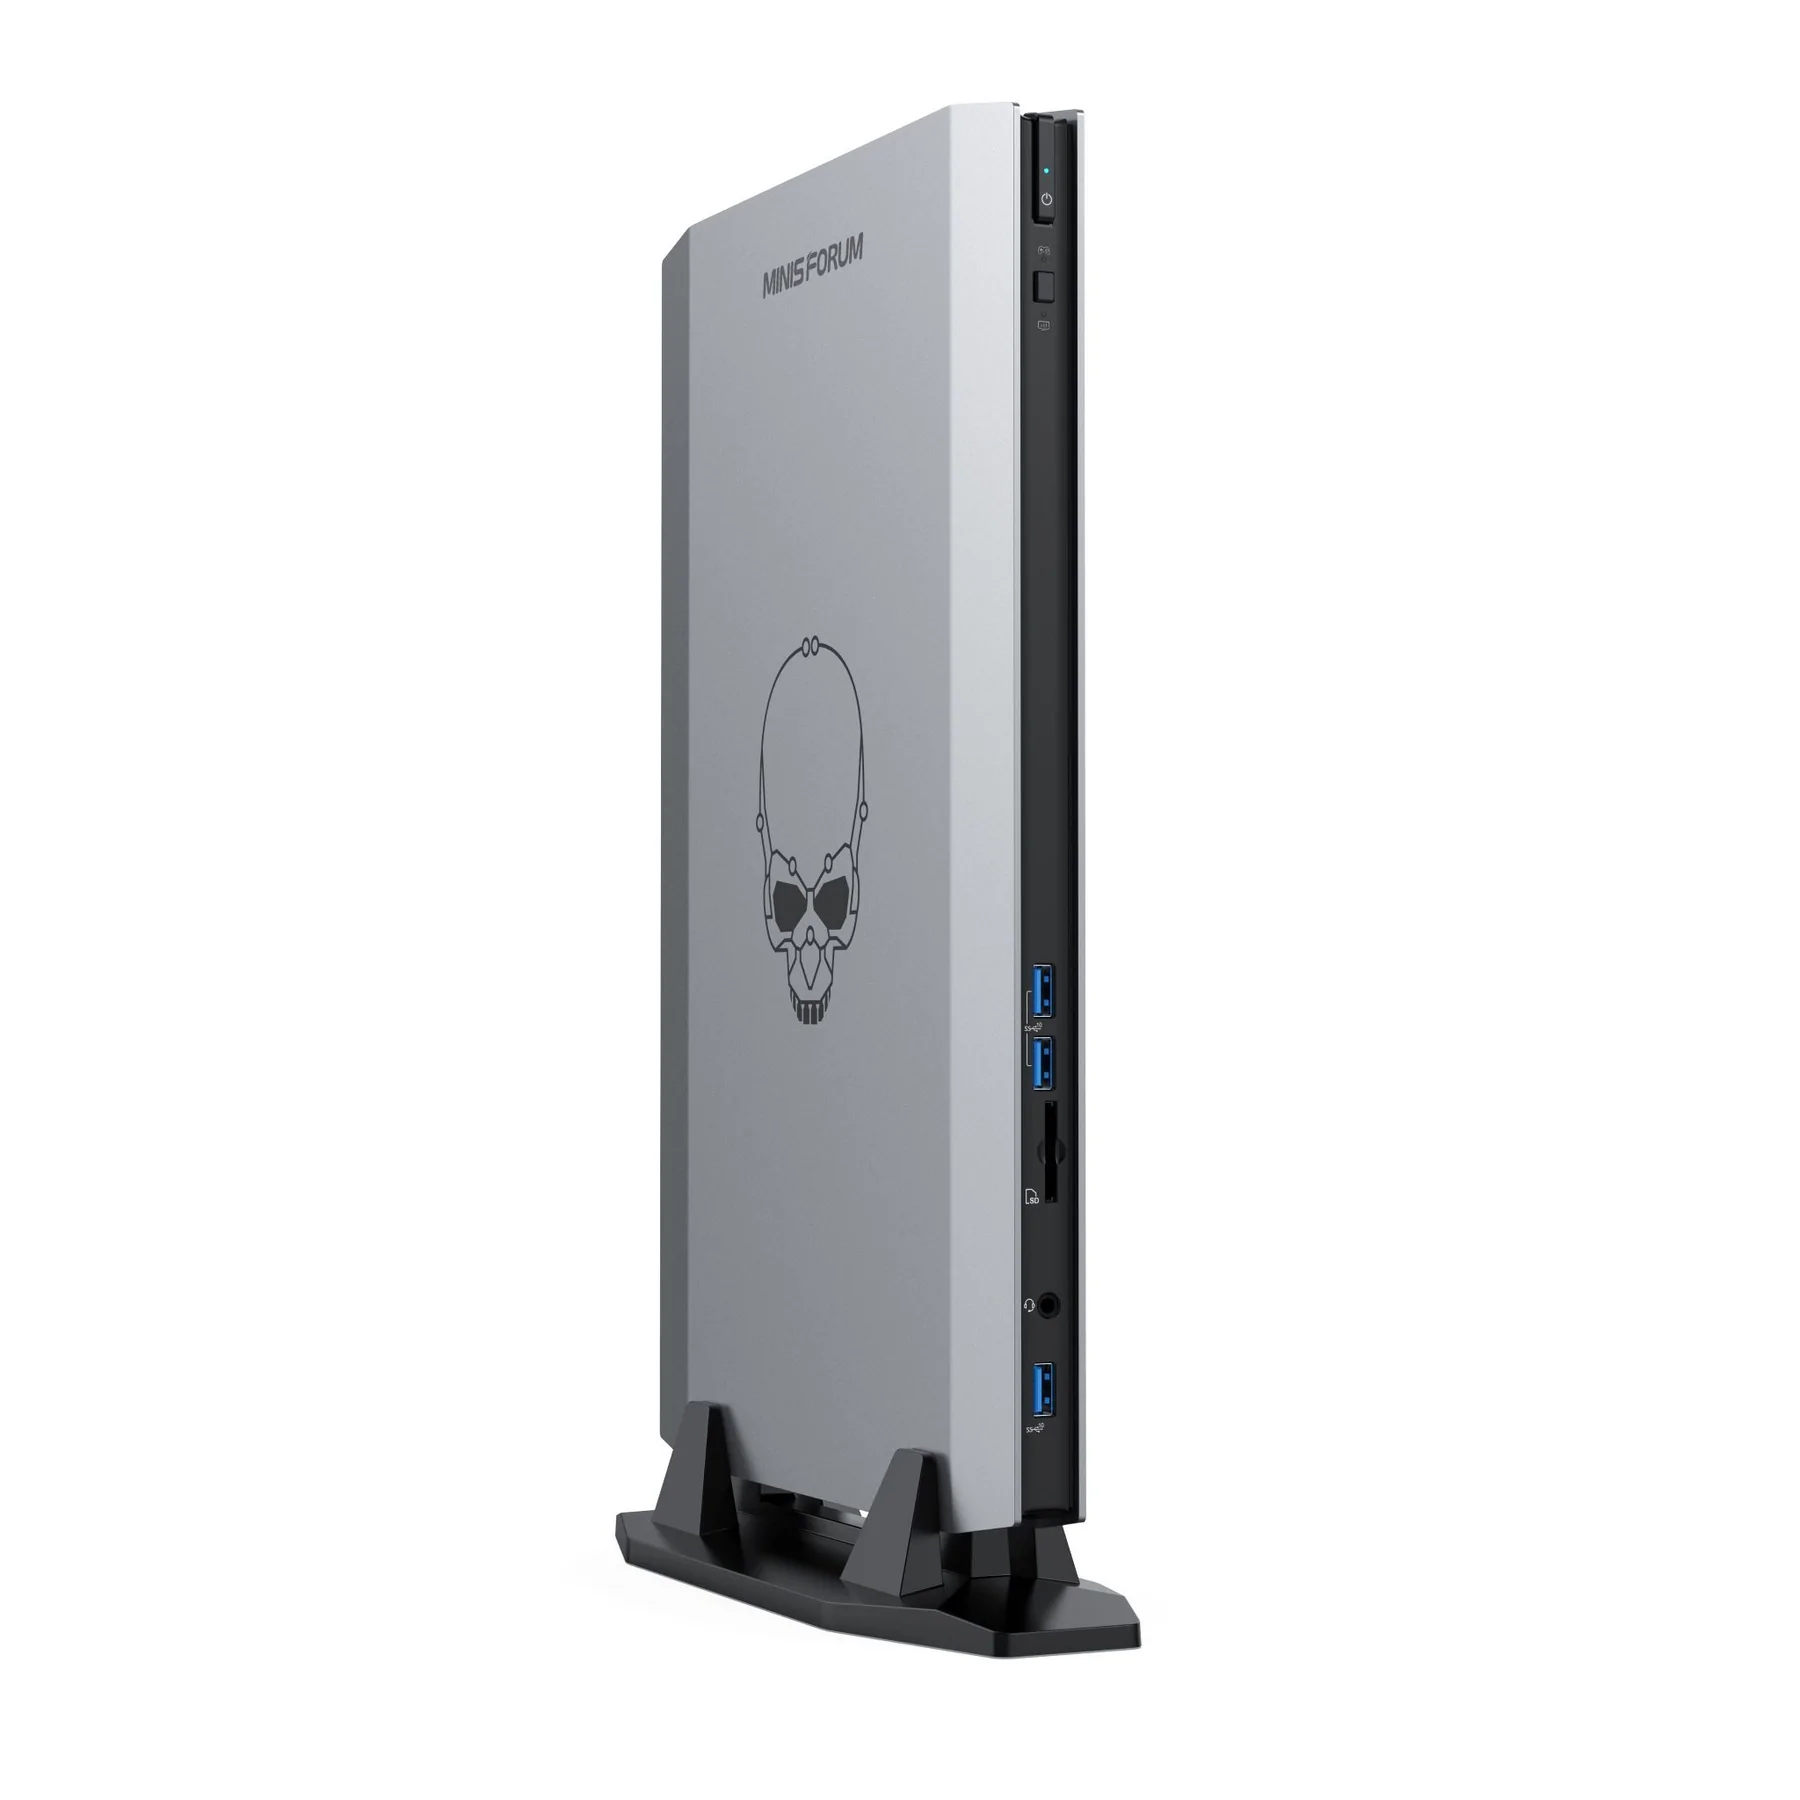
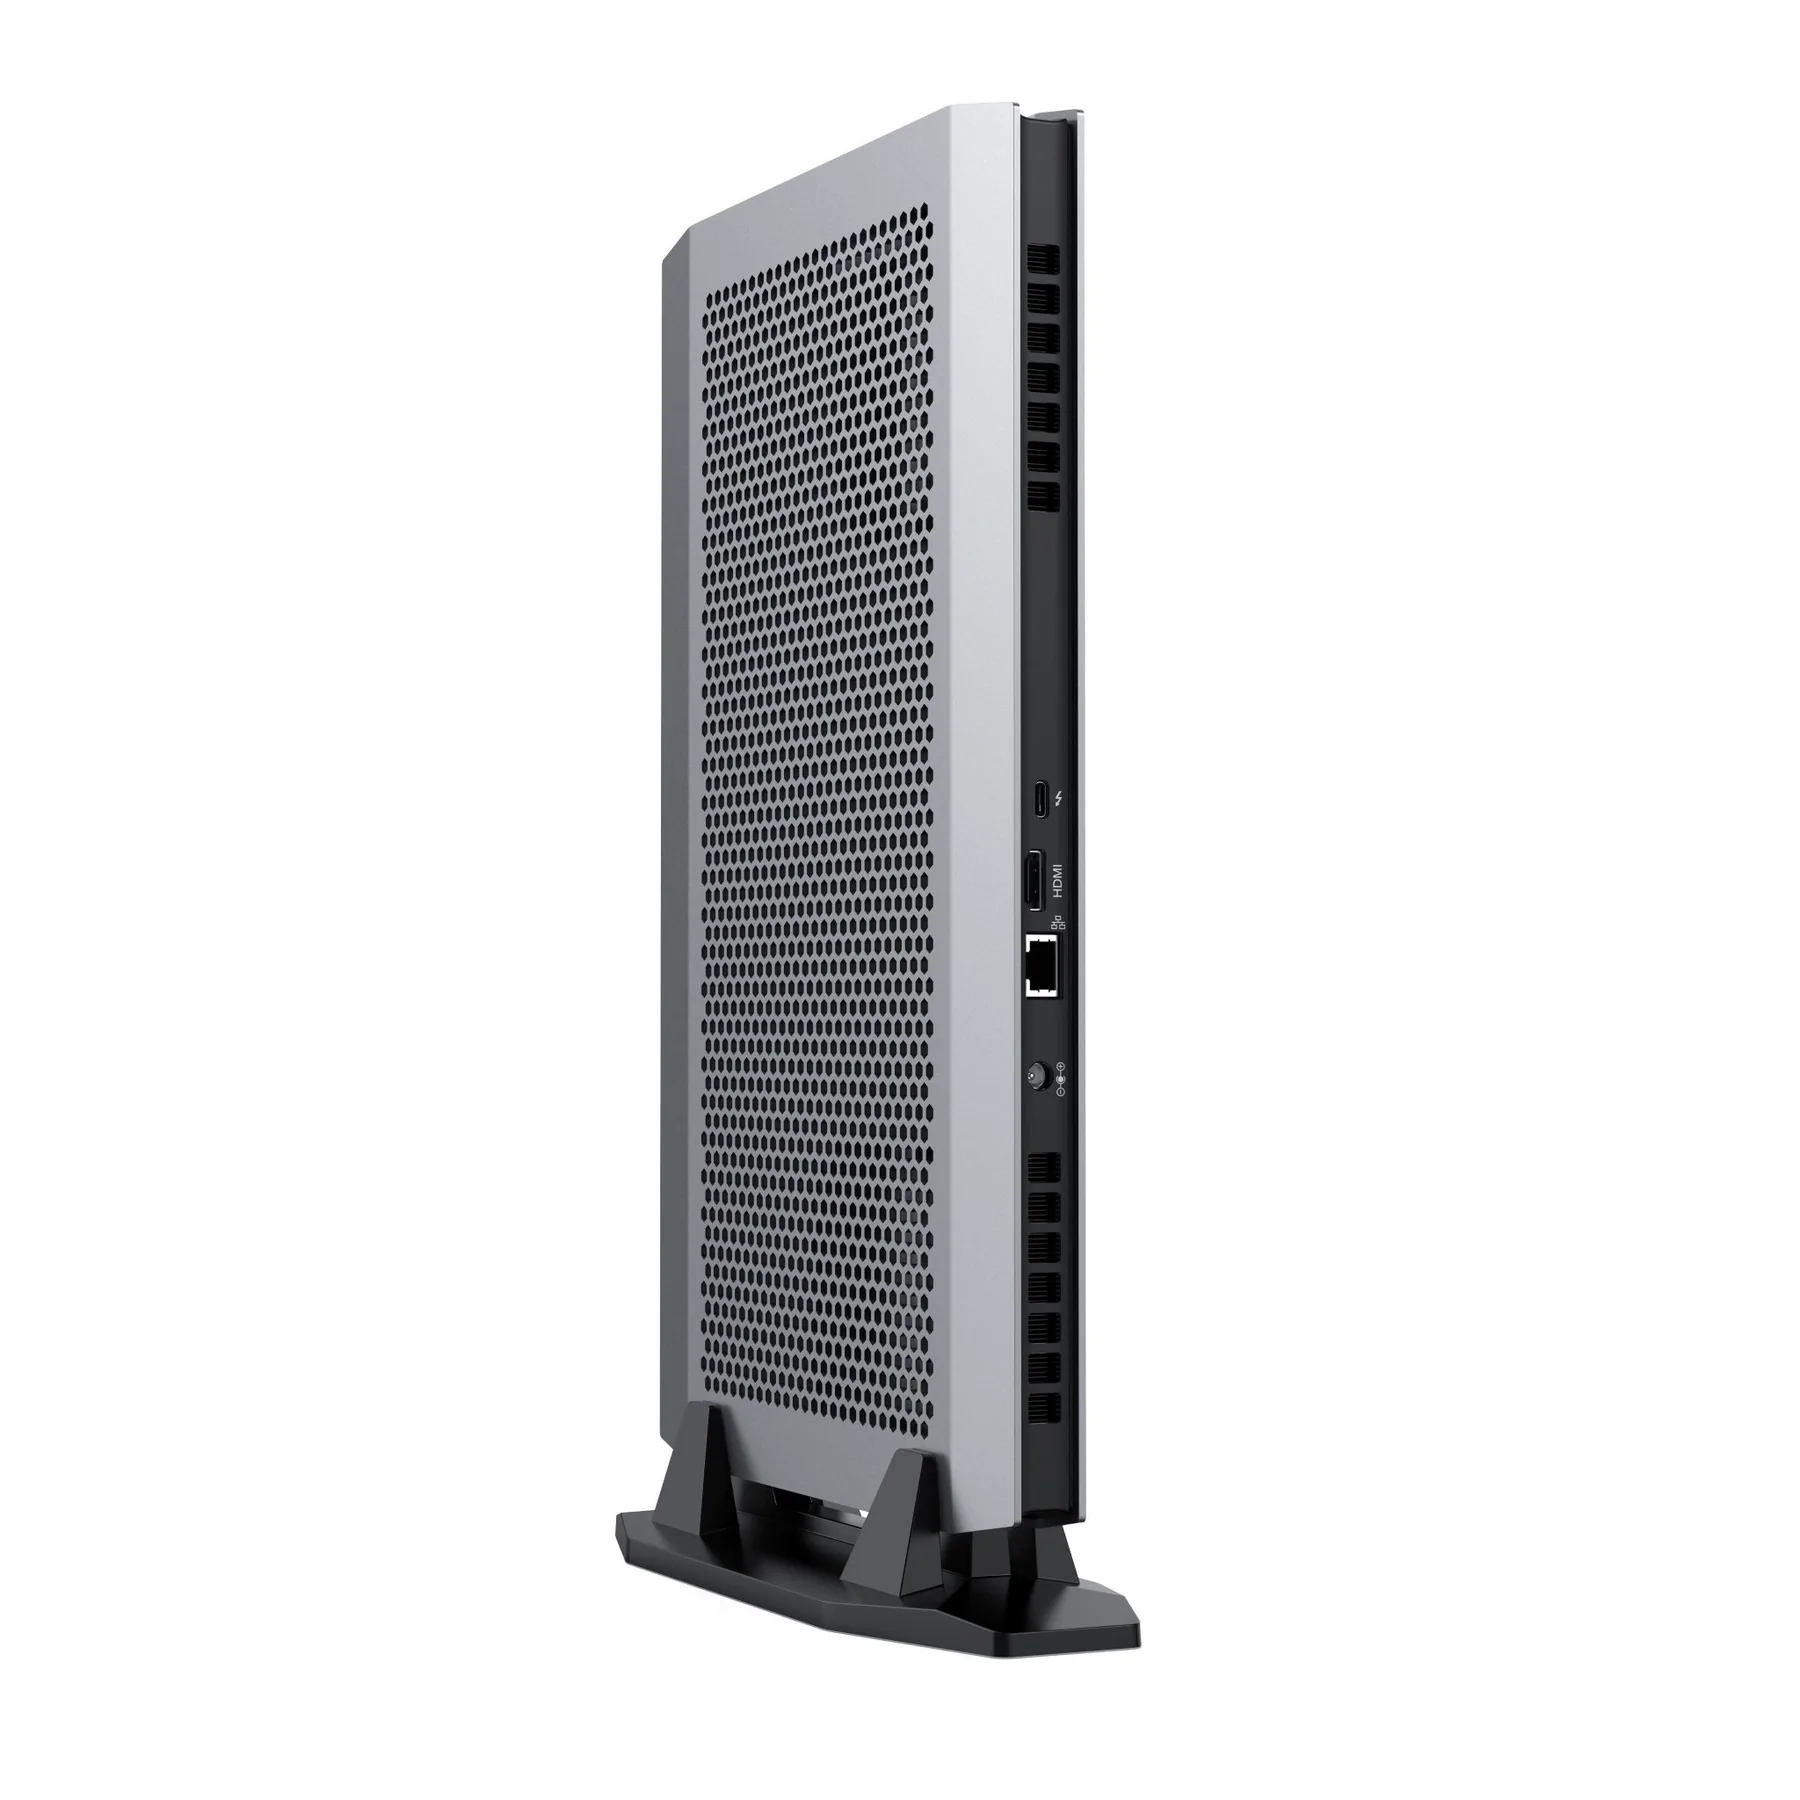
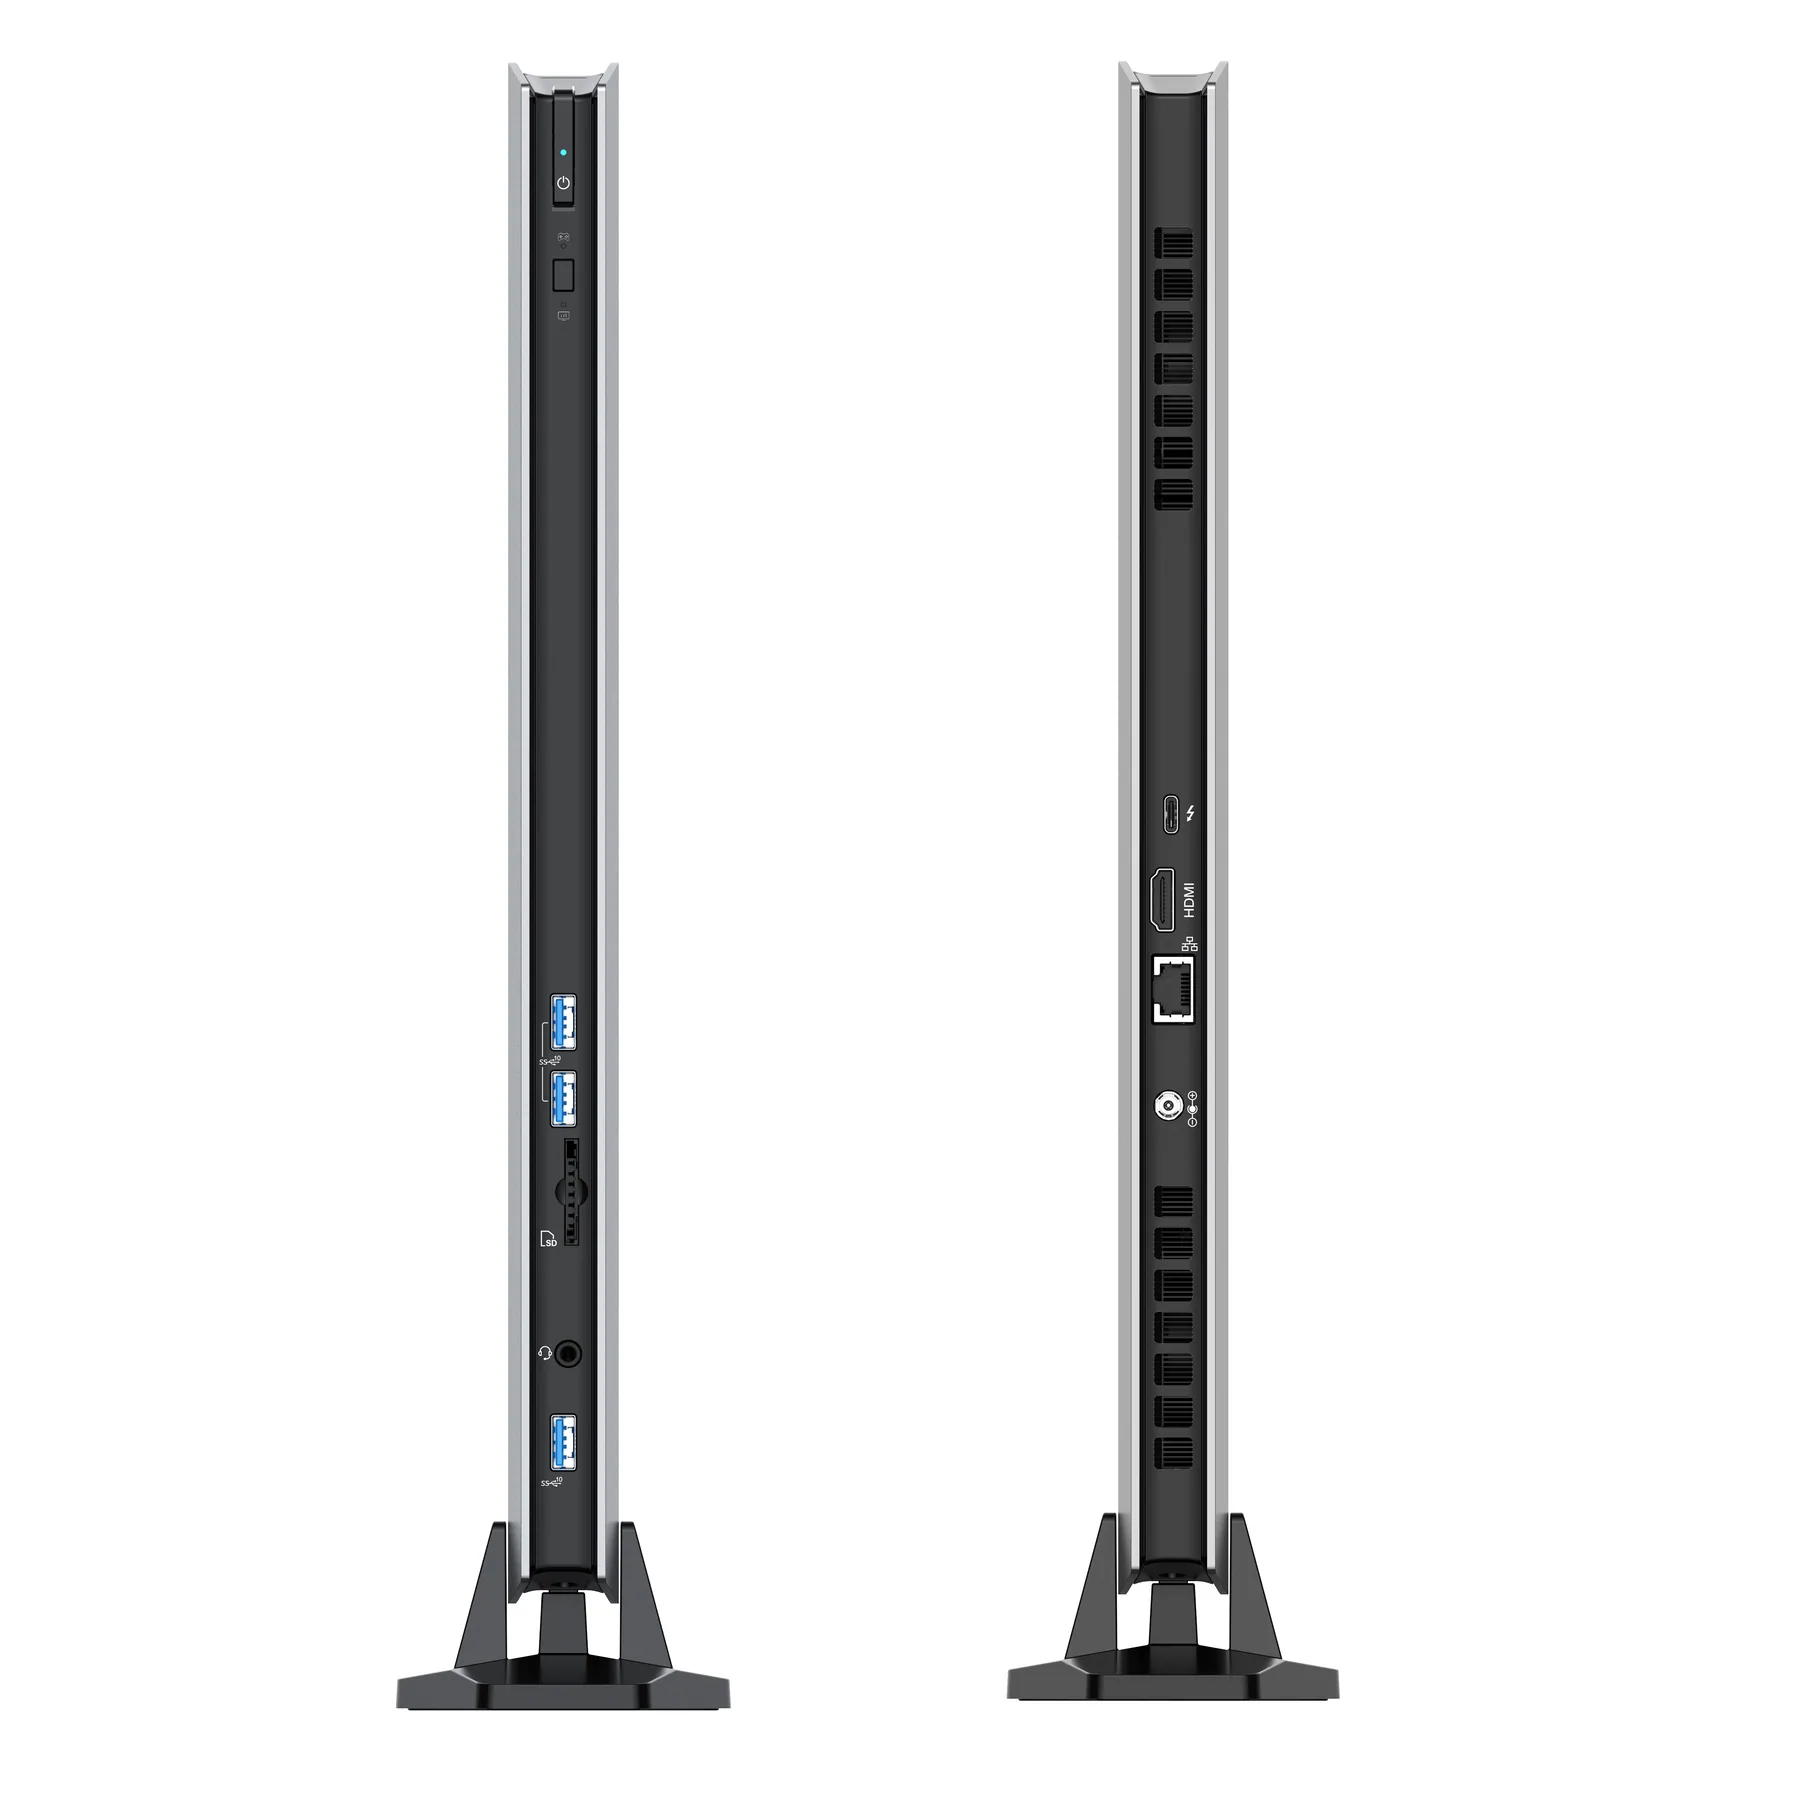
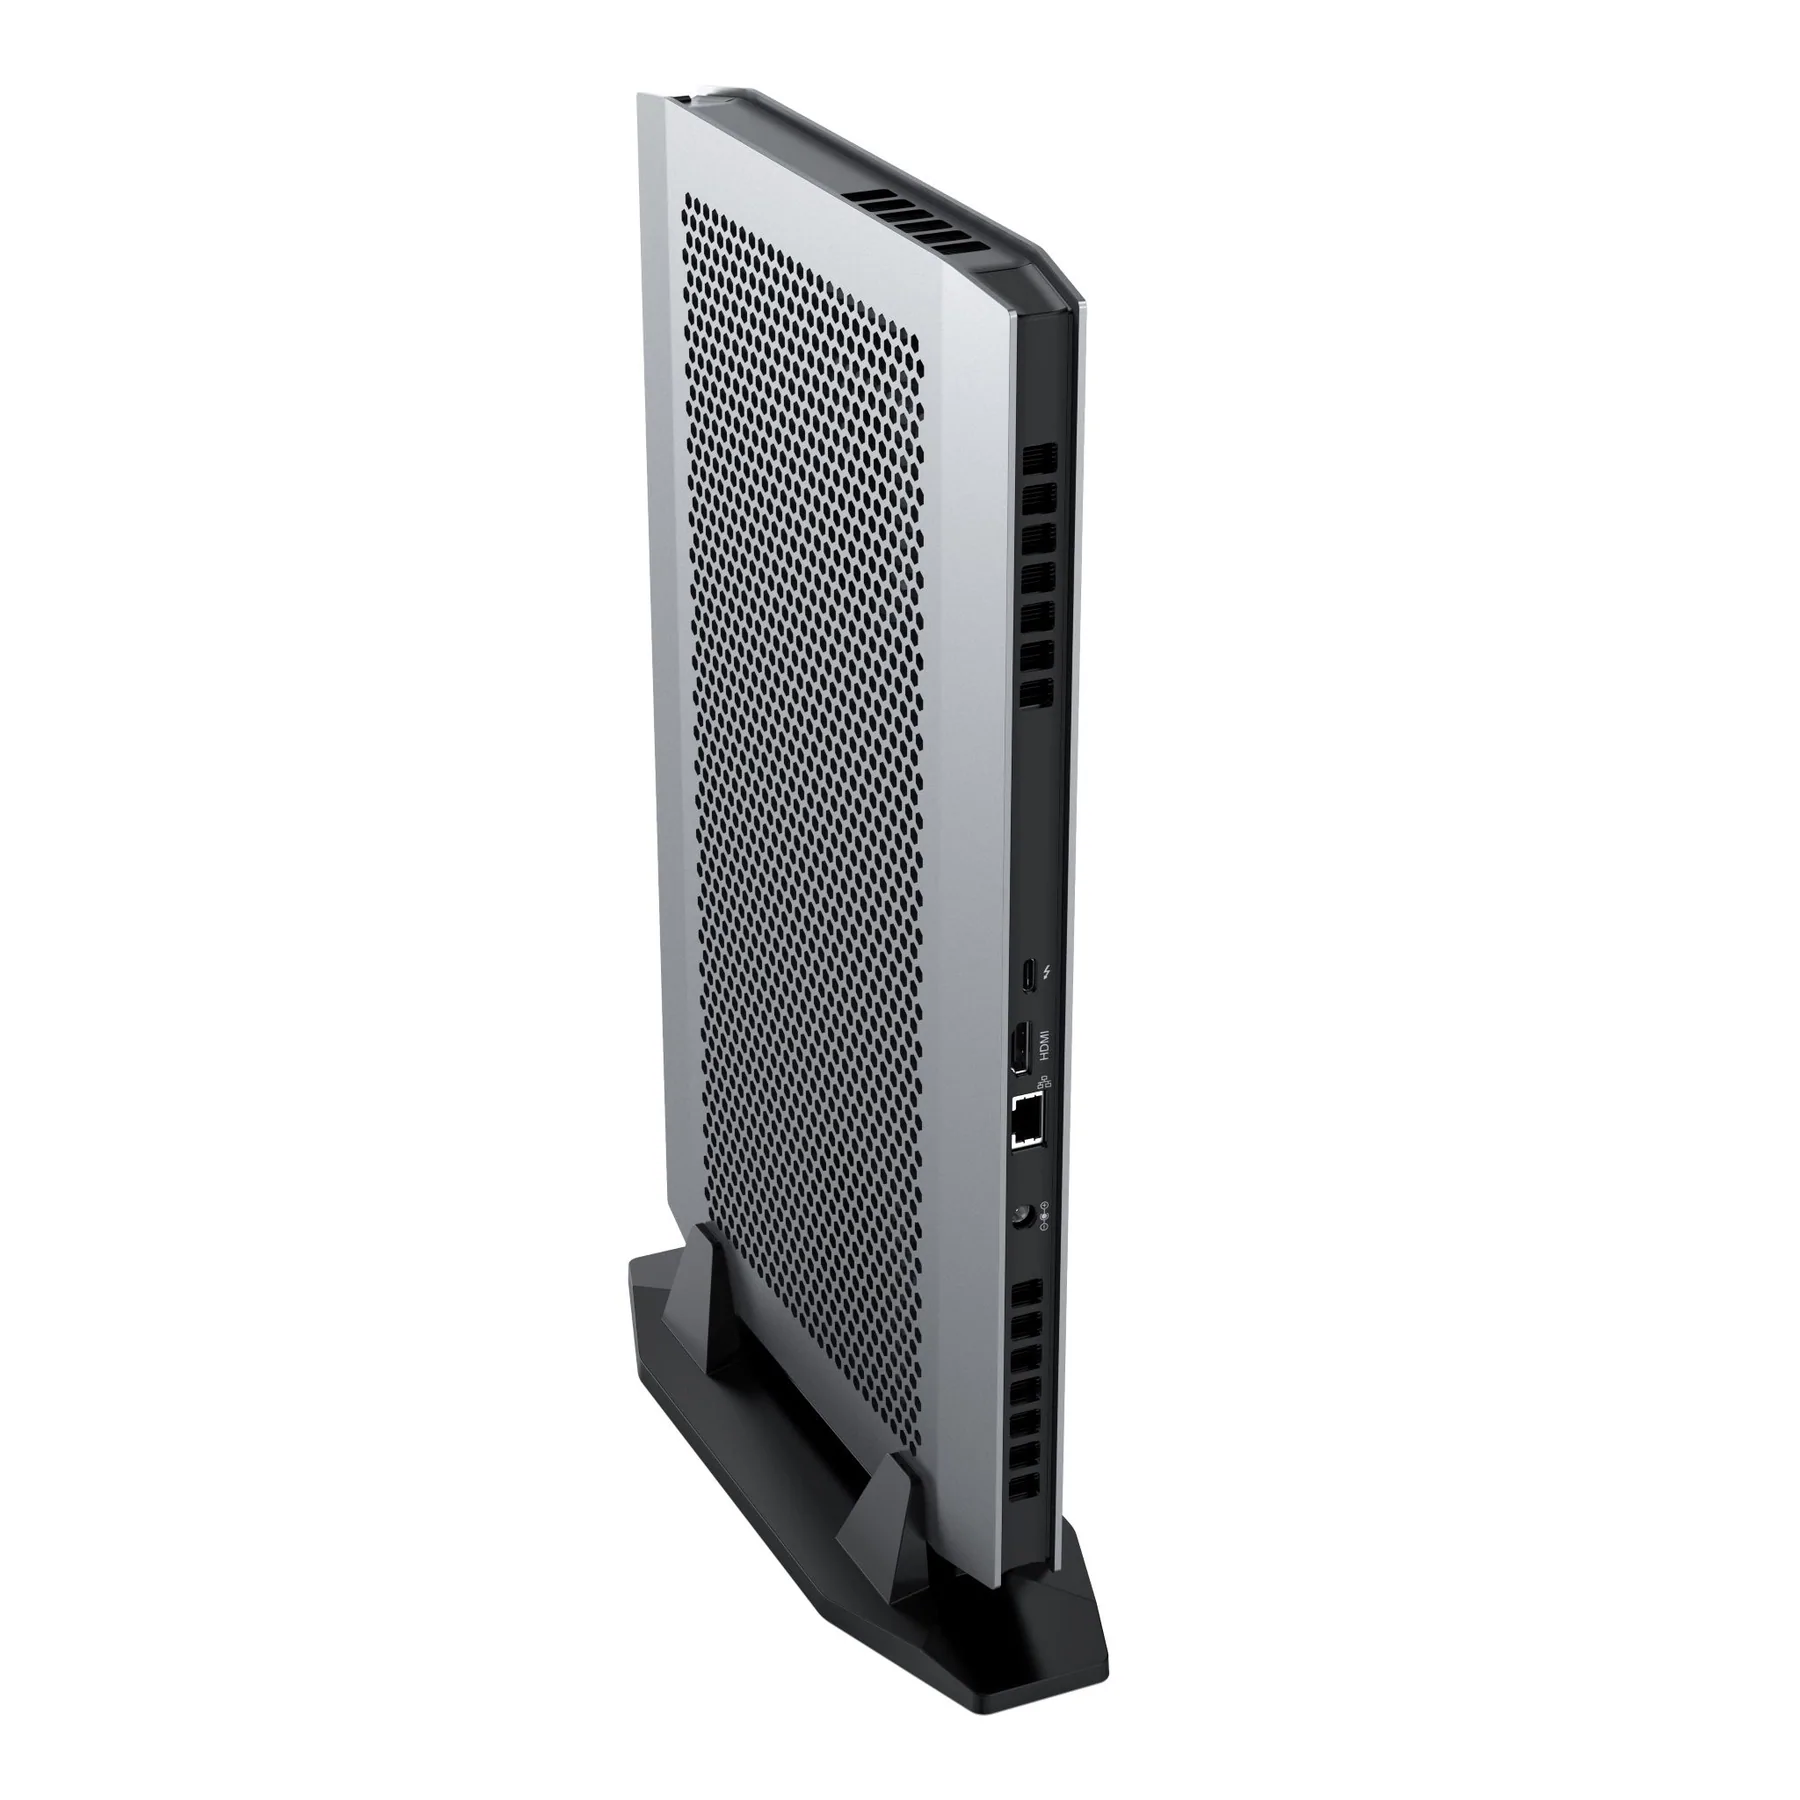
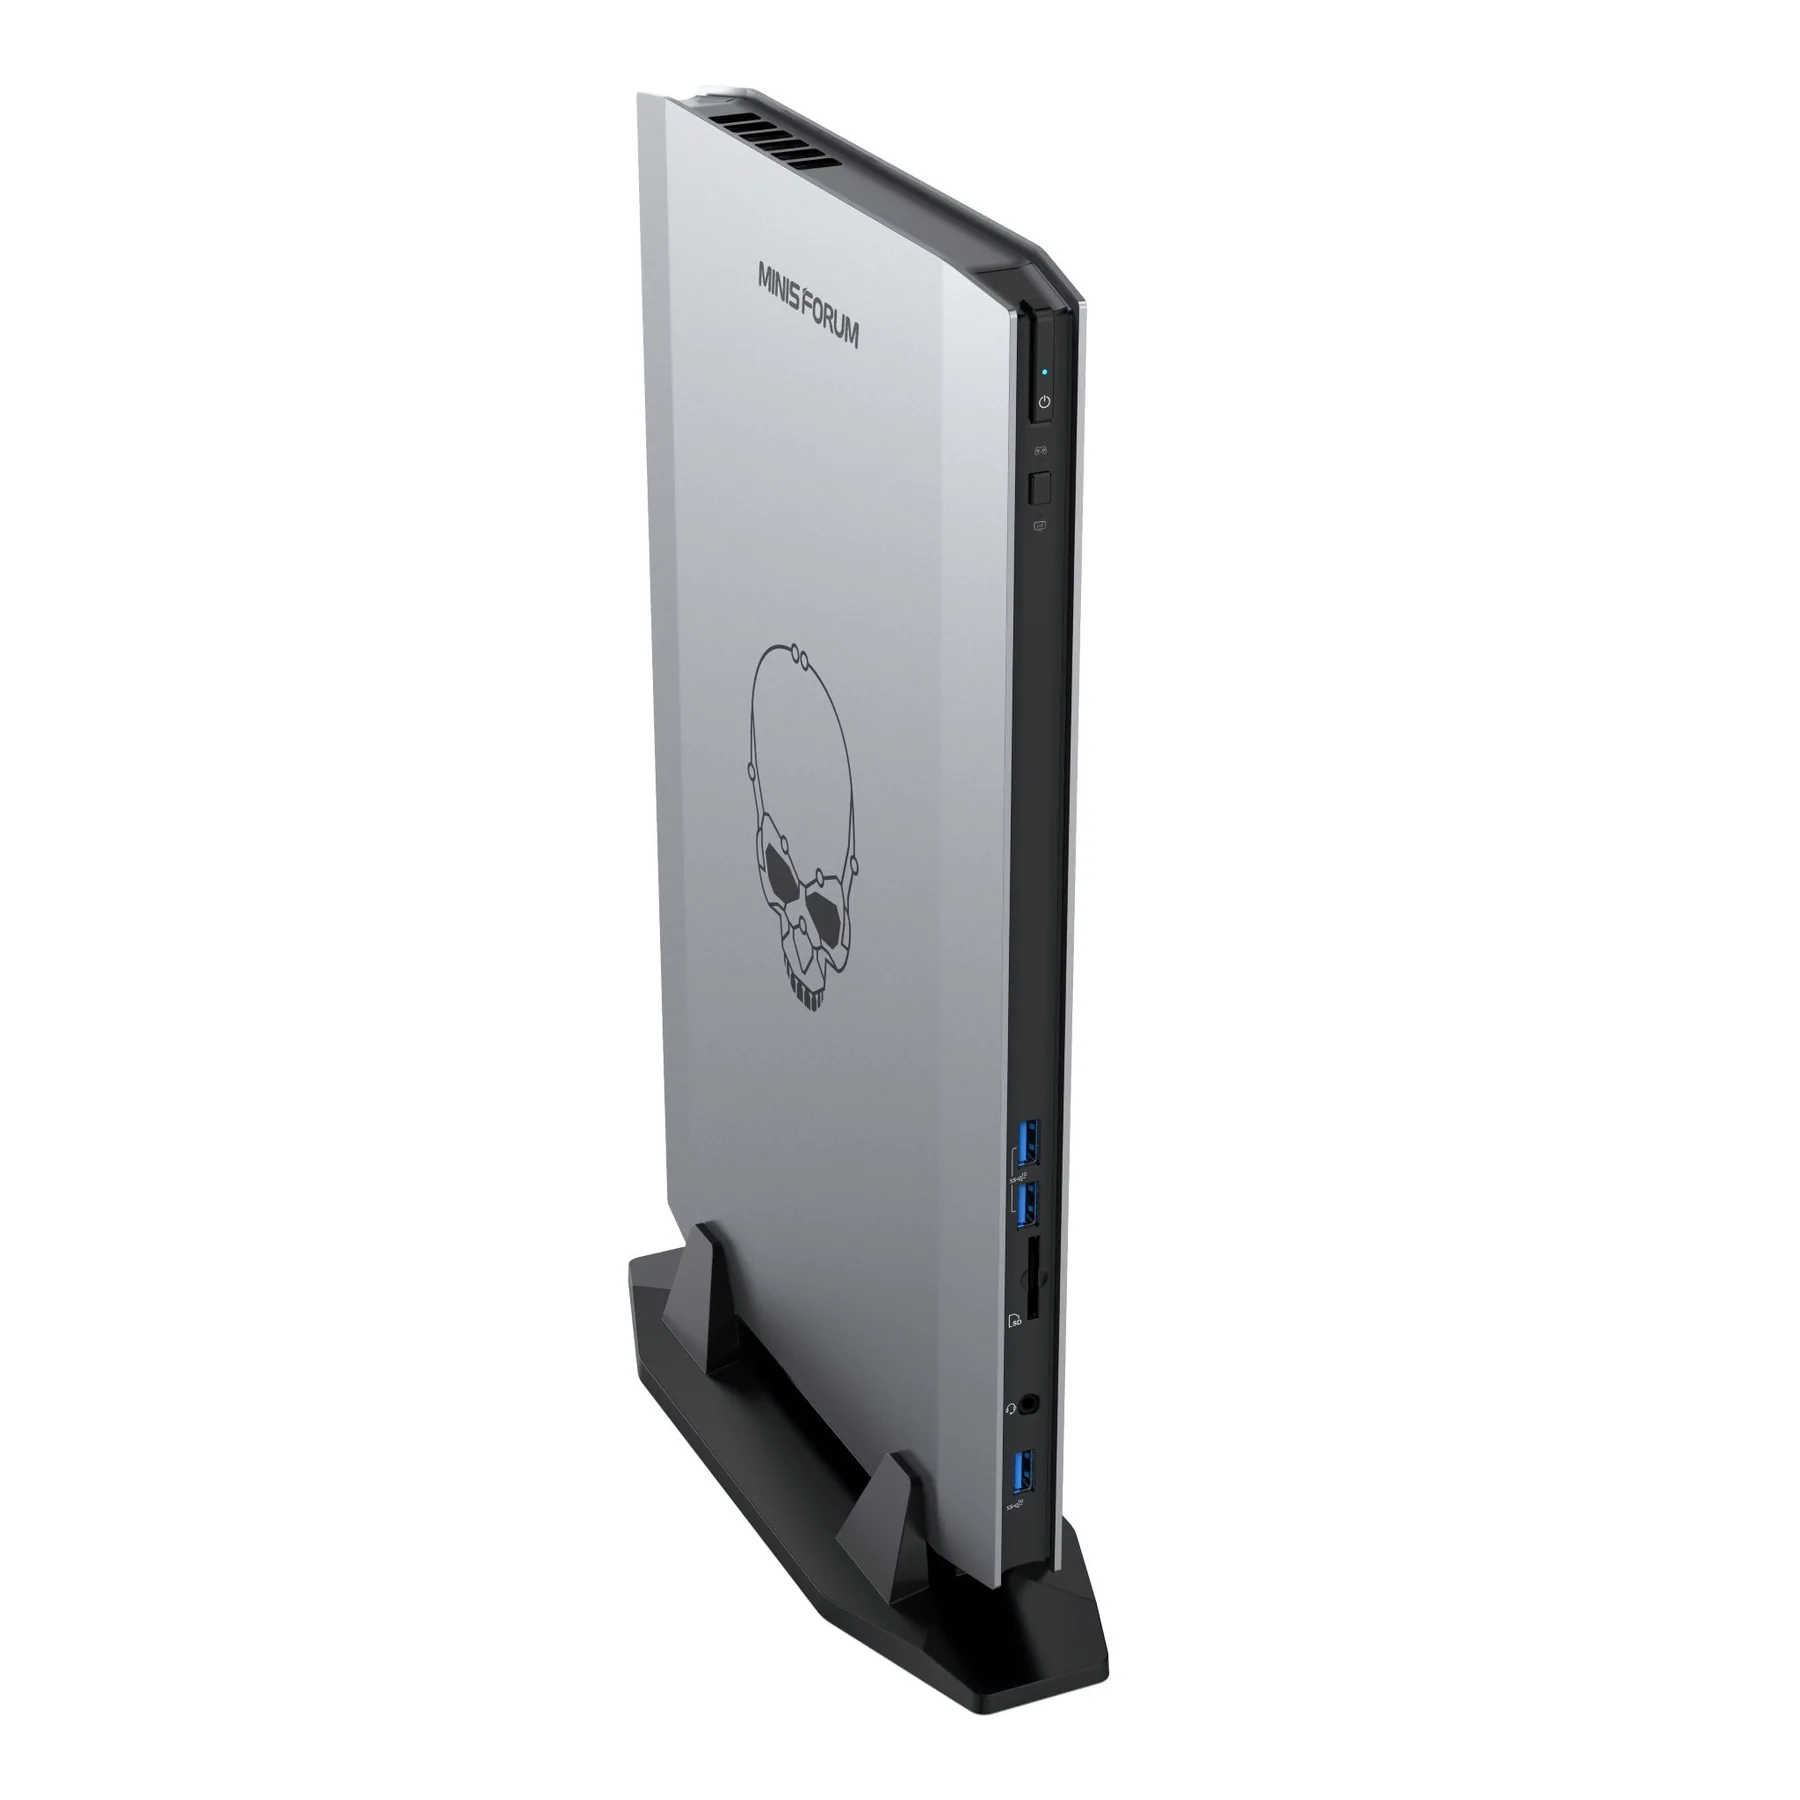
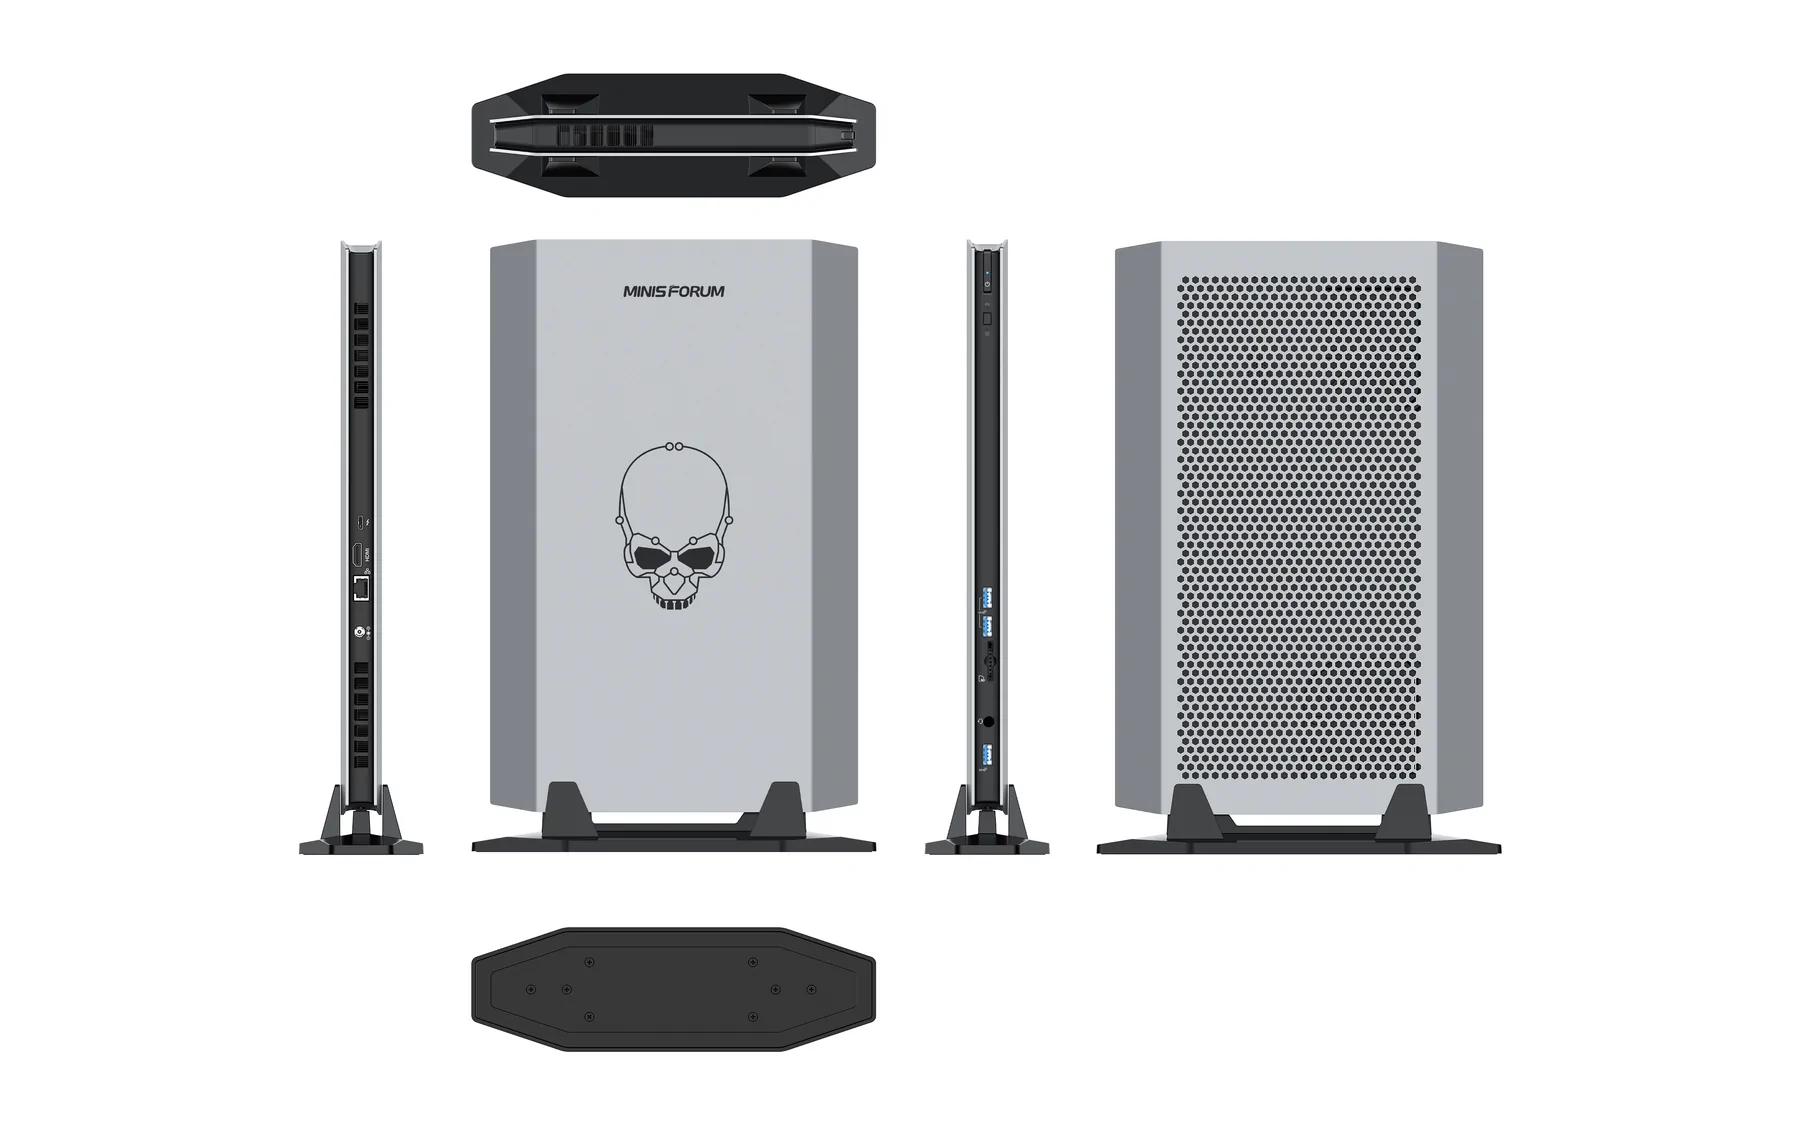
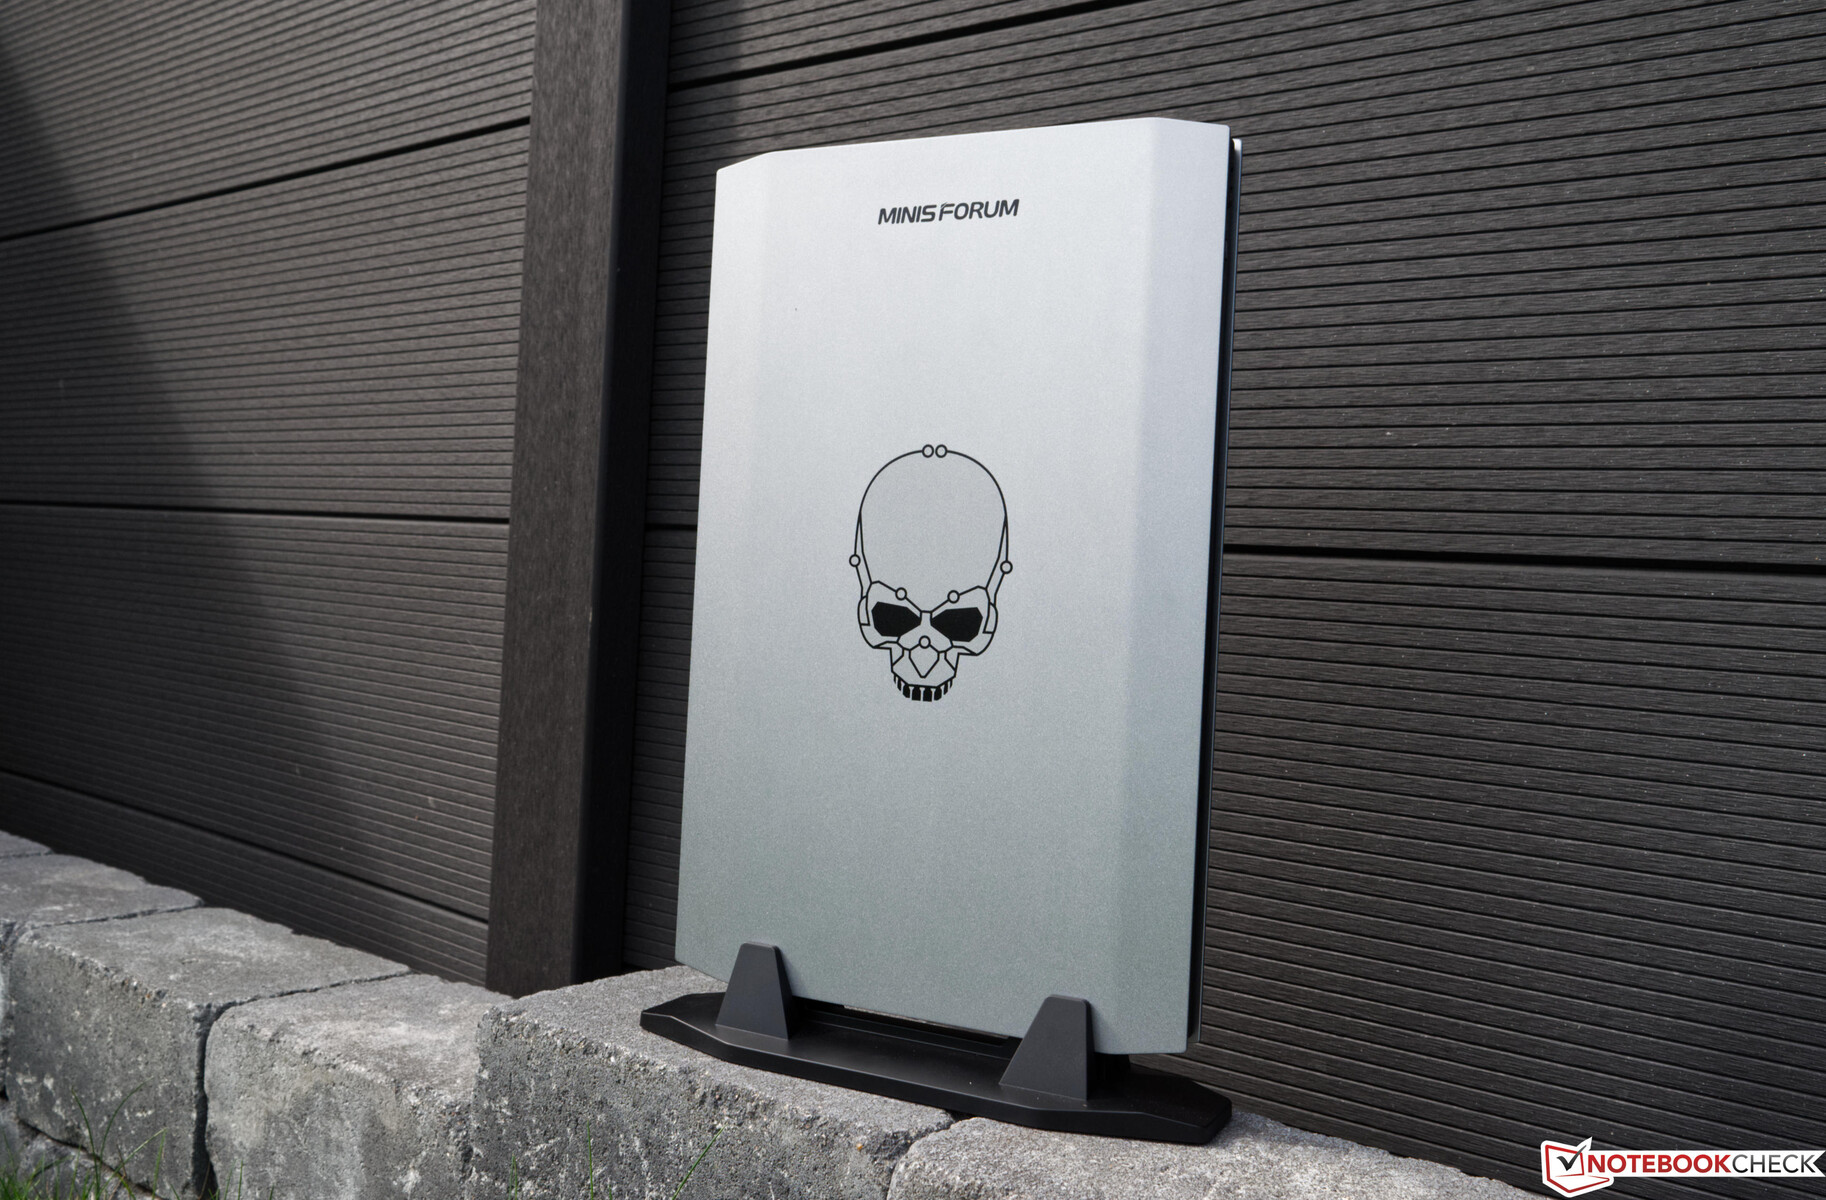
Minisforum NUCXi7并不小,在我们看来不是一款经典的迷你PC。然而,该设备仍然非常苗条,让人想起没有显示屏和输入设备的笔记本电脑。箱子的大部分是由塑料制成的,同时仍然给人以高质量的触觉印象。虽然铝制底座可能会更重,但该设备在质量印象方面会有明显的提升。从外观上看,左侧有一个骷髅头的装饰,使原本平淡无奇的银色面更加生动。背面有一个大的蜂窝状设计,以确保良好的冷却。该设备被拧在一个稳定的支架上,只能在垂直位置运行。Minisforum NUCXi7并不是为水平运行而设计的,因为这可能也会对冷却特性造成明显损害。
包括支架在内,Minisforum NUCXi7只带来了2.4公斤(约5.3磅)的重量,这是非常轻的。另一方面,支架的重量使它不容易倒下。对于外部电源,你还必须再增加大约0.5公斤(约1.1磅)的重量。
设备
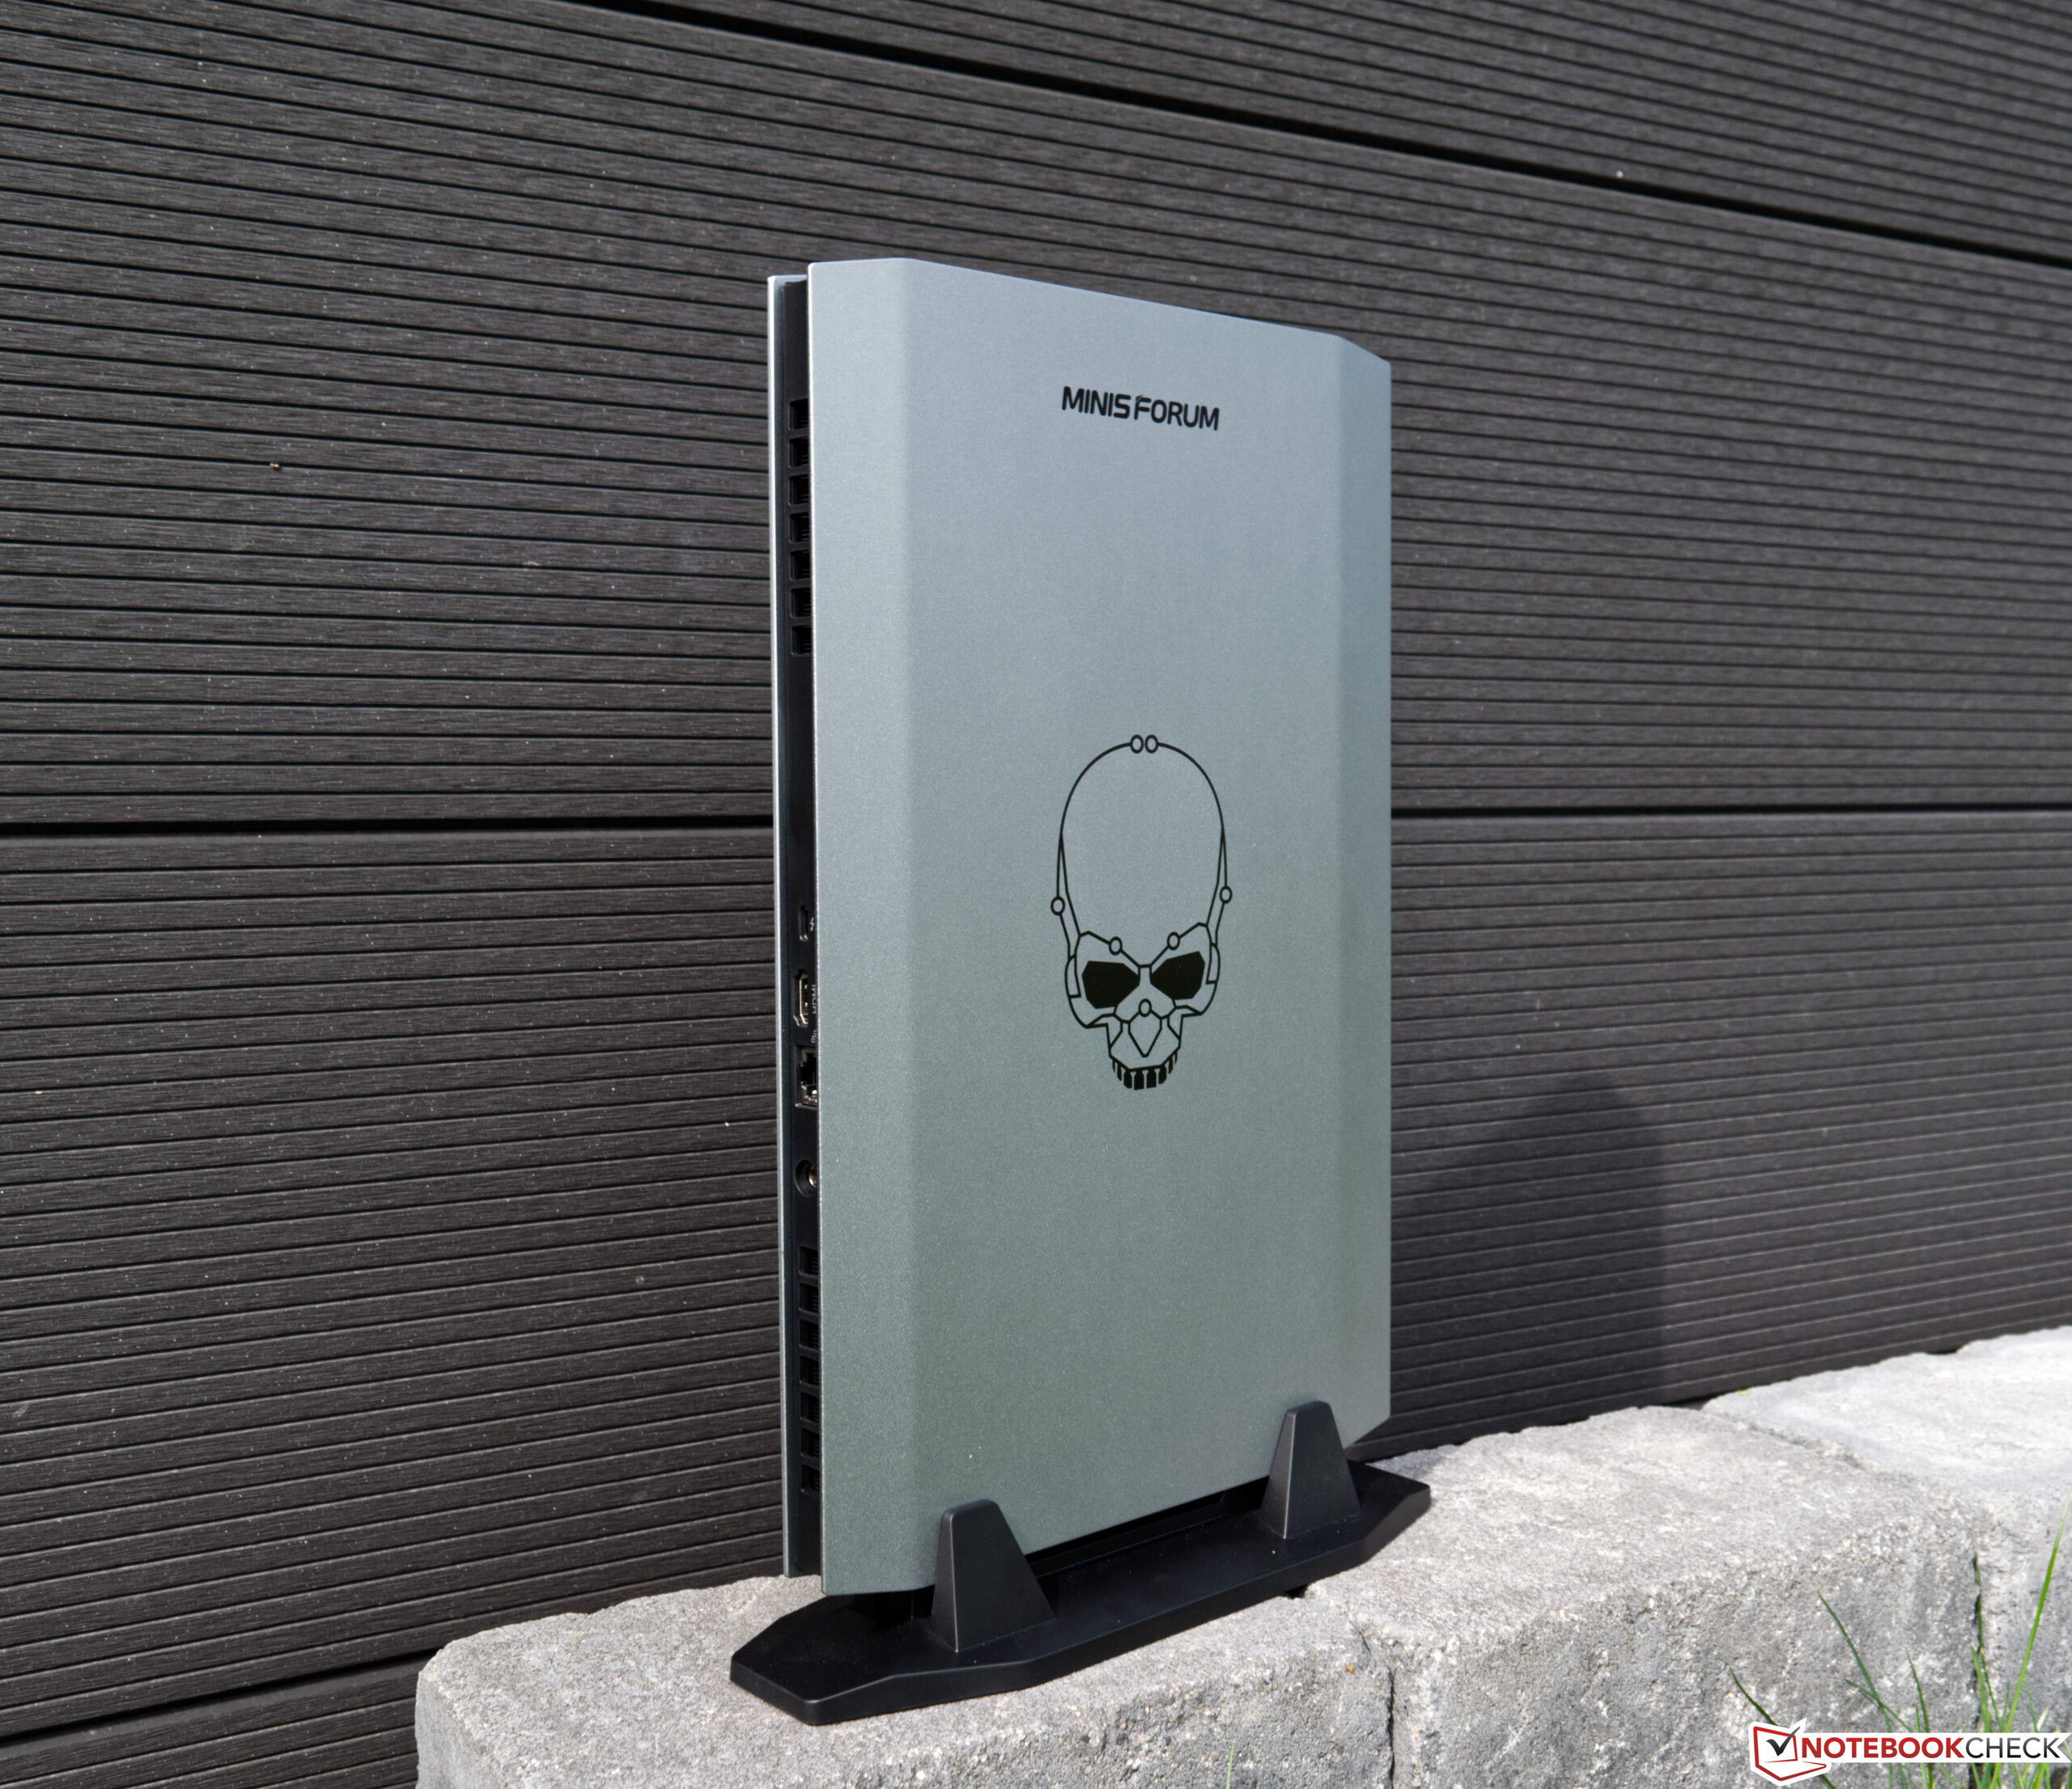
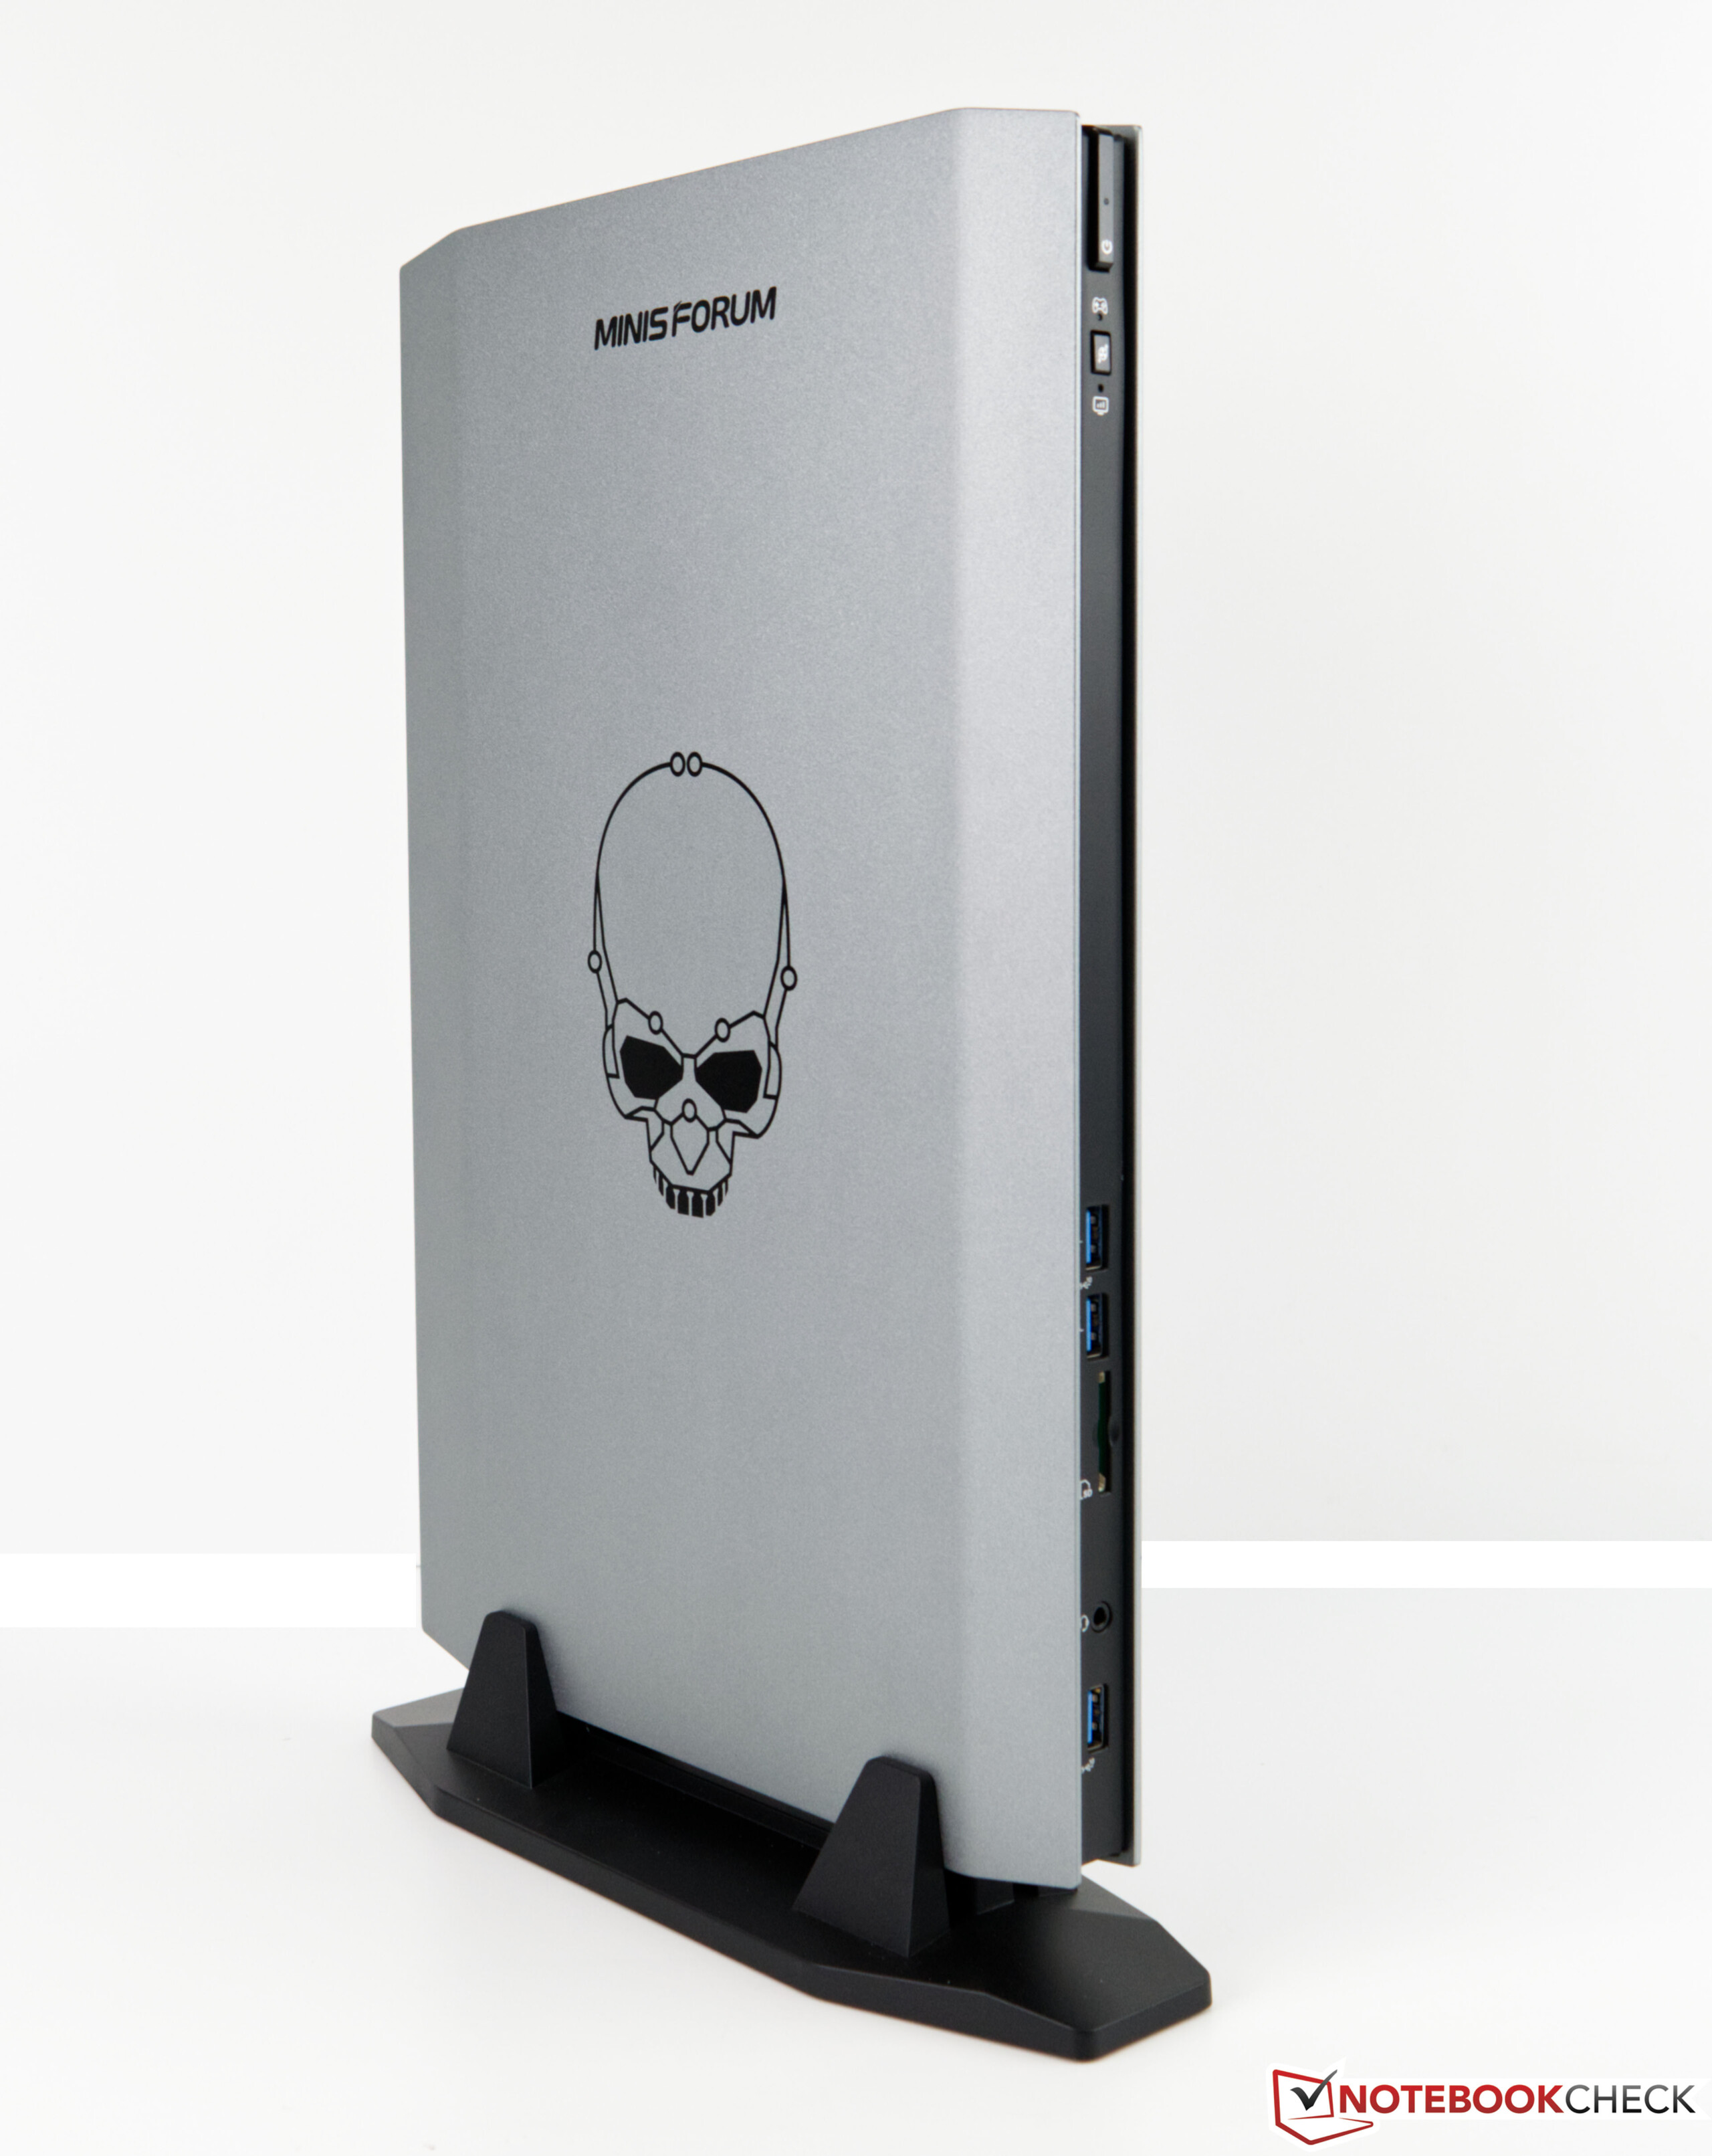
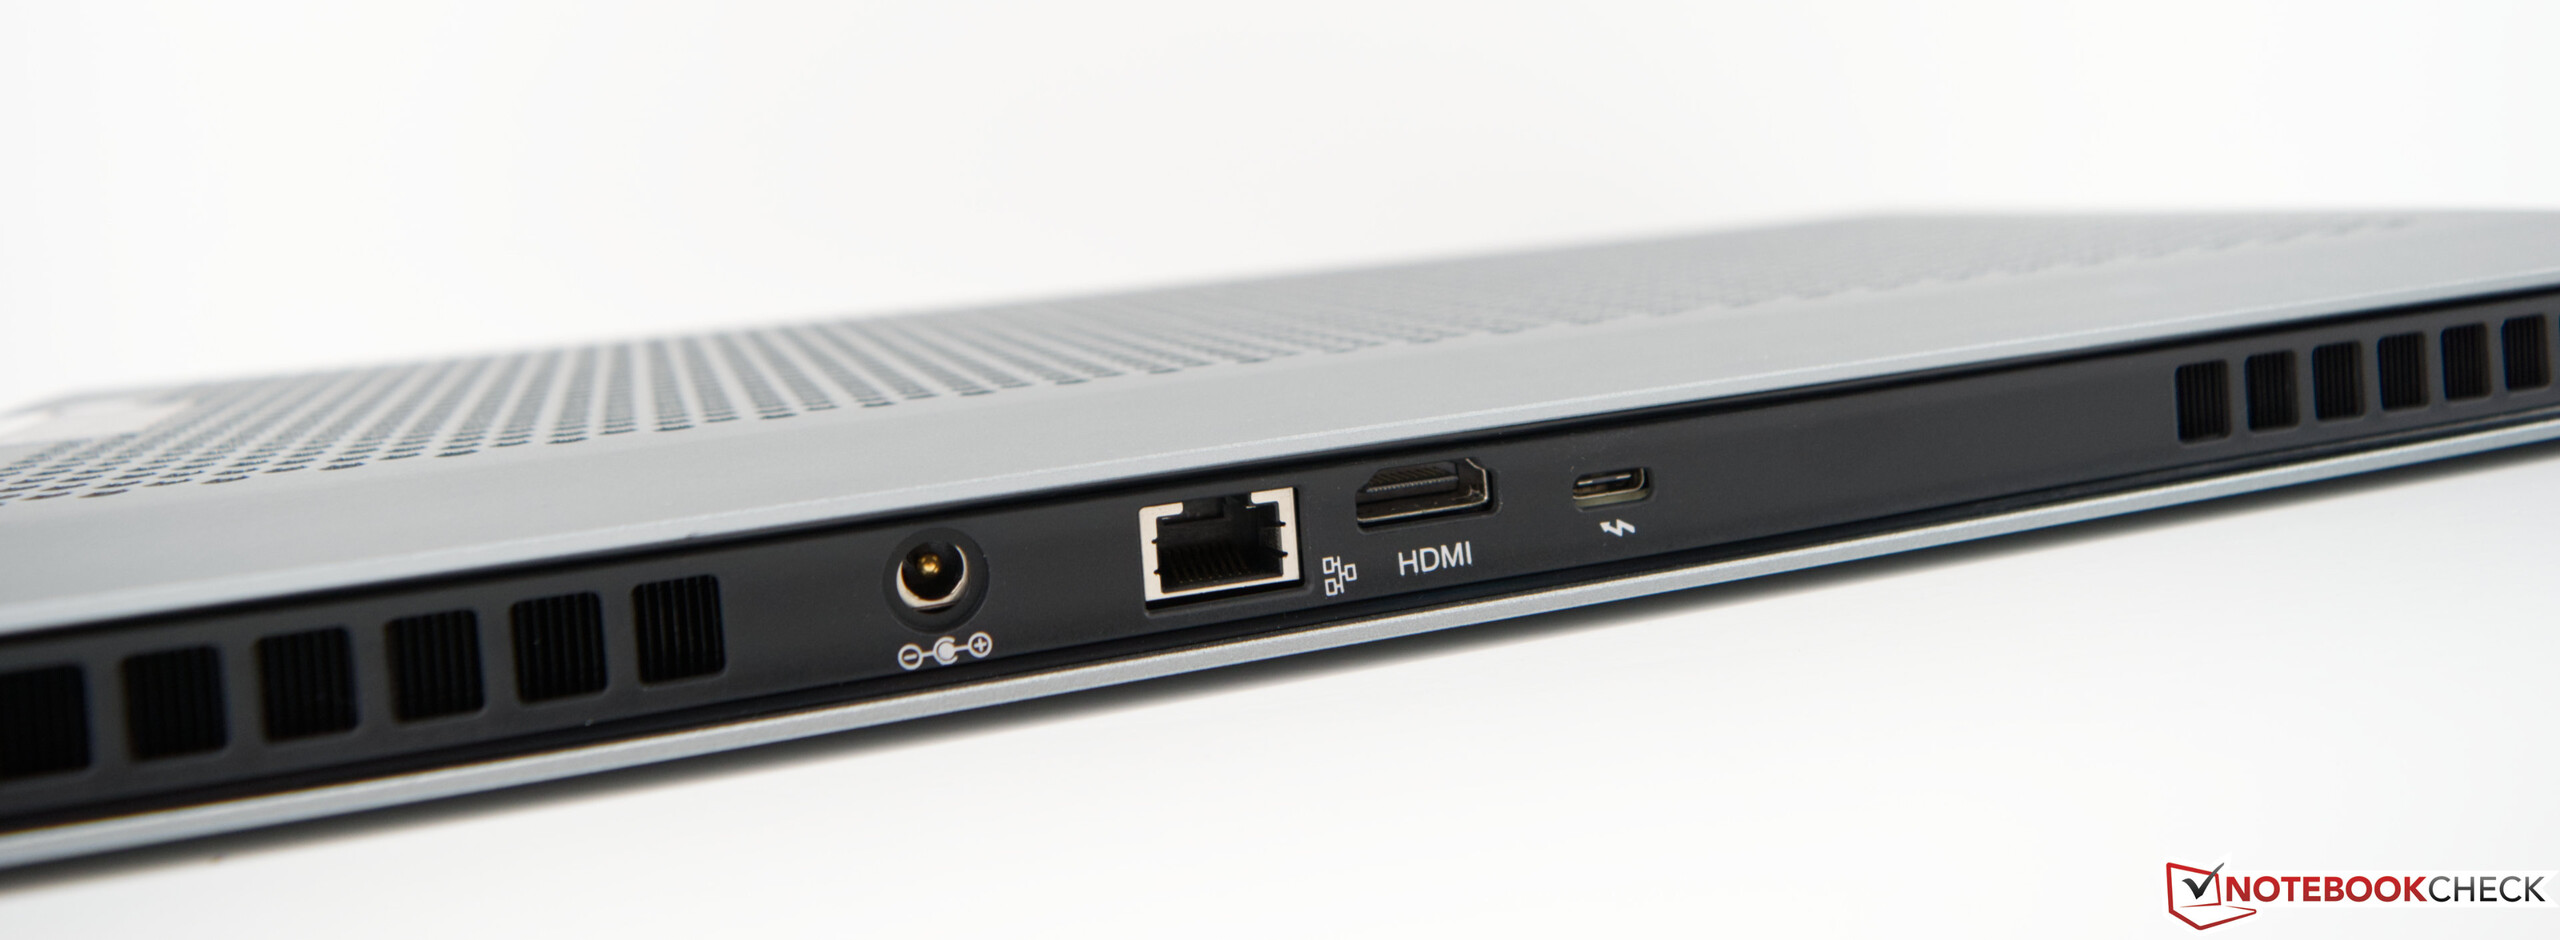
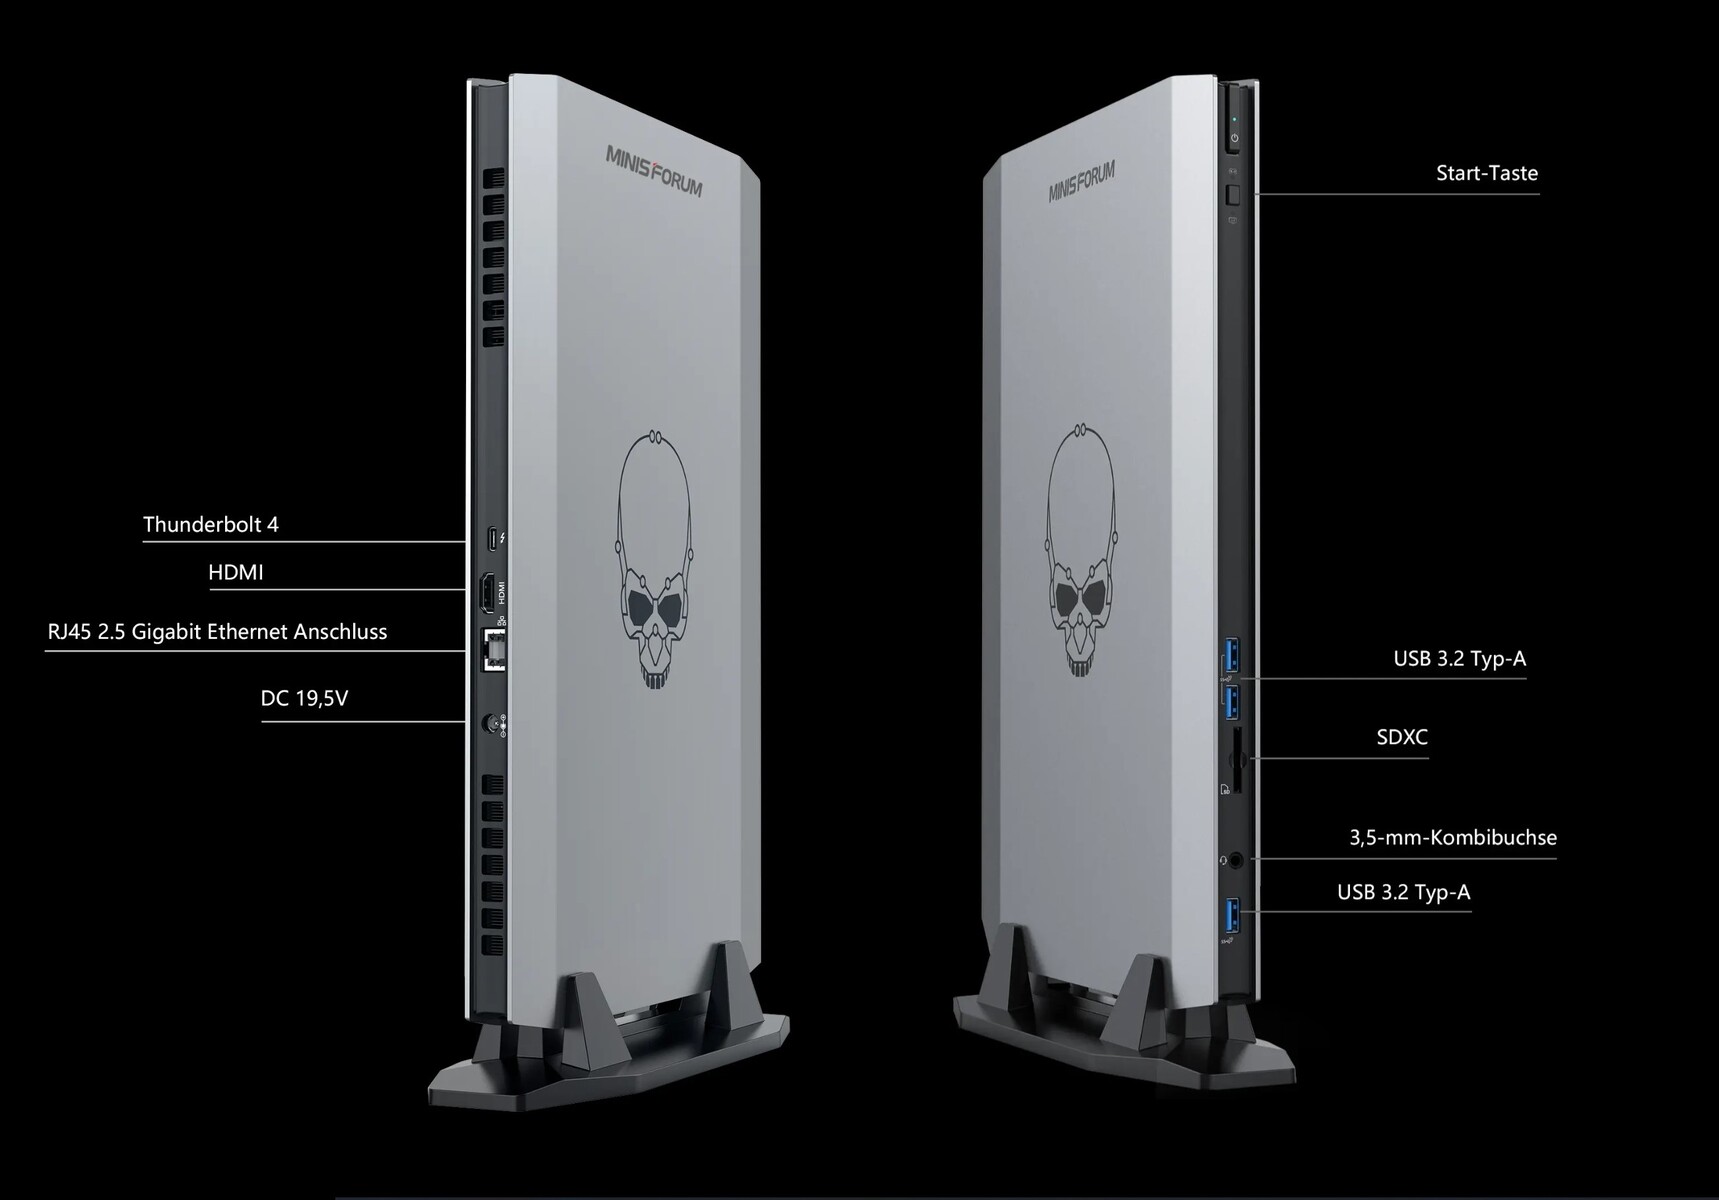
乍一看,所有重要的连接都可用。甚至还有一个现代的Thunderbolt端口。同时,你可以对可用的USB 3.2 Type-A端口的数量有不同意见。该设备只提供三个,而且都在前面。我们本想在后面至少多一个USB端口。但不幸的是,制造商被束缚在主板布局上,这将使其更加困难。 你可以通过HDMI或Thunderbolt连接显示器,这两个选项在我们的测试中没有任何问题。在这里你也不必没有SD卡读卡器。
SD卡阅读器
Minisforum NUCXi7配备了一个SD读卡器,以USB 3速度运行。我们在测试中使用参考卡(Angelbird AV Pro V60)与UHS-II连接测得的76MB/s也证实了USB 3的速度。然而,这一性能仍然比该级别的平均水平差。
| SD Card Reader - average JPG Copy Test (av. of 3 runs) | |
| Asus ROG Zephyrus Duo 16 GX650RX (AV PRO microSD 128 GB V60) | |
| Razer Blade 17 Early 2022 (AV PRO microSD 128 GB V60) | |
| Minisforum NUCX i7 (AV Pro SD microSD 128 GB V60) | |
| MSI Titan GT77 12UHS (AV PRO microSD 128 GB V60) | |
| Acer Predator Triton 500 SE PT516-52s-70KX (AV PRO microSD 128 GB V60) | |
| MSI Raider GE77 HX 12UHS (AV PRO microSD 128 GB V60) | |
沟通
Minisforum在NUCXi7中使用英特尔Wi-Fi 6E-AX210模块。在我们与华硕ROG Rapture GT-AXE11000路由器的测试中,我们无法达到对比设备的良好性能。Minisforum NUCXi7放置在比较领域的最后,显然在这里被抛在后面。集成的LAN端口为无线连接提供了一个很好的选择,支持高达2.5Gbit/s。
辅料
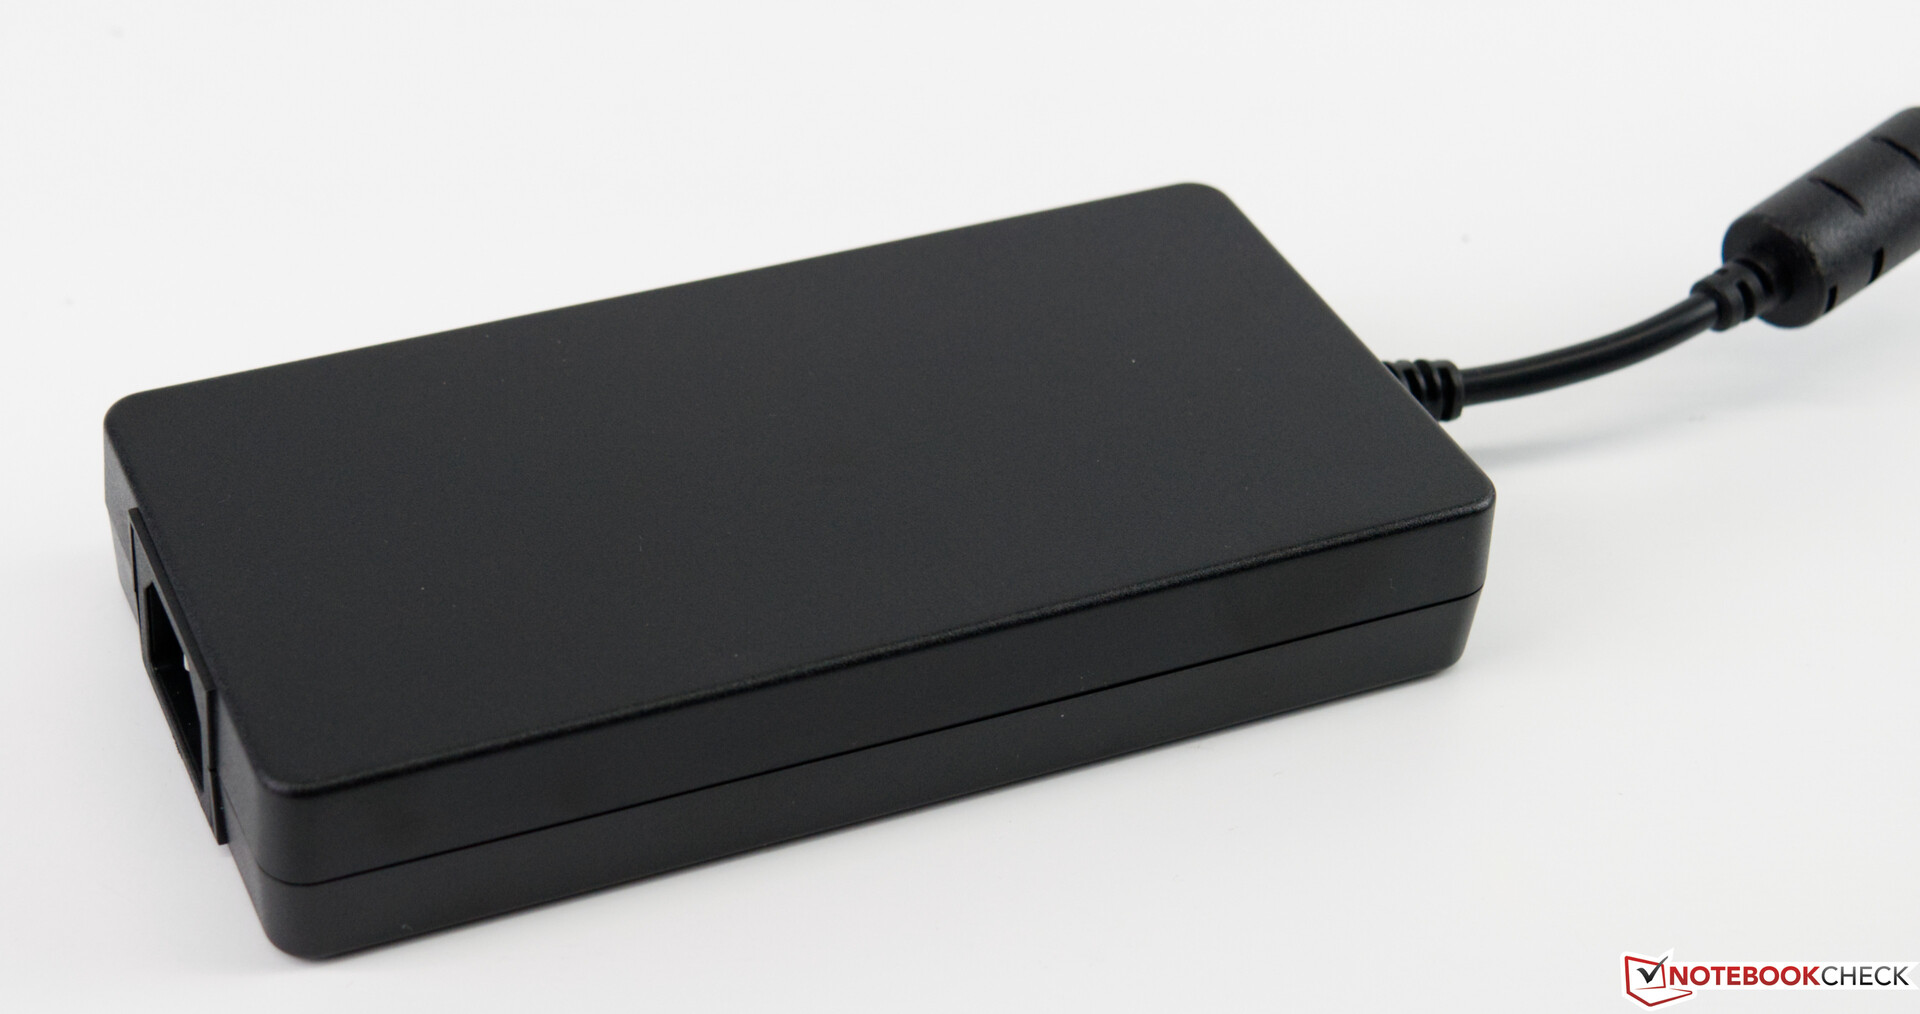
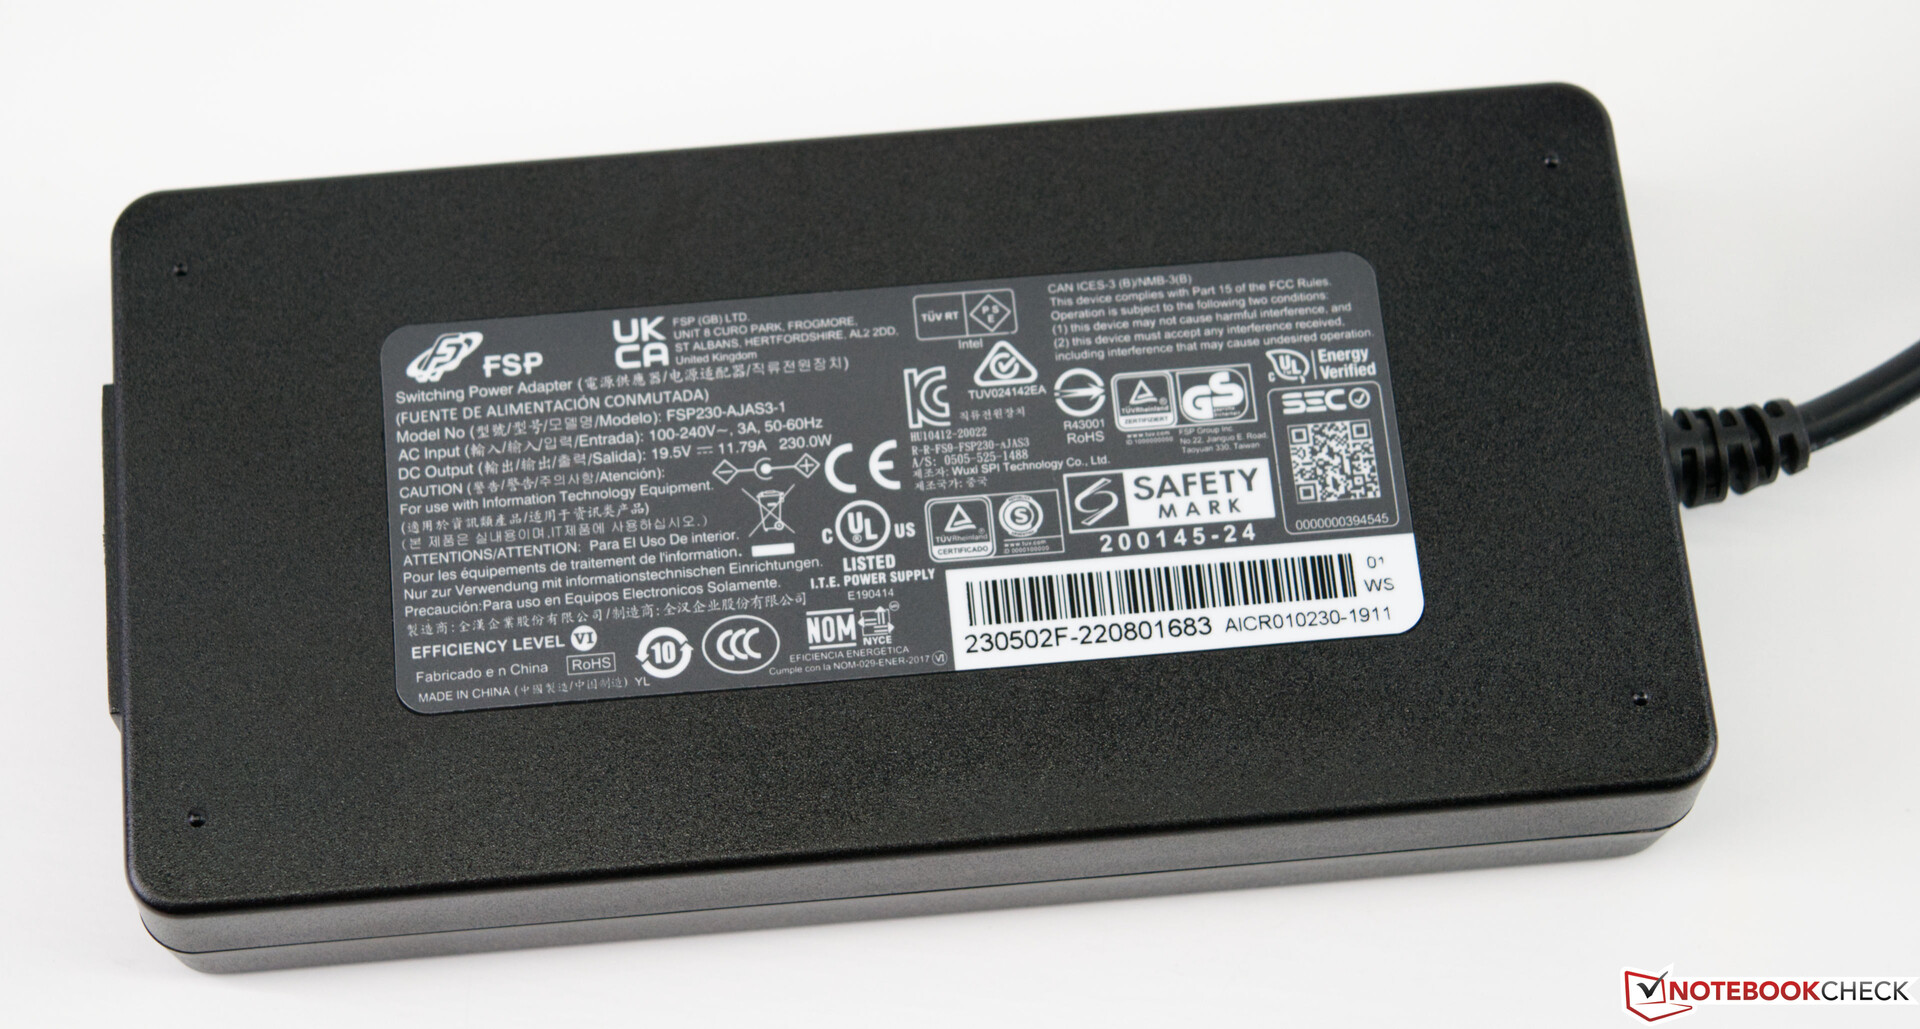
除了电脑本身,盒子里还包括230瓦的电源和支架,允许你将设备水平放置。
维护
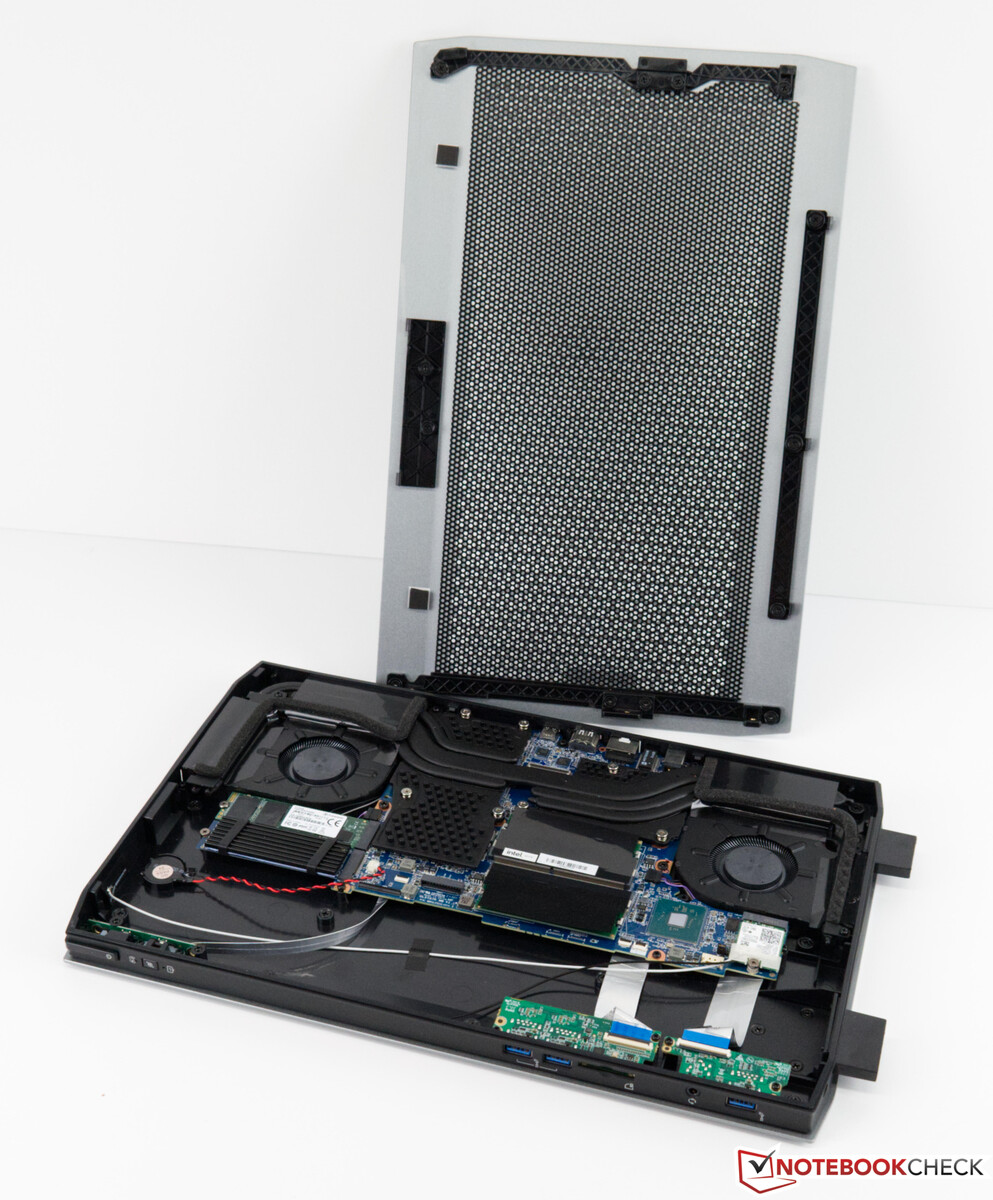
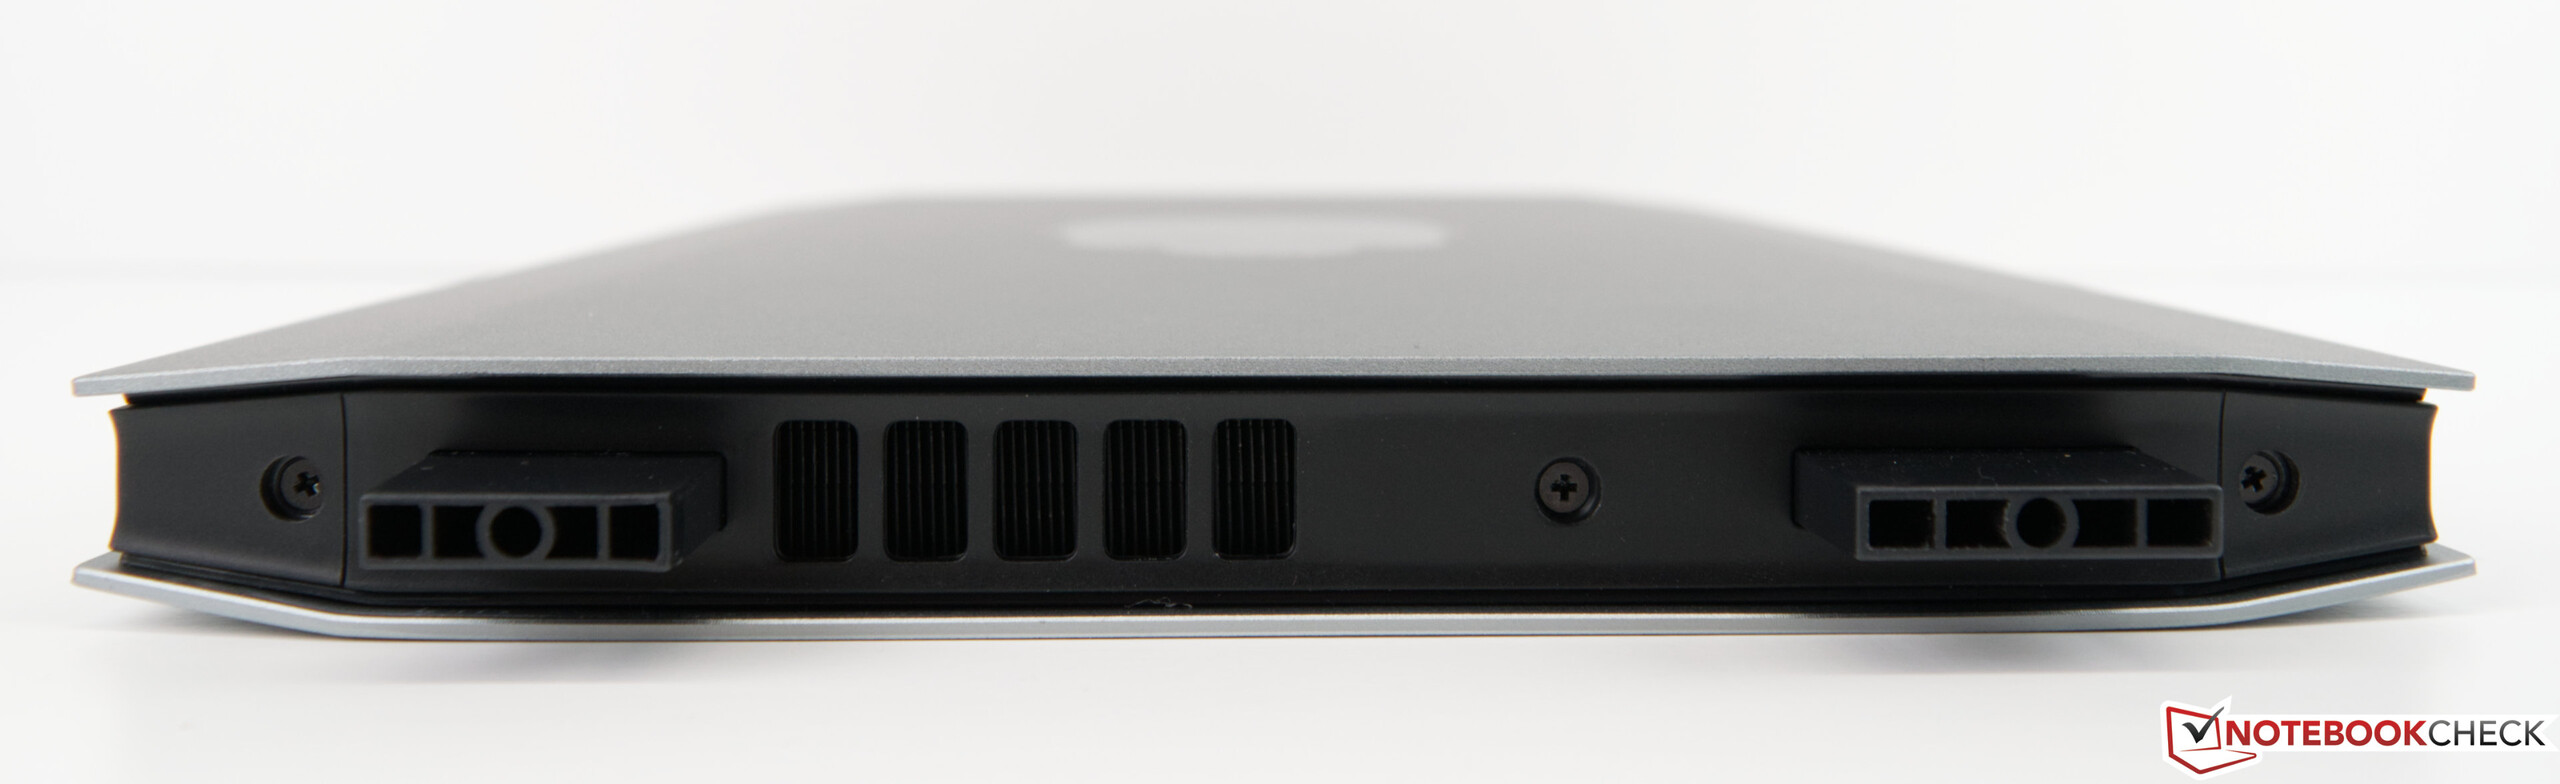
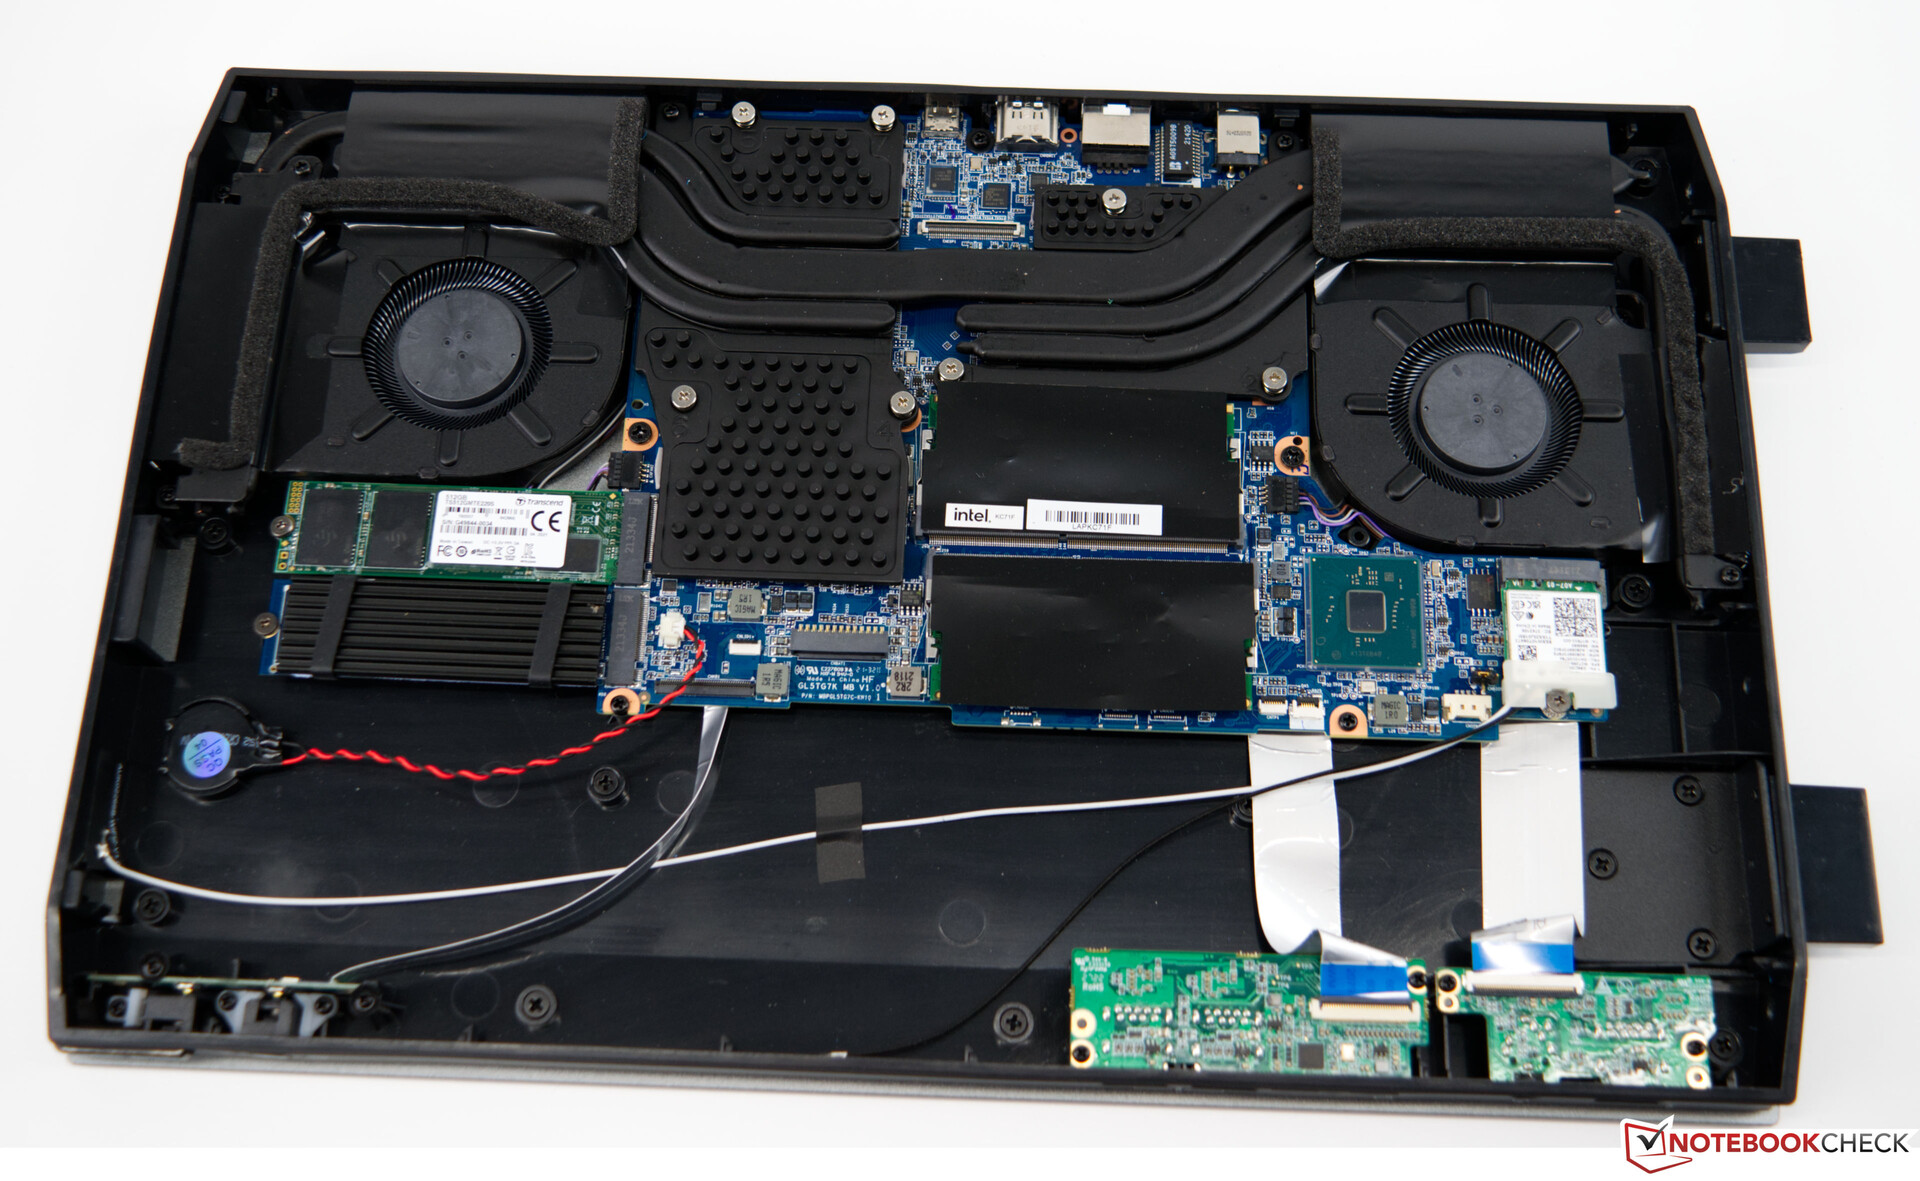
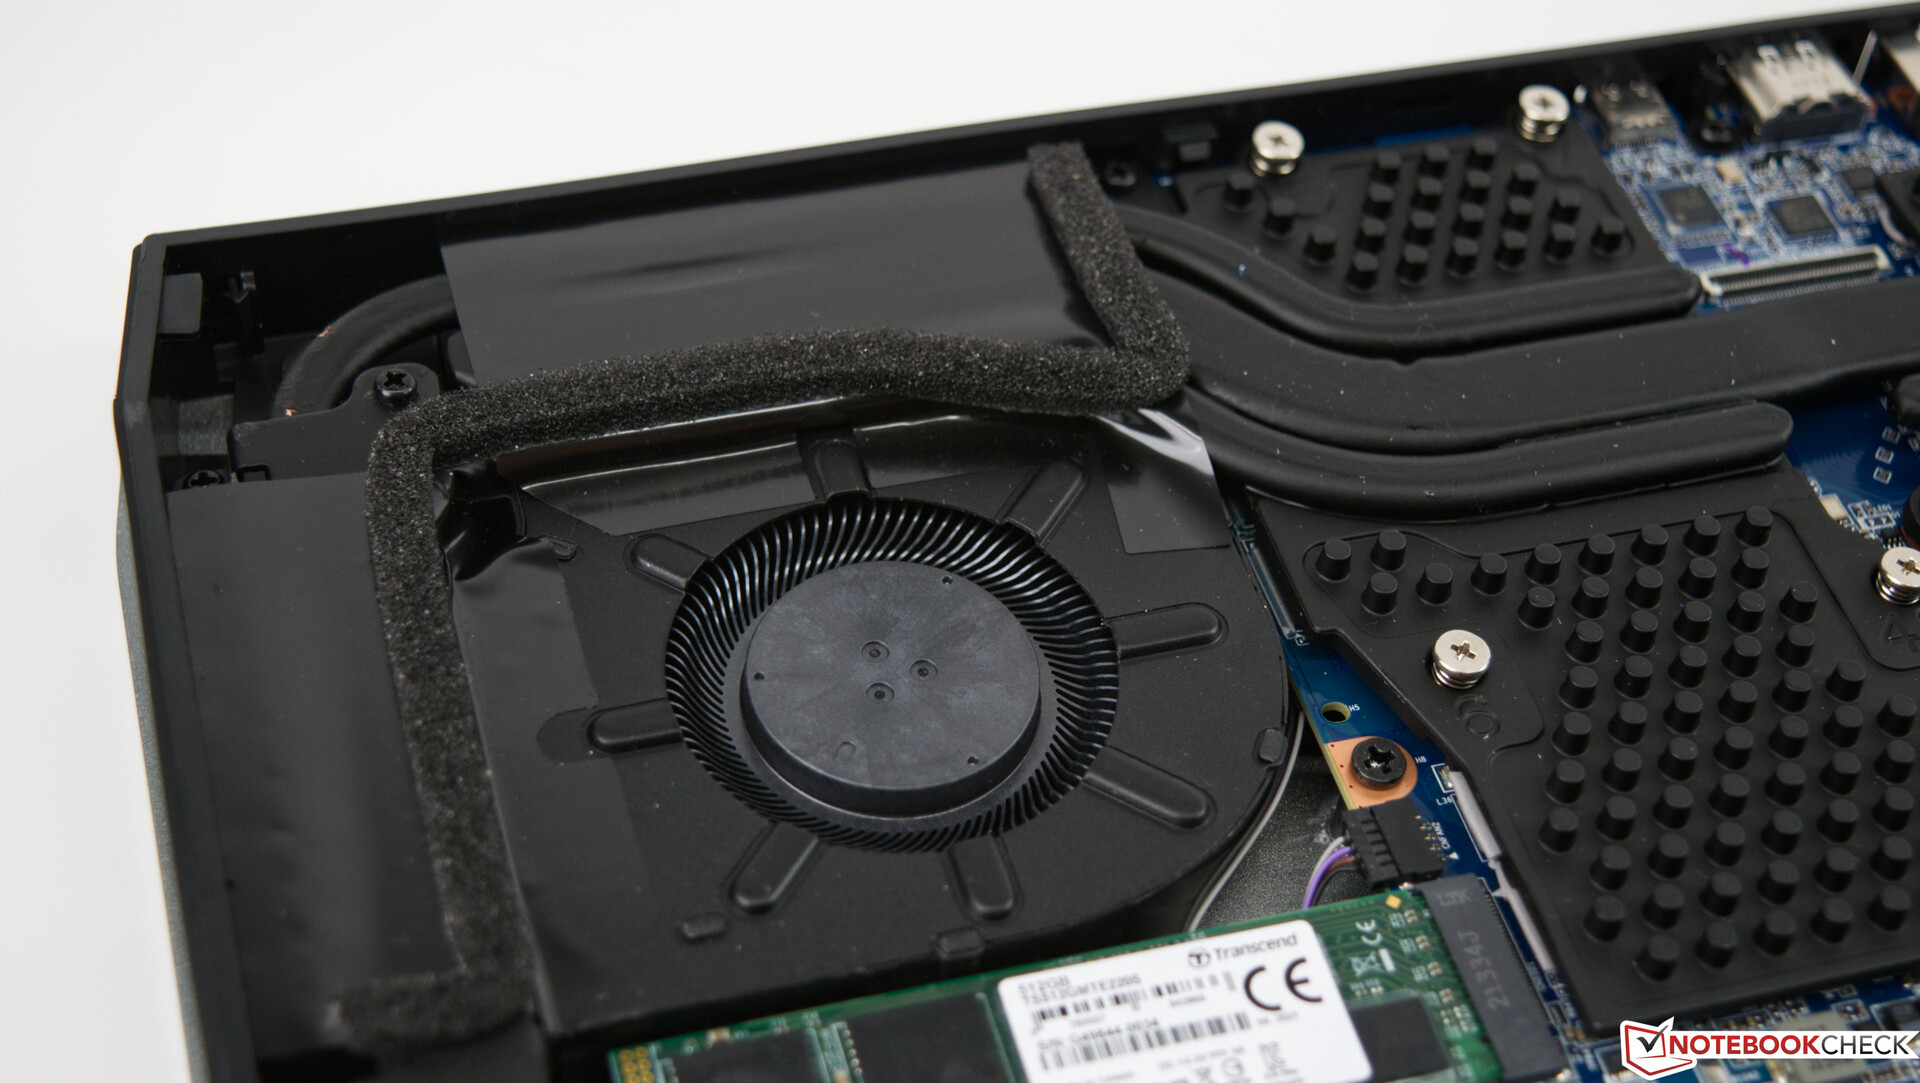
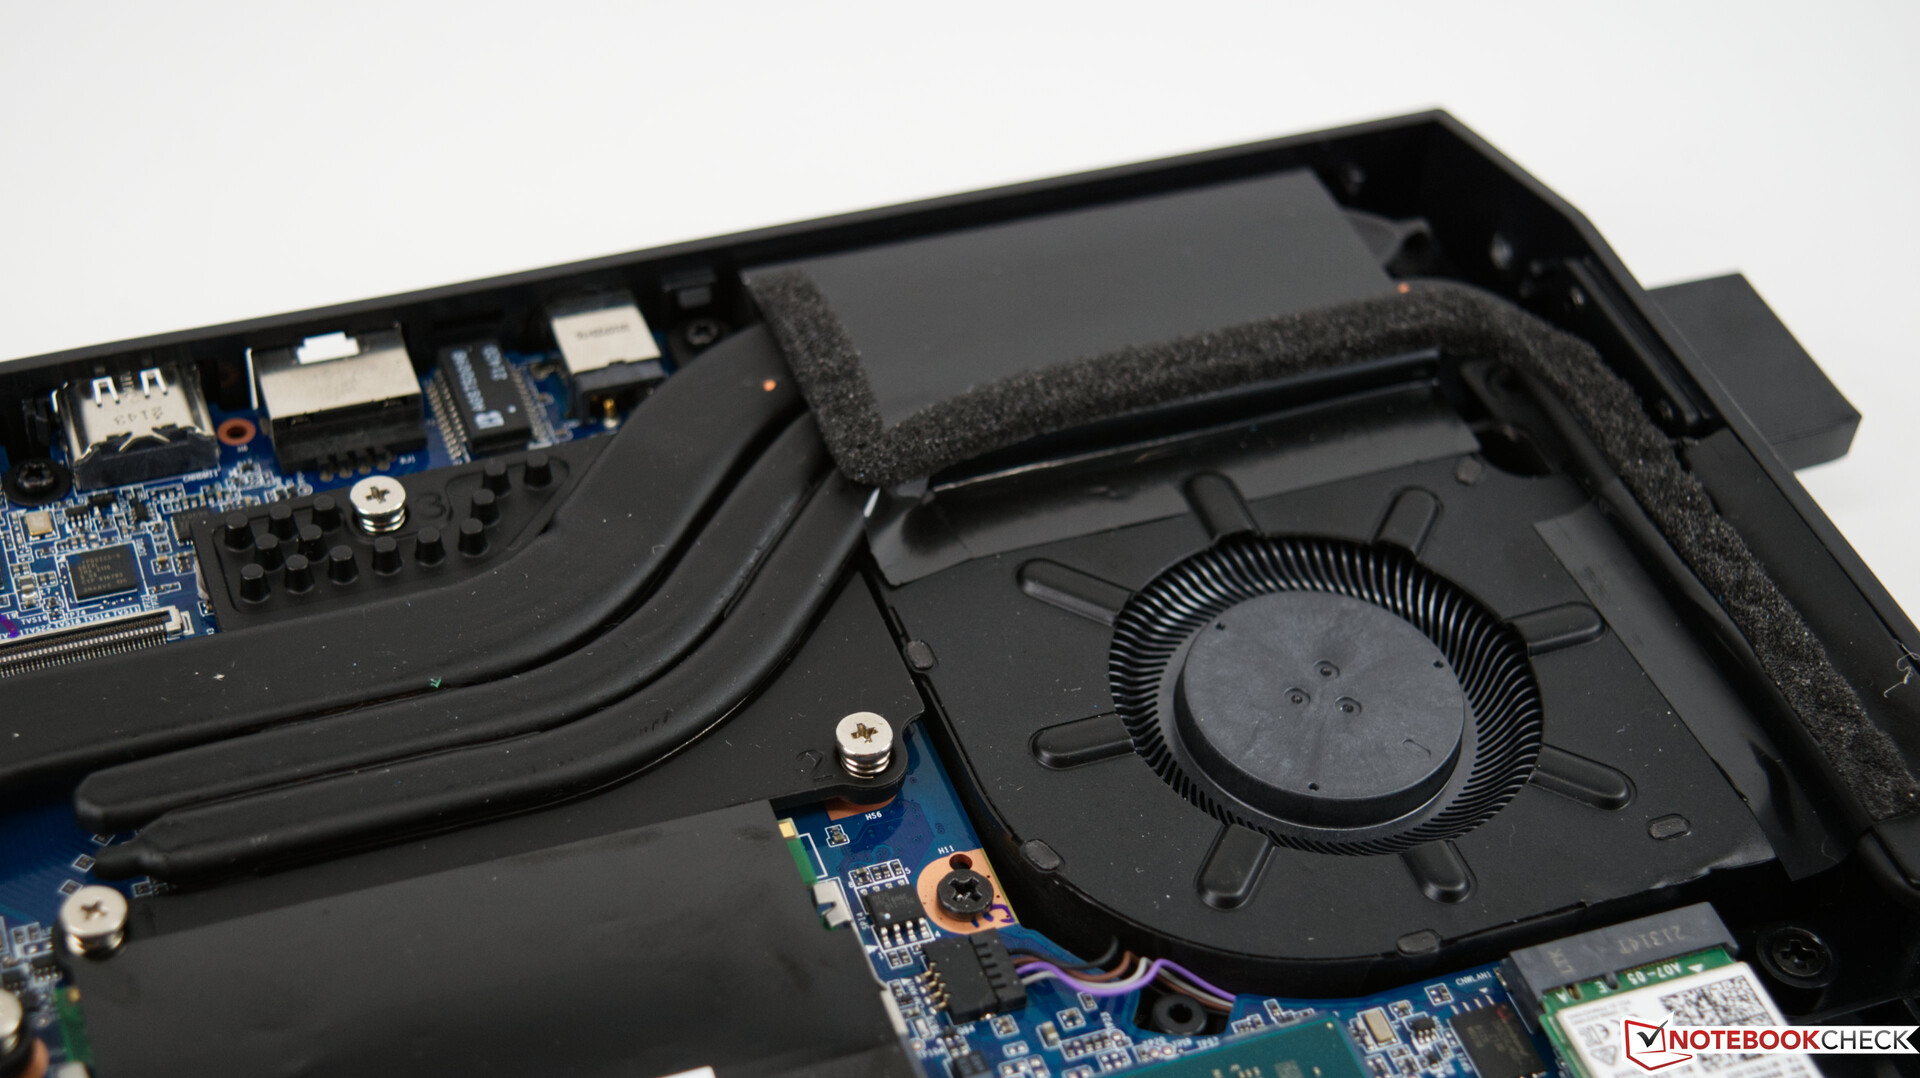
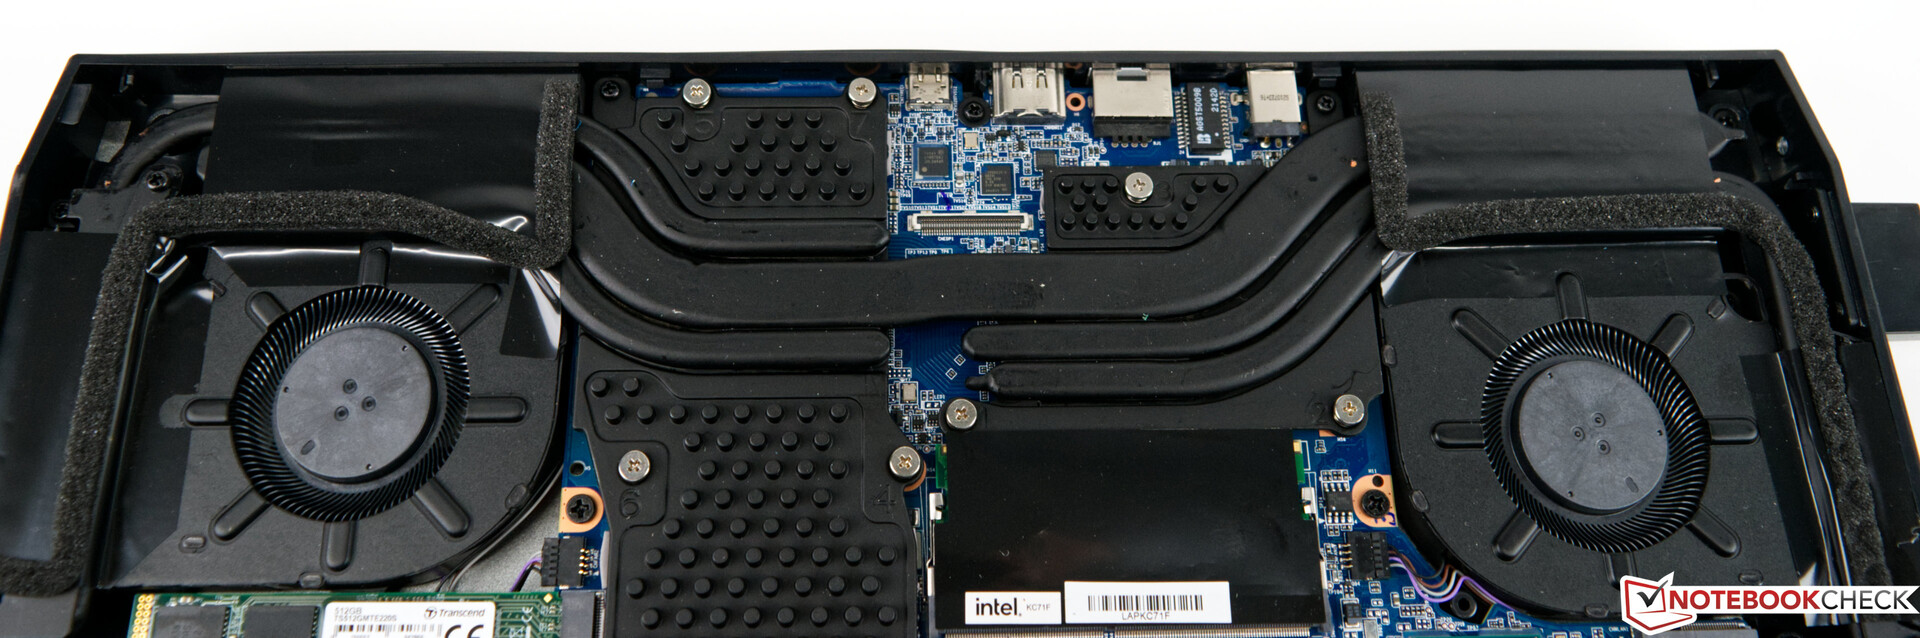
对于扩展或维护任务,你可以取下设备的侧盖,它是用三颗螺丝固定在底部的,取下这些螺丝后,你可以不费吹灰之力就取下盖子。附带的小册子也解释了如何做这件事。取下盖子后,你可能会被误导,以为你看到的是一台笔记本电脑。但是仍然有很多未使用的空间,这些空间通常是为电池保留的。你也可以看到为什么你不能轻易地在后面添加一些USB接口。唯一可以增加一些连接的空间是在前面。
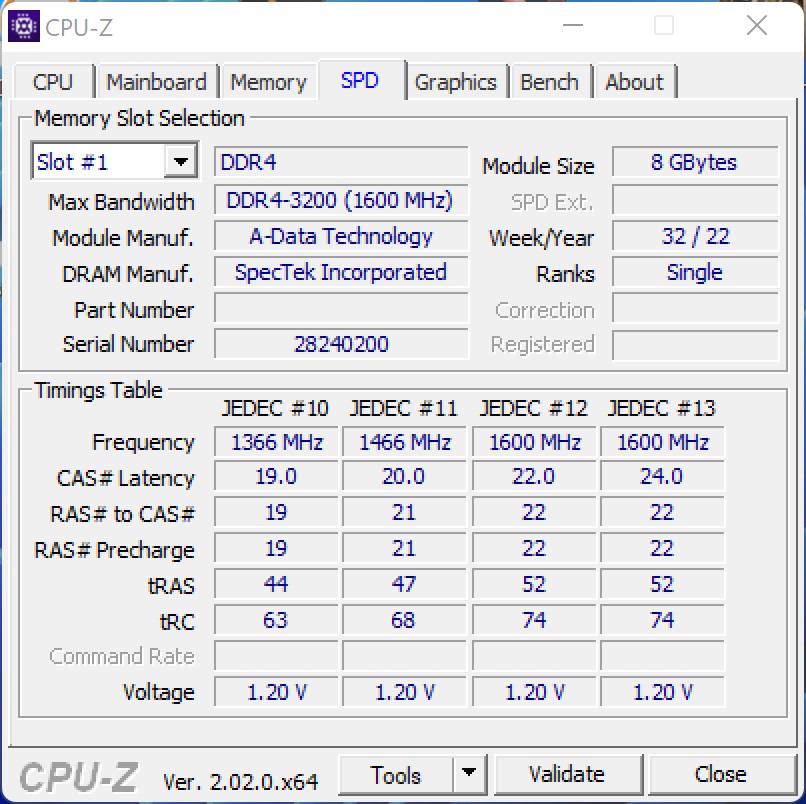
你可以在设备中安装两个M.2固态硬盘,我们在这个测试中也是这样做的。要扩大工作内存,你只能选择更换模块,因为两个SO-Dimm插槽都已经被8GB模块占据了。
性能 - 快速的Core i7-11800H
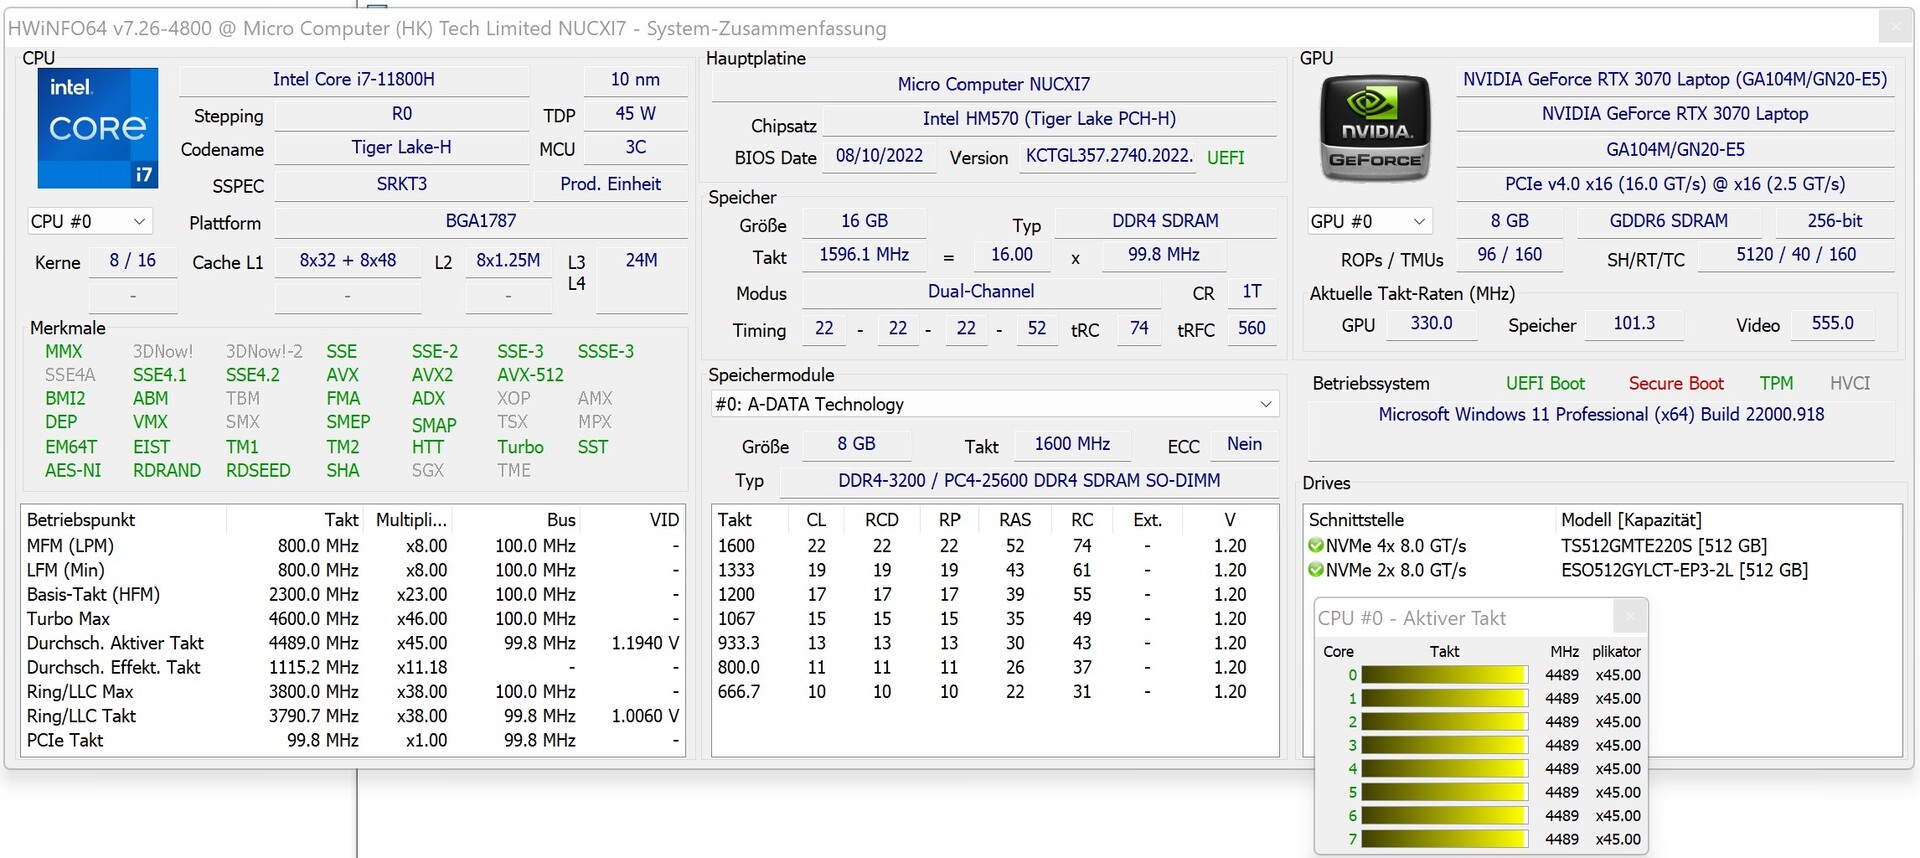
有了 英特尔酷睿i7-11800H我们的测试设备为处理高要求的应用程序提供了良好的基础。 在与 NvidiaGeForce RTX 3070 笔记本电脑GPU,MINISFORUM NUCXi7看起来像一个装备精良的游戏笔记本电脑。16GB的内存通常足以应付目前所有的游戏,尽管空间会因为512GB的固态硬盘而变得有些紧张。有了这些设备,你还可以在1,440p下享受当前的游戏。那些只想以1,080p玩游戏的人应该仔细看看Minisforum NUCXi5.
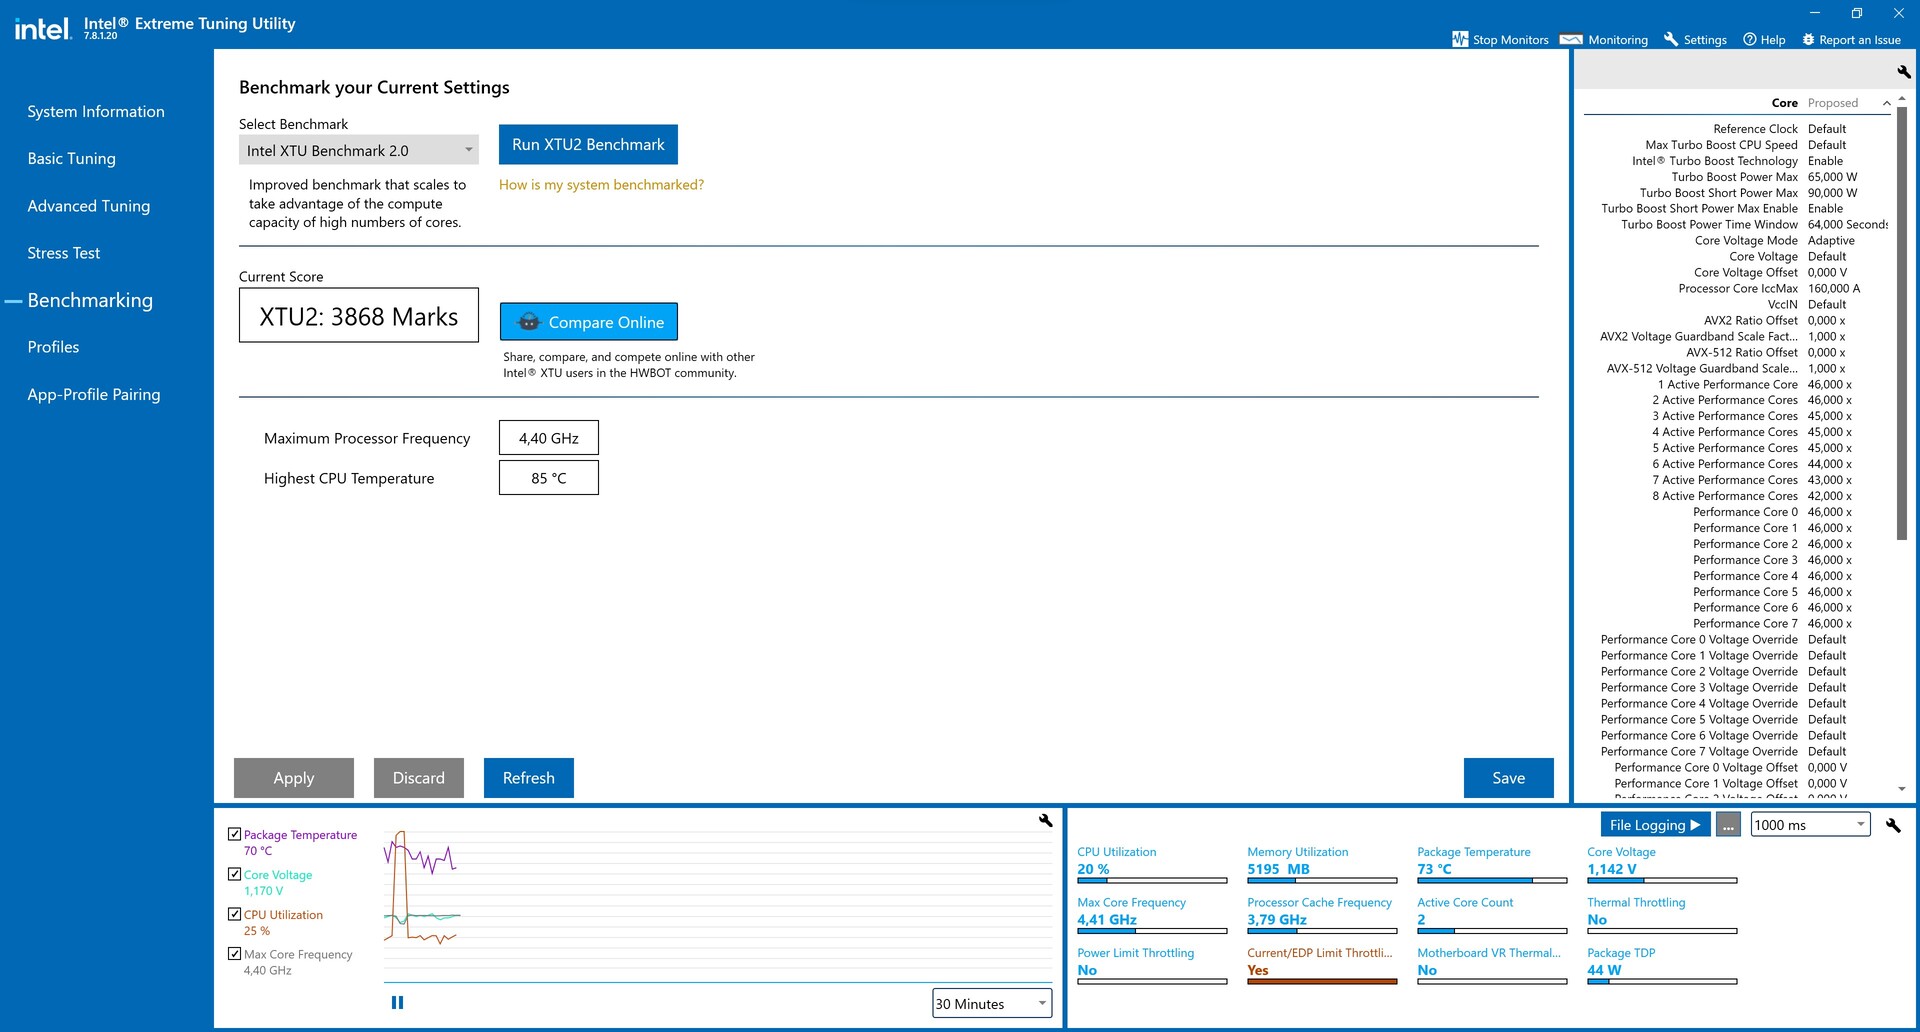
测试条件
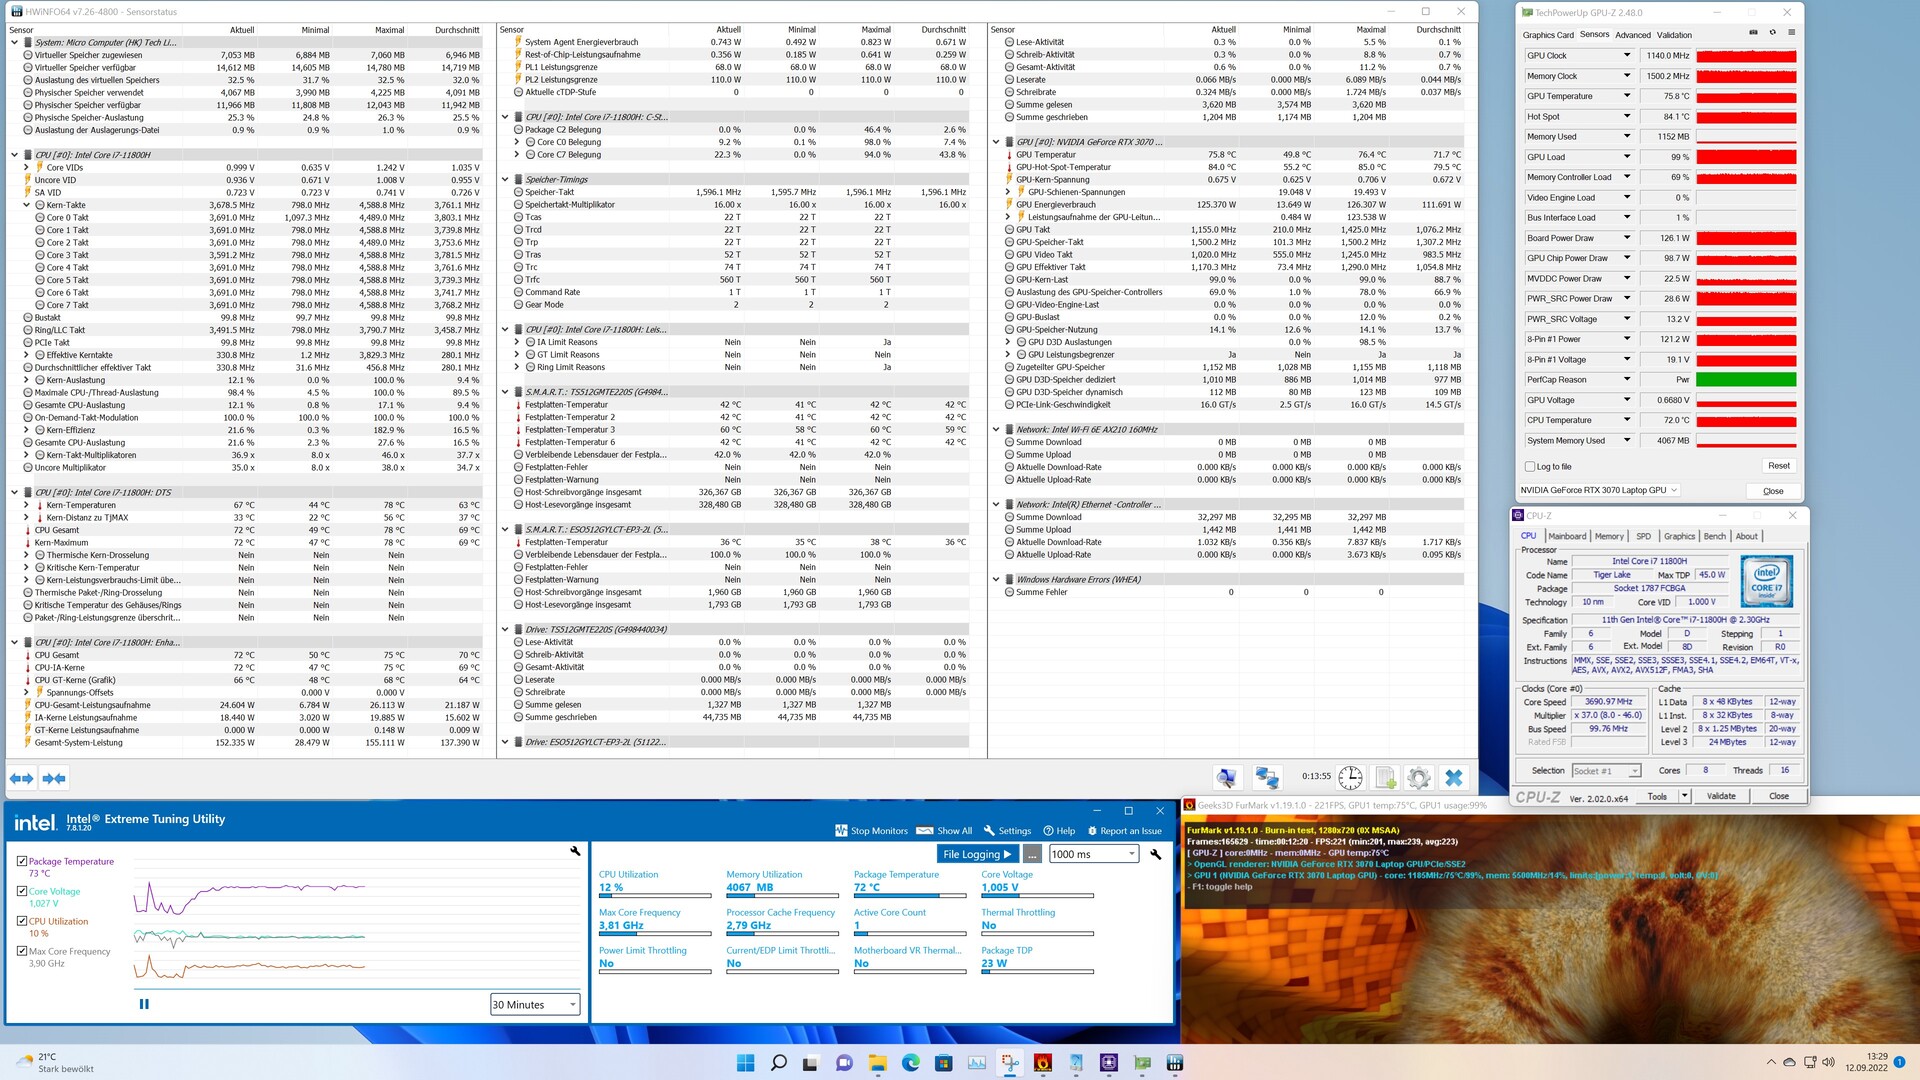
我们在游戏模式下进行了所有的性能测试。这可以通过按下前面的一个按钮来激活,使GPU在负载下具有更高的功耗。确切地说,这相当于将GPU的功耗增加到125瓦。
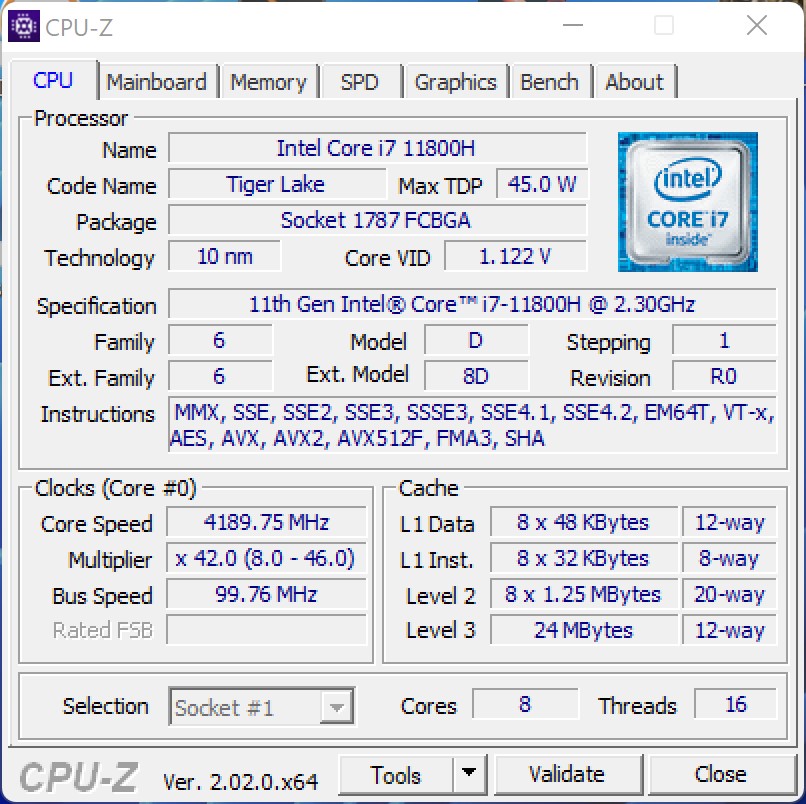
处理器
的英特尔酷睿i7-11800H提供八个原生计算核心,基于英特尔的Tiger Lake 架构。在功耗方面,Minicforum给出了一些高达110瓦(PL2)的头部空间,尽管在68瓦时,PL1仍然是一个非常好的价值,以实现高性能。而事实也确实如此,因为我们的测试设备在我们的测试中取得的性能能够确保在该领域的中间位置。在更快的对比设备后面的缺点是很小的,主观上不明显。
你可以找到处理器的其他基准测试 这里.
| Performance rating - Percent | |
| Intel Dragon Canyon NUC - RTX 3060 | |
| Gigabyte A7 X1 -17! | |
| Intel Beast Canyon NUC | |
| Minisforum NUCX i7 | |
| Average Intel Core i7-11800H | |
| Zotac ZBOX Magnus EN173070C | |
| Zotac Magnus One (ECM73070C) -2! | |
| Zotac MEK Mini (RTX 2070 Super) | |
| Cinebench R15 | |
| CPU Single 64Bit | |
| Intel Dragon Canyon NUC - RTX 3060 | |
| Intel Beast Canyon NUC | |
| Gigabyte A7 X1 | |
| Minisforum NUCX i7 | |
| Average Intel Core i7-11800H (201 - 231, n=46) | |
| Zotac ZBOX Magnus EN173070C | |
| Zotac MEK Mini (RTX 2070 Super) | |
| Zotac Magnus One (ECM73070C) | |
| CPU Multi 64Bit | |
| Intel Dragon Canyon NUC - RTX 3060 | |
| Gigabyte A7 X1 | |
| Minisforum NUCX i7 | |
| Intel Beast Canyon NUC | |
| Average Intel Core i7-11800H (1342 - 2173, n=50) | |
| Zotac ZBOX Magnus EN173070C | |
| Zotac Magnus One (ECM73070C) | |
| Zotac MEK Mini (RTX 2070 Super) | |
| Cinebench R20 | |
| CPU (Single Core) | |
| Intel Dragon Canyon NUC - RTX 3060 | |
| Intel Beast Canyon NUC | |
| Gigabyte A7 X1 | |
| Minisforum NUCX i7 | |
| Average Intel Core i7-11800H (520 - 586, n=47) | |
| Zotac ZBOX Magnus EN173070C | |
| Zotac MEK Mini (RTX 2070 Super) | |
| CPU (Multi Core) | |
| Intel Dragon Canyon NUC - RTX 3060 | |
| Gigabyte A7 X1 | |
| Minisforum NUCX i7 | |
| Intel Beast Canyon NUC | |
| Average Intel Core i7-11800H (2498 - 5408, n=50) | |
| Zotac ZBOX Magnus EN173070C | |
| Zotac MEK Mini (RTX 2070 Super) | |
| Cinebench R11.5 | |
| CPU Single 64Bit | |
| Intel Dragon Canyon NUC - RTX 3060 | |
| Intel Beast Canyon NUC | |
| Minisforum NUCX i7 | |
| Zotac ZBOX Magnus EN173070C | |
| Average Intel Core i7-11800H (2.45 - 2.62, n=4) | |
| Zotac Magnus One (ECM73070C) | |
| Zotac MEK Mini (RTX 2070 Super) | |
| CPU Multi 64Bit | |
| Intel Dragon Canyon NUC - RTX 3060 | |
| Intel Beast Canyon NUC | |
| Minisforum NUCX i7 | |
| Zotac ZBOX Magnus EN173070C | |
| Average Intel Core i7-11800H (16 - 21.9, n=4) | |
| Zotac Magnus One (ECM73070C) | |
| Zotac MEK Mini (RTX 2070 Super) | |
| Cinebench R10 | |
| Rendering Single CPUs 64Bit | |
| Intel Dragon Canyon NUC - RTX 3060 | |
| Intel Beast Canyon NUC | |
| Minisforum NUCX i7 | |
| Zotac ZBOX Magnus EN173070C | |
| Average Intel Core i7-11800H (10903 - 11957, n=4) | |
| Zotac Magnus One (ECM73070C) | |
| Zotac MEK Mini (RTX 2070 Super) | |
| Rendering Multiple CPUs 64Bit | |
| Intel Dragon Canyon NUC - RTX 3060 | |
| Minisforum NUCX i7 | |
| Intel Beast Canyon NUC | |
| Zotac ZBOX Magnus EN173070C | |
| Average Intel Core i7-11800H (49232 - 67486, n=4) | |
| Zotac Magnus One (ECM73070C) | |
| Zotac MEK Mini (RTX 2070 Super) | |
| Blender - v2.79 BMW27 CPU | |
| Zotac MEK Mini (RTX 2070 Super) | |
| Zotac Magnus One (ECM73070C) | |
| Zotac ZBOX Magnus EN173070C | |
| Average Intel Core i7-11800H (217 - 454, n=46) | |
| Intel Beast Canyon NUC | |
| Intel Dragon Canyon NUC - RTX 3060 | |
| Minisforum NUCX i7 | |
| Gigabyte A7 X1 | |
| wPrime 2.10 | |
| 32m | |
| Zotac MEK Mini (RTX 2070 Super) | |
| Zotac ZBOX Magnus EN173070C | |
| Average Intel Core i7-11800H (3.41 - 4.19, n=3) | |
| Intel Beast Canyon NUC | |
| Minisforum NUCX i7 | |
| Zotac Magnus One (ECM73070C) | |
| Intel Dragon Canyon NUC - RTX 3060 | |
| 1024m | |
| Intel Dragon Canyon NUC - RTX 3060 | |
| Zotac MEK Mini (RTX 2070 Super) | |
| Zotac ZBOX Magnus EN173070C | |
| Zotac Magnus One (ECM73070C) | |
| Average Intel Core i7-11800H (98.3 - 121.1, n=3) | |
| Intel Beast Canyon NUC | |
| Minisforum NUCX i7 | |
| X264 HD Benchmark 4.0 | |
| Pass 1 | |
| Intel Dragon Canyon NUC - RTX 3060 | |
| Intel Beast Canyon NUC | |
| Minisforum NUCX i7 | |
| Average Intel Core i7-11800H (242 - 258, n=3) | |
| Zotac MEK Mini (RTX 2070 Super) | |
| Zotac ZBOX Magnus EN173070C | |
| Zotac Magnus One (ECM73070C) | |
| Pass 2 | |
| Intel Dragon Canyon NUC - RTX 3060 | |
| Minisforum NUCX i7 | |
| Intel Beast Canyon NUC | |
| Average Intel Core i7-11800H (86.3 - 109.3, n=3) | |
| Zotac ZBOX Magnus EN173070C | |
| Zotac Magnus One (ECM73070C) | |
| Zotac MEK Mini (RTX 2070 Super) | |
| WinRAR - Result | |
| Intel Dragon Canyon NUC - RTX 3060 | |
| Intel Beast Canyon NUC | |
| Average Intel Core i7-11800H (7925 - 8569, n=3) | |
| Minisforum NUCX i7 | |
| Zotac ZBOX Magnus EN173070C | |
| Zotac MEK Mini (RTX 2070 Super) | |
| Zotac Magnus One (ECM73070C) | |
| TrueCrypt | |
| AES Mean 100MB | |
| Intel Dragon Canyon NUC - RTX 3060 | |
| Intel Beast Canyon NUC | |
| Minisforum NUCX i7 | |
| Zotac Magnus One (ECM73070C) | |
| Zotac ZBOX Magnus EN173070C | |
| Average Intel Core i7-11800H (6.5 - 11.6, n=4) | |
| Zotac MEK Mini (RTX 2070 Super) | |
| Twofish Mean 100MB | |
| Intel Dragon Canyon NUC - RTX 3060 | |
| Zotac Magnus One (ECM73070C) | |
| Intel Beast Canyon NUC | |
| Minisforum NUCX i7 | |
| Average Intel Core i7-11800H (1.5 - 1.7, n=4) | |
| Zotac ZBOX Magnus EN173070C | |
| Zotac MEK Mini (RTX 2070 Super) | |
| Serpent Mean 100MB | |
| Intel Dragon Canyon NUC - RTX 3060 | |
| Zotac Magnus One (ECM73070C) | |
| Intel Beast Canyon NUC | |
| Minisforum NUCX i7 | |
| Average Intel Core i7-11800H (0.9 - 1.1, n=4) | |
| Zotac ZBOX Magnus EN173070C | |
| Zotac MEK Mini (RTX 2070 Super) | |
| Geekbench 5.5 | |
| Multi-Core | |
| Minisforum NUCX i7 | |
| Intel Beast Canyon NUC | |
| Intel Dragon Canyon NUC - RTX 3060 | |
| Average Intel Core i7-11800H (4655 - 9851, n=40) | |
| Zotac ZBOX Magnus EN173070C | |
| Zotac Magnus One (ECM73070C) | |
| Gigabyte A7 X1 | |
| Zotac MEK Mini (RTX 2070 Super) | |
| Single-Core | |
| Intel Beast Canyon NUC | |
| Intel Dragon Canyon NUC - RTX 3060 | |
| Zotac ZBOX Magnus EN173070C | |
| Minisforum NUCX i7 | |
| Average Intel Core i7-11800H (1429 - 1625, n=40) | |
| Gigabyte A7 X1 | |
| Zotac MEK Mini (RTX 2070 Super) | |
| Zotac Magnus One (ECM73070C) | |
| Geekbench 5.0 | |
| 5.0 Multi-Core | |
| Minisforum NUCX i7 | |
| Intel Beast Canyon NUC | |
| Intel Dragon Canyon NUC - RTX 3060 | |
| Zotac Magnus One (ECM73070C) | |
| Zotac ZBOX Magnus EN173070C | |
| Average Intel Core i7-11800H (6340 - 9103, n=8) | |
| Zotac MEK Mini (RTX 2070 Super) | |
| 5.0 Single-Core | |
| Intel Beast Canyon NUC | |
| Intel Dragon Canyon NUC - RTX 3060 | |
| Zotac ZBOX Magnus EN173070C | |
| Minisforum NUCX i7 | |
| Average Intel Core i7-11800H (1436 - 1571, n=8) | |
| Zotac Magnus One (ECM73070C) | |
| Zotac MEK Mini (RTX 2070 Super) | |
| Geekbench 4.4 | |
| 64 Bit Single-Core Score | |
| Intel Beast Canyon NUC | |
| Intel Dragon Canyon NUC - RTX 3060 | |
| Zotac ZBOX Magnus EN173070C | |
| Minisforum NUCX i7 | |
| Average Intel Core i7-11800H (6104 - 6747, n=7) | |
| Zotac MEK Mini (RTX 2070 Super) | |
| Zotac Magnus One (ECM73070C) | |
| 64 Bit Multi-Core Score | |
| Minisforum NUCX i7 | |
| Intel Beast Canyon NUC | |
| Intel Dragon Canyon NUC - RTX 3060 | |
| Average Intel Core i7-11800H (27454 - 36706, n=7) | |
| Zotac ZBOX Magnus EN173070C | |
| Zotac Magnus One (ECM73070C) | |
| Zotac MEK Mini (RTX 2070 Super) | |
| 3DMark 11 - 1280x720 Performance Physics | |
| Intel Dragon Canyon NUC - RTX 3060 | |
| Intel Beast Canyon NUC | |
| Minisforum NUCX i7 | |
| Average Intel Core i7-11800H (10590 - 19167, n=46) | |
| Zotac ZBOX Magnus EN173070C | |
| Zotac Magnus One (ECM73070C) | |
| Gigabyte A7 X1 | |
| Zotac MEK Mini (RTX 2070 Super) | |
| 7-Zip 18.03 | |
| 7z b 4 | |
| Gigabyte A7 X1 | |
| Minisforum NUCX i7 | |
| Intel Beast Canyon NUC | |
| Intel Dragon Canyon NUC - RTX 3060 | |
| Average Intel Core i7-11800H (33718 - 56758, n=46) | |
| Zotac ZBOX Magnus EN173070C | |
| Zotac Magnus One (ECM73070C) | |
| Zotac MEK Mini (RTX 2070 Super) | |
| 7z b 4 -mmt1 | |
| Intel Beast Canyon NUC | |
| Intel Dragon Canyon NUC - RTX 3060 | |
| Gigabyte A7 X1 | |
| Zotac ZBOX Magnus EN173070C | |
| Average Intel Core i7-11800H (5138 - 5732, n=46) | |
| Minisforum NUCX i7 | |
| Zotac Magnus One (ECM73070C) | |
| Zotac MEK Mini (RTX 2070 Super) | |
| HWBOT x265 Benchmark v2.2 - 4k Preset | |
| Gigabyte A7 X1 | |
| Minisforum NUCX i7 | |
| Intel Beast Canyon NUC | |
| Intel Dragon Canyon NUC - RTX 3060 | |
| Average Intel Core i7-11800H (7.38 - 17.4, n=46) | |
| Zotac ZBOX Magnus EN173070C | |
| Zotac Magnus One (ECM73070C) | |
| Zotac MEK Mini (RTX 2070 Super) | |
| R Benchmark 2.5 - Overall mean | |
| Zotac MEK Mini (RTX 2070 Super) | |
| Zotac Magnus One (ECM73070C) | |
| Average Intel Core i7-11800H (0.548 - 0.615, n=46) | |
| Minisforum NUCX i7 | |
| Zotac ZBOX Magnus EN173070C | |
| Intel Beast Canyon NUC | |
| Intel Dragon Canyon NUC - RTX 3060 | |
| Gigabyte A7 X1 | |
| LibreOffice - 20 Documents To PDF | |
| Zotac Magnus One (ECM73070C) | |
| Gigabyte A7 X1 | |
| Minisforum NUCX i7 | |
| Zotac MEK Mini (RTX 2070 Super) | |
| Zotac ZBOX Magnus EN173070C | |
| Average Intel Core i7-11800H (38.6 - 59.9, n=45) | |
| Intel Beast Canyon NUC | |
| Intel Dragon Canyon NUC - RTX 3060 | |
| WebXPRT 3 - Overall | |
| Gigabyte A7 X1 | |
| Intel Beast Canyon NUC | |
| Intel Dragon Canyon NUC - RTX 3060 | |
| Zotac ZBOX Magnus EN173070C | |
| Average Intel Core i7-11800H (251 - 280, n=40) | |
| Minisforum NUCX i7 | |
| Zotac Magnus One (ECM73070C) | |
| Zotac MEK Mini (RTX 2070 Super) | |
| Mozilla Kraken 1.1 - Total | |
| Zotac MEK Mini (RTX 2070 Super) | |
| Zotac Magnus One (ECM73070C) | |
| Average Intel Core i7-11800H (600 - 690, n=45) | |
| Zotac ZBOX Magnus EN173070C | |
| Minisforum NUCX i7 | |
| Gigabyte A7 X1 | |
| Intel Beast Canyon NUC | |
| Intel Dragon Canyon NUC - RTX 3060 | |
| 3DMark | |
| 3840x2160 Fire Strike Ultra Physics | |
| Intel Dragon Canyon NUC - RTX 3060 | |
| Intel Beast Canyon NUC | |
| Average Intel Core i7-11800H (21176 - 25203, n=16) | |
| Minisforum NUCX i7 | |
| Zotac ZBOX Magnus EN173070C | |
| Zotac Magnus One (ECM73070C) | |
| Zotac MEK Mini (RTX 2070 Super) | |
| 1920x1080 Fire Strike Physics | |
| Intel Dragon Canyon NUC - RTX 3060 | |
| Gigabyte A7 X1 | |
| Minisforum NUCX i7 | |
| Intel Beast Canyon NUC | |
| Zotac ZBOX Magnus EN173070C | |
| Average Intel Core i7-11800H (12843 - 25145, n=47) | |
| Zotac Magnus One (ECM73070C) | |
| Zotac MEK Mini (RTX 2070 Super) | |
| 2560x1440 Time Spy CPU | |
| Intel Dragon Canyon NUC - RTX 3060 | |
| Minisforum NUCX i7 | |
| Intel Beast Canyon NUC | |
| Zotac ZBOX Magnus EN173070C | |
| Average Intel Core i7-11800H (5086 - 11076, n=47) | |
| Gigabyte A7 X1 | |
| Zotac Magnus One (ECM73070C) | |
| Zotac MEK Mini (RTX 2070 Super) | |
* ... smaller is better
AIDA64: FP32 Ray-Trace | FPU Julia | CPU SHA3 | CPU Queen | FPU SinJulia | FPU Mandel | CPU AES | CPU ZLib | FP64 Ray-Trace | CPU PhotoWorxx
| Performance rating | |
| Average of class Desktop | |
| Gigabyte A7 X1 | |
| Intel Beast Canyon NUC | |
| Intel Dragon Canyon NUC - RTX 3060 | |
| Minisforum NUCX i7 | |
| Zotac ZBOX Magnus EN173070C | |
| Zotac MEK Mini (RTX 2070 Super) | |
| AIDA64 / FP32 Ray-Trace | |
| Average of class Desktop (12248 - 84577, n=21, last 2 years) | |
| Gigabyte A7 X1 | |
| Intel Beast Canyon NUC | |
| Intel Dragon Canyon NUC - RTX 3060 | |
| Zotac ZBOX Magnus EN173070C | |
| Minisforum NUCX i7 | |
| Zotac MEK Mini (RTX 2070 Super) | |
| AIDA64 / FPU Julia | |
| Average of class Desktop (65152 - 246125, n=21, last 2 years) | |
| Gigabyte A7 X1 | |
| Intel Beast Canyon NUC | |
| Intel Dragon Canyon NUC - RTX 3060 | |
| Zotac ZBOX Magnus EN173070C | |
| Minisforum NUCX i7 | |
| Zotac MEK Mini (RTX 2070 Super) | |
| AIDA64 / CPU SHA3 | |
| Average of class Desktop (2982 - 10804, n=21, last 2 years) | |
| Intel Beast Canyon NUC | |
| Intel Dragon Canyon NUC - RTX 3060 | |
| Zotac ZBOX Magnus EN173070C | |
| Minisforum NUCX i7 | |
| Gigabyte A7 X1 | |
| Zotac MEK Mini (RTX 2070 Super) | |
| AIDA64 / CPU Queen | |
| Average of class Desktop (76512 - 187912, n=18, last 2 years) | |
| Gigabyte A7 X1 | |
| Intel Beast Canyon NUC | |
| Intel Dragon Canyon NUC - RTX 3060 | |
| Minisforum NUCX i7 | |
| Zotac ZBOX Magnus EN173070C | |
| Zotac MEK Mini (RTX 2070 Super) | |
| AIDA64 / FPU SinJulia | |
| Average of class Desktop (6443 - 35251, n=21, last 2 years) | |
| Gigabyte A7 X1 | |
| Intel Beast Canyon NUC | |
| Intel Dragon Canyon NUC - RTX 3060 | |
| Minisforum NUCX i7 | |
| Zotac ZBOX Magnus EN173070C | |
| Zotac MEK Mini (RTX 2070 Super) | |
| AIDA64 / FPU Mandel | |
| Average of class Desktop (31697 - 129745, n=21, last 2 years) | |
| Gigabyte A7 X1 | |
| Intel Beast Canyon NUC | |
| Intel Dragon Canyon NUC - RTX 3060 | |
| Zotac ZBOX Magnus EN173070C | |
| Minisforum NUCX i7 | |
| Zotac MEK Mini (RTX 2070 Super) | |
| AIDA64 / CPU AES | |
| Average of class Desktop (57777 - 513073, n=21, last 2 years) | |
| Intel Beast Canyon NUC | |
| Intel Dragon Canyon NUC - RTX 3060 | |
| Minisforum NUCX i7 | |
| Zotac ZBOX Magnus EN173070C | |
| Gigabyte A7 X1 | |
| Zotac MEK Mini (RTX 2070 Super) | |
| AIDA64 / CPU ZLib | |
| Average of class Desktop (887 - 2674, n=21, last 2 years) | |
| Gigabyte A7 X1 | |
| Minisforum NUCX i7 | |
| Intel Beast Canyon NUC | |
| Intel Dragon Canyon NUC - RTX 3060 | |
| Zotac ZBOX Magnus EN173070C | |
| Zotac MEK Mini (RTX 2070 Super) | |
| AIDA64 / FP64 Ray-Trace | |
| Average of class Desktop (6471 - 44013, n=21, last 2 years) | |
| Gigabyte A7 X1 | |
| Intel Beast Canyon NUC | |
| Intel Dragon Canyon NUC - RTX 3060 | |
| Zotac ZBOX Magnus EN173070C | |
| Minisforum NUCX i7 | |
| Zotac MEK Mini (RTX 2070 Super) | |
| AIDA64 / CPU PhotoWorxx | |
| Average of class Desktop (38071 - 63949, n=21, last 2 years) | |
| Zotac ZBOX Magnus EN173070C | |
| Minisforum NUCX i7 | |
| Intel Beast Canyon NUC | |
| Intel Dragon Canyon NUC - RTX 3060 | |
| Zotac MEK Mini (RTX 2070 Super) | |
| Gigabyte A7 X1 | |
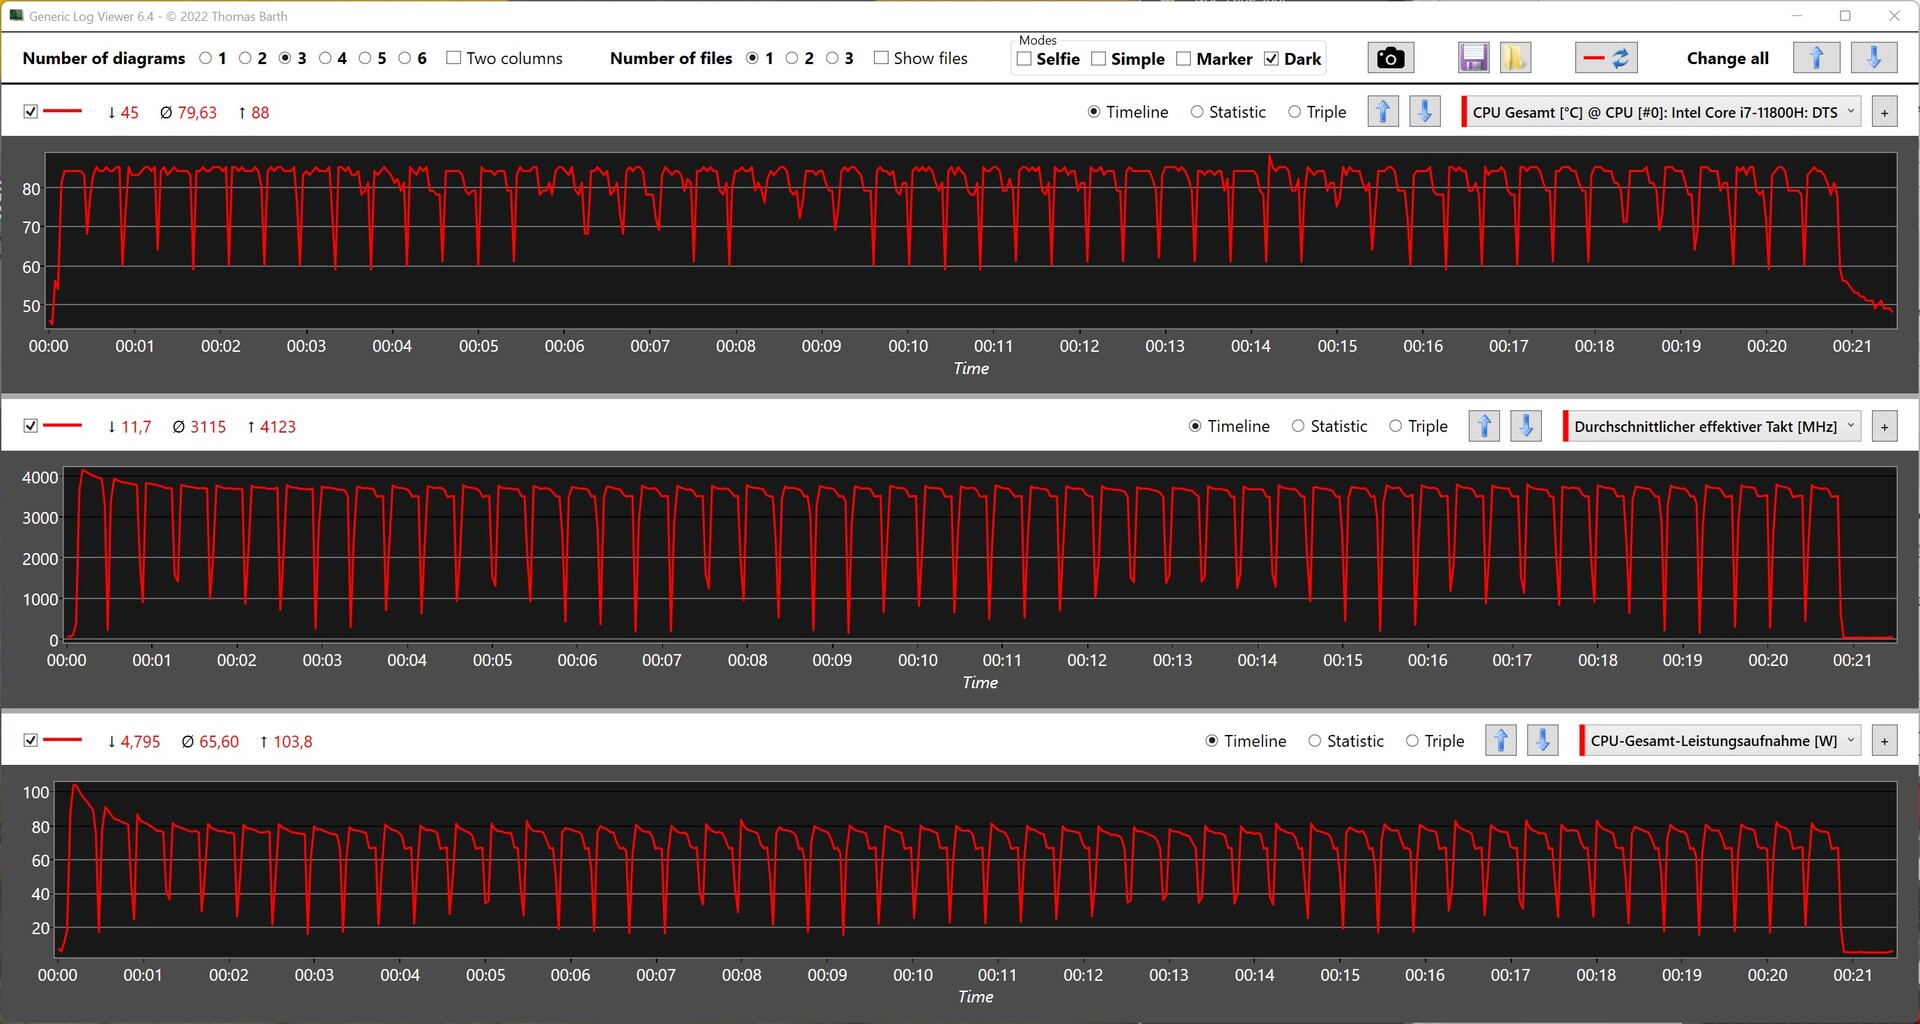
Minisforum NUCXi7在Cinebench R15多重循环中的表现
Cinebench R15恒定负载测试的循环给人以内置冷却系统的效率的良好印象。在第一次运行后,性能仅有最小的下降,然后继续保持在平均1828分的水平。
系统性能
Minisforum NUCXi7在系统基准测试中留下了良好的印象。在配备英特尔酷睿i9-12900的英特尔龙谷NUC后面的劣势是17%。在同一时间, 英特尔酷睿i7-11800H在这一点上已经超过一年了,也表明它在相当长的一段时间内不会属于废品堆。尽管如此,Minisforum也可以通过升级到英特尔的Alder Lake SoC而获得一些重大改进。但在目前的设备配置中,MINISFORUM NUCXi7提供了坚实的性能,在日常运行中也是令人信服的。
| Performance rating - Percent | |
| Intel Dragon Canyon NUC - RTX 3060, Intel Core i9-12900 | |
| Intel Beast Canyon NUC, Intel Core i9-11900KB | |
| Gigabyte A7 X1, AMD Ryzen 9 5900HX | |
| Zotac ZBOX Magnus EN173070C, Intel Core i7-11800H | |
| Minisforum NUCX i7, Intel Core i7-11800H | |
| Zotac Magnus One (ECM73070C), Intel Core i7-10700 | |
| Zotac MEK Mini (RTX 2070 Super), Intel Core i7-9700 | |
| AIDA64 / Memory Copy | |
| Average of class Desktop (54743 - 98416, n=21, last 2 years) | |
| Intel Beast Canyon NUC | |
| Intel Dragon Canyon NUC - RTX 3060 | |
| Minisforum NUCX i7 | |
| Zotac ZBOX Magnus EN173070C | |
| Average Intel Core i7-11800H (24508 - 48144, n=21) | |
| Gigabyte A7 X1 | |
| Zotac MEK Mini (RTX 2070 Super) | |
| AIDA64 / Memory Read | |
| Average of class Desktop (58375 - 110448, n=21, last 2 years) | |
| Zotac ZBOX Magnus EN173070C | |
| Intel Beast Canyon NUC | |
| Intel Dragon Canyon NUC - RTX 3060 | |
| Minisforum NUCX i7 | |
| Average Intel Core i7-11800H (25882 - 50365, n=20) | |
| Gigabyte A7 X1 | |
| Zotac MEK Mini (RTX 2070 Super) | |
| AIDA64 / Memory Write | |
| Average of class Desktop (60635 - 93889, n=21, last 2 years) | |
| Zotac ZBOX Magnus EN173070C | |
| Minisforum NUCX i7 | |
| Intel Beast Canyon NUC | |
| Intel Dragon Canyon NUC - RTX 3060 | |
| Average Intel Core i7-11800H (22240 - 46214, n=20) | |
| Zotac MEK Mini (RTX 2070 Super) | |
| Gigabyte A7 X1 | |
| AIDA64 / Memory Latency | |
| Minisforum NUCX i7 | |
| Average of class Desktop (68.5 - 168, n=21, last 2 years) | |
| Intel Beast Canyon NUC | |
| Intel Dragon Canyon NUC - RTX 3060 | |
| Zotac ZBOX Magnus EN173070C | |
| Gigabyte A7 X1 | |
| Zotac MEK Mini (RTX 2070 Super) | |
| Average Intel Core i7-11800H (71.9 - 104.1, n=44) | |
* ... smaller is better
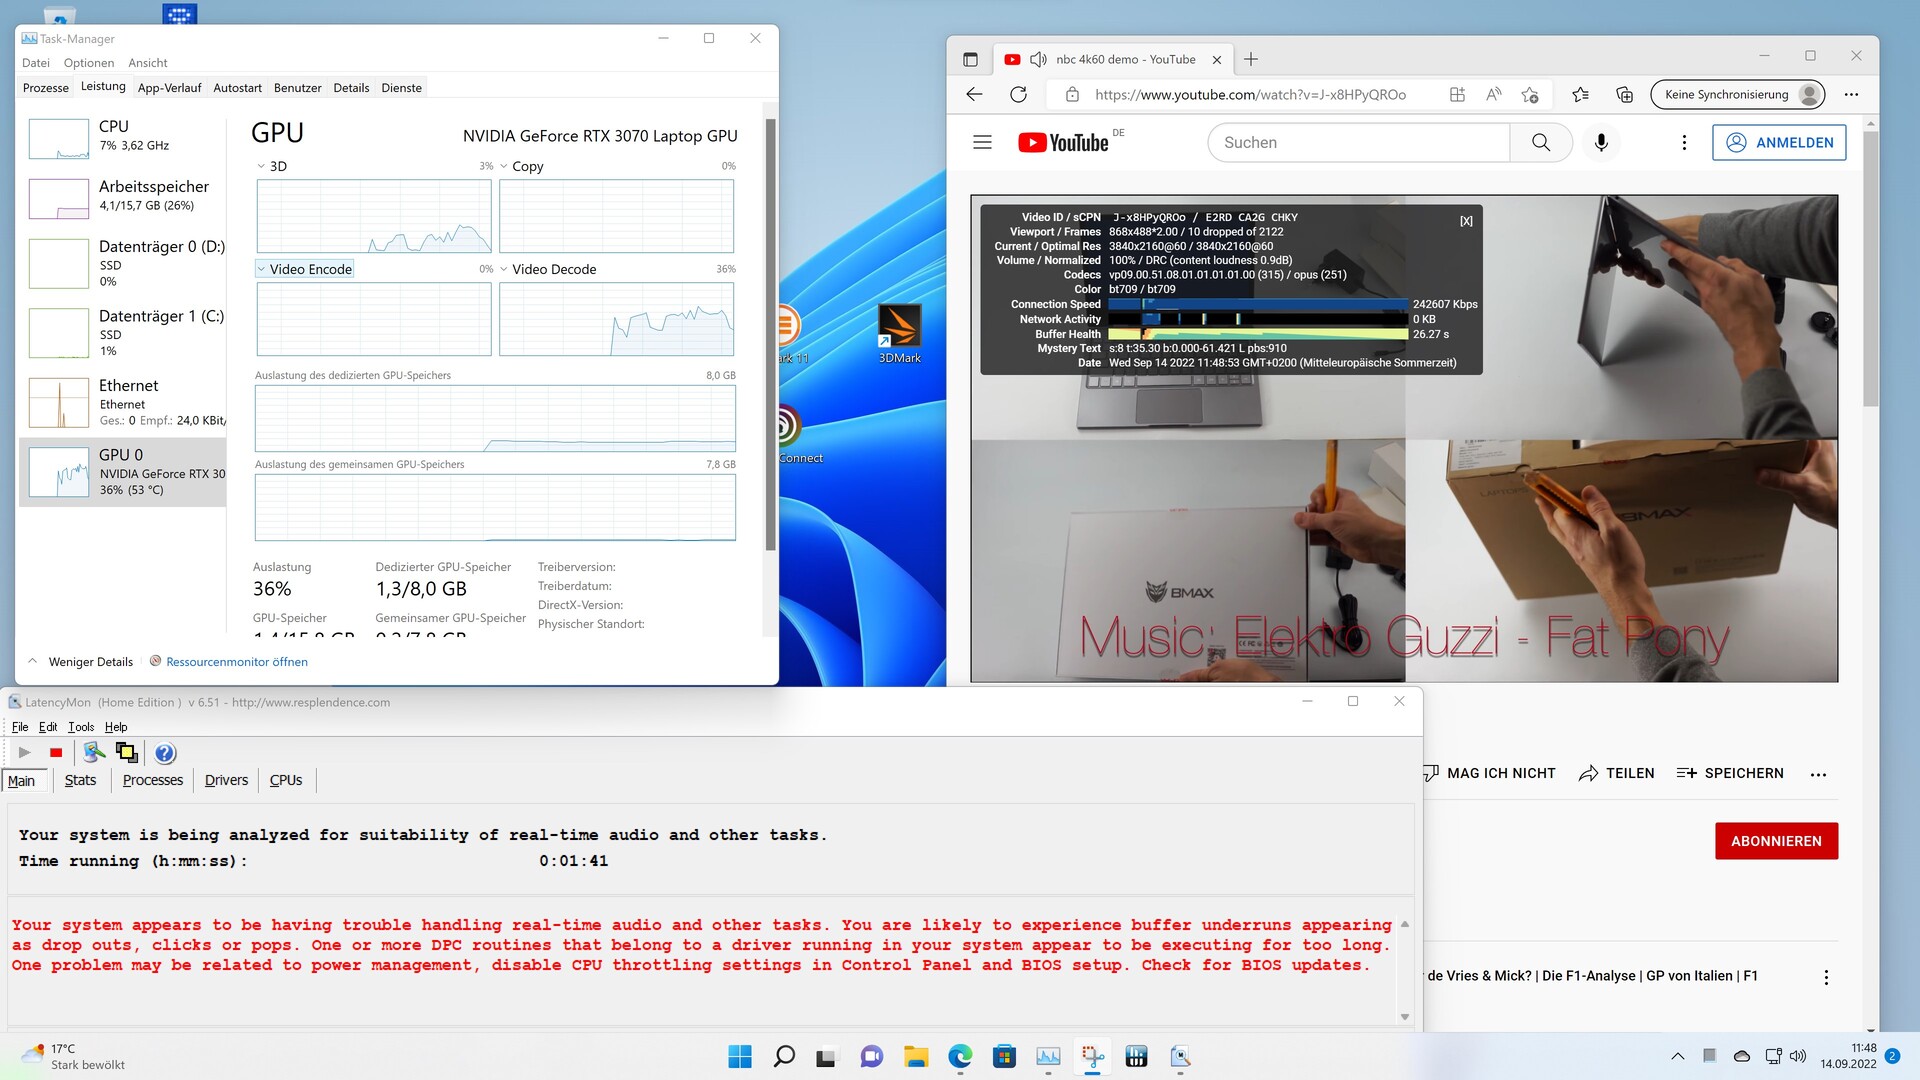
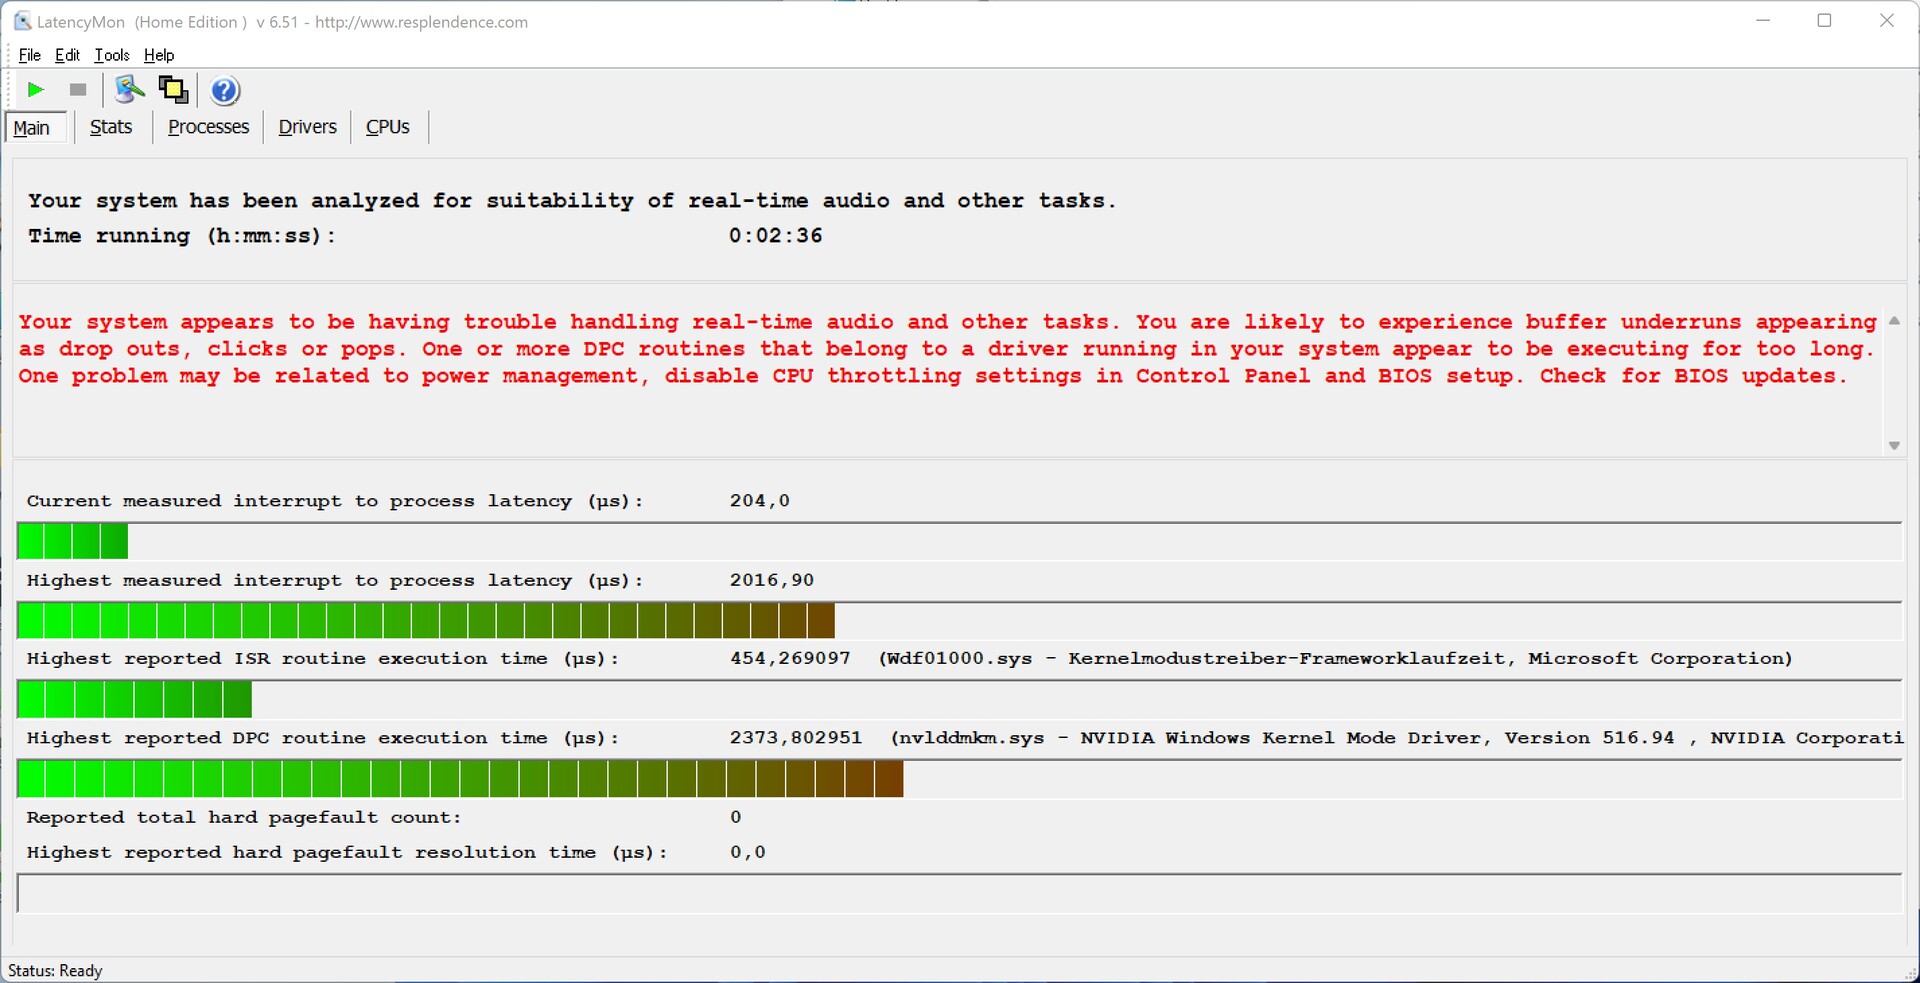
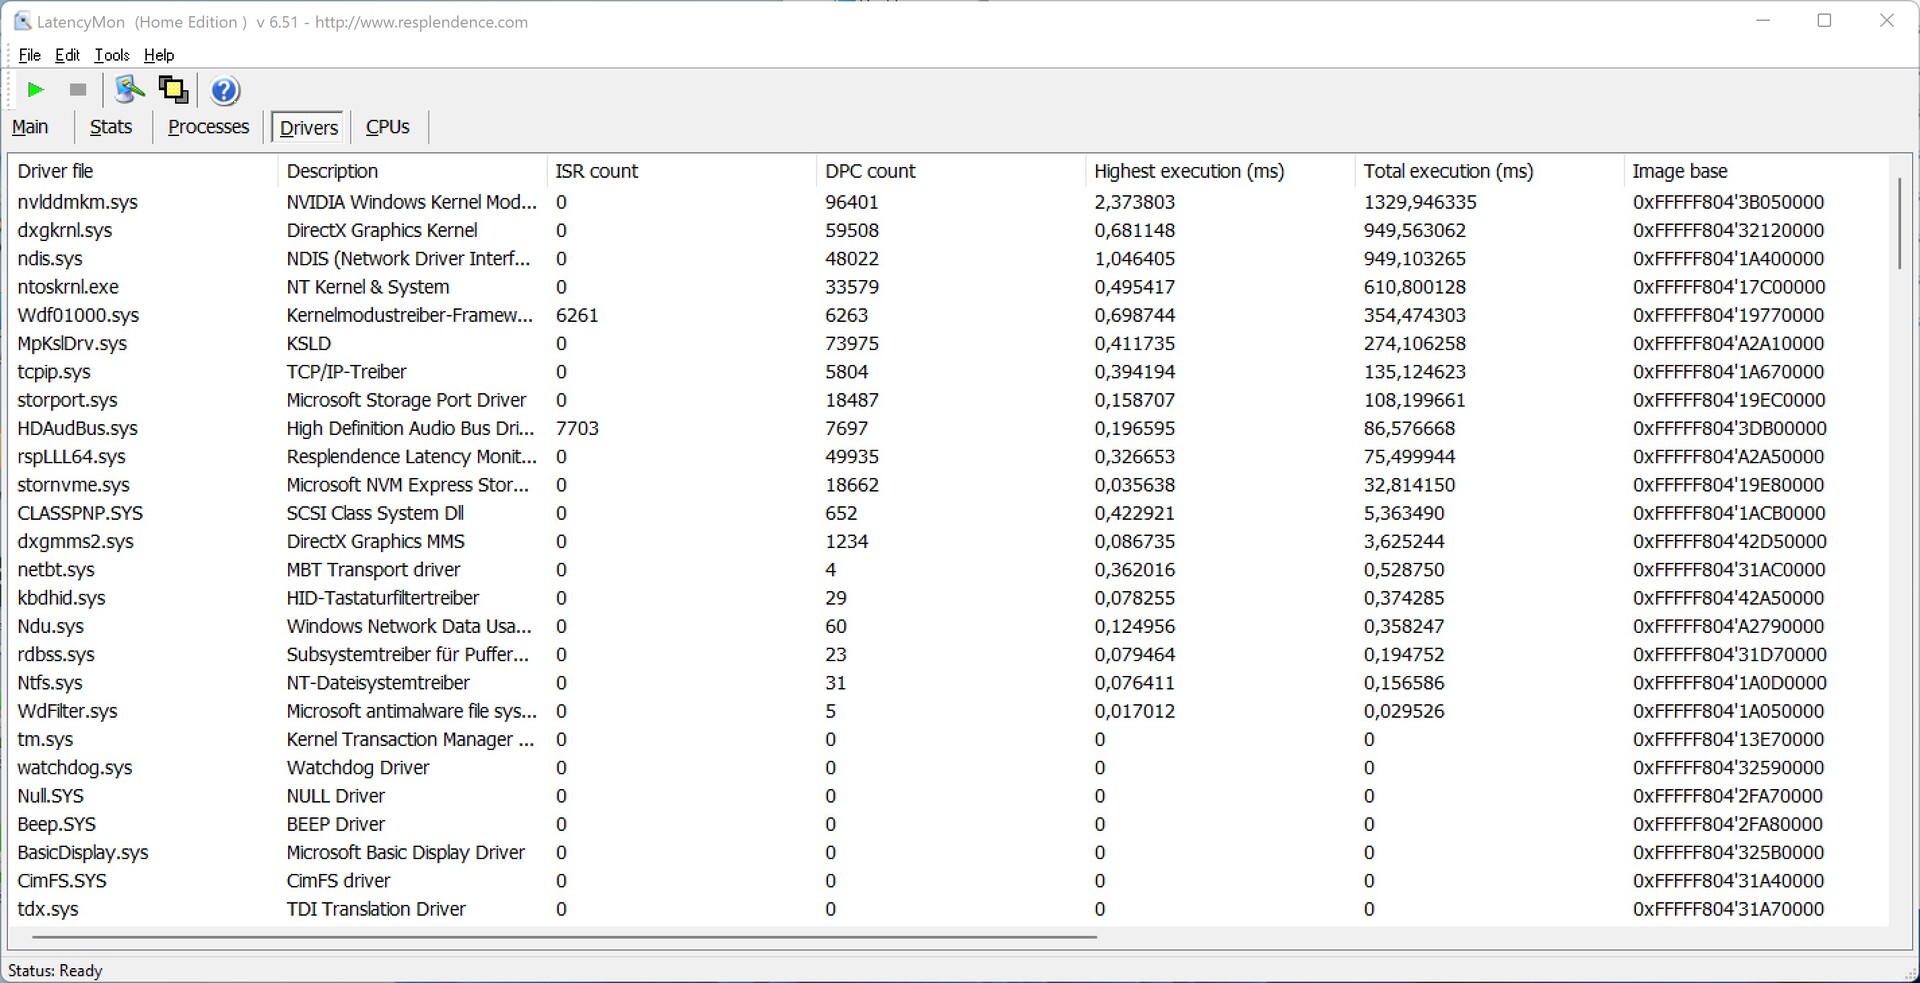
DPC延迟
Minisforum NUCXi7在Edge浏览器中打开几个标签时,已经在与增加的延迟作斗争。当播放我们的4K测试视频时, NvidiaGeForce RTX 3070 笔记本GPU被加载到大约36%。
| DPC Latencies / LatencyMon - interrupt to process latency (max), Web, Youtube, Prime95 | |
| Minisforum NUCX i7, Intel Core i7-11800H | |
| Zotac ZBOX Magnus EN173070C, Intel Core i7-11800H | |
| Gigabyte A7 X1, AMD Ryzen 9 5900HX | |
* ... smaller is better
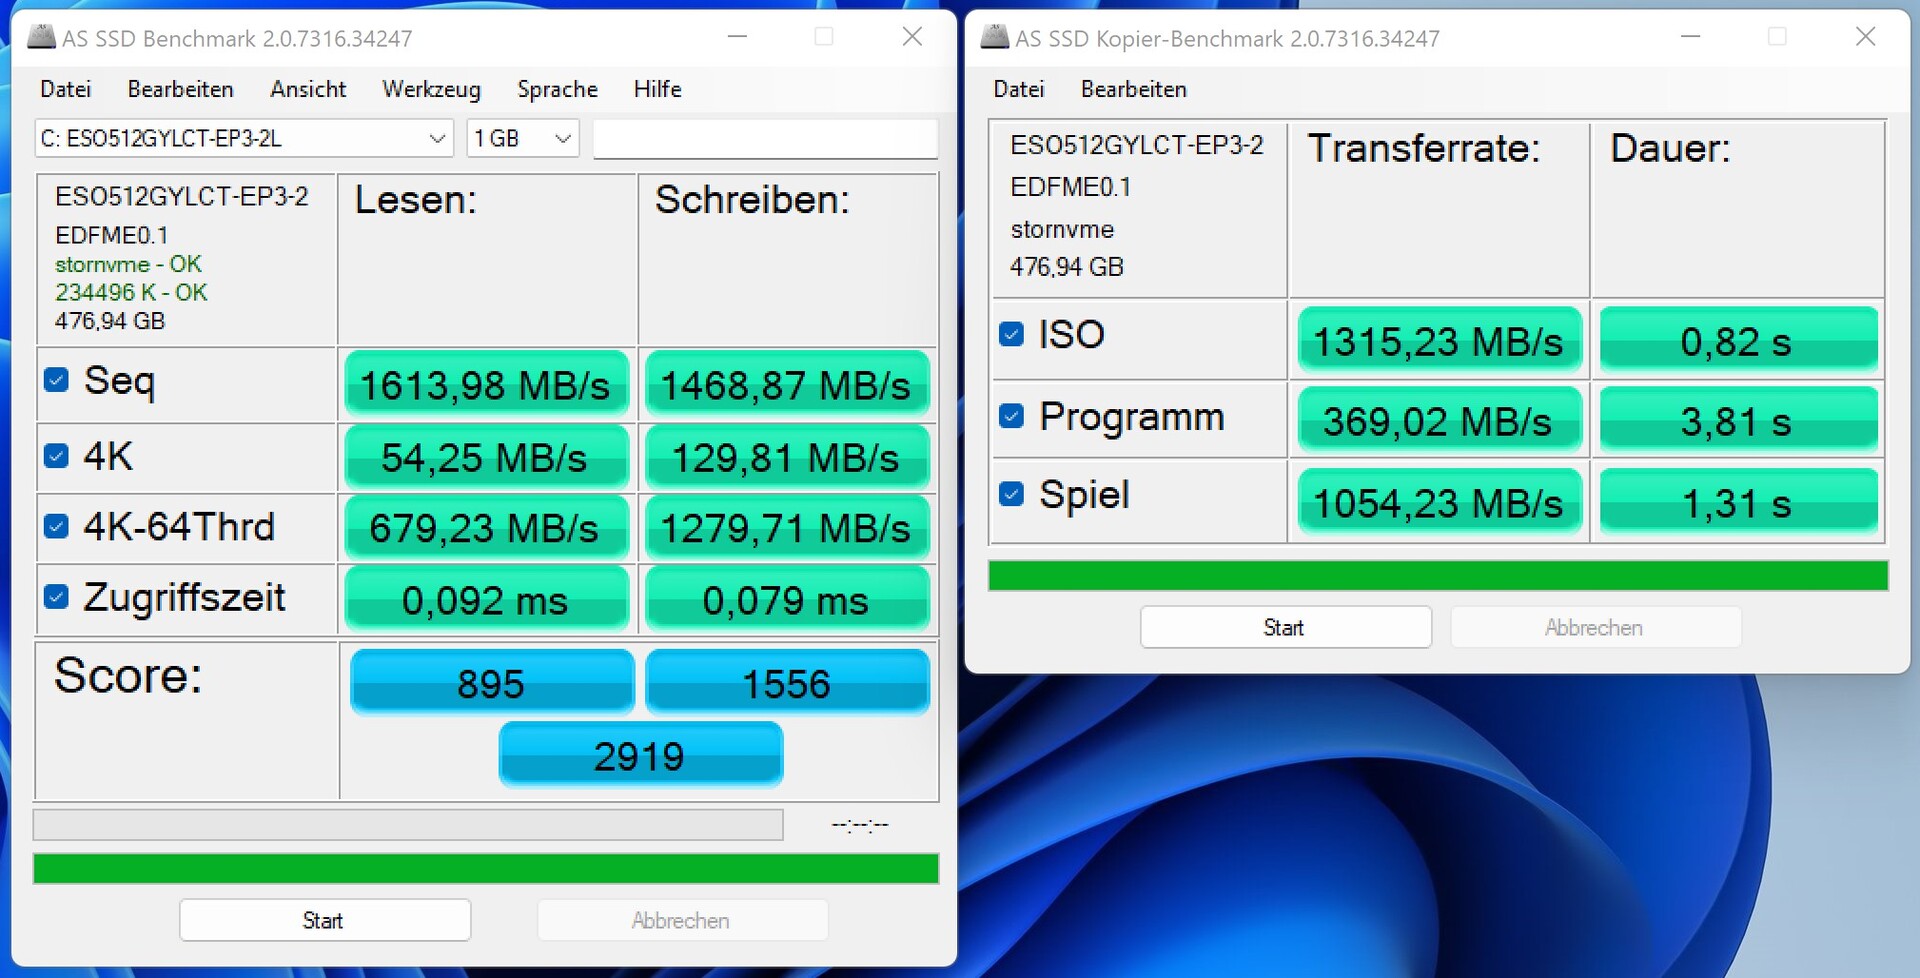
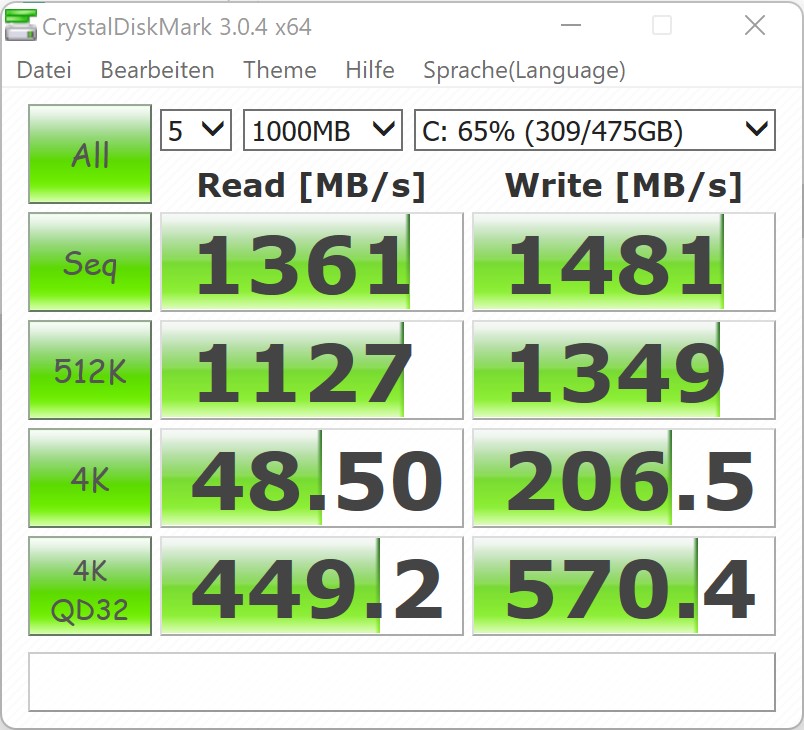
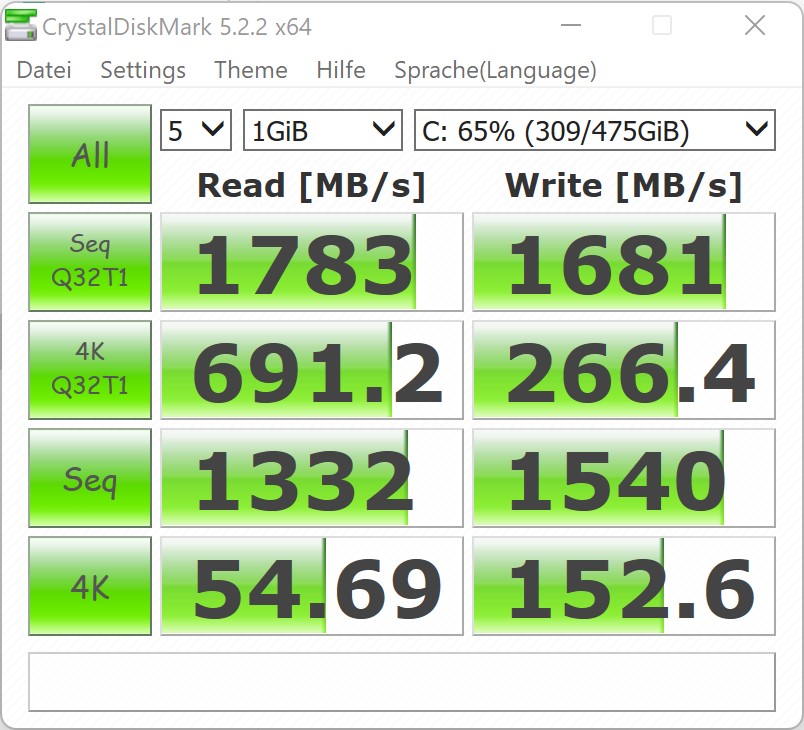
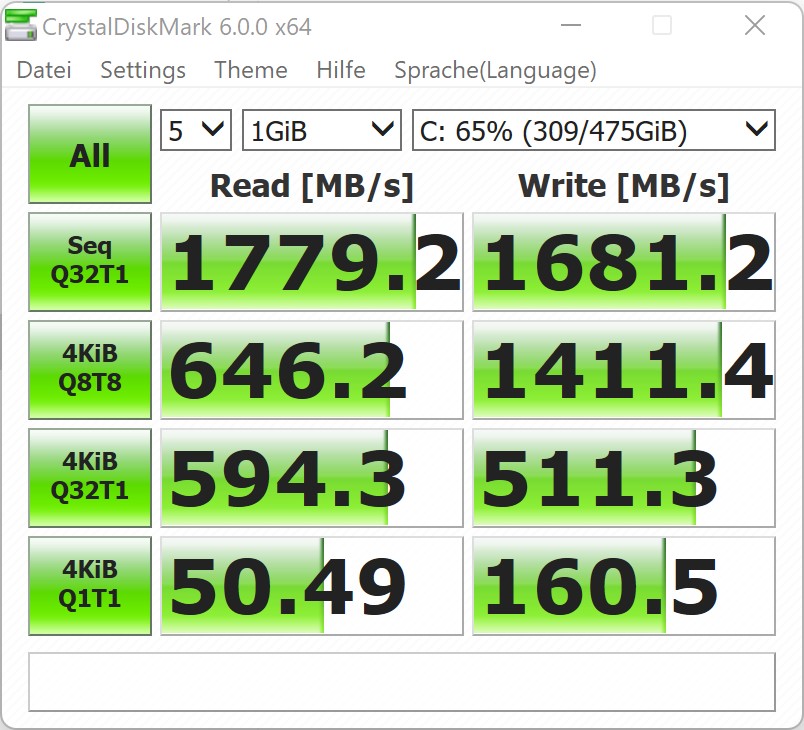
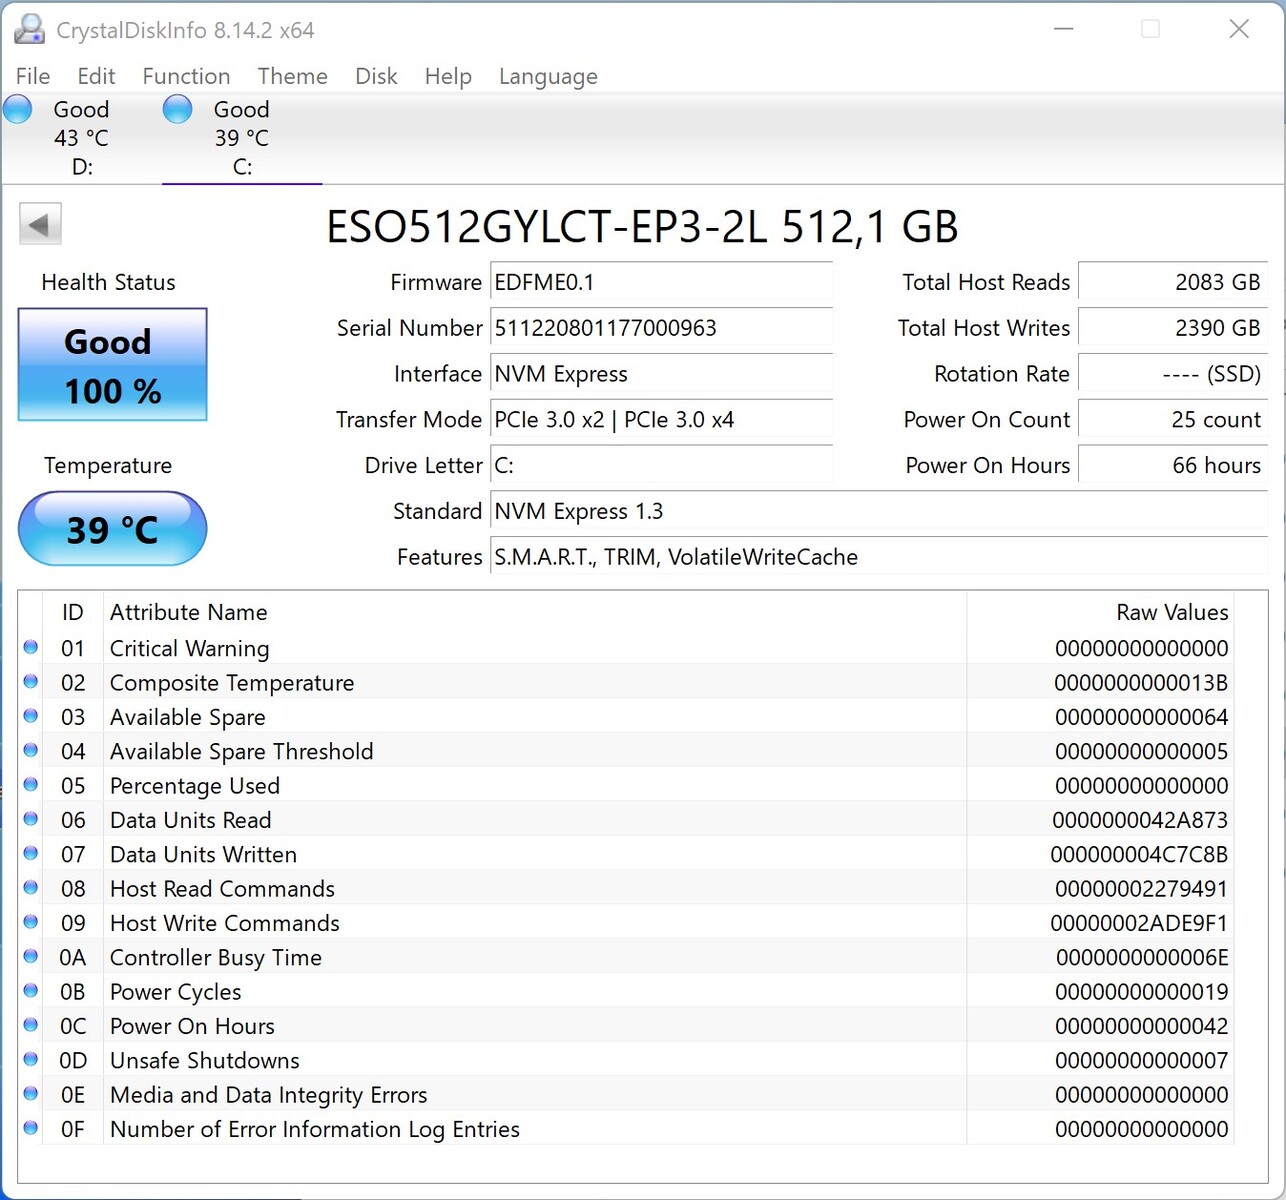
存储解决方案
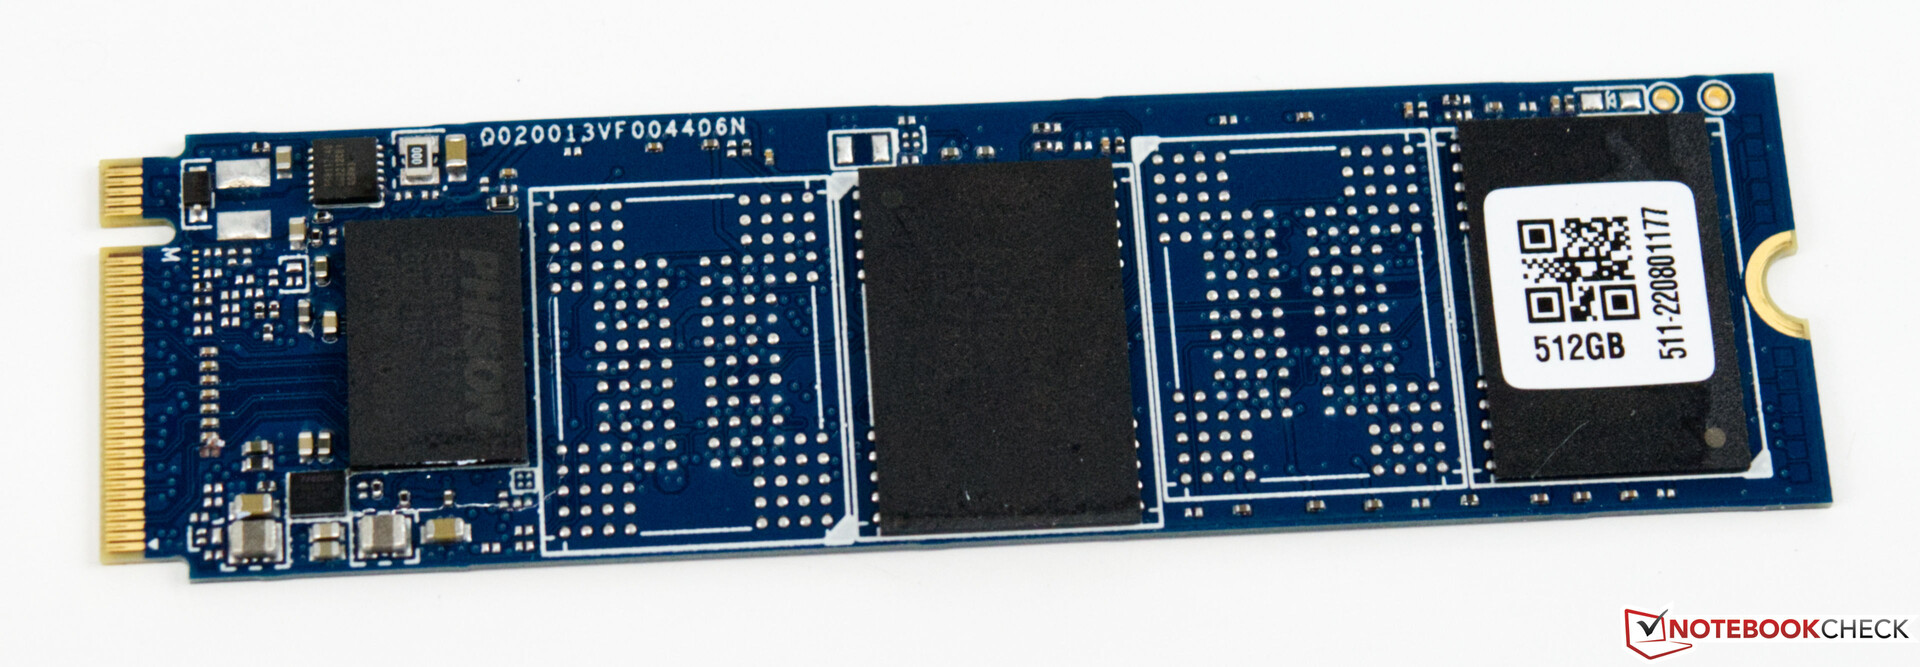
在我们的配置中,存储解决方案是一个拥有512GB存储空间的NVMe SSD。虽然使用的型号很快,但它还不能完全跟上我们的对比设备的性能。然而,对于所有通常的应用程序来说,其性能仍然是足够的。此外,我们无法看到由于固态硬盘的性能而产生的任何不必要的延迟。另一方面,考虑到目标用户群,存储空间原来非常低,只有512GB。对于一个游戏设备,我们期望至少有1TB的存储空间。同时,你也可以在以后使用第二个M.2插槽扩展存储空间。
你可以在我们的比较图中找到更多的比较和基准。 比较表.

| Drive Performance rating - Percent | |
| Average of class Desktop | |
| Intel Beast Canyon NUC | |
| Intel Dragon Canyon NUC - RTX 3060 -11! | |
| Gigabyte A7 X1 | |
| Zotac ZBOX Magnus EN173070C | |
| Zotac Magnus One (ECM73070C) | |
| Minisforum NUCX i7 | |
| Global Average -3 | |
| Zotac MEK Mini (RTX 2070 Super) | |
* ... smaller is better
Constant Performance Reading: DiskSpd Read Loop, Queue Depth 8
图形卡
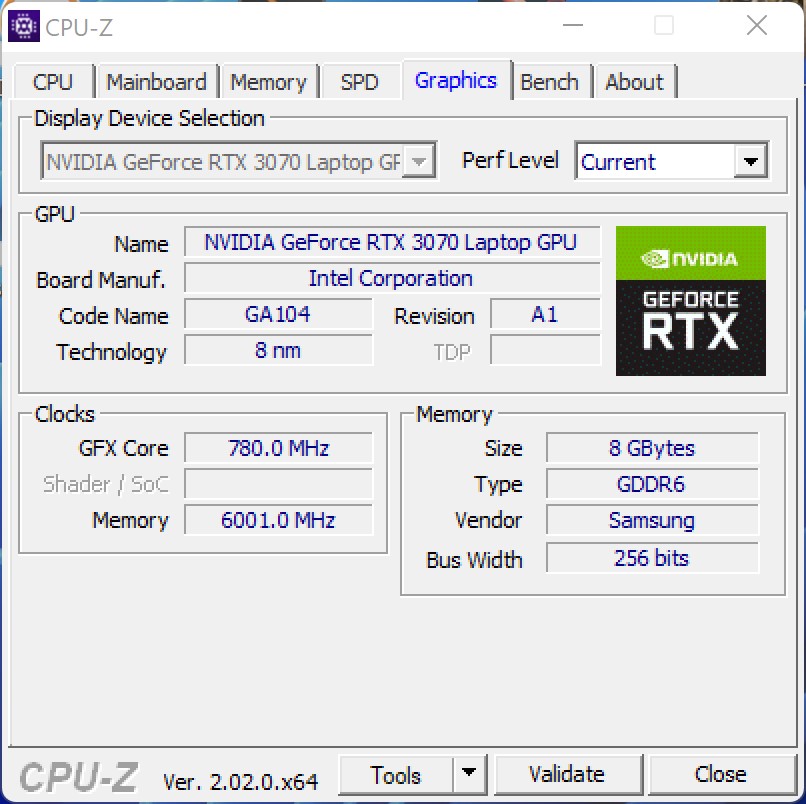
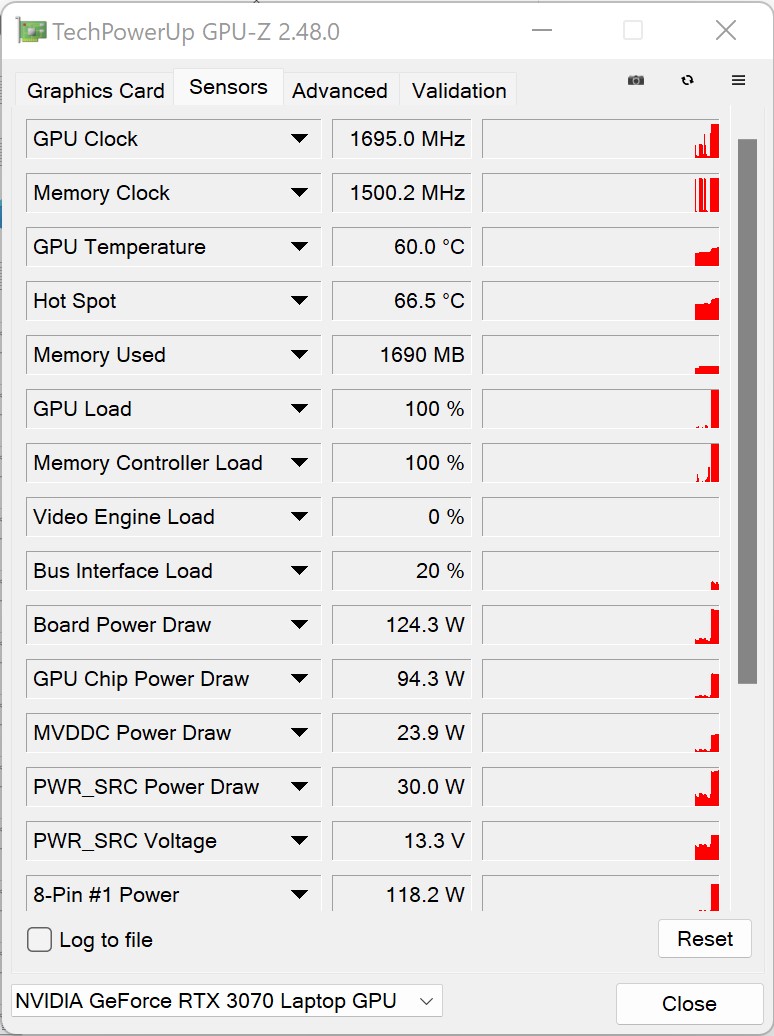
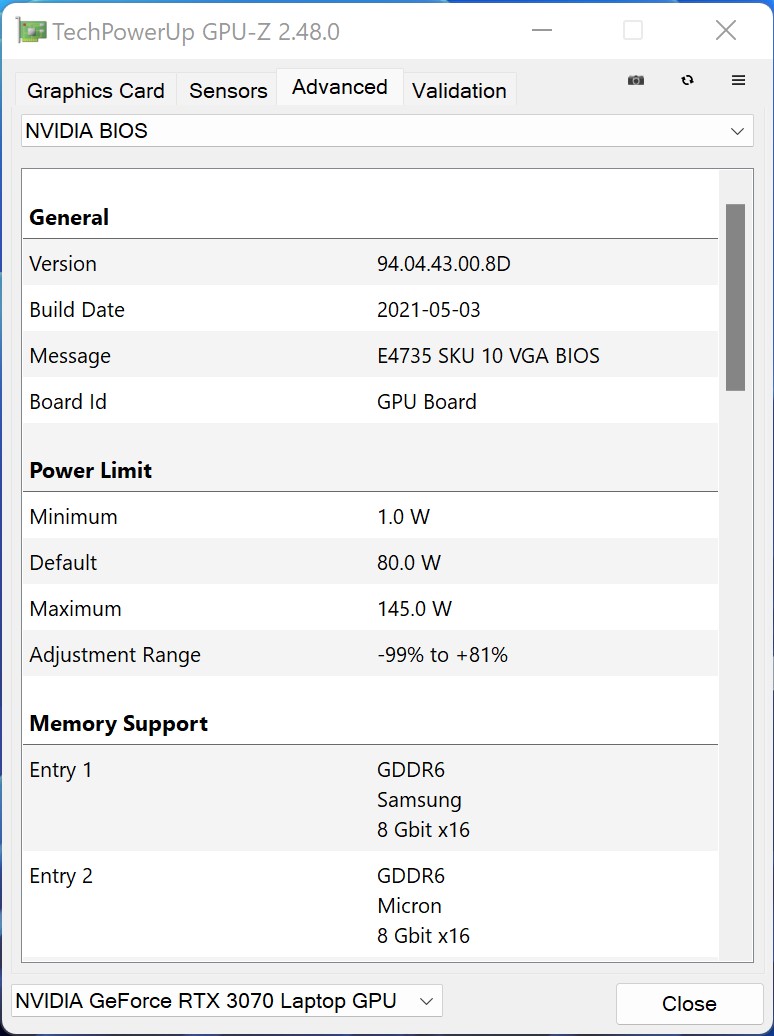
的NvidiaGeForce RTX 3070 笔记本电脑GPU在MINISFORUM NUCXi7中运行,能够在游戏模式下使用其125瓦的全部性能。然而,你仍然要注意,这是GeForce RTX 3070的移动版本,其性能并不接近桌面版本。NvidiaGeForce RTX 3070 笔记本GPU的速度约为25至30%,比NvidiaGeForce RTX 3070 桌面GPU.然而,我们的测试装置让那些基于NvidiaGeForce RTX 3060桌面GPU的竞争对手轻松地控制住了。为了衡量MINISFORUM NUCXi5的大致性能,我们还包括了Nvidia RTX 3060桌面GPU的平均性能值。 NvidiaGeForce RTX 3060 笔记本GPU在我们的图表中。
你可以找到关于NvidiaGeForce RTX 3070的其他基准测试 这里.
| 3DMark Performance rating - Percent | |
| MSI GeForce RTX 3070 Ventus 3X | |
| Zotac Magnus One (ECM73070C) | |
| Zotac ZBOX Magnus EN173070C | |
| Minisforum NUCX i7 | |
| Average NVIDIA GeForce RTX 3070 Laptop GPU | |
| Zotac MEK Mini (RTX 2070 Super) | |
| Intel Dragon Canyon NUC - RTX 3060 | |
| Intel Beast Canyon NUC | |
| Average NVIDIA GeForce RTX 3060 Laptop GPU | |
| 3DMark 11 - 1280x720 Performance GPU | |
| MSI GeForce RTX 3070 Ventus 3X | |
| Zotac Magnus One (ECM73070C) | |
| Minisforum NUCX i7 | |
| Zotac ZBOX Magnus EN173070C | |
| Zotac MEK Mini (RTX 2070 Super) | |
| Average NVIDIA GeForce RTX 3070 Laptop GPU (12535 - 38275, n=54) | |
| Intel Dragon Canyon NUC - RTX 3060 | |
| Intel Beast Canyon NUC | |
| Average NVIDIA GeForce RTX 3060 Laptop GPU (13799 - 30772, n=43) | |
| Performance rating - Percent | |
| Zotac Magnus One (ECM73070C) | |
| Zotac ZBOX Magnus EN173070C | |
| Average NVIDIA GeForce RTX 3070 Laptop GPU | |
| Minisforum NUCX i7 | |
| Intel Dragon Canyon NUC - RTX 3060 | |
| Intel Beast Canyon NUC | |
| Average NVIDIA GeForce RTX 3060 Laptop GPU | |
| Unigine Heaven 4.0 | |
| Extreme Preset OpenGL | |
| Zotac Magnus One (ECM73070C) | |
| Zotac ZBOX Magnus EN173070C | |
| Average NVIDIA GeForce RTX 3070 Laptop GPU (139.4 - 152.9, n=2) | |
| Minisforum NUCX i7 | |
| Intel Dragon Canyon NUC - RTX 3060 | |
| Intel Beast Canyon NUC | |
| Average NVIDIA GeForce RTX 3060 Laptop GPU (n=1) | |
| Extreme Preset DX11 | |
| Zotac Magnus One (ECM73070C) | |
| Zotac ZBOX Magnus EN173070C | |
| Average NVIDIA GeForce RTX 3070 Laptop GPU (152.9 - 165.1, n=2) | |
| Minisforum NUCX i7 | |
| Intel Dragon Canyon NUC - RTX 3060 | |
| Intel Beast Canyon NUC | |
| Average NVIDIA GeForce RTX 3060 Laptop GPU (n=1) | |
| Unigine Valley 1.0 | |
| 1920x1080 Extreme HD DirectX AA:x8 | |
| Zotac Magnus One (ECM73070C) | |
| Zotac ZBOX Magnus EN173070C | |
| Average NVIDIA GeForce RTX 3070 Laptop GPU (120.9 - 131.6, n=2) | |
| Minisforum NUCX i7 | |
| Intel Dragon Canyon NUC - RTX 3060 | |
| Intel Beast Canyon NUC | |
| Average NVIDIA GeForce RTX 3060 Laptop GPU (n=1) | |
| 1920x1080 Extreme HD Preset OpenGL AA:x8 | |
| Zotac Magnus One (ECM73070C) | |
| Zotac ZBOX Magnus EN173070C | |
| Average NVIDIA GeForce RTX 3070 Laptop GPU (104.8 - 115.3, n=2) | |
| Minisforum NUCX i7 | |
| Intel Dragon Canyon NUC - RTX 3060 | |
| Intel Beast Canyon NUC | |
| Average NVIDIA GeForce RTX 3060 Laptop GPU (n=1) | |
| Unigine Superposition | |
| 1920x1080 1080p High | |
| Zotac Magnus One (ECM73070C) | |
| Zotac ZBOX Magnus EN173070C | |
| Average NVIDIA GeForce RTX 3070 Laptop GPU (12667 - 13502, n=2) | |
| Minisforum NUCX i7 | |
| Average NVIDIA GeForce RTX 3060 Laptop GPU (n=1) | |
| Intel Beast Canyon NUC | |
| Intel Dragon Canyon NUC - RTX 3060 | |
| 1920x1080 1080p Extreme | |
| Zotac Magnus One (ECM73070C) | |
| Zotac ZBOX Magnus EN173070C | |
| Average NVIDIA GeForce RTX 3070 Laptop GPU (5847 - 6259, n=2) | |
| Minisforum NUCX i7 | |
| Intel Dragon Canyon NUC - RTX 3060 | |
| Intel Beast Canyon NUC | |
| Average NVIDIA GeForce RTX 3060 Laptop GPU (n=1) | |
| 3840x2160 4k Optimized | |
| Zotac Magnus One (ECM73070C) | |
| Zotac ZBOX Magnus EN173070C | |
| Average NVIDIA GeForce RTX 3070 Laptop GPU (7574 - 7997, n=2) | |
| Minisforum NUCX i7 | |
| Intel Beast Canyon NUC | |
| Average NVIDIA GeForce RTX 3060 Laptop GPU (n=1) | |
| Intel Dragon Canyon NUC - RTX 3060 | |
| 3DMark 05 Standard | 46264 points | |
| 3DMark 06 Standard Score | 47138 points | |
| 3DMark Vantage P Result | 76594 points | |
| 3DMark 11 Performance | 27592 points | |
| 3DMark Ice Storm Standard Score | 218821 points | |
| 3DMark Cloud Gate Standard Score | 53894 points | |
| 3DMark Fire Strike Score | 21258 points | |
| 3DMark Fire Strike Extreme Score | 11291 points | |
| 3DMark Time Spy Score | 9337 points | |
| 3DMark Steel Nomad Score | 2368 points | |
| 3DMark Steel Nomad Light Score | 10548 points | |
Help | ||
游戏性能
Minisforum NUCXi7令人惊讶地适合作为游戏PC。在大多数情况下,系统性能足以应付1,440p的游戏。时不时地,你还可以从2,160p的 NvidiaGeForce RTX 3070 笔记本GPU,只要游戏不对硬件提出太高要求。然而,这里记录的游戏性能相比之下是惊人的。通常情况下,我们的测试装置能够跟上基于更快的桌面GPU的对比设备,甚至超过它们。
你可以找到我们所有测试游戏的性能概览,与其他型号相比,在我们的 GPU游戏列表.
| GTA V | |
| 1920x1080 Highest AA:4xMSAA + FX AF:16x | |
| Minisforum NUCX i7 | |
| Zotac ZBOX Magnus EN173070C | |
| Intel Beast Canyon NUC | |
| Intel Dragon Canyon NUC - RTX 3060 | |
| Zotac Magnus One (ECM73070C) | |
| Average NVIDIA GeForce RTX 3070 Laptop GPU (21.7 - 125.8, n=50) | |
| Gigabyte A7 X1 | |
| 1920x1080 High/On (Advanced Graphics Off) AA:2xMSAA + FX AF:8x | |
| Intel Beast Canyon NUC | |
| Intel Dragon Canyon NUC - RTX 3060 | |
| Minisforum NUCX i7 | |
| Zotac ZBOX Magnus EN173070C | |
| Zotac Magnus One (ECM73070C) | |
| Average NVIDIA GeForce RTX 3070 Laptop GPU (58.2 - 181.4, n=38) | |
| Gigabyte A7 X1 | |
| The Witcher 3 | |
| 1920x1080 High Graphics & Postprocessing (Nvidia HairWorks Off) | |
| Zotac Magnus One (ECM73070C) | |
| Minisforum NUCX i7 | |
| Zotac ZBOX Magnus EN173070C | |
| Intel Dragon Canyon NUC - RTX 3060 | |
| Zotac MEK Mini (RTX 2070 Super) | |
| Average NVIDIA GeForce RTX 3070 Laptop GPU (122.1 - 207, n=34) | |
| 1920x1080 Ultra Graphics & Postprocessing (HBAO+) | |
| Zotac Magnus One (ECM73070C) | |
| Zotac ZBOX Magnus EN173070C | |
| Minisforum NUCX i7 | |
| Gigabyte A7 X1 | |
| Zotac MEK Mini (RTX 2070 Super) | |
| Average NVIDIA GeForce RTX 3070 Laptop GPU (34.9 - 109, n=52) | |
| Intel Dragon Canyon NUC - RTX 3060 | |
| Far Cry 5 | |
| 1920x1080 Ultra Preset AA:T | |
| Intel Dragon Canyon NUC - RTX 3060 | |
| Intel Beast Canyon NUC | |
| Zotac ZBOX Magnus EN173070C | |
| Minisforum NUCX i7 | |
| Zotac Magnus One (ECM73070C) | |
| Zotac MEK Mini (RTX 2070 Super) | |
| Average NVIDIA GeForce RTX 3070 Laptop GPU (89 - 140, n=36) | |
| 2560x1440 Ultra Preset AA:T | |
| Zotac Magnus One (ECM73070C) | |
| Zotac ZBOX Magnus EN173070C | |
| Minisforum NUCX i7 | |
| Intel Beast Canyon NUC | |
| Intel Dragon Canyon NUC - RTX 3060 | |
| Zotac MEK Mini (RTX 2070 Super) | |
| Average NVIDIA GeForce RTX 3070 Laptop GPU (81 - 101, n=18) | |
| Far Cry New Dawn | |
| 2560x1440 Ultra Preset | |
| Zotac Magnus One (ECM73070C) | |
| Intel Dragon Canyon NUC - RTX 3060 | |
| Zotac ZBOX Magnus EN173070C | |
| Minisforum NUCX i7 | |
| Intel Beast Canyon NUC | |
| Average NVIDIA GeForce RTX 3070 Laptop GPU (62 - 91, n=5) | |
| Zotac MEK Mini (RTX 2070 Super) | |
| 1920x1080 Ultra Preset | |
| Intel Dragon Canyon NUC - RTX 3060 | |
| Intel Beast Canyon NUC | |
| Zotac ZBOX Magnus EN173070C | |
| Minisforum NUCX i7 | |
| Zotac Magnus One (ECM73070C) | |
| Average NVIDIA GeForce RTX 3070 Laptop GPU (70 - 101, n=6) | |
| Zotac MEK Mini (RTX 2070 Super) | |
| F1 2020 | |
| 2560x1440 Ultra High Preset AA:T AF:16x | |
| Minisforum NUCX i7 | |
| Zotac ZBOX Magnus EN173070C | |
| Intel Beast Canyon NUC | |
| Intel Dragon Canyon NUC - RTX 3060 | |
| Average NVIDIA GeForce RTX 3070 Laptop GPU (74 - 123.7, n=4) | |
| 1920x1080 Ultra High Preset AA:T AF:16x | |
| Minisforum NUCX i7 | |
| Zotac ZBOX Magnus EN173070C | |
| Intel Beast Canyon NUC | |
| Intel Dragon Canyon NUC - RTX 3060 | |
| Average NVIDIA GeForce RTX 3070 Laptop GPU (97 - 173, n=7) | |
| Strange Brigade | |
| 2560x1440 ultra AA:ultra AF:16 | |
| Zotac Magnus One (ECM73070C) | |
| Zotac ZBOX Magnus EN173070C | |
| Minisforum NUCX i7 | |
| Average NVIDIA GeForce RTX 3070 Laptop GPU (82.3 - 140.5, n=18) | |
| Intel Beast Canyon NUC | |
| Intel Dragon Canyon NUC - RTX 3060 | |
| 1920x1080 ultra AA:ultra AF:16 | |
| Zotac Magnus One (ECM73070C) | |
| Zotac ZBOX Magnus EN173070C | |
| Gigabyte A7 X1 | |
| Minisforum NUCX i7 | |
| Average NVIDIA GeForce RTX 3070 Laptop GPU (36.2 - 194, n=46) | |
| Intel Beast Canyon NUC | |
| Intel Dragon Canyon NUC - RTX 3060 | |
| Borderlands 3 | |
| 2560x1440 Badass Overall Quality (DX11) | |
| Zotac Magnus One (ECM73070C) | |
| Intel Beast Canyon NUC | |
| Minisforum NUCX i7 | |
| Zotac ZBOX Magnus EN173070C | |
| Intel Dragon Canyon NUC - RTX 3060 | |
| Average NVIDIA GeForce RTX 3070 Laptop GPU (47.2 - 64.3, n=4) | |
| Zotac MEK Mini (RTX 2070 Super) | |
| 1920x1080 Badass Overall Quality (DX11) | |
| Intel Beast Canyon NUC | |
| Zotac Magnus One (ECM73070C) | |
| Intel Dragon Canyon NUC - RTX 3060 | |
| Minisforum NUCX i7 | |
| Zotac ZBOX Magnus EN173070C | |
| Average NVIDIA GeForce RTX 3070 Laptop GPU (65.4 - 88.3, n=4) | |
| Zotac MEK Mini (RTX 2070 Super) | |
| Metro Exodus | |
| 1920x1080 Ultra Quality AF:16x | |
| Zotac Magnus One (ECM73070C) | |
| Zotac ZBOX Magnus EN173070C | |
| Minisforum NUCX i7 | |
| Average NVIDIA GeForce RTX 3070 Laptop GPU (57.1 - 77.2, n=4) | |
| Zotac MEK Mini (RTX 2070 Super) | |
| Intel Dragon Canyon NUC - RTX 3060 | |
| Intel Beast Canyon NUC | |
| 2560x1440 Ultra Quality AF:16x | |
| Zotac Magnus One (ECM73070C) | |
| Minisforum NUCX i7 | |
| Zotac ZBOX Magnus EN173070C | |
| Average NVIDIA GeForce RTX 3070 Laptop GPU (45.3 - 61.6, n=4) | |
| Zotac MEK Mini (RTX 2070 Super) | |
| Intel Dragon Canyon NUC - RTX 3060 | |
| Intel Beast Canyon NUC | |
| low | med. | high | ultra | QHD DLSS | QHD | 4K DLSS | 4K FSR | 4K | |
|---|---|---|---|---|---|---|---|---|---|
| GTA V (2015) | 184.7 | 179.4 | 171.5 | 106 | 90.6 | 85.6 | |||
| The Witcher 3 (2015) | 417 | 315 | 204 | 104.1 | 71.6 | ||||
| Dota 2 Reborn (2015) | 169.9 | 151.2 | 145.8 | 135.6 | 124.3 | ||||
| Rise of the Tomb Raider (2016) | 293 | 206 | 138.7 | 122 | 56.9 | ||||
| Final Fantasy XV Benchmark (2018) | 187.3 | 135.9 | 103.3 | 76.7 | 45.6 | ||||
| X-Plane 11.11 (2018) | 143.2 | 125.9 | 94.8 | 81.5 | |||||
| Far Cry 5 (2018) | 157 | 134 | 127 | 119 | 99 | 55 | |||
| Strange Brigade (2018) | 501 | 265 | 213 | 184.7 | 137.3 | 78.6 | |||
| Shadow of the Tomb Raider (2018) | 167.7 | 143.5 | 134.3 | 123.1 | 88.6 | 48 | |||
| Forza Horizon 4 (2018) | 211 | 189 | 188 | 167 | 140 | 93 | |||
| Far Cry New Dawn (2019) | 133 | 115 | 112 | 100 | 91 | 58 | |||
| Metro Exodus (2019) | 185 | 120.8 | 93.1 | 74.6 | 59.9 | 37.6 | |||
| Anno 1800 (2019) | 143.6 | 132.6 | 109.8 | 56.7 | 48.2 | 32.1 | |||
| Control (2019) | 240 | 131.7 | 96.1 | 61 | 30.3 | ||||
| Borderlands 3 (2019) | 141.9 | 124.9 | 101 | 84.7 | 62.6 | 34.8 | |||
| F1 2020 (2020) | 333 | 273 | 230 | 166.2 | 123.7 | 69.7 | |||
| Watch Dogs Legion (2020) | 114 | 106 | 96 | 73 | 64 | 27 | |||
| Dirt 5 (2020) | 210 | 147 | 114 | 91 | 73 | 49 | |||
| F1 2021 (2021) | 381 | 303 | 244 | 123.1 | 90.2 | 51.1 | |||
| New World (2021) | 115.7 | 95.2 | 89.1 | 84.2 | 67.5 | 35.7 | |||
| Far Cry 6 (2021) | 139.1 | 120 | 106.5 | 102.3 | 78.6 | ||||
| Forza Horizon 5 (2021) | 206 | 145 | 132 | 81 | 70 | 50 | |||
| God of War (2022) | 128.1 | 111 | 91.5 | 67.7 | 57.4 | 37 | |||
| GRID Legends (2022) | 147 | 163 | 153 | 122 | 81 | 56 | |||
| Cyberpunk 2077 1.6 (2022) | 145.6 | 129.2 | 113.9 | 72.3 | 47.3 | 22.3 | |||
| Tiny Tina's Wonderlands (2022) | 194.1 | 158.8 | 111.6 | 88.3 | 62.1 | 33.6 | |||
| F1 22 (2022) | 239 | 208 | 172.1 | 61.9 | 39.7 | 19.1 | |||
| A Plague Tale Requiem (2022) | 107.9 | 84.8 | 66.2 | 50.1 | 36.3 | 20.4 | |||
| Uncharted Legacy of Thieves Collection (2022) | 83.4 | 80.6 | 76.8 | 73.7 | 56.4 | 21.9 | |||
| Call of Duty Modern Warfare 2 2022 (2022) | 129 | 117 | 90 | 87 | 62 | 58 | 37 | ||
| Spider-Man Miles Morales (2022) | 124.8 | 114.7 | 111.3 | 100.4 | 66.6 | 44.6 | |||
| The Callisto Protocol (2022) | 124.9 | 105.2 | 100.2 | 72.5 | 53.2 | 30.8 | |||
| Need for Speed Unbound (2022) | 116.8 | 108.2 | 92.7 | 89.7 | 78.1 | 44.8 | |||
| High On Life (2023) | 216 | 157 | 124.3 | 103 | 65.5 | 27.6 | |||
| The Witcher 3 v4 (2023) | 161.1 | 151.2 | 128.4 | 112.6 | 81.9 | 46.5 | |||
| Dead Space Remake (2023) | 87.7 | 83.9 | 73.3 | 73.6 | 53.8 | 27.5 | |||
| Hogwarts Legacy (2023) | 97.1 | 88.4 | 72.4 | 59.1 | 47 | 26.7 | |||
| Returnal (2023) | 104 | 101 | 93 | 79 | 59 | 34 | |||
| Atomic Heart (2023) | 186.7 | 143.9 | 88.5 | 69.8 | 53.8 | 32.5 | |||
| Company of Heroes 3 (2023) | 193.5 | 167.4 | 134.3 | 133.9 | 100.8 | 58.4 | |||
| Sons of the Forest (2023) | 80.4 | 75.8 | 72.8 | 72.5 | 57.7 | 37.8 | |||
| Resident Evil 4 Remake (2023) | 140 | 103.1 | 96.7 | 67.6 | 52.6 | 30.5 | |||
| The Last of Us (2023) | 96.6 | 82.2 | 71.6 | 56.9 | 36.6 | 31 | 16.5 | ||
| Dead Island 2 (2023) | 209 | 205 | 164.3 | 126.1 | 89.9 | 45.1 | |||
| Star Wars Jedi Survivor (2023) | 81.1 | 72.3 | 67.4 | 64.2 | 40.5 | 19.8 | |||
| Diablo 4 (2023) | 250 | 197.9 | 164.1 | 155.6 | 111.2 | 57.3 | |||
| Ratchet & Clank Rift Apart (2023) | 87.6 | 75.7 | 66.8 | 63.5 | 61.7 | 51.3 | |||
| Atlas Fallen (2023) | 144.5 | 135 | 127 | 106.8 | 42.6 | 75.9 | |||
| Immortals of Aveum (2023) | 62.4 | 51.2 | 41.7 | 28.2 | 15.9 | ||||
| Armored Core 6 (2023) | 104.3 | 102.4 | 101.1 | 96.3 | 76.6 | 44.6 | |||
| Starfield (2023) | 73.5 | 64 | 51.6 | 47.1 | 32.5 | 23.1 | |||
| Lies of P (2023) | 160.7 | 152 | 130.2 | 117.1 | 80.2 | 65 | 41.6 | ||
| Baldur's Gate 3 (2023) | 163.1 | 121.6 | 102 | 86.7 | 84.7 | 30.3 | |||
| Cyberpunk 2077 (2023) | 122.9 | 99.3 | 84.8 | 75 | 46.9 | 20.9 | |||
| Counter-Strike 2 (2023) | 241 | 230 | 193.8 | 149.5 | 105.9 | 63.3 | |||
| EA Sports FC 24 (2023) | 249 | 199.3 | 161.7 | 151.4 | 129 | 79.5 | |||
| Assassin's Creed Mirage (2023) | 114 | 106 | 101 | 79 | 64 | 52 | 41 | ||
| Total War Pharaoh (2023) | 329.3 | 205.4 | 127.1 | 99.1 | 78.3 | 42.5 | |||
| Lords of the Fallen (2023) | 68 | 68.1 | 65.2 | 53.9 | 54.6 | 26.1 | 34 | ||
| Alan Wake 2 (2023) | 67 | 61.2 | 53.2 | 33.6 | 14.1 | ||||
| EA Sports WRC (2023) | 130.8 | 98.1 | 90.7 | 83.4 | 63.2 | 52.5 | 35.5 | ||
| Call of Duty Modern Warfare 3 2023 (2023) | 146 | 129 | 101 | 83 | 67 | 46 | 43 | ||
| Avatar Frontiers of Pandora (2023) | 76 | 72 | 61 | 46 | 31 | 28 | 16 | ||
| The Finals (2023) | 222 | 181.7 | 160.6 | 127.2 | 80.2 | 37.6 | |||
| Ready or Not (2023) | 210 | 189.1 | 174.8 | 131.3 | 82 | 75.1 | 37.2 | ||
| Prince of Persia The Lost Crown (2024) | 356 | 356 | 356 | 340 | 178 | ||||
| Palworld (2024) | 116.7 | 106.1 | 103 | 102.1 | 72.9 | 54.9 | 38.7 | ||
| Enshrouded (2024) | 80.3 | 68.8 | 58.8 | 49.2 | 38 | 34 | 32.8 | 22.8 | |
| Helldivers 2 (2024) | 130 | 101 | 91.3 | 89.5 | 65.6 | 35.3 | |||
| Skull & Bones (2024) | 112 | 103 | 84 | 63 | 50 | 46 | 43 | 31 | |
| Last Epoch (2024) | 192.2 | 184.2 | 167.2 | 127.3 | 83.6 | 40.7 | |||
| Alone in the Dark (2024) | 172.9 | 156.8 | 149.9 | 102.4 | 51.5 | 36.7 | 53.1 | 16.1 | |
| Dragon's Dogma 2 (2024) | 54.2 | 52.7 | 49.3 | 38.7 | 37.5 | 33.9 | |||
| Horizon Forbidden West (2024) | 104.2 | 96.2 | 62.7 | 60.5 | 47 | 42.2 | 38.8 | 29.3 | |
| Ghost of Tsushima (2024) | 88.6 | 80.7 | 74.5 | 60.3 | 63 | 48.3 | 8.5 | 4.8 | |
| Senua's Saga Hellblade 2 (2024) | 60.9 | 52.5 | 38.4 | 39.2 | 26.1 | 24.8 | 9.4 | ||
| F1 24 (2024) | 248 | 234 | 181.7 | 60 | 61.7 | 38.1 | 33 | 18.3 | |
| The First Descendant (2024) | 151.7 | 96.9 | 78.4 | 66.1 | 43.6 | 23.3 | 23.8 | ||
| Once Human (2024) | 184.4 | 126.1 | 108.6 | 99 | 68.2 | 35.6 | |||
| Black Myth: Wukong (2024) | 80 | 60 | 46 | 24 | 27 | 18 | 19 | 10 | |
| Star Wars Outlaws (2024) | 50.2 | 44.9 | 38.1 | 30.9 | 30.8 | 22.2 | |||
| Space Marine 2 (2024) | 77.3 | 71 | 68 | 62 | 61.8 | 46.4 | 38.8 | 24.2 | |
| Final Fantasy XVI (2024) | 69.4 | 66.7 | 56.5 | 49.6 | 40.8 | 36.2 | 17.9 | ||
| God of War Ragnarök (2024) | 127.7 | 107 | 91.4 | 83.1 | 90.6 | 63.2 | 35.6 | ||
| Until Dawn (2024) | 65.3 | 51.5 | 39.1 | 28.1 | 16.1 | ||||
| Call of Duty Black Ops 6 (2024) | 111 | 99 | 72 | 69 | 50 | 31 | |||
| Stalker 2 (2024) | 77.7 | 66.7 | 53.3 | 43.9 | 36.1 | ||||
| Indiana Jones and the Great Circle (2024) | 93.5 | 63 | |||||||
| Kingdom Come Deliverance 2 (2025) | 109 | 84.3 | 69.2 | 50.2 | 49.1 | 35.9 | 23 | 20.1 | |
| Monster Hunter Wilds (2025) | 60.2 | 51.1 | 30.5 | 31.1 | 24.6 | ||||
| Civilization 7 (2025) | 292 | 174.7 | 122.3 | 79.9 | 34.9 | ||||
| Assassin's Creed Shadows (2025) | 54 | 45 | 39 | 24 | 23 | ||||
| The Elder Scrolls IV Oblivion Remastered (2025) | 80.4 | 70.4 | 47.9 | 23.7 | 25.8 | 14.2 | |||
| Doom: The Dark Ages (2025) | 68 | 60.2 | 54.7 | 52.6 | 49.9 | 33.1 | |||
| F1 25 (2025) | 185.3 | 167.5 | 138.1 | 14.9 | 15.2 | 8.48 | 6.36 | 3.44 | |
| Borderlands 4 (2025) | 56.4 | 49.4 | 40 | 26.9 | 31.1 | 18.5 | |||
| Battlefield 6 (2025) | 104.7 | 94.3 | 80.5 | 60.2 | 38.4 | 39.1 | 23 | 17.7 | |
| The Outer Worlds 2 (2025) | 86.3 | 80.4 | 64.6 | 36.5 | 31 | 23 | |||
| ARC Raiders (2025) | 181.7 | 114.9 | 92.4 | 57.5 | 58.1 | 40.2 | 36.4 | 22.7 | |
| Anno 117: Pax Romana (2025) | 95.6 | 73.5 | 55.9 | 30 | 30.6 | 21.5 | |||
| Resident Evil Requiem (2026) | 112.5 | 85.2 | 79.5 | 42.2 | 13.3 | ||||
| Death Stranding 2 (2026) | 71.4 | 61.8 | 56.8 | 44.4 | 47.9 | 33.3 | 29.6 | 20.6 | |
| Crimson Desert (2026) | 90.9 | 57.4 | 53.9 | 46.2 | 37.6 | 35.9 | 22.2 | 20.5 | |
| Pragmata (2026) | 114.4 | 86.2 | 69.2 | 67.4 | 50.6 | 42.7 | 27.7 | ||
| Forza Horizon 6 (2026) | 142 | 90 | 48 | 21 | 18 | 17 | |||
| 007 First Light (2026) | 63.7 | 52.9 | 57.8 | 49.3 | 6.93 |
排放--冷却效果好,负载下安静
噪声排放
Minisforum NUCXi7的冷却系统由五根热管和两个风扇组成,在空闲运行时几乎听不见,甚至完全无声。但即使在负载情况下,该设备也不会变得非常响亮,我们测量的最大噪音水平为40.8 dB(A)。
Noise level
| Idle |
| 29.5 / 29.5 / 29.5 dB(A) |
| Load |
| 32.8 / 40.8 dB(A) |
 | ||
30 dB silent 40 dB(A) audible 50 dB(A) loud |
||
min: | ||
| Minisforum NUCX i7 i7-11800H, GeForce RTX 3070 Laptop GPU | Zotac Magnus One (ECM73070C) i7-10700, GeForce RTX 3070 | Zotac ZBOX Magnus EN173070C i7-11800H, GeForce RTX 3070 Laptop GPU | Intel Dragon Canyon NUC - RTX 3060 i9-12900, GeForce RTX 3060 | |
|---|---|---|---|---|
| Noise | -18% | -13% | -4% | |
| off / environment * (dB) | 29.5 | 30 -2% | 30.7 -4% | 30.2 -2% |
| Idle Minimum * (dB) | 29.5 | 33.58 -14% | 32.7 -11% | 30.2 -2% |
| Idle Average * (dB) | 29.5 | 32.8 -11% | 30.4 -3% | |
| Idle Maximum * (dB) | 29.5 | 32.8 -11% | 30.8 -4% | |
| Load Average * (dB) | 32.8 | 44.25 -35% | 41.7 -27% | |
| Load Maximum * (dB) | 40.8 | 48.72 -19% | 45.4 -11% | 45.1 -11% |
* ... smaller is better
温度
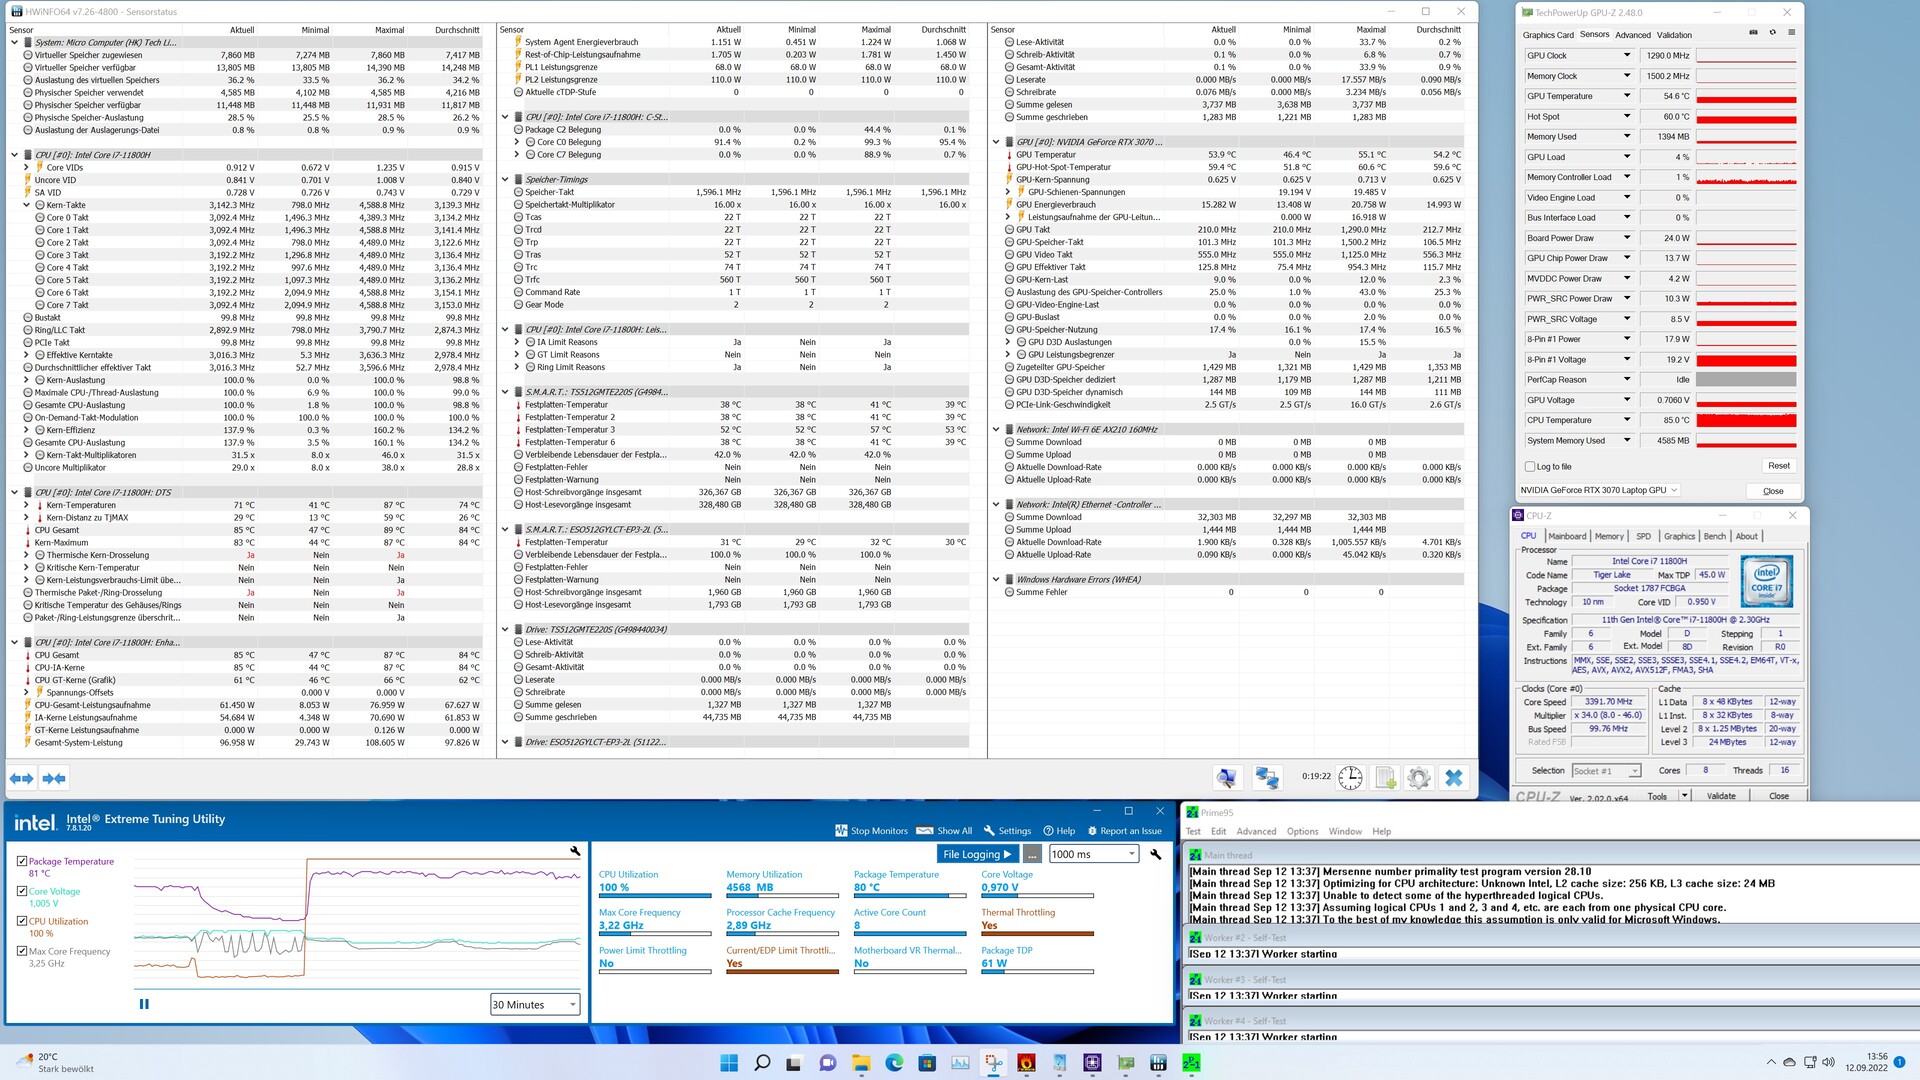
由于结构的原因,机箱的温度与游戏笔记本的温度非常相似。在压力测试中,我们在可见的一侧测量到45.9 °C (114.6 °F)的最热位置,该位置也显示了商标和标签。我们在游戏过程中测量的机箱温度略低。
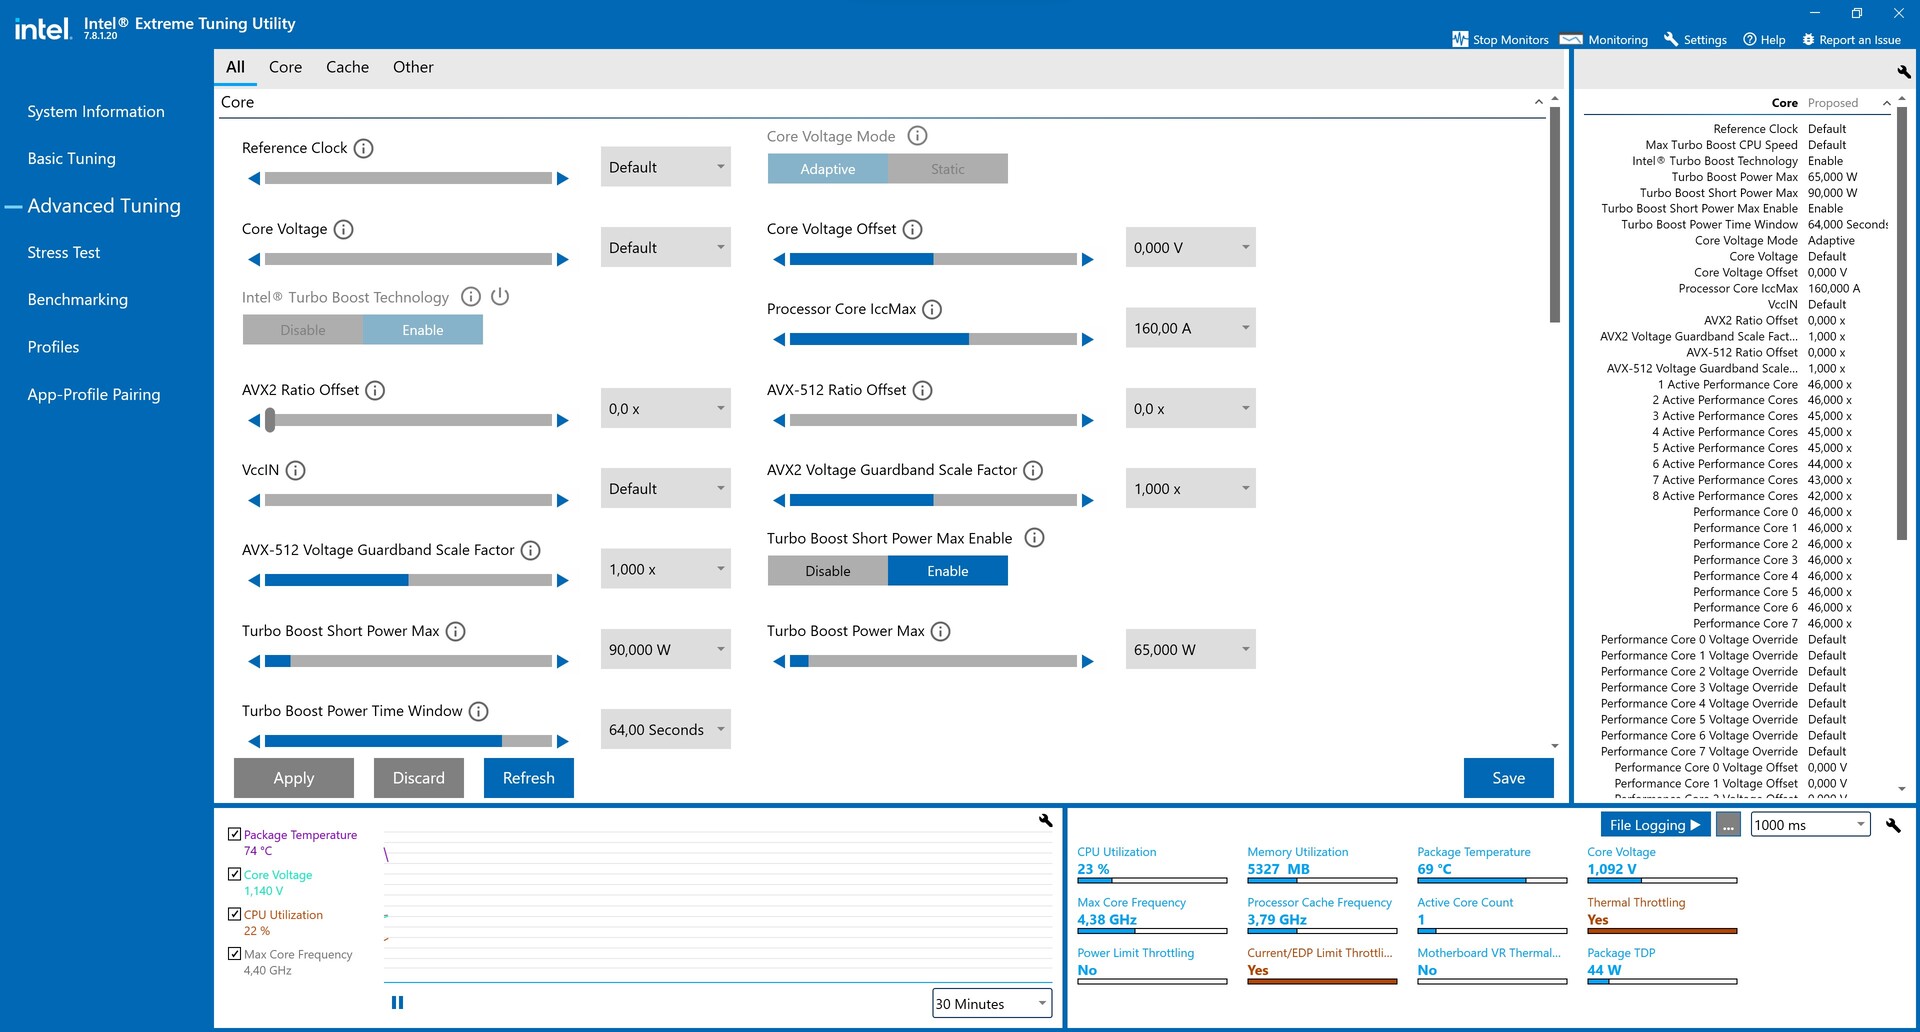
组件方面的情况看起来也很好。英特尔酷睿i7-11800H 在负载下达到86°C(187°F),尽管NvidiaGeForce RTX 3070 Laptop GPU 在压力测试中仍然略微冷却,为77°C(°F)。英特尔XTU以及HWiNFO报告了负载下的热节流,这证实了制造商为处理器定义了85℃(185°F)的热限制。你可以在BIOS中把处理器的这个极限提高到94 °C(201 °F)。另一方面,显卡的87 °C (189 °F)的限制始终保持固定。
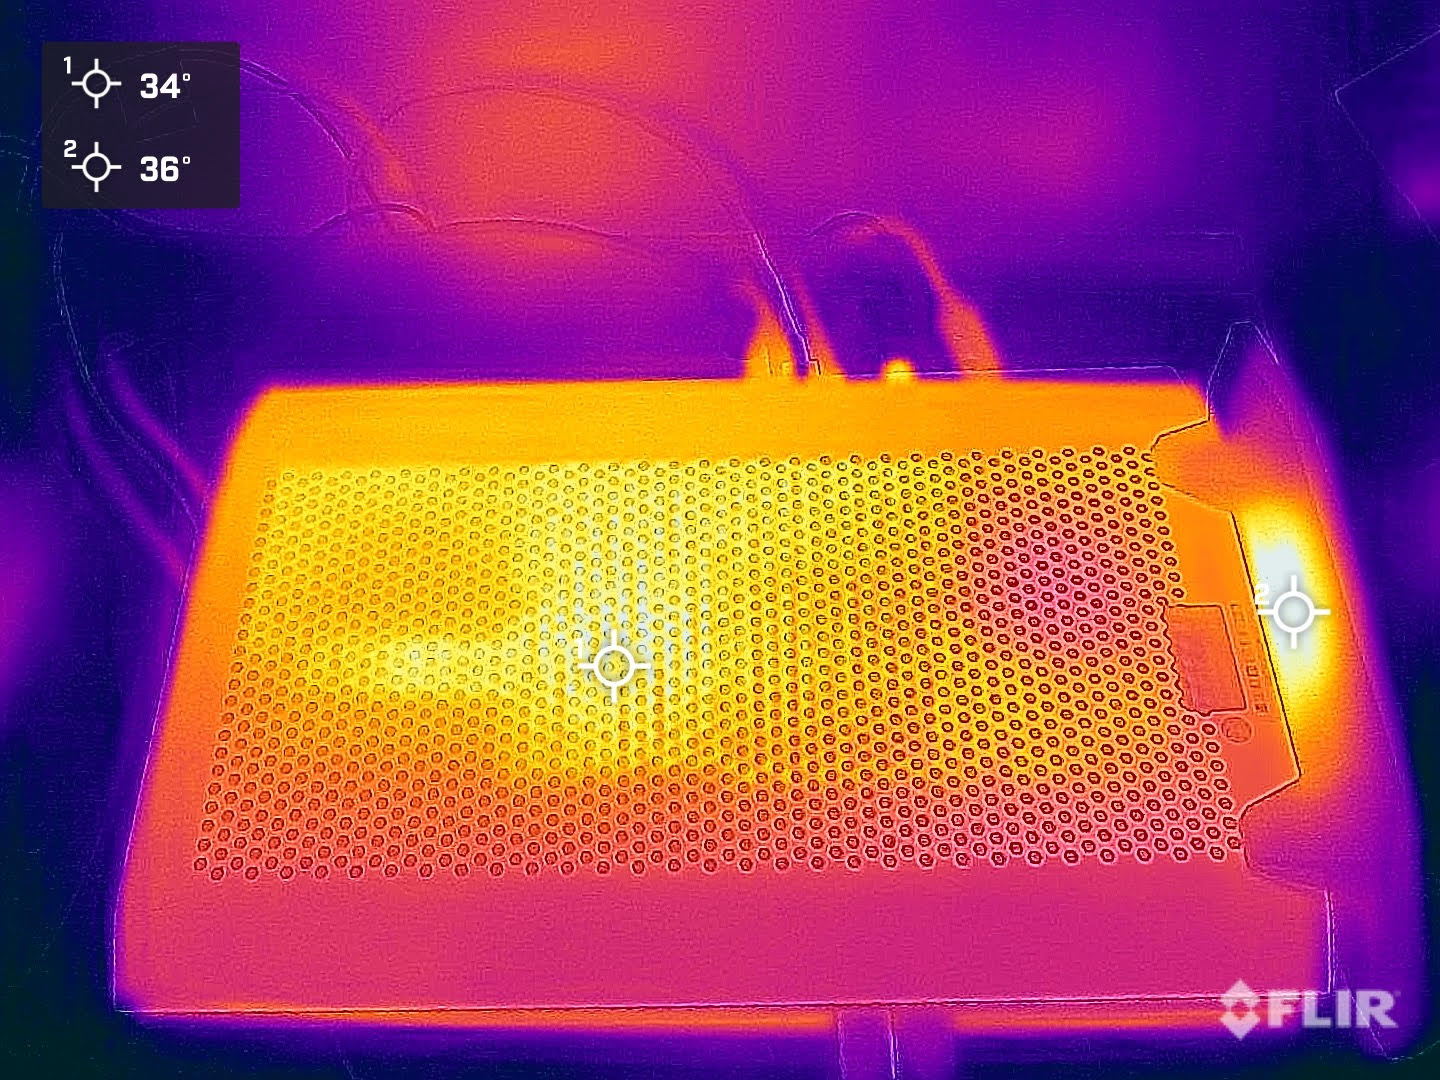
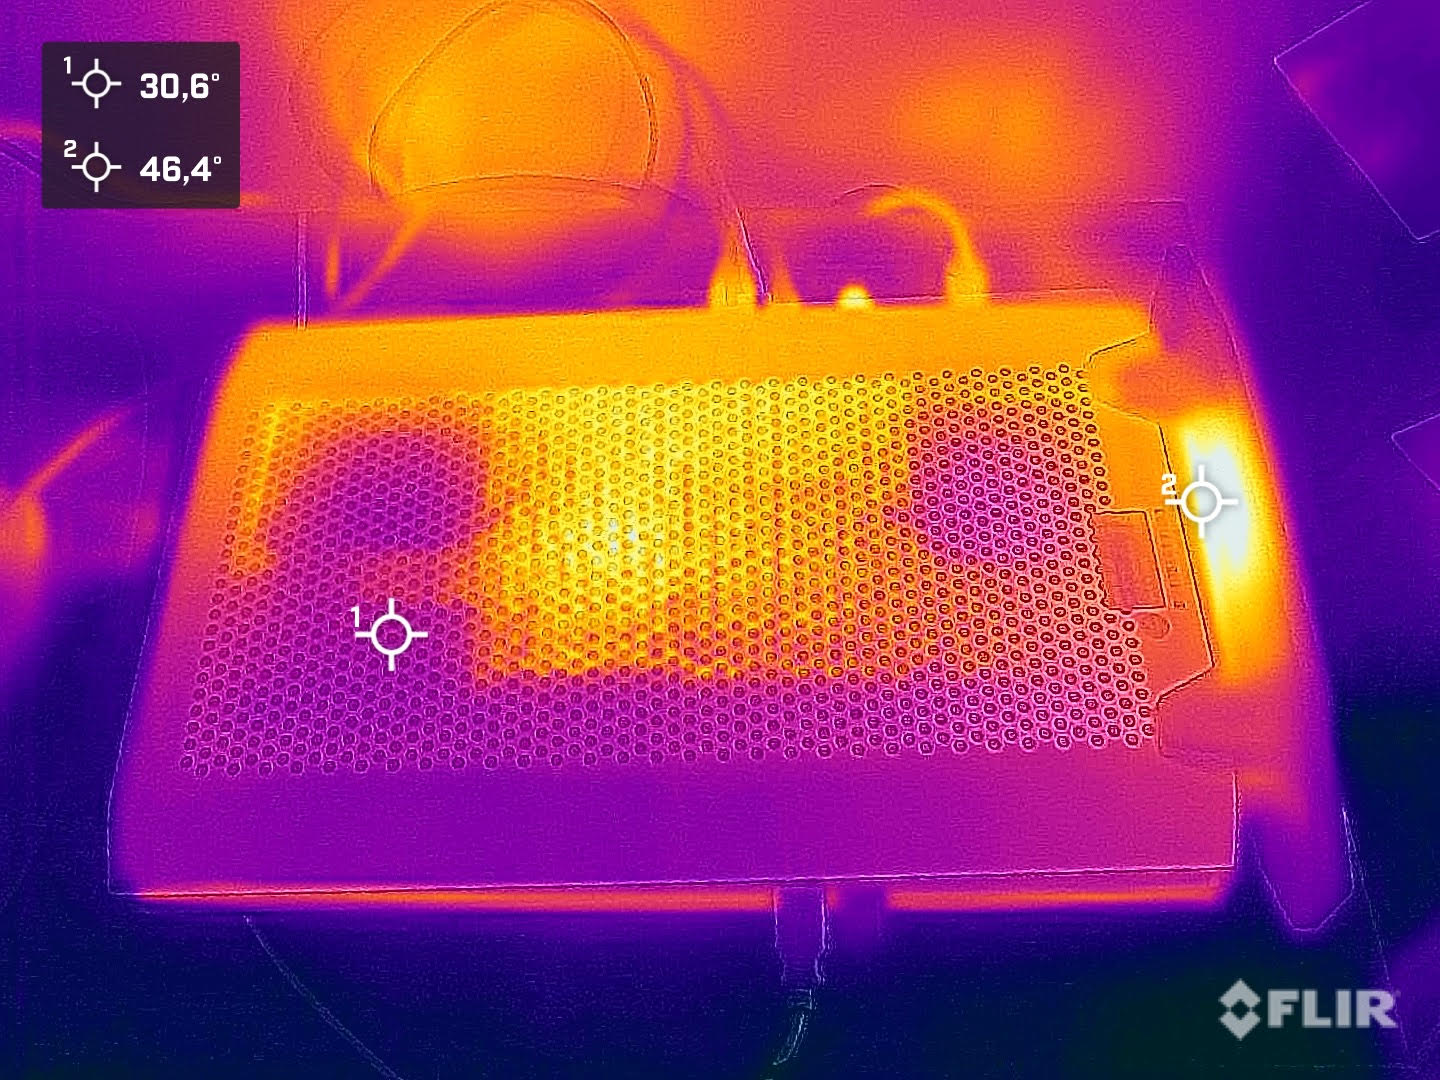
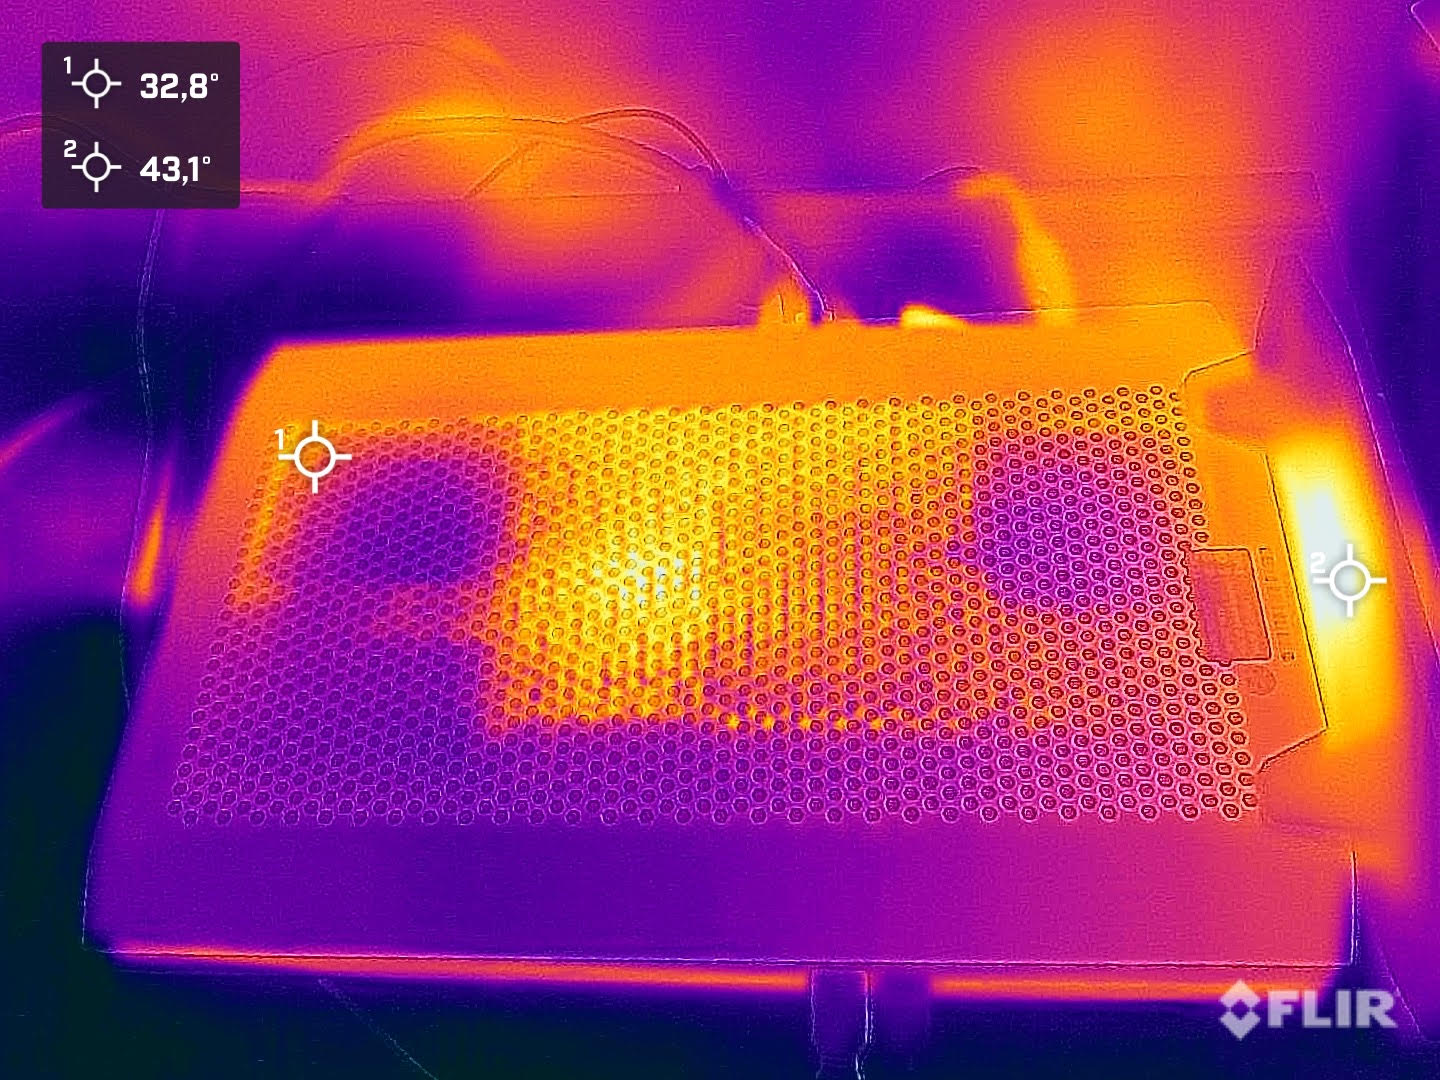
(-) The maximum temperature on the upper side is 45.9 °C / 115 F, compared to the average of 33.9 °C / 93 F, ranging from 25 to 47 °C for the class Desktop.
(+) The bottom heats up to a maximum of 39.3 °C / 103 F, compared to the average of 33.6 °C / 92 F
(±) In idle usage, the average temperature for the upper side is 35.7 °C / 96 F, compared to the device average of 29.5 °C / 85 F.
(-) Playing The Witcher 3, the average temperature for the upper side is 40.2 °C / 104 F, compared to the device average of 29.5 °C / 85 F.
消耗功率
与普通台式电脑相比,MINISFORUM NUCXi7因其高效的组件而具有明显优势。即使与 Zotac ZBOX Magnus EN1730C我们的测试设备明显领先,尽管硬件几乎相同,但效率明显更高,同时不失任何性能。28至36瓦,在没有负载的情况下,功耗很低,但与技嘉A7 X1相比仍然明显较高。在负载情况下,MINISFORUM NUCXi7的平均功耗为83瓦,尽管我们在游戏时测量到167瓦。我们还注意到高达215瓦的短暂峰值,这不会达到230瓦的电源的极限。
| Off / Standby | |
| Idle | |
| Load |
|
Key:
min: | |
| Minisforum NUCX i7 i7-11800H, GeForce RTX 3070 Laptop GPU | Zotac ZBOX Magnus EN173070C i7-11800H, GeForce RTX 3070 Laptop GPU | Gigabyte A7 X1 R9 5900HX, GeForce RTX 3070 Laptop GPU | Average NVIDIA GeForce RTX 3070 Laptop GPU | Average of class Desktop | |
|---|---|---|---|---|---|
| Power Consumption | -37% | 15% | 13% | 3% | |
| Idle Minimum * (Watt) | 28.2 | 31.3 -11% | 12 57% | 15.6 ? 45% | 17.9 ? 37% |
| Idle Average * (Watt) | 29.9 | 35.1 -17% | 14 53% | 20.1 ? 33% | 37.2 ? -24% |
| Idle Maximum * (Watt) | 36.2 | 41.6 -15% | 19 48% | 29.4 ? 19% | 41.3 ? -14% |
| Load Average * (Watt) | 83.2 | 214 -157% | 118 -42% | 110.8 ? -33% | 96.7 ? -16% |
| Witcher 3 ultra * (Watt) | 167 | 193.5 -16% | 205 -23% | ||
| Cyberpunk 2077 ultra external monitor * (Watt) | 177 | ||||
| Load Maximum * (Watt) | 215.7 | 231 -7% | 229 -6% | 214 ? 1% | 141.6 ? 34% |
* ... smaller is better
Power Consumption With External Monitor
Pros
Cons
结论 - 一个超薄的游戏电脑
通过MINISFORUM NUCXi7,制造商提供了一个非常令人兴奋的游戏PC,使用成熟的笔记本电脑技术。结合了 英特尔酷睿i7-11800H和 NvidiaGeForce RTX 3070 笔记本电脑GPU工作非常好,确保了系统的快速运行。非常薄的外壳看起来质量很高,同时也很现代。由于冷却的原因,MINISFORUM NUCXi7只能在垂直位置运行。这是你在决定购买该设备时必须接受的事情。你还必须接受在连接种类方面的一些小妥协,因为通常用于鼠标和键盘的USB-A端口被放置在设备的前面。有了512GB的固态硬盘,你在开始时就有了相当好的装备。然而,考虑到目标用户,游戏玩家可能很快就会碰到它的极限,我们建议至少以1TB为标准。
Minisforum NUCXi7是一款安静的游戏电脑,采用超薄机箱,专为1,440p游戏设计。
我们非常喜欢MINISFORUM NUCXi7的低排放值:该设备不仅安静,而且高效,始终保持温度可控。同时,你不必忍受CPU和GPU的性能下降。此外,我们的测试样本在任何时候都没有犯任何坏的错误。在工作或游戏时,系统性能都很好。在某些部分,MINISFORUM NUCXi7甚至能够跟上普通台式电脑。
作为Minisforum NUCXi7的可能替代方案,你也可以看看游戏笔记本电脑。尽管类似的设备也有少量的额外溢价,但绝对有额外的价值。Gigabyte A7 X1的价格约为1800美元.
价格和可用性
Minisforum NUCXi7已在MINISFORUM商店上市,订单将在10月中旬发货。目前仍有一些有吸引力的 "预售 "折扣。例如,我们的测试单元目前的价格为1169美元.如果没有回扣,正常价格是1339美元。更实惠的NUCXi5目前,价格为979美元相同的内存和SSD设备(原价1129美元)。
Minisforum NUCX i7
- 09/14/2022 v7 (old)
Sebastian Bade

