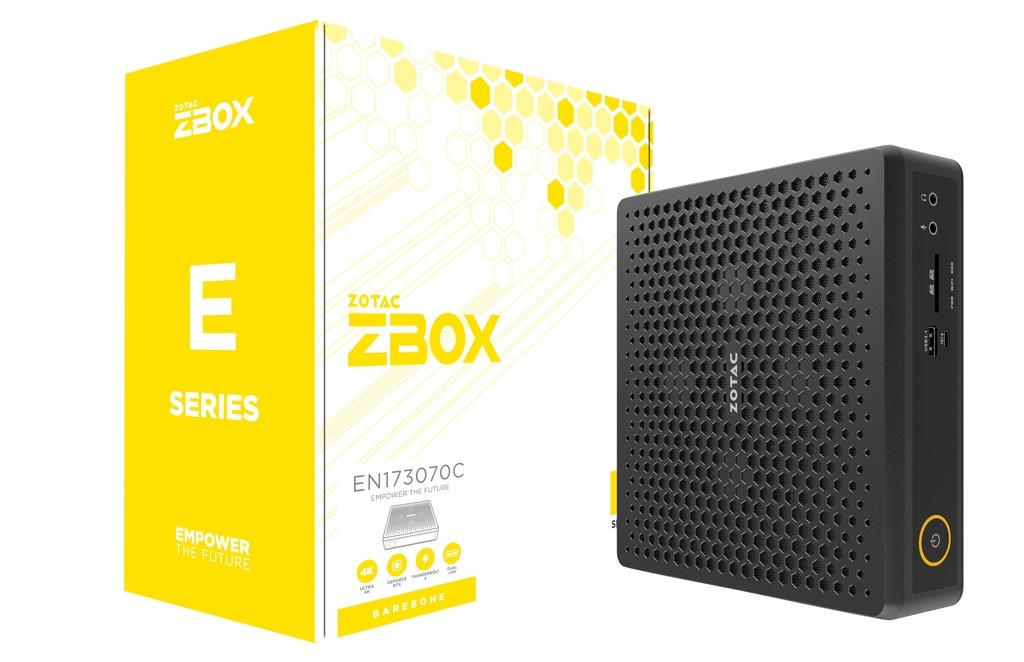
Zotac ZBOX Magnus回顾。 GeForce RTX 3070移动版和Tiger Lake SoC在一个2.65升的箱子里
在Zotac ZBOX标签下,制造商提供了许多紧凑的PC,旨在为各种个人使用场景。结合Magnus标签的增加,其方向是游戏PC,这也反映在内置组件上。当前版本的Magnus EN173070C包含一个 英特尔酷睿i7-11800H,这应该是为了确保快速的游戏操作,并结合 NvidiaGeForce RTX 3070 Laptop图形。这种组合对我们这个笔记本评测平台来说并不新鲜,我们已经可以对预期的性能作出粗略估计。
在我们的设备配置中,Magnus EN173070C的价格接近1650欧元(约1743美元)。然而,由于这始终是一个裸机系统,你还必须计算固态硬盘、内存和Windows许可证。根据你选择的组件,总账单可以轻松超过2000欧元(约合2113美元)。那些对性能有要求的人 NvidiaGeForce RTX 3070 笔记本电脑GPU还不够,还可以购买EN173080C版本的Magnus,其中包含一个更快的GPU与 NvidiaGeForce RTX 3080 Laptop图形。CPU仍然是相同的,有 英特尔酷睿i7-11800H.你也可以得到Magnus EN153060C,它的性能略低,包括英特尔酷睿i5-11400HCPU和 NvidiaGeForce RTX 3060 LaptopGPU。
Zotac ZBOX Magnus EN173070C的详细介绍
案例
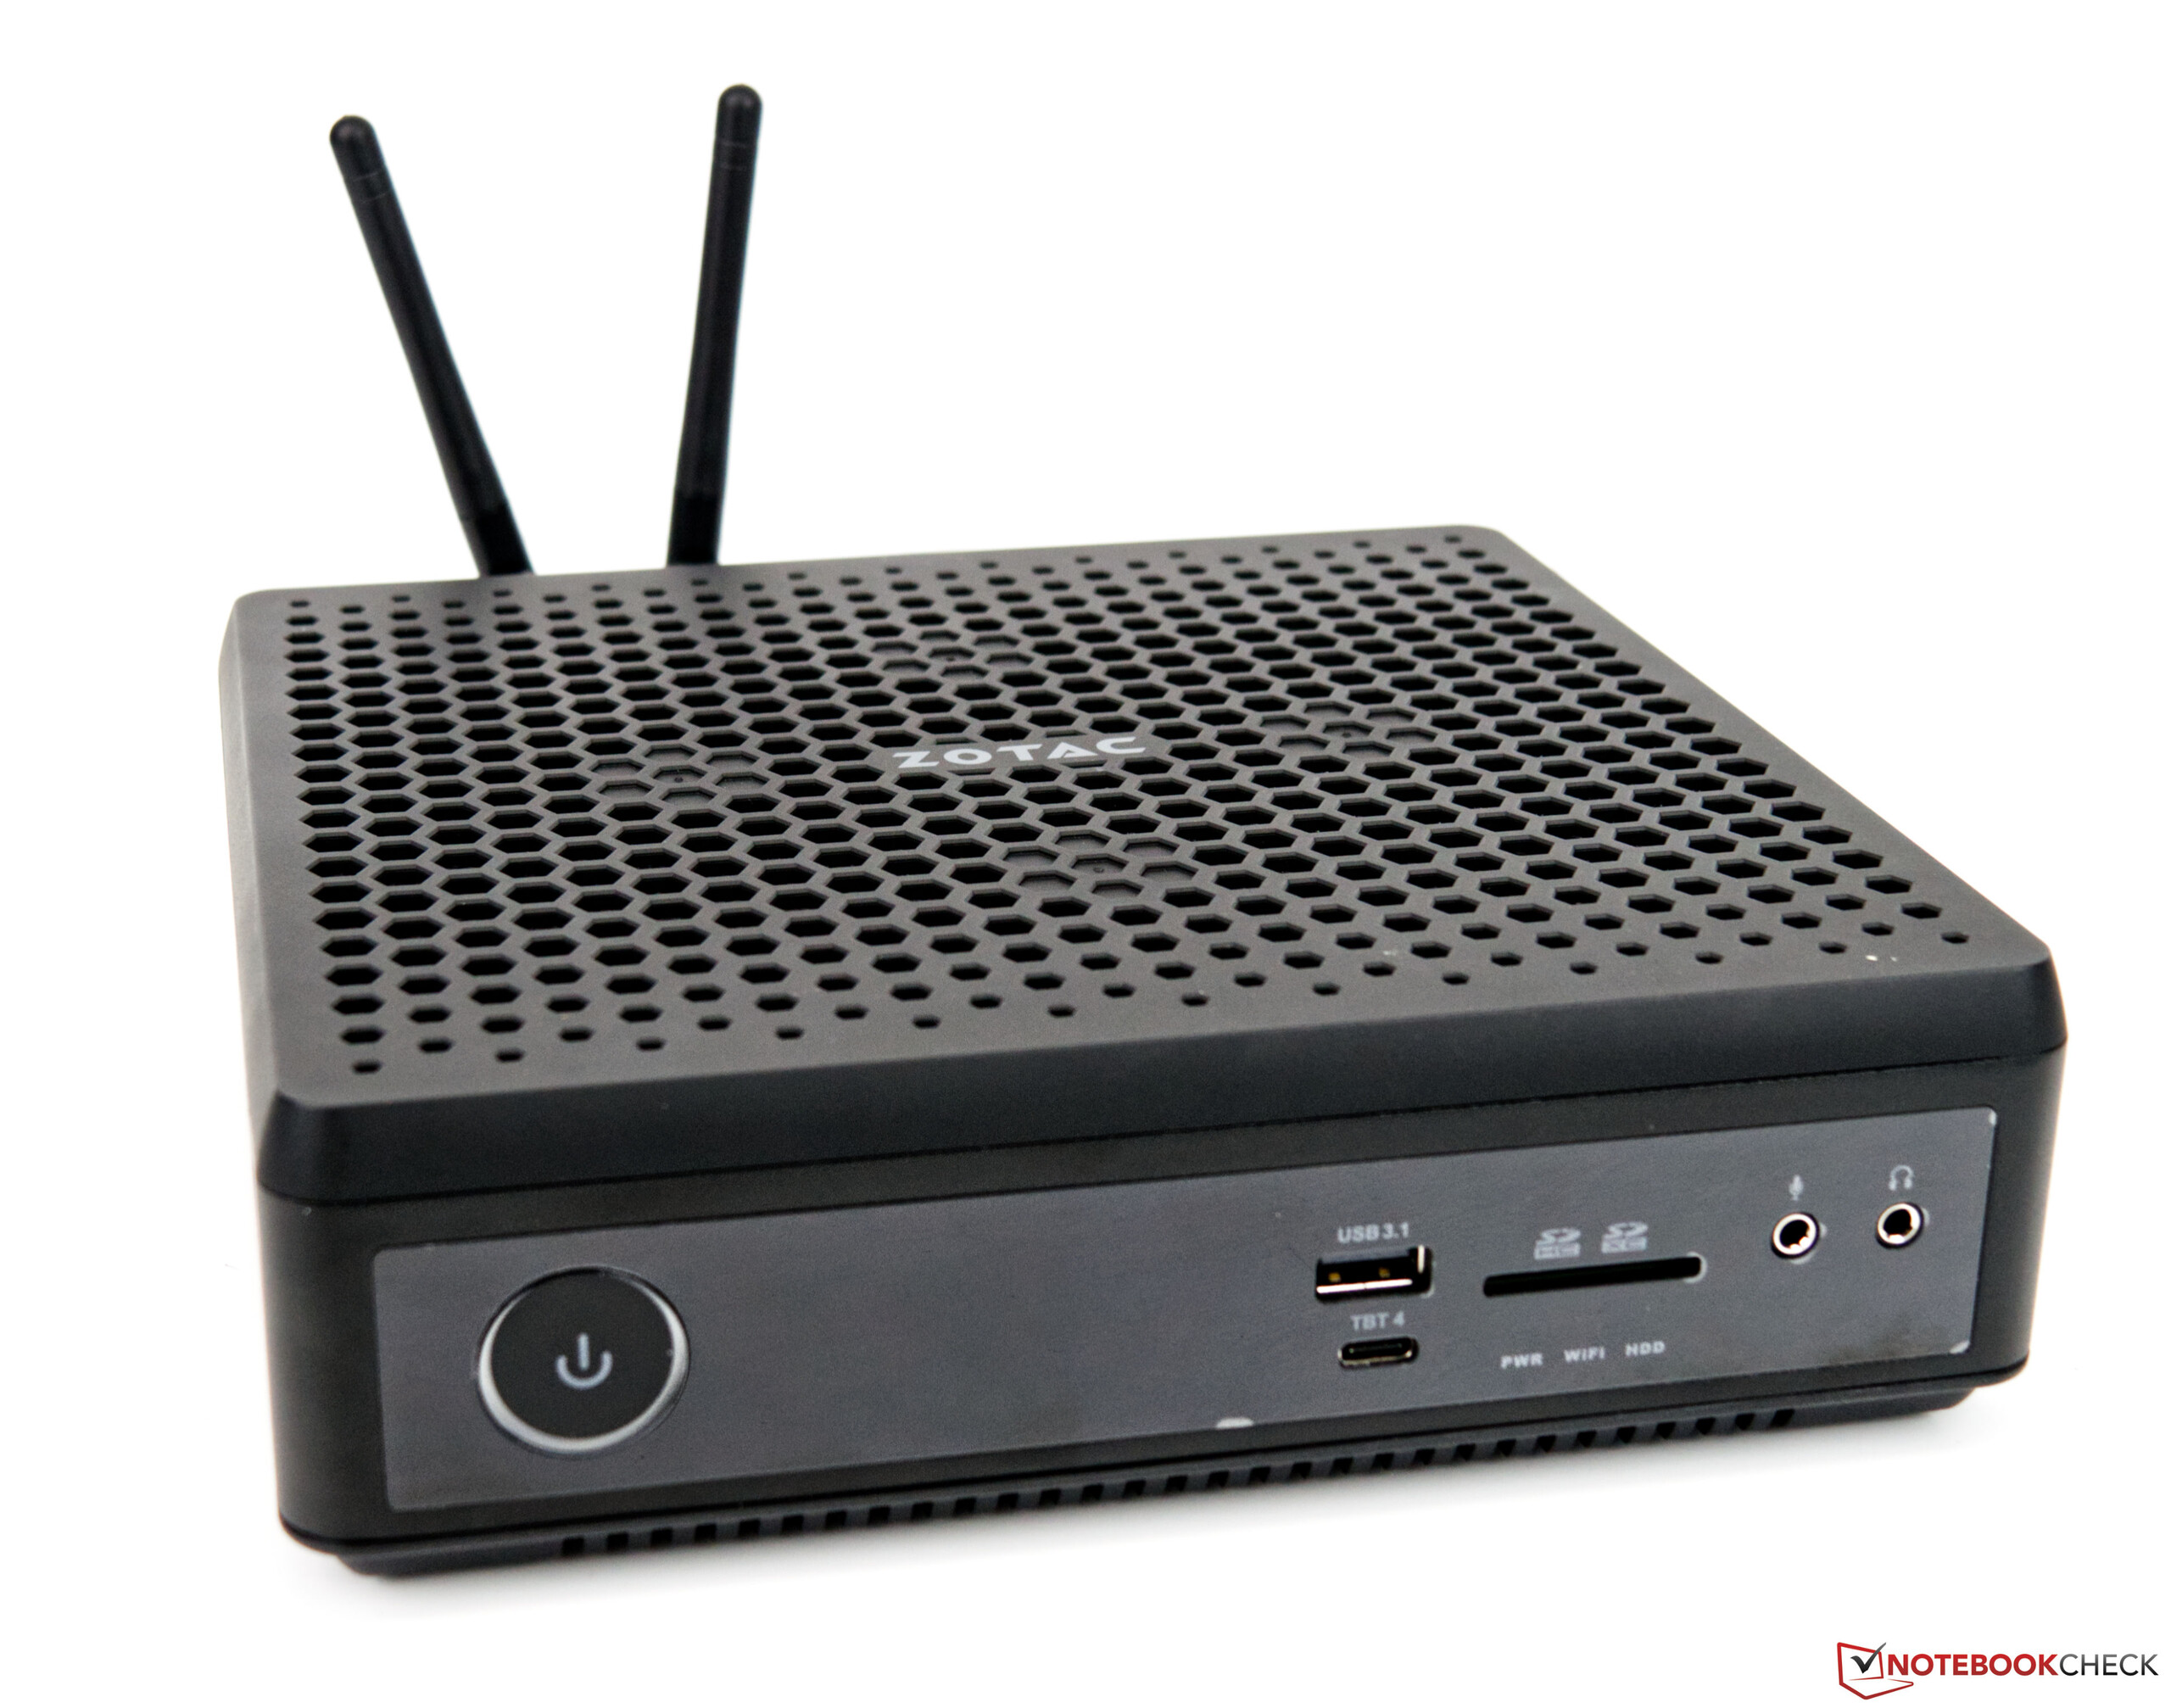
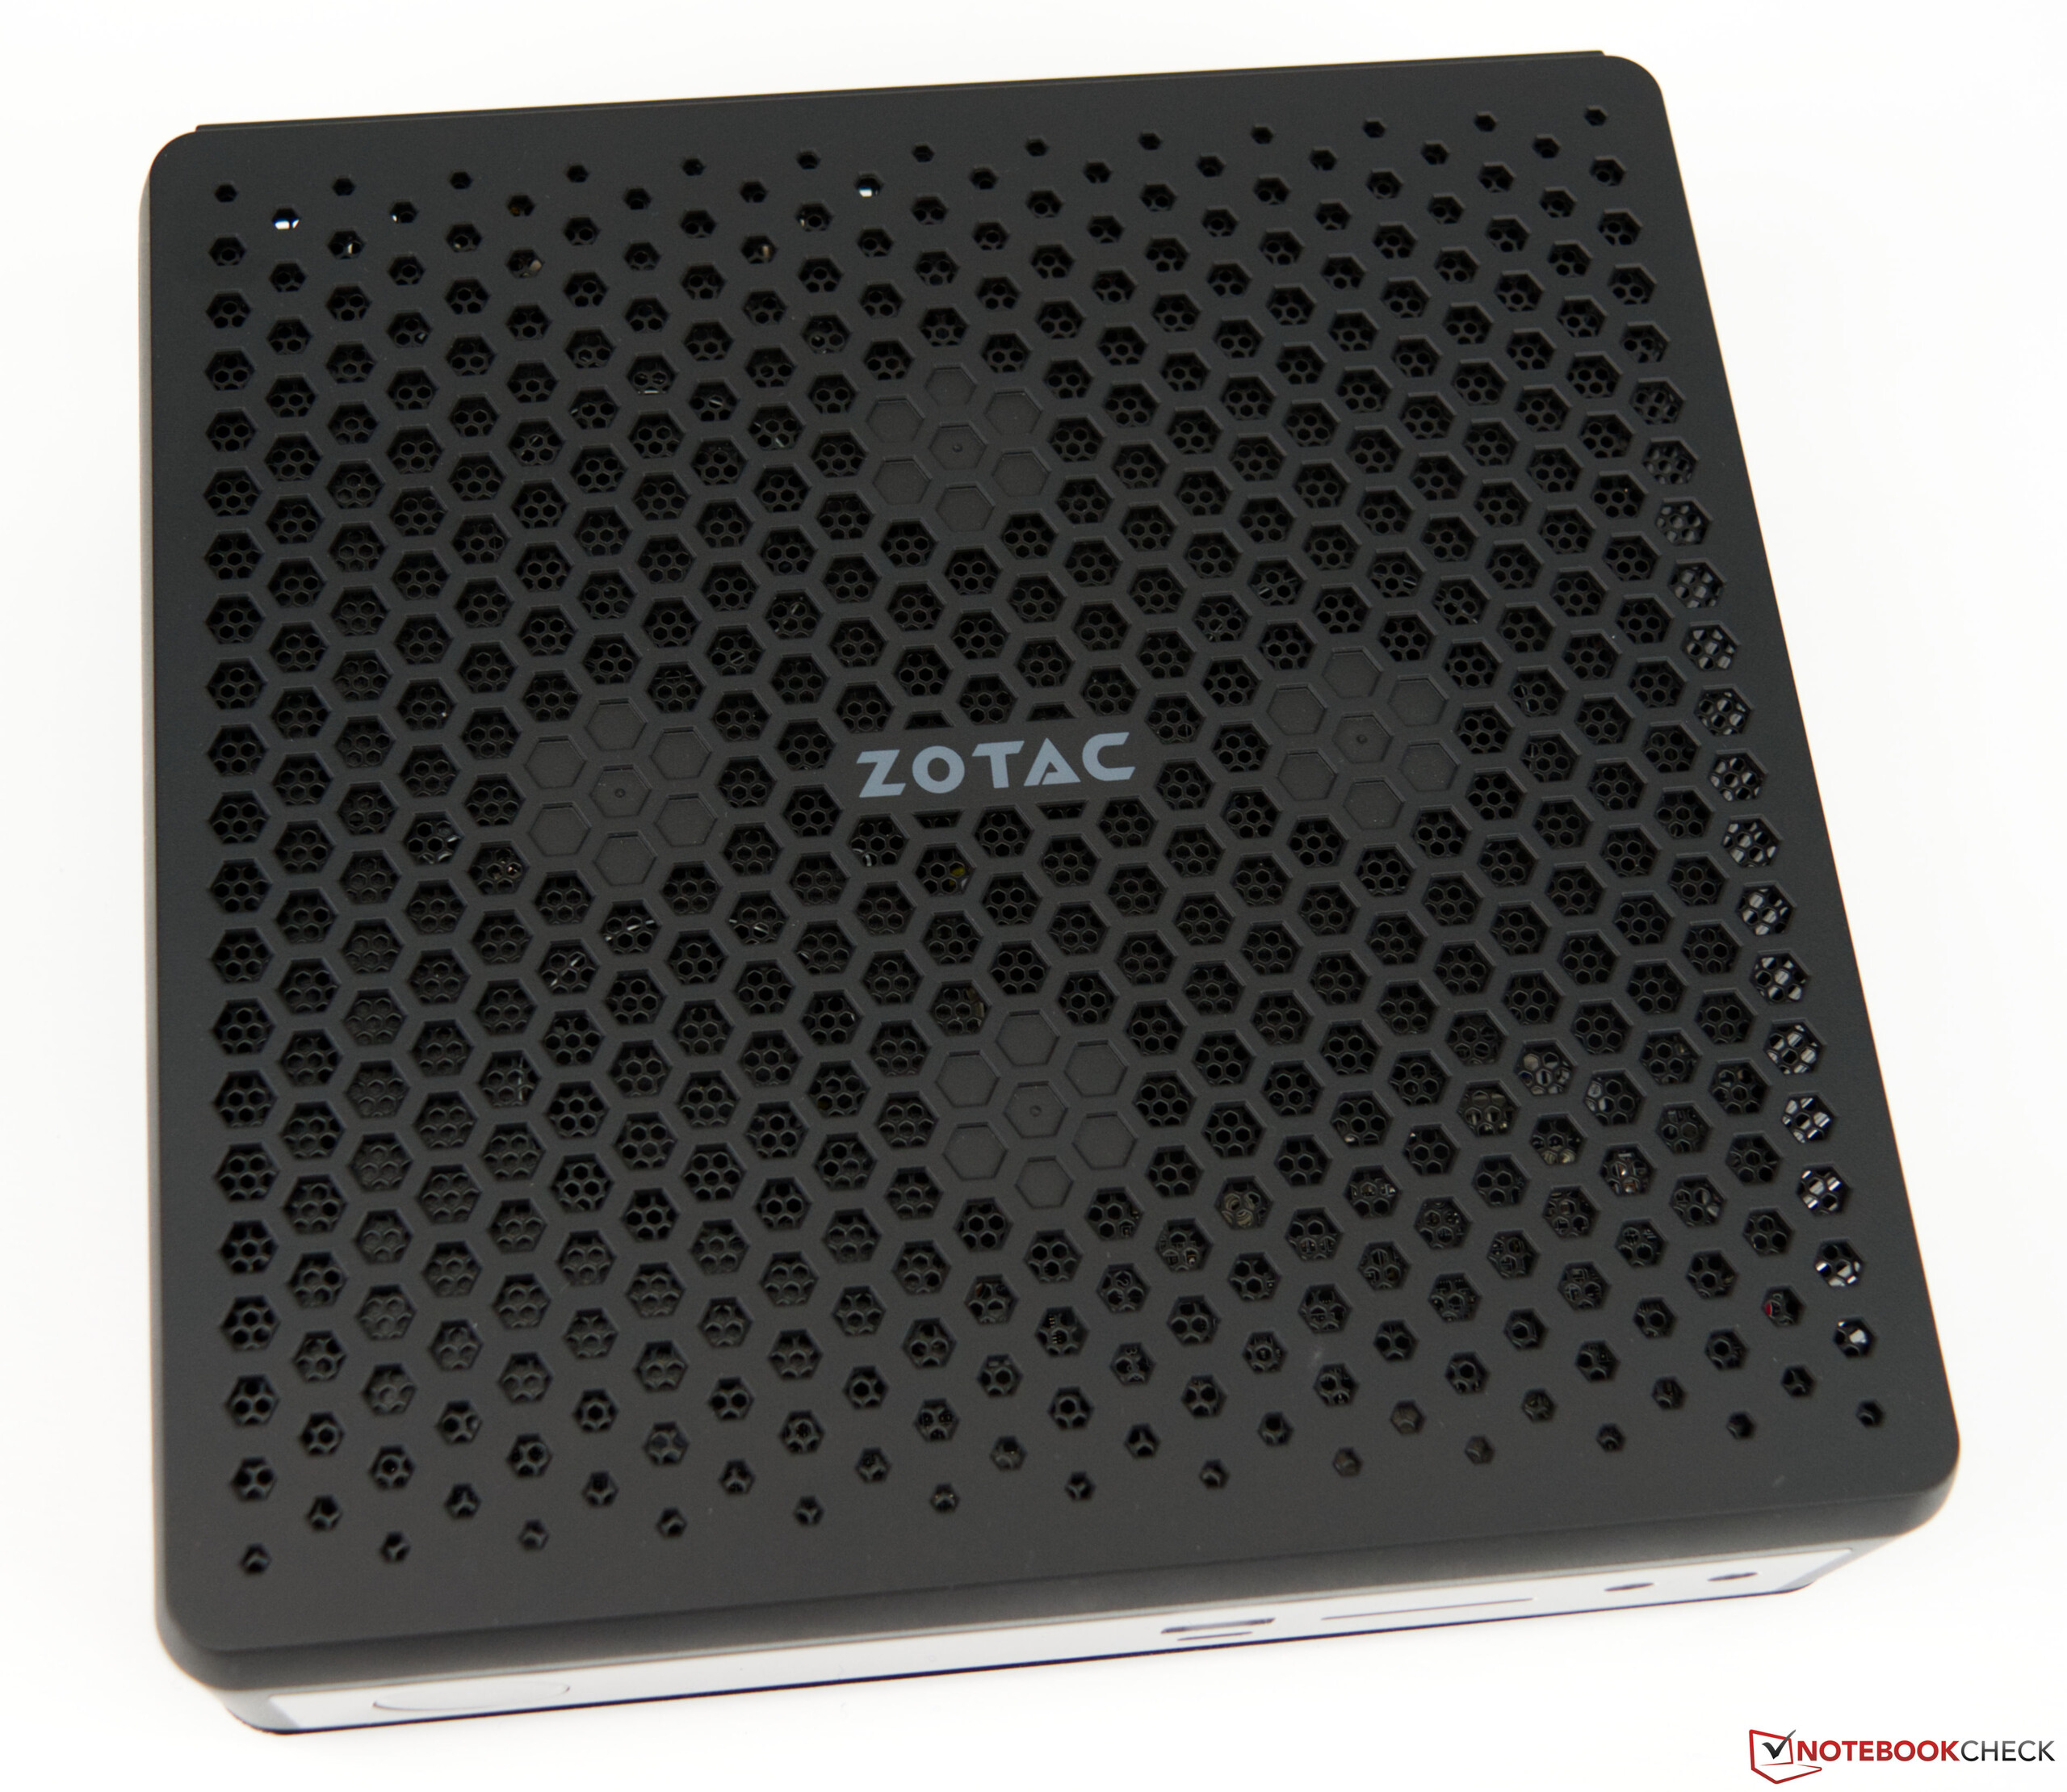
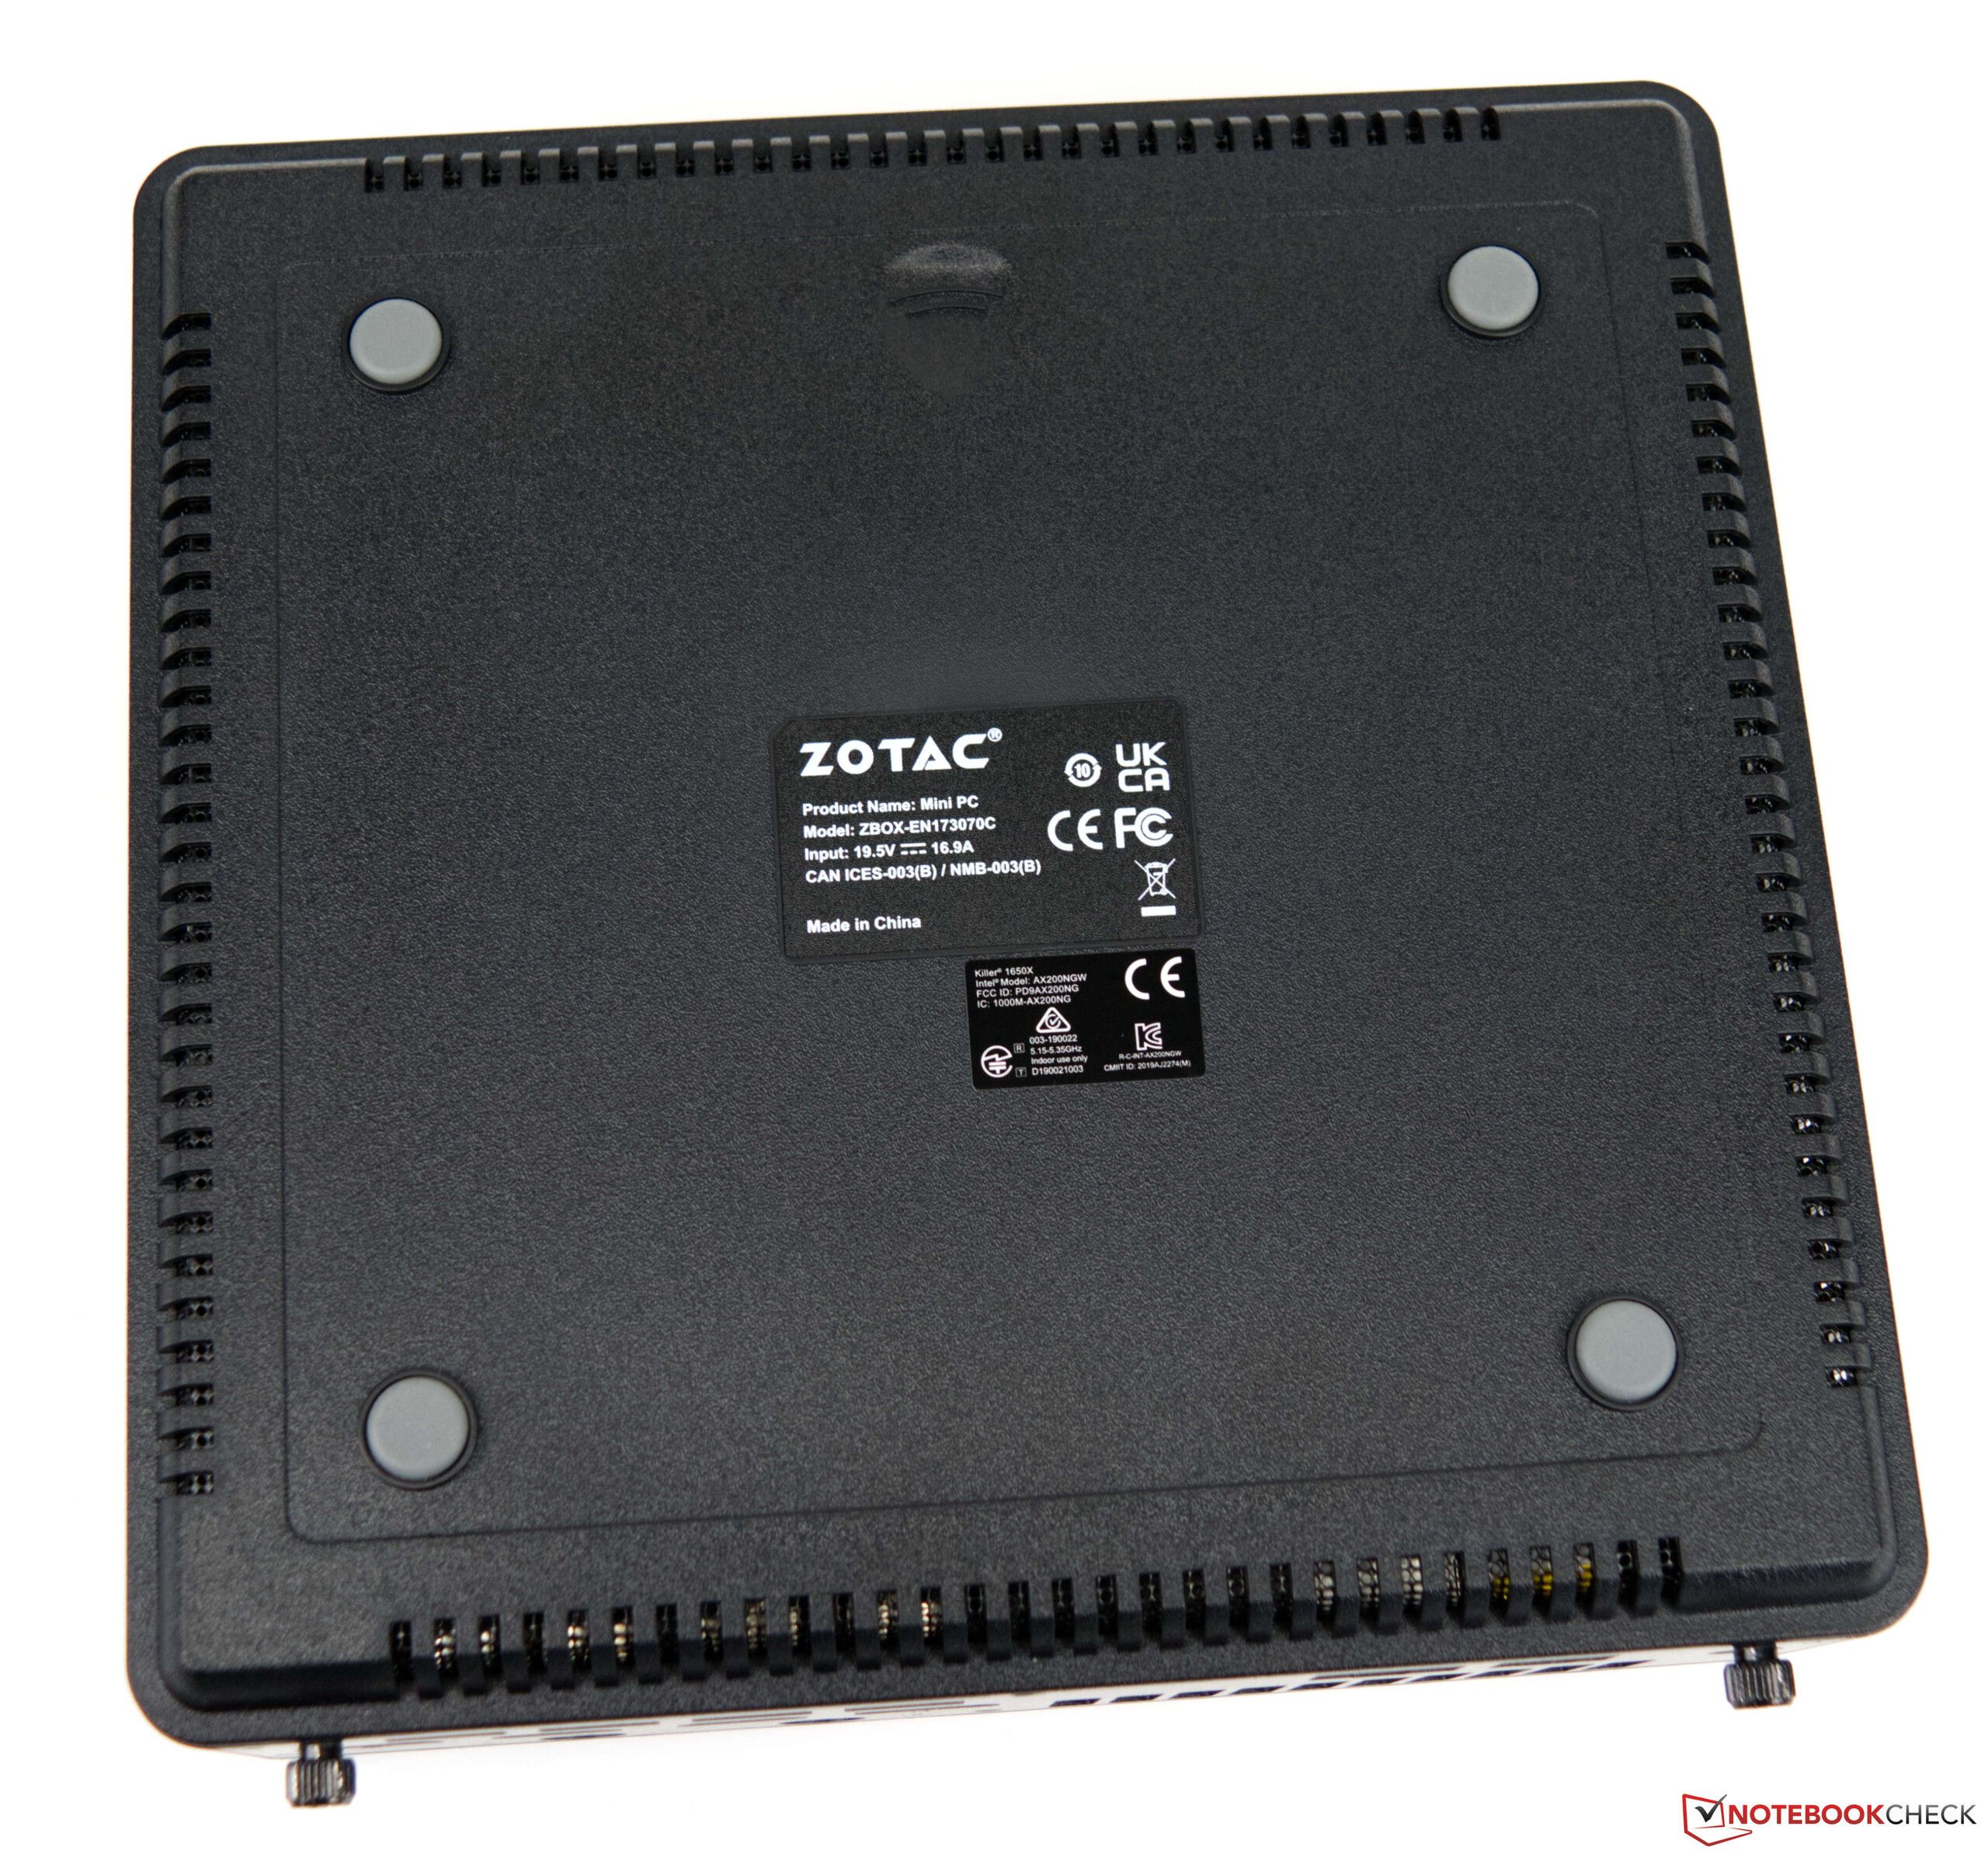
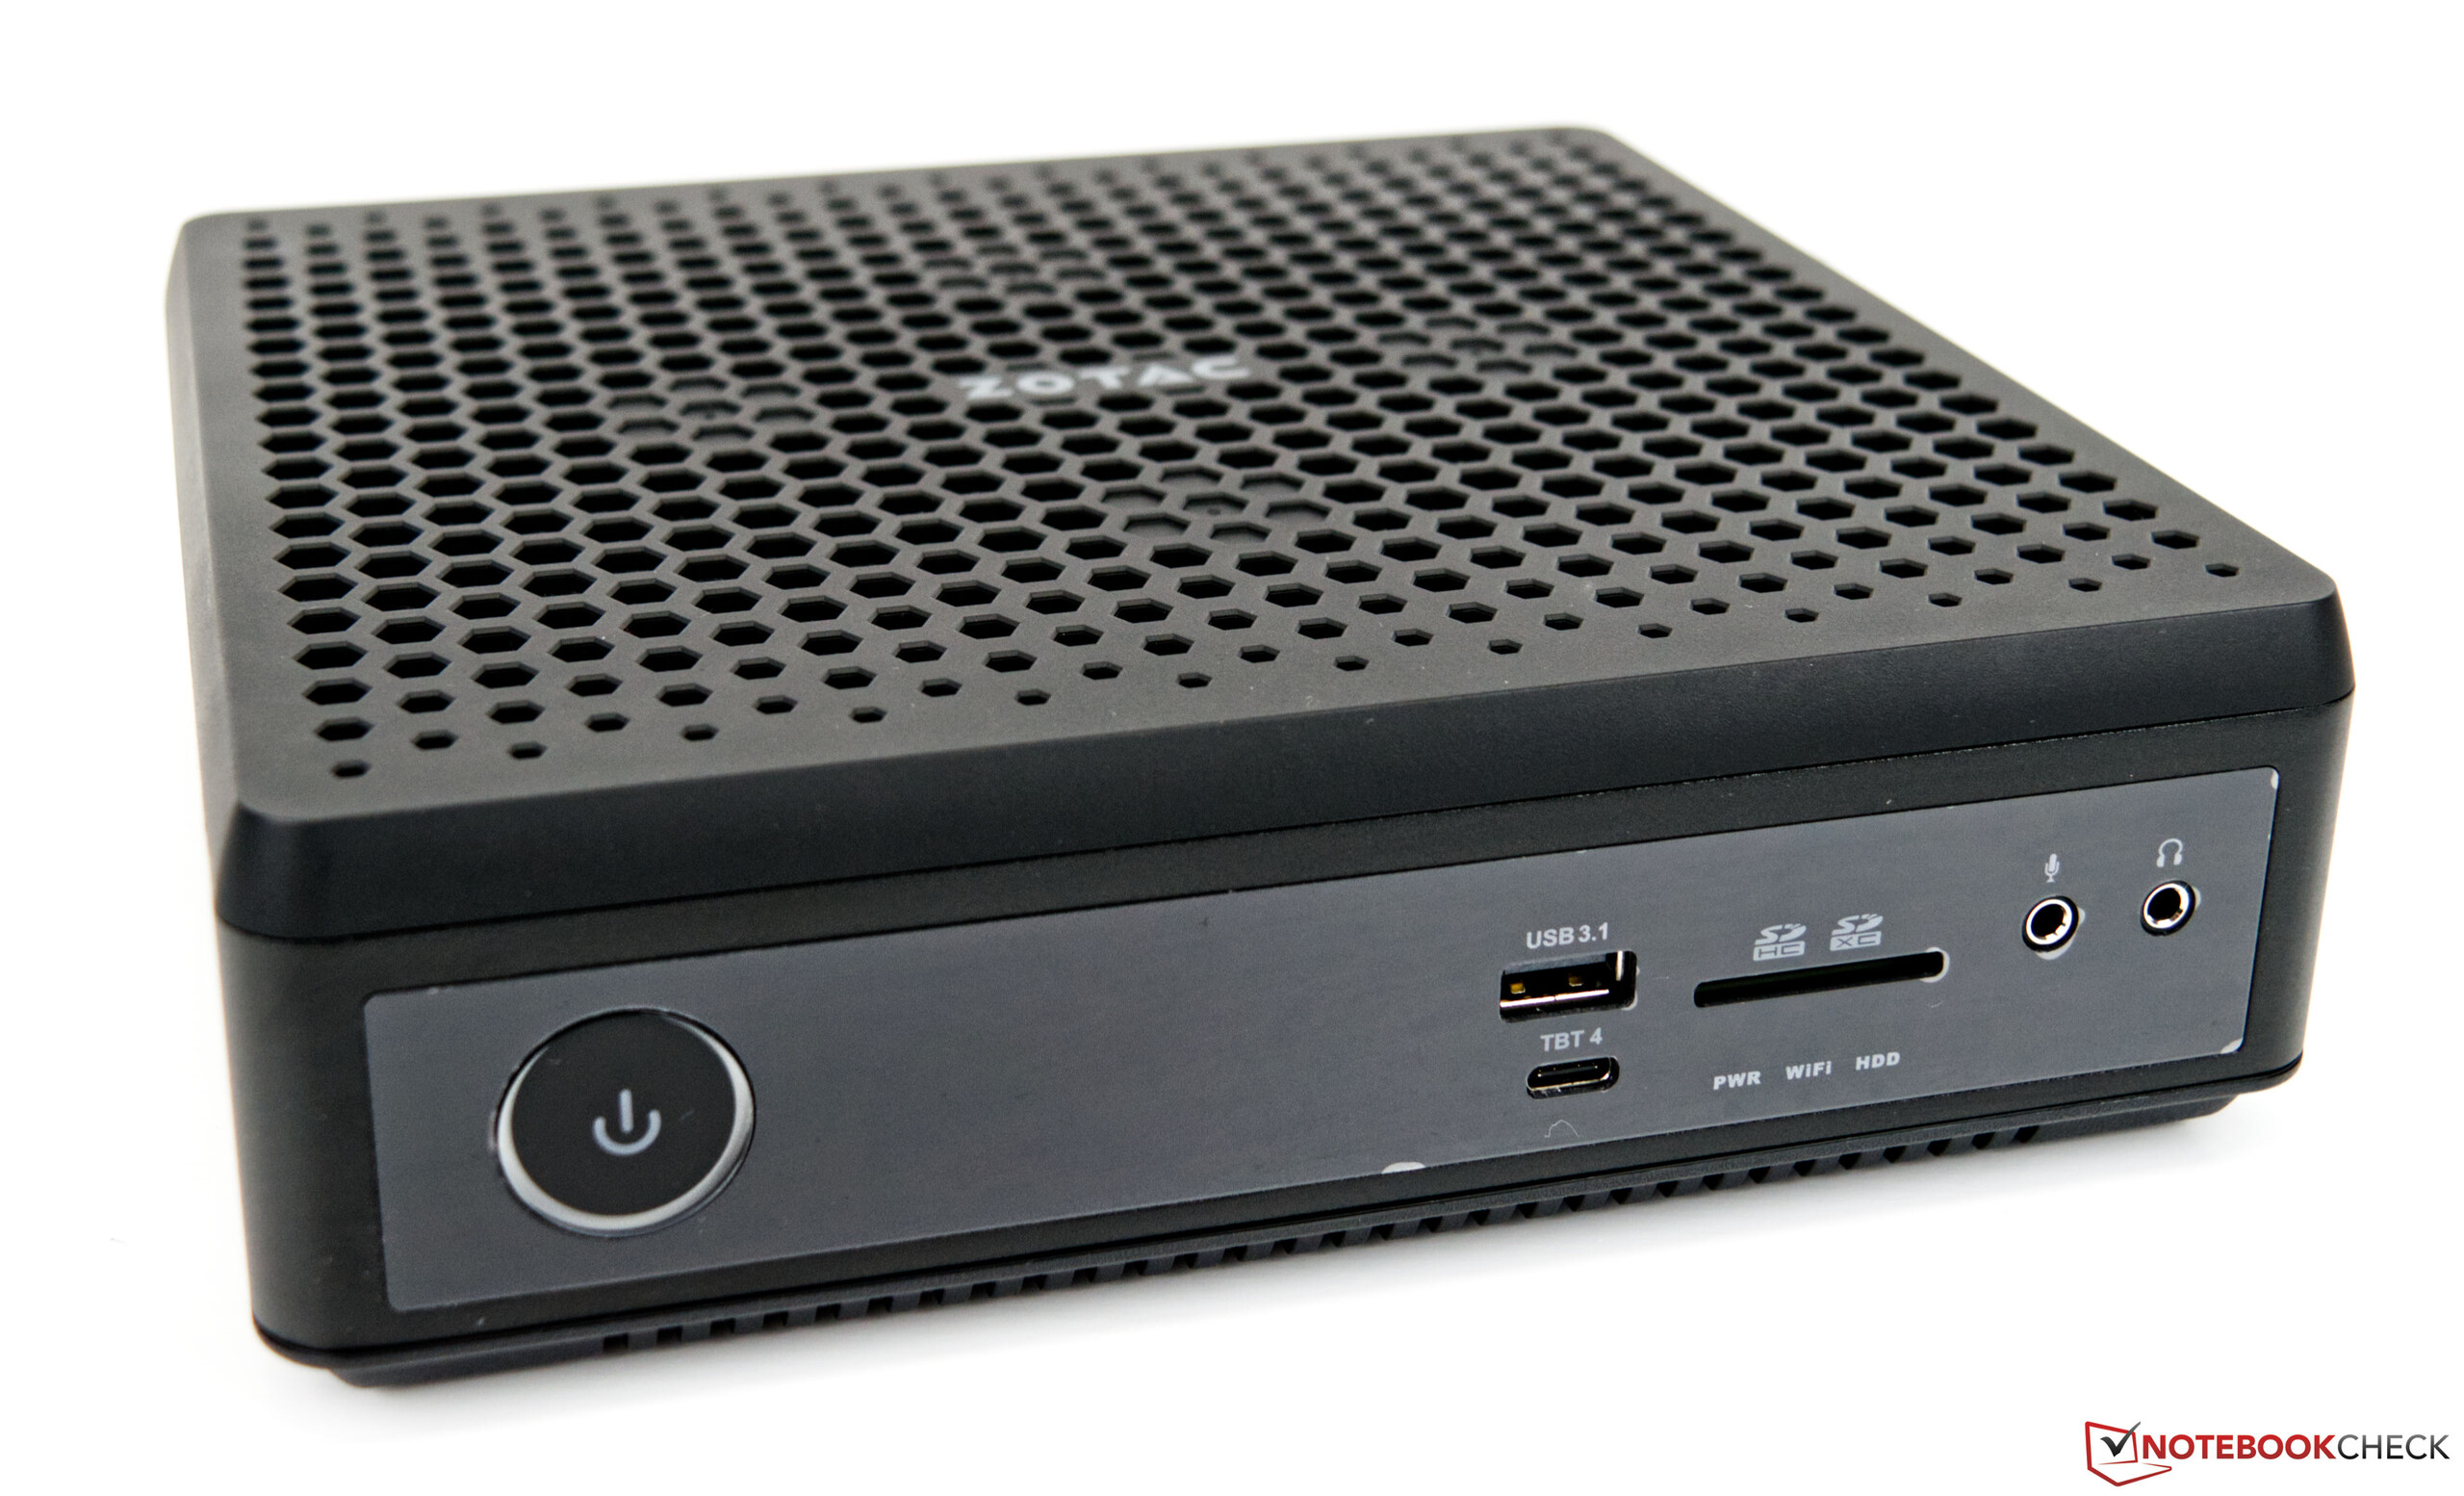
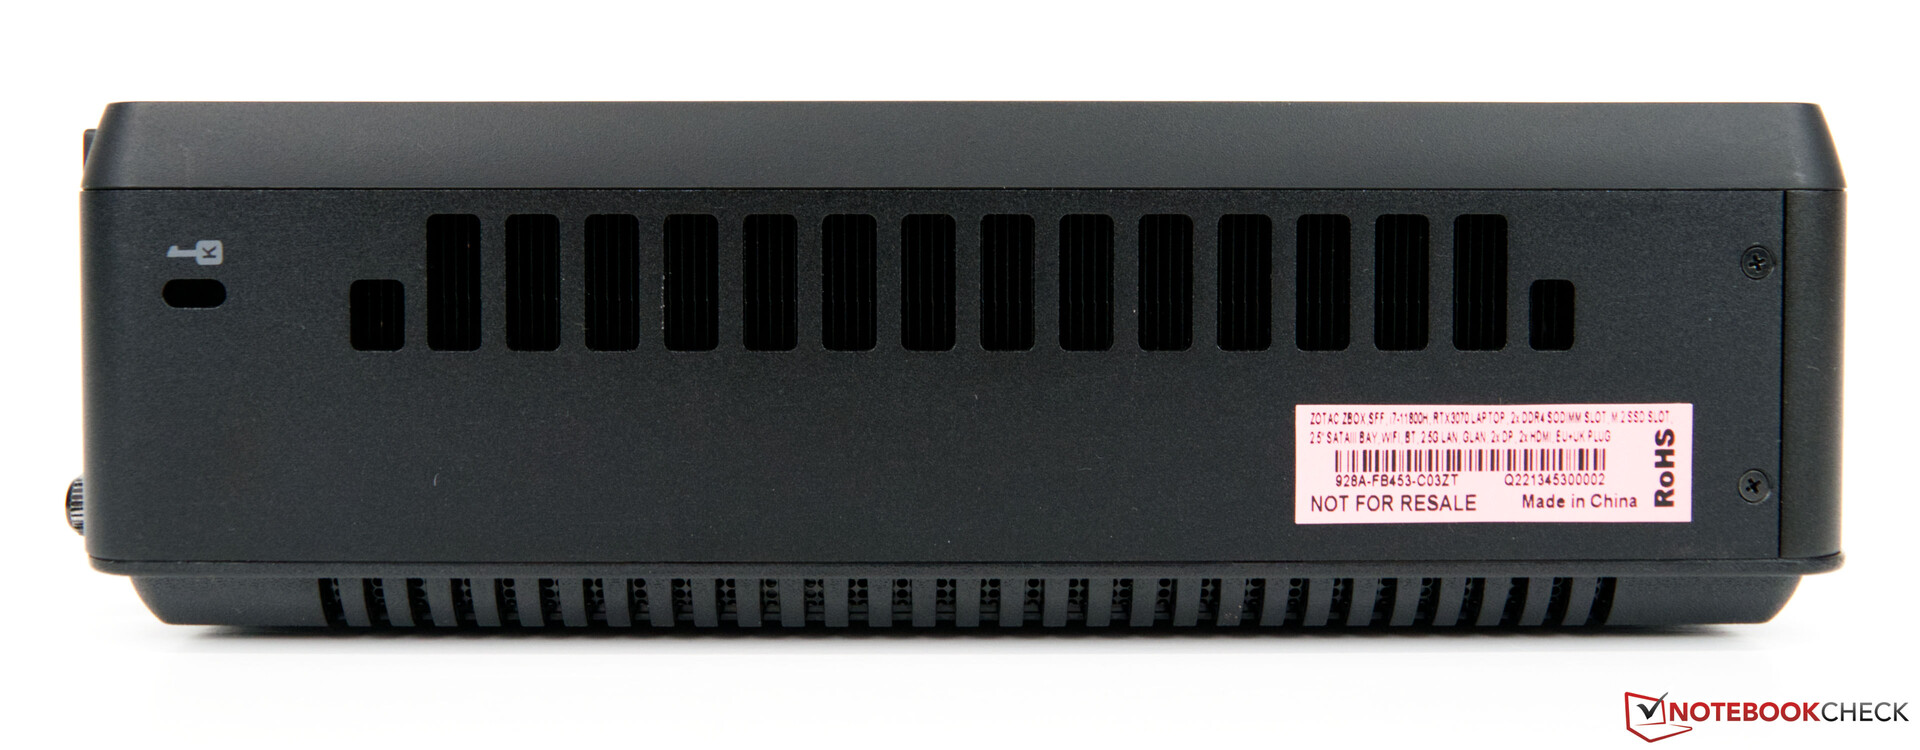
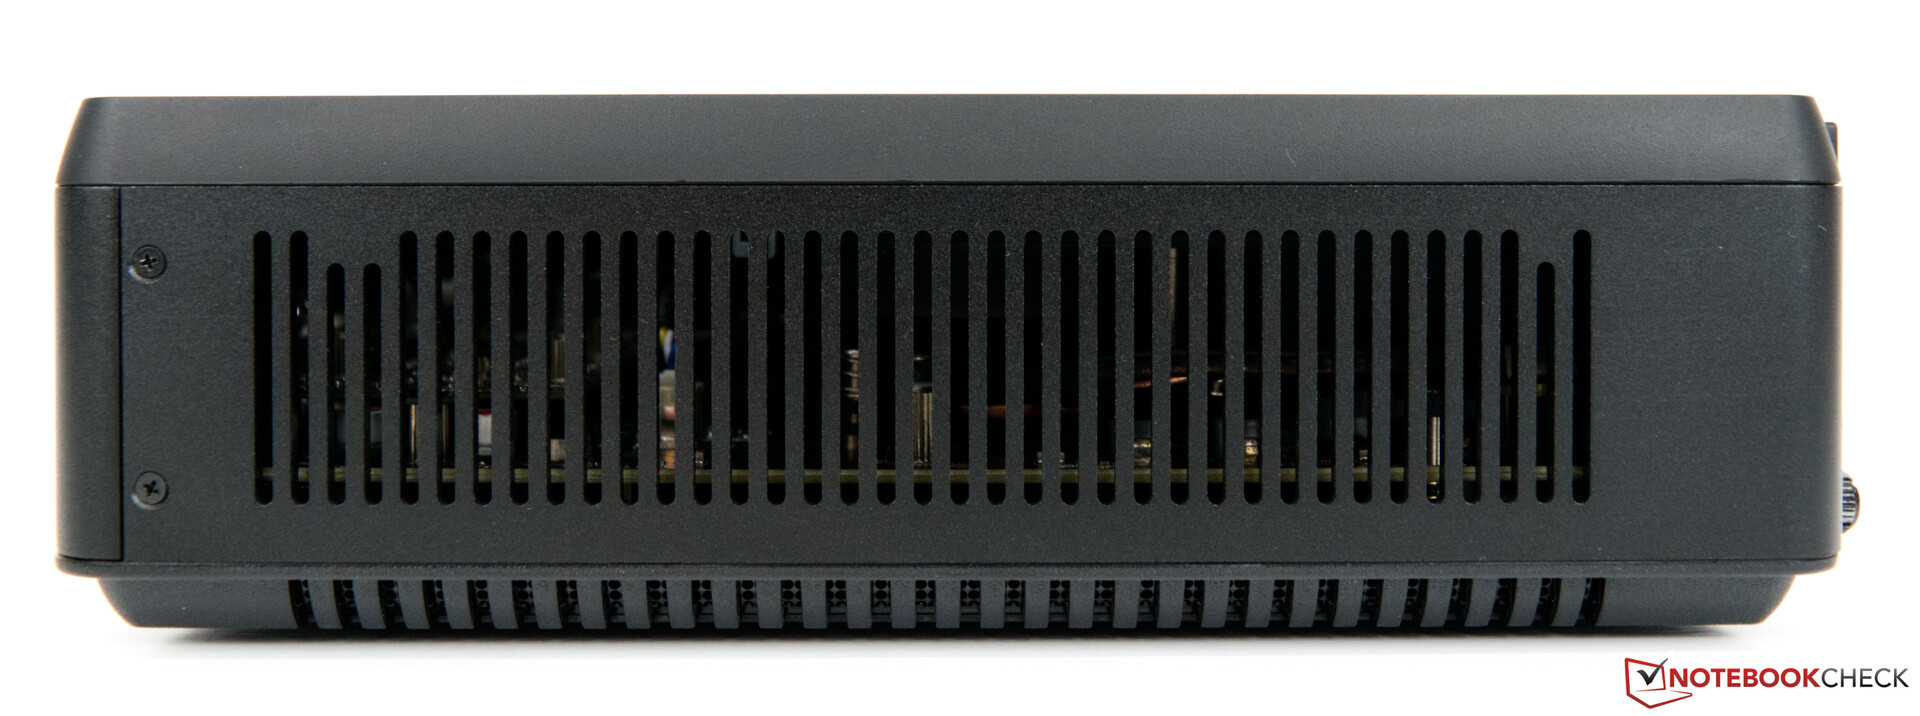
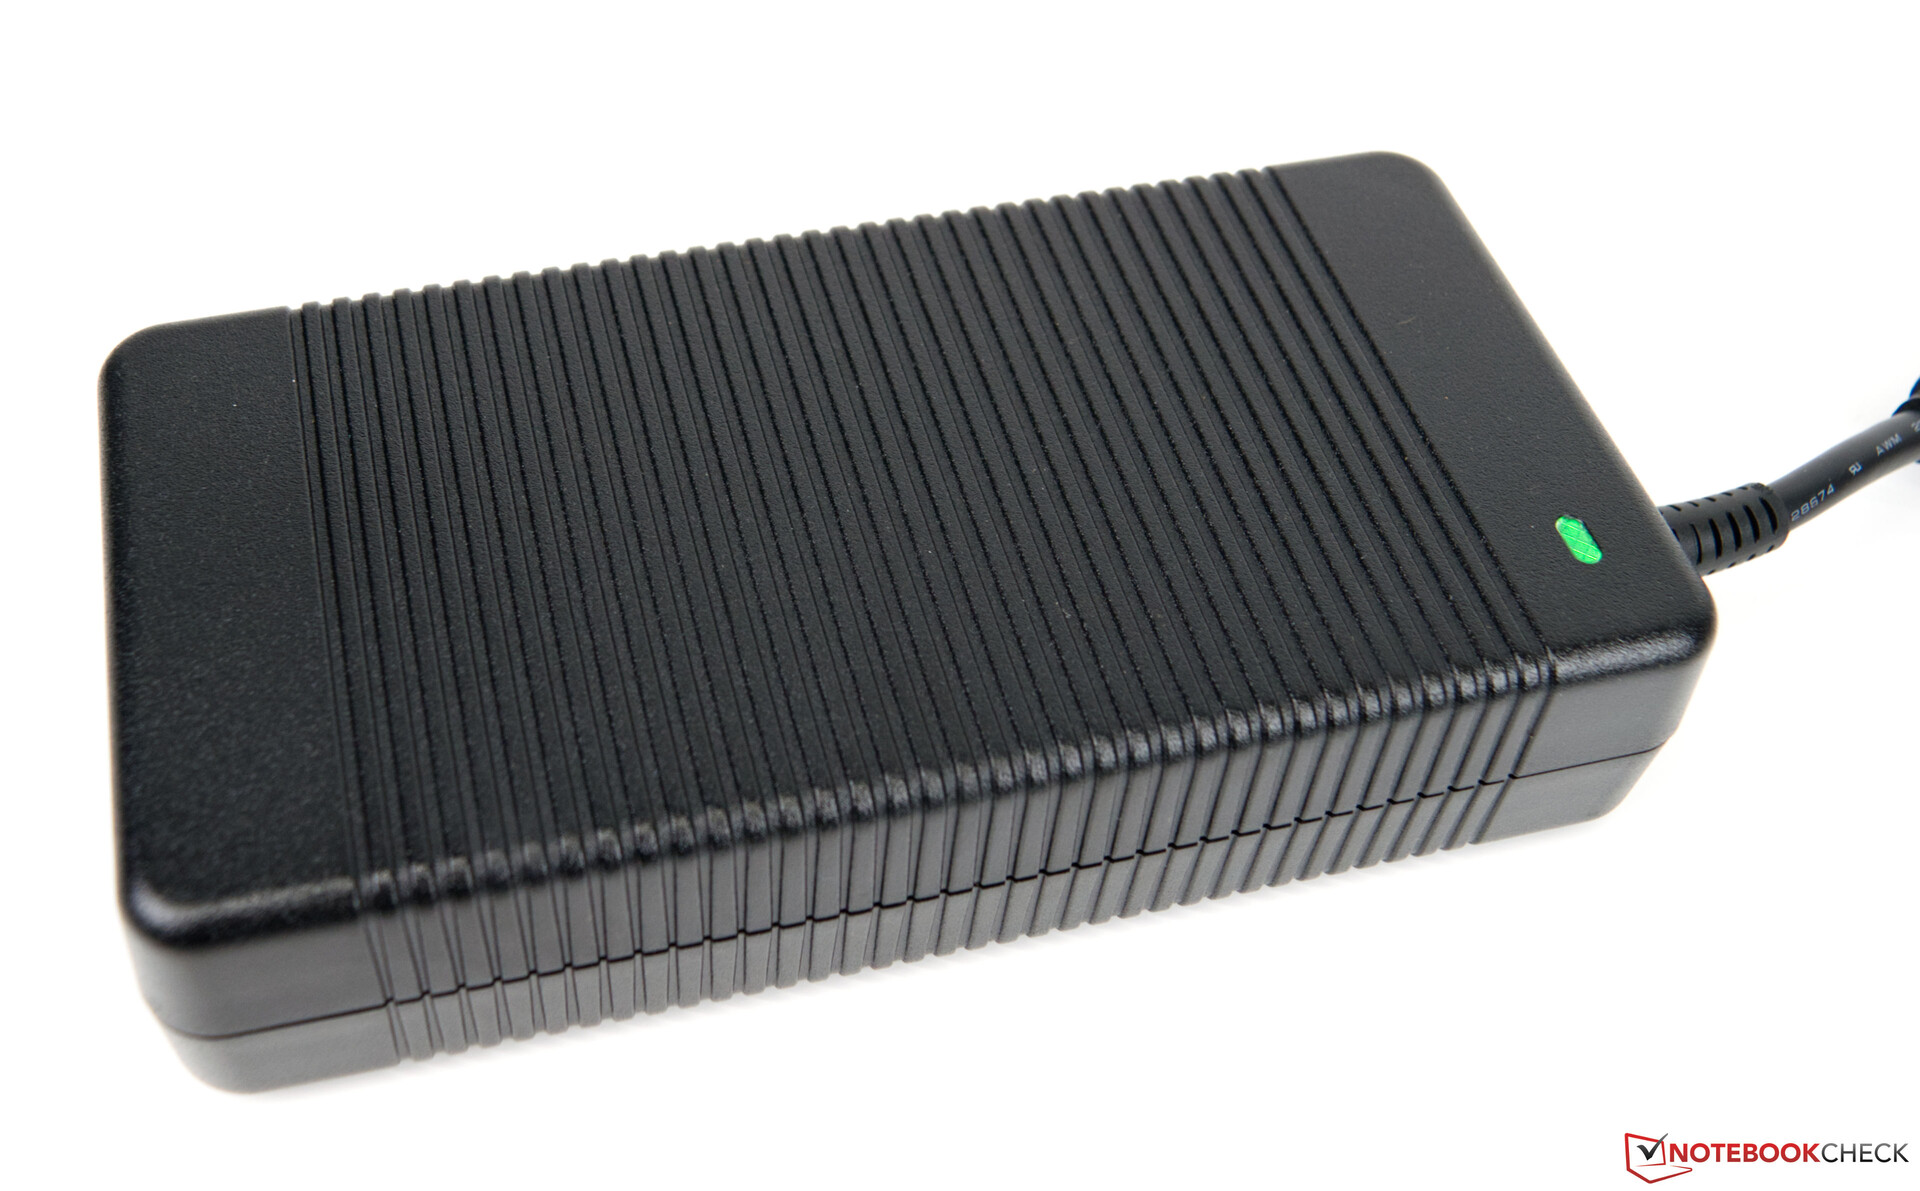
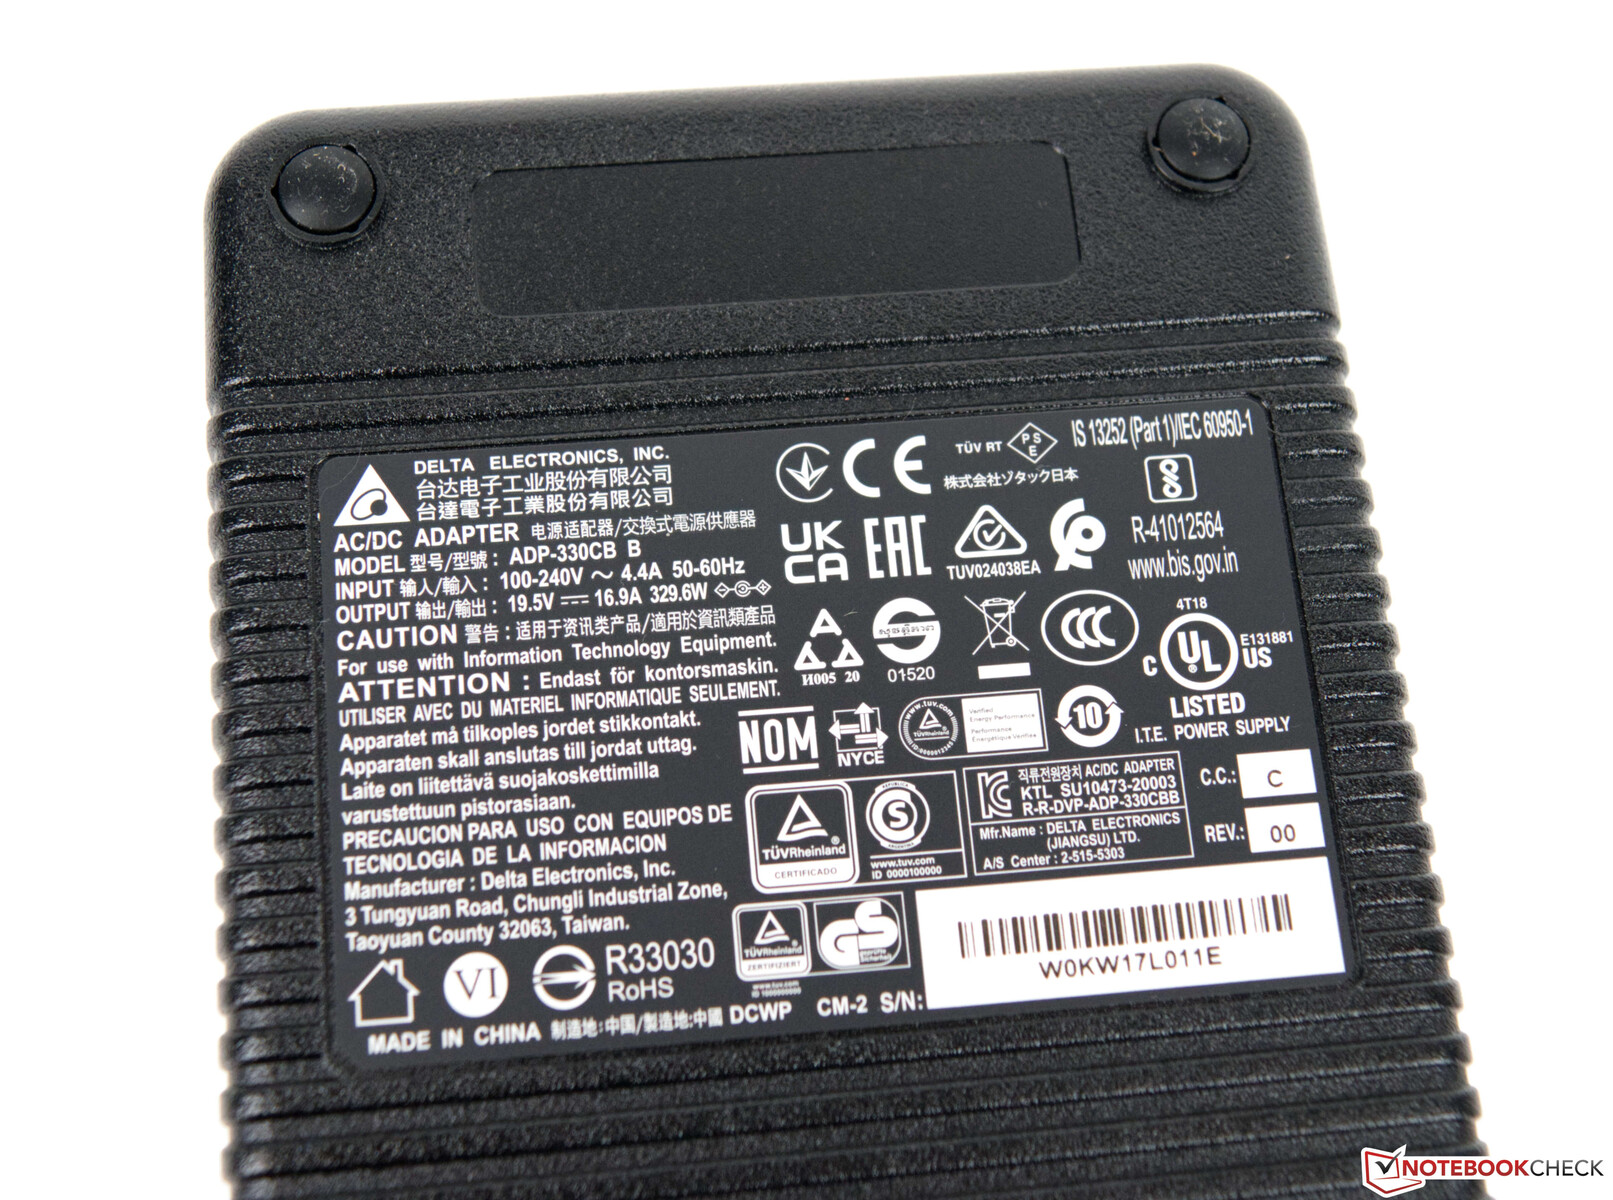
从视觉上看,Zotac ZBOX Magnus EN173070C可以明显区分出来。Zotac ZBOX Magnus EN72080V已经基于紧凑的机箱,只在前面有最小的变化。事情也可以完全没有RGB,正如Zotac在这里展示的那样。那些喜欢简单和紧凑设计的人将会很高兴。该机箱由塑料制成,在我们心中留下了非常好的触觉印象。加上增加的内存和两个M.2固态硬盘,系统的重量略低于1.8公斤(约4磅)。添加的是厚重的330瓦电源,它的重量为1.3公斤(约2.9磅)。就尺寸而言,电源约为Magnus EN173070C本身的一半大,它不需要太多的空间,占地面积为21 x 20.3厘米(约8.3 x 8英寸)。该设备的高度只有6.22厘米(约2.45英寸),也比较纤细。
连接设备
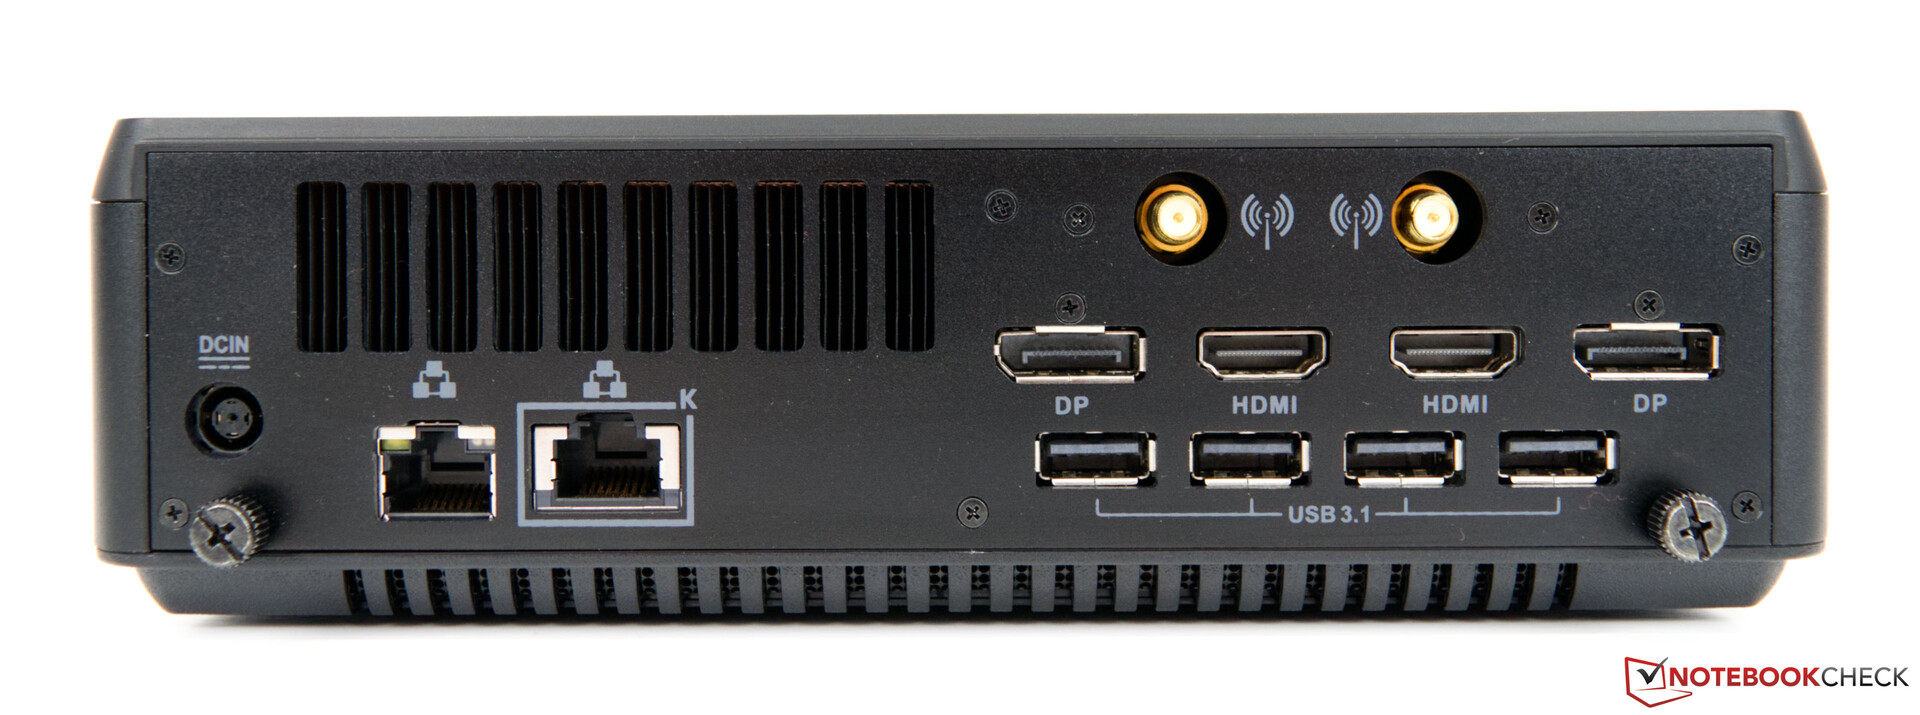
Zotac ZBOX Magnus EN173070C提供了各种各样的外部连接,但这也应该是台式电脑的预期。总共有五个USB Type-A端口和一个Type-C连接,支持Thunderbolt 4。然而,后者有一个限制,即它只用于数据。此外,你最多可以同时运行四个外部显示器。为了连接它们,有两个DisplayPort和两个HDMI端口。此外,用户也不必在没有SD卡读卡器的情况下生活。
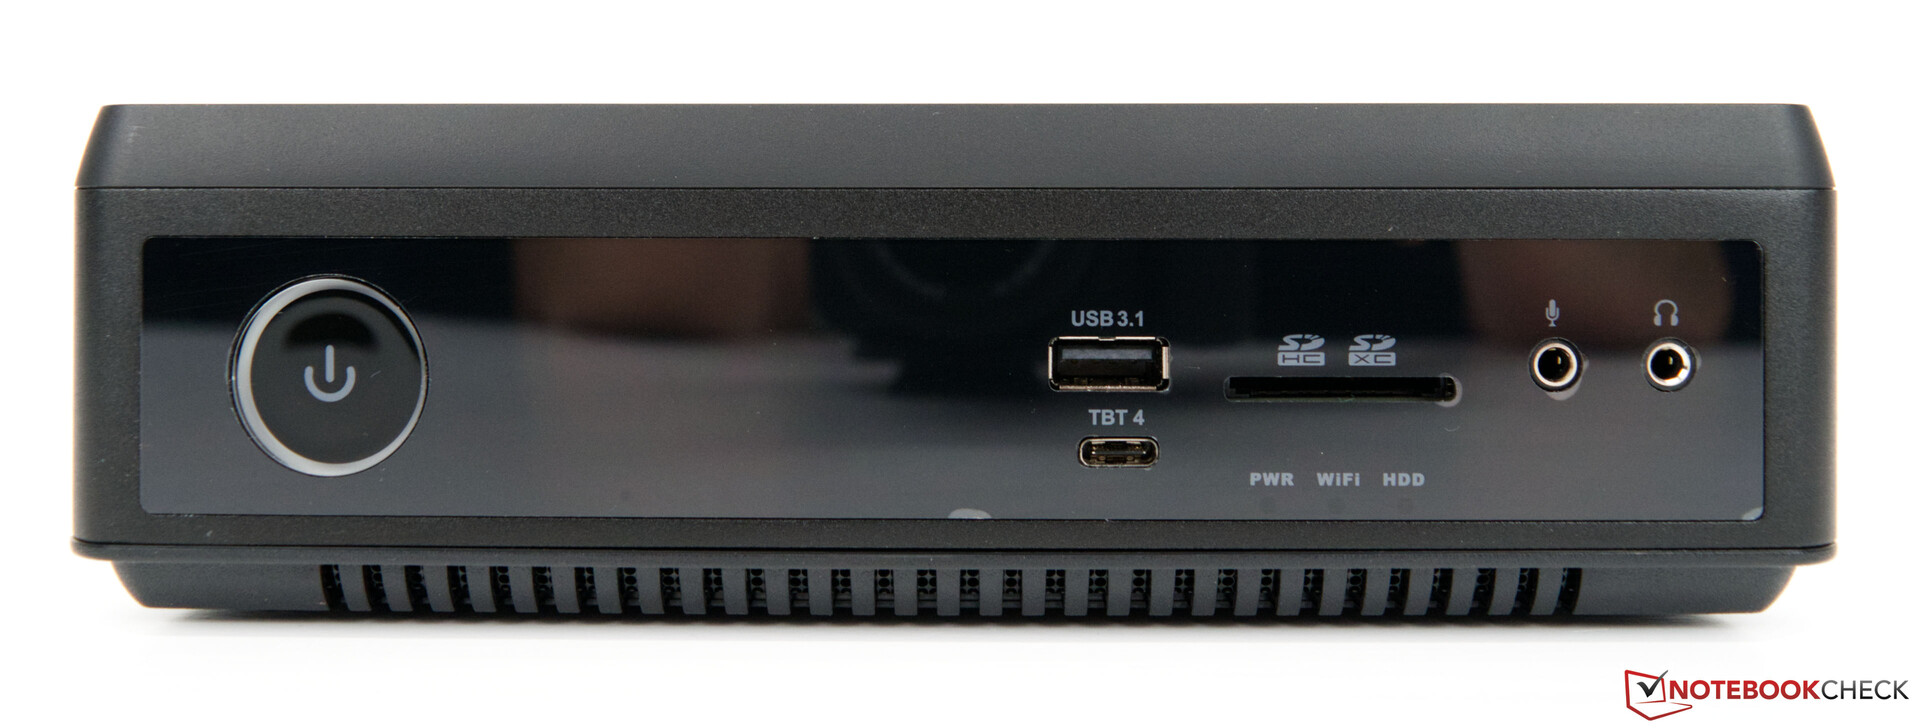
SD卡阅读器
里面的SD读卡器提供USB-3速度,无法使用我们的测试卡(AV Pro SD microSD 128 GB V60)的全部性能。与此相反, 英特尔龙之谷NUC显示了UHS II支持的可能性。
| SD Card Reader | |
| average JPG Copy Test (av. of 3 runs) | |
| Intel Dragon Canyon NUC | |
| Zotac ZBOX Magnus EN173070C (AV Pro SD microSD 128 GB V60) | |
| maximum AS SSD Seq Read Test (1GB) | |
| Intel Dragon Canyon NUC | |
| Zotac ZBOX Magnus EN173070C (AV Pro SD microSD 128 GB V60) | |
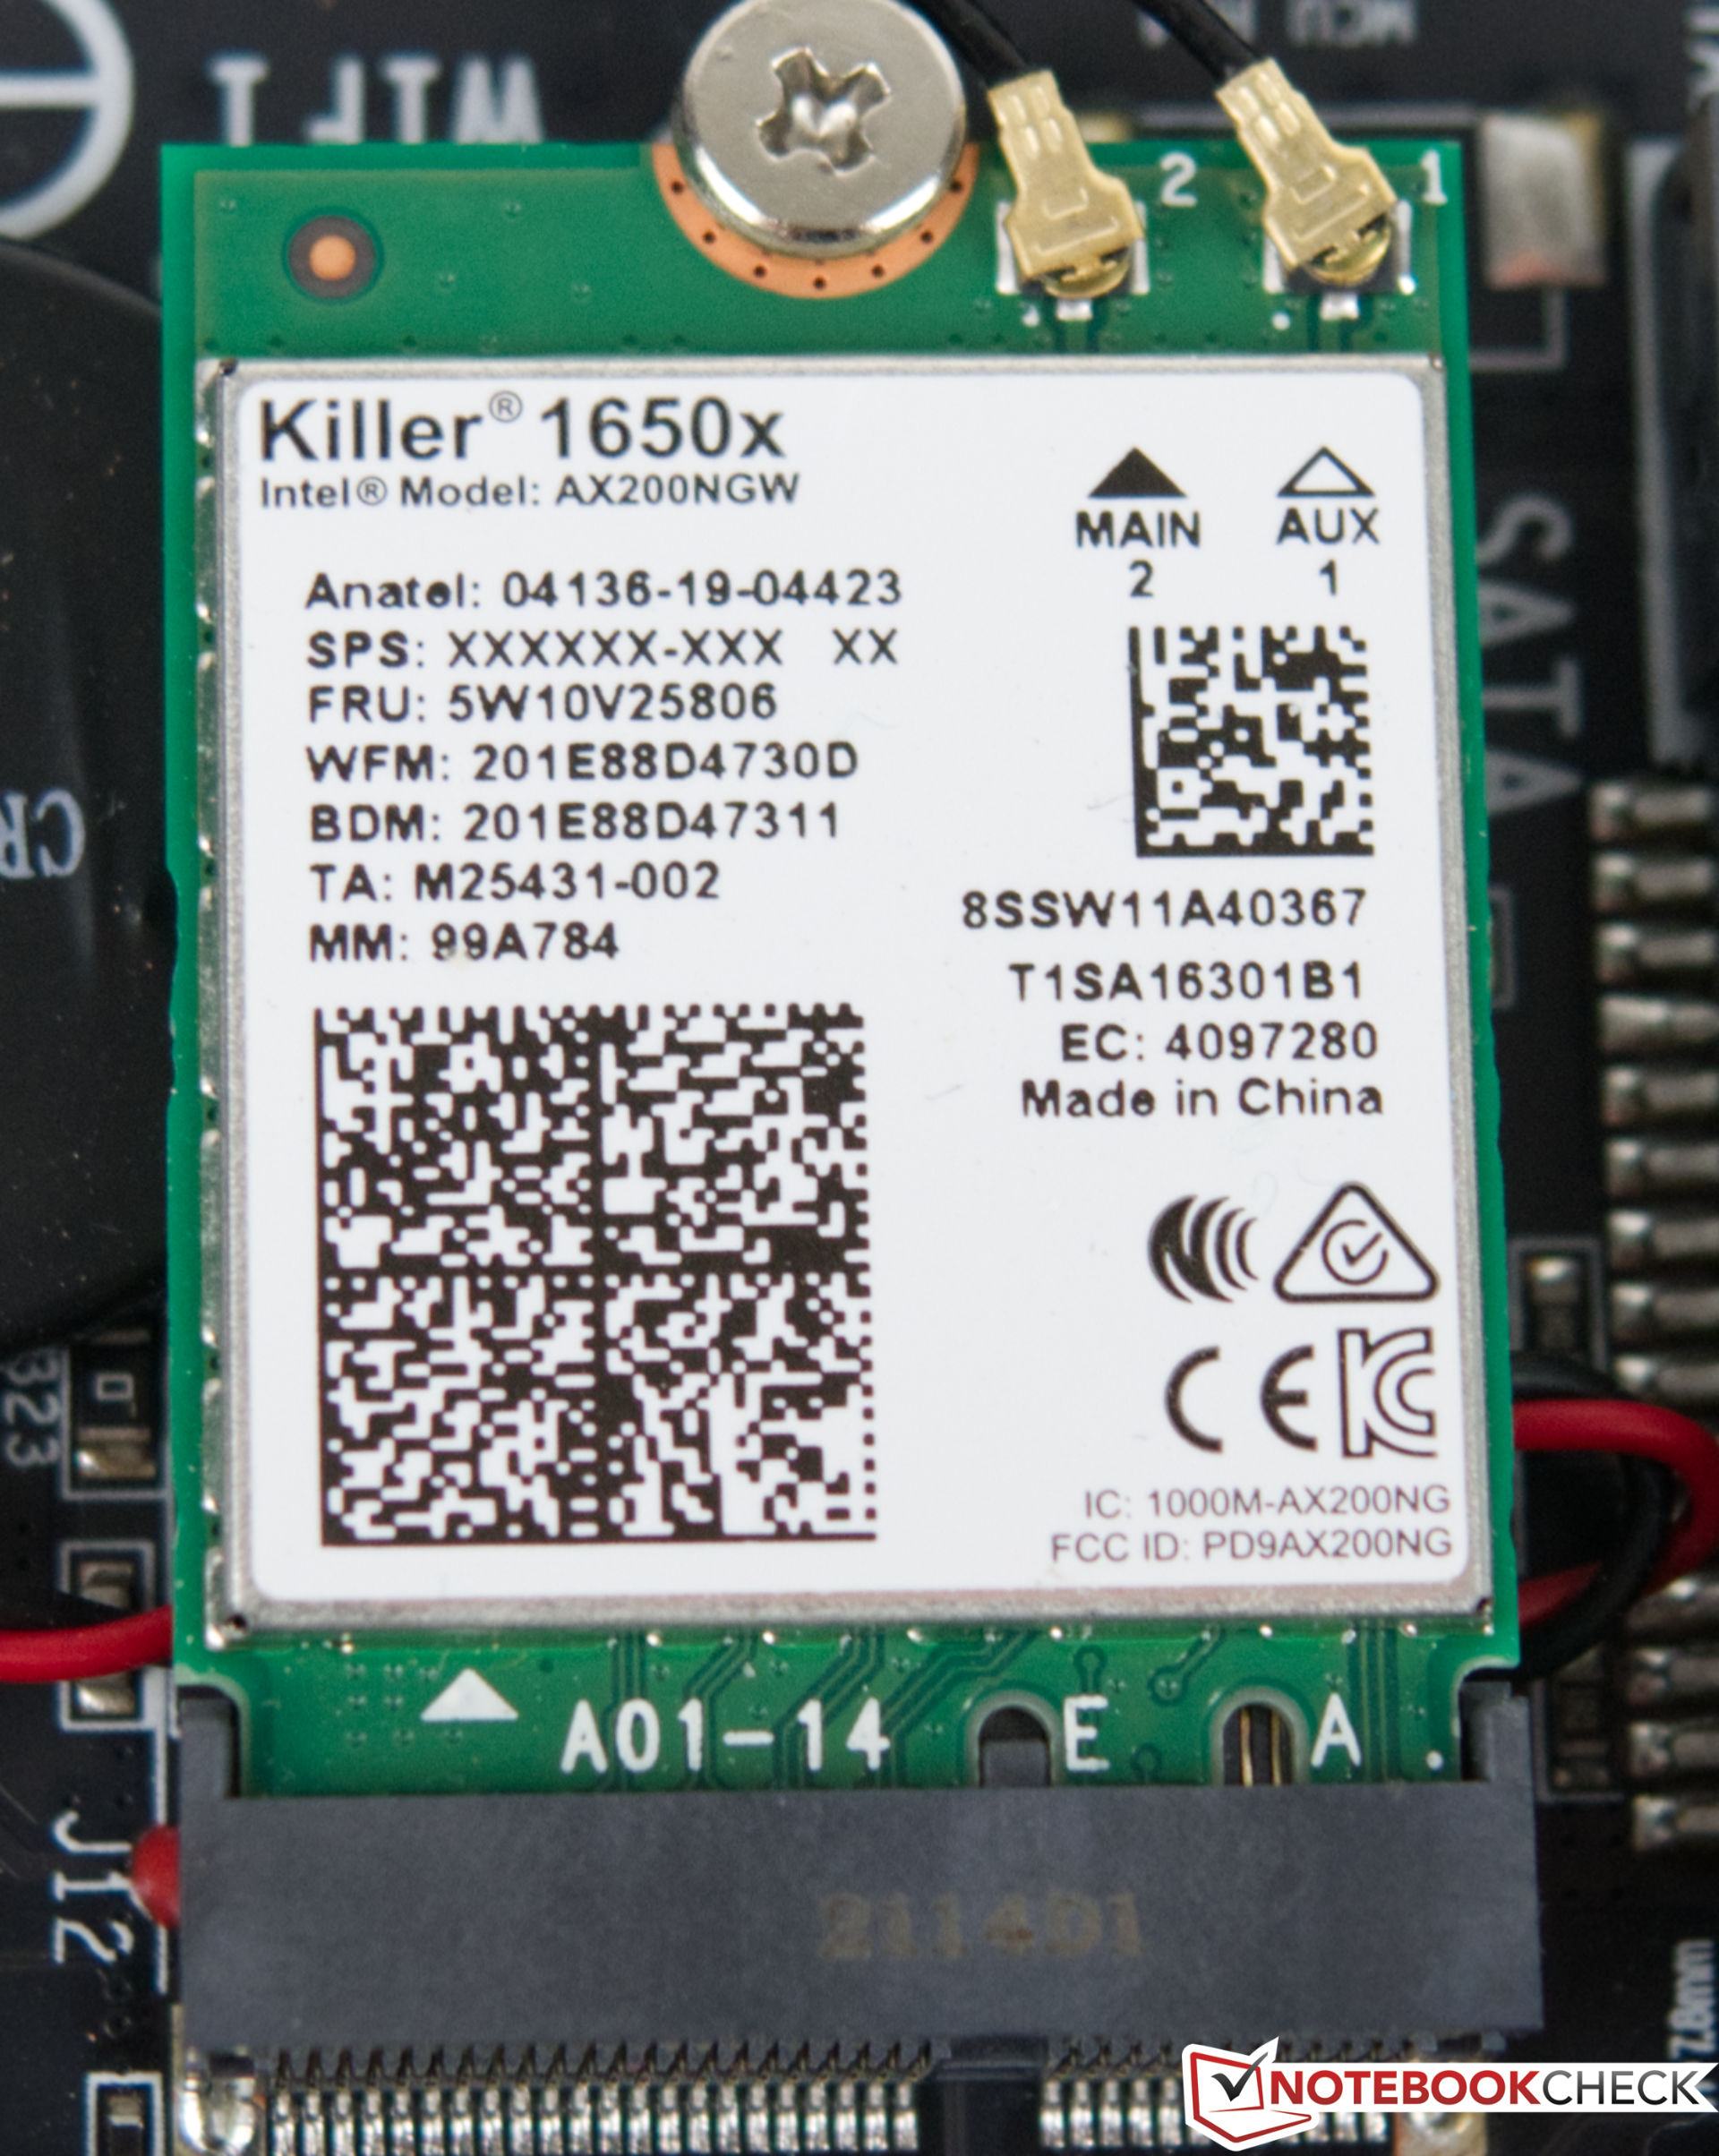
沟通
Zotac在Magnus EN173070C中使用了一个来自Killer的WLAN模块。AX1650x提供Wi-Fi 6,在我们的测试中做得非常好。即使在较长的时间内,性能仍然稳定,没有明显的变化。然而,在直接比较中, 英特尔龙之谷NUC与英特尔Wi-Fi 6E AX211是能够提供更好的价值。我们在最佳条件下使用华硕GT-AXE1000WiFi-6E WLAN游戏路由器进行了测试。
业绩
处理器
Zotac ZBOX Magnus EN173070C使用了一个英特尔酷睿i7-11800HCPU。这款处理器确实是为笔记本电脑准备的,提供8个核心和16个线程,最高时钟速度可达4.6GHz。这款属于Tiger Lake 系列的SoC在紧凑的系统中做得很好。Zotac将PL1值定义为55瓦,而该系统能够在短时间内消耗高达69瓦。虽然性能并没有真正反映在结果中,但我们测试装置的SoC运行在 英特尔酷睿i9-10900K的水平,有时甚至能够超过这个水平。另一方面,英特尔酷睿i7-11800H则被AMD Ryzen 9 5900HX在许多测试中超过了。我们只期望英特尔的Alder Lake P SoC有明显的性能跳跃。也许Zotac已经计划在不久的将来在这里进行一次小的升级,这应该会提高所有领域的性能。
| Cinebench R15 | |
| CPU Single 64Bit | |
| Intel Core i5-12600K, NVIDIA Titan RTX | |
| AMD Ryzen 7 5800X, NVIDIA Titan RTX | |
| AMD Ryzen 9 5900HX, AMD Radeon RX Vega 8 (Ryzen 4000/5000) | |
| Average Intel Core i7-11800H (201 - 231, n=46) | |
| Intel Core i9-10900K, NVIDIA Titan RTX | |
| Intel Core i7-11800H, NVIDIA GeForce RTX 3070 Laptop GPU | |
| Intel Core i9-9980HK, NVIDIA GeForce RTX 2070 (Desktop) | |
| Intel Core i5-10600K, NVIDIA Titan RTX | |
| Intel Core i7-10700, NVIDIA GeForce RTX 3070 | |
| CPU Multi 64Bit | |
| Intel Core i9-10900K, NVIDIA Titan RTX | |
| AMD Ryzen 7 5800X, NVIDIA Titan RTX | |
| Intel Core i5-12600K, NVIDIA Titan RTX | |
| AMD Ryzen 9 5900HX, AMD Radeon RX Vega 8 (Ryzen 4000/5000) | |
| Average Intel Core i7-11800H (1342 - 2173, n=50) | |
| Intel Core i7-11800H, NVIDIA GeForce RTX 3070 Laptop GPU | |
| Intel Core i9-9980HK, NVIDIA GeForce RTX 2070 (Desktop) | |
| Intel Core i7-10700, NVIDIA GeForce RTX 3070 | |
| Intel Core i5-10600K, NVIDIA Titan RTX | |
| Cinebench R20 | |
| CPU (Single Core) | |
| Intel Core i5-12600K, NVIDIA Titan RTX | |
| AMD Ryzen 7 5800X, NVIDIA Titan RTX | |
| AMD Ryzen 9 5900HX, AMD Radeon RX Vega 8 (Ryzen 4000/5000) | |
| Average Intel Core i7-11800H (520 - 586, n=47) | |
| Intel Core i7-11800H, NVIDIA GeForce RTX 3070 Laptop GPU | |
| Intel Core i9-10900K, NVIDIA Titan RTX | |
| Intel Core i9-9980HK, NVIDIA GeForce RTX 2070 (Desktop) | |
| Intel Core i5-10600K, NVIDIA Titan RTX | |
| CPU (Multi Core) | |
| Intel Core i5-12600K, NVIDIA Titan RTX | |
| Intel Core i9-10900K, NVIDIA Titan RTX | |
| AMD Ryzen 7 5800X, NVIDIA Titan RTX | |
| AMD Ryzen 9 5900HX, AMD Radeon RX Vega 8 (Ryzen 4000/5000) | |
| Average Intel Core i7-11800H (2498 - 5408, n=50) | |
| Intel Core i7-11800H, NVIDIA GeForce RTX 3070 Laptop GPU | |
| Intel Core i5-10600K, NVIDIA Titan RTX | |
| Intel Core i9-9980HK, NVIDIA GeForce RTX 2070 (Desktop) | |
| Cinebench R11.5 | |
| CPU Single 64Bit | |
| Intel Core i5-12600K, NVIDIA Titan RTX | |
| AMD Ryzen 7 5800X, NVIDIA Titan RTX | |
| AMD Ryzen 9 5900HX, AMD Radeon RX Vega 8 (Ryzen 4000/5000) | |
| Intel Core i7-11800H, NVIDIA GeForce RTX 3070 Laptop GPU | |
| Average Intel Core i7-11800H (2.45 - 2.62, n=4) | |
| Intel Core i9-10900K, NVIDIA Titan RTX | |
| Intel Core i9-9980HK, NVIDIA GeForce RTX 2070 (Desktop) | |
| Intel Core i7-10700, NVIDIA GeForce RTX 3070 | |
| Intel Core i5-10600K, NVIDIA Titan RTX | |
| CPU Multi 64Bit | |
| Intel Core i5-12600K, NVIDIA Titan RTX | |
| AMD Ryzen 7 5800X, NVIDIA Titan RTX | |
| Intel Core i9-10900K, NVIDIA Titan RTX | |
| AMD Ryzen 9 5900HX, AMD Radeon RX Vega 8 (Ryzen 4000/5000) | |
| Intel Core i7-11800H, NVIDIA GeForce RTX 3070 Laptop GPU | |
| Average Intel Core i7-11800H (16 - 21.9, n=4) | |
| Intel Core i9-9980HK, NVIDIA GeForce RTX 2070 (Desktop) | |
| Intel Core i7-10700, NVIDIA GeForce RTX 3070 | |
| Intel Core i5-10600K, NVIDIA Titan RTX | |
| Cinebench R10 | |
| Rendering Single CPUs 64Bit | |
| Intel Core i5-12600K, NVIDIA Titan RTX | |
| AMD Ryzen 7 5800X, NVIDIA Titan RTX | |
| AMD Ryzen 9 5900HX, AMD Radeon RX Vega 8 (Ryzen 4000/5000) | |
| Intel Core i7-11800H, NVIDIA GeForce RTX 3070 Laptop GPU | |
| Average Intel Core i7-11800H (10903 - 11957, n=4) | |
| Intel Core i9-10900K, NVIDIA Titan RTX | |
| Intel Core i9-9980HK, NVIDIA GeForce RTX 2070 (Desktop) | |
| Intel Core i7-10700, NVIDIA GeForce RTX 3070 | |
| Intel Core i5-10600K, NVIDIA Titan RTX | |
| Rendering Multiple CPUs 64Bit | |
| Intel Core i5-12600K, NVIDIA Titan RTX | |
| AMD Ryzen 7 5800X, NVIDIA Titan RTX | |
| Intel Core i9-10900K, NVIDIA Titan RTX | |
| AMD Ryzen 9 5900HX, AMD Radeon RX Vega 8 (Ryzen 4000/5000) | |
| Intel Core i7-11800H, NVIDIA GeForce RTX 3070 Laptop GPU | |
| Average Intel Core i7-11800H (49232 - 67486, n=4) | |
| Intel Core i9-9980HK, NVIDIA GeForce RTX 2070 (Desktop) | |
| Intel Core i7-10700, NVIDIA GeForce RTX 3070 | |
| Intel Core i5-10600K, NVIDIA Titan RTX | |
| Blender - v2.79 BMW27 CPU | |
| Intel Core i9-9980HK, NVIDIA GeForce RTX 2070 (Desktop) | |
| Intel Core i7-10700, NVIDIA GeForce RTX 3070 | |
| Intel Core i5-10600K, NVIDIA Titan RTX | |
| Intel Core i7-11800H, NVIDIA GeForce RTX 3070 Laptop GPU | |
| Average Intel Core i7-11800H (217 - 454, n=46) | |
| AMD Ryzen 9 5900HX, AMD Radeon RX Vega 8 (Ryzen 4000/5000) | |
| AMD Ryzen 7 5800X, NVIDIA Titan RTX | |
| Intel Core i5-12600K, NVIDIA Titan RTX | |
| Intel Core i9-10900K, NVIDIA Titan RTX | |
| wPrime 2.10 | |
| 32m | |
| Intel Core i5-12600K, NVIDIA Titan RTX | |
| Intel Core i5-10600K, NVIDIA Titan RTX | |
| Intel Core i7-11800H, NVIDIA GeForce RTX 3070 Laptop GPU | |
| Average Intel Core i7-11800H (3.41 - 4.19, n=3) | |
| Intel Core i9-9980HK, NVIDIA GeForce RTX 2070 (Desktop) | |
| Intel Core i9-10900K, NVIDIA Titan RTX | |
| AMD Ryzen 9 5900HX, AMD Radeon RX Vega 8 (Ryzen 4000/5000) | |
| Intel Core i7-10700, NVIDIA GeForce RTX 3070 | |
| AMD Ryzen 7 5800X, NVIDIA Titan RTX | |
| 1024m | |
| Intel Core i5-12600K, NVIDIA Titan RTX | |
| Intel Core i7-11800H, NVIDIA GeForce RTX 3070 Laptop GPU | |
| Intel Core i9-9980HK, NVIDIA GeForce RTX 2070 (Desktop) | |
| Intel Core i7-10700, NVIDIA GeForce RTX 3070 | |
| Average Intel Core i7-11800H (98.3 - 121.1, n=3) | |
| Intel Core i5-10600K, NVIDIA Titan RTX | |
| AMD Ryzen 9 5900HX, AMD Radeon RX Vega 8 (Ryzen 4000/5000) | |
| AMD Ryzen 7 5800X, NVIDIA Titan RTX | |
| Intel Core i9-10900K, NVIDIA Titan RTX | |
| X264 HD Benchmark 4.0 | |
| Pass 1 | |
| AMD Ryzen 7 5800X, NVIDIA Titan RTX | |
| Intel Core i5-12600K, NVIDIA Titan RTX | |
| Intel Core i9-10900K, NVIDIA Titan RTX | |
| AMD Ryzen 9 5900HX, AMD Radeon RX Vega 8 (Ryzen 4000/5000) | |
| Intel Core i5-10600K, NVIDIA Titan RTX | |
| Average Intel Core i7-11800H (242 - 258, n=3) | |
| Intel Core i7-11800H, NVIDIA GeForce RTX 3070 Laptop GPU | |
| Intel Core i9-9980HK, NVIDIA GeForce RTX 2070 (Desktop) | |
| Intel Core i7-10700, NVIDIA GeForce RTX 3070 | |
| Pass 2 | |
| AMD Ryzen 7 5800X, NVIDIA Titan RTX | |
| Intel Core i9-10900K, NVIDIA Titan RTX | |
| Intel Core i5-12600K, NVIDIA Titan RTX | |
| AMD Ryzen 9 5900HX, AMD Radeon RX Vega 8 (Ryzen 4000/5000) | |
| Average Intel Core i7-11800H (86.3 - 109.3, n=3) | |
| Intel Core i7-11800H, NVIDIA GeForce RTX 3070 Laptop GPU | |
| Intel Core i9-9980HK, NVIDIA GeForce RTX 2070 (Desktop) | |
| Intel Core i5-10600K, NVIDIA Titan RTX | |
| Intel Core i7-10700, NVIDIA GeForce RTX 3070 | |
| WinRAR - Result | |
| AMD Ryzen 7 5800X, NVIDIA Titan RTX | |
| Intel Core i9-10900K, NVIDIA Titan RTX | |
| Average Intel Core i7-11800H (7925 - 8569, n=3) | |
| Intel Core i7-11800H, NVIDIA GeForce RTX 3070 Laptop GPU | |
| Intel Core i9-9980HK, NVIDIA GeForce RTX 2070 (Desktop) | |
| Intel Core i7-10700, NVIDIA GeForce RTX 3070 | |
| Intel Core i5-10600K, NVIDIA Titan RTX | |
| Intel Core i5-12600K, NVIDIA Titan RTX | |
| AMD Ryzen 9 5900HX, AMD Radeon RX Vega 8 (Ryzen 4000/5000) | |
| TrueCrypt | |
| AES Mean 100MB | |
| AMD Ryzen 7 5800X, NVIDIA Titan RTX | |
| Intel Core i9-10900K, NVIDIA Titan RTX | |
| Intel Core i5-12600K, NVIDIA Titan RTX | |
| Intel Core i7-10700, NVIDIA GeForce RTX 3070 | |
| Intel Core i9-9980HK, NVIDIA GeForce RTX 2070 (Desktop) | |
| Intel Core i7-11800H, NVIDIA GeForce RTX 3070 Laptop GPU | |
| Average Intel Core i7-11800H (6.5 - 11.6, n=4) | |
| Intel Core i5-10600K, NVIDIA Titan RTX | |
| AMD Ryzen 9 5900HX, AMD Radeon RX Vega 8 (Ryzen 4000/5000) | |
| Twofish Mean 100MB | |
| Intel Core i9-10900K, NVIDIA Titan RTX | |
| Intel Core i5-12600K, NVIDIA Titan RTX | |
| AMD Ryzen 7 5800X, NVIDIA Titan RTX | |
| AMD Ryzen 9 5900HX, AMD Radeon RX Vega 8 (Ryzen 4000/5000) | |
| Intel Core i7-10700, NVIDIA GeForce RTX 3070 | |
| Intel Core i9-9980HK, NVIDIA GeForce RTX 2070 (Desktop) | |
| Average Intel Core i7-11800H (1.5 - 1.7, n=4) | |
| Intel Core i7-11800H, NVIDIA GeForce RTX 3070 Laptop GPU | |
| Intel Core i5-10600K, NVIDIA Titan RTX | |
| Serpent Mean 100MB | |
| Intel Core i9-10900K, NVIDIA Titan RTX | |
| AMD Ryzen 7 5800X, NVIDIA Titan RTX | |
| Intel Core i5-12600K, NVIDIA Titan RTX | |
| AMD Ryzen 9 5900HX, AMD Radeon RX Vega 8 (Ryzen 4000/5000) | |
| Intel Core i7-10700, NVIDIA GeForce RTX 3070 | |
| Intel Core i9-9980HK, NVIDIA GeForce RTX 2070 (Desktop) | |
| Average Intel Core i7-11800H (0.9 - 1.1, n=4) | |
| Intel Core i7-11800H, NVIDIA GeForce RTX 3070 Laptop GPU | |
| Intel Core i5-10600K, NVIDIA Titan RTX | |
| Geekbench 5.5 | |
| Multi-Core | |
| Intel Core i5-12600K, NVIDIA Titan RTX | |
| Intel Core i9-10900K, NVIDIA Titan RTX | |
| AMD Ryzen 7 5800X, NVIDIA Titan RTX | |
| Average Intel Core i7-11800H (4655 - 9851, n=40) | |
| Intel Core i7-11800H, NVIDIA GeForce RTX 3070 Laptop GPU | |
| Intel Core i7-10700, NVIDIA GeForce RTX 3070 | |
| AMD Ryzen 9 5900HX, AMD Radeon RX Vega 8 (Ryzen 4000/5000) | |
| Intel Core i9-9980HK, NVIDIA GeForce RTX 2070 (Desktop) | |
| Intel Core i5-10600K, NVIDIA Titan RTX | |
| Single-Core | |
| Intel Core i5-12600K, NVIDIA Titan RTX | |
| AMD Ryzen 7 5800X, NVIDIA Titan RTX | |
| Intel Core i7-11800H, NVIDIA GeForce RTX 3070 Laptop GPU | |
| Average Intel Core i7-11800H (1429 - 1625, n=40) | |
| AMD Ryzen 9 5900HX, AMD Radeon RX Vega 8 (Ryzen 4000/5000) | |
| Intel Core i9-10900K, NVIDIA Titan RTX | |
| Intel Core i9-9980HK, NVIDIA GeForce RTX 2070 (Desktop) | |
| Intel Core i7-10700, NVIDIA GeForce RTX 3070 | |
| Intel Core i5-10600K, NVIDIA Titan RTX | |
| Geekbench 5.0 | |
| 5.0 Multi-Core | |
| Intel Core i5-12600K, NVIDIA Titan RTX | |
| Intel Core i9-10900K, NVIDIA Titan RTX | |
| AMD Ryzen 7 5800X, NVIDIA Titan RTX | |
| Intel Core i7-10700, NVIDIA GeForce RTX 3070 | |
| Intel Core i7-11800H, NVIDIA GeForce RTX 3070 Laptop GPU | |
| AMD Ryzen 9 5900HX, AMD Radeon RX Vega 8 (Ryzen 4000/5000) | |
| Average Intel Core i7-11800H (6340 - 9103, n=8) | |
| Intel Core i9-9980HK, NVIDIA GeForce RTX 2070 (Desktop) | |
| Intel Core i5-10600K, NVIDIA Titan RTX | |
| 5.0 Single-Core | |
| Intel Core i5-12600K, NVIDIA Titan RTX | |
| AMD Ryzen 7 5800X, NVIDIA Titan RTX | |
| Intel Core i7-11800H, NVIDIA GeForce RTX 3070 Laptop GPU | |
| Average Intel Core i7-11800H (1436 - 1571, n=8) | |
| AMD Ryzen 9 5900HX, AMD Radeon RX Vega 8 (Ryzen 4000/5000) | |
| Intel Core i9-10900K, NVIDIA Titan RTX | |
| Intel Core i9-9980HK, NVIDIA GeForce RTX 2070 (Desktop) | |
| Intel Core i7-10700, NVIDIA GeForce RTX 3070 | |
| Intel Core i5-10600K, NVIDIA Titan RTX | |
| Geekbench 4.4 | |
| 64 Bit Single-Core Score | |
| Intel Core i5-12600K, NVIDIA Titan RTX | |
| AMD Ryzen 7 5800X, NVIDIA Titan RTX | |
| Intel Core i7-11800H, NVIDIA GeForce RTX 3070 Laptop GPU | |
| Average Intel Core i7-11800H (6104 - 6747, n=7) | |
| AMD Ryzen 9 5900HX, AMD Radeon RX Vega 8 (Ryzen 4000/5000) | |
| Intel Core i9-10900K, NVIDIA Titan RTX | |
| Intel Core i9-9980HK, NVIDIA GeForce RTX 2070 (Desktop) | |
| Intel Core i5-10600K, NVIDIA Titan RTX | |
| Intel Core i7-10700, NVIDIA GeForce RTX 3070 | |
| 64 Bit Multi-Core Score | |
| Intel Core i5-12600K, NVIDIA Titan RTX | |
| AMD Ryzen 7 5800X, NVIDIA Titan RTX | |
| Intel Core i9-10900K, NVIDIA Titan RTX | |
| Average Intel Core i7-11800H (27454 - 36706, n=7) | |
| Intel Core i7-11800H, NVIDIA GeForce RTX 3070 Laptop GPU | |
| AMD Ryzen 9 5900HX, AMD Radeon RX Vega 8 (Ryzen 4000/5000) | |
| Intel Core i7-10700, NVIDIA GeForce RTX 3070 | |
| Intel Core i9-9980HK, NVIDIA GeForce RTX 2070 (Desktop) | |
| Intel Core i5-10600K, NVIDIA Titan RTX | |
| 3DMark 11 - 1280x720 Performance Physics | |
| Intel Core i5-12600K, NVIDIA Titan RTX | |
| AMD Ryzen 7 5800X, NVIDIA Titan RTX | |
| Intel Core i9-10900K, NVIDIA Titan RTX | |
| Intel Core i9-9980HK, NVIDIA GeForce RTX 2070 (Desktop) | |
| Average Intel Core i7-11800H (10590 - 19167, n=46) | |
| Intel Core i5-10600K, NVIDIA Titan RTX | |
| Intel Core i7-11800H, NVIDIA GeForce RTX 3070 Laptop GPU | |
| Intel Core i7-10700, NVIDIA GeForce RTX 3070 | |
| AMD Ryzen 9 5900HX, AMD Radeon RX Vega 8 (Ryzen 4000/5000) | |
| 7-Zip 18.03 | |
| 7z b 4 | |
| AMD Ryzen 7 5800X, NVIDIA Titan RTX | |
| Intel Core i9-10900K, NVIDIA Titan RTX | |
| Intel Core i5-12600K, NVIDIA Titan RTX | |
| AMD Ryzen 9 5900HX, AMD Radeon RX Vega 8 (Ryzen 4000/5000) | |
| Average Intel Core i7-11800H (33718 - 56758, n=46) | |
| Intel Core i7-11800H, NVIDIA GeForce RTX 3070 Laptop GPU | |
| Intel Core i9-9980HK, NVIDIA GeForce RTX 2070 (Desktop) | |
| Intel Core i7-10700, NVIDIA GeForce RTX 3070 | |
| Intel Core i5-10600K, NVIDIA Titan RTX | |
| 7z b 4 -mmt1 | |
| AMD Ryzen 7 5800X, NVIDIA Titan RTX | |
| Intel Core i9-10900K, NVIDIA Titan RTX | |
| Intel Core i5-12600K, NVIDIA Titan RTX | |
| AMD Ryzen 9 5900HX, AMD Radeon RX Vega 8 (Ryzen 4000/5000) | |
| Intel Core i9-9980HK, NVIDIA GeForce RTX 2070 (Desktop) | |
| Intel Core i7-11800H, NVIDIA GeForce RTX 3070 Laptop GPU | |
| Average Intel Core i7-11800H (5138 - 5732, n=46) | |
| Intel Core i7-10700, NVIDIA GeForce RTX 3070 | |
| Intel Core i5-10600K, NVIDIA Titan RTX | |
| HWBOT x265 Benchmark v2.2 - 4k Preset | |
| Intel Core i5-12600K, NVIDIA Titan RTX | |
| Intel Core i9-10900K, NVIDIA Titan RTX | |
| AMD Ryzen 7 5800X, NVIDIA Titan RTX | |
| AMD Ryzen 9 5900HX, AMD Radeon RX Vega 8 (Ryzen 4000/5000) | |
| Average Intel Core i7-11800H (7.38 - 17.4, n=46) | |
| Intel Core i7-11800H, NVIDIA GeForce RTX 3070 Laptop GPU | |
| Intel Core i5-10600K, NVIDIA Titan RTX | |
| Intel Core i7-10700, NVIDIA GeForce RTX 3070 | |
| Intel Core i9-9980HK, NVIDIA GeForce RTX 2070 (Desktop) | |
| R Benchmark 2.5 - Overall mean | |
| Intel Core i5-10600K, NVIDIA Titan RTX | |
| Intel Core i7-10700, NVIDIA GeForce RTX 3070 | |
| Average Intel Core i7-11800H (0.548 - 0.615, n=46) | |
| Intel Core i7-11800H, NVIDIA GeForce RTX 3070 Laptop GPU | |
| Intel Core i9-9980HK, NVIDIA GeForce RTX 2070 (Desktop) | |
| Intel Core i9-10900K, NVIDIA Titan RTX | |
| AMD Ryzen 9 5900HX, AMD Radeon RX Vega 8 (Ryzen 4000/5000) | |
| AMD Ryzen 7 5800X, NVIDIA Titan RTX | |
| Intel Core i5-12600K, NVIDIA Titan RTX | |
| LibreOffice - 20 Documents To PDF | |
| Intel Core i9-10900K, NVIDIA Titan RTX | |
| Intel Core i5-12600K, NVIDIA Titan RTX | |
| Intel Core i7-10700, NVIDIA GeForce RTX 3070 | |
| AMD Ryzen 9 5900HX, AMD Radeon RX Vega 8 (Ryzen 4000/5000) | |
| Intel Core i7-11800H, NVIDIA GeForce RTX 3070 Laptop GPU | |
| Average Intel Core i7-11800H (38.6 - 59.9, n=45) | |
| Intel Core i5-10600K, NVIDIA Titan RTX | |
| Intel Core i9-9980HK, NVIDIA GeForce RTX 2070 (Desktop) | |
| AMD Ryzen 7 5800X, NVIDIA Titan RTX | |
| WebXPRT 3 - Overall | |
| AMD Ryzen 7 5800X, NVIDIA Titan RTX | |
| Intel Core i5-12600K, NVIDIA Titan RTX | |
| AMD Ryzen 9 5900HX, AMD Radeon RX Vega 8 (Ryzen 4000/5000) | |
| Intel Core i7-11800H, NVIDIA GeForce RTX 3070 Laptop GPU | |
| Average Intel Core i7-11800H (251 - 280, n=40) | |
| Intel Core i9-10900K, NVIDIA Titan RTX | |
| Intel Core i7-10700, NVIDIA GeForce RTX 3070 | |
| Intel Core i5-10600K, NVIDIA Titan RTX | |
| Intel Core i9-9980HK, NVIDIA GeForce RTX 2070 (Desktop) | |
| Mozilla Kraken 1.1 - Total | |
| Intel Core i5-10600K, NVIDIA Titan RTX | |
| Intel Core i9-9980HK, NVIDIA GeForce RTX 2070 (Desktop) | |
| Intel Core i7-10700, NVIDIA GeForce RTX 3070 | |
| Intel Core i9-10900K, NVIDIA Titan RTX | |
| Average Intel Core i7-11800H (600 - 690, n=45) | |
| Intel Core i7-11800H, NVIDIA GeForce RTX 3070 Laptop GPU | |
| AMD Ryzen 9 5900HX, AMD Radeon RX Vega 8 (Ryzen 4000/5000) | |
| AMD Ryzen 7 5800X, NVIDIA Titan RTX | |
| Intel Core i5-12600K, NVIDIA Titan RTX | |
| 3DMark | |
| 3840x2160 Fire Strike Ultra Physics | |
| AMD Ryzen 7 5800X, NVIDIA Titan RTX | |
| Intel Core i5-12600K, NVIDIA Titan RTX | |
| Intel Core i9-10900K, NVIDIA Titan RTX | |
| Average Intel Core i7-11800H (21176 - 25203, n=16) | |
| AMD Ryzen 9 5900HX, AMD Radeon RX Vega 8 (Ryzen 4000/5000) | |
| Intel Core i7-11800H, NVIDIA GeForce RTX 3070 Laptop GPU | |
| Intel Core i9-9980HK, NVIDIA GeForce RTX 2070 (Desktop) | |
| Intel Core i7-10700, NVIDIA GeForce RTX 3070 | |
| Intel Core i5-10600K, NVIDIA Titan RTX | |
| 1920x1080 Fire Strike Physics | |
| AMD Ryzen 7 5800X, NVIDIA Titan RTX | |
| Intel Core i9-10900K, NVIDIA Titan RTX | |
| Intel Core i5-12600K, NVIDIA Titan RTX | |
| AMD Ryzen 9 5900HX, AMD Radeon RX Vega 8 (Ryzen 4000/5000) | |
| Intel Core i7-11800H, NVIDIA GeForce RTX 3070 Laptop GPU | |
| Average Intel Core i7-11800H (12843 - 25145, n=47) | |
| Intel Core i9-9980HK, NVIDIA GeForce RTX 2070 (Desktop) | |
| Intel Core i7-10700, NVIDIA GeForce RTX 3070 | |
| Intel Core i5-10600K, NVIDIA Titan RTX | |
| 2560x1440 Time Spy CPU | |
| Intel Core i9-10900K, NVIDIA Titan RTX | |
| Intel Core i5-12600K, NVIDIA Titan RTX | |
| AMD Ryzen 7 5800X, NVIDIA Titan RTX | |
| Intel Core i9-9980HK, NVIDIA GeForce RTX 2070 (Desktop) | |
| Intel Core i7-11800H, NVIDIA GeForce RTX 3070 Laptop GPU | |
| Average Intel Core i7-11800H (5086 - 11076, n=47) | |
| Intel Core i7-10700, NVIDIA GeForce RTX 3070 | |
| Intel Core i5-10600K, NVIDIA Titan RTX | |
| AMD Ryzen 9 5900HX, AMD Radeon RX Vega 8 (Ryzen 4000/5000) | |
* ... smaller is better
AIDA64: FP32 Ray-Trace | FPU Julia | CPU SHA3 | CPU Queen | FPU SinJulia | FPU Mandel | CPU AES | CPU ZLib | FP64 Ray-Trace | CPU PhotoWorxx
| Performance rating | |
| Average of class Desktop | |
| Minisforum EliteMini HX90 | |
| AMD Ryzen 7 5800X | |
| Zotac ZBOX Magnus EN173070C | |
| Average Intel Core i7-11800H | |
| Intel Core i5-12600K | |
| Intel Ghost Canyon NUC (RTX 2070) -1! | |
| AIDA64 / FP32 Ray-Trace | |
| Average of class Desktop (12248 - 84577, n=21, last 2 years) | |
| AMD Ryzen 7 5800X | |
| Minisforum EliteMini HX90 | |
| Average Intel Core i7-11800H (8772 - 15961, n=20) | |
| Zotac ZBOX Magnus EN173070C | |
| Intel Ghost Canyon NUC (RTX 2070) | |
| Intel Core i5-12600K | |
| AIDA64 / FPU Julia | |
| Average of class Desktop (65152 - 246125, n=21, last 2 years) | |
| Minisforum EliteMini HX90 | |
| AMD Ryzen 7 5800X | |
| Average Intel Core i7-11800H (39404 - 65636, n=20) | |
| Zotac ZBOX Magnus EN173070C | |
| Intel Ghost Canyon NUC (RTX 2070) | |
| Intel Core i5-12600K | |
| AIDA64 / CPU SHA3 | |
| Average of class Desktop (2982 - 10804, n=21, last 2 years) | |
| Average Intel Core i7-11800H (2599 - 4439, n=20) | |
| Zotac ZBOX Magnus EN173070C | |
| Minisforum EliteMini HX90 | |
| Intel Core i5-12600K | |
| Intel Ghost Canyon NUC (RTX 2070) | |
| AMD Ryzen 7 5800X | |
| AIDA64 / CPU Queen | |
| Average of class Desktop (76512 - 187912, n=18, last 2 years) | |
| AMD Ryzen 7 5800X | |
| Minisforum EliteMini HX90 | |
| Average Intel Core i7-11800H (85233 - 91941, n=20) | |
| Zotac ZBOX Magnus EN173070C | |
| Intel Core i5-12600K | |
| AIDA64 / FPU SinJulia | |
| Average of class Desktop (6443 - 35251, n=21, last 2 years) | |
| AMD Ryzen 7 5800X | |
| Minisforum EliteMini HX90 | |
| Intel Core i5-12600K | |
| Zotac ZBOX Magnus EN173070C | |
| Intel Ghost Canyon NUC (RTX 2070) | |
| Average Intel Core i7-11800H (6420 - 9792, n=20) | |
| AIDA64 / FPU Mandel | |
| Average of class Desktop (31697 - 129745, n=21, last 2 years) | |
| Minisforum EliteMini HX90 | |
| AMD Ryzen 7 5800X | |
| Average Intel Core i7-11800H (23365 - 39464, n=20) | |
| Zotac ZBOX Magnus EN173070C | |
| Intel Ghost Canyon NUC (RTX 2070) | |
| Intel Core i5-12600K | |
| AIDA64 / CPU AES | |
| Average of class Desktop (57777 - 513073, n=21, last 2 years) | |
| Minisforum EliteMini HX90 | |
| Zotac ZBOX Magnus EN173070C | |
| Average Intel Core i7-11800H (74617 - 149388, n=20) | |
| AMD Ryzen 7 5800X | |
| Intel Core i5-12600K | |
| Intel Ghost Canyon NUC (RTX 2070) | |
| AIDA64 / CPU ZLib | |
| Average of class Desktop (887 - 2674, n=21, last 2 years) | |
| Intel Core i5-12600K | |
| AMD Ryzen 7 5800X | |
| Minisforum EliteMini HX90 | |
| Zotac ZBOX Magnus EN173070C | |
| Intel Ghost Canyon NUC (RTX 2070) | |
| Average Intel Core i7-11800H (461 - 830, n=43) | |
| AIDA64 / FP64 Ray-Trace | |
| Average of class Desktop (6471 - 44013, n=21, last 2 years) | |
| AMD Ryzen 7 5800X | |
| Minisforum EliteMini HX90 | |
| Average Intel Core i7-11800H (4545 - 8717, n=21) | |
| Zotac ZBOX Magnus EN173070C | |
| Intel Ghost Canyon NUC (RTX 2070) | |
| Intel Core i5-12600K | |
| AIDA64 / CPU PhotoWorxx | |
| Intel Core i5-12600K | |
| Average of class Desktop (38071 - 63949, n=21, last 2 years) | |
| AMD Ryzen 7 5800X | |
| Zotac ZBOX Magnus EN173070C | |
| Intel Ghost Canyon NUC (RTX 2070) | |
| Average Intel Core i7-11800H (11898 - 26757, n=21) | |
| Minisforum EliteMini HX90 | |
Zotac ZBOX Magnus在Cinebench R15多重循环中的表现
紧凑的结构需要一个精心设计和有效的冷却系统。Zotac在这里恰恰提供了这一点,因为在重复的Cinebench R15负载循环中,我们没有测量到恒定负载下的任何强烈性能损失。
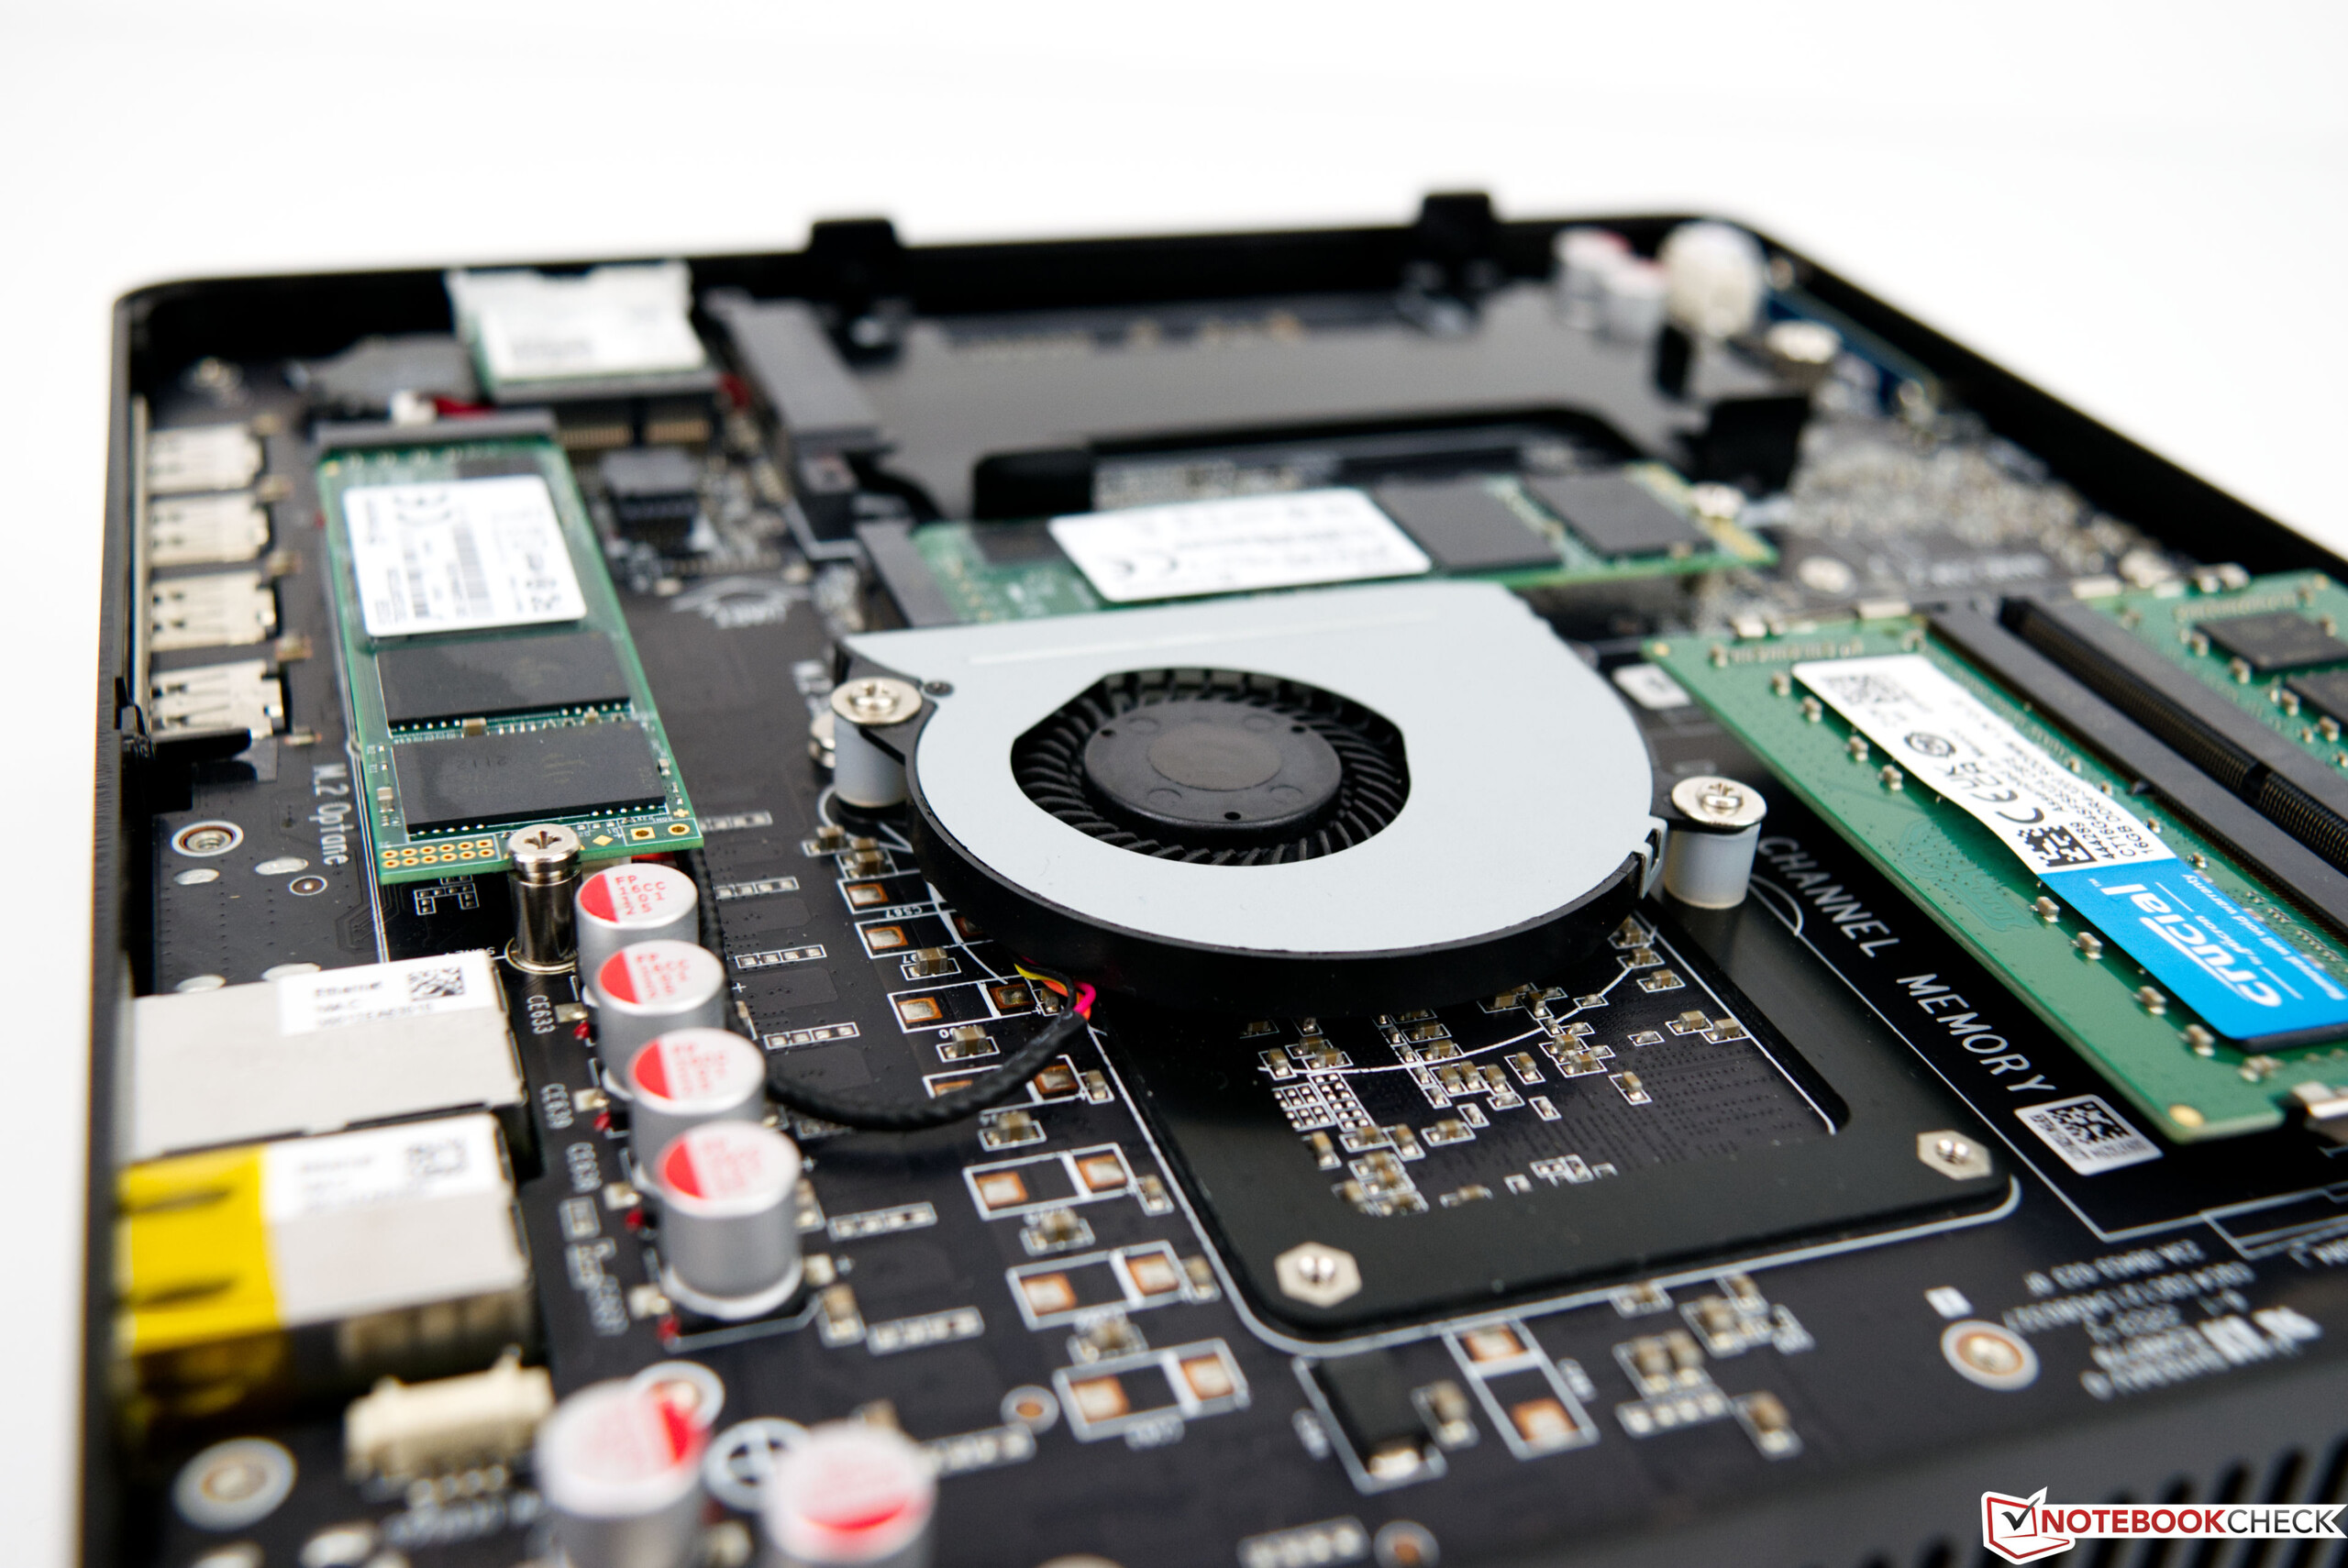
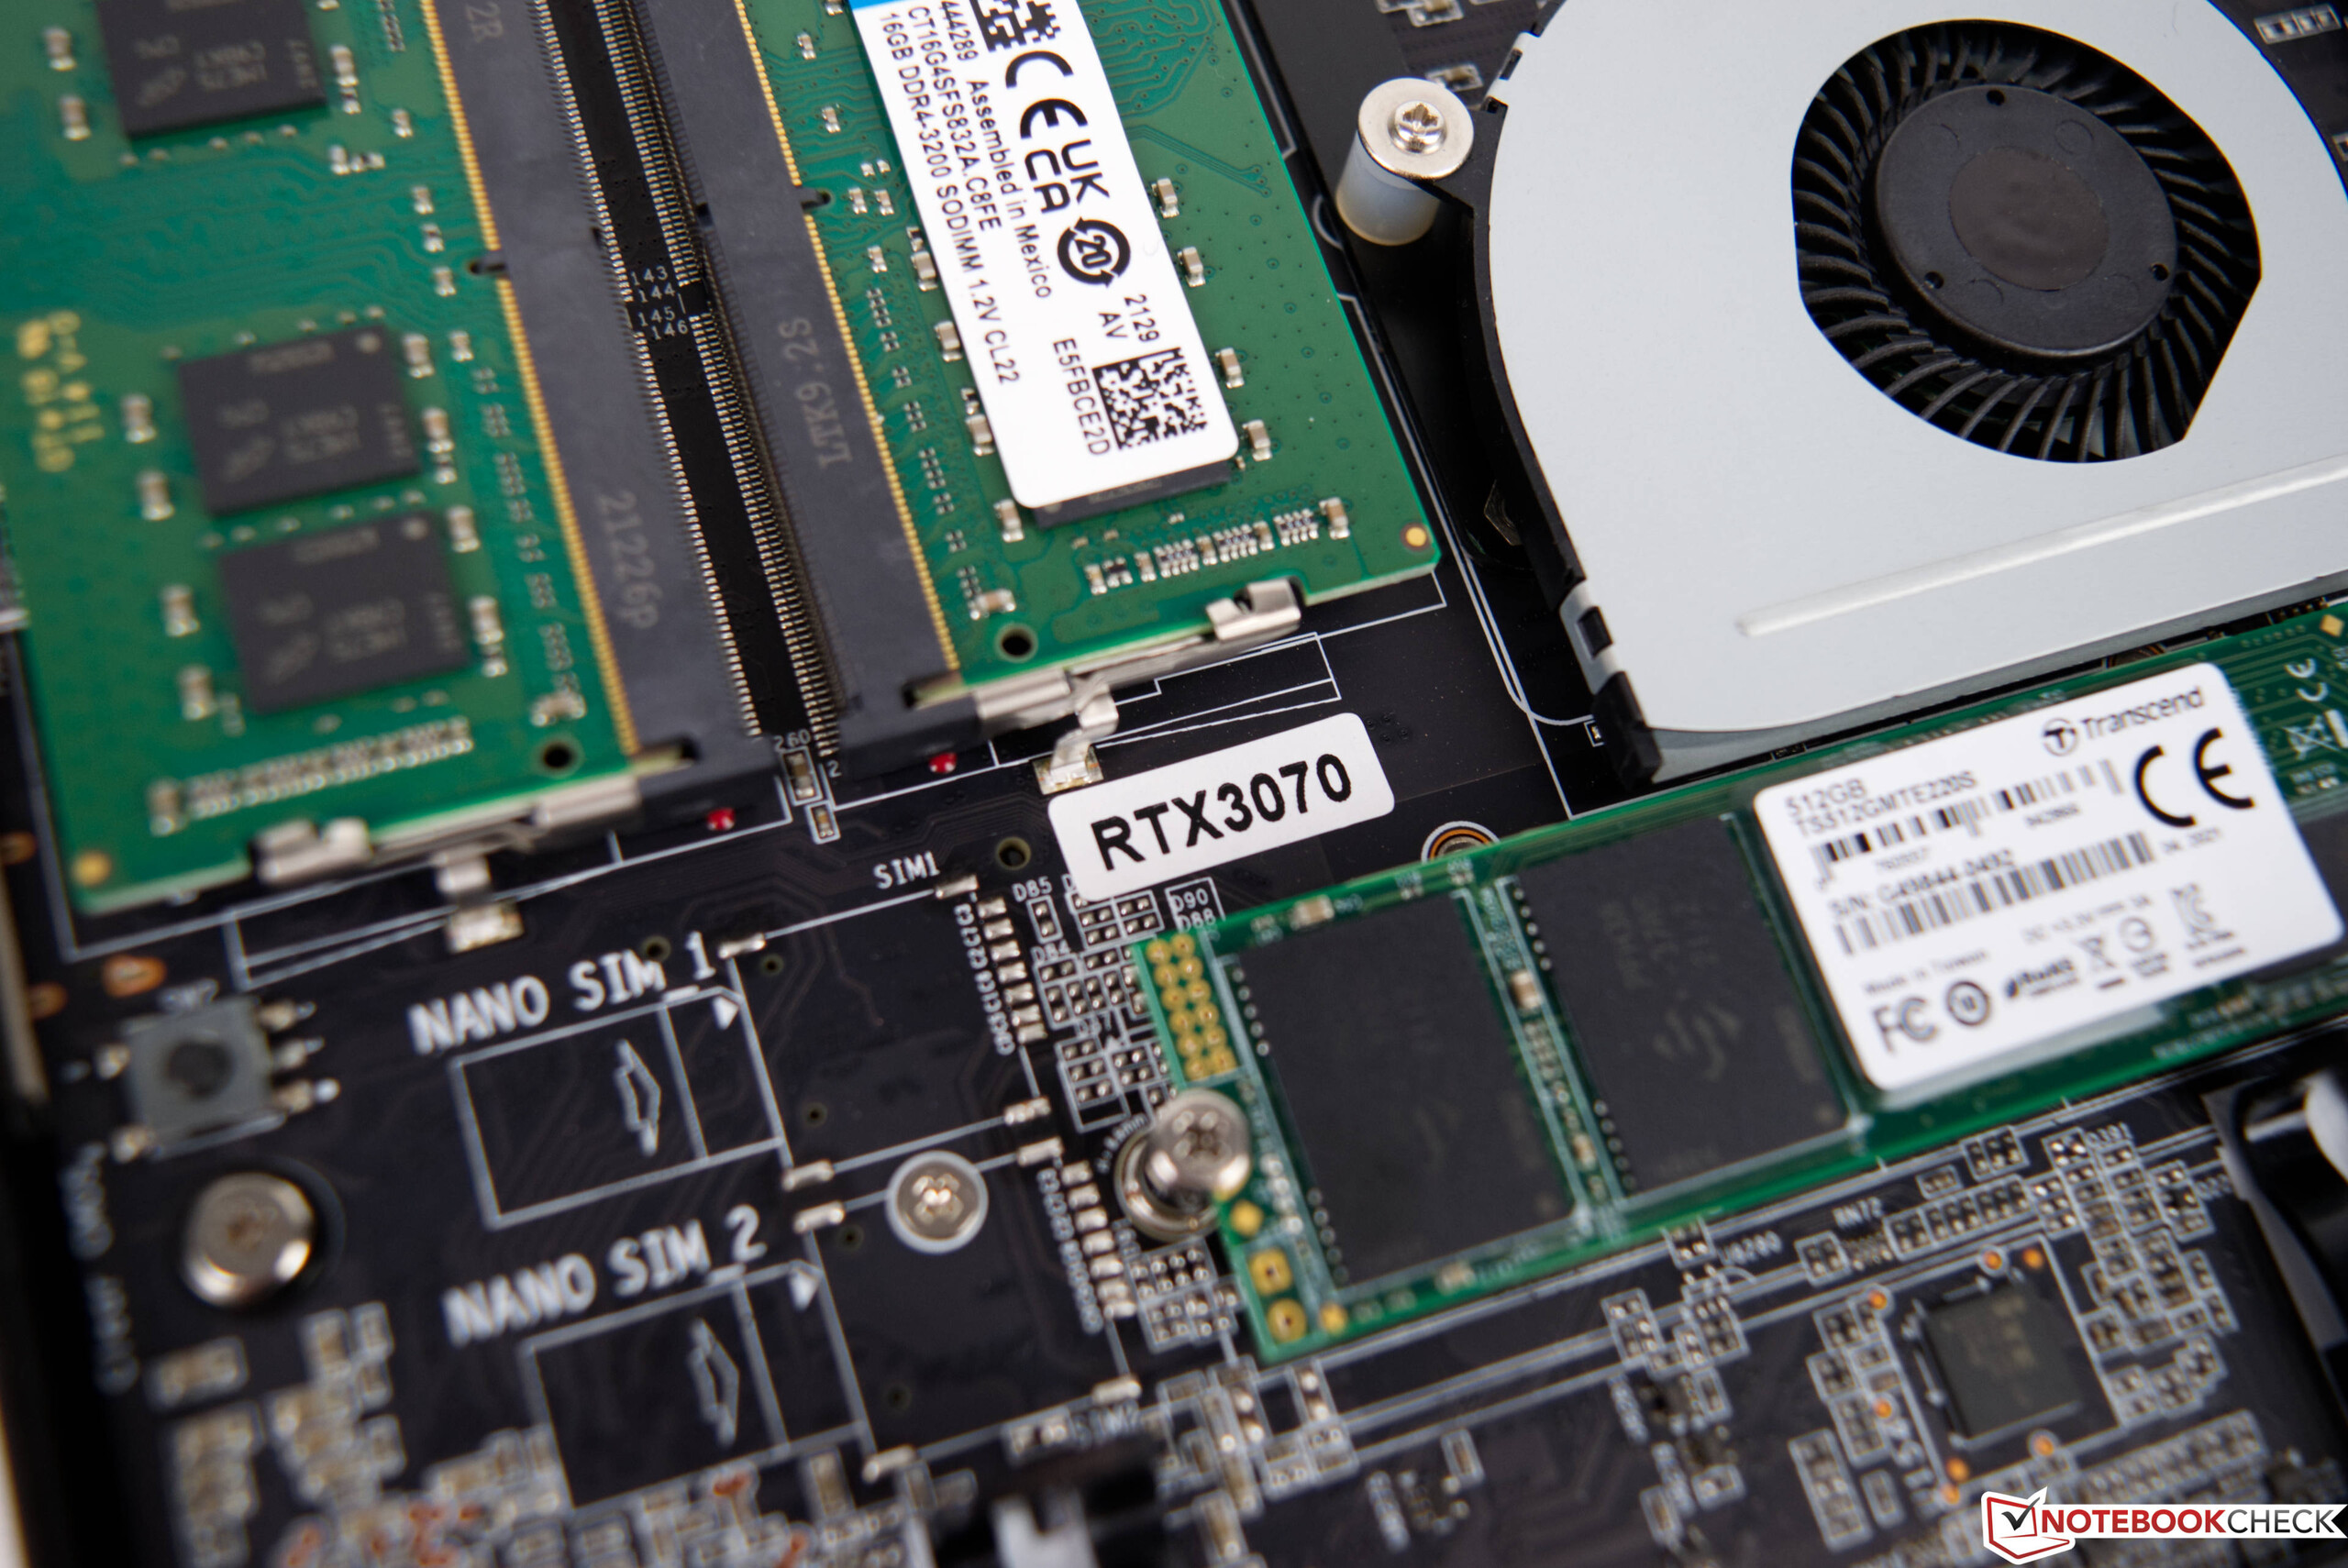
应用性能和存储解决方案
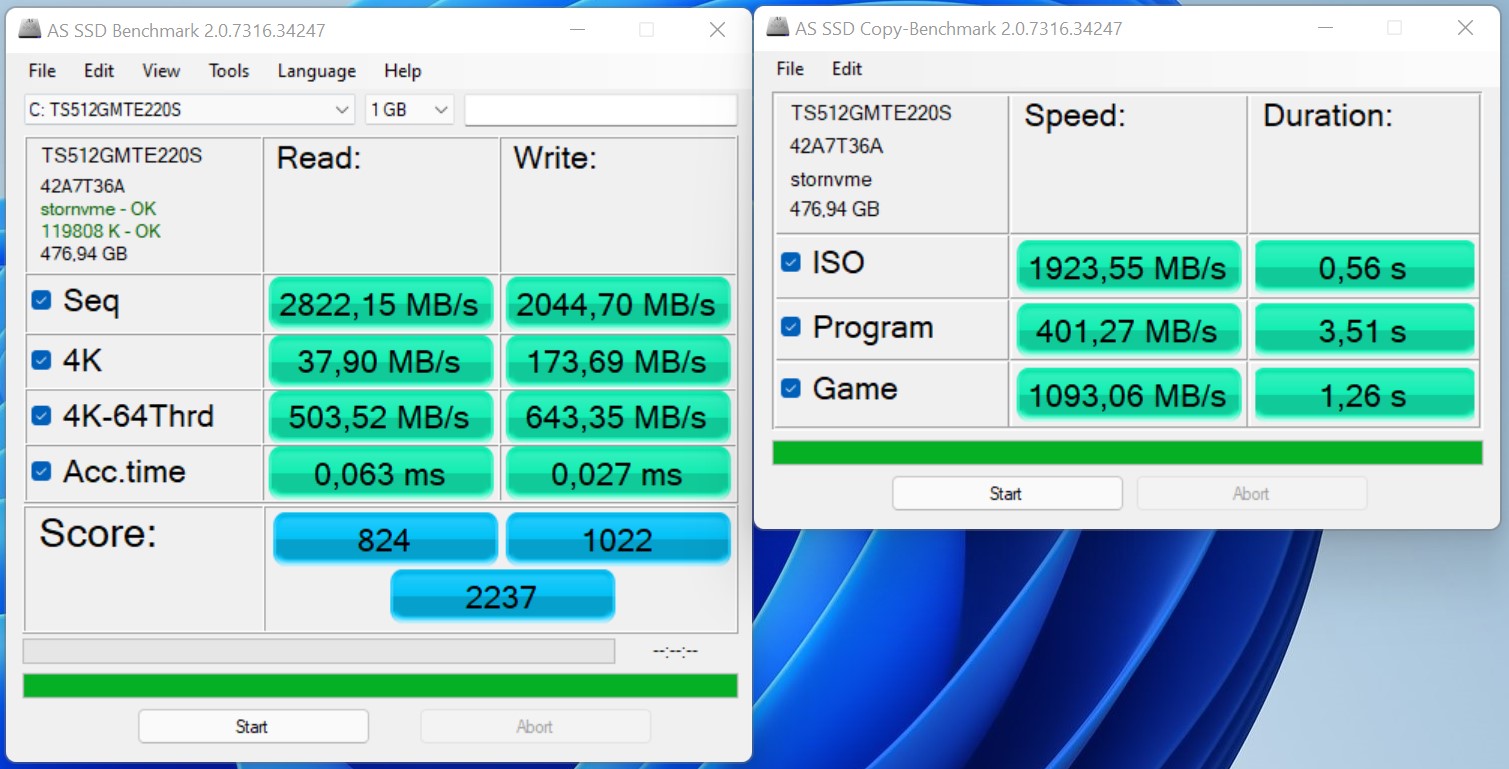
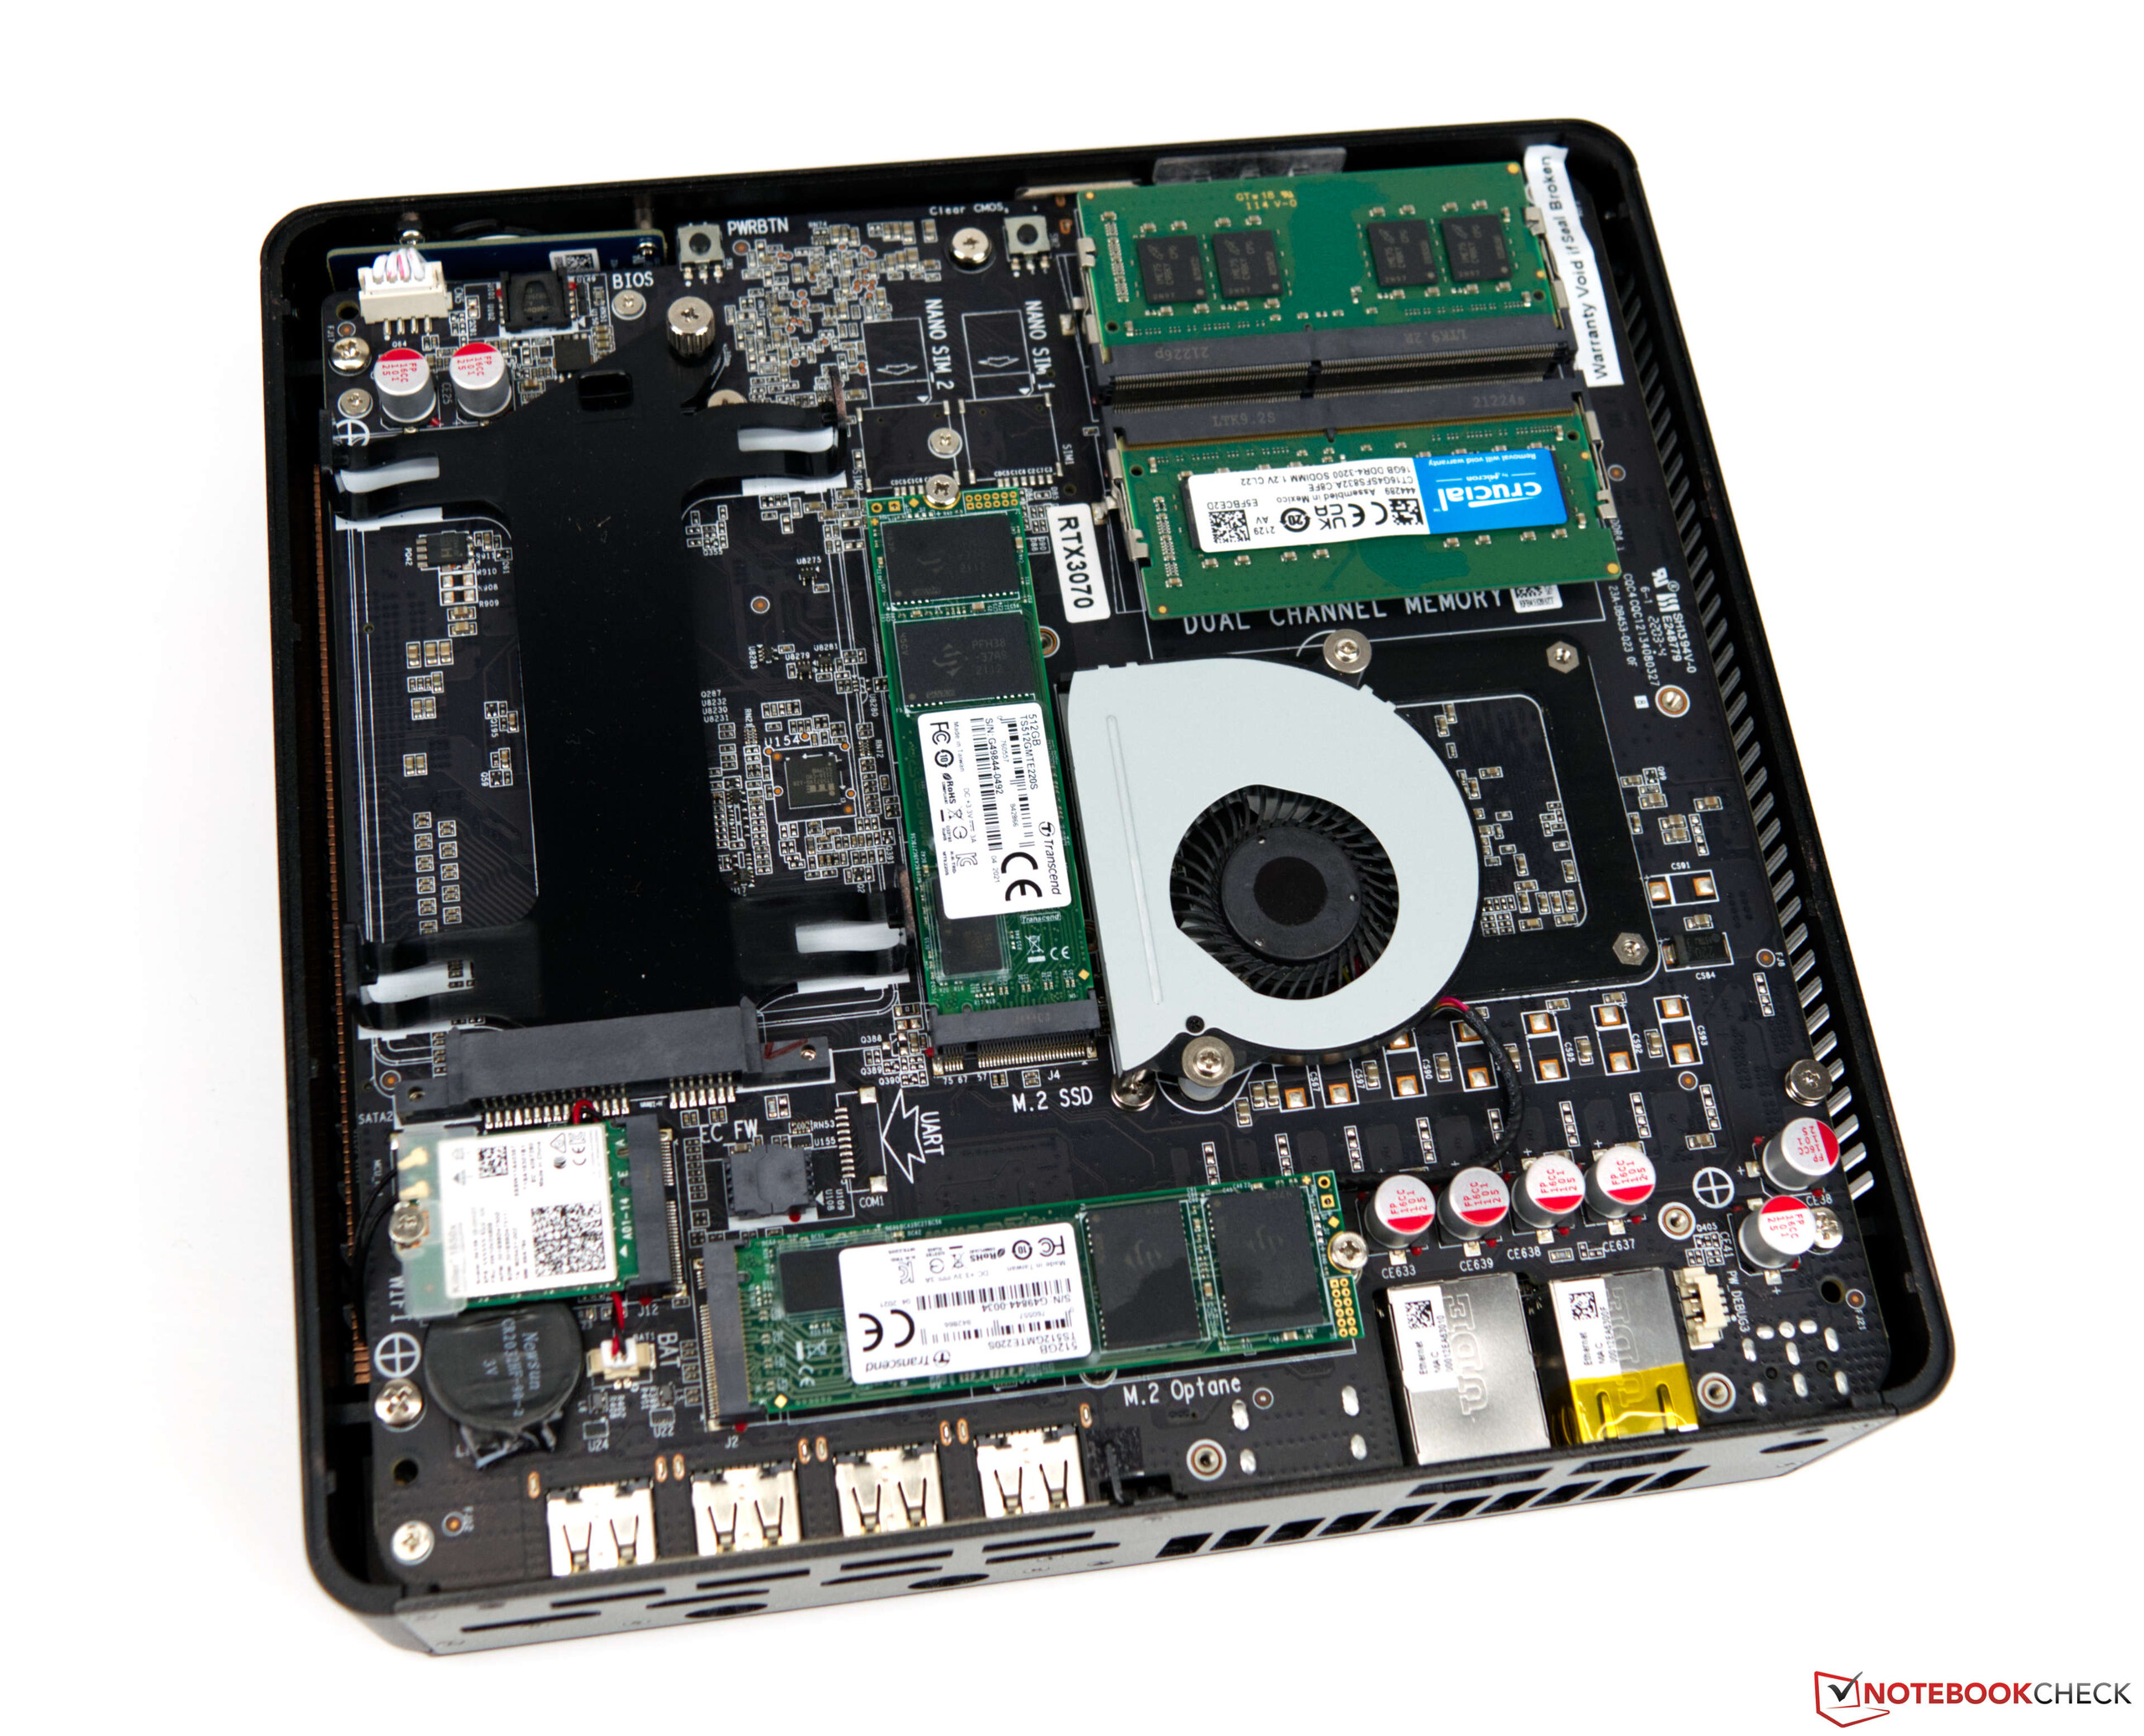
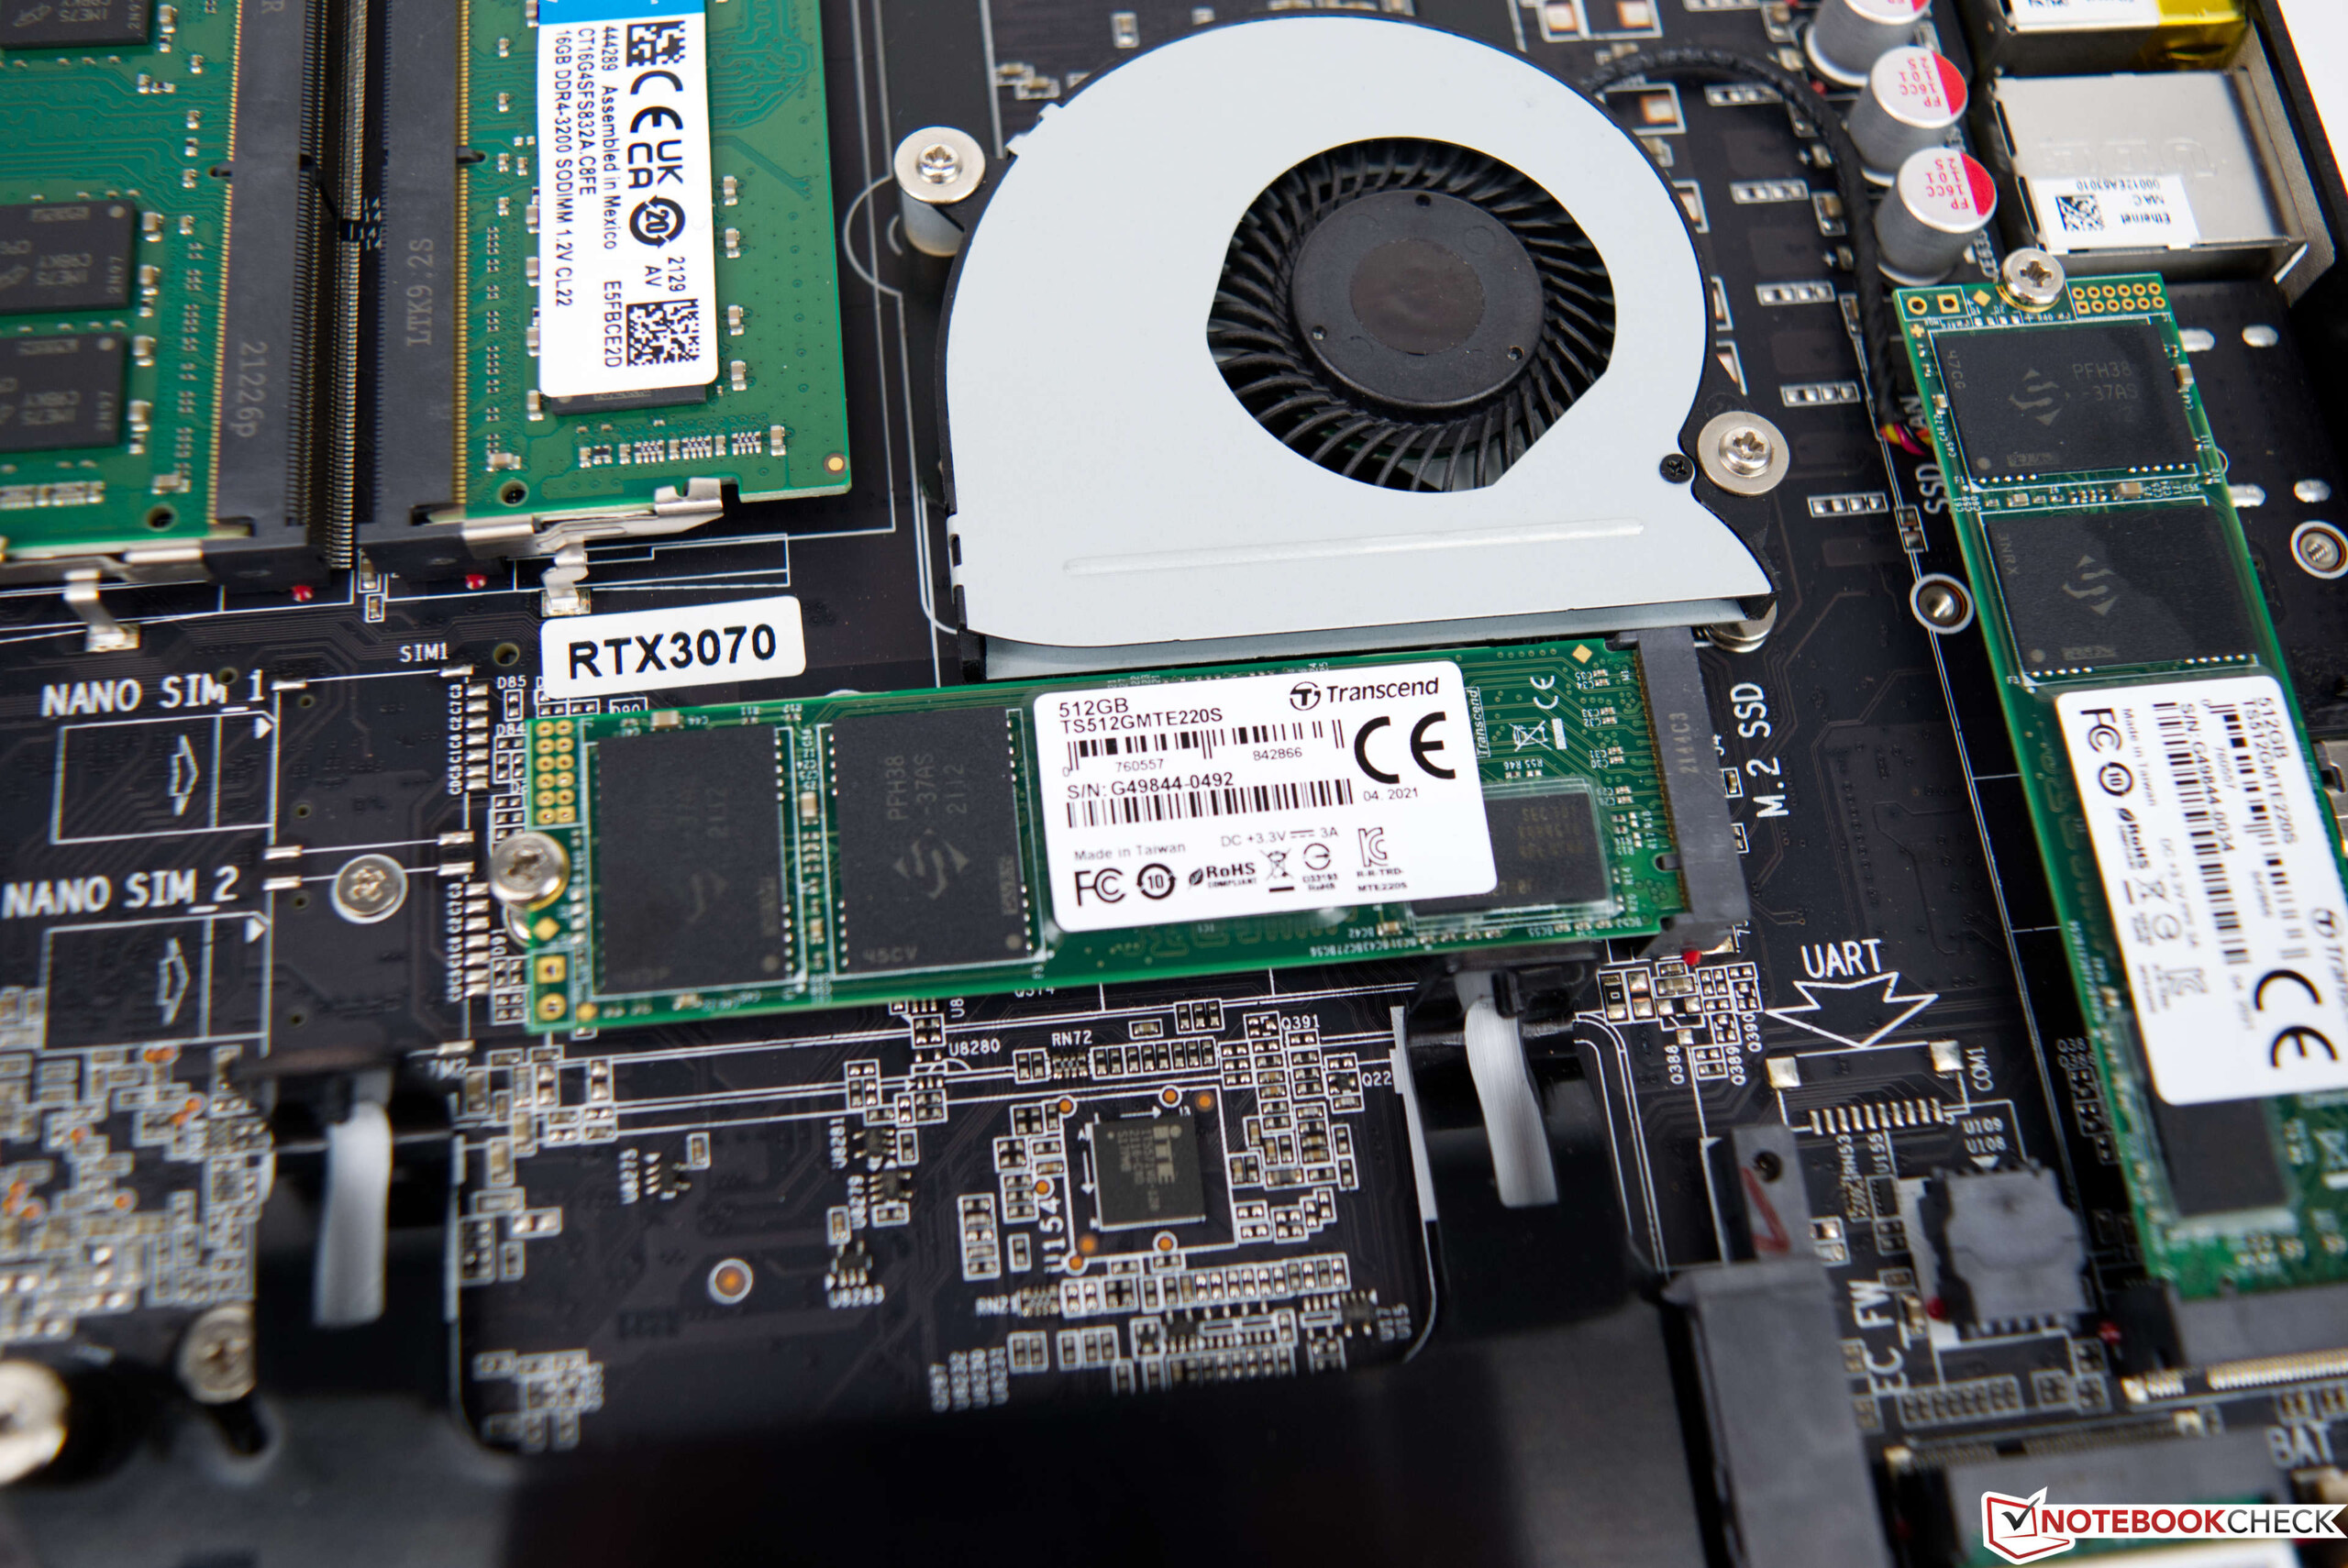
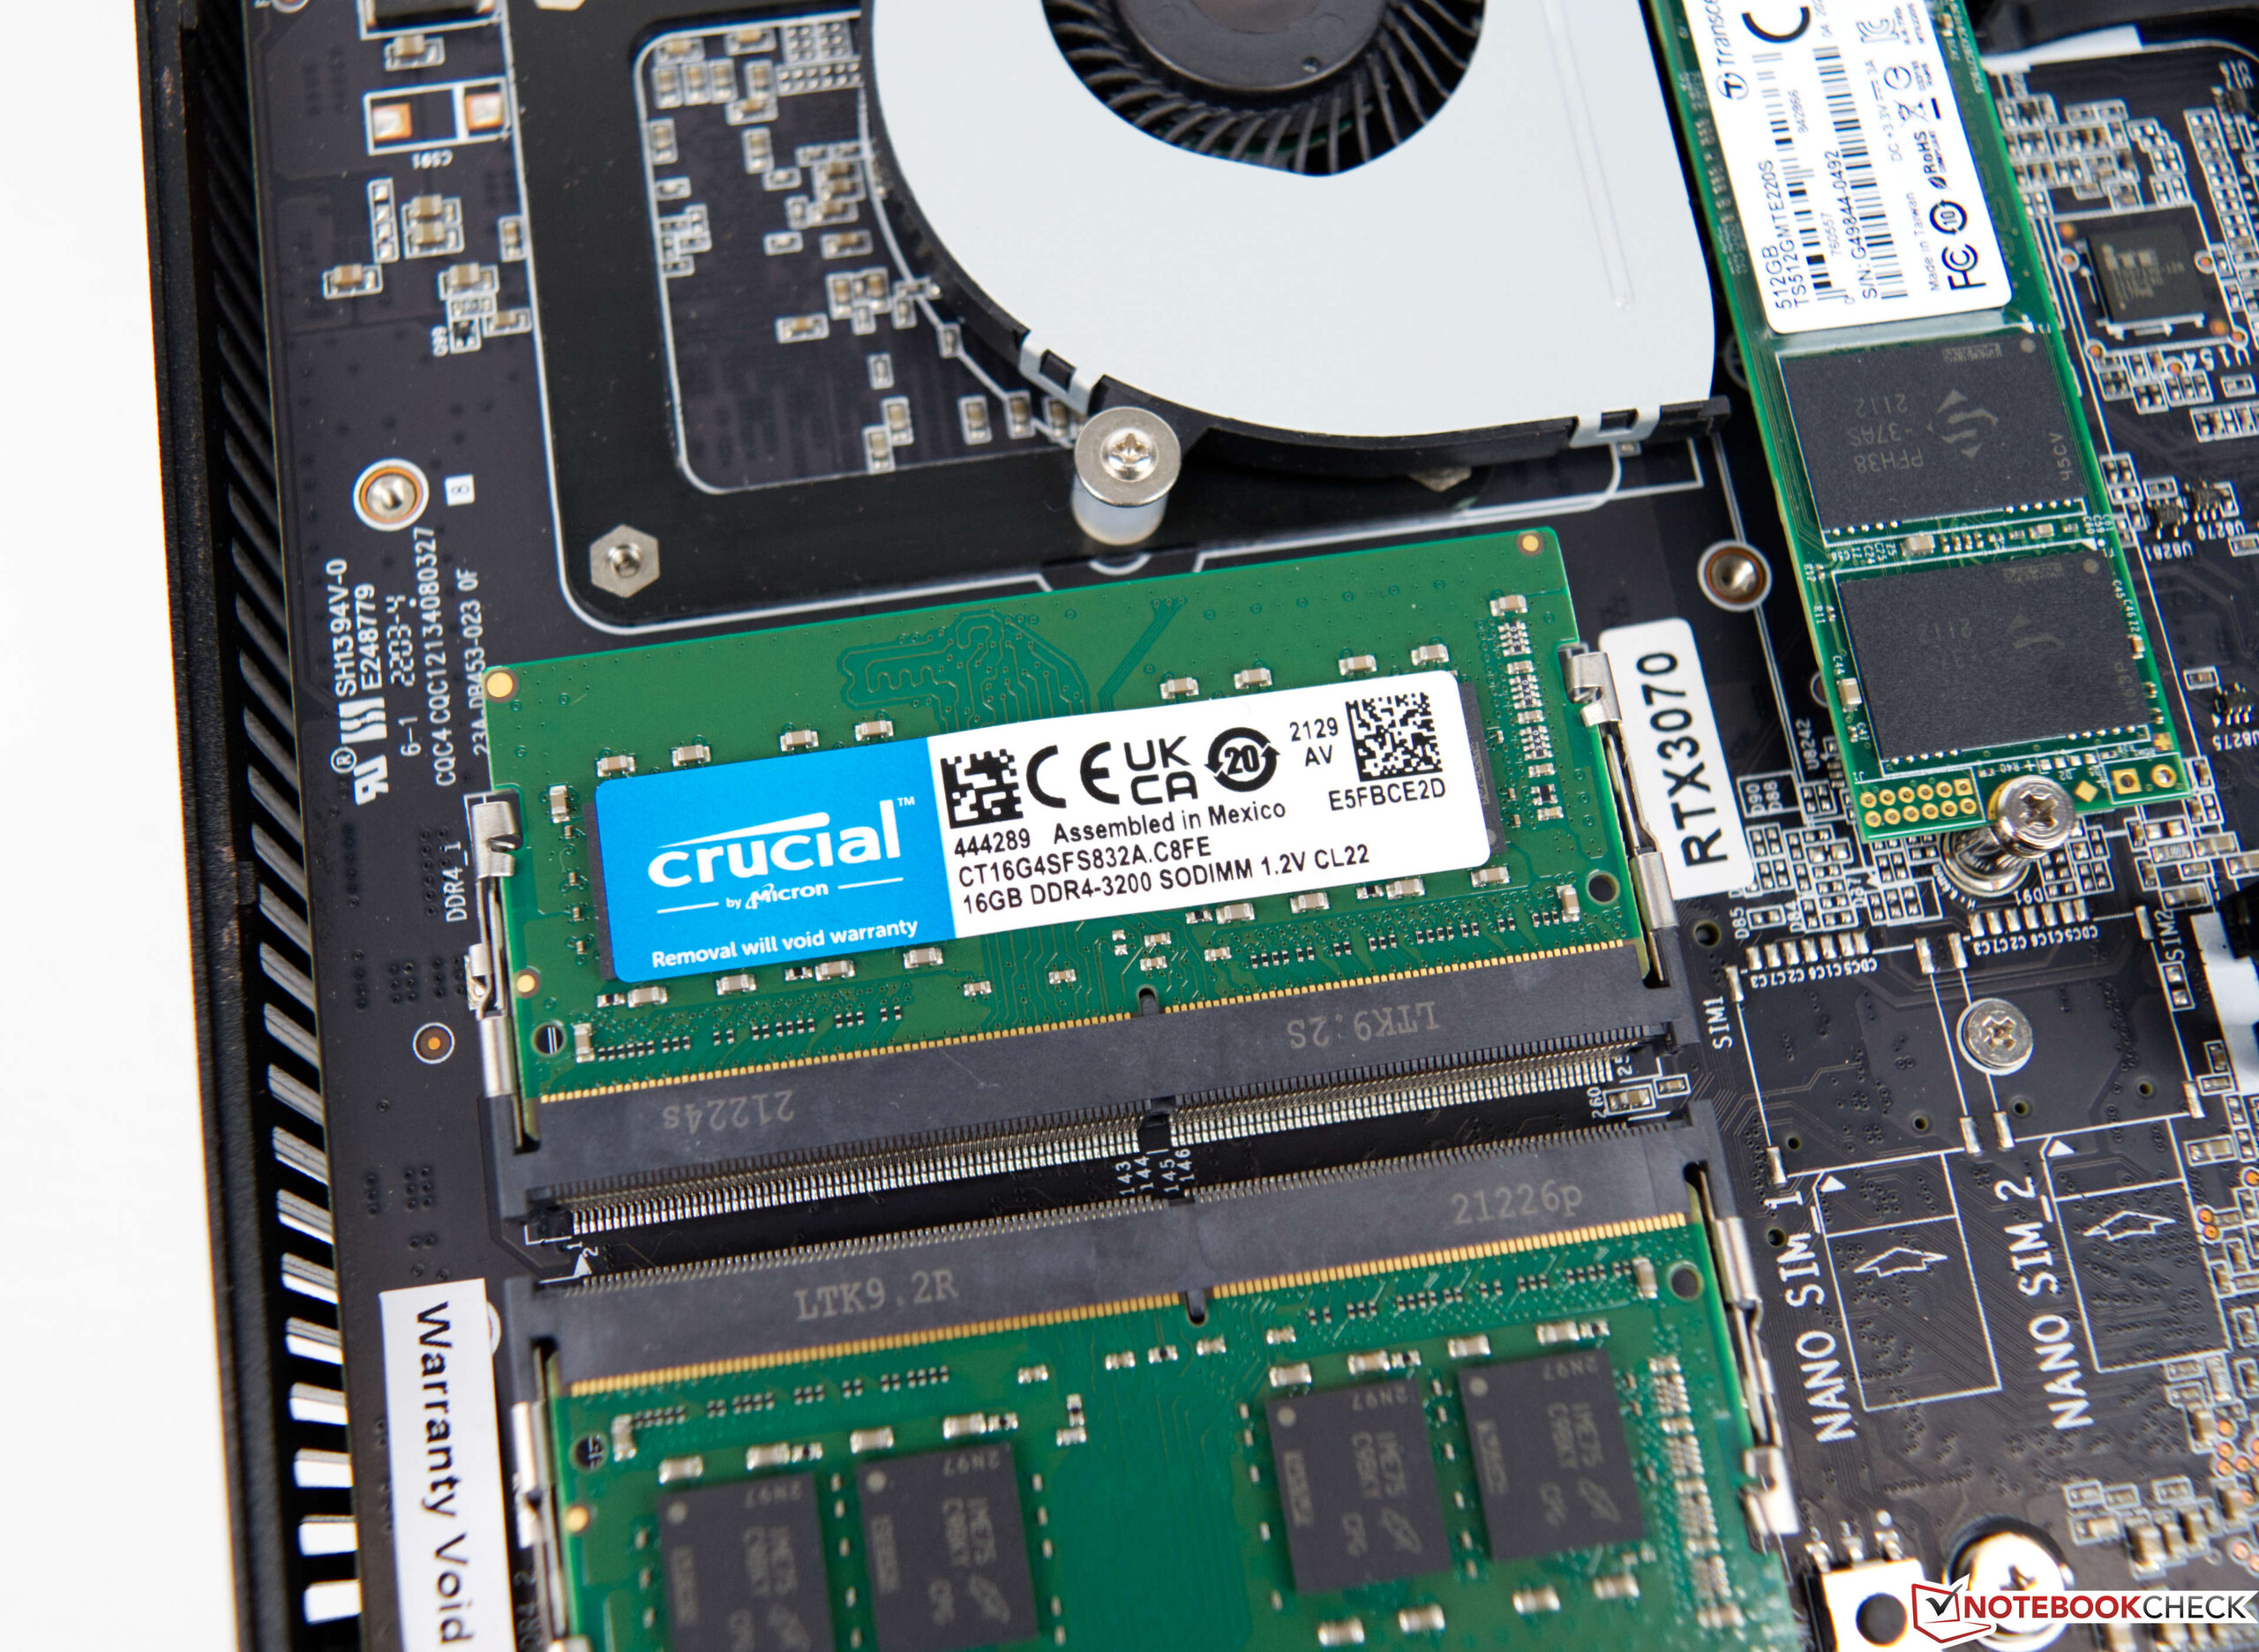
在应用程序的基准测试中,我们看到了一个明显的性能提升,相比于 Zotac ZBOX Magus EN72080V.较新的SoC和明显更快的显卡共同确保了良好的结果。总的来说,Zotac ZBOX Magnus EN173070C甚至比拥有全尺寸桌面GPU和更多当前Alder Lake CPU的Intel Dragon Canyon NUC略快。在渲染测试中,与GeForce RTX 3060相比,GeForce RTX 3070 Mobile能够获得决定性的分数。从主观上看,日常操作中的速度非常好。无论你是上网、看视频还是玩游戏,Zotac ZBOX Magnus EN173070C都能毫无问题地掌握所有这些任务。在这次审查中,我们为这台迷你电脑配备了32GB的DDR4-RAM和两个512GB的SSD。来自创见的型号提供了一个坚实的性能。然而,通过使用更快的固态硬盘,你仍然可以在性能方面再挤出几个百分点。该机箱最多可以容纳三个存储解决方案。除了两个不仅限于80毫米长度的M.2连接之外,你还可以安装一个2.5英寸的驱动器。
| PCMark 10 - Score | |
| Intel Dragon Canyon NUC - RTX 3060, Intel Core i9-12900 | |
| Intel Core i9-10900K, Intel Core i9-10900K | |
| Corsair One i160, Intel Core i9-9900K | |
| Intel Beast Canyon NUC, Intel Core i9-11900KB | |
| Zotac ZBOX Magnus EN173070C, Intel Core i7-11800H | |
| Intel Ghost Canyon NUC (RTX 2070), Intel Core i9-9980HK | |
| Minisforum EliteMini HX90, AMD Ryzen 9 5900HX | |
| Zotac Magnus One (ECM73070C), Intel Core i7-10700 | |
| Zotac MEK Mini (RTX 2070 Super), Intel Core i7-9700 | |
| Zotac ZBOX Magnus EN72070V, Intel Core i7-9750H | |
| SPECviewperf 12 | |
| 1900x1060 Solidworks (sw-03) | |
| Intel Core i9-10900K, Intel Core i9-10900K | |
| Corsair One i160, Intel Core i9-9900K | |
| Zotac Magnus One (ECM73070C), Intel Core i7-10700 | |
| Zotac ZBOX Magnus EN173070C, Intel Core i7-11800H | |
| Intel Dragon Canyon NUC - RTX 3060, Intel Core i9-12900 | |
| Zotac MEK Mini (RTX 2070 Super), Intel Core i7-9700 | |
| Intel Beast Canyon NUC, Intel Core i9-11900KB | |
| Zotac ZBOX Magnus EN72070V, Intel Core i7-9750H | |
| Minisforum EliteMini HX90, AMD Ryzen 9 5900HX | |
| Intel Ghost Canyon NUC (RTX 2070), Intel Core i9-9980HK | |
| Inno3D GeForce RTX 3060 Twin X2, AMD Ryzen 9 5900X | |
| 1900x1060 Siemens NX (snx-02) | |
| Intel Core i9-10900K, Intel Core i9-10900K | |
| Minisforum EliteMini HX90, AMD Ryzen 9 5900HX | |
| Corsair One i160, Intel Core i9-9900K | |
| Zotac Magnus One (ECM73070C), Intel Core i7-10700 | |
| Zotac MEK Mini (RTX 2070 Super), Intel Core i7-9700 | |
| Zotac ZBOX Magnus EN72070V, Intel Core i7-9750H | |
| Zotac ZBOX Magnus EN173070C, Intel Core i7-11800H | |
| Intel Dragon Canyon NUC - RTX 3060, Intel Core i9-12900 | |
| Intel Ghost Canyon NUC (RTX 2070), Intel Core i9-9980HK | |
| Inno3D GeForce RTX 3060 Twin X2, AMD Ryzen 9 5900X | |
| Intel Beast Canyon NUC, Intel Core i9-11900KB | |
| 1900x1060 Showcase (showcase-01) | |
| Intel Core i9-10900K, Intel Core i9-10900K | |
| Corsair One i160, Intel Core i9-9900K | |
| Zotac Magnus One (ECM73070C), Intel Core i7-10700 | |
| Zotac ZBOX Magnus EN173070C, Intel Core i7-11800H | |
| Zotac MEK Mini (RTX 2070 Super), Intel Core i7-9700 | |
| Zotac ZBOX Magnus EN72070V, Intel Core i7-9750H | |
| Intel Ghost Canyon NUC (RTX 2070), Intel Core i9-9980HK | |
| Intel Dragon Canyon NUC - RTX 3060, Intel Core i9-12900 | |
| Inno3D GeForce RTX 3060 Twin X2, AMD Ryzen 9 5900X | |
| Intel Beast Canyon NUC, Intel Core i9-11900KB | |
| Minisforum EliteMini HX90, AMD Ryzen 9 5900HX | |
| 1900x1060 Medical (medical-01) | |
| Intel Core i9-10900K, Intel Core i9-10900K | |
| Zotac ZBOX Magnus EN173070C, Intel Core i7-11800H | |
| Corsair One i160, Intel Core i9-9900K | |
| Intel Dragon Canyon NUC - RTX 3060, Intel Core i9-12900 | |
| Zotac Magnus One (ECM73070C), Intel Core i7-10700 | |
| Zotac MEK Mini (RTX 2070 Super), Intel Core i7-9700 | |
| Intel Beast Canyon NUC, Intel Core i9-11900KB | |
| Intel Ghost Canyon NUC (RTX 2070), Intel Core i9-9980HK | |
| Zotac ZBOX Magnus EN72070V, Intel Core i7-9750H | |
| Inno3D GeForce RTX 3060 Twin X2, AMD Ryzen 9 5900X | |
| Minisforum EliteMini HX90, AMD Ryzen 9 5900HX | |
| 1900x1060 Maya (maya-04) | |
| Zotac ZBOX Magnus EN173070C, Intel Core i7-11800H | |
| Zotac Magnus One (ECM73070C), Intel Core i7-10700 | |
| Intel Dragon Canyon NUC - RTX 3060, Intel Core i9-12900 | |
| Intel Beast Canyon NUC, Intel Core i9-11900KB | |
| Corsair One i160, Intel Core i9-9900K | |
| Intel Core i9-10900K, Intel Core i9-10900K | |
| Inno3D GeForce RTX 3060 Twin X2, AMD Ryzen 9 5900X | |
| Intel Ghost Canyon NUC (RTX 2070), Intel Core i9-9980HK | |
| Zotac ZBOX Magnus EN72070V, Intel Core i7-9750H | |
| Zotac MEK Mini (RTX 2070 Super), Intel Core i7-9700 | |
| Minisforum EliteMini HX90, AMD Ryzen 9 5900HX | |
| 1900x1060 Energy (energy-01) | |
| Intel Core i9-10900K, Intel Core i9-10900K | |
| Corsair One i160, Intel Core i9-9900K | |
| Zotac Magnus One (ECM73070C), Intel Core i7-10700 | |
| Zotac ZBOX Magnus EN173070C, Intel Core i7-11800H | |
| Zotac MEK Mini (RTX 2070 Super), Intel Core i7-9700 | |
| Zotac ZBOX Magnus EN72070V, Intel Core i7-9750H | |
| Intel Ghost Canyon NUC (RTX 2070), Intel Core i9-9980HK | |
| Intel Dragon Canyon NUC - RTX 3060, Intel Core i9-12900 | |
| Intel Beast Canyon NUC, Intel Core i9-11900KB | |
| Inno3D GeForce RTX 3060 Twin X2, AMD Ryzen 9 5900X | |
| Minisforum EliteMini HX90, AMD Ryzen 9 5900HX | |
| 1900x1060 Creo (creo-01) | |
| Intel Core i9-10900K, Intel Core i9-10900K | |
| Corsair One i160, Intel Core i9-9900K | |
| Zotac Magnus One (ECM73070C), Intel Core i7-10700 | |
| Zotac ZBOX Magnus EN173070C, Intel Core i7-11800H | |
| Zotac ZBOX Magnus EN72070V, Intel Core i7-9750H | |
| Intel Dragon Canyon NUC - RTX 3060, Intel Core i9-12900 | |
| Zotac MEK Mini (RTX 2070 Super), Intel Core i7-9700 | |
| Inno3D GeForce RTX 3060 Twin X2, AMD Ryzen 9 5900X | |
| Intel Ghost Canyon NUC (RTX 2070), Intel Core i9-9980HK | |
| Intel Beast Canyon NUC, Intel Core i9-11900KB | |
| Minisforum EliteMini HX90, AMD Ryzen 9 5900HX | |
| 1900x1060 Catia (catia-04) | |
| Intel Core i9-10900K, Intel Core i9-10900K | |
| Corsair One i160, Intel Core i9-9900K | |
| Zotac Magnus One (ECM73070C), Intel Core i7-10700 | |
| Zotac ZBOX Magnus EN173070C, Intel Core i7-11800H | |
| Zotac ZBOX Magnus EN72070V, Intel Core i7-9750H | |
| Zotac MEK Mini (RTX 2070 Super), Intel Core i7-9700 | |
| Intel Ghost Canyon NUC (RTX 2070), Intel Core i9-9980HK | |
| Intel Dragon Canyon NUC - RTX 3060, Intel Core i9-12900 | |
| Intel Beast Canyon NUC, Intel Core i9-11900KB | |
| Inno3D GeForce RTX 3060 Twin X2, AMD Ryzen 9 5900X | |
| Minisforum EliteMini HX90, AMD Ryzen 9 5900HX | |
| 1900x1060 3ds Max (3dsmax-05) | |
| Intel Core i9-10900K, Intel Core i9-10900K | |
| Corsair One i160, Intel Core i9-9900K | |
| Zotac ZBOX Magnus EN173070C, Intel Core i7-11800H | |
| Inno3D GeForce RTX 3060 Twin X2, AMD Ryzen 9 5900X | |
| Intel Dragon Canyon NUC - RTX 3060, Intel Core i9-12900 | |
| Zotac Magnus One (ECM73070C), Intel Core i7-10700 | |
| Zotac ZBOX Magnus EN72070V, Intel Core i7-9750H | |
| Zotac MEK Mini (RTX 2070 Super), Intel Core i7-9700 | |
| Intel Beast Canyon NUC, Intel Core i9-11900KB | |
| Intel Ghost Canyon NUC (RTX 2070), Intel Core i9-9980HK | |
| Minisforum EliteMini HX90, AMD Ryzen 9 5900HX | |
| SPECviewperf 13 | |
| Solidworks (sw-04) | |
| Intel Core i9-10900K, Intel Core i9-10900K | |
| Corsair One i160, Intel Core i9-9900K | |
| Zotac Magnus One (ECM73070C), Intel Core i7-10700 | |
| Zotac ZBOX Magnus EN173070C, Intel Core i7-11800H | |
| Intel Dragon Canyon NUC - RTX 3060, Intel Core i9-12900 | |
| Intel Beast Canyon NUC, Intel Core i9-11900KB | |
| Zotac MEK Mini (RTX 2070 Super), Intel Core i7-9700 | |
| Zotac ZBOX Magnus EN72070V, Intel Core i7-9750H | |
| Intel Ghost Canyon NUC (RTX 2070), Intel Core i9-9980HK | |
| Inno3D GeForce RTX 3060 Twin X2, AMD Ryzen 9 5900X | |
| Minisforum EliteMini HX90, AMD Ryzen 9 5900HX | |
| Siemens NX (snx-03) | |
| Intel Core i9-10900K, Intel Core i9-10900K | |
| Minisforum EliteMini HX90, AMD Ryzen 9 5900HX | |
| Corsair One i160, Intel Core i9-9900K | |
| Zotac Magnus One (ECM73070C), Intel Core i7-10700 | |
| Zotac MEK Mini (RTX 2070 Super), Intel Core i7-9700 | |
| Zotac ZBOX Magnus EN72070V, Intel Core i7-9750H | |
| Zotac ZBOX Magnus EN173070C, Intel Core i7-11800H | |
| Intel Dragon Canyon NUC - RTX 3060, Intel Core i9-12900 | |
| Intel Ghost Canyon NUC (RTX 2070), Intel Core i9-9980HK | |
| Inno3D GeForce RTX 3060 Twin X2, AMD Ryzen 9 5900X | |
| Intel Beast Canyon NUC, Intel Core i9-11900KB | |
| Showcase (showcase-02) | |
| Intel Core i9-10900K, Intel Core i9-10900K | |
| Corsair One i160, Intel Core i9-9900K | |
| Zotac Magnus One (ECM73070C), Intel Core i7-10700 | |
| Zotac ZBOX Magnus EN173070C, Intel Core i7-11800H | |
| Zotac MEK Mini (RTX 2070 Super), Intel Core i7-9700 | |
| Zotac ZBOX Magnus EN72070V, Intel Core i7-9750H | |
| Intel Ghost Canyon NUC (RTX 2070), Intel Core i9-9980HK | |
| Intel Dragon Canyon NUC - RTX 3060, Intel Core i9-12900 | |
| Inno3D GeForce RTX 3060 Twin X2, AMD Ryzen 9 5900X | |
| Intel Beast Canyon NUC, Intel Core i9-11900KB | |
| Minisforum EliteMini HX90, AMD Ryzen 9 5900HX | |
| Medical (medical-02) | |
| Intel Core i9-10900K, Intel Core i9-10900K | |
| Corsair One i160, Intel Core i9-9900K | |
| Zotac Magnus One (ECM73070C), Intel Core i7-10700 | |
| Zotac ZBOX Magnus EN173070C, Intel Core i7-11800H | |
| Zotac MEK Mini (RTX 2070 Super), Intel Core i7-9700 | |
| Zotac ZBOX Magnus EN72070V, Intel Core i7-9750H | |
| Intel Ghost Canyon NUC (RTX 2070), Intel Core i9-9980HK | |
| Intel Dragon Canyon NUC - RTX 3060, Intel Core i9-12900 | |
| Inno3D GeForce RTX 3060 Twin X2, AMD Ryzen 9 5900X | |
| Intel Beast Canyon NUC, Intel Core i9-11900KB | |
| Minisforum EliteMini HX90, AMD Ryzen 9 5900HX | |
| Maya (maya-05) | |
| Intel Core i9-10900K, Intel Core i9-10900K | |
| Corsair One i160, Intel Core i9-9900K | |
| Zotac Magnus One (ECM73070C), Intel Core i7-10700 | |
| Zotac ZBOX Magnus EN173070C, Intel Core i7-11800H | |
| Zotac ZBOX Magnus EN72070V, Intel Core i7-9750H | |
| Intel Ghost Canyon NUC (RTX 2070), Intel Core i9-9980HK | |
| Intel Dragon Canyon NUC - RTX 3060, Intel Core i9-12900 | |
| Intel Beast Canyon NUC, Intel Core i9-11900KB | |
| Inno3D GeForce RTX 3060 Twin X2, AMD Ryzen 9 5900X | |
| Zotac MEK Mini (RTX 2070 Super), Intel Core i7-9700 | |
| Minisforum EliteMini HX90, AMD Ryzen 9 5900HX | |
| Energy (energy-02) | |
| Intel Core i9-10900K, Intel Core i9-10900K | |
| Corsair One i160, Intel Core i9-9900K | |
| Zotac Magnus One (ECM73070C), Intel Core i7-10700 | |
| Zotac ZBOX Magnus EN173070C, Intel Core i7-11800H | |
| Zotac MEK Mini (RTX 2070 Super), Intel Core i7-9700 | |
| Intel Ghost Canyon NUC (RTX 2070), Intel Core i9-9980HK | |
| Zotac ZBOX Magnus EN72070V, Intel Core i7-9750H | |
| Intel Beast Canyon NUC, Intel Core i9-11900KB | |
| Intel Dragon Canyon NUC - RTX 3060, Intel Core i9-12900 | |
| Inno3D GeForce RTX 3060 Twin X2, AMD Ryzen 9 5900X | |
| Minisforum EliteMini HX90, AMD Ryzen 9 5900HX | |
| Creo (creo-02) | |
| Intel Core i9-10900K, Intel Core i9-10900K | |
| Corsair One i160, Intel Core i9-9900K | |
| Zotac Magnus One (ECM73070C), Intel Core i7-10700 | |
| Zotac ZBOX Magnus EN173070C, Intel Core i7-11800H | |
| Zotac ZBOX Magnus EN72070V, Intel Core i7-9750H | |
| Intel Dragon Canyon NUC - RTX 3060, Intel Core i9-12900 | |
| Intel Ghost Canyon NUC (RTX 2070), Intel Core i9-9980HK | |
| Inno3D GeForce RTX 3060 Twin X2, AMD Ryzen 9 5900X | |
| Zotac MEK Mini (RTX 2070 Super), Intel Core i7-9700 | |
| Intel Beast Canyon NUC, Intel Core i9-11900KB | |
| Minisforum EliteMini HX90, AMD Ryzen 9 5900HX | |
| Catia (catia-05) | |
| Intel Core i9-10900K, Intel Core i9-10900K | |
| Corsair One i160, Intel Core i9-9900K | |
| Zotac Magnus One (ECM73070C), Intel Core i7-10700 | |
| Zotac ZBOX Magnus EN173070C, Intel Core i7-11800H | |
| Zotac ZBOX Magnus EN72070V, Intel Core i7-9750H | |
| Zotac MEK Mini (RTX 2070 Super), Intel Core i7-9700 | |
| Intel Ghost Canyon NUC (RTX 2070), Intel Core i9-9980HK | |
| Inno3D GeForce RTX 3060 Twin X2, AMD Ryzen 9 5900X | |
| Intel Dragon Canyon NUC - RTX 3060, Intel Core i9-12900 | |
| Intel Beast Canyon NUC, Intel Core i9-11900KB | |
| Minisforum EliteMini HX90, AMD Ryzen 9 5900HX | |
| 3ds Max (3dsmax-06) | |
| Intel Core i9-10900K, Intel Core i9-10900K | |
| Corsair One i160, Intel Core i9-9900K | |
| Zotac ZBOX Magnus EN173070C, Intel Core i7-11800H | |
| Inno3D GeForce RTX 3060 Twin X2, AMD Ryzen 9 5900X | |
| Zotac Magnus One (ECM73070C), Intel Core i7-10700 | |
| Intel Dragon Canyon NUC - RTX 3060, Intel Core i9-12900 | |
| Zotac MEK Mini (RTX 2070 Super), Intel Core i7-9700 | |
| Zotac ZBOX Magnus EN72070V, Intel Core i7-9750H | |
| Intel Beast Canyon NUC, Intel Core i9-11900KB | |
| Intel Ghost Canyon NUC (RTX 2070), Intel Core i9-9980HK | |
| Minisforum EliteMini HX90, AMD Ryzen 9 5900HX | |
| LuxMark v2.0 64Bit | |
| Sala GPUs-only | |
| Corsair One i160, Intel Core i9-9900K | |
| Zotac ZBOX Magnus EN173070C, Intel Core i7-11800H | |
| Intel Beast Canyon NUC, Intel Core i9-11900KB | |
| Intel Dragon Canyon NUC - RTX 3060, Intel Core i9-12900 | |
| Inno3D GeForce RTX 3060 Twin X2, AMD Ryzen 9 5900X | |
| Minisforum EliteMini HX90, AMD Ryzen 9 5900HX | |
| Room GPUs-only | |
| Zotac ZBOX Magnus EN173070C, Intel Core i7-11800H | |
| Corsair One i160, Intel Core i9-9900K | |
| Intel Beast Canyon NUC, Intel Core i9-11900KB | |
| Intel Dragon Canyon NUC - RTX 3060, Intel Core i9-12900 | |
| Inno3D GeForce RTX 3060 Twin X2, AMD Ryzen 9 5900X | |
| Minisforum EliteMini HX90, AMD Ryzen 9 5900HX | |
| DPC Latencies / LatencyMon - interrupt to process latency (max), Web, Youtube, Prime95 | |
| Zotac ZBOX Magnus EN173070C, Intel Core i7-11800H | |
| Minisforum EliteMini HX90, AMD Ryzen 9 5900HX | |
| CrossMark | |
| Responsiveness | |
| Intel Beast Canyon NUC, Intel Core i9-11900KB | |
| Intel Dragon Canyon NUC - RTX 3060, Intel Core i9-12900 | |
| Zotac ZBOX Magnus EN173070C, Intel Core i7-11800H | |
| Intel Ghost Canyon NUC (RTX 2070), Intel Core i9-9980HK | |
| Creativity | |
| Intel Beast Canyon NUC, Intel Core i9-11900KB | |
| Intel Dragon Canyon NUC - RTX 3060, Intel Core i9-12900 | |
| Zotac ZBOX Magnus EN173070C, Intel Core i7-11800H | |
| Intel Ghost Canyon NUC (RTX 2070), Intel Core i9-9980HK | |
| Productivity | |
| Intel Beast Canyon NUC, Intel Core i9-11900KB | |
| Intel Dragon Canyon NUC - RTX 3060, Intel Core i9-12900 | |
| Zotac ZBOX Magnus EN173070C, Intel Core i7-11800H | |
| Intel Ghost Canyon NUC (RTX 2070), Intel Core i9-9980HK | |
| Overall | |
| Intel Beast Canyon NUC, Intel Core i9-11900KB | |
| Intel Dragon Canyon NUC - RTX 3060, Intel Core i9-12900 | |
| Zotac ZBOX Magnus EN173070C, Intel Core i7-11800H | |
| Intel Ghost Canyon NUC (RTX 2070), Intel Core i9-9980HK | |
* ... smaller is better
3D和游戏性能
对于游戏PC来说,快速的显卡对于实现流畅的帧率是必不可少的。在我们的案例中,有一个快速显卡,有8GB的VRAM,有 NvidiaGeForce RTX 3070 Mobile.同时,你不能真正将其与相同命名的桌面版本进行比较。相反,移动版的 GeForce RTX 3070达到了类似的性能,作为一个 NvidiaGeForce RTX 3060.与英特尔Beast Canyon NUC的直接比较很好地说明了这一点。
在TDP分类中,Zotac全速前进,允许负载下的功率高达125瓦。有了这个,专用显卡的性能就不会受到人为的限制,这在紧凑型笔记本电脑中是经常发生的。这也导致了与图形适配器的平均性能相比,有时会出现良好的结果。我们测试的游戏可以在FHD和QHD分辨率下以最大细节水平再现,没有任何问题。然而,当分辨率向4K移动时,情况有时会变得紧张。但仍有许多游戏在这种高分辨率下也能顺利再现。
| Performance rating - Percent | |
| Inno3D GeForce RTX 3060 Twin X2 | |
| Zotac Magnus One (ECM73070C) | |
| Intel Dragon Canyon NUC - RTX 3060 | |
| Average NVIDIA GeForce RTX 3070 Ti Laptop GPU -3! | |
| Zotac ZBOX Magnus EN173070C | |
| Intel Beast Canyon NUC | |
| Average NVIDIA GeForce RTX 3080 Laptop GPU | |
| Average NVIDIA GeForce RTX 3070 Laptop GPU | |
| AMD Radeon RX 6600 | |
| Intel Ghost Canyon NUC (RTX 2070) -2! | |
| Borderlands 3 | |
| 1280x720 Very Low Overall Quality (DX11) | |
| Intel Dragon Canyon NUC - RTX 3060 | |
| Inno3D GeForce RTX 3060 Twin X2 | |
| Average NVIDIA GeForce RTX 3080 Laptop GPU (158.7 - 170.4, n=2) | |
| Intel Beast Canyon NUC | |
| Intel Ghost Canyon NUC (RTX 2070) | |
| Zotac Magnus One (ECM73070C) | |
| Average NVIDIA GeForce RTX 3070 Laptop GPU (135.5 - 141.9, n=2) | |
| Zotac ZBOX Magnus EN173070C | |
| AMD Radeon RX 6600 | |
| 1920x1080 Badass Overall Quality (DX11) | |
| Intel Beast Canyon NUC | |
| Zotac Magnus One (ECM73070C) | |
| Average NVIDIA GeForce RTX 3080 Laptop GPU (76.5 - 91.3, n=4) | |
| Intel Dragon Canyon NUC - RTX 3060 | |
| Zotac ZBOX Magnus EN173070C | |
| Average NVIDIA GeForce RTX 3070 Ti Laptop GPU (n=1) | |
| Average NVIDIA GeForce RTX 3070 Laptop GPU (65.4 - 88.3, n=4) | |
| Inno3D GeForce RTX 3060 Twin X2 | |
| Intel Ghost Canyon NUC (RTX 2070) | |
| AMD Radeon RX 6600 | |
| Metro Exodus | |
| 1280x720 Low Quality AF:4x | |
| AMD Radeon RX 6600 | |
| Intel Dragon Canyon NUC - RTX 3060 | |
| Inno3D GeForce RTX 3060 Twin X2 | |
| Intel Beast Canyon NUC | |
| Average NVIDIA GeForce RTX 3070 Laptop GPU (177.1 - 185, n=2) | |
| Intel Ghost Canyon NUC (RTX 2070) | |
| Average NVIDIA GeForce RTX 3080 Laptop GPU (147 - 214, n=4) | |
| Zotac ZBOX Magnus EN173070C | |
| Zotac Magnus One (ECM73070C) | |
| Average NVIDIA GeForce RTX 3070 Ti Laptop GPU (140.3 - 149.2, n=2) | |
| 1920x1080 Ultra Quality AF:16x | |
| Zotac Magnus One (ECM73070C) | |
| Average NVIDIA GeForce RTX 3080 Laptop GPU (68.7 - 87.9, n=6) | |
| Zotac ZBOX Magnus EN173070C | |
| Average NVIDIA GeForce RTX 3070 Ti Laptop GPU (71 - 77.2, n=2) | |
| Average NVIDIA GeForce RTX 3070 Laptop GPU (57.1 - 77.2, n=4) | |
| Intel Dragon Canyon NUC - RTX 3060 | |
| AMD Radeon RX 6600 | |
| Intel Ghost Canyon NUC (RTX 2070) | |
| Intel Beast Canyon NUC | |
| Inno3D GeForce RTX 3060 Twin X2 | |
| Far Cry New Dawn | |
| 1280x720 Low Preset | |
| Inno3D GeForce RTX 3060 Twin X2 | |
| Intel Dragon Canyon NUC - RTX 3060 | |
| Intel Beast Canyon NUC | |
| AMD Radeon RX 6600 | |
| Zotac ZBOX Magnus EN173070C | |
| Intel Ghost Canyon NUC (RTX 2070) | |
| Average NVIDIA GeForce RTX 3070 Laptop GPU (112 - 134, n=4) | |
| Zotac Magnus One (ECM73070C) | |
| Average NVIDIA GeForce RTX 3080 Laptop GPU (80 - 143, n=4) | |
| 1920x1080 Ultra Preset | |
| Intel Dragon Canyon NUC - RTX 3060 | |
| Inno3D GeForce RTX 3060 Twin X2 | |
| Intel Beast Canyon NUC | |
| AMD Radeon RX 6600 | |
| Zotac ZBOX Magnus EN173070C | |
| Zotac Magnus One (ECM73070C) | |
| Average NVIDIA GeForce RTX 3080 Laptop GPU (62 - 110, n=6) | |
| Average NVIDIA GeForce RTX 3070 Laptop GPU (70 - 101, n=6) | |
| Intel Ghost Canyon NUC (RTX 2070) | |
| Far Cry 5 | |
| 1280x720 Low Preset AA:T | |
| Inno3D GeForce RTX 3060 Twin X2 | |
| Intel Dragon Canyon NUC - RTX 3060 | |
| Intel Beast Canyon NUC | |
| Average NVIDIA GeForce RTX 3070 Ti Laptop GPU (134 - 187, n=15) | |
| AMD Radeon RX 6600 | |
| Zotac ZBOX Magnus EN173070C | |
| Average NVIDIA GeForce RTX 3080 Laptop GPU (94 - 189, n=26) | |
| Zotac Magnus One (ECM73070C) | |
| Intel Ghost Canyon NUC (RTX 2070) | |
| Average NVIDIA GeForce RTX 3070 Laptop GPU (123 - 176, n=25) | |
| 1920x1080 Ultra Preset AA:T | |
| Inno3D GeForce RTX 3060 Twin X2 | |
| Intel Dragon Canyon NUC - RTX 3060 | |
| Intel Beast Canyon NUC | |
| Average NVIDIA GeForce RTX 3070 Ti Laptop GPU (91 - 138, n=25) | |
| Zotac ZBOX Magnus EN173070C | |
| AMD Radeon RX 6600 | |
| Zotac Magnus One (ECM73070C) | |
| Average NVIDIA GeForce RTX 3080 Laptop GPU (75 - 146, n=33) | |
| Average NVIDIA GeForce RTX 3070 Laptop GPU (89 - 140, n=36) | |
| Intel Ghost Canyon NUC (RTX 2070) | |
| X-Plane 11.11 | |
| 1280x720 low (fps_test=1) | |
| Inno3D GeForce RTX 3060 Twin X2 | |
| Intel Beast Canyon NUC | |
| Intel Dragon Canyon NUC - RTX 3060 | |
| Zotac ZBOX Magnus EN173070C | |
| Average NVIDIA GeForce RTX 3070 Ti Laptop GPU (68.8 - 166.8, n=36) | |
| Intel Ghost Canyon NUC (RTX 2070) | |
| Zotac Magnus One (ECM73070C) | |
| Average NVIDIA GeForce RTX 3080 Laptop GPU (93.7 - 156, n=45) | |
| Average NVIDIA GeForce RTX 3070 Laptop GPU (15.3 - 152.8, n=61) | |
| AMD Radeon RX 6600 | |
| 1920x1080 high (fps_test=3) | |
| Inno3D GeForce RTX 3060 Twin X2 | |
| Intel Beast Canyon NUC | |
| Intel Dragon Canyon NUC - RTX 3060 | |
| Zotac ZBOX Magnus EN173070C | |
| Average NVIDIA GeForce RTX 3070 Ti Laptop GPU (51.6 - 116.9, n=37) | |
| Intel Ghost Canyon NUC (RTX 2070) | |
| Zotac Magnus One (ECM73070C) | |
| Average NVIDIA GeForce RTX 3080 Laptop GPU (65.6 - 113, n=44) | |
| Average NVIDIA GeForce RTX 3070 Laptop GPU (12.4 - 118.8, n=61) | |
| AMD Radeon RX 6600 | |
| Final Fantasy XV Benchmark | |
| 1280x720 Lite Quality | |
| AMD Radeon RX 6600 | |
| Inno3D GeForce RTX 3060 Twin X2 | |
| Intel Beast Canyon NUC | |
| Intel Dragon Canyon NUC - RTX 3060 | |
| Intel Ghost Canyon NUC (RTX 2070) | |
| Zotac ZBOX Magnus EN173070C | |
| Average NVIDIA GeForce RTX 3070 Ti Laptop GPU (141.1 - 211, n=20) | |
| Average NVIDIA GeForce RTX 3080 Laptop GPU (123 - 199, n=27) | |
| Zotac Magnus One (ECM73070C) | |
| Average NVIDIA GeForce RTX 3070 Laptop GPU (137 - 207, n=30) | |
| 1920x1080 High Quality | |
| Zotac Magnus One (ECM73070C) | |
| Zotac ZBOX Magnus EN173070C | |
| Average NVIDIA GeForce RTX 3080 Laptop GPU (55.5 - 115, n=34) | |
| Average NVIDIA GeForce RTX 3070 Ti Laptop GPU (49.5 - 122.4, n=35) | |
| Intel Ghost Canyon NUC (RTX 2070) | |
| Inno3D GeForce RTX 3060 Twin X2 | |
| Intel Beast Canyon NUC | |
| Intel Dragon Canyon NUC - RTX 3060 | |
| Average NVIDIA GeForce RTX 3070 Laptop GPU (27.9 - 107, n=49) | |
| AMD Radeon RX 6600 | |
| Dota 2 Reborn | |
| 1280x720 min (0/3) fastest | |
| Inno3D GeForce RTX 3060 Twin X2 | |
| AMD Radeon RX 6600 | |
| Intel Beast Canyon NUC | |
| Intel Dragon Canyon NUC - RTX 3060 | |
| Average NVIDIA GeForce RTX 3070 Ti Laptop GPU (89.3 - 199, n=37) | |
| Zotac ZBOX Magnus EN173070C | |
| Zotac Magnus One (ECM73070C) | |
| Average NVIDIA GeForce RTX 3080 Laptop GPU (132.7 - 183, n=45) | |
| Intel Ghost Canyon NUC (RTX 2070) | |
| Average NVIDIA GeForce RTX 3070 Laptop GPU (35.2 - 211, n=58) | |
| 1920x1080 ultra (3/3) best looking | |
| Inno3D GeForce RTX 3060 Twin X2 | |
| Intel Beast Canyon NUC | |
| Intel Dragon Canyon NUC - RTX 3060 | |
| Average NVIDIA GeForce RTX 3070 Ti Laptop GPU (68.7 - 160.5, n=38) | |
| Zotac ZBOX Magnus EN173070C | |
| Intel Ghost Canyon NUC (RTX 2070) | |
| Zotac Magnus One (ECM73070C) | |
| Average NVIDIA GeForce RTX 3080 Laptop GPU (98 - 156, n=45) | |
| Average NVIDIA GeForce RTX 3070 Laptop GPU (26.9 - 163.9, n=58) | |
| AMD Radeon RX 6600 | |
| 3DMark 11 | |
| 1280x720 Performance GPU | |
| Zotac Magnus One (ECM73070C) | |
| Average NVIDIA GeForce RTX 3080 Laptop GPU (31288 - 43744, n=40) | |
| Average NVIDIA GeForce RTX 3070 Ti Laptop GPU (13799 - 42569, n=36) | |
| Zotac ZBOX Magnus EN173070C | |
| Average NVIDIA GeForce RTX 3070 Laptop GPU (12535 - 38275, n=54) | |
| AMD Radeon RX 6600 | |
| Intel Dragon Canyon NUC - RTX 3060 | |
| Intel Beast Canyon NUC | |
| Intel Ghost Canyon NUC (RTX 2070) | |
| Inno3D GeForce RTX 3060 Twin X2 | |
| 1280x720 Performance | |
| Average NVIDIA GeForce RTX 3070 Ti Laptop GPU (14168 - 34703, n=36) | |
| Zotac Magnus One (ECM73070C) | |
| Average NVIDIA GeForce RTX 3080 Laptop GPU (22428 - 32922, n=40) | |
| Intel Dragon Canyon NUC - RTX 3060 | |
| AMD Radeon RX 6600 | |
| Inno3D GeForce RTX 3060 Twin X2 | |
| Zotac ZBOX Magnus EN173070C | |
| Intel Beast Canyon NUC | |
| Average NVIDIA GeForce RTX 3070 Laptop GPU (8279 - 30240, n=54) | |
| Intel Ghost Canyon NUC (RTX 2070) | |
| low | med. | high | ultra | QHD | 4K | |
|---|---|---|---|---|---|---|
| GTA V (2015) | 182.7 | 177.1 | 167.5 | 104.9 | 94.4 | 100.8 |
| The Witcher 3 (2015) | 435 | 331 | 190.1 | 105.5 | 70.7 | |
| Dota 2 Reborn (2015) | 164.4 | 148.3 | 142.9 | 133.9 | 127.7 | |
| Rise of the Tomb Raider (2016) | 302 | 216 | 141.9 | 116.2 | 55.4 | |
| Final Fantasy XV Benchmark (2018) | 190.1 | 139 | 101 | 75.3 | 43.5 | |
| X-Plane 11.11 (2018) | 136.6 | 121.2 | 95.7 | 82.3 | ||
| Far Cry 5 (2018) | 159 | 136 | 129 | 120 | 101 | 55 |
| Strange Brigade (2018) | 437 | 267 | 216 | 186.7 | 137.3 | 78.1 |
| Shadow of the Tomb Raider (2018) | 169.6 | 146.4 | 142.5 | 133.7 | 95.1 | 50.8 |
| Far Cry New Dawn (2019) | 134 | 116 | 112 | 100 | 91 | 57 |
| Metro Exodus (2019) | 177.1 | 123 | 94 | 74.6 | 58.7 | 36.6 |
| Control (2019) | 240 | 128 | 93.7 | 60.9 | 30.3 | |
| Borderlands 3 (2019) | 135.5 | 117.3 | 101 | 84.6 | 62.2 | 34.2 |
| F1 2020 (2020) | 315 | 267 | 238 | 165.8 | 123.6 | 68.3 |
| Dirt 5 (2020) | 227 | 153 | 123 | 96 | 75 | 49 |
| F1 2021 (2021) | 367 | 309 | 246 | 122.7 | 88.3 | 49.8 |
| Alan Wake Remastered (2021) | 119.2 | 118.2 | 118.2 | 113.1 | ||
| Far Cry 6 (2021) | 127.5 | 109.5 | 99 | 99.8 | 79.2 | 41 |
| Guardians of the Galaxy (2021) | 123 | 124 | 122 | 120 | 102 | 55 |
| Riders Republic (2021) | 174 | 144 | 118 | 107 | 77 | 40 |
| Forza Horizon 5 (2021) | 213 | 141 | 129 | 82 | 70 | 48 |
| Farming Simulator 22 (2021) | 205 | 161.1 | 138.8 | 132.8 | 124.8 | 79.2 |
| God of War (2022) | 122.2 | 109.4 | 88.1 | 61.7 | 50.7 | 33.8 |
| Rainbow Six Extraction (2022) | 241 | 182 | 181 | 149 | 97 | 49 |
| GRID Legends (2022) | 194 | 189 | 158 | 123 | 95 | 62 |
| Cyberpunk 2077 1.6 (2022) | 139 | 116 | 92 | 76 | 47 | 22 |
| Elex 2 (2022) | 98.4 | 95.1 | 87.3 | 79.5 | 61.8 | 34.5 |
排放
噪声排放
当你购买一台游戏笔记本电脑时,你通常会意识到这带来的噪音水平的增加。 然而,对于台式电脑来说,情况往往是不同的,因为更大的冷却系统能够更有效和安静地散热。但是,由于Zotac在这里使用了一个非常紧凑的机箱,内置的风扇在负载下必须相当努力地工作。负载下的噪音水平让我们想起了普通的游戏笔记本。在45dB(A)时,该设备是清晰可闻的。 在低负载下,我们仍然测量到41dB(A)。在2D操作中,风扇静静地呼呼作响,几乎看不出来。
Noise level
| Idle |
| 32.7 / 32.8 / 32.8 dB(A) |
| Load |
| 41.7 / 45.4 dB(A) |
 | ||
30 dB silent 40 dB(A) audible 50 dB(A) loud |
||
min: | ||
| Zotac ZBOX Magnus EN173070C GeForce RTX 3070 Laptop GPU, i7-11800H, Transcend M.2 SSD 2200S TS512GMTE220S | Zotac Magnus One (ECM73070C) GeForce RTX 3070, i7-10700, Phison 512GB PA6620060U | Minisforum EliteMini HX90 Vega 8, R9 5900HX, Kingston OM8PCP3512F-AB | |
|---|---|---|---|
| Noise | -4% | 10% | |
| off / environment * (dB) | 30.7 | 30 2% | 30.8 -0% |
| Idle Minimum * (dB) | 32.7 | 33.58 -3% | |
| Idle Average * (dB) | 32.8 | 31.6 4% | |
| Idle Maximum * (dB) | 32.8 | ||
| Load Average * (dB) | 41.7 | 44.25 -6% | |
| Load Maximum * (dB) | 45.4 | 48.72 -7% | 33.4 26% |
* ... smaller is better
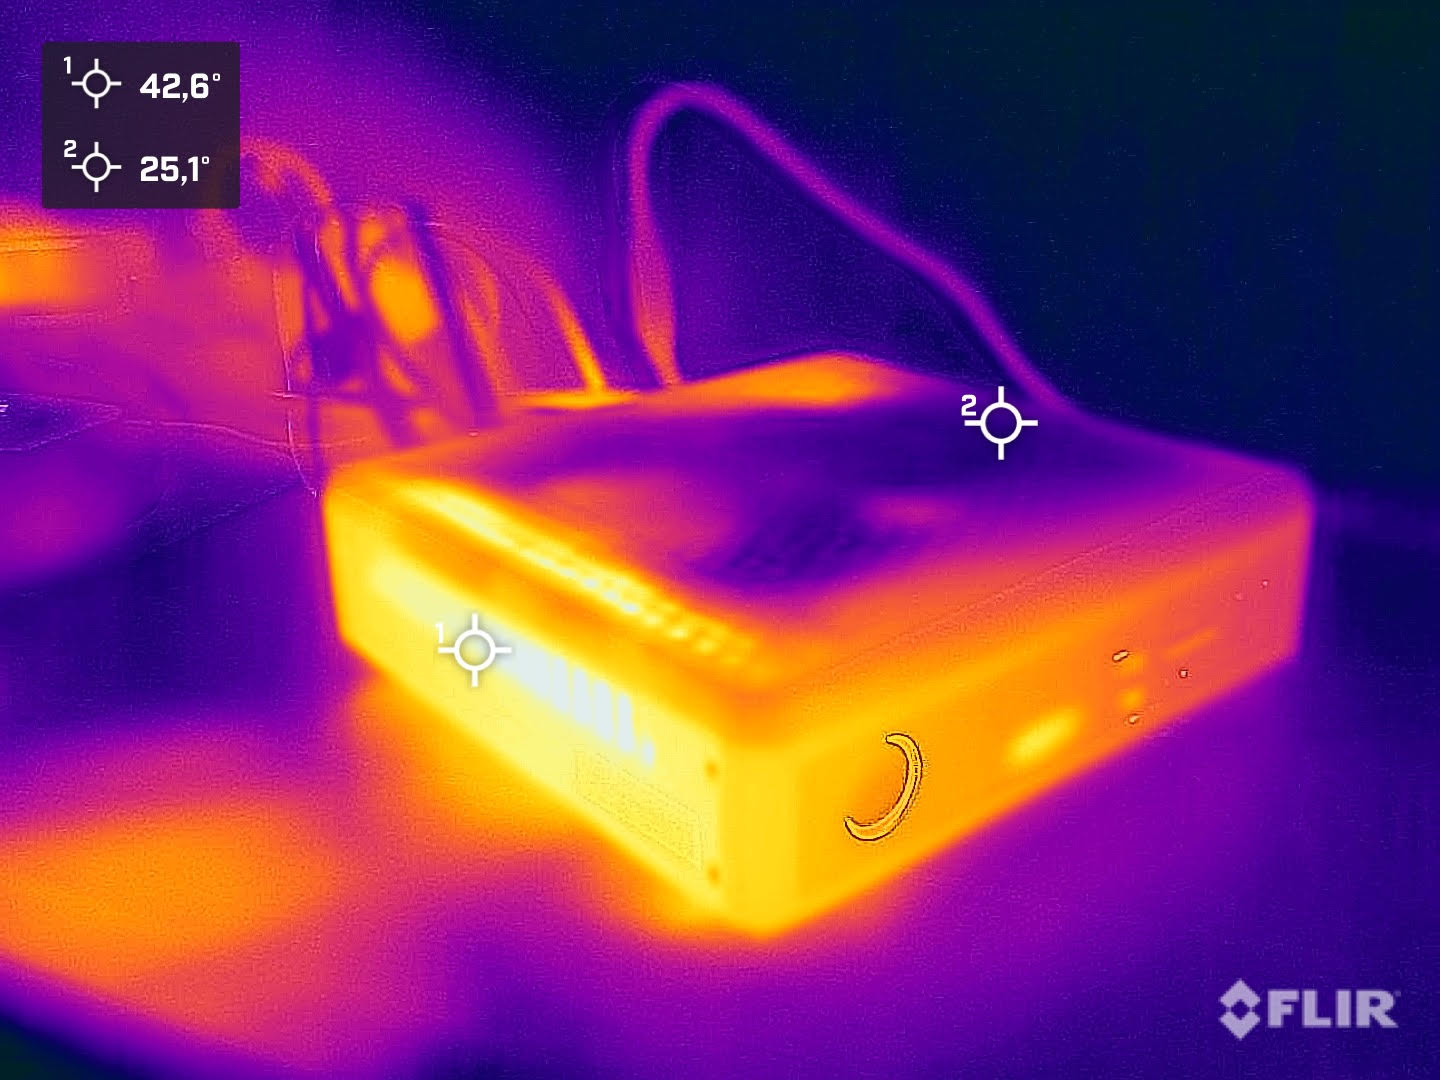
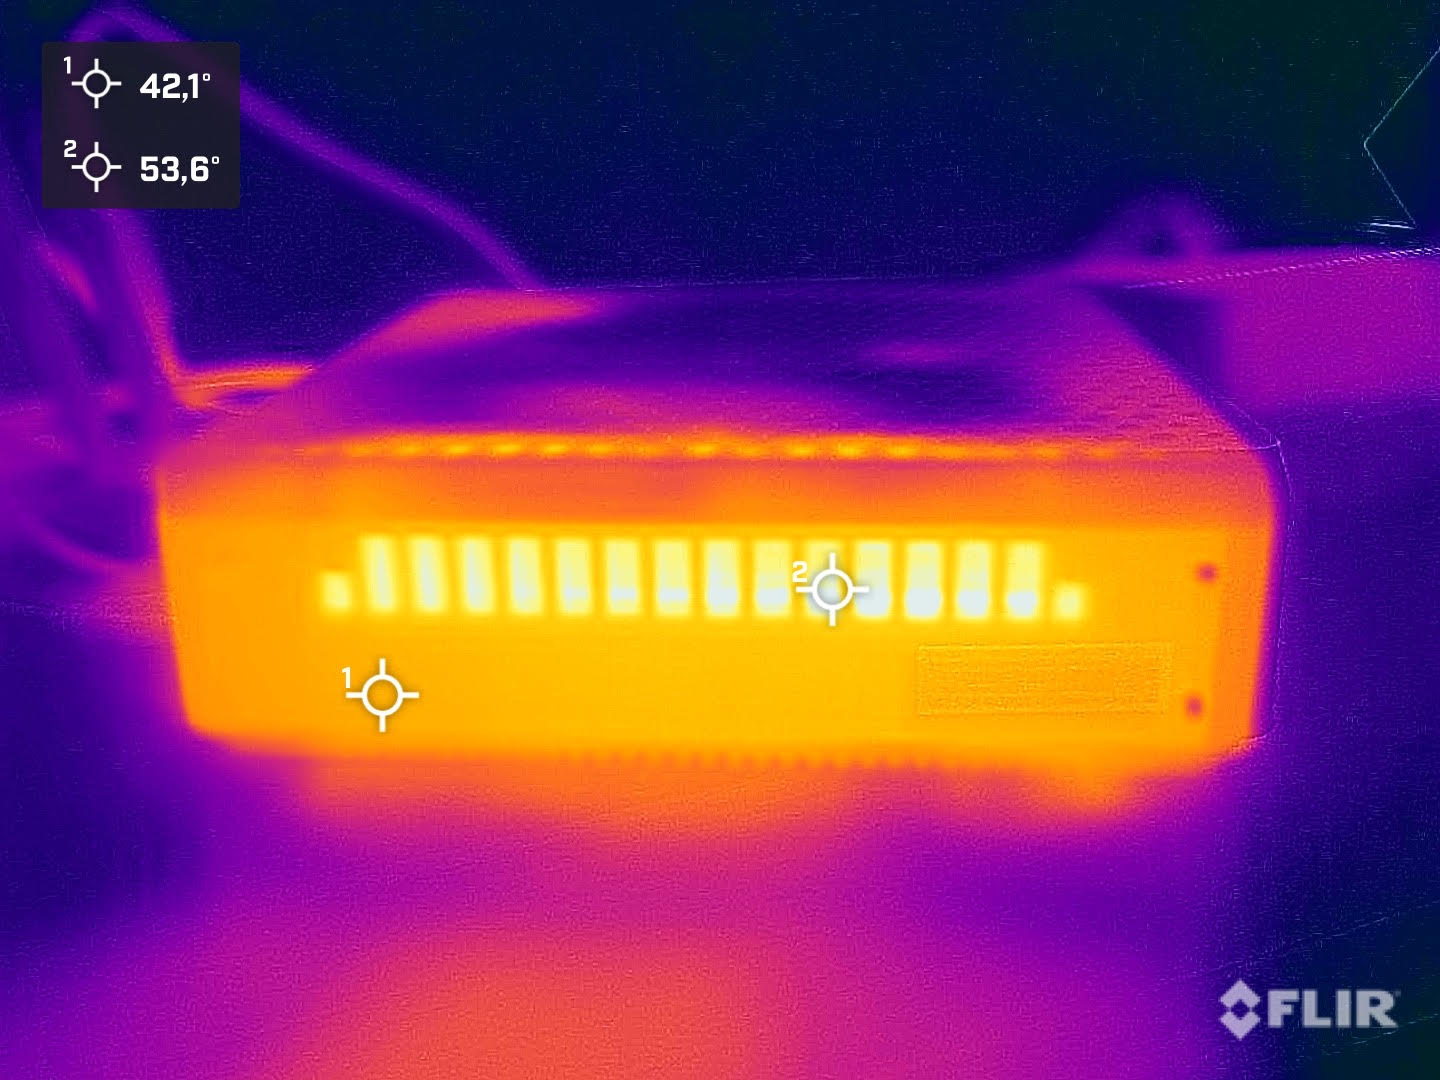
温度
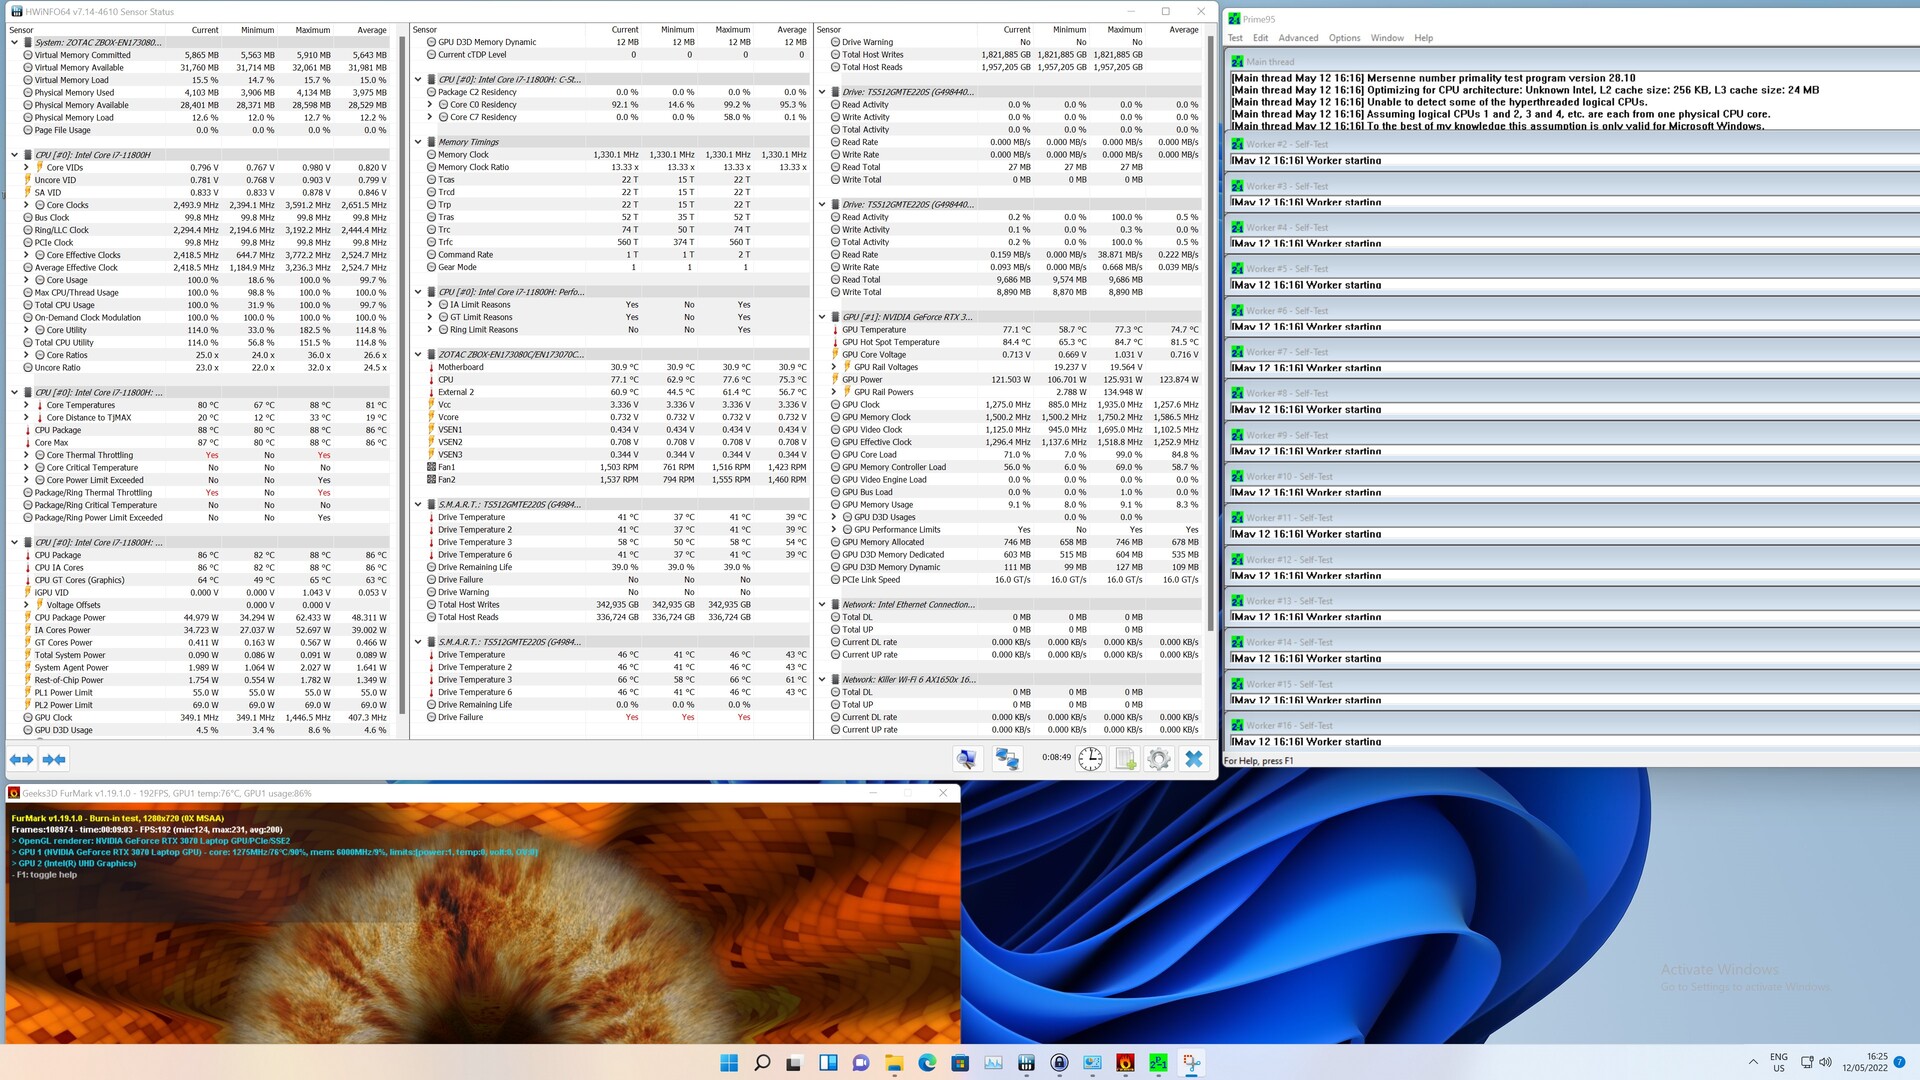
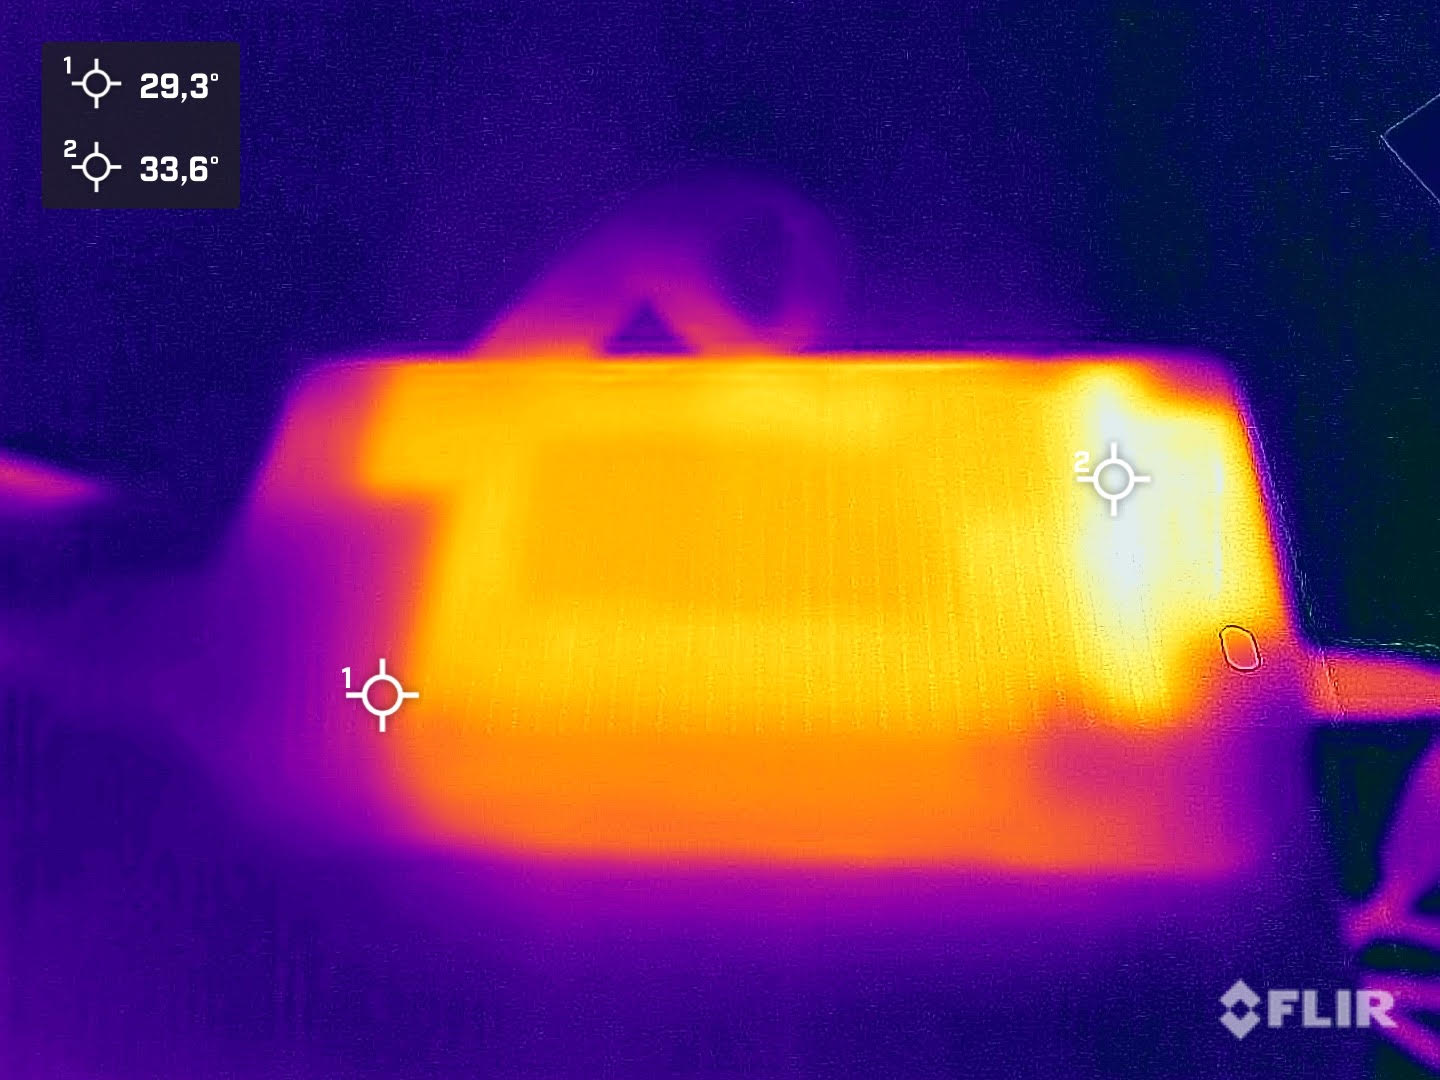
在压力测试中,我们用Prime95和FurMark给系统施加了最高的负载水平。在这种最坏的情况下, 英特尔酷睿i7-11800H达到了88℃(190°F)的最高温度。在显卡方面,我们测量的数值略低,为77℃(171°F)。CPU的时钟速度为2.6 GHz,比2.3 GHz的基本时钟速度要高。所有组件上的恒定负载并没有产生负面影响,紧接着的3D基准测试与冷启动时相比产生了相同的结果。
消耗功率
在空闲运行期间,Zotac ZBOX Magnus EN173070C的功耗在31至41瓦之间。对于一个台式机系统来说,这些是非常好的数值。另一方面,与类似配置的笔记本电脑相比,这些数值太高了。在负载情况下,我们测得的平均功率为214瓦。同时,这个高大的电源能够轻松处理我们测得的只有231瓦的峰值消耗。
| Idle | |
| Load |
|
Key:
min: | |
Power Consumption With External Monitor
Pros
Cons
结论 - 一台超紧凑的游戏电脑

通过ZBOX Magnus EN173070C,Zotac提供了一个良好的产品升级。 快速的英特尔酷睿i7-11800H提供了一个非常好的运行速度,而 NvidiaGeForce RTX 3070 Mobile同样能够产生良好的性能,而不会被人为地扼杀。这里有完整的125瓦,这意味着,即使是 NvidiaGeForce RTX 3080 Mobile也经常被超越。然而,我们仍然要考虑到,性能水平是在一个NvidiaGeForce RTX 3060桌面GPU。但考虑到只有2.65升的机箱的紧凑性,Zotac在这里能用其ZBOX提供的东西是惊人的。
所有这些当然也有其价格。与负担得起的游戏笔记本电脑相比,如 Acer Nitro5 AN515,价格处于类似水平。有时你甚至需要支付更多,因为基本设备中不包括SSD和内存。1650欧元(约1743美元),Zotac要求的价格很高。另一方面,你也得到了一台超紧凑的游戏电脑,你可以像笔记本电脑一样轻松地存储或携带。
游戏性能能够说服我们,各种连接也是足够的。 同时,你还必须记住,你只能通过雷电4传输数据,但不能用它来运行外部显卡。在我们看来,这是不幸的,因为否则你就可以提高3D性能,而不必购买一个全新的设备。
Zotac ZBOX Magnus EN173070C是一款基于移动组件的非常快速的游戏PC。然而,在购买它之前,你应该熟悉裸机系统的特点。
在噪音水平方面,Zotac ZBOX Magnus EN173070C与传统的台式电脑相比有所下降。在负载情况下,风扇必须大幅旋转,但风扇的噪音仍然相对舒适,不会太高。另一个选择是由英特尔提供的 龙之谷NUC这是另一个裸机系统,就像ZBOX Magnus EN173070C。虽然该设备不是很紧凑,但它也可以配备传统的桌面显卡。像往常一样,客户有选择权,需要决定哪些参数在他们的购买中是最重要的。
价格和可用性
虽然Zotac ZBOX Magnus EN173070C在Zotac美国网站上列出以及其他许多国家的网站上,但在美国似乎很难找到购买的机会。 在美国最普遍的型号似乎是ZOTAC Magnus ONE ECM7307LH迷你电脑,它使用不同的机箱,已经包括了内存、SSD和硬盘,在亚马逊 ,价格为2130美元。

