欧通RX315笔记本电脑评测。微星GS66的隐形替代品
")
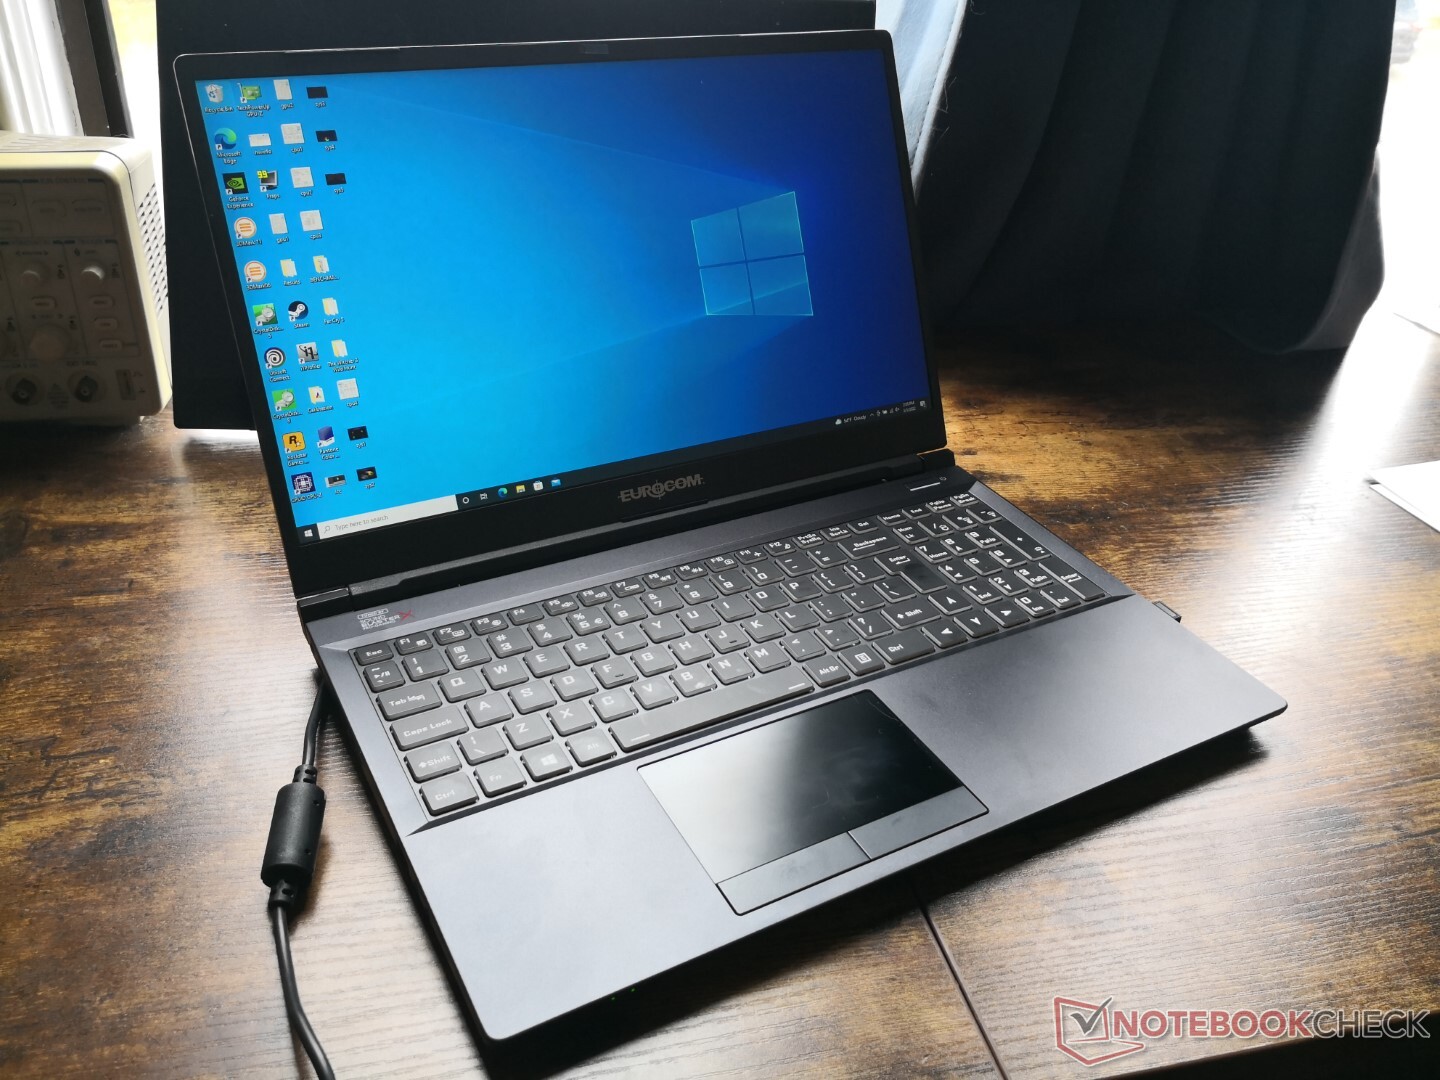
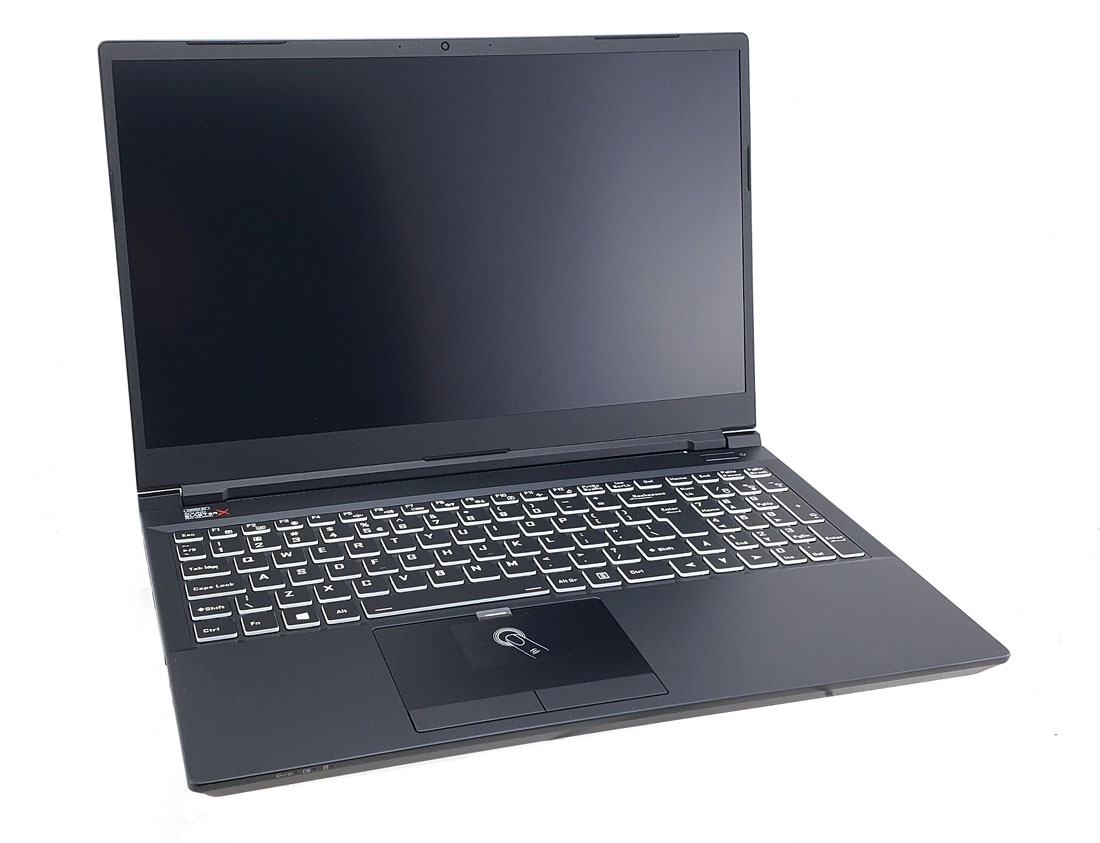
Eurocom RX315 NH57AF1是一个不同配置的 申克XMG Pro 15的不同配置,我们在今年早些时候进行了审查。因此,我们建议查看我们现有的Schenker评测,以了解更多关于机箱和物理特性的信息,因为这两个型号在视觉上是相同的。本页将转而关注用户可以期待的RX315的性能。
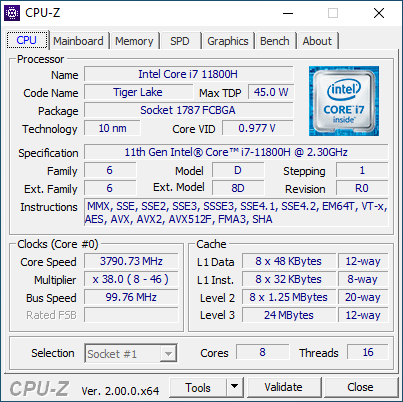
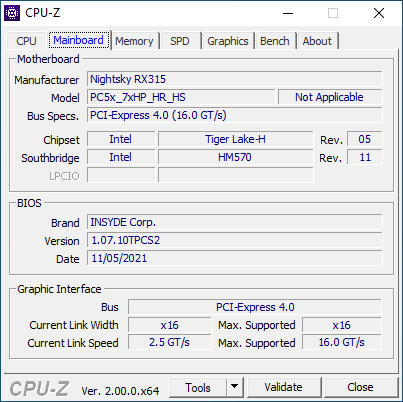
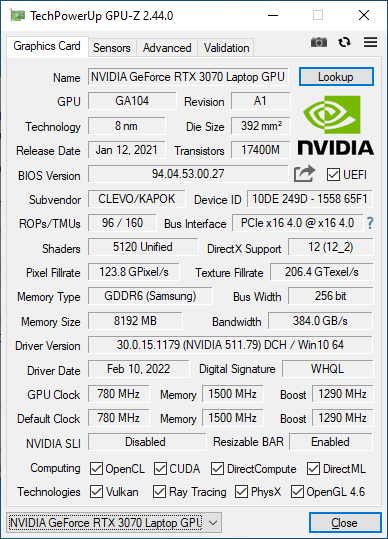
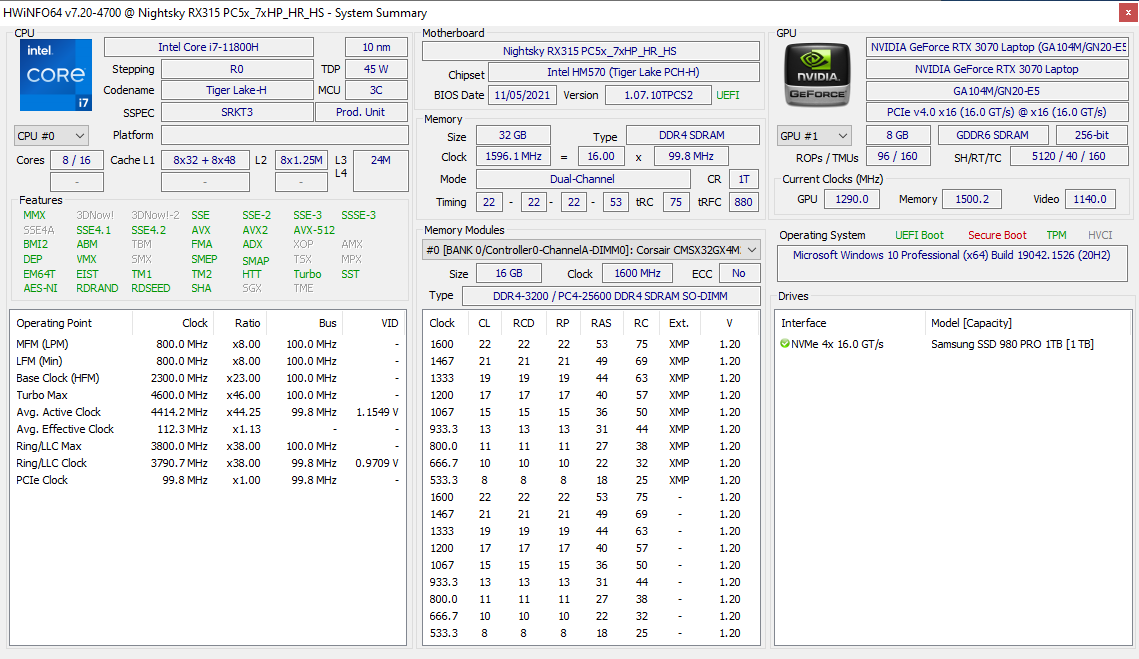
我们审查的设备配备了第11代酷睿i7-11800H CPU,105 W TGPGeForce RTX 3070 GPU,以及240 Hz IPS显示屏。其他配置选项可以在这里找到https://eurocom.com/ec/configure(2,482,0)NighskyRX315.Eurocom表示,第12代英特尔CPU和RTX 3080 Ti将在不久的将来推出。
RX315的替代品包括其他超薄的15.6英寸游戏笔记本,如 微星GS66, 华硕Zephyrus S15系列, Razer Blade 15,或Alienware X15。Eurocom RX315不应与较厚的ARX15或ARX315相混淆。
更多Eurocom评论。
潜在的竞争对手比较
Rating | Date | Model | Weight | Height | Size | Resolution | Price |
|---|---|---|---|---|---|---|---|
| 85.2 % v7 (old) | 03 / 2022 | Eurocom RX315 NH57AF1 i7-11800H, GeForce RTX 3070 Laptop GPU | 2 kg | 20 mm | 15.60" | 1920x1080 | |
| 84.5 % v7 (old) | 02 / 2022 | MSI Stealth GS66 12UGS i7-12700H, GeForce RTX 3070 Ti Laptop GPU | 2.2 kg | 19.8 mm | 15.60" | 2560x1440 | |
| 83 % v7 (old) | 01 / 2022 | Eurocom Nightsky ARX315 R9 5900X, GeForce RTX 3070 Laptop GPU | 2.6 kg | 32.5 mm | 15.60" | 1920x1080 | |
| 86.1 % v7 (old) | 11 / 2021 | Alienware m15 R6, i7-11800H RTX 3080 i7-11800H, GeForce RTX 3080 Laptop GPU | 2.5 kg | 22.85 mm | 15.60" | 1920x1080 | |
| 82.7 % v7 (old) | 10 / 2021 | Dell G15 5515 R7 5800H, GeForce RTX 3050 Ti Laptop GPU | 2.4 kg | 24.9 mm | 15.60" | 1920x1080 | |
| 88.9 % v7 (old) | 10 / 2021 | Razer Blade 15 Advanced (Mid 2021) i7-11800H, GeForce RTX 3080 Laptop GPU | 2 kg | 16.99 mm | 15.60" | 1920x1080 |
案例
沟通
网络摄像头


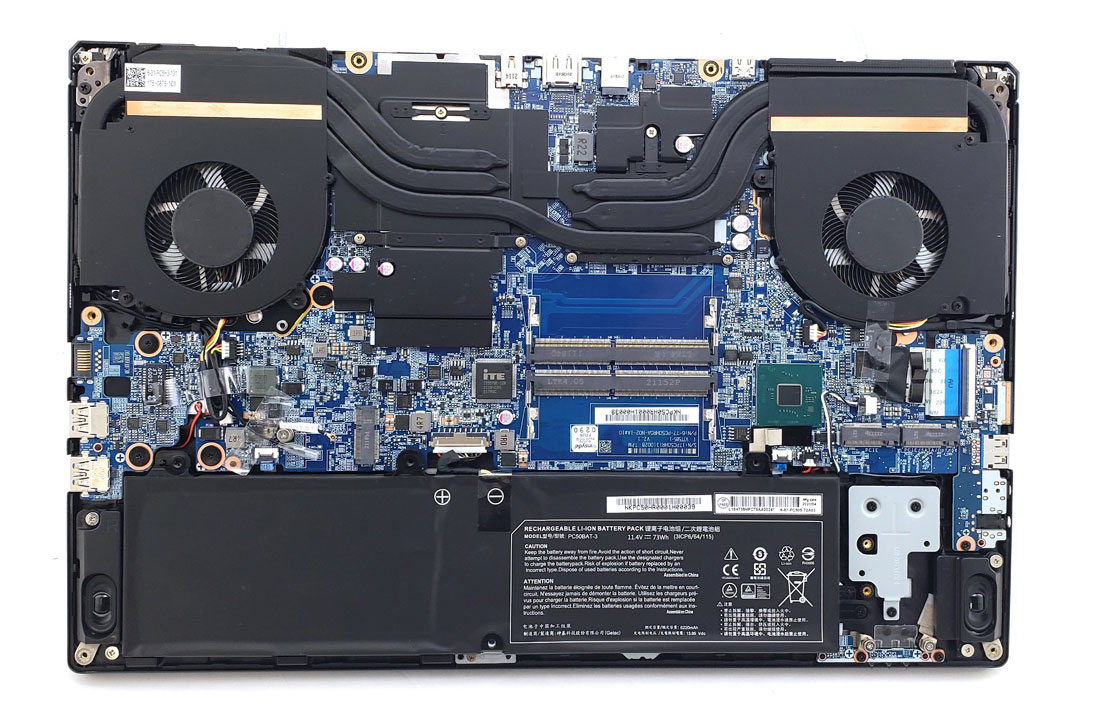
维护
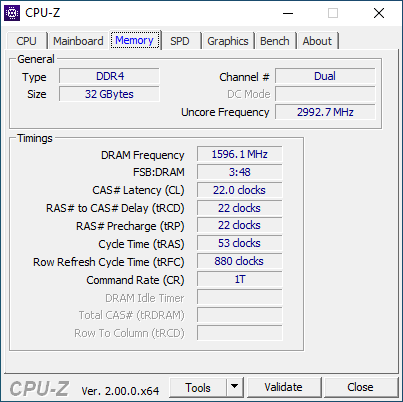
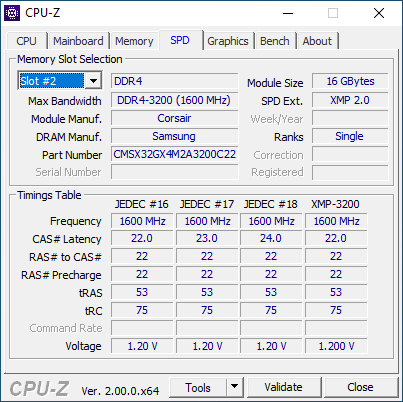
用户最多可以安装两个DDR4 SODIMM内存模块,两个PCIe4 x4 M.2 2280 NVMe固态硬盘,以及一个WLAN模块。
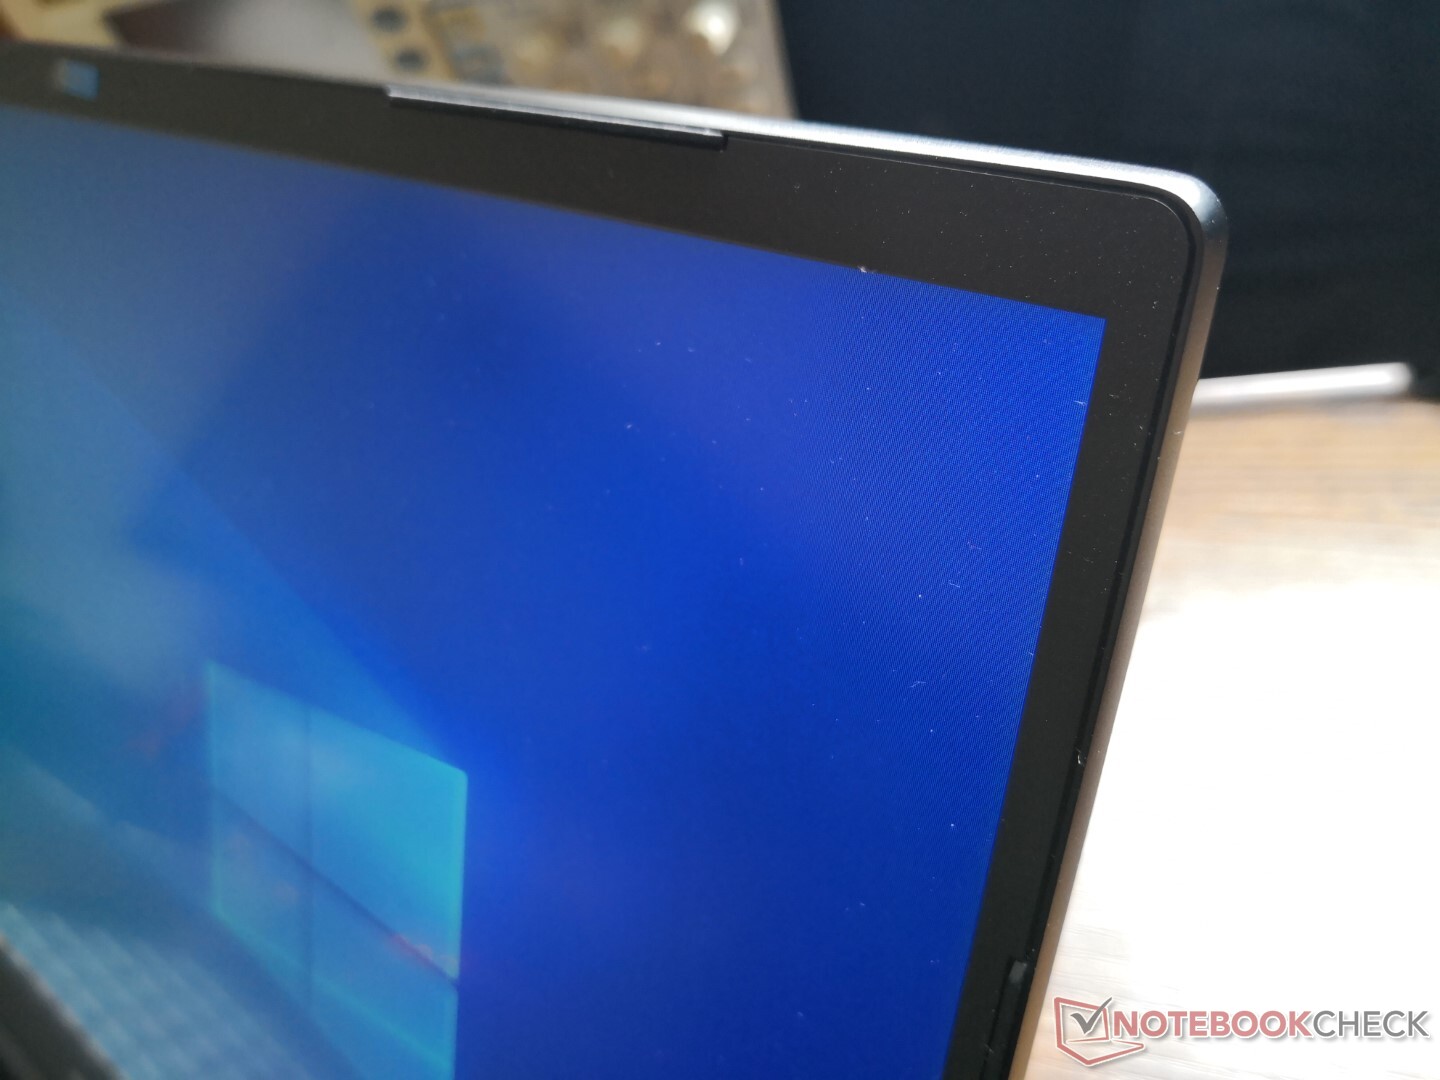
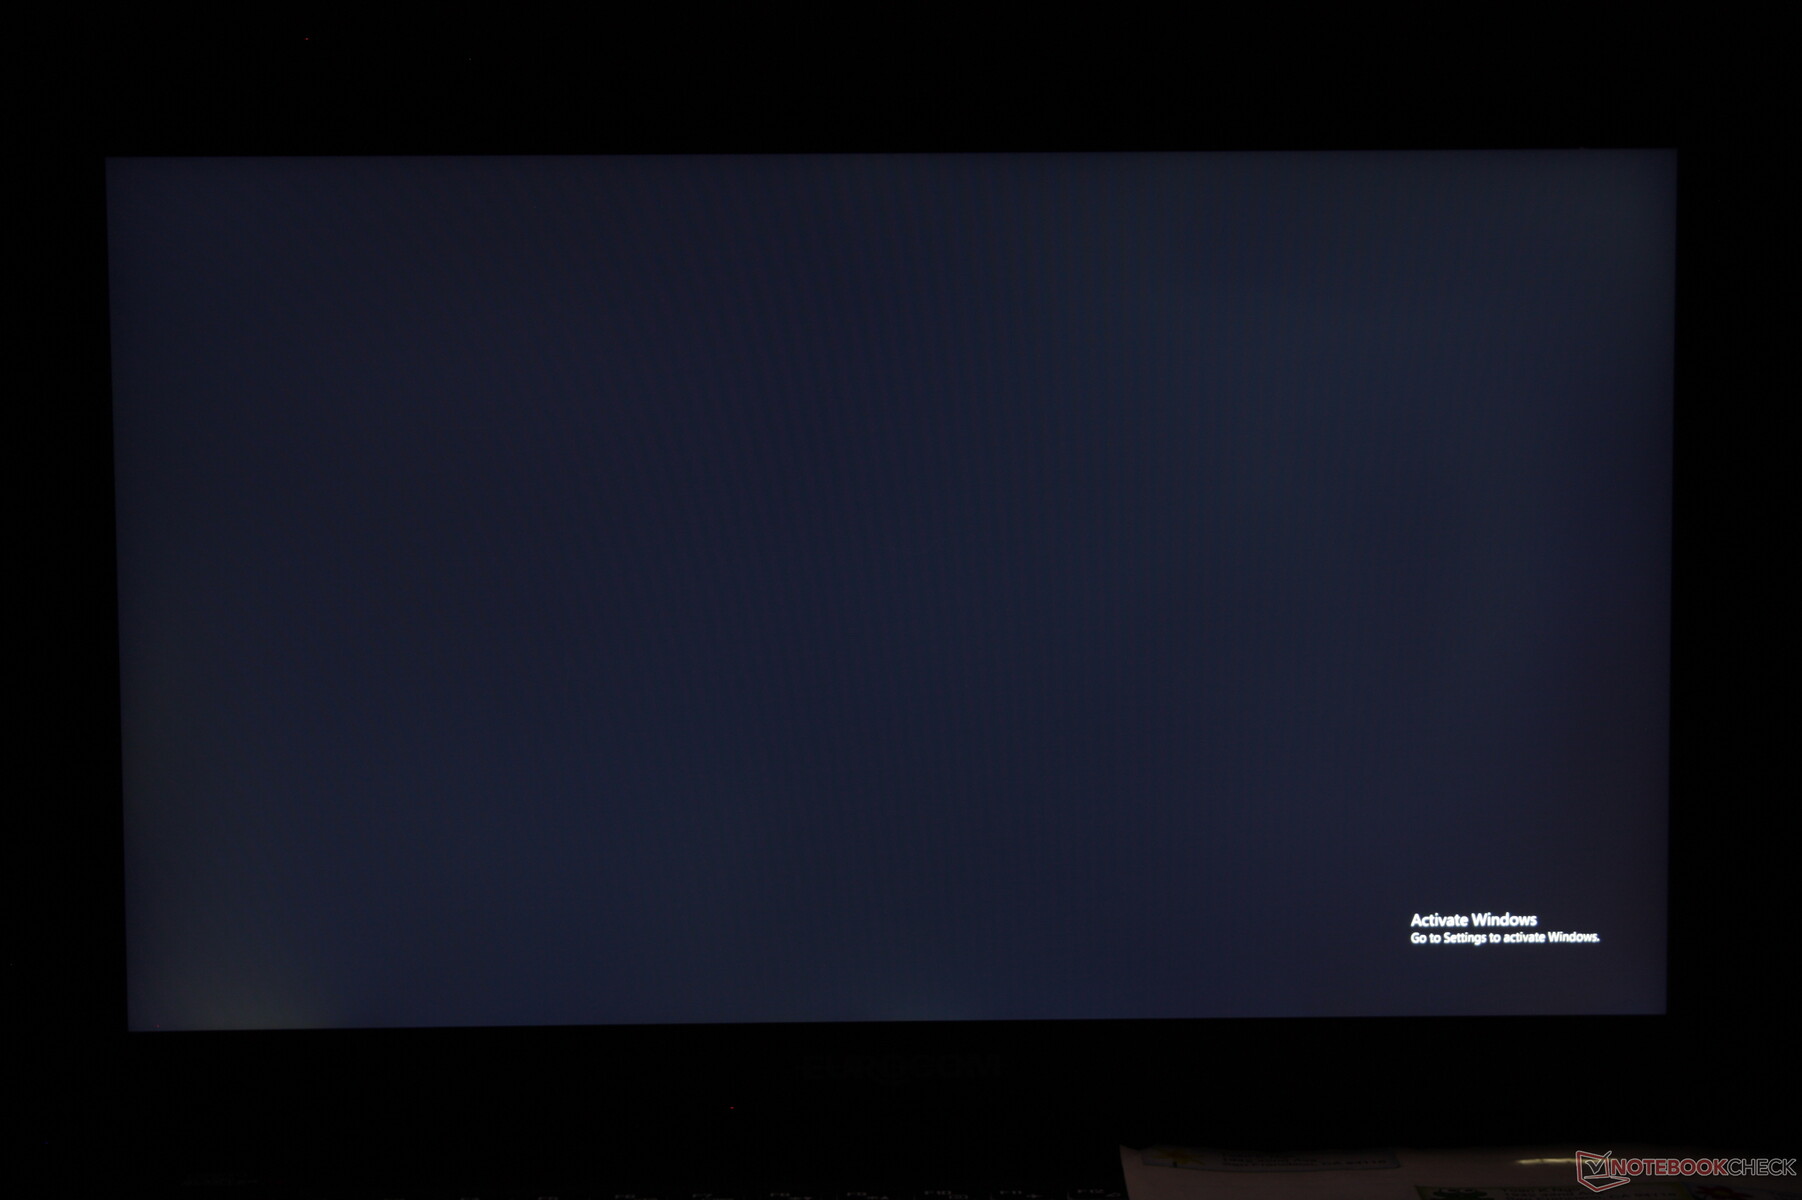
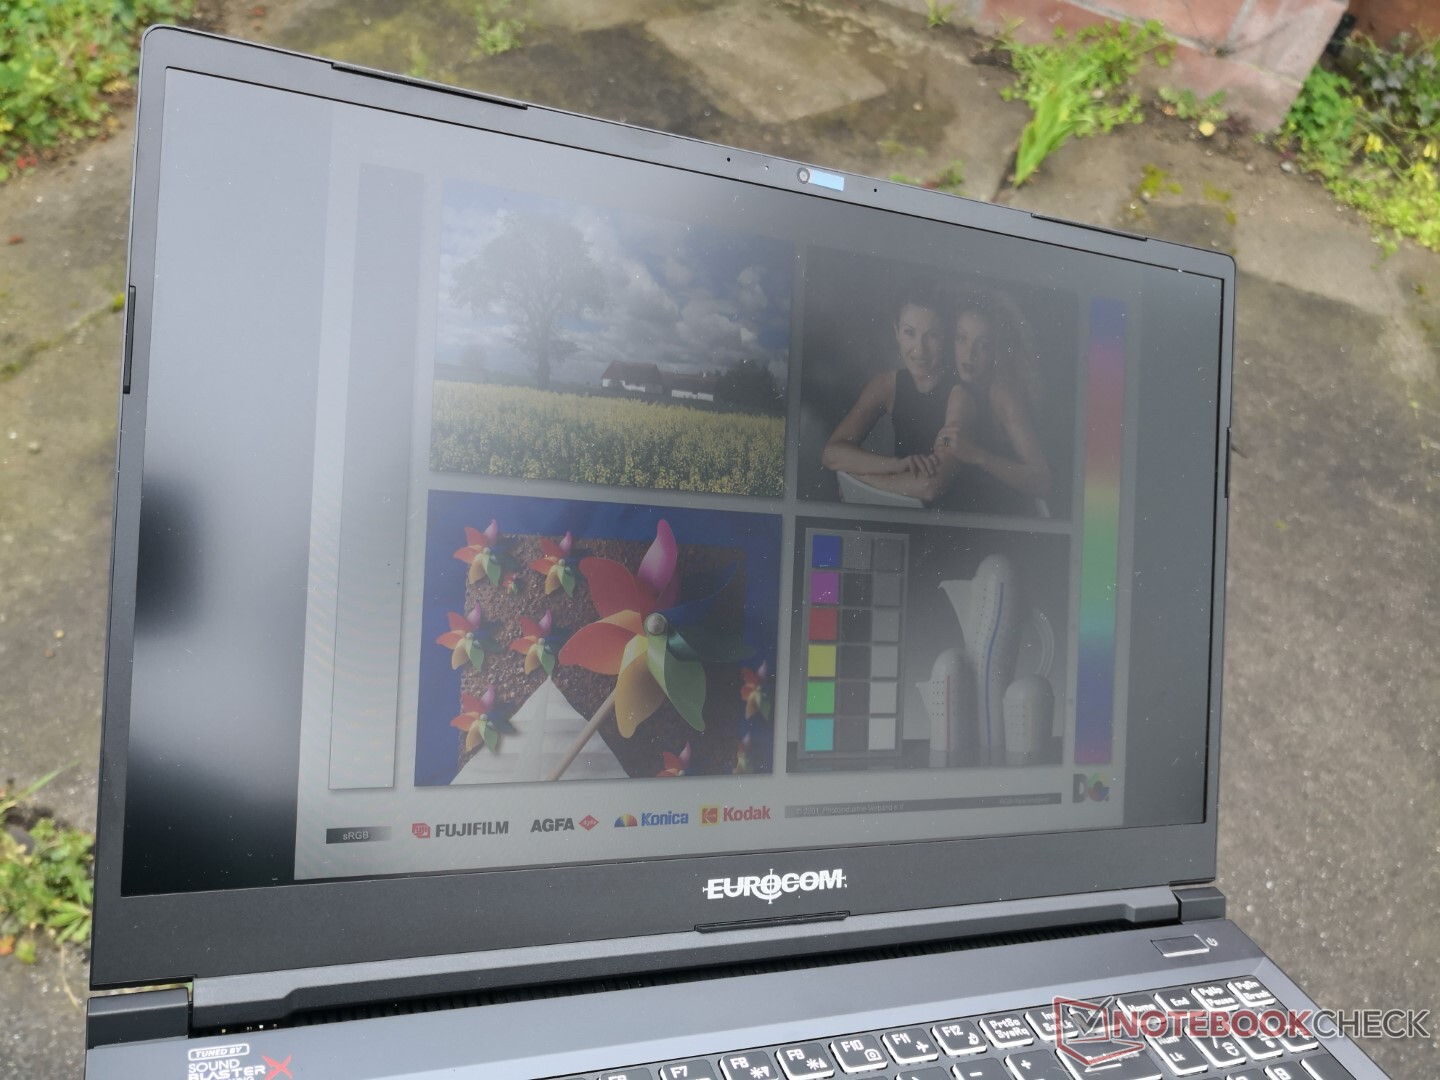
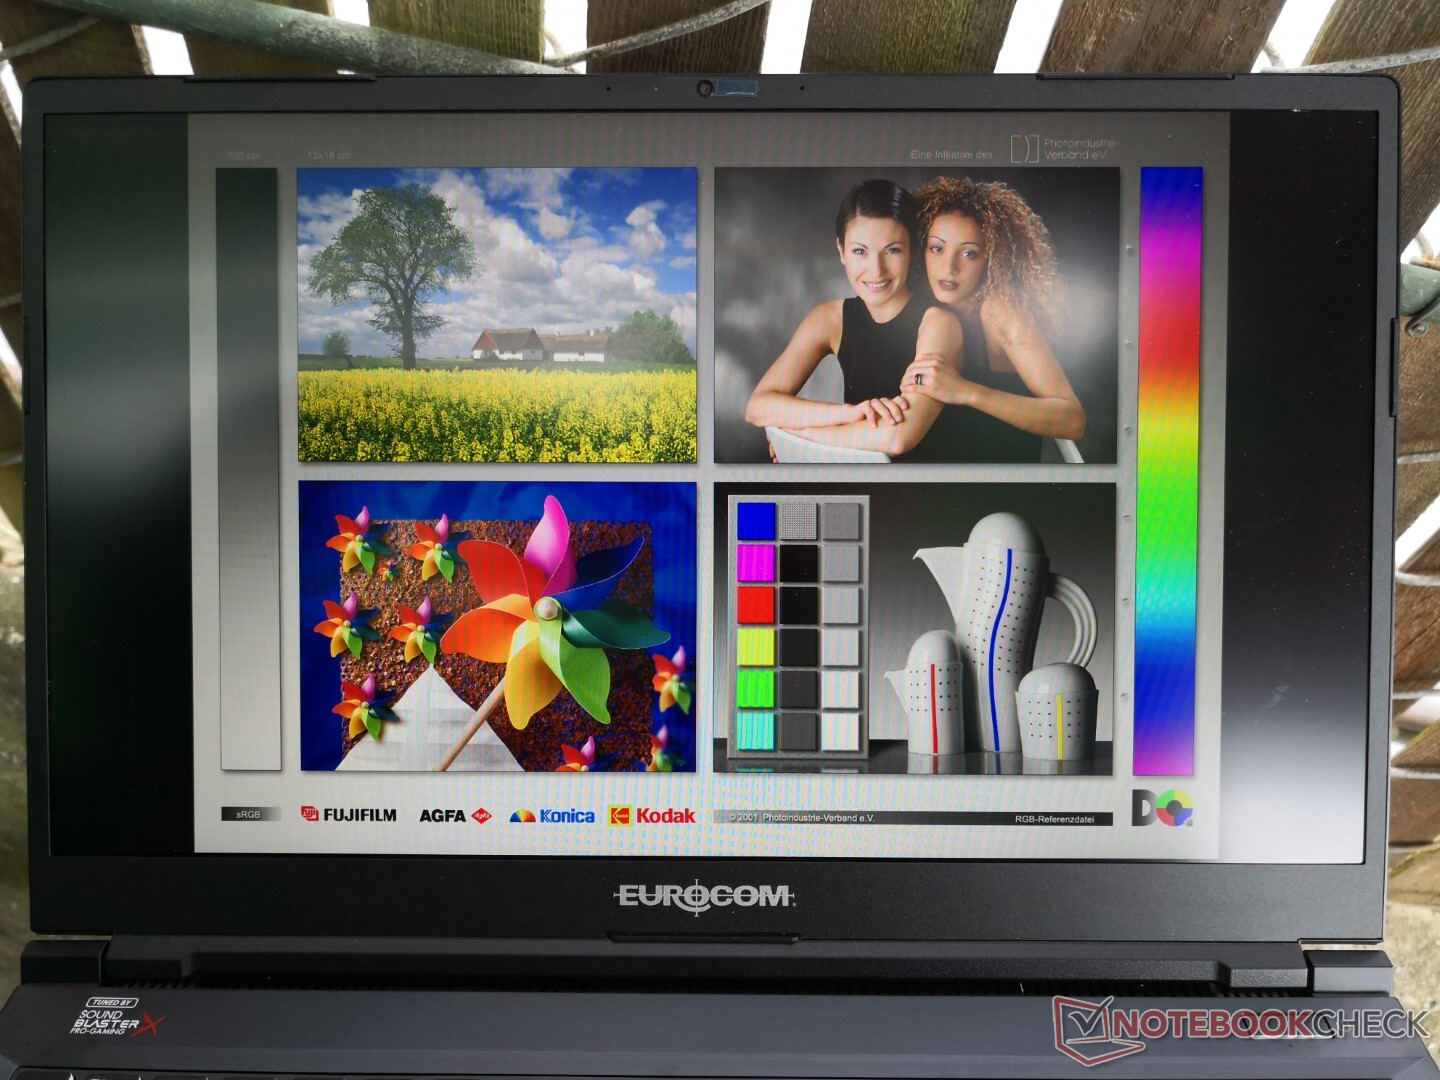
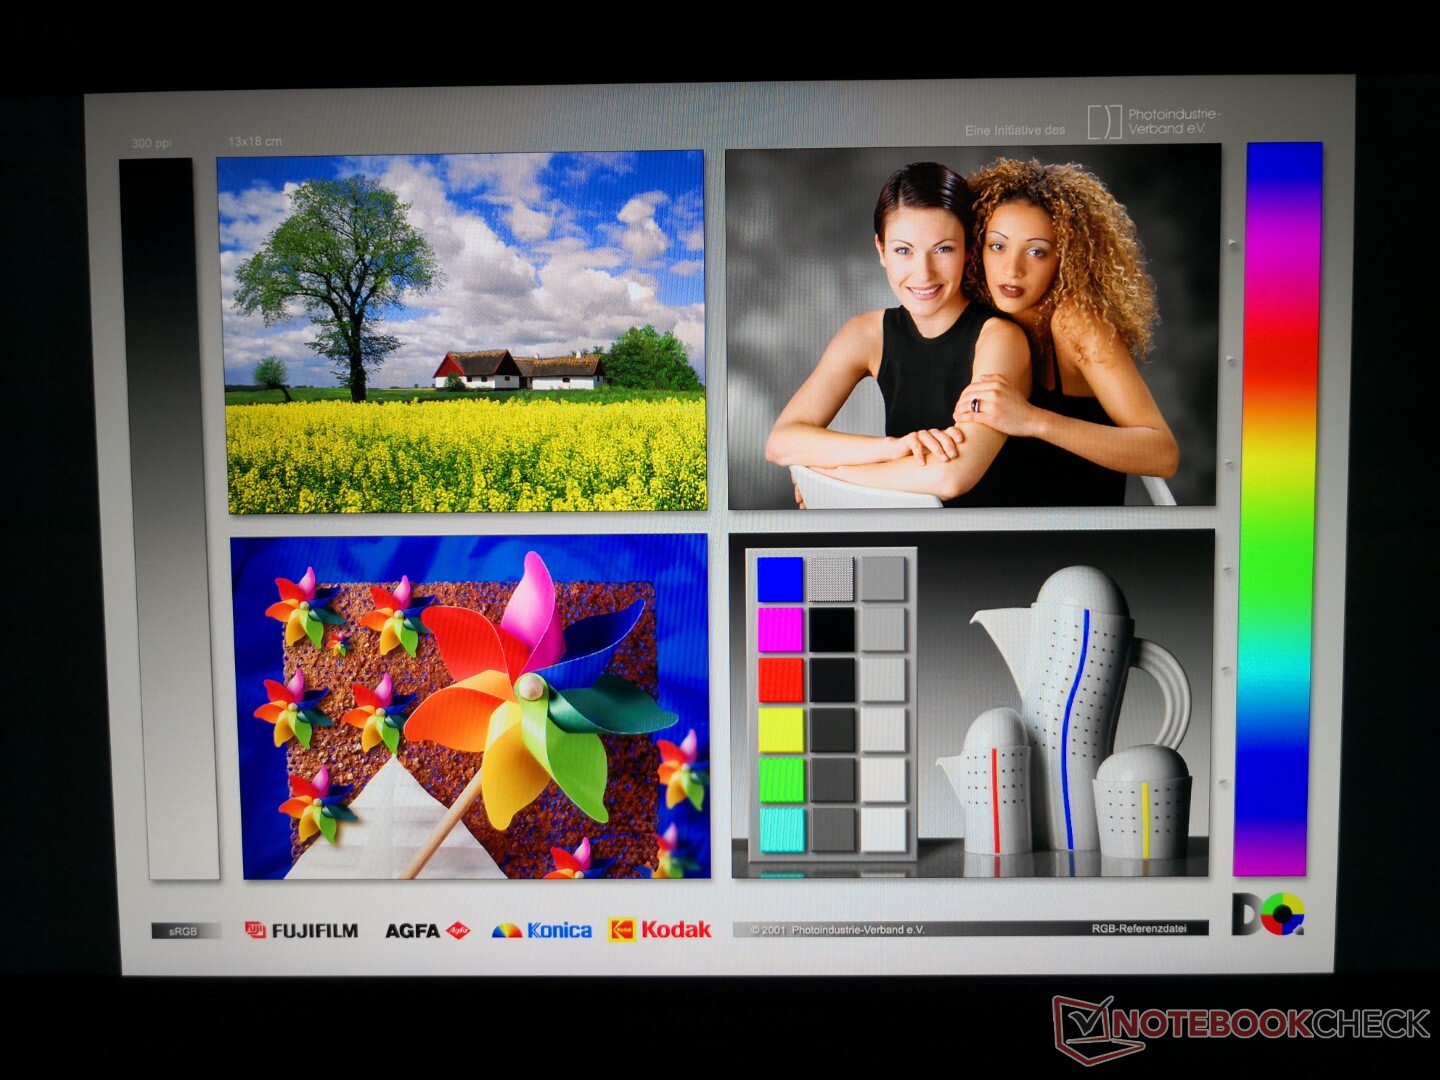
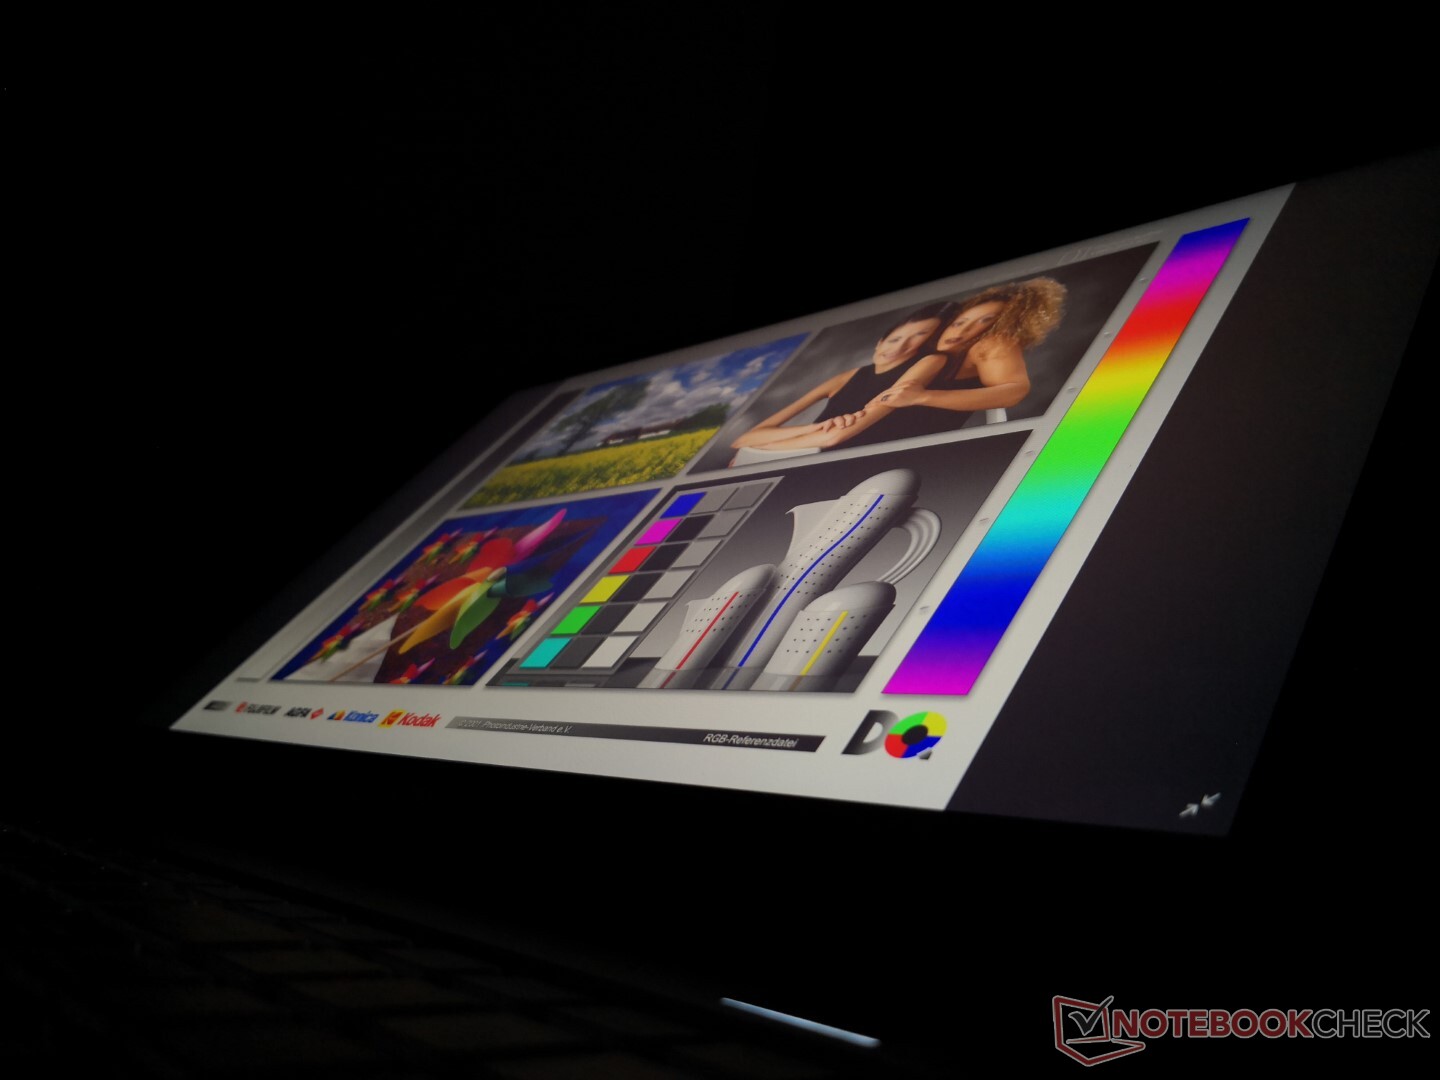
显示
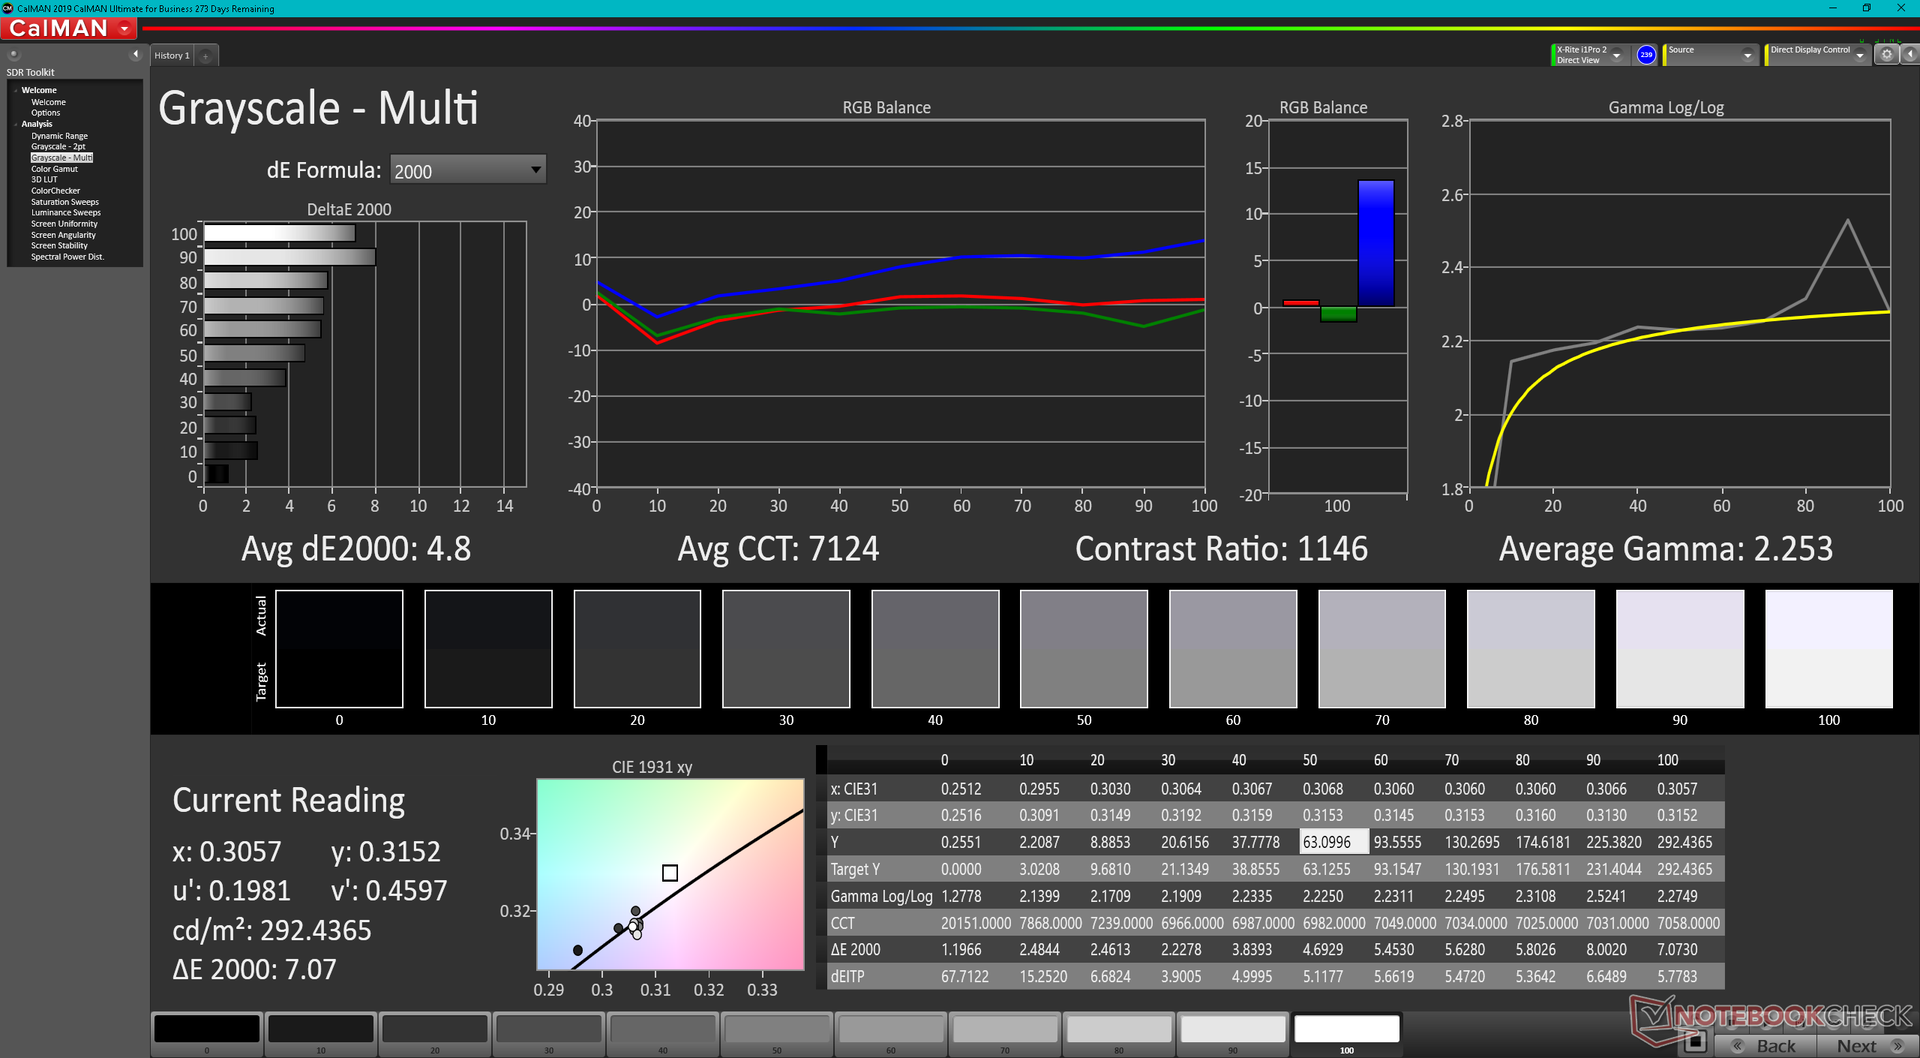
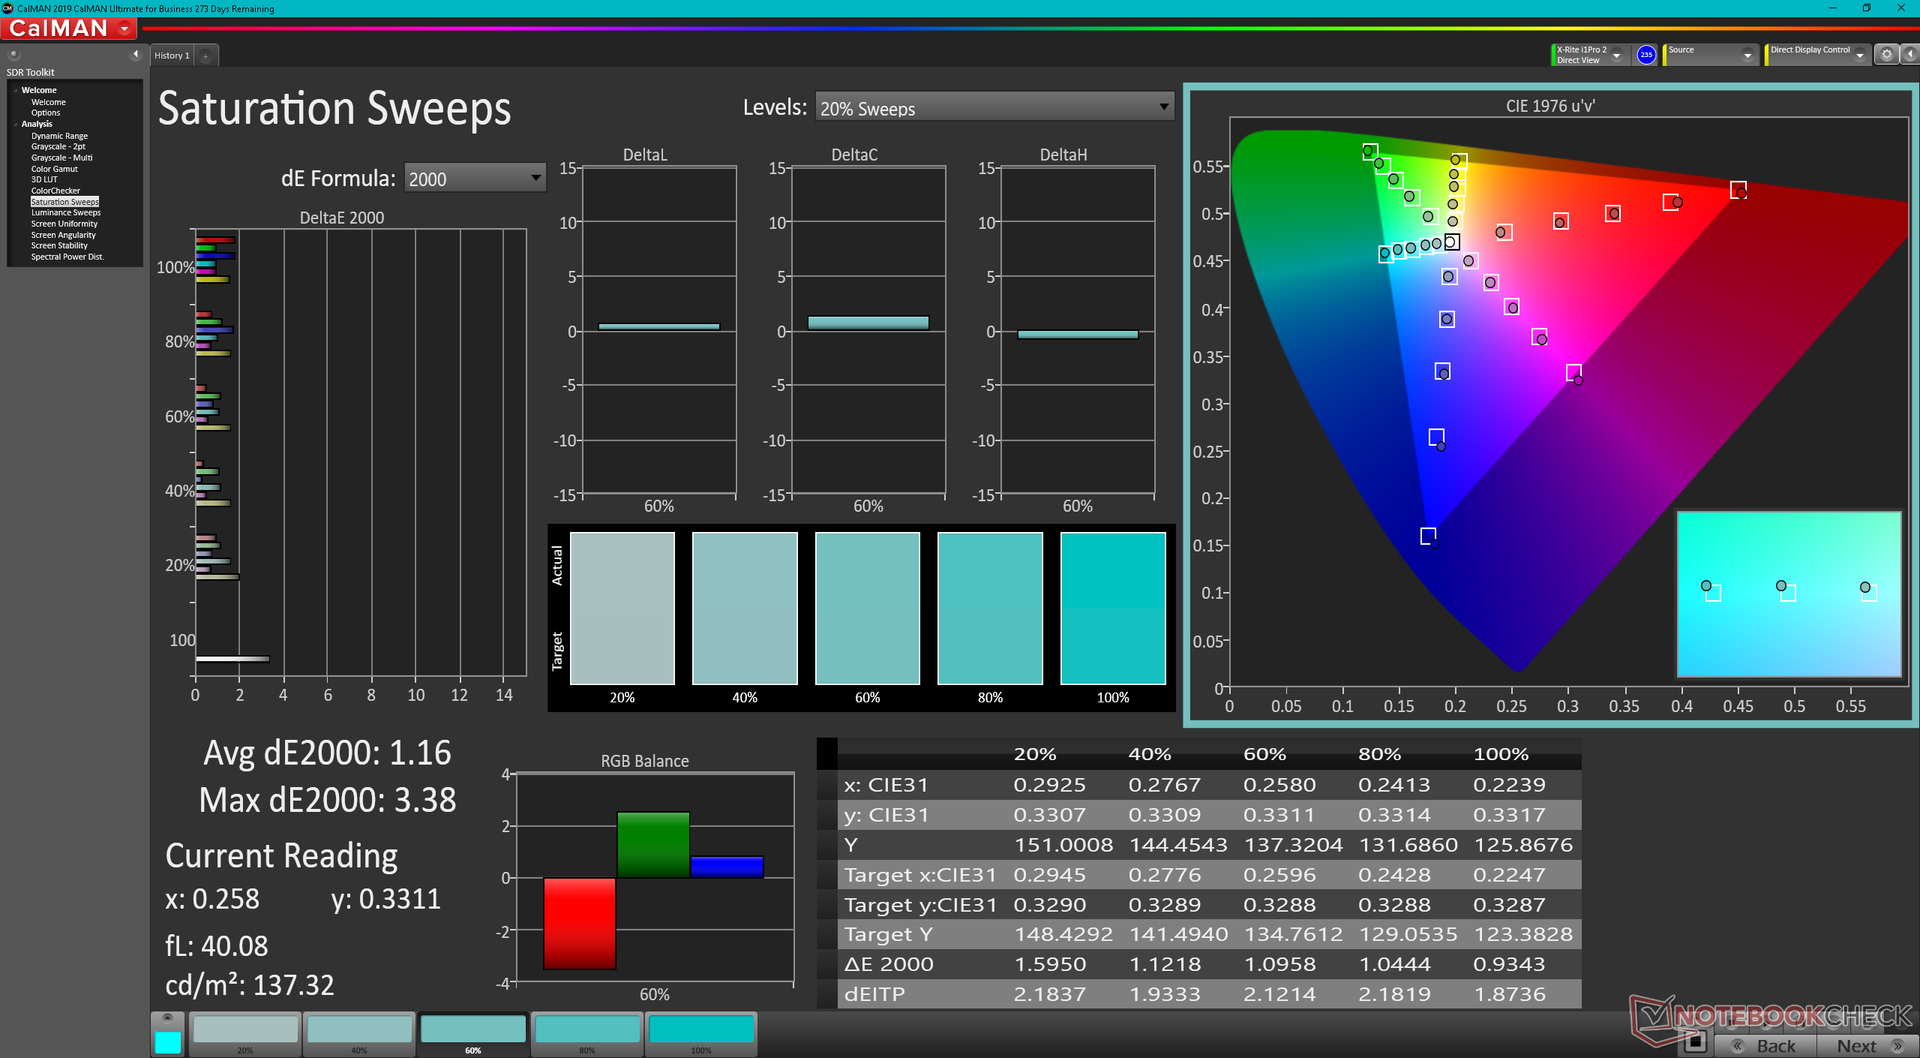
与4K OLED选项相比,我们的FHD IPS面板具有较慢的黑白和灰度响应时间,较暗的背光,较低的对比度,以及较窄的色域,总体而言画面质量较低。作为回报,用户可以获得更快的240赫兹原始刷新率,以减少屏幕撕裂和更顺畅的游戏体验。然而,内部显示器不支持G-Sync。

| |||||||||||||||||||||||||
Brightness Distribution: 91 %
Center on Battery: 291.3 cd/m²
Contrast: 832:1 (Black: 0.35 cd/m²)
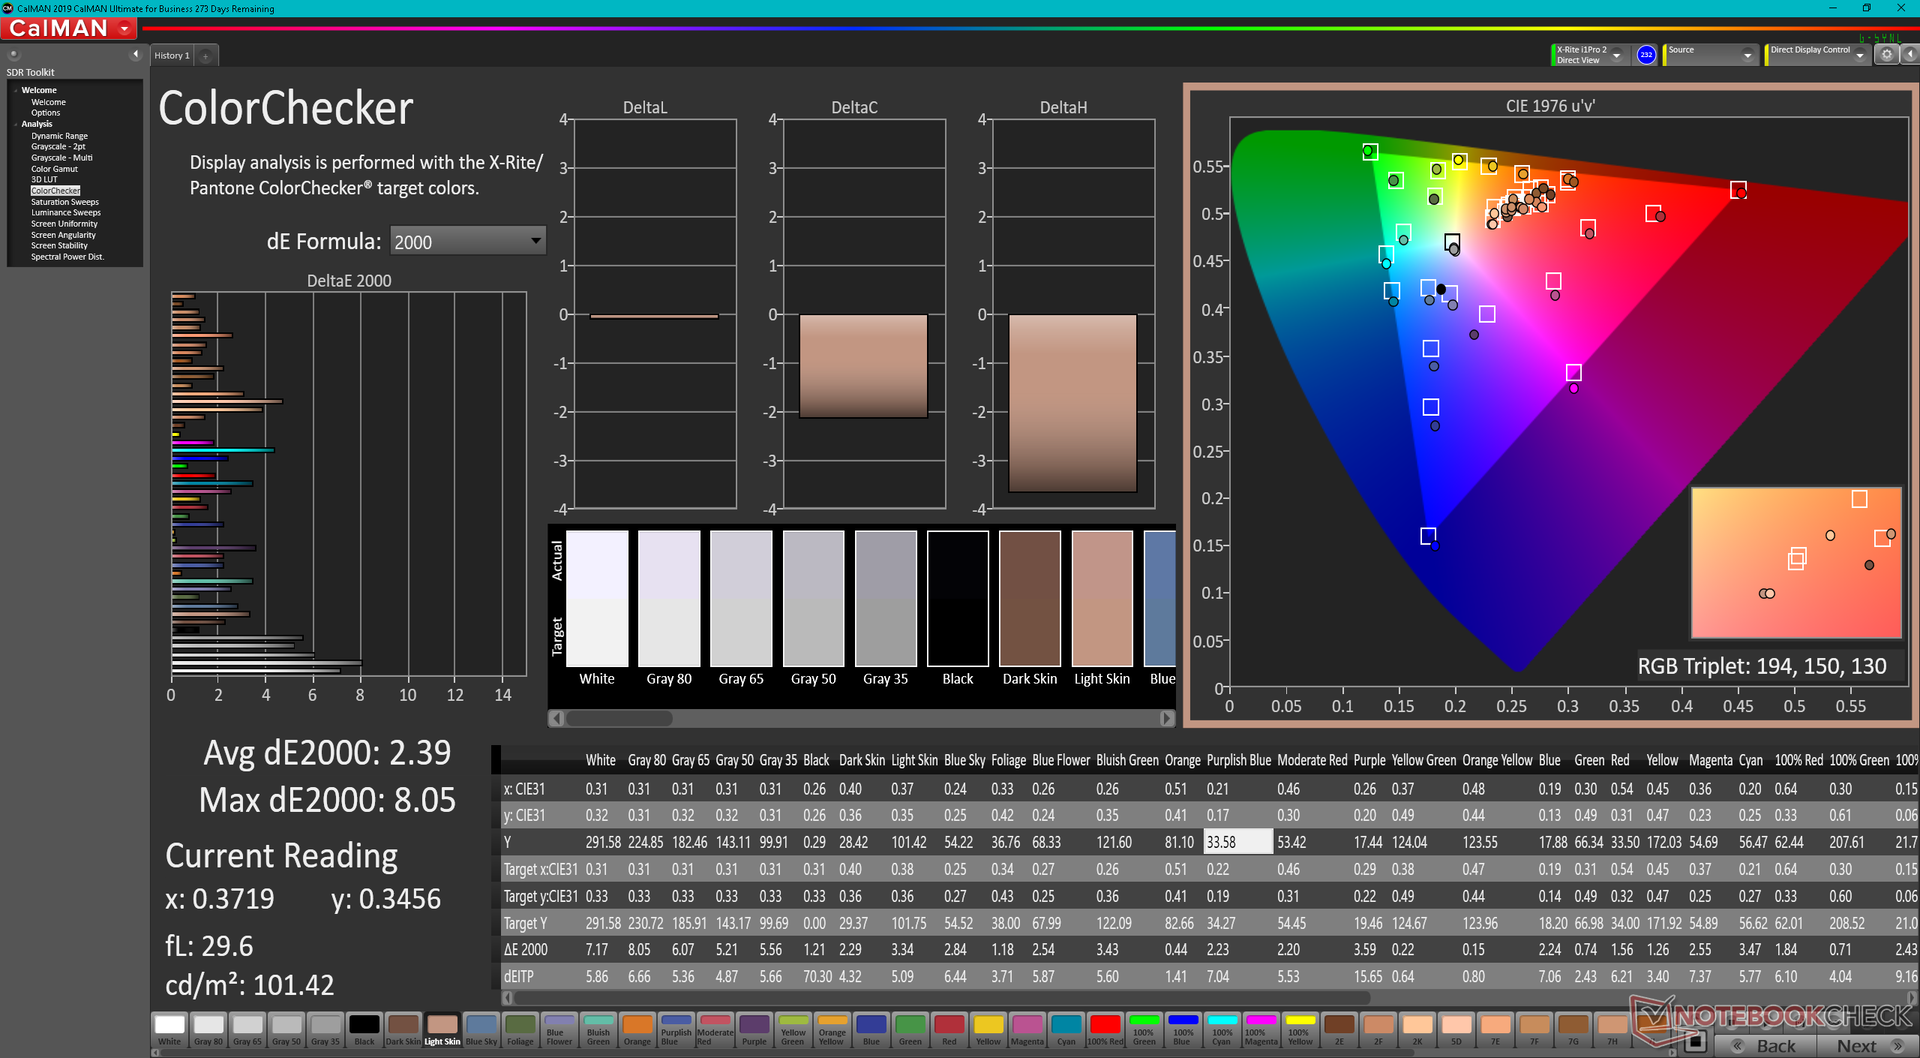
ΔE ColorChecker Calman: 2.39 | ∀{0.5-29.43 Ø4.71}
calibrated: 1.49
ΔE Greyscale Calman: 4.8 | ∀{0.09-98 Ø4.96}
68.5% AdobeRGB 1998 (Argyll 3D)
98% sRGB (Argyll 3D)
67.5% Display P3 (Argyll 3D)
Gamma: 2.25
CCT: 7124 K
| Eurocom RX315 NH57AF1 Sharp LQ156M1JW03, IPS, 1920x1080, 15.6" | MSI Stealth GS66 12UGS Sharp LQ156T1JW04 (SHP153C), IPS-Level, 2560x1440, 15.6" | Eurocom Nightsky ARX315 Sharp LQ156M1JW03, IPS, 1920x1080, 15.6" | Alienware m15 R6, i7-11800H RTX 3080 AU Optronics AUO9092 (B156HAN), IPS, 1920x1080, 15.6" | Dell G15 5515 BOE092A, IPS, 1920x1080, 15.6" | Razer Blade 15 Advanced (Mid 2021) TL156VDXP02-0, IPS, 1920x1080, 15.6" | |
|---|---|---|---|---|---|---|
| Display | 23% | 4% | 8% | -42% | -0% | |
| Display P3 Coverage (%) | 67.5 | 96.4 43% | 67.9 1% | 74.1 10% | 39.1 -42% | 66.9 -1% |
| sRGB Coverage (%) | 98 | 99.7 2% | 99.7 2% | 99.5 2% | 56.9 -42% | 97.1 -1% |
| AdobeRGB 1998 Coverage (%) | 68.5 | 85.6 25% | 73.7 8% | 75.7 11% | 40.4 -41% | 69 1% |
| Response Times | 35% | -22% | 63% | -94% | 37% | |
| Response Time Grey 50% / Grey 80% * (ms) | 10.4 ? | 6 ? 42% | 15.2 ? -46% | 2.8 73% | 25.2 ? -142% | 4.2 ? 60% |
| Response Time Black / White * (ms) | 11.6 ? | 8.4 ? 28% | 11.2 ? 3% | 5.6 52% | 16.8 ? -45% | 10 ? 14% |
| PWM Frequency (Hz) | 22730 ? | 23150 ? | 200 ? | |||
| Screen | -4% | 10% | -3% | -55% | 21% | |
| Brightness middle (cd/m²) | 291.3 | 272 -7% | 312.8 7% | 359 23% | 278 -5% | 353.4 21% |
| Brightness (cd/m²) | 273 | 253 -7% | 294 8% | 344 26% | 262 -4% | 340 25% |
| Brightness Distribution (%) | 91 | 87 -4% | 90 -1% | 85 -7% | 83 -9% | 92 1% |
| Black Level * (cd/m²) | 0.35 | 0.25 29% | 0.28 20% | 0.35 -0% | 0.36 -3% | 0.31 11% |
| Contrast (:1) | 832 | 1088 31% | 1117 34% | 1026 23% | 772 -7% | 1140 37% |
| Colorchecker dE 2000 * | 2.39 | 3.73 -56% | 2.96 -24% | 3.3 -38% | 5.74 -140% | 2.17 9% |
| Colorchecker dE 2000 max. * | 8.05 | 9.43 -17% | 6.23 23% | 4.84 40% | 19.63 -144% | 5.69 29% |
| Colorchecker dE 2000 calibrated * | 1.49 | 0.98 34% | 3.28 -120% | 4.7 -215% | 1.05 30% | |
| Greyscale dE 2000 * | 4.8 | 6.5 -35% | 4.2 12% | 3.66 24% | 3.1 35% | 3.4 29% |
| Gamma | 2.25 98% | 2.172 101% | 2.32 95% | 2.43 91% | 2.011 109% | 2.2 100% |
| CCT | 7124 91% | 6485 100% | 7145 91% | 5896 110% | 6207 105% | 6830 95% |
| Total Average (Program / Settings) | 18% /
8% | -3% /
4% | 23% /
9% | -64% /
-57% | 19% /
19% |
* ... smaller is better
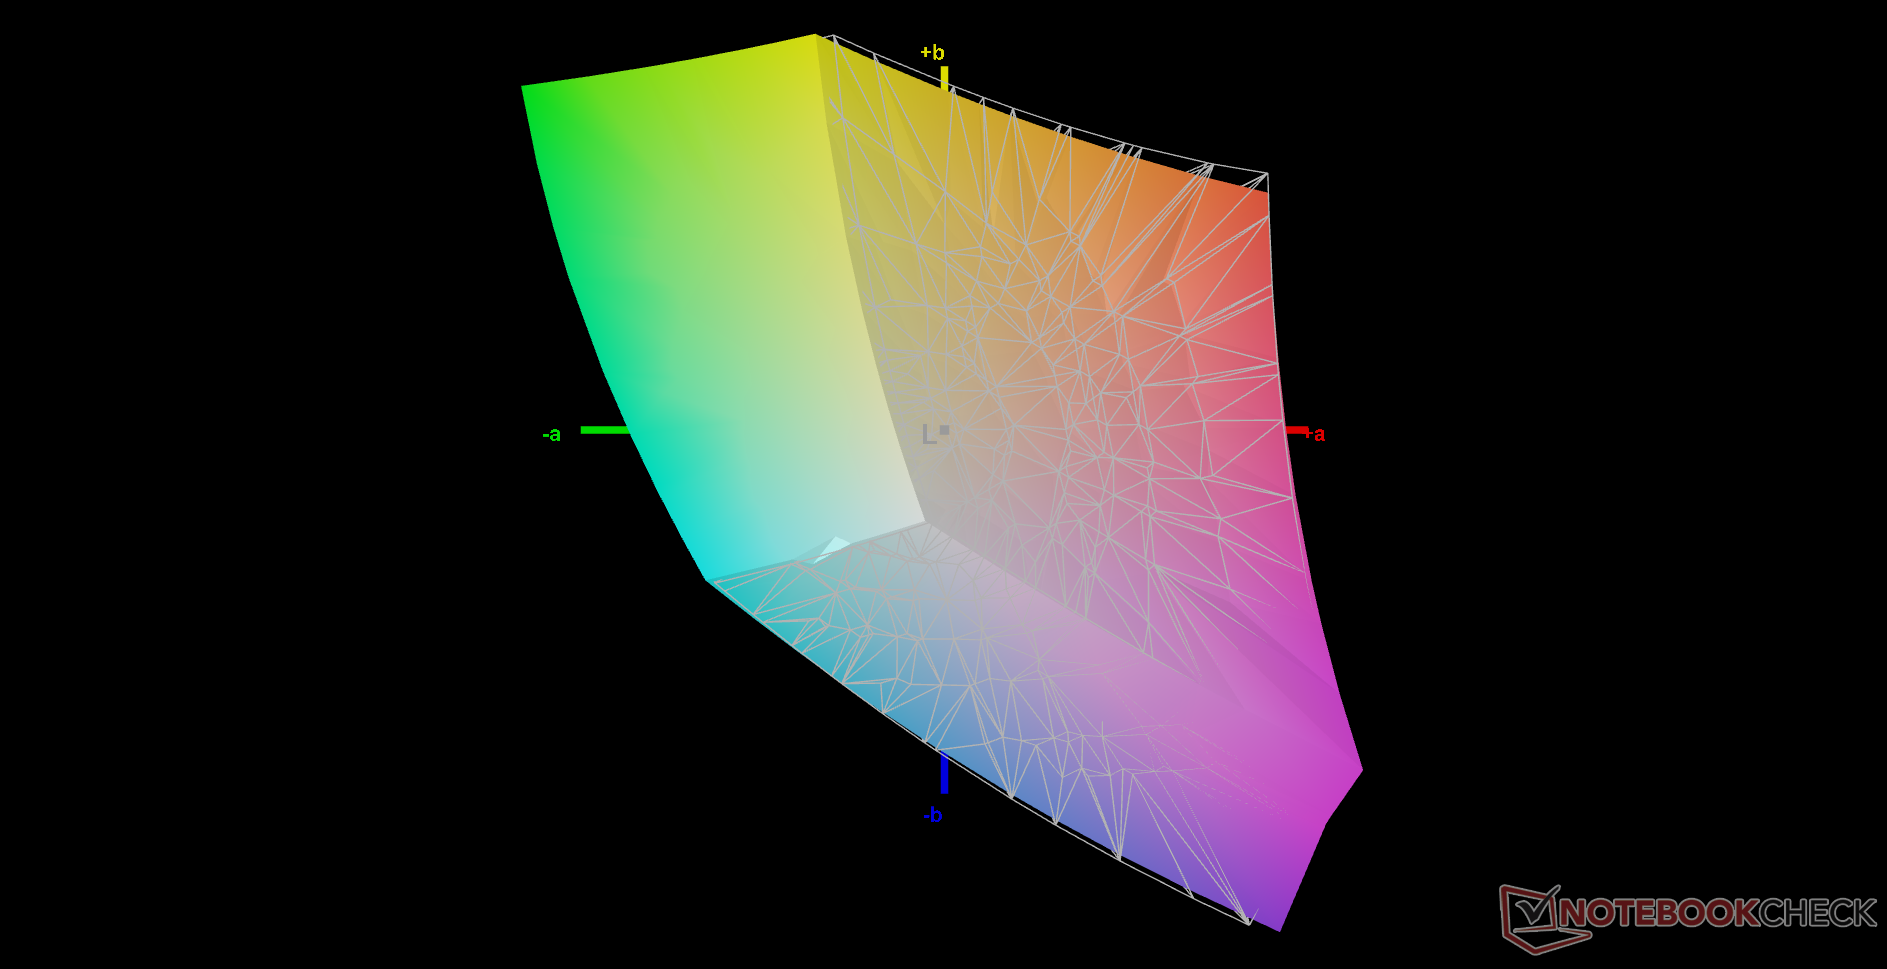
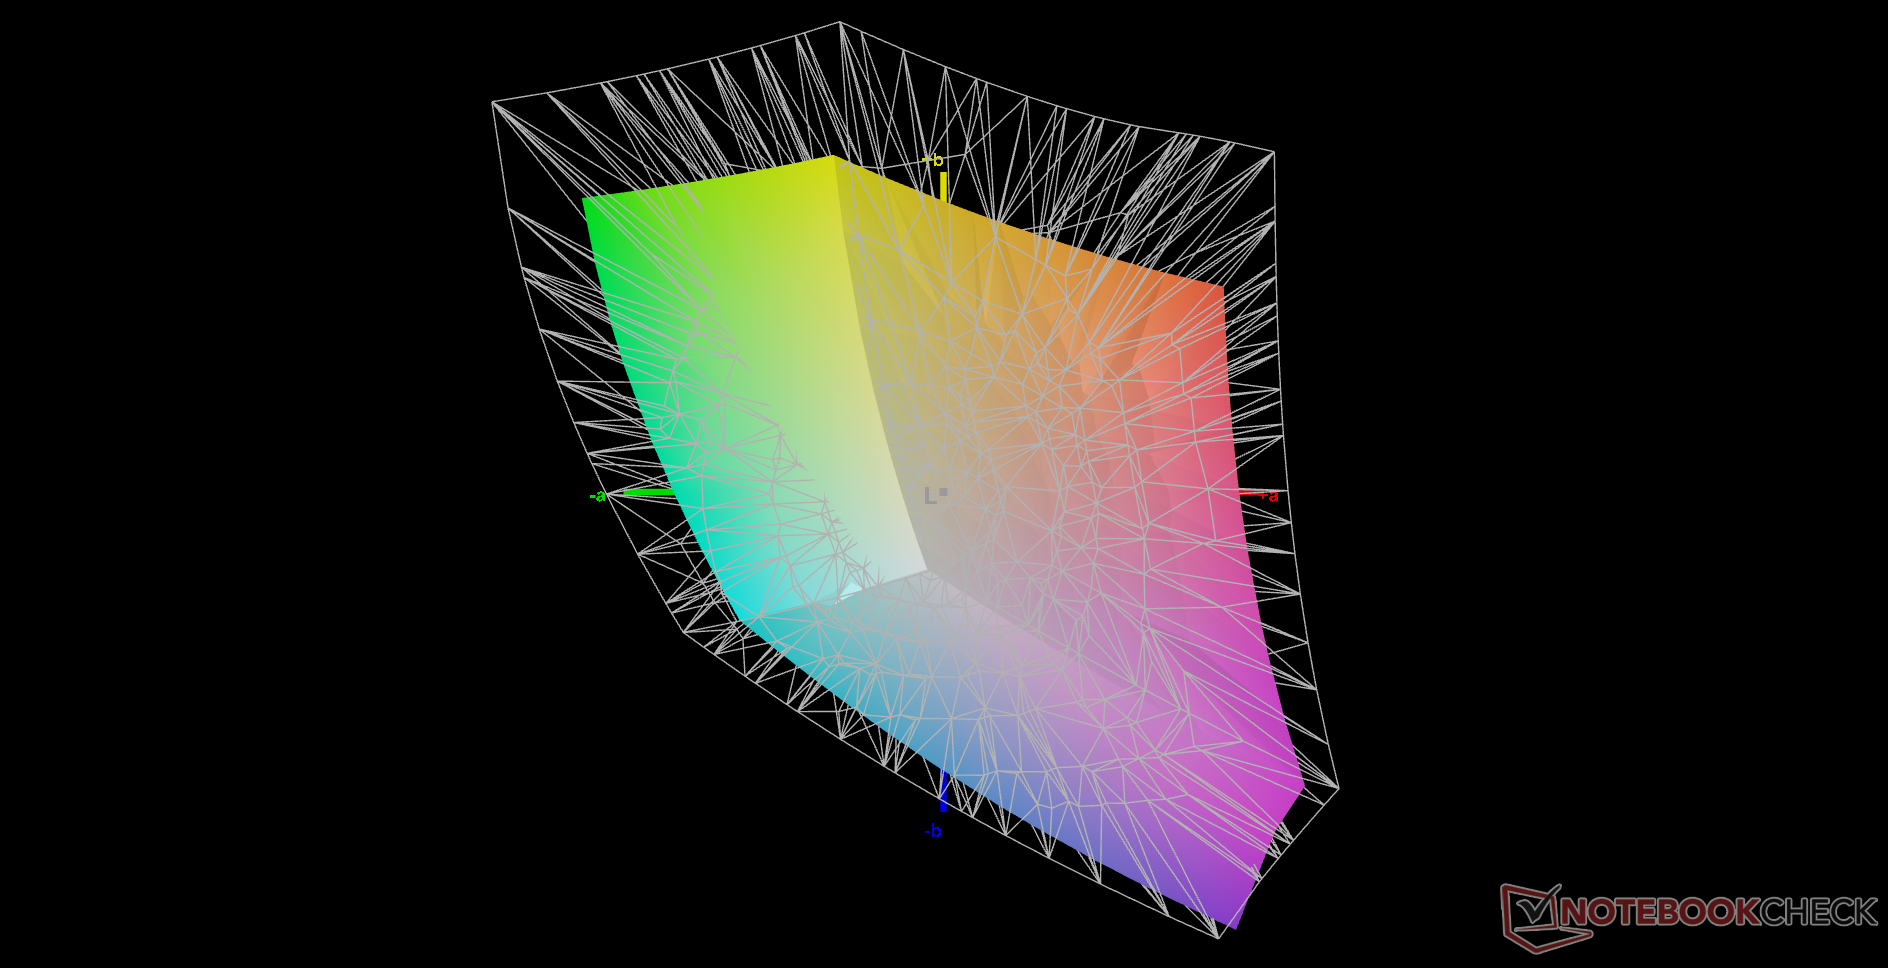
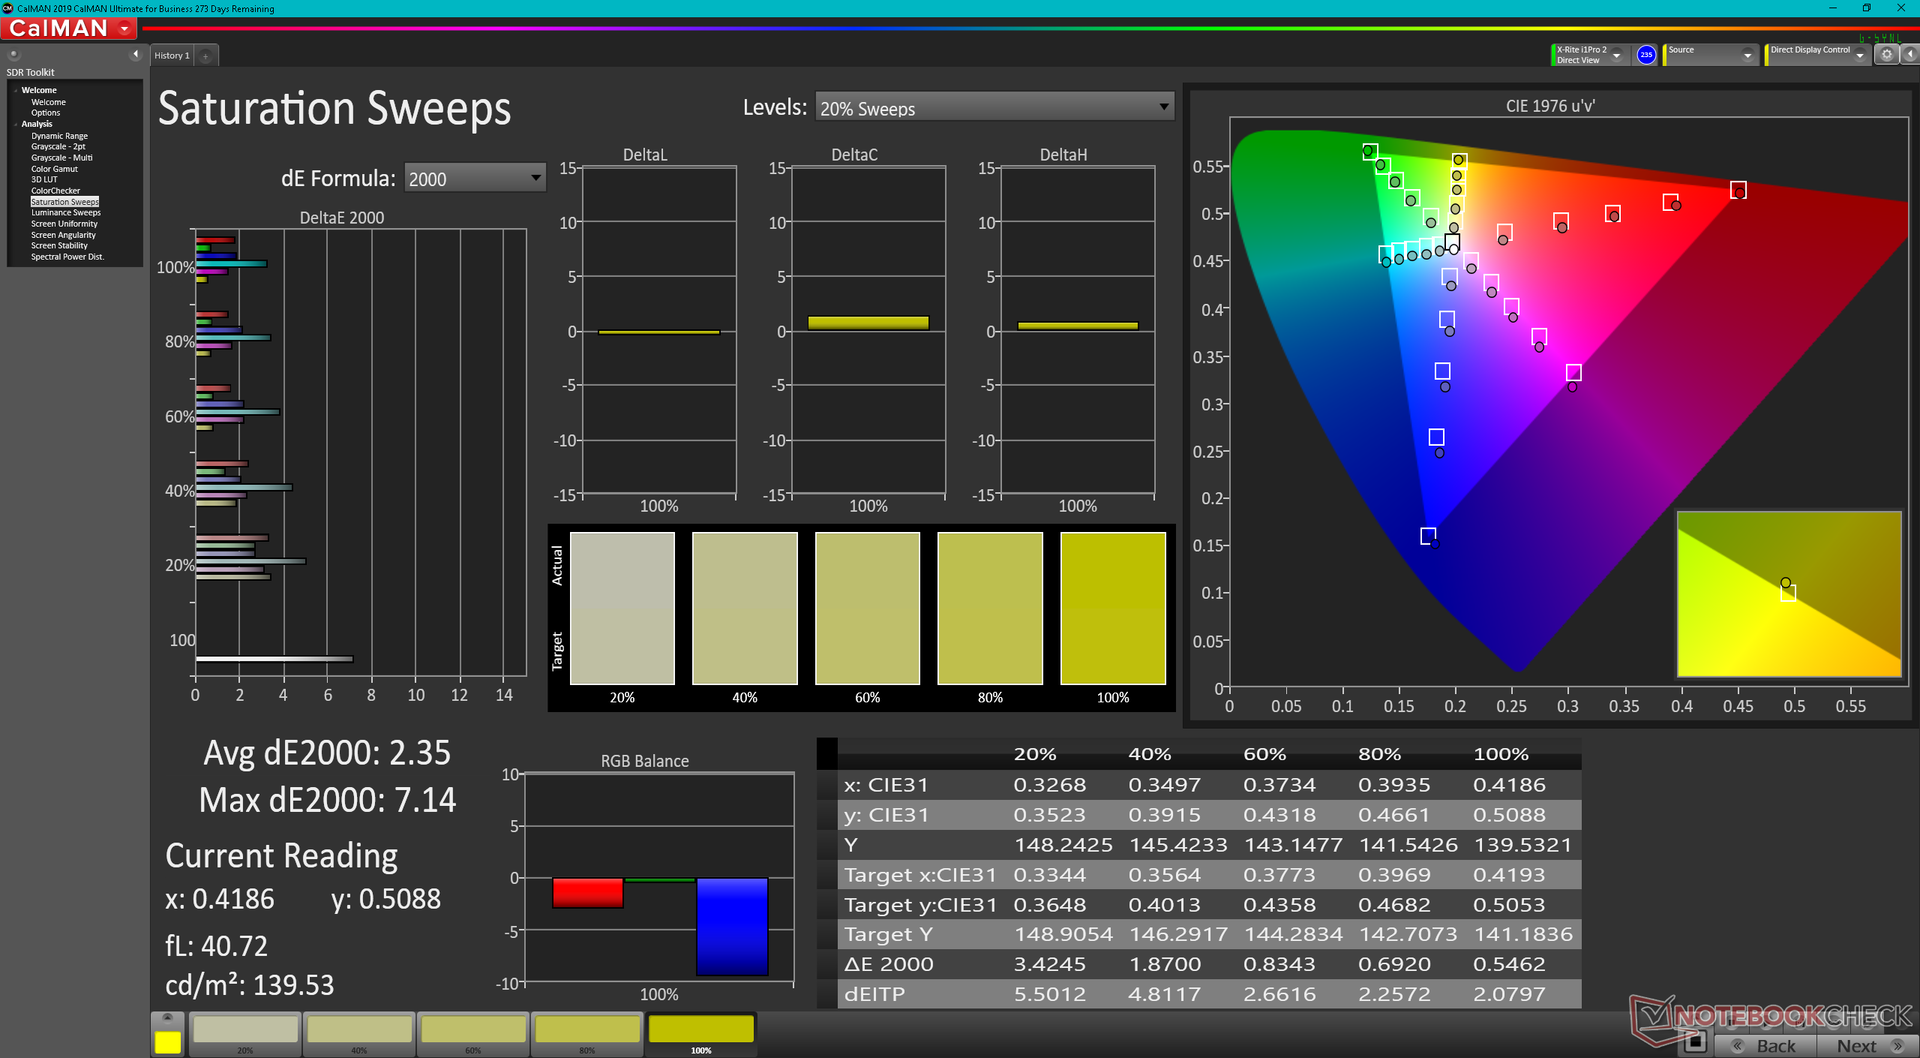
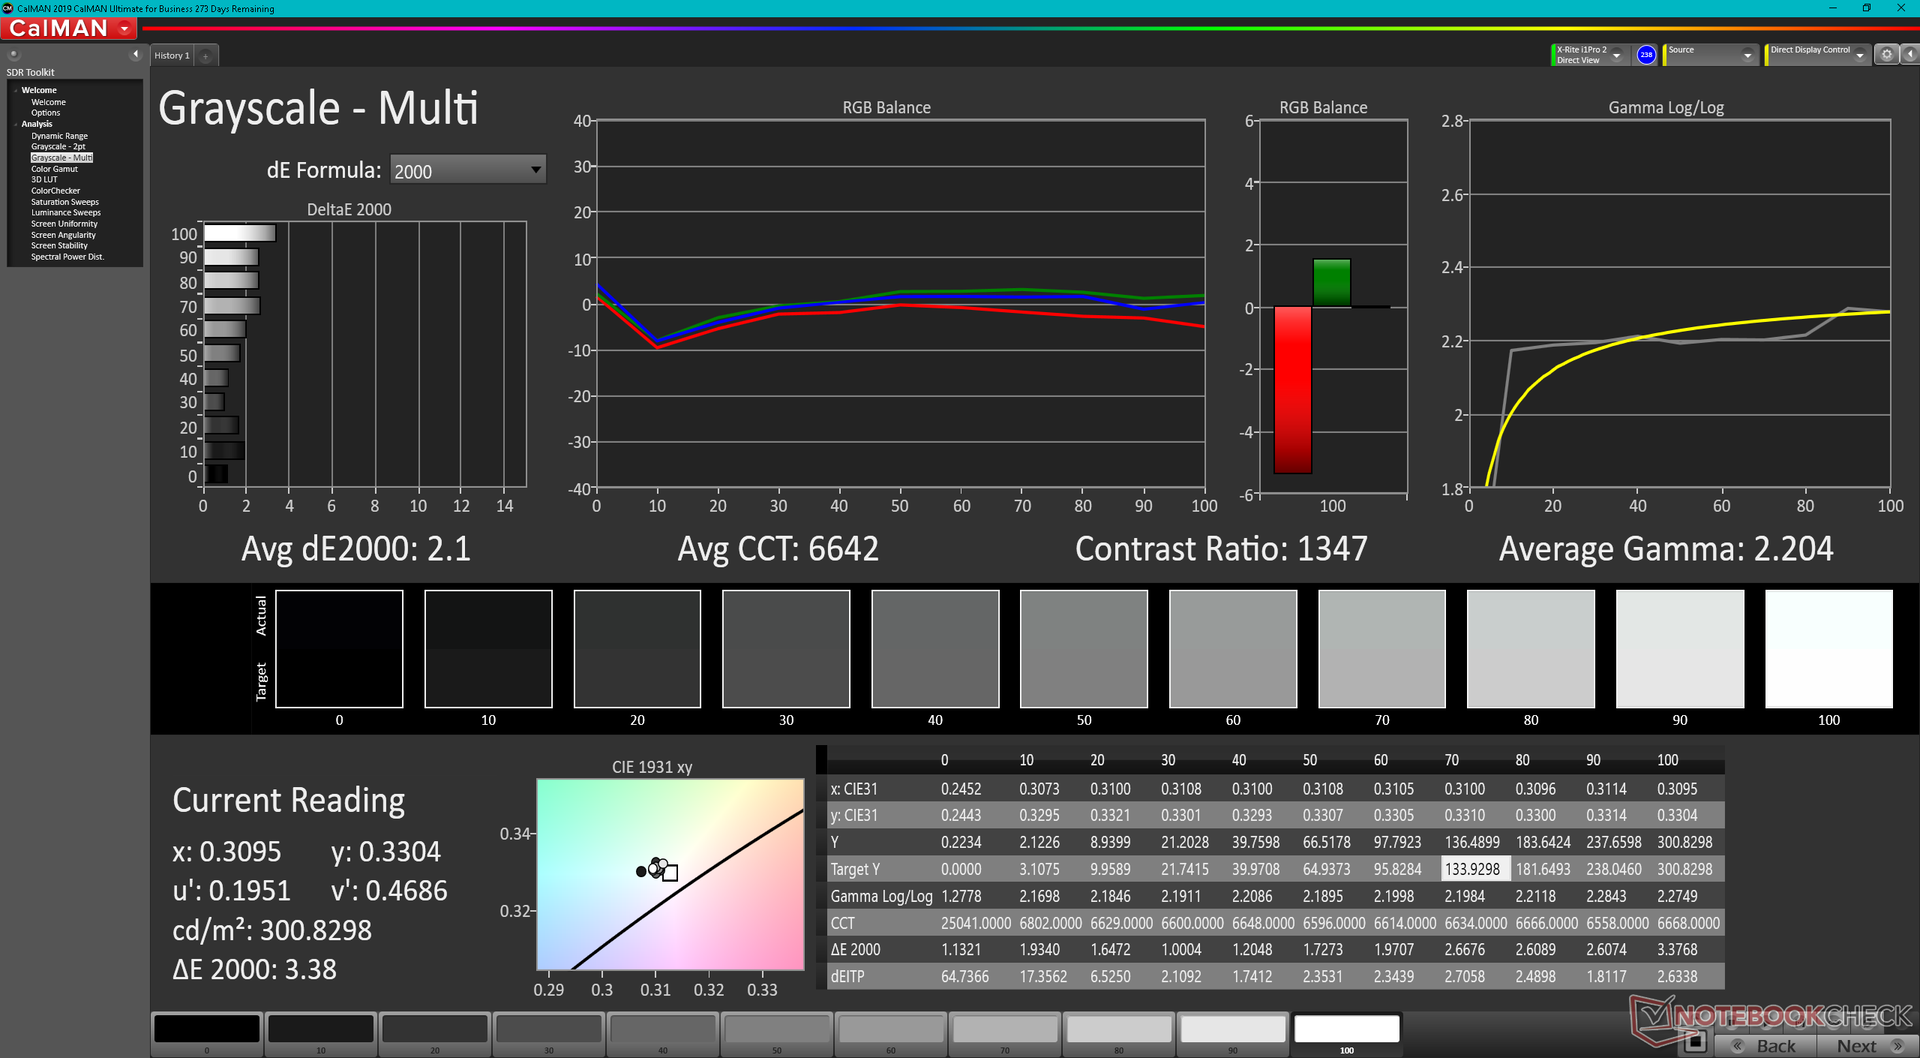
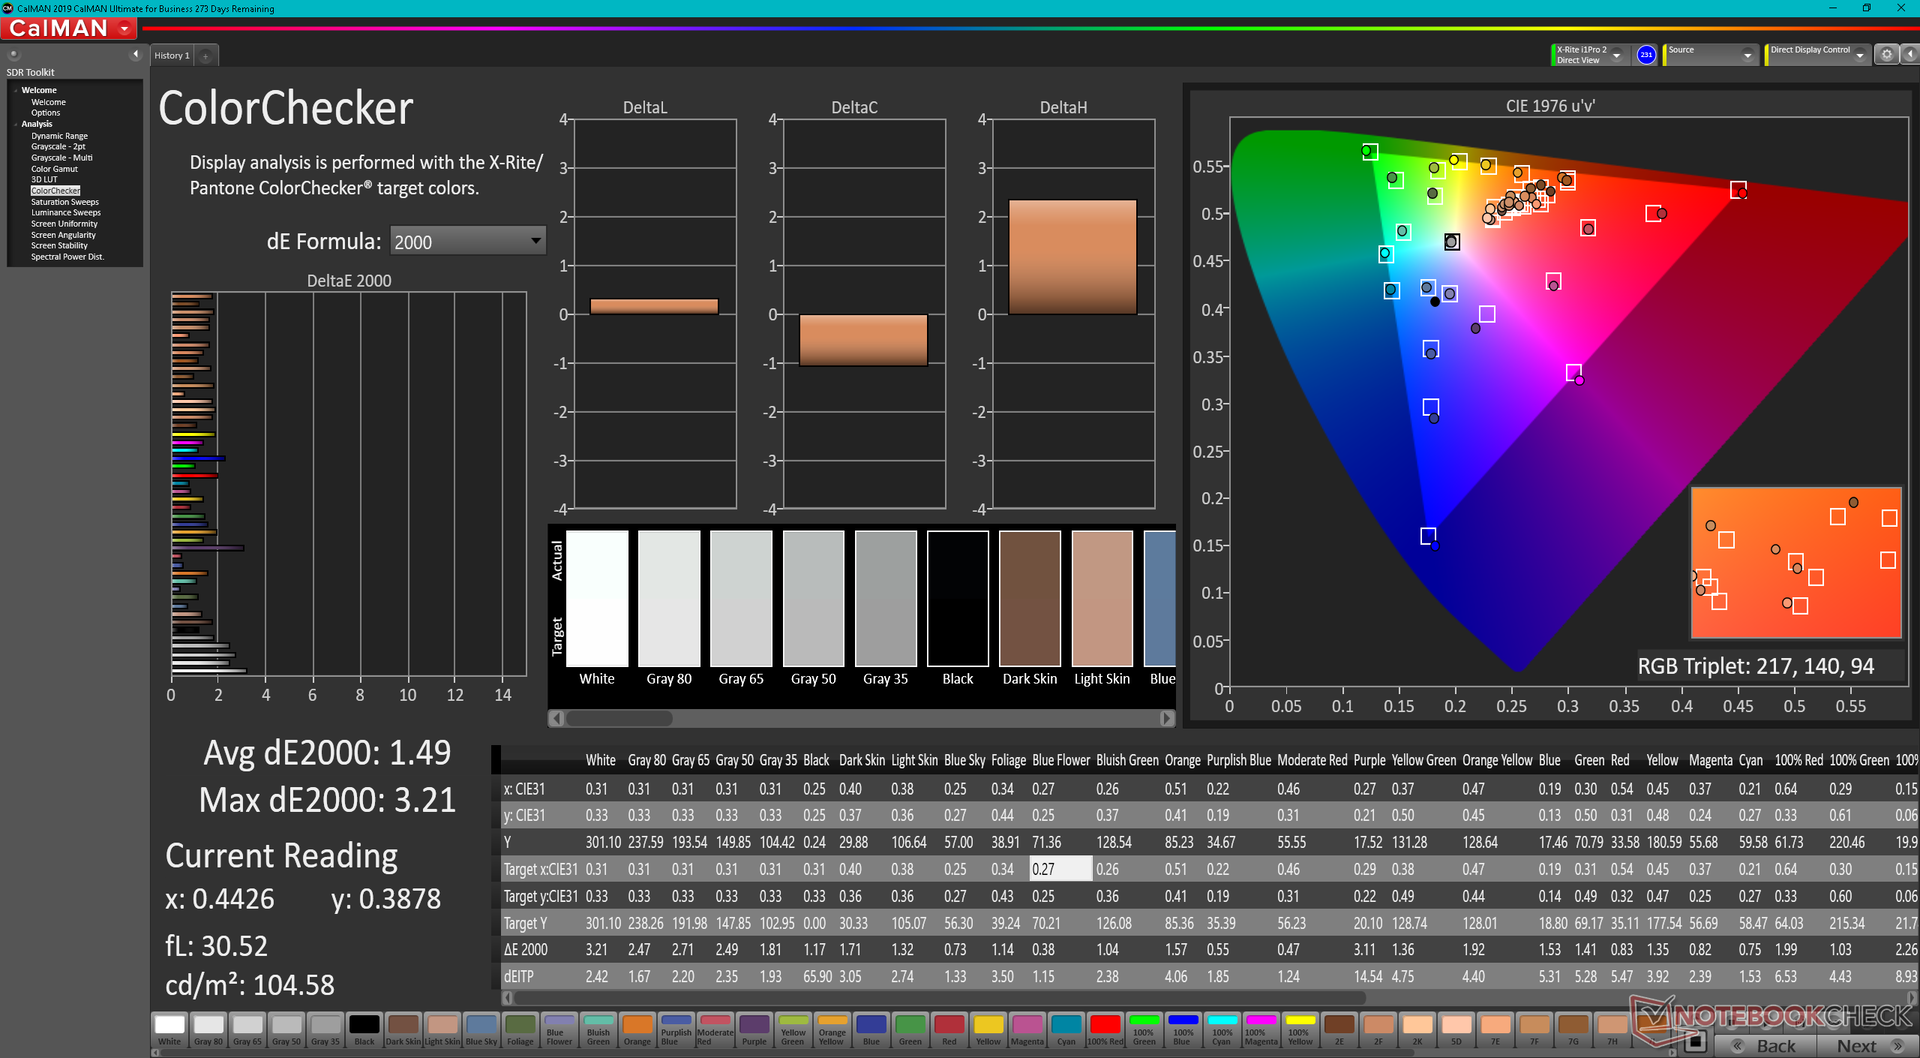
开箱后的色温略微过冷。用我们的X-Rite色度计校准后,平均灰度和色彩deltaE值将分别从4.8和2.39提高到2.1和1.49。
Display Response Times
| ↔ Response Time Black to White | ||
|---|---|---|
| 11.6 ms ... rise ↗ and fall ↘ combined | ↗ 5.6 ms rise | 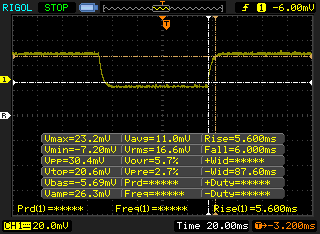 |
| ↘ 6 ms fall | ||
| The screen shows good response rates in our tests, but may be too slow for competitive gamers. In comparison, all tested devices range from 0.1 (minimum) to 240 (maximum) ms. » 31 % of all devices are better. This means that the measured response time is better than the average of all tested devices (19.8 ms). | ||
| ↔ Response Time 50% Grey to 80% Grey | ||
| 10.4 ms ... rise ↗ and fall ↘ combined | ↗ 5.2 ms rise | 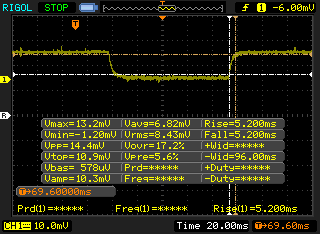 |
| ↘ 5.2 ms fall | ||
| The screen shows good response rates in our tests, but may be too slow for competitive gamers. In comparison, all tested devices range from 0.165 (minimum) to 636 (maximum) ms. » 24 % of all devices are better. This means that the measured response time is better than the average of all tested devices (31 ms). | ||
Screen Flickering / PWM (Pulse-Width Modulation)
| Screen flickering / PWM detected | 22730 Hz | ≤ 24 % brightness setting | 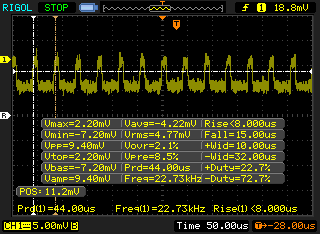 |
The display backlight flickers at 22730 Hz (worst case, e.g., utilizing PWM) Flickering detected at a brightness setting of 24 % and below. There should be no flickering or PWM above this brightness setting. The frequency of 22730 Hz is quite high, so most users sensitive to PWM should not notice any flickering. In comparison: 52 % of all tested devices do not use PWM to dim the display. If PWM was detected, an average of 7757 (minimum: 5 - maximum: 343500) Hz was measured. | |||

业绩
测试条件
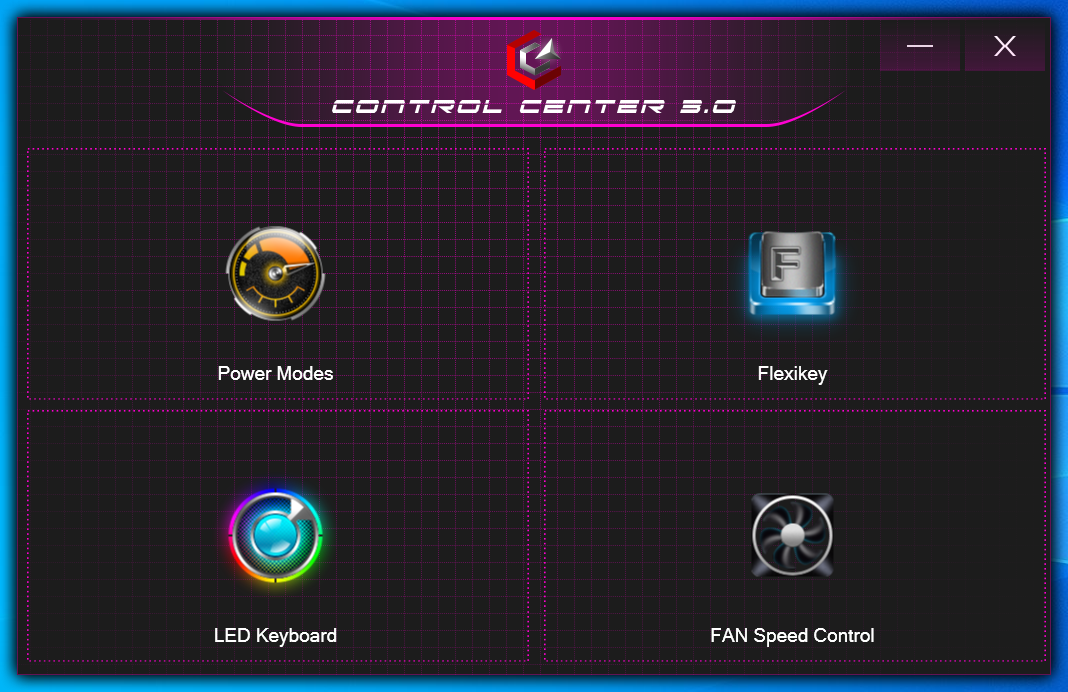
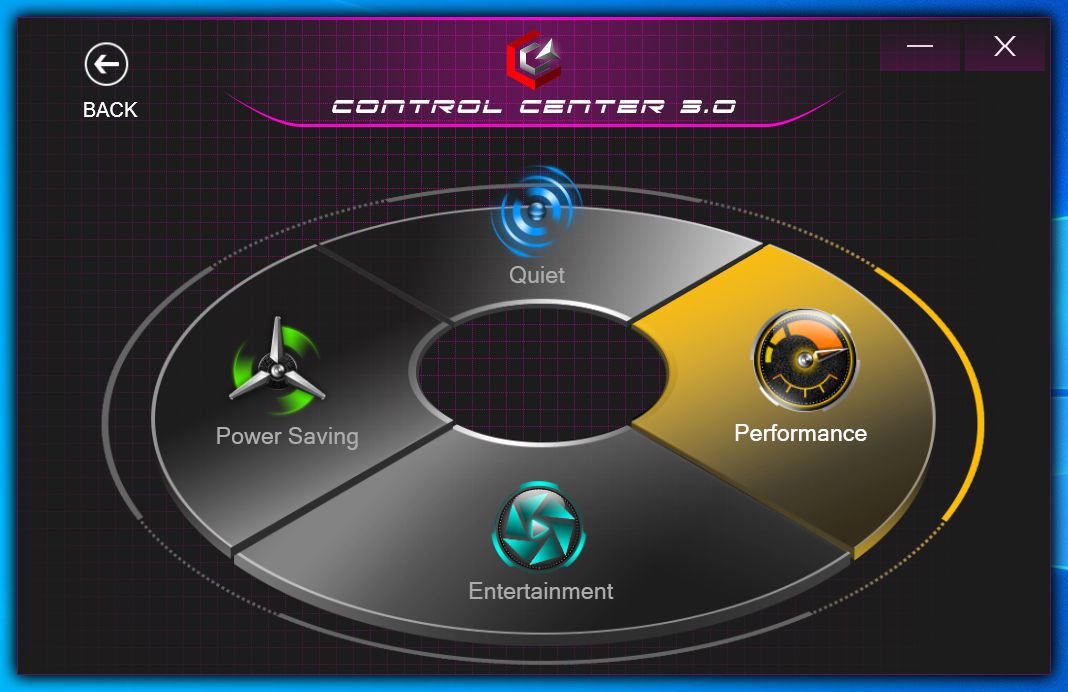
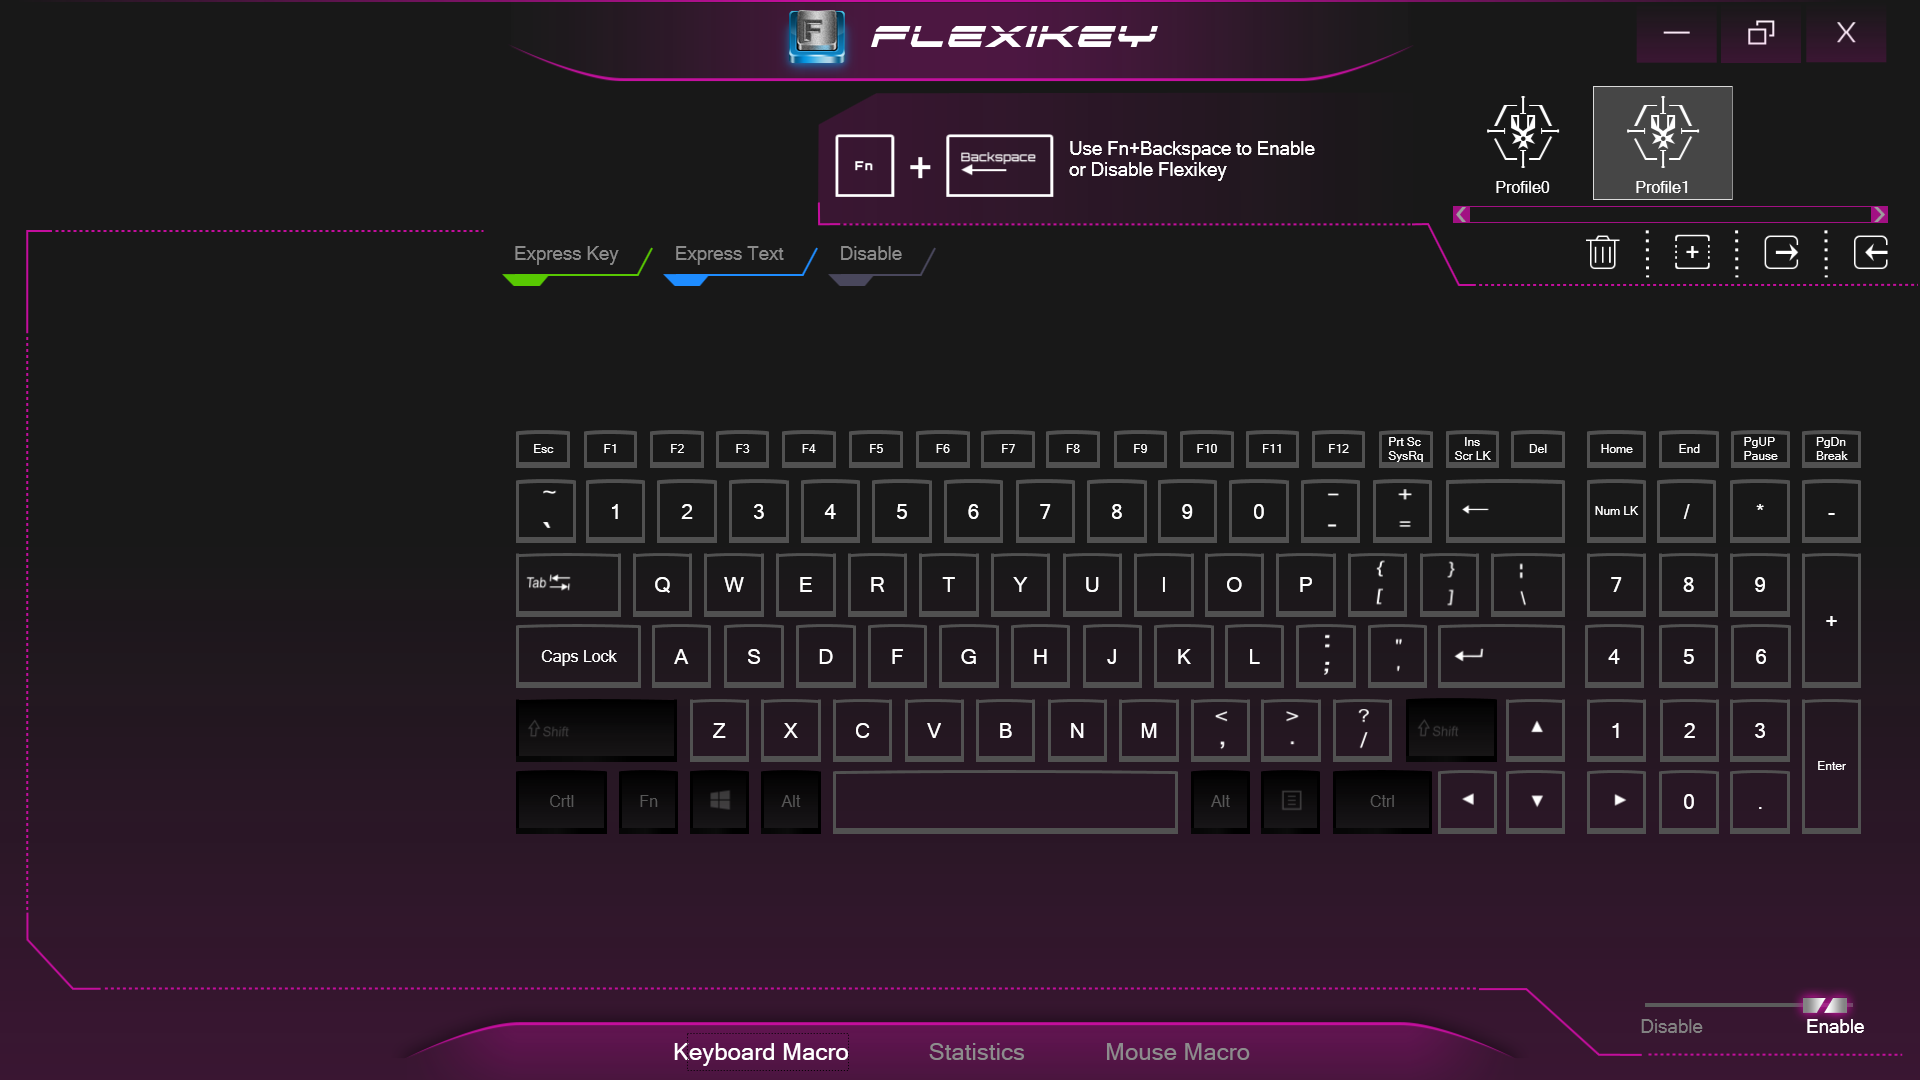
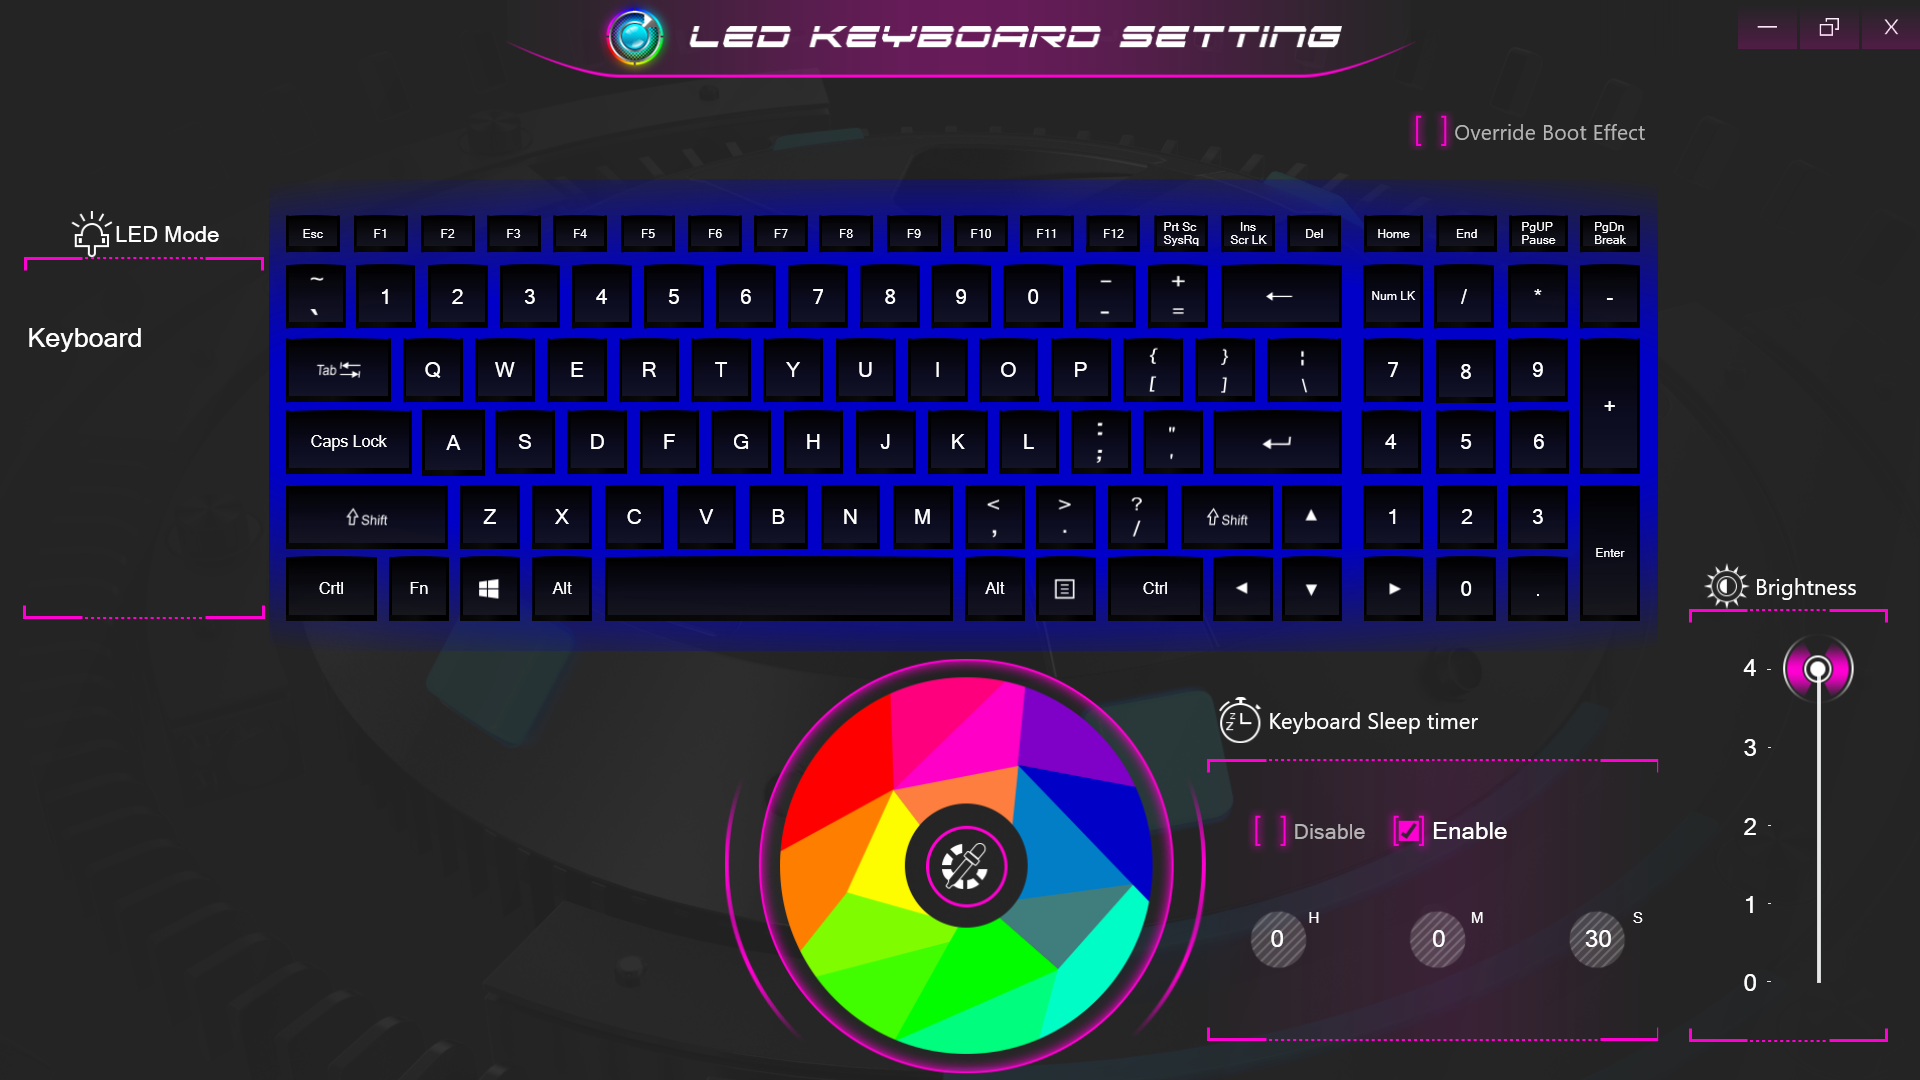
在运行以下性能基准测试之前,我们的设备通过控制中心3.0软件被设置为性能模式,以获得尽可能高的分数。用户应该熟悉这个软件,因为重要的功能在这里被切换,包括键盘照明、风扇控制等等。
请记住,RX315上没有MUX。
处理器
芯片 酷睿i7-11800H相对于其他配备相同CPU的笔记本电脑,它的表现是我们所期望的。目前没有其他处理器可供选择。
Cinebench R15 Multi Loop
Cinebench R20: CPU (Multi Core) | CPU (Single Core)
Cinebench R15: CPU Multi 64Bit | CPU Single 64Bit
Blender: v2.79 BMW27 CPU
7-Zip 18.03: 7z b 4 | 7z b 4 -mmt1
Geekbench 5.5: Multi-Core | Single-Core
HWBOT x265 Benchmark v2.2: 4k Preset
LibreOffice : 20 Documents To PDF
R Benchmark 2.5: Overall mean
| Cinebench R23 / Multi Core | |
| Corsair One i300 | |
| MSI Stealth GS66 12UGS | |
| MSI Vector GP66 12UGS | |
| Eurocom Nightsky ARX315 | |
| Schenker XMG Apex 15 NH57E PS | |
| Eurocom RX315 NH57AF1 | |
| Average Intel Core i7-11800H (6508 - 14088, n=48) | |
| Schenker XMG Core 15 Ampere | |
| Alienware m15 R4 RTX 3080 | |
| Gigabyte G5 GD | |
| Razer Blade 15 Advanced Model Early 2021 | |
| Cinebench R23 / Single Core | |
| Corsair One i300 | |
| MSI Vector GP66 12UGS | |
| MSI Stealth GS66 12UGS | |
| Eurocom Nightsky ARX315 | |
| Eurocom RX315 NH57AF1 | |
| Average Intel Core i7-11800H (1386 - 1522, n=45) | |
| Gigabyte G5 GD | |
| Schenker XMG Apex 15 NH57E PS | |
| Schenker XMG Core 15 Ampere | |
| Alienware m15 R4 RTX 3080 | |
| Razer Blade 15 Advanced Model Early 2021 | |
| Cinebench R20 / CPU (Multi Core) | |
| Corsair One i300 | |
| MSI Stealth GS66 12UGS | |
| MSI Vector GP66 12UGS | |
| Eurocom Nightsky ARX315 | |
| Schenker XMG Apex 15 NH57E PS | |
| Eurocom RX315 NH57AF1 | |
| Average Intel Core i7-11800H (2498 - 5408, n=50) | |
| Schenker XMG Core 15 Ampere | |
| Alienware m15 R4 RTX 3080 | |
| Gigabyte G5 GD | |
| Razer Blade 15 Advanced Model Early 2021 | |
| Cinebench R20 / CPU (Single Core) | |
| Corsair One i300 | |
| MSI Vector GP66 12UGS | |
| MSI Stealth GS66 12UGS | |
| Eurocom Nightsky ARX315 | |
| Eurocom RX315 NH57AF1 | |
| Average Intel Core i7-11800H (520 - 586, n=47) | |
| Gigabyte G5 GD | |
| Schenker XMG Apex 15 NH57E PS | |
| Schenker XMG Core 15 Ampere | |
| Alienware m15 R4 RTX 3080 | |
| Razer Blade 15 Advanced Model Early 2021 | |
| Cinebench R15 / CPU Multi 64Bit | |
| Corsair One i300 | |
| MSI Stealth GS66 12UGS | |
| MSI Vector GP66 12UGS | |
| Eurocom Nightsky ARX315 | |
| Schenker XMG Apex 15 NH57E PS | |
| Schenker XMG Core 15 Ampere | |
| Average Intel Core i7-11800H (1342 - 2173, n=50) | |
| Eurocom RX315 NH57AF1 | |
| Alienware m15 R4 RTX 3080 | |
| Gigabyte G5 GD | |
| Razer Blade 15 Advanced Model Early 2021 | |
| Cinebench R15 / CPU Single 64Bit | |
| Corsair One i300 | |
| MSI Vector GP66 12UGS | |
| MSI Stealth GS66 12UGS | |
| Eurocom Nightsky ARX315 | |
| Schenker XMG Apex 15 NH57E PS | |
| Eurocom RX315 NH57AF1 | |
| Average Intel Core i7-11800H (201 - 231, n=46) | |
| Gigabyte G5 GD | |
| Razer Blade 15 Advanced Model Early 2021 | |
| Alienware m15 R4 RTX 3080 | |
| Schenker XMG Core 15 Ampere | |
| Blender / v2.79 BMW27 CPU | |
| Razer Blade 15 Advanced Model Early 2021 | |
| Gigabyte G5 GD | |
| Alienware m15 R4 RTX 3080 | |
| Average Intel Core i7-11800H (217 - 454, n=46) | |
| Eurocom RX315 NH57AF1 | |
| Schenker XMG Core 15 Ampere | |
| Schenker XMG Apex 15 NH57E PS | |
| Eurocom Nightsky ARX315 | |
| MSI Vector GP66 12UGS | |
| MSI Stealth GS66 12UGS | |
| Corsair One i300 | |
| 7-Zip 18.03 / 7z b 4 | |
| Corsair One i300 | |
| Eurocom Nightsky ARX315 | |
| MSI Stealth GS66 12UGS | |
| MSI Vector GP66 12UGS | |
| Schenker XMG Apex 15 NH57E PS | |
| Schenker XMG Core 15 Ampere | |
| Alienware m15 R4 RTX 3080 | |
| Average Intel Core i7-11800H (33718 - 56758, n=46) | |
| Eurocom RX315 NH57AF1 | |
| Gigabyte G5 GD | |
| Razer Blade 15 Advanced Model Early 2021 | |
| 7-Zip 18.03 / 7z b 4 -mmt1 | |
| Corsair One i300 | |
| Eurocom Nightsky ARX315 | |
| MSI Vector GP66 12UGS | |
| MSI Stealth GS66 12UGS | |
| Schenker XMG Apex 15 NH57E PS | |
| Average Intel Core i7-11800H (5138 - 5732, n=46) | |
| Eurocom RX315 NH57AF1 | |
| Alienware m15 R4 RTX 3080 | |
| Razer Blade 15 Advanced Model Early 2021 | |
| Gigabyte G5 GD | |
| Schenker XMG Core 15 Ampere | |
| Geekbench 5.5 / Multi-Core | |
| Corsair One i300 | |
| MSI Stealth GS66 12UGS | |
| MSI Vector GP66 12UGS | |
| Eurocom Nightsky ARX315 | |
| Eurocom RX315 NH57AF1 | |
| Average Intel Core i7-11800H (4655 - 9851, n=40) | |
| Schenker XMG Apex 15 NH57E PS | |
| Schenker XMG Core 15 Ampere | |
| Alienware m15 R4 RTX 3080 | |
| Gigabyte G5 GD | |
| Razer Blade 15 Advanced Model Early 2021 | |
| Geekbench 5.5 / Single-Core | |
| Corsair One i300 | |
| MSI Vector GP66 12UGS | |
| MSI Stealth GS66 12UGS | |
| Eurocom Nightsky ARX315 | |
| Average Intel Core i7-11800H (1429 - 1625, n=40) | |
| Eurocom RX315 NH57AF1 | |
| Gigabyte G5 GD | |
| Schenker XMG Apex 15 NH57E PS | |
| Alienware m15 R4 RTX 3080 | |
| Razer Blade 15 Advanced Model Early 2021 | |
| Schenker XMG Core 15 Ampere | |
| HWBOT x265 Benchmark v2.2 / 4k Preset | |
| Corsair One i300 | |
| MSI Vector GP66 12UGS | |
| MSI Stealth GS66 12UGS | |
| Eurocom Nightsky ARX315 | |
| Schenker XMG Apex 15 NH57E PS | |
| Eurocom RX315 NH57AF1 | |
| Average Intel Core i7-11800H (7.38 - 17.4, n=46) | |
| Schenker XMG Core 15 Ampere | |
| Alienware m15 R4 RTX 3080 | |
| Gigabyte G5 GD | |
| Razer Blade 15 Advanced Model Early 2021 | |
| LibreOffice / 20 Documents To PDF | |
| Alienware m15 R4 RTX 3080 | |
| Schenker XMG Core 15 Ampere | |
| Razer Blade 15 Advanced Model Early 2021 | |
| Schenker XMG Apex 15 NH57E PS | |
| Eurocom RX315 NH57AF1 | |
| Eurocom Nightsky ARX315 | |
| Average Intel Core i7-11800H (38.6 - 59.9, n=45) | |
| Gigabyte G5 GD | |
| MSI Stealth GS66 12UGS | |
| MSI Vector GP66 12UGS | |
| Corsair One i300 | |
| R Benchmark 2.5 / Overall mean | |
| Alienware m15 R4 RTX 3080 | |
| Gigabyte G5 GD | |
| Razer Blade 15 Advanced Model Early 2021 | |
| Schenker XMG Core 15 Ampere | |
| Eurocom RX315 NH57AF1 | |
| Average Intel Core i7-11800H (0.548 - 0.615, n=46) | |
| Schenker XMG Apex 15 NH57E PS | |
| Eurocom Nightsky ARX315 | |
| MSI Stealth GS66 12UGS | |
| MSI Vector GP66 12UGS | |
| Corsair One i300 | |
* ... smaller is better
AIDA64: FP32 Ray-Trace | FPU Julia | CPU SHA3 | CPU Queen | FPU SinJulia | FPU Mandel | CPU AES | CPU ZLib | FP64 Ray-Trace | CPU PhotoWorxx
| Performance rating | |
| Eurocom Nightsky ARX315 | |
| Alienware m15 R6, i7-11800H RTX 3080 | |
| Eurocom RX315 NH57AF1 | |
| Dell G15 5515 | |
| MSI Stealth GS66 12UGS | |
| Average Intel Core i7-11800H | |
| Razer Blade 15 Advanced (Mid 2021) -9! | |
| AIDA64 / FP32 Ray-Trace | |
| Alienware m15 R6, i7-11800H RTX 3080 | |
| Eurocom RX315 NH57AF1 | |
| Dell G15 5515 | |
| Average Intel Core i7-11800H (8772 - 15961, n=20) | |
| Eurocom Nightsky ARX315 | |
| MSI Stealth GS66 12UGS | |
| AIDA64 / FPU Julia | |
| Eurocom Nightsky ARX315 | |
| Dell G15 5515 | |
| Alienware m15 R6, i7-11800H RTX 3080 | |
| Eurocom RX315 NH57AF1 | |
| Average Intel Core i7-11800H (39404 - 65636, n=20) | |
| MSI Stealth GS66 12UGS | |
| AIDA64 / CPU SHA3 | |
| Alienware m15 R6, i7-11800H RTX 3080 | |
| Eurocom RX315 NH57AF1 | |
| Average Intel Core i7-11800H (2599 - 4439, n=20) | |
| MSI Stealth GS66 12UGS | |
| Eurocom Nightsky ARX315 | |
| Dell G15 5515 | |
| AIDA64 / CPU Queen | |
| Eurocom Nightsky ARX315 | |
| MSI Stealth GS66 12UGS | |
| Dell G15 5515 | |
| Alienware m15 R6, i7-11800H RTX 3080 | |
| Eurocom RX315 NH57AF1 | |
| Average Intel Core i7-11800H (85233 - 91941, n=20) | |
| AIDA64 / FPU SinJulia | |
| Eurocom Nightsky ARX315 | |
| Dell G15 5515 | |
| MSI Stealth GS66 12UGS | |
| Alienware m15 R6, i7-11800H RTX 3080 | |
| Eurocom RX315 NH57AF1 | |
| Average Intel Core i7-11800H (6420 - 9792, n=20) | |
| AIDA64 / FPU Mandel | |
| Eurocom Nightsky ARX315 | |
| Dell G15 5515 | |
| Alienware m15 R6, i7-11800H RTX 3080 | |
| Eurocom RX315 NH57AF1 | |
| Average Intel Core i7-11800H (23365 - 39464, n=20) | |
| MSI Stealth GS66 12UGS | |
| AIDA64 / CPU AES | |
| Alienware m15 R6, i7-11800H RTX 3080 | |
| Eurocom RX315 NH57AF1 | |
| Eurocom Nightsky ARX315 | |
| Average Intel Core i7-11800H (74617 - 149388, n=20) | |
| Dell G15 5515 | |
| MSI Stealth GS66 12UGS | |
| AIDA64 / CPU ZLib | |
| MSI Stealth GS66 12UGS | |
| Eurocom Nightsky ARX315 | |
| Alienware m15 R6, i7-11800H RTX 3080 | |
| Eurocom RX315 NH57AF1 | |
| Dell G15 5515 | |
| Average Intel Core i7-11800H (461 - 830, n=43) | |
| Razer Blade 15 Advanced (Mid 2021) | |
| AIDA64 / FP64 Ray-Trace | |
| Alienware m15 R6, i7-11800H RTX 3080 | |
| Eurocom RX315 NH57AF1 | |
| Dell G15 5515 | |
| Average Intel Core i7-11800H (4545 - 8717, n=21) | |
| Eurocom Nightsky ARX315 | |
| MSI Stealth GS66 12UGS | |
| AIDA64 / CPU PhotoWorxx | |
| MSI Stealth GS66 12UGS | |
| Alienware m15 R6, i7-11800H RTX 3080 | |
| Eurocom RX315 NH57AF1 | |
| Average Intel Core i7-11800H (11898 - 26757, n=21) | |
| Eurocom Nightsky ARX315 | |
| Dell G15 5515 | |
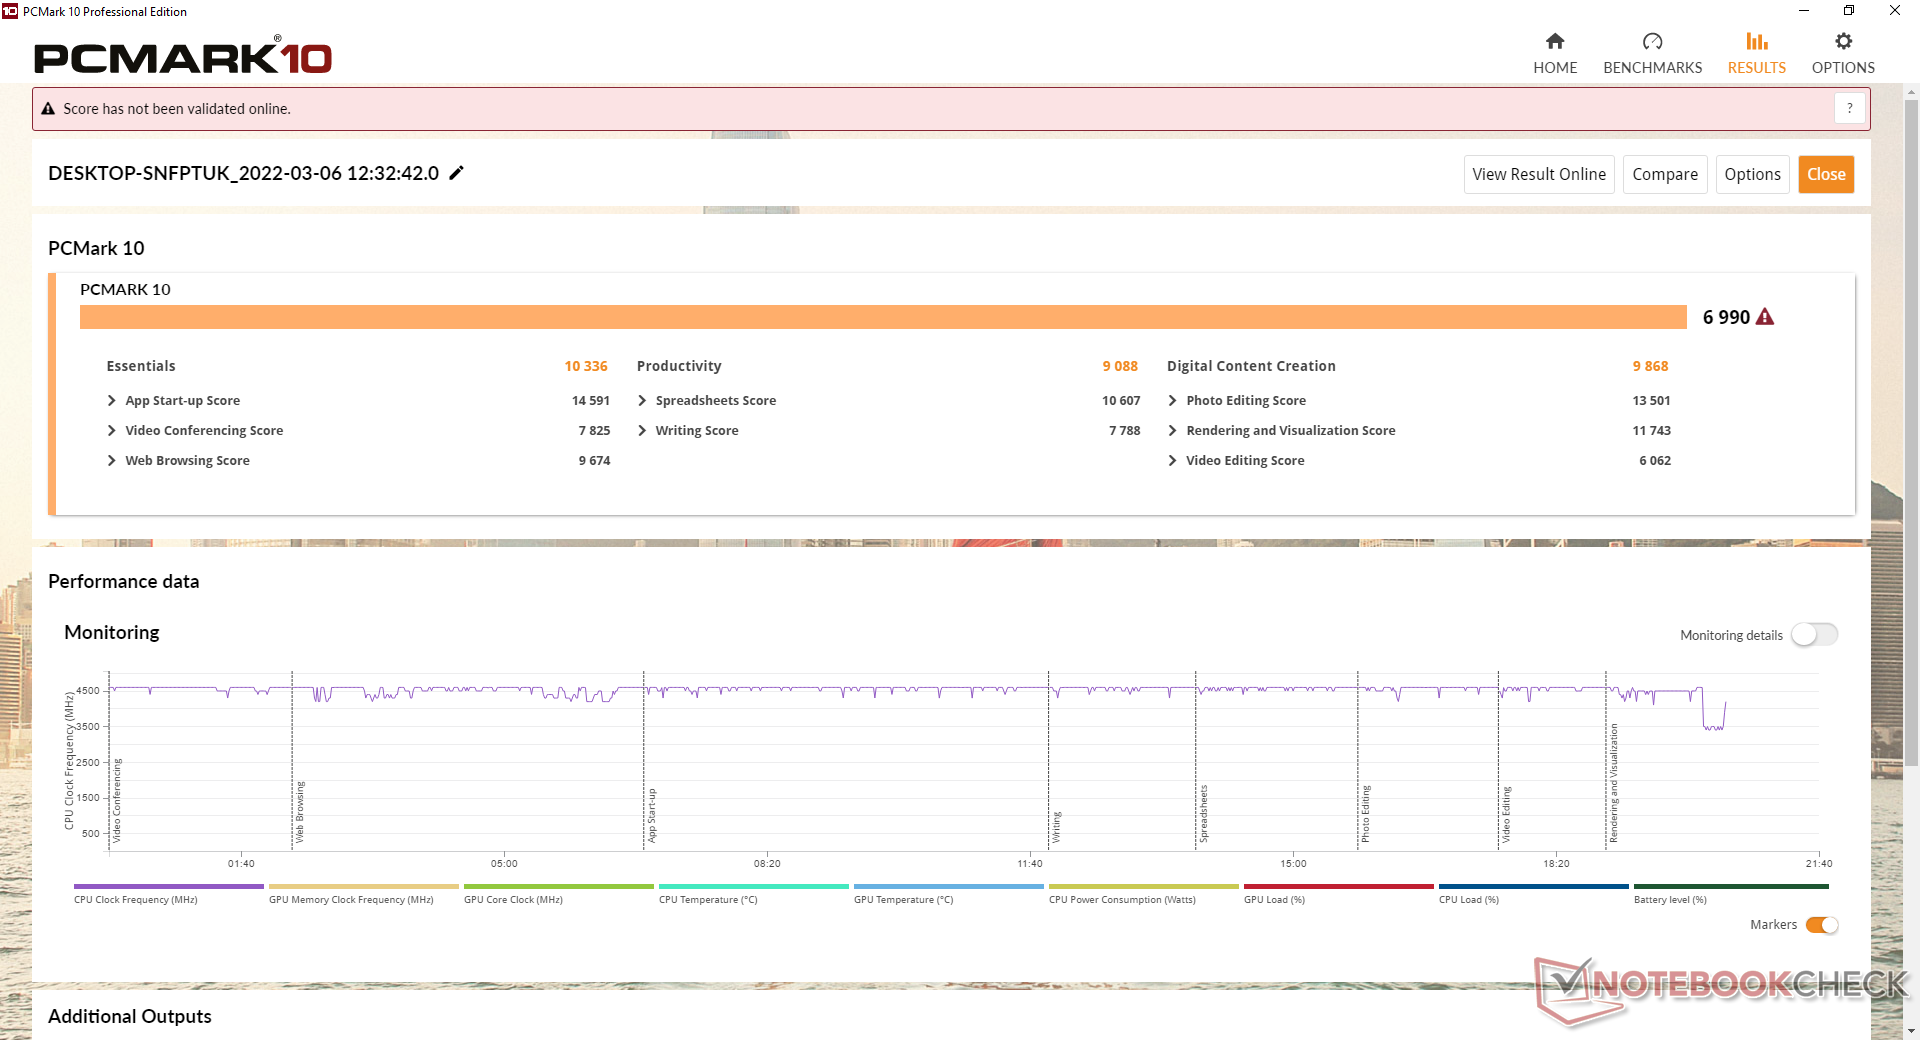
系统性能
| PCMark 10 / Score | |
| MSI Stealth GS66 12UGS | |
| Razer Blade 15 Advanced (Mid 2021) | |
| Eurocom Nightsky ARX315 | |
| Alienware m15 R6, i7-11800H RTX 3080 | |
| Eurocom RX315 NH57AF1 | |
| Average Intel Core i7-11800H, NVIDIA GeForce RTX 3070 Laptop GPU (6126 - 7311, n=11) | |
| Dell G15 5515 | |
| PCMark 10 / Essentials | |
| Razer Blade 15 Advanced (Mid 2021) | |
| MSI Stealth GS66 12UGS | |
| Eurocom Nightsky ARX315 | |
| Eurocom RX315 NH57AF1 | |
| Average Intel Core i7-11800H, NVIDIA GeForce RTX 3070 Laptop GPU (9248 - 10832, n=11) | |
| Alienware m15 R6, i7-11800H RTX 3080 | |
| Dell G15 5515 | |
| PCMark 10 / Productivity | |
| MSI Stealth GS66 12UGS | |
| Eurocom Nightsky ARX315 | |
| Alienware m15 R6, i7-11800H RTX 3080 | |
| Eurocom RX315 NH57AF1 | |
| Average Intel Core i7-11800H, NVIDIA GeForce RTX 3070 Laptop GPU (8571 - 9669, n=11) | |
| Razer Blade 15 Advanced (Mid 2021) | |
| Dell G15 5515 | |
| PCMark 10 / Digital Content Creation | |
| MSI Stealth GS66 12UGS | |
| Razer Blade 15 Advanced (Mid 2021) | |
| Alienware m15 R6, i7-11800H RTX 3080 | |
| Eurocom Nightsky ARX315 | |
| Eurocom RX315 NH57AF1 | |
| Average Intel Core i7-11800H, NVIDIA GeForce RTX 3070 Laptop GPU (7627 - 10851, n=11) | |
| Dell G15 5515 | |
| PCMark 10 Score | 6990 points | |
Help | ||
| AIDA64 / Memory Copy | |
| MSI Stealth GS66 12UGS | |
| Alienware m15 R6, i7-11800H RTX 3080 | |
| Eurocom RX315 NH57AF1 | |
| Average Intel Core i7-11800H (24508 - 48144, n=21) | |
| Eurocom Nightsky ARX315 | |
| Dell G15 5515 | |
| AIDA64 / Memory Read | |
| MSI Stealth GS66 12UGS | |
| Alienware m15 R6, i7-11800H RTX 3080 | |
| Eurocom RX315 NH57AF1 | |
| Eurocom Nightsky ARX315 | |
| Average Intel Core i7-11800H (25882 - 50365, n=20) | |
| Dell G15 5515 | |
| AIDA64 / Memory Write | |
| MSI Stealth GS66 12UGS | |
| Eurocom Nightsky ARX315 | |
| Alienware m15 R6, i7-11800H RTX 3080 | |
| Eurocom RX315 NH57AF1 | |
| Average Intel Core i7-11800H (22240 - 46214, n=20) | |
| Dell G15 5515 | |
| AIDA64 / Memory Latency | |
| Alienware m15 R6, i7-11800H RTX 3080 | |
| MSI Stealth GS66 12UGS | |
| Eurocom RX315 NH57AF1 | |
| Dell G15 5515 | |
| Eurocom Nightsky ARX315 | |
| Average Intel Core i7-11800H (71.9 - 104.1, n=44) | |
| Razer Blade 15 Advanced (Mid 2021) | |
* ... smaller is better
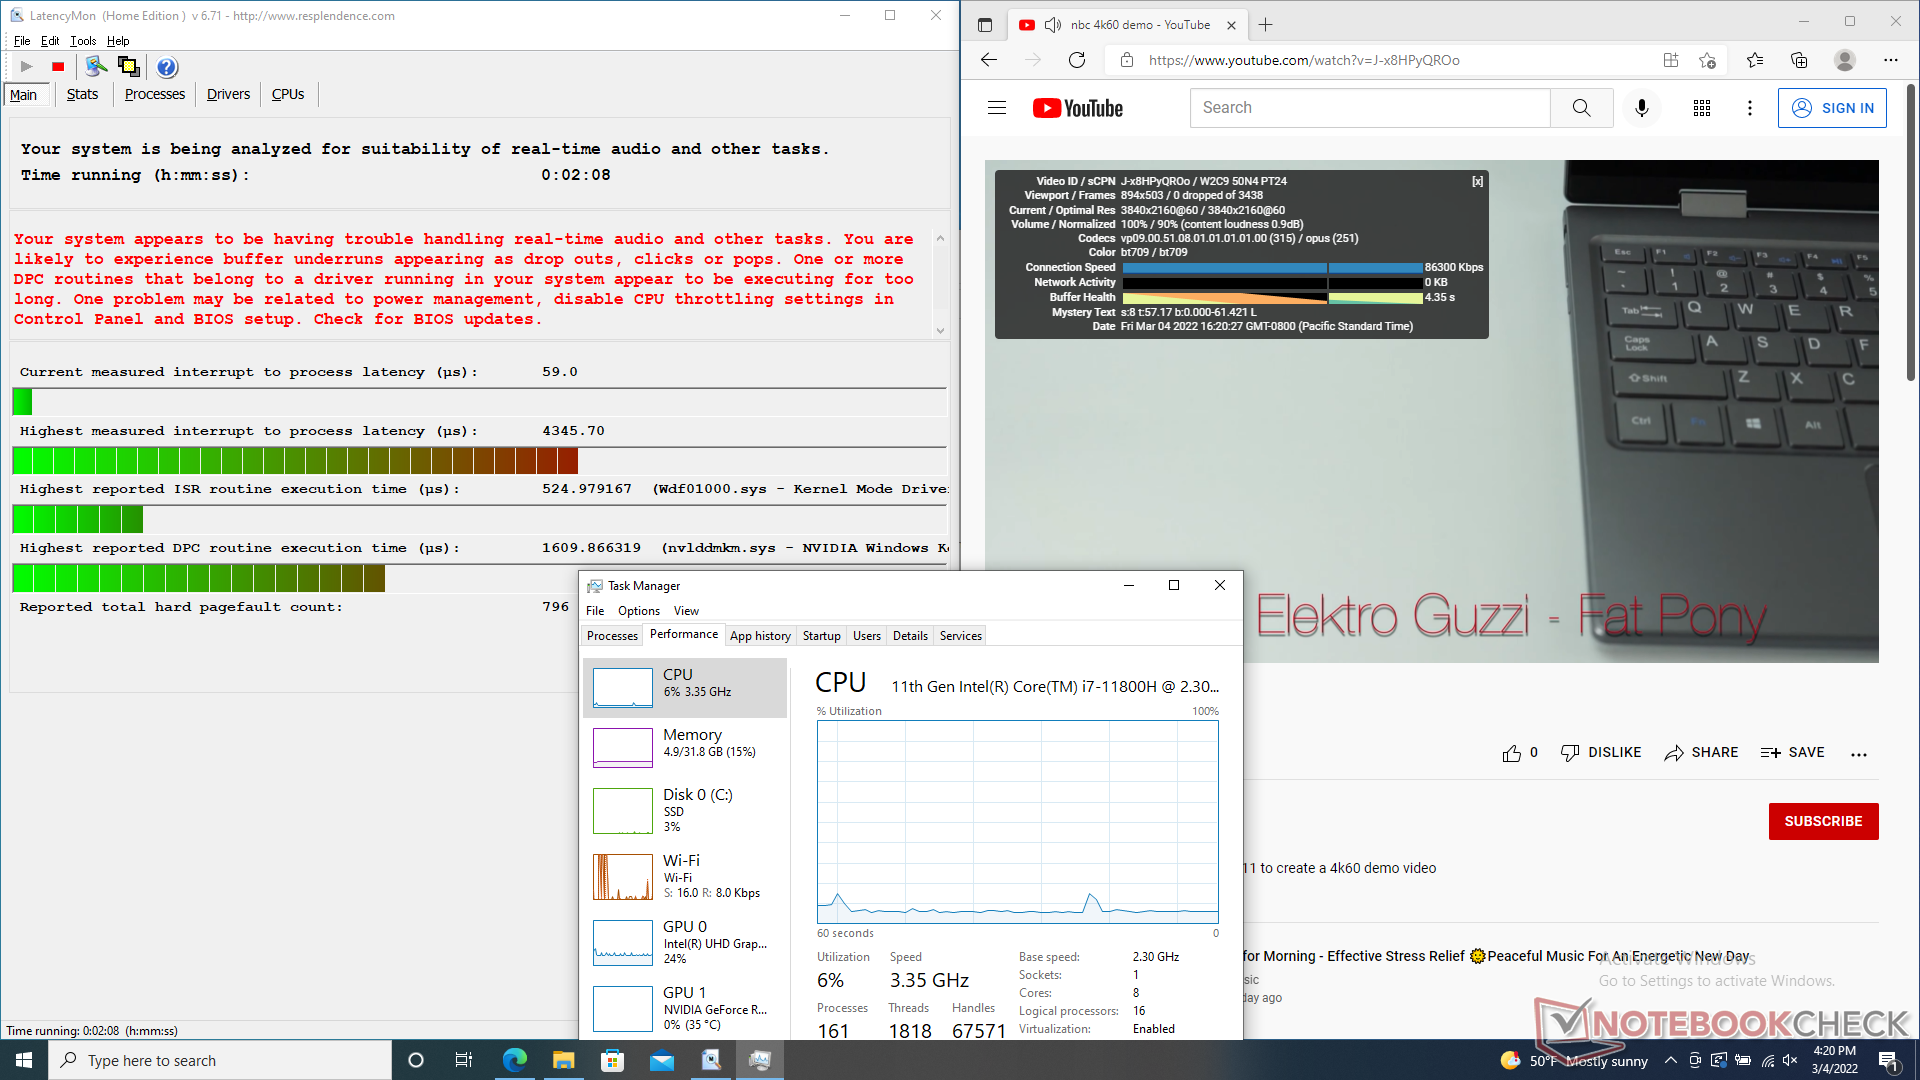
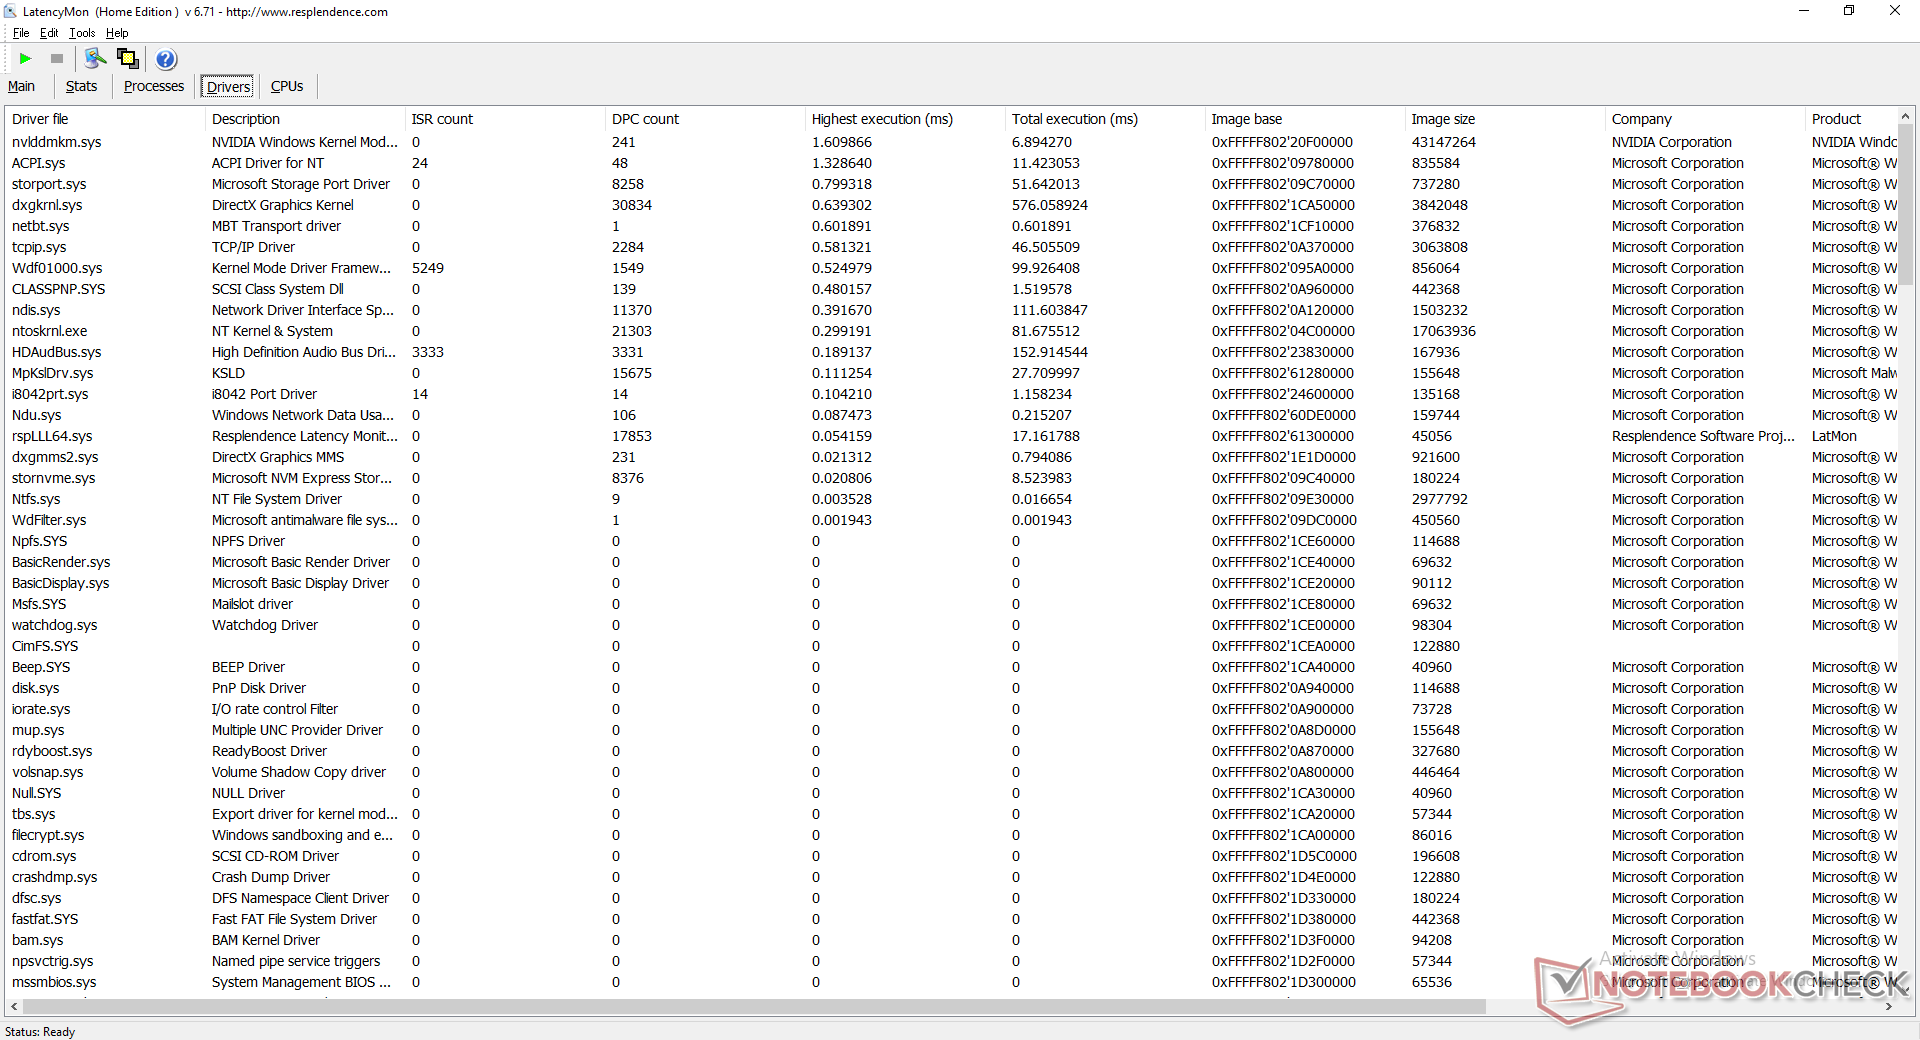
DPC延时
LatencyMon显示了在打开我们的主页的多个浏览器标签时的DPC问题。4K UHD视频在60 FPS下的播放很流畅,没有丢帧。
| DPC Latencies / LatencyMon - interrupt to process latency (max), Web, Youtube, Prime95 | |
| Razer Blade 15 Advanced (Mid 2021) | |
| Eurocom RX315 NH57AF1 | |
| MSI Stealth GS66 12UGS | |
| Alienware m15 R6, i7-11800H RTX 3080 | |
| Dell G15 5515 | |
| Eurocom Nightsky ARX315 | |
* ... smaller is better
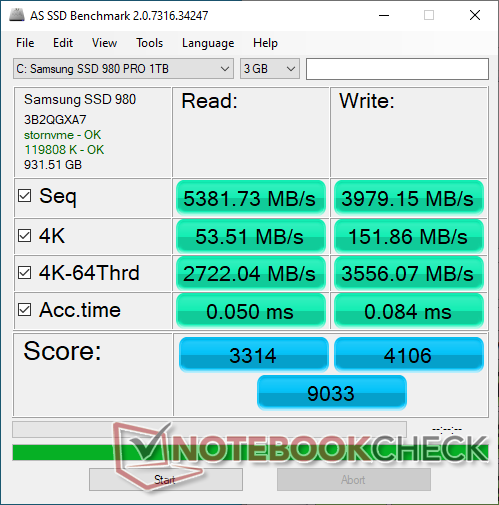
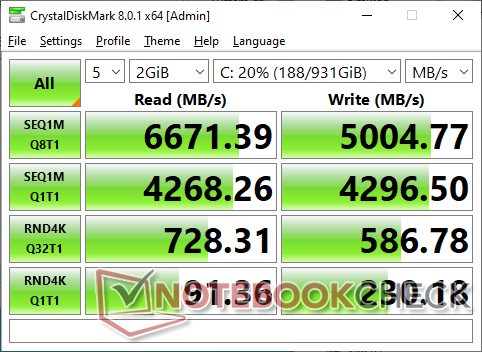
存储设备
我们设备中的PCIe4 x4 1 TB三星固态硬盘980 Pro的传输率可以达到6500 MB/s。性能的可持续性也相当好,因为在我们的DiskSpd压力测试的后三分之一期间,这个最大速率会略微下降到5900 MB/s。

* ... smaller is better
Disk Throttling: DiskSpd Read Loop, Queue Depth 8
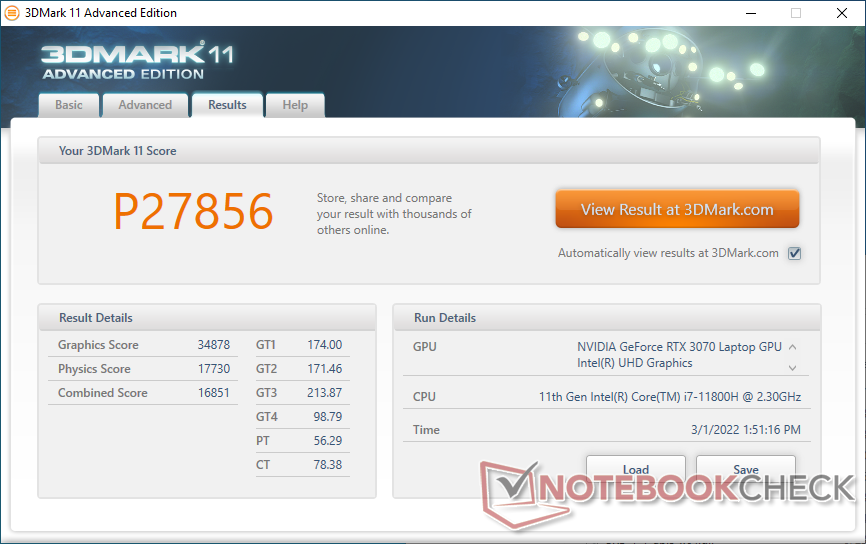
GPU性能
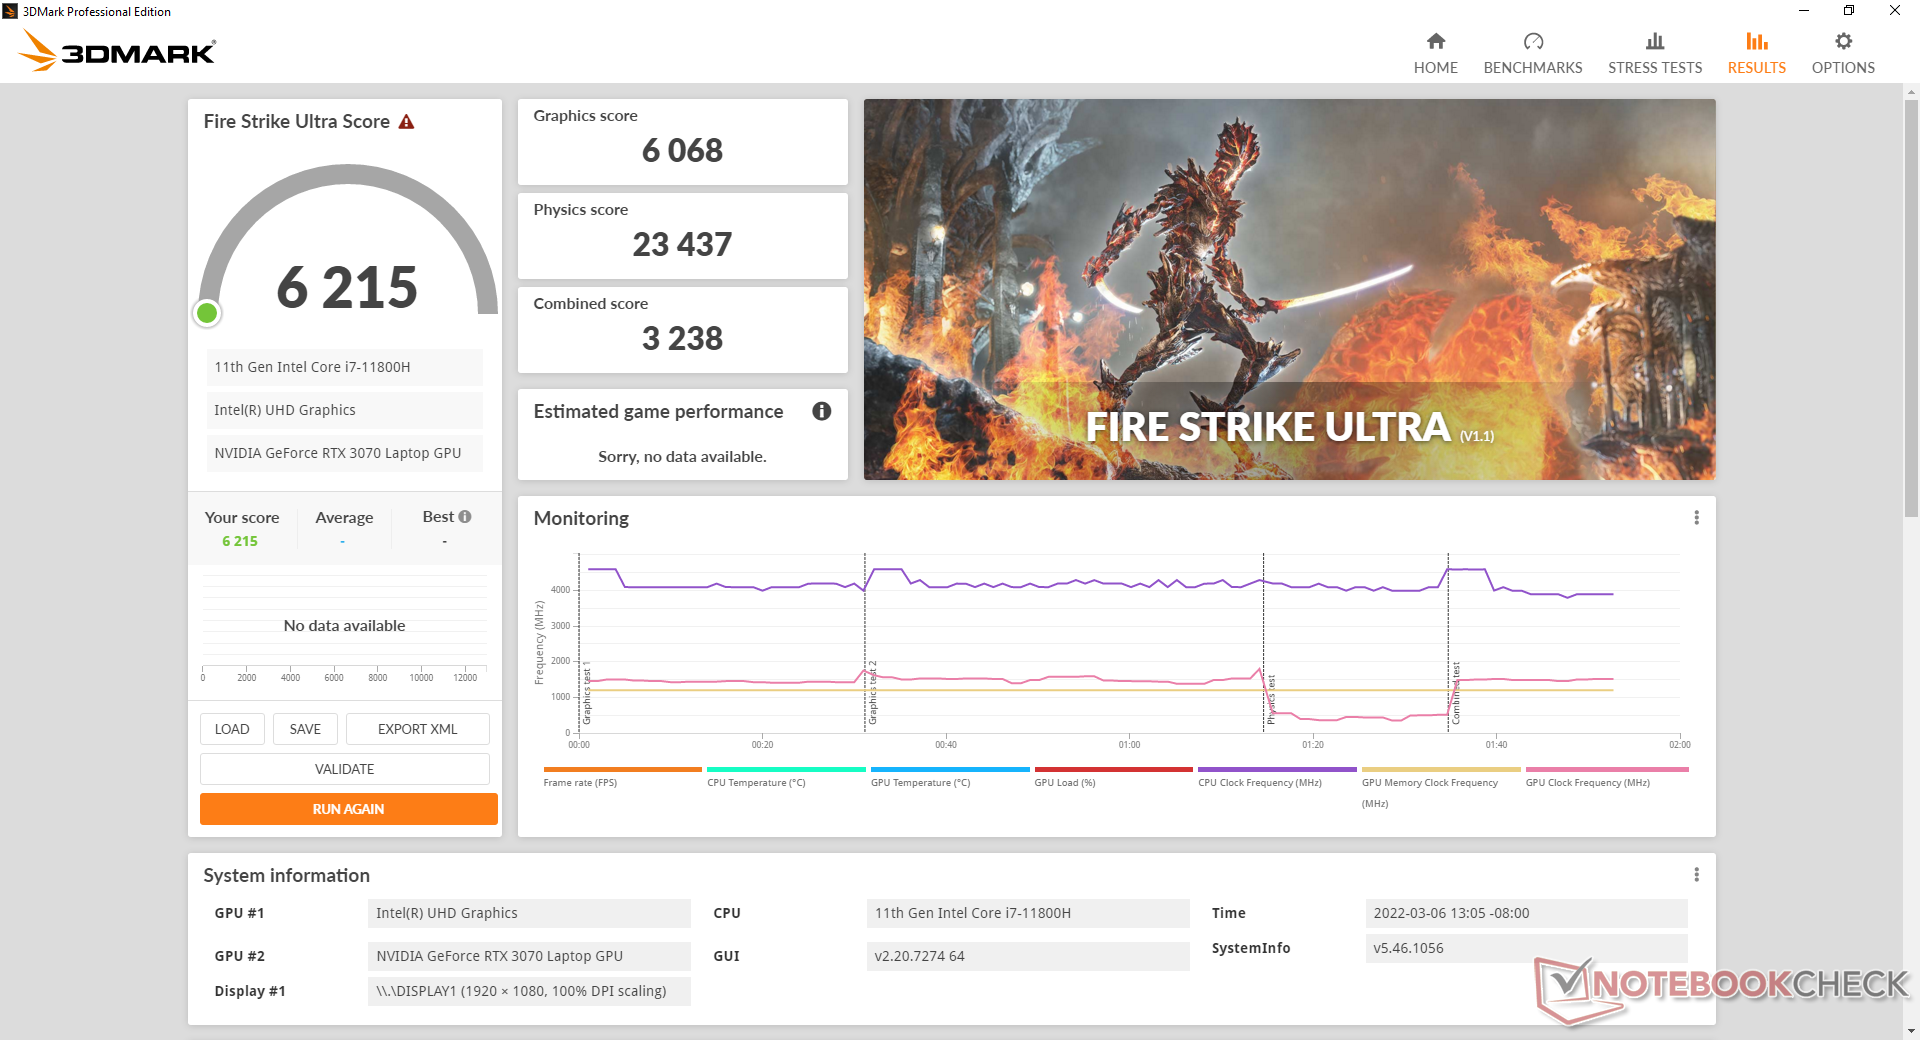
105瓦的 GeForce RTX 3070比新的150瓦的RTX 3070 Ti要慢大约15%到20%。 GeForce RTX 3070 Ti.相对于其他具有相同移动RTX 3070 GPU的笔记本电脑,整体性能是我们所期望的。
| 3DMark 11 - 1280x720 Performance GPU | |
| Corsair One i300 | |
| MSI Vector GP66 12UGS | |
| Alienware m15 R4 RTX 3080 | |
| Eurocom Nightsky ARX315 | |
| Eurocom RX315 NH57AF1 | |
| MSI Delta 15 A5EFK | |
| Razer Blade 15 Advanced Model Early 2021 | |
| Average NVIDIA GeForce RTX 3070 Laptop GPU (12535 - 38275, n=54) | |
| Schenker XMG Apex 15 NH57E PS | |
| Schenker XMG Core 15 Ampere | |
| Dell G15 5515 | |
| Gigabyte G5 GD | |
| 3DMark 11 Performance | 27856 points | |
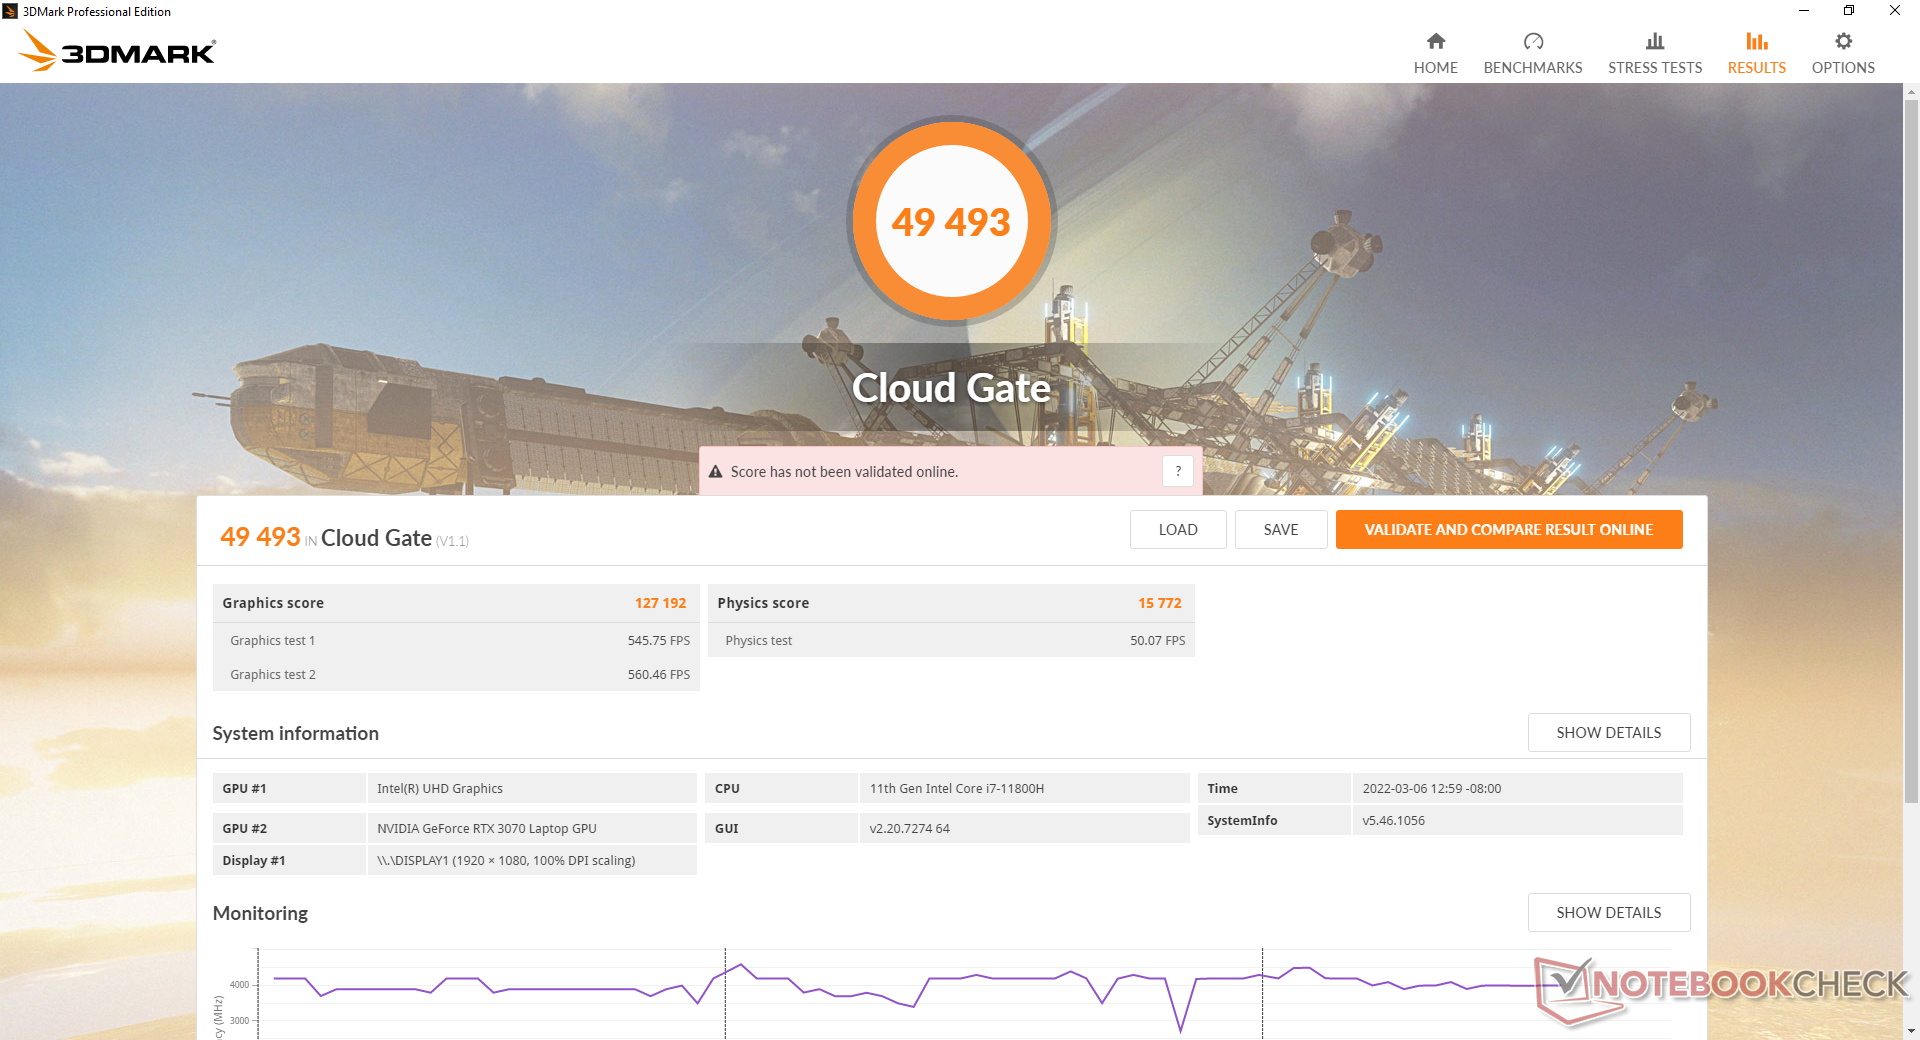
| 3DMark Cloud Gate Standard Score | 49493 points | |
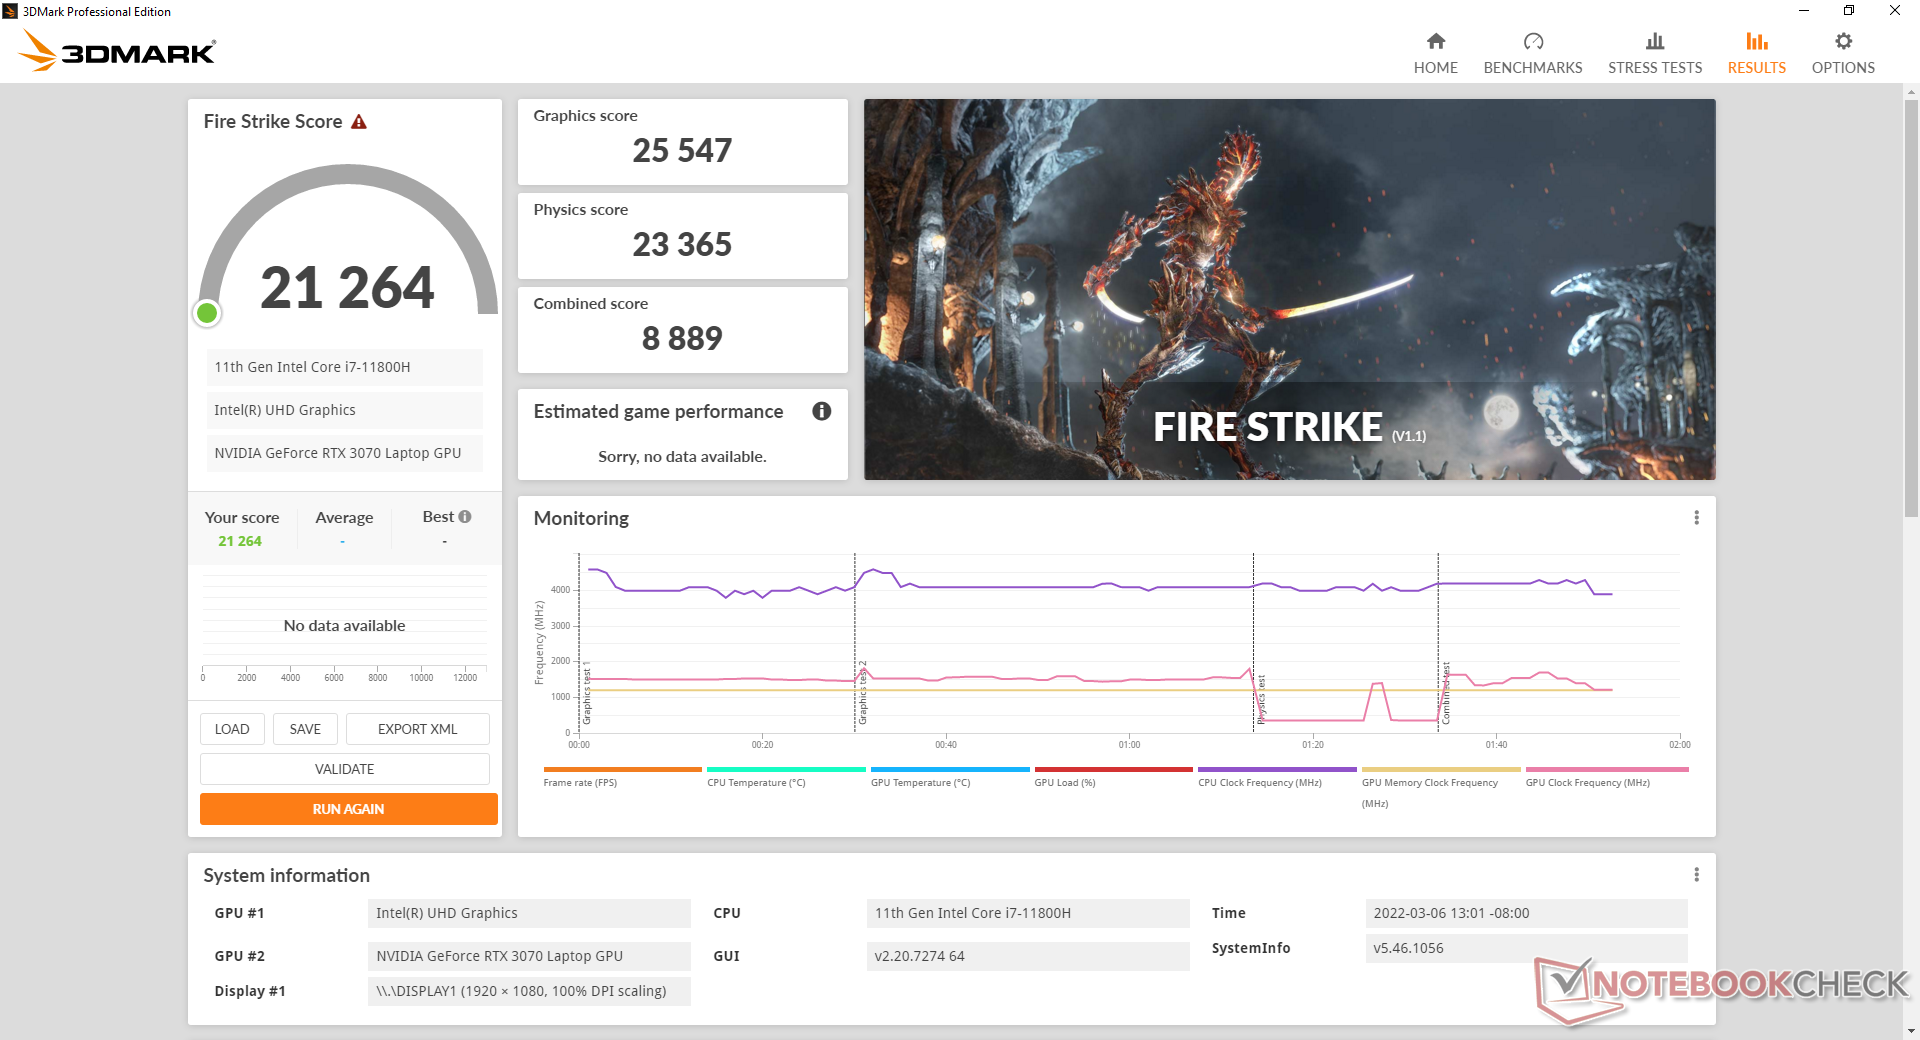
| 3DMark Fire Strike Score | 21264 points | |
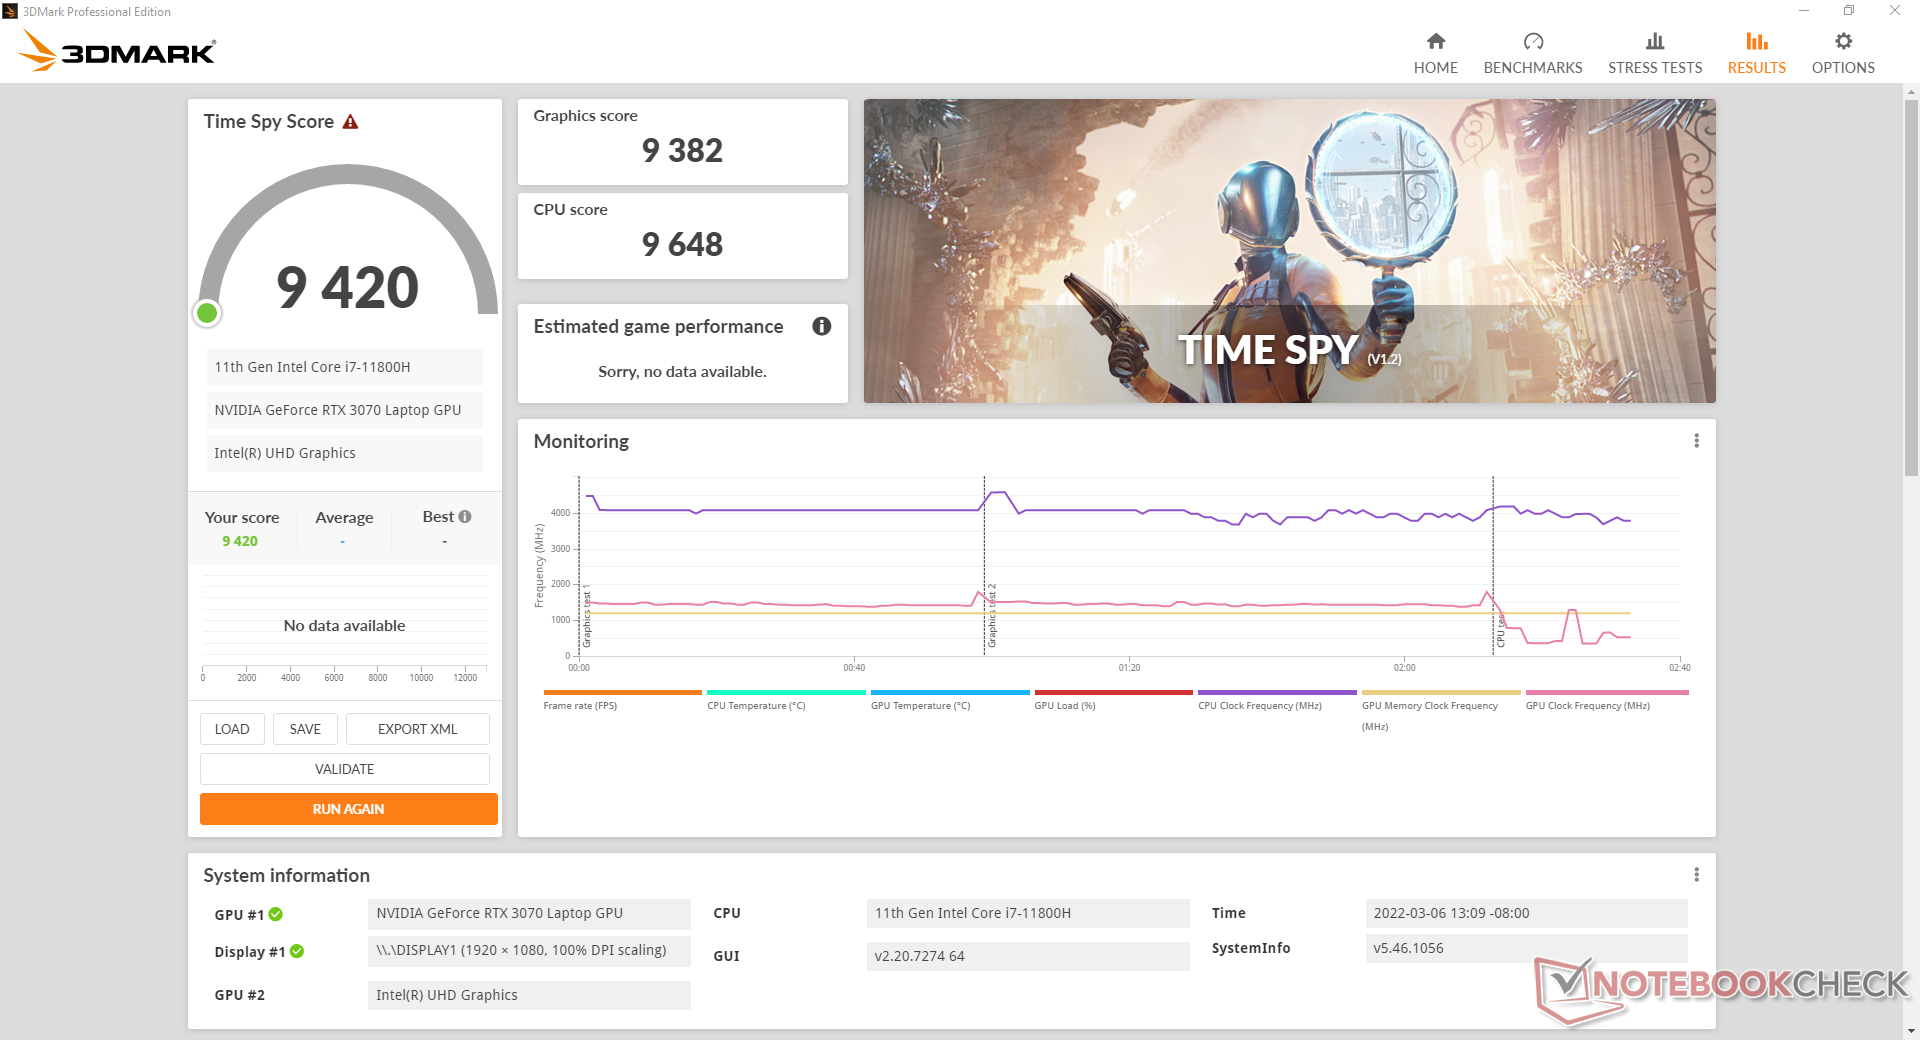
| 3DMark Time Spy Score | 9420 points | |
Help | ||
| X-Plane 11.11 | |
| 1280x720 low (fps_test=1) | |
| Corsair One i300 | |
| MSI Vector GP66 12UGS | |
| Eurocom Nightsky ARX315 | |
| Eurocom RX315 NH57AF1 | |
| Alienware m15 R4 RTX 3080 | |
| Average NVIDIA GeForce RTX 3070 Laptop GPU (15.3 - 152.8, n=61) | |
| Gigabyte G5 GD | |
| Razer Blade 15 Advanced Model Early 2021 | |
| Schenker XMG Apex 15 NH57E PS | |
| Dell G15 5515 | |
| Schenker XMG Core 15 Ampere | |
| 1920x1080 med (fps_test=2) | |
| Corsair One i300 | |
| MSI Vector GP66 12UGS | |
| Eurocom Nightsky ARX315 | |
| Eurocom RX315 NH57AF1 | |
| Alienware m15 R4 RTX 3080 | |
| Average NVIDIA GeForce RTX 3070 Laptop GPU (13.7 - 144.7, n=61) | |
| Gigabyte G5 GD | |
| Schenker XMG Apex 15 NH57E PS | |
| Razer Blade 15 Advanced Model Early 2021 | |
| Dell G15 5515 | |
| Schenker XMG Core 15 Ampere | |
| 1920x1080 high (fps_test=3) | |
| Corsair One i300 | |
| MSI Vector GP66 12UGS | |
| Eurocom Nightsky ARX315 | |
| Alienware m15 R4 RTX 3080 | |
| Eurocom RX315 NH57AF1 | |
| Average NVIDIA GeForce RTX 3070 Laptop GPU (12.4 - 118.8, n=61) | |
| Gigabyte G5 GD | |
| Razer Blade 15 Advanced Model Early 2021 | |
| Schenker XMG Apex 15 NH57E PS | |
| Dell G15 5515 | |
| Schenker XMG Core 15 Ampere | |
Witcher 3 FPS Chart
| low | med. | high | ultra | |
|---|---|---|---|---|
| GTA V (2015) | 182 | 176 | 159 | 95.5 |
| The Witcher 3 (2015) | 388.1 | 279.3 | 177.8 | 96.5 |
| Dota 2 Reborn (2015) | 163 | 146 | 137 | 129 |
| Final Fantasy XV Benchmark (2018) | 162 | 116 | 90.4 | |
| X-Plane 11.11 (2018) | 125 | 104 | 82.9 | |
| Far Cry 5 (2018) | 148 | 120 | 114 | 107 |
| Strange Brigade (2018) | 442 | 236 | 193 | 171 |
排放
系统噪音
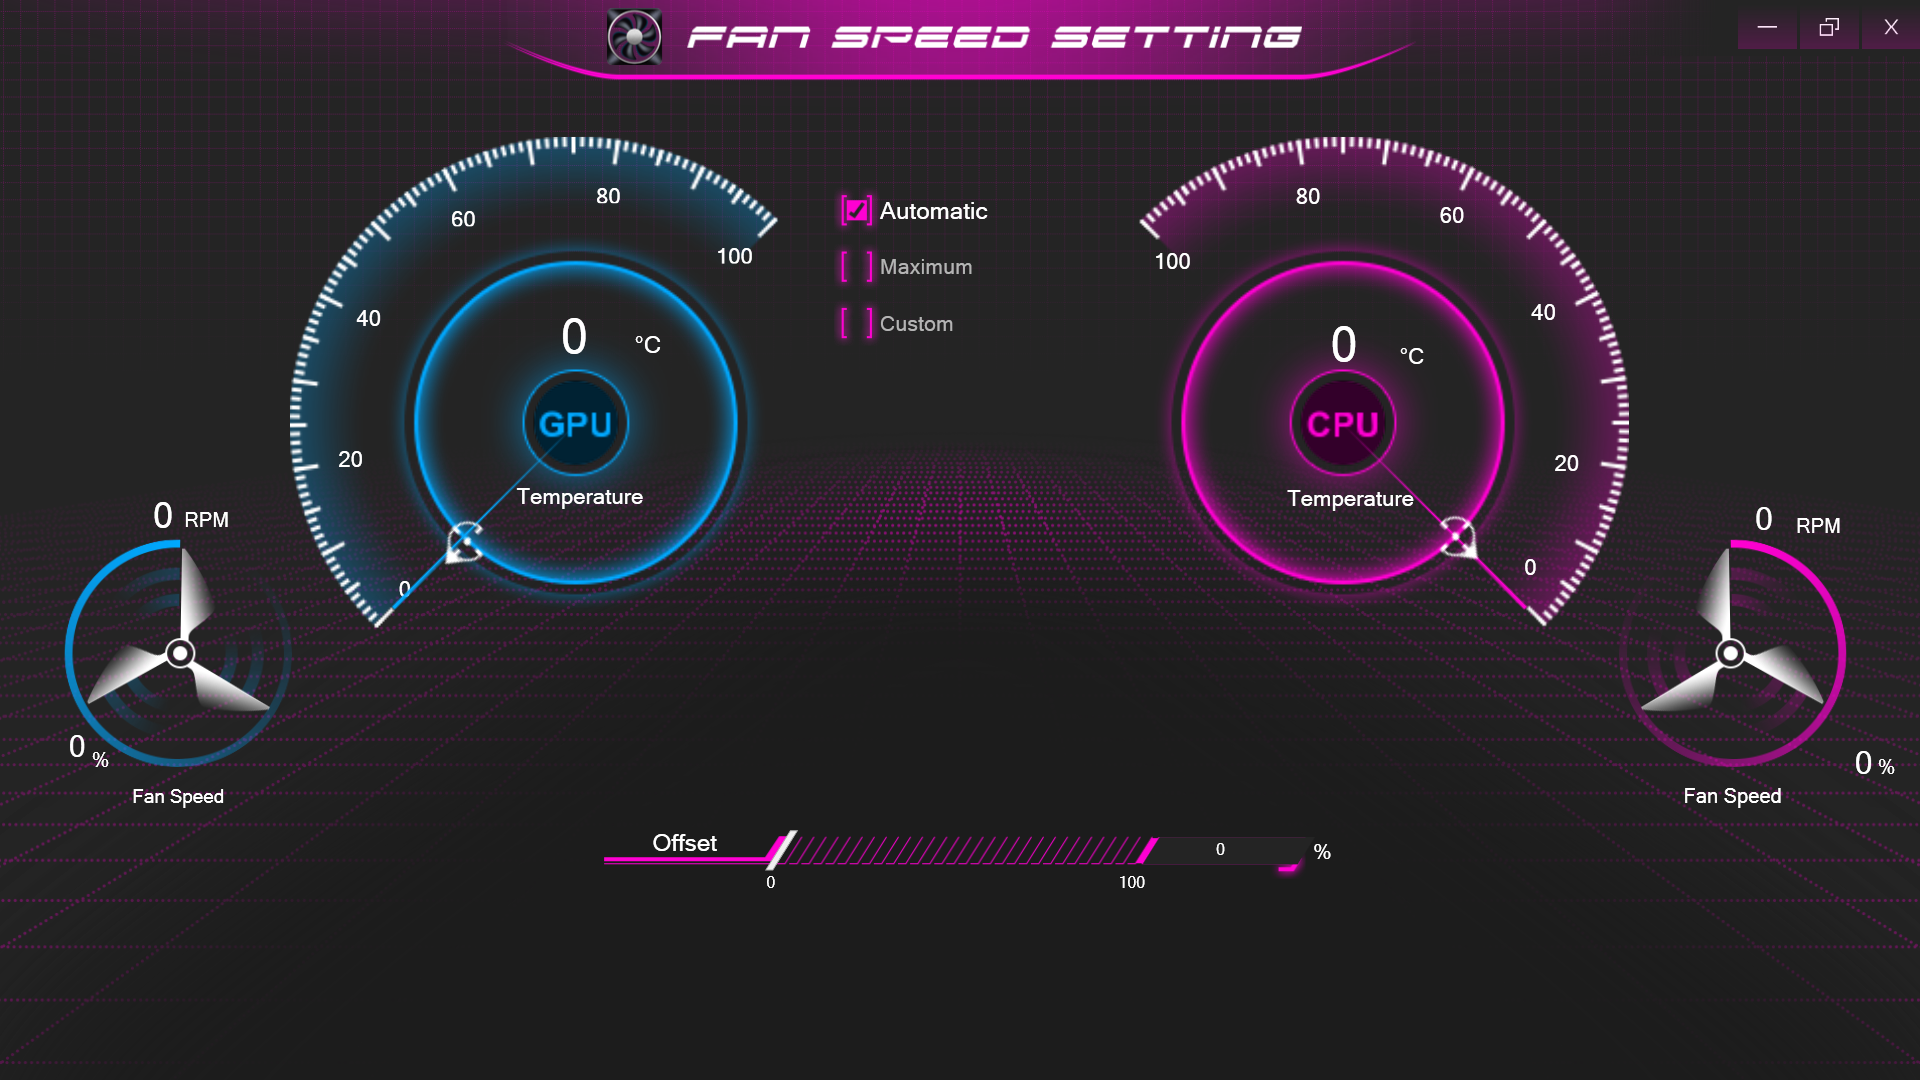
风扇噪音在很大程度上取决于四个电源配置文件控制中心的设置。静音、省电、娱乐和性能。还有第五个手动最大风扇模式设置,将风扇固定在57 dB(A)的最大声,无论屏幕上的负载如何。
如果只是简单地浏览网页或处理文字,建议在省电模式下运行系统,因为在性能模式下,风扇的脉冲频率往往在26至34 dB(A)之间。在性能模式下的游戏声音比我们在Razer Blade 15 Advanced上记录的要大。Razer Blade 15 Advanced或微星GS66的噪音。
Noise level
| Idle |
| 26.4 / 31 / 34 dB(A) |
| Load |
| 47.8 / 57.1 dB(A) |
 | ||
30 dB silent 40 dB(A) audible 50 dB(A) loud |
||
min: | ||
| Eurocom RX315 NH57AF1 GeForce RTX 3070 Laptop GPU, i7-11800H, Samsung SSD 980 Pro 1TB MZ-V8P1T0BW | MSI Stealth GS66 12UGS GeForce RTX 3070 Ti Laptop GPU, i7-12700H, WDC PC SN810 1TB | Eurocom Nightsky ARX315 GeForce RTX 3070 Laptop GPU, R9 5900X, Samsung SSD 980 Pro 1TB MZ-V8P1T0BW | Alienware m15 R6, i7-11800H RTX 3080 GeForce RTX 3080 Laptop GPU, i7-11800H, Samsung PM9A1 MZVL21T0HCLR | Dell G15 5515 GeForce RTX 3050 Ti Laptop GPU, R7 5800H, Samsung PM991a MZ9LQ512HBLU-00BD1 | Razer Blade 15 Advanced (Mid 2021) GeForce RTX 3080 Laptop GPU, i7-11800H, SSSTC CA6-8D1024 | |
|---|---|---|---|---|---|---|
| Noise | 3% | -4% | 12% | 12% | 12% | |
| off / environment * (dB) | 26.3 | 24 9% | 25.3 4% | 23 13% | 24 9% | 25.1 5% |
| Idle Minimum * (dB) | 26.4 | 31 -17% | 25.9 2% | 23 13% | 25 5% | 25.3 4% |
| Idle Average * (dB) | 31 | 32 -3% | 27.9 10% | 23 26% | 26 16% | 25.3 18% |
| Idle Maximum * (dB) | 34 | 35 -3% | 40.8 -20% | 30 12% | 30 12% | 25.3 26% |
| Load Average * (dB) | 47.8 | 48 -0% | 55.2 -15% | 41.26 14% | 44 8% | 42 12% |
| Witcher 3 ultra * (dB) | 51.7 | 43 17% | 52.4 -1% | 53.4 -3% | 44 15% | 45.6 12% |
| Load Maximum * (dB) | 57.1 | 48 16% | 60.3 -6% | 53.37 7% | 48 16% | 51.6 10% |
* ... smaller is better
温度
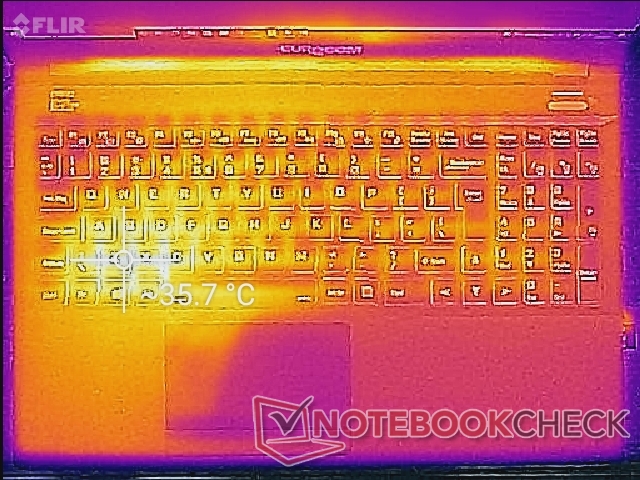
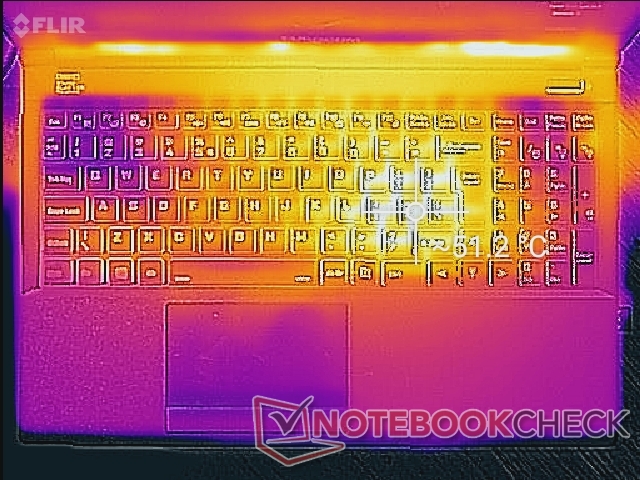
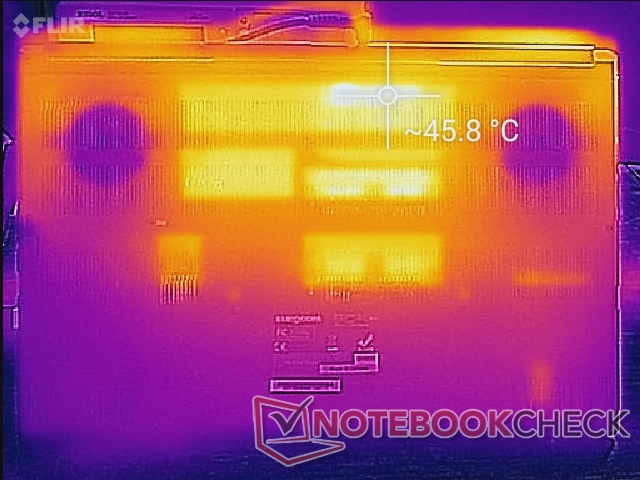
游戏时,键盘中心附近的表面温度可以达到51摄氏度,而Razer Blade 15的表面温度为44摄氏度。与大多数游戏笔记本电脑一样,两个风扇被安置在WASD和小键盘下方,以保持笔记本电脑的这些部分在任何情况下都相对凉爽。
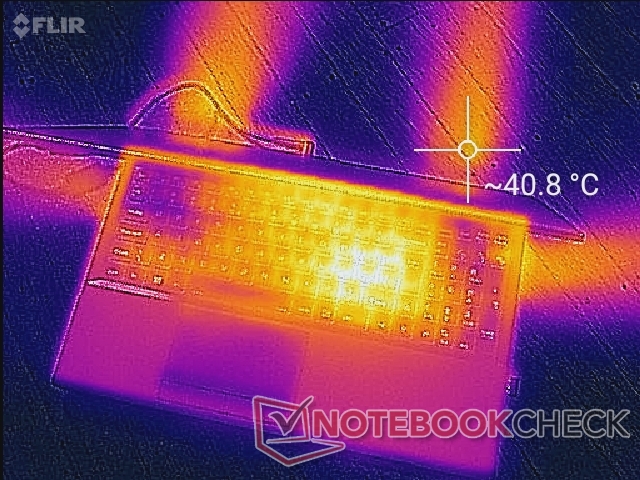
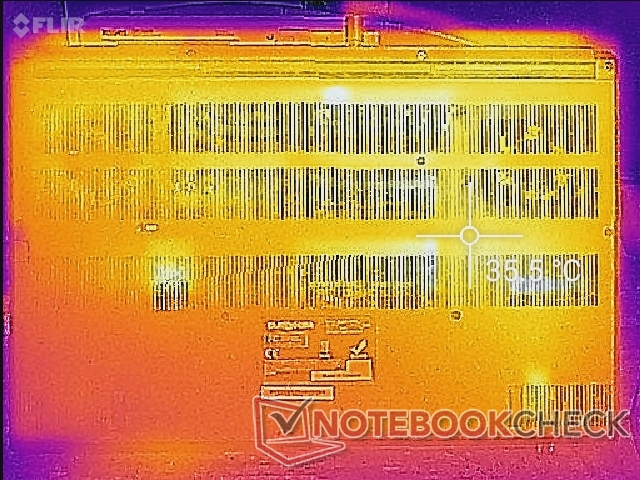
(+) The maximum temperature on the upper side is 36 °C / 97 F, compared to the average of 40.4 °C / 105 F, ranging from 21.2 to 68.8 °C for the class Gaming.
(-) The bottom heats up to a maximum of 46 °C / 115 F, compared to the average of 43.2 °C / 110 F
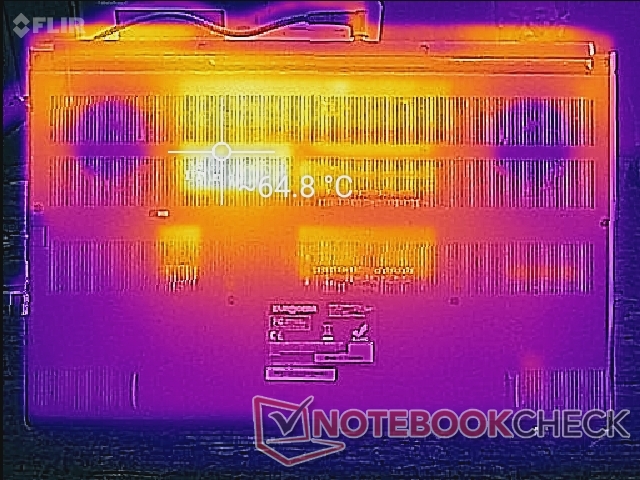
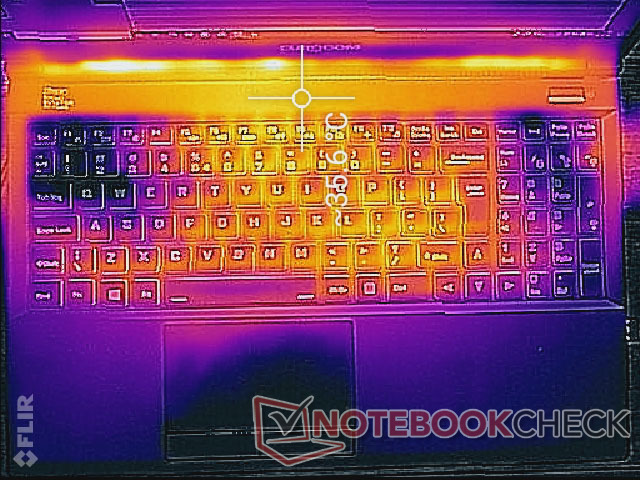
(+) In idle usage, the average temperature for the upper side is 31.4 °C / 89 F, compared to the device average of 33.9 °C / 93 F.
(±) Playing The Witcher 3, the average temperature for the upper side is 37.1 °C / 99 F, compared to the device average of 33.9 °C / 93 F.
(+) The palmrests and touchpad are cooler than skin temperature with a maximum of 31.2 °C / 88.2 F and are therefore cool to the touch.
(-) The average temperature of the palmrest area of similar devices was 28.8 °C / 83.8 F (-2.4 °C / -4.4 F).
| Eurocom RX315 NH57AF1 Intel Core i7-11800H, NVIDIA GeForce RTX 3070 Laptop GPU | MSI Stealth GS66 12UGS Intel Core i7-12700H, NVIDIA GeForce RTX 3070 Ti Laptop GPU | Eurocom Nightsky ARX315 AMD Ryzen 9 5900X, NVIDIA GeForce RTX 3070 Laptop GPU | Alienware m15 R6, i7-11800H RTX 3080 Intel Core i7-11800H, NVIDIA GeForce RTX 3080 Laptop GPU | Dell G15 5515 AMD Ryzen 7 5800H, NVIDIA GeForce RTX 3050 Ti Laptop GPU | Razer Blade 15 Advanced (Mid 2021) Intel Core i7-11800H, NVIDIA GeForce RTX 3080 Laptop GPU | |
|---|---|---|---|---|---|---|
| Heat | -6% | -5% | -25% | 3% | -14% | |
| Maximum Upper Side * (°C) | 36 | 54 -50% | 36.2 -1% | 61 -69% | 50 -39% | 51 -42% |
| Maximum Bottom * (°C) | 46 | 59 -28% | 49.6 -8% | 58 -26% | 49 -7% | 52 -13% |
| Idle Upper Side * (°C) | 35.6 | 26 27% | 32.6 8% | 38 -7% | 26 27% | 35.2 1% |
| Idle Bottom * (°C) | 36.8 | 27 27% | 43.2 -17% | 36 2% | 26 29% | 37.8 -3% |
* ... smaller is better
压力测试
当运行Prime95时,CPU会在前70秒内提升到3.5至3.7GHz,封装功耗为95W,核心温度为99C。之后,CPU将稳定在一个更舒适的76摄氏度和54瓦的封装功耗,尽管时钟频率较低,为2.8GHz。
当运行 Witcher 3GPU-Z报告的板卡功耗为102W,非常接近宣传的105W TGP目标。
用电池供电运行将限制性能。在电池上进行的Fire Strike 测试将返回物理和图形分数,分别为15083和2154分,而在主电源上则为23365和25547分。
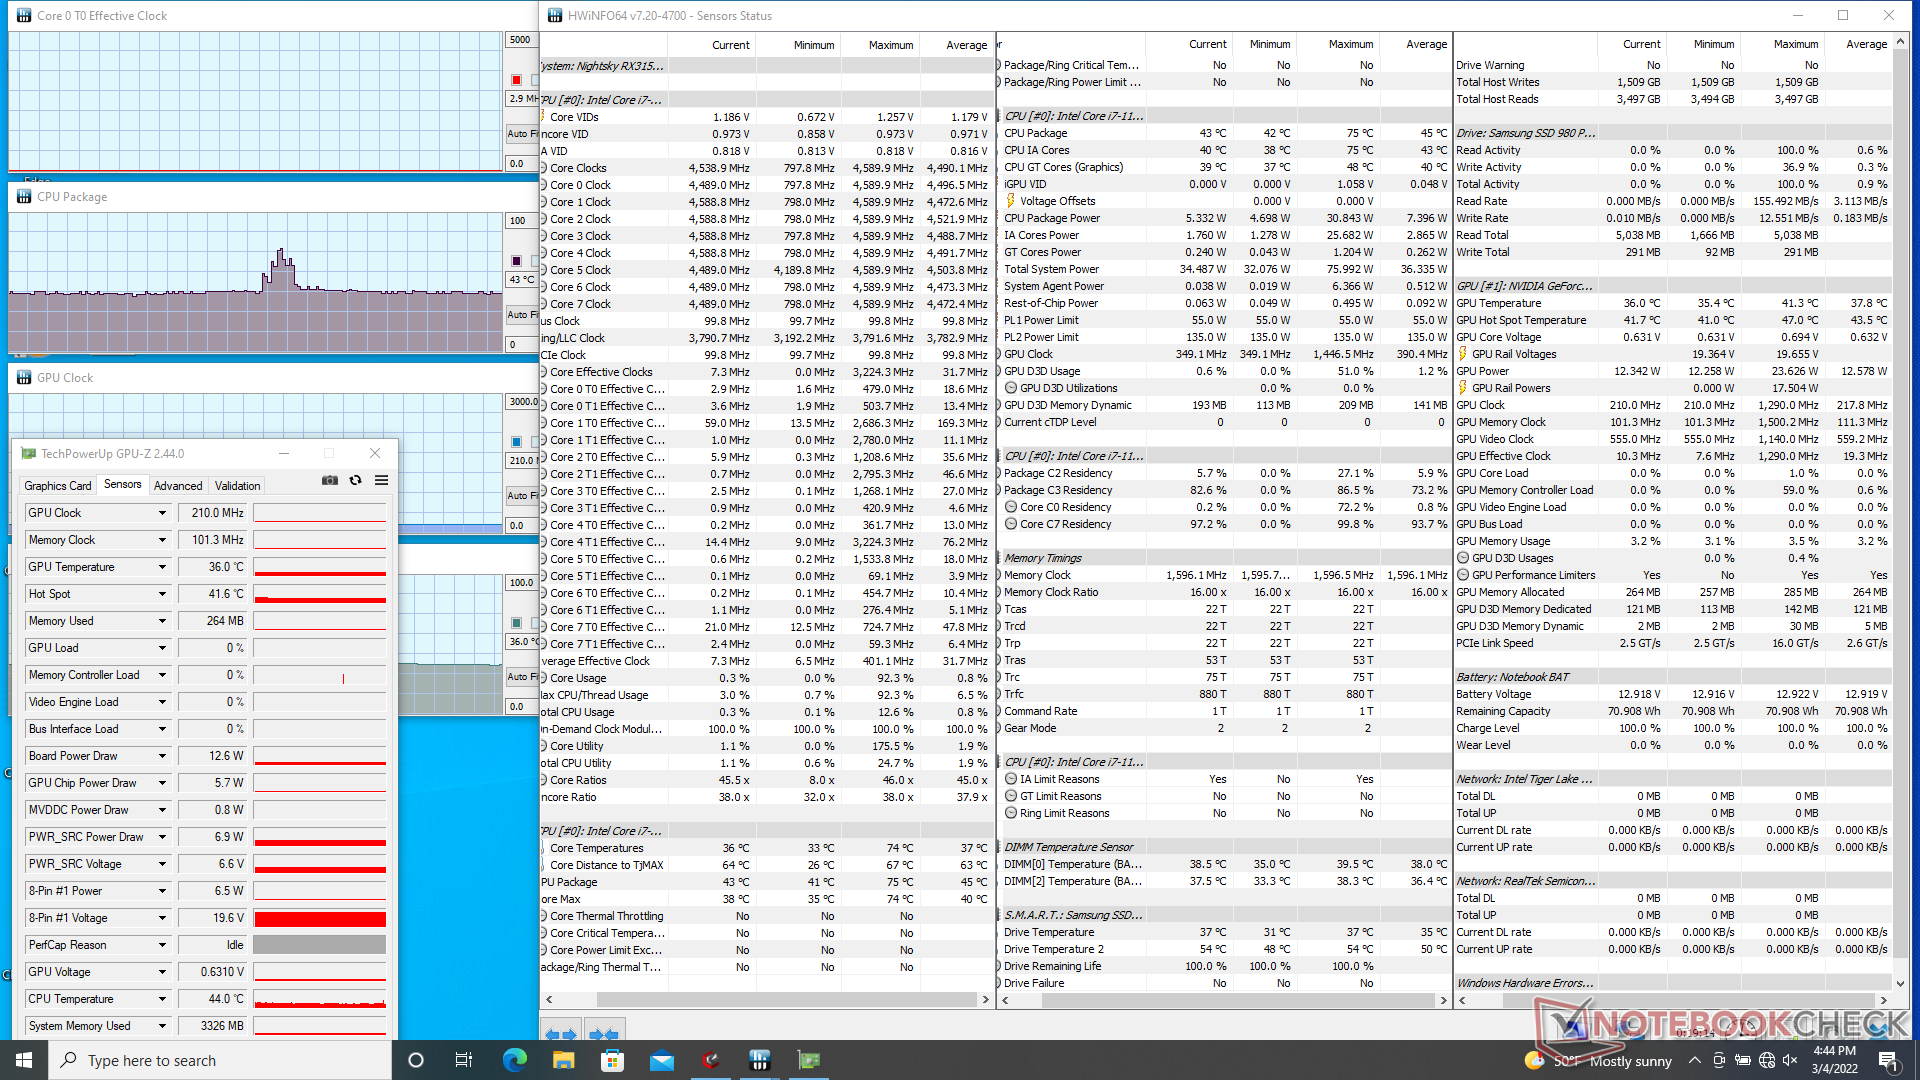
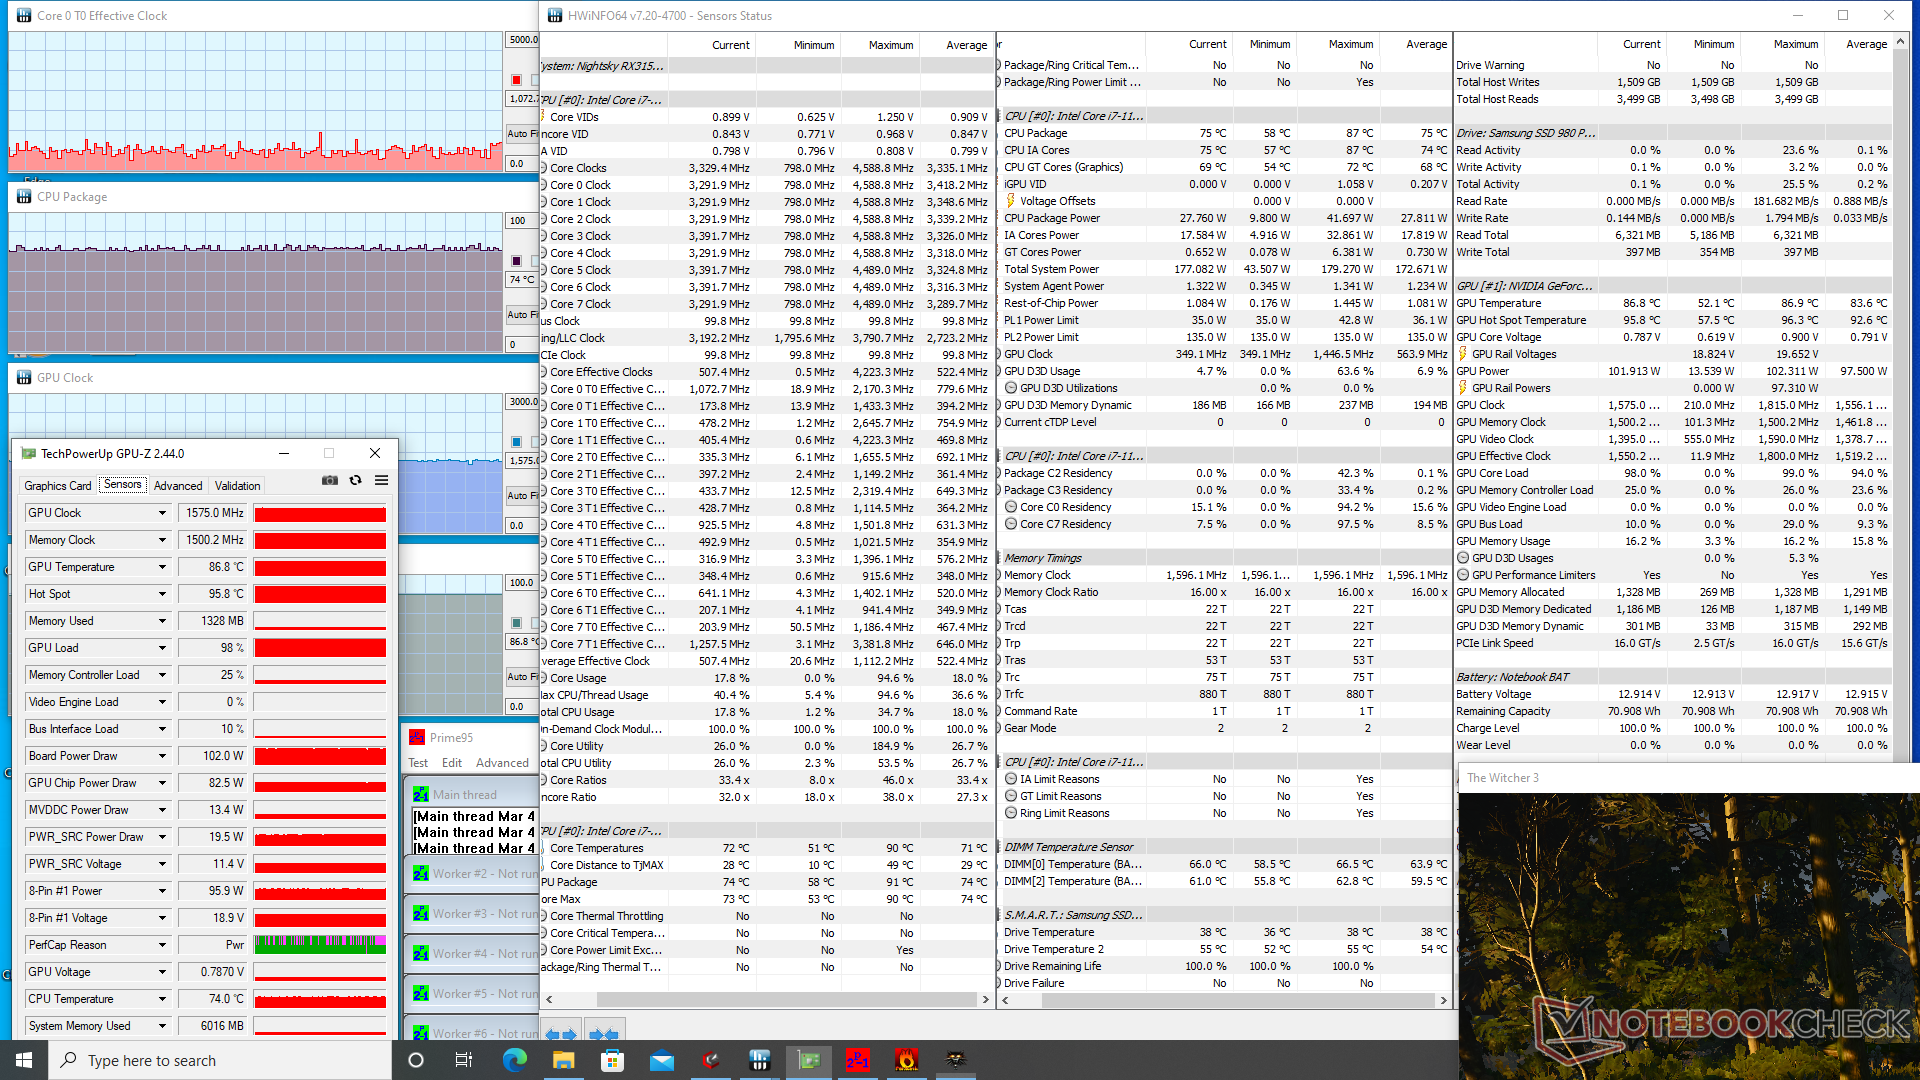
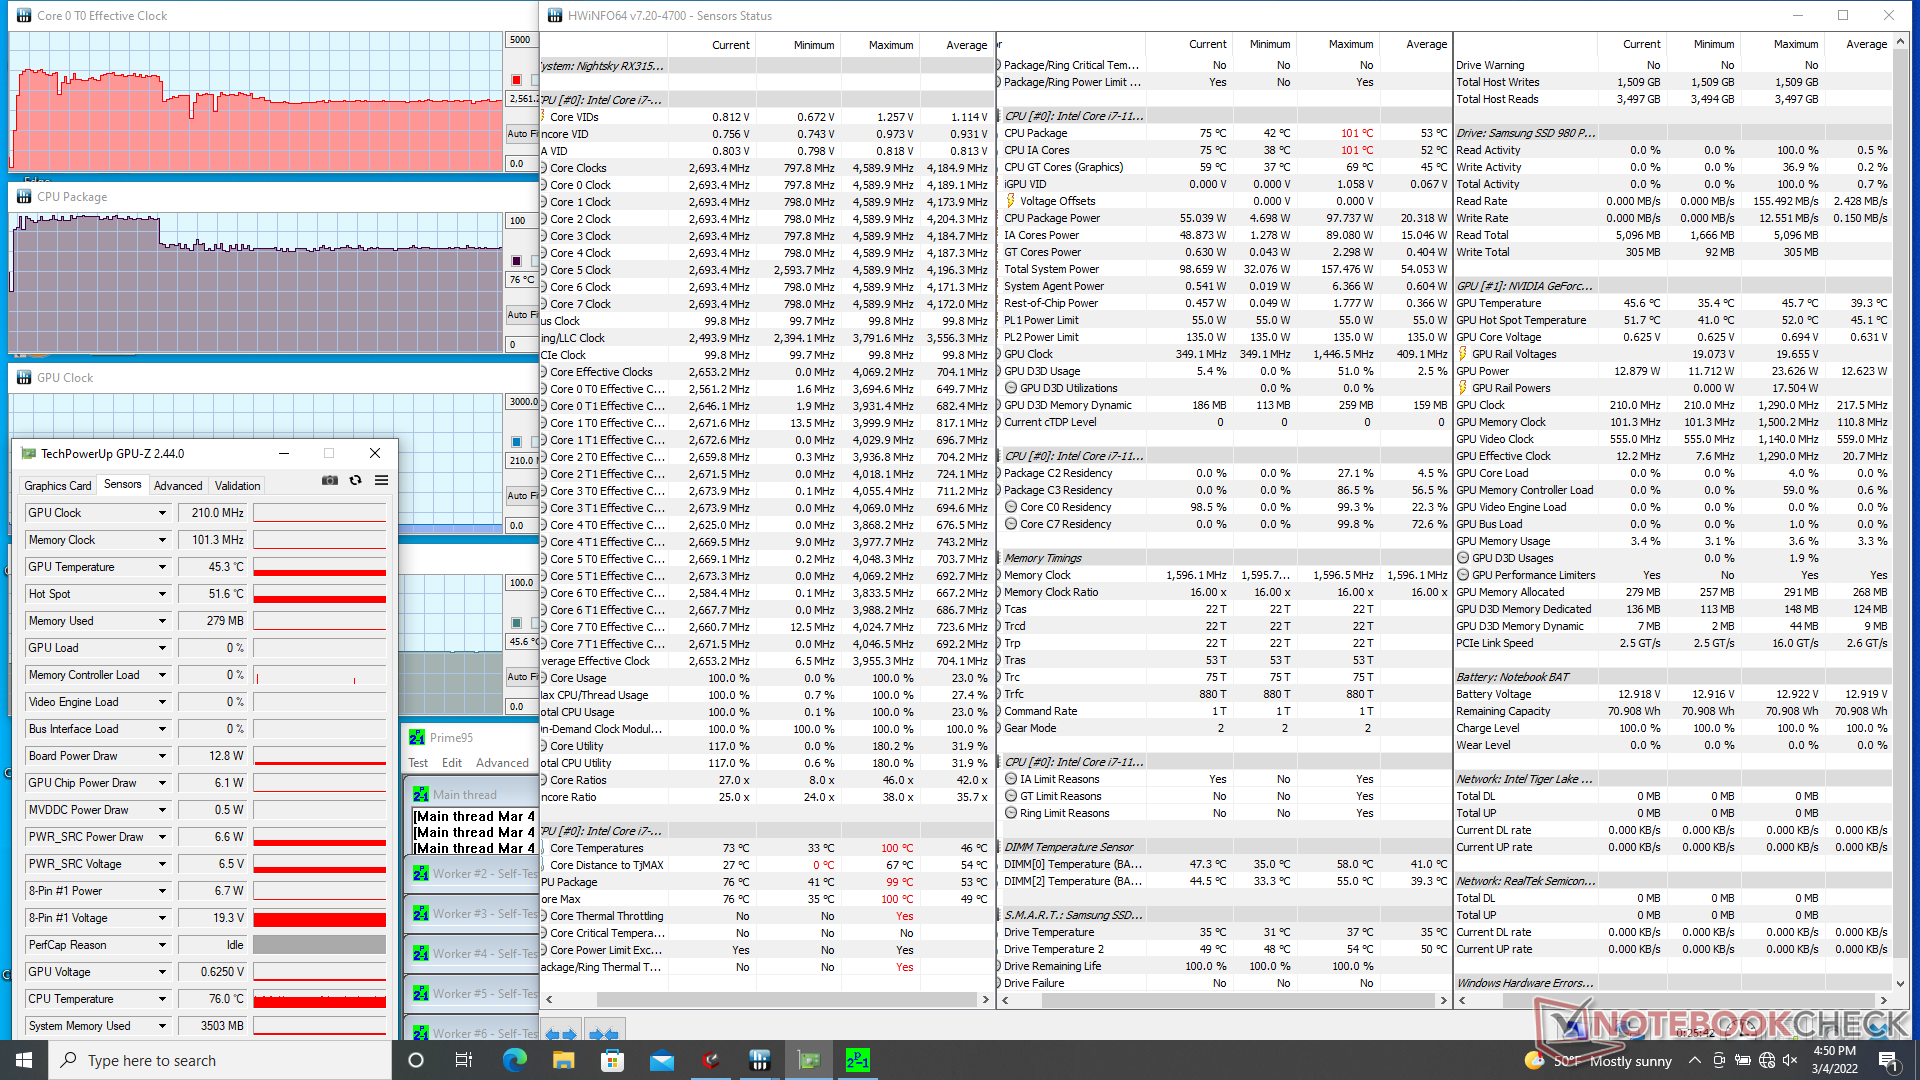
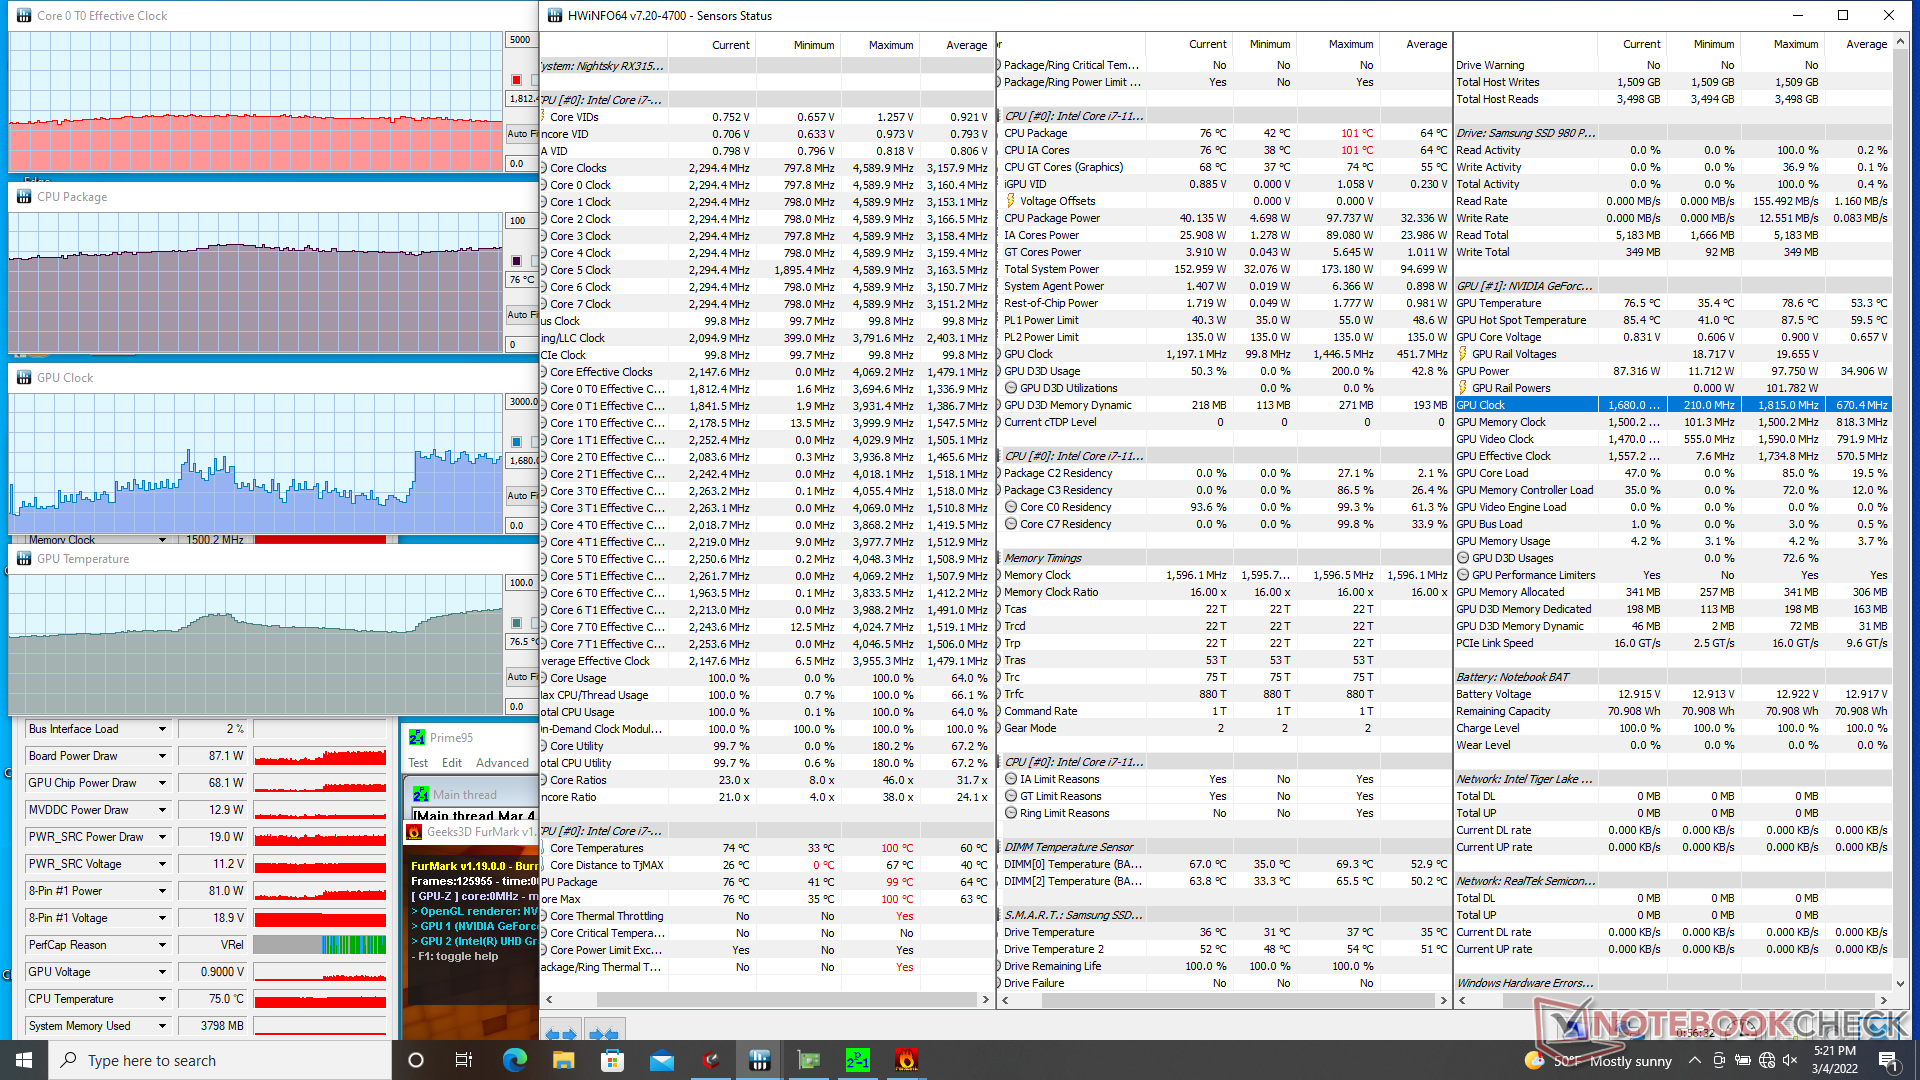
| CPU时钟(GHz) | GPU时钟(MHz) | CPU平均温度(℃) | GPU平均温度(℃) | |
| 系统空闲 | -- | -- | 43 | 36 |
| Prime95压力 | 2.6 | -- | 76 | 46 |
| Prime95 + FurMark 压力 | 1.6 - 2.1 | 700 - 1800 | 70 - 78 | 60 - 77 |
| Witcher 3 应力 | ~1.0 | 1575 | 74 | 87 |
发言人
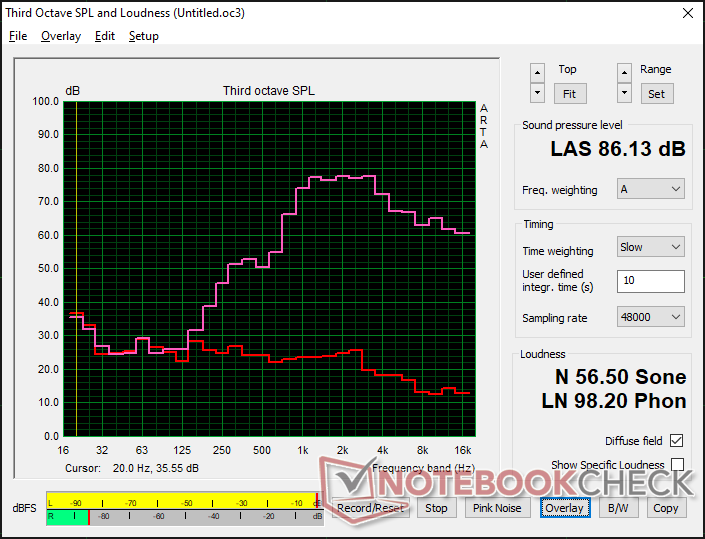
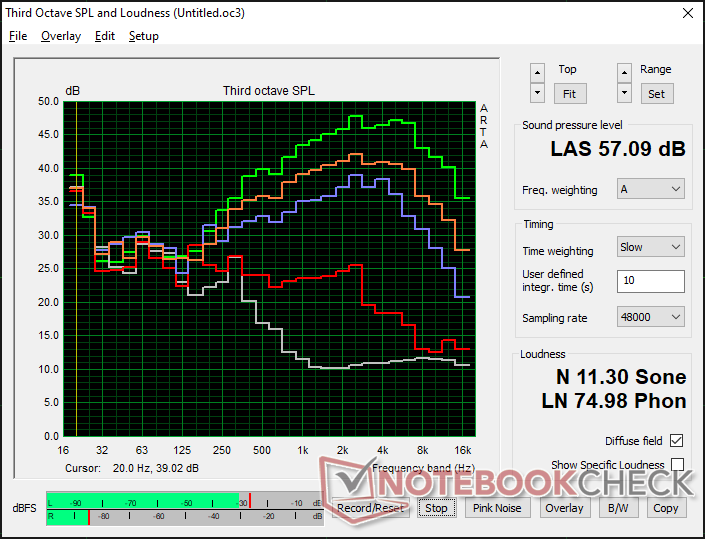
Eurocom RX315 NH57AF1 audio analysis
(+) | speakers can play relatively loud (86.1 dB)
Bass 100 - 315 Hz
(-) | nearly no bass - on average 26.3% lower than median
(±) | linearity of bass is average (11.2% delta to prev. frequency)
Mids 400 - 2000 Hz
(±) | higher mids - on average 11% higher than median
(±) | linearity of mids is average (10.3% delta to prev. frequency)
Highs 2 - 16 kHz
(±) | higher highs - on average 6.9% higher than median
(+) | highs are linear (6.7% delta to prev. frequency)
Overall 100 - 16.000 Hz
(-) | overall sound is not linear (33.3% difference to median)
Compared to same class
» 98% of all tested devices in this class were better, 1% similar, 1% worse
» The best had a delta of 6%, average was 18%, worst was 132%
Compared to all devices tested
» 92% of all tested devices were better, 1% similar, 6% worse
» The best had a delta of 4%, average was 23%, worst was 134%
Apple MacBook Pro 16 2021 M1 Pro audio analysis
(+) | speakers can play relatively loud (84.7 dB)
Bass 100 - 315 Hz
(+) | good bass - only 3.8% away from median
(+) | bass is linear (5.2% delta to prev. frequency)
Mids 400 - 2000 Hz
(+) | balanced mids - only 1.3% away from median
(+) | mids are linear (2.1% delta to prev. frequency)
Highs 2 - 16 kHz
(+) | balanced highs - only 1.9% away from median
(+) | highs are linear (2.7% delta to prev. frequency)
Overall 100 - 16.000 Hz
(+) | overall sound is linear (4.6% difference to median)
Compared to same class
» 0% of all tested devices in this class were better, 0% similar, 100% worse
» The best had a delta of 5%, average was 17%, worst was 45%
Compared to all devices tested
» 0% of all tested devices were better, 0% similar, 100% worse
» The best had a delta of 4%, average was 23%, worst was 134%
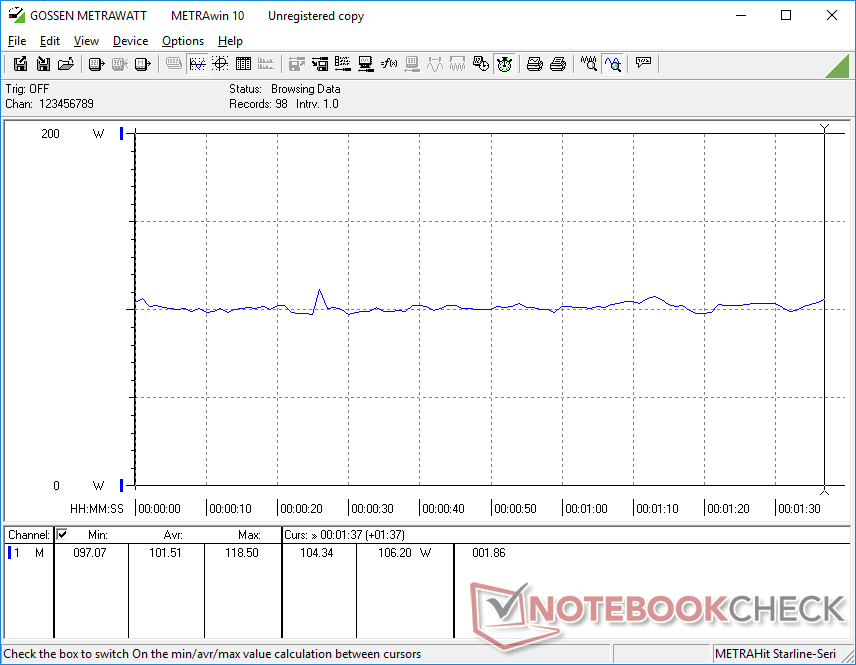
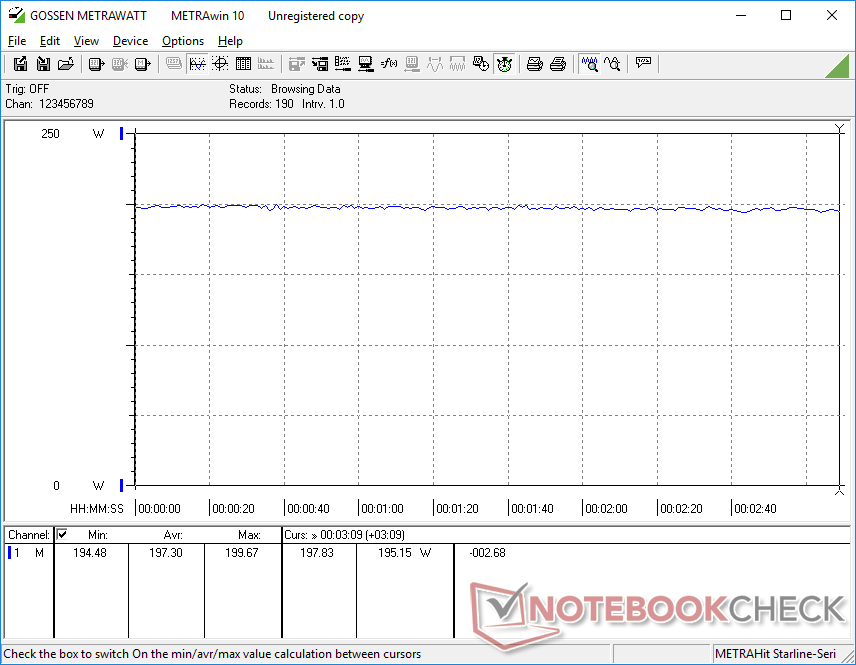
能源管理
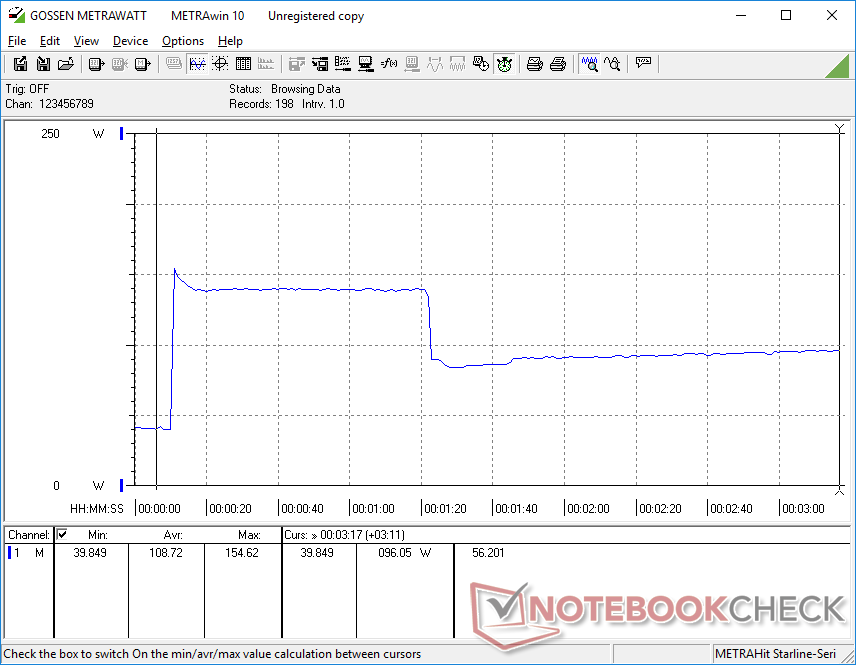
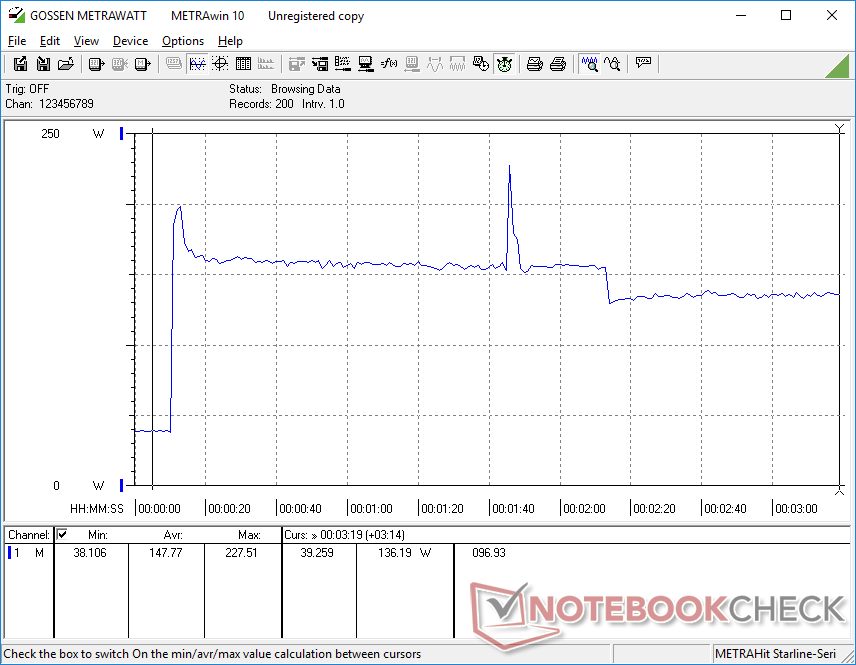
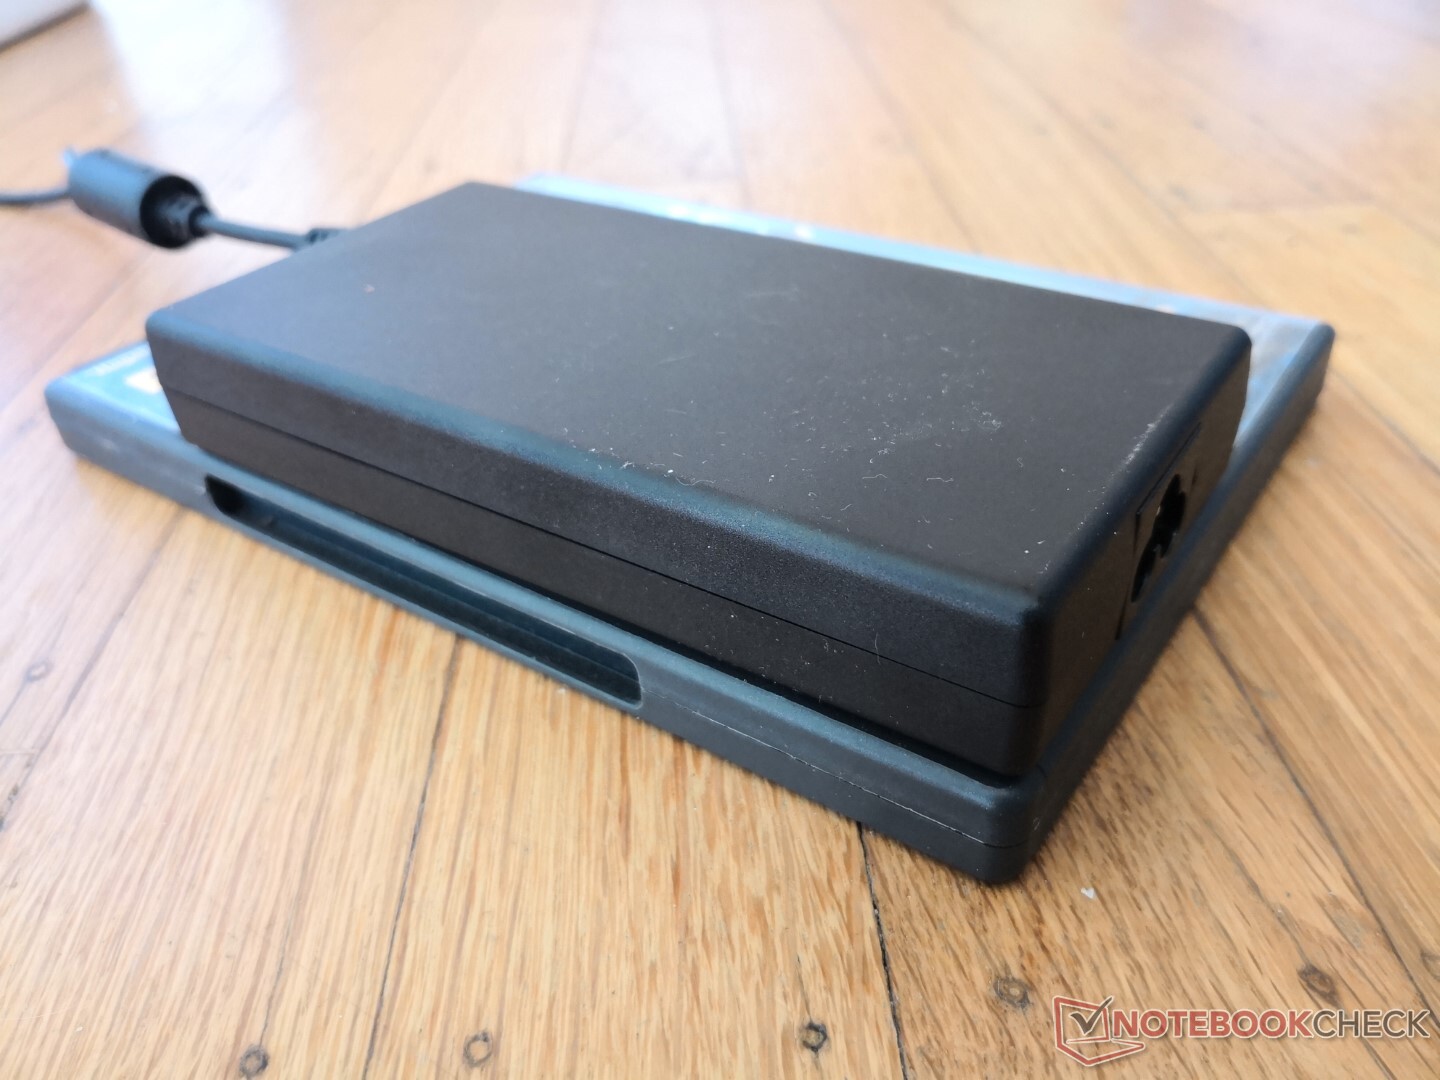
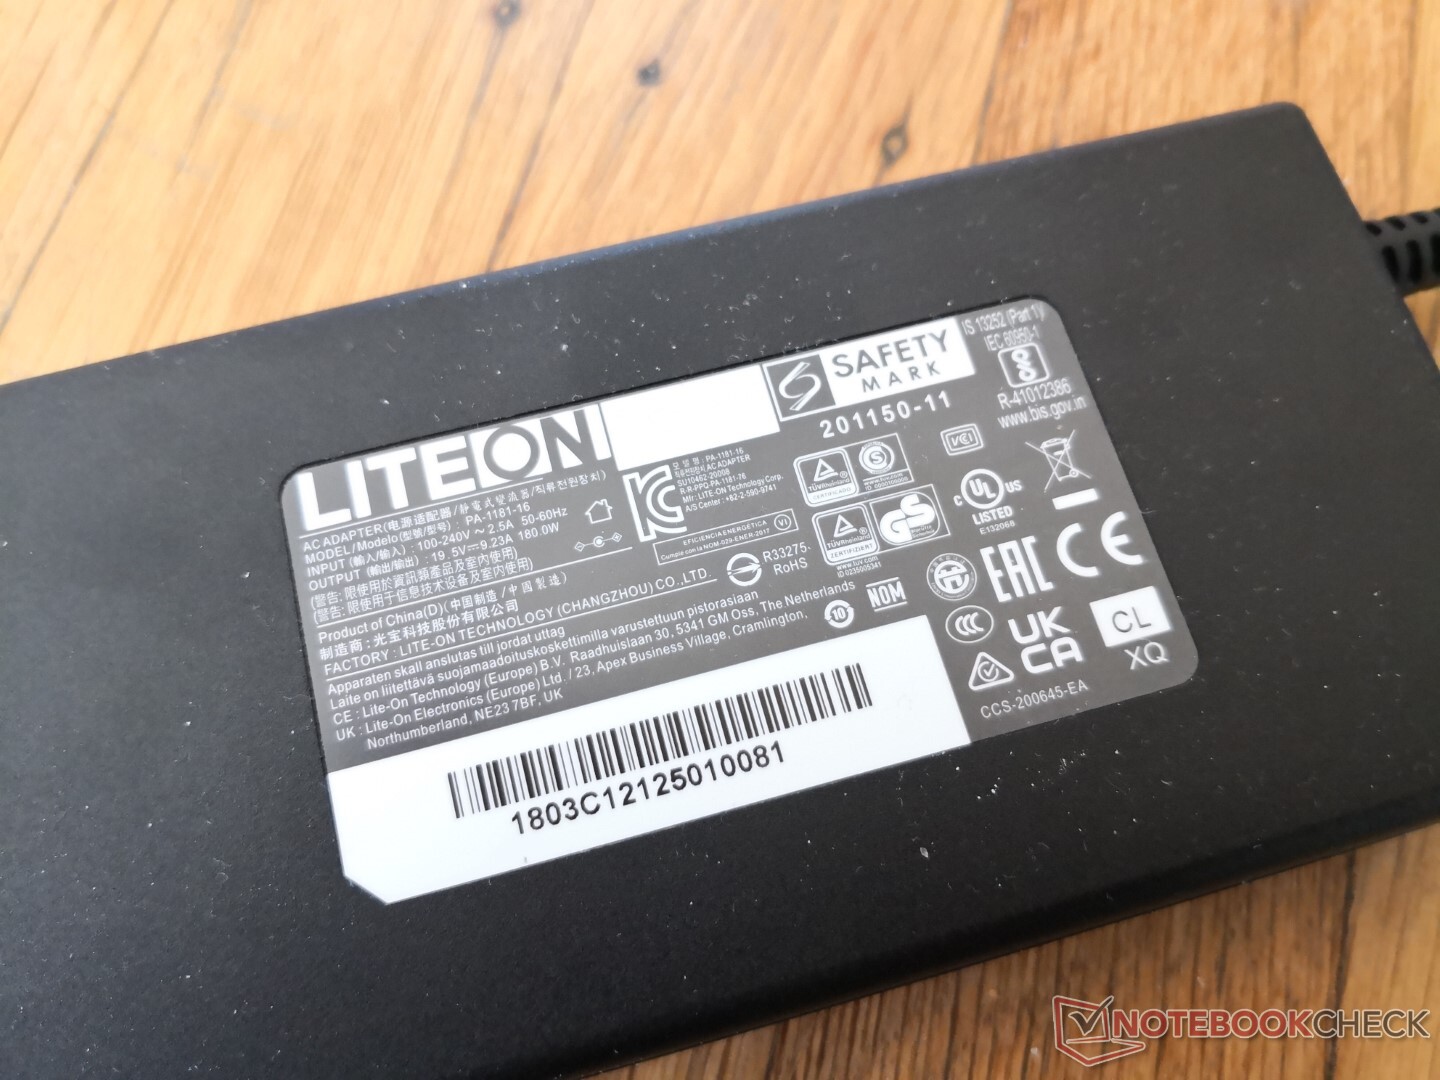
消耗功率
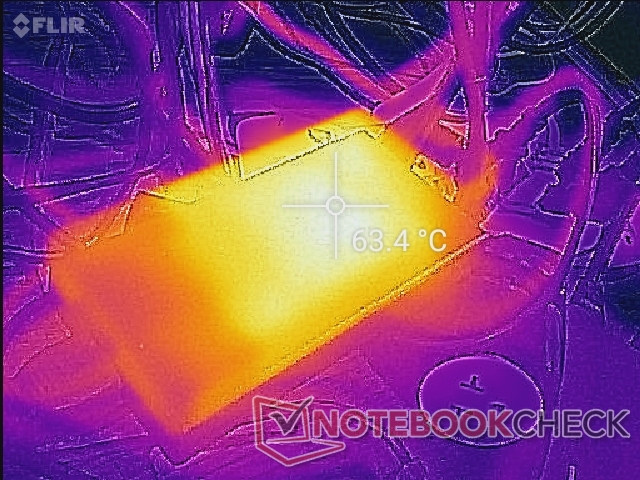
该系统要求的功率超过了有限的180W交流适配器所能提供的额定功率。例如,在运行时,功耗将稳定在197瓦。 Witcher 3小巧的180瓦适配器(约14.5 x 7.4 x 2.5厘米)肯定比大多数其他游戏笔记本的交流适配器更便携,但是一个更大和更有能力的适配器有可能在游戏时获得更高的持续性能和更快的充电速度。
| Off / Standby | |
| Idle | |
| Load |
|
Key:
min: | |
| Eurocom RX315 NH57AF1 i7-11800H, GeForce RTX 3070 Laptop GPU, Samsung SSD 980 Pro 1TB MZ-V8P1T0BW, IPS, 1920x1080, 15.6" | MSI Stealth GS66 12UGS i7-12700H, GeForce RTX 3070 Ti Laptop GPU, WDC PC SN810 1TB, IPS-Level, 2560x1440, 15.6" | Eurocom Nightsky ARX315 R9 5900X, GeForce RTX 3070 Laptop GPU, Samsung SSD 980 Pro 1TB MZ-V8P1T0BW, IPS, 1920x1080, 15.6" | Alienware m15 R6, i7-11800H RTX 3080 i7-11800H, GeForce RTX 3080 Laptop GPU, Samsung PM9A1 MZVL21T0HCLR, IPS, 1920x1080, 15.6" | Dell G15 5515 R7 5800H, GeForce RTX 3050 Ti Laptop GPU, Samsung PM991a MZ9LQ512HBLU-00BD1, IPS, 1920x1080, 15.6" | Razer Blade 15 Advanced (Mid 2021) i7-11800H, GeForce RTX 3080 Laptop GPU, SSSTC CA6-8D1024, IPS, 1920x1080, 15.6" | |
|---|---|---|---|---|---|---|
| Power Consumption | 8% | -141% | 1% | 35% | -17% | |
| Idle Minimum * (Watt) | 12.7 | 11 13% | 55 -333% | 14 -10% | 5 61% | 19.5 -54% |
| Idle Average * (Watt) | 16.4 | 16 2% | 68.2 -316% | 18 -10% | 9 45% | 23.3 -42% |
| Idle Maximum * (Watt) | 36.1 | 23 36% | 72.5 -101% | 29 20% | 20 45% | 40.1 -11% |
| Load Average * (Watt) | 101.5 | 110 -8% | 149.2 -47% | 93 8% | 94 7% | 98.9 3% |
| Witcher 3 ultra * (Watt) | 197 | 151 23% | 233 -18% | 190 4% | 123 38% | 174 12% |
| Load Maximum * (Watt) | 196.1 | 230 -17% | 255.8 -30% | 203 -4% | 172 12% | 214 -9% |
* ... smaller is better
Power Consumption Witcher 3 / Stresstest
Power Consumption external Monitor
电池寿命
预计在集成GPU激活的情况下,在平衡模式下实际使用WLAN的时间不到5小时。用附带的交流适配器充电需要大约2.5小时,但由于180瓦的低输出,在运行游戏时速度会减慢到缓慢。不支持通过USB-C适配器进行充电。
| Eurocom RX315 NH57AF1 i7-11800H, GeForce RTX 3070 Laptop GPU, 71 Wh | MSI Stealth GS66 12UGS i7-12700H, GeForce RTX 3070 Ti Laptop GPU, 99.9 Wh | Eurocom Nightsky ARX315 R9 5900X, GeForce RTX 3070 Laptop GPU, 62 Wh | Alienware m15 R6, i7-11800H RTX 3080 i7-11800H, GeForce RTX 3080 Laptop GPU, 84 Wh | Dell G15 5515 R7 5800H, GeForce RTX 3050 Ti Laptop GPU, 56 Wh | Razer Blade 15 Advanced (Mid 2021) i7-11800H, GeForce RTX 3080 Laptop GPU, 80 Wh | |
|---|---|---|---|---|---|---|
| Battery runtime | 13% | -79% | 4% | 67% | 23% | |
| WiFi v1.3 (h) | 4.8 | 5.4 13% | 1 -79% | 5 4% | 8 67% | 5.9 23% |
| Reader / Idle (h) | 7.8 | 13.5 | ||||
| Load (h) | 1.6 | 1.6 | 1.5 | |||
| H.264 (h) | 5.6 | 8.8 |
Pros
Cons
判决书
与竞争对手的超薄游戏笔记本电脑相比,Eurocom RX315的主要优势在于 Razer Blade 15或 微星GS66的主要优势在于其较低的重量和较容易的可维修性。用户可以很容易地安装两个M.2固态硬盘,而Blade 15上只有一个,而GS66总体上是一个更大和更重的模型。对于经常旅行并希望安装第二块M.2固态硬盘的用户来说,这些特性可能是他们所希望的。
强大的超薄性能,易于维修,键盘按键舒适。
RX315的冷却解决方案和电池分别不如上述Razer或MSI替代品的有效或大。因此,Eurocom上的风扇噪音比较大,作为补偿,而电池寿命总体上比较短。机箱刚性也比Blade 15或GS66低一两级,给人的第一印象稍弱。
价格和可用性
Eurocom Nightsky RX315是,目前正在发货。起价为2750美元,配备Core i7-11800H CPU和GeForce RTX 3070 GPU。
Eurocom RX315 NH57AF1
- 03/08/2022 v7 (old)
Allen Ngo
Price comparison

