微星Pulse GL76笔记本电脑评测。105 W TGPGeForce RTX 3070图形
Pulse GL76是一款中端微星游戏笔记本,介于便宜的Katana或Sword系列和更昂贵的GE Raider或GT Titan系列之间。它基本上是较小的15.6英寸的17.3英寸版本的 脉冲GL66.2021年和2022年的GL76型号采用了相同的机箱设计。
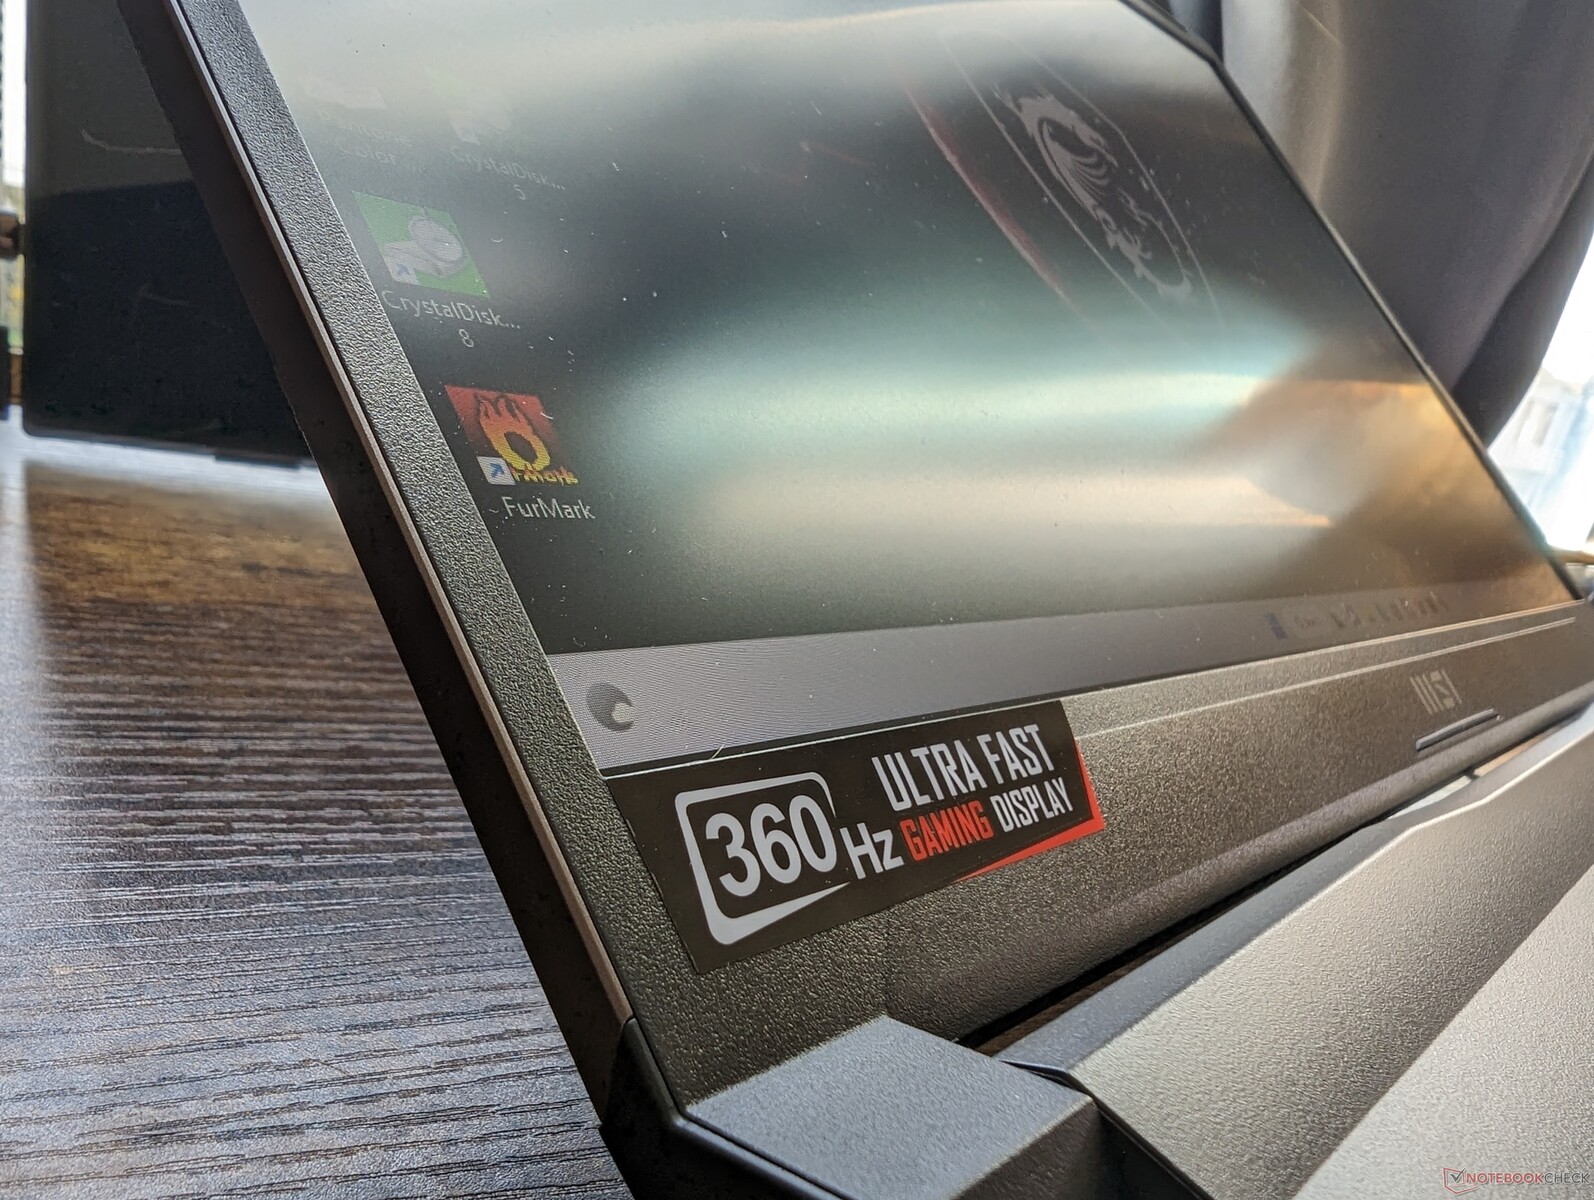
我们审查的单位是一个更高端的配置,配备12代酷睿i7-12700H CPU,105 WGeForce RTX 3070 GPU,以及360 Hz 1080p IPS显示屏,零售价约为1300美元。其他SKU可使用较慢的显示屏刷新率、GeForce RTX 3050/3050 Ti/3060 GPU或酷睿i5-12500H CPU。
脉冲GL76的竞争对手包括其他中档17.3英寸游戏笔记本电脑,如 Acer Nitro 5, 华硕TUF系列, 惠普Victus系列, 或 戴尔G系列.
更多MSI评论。
潜在的竞争对手比较
Rating | Date | Model | Weight | Height | Size | Resolution | Price |
|---|---|---|---|---|---|---|---|
| 83.2 % v7 (old) | 01 / 2023 | MSI Pulse GL76 12UGK i7-12700H, GeForce RTX 3070 Laptop GPU | 2.6 kg | 24.2 mm | 17.30" | 1920x1080 | |
| 86.1 % v7 (old) | 01 / 2023 | Alienware m17 R5 (R9 6900HX, RX 6850M XT) R9 6900HX, Radeon RX 6850M XT | 3.4 kg | 26.7 mm | 17.00" | 3840x2160 | |
| 86.9 % v7 (old) | 11 / 2022 | Asus ROG Strix Scar 17 SE G733CX-LL014W i9-12950HX, GeForce RTX 3080 Ti Laptop GPU | 2.9 kg | 28.3 mm | 17.30" | 2560x1440 | |
| 86.5 % v7 (old) | 11 / 2022 | Acer Predator Helios 300 (i7-12700H, RTX 3070 Ti) i7-12700H, GeForce RTX 3070 Ti Laptop GPU | 3 kg | 27.65 mm | 17.30" | 2560x1440 | |
| 89.9 % v7 (old) | 07 / 2022 | Razer Blade 17 Early 2022 i9-12900H, GeForce RTX 3080 Ti Laptop GPU | 2.8 kg | 19.9 mm | 17.30" | 3840x2160 | |
| 86.7 % v7 (old) | 05 / 2022 | MSI Vector GP76 12UGS-434 i7-12700H, GeForce RTX 3070 Ti Laptop GPU | 2.9 kg | 25.9 mm | 17.30" | 1920x1080 |
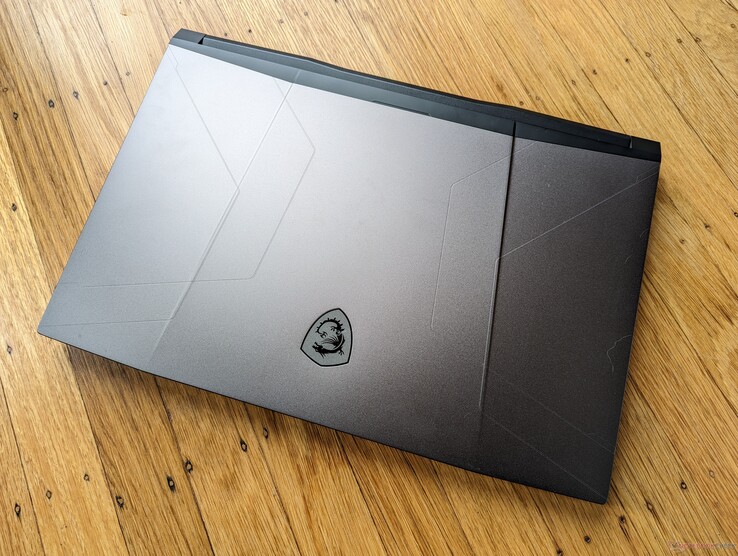
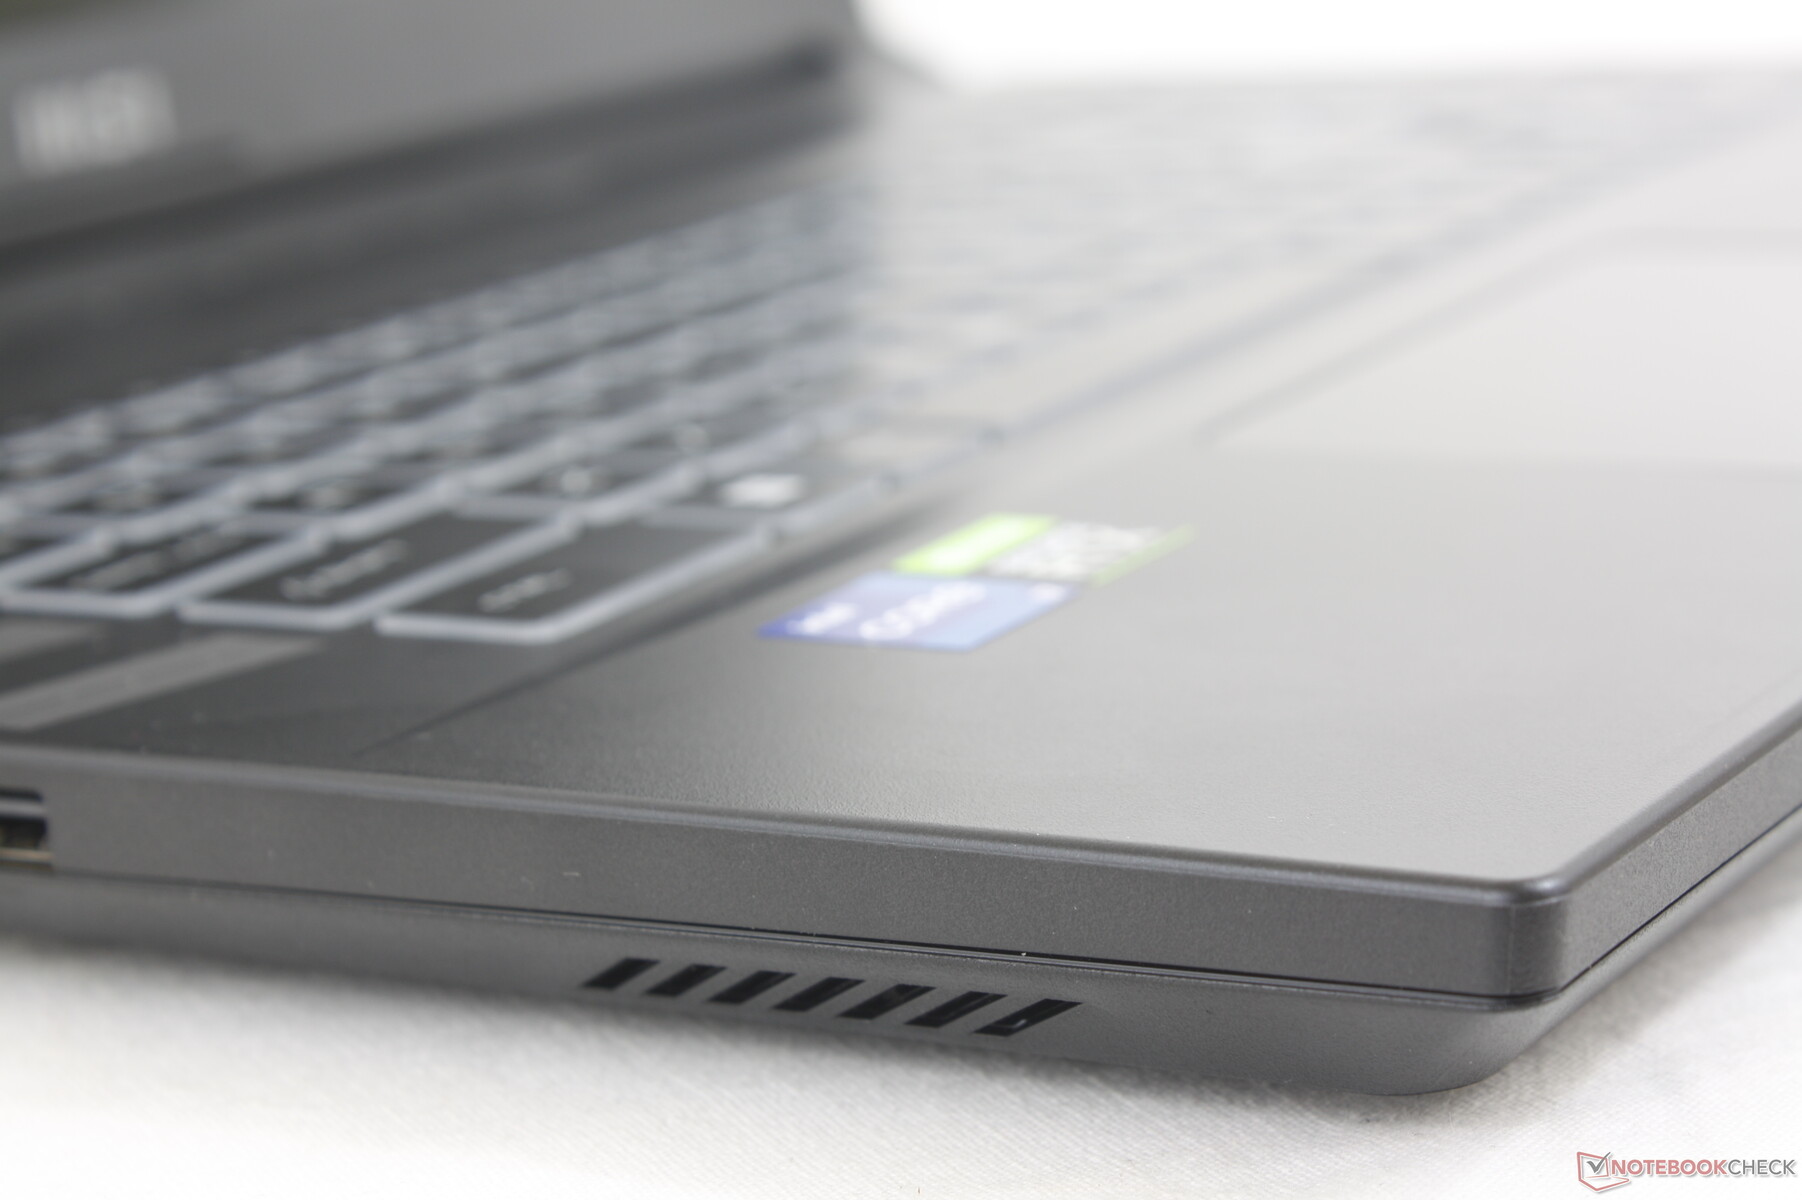
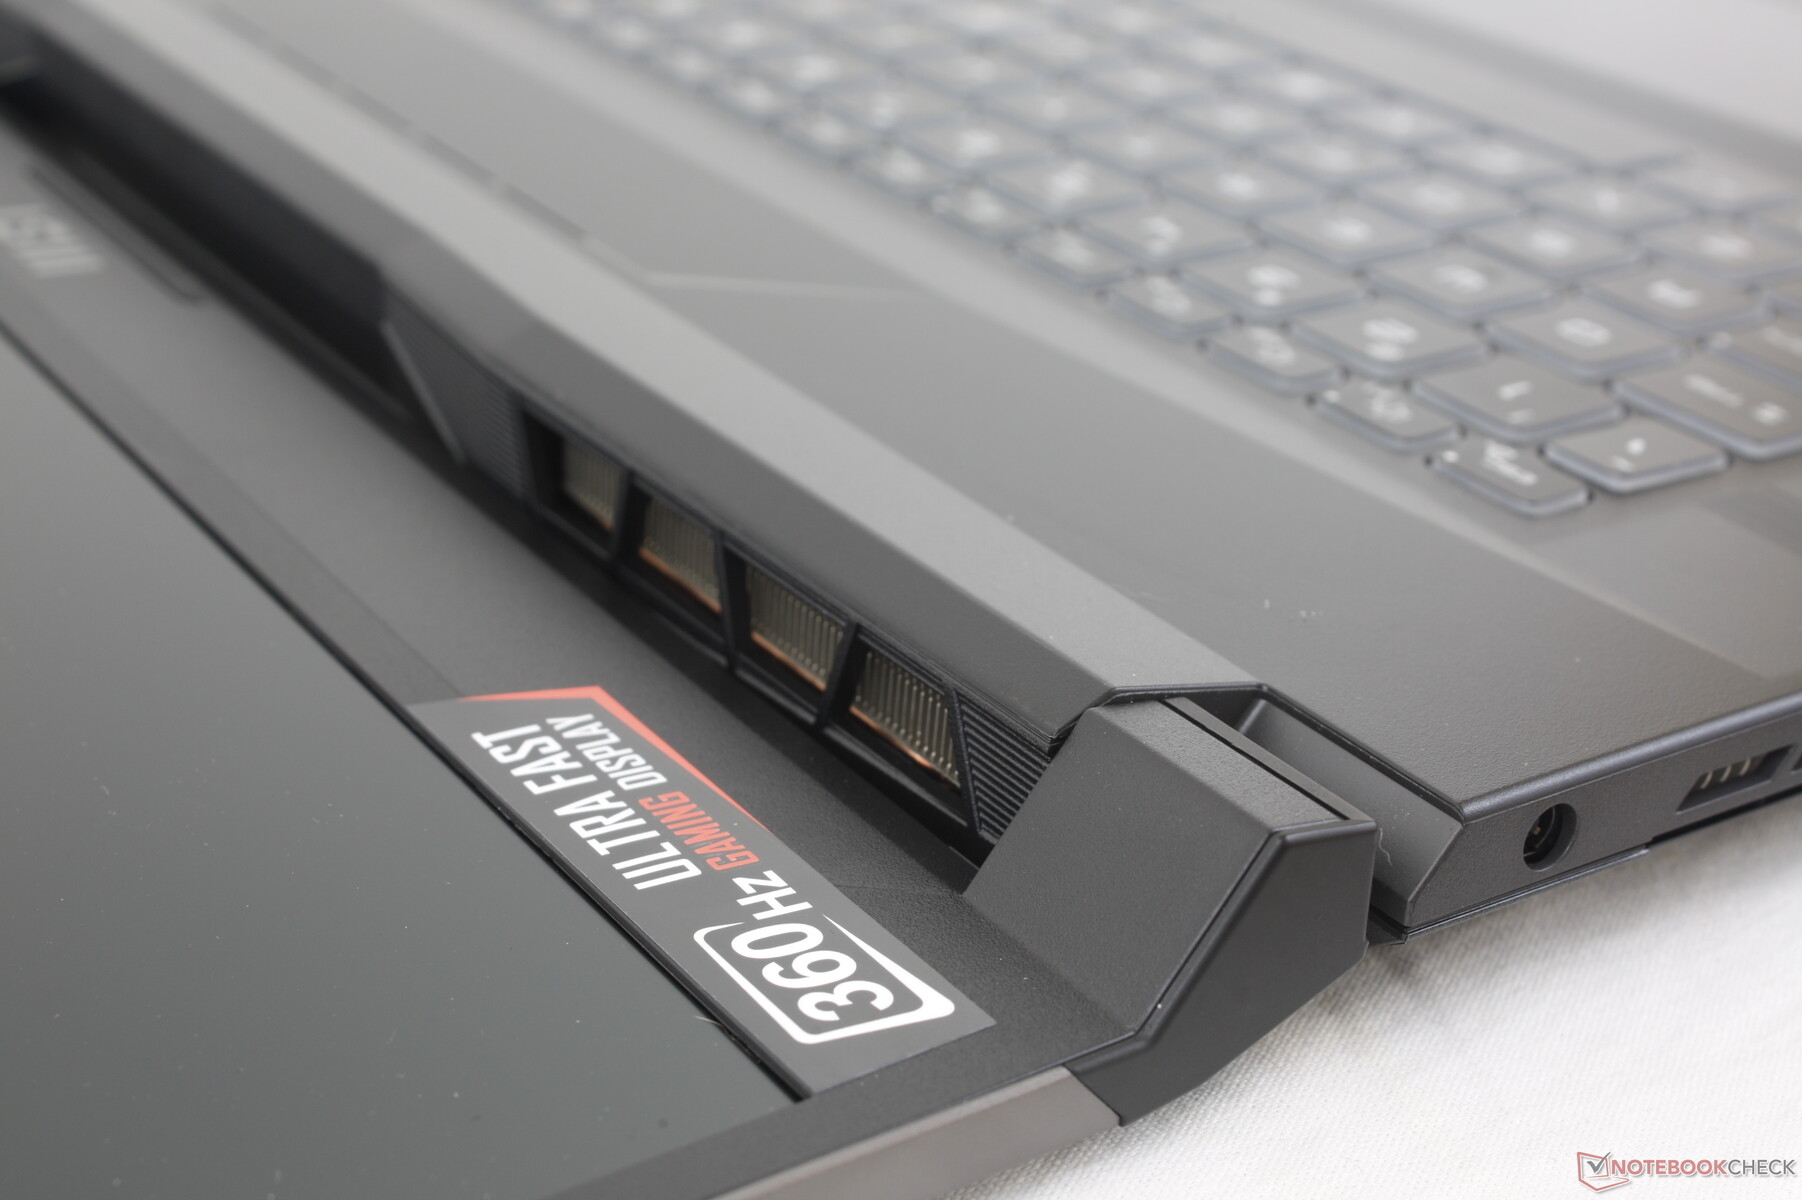
外壳 - 没有花哨的颜色或LED
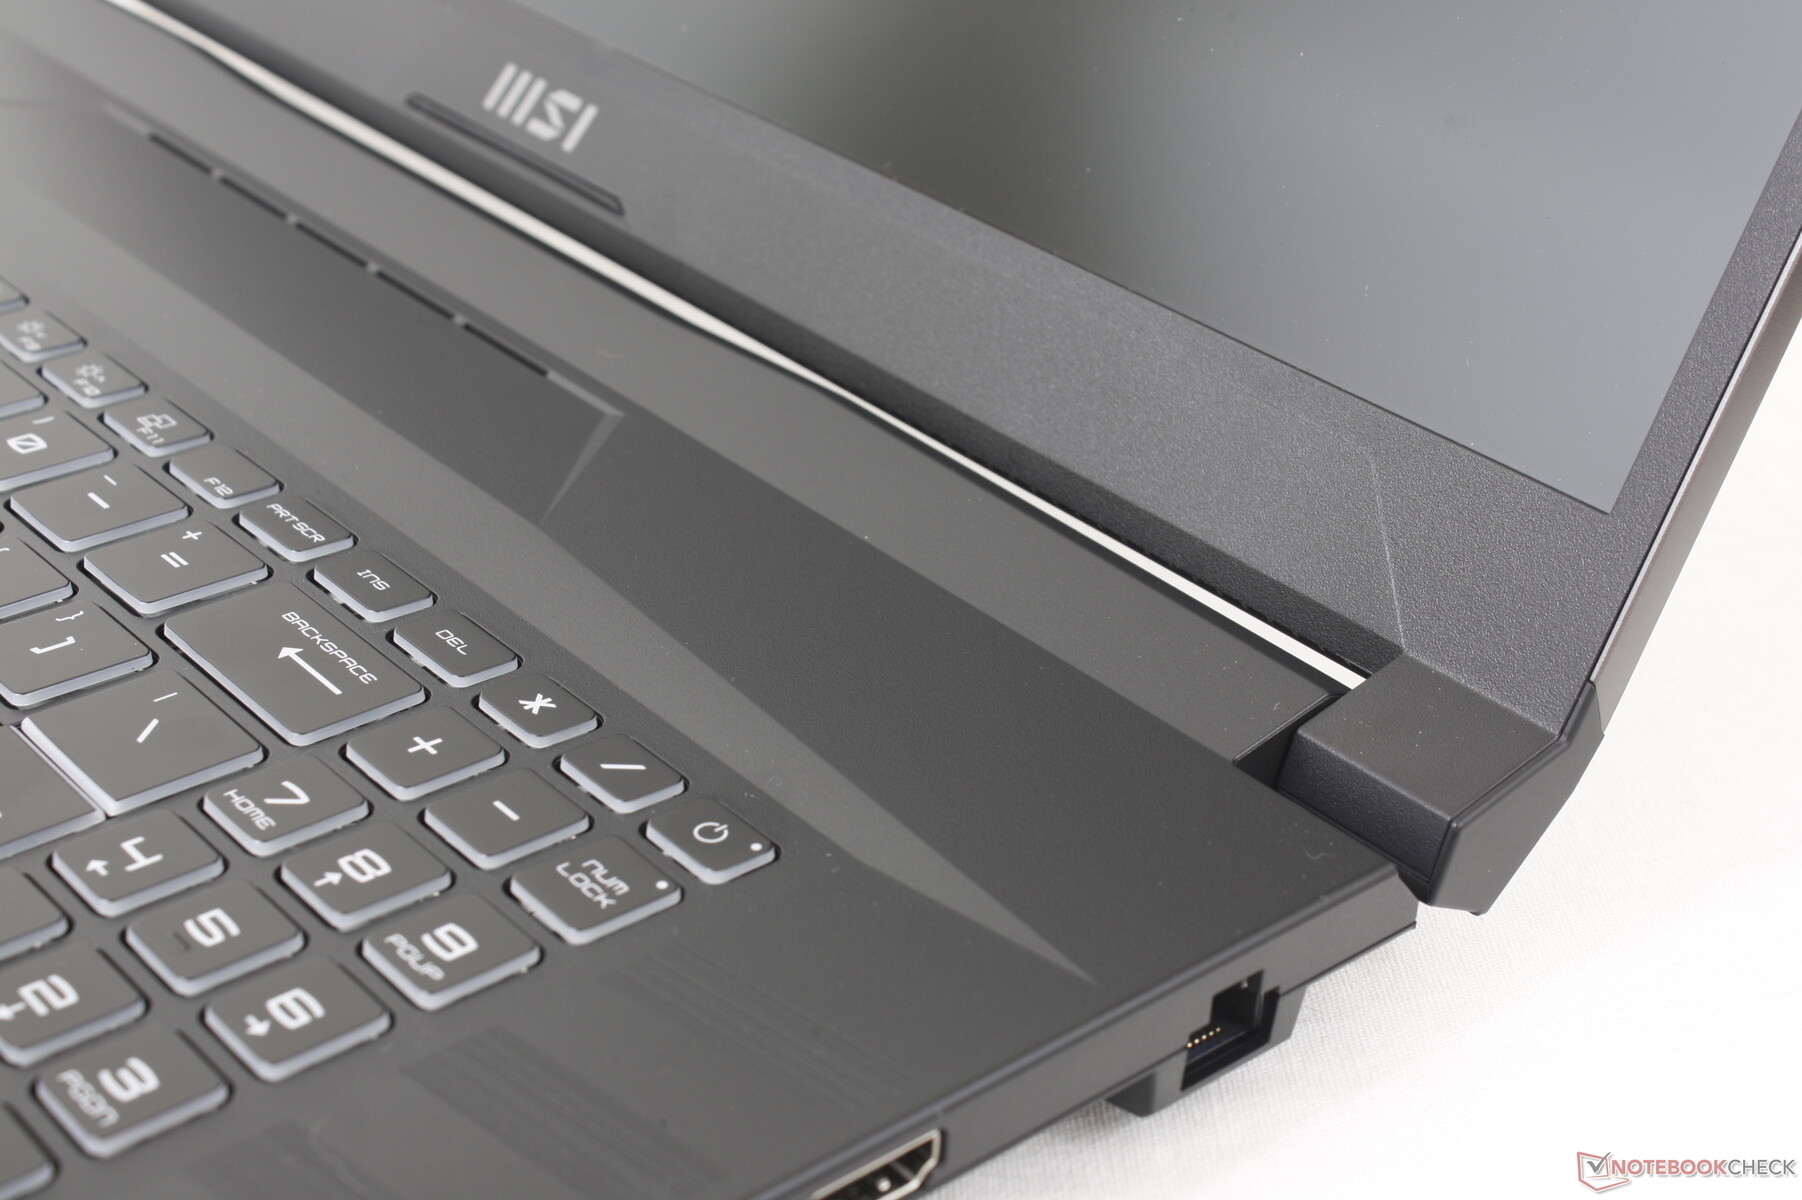
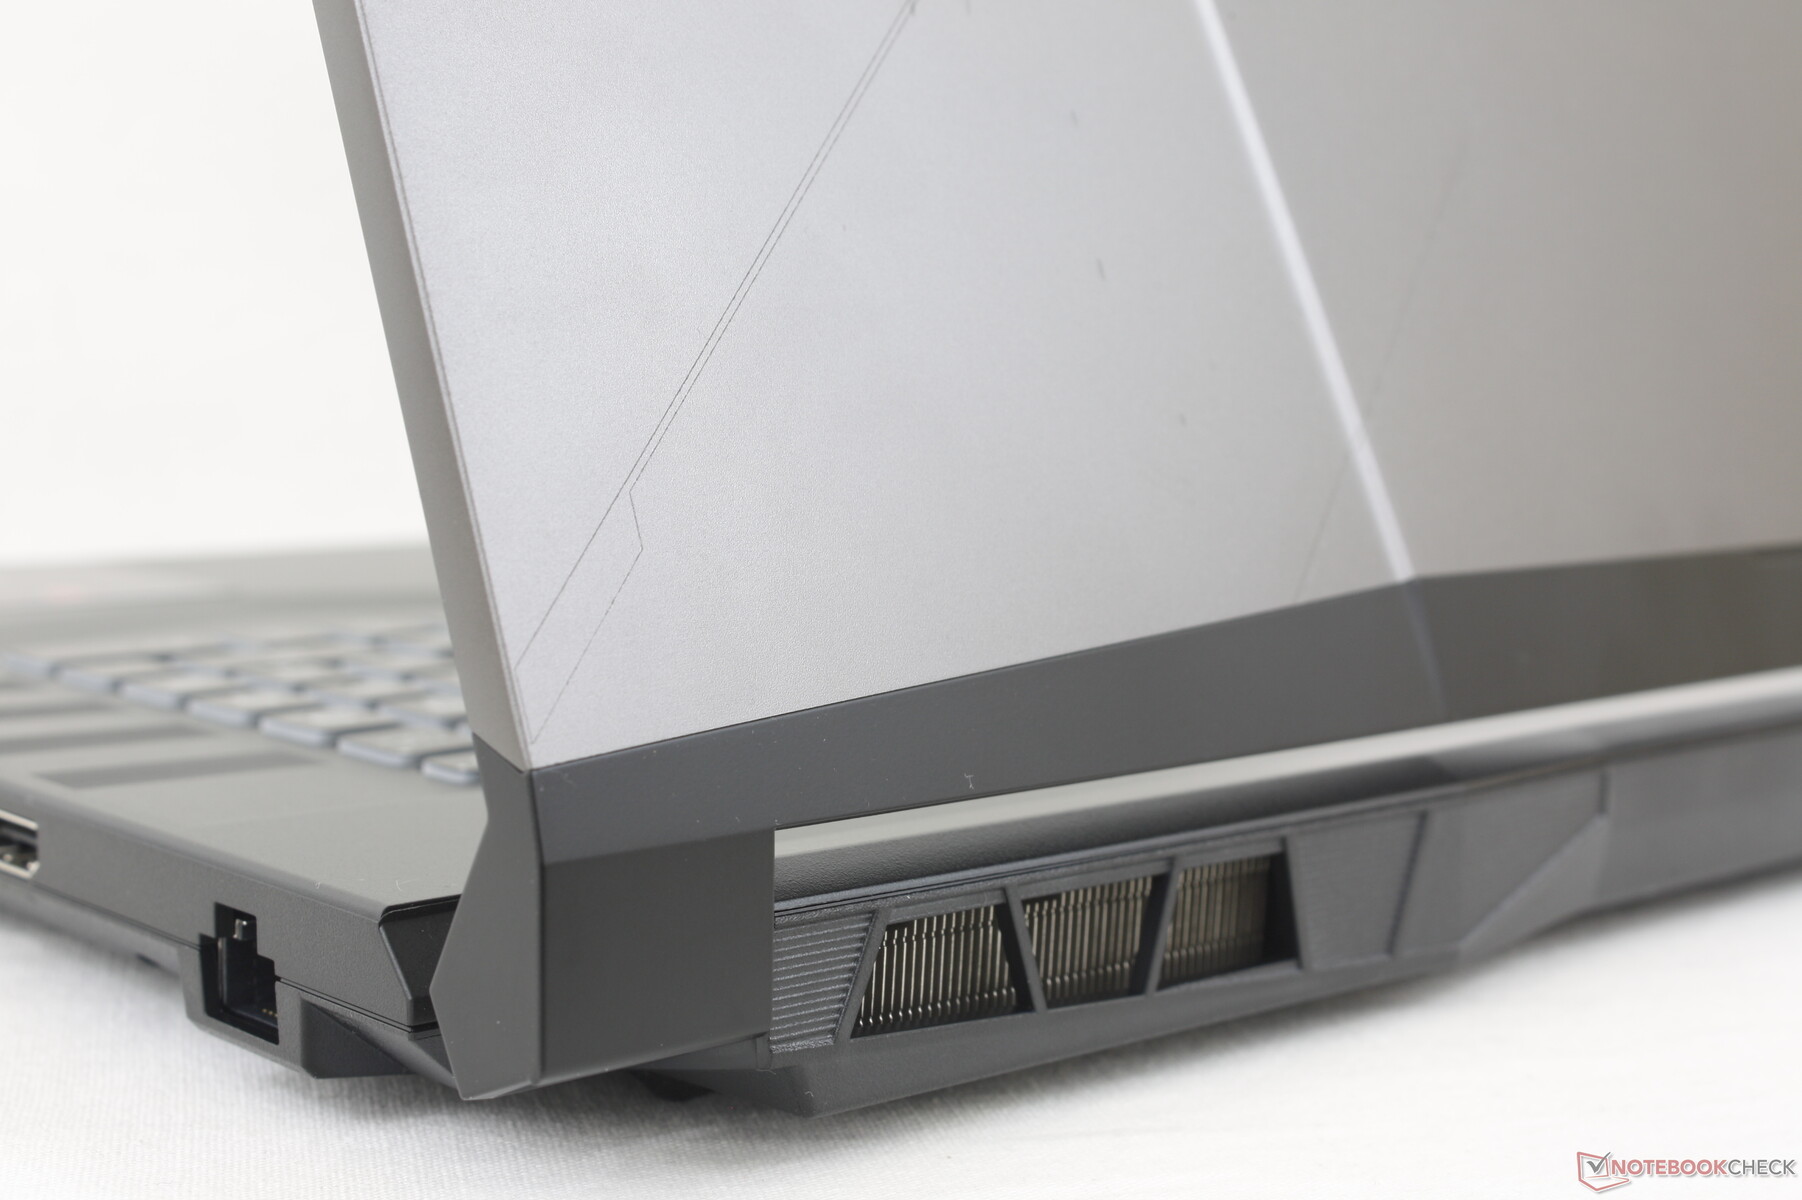
机箱大部分是塑料的,就像所有微星的预算和中档游戏笔记本一样。它缺乏豪华的触感,华丽的LED,以及像微星GE77这样的高端机型的平滑感觉。 微星GE77或 Razer Blade 17给人一种更平淡的印象。这并不令人惊讶,因为在削减预算和中端游戏模型的成本时,外观是最先被砍掉的东西之一。
值得庆幸的是,机箱的刚度没有受到影响。虽然塑料表面的触感比GE、GS或GT型号的便宜,但它们还是相当坚固的,即使在键盘中心或外盖上也能抵抗扭曲或凹陷。也没有大的吱嘎声问题。然而,铰链可以在更大的角度上更硬,以获得更好的寿命感。
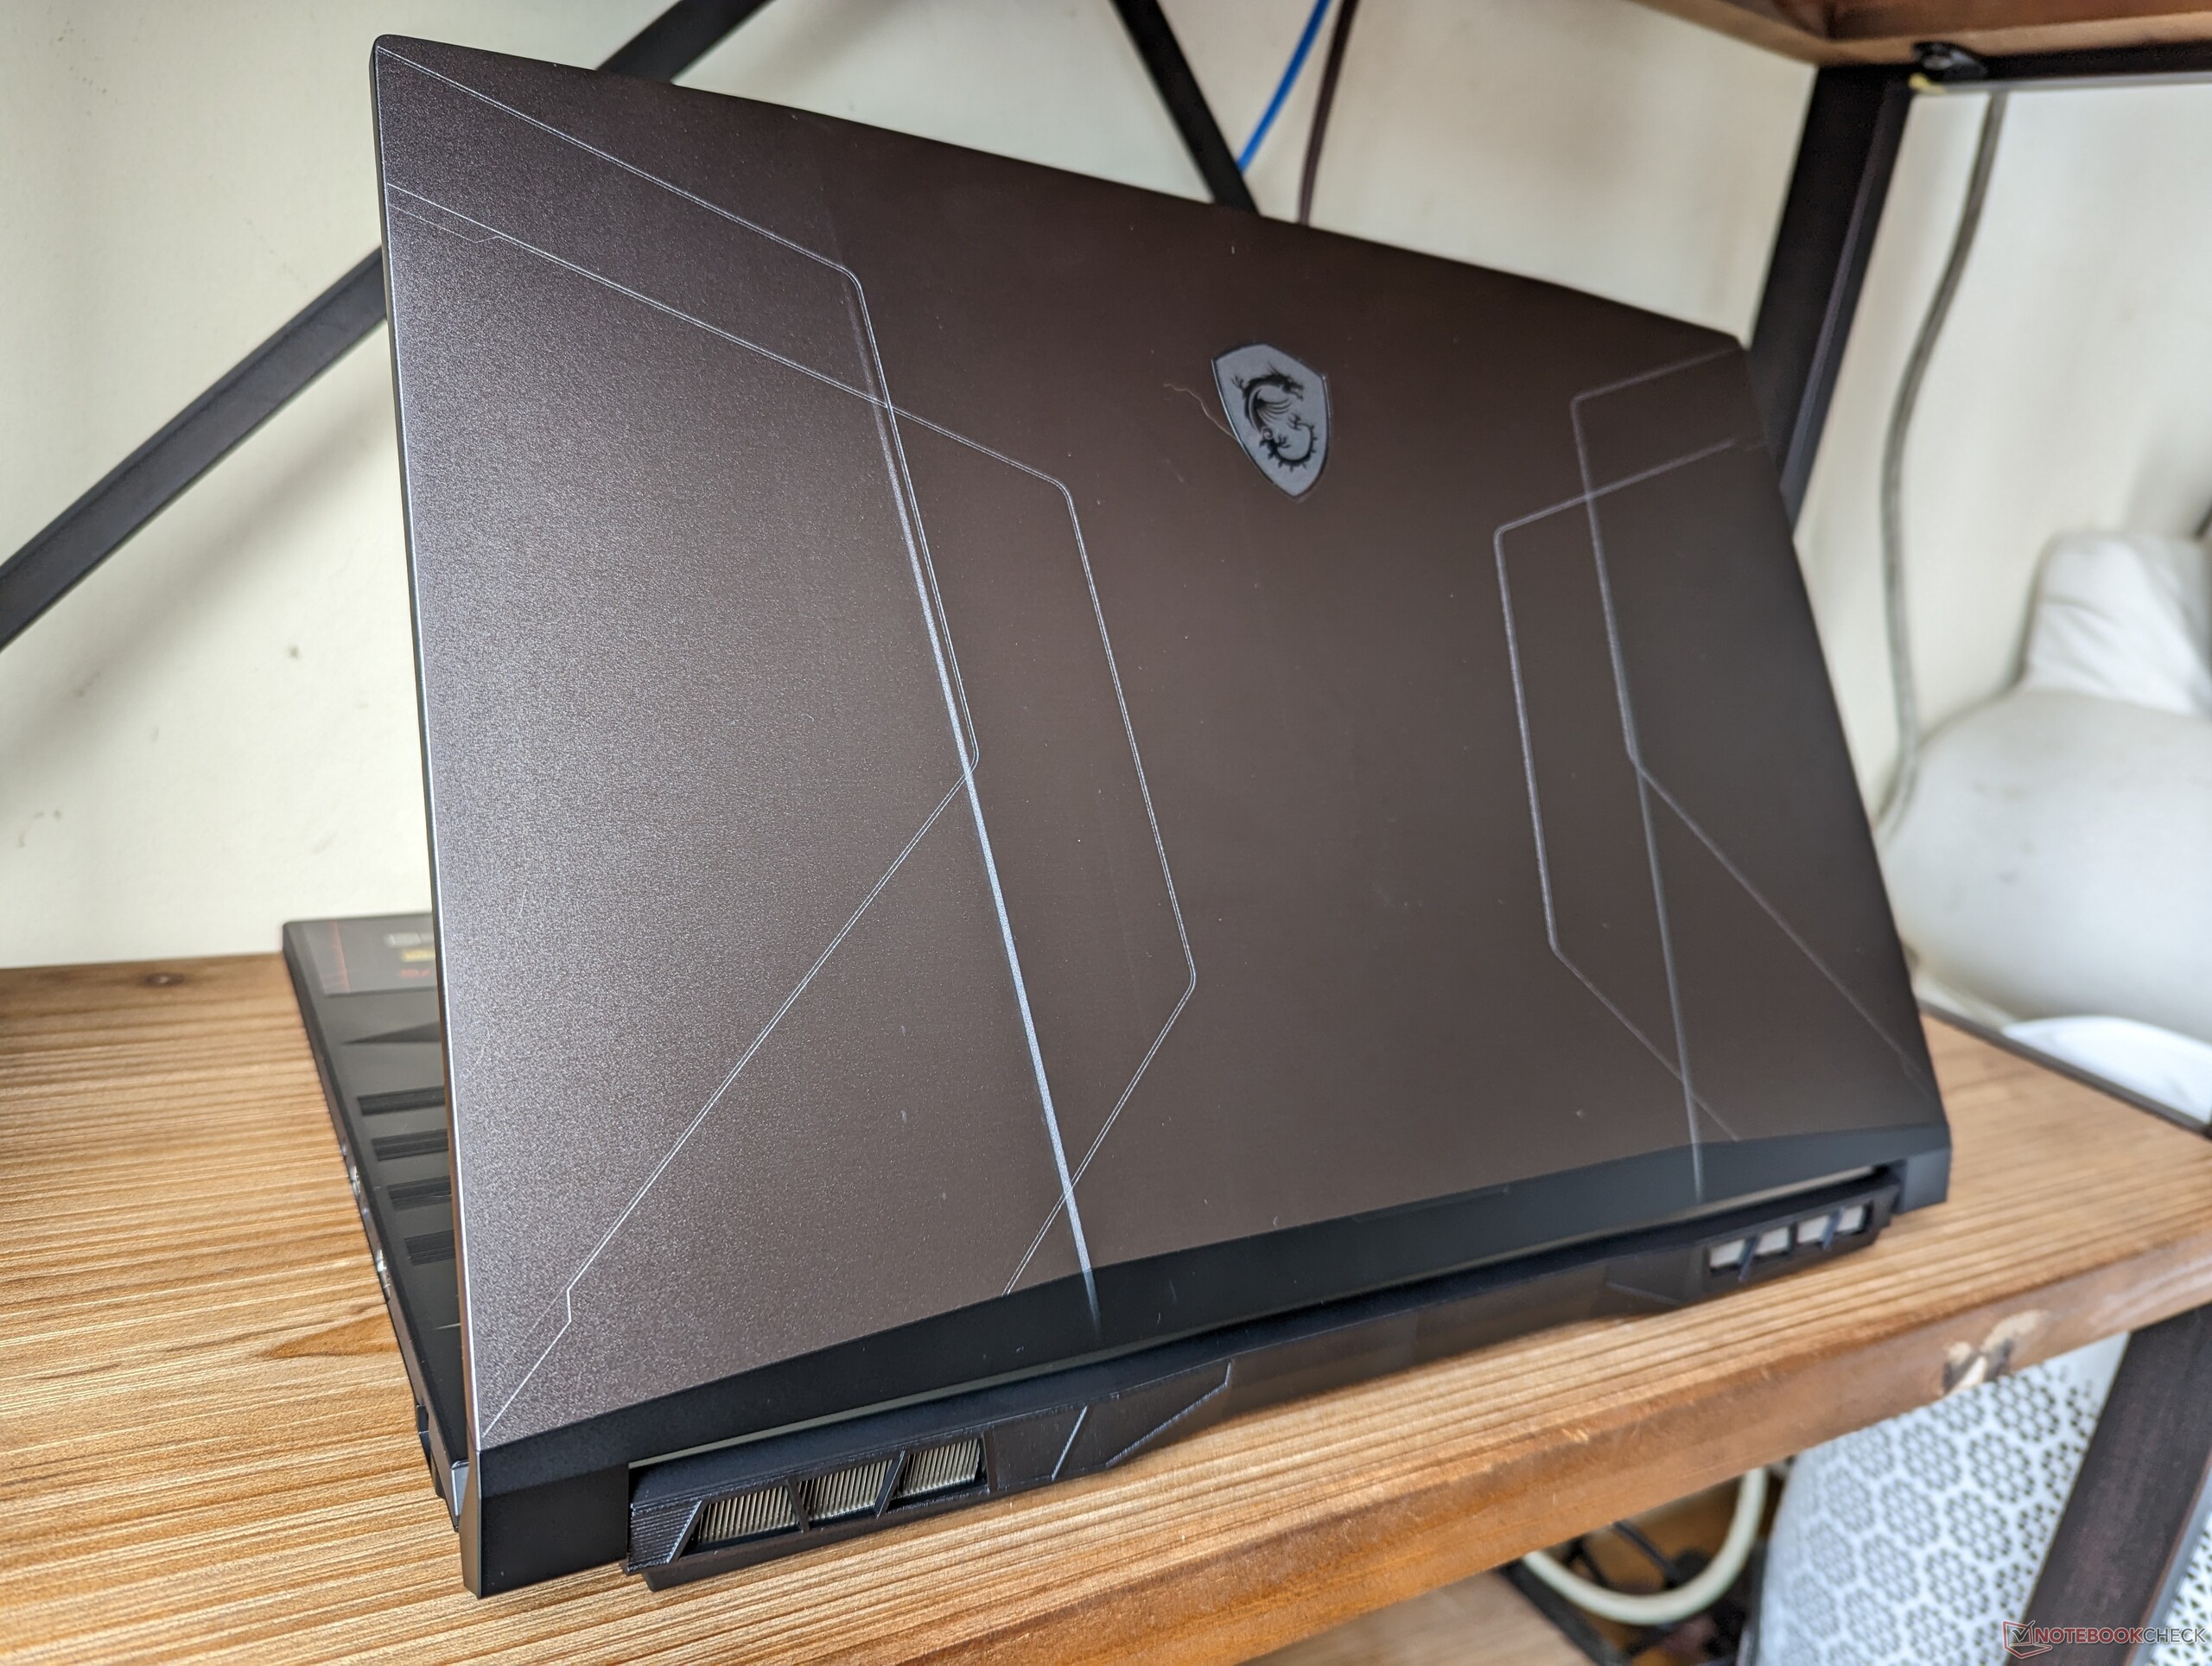
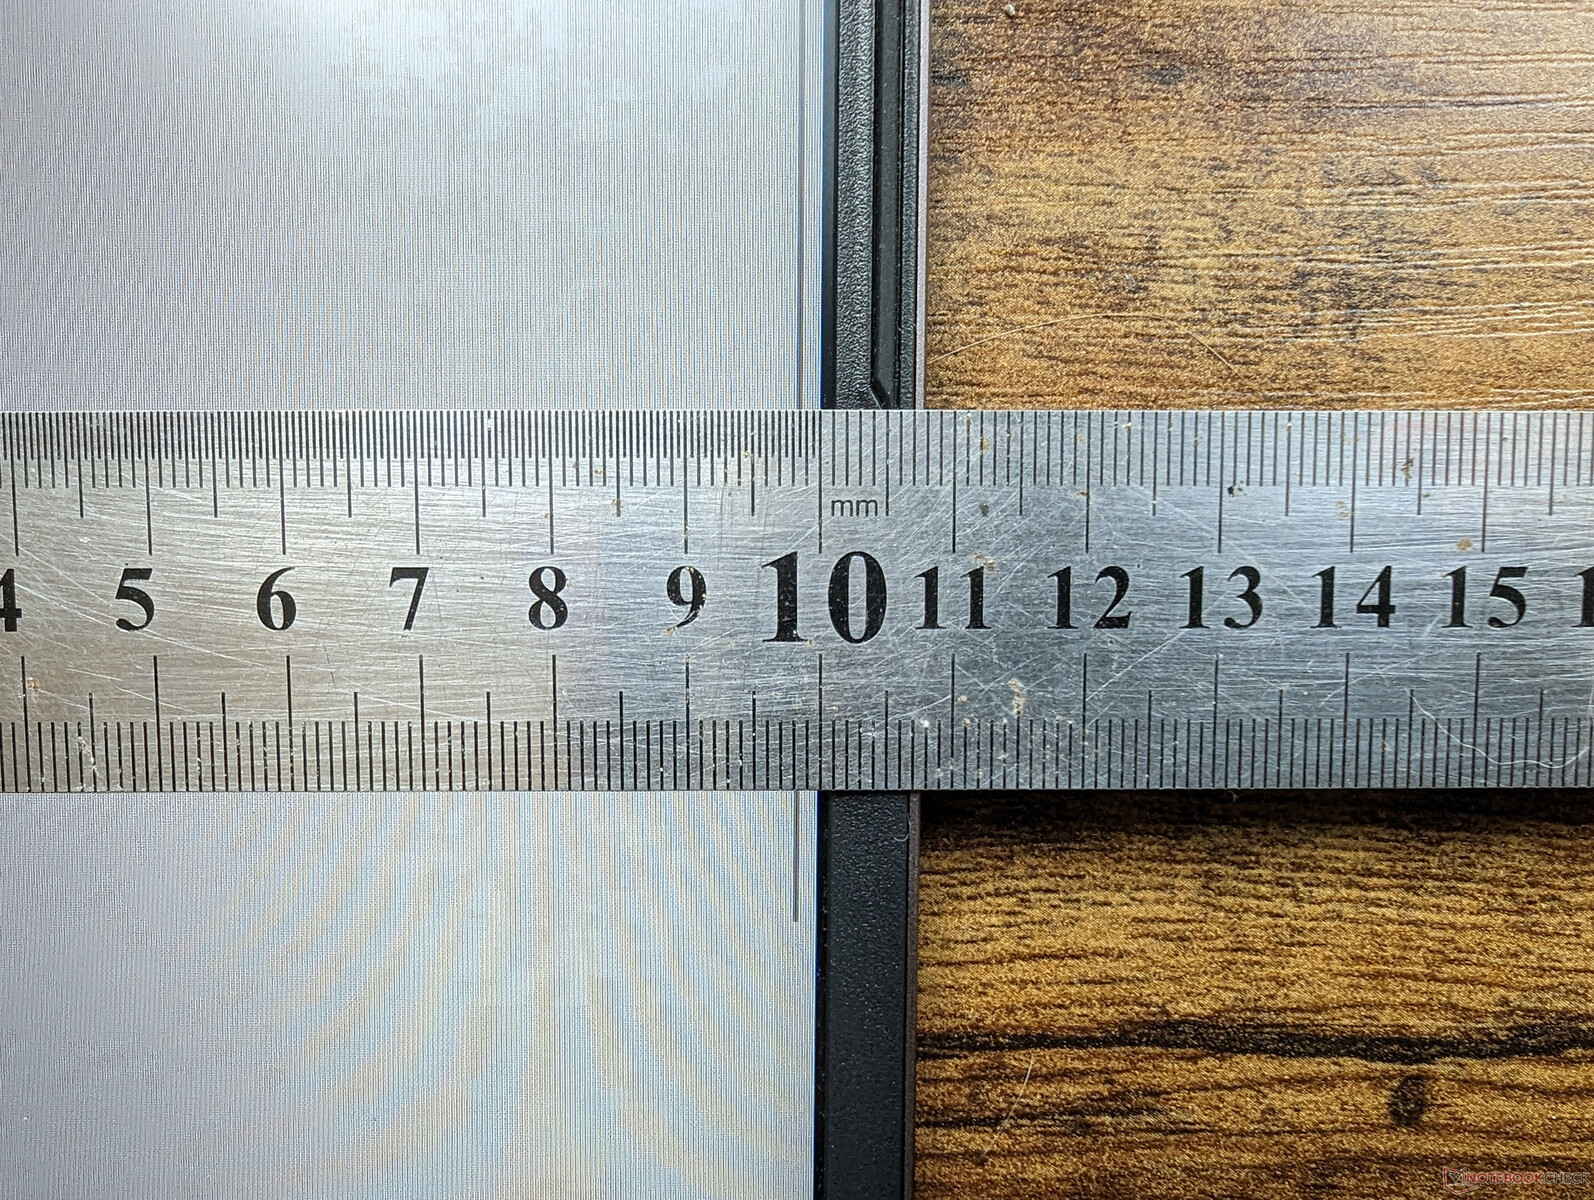
该系统比预期的要轻,特别是对于17.3英寸的游戏笔记本电脑。在2.6公斤,它比Razer Blade 17,华硕ROG Strix Scar 17,和宏碁掠夺者Helios 300各有几百克的重量。重量上的优势可能是由于GL76机箱设计的长度明显缩短。然而,它有一点宽,但重量的节省弥补了稍长的足迹。
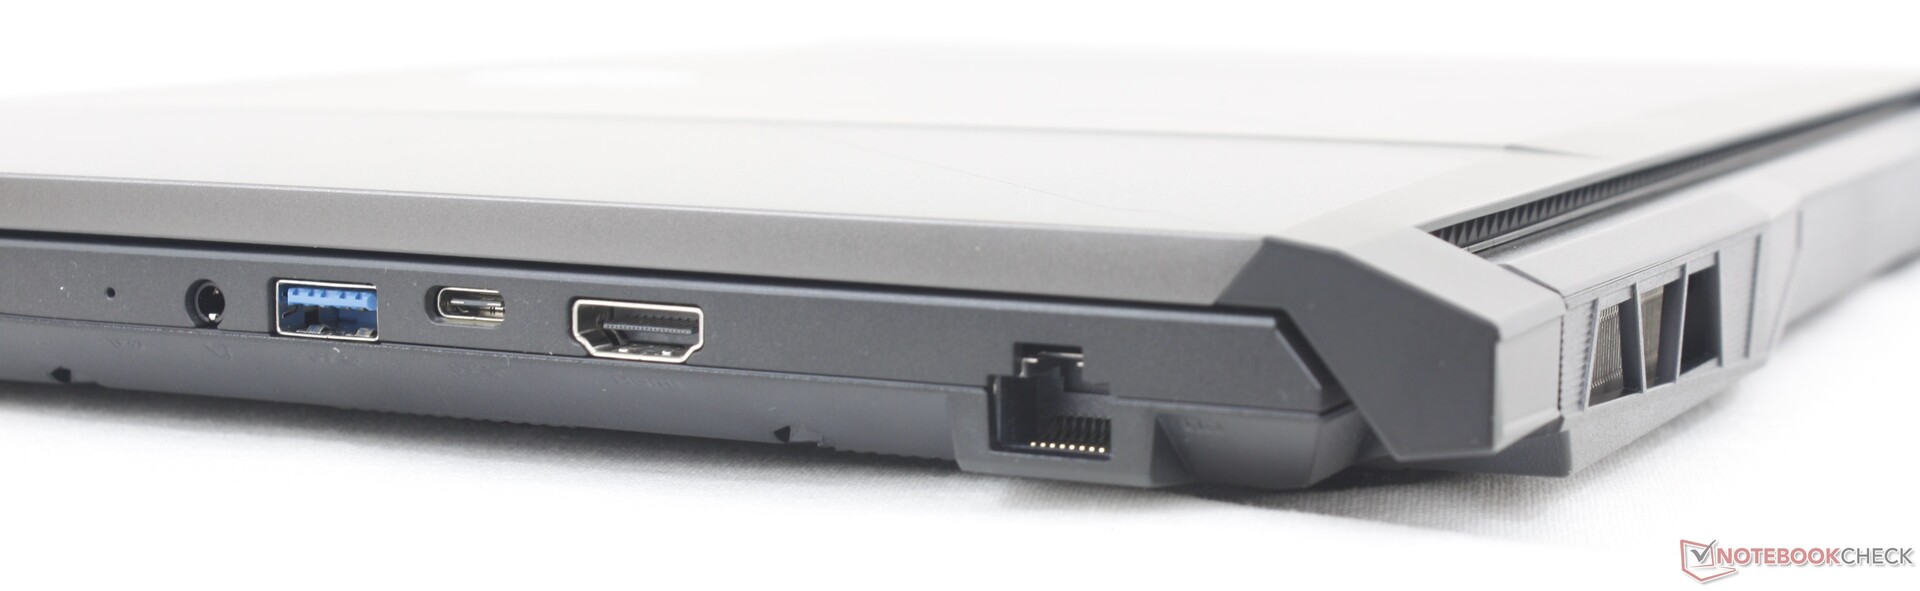
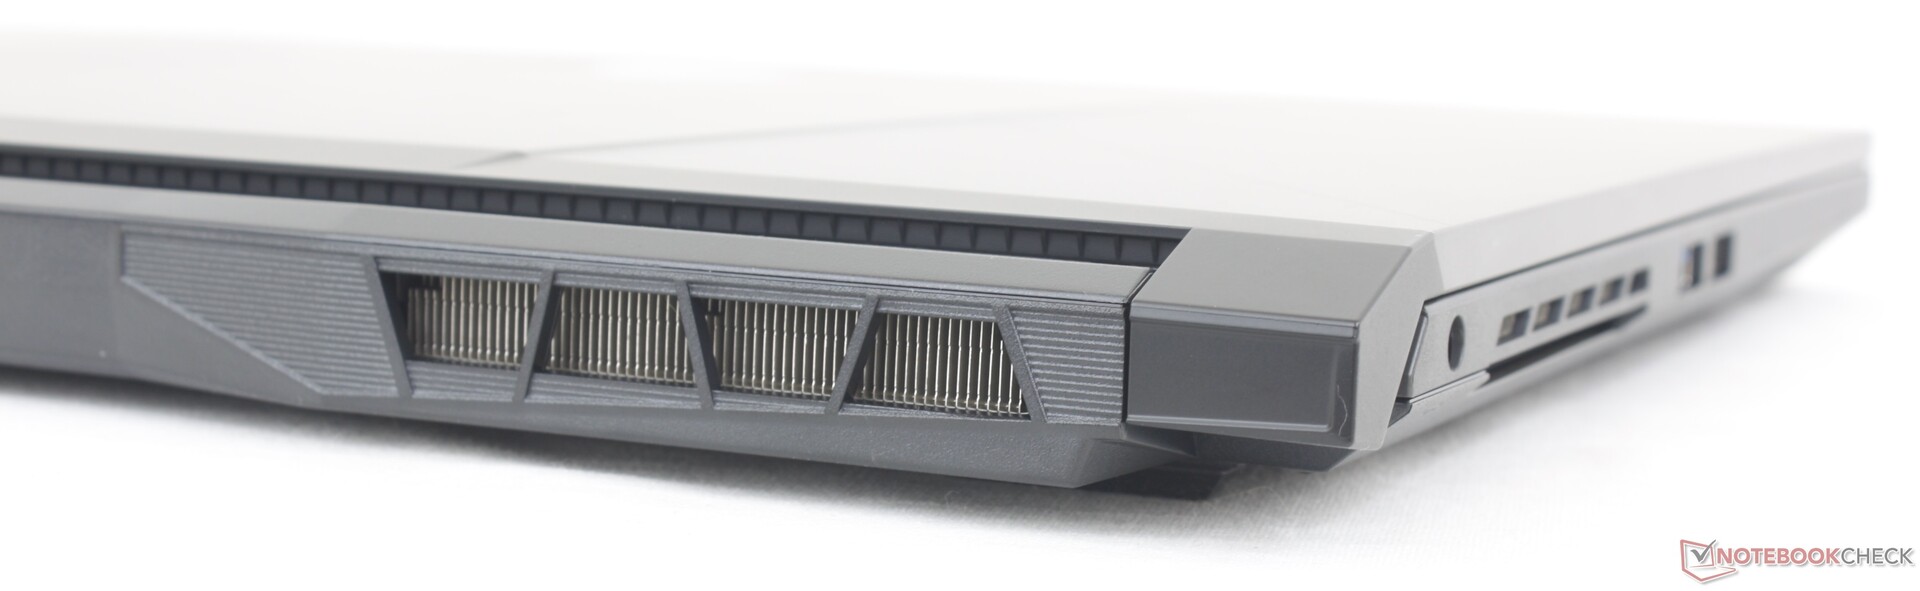
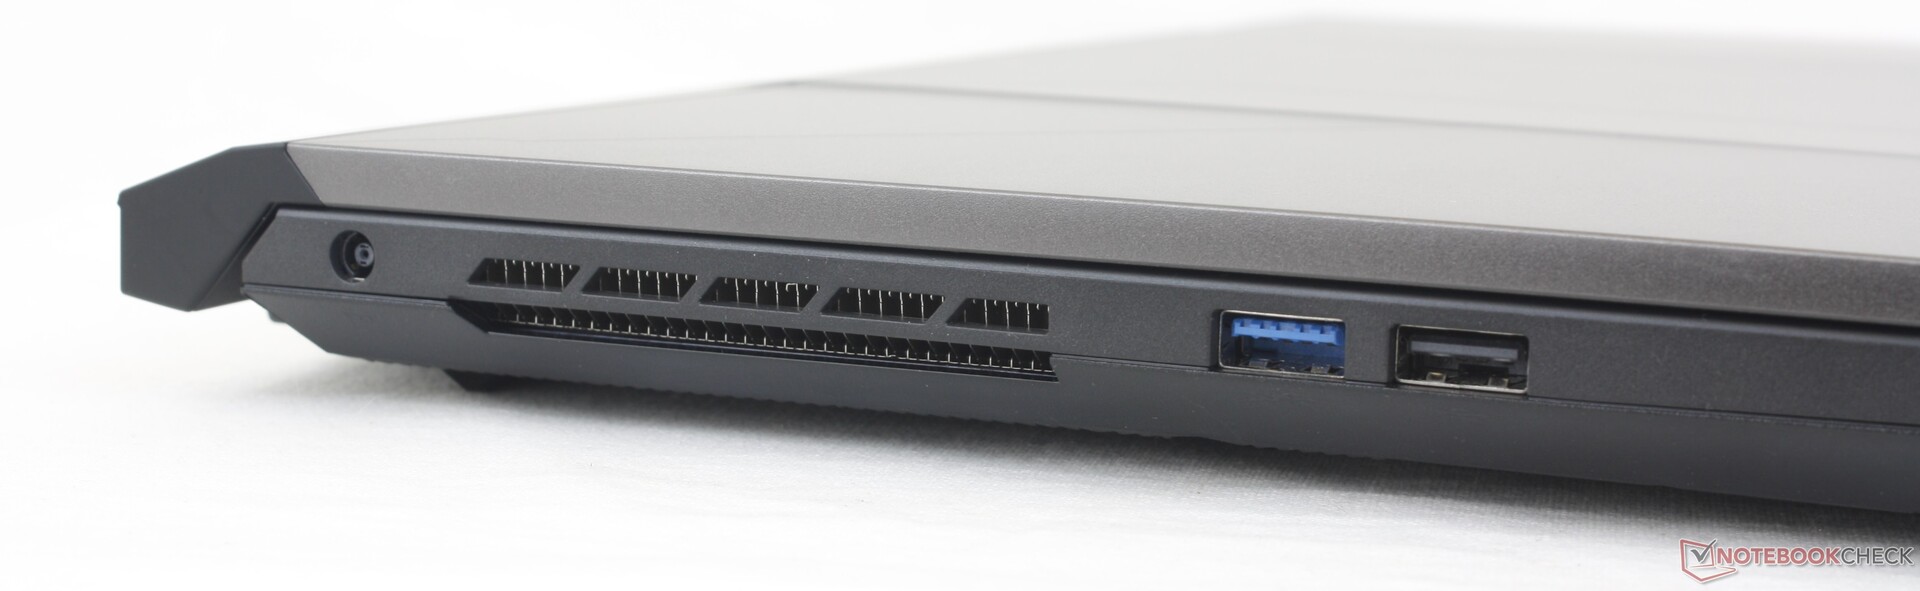
连接性 - 对于尺寸来说是有限的
与其他中端游戏笔记本电脑相比,端口选项更为有限,如 戴尔G16,宏碁Nitro 5,或华硕TUF G17。这里最重要的遗漏是缺乏对Thunderbolt的支持,而前面提到的三个替代品都有这种支持。这可能是微星有意识的努力,鼓励用户考虑更高端的GE、GS或GT系列。
不支持DisplayPort-over-USB。我们的测试设备无法通过USB-C识别任何外部显示器。
沟通
英特尔AX201是Wi-Fi 6和蓝牙5.2连接的标准配置。Wi-Fi 6E不包括在内,可能是为了节省成本,但最终用户的升级还是很直接的。当与我们的华硕AXE11000路由器配对时,性能仍然稳定,没有明显的问题。
| Networking | |
| iperf3 transmit AX12 | |
| MSI Vector GP76 12UGS-434 | |
| iperf3 receive AX12 | |
| MSI Vector GP76 12UGS-434 | |
| iperf3 receive AXE11000 6GHz | |
| Asus ROG Strix Scar 17 SE G733CX-LL014W | |
| Acer Predator Helios 300 (i7-12700H, RTX 3070 Ti) | |
| iperf3 receive AXE11000 | |
| Razer Blade 17 Early 2022 | |
| MSI Pulse GL76 12UGK | |
| Alienware m17 R5 (R9 6900HX, RX 6850M XT) | |
| iperf3 transmit AXE11000 | |
| MSI Pulse GL76 12UGK | |
| Alienware m17 R5 (R9 6900HX, RX 6850M XT) | |
| iperf3 transmit AXE11000 6GHz | |
| Asus ROG Strix Scar 17 SE G733CX-LL014W | |
| Acer Predator Helios 300 (i7-12700H, RTX 3070 Ti) | |
网络摄像头
集成的720p网络摄像头产生的照片颜色很差,很浑浊。一个非游戏的替代品,如 HP Spectre如果摄像头质量很重要的话,建议使用惠普Spectre这样的非游戏产品。
数码相机关闭开关与F7键绑定,同时不支持Windows Hello。


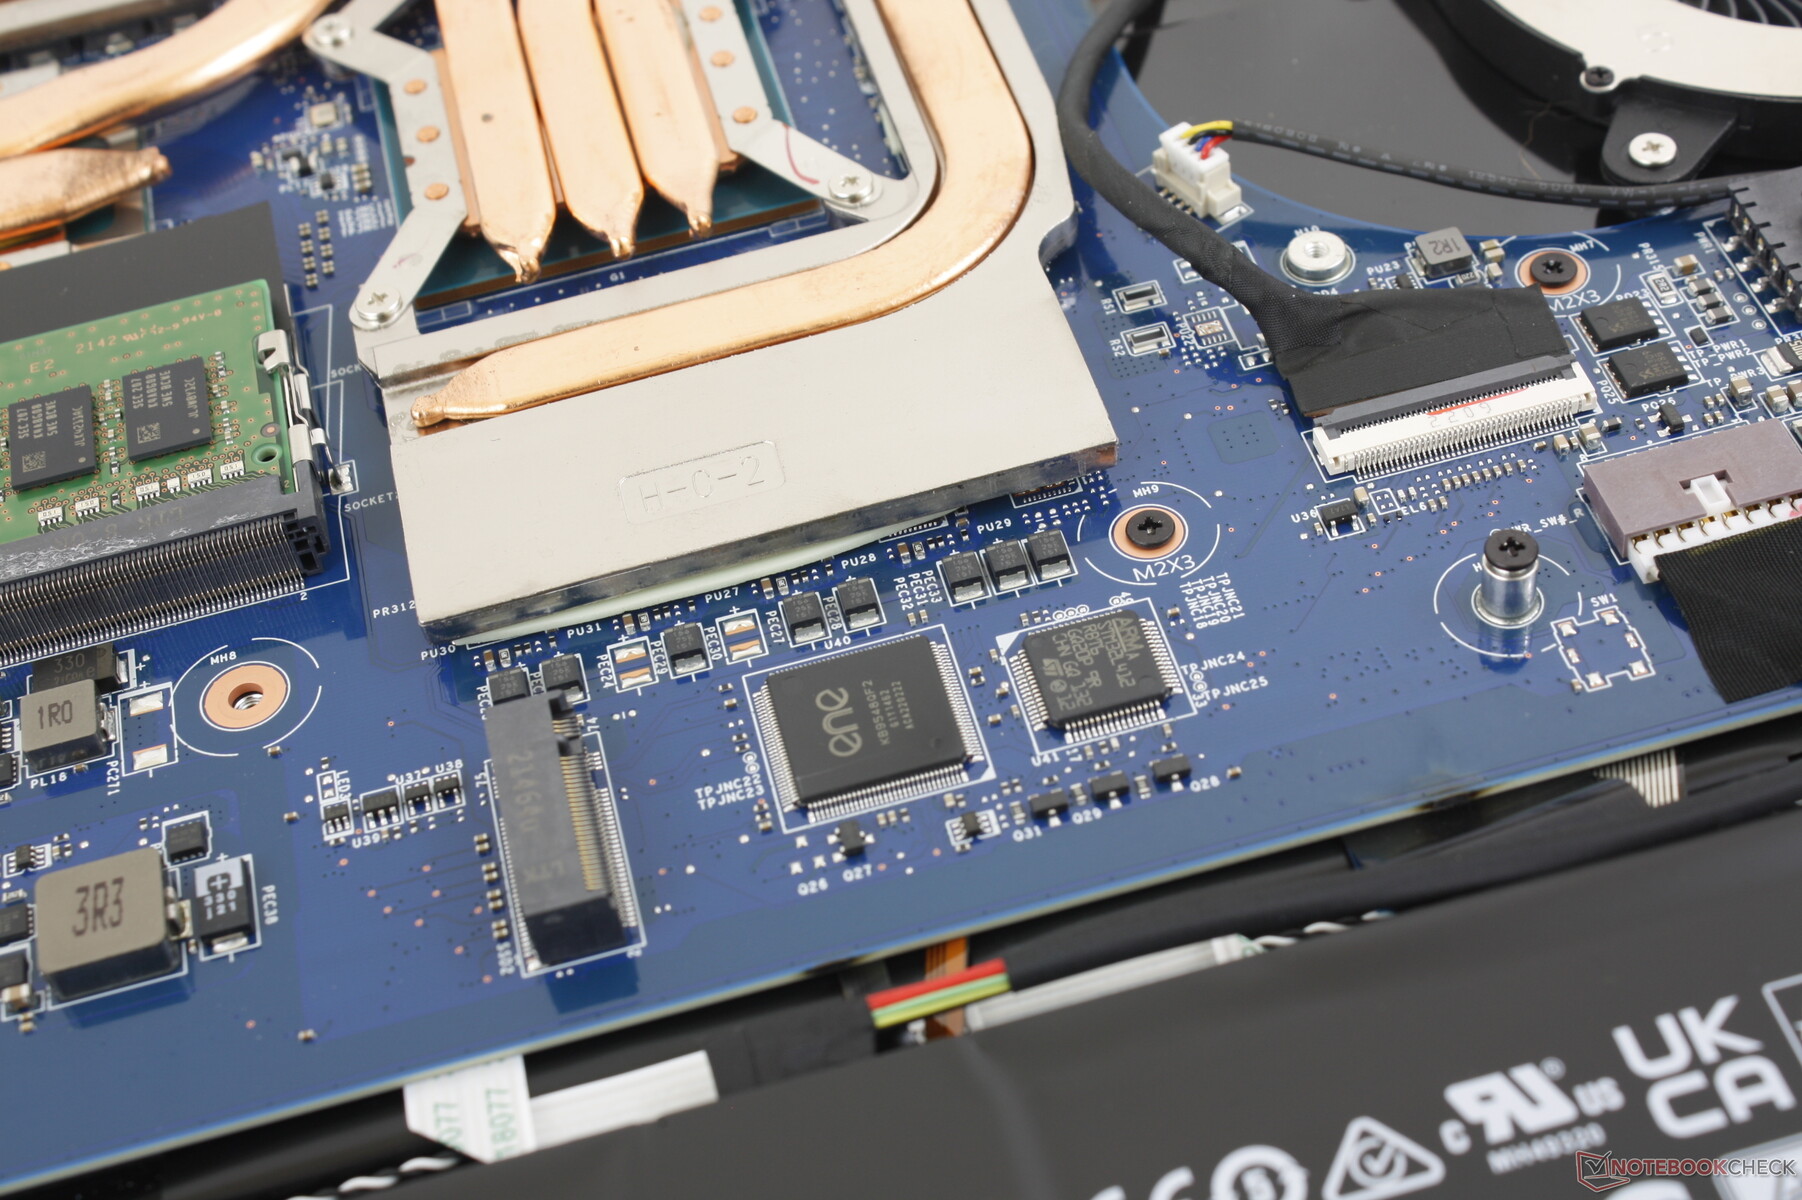
维护
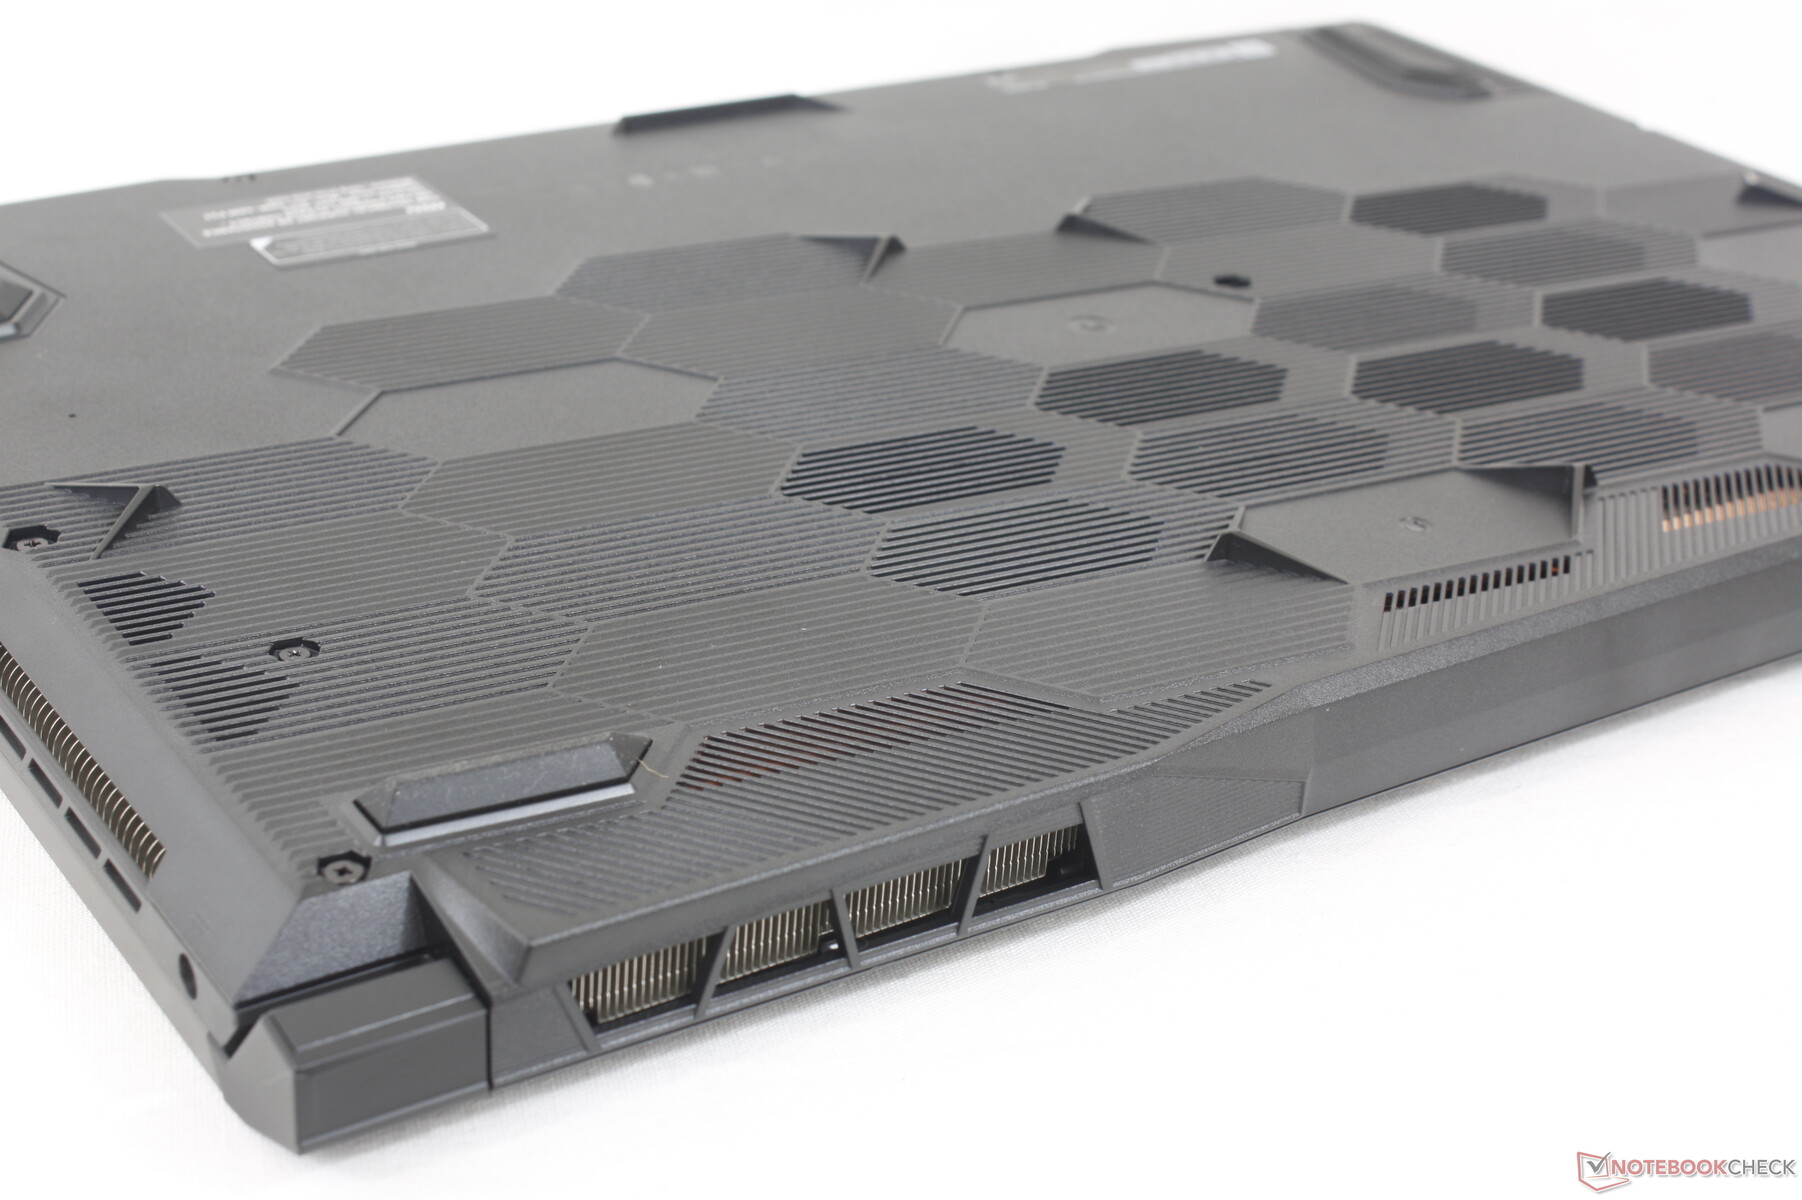
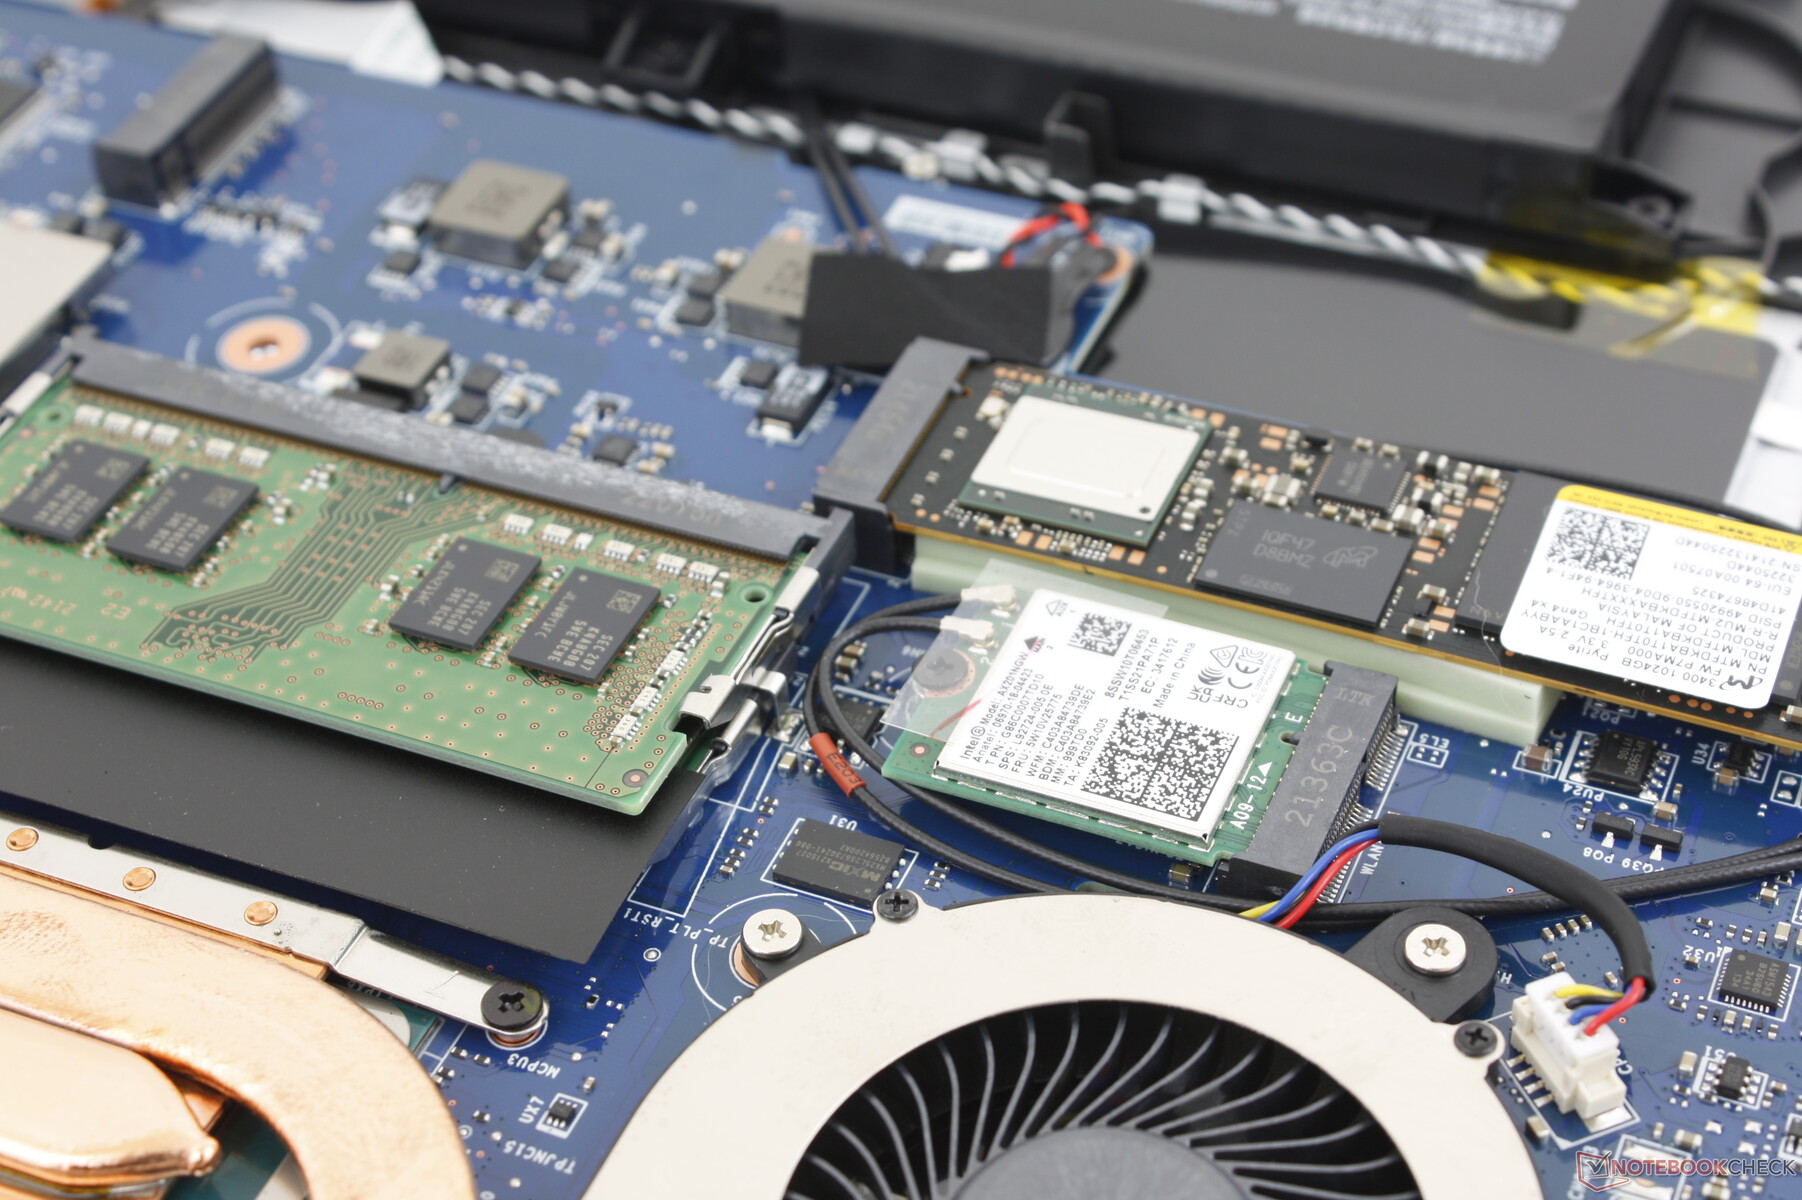
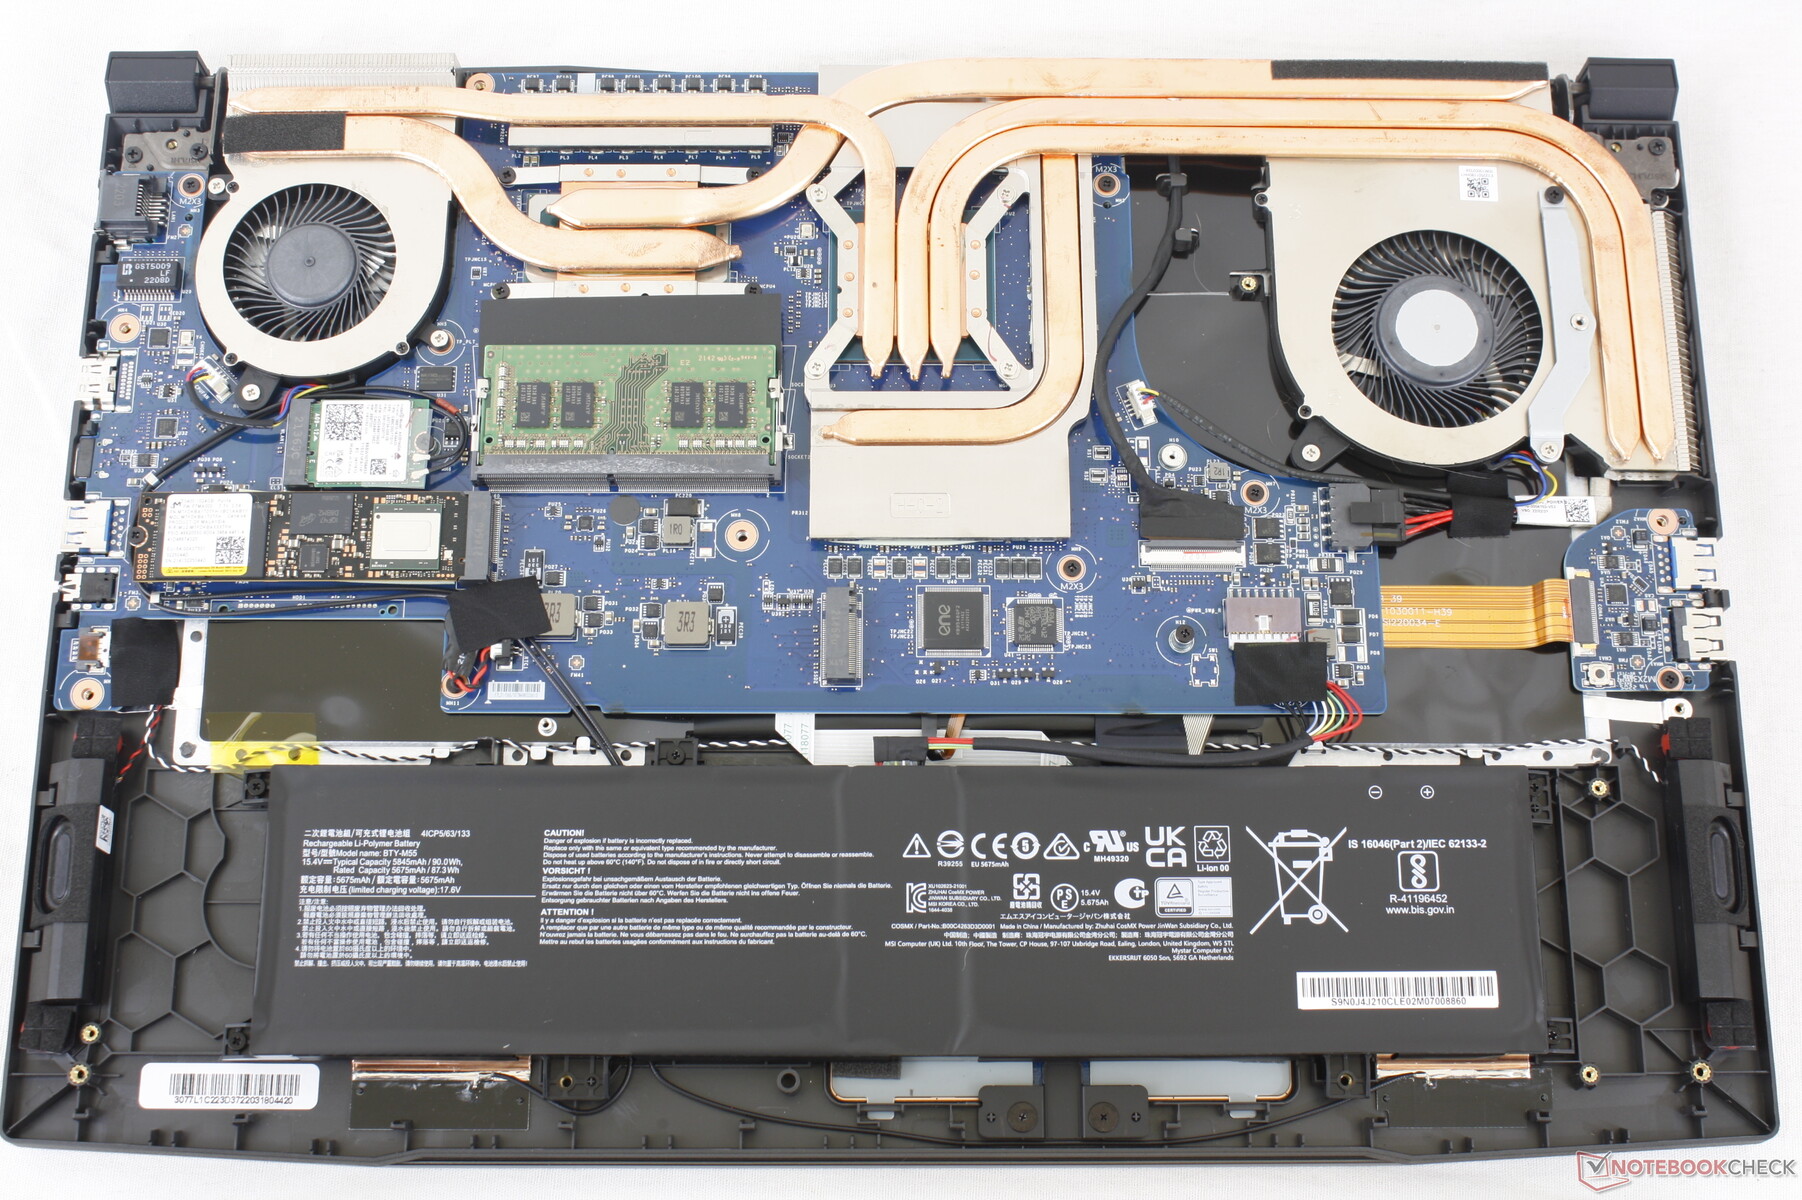
底部面板由13颗容易拆卸的飞利浦螺钉固定。然而,请记住,必须打破工厂密封贴纸才能这样做。微星仍然是极少数有工厂密封贴纸的主要制造商之一,即使是简单的升级,如内存或存储。
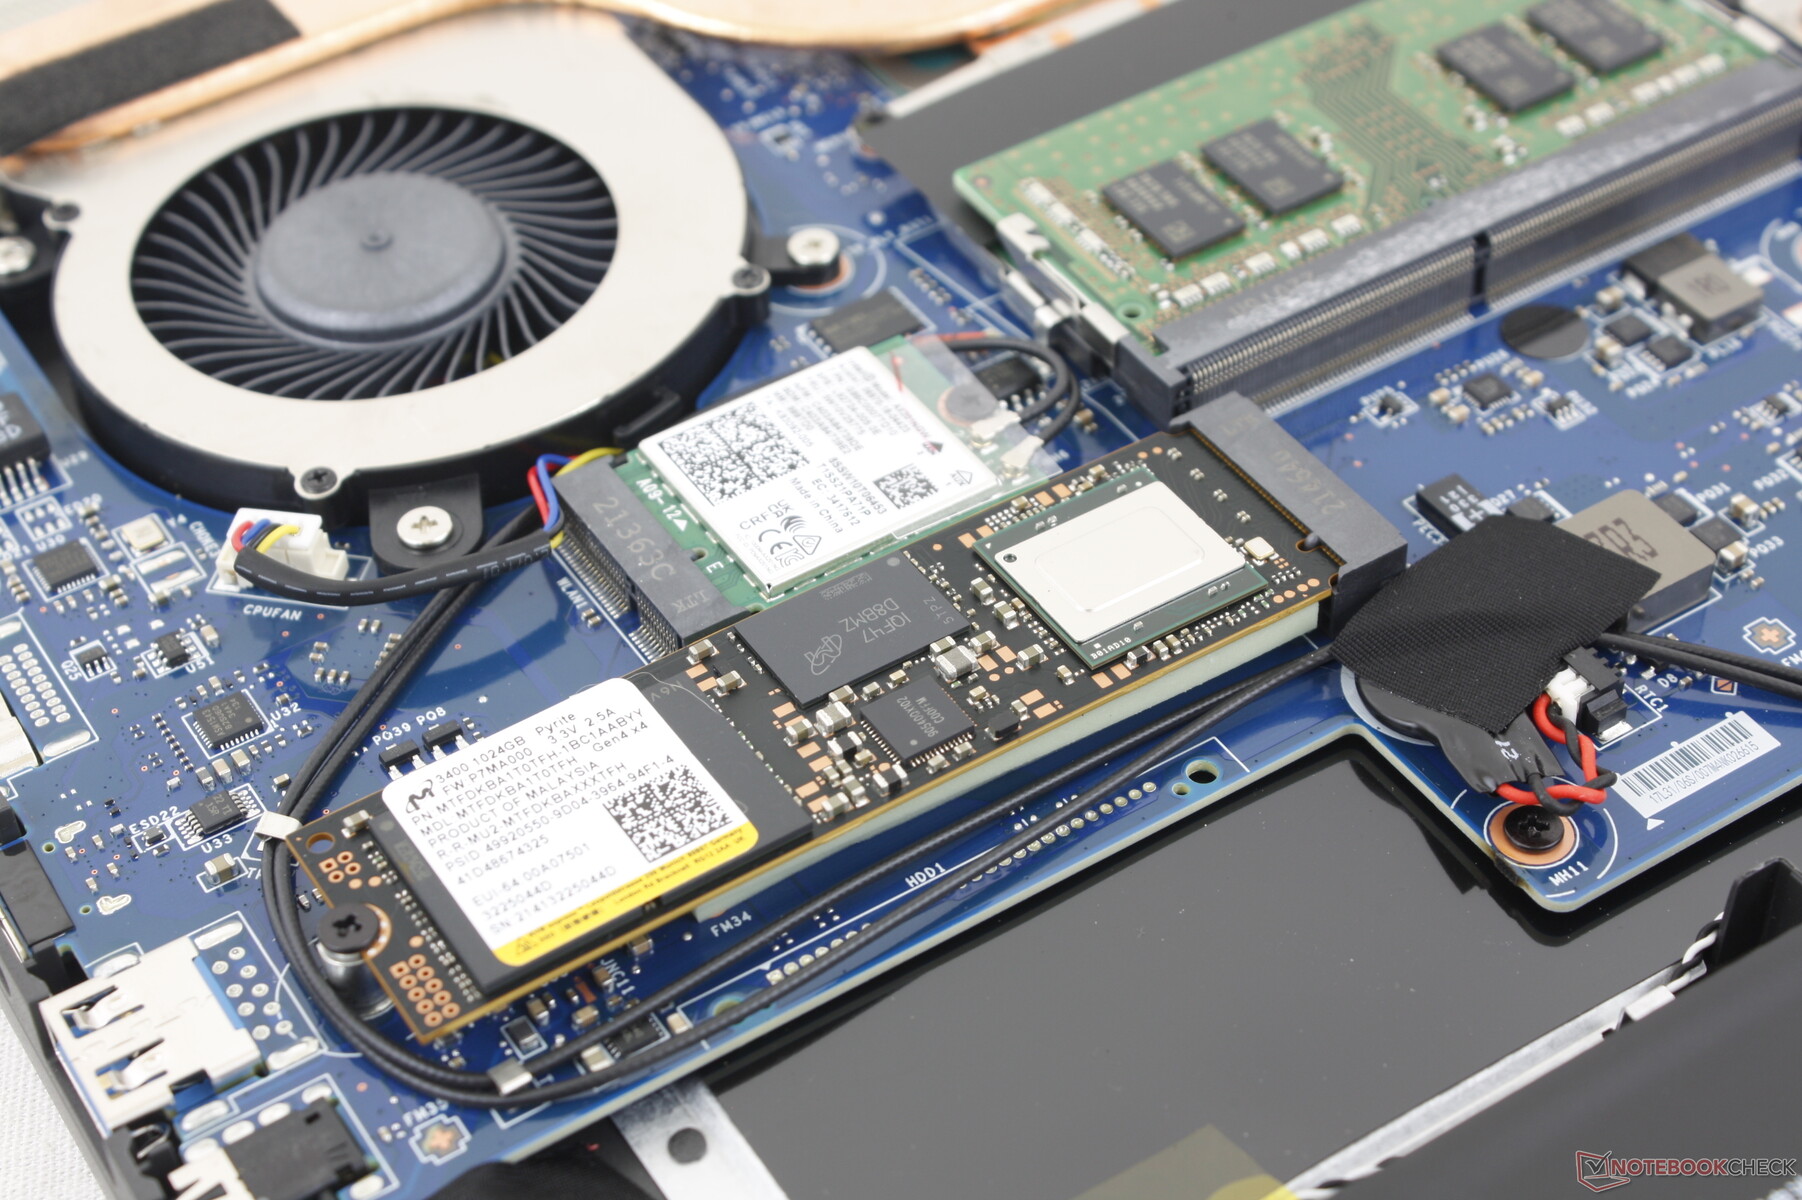
一旦进入内部,用户将可以直接接触到2个PCIe4 SSD插槽,2个SODIMM插槽,WLAN模块,电池和冷却解决方案。
配件和保修
除了交流电适配器和文件外,零售盒中没有其他额外的东西。如果在美国购买,则适用一年的标准有限保修。
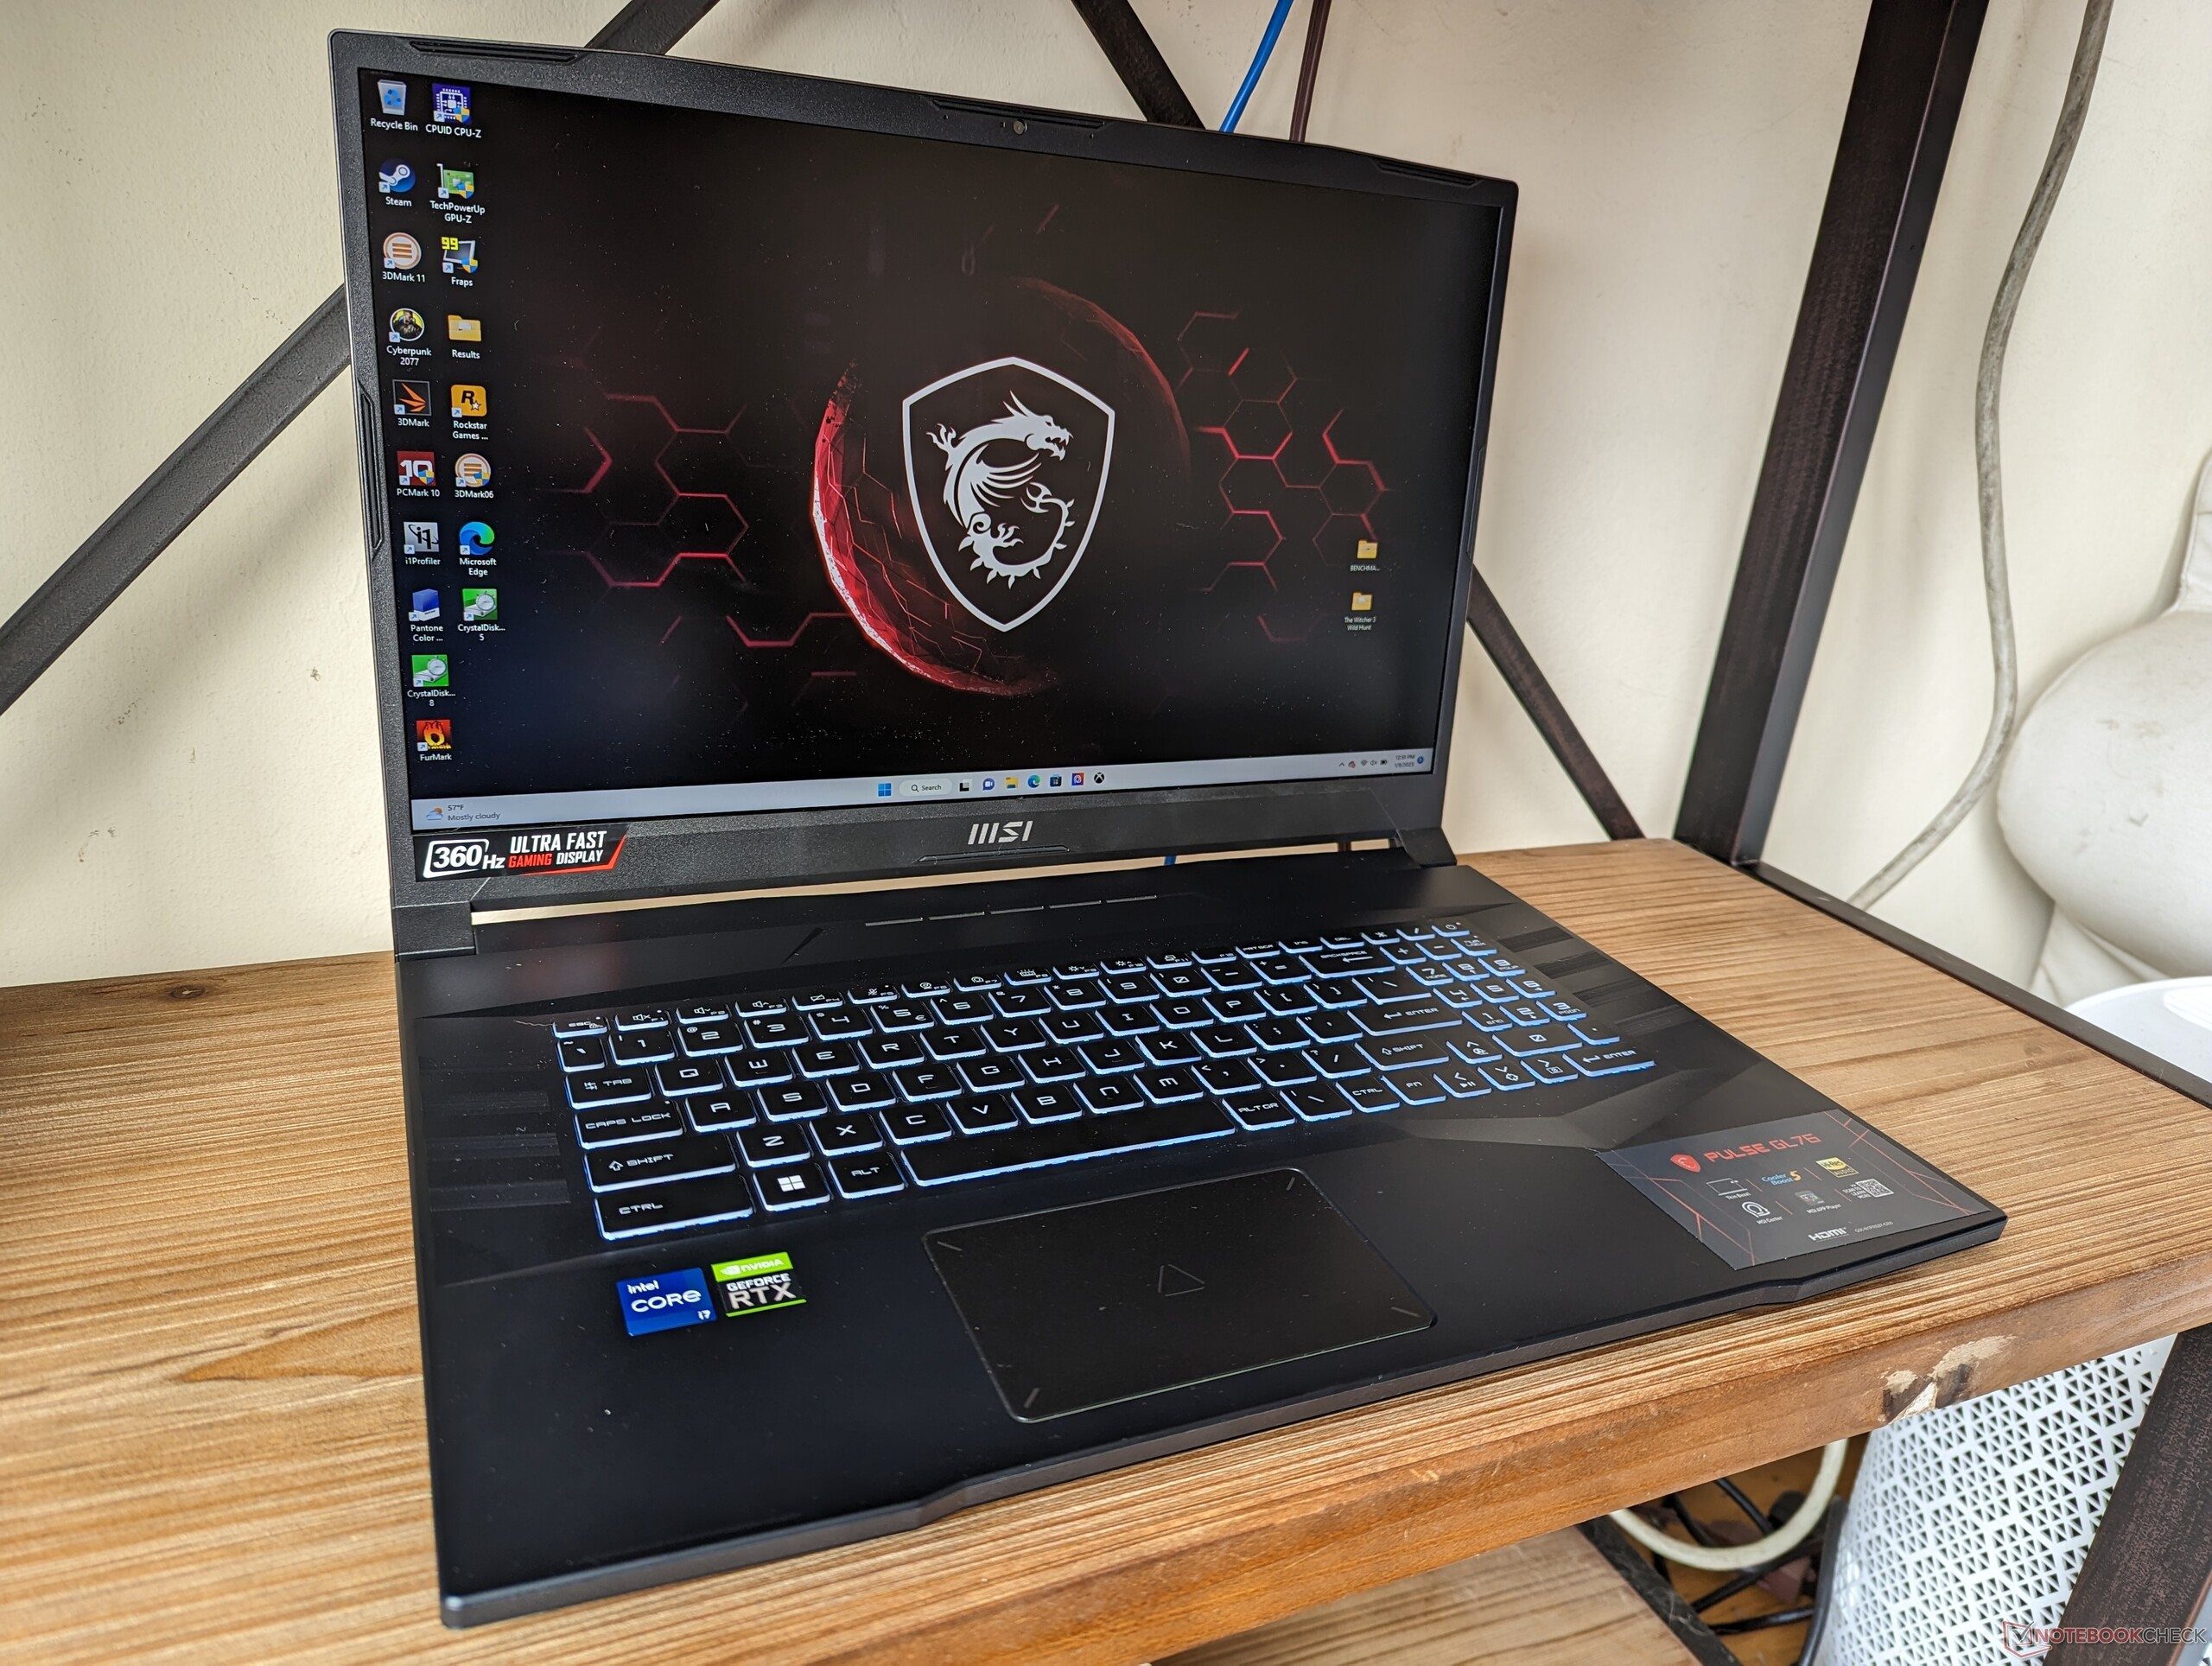
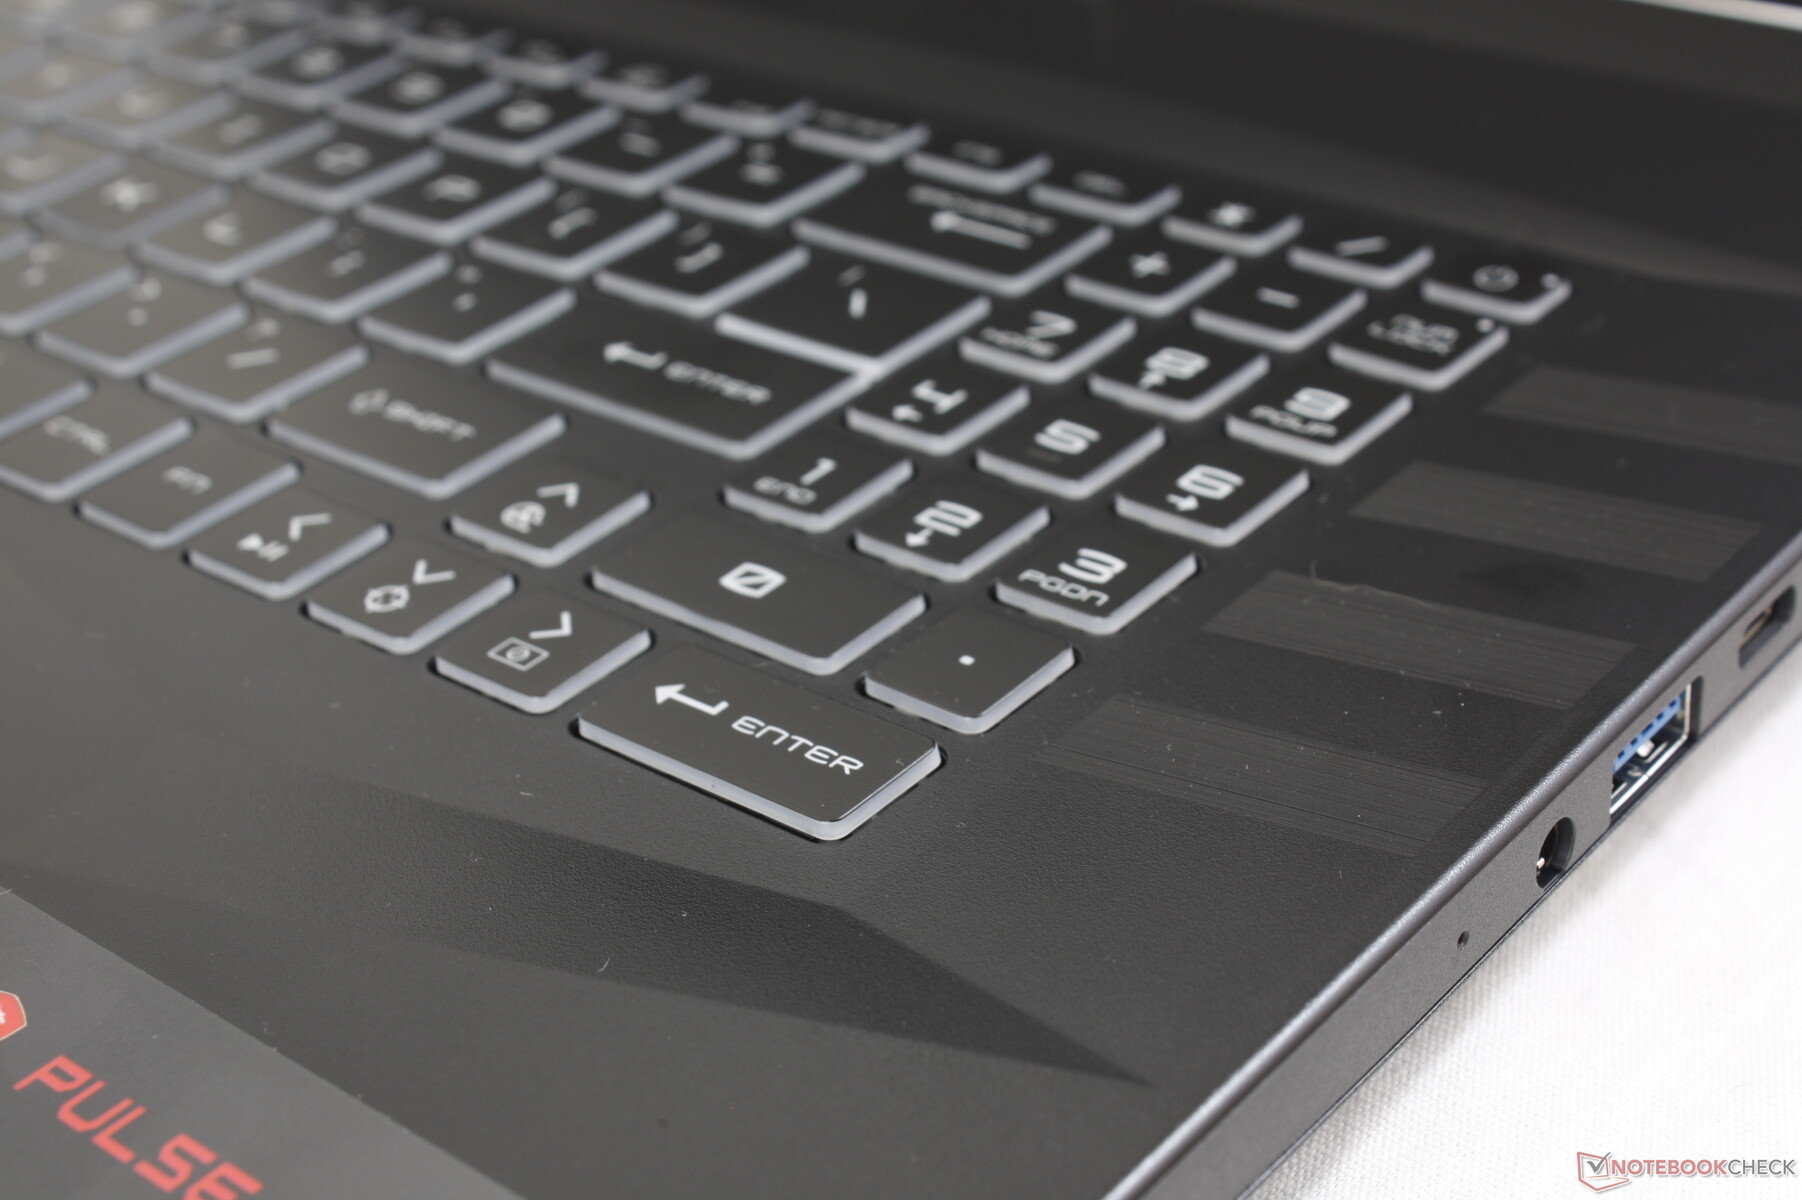
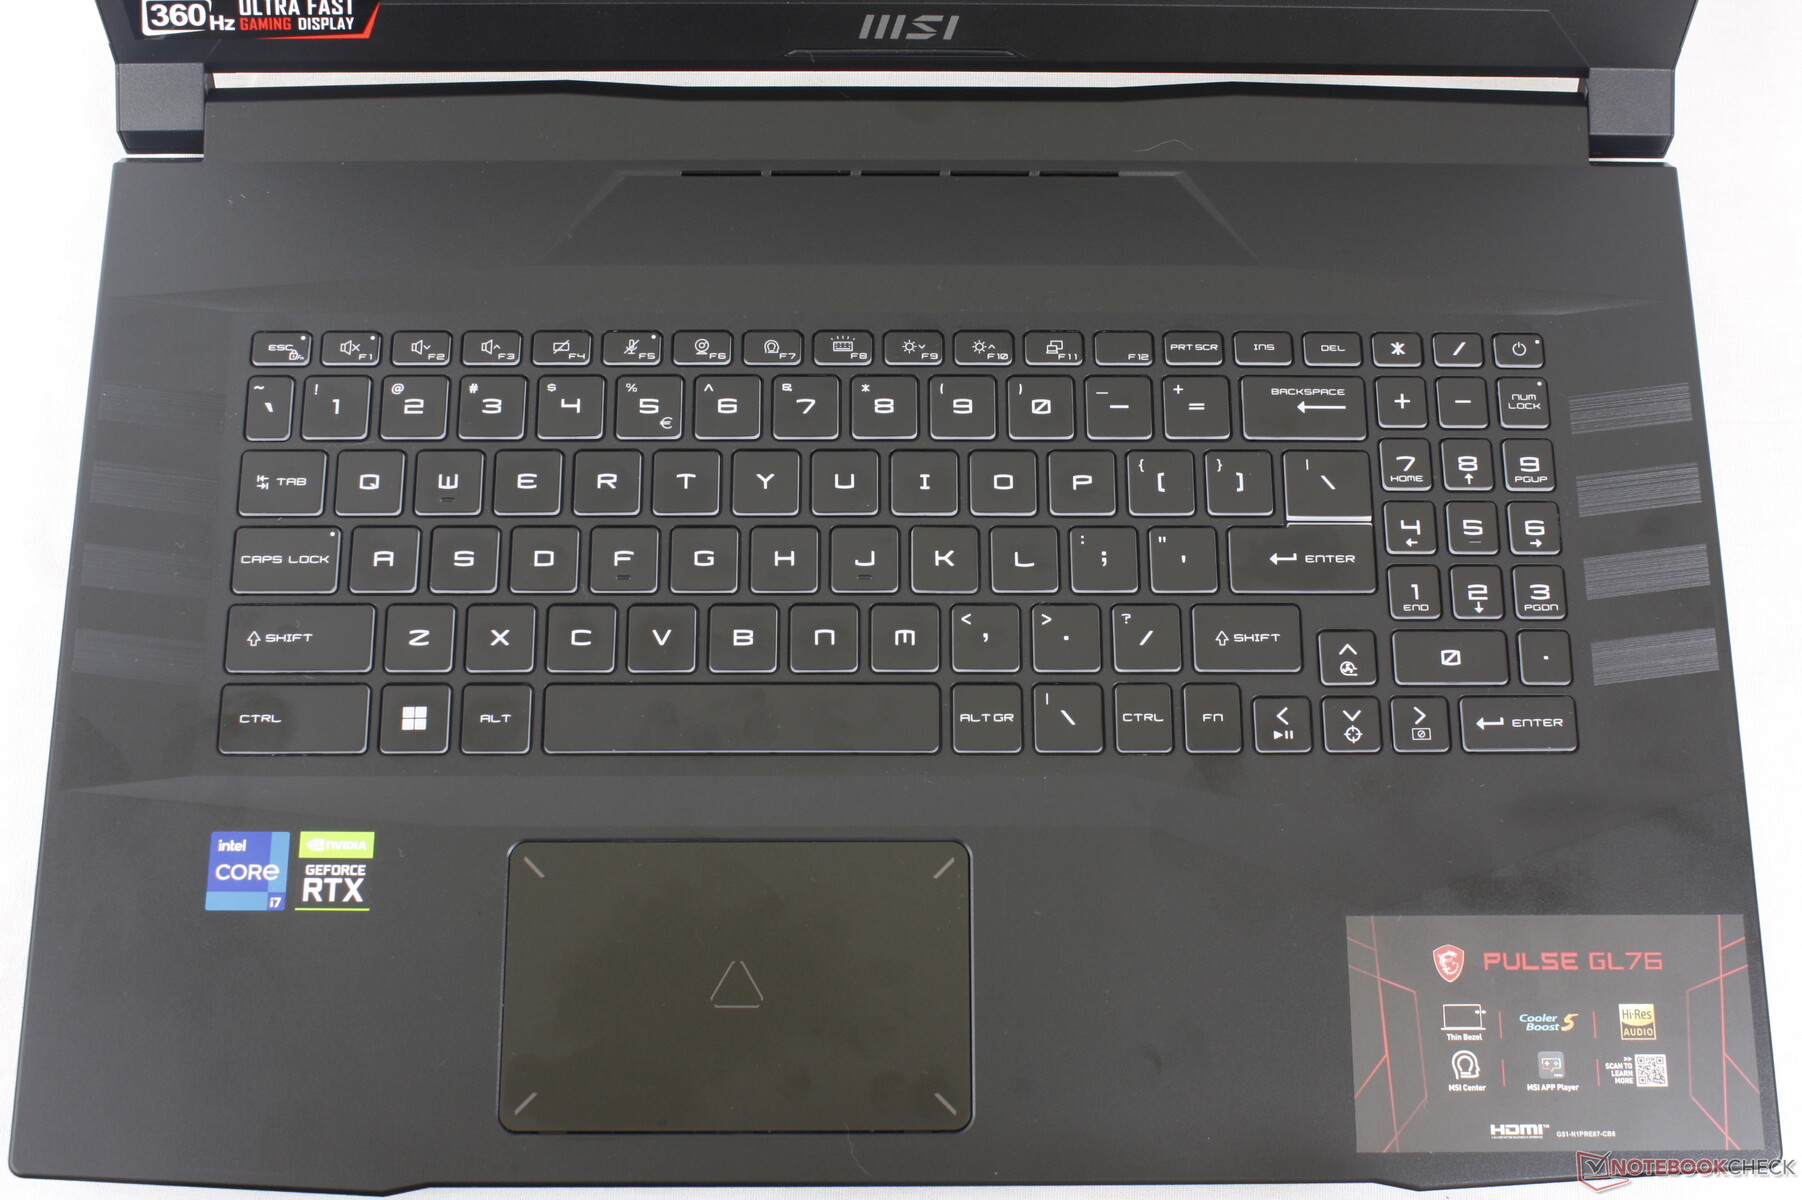
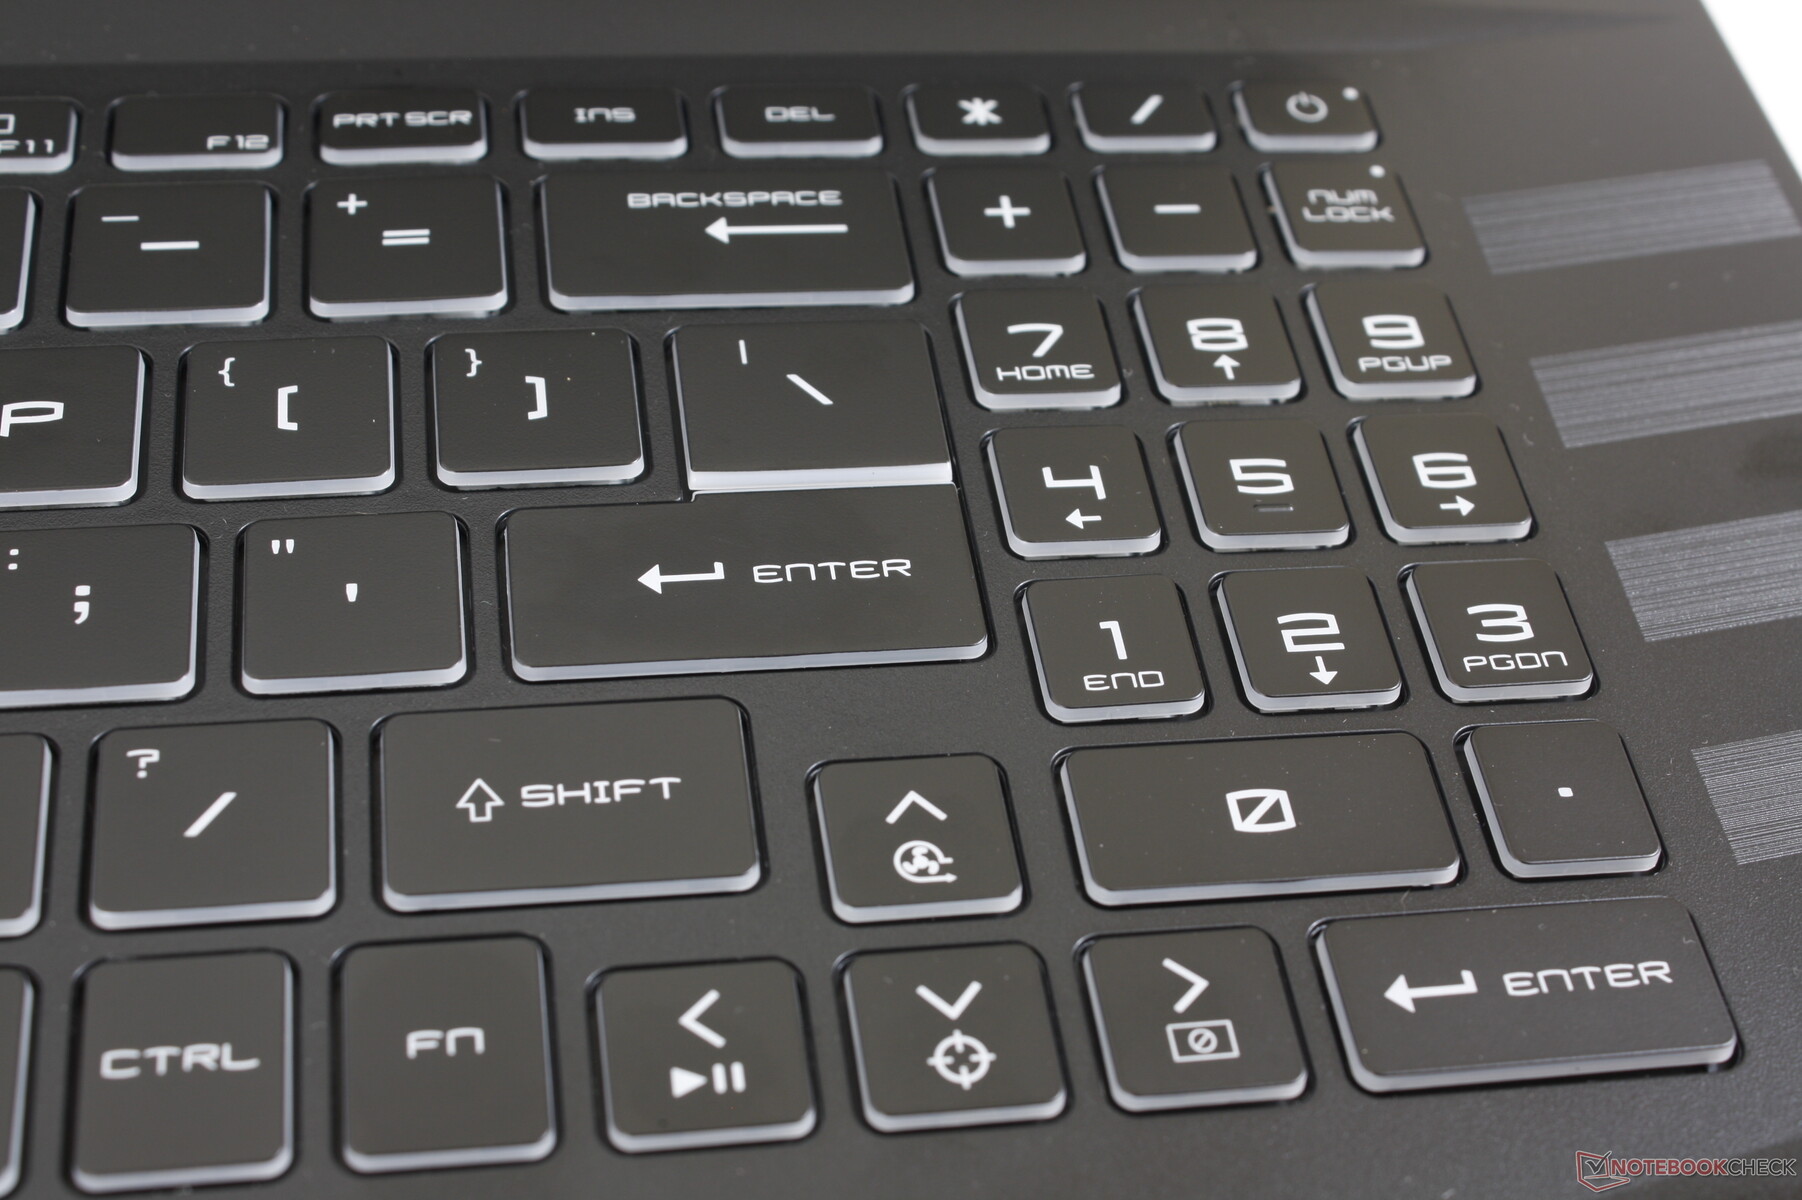
输入设备 - OK键盘,海绵状点击板
键盘
GL76的键盘和打字体验与GL66的相同。 键盘和打字体验,与GL66相同。尽管它们的外形尺寸不同。因此,GL66的短键程和合格的反馈在GL76上也适用。不幸的是,微星没有通过增加数字键盘和方向键的尺寸来更好地利用更大的17.3英寸的外形尺寸,因为与更大的QWERTY键相比,它们更小、更有弹性、更拥挤。这个特点是与 华硕TUF游戏机F17.
单区RGB背光是标准配置,没有每个键的RGB选项。所有的键和符号都被照亮。
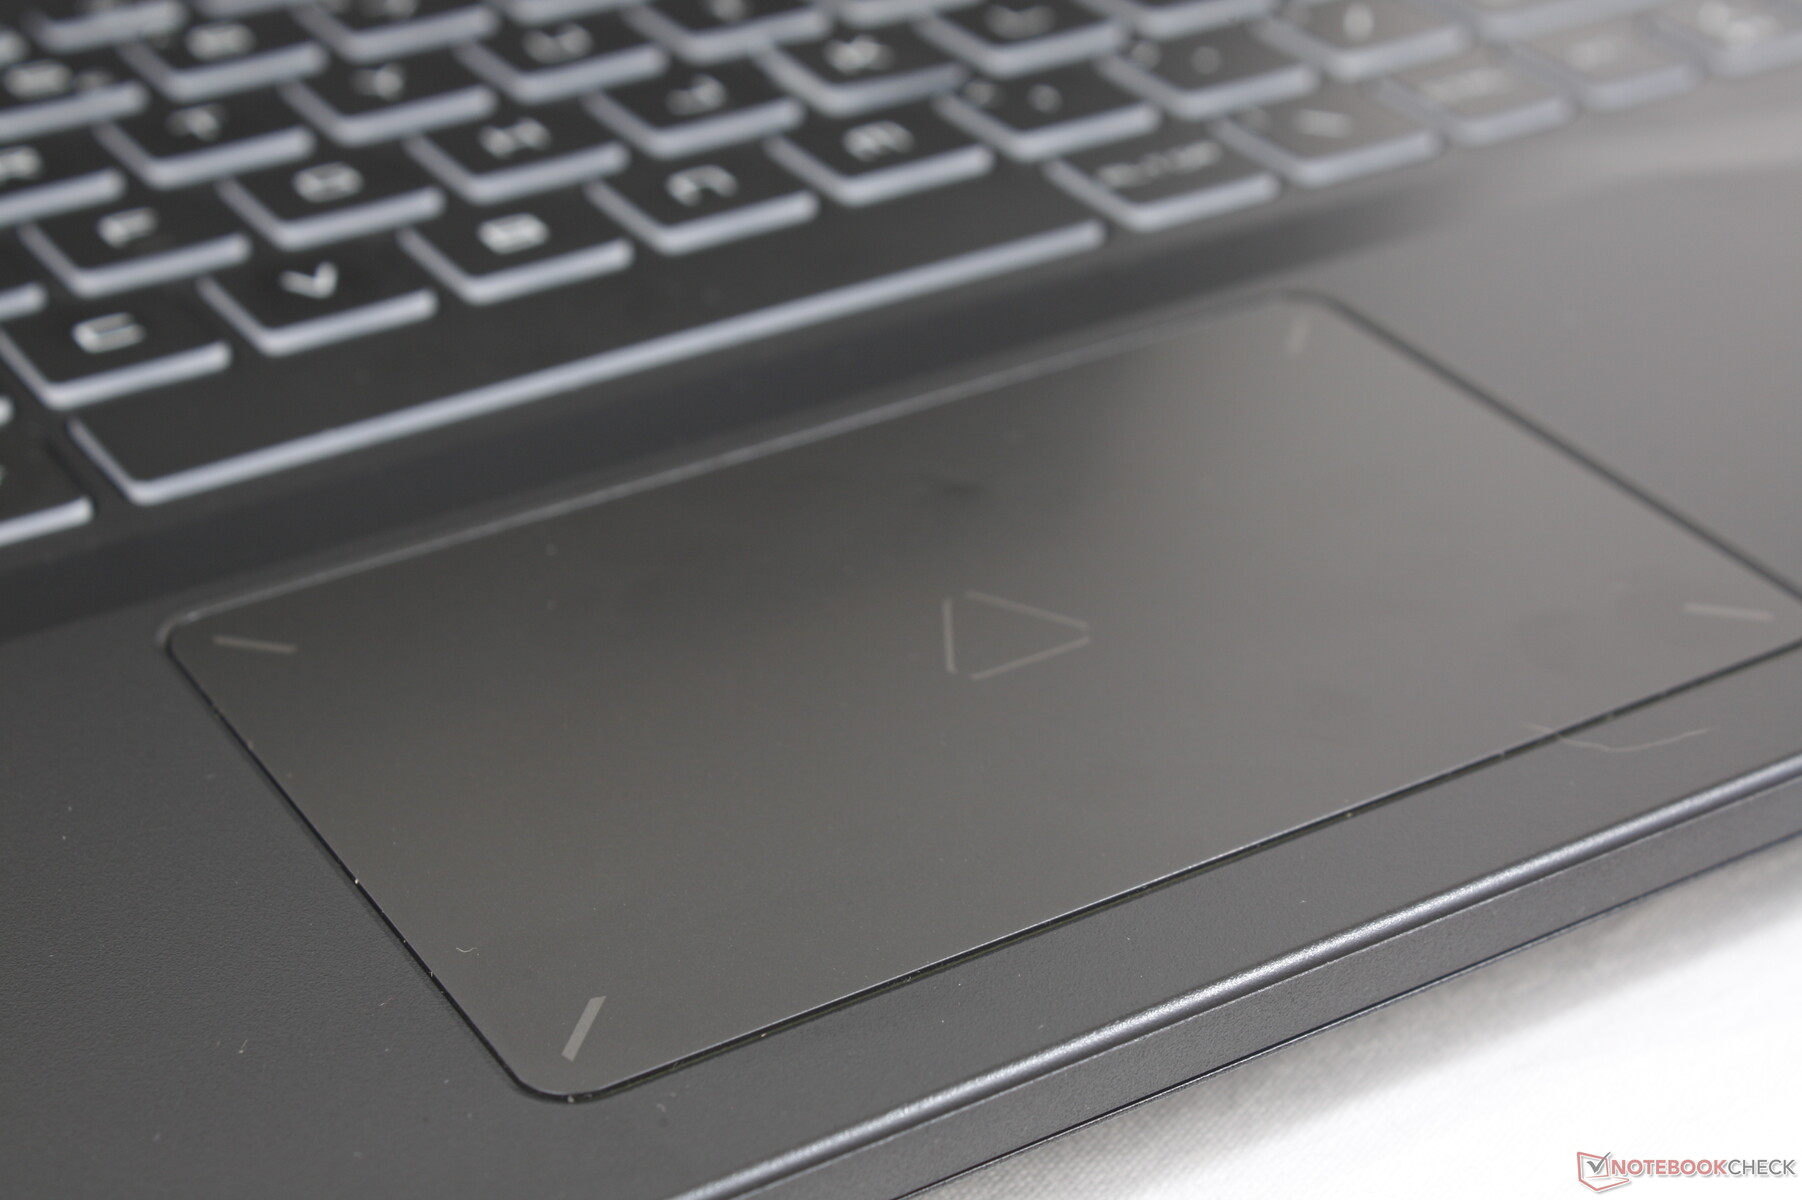
触摸板
点击板相对较小,为10.5 x 6.7厘米,但它至少比10.5 x 6厘米的点击板略大。 戴尔G16.它的塑料表面在以中等或较慢的速度滑行时往往会粘住,有时会使光标控制有点颠簸。此外,点击该表面时的反馈是海绵状的,感觉非常不满意。只要有可能,你肯定会想要一个合适的外部鼠标。

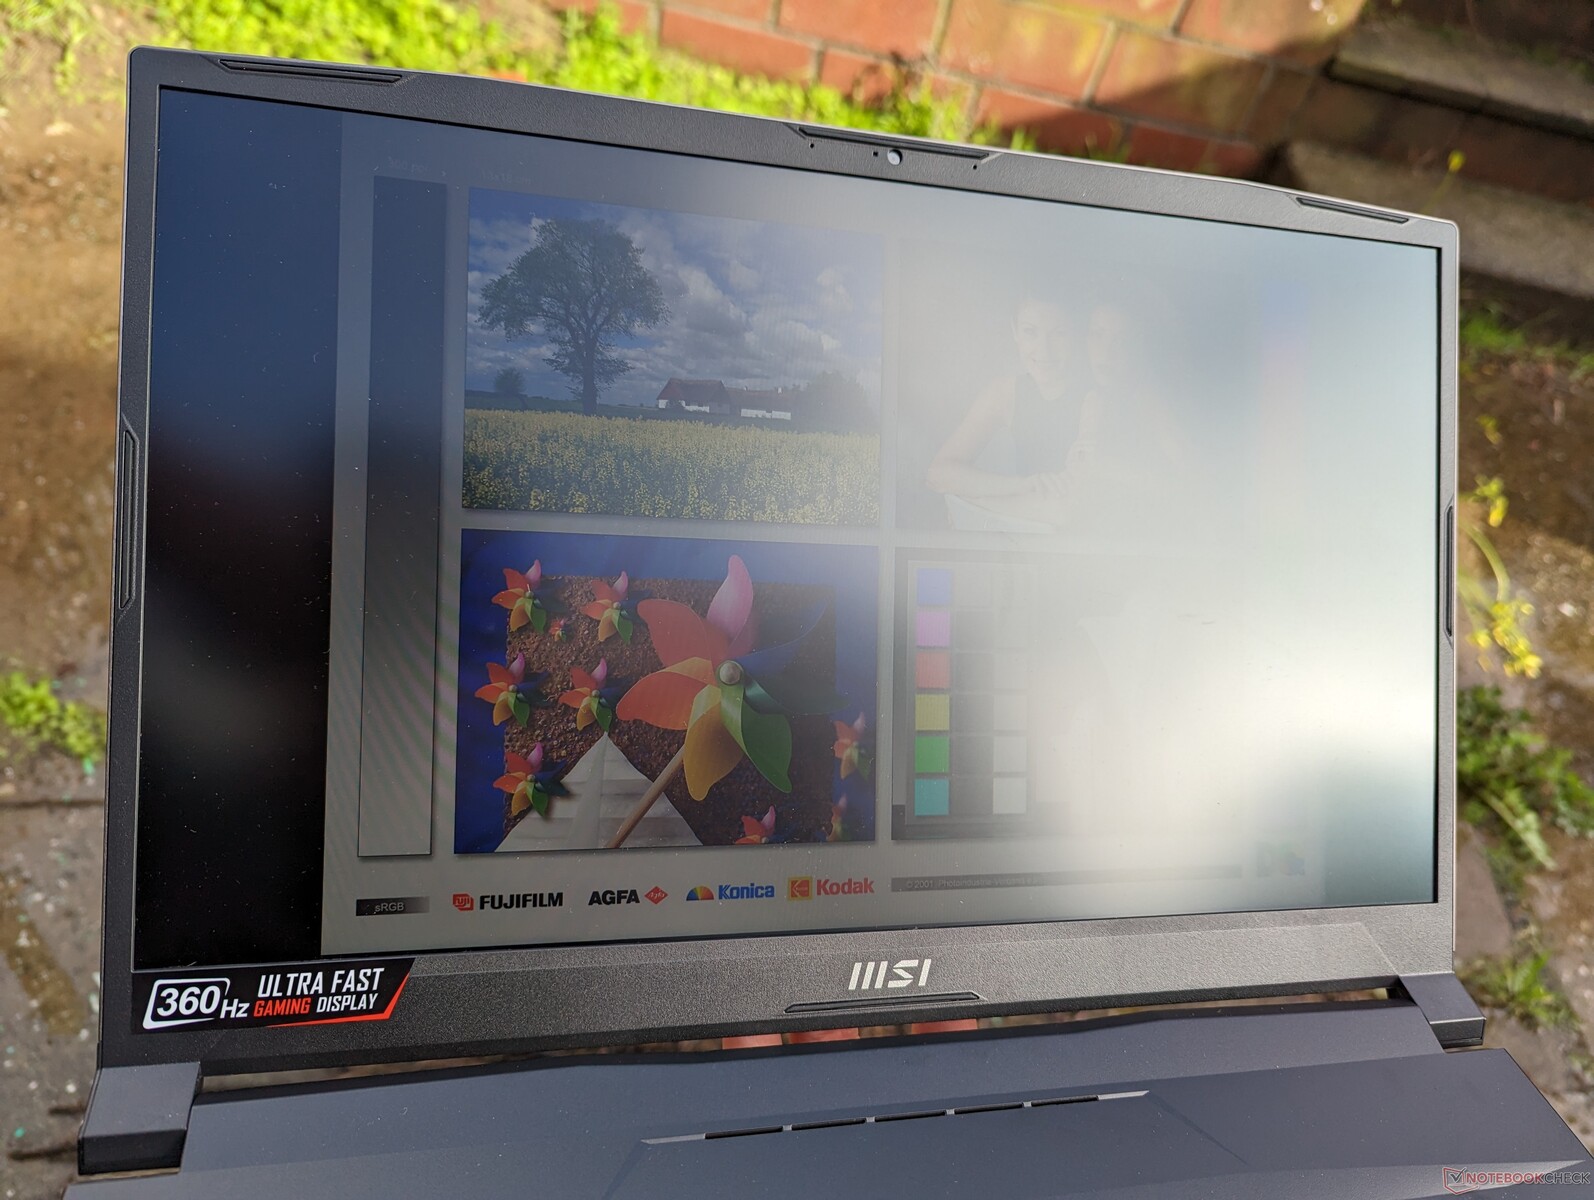
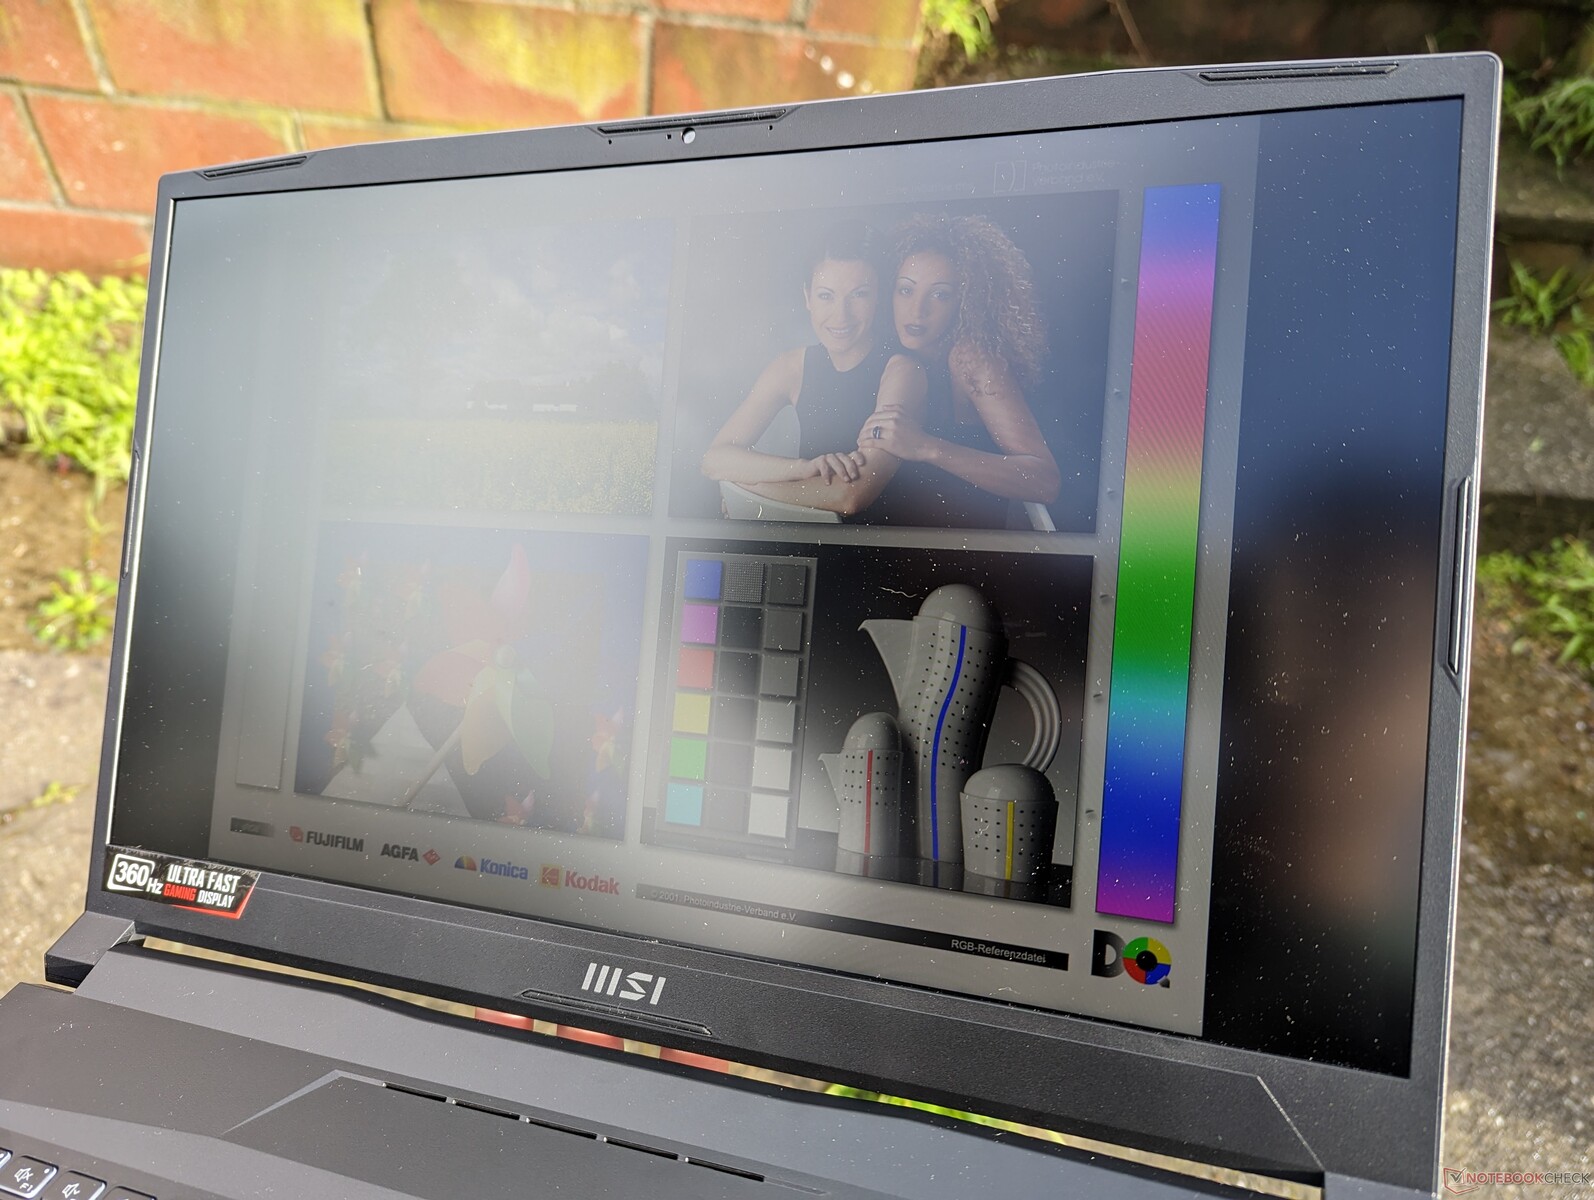
显示屏 - 仅1080p
2022年的GL76只有两种面板选择,如下表所示。1080p是目前唯一的分辨率选项,而2021年的型号有一个QHD SKU。
- 144 Hz, 1080p, 60% sRGB, IPS
- 360赫兹,1080p,100% sRGB,IPS
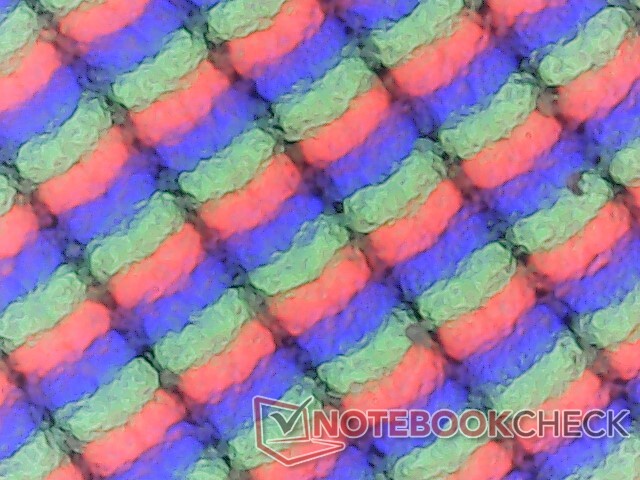
360赫兹面板的黑白响应时间比144赫兹面板快得多。它也是夏普LQ173M1JW08的IPS面板,微星也在其旗舰产品Titan GT77 。我们建议避免使用144赫兹的选项,因为其有限的色彩空间是一个非常廉价的面板的良好指标。
由于刷新率极快,图像质量非常好,而且非常流畅。请记住,由于PPI相对较低,它不像大多数超极本或较小的15.6英寸游戏笔记本那样清晰。这种特殊的面板优先考虑响应速度和帧率而不是分辨率。
| |||||||||||||||||||||||||
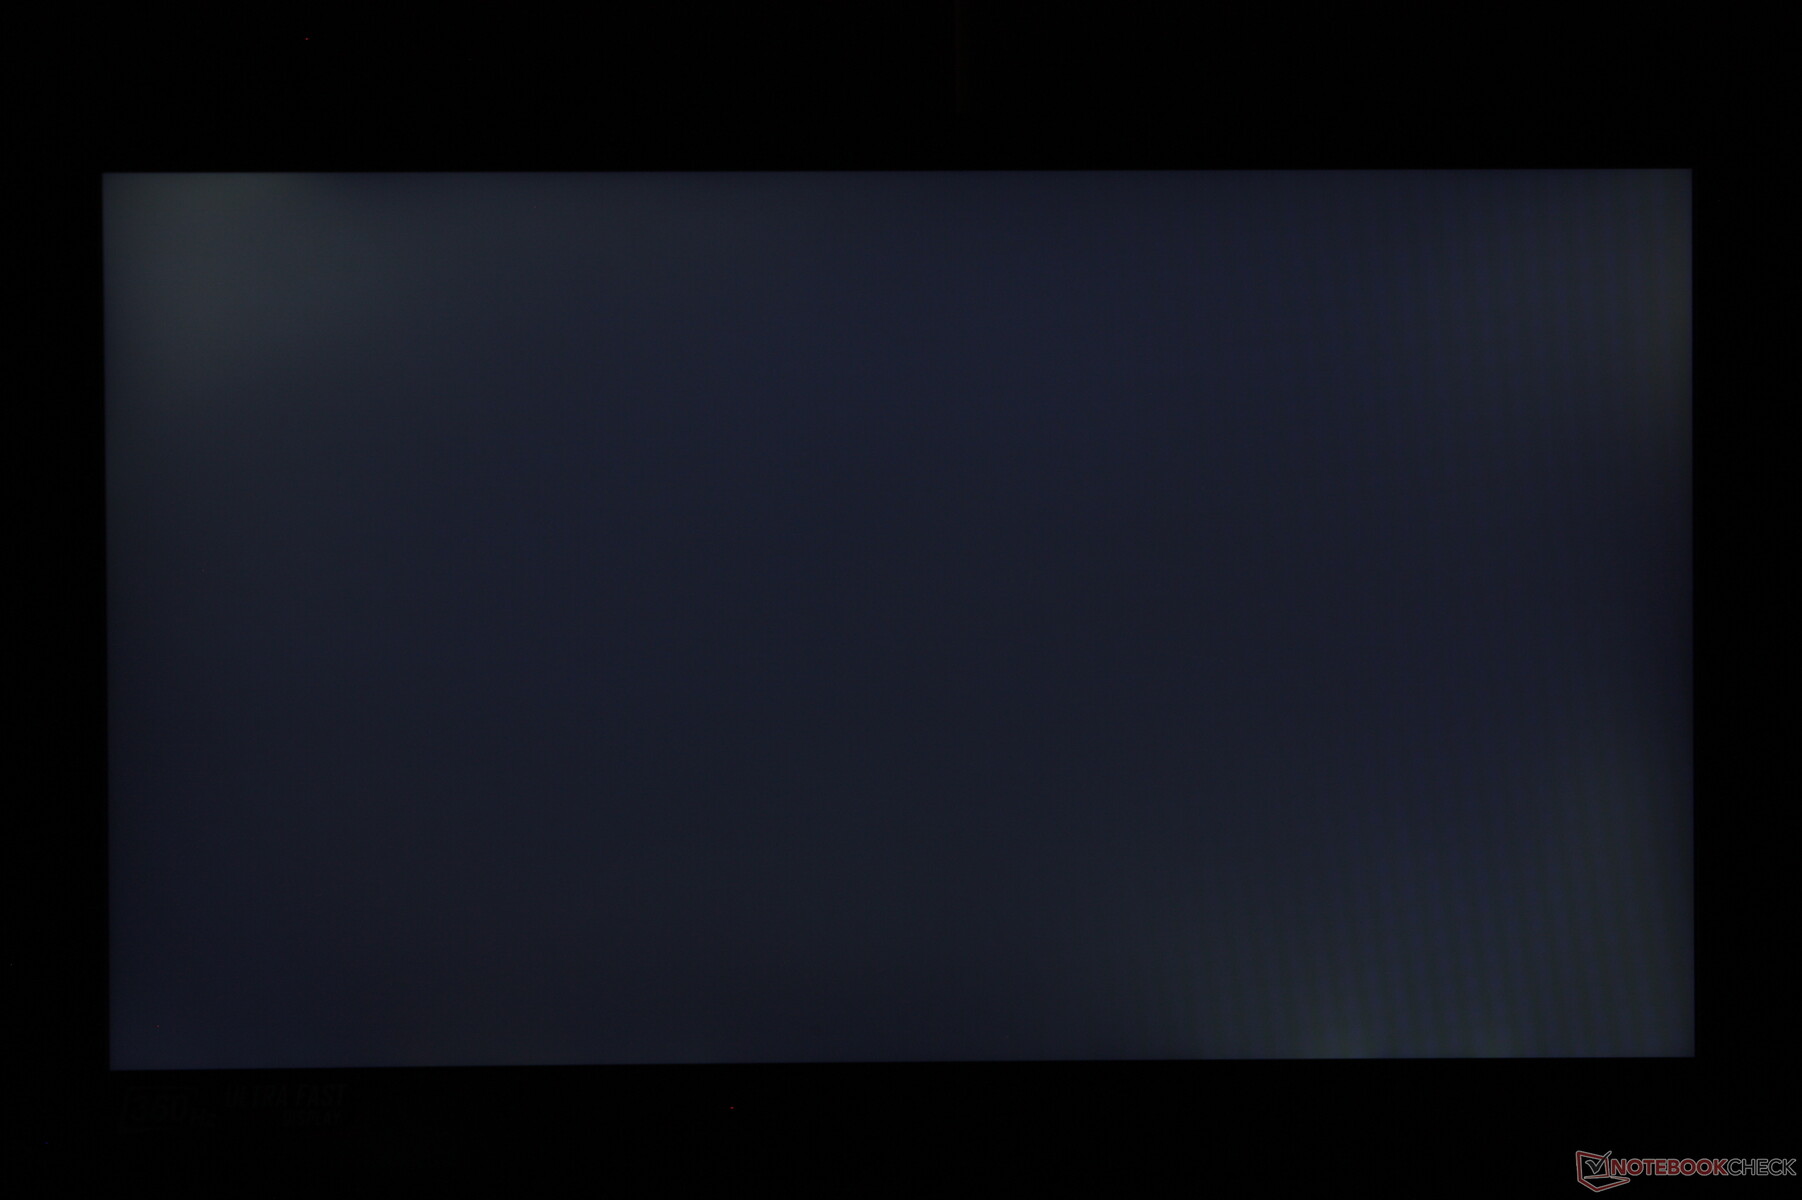
Brightness Distribution: 82 %
Center on Battery: 337.7 cd/m²
Contrast: 1089:1 (Black: 0.31 cd/m²)
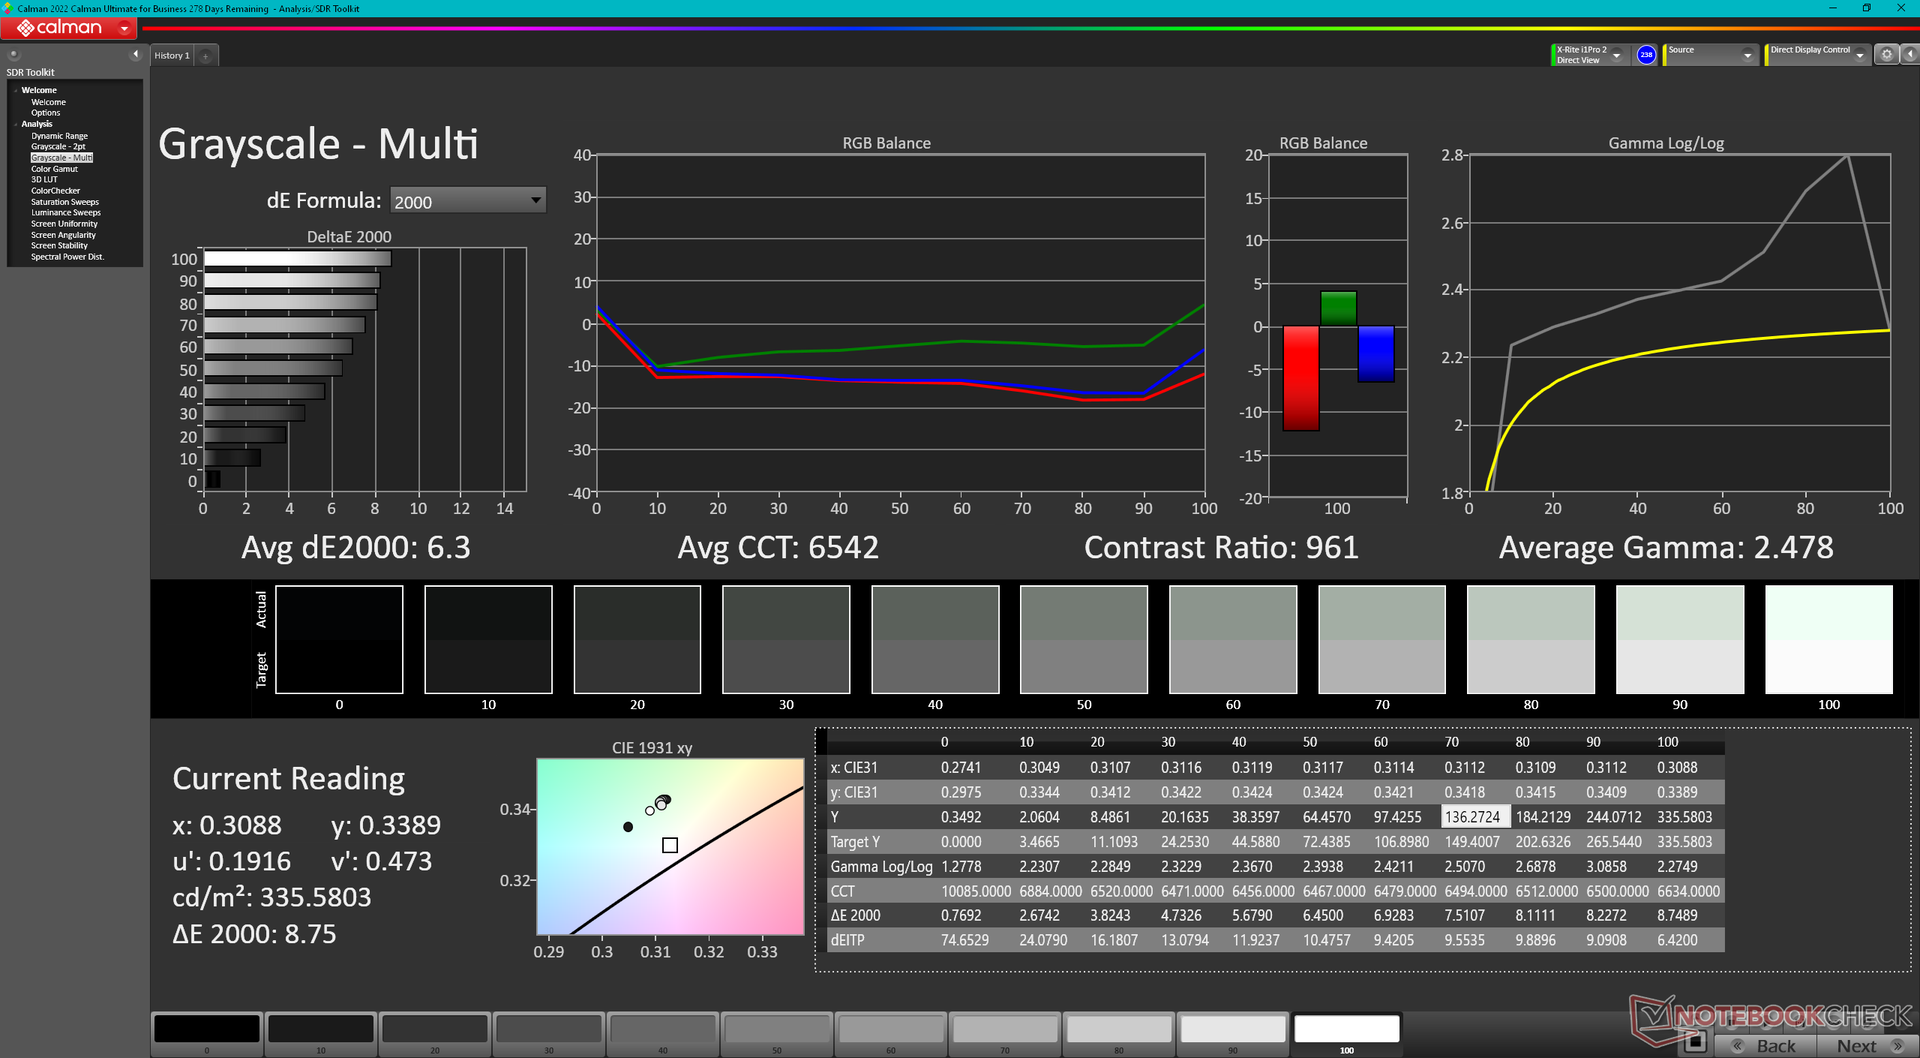
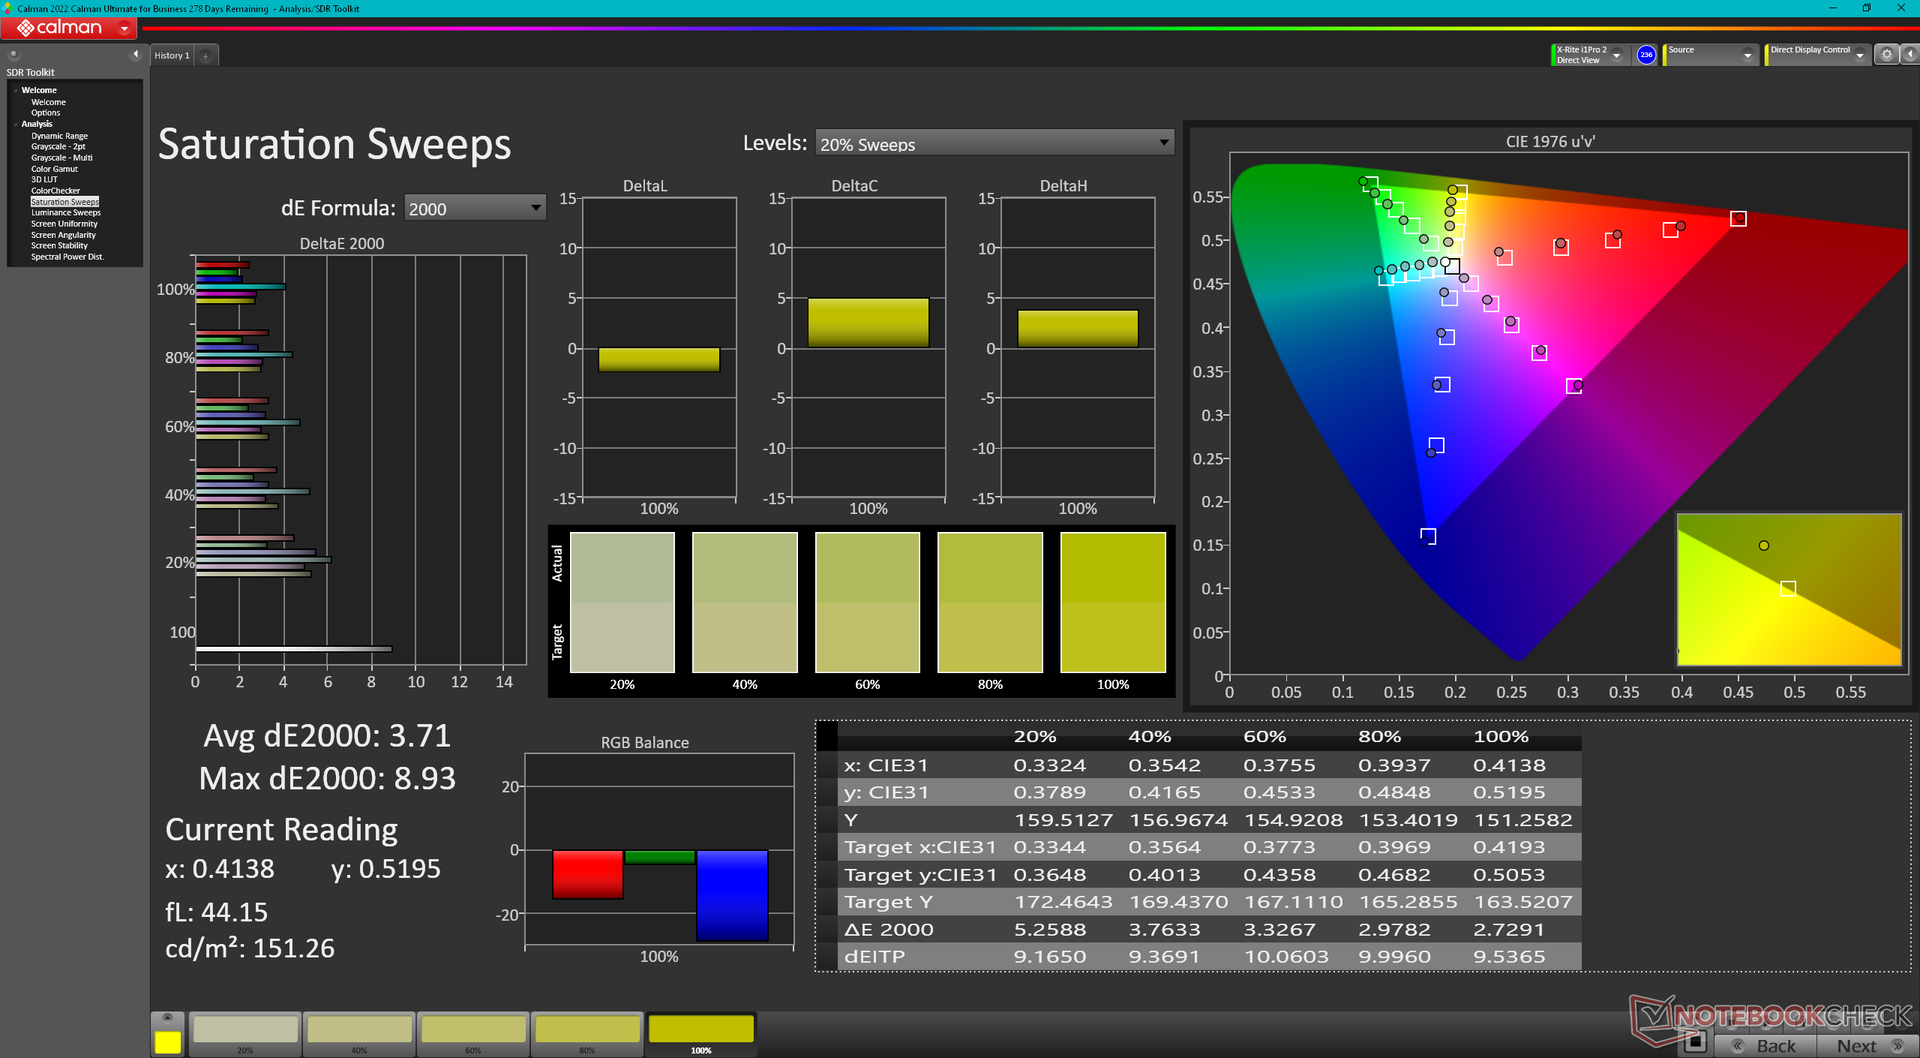
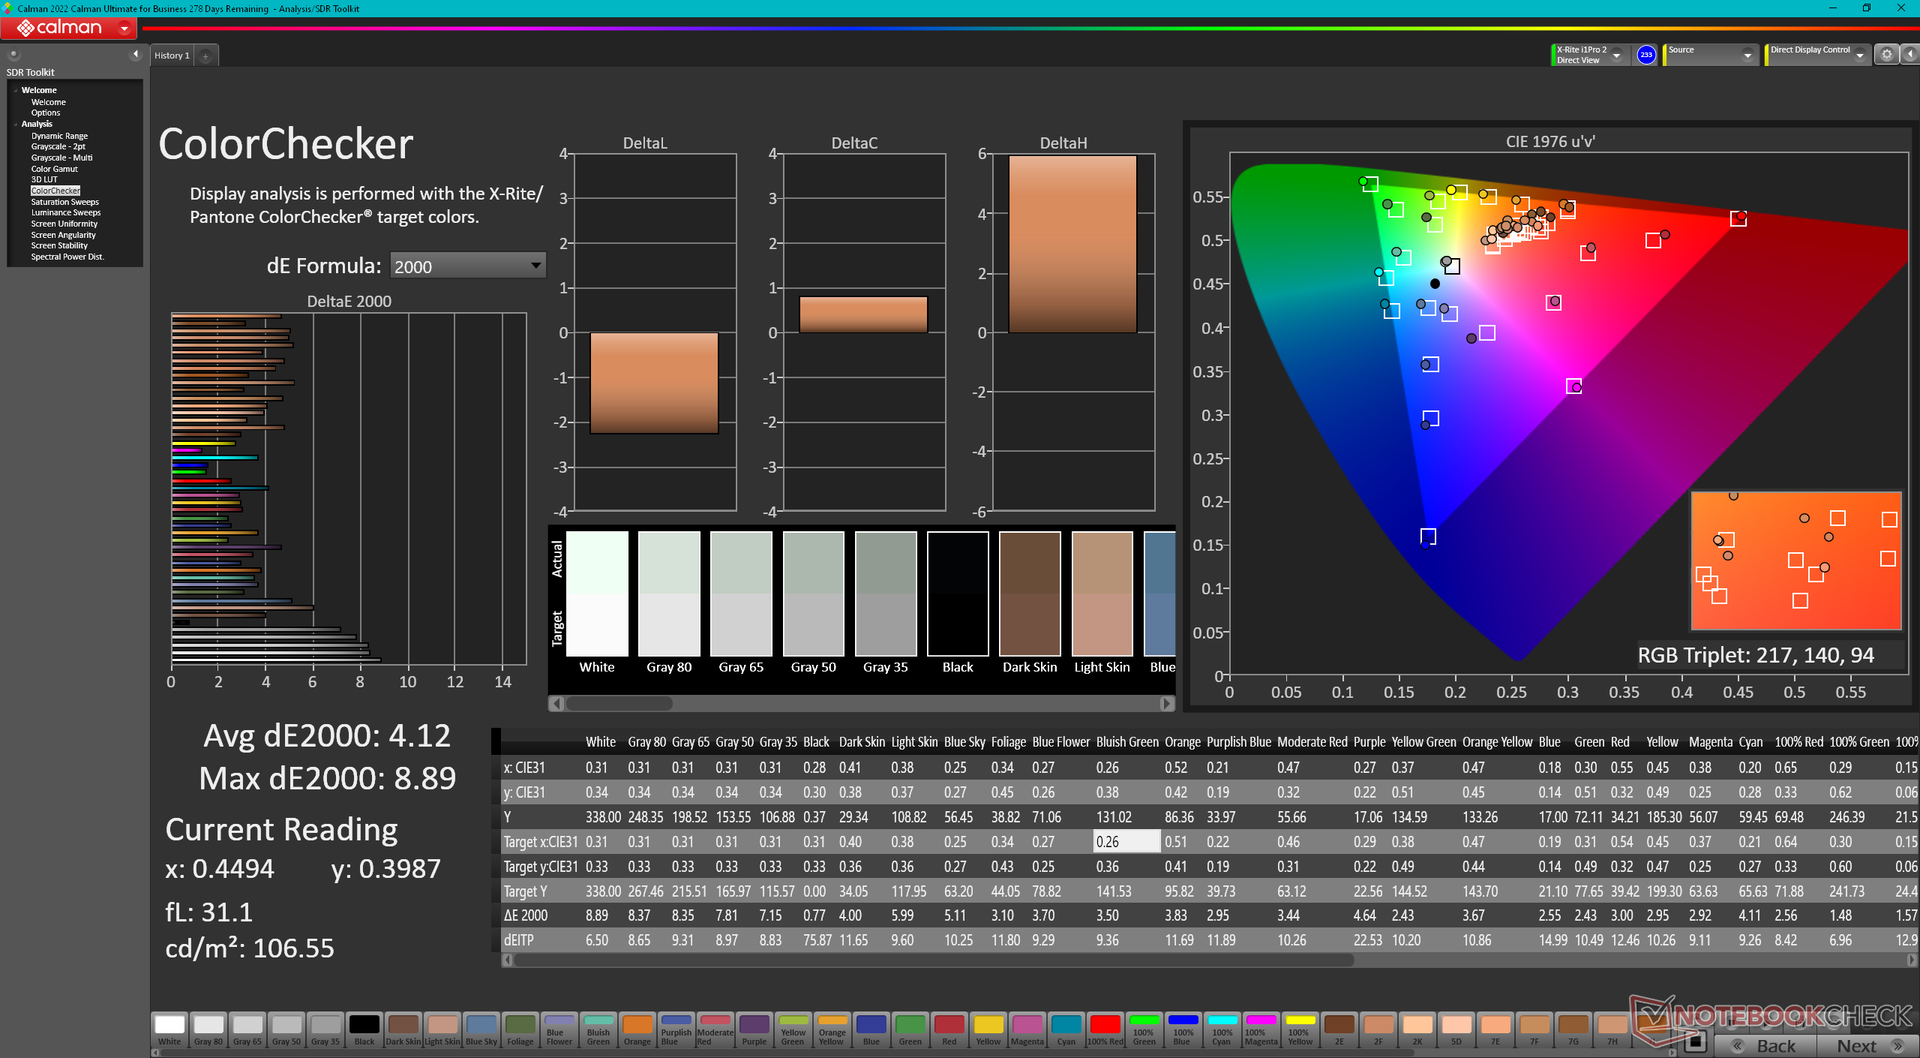
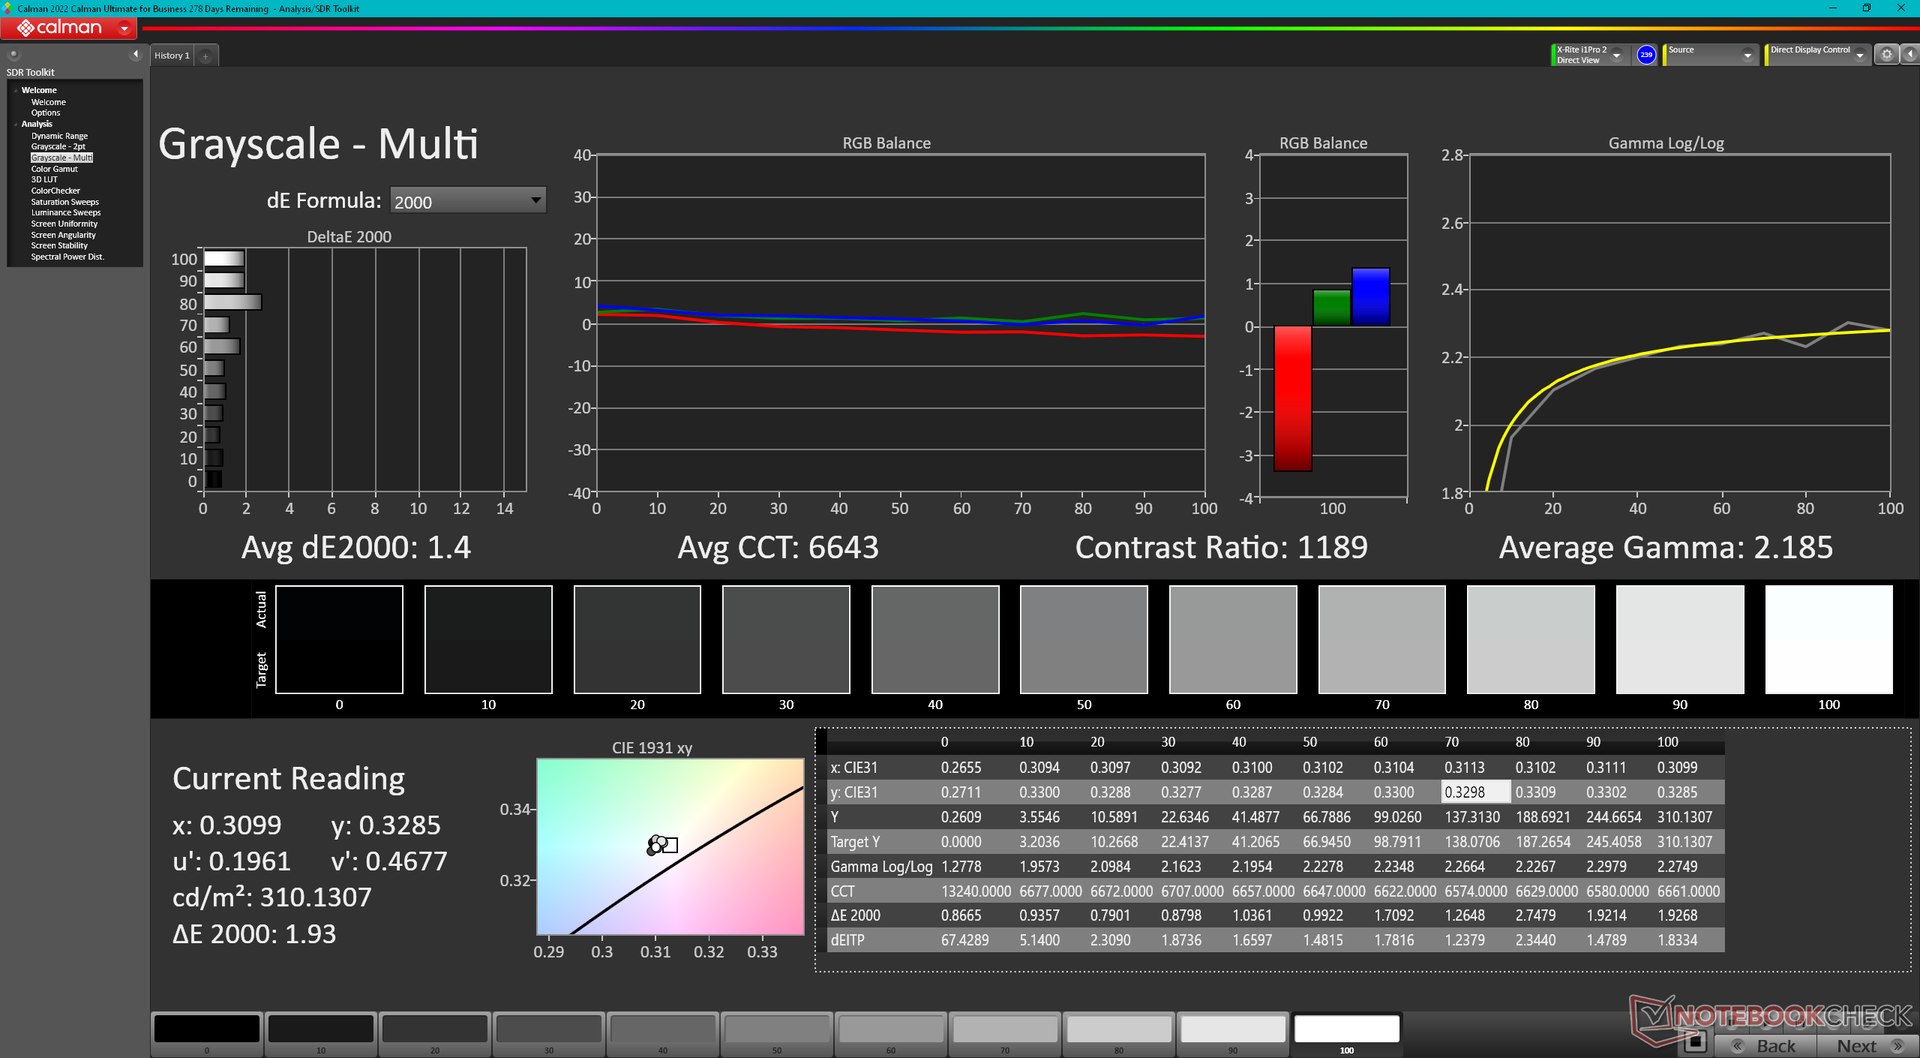
ΔE ColorChecker Calman: 4.12 | ∀{0.5-29.43 Ø4.71}
calibrated: 0.98
ΔE Greyscale Calman: 6.3 | ∀{0.09-98 Ø4.96}
73.7% AdobeRGB 1998 (Argyll 3D)
99.9% sRGB (Argyll 3D)
71.9% Display P3 (Argyll 3D)
Gamma: 2.48
CCT: 6542 K
| MSI Pulse GL76 12UGK Sharp LQ173M1JW08, IPS, 1920x1080, 17.3" | Alienware m17 R5 (R9 6900HX, RX 6850M XT) AU Optronics AUODBA3, IPS, 3840x2160, 17" | Asus ROG Strix Scar 17 SE G733CX-LL014W NE173QHM-NZ2, IPS, 2560x1440, 17.3" | Acer Predator Helios 300 (i7-12700H, RTX 3070 Ti) BOE0A1A, IPS, 2560x1440, 17.3" | Razer Blade 17 Early 2022 AU Optronics B173ZAN06.9, IPS, 3840x2160, 17.3" | MSI Vector GP76 12UGS-434 AUO B173HAN05.4, IPS, 1920x1080, 17.3" | |
|---|---|---|---|---|---|---|
| Display | 18% | 17% | 17% | 19% | -3% | |
| Display P3 Coverage (%) | 71.9 | 97.2 35% | 97.1 35% | 96.8 35% | 99.4 38% | 70.09 -3% |
| sRGB Coverage (%) | 99.9 | 99.6 0% | 99.9 0% | 99.9 0% | 100 0% | 98.98 -1% |
| AdobeRGB 1998 Coverage (%) | 73.7 | 88.4 20% | 84.8 15% | 84.8 15% | 87.3 18% | 70.91 -4% |
| Response Times | -131% | -7% | -129% | -7% | 21% | |
| Response Time Grey 50% / Grey 80% * (ms) | 4.6 ? | 16.4 ? -257% | 5.7 ? -24% | 16.4 ? -257% | 7.5 ? -63% | 4 ? 13% |
| Response Time Black / White * (ms) | 11.2 ? | 11.6 ? -4% | 10.1 ? 10% | 11.2 ? -0% | 5.6 ? 50% | 8 ? 29% |
| PWM Frequency (Hz) | ||||||
| Screen | -43% | 28% | -12% | 34% | 11% | |
| Brightness middle (cd/m²) | 337.7 | 484 43% | 320 -5% | 366 8% | 503 49% | 274 -19% |
| Brightness (cd/m²) | 331 | 449 36% | 303 -8% | 340 3% | 486 47% | 264 -20% |
| Brightness Distribution (%) | 82 | 87 6% | 87 6% | 85 4% | 84 2% | 87 6% |
| Black Level * (cd/m²) | 0.31 | 0.55 -77% | 0.3 3% | 0.31 -0% | 0.44 -42% | 0.25 19% |
| Contrast (:1) | 1089 | 880 -19% | 1067 -2% | 1181 8% | 1143 5% | 1096 1% |
| Colorchecker dE 2000 * | 4.12 | 4.8 -17% | 1.1 73% | 3.56 14% | 1.08 74% | 2.53 39% |
| Colorchecker dE 2000 max. * | 8.89 | 7.48 16% | 2.7 70% | 5.66 36% | 4.54 49% | 6.76 24% |
| Colorchecker dE 2000 calibrated * | 0.98 | 4.74 -384% | 3.31 -238% | 0.6 39% | 0.98 -0% | |
| Greyscale dE 2000 * | 6.3 | 5.5 13% | 1.1 83% | 2.84 55% | 1.3 79% | 3.49 45% |
| Gamma | 2.48 89% | 2.42 91% | 2.13 103% | 2.29 96% | 2.151 102% | 2.31 95% |
| CCT | 6542 99% | 6148 106% | 6599 98% | 6835 95% | 6541 99% | 6714 97% |
| Total Average (Program / Settings) | -52% /
-42% | 13% /
20% | -41% /
-23% | 15% /
25% | 10% /
9% |
* ... smaller is better
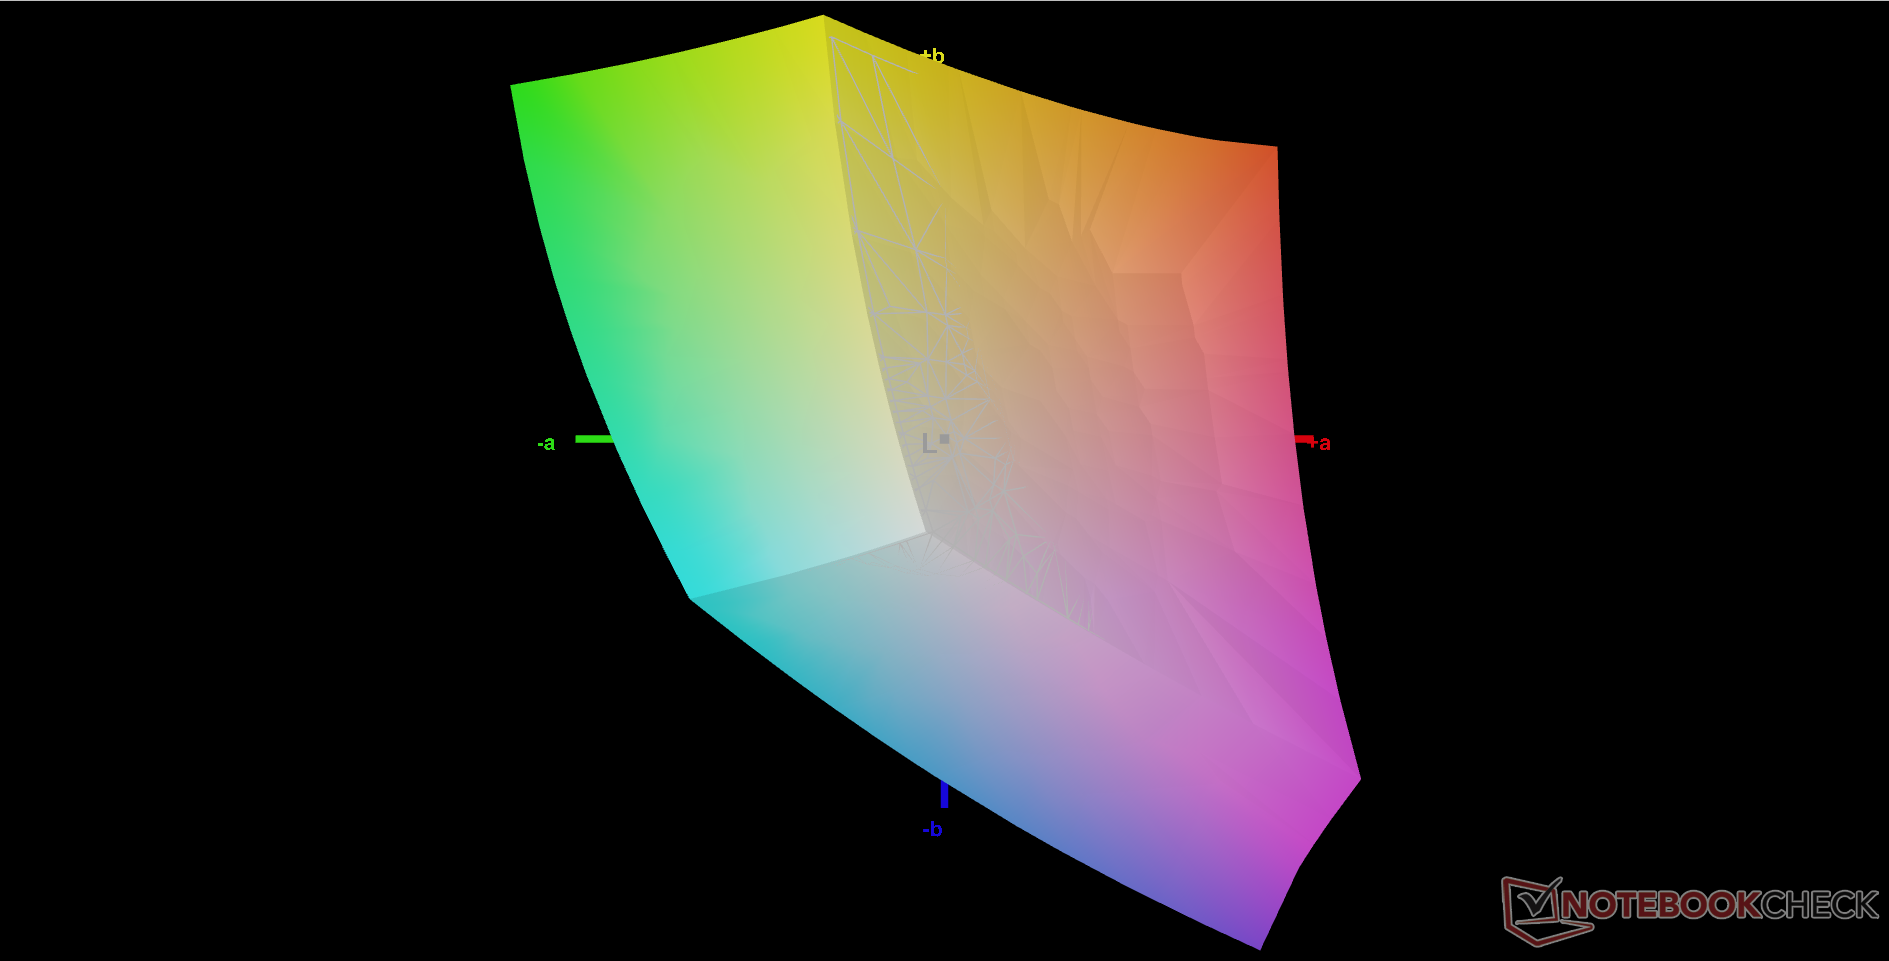
该显示器没有经过开箱校准。用X-Rite色度计进行适当校准后,平均灰度和彩色DeltaE值将分别从6.3和4.12大幅提高到1.4和0.98。我们建议应用我们的上述ICM配置文件,以更好地利用面板的全部sRGB覆盖。
Display Response Times
| ↔ Response Time Black to White | ||
|---|---|---|
| 11.2 ms ... rise ↗ and fall ↘ combined | ↗ 6.8 ms rise | 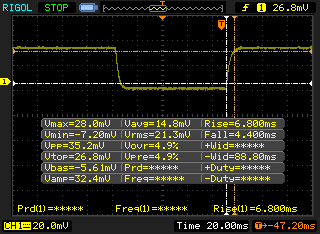 |
| ↘ 4.4 ms fall | ||
| The screen shows good response rates in our tests, but may be too slow for competitive gamers. In comparison, all tested devices range from 0.1 (minimum) to 240 (maximum) ms. » 30 % of all devices are better. This means that the measured response time is better than the average of all tested devices (19.8 ms). | ||
| ↔ Response Time 50% Grey to 80% Grey | ||
| 4.6 ms ... rise ↗ and fall ↘ combined | ↗ 2.2 ms rise | 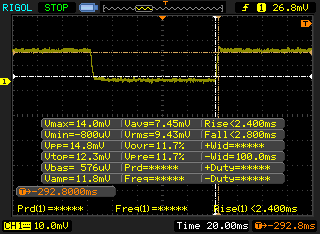 |
| ↘ 2.4 ms fall | ||
| The screen shows very fast response rates in our tests and should be very well suited for fast-paced gaming. In comparison, all tested devices range from 0.165 (minimum) to 636 (maximum) ms. » 16 % of all devices are better. This means that the measured response time is better than the average of all tested devices (31 ms). | ||
Screen Flickering / PWM (Pulse-Width Modulation)
| Screen flickering / PWM not detected | 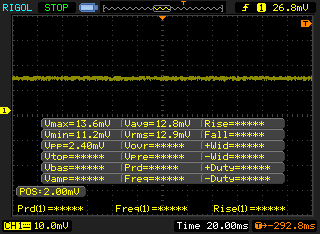 | ||
In comparison: 52 % of all tested devices do not use PWM to dim the display. If PWM was detected, an average of 7754 (minimum: 5 - maximum: 343500) Hz was measured. | |||
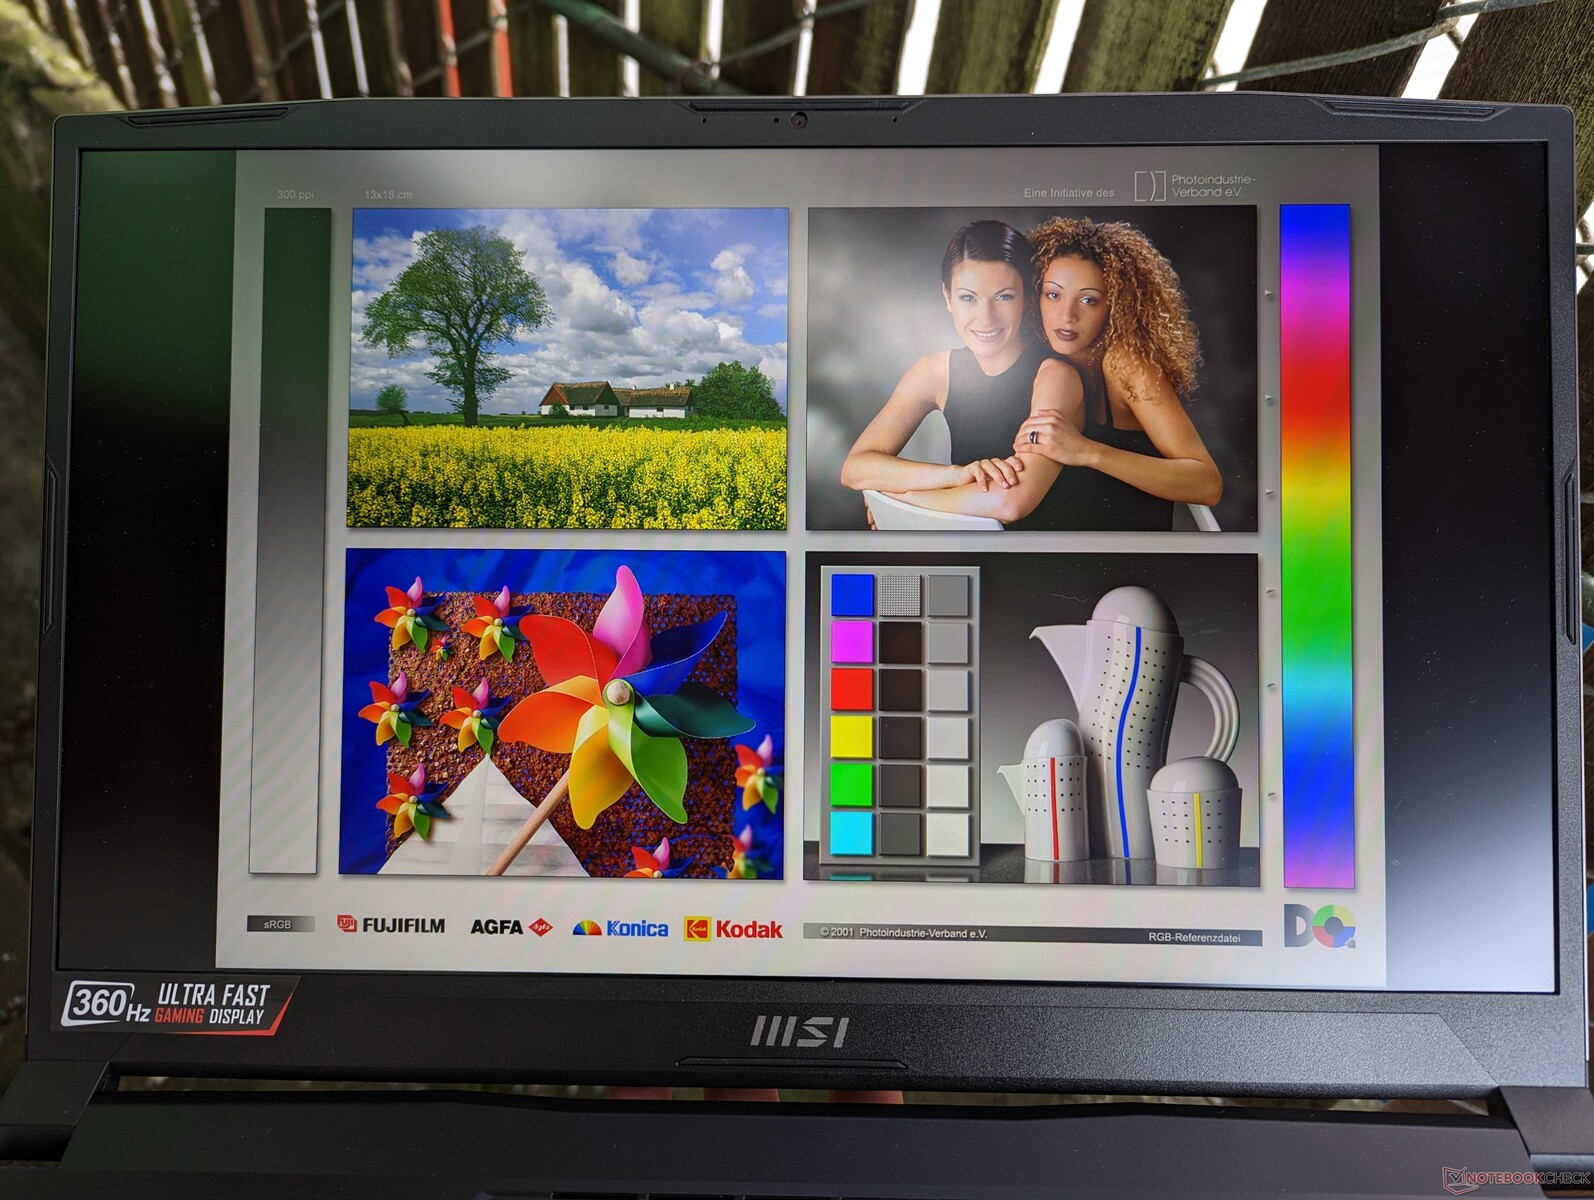
哑光显示屏的亮度足以在阴凉处使用,但除此之外,它并不是为更明亮的户外条件设计的。一些游戏笔记本电脑,如 Razer Blade 17 OLED,有更亮的500尼特显示屏,在户外更容易阅读。
性能 - 英特尔第12代Alder Lake-H
测试条件
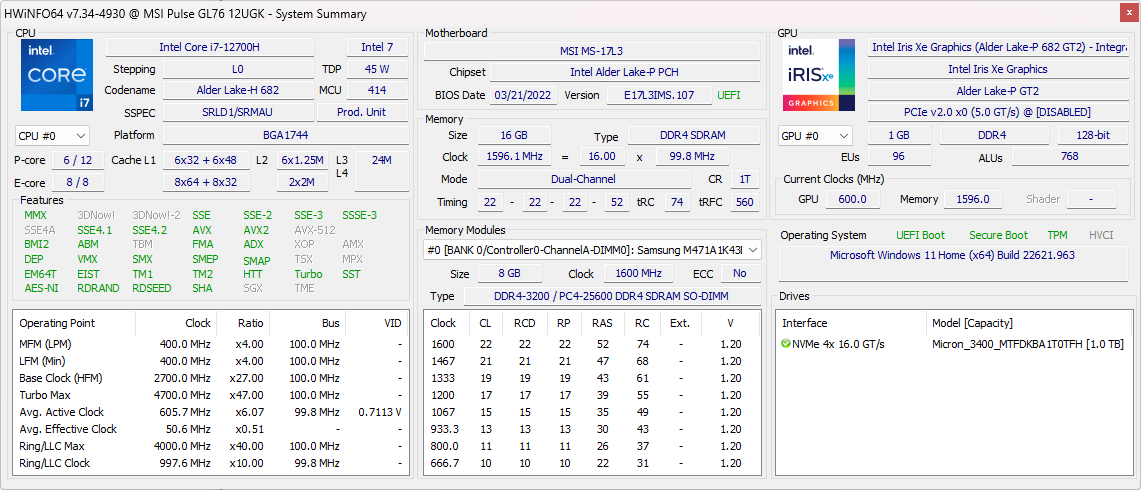
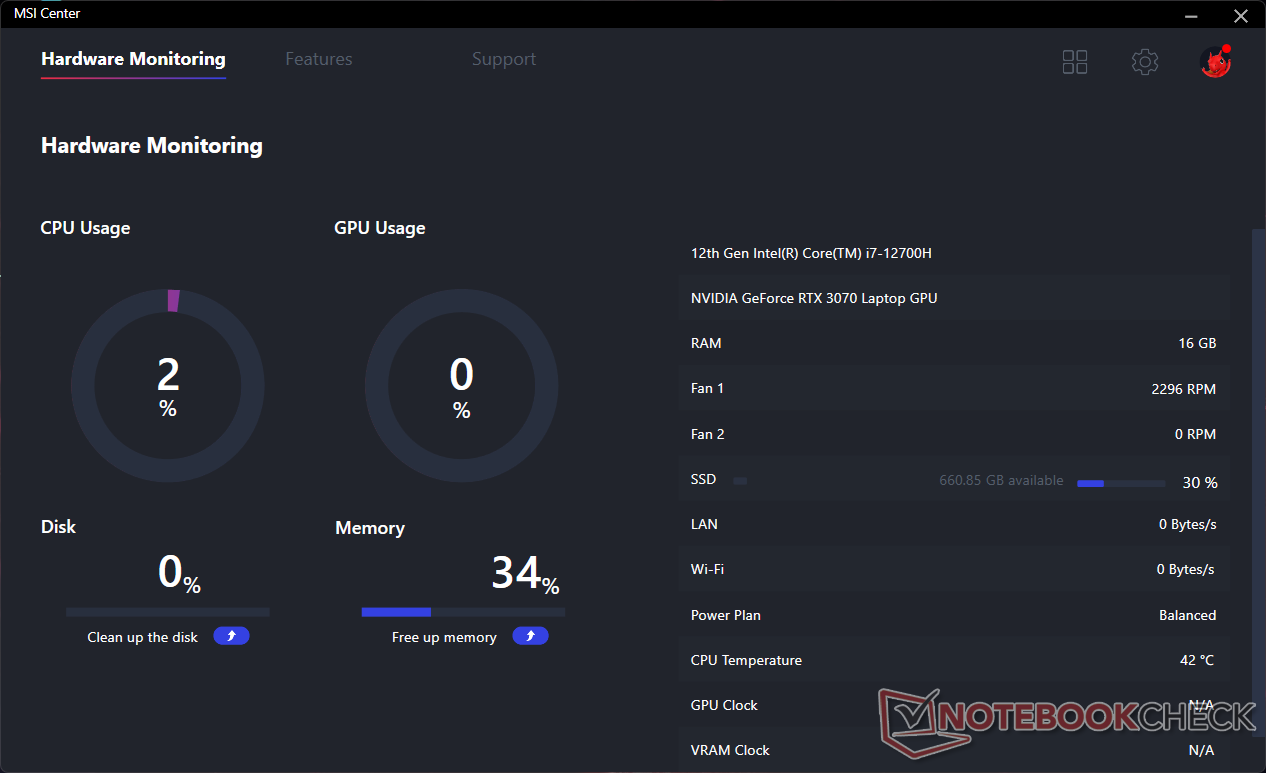
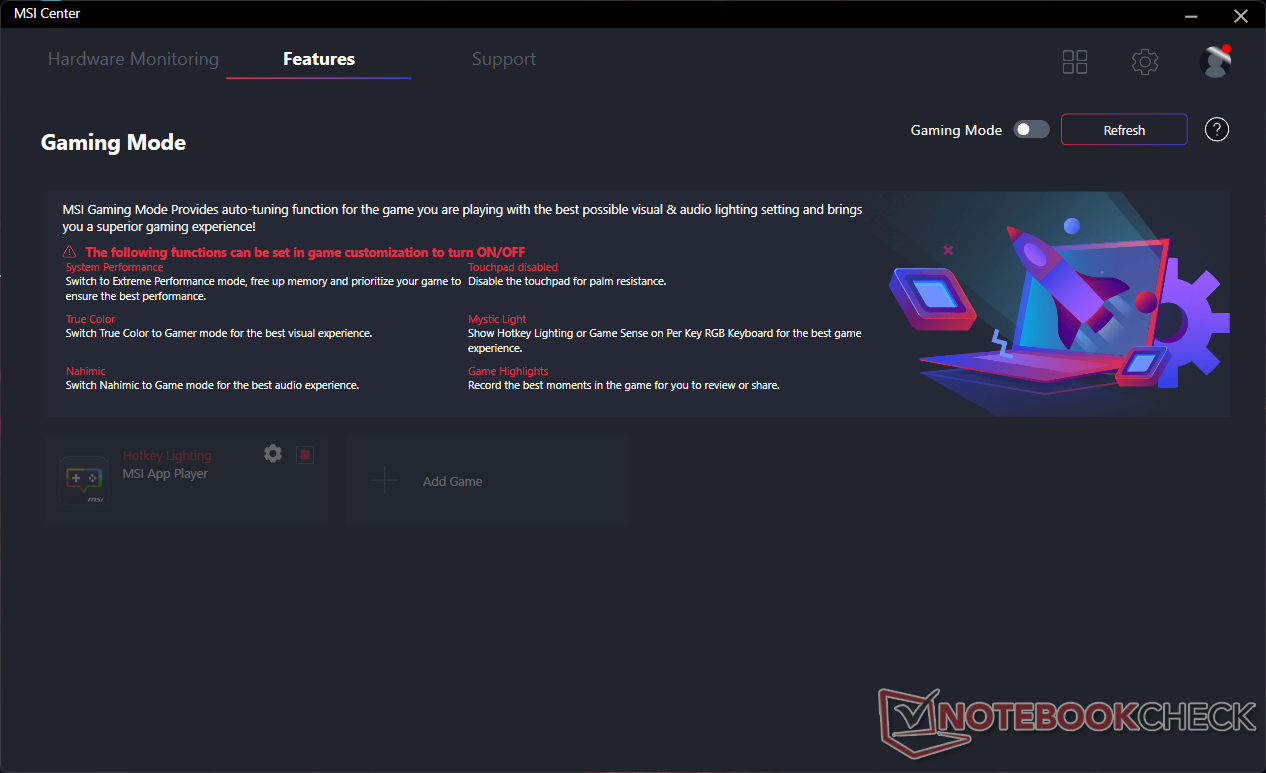
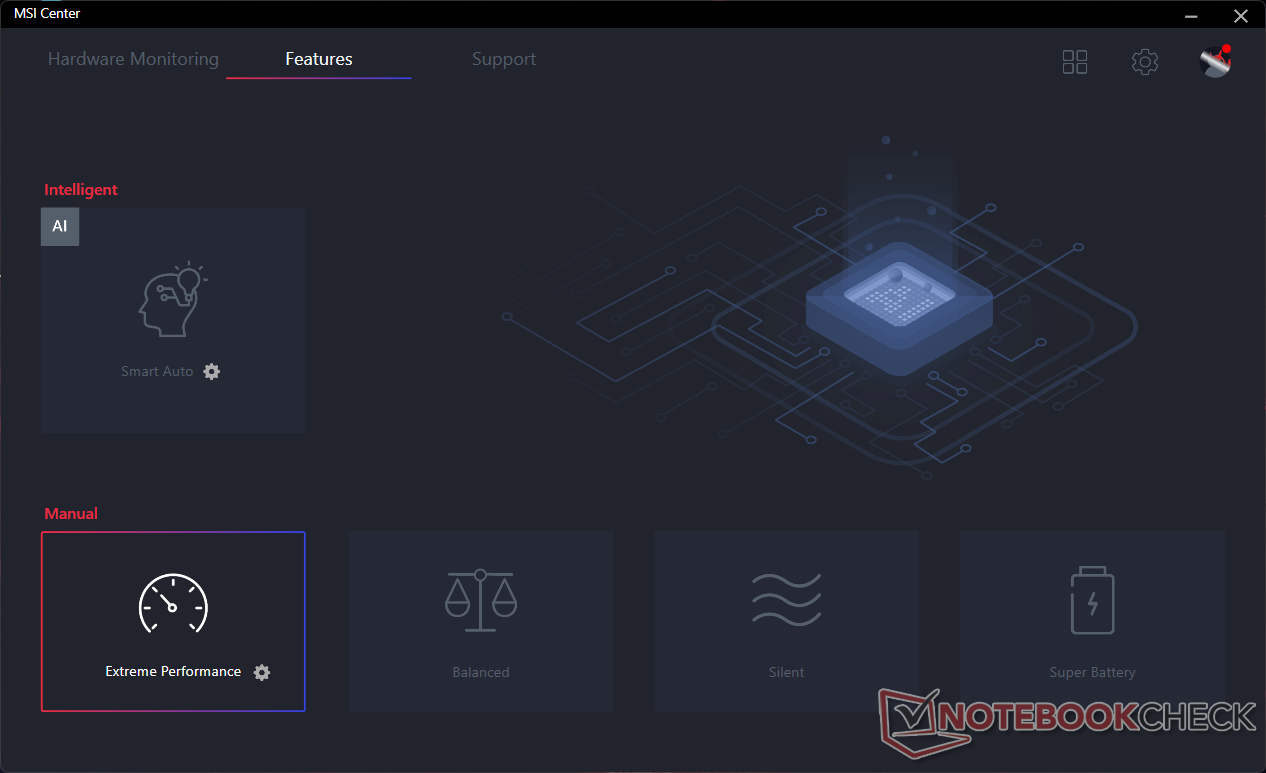
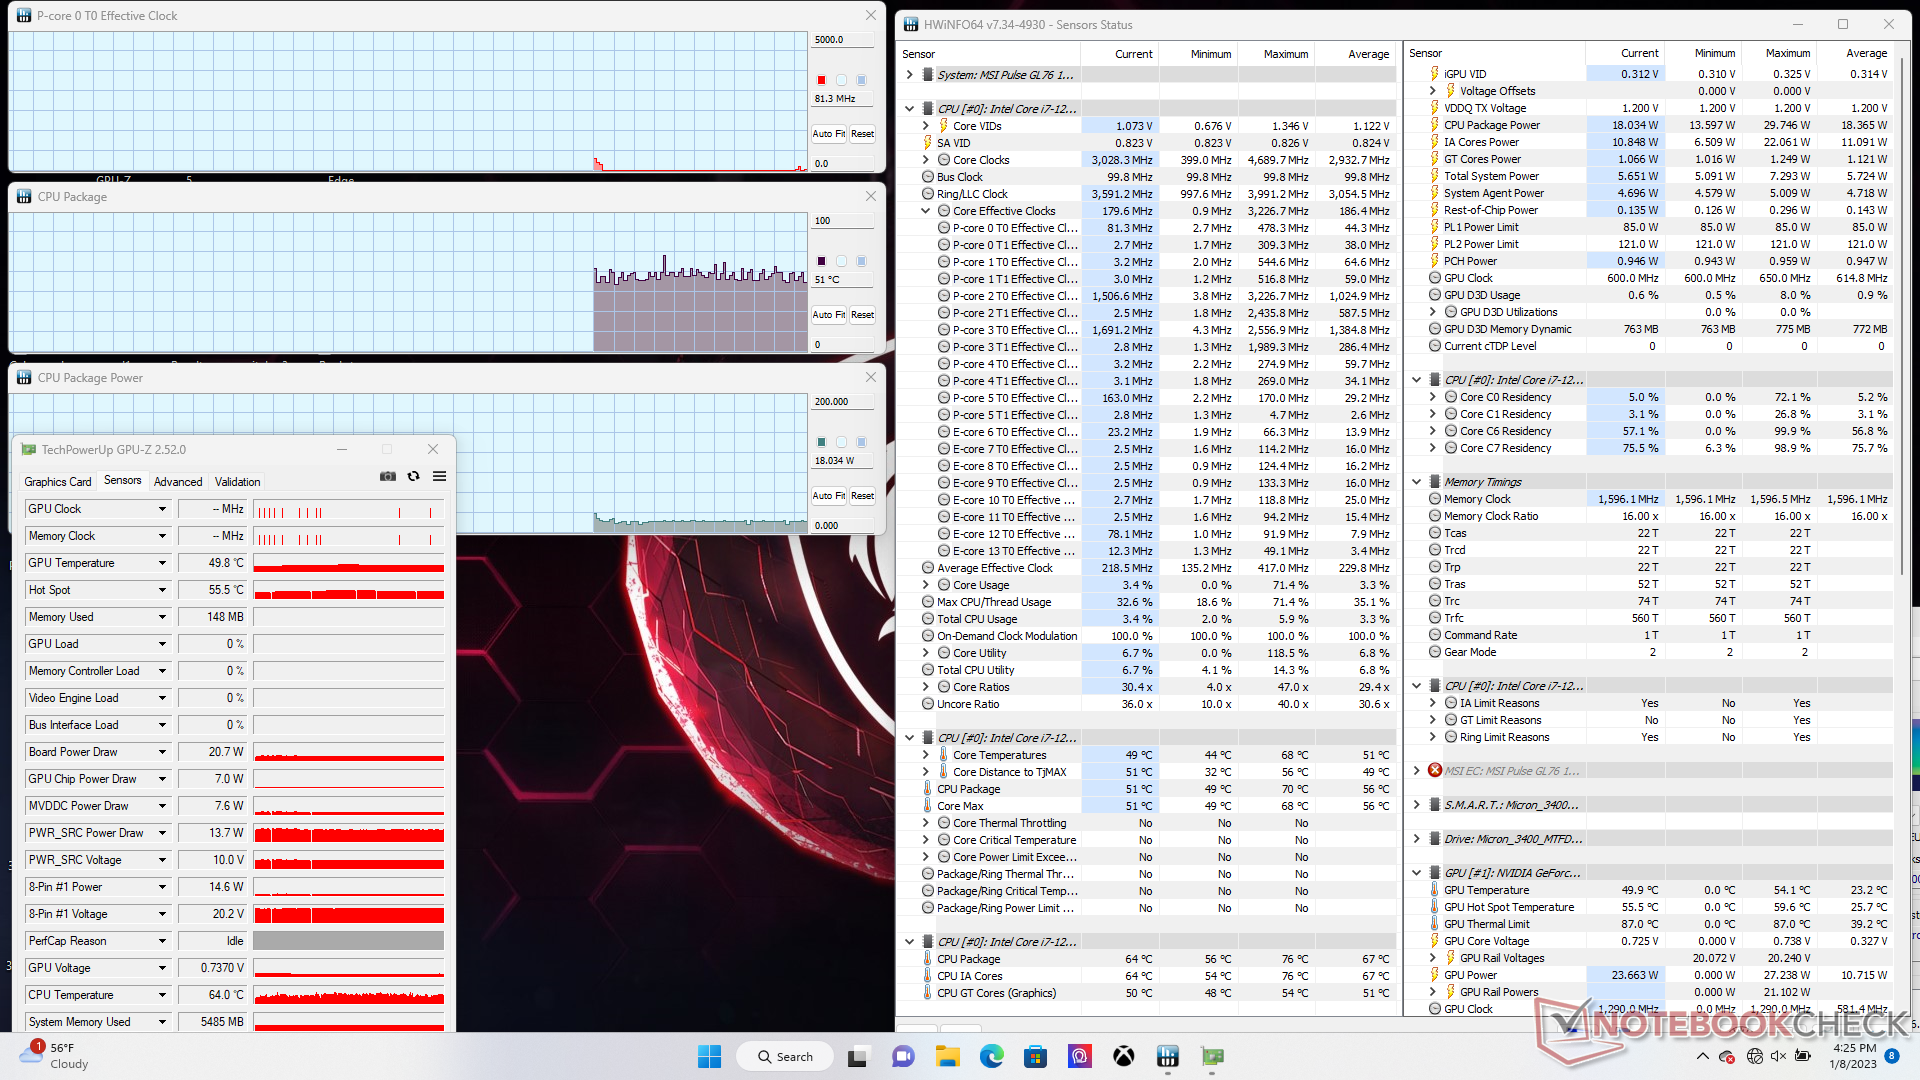
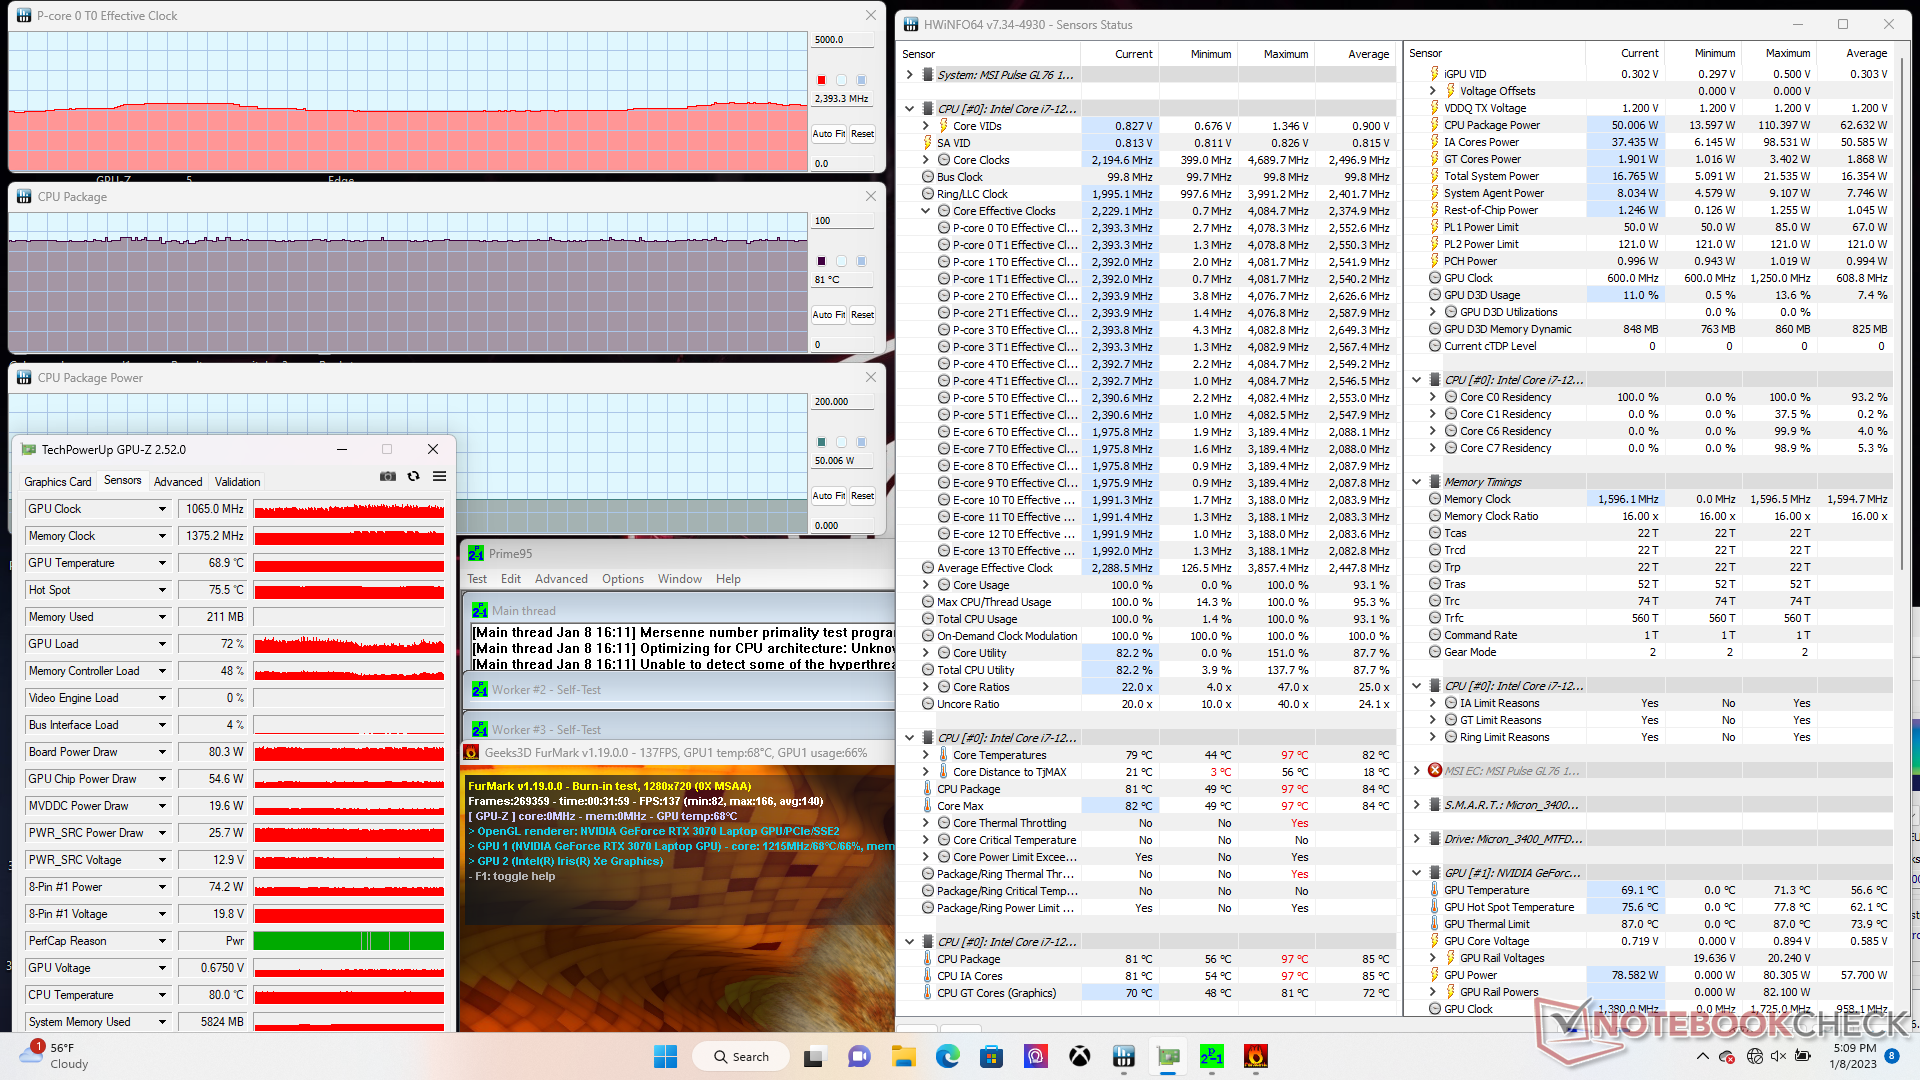
在运行以下任何性能基准之前,我们通过Windows将我们的设备设置为性能模式,并通过MSI中心将极致性能模式与dGPU激活。风扇模式也被设置为自动。用户应该熟悉微星中心,因为它是微星特定更新、性能配置文件、硬件监控等的控制中心,如下图所示。
在GL76系列上没有高级优化或MUX支持。
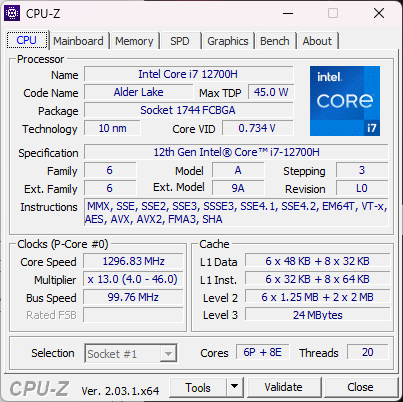
处理器
CPU性能非常好,多线程结果比我们数据库中配备相同的笔记本电脑平均快10%左右。 酷睿i7-12700H CPU。总的来说,它的速度仅在几个百分点之内。 酷睿i9-12900H在更昂贵的 艾丽华x15 R2.
选择低端的 酷睿i5-12500H而不是我们的酷睿i7配置将导致多线程性能下降约15%。
Cinebench R15 Multi Loop
Cinebench R20: CPU (Multi Core) | CPU (Single Core)
Cinebench R23: Multi Core | Single Core
Cinebench R15: CPU Multi 64Bit | CPU Single 64Bit
Blender: v2.79 BMW27 CPU
7-Zip 18.03: 7z b 4 | 7z b 4 -mmt1
Geekbench 5.5: Multi-Core | Single-Core
HWBOT x265 Benchmark v2.2: 4k Preset
LibreOffice : 20 Documents To PDF
R Benchmark 2.5: Overall mean
| CPU Performance rating | |
| Asus ROG Strix Scar 17 SE G733CX-LL014W | |
| MSI GE67 HX 12UGS | |
| Alienware x15 R2 P111F | |
| MSI Pulse GL76 12UGK | |
| Average Intel Core i7-12700H | |
| Razer Blade 15 2022 | |
| Alienware m17 R5 (R9 6900HX, RX 6850M XT) | |
| Lenovo IdeaPad Gaming 3 15IAH7 | |
| HP Omen 16-n0033dx | |
| Schenker XMG Apex 15 Max | |
| MSI GE76 Raider 10UH | |
| MSI Creator 15 -3! | |
| Cinebench R20 / CPU (Multi Core) | |
| MSI GE67 HX 12UGS | |
| Asus ROG Strix Scar 17 SE G733CX-LL014W | |
| Alienware x15 R2 P111F | |
| MSI Pulse GL76 12UGK | |
| Average Intel Core i7-12700H (1576 - 7407, n=64) | |
| Razer Blade 15 2022 | |
| Lenovo IdeaPad Gaming 3 15IAH7 | |
| Alienware m17 R5 (R9 6900HX, RX 6850M XT) | |
| HP Omen 16-n0033dx | |
| MSI Creator 15 | |
| MSI Creator 15 | |
| Schenker XMG Apex 15 Max | |
| MSI GE76 Raider 10UH | |
| Cinebench R20 / CPU (Single Core) | |
| Asus ROG Strix Scar 17 SE G733CX-LL014W | |
| Alienware x15 R2 P111F | |
| Razer Blade 15 2022 | |
| Average Intel Core i7-12700H (300 - 704, n=64) | |
| MSI GE67 HX 12UGS | |
| MSI Pulse GL76 12UGK | |
| Lenovo IdeaPad Gaming 3 15IAH7 | |
| Alienware m17 R5 (R9 6900HX, RX 6850M XT) | |
| HP Omen 16-n0033dx | |
| Schenker XMG Apex 15 Max | |
| MSI Creator 15 | |
| MSI Creator 15 | |
| MSI GE76 Raider 10UH | |
| Cinebench R15 / CPU Multi 64Bit | |
| MSI GE67 HX 12UGS | |
| Asus ROG Strix Scar 17 SE G733CX-LL014W | |
| Alienware x15 R2 P111F | |
| MSI Pulse GL76 12UGK | |
| Average Intel Core i7-12700H (1379 - 2916, n=70) | |
| Alienware m17 R5 (R9 6900HX, RX 6850M XT) | |
| Lenovo IdeaPad Gaming 3 15IAH7 | |
| Razer Blade 15 2022 | |
| HP Omen 16-n0033dx | |
| MSI Creator 15 | |
| Schenker XMG Apex 15 Max | |
| MSI GE76 Raider 10UH | |
| Cinebench R15 / CPU Single 64Bit | |
| Alienware x15 R2 P111F | |
| Asus ROG Strix Scar 17 SE G733CX-LL014W | |
| MSI GE67 HX 12UGS | |
| Razer Blade 15 2022 | |
| MSI Pulse GL76 12UGK | |
| Average Intel Core i7-12700H (113 - 263, n=65) | |
| Alienware m17 R5 (R9 6900HX, RX 6850M XT) | |
| Lenovo IdeaPad Gaming 3 15IAH7 | |
| HP Omen 16-n0033dx | |
| Schenker XMG Apex 15 Max | |
| MSI Creator 15 | |
| MSI GE76 Raider 10UH | |
| Blender / v2.79 BMW27 CPU | |
| MSI Creator 15 | |
| MSI Creator 15 | |
| Schenker XMG Apex 15 Max | |
| MSI GE76 Raider 10UH | |
| HP Omen 16-n0033dx | |
| Razer Blade 15 2022 | |
| Average Intel Core i7-12700H (168 - 732, n=63) | |
| Lenovo IdeaPad Gaming 3 15IAH7 | |
| Alienware m17 R5 (R9 6900HX, RX 6850M XT) | |
| MSI Pulse GL76 12UGK | |
| Alienware x15 R2 P111F | |
| Asus ROG Strix Scar 17 SE G733CX-LL014W | |
| MSI GE67 HX 12UGS | |
| 7-Zip 18.03 / 7z b 4 | |
| Asus ROG Strix Scar 17 SE G733CX-LL014W | |
| MSI GE67 HX 12UGS | |
| Alienware x15 R2 P111F | |
| MSI Pulse GL76 12UGK | |
| Schenker XMG Apex 15 Max | |
| Alienware m17 R5 (R9 6900HX, RX 6850M XT) | |
| Razer Blade 15 2022 | |
| Average Intel Core i7-12700H (22844 - 73067, n=63) | |
| HP Omen 16-n0033dx | |
| MSI Creator 15 | |
| MSI Creator 15 | |
| MSI GE76 Raider 10UH | |
| Lenovo IdeaPad Gaming 3 15IAH7 | |
| 7-Zip 18.03 / 7z b 4 -mmt1 | |
| Schenker XMG Apex 15 Max | |
| Asus ROG Strix Scar 17 SE G733CX-LL014W | |
| Alienware x15 R2 P111F | |
| Alienware m17 R5 (R9 6900HX, RX 6850M XT) | |
| Razer Blade 15 2022 | |
| MSI Pulse GL76 12UGK | |
| HP Omen 16-n0033dx | |
| Average Intel Core i7-12700H (2743 - 5972, n=63) | |
| MSI GE67 HX 12UGS | |
| Lenovo IdeaPad Gaming 3 15IAH7 | |
| MSI Creator 15 | |
| MSI Creator 15 | |
| MSI GE76 Raider 10UH | |
| Geekbench 5.5 / Multi-Core | |
| Asus ROG Strix Scar 17 SE G733CX-LL014W | |
| MSI GE67 HX 12UGS | |
| Alienware x15 R2 P111F | |
| Razer Blade 15 2022 | |
| MSI Pulse GL76 12UGK | |
| Average Intel Core i7-12700H (5144 - 13745, n=64) | |
| Alienware m17 R5 (R9 6900HX, RX 6850M XT) | |
| HP Omen 16-n0033dx | |
| Schenker XMG Apex 15 Max | |
| MSI Creator 15 | |
| Lenovo IdeaPad Gaming 3 15IAH7 | |
| MSI GE76 Raider 10UH | |
| Geekbench 5.5 / Single-Core | |
| Asus ROG Strix Scar 17 SE G733CX-LL014W | |
| Alienware x15 R2 P111F | |
| MSI GE67 HX 12UGS | |
| Razer Blade 15 2022 | |
| Average Intel Core i7-12700H (803 - 1851, n=64) | |
| MSI Pulse GL76 12UGK | |
| Lenovo IdeaPad Gaming 3 15IAH7 | |
| Alienware m17 R5 (R9 6900HX, RX 6850M XT) | |
| Schenker XMG Apex 15 Max | |
| HP Omen 16-n0033dx | |
| MSI Creator 15 | |
| MSI GE76 Raider 10UH | |
| HWBOT x265 Benchmark v2.2 / 4k Preset | |
| MSI GE67 HX 12UGS | |
| Asus ROG Strix Scar 17 SE G733CX-LL014W | |
| Alienware x15 R2 P111F | |
| MSI Pulse GL76 12UGK | |
| Razer Blade 15 2022 | |
| Alienware m17 R5 (R9 6900HX, RX 6850M XT) | |
| Average Intel Core i7-12700H (4.67 - 21.8, n=64) | |
| HP Omen 16-n0033dx | |
| Lenovo IdeaPad Gaming 3 15IAH7 | |
| MSI GE76 Raider 10UH | |
| Schenker XMG Apex 15 Max | |
| LibreOffice / 20 Documents To PDF | |
| HP Omen 16-n0033dx | |
| Alienware m17 R5 (R9 6900HX, RX 6850M XT) | |
| MSI Creator 15 | |
| MSI Creator 15 | |
| Razer Blade 15 2022 | |
| Schenker XMG Apex 15 Max | |
| Lenovo IdeaPad Gaming 3 15IAH7 | |
| MSI GE76 Raider 10UH | |
| Alienware x15 R2 P111F | |
| Average Intel Core i7-12700H (34.2 - 95.3, n=63) | |
| MSI Pulse GL76 12UGK | |
| MSI GE67 HX 12UGS | |
| Asus ROG Strix Scar 17 SE G733CX-LL014W | |
| R Benchmark 2.5 / Overall mean | |
| MSI Creator 15 | |
| MSI Creator 15 | |
| MSI GE76 Raider 10UH | |
| Schenker XMG Apex 15 Max | |
| Lenovo IdeaPad Gaming 3 15IAH7 | |
| HP Omen 16-n0033dx | |
| Alienware m17 R5 (R9 6900HX, RX 6850M XT) | |
| MSI Pulse GL76 12UGK | |
| Average Intel Core i7-12700H (0.4441 - 1.052, n=63) | |
| Razer Blade 15 2022 | |
| MSI GE67 HX 12UGS | |
| Alienware x15 R2 P111F | |
| Asus ROG Strix Scar 17 SE G733CX-LL014W | |
* ... smaller is better
AIDA64: FP32 Ray-Trace | FPU Julia | CPU SHA3 | CPU Queen | FPU SinJulia | FPU Mandel | CPU AES | CPU ZLib | FP64 Ray-Trace | CPU PhotoWorxx
| AIDA64 / FP32 Ray-Trace | |
| Asus ROG Strix Scar 17 SE G733CX-LL014W | |
| Acer Predator Helios 300 (i7-12700H, RTX 3070 Ti) | |
| MSI Pulse GL76 12UGK | |
| Alienware m17 R5 (R9 6900HX, RX 6850M XT) | |
| Average Intel Core i7-12700H (2585 - 17957, n=64) | |
| MSI Vector GP76 12UGS-434 | |
| Razer Blade 17 Early 2022 | |
| AIDA64 / FP64 Ray-Trace | |
| Acer Predator Helios 300 (i7-12700H, RTX 3070 Ti) | |
| Asus ROG Strix Scar 17 SE G733CX-LL014W | |
| MSI Pulse GL76 12UGK | |
| Alienware m17 R5 (R9 6900HX, RX 6850M XT) | |
| Average Intel Core i7-12700H (1437 - 9692, n=64) | |
| MSI Vector GP76 12UGS-434 | |
| Razer Blade 17 Early 2022 | |
| AIDA64 / CPU PhotoWorxx | |
| Asus ROG Strix Scar 17 SE G733CX-LL014W | |
| Acer Predator Helios 300 (i7-12700H, RTX 3070 Ti) | |
| Razer Blade 17 Early 2022 | |
| Average Intel Core i7-12700H (12863 - 52207, n=64) | |
| Alienware m17 R5 (R9 6900HX, RX 6850M XT) | |
| MSI Pulse GL76 12UGK | |
| MSI Vector GP76 12UGS-434 | |
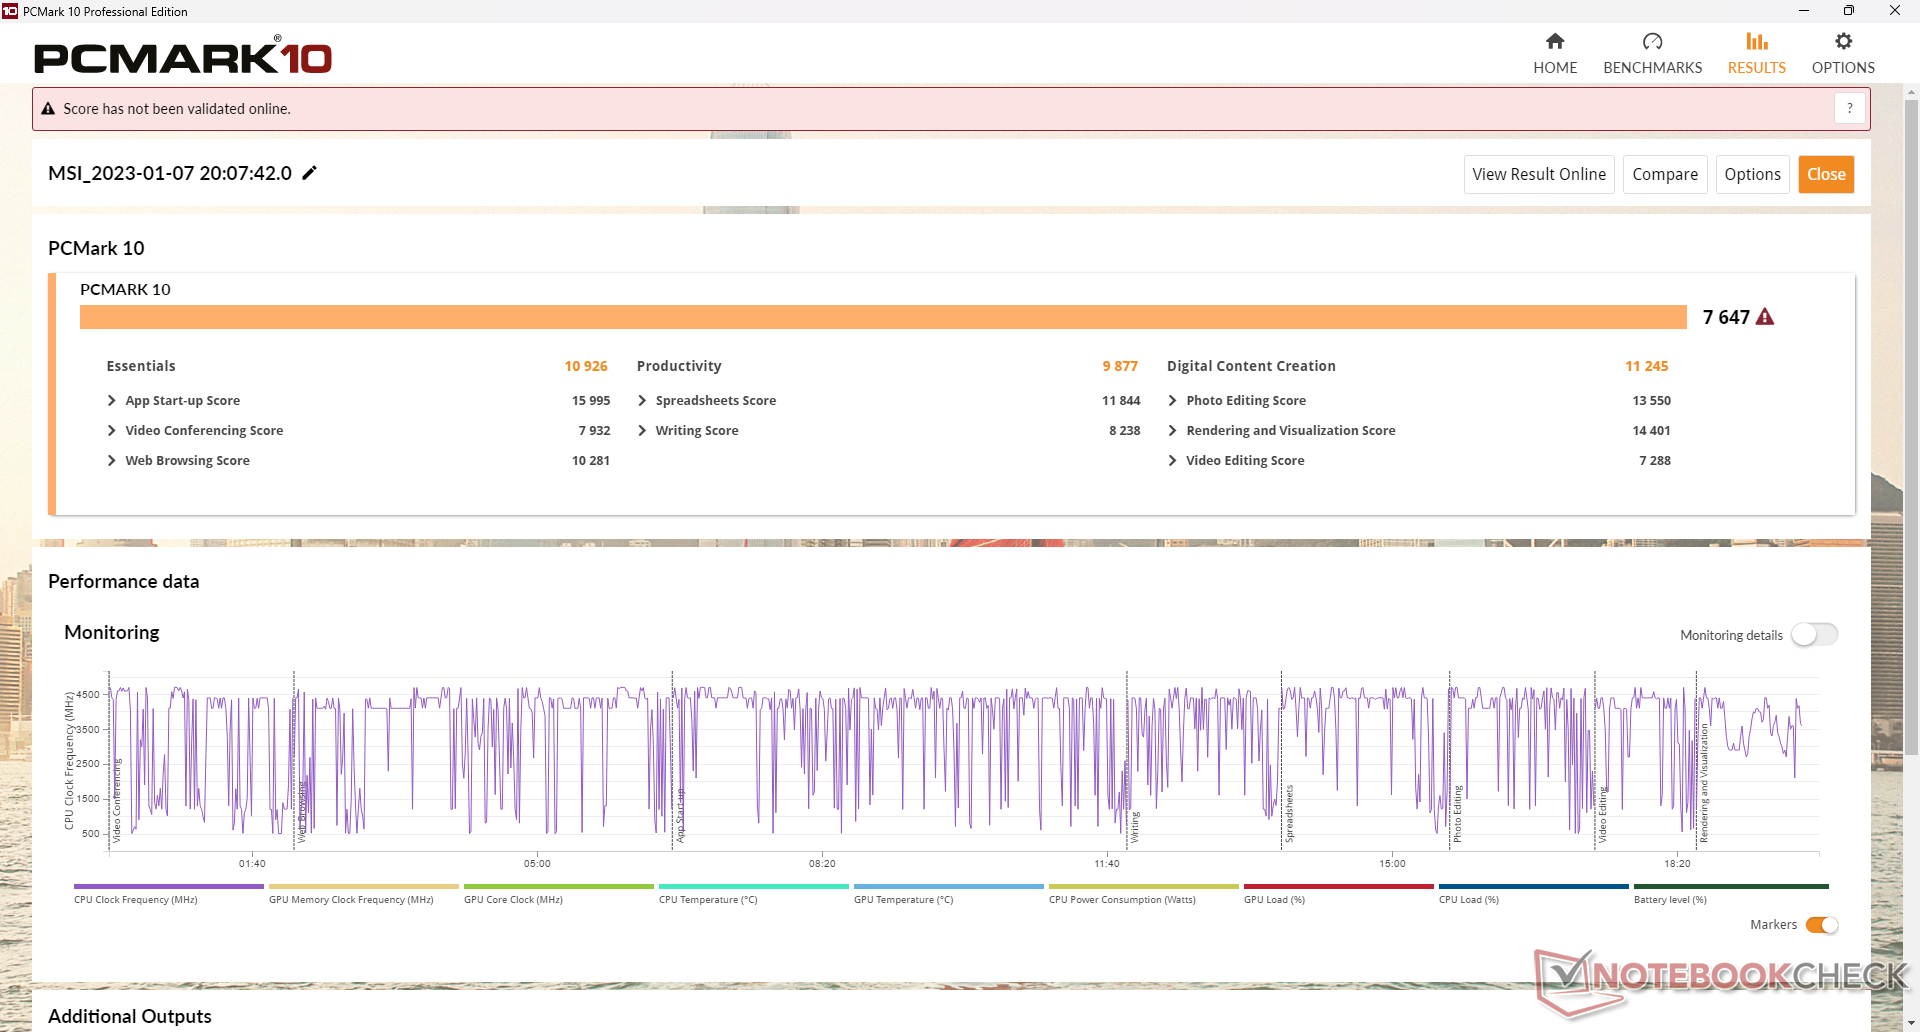
系统性能
PCMark的结果很好,可与更高端的游戏笔记本相媲美,如华硕ROG Strix Scar 17.换句话说,GL76可以提供几乎与旗舰替代品相同的性能,但花的钱要少得多。
CrossMark: Overall | Productivity | Creativity | Responsiveness
| PCMark 10 / Score | |
| MSI Vector GP76 12UGS-434 | |
| Acer Predator Helios 300 (i7-12700H, RTX 3070 Ti) | |
| MSI Pulse GL76 12UGK | |
| Average Intel Core i7-12700H, NVIDIA GeForce RTX 3070 Laptop GPU (7082 - 7647, n=2) | |
| Alienware m17 R5 (R9 6900HX, RX 6850M XT) | |
| Asus ROG Strix Scar 17 SE G733CX-LL014W | |
| Razer Blade 17 Early 2022 | |
| PCMark 10 / Essentials | |
| MSI Pulse GL76 12UGK | |
| Acer Predator Helios 300 (i7-12700H, RTX 3070 Ti) | |
| MSI Vector GP76 12UGS-434 | |
| Average Intel Core i7-12700H, NVIDIA GeForce RTX 3070 Laptop GPU (10076 - 10926, n=2) | |
| Asus ROG Strix Scar 17 SE G733CX-LL014W | |
| Razer Blade 17 Early 2022 | |
| Alienware m17 R5 (R9 6900HX, RX 6850M XT) | |
| PCMark 10 / Productivity | |
| MSI Vector GP76 12UGS-434 | |
| Acer Predator Helios 300 (i7-12700H, RTX 3070 Ti) | |
| MSI Pulse GL76 12UGK | |
| Asus ROG Strix Scar 17 SE G733CX-LL014W | |
| Average Intel Core i7-12700H, NVIDIA GeForce RTX 3070 Laptop GPU (9460 - 9877, n=2) | |
| Razer Blade 17 Early 2022 | |
| Alienware m17 R5 (R9 6900HX, RX 6850M XT) | |
| PCMark 10 / Digital Content Creation | |
| Acer Predator Helios 300 (i7-12700H, RTX 3070 Ti) | |
| MSI Vector GP76 12UGS-434 | |
| Alienware m17 R5 (R9 6900HX, RX 6850M XT) | |
| MSI Pulse GL76 12UGK | |
| Average Intel Core i7-12700H, NVIDIA GeForce RTX 3070 Laptop GPU (10113 - 11245, n=2) | |
| Razer Blade 17 Early 2022 | |
| Asus ROG Strix Scar 17 SE G733CX-LL014W | |
| CrossMark / Overall | |
| Asus ROG Strix Scar 17 SE G733CX-LL014W | |
| MSI Vector GP76 12UGS-434 | |
| Average Intel Core i7-12700H, NVIDIA GeForce RTX 3070 Laptop GPU (1844 - 2003, n=2) | |
| Acer Predator Helios 300 (i7-12700H, RTX 3070 Ti) | |
| MSI Pulse GL76 12UGK | |
| Razer Blade 17 Early 2022 | |
| Alienware m17 R5 (R9 6900HX, RX 6850M XT) | |
| CrossMark / Productivity | |
| Asus ROG Strix Scar 17 SE G733CX-LL014W | |
| MSI Vector GP76 12UGS-434 | |
| Average Intel Core i7-12700H, NVIDIA GeForce RTX 3070 Laptop GPU (1785 - 1971, n=2) | |
| MSI Pulse GL76 12UGK | |
| Acer Predator Helios 300 (i7-12700H, RTX 3070 Ti) | |
| Razer Blade 17 Early 2022 | |
| Alienware m17 R5 (R9 6900HX, RX 6850M XT) | |
| CrossMark / Creativity | |
| Asus ROG Strix Scar 17 SE G733CX-LL014W | |
| Acer Predator Helios 300 (i7-12700H, RTX 3070 Ti) | |
| Average Intel Core i7-12700H, NVIDIA GeForce RTX 3070 Laptop GPU (1912 - 1979, n=2) | |
| MSI Vector GP76 12UGS-434 | |
| MSI Pulse GL76 12UGK | |
| Razer Blade 17 Early 2022 | |
| Alienware m17 R5 (R9 6900HX, RX 6850M XT) | |
| CrossMark / Responsiveness | |
| MSI Vector GP76 12UGS-434 | |
| Average Intel Core i7-12700H, NVIDIA GeForce RTX 3070 Laptop GPU (1824 - 2182, n=2) | |
| Asus ROG Strix Scar 17 SE G733CX-LL014W | |
| MSI Pulse GL76 12UGK | |
| Acer Predator Helios 300 (i7-12700H, RTX 3070 Ti) | |
| Razer Blade 17 Early 2022 | |
| Alienware m17 R5 (R9 6900HX, RX 6850M XT) | |
| PCMark 10 Score | 7647 points | |
Help | ||
| AIDA64 / Memory Latency | |
| Alienware m17 R5 (R9 6900HX, RX 6850M XT) | |
| MSI Pulse GL76 12UGK | |
| MSI Vector GP76 12UGS-434 | |
| Acer Predator Helios 300 (i7-12700H, RTX 3070 Ti) | |
| Asus ROG Strix Scar 17 SE G733CX-LL014W | |
| Average Intel Core i7-12700H (76.2 - 133.9, n=62) | |
* ... smaller is better
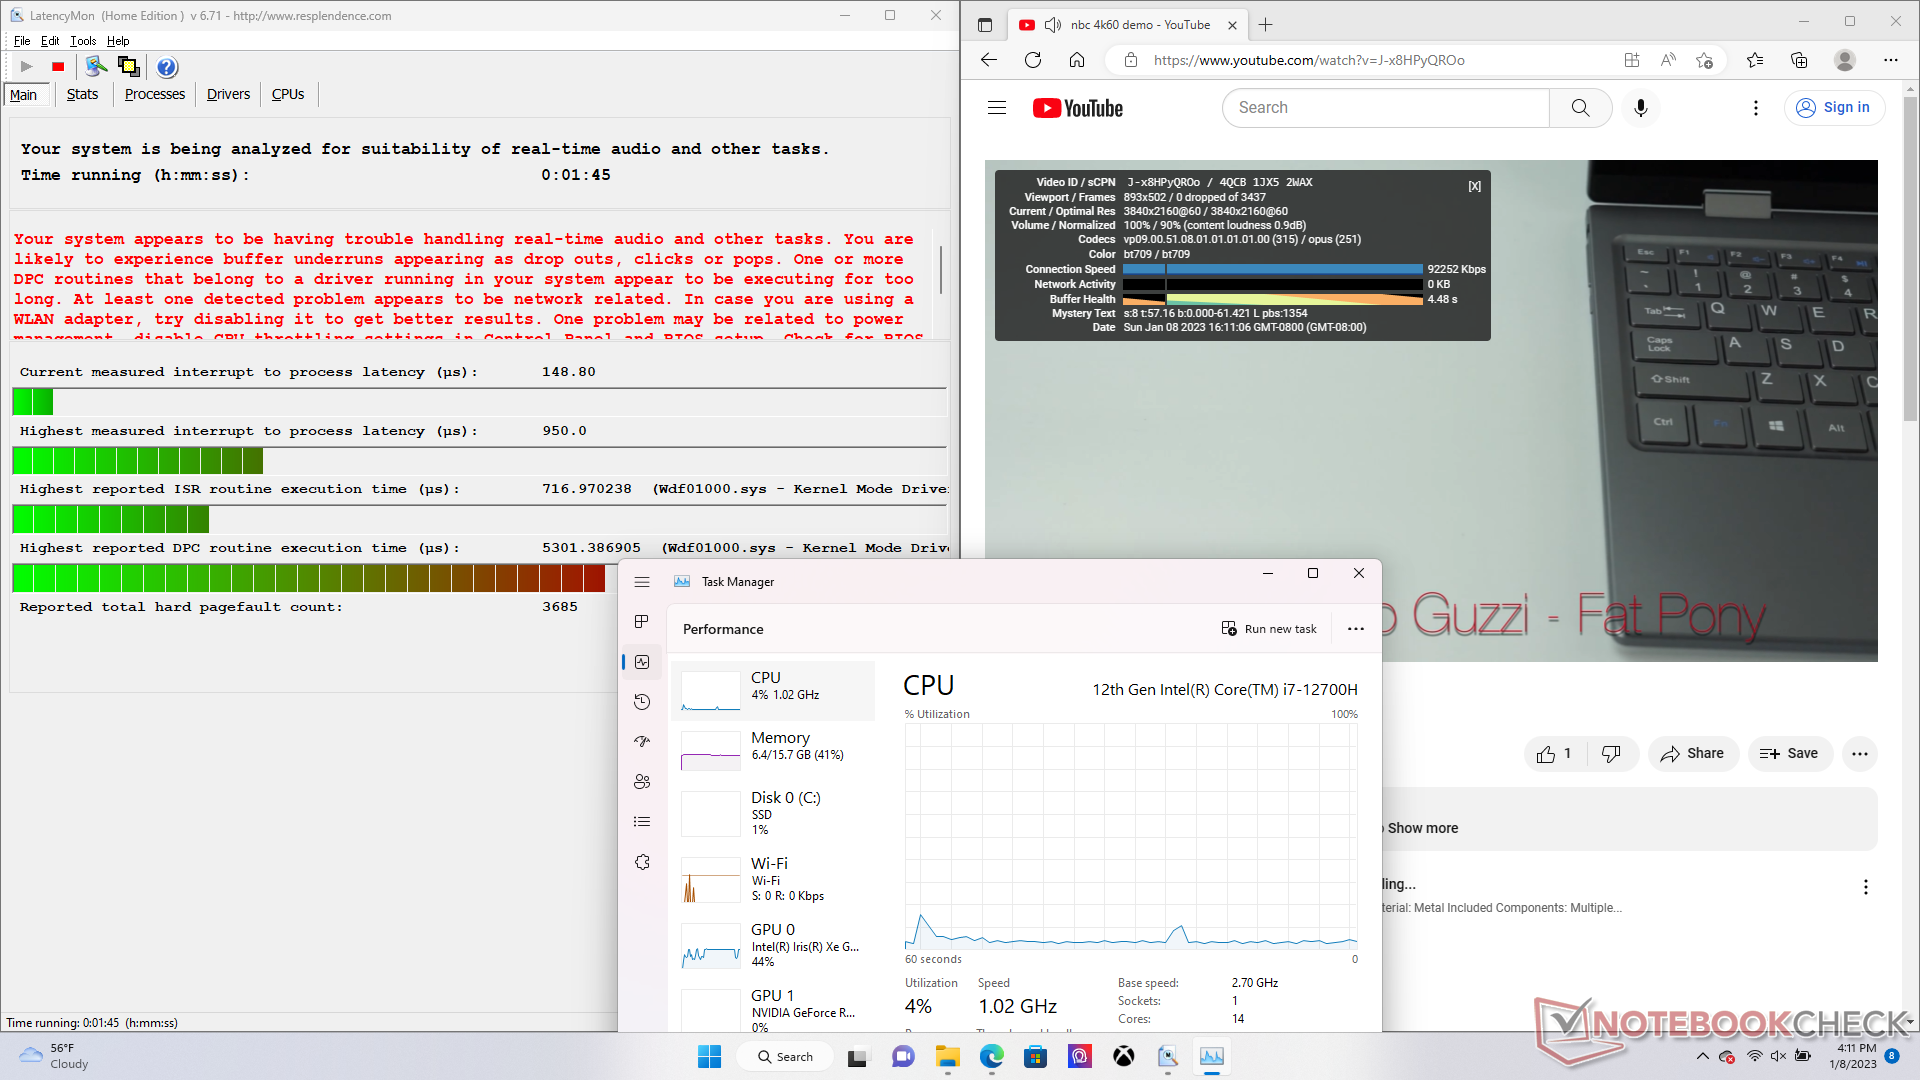
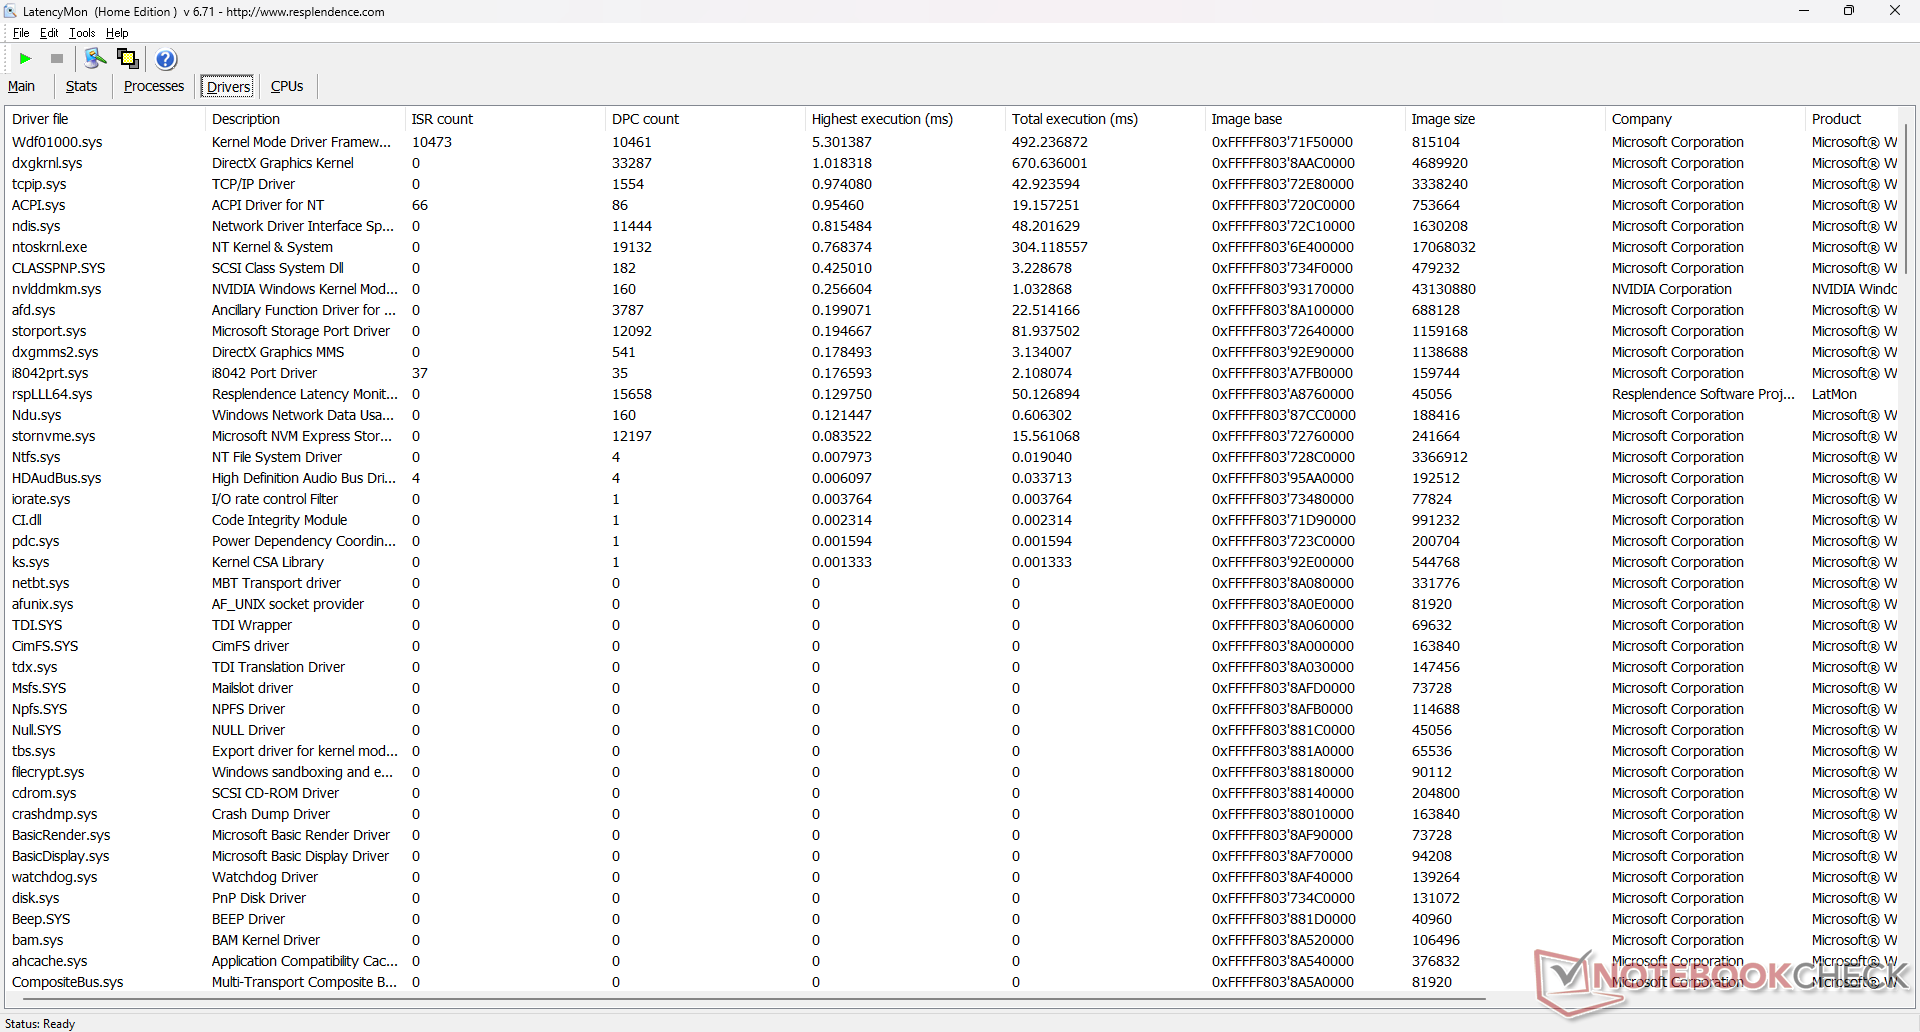
DPC延时
LatencyMon显示,在打开我们主页的多个浏览器标签时没有DPC问题。在60FPS下的4K视频播放也是完美无缺的,没有掉帧。
| DPC Latencies / LatencyMon - interrupt to process latency (max), Web, Youtube, Prime95 | |
| Asus ROG Strix Scar 17 SE G733CX-LL014W | |
| MSI Vector GP76 12UGS-434 | |
| Acer Predator Helios 300 (i7-12700H, RTX 3070 Ti) | |
| Alienware m17 R5 (R9 6900HX, RX 6850M XT) | |
| MSI Pulse GL76 12UGK | |
| Razer Blade 17 Early 2022 | |
* ... smaller is better
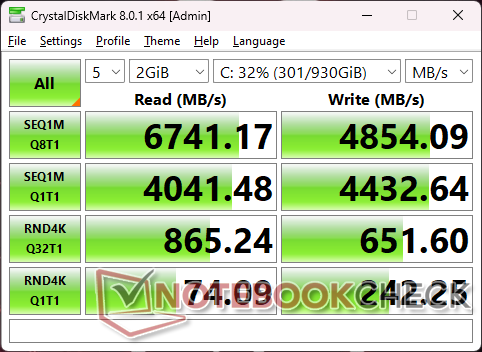
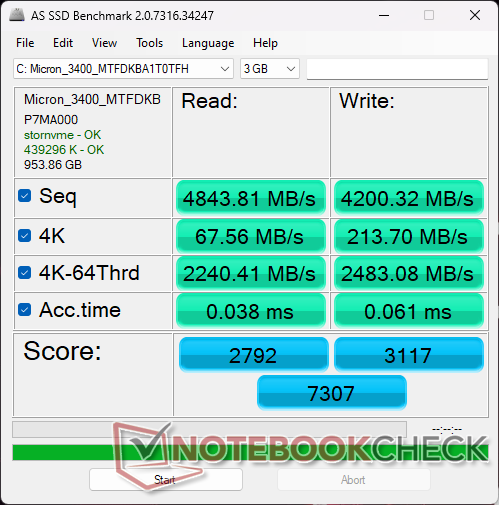
存储设备 - 多达两个NVMe固态硬盘
我们的设备配备了一个 1TB美光3400PCIe4 x4 NVMe SSD,而不是更常见的1TB三星PM9A1,可能是为了节省成本。传输速率只是略微慢了一些,平均约为10%。我们对该驱动器在没有散热片的情况下长时间保持6400MB/s以上的高传输率的能力印象更加深刻。

* ... smaller is better
Disk Throttling: DiskSpd Read Loop, Queue Depth 8
GPU性能 - 105 W TGP图形
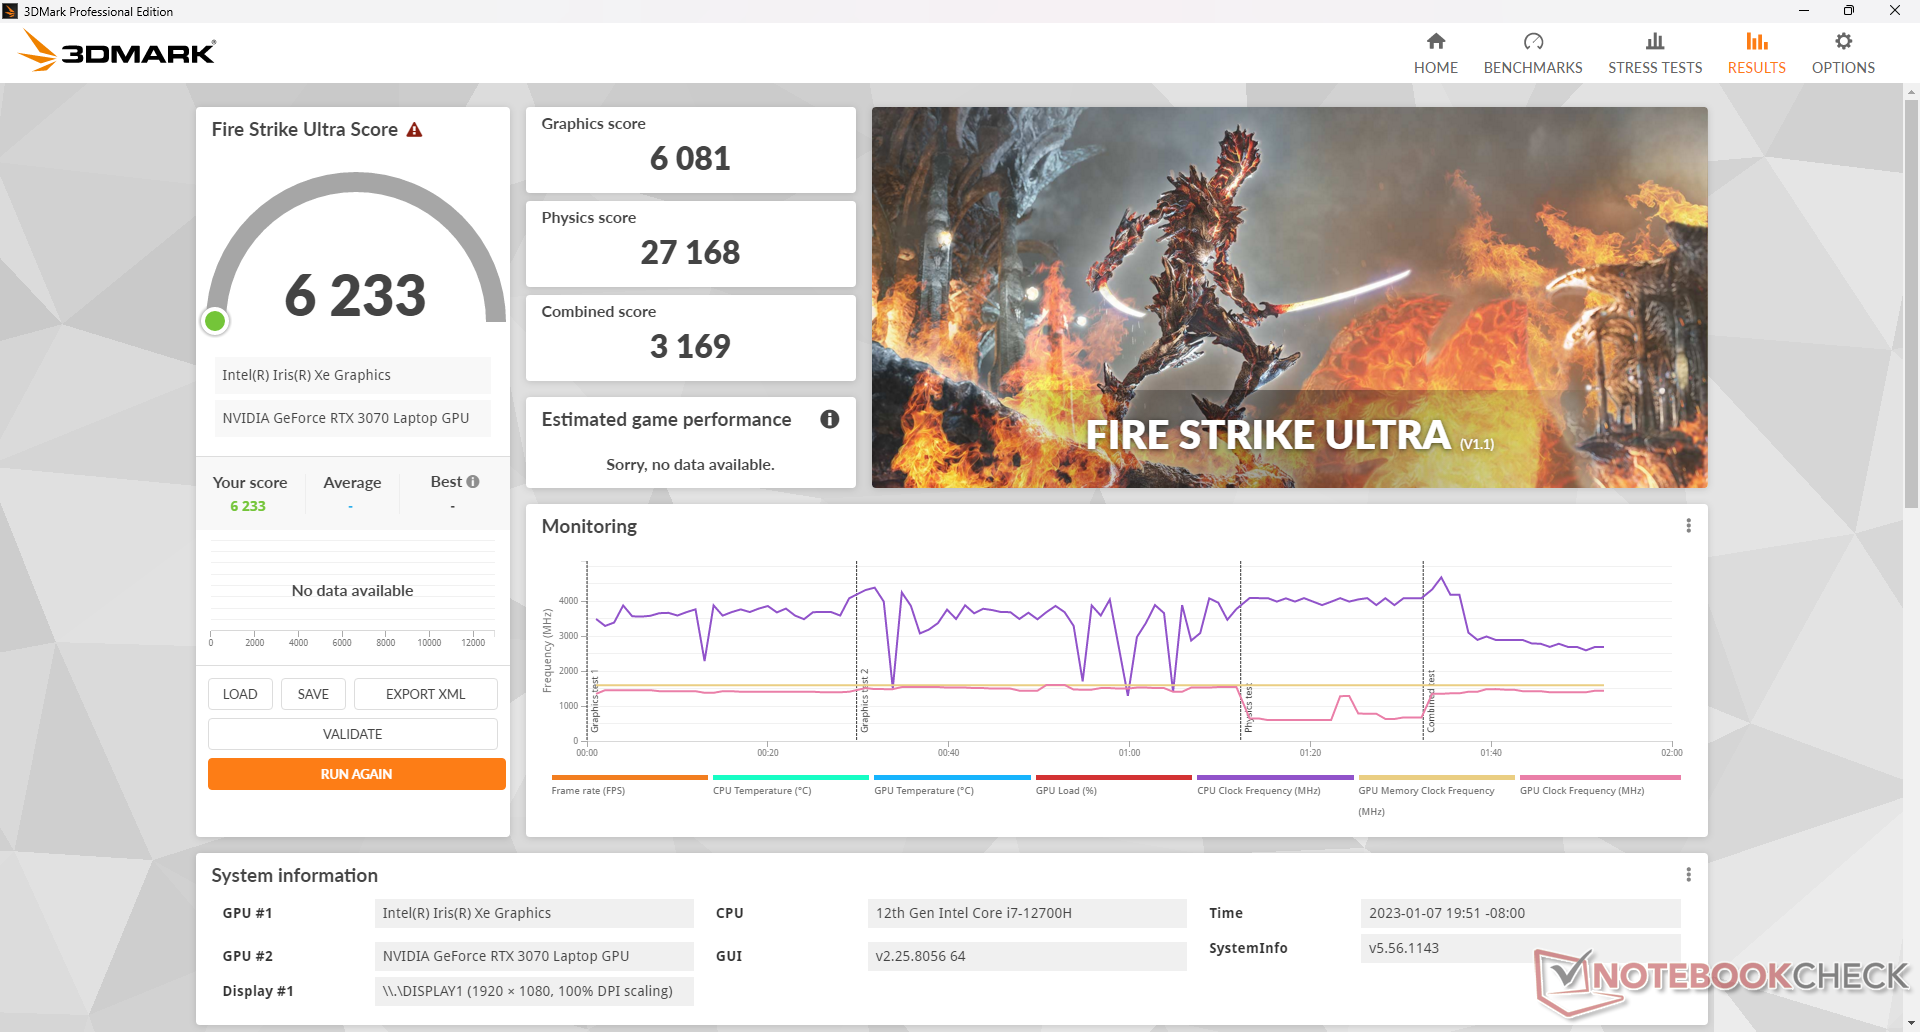
原始图形性能大约比我们的 GeForce RTX 3070桌面参考.当与115W的GeForce RTX 3070中的 XMG Apex 15相比,我们的105W版本只落后5%左右。降级到RTX 3060或 RTX 3050将分别影响图形性能约10%至15%和40%至45%。
目前所有的游戏都可以在设置为最大的原始1080p分辨率下播放。然而,为了更好地利用快速的360赫兹原生刷新率,你可能要考虑将设置调到中等或更低,特别是在《CS:GO》或《守望先锋》等竞技游戏中。
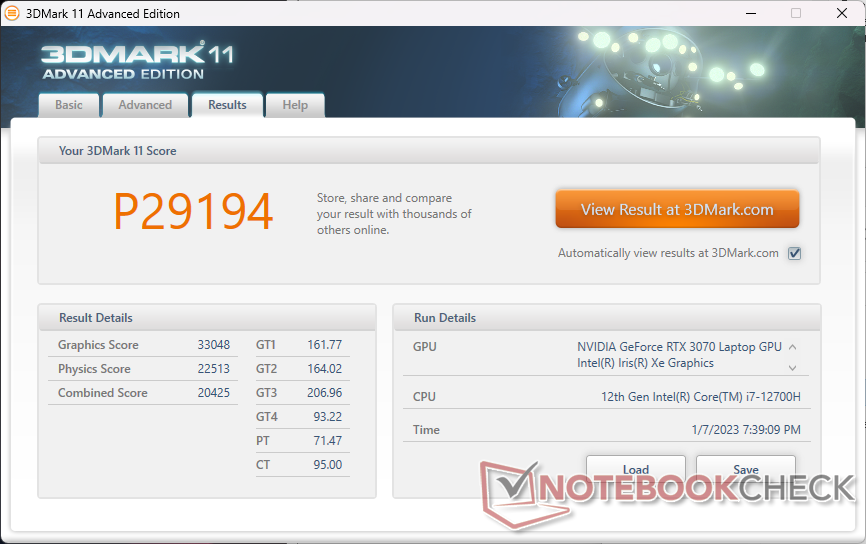
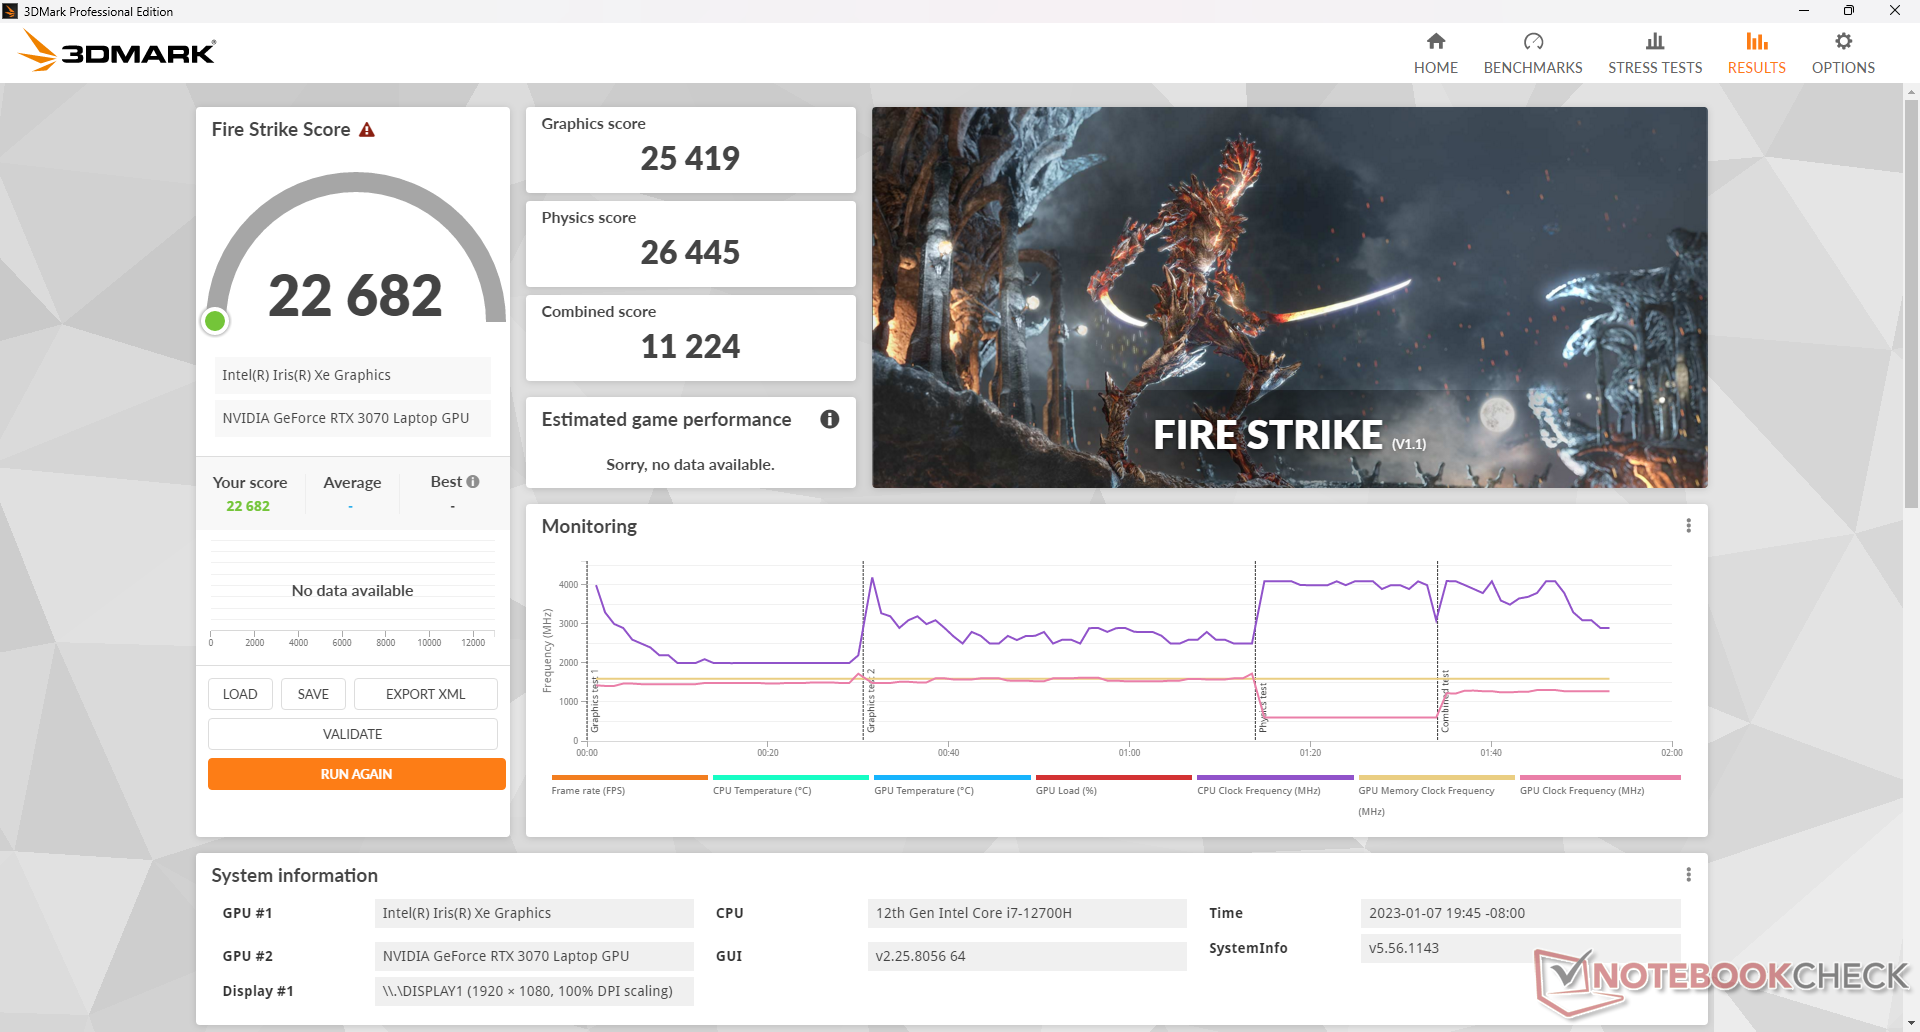
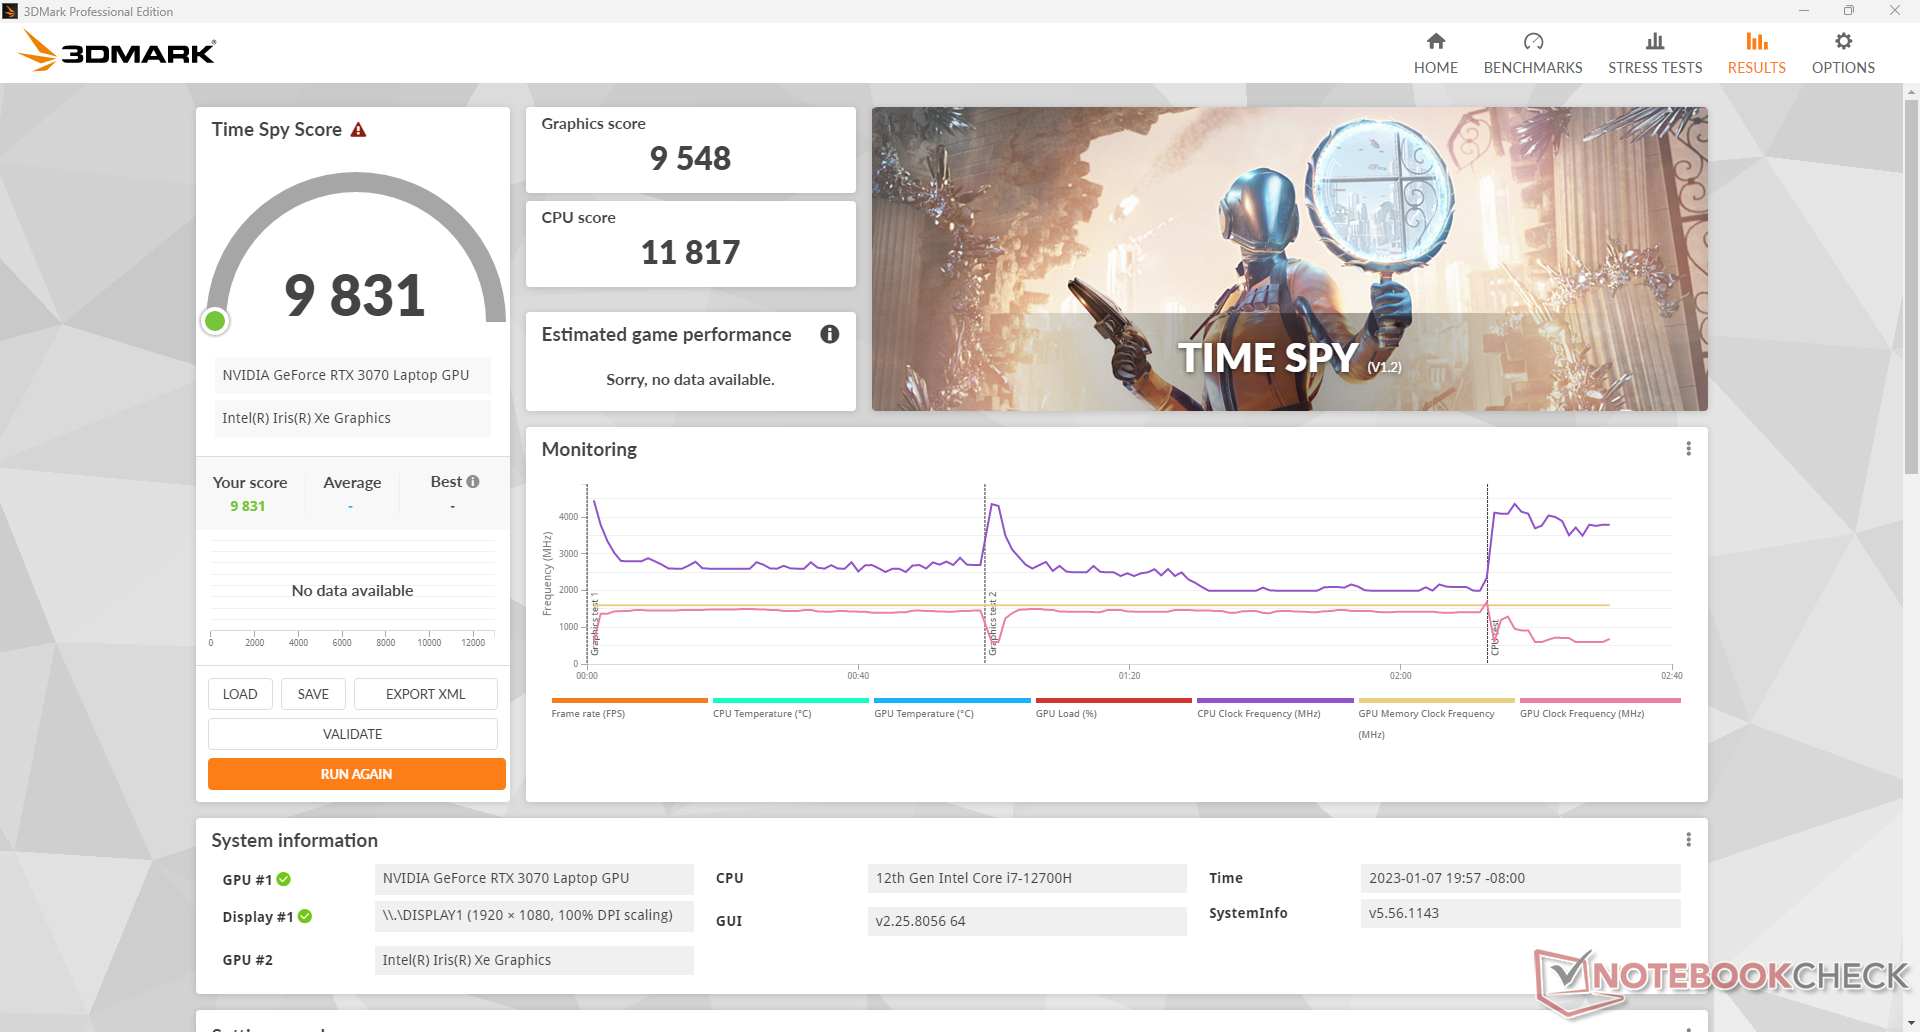
| 3DMark 11 Performance | 29194 points | |
| 3DMark Fire Strike Score | 22682 points | |
| 3DMark Time Spy Score | 9831 points | |
Help | ||
* ... smaller is better
Witcher 3 FPS Chart
| low | med. | high | ultra | |
|---|---|---|---|---|
| GTA V (2015) | 185.7 | 182.3 | 175.5 | 108.1 |
| The Witcher 3 (2015) | 377.1 | 252.8 | 170.5 | 92.8 |
| Dota 2 Reborn (2015) | 168.1 | 152.1 | 141.2 | 132.8 |
| Final Fantasy XV Benchmark (2018) | 186.3 | 118.5 | 89.7 | |
| X-Plane 11.11 (2018) | 139.9 | 122.9 | 97.7 | |
| Strange Brigade (2018) | 414 | 224 | 186.6 | 164.5 |
| Cyberpunk 2077 1.6 (2022) | 118.8 | 102.4 | 83.2 | 69.8 |
排放 - 不太响亮
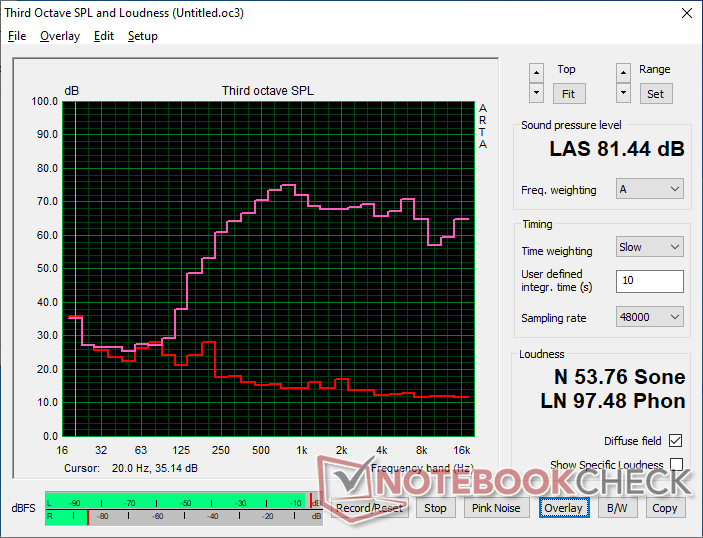
系统噪音
即使设置为 "静音 "模式,风扇也不会空转。我们能够在24.1dB(A)的静音背景下记录到最低的26.9dB(A),这在大多数情况下只是勉强可以听到而已。相反,"静音 "模式在防止内部风扇因屏幕负载变化而跳动方面表现出色。例如,在流媒体视频或网络浏览时,建议使用 "静音 "模式,而不是平衡模式,后者的风扇会在27至43.8 dB(A)之间频繁跳动。
风扇运行时的噪音 Witcher 3如下表所示,风扇噪音稳定在略低于45 dB(A)的水平,比许多竞争对手都要安静。如果启用Cooler Boost(即最大风扇模式),风扇噪音将跃升至高达58 dB(A)。这种模式更多的是为了降低温度,而不是提高性能,因此对于大多数游戏场景来说,它并不是必要的。
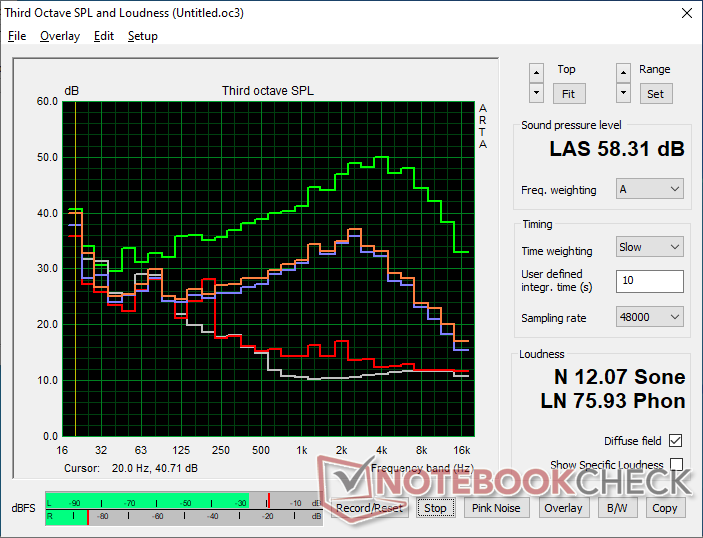
Noise level
| Idle |
| 26.9 / 26.9 / 27 dB(A) |
| Load |
| 43.8 / 58.3 dB(A) |
 | ||
30 dB silent 40 dB(A) audible 50 dB(A) loud |
||
min: | ||
| MSI Pulse GL76 12UGK GeForce RTX 3070 Laptop GPU, i7-12700H, Micron 3400 1TB MTFDKBA1T0TFH | Alienware m17 R5 (R9 6900HX, RX 6850M XT) Radeon RX 6850M XT, R9 6900HX, SSSTC CA6-8D1024 | Asus ROG Strix Scar 17 SE G733CX-LL014W GeForce RTX 3080 Ti Laptop GPU, i9-12950HX, Samsung PM9A1 MZVL22T0HBLB | Acer Predator Helios 300 (i7-12700H, RTX 3070 Ti) GeForce RTX 3070 Ti Laptop GPU, i7-12700H, Samsung PM9A1 MZVL21T0HCLR | Razer Blade 17 Early 2022 GeForce RTX 3080 Ti Laptop GPU, i9-12900H, Samsung PM9A1 MZVL21T0HCLR | MSI Vector GP76 12UGS-434 GeForce RTX 3070 Ti Laptop GPU, i7-12700H, Micron 2450 1TB MTFDKBA1T0TFK | |
|---|---|---|---|---|---|---|
| Noise | 6% | 13% | -10% | -6% | -6% | |
| off / environment * (dB) | 24.1 | 23 5% | 23.9 1% | 23 5% | 26 -8% | 25.6 -6% |
| Idle Minimum * (dB) | 26.9 | 23 14% | 23.9 11% | 23 14% | 26 3% | 27 -0% |
| Idle Average * (dB) | 26.9 | 28.11 -4% | 23.9 11% | 25.92 4% | 27 -0% | 27 -0% |
| Idle Maximum * (dB) | 27 | 28.11 -4% | 23.9 11% | 40.67 -51% | 32 -19% | 30.1 -11% |
| Load Average * (dB) | 43.8 | 30.62 30% | 34.3 22% | 42.7 3% | 50 -14% | 54.4 -24% |
| Witcher 3 ultra * (dB) | 44.7 | 49.75 -11% | 62.48 -40% | 51 -14% | ||
| Load Maximum * (dB) | 58.3 | 50.17 14% | 45.9 21% | 62.67 -7% | 51 13% | 56.2 4% |
* ... smaller is better
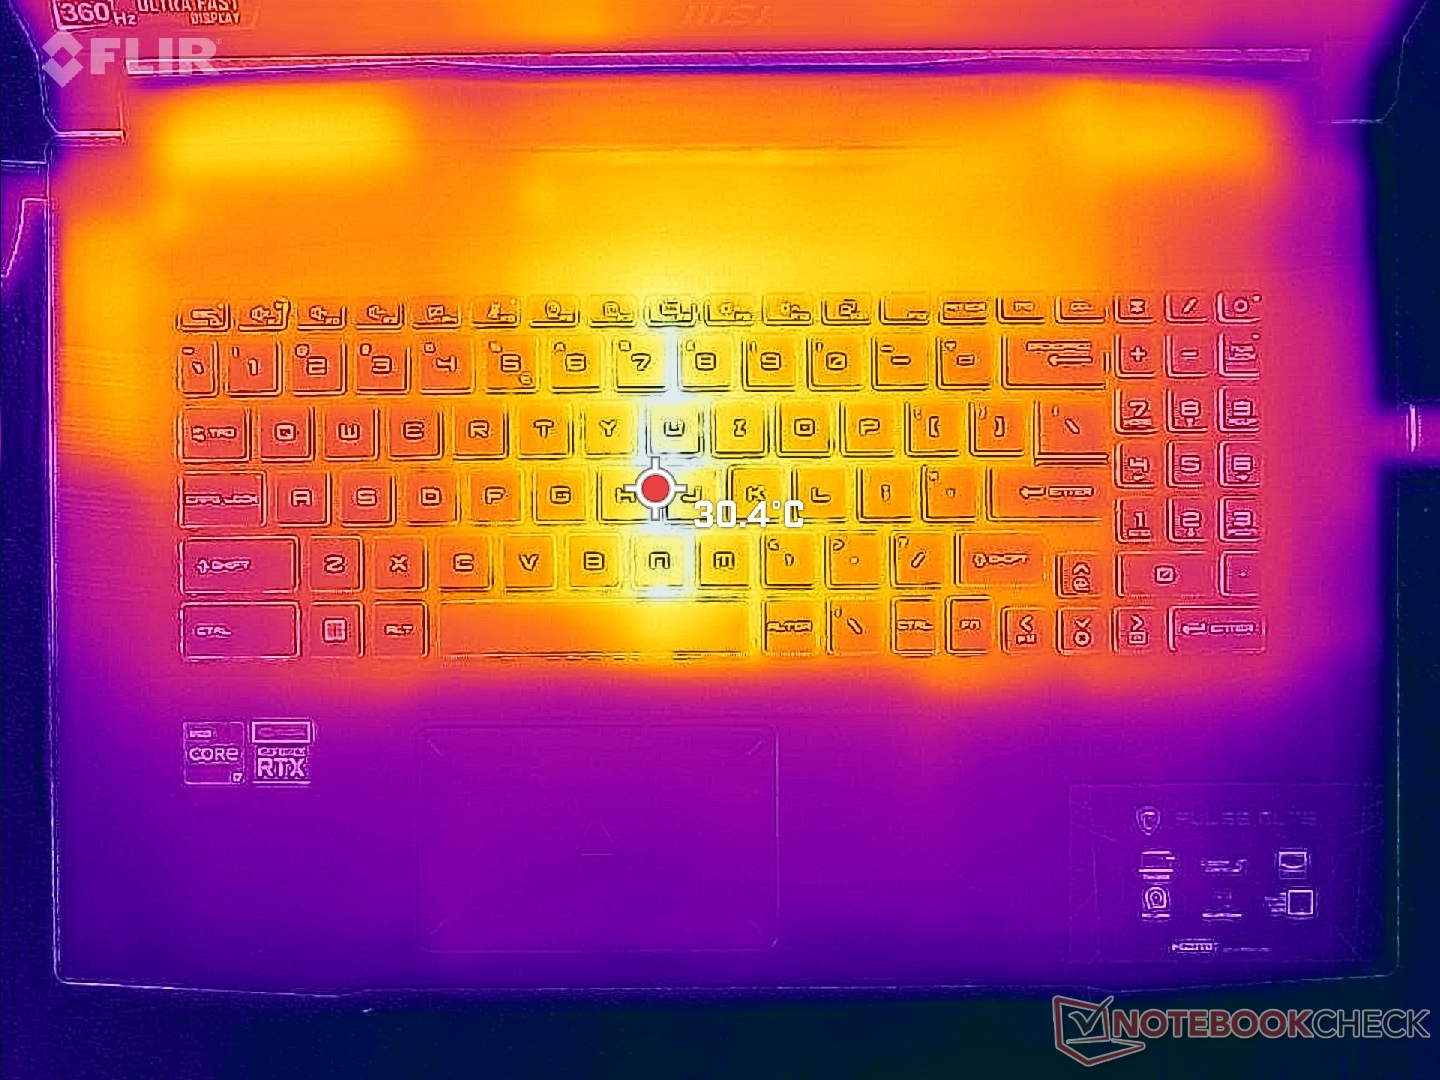
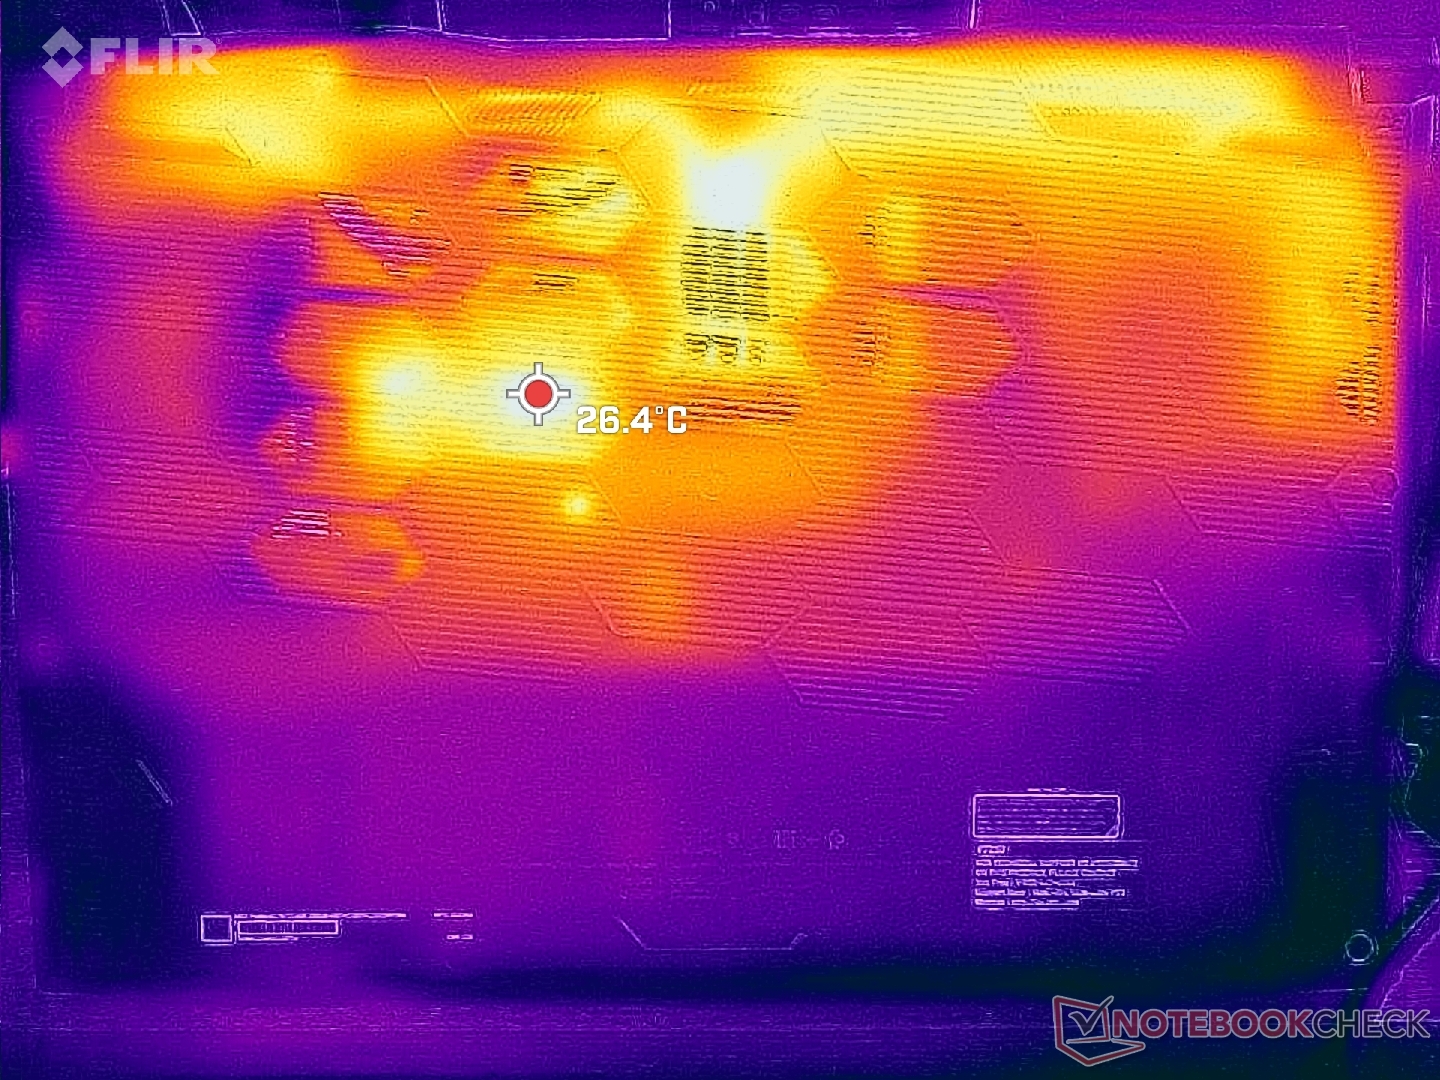
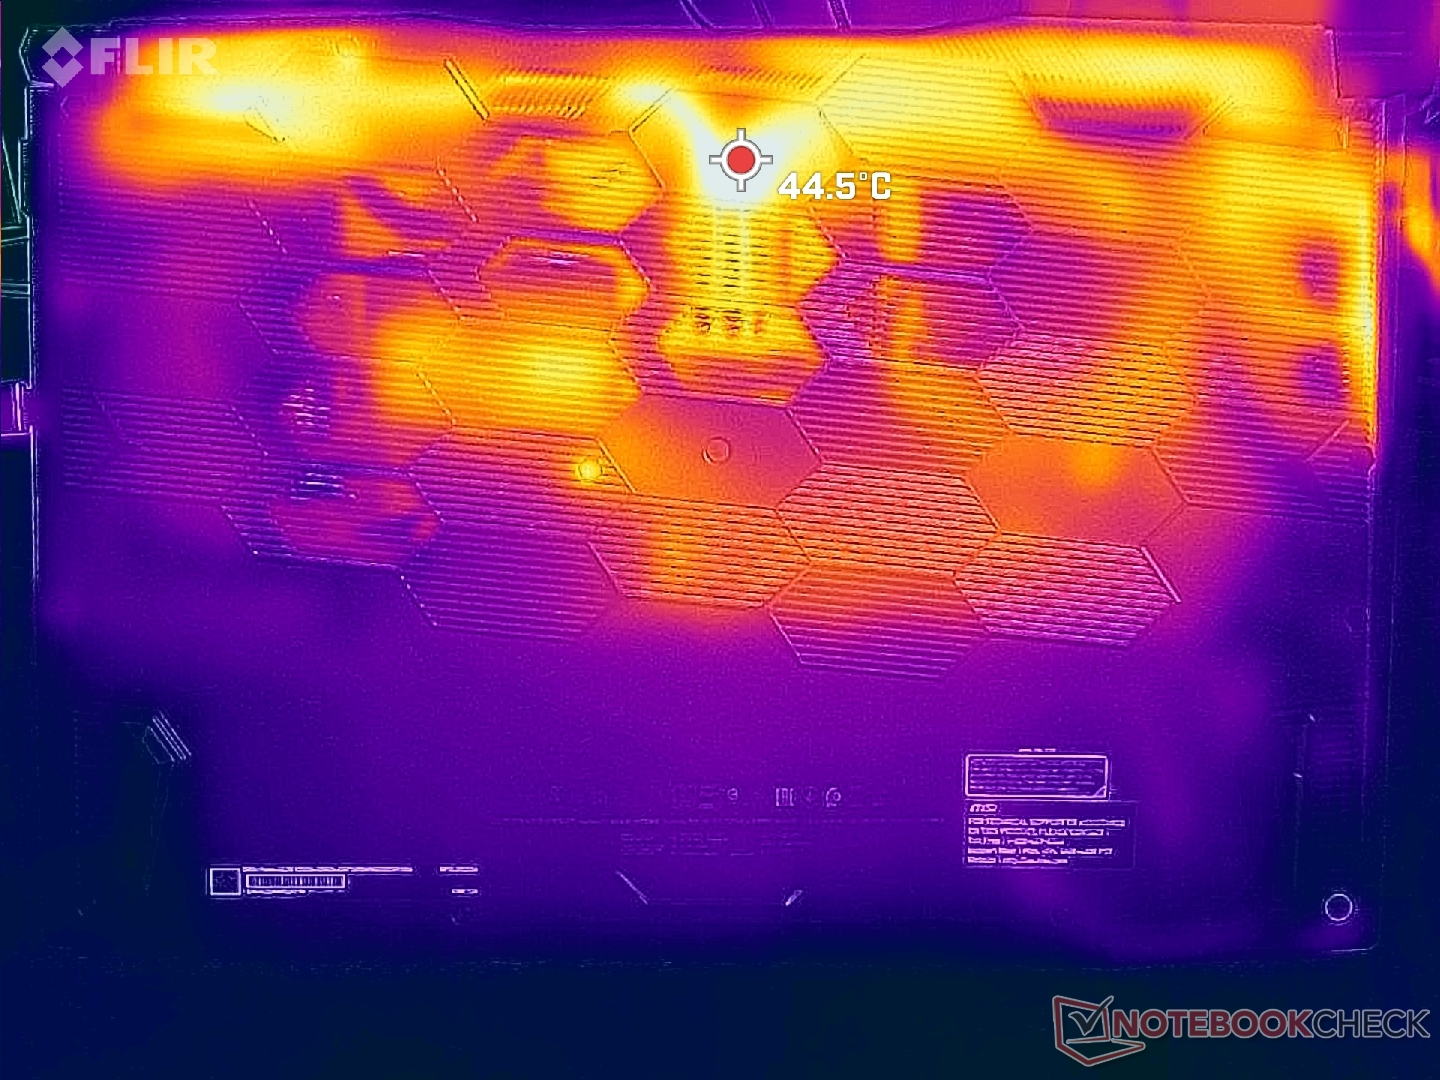
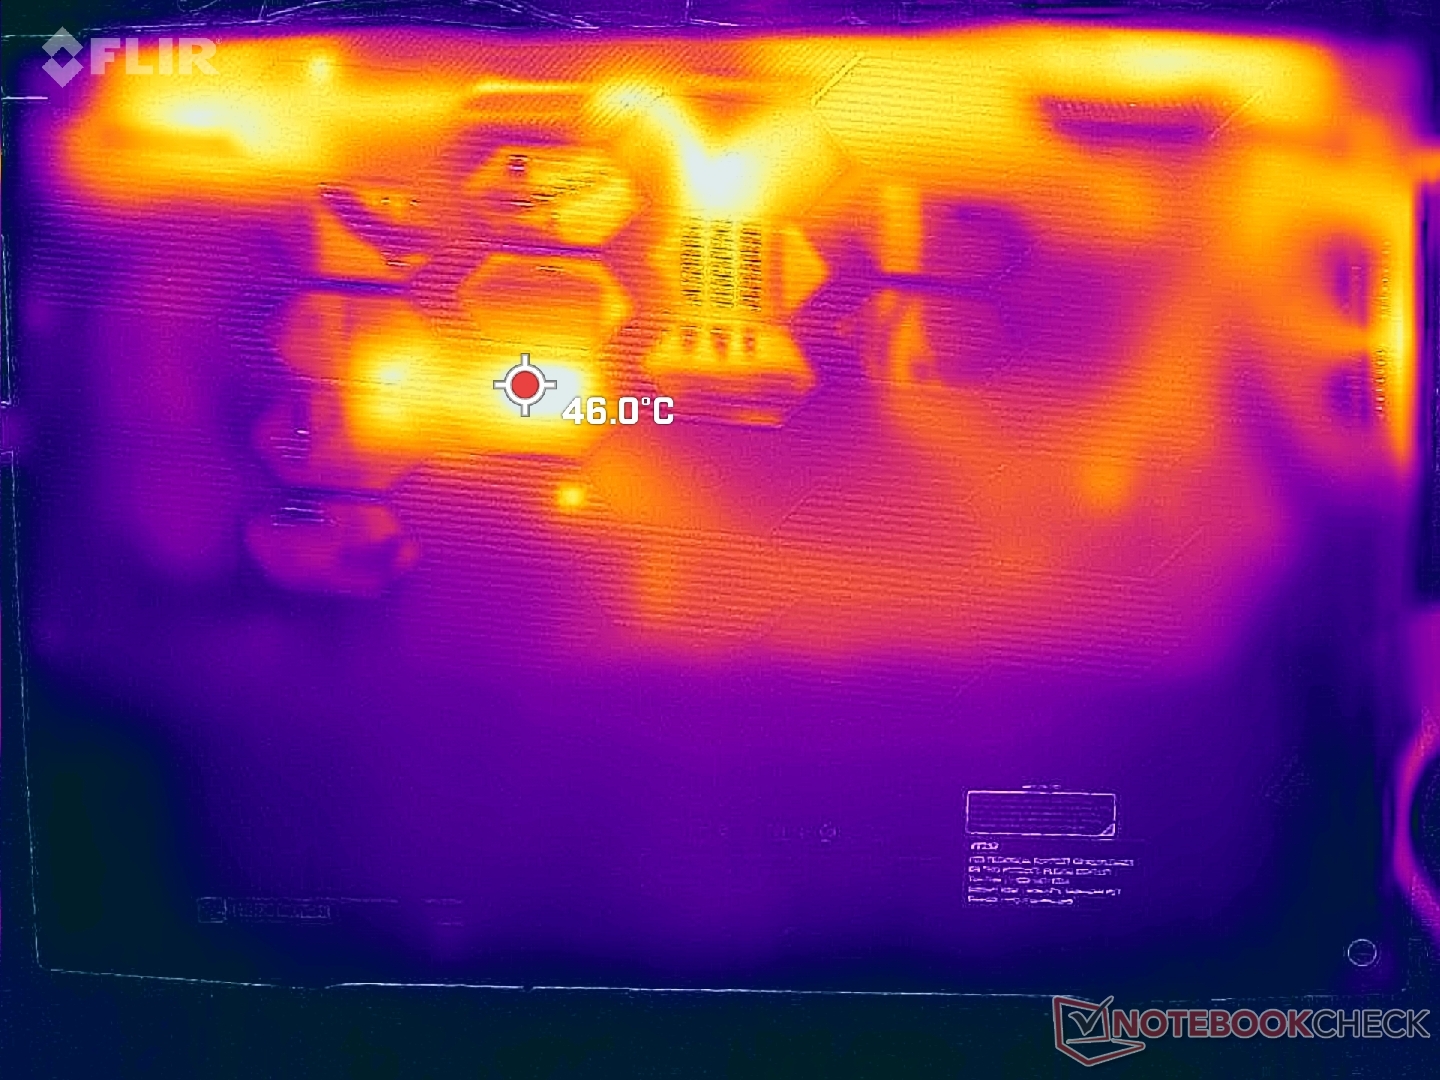
温度
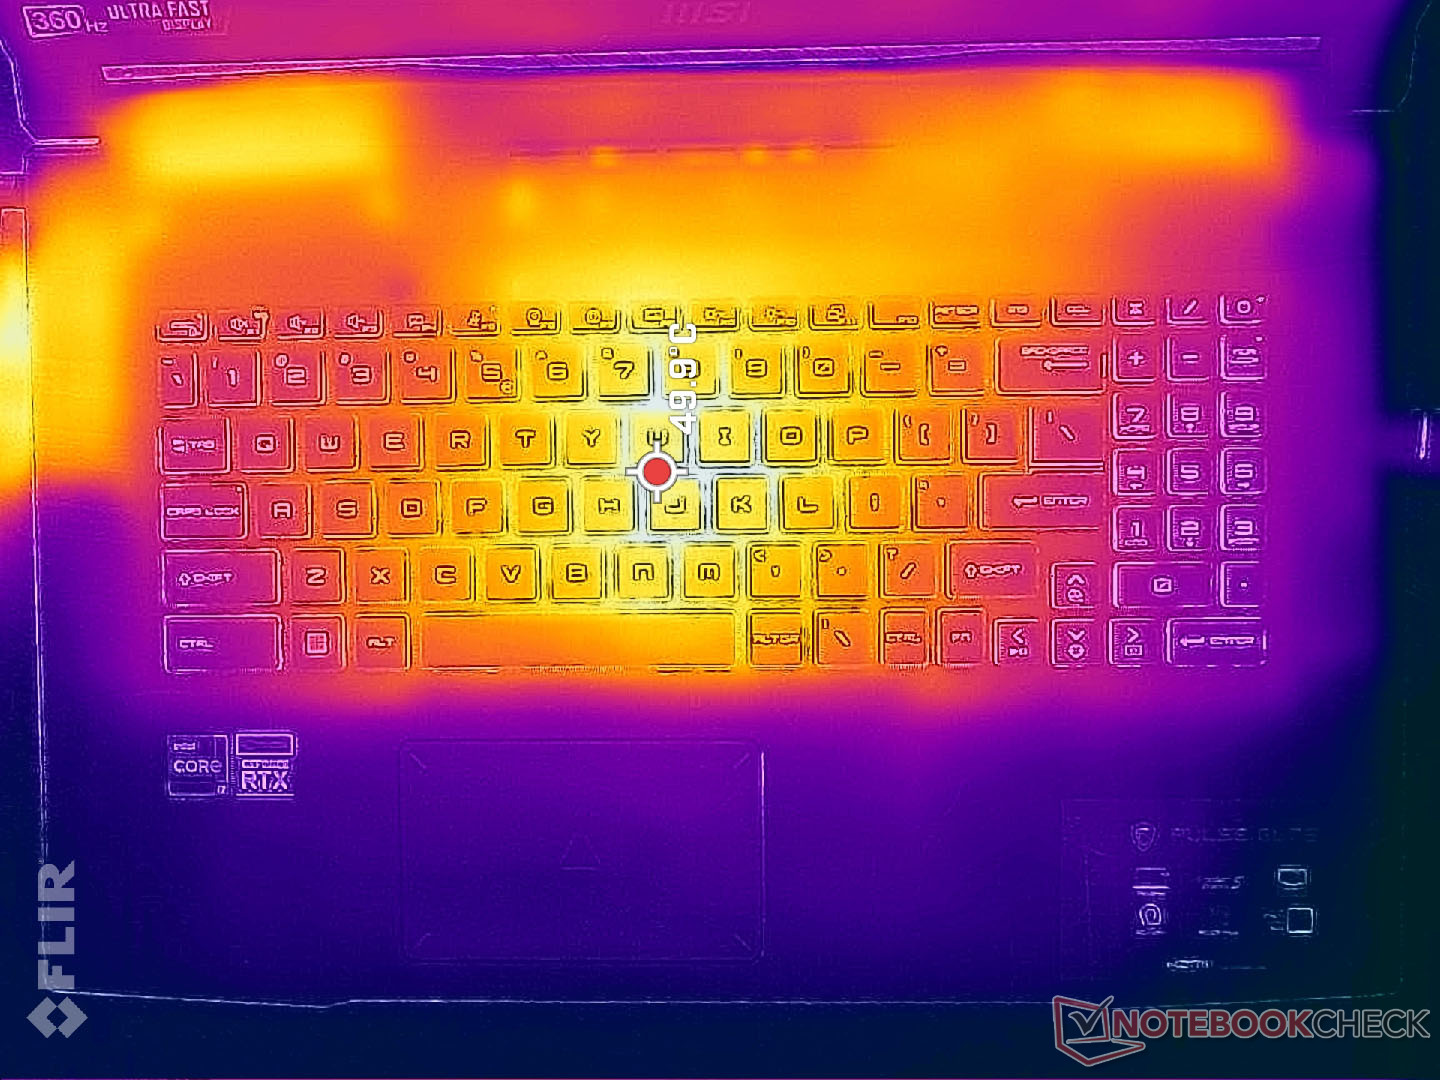
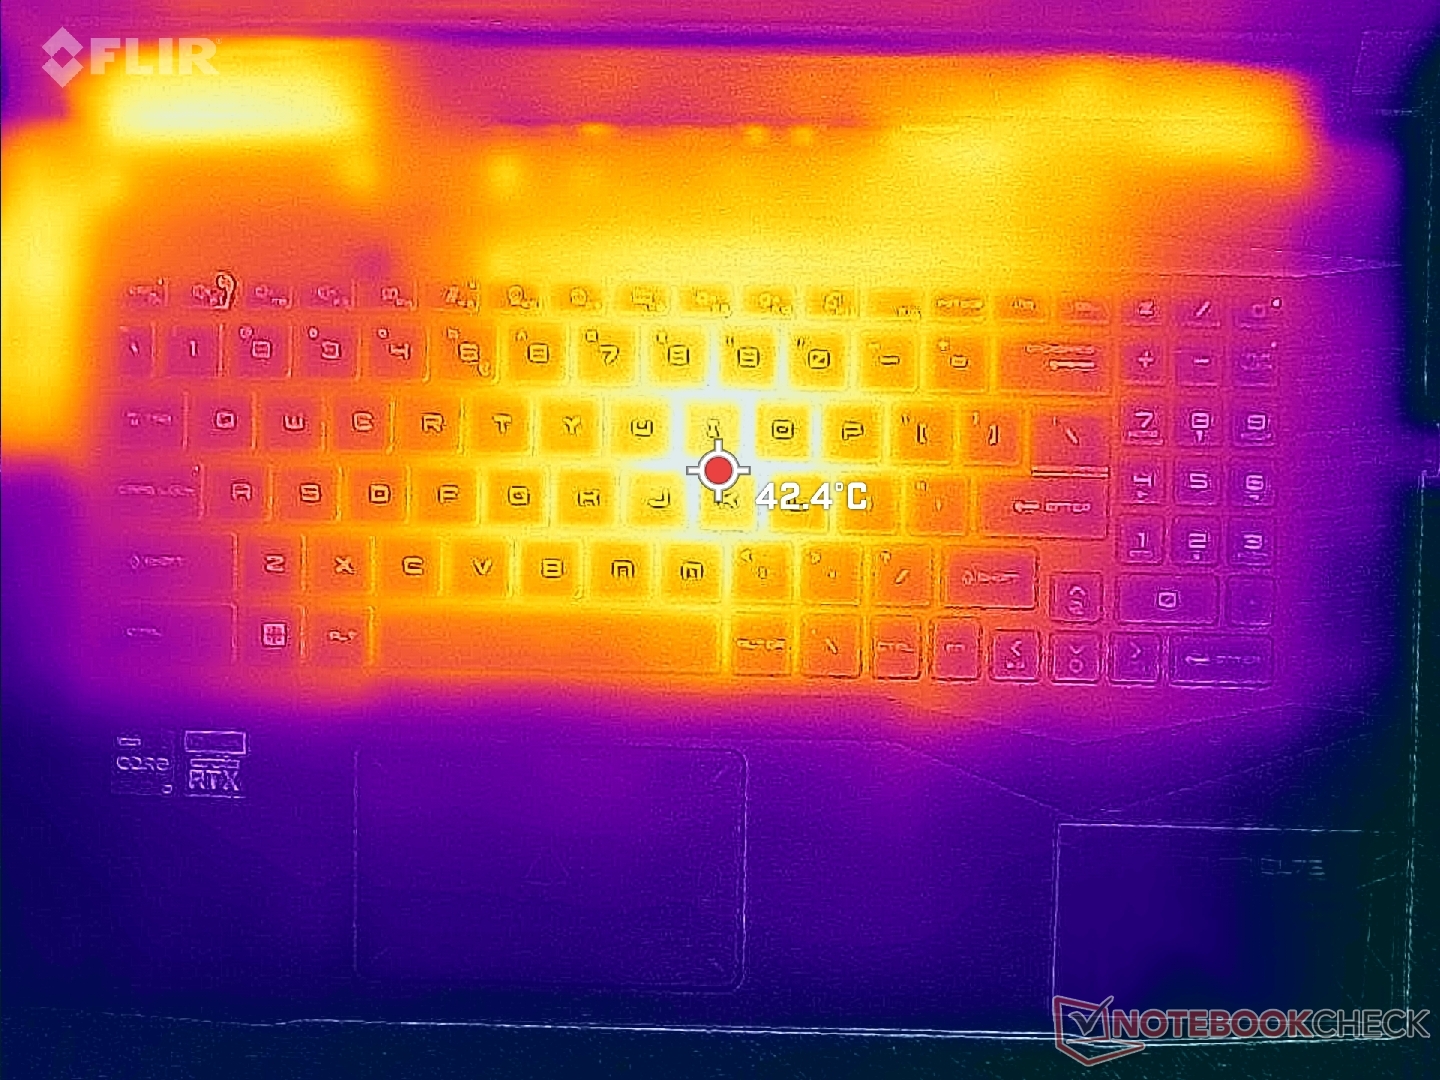
由于17.3英寸的大尺寸和大部分塑料机箱,平均表面温度不会令人不舒服,任何热点都是非常孤立的。例如,在游戏时,键盘中心可以达到近50摄氏度,而掌托和键盘两侧的温度要低得多,分别在20摄氏度和30摄氏度左右。在游戏时,顶部和底部的热点很少被注意到,因为这些区域的皮肤接触并不常见。
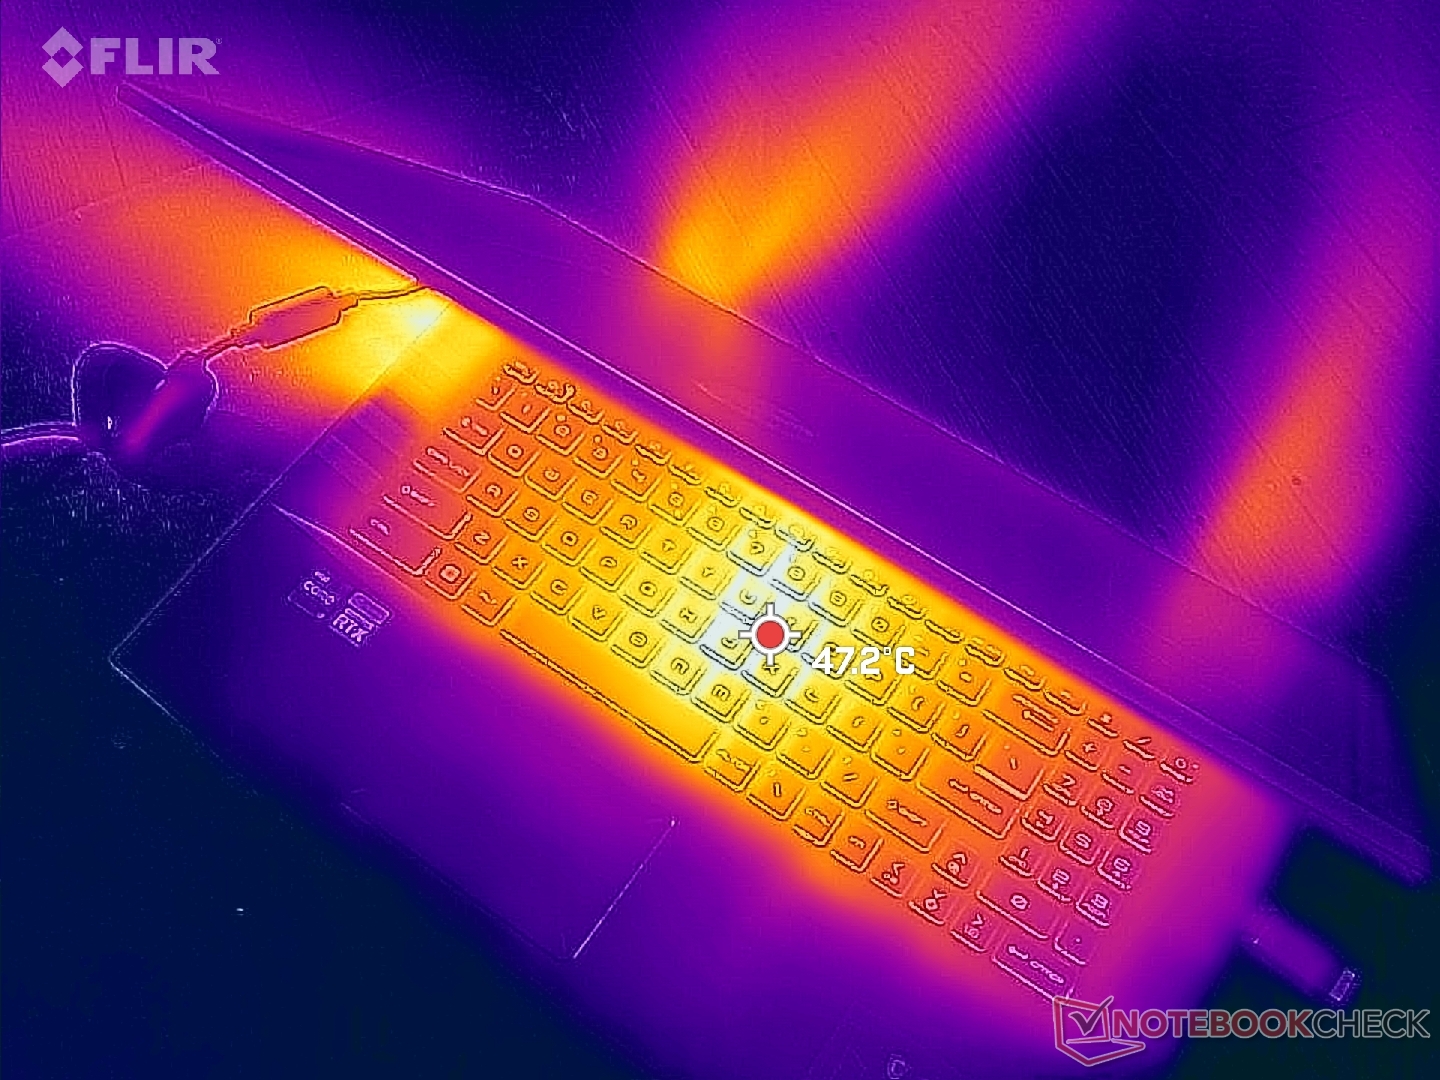
(±) The maximum temperature on the upper side is 44.2 °C / 112 F, compared to the average of 40.4 °C / 105 F, ranging from 21.2 to 68.8 °C for the class Gaming.
(-) The bottom heats up to a maximum of 45.2 °C / 113 F, compared to the average of 43.2 °C / 110 F
(+) In idle usage, the average temperature for the upper side is 27.7 °C / 82 F, compared to the device average of 33.9 °C / 93 F.
(±) Playing The Witcher 3, the average temperature for the upper side is 35.1 °C / 95 F, compared to the device average of 33.9 °C / 93 F.
(+) The palmrests and touchpad are cooler than skin temperature with a maximum of 25.4 °C / 77.7 F and are therefore cool to the touch.
(+) The average temperature of the palmrest area of similar devices was 28.8 °C / 83.8 F (+3.4 °C / 6.1 F).
| MSI Pulse GL76 12UGK Intel Core i7-12700H, NVIDIA GeForce RTX 3070 Laptop GPU | Alienware m17 R5 (R9 6900HX, RX 6850M XT) AMD Ryzen 9 6900HX, AMD Radeon RX 6850M XT | Asus ROG Strix Scar 17 SE G733CX-LL014W Intel Core i9-12950HX, NVIDIA GeForce RTX 3080 Ti Laptop GPU | Acer Predator Helios 300 (i7-12700H, RTX 3070 Ti) Intel Core i7-12700H, NVIDIA GeForce RTX 3070 Ti Laptop GPU | Razer Blade 17 Early 2022 Intel Core i9-12900H, NVIDIA GeForce RTX 3080 Ti Laptop GPU | MSI Vector GP76 12UGS-434 Intel Core i7-12700H, NVIDIA GeForce RTX 3070 Ti Laptop GPU | |
|---|---|---|---|---|---|---|
| Heat | -3% | -2% | 6% | -12% | -3% | |
| Maximum Upper Side * (°C) | 44.2 | 53 -20% | 48.8 -10% | 35 21% | 50 -13% | 46.3 -5% |
| Maximum Bottom * (°C) | 45.2 | 56 -24% | 52.4 -16% | 53 -17% | 56 -24% | 45 -0% |
| Idle Upper Side * (°C) | 35.4 | 30 15% | 30.4 14% | 29 18% | 36 -2% | 34.2 3% |
| Idle Bottom * (°C) | 35 | 29 17% | 34.1 3% | 34 3% | 38 -9% | 38.3 -9% |
* ... smaller is better
压力测试
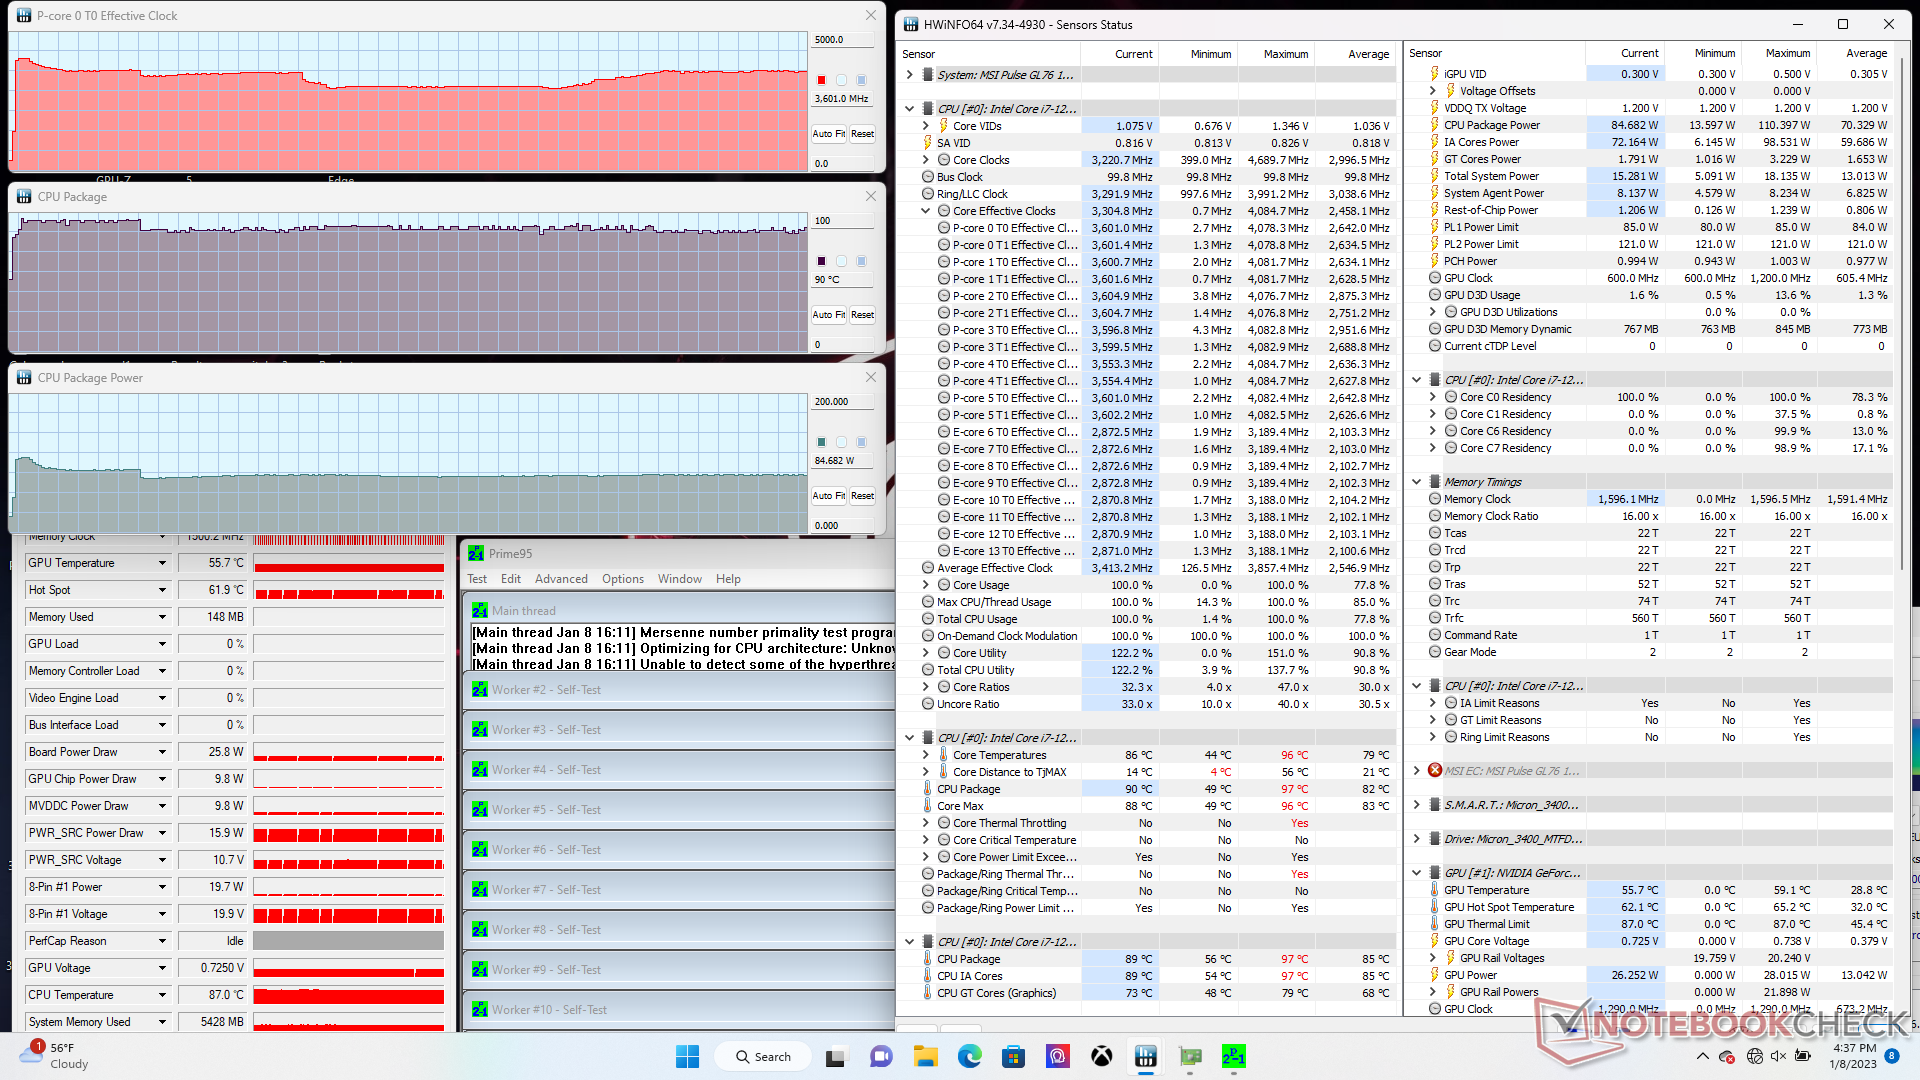
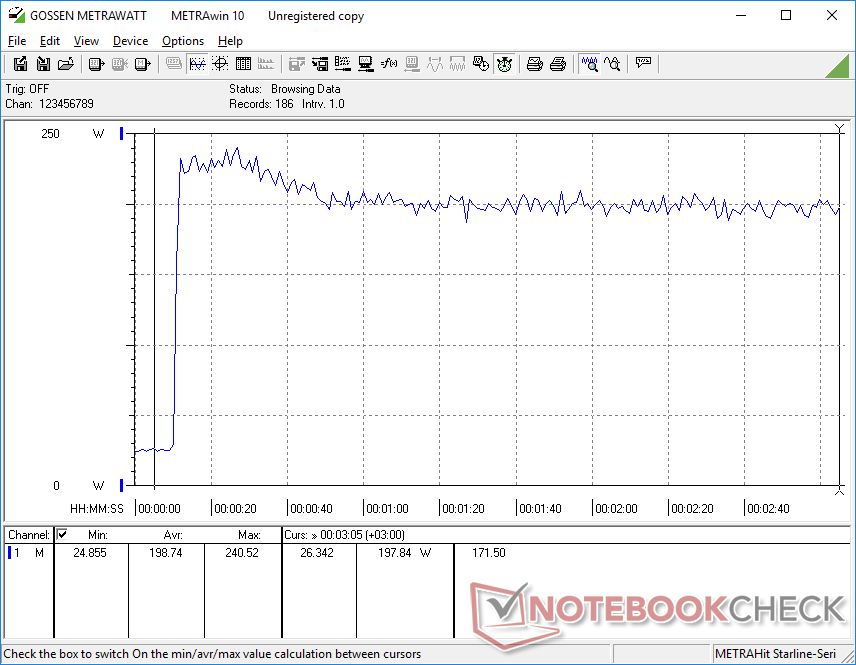
当运行Prime95时,CPU时钟频率和电路板功耗将分别提升到4.1 GHz和110 W,仅持续几秒钟或直到核心温度达到95 C。此后,时钟频率和电路板功耗将下降到3.6 GHz和92 W,最后分别稳定在3.1至3.6 GHz和85 W。核心温度也将稳定在90摄氏度,表明冷却解决方案已基本达到极限。
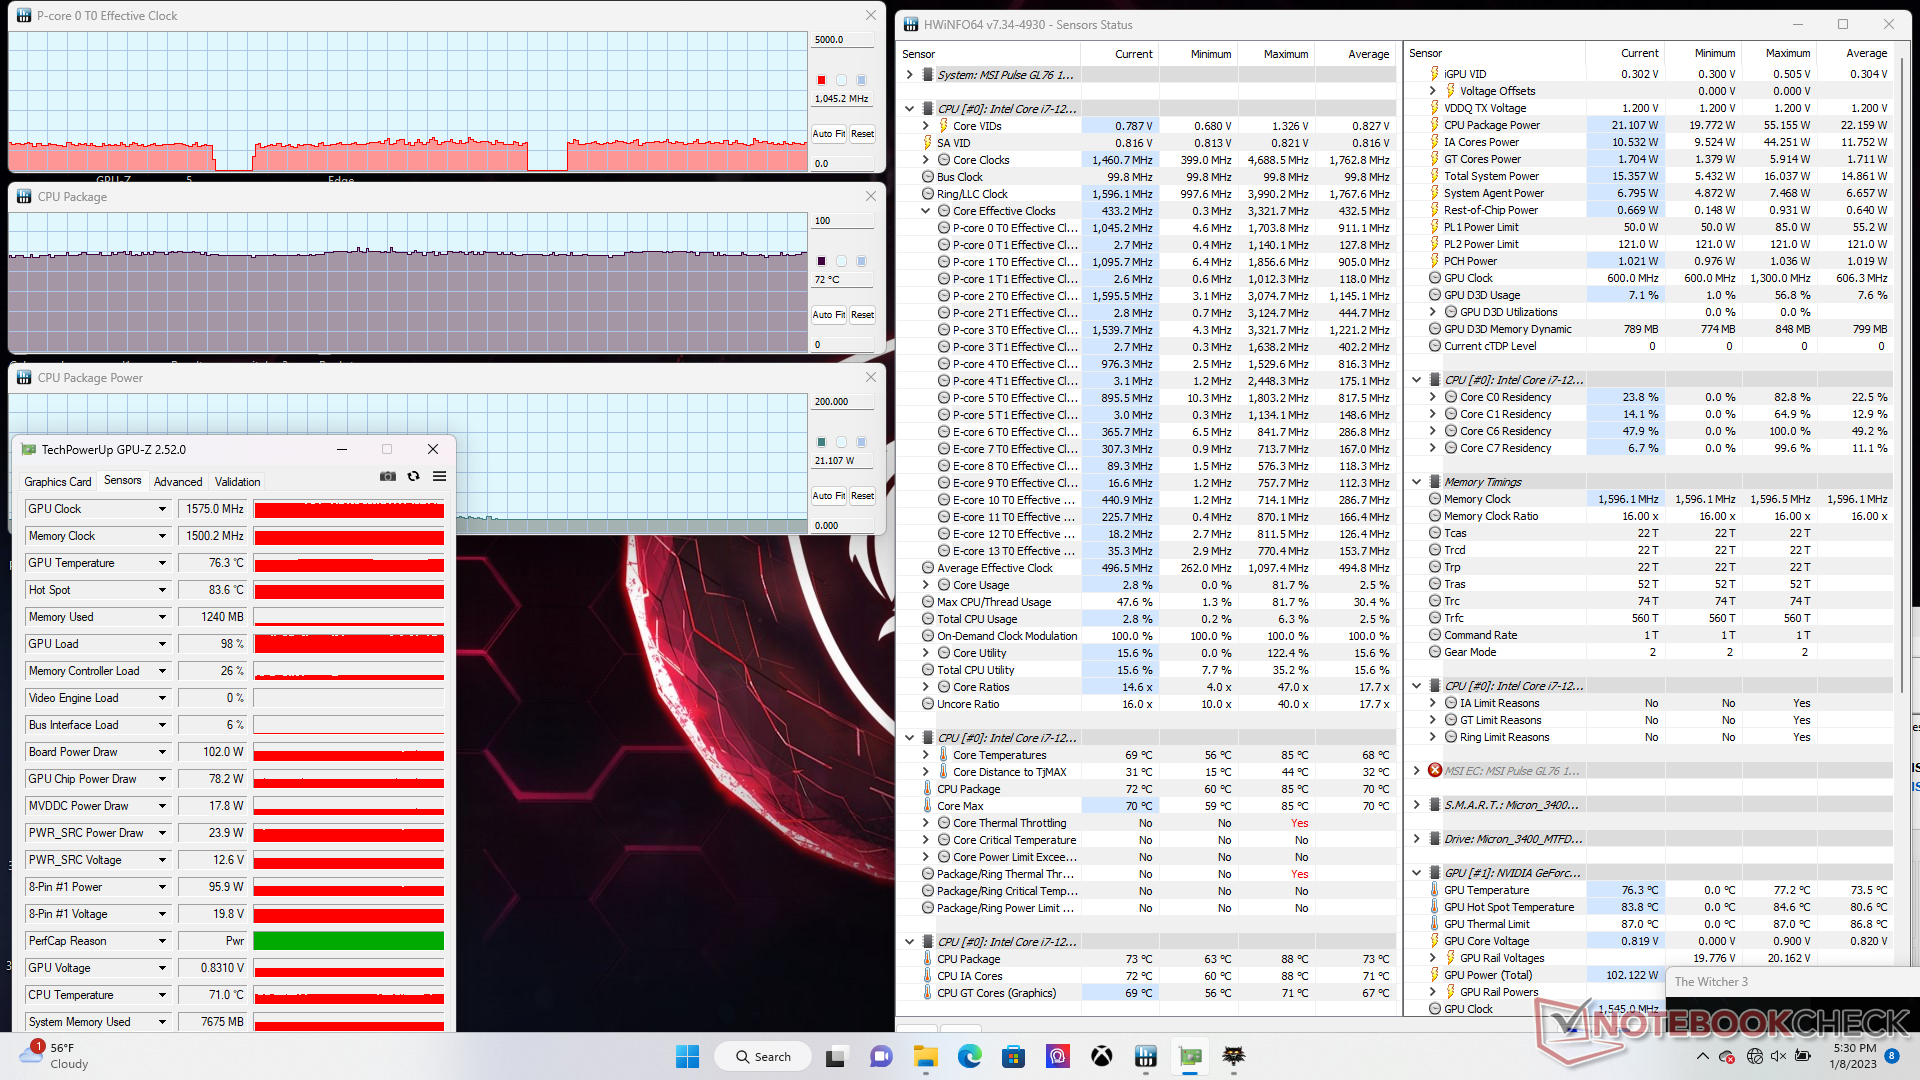
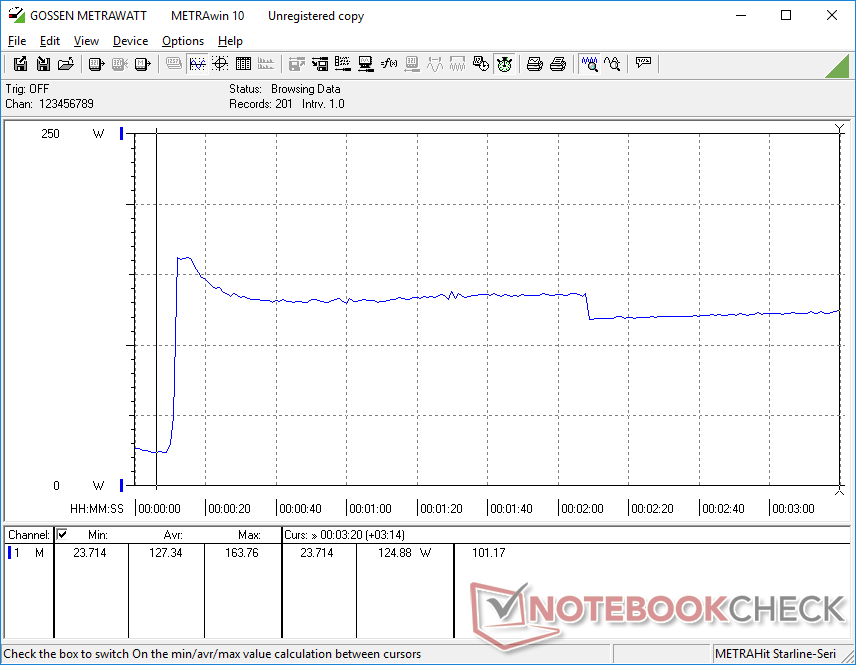
当运行Witcher 3 ,Nvidia GPU将稳定在1575 MHz和76 C,而Razer Blade 17配备了更高的130 W TGPGeForce RTX 3070的1725 MHz和72 C。我们的MSI测试装置上的GPU-Z也会显示GPU板的功耗为102W,非常接近广告中的105W目标。
用电池供电运行限制了性能。在电池上进行的3DMark 11测试将返回物理和图形分数,分别为9089和11291分,而在主电源上则为22513和33048分。
| CPU时钟(GHz) | GPU时钟(MHz) | CPU平均温度(℃) | GPU平均温度(℃) | |
| 系统空闲 | -- | -- | 51 | 50 |
| Prime95压力 | 3.4 - 3.6 | -- | 90 | 56 |
| Prime95 + FurMark 压力 | 2.3 - 2.4 | 1065 | 81 | 69 |
| Witcher 3 应力 | ~1.1 | 1575 | 72 | 76 |
发言人
MSI Pulse GL76 12UGK audio analysis
(±) | speaker loudness is average but good (81.4 dB)
Bass 100 - 315 Hz
(-) | nearly no bass - on average 17.5% lower than median
(±) | linearity of bass is average (11.8% delta to prev. frequency)
Mids 400 - 2000 Hz
(+) | balanced mids - only 3.7% away from median
(+) | mids are linear (4.3% delta to prev. frequency)
Highs 2 - 16 kHz
(+) | balanced highs - only 3.1% away from median
(+) | highs are linear (6.6% delta to prev. frequency)
Overall 100 - 16.000 Hz
(+) | overall sound is linear (14.8% difference to median)
Compared to same class
» 30% of all tested devices in this class were better, 7% similar, 63% worse
» The best had a delta of 6%, average was 18%, worst was 132%
Compared to all devices tested
» 20% of all tested devices were better, 4% similar, 76% worse
» The best had a delta of 4%, average was 23%, worst was 134%
Apple MacBook Pro 16 2021 M1 Pro audio analysis
(+) | speakers can play relatively loud (84.7 dB)
Bass 100 - 315 Hz
(+) | good bass - only 3.8% away from median
(+) | bass is linear (5.2% delta to prev. frequency)
Mids 400 - 2000 Hz
(+) | balanced mids - only 1.3% away from median
(+) | mids are linear (2.1% delta to prev. frequency)
Highs 2 - 16 kHz
(+) | balanced highs - only 1.9% away from median
(+) | highs are linear (2.7% delta to prev. frequency)
Overall 100 - 16.000 Hz
(+) | overall sound is linear (4.6% difference to median)
Compared to same class
» 0% of all tested devices in this class were better, 0% similar, 100% worse
» The best had a delta of 5%, average was 17%, worst was 45%
Compared to all devices tested
» 0% of all tested devices were better, 0% similar, 100% worse
» The best had a delta of 4%, average was 23%, worst was 134%
能源管理--比预期的更省电
消耗功率
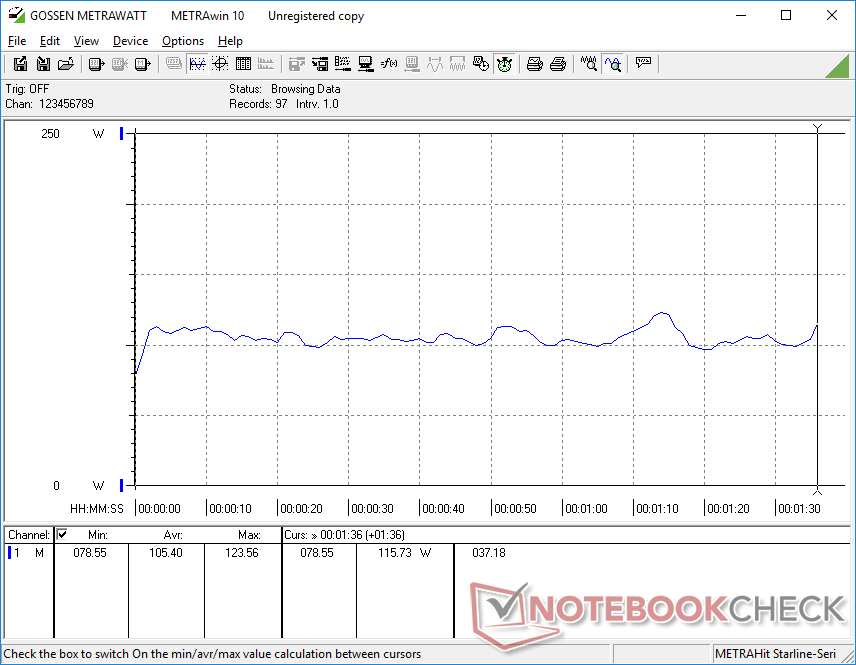
在iGPU处于激活状态且亮度设置为最低的情况下,在桌面上空转仅消耗12瓦。相反,在极端性能模式下,亮度设置为最大时,桌面上的空转可以消耗25W以上。因此,在电源模式之间切换是延长电池寿命的一个重要因素。
总体功耗低于大多数其他17.3英寸游戏笔记本电脑。运行Witcher 3 ,例如,仅消耗150W,而微星Vector GP76和宏碁Predator Helios 300分别为199W和231W,每台都有RTX 3070 Ti GPU。消耗量也明显低于搭载Radeon RX 6850M XT的Alienware m17 R5,同时提供几乎相同的原始图形性能。
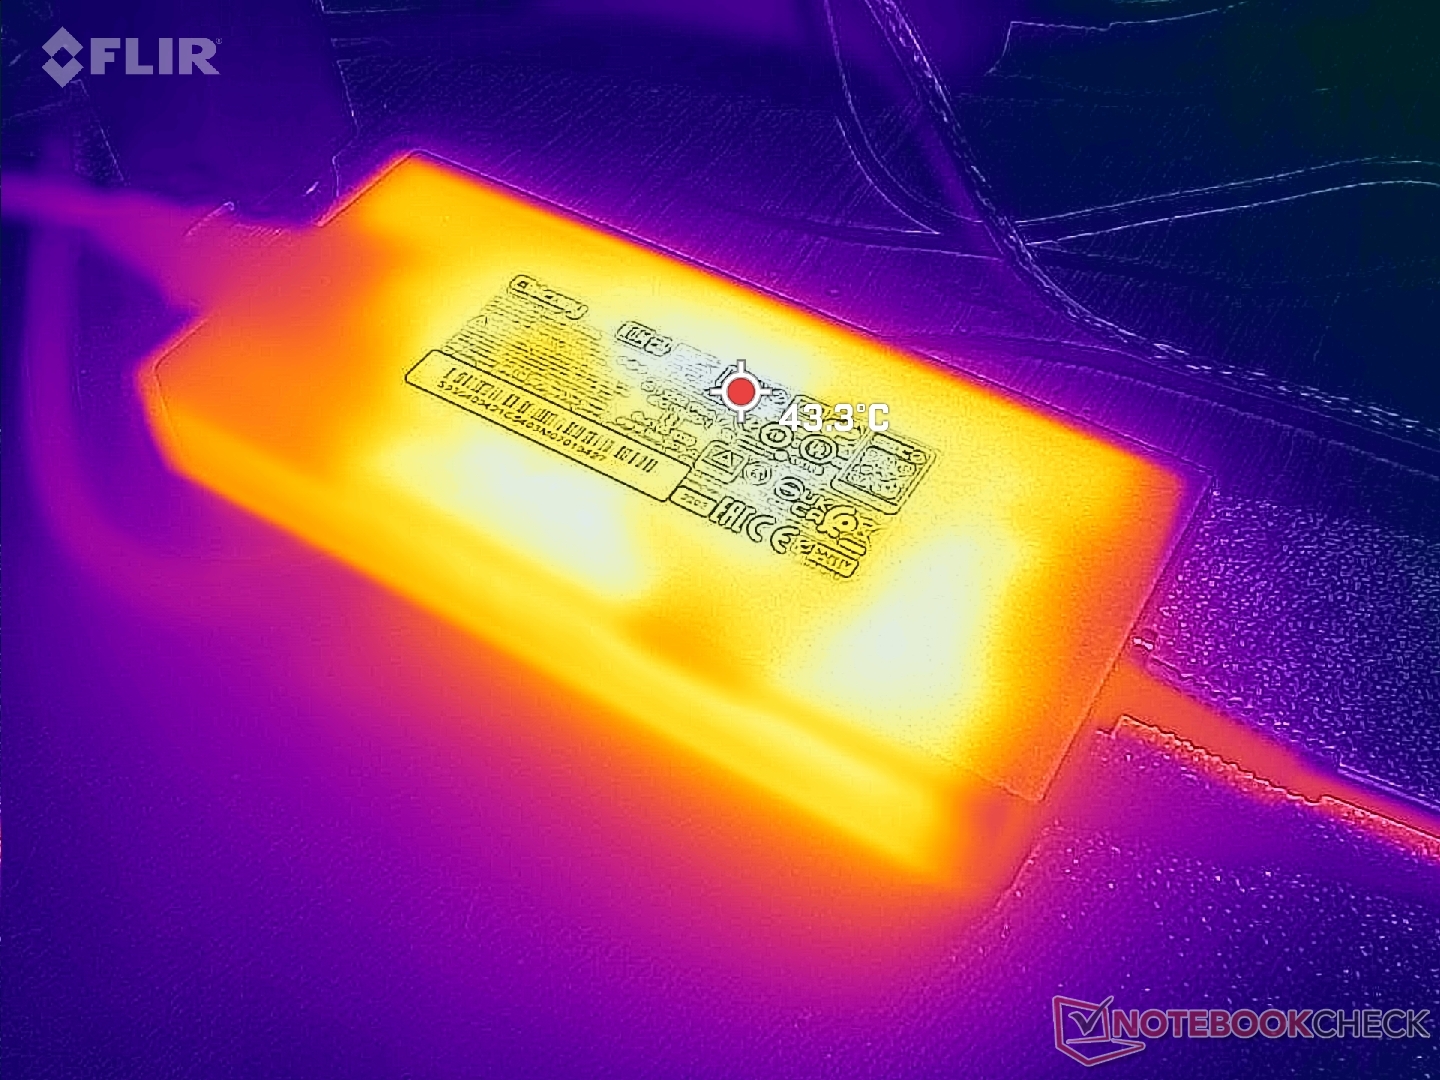
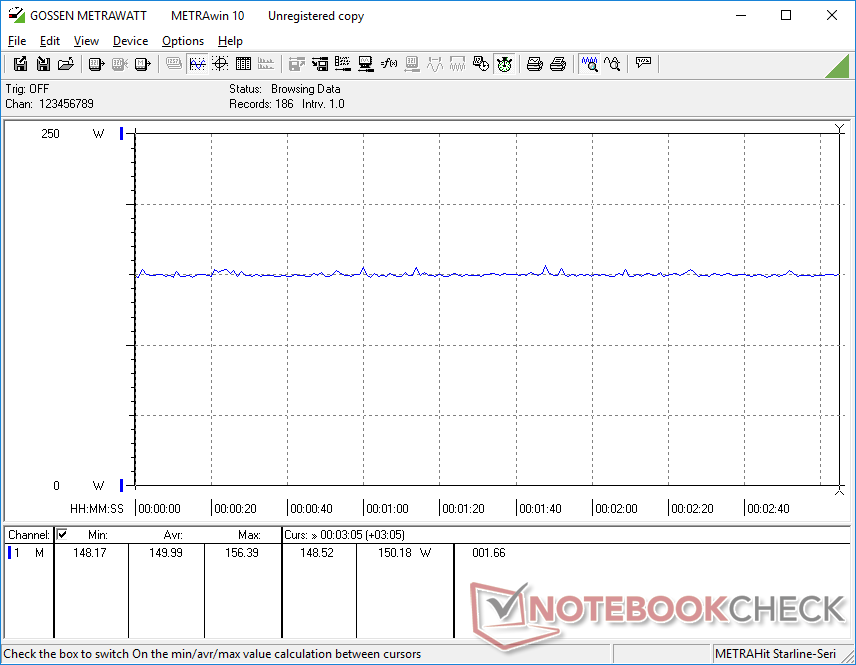
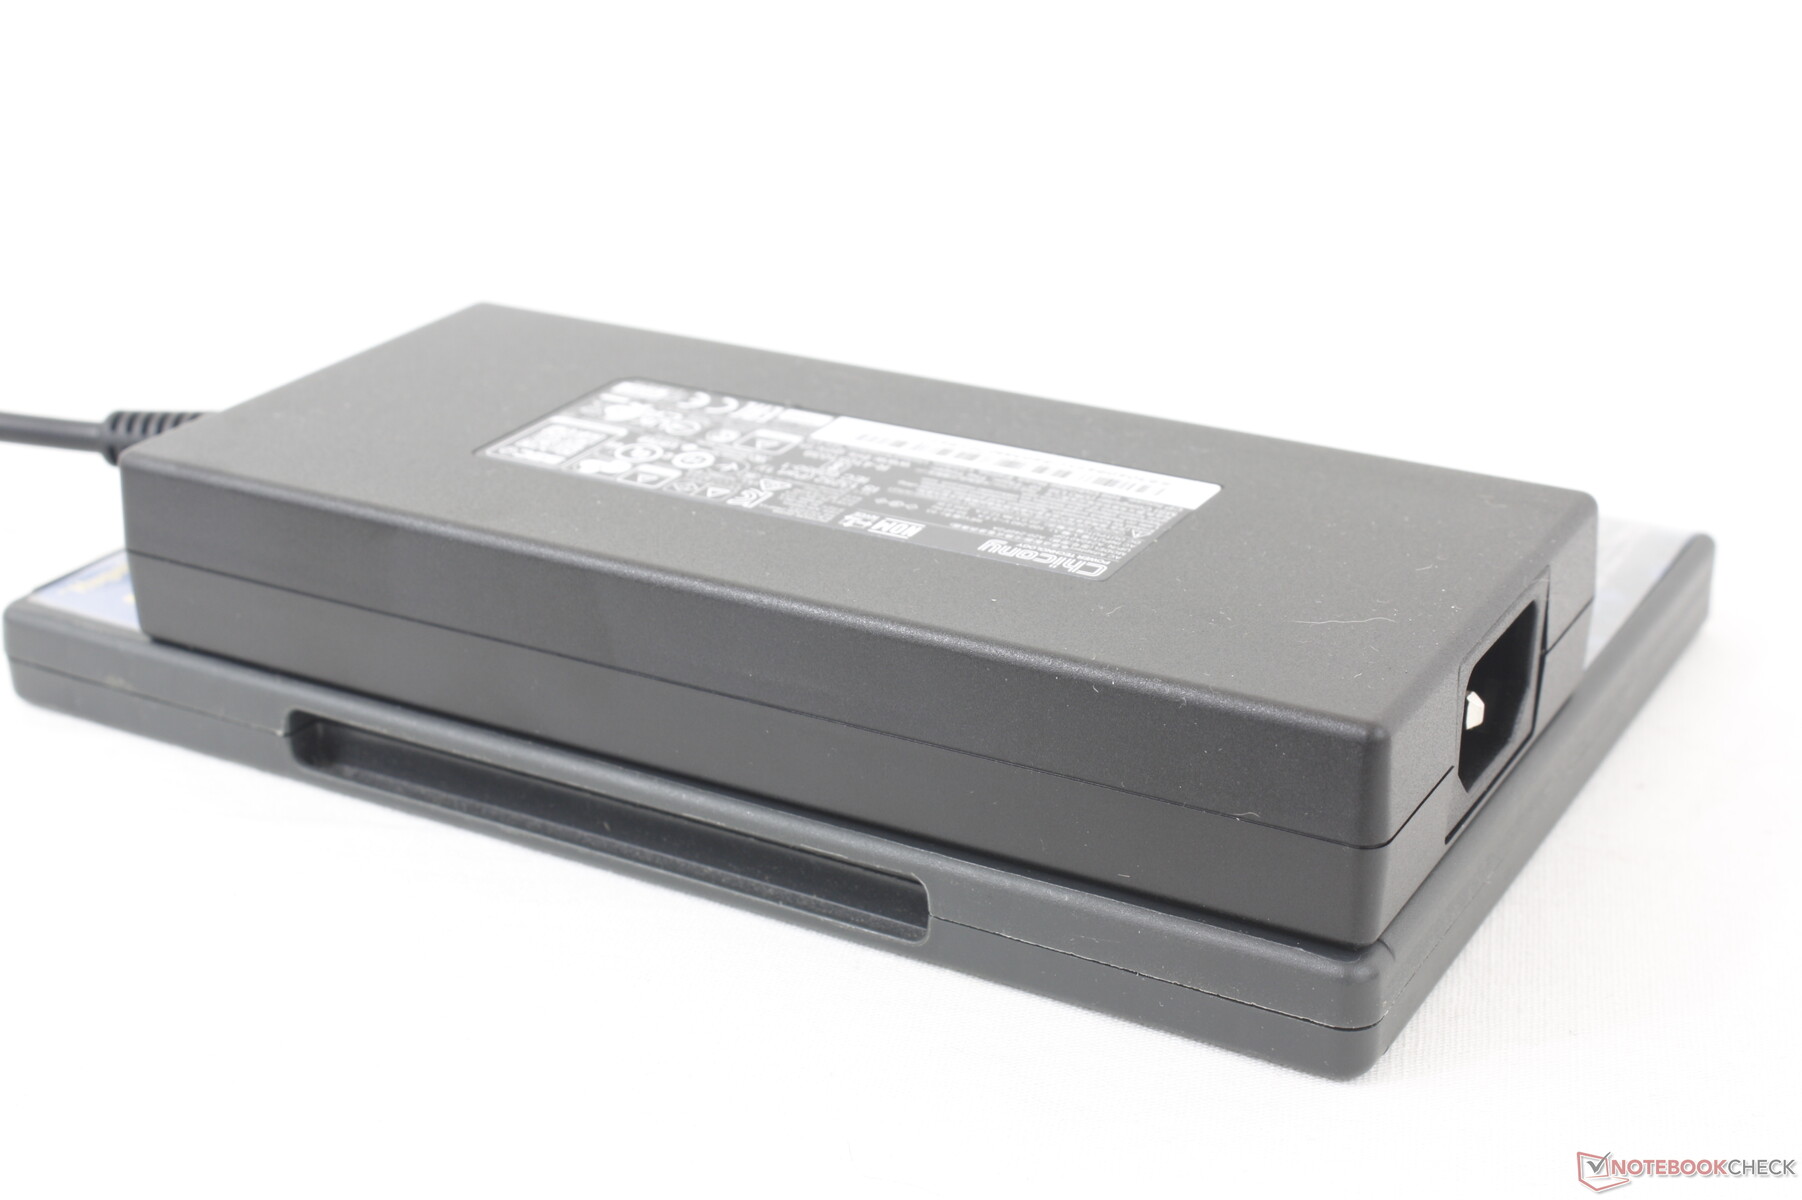
当CPU和GPU的利用率为100%时,我们能够从中等大小(约16.4 x 7.4 x 2.5厘米)的240瓦交流适配器中测量到最大功耗为241瓦。如下面的截图所示,由于CPU的Turbo Boost潜力有限,这一比率只是暂时的。在运行游戏等高负荷时,电池仍能以适当的速度充电。
| Off / Standby | |
| Idle | |
| Load |
|
Key:
min: | |
| MSI Pulse GL76 12UGK i7-12700H, GeForce RTX 3070 Laptop GPU, Micron 3400 1TB MTFDKBA1T0TFH, IPS, 1920x1080, 17.3" | Alienware m17 R5 (R9 6900HX, RX 6850M XT) R9 6900HX, Radeon RX 6850M XT, SSSTC CA6-8D1024, IPS, 3840x2160, 17" | Asus ROG Strix Scar 17 SE G733CX-LL014W i9-12950HX, GeForce RTX 3080 Ti Laptop GPU, Samsung PM9A1 MZVL22T0HBLB, IPS, 2560x1440, 17.3" | Acer Predator Helios 300 (i7-12700H, RTX 3070 Ti) i7-12700H, GeForce RTX 3070 Ti Laptop GPU, Samsung PM9A1 MZVL21T0HCLR, IPS, 2560x1440, 17.3" | Razer Blade 17 Early 2022 i9-12900H, GeForce RTX 3080 Ti Laptop GPU, Samsung PM9A1 MZVL21T0HCLR, IPS, 3840x2160, 17.3" | MSI Vector GP76 12UGS-434 i7-12700H, GeForce RTX 3070 Ti Laptop GPU, Micron 2450 1TB MTFDKBA1T0TFK, IPS, 1920x1080, 17.3" | |
|---|---|---|---|---|---|---|
| Power Consumption | -8% | -46% | -27% | -36% | -27% | |
| Idle Minimum * (Watt) | 12.4 | 13 -5% | 19.3 -56% | 15 -21% | 17 -37% | 13.5 -9% |
| Idle Average * (Watt) | 13.1 | 16.5 -26% | 26.5 -102% | 20 -53% | 23 -76% | 15.6 -19% |
| Idle Maximum * (Watt) | 25.3 | 17 33% | 27.1 -7% | 22.3 12% | 34 -34% | 20.6 19% |
| Load Average * (Watt) | 105.4 | 93 12% | 141 -34% | 133 -26% | 120 -14% | 198 -88% |
| Witcher 3 ultra * (Watt) | 150 | 239 -59% | 225 -50% | 231 -54% | 229 -53% | 199 -33% |
| Load Maximum * (Watt) | 240.5 | 251 -4% | 307.9 -28% | 290 -21% | 243 -1% | 319 -33% |
* ... smaller is better
Power Consumption Witcher 3 / Stresstest
Power Consumption external Monitor
电池寿命 - 99Wh锂离子电池组
有趣的是,微星的官方规格声称GL76的电池组为53Wh,而仔细观察WiNFO和我们测试设备的物理电池组,显示容量为90Wh。这种差异可能是制造商的一个错误。尽管如此,电池寿命对于一台游戏笔记本来说还是不错的。我们能够记录到的无线网络运行时间略低于6小时,比雷蛇Blade 17或华硕ROG Strix Scar 17多出大约2小时。
从空电到满电只需要2个多小时。不支持USB-PD,因此该系统只能用附带的桶型AC适配器充电。
| MSI Pulse GL76 12UGK i7-12700H, GeForce RTX 3070 Laptop GPU, 90 Wh | Alienware m17 R5 (R9 6900HX, RX 6850M XT) R9 6900HX, Radeon RX 6850M XT, 97 Wh | Asus ROG Strix Scar 17 SE G733CX-LL014W i9-12950HX, GeForce RTX 3080 Ti Laptop GPU, 90 Wh | Acer Predator Helios 300 (i7-12700H, RTX 3070 Ti) i7-12700H, GeForce RTX 3070 Ti Laptop GPU, 90 Wh | Razer Blade 17 Early 2022 i9-12900H, GeForce RTX 3080 Ti Laptop GPU, 82 Wh | MSI Vector GP76 12UGS-434 i7-12700H, GeForce RTX 3070 Ti Laptop GPU, 65 Wh | |
|---|---|---|---|---|---|---|
| Battery runtime | -17% | -29% | -6% | -19% | -11% | |
| Reader / Idle (h) | 7.3 | 7.1 -3% | 7.3 0% | |||
| WiFi v1.3 (h) | 5.9 | 4.8 -19% | 4.2 -29% | 6 2% | 3.8 -36% | 5.1 -14% |
| Load (h) | 2.1 | 1.8 -14% | 1.8 -14% | 1.7 -19% | 1.7 -19% | |
| H.264 (h) | 4.9 | 5.9 | 4.8 |
Pros
Cons
评语--拥有大量的原始动力,但缺少一些关键功能
Pulse GL76在价格、性能和显示方面都很出色。酷睿i7-12700H与GeForce RTX 3070配对,而360赫兹1080p面板与微星用于其更昂贵的 GT77 Titan.以1400美元甚至1200美元的价格出售,很难找到另一台17.3英寸的游戏笔记本,它的CPU、GPU和显示屏都比我们的GL76好。
然而,一旦你超越了处理器和显示器,削减的角落就开始显现。特别是缺乏G-Sync、MUX、Advanced Optimus和Thunderbolt支持,这确实给一个强大的系统带来了阻碍。替代品,如华硕TUF游戏F17 或宏碁掠夺者Helios 300 携带许多这些缺失的功能,高级用户或游戏玩家可能会喜欢。我们不期望预算游戏笔记本有这样的现代功能,但GL76的价格远远超过1000美元,至少应该有其中的一些功能。
微星Pulse GL76将英特尔和英伟达的原始性能与高质量的360赫兹IPS显示屏放在首位。少了一些高级功能可能是为了控制成本。
其他缺点,如海绵状的点击板,浑浊的网络摄像头,普通的铰链,大部分的塑料设计,以及缺乏每个键的RGB照明,在中端游戏笔记本上大多是典型的,并不影响交易。想要最大限度地提高性能和显示质量而又不破费钱财的玩家仍应考虑GL76。
价格和可用性
配置的Pulse GL76目前在Costco有售,价格为1200至1400美元。.该型号在亚马逊 上也有售,价格为1650美元,Newegg 1750美元,或百思买1700美元。
MSI Pulse GL76 12UGK
- 01/11/2023 v7 (old)
Allen Ngo
Price comparison

